Costs and Enrollment - National Bureau of Economic Research
26
This PDF is a selection from an out-of-print volume from the National Bureau of Economic Research Volume Title: Economic Challenges in Higher Education Volume Author/Editor: Charles T. Clotfelter, Ronald G. Ehrenberg, Malcolm Getz, and John J. Siegfried Volume Publisher: University of Chicago Press Volume ISBN: 0-226-11050-8 Volume URL: http://www.nber.org/books/clot91-1 Publication Date: January 1991 Chapter Title: Costs and Enrollment Chapter Author: Malcolm Getz, John J. Siegfried Chapter URL: http://www.nber.org/chapters/c6090 Chapter pages in book: (p. 332 - 356)
-
Upload
khangminh22 -
Category
Documents
-
view
0 -
download
0
Transcript of Costs and Enrollment - National Bureau of Economic Research
This PDF is a selection from an out-of-print volume from the National Bureauof Economic Research
Volume Title: Economic Challenges in Higher Education
Volume Author/Editor: Charles T. Clotfelter, Ronald G. Ehrenberg, MalcolmGetz, and John J. Siegfried
Volume Publisher: University of Chicago Press
Volume ISBN: 0-226-11050-8
Volume URL: http://www.nber.org/books/clot91-1
Publication Date: January 1991
Chapter Title: Costs and Enrollment
Chapter Author: Malcolm Getz, John J. Siegfried
Chapter URL: http://www.nber.org/chapters/c6090
Chapter pages in book: (p. 332 - 356)

13 Costs and Enrollments
College enrollments grow, sometimes rapidly, as new programs are launched, as population in an area surges, and as institutions gain reputation. Enroll- ments may remain stable because demand for particular programs in a partic- ular place remains steady. Enrollment may also remain stable by design. Insti- tutions may decide to limit enrollment to a particular level in order to become more selective in admissions. Enrollment may also decline, sometimes pre- cipitously, as population shifts, student tastes for particular programs wane, or an institution loses reputation. Significant numbers of institutions were in each of these three sets of circumstances in the 1980s. The pattern of change in enrollments has important effects on costs. Changes in costs per student as a consequence of recent changes in enrollment can also cloud understanding of how costs vary with the size of an institution, the second principal subject of this chapter. Taking recent changes in enrollment into account will help us understand the pattern of costs per student in higher education.
13.1 Adjusting to Changing Enrollment
In a dynamic market economy, resources are constantly reallocated in re- sponse to price signals about the value consumers place on various products and services. Price increases entice suppliers to expand production of those products and services currently in favor. As consumer demand for college and university attendance changes, we would expect the management of these in- stitutions to adjust supply accordingly, increasing faculty, classroom space, and academic support services when more students enroll and cutting back on inputs when enrollments decline.
A few hundred colleges and universities differentiate their services by maintaining and emphasizing their selectivity. These institutions appeal to a
332

333 Costs and Enrollment
selective group of students who have been successful in high school and who thrive on competition. The demand for selectivity has other bases as well. Students learn from their peers, and one can expect to learn more from peers who know more themselves. In addition, the screening process of highly se- lective institutions may be valuable in itself. Prospective employers and grad- uate and professional school admissions committees may acknowledge admis- sion to a highly selective institution as an indicator of likely success in a career (Arrow 1973).
When selective colleges experience an increase in demand, they have the option of expanding enrollments or further increasing their selectivity. Greater selectivity will benefit both current students and alumni and may also enhance the stature of the institution’s faculty and administrators if their prestige is connected to the academic quality of their students. Thus, some selective col- leges may enforce a rigid ceiling on enrollments even as their applications grow, forcing more applicants to attend slightly less selective institutions. In such circumstances, the increased demand for places will manifest itself through expanded enrollments in less selective colleges, as students work their way down the pecking order.
The academic labor market operates with particularly long lead times. Fac- ulty are usually hired in the spring of a year to begin work in September. The personnel policies of many colleges and universities require at least a full year’s notice to untenured faculty prior to termination. And, of course, insti- tutions usually retain tenured faculty for the rest of their lives if they do not resign or retire. Because of these institutional characteristics, adjustment to unexpected changes in enrollments can be slow in academe, and we might therefore observe a weaker relation between enrollment and cost than would be expected in for-profit firms.
To examine the effect of changing enrollment rates on expenditures, we computed the annual growth rate of full-time-equivalent enrollment for each institution in our sample of 2,045 over the period 1978-79 to 1987-88. The growth rate is based on an ordinary least squares regression of the natural logarithm of enrollments on time. The coefficient on time in the estimated equation is the best single estimate of the average annual growth rate of en- rollment over the period, based on the four years of data we had available:
The average annual growth rates of enrollment vary from a low of - 18 percent per year (Spertus College) to a high of 20 percent per year (Hawaii Pacific College). Forty-seven institutions in our sample lost enrollments at an average rate of 5 percent or more annually, while 174 grew at an average annual rate of 5 percent or more. Over a nine-year period, an annual growth
1978-79, 1983-84, 1985-86, and 1987-88.’
1. A growth rate of enrollment calculated on the basis of the best general relation between enrollment and time over the period is preferred to a simple comparison of enrollments in 1978- 79 with enrollments in 1987-88 because it is less sensitive to the possibility that 1978-79 or 1987- 88 is an aberration.

334 Malcolm Getz and John J. Siegfried
rate of 5 percent would convert a college with 3 ,OOO students into one enroll- ing 4,654 students and could easily change the character of the institution.
The median growth rate of enrollment across all institutions is 0.8 percent per year. About one-third of our institutions experienced enrollment growth rates exceeding 1.8 percent annually, and another third actually suffered a de- cline in enrollments over the period. We divided the institutions into three equal size groups, those whose enrollments rose by 1.8 percent or more an- nually, those that experienced relatively stable enrollments, their growth rate varying from zero to 1.8 percent annually, and those that experienced declin- ing enrollments. Comparisons among these groups may reveal how quickly colleges and universities are able to adapt to enrollment fluctuations, that is, how flexible they are.2
How well did the management of the institutions whose enrollments changed substantially adapt to the change? Were they able to cut costs quickly in the face of declining enrollments, and did they expand resources adequately when enrollment increased?
Clues to these questions are revealed in Tables 13.1-13.4, which report changes in the distribution of adjusted educational and general (AE&G) ex- penditures, AE&G expenditures per full-time-equivalent student, and their functional composition from 1978-79 to 1987-88. Over the period, instruc- tion accounted for an increasing share of the expenditures of four-year insti- tutions whose enrollments were growing at 1.8 percent annually or more and a declining share of the expenditures of four-year institutions whose enroll- ments were falling. There appears to be little difference in the expenditure pattern over time between rapidly growing and declining 'Iko-Year colleges.
Changes in expenditures per full-time-equivalent student at four-year insti- tutions, shown in Table 13.3, disclose what is happening. Expenditures per student at the 350 four-year colleges that grew faster than 1.8 percent annually over the period and the 390 four-year institutions whose enrollments actually declined over the period were similar in 1978-79. But AE&G expenditures per student increased more than twice as fast at the contracting schools as at the growing institutions. This pattern holds for all categories of expenditures, but it is especially pronounced for public service, academic support, and plant operations, where expenditures per student increased three times as fast at contracting as at rapidly expanding institutions.
The institutions with stable enrollments experienced cost increases almost as large as those of the contracting schools, but they seem to have been able to control expenditures per student marginally better in the "overhead" cate- gories of academic support, student services, institutional support, and plant operations. The biggest difference in the growth of expenditures per student is between the rapidly growing institutions and the others. Indeed, the annual
2. We are here implicitly assuming that each institution was in equilibrium at the beginning of the period. This assumption will clearly be inaccurate for some colleges, whose enrollment fluc- tuations over the 1980s helped them adjust to an existing disequilibrium in 1978-79.

335 Costs and Enrollment
rate of growth of expenditures per student was only 1.8 percent per year for the growing institutions compared to 2.9 percent for the stable enrollment colleges and 3.8 percent for the schools whose enrollment was dropping. These differences reveal the important role of the denominator in cost per student calculations. Expenditures obviously change less rapidly than enroll- ments.
13.2 Changes within Groups
The comparisons displayed in Tables 13.1-13.4 can be misleading if a sys- tematic relation exists between enrollment growth rates and some other char- acteristic that is highly correlated with the rate of cost increase. For example, if most of the shrinking institutions are Liberal Arts I and Other-Four-Year colleges, we may inadvertently attribute to different growth rates those cost differences that are more accurately traced to differences in institutional mis- sion and their corresponding output mixes.
A comparison of cost increases between contracting and rapidly growing institutions that holds some of the other important characteristics of colleges and universities constant can be accomplished with the use of the 24 cate- gories of institutions delineated in Chapter 12 (Table 12.6). Those categories distinguish institutions by control, Carnegie classification (mission), and medical school status and, where sample size permits, also separate institu- tions by size. They also segregate institutions with on-campus medical schools. In Table 13.5, we report the change in AE&G expenditures per full- time-equivalent student for the declining enrollment, stable enrollment, and rapidly growing enrollment institutions for nine selected groups from among the 24 categories. The criterion for selection was primarily sample size. We also tried to select both some public and some private institutions and groups from different Carnegie classifications. None of the groups contain institutions with on-campus medical schools.
The results in Table 13.5 confirm the conclusion that rapidly growing col- leges and universities experienced much smaller increases in expenditures per student over the 1980s than institutions who were losing students. There are no exceptions to this conclusion. The average annual growth rate of AE&G per student for declining institutions is 3.7, compared to 1 percent for growing schools, a dramatic difference. Contracting colleges experienced larger in- creases in expenditures per student than did rapidly growing institutions for all functional categories (except mandatory transfers) for all nine groups of colleges and universities. Clearly, expenditures respond to shifts in enroll- ment with a noticeable lag.
3. For our entire sample, the elasticity of the growth in AE&G per student with respect to the growth in enrollment is -0.041 and, while very inelastic, is statistically significantly different from zero. This estimate was computed using enrollment and dummy variables for the Camegie classifications as independent variables, using ordinary least squares. The sign of each coefficient

Table 13.1 Adjusted Educational and General (AE&G) Expenditure Distribution Trends for Four-Year Institutions, 1978-79 and 1987-88, by Enrollment ?kn&
~~
Distribution Instruction and Public Academic Student Institutional Plant Internal Mandatory Total of AE&G Self-supported Research Service' Supportb Servicesc Support" Operations Scholarships' Transfers' AE&@
Growing enrollments (N = 350): 1918-19 .472 1987-88 .477 Change + .005
Stable enrollments (N = 452): 1978-79 .493 1987-88 ,477 Change - ,016
Declining enrollment (N = 390): 1978-79 .482 1987-88 .451 Change - .031
,051 .045
- ,006
.050 ,052
+ ,002
,056 ,054
- .002
.I07
.I05 - .002
.lo9
. i l l + .002
.I00
.lo9 + ,009
.066 ,071
+ .005
.060 ,064
+ .004
.067 ,071
+ .004
,131 ,137
+ ,006
,118 .I22
+ ,004
,125 ,138
+ ,013
.I28 ,106
- ,022
. I19
. lo6 - .013
,121 ,111
- ,010
.026
.040 + .014
.031 ,047
+ ,016
.029 ,048
+ ,019
,019 ,018
- ,001
.021
.020 - .001
,019 ,017
- .002
1 .Ooo 1 .Ooo .Ooo
1 .Ooo 1 .Ooo .Ooo
1 .Ooo 1 .Ooo .Ooo
Source: Computations by authors based on HEGIS/IPEDS data. 'Includes extension services. bComputers, libraries, and deans. 'Admissions, registrars, counseling, student health, and recreation. dAdministration, accounting, security, alumni, and development. 'Scholarships from internal funds. 'Debt service. gTotal E&G expenditures under control of chief executive officer.

lhbte 13.2 Adjusted Fdueational and General (AE&G) Expenditure Distribution mends for 'Lk.o-Year Colleges, 1978-79 and 1987-88, by Enroilmeat Wends
Distribution Instruction and Public Academic Student Institutional Plant Internal Mandatory Total of AE&G Self-supported Research Service' Supportb ServicesC Suppod Operations Scholarshipse Transfers' AE&Gg
Growing enrollments (N = 332): 1978-79 .517 1987-88 .502 Change - ,015
I 978-79 ,517 1987-88 ,494 Change - .023
Declining enrollment (N = 292): 1978-79 .511 1987-88 ,497 Change - .014
Stable enrollments (N = 229):
.021 ,025
+ .004
,015 ,023
+ ,008
.Ol6
.020 + .004
,078 .085
+ .007
.086 ,090
+ ,004
,075 .083
+ ,008
.087
.I03 + .016
.085 ,096
+.011
.087 ,108
+ .021
.I48
.I54 + ,006
.I47
.166 + ,019
,156 .I59
+ .003
. I19
.I14 - .005
,122 .117
- .005
,113 .I19
+ .006
,006 .009
+ .003
,005 .006
+ .001
.005
.007 + ,002
.025 ,010
- .015
,024 .009
- .015
.036 ,007
- .029
1 .Ooo 1 .Ooo .Ooo
1 .Ooo 1 .Ooo .Ooo
1 .Ooo 1 .Ooo
.Ooo ~ ~~
Source: Computations by authors based on HEGWIPEDS data. 'Includes extension services. bComputers, libraries, and deans. cAdmissions, registrars, counseling, student health, and recreation. dAdministmtion, accounting, security, alumni, and development. 'Scholarships from internal funds. Qebt service. #Total E&G expenditures under control of chief executive officer.

Table 13.3 Adjusted Educational and General (AE&G) Expenditure per Full-Time-Equivalent (FTE) Student, Trends for Four-Year Institutions, 1978-79 and 1987-88, by Enrollment Trends
AE&G per Instruction and Public Academic Student Institutional Plant Internal Mandatory Total R E Student Self-supported Research Service' Supportb ServicesC Supportd Operations Scholarships' Transfers' AE&Ge
Growing enrollments (N = 350): 1978-79 1987-88 Change Share of increase Share of AE&G expendi-
tures, 1987-88 Stable enrollments (N = 452):
1978-79 1987-88 Change Share of increase Share of AE&G expendi-
tures, 1987-88 Declining enrollment (N = 390):
1978-79 1987-88 Change Share of increase Share of AE&G expendi-
tures, 1987-88
3,244 3,842 + 598 50.6 47.7
3,850 4,844 + 994 42.1 47.7
3,190 4,174 + 984 37.2 45.1
352 365
+ 13 1.1 4.5
394 525
+ I31 5.6 5.2
373 500
+ 127 4.8 5.4
735 454 844 572
+ 109 +I18 9.2 10.0
10.5 7.1
849 47 1 1,124 65 1 + 275 + 180
11.8 7.7 11.1 6.4
660 445 1,005 660 + 345 +215
13.1 8.1 10.9 7.1
903 1,103 + 200
16.9 13.7
920 1,240 + 320
13.7 12.2
826 1,286 + 460
17.4 13.8
878 853 - 25
-2.1 10.6
927 1,073 + 146
6.3 10.6
799 1,026 + 221
8.6 11.1
178 326
+ 148 12.5 4.0
245 480
+ 235 10.1 4.7
195 444
+ 249 9.4 4.8
127 147
+ 20 1.7 1.8
160 208
+ 48 2.1 2.0
125 159
+ 34 1.3 1.7
6,871 8,052
+ 1,181 100.0 100.0
7,816 10,146
+ 2,330 100.0 100.0
6,612 9,255
+ 2,643 100.0 100.0
Source: Computations by authors based on HEGlSlIPEDS data.
Ilncludes extension services.
bComputers, libraries, and deans.
'Admissions, registrars, counseling, student health, and recreation.
dAdministration, accounting, security, alumni, and development.
CScholarships from internal funds.
'Debt service.
eTotal E&G expenditures under control of chief executive officer.
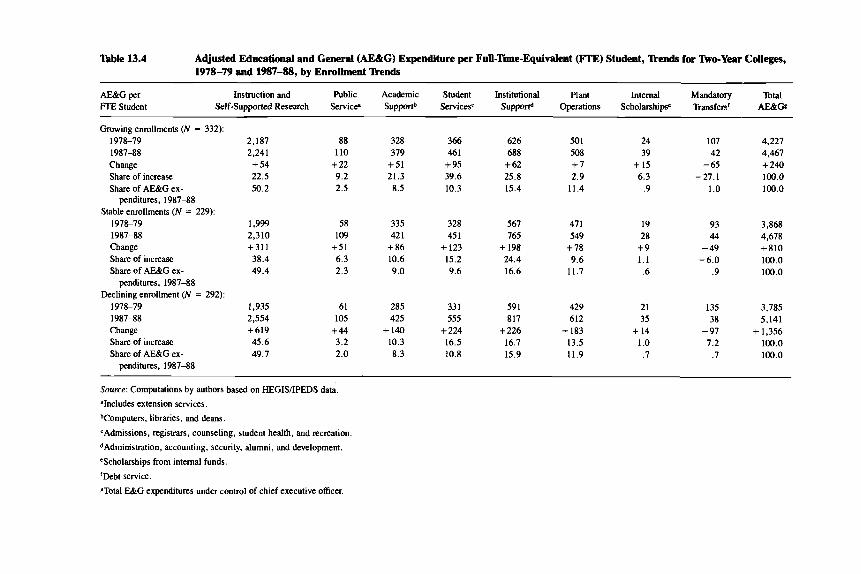
Table 13.4 Adjusted Educational and Genernl (AE&G) Expenditure per Full-Ihe-Equivalent (FTE) Student, 'Lknds for 'Iko-Year Cdeges, 1978-79 and 198-88, by Enrollment 'ken&
AE&G per FIX Student
Instruction and Public Academic Student Institutional Plant Internal Mandatory Total Self-supported Research Service S u p p d Servicesc Supportd Operations Scholarshipsc Transfers' AFiQGl
Growing enrollments (N = 332): 1978-79 1987-88 Change Share of increase Share of AE&G ex-
penditures, 1987-88 Stable enrollments (N = 229):
1978-79 1987-88 Change Share of increase Share of AE&G ex-
penditures, 1987-88 Declining enrollment (N = 292):
1978-79 1987-88 Change Share of increase Share of AE&G ex-
penditures, 1987-88
2,187 2.241 + 54 22.5 50.2
1,999 2,310 +311 38.4 49.4
1,935 2,554 +619 45.6 49.7
88 1 LO
+ 22 9.2 2.5
58 109
+51 6.3 2.3
61 105
+44 3.2 2.0
328 379 + 51 21.3 8.5
335 42 1 + 86 10.6 9.0
285 425
+ 140 10.3 8.3
366 461 + 95 39.6 10.3
328 45 1
+ 123 15.2 9.6
33 1 555
+ 224 16.5 10.8
626 688 + 62 25.8 15.4
567 765
+ 198 24.4 16.6
591 817
+ 226 16.7 15.9
501 508 +7 2.9
11.4
47 I 549
+ 78 9.6
11.7
429 612
+ 183 13.5 11.9
24 39
+ 15 6.3
.9
19 28
+9 1.1 .6
21 35
+ 14 1 .o .7
107 42
- 65 -27.1
1 .o
93 44
- 49 - 6.0
.9
135 38
- 97 7.2
.7
4,227 4,467 + 240 100.0 100.0
3,868 4,678 +810 100.0 100.0
3,785 5,141
+ 1,356 100.0 100.0
Source: Computations by authors based on HEGWIPEDS data.
"Includes extension services.
bComputers. libraries, and deans.
'Admissions, registrars, counseling, student health, and recreation
dAdministration, accounting, security, alumni, and development.
CScholarships from internal funds.
'Debt service.
!Total E&G expenditures under control of chief executive officer.

Table 13.5 Change in Adjusted Educational and General (AE&G) Expenditures per Student from 1978-79 to 1987-88 by Enrollment Rends for Homogeneous Groups of Institutions, All without Medical Schools
Category
Average Annual % Change in AE&G per Student Change in AE&G per Student ($)
N U ~ L P Carnegie Classification Control Size Growing Stable Declining Growing Stable Declining
5 Doctoral Public 4,000-20,OOo +519 +917 + 1,660 .8 1.7 2.6
10 Comprehensive & Public 1,OOO-3,OOO + 37 +615 + 1,635 .1 1.1 2.9
11 Comprehensive & Public 3,OOO-10,OOo +314 + 557 + 1,584 .6 1 . 1 3.0
14 Comprehensive Private C3.000 + 1,405 + 2,144 + 2,798 2.6 3.6 4.8
19 Other-Four-Year Private C-1,OOO + 503 + 1,793 + 2,608 .8 2.7 4.0
21 Two-Year Public C1,OOO + 582 +913 + 1,902 1.4 2.0 4.0
(N = 12) (N = 27) ( N = 11)
Other-Four-Year ( N = 46) (N = 29) ( N = 26)
Other-Four-Year ( N = 59) (N = 67) (N = 44)
( N = 57) ( N = 56) (N = 47)
( N = 86) (N = 57) ( N = 24)
( N = 101) (N = 51) ( N = 57)
(N = 127) ( N = 97) ( N = 104) 22 Two-Year Public 1 ,W3,OOO + 200 + 1,084 + 1,299 .5 2.6 3.3
23 Two-Year Public 3,OOO-16,OOO + 140 + 647 + 1,273 .4 1.8 3.4
24 Two-Year Private 0-3,OOO + 1,017 + 1,553 +2,617 2.0 3.5 5.4 ( N = 68) ( N = 63) (N = 82)
(N = 36) (N = +18) ( N = +49)
Source: Calculations by authors based on HEGISlIPEDS data. 'For category descriptions, see Table 12.6.
constant 1987-88 dollars, deflated by GNP implicit price deflator.

341 Costs and Enrollment
Institutions with growing enrollments are the only category of colleges and universities we uncovered in this study for which instruction and self- supported research account for a greater share of the increase in expenditures per student than their share of AE&G. The data suggest the following sce- nario. As enrollments rise, expenditures in most functional categories do not respond much. Deans and faculty are asked to provide services to the addi- tional students, but their budgets are augmented only marginally. The rising enrollments force down expenditures per student as more students are accom- modated with the same computers, deans, library, recreation hall, registrar, admissions office, president, and grounds crew.
More students quickly place pressure on class sizes in certain departments, particularly those where the institution's culture requires smaller classes (e.g., writing and mathematics courses). If the institution is to maintain smaller class sizes in freshman English, calculus, and foreign languages, it must ac- commodate the rising enrollments with additional faculty. Many of these fac- ulty may be part-time teachers at first, but, once the institution acknowledges the change in enrollment to be permanent, they are converted to full-time positions. Instruction rises as a fraction of total expenditures for institutions with rising enrollments because there is some response in the number of full- time faculty to growing enrollments, at least over our nine-year period. Even though instructional expenditures per student rise less at growing institutions than at stable and declining ones, they rise relatively faster than other types of expenditures at the rapidly growing institutions, primarily because the other expenditures rise hardly at all.
The substantial difference in cost increases between growing and declining institutions suggests considerable sluggishness in resource adjustments to shifts in demand. The differences are clear and large over the period of anal- ysis.
A similar pattern of cost increases occurred in Two-Year colleges over the period, as shown in Table 13.4. At Two-Year colleges whose enrollments grew 1.8 percent or more annually, AE&G per student increased only 0.7 percent annually compared to 3.4 percent for Two-Year colleges with declin- ing enrollments. It appears that having more students at 'Ibo-Year colleges does not generate additional instructional or plant operations expenditures. Class size must simply be allowed to rise in the existing classrooms.
The pattern of cost increases for institutions experiencing different enroll- ment trends suggests that changes in the college age cohort and enrollment rates have a noticeable effect on costs per student. The college and university business appears to be one in which adjustment to change is slow. In the mean-
was plausible, and each was statistically significantly different from zero. liventy-eight percent of the linear variation in AE&G per student was explained by the linear variation in the independent variables. The elasticity was computed at the mean values of AE&G per student and the growth rate of enrollment.

342 Malcolm Getz and John J. Siegfried
time, the resources on hand are used to serve whatever number of students show up at registration. As difficult as they are, predictions of aggregate col- lege student enrollment are easier to pin down than estimates of future enroll- ments at specific institutions. Changes in student tastes and the attraction of different institutions weaken the accuracy of forecasted enrollments at specific institutions, even over a period as short as a decade. This phenomenon may have helped control costs during the 1960s and 1970s, when enrollments rose rapidly at two-thirds of all colleges and universities and existing expenditures were perpetually being spread over an ever increasing student population. It also suggests that, as the shrinking college age cohort finally overtakes rising enrollment rates and the absolute number of students in higher education de- clines in the early 1990s, costs per student may rise even faster than we have seen so far because more institutions may contract.
13.3 Estimating Economies of Scale
Scale economies allow the production of goods or services at a lower per- unit cost when the scale of operation is enlarged. Knowledge about the rela- tion between average cost and enrollment can usefully guide management or government policy decisions about enrollment growth and the number of col- leges required to serve students at the lowest possible cost. There are scores of empirical estimates of scale economies in higher education (Brinkman and Leslie 1986; Brinkman 1990). Substantial variation in the size of colleges and universities, ranging from multiversity campuses so large that bus transporta- tion is essential to colleges so small that all students are on a first-name basis, facilitates studies of scale economies in higher education. Unfortunately, most of the studies illustrate the various pitfalls surrounding attempts to identify the minimum long-run average cost at various enrollment levels from cross- sectional data.
Most of the studies are statistical cost analyses (Johnston 1960) conducted by relating the cost per unit of “output” (usually measured as annual educa- tional and general [E&G] expenditures per full-time-equivalent student) to the scale of operation (usually measured in terms of annual full-time-equivalent enrollment). A number of (frequently implicit) assumptions are made when such an effort consists of regressing E&G per student on various specifications of annual enrollment.
First, it is usually assumed that all institutions in the analysis have similar objectives and produce a homogeneous “output” that is, annual student en- rollments. The homogeneous output assumption may be appropriate for those colleges and universities that do not emphasize faculty research and that have few, if any, postbaccalaureate programs. But it is clearly invalid for Research, Doctoral, and Comprehensive universities, where, among other differences, some institutions have on-campus medical schools. Liberal Arts I, Other-

343 Costs and Enrollment
Four-Year colleges, and Two-Year colleges probably produce as workably ho- mogeneous an output as can be found among the Carnegie classifications.
When output is measured by enrollment, each year of higher education is valued equally. No premium is attributed to graduation beyond the learning acquired during the final year of baccalaureate study. But the proportion of students graduating differs across institutions. Using enrollment to measure output also values a year’s college experience equally, whether at a more or less selective institution, whether it consists of intimate honors seminars or mass lectures delivered via closed-circuit television, or whether it involves more or less effective pedagogical methods.
Second, the nonprofit status of colleges and universities calls into question a related assumption critical to estimating the minimum long-run cost curve, namely, that all institutions strive equally to minimize costs (Newhouse 1970). Hoenack (1990) argues that the organizational character of colleges and universities permits units within them to capture varying amounts of rents by exerting local “market power.” Individual units within colleges and univer- sities may not share with the institution’s central management the goal of pro- ducing a given quality of product at minimum cost. Because monitoring and enforcement costs grow with an organization’s size, one would expect sub- units in larger universities to be more effective in achieving their own goals. Furthermore, one might question whether the objectives of the central man- agement of nonprofit organizations embrace cost minimization at all.
Third, statistical cost studies of higher education scale economies implic- itly assume that the technology and factor prices faced by each institution in the sample were similar when each selected its factor proportions and produc- tion methods. If the observed institutions selected their production methods from menus available to them at different points in time, and if technology has changed over time, cross-sectional analysis will be unable to disentangle scale economies from shifts in the long-run scale curve caused by technological improvement (or long-run adjustments in factor prices). It can be argued that, on these grounds, higher education is particularly well suited to estimating scale economies because its technology is stagnant. In other work, however, we gather evidence that calls that conclusion into question (Getz and Siegfried 1990).
Fourth, Friedman (1955) argued long ago that statistical cost analyses are destined to reveal horizontal long-run average cost curves because institutions of the most efficient size will command a premium in the secondary asset market, thus increasing their measured costs under new ownership, and vice versa for inefficiently sized institutions. ,ecause few colleges or universities are sold, this problem does not appear to plague scale economies estimates in higher education.
What is a problem with college and university accounting data, however, is the absence of uniform capital accounts. Almost all colleges and universities

344 Malcolm Getz and John J. Siegfried
operate exclusively on a current account basis, with no allowance for the de- preciation of long-lived asset^.^ The E&G data of the U.S. Department of Education measure annual direct educational operating expenses. Excluded are expenditures on auxiliary operations (e.g., food service, bookstores, housing), hospitals, and federally funded research centers as well as the an- nual depreciation related to the flow of services from plant and eq~ipment .~ This implies that scale economy estimates based on current account data are likely to understate the importance of scale economies in higher education and understate the enrollment level at which costs are minimized because average capital costs usually decline with size.6
Fifth, the financing of public higher education in America may eliminate, or at least obscure, any real relation between average cost and size. Funding formulas at many public universities depend on enrollments (Caruthers and Marks 1988; Lyddon 1986; Tennessee Higher Education Commission 1990). In addition, tuition revenues are approximately proportional to enrollments. If one views legislative funding of public institutions as a residual, in which the state provides resources sufficient to cover the excess of costs over tuition at state colleges and universities, and if “needed” revenue per student is estab- lished exogenously through negotiations among the institutions, higher edu- cation commissions, and the state legislatures, then state universities will want to spend all their state revenues. Thus, expenditures per student will track revenues per student. Even if the marginal cost of additional enrollments in reality declines to a point where it is quite low, the institution will report a constant average cost because an incentive exists to spend “excess” revenues on “slack,” to use Williamson’s (1975) term. Slack consists of expenditures over and above what is necessary to attract and retain the necessary resources to accomplish an assigned task.’ In higher education, slack may take the form of expenditures on recruitment, expenditures to improve the quality of the student body and enhance the reputation of faculty and administration, ex- penditures on secretaries, new microcomputers, and library acquisitions to foster research, or expenditures on the working environment, for example, new furniture or campus beautification projects. In this view, expenditures per
4. Accepted accounting practices as promulgated by the National Association of College and University Business Officers do not call for recognition of the annual cost of depreciation. In recent years, however, some institutions, particularly private universities, began recording some depreciation costs.
5 . The HEGISIIPEDS data (see Chapter 11, n. 14, above) do include information on the book value of buildings, equipment, and land, but they do not contain a measure of the annual flow of depreciation of these assets.
6. If the technology that permits lower unit costs at larger scales of operation involves a sub- stantial substitution of capital for labor, it is possible for average capital costs to rise with size. Scale economies can exist under such circumstances so long as the savings in variable inputs per unit outweigh the increased capital costs per unit at larger scales of operation.
7. Whether such “slack” represents inefficiency or whether it creates alternative leisure value of equivalent or greater value to the management or workers who “capture” it is controversial (see Leibenstein 1978; and Stigler 1976; a summary of the debate is contained in Siegfried and Wheeler 1981).

345 Costs and Enrollment
student may be constant across a wide variety of enrollment levels even if minimum required costs decline with enrollment. Public universities will identify other expenditures, presumably “unnecessary,” in order to avoid re- turning revenues to the state legislature, and expenditures per student will then be determined by revenue formulas rather than by minimum necessary costs.
Sixth, attempts to estimate the long-run scale curve from cross-sectional data implicitly assume that each institution is in long-run cost-minimizing equilibrium, that it is on, not above, the long-run scale curve. But, as we documented earlier in this chapter, some colleges and universities operate temporarily at lower than planned enrollment levels, while others periodically operate beyond their planned enrollment levels. Even sophisticated estimates of scale economies in higher education (e.g., Cohn, Rhine, and Santos 1989) treat all institutions as if they are in long-run equilibrium, although several take care to argue specifically that their estimates describe the average behav- ior of colleges and universities rather than the minimum cost frontier (Brink- man 1985, 341; Cohn and Geske 1990, 167). As Brinkman (1990) noted, failure to control for the rate of change in enrollment will lead to understate- ments of cost during periods of enrollment growth and overstatements during periods of decline, which may generate false evidence of scale economies.
13.4 Disequilibrium and the Estimation of Economies of Scale
Economies of scale estimates are supposed to disclose the lowest average cost of producing each of many different possible output levels when all inputs can be varied. In the short run, a large proportion of college and university costs are fixed, or at least quasi-fixed, in the sense that they cannot be adjusted quickly to accommodate the actual enrollment level optimally. In the long run, institutions have more flexibility to adjust “plant” size (here including quasi- fixed factors such as tenured faculty) to accommodate the realized output level.
If the long-run scale curve declines over the relevant range of output, costs likely will be higher than expected for institutions experiencing declining en- rollments and lower than expected for institutions growing modestly faster than expected (because, as output expands beyond the equilibrium level, the short-run average cost curve first declines before eventually rising). The cost disadvantage of operating in disequilibrium will appear to be more for insti- tutions experiencing declining enrollments because the short-run average cost curve rises immediately as output falls below the long-run equilibrium level. Of course, the divergence of short-run from long-run cost curves at output levels above expected enrollment might actually be greater or less than the divergence at enrollment levels comparably below the planned level, and it is doubtful that instructional quality, at least as reflected in the studenvfaculty ratio, remains constant in the face of unexpected enrollment outcomes.
If an institution is growing or declining rapidly, it is likely to find itself
346 Malcolm Getz and John J. Siegfried
operating on a short-run cost relation, making due with the relatively “fixed” inputs of full-time faculty and physical facilities selected for a different en- rollment level and adjusting the few inputs over which it has immediate con- trol (e.g., part-time faculty) in order to accommodate the unexpected level of enrollments.
The evidence presented in Tables 13.1-13.4 suggests a much greater cost disadvantage for institutions with declining enrollments than for those with growing enrollments. If anything, expanding colleges appear to enjoy much smaller increases in costs than stable or declining institutions, suggesting that students at growing institutions are accommodated with existing resources. This implies that the short-run marginal cost of additional students is modest, although a decline in the quality of education is also likely to accompany spurts in enrollment if resources have any effect on the quality of education.
To evaluate the importance of the equilibrium assumption for estimates of scale economies, we assume that each institution expects its own enrollment to grow at approximately the average rate over the period. The average rate can be predicted by institutions with reasonable accuracy on the basis of dem- ographic trends, even if it is more difficult to predict enrollment growth for specific institutions.*
To illustrate the possible consequences for scale economies estimates of including data from colleges and universities operating in disequilibrium, we estimate average cost functions for the private four-year institutions in each of the Carnegie classifications. For each category, we estimate 1987-88 AE&G expenditures per full-time-equivalent student as a quadratic function of enroll- ment, first using only those institutions experiencing enrollment growth rates between zero and 1.8 percent annually from 1978-79 to 1987-88 (the middle third of the enrollment growth rates), which we call “stable.” Limiting the observations to institutions with relatively stable enrollment growth rates should eliminate from the sample those institutions most likely to be operating off their long-run cost curve. We then compute the estimated minimum effi- cient scale for the entire sample so as to compare with results obtained when the declining and rapidly growing institutions are excluded.
Estimates are computed only for private institutions because the average cost-size relation of public institutions is likely skewed by the institutional character of funding higher education in the various states. Under such con- ditions, it is difficult, if not impossible, to identify minimum average cost for different enrollment levels.
Decision making could be improved if the source of scale economies could be identified. That is, scale economies in, say, library and computer functions, as opposed to plant operations functions, suggest specific strategies to mini- mize costs. Nevertheless, we do not estimate scale economies for the func- tional categories in the HEGWIPEDS accounting system because we believe
8. Changes in enrollment rates, however, can lead to errors in predicting enrollments from demographic trends alone, as was experienced during the 1980s.

347 Costs and Enrollment
that the classification of costs among categories may be systematically related to institutional size. At larger institutions, management is more specialized and often more sophisticated; accounting categories are more refined, and greater care is given to developing an accurate accounting system. It is more difficult for top management at larger institutions to learn about their college or university informally. Therefore, accounts are more important for manage- ment of larger institutions. For example, HEGIS/IPEDS indicates that public service and sponsored research expenditures should be reported separately, if possible. Many smaller colleges (and a few larger institutions) did not report these categories separately, including relevant expenditures, instead, in in- struction. Thus, instructional expenditures may appear to decline with size of institution because of the accounting treatment of public service and spon- sored research.
In addition, many inputs are used in more than one function, necessitating joint cost allocations. How these are done may also be related to institutional size. Consequently, we estimate scale economies only for total AE&G ex- penditures per ~ tudent .~
The relation between average costs and size may be estimated a number of different ways. First, one must decide whether to estimate how total costs vary with enrollment and from that estimate derive computationally the average cost-enrollment relation or whether instead to estimate the average cost- enrollment relation directly. The decision hinges primarily on econometric considerations. lo An examination of the alternatives indicates that a better es- timate is obtained by relating average cost directly to enrollment.
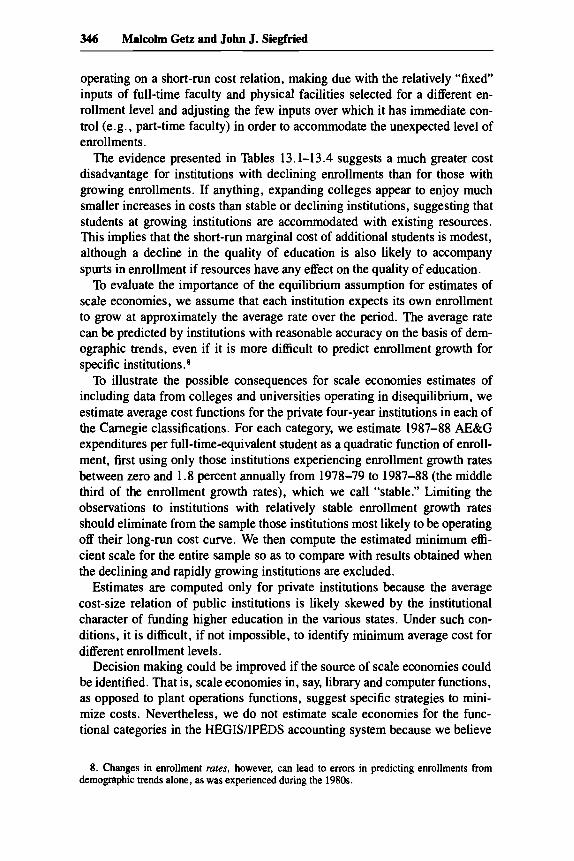
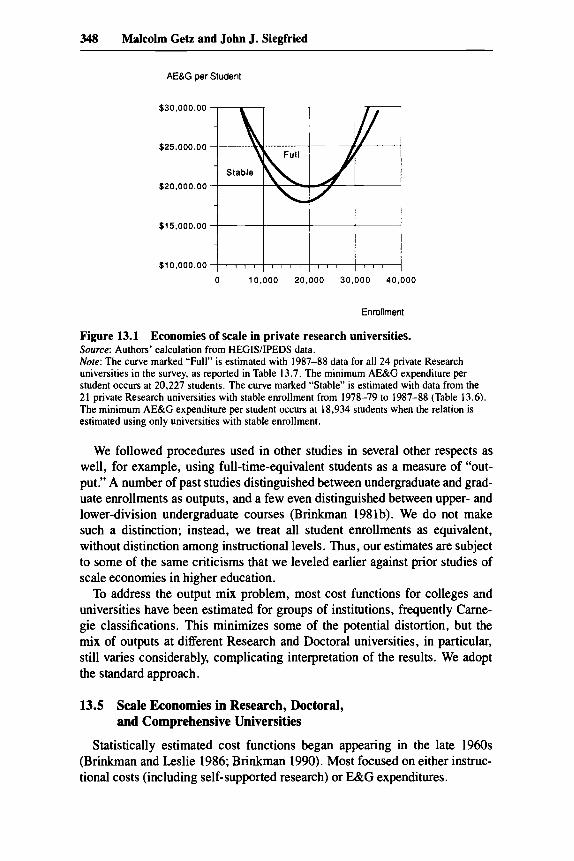
Second, one must decide what functional specification best describes the relation between cost and size. The traditional specification, consistent with average cost first declining and eventually rising with size, is a quadratic form. We adopted this form (illustrated in Figure 13. l) . l l
9. The fear is that cross-sectional comparisons of expenditures per student in various functional categories are invalid. The analysis in Chapter 12 also relied on functional categories. However, most of the comparisons in Chapter 12 were in terms of the change in expenditures over time in different categories and were essentially time-series comparisons. We, of course, rely on the prin- ciple of accounting consistency, and, where individual institutions refined or altered their account- ing practices, the comparisons in Chapter 12 also may be subject to error.
10. The choice, in part, depends on the extent to which the “tightness” of the estimated relation varies with the size of the institution. A test for heteroskedasticity revealed that the error terms are correlated with enrollment size for all Camegie classifications when estimating total cost as a function of enrollment. When estimating average cost directly, only two of the five equations estimated for Camegie classifications suffered from this defect.
11. Estimating average total cost with a quadratic implies that all costs vary, to some degree, with output. That is, if the quadratic equation for average total cost were multiplied through by enrollment, there would be no term independent of enrollment, thus no term expressing fixed costs. We experimented with an alternative form that explicitly allowed for fixed costs:
a average total cost = _1 + a2 + a,E + a$?,
E
where E = enrollment. Estimates of the alternative form suffered from severe heteroskedasticity; we therefore abandoned it.
348 Malcolm Getz and John J. Siegfried
AE&G per Student
0 10,000 20,000 30,000 40,000
Enrollment
Figure 13.1 Economies of scale in private research universities. Source: Authors’ calculation from HEGWIPEDS data. Note: The curve marked “Full” is estimated with 1987-88 data for all 24 private Research universities in the survey, as reported in Table 13.7. The minimum AE&G expenditure per student occurs at 20,227 students. The curve marked “Stable” is estimated with data from the 21 private Research universities with stable enrollment from 1978-79 to 1987-88 (Table 13.6). The minimum AE&G expenditure per student occurs at 18,934 students when the relation is estimated using only universities with stable enrollment.
We followed procedures used in other studies in several other respects as well, for example, using full-time-equivalent students as a measure of “out- put.” A number of past studies distinguished between undergraduate and grad- uate enrollments as outputs, and a few even distinguished between upper- and lower-division undergraduate courses (Brinkman 1981 b). We do not make such a distinction; instead, we treat all student enrollments as equivalent, without distinction among instructional levels. Thus, our estimates are subject to some of the same criticisms that we leveled earlier against prior studies of scale economies in higher education.
To address the output mix problem, most cost functions for colleges and universities have been estimated for groups of institutions, frequently Carne- gie classifications. This minimizes some of the potential distortion, but the mix of outputs at different Research and Doctoral universities, in particular, still varies considerably, complicating interpretation of the results. We adopt the standard approach.
13.5 Scale Economies in Research, Doctoral, and Comprehensive Universities
Statistically estimated cost functions began appearing in the late 1960s (Brinkman and Leslie 1986; Brinkman 1990). Most focused on either instruc- tional costs (including self-supported research) or E&G expenditures.

349 Costs and Enrollment
Output in the cost studies is usually measured by enrollments, sometimes delineated by level of instruction. A few studies (e.g., Verry and Davies 1976; Cohn, Rhine, and Santos 1989) also attempt to measure research outputs. None, to our knowledge, has attempted to measure and include public service outputs, and few have made any attempt to value student enrollments (but see Verry and Davies 1976). Thus, a student enrolled in a course is said to create the same “output” no matter the size or character of the course and no matter the type, size, or control of the institution. A year’s experience in small semi- nars at Davidson or Princeton is equivalent to a year’s worth of lectures held in the gymnasium of a large state university. Likewise, a full-time-equivalent student year at Berkeley or Michigan is valued equally to a year spent at a tiny private liberal arts college with eight full-time faculty, not one of whom has a Ph.D.
A number of studies of cost functions estimate marginal and average costs at the average-size institution. If average costs exceed marginal costs, econo- mies of scale exist at that output level. If marginal costs exceed average costs, diseconomies of scale exist. Using this method of analysis, Tierney (1980a), Brovender (1974), and Brinkman (1981b, 1984) discovered economies of scale for departments in selective private liberal arts colleges, a large public research university, and less selective liberal arts colleges.
The most common method used to identify scale economies has been to estimate average costs as a function of enrollment. The literature based on this methodology reports mixed findings about economies of scale in research uni- versities (Brinkman 1990; Hoenack 1990). For example, Broomall et al. (1978) found no evidence for scale economies in public research and doctoral universities, while Cohn, Rhine, and Santos (1989), using a multiple output production function, found evidence of scale economies for the simultaneous expansion of undergraduate, graduate, and research programs up to about 5,000 students and for research alone up to the size of all but the largest public research universities. They applied an econometric estimation method that captures the independent and joint effects on cost of expanding any of three outputs: undergraduate enrollment, graduate enrollment, and research. In an extension of this analysis, de Groot, McMahon, and Volkwein (1989) also discovered strong evidence of scale economies in producing teaching and re- search at research universities. The lowest-cost research university turns out to be quite large, according to their evidence, with cost minimizing under- graduate enrollment even larger than in any of the existing institutions.
Brinkman (198 la) found no evidence of instructional cost advantages to larger public research institutions. This finding might be due to the institu- tional environment of public institutions’ revenue formulas. When Brinkman combined public and private universities, scale economies appeared to sur- face, but these could be an illusion based on differences in the output mix and quality of instruction between public and private institutions. Of course, qual- ity differences in the education provided at different size institutions may un- dermine all the efforts to detect scale economies. Verry and Davies (1976), in
350 Malcolm Getz and John J. Siegfried
a study of British universities excluding Oxford, Cambridge, and London, attempted to control for the quality of teaching across institutions by using graduation rates and improvements in examination scores. They found some evidence that the value of education may improve with institutional size. If their conclusion is correct, scale economies studies may systematically under- estimate the “output” of larger institutions and understate the advantages of size in higher education. Even without using such a correction for quality, Corral10 (1970) discovered that expenditures per student were lower at larger research universities. In his classic study of college and university costs, Bowen (1980) found an irregular relation between “educational costs” (a con- cept very close to our AE&G) and enrollment. In sum, the evidence of scale economies for research universities is mixed.
Our empirical results based on 1987-88 data are reported in Tables 13.6 (for stable-growth private colleges and universities only) and 13.7 (for all pri- vate institutions). For private Doctoral and Comprehensive institutions, there is no evidence of a relation between average cost and enrollment. Indeed, for the estimates based on the sample of institutions that we expect to be closest to operating on the minimum long-run average cost curve (Table 13.6), the signs of the coefficients are not even “correct.” The usual (U-shaped) cost curve, as shown in Figure 13.1, requires a negative sign on the enrollment coefficient and a positive sign on the coefficient of enrollment squared.
For the private Research universities, we obtain different results, depending on the sample used. This illustrates the importance of excluding institutions in the midst of large enrollment change and ensuring that institutions in the sample share a common mission. The results based on all 24 private Research universities in our sample, reported in Table 13.7, reveal a flat average cost curve. Because neither of the coefficients related to enrollment is statistically different from zero, it is proper to interpret the results as indicating no relation between AE&G per student and enrollment. Although the scale curve esti- mated with the full sample appears in Figure 13.1 to exhibit declining unit costs until an enrollment level of 20,000 students, the relation is too uncertain to draw such a conclusion.
In contrast, the private Research universities display a declining average cost curve up to an enrollment level around 19,000 students, when only the 21 (of 24) private Research universities with stable enrollments are used in the estimation. These results are shown in Table 13.6 and Figure 13.1. The rela- tion appears sufficiently consistent to lend confidence to the conclusion that average costs do decline in private Research universities up to an enrollment level of about 19,000. That only three universities could change the results so much indicates the importance of rapidly declining or growing institutions. I *
Although the coefficient on enrollment squared is not statistically signifi-
12. The three private Research universities in our sample that did not experience stable enroll- ments from 1978-79 to 1987-88 were Carnegie-Mellon, Harvard, and Johns Hopkins. All three experienced average annual enrollment growth exceeding 1.8 percent per year.

Table 13.6 Estimated Scale Economies for Private Four-Year Colleges and Universities, 1987-88, by Carnegie Classification, Stable-Growth Institutions Only
Carnegie Classification
Sample Size
Estimated Average Cost (E = enrollment)
Minimum % Cost Efficient Scale Elevation at E
R 2 (MES) = %MES
Research 21 AE&G ~ = 39,786 - 2.31E + .000061E*
E ( - 1.70)* (1.24)
- 14,563 + .67E - .000103F AE&G ~- Doctoral 15
E (.25) (-0.56)
AE&G ~- Comprehensive 76
- 6,841.3 + .46E + .MX)021F E
Liberal Arts I
Other-Four-Year
(39) (.36) - AE&G
~- 75
- 14.105 - .77E + .000170E2 E
72 AE&G - ~- - 11,610 - 6.82E + .003057E2
(-2.31)* (1.94)*
~~
.I9 18,934'
. I 1 b
. l l h
.03 b
.06 1,100
~~
30.5
b
b
b
11.9
Source: Computations by authors based on HEGIVIPEDS data. 'See text for proper interpretation of Research university resuilts. bNot available. *Statistically significant at the 90 percent confidence level, using a one-tailed test.

Table 13.7 Estimated Scale Economies for Private Four-Year Colleges and Universities, 1987-88, by Carnegie Classifications, All Institutions
Carnegie Sample Classification Size
Estimated Average Cost (E = enrollment)
Minimum 8 cost Efficient Scale Elevation at E
R z (MES) = %MES
Research 24 AE&G .08 - = 37,834 - 1.78E + .000044F
E (-1.14) (.77)
Doctoral 36 AE&G .08 - = 15,067 - .54E + .000008F
E (-1.04) (.36)
Comprehensive 219 AE&G .04 - = 7,223 + .34E + .000008F
E ~ 9 1 )
Liberal Arts I 1 29 AE&G .01 1,600 5.0 - = 14,848 - 3.06E + .000965E2
( - 1.56)* (1.62)*
- = 12,302 - 6.00E + .001391F
(-5.72)* (3.95)*
E
Other-Four-Year 33 1 AE&G .09 2,150 27.6 E
Source: Computations by authors based on HEGWIPEDS data. *Statistically significant at the 90 percent confidence level, using a one-tailed test. 'Not available.

353 Costs and Enrollment
cantly different than zero at the conventional 90 percent confidence level, we nevertheless calculate the enrollment size that would minimize costs for pri- vate Research universities as if the declining cost curve did eventually begin to rise at larger enrollment 1e~els . I~ So calculated, minimum efficient scale occurs at about 19,000 students, well above the average size of the private Research universities (1 1,250 students). Costs per student are about 30 per- cent higher for a private Research university of 9,500, a substantial “cost pen- alty” to pay for operating at half the minimum efficient scale.I4
The appearance of scale economies here is deceiving. The 21 private Re- search universities with stable enrollments over the period include 15 with medical centers on their campuses and six without. As demonstrated in Chap- ter 12 (Table 12.3), Research universities with and without medical schools have different cost structures. The average 1987-88 AE&G expenditure per full-time-equivalent student at the 17 private Research universities with med- ical centers was $24,145, compared to $18,264 at the seven private Research universities without medical schools. The private Research universities with- out on-campus medical schools are, on average, much smaller (7,550 full- time-equivalent students) than their counterparts with medical schools (12,750 full-time-equivalent students). Under these circumstances, depending on the cost levels of individual universities, it is possible to observe scale economies for the combined institutions (grouping together those with and without medical schools) when, in fact, for each group separately the scale relation is flat. Thus, estimated scale economies based on a combined sample may portray an illusion of declining costs because the average cost levels of characteristically different types of institutions are being inadvertently com- pared. Further statistical analysis of our data verifies this account. If private Research universities with medical schools are appropriately considered as different from those without medical schools in ways that affect their average costs, they should be analyzed separately. When analyzed separately, evidence of scale economies for private Research universities evaporates, regardless of the sample used (the 21 stable-growth universities or all 24 institutions). We conclude that estimates of scale economies for private Research universities that lump together those with and those without medical schools produce a misleading conclusion. In contrast to most of the previous findings about cost differences between large and small Research universities, we find no evi- dence of any systematic relation between average cost and size for private Research universities. Is
13. Formally, because the negative coefficient on enrollment is statistically significantly differ- ent from zero and the positive coefficient on enrollment squared it not statistically significantly different from zero, the scale curve for private Research universities continues to decline at higher and higher enrollment levels, never attaining an enrollment level beyond which average costs rise.
14. We estimated the scale economies relations for 1978-79, 1983-84, and 1985-86 too. The results are virtually the same for each category of institution.
15. This conclusion helps explain an anomaly between the behavior of the prestigious Research universities and an implication of the usual finding in the literature-that scale economies exist

354 Malcolm Getz and John J. Siegfried
13.6 Scale Economies in Liberal Arts Colleges
In their comprehensive summary of scale economies studies on liberal arts colleges, Brinkman and Leslie (1986, 18) conclude that these institutions “typically seem to achieve most of their scale-related economies by the time enrollment reaches 1,500 to 2,000 full-time-equivalent students . . . , or even a little sooner.” Whether E&G expenditures per student actually rise at liberal arts colleges after reaching their minimum is unknown. Maynard (1971) and Bowen (1980) point to evidence of diseconomies of scale of the largest liberal arts colleges, but Brinkman (1981b), Carlson (1972), and Metz (1964) report a flat unit cost curve after scale economies are exhausted.
We were able to detect no relation between expenditures per student and enrollment levels for stable-enrollment private Liberal Arts I colleges (see Table 13.6). The difference between our results and past studies, which usu- ally report a declining long-run average cost curve, may be caused by restrict- ing our sample to only those institutions whose enrollments were relatively stable over the nine prior years. l6 Using the stable-enrollments criterion elim- inated 27 of the 40 Liberal Arts I colleges with fewer than 1 ,OOO students from the sample; 20 of the 27 experienced declining enrollments over the period, while enrollments at seven grew faster than 1.8 percent annually. Only 13 of the 40 were “stable.” For the 89 Liberal A r t s I colleges enrolling more than 1,OOO students (all but one of which had fewer than 3,000), 62 experienced stable enrollments, 18 had declining enrollments, and the enrollments at nine grew faster than 1.8 percent per year. Based on these facts, we would expect to observe scale economies if the long-run average cost curve were estimated with the entire sample, including the vast majority of relatively smaller insti- tutions that experienced declining enrollments. Including all the smaller col- leges overstates their long-run equilibrium costs. By comparing the (higher) short-run disequilibrium costs of smaller schools that recently lost enrollment to the long-run equilibrium costs of larger colleges, it is possible to infer evi- dence of scale economies when none exist. The results reported in Table 13.7
up to an enrollment level of about 20,000 students. Only three of the 24 private Research univer- sities in our sample are larger than 20,000 students, and those three by only a slight amount (Boston University, New York University, and the University of Southern California each enrolled about 23,000 full-time-equivalent students in 1987-88). If scale economies were possible up to an enrollment level of, say, 19,000, and if institutions of half that size suffered a 30 percent cost disadvantage (see Table 13.6), why would a majority of these institutions (14 of 24) operate at less than half the size necessary to minimize their costs? The answer is that in all likelihood the apparent scale economies are a mirage.
16. An alternative explanation for the difference is that we estimated separate scale curves for Liberal Arts I and Other-Four-Year institutions while most of the previous attempts to identify scale effects for liberal arts colleges combined the two categories. Because Liberal Arts I colleges are, on average, larger and more expensive than Other-Four-Year colleges, a scale curve estimated for the combined categories is likely to be flatter than one estimated for either group of institutions separately. Therefore, this is not likely the reason we find an absence of scale effects for Liberal Arts I colleges while “the literature” reports declining unit costs with enrollment.

355 Costs and Enrollment
$20,000.00
$15,000.00
$10,000.00
$5,000.00
$0.00 -1 0 1.000 2,000 3,000
Enldmenl
Figure 13.2 Economies of scale in Other-Four-Year colleges. Source: Authors’ calculation from HEGWIPEDS data. Note: The curve marked “Full” is estimated with 1987-88 data for all 331 Other-Four-Year colleges in the survey, as reported in Table 13.7. The minimum AE&G expenditure per student occurs at 2,150 students. The curve marked “Stable” is estimated with data from the 72 Other- Four-Year colleges with stable enrollment from 1978-79 to 1987-88 (Table 13.6). The minimum AE&G expenditure per student occurs at 1,100 students when the relation is estimated using only data from colleges with stable enrollment.
confirm this story; using all the data to estimate the average cost curve, it (incorrectly) appears that institutions of fewer than 1,600 students suffer a unit cost disadvantage, just as is generally found in the literature (Brinkman and Leslie 1986). Using only those Liberal Arts I colleges with stable enrollment (Table 13.6) yields a horizontal unit cost curve.
The evidence from the private Other-Four-Year colleges reveals an analo- gous (but opposite) effect of disequilibrium. The estimates of the cost per student relation for private Other-Four-Year colleges using the full sample and stable-enrollment institutions are illustrated in Figure 13.2. Table 13.6 shows that, for the stable enrollment Other-Four-Year colleges (only about 22 per- cent of the category), economies of scale are evident until an enrollment level of about 1,100. There is a cost disadvantage of about 12 percent for operating at half this size.” With the entire sample included, the estimated minimum efficient scale enrollment rises to 2,150, closer to the 1,500-2,OOO range ob- served in the literature (Brinkman and Leslie 1986). The usual conclusion from past studies is suspect because it is derived from statistical cost analyses
17. The average enrollment of the 72 Other-Four-Year colleges with stable enrollment growth was 800 in 1987-88. Only 17 of them were as small as 550 students, half the lowest cost scale.

356 Malcolm Getz and John J. Siegfried
that are based on many institutions that are operating on a short-run cost curve that is above minimum long-run costs. We find that scale economies do exist for private Other-Four-Year colleges, but only up to the modest annual enroll- ment of 1,100 students.18
13.7 Summary
For many colleges and universities, enrollment level is not fixed by policy but rather is an outcome subject to significant variability. Some institutions experience significant growth in enrollment; others experience sustained de- clines. In view of the fact that enrollment at some institutions is controlled by a selective admissions process or by the state agency responsible for higher education, the volatility in enrollment among so many institutions is remark- able.
The variation in enrollment has important consequences for costs. In partic- ular, holding other characteristics constant, institutions with declining enroll- ments tend to exhibit higher current operating costs per student. Institutions with increasing enrollments tend to have lower costs per student. Colleges and universities, then, appear to be slow to adjust their operations to changing enrollment levels. If the accounting records included the costs of space and facilities, that is, the cost of the capital used, the disparity in cost per student between declining, stable, and expanding institutions would be all the more striking.
The effect of changes in enrollment on cost per student has important con- sequences for efforts to measure economies of scale. When enrollment change is taken into account in a simple way, estimates of minimum cost scale change. When ignoring enrollment fluctuations, our estimates of scale econ- omies are similar to those of many other investigators. When we take account of changes in enrollment, however, estimated scale effects differ. Because rates of change in enrollments vary widely across higher education, control- ling for enrollment change in estimating scale effects is important. Until cross- sectional studies of scale economies account for recent trends in enrollment, the numbers that are derived from them should be used only with considerable caution. I9
18. Although we believe that unrestricted scholarships should be viewed as a cost of college (see Chapter 12, sec. 12.2). it can be argued that they are better treated as a revenue offset and, thus, should not be included in costs. We excluded unrestricted scholarships from AE&G and reestimated the scale economies equations; the results were virtually the same.
19. Even if the disequilibrium problem can be overcome, the output mix, nonprofit incentives, different cohorts, absence of capital costs, and public funding formula problems may be so severe that we are unlikely to obtain scale economies estimates that are of sufficient quality to inform higher education managers or public policy about optimal college size.