Q3RD(March to November 2020) Results of 2021 Ending Feb.
27
Results Briefing: Q3RD(March to November 2020) Results of 2021 Ending Feb. 2021.1.14
-
Upload
khangminh22 -
Category
Documents
-
view
4 -
download
0
Transcript of Q3RD(March to November 2020) Results of 2021 Ending Feb.

Results Briefing: Q3RD(March to November 2020) Results of 2021 Ending Feb.
2021.1.14

I. Results Overview
2

1. Consolidated Financial Highlights -Profit and Loss-
3
Unit:Million Yen
Cumulative Q3RD 2020
Ending Feb.Cumulative Q3RD 2021 Ending Feb.
Net Sales 125,823 100.0 97,219 100.0 -28,603 77.3
Gross Profit 68,524 54.5 46,741 48.1 -21,783 68.2
SG&A Expenses 66,583 52.9 55,012 56.6 -11,570 82.6
SG&A Expenses(excl. Goodwill Amortization, Depreciation and Amortization) 62,547 49.7 51,699 53.2 -10,848 82.7
Goodwill Amortization 774 0.6 598 0.6 -176 77.3
Depreciation and Amortization 3,261 2.6 2,714 2.8 -546 83.2
Operating Income 1,940 1.5 -8,271 -8.5 -10,212 -
Ordinary Income 3,312 2.6 -7,012 -7.2 -10,324 -
Extraordinary Income 3,109 2.5 2,485 2.6 -623 79.9
Extraordinary Loss 145 0.1 4,906 5.0 4,760 3377.6
Profit Before Taxes 6,276 5.0 -9,433 -9.7 -15,709 -
Profit Attributable to Owners of Parent 4,821 3.8 -11,126 -11.4 -15,947 -
EBITDA ※ 5,976 4.7 -4,958 -5.1 -10,934 -
*EBITDA=Operating Income + Goodwill Amortization + Depreciation and Amortization
Y/Y (%)ResultsComposition
Rate (%)Results
Composition
Rate (%)
Y/Y
Change
2. Consolidated Financial Highlights -Profit and Loss-(September to November)
4
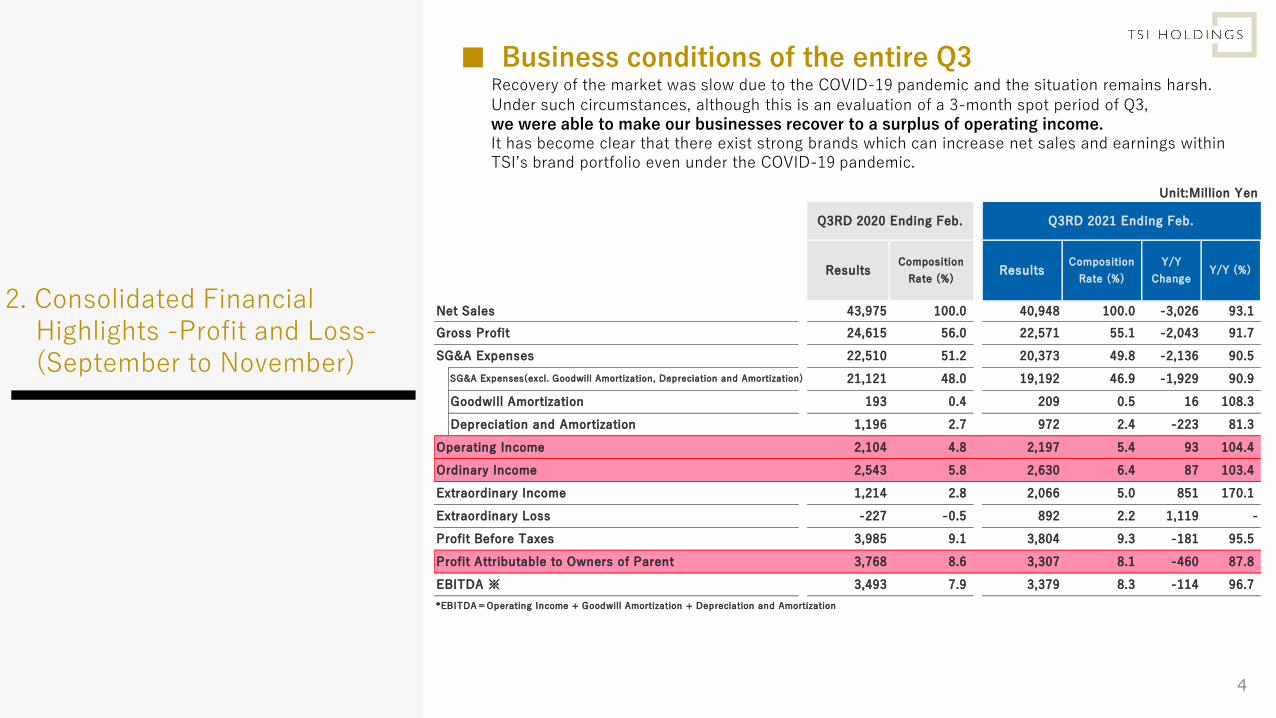
Unit:Million Yen
Q3RD 2020 Ending Feb. Q3RD 2021 Ending Feb.
Net Sales 43,975 100.0 40,948 100.0 -3,026 93.1
Gross Profit 24,615 56.0 22,571 55.1 -2,043 91.7
SG&A Expenses 22,510 51.2 20,373 49.8 -2,136 90.5
SG&A Expenses(excl. Goodwill Amortization, Depreciation and Amortization) 21,121 48.0 19,192 46.9 -1,929 90.9
Goodwill Amortization 193 0.4 209 0.5 16 108.3
Depreciation and Amortization 1,196 2.7 972 2.4 -223 81.3
Operating Income 2,104 4.8 2,197 5.4 93 104.4
Ordinary Income 2,543 5.8 2,630 6.4 87 103.4
Extraordinary Income 1,214 2.8 2,066 5.0 851 170.1
Extraordinary Loss -227 -0.5 892 2.2 1,119 -
Profit Before Taxes 3,985 9.1 3,804 9.3 -181 95.5
Profit Attributable to Owners of Parent 3,768 8.6 3,307 8.1 -460 87.8
EBITDA ※ 3,493 7.9 3,379 8.3 -114 96.7
*EBITDA=Operating Income + Goodwill Amortization + Depreciation and Amortization
ResultsComposition
Rate (%)Results
Composition
Rate (%)
Y/Y
ChangeY/Y (%)
■ Business conditions of the entire Q3Recovery of the market was slow due to the COVID-19 pandemic and the situation remains harsh. Under such circumstances, although this is an evaluation of a 3-month spot period of Q3,we were able to make our businesses recover to a surplus of operating income.It has become clear that there exist strong brands which can increase net sales and earnings within TSI’s brand portfolio even under the COVID-19 pandemic.
5
3. Consolidated Financial Highlights -Profit and Loss-(Quarterly) Net Sales
Gross Profit
SG&A Expenses
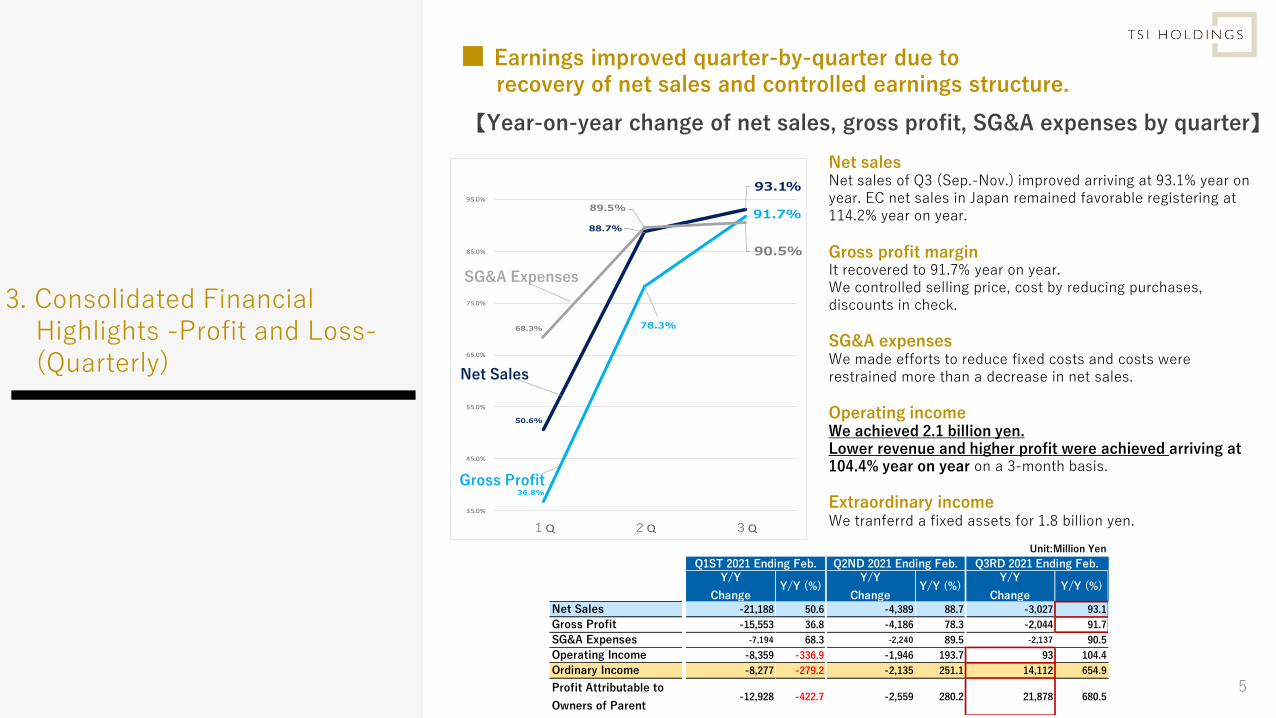
Unit:Million Yen
Y/Y
ChangeY/Y (%)
Y/Y
ChangeY/Y (%)
Y/Y
ChangeY/Y (%)
Net Sales -21,188 50.6 -4,389 88.7 -3,027 93.1
Gross Profit -15,553 36.8 -4,186 78.3 -2,044 91.7
SG&A Expenses -7,194 68.3 -2,240 89.5 -2,137 90.5
Operating Income -8,359 -336.9 -1,946 193.7 93 104.4
Ordinary Income -8,277 -279.2 -2,135 251.1 14,112 654.9
Profit Attributable to
Owners of Parent-12,928 -422.7 -2,559 280.2 21,878 680.5
Q1ST 2021 Ending Feb. Q2ND 2021 Ending Feb. Q3RD 2021 Ending Feb.
■ Earnings improved quarter-by-quarter due to recovery of net sales and controlled earnings structure.
【Year-on-year change of net sales, gross profit, SG&A expenses by quarter】
Net salesNet sales of Q3 (Sep.-Nov.) improved arriving at 93.1% year on year. EC net sales in Japan remained favorable registering at 114.2% year on year.
Gross profit marginIt recovered to 91.7% year on year. We controlled selling price, cost by reducing purchases, discounts in check.
SG&A expensesWe made efforts to reduce fixed costs and costs were restrained more than a decrease in net sales.
Operating incomeWe achieved 2.1 billion yen.Lower revenue and higher profit were achieved arriving at 104.4% year on year on a 3-month basis.
Extraordinary incomeWe tranferrd a fixed assets for 1.8 billion yen.
4. Brands Overview(September to November)
6
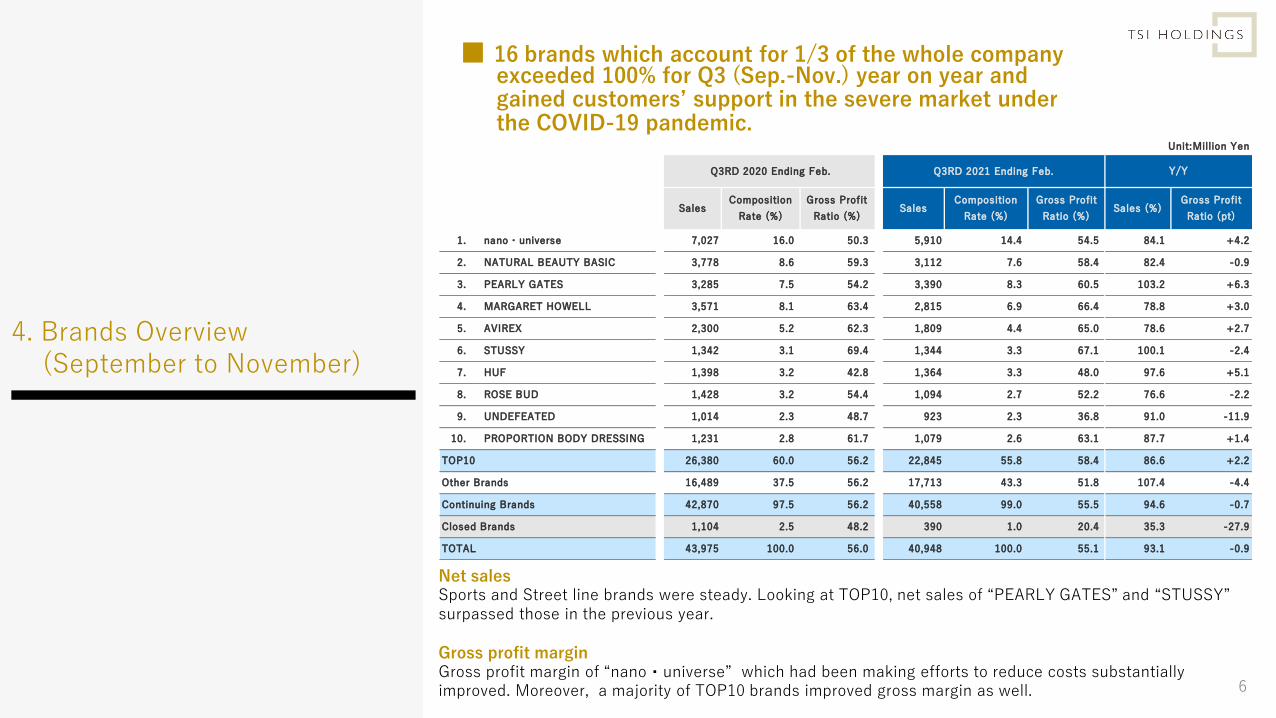
Unit:Million Yen
Q3RD 2020 Ending Feb. Q3RD 2021 Ending Feb.
1. nano・universe 7,027 16.0 50.3 5,910 14.4 54.5 84.1 +4.2
2. NATURAL BEAUTY BASIC 3,778 8.6 59.3 3,112 7.6 58.4 82.4 -0.9
3. PEARLY GATES 3,285 7.5 54.2 3,390 8.3 60.5 103.2 +6.3
4. MARGARET HOWELL 3,571 8.1 63.4 2,815 6.9 66.4 78.8 +3.0
5. AVIREX 2,300 5.2 62.3 1,809 4.4 65.0 78.6 +2.7
6. STUSSY 1,342 3.1 69.4 1,344 3.3 67.1 100.1 -2.4
7. HUF 1,398 3.2 42.8 1,364 3.3 48.0 97.6 +5.1
8. ROSE BUD 1,428 3.2 54.4 1,094 2.7 52.2 76.6 -2.2
9. UNDEFEATED 1,014 2.3 48.7 923 2.3 36.8 91.0 -11.9
10. PROPORTION BODY DRESSING 1,231 2.8 61.7 1,079 2.6 63.1 87.7 +1.4
TOP10 26,380 60.0 56.2 22,845 55.8 58.4 86.6 +2.2
Other Brands 16,489 37.5 56.2 17,713 43.3 51.8 107.4 -4.4
Continuing Brands 42,870 97.5 56.2 40,558 99.0 55.5 94.6 -0.7
Closed Brands 1,104 2.5 48.2 390 1.0 20.4 35.3 -27.9
TOTAL 43,975 100.0 56.0 40,948 100.0 55.1 93.1 -0.9
Y/Y
SalesComposition
Rate (%)
Gross Profit
Ratio (%)Sales
Composition
Rate (%)
Gross Profit
Ratio (%)Sales (%)
Gross Profit
Ratio (pt)
Net sales Sports and Street line brands were steady. Looking at TOP10, net sales of “PEARLY GATES” and “STUSSY” surpassed those in the previous year.
Gross profit margin Gross profit margin of “nano・universe” which had been making efforts to reduce costs substantially improved. Moreover, a majority of TOP10 brands improved gross margin as well.
■ 16 brands which account for 1/3 of the whole company exceeded 100% for Q3 (Sep.-Nov.) year on year and gained customers’ support in the severe market under the COVID-19 pandemic.
7
Higher revenue/higher profit
Lower revenue/higher profit
Men
’ s/L
ad
ies
Higher revenue/lower profit
Sp
orts
Stre
et
Men
’ s/L
ad
ies
Ou
tdoor
Sp
orts
Stre
et
Lad
ies
Cosm
etics
/oth
ers
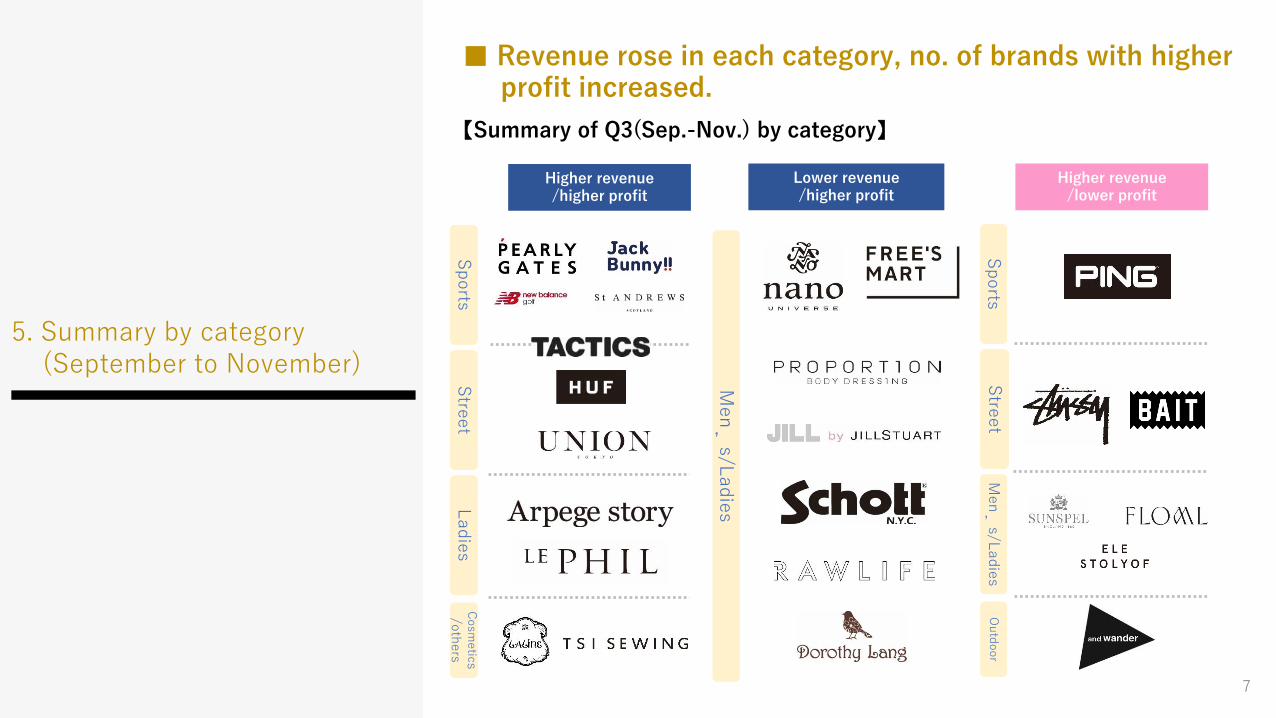
■ Revenue rose in each category, no. of brands with higher profit increased.
【Summary of Q3(Sep.-Nov.) by category】
5. Summary by category(September to November)
Cumulative Q3RD 2020
Ending Feb.
Composition Rate
Y/Y Change
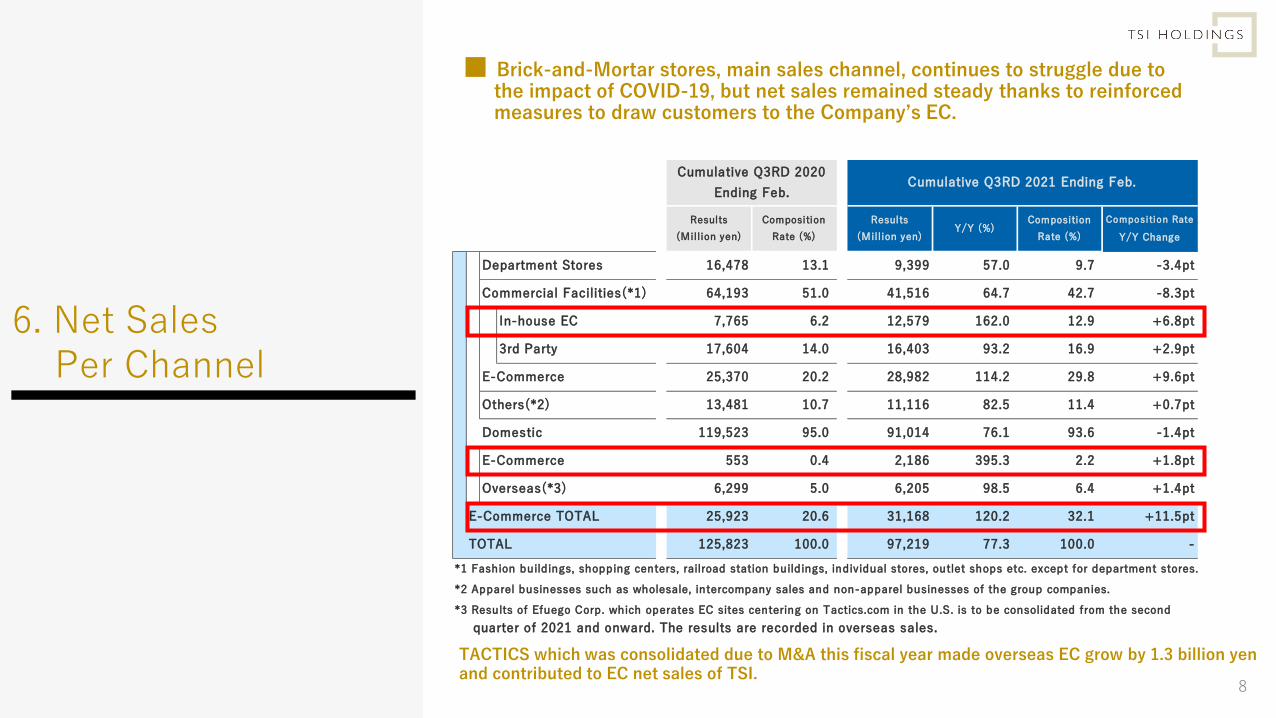
Department Stores 16,478 13.1 9,399 57.0 9.7 -3.4pt
Commercial Facilities(*1) 64,193 51.0 41,516 64.7 42.7 -8.3pt
In-house EC 7,765 6.2 12,579 162.0 12.9 +6.8pt
3rd Party 17,604 14.0 16,403 93.2 16.9 +2.9pt
E-Commerce 25,370 20.2 28,982 114.2 29.8 +9.6pt
Others(*2) 13,481 10.7 11,116 82.5 11.4 +0.7pt
Domestic 119,523 95.0 91,014 76.1 93.6 -1.4pt
E-Commerce 553 0.4 2,186 395.3 2.2 +1.8pt
Overseas(*3) 6,299 5.0 6,205 98.5 6.4 +1.4pt
E-Commerce TOTAL 25,923 20.6 31,168 120.2 32.1 +11.5pt
TOTAL 125,823 100.0 97,219 77.3 100.0 -
*1 Fashion buildings, shopping centers, railroad station buildings, individual stores, outlet shops etc. except for department stores.
*2 Apparel businesses such as wholesale, intercompany sales and non-apparel businesses of the group companies.
*3 Results of Efuego Corp. which operates EC sites centering on Tactics.com in the U.S. is to be consolidated from the second
quarter of 2021 and onward. The results are recorded in overseas sales.
Results
(Million yen)
Composition
Rate (%)
Cumulative Q3RD 2021 Ending Feb.
Results
(Million yen)Y/Y (%)
Composition
Rate (%)
8
6. Net Sales Per Channel
■ Brick-and-Mortar stores, main sales channel, continues to struggle due to the impact of COVID-19, but net sales remained steady thanks to reinforced measures to draw customers to the Company’s EC.
TACTICS which was consolidated due to M&A this fiscal year made overseas EC grow by 1.3 billion yen and contributed to EC net sales of TSI.
7. Sales of In-house EC
9
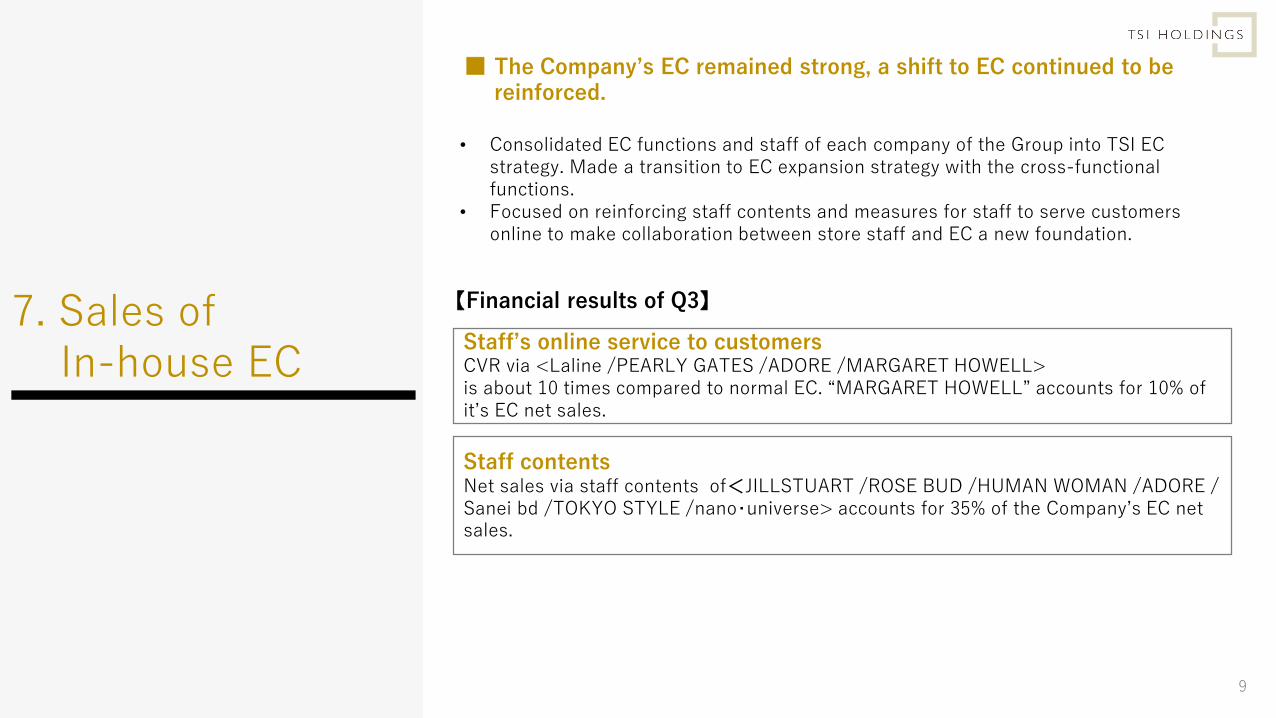
• Consolidated EC functions and staff of each company of the Group into TSI EC strategy. Made a transition to EC expansion strategy with the cross-functional functions.
• Focused on reinforcing staff contents and measures for staff to serve customers online to make collaboration between store staff and EC a new foundation.
■ The Company’s EC remained strong, a shift to EC continued to be reinforced.
Staff’s online service to customers CVR via <Laline /PEARLY GATES /ADORE /MARGARET HOWELL>is about 10 times compared to normal EC. “MARGARET HOWELL” accounts for 10% of it’s EC net sales.
【Financial results of Q3】
Staff contents Net sales via staff contents of<JILLSTUART /ROSE BUD /HUMAN WOMAN /ADORE /Sanei bd /TOKYO STYLE /nano・universe> accounts for 35% of the Company’s EC net sales.
8. Consolidated Financial Highlights -Balance sheet-
10
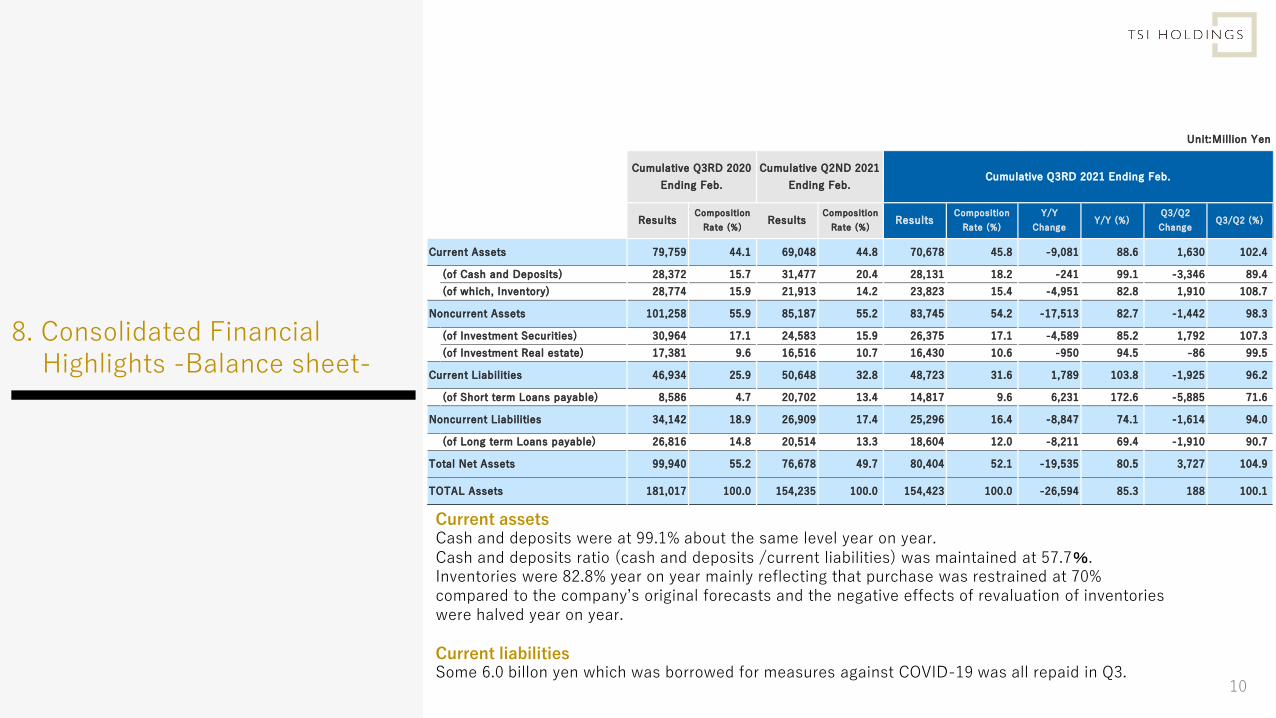
Current assetsCash and deposits were at 99.1% about the same level year on year. Cash and deposits ratio (cash and deposits /current liabilities) was maintained at 57.7%. Inventories were 82.8% year on year mainly reflecting that purchase was restrained at 70% compared to the company’s original forecasts and the negative effects of revaluation of inventories were halved year on year.
Current liabilitiesSome 6.0 billon yen which was borrowed for measures against COVID-19 was all repaid in Q3.
Unit:Million Yen
Cumulative Q3RD 2020
Ending Feb.
Cumulative Q2ND 2021
Ending Feb.Cumulative Q3RD 2021 Ending Feb.
Current Assets 79,759 44.1 69,048 44.8 70,678 45.8 -9,081 88.6 1,630 102.4
(of Cash and Deposits) 28,372 15.7 31,477 20.4 28,131 18.2 -241 99.1 -3,346 89.4
(of which, Inventory) 28,774 15.9 21,913 14.2 23,823 15.4 -4,951 82.8 1,910 108.7
Noncurrent Assets 101,258 55.9 85,187 55.2 83,745 54.2 -17,513 82.7 -1,442 98.3
(of Investment Securities) 30,964 17.1 24,583 15.9 26,375 17.1 -4,589 85.2 1,792 107.3
(of Investment Real estate) 17,381 9.6 16,516 10.7 16,430 10.6 -950 94.5 -86 99.5
Current Liabilities 46,934 25.9 50,648 32.8 48,723 31.6 1,789 103.8 -1,925 96.2
(of Short term Loans payable) 8,586 4.7 20,702 13.4 14,817 9.6 6,231 172.6 -5,885 71.6
Noncurrent Liabilities 34,142 18.9 26,909 17.4 25,296 16.4 -8,847 74.1 -1,614 94.0
(of Long term Loans payable) 26,816 14.8 20,514 13.3 18,604 12.0 -8,211 69.4 -1,910 90.7
Total Net Assets 99,940 55.2 76,678 49.7 80,404 52.1 -19,535 80.5 3,727 104.9
TOTAL Assets 181,017 100.0 154,235 100.0 154,423 100.0 -26,594 85.3 188 100.1
Q3/Q2
ChangeQ3/Q2 (%)
Y/Y
ChangeY/Y (%)Results
Composition
Rate (%)Results
Composition
Rate (%)Results
Composition
Rate (%)
11
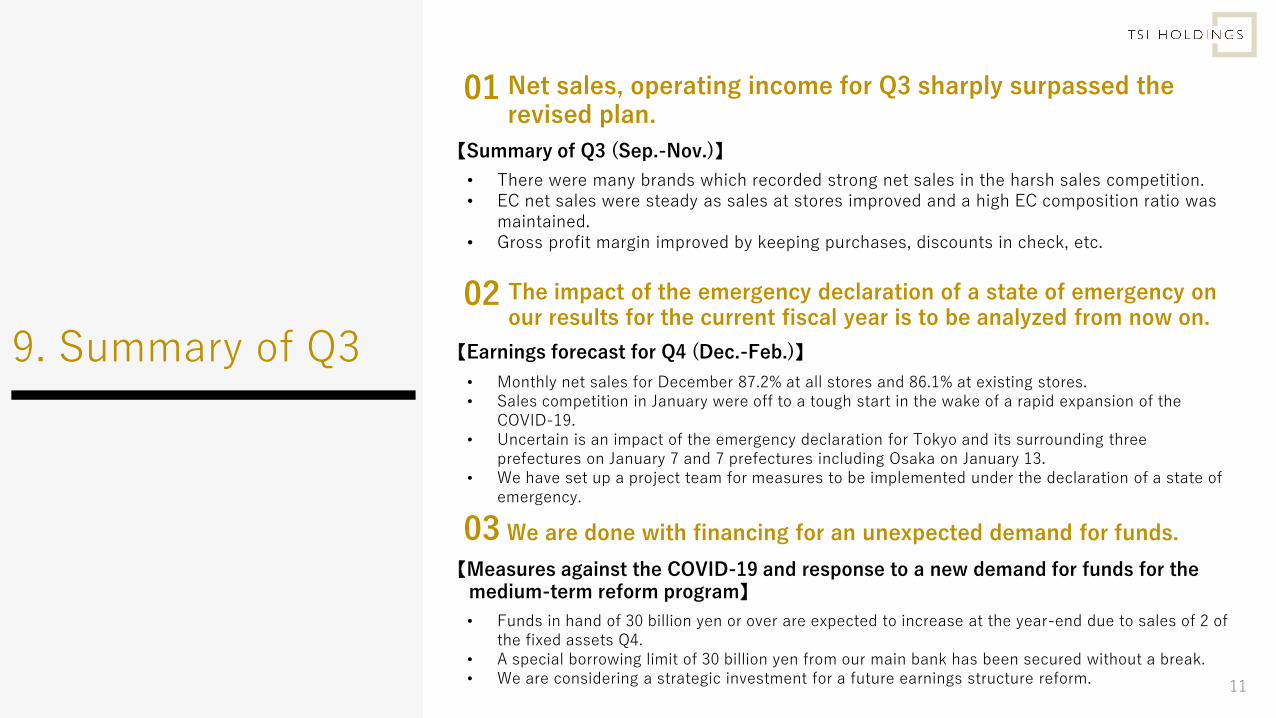
01 Net sales, operating income for Q3 sharply surpassed the revised plan.
【Summary of Q3 (Sep.-Nov.)】
02 The impact of the emergency declaration of a state of emergency on our results for the current fiscal year is to be analyzed from now on.
【Earnings forecast for Q4 (Dec.-Feb.)】
• There were many brands which recorded strong net sales in the harsh sales competition. • EC net sales were steady as sales at stores improved and a high EC composition ratio was
maintained. • Gross profit margin improved by keeping purchases, discounts in check, etc.
• Monthly net sales for December 87.2% at all stores and 86.1% at existing stores. • Sales competition in January were off to a tough start in the wake of a rapid expansion of the
COVID-19. • Uncertain is an impact of the emergency declaration for Tokyo and its surrounding three
prefectures on January 7 and 7 prefectures including Osaka on January 13. • We have set up a project team for measures to be implemented under the declaration of a state of
emergency.
03 We are done with financing for an unexpected demand for funds.
【Measures against the COVID-19 and response to a new demand for funds for the medium-term reform program】
• Funds in hand of 30 billion yen or over are expected to increase at the year-end due to sales of 2 of the fixed assets Q4.
• A special borrowing limit of 30 billion yen from our main bank has been secured without a break. • We are considering a strategic investment for a future earnings structure reform.
9. Summary of Q3

12
Ⅱ The progress of Medium-Term Reform programs
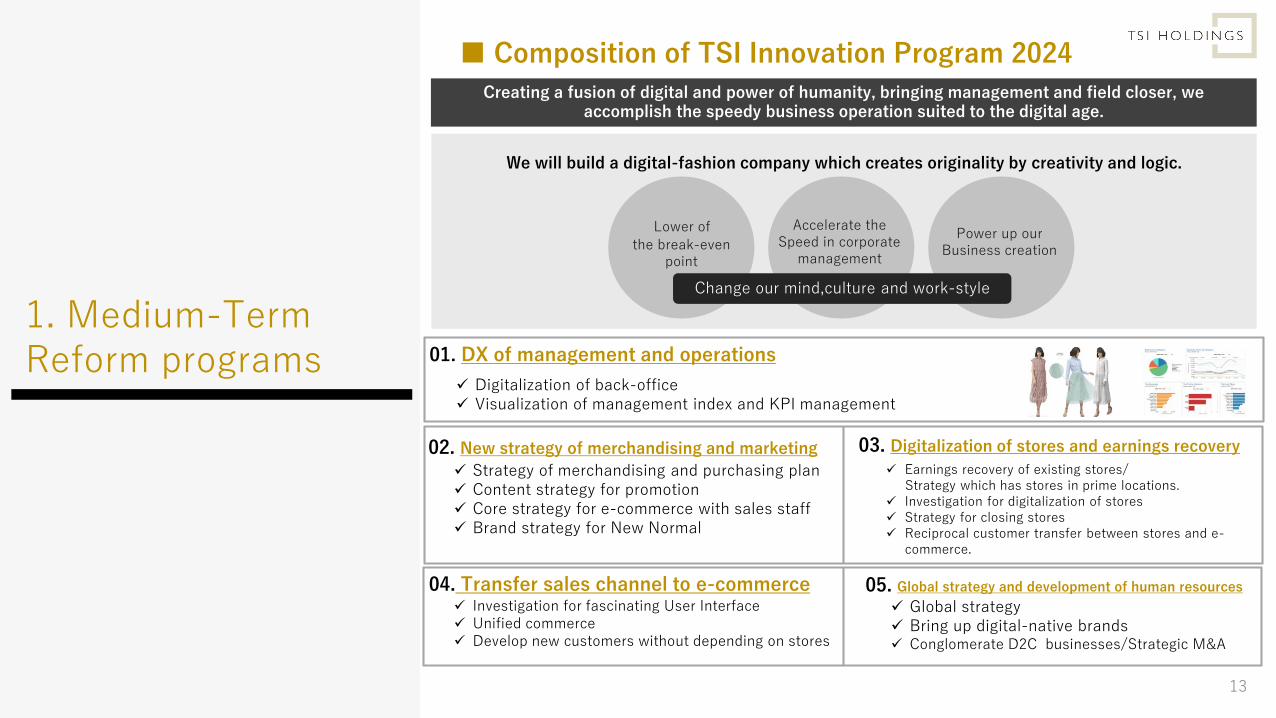
Creating a fusion of digital and power of humanity, bringing management and field closer, we accomplish the speedy business operation suited to the digital age.
Lower of
the break-evenpoint
Accelerate the Speed in corporate
management
We will build a digital-fashion company which creates originality by creativity and logic.
01. DX of management and operations
✓ Digitalization of back-office✓ Visualization of management index and KPI management
05. Global strategy and development of human resources
✓ Global strategy ✓ Bring up digital-native brands✓ Conglomerate D2C businesses/Strategic M&A
02. New strategy of merchandising and marketing
✓ Strategy of merchandising and purchasing plan✓ Content strategy for promotion✓ Core strategy for e-commerce with sales staff✓ Brand strategy for New Normal
03. Digitalization of stores and earnings recovery
✓ Earnings recovery of existing stores/Strategy which has stores in prime locations.
✓ Investigation for digitalization of stores✓ Strategy for closing stores✓ Reciprocal customer transfer between stores and e-
commerce.
✓ Investigation for fascinating User Interface ✓ Unified commerce✓ Develop new customers without depending on stores
04. Transfer sales channel to e-commerce
Power up our Business creation
Change our mind,culture and work-style
1. Medium-TermReform programs
■ Composition of TSI Innovation Program 2024
13
14
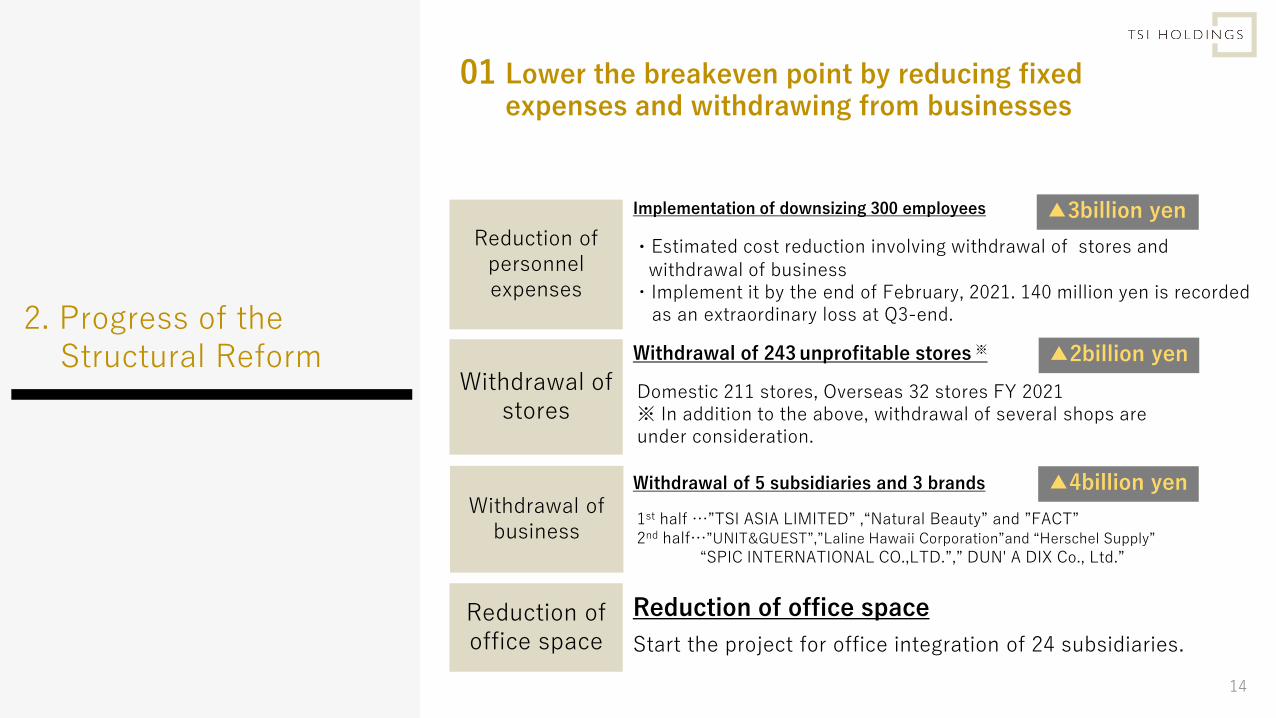
Reduction of personnel expenses
Withdrawal of stores
Withdrawal of business
Reduction of office space
Implementation of downsizing 300 employees
Withdrawal of 243 unprofitable stores ※
・Estimated cost reduction involving withdrawal of stores andwithdrawal of business
・Implement it by the end of February, 2021. 140 million yen is recorded as an extraordinary loss at Q3-end.
Withdrawal of 5 subsidiaries and 3 brands
Reduction of office space
Start the project for office integration of 24 subsidiaries.
Domestic 211 stores, Overseas 32 stores FY 2021※ In addition to the above, withdrawal of several shops are under consideration.
1st half …”TSI ASIA LIMITED” ,“Natural Beauty” and ”FACT”2nd half…”UNIT&GUEST”,”Laline Hawaii Corporation”and “Herschel Supply”
“SPIC INTERNATIONAL CO.,LTD.”,” DUN' A DIX Co., Ltd.”
▲2billion yen
▲3billion yen
▲4billion yen
01 Lower the breakeven point by reducing fixed expenses and withdrawing from businesses
2. Progress of the Structural Reform
15
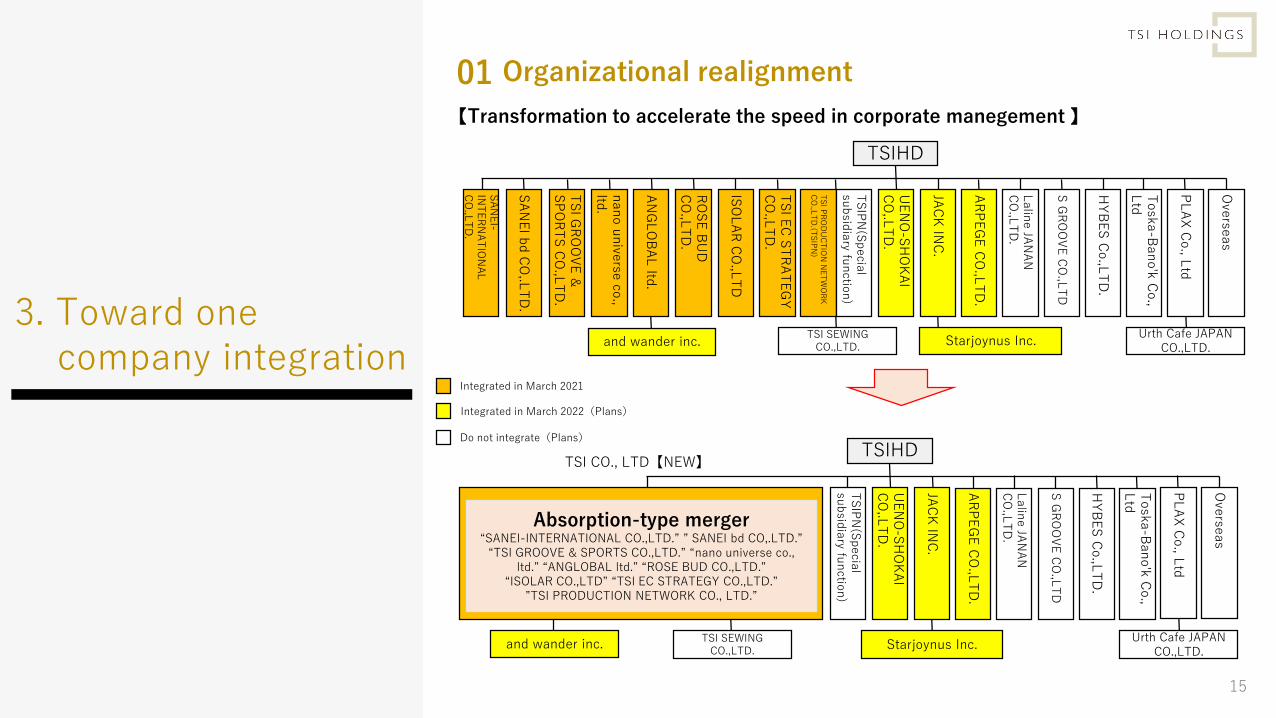
Integrated in March 2021
Integrated in March 2022(Plans)
Do not integrate(Plans)
TSI CO., LTD【NEW】
TSIHD
SA
NE
I-IN
TE
RN
AT
ION
AL
C
O.,L
TD
.
SA
NE
I bd
CO
,.LT
D.
TS
I GR
OO
VE
&
SP
OR
TS
CO
.,LT
D.
nan
ou
nive
rse c
o.,
ltd.
AN
GL
OB
AL
ltd.
RO
SE
BU
D
CO
.,LT
D.
ISO
LA
R C
O.,L
TD
TS
I EC
ST
RA
TE
GY
C
O.,L
TD
.
TS
I PR
OD
UC
TIO
N N
ET
WO
RK
C
O.,L
TD
.(TS
IPN
)
TS
IPN
(Sp
ecia
l su
bsid
iary fu
nctio
n)
UE
NO
-SH
OK
AI
CO
,.LT
D.
JAC
K IN
C.
AR
PE
GE
CO
.,LT
D.
Lalin
eJA
NA
N
CO
.,LT
D.
S G
RO
OV
E C
O.,L
TD
HY
BE
S C
o.,L
TD
.
Toska-B
an
o'k
Co.,
Ltd
PL
AX
Co., L
td
Ove
rseas
and wander inc.TSI SEWING
CO.,LTD.Starjoynus Inc.
Urth Cafe JAPAN CO.,LTD.
TSIHD
TS
IPN
(Sp
ecia
l su
bsid
iary fu
nctio
n)
UE
NO
-SH
OK
AI
CO
,.LT
D.
JAC
K IN
C.
AR
PE
GE
CO
.,LT
D.
Lalin
eJA
NA
N
CO
.,LT
D.
S G
RO
OV
E C
O.,L
TD
HY
BE
S C
o.,L
TD
.
Toska-B
an
o'k
Co.,
Ltd
PL
AX
Co., L
td
Ove
rseas
and wander inc.TSI SEWING
CO.,LTD.Starjoynus Inc.
Urth Cafe JAPAN CO.,LTD.
Absorption-type merger“SANEI-INTERNATIONAL CO.,LTD.” ” SANEI bd CO,.LTD.”
“TSI GROOVE & SPORTS CO.,LTD.” “nano universe co., ltd.” “ANGLOBAL ltd.” “ROSE BUD CO.,LTD.”
“ISOLAR CO.,LTD” “TSI EC STRATEGY CO.,LTD.” ”TSI PRODUCTION NETWORK CO., LTD.”
3. Toward onecompany integration
Organizational realignment01【Transformation to accelerate the speed in corporate manegement 】
16
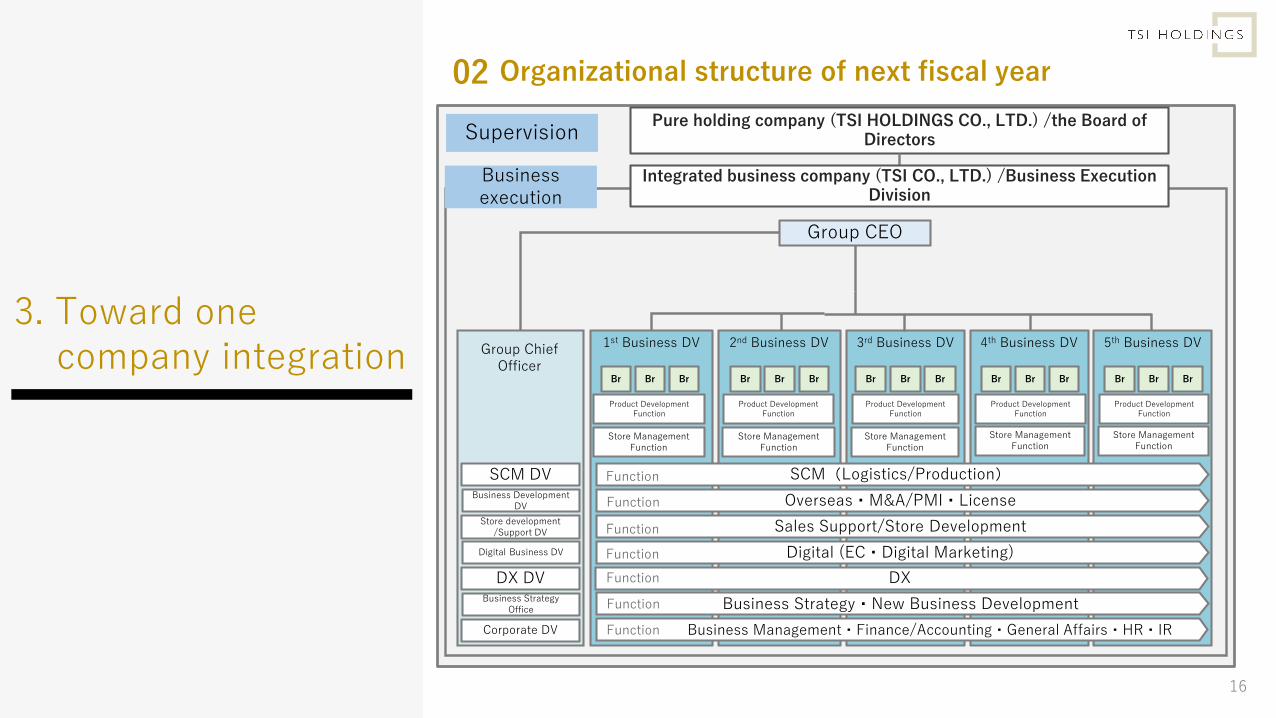
02 Organizational structure of next fiscal year
Pure holding company (TSI HOLDINGS CO., LTD.) /the Board of Directors
1st Business DV 2nd Business DV 3rd Business DV 4th Business DV
Product Development Function
Br Br BrBr Br Br Br Br Br
Product Development Function
Product Development Function
Product Development Function
DX DV
SCM DV
Digital Business DV
Store development/Support DV
Group Chief Officer
Business execution
Br Br Br
Integrated business company (TSI CO., LTD.) /Business Execution Division
Corporate DV
Store Management Function
Store Management Function
Store Management Function
Store Management Function
Supervision
Group CEO
5th Business DV
Br Br Br
Product Development Function
Store Management Function
DX
Sales Support/Store Development
Digital (EC・Digital Marketing)
SCM(Logistics/Production)
Business Management・Finance/Accounting・General Affairs・HR・IR
Function
Function
Function
Function
Function
Overseas・M&A/PMI・LicenseFunctionBusiness Development
DV
Business Strategy Office Business Strategy・New Business DevelopmentFunction
3. Toward onecompany integration
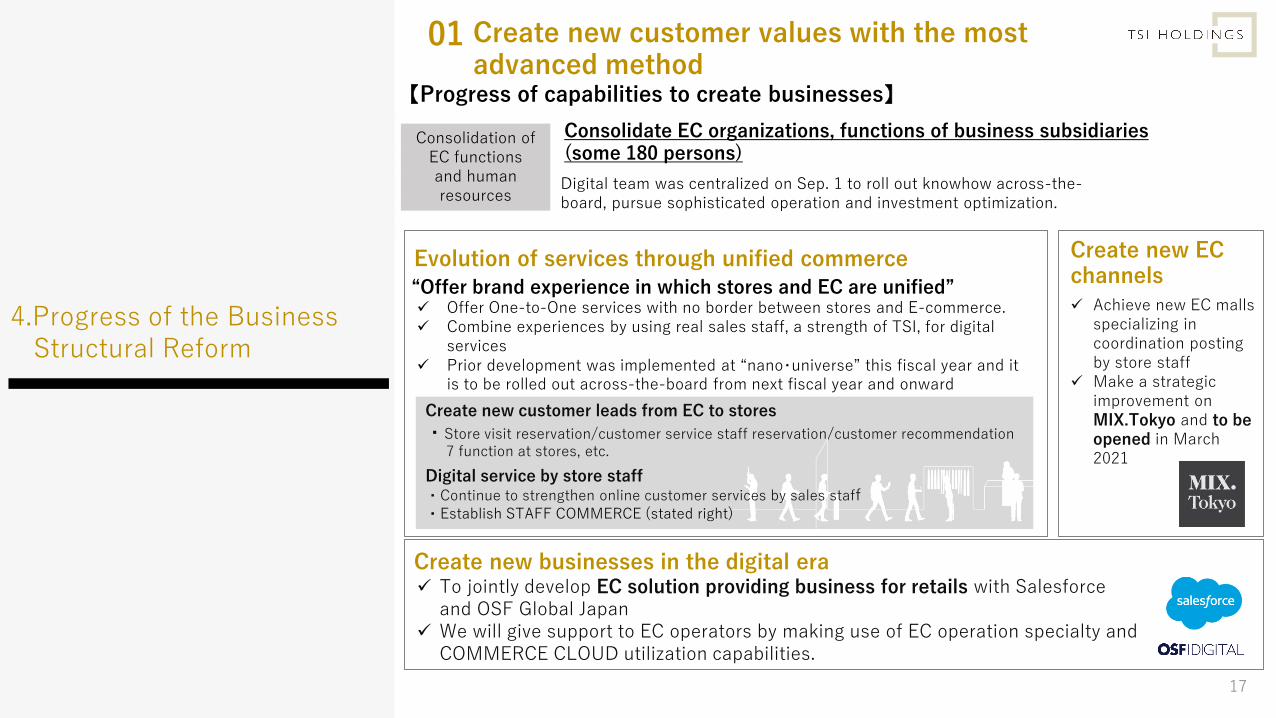
01 Create new customer values with the most advanced method
Evolution of services through unified commerce Create new EC channels
✓ Achieve new EC malls specializing in coordination posting by store staff
✓ Make a strategic improvement on MIX.Tokyo and to be opened in March 2021
“Offer brand experience in which stores and EC are unified” ✓ Offer One-to-One services with no border between stores and E-commerce.✓ Combine experiences by using real sales staff, a strength of TSI, for digital
services✓ Prior development was implemented at “nano・universe” this fiscal year and it
is to be rolled out across-the-board from next fiscal year and onward
Create new customer leads from EC to stores
・Store visit reservation/customer service staff reservation/customer recommendation 7 function at stores, etc.
Digital service by store staff ・Continue to strengthen online customer services by sales staff ・Establish STAFF COMMERCE (stated right)
Create new businesses in the digital era ✓ To jointly develop EC solution providing business for retails with Salesforce
and OSF Global Japan✓ We will give support to EC operators by making use of EC operation specialty and
COMMERCE CLOUD utilization capabilities.
【Progress of capabilities to create businesses】
4.Progress of the Business Structural Reform
17
Consolidate EC organizations, functions of business subsidiaries (some 180 persons)
Digital team was centralized on Sep. 1 to roll out knowhow across-the-board, pursue sophisticated operation and investment optimization.
Consolidation of EC functions and human resources
18
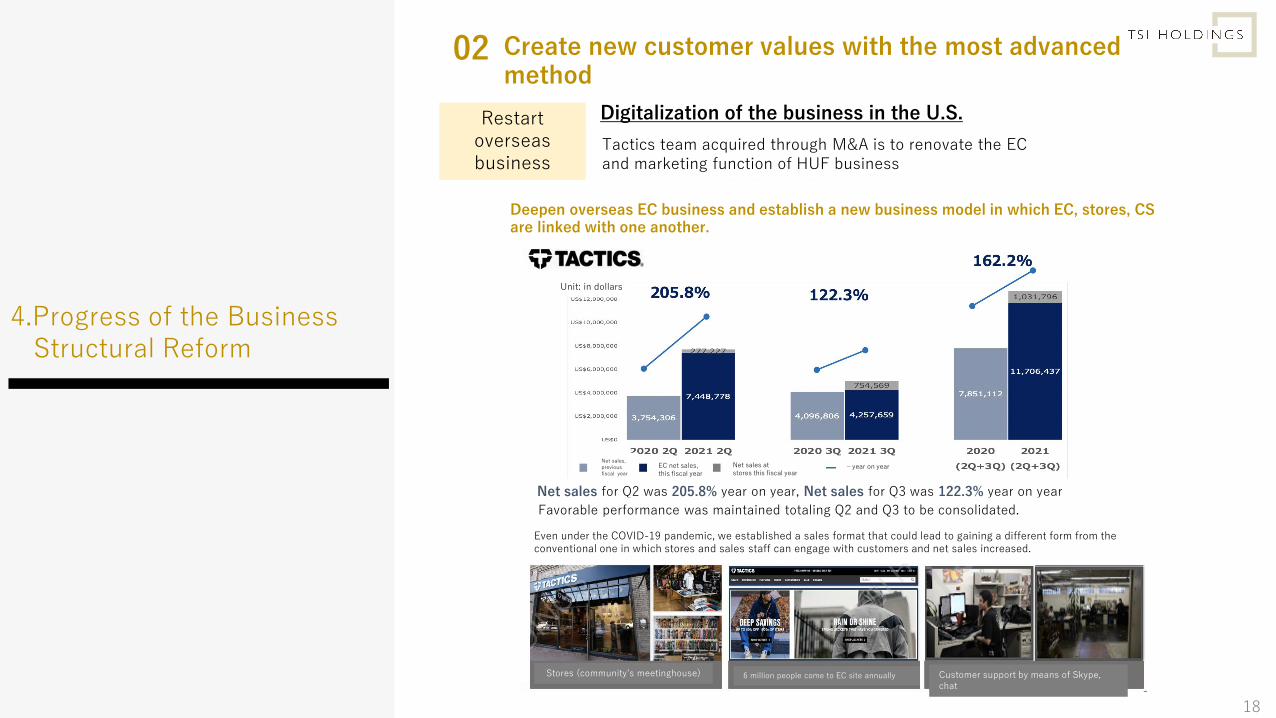
02 Create new customer values with the most advanced method
Digitalization of the business in the U.S.
Tactics team acquired through M&A is to renovate the EC and marketing function of HUF business
Deepen overseas EC business and establish a new business model in which EC, stores, CS are linked with one another.
Net sales for Q2 was 205.8% year on year, Net sales for Q3 was 122.3% year on year
Favorable performance was maintained totaling Q2 and Q3 to be consolidated.
Even under the COVID-19 pandemic, we established a sales format that could lead to gaining a different form from the conventional one in which stores and sales staff can engage with customers and net sales increased.
Stores (community’s meetinghouse) 6 million people come to EC site annually Customer support by means of Skype, chat
Unit: in dollars
Net sales, previous fiscal year
EC net sales, this fiscal year
Net sales at stores this fiscal year
– year on year
Restart overseas business
4.Progress of the Business Structural Reform
19
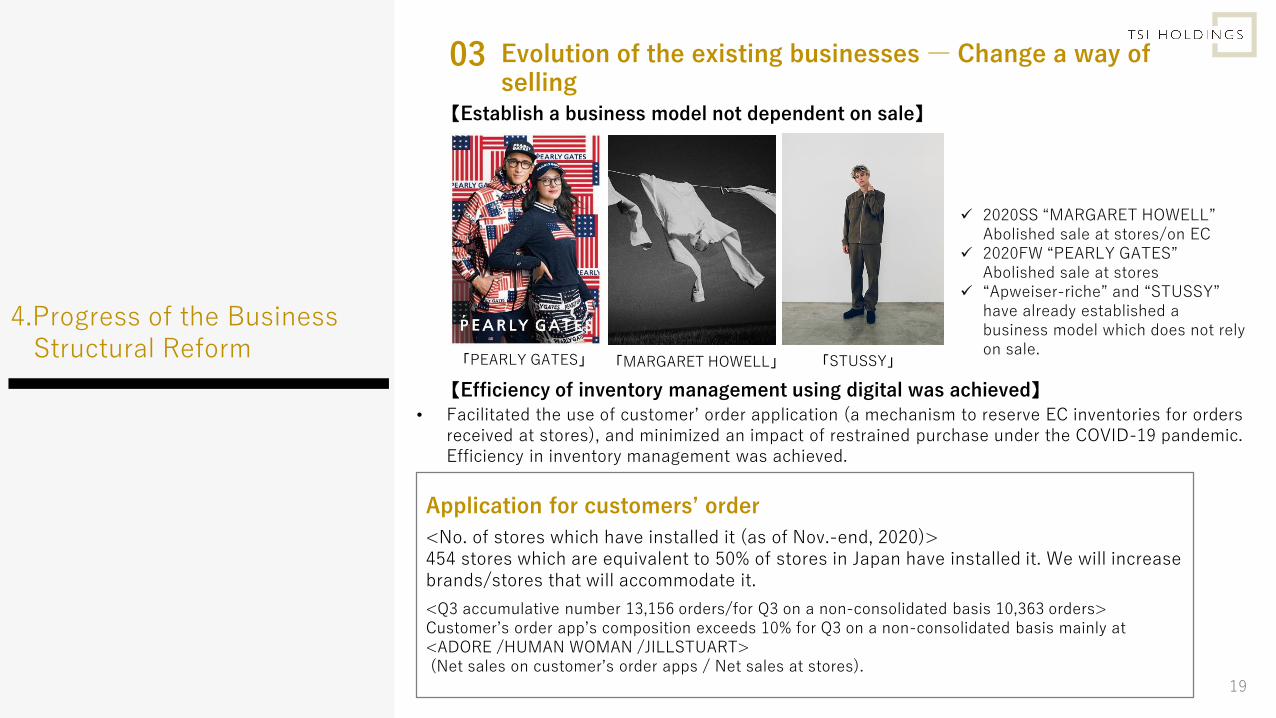
【Establish a business model not dependent on sale】
Application for customers’ order
<No. of stores which have installed it (as of Nov.-end, 2020)>454 stores which are equivalent to 50% of stores in Japan have installed it. We will increase brands/stores that will accommodate it.
<Q3 accumulative number 13,156 orders/for Q3 on a non-consolidated basis 10,363 orders>Customer’s order app’s composition exceeds 10% for Q3 on a non-consolidated basis mainly at <ADORE /HUMAN WOMAN /JILLSTUART>(Net sales on customer’s order apps / Net sales at stores).
【Efficiency of inventory management using digital was achieved】
「PEARLY GATES」 「MARGARET HOWELL」 「STUSSY」
✓ 2020SS “MARGARET HOWELL” Abolished sale at stores/on EC
✓ 2020FW “PEARLY GATES” Abolished sale at stores
✓ “Apweiser-riche” and “STUSSY” have already established a business model which does not rely on sale.
03 Evolution of the existing businesses ― Change a way of selling
• Facilitated the use of customer’ order application (a mechanism to reserve EC inventories for orders received at stores), and minimized an impact of restrained purchase under the COVID-19 pandemic. Efficiency in inventory management was achieved.
4.Progress of the Business Structural Reform
20
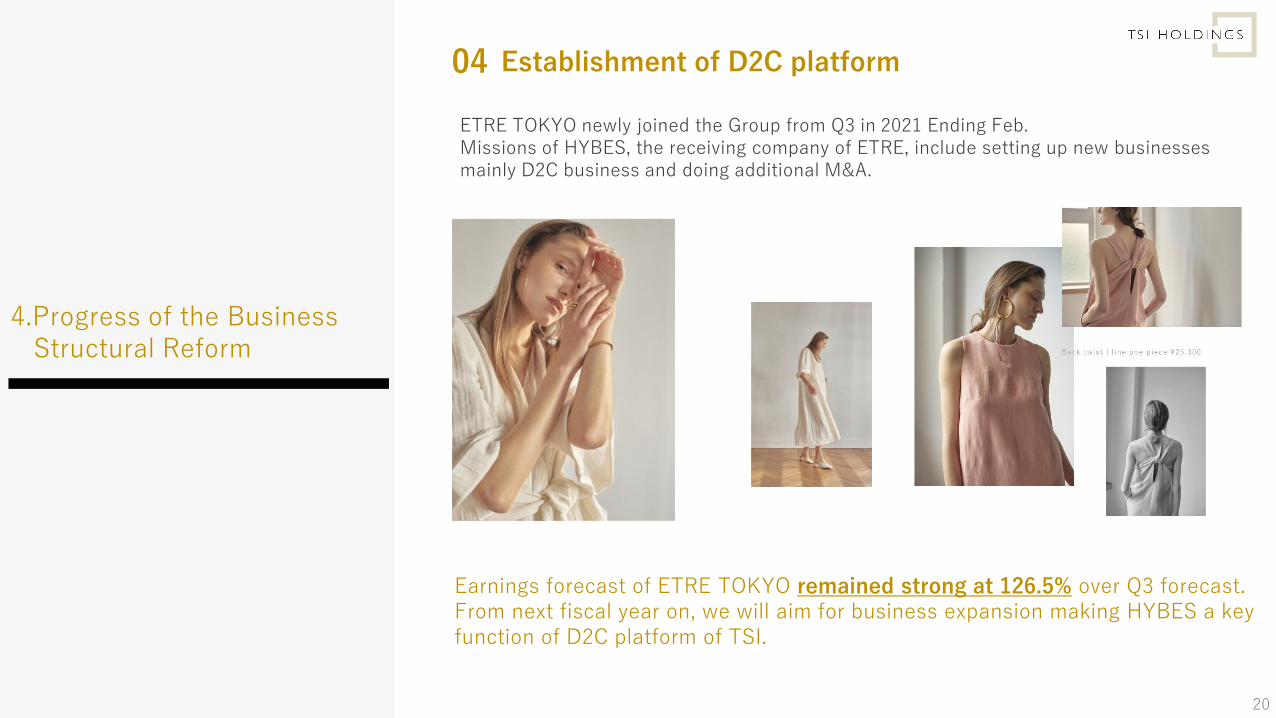
ETRE TOKYO newly joined the Group from Q3 in 2021 Ending Feb. Missions of HYBES, the receiving company of ETRE, include setting up new businesses mainly D2C business and doing additional M&A.
04 Establishment of D2C platform
Earnings forecast of ETRE TOKYO remained strong at 126.5% over Q3 forecast.From next fiscal year on, we will aim for business expansion making HYBES a key function of D2C platform of TSI.
4.Progress of the Business Structural Reform
5.Conclusion
21
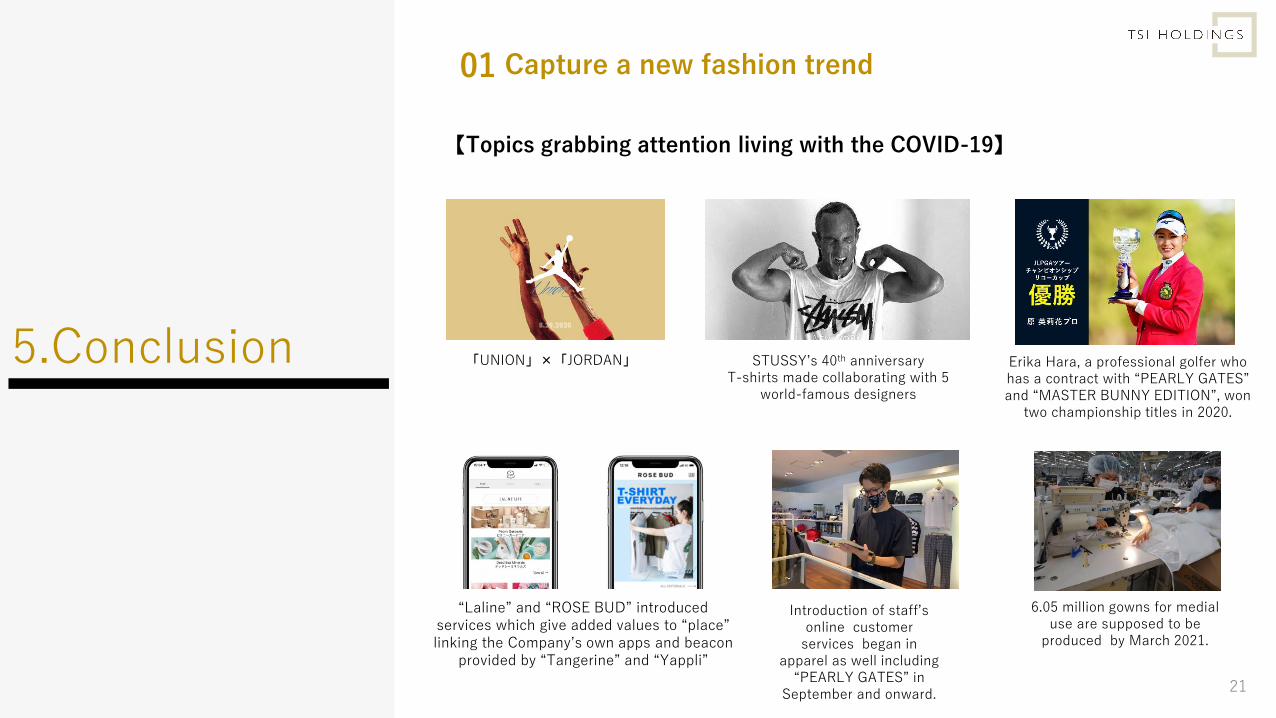
Erika Hara, a professional golfer who has a contract with “PEARLY GATES”and “MASTER BUNNY EDITION”, won
two championship titles in 2020.
「UNION」×「JORDAN」
“Laline” and “ROSE BUD” introduced services which give added values to “place” linking the Company’s own apps and beacon
provided by “Tangerine” and “Yappli”
STUSSY’s 40th anniversary T-shirts made collaborating with 5
world-famous designers
Introduction of staff’s online customer
services began in apparel as well including
“PEARLY GATES” in September and onward.
Capture a new fashion trend01
【Topics grabbing attention living with the COVID-19】
6.05 million gowns for medial use are supposed to be
produced by March 2021.
22
Severe market environment is expected to continue. 02
Lowering the breakeven point is progressing steadily.
04 We began to establish a new business model with lower revenue and higher profit.
03 Pursue speedy business management.
We are to analyze the impact of the declaration of a state of emergency on our results for the current fiscal year from now on.
As for our forecasts this fiscal year, we plan to maintain the disclosed figures in Q2.
Eliminate overlaps of the headquarters’ organization by establishing a new organizational structure based on one company integration.
Increase profitability with two perspectives of business and function through the CXO structure.
A line of strong brands emerged even under the COVID-19 pandemic, and strategies became clear.
5.Conclusion
23
Ⅲ Reference Data
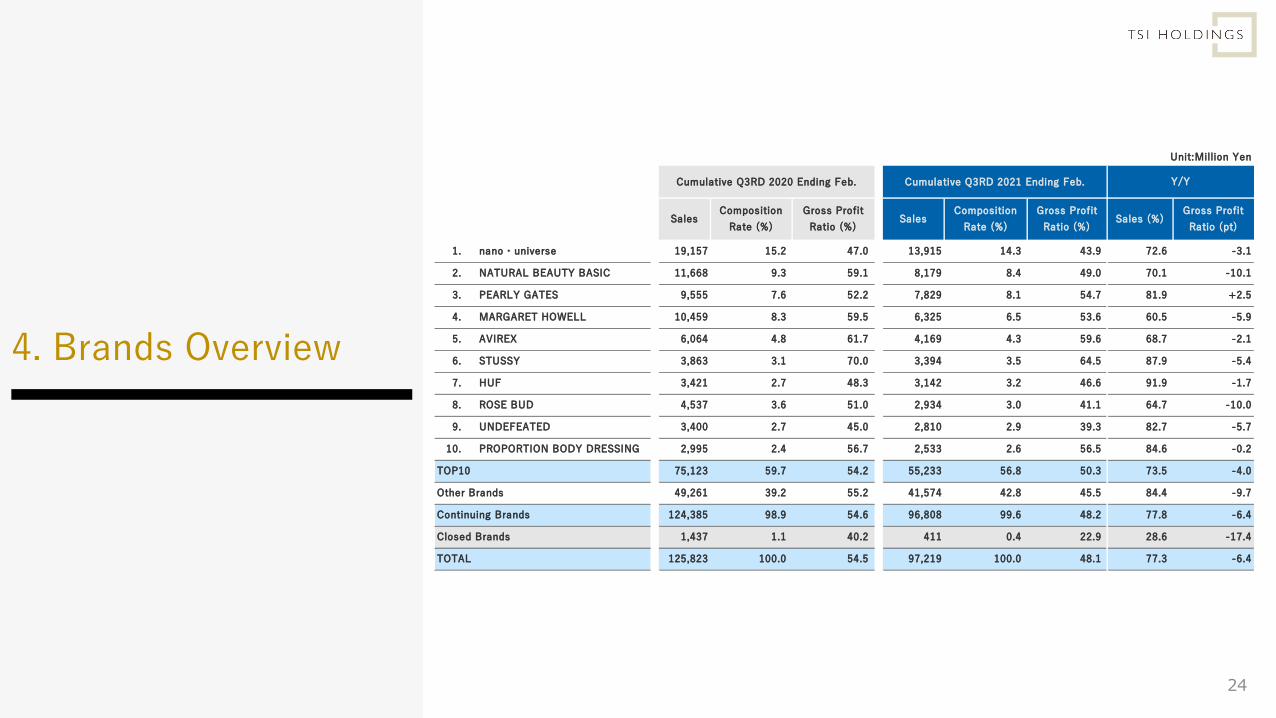
4. Brands Overview
24
Unit:Million Yen
Cumulative Q3RD 2020 Ending Feb. Cumulative Q3RD 2021 Ending Feb.
1. nano・universe 19,157 15.2 47.0 13,915 14.3 43.9 72.6 -3.1
2. NATURAL BEAUTY BASIC 11,668 9.3 59.1 8,179 8.4 49.0 70.1 -10.1
3. PEARLY GATES 9,555 7.6 52.2 7,829 8.1 54.7 81.9 +2.5
4. MARGARET HOWELL 10,459 8.3 59.5 6,325 6.5 53.6 60.5 -5.9
5. AVIREX 6,064 4.8 61.7 4,169 4.3 59.6 68.7 -2.1
6. STUSSY 3,863 3.1 70.0 3,394 3.5 64.5 87.9 -5.4
7. HUF 3,421 2.7 48.3 3,142 3.2 46.6 91.9 -1.7
8. ROSE BUD 4,537 3.6 51.0 2,934 3.0 41.1 64.7 -10.0
9. UNDEFEATED 3,400 2.7 45.0 2,810 2.9 39.3 82.7 -5.7
10. PROPORTION BODY DRESSING 2,995 2.4 56.7 2,533 2.6 56.5 84.6 -0.2
TOP10 75,123 59.7 54.2 55,233 56.8 50.3 73.5 -4.0
Other Brands 49,261 39.2 55.2 41,574 42.8 45.5 84.4 -9.7
Continuing Brands 124,385 98.9 54.6 96,808 99.6 48.2 77.8 -6.4
Closed Brands 1,437 1.1 40.2 411 0.4 22.9 28.6 -17.4
TOTAL 125,823 100.0 54.5 97,219 100.0 48.1 77.3 -6.4
Y/Y
Gross Profit
Ratio (%)Sales (%)
Gross Profit
Ratio (pt)Sales
Composition
Rate (%)
Gross Profit
Ratio (%)Sales
Composition
Rate (%)
25
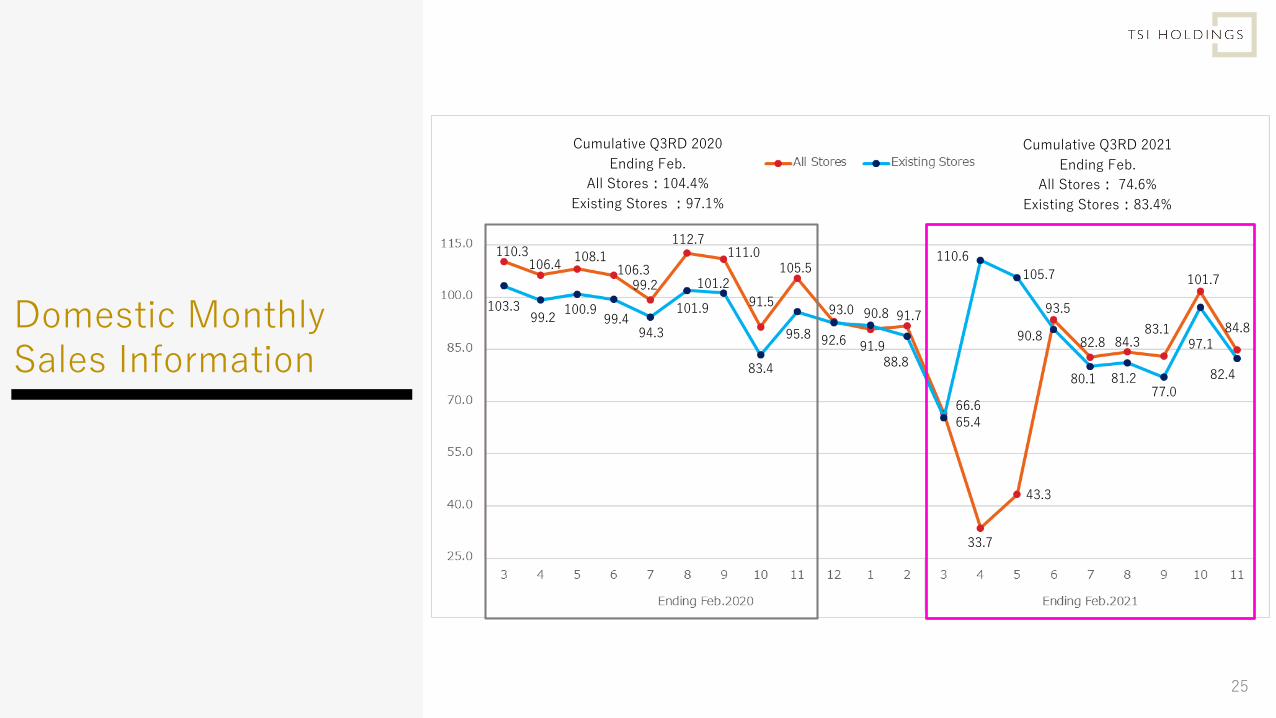
Domestic Monthly Sales Information
Cumulative Q3RD 2020
Ending Feb.
All Stores:104.4%
Existing Stores :97.1%
Cumulative Q3RD 2021
Ending Feb.
All Stores: 74.6%
Existing Stores:83.4%
110.3106.4
108.1106.3
99.2
112.7111.0
91.5
105.5
93.0 90.8 91.7
66.6
33.7
43.3
103.399.2
100.999.4
94.3
101.9
101.2
83.4
95.8 92.6 91.988.8
65.4
110.6
105.7
93.5
82.8
80.1
84.3
81.2
90.883.1
77.0
101.7
97.184.8
82.4
26
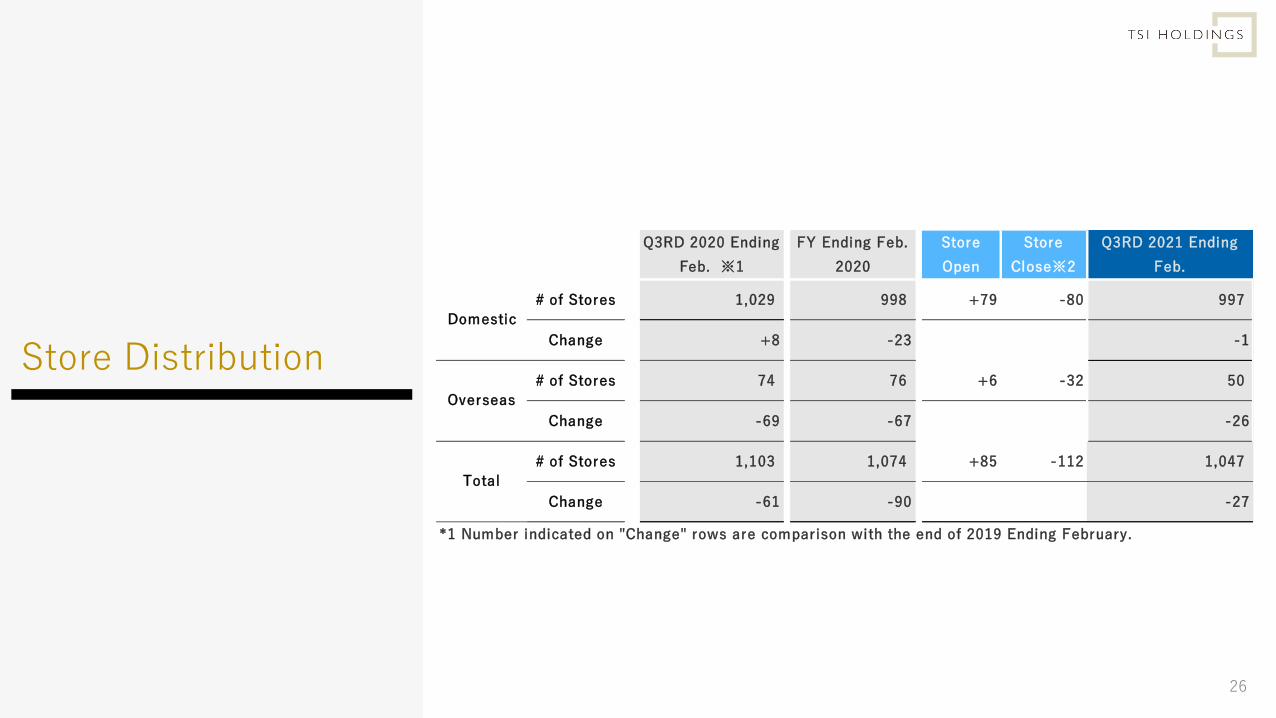
Store Distribution
Q3RD 2020 Ending
Feb. ※1
FY Ending Feb.
2020
Store
Open
Store
Close※2
Q3RD 2021 Ending
Feb.
# of Stores 1,029 998 +79 -80 997
Change +8 -23 -1
# of Stores 74 76 +6 -32 50
Change -69 -67 -26
# of Stores 1,103 1,074 +85 -112 1,047
Change -61 -90 -27
*1 Number indicated on "Change" rows are comparison with the end of 2019 Ending February.
Domestic
Overseas
Total
27
Descriptions about future within this document are based on the information
that the company obtains on the date of this report and certain assumptions
deemed to be reasonable. Actual earnings may differ materially from various
future factors.
Disclaimer