Purine Nucleoside Analog - Sulfinosine Modulates Diverse Mechanisms of Cancer Progression in...
15
Purine Nucleoside Analog - Sulfinosine Modulates Diverse Mechanisms of Cancer Progression in Multi-Drug Resistant Cancer Cell Lines Mirjana Dac ˇevic ´ 1 , Aleksandra Isakovic ´ 1 , Ana Podolski-Renic ´ 2 , Andelka M. Isakovic ´ 1 , Tijana Stankovic ´ 2 , Zorica Milos ˇevic ´ 2 , Ljubisav Rakic ´ 3 , Sabera Ruz ˇdijic ´ 2 , Milica Pes ˇic ´ 2 * 1 Faculty of Medicine, University of Belgrade, Doktora Subotic ´a 8, Belgrade, Serbia, 2 Institute for Biological Research, Department of Neurobiology, University of Belgrade, Bulevar Despota Stefana 142, Belgrade, Serbia, 3 Serbian Academy of Sciences and Arts, Knez Mihailova 35, Belgrade, Serbia Abstract Achieving an effective treatment of cancer is difficult, particularly when resistance to conventional chemotherapy is developed. P-glycoprotein (P-gp) activity governs multi-drug resistance (MDR) development in different cancer cell types. Identification of anti-cancer agents with the potential to kill cancer cells and at the same time inhibit MDR is important to intensify the search for novel therapeutic approaches. We examined the effects of sulfinosine (SF), a quite unexplored purine nucleoside analog, in MDR (P-gp over-expressing) non-small cell lung carcinoma (NSCLC) and glioblastoma cell lines (NCI-H460/R and U87-TxR, respectively). SF showed the same efficacy against MDR cancer cell lines and their sensitive counterparts. However, it was non-toxic for normal human keratinocytes (HaCaT). SF induced caspase-dependent apoptotic cell death and autophagy in MDR cancer cells. After SF application, reactive oxygen species (ROS) were generated and glutathione (GSH) concentration was decreased. The expression of key enzyme for GSH synthesis, gamma Glutamyl- cysteine-synthetase (cGCS) was decreased as well as the expression of gst-p mRNA. Consequently, SF significantly decreased the expression of hif-1a, mdr1 and vegf mRNAs even in hypoxic conditions. SF caused the inhibition of P-gp (coded by mdr1) expression and activity. The accumulation of standard chemotherapeutic agent – doxorubicin (DOX) was induced by SF in concentration- and time-dependent manner. The best effect of SF was obtained after 72 h when it attained the effect of known P-gp inhibitors (Dex-verapamil and tariquidar). Accordingly, SF sensitized the resistant cancer cells to DOX in subsequent treatment. Furthermore, SF decreased the experssion of vascular endothelial growth factor (VEGF) on mRNA and protein level and modulated its secretion. In conclusion, the effects on P-gp (implicated in pharmacokinetics and MDR), GSH (implicated in detoxification) and VEGF (implicated in tumor-angiogenesis and progression) qualify SF as multi-potent anti-cancer agent, which use must be considered, in particular for resistant malignancies. Citation: Dac ˇevic ´ M, Isakovic ´ A, Podolski-Renic ´ A, Isakovic ´ AM, Stankovic ´ T, et al. (2013) Purine Nucleoside Analog - Sulfinosine Modulates Diverse Mechanisms of Cancer Progression in Multi-Drug Resistant Cancer Cell Lines. PLoS ONE 8(1): e54044. doi:10.1371/journal.pone.0054044 Editor: Michihiko Kuwano, Kyushu University, Japan Received July 26, 2012; Accepted December 5, 2012; Published January 11, 2013 Copyright: ß 2013 Dac ˇevic ´ et al. This is an open-access article distributed under the terms of the Creative Commons Attribution License, which permits unrestricted use, distribution, and reproduction in any medium, provided the original author and source are credited. Funding: Ministry of Education, Science and Technological Development of Serbia (grant numbers III 41031 and III 41025) supported this research. The funders had no role in study design, data collection and analysis, decision to publish, or preparation of the manuscript. Competing Interests: The authors have declared that no competing interests exist. * E-mail: [email protected] Introduction Sulfinosine or SF (Figure 1, [R,S]-2-amino-9-b-D-ribofurano- sylpurine-6-sulfinamide) is the oxidized form of 6-thioguanosine [1]. It is a quite unexplored anti-cancer agent in comparison to other thiopurines (6-thioguanine and 6-mercaptopurine). SF inhibits cancer cell growth, at least partially, by the incorporation of its phosphorylated derivative into DNA. The metabolic conversion of SF to corresponding 59-monophosphate derivative is more complex than that of other thiopurines [2]. Since SF utilizes different metabolic pathways for its intracel- lular activation, SF treatment does not induce resistance in cancer cells. In contrast, the deletion of a single enzyme responsible for the metabolic activation of other purine nucleoside analogs is enough for the development of resistance. SF better penetrates the central nervous system (CNS) than its parental molecule - 6- thioguanosine and is more effective in cancer treatment. SF is useful against malignancies resistant to other thiopurines [3]. Despite limitations for their use, some purine analogs closely related to SF showed considerable anti-angiogenic activities that deserve scientific attention [4]. The metabolism of SF involves the cells’ glutathione system. SF readily adducts to sulfhydryl compounds (glutathione and cysteine) and by suppressing the glutathione detoxification system and elevating the concentration of reactive oxygen species (ROS), SF may induce the death of cancer cells [2]. In view of its considerable efficacy in cancer treatment and moderate toxicity to normal cells [2], SF is suitable for combining with other chemotherapeutic agents. SF acts synergistically with doxorubicin (DOX), curcumine (CUR) and verapamil (VER) in non-small cell lung cancer (NSCLC) cell lines [5–7]. The effectiveness of the combined application with SF allowed the use of these drugs at lower concentrations that are less toxic with fewer adverse effects. We hypothesized that all mentioned anti- cancer effects of SF could be useful for the reversion of resistance to chemotherapeutics. PLOS ONE | www.plosone.org 1 January 2013 | Volume 8 | Issue 1 | e54044
Transcript of Purine Nucleoside Analog - Sulfinosine Modulates Diverse Mechanisms of Cancer Progression in...
Purine Nucleoside Analog - Sulfinosine ModulatesDiverse Mechanisms of Cancer Progression in Multi-DrugResistant Cancer Cell LinesMirjana Dacevic1, Aleksandra Isakovic1, Ana Podolski-Renic2, Andelka M. Isakovic1, Tijana Stankovic2,
Zorica Milosevic2, Ljubisav Rakic3, Sabera Ruzdijic2, Milica Pesic2*
1 Faculty of Medicine, University of Belgrade, Doktora Subotica 8, Belgrade, Serbia, 2 Institute for Biological Research, Department of Neurobiology, University of Belgrade,
Bulevar Despota Stefana 142, Belgrade, Serbia, 3 Serbian Academy of Sciences and Arts, Knez Mihailova 35, Belgrade, Serbia
Abstract
Achieving an effective treatment of cancer is difficult, particularly when resistance to conventional chemotherapy isdeveloped. P-glycoprotein (P-gp) activity governs multi-drug resistance (MDR) development in different cancer cell types.Identification of anti-cancer agents with the potential to kill cancer cells and at the same time inhibit MDR is important tointensify the search for novel therapeutic approaches. We examined the effects of sulfinosine (SF), a quite unexploredpurine nucleoside analog, in MDR (P-gp over-expressing) non-small cell lung carcinoma (NSCLC) and glioblastoma cell lines(NCI-H460/R and U87-TxR, respectively). SF showed the same efficacy against MDR cancer cell lines and their sensitivecounterparts. However, it was non-toxic for normal human keratinocytes (HaCaT). SF induced caspase-dependent apoptoticcell death and autophagy in MDR cancer cells. After SF application, reactive oxygen species (ROS) were generated andglutathione (GSH) concentration was decreased. The expression of key enzyme for GSH synthesis, gamma Glutamyl-cysteine-synthetase (cGCS) was decreased as well as the expression of gst-p mRNA. Consequently, SF significantly decreasedthe expression of hif-1a, mdr1 and vegf mRNAs even in hypoxic conditions. SF caused the inhibition of P-gp (coded by mdr1)expression and activity. The accumulation of standard chemotherapeutic agent – doxorubicin (DOX) was induced by SF inconcentration- and time-dependent manner. The best effect of SF was obtained after 72 h when it attained the effect ofknown P-gp inhibitors (Dex-verapamil and tariquidar). Accordingly, SF sensitized the resistant cancer cells to DOX insubsequent treatment. Furthermore, SF decreased the experssion of vascular endothelial growth factor (VEGF) on mRNAand protein level and modulated its secretion. In conclusion, the effects on P-gp (implicated in pharmacokinetics and MDR),GSH (implicated in detoxification) and VEGF (implicated in tumor-angiogenesis and progression) qualify SF as multi-potentanti-cancer agent, which use must be considered, in particular for resistant malignancies.
Citation: Dacevic M, Isakovic A, Podolski-Renic A, Isakovic AM, Stankovic T, et al. (2013) Purine Nucleoside Analog - Sulfinosine Modulates Diverse Mechanisms ofCancer Progression in Multi-Drug Resistant Cancer Cell Lines. PLoS ONE 8(1): e54044. doi:10.1371/journal.pone.0054044
Editor: Michihiko Kuwano, Kyushu University, Japan
Received July 26, 2012; Accepted December 5, 2012; Published January 11, 2013
Copyright: � 2013 Dacevic et al. This is an open-access article distributed under the terms of the Creative Commons Attribution License, which permitsunrestricted use, distribution, and reproduction in any medium, provided the original author and source are credited.
Funding: Ministry of Education, Science and Technological Development of Serbia (grant numbers III 41031 and III 41025) supported this research. The fundershad no role in study design, data collection and analysis, decision to publish, or preparation of the manuscript.
Competing Interests: The authors have declared that no competing interests exist.
* E-mail: [email protected]
Introduction
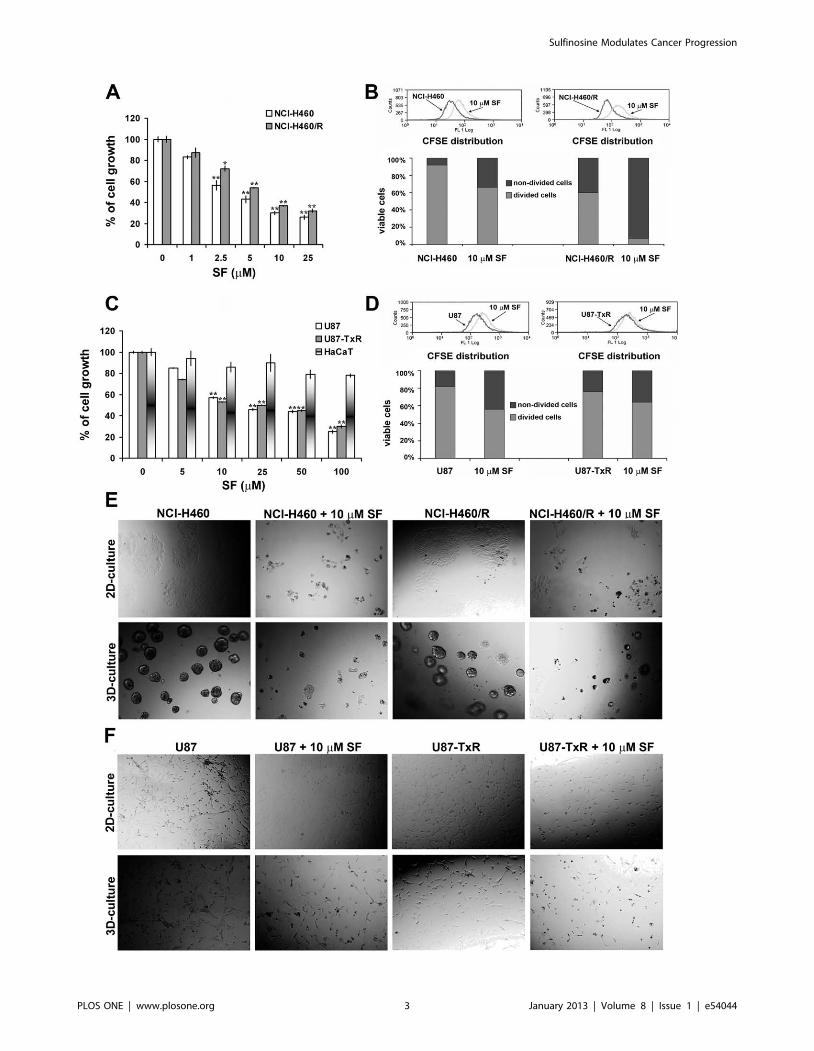
Sulfinosine or SF (Figure 1, [R,S]-2-amino-9-b-D-ribofurano-
sylpurine-6-sulfinamide) is the oxidized form of 6-thioguanosine
[1]. It is a quite unexplored anti-cancer agent in comparison to
other thiopurines (6-thioguanine and 6-mercaptopurine). SF
inhibits cancer cell growth, at least partially, by the incorporation
of its phosphorylated derivative into DNA. The metabolic
conversion of SF to corresponding 59-monophosphate derivative
is more complex than that of other thiopurines [2].
Since SF utilizes different metabolic pathways for its intracel-
lular activation, SF treatment does not induce resistance in cancer
cells. In contrast, the deletion of a single enzyme responsible for
the metabolic activation of other purine nucleoside analogs is
enough for the development of resistance. SF better penetrates the
central nervous system (CNS) than its parental molecule - 6-
thioguanosine and is more effective in cancer treatment. SF is
useful against malignancies resistant to other thiopurines [3].
Despite limitations for their use, some purine analogs closely
related to SF showed considerable anti-angiogenic activities that
deserve scientific attention [4].
The metabolism of SF involves the cells’ glutathione system. SF
readily adducts to sulfhydryl compounds (glutathione and cysteine)
and by suppressing the glutathione detoxification system and
elevating the concentration of reactive oxygen species (ROS), SF
may induce the death of cancer cells [2].
In view of its considerable efficacy in cancer treatment and
moderate toxicity to normal cells [2], SF is suitable for combining
with other chemotherapeutic agents. SF acts synergistically with
doxorubicin (DOX), curcumine (CUR) and verapamil (VER) in
non-small cell lung cancer (NSCLC) cell lines [5–7]. The
effectiveness of the combined application with SF allowed the
use of these drugs at lower concentrations that are less toxic with
fewer adverse effects. We hypothesized that all mentioned anti-
cancer effects of SF could be useful for the reversion of resistance
to chemotherapeutics.
PLOS ONE | www.plosone.org 1 January 2013 | Volume 8 | Issue 1 | e54044
Multi-drug resistance (MDR) is the main limitation for the
accomplishment of successful cancer treatment. MDR phenotype
often relates to the over-expression of P-glycoprotein (P-gp), a
membrane transporter that effectively extrudes the cytotoxic drugs
from cancer cells and changes their pharmacokinetics. P-gp acts as
an efflux pump for various hydrophobic anticancer drugs such as
anthracyclines, vinca alkaloids, taxanes, epipodophyllotoxins, and
some of the new drugs (e.g. imatinib, nilotinib, everolimus). P-gp
over-expression is common in experimental cancer models as well
as in cancerous tissues from patients [8]. Therefore, P-gp has
become a main therapeutic target for overcoming MDR.
Among many options for reverting MDR, the agents with an
anti-cancer activity of their own could be examined as potential
MDR modulators. We speculated earlier that besides the synergy
between SF and DOX as anti-cancer drugs acting through
separate pathways, the alterations of MDR-related genes expres-
sion and reduction of P-gp activity could contribute to the chemo-
sensitization effect of SF [5], [6].
Therefore, we conducted further investigation of mechanisms
involved in SF action in resistant and incurable cancers. For that
purpose, we employed two different MDR cancer cell lines with
the over-expression of P-gp (NCI-H460/R and U87-TxR) [9],
[10]. We studied the potential of SF to kill resistant cancer cells
and induce autophagy as well as to modulate the mechanisms
involved in cancer progression, such as glutathione (GSH)
detoxification system, P-gp mediated drug transport, vascular
endothelial growth factor (VEGF) expression and.secretion. We
found that the modification of redox status by SF led to the
decrease in the expression of hypoxia inducible factor-1a (HIF-1a)
which regulates the expression of P-gp and VEGF. Thus, the
modulation of MDR by SF is the consequence of GSH
detoxification system suppression.
Materials and Methods
DrugsSF ([R,S]-2-amino-9-b-D-ribofuranosylpurine-6-sulfinamide)
was synthesized from 6-thioguanosine according to the published
procedure [1]. DOX solution was obtained from EBEWE
Arzneimittel GmbH, Vienna, Austria. R6Verapamil (Dex-VER)
was purchased from Sigma-Aldrich Chemie GmbH, Germany.
Tariquidar (TQ) was kindly provided by Dr. Sven Rottenberg
from The Netherlands Cancer Institute, Amsterdam. CoCl2 was
obtained from Fisher Scientific, USA. SF was kept at 220uC.
Before treatment, SF and CoCl2 were freshly diluted in water,
while aliquots of DOX were thawed from 220uC. Dex-VER was
kept as 1 mM stock solution at room temperature. TQ was diluted
in dimethyl sulfoxide (DMSO) and 10 mM aliquots were kept at
220uC.
ChemicalsRPMI 1640 medium, Minimum Essential Medium (MEM),
penicillin-streptomycin solution, antibiotic-antimycotic solution,
L-glutamine and trypsin/EDTA were purchased from PAA,
Vienna, Austria. Fetal bovine serum (FBS), sulforhodamine B
(SRB) and acridine orange were obtained from Sigma-Aldrich
Chemie GmbH, Germany. Matrigel was kindly provided by Dr.
Sanja Mijatovic from the Institute for Biological Research ‘‘Sinisa
Stankovic’’, University of Belgrade, Serbia. Propidium iodide (PI)
was purchased from Roche Applied Science, Basel, Switzerland
and Annexin-V-FITC (AV) from Abcam, Cambridge, UK. FITC-
conjugated anti-P-gp antibody was provided by BD Biosciences,
United Kingdom, while PE-conjugated anti-VEGF antibody was
obtained from R&D Systems, Minneapolis, MN USA. Carboxy-
fluorescein succinimidyl ester (CFSE), dihydroethidium (DHE) was
obtained from Molecular ProbesH, Invitrogen, CA, USA. Primary
antibodies against caspase 3 and b-actin were purchased from Cell
Signaling Technology Inc, Danvers, MA, USA, while primary
antibody against gamma-glutamylcysteine synthetase (cGCS) was
a kind gift from Dr Bato Korac, Institute for Biological Research
‘‘Sinisa Stankovic’’, University of Belgrade, Serbia. Peroxidase-
conjugated goat anti-rabbit IgG was obtained from Jackson
ImmunoResearch Laboratories Inc, West Grove, PA, USA.
Cells and Cell CultureNCI-H460 and U87 cell lines were purchased from the
American Type Culture Collection, Rockville, MD. NCI-H460
cells were maintained in RPMI 1640 supplemented with 10%
FBS, 2 mM L-glutamine, 4.5 g/L glucose, 10,000 U/mL penicil-
lin, 10 mg/mL streptomycin, 25 mg/mL amphotericin B solution
at 37uC in a humidified 5% CO2 atmosphere. NCI-H460/R cells
were originally selected from NCI-H460 cells in our laboratory
and cultured in a medium containing 100 nM DOX as described
previously [9]. U87 cells were cultured in MEM supplemented
with 10% FBS, L-glutamine (2 mM) and 5000 U/ml penicilin,
5 mg/ml streptomycin solution. U87-TxR cells were selected from
U87 cells in our laboratory after continuous exposure to stepwise
increasing concentrations of paclitaxel (100–300 nM) for a period
of 9 months as already published [10]. HaCaT cell line (normal
human keratinocytes obtained from CLS - Cell Lines Service,
Eppelheim, Germany) was generous gift from Prof. Andra Jorg,
Division of Biophysics, Research Center Borstel, Leibniz-Center
for Medicine and Biosciences, Borstel, Germany. HaCaT cells
were cultured in DMEM supplemented with 10% FBS, 4 g/L
glucose, L-glutamine (2 mM) and 5000 U/ml penicilin, 5 mg/ml
streptomycin solution. MDR cancer cells were sub-cultured at
72 h intervals using 0.25% trypsin/EDTA and seeded into a fresh
medium at the following densities: 8,000 cells/cm2 for NCI-H460,
16,000 cells/cm2 for NCI-H460/R and U87, 32,000 cells/cm2
for U87-TxR. HaCaT cells were sub-cultured at 144 h intervals
using 0.25% trypsin/EDTA and seeded into a fresh medium at 64,
000 cells/cm2.
Sulforhodamine B AssayCells grown in 25 cm2 tissue flasks were trypsinized, seeded into
flat-bottomed 96-well tissue culture plates and incubated over-
Figure 1. Chemical structure of purine nucleoside analog –sulfinosine (SF).doi:10.1371/journal.pone.0054044.g001
Sulfinosine Modulates Cancer Progression
PLOS ONE | www.plosone.org 2 January 2013 | Volume 8 | Issue 1 | e54044
Sulfinosine Modulates Cancer Progression
PLOS ONE | www.plosone.org 3 January 2013 | Volume 8 | Issue 1 | e54044
night. Investigated cell lines NCI-H460, NCI-H460/R, U87, U87-
TxR and HaCaT cells were seeded at 4, 000, 8,000, 8,000 and
16,000 cells/well, respectively. SF treatment (1–100 mM) lasted
72 h. The cellular proteins were stained with sulforhodamine B
(SRB) assay, following slightly modified protocol of Skehan et al
[11]. Briefly, the cells in 96-well plates were fixed in 50%
trichloroacetic acid (50 mL/well) for 1 h at 4uC, rinsed in tap
water and stained with 0.4% (w/v) sulforhodamine B in 1% acetic
acid (50 mL/well) for 30 min at room temperature. The cells were
then rinsed three times in 1% acetic acid to remove the unbound
stain. The protein-bound stain was extracted with 200 mL 10 mM
Tris base (pH 10.5) per well. The optical density was read at
540 nm, with correction at 670 nm (LKB 5060-006 Micro Plate
Reader, Vienna, Austria).
Matrigel GrowthFor three-dimensional (3-D) cultures, cells were plated at the
same densities as for two (2-D) cultures onto reconstituted (pre-
gelled) basement membrane (Matrigel; BD Biosciences, San Jose,
CA, USA) in RPMI 1640 medium with 10% FBS. Cells were
incubated for 72 h and photographed live by phase microscopy.
Determination of Cell Proliferation (CFSE Staining)The rate of cell proliferation was measured by flow-cytometric
analysis of cells labeled with carboxyfluorescein succinimidyl ester
or CFSE [12]. Briefly, detached cells (56106 cells/mL) were
stained with 1 mM CFSE for 10 min in dark at 37uC, washed
twice in fresh medium, seeded in six-well plates at 56104 per well,
and then exposed to SF. After 72 h of cultivation, cells were
trypsinized and washed twice in PBS. Finally, the cells were
resuspended in PBS and analyzed by flow-cytometry. Green
fluorescence emission was measured using a FACSCalibur flow-
cytometer (Becton Dickinson, Oxford, United Kingdom) and
analyzed using Cell-Quest software.
Cell Death DetectionThe percentages of apoptotic, necrotic and viable cells were
determined by Annexin-V-FITC (AV) and propidium iodide (PI)
labeling. NCI-H460/R and U87-TxR cells were plated and
incubated overnight in 6-well plates at density of 80,000 and
160,000 cells/well, respectively. After 72 h of SF treatment, the
attached and floating cells were collected by centrifugation. The
cells pellet was re-suspended in 100 mL of binding buffer
containing 10 mM HEPES/NaOH, 140 mM NaCl, 5 mM CaCl2(pH 7.4), supplemented with 0.2 mg AV and 1 mg PI. After the
incubation period (30 min at 37uC in dark), additional 400 mL of
binding buffer was added and AV/PI staining was analyzed within
1 h by flow-cytometry. The fluorescence intensity (green FL1-H
and red FL2-H) was measured on FACSClibur flow-cytometer
(Becton Dickinson, Oxford, United Kingdom). In each sample,
10,000 cells were recorded (gated to exclude cell debris), and the
percentages of viable (AV2 PI2), early apoptotic (AV+ PI2),
apoptotic and necrotic (AV+ PI+), and already dead (AV2 PI+)
cells were analyzed by CellQuest Pro data analysis software.
Caspase ActivationActivation of caspases was measured by flow-cytometry after
labelling the cells with a cell-permeable, FITC-conjugated pan-
caspases inhibitor (ApoStat; R&D Systems, Minneapolis, MN)
according to the manufacturers instructions. The increase in green
fluorescence (FL1-H) as a measure of caspase activity within
individual cells of the treated population was determined using
FACSCalibur flow-cytometer (Becton Dickinson, Oxford, United
Kingdom).
Autophagy AssessmentThe appearance of acidic autophagic vesicles was detected by
flow-cytometry. After SF treatment cells were trypsinized, washed
and incubated for 15 min at 37uC with 1 mM acridine orange.
Acridine orange-stained cell nuclei are fluorescent green, while
autophagic lysosomes are fluorescent orange-red. The increase in
red vs. green (FL3/FL1) fluorescence ratio, reflecting the
autophagy, was determined using a FACSCalibur flow-cytometer
(Becton Dickinson, Oxford, United Kingdom) and Cell Quest Pro
software.
Western BlotCells grown in 100 mm Petri dishes at following densities:
400,000 cells per dish for NCI-H460/R and 750,000 per dish for
U87-TxR were lysed after SF treatment with lysis buffer (30 mM
Tris-HCl pH 8.9, 150 mM NaCl, 1% NP-40) containing 1 mM
phenylmethylsulfonyl fluoride and protease inhibitor cocktail
(Sigma-Aldrich Chemie GmbH, Germany). After 30 min on ice,
samples were centrifuged at 14 000 g for 15 min at 4uC, and
supernatants were collected. Equal amounts of protein from each
sample was separated by SDS-PAGE on 6–15% gels and
transferred to nitrocellulose membranes (Bio-Rad, Hercules, CA,
USA). Following incubation with primary antibodies against
caspase 3, b-actin and gamma glutamylcstein synthetase (cGCS)
and peroxidase-conjugated goat anti-rabbit IgG as the secondary
antibody, specific protein bands were visualized using Amersham
ECL reagent (GE Healthcare Life Sciences, UK). The protein
levels of cGCS were quantified by densitometry using ImageJ
software and expressed relative to b-actin.
DHE StainingFlow-cytometric measurements of dihydroethidium (DHE)-
fluorescence were used to measure ROS concentration in MDR
cancer cells. Adherent cells were rinsed with PBS and harvested by
trypsinization. Cells were incubated in PBS with 10% FBS and
10 mM DHE for 45 min. DHE-fluorescence was analyzed by flow-
cytometry (excitation 488 nm, and emission 585 nm, FL2-H
channel). Mean fluorescence intensity (MFI) was calculated after
correction for autofluorescence.
Colorimetric Detection of Glutathione (GSH)Cells grown in 25 cm2 tissue flasks were trypsinized and
counted. The same number of cells (2.56106) for each sample
was exposed to further procedure. Briefly, the cells were collected
by centrifugation at 7006g for 5 minutes at 4uC and the
supernatant was removed. Then, the cell pellet was resuspended in
0.5 ml ice-cold PBS and centrifuged at 7006g for another 5
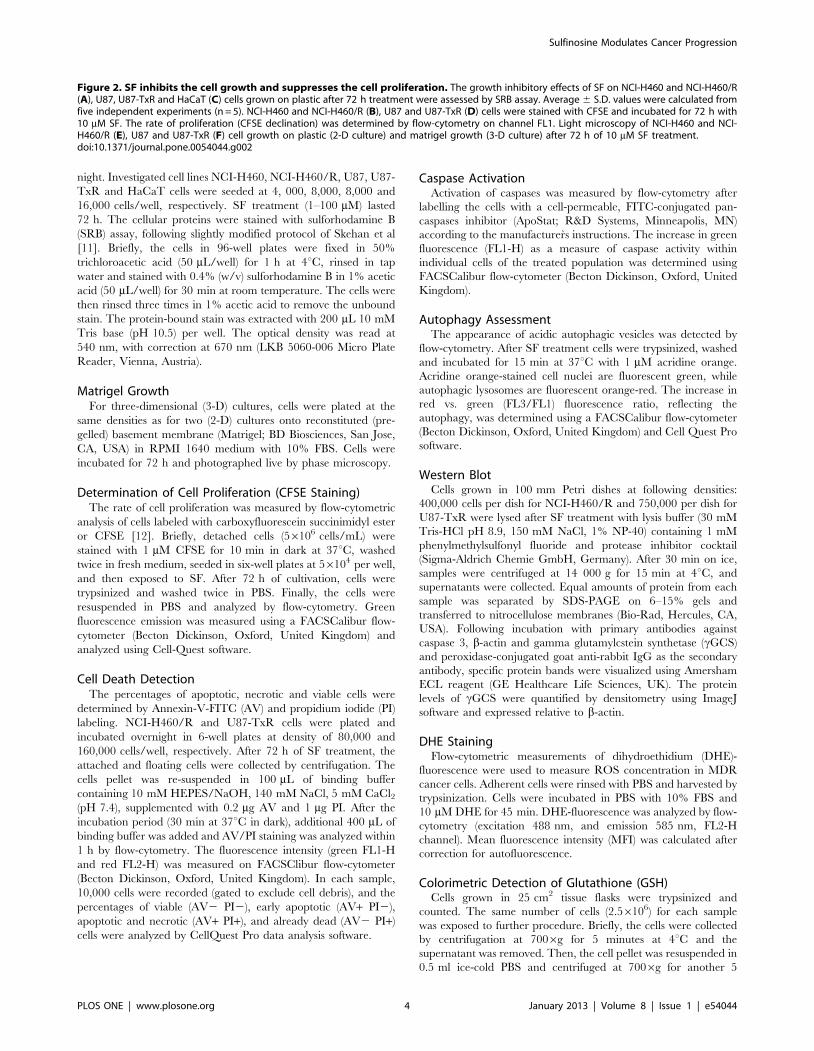
Figure 2. SF inhibits the cell growth and suppresses the cell proliferation. The growth inhibitory effects of SF on NCI-H460 and NCI-H460/R(A), U87, U87-TxR and HaCaT (C) cells grown on plastic after 72 h treatment were assessed by SRB assay. Average 6 S.D. values were calculated fromfive independent experiments (n = 5). NCI-H460 and NCI-H460/R (B), U87 and U87-TxR (D) cells were stained with CFSE and incubated for 72 h with10 mM SF. The rate of proliferation (CFSE declination) was determined by flow-cytometry on channel FL1. Light microscopy of NCI-H460 and NCI-H460/R (E), U87 and U87-TxR (F) cell growth on plastic (2-D culture) and matrigel growth (3-D culture) after 72 h of 10 mM SF treatment.doi:10.1371/journal.pone.0054044.g002
Sulfinosine Modulates Cancer Progression
PLOS ONE | www.plosone.org 4 January 2013 | Volume 8 | Issue 1 | e54044
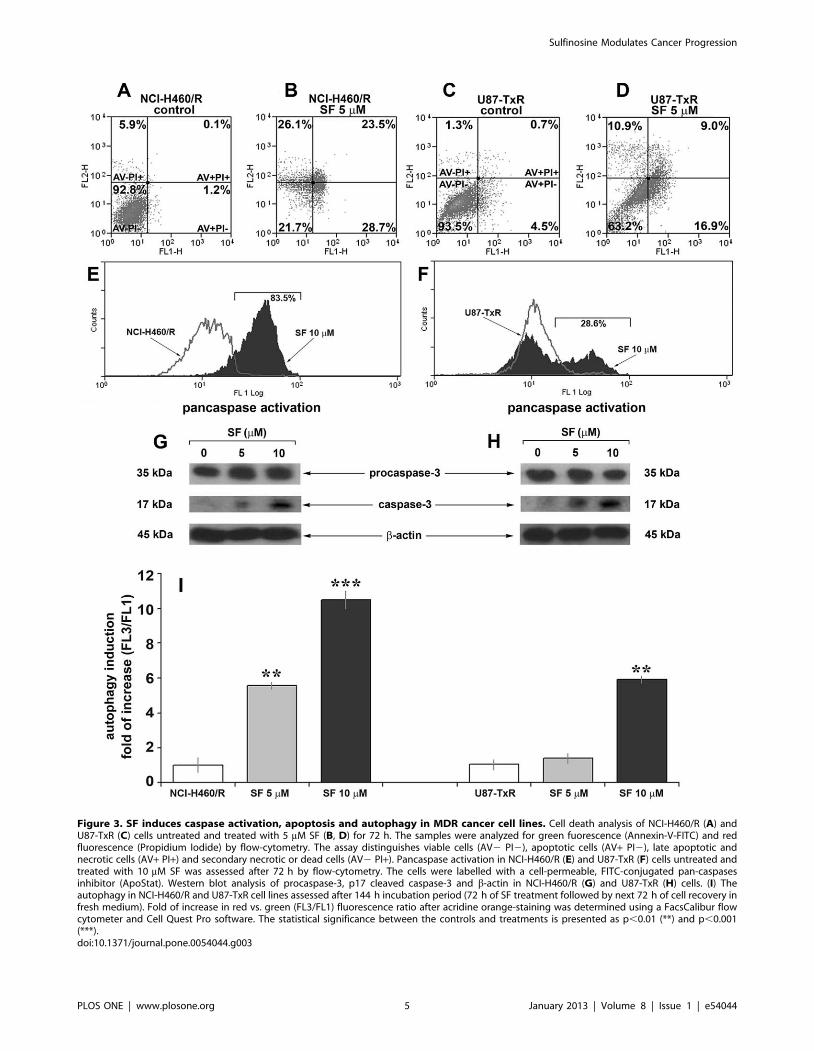
Figure 3. SF induces caspase activation, apoptosis and autophagy in MDR cancer cell lines. Cell death analysis of NCI-H460/R (A) andU87-TxR (C) cells untreated and treated with 5 mM SF (B, D) for 72 h. The samples were analyzed for green fuorescence (Annexin-V-FITC) and redfluorescence (Propidium Iodide) by flow-cytometry. The assay distinguishes viable cells (AV2 PI2), apoptotic cells (AV+ PI2), late apoptotic andnecrotic cells (AV+ PI+) and secondary necrotic or dead cells (AV2 PI+). Pancaspase activation in NCI-H460/R (E) and U87-TxR (F) cells untreated andtreated with 10 mM SF was assessed after 72 h by flow-cytometry. The cells were labelled with a cell-permeable, FITC-conjugated pan-caspasesinhibitor (ApoStat). Western blot analysis of procaspase-3, p17 cleaved caspase-3 and b-actin in NCI-H460/R (G) and U87-TxR (H) cells. (I) Theautophagy in NCI-H460/R and U87-TxR cell lines assessed after 144 h incubation period (72 h of SF treatment followed by next 72 h of cell recovery infresh medium). Fold of increase in red vs. green (FL3/FL1) fluorescence ratio after acridine orange-staining was determined using a FacsCalibur flowcytometer and Cell Quest Pro software. The statistical significance between the controls and treatments is presented as p,0.01 (**) and p,0.001(***).doi:10.1371/journal.pone.0054044.g003
Sulfinosine Modulates Cancer Progression
PLOS ONE | www.plosone.org 5 January 2013 | Volume 8 | Issue 1 | e54044
Sulfinosine Modulates Cancer Progression
PLOS ONE | www.plosone.org 6 January 2013 | Volume 8 | Issue 1 | e54044
minutes at 4uC. The supernatant was removed and the cells were
lysed in 80 ml ice-cold Glutathione Buffer (GSH Colorimetric
Detection Kit, Bio-Vision, CA) for 10 minutes on ice. Then, 20 ml
of 5% Sulfosalicylic Acid was added and the samples were
centrifuged at 80006g for 10 minutes at 4uC. The supernatant was
transferred to a fresh tube and used for GSH assay. Glutathione
Buffer was added to each well (96-well plate) at a volume of 160 ml
and incubated 10 minutes at room temperature. Afterwards, 20 ml
of either prepared standards or samples was added to each well
and incubated for another 10 minutes at room temperature.
Finally, 20 ml of Substrate Solution (GSH Colorimetric Detection
Kit, BioVision, CA) was added and the absorbance of generated
product (2-nitro-5-thiobenzoic acid) was read at 405 nm (LKB
5060–006 Micro Plate Reader, Vienna, Austria). The concentra-
tions of GSH were determined by using the standard GSH
calibration curve and related to the concentrations of proteins in
cell lysates. The GSH detection for each sample was performed at
least six times.
RNA Extraction and RT-PCRTotal RNA was extracted from untreated NCI-H460/R and
U87-TxR cells and the cells treated with SF. The isolation was
carried out using Trizol (Invitrogen Life Technologies, CA, USA)
according to the manufacturer’s instructions. RNA was quantified
on spectrophotometer and quality was determined by agarose gel
electrophoresis. Reverse transcription (RT) reactions using 25 mg
total RNA were performed with oligo-dT primers using M-MLV
Reverse Transcriptase (Gibco BRL, USA) following the manufac-
turer’s instructions. PCR reactions were performed with primers
specific for, gst-p, vegf, mdr1 and hif-1a [13–16], b-actin [17] and
gapdh [18] was used as an internal control and co-amplified with
genes of interest in all PCR experiments.
The PCR reactions were performed on the GeneAmpH PCR
System 9700 (Applied Biosystems, CA, USA) under the following
conditions for hif-1a, mdr1 and gst-p: initial denaturation at 95uCfor 5 min, 24, 25 or 28 cycles (respectively) at 95uC for 15 s, 56uCfor 30 s, 72uC for 30 s and at 4uC indefinitely. When PCR was
performed to determine the expression of the vegf gene, 35 cycles
were applied with the annealing temperature of 62uC. The gapdh
primers were used at following ratios: 1:4 to the mdr1 primers and
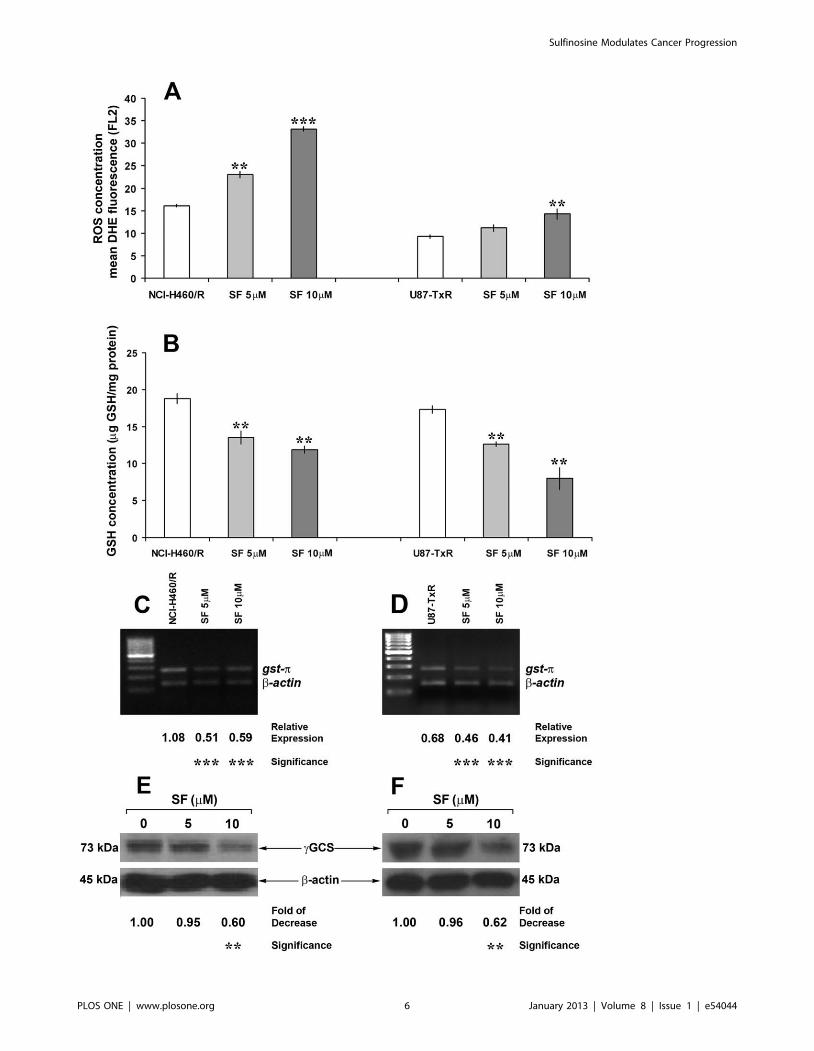
Figure 4. SF increases ROS concentration and inhibits GSH detoxification in MDR cancer cell lines. Flow-cytometric measurements ofdihydroethidium (DHE)-fluorescence correspond to cellular ROS levels (A). Mean fluorescence intensity (MFI) calculated after correction forautofluorescence is presented. The data indicate the average 6 S.D. of three experiments carried out in triplicate. Statistical significance of SFtreatment compared to untreated control: p,0.01 (**) and p,0.001 (***). Detection of GSH concentration (B) for each sample was performed at leastsix times. The data indicate the average 6 S.D. Statistical significance of SF treatment compared to untreated control: p,0.01 (**). The expression ofgst-p mRNA in NCI-H460/R (C) and U87-TxR cells (D) was evaluated relative to the internal control - b-actin. The PCR products were separated onagarose gels beside a 100 bp DNA ladder. Statistical significance between treated and untreated cells is presented as p,0.001 (***).The decreases incGCS expression in NCI-H460/R (E) and U87-TxR cells (F) after SF treatments were calculated relative to b-actin expression and untreated samples.Statistical significance between treated and untreated cells is presented as p,0.01 (**).doi:10.1371/journal.pone.0054044.g004
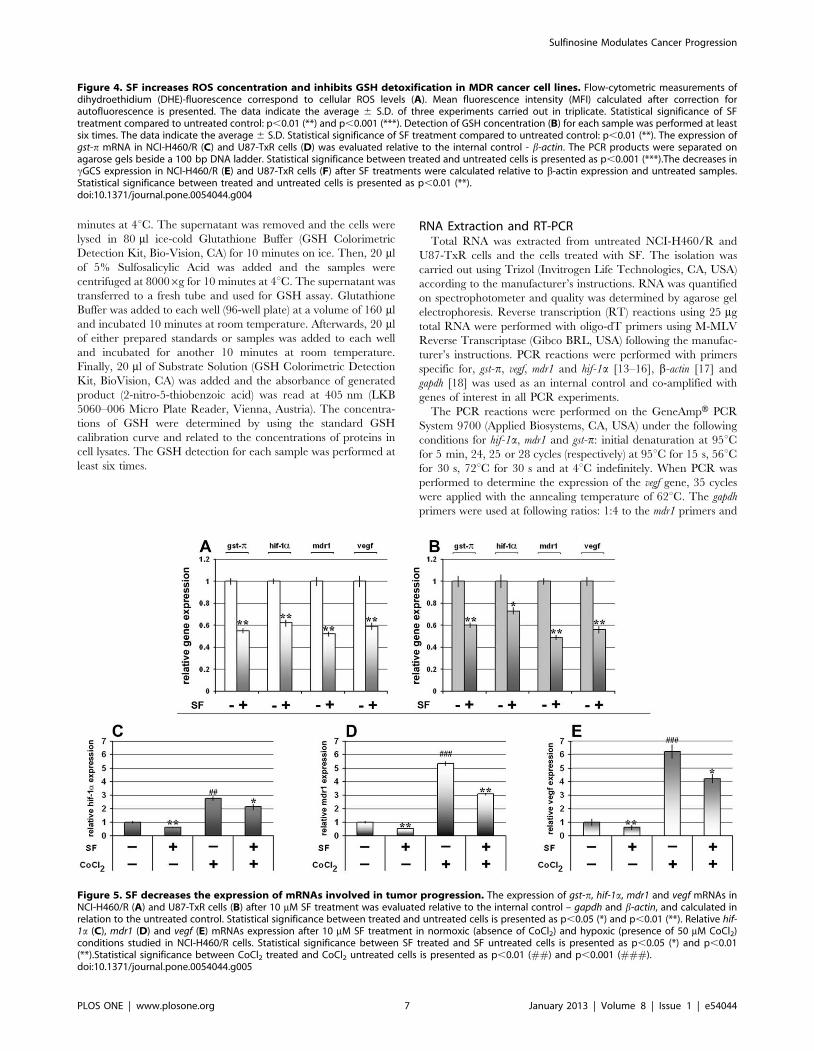
Figure 5. SF decreases the expression of mRNAs involved in tumor progression. The expression of gst-p, hif-1a, mdr1 and vegf mRNAs inNCI-H460/R (A) and U87-TxR cells (B) after 10 mM SF treatment was evaluated relative to the internal control – gapdh and b-actin, and calculated inrelation to the untreated control. Statistical significance between treated and untreated cells is presented as p,0.05 (*) and p,0.01 (**). Relative hif-1a (C), mdr1 (D) and vegf (E) mRNAs expression after 10 mM SF treatment in normoxic (absence of CoCl2) and hypoxic (presence of 50 mM CoCl2)conditions studied in NCI-H460/R cells. Statistical significance between SF treated and SF untreated cells is presented as p,0.05 (*) and p,0.01(**).Statistical significance between CoCl2 treated and CoCl2 untreated cells is presented as p,0.01 (##) and p,0.001 (###).doi:10.1371/journal.pone.0054044.g005
Sulfinosine Modulates Cancer Progression
PLOS ONE | www.plosone.org 7 January 2013 | Volume 8 | Issue 1 | e54044
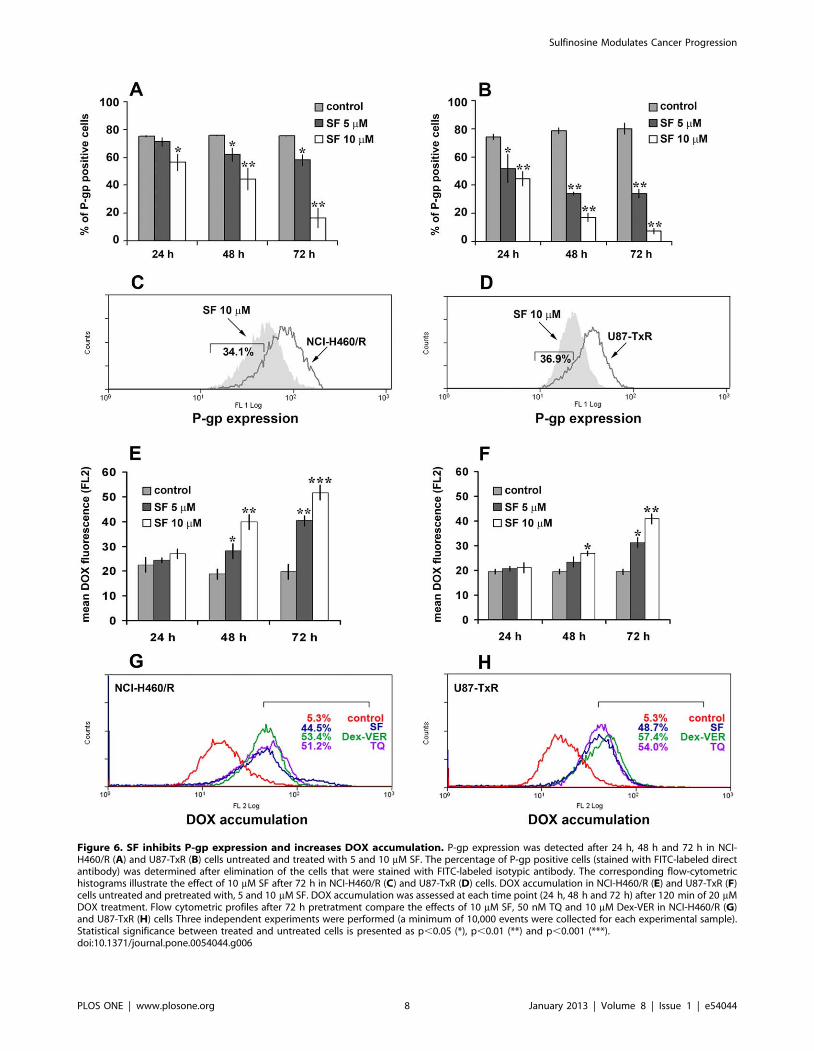
Figure 6. SF inhibits P-gp expression and increases DOX accumulation. P-gp expression was detected after 24 h, 48 h and 72 h in NCI-H460/R (A) and U87-TxR (B) cells untreated and treated with 5 and 10 mM SF. The percentage of P-gp positive cells (stained with FITC-labeled directantibody) was determined after elimination of the cells that were stained with FITC-labeled isotypic antibody. The corresponding flow-cytometrichistograms illustrate the effect of 10 mM SF after 72 h in NCI-H460/R (C) and U87-TxR (D) cells. DOX accumulation in NCI-H460/R (E) and U87-TxR (F)cells untreated and pretreated with, 5 and 10 mM SF. DOX accumulation was assessed at each time point (24 h, 48 h and 72 h) after 120 min of 20 mMDOX treatment. Flow cytometric profiles after 72 h pretratment compare the effects of 10 mM SF, 50 nM TQ and 10 mM Dex-VER in NCI-H460/R (G)and U87-TxR (H) cells Three independent experiments were performed (a minimum of 10,000 events were collected for each experimental sample).Statistical significance between treated and untreated cells is presented as p,0.05 (*), p,0.01 (**) and p,0.001 (***).doi:10.1371/journal.pone.0054044.g006
Sulfinosine Modulates Cancer Progression
PLOS ONE | www.plosone.org 8 January 2013 | Volume 8 | Issue 1 | e54044

1:6 to the hif-1a primers in order to attain linear amplification
conditions. The b-actin primers were used at following ratios: 1:2 to
the gst-p primers and 1:5 to the vegf primers in order to attain linear
amplification conditions. The PCR products were separated in 2%
agarose gels stained with ethidium bromide. Multi-Analyst/PC
Software Image Analysis (Bio-Rad Gel Doc 1000, CA, USA) was
employed for densitometry analysis.
DOX Accumulation AssayDOX accumulation was analyzed by flow-cytometry utilizing
the ability of DOX to emit fluorescence. The intensity of the
fluorescence was proportional to DOX accumulation. Studies
were carried out after 24 h, 48 h and 72 h SF treatment. NCI-
H460/R and U87-TxR cells were cultured in 25 cm2 flasks,
trypsinized and re-suspended in 10 mL centrifuge tubes in a
DOX-containing medium (20 mM). Then, the cells were incubat-
ed at 37uC in 5% CO2 for 120 min. At the end of the
accumulation period, the cells were pelleted by centrifugation,
washed with phosphate buffered saline (PBS) and placed in cold
PBS. The samples were kept on ice in dark until the analysis on
FACScalibur flow-cytometer (Becton Dickinson, Oxford, United
Kingdom). The fluorescence of DOX was assessed on fluorescence
channel 2 (FL2-H) at 530 nm. A minimum of 10,000 events were
assayed for each sample. The differences in curve shape were
quantified using a Komogorov-Smirnov nonparametric statistic. P
values were calculated (available on request) in CellQuest Pro and
run on a Macintosh computer.
Flow-cytometric Analysis of P-gp and VEGF ExpressionFlow-cytometry was used to measure P-gp and VEGF
expression levels in MDR cancer cells. Untreated and SF treated
cells (26105) were collected by trypsinization, washed in ice-cold
PBS, and then directly immuno-stained by FITC-conjugated anti-
P-gp antibody according to the manufacturers’ protocol (BD
Biosciences, United Kingdom). An isotype control IgG2bk(Abcam, Cambridge, United Kingdom) was evaluated for each
experimental sample to discriminate the level of background
fluorescence of negative cells. For VEGF expression analysis, the
cells were fixed in 4% paraformaldehyde, 10 min at room
temperature, washed and resuspended at saponin 0.05% (w/v)
buffer and incubated with PE-conjugated anti-VEGF antibody
according to the manufacturers’ protocol (R&D Systems, USA).
An isotype control IgG2a (Abcam, Cambridge, United Kingdom)
was evaluated for each experimental sample to discriminate the
level of background fluorescence of negative cells. Mean fluores-
cence intensity was determined for positively stained cells. The
samples were kept on ice in dark until the analysis on FACScalibur
flow-cytometer (Becton Dickinson, Oxford, United Kingdom).
The fluorescence of FITC-conjugated anti-P-gp was assessed on
fluorescence channel 1 (FL1-H) at 530 nm, while PE-conjugated
anti-VEGF was assessed on fluorescence channel 2 (FL2-H) at
585 nm. A minimum of 10,000 events were assayed for each
sample (the gate excluded cell debris and dead cells) and the
obtained results were analysed using Cell Quest Pro Software
(Becton Dickinson, Oxford, United Kingdom).
MTT AssayCell metabolic activity was assessed by the MTT assay based on
the reduction of 3-(4,5-dimethyl-2-thizolyl)-2,5-diphenyl-2H-tetra-
zolium bromide (MTT, Sigma, St Louis, MO) into formazan dye
by active mitochondria of living cells. The combined effects of
simultaneous and subsequent treatment were studied on MDR
cancer cell lines. NCI-H460/R and U87-TxR cells prepared for
simultaneous treatment were seeded at 4, 000 and 8,000 cells/
well, respectively. SF treatment (5 mM) in combination with
different DOX concentrations lasted 72 h. The subsequent
treatments were performed on NCI-H460/R and U87-TxR cells
initially seeded at lower densities (500 cells/well and 1,000 cells/
well, respectively). Pretreatment with 5 mM SF lasted for 72 h and
was followed by additional 72 h treatment with different
concentrations of DOX. MTT was added to final concentration
of 0.1 mg/ml in each well of a 96-well microplate and plates were
incubated at 37uC for 4 h. Then, DMSO was added to dissolve
formazan product, which amount was proportional to the number
of live cells. The absorbance of dissolved dye was measured at
540 nm using an automatic microplate reader (LKB 5060-006
Micro Plate Reader, Vienna, Austria). Growth inhibition (I) was
determined according to the following equitation:
I %ð Þ~ 1� A treated sample=A untreated controlð Þð Þ| 100
where A is for absorbance.
IC50 value was defined as concentration of each drug that
inhibited cell growth by 50%. IC50 was calculated by linear
regression analysis using Excel software.
ELISA for Detection of Human VEGF165 in Cell CultureMedium
MDR cells (NCI-H460/R and U87-TxR), seeded in 6-well
plates, were incubated overnight and then treated with SF. The
cell medium (supernatant) was collected 24 h, 48 h and 72 h after
treatment for determination of secreted VEGF165 protein by
VEGF immunoassay kit (Quantikine Human VEGF ELISA Kit,
R&D Systems, Minneapolis, USA). The procedure was complied
according to the manufacturers’ manual. The results were
normalized based on the same amount of cells analyzed. A
standard curve was generated using recombinant VEGF165
supplied with the kit. The concentrations of VEGF in cell-free
culture supernatants were examined in triplicates in two indepen-
dent experiments.
Table 1. Relative reversion of resistance to DOX insimultaneous and subsequent treatments with SF.
Cell Lines Drugs IC50 (mM)RelativeReversion
NCI-H460/R DOX 3.25060.260
SF 5 mM (+ DOX)
simultaneously 3.03660.091 1.07
DOX 7.08360.212
SF 5 mM (+ DOX)
subsequently 0.97660.010 7.26
U87-TxR DOX 0.22460.027
SF 5 mM (+ DOX)
simultaneously 0.09860.025 2.28
DOX 4.10060.079
SF 5 mM (+ DOX)
subsequently 0.24160.019 17.01
doi:10.1371/journal.pone.0054044.t001
Sulfinosine Modulates Cancer Progression
PLOS ONE | www.plosone.org 9 January 2013 | Volume 8 | Issue 1 | e54044
Sulfinosine Modulates Cancer Progression
PLOS ONE | www.plosone.org 10 January 2013 | Volume 8 | Issue 1 | e54044

Statistical AnalysisStatistical analysis was performed by Statistica 6.0 software. The
results were tested for normality. If obtained values were not
normally distributed, the groups were compared by Student’s t –
test. For normally distributed variables, one-way analysis of
variance (ANOVA) was used. When statistical significance was
observed, the Tukey honest significant difference (HSD) test was
applied. Statistical significance was accepted if p,0.05 (*), p,0.01
(**), p,0.001 (***).
Results and Discussion
SF Inhibits the Growth of MDR Cancer CellsWe established NSCLC and glioblastoma P-gp over-expressing
cell lines (NCI-H460/R and U87-TxR) with MDR phenotype in
order to investigate potential anti-cancer agents [9], [10]. NCI-
H460/R and U87-TxR are MDR cancer cell lines that originated
from NCI-H460 (NSCLC cell line) and U87 (glioblastoma cell
line). The parental cell lines were considered as sensitive since the
cells derived from patients who had not undergone chemotherapy.
In the present study, we tried to elucidate the action of sulfinosine
(SF), a synthetic purine nucleoside analog, in these two MDR
cancer cell lines. We choose SF because of evidences that its
therapeutically effective concentrations could not induce the
resistance. SF also efficiently penetrates to CNS [2]. Moreover,
recent clinical study showed that the combination therapy
including 6-thioguanine (closely related molecule to SF) is
promising for patients with recurrent high-grade anaplastic glioma
[19].
The effects of SF on cancer cell growth after 72 h treatment
were evaluated by the chemo-sensitivity assay - sulforhodamine B
(SRB). SF inhibited the growth of sensitive and MDR cancer cell
lines in a dose-dependent manner (Figure 2A, C). Since
application of anti-cancer agents is limited by their toxicity
towards normal cells, we tested the effect of SF on HaCaT cells
(normal human keratinocytes). The effects on growth of HaCaT
after continuous treatment of 72 h were assessed also by SRB
assay. SF did not reduce significantly the number of normal cells
even with the highest concentration (100 mM) (Figure 2C). We
demonstrated that SF inhibits the growth of sensitive as well as
resistant NSCLC and glioblastoma cells in micro-molar range of
concentrations, and that its efficacy was not affected by the
presence of the MDR phenotype. Moreover, SF was non-toxic to
normal cells (HaCaT) in the range of concentrations necessary to
inhibit the growth of cancer cells.
Next, we evaluated the cytostatic effect of 10 mM SF in each cell
line by CFSE staining (Figure 2B, D). CFSE is a vital dye stable in
the cytoplasm for about 7–8 generations, but the intensity of CFSE
fluorescence declines due to its progressive halving within daughter
cells following each cell division. In that way, the CFSE
distribution in the cells can estimate the rate of cell proliferation.
The CFSE distribution in control and SF treated samples is
illustrated by flow-cytometric profiled histograms (Figure 2B, D).
The inhibition of proliferation observed in the presence of SF was
the most pronunced in NCI-H460/R cells. These results indicated
that the inhibition of proliferation is partly responsible for the anti-
cancer activity of SF.
Since NSCLC and glioblastoma cell lines have high metastatic
potential, we compared the effects of SF to inhibit the cell growth
after 72 h on plastic (2-D culture) and in reconstituted basement
membrane – matrigel (3-D culture) (Figure 2E, F). We found that
SF inhibited the growth in 3-D culture with the same efficacy
observed in 2-D culture. The fact that the cells were detached
from each other after SF treatment in matrigel, especially
glioblastoma cells, points to the change in their adhesive
properties. Therefore, we speculate that SF could affect the
affinity of cancer cells to invade the blood vessels, induce tumor-
angiogenesis and metastasis.
SF Induces Caspase-dependent Apoptosis in MDR CancerCells
Next, we proceeded to examine whether induction of apoptosis
contributes to the anti-cancer action of SF in MDR cancer cell
lines. To assess the apoptosis induced by SF after 72 h the cells
were seeded at optimal density for their growing properties. In that
way, the untreated controls did not achieve confluence at the end
of incubation period. Annexin-V-FITC/Propidium Iodide stain-
ing revealed that SF increases the proportion of apoptotic cells
(AV+PI2) in both MDR cancer cell lines. The results are
summarized in (Figure 3A, B, C, D): alive cells are negative for
both, Annexin-V and Propidium Iodide (AV2PI2); apoptotic
cells only bind Annexin-V (AV+ PI2), apoptotic and necrotic cells
are Annexin-V and Propidium Iodide positive (AV+ PI+) and
secondary necrotic cells, that were already dead, are positive only
for Propidium Iodide (AV2 PI+). The percentages of apoptotic
and necrotic cells were increased in samples treated with 5 mM SF
(Figure 3B, D).
Caspases play a key role in the apoptotic pathway. Initiator
caspases, which include caspases-2, -8, -9 and -10, activate the
caspase cascade through the removal of the inactive prodomains of
the effector caspases. Once activated, effector caspases, including
caspases-3, -6 and -7, cleave several dozen key substrates within
the cell in order to carry out the apoptotic process [20]. We
showed by a fluorochrome-labeled pan-caspase inhibitor ApoStat
that SF induced the activation of caspases (Figure 3E, F). SF
caused the shift of ApoStat flow-cytometric profile by 83.5% and
28.6% in NCI-H460/R and U87-TxR cells, respectively
(Figure 3E, F). We found that the induction of apoptosis by SF
after 72 h was caspase-dependent in both resistant cell lines.
However, the caspase activation was more pronounced in resistant
NSCLC than in glioblastoma cells. In order to find if an effector
caspase-3 was activated after SF treatment, we analyzed the
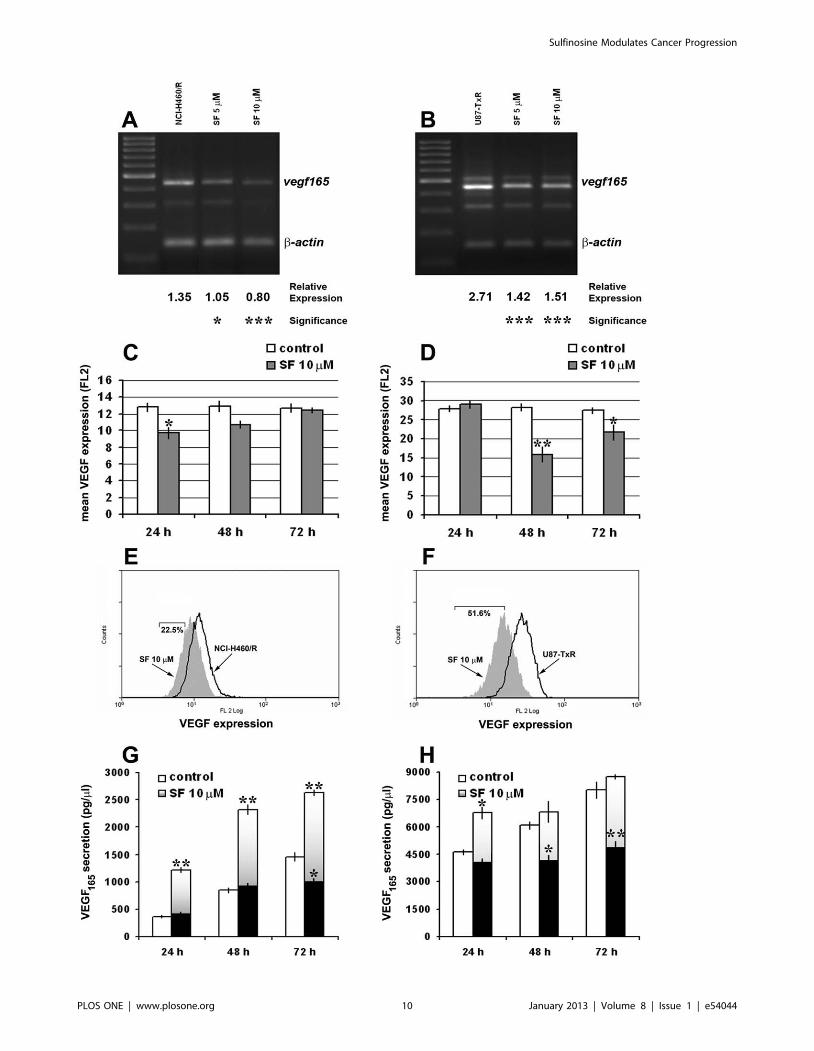
Figure 7. SF modulates VEGF165 expression and secretion in MDR cancer cell lines. The amplified NCI-H460/R (A) and U87-TxR samples (B)of the vegf gene (four splicing products of vegf mRNA) were visualized with ethidium-bromide in agarose gel next to a DNA ladder (100 bp). The PCRproduct of b-actin was co-amplified with vegf. The relative expression of vegf165 was calculated in relation to b-actin expression. Statisticalsignificance between treated and untreated cells is presented as p,0.05 (*) and p,0.001 (***). VEGF expression was detected after 24 h, 48 h and72 h in NCI-H460/R (C) and U87-TxR (D) cells untreated and treated with 10 mM SF. The mean fluorescence of VEGF (PE-labeled direct antibody) wasdetermined after elimination of the signal obtained with PE-labeled isotypic antibody. The corresponding flow-cytometric histograms illustrate theeffect of 10 mM SF after 24 h in NCI-H460/R (E) and 48 h in U87-TxR (F) cells. VEGF secretion levels in culture medium were evaluated after 24 h, 48 h,and 72 h using Human VEGF Immunoassay Kit. NCI-H460/R (G) and U87-TxR cells (H) were treated with 10 mM SF. The data indicate the average 6S.D. of four experiments carried out in triplicate. Statistical significance of SF treatment compared to untreated control when the secretion levels werenormalized based on the same amount of cells analyzed in untreated and treated samples, grey bars: p,0.05 (*) and p,0.01 (**). Statisticalsignificance of SF treatment compared to untreated control when the secretion levels of treated cells were not normalized, black bars: p,0.05 (*) andp,0.01 (**).doi:10.1371/journal.pone.0054044.g007
Sulfinosine Modulates Cancer Progression
PLOS ONE | www.plosone.org 11 January 2013 | Volume 8 | Issue 1 | e54044
expression of its precursor procaspase-3 (35 kDa) and cleaved
caspase-3 (17 kDa) by Western blotting (Figure 3G, H). The results
revealed the obvious increase in 17 kDa form after 5 and 10 mM
SF application in both MDR cancer cell lines. Although, the
expression of procaspase-3 was not affected by SF treatment, the
increase of cleaved form corresponds to the activation of caspase-
3.
Our previous study revealed that p53 has undergone mutations
during induction of resistance in NSCLC (NCI-H460/R) cells [6].
p53 mutation is often associated with increased resistance to
chemotherapy [21]. However, the anti-cancer action of SF
certainty included induction of apoptosis in resistant NSCLC
cells. The proposed mechanism for SF anti-cancer action involves
the formation of adducts with sulfhydryl compounds - glutathione
and cysteine [22], [23]. Depletion of glutathione pool may cause
down-regulation of Bcl-2 [24], release of cytochrom c from
mitochondria and activation of caspases [25]. Therefore, the cell
death induced by SF in resistant NSCLC cell line could be p53-
independent.
Several anti-apoptotic mechanisms, such as over-expression of
PKA, HSP70, Bcl-2 and deficiency in PTEN are responsible for
the evading apoptosis in glioblastoma sensitive cell line (U87) [26–
29]. We assume that the same mechanisms are present in resistant
glioblastoma cell line (U87-TxR). However, U87-TxR cells were
susceptible to the induction of cell death by SF.
Autophagy, a catabolic process responsible for the removal of
long-lived proteins and damaged organelles through the lysosomal
machinery, and apoptosis may be induced by common upstream
signals, and thus results in combined autophagy and apoptosis.
Under certain circumstances, autophagy constitutes a stress
adaptation that avoids cell death and suppresses apoptosis [30].
In order to reveal the possible connection between SF driven
apoptosis and autophagy, we investigated by flow-cytometry
whether SF could induce the appearance of autophagy-associated
acidic vesicles (Figure 3I). The changes in the level of autophagy
were obtained after removal of SF from medium. Significant
increases in autophagy were observed after 5 and 10 mM SF
treatments in NCI-H460/R and U87-TxR cells, respectively
(Figure 3I).
SF Modulates Detoxification Capacity of MDR CancerCells
Cellular redox environment is a delicate balance between the
levels of reactive oxygen species (ROS i.e., superoxide and
hydrogen peroxide) and the antioxidant system that scavenges
them (i.e., glutathione/glutathione peroxidase and tioredoxin/
peroxiredoxin pathways) [31]. Considering that ROS can be
generated from exogenous sources (e.g. ionizing radiation,
chemicals), we examined whether SF changes the ROS concen-
tration in MDR cancer cells. We used dihydroethidium (DHE)-
fluorescence and flow-cytometry to measure the ROS levels. DHE
is a non-fluorescent chemical that upon entry into the cell
undergoes oxidation to yield the fluorescent chemical, 2-hydro-
xyethidium (HE). HE intercalates with DNA and shows strong
fluorescence in presence of superoxide radical [32]. Indeed,
10 mM SF significantly increased the ROS concentration in both
resistant cancer cell lines, while even 5 mM SF induced consid-
erable change in NCI-H460/R cells (Figure 4A).
The main cellular antioxidant detoxification pathway – GSH
system scavenges ROS and prevents them from causing intracel-
lular damage including lipid peroxidation, DNA damage and
protein oxidation [33]. Therefore, we studied the effects of SF on
GSH concentration. The concentration of reduced glutathione
(GSH) was measured in untreated cells and cells treated for 72 h
with 5 and 10 mM SF. SF caused strong and significant depletion
of GSH in both resistant cancer cell lines (Figure 4B). After 10 mM
SF treatments, the concentrations decreased from19 to 12 mg
GSH/ml protein in NCI-H460/R and from 17 to 7 mg GSH/ml
protein in U87-TxR cells (Figure 4B).
We also measured the level of mRNA expression of the
common drug resistance marker glutathione-S-transferase p (gst-
p), which is a component of GSH system. Application of SF to the
resistant cell lines induced a significant reduction in gst-pexpression compared to untreated cells (Figure 4C, D). Herein,
we also showed that 10 mM SF significantly decreased the
expression of gamma Glutamyl-cysteine-synthetase (cGCS), the
enzyme critical for GSH synthesis (Figure 4E, F).
The role of GSH and related enzymes in cellular resistance to
xenobiotics, including chemotherapy, is well established. Clearly,
SF has a potential to modulate GSH system to therapeutic
advantage. SF significantly decreased intracellular GSH levels by
inhibition of its synthesis. This contributes further to the increase
of ROS, the induction of cell damage and eventually the cell
death.
SF Decreases the Expression of hif-1a and hif-1aRegulated mRNAs
We assumed that SF action through modification of redox status
(GSH depletion and ROS generation) could influence the
expression level of hypoxia inducible factor-1a (HIF-1a) and
indirectly decrease the expression of P-gp and VEGF. We found
that 10 mM SF significantly decreased the mRNA battery (gst-p,
hif-1a, mdr1 and vegf) in both MDR cancer cell lines (Figure 5A, B).
In order to reveal whether SF could regulate the HIF-1aexpression induced by hypoxia, MDR cancer cells were treated
with cobalt chloride (CoCl2) that stabilizes HIF-1a and induces
HIF-1 responsive genes similarly to that of hypoxic condition [16].
We showed that SF retained the potential to inhibit the expression
of hif-1a, mdr1 and vegf mRNAs even in hypoxic mimic condition in
NCI-H460/R cell line (Figure 5C, D, E).
SF Inhibits P-gp Expression and ActivityConsidering the obtained results on mRNAs expression,
especially mdr1 gene, next, we studied the potential of SF to
modulate MDR. Therefore, we assessed the P-gp (coded by mdr1)
expression by flow-cytometry (Figure 6A, B, C, D). We used direct
FITC-labeled antibody for P-gp to study the changes in protein
expression level. After determination of background fluorescence
with isotypic control antibody, we were able to define the portion
of P-gp positive cells in each tested sample. Significant decreases in
amount of P-gp positive NCI-H460/R and U87-TxR cells were
observed after SF treatment (Figure 6A, B). The effect of SF on P-
gp expression was concentration- and time-dependent. The best
effect was achieved after 72 h and illustrated by flow-cytometric
profiled histogram (Figure 6C, D). The fluorescence in SF treated
samples declined in comparison to untreated controls of NCI-
H460/R and U87-TxR by 34.1% and 36.9%, respectively. SF
clearly decreased the fraction of P-gp expressing cells in both
resistant cancer cell lines.
In order to investigate the effect of SF on P-gp function in NCI-
H460/R and U87-TxR cell lines, we analyzed intracellular
accumulation of chemotherapeutic (DOX), which is P-gp substrate
(Figure 6E, F, G, H). We confirmed that MDR in NCI-H460/R
and U87-TxR cell lines correlates with over-expression of P-gp
membrane transporter. Low intracellular accumulation of P-gp
substrates – DOX and Rhodamine 123 shown in these cell lines
was the consequence of high P-gp activity [9], [10].
Sulfinosine Modulates Cancer Progression
PLOS ONE | www.plosone.org 12 January 2013 | Volume 8 | Issue 1 | e54044

The accumulation of DOX was assessed by flow-cytometry and
compared among SF, TQ (non-competitive P-gp inhibitor) and
Dex-VER (competitive P-gp inhibitor). Marked increases in DOX
accumulation were observed in NCI-H460/R and U87-TxR cells
pretreated with SF during 48 h and 72 h (Figure 6E, F). SF was
the most efficient in the modulation of P-gp activity after 72 h
showing the same potential as TQ and Dex-VER in both MDR
cancer cell lines (Figure 6G, H). We verified that the effect of SF
on DOX accumulation was concentration- and time-dependent.
The effect on P-gp expression was in accordance with obtained
increases in DOX accumulation. We showed that the decrease in
P-gp expression correlates with the strongest inhibition of P-gp
activity after 72 h of SF application. Therefore, we confirmed the
P-gp modifying effect of SF in two different MDR cancer cell lines.
SF Chemo-sensitizes MDR Cancer CellsSince SF significantly inhibits P-gp activity and expression, we
decided to combine SF and DOX with the expectation that SF
would improve DOX anti-cancer action. The effects of 5 mM SF
on the chemo-sensitivity of MDR cancer cell lines were assessed by
the MTT assay. We chose 5 mM SF as relevant concentration,
which considerably decreased the percentage of P-gp positive cells
in both MDR cancer cell lines. In order to distinguish the possible
synergistic interaction of DOX and SF from chemo-sensitizing
effect of SF, we compared the effects of simultaneous and
subsequent treatment (Table 1). The IC50 value for DOX
decreased in NCI-H460/R cells from 3.250 mM to only
3.036 mM in simultaneous treatment with SF. However, SF
promoted significant reversal of resistance to DOX (7.26-fold) in
subsequent treatment by decreasing the IC50 value for DOX from
7.083 mM to 0.976 mM (Table 1). SF also achieved significant
chemo-sensitizing effect in U87-TxR cells in subsequent treatment
promoting 17.01-fold reversal of DOX resistance (Table 1). The
decrease in IC50 value for DOX in simultaneous treatment with
SF (from 0.224 mM to 0.098 mM) was not significant in U87-TxR
cells. We confirmed the chemo-sensitizing effect of SF in
subsequent treatment with DOX. However, the improvement of
DOX effect in simultaneous treatment with SF was negligible. In
previous study, we showed that SF decreased the expression of
topo IIa, which is the main target of DOX [5]. It implies that the
effect of these two drugs in combination should be antagonistic.
Therefore, the synergy between SF and DOX observed in
subsequent treatment is obviously the result of SF facilitated
DOX accumulation and the chemo-sensitization achieved by SF
could not be merely the consequence of SF and DOX intracellular
interaction.
In this manner, we showed that SF significantly enhanced DOX
cytotoxicity in subsequent treatment. Our results suggest that the
improvement of DOX cytotoxicity was caused by SF induced
inhibition of P-gp expression and activity. In favor to this are also
the evidences that purine analogs could alter membrane glyco-
protein synthesis [34].
SF Modulates the Intracellular Pool of VEGF165 in MDRCells
Vascular endothelial growth factor (VEGF) mediates pro-
angiogenic effects. VEGF expression has been found to signifi-
cantly correlate with new vessel formation and tumor progression
in patients with NSCLC [35], while gliomas are reputed for their
high micro-vascular proliferation [36]. New targeting strategies are
aimed to block neo-angiogenesis in these two malignancies [37],
[38].
Since it was shown that 6-thioguanine has anti-angiogenic
potential [4], we decided to examine the effect of SF on gene
expression and protein secretion of VEGF165 in resistant NCI-
H460/R and U87-TxR cells. Additionally, VEGF and P-gp
expression are regulated by the same transcriptional factor –
hypoxia inducible factor-1a (HIF-1a) [39], and high concentra-
tions of VEGF could decrease the expression of P-gp [40], [41].
We examined the changes in vegf165 mRNA expression levels in
NCI-H460/R (Figure 7A) and U87-TxR cells (Figure 7B) treated
with 5 and 10 mM. The reduction of vegf165 mRNA expression in
NCI-H460/R cells achieved with 5 and 10 mM SF was 22% and
41%, respectively (Figure 7A). SF also significantly decreased
vegf165 expression in U87-TxR cells treated with 5 and 10 mM by
48% and 45%, respectively (Figure 7B).
We also assessed the VEGF expression by flow-cytometry
(Figure 7C, D, E, F). We used direct PE-labeled antibody for
VEGF to study the changes in protein expression level. Significant
decreases in mean VEGF fluorescence of NCI-H460/R and U87-
TxR cells treated with 10 mM SF were observed after 24 h and
48 h, respectively (Figure 7C, D). The decrease of VEGF
expression was transient. The best effect was illustrated by flow-
cytometric profiled histogram (Figure 7E, F). The fluorescence in
SF treated samples declined in comparison to untreated controls of
NCI-H460/R and U87-TxR by 22.5% and 51.6%, respectively.
The secretion of VEGF165 protein was examined in cell culture
medium (Figure 7G, H). The culture medium was collected from
untreated and treated samples with the same amount of cells as
well as when the amount of cells in treated samples decreased due
to SF action.
The secretion of VEGF165 after 24 h, 48 h and 72 h by
untreated U87-TxR cells (4620, 6070 and 8020 pg/ml, respec-
tively) exceeded the secretion obtained by untreated NCI-H460/R
cells (359, 845 and 1459 pg/ml, respectively). Secretion of
VEGF165 was highly stimulated (1220, 2323 and 2629 pg/ml,
respectively) when NCI-H460/R cells were treated with 10 mM SF
(Figure 7G, grey bars). However, the level of secreted VEGF165
decreased significantly after 72 h from 1459 pg/ml in control
samples to 973 pg/ml in SF treated samples if the results were not
normalized (Figure 7G, black bars). U87-TxR cells also signifi-
cantly elevated the level of secreted VEGF165 after 10 mM SF
treatment, but only at 24 h (Figure 7H, grey bars). Contrary, when
the levels of secretion were not normalized, significant decreases in
detected VEGF165 were observed after 48 h and 72 h of SF
treatment (Figure 7H, black bars). This could be the consequence
of SF anti-proliferative and apoptotic effect as well as of significant
decrease of VEGF expression observed in U87-TxR cells after
48 h of SF treatment.
According to obtained results, SF modulates the secretion of
VEGF and reduces its expression and the synthesis of correspond-
ing mRNA. Therefore, we assume that SF exerts its anti-
angiogenic potential by empting the intracellular pool of VEGF
and preventing the renewal of its synthesis. However, the detected
elevation of secreted VEGF in medium could be the consequence
of VEGF leaking from dying cells. This is supported by the fact
that the level of VEGF in medium was actually decreased along
with the decrease in number of viable cells after SF treatment.
Further experiments, particularly in co-culture with endothelial
cells, are required to clarify this point.
ConclusionsAchieving an effective treatment of lung cancer is difficult, in
particular in advanced stage diagnosed disease [42]. Physiological
CNS barriers that prevent penetration of systemically delivered
molecules limit treatment of brain malignancies [43]. Further-
more, resistance to standard chemotherapeutic agents presents
major challenge in cancer treatment. MDR phenotype allows a
Sulfinosine Modulates Cancer Progression
PLOS ONE | www.plosone.org 13 January 2013 | Volume 8 | Issue 1 | e54044
cancer cell exposed to a single agent to become simultaneously
resistant to both that drug and to other drugs of unrelated
structure or function. P-gp, which is often involved in development
of MDR, is responsible for the unidirectional efflux of drugs from
cancer cells [44].
We showed that SF anti-cancer effects in resistant NSCLC and
glioblastoma cell lines include depletion of GSH, reversion of
MDR through inhibition of P-gp expression and activity, and
modulation of VEGF intracellular pool. This mechanistic study
explains SF action through modification of redox status and HIF-
1a regulation and rationalize the use of SF alone or in
combination with conventional anti-cancer agents. By this means,
SF should be considered as drug that disturbs diverse mechanisms
involved in cancer progression, beneficial for combination with
other chemotherapeutics, particularly substrates for P-gp. Since SF
inhibits HIF-1a-induced transcription of target genes important
for chemoresistance and metastasis such as mdr1 and vegf, our
results may be useful for translation in clinic, especially for
targeting solid tumors with hypoxic regions or highly-angiogenic
tumors.
Author Contributions
Revised critically the article for important intellectual content: LR SR.
Conceived and designed the experiments: MD AI MP. Performed the
experiments: MD AI AMI APR TS ZM MP. Analyzed the data: MP.
Wrote the paper: MP.
References
1. Revankar GR, Hanna NB, Imamura N, Lewis AF, Larson SB, et al. (1990)
Synthesis and in vivo antitumor activity of 2-amino-9H-purine-6-sulfenamide, -
sulfinamide, and -sulfonamide and related purine ribonucleosides. J Med Chem
33: 121–128.
2. Avery TL, Finch RA, Vasquez KM, Radparvar S, Hanna NB, et al. (1990)
Chemotherapeutic characterization in mice of 2-amino-9-beta-D-ribofuranosyl-
purine-6-sulfinamide (sulfinosine), a novel purine nucleoside with unique
antitumor properties. Cancer Res 50: 2625–2630.
3. Bosch TM, Meijerman I, Beijnen JH, Schellens JH (2006) Genetic polymor-
phisms of drug-metabolising enzymes and drug transporters in the chemother-
apeutic treatment of cancer. Clin Pharmacokinet 45: 253–285.
4. Presta M, Belleri M, Vacca A, Ribatti D (2002) Anti-angiogenic activity of the
purine analog 6-thioguanine. Leukemia 16: 1490–1499.
5. Pesic M, Andjelkovic T, Bankovic J, Markovic ID, Rakic L, et al. (2009)
Sulfinosine enhances doxorubicin efficacy through synergism and by reversing
multidrug resistance in the human non-small cell lung carcinoma cell line (NCI-
H460/R). Invest New Drugs, 27: 99–110.
6. Andjelkovic T, Pesic M, Bankovic J, Tanic N, Markovic ID, et al. (2008) S:
Synergistic effects of the purine analog sulfinosine and curcumin on the
multidrug resistant human non-small cell lung carcinoma cell line (NCI-H460/
R). Cancer Biol Ther 7: 1024–1032.
7. Pesic M, Podolski A, Rakic L, Ruzdijic S (2010) Purine analogs sensitize the
multidrug resistant cell line (NCI-H460/R) to doxorubicin and stimulate the cell
growth inhibitory effect of verapamil. Invest New Drugs 28: 482–492.
8. Nobili S, Landini I, Mazzei T, Mini E (2011) Overcoming tumor multidrug
resistance using drugs able to evade P-glycoprotein or to exploit its expression.
Med Res Rev, doi:10.1002/med.20239.
9. Pesic M, Markovic JZ, Jankovic D, Kanazir S, Markovic ID, et al. (2006)
Induced resistance in the human non small cell lung carcinoma (NCI-H460) cell
line in vitro by anticancer drugs. J Chemother 18: 66–73.
10. Podolski-Renic A, Andelkovic T, Bankovic J, Tanic N, Ruzdijic S, et al. (2011)
The role of paclitaxel in the development and treatment of multidrug resistant
cancer cell lines. Biomed Pharmacother 65: 345–353.
11. Skehan P, Storeng R, Scudiero D, Monks A, McMahon J, et al. (1990) New
colorimetric cytotoxicity assay for anticancer-drug screening. J Natl Cancer Inst
82: 1107–1112.
12. Kang W, Nielsen O, Fenger C, Leslie G, Holmskov U, et al. (2005) Induction of
DMBT1 expression by reduced ERK activity during a gastric mucosa
differentiation-like process and its association with human gastric cancer.
Carcinogenesis 26: 1129–1137.
13. O’Driscoll L, Daly C, Saleh M, Clynes M (1993) The use of reverse
transcriptase-polymerase chain reaction (RT-PCR) to investigate specific gene
expression in multidrug-resistant cells. Cytotechnology 12: 289–314.
14. Harada H, Nakagawa K, Iwata S, Saito M, Kumon Y, et al. (1999) Restoration
of wild-type p16 down-regulates vascular endothelial growth factor expression
and inhibits angiogenesis in human gliomas. Cancer Res 59: 3783–3789.
15. Bosch S, Siavoshian S, Jacquot C, Tomasoni C, Dabouis G, et al. (1997)
Correlation between multidrug resistance and the degree of differentiation of
non-small-cell bronchopulmonary carcinoma (NSCLC) in vitro and in vivo.
Anticancer Res 17: 4595–4598.
16. Nardinocchi L, Puca R, Sacchi A, D’Orazi G (2009) Inhibition of HIF-1alpha
activity by homeodomain-interacting protein kinase-2 correlates with sensitiza-
tion of chemoresistant cells to undergo apoptosis. Mol Cancer 8: 1.
17. NicAmhlaoibh R, Heenan M, Cleary I, Touhey S, O’Loughlin C, et al. (1999)
Altered expression of mRNAs for apoptosis-modulating proteins in a low level
multidrug resistant variant of a human lung carcinoma cell line that also
expresses mdr1 mRNA. Int J Cancer 82: 368–376.
18. Wong H, Anderson WD, Cheng T, Riabowol KT (1994) Monitoring mRNA
expression by polymerase chain reaction: the ‘‘primer-dropping’’ method. Anal
Biochem 223: 251–258.
19. Walbert T, Gilbert MR, Groves MD, Puduvalli VK, Yung WK, et al. (2011)Combination of 6-thioguanine, capecitabine, and celecoxib with temozolomide
or lomustine for recurrent high-grade glioma. J Neurooncol 102: 273–280.
20. Taylor RC, Cullen SP, Martin SJ (2008) Apoptosis: controlled demolition at thecellular level. Nat Rev Mol Cell Biol 9: 231–241.
21. Xu Y (2008) Induction of genetic instability by gain-of-function p53 cancer
mutants. Oncogene 27: 3501–3507.
22. Fujitaki JM, Nord LD, Willis RC (1989) Cellular metabolism of the antitumor
nucleoside, sulfinosine, 2-amino-9-(b-D-ribofuranosyl) purine-6-sulfinamide.Proc Am Assoc Cancer Res 30: 596.
23. Riley TA, Finch RA, Vasquez KM (1989): Isolation, identification, synthesis and
therapeutic evaluation of selected metabolites of sulfinosine a novel purine
nucleoside analog active against thiopurine refractory experimental leukemia.Proc Am Assoc Cancer Res 30: 599.
24. Rudin CM, Yang Z, Schumaker LM, VanderWeele DJ, Newkirk K, et al. (2003)
Inhibition of glutathione synthesis reverses Bcl-2-mediated cisplatin resistance.Cancer Res 63: 312–318.
25. Ghibelli L, Coppola S, Fanelli C, Rotilio G, Civitareale P, et al. (1999)
Glutathione depletion causes cytochrome c release even in the absence of cell
commitment to apoptosis. FASEB J 13: 2031–2036.
26. Chang CY, Shen CC, Su HL, Chen CJ (2011) Gefitinib induces apoptosis inhuman glioma cells by targeting Bad phosphorylation. J Neurooncol.
doi:10.1007/s11060-011-0632-3.
27. Li G, Xu Y, Guan D, Liu Z, Liu DX (2011) HSP70 protein promotes survival ofC6 and U87 glioma cells by inhibition of ATF5 degradation. J Biol Chem 286:
20251–20259.
28. Voss V, Senft C, Lang V, Ronellenfitsch MW, Steinbach JP, et al. (2010) The
pan-Bcl-2 inhibitor (2)-gossypol triggers autophagic cell death in malignantglioma. Mol Cancer Res 8: 1002–1016.
29. Eimer S, Belaud-Rotureau MA, Airiau K, Jeanneteau M, Laharanne E, et al.
(2011) Autophagy inhibition cooperates with erlotinib to induce glioblastoma cell
death. Cancer Biol Ther 11: 1017–1027.
30. Maiuri MC, Zalckvar E, Kimchi A, Kroemer G (2007) Self-eating and self-killing: crosstalk between autophagy and apoptosis. Nat Rev Mol Cell Biol 8:
741–752.
31. Menon SG, Goswami PC (2007) A redox cycle within the cell cycle: ring in theold with the new. Oncogene 26: 1101–1109.
32. Zhao H, Kalivendi S, Zhang H, Joseph J, Nithipatikom K, et al. (2003)Superoxide reacts with hydroethidine but forms a fluorescent product that is
distinctly different from ethidium: potential implications in intracellularfluorescence detection of superoxide. Free Radic Biol Med 34: 1359–1368.
33. Townsend DM, Tew KD, Tapiero H (2003) The importance of glutathione in
human disease. Biomed. Pharmacother 57: 145–155.
34. Sokoloski JA, Sartorelli AC (1987) Inhibition of the synthesis of glycoproteins
and induction of the differentiation of HL-60 promyelocytic leukemia cells by 6-methylmercaptopurine ribonucleoside. Cancer Res 47: 6283–6287.
35. Fontanini G, Vignati S, Boldrini L, Chine S, Silvestri V, et al. (1997) Vascular
endothelial growth factor is associated with neovascularization and influencesprogression of non-small cell lung carcinoma. Clin Cancer Res 3: 861–865.
36. Jansen M, de Witt Hamer PC, Witmer AN, Troost D, van Noorden CJ (2004)Current perspectives on antiangiogenesis strategies in the treatment of malignant
gliomas. Brain Res Rev 45: 143–163.
37. Horn L, Sandler AB (2009) Emerging data with antiangiogenic therapies in earlyand advanced non-small-cell lung cancer. Clin Lung Cancer 10: S7–16.
38. Underiner TL, Ruggeri B, Gingrich DE (2004) Development of vascular
endothelial growth factor receptor (VEGFR) kinase inhibitors as anti-angiogenic
agents in cancer therapy. Curr Med Chem 11: 731–745.
39. Jin WS, Kong ZL, Shen ZF, Jin YZ, Zhang WK et al. (2011) Regulation ofhypoxia inducible factor-1a expression by the alteration of redox status in
HepG2 cells. J Exp Clin Cancer Res 30: 61.
40. Dunne G, Breen L, Collins DM, Roche S, Clynes M, et al. (2011) Modulation of
P-gp expression by lapatinib. Invest New Drugs 29: 1284–1293.
Sulfinosine Modulates Cancer Progression
PLOS ONE | www.plosone.org 14 January 2013 | Volume 8 | Issue 1 | e54044
41. Hawkins BT, Sykes DB, Miller DS (2010) Rapid, reversible modulation of
blood-brain barrier P-glycoprotein transport activity by vascular endothelialgrowth factor. J Neurosci 30: 1417–1425.
42. Gridelli C, Rossi A, Maione P (2003) Treatment of non-small-cell lung cancer:
state of the art and development of new biologic agents. Oncogene 22: 6629–6638.
43. Nies AT (2007) The role of membrane transporters in drug delivery to brain
tumors. Cancer Lett 254: 11–29.
44. Sarkadi B, Homolya L, Szakacs G, Varadi A (2006) Human multidrug resistance
ABCB and ABCG transporters: participation in a chemoimmunity defense
system. Physiol Rev 86: 1179–1236.
Sulfinosine Modulates Cancer Progression
PLOS ONE | www.plosone.org 15 January 2013 | Volume 8 | Issue 1 | e54044