Pulse Manual 43 - Updated for Release 230 - Tyler ...
401
Tyler Pulse ____________________________________________________ Administration Manual Version 229
-
Upload
khangminh22 -
Category
Documents
-
view
1 -
download
0
Transcript of Pulse Manual 43 - Updated for Release 230 - Tyler ...

Tyler Pulse ____________________________________________________
Administration Manual Version 229
For more information, visit www.tylertech.com.
2
Tyler Pulse -‐ Introduction
Tyler Pulse is an information/data warehouse that is uniquely specialized for the delivery of highly processed information to the managers of a school district or local government (decision support). In any local government or school district, accurate and timely information is the key to improved management. Yet, most of these organizations spend more time gathering information than managing with it. Tyler Pulse is designed to address information needs at all levels of public sector management, from the superintendent/government manager to department heads to principals to teachers. Tyler Pulse employs unique and new technology to establish a low cost and easily managed tool to deliver information to all stakeholders in a public sector organization.
Government is awash in data generated by various application systems. Tyler Pulse is designed as a tool to translate all of these data sources into highly processed management information. Designed specifically for government and education as a data warehouse and decision support system, Tyler Pulse will simply change the way an organization does business.
Pulse is designed to access the most in-‐depth and complex data that generates the most meaningful management information. As such, it delivers immediate and comprehensive management information to users and managers that are starved for information on the organization, their schools, their departments and other areas of responsibility.
In summary, Tyler Pulse employs innovation and radical new design processes to generate a management system that is far faster, that is far easier to manage, that uses far fewer resources, which is more comprehensive, and is far less expensive than any other data management tool available in the marketplace today. The local government or school district's data is literally transformed into "information" and constantly available for management use. Tyler Pulse is delivered to its clients as two key components. The Pulse Engine provides the basis
to develop and support comprehensive Information Warehouses and Pulse Models. Pulse Models are developed using the Pulse Engine. They read specific raw data from various application software pages (Financial Systems, Student Systems, Transportation Systems, Assessment Results, etc.) and transform that data into highly processed management information. This information is then delivered to end users in the form of data tables, graphs and other data representing objects.
This manual is primarily developed for the administrator of Pulse existing models and to support
the development of new Pulse models. It is not designed for end users. End user documentation is embedded into each model as interactive help. As such, it addresses how to maintain and support existing Pulse models. It also provides extensive support and reference documentation related to the development of new Pulse Models.
3
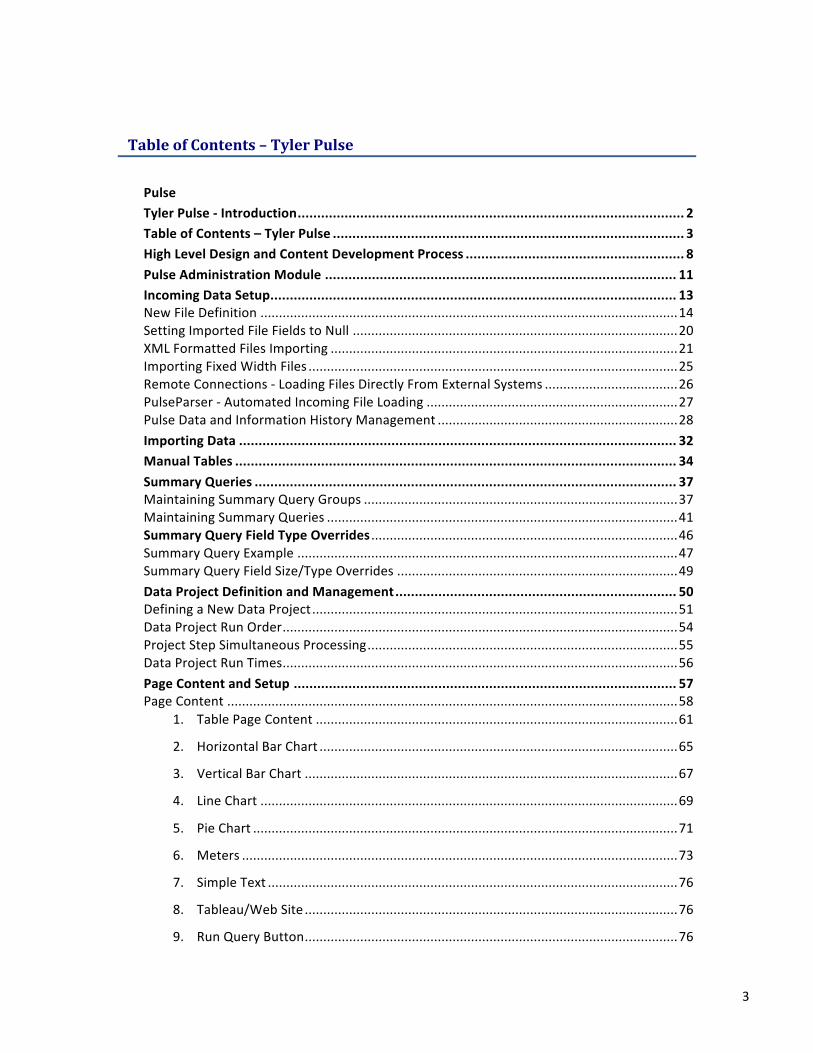
Table of Contents – Tyler Pulse Pulse Tyler Pulse -‐ Introduction ................................................................................................... 2 Table of Contents – Tyler Pulse .......................................................................................... 3 High Level Design and Content Development Process ........................................................ 8 Pulse Administration Module .......................................................................................... 11 Incoming Data Setup ........................................................................................................ 13 New File Definition ................................................................................................................. 14 Setting Imported File Fields to Null ........................................................................................ 20 XML Formatted Files Importing .............................................................................................. 21 Importing Fixed Width Files .................................................................................................... 25 Remote Connections -‐ Loading Files Directly From External Systems .................................... 26 PulseParser -‐ Automated Incoming File Loading .................................................................... 27 Pulse Data and Information History Management ................................................................. 28 Importing Data ................................................................................................................ 32 Manual Tables ................................................................................................................. 34 Summary Queries ............................................................................................................ 37 Maintaining Summary Query Groups ..................................................................................... 37 Maintaining Summary Queries ............................................................................................... 41 Summary Query Field Type Overrides ................................................................................... 46 Summary Query Example ....................................................................................................... 47 Summary Query Field Size/Type Overrides ............................................................................ 49 Data Project Definition and Management ........................................................................ 50 Defining a New Data Project ................................................................................................... 51 Data Project Run Order ........................................................................................................... 54 Project Step Simultaneous Processing .................................................................................... 55 Data Project Run Times ........................................................................................................... 56 Page Content and Setup .................................................................................................. 57 Page Content .......................................................................................................................... 58
1. Table Page Content .................................................................................................. 61
2. Horizontal Bar Chart ................................................................................................. 65
3. Vertical Bar Chart ..................................................................................................... 67
4. Line Chart ................................................................................................................. 69
5. Pie Chart ................................................................................................................... 71
6. Meters ...................................................................................................................... 73
7. Simple Text ............................................................................................................... 76
8. Tableau/Web Site ..................................................................................................... 76
9. Run Query Button ..................................................................................................... 76
4
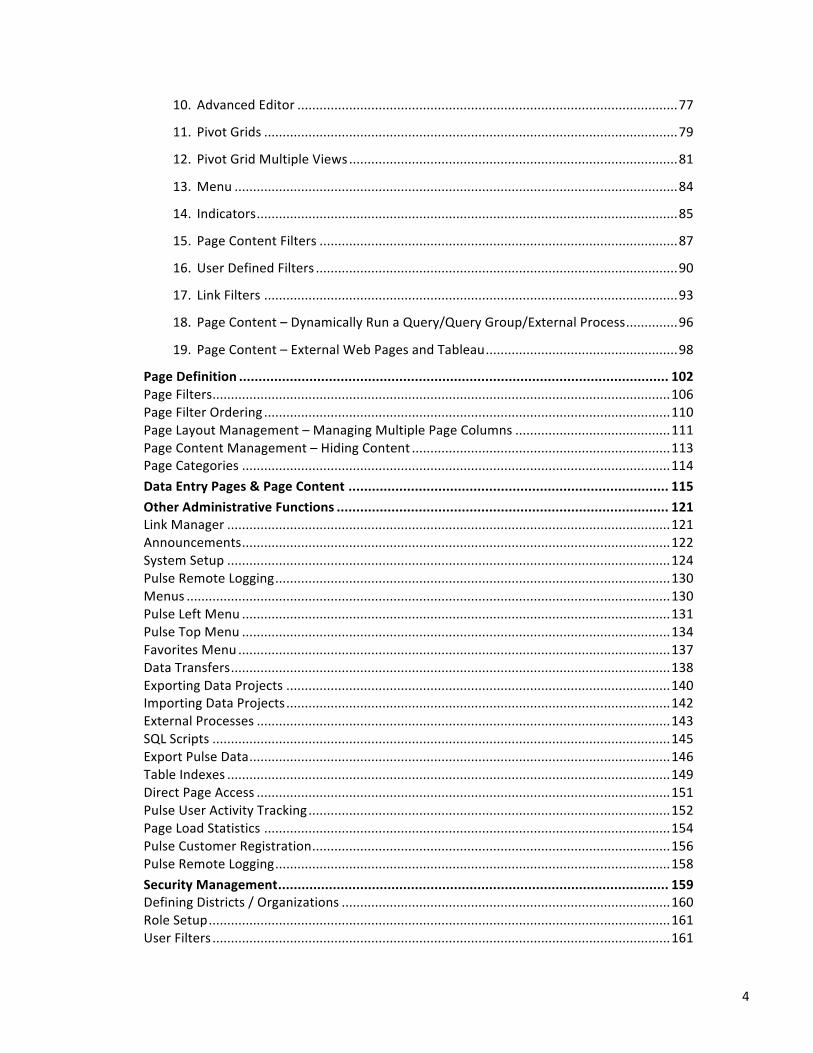
10. Advanced Editor ....................................................................................................... 77
11. Pivot Grids ................................................................................................................ 79
12. Pivot Grid Multiple Views ......................................................................................... 81
13. Menu ........................................................................................................................ 84
14. Indicators .................................................................................................................. 85
15. Page Content Filters ................................................................................................. 87
16. User Defined Filters .................................................................................................. 90
17. Link Filters ................................................................................................................ 93
18. Page Content – Dynamically Run a Query/Query Group/External Process .............. 96
19. Page Content – External Web Pages and Tableau .................................................... 98
Page Definition .............................................................................................................. 102 Page Filters ............................................................................................................................ 106 Page Filter Ordering .............................................................................................................. 110 Page Layout Management – Managing Multiple Page Columns .......................................... 111 Page Content Management – Hiding Content ...................................................................... 113 Page Categories .................................................................................................................... 114 Data Entry Pages & Page Content .................................................................................. 115 Other Administrative Functions ..................................................................................... 121 Link Manager ........................................................................................................................ 121 Announcements .................................................................................................................... 122 System Setup ........................................................................................................................ 124 Pulse Remote Logging ........................................................................................................... 130 Menus ................................................................................................................................... 130 Pulse Left Menu .................................................................................................................... 131 Pulse Top Menu .................................................................................................................... 134 Favorites Menu ..................................................................................................................... 137 Data Transfers ....................................................................................................................... 138 Exporting Data Projects ........................................................................................................ 140 Importing Data Projects ........................................................................................................ 142 External Processes ................................................................................................................ 143 SQL Scripts ............................................................................................................................ 145 Export Pulse Data .................................................................................................................. 146 Table Indexes ........................................................................................................................ 149 Direct Page Access ................................................................................................................ 151 Pulse User Activity Tracking .................................................................................................. 152 Page Load Statistics .............................................................................................................. 154 Pulse Customer Registration ................................................................................................. 156 Pulse Remote Logging ........................................................................................................... 158 Security Management .................................................................................................... 159 Defining Districts / Organizations ......................................................................................... 160 Role Setup ............................................................................................................................. 161 User Filters ............................................................................................................................ 161
5
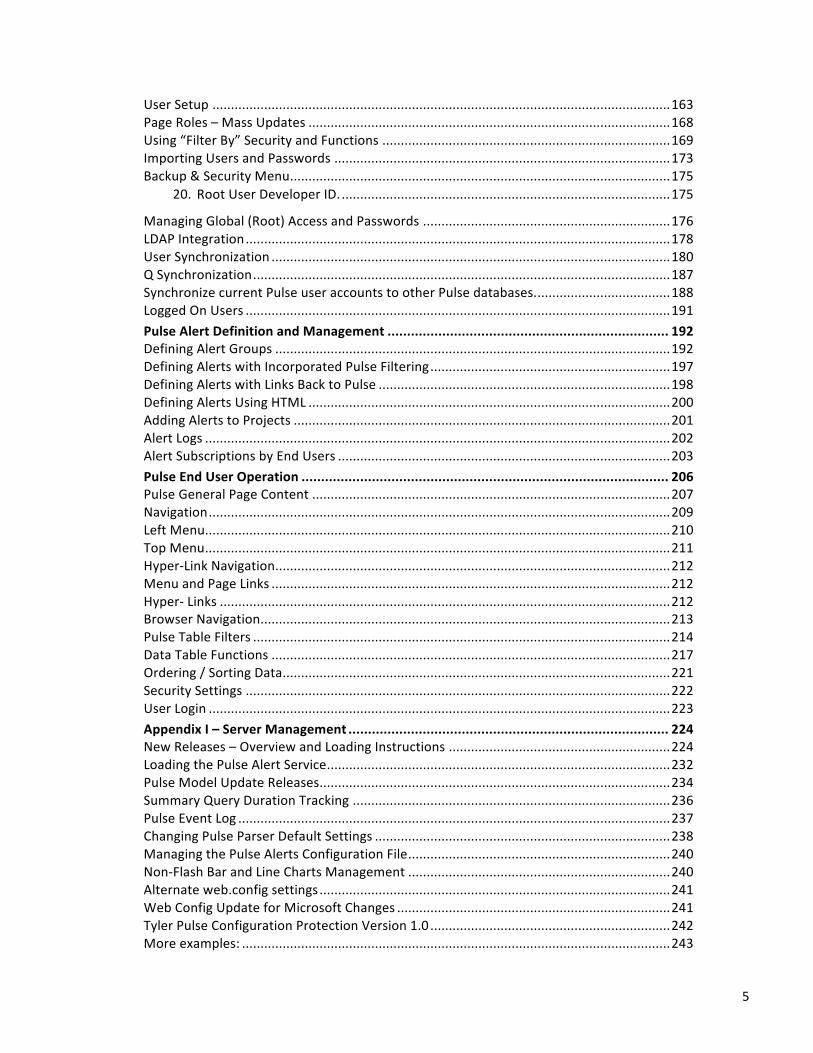
User Setup ............................................................................................................................ 163 Page Roles – Mass Updates .................................................................................................. 168 Using “Filter By” Security and Functions .............................................................................. 169 Importing Users and Passwords ........................................................................................... 173 Backup & Security Menu ....................................................................................................... 175
20. Root User Developer ID. ......................................................................................... 175
Managing Global (Root) Access and Passwords ................................................................... 176 LDAP Integration ................................................................................................................... 178 User Synchronization ............................................................................................................ 180 Q Synchronization ................................................................................................................. 187 Synchronize current Pulse user accounts to other Pulse databases. .................................... 188 Logged On Users ................................................................................................................... 191 Pulse Alert Definition and Management ........................................................................ 192 Defining Alert Groups ........................................................................................................... 192 Defining Alerts with Incorporated Pulse Filtering ................................................................. 197 Defining Alerts with Links Back to Pulse ............................................................................... 198 Defining Alerts Using HTML .................................................................................................. 200 Adding Alerts to Projects ...................................................................................................... 201 Alert Logs .............................................................................................................................. 202 Alert Subscriptions by End Users .......................................................................................... 203 Pulse End User Operation .............................................................................................. 206 Pulse General Page Content ................................................................................................. 207 Navigation ............................................................................................................................. 209 Left Menu .............................................................................................................................. 210 Top Menu .............................................................................................................................. 211 Hyper-‐Link Navigation ........................................................................................................... 212 Menu and Page Links ............................................................................................................ 212 Hyper-‐ Links .......................................................................................................................... 212 Browser Navigation ............................................................................................................... 213 Pulse Table Filters ................................................................................................................. 214 Data Table Functions ............................................................................................................ 217 Ordering / Sorting Data ......................................................................................................... 221 Security Settings ................................................................................................................... 222 User Login ............................................................................................................................. 223 Appendix I – Server Management .................................................................................. 224 New Releases – Overview and Loading Instructions ............................................................ 224 Loading the Pulse Alert Service ............................................................................................. 232 Pulse Model Update Releases ............................................................................................... 234 Summary Query Duration Tracking ...................................................................................... 236 Pulse Event Log ..................................................................................................................... 237 Changing Pulse Parser Default Settings ................................................................................ 238 Managing the Pulse Alerts Configuration File ....................................................................... 240 Non-‐Flash Bar and Line Charts Management ....................................................................... 240 Alternate web.config settings ............................................................................................... 241 Web Config Update for Microsoft Changes .......................................................................... 241 Tyler Pulse Configuration Protection Version 1.0 ................................................................. 242 More examples: .................................................................................................................... 243
6
ASP/Cloud web.config Settings ............................................................................................ 244 Monthly Maintenance .......................................................................................................... 245 Pulse Settings File ................................................................................................................. 246 Pulse Useful Information ...................................................................................................... 247 Changing IIS Timeout ............................................................................................................ 247 Missouri MAP (NCLB) File Loading Locations ........................................................................ 249 Transferring a File and its Data Contents in SQL Studio ....................................................... 249 Loading .NET Framework to a Pulse Server .......................................................................... 250 Setting Web Services Extensions when Setting up IIS for Pulse Operations ......................... 250 Command-‐line Pulse Project Transfers (PTML file loading) .................................................. 251 Appendix II – SQL Examples – Pulse Usage ..................................................................... 252 Appendix III -‐ Other Assessments ................................................................................... 262 Other Assessments – Conceptual design .............................................................................. 263 Loading and Managing Assessment Data ............................................................................. 268 Running the Other Assessments Model ................................................................................ 274 Quick Reference – Steps to Load OA Scores after Initial Setup ............................................ 275 Using / Defining Tier Scores .................................................................................................. 276 Other Assessment Parameter Tables .................................................................................... 277 Defining Tiers/Virtual Tests .................................................................................................. 281 Defining Tier Names .............................................................................................................. 283 Defining “Do Not Load Rows” ............................................................................................... 285 Establish SIS Interface Options ............................................................................................. 286 NWEA Score Definition ......................................................................................................... 287 NWEA MAP Test Name Translation ...................................................................................... 288 AYP Score Definition ............................................................................................................. 289 Parameter Menu Warnings and Start Buttons ..................................................................... 290 Override Test Display Order .................................................................................................. 291 Benchmark Assessments Setup ............................................................................................ 292 Defining Progression Scores ................................................................................................. 296 Defining Selected Scores ....................................................................................................... 297 Defining College Readiness Testing ...................................................................................... 298 No ID Process Student Statistics ........................................................................................... 299 Competency Level Definitions .............................................................................................. 300 Relabel Competency Levels and Assign Grades .................................................................... 302 Benchmark Growth Category Ranges ................................................................................... 303 Detail Test Analysis Goals ..................................................................................................... 304 Infinite Campus Test Score Importing ................................................................................... 306 Alpha Score Definition and Sequencing ................................................................................ 309 Test Score Direct Data Entry ................................................................................................. 310 Student Export Analysis Listing ............................................................................................. 313 Teacher Value Added Analysis .............................................................................................. 314 Teacher Value Added Setup and Usage ................................................................................ 318 The Other Assessments Main Menu ..................................................................................... 325 Appendix IV – Tableau with Pulse Outline ...................................................................... 331 Appendix V – Risk Analysis – Setup Instructions ............................................................. 338 Appendix VI – Single Login Synchronization with SIS Systems ........................................ 348 Revision History .................................................................................................................... 349
7
Single Login with SISk12 – Setup Instructions ....................................................................... 355 Zangle SIS User Account Auto Login ..................................................................................... 357 Appendix VII – Manual Table / Customer Responsibilities .............................................. 360 Pulse User Managed Tables .................................................................................................. 361 Appendix VIII – Setup Processes for the Tyler Munis Financial Models ........................... 370 Appendix IX – Pulse System Recommendations and Guidelines ..................................... 378 Tyler Pulse System Recommendations ................................................................................. 379 Appendix X – Security and Management Setup Guide .................................................... 382 Security Setup ....................................................................................................................... 385 Examples ............................................................................................................................... 390 Appendix XI – Grades Model Setup ................................................................................ 391 Appendix XII – Maintaining Skyward Terms for Grade Exports ....................................... 395
8
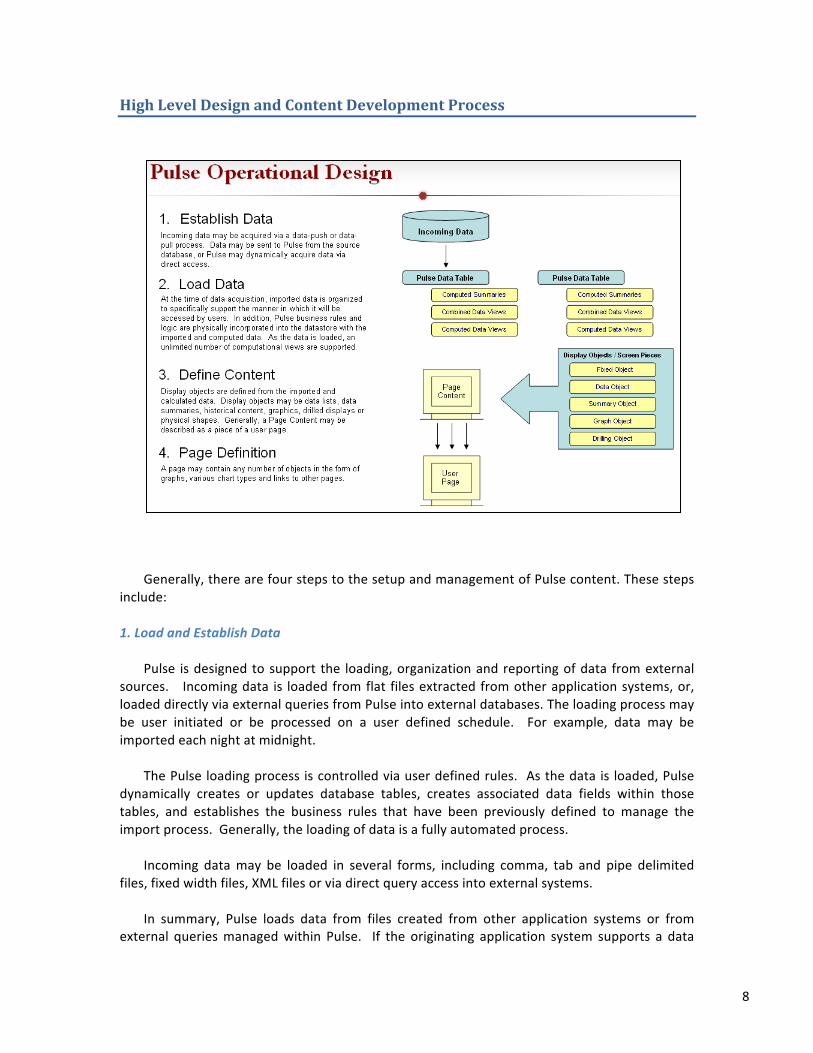
High Level Design and Content Development Process
Generally, there are four steps to the setup and management of Pulse content. These steps include:
1. Load and Establish Data
Pulse is designed to support the loading, organization and reporting of data from external
sources. Incoming data is loaded from flat files extracted from other application systems, or, loaded directly via external queries from Pulse into external databases. The loading process may be user initiated or be processed on a user defined schedule. For example, data may be imported each night at midnight.
The Pulse loading process is controlled via user defined rules. As the data is loaded, Pulse
dynamically creates or updates database tables, creates associated data fields within those tables, and establishes the business rules that have been previously defined to manage the import process. Generally, the loading of data is a fully automated process.
Incoming data may be loaded in several forms, including comma, tab and pipe delimited
files, fixed width files, XML files or via direct query access into external systems. In summary, Pulse loads data from files created from other application systems or from
external queries managed within Pulse. If the originating application system supports a data
9
export process that can export data to flat files in an efficient manner, it is most often appropriate to use that export process since they are native to the source application and likely to be the best option for exporting. In the case that the source application does not support these types of export tools, utilities in Pulse or other external processes may be used to access data from virtually any type of external system.
2. Process Data into Information After the initial loading of external data into Pulse, administrative users define Summary
Queries to further refine the data into information. At the time of data loading, Pulse creates a data file containing all of the raw imported data. A Summary Query is a SQL statement that instructs Pulse to create a separate data table containing computed information from that imported data. Virtually any type of calculation may be performed using summary queries to refine data, including but not limited to calculating totals, percentages, trends, combining data from multiple raw import tables, summarizing data and much more.
Based on this process, multiple data sets are calculated, stored and available for the
creation of screens/page content.
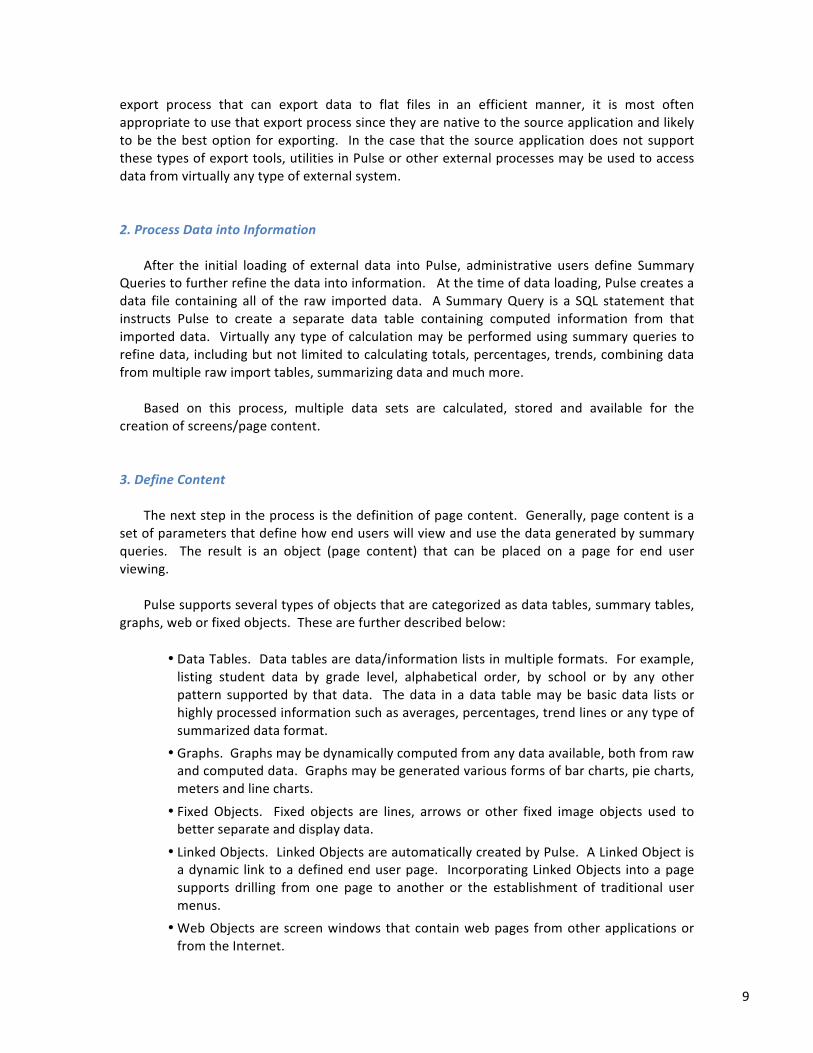
3. Define Content The next step in the process is the definition of page content. Generally, page content is a
set of parameters that define how end users will view and use the data generated by summary queries. The result is an object (page content) that can be placed on a page for end user viewing.
Pulse supports several types of objects that are categorized as data tables, summary tables,
graphs, web or fixed objects. These are further described below:
• Data Tables. Data tables are data/information lists in multiple formats. For example, listing student data by grade level, alphabetical order, by school or by any other pattern supported by that data. The data in a data table may be basic data lists or highly processed information such as averages, percentages, trend lines or any type of summarized data format.
• Graphs. Graphs may be dynamically computed from any data available, both from raw and computed data. Graphs may be generated various forms of bar charts, pie charts, meters and line charts.
• Fixed Objects. Fixed objects are lines, arrows or other fixed image objects used to better separate and display data.
• Linked Objects. Linked Objects are automatically created by Pulse. A Linked Object is a dynamic link to a defined end user page. Incorporating Linked Objects into a page supports drilling from one page to another or the establishment of traditional user menus.
• Web Objects are screen windows that contain web pages from other applications or from the Internet.
10
• Text Objects may be a simple text notation or may be highly processed text. For example, text may include embedded images and videos. It may also include traditional text editing found in most word processing systems.
• Menu Objects are table oriented menus that contain formatted links to pages throughout the Pulse model.
Once defined, a Page Content may be incorporated into any number of user pages. For example, the same graph may be used as a part of any number of page displays.
Page Content also supports the incorporation of viewing rules for better data
communication. For example, business rules support definition and use of colors to highlight alerts, data formatting, the addition of additional characters such as percent signs, relabeling data fields, the ordering of data fields, calculated statistics and totals and much more. In general, page content is the generation of the business rules defining how end users view information.
4. Page Definition The last step in the setup process is to define end user pages. This process supports the
combination of any number of Page Content objects into a single page for end user viewing. Pages may be defined as ‘Menus’ so that they are displayed on the primary Pulse Menu, or, they may be displayed as linked pages. Linked pages are accessed either in a traditional menu format or as drilling components on a viewed page.
Pages may be designed in any format desired. For example, a page may contain an
unlimited number of different tables, summaries, and charts from various application sources. A page may display various types of student data such as attendance, testing and discipline, and then also display human resource and transportation data as a part of the same page. Another approach is to construct each page to display information about a discrete subject, such as student attendance data or human resource data. The approach or approaches used for page design is completely in the control of the administrative developer.
In all cases, one or more startup or home pages are defined. These pages are often referred
to as Information-‐Boards because they are similar to dash boards but contain far more information that traditional dash boards. All other pages are accessed from these home menu pages or via drilling functionality that may be imbedded into all pages.
11
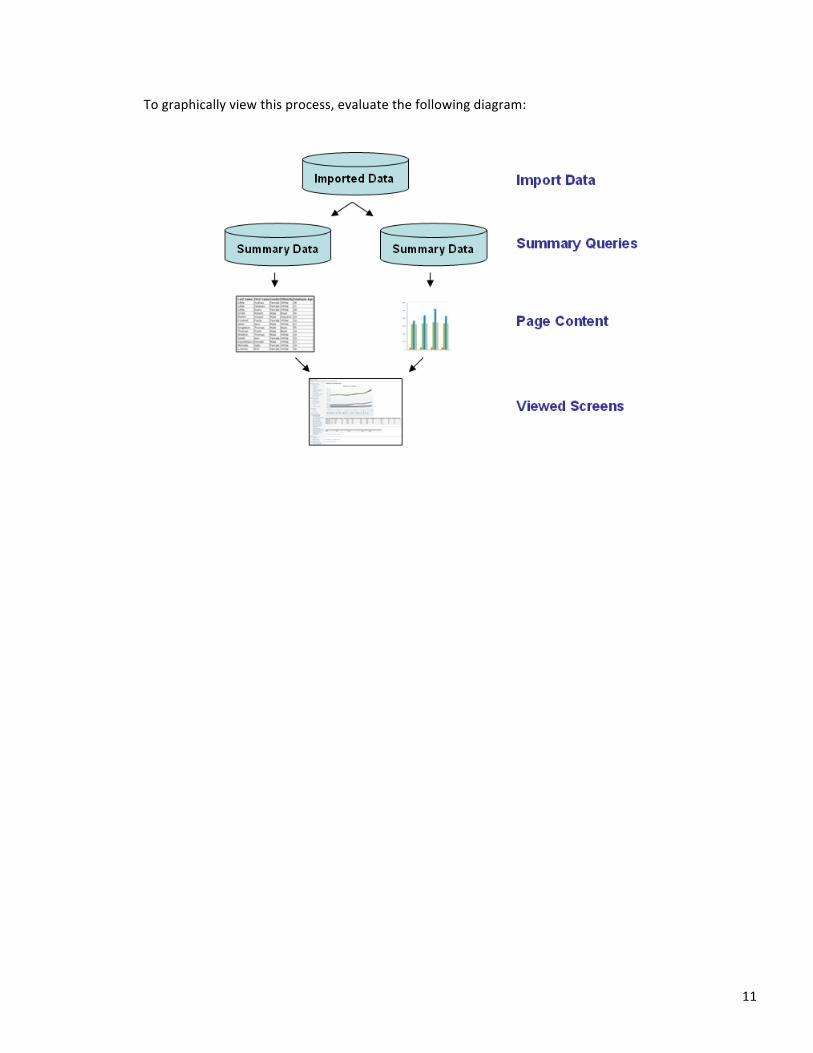
To graphically view this process, evaluate the following diagram:
12
Pulse Administration Module
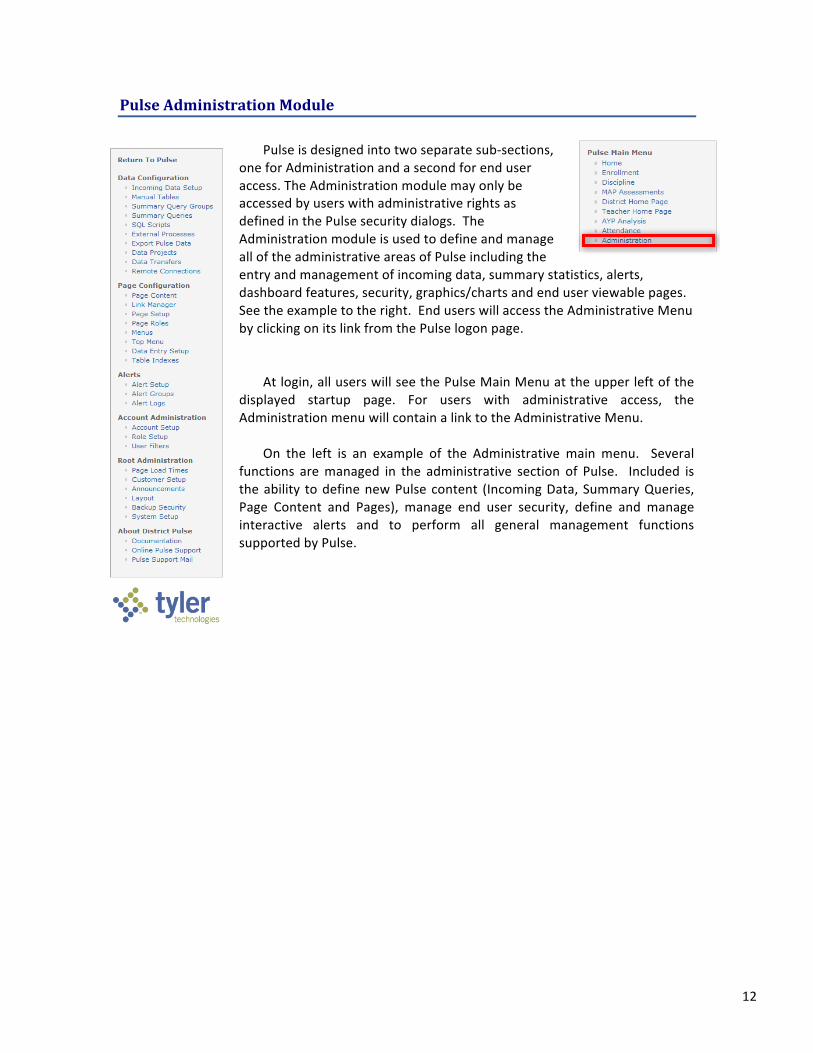
Pulse is designed into two separate sub-‐sections, one for Administration and a second for end user access. The Administration module may only be accessed by users with administrative rights as defined in the Pulse security dialogs. The Administration module is used to define and manage all of the administrative areas of Pulse including the entry and management of incoming data, summary statistics, alerts, dashboard features, security, graphics/charts and end user viewable pages. See the example to the right. End users will access the Administrative Menu by clicking on its link from the Pulse logon page.
At login, all users will see the Pulse Main Menu at the upper left of the
displayed startup page. For users with administrative access, the Administration menu will contain a link to the Administrative Menu.
On the left is an example of the Administrative main menu. Several
functions are managed in the administrative section of Pulse. Included is the ability to define new Pulse content (Incoming Data, Summary Queries, Page Content and Pages), manage end user security, define and manage interactive alerts and to perform all general management functions supported by Pulse.
13
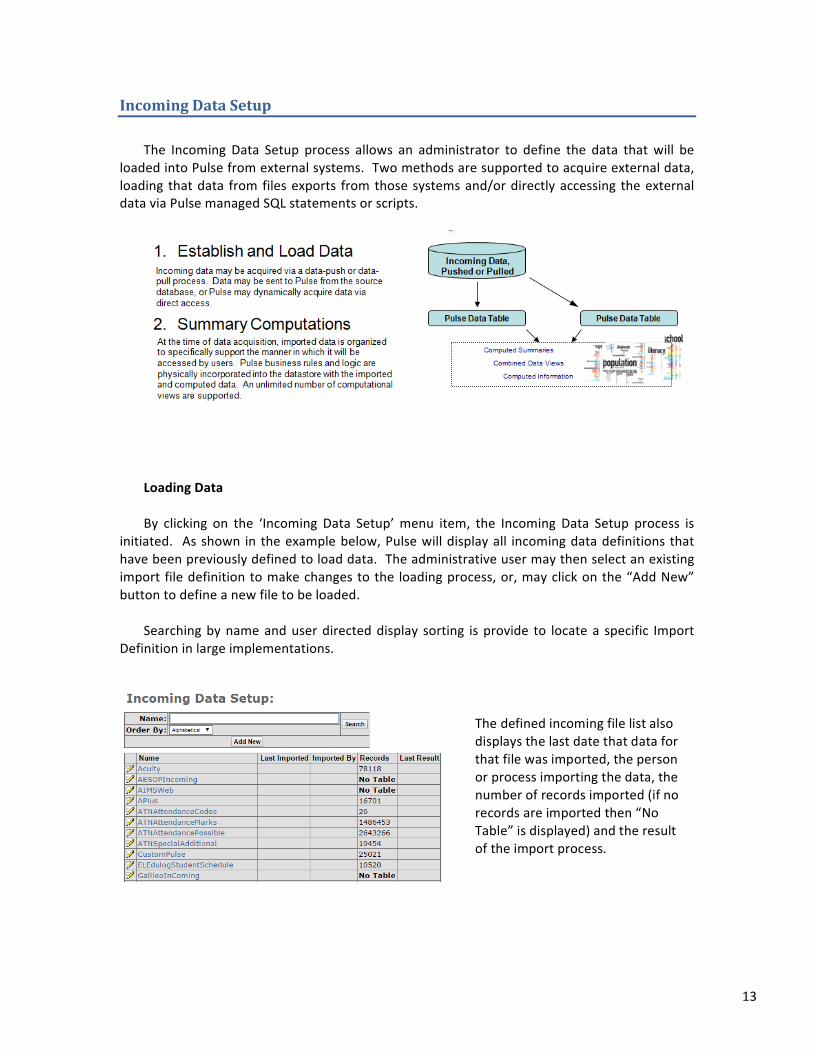
Incoming Data Setup The Incoming Data Setup process allows an administrator to define the data that will be
loaded into Pulse from external systems. Two methods are supported to acquire external data, loading that data from files exports from those systems and/or directly accessing the external data via Pulse managed SQL statements or scripts.
Loading Data By clicking on the ‘Incoming Data Setup’ menu item, the Incoming Data Setup process is
initiated. As shown in the example below, Pulse will display all incoming data definitions that have been previously defined to load data. The administrative user may then select an existing import file definition to make changes to the loading process, or, may click on the “Add New” button to define a new file to be loaded.
Searching by name and user directed display sorting is provide to locate a specific Import
Definition in large implementations.
The defined incoming file list also displays the last date that data for that file was imported, the person or process importing the data, the number of records imported (if no records are imported then “No Table” is displayed) and the result of the import process.
14
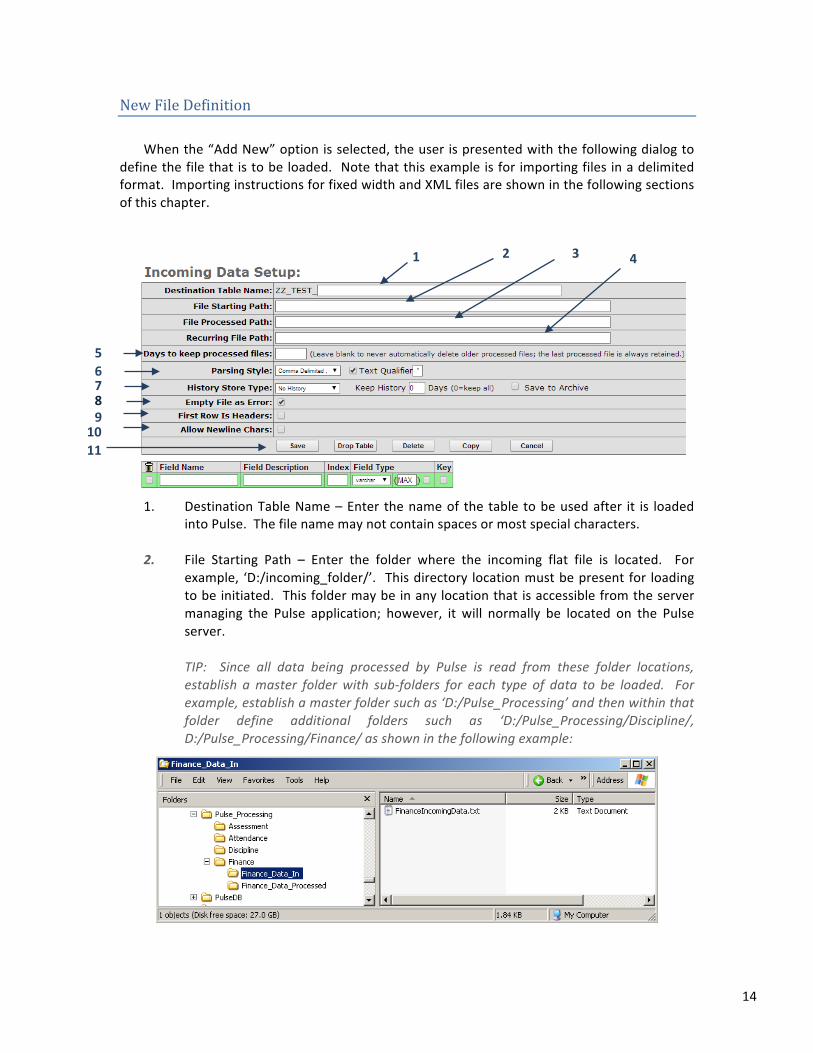
New File Definition When the “Add New” option is selected, the user is presented with the following dialog to
define the file that is to be loaded. Note that this example is for importing files in a delimited format. Importing instructions for fixed width and XML files are shown in the following sections of this chapter.
1. Destination Table Name – Enter the name of the table to be used after it is loaded
into Pulse. The file name may not contain spaces or most special characters. 2. File Starting Path – Enter the folder where the incoming flat file is located. For
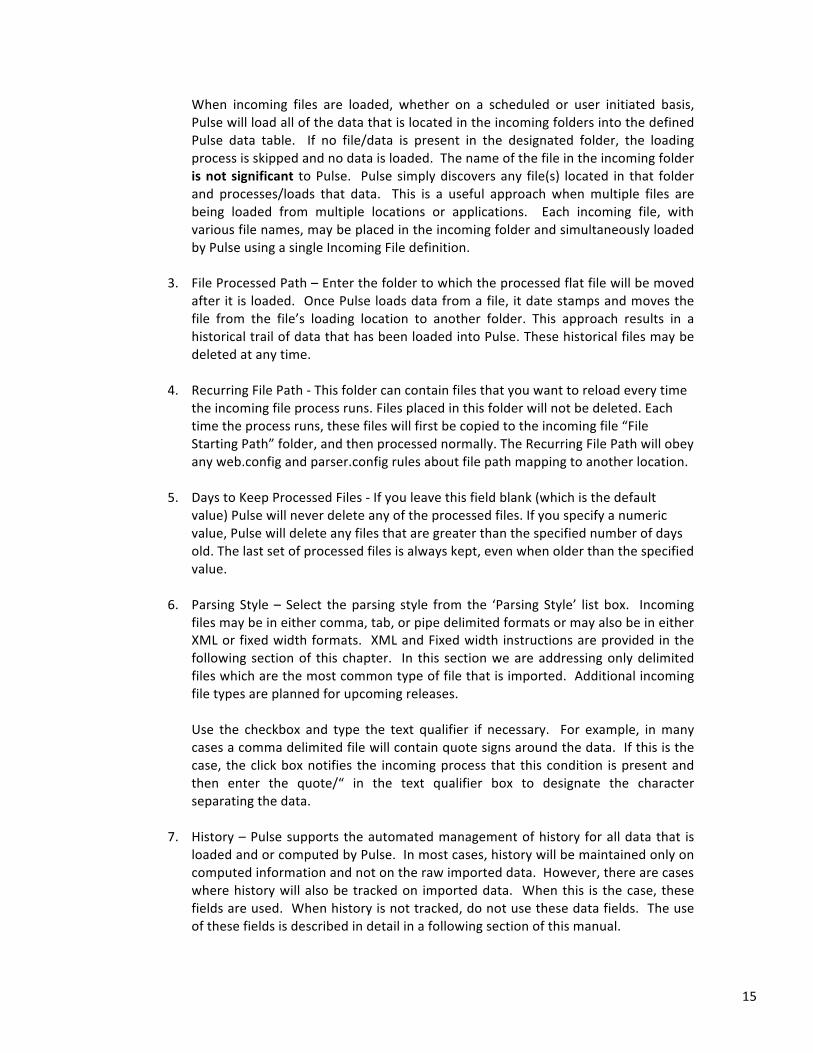
example, ‘D:/incoming_folder/’. This directory location must be present for loading to be initiated. This folder may be in any location that is accessible from the server managing the Pulse application; however, it will normally be located on the Pulse server. TIP: Since all data being processed by Pulse is read from these folder locations, establish a master folder with sub-‐folders for each type of data to be loaded. For example, establish a master folder such as ‘D:/Pulse_Processing’ and then within that folder define additional folders such as ‘D:/Pulse_Processing/Discipline/, D:/Pulse_Processing/Finance/ as shown in the following example:
1 2 3 4
6
9
5
7 8
10 11
15
When incoming files are loaded, whether on a scheduled or user initiated basis, Pulse will load all of the data that is located in the incoming folders into the defined Pulse data table. If no file/data is present in the designated folder, the loading process is skipped and no data is loaded. The name of the file in the incoming folder is not significant to Pulse. Pulse simply discovers any file(s) located in that folder and processes/loads that data. This is a useful approach when multiple files are being loaded from multiple locations or applications. Each incoming file, with various file names, may be placed in the incoming folder and simultaneously loaded by Pulse using a single Incoming File definition.
3. File Processed Path – Enter the folder to which the processed flat file will be moved
after it is loaded. Once Pulse loads data from a file, it date stamps and moves the file from the file’s loading location to another folder. This approach results in a historical trail of data that has been loaded into Pulse. These historical files may be deleted at any time.
4. Recurring File Path -‐ This folder can contain files that you want to reload every time
the incoming file process runs. Files placed in this folder will not be deleted. Each time the process runs, these files will first be copied to the incoming file “File Starting Path” folder, and then processed normally. The Recurring File Path will obey any web.config and parser.config rules about file path mapping to another location.
5. Days to Keep Processed Files -‐ If you leave this field blank (which is the default value) Pulse will never delete any of the processed files. If you specify a numeric value, Pulse will delete any files that are greater than the specified number of days old. The last set of processed files is always kept, even when older than the specified value.
6. Parsing Style – Select the parsing style from the ‘Parsing Style’ list box. Incoming
files may be in either comma, tab, or pipe delimited formats or may also be in either XML or fixed width formats. XML and Fixed width instructions are provided in the following section of this chapter. In this section we are addressing only delimited files which are the most common type of file that is imported. Additional incoming file types are planned for upcoming releases. Use the checkbox and type the text qualifier if necessary. For example, in many cases a comma delimited file will contain quote signs around the data. If this is the case, the click box notifies the incoming process that this condition is present and then enter the quote/“ in the text qualifier box to designate the character separating the data.
7. History – Pulse supports the automated management of history for all data that is
loaded and or computed by Pulse. In most cases, history will be maintained only on computed information and not on the raw imported data. However, there are cases where history will also be tracked on imported data. When this is the case, these fields are used. When history is not tracked, do not use these data fields. The use of these fields is described in detail in a following section of this manual.
16
8. Empty File as Error – The import process determines if there is an error when importing data. An error may be detected by Pulse when there is an improperly formed incoming file, or, an error may be recognized when there is no file to be imported. Business rules are used to establish (see below) alternative processes to use when there is an error during importing. When missing data should be considered an error, this checkbox should be selected. Any errors will be noted in the Pulse logs which will be described later in this document.
9. First Row is Headers – In some cases, the first line of the incoming data file is a
header line that contains the names of the fields in the incoming file. Pulse does not use this line since is it not a dependable source of data names. When this line is checked, Pulse will skip the first line during the import process so that inappropriate data is not loaded.
10. Allow Newline Chars -‐ Check this option when the data being loaded contains or
main contain characters that indicate multiple lines of data. For example, when a carriage return is present in a text field. It is not often that a single data field will contain “multiple lines” of data, however, when that is the case Pulse will filter out the new line entries and treat the field as a single line/field for internal Pulse processes.
11. Button Selections:
• Save: Save the current query • Drop Table: This process deletes the table and data in the Pulse database; it
does not delete the Incoming Data Setup definition. This is not usually necessary, but can be done if load errors are suspected.
• Cancel: Exits the group without saving changes and returns to the previously viewed menu.
• Copy: You may copy an Incoming Data Setup. Simply click the “copy” button, supply a new unique name (Pulse will attempt to create a unique name for you but you can change it), then click “copy” in the popup window. After clicking copy, the new copy is immediately loaded. At that point you should change the file starting, processed and recurring file paths:
17
13
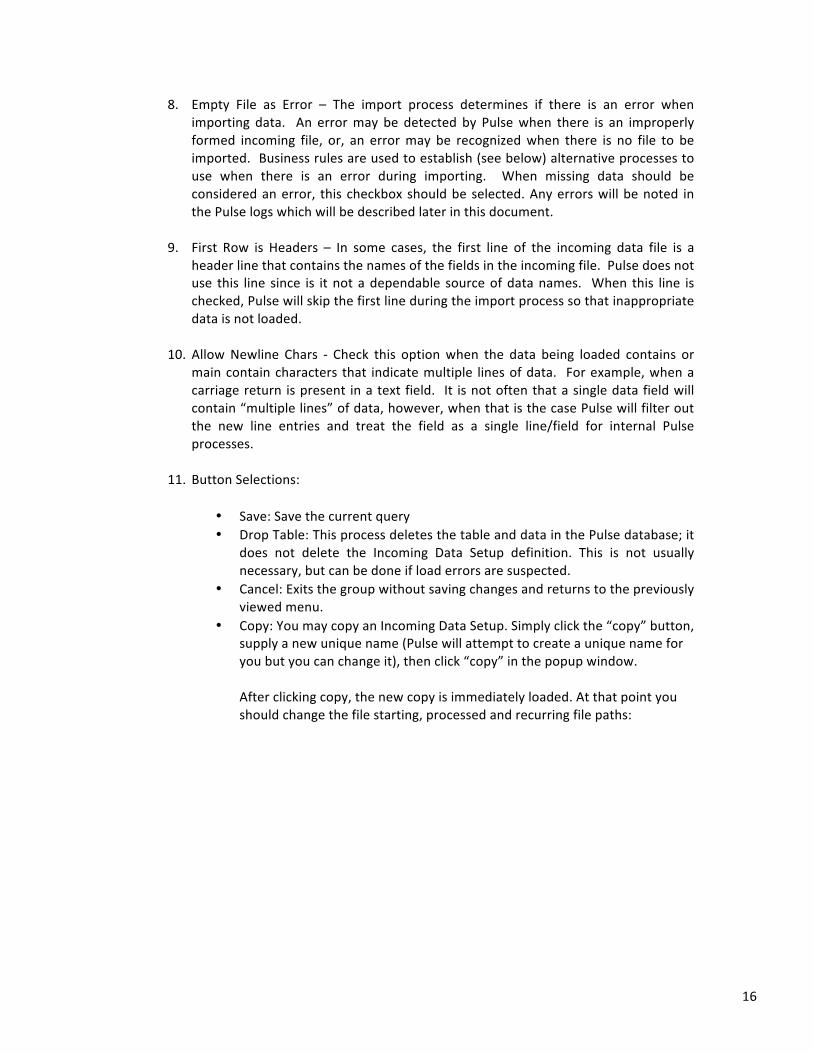
12. Line Delete – The left column contains a icon. A line may be deleted by clicking on the checkbox in this column, and selecting Save. At the time the box is clicked, the line will be highlighted with a light red background. The re-‐entry of a line may be made at the end of the entry list. It is not necessary that all data fields be entered in order because Pulse uses the Index number to control the order of fields in the incoming file.
13. Field Definitions – The next step is to define each data field in the delimited file that
is being loaded. To enter each data field:
a. Field Name: This will be used to create the new column name in the database; it may not contain spaces or most special characters
b. Field Description: The description is informational only for future reference. It MAY contain spaces and special characters.
c. Index: Enter the Index Number for the field beginning with ‘0’ and progressing to 1, 2, 3, etc. until all of the data fields have been defined. '0' can be thought of as column A in an Excel display, index '1' is column B, etc. It is not necessary to load all of the data from a file. If a data field is to be skipped, skip its relative number in the data entry.
For example, you may enter field 0,1,2,3,5 to skip the fifth (labeled 4) field in the incoming file. Likewise, fields can be listed out of order as long as the Index number is in the correct order: 0,1,3,5,4,2.
d. Field Type:
i. Varchar: Alpha or mixed (numeric and alpha) fields
ii. Integer: Numeric fields
12
14
15
18
iii. Date Time: Date and time fields
iv. Decimal: Decimal or other numeric fields
NOTE: Be sure that the data being loaded complies with the definitions entered. For example, if Pulse finds text in a field defined as numeric, that data record (row) will be rejected during the loading process.
• Field Length (Varchar only): A maximum length may be specified for any Varchar field. The default length is set to “MAX” and has no practical limit. If a limit is entered, check the box adjacent to the Field Length to truncate incoming data. Leave the click box unchecked if the row is to be skipped if the data exceeds the length specified. After the initial definition, any modifications to further limit a field length will display a warning of “Decreasing this size value could cause data to be truncated”.
e. Key: The key is rarely. Keys are used to manage accessing multiple sets of data loaded at different dates, not for tradition key purposes. The use of this field will be described in more detail in following chapters.
The vast majority of the time that a key field will be defined is when history is being maintained (see above) on the imported data. The key field is then used to resolve between various ages of the imported data containing the same key. See the following sections and the Summary Query section of this manual for additional information on both history and key fields
f. When the field type is a varchar type the size will default to varchar (max). To change the size of the varchar types enter the desired size, such as varchar (100).
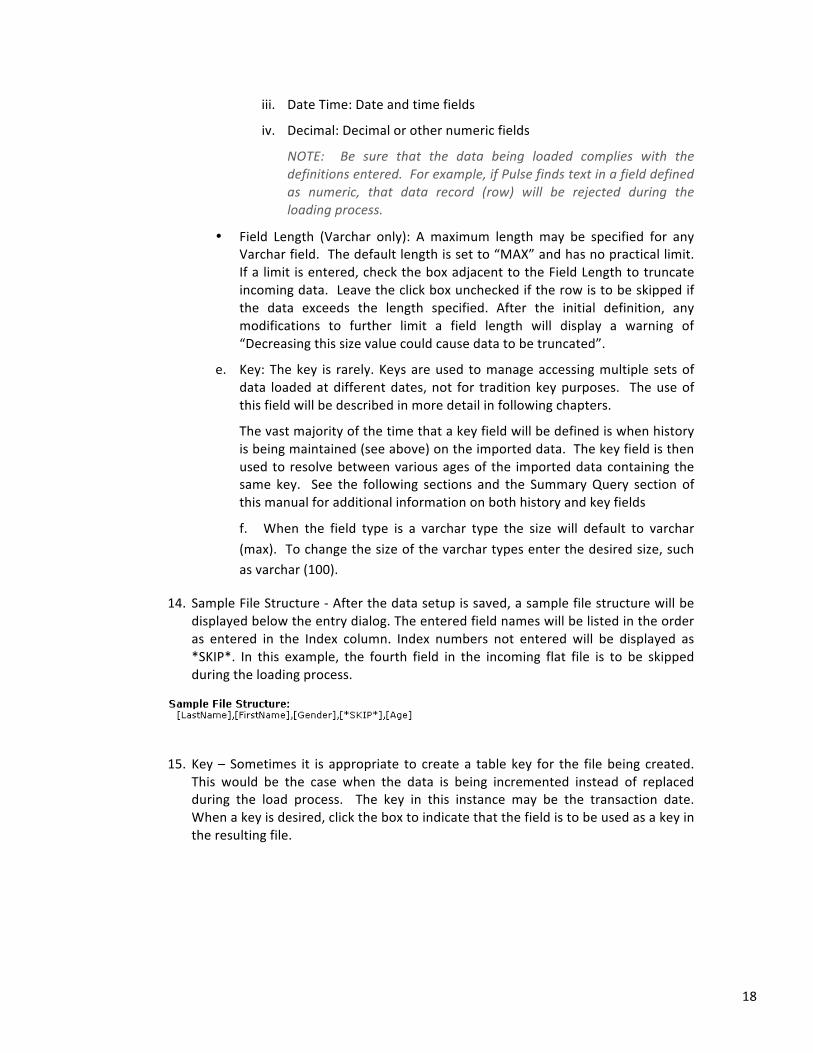
14. Sample File Structure -‐ After the data setup is saved, a sample file structure will be displayed below the entry dialog. The entered field names will be listed in the order as entered in the Index column. Index numbers not entered will be displayed as *SKIP*. In this example, the fourth field in the incoming flat file is to be skipped during the loading process.
15. Key – Sometimes it is appropriate to create a table key for the file being created.
This would be the case when the data is being incremented instead of replaced during the load process. The key in this instance may be the transaction date. When a key is desired, click the box to indicate that the field is to be used as a key in the resulting file.
19
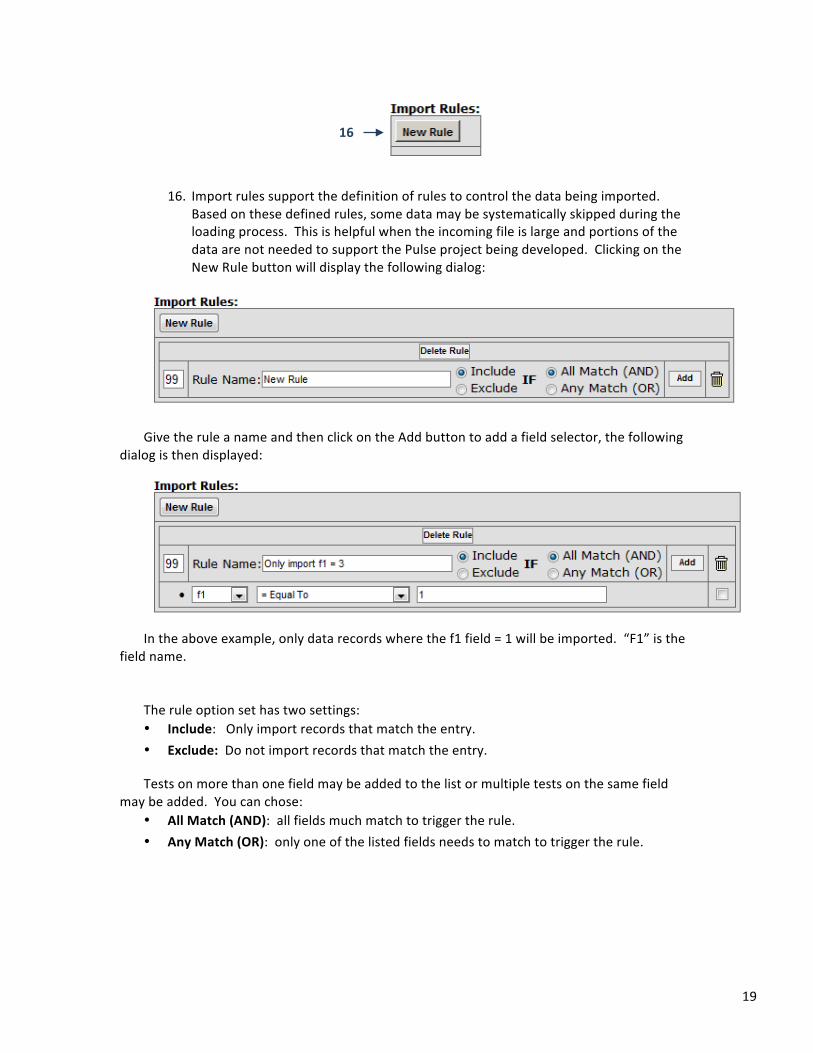
16. Import rules support the definition of rules to control the data being imported. Based on these defined rules, some data may be systematically skipped during the loading process. This is helpful when the incoming file is large and portions of the data are not needed to support the Pulse project being developed. Clicking on the New Rule button will display the following dialog:
Give the rule a name and then click on the Add button to add a field selector, the following
dialog is then displayed:
In the above example, only data records where the f1 field = 1 will be imported. “F1” is the
field name. The rule option set has two settings: • Include: Only import records that match the entry. • Exclude: Do not import records that match the entry.
Tests on more than one field may be added to the list or multiple tests on the same field may be added. You can chose:
• All Match (AND): all fields much match to trigger the rule. • Any Match (OR): only one of the listed fields needs to match to trigger the rule.
16
20
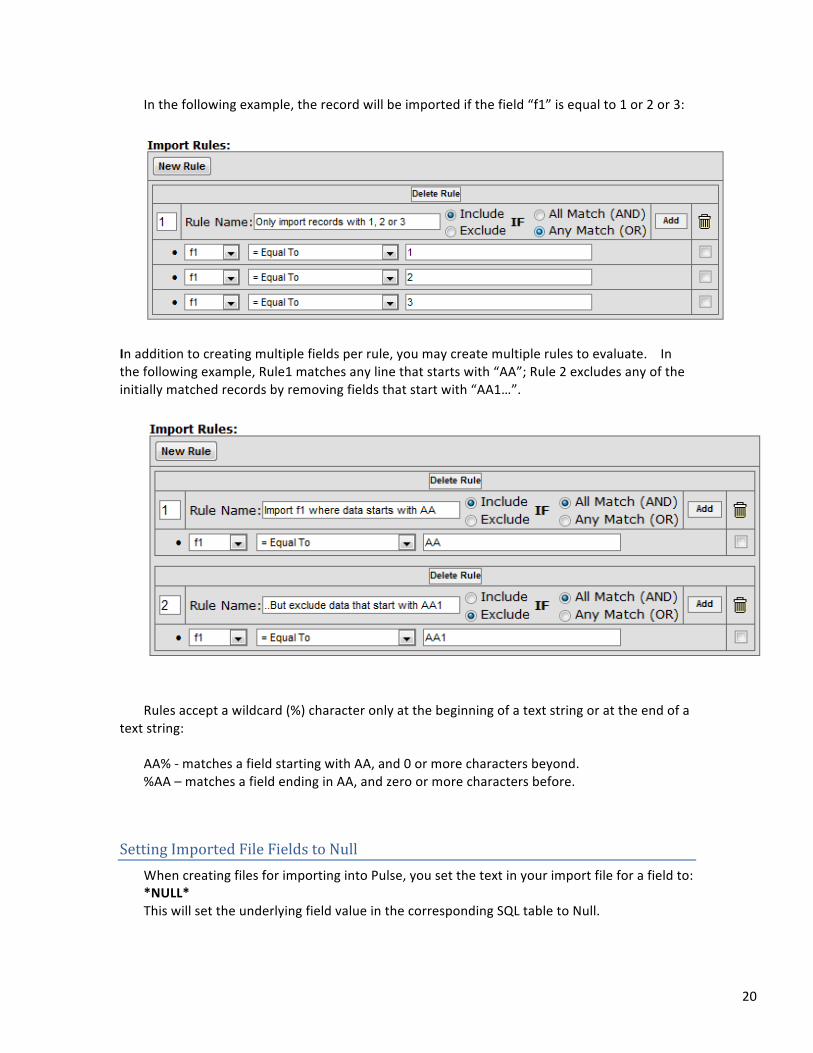
In the following example, the record will be imported if the field “f1” is equal to 1 or 2 or 3:
In addition to creating multiple fields per rule, you may create multiple rules to evaluate. In the following example, Rule1 matches any line that starts with “AA”; Rule 2 excludes any of the initially matched records by removing fields that start with “AA1…”.
Rules accept a wildcard (%) character only at the beginning of a text string or at the end of a
text string: AA% -‐ matches a field starting with AA, and 0 or more characters beyond. %AA – matches a field ending in AA, and zero or more characters before.
Setting Imported File Fields to Null When creating files for importing into Pulse, you set the text in your import file for a field to: *NULL* This will set the underlying field value in the corresponding SQL table to Null.
21
XML Formatted Files Importing The previous section addresses the importing of delimited data files into Pulse. These files
may be comma, tab or pipe delimited. Additionally, Pulse supports either fixed width (following section) or XML files to be imported. This section provides additional information on how to import these file types.
Importing XML Files Importing XML files can be a very technical process because of the design and flexibility of
XML files. Pulse can import XML files in two formats. The first format contains unique tags for each field name. The second format contains XML tags where each data column is not unique, but appears multiple times for each column.
The following example shows how to parse an XML file where the field names are uniquely
tagged. This explanation builds on the more detailed examples for importing delimited files outlined in the previous sections of this chapter. Since XML files are not delimited, their definition in Pulse is quite different from that of a delimited file.
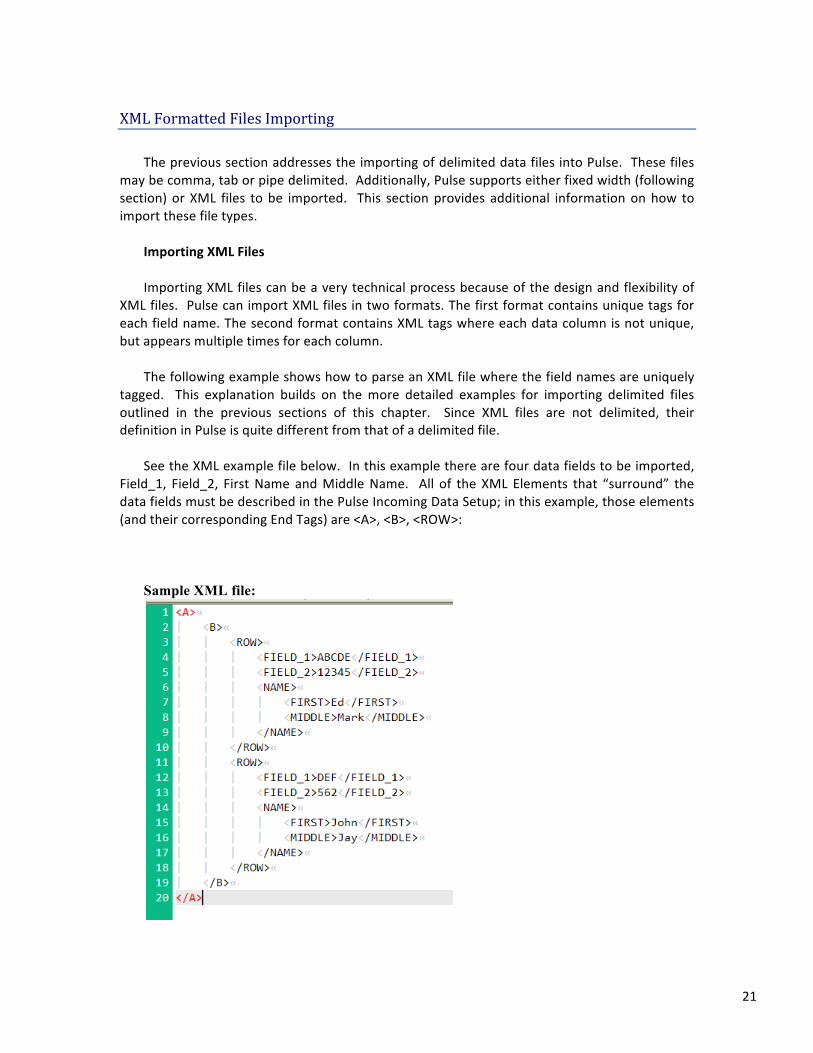
See the XML example file below. In this example there are four data fields to be imported,
Field_1, Field_2, First Name and Middle Name. All of the XML Elements that “surround” the data fields must be described in the Pulse Incoming Data Setup; in this example, those elements (and their corresponding End Tags) are <A>, <B>, <ROW>:
Sample XML file:
22
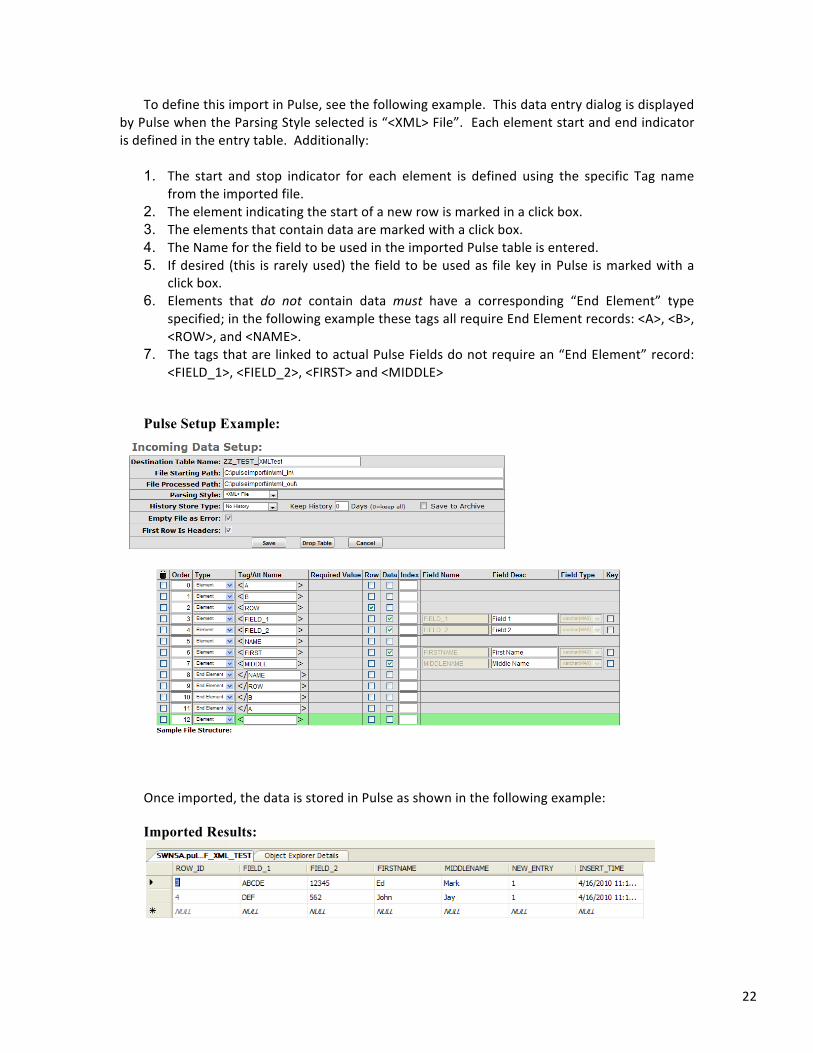
To define this import in Pulse, see the following example. This data entry dialog is displayed by Pulse when the Parsing Style selected is “<XML> File”. Each element start and end indicator is defined in the entry table. Additionally:
1. The start and stop indicator for each element is defined using the specific Tag name
from the imported file. 2. The element indicating the start of a new row is marked in a click box. 3. The elements that contain data are marked with a click box. 4. The Name for the field to be used in the imported Pulse table is entered. 5. If desired (this is rarely used) the field to be used as file key in Pulse is marked with a
click box. 6. Elements that do not contain data must have a corresponding “End Element” type
specified; in the following example these tags all require End Element records: <A>, <B>, <ROW>, and <NAME>.
7. The tags that are linked to actual Pulse Fields do not require an “End Element” record: <FIELD_1>, <FIELD_2>, <FIRST> and <MIDDLE>
Pulse Setup Example:
Once imported, the data is stored in Pulse as shown in the following example: Imported Results:
23
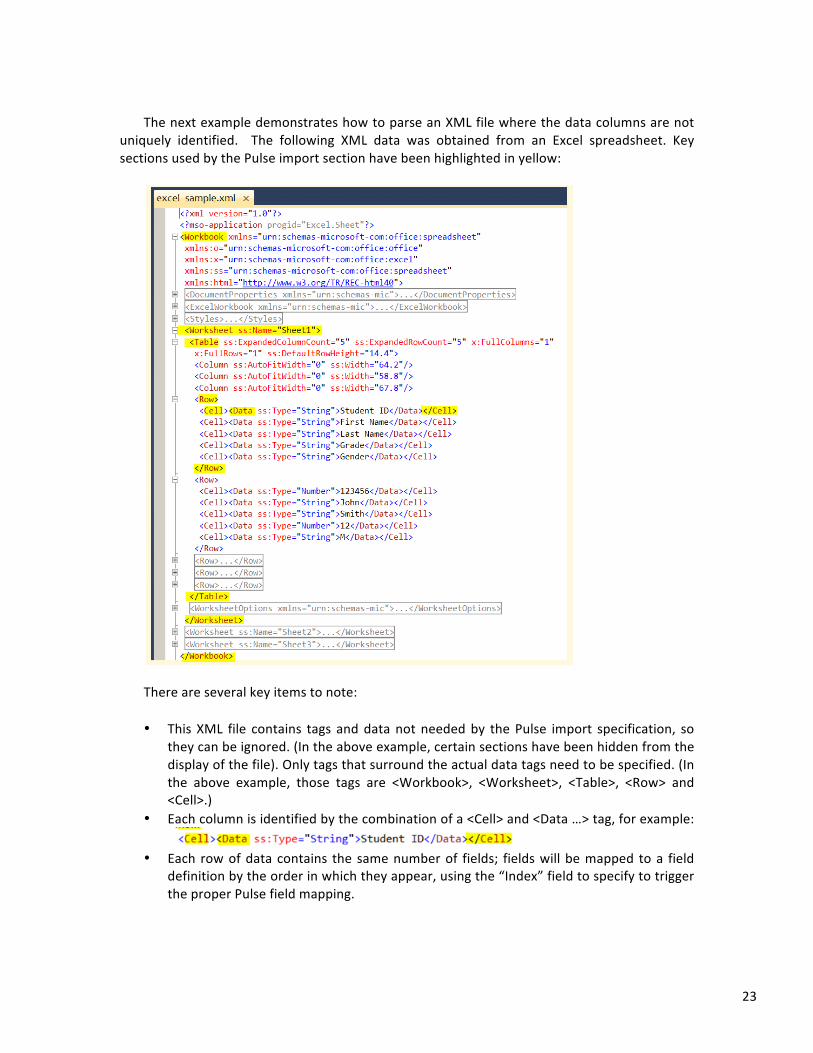
The next example demonstrates how to parse an XML file where the data columns are not
uniquely identified. The following XML data was obtained from an Excel spreadsheet. Key sections used by the Pulse import section have been highlighted in yellow:
There are several key items to note: • This XML file contains tags and data not needed by the Pulse import specification, so
they can be ignored. (In the above example, certain sections have been hidden from the display of the file). Only tags that surround the actual data tags need to be specified. (In the above example, those tags are <Workbook>, <Worksheet>, <Table>, <Row> and <Cell>.)
• Each column is identified by the combination of a <Cell> and <Data …> tag, for example:
• Each row of data contains the same number of fields; fields will be mapped to a field
definition by the order in which they appear, using the “Index” field to specify to trigger the proper Pulse field mapping.
24
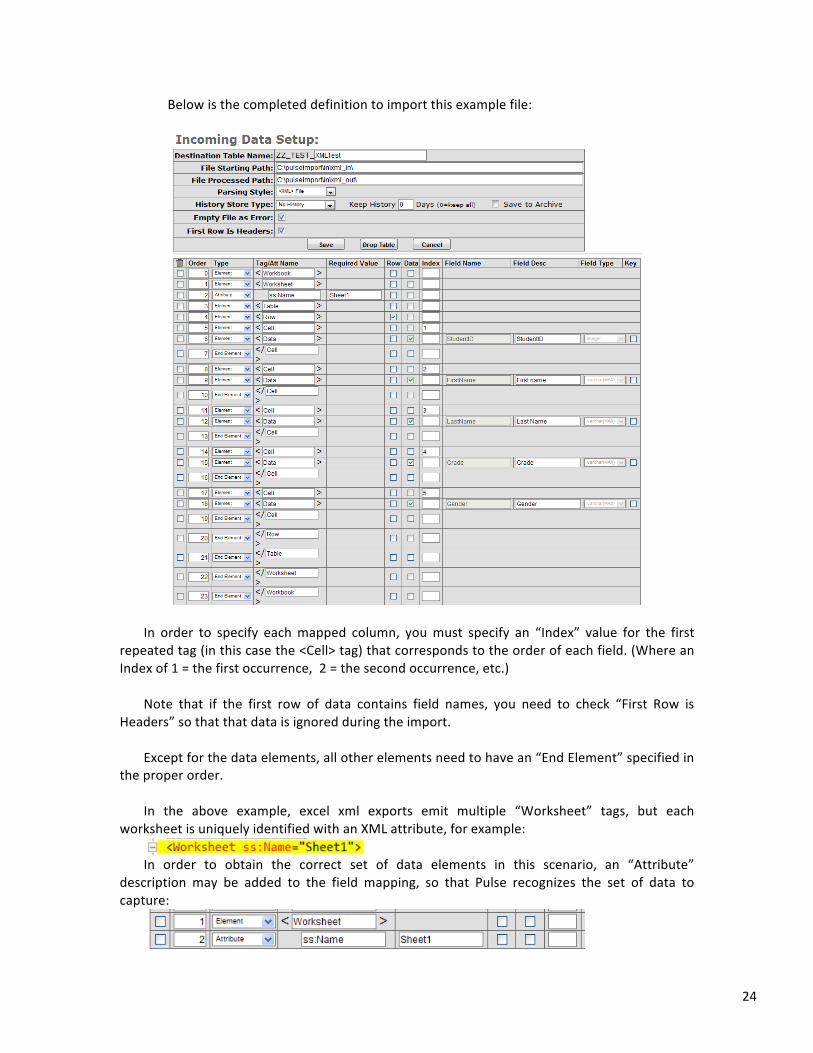
Below is the completed definition to import this example file:
In order to specify each mapped column, you must specify an “Index” value for the first
repeated tag (in this case the <Cell> tag) that corresponds to the order of each field. (Where an Index of 1 = the first occurrence, 2 = the second occurrence, etc.)
Note that if the first row of data contains field names, you need to check “First Row is
Headers” so that that data is ignored during the import. Except for the data elements, all other elements need to have an “End Element” specified in
the proper order. In the above example, excel xml exports emit multiple “Worksheet” tags, but each
worksheet is uniquely identified with an XML attribute, for example:
In order to obtain the correct set of data elements in this scenario, an “Attribute” description may be added to the field mapping, so that Pulse recognizes the set of data to capture:
25
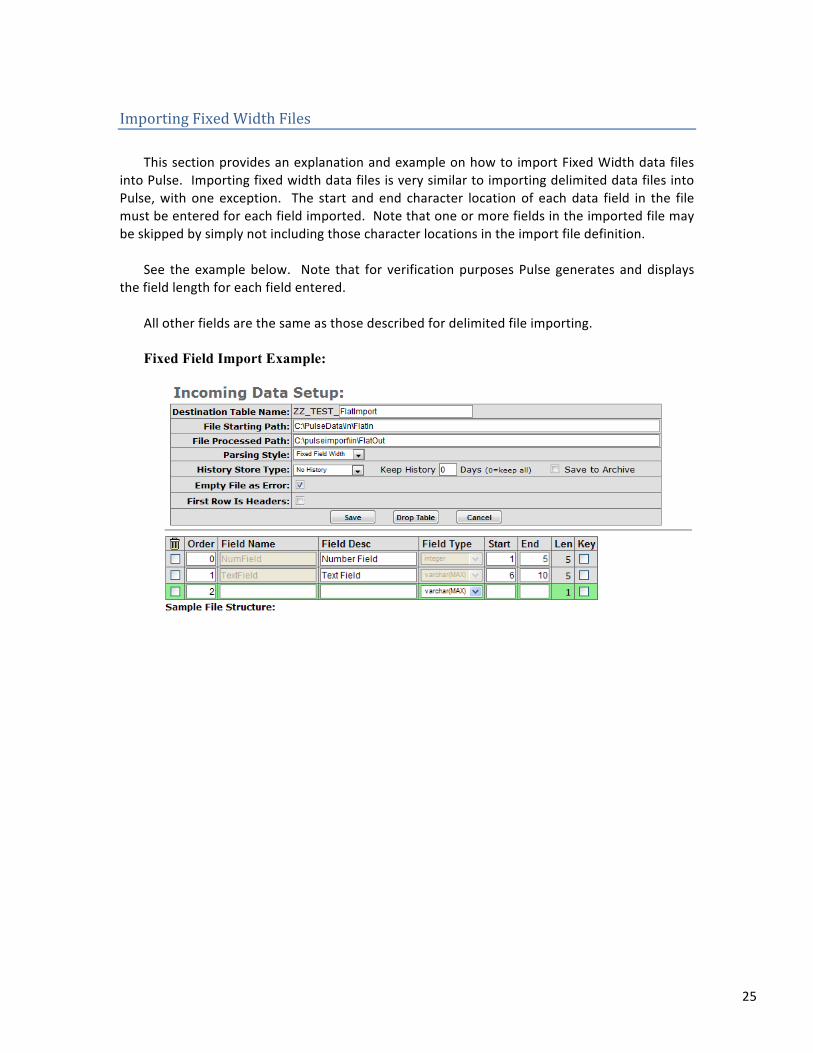
Importing Fixed Width Files This section provides an explanation and example on how to import Fixed Width data files
into Pulse. Importing fixed width data files is very similar to importing delimited data files into Pulse, with one exception. The start and end character location of each data field in the file must be entered for each field imported. Note that one or more fields in the imported file may be skipped by simply not including those character locations in the import file definition.
See the example below. Note that for verification purposes Pulse generates and displays
the field length for each field entered. All other fields are the same as those described for delimited file importing. Fixed Field Import Example:
26
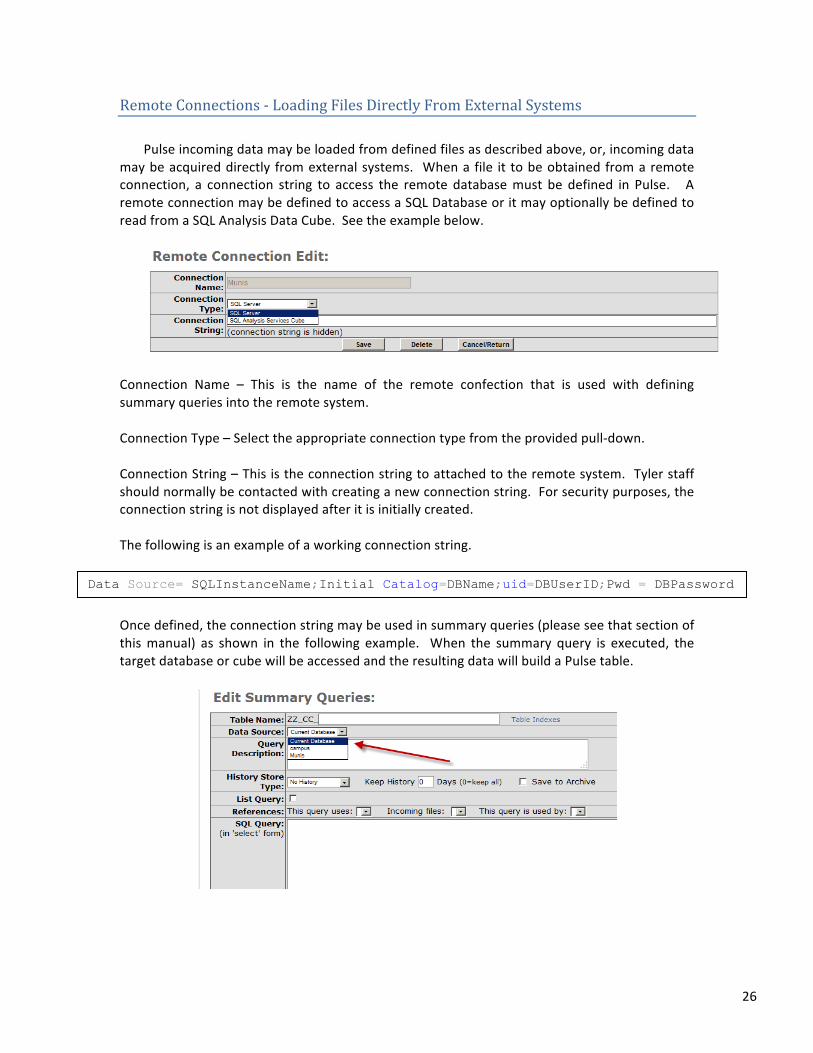
Remote Connections -‐ Loading Files Directly From External Systems Pulse incoming data may be loaded from defined files as described above, or, incoming data
may be acquired directly from external systems. When a file it to be obtained from a remote connection, a connection string to access the remote database must be defined in Pulse. A remote connection may be defined to access a SQL Database or it may optionally be defined to read from a SQL Analysis Data Cube. See the example below.
Connection Name – This is the name of the remote confection that is used with defining summary queries into the remote system. Connection Type – Select the appropriate connection type from the provided pull-‐down. Connection String – This is the connection string to attached to the remote system. Tyler staff should normally be contacted with creating a new connection string. For security purposes, the connection string is not displayed after it is initially created. The following is an example of a working connection string.
Once defined, the connection string may be used in summary queries (please see that section of this manual) as shown in the following example. When the summary query is executed, the target database or cube will be accessed and the resulting data will build a Pulse table.
Data Source= SQLInstanceName;Initial Catalog=DBName;uid=DBUserID;Pwd = DBPassword
27
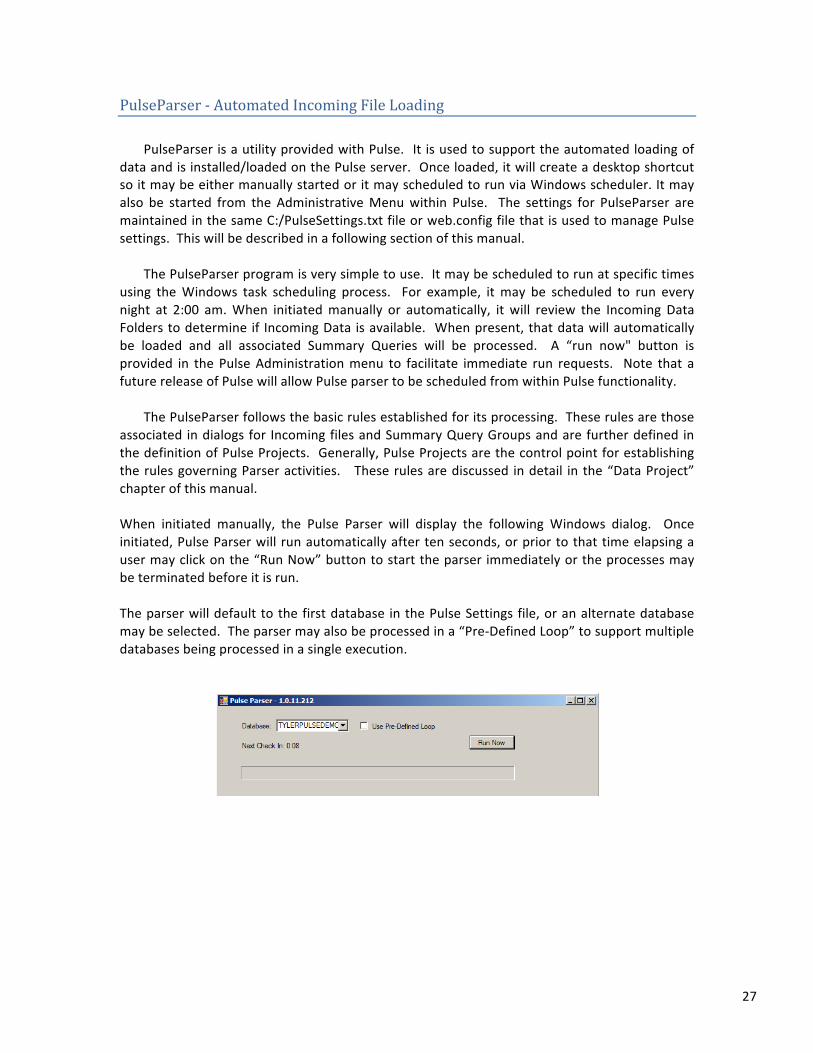
PulseParser -‐ Automated Incoming File Loading PulseParser is a utility provided with Pulse. It is used to support the automated loading of
data and is installed/loaded on the Pulse server. Once loaded, it will create a desktop shortcut so it may be either manually started or it may scheduled to run via Windows scheduler. It may also be started from the Administrative Menu within Pulse. The settings for PulseParser are maintained in the same C:/PulseSettings.txt file or web.config file that is used to manage Pulse settings. This will be described in a following section of this manual.
The PulseParser program is very simple to use. It may be scheduled to run at specific times
using the Windows task scheduling process. For example, it may be scheduled to run every night at 2:00 am. When initiated manually or automatically, it will review the Incoming Data Folders to determine if Incoming Data is available. When present, that data will automatically be loaded and all associated Summary Queries will be processed. A “run now" button is provided in the Pulse Administration menu to facilitate immediate run requests. Note that a future release of Pulse will allow Pulse parser to be scheduled from within Pulse functionality.
The PulseParser follows the basic rules established for its processing. These rules are those
associated in dialogs for Incoming files and Summary Query Groups and are further defined in the definition of Pulse Projects. Generally, Pulse Projects are the control point for establishing the rules governing Parser activities. These rules are discussed in detail in the “Data Project” chapter of this manual. When initiated manually, the Pulse Parser will display the following Windows dialog. Once initiated, Pulse Parser will run automatically after ten seconds, or prior to that time elapsing a user may click on the “Run Now” button to start the parser immediately or the processes may be terminated before it is run. The parser will default to the first database in the Pulse Settings file, or an alternate database may be selected. The parser may also be processed in a “Pre-‐Defined Loop” to support multiple databases being processed in a single execution.
28
Pulse Data and Information History Management NOTE: This section applies to both Incoming Data and to Summary Queries. It has been
referenced several times in those sections. Overview –Pulse incorporates functionality to maintain historical data for both incoming
data files and for summary query data. As described in the previous section, incoming data files are the raw data imported by Pulse from other application systems. If the incoming data file is a transaction based file containing all YTD transactions, then it is unlikely that history needs to be maintained on this file. It already incorporates its own history. This would also be the case in a table reference file. In this case, the data imported represents the totality of what is needed to use that data. However, if the file being imported contains daily or periodic information, or contains only records that that have changed from the prior day, it is mandatory that the data from previous imports be updated from this data rather than being replaced by it. If current Pulse projects are considered, it is not common to experience this situation, but it does occur on an exception basis.
The Pulse importing process will, by default, replace the data in the incoming files with all
new data that is imported. Maintaining history on that data, or, updating that data with data being imported may be defined in the incoming data or summary query dialogs. The process for both is the same.
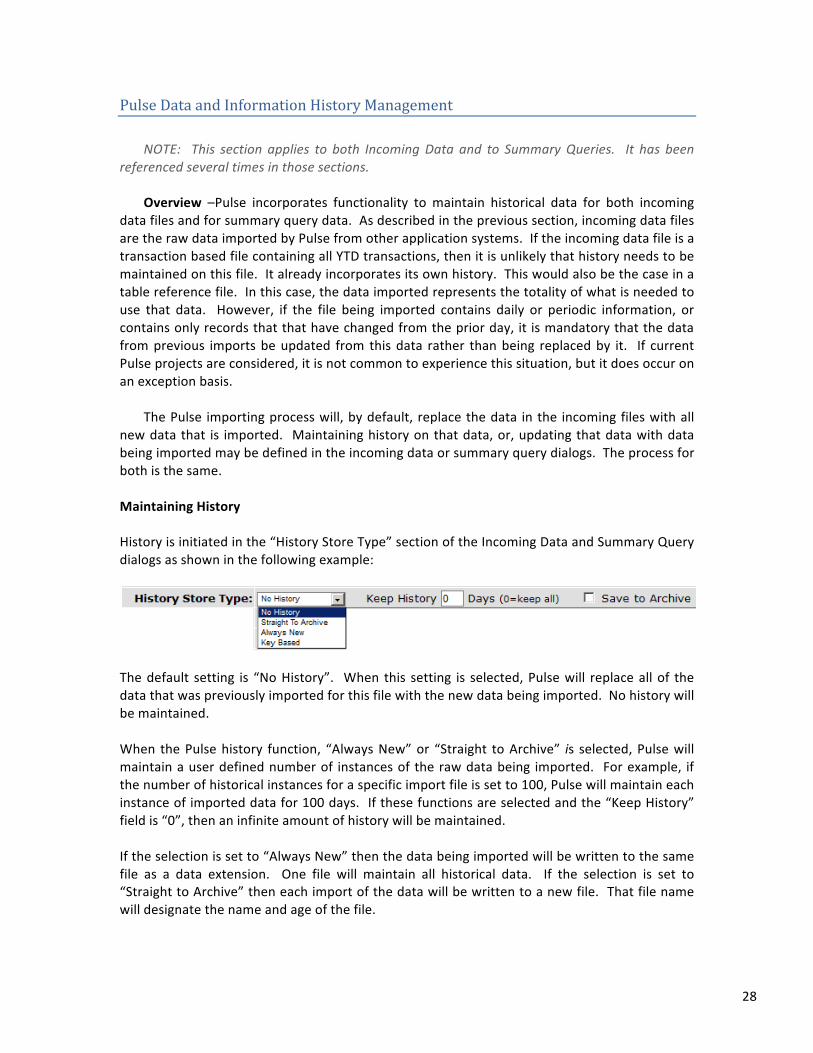
Maintaining History History is initiated in the “History Store Type” section of the Incoming Data and Summary Query dialogs as shown in the following example:
The default setting is “No History”. When this setting is selected, Pulse will replace all of the data that was previously imported for this file with the new data being imported. No history will be maintained. When the Pulse history function, “Always New” or “Straight to Archive” is selected, Pulse will maintain a user defined number of instances of the raw data being imported. For example, if the number of historical instances for a specific import file is set to 100, Pulse will maintain each instance of imported data for 100 days. If these functions are selected and the “Keep History” field is “0”, then an infinite amount of history will be maintained. If the selection is set to “Always New” then the data being imported will be written to the same file as a data extension. One file will maintain all historical data. If the selection is set to “Straight to Archive” then each import of the data will be written to a new file. That file name will designate the name and age of the file.
29
Key Based Data and History When the selection is set to “Key Based”, Pulse will use a designated field key from the data
to update the file with the data being loaded. When an imported file (or summary query) is processed, Pulse compares the data in the associated Pulse data tables based on the key. When, based on this key, the existing data matches the keys of any of newly imported data, the existing data that is matched that key will be deleted and replaced with the newly imported data. When the key does not match any of the existing data records, the data is added to the file.
For example, if the key being used is an employee number, then when a record already
exists in the file for the targeted employee number, the data in the import or summary query file will replace that record in the file. When the employee number does not already exist in the file, the record will be added.
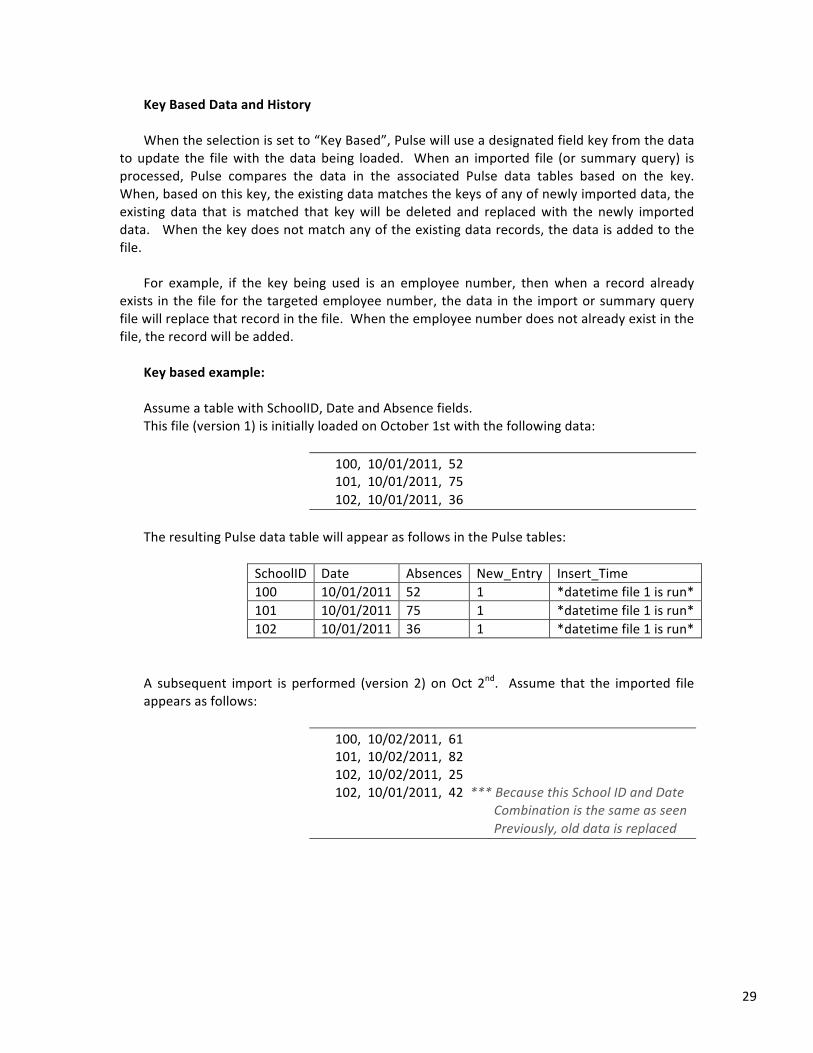
Key based example: Assume a table with SchoolID, Date and Absence fields. This file (version 1) is initially loaded on October 1st with the following data:
100, 10/01/2011, 52 101, 10/01/2011, 75 102, 10/01/2011, 36
The resulting Pulse data table will appear as follows in the Pulse tables:
SchoolID Date Absences New_Entry Insert_Time 100 10/01/2011 52 1 *datetime file 1 is run* 101 10/01/2011 75 1 *datetime file 1 is run* 102 10/01/2011 36 1 *datetime file 1 is run*
A subsequent import is performed (version 2) on Oct 2nd. Assume that the imported file appears as follows:
100, 10/02/2011, 61 101, 10/02/2011, 82 102, 10/02/2011, 25 102, 10/01/2011, 42 *** Because this School ID and Date Combination is the same as seen Previously, old data is replaced
30
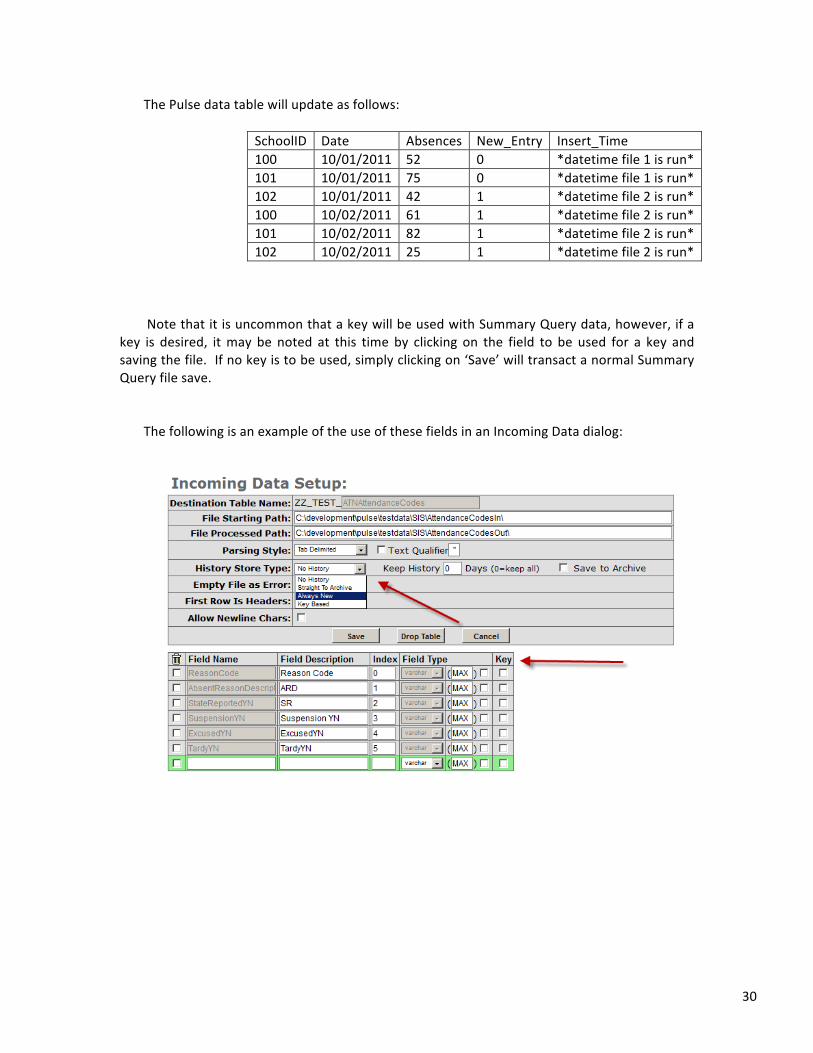
The Pulse data table will update as follows:
SchoolID Date Absences New_Entry Insert_Time 100 10/01/2011 52 0 *datetime file 1 is run* 101 10/01/2011 75 0 *datetime file 1 is run* 102 10/01/2011 42 1 *datetime file 2 is run* 100 10/02/2011 61 1 *datetime file 2 is run* 101 10/02/2011 82 1 *datetime file 2 is run* 102 10/02/2011 25 1 *datetime file 2 is run*
Note that it is uncommon that a key will be used with Summary Query data, however, if a
key is desired, it may be noted at this time by clicking on the field to be used for a key and saving the file. If no key is to be used, simply clicking on ‘Save’ will transact a normal Summary Query file save.
The following is an example of the use of these fields in an Incoming Data dialog:
31
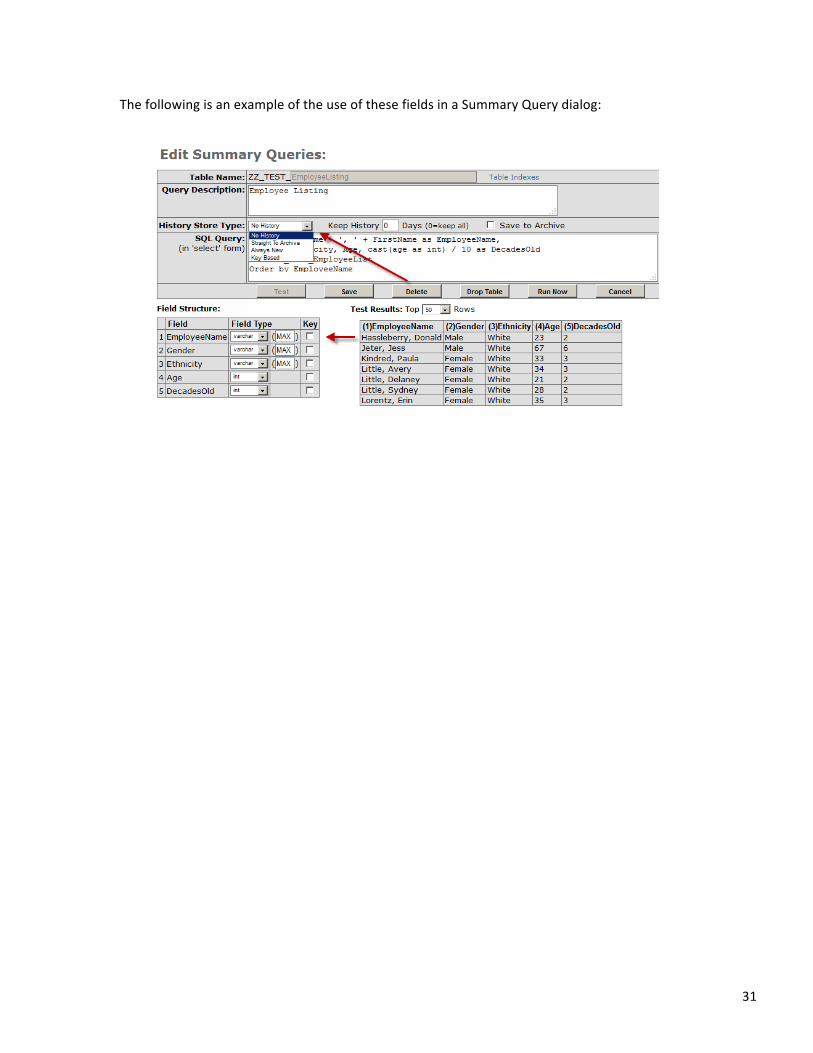
The following is an example of the use of these fields in a Summary Query dialog:

32
Importing Data Data being imported into Pulse is generally imported on a scheduled and unattended basis.
When this is the case, Pulse provides a utility, Pulse Parser, which is scheduled on a user defined basis to control the data importing process. Also note that this scheduled process may incorporate more than simple data importing. It may also include processing summary queries (see following sections on summary queries) to manipulate that data into refined information. The details of this scheduled process are user managed and will be discussed in more detail in upcoming sections of this manual.
While performing data loads on a user defined schedule is the most common process to
load data, this and other methods may be used on exception. These methods include:
• Scheduled Import Processes. For example, performing all imports at 12:00 AM each night or each weekday night.
• User Initiated Imports. User initiated import processes to import all data that is available.
• Selective Initiated Imports. Imports may be performed for selected data files or for selected files.
User and Schedule Initiated Importing When the Pulse Parser/Importing Data process is to be scheduled, the
Pulse Parser may be scheduled using Windows Task Scheduler on the Pulse Server. Upcoming releases of Pulse will also allow the Parser schedule to be maintained in Pulse Dialogs.
While it is unusual that the Parser is initiated manually, this is also
supported. The Parser may be manually initiated by either clicking on the ‘Run Parser’ selection on the Pulse Administration Menu or by clicking the Pulse Parser icon on the desktop of the Pulse Server.
Once the Pulse Parser is initiated, Pulse will interrogate all incoming file
folders, import all available data and dynamically execute all associated summary queries. After the process is complete, an on-‐screen summary is displayed for user review and verification. If the incoming folder contained no data, a “No File” result is listed. When data is imported the result message is “Success”. If the file is imported, but some rows of the data were skipped because of inadequate data (for example alpha in a numeric field) Pulse will report the number of rows that were loaded and/or skipped.
33
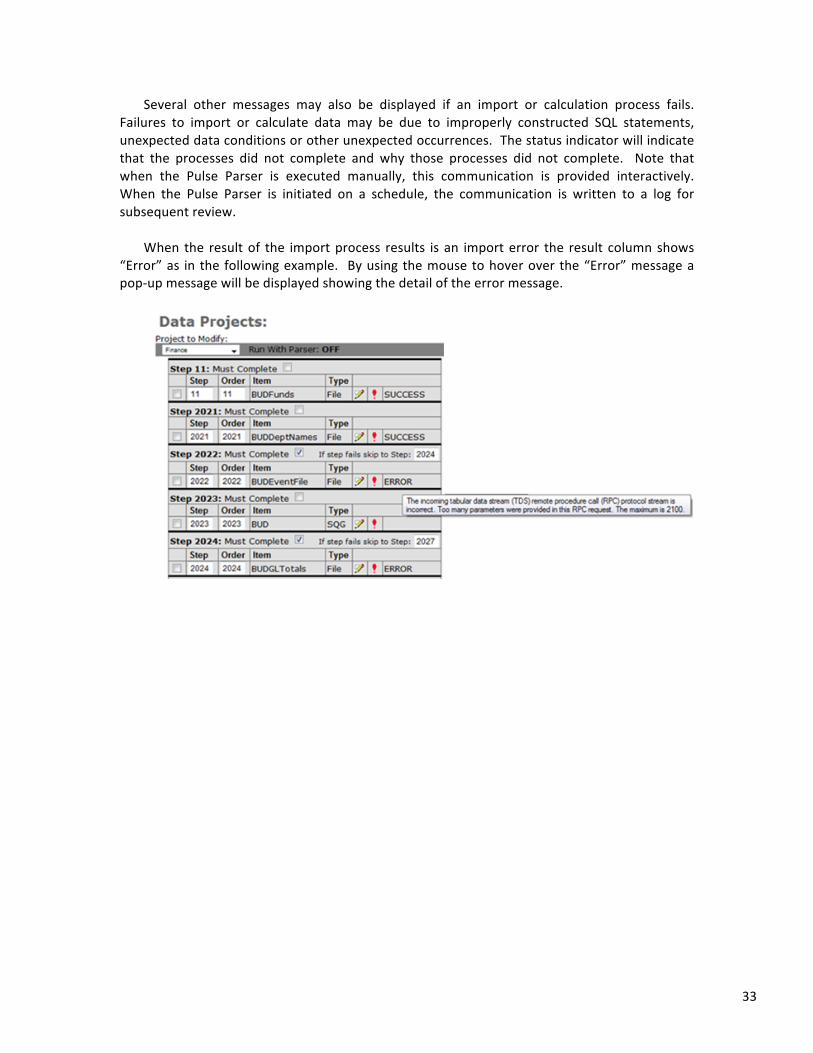
Several other messages may also be displayed if an import or calculation process fails. Failures to import or calculate data may be due to improperly constructed SQL statements, unexpected data conditions or other unexpected occurrences. The status indicator will indicate that the processes did not complete and why those processes did not complete. Note that when the Pulse Parser is executed manually, this communication is provided interactively. When the Pulse Parser is initiated on a schedule, the communication is written to a log for subsequent review.
When the result of the import process results is an import error the result column shows
“Error” as in the following example. By using the mouse to hover over the “Error” message a pop-‐up message will be displayed showing the detail of the error message.
34
Manual Tables Generally, most data managed by Pulse is imported from other applications or generated
from data imported from other applications. There are situations, however, where a Pulse developer may want to manually build a data table into Pulse. This would be the case when the data being manually added to Pulse is either not otherwise available in an electronic format or some type of control data is entered for management purposes. An example may be to store and use a school year. If the current school year is 2011, putting this into a manual table and reading it from there, instead of hard-‐coding it in Pulse logic, makes the change of the school year a one-‐time occurance. There are numerous other uses for manaual/parameter tables, but almost all of them are associated with management control of information generation. It is NOT EXPECTED that this process be used to generate ongoing data entry files. It is designed for parameter files only. Pulse provides a separate data entry process for ongoing data entry requirements.
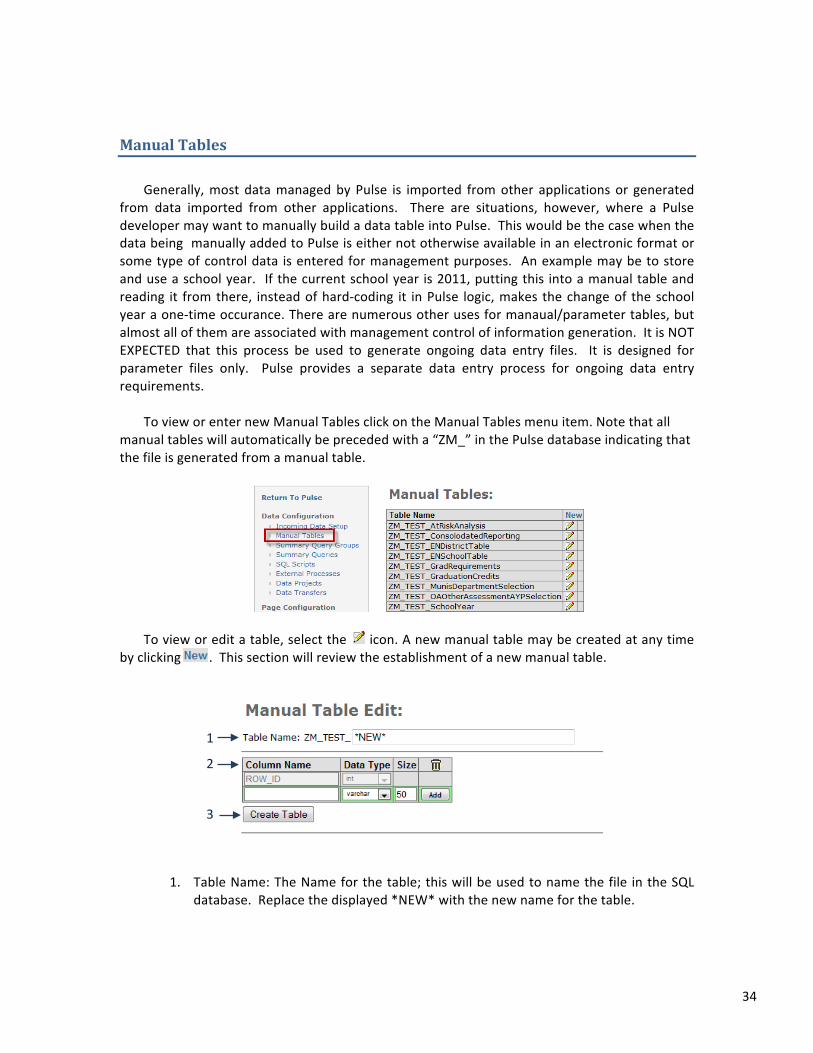
To view or enter new Manual Tables click on the Manual Tables menu item. Note that all
manual tables will automatically be preceded with a “ZM_” in the Pulse database indicating that the file is generated from a manual table.
To view or edit a table, select the icon. A new manual table may be created at any time
by clicking . This section will review the establishment of a new manual table.
1. Table Name: The Name for the table; this will be used to name the file in the SQL database. Replace the displayed *NEW* with the new name for the table.
1
2
3
35
2. Column Detail:
• Column Name: Name to be used for that field or column in the database table
• Data Type: i. Varchar: Alpha fields, or mixed (numeric and alpha). The size of the
field defaults to 50 characters, however, it may be changed to any size desired.
ii. Integer: Numeric fields.
iii. Decimal: A maximum character size and number of decimal places are required.
iv. True/False: This option will place a checkbox in the manual table.
• Add: After entering the information for a column, select to include the column in the manual table. An unlimited number of columns (fields) may be created
Once completely entered, click to create the table in the Pulse database.
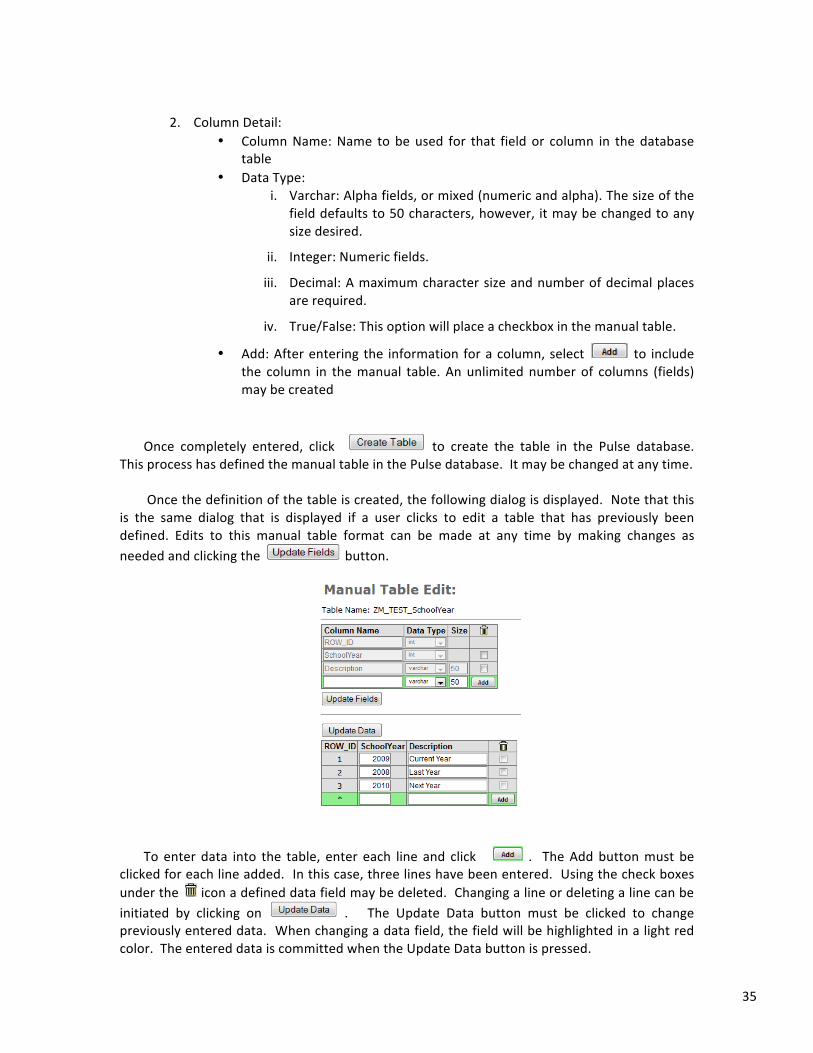
This process has defined the manual table in the Pulse database. It may be changed at any time. Once the definition of the table is created, the following dialog is displayed. Note that this
is the same dialog that is displayed if a user clicks to edit a table that has previously been defined. Edits to this manual table format can be made at any time by making changes as needed and clicking the button.
To enter data into the table, enter each line and click . The Add button must be
clicked for each line added. In this case, three lines have been entered. Using the check boxes under the icon a defined data field may be deleted. Changing a line or deleting a line can be initiated by clicking on . The Update Data button must be clicked to change previously entered data. When changing a data field, the field will be highlighted in a light red color. The entered data is committed when the Update Data button is pressed.
36
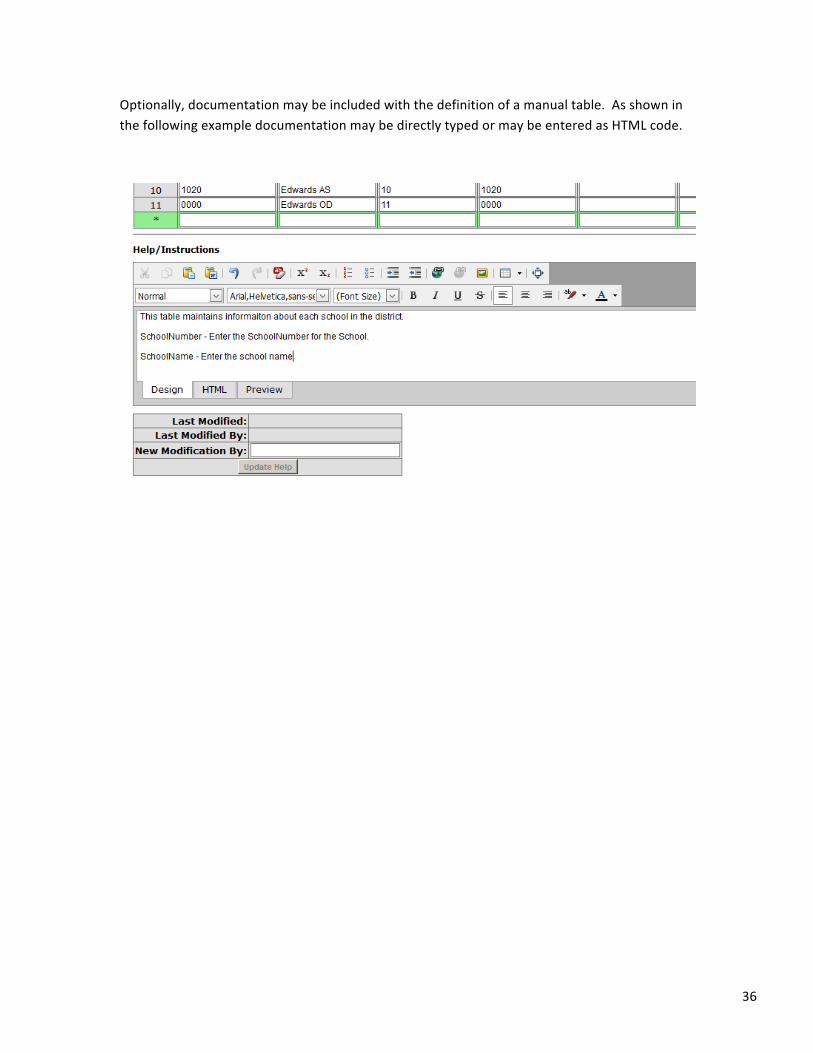
Optionally, documentation may be included with the definition of a manual table. As shown in the following example documentation may be directly typed or may be entered as HTML code.
37
Summary Queries Summary Queries are SQL statements that read incoming data and/or data generated from
other summary queries. In all cases, a Summary Query generates a new data file in the Pulse database containing the resulting data from that query. The database table is assigned the same name as that assigned to the Summary Query. As such, Summary Queries are used to manipulate imported data into processed information for end user consumption. Simple examples are to create totals, averages and other data results. More advanced uses would be to generate trend lines or future projections. They are also used to combine data from different application systems. For example, they may be used to combine financial data with student data for advanced user access.
Summary Queries: • are combined into groupings called Summary Query Groups • are used to generate summary, statistical or simply modified information from the
incoming data that is loaded into Pulse • automatically process at the same time data is loaded, and, updated each time data is
loaded, as part of a project (projects will be defined in an upcoming section of this manual)
• can be recalculated at any time from existing data, without reloading Incoming Files • are time-‐stamped and saved by Pulse for an indefinite period of time, allowing the
creation of historical data and statistics for automated reporting, trending and graphical representation.
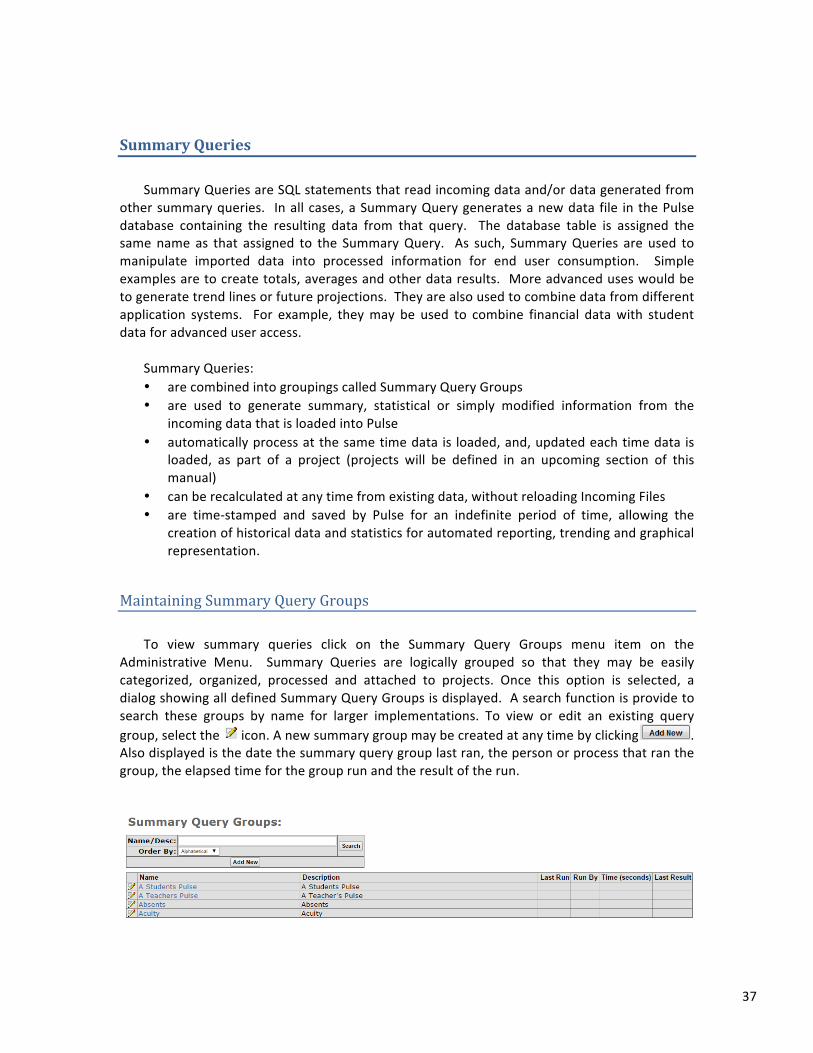
Maintaining Summary Query Groups To view summary queries click on the Summary Query Groups menu item on the
Administrative Menu. Summary Queries are logically grouped so that they may be easily categorized, organized, processed and attached to projects. Once this option is selected, a dialog showing all defined Summary Query Groups is displayed. A search function is provide to search these groups by name for larger implementations. To view or edit an existing query group, select the icon. A new summary group may be created at any time by clicking . Also displayed is the date the summary query group last ran, the person or process that ran the group, the elapsed time for the group run and the result of the run.

38
39
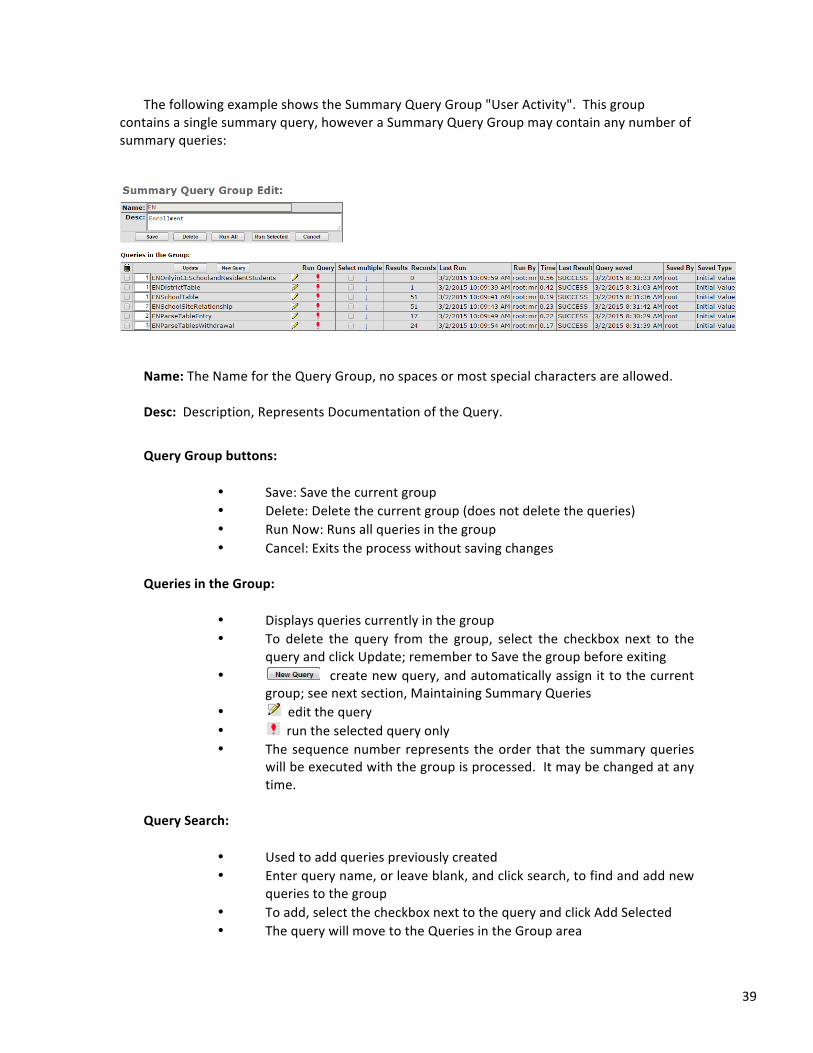
The following example shows the Summary Query Group "User Activity". This group contains a single summary query, however a Summary Query Group may contain any number of summary queries:
Name: The Name for the Query Group, no spaces or most special characters are allowed. Desc: Description, Represents Documentation of the Query. Query Group buttons:
• Save: Save the current group • Delete: Delete the current group (does not delete the queries) • Run Now: Runs all queries in the group • Cancel: Exits the process without saving changes
Queries in the Group:
• Displays queries currently in the group • To delete the query from the group, select the checkbox next to the
query and click Update; remember to Save the group before exiting • create new query, and automatically assign it to the current
group; see next section, Maintaining Summary Queries • edit the query • run the selected query only • The sequence number represents the order that the summary queries
will be executed with the group is processed. It may be changed at any time.
Query Search:
• Used to add queries previously created • Enter query name, or leave blank, and click search, to find and add new
queries to the group • To add, select the checkbox next to the query and click Add Selected • The query will move to the Queries in the Group area

40
• A single query may be added to multiple groups, though this would not be a common action
Supporting Data:
• The number of records processed the last time the query was run. • The date and time the query was last processed. • The person or process last running the query. • The result the last time the process was run. • The date and time of the last time the query was saved. • The user that last saved the query. • The type of save that was performed.
41
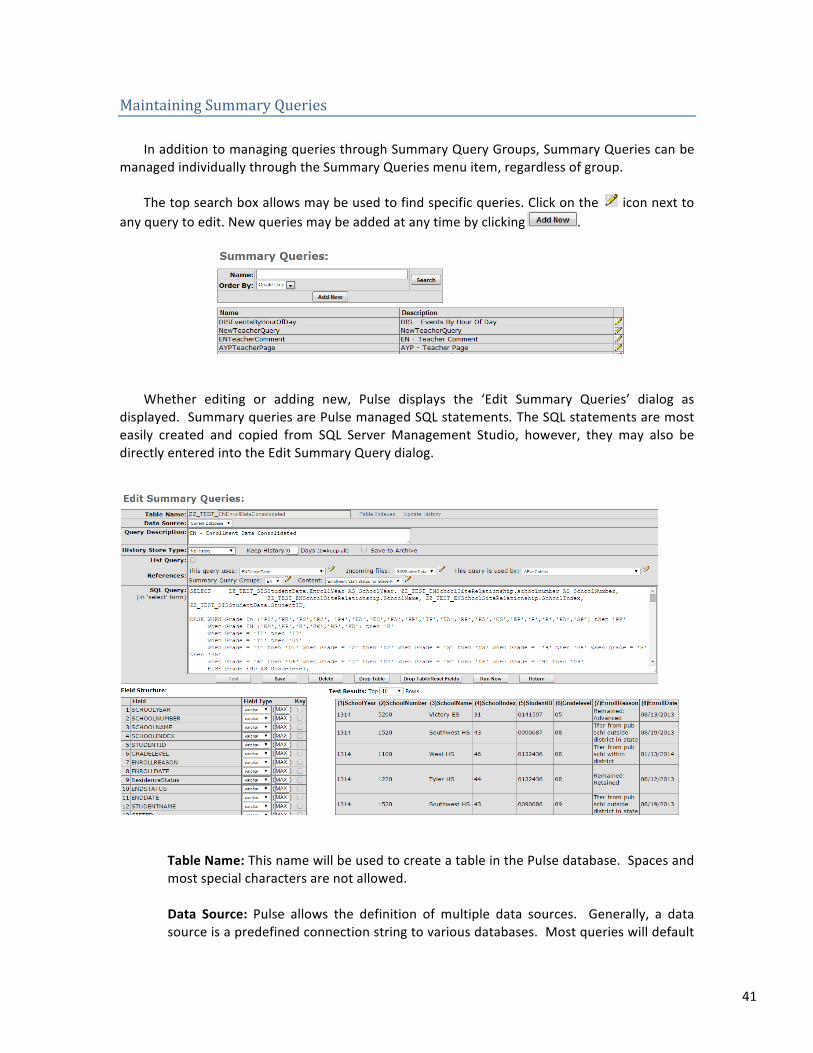
Maintaining Summary Queries In addition to managing queries through Summary Query Groups, Summary Queries can be
managed individually through the Summary Queries menu item, regardless of group. The top search box allows may be used to find specific queries. Click on the icon next to
any query to edit. New queries may be added at any time by clicking .
Whether editing or adding new, Pulse displays the ‘Edit Summary Queries’ dialog as
displayed. Summary queries are Pulse managed SQL statements. The SQL statements are most easily created and copied from SQL Server Management Studio, however, they may also be directly entered into the Edit Summary Query dialog.
Table Name: This name will be used to create a table in the Pulse database. Spaces and most special characters are not allowed. Data Source: Pulse allows the definition of multiple data sources. Generally, a data source is a predefined connection string to various databases. Most queries will default
42
to the Pulse database, however, often an external database will be accessed. An example of this is when a student database (such as Powerschool, Infinite Campus or others) is accessed to pull data from that database into Pulse. This field will always default to the Pulse database, but may be changed when appropriate. Table Indexes: Table Indexes are not used with most summary queries. When used they provide a valuable function. The use of indexes may significantly improve the response time when viewing data generated as a result of the summary query. See “Table Indexes” under ”Other Administrative Functions” for more information on the use for this feature.
Query Description: Enter a short description of the summary query. The description is used for documentation purposes only.
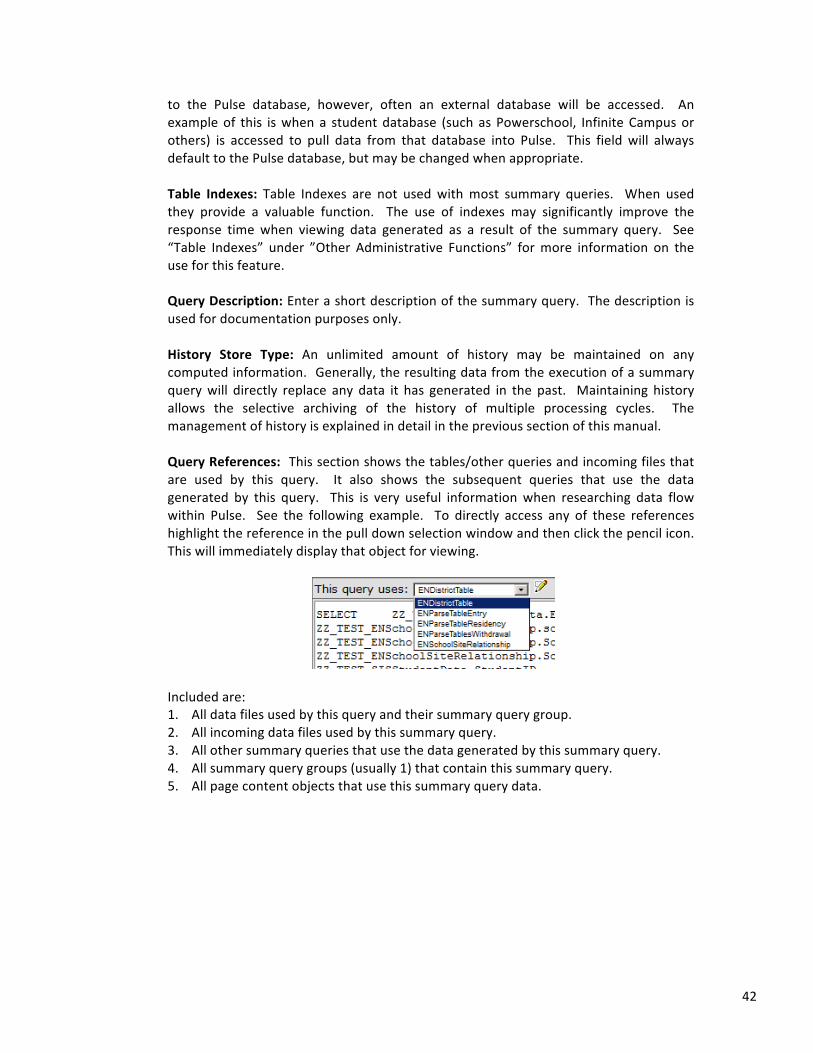
History Store Type: An unlimited amount of history may be maintained on any computed information. Generally, the resulting data from the execution of a summary query will directly replace any data it has generated in the past. Maintaining history allows the selective archiving of the history of multiple processing cycles. The management of history is explained in detail in the previous section of this manual. Query References: This section shows the tables/other queries and incoming files that are used by this query. It also shows the subsequent queries that use the data generated by this query. This is very useful information when researching data flow within Pulse. See the following example. To directly access any of these references highlight the reference in the pull down selection window and then click the pencil icon. This will immediately display that object for viewing.
Included are: 1. All data files used by this query and their summary query group. 2. All incoming data files used by this summary query. 3. All other summary queries that use the data generated by this summary query. 4. All summary query groups (usually 1) that contain this summary query. 5. All page content objects that use this summary query data.
43
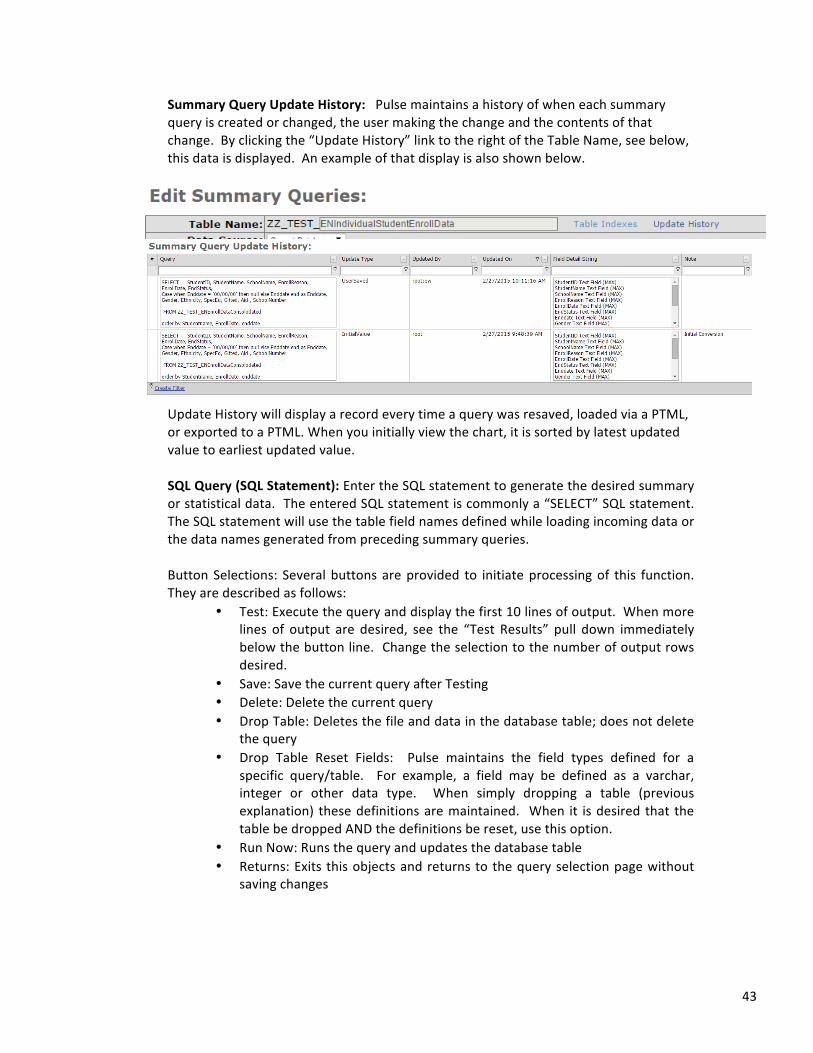
Summary Query Update History: Pulse maintains a history of when each summary query is created or changed, the user making the change and the contents of that change. By clicking the “Update History” link to the right of the Table Name, see below, this data is displayed. An example of that display is also shown below.
Update History will display a record every time a query was resaved, loaded via a PTML, or exported to a PTML. When you initially view the chart, it is sorted by latest updated value to earliest updated value. SQL Query (SQL Statement): Enter the SQL statement to generate the desired summary or statistical data. The entered SQL statement is commonly a “SELECT” SQL statement. The SQL statement will use the table field names defined while loading incoming data or the data names generated from preceding summary queries.
Button Selections: Several buttons are provided to initiate processing of this function. They are described as follows:
• Test: Execute the query and display the first 10 lines of output. When more lines of output are desired, see the “Test Results” pull down immediately below the button line. Change the selection to the number of output rows desired.
• Save: Save the current query after Testing • Delete: Delete the current query • Drop Table: Deletes the file and data in the database table; does not delete
the query • Drop Table Reset Fields: Pulse maintains the field types defined for a
specific query/table. For example, a field may be defined as a varchar, integer or other data type. When simply dropping a table (previous explanation) these definitions are maintained. When it is desired that the table be dropped AND the definitions be reset, use this option.
• Run Now: Runs the query and updates the database table • Returns: Exits this objects and returns to the query selection page without
saving changes
44
Field Structure: After the query is successfully tested using the Test button, a field structure will be generated by Pulse and displayed. Each field selected in the SQL Statement will be displayed:
a. Order number b. Field: name used in query for the field name c. Field Type:
- Varchar: Alpha fields, or mixed (numeric and alpha) - Integer: Numeric fields - Date Time: Date and time fields - Decimal: Decimal or other numeric fields
The Field type is automatically calculated by Pulse based on the contents of the data field in the resulting query results.
d. Field Length (Varchar only): maximum length of field; defaults to “MAX” with no practical limit, it may be changed if desired.
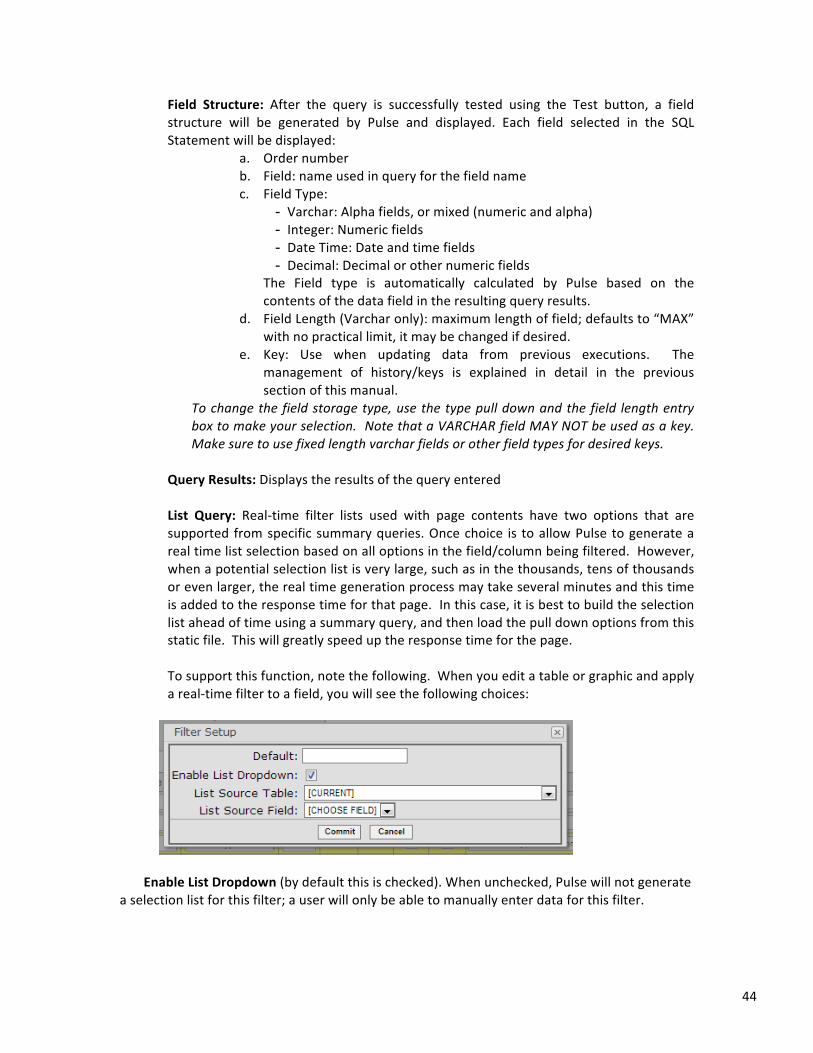
e. Key: Use when updating data from previous executions. The management of history/keys is explained in detail in the previous section of this manual.
To change the field storage type, use the type pull down and the field length entry box to make your selection. Note that a VARCHAR field MAY NOT be used as a key. Make sure to use fixed length varchar fields or other field types for desired keys.
Query Results: Displays the results of the query entered List Query: Real-‐time filter lists used with page contents have two options that are supported from specific summary queries. Once choice is to allow Pulse to generate a real time list selection based on all options in the field/column being filtered. However, when a potential selection list is very large, such as in the thousands, tens of thousands or even larger, the real time generation process may take several minutes and this time is added to the response time for that page. In this case, it is best to build the selection list ahead of time using a summary query, and then load the pull down options from this static file. This will greatly speed up the response time for the page. To support this function, note the following. When you edit a table or graphic and apply a real-‐time filter to a field, you will see the following choices:
Enable List Dropdown (by default this is checked). When unchecked, Pulse will not generate
a selection list for this filter; a user will only be able to manually enter data for this filter.
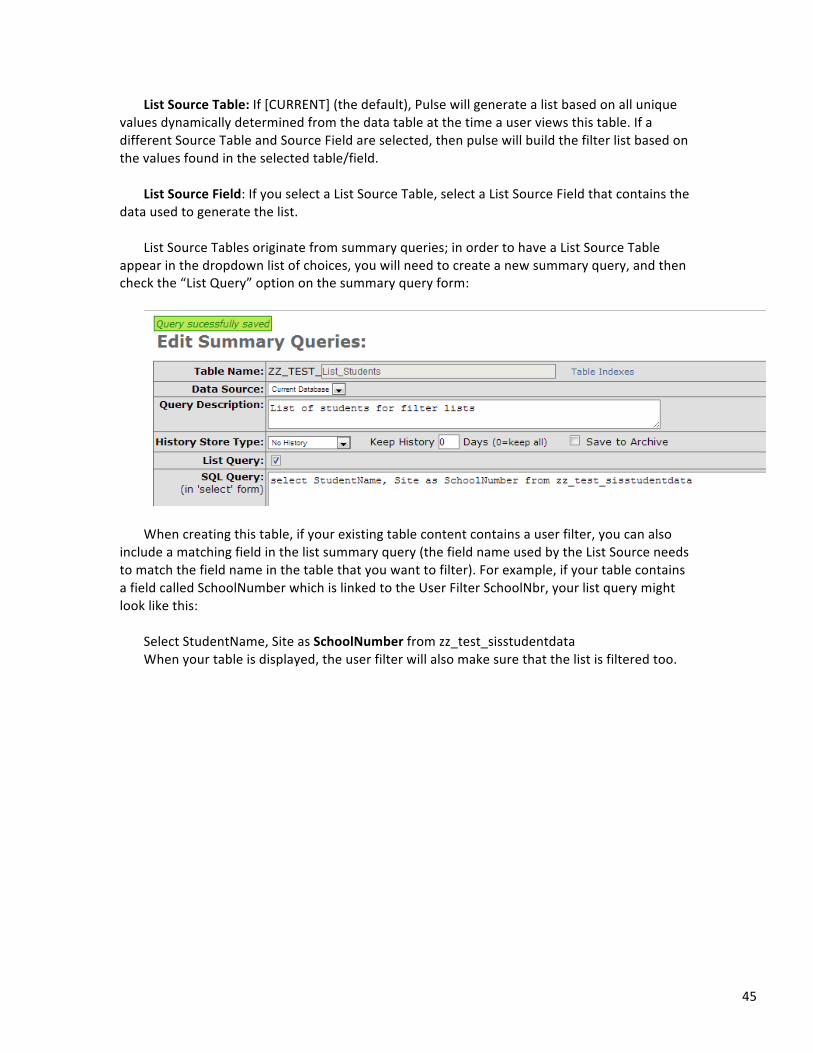
45
List Source Table: If [CURRENT] (the default), Pulse will generate a list based on all unique values dynamically determined from the data table at the time a user views this table. If a different Source Table and Source Field are selected, then pulse will build the filter list based on the values found in the selected table/field.
List Source Field: If you select a List Source Table, select a List Source Field that contains the
data used to generate the list. List Source Tables originate from summary queries; in order to have a List Source Table
appear in the dropdown list of choices, you will need to create a new summary query, and then check the “List Query” option on the summary query form:
When creating this table, if your existing table content contains a user filter, you can also
include a matching field in the list summary query (the field name used by the List Source needs to match the field name in the table that you want to filter). For example, if your table contains a field called SchoolNumber which is linked to the User Filter SchoolNbr, your list query might look like this:
Select StudentName, Site as SchoolNumber from zz_test_sisstudentdata When your table is displayed, the user filter will also make sure that the list is filtered too.
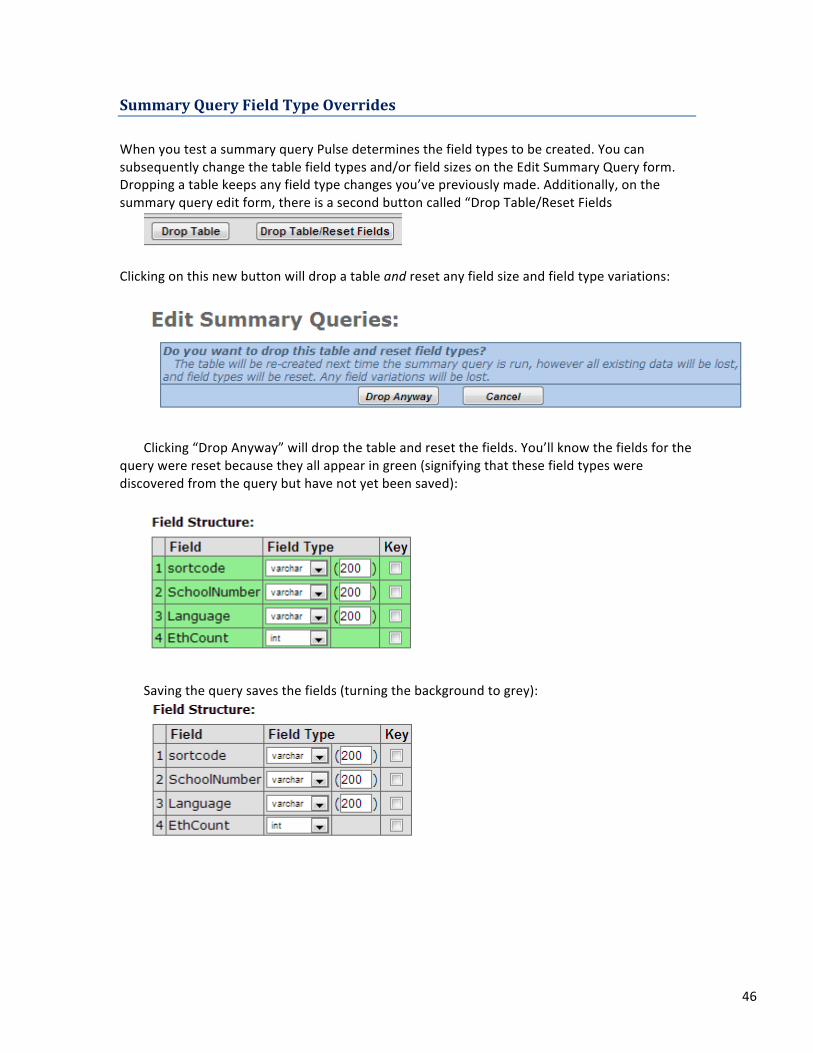
46
Summary Query Field Type Overrides When you test a summary query Pulse determines the field types to be created. You can subsequently change the table field types and/or field sizes on the Edit Summary Query form. Dropping a table keeps any field type changes you’ve previously made. Additionally, on the summary query edit form, there is a second button called “Drop Table/Reset Fields
Clicking on this new button will drop a table and reset any field size and field type variations:
Clicking “Drop Anyway” will drop the table and reset the fields. You’ll know the fields for the
query were reset because they all appear in green (signifying that these field types were discovered from the query but have not yet been saved):
Saving the query saves the fields (turning the background to grey):
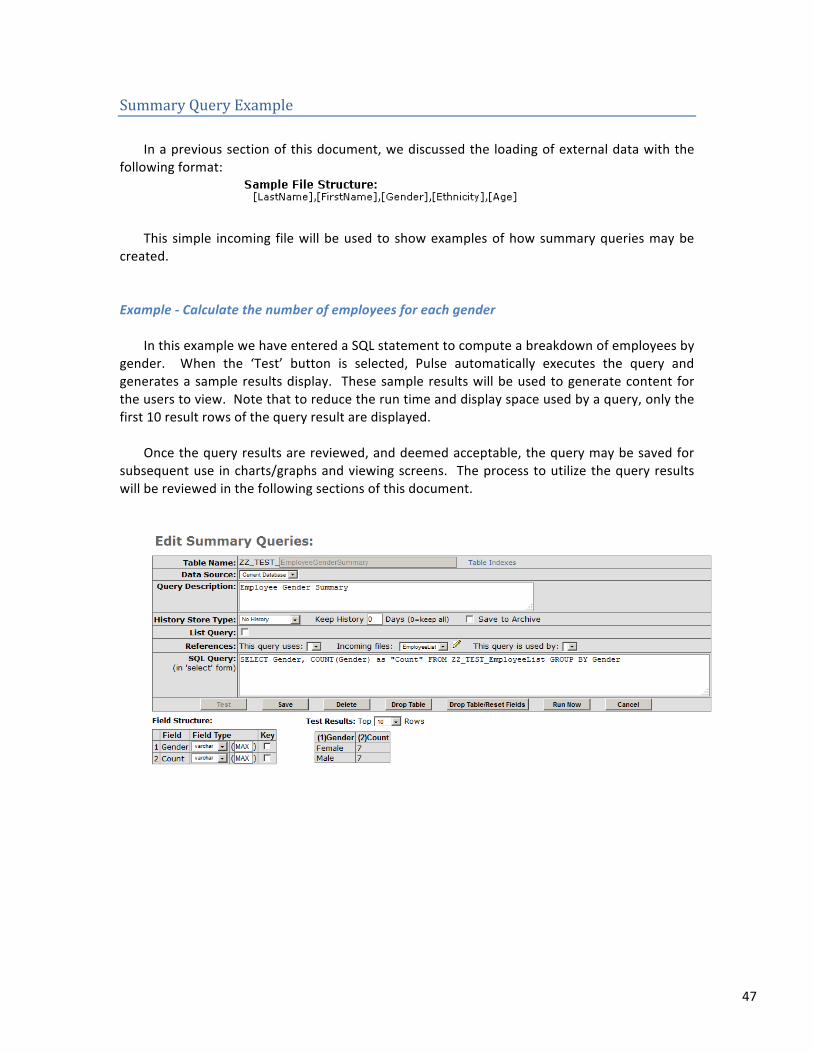
47
Summary Query Example In a previous section of this document, we discussed the loading of external data with the
following format: This simple incoming file will be used to show examples of how summary queries may be
created.
Example -‐ Calculate the number of employees for each gender In this example we have entered a SQL statement to compute a breakdown of employees by
gender. When the ‘Test’ button is selected, Pulse automatically executes the query and generates a sample results display. These sample results will be used to generate content for the users to view. Note that to reduce the run time and display space used by a query, only the first 10 result rows of the query result are displayed.
Once the query results are reviewed, and deemed acceptable, the query may be saved for
subsequent use in charts/graphs and viewing screens. The process to utilize the query results will be reviewed in the following sections of this document.
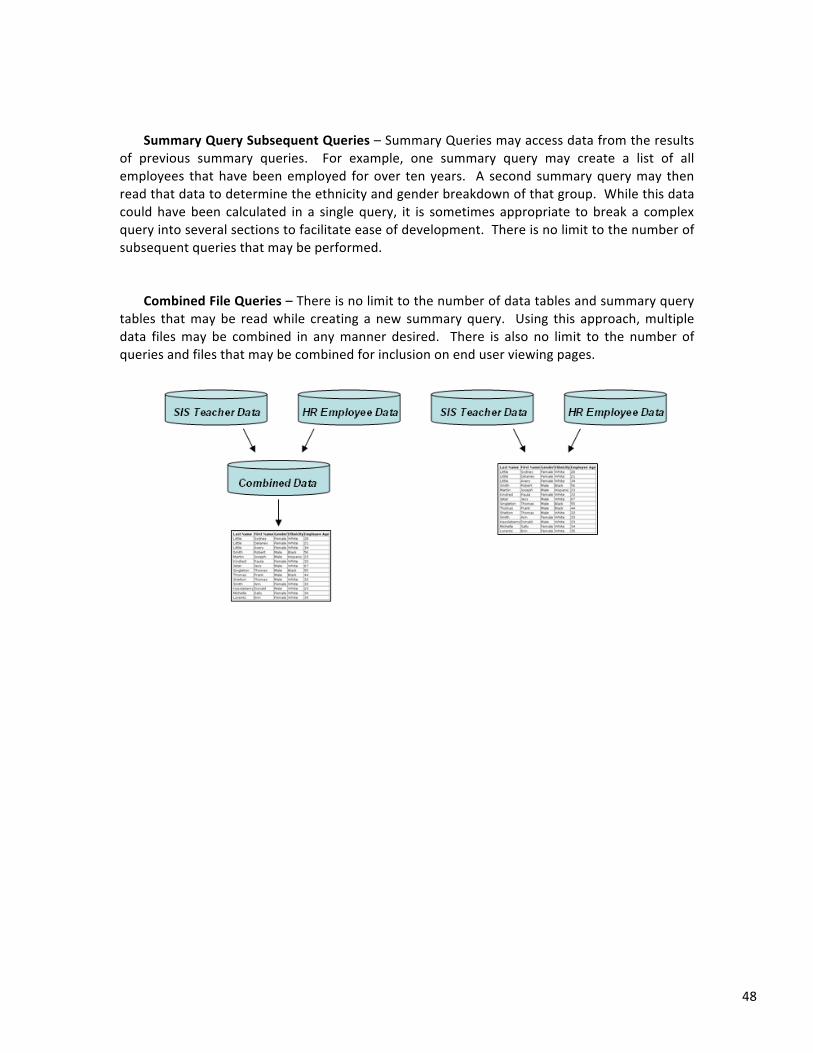
48
Summary Query Subsequent Queries – Summary Queries may access data from the results
of previous summary queries. For example, one summary query may create a list of all employees that have been employed for over ten years. A second summary query may then read that data to determine the ethnicity and gender breakdown of that group. While this data could have been calculated in a single query, it is sometimes appropriate to break a complex query into several sections to facilitate ease of development. There is no limit to the number of subsequent queries that may be performed.
Combined File Queries – There is no limit to the number of data tables and summary query
tables that may be read while creating a new summary query. Using this approach, multiple data files may be combined in any manner desired. There is also no limit to the number of queries and files that may be combined for inclusion on end user viewing pages.
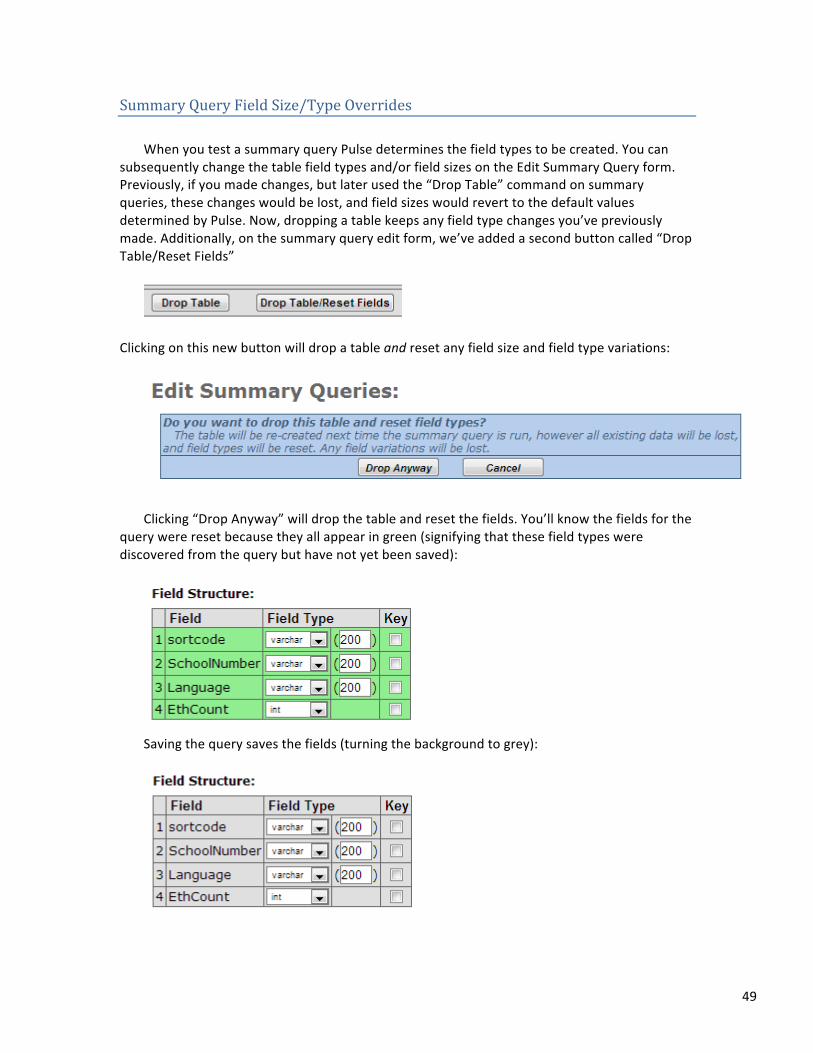
49
Summary Query Field Size/Type Overrides When you test a summary query Pulse determines the field types to be created. You can
subsequently change the table field types and/or field sizes on the Edit Summary Query form. Previously, if you made changes, but later used the “Drop Table” command on summary queries, these changes would be lost, and field sizes would revert to the default values determined by Pulse. Now, dropping a table keeps any field type changes you’ve previously made. Additionally, on the summary query edit form, we’ve added a second button called “Drop Table/Reset Fields”
Clicking on this new button will drop a table and reset any field size and field type variations:
Clicking “Drop Anyway” will drop the table and reset the fields. You’ll know the fields for the
query were reset because they all appear in green (signifying that these field types were discovered from the query but have not yet been saved):
Saving the query saves the fields (turning the background to grey):
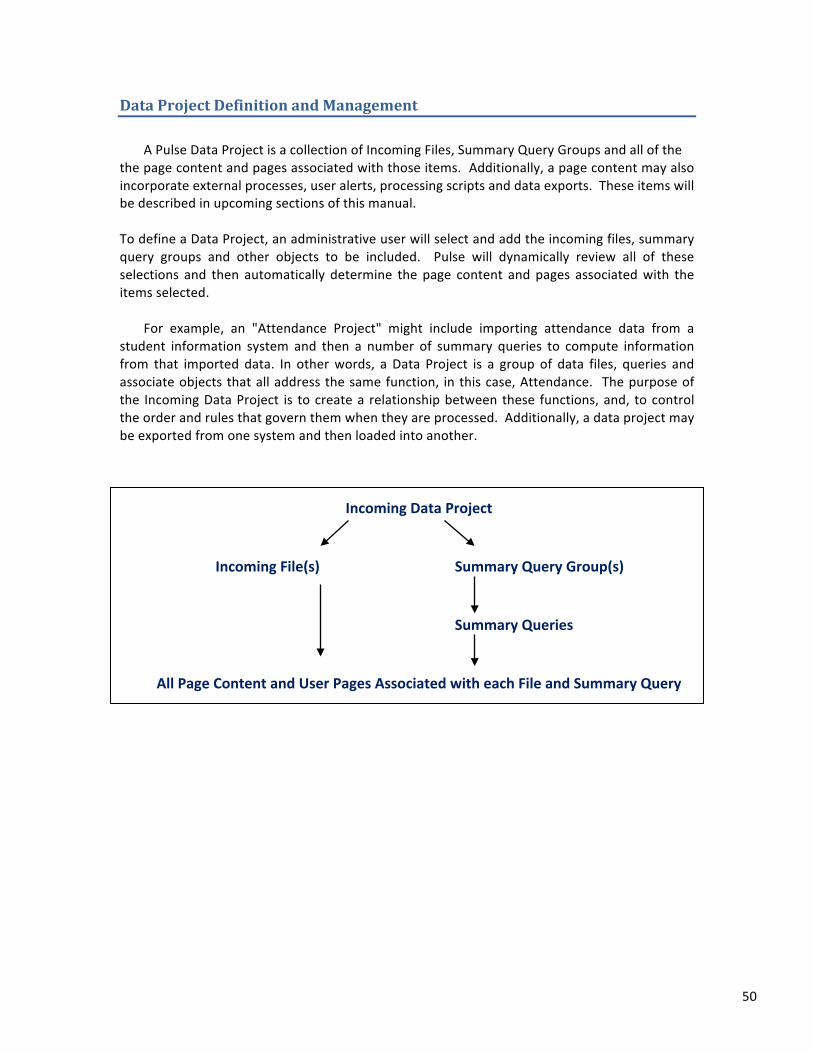
50
Data Project Definition and Management A Pulse Data Project is a collection of Incoming Files, Summary Query Groups and all of the
the page content and pages associated with those items. Additionally, a page content may also incorporate external processes, user alerts, processing scripts and data exports. These items will be described in upcoming sections of this manual. To define a Data Project, an administrative user will select and add the incoming files, summary query groups and other objects to be included. Pulse will dynamically review all of these selections and then automatically determine the page content and pages associated with the items selected.
For example, an "Attendance Project" might include importing attendance data from a
student information system and then a number of summary queries to compute information from that imported data. In other words, a Data Project is a group of data files, queries and associate objects that all address the same function, in this case, Attendance. The purpose of the Incoming Data Project is to create a relationship between these functions, and, to control the order and rules that govern them when they are processed. Additionally, a data project may be exported from one system and then loaded into another.
Incoming Data Project
Incoming File(s) Summary Query Group(s)
Summary Queries All Page Content and User Pages Associated with each File and Summary Query

51
Defining a New Data Project The first step in managing Data Projects is its definition. By clicking on the Incoming Data
Project option on the administration left menu, the Incoming Project transaction dialog is displayed as depicted in the following example.
Projects may be edited by selecting the button next to the project. To define a new
Incoming Data Project, Click on the Add New button. The following dialog is displayed.
1. Active: Check if this project should be considered active.
2. Run with Parser: This option determines whether or not the Pulse Parser will process
this project on a schedule. Infrequently updated files, such as state testing, are usually not run with the parser. These projects will be initiated manually instead of being processed by the Pulse Parser.
3. Name: This name will be used to display the project and may contain spaces and/or special characters.
4. Description: Enter a short description of the summary query. The description is used for documentation purposes only.
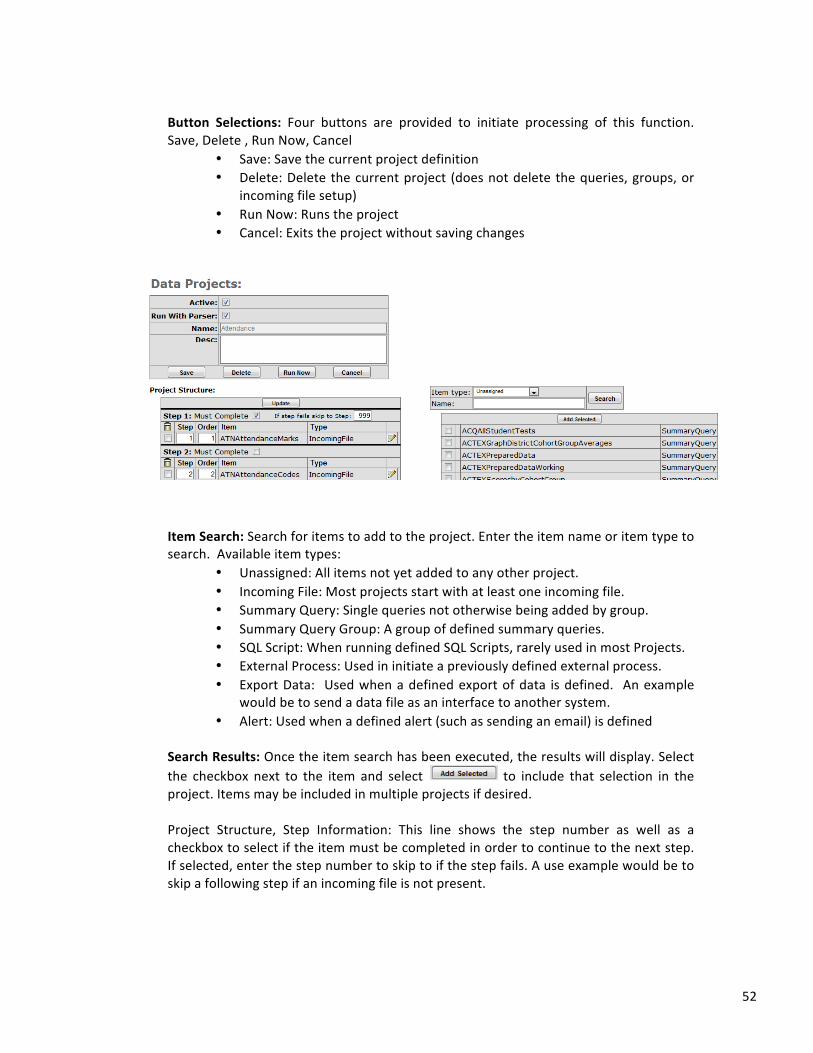
52
Button Selections: Four buttons are provided to initiate processing of this function. Save, Delete , Run Now, Cancel
• Save: Save the current project definition • Delete: Delete the current project (does not delete the queries, groups, or
incoming file setup) • Run Now: Runs the project • Cancel: Exits the project without saving changes
Item Search: Search for items to add to the project. Enter the item name or item type to search. Available item types:
• Unassigned: All items not yet added to any other project. • Incoming File: Most projects start with at least one incoming file. • Summary Query: Single queries not otherwise being added by group. • Summary Query Group: A group of defined summary queries. • SQL Script: When running defined SQL Scripts, rarely used in most Projects. • External Process: Used in initiate a previously defined external process. • Export Data: Used when a defined export of data is defined. An example
would be to send a data file as an interface to another system. • Alert: Used when a defined alert (such as sending an email) is defined
Search Results: Once the item search has been executed, the results will display. Select the checkbox next to the item and select to include that selection in the project. Items may be included in multiple projects if desired.
Project Structure, Step Information: This line shows the step number as well as a checkbox to select if the item must be completed in order to continue to the next step. If selected, enter the step number to skip to if the step fails. A use example would be to skip a following step if an incoming file is not present.
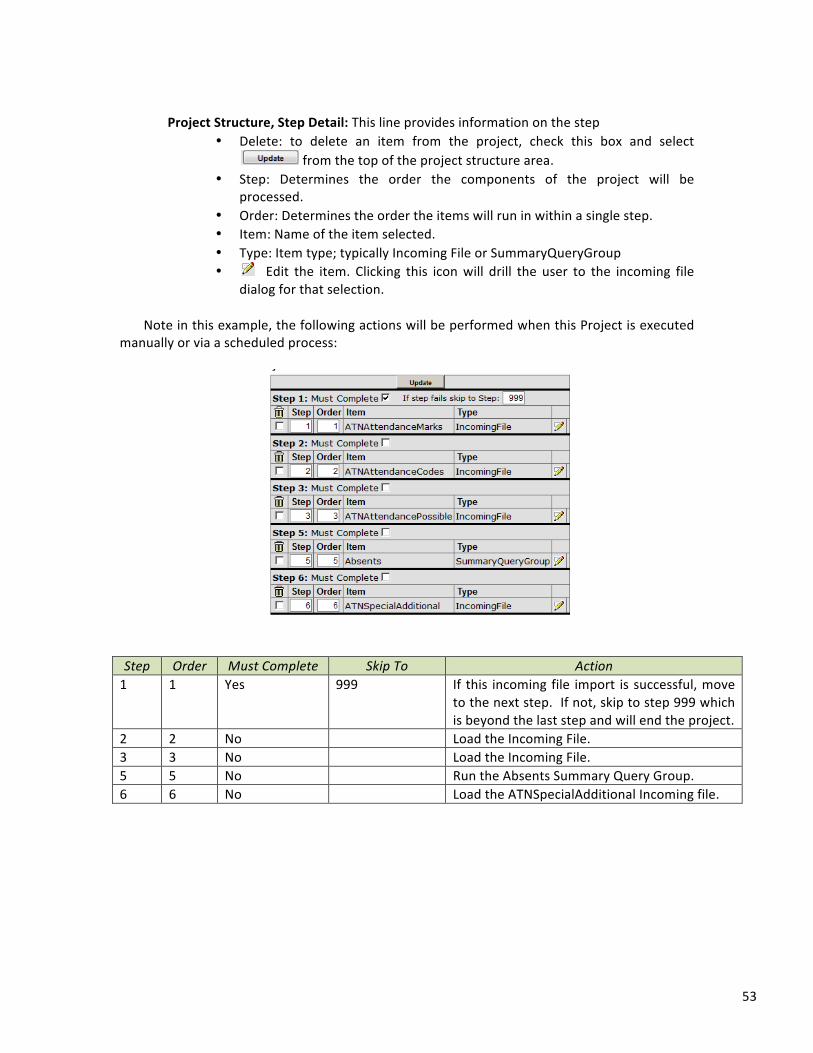
53
Project Structure, Step Detail: This line provides information on the step
• Delete: to delete an item from the project, check this box and select from the top of the project structure area.
• Step: Determines the order the components of the project will be processed.
• Order: Determines the order the items will run in within a single step. • Item: Name of the item selected. • Type: Item type; typically Incoming File or SummaryQueryGroup • Edit the item. Clicking this icon will drill the user to the incoming file
dialog for that selection. Note in this example, the following actions will be performed when this Project is executed
manually or via a scheduled process:
Step Order Must Complete Skip To Action 1 1 Yes 999 If this incoming file import is successful, move
to the next step. If not, skip to step 999 which is beyond the last step and will end the project.
2 2 No Load the Incoming File. 3 3 No Load the Incoming File. 5 5 No Run the Absents Summary Query Group. 6 6 No Load the ATNSpecialAdditional Incoming file.
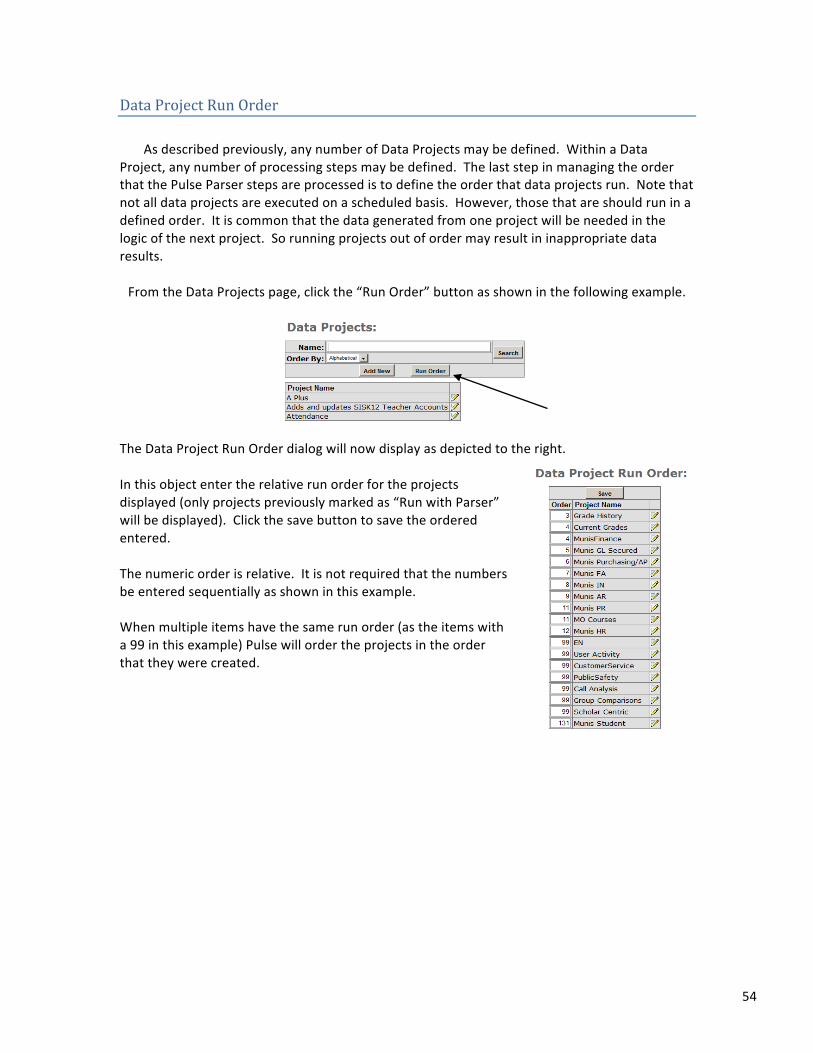
54
Data Project Run Order As described previously, any number of Data Projects may be defined. Within a Data
Project, any number of processing steps may be defined. The last step in managing the order that the Pulse Parser steps are processed is to define the order that data projects run. Note that not all data projects are executed on a scheduled basis. However, those that are should run in a defined order. It is common that the data generated from one project will be needed in the logic of the next project. So running projects out of order may result in inappropriate data results. From the Data Projects page, click the “Run Order” button as shown in the following example.
The Data Project Run Order dialog will now display as depicted to the right.
In this object enter the relative run order for the projects displayed (only projects previously marked as “Run with Parser” will be displayed). Click the save button to save the ordered entered. The numeric order is relative. It is not required that the numbers be entered sequentially as shown in this example. When multiple items have the same run order (as the items with a 99 in this example) Pulse will order the projects in the order that they were created.
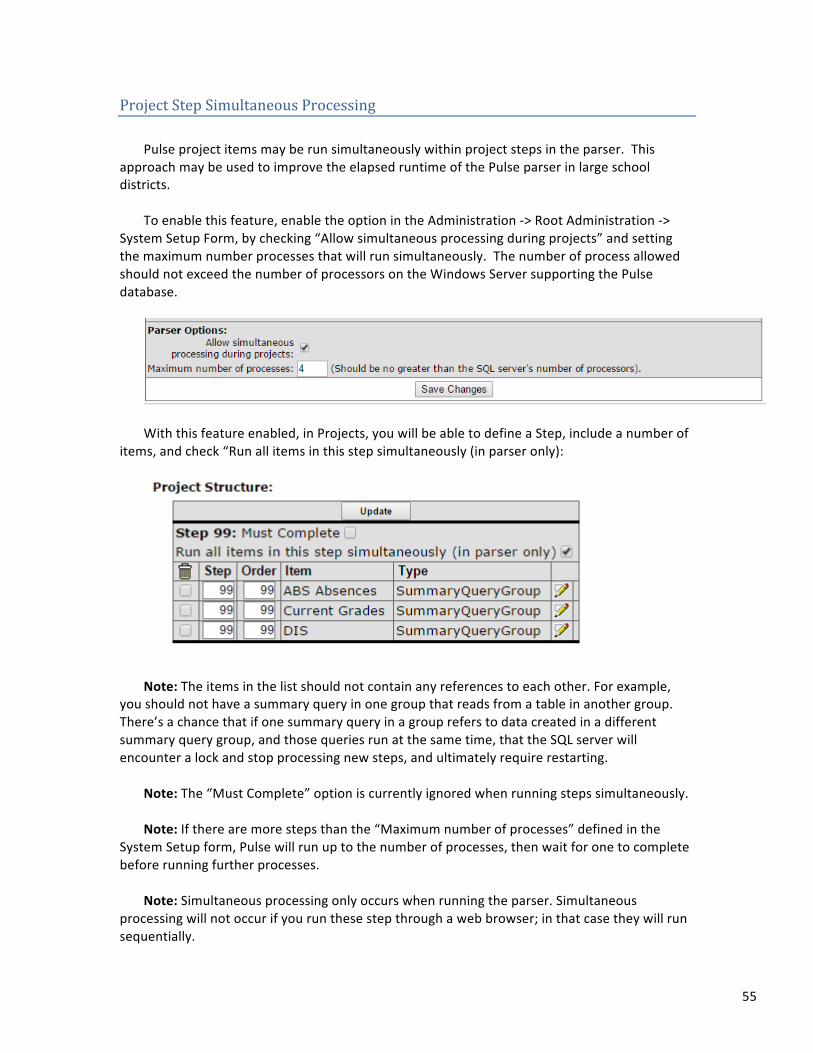
55
Project Step Simultaneous Processing Pulse project items may be run simultaneously within project steps in the parser. This
approach may be used to improve the elapsed runtime of the Pulse parser in large school districts.
To enable this feature, enable the option in the Administration -‐> Root Administration -‐>
System Setup Form, by checking “Allow simultaneous processing during projects” and setting the maximum number processes that will run simultaneously. The number of process allowed should not exceed the number of processors on the Windows Server supporting the Pulse database.
With this feature enabled, in Projects, you will be able to define a Step, include a number of
items, and check “Run all items in this step simultaneously (in parser only):
Note: The items in the list should not contain any references to each other. For example,
you should not have a summary query in one group that reads from a table in another group. There’s a chance that if one summary query in a group refers to data created in a different summary query group, and those queries run at the same time, that the SQL server will encounter a lock and stop processing new steps, and ultimately require restarting.
Note: The “Must Complete” option is currently ignored when running steps simultaneously. Note: If there are more steps than the “Maximum number of processes” defined in the
System Setup form, Pulse will run up to the number of processes, then wait for one to complete before running further processes.
Note: Simultaneous processing only occurs when running the parser. Simultaneous
processing will not occur if you run these step through a web browser; in that case they will run sequentially.

56
Data Project Run Times Pulse records run times for all project-‐based activity, and displays the last run time and
results for all actions. For example, Data Projects will show the last time the parser started and completed, with a total run time, and then for each project, similar information, see the example below:
Run times are available for viewing under Incoming Data, Summary Query Groups, Summary
Queries, SQL Scripts, Exports, Data Projects and Data Projects Run Order.
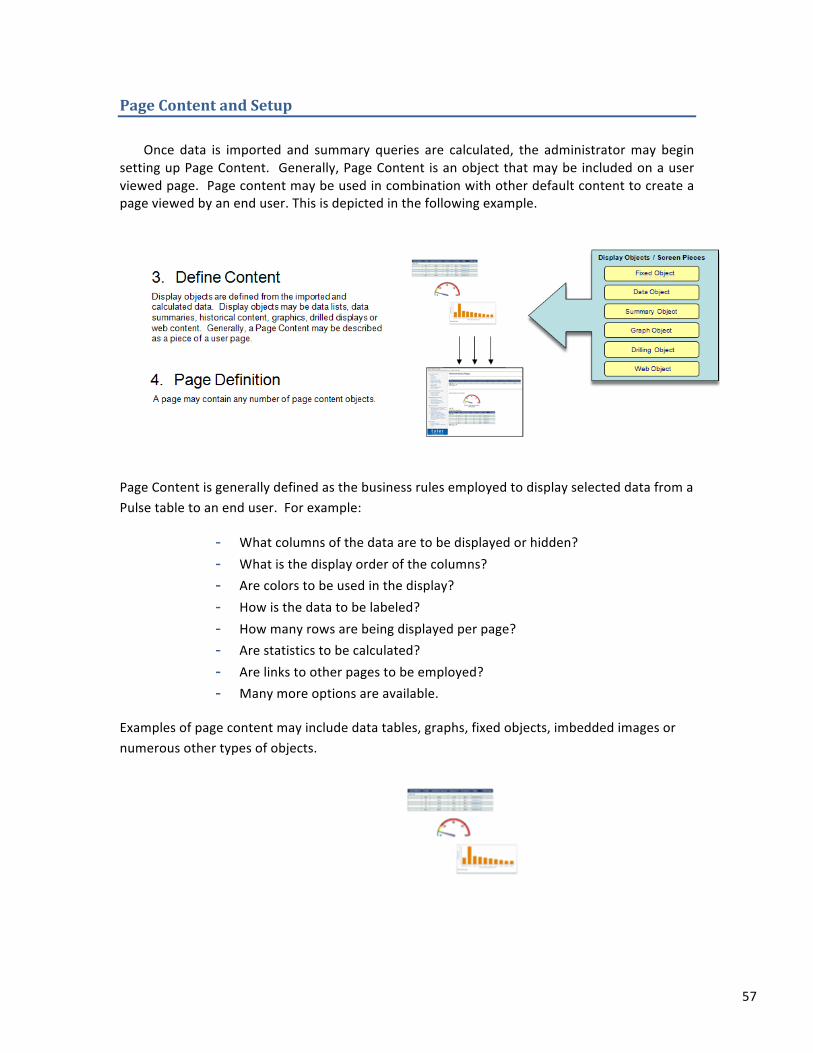
57
Page Content and Setup Once data is imported and summary queries are calculated, the administrator may begin
setting up Page Content. Generally, Page Content is an object that may be included on a user viewed page. Page content may be used in combination with other default content to create a page viewed by an end user. This is depicted in the following example.
Page Content is generally defined as the business rules employed to display selected data from a Pulse table to an end user. For example:
- What columns of the data are to be displayed or hidden? - What is the display order of the columns? - Are colors to be used in the display? - How is the data to be labeled? - How many rows are being displayed per page? - Are statistics to be calculated? - Are links to other pages to be employed? - Many more options are available.
Examples of page content may include data tables, graphs, fixed objects, imbedded images or numerous other types of objects.
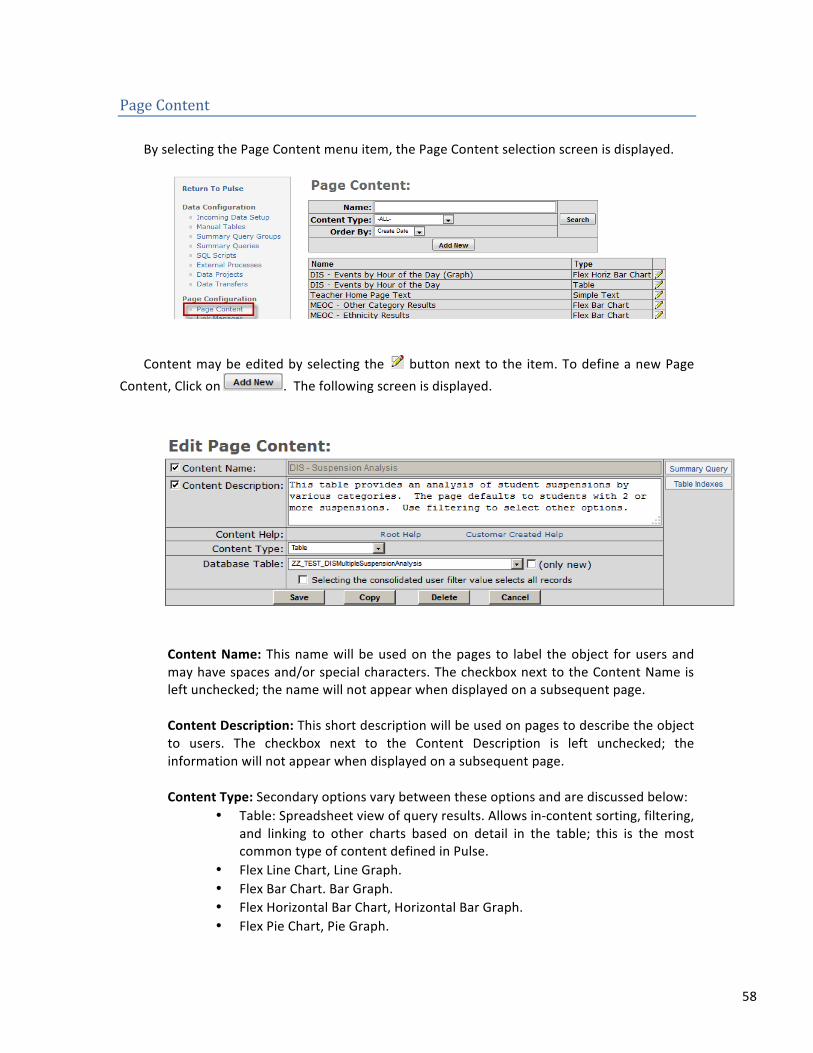
58
Page Content By selecting the Page Content menu item, the Page Content selection screen is displayed.
Content may be edited by selecting the button next to the item. To define a new Page
Content, Click on . The following screen is displayed.
Content Name: This name will be used on the pages to label the object for users and may have spaces and/or special characters. The checkbox next to the Content Name is left unchecked; the name will not appear when displayed on a subsequent page. Content Description: This short description will be used on pages to describe the object to users. The checkbox next to the Content Description is left unchecked; the information will not appear when displayed on a subsequent page.
Content Type: Secondary options vary between these options and are discussed below:
• Table: Spreadsheet view of query results. Allows in-‐content sorting, filtering, and linking to other charts based on detail in the table; this is the most common type of content defined in Pulse.
• Flex Line Chart, Line Graph. • Flex Bar Chart. Bar Graph. • Flex Horizontal Bar Chart, Horizontal Bar Graph. • Flex Pie Chart, Pie Graph.
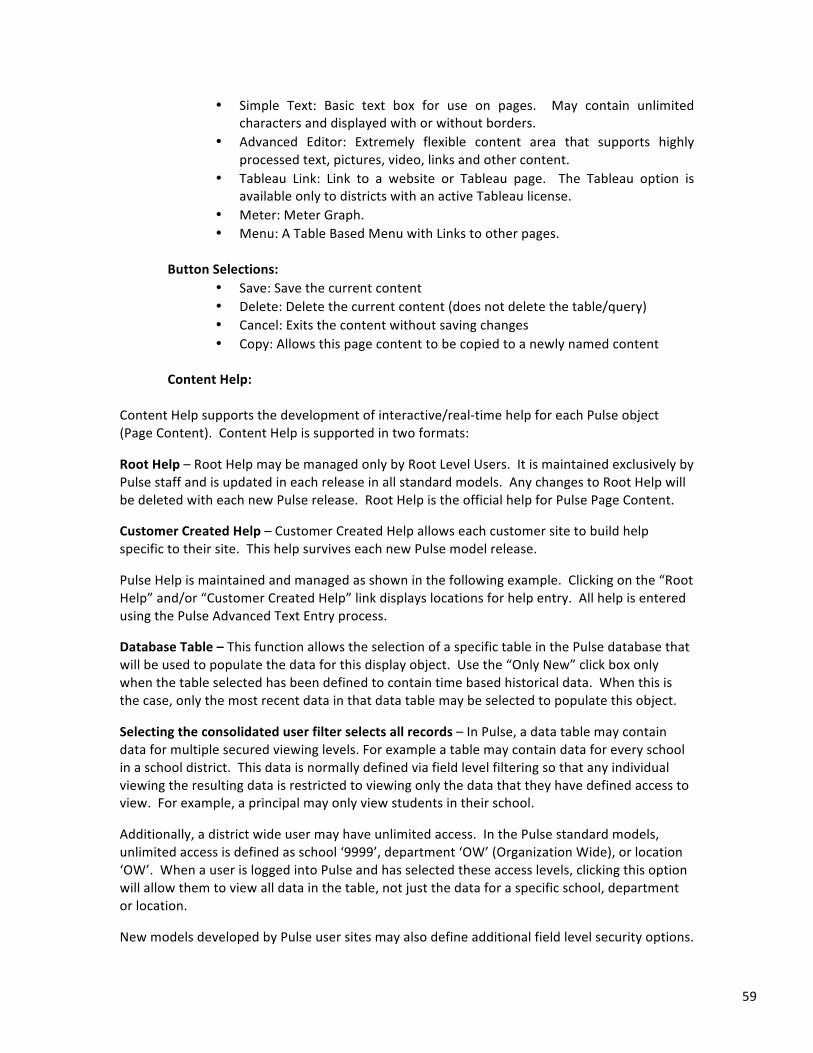
59
• Simple Text: Basic text box for use on pages. May contain unlimited characters and displayed with or without borders.
• Advanced Editor: Extremely flexible content area that supports highly processed text, pictures, video, links and other content.
• Tableau Link: Link to a website or Tableau page. The Tableau option is available only to districts with an active Tableau license.
• Meter: Meter Graph. • Menu: A Table Based Menu with Links to other pages.
Button Selections:
• Save: Save the current content • Delete: Delete the current content (does not delete the table/query) • Cancel: Exits the content without saving changes • Copy: Allows this page content to be copied to a newly named content
Content Help:
Content Help supports the development of interactive/real-‐time help for each Pulse object (Page Content). Content Help is supported in two formats:
Root Help – Root Help may be managed only by Root Level Users. It is maintained exclusively by Pulse staff and is updated in each release in all standard models. Any changes to Root Help will be deleted with each new Pulse release. Root Help is the official help for Pulse Page Content.
Customer Created Help – Customer Created Help allows each customer site to build help specific to their site. This help survives each new Pulse model release.
Pulse Help is maintained and managed as shown in the following example. Clicking on the “Root Help” and/or “Customer Created Help” link displays locations for help entry. All help is entered using the Pulse Advanced Text Entry process.
Database Table – This function allows the selection of a specific table in the Pulse database that will be used to populate the data for this display object. Use the “Only New” click box only when the table selected has been defined to contain time based historical data. When this is the case, only the most recent data in that data table may be selected to populate this object.
Selecting the consolidated user filter selects all records – In Pulse, a data table may contain data for multiple secured viewing levels. For example a table may contain data for every school in a school district. This data is normally defined via field level filtering so that any individual viewing the resulting data is restricted to viewing only the data that they have defined access to view. For example, a principal may only view students in their school.
Additionally, a district wide user may have unlimited access. In the Pulse standard models, unlimited access is defined as school ‘9999’, department ‘OW’ (Organization Wide), or location ‘OW’. When a user is logged into Pulse and has selected these access levels, clicking this option will allow them to view all data in the table, not just the data for a specific school, department or location.
New models developed by Pulse user sites may also define additional field level security options.
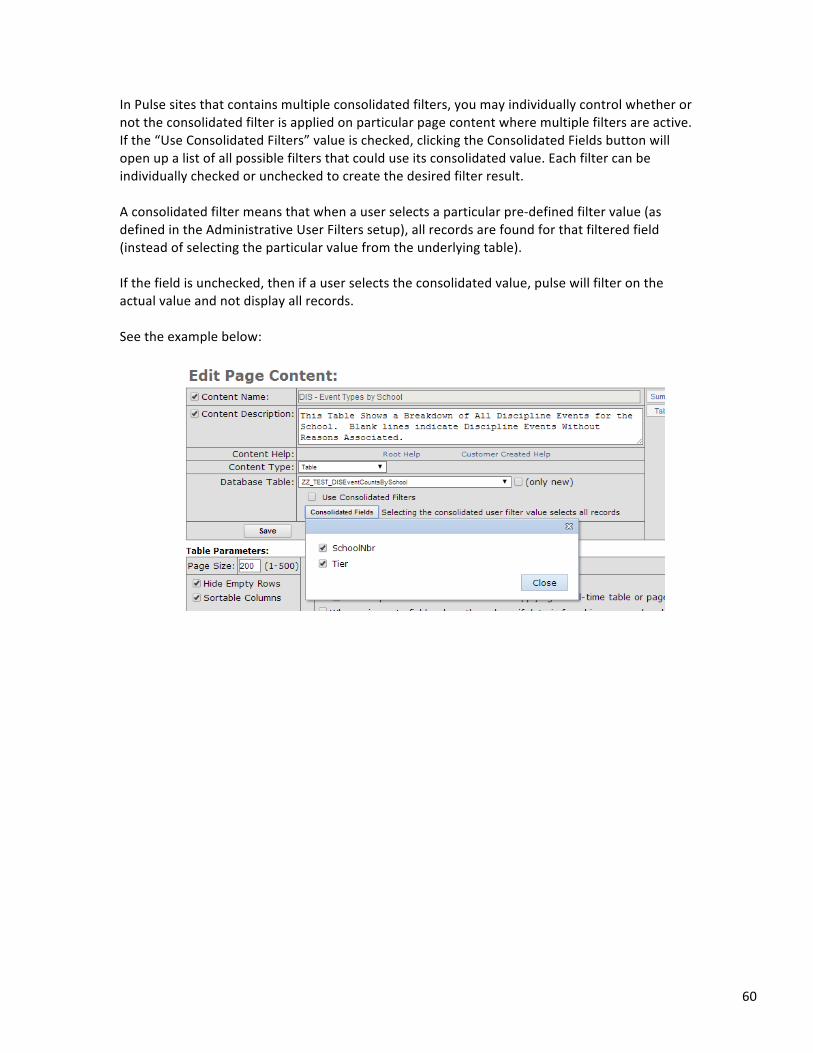
60
In Pulse sites that contains multiple consolidated filters, you may individually control whether or not the consolidated filter is applied on particular page content where multiple filters are active. If the “Use Consolidated Filters” value is checked, clicking the Consolidated Fields button will open up a list of all possible filters that could use its consolidated value. Each filter can be individually checked or unchecked to create the desired filter result. A consolidated filter means that when a user selects a particular pre-‐defined filter value (as defined in the Administrative User Filters setup), all records are found for that filtered field (instead of selecting the particular value from the underlying table). If the field is unchecked, then if a user selects the consolidated value, pulse will filter on the actual value and not display all records. See the example below:
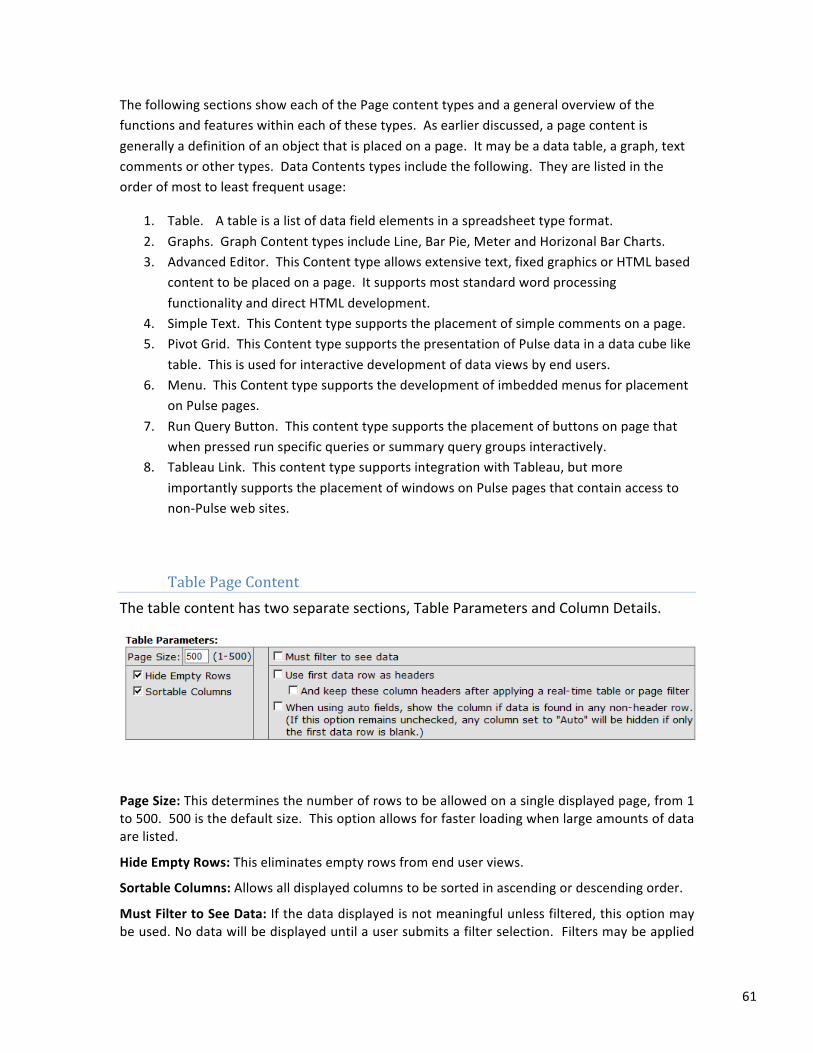
61
The following sections show each of the Page content types and a general overview of the functions and features within each of these types. As earlier discussed, a page content is generally a definition of an object that is placed on a page. It may be a data table, a graph, text comments or other types. Data Contents types include the following. They are listed in the order of most to least frequent usage:
1. Table. A table is a list of data field elements in a spreadsheet type format. 2. Graphs. Graph Content types include Line, Bar Pie, Meter and Horizonal Bar Charts. 3. Advanced Editor. This Content type allows extensive text, fixed graphics or HTML based
content to be placed on a page. It supports most standard word processing functionality and direct HTML development.
4. Simple Text. This Content type supports the placement of simple comments on a page. 5. Pivot Grid. This Content type supports the presentation of Pulse data in a data cube like
table. This is used for interactive development of data views by end users. 6. Menu. This Content type supports the development of imbedded menus for placement
on Pulse pages. 7. Run Query Button. This content type supports the placement of buttons on page that
when pressed run specific queries or summary query groups interactively. 8. Tableau Link. This content type supports integration with Tableau, but more
importantly supports the placement of windows on Pulse pages that contain access to non-‐Pulse web sites.
Table Page Content The table content has two separate sections, Table Parameters and Column Details.
Page Size: This determines the number of rows to be allowed on a single displayed page, from 1 to 500. 500 is the default size. This option allows for faster loading when large amounts of data are listed.
Hide Empty Rows: This eliminates empty rows from end user views.
Sortable Columns: Allows all displayed columns to be sorted in ascending or descending order.
Must Filter to See Data: If the data displayed is not meaningful unless filtered, this option may be used. No data will be displayed until a user submits a filter selection. Filters may be applied
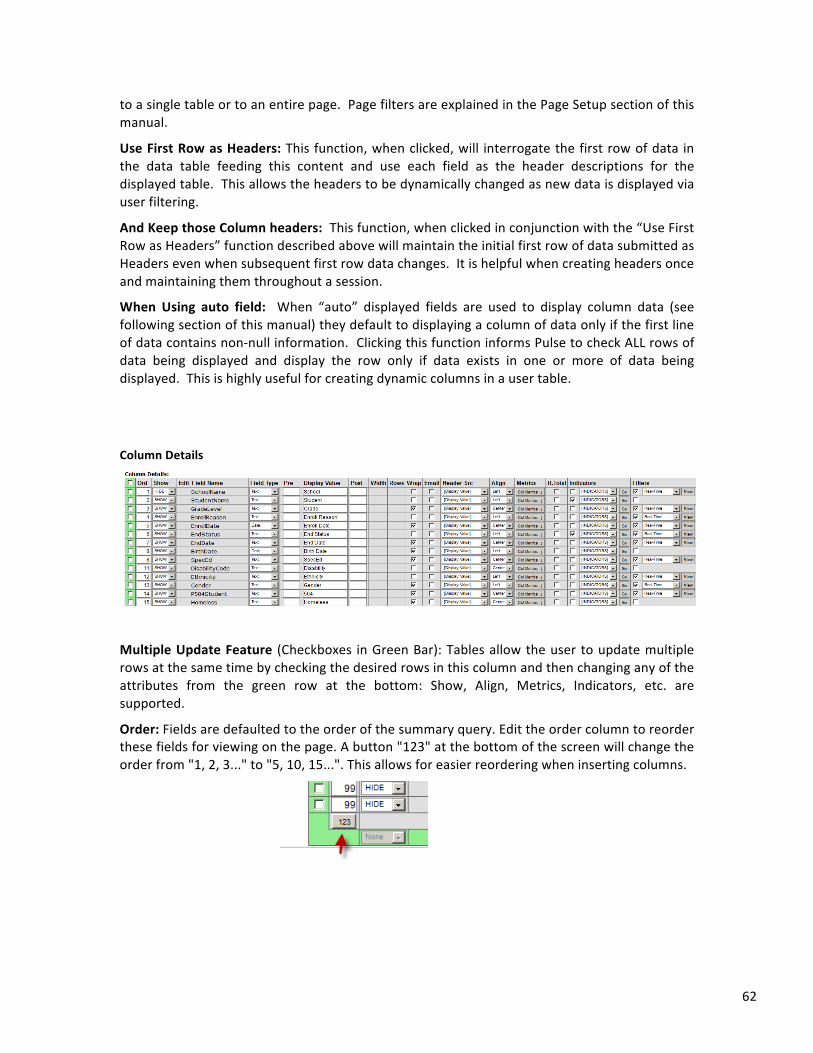
62
to a single table or to an entire page. Page filters are explained in the Page Setup section of this manual.
Use First Row as Headers: This function, when clicked, will interrogate the first row of data in the data table feeding this content and use each field as the header descriptions for the displayed table. This allows the headers to be dynamically changed as new data is displayed via user filtering.
And Keep those Column headers: This function, when clicked in conjunction with the “Use First Row as Headers” function described above will maintain the initial first row of data submitted as Headers even when subsequent first row data changes. It is helpful when creating headers once and maintaining them throughout a session.
When Using auto field: When “auto” displayed fields are used to display column data (see following section of this manual) they default to displaying a column of data only if the first line of data contains non-‐null information. Clicking this function informs Pulse to check ALL rows of data being displayed and display the row only if data exists in one or more of data being displayed. This is highly useful for creating dynamic columns in a user table.
Column Details
Multiple Update Feature (Checkboxes in Green Bar): Tables allow the user to update multiple rows at the same time by checking the desired rows in this column and then changing any of the attributes from the green row at the bottom: Show, Align, Metrics, Indicators, etc. are supported.
Order: Fields are defaulted to the order of the summary query. Edit the order column to reorder these fields for viewing on the page. A button "123" at the bottom of the screen will change the order from "1, 2, 3..." to "5, 10, 15...". This allows for easier reordering when inserting columns.
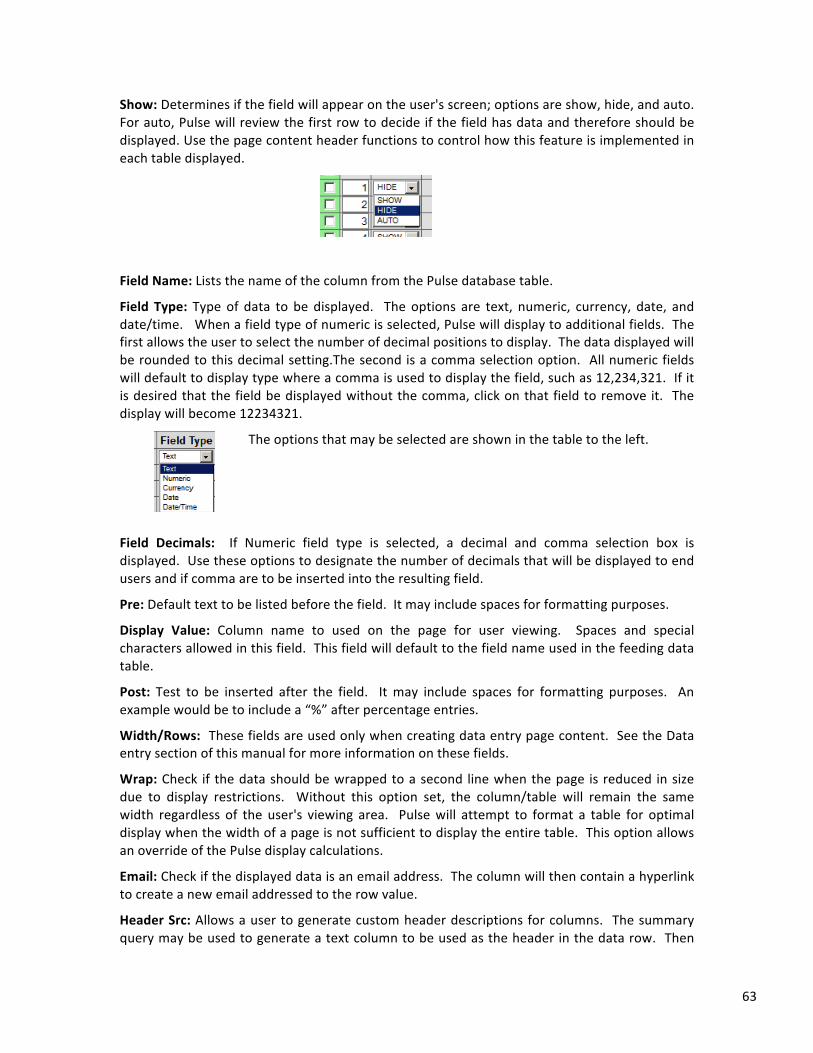
63
Show: Determines if the field will appear on the user's screen; options are show, hide, and auto. For auto, Pulse will review the first row to decide if the field has data and therefore should be displayed. Use the page content header functions to control how this feature is implemented in each table displayed.
Field Name: Lists the name of the column from the Pulse database table.
Field Type: Type of data to be displayed. The options are text, numeric, currency, date, and date/time. When a field type of numeric is selected, Pulse will display to additional fields. The first allows the user to select the number of decimal positions to display. The data displayed will be rounded to this decimal setting.The second is a comma selection option. All numeric fields will default to display type where a comma is used to display the field, such as 12,234,321. If it is desired that the field be displayed without the comma, click on that field to remove it. The display will become 12234321.
The options that may be selected are shown in the table to the left.
Field Decimals: If Numeric field type is selected, a decimal and comma selection box is displayed. Use these options to designate the number of decimals that will be displayed to end users and if comma are to be inserted into the resulting field.
Pre: Default text to be listed before the field. It may include spaces for formatting purposes.
Display Value: Column name to used on the page for user viewing. Spaces and special characters allowed in this field. This field will default to the field name used in the feeding data table.
Post: Test to be inserted after the field. It may include spaces for formatting purposes. An example would be to include a “%” after percentage entries.
Width/Rows: These fields are used only when creating data entry page content. See the Data entry section of this manual for more information on these fields.
Wrap: Check if the data should be wrapped to a second line when the page is reduced in size due to display restrictions. Without this option set, the column/table will remain the same width regardless of the user's viewing area. Pulse will attempt to format a table for optimal display when the width of a page is not sufficient to display the entire table. This option allows an override of the Pulse display calculations.
Email: Check if the displayed data is an email address. The column will then contain a hyperlink to create a new email addressed to the row value.
Header Src: Allows a user to generate custom header descriptions for columns. The summary query may be used to generate a text column to be used as the header in the data row. Then
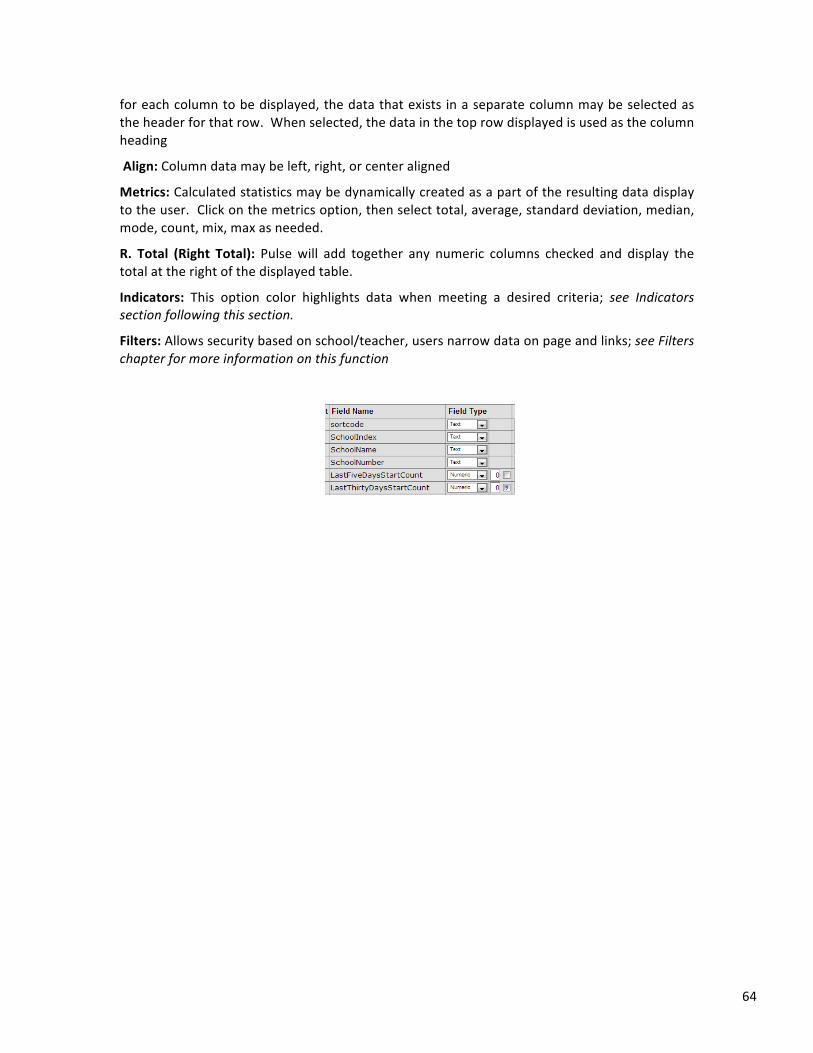
64
for each column to be displayed, the data that exists in a separate column may be selected as the header for that row. When selected, the data in the top row displayed is used as the column heading
Align: Column data may be left, right, or center aligned
Metrics: Calculated statistics may be dynamically created as a part of the resulting data display to the user. Click on the metrics option, then select total, average, standard deviation, median, mode, count, mix, max as needed.
R. Total (Right Total): Pulse will add together any numeric columns checked and display the total at the right of the displayed table.
Indicators: This option color highlights data when meeting a desired criteria; see Indicators section following this section.
Filters: Allows security based on school/teacher, users narrow data on page and links; see Filters chapter for more information on this function
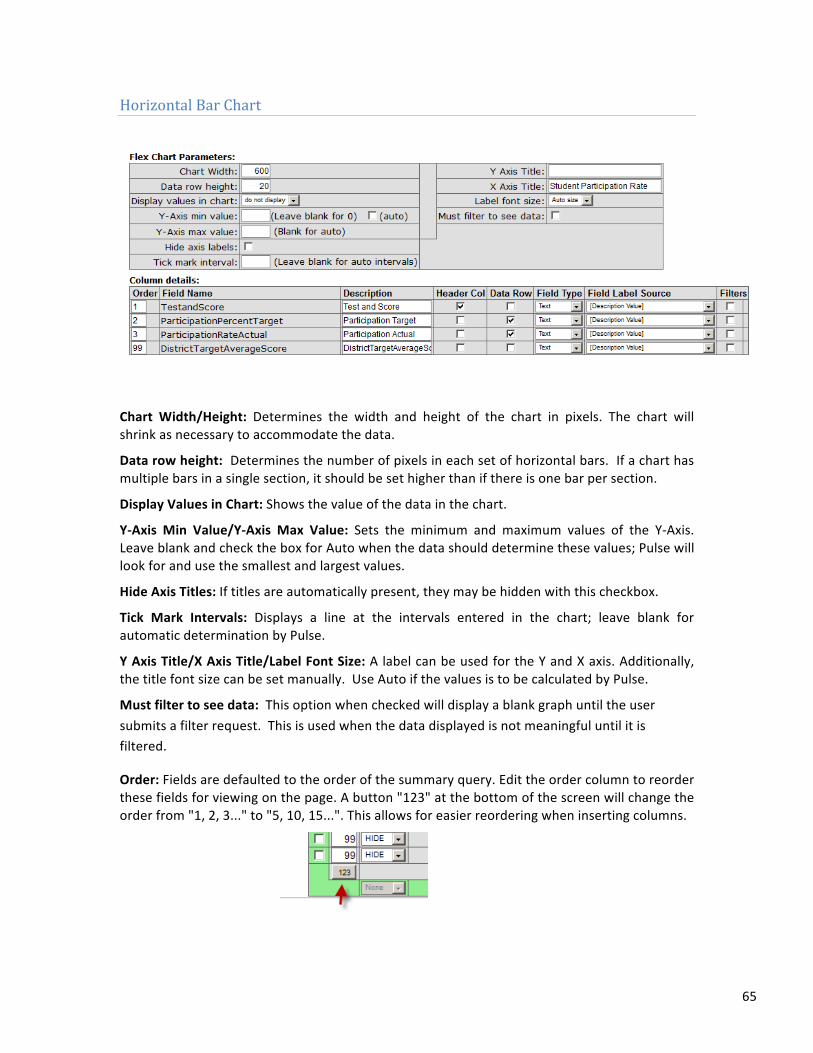
65
Horizontal Bar Chart
Chart Width/Height: Determines the width and height of the chart in pixels. The chart will shrink as necessary to accommodate the data.
Data row height: Determines the number of pixels in each set of horizontal bars. If a chart has multiple bars in a single section, it should be set higher than if there is one bar per section.
Display Values in Chart: Shows the value of the data in the chart.
Y-‐Axis Min Value/Y-‐Axis Max Value: Sets the minimum and maximum values of the Y-‐Axis. Leave blank and check the box for Auto when the data should determine these values; Pulse will look for and use the smallest and largest values.
Hide Axis Titles: If titles are automatically present, they may be hidden with this checkbox.
Tick Mark Intervals: Displays a line at the intervals entered in the chart; leave blank for automatic determination by Pulse.
Y Axis Title/X Axis Title/Label Font Size: A label can be used for the Y and X axis. Additionally, the title font size can be set manually. Use Auto if the values is to be calculated by Pulse.
Must filter to see data: This option when checked will display a blank graph until the user submits a filter request. This is used when the data displayed is not meaningful until it is filtered.
Order: Fields are defaulted to the order of the summary query. Edit the order column to reorder these fields for viewing on the page. A button "123" at the bottom of the screen will change the order from "1, 2, 3..." to "5, 10, 15...". This allows for easier reordering when inserting columns.
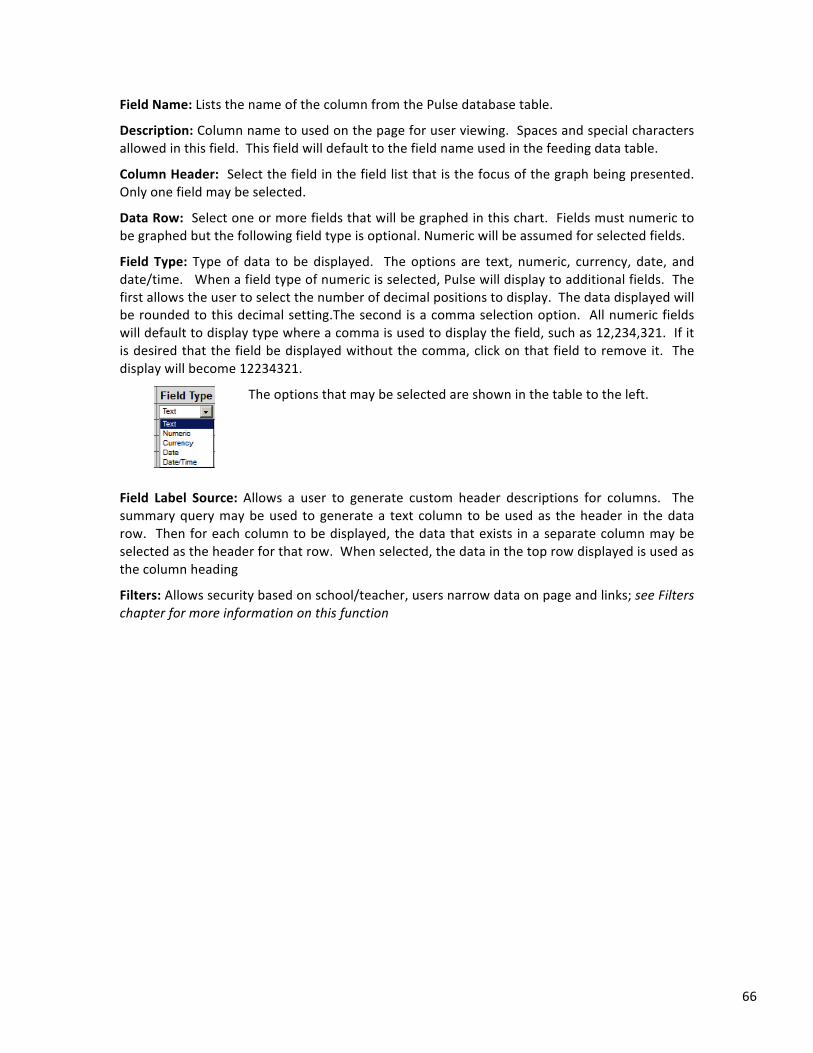
66
Field Name: Lists the name of the column from the Pulse database table.
Description: Column name to used on the page for user viewing. Spaces and special characters allowed in this field. This field will default to the field name used in the feeding data table.
Column Header: Select the field in the field list that is the focus of the graph being presented. Only one field may be selected.
Data Row: Select one or more fields that will be graphed in this chart. Fields must numeric to be graphed but the following field type is optional. Numeric will be assumed for selected fields.
Field Type: Type of data to be displayed. The options are text, numeric, currency, date, and date/time. When a field type of numeric is selected, Pulse will display to additional fields. The first allows the user to select the number of decimal positions to display. The data displayed will be rounded to this decimal setting.The second is a comma selection option. All numeric fields will default to display type where a comma is used to display the field, such as 12,234,321. If it is desired that the field be displayed without the comma, click on that field to remove it. The display will become 12234321.
The options that may be selected are shown in the table to the left.
Field Label Source: Allows a user to generate custom header descriptions for columns. The summary query may be used to generate a text column to be used as the header in the data row. Then for each column to be displayed, the data that exists in a separate column may be selected as the header for that row. When selected, the data in the top row displayed is used as the column heading
Filters: Allows security based on school/teacher, users narrow data on page and links; see Filters chapter for more information on this function
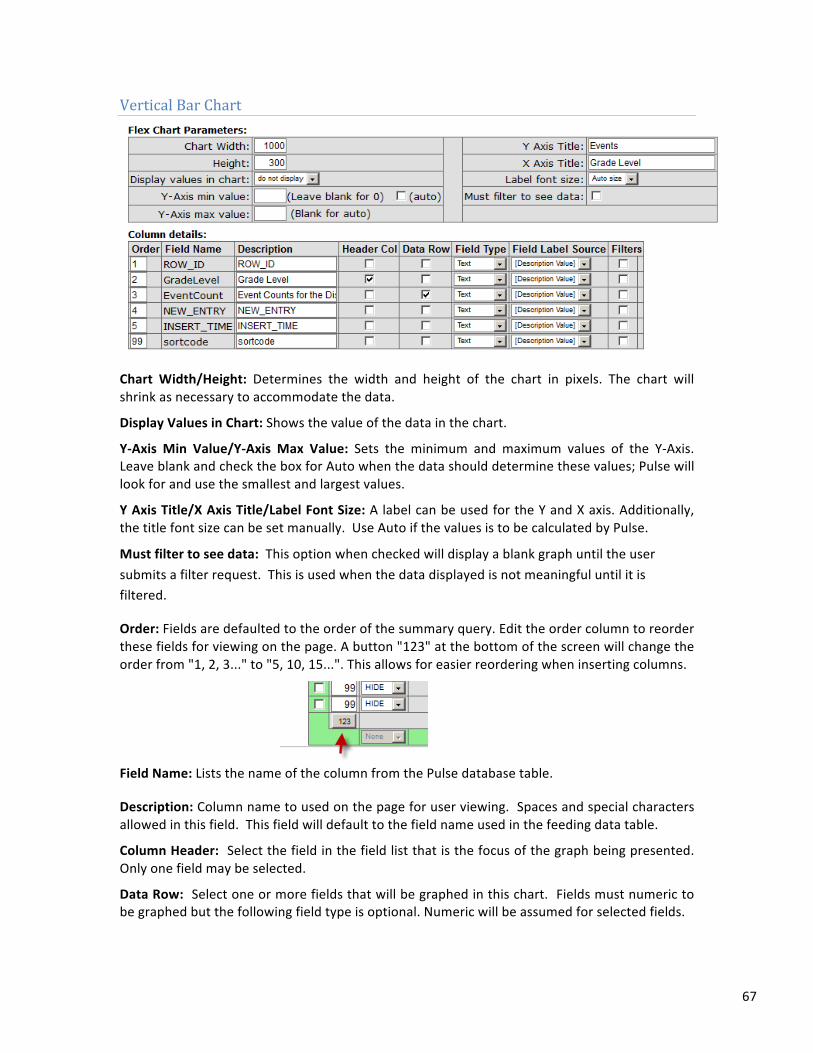
67
Vertical Bar Chart
Chart Width/Height: Determines the width and height of the chart in pixels. The chart will shrink as necessary to accommodate the data.
Display Values in Chart: Shows the value of the data in the chart.
Y-‐Axis Min Value/Y-‐Axis Max Value: Sets the minimum and maximum values of the Y-‐Axis. Leave blank and check the box for Auto when the data should determine these values; Pulse will look for and use the smallest and largest values.
Y Axis Title/X Axis Title/Label Font Size: A label can be used for the Y and X axis. Additionally, the title font size can be set manually. Use Auto if the values is to be calculated by Pulse.
Must filter to see data: This option when checked will display a blank graph until the user submits a filter request. This is used when the data displayed is not meaningful until it is filtered.
Order: Fields are defaulted to the order of the summary query. Edit the order column to reorder these fields for viewing on the page. A button "123" at the bottom of the screen will change the order from "1, 2, 3..." to "5, 10, 15...". This allows for easier reordering when inserting columns.
Field Name: Lists the name of the column from the Pulse database table.
Description: Column name to used on the page for user viewing. Spaces and special characters allowed in this field. This field will default to the field name used in the feeding data table.
Column Header: Select the field in the field list that is the focus of the graph being presented. Only one field may be selected.
Data Row: Select one or more fields that will be graphed in this chart. Fields must numeric to be graphed but the following field type is optional. Numeric will be assumed for selected fields.
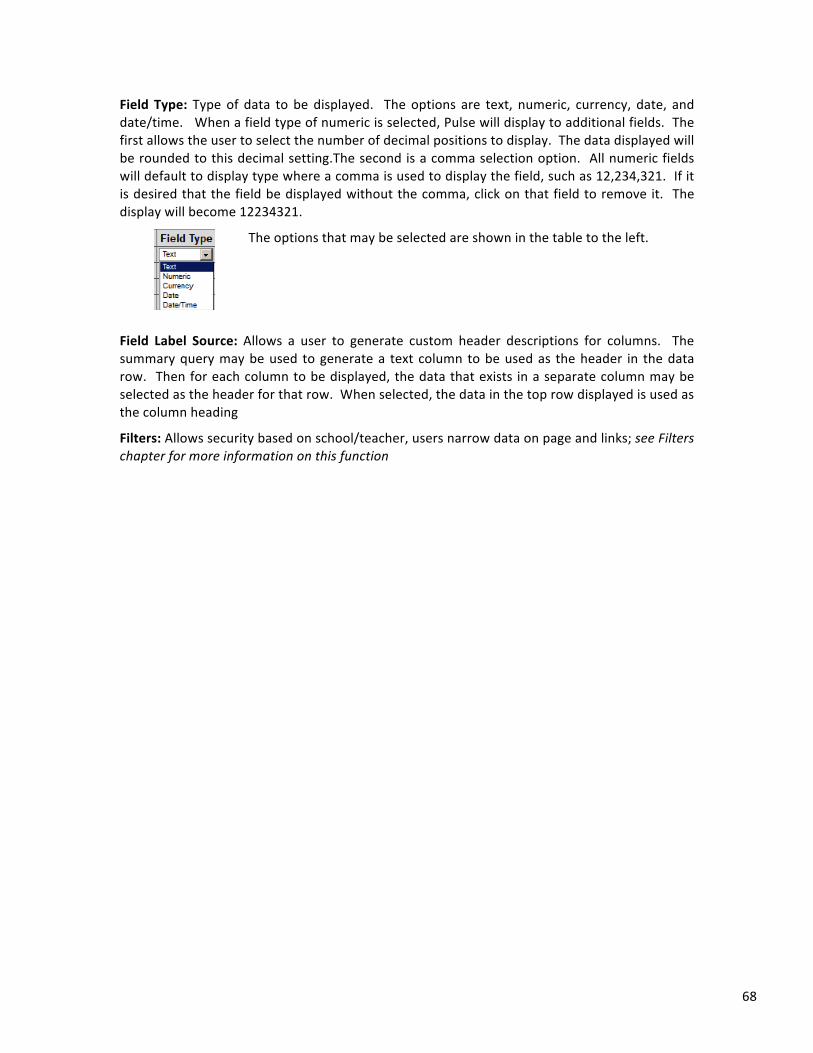
68
Field Type: Type of data to be displayed. The options are text, numeric, currency, date, and date/time. When a field type of numeric is selected, Pulse will display to additional fields. The first allows the user to select the number of decimal positions to display. The data displayed will be rounded to this decimal setting.The second is a comma selection option. All numeric fields will default to display type where a comma is used to display the field, such as 12,234,321. If it is desired that the field be displayed without the comma, click on that field to remove it. The display will become 12234321.
The options that may be selected are shown in the table to the left.
Field Label Source: Allows a user to generate custom header descriptions for columns. The summary query may be used to generate a text column to be used as the header in the data row. Then for each column to be displayed, the data that exists in a separate column may be selected as the header for that row. When selected, the data in the top row displayed is used as the column heading
Filters: Allows security based on school/teacher, users narrow data on page and links; see Filters chapter for more information on this function
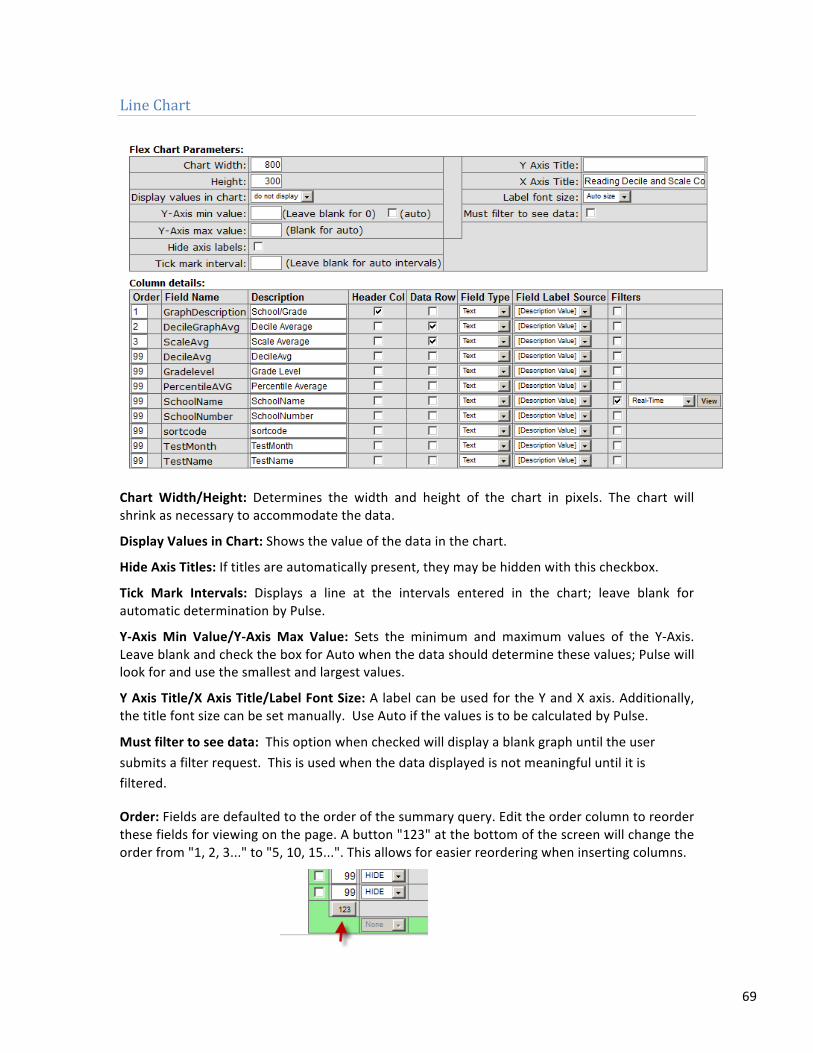
69
Line Chart
Chart Width/Height: Determines the width and height of the chart in pixels. The chart will shrink as necessary to accommodate the data.
Display Values in Chart: Shows the value of the data in the chart.
Hide Axis Titles: If titles are automatically present, they may be hidden with this checkbox.
Tick Mark Intervals: Displays a line at the intervals entered in the chart; leave blank for automatic determination by Pulse.
Y-‐Axis Min Value/Y-‐Axis Max Value: Sets the minimum and maximum values of the Y-‐Axis. Leave blank and check the box for Auto when the data should determine these values; Pulse will look for and use the smallest and largest values.
Y Axis Title/X Axis Title/Label Font Size: A label can be used for the Y and X axis. Additionally, the title font size can be set manually. Use Auto if the values is to be calculated by Pulse.
Must filter to see data: This option when checked will display a blank graph until the user submits a filter request. This is used when the data displayed is not meaningful until it is filtered.
Order: Fields are defaulted to the order of the summary query. Edit the order column to reorder these fields for viewing on the page. A button "123" at the bottom of the screen will change the order from "1, 2, 3..." to "5, 10, 15...". This allows for easier reordering when inserting columns.
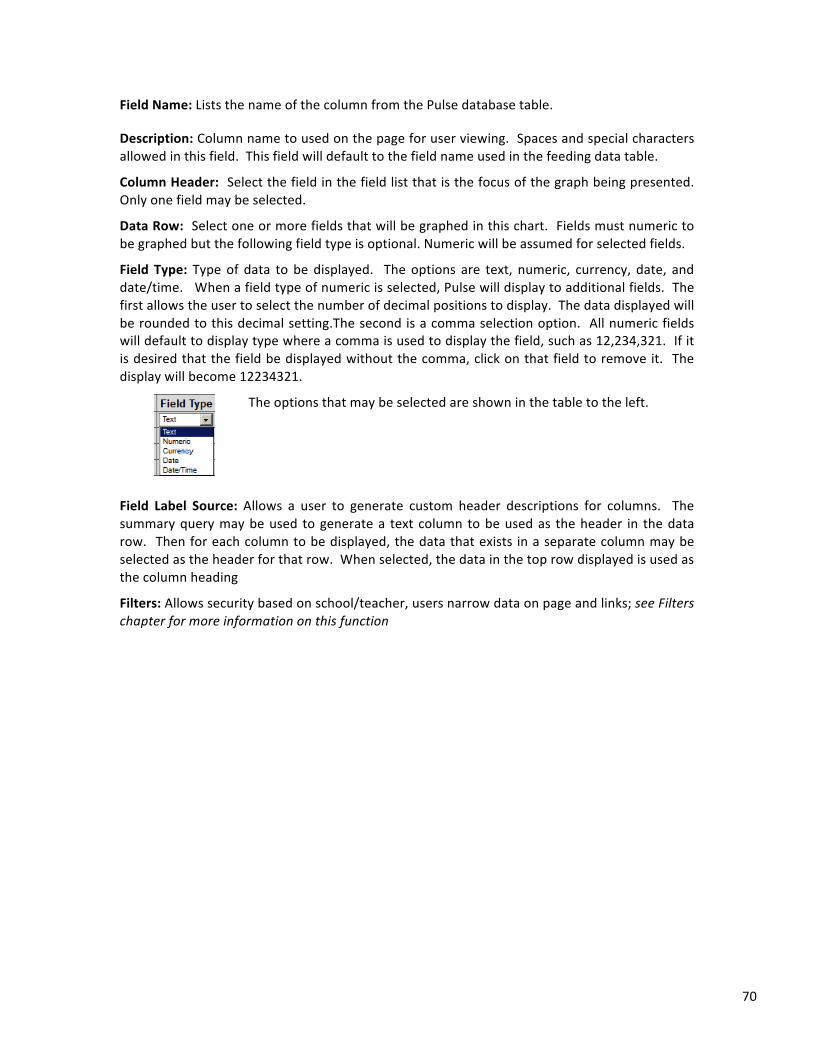
70
Field Name: Lists the name of the column from the Pulse database table.
Description: Column name to used on the page for user viewing. Spaces and special characters allowed in this field. This field will default to the field name used in the feeding data table.
Column Header: Select the field in the field list that is the focus of the graph being presented. Only one field may be selected.
Data Row: Select one or more fields that will be graphed in this chart. Fields must numeric to be graphed but the following field type is optional. Numeric will be assumed for selected fields.
Field Type: Type of data to be displayed. The options are text, numeric, currency, date, and date/time. When a field type of numeric is selected, Pulse will display to additional fields. The first allows the user to select the number of decimal positions to display. The data displayed will be rounded to this decimal setting.The second is a comma selection option. All numeric fields will default to display type where a comma is used to display the field, such as 12,234,321. If it is desired that the field be displayed without the comma, click on that field to remove it. The display will become 12234321.
The options that may be selected are shown in the table to the left.
Field Label Source: Allows a user to generate custom header descriptions for columns. The summary query may be used to generate a text column to be used as the header in the data row. Then for each column to be displayed, the data that exists in a separate column may be selected as the header for that row. When selected, the data in the top row displayed is used as the column heading
Filters: Allows security based on school/teacher, users narrow data on page and links; see Filters chapter for more information on this function
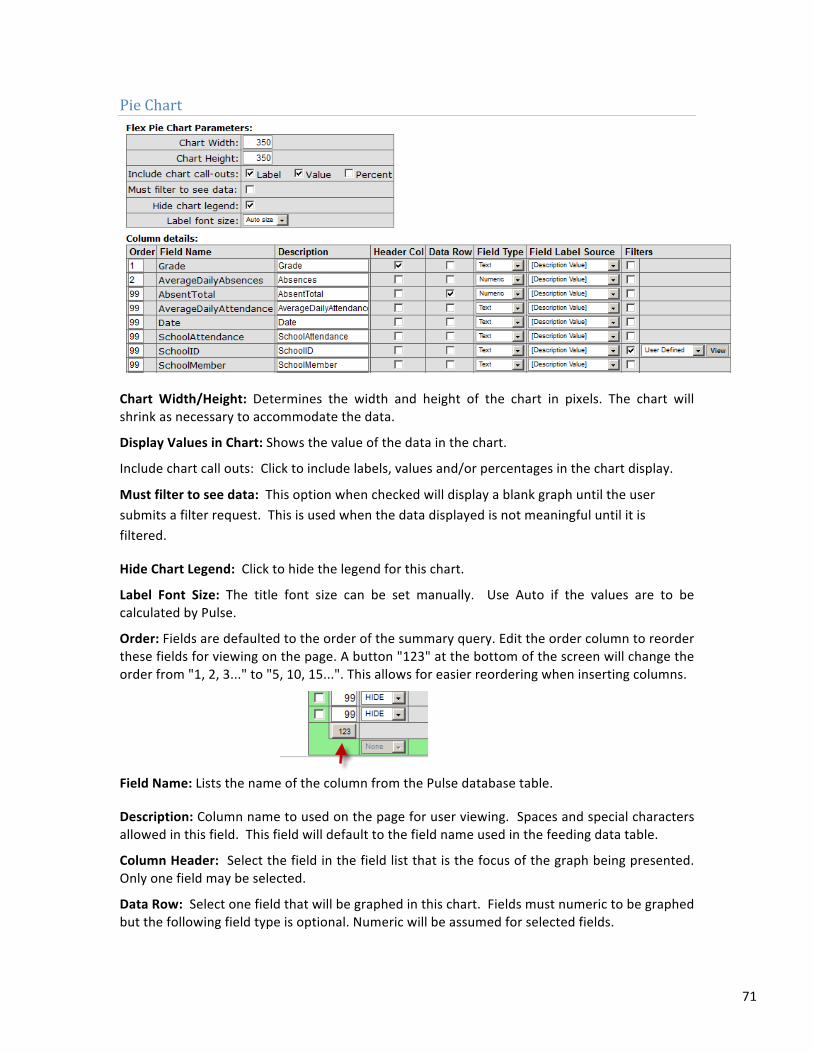
71
Pie Chart
Chart Width/Height: Determines the width and height of the chart in pixels. The chart will shrink as necessary to accommodate the data.
Display Values in Chart: Shows the value of the data in the chart.
Include chart call outs: Click to include labels, values and/or percentages in the chart display.
Must filter to see data: This option when checked will display a blank graph until the user submits a filter request. This is used when the data displayed is not meaningful until it is filtered.
Hide Chart Legend: Click to hide the legend for this chart.
Label Font Size: The title font size can be set manually. Use Auto if the values are to be calculated by Pulse.
Order: Fields are defaulted to the order of the summary query. Edit the order column to reorder these fields for viewing on the page. A button "123" at the bottom of the screen will change the order from "1, 2, 3..." to "5, 10, 15...". This allows for easier reordering when inserting columns.
Field Name: Lists the name of the column from the Pulse database table.
Description: Column name to used on the page for user viewing. Spaces and special characters allowed in this field. This field will default to the field name used in the feeding data table.
Column Header: Select the field in the field list that is the focus of the graph being presented. Only one field may be selected.
Data Row: Select one field that will be graphed in this chart. Fields must numeric to be graphed but the following field type is optional. Numeric will be assumed for selected fields.

72
Field Type: Type of data to be displayed. The options are text, numeric, currency, date, and date/time. When a field type of numeric is selected, Pulse will display to additional fields. The first allows the user to select the number of decimal positions to display. The data displayed will be rounded to this decimal setting.The second is a comma selection option. All numeric fields will default to display type where a comma is used to display the field, such as 12,234,321. If it is desired that the field be displayed without the comma, click on that field to remove it. The display will become 12234321.
The options that may be selected are shown in the table to the left.
Field Label Source: Allows a user to generate custom header descriptions for columns. The summary query may be used to generate a text column to be used as the header in the data row. Then for each column to be displayed, the data that exists in a separate column may be selected as the header for that row. When selected, the data in the top row displayed is used as the column heading
Filters: Allows security based on school/teacher, users narrow data on page and links; see Filters chapter for more information on this function
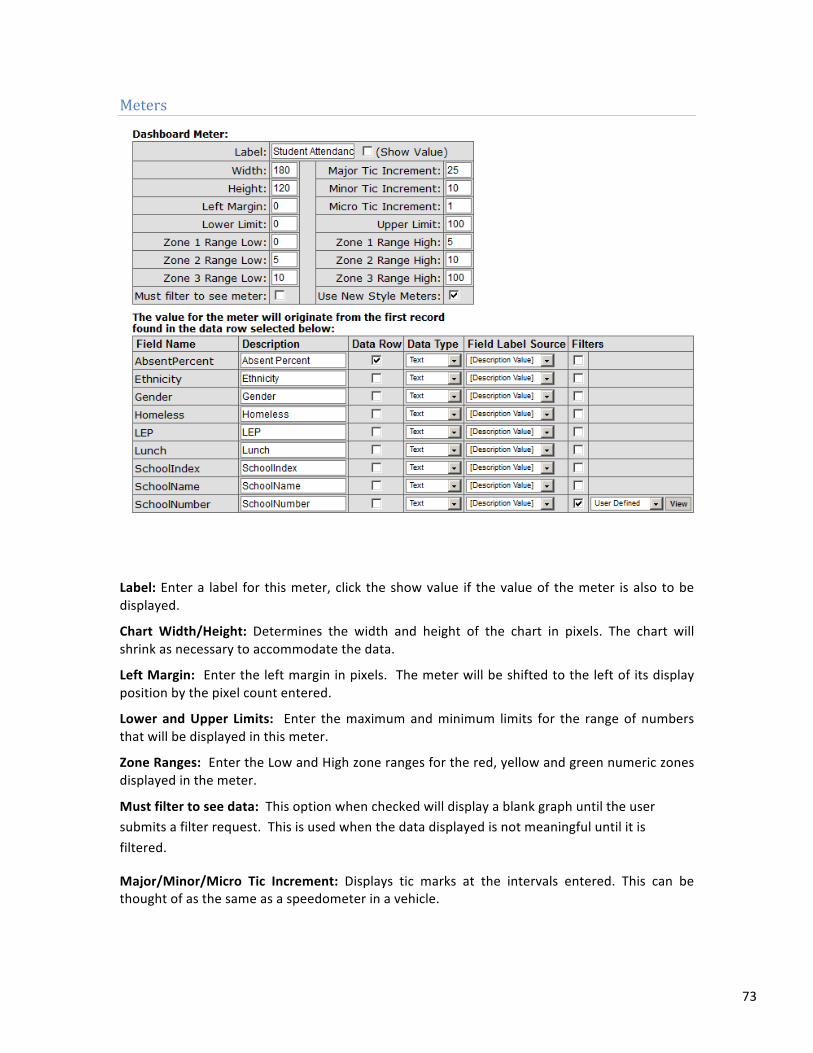
73
Meters
Label: Enter a label for this meter, click the show value if the value of the meter is also to be displayed.
Chart Width/Height: Determines the width and height of the chart in pixels. The chart will shrink as necessary to accommodate the data.
Left Margin: Enter the left margin in pixels. The meter will be shifted to the left of its display position by the pixel count entered.
Lower and Upper Limits: Enter the maximum and minimum limits for the range of numbers that will be displayed in this meter.
Zone Ranges: Enter the Low and High zone ranges for the red, yellow and green numeric zones displayed in the meter.
Must filter to see data: This option when checked will display a blank graph until the user submits a filter request. This is used when the data displayed is not meaningful until it is filtered.
Major/Minor/Micro Tic Increment: Displays tic marks at the intervals entered. This can be thought of as the same as a speedometer in a vehicle.
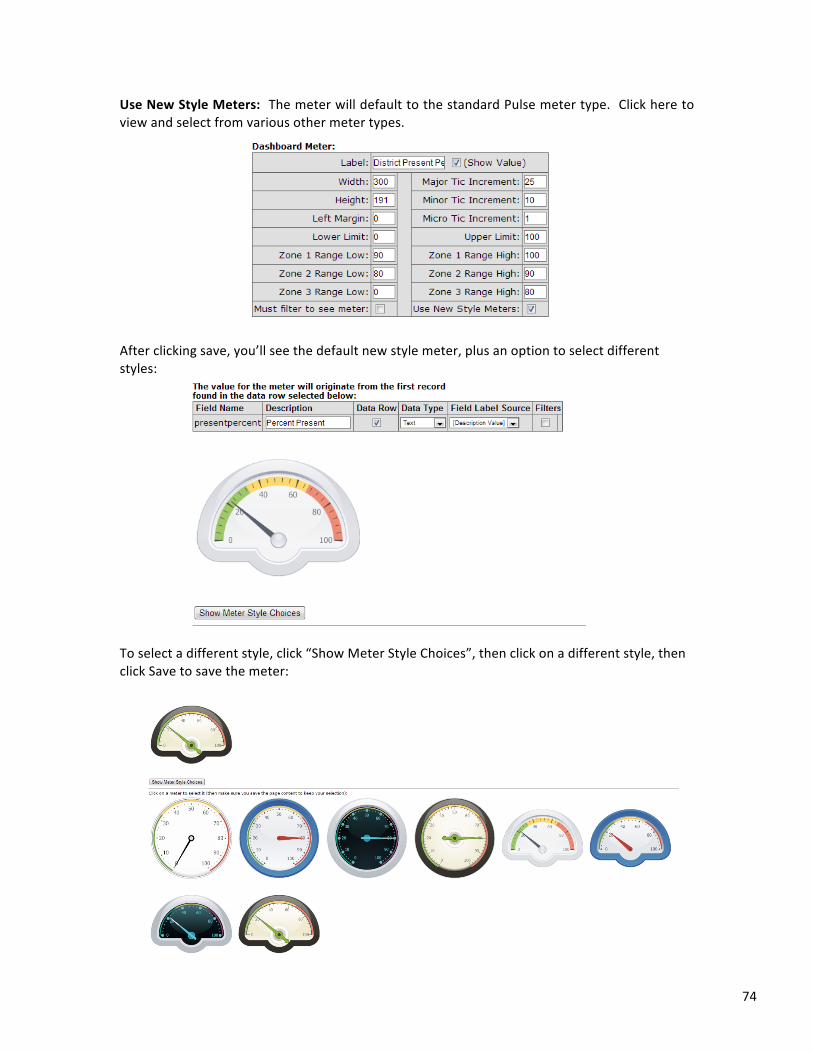
74
Use New Style Meters: The meter will default to the standard Pulse meter type. Click here to view and select from various other meter types.
After clicking save, you’ll see the default new style meter, plus an option to select different styles:
To select a different style, click “Show Meter Style Choices”, then click on a different style, then click Save to save the meter:
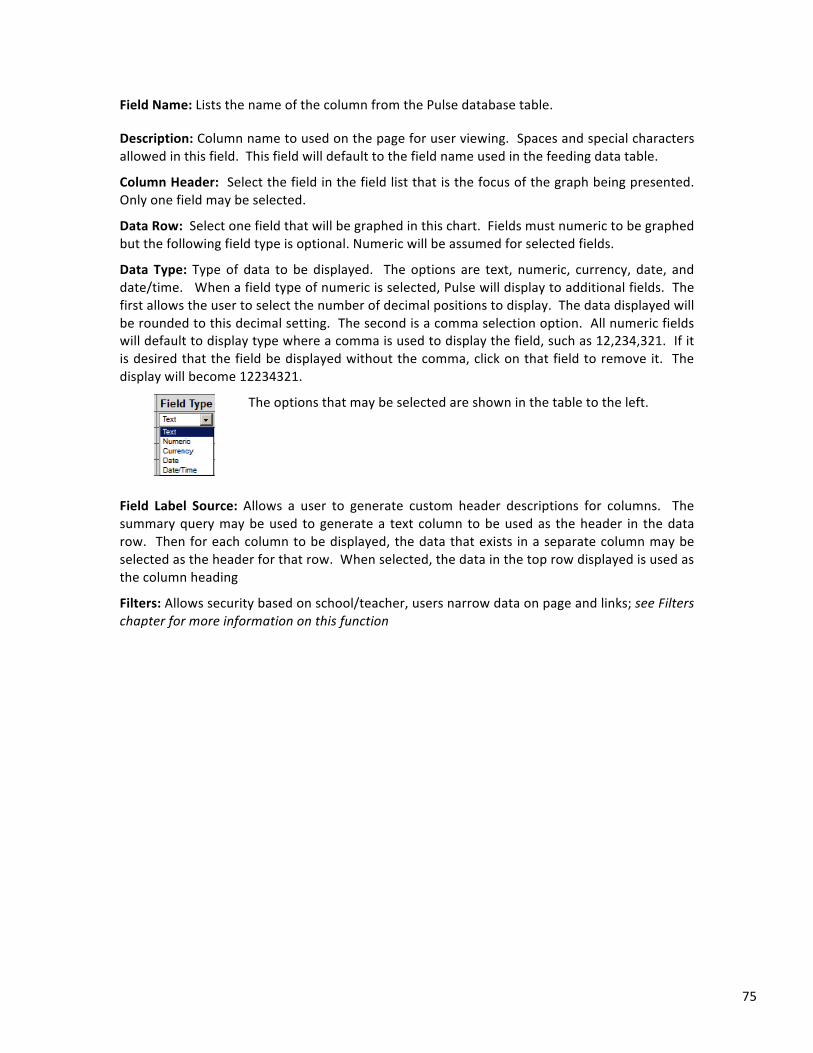
75
Field Name: Lists the name of the column from the Pulse database table.
Description: Column name to used on the page for user viewing. Spaces and special characters allowed in this field. This field will default to the field name used in the feeding data table.
Column Header: Select the field in the field list that is the focus of the graph being presented. Only one field may be selected.
Data Row: Select one field that will be graphed in this chart. Fields must numeric to be graphed but the following field type is optional. Numeric will be assumed for selected fields.
Data Type: Type of data to be displayed. The options are text, numeric, currency, date, and date/time. When a field type of numeric is selected, Pulse will display to additional fields. The first allows the user to select the number of decimal positions to display. The data displayed will be rounded to this decimal setting. The second is a comma selection option. All numeric fields will default to display type where a comma is used to display the field, such as 12,234,321. If it is desired that the field be displayed without the comma, click on that field to remove it. The display will become 12234321.
The options that may be selected are shown in the table to the left.
Field Label Source: Allows a user to generate custom header descriptions for columns. The summary query may be used to generate a text column to be used as the header in the data row. Then for each column to be displayed, the data that exists in a separate column may be selected as the header for that row. When selected, the data in the top row displayed is used as the column heading
Filters: Allows security based on school/teacher, users narrow data on page and links; see Filters chapter for more information on this function
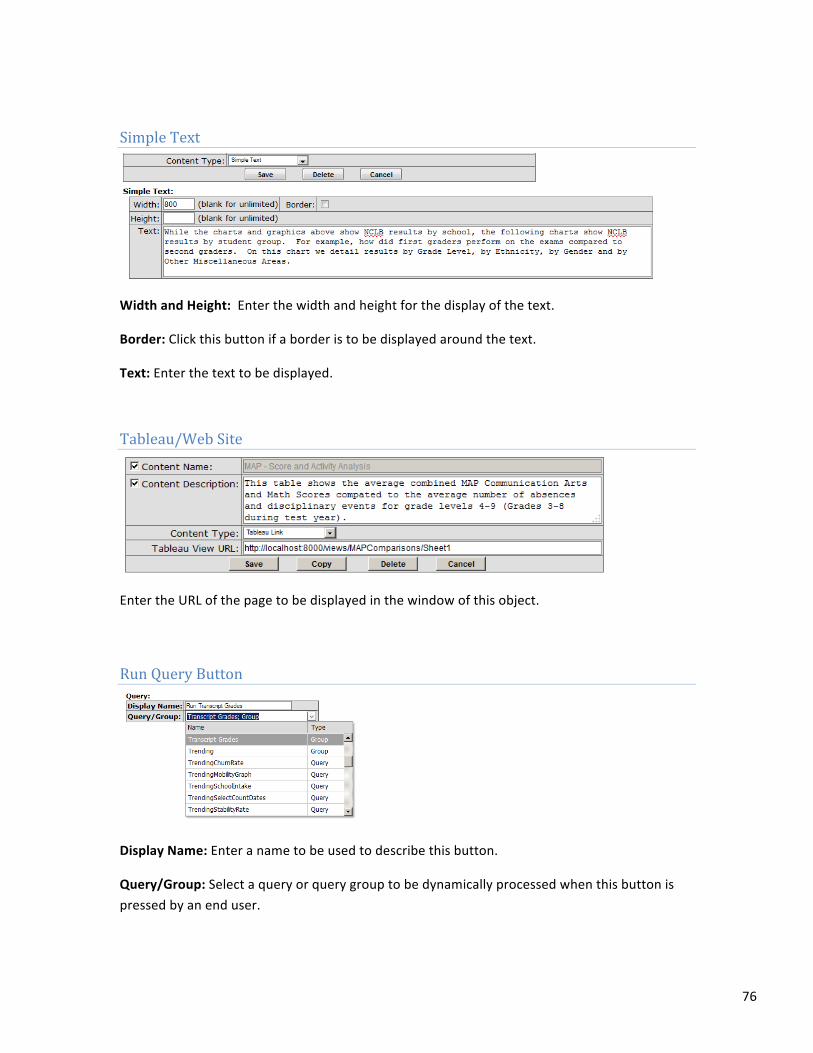
76
Simple Text
Width and Height: Enter the width and height for the display of the text.
Border: Click this button if a border is to be displayed around the text.
Text: Enter the text to be displayed.
Tableau/Web Site
Enter the URL of the page to be displayed in the window of this object.
Run Query Button
Display Name: Enter a name to be used to describe this button.
Query/Group: Select a query or query group to be dynamically processed when this button is pressed by an end user.
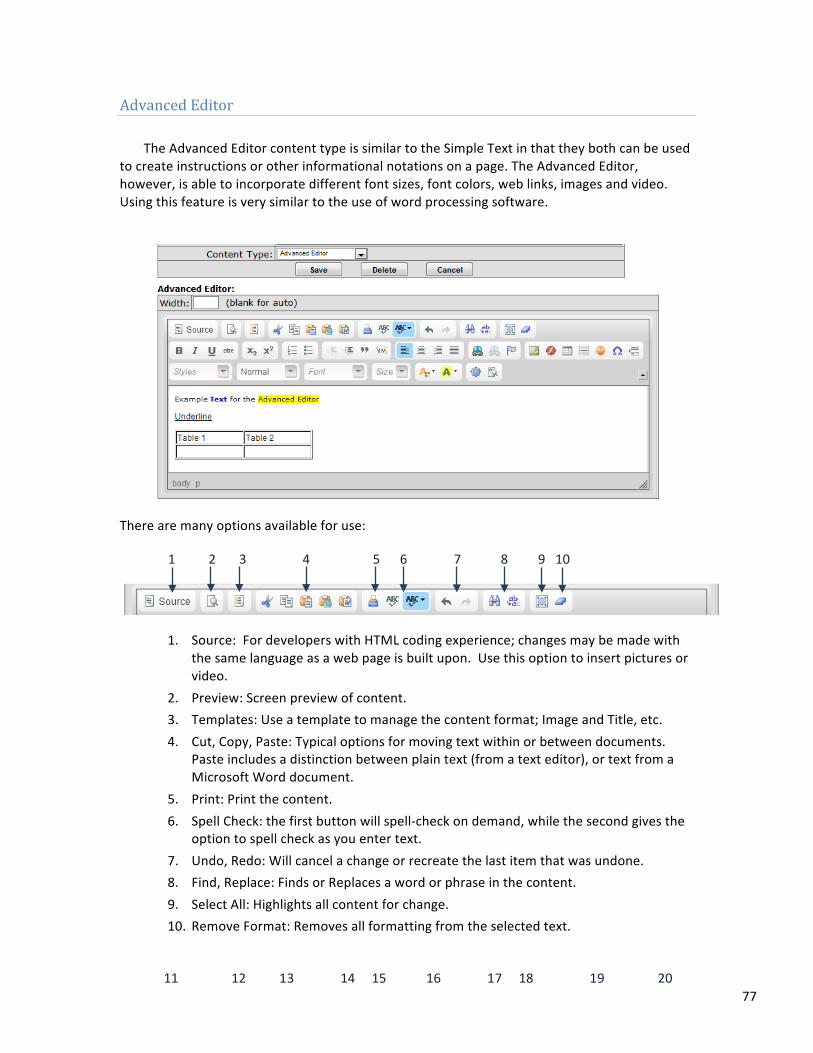
77
Advanced Editor The Advanced Editor content type is similar to the Simple Text in that they both can be used
to create instructions or other informational notations on a page. The Advanced Editor, however, is able to incorporate different font sizes, font colors, web links, images and video. Using this feature is very similar to the use of word processing software.
There are many options available for use:
1. Source: For developers with HTML coding experience; changes may be made with the same language as a web page is built upon. Use this option to insert pictures or video.
2. Preview: Screen preview of content. 3. Templates: Use a template to manage the content format; Image and Title, etc. 4. Cut, Copy, Paste: Typical options for moving text within or between documents.
Paste includes a distinction between plain text (from a text editor), or text from a Microsoft Word document.
5. Print: Print the content. 6. Spell Check: the first button will spell-‐check on demand, while the second gives the
option to spell check as you enter text. 7. Undo, Redo: Will cancel a change or recreate the last item that was undone. 8. Find, Replace: Finds or Replaces a word or phrase in the content. 9. Select All: Highlights all content for change. 10. Remove Format: Removes all formatting from the selected text.
1 2 3 4 5 6 7 8 9 10
11 12 13 14 15 16 17 18 19 20
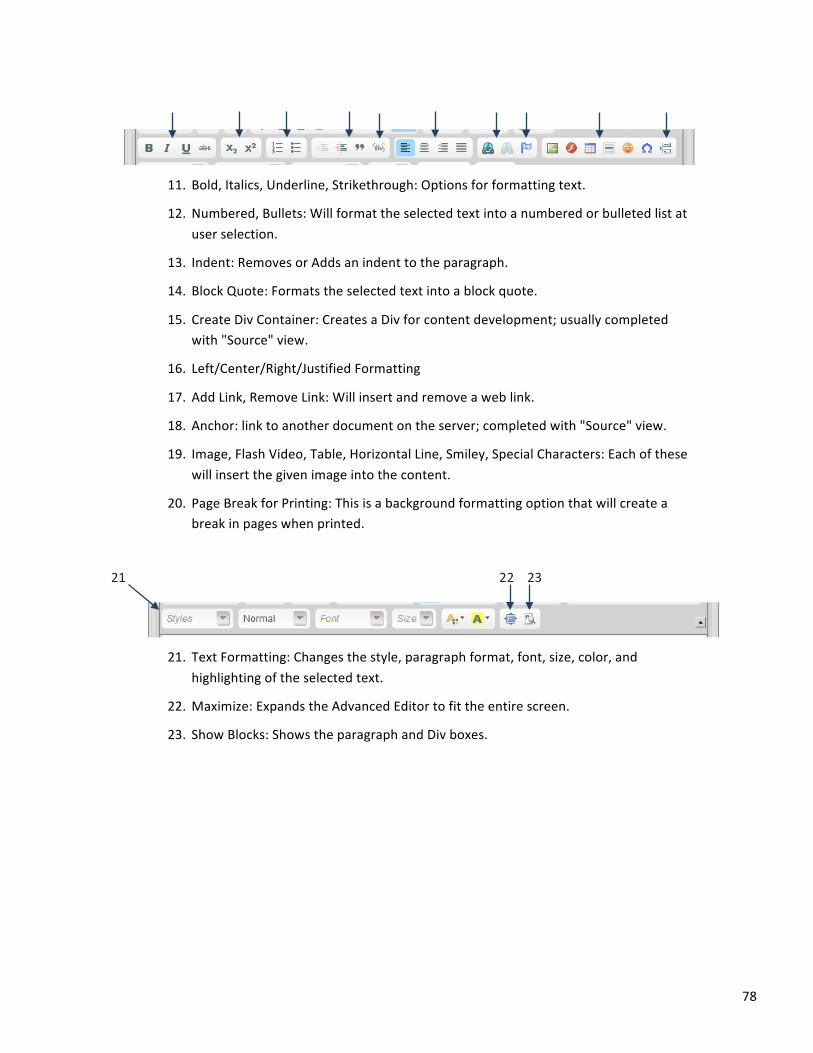
78
11. Bold, Italics, Underline, Strikethrough: Options for formatting text.
12. Numbered, Bullets: Will format the selected text into a numbered or bulleted list at user selection.
13. Indent: Removes or Adds an indent to the paragraph.
14. Block Quote: Formats the selected text into a block quote.
15. Create Div Container: Creates a Div for content development; usually completed with "Source" view.
16. Left/Center/Right/Justified Formatting
17. Add Link, Remove Link: Will insert and remove a web link.
18. Anchor: link to another document on the server; completed with "Source" view.
19. Image, Flash Video, Table, Horizontal Line, Smiley, Special Characters: Each of these will insert the given image into the content.
20. Page Break for Printing: This is a background formatting option that will create a break in pages when printed.
21. Text Formatting: Changes the style, paragraph format, font, size, color, and highlighting of the selected text.
22. Maximize: Expands the Advanced Editor to fit the entire screen.
23. Show Blocks: Shows the paragraph and Div boxes.
21 22 23

79
Pivot Grids Pulse supports the creation of Pivot Grids as page content. These types of objects allows end users to interact with Pulse data via a drag and drop process. Below is an example of a Pulse Pivot Grid definition. Generally, the top portion of the definition is the same as that for other types of Pulse Page content as described above.
1. Select the Pivot Grid Page Content type. 2. Select the type of source data that will be use to provide data
to the grid being defined. Pivot grids may be populated from any Pulse data table, or from an Excel Cube built outside of Pulse. In most cases a Pulse data table will be used to populate the grid.
3. Select the name of the Pulse table or external cube that will be used. 4. Specify if a graphic of the data is to be displayed and the size of the graph to be
displayed. 5. All field names from the data source will be listed. 6. Optionally, the data name from the data source may be overridden for end user use.
For example, a field name named “StudentName” may be changed to “Student Name”. 7. Each pivot grid contains four areas for data control. These are Data
Areas, Column Areas, Row Areas or Filter Areas. A field may also be hidden and not used in the grid display. See then example below showing each of these areas and how they are used.
8. The order of the field to be displayed in the selection list may be entered. 9. The User Filter is used to establish field level security for data usage and
viewing.
1 2 3
5 6 7 8 9
4
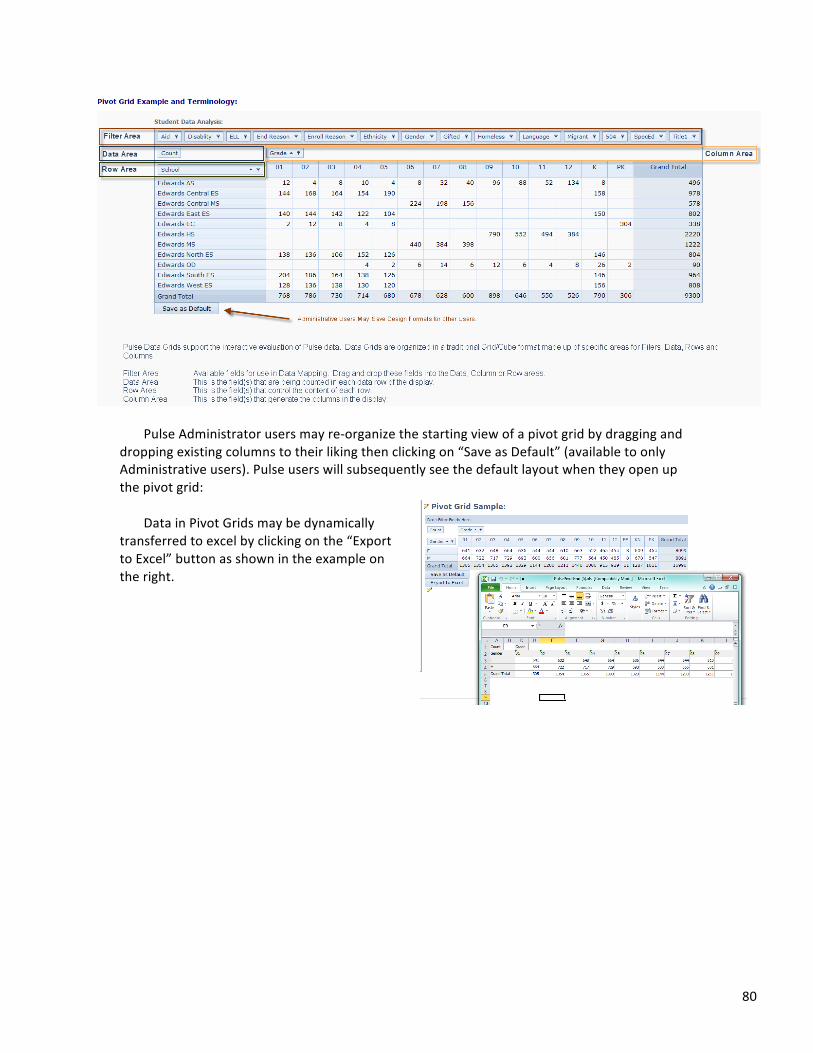
80
Pulse Administrator users may re-‐organize the starting view of a pivot grid by dragging and
dropping existing columns to their liking then clicking on “Save as Default” (available to only Administrative users). Pulse users will subsequently see the default layout when they open up the pivot grid:
Data in Pivot Grids may be dynamically
transferred to excel by clicking on the “Export to Excel” button as shown in the example on the right.
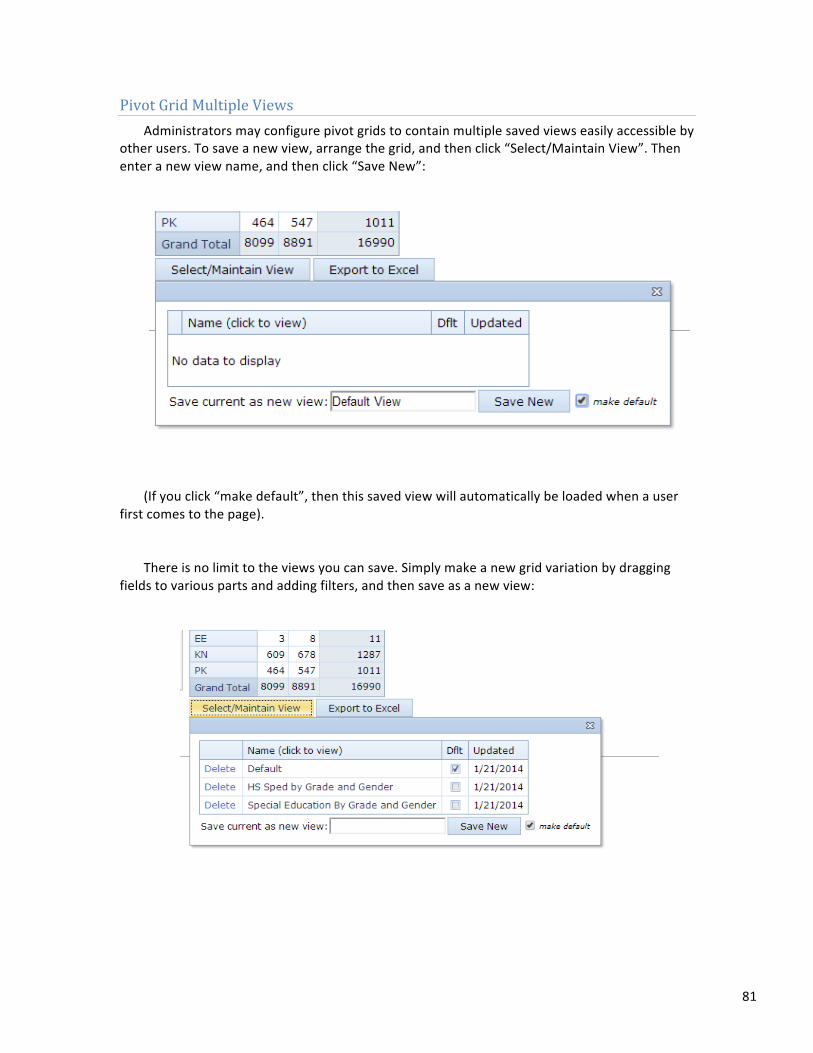
81
Pivot Grid Multiple Views Administrators may configure pivot grids to contain multiple saved views easily accessible by
other users. To save a new view, arrange the grid, and then click “Select/Maintain View”. Then enter a new view name, and then click “Save New”:
(If you click “make default”, then this saved view will automatically be loaded when a user
first comes to the page). There is no limit to the views you can save. Simply make a new grid variation by dragging
fields to various parts and adding filters, and then save as a new view:
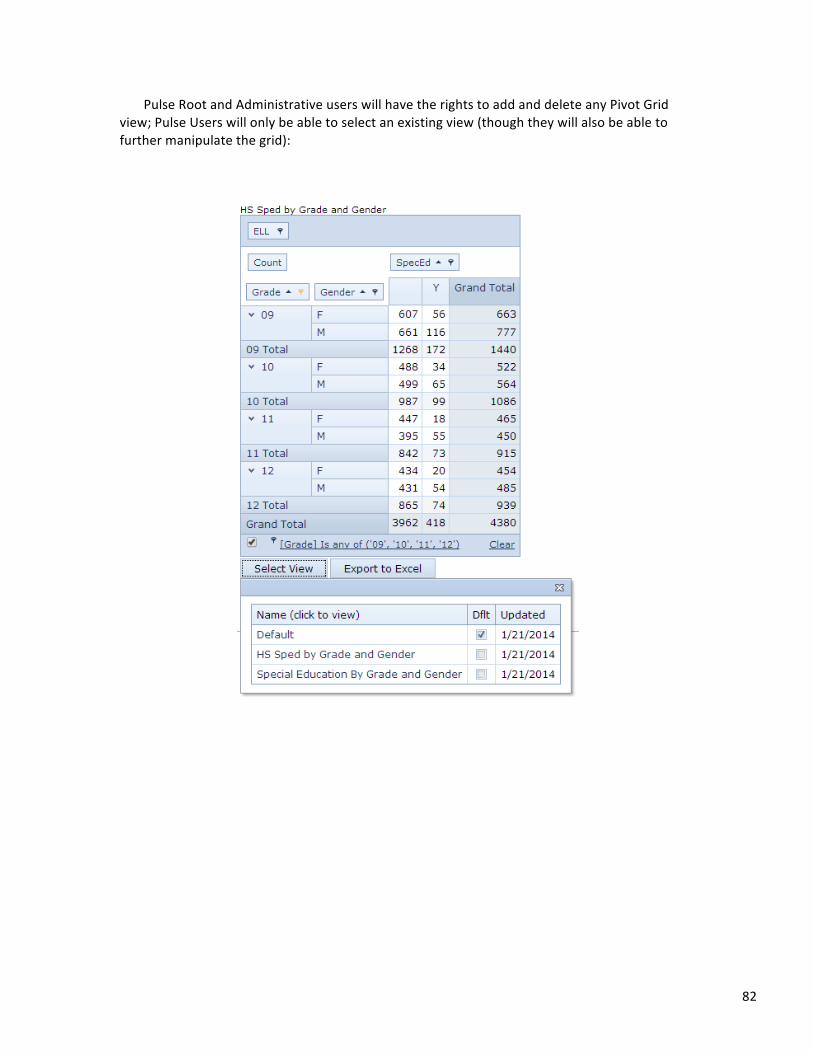
82
Pulse Root and Administrative users will have the rights to add and delete any Pivot Grid view; Pulse Users will only be able to select an existing view (though they will also be able to further manipulate the grid):
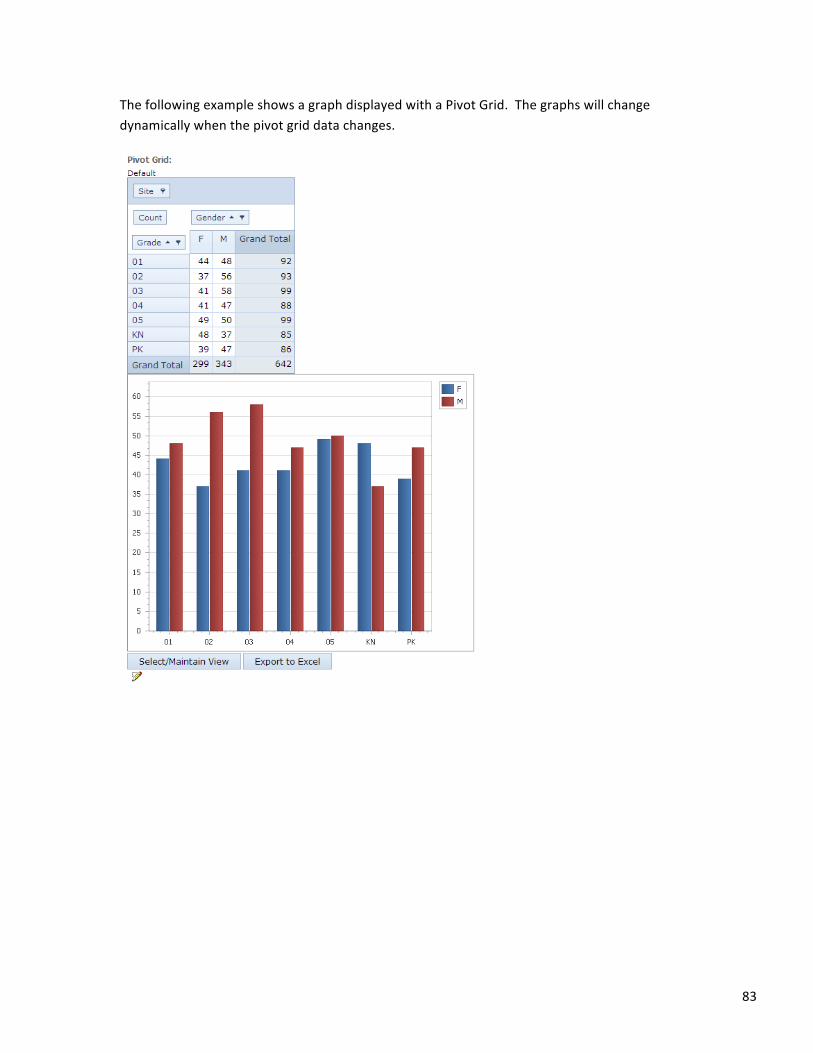
83
The following example shows a graph displayed with a Pivot Grid. The graphs will change dynamically when the pivot grid data changes.
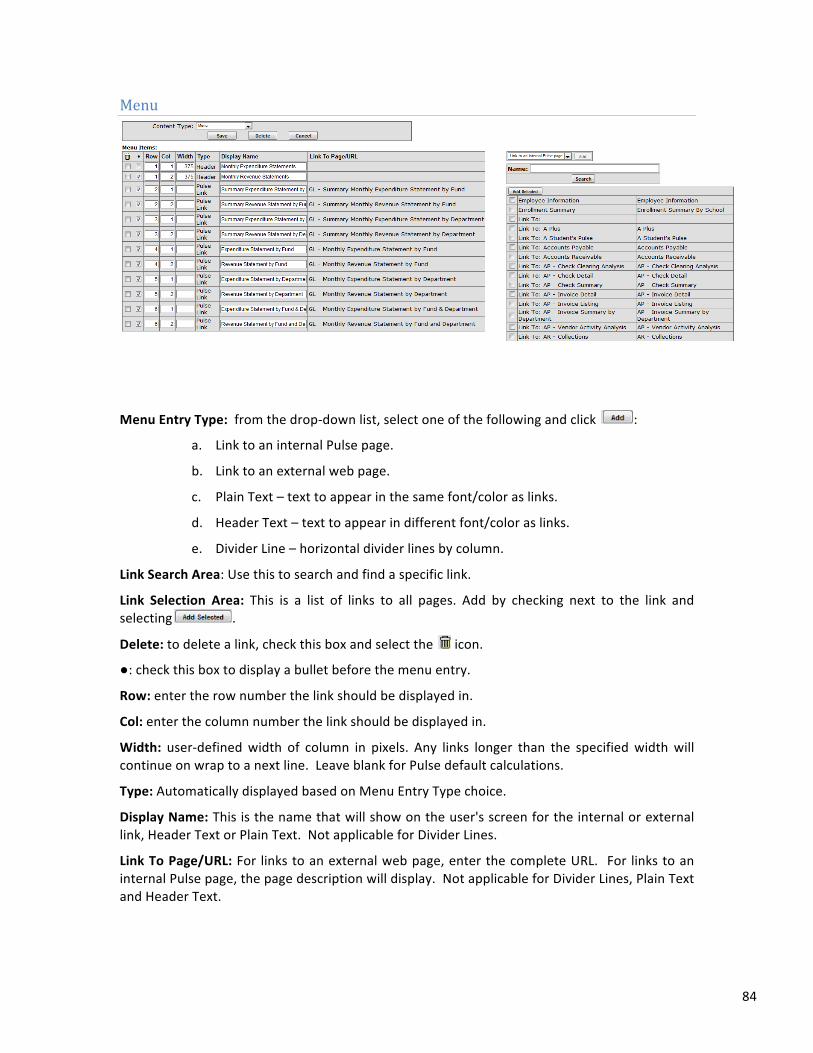
84
Menu
Menu Entry Type: from the drop-‐down list, select one of the following and click :
a. Link to an internal Pulse page.
b. Link to an external web page.
c. Plain Text – text to appear in the same font/color as links.
d. Header Text – text to appear in different font/color as links.
e. Divider Line – horizontal divider lines by column.
Link Search Area: Use this to search and find a specific link.
Link Selection Area: This is a list of links to all pages. Add by checking next to the link and selecting .
Delete: to delete a link, check this box and select the icon.
●: check this box to display a bullet before the menu entry.
Row: enter the row number the link should be displayed in.
Col: enter the column number the link should be displayed in.
Width: user-‐defined width of column in pixels. Any links longer than the specified width will continue on wrap to a next line. Leave blank for Pulse default calculations.
Type: Automatically displayed based on Menu Entry Type choice.
Display Name: This is the name that will show on the user's screen for the internal or external link, Header Text or Plain Text. Not applicable for Divider Lines.
Link To Page/URL: For links to an external web page, enter the complete URL. For links to an internal Pulse page, the page description will display. Not applicable for Divider Lines, Plain Text and Header Text.
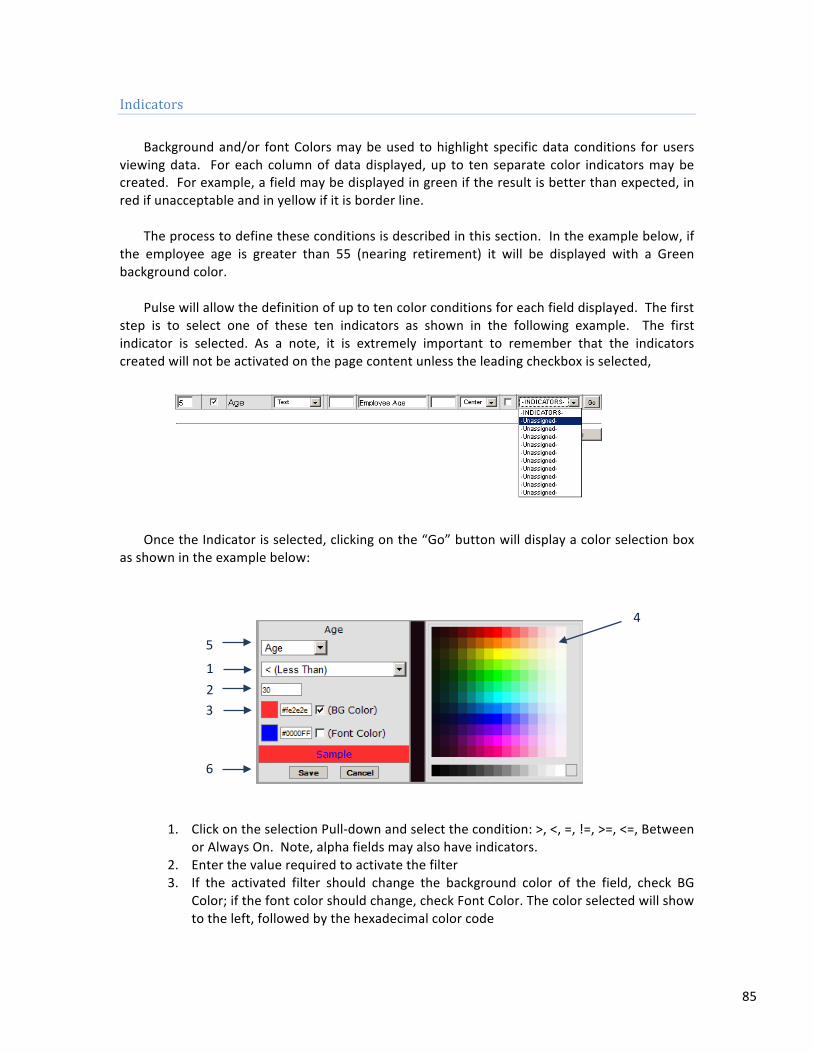
85
Indicators
Background and/or font Colors may be used to highlight specific data conditions for users
viewing data. For each column of data displayed, up to ten separate color indicators may be created. For example, a field may be displayed in green if the result is better than expected, in red if unacceptable and in yellow if it is border line.
The process to define these conditions is described in this section. In the example below, if
the employee age is greater than 55 (nearing retirement) it will be displayed with a Green background color.
Pulse will allow the definition of up to ten color conditions for each field displayed. The first
step is to select one of these ten indicators as shown in the following example. The first indicator is selected. As a note, it is extremely important to remember that the indicators created will not be activated on the page content unless the leading checkbox is selected,
Once the Indicator is selected, clicking on the “Go” button will display a color selection box
as shown in the example below:
1. Click on the selection Pull-‐down and select the condition: >, <, =, !=, >=, <=, Between
or Always On. Note, alpha fields may also have indicators. 2. Enter the value required to activate the filter 3. If the activated filter should change the background color of the field, check BG
Color; if the font color should change, check Font Color. The color selected will show to the left, followed by the hexadecimal color code
2 3
4
1
6
5
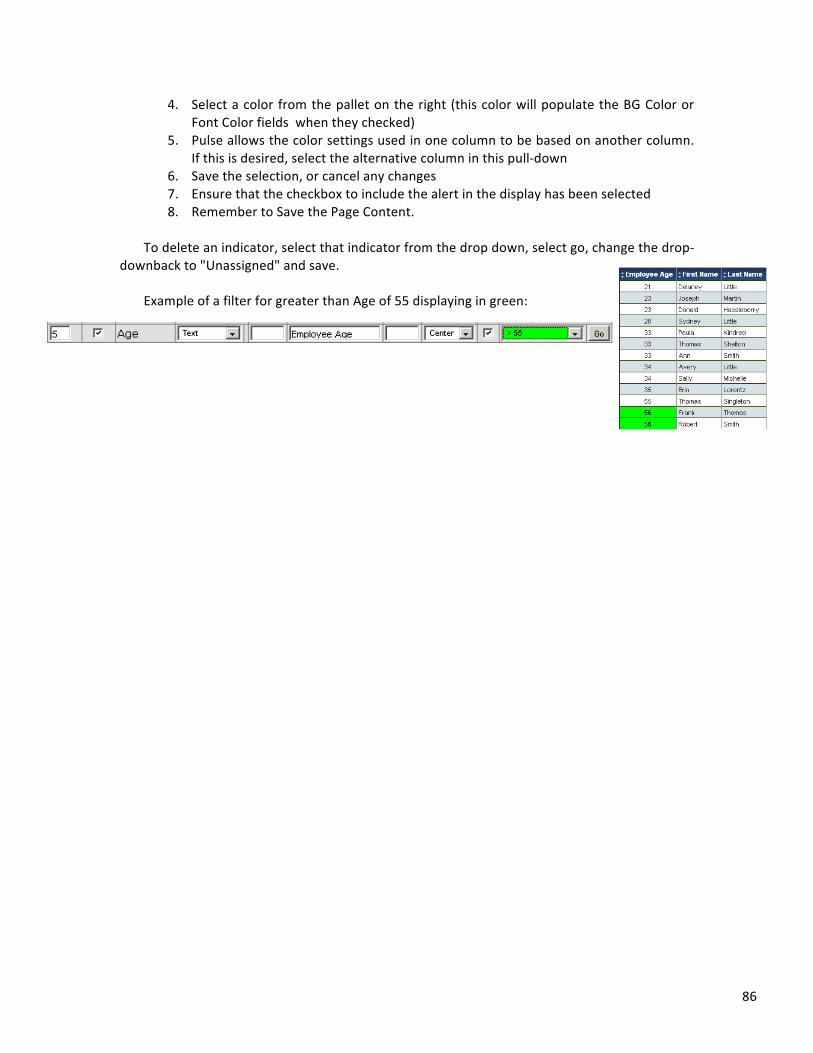
86
4. Select a color from the pallet on the right (this color will populate the BG Color or Font Color fields when they checked)
5. Pulse allows the color settings used in one column to be based on another column. If this is desired, select the alternative column in this pull-‐down
6. Save the selection, or cancel any changes 7. Ensure that the checkbox to include the alert in the display has been selected 8. Remember to Save the Page Content.
To delete an indicator, select that indicator from the drop down, select go, change the drop-‐
downback to "Unassigned" and save. Example of a filter for greater than Age of 55 displaying in green:
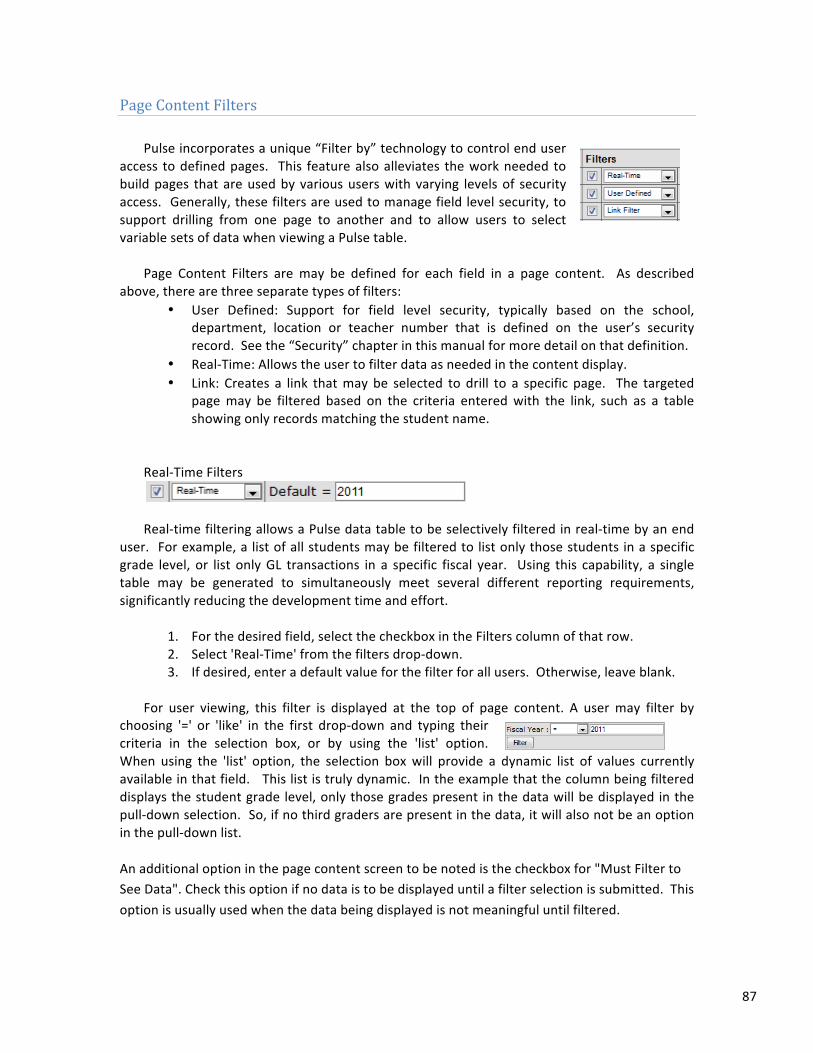
87
Page Content Filters Pulse incorporates a unique “Filter by” technology to control end user
access to defined pages. This feature also alleviates the work needed to build pages that are used by various users with varying levels of security access. Generally, these filters are used to manage field level security, to support drilling from one page to another and to allow users to select variable sets of data when viewing a Pulse table.
Page Content Filters are may be defined for each field in a page content. As described
above, there are three separate types of filters: • User Defined: Support for field level security, typically based on the school,
department, location or teacher number that is defined on the user’s security record. See the “Security” chapter in this manual for more detail on that definition.
• Real-‐Time: Allows the user to filter data as needed in the content display. • Link: Creates a link that may be selected to drill to a specific page. The targeted
page may be filtered based on the criteria entered with the link, such as a table showing only records matching the student name.
Real-‐Time Filters
Real-‐time filtering allows a Pulse data table to be selectively filtered in real-‐time by an end
user. For example, a list of all students may be filtered to list only those students in a specific grade level, or list only GL transactions in a specific fiscal year. Using this capability, a single table may be generated to simultaneously meet several different reporting requirements, significantly reducing the development time and effort.
1. For the desired field, select the checkbox in the Filters column of that row. 2. Select 'Real-‐Time' from the filters drop-‐down. 3. If desired, enter a default value for the filter for all users. Otherwise, leave blank.
For user viewing, this filter is displayed at the top of page content. A user may filter by
choosing '=' or 'like' in the first drop-‐down and typing their criteria in the selection box, or by using the 'list' option. When using the 'list' option, the selection box will provide a dynamic list of values currently available in that field. This list is truly dynamic. In the example that the column being filtered displays the student grade level, only those grades present in the data will be displayed in the pull-‐down selection. So, if no third graders are present in the data, it will also not be an option in the pull-‐down list.
An additional option in the page content screen to be noted is the checkbox for "Must Filter to See Data". Check this option if no data is to be displayed until a filter selection is submitted. This option is usually used when the data being displayed is not meaningful until filtered.
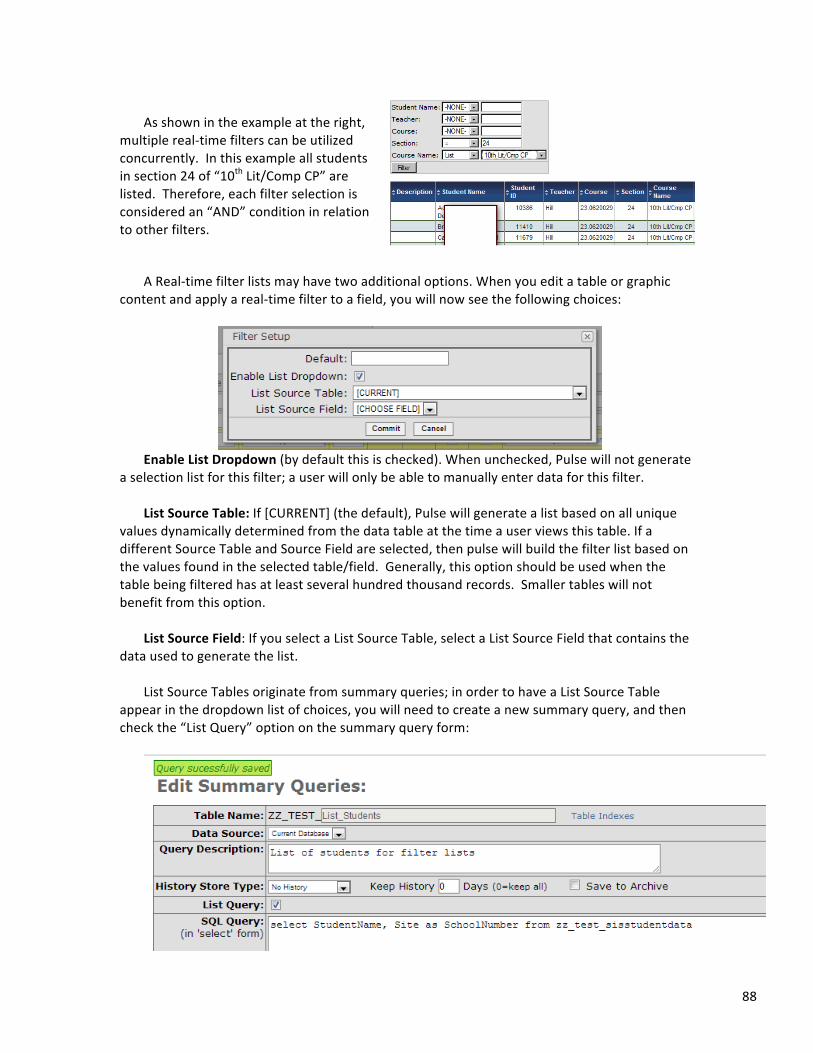
88
As shown in the example at the right,
multiple real-‐time filters can be utilized concurrently. In this example all students in section 24 of “10th Lit/Comp CP” are listed. Therefore, each filter selection is considered an “AND” condition in relation to other filters.
A Real-‐time filter lists may have two additional options. When you edit a table or graphic content and apply a real-‐time filter to a field, you will now see the following choices:
Enable List Dropdown (by default this is checked). When unchecked, Pulse will not generate
a selection list for this filter; a user will only be able to manually enter data for this filter. List Source Table: If [CURRENT] (the default), Pulse will generate a list based on all unique
values dynamically determined from the data table at the time a user views this table. If a different Source Table and Source Field are selected, then pulse will build the filter list based on the values found in the selected table/field. Generally, this option should be used when the table being filtered has at least several hundred thousand records. Smaller tables will not benefit from this option.
List Source Field: If you select a List Source Table, select a List Source Field that contains the
data used to generate the list. List Source Tables originate from summary queries; in order to have a List Source Table
appear in the dropdown list of choices, you will need to create a new summary query, and then check the “List Query” option on the summary query form:
89
When creating this table, if your existing table content contains a user filter, you can also
include a matching field in the list summary query (the field name used by the List Source needs to match the field name in the table that you want to filter). For example, if your table contains a field called SchoolNumber which is linked to the User Filter SchoolNbr, your list query might look like this:
Select StudentName, Site as SchoolNumber from zz_test_sisstudentdata When your table is displayed, the user filter will also make sure that the list is filtered too.

90
User Defined Filters User Defined Filters are designed to limit the data that users view, usually for security
reasons. They are defined by choosing “User Defined” in the Filters drop-‐down, followed by a criteria in the second dropdown. This criterion is typically a school number, department number, location number or teacher id. The criteria are defined by clicking the “View” Button in the transaction.
The filter will restrict the data displayed to only that data which matches the filter. In the
example of a school number, the users will only see data from the school(s) they have been given permission to see from their Account Setup screen (see the security section of this manual for information about setting up user security).
To establish this feature there are three steps. Generally, the first step (define global filter)
is a one-‐time process to simply define the security fields that will be used. The second step (define user security) is performed only when setting up a new user. The third step, defining the filter in a page content, is performed each time a new page content is defined. In summary:
1. Define the fields that are to be used for security as User Filters. 2. Define the fields to which a specific user is to be restricted in the user security
record. 3. Define the use of the filter in the specific page content (data table) so that security
is applied to that table.
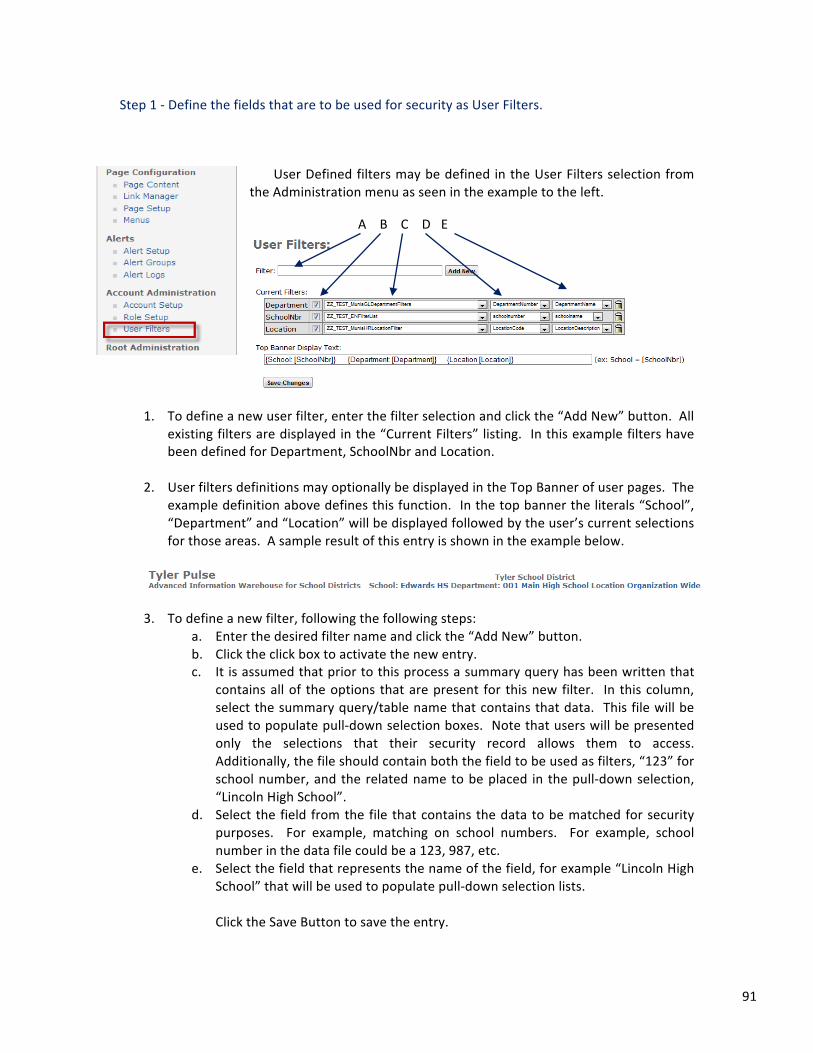
91
Step 1 -‐ Define the fields that are to be used for security as User Filters.
User Defined filters may be defined in the User Filters selection from the Administration menu as seen in the example to the left.
1. To define a new user filter, enter the filter selection and click the “Add New” button. All
existing filters are displayed in the “Current Filters” listing. In this example filters have been defined for Department, SchoolNbr and Location.
2. User filters definitions may optionally be displayed in the Top Banner of user pages. The example definition above defines this function. In the top banner the literals “School”, “Department” and “Location” will be displayed followed by the user’s current selections for those areas. A sample result of this entry is shown in the example below.
3. To define a new filter, following the following steps:
a. Enter the desired filter name and click the “Add New” button. b. Click the click box to activate the new entry. c. It is assumed that prior to this process a summary query has been written that
contains all of the options that are present for this new filter. In this column, select the summary query/table name that contains that data. This file will be used to populate pull-‐down selection boxes. Note that users will be presented only the selections that their security record allows them to access. Additionally, the file should contain both the field to be used as filters, “123” for school number, and the related name to be placed in the pull-‐down selection, “Lincoln High School”.
d. Select the field from the file that contains the data to be matched for security purposes. For example, matching on school numbers. For example, school number in the data file could be a 123, 987, etc.
e. Select the field that represents the name of the field, for example “Lincoln High School” that will be used to populate pull-‐down selection lists.
Click the Save Button to save the entry.
A B C D E
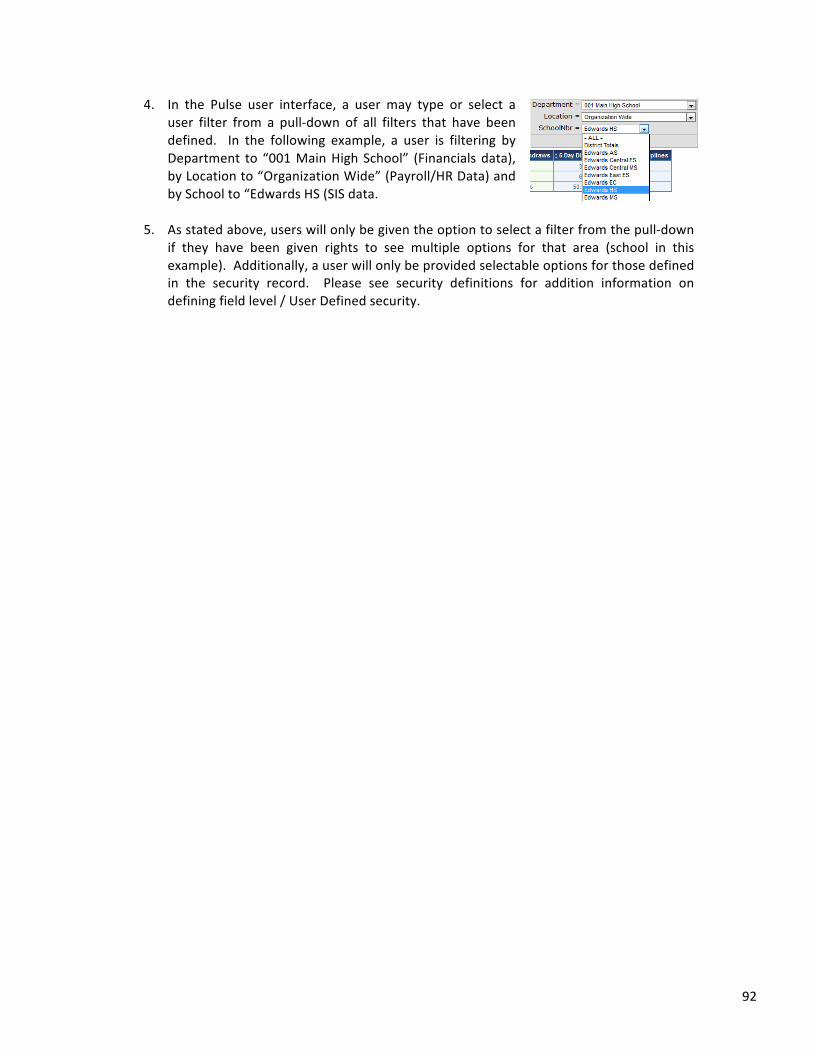
92
4. In the Pulse user interface, a user may type or select a user filter from a pull-‐down of all filters that have been defined. In the following example, a user is filtering by Department to “001 Main High School” (Financials data), by Location to “Organization Wide” (Payroll/HR Data) and by School to “Edwards HS (SIS data.
5. As stated above, users will only be given the option to select a filter from the pull-‐down
if they have been given rights to see multiple options for that area (school in this example). Additionally, a user will only be provided selectable options for those defined in the security record. Please see security definitions for addition information on defining field level / User Defined security.
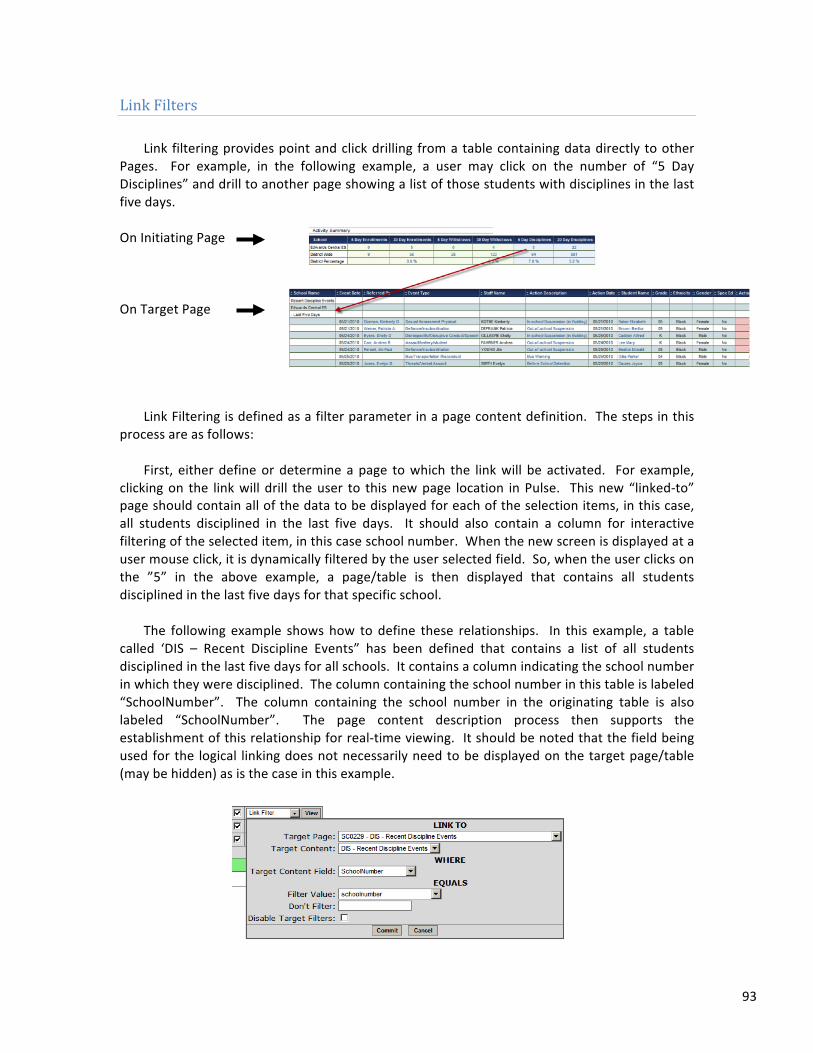
93
Link Filters
Link filtering provides point and click drilling from a table containing data directly to other Pages. For example, in the following example, a user may click on the number of “5 Day Disciplines” and drill to another page showing a list of those students with disciplines in the last five days.
On Initiating Page
On Target Page Link Filtering is defined as a filter parameter in a page content definition. The steps in this
process are as follows: First, either define or determine a page to which the link will be activated. For example,
clicking on the link will drill the user to this new page location in Pulse. This new “linked-‐to” page should contain all of the data to be displayed for each of the selection items, in this case, all students disciplined in the last five days. It should also contain a column for interactive filtering of the selected item, in this case school number. When the new screen is displayed at a user mouse click, it is dynamically filtered by the user selected field. So, when the user clicks on the ”5” in the above example, a page/table is then displayed that contains all students disciplined in the last five days for that specific school.
The following example shows how to define these relationships. In this example, a table
called ‘DIS – Recent Discipline Events” has been defined that contains a list of all students disciplined in the last five days for all schools. It contains a column indicating the school number in which they were disciplined. The column containing the school number in this table is labeled “SchoolNumber”. The column containing the school number in the originating table is also labeled “SchoolNumber”. The page content description process then supports the establishment of this relationship for real-‐time viewing. It should be noted that the field being used for the logical linking does not necessarily need to be displayed on the target page/table (may be hidden) as is the case in this example.
1. From the display page, click on the Pencil icon to display the page content for the table
from which a link will be initiated. Then when the page content is displayed, the first step is to select the “Link Filter” option.
The next step is to select the Page to which clinking on the table will display after the link is
selected. Clicking on this pull-‐down box will display all available pages in Pulse.
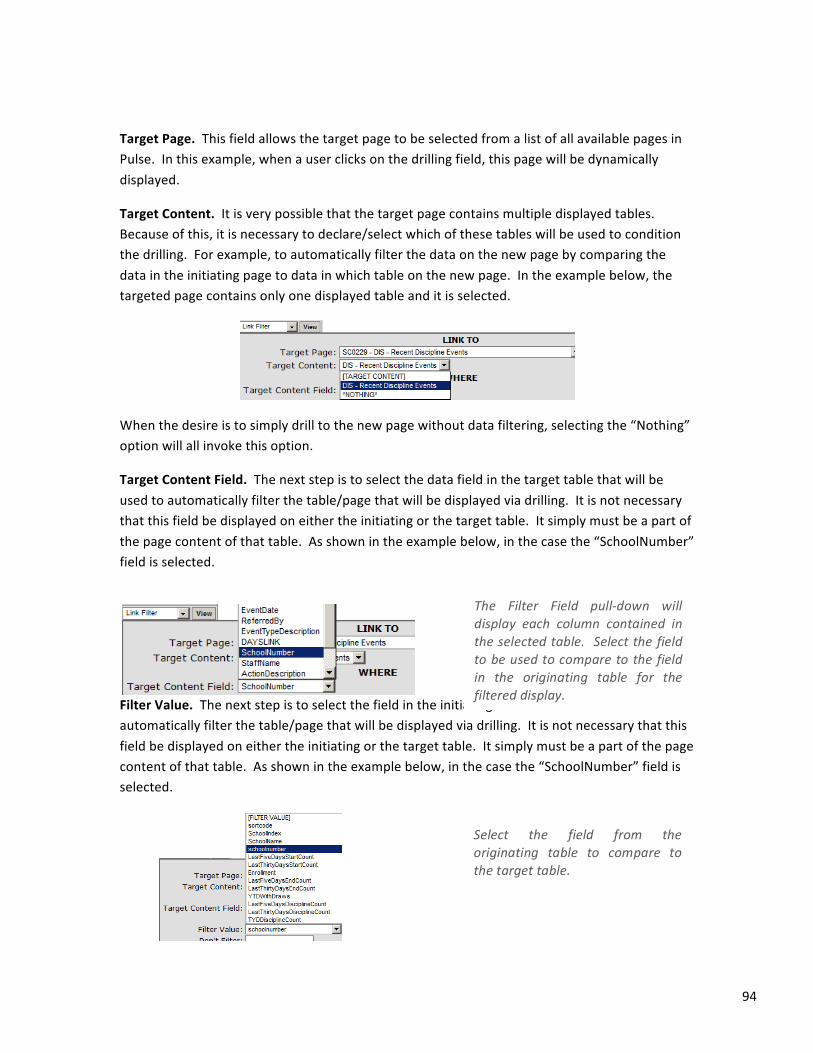
94
Target Page. This field allows the target page to be selected from a list of all available pages in Pulse. In this example, when a user clicks on the drilling field, this page will be dynamically displayed.
Target Content. It is very possible that the target page contains multiple displayed tables. Because of this, it is necessary to declare/select which of these tables will be used to condition the drilling. For example, to automatically filter the data on the new page by comparing the data in the initiating page to data in which table on the new page. In the example below, the targeted page contains only one displayed table and it is selected.
When the desire is to simply drill to the new page without data filtering, selecting the “Nothing” option will all invoke this option.
Target Content Field. The next step is to select the data field in the target table that will be used to automatically filter the table/page that will be displayed via drilling. It is not necessary that this field be displayed on either the initiating or the target table. It simply must be a part of the page content of that table. As shown in the example below, in the case the “SchoolNumber” field is selected.
Filter Value. The next step is to select the field in the initiating table that will be used to automatically filter the table/page that will be displayed via drilling. It is not necessary that this field be displayed on either the initiating or the target table. It simply must be a part of the page content of that table. As shown in the example below, in the case the “SchoolNumber” field is selected.
The Filter Field pull-‐down will display each column contained in the selected table. Select the field to be used to compare to the field in the originating table for the filtered display.
Select the field from the originating table to compare to the target table.
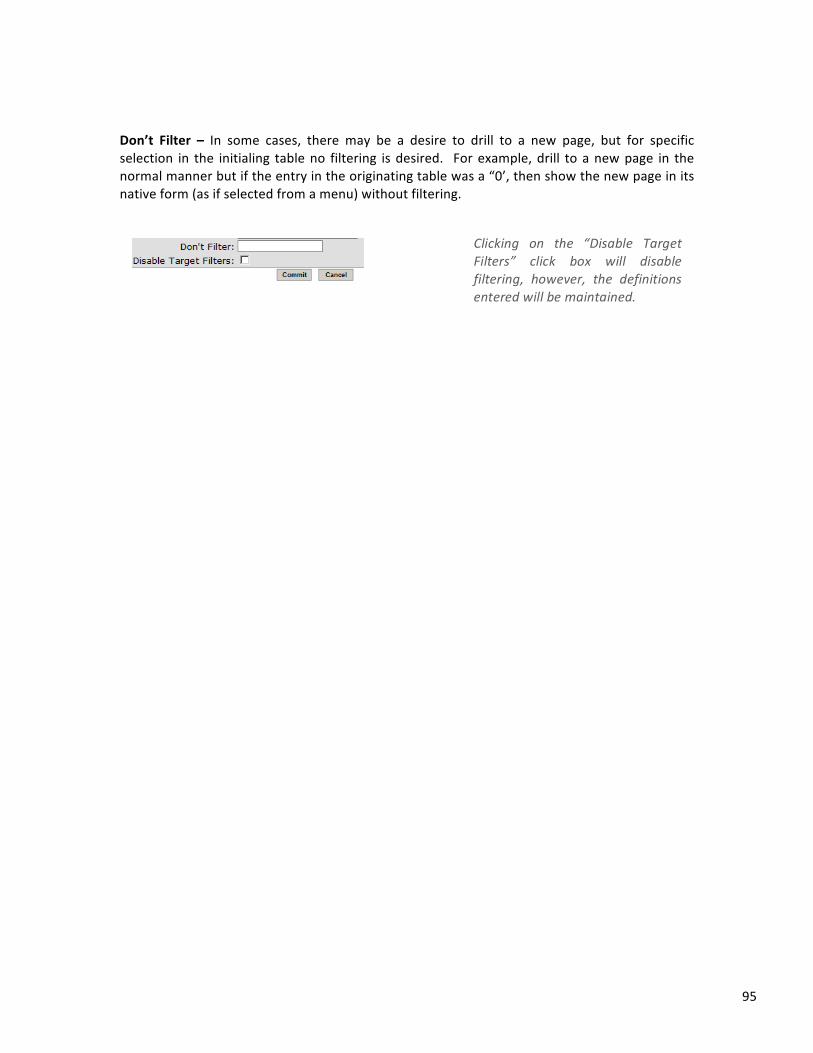
95
Don’t Filter – In some cases, there may be a desire to drill to a new page, but for specific selection in the initialing table no filtering is desired. For example, drill to a new page in the normal manner but if the entry in the originating table was a “0’, then show the new page in its native form (as if selected from a menu) without filtering.
Clicking on the “Disable Target Filters” click box will disable filtering, however, the definitions entered will be maintained.
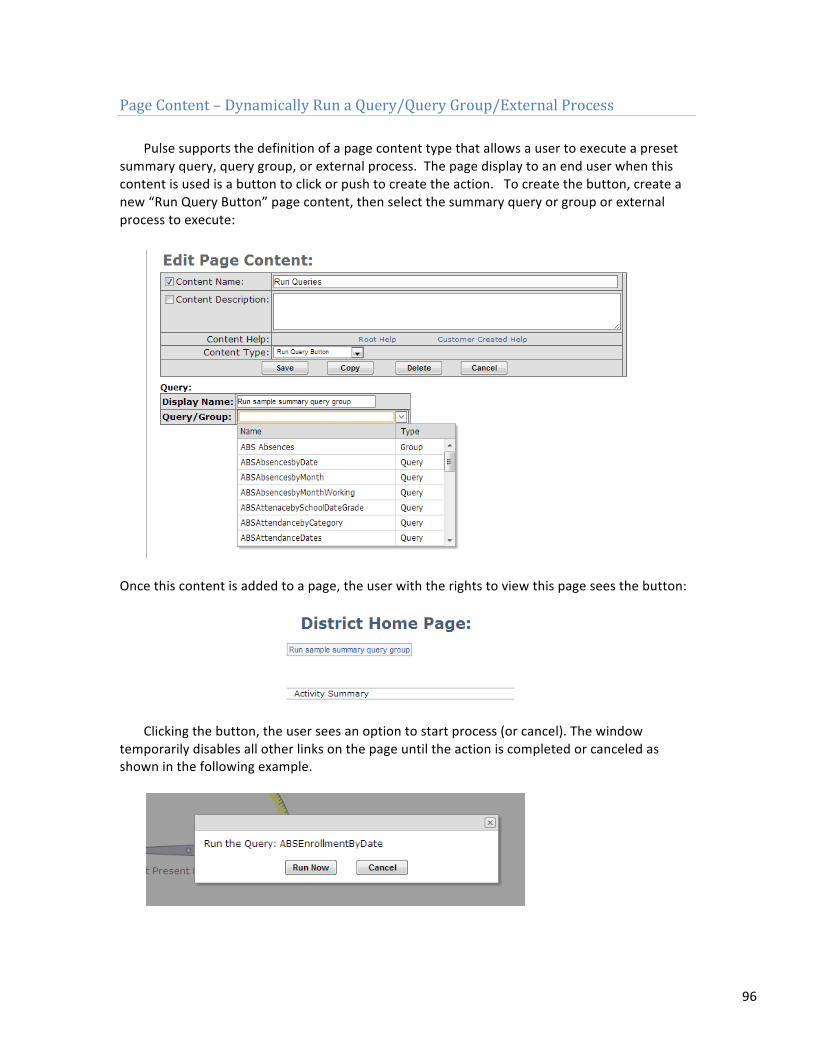
96
Page Content – Dynamically Run a Query/Query Group/External Process Pulse supports the definition of a page content type that allows a user to execute a preset
summary query, query group, or external process. The page display to an end user when this content is used is a button to click or push to create the action. To create the button, create a new “Run Query Button” page content, then select the summary query or group or external process to execute:
Once this content is added to a page, the user with the rights to view this page sees the button:
Clicking the button, the user sees an option to start process (or cancel). The window temporarily disables all other links on the page until the action is completed or canceled as shown in the following example.
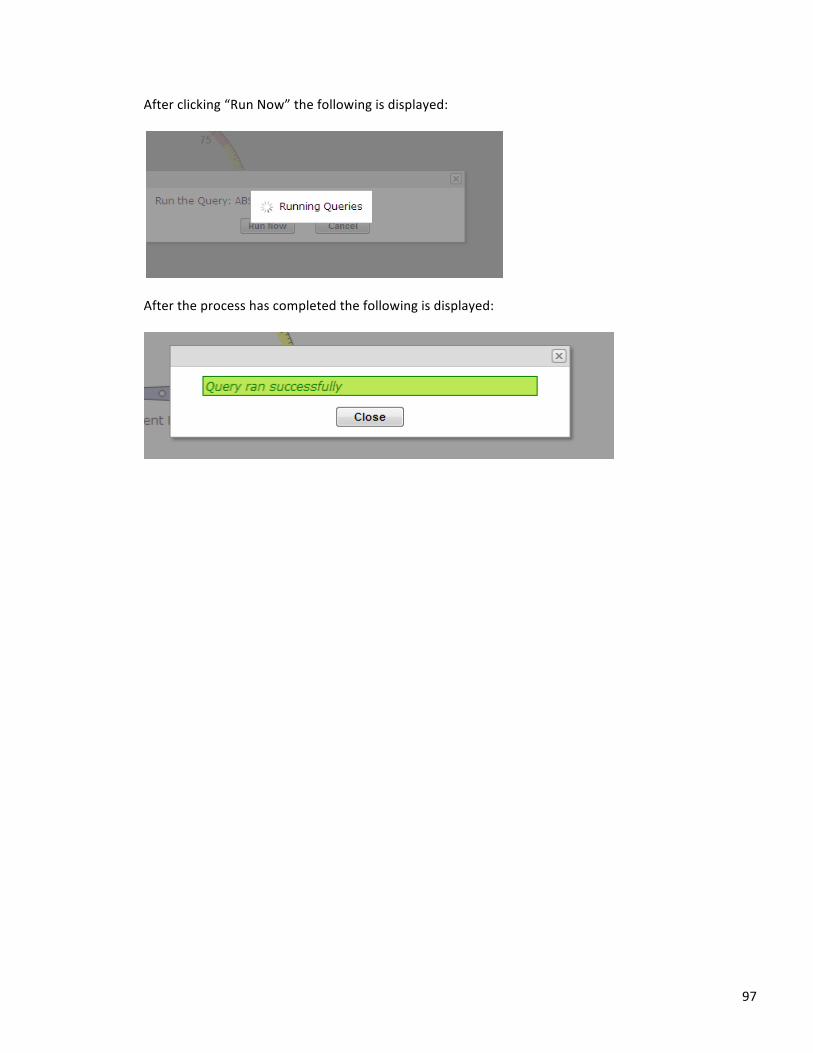
97
After clicking “Run Now” the following is displayed:
After the process has completed the following is displayed:
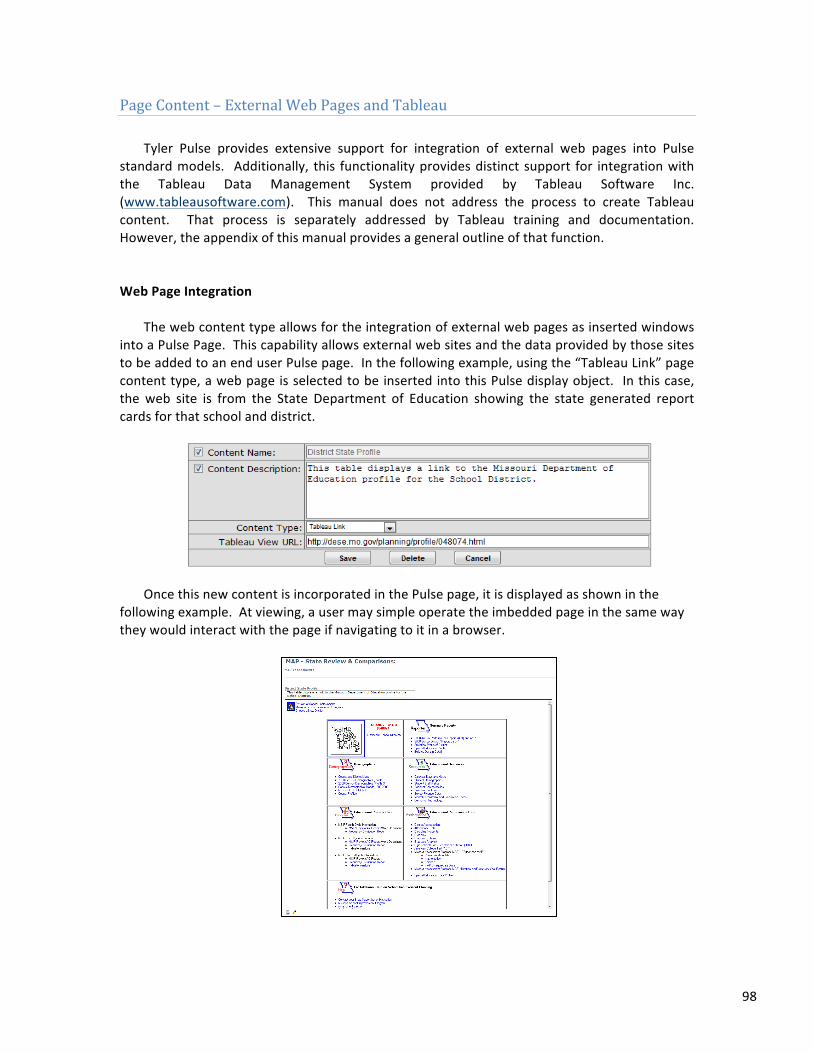
98
Page Content – External Web Pages and Tableau Tyler Pulse provides extensive support for integration of external web pages into Pulse
standard models. Additionally, this functionality provides distinct support for integration with the Tableau Data Management System provided by Tableau Software Inc. (www.tableausoftware.com). This manual does not address the process to create Tableau content. That process is separately addressed by Tableau training and documentation. However, the appendix of this manual provides a general outline of that function. Web Page Integration
The web content type allows for the integration of external web pages as inserted windows
into a Pulse Page. This capability allows external web sites and the data provided by those sites to be added to an end user Pulse page. In the following example, using the “Tableau Link” page content type, a web page is selected to be inserted into this Pulse display object. In this case, the web site is from the State Department of Education showing the state generated report cards for that school and district.
Once this new content is incorporated in the Pulse page, it is displayed as shown in the
following example. At viewing, a user may simple operate the imbedded page in the same way they would interact with the page if navigating to it in a browser.
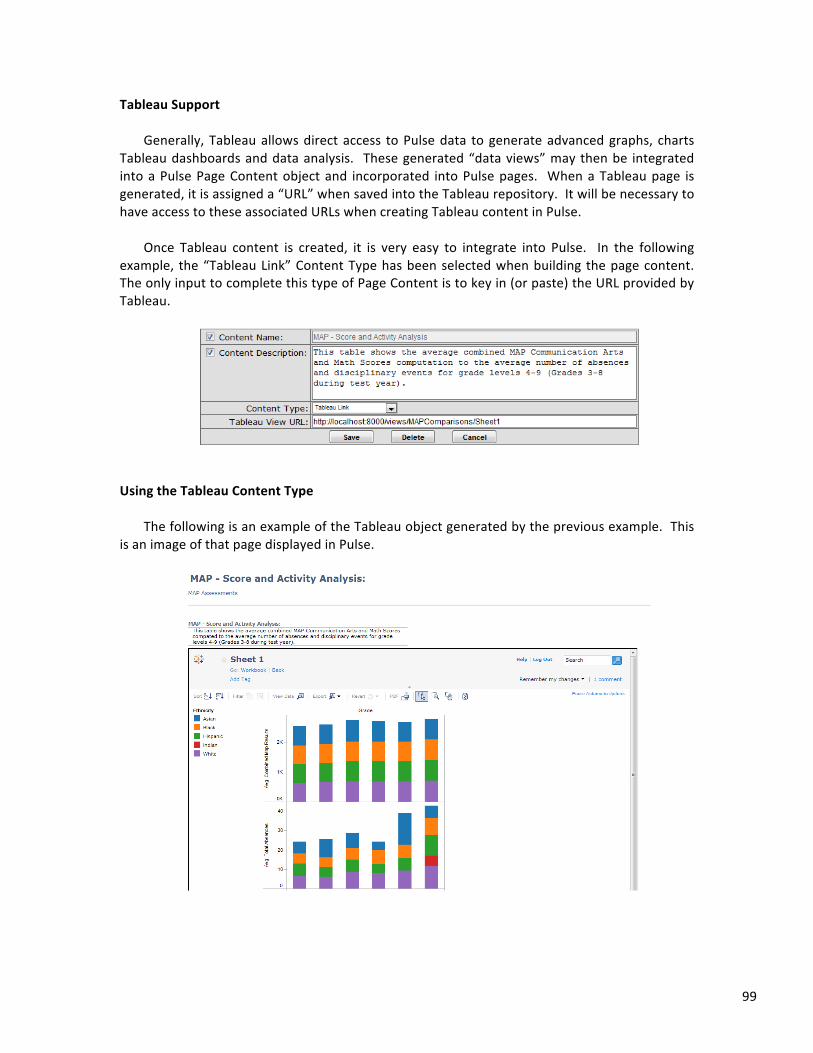
99
Tableau Support Generally, Tableau allows direct access to Pulse data to generate advanced graphs, charts
Tableau dashboards and data analysis. These generated “data views” may then be integrated into a Pulse Page Content object and incorporated into Pulse pages. When a Tableau page is generated, it is assigned a “URL” when saved into the Tableau repository. It will be necessary to have access to these associated URLs when creating Tableau content in Pulse.
Once Tableau content is created, it is very easy to integrate into Pulse. In the following
example, the “Tableau Link” Content Type has been selected when building the page content. The only input to complete this type of Page Content is to key in (or paste) the URL provided by Tableau.
Using the Tableau Content Type The following is an example of the Tableau object generated by the previous example. This
is an image of that page displayed in Pulse.

100
There are several functions available within the displayed object. These options are:
Sorting – By clicking on the sort up or sort down icon, the order of the displayed data or
graph may be changed.
Filtering – By using the mouse to double click, or to draw a box around selected data, only
that data will be displayed.
Viewing Data -‐ By using the mouse to double click, or to draw a box around selected data,
clicking on the view data option will display the underlying data supporting that part of the displayed graphic. The data being viewed is supplied directly by Pulse and is included in a new browser session. In the following example, the fourth grade chart in this displayed has been highlighted and the “View Data” button clicked. This display shows only the data from the data source that is used to generate the chart being displayed
Click on the “Show All Columns” button to view all data from Pulse data source. Note in
this example, the data used to generate the graph is highlighted and other data from the Pulse data source is not.
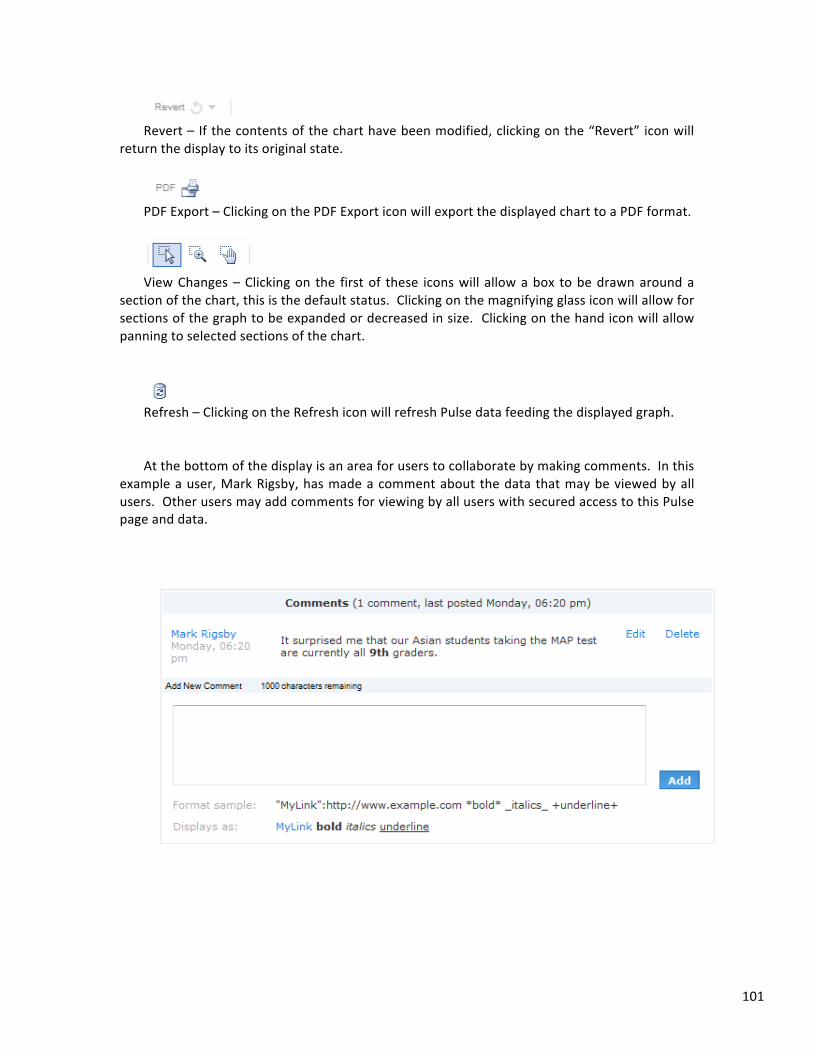
101
Revert – If the contents of the chart have been modified, clicking on the “Revert” icon will
return the display to its original state.
PDF Export – Clicking on the PDF Export icon will export the displayed chart to a PDF format.
View Changes – Clicking on the first of these icons will allow a box to be drawn around a
section of the chart, this is the default status. Clicking on the magnifying glass icon will allow for sections of the graph to be expanded or decreased in size. Clicking on the hand icon will allow panning to selected sections of the chart.
Refresh – Clicking on the Refresh icon will refresh Pulse data feeding the displayed graph. At the bottom of the display is an area for users to collaborate by making comments. In this
example a user, Mark Rigsby, has made a comment about the data that may be viewed by all users. Other users may add comments for viewing by all users with secured access to this Pulse page and data.
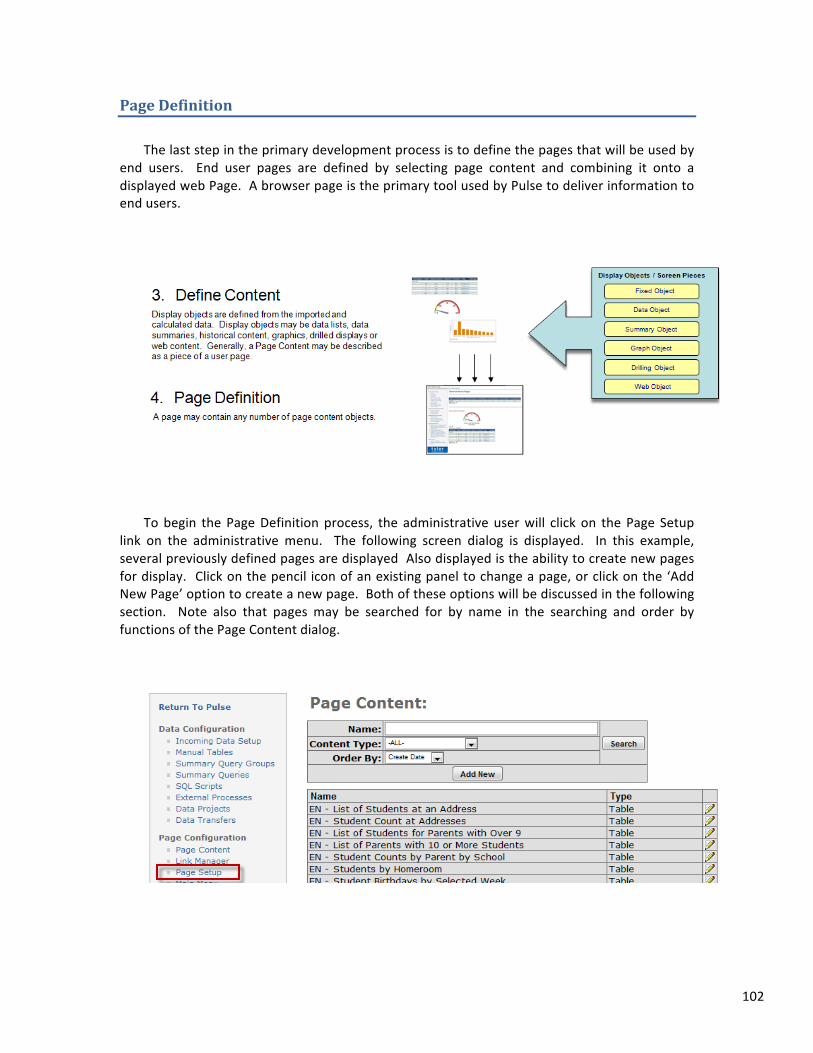
102
Page Definition The last step in the primary development process is to define the pages that will be used by
end users. End user pages are defined by selecting page content and combining it onto a displayed web Page. A browser page is the primary tool used by Pulse to deliver information to end users.
To begin the Page Definition process, the administrative user will click on the Page Setup
link on the administrative menu. The following screen dialog is displayed. In this example, several previously defined pages are displayed Also displayed is the ability to create new pages for display. Click on the pencil icon of an existing panel to change a page, or click on the ‘Add New Page’ option to create a new page. Both of these options will be discussed in the following section. Note also that pages may be searched for by name in the searching and order by functions of the Page Content dialog.
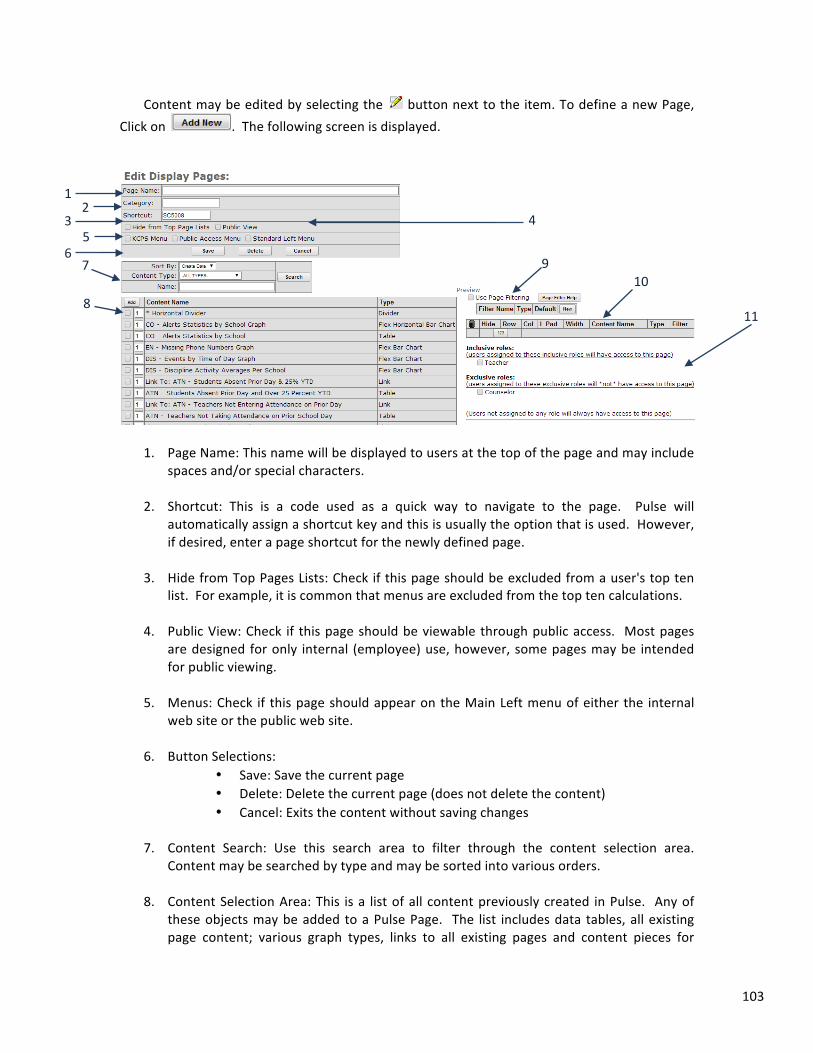
103
Content may be edited by selecting the button next to the item. To define a new Page, Click on . The following screen is displayed.
1. Page Name: This name will be displayed to users at the top of the page and may include spaces and/or special characters.
2. Shortcut: This is a code used as a quick way to navigate to the page. Pulse will automatically assign a shortcut key and this is usually the option that is used. However, if desired, enter a page shortcut for the newly defined page.
3. Hide from Top Pages Lists: Check if this page should be excluded from a user's top ten list. For example, it is common that menus are excluded from the top ten calculations.
4. Public View: Check if this page should be viewable through public access. Most pages
are designed for only internal (employee) use, however, some pages may be intended for public viewing.
5. Menus: Check if this page should appear on the Main Left menu of either the internal
web site or the public web site.
6. Button Selections: • Save: Save the current page • Delete: Delete the current page (does not delete the content) • Cancel: Exits the content without saving changes
7. Content Search: Use this search area to filter through the content selection area.
Content may be searched by type and may be sorted into various orders.
8. Content Selection Area: This is a list of all content previously created in Pulse. Any of these objects may be added to a Pulse Page. The list includes data tables, all existing page content; various graph types, links to all existing pages and content pieces for
2 3
6 5
7 9 10
8 11
1
4
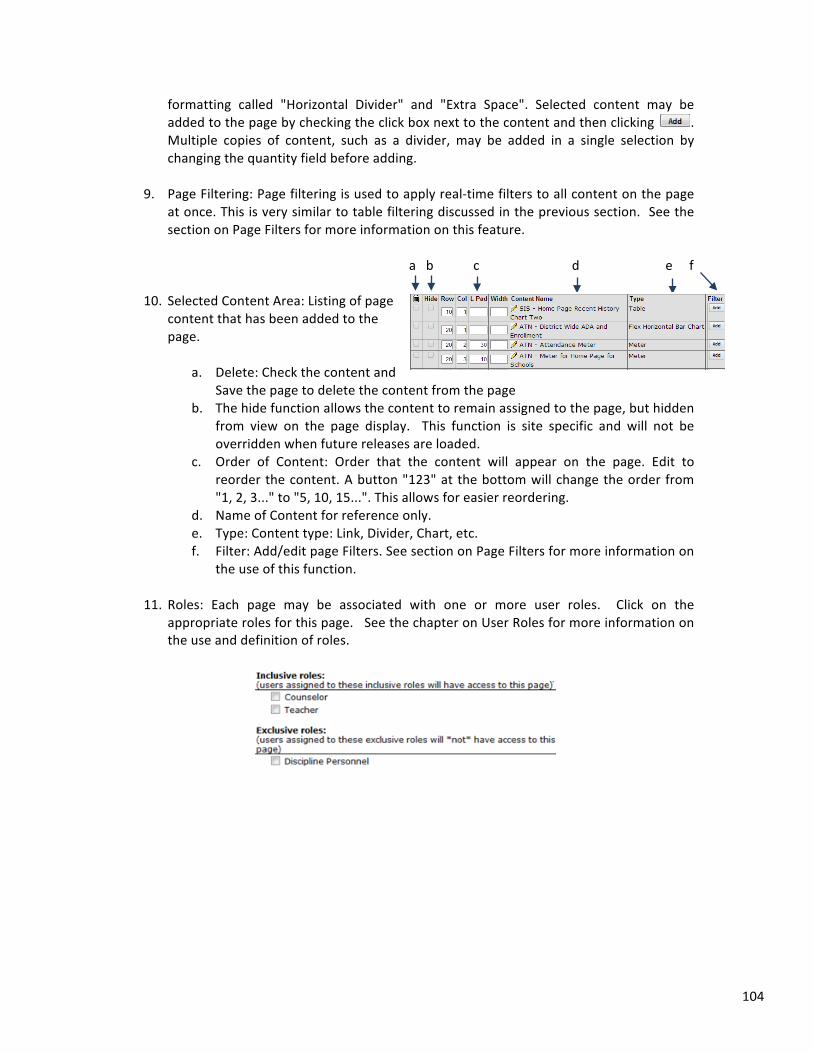
104
formatting called "Horizontal Divider" and "Extra Space". Selected content may be added to the page by checking the click box next to the content and then clicking . Multiple copies of content, such as a divider, may be added in a single selection by changing the quantity field before adding.
9. Page Filtering: Page filtering is used to apply real-‐time filters to all content on the page at once. This is very similar to table filtering discussed in the previous section. See the section on Page Filters for more information on this feature.
a b c d e f
10. Selected Content Area: Listing of page
content that has been added to the page.
a. Delete: Check the content and
Save the page to delete the content from the page b. The hide function allows the content to remain assigned to the page, but hidden
from view on the page display. This function is site specific and will not be overridden when future releases are loaded.
c. Order of Content: Order that the content will appear on the page. Edit to reorder the content. A button "123" at the bottom will change the order from "1, 2, 3..." to "5, 10, 15...". This allows for easier reordering.
d. Name of Content for reference only. e. Type: Content type: Link, Divider, Chart, etc. f. Filter: Add/edit page Filters. See section on Page Filters for more information on
the use of this function.
11. Roles: Each page may be associated with one or more user roles. Click on the appropriate roles for this page. See the chapter on User Roles for more information on the use and definition of roles.
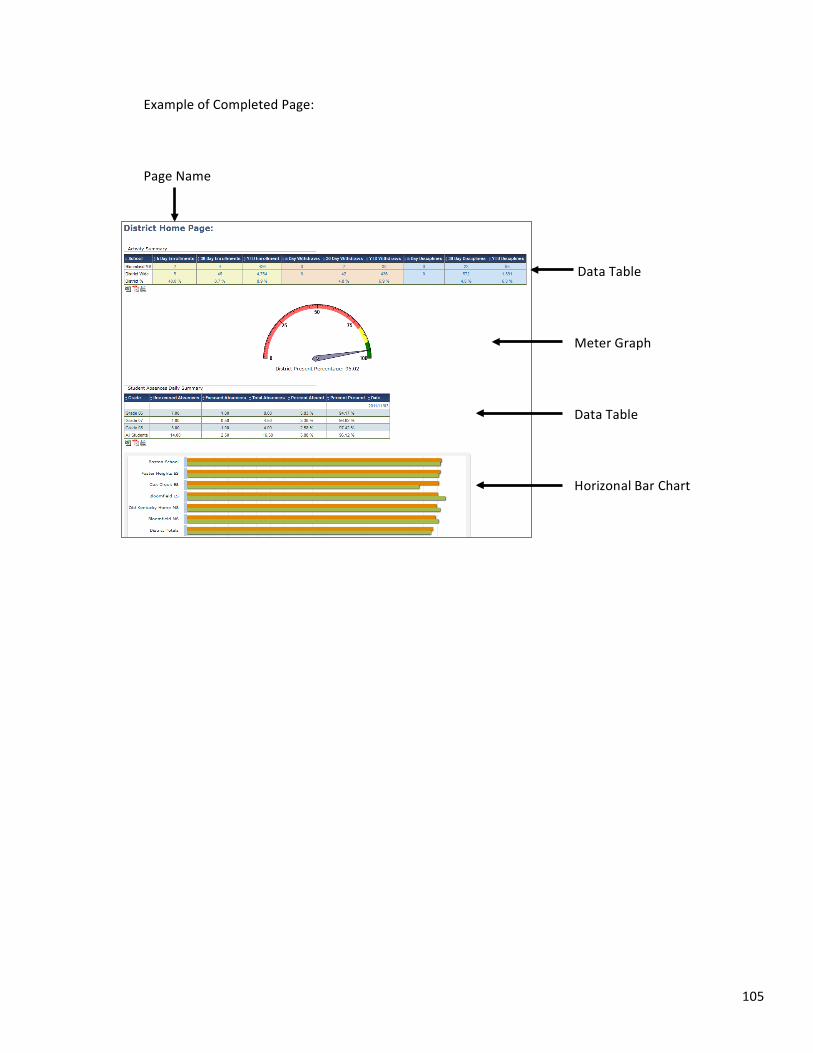
105
Example of Completed Page: Page Name
Data Table Meter Graph Data Table Horizonal Bar Chart
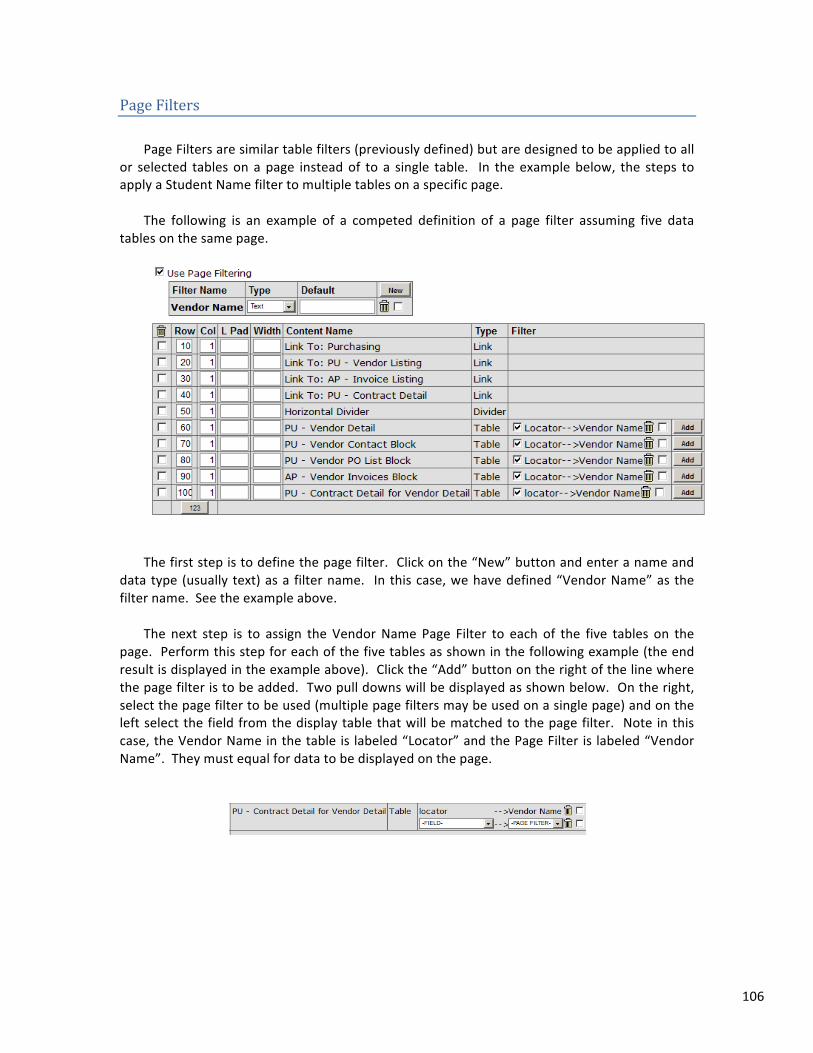
106
Page Filters Page Filters are similar table filters (previously defined) but are designed to be applied to all
or selected tables on a page instead of to a single table. In the example below, the steps to apply a Student Name filter to multiple tables on a specific page.
The following is an example of a competed definition of a page filter assuming five data
tables on the same page.
The first step is to define the page filter. Click on the “New” button and enter a name and
data type (usually text) as a filter name. In this case, we have defined “Vendor Name” as the filter name. See the example above.
The next step is to assign the Vendor Name Page Filter to each of the five tables on the
page. Perform this step for each of the five tables as shown in the following example (the end result is displayed in the example above). Click the “Add” button on the right of the line where the page filter is to be added. Two pull downs will be displayed as shown below. On the right, select the page filter to be used (multiple page filters may be used on a single page) and on the left select the field from the display table that will be matched to the page filter. Note in this case, the Vendor Name in the table is labeled “Locator” and the Page Filter is labeled “Vendor Name”. They must equal for data to be displayed on the page.
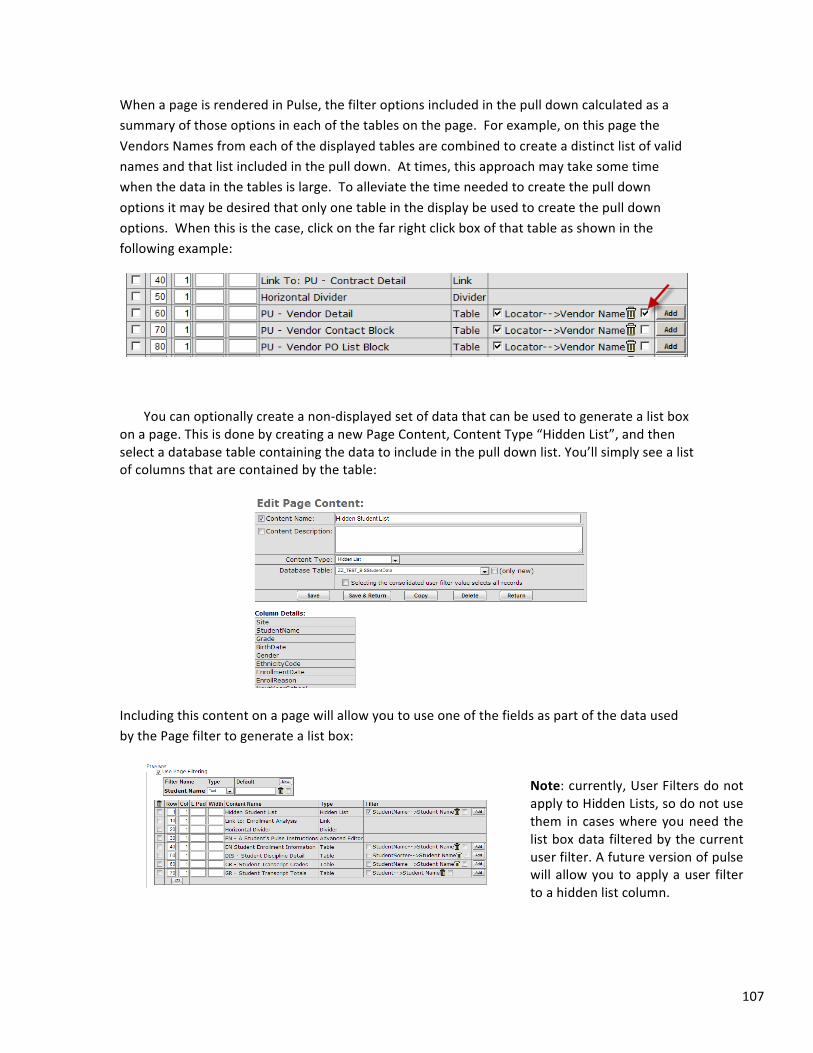
107
When a page is rendered in Pulse, the filter options included in the pull down calculated as a summary of those options in each of the tables on the page. For example, on this page the Vendors Names from each of the displayed tables are combined to create a distinct list of valid names and that list included in the pull down. At times, this approach may take some time when the data in the tables is large. To alleviate the time needed to create the pull down options it may be desired that only one table in the display be used to create the pull down options. When this is the case, click on the far right click box of that table as shown in the following example:
You can optionally create a non-‐displayed set of data that can be used to generate a list box on a page. This is done by creating a new Page Content, Content Type “Hidden List”, and then select a database table containing the data to include in the pull down list. You’ll simply see a list of columns that are contained by the table:
Including this content on a page will allow you to use one of the fields as part of the data used by the Page filter to generate a list box:
Note: currently, User Filters do not apply to Hidden Lists, so do not use them in cases where you need the list box data filtered by the current user filter. A future version of pulse will allow you to apply a user filter to a hidden list column.
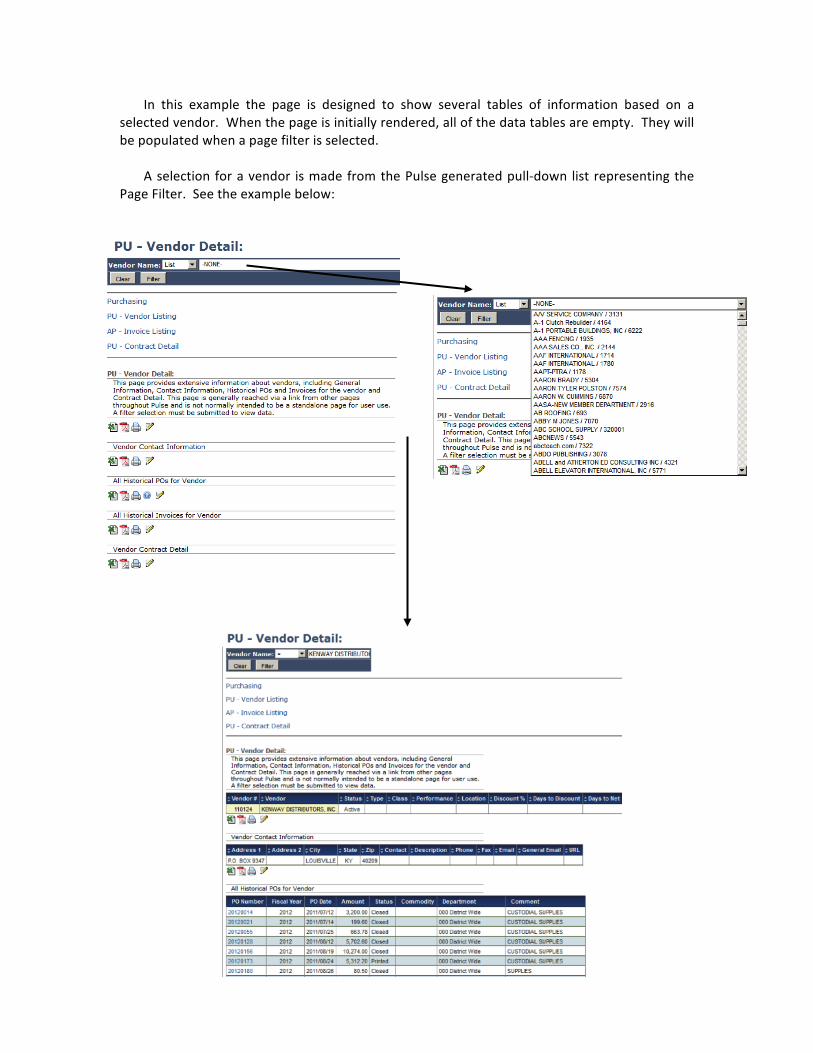
108
In this example the page is designed to show several tables of information based on a selected vendor. When the page is initially rendered, all of the data tables are empty. They will be populated when a page filter is selected.
A selection for a vendor is made from the Pulse generated pull-‐down list representing the
Page Filter. See the example below:
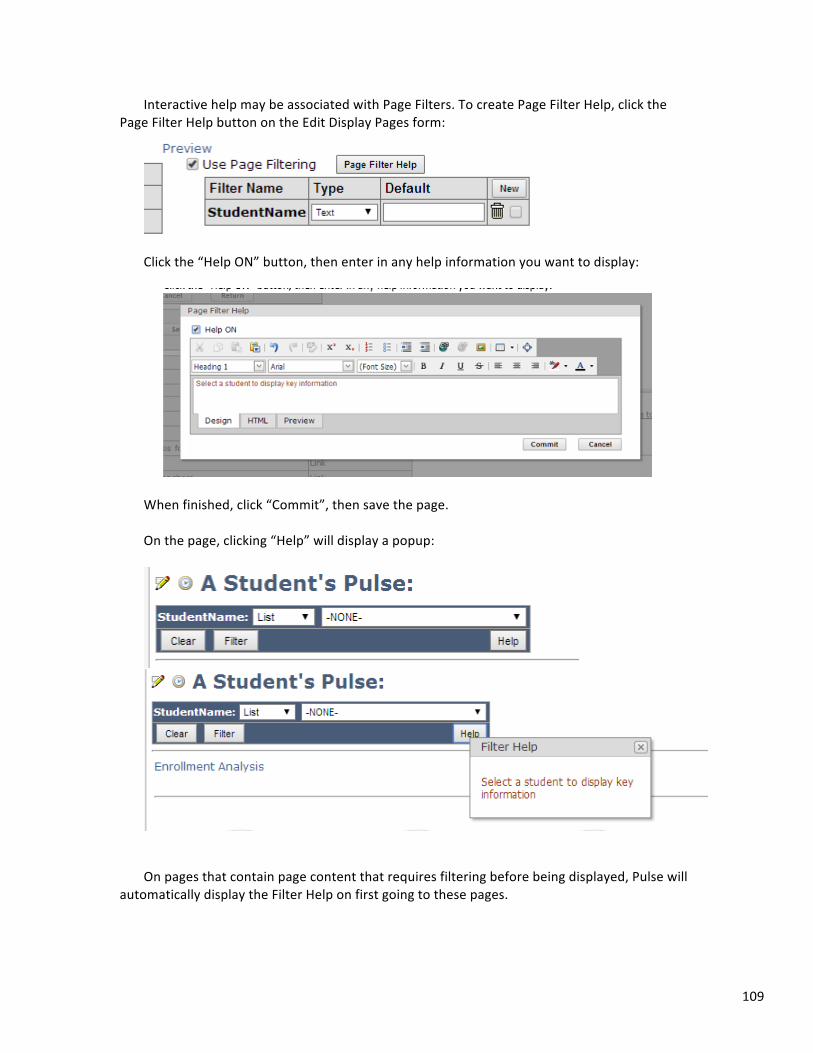
109
Interactive help may be associated with Page Filters. To create Page Filter Help, click the Page Filter Help button on the Edit Display Pages form:
Click the “Help ON” button, then enter in any help information you want to display:
When finished, click “Commit”, then save the page. On the page, clicking “Help” will display a popup:
On pages that contain page content that requires filtering before being displayed, Pulse will
automatically display the Filter Help on first going to these pages.
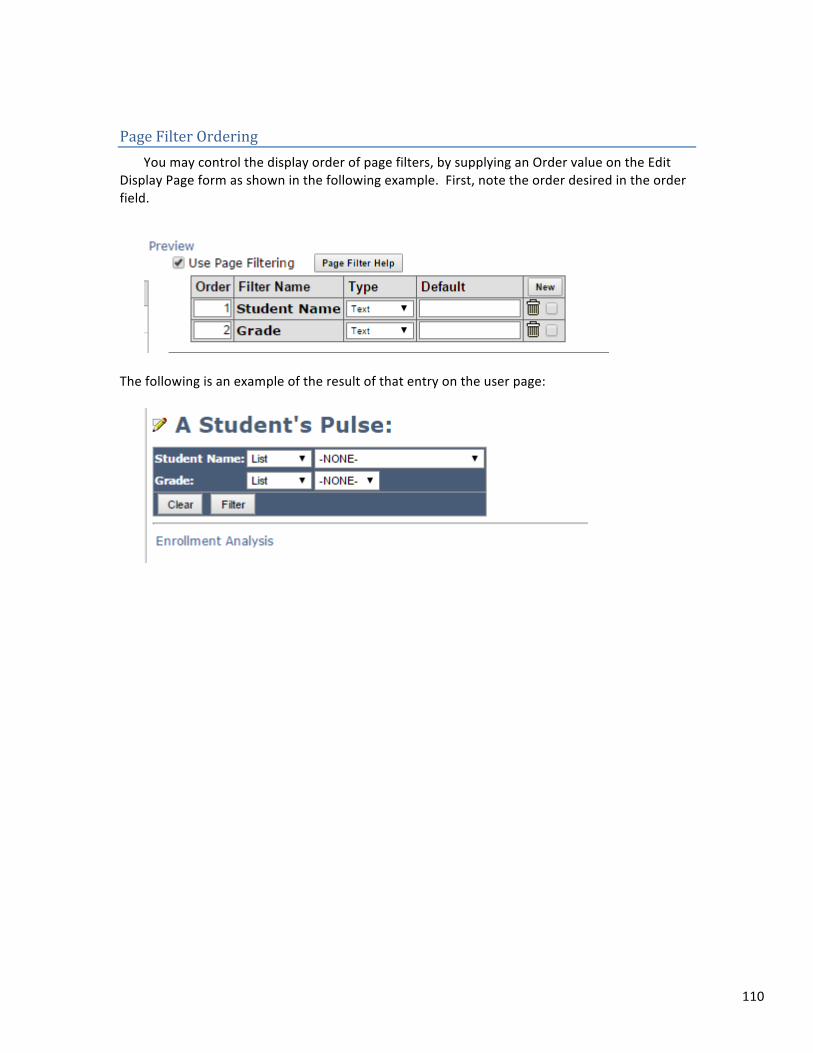
110
Page Filter Ordering You may control the display order of page filters, by supplying an Order value on the Edit
Display Page form as shown in the following example. First, note the order desired in the order field.
The following is an example of the result of that entry on the user page:
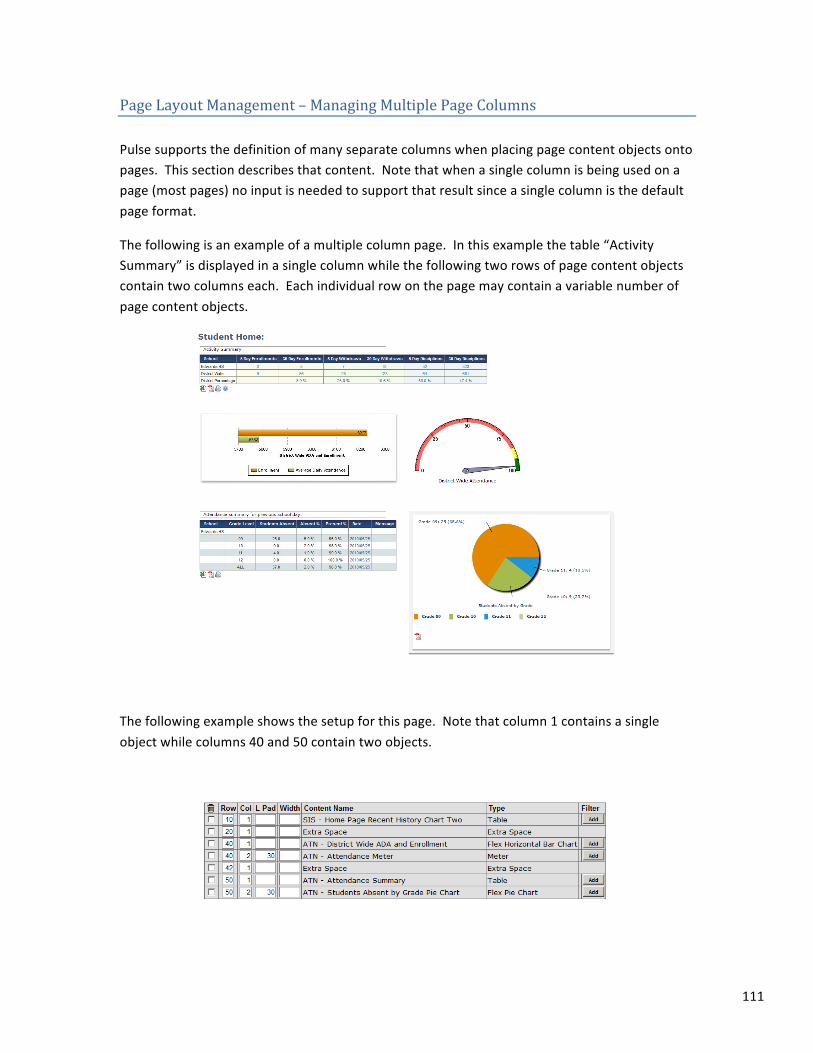
111
Page Layout Management – Managing Multiple Page Columns
Pulse supports the definition of many separate columns when placing page content objects onto pages. This section describes that content. Note that when a single column is being used on a page (most pages) no input is needed to support that result since a single column is the default page format.
The following is an example of a multiple column page. In this example the table “Activity Summary” is displayed in a single column while the following two rows of page content objects contain two columns each. Each individual row on the page may contain a variable number of page content objects.
The following example shows the setup for this page. Note that column 1 contains a single object while columns 40 and 50 contain two objects.
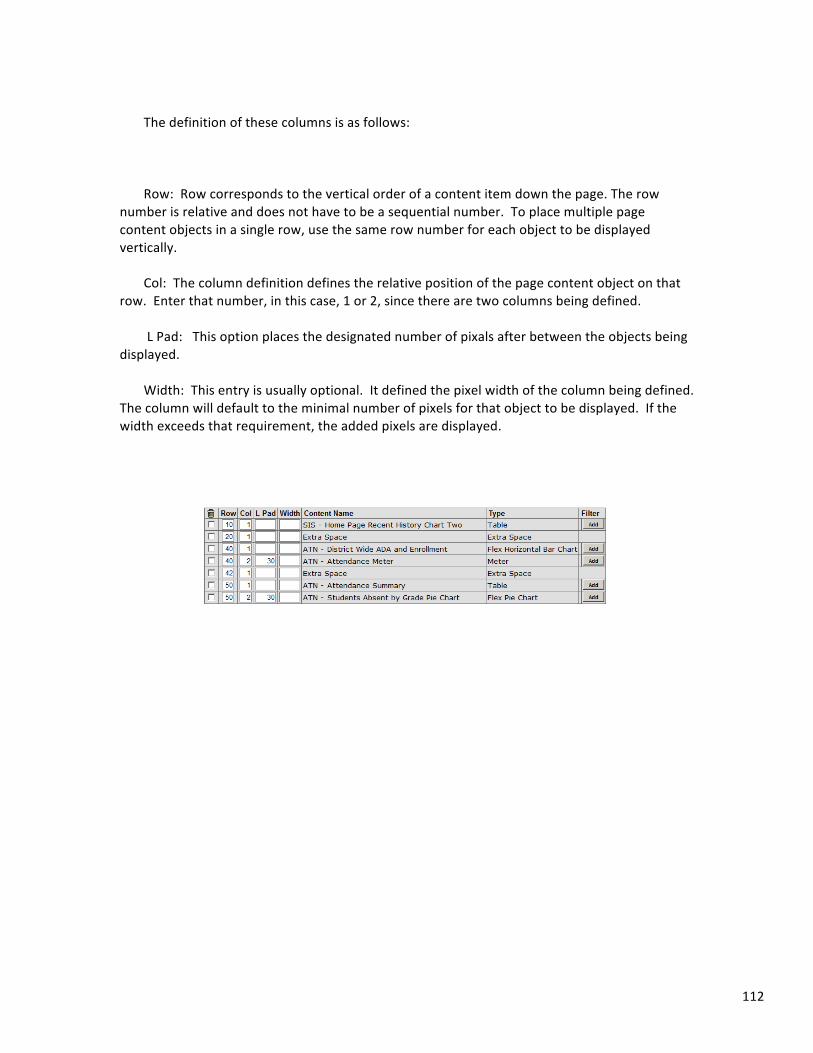
112
The definition of these columns is as follows: Row: Row corresponds to the vertical order of a content item down the page. The row
number is relative and does not have to be a sequential number. To place multiple page content objects in a single row, use the same row number for each object to be displayed vertically.
Col: The column definition defines the relative position of the page content object on that
row. Enter that number, in this case, 1 or 2, since there are two columns being defined. L Pad: This option places the designated number of pixals after between the objects being
displayed. Width: This entry is usually optional. It defined the pixel width of the column being defined.
The column will default to the minimal number of pixels for that object to be displayed. If the width exceeds that requirement, the added pixels are displayed.
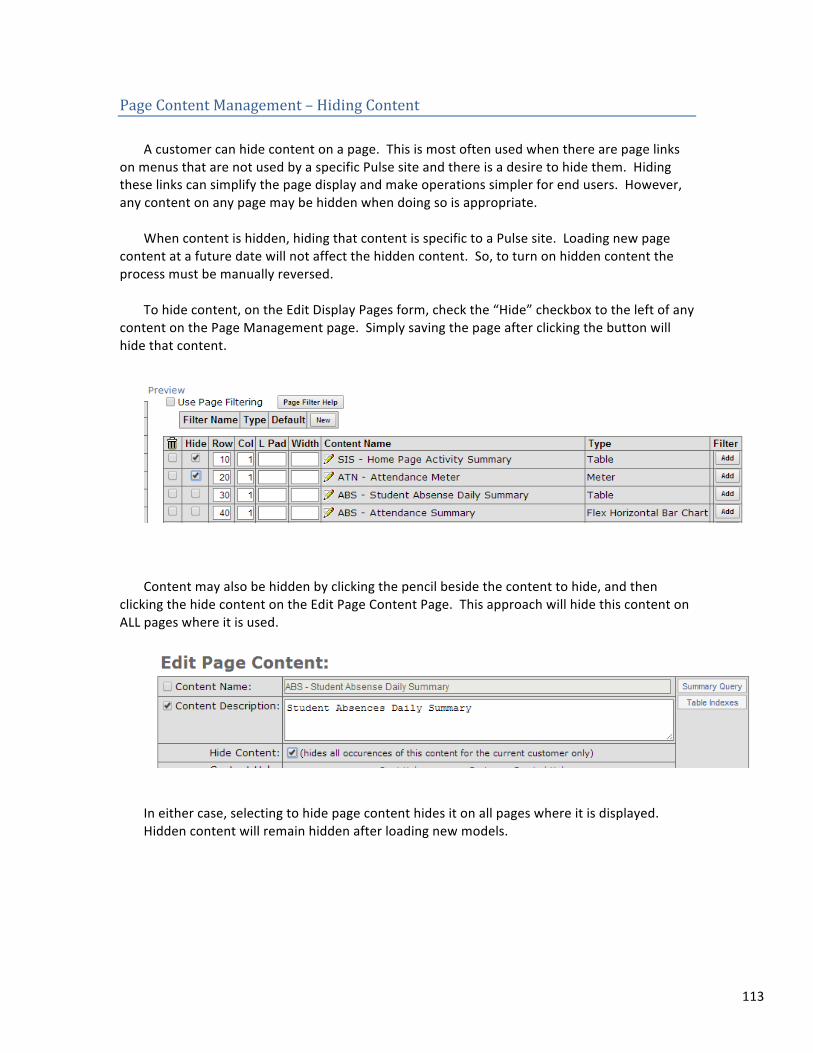
113
Page Content Management – Hiding Content A customer can hide content on a page. This is most often used when there are page links
on menus that are not used by a specific Pulse site and there is a desire to hide them. Hiding these links can simplify the page display and make operations simpler for end users. However, any content on any page may be hidden when doing so is appropriate.
When content is hidden, hiding that content is specific to a Pulse site. Loading new page
content at a future date will not affect the hidden content. So, to turn on hidden content the process must be manually reversed.
To hide content, on the Edit Display Pages form, check the “Hide” checkbox to the left of any
content on the Page Management page. Simply saving the page after clicking the button will hide that content.
Content may also be hidden by clicking the pencil beside the content to hide, and then
clicking the hide content on the Edit Page Content Page. This approach will hide this content on ALL pages where it is used.
In either case, selecting to hide page content hides it on all pages where it is displayed. Hidden content will remain hidden after loading new models.
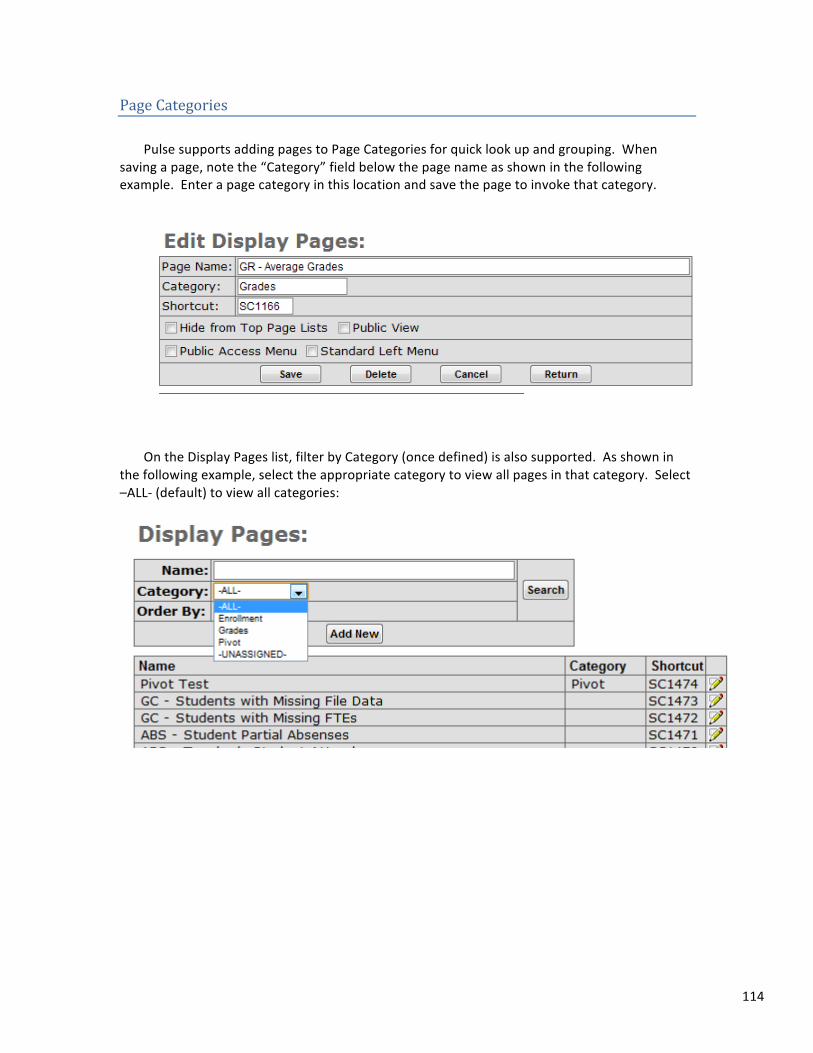
114
Page Categories Pulse supports adding pages to Page Categories for quick look up and grouping. When
saving a page, note the “Category” field below the page name as shown in the following example. Enter a page category in this location and save the page to invoke that category.
On the Display Pages list, filter by Category (once defined) is also supported. As shown in
the following example, select the appropriate category to view all pages in that category. Select –ALL-‐ (default) to view all categories:
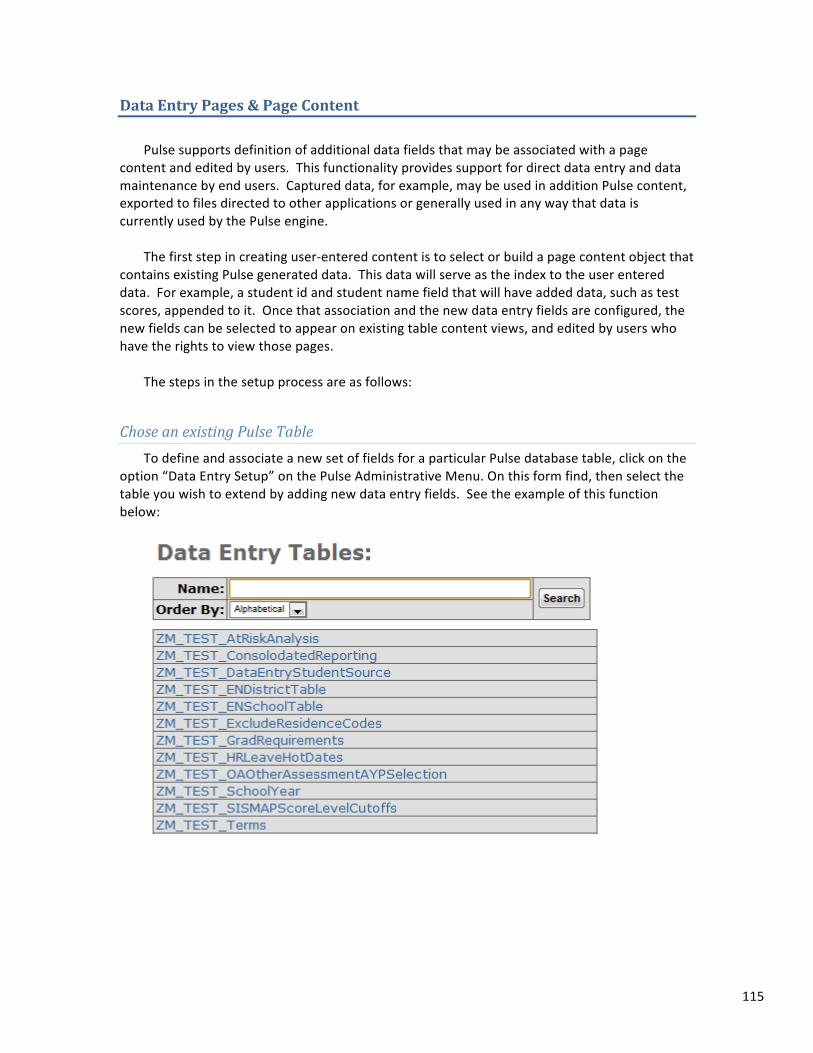
115
Data Entry Pages & Page Content Pulse supports definition of additional data fields that may be associated with a page
content and edited by users. This functionality provides support for direct data entry and data maintenance by end users. Captured data, for example, may be used in addition Pulse content, exported to files directed to other applications or generally used in any way that data is currently used by the Pulse engine.
The first step in creating user-‐entered content is to select or build a page content object that
contains existing Pulse generated data. This data will serve as the index to the user entered data. For example, a student id and student name field that will have added data, such as test scores, appended to it. Once that association and the new data entry fields are configured, the new fields can be selected to appear on existing table content views, and edited by users who have the rights to view those pages.
The steps in the setup process are as follows:
Chose an existing Pulse Table To define and associate a new set of fields for a particular Pulse database table, click on the
option “Data Entry Setup” on the Pulse Administrative Menu. On this form find, then select the table you wish to extend by adding new data entry fields. See the example of this function below:
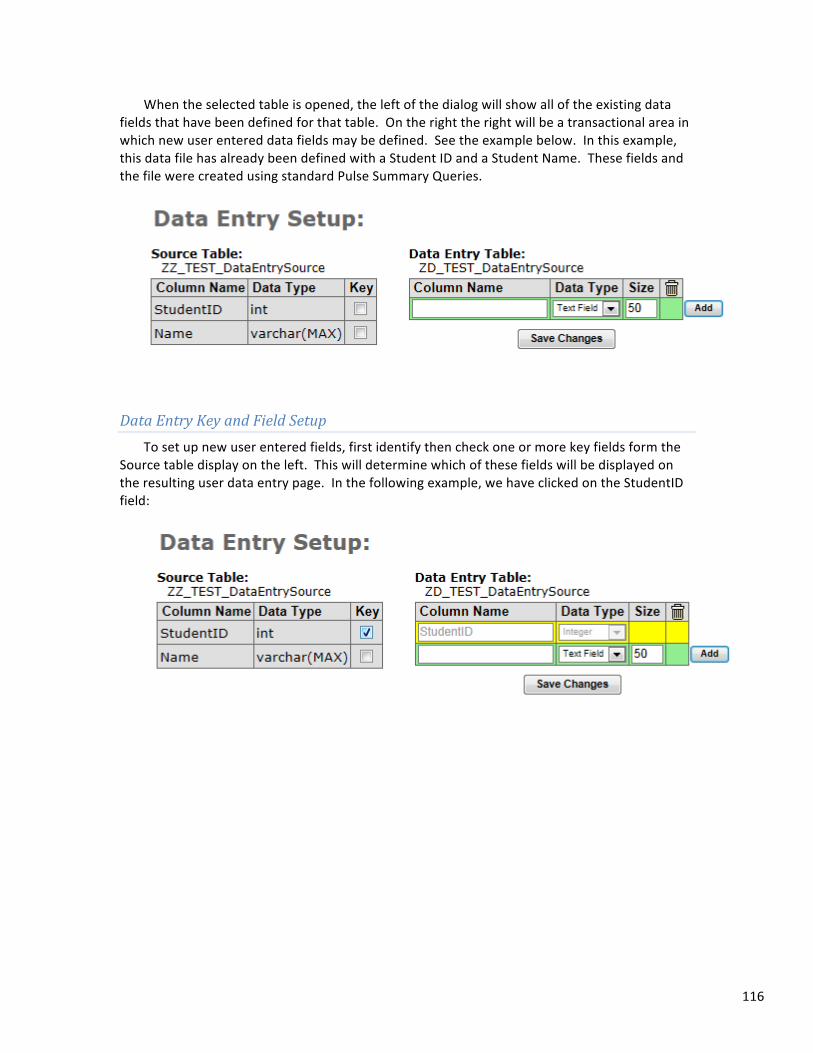
116
When the selected table is opened, the left of the dialog will show all of the existing data fields that have been defined for that table. On the right the right will be a transactional area in which new user entered data fields may be defined. See the example below. In this example, this data file has already been defined with a Student ID and a Student Name. These fields and the file were created using standard Pulse Summary Queries.
Data Entry Key and Field Setup To set up new user entered fields, first identify then check one or more key fields form the
Source table display on the left. This will determine which of these fields will be displayed on the resulting user data entry page. In the following example, we have clicked on the StudentID field:
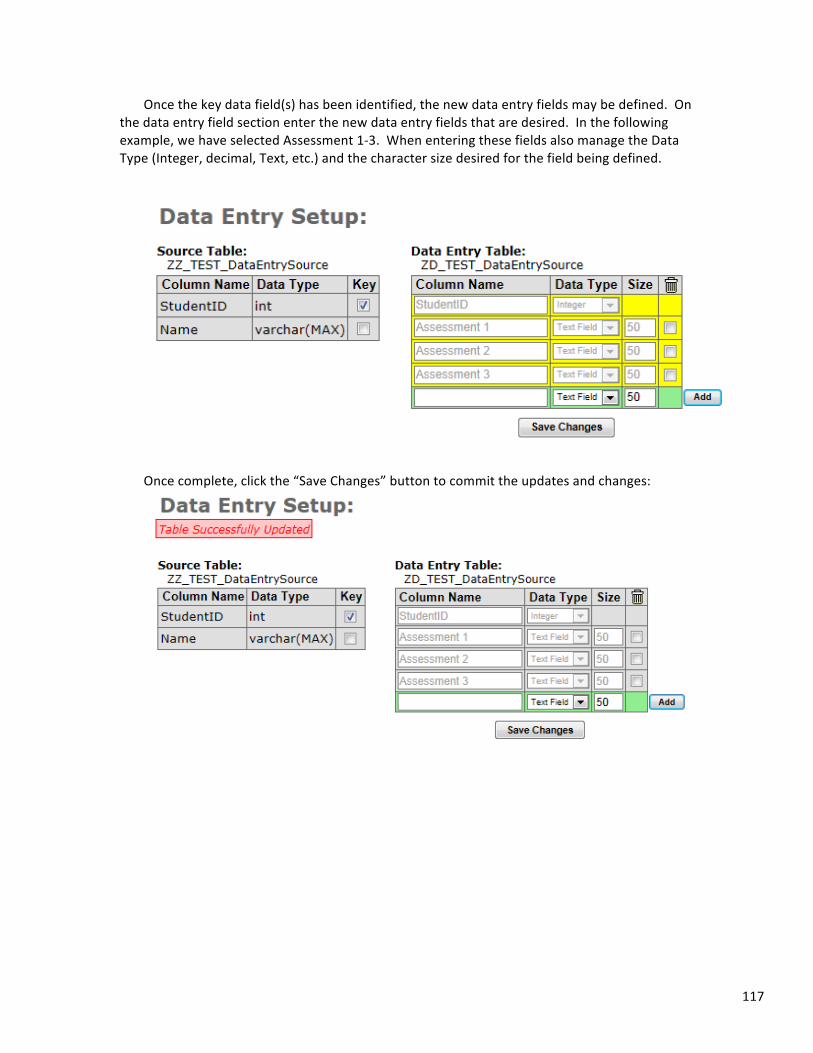
117
Once the key data field(s) has been identified, the new data entry fields may be defined. On the data entry field section enter the new data entry fields that are desired. In the following example, we have selected Assessment 1-‐3. When entering these fields also manage the Data Type (Integer, decimal, Text, etc.) and the character size desired for the field being defined.
Once complete, click the “Save Changes” button to commit the updates and changes:
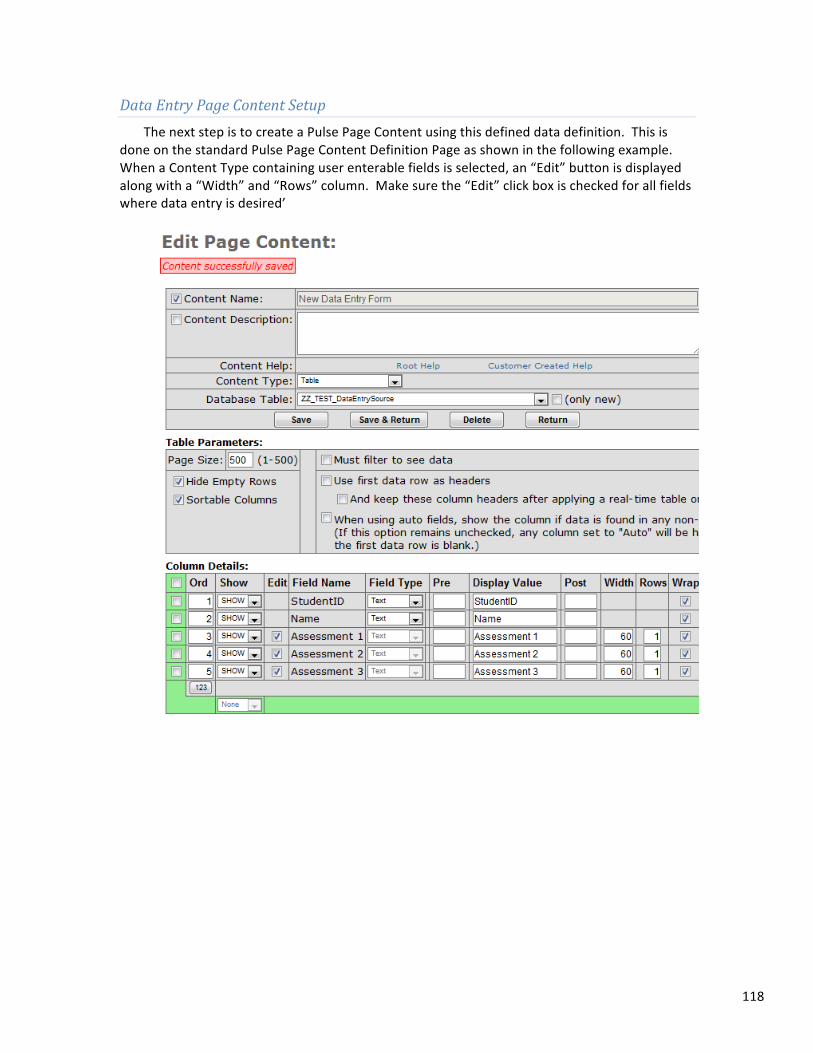
118
Data Entry Page Content Setup The next step is to create a Pulse Page Content using this defined data definition. This is
done on the standard Pulse Page Content Definition Page as shown in the following example. When a Content Type containing user enterable fields is selected, an “Edit” button is displayed along with a “Width” and “Rows” column. Make sure the “Edit” click box is checked for all fields where data entry is desired’
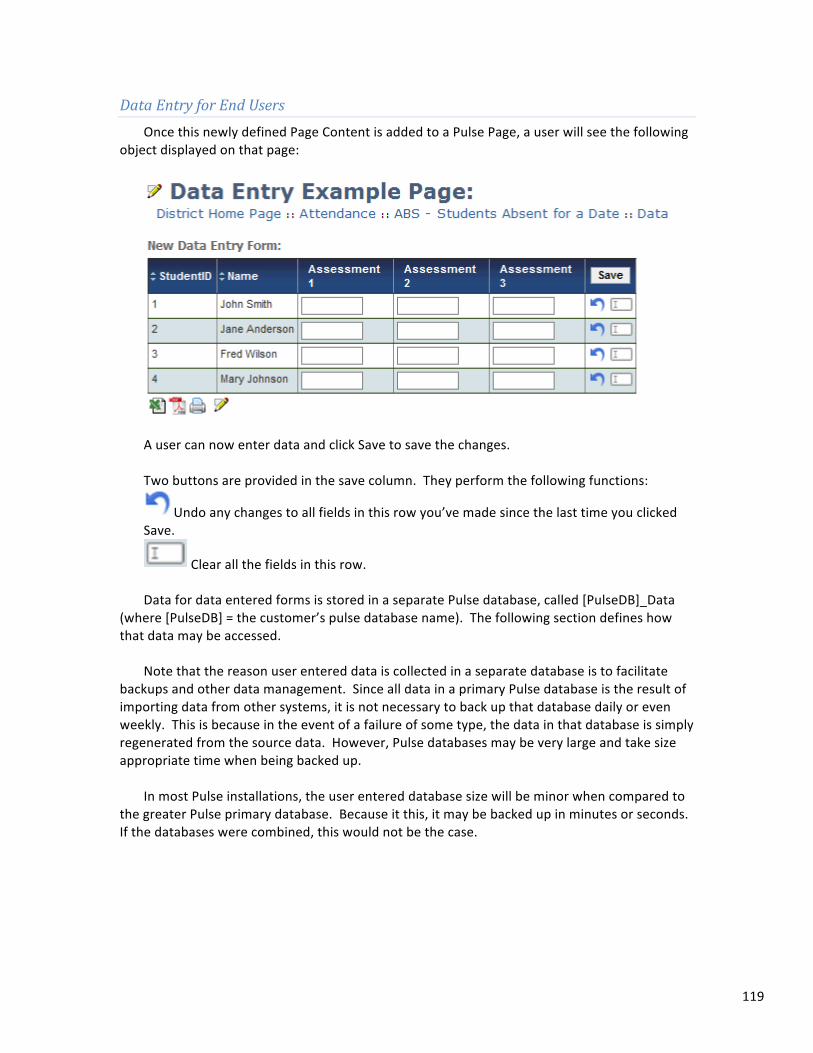
119
Data Entry for End Users Once this newly defined Page Content is added to a Pulse Page, a user will see the following
object displayed on that page:
A user can now enter data and click Save to save the changes. Two buttons are provided in the save column. They perform the following functions:
Undo any changes to all fields in this row you’ve made since the last time you clicked Save.
Clear all the fields in this row. Data for data entered forms is stored in a separate Pulse database, called [PulseDB]_Data
(where [PulseDB] = the customer’s pulse database name). The following section defines how that data may be accessed.
Note that the reason user entered data is collected in a separate database is to facilitate
backups and other data management. Since all data in a primary Pulse database is the result of importing data from other systems, it is not necessary to back up that database daily or even weekly. This is because in the event of a failure of some type, the data in that database is simply regenerated from the source data. However, Pulse databases may be very large and take size appropriate time when being backed up.
In most Pulse installations, the user entered database size will be minor when compared to
the greater Pulse primary database. Because it this, it may be backed up in minutes or seconds. If the databases were combined, this would not be the case.
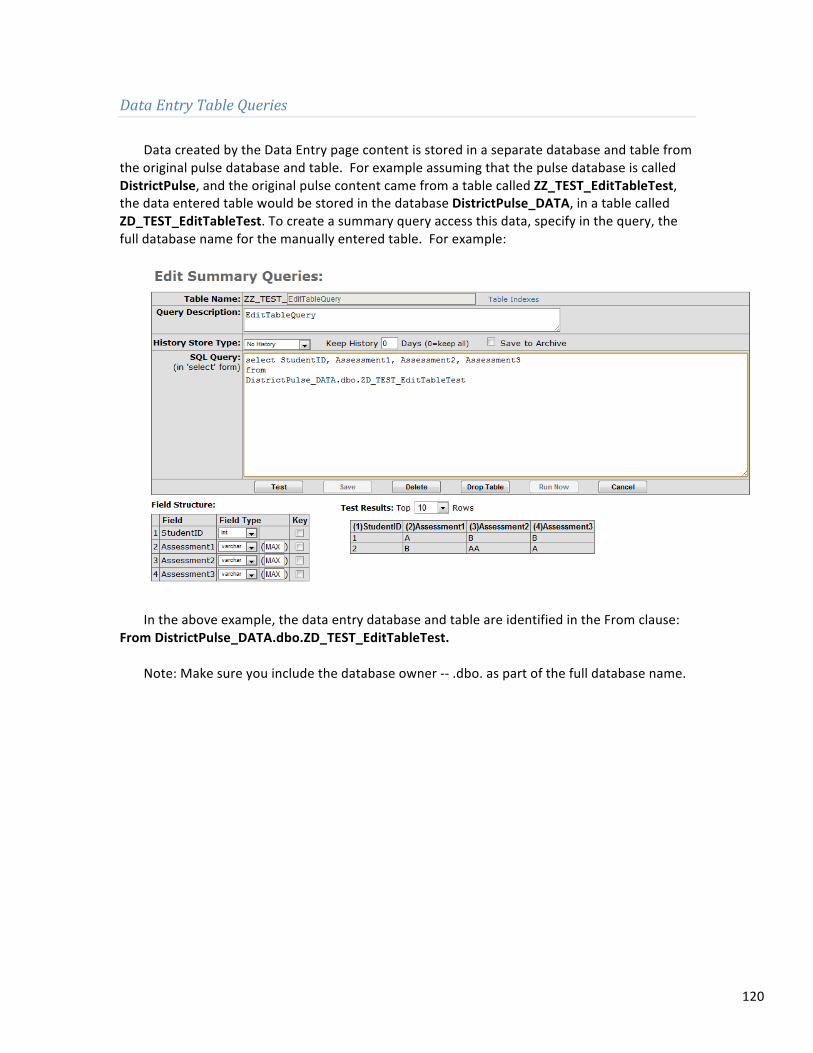
120
Data Entry Table Queries Data created by the Data Entry page content is stored in a separate database and table from
the original pulse database and table. For example assuming that the pulse database is called DistrictPulse, and the original pulse content came from a table called ZZ_TEST_EditTableTest, the data entered table would be stored in the database DistrictPulse_DATA, in a table called ZD_TEST_EditTableTest. To create a summary query access this data, specify in the query, the full database name for the manually entered table. For example:
In the above example, the data entry database and table are identified in the From clause:
From DistrictPulse_DATA.dbo.ZD_TEST_EditTableTest. Note: Make sure you include the database owner -‐-‐ .dbo. as part of the full database name.
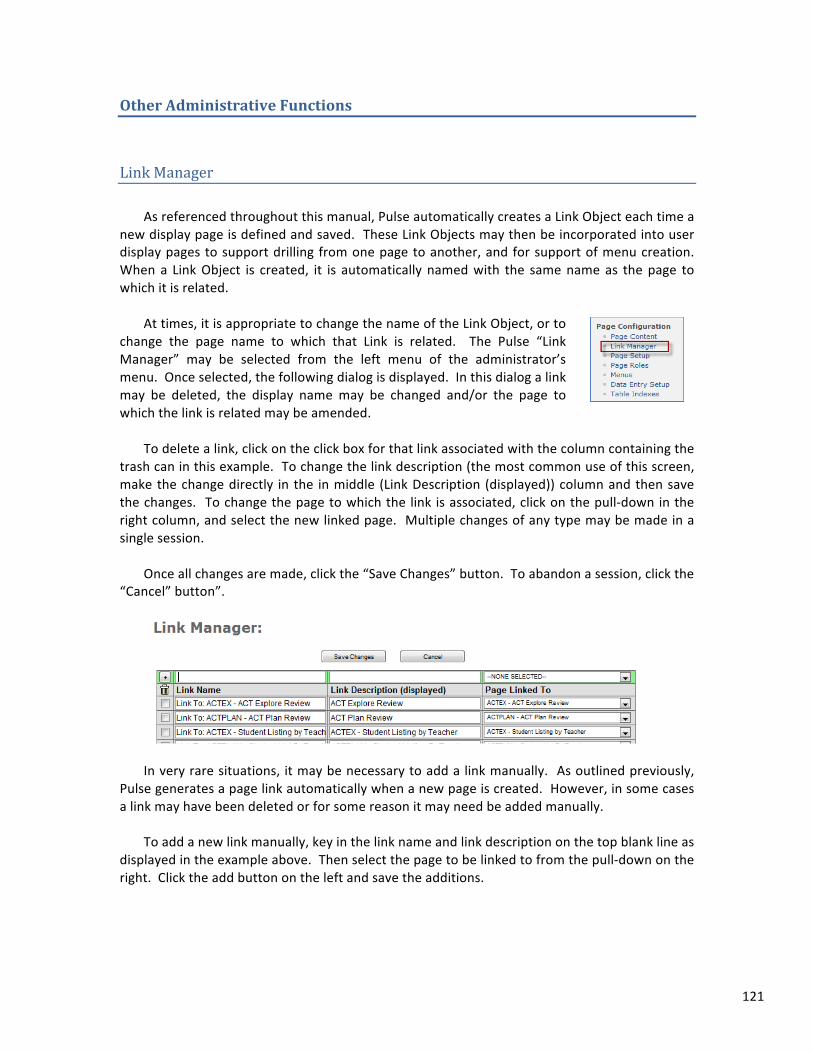
121
Other Administrative Functions
Link Manager As referenced throughout this manual, Pulse automatically creates a Link Object each time a
new display page is defined and saved. These Link Objects may then be incorporated into user display pages to support drilling from one page to another, and for support of menu creation. When a Link Object is created, it is automatically named with the same name as the page to which it is related.
At times, it is appropriate to change the name of the Link Object, or to
change the page name to which that Link is related. The Pulse “Link Manager” may be selected from the left menu of the administrator’s menu. Once selected, the following dialog is displayed. In this dialog a link may be deleted, the display name may be changed and/or the page to which the link is related may be amended.
To delete a link, click on the click box for that link associated with the column containing the
trash can in this example. To change the link description (the most common use of this screen, make the change directly in the in middle (Link Description (displayed)) column and then save the changes. To change the page to which the link is associated, click on the pull-‐down in the right column, and select the new linked page. Multiple changes of any type may be made in a single session.
Once all changes are made, click the “Save Changes” button. To abandon a session, click the
“Cancel” button”.
In very rare situations, it may be necessary to add a link manually. As outlined previously,
Pulse generates a page link automatically when a new page is created. However, in some cases a link may have been deleted or for some reason it may need be added manually.
To add a new link manually, key in the link name and link description on the top blank line as
displayed in the example above. Then select the page to be linked to from the pull-‐down on the right. Click the add button on the left and save the additions.
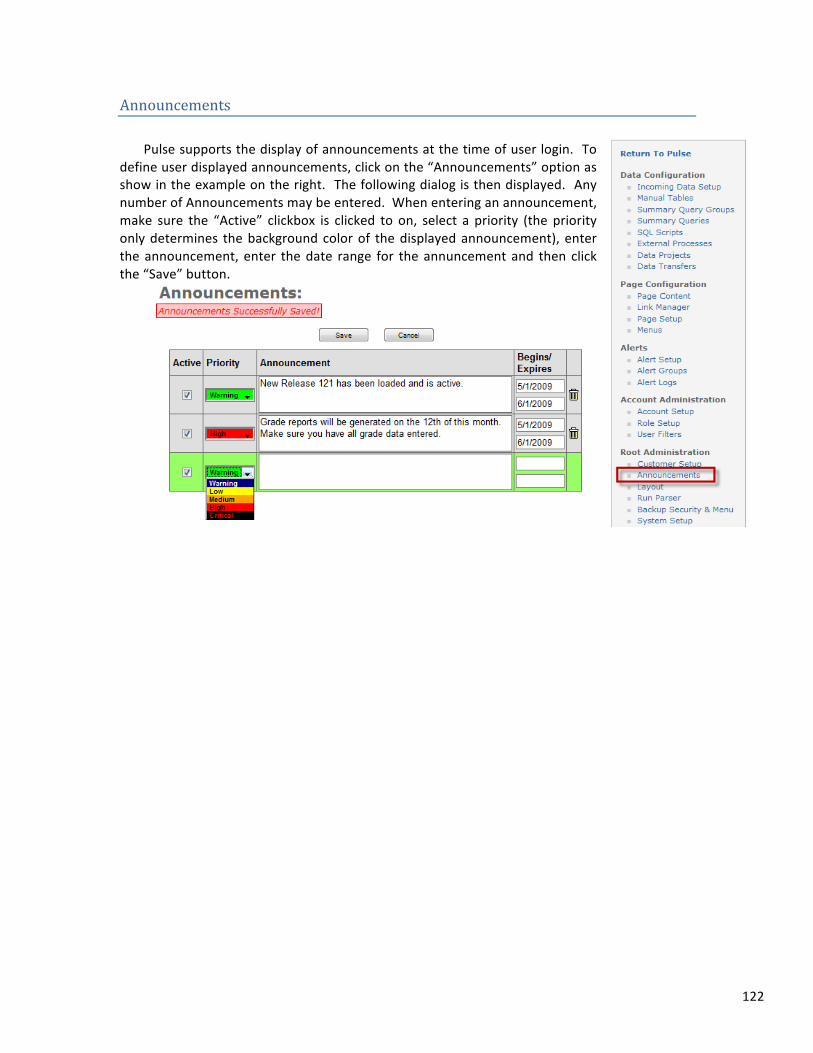
122
Announcements Pulse supports the display of announcements at the time of user login. To
define user displayed announcements, click on the “Announcements” option as show in the example on the right. The following dialog is then displayed. Any number of Announcements may be entered. When entering an announcement, make sure the “Active” clickbox is clicked to on, select a priority (the priority only determines the background color of the displayed announcement), enter the announcement, enter the date range for the annuncement and then click the “Save” button.
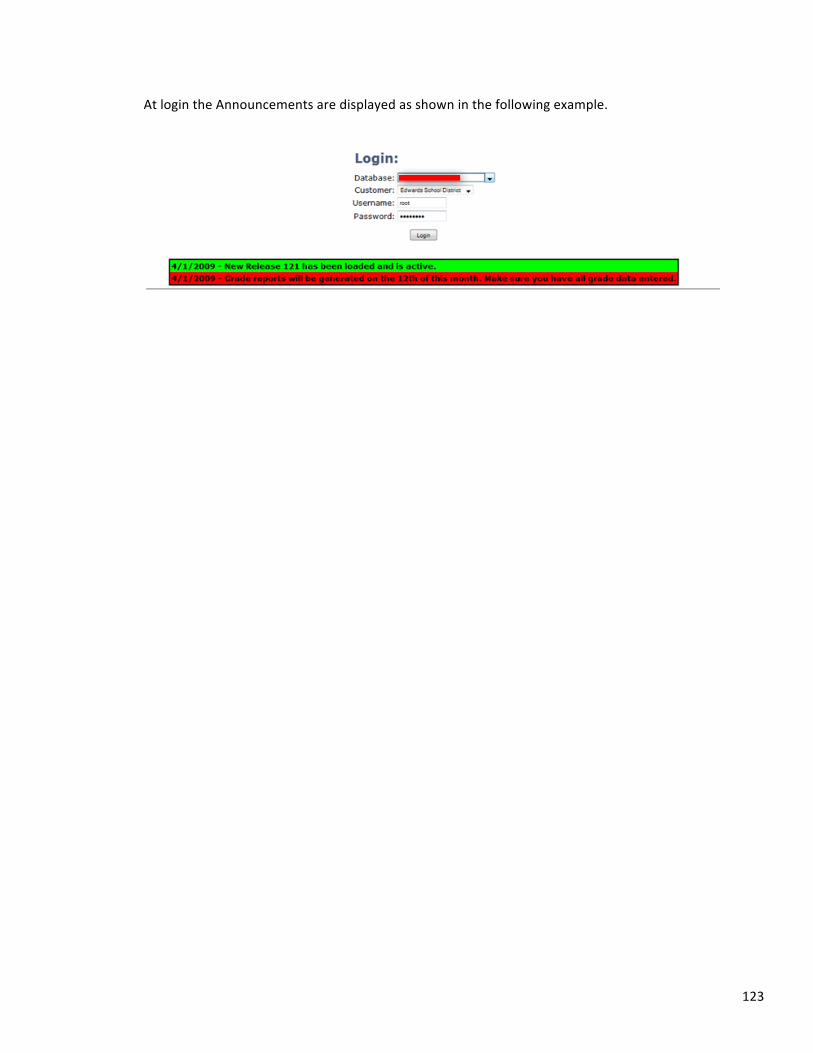
123
At login the Announcements are displayed as shown in the following example.
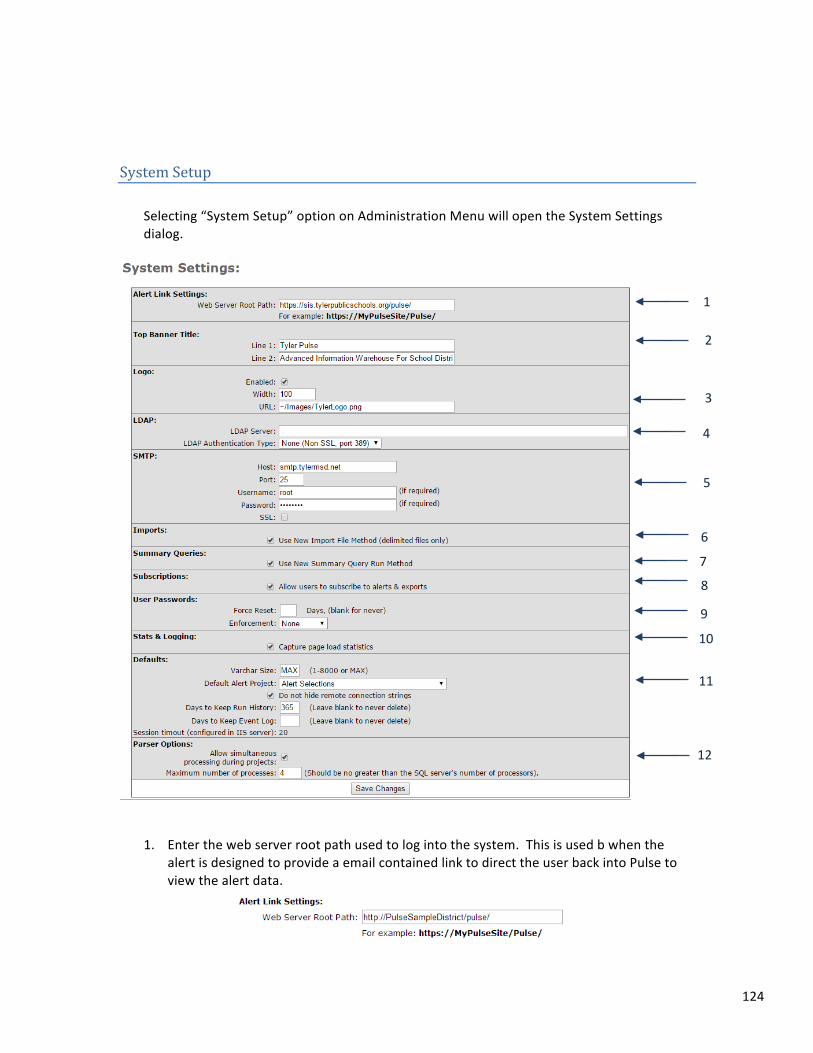
124
System Setup Selecting “System Setup” option on Administration Menu will open the System Settings dialog.
1. Enter the web server root path used to log into the system. This is used b when the alert is designed to provide a email contained link to direct the user back into Pulse to view the alert data.
1
2
3
4
5
6
7
8
9
10
12
11
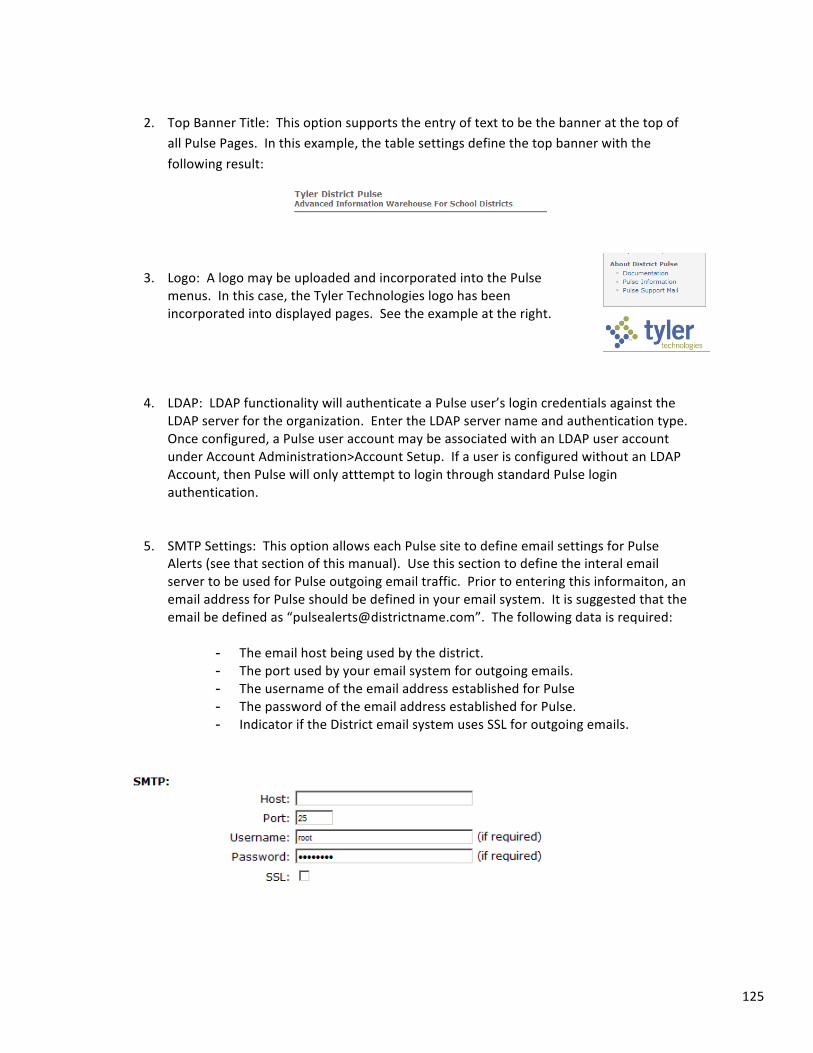
125
2. Top Banner Title: This option supports the entry of text to be the banner at the top of
all Pulse Pages. In this example, the table settings define the top banner with the following result:
3. Logo: A logo may be uploaded and incorporated into the Pulse
menus. In this case, the Tyler Technologies logo has been incorporated into displayed pages. See the example at the right.
4. LDAP: LDAP functionality will authenticate a Pulse user’s login credentials against the
LDAP server for the organization. Enter the LDAP server name and authentication type. Once configured, a Pulse user account may be associated with an LDAP user account under Account Administration>Account Setup. If a user is configured without an LDAP Account, then Pulse will only atttempt to login through standard Pulse login authentication.
5. SMTP Settings: This option allows each Pulse site to define email settings for Pulse Alerts (see that section of this manual). Use this section to define the interal email server to be used for Pulse outgoing email traffic. Prior to entering this informaiton, an email address for Pulse should be defined in your email system. It is suggested that the email be defined as “[email protected]”. The following data is required:
- The email host being used by the district. - The port used by your email system for outgoing emails. - The username of the email address established for Pulse - The password of the email address established for Pulse. - Indicator if the District email system uses SSL for outgoing emails.
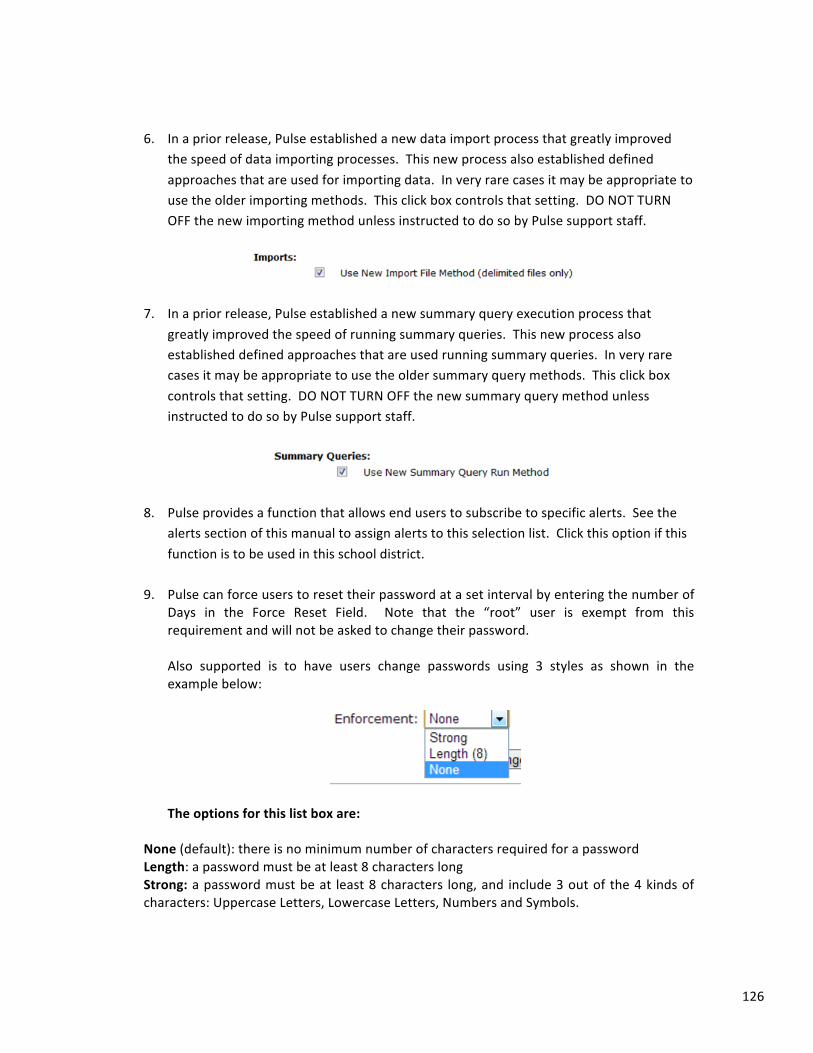
126
6. In a prior release, Pulse established a new data import process that greatly improved the speed of data importing processes. This new process also established defined approaches that are used for importing data. In very rare cases it may be appropriate to use the older importing methods. This click box controls that setting. DO NOT TURN OFF the new importing method unless instructed to do so by Pulse support staff.
7. In a prior release, Pulse established a new summary query execution process that greatly improved the speed of running summary queries. This new process also established defined approaches that are used running summary queries. In very rare cases it may be appropriate to use the older summary query methods. This click box controls that setting. DO NOT TURN OFF the new summary query method unless instructed to do so by Pulse support staff.
8. Pulse provides a function that allows end users to subscribe to specific alerts. See the alerts section of this manual to assign alerts to this selection list. Click this option if this function is to be used in this school district.
9. Pulse can force users to reset their password at a set interval by entering the number of Days in the Force Reset Field. Note that the “root” user is exempt from this requirement and will not be asked to change their password. Also supported is to have users change passwords using 3 styles as shown in the example below:
The options for this list box are: None (default): there is no minimum number of characters required for a password Length: a password must be at least 8 characters long Strong: a password must be at least 8 characters long, and include 3 out of the 4 kinds of characters: Uppercase Letters, Lowercase Letters, Numbers and Symbols.
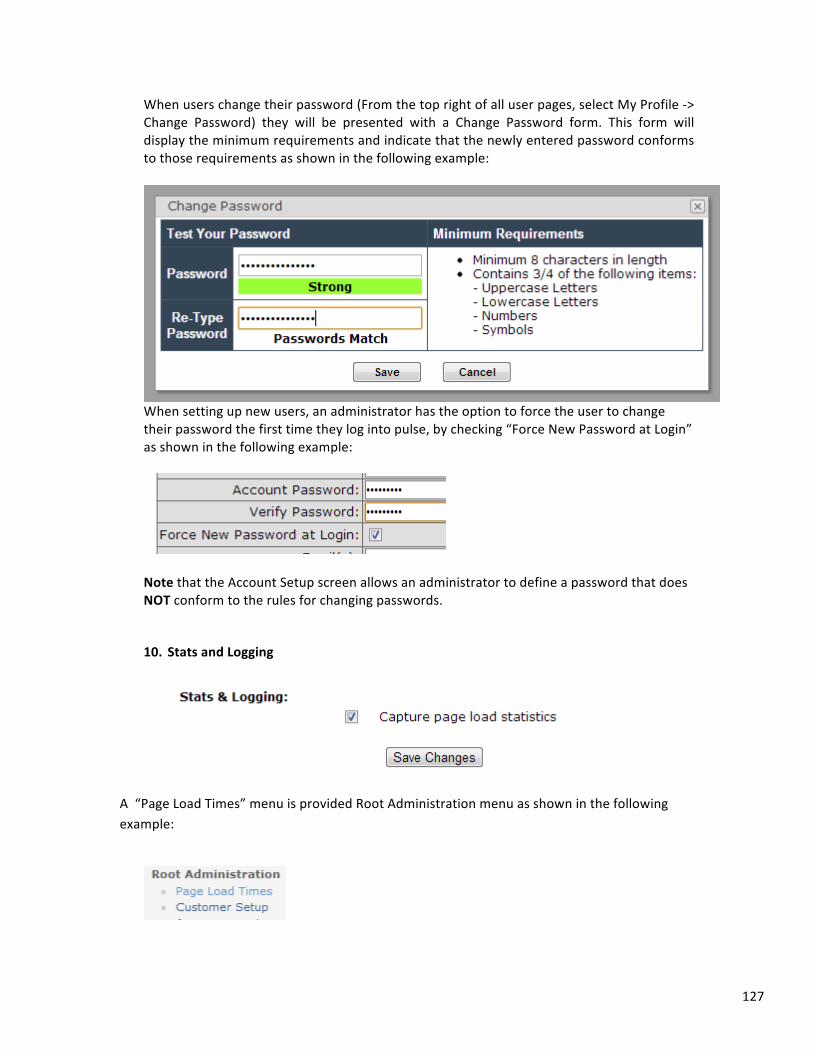
127
When users change their password (From the top right of all user pages, select My Profile -‐> Change Password) they will be presented with a Change Password form. This form will display the minimum requirements and indicate that the newly entered password conforms to those requirements as shown in the following example:
When setting up new users, an administrator has the option to force the user to change their password the first time they log into pulse, by checking “Force New Password at Login” as shown in the following example:
Note that the Account Setup screen allows an administrator to define a password that does NOT conform to the rules for changing passwords.
10. Stats and Logging
A “Page Load Times” menu is provided Root Administration menu as shown in the following example:
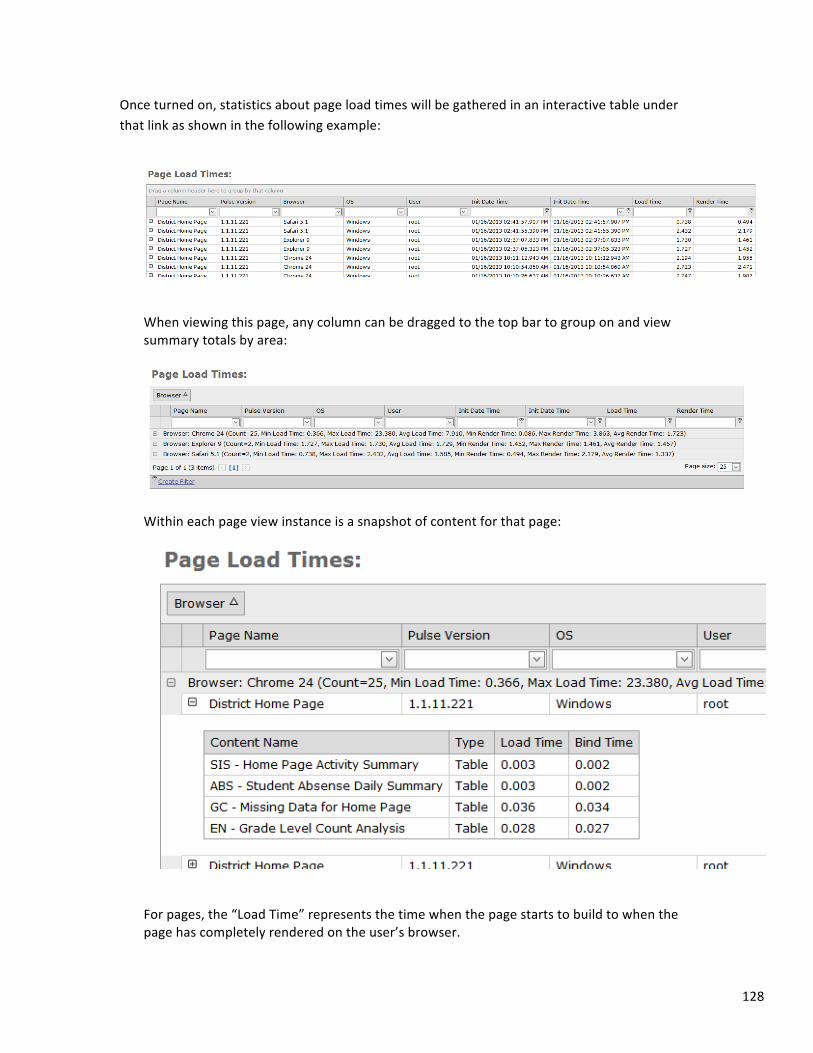
128
Once turned on, statistics about page load times will be gathered in an interactive table under that link as shown in the following example:
When viewing this page, any column can be dragged to the top bar to group on and view summary totals by area:
Within each page view instance is a snapshot of content for that page:
For pages, the “Load Time” represents the time when the page starts to build to when the page has completely rendered on the user’s browser.
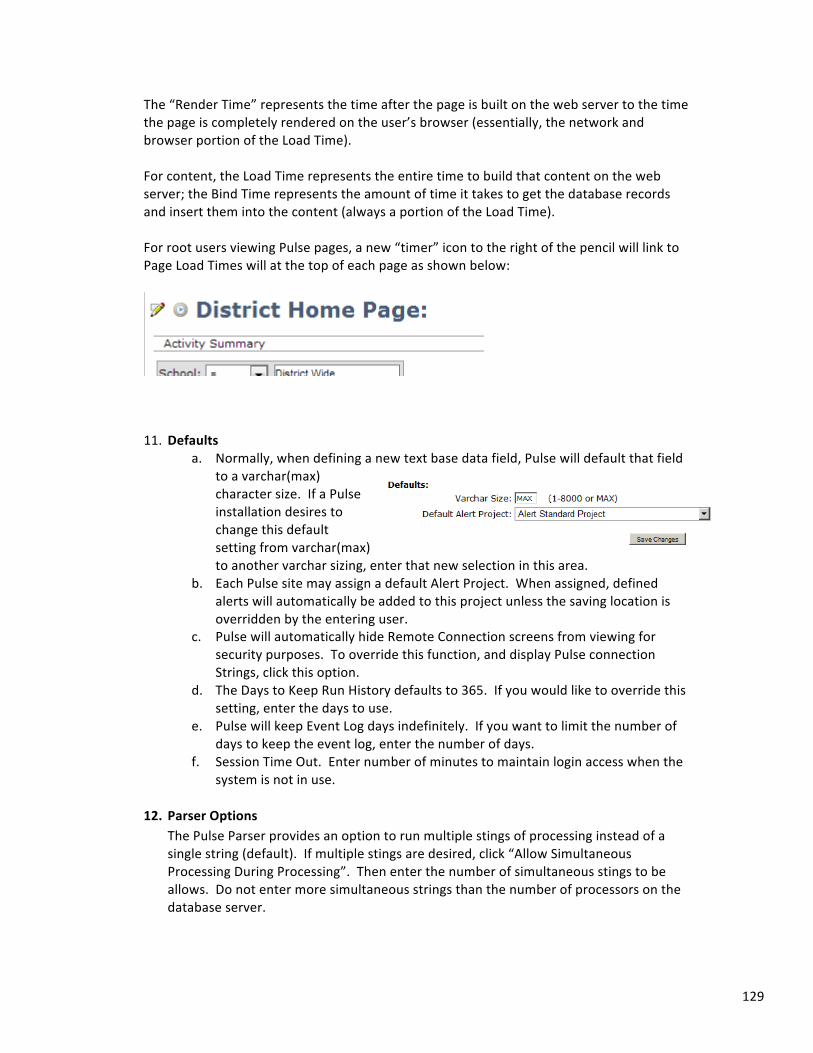
129
The “Render Time” represents the time after the page is built on the web server to the time the page is completely rendered on the user’s browser (essentially, the network and browser portion of the Load Time). For content, the Load Time represents the entire time to build that content on the web server; the Bind Time represents the amount of time it takes to get the database records and insert them into the content (always a portion of the Load Time). For root users viewing Pulse pages, a new “timer” icon to the right of the pencil will link to Page Load Times will at the top of each page as shown below:
11. Defaults
a. Normally, when defining a new text base data field, Pulse will default that field to a varchar(max) character size. If a Pulse installation desires to change this default setting from varchar(max) to another varchar sizing, enter that new selection in this area.
b. Each Pulse site may assign a default Alert Project. When assigned, defined alerts will automatically be added to this project unless the saving location is overridden by the entering user.
c. Pulse will automatically hide Remote Connection screens from viewing for security purposes. To override this function, and display Pulse connection Strings, click this option.
d. The Days to Keep Run History defaults to 365. If you would like to override this setting, enter the days to use.
e. Pulse will keep Event Log days indefinitely. If you want to limit the number of days to keep the event log, enter the number of days.
f. Session Time Out. Enter number of minutes to maintain login access when the system is not in use.
12. Parser Options
The Pulse Parser provides an option to run multiple stings of processing instead of a single string (default). If multiple stings are desired, click “Allow Simultaneous Processing During Processing”. Then enter the number of simultaneous stings to be allows. Do not enter more simultaneous strings than the number of processors on the database server.
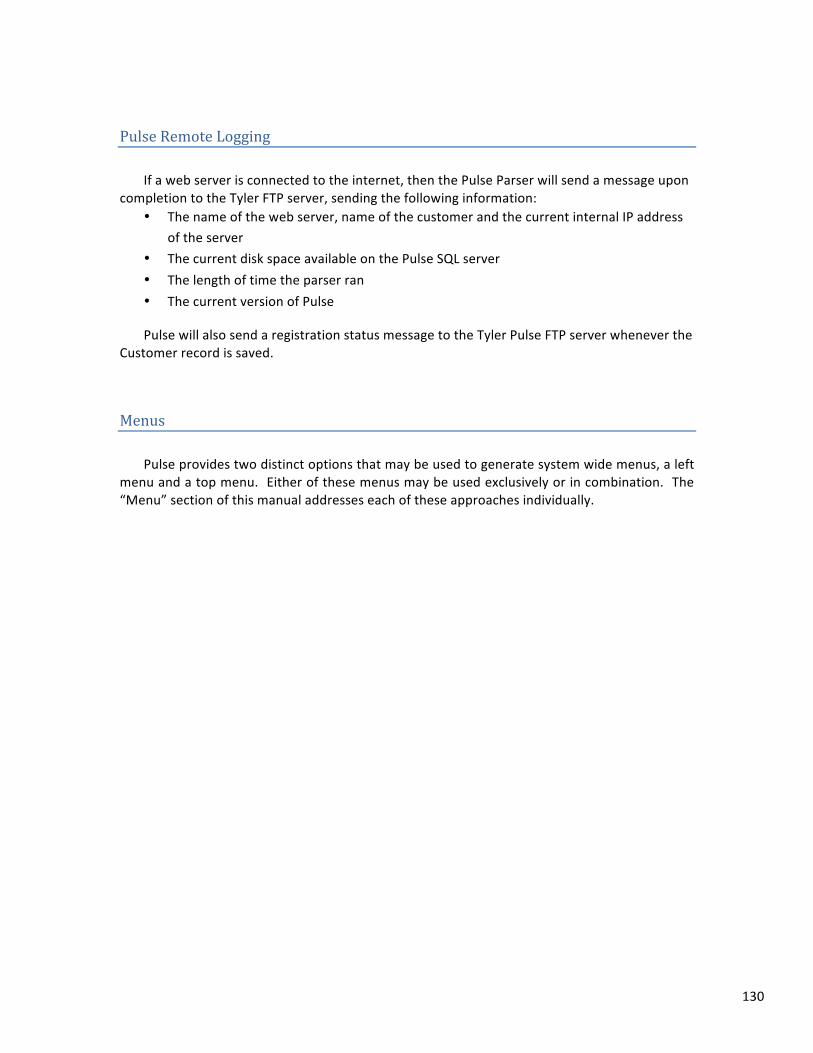
130
Pulse Remote Logging If a web server is connected to the internet, then the Pulse Parser will send a message upon
completion to the Tyler FTP server, sending the following information: • The name of the web server, name of the customer and the current internal IP address
of the server • The current disk space available on the Pulse SQL server • The length of time the parser ran • The current version of Pulse
Pulse will also send a registration status message to the Tyler Pulse FTP server whenever the Customer record is saved.
Menus Pulse provides two distinct options that may be used to generate system wide menus, a left
menu and a top menu. Either of these menus may be used exclusively or in combination. The “Menu” section of this manual addresses each of these approaches individually.
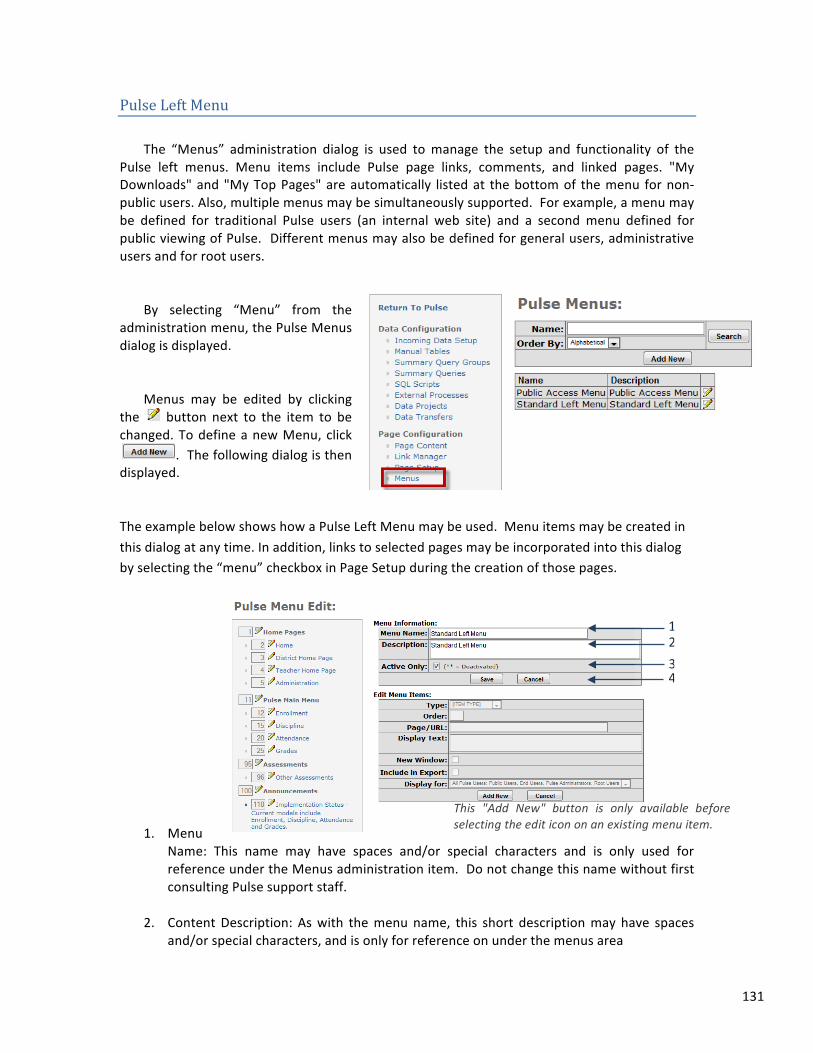
131
Pulse Left Menu The “Menus” administration dialog is used to manage the setup and functionality of the
Pulse left menus. Menu items include Pulse page links, comments, and linked pages. "My Downloads" and "My Top Pages" are automatically listed at the bottom of the menu for non-‐public users. Also, multiple menus may be simultaneously supported. For example, a menu may be defined for traditional Pulse users (an internal web site) and a second menu defined for public viewing of Pulse. Different menus may also be defined for general users, administrative users and for root users.
By selecting “Menu” from the
administration menu, the Pulse Menus dialog is displayed.
Menus may be edited by clicking
the button next to the item to be changed. To define a new Menu, click
. The following dialog is then displayed.
The example below shows how a Pulse Left Menu may be used. Menu items may be created in this dialog at any time. In addition, links to selected pages may be incorporated into this dialog by selecting the “menu” checkbox in Page Setup during the creation of those pages.
1. Menu
Name: This name may have spaces and/or special characters and is only used for reference under the Menus administration item. Do not change this name without first consulting Pulse support staff.
2. Content Description: As with the menu name, this short description may have spaces and/or special characters, and is only for reference on under the menus area
1 2 3 4
This "Add New" button is only available before selecting the edit icon on an existing menu item.
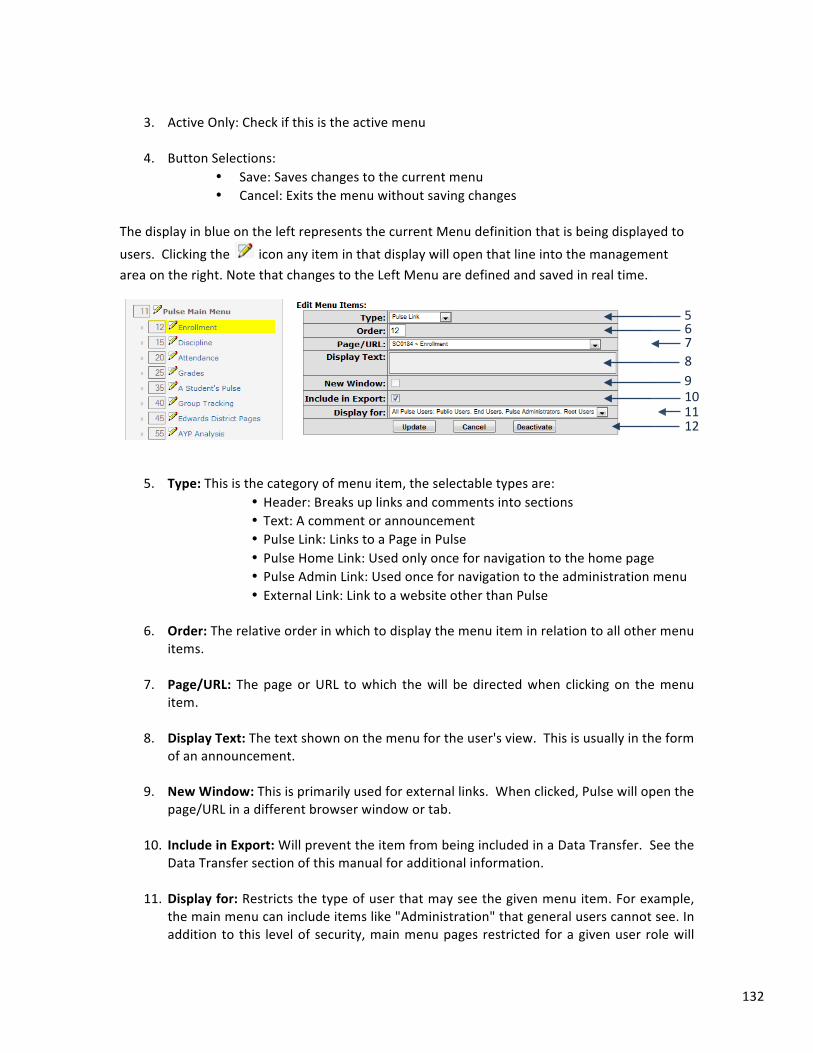
132
3. Active Only: Check if this is the active menu
4. Button Selections:
• Save: Saves changes to the current menu • Cancel: Exits the menu without saving changes
The display in blue on the left represents the current Menu definition that is being displayed to users. Clicking the icon any item in that display will open that line into the management area on the right. Note that changes to the Left Menu are defined and saved in real time.
5. Type: This is the category of menu item, the selectable types are:
• Header: Breaks up links and comments into sections • Text: A comment or announcement • Pulse Link: Links to a Page in Pulse • Pulse Home Link: Used only once for navigation to the home page • Pulse Admin Link: Used once for navigation to the administration menu • External Link: Link to a website other than Pulse
6. Order: The relative order in which to display the menu item in relation to all other menu
items.
7. Page/URL: The page or URL to which the will be directed when clicking on the menu item.
8. Display Text: The text shown on the menu for the user's view. This is usually in the form
of an announcement.
9. New Window: This is primarily used for external links. When clicked, Pulse will open the page/URL in a different browser window or tab.
10. Include in Export: Will prevent the item from being included in a Data Transfer. See the Data Transfer section of this manual for additional information.
11. Display for: Restricts the type of user that may see the given menu item. For example, the main menu can include items like "Administration" that general users cannot see. In addition to this level of security, main menu pages restricted for a given user role will
5 6 7 8 9 10 11 12
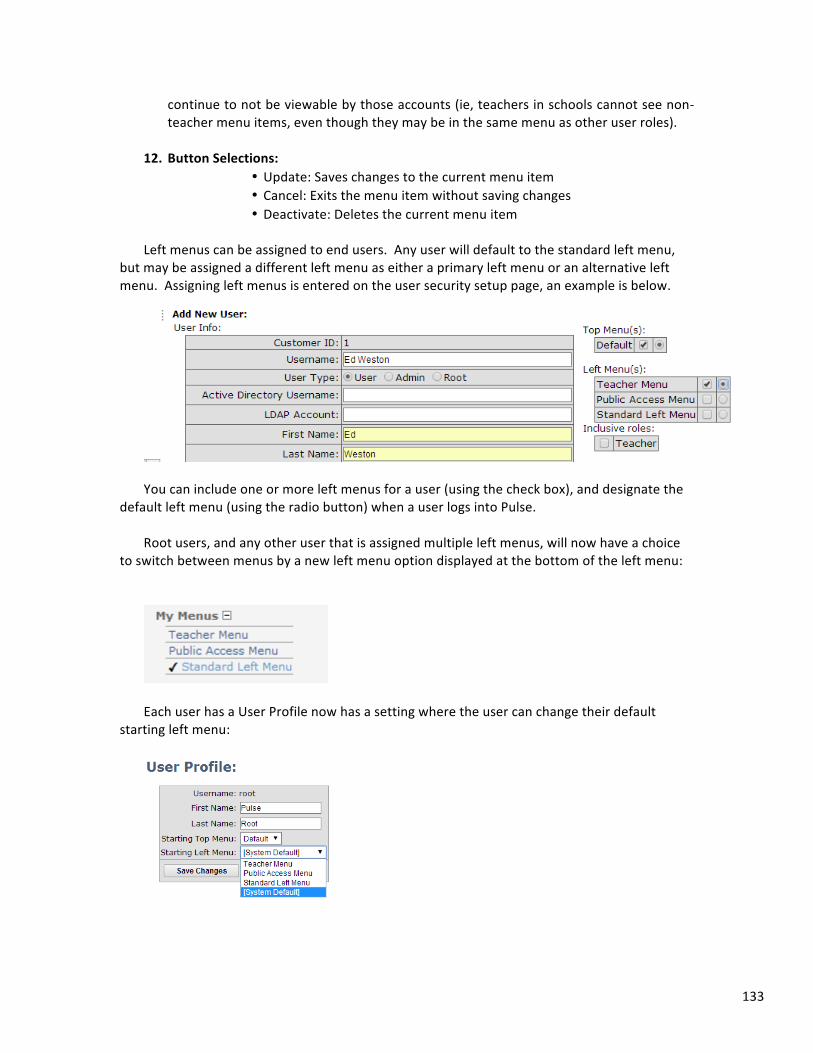
133
continue to not be viewable by those accounts (ie, teachers in schools cannot see non-‐teacher menu items, even though they may be in the same menu as other user roles).
12. Button Selections:
• Update: Saves changes to the current menu item • Cancel: Exits the menu item without saving changes • Deactivate: Deletes the current menu item
Left menus can be assigned to end users. Any user will default to the standard left menu,
but may be assigned a different left menu as either a primary left menu or an alternative left menu. Assigning left menus is entered on the user security setup page, an example is below.
You can include one or more left menus for a user (using the check box), and designate the
default left menu (using the radio button) when a user logs into Pulse. Root users, and any other user that is assigned multiple left menus, will now have a choice
to switch between menus by a new left menu option displayed at the bottom of the left menu:
Each user has a User Profile now has a setting where the user can change their default
starting left menu:
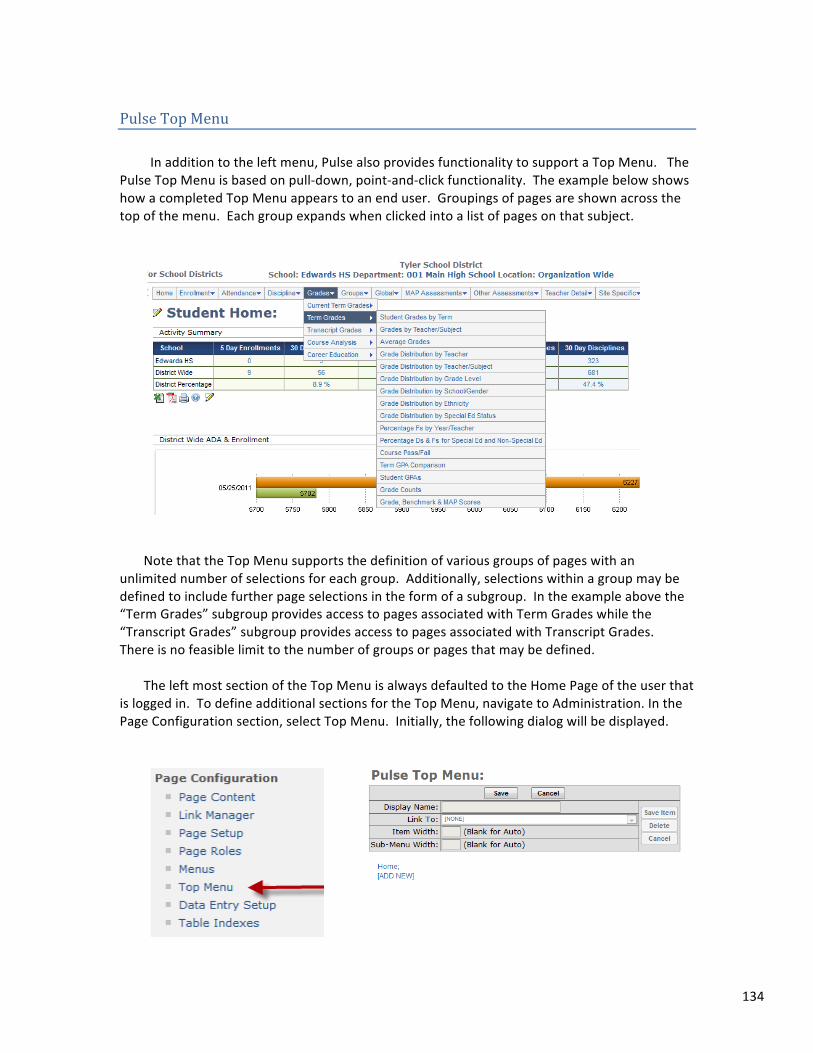
134
Pulse Top Menu In addition to the left menu, Pulse also provides functionality to support a Top Menu. The
Pulse Top Menu is based on pull-‐down, point-‐and-‐click functionality. The example below shows how a completed Top Menu appears to an end user. Groupings of pages are shown across the top of the menu. Each group expands when clicked into a list of pages on that subject.
Note that the Top Menu supports the definition of various groups of pages with an
unlimited number of selections for each group. Additionally, selections within a group may be defined to include further page selections in the form of a subgroup. In the example above the “Term Grades” subgroup provides access to pages associated with Term Grades while the “Transcript Grades” subgroup provides access to pages associated with Transcript Grades. There is no feasible limit to the number of groups or pages that may be defined.
The left most section of the Top Menu is always defaulted to the Home Page of the user that
is logged in. To define additional sections for the Top Menu, navigate to Administration. In the Page Configuration section, select Top Menu. Initially, the following dialog will be displayed.
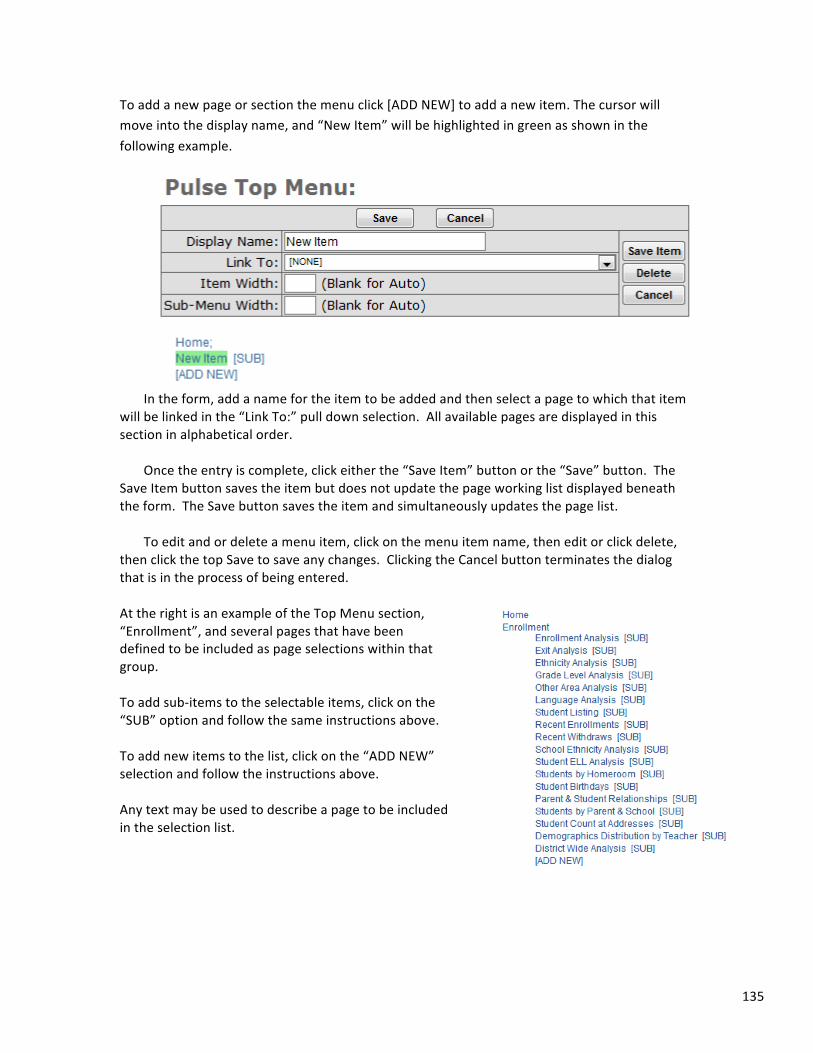
135
To add a new page or section the menu click [ADD NEW] to add a new item. The cursor will move into the display name, and “New Item” will be highlighted in green as shown in the following example.
In the form, add a name for the item to be added and then select a page to which that item
will be linked in the “Link To:” pull down selection. All available pages are displayed in this section in alphabetical order.
Once the entry is complete, click either the “Save Item” button or the “Save” button. The
Save Item button saves the item but does not update the page working list displayed beneath the form. The Save button saves the item and simultaneously updates the page list.
To edit and or delete a menu item, click on the menu item name, then edit or click delete,
then click the top Save to save any changes. Clicking the Cancel button terminates the dialog that is in the process of being entered. At the right is an example of the Top Menu section, “Enrollment”, and several pages that have been defined to be included as page selections within that group. To add sub-‐items to the selectable items, click on the “SUB” option and follow the same instructions above. To add new items to the list, click on the “ADD NEW” selection and follow the instructions above. Any text may be used to describe a page to be included in the selection list.
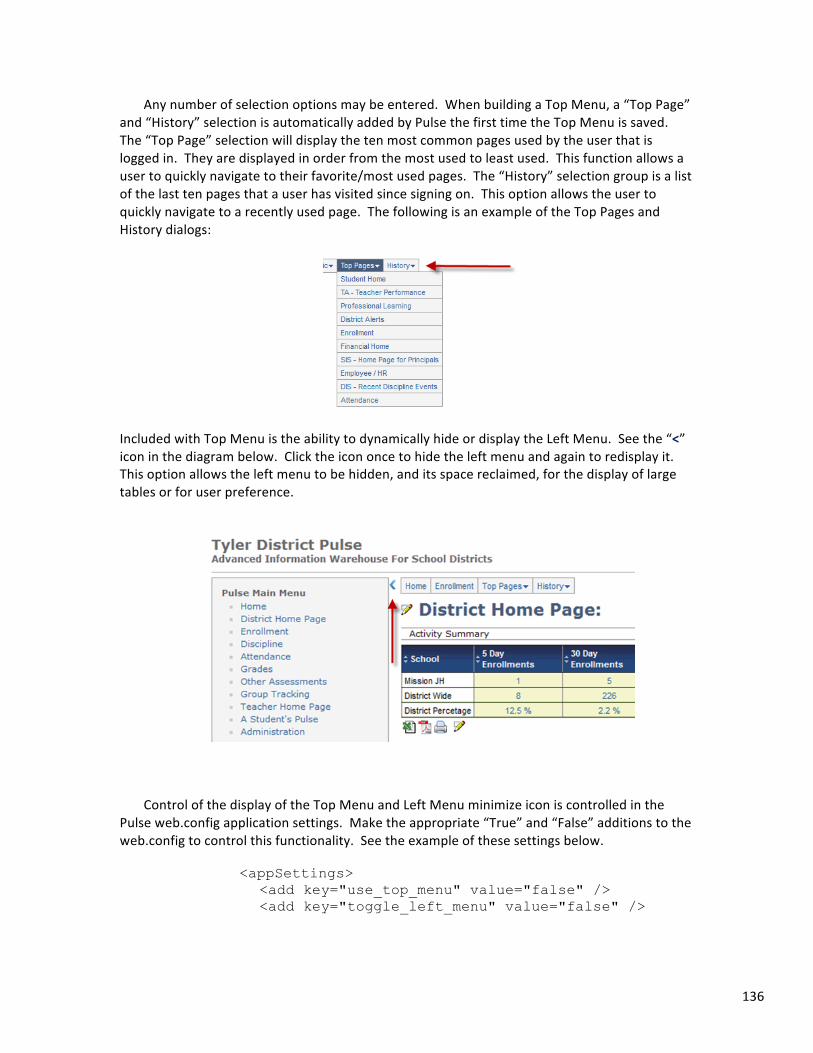
136
Any number of selection options may be entered. When building a Top Menu, a “Top Page” and “History” selection is automatically added by Pulse the first time the Top Menu is saved. The “Top Page” selection will display the ten most common pages used by the user that is logged in. They are displayed in order from the most used to least used. This function allows a user to quickly navigate to their favorite/most used pages. The “History” selection group is a list of the last ten pages that a user has visited since signing on. This option allows the user to quickly navigate to a recently used page. The following is an example of the Top Pages and History dialogs:
Included with Top Menu is the ability to dynamically hide or display the Left Menu. See the “<” icon in the diagram below. Click the icon once to hide the left menu and again to redisplay it. This option allows the left menu to be hidden, and its space reclaimed, for the display of large tables or for user preference.
Control of the display of the Top Menu and Left Menu minimize icon is controlled in the
Pulse web.config application settings. Make the appropriate “True” and “False” additions to the web.config to control this functionality. See the example of these settings below.
<appSettings>
<add key="use_top_menu" value="false" /> <add key="toggle_left_menu" value="false" />
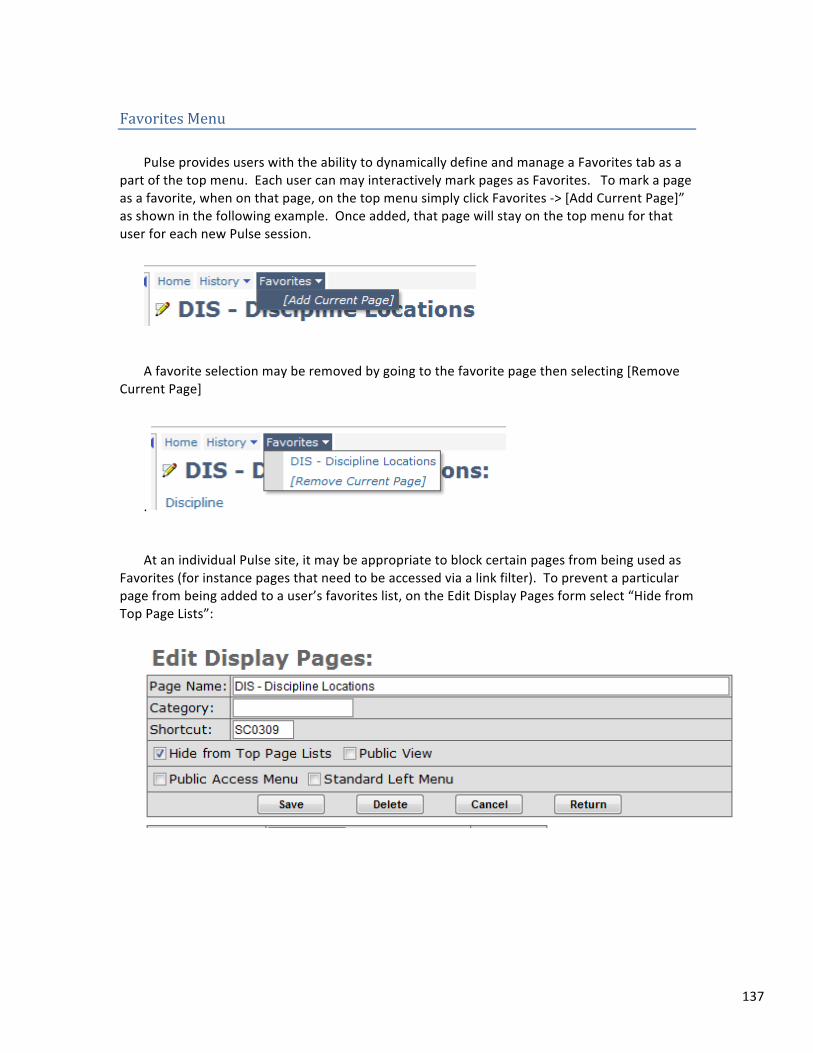
137
Favorites Menu Pulse provides users with the ability to dynamically define and manage a Favorites tab as a
part of the top menu. Each user can may interactively mark pages as Favorites. To mark a page as a favorite, when on that page, on the top menu simply click Favorites -‐> [Add Current Page]” as shown in the following example. Once added, that page will stay on the top menu for that user for each new Pulse session.
A favorite selection may be removed by going to the favorite page then selecting [Remove
Current Page]
. At an individual Pulse site, it may be appropriate to block certain pages from being used as
Favorites (for instance pages that need to be accessed via a link filter). To prevent a particular page from being added to a user’s favorites list, on the Edit Display Pages form select “Hide from Top Page Lists”:
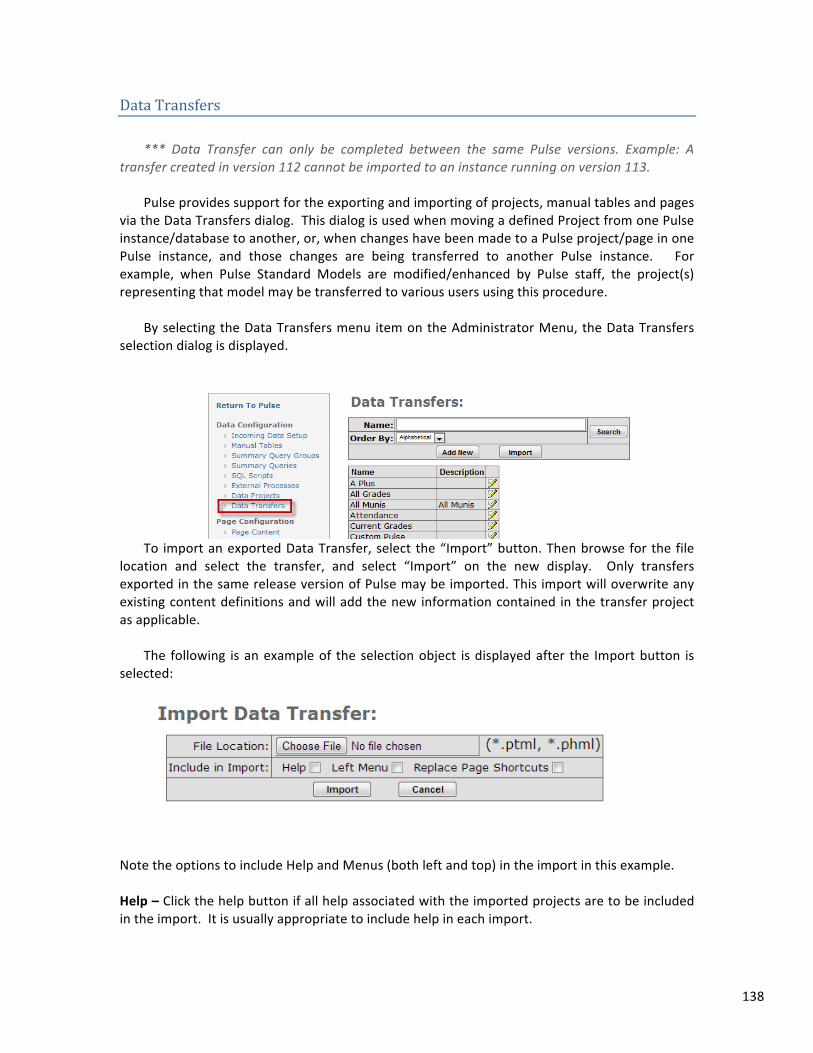
138
Data Transfers *** Data Transfer can only be completed between the same Pulse versions. Example: A
transfer created in version 112 cannot be imported to an instance running on version 113. Pulse provides support for the exporting and importing of projects, manual tables and pages
via the Data Transfers dialog. This dialog is used when moving a defined Project from one Pulse instance/database to another, or, when changes have been made to a Pulse project/page in one Pulse instance, and those changes are being transferred to another Pulse instance. For example, when Pulse Standard Models are modified/enhanced by Pulse staff, the project(s) representing that model may be transferred to various users using this procedure.
By selecting the Data Transfers menu item on the Administrator Menu, the Data Transfers
selection dialog is displayed.
To import an exported Data Transfer, select the “Import” button. Then browse for the file
location and select the transfer, and select “Import” on the new display. Only transfers exported in the same release version of Pulse may be imported. This import will overwrite any existing content definitions and will add the new information contained in the transfer project as applicable.
The following is an example of the selection object is displayed after the Import button is
selected:
Note the options to include Help and Menus (both left and top) in the import in this example. Help – Click the help button if all help associated with the imported projects are to be included in the import. It is usually appropriate to include help in each import.
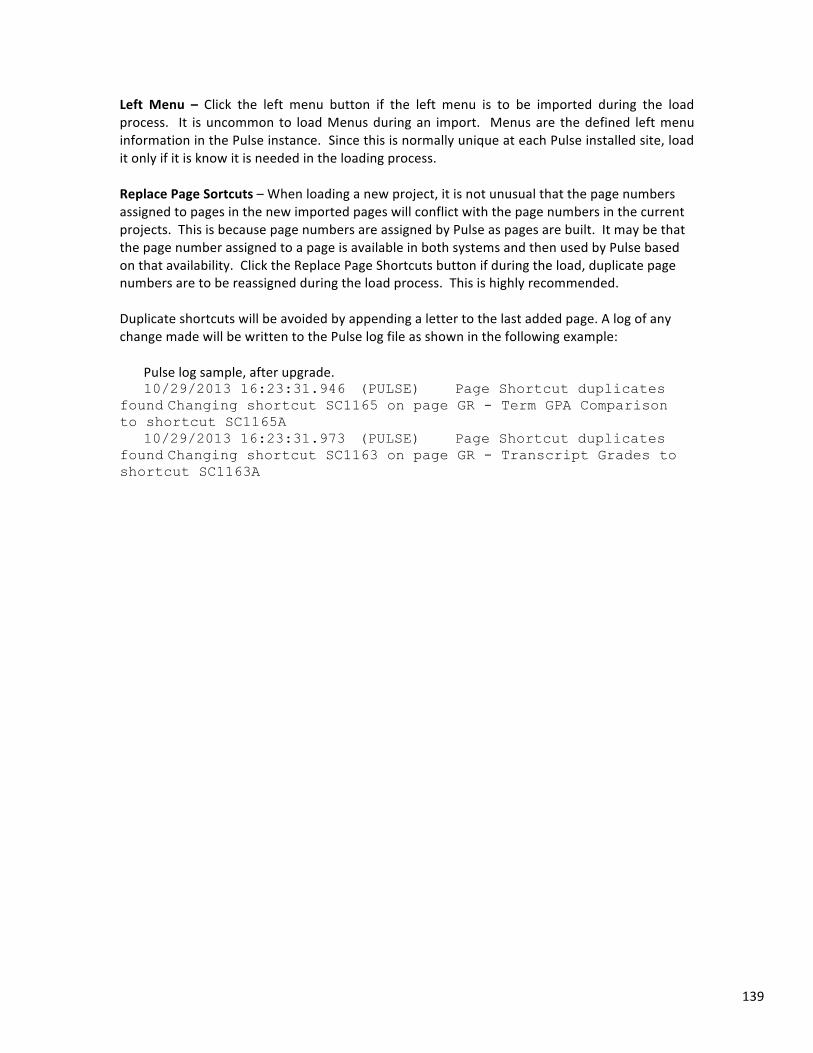
139
Left Menu – Click the left menu button if the left menu is to be imported during the load process. It is uncommon to load Menus during an import. Menus are the defined left menu information in the Pulse instance. Since this is normally unique at each Pulse installed site, load it only if it is know it is needed in the loading process. Replace Page Sortcuts – When loading a new project, it is not unusual that the page numbers assigned to pages in the new imported pages will conflict with the page numbers in the current projects. This is because page numbers are assigned by Pulse as pages are built. It may be that the page number assigned to a page is available in both systems and then used by Pulse based on that availability. Click the Replace Page Shortcuts button if during the load, duplicate page numbers are to be reassigned during the load process. This is highly recommended. Duplicate shortcuts will be avoided by appending a letter to the last added page. A log of any change made will be written to the Pulse log file as shown in the following example:
Pulse log sample, after upgrade. 10/29/2013 16:23:31.946 (PULSE) Page Shortcut duplicates
found Changing shortcut SC1165 on page GR - Term GPA Comparison to shortcut SC1165A
10/29/2013 16:23:31.973 (PULSE) Page Shortcut duplicates found Changing shortcut SC1163 on page GR - Transcript Grades to shortcut SC1163A
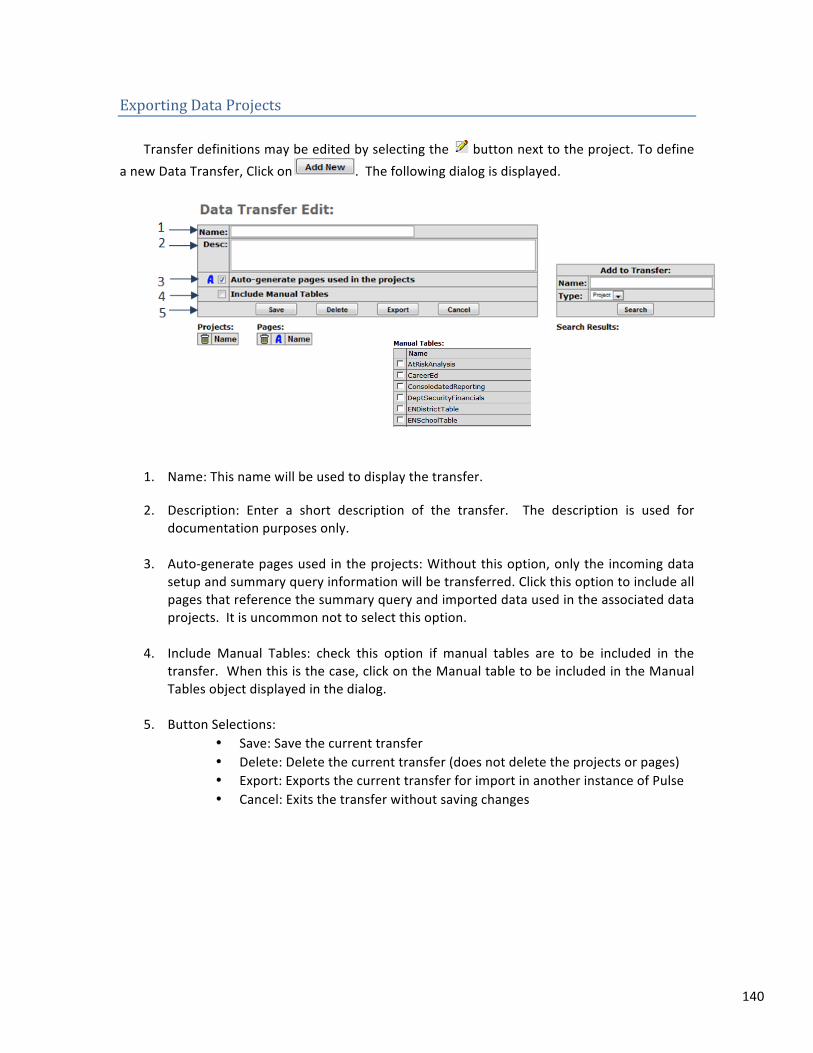
140
Exporting Data Projects Transfer definitions may be edited by selecting the button next to the project. To define
a new Data Transfer, Click on . The following dialog is displayed.
1. Name: This name will be used to display the transfer.
2. Description: Enter a short description of the transfer. The description is used for documentation purposes only.
3. Auto-‐generate pages used in the projects: Without this option, only the incoming data
setup and summary query information will be transferred. Click this option to include all pages that reference the summary query and imported data used in the associated data projects. It is uncommon not to select this option.
4. Include Manual Tables: check this option if manual tables are to be included in the
transfer. When this is the case, click on the Manual table to be included in the Manual Tables object displayed in the dialog.
5. Button Selections:
• Save: Save the current transfer • Delete: Delete the current transfer (does not delete the projects or pages) • Export: Exports the current transfer for import in another instance of Pulse • Cancel: Exits the transfer without saving changes

141
6. Add to Transfer Area: When creating or updating a data transfer, search for the new
project or page using the “Add to Transfer” search box. To add the project or page, select the checkbox for the item and click . To delete the project or page, select the checkbox next to the item and select .
7. Projects: This is a list of the selected projects. These projects include all Incoming Files, Summary Query Groups and all other objects that are defined in the project(s).
8. Pages: This is a list of selected pages. Pages associated with projects are automatically included when projects are added. Additional pages ages included through the Add to Transfer Area.
9. Manual Tables: Selected Manual Tables to be included in the project export.
When selecting , the transfer will automatically process and create an export file. A save file dialog window will open to save the text file. Select the desired disk location and save the file.
Pulse will read through the entire project and page information and include ALL of the
content and pages that use the summary queries and imported data in the project(s). It is not uncommon that a user page will use information from multiple projects (such as combining assessment data from an assessment project with student demographic data from a student project). In this case, a page may be a part of multiple projects and, therefore, exported or imported each time a project in which it is a member is processed.
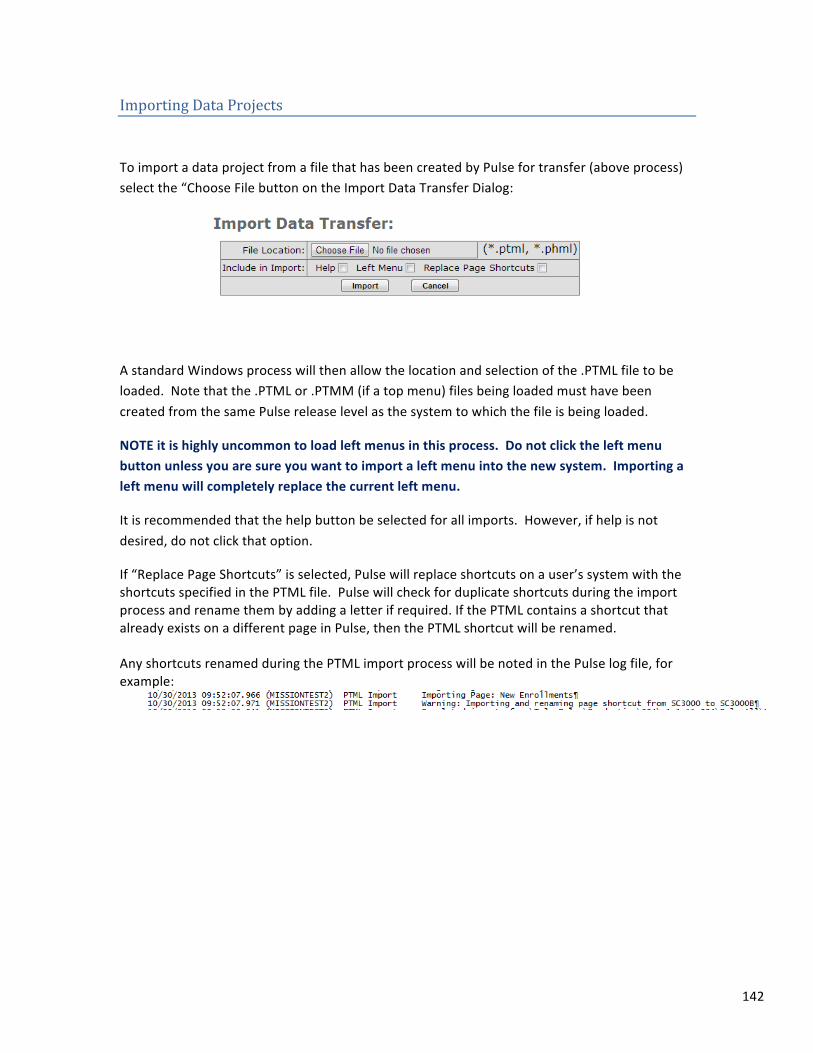
142
Importing Data Projects
To import a data project from a file that has been created by Pulse for transfer (above process) select the “Choose File button on the Import Data Transfer Dialog:
A standard Windows process will then allow the location and selection of the .PTML file to be loaded. Note that the .PTML or .PTMM (if a top menu) files being loaded must have been created from the same Pulse release level as the system to which the file is being loaded.
NOTE it is highly uncommon to load left menus in this process. Do not click the left menu button unless you are sure you want to import a left menu into the new system. Importing a left menu will completely replace the current left menu.
It is recommended that the help button be selected for all imports. However, if help is not desired, do not click that option.
If “Replace Page Shortcuts” is selected, Pulse will replace shortcuts on a user’s system with the shortcuts specified in the PTML file. Pulse will check for duplicate shortcuts during the import process and rename them by adding a letter if required. If the PTML contains a shortcut that already exists on a different page in Pulse, then the PTML shortcut will be renamed. Any shortcuts renamed during the PTML import process will be noted in the Pulse log file, for example:
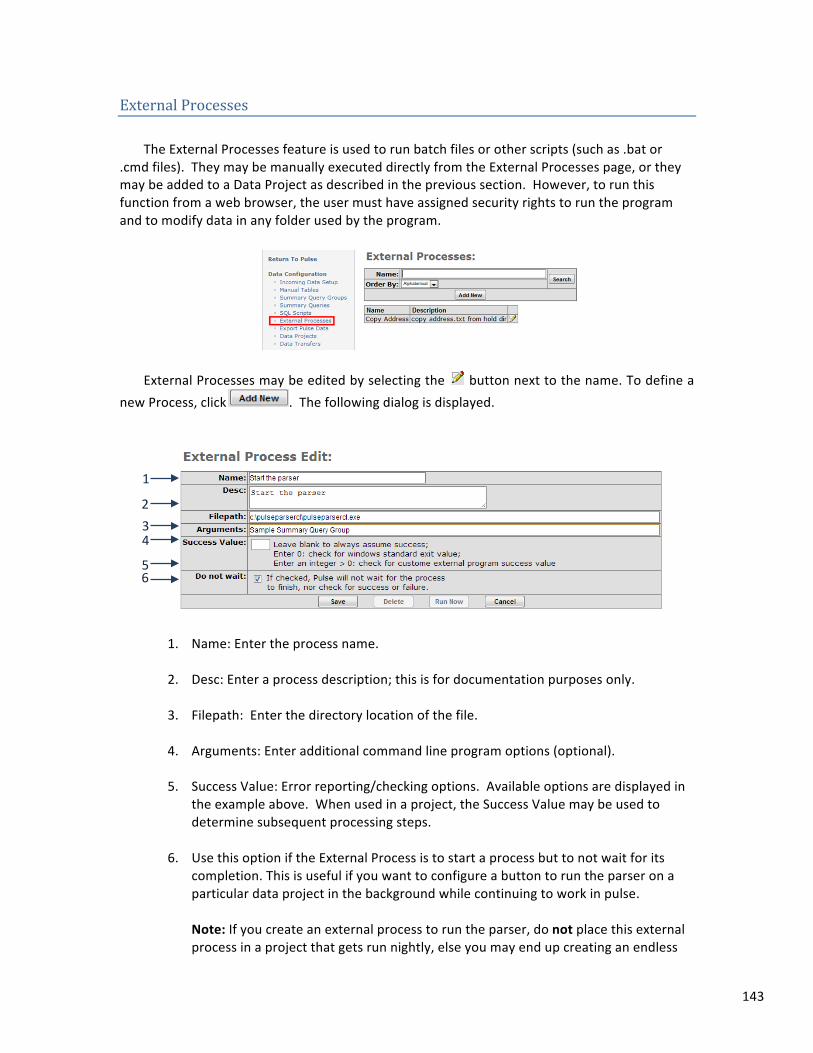
143
External Processes The External Processes feature is used to run batch files or other scripts (such as .bat or
.cmd files). They may be manually executed directly from the External Processes page, or they may be added to a Data Project as described in the previous section. However, to run this function from a web browser, the user must have assigned security rights to run the program and to modify data in any folder used by the program.
External Processes may be edited by selecting the button next to the name. To define a
new Process, click . The following dialog is displayed.
1. Name: Enter the process name.
2. Desc: Enter a process description; this is for documentation purposes only.
3. Filepath: Enter the directory location of the file.
4. Arguments: Enter additional command line program options (optional).
5. Success Value: Error reporting/checking options. Available options are displayed in
the example above. When used in a project, the Success Value may be used to determine subsequent processing steps.
6. Use this option if the External Process is to start a process but to not wait for its completion. This is useful if you want to configure a button to run the parser on a particular data project in the background while continuing to work in pulse. Note: If you create an external process to run the parser, do not place this external process in a project that gets run nightly, else you may end up creating an endless
1
5
4 3 2
6

144
loop (the parser would call an external process which calls the parser, over and over again, until the system runs out of memory). Note: The Do not wait option simply attempts to start an external process but does not check to see whether the process completed successfully. Such processes should be tested on systems to make sure that the pulse web server has the proper security to start the program specified in the Filepath.
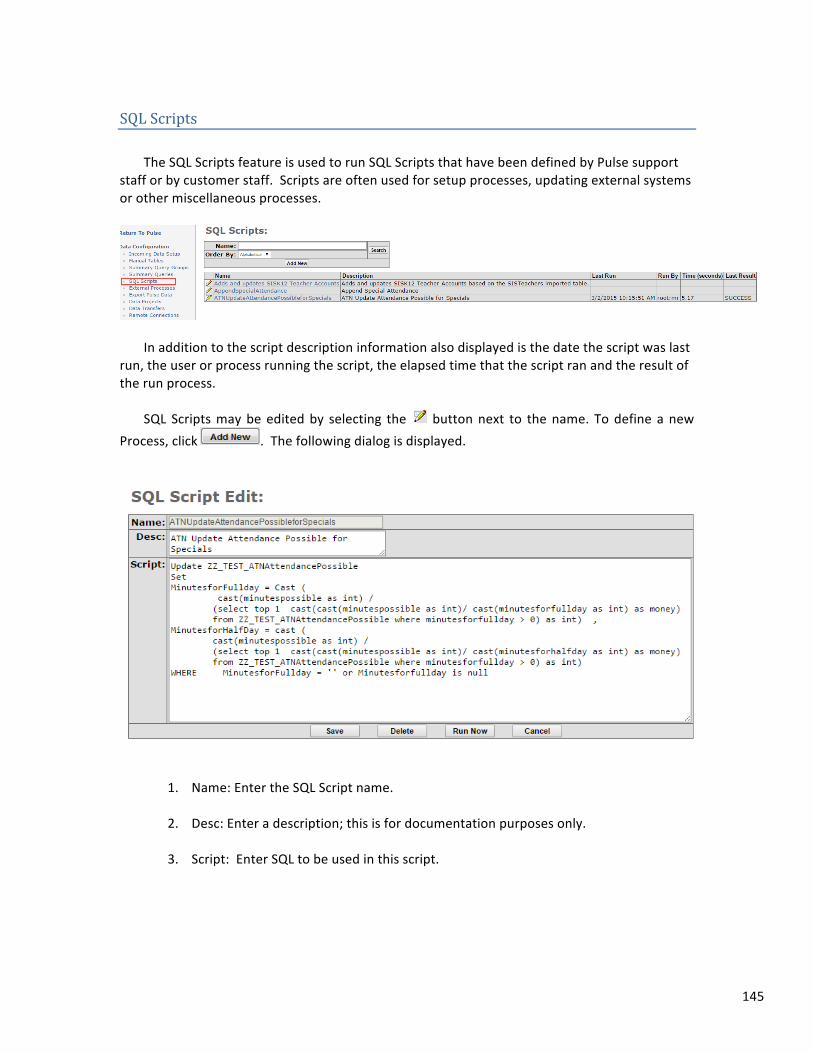
145
SQL Scripts The SQL Scripts feature is used to run SQL Scripts that have been defined by Pulse support
staff or by customer staff. Scripts are often used for setup processes, updating external systems or other miscellaneous processes.
In addition to the script description information also displayed is the date the script was last
run, the user or process running the script, the elapsed time that the script ran and the result of the run process.
SQL Scripts may be edited by selecting the button next to the name. To define a new
Process, click . The following dialog is displayed.
1. Name: Enter the SQL Script name.
2. Desc: Enter a description; this is for documentation purposes only.
3. Script: Enter SQL to be used in this script.

146
Export Pulse Data The Export Pulse Data feature allows data to be exported from pulse tables to a local file.
Data may be optionally sent as an attached file via email to one or more recipients. An export may be run manually, directly from the definition page or added to a Data Project as an automated step.
External Processes may be edited by selecting the button next to the name. To define a
new Process, click . The following screen is displayed.
1. Filename: Enter the name of the export file to be created. Do not use spaces or most special characters.
2. Desc: Enter the filename description; this is for documentation purposes only.
3. Table: Select the source Pulse table from the drop-‐down list from which the export data will be created.
4. Export Style: Choose one of three possible formats. These are either comma, tab or pipe delimited files.
5. Text Qualifier: Optionally enter one or more characters to surround text fields in an export.
1 2 3 4 5 6 7
9 10 11 12 13 14 15
16 17 18 19 20 21 22 23
8
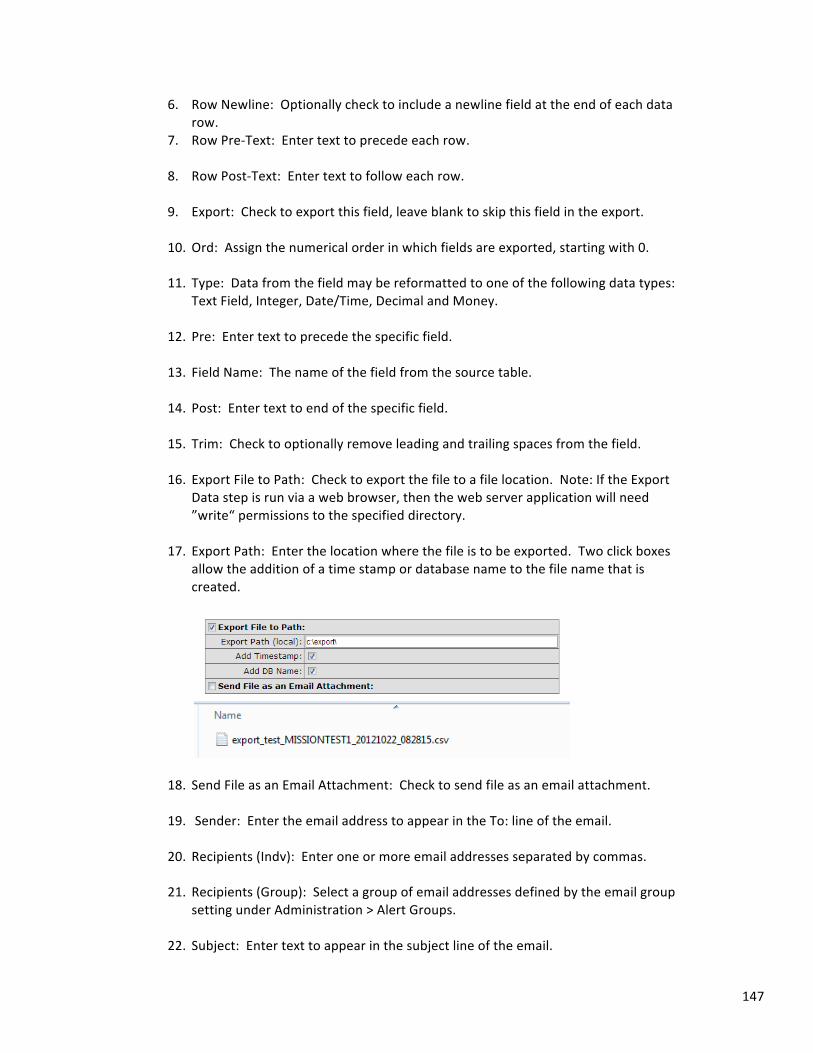
147
6. Row Newline: Optionally check to include a newline field at the end of each data row.
7. Row Pre-‐Text: Enter text to precede each row.
8. Row Post-‐Text: Enter text to follow each row.
9. Export: Check to export this field, leave blank to skip this field in the export.
10. Ord: Assign the numerical order in which fields are exported, starting with 0.
11. Type: Data from the field may be reformatted to one of the following data types: Text Field, Integer, Date/Time, Decimal and Money.
12. Pre: Enter text to precede the specific field.
13. Field Name: The name of the field from the source table.
14. Post: Enter text to end of the specific field.
15. Trim: Check to optionally remove leading and trailing spaces from the field.
16. Export File to Path: Check to export the file to a file location. Note: If the Export Data step is run via a web browser, then the web server application will need ”write“ permissions to the specified directory.
17. Export Path: Enter the location where the file is to be exported. Two click boxes allow the addition of a time stamp or database name to the file name that is created.
18. Send File as an Email Attachment: Check to send file as an email attachment.
19. Sender: Enter the email address to appear in the To: line of the email.
20. Recipients (Indv): Enter one or more email addresses separated by commas.
21. Recipients (Group): Select a group of email addresses defined by the email group setting under Administration > Alert Groups.
22. Subject: Enter text to appear in the subject line of the email.

148
23. Body: Enter text to appear in the body of the email. A series of may also be used,
they include ExportName, ExportDescription, FileName, SystemDateTime, SystemDate and SystemTime.
Once added, an Export Data File may be added to a Data Project for automated scheduling.
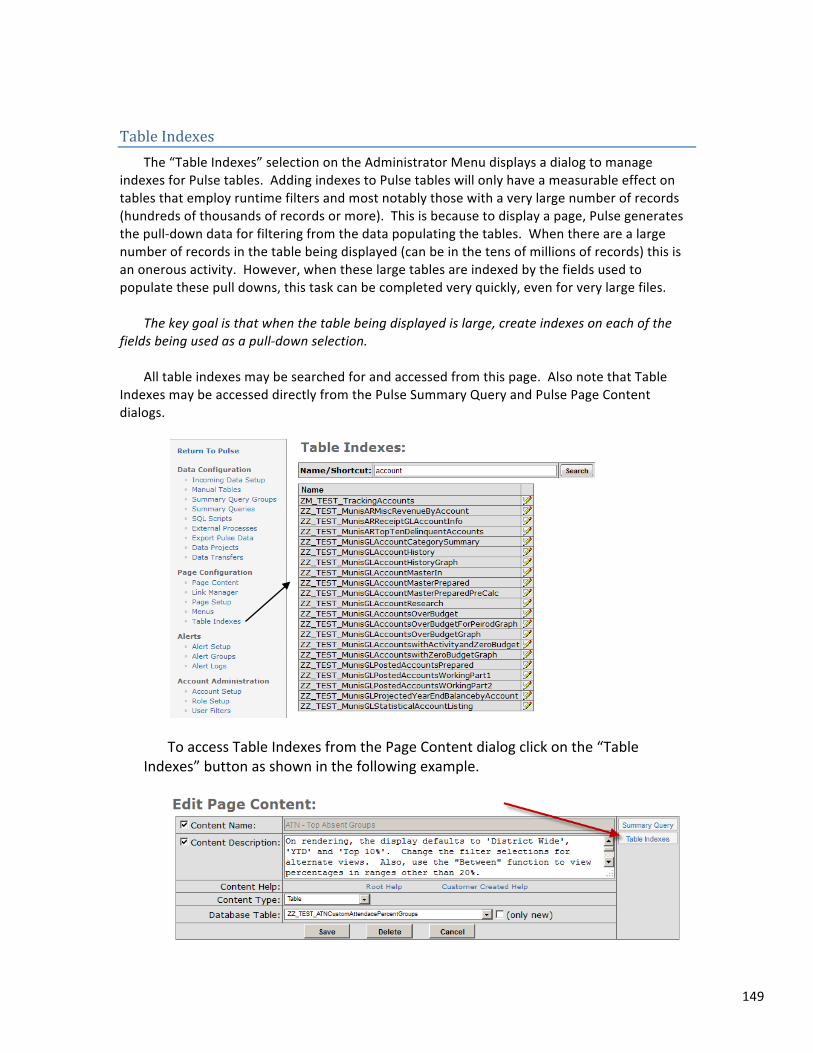
149
Table Indexes The “Table Indexes” selection on the Administrator Menu displays a dialog to manage
indexes for Pulse tables. Adding indexes to Pulse tables will only have a measurable effect on tables that employ runtime filters and most notably those with a very large number of records (hundreds of thousands of records or more). This is because to display a page, Pulse generates the pull-‐down data for filtering from the data populating the tables. When there are a large number of records in the table being displayed (can be in the tens of millions of records) this is an onerous activity. However, when these large tables are indexed by the fields used to populate these pull downs, this task can be completed very quickly, even for very large files.
The key goal is that when the table being displayed is large, create indexes on each of the
fields being used as a pull-‐down selection. All table indexes may be searched for and accessed from this page. Also note that Table
Indexes may be accessed directly from the Pulse Summary Query and Pulse Page Content dialogs.
To access Table Indexes from the Page Content dialog click on the “Table Indexes” button as shown in the following example.
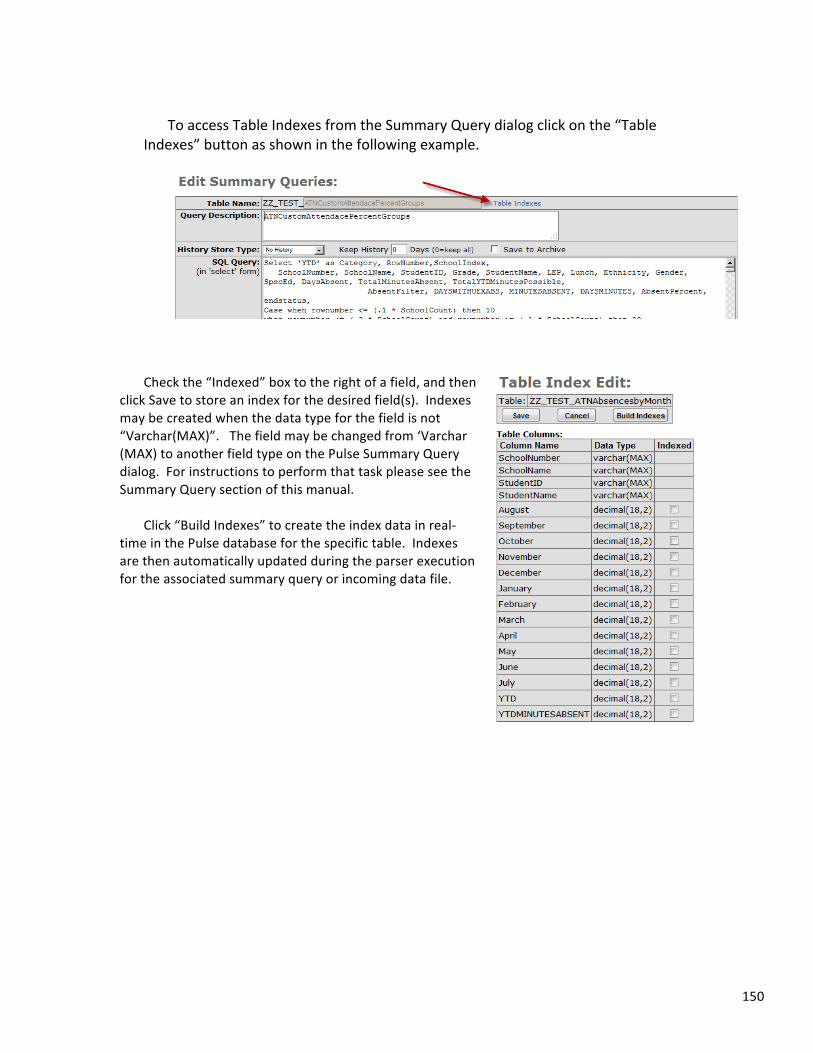
150
To access Table Indexes from the Summary Query dialog click on the “Table
Indexes” button as shown in the following example.
Check the “Indexed” box to the right of a field, and then
click Save to store an index for the desired field(s). Indexes may be created when the data type for the field is not “Varchar(MAX)”. The field may be changed from ‘Varchar (MAX) to another field type on the Pulse Summary Query dialog. For instructions to perform that task please see the Summary Query section of this manual.
Click “Build Indexes” to create the index data in real-‐
time in the Pulse database for the specific table. Indexes are then automatically updated during the parser execution for the associated summary query or incoming data file.
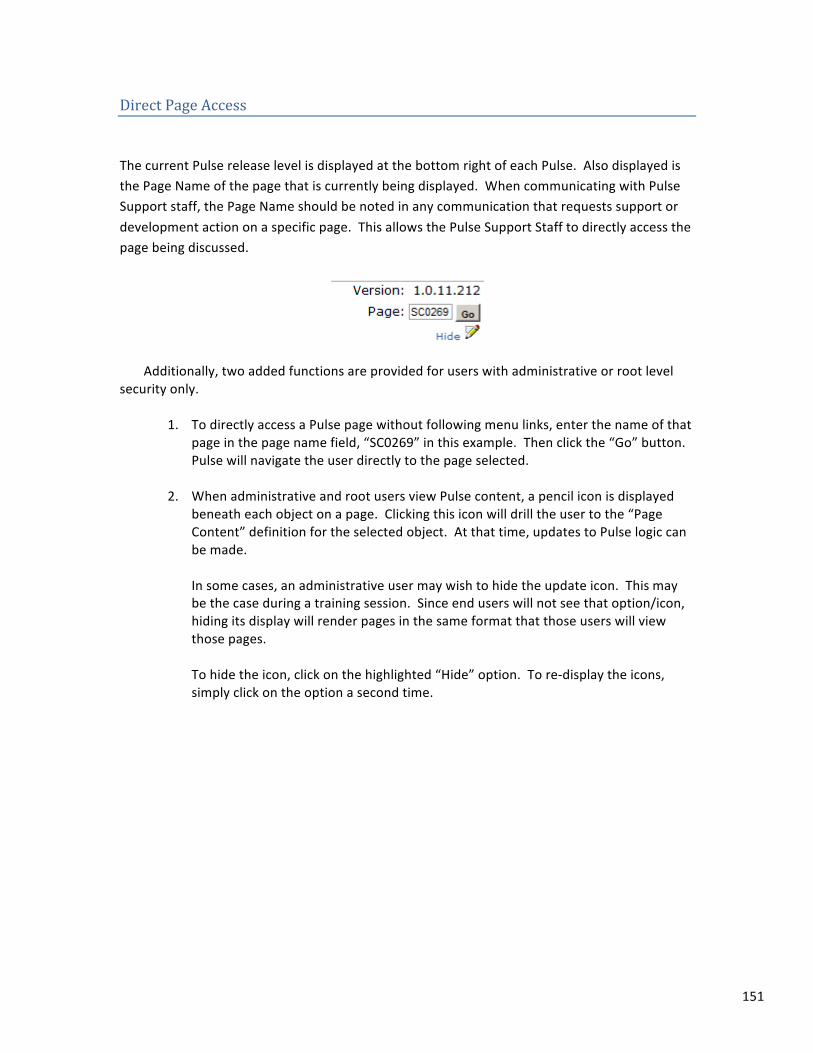
151
Direct Page Access
The current Pulse release level is displayed at the bottom right of each Pulse. Also displayed is the Page Name of the page that is currently being displayed. When communicating with Pulse Support staff, the Page Name should be noted in any communication that requests support or development action on a specific page. This allows the Pulse Support Staff to directly access the page being discussed.
Additionally, two added functions are provided for users with administrative or root level security only.
1. To directly access a Pulse page without following menu links, enter the name of that page in the page name field, “SC0269” in this example. Then click the “Go” button. Pulse will navigate the user directly to the page selected.
2. When administrative and root users view Pulse content, a pencil icon is displayed
beneath each object on a page. Clicking this icon will drill the user to the “Page Content” definition for the selected object. At that time, updates to Pulse logic can be made. In some cases, an administrative user may wish to hide the update icon. This may be the case during a training session. Since end users will not see that option/icon, hiding its display will render pages in the same format that those users will view those pages. To hide the icon, click on the highlighted “Hide” option. To re-‐display the icons, simply click on the option a second time.
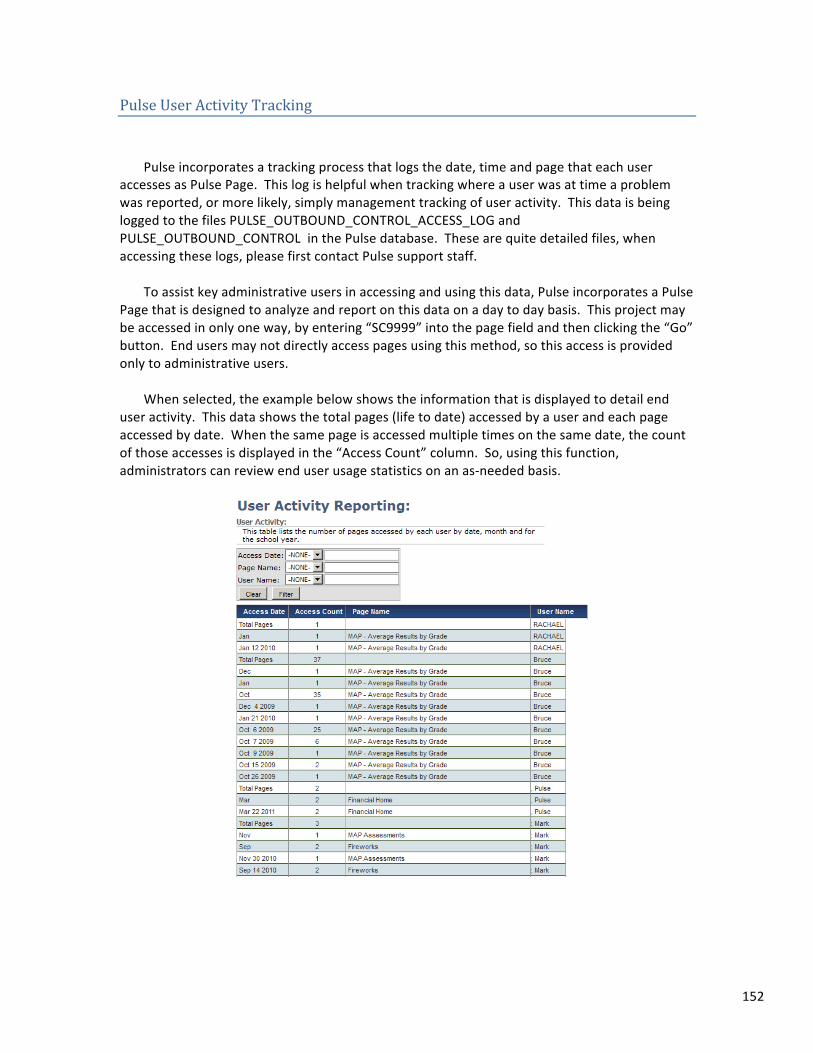
152
Pulse User Activity Tracking
Pulse incorporates a tracking process that logs the date, time and page that each user
accesses as Pulse Page. This log is helpful when tracking where a user was at time a problem was reported, or more likely, simply management tracking of user activity. This data is being logged to the files PULSE_OUTBOUND_CONTROL_ACCESS_LOG and PULSE_OUTBOUND_CONTROL in the Pulse database. These are quite detailed files, when accessing these logs, please first contact Pulse support staff.
To assist key administrative users in accessing and using this data, Pulse incorporates a Pulse
Page that is designed to analyze and report on this data on a day to day basis. This project may be accessed in only one way, by entering “SC9999” into the page field and then clicking the “Go” button. End users may not directly access pages using this method, so this access is provided only to administrative users.
When selected, the example below shows the information that is displayed to detail end
user activity. This data shows the total pages (life to date) accessed by a user and each page accessed by date. When the same page is accessed multiple times on the same date, the count of those accesses is displayed in the “Access Count” column. So, using this function, administrators can review end user usage statistics on an as-‐needed basis.
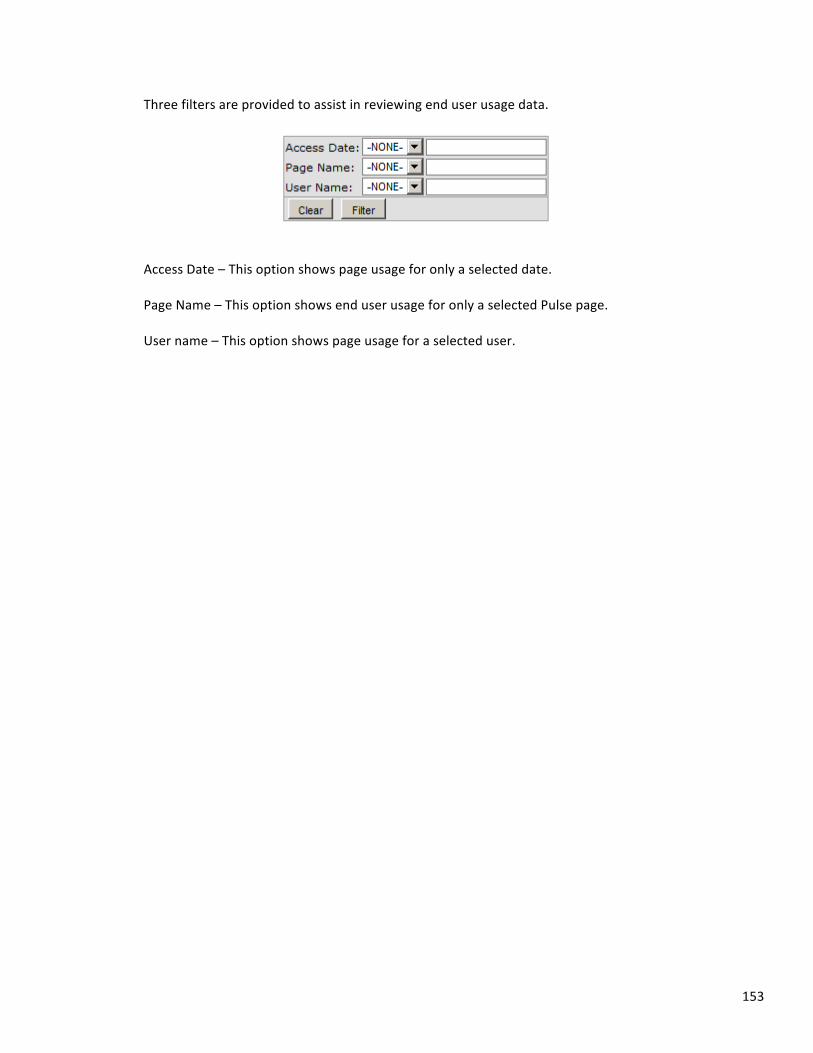
153
Three filters are provided to assist in reviewing end user usage data.
Access Date – This option shows page usage for only a selected date. Page Name – This option shows end user usage for only a selected Pulse page. User name – This option shows page usage for a selected user.
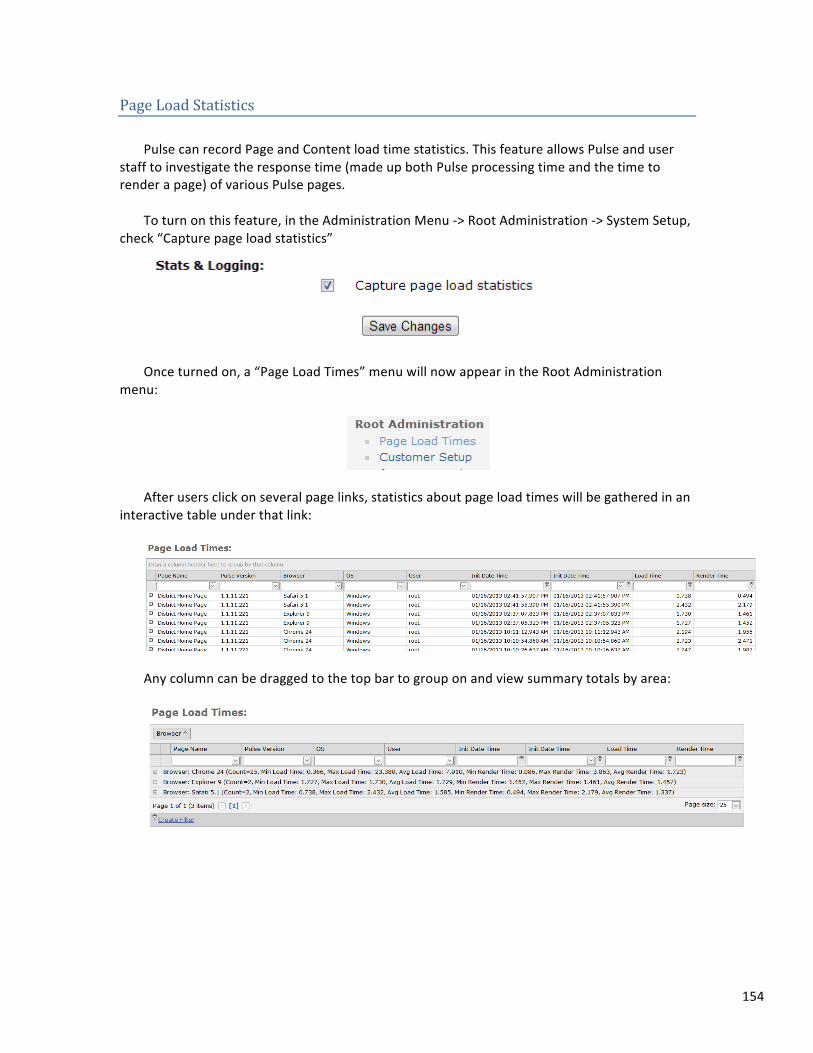
154
Page Load Statistics Pulse can record Page and Content load time statistics. This feature allows Pulse and user
staff to investigate the response time (made up both Pulse processing time and the time to render a page) of various Pulse pages.
To turn on this feature, in the Administration Menu -‐> Root Administration -‐> System Setup,
check “Capture page load statistics”
Once turned on, a “Page Load Times” menu will now appear in the Root Administration
menu:
After users click on several page links, statistics about page load times will be gathered in an
interactive table under that link:
Any column can be dragged to the top bar to group on and view summary totals by area:
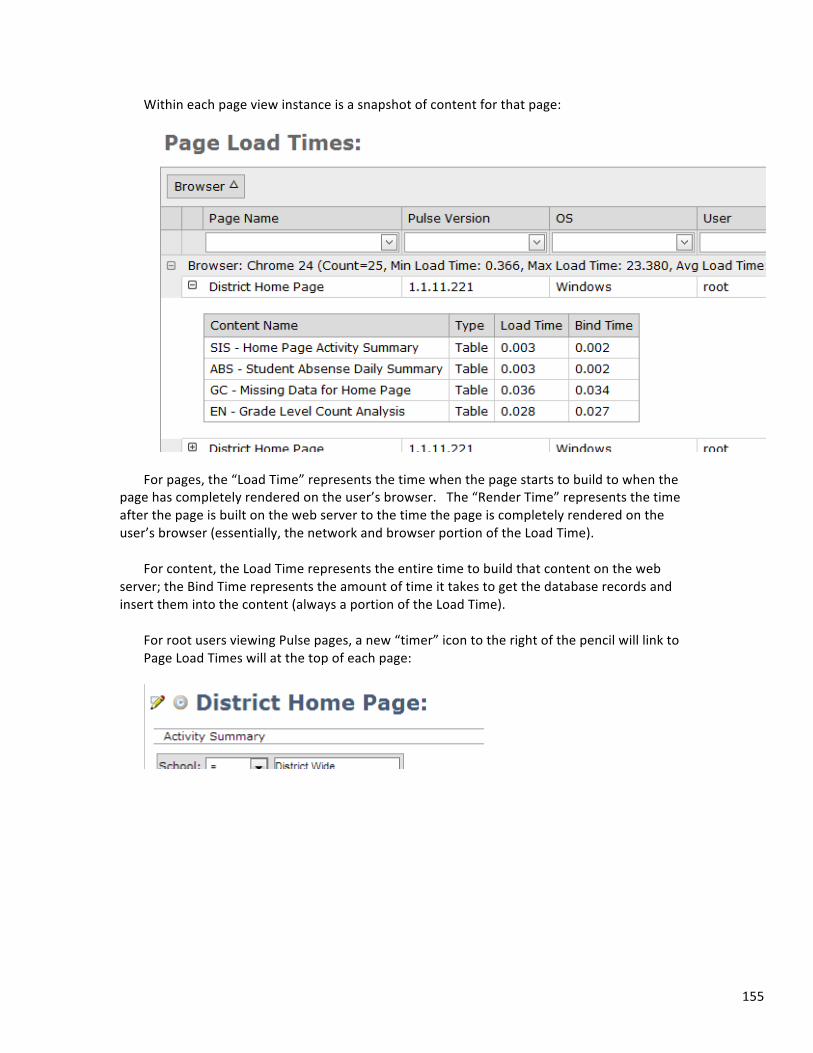
155
Within each page view instance is a snapshot of content for that page:
For pages, the “Load Time” represents the time when the page starts to build to when the
page has completely rendered on the user’s browser. The “Render Time” represents the time after the page is built on the web server to the time the page is completely rendered on the user’s browser (essentially, the network and browser portion of the Load Time).
For content, the Load Time represents the entire time to build that content on the web
server; the Bind Time represents the amount of time it takes to get the database records and insert them into the content (always a portion of the Load Time).
For root users viewing Pulse pages, a new “timer” icon to the right of the pencil will link to Page Load Times will at the top of each page:
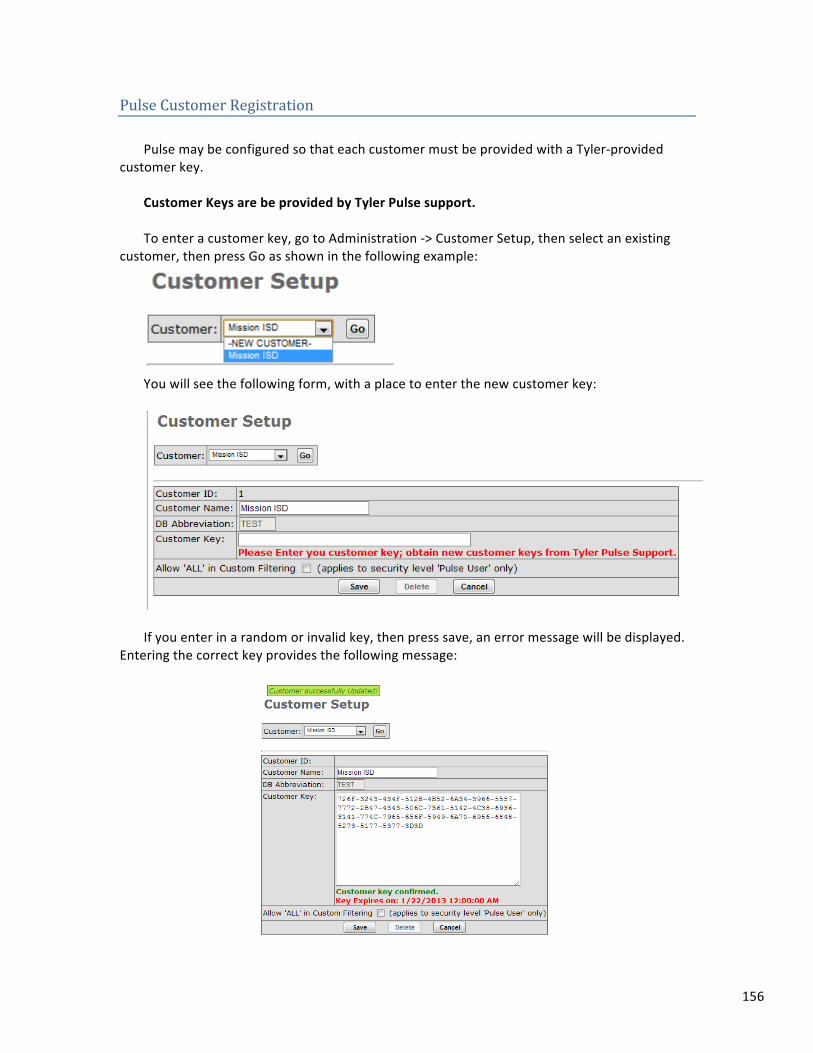
156
Pulse Customer Registration Pulse may be configured so that each customer must be provided with a Tyler-‐provided
customer key. Customer Keys are be provided by Tyler Pulse support. To enter a customer key, go to Administration -‐> Customer Setup, then select an existing
customer, then press Go as shown in the following example:
You will see the following form, with a place to enter the new customer key:
If you enter in a random or invalid key, then press save, an error message will be displayed.
Entering the correct key provides the following message:
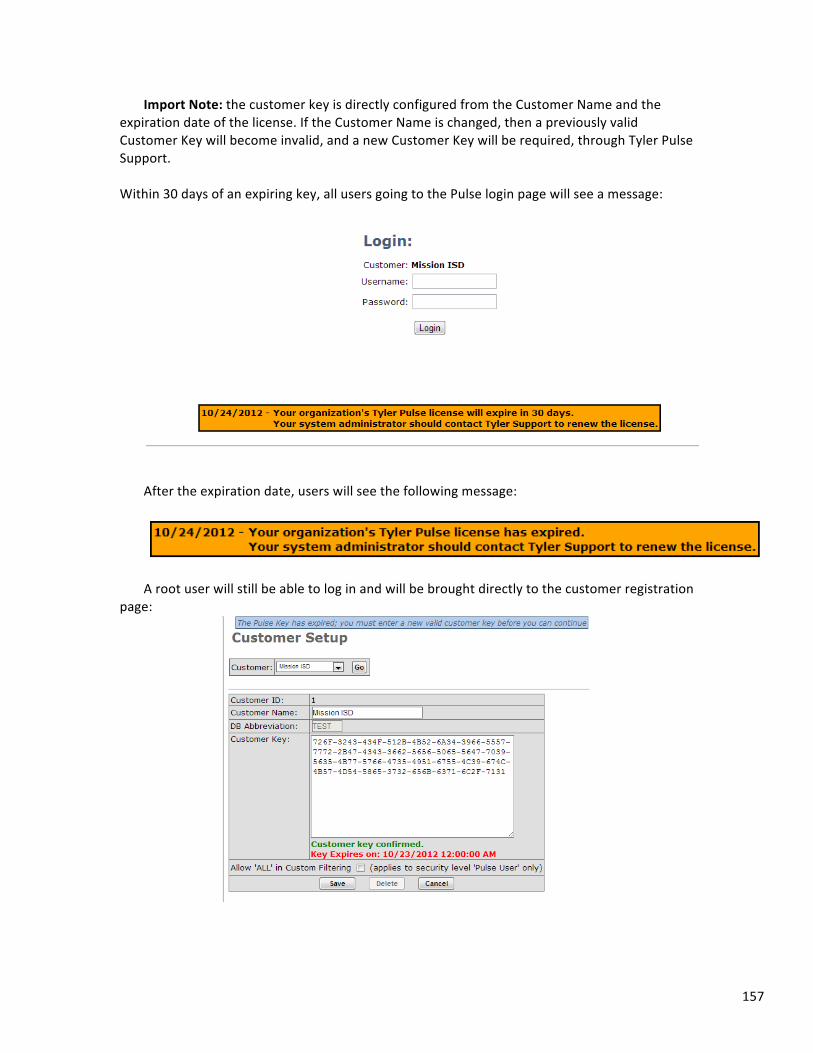
157
Import Note: the customer key is directly configured from the Customer Name and the expiration date of the license. If the Customer Name is changed, then a previously valid Customer Key will become invalid, and a new Customer Key will be required, through Tyler Pulse Support.
Within 30 days of an expiring key, all users going to the Pulse login page will see a message:
After the expiration date, users will see the following message:
A root user will still be able to log in and will be brought directly to the customer registration
page:
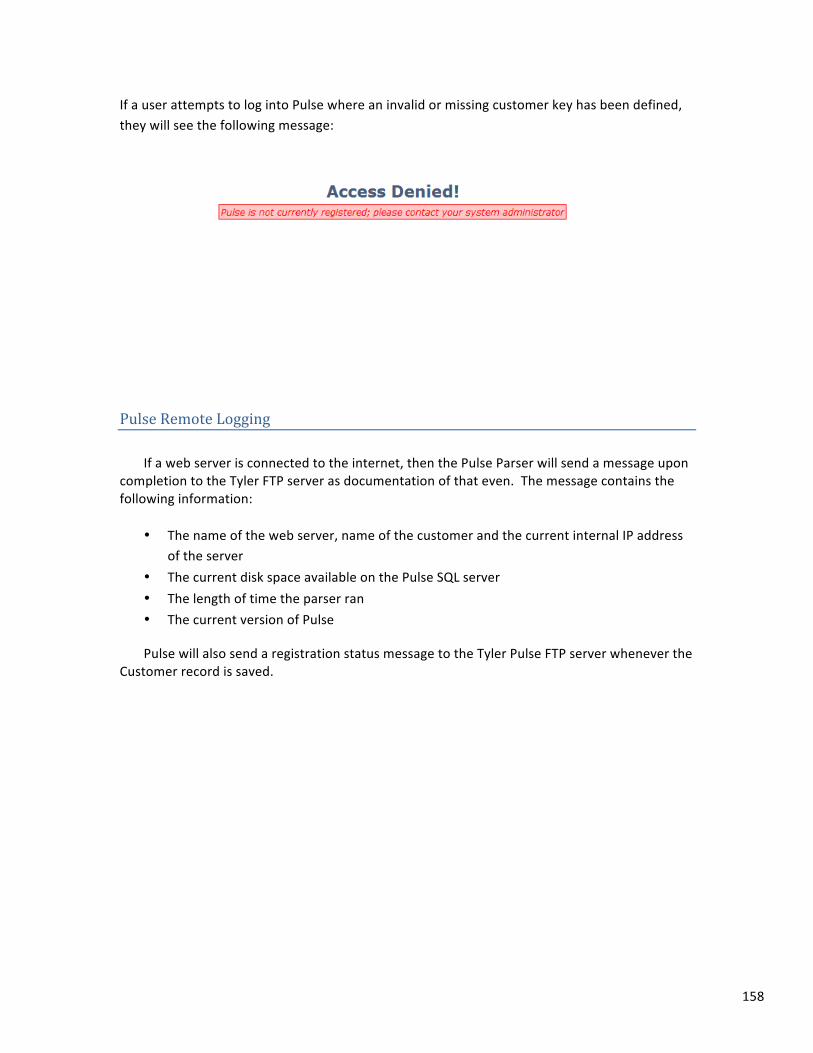
158
If a user attempts to log into Pulse where an invalid or missing customer key has been defined, they will see the following message:
Pulse Remote Logging If a web server is connected to the internet, then the Pulse Parser will send a message upon
completion to the Tyler FTP server as documentation of that even. The message contains the following information:
• The name of the web server, name of the customer and the current internal IP address
of the server • The current disk space available on the Pulse SQL server • The length of time the parser ran • The current version of Pulse
Pulse will also send a registration status message to the Tyler Pulse FTP server whenever the Customer record is saved.
159
Security Management Pulse provides several options to support the control of data distributed to and viewed by
end users. Generally, the levels of security that are provided include: • Traditional Role Based Security. Users may be associated with one or more user roles
(for example a user may be both Principal and Teacher). Additionally, each Pulse data page may be assigned to one or more user roles. For Inclusive Roles, users will only be allowed to view Pages that share at least one role with the roles assigned to that user. For Exclusive Roles, all pages will be viewable except those marked.
• Multiple Level Securities. Each user is assigned to be either a root, administrative or
general user. Root users are developers that have no security restrictions. Administrative users are given extended functions, such as the ability to manage security settings, but are not provided all development options. End users are allowed only to view pages and data to which they have been given access.
• Field Level Security. Pulse makes extensive use of field level security (data filtering). Any number of fields may be used to control user access to data, such as school or department number. Data displayed on pages is filtered to allow an end user to view only the data that they are allowed to view.
Prior to setting up end user security, it is first necessary to define the organizations that will
be using the instance of Pulse that is being used. An organization may be a school district, a city, a county or any other type of Pulse client. Note that any number of organizations may simultaneously use a single instance of Pulse in either an ASP (cloud) or shared server environment. Therefore, in some instances, multiple organizations are defined, however, in the vast majority of implementations, there is a single organization. Note that in almost all cases, Pulse support staff will have already defined all organizations for each Pulse customer.
Once the organization is defined, various user roles are defined, fields for field level security
are defined and end users are defined and then associated with those roles and filters. This manual will address each of the steps to define security in Pulse.
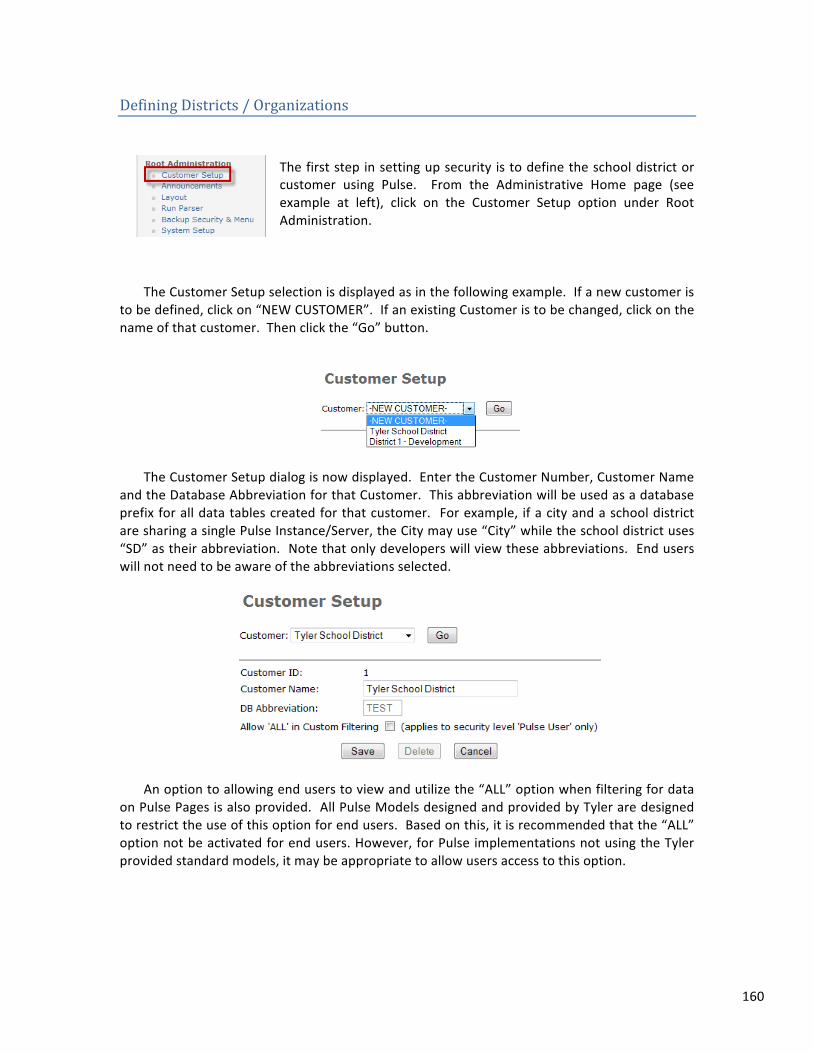
160
Defining Districts / Organizations
The first step in setting up security is to define the school district or customer using Pulse. From the Administrative Home page (see example at left), click on the Customer Setup option under Root Administration.
The Customer Setup selection is displayed as in the following example. If a new customer is
to be defined, click on “NEW CUSTOMER”. If an existing Customer is to be changed, click on the name of that customer. Then click the “Go” button.
The Customer Setup dialog is now displayed. Enter the Customer Number, Customer Name
and the Database Abbreviation for that Customer. This abbreviation will be used as a database prefix for all data tables created for that customer. For example, if a city and a school district are sharing a single Pulse Instance/Server, the City may use “City” while the school district uses “SD” as their abbreviation. Note that only developers will view these abbreviations. End users will not need to be aware of the abbreviations selected.
An option to allowing end users to view and utilize the “ALL” option when filtering for data on Pulse Pages is also provided. All Pulse Models designed and provided by Tyler are designed to restrict the use of this option for end users. Based on this, it is recommended that the “ALL” option not be activated for end users. However, for Pulse implementations not using the Tyler provided standard models, it may be appropriate to allow users access to this option.
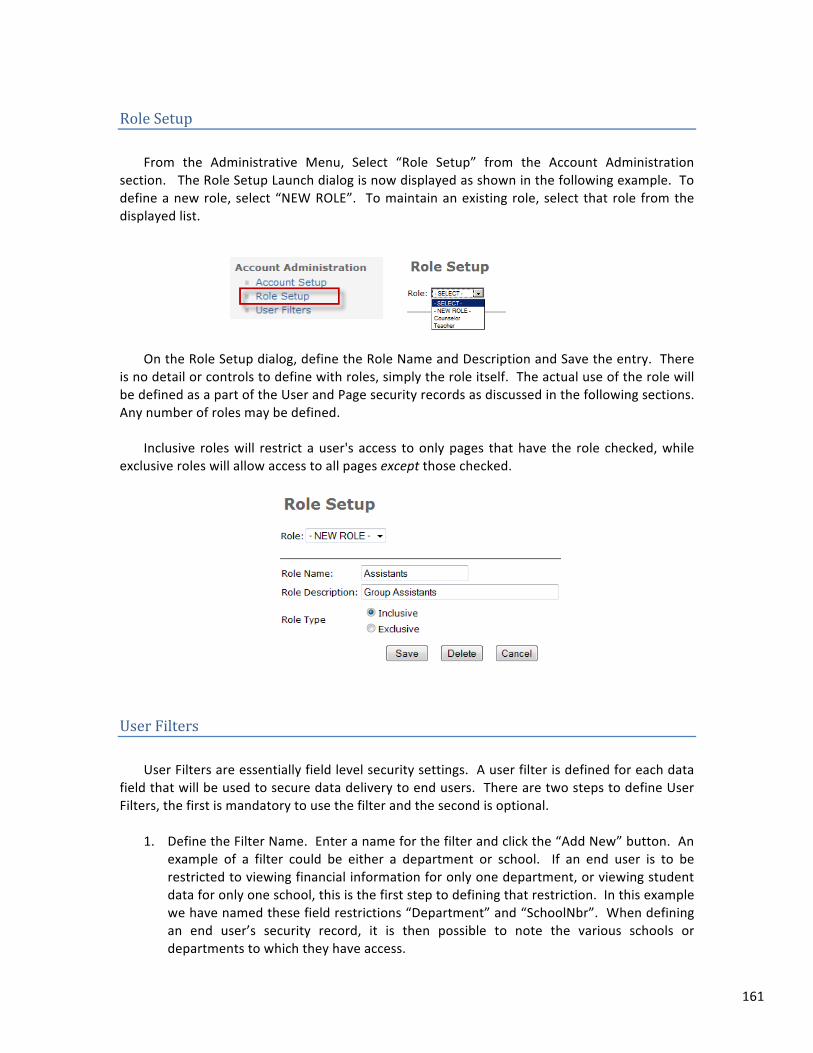
161
Role Setup From the Administrative Menu, Select “Role Setup” from the Account Administration
section. The Role Setup Launch dialog is now displayed as shown in the following example. To define a new role, select “NEW ROLE”. To maintain an existing role, select that role from the displayed list.
On the Role Setup dialog, define the Role Name and Description and Save the entry. There
is no detail or controls to define with roles, simply the role itself. The actual use of the role will be defined as a part of the User and Page security records as discussed in the following sections. Any number of roles may be defined.
Inclusive roles will restrict a user's access to only pages that have the role checked, while
exclusive roles will allow access to all pages except those checked.
User Filters User Filters are essentially field level security settings. A user filter is defined for each data
field that will be used to secure data delivery to end users. There are two steps to define User Filters, the first is mandatory to use the filter and the second is optional.
1. Define the Filter Name. Enter a name for the filter and click the “Add New” button. An
example of a filter could be either a department or school. If an end user is to be restricted to viewing financial information for only one department, or viewing student data for only one school, this is the first step to defining that restriction. In this example we have named these field restrictions “Department” and “SchoolNbr”. When defining an end user’s security record, it is then possible to note the various schools or departments to which they have access.
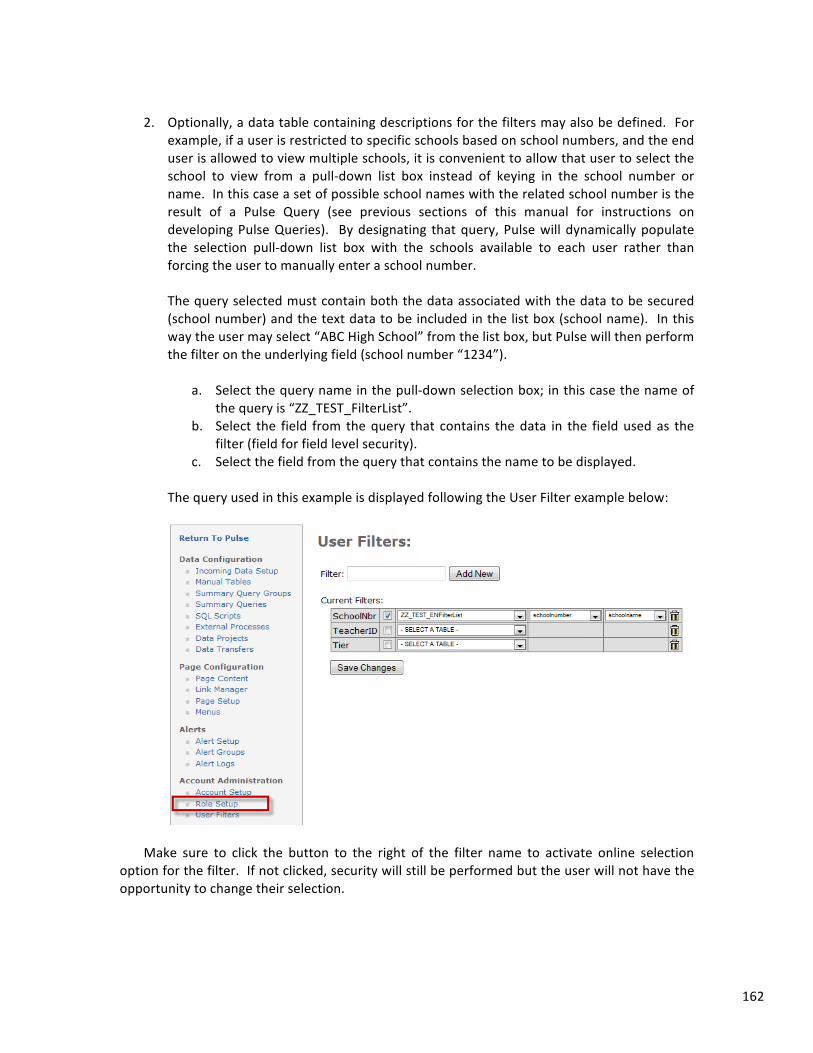
162
2. Optionally, a data table containing descriptions for the filters may also be defined. For
example, if a user is restricted to specific schools based on school numbers, and the end user is allowed to view multiple schools, it is convenient to allow that user to select the school to view from a pull-‐down list box instead of keying in the school number or name. In this case a set of possible school names with the related school number is the result of a Pulse Query (see previous sections of this manual for instructions on developing Pulse Queries). By designating that query, Pulse will dynamically populate the selection pull-‐down list box with the schools available to each user rather than forcing the user to manually enter a school number.
The query selected must contain both the data associated with the data to be secured (school number) and the text data to be included in the list box (school name). In this way the user may select “ABC High School” from the list box, but Pulse will then perform the filter on the underlying field (school number “1234”).
a. Select the query name in the pull-‐down selection box; in this case the name of
the query is “ZZ_TEST_FilterList”. b. Select the field from the query that contains the data in the field used as the
filter (field for field level security). c. Select the field from the query that contains the name to be displayed.
The query used in this example is displayed following the User Filter example below:
Make sure to click the button to the right of the filter name to activate online selection
option for the filter. If not clicked, security will still be performed but the user will not have the opportunity to change their selection.
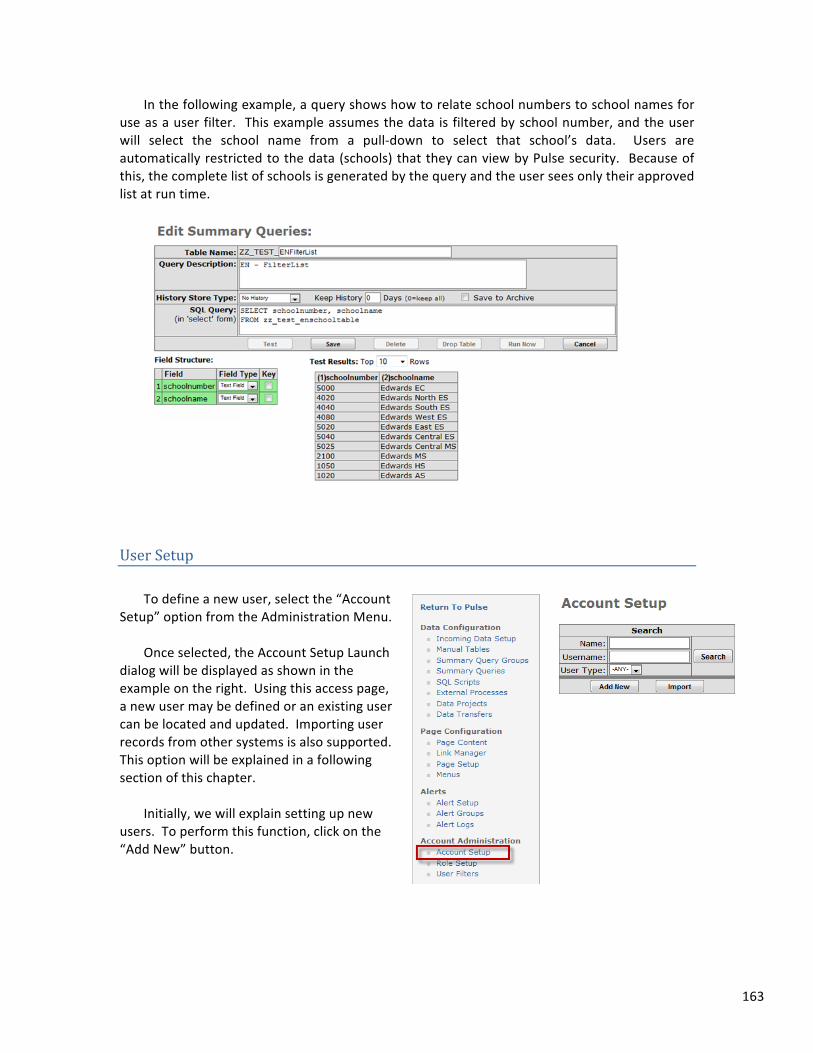
163
In the following example, a query shows how to relate school numbers to school names for use as a user filter. This example assumes the data is filtered by school number, and the user will select the school name from a pull-‐down to select that school’s data. Users are automatically restricted to the data (schools) that they can view by Pulse security. Because of this, the complete list of schools is generated by the query and the user sees only their approved list at run time.
User Setup To define a new user, select the “Account
Setup” option from the Administration Menu. Once selected, the Account Setup Launch
dialog will be displayed as shown in the example on the right. Using this access page, a new user may be defined or an existing user can be located and updated. Importing user records from other systems is also supported. This option will be explained in a following section of this chapter.
Initially, we will explain setting up new
users. To perform this function, click on the “Add New” button.
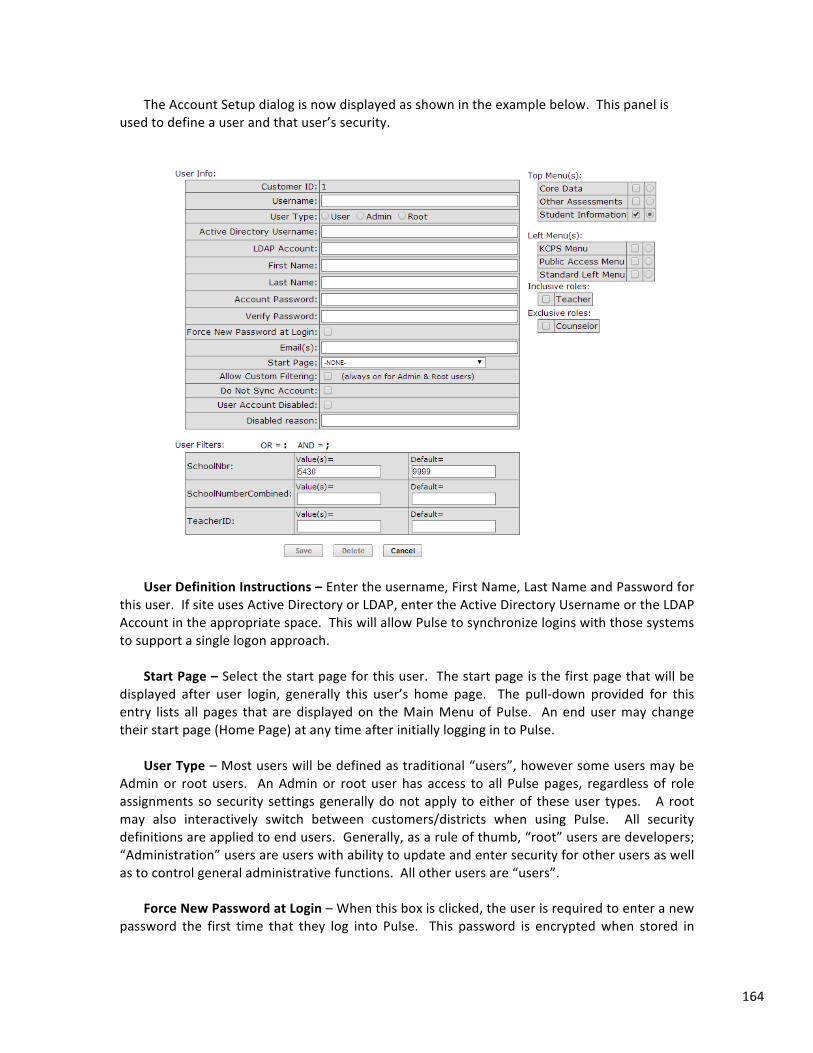
164
The Account Setup dialog is now displayed as shown in the example below. This panel is used to define a user and that user’s security.
User Definition Instructions – Enter the username, First Name, Last Name and Password for
this user. If site uses Active Directory or LDAP, enter the Active Directory Username or the LDAP Account in the appropriate space. This will allow Pulse to synchronize logins with those systems to support a single logon approach.
Start Page – Select the start page for this user. The start page is the first page that will be
displayed after user login, generally this user’s home page. The pull-‐down provided for this entry lists all pages that are displayed on the Main Menu of Pulse. An end user may change their start page (Home Page) at any time after initially logging in to Pulse.
User Type – Most users will be defined as traditional “users”, however some users may be
Admin or root users. An Admin or root user has access to all Pulse pages, regardless of role assignments so security settings generally do not apply to either of these user types. A root may also interactively switch between customers/districts when using Pulse. All security definitions are applied to end users. Generally, as a rule of thumb, “root” users are developers; “Administration” users are users with ability to update and enter security for other users as well as to control general administrative functions. All other users are “users”.
Force New Password at Login – When this box is clicked, the user is required to enter a new
password the first time that they log into Pulse. This password is encrypted when stored in
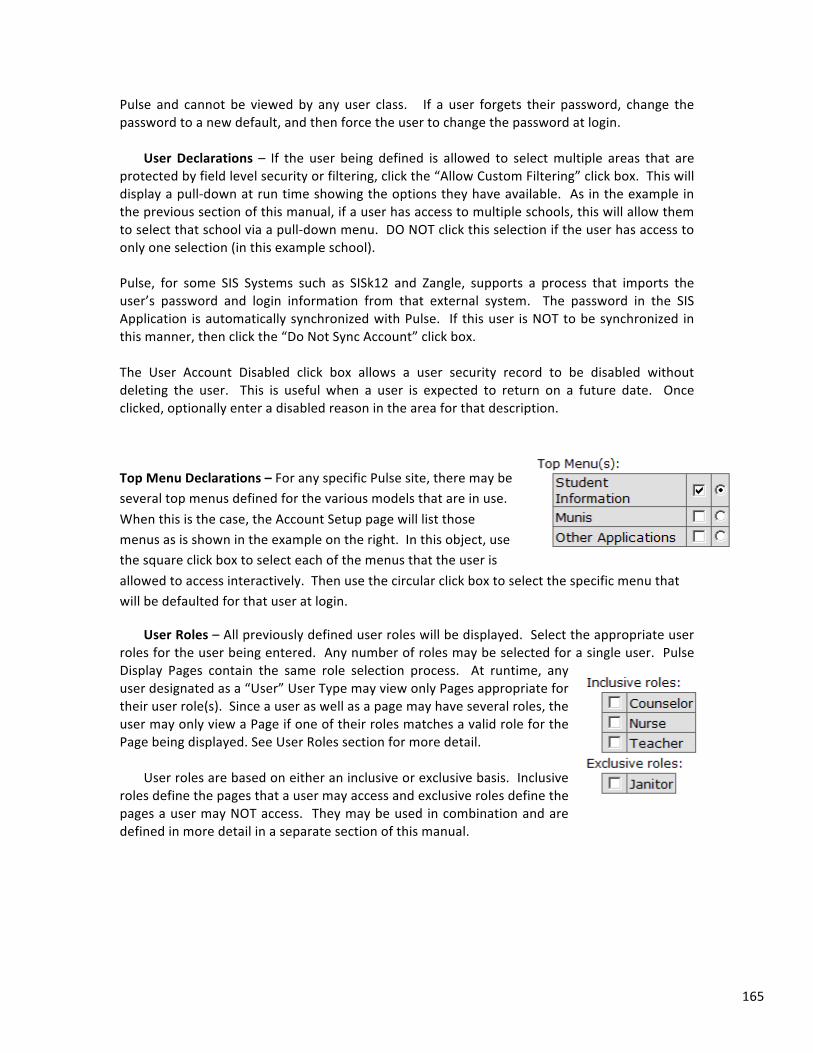
165
Pulse and cannot be viewed by any user class. If a user forgets their password, change the password to a new default, and then force the user to change the password at login.
User Declarations – If the user being defined is allowed to select multiple areas that are
protected by field level security or filtering, click the “Allow Custom Filtering” click box. This will display a pull-‐down at run time showing the options they have available. As in the example in the previous section of this manual, if a user has access to multiple schools, this will allow them to select that school via a pull-‐down menu. DO NOT click this selection if the user has access to only one selection (in this example school). Pulse, for some SIS Systems such as SISk12 and Zangle, supports a process that imports the user’s password and login information from that external system. The password in the SIS Application is automatically synchronized with Pulse. If this user is NOT to be synchronized in this manner, then click the “Do Not Sync Account” click box. The User Account Disabled click box allows a user security record to be disabled without deleting the user. This is useful when a user is expected to return on a future date. Once clicked, optionally enter a disabled reason in the area for that description.
Top Menu Declarations – For any specific Pulse site, there may be several top menus defined for the various models that are in use. When this is the case, the Account Setup page will list those menus as is shown in the example on the right. In this object, use the square click box to select each of the menus that the user is allowed to access interactively. Then use the circular click box to select the specific menu that will be defaulted for that user at login.
User Roles – All previously defined user roles will be displayed. Select the appropriate user roles for the user being entered. Any number of roles may be selected for a single user. Pulse Display Pages contain the same role selection process. At runtime, any user designated as a “User” User Type may view only Pages appropriate for their user role(s). Since a user as well as a page may have several roles, the user may only view a Page if one of their roles matches a valid role for the Page being displayed. See User Roles section for more detail.
User roles are based on either an inclusive or exclusive basis. Inclusive
roles define the pages that a user may access and exclusive roles define the pages a user may NOT access. They may be used in combination and are defined in more detail in a separate section of this manual.
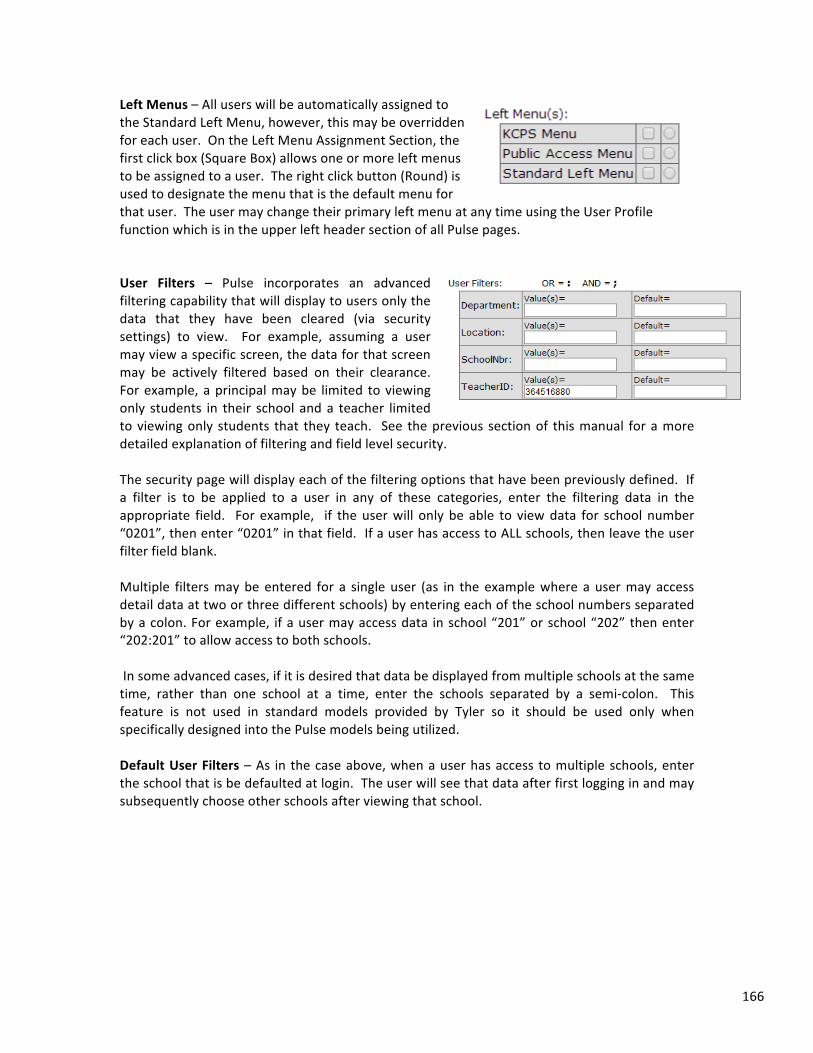
166
Left Menus – All users will be automatically assigned to the Standard Left Menu, however, this may be overridden for each user. On the Left Menu Assignment Section, the first click box (Square Box) allows one or more left menus to be assigned to a user. The right click button (Round) is used to designate the menu that is the default menu for that user. The user may change their primary left menu at any time using the User Profile function which is in the upper left header section of all Pulse pages.
User Filters – Pulse incorporates an advanced filtering capability that will display to users only the data that they have been cleared (via security settings) to view. For example, assuming a user may view a specific screen, the data for that screen may be actively filtered based on their clearance. For example, a principal may be limited to viewing only students in their school and a teacher limited to viewing only students that they teach. See the previous section of this manual for a more detailed explanation of filtering and field level security.
The security page will display each of the filtering options that have been previously defined. If a filter is to be applied to a user in any of these categories, enter the filtering data in the appropriate field. For example, if the user will only be able to view data for school number “0201”, then enter “0201” in that field. If a user has access to ALL schools, then leave the user filter field blank.
Multiple filters may be entered for a single user (as in the example where a user may access detail data at two or three different schools) by entering each of the school numbers separated by a colon. For example, if a user may access data in school “201” or school “202” then enter “202:201” to allow access to both schools.
In some advanced cases, if it is desired that data be displayed from multiple schools at the same time, rather than one school at a time, enter the schools separated by a semi-‐colon. This feature is not used in standard models provided by Tyler so it should be used only when specifically designed into the Pulse models being utilized.
Default User Filters – As in the case above, when a user has access to multiple schools, enter the school that is be defaulted at login. The user will see that data after first logging in and may subsequently choose other schools after viewing that school.
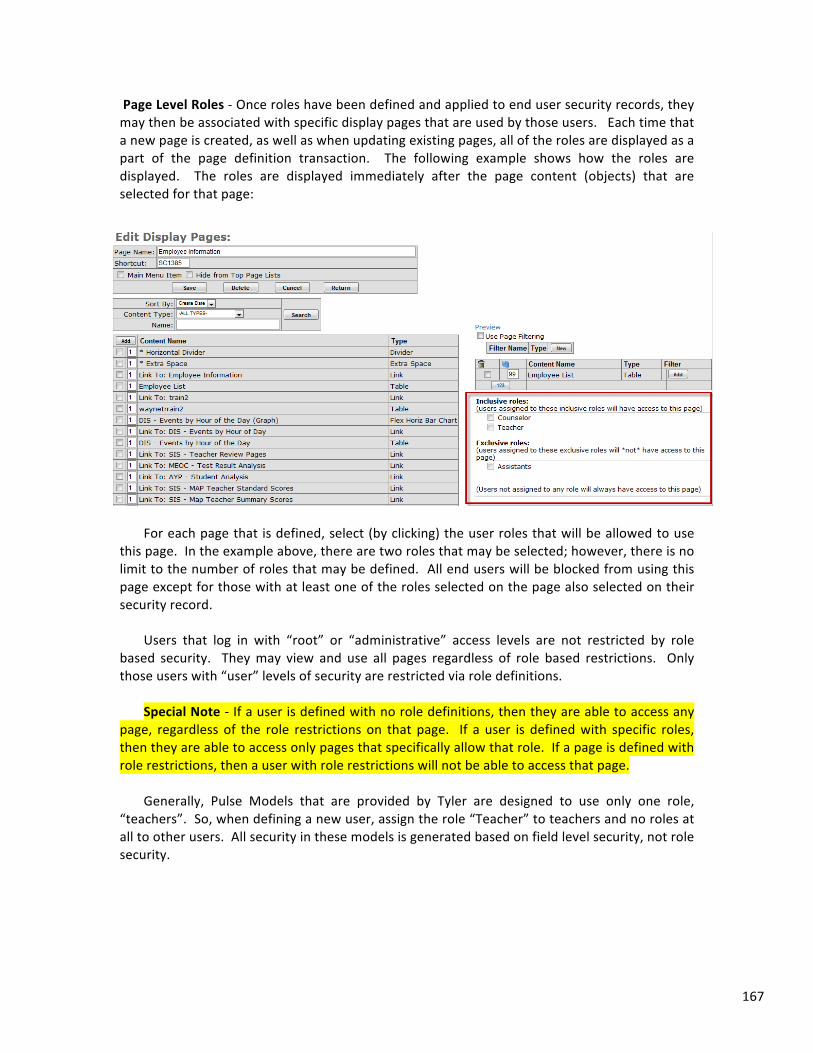
167
Page Level Roles -‐ Once roles have been defined and applied to end user security records, they may then be associated with specific display pages that are used by those users. Each time that a new page is created, as well as when updating existing pages, all of the roles are displayed as a part of the page definition transaction. The following example shows how the roles are displayed. The roles are displayed immediately after the page content (objects) that are selected for that page:
For each page that is defined, select (by clicking) the user roles that will be allowed to use
this page. In the example above, there are two roles that may be selected; however, there is no limit to the number of roles that may be defined. All end users will be blocked from using this page except for those with at least one of the roles selected on the page also selected on their security record.
Users that log in with “root” or “administrative” access levels are not restricted by role
based security. They may view and use all pages regardless of role based restrictions. Only those users with “user” levels of security are restricted via role definitions.
Special Note -‐ If a user is defined with no role definitions, then they are able to access any
page, regardless of the role restrictions on that page. If a user is defined with specific roles, then they are able to access only pages that specifically allow that role. If a page is defined with role restrictions, then a user with role restrictions will not be able to access that page.
Generally, Pulse Models that are provided by Tyler are designed to use only one role,
“teachers”. So, when defining a new user, assign the role “Teacher” to teachers and no roles at all to other users. All security in these models is generated based on field level security, not role security.

168
Page Roles – Mass Updates
Pulse allows Page Roles to be established directly on the page definition dialog (previous section) or in mass using the “Page Roles” option on the Administrative Main Menu. Using this function, a user may assign page roles from a list of defined pages.
When the Page Roles dialog is displayed, a user may first search for and locate the selected pages that are to be changed. In this example, all pages containing the literal “MAP”. Once the pages are displayed, click the appropriate rolls for each page, or click the click box at the top of each column to assign all pages to that roll. Click the clear button on the left of each line to unclick all rolls for a selected page. Click the Save button to save the role setup. Click the “Cancel” button to leave the page without committing changes.
Roles ending in (I) are inclusive roles; roles ending in (E) are exclusive roles. (A user assigned an inclusive role can only see pages also assigned to that inclusive role; a user assigned to an exclusive role can see all pages except those assigned to that exclusive role).
169
Using “Filter By” Security and Functions As discussed in previous sections of this chapter, Pulse provides a unique “Filter by”
technology (field level security) to control end user access to data. In addition to providing a security function, this functionality may also be used to significantly reduce development work. This is because a single page may be defined for use by users with variable sets of access security. For example, a page showing detailed school information can dynamically display that information for only the school or schools to which a user has access. Therefore, instead of developing multiple pages for multiple user sets, a single page may be designed to support any number of user types.
As further clarification, using the “Filter by” function, a page and page content (tables and
graphs) may be developed to be used by any number of users with the same role definitions. For example, a page that is simultaneously used by multiple principals or teachers may be defined. The data tables that are displayed on a page for these users may then be developed to show all of the students in a school district with little or no thought to the user that will be using that page. The output of data to that page, however, may then be filtered based on the user that is logged-‐in and viewing the data. For example, even though a table being displayed may include all of the students in a school, a teacher will be able to see only those students that they teach and a principal viewing the same page sees only the students enrolled in their school.
Filtering may be performed on any data field in the data table that is being displayed. The
specific field being used for the filtering may or may not be displayed to the user on the page; however, it must be a part of the underlying table populating the display. For example, the data from a table may be filtered on the teacher number; however, it is not necessary that the teacher number be displayed in the table when presented to the end user.
In the following examples we provide a simple example to show how to set up a single
screen that will be used by multiple teachers. In this example, we want each teacher to view only the students that they teach. To perform this task, some type of teacher identification must be a part of the table being displayed. In this case, it will be the “TeacherID” number. Remember, the “TeacherID” number field containing the teacher’s ID Number must be entered on the security record for that teacher.
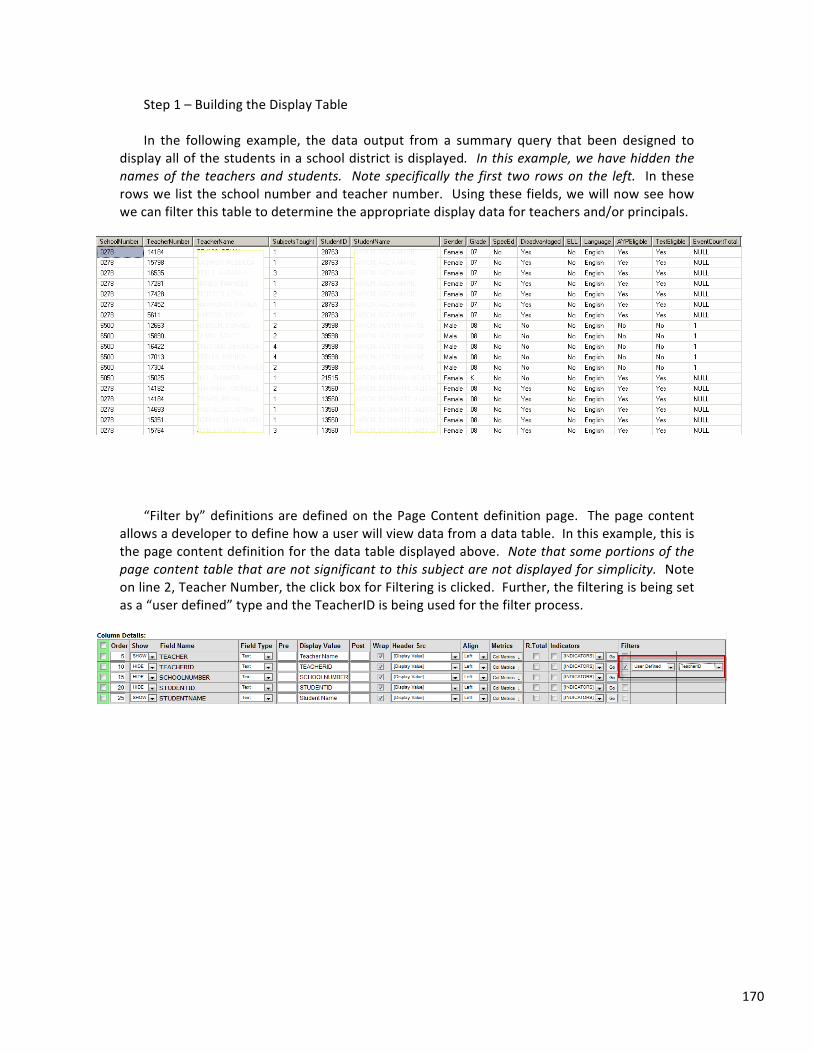
170
Step 1 – Building the Display Table In the following example, the data output from a summary query that been designed to
display all of the students in a school district is displayed. In this example, we have hidden the names of the teachers and students. Note specifically the first two rows on the left. In these rows we list the school number and teacher number. Using these fields, we will now see how we can filter this table to determine the appropriate display data for teachers and/or principals.
“Filter by” definitions are defined on the Page Content definition page. The page content
allows a developer to define how a user will view data from a data table. In this example, this is the page content definition for the data table displayed above. Note that some portions of the page content table that are not significant to this subject are not displayed for simplicity. Note on line 2, Teacher Number, the click box for Filtering is clicked. Further, the filtering is being set as a “user defined” type and the TeacherID is being used for the filter process.
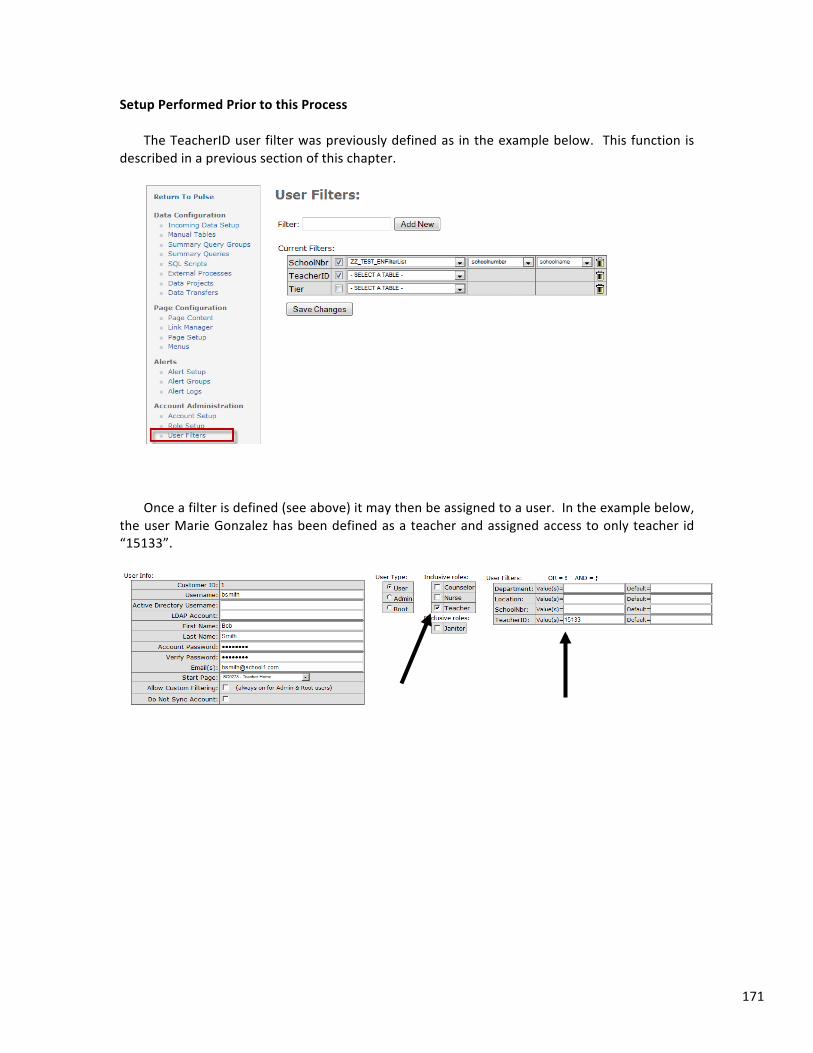
171
Setup Performed Prior to this Process The TeacherID user filter was previously defined as in the example below. This function is
described in a previous section of this chapter.
Once a filter is defined (see above) it may then be assigned to a user. In the example below,
the user Marie Gonzalez has been defined as a teacher and assigned access to only teacher id “15133”.
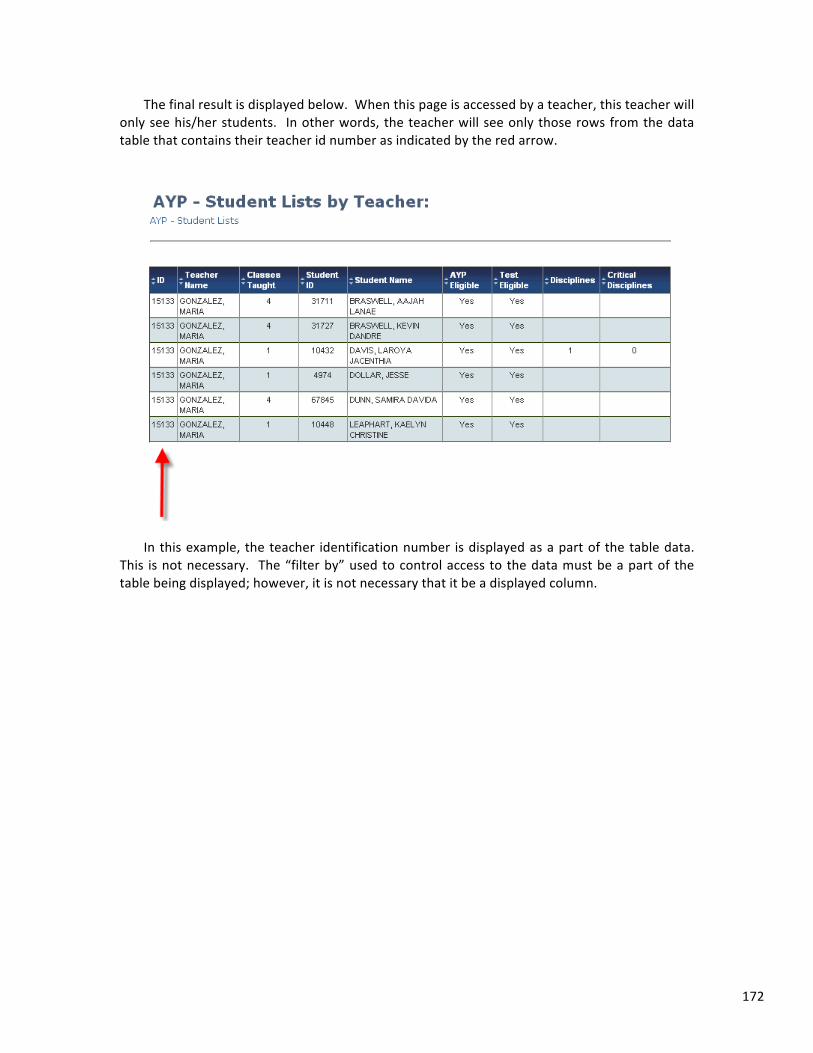
172
The final result is displayed below. When this page is accessed by a teacher, this teacher will only see his/her students. In other words, the teacher will see only those rows from the data table that contains their teacher id number as indicated by the red arrow.
In this example, the teacher identification number is displayed as a part of the table data.
This is not necessary. The “filter by” used to control access to the data must be a part of the table being displayed; however, it is not necessary that it be a displayed column.
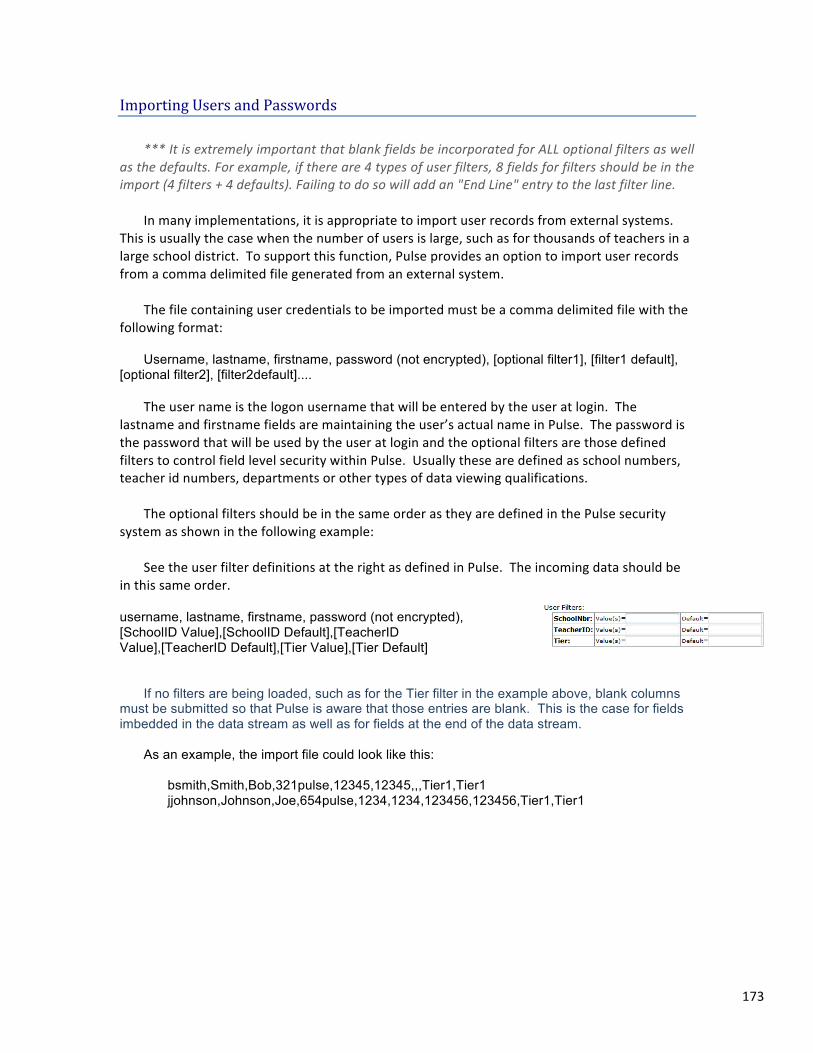
173
Importing Users and Passwords *** It is extremely important that blank fields be incorporated for ALL optional filters as well
as the defaults. For example, if there are 4 types of user filters, 8 fields for filters should be in the import (4 filters + 4 defaults). Failing to do so will add an "End Line" entry to the last filter line.
In many implementations, it is appropriate to import user records from external systems.
This is usually the case when the number of users is large, such as for thousands of teachers in a large school district. To support this function, Pulse provides an option to import user records from a comma delimited file generated from an external system.
The file containing user credentials to be imported must be a comma delimited file with the
following format: Username, lastname, firstname, password (not encrypted), [optional filter1], [filter1 default],
[optional filter2], [filter2default].... The user name is the logon username that will be entered by the user at login. The
lastname and firstname fields are maintaining the user’s actual name in Pulse. The password is the password that will be used by the user at login and the optional filters are those defined filters to control field level security within Pulse. Usually these are defined as school numbers, teacher id numbers, departments or other types of data viewing qualifications.
The optional filters should be in the same order as they are defined in the Pulse security
system as shown in the following example: See the user filter definitions at the right as defined in Pulse. The incoming data should be
in this same order.
username, lastname, firstname, password (not encrypted), [SchoolID Value],[SchoolID Default],[TeacherID Value],[TeacherID Default],[Tier Value],[Tier Default]
If no filters are being loaded, such as for the Tier filter in the example above, blank columns
must be submitted so that Pulse is aware that those entries are blank. This is the case for fields imbedded in the data stream as well as for fields at the end of the data stream.
As an example, the import file could look like this:
bsmith,Smith,Bob,321pulse,12345,12345,,,Tier1,Tier1 jjohnson,Johnson,Joe,654pulse,1234,1234,123456,123456,Tier1,Tier1
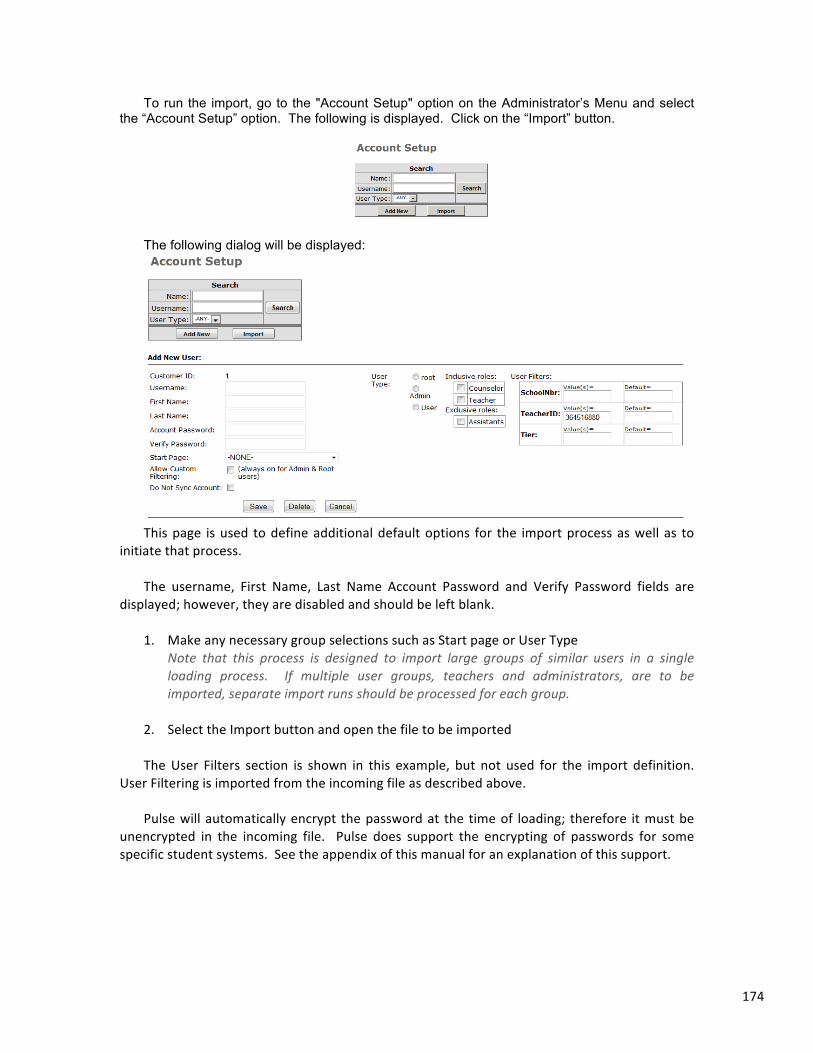
174
To run the import, go to the "Account Setup" option on the Administrator’s Menu and select the “Account Setup” option. The following is displayed. Click on the “Import” button.
The following dialog will be displayed:
This page is used to define additional default options for the import process as well as to
initiate that process. The username, First Name, Last Name Account Password and Verify Password fields are
displayed; however, they are disabled and should be left blank. 1. Make any necessary group selections such as Start page or User Type
Note that this process is designed to import large groups of similar users in a single loading process. If multiple user groups, teachers and administrators, are to be imported, separate import runs should be processed for each group.
2. Select the Import button and open the file to be imported The User Filters section is shown in this example, but not used for the import definition.
User Filtering is imported from the incoming file as described above. Pulse will automatically encrypt the password at the time of loading; therefore it must be
unencrypted in the incoming file. Pulse does support the encrypting of passwords for some specific student systems. See the appendix of this manual for an explanation of this support.
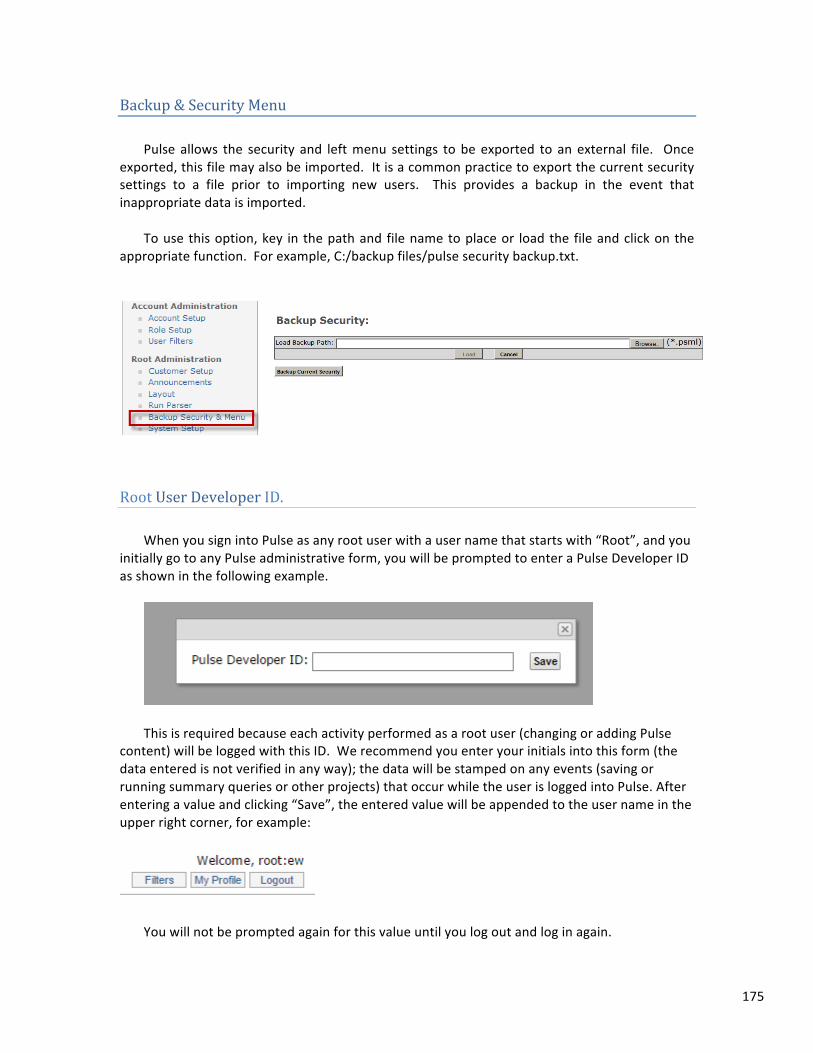
175
Backup & Security Menu Pulse allows the security and left menu settings to be exported to an external file. Once
exported, this file may also be imported. It is a common practice to export the current security settings to a file prior to importing new users. This provides a backup in the event that inappropriate data is imported.
To use this option, key in the path and file name to place or load the file and click on the
appropriate function. For example, C:/backup files/pulse security backup.txt.
Root User Developer ID. When you sign into Pulse as any root user with a user name that starts with “Root”, and you
initially go to any Pulse administrative form, you will be prompted to enter a Pulse Developer ID as shown in the following example.
This is required because each activity performed as a root user (changing or adding Pulse
content) will be logged with this ID. We recommend you enter your initials into this form (the data entered is not verified in any way); the data will be stamped on any events (saving or running summary queries or other projects) that occur while the user is logged into Pulse. After entering a value and clicking “Save”, the entered value will be appended to the user name in the upper right corner, for example:
You will not be prompted again for this value until you log out and log in again.
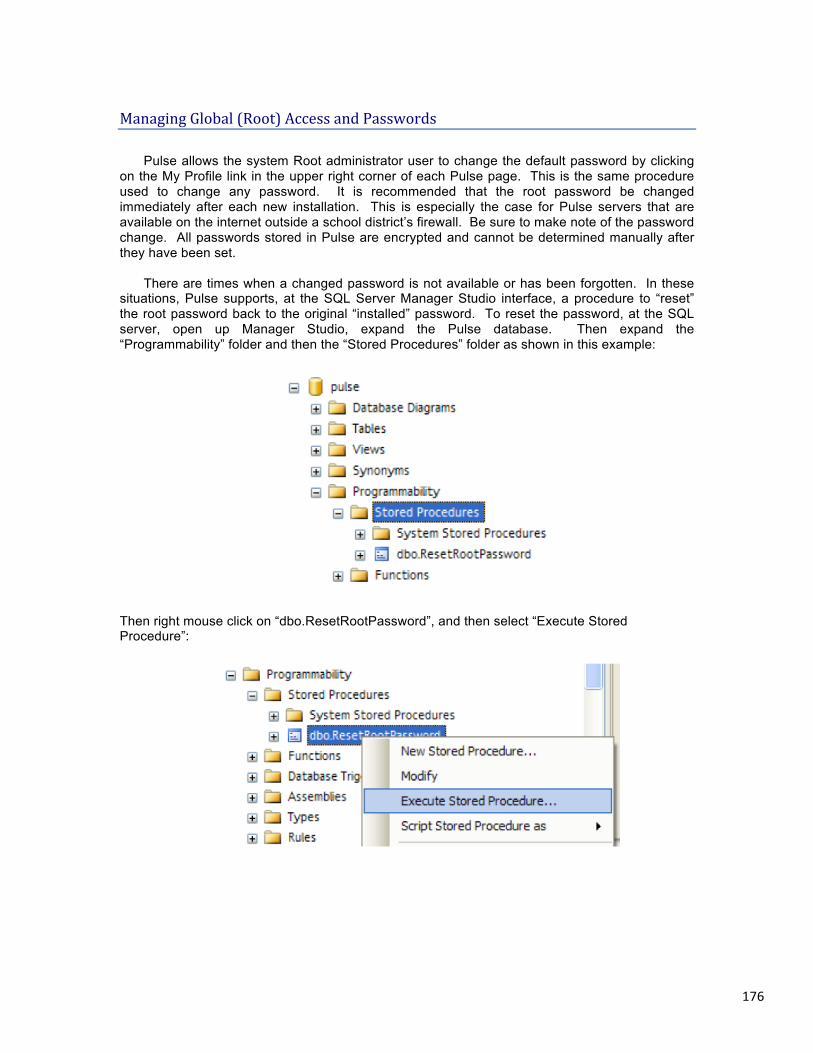
176
Managing Global (Root) Access and Passwords Pulse allows the system Root administrator user to change the default password by clicking
on the My Profile link in the upper right corner of each Pulse page. This is the same procedure used to change any password. It is recommended that the root password be changed immediately after each new installation. This is especially the case for Pulse servers that are available on the internet outside a school district’s firewall. Be sure to make note of the password change. All passwords stored in Pulse are encrypted and cannot be determined manually after they have been set.
There are times when a changed password is not available or has been forgotten. In these
situations, Pulse supports, at the SQL Server Manager Studio interface, a procedure to “reset” the root password back to the original “installed” password. To reset the password, at the SQL server, open up Manager Studio, expand the Pulse database. Then expand the “Programmability” folder and then the “Stored Procedures” folder as shown in this example:
Then right mouse click on “dbo.ResetRootPassword”, and then select “Execute Stored Procedure”:
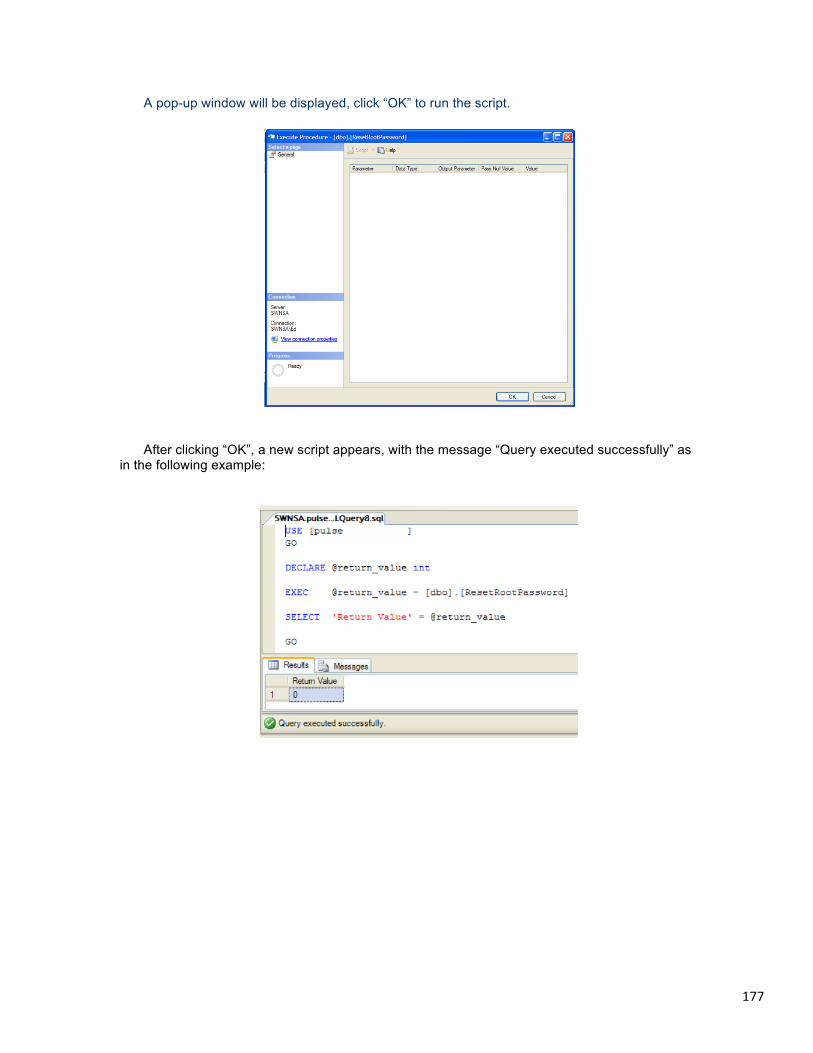
177
A pop-up window will be displayed, click “OK” to run the script.
After clicking “OK”, a new script appears, with the message “Query executed successfully” as
in the following example:
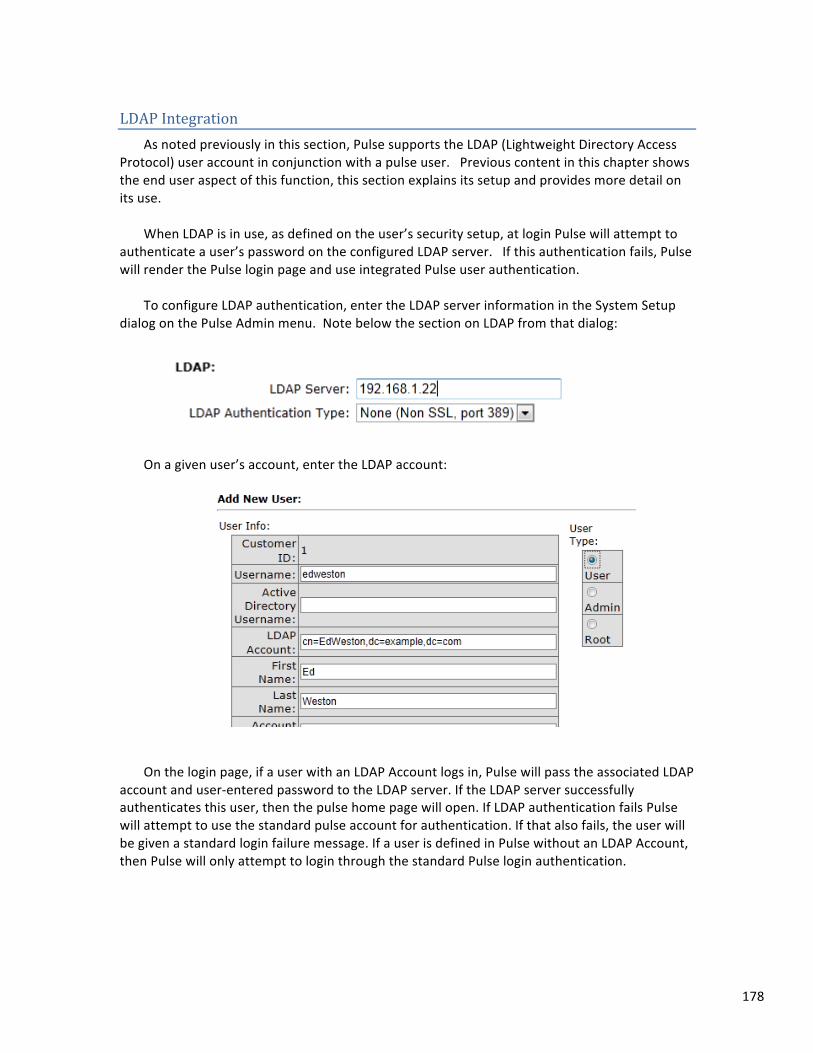
178
LDAP Integration As noted previously in this section, Pulse supports the LDAP (Lightweight Directory Access
Protocol) user account in conjunction with a pulse user. Previous content in this chapter shows the end user aspect of this function, this section explains its setup and provides more detail on its use.
When LDAP is in use, as defined on the user’s security setup, at login Pulse will attempt to
authenticate a user’s password on the configured LDAP server. If this authentication fails, Pulse will render the Pulse login page and use integrated Pulse user authentication.
To configure LDAP authentication, enter the LDAP server information in the System Setup
dialog on the Pulse Admin menu. Note below the section on LDAP from that dialog:
On a given user’s account, enter the LDAP account:
On the login page, if a user with an LDAP Account logs in, Pulse will pass the associated LDAP
account and user-‐entered password to the LDAP server. If the LDAP server successfully authenticates this user, then the pulse home page will open. If LDAP authentication fails Pulse will attempt to use the standard pulse account for authentication. If that also fails, the user will be given a standard login failure message. If a user is defined in Pulse without an LDAP Account, then Pulse will only attempt to login through the standard Pulse login authentication.
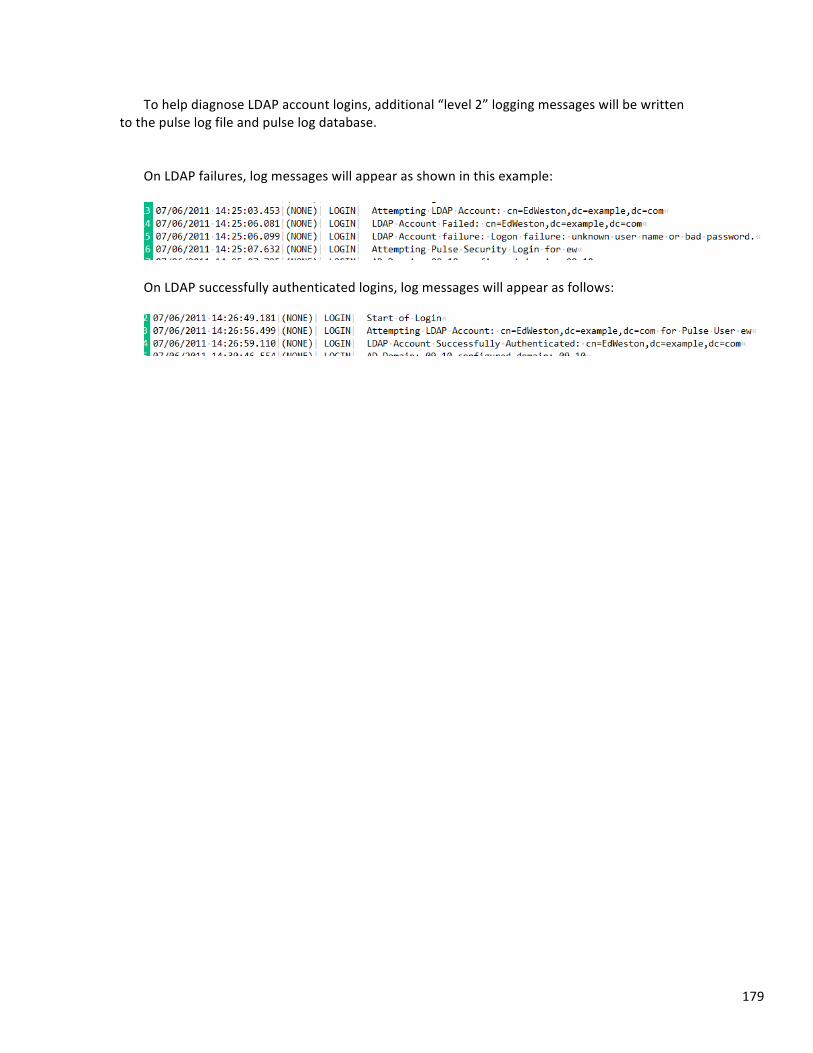
179
To help diagnose LDAP account logins, additional “level 2” logging messages will be written to the pulse log file and pulse log database.
On LDAP failures, log messages will appear as shown in this example:
On LDAP successfully authenticated logins, log messages will appear as follows:
180
User Synchronization Pulse supports standard user account synchronization. New customers wanting to
synchronize data will have a specification for standard file imports that can be read by the pulse parser to automatically add and maintain users in the Pulse database
Summary In order to standardize and simplify requirements for synchronizing users from other
systems into Pulse, Tyler has designed a specification for a standard set of Pulse tables that, if populated either directly via a file import, or indirectly through Pulse Summary Queries, can be used to automatically maintain Pulse user security access rights. This specification contains simplified data layouts designed to support all of Pulse’s security capabilities.
Setup Requirements To setup up Pulse security synchronization, you should be familiar with how to create a
Pulse import, Pulse summary queries, and Pulse data projects. Pulse security synchonization requires Pulse version 1.1.11.221 or greater.
Data requirements This document describes a series of pulse standard name table layouts (see the
Synchronization Tables section) required for synchronizing user names and user attributes into Pulse from other sources. Customers can chose one of two methods to integrate security records into Pulse:
Method 1: Direct Imports Customers can design comma or tab delimited files containing all of the data specified in the
synchronization tables below, and directly import that data to the specified table names. This import can then be added to a regularly scheduled Pulse project and synchronization can be included in nightly or weekly Parser runs.
Method 2: Indirect Imports with Pulse Summary Queries Customers can design comma or tab delimited files or use Remote SQL queries to obtain all
the necessary data, though not in the precisely required format. This data, once imported into Pulse, can be further reformed using Pulse Summary Queries into the final specified layouts.
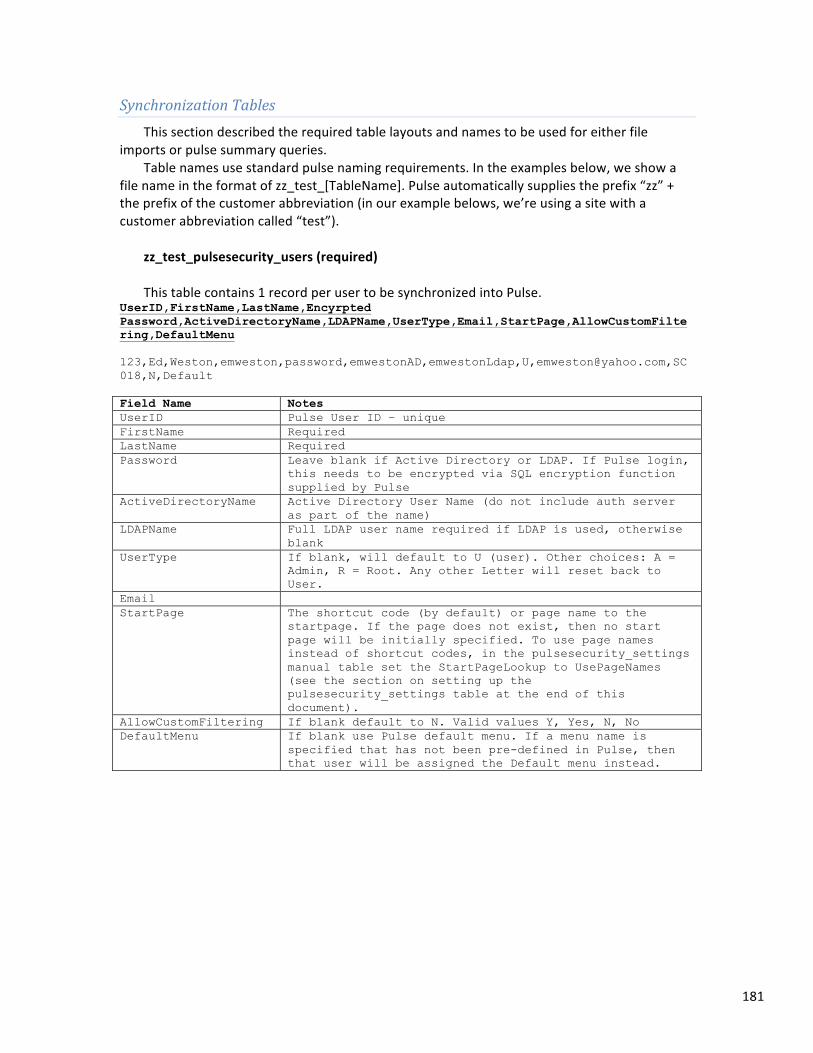
181
Synchronization Tables This section described the required table layouts and names to be used for either file
imports or pulse summary queries. Table names use standard pulse naming requirements. In the examples below, we show a
file name in the format of zz_test_[TableName]. Pulse automatically supplies the prefix “zz” + the prefix of the customer abbreviation (in our example belows, we’re using a site with a customer abbreviation called “test”).
zz_test_pulsesecurity_users (required) This table contains 1 record per user to be synchronized into Pulse.
UserID,FirstName,LastName,Encyrpted Password,ActiveDirectoryName,LDAPName,UserType,Email,StartPage,AllowCustomFiltering,DefaultMenu 123,Ed,Weston,emweston,password,emwestonAD,emwestonLdap,U,[email protected],SC018,N,Default Field Name Notes UserID Pulse User ID – unique FirstName Required LastName Required Password Leave blank if Active Directory or LDAP. If Pulse login,
this needs to be encrypted via SQL encryption function supplied by Pulse
ActiveDirectoryName Active Directory User Name (do not include auth server as part of the name)
LDAPName Full LDAP user name required if LDAP is used, otherwise blank
UserType If blank, will default to U (user). Other choices: A = Admin, R = Root. Any other Letter will reset back to User.
Email StartPage The shortcut code (by default) or page name to the
startpage. If the page does not exist, then no start page will be initially specified. To use page names instead of shortcut codes, in the pulsesecurity_settings manual table set the StartPageLookup to UsePageNames (see the section on setting up the pulsesecurity_settings table at the end of this document).
AllowCustomFiltering If blank default to N. Valid values Y, Yes, N, No DefaultMenu If blank use Pulse default menu. If a menu name is
specified that has not been pre-defined in Pulse, then that user will be assigned the Default menu instead.
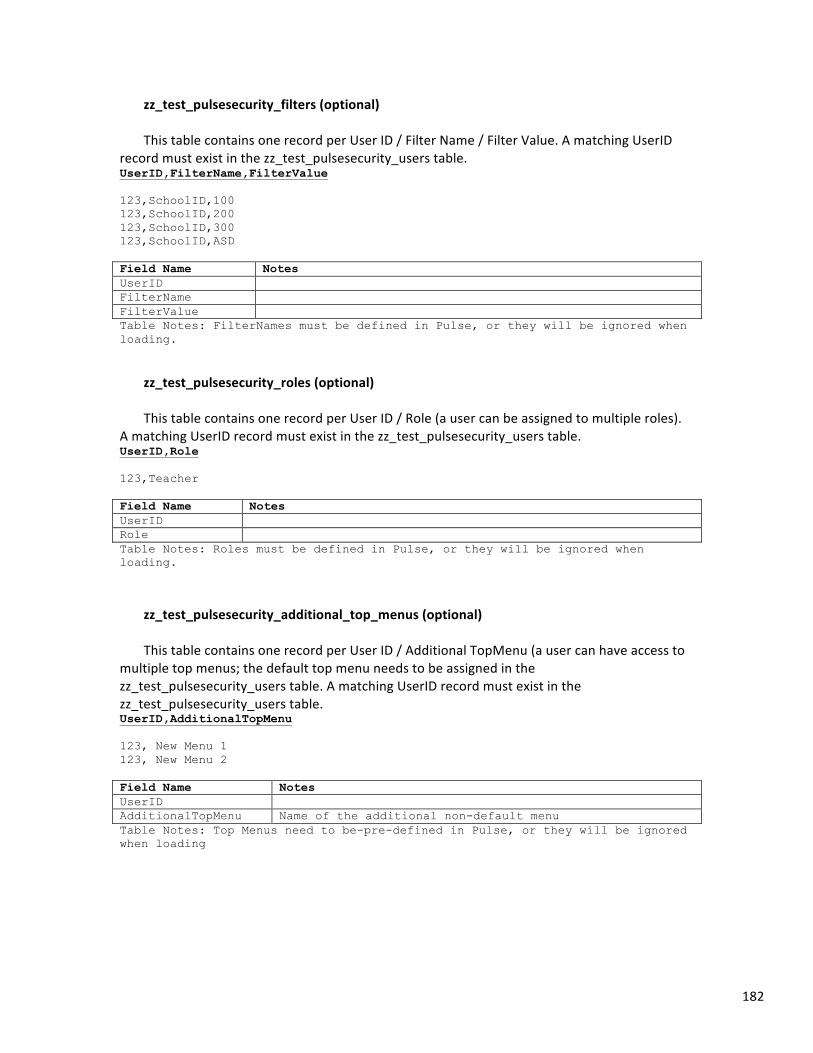
182
zz_test_pulsesecurity_filters (optional) This table contains one record per User ID / Filter Name / Filter Value. A matching UserID
record must exist in the zz_test_pulsesecurity_users table. UserID,FilterName,FilterValue 123,SchoolID,100 123,SchoolID,200 123,SchoolID,300 123,SchoolID,ASD Field Name Notes UserID FilterName FilterValue Table Notes: FilterNames must be defined in Pulse, or they will be ignored when loading.
zz_test_pulsesecurity_roles (optional) This table contains one record per User ID / Role (a user can be assigned to multiple roles).
A matching UserID record must exist in the zz_test_pulsesecurity_users table. UserID,Role 123,Teacher Field Name Notes UserID Role Table Notes: Roles must be defined in Pulse, or they will be ignored when loading.
zz_test_pulsesecurity_additional_top_menus (optional) This table contains one record per User ID / Additional TopMenu (a user can have access to
multiple top menus; the default top menu needs to be assigned in the zz_test_pulsesecurity_users table. A matching UserID record must exist in the zz_test_pulsesecurity_users table. UserID,AdditionalTopMenu 123, New Menu 1 123, New Menu 2 Field Name Notes UserID AdditionalTopMenu Name of the additional non-default menu Table Notes: Top Menus need to be-pre-defined in Pulse, or they will be ignored when loading
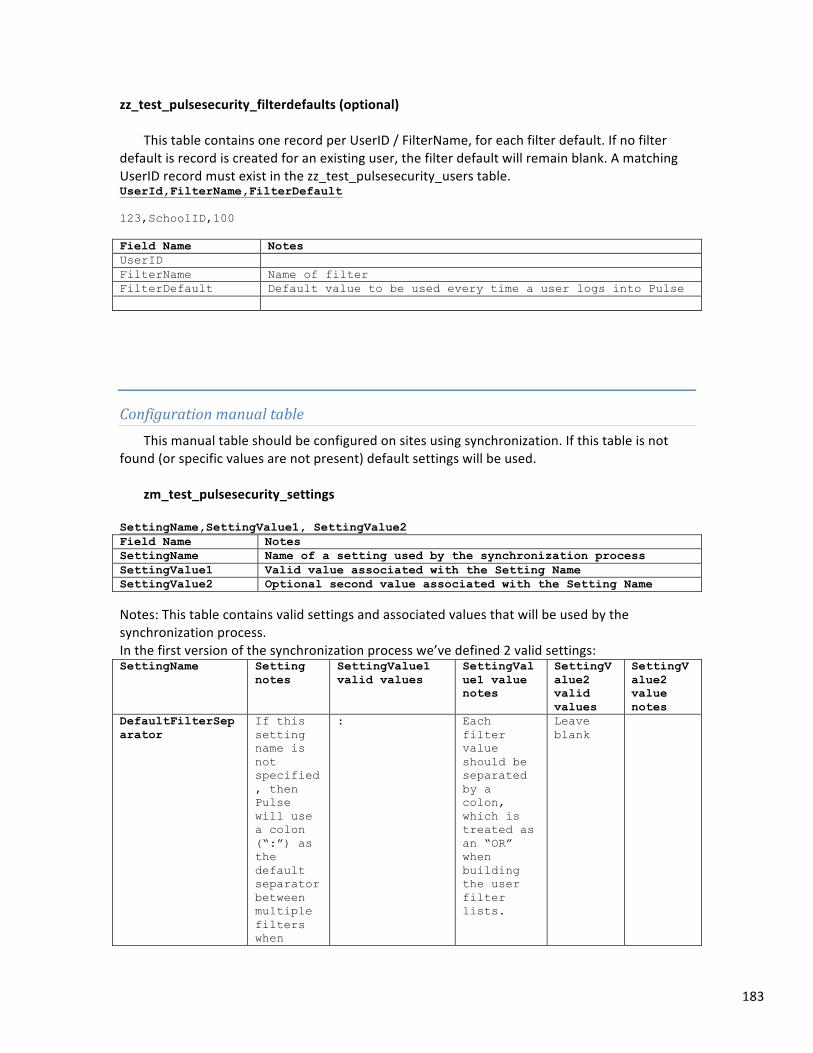
183
zz_test_pulsesecurity_filterdefaults (optional)
This table contains one record per UserID / FilterName, for each filter default. If no filter default is record is created for an existing user, the filter default will remain blank. A matching UserID record must exist in the zz_test_pulsesecurity_users table. UserId,FilterName,FilterDefault 123,SchoolID,100 Field Name Notes UserID FilterName Name of filter FilterDefault Default value to be used every time a user logs into Pulse
Configuration manual table This manual table should be configured on sites using synchronization. If this table is not
found (or specific values are not present) default settings will be used. zm_test_pulsesecurity_settings
SettingName,SettingValue1, SettingValue2 Field Name Notes SettingName Name of a setting used by the synchronization process SettingValue1 Valid value associated with the Setting Name SettingValue2 Optional second value associated with the Setting Name Notes: This table contains valid settings and associated values that will be used by the synchronization process. In the first version of the synchronization process we’ve defined 2 valid settings: SettingName Setting
notes SettingValue1 valid values
SettingValue1 value notes
SettingValue2 valid values
SettingValue2 value notes
DefaultFilterSeparator
If this setting name is not specified, then Pulse will use a colon (“:”) as the default separator between multiple filters when
: Each filter value should be separated by a colon, which is treated as an “OR” when building the user filter lists.
Leave blank
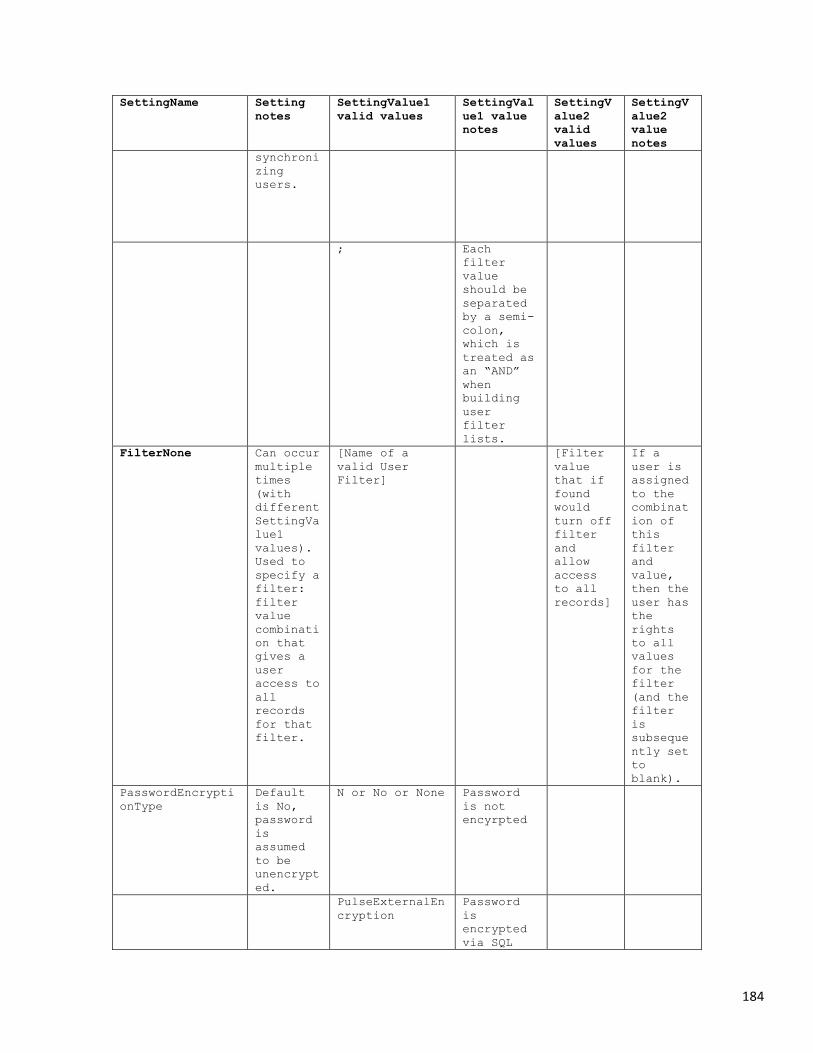
184
SettingName Setting notes
SettingValue1 valid values
SettingValue1 value notes
SettingValue2 valid values
SettingValue2 value notes
synchronizing users.
; Each filter value should be separated by a semi-colon, which is treated as an “AND” when building user filter lists.
FilterNone
Can occur multiple times (with different SettingValue1 values). Used to specify a filter: filter value combination that gives a user access to all records for that filter.
[Name of a valid User Filter]
[Filter value that if found would turn off filter and allow access to all records]
If a user is assigned to the combination of this filter and value, then the user has the rights to all values for the filter (and the filter is subsequently set to blank).
PasswordEncryptionType
Default is No, password is assumed to be unencrypted.
N or No or None Password is not encyrpted
PulseExternalEncryption
Password is encrypted via SQL
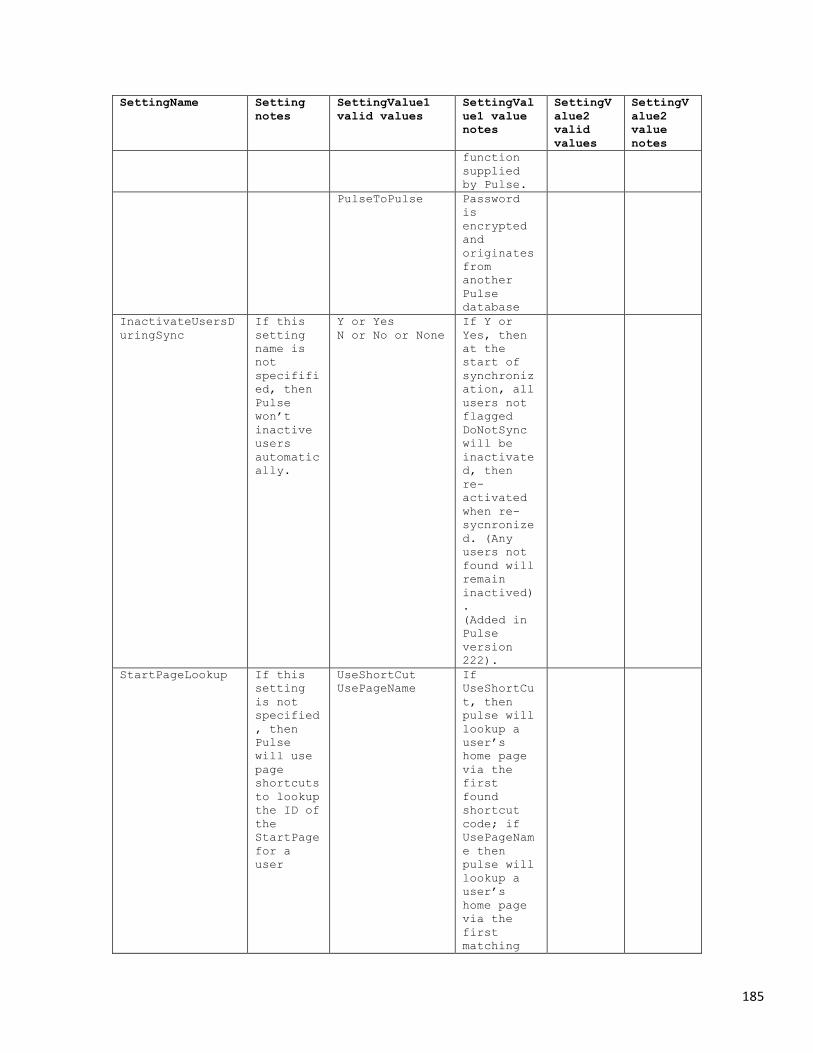
185
SettingName Setting notes
SettingValue1 valid values
SettingValue1 value notes
SettingValue2 valid values
SettingValue2 value notes
function supplied by Pulse.
PulseToPulse Password is encrypted and originates from another Pulse database
InactivateUsersDuringSync
If this setting name is not specifified, then Pulse won’t inactive users automatically.
Y or Yes N or No or None
If Y or Yes, then at the start of synchronization, all users not flagged DoNotSync will be inactivated, then re-activated when re-sycnronized. (Any users not found will remain inactived). (Added in Pulse version 222).
StartPageLookup If this setting is not specified, then Pulse will use page shortcuts to lookup the ID of the StartPage for a user
UseShortCut UsePageName
If UseShortCut, then pulse will lookup a user’s home page via the first found shortcut code; if UsePageName then pulse will lookup a user’s home page via the first matching
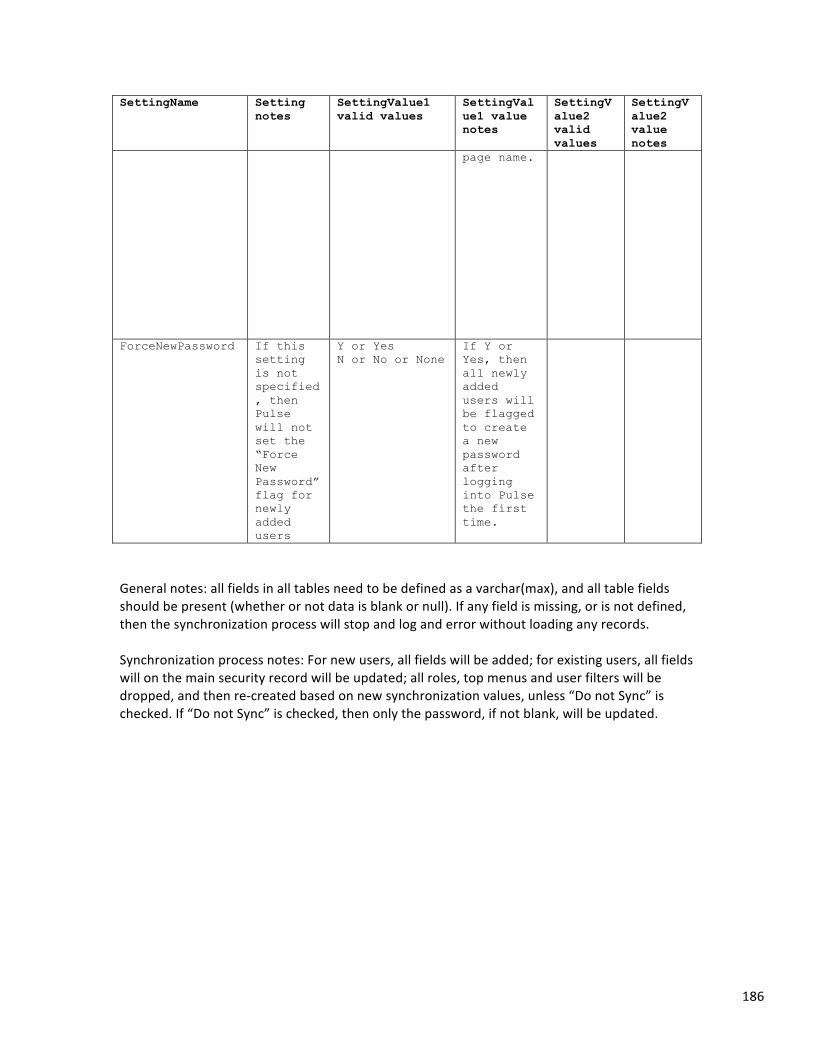
186
SettingName Setting notes
SettingValue1 valid values
SettingValue1 value notes
SettingValue2 valid values
SettingValue2 value notes
page name.
ForceNewPassword If this setting is not specified, then Pulse will not set the “Force New Password” flag for newly added users
Y or Yes N or No or None
If Y or Yes, then all newly added users will be flagged to create a new password after logging into Pulse the first time.
General notes: all fields in all tables need to be defined as a varchar(max), and all table fields should be present (whether or not data is blank or null). If any field is missing, or is not defined, then the synchronization process will stop and log and error without loading any records. Synchronization process notes: For new users, all fields will be added; for existing users, all fields will on the main security record will be updated; all roles, top menus and user filters will be dropped, and then re-‐created based on new synchronization values, unless “Do not Sync” is checked. If “Do not Sync” is checked, then only the password, if not blank, will be updated.
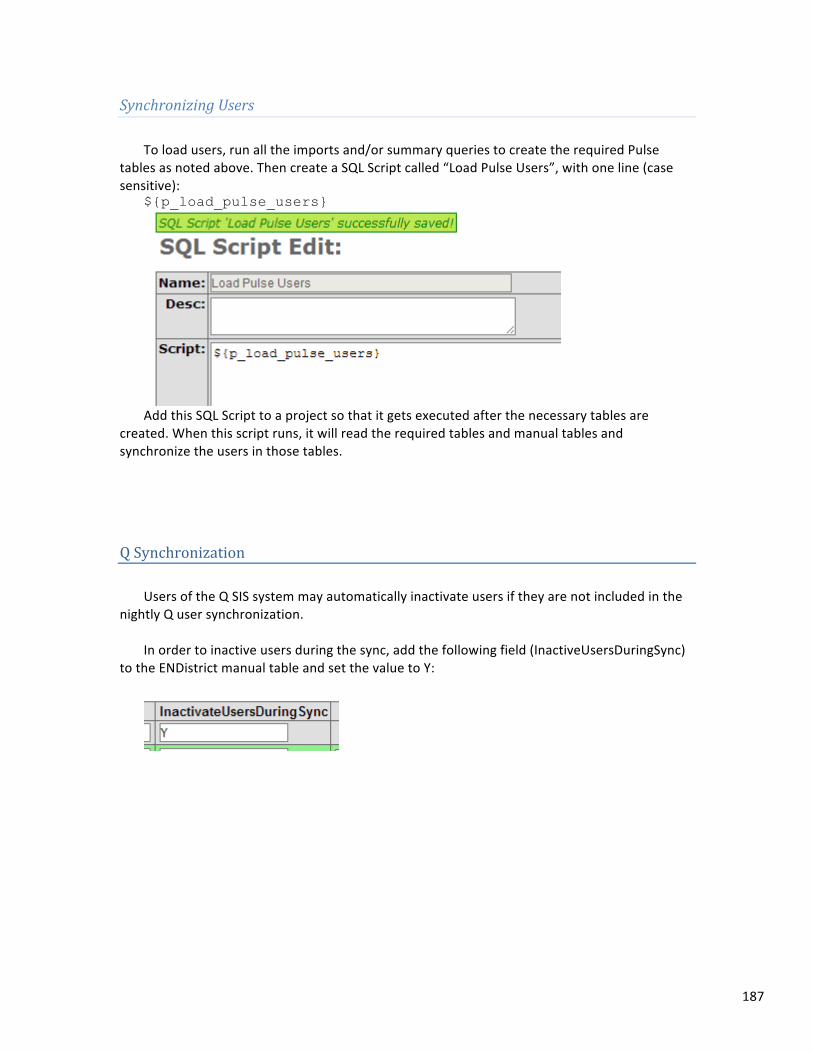
187
Synchronizing Users To load users, run all the imports and/or summary queries to create the required Pulse
tables as noted above. Then create a SQL Script called “Load Pulse Users”, with one line (case sensitive):
${p_load_pulse_users}
Add this SQL Script to a project so that it gets executed after the necessary tables are
created. When this script runs, it will read the required tables and manual tables and synchronize the users in those tables.
Q Synchronization Users of the Q SIS system may automatically inactivate users if they are not included in the
nightly Q user synchronization. In order to inactive users during the sync, add the following field (InactiveUsersDuringSync)
to the ENDistrict manual table and set the value to Y:
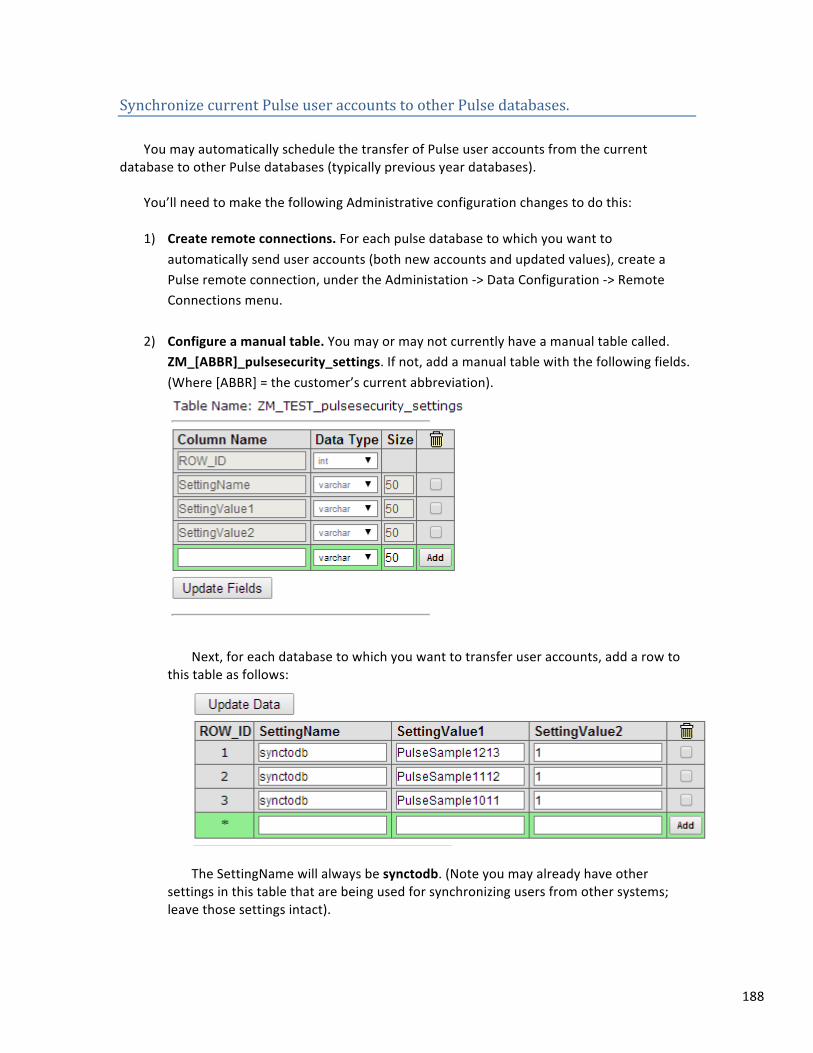
188
Synchronize current Pulse user accounts to other Pulse databases. You may automatically schedule the transfer of Pulse user accounts from the current
database to other Pulse databases (typically previous year databases). You’ll need to make the following Administrative configuration changes to do this: 1) Create remote connections. For each pulse database to which you want to
automatically send user accounts (both new accounts and updated values), create a Pulse remote connection, under the Administation -‐> Data Configuration -‐> Remote Connections menu.
2) Configure a manual table. You may or may not currently have a manual table called. ZM_[ABBR]_pulsesecurity_settings. If not, add a manual table with the following fields. (Where [ABBR] = the customer’s current abbreviation).
Next, for each database to which you want to transfer user accounts, add a row to
this table as follows:
The SettingName will always be synctodb. (Note you may already have other
settings in this table that are being used for synchronizing users from other systems; leave those settings intact).
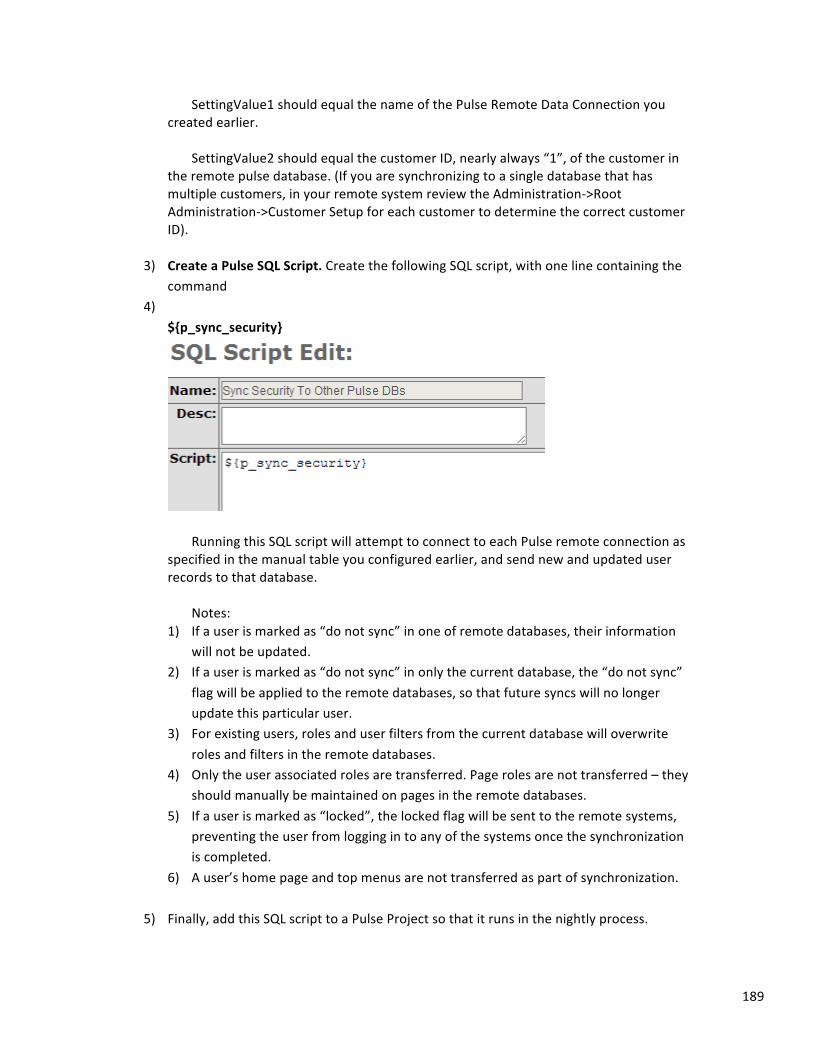
189
SettingValue1 should equal the name of the Pulse Remote Data Connection you created earlier.
SettingValue2 should equal the customer ID, nearly always “1”, of the customer in
the remote pulse database. (If you are synchronizing to a single database that has multiple customers, in your remote system review the Administration-‐>Root Administration-‐>Customer Setup for each customer to determine the correct customer ID).
3) Create a Pulse SQL Script. Create the following SQL script, with one line containing the
command 4)
${p_sync_security}
Running this SQL script will attempt to connect to each Pulse remote connection as
specified in the manual table you configured earlier, and send new and updated user records to that database.
Notes:
1) If a user is marked as “do not sync” in one of remote databases, their information will not be updated.
2) If a user is marked as “do not sync” in only the current database, the “do not sync” flag will be applied to the remote databases, so that future syncs will no longer update this particular user.
3) For existing users, roles and user filters from the current database will overwrite roles and filters in the remote databases.
4) Only the user associated roles are transferred. Page roles are not transferred – they should manually be maintained on pages in the remote databases.
5) If a user is marked as “locked”, the locked flag will be sent to the remote systems, preventing the user from logging in to any of the systems once the synchronization is completed.
6) A user’s home page and top menus are not transferred as part of synchronization.
5) Finally, add this SQL script to a Pulse Project so that it runs in the nightly process.

190
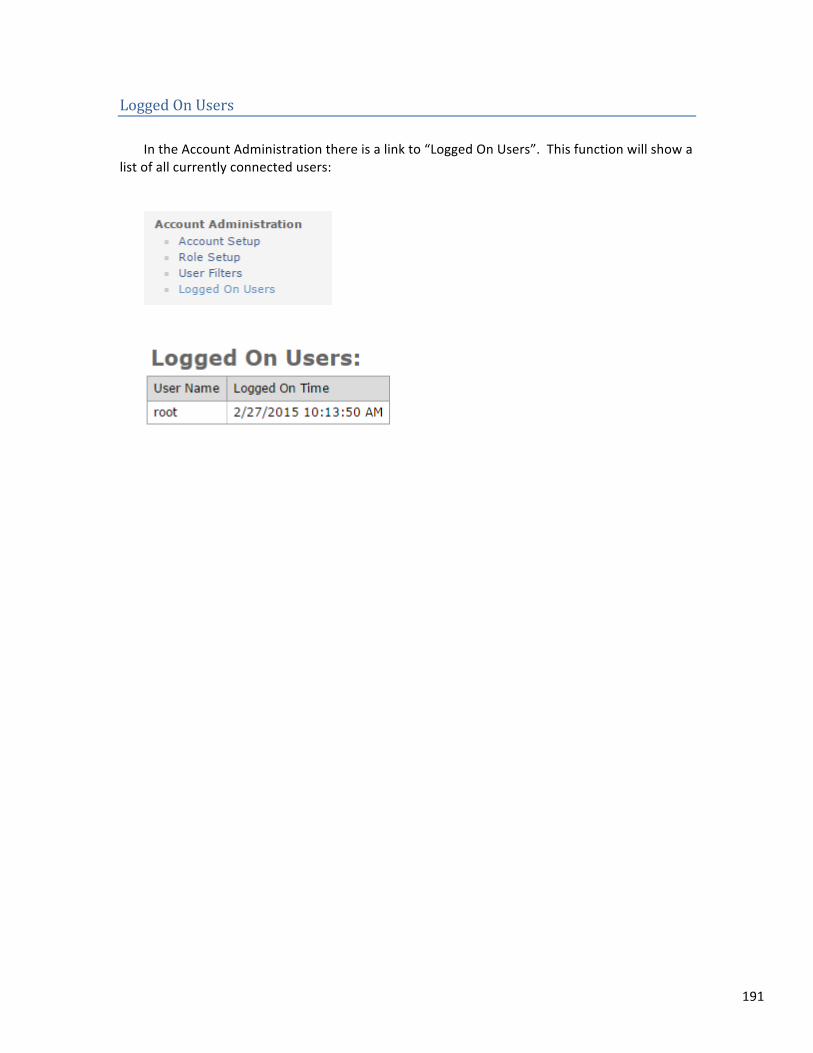
191
Logged On Users In the Account Administration there is a link to “Logged On Users”. This function will show a
list of all currently connected users:
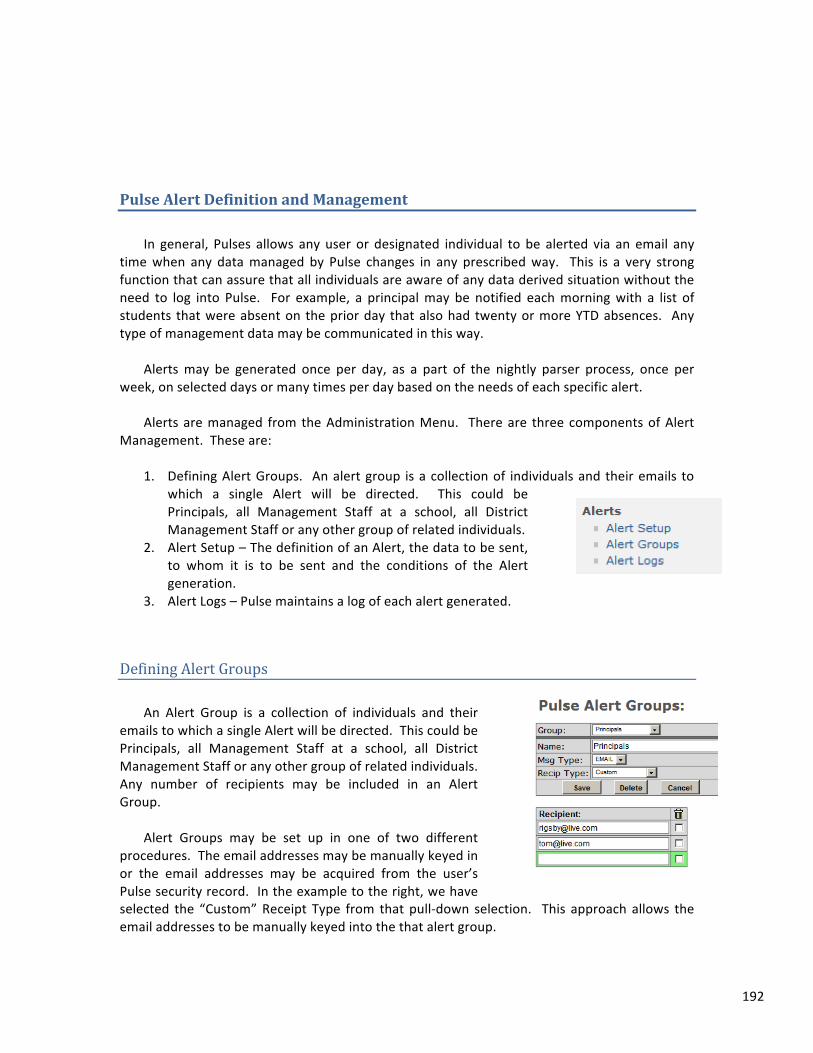
192
Pulse Alert Definition and Management In general, Pulses allows any user or designated individual to be alerted via an email any
time when any data managed by Pulse changes in any prescribed way. This is a very strong function that can assure that all individuals are aware of any data derived situation without the need to log into Pulse. For example, a principal may be notified each morning with a list of students that were absent on the prior day that also had twenty or more YTD absences. Any type of management data may be communicated in this way.
Alerts may be generated once per day, as a part of the nightly parser process, once per
week, on selected days or many times per day based on the needs of each specific alert. Alerts are managed from the Administration Menu. There are three components of Alert
Management. These are: 1. Defining Alert Groups. An alert group is a collection of individuals and their emails to
which a single Alert will be directed. This could be Principals, all Management Staff at a school, all District Management Staff or any other group of related individuals.
2. Alert Setup – The definition of an Alert, the data to be sent, to whom it is to be sent and the conditions of the Alert generation.
3. Alert Logs – Pulse maintains a log of each alert generated.
Defining Alert Groups An Alert Group is a collection of individuals and their
emails to which a single Alert will be directed. This could be Principals, all Management Staff at a school, all District Management Staff or any other group of related individuals. Any number of recipients may be included in an Alert Group.
Alert Groups may be set up in one of two different
procedures. The email addresses may be manually keyed in or the email addresses may be acquired from the user’s Pulse security record. In the example to the right, we have selected the “Custom” Receipt Type from that pull-‐down selection. This approach allows the email addresses to be manually keyed into the that alert group.
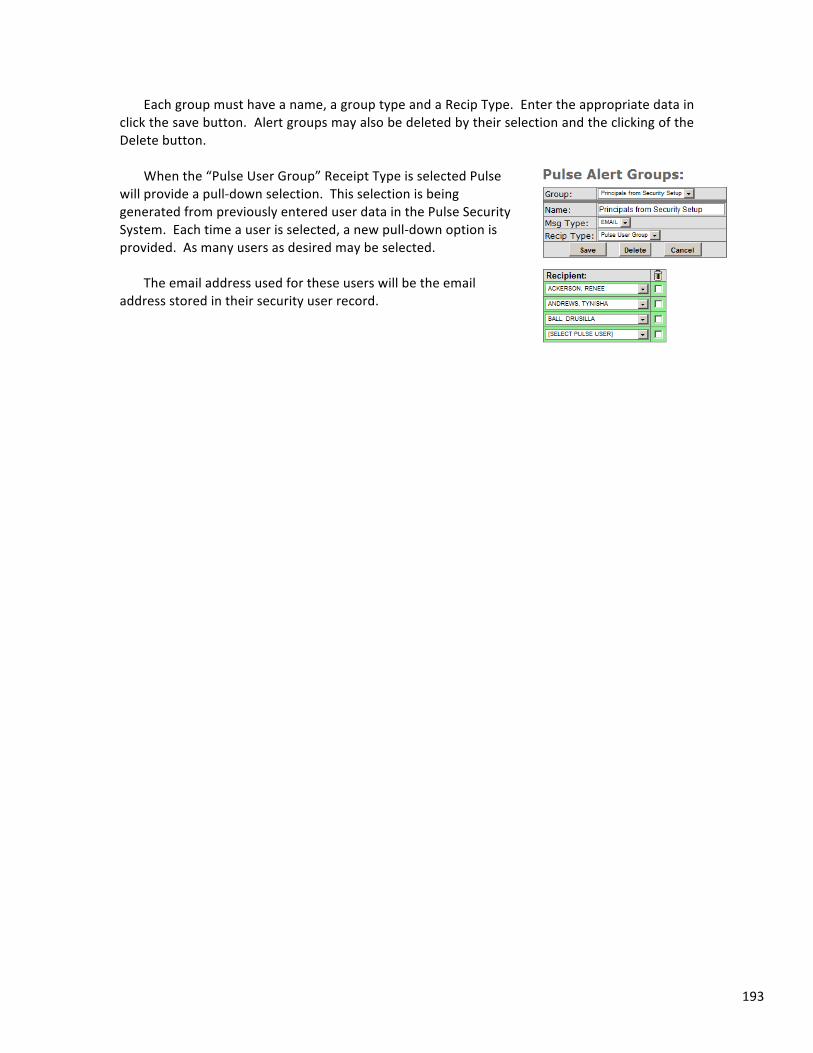
193
Each group must have a name, a group type and a Recip Type. Enter the appropriate data in click the save button. Alert groups may also be deleted by their selection and the clicking of the Delete button.
When the “Pulse User Group” Receipt Type is selected Pulse
will provide a pull-‐down selection. This selection is being generated from previously entered user data in the Pulse Security System. Each time a user is selected, a new pull-‐down option is provided. As many users as desired may be selected.
The email address used for these users will be the email
address stored in their security user record.
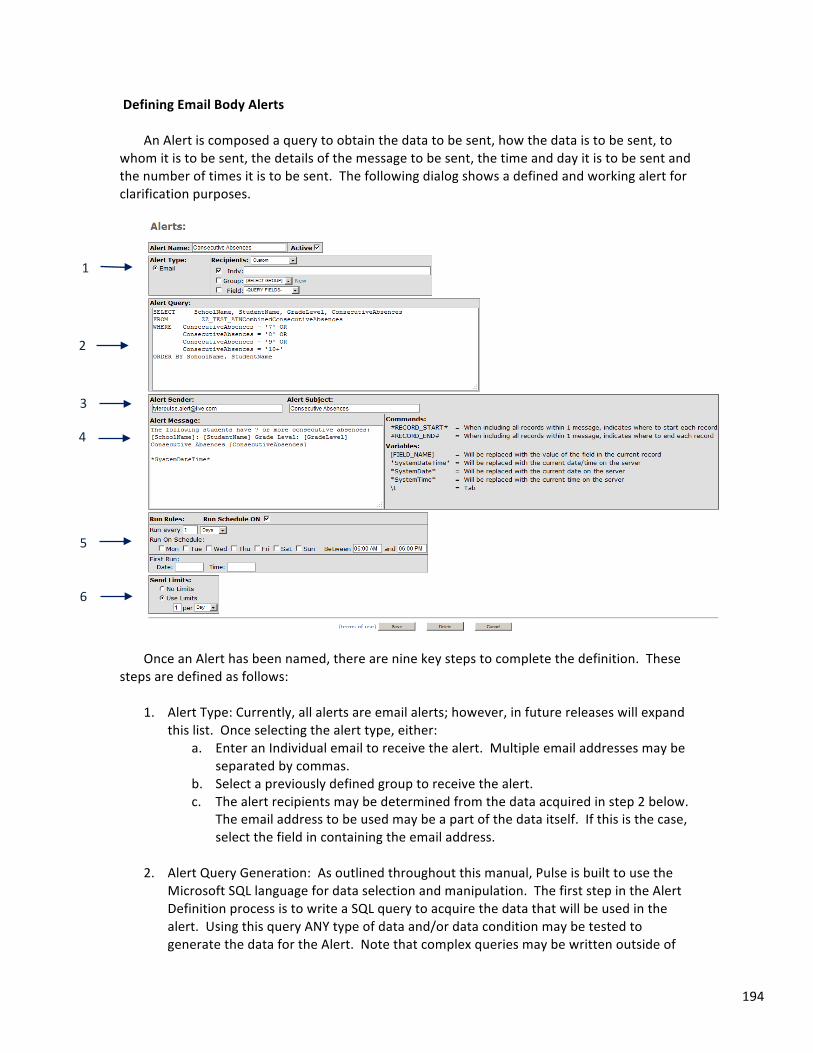
194
Defining Email Body Alerts An Alert is composed a query to obtain the data to be sent, how the data is to be sent, to
whom it is to be sent, the details of the message to be sent, the time and day it is to be sent and the number of times it is to be sent. The following dialog shows a defined and working alert for clarification purposes.
Once an Alert has been named, there are nine key steps to complete the definition. These
steps are defined as follows: 1. Alert Type: Currently, all alerts are email alerts; however, in future releases will expand
this list. Once selecting the alert type, either: a. Enter an Individual email to receive the alert. Multiple email addresses may be
separated by commas. b. Select a previously defined group to receive the alert. c. The alert recipients may be determined from the data acquired in step 2 below.
The email address to be used may be a part of the data itself. If this is the case, select the field in containing the email address.
2. Alert Query Generation: As outlined throughout this manual, Pulse is built to use the
Microsoft SQL language for data selection and manipulation. The first step in the Alert Definition process is to write a SQL query to acquire the data that will be used in the alert. Using this query ANY type of data and/or data condition may be tested to generate the data for the Alert. Note that complex queries may be written outside of
1
2
3
4
5
6
195
the alert process and the results of those queries included in the alert as a very simple SQL statement.
3. Alert Message Information: The next step is to define the message controls for the alert. a. First, enter the email address from which the alert message will originate. This
email address must have been previously defined in the organization email system for Pulse use.
b. Insert the Subject Line that will be used in the resulting email.
4. Define the Email Message: Using this process the data resulting from the query defined in item 1 above may be integrated with surrounding text supplied in this step.
For Example, if the query contains a student name and the number of times a student has been absent in the fields “StudentName” and “AbsentCount”, they may be integrated with text in the following way. Dear Parent, your child, [StudentName], has been absent [AbsentCount] times this year. Dear Parent, your child, John Doe, has been absent 22 times this year.
Additionally, this process allows the definition of how many emails will be sent from the source data. For example, if the source data generates a list of ten students, should ten separate emails be generated or a single email containing a list of the ten students? If ten emails are desired, no special notations in the definition are necessary, if one email with all ten students detailed is desired, a Command Function is provided for this process.
For example, if the query contains ten rows of data and ten emails are desired, the following may be entered:
[StudentName] has a total of [AbsentCount] absences.
If one email is desired, the query generated data may be inserted inside of a start and end function as shown below:
The following is a list of students with their absence counts: #RECORD_START Student Name – [StudentName], [AbsentCount] absences. #RECORD_END#
Note that the functions must be entered in capital letters.
196
Several inserted variables may also be inserted into the message. These variables are as follows:
• *SystemDateTime* will insert the date and time the email is
sent into the email. • *SystemDate* will insert the date that the email is sent into
the email. • *SystemTime* will insert the time that the email is sent into
the email.
5. Define the Alert Run Rules: The next step is to define when the Alert is to be processed. Note these steps as follows:
a. Define the Run Interval. How often is the query that generates data to be run. To decide on the interval consider how often the data being read by the query is updated. If it is updated daily, it makes little sense to acquire new data more often that daily since it would be the same data each time it was acquired on each day. If the data is acquired hourly, then hourly may be the best option.
b. Determine what days of the week and the time on those days that the query is to be run. For example, click each day for each day of the week, but if the data is desired only on Friday, then only select Friday.
c. Select the date and time for the alert process to begin. Use the date format “3/12/2010” and the time format “8:00 AM”.
6. Define the Sending Rules: This step is to determine how many times a day the alert will
be sent. Selecting no limits means that the Alert will be sent each time new data is acquired as detailed in the previous paragraph. When further limits are to be used, enter the number of alerts limit and then select the duration from the pull-‐down box.
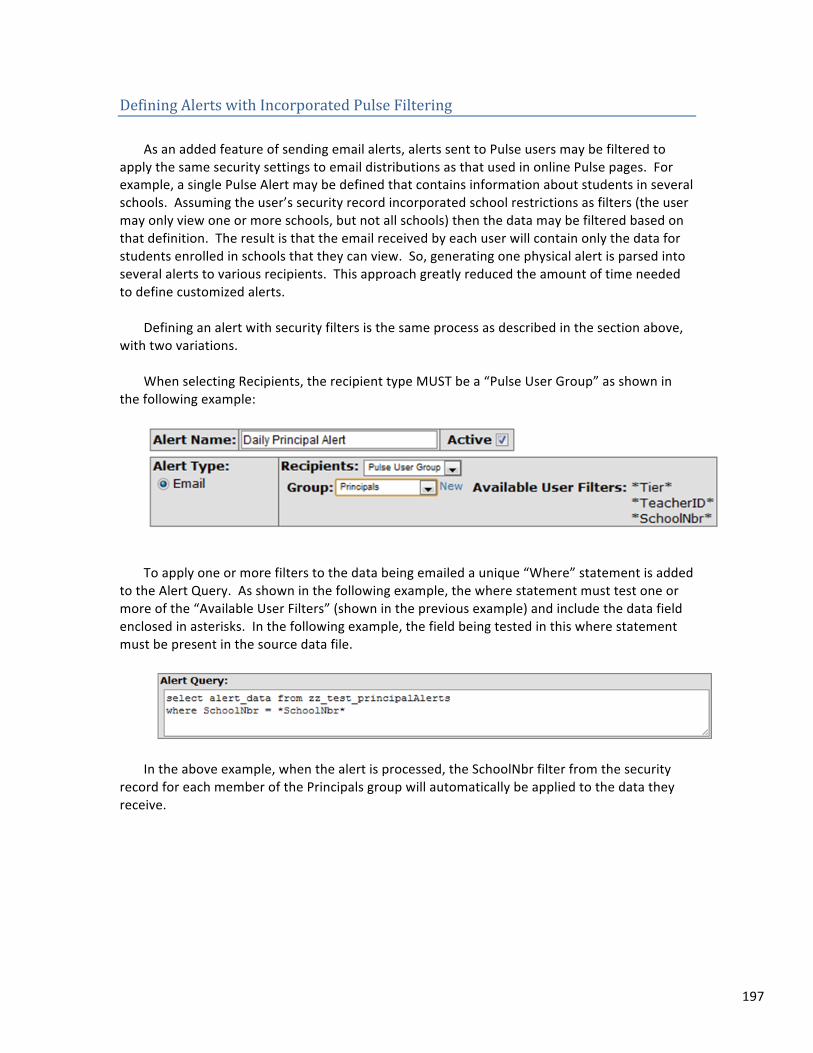
197
Defining Alerts with Incorporated Pulse Filtering As an added feature of sending email alerts, alerts sent to Pulse users may be filtered to
apply the same security settings to email distributions as that used in online Pulse pages. For example, a single Pulse Alert may be defined that contains information about students in several schools. Assuming the user’s security record incorporated school restrictions as filters (the user may only view one or more schools, but not all schools) then the data may be filtered based on that definition. The result is that the email received by each user will contain only the data for students enrolled in schools that they can view. So, generating one physical alert is parsed into several alerts to various recipients. This approach greatly reduced the amount of time needed to define customized alerts.
Defining an alert with security filters is the same process as described in the section above,
with two variations. When selecting Recipients, the recipient type MUST be a “Pulse User Group” as shown in
the following example:
To apply one or more filters to the data being emailed a unique “Where” statement is added
to the Alert Query. As shown in the following example, the where statement must test one or more of the “Available User Filters” (shown in the previous example) and include the data field enclosed in asterisks. In the following example, the field being tested in this where statement must be present in the source data file.
In the above example, when the alert is processed, the SchoolNbr filter from the security
record for each member of the Principals group will automatically be applied to the data they receive.
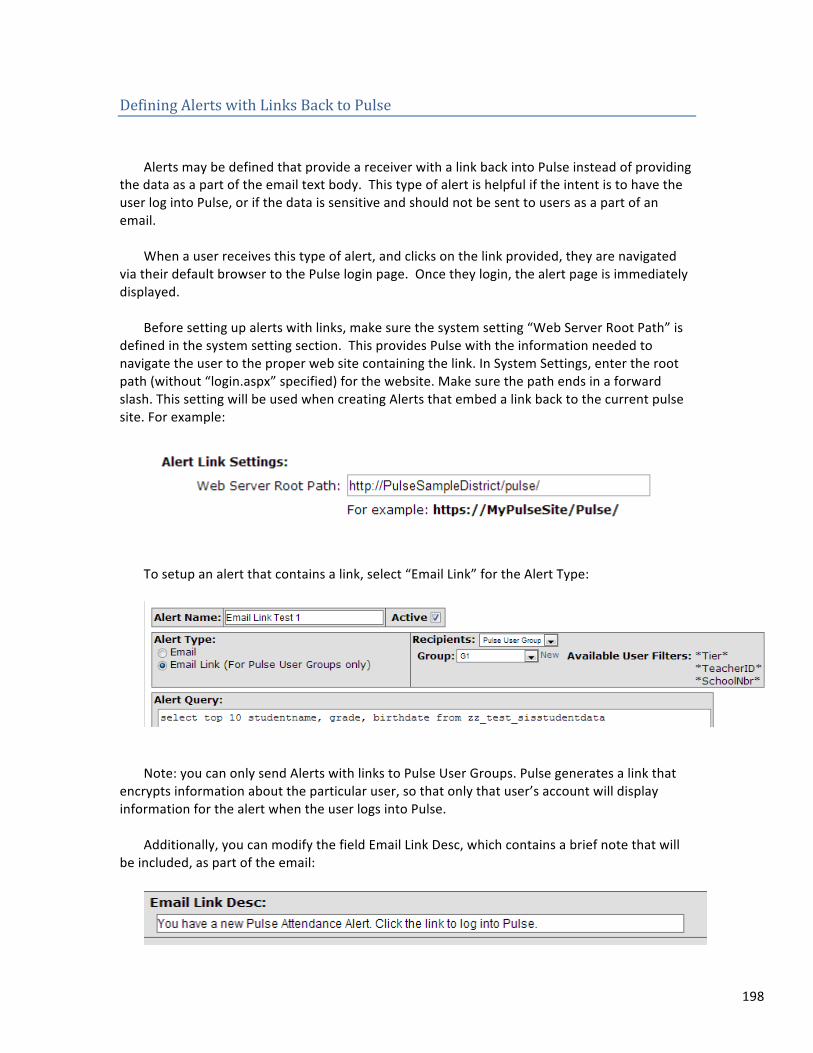
198
Defining Alerts with Links Back to Pulse Alerts may be defined that provide a receiver with a link back into Pulse instead of providing
the data as a part of the email text body. This type of alert is helpful if the intent is to have the user log into Pulse, or if the data is sensitive and should not be sent to users as a part of an email.
When a user receives this type of alert, and clicks on the link provided, they are navigated
via their default browser to the Pulse login page. Once they login, the alert page is immediately displayed.
Before setting up alerts with links, make sure the system setting “Web Server Root Path” is
defined in the system setting section. This provides Pulse with the information needed to navigate the user to the proper web site containing the link. In System Settings, enter the root path (without “login.aspx” specified) for the website. Make sure the path ends in a forward slash. This setting will be used when creating Alerts that embed a link back to the current pulse site. For example:
To setup an alert that contains a link, select “Email Link” for the Alert Type:
Note: you can only send Alerts with links to Pulse User Groups. Pulse generates a link that
encrypts information about the particular user, so that only that user’s account will display information for the alert when the user logs into Pulse.
Additionally, you can modify the field Email Link Desc, which contains a brief note that will
be included, as part of the email:
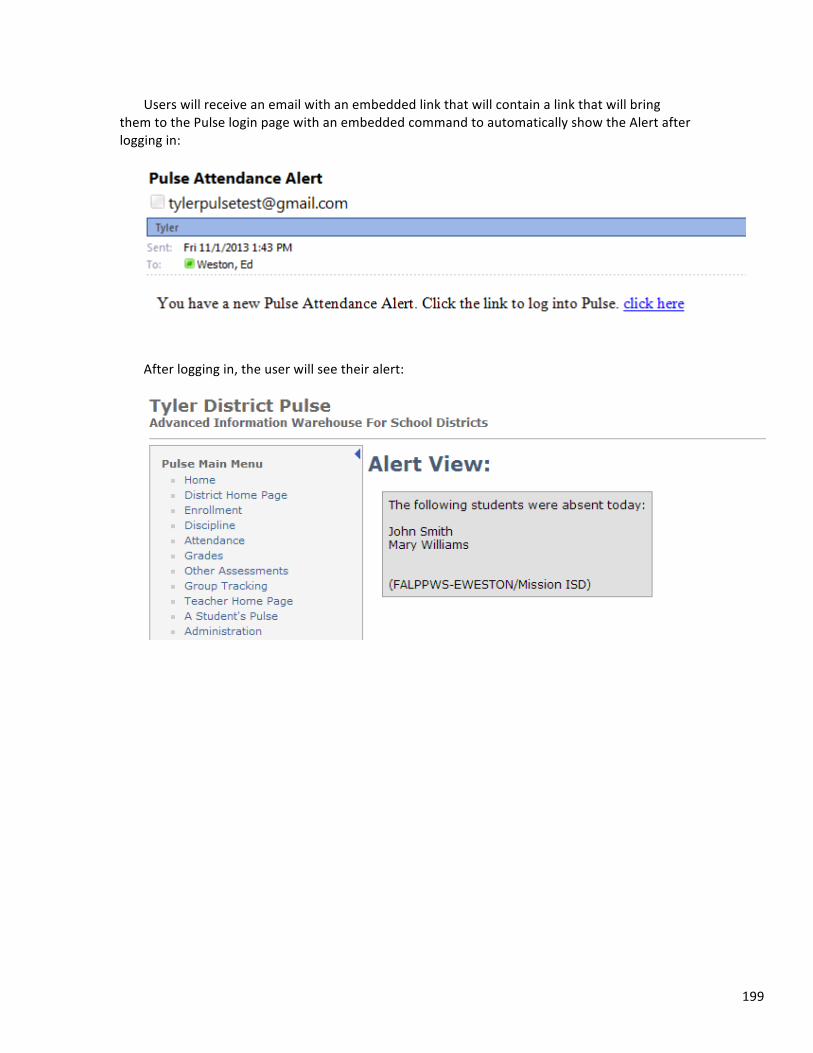
199
Users will receive an email with an embedded link that will contain a link that will bring them to the Pulse login page with an embedded command to automatically show the Alert after logging in:
After logging in, the user will see their alert:
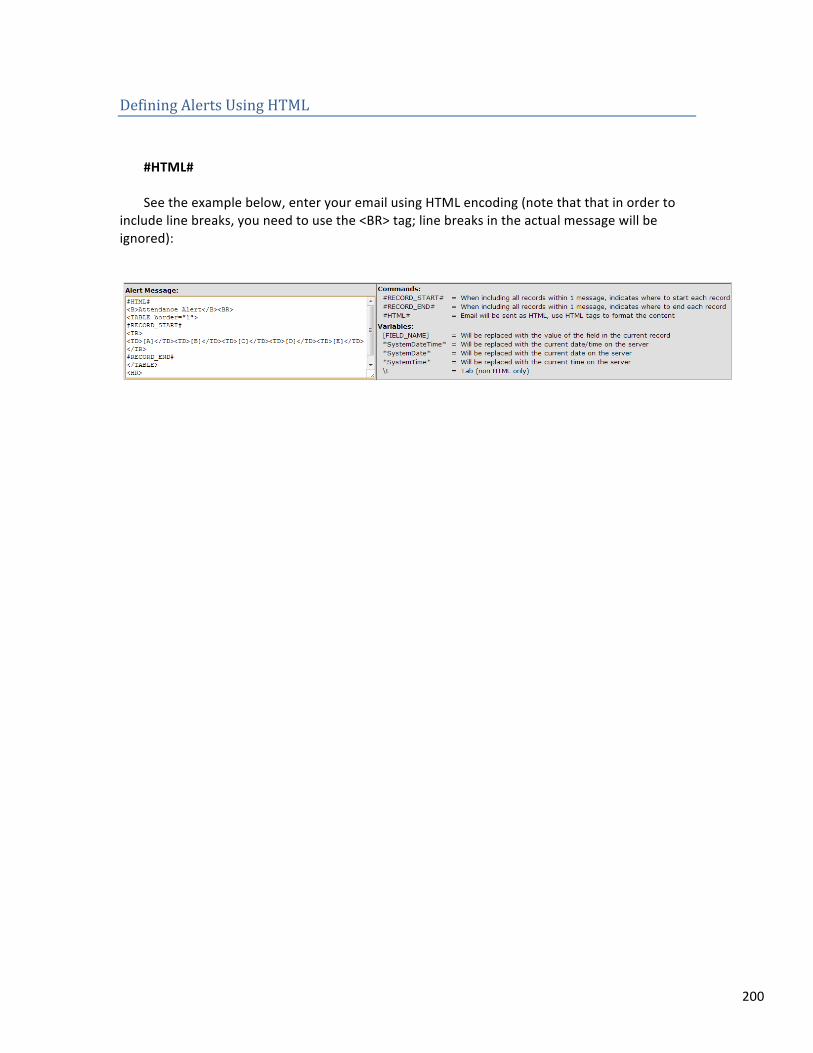
200
Defining Alerts Using HTML #HTML# See the example below, enter your email using HTML encoding (note that that in order to
include line breaks, you need to use the <BR> tag; line breaks in the actual message will be ignored):
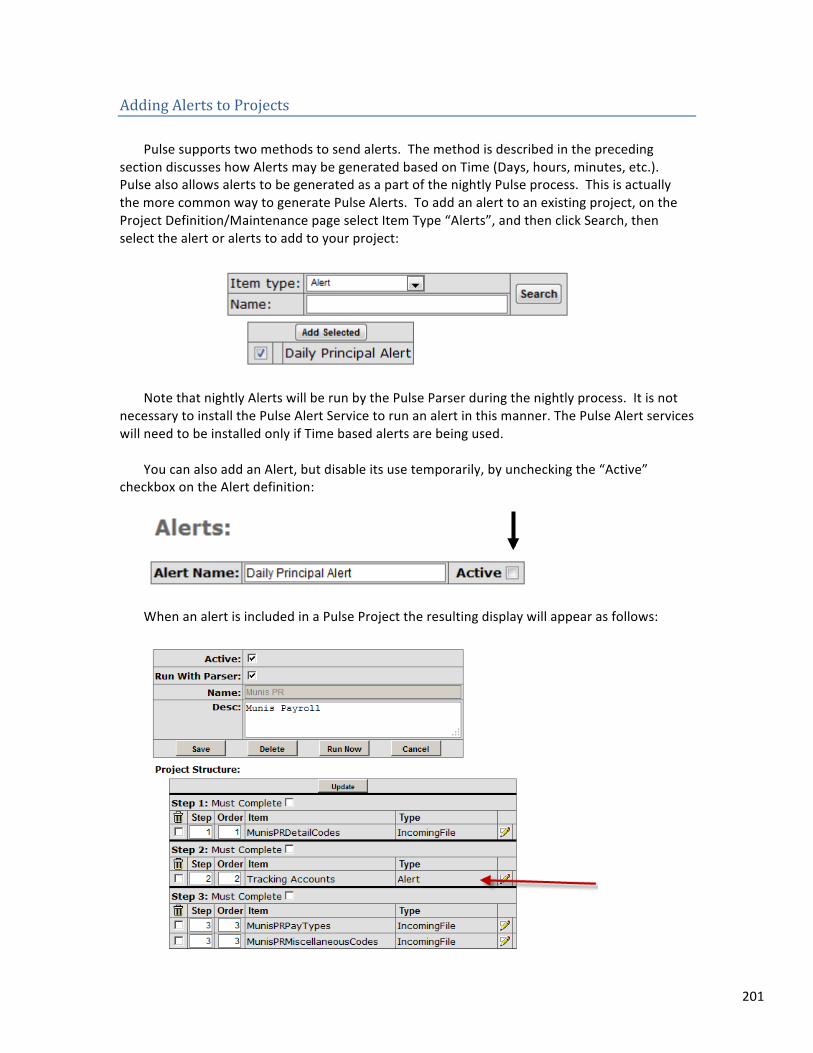
201
Adding Alerts to Projects Pulse supports two methods to send alerts. The method is described in the preceding
section discusses how Alerts may be generated based on Time (Days, hours, minutes, etc.). Pulse also allows alerts to be generated as a part of the nightly Pulse process. This is actually the more common way to generate Pulse Alerts. To add an alert to an existing project, on the Project Definition/Maintenance page select Item Type “Alerts”, and then click Search, then select the alert or alerts to add to your project:
Note that nightly Alerts will be run by the Pulse Parser during the nightly process. It is not
necessary to install the Pulse Alert Service to run an alert in this manner. The Pulse Alert services will need to be installed only if Time based alerts are being used.
You can also add an Alert, but disable its use temporarily, by unchecking the “Active”
checkbox on the Alert definition:
When an alert is included in a Pulse Project the resulting display will appear as follows:
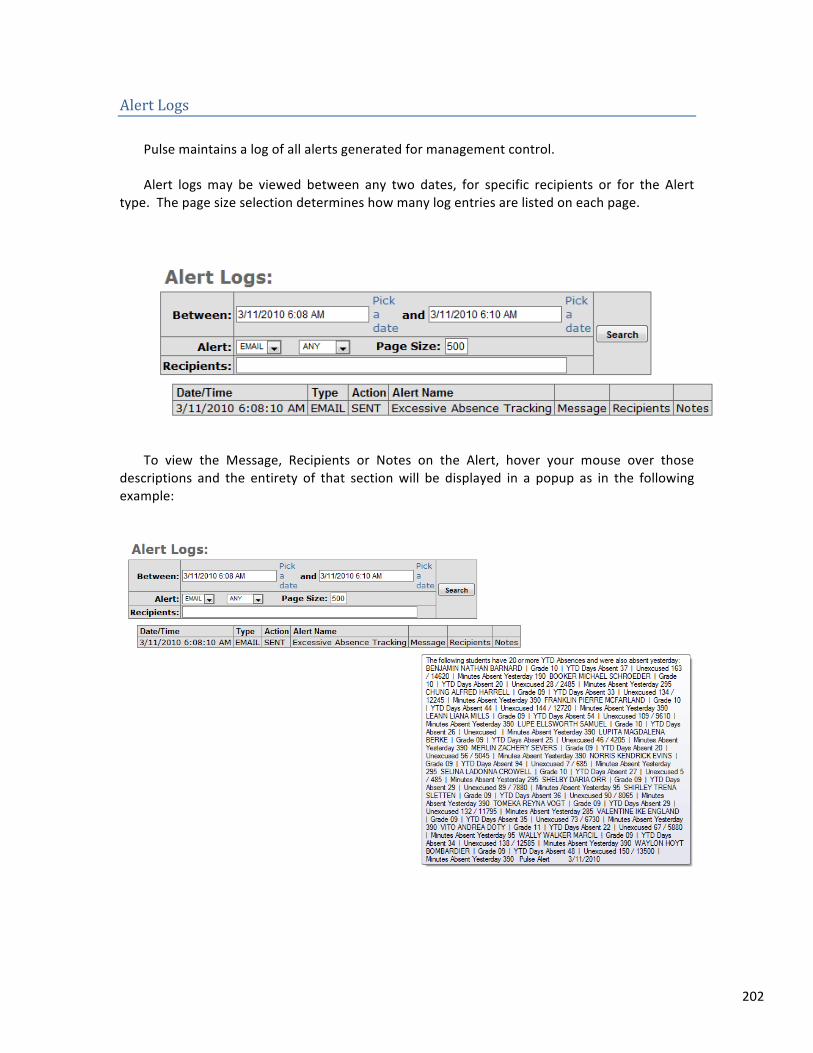
202
Alert Logs Pulse maintains a log of all alerts generated for management control. Alert logs may be viewed between any two dates, for specific recipients or for the Alert
type. The page size selection determines how many log entries are listed on each page.
To view the Message, Recipients or Notes on the Alert, hover your mouse over those
descriptions and the entirety of that section will be displayed in a popup as in the following example:
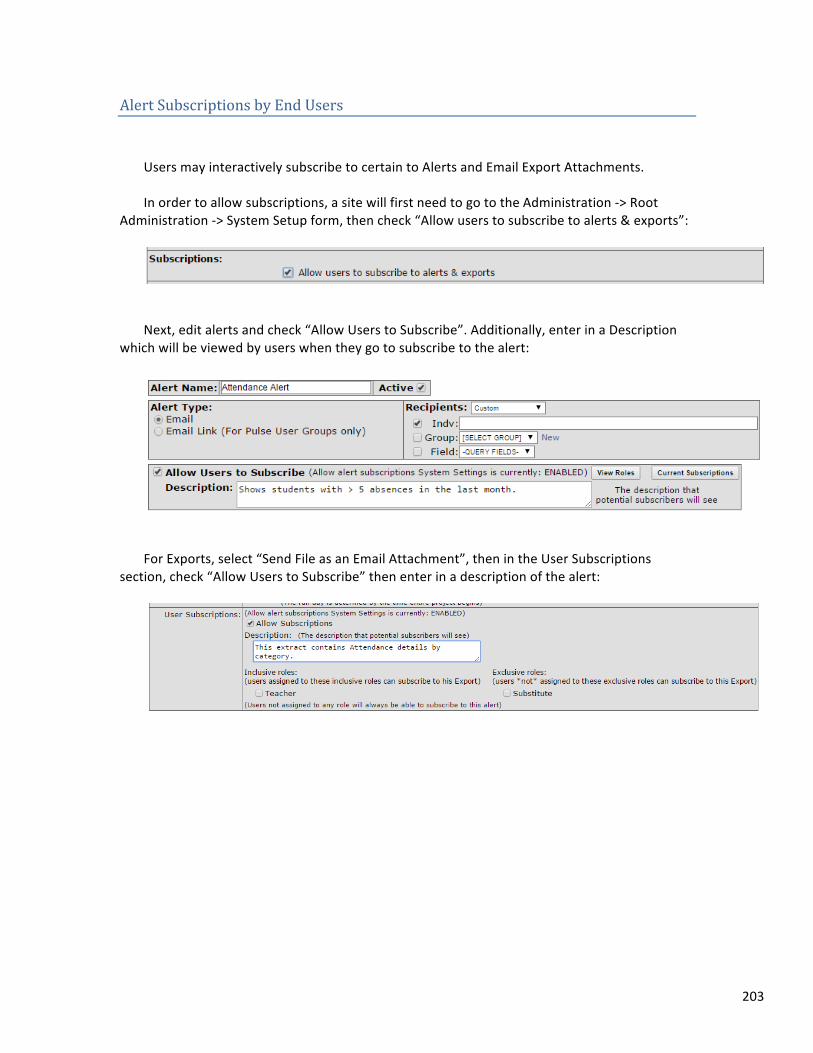
203
Alert Subscriptions by End Users Users may interactively subscribe to certain to Alerts and Email Export Attachments. In order to allow subscriptions, a site will first need to go to the Administration -‐> Root
Administration -‐> System Setup form, then check “Allow users to subscribe to alerts & exports”:
Next, edit alerts and check “Allow Users to Subscribe”. Additionally, enter in a Description
which will be viewed by users when they go to subscribe to the alert:
For Exports, select “Send File as an Email Attachment”, then in the User Subscriptions
section, check “Allow Users to Subscribe” then enter in a description of the alert:
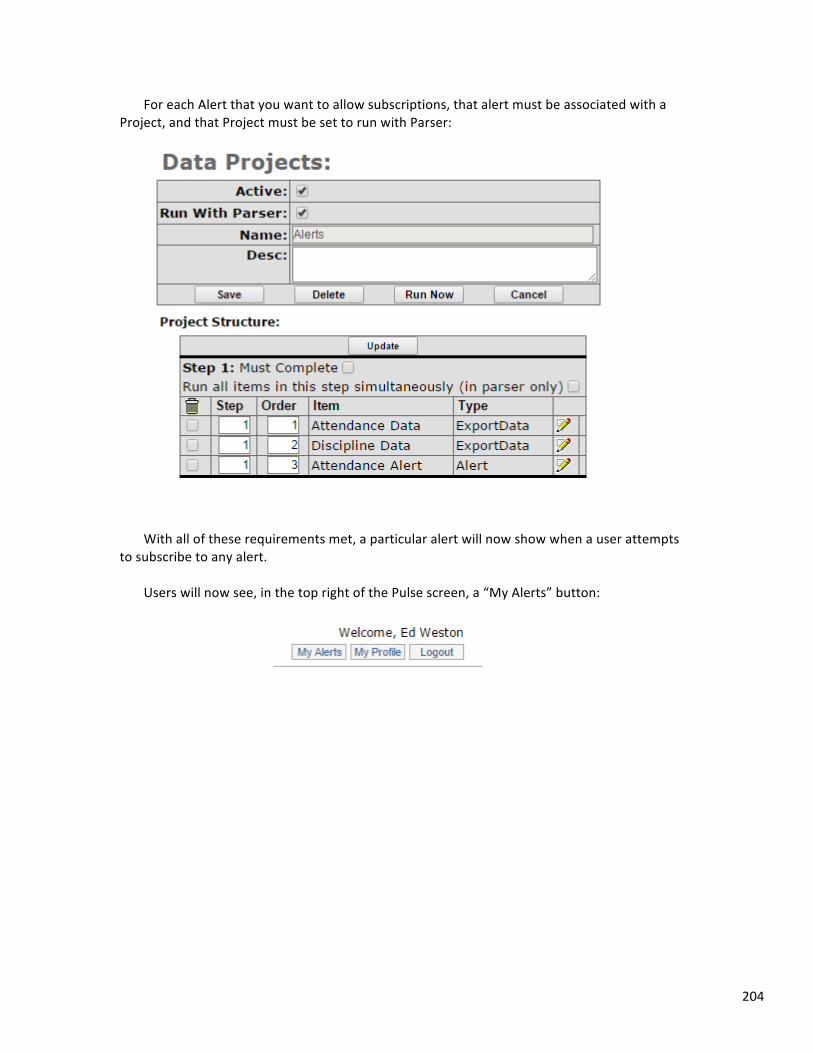
204
For each Alert that you want to allow subscriptions, that alert must be associated with a Project, and that Project must be set to run with Parser:
With all of these requirements met, a particular alert will now show when a user attempts
to subscribe to any alert. Users will now see, in the top right of the Pulse screen, a “My Alerts” button:
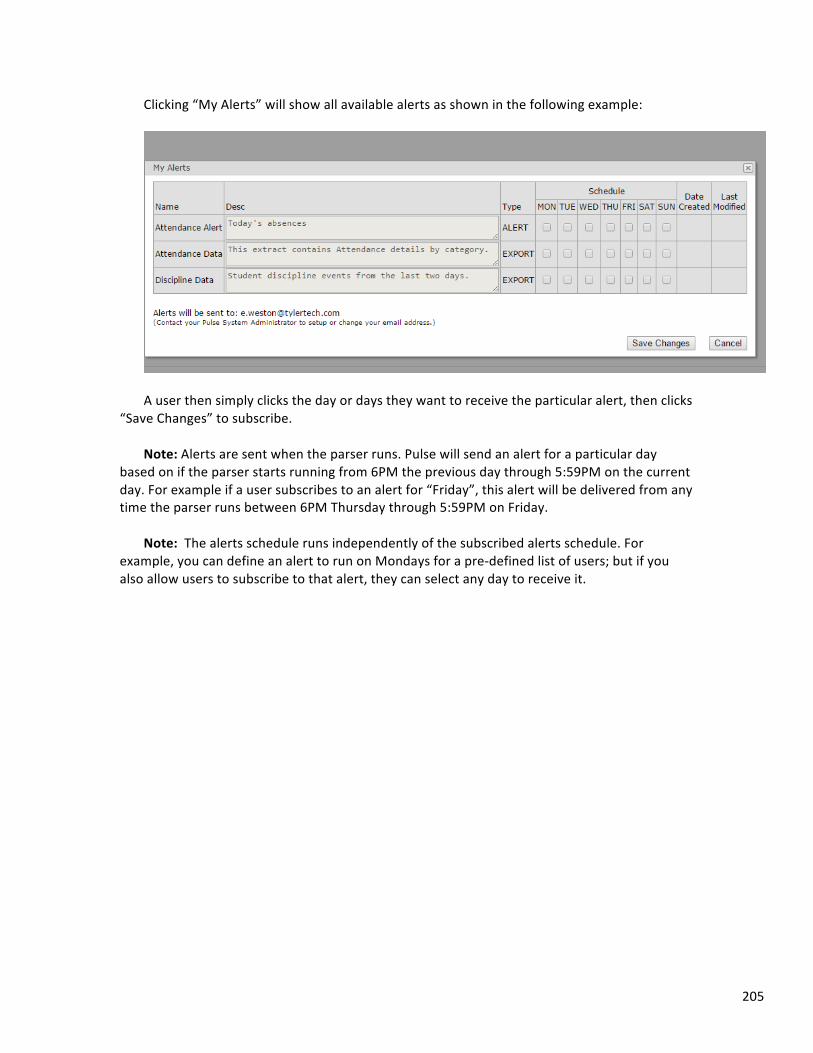
205
Clicking “My Alerts” will show all available alerts as shown in the following example:
A user then simply clicks the day or days they want to receive the particular alert, then clicks
“Save Changes” to subscribe. Note: Alerts are sent when the parser runs. Pulse will send an alert for a particular day
based on if the parser starts running from 6PM the previous day through 5:59PM on the current day. For example if a user subscribes to an alert for “Friday”, this alert will be delivered from any time the parser runs between 6PM Thursday through 5:59PM on Friday.
Note: The alerts schedule runs independently of the subscribed alerts schedule. For
example, you can define an alert to run on Mondays for a pre-‐defined list of users; but if you also allow users to subscribe to that alert, they can select any day to receive it.
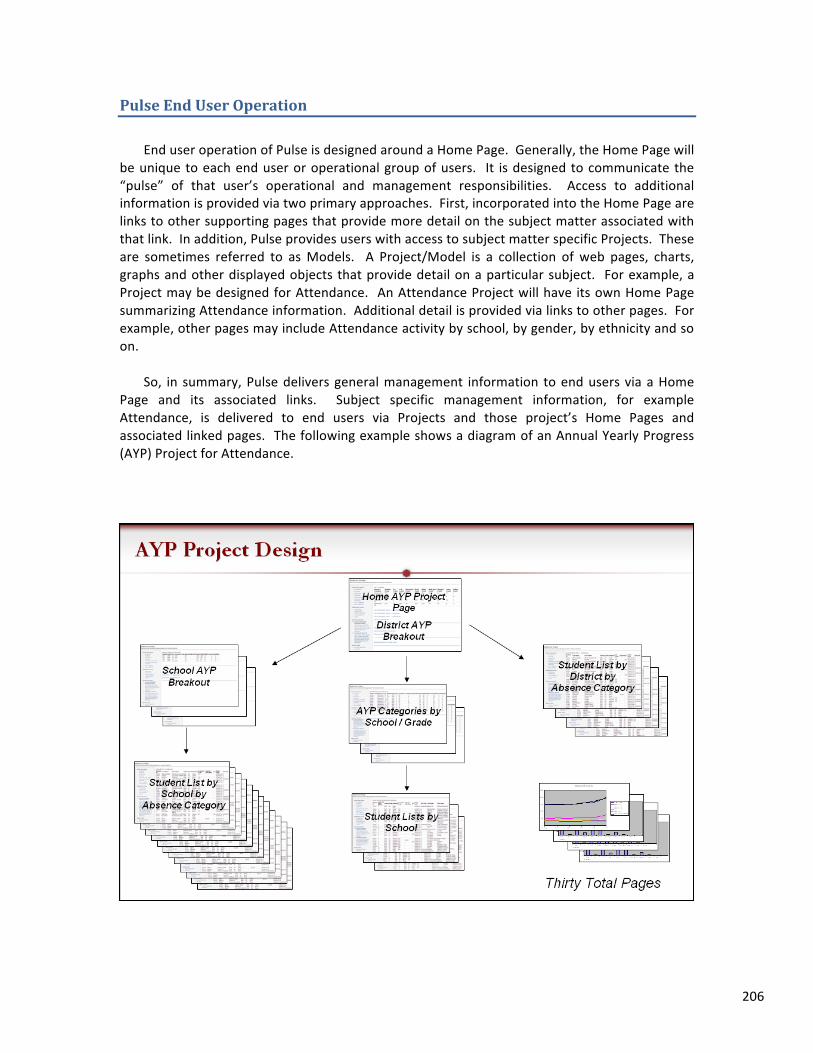
206
Pulse End User Operation End user operation of Pulse is designed around a Home Page. Generally, the Home Page will
be unique to each end user or operational group of users. It is designed to communicate the “pulse” of that user’s operational and management responsibilities. Access to additional information is provided via two primary approaches. First, incorporated into the Home Page are links to other supporting pages that provide more detail on the subject matter associated with that link. In addition, Pulse provides users with access to subject matter specific Projects. These are sometimes referred to as Models. A Project/Model is a collection of web pages, charts, graphs and other displayed objects that provide detail on a particular subject. For example, a Project may be designed for Attendance. An Attendance Project will have its own Home Page summarizing Attendance information. Additional detail is provided via links to other pages. For example, other pages may include Attendance activity by school, by gender, by ethnicity and so on.
So, in summary, Pulse delivers general management information to end users via a Home
Page and its associated links. Subject specific management information, for example Attendance, is delivered to end users via Projects and those project’s Home Pages and associated linked pages. The following example shows a diagram of an Annual Yearly Progress (AYP) Project for Attendance.
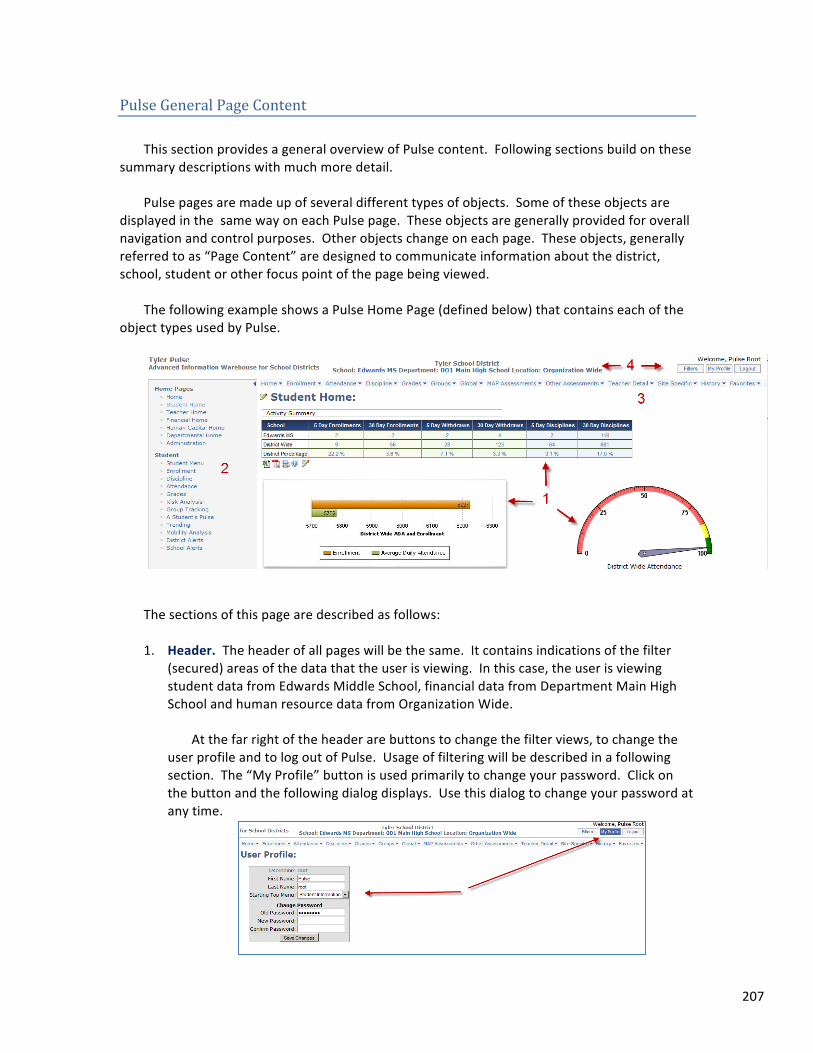
207
Pulse General Page Content This section provides a general overview of Pulse content. Following sections build on these
summary descriptions with much more detail. Pulse pages are made up of several different types of objects. Some of these objects are
displayed in the same way on each Pulse page. These objects are generally provided for overall navigation and control purposes. Other objects change on each page. These objects, generally referred to as “Page Content” are designed to communicate information about the district, school, student or other focus point of the page being viewed.
The following example shows a Pulse Home Page (defined below) that contains each of the
object types used by Pulse.
The sections of this page are described as follows: 1. Header. The header of all pages will be the same. It contains indications of the filter
(secured) areas of the data that the user is viewing. In this case, the user is viewing student data from Edwards Middle School, financial data from Department Main High School and human resource data from Organization Wide.
At the far right of the header are buttons to change the filter views, to change the
user profile and to log out of Pulse. Usage of filtering will be described in a following section. The “My Profile” button is used primarily to change your password. Click on the button and the following dialog displays. Use this dialog to change your password at any time.
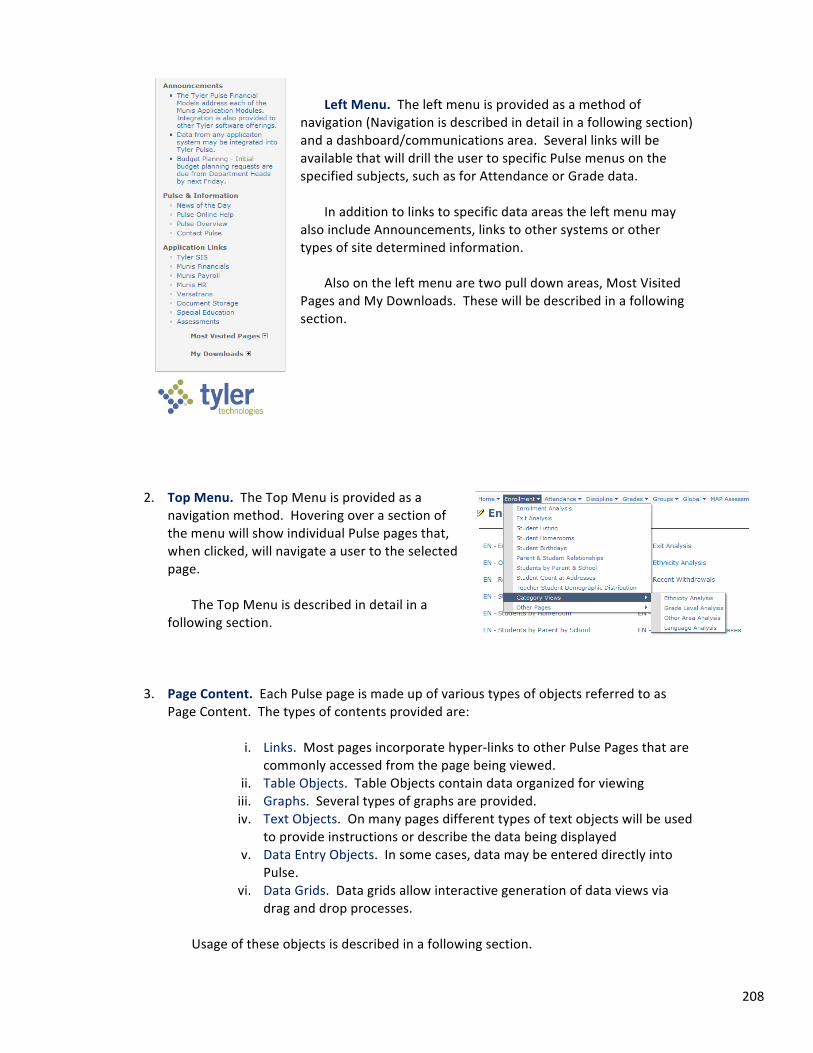
208
Left Menu. The left menu is provided as a method of navigation (Navigation is described in detail in a following section) and a dashboard/communications area. Several links will be available that will drill the user to specific Pulse menus on the specified subjects, such as for Attendance or Grade data.
In addition to links to specific data areas the left menu may
also include Announcements, links to other systems or other types of site determined information.
Also on the left menu are two pull down areas, Most Visited
Pages and My Downloads. These will be described in a following section.
2. Top Menu. The Top Menu is provided as a
navigation method. Hovering over a section of the menu will show individual Pulse pages that, when clicked, will navigate a user to the selected page.
The Top Menu is described in detail in a
following section. 3. Page Content. Each Pulse page is made up of various types of objects referred to as
Page Content. The types of contents provided are:
i. Links. Most pages incorporate hyper-‐links to other Pulse Pages that are commonly accessed from the page being viewed.
ii. Table Objects. Table Objects contain data organized for viewing iii. Graphs. Several types of graphs are provided. iv. Text Objects. On many pages different types of text objects will be used
to provide instructions or describe the data being displayed v. Data Entry Objects. In some cases, data may be entered directly into
Pulse. vi. Data Grids. Data grids allow interactive generation of data views via
drag and drop processes.
Usage of these objects is described in a following section.
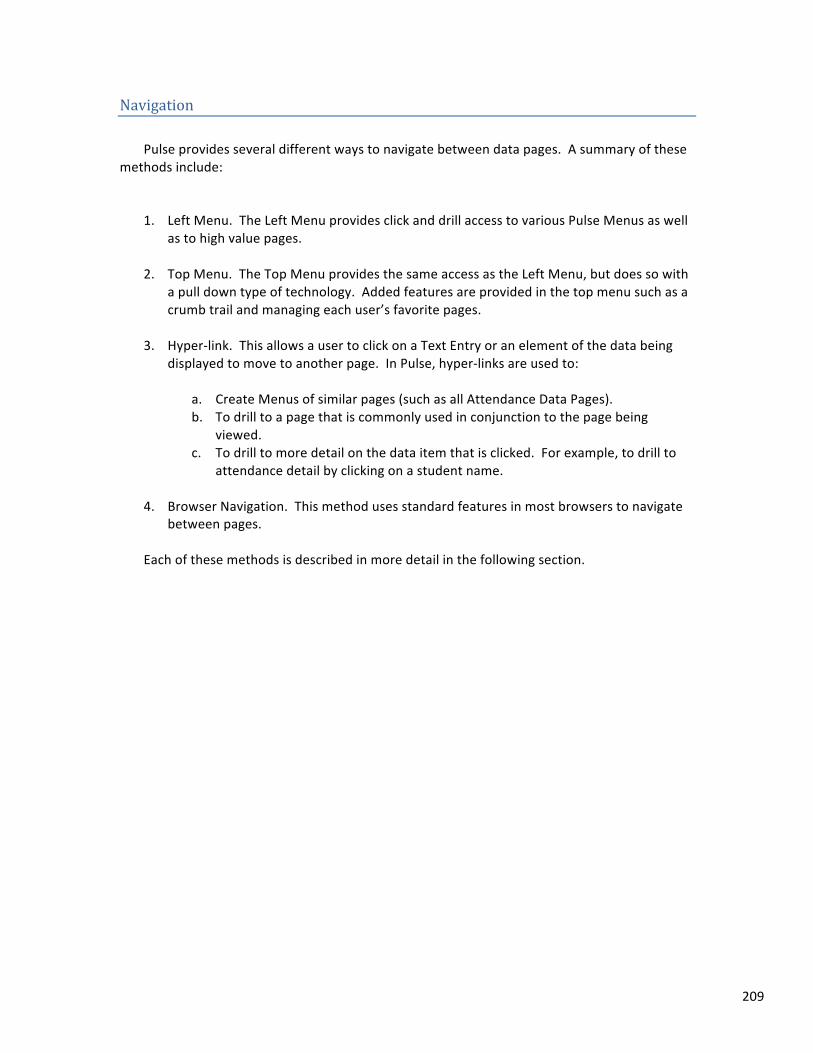
209
Navigation Pulse provides several different ways to navigate between data pages. A summary of these
methods include: 1. Left Menu. The Left Menu provides click and drill access to various Pulse Menus as well
as to high value pages. 2. Top Menu. The Top Menu provides the same access as the Left Menu, but does so with
a pull down type of technology. Added features are provided in the top menu such as a crumb trail and managing each user’s favorite pages.
3. Hyper-‐link. This allows a user to click on a Text Entry or an element of the data being
displayed to move to another page. In Pulse, hyper-‐links are used to:
a. Create Menus of similar pages (such as all Attendance Data Pages). b. To drill to a page that is commonly used in conjunction to the page being
viewed. c. To drill to more detail on the data item that is clicked. For example, to drill to
attendance detail by clicking on a student name.
4. Browser Navigation. This method uses standard features in most browsers to navigate between pages.
Each of these methods is described in more detail in the following section.
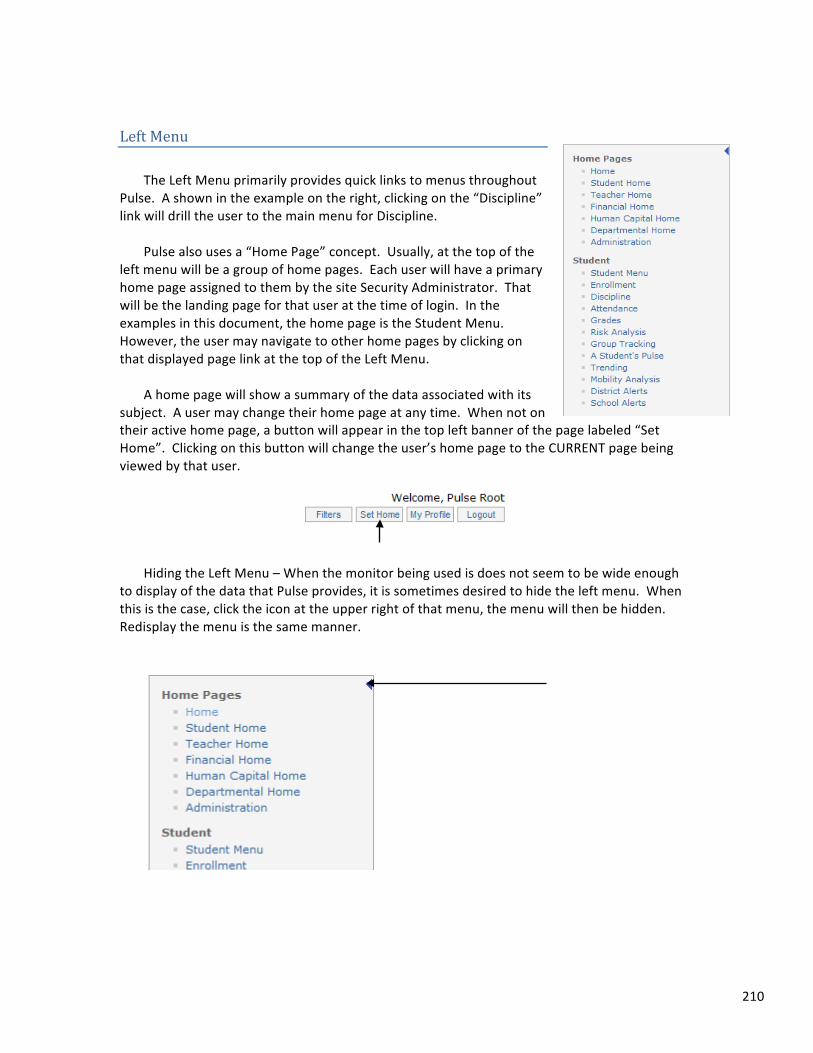
210
Left Menu The Left Menu primarily provides quick links to menus throughout
Pulse. A shown in the example on the right, clicking on the “Discipline” link will drill the user to the main menu for Discipline.
Pulse also uses a “Home Page” concept. Usually, at the top of the
left menu will be a group of home pages. Each user will have a primary home page assigned to them by the site Security Administrator. That will be the landing page for that user at the time of login. In the examples in this document, the home page is the Student Menu. However, the user may navigate to other home pages by clicking on that displayed page link at the top of the Left Menu.
A home page will show a summary of the data associated with its
subject. A user may change their home page at any time. When not on their active home page, a button will appear in the top left banner of the page labeled “Set Home”. Clicking on this button will change the user’s home page to the CURRENT page being viewed by that user.
Hiding the Left Menu – When the monitor being used is does not seem to be wide enough
to display of the data that Pulse provides, it is sometimes desired to hide the left menu. When this is the case, click the icon at the upper right of that menu, the menu will then be hidden. Redisplay the menu is the same manner.
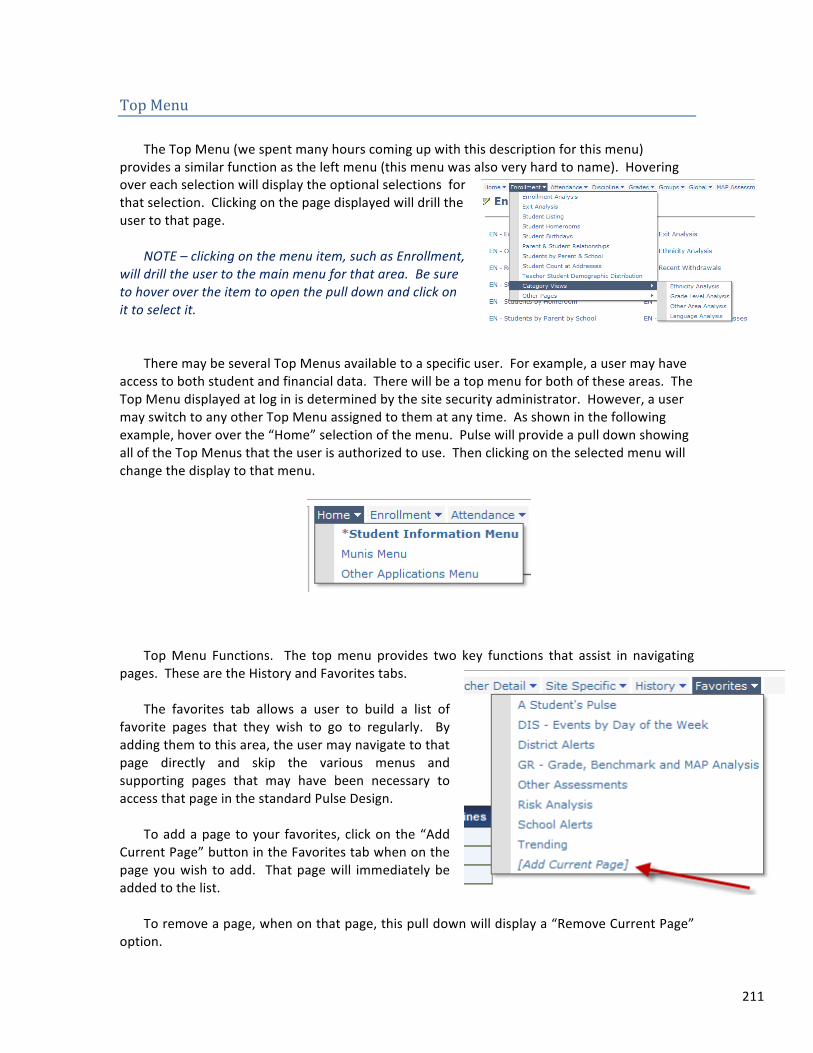
211
Top Menu The Top Menu (we spent many hours coming up with this description for this menu)
provides a similar function as the left menu (this menu was also very hard to name). Hovering over each selection will display the optional selections for that selection. Clicking on the page displayed will drill the user to that page.
NOTE – clicking on the menu item, such as Enrollment,
will drill the user to the main menu for that area. Be sure to hover over the item to open the pull down and click on it to select it.
There may be several Top Menus available to a specific user. For example, a user may have
access to both student and financial data. There will be a top menu for both of these areas. The Top Menu displayed at log in is determined by the site security administrator. However, a user may switch to any other Top Menu assigned to them at any time. As shown in the following example, hover over the “Home” selection of the menu. Pulse will provide a pull down showing all of the Top Menus that the user is authorized to use. Then clicking on the selected menu will change the display to that menu.
Top Menu Functions. The top menu provides two key functions that assist in navigating
pages. These are the History and Favorites tabs. The favorites tab allows a user to build a list of
favorite pages that they wish to go to regularly. By adding them to this area, the user may navigate to that page directly and skip the various menus and supporting pages that may have been necessary to access that page in the standard Pulse Design.
To add a page to your favorites, click on the “Add
Current Page” button in the Favorites tab when on the page you wish to add. That page will immediately be added to the list.
To remove a page, when on that page, this pull down will display a “Remove Current Page”
option.
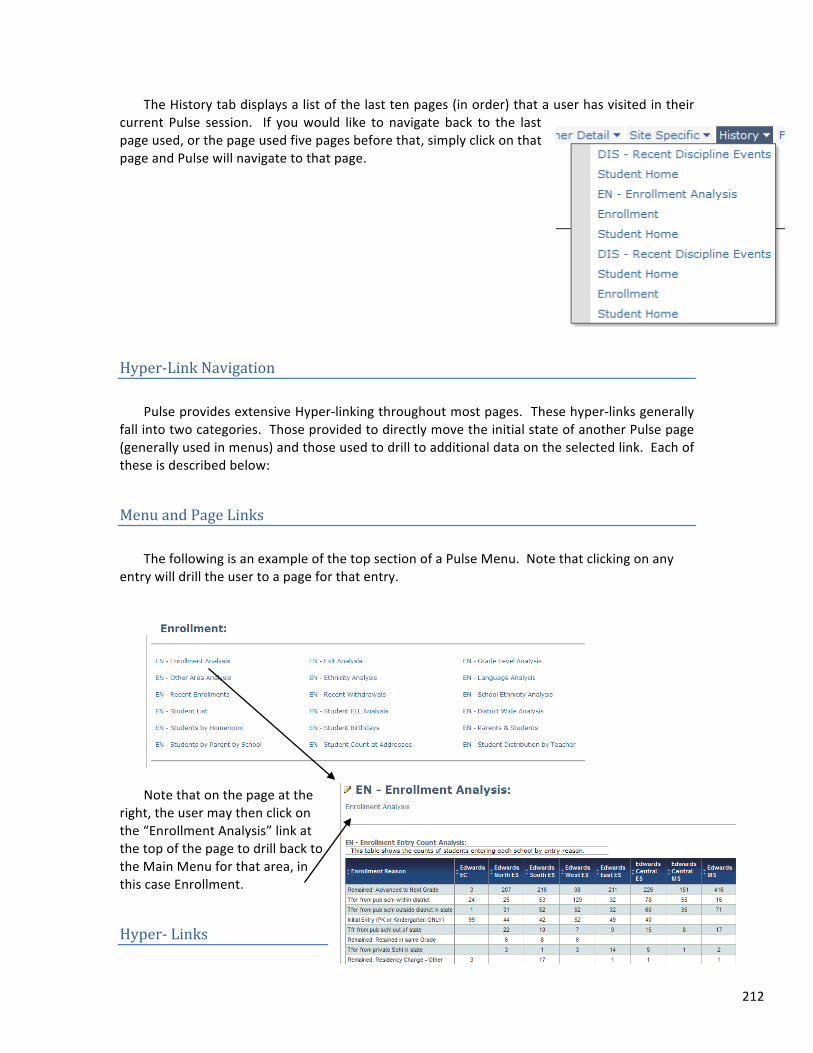
212
The History tab displays a list of the last ten pages (in order) that a user has visited in their current Pulse session. If you would like to navigate back to the last page used, or the page used five pages before that, simply click on that page and Pulse will navigate to that page.
Hyper-‐Link Navigation Pulse provides extensive Hyper-‐linking throughout most pages. These hyper-‐links generally
fall into two categories. Those provided to directly move the initial state of another Pulse page (generally used in menus) and those used to drill to additional data on the selected link. Each of these is described below:
Menu and Page Links The following is an example of the top section of a Pulse Menu. Note that clicking on any
entry will drill the user to a page for that entry.
Note that on the page at the
right, the user may then click on the “Enrollment Analysis” link at the top of the page to drill back to the Main Menu for that area, in this case Enrollment.
Hyper-‐ Links
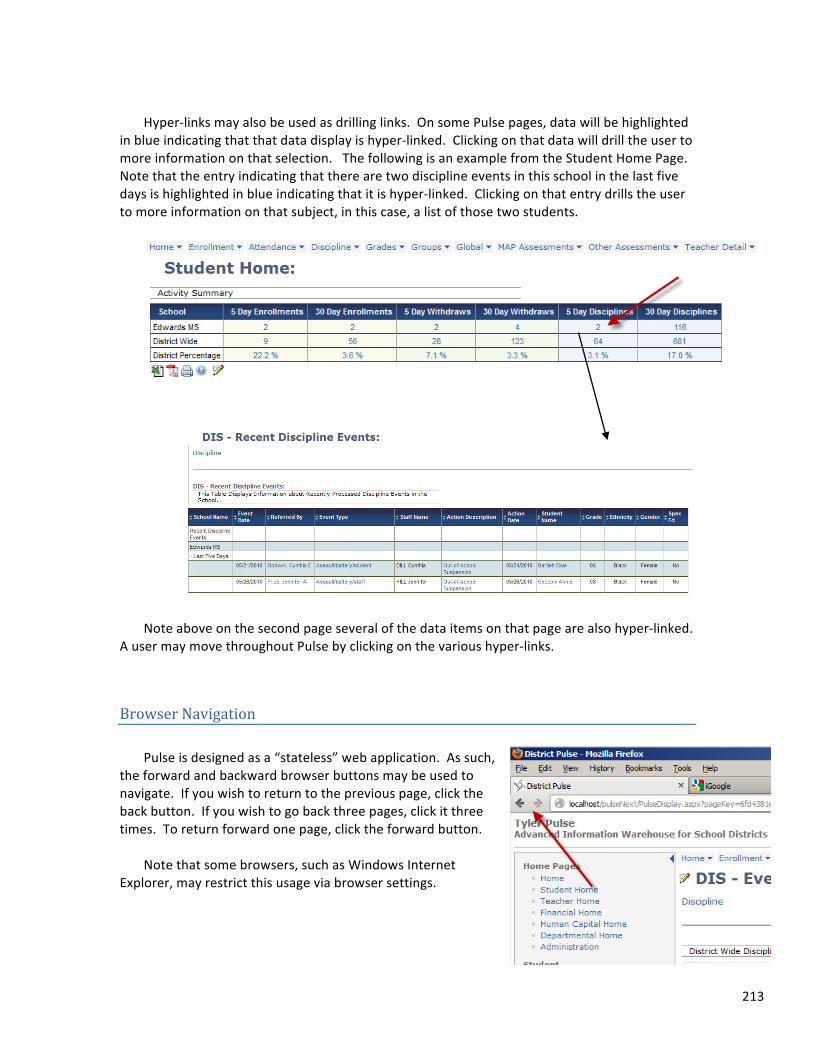
213
Hyper-‐links may also be used as drilling links. On some Pulse pages, data will be highlighted
in blue indicating that that data display is hyper-‐linked. Clicking on that data will drill the user to more information on that selection. The following is an example from the Student Home Page. Note that the entry indicating that there are two discipline events in this school in the last five days is highlighted in blue indicating that it is hyper-‐linked. Clicking on that entry drills the user to more information on that subject, in this case, a list of those two students.
Note above on the second page several of the data items on that page are also hyper-‐linked. A user may move throughout Pulse by clicking on the various hyper-‐links.
Browser Navigation Pulse is designed as a “stateless” web application. As such,
the forward and backward browser buttons may be used to navigate. If you wish to return to the previous page, click the back button. If you wish to go back three pages, click it three times. To return forward one page, click the forward button.
Note that some browsers, such as Windows Internet
Explorer, may restrict this usage via browser settings.
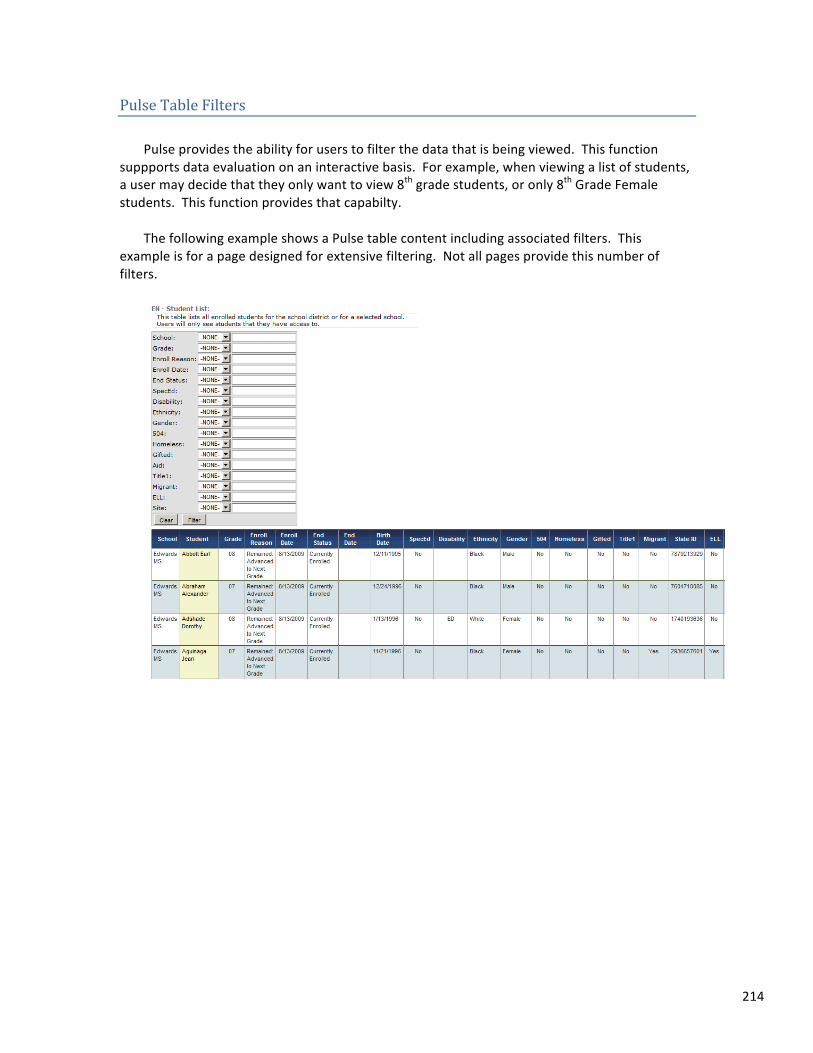
214
Pulse Table Filters Pulse provides the ability for users to filter the data that is being viewed. This function
suppports data evaluation on an interactive basis. For example, when viewing a list of students, a user may decide that they only want to view 8th grade students, or only 8th Grade Female students. This function provides that capabilty.
The following example shows a Pulse table content including associated filters. This
example is for a page designed for extensive filtering. Not all pages provide this number of filters.
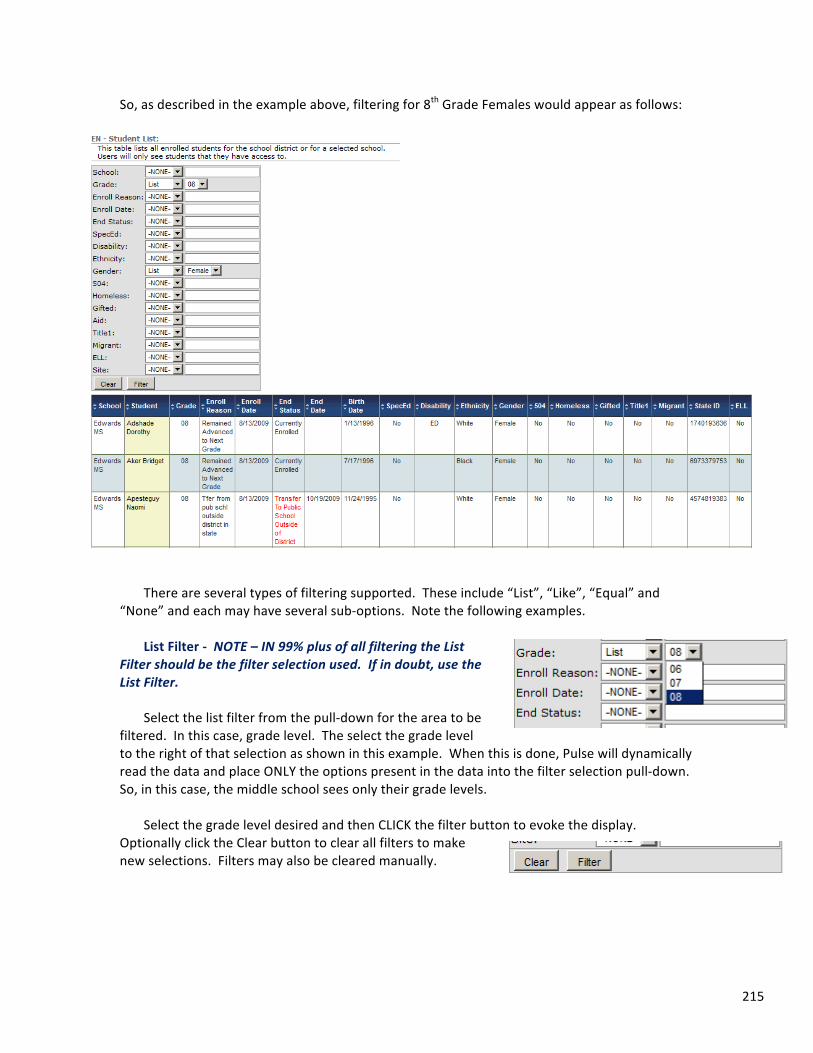
215
So, as described in the example above, filtering for 8th Grade Females would appear as follows:
There are several types of filtering supported. These include “List”, “Like”, “Equal” and
“None” and each may have several sub-‐options. Note the following examples. List Filter -‐ NOTE – IN 99% plus of all filtering the List
Filter should be the filter selection used. If in doubt, use the List Filter.
Select the list filter from the pull-‐down for the area to be
filtered. In this case, grade level. The select the grade level to the right of that selection as shown in this example. When this is done, Pulse will dynamically read the data and place ONLY the options present in the data into the filter selection pull-‐down. So, in this case, the middle school sees only their grade levels.
Select the grade level desired and then CLICK the filter button to evoke the display.
Optionally click the Clear button to clear all filters to make new selections. Filters may also be cleared manually.
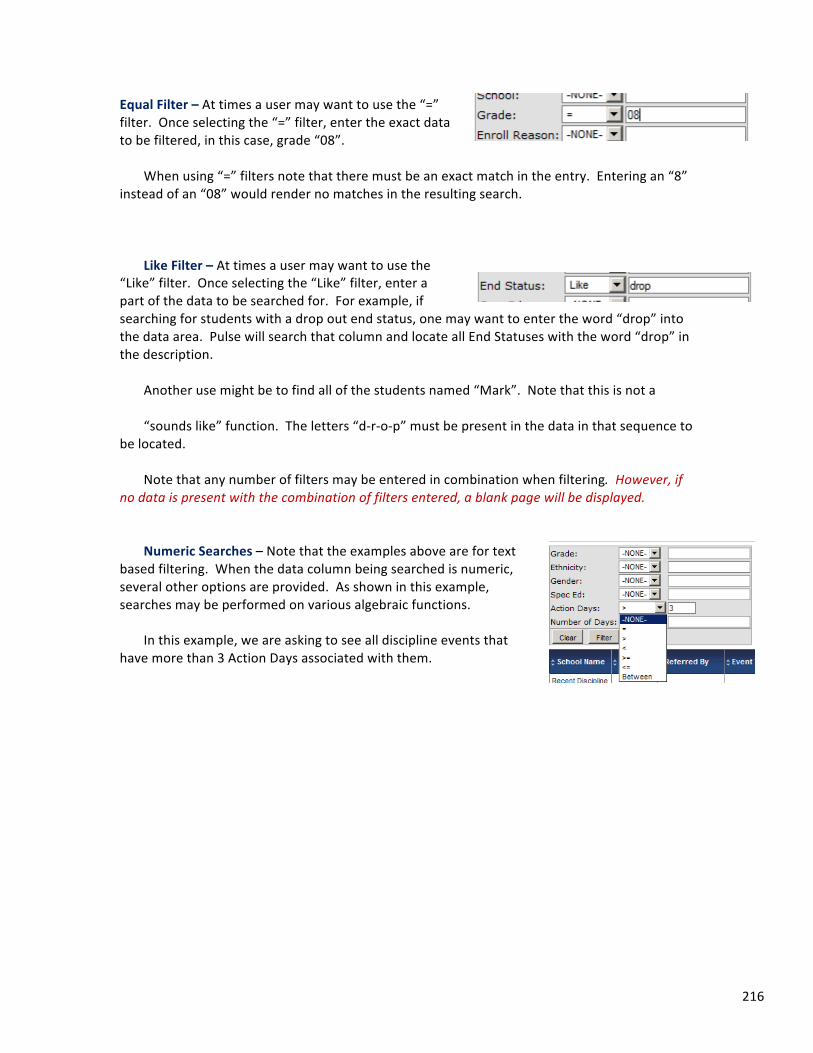
216
Equal Filter – At times a user may want to use the “=” filter. Once selecting the “=” filter, enter the exact data to be filtered, in this case, grade “08”.
When using “=” filters note that there must be an exact match in the entry. Entering an “8”
instead of an “08” would render no matches in the resulting search. Like Filter – At times a user may want to use the
“Like” filter. Once selecting the “Like” filter, enter a part of the data to be searched for. For example, if searching for students with a drop out end status, one may want to enter the word “drop” into the data area. Pulse will search that column and locate all End Statuses with the word “drop” in the description.
Another use might be to find all of the students named “Mark”. Note that this is not a “sounds like” function. The letters “d-‐r-‐o-‐p” must be present in the data in that sequence to
be located. Note that any number of filters may be entered in combination when filtering. However, if
no data is present with the combination of filters entered, a blank page will be displayed. Numeric Searches – Note that the examples above are for text
based filtering. When the data column being searched is numeric, several other options are provided. As shown in this example, searches may be performed on various algebraic functions.
In this example, we are asking to see all discipline events that
have more than 3 Action Days associated with them.

217
Data Table Functions Below each data table and m any graphs is a series of clickable functions. See the example
below. Clicking on each of these functions generates a specific type of dialog which is further described below this example:
This icon allows the data in the table to be exported to Excel. When it is
clicked, an Excel dialog is displayed as shown in the following example:
A user may convert the data directly into Excel by clicking the “Convert” button. Note that Pulse does not directly generate a native Excel spreadsheet. Most organizational networks will block these types of files as a security risk, however, a comma or tab delimited file is normally allowed.
The file defaults to a comma delimited file, but a tab delimited file may be selected. The “Include Headers” option is set by default. If only data without field headers is desired,
click this option.
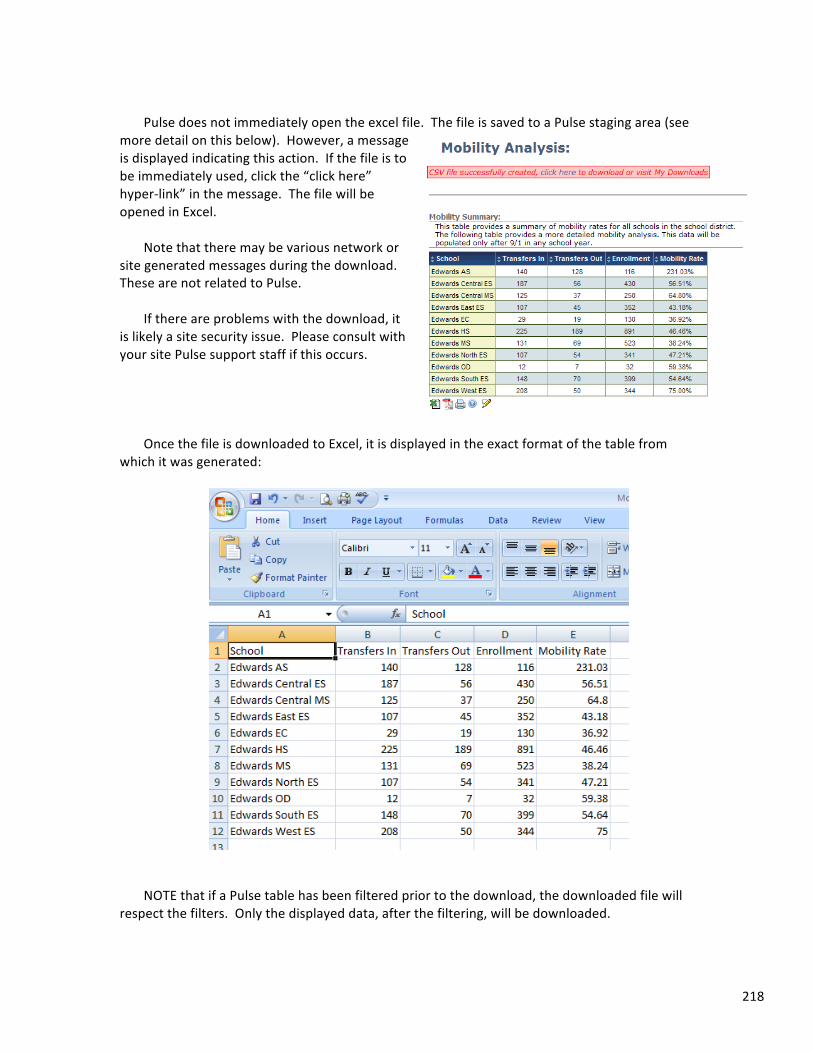
218
Pulse does not immediately open the excel file. The file is saved to a Pulse staging area (see
more detail on this below). However, a message is displayed indicating this action. If the file is to be immediately used, click the “click here” hyper-‐link” in the message. The file will be opened in Excel.
Note that there may be various network or
site generated messages during the download. These are not related to Pulse.
If there are problems with the download, it
is likely a site security issue. Please consult with your site Pulse support staff if this occurs.
Once the file is downloaded to Excel, it is displayed in the exact format of the table from
which it was generated:
NOTE that if a Pulse table has been filtered prior to the download, the downloaded file will
respect the filters. Only the displayed data, after the filtering, will be downloaded.
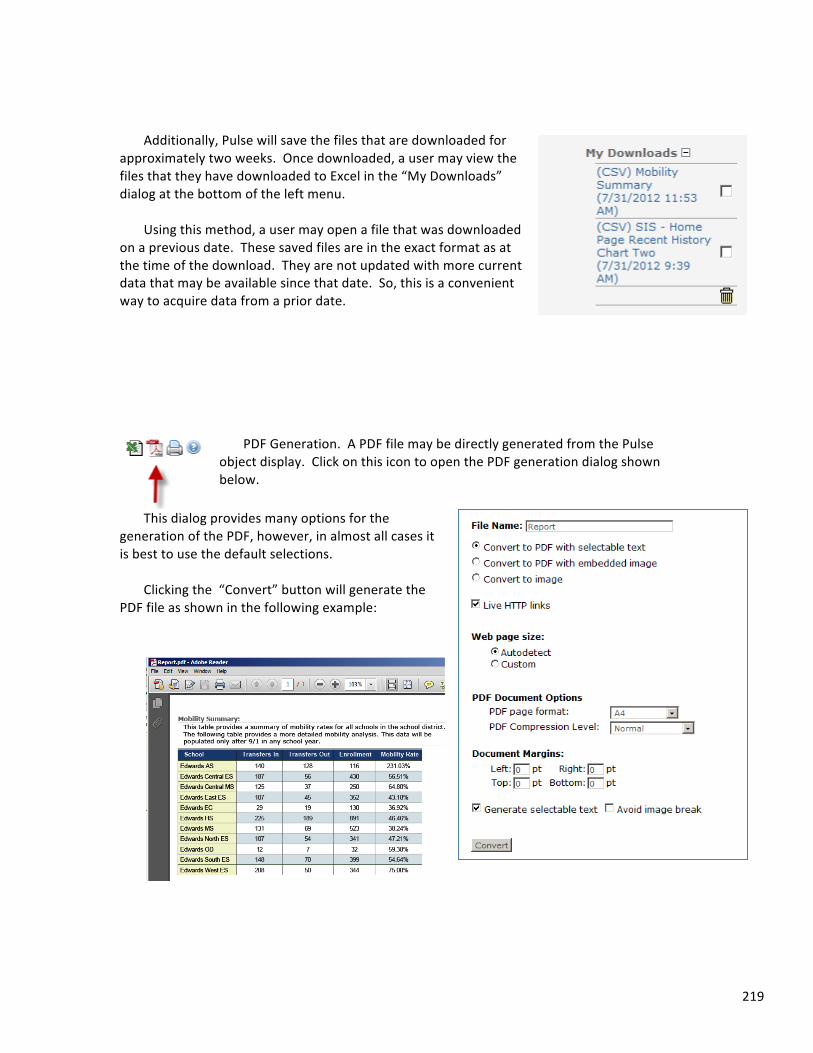
219
Additionally, Pulse will save the files that are downloaded for
approximately two weeks. Once downloaded, a user may view the files that they have downloaded to Excel in the “My Downloads” dialog at the bottom of the left menu.
Using this method, a user may open a file that was downloaded
on a previous date. These saved files are in the exact format as at the time of the download. They are not updated with more current data that may be available since that date. So, this is a convenient way to acquire data from a prior date.
PDF Generation. A PDF file may be directly generated from the Pulse object display. Click on this icon to open the PDF generation dialog shown below.
This dialog provides many options for the
generation of the PDF, however, in almost all cases it is best to use the default selections.
Clicking the “Convert” button will generate the
PDF file as shown in the following example:
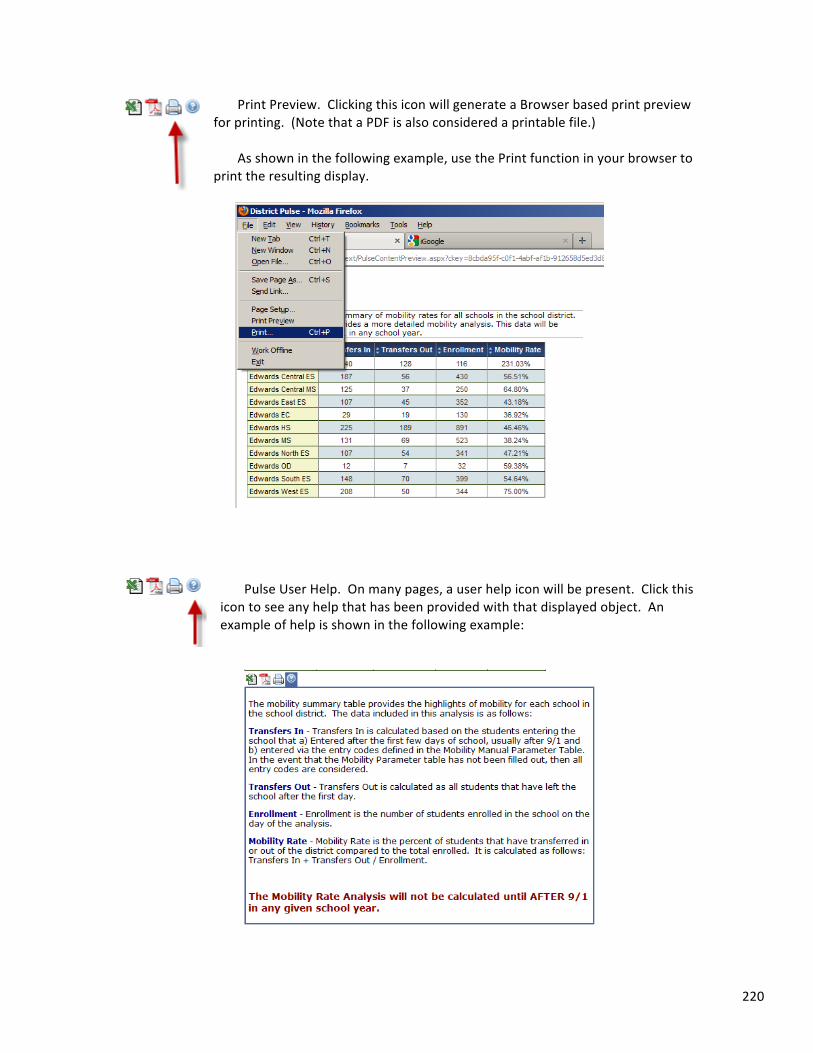
220
Print Preview. Clicking this icon will generate a Browser based print preview for printing. (Note that a PDF is also considered a printable file.)
As shown in the following example, use the Print function in your browser to
print the resulting display.
Pulse User Help. On many pages, a user help icon will be present. Click this
icon to see any help that has been provided with that displayed object. An example of help is shown in the following example:
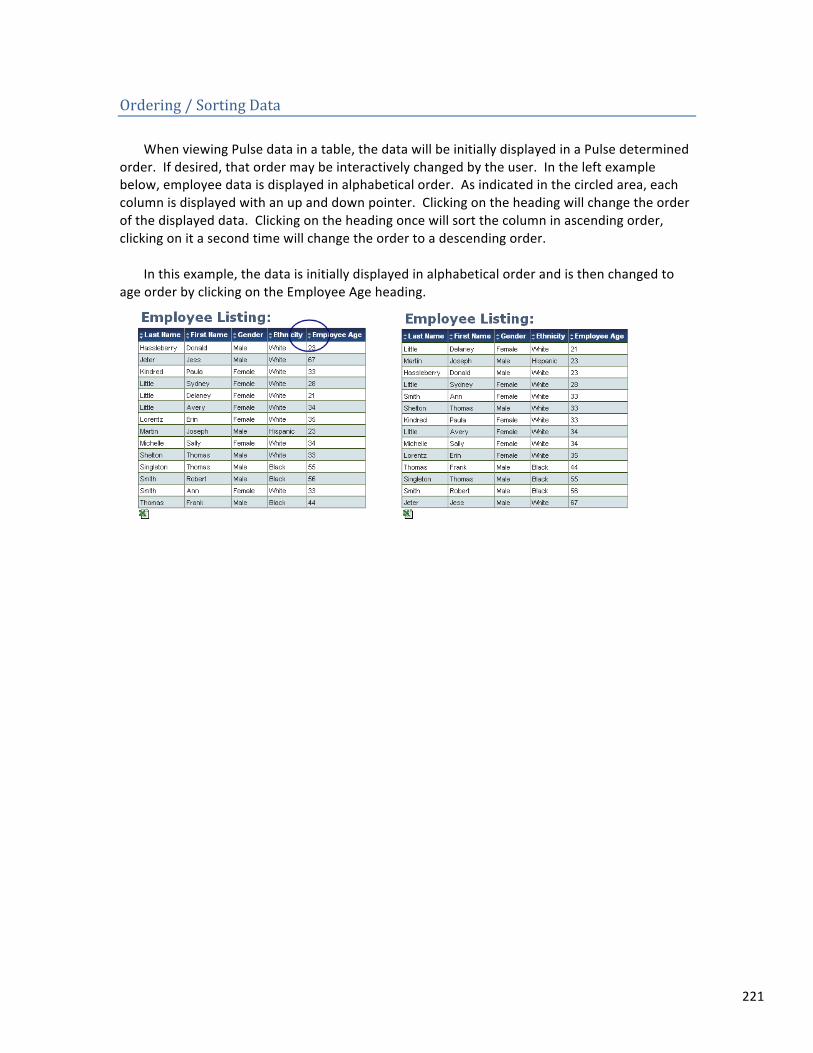
221
Ordering / Sorting Data When viewing Pulse data in a table, the data will be initially displayed in a Pulse determined
order. If desired, that order may be interactively changed by the user. In the left example below, employee data is displayed in alphabetical order. As indicated in the circled area, each column is displayed with an up and down pointer. Clicking on the heading will change the order of the displayed data. Clicking on the heading once will sort the column in ascending order, clicking on it a second time will change the order to a descending order.
In this example, the data is initially displayed in alphabetical order and is then changed to
age order by clicking on the Employee Age heading.
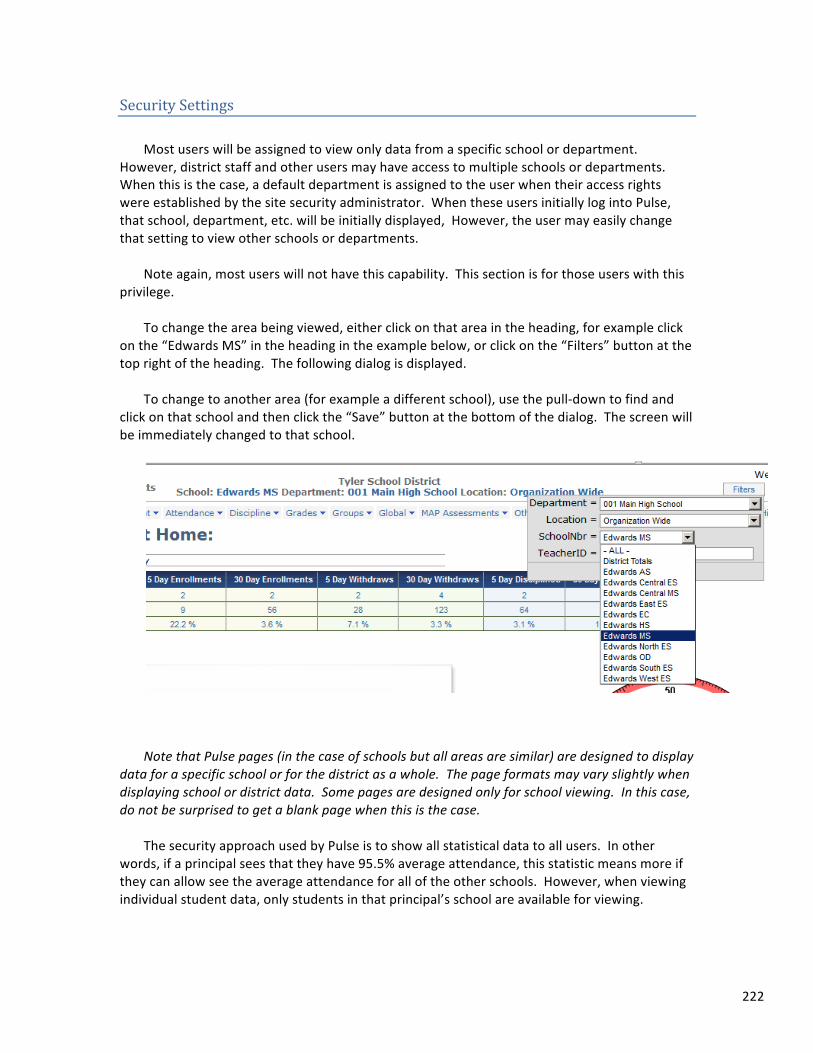
222
Security Settings Most users will be assigned to view only data from a specific school or department.
However, district staff and other users may have access to multiple schools or departments. When this is the case, a default department is assigned to the user when their access rights were established by the site security administrator. When these users initially log into Pulse, that school, department, etc. will be initially displayed, However, the user may easily change that setting to view other schools or departments.
Note again, most users will not have this capability. This section is for those users with this
privilege. To change the area being viewed, either click on that area in the heading, for example click
on the “Edwards MS” in the heading in the example below, or click on the “Filters” button at the top right of the heading. The following dialog is displayed.
To change to another area (for example a different school), use the pull-‐down to find and
click on that school and then click the “Save” button at the bottom of the dialog. The screen will be immediately changed to that school.
Note that Pulse pages (in the case of schools but all areas are similar) are designed to display
data for a specific school or for the district as a whole. The page formats may vary slightly when displaying school or district data. Some pages are designed only for school viewing. In this case, do not be surprised to get a blank page when this is the case.
The security approach used by Pulse is to show all statistical data to all users. In other
words, if a principal sees that they have 95.5% average attendance, this statistic means more if they can allow see the average attendance for all of the other schools. However, when viewing individual student data, only students in that principal’s school are available for viewing.
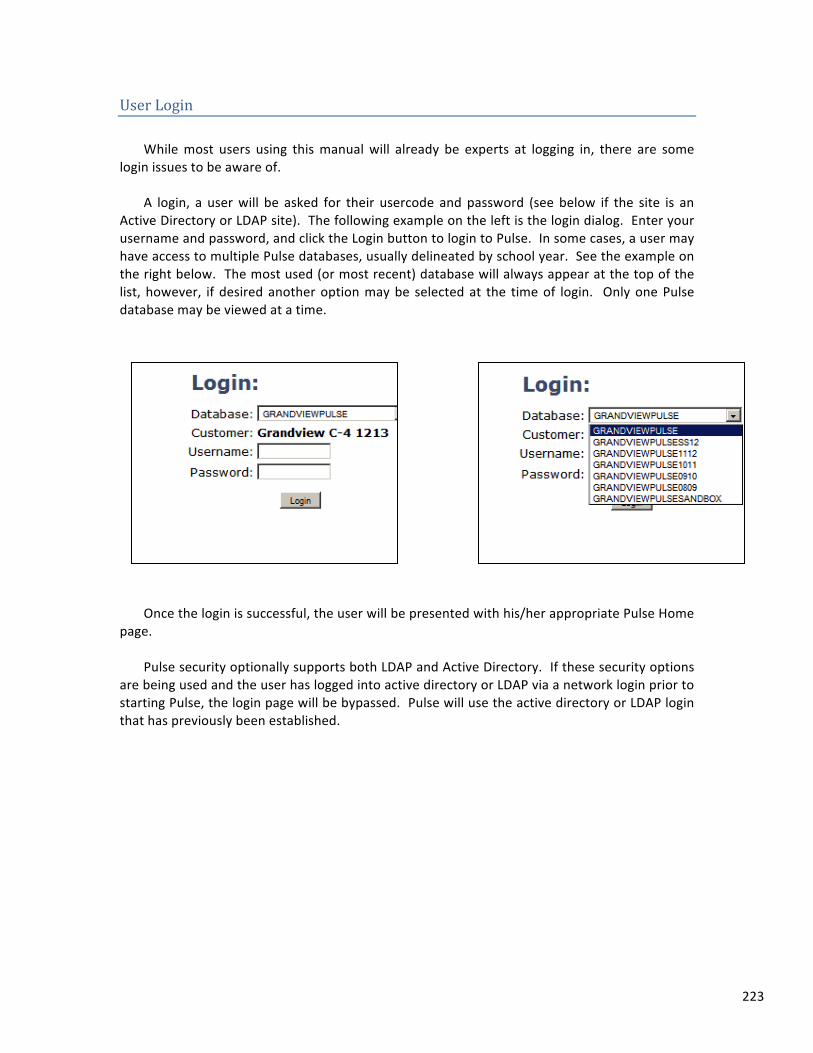
223
User Login While most users using this manual will already be experts at logging in, there are some
login issues to be aware of. A login, a user will be asked for their usercode and password (see below if the site is an
Active Directory or LDAP site). The following example on the left is the login dialog. Enter your username and password, and click the Login button to login to Pulse. In some cases, a user may have access to multiple Pulse databases, usually delineated by school year. See the example on the right below. The most used (or most recent) database will always appear at the top of the list, however, if desired another option may be selected at the time of login. Only one Pulse database may be viewed at a time.
Once the login is successful, the user will be presented with his/her appropriate Pulse Home page.
Pulse security optionally supports both LDAP and Active Directory. If these security options
are being used and the user has logged into active directory or LDAP via a network login prior to starting Pulse, the login page will be bypassed. Pulse will use the active directory or LDAP login that has previously been established.
224
Appendix I – Server Management Once implemented, Pulse requires very little maintenance for daily operation, however,
some basic support is appropriate to make sure all of the Pulse components are working properly and that the server is properly functioning.
Generally, maintenance activities are broken down into monthly, weekly and those sets
appropriate to load new releases. As an overview, this process entails: Loading Pulse Engine Releases
-‐ Back up the Pulse Database -‐ Loading the Pulse Executables -‐ Loading the Pulse Parser -‐ Optionally Loading Pulse Alerts
Loading Pulse Model Releases
-‐ Loading Projects Via Data Project Transfer The steps to perform each of these processes are detailed below.
New Releases – Overview and Loading Instructions Pulse is made up of two distinct executables. These Pulse components are the Pulse Engine
made up of all Pulse executables and Pulse Models that are developed for end users. Pulse Models are developed using the Pulse Engine. In most Pulse implementations, Tyler also provides standard models for the management of student, assessment, finance or other types of data. Based on this, when a new release of Pulse is made available, both the Pulse Engine and the Pulse Models are updated.
New Pulse releases are distributed on a periodic basis. These releases are sent directly to
each Pulse user site via email or FTP distribution or a combination of these methods. It is a customer responsibility to load new releases after the training to perform this activity has been provided by Tyler staff. Pulse support staff will assist any customer with the loading of new releases when requested to do so. Please note that the instructions in this section are targeted for the Pulse technical user that has been trained in this process. They may or may not be helpful to a user not previously trained to load new releases.
This section will review the loading of both of the Pulse Engine and new Model releases.
Releases are reasonably simple to load and implement.
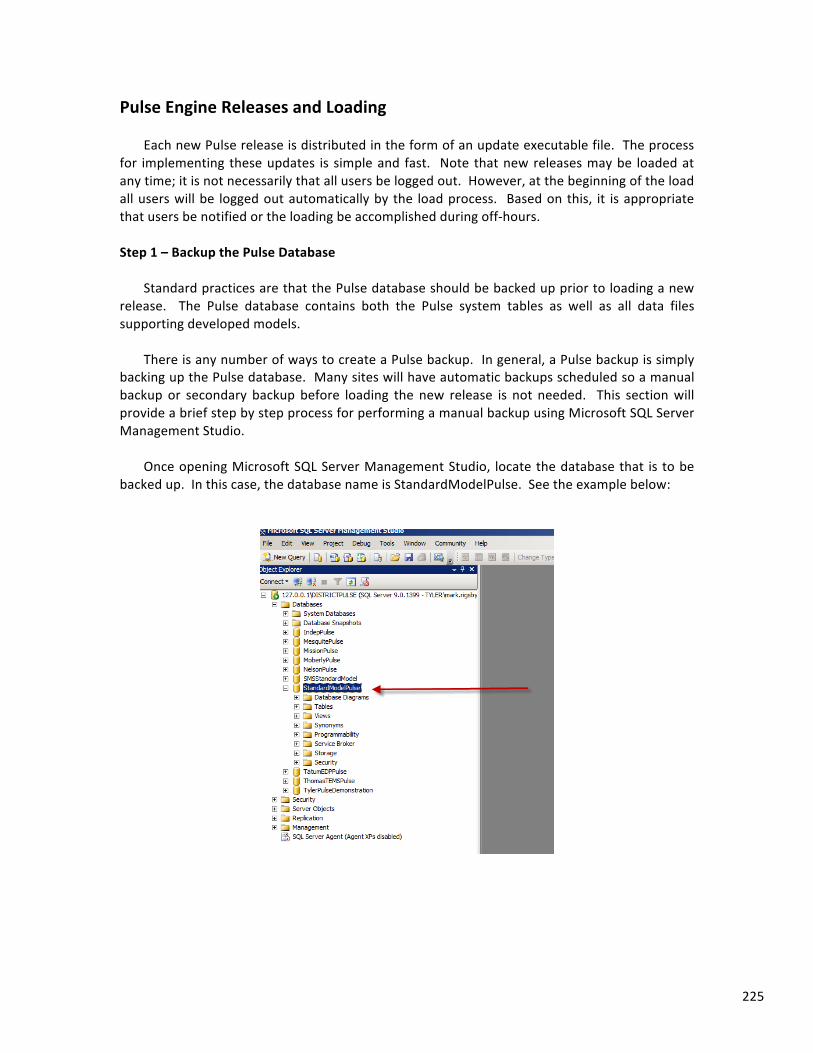
225
Pulse Engine Releases and Loading
Each new Pulse release is distributed in the form of an update executable file. The process for implementing these updates is simple and fast. Note that new releases may be loaded at any time; it is not necessarily that all users be logged out. However, at the beginning of the load all users will be logged out automatically by the load process. Based on this, it is appropriate that users be notified or the loading be accomplished during off-‐hours.
Step 1 – Backup the Pulse Database
Standard practices are that the Pulse database should be backed up prior to loading a new
release. The Pulse database contains both the Pulse system tables as well as all data files supporting developed models.
There is any number of ways to create a Pulse backup. In general, a Pulse backup is simply
backing up the Pulse database. Many sites will have automatic backups scheduled so a manual backup or secondary backup before loading the new release is not needed. This section will provide a brief step by step process for performing a manual backup using Microsoft SQL Server Management Studio.
Once opening Microsoft SQL Server Management Studio, locate the database that is to be
backed up. In this case, the database name is StandardModelPulse. See the example below:
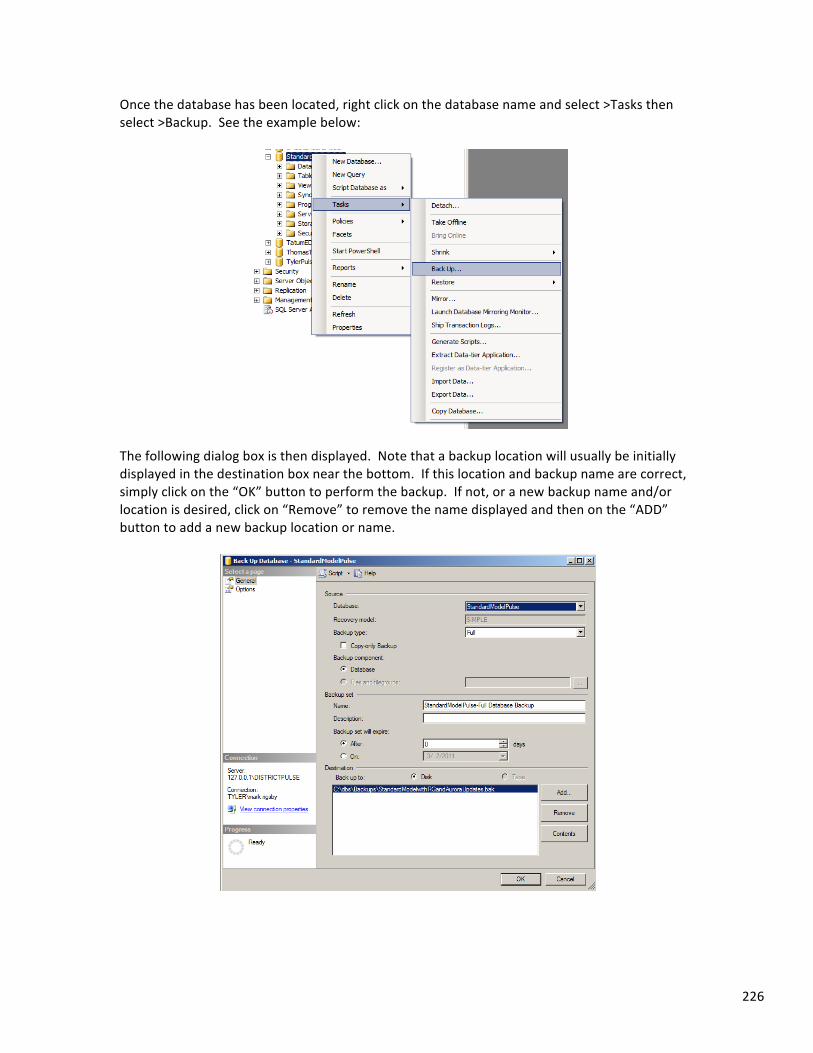
226
Once the database has been located, right click on the database name and select >Tasks then select >Backup. See the example below:
The following dialog box is then displayed. Note that a backup location will usually be initially displayed in the destination box near the bottom. If this location and backup name are correct, simply click on the “OK” button to perform the backup. If not, or a new backup name and/or location is desired, click on “Remove” to remove the name displayed and then on the “ADD” button to add a new backup location or name.
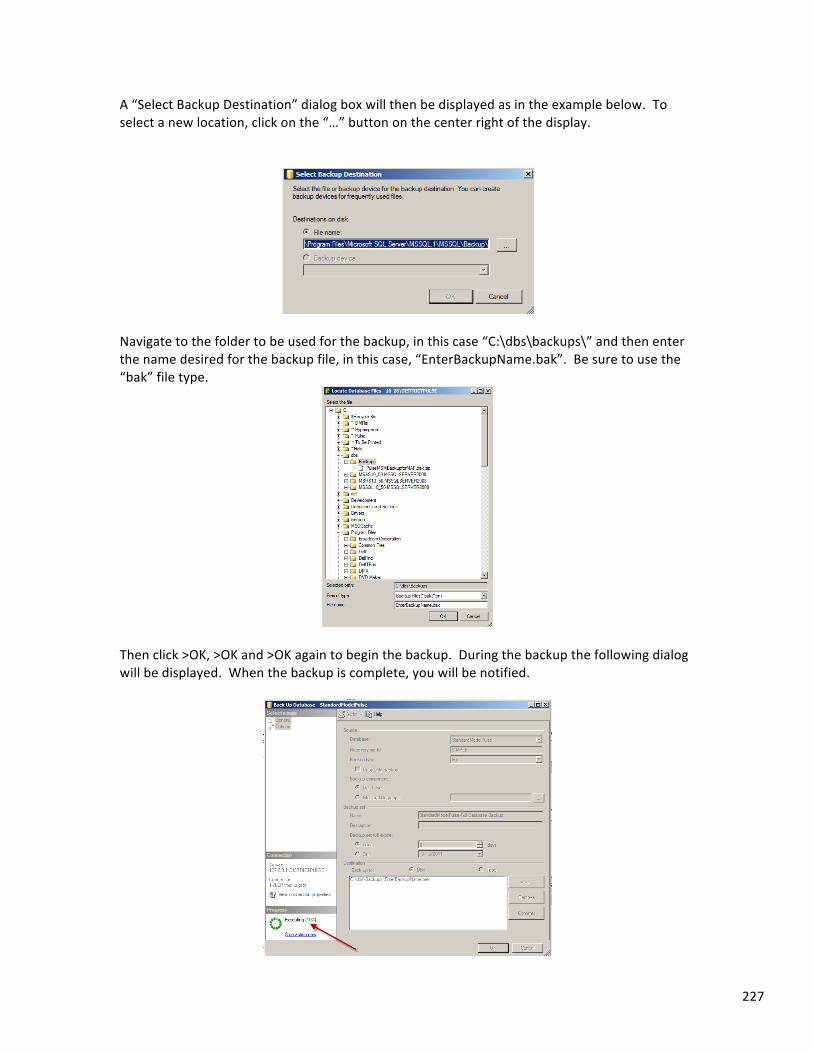
227
A “Select Backup Destination” dialog box will then be displayed as in the example below. To select a new location, click on the “…” button on the center right of the display.
Navigate to the folder to be used for the backup, in this case “C:\dbs\backups\” and then enter the name desired for the backup file, in this case, “EnterBackupName.bak”. Be sure to use the “bak” file type.
Then click >OK, >OK and >OK again to begin the backup. During the backup the following dialog will be displayed. When the backup is complete, you will be notified.
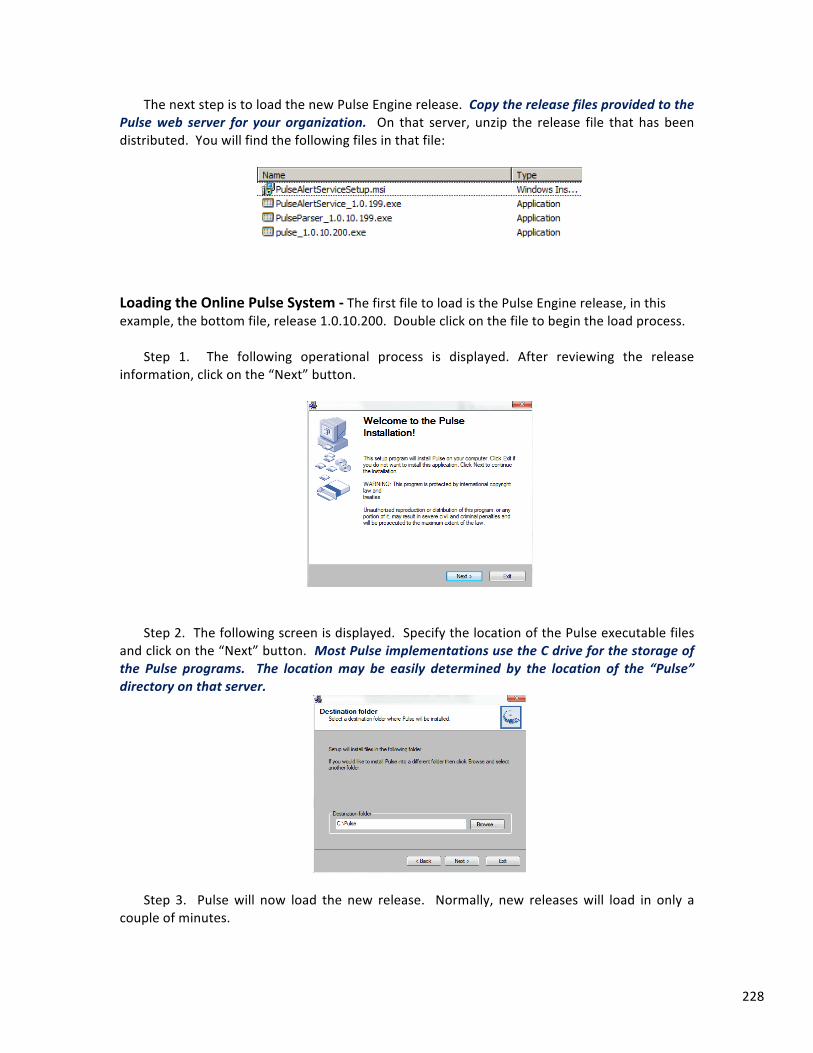
228
The next step is to load the new Pulse Engine release. Copy the release files provided to the Pulse web server for your organization. On that server, unzip the release file that has been distributed. You will find the following files in that file:
Loading the Online Pulse System -‐ The first file to load is the Pulse Engine release, in this example, the bottom file, release 1.0.10.200. Double click on the file to begin the load process.
Step 1. The following operational process is displayed. After reviewing the release
information, click on the “Next” button.
Step 2. The following screen is displayed. Specify the location of the Pulse executable files
and click on the “Next” button. Most Pulse implementations use the C drive for the storage of the Pulse programs. The location may be easily determined by the location of the “Pulse” directory on that server.
Step 3. Pulse will now load the new release. Normally, new releases will load in only a
couple of minutes.
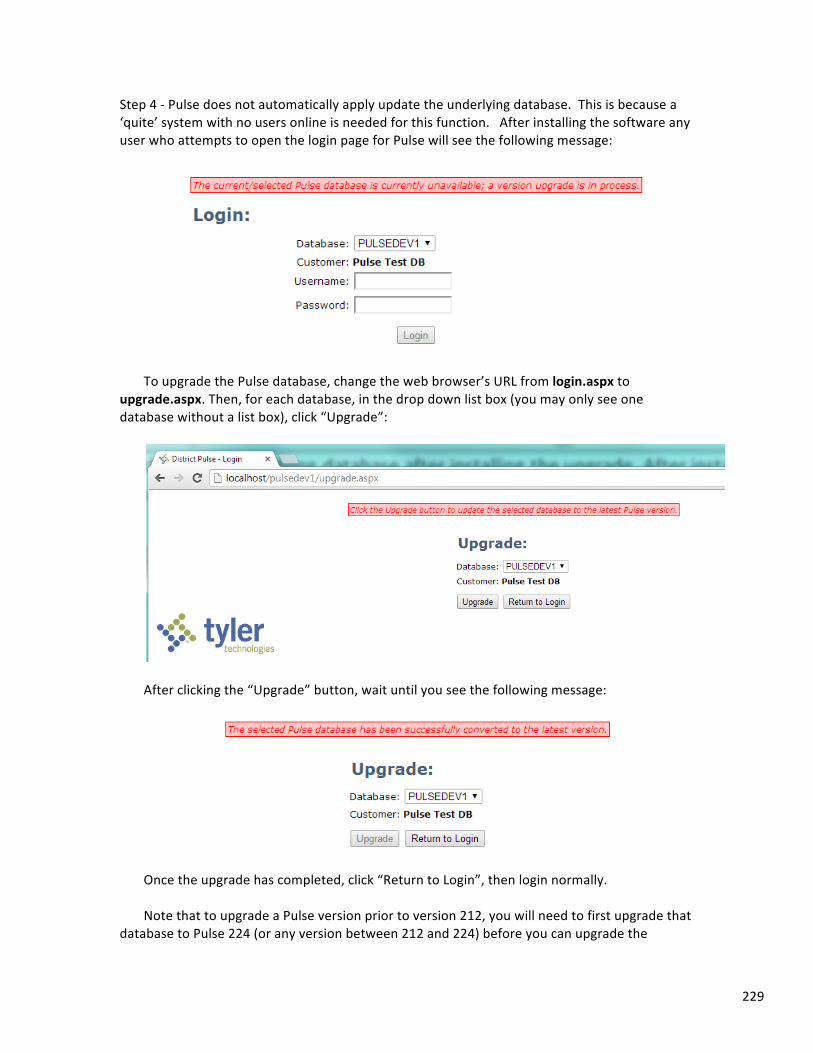
229
Step 4 -‐ Pulse does not automatically apply update the underlying database. This is because a ‘quite’ system with no users online is needed for this function. After installing the software any user who attempts to open the login page for Pulse will see the following message:
To upgrade the Pulse database, change the web browser’s URL from login.aspx to
upgrade.aspx. Then, for each database, in the drop down list box (you may only see one database without a list box), click “Upgrade”:
After clicking the “Upgrade” button, wait until you see the following message:
Once the upgrade has completed, click “Return to Login”, then login normally. Note that to upgrade a Pulse version prior to version 212, you will need to first upgrade that
database to Pulse 224 (or any version between 212 and 224) before you can upgrade the
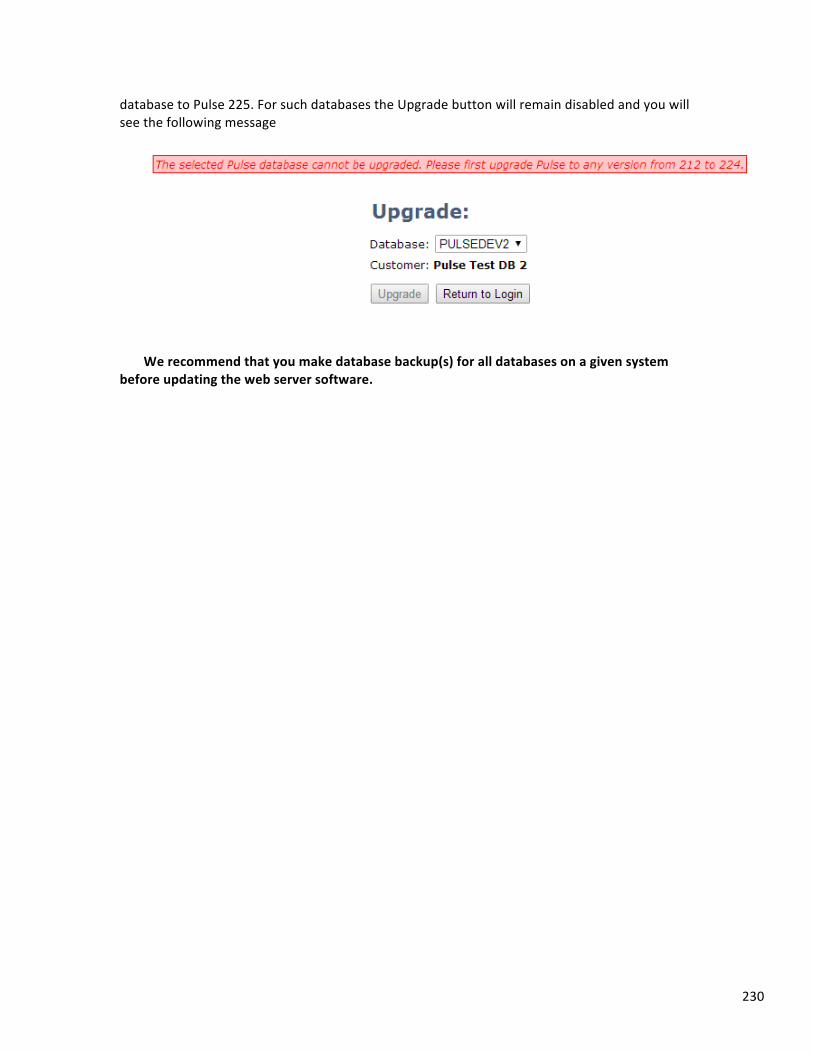
230
database to Pulse 225. For such databases the Upgrade button will remain disabled and you will see the following message
We recommend that you make database backup(s) for all databases on a given system
before updating the web server software.
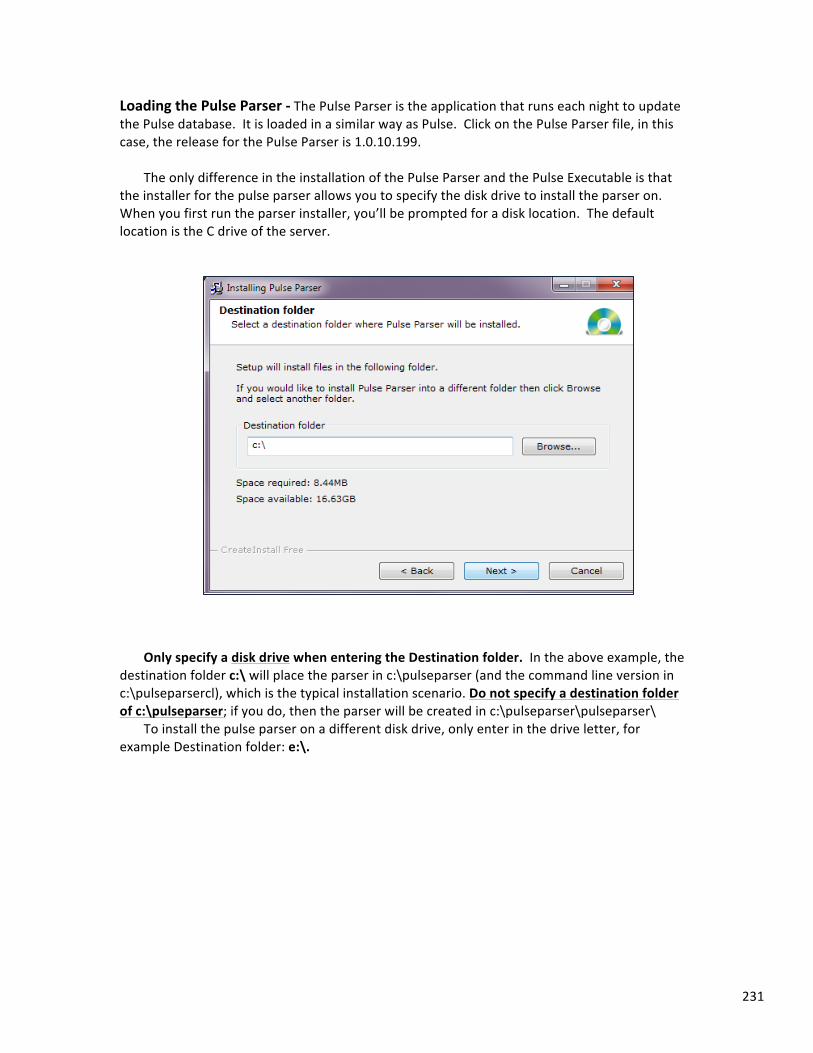
231
Loading the Pulse Parser -‐ The Pulse Parser is the application that runs each night to update the Pulse database. It is loaded in a similar way as Pulse. Click on the Pulse Parser file, in this case, the release for the Pulse Parser is 1.0.10.199.
The only difference in the installation of the Pulse Parser and the Pulse Executable is that the installer for the pulse parser allows you to specify the disk drive to install the parser on. When you first run the parser installer, you’ll be prompted for a disk location. The default location is the C drive of the server.
Only specify a disk drive when entering the Destination folder. In the above example, the
destination folder c:\ will place the parser in c:\pulseparser (and the command line version in c:\pulseparsercl), which is the typical installation scenario. Do not specify a destination folder of c:\pulseparser; if you do, then the parser will be created in c:\pulseparser\pulseparser\
To install the pulse parser on a different disk drive, only enter in the drive letter, for example Destination folder: e:\.
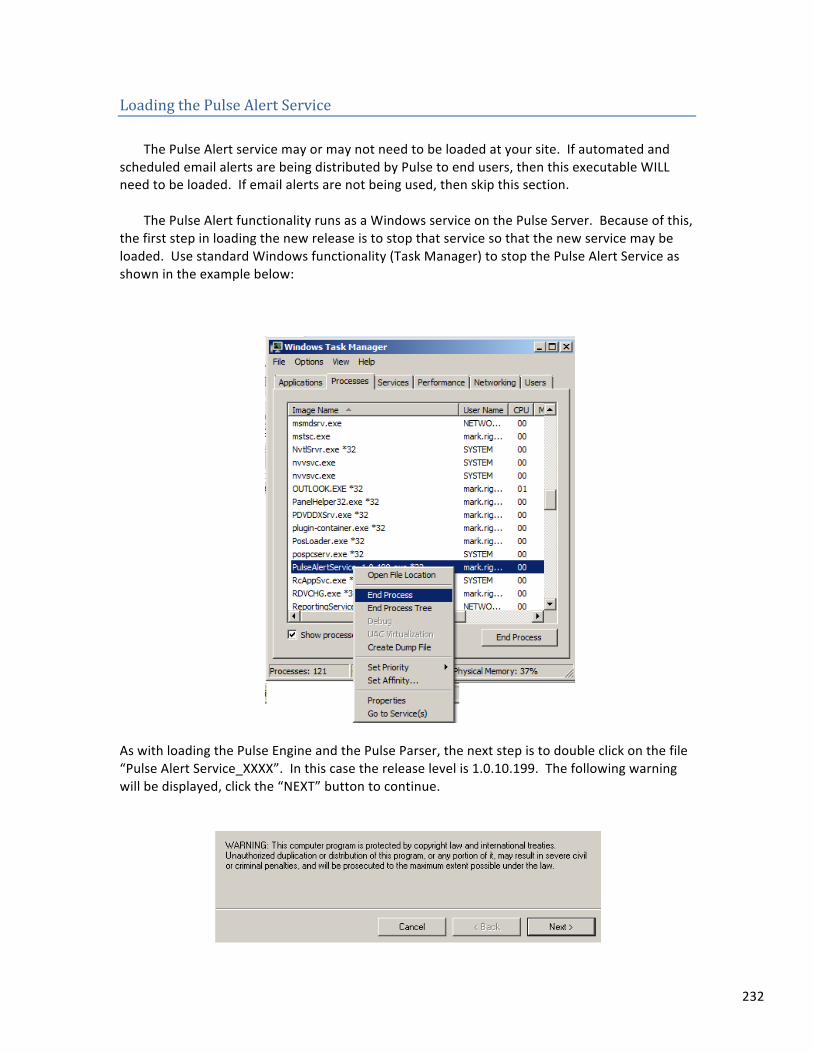
232
Loading the Pulse Alert Service The Pulse Alert service may or may not need to be loaded at your site. If automated and
scheduled email alerts are being distributed by Pulse to end users, then this executable WILL need to be loaded. If email alerts are not being used, then skip this section.
The Pulse Alert functionality runs as a Windows service on the Pulse Server. Because of this,
the first step in loading the new release is to stop that service so that the new service may be loaded. Use standard Windows functionality (Task Manager) to stop the Pulse Alert Service as shown in the example below:
As with loading the Pulse Engine and the Pulse Parser, the next step is to double click on the file “Pulse Alert Service_XXXX”. In this case the release level is 1.0.10.199. The following warning will be displayed, click the “NEXT” button to continue.
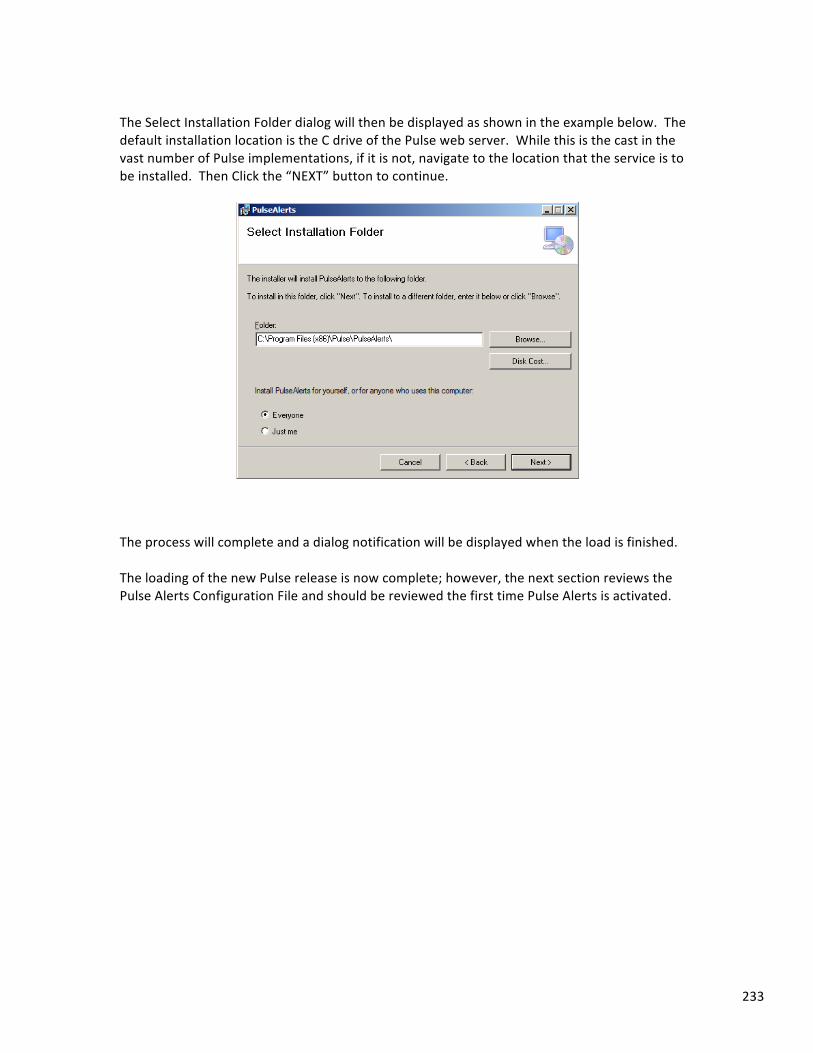
233
The Select Installation Folder dialog will then be displayed as shown in the example below. The default installation location is the C drive of the Pulse web server. While this is the cast in the vast number of Pulse implementations, if it is not, navigate to the location that the service is to be installed. Then Click the “NEXT” button to continue.
The process will complete and a dialog notification will be displayed when the load is finished. The loading of the new Pulse release is now complete; however, the next section reviews the Pulse Alerts Configuration File and should be reviewed the first time Pulse Alerts is activated.
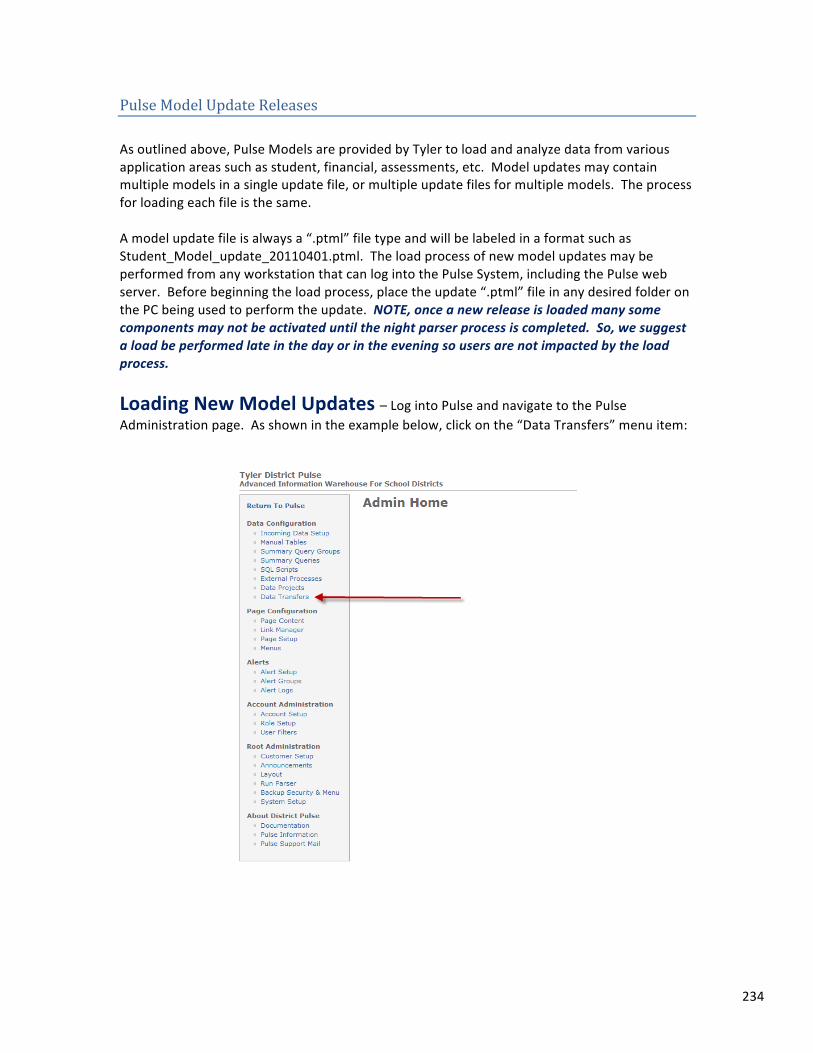
234
Pulse Model Update Releases As outlined above, Pulse Models are provided by Tyler to load and analyze data from various application areas such as student, financial, assessments, etc. Model updates may contain multiple models in a single update file, or multiple update files for multiple models. The process for loading each file is the same. A model update file is always a “.ptml” file type and will be labeled in a format such as Student_Model_update_20110401.ptml. The load process of new model updates may be performed from any workstation that can log into the Pulse System, including the Pulse web server. Before beginning the load process, place the update “.ptml” file in any desired folder on the PC being used to perform the update. NOTE, once a new release is loaded many some components may not be activated until the night parser process is completed. So, we suggest a load be performed late in the day or in the evening so users are not impacted by the load process.
Loading New Model Updates – Log into Pulse and navigate to the Pulse Administration page. As shown in the example below, click on the “Data Transfers” menu item:
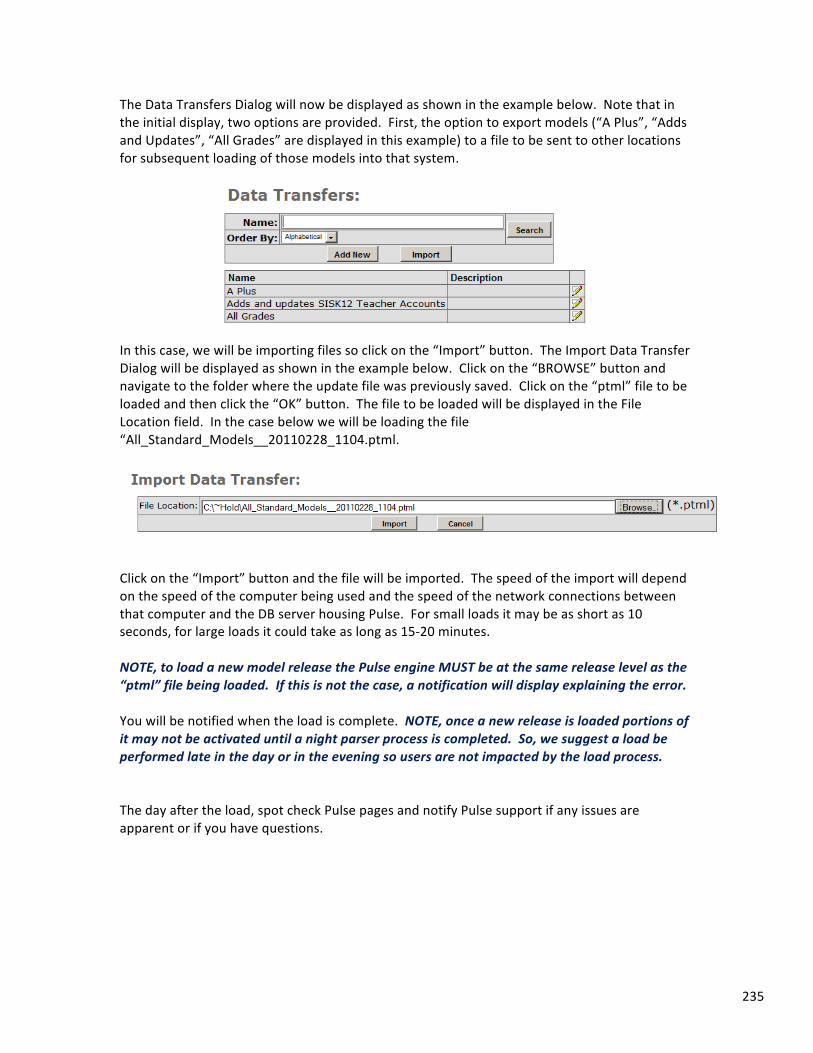
235
The Data Transfers Dialog will now be displayed as shown in the example below. Note that in the initial display, two options are provided. First, the option to export models (“A Plus”, “Adds and Updates”, “All Grades” are displayed in this example) to a file to be sent to other locations for subsequent loading of those models into that system.
In this case, we will be importing files so click on the “Import” button. The Import Data Transfer Dialog will be displayed as shown in the example below. Click on the “BROWSE” button and navigate to the folder where the update file was previously saved. Click on the “ptml” file to be loaded and then click the “OK” button. The file to be loaded will be displayed in the File Location field. In the case below we will be loading the file “All_Standard_Models__20110228_1104.ptml.
Click on the “Import” button and the file will be imported. The speed of the import will depend on the speed of the computer being used and the speed of the network connections between that computer and the DB server housing Pulse. For small loads it may be as short as 10 seconds, for large loads it could take as long as 15-‐20 minutes. NOTE, to load a new model release the Pulse engine MUST be at the same release level as the “ptml” file being loaded. If this is not the case, a notification will display explaining the error. You will be notified when the load is complete. NOTE, once a new release is loaded portions of it may not be activated until a night parser process is completed. So, we suggest a load be performed late in the day or in the evening so users are not impacted by the load process. The day after the load, spot check Pulse pages and notify Pulse support if any issues are apparent or if you have questions.
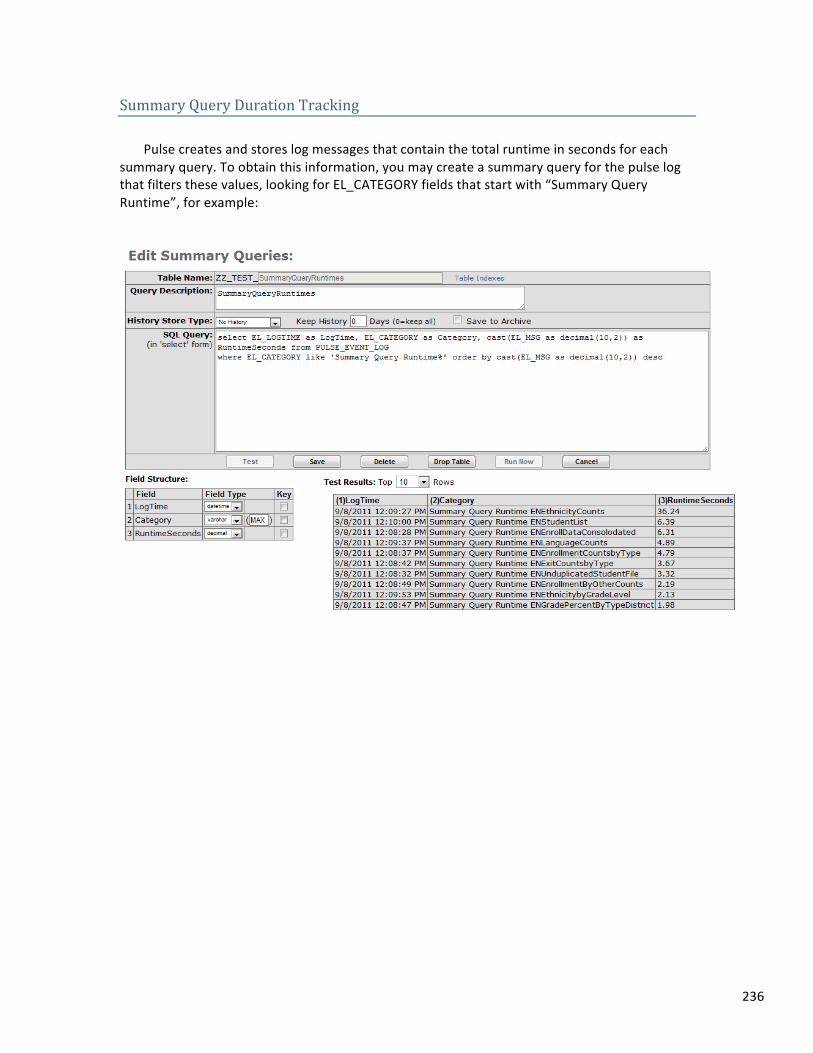
236
Summary Query Duration Tracking Pulse creates and stores log messages that contain the total runtime in seconds for each
summary query. To obtain this information, you may create a summary query for the pulse log that filters these values, looking for EL_CATEGORY fields that start with “Summary Query Runtime”, for example:
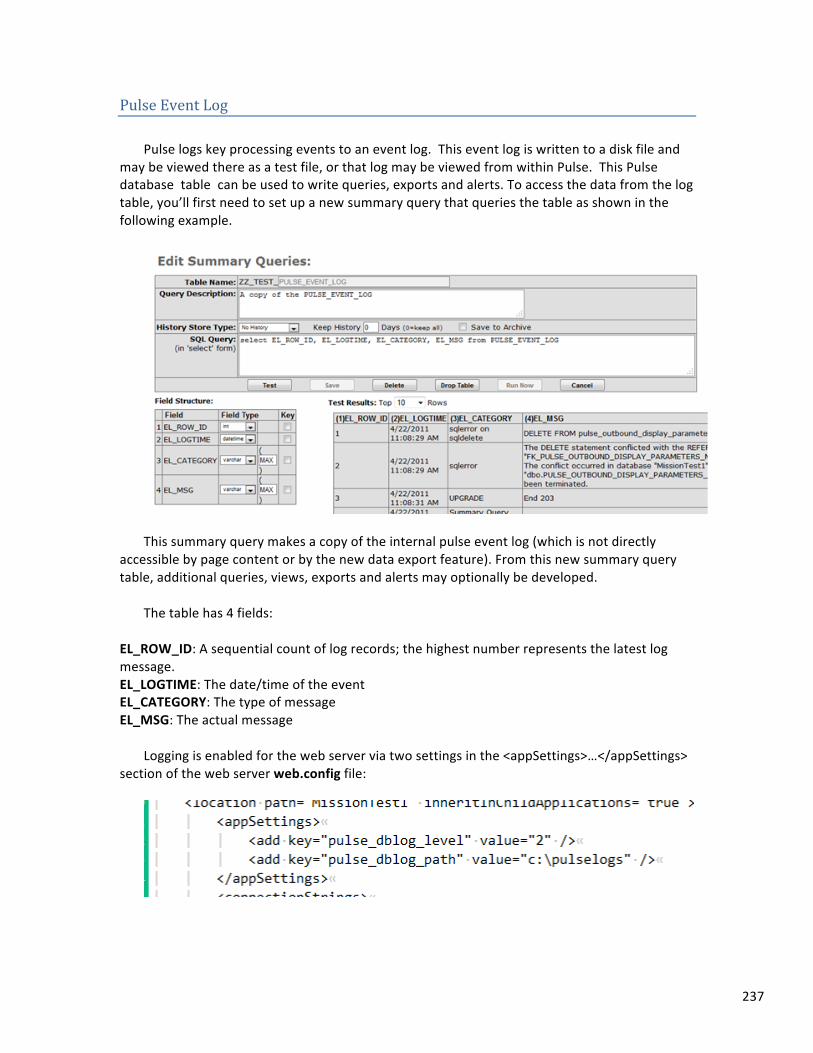
237
Pulse Event Log
Pulse logs key processing events to an event log. This event log is written to a disk file and may be viewed there as a test file, or that log may be viewed from within Pulse. This Pulse database table can be used to write queries, exports and alerts. To access the data from the log table, you’ll first need to set up a new summary query that queries the table as shown in the following example.
This summary query makes a copy of the internal pulse event log (which is not directly
accessible by page content or by the new data export feature). From this new summary query table, additional queries, views, exports and alerts may optionally be developed.
The table has 4 fields:
EL_ROW_ID: A sequential count of log records; the highest number represents the latest log message. EL_LOGTIME: The date/time of the event EL_CATEGORY: The type of message EL_MSG: The actual message
Logging is enabled for the web server via two settings in the <appSettings>…</appSettings>
section of the web server web.config file:
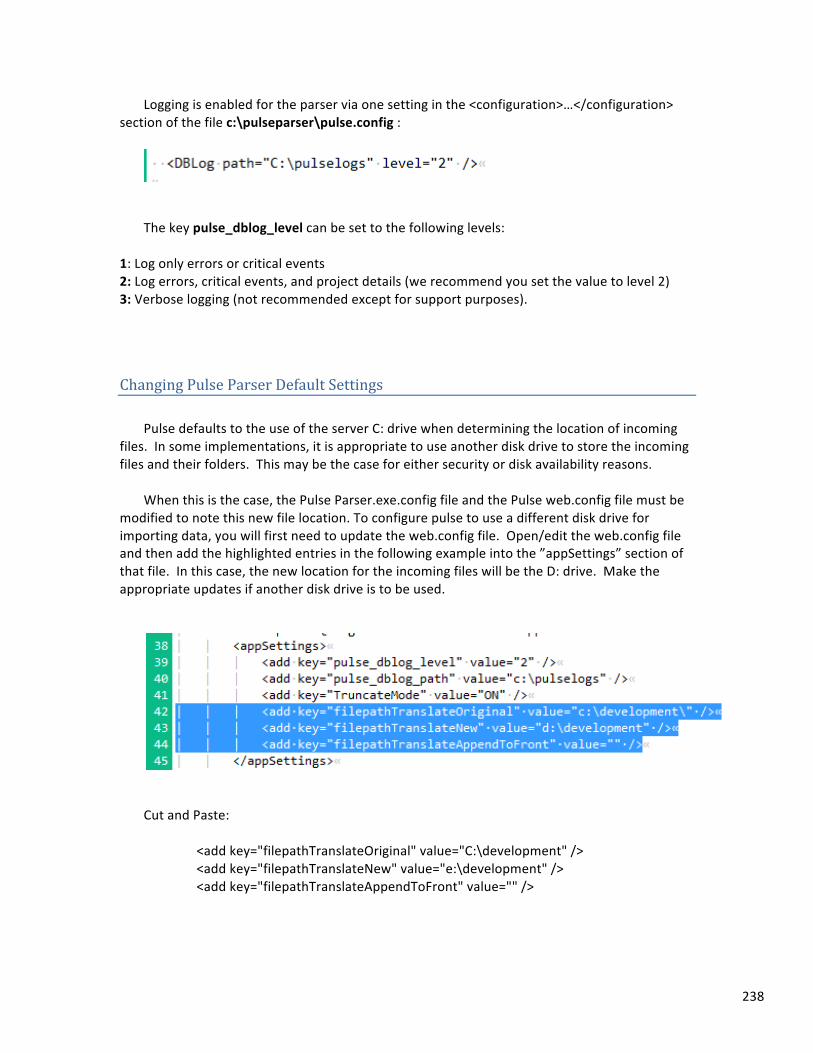
238
Logging is enabled for the parser via one setting in the <configuration>…</configuration> section of the file c:\pulseparser\pulse.config :
The key pulse_dblog_level can be set to the following levels:
1: Log only errors or critical events 2: Log errors, critical events, and project details (we recommend you set the value to level 2) 3: Verbose logging (not recommended except for support purposes).
Changing Pulse Parser Default Settings Pulse defaults to the use of the server C: drive when determining the location of incoming
files. In some implementations, it is appropriate to use another disk drive to store the incoming files and their folders. This may be the case for either security or disk availability reasons.
When this is the case, the Pulse Parser.exe.config file and the Pulse web.config file must be
modified to note this new file location. To configure pulse to use a different disk drive for importing data, you will first need to update the web.config file. Open/edit the web.config file and then add the highlighted entries in the following example into the ”appSettings” section of that file. In this case, the new location for the incoming files will be the D: drive. Make the appropriate updates if another disk drive is to be used.
Cut and Paste: <add key="filepathTranslateOriginal" value="C:\development" /> <add key="filepathTranslateNew" value="e:\development" /> <add key="filepathTranslateAppendToFront" value="" />
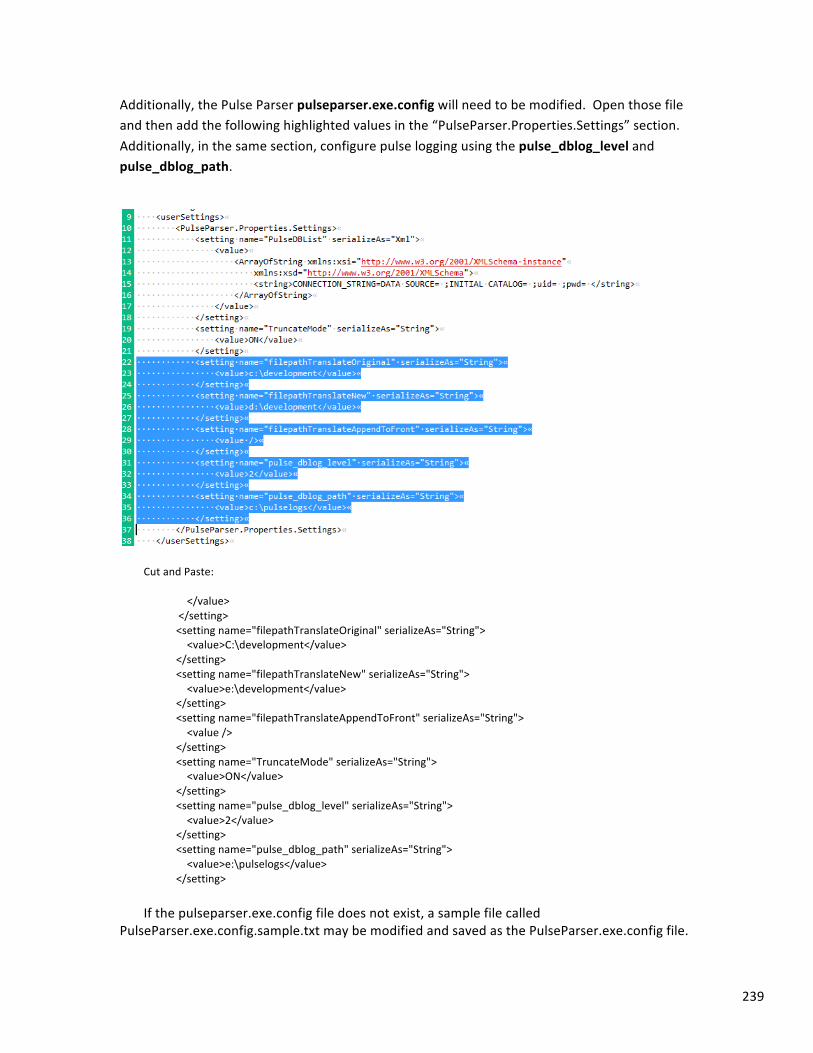
239
Additionally, the Pulse Parser pulseparser.exe.config will need to be modified. Open those file and then add the following highlighted values in the “PulseParser.Properties.Settings” section. Additionally, in the same section, configure pulse logging using the pulse_dblog_level and pulse_dblog_path.
Cut and Paste: </value> </setting> <setting name="filepathTranslateOriginal" serializeAs="String"> <value>C:\development</value> </setting> <setting name="filepathTranslateNew" serializeAs="String"> <value>e:\development</value> </setting> <setting name="filepathTranslateAppendToFront" serializeAs="String"> <value /> </setting> <setting name="TruncateMode" serializeAs="String"> <value>ON</value> </setting> <setting name="pulse_dblog_level" serializeAs="String"> <value>2</value> </setting> <setting name="pulse_dblog_path" serializeAs="String"> <value>e:\pulselogs</value> </setting> If the pulseparser.exe.config file does not exist, a sample file called
PulseParser.exe.config.sample.txt may be modified and saved as the PulseParser.exe.config file.
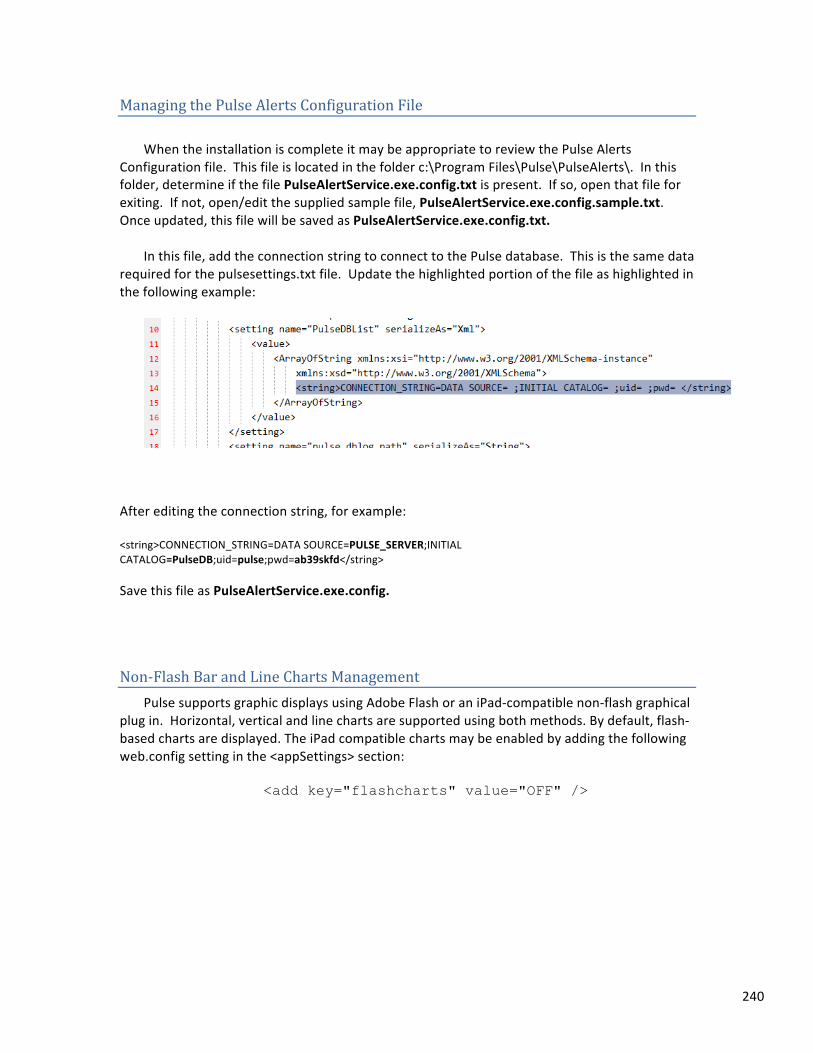
240
Managing the Pulse Alerts Configuration File When the installation is complete it may be appropriate to review the Pulse Alerts
Configuration file. This file is located in the folder c:\Program Files\Pulse\PulseAlerts\. In this folder, determine if the file PulseAlertService.exe.config.txt is present. If so, open that file for exiting. If not, open/edit the supplied sample file, PulseAlertService.exe.config.sample.txt. Once updated, this file will be saved as PulseAlertService.exe.config.txt.
In this file, add the connection string to connect to the Pulse database. This is the same data
required for the pulsesettings.txt file. Update the highlighted portion of the file as highlighted in the following example:
After editing the connection string, for example: <string>CONNECTION_STRING=DATA SOURCE=PULSE_SERVER;INITIAL CATALOG=PulseDB;uid=pulse;pwd=ab39skfd</string> Save this file as PulseAlertService.exe.config.
Non-‐Flash Bar and Line Charts Management Pulse supports graphic displays using Adobe Flash or an iPad-‐compatible non-‐flash graphical
plug in. Horizontal, vertical and line charts are supported using both methods. By default, flash-‐based charts are displayed. The iPad compatible charts may be enabled by adding the following web.config setting in the <appSettings> section:
<add key="flashcharts" value="OFF" />
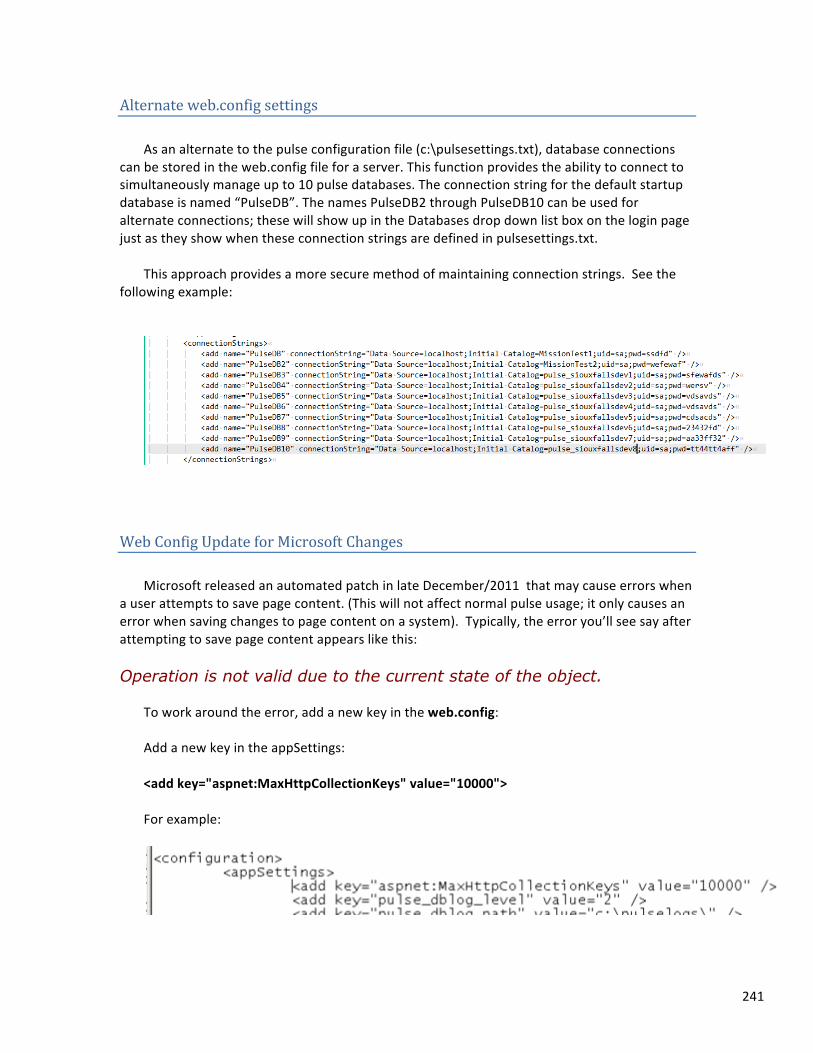
241
Alternate web.config settings As an alternate to the pulse configuration file (c:\pulsesettings.txt), database connections
can be stored in the web.config file for a server. This function provides the ability to connect to simultaneously manage up to 10 pulse databases. The connection string for the default startup database is named “PulseDB”. The names PulseDB2 through PulseDB10 can be used for alternate connections; these will show up in the Databases drop down list box on the login page just as they show when these connection strings are defined in pulsesettings.txt.
This approach provides a more secure method of maintaining connection strings. See the
following example:
Web Config Update for Microsoft Changes Microsoft released an automated patch in late December/2011 that may cause errors when
a user attempts to save page content. (This will not affect normal pulse usage; it only causes an error when saving changes to page content on a system). Typically, the error you’ll see say after attempting to save page content appears like this:
Operation is not valid due to the current state of the object.
To work around the error, add a new key in the web.config: Add a new key in the appSettings: <add key="aspnet:MaxHttpCollectionKeys" value="10000"> For example:
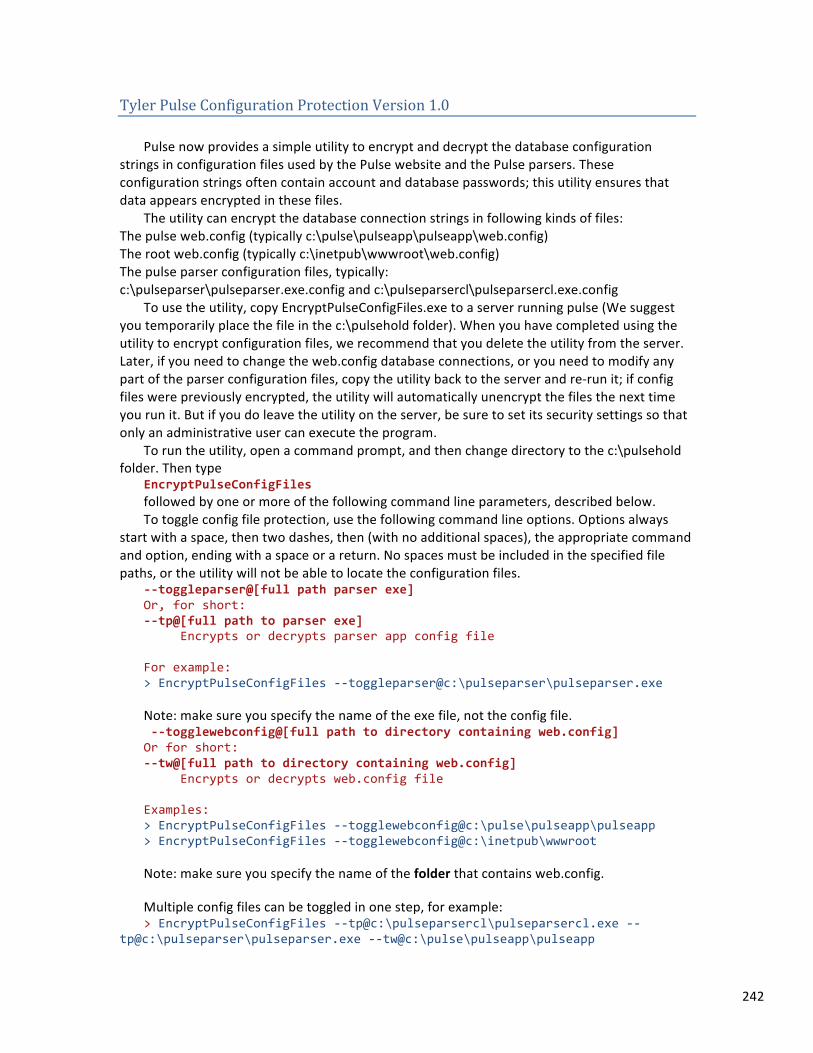
242
Tyler Pulse Configuration Protection Version 1.0 Pulse now provides a simple utility to encrypt and decrypt the database configuration
strings in configuration files used by the Pulse website and the Pulse parsers. These configuration strings often contain account and database passwords; this utility ensures that data appears encrypted in these files.
The utility can encrypt the database connection strings in following kinds of files: The pulse web.config (typically c:\pulse\pulseapp\pulseapp\web.config) The root web.config (typically c:\inetpub\wwwroot\web.config) The pulse parser configuration files, typically: c:\pulseparser\pulseparser.exe.config and c:\pulseparsercl\pulseparsercl.exe.config
To use the utility, copy EncryptPulseConfigFiles.exe to a server running pulse (We suggest you temporarily place the file in the c:\pulsehold folder). When you have completed using the utility to encrypt configuration files, we recommend that you delete the utility from the server. Later, if you need to change the web.config database connections, or you need to modify any part of the parser configuration files, copy the utility back to the server and re-‐run it; if config files were previously encrypted, the utility will automatically unencrypt the files the next time you run it. But if you do leave the utility on the server, be sure to set its security settings so that only an administrative user can execute the program.
To run the utility, open a command prompt, and then change directory to the c:\pulsehold folder. Then type
EncryptPulseConfigFiles followed by one or more of the following command line parameters, described below. To toggle config file protection, use the following command line options. Options always
start with a space, then two dashes, then (with no additional spaces), the appropriate command and option, ending with a space or a return. No spaces must be included in the specified file paths, or the utility will not be able to locate the configuration files.
-‐-‐toggleparser@[full path parser exe] Or, for short: -‐-‐tp@[full path to parser exe] Encrypts or decrypts parser app config file For example: > EncryptPulseConfigFiles -‐-‐toggleparser@c:\pulseparser\pulseparser.exe Note: make sure you specify the name of the exe file, not the config file. -‐-‐togglewebconfig@[full path to directory containing web.config] Or for short: -‐-‐tw@[full path to directory containing web.config] Encrypts or decrypts web.config file Examples: > EncryptPulseConfigFiles -‐-‐togglewebconfig@c:\pulse\pulseapp\pulseapp > EncryptPulseConfigFiles -‐-‐togglewebconfig@c:\inetpub\wwwroot Note: make sure you specify the name of the folder that contains web.config. Multiple config files can be toggled in one step, for example: > EncryptPulseConfigFiles -‐-‐tp@c:\pulseparsercl\pulseparsercl.exe -‐-‐
tp@c:\pulseparser\pulseparser.exe -‐-‐tw@c:\pulse\pulseapp\pulseapp
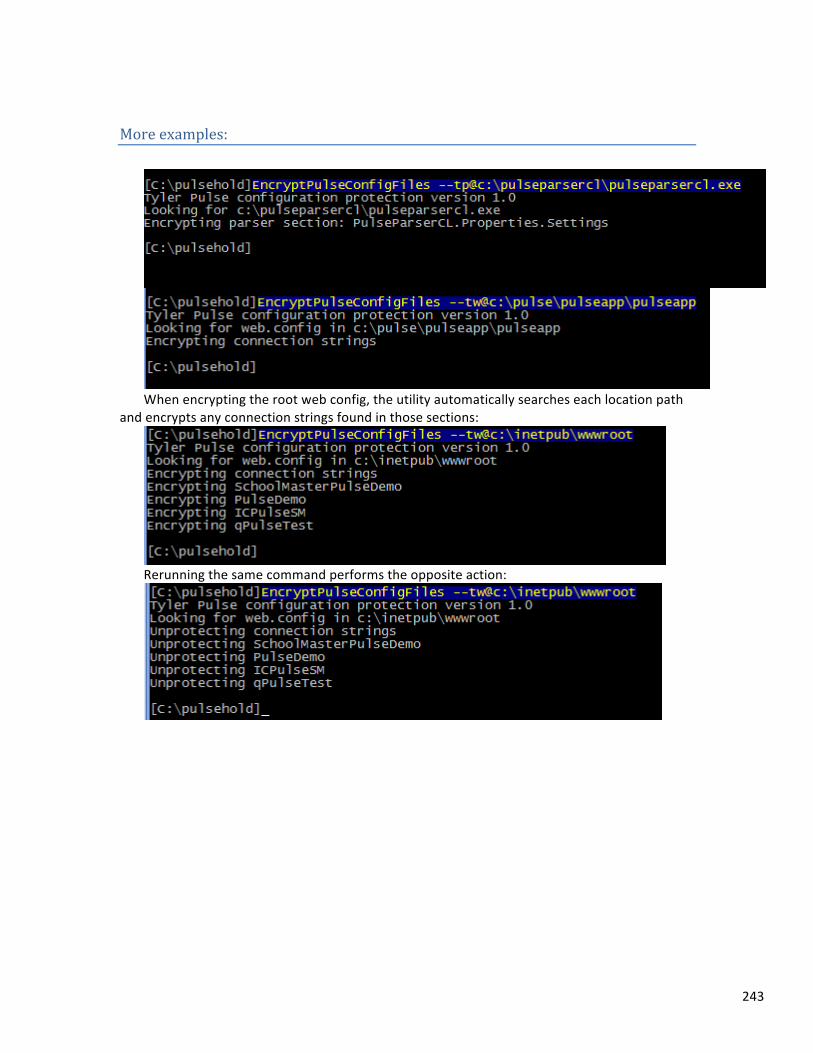
243
More examples:
When encrypting the root web config, the utility automatically searches each location path
and encrypts any connection strings found in those sections:
Rerunning the same command performs the opposite action:
244
ASP/Cloud web.config Settings
When a processing center is supporting multiple school districts from a single server, the web config is set up to specifically support multiple URLs and databases. The IIS settings should be defined to support an application path for each customer supported on a specific server. This way, each customer will use a different URL to access Pulse, and will not see the other customers that are also supported from that server.
The following is an example of a web config that is inserted into the C:\inetpub\wwwrootAYP directory. Note that the Pulse_dblog_level and Pulse_dblog_path key lines should be deleted from the web.config file in C:\pulse\pulseapp\pulseapp.
The location path should match the IIS application path.
<?xml version="1.0" encoding="utf-‐8"?> <configuration> <location path="DetroitPulse" inheritInChildApplications="true"> <connectionStrings> <add name="PulseDB" connectionString="Data Source=(local);Initial Catalog=DetroitPulse;user id=pulse;Password = 321pulse;" /> Catalog=DetroitPulse1112;user id=pulse;Password = 321pulse;" /> </connectionStrings> <appSettings> <add key="pulse_dblog_level" value="2" /> <add key="pulse_dblog_path" value="c:\pulselogs\Detroit" /> </appSettings> </location> <location path="DetroitTest" inheritInChildApplications="true"> <connectionStrings> <add name="PulseDB" connectionString="Data Source=(local);Initial Catalog=DetroitTestPulse;user id=pulse;Password = 321pulse;" /> </connectionStrings> <appSettings> <add key="pulse_dblog_level" value="2" /> <add key="pulse_dblog_path" value="c:\pulselogs\DetroitTest" /> </appSettings> </location> </configuration> This example shows two districts, Detroit and DetroitTest, any number of sites may be defined.
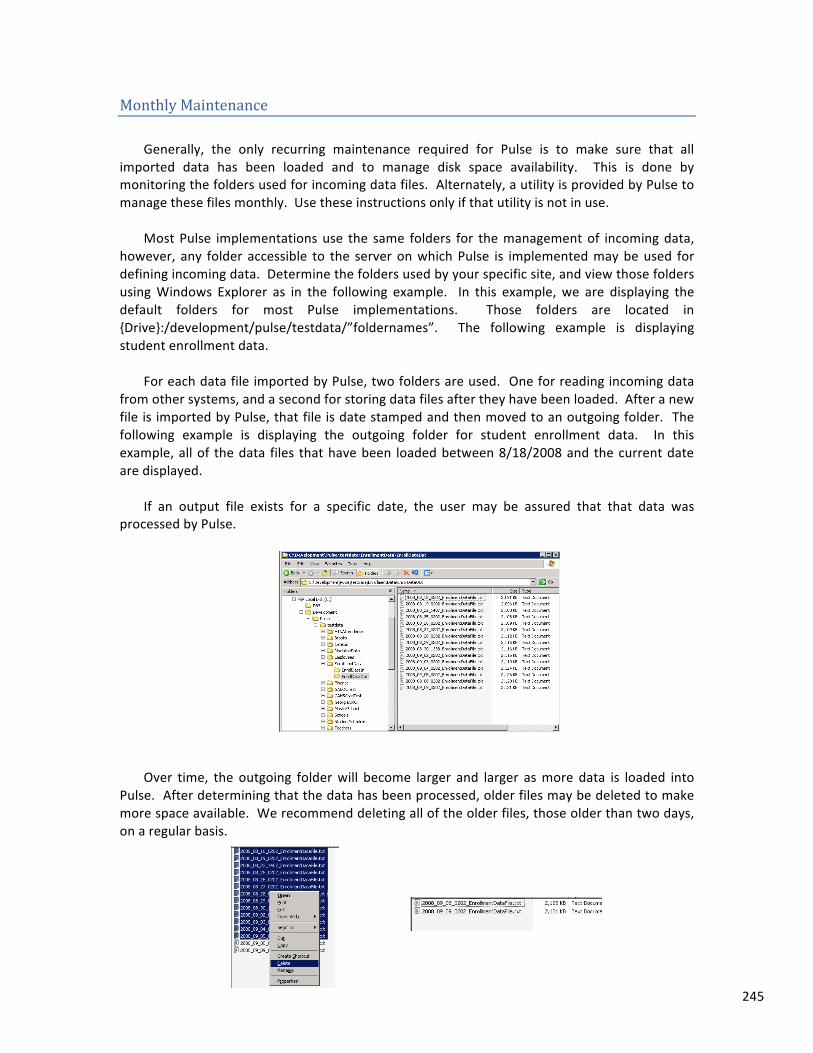
245
Monthly Maintenance Generally, the only recurring maintenance required for Pulse is to make sure that all
imported data has been loaded and to manage disk space availability. This is done by monitoring the folders used for incoming data files. Alternately, a utility is provided by Pulse to manage these files monthly. Use these instructions only if that utility is not in use.
Most Pulse implementations use the same folders for the management of incoming data,
however, any folder accessible to the server on which Pulse is implemented may be used for defining incoming data. Determine the folders used by your specific site, and view those folders using Windows Explorer as in the following example. In this example, we are displaying the default folders for most Pulse implementations. Those folders are located in {Drive}:/development/pulse/testdata/”foldernames”. The following example is displaying student enrollment data.
For each data file imported by Pulse, two folders are used. One for reading incoming data
from other systems, and a second for storing data files after they have been loaded. After a new file is imported by Pulse, that file is date stamped and then moved to an outgoing folder. The following example is displaying the outgoing folder for student enrollment data. In this example, all of the data files that have been loaded between 8/18/2008 and the current date are displayed.
If an output file exists for a specific date, the user may be assured that that data was
processed by Pulse.
Over time, the outgoing folder will become larger and larger as more data is loaded into
Pulse. After determining that the data has been processed, older files may be deleted to make more space available. We recommend deleting all of the older files, those older than two days, on a regular basis.
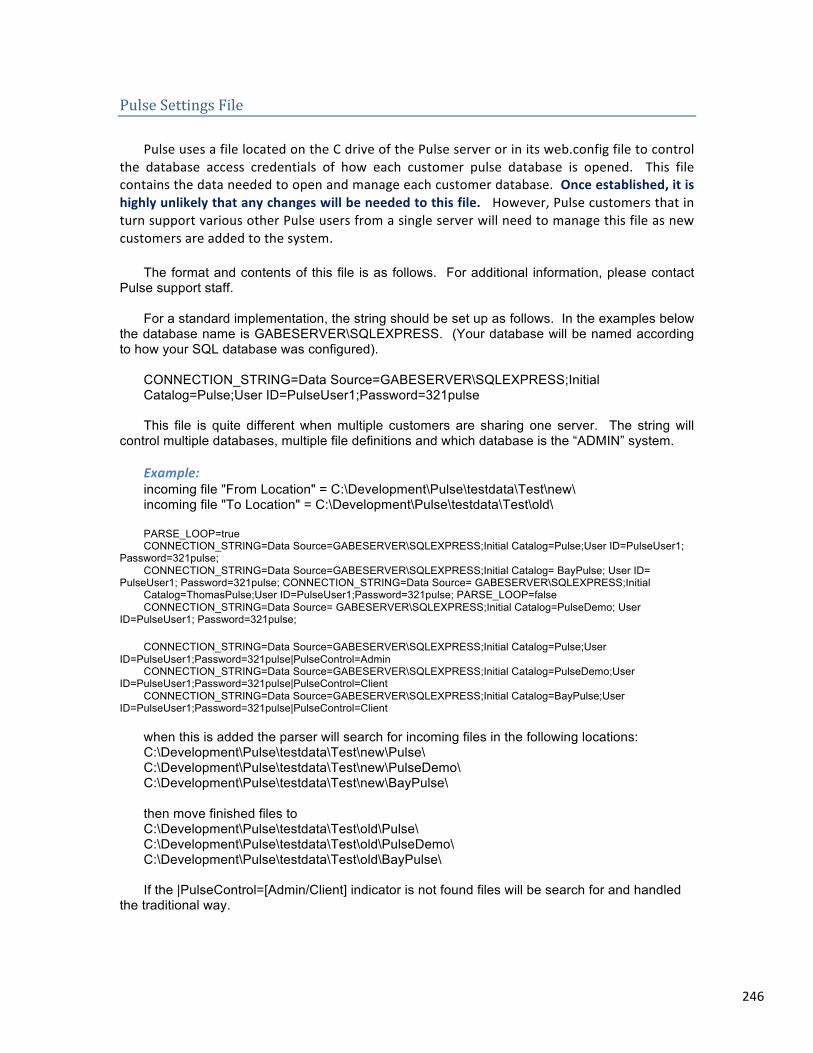
246
Pulse Settings File Pulse uses a file located on the C drive of the Pulse server or in its web.config file to control
the database access credentials of how each customer pulse database is opened. This file contains the data needed to open and manage each customer database. Once established, it is highly unlikely that any changes will be needed to this file. However, Pulse customers that in turn support various other Pulse users from a single server will need to manage this file as new customers are added to the system.
The format and contents of this file is as follows. For additional information, please contact
Pulse support staff. For a standard implementation, the string should be set up as follows. In the examples below
the database name is GABESERVER\SQLEXPRESS. (Your database will be named according to how your SQL database was configured).
CONNECTION_STRING=Data Source=GABESERVER\SQLEXPRESS;Initial Catalog=Pulse;User ID=PulseUser1;Password=321pulse This file is quite different when multiple customers are sharing one server. The string will
control multiple databases, multiple file definitions and which database is the “ADMIN” system. Example: incoming file "From Location" = C:\Development\Pulse\testdata\Test\new\ incoming file "To Location" = C:\Development\Pulse\testdata\Test\old\ PARSE_LOOP=true CONNECTION_STRING=Data Source=GABESERVER\SQLEXPRESS;Initial Catalog=Pulse;User ID=PulseUser1;
Password=321pulse; CONNECTION_STRING=Data Source=GABESERVER\SQLEXPRESS;Initial Catalog= BayPulse; User ID=
PulseUser1; Password=321pulse; CONNECTION_STRING=Data Source= GABESERVER\SQLEXPRESS;Initial Catalog=ThomasPulse;User ID=PulseUser1;Password=321pulse; PARSE_LOOP=false CONNECTION_STRING=Data Source= GABESERVER\SQLEXPRESS;Initial Catalog=PulseDemo; User
ID=PulseUser1; Password=321pulse; CONNECTION_STRING=Data Source=GABESERVER\SQLEXPRESS;Initial Catalog=Pulse;User
ID=PulseUser1;Password=321pulse|PulseControl=Admin CONNECTION_STRING=Data Source=GABESERVER\SQLEXPRESS;Initial Catalog=PulseDemo;User
ID=PulseUser1;Password=321pulse|PulseControl=Client CONNECTION_STRING=Data Source=GABESERVER\SQLEXPRESS;Initial Catalog=BayPulse;User
ID=PulseUser1;Password=321pulse|PulseControl=Client when this is added the parser will search for incoming files in the following locations: C:\Development\Pulse\testdata\Test\new\Pulse\ C:\Development\Pulse\testdata\Test\new\PulseDemo\ C:\Development\Pulse\testdata\Test\new\BayPulse\ then move finished files to C:\Development\Pulse\testdata\Test\old\Pulse\ C:\Development\Pulse\testdata\Test\old\PulseDemo\ C:\Development\Pulse\testdata\Test\old\BayPulse\ If the |PulseControl=[Admin/Client] indicator is not found files will be search for and handled
the traditional way.
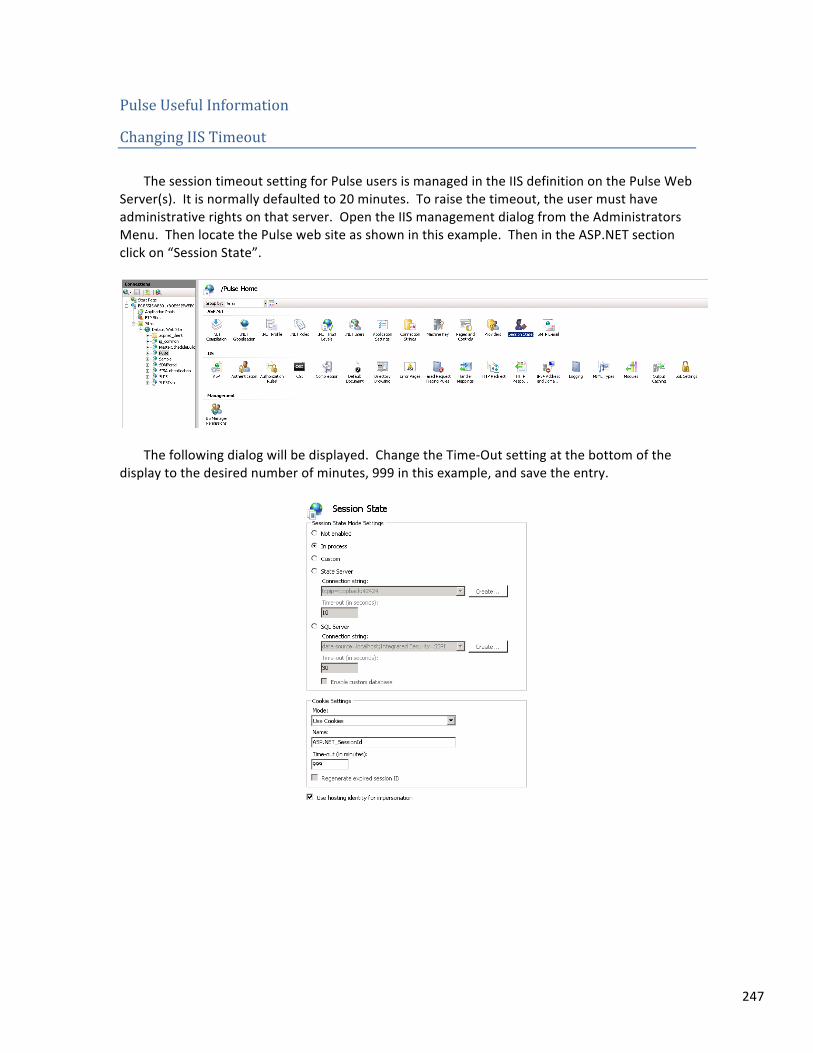
247
Pulse Useful Information
Changing IIS Timeout The session timeout setting for Pulse users is managed in the IIS definition on the Pulse Web
Server(s). It is normally defaulted to 20 minutes. To raise the timeout, the user must have administrative rights on that server. Open the IIS management dialog from the Administrators Menu. Then locate the Pulse web site as shown in this example. Then in the ASP.NET section click on “Session State”.
The following dialog will be displayed. Change the Time-‐Out setting at the bottom of the
display to the desired number of minutes, 999 in this example, and save the entry.
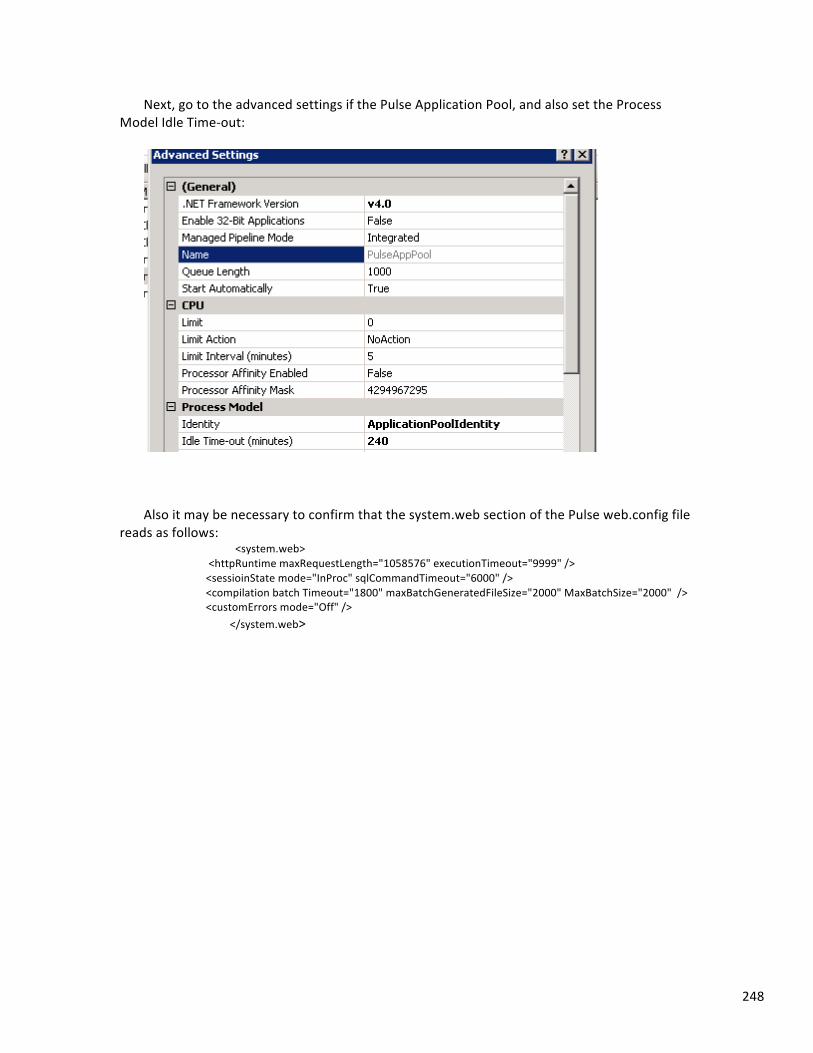
248
Next, go to the advanced settings if the Pulse Application Pool, and also set the Process Model Idle Time-‐out:
Also it may be necessary to confirm that the system.web section of the Pulse web.config file
reads as follows: <system.web>
<httpRuntime maxRequestLength="1058576" executionTimeout="9999" /> <sessioinState mode="InProc" sqlCommandTimeout="6000" /> <compilation batch Timeout="1800" maxBatchGeneratedFileSize="2000" MaxBatchSize="2000" /> <customErrors mode="Off" />
</system.web>
249
Missouri MAP (NCLB) File Loading Locations 1. SIS MAP Student Summary File
i. File Name -‐ Student_test_99999999999 ii. Folder Name – MapSummaryIn
2. SIS MAP Student Standard File i. File Name – Content Standard Report ii. Folder Name – MapStandardsIn
3. SIS MAP Totals File i. File Name – Achievement_Level_4levels_999999999 ii. Folder Name – MapTotalsIn
4. SIS MAP Test Item File i. File Name – Student_test_item_999999999 ii. Folder Name – MapTestItemsIn
5. SIS MAP Test Items Expanded i. File Name – Special file downloaded from state web site ii. Folder Name -‐ MapTestItemsExpanded
Transferring a File and its Data Contents in SQL Studio These steps are used to transfer a file in an SQL Database to an export file that may be transferred and loaded in a different database. This is a very useful process for moving manual files from one Pulse System to another. In Microsoft SQL Studio:
1. Right click on the database name 2. Select Tasks > Generate Scripts 3. Click Next 4. Click Radio Button for Select Specific Database Objects 5. Expand tables 6. Check the box by the table you want to generate a script for to export 7. Click Next 8. File name ~ normally change this to the name of the table.txt 9. Click Advanced 10. Scroll down to Script Drop and Create. It will indicate Script Create in the right column.
Click here and change to Script Drop and Create 11. Scroll down to where it indicates the Type of data to script. It will show Schema Only in
the right column. Click here and change to Schema and Data. 12. Click OK 13. Click Next 14. Click Next ~ File will be created 15. Open file and run as query in the database.
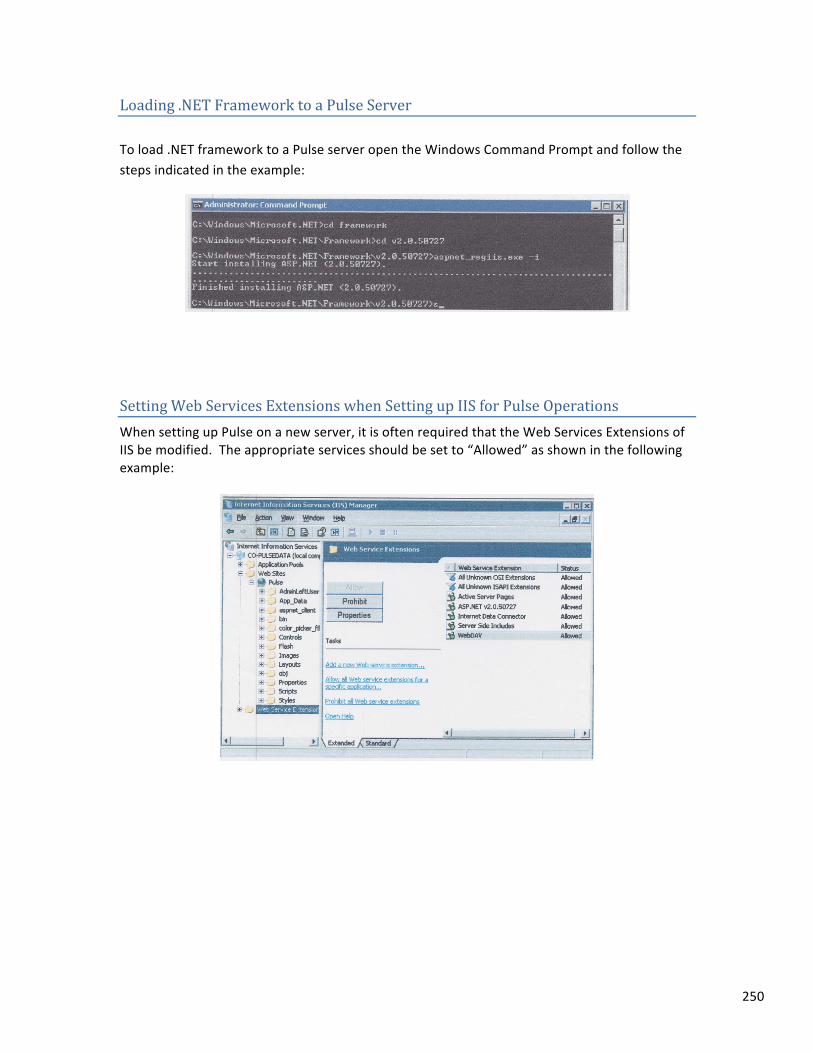
250
Loading .NET Framework to a Pulse Server To load .NET framework to a Pulse server open the Windows Command Prompt and follow the steps indicated in the example:
Setting Web Services Extensions when Setting up IIS for Pulse Operations When setting up Pulse on a new server, it is often required that the Web Services Extensions of IIS be modified. The appropriate services should be set to “Allowed” as shown in the following example:
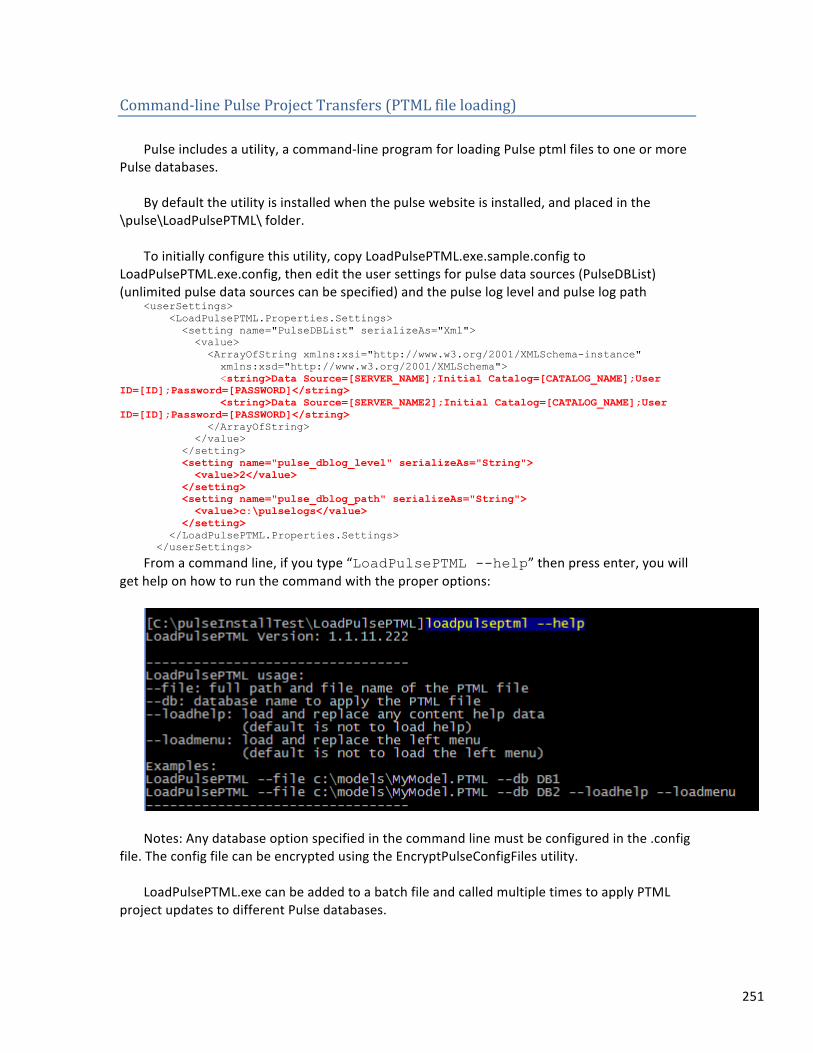
251
Command-‐line Pulse Project Transfers (PTML file loading) Pulse includes a utility, a command-‐line program for loading Pulse ptml files to one or more
Pulse databases. By default the utility is installed when the pulse website is installed, and placed in the
\pulse\LoadPulsePTML\ folder. To initially configure this utility, copy LoadPulsePTML.exe.sample.config to
LoadPulsePTML.exe.config, then edit the user settings for pulse data sources (PulseDBList) (unlimited pulse data sources can be specified) and the pulse log level and pulse log path
<userSettings> <LoadPulsePTML.Properties.Settings> <setting name="PulseDBList" serializeAs="Xml"> <value> <ArrayOfString xmlns:xsi="http://www.w3.org/2001/XMLSchema-instance" xmlns:xsd="http://www.w3.org/2001/XMLSchema"> <string>Data Source=[SERVER_NAME];Initial Catalog=[CATALOG_NAME];User
ID=[ID];Password=[PASSWORD]</string> <string>Data Source=[SERVER_NAME2];Initial Catalog=[CATALOG_NAME];User
ID=[ID];Password=[PASSWORD]</string> </ArrayOfString> </value> </setting> <setting name="pulse_dblog_level" serializeAs="String"> <value>2</value> </setting> <setting name="pulse_dblog_path" serializeAs="String"> <value>c:\pulselogs</value> </setting> </LoadPulsePTML.Properties.Settings> </userSettings>
From a command line, if you type “LoadPulsePTML --help” then press enter, you will get help on how to run the command with the proper options:
Notes: Any database option specified in the command line must be configured in the .config
file. The config file can be encrypted using the EncryptPulseConfigFiles utility. LoadPulsePTML.exe can be added to a batch file and called multiple times to apply PTML
project updates to different Pulse databases.
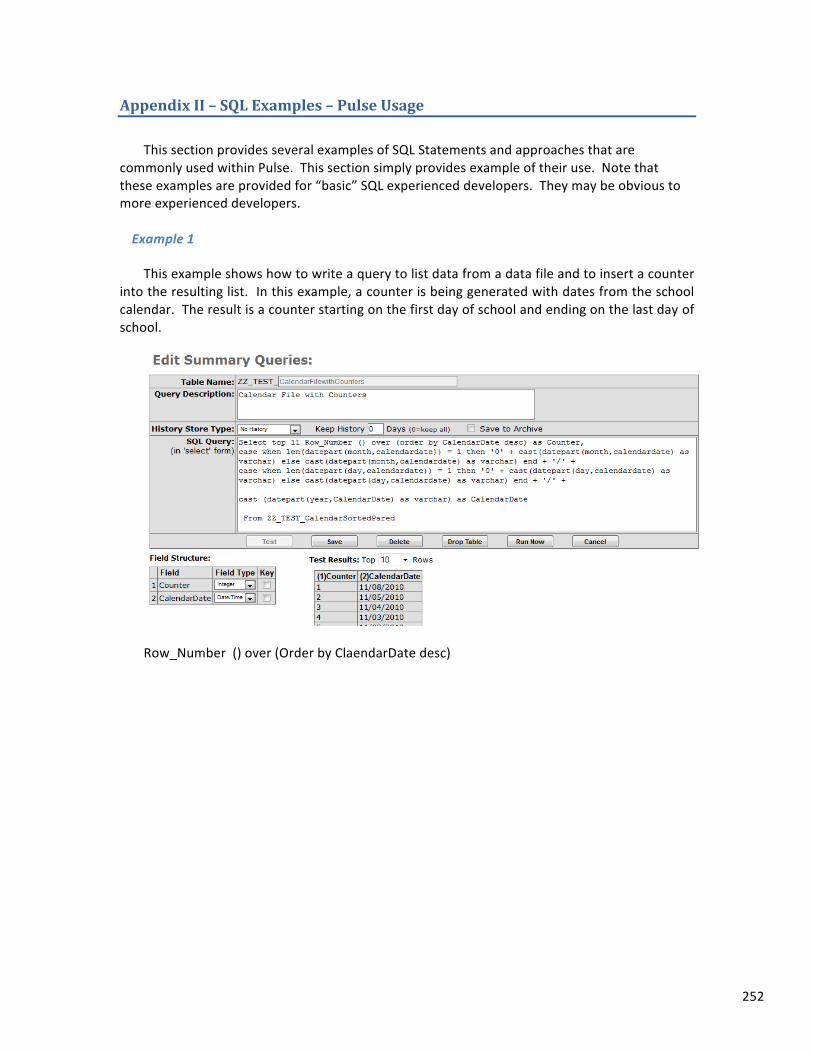
252
Appendix II – SQL Examples – Pulse Usage This section provides several examples of SQL Statements and approaches that are
commonly used within Pulse. This section simply provides example of their use. Note that these examples are provided for “basic” SQL experienced developers. They may be obvious to more experienced developers.
Example 1
This example shows how to write a query to list data from a data file and to insert a counter
into the resulting list. In this example, a counter is being generated with dates from the school calendar. The result is a counter starting on the first day of school and ending on the last day of school.
Row_Number () over (Order by ClaendarDate desc)
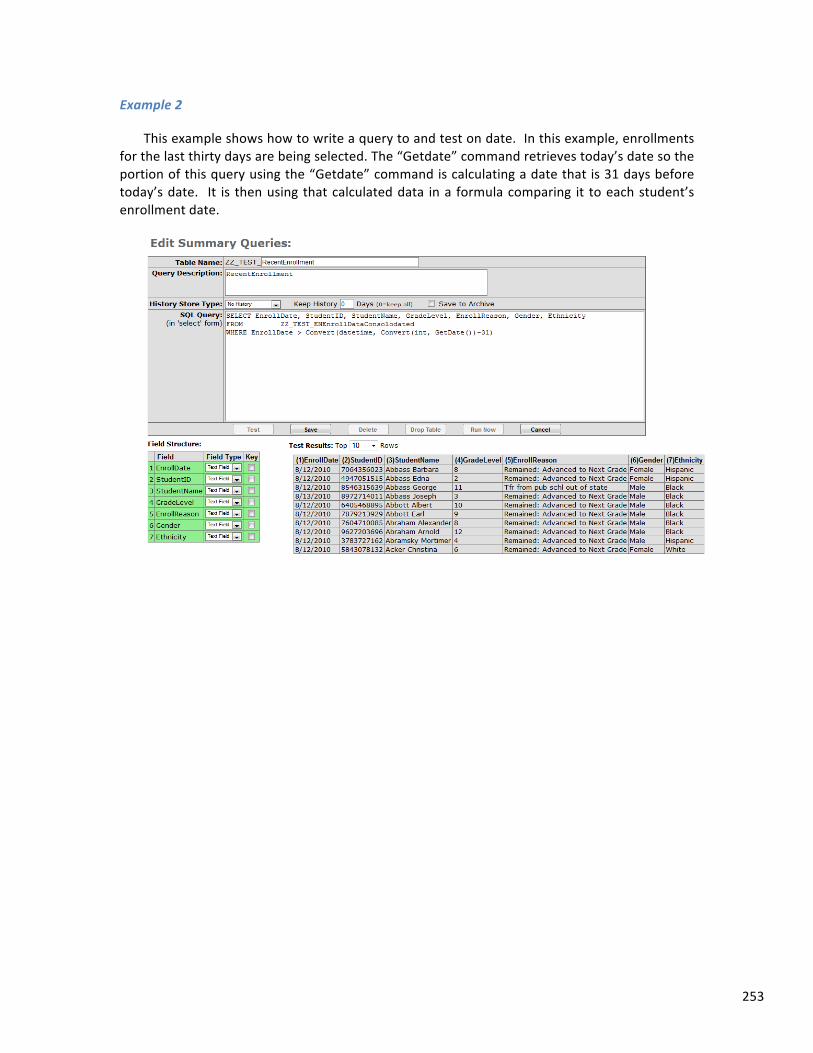
253
Example 2
This example shows how to write a query to and test on date. In this example, enrollments for the last thirty days are being selected. The “Getdate” command retrieves today’s date so the portion of this query using the “Getdate” command is calculating a date that is 31 days before today’s date. It is then using that calculated data in a formula comparing it to each student’s enrollment date.
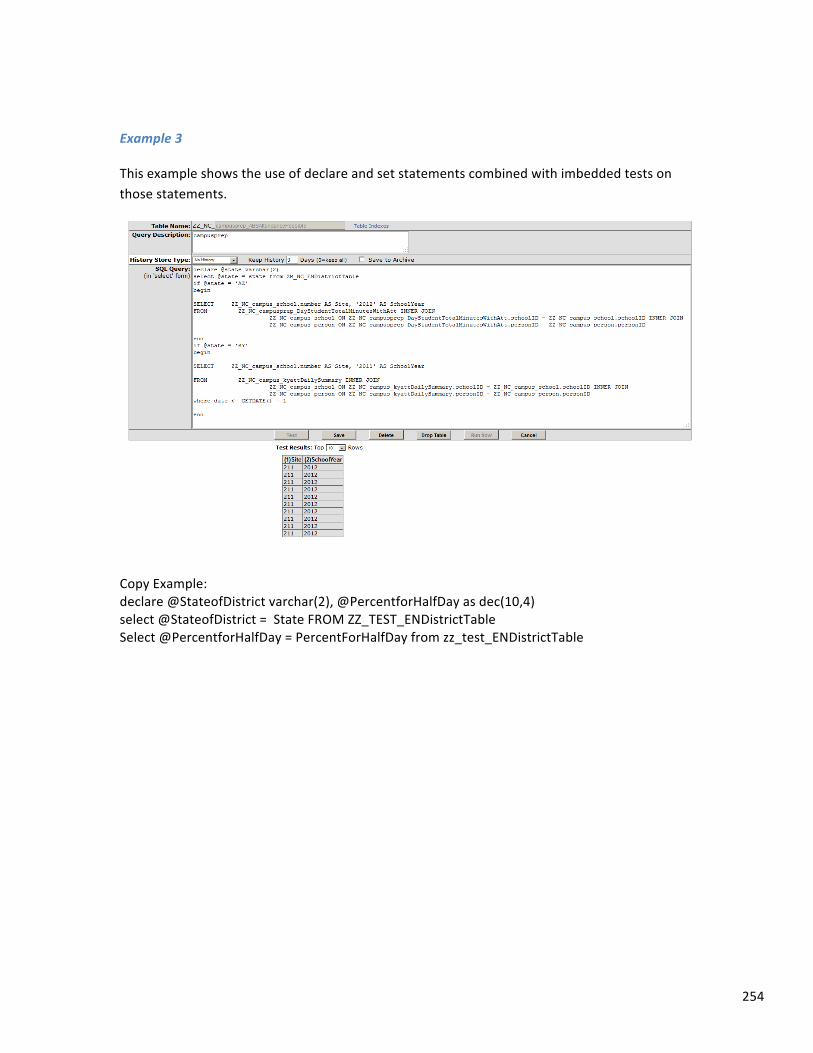
254
Example 3
This example shows the use of declare and set statements combined with imbedded tests on those statements.
Copy Example: declare @StateofDistrict varchar(2), @PercentforHalfDay as dec(10,4) select @StateofDistrict = State FROM ZZ_TEST_ENDistrictTable Select @PercentforHalfDay = PercentForHalfDay from zz_test_ENDistrictTable

255
Example 4
The following query may be used to break a combined student name field into individual name fields. For example, “Doe, John C” to “Doe” as LastName, “John” as FirstName and “C” as Middle Name. Minor changes may be needed to address various name formats.
Select Studentid, StudentName, left(replace(studentName,',',''), CHARINDEX(' ', replace(studentName,',',''))-1) as LastName, case when CHARINDEX(' ', rtrim(ltrim(right(replace(studentName,',',''),len(replace(studentName,',','')) - len(left(replace(studentName,',',''), CHARINDEX(' ', replace(studentName,',','')))) ))) ) is null then null when CHARINDEX(' ', rtrim(ltrim(right(replace(studentName,',',''),len(replace(studentName,',','')) - len(left(replace(studentName,',',''), CHARINDEX(' ', replace(studentName,',','')))) ))) ) = 0 then ltrim(right(replace(ltrim(rtrim(studentname)),',',''),len(replace(ltrim(rtrim(studentname)),',','')) - len(left(replace(ltrim(rtrim(studentname)),',',''), CHARINDEX(' ', replace(ltrim(rtrim(studentname)),',','')))) )) else left((right(replace(ltrim(rtrim(studentname)),',','') , len(replace(ltrim(rtrim(studentname)),',','')) - CHARINDEX(' ', replace(ltrim(rtrim(studentname)),',',''))-0)), charindex(' ', right(replace(ltrim(rtrim(studentname)),',','') , len(replace(ltrim(rtrim(studentname)),',','')) - CHARINDEX(' ', replace(ltrim(rtrim(studentname)),',',''))-1)))end FirstName, Case when len(studentName) - len(Replace(StudentName,' ','')) = 1 then null else right(ltrim(rtrim(replace(studentName,',',''))), ((len(ltrim(rtrim(replace(studentName,',','')))) - CHARINDEX(' ', ltrim(rtrim(replace(studentName,',','')))) - charindex(' ', right(ltrim(rtrim(replace(studentName,',',''))) , len(ltrim(rtrim(replace(studentName,',','')))) - CHARINDEX(' ', ltrim(rtrim(replace(studentName,',',''))))-1))) -1)) end as MiddleName from ZZ_Test_enenrolldataconsolodated
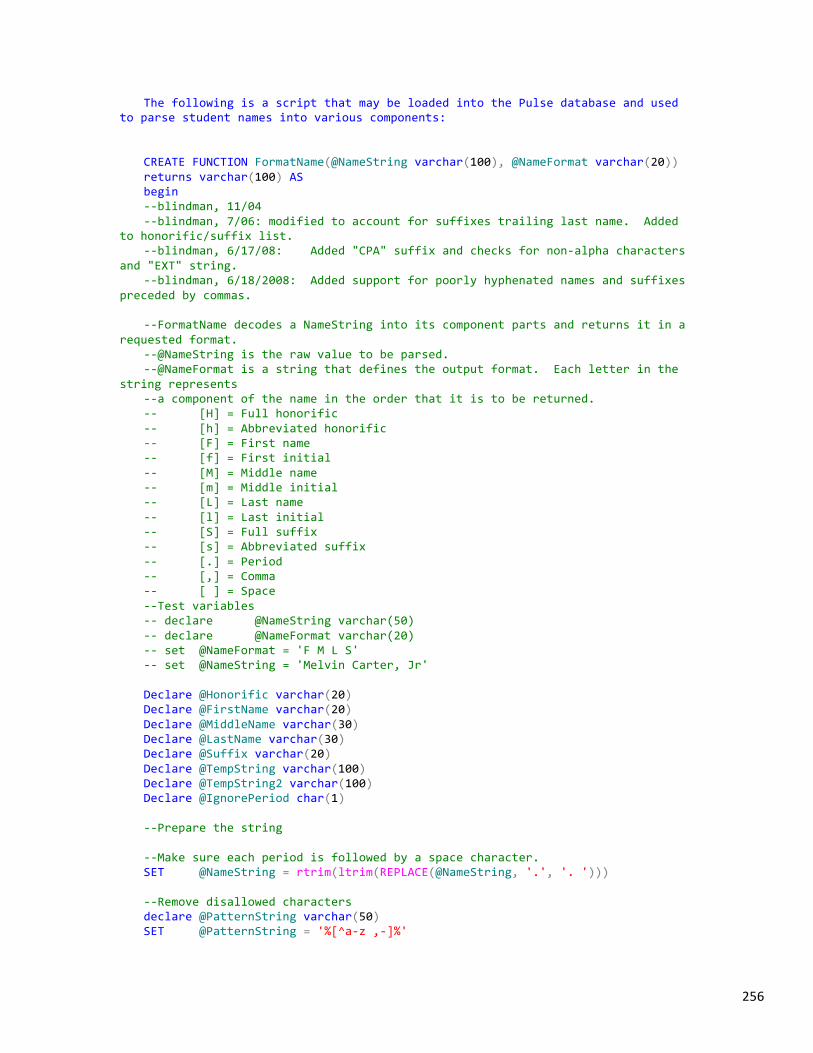
256
The following is a script that may be loaded into the Pulse database and used to parse student names into various components:
CREATE FUNCTION FormatName(@NameString varchar(100), @NameFormat varchar(20)) returns varchar(100) AS begin -‐-‐blindman, 11/04 -‐-‐blindman, 7/06: modified to account for suffixes trailing last name. Added
to honorific/suffix list. -‐-‐blindman, 6/17/08: Added "CPA" suffix and checks for non-‐alpha characters
and "EXT" string. -‐-‐blindman, 6/18/2008: Added support for poorly hyphenated names and suffixes
preceded by commas. -‐-‐FormatName decodes a NameString into its component parts and returns it in a
requested format. -‐-‐@NameString is the raw value to be parsed. -‐-‐@NameFormat is a string that defines the output format. Each letter in the
string represents -‐-‐a component of the name in the order that it is to be returned. -‐-‐ [H] = Full honorific -‐-‐ [h] = Abbreviated honorific -‐-‐ [F] = First name -‐-‐ [f] = First initial -‐-‐ [M] = Middle name -‐-‐ [m] = Middle initial -‐-‐ [L] = Last name -‐-‐ [l] = Last initial -‐-‐ [S] = Full suffix -‐-‐ [s] = Abbreviated suffix -‐-‐ [.] = Period -‐-‐ [,] = Comma -‐-‐ [ ] = Space -‐-‐Test variables -‐-‐ declare @NameString varchar(50) -‐-‐ declare @NameFormat varchar(20) -‐-‐ set @NameFormat = 'F M L S' -‐-‐ set @NameString = 'Melvin Carter, Jr' Declare @Honorific varchar(20) Declare @FirstName varchar(20) Declare @MiddleName varchar(30) Declare @LastName varchar(30) Declare @Suffix varchar(20) Declare @TempString varchar(100) Declare @TempString2 varchar(100) Declare @IgnorePeriod char(1) -‐-‐Prepare the string -‐-‐Make sure each period is followed by a space character. SET @NameString = rtrim(ltrim(REPLACE(@NameString, '.', '. '))) -‐-‐Remove disallowed characters declare @PatternString varchar(50) SET @PatternString = '%[^a-‐z ,-‐]%'
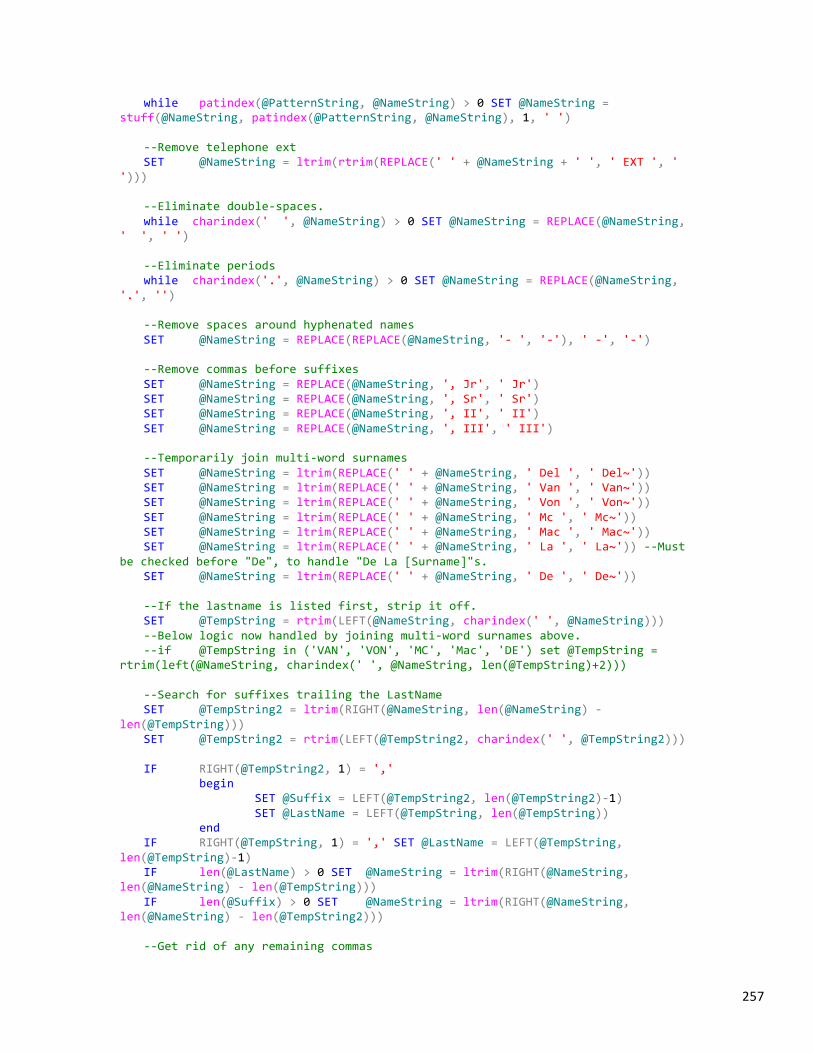
257
while patindex(@PatternString, @NameString) > 0 SET @NameString = stuff(@NameString, patindex(@PatternString, @NameString), 1, ' ')
-‐-‐Remove telephone ext SET @NameString = ltrim(rtrim(REPLACE(' ' + @NameString + ' ', ' EXT ', '
'))) -‐-‐Eliminate double-‐spaces. while charindex(' ', @NameString) > 0 SET @NameString = REPLACE(@NameString,
' ', ' ') -‐-‐Eliminate periods while charindex('.', @NameString) > 0 SET @NameString = REPLACE(@NameString,
'.', '') -‐-‐Remove spaces around hyphenated names SET @NameString = REPLACE(REPLACE(@NameString, '-‐ ', '-‐'), ' -‐', '-‐') -‐-‐Remove commas before suffixes SET @NameString = REPLACE(@NameString, ', Jr', ' Jr') SET @NameString = REPLACE(@NameString, ', Sr', ' Sr') SET @NameString = REPLACE(@NameString, ', II', ' II') SET @NameString = REPLACE(@NameString, ', III', ' III') -‐-‐Temporarily join multi-‐word surnames SET @NameString = ltrim(REPLACE(' ' + @NameString, ' Del ', ' Del~')) SET @NameString = ltrim(REPLACE(' ' + @NameString, ' Van ', ' Van~')) SET @NameString = ltrim(REPLACE(' ' + @NameString, ' Von ', ' Von~')) SET @NameString = ltrim(REPLACE(' ' + @NameString, ' Mc ', ' Mc~')) SET @NameString = ltrim(REPLACE(' ' + @NameString, ' Mac ', ' Mac~')) SET @NameString = ltrim(REPLACE(' ' + @NameString, ' La ', ' La~')) -‐-‐Must
be checked before "De", to handle "De La [Surname]"s. SET @NameString = ltrim(REPLACE(' ' + @NameString, ' De ', ' De~')) -‐-‐If the lastname is listed first, strip it off. SET @TempString = rtrim(LEFT(@NameString, charindex(' ', @NameString))) -‐-‐Below logic now handled by joining multi-‐word surnames above. -‐-‐if @TempString in ('VAN', 'VON', 'MC', 'Mac', 'DE') set @TempString =
rtrim(left(@NameString, charindex(' ', @NameString, len(@TempString)+2))) -‐-‐Search for suffixes trailing the LastName SET @TempString2 = ltrim(RIGHT(@NameString, len(@NameString) -‐
len(@TempString))) SET @TempString2 = rtrim(LEFT(@TempString2, charindex(' ', @TempString2))) IF RIGHT(@TempString2, 1) = ',' begin SET @Suffix = LEFT(@TempString2, len(@TempString2)-‐1) SET @LastName = LEFT(@TempString, len(@TempString)) end IF RIGHT(@TempString, 1) = ',' SET @LastName = LEFT(@TempString,
len(@TempString)-‐1) IF len(@LastName) > 0 SET @NameString = ltrim(RIGHT(@NameString,
len(@NameString) -‐ len(@TempString))) IF len(@Suffix) > 0 SET @NameString = ltrim(RIGHT(@NameString,
len(@NameString) -‐ len(@TempString2))) -‐-‐Get rid of any remaining commas
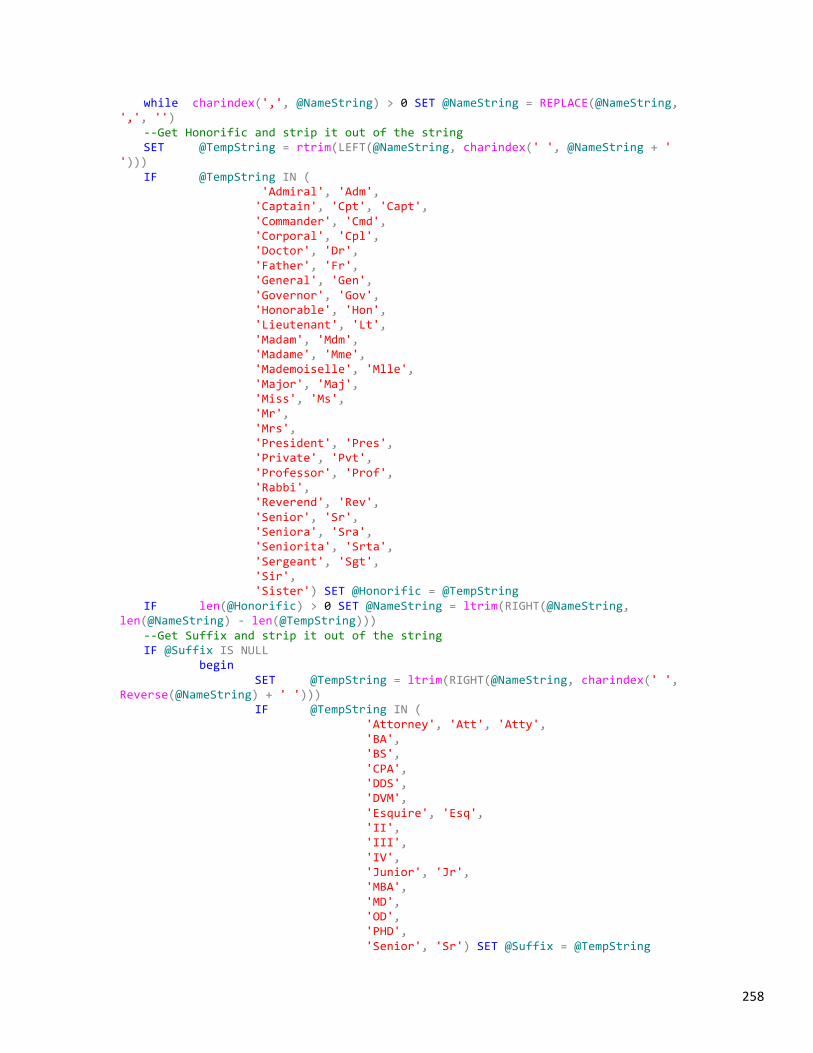
258
while charindex(',', @NameString) > 0 SET @NameString = REPLACE(@NameString, ',', '')
-‐-‐Get Honorific and strip it out of the string SET @TempString = rtrim(LEFT(@NameString, charindex(' ', @NameString + '
'))) IF @TempString IN ( 'Admiral', 'Adm', 'Captain', 'Cpt', 'Capt', 'Commander', 'Cmd', 'Corporal', 'Cpl', 'Doctor', 'Dr', 'Father', 'Fr', 'General', 'Gen', 'Governor', 'Gov', 'Honorable', 'Hon', 'Lieutenant', 'Lt', 'Madam', 'Mdm', 'Madame', 'Mme', 'Mademoiselle', 'Mlle', 'Major', 'Maj', 'Miss', 'Ms', 'Mr', 'Mrs', 'President', 'Pres', 'Private', 'Pvt', 'Professor', 'Prof', 'Rabbi', 'Reverend', 'Rev', 'Senior', 'Sr', 'Seniora', 'Sra', 'Seniorita', 'Srta', 'Sergeant', 'Sgt', 'Sir', 'Sister') SET @Honorific = @TempString IF len(@Honorific) > 0 SET @NameString = ltrim(RIGHT(@NameString,
len(@NameString) -‐ len(@TempString))) -‐-‐Get Suffix and strip it out of the string IF @Suffix IS NULL begin SET @TempString = ltrim(RIGHT(@NameString, charindex(' ',
Reverse(@NameString) + ' '))) IF @TempString IN ( 'Attorney', 'Att', 'Atty', 'BA', 'BS', 'CPA', 'DDS', 'DVM', 'Esquire', 'Esq', 'II', 'III', 'IV', 'Junior', 'Jr', 'MBA', 'MD', 'OD', 'PHD', 'Senior', 'Sr') SET @Suffix = @TempString
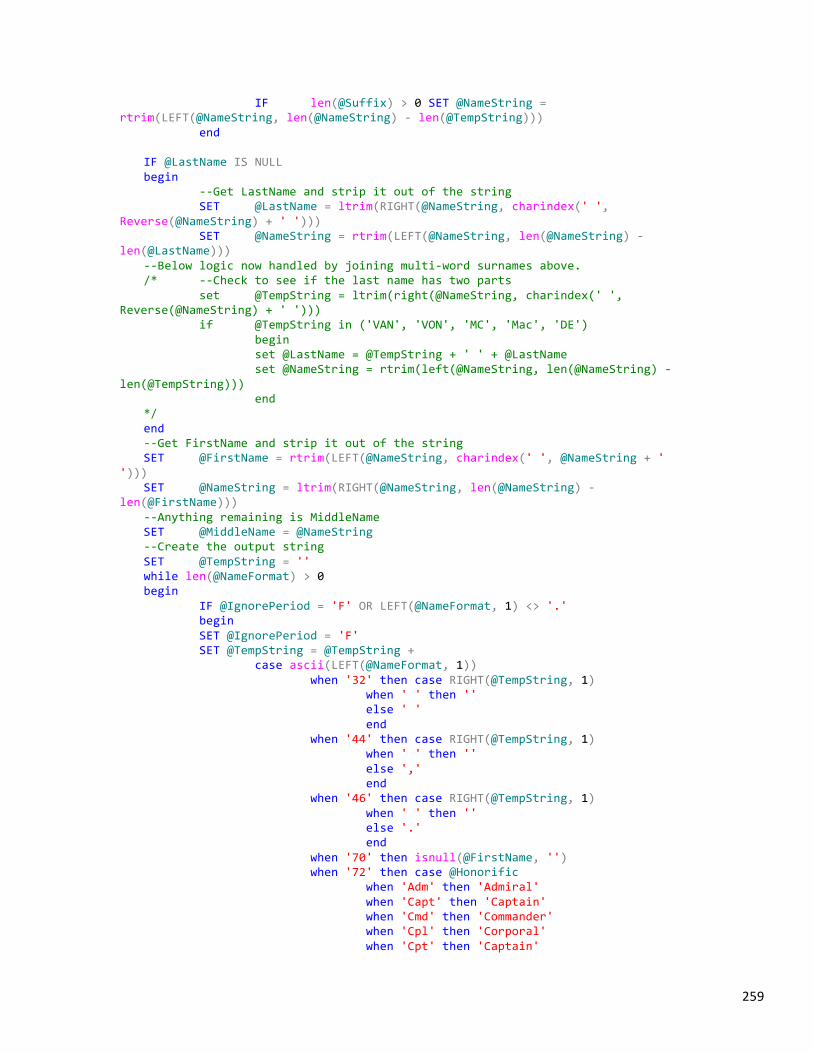
259
IF len(@Suffix) > 0 SET @NameString = rtrim(LEFT(@NameString, len(@NameString) -‐ len(@TempString)))
end IF @LastName IS NULL begin -‐-‐Get LastName and strip it out of the string SET @LastName = ltrim(RIGHT(@NameString, charindex(' ',
Reverse(@NameString) + ' '))) SET @NameString = rtrim(LEFT(@NameString, len(@NameString) -‐
len(@LastName))) -‐-‐Below logic now handled by joining multi-‐word surnames above. /* -‐-‐Check to see if the last name has two parts set @TempString = ltrim(right(@NameString, charindex(' ',
Reverse(@NameString) + ' '))) if @TempString in ('VAN', 'VON', 'MC', 'Mac', 'DE') begin set @LastName = @TempString + ' ' + @LastName set @NameString = rtrim(left(@NameString, len(@NameString) -‐
len(@TempString))) end */ end -‐-‐Get FirstName and strip it out of the string SET @FirstName = rtrim(LEFT(@NameString, charindex(' ', @NameString + '
'))) SET @NameString = ltrim(RIGHT(@NameString, len(@NameString) -‐
len(@FirstName))) -‐-‐Anything remaining is MiddleName SET @MiddleName = @NameString -‐-‐Create the output string SET @TempString = '' while len(@NameFormat) > 0 begin IF @IgnorePeriod = 'F' OR LEFT(@NameFormat, 1) <> '.' begin SET @IgnorePeriod = 'F' SET @TempString = @TempString + case ascii(LEFT(@NameFormat, 1)) when '32' then case RIGHT(@TempString, 1) when ' ' then '' else ' ' end when '44' then case RIGHT(@TempString, 1) when ' ' then '' else ',' end when '46' then case RIGHT(@TempString, 1) when ' ' then '' else '.' end when '70' then isnull(@FirstName, '') when '72' then case @Honorific when 'Adm' then 'Admiral' when 'Capt' then 'Captain' when 'Cmd' then 'Commander' when 'Cpl' then 'Corporal' when 'Cpt' then 'Captain'
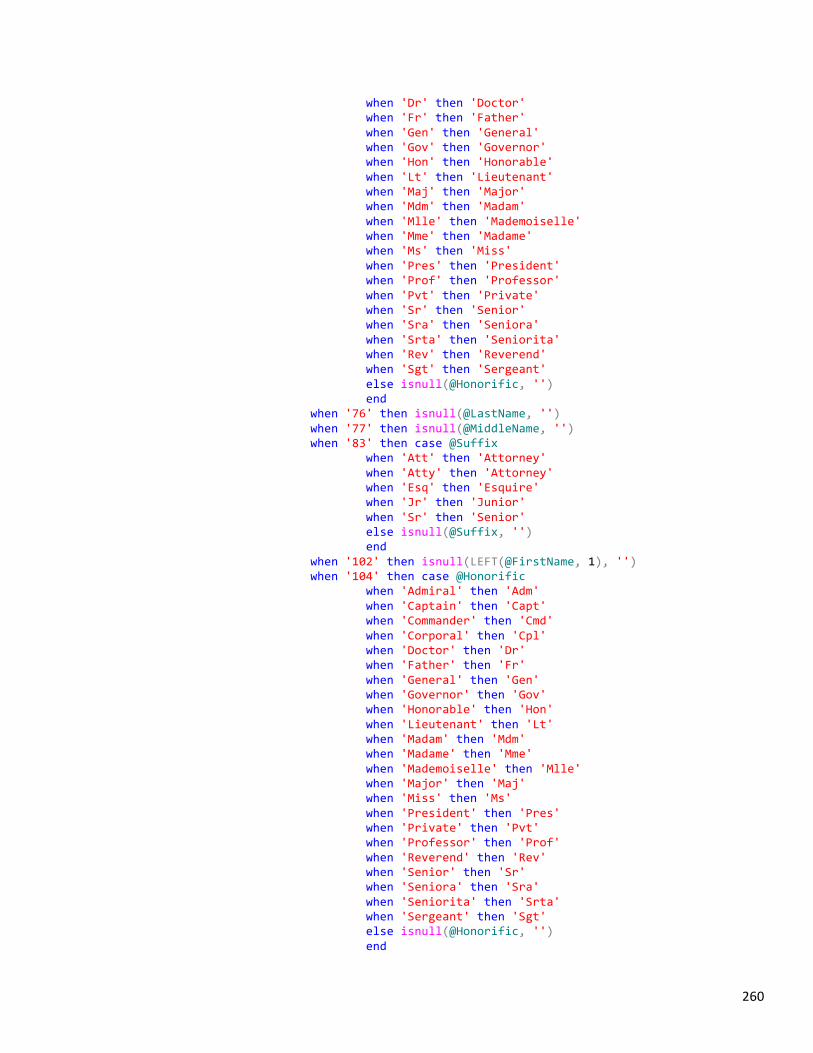
260
when 'Dr' then 'Doctor' when 'Fr' then 'Father' when 'Gen' then 'General' when 'Gov' then 'Governor' when 'Hon' then 'Honorable' when 'Lt' then 'Lieutenant' when 'Maj' then 'Major' when 'Mdm' then 'Madam' when 'Mlle' then 'Mademoiselle' when 'Mme' then 'Madame' when 'Ms' then 'Miss' when 'Pres' then 'President' when 'Prof' then 'Professor' when 'Pvt' then 'Private' when 'Sr' then 'Senior' when 'Sra' then 'Seniora' when 'Srta' then 'Seniorita' when 'Rev' then 'Reverend' when 'Sgt' then 'Sergeant' else isnull(@Honorific, '') end when '76' then isnull(@LastName, '') when '77' then isnull(@MiddleName, '') when '83' then case @Suffix when 'Att' then 'Attorney' when 'Atty' then 'Attorney' when 'Esq' then 'Esquire' when 'Jr' then 'Junior' when 'Sr' then 'Senior' else isnull(@Suffix, '') end when '102' then isnull(LEFT(@FirstName, 1), '') when '104' then case @Honorific when 'Admiral' then 'Adm' when 'Captain' then 'Capt' when 'Commander' then 'Cmd' when 'Corporal' then 'Cpl' when 'Doctor' then 'Dr' when 'Father' then 'Fr' when 'General' then 'Gen' when 'Governor' then 'Gov' when 'Honorable' then 'Hon' when 'Lieutenant' then 'Lt' when 'Madam' then 'Mdm' when 'Madame' then 'Mme' when 'Mademoiselle' then 'Mlle' when 'Major' then 'Maj' when 'Miss' then 'Ms' when 'President' then 'Pres' when 'Private' then 'Pvt' when 'Professor' then 'Prof' when 'Reverend' then 'Rev' when 'Senior' then 'Sr' when 'Seniora' then 'Sra' when 'Seniorita' then 'Srta' when 'Sergeant' then 'Sgt' else isnull(@Honorific, '') end
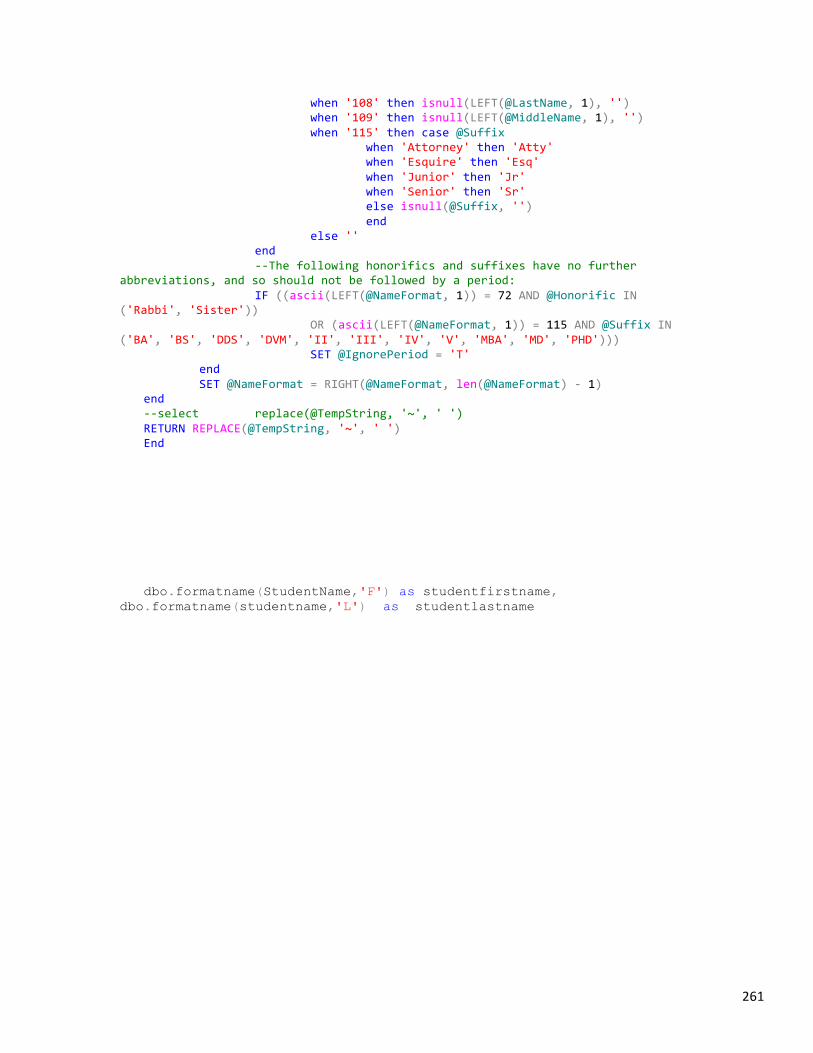
261
when '108' then isnull(LEFT(@LastName, 1), '') when '109' then isnull(LEFT(@MiddleName, 1), '') when '115' then case @Suffix when 'Attorney' then 'Atty' when 'Esquire' then 'Esq' when 'Junior' then 'Jr' when 'Senior' then 'Sr' else isnull(@Suffix, '') end else '' end -‐-‐The following honorifics and suffixes have no further
abbreviations, and so should not be followed by a period: IF ((ascii(LEFT(@NameFormat, 1)) = 72 AND @Honorific IN
('Rabbi', 'Sister')) OR (ascii(LEFT(@NameFormat, 1)) = 115 AND @Suffix IN
('BA', 'BS', 'DDS', 'DVM', 'II', 'III', 'IV', 'V', 'MBA', 'MD', 'PHD'))) SET @IgnorePeriod = 'T' end SET @NameFormat = RIGHT(@NameFormat, len(@NameFormat) -‐ 1) end -‐-‐select replace(@TempString, '~', ' ') RETURN REPLACE(@TempString, '~', ' ') End
dbo.formatname(StudentName,'F') as studentfirstname, dbo.formatname(studentname,'L') as studentlastname

262
Appendix III -‐ Other Assessments The Tyler Pulse Other Assessments Model is designed to import and manage student
assessments that are not state NCLB Scores and/or are not otherwise state mandated. Tyler Pulse provides extensive models to support NCLB testing in each state, so there is no reason to load these scores a second time into this model. The Other Assessments model is used for all “other” assessments that are not state mandated.
This model is designed to import and report any type of assessment score. Scores may be
loaded from a flat/text file containing assessment data, from scores previously loaded into a student information system or from scores directly entered by teachers and administrators. The type of test generating these scores may be standardized assessments, district unique assessments or benchmark/longitudinal assessments which are administered to students multiple times per year. Virtually any type of assessment may be loaded.
The operation of the Other Assessment Model requires maintenance of parameter tables
that define the assessments to be loaded. The model provides several specific parameter tables that control the loading and display of data for end user use. These tables must be established and maintained so that data is loaded and displayed in the manner desired by the District.
While virtually any test result may be imported into the Other Assessments model, the files
containing the data to be imported must be updated to a format mandated by the importing process. This is usually done by first loading the data into Excel and modifying it to the prescribed format. Any tool may be used to update the data format; however, Excel is an excellent tool for this task. For tests that are used nationally by many school districts, such as the NWEA and Galileo Assessments, the Other Assessments model supports the direct loading of those files using that test’s native data format.
In summary, up to 25 test names and up to 25 scores per test name may be imported and managed in the Other Assessments Model. An unlimited number of student score results and test dates may be loaded for each test name.
263
Other Assessments – Conceptual design
The Tyler Pulse Other Assessments Model is designed to import and manage virtually any assessment administered to a student. Testing results may be imported directly from a student information system, from modified score files provided by testing vendors, directly from a testing vendor's score files for selected tests or from scores directly entered by teachers and/or administrators. Up to 25 test names and up to 25 scores per test name may be imported into the Other Assessments Model. The home page for the Other Assessments model incorporates a table showing all of the tests and scores that have been loaded for easy reference. An unlimited number of student testings and test dates may be loaded for each test. In addition to importing extensive assessment data, the OA Model also combines that data with all appropriate data from the student information system in use in the school district. This data includes, but is not limited to, student demographics, student risk data, attendance/discipline data and master schedule data. Master schedule data is used to determine the students enrolled in each section of each class, and the teachers that teach them. Using this information, this model not only addresses student individual performance, but also that of each classroom, student group, school and teacher. In addition, evaluating student assessment data in conjunction with other student data, such as a student’s risk position, adds exponentially to the ability to evaluate the entirety of a student’s learning needs.
So, in summary, the other assessments model maintains an extensive data set of student assessment results made up of up to 25 tests, up to 25 scores per test and extensive demographics, operational and scheduling data for each student. It then organizes this data to support a very detailed evaluation of each of these areas. It also provides robust support for planning curriculum and other actions at the district, school, teacher, classroom and student level to assist in improving student performance. To provide this support, user pages in the other assessments model are broken down into the following categories:
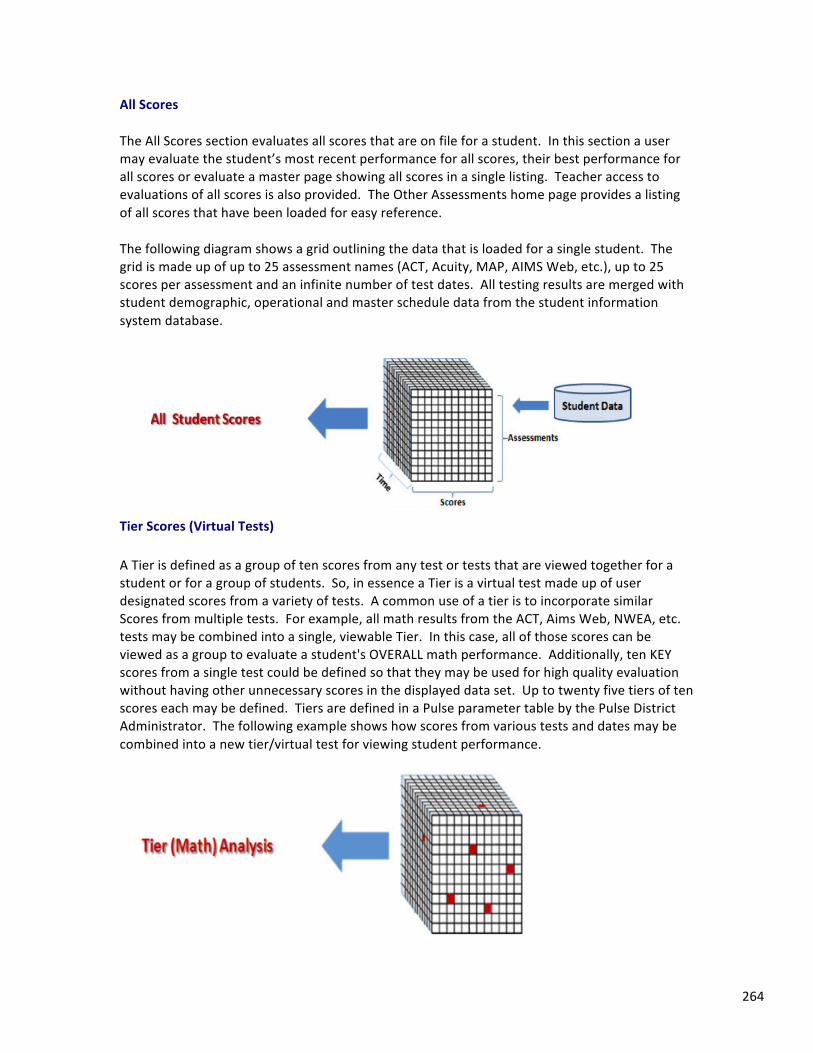
264
All Scores
The All Scores section evaluates all scores that are on file for a student. In this section a user may evaluate the student’s most recent performance for all scores, their best performance for all scores or evaluate a master page showing all scores in a single listing. Teacher access to evaluations of all scores is also provided. The Other Assessments home page provides a listing of all scores that have been loaded for easy reference.
The following diagram shows a grid outlining the data that is loaded for a single student. The grid is made up of up to 25 assessment names (ACT, Acuity, MAP, AIMS Web, etc.), up to 25 scores per assessment and an infinite number of test dates. All testing results are merged with student demographic, operational and master schedule data from the student information system database.
Tier Scores (Virtual Tests)
A Tier is defined as a group of ten scores from any test or tests that are viewed together for a student or for a group of students. So, in essence a Tier is a virtual test made up of user designated scores from a variety of tests. A common use of a tier is to incorporate similar Scores from multiple tests. For example, all math results from the ACT, Aims Web, NWEA, etc. tests may be combined into a single, viewable Tier. In this case, all of those scores can be viewed as a group to evaluate a student's OVERALL math performance. Additionally, ten KEY scores from a single test could be defined so that they may be used for high quality evaluation without having other unnecessary scores in the displayed data set. Up to twenty five tiers of ten scores each may be defined. Tiers are defined in a Pulse parameter table by the Pulse District Administrator. The following example shows how scores from various tests and dates may be combined into a new tier/virtual test for viewing student performance.
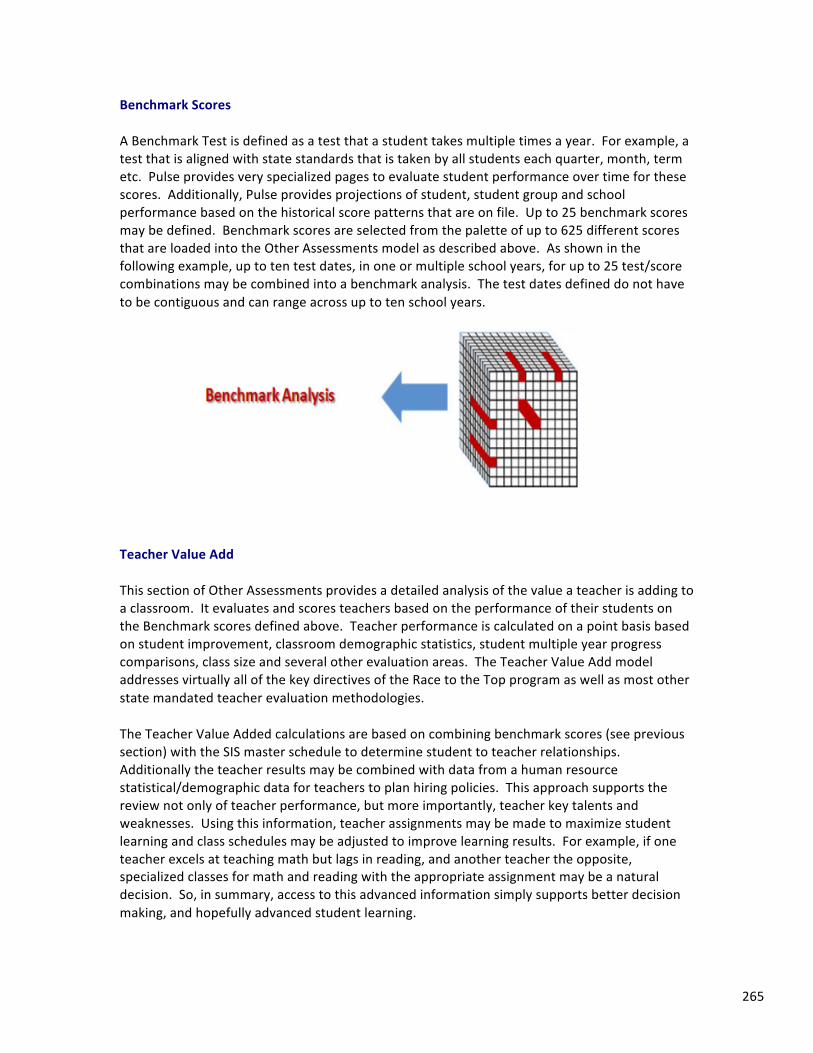
265
Benchmark Scores
A Benchmark Test is defined as a test that a student takes multiple times a year. For example, a test that is aligned with state standards that is taken by all students each quarter, month, term etc. Pulse provides very specialized pages to evaluate student performance over time for these scores. Additionally, Pulse provides projections of student, student group and school performance based on the historical score patterns that are on file. Up to 25 benchmark scores may be defined. Benchmark scores are selected from the palette of up to 625 different scores that are loaded into the Other Assessments model as described above. As shown in the following example, up to ten test dates, in one or multiple school years, for up to 25 test/score combinations may be combined into a benchmark analysis. The test dates defined do not have to be contiguous and can range across up to ten school years.
Teacher Value Add
This section of Other Assessments provides a detailed analysis of the value a teacher is adding to a classroom. It evaluates and scores teachers based on the performance of their students on the Benchmark scores defined above. Teacher performance is calculated on a point basis based on student improvement, classroom demographic statistics, student multiple year progress comparisons, class size and several other evaluation areas. The Teacher Value Add model addresses virtually all of the key directives of the Race to the Top program as well as most other state mandated teacher evaluation methodologies.
The Teacher Value Added calculations are based on combining benchmark scores (see previous section) with the SIS master schedule to determine student to teacher relationships. Additionally the teacher results may be combined with data from a human resource statistical/demographic data for teachers to plan hiring policies. This approach supports the review not only of teacher performance, but more importantly, teacher key talents and weaknesses. Using this information, teacher assignments may be made to maximize student learning and class schedules may be adjusted to improve learning results. For example, if one teacher excels at teaching math but lags in reading, and another teacher the opposite, specialized classes for math and reading with the appropriate assignment may be a natural decision. So, in summary, access to this advanced information simply supports better decision making, and hopefully advanced student learning.
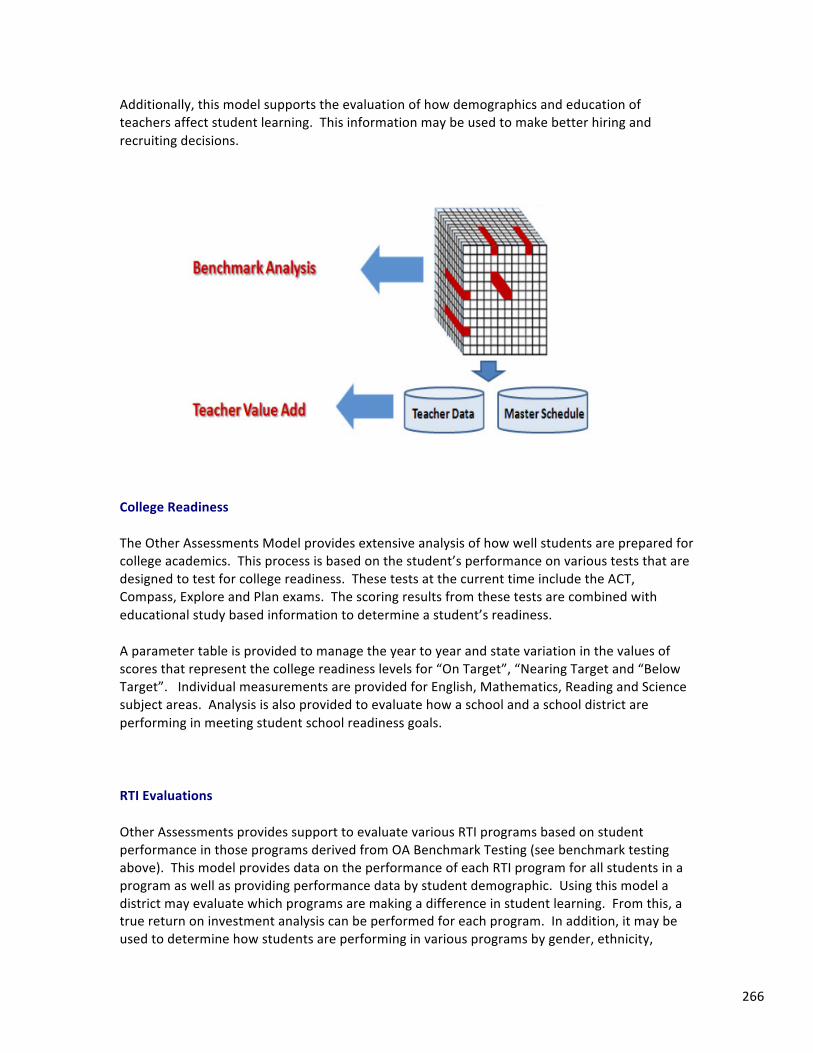
266
Additionally, this model supports the evaluation of how demographics and education of teachers affect student learning. This information may be used to make better hiring and recruiting decisions.
College Readiness
The Other Assessments Model provides extensive analysis of how well students are prepared for college academics. This process is based on the student’s performance on various tests that are designed to test for college readiness. These tests at the current time include the ACT, Compass, Explore and Plan exams. The scoring results from these tests are combined with educational study based information to determine a student’s readiness.
A parameter table is provided to manage the year to year and state variation in the values of scores that represent the college readiness levels for “On Target”, “Nearing Target and “Below Target”. Individual measurements are provided for English, Mathematics, Reading and Science subject areas. Analysis is also provided to evaluate how a school and a school district are performing in meeting student school readiness goals.
RTI Evaluations
Other Assessments provides support to evaluate various RTI programs based on student performance in those programs derived from OA Benchmark Testing (see benchmark testing above). This model provides data on the performance of each RTI program for all students in a program as well as providing performance data by student demographic. Using this model a district may evaluate which programs are making a difference in student learning. From this, a true return on investment analysis can be performed for each program. In addition, it may be used to determine how students are performing in various programs by gender, ethnicity,
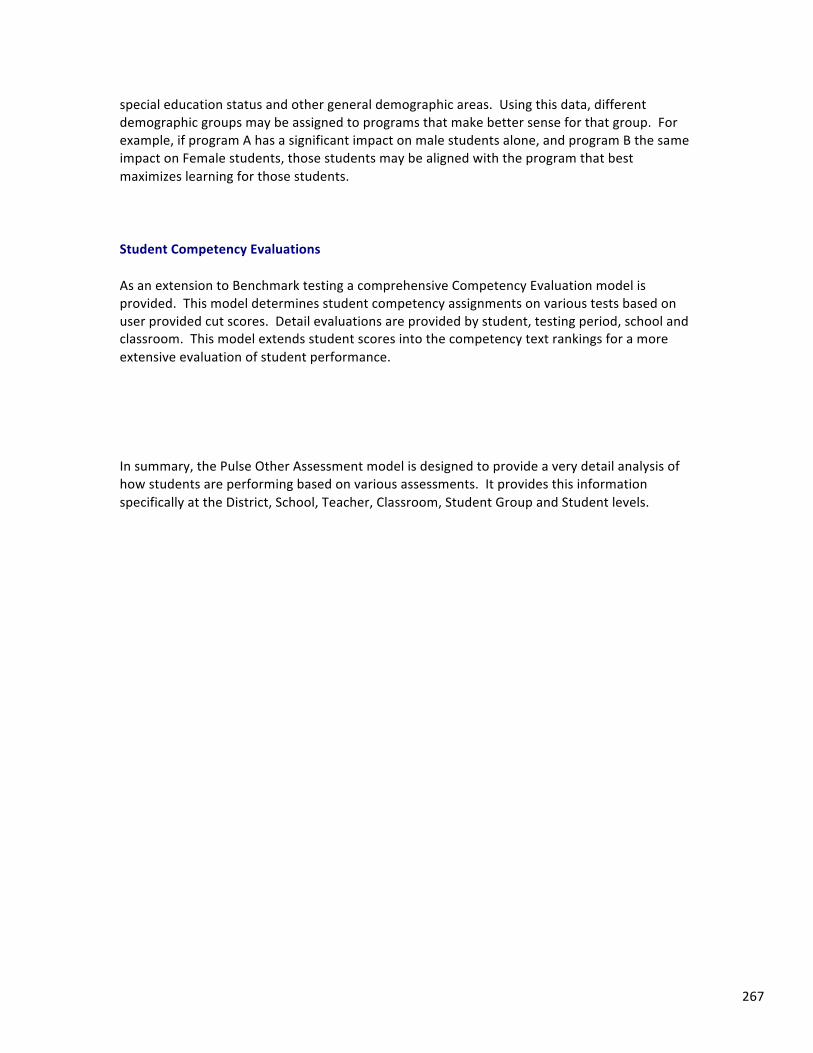
267
special education status and other general demographic areas. Using this data, different demographic groups may be assigned to programs that make better sense for that group. For example, if program A has a significant impact on male students alone, and program B the same impact on Female students, those students may be aligned with the program that best maximizes learning for those students.
Student Competency Evaluations
As an extension to Benchmark testing a comprehensive Competency Evaluation model is provided. This model determines student competency assignments on various tests based on user provided cut scores. Detail evaluations are provided by student, testing period, school and classroom. This model extends student scores into the competency text rankings for a more extensive evaluation of student performance.
In summary, the Pulse Other Assessment model is designed to provide a very detail analysis of how students are performing based on various assessments. It provides this information specifically at the District, School, Teacher, Classroom, Student Group and Student levels.
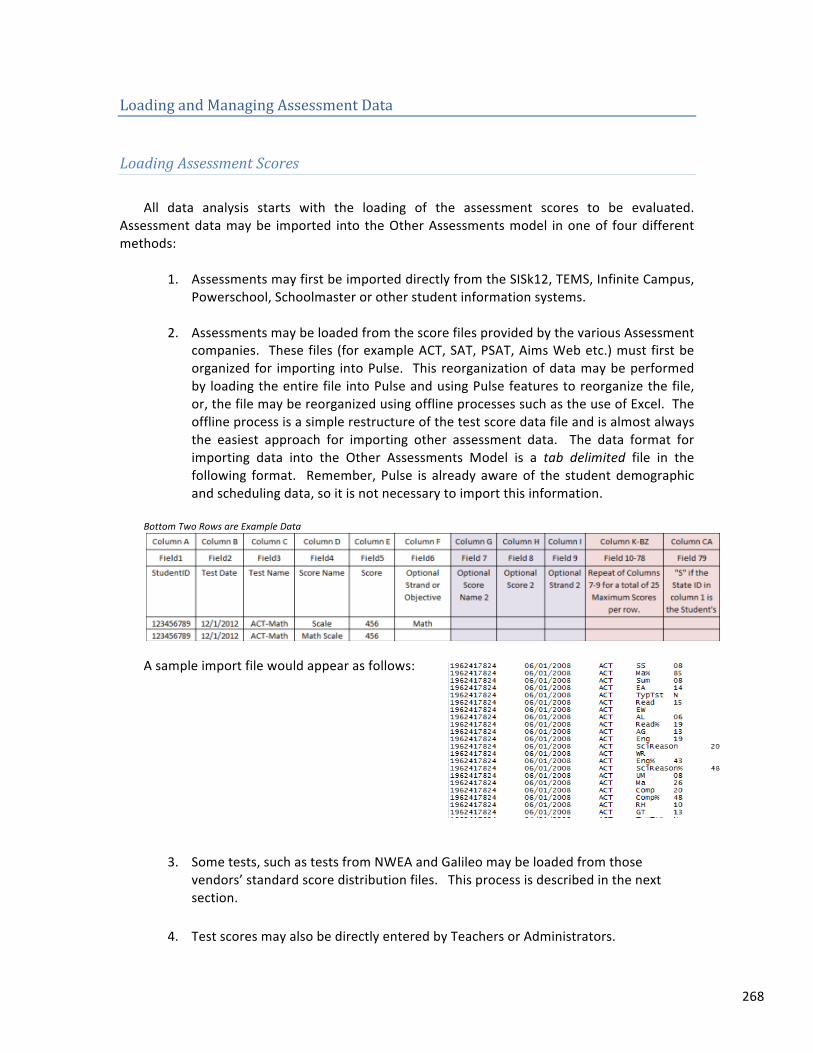
268
Loading and Managing Assessment Data
Loading Assessment Scores All data analysis starts with the loading of the assessment scores to be evaluated.
Assessment data may be imported into the Other Assessments model in one of four different methods:
1. Assessments may first be imported directly from the SISk12, TEMS, Infinite Campus,
Powerschool, Schoolmaster or other student information systems.
2. Assessments may be loaded from the score files provided by the various Assessment companies. These files (for example ACT, SAT, PSAT, Aims Web etc.) must first be organized for importing into Pulse. This reorganization of data may be performed by loading the entire file into Pulse and using Pulse features to reorganize the file, or, the file may be reorganized using offline processes such as the use of Excel. The offline process is a simple restructure of the test score data file and is almost always the easiest approach for importing other assessment data. The data format for importing data into the Other Assessments Model is a tab delimited file in the following format. Remember, Pulse is already aware of the student demographic and scheduling data, so it is not necessary to import this information.
Bottom Two Rows are Example Data
A sample import file would appear as follows:
3. Some tests, such as tests from NWEA and Galileo may be loaded from those vendors’ standard score distribution files. This process is described in the next section.
4. Test scores may also be directly entered by Teachers or Administrators.
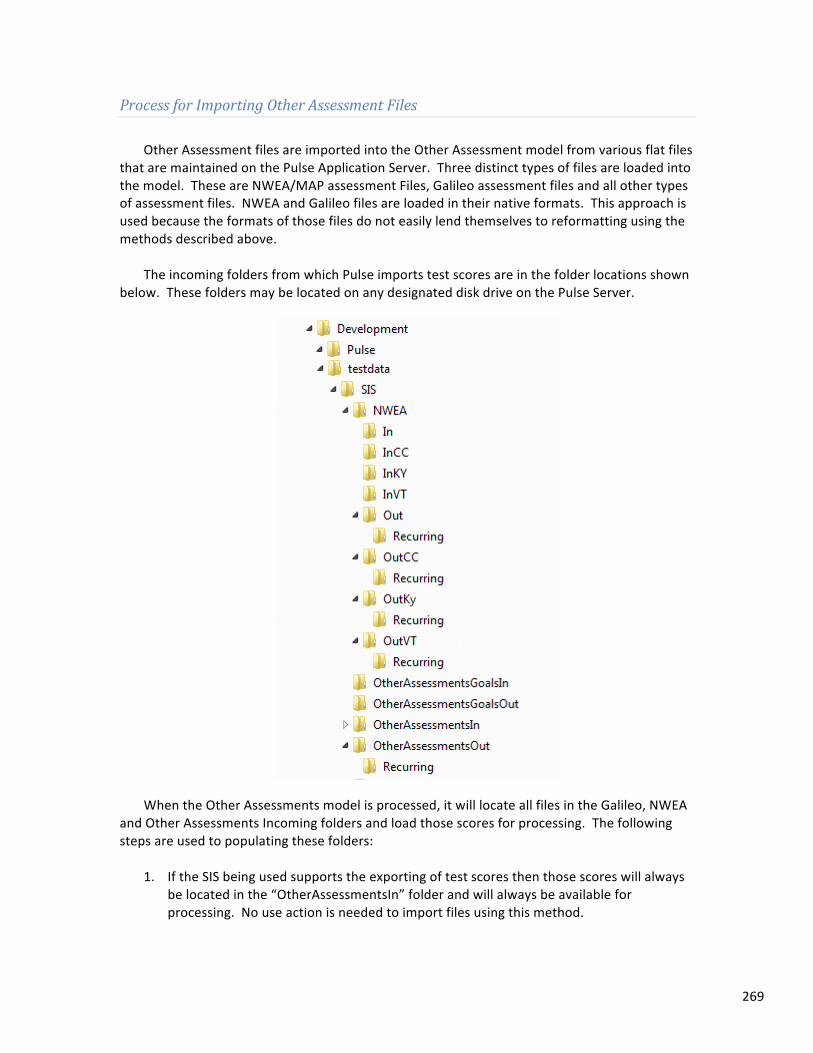
269
Process for Importing Other Assessment Files Other Assessment files are imported into the Other Assessment model from various flat files
that are maintained on the Pulse Application Server. Three distinct types of files are loaded into the model. These are NWEA/MAP assessment Files, Galileo assessment files and all other types of assessment files. NWEA and Galileo files are loaded in their native formats. This approach is used because the formats of those files do not easily lend themselves to reformatting using the methods described above.
The incoming folders from which Pulse imports test scores are in the folder locations shown
below. These folders may be located on any designated disk drive on the Pulse Server.
When the Other Assessments model is processed, it will locate all files in the Galileo, NWEA and Other Assessments Incoming folders and load those scores for processing. The following steps are used to populating these folders:
1. If the SIS being used supports the exporting of test scores then those scores will always
be located in the “OtherAssessmentsIn” folder and will always be available for processing. No use action is needed to import files using this method.
270
2. Each of the test types (Other, NWEA and Galileo) have a recurring folder located in the “Out” folder for those tests. When a file to be imported is manually created, it should be placed in these Recurring Folders. When the Other Assessments model is processed, as a first step it will copy all recurring files into the incoming locations for processing. This way, once a file is created it will be automatically processed each time the Other Assessments model is run.
A School District should periodically review the files in their incoming folders. Any test files that are no longer used should be removed. For example, it may be that 2006 files for tests contain only scores for graduated students. It is therefore not appropriate to continue loading those scores. It simply increases the run time of the Other Assessment model.
So, in summary, the steps for processing Other Assessment Test files are as follows:
Test Files Coming from the SIS Application
These files will be automatically placed in the /development/pulse/testdata/sis/otherassessments/in/ folder by the SIS Application. They will be automatically processed when the Other Assessments Model is processed. No intervention is needed for these files.
Test Files Originating from Manually Prepared Files
Once the data is prepared in this manner described above it should be placed in the Other Assessments Out Recurring data folder:
(/development/pulse/testdata/sis/otherassessmentsOut/Recurring/)
All files in that folder will be processed each time the Other Assessment model is executed.
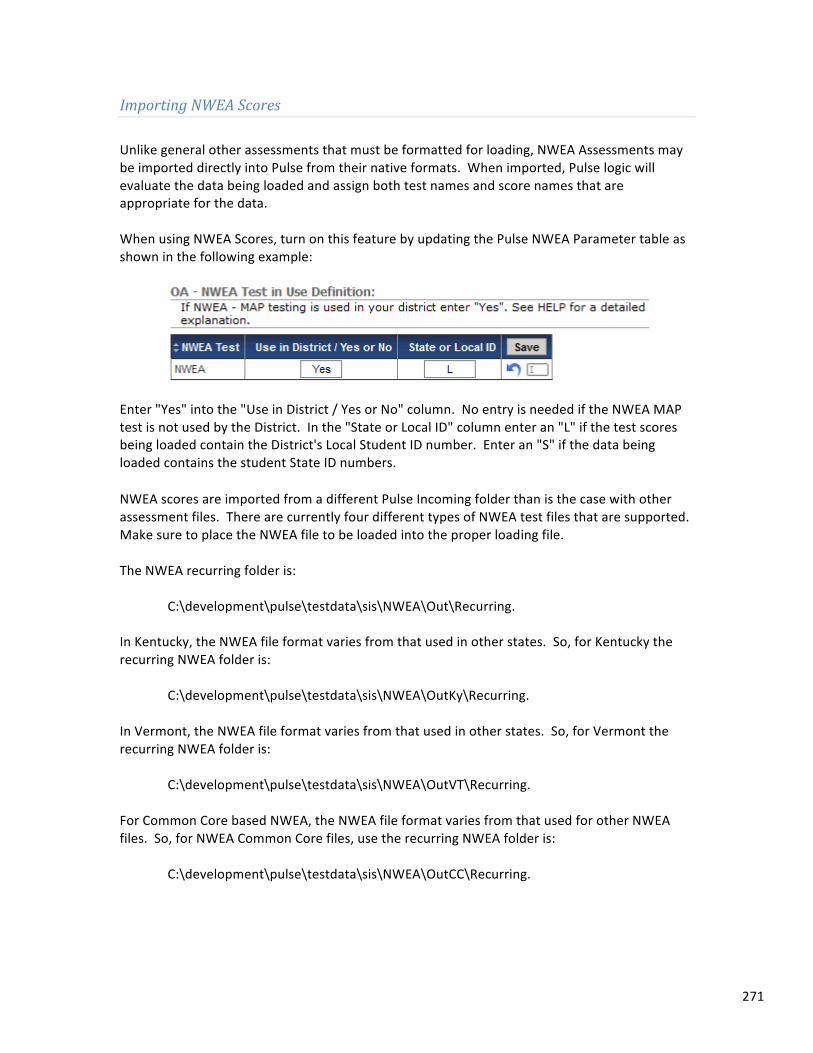
271
Importing NWEA Scores
Unlike general other assessments that must be formatted for loading, NWEA Assessments may be imported directly into Pulse from their native formats. When imported, Pulse logic will evaluate the data being loaded and assign both test names and score names that are appropriate for the data. When using NWEA Scores, turn on this feature by updating the Pulse NWEA Parameter table as shown in the following example:
Enter "Yes" into the "Use in District / Yes or No" column. No entry is needed if the NWEA MAP test is not used by the District. In the "State or Local ID" column enter an "L" if the test scores being loaded contain the District's Local Student ID number. Enter an "S" if the data being loaded contains the student State ID numbers. NWEA scores are imported from a different Pulse Incoming folder than is the case with other assessment files. There are currently four different types of NWEA test files that are supported. Make sure to place the NWEA file to be loaded into the proper loading file. The NWEA recurring folder is:
C:\development\pulse\testdata\sis\NWEA\Out\Recurring. In Kentucky, the NWEA file format varies from that used in other states. So, for Kentucky the recurring NWEA folder is:
C:\development\pulse\testdata\sis\NWEA\OutKy\Recurring.
In Vermont, the NWEA file format varies from that used in other states. So, for Vermont the recurring NWEA folder is:
C:\development\pulse\testdata\sis\NWEA\OutVT\Recurring. For Common Core based NWEA, the NWEA file format varies from that used for other NWEA files. So, for NWEA Common Core files, use the recurring NWEA folder is:
C:\development\pulse\testdata\sis\NWEA\OutCC\Recurring.
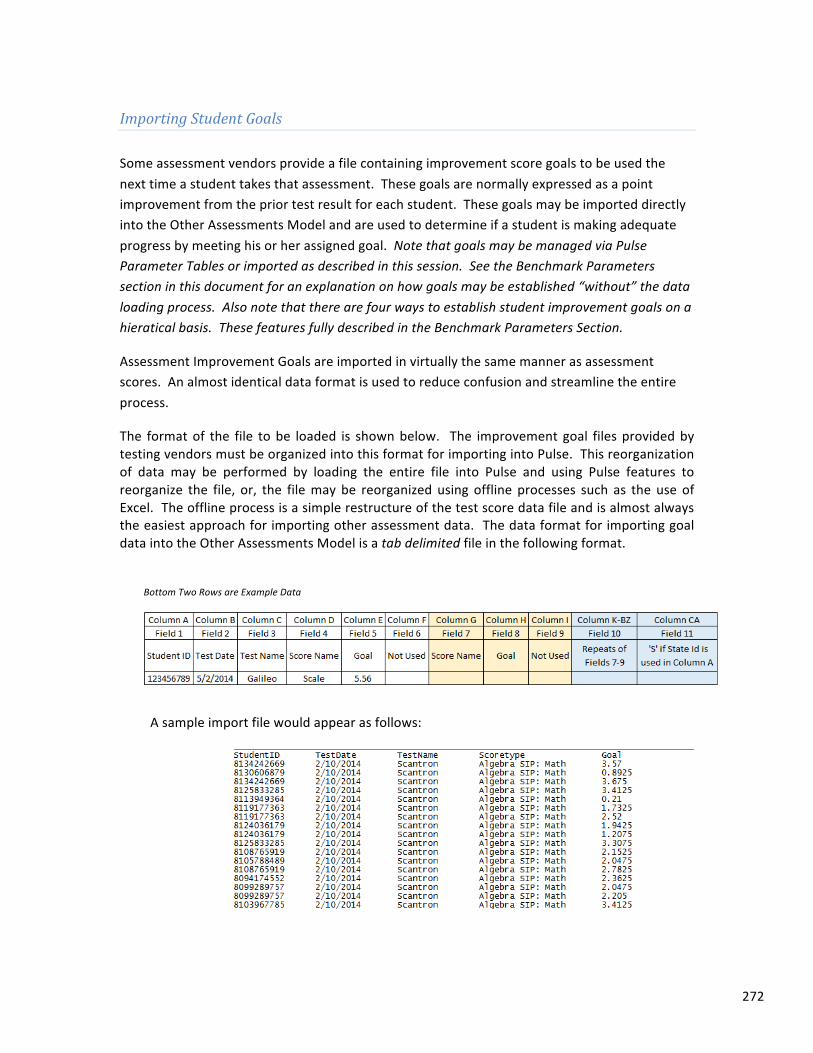
272
Importing Student Goals
Some assessment vendors provide a file containing improvement score goals to be used the next time a student takes that assessment. These goals are normally expressed as a point improvement from the prior test result for each student. These goals may be imported directly into the Other Assessments Model and are used to determine if a student is making adequate progress by meeting his or her assigned goal. Note that goals may be managed via Pulse Parameter Tables or imported as described in this session. See the Benchmark Parameters section in this document for an explanation on how goals may be established “without” the data loading process. Also note that there are four ways to establish student improvement goals on a hieratical basis. These features fully described in the Benchmark Parameters Section.
Assessment Improvement Goals are imported in virtually the same manner as assessment scores. An almost identical data format is used to reduce confusion and streamline the entire process.
The format of the file to be loaded is shown below. The improvement goal files provided by testing vendors must be organized into this format for importing into Pulse. This reorganization of data may be performed by loading the entire file into Pulse and using Pulse features to reorganize the file, or, the file may be reorganized using offline processes such as the use of Excel. The offline process is a simple restructure of the test score data file and is almost always the easiest approach for importing other assessment data. The data format for importing goal data into the Other Assessments Model is a tab delimited file in the following format.
Bottom Two Rows are Example Data
A sample import file would appear as follows:
273
Once the file is prepared it should be placed into the <disk drive>:\development\pulse\testdata\sis\OtherAssessmentsGoalsIn folder on the Pulse server. The next time that the Other Assessment Project is executed, the goals will be imported and used in the assessment reporting process.
Importing Galileo Scores
Unlike general other assessments that must be formatted for loading, Galileo Assessments may be imported directly into Pulse from their native formats. When imported, Pulse logic will evaluate the data being loaded and assign both test names and score names that are appropriate for the data. Galileo scores are imported from a different Pulse Incoming folder than general other assessments. The Galileo recurring folder is:
C:\development\pulse\testdata\sis\Galileo\out\recurring.
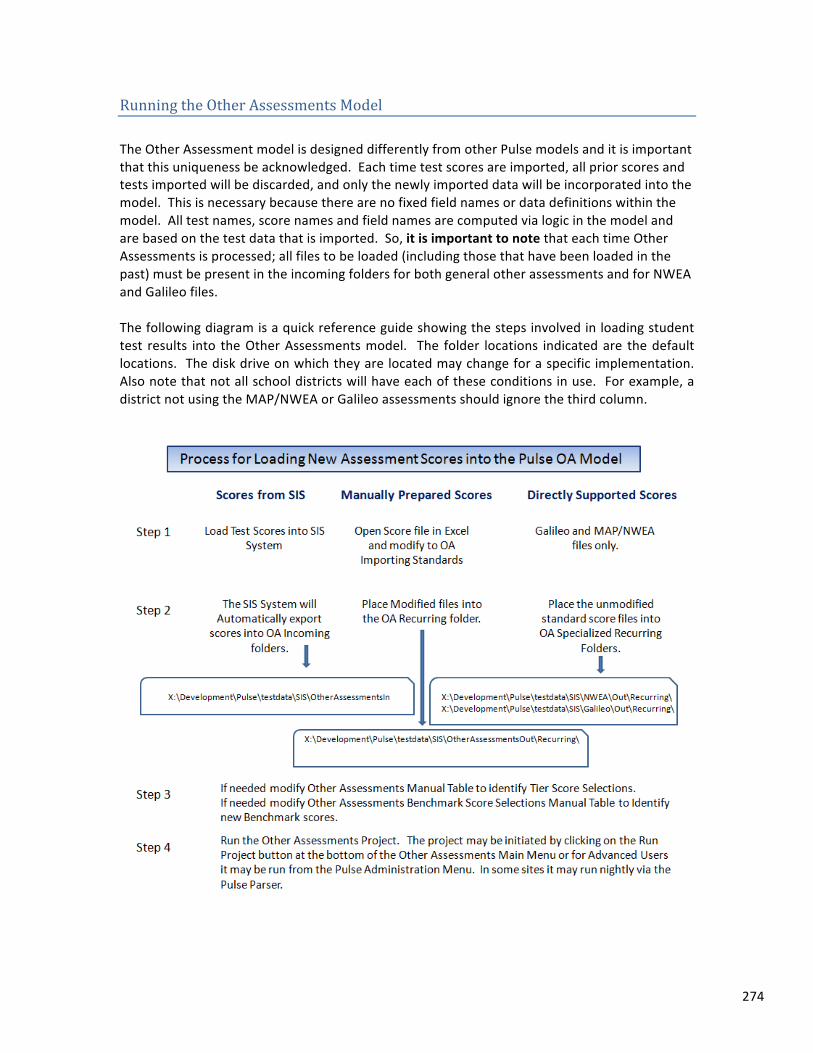
274
Running the Other Assessments Model
The Other Assessment model is designed differently from other Pulse models and it is important that this uniqueness be acknowledged. Each time test scores are imported, all prior scores and tests imported will be discarded, and only the newly imported data will be incorporated into the model. This is necessary because there are no fixed field names or data definitions within the model. All test names, score names and field names are computed via logic in the model and are based on the test data that is imported. So, it is important to note that each time Other Assessments is processed; all files to be loaded (including those that have been loaded in the past) must be present in the incoming folders for both general other assessments and for NWEA and Galileo files. The following diagram is a quick reference guide showing the steps involved in loading student test results into the Other Assessments model. The folder locations indicated are the default locations. The disk drive on which they are located may change for a specific implementation. Also note that not all school districts will have each of these conditions in use. For example, a district not using the MAP/NWEA or Galileo assessments should ignore the third column.
275
Quick Reference – Steps to Load OA Scores after Initial Setup
1. Format the score file into the standard loading format
a. If the files to be loaded are NWEA files, confirm that the file formats are consistent with past file layout formats.
2. Place the formatted files into
<Disk Drive>:\Development\Pulse\testdata\SIS\OtherAssessmentsOut\Recurring
If the scores are NWEA MAP files place them into:
<Disk drive>:\Development\Pulse\testdata\SIS\NWEA\Out
The folder “out” referenced above may be replaced with VTOut, KYOut or CCOut depending on the state and type of NWEA file that is being loaded. NWEA file formats vary by state and type.
3. If the new scores being loaded are Benchmark Scores, update the benchmark parameters on the “Benchmark Test Preparation” page.
4. If this is a new test that has not been loaded in the past. Update the tables on the “Data Loading Preparation Tables”. Note it is usually appropriate to Run the OA Model (step 5) first, and then rerun steps 4 and 5. This is often easier since the test and score names are available to cut and paste on this page after they have been loaded.
5. Run the Other Assessments Project. This may take as long as an hour, longer in large districts and less in small districts. There are many ways to run the project, but it is suggested that the following method is used:
a. From the Pulse Admin Menu, click on the Data Projects menu selection.
b. Click on the Other Assessments Project
c. Click on the “Run Now” button
d. Once started, do not close the browser page until the project is complete. Pulse will provide operation statistics to the page at completion.
e. It is usually appropriate NOT to use Microsoft Internet Explorer to run the project. IE has a built in one hour limit on wait times for page responses. If the project runs for more than one hour, a page error will display and the statistics will not be viewable. If this happens, the Other Assessments Project will complete, the page error is for display of the statistics only.
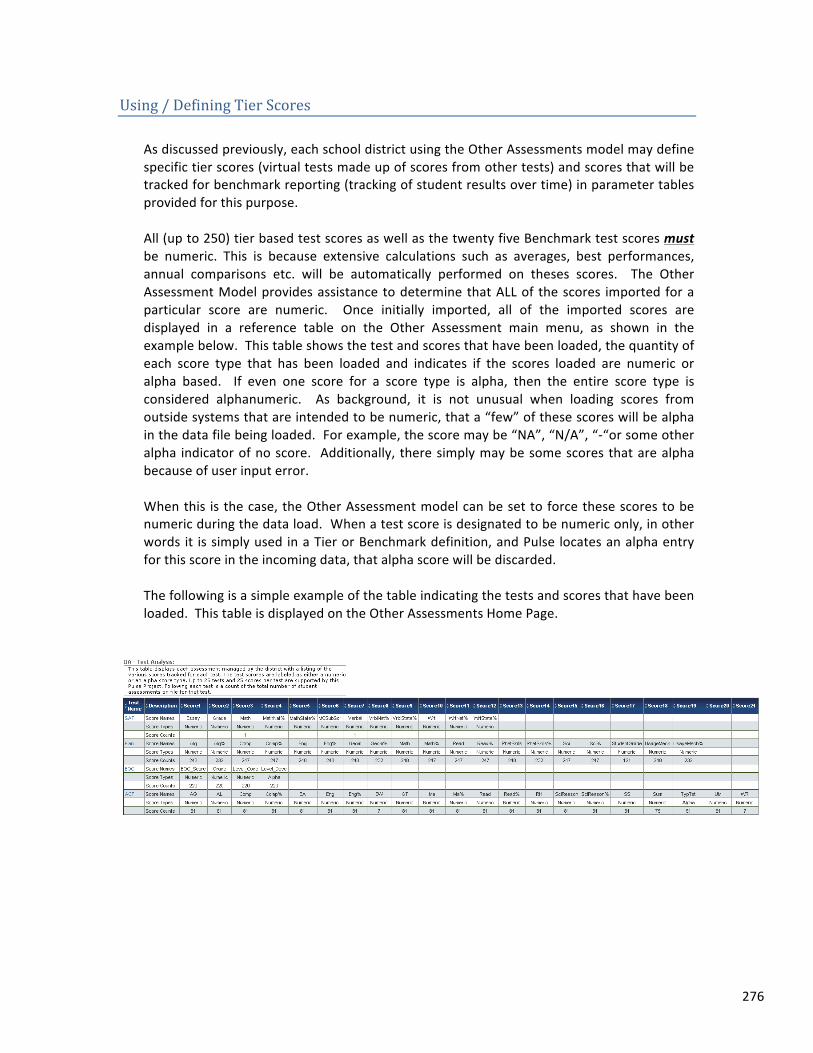
276
Using / Defining Tier Scores As discussed previously, each school district using the Other Assessments model may define specific tier scores (virtual tests made up of scores from other tests) and scores that will be tracked for benchmark reporting (tracking of student results over time) in parameter tables provided for this purpose. All (up to 250) tier based test scores as well as the twenty five Benchmark test scores must be numeric. This is because extensive calculations such as averages, best performances, annual comparisons etc. will be automatically performed on theses scores. The Other Assessment Model provides assistance to determine that ALL of the scores imported for a particular score are numeric. Once initially imported, all of the imported scores are displayed in a reference table on the Other Assessment main menu, as shown in the example below. This table shows the test and scores that have been loaded, the quantity of each score type that has been loaded and indicates if the scores loaded are numeric or alpha based. If even one score for a score type is alpha, then the entire score type is considered alphanumeric. As background, it is not unusual when loading scores from outside systems that are intended to be numeric, that a “few” of these scores will be alpha in the data file being loaded. For example, the score may be “NA”, “N/A”, “-‐“or some other alpha indicator of no score. Additionally, there simply may be some scores that are alpha because of user input error. When this is the case, the Other Assessment model can be set to force these scores to be numeric during the data load. When a test score is designated to be numeric only, in other words it is simply used in a Tier or Benchmark definition, and Pulse locates an alpha entry for this score in the incoming data, that alpha score will be discarded. The following is a simple example of the table indicating the tests and scores that have been loaded. This table is displayed on the Other Assessments Home Page.
277
Other Assessment Parameter Tables
The following sections outline each of the parameter tables that are provided to manage the data and how that data is to be displayed on Pulse pages. The Other Assessment model is almost completely configurable so that the data displayed may mirror how each user District would want to use it. This flexibility, however, mandates that several parameter tables be maintained by District staff.
Pages that are managed by parameter tables that have not been defined will not display data. Users accessing these pages will usually assume that there is some type of system problem with this condition is encountered. To avoid this situation Pulse provides the ability for each District to mark the links to pages and other content that should NOT be displayed on their menus. This approach means that only the key pages used by the District are displayed on menus. Users see much more focused menus that are easier to use, and, all pages are populated with data. It is key that the planning and activity to create specific views of the Other Assessment pages be performed by each District prior to live processing.
As an overview, Pulse Other Assessment Parameter setup falls into the following categories:
Data Loading – There are several tables on this page that define assessment data is loaded into Pulse. Also on this page all Tier/Virtual Tests are defined. This is a mandatory group of tables that is a prerequisite to Other Assessment use.
College Readiness – Several tests such as ACT, Compass, Plan, ASVAB and others are designed to predict college readiness. To use this function, cut scores must be entered to control the calculations to calculate college readiness.
Alpha Score Management – Most OA functionality is built around numeric scores so that trends, averages and other statistics may be calculated. This function provides the ability to define high value alpha scores that merit additional review.
Progression Scores – Sometimes scores should be viewed in progression, but are otherwise related for trending comparisons. For example a series of tests on chapters of a Math textbook. In this case, each test is different and on different standards, but the results should be viewed in progression such as Chapter 1, then Chapter 2, etc.
Selected Scores – Sometimes it is appropriate to simply pick a series of scores to view all at once, usually a mixture of alpha and numeric scores. These tables provide the functionality to define these scores and the order that they are displayed.
Tests with No Ids – Sometimes the test data that is loaded will not contain student ids. In this case, it is necessary to match up students based on their name and date of birth. This page shows a summary of students rejected (no matches) and loaded.
278
Gradebook Interface – Other Assessments provides the ability to integrate test scores entered into teacher’s gradebooks. When this is the case, the scores to be loaded must be defined.
Students Not Taking Tests – When it is appropriate to track students NOT taking certain tests, the tests and grade levels to be checked must be defined.
Benchmark Test Preparation – This is a KEY table. It provides for the definition of each test that will be tracked as a benchmark test for progression tracking. Also included for benchmarks is an optional table defining ranges of Benchmark scores for specialized viewing, for example, spring to spring comparisons.
Competency Definitions – When OA is to track and compute student competency levels (such as proficient, advanced, etc.) the cut scores defining the calculation must be defined.
Teacher Value Added – There are several pages that are specific to measuring teacher performance. Key to this is a table to define cross references between courses and tests to areas such as Math, Reading, Science and Social Studies and a second table to define weighting for the TVA calculations.
RTI Tables – This table defines which programs in the District are to be used for RTI calculations.
Alerts – Alerts (comments) on students is supported as a part of other assessments, this table supports that function.
Data Entry – The Other Assessments model supports the direct entry of test scores into the model when other loading sources are not available. Several tables are provided to define and support this activity.
Other Parameter Tables – Other tables are provided to manage the order of test displays, how specific testing systems are managed (NWEA MAP, ACT and others) how data is transferred from specific student systems (Infinite Campus, SISk12 and others).
The follow sections define the use of EACH of these parameter tables.
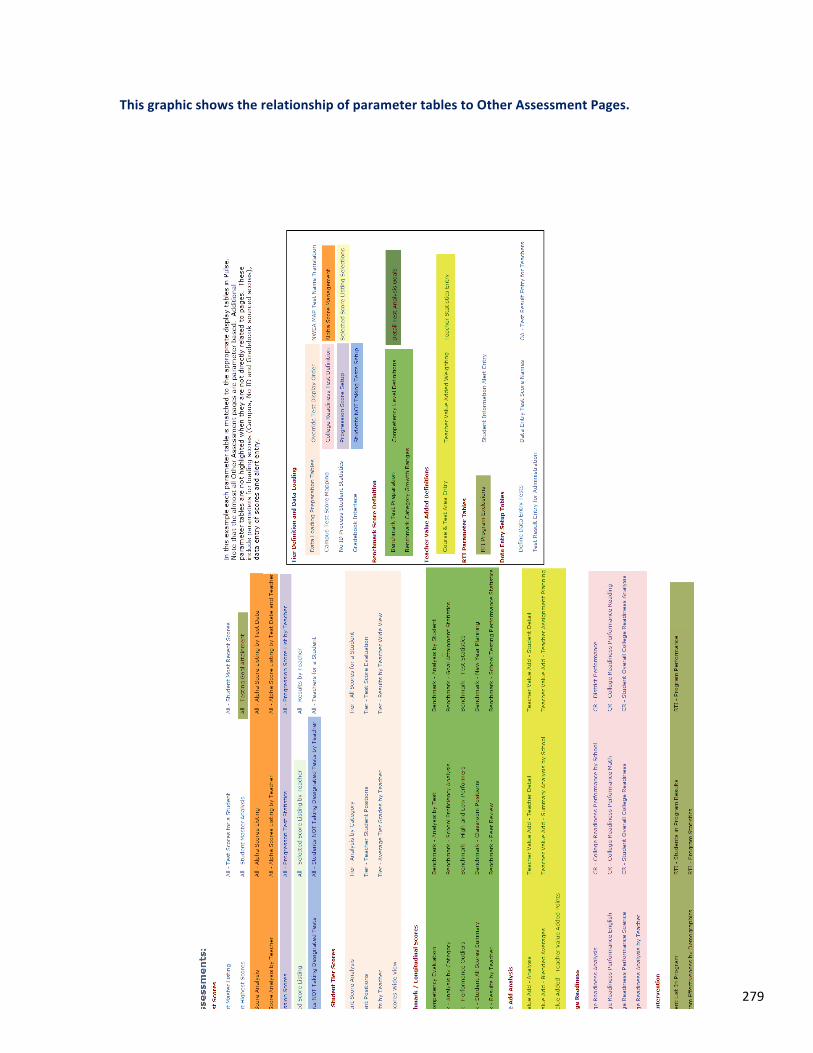
279
This graphic shows the relationship of parameter tables to Other Assessment Pages.
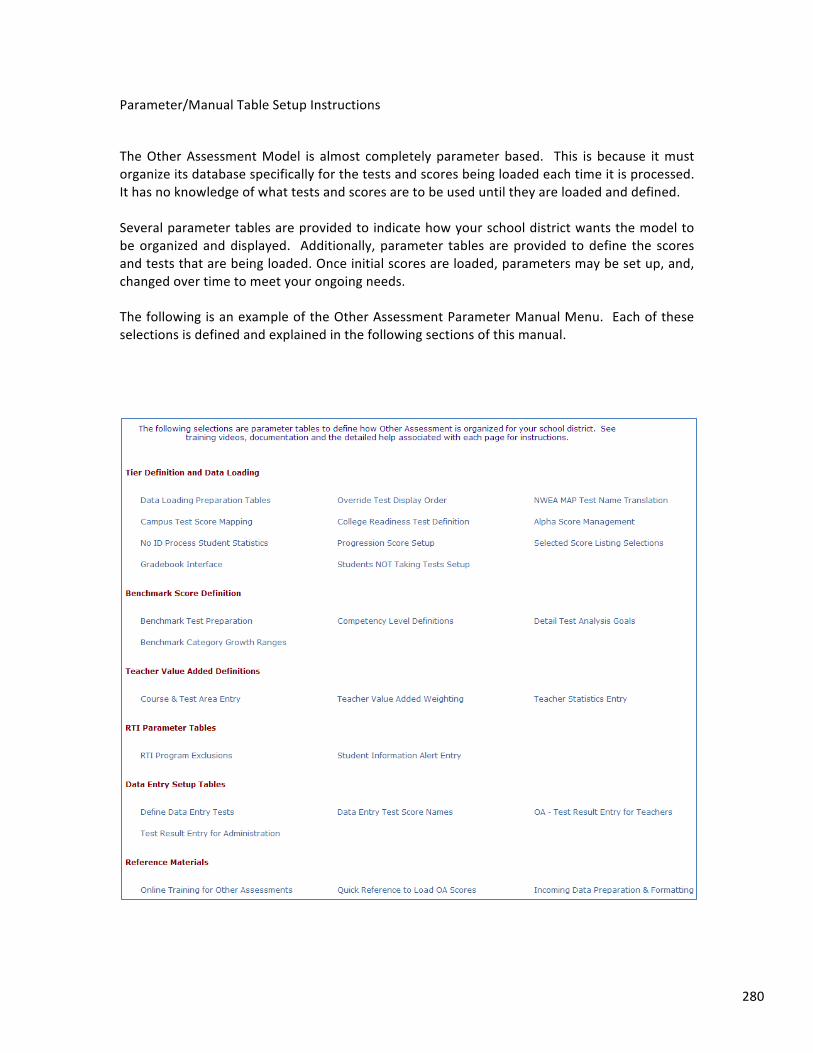
280
Parameter/Manual Table Setup Instructions
The Other Assessment Model is almost completely parameter based. This is because it must organize its database specifically for the tests and scores being loaded each time it is processed. It has no knowledge of what tests and scores are to be used until they are loaded and defined. Several parameter tables are provided to indicate how your school district wants the model to be organized and displayed. Additionally, parameter tables are provided to define the scores and tests that are being loaded. Once initial scores are loaded, parameters may be set up, and, changed over time to meet your ongoing needs. The following is an example of the Other Assessment Parameter Manual Menu. Each of these selections is defined and explained in the following sections of this manual.
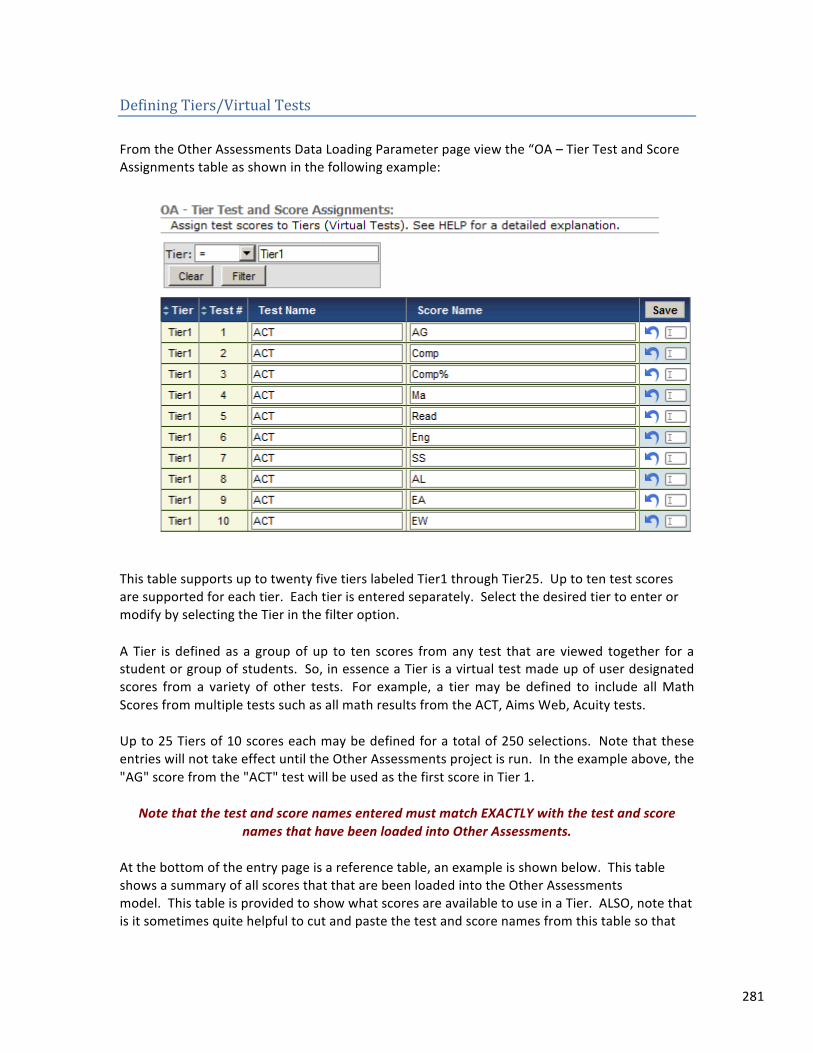
281
Defining Tiers/Virtual Tests From the Other Assessments Data Loading Parameter page view the “OA – Tier Test and Score Assignments table as shown in the following example:
This table supports up to twenty five tiers labeled Tier1 through Tier25. Up to ten test scores are supported for each tier. Each tier is entered separately. Select the desired tier to enter or modify by selecting the Tier in the filter option.
A Tier is defined as a group of up to ten scores from any test that are viewed together for a student or group of students. So, in essence a Tier is a virtual test made up of user designated scores from a variety of other tests. For example, a tier may be defined to include all Math Scores from multiple tests such as all math results from the ACT, Aims Web, Acuity tests.
Up to 25 Tiers of 10 scores each may be defined for a total of 250 selections. Note that these entries will not take effect until the Other Assessments project is run. In the example above, the "AG" score from the "ACT" test will be used as the first score in Tier 1.
Note that the test and score names entered must match EXACTLY with the test and score names that have been loaded into Other Assessments.
At the bottom of the entry page is a reference table, an example is shown below. This table shows a summary of all scores that that are been loaded into the Other Assessments model. This table is provided to show what scores are available to use in a Tier. ALSO, note that is it sometimes quite helpful to cut and paste the test and score names from this table so that
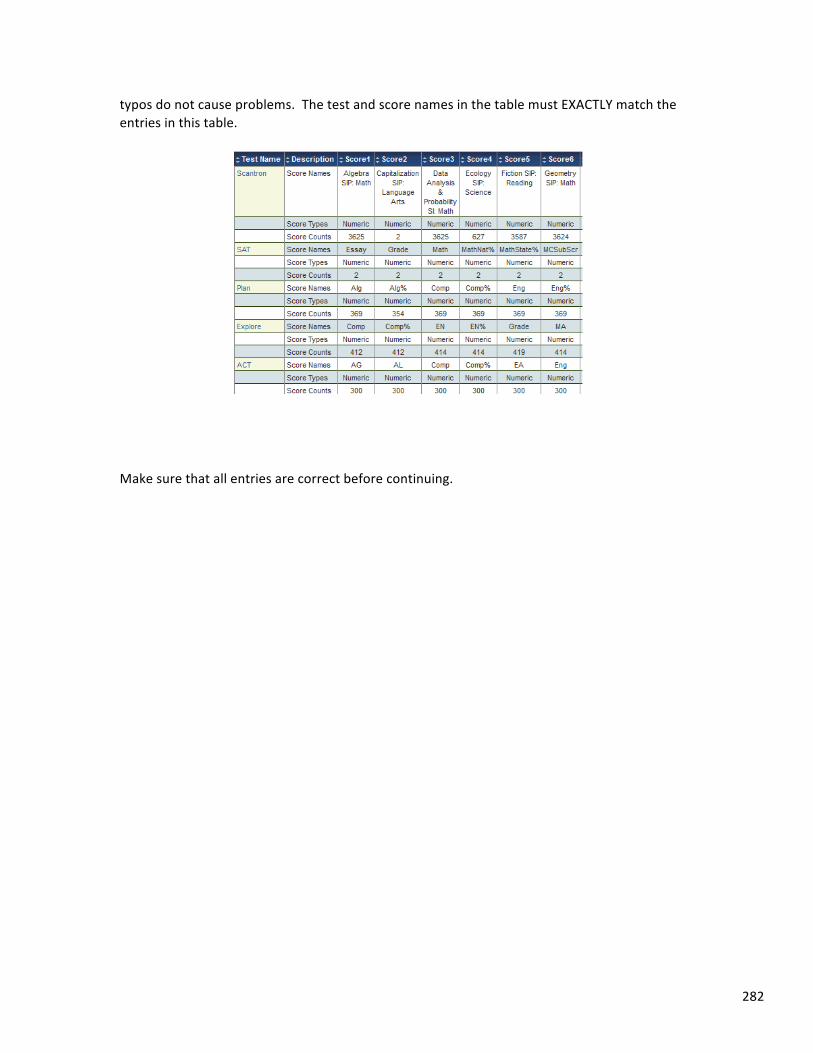
282
typos do not cause problems. The test and score names in the table must EXACTLY match the entries in this table.
Make sure that all entries are correct before continuing.
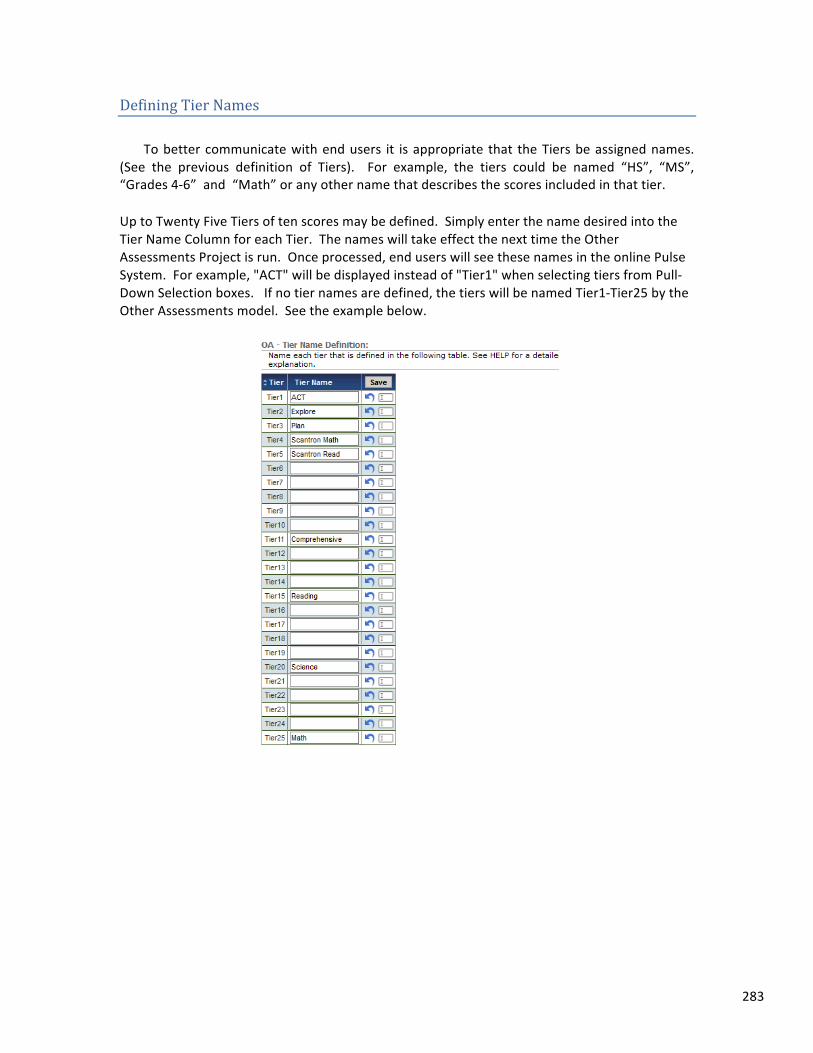
283
Defining Tier Names
To better communicate with end users it is appropriate that the Tiers be assigned names. (See the previous definition of Tiers). For example, the tiers could be named “HS”, “MS”, “Grades 4-‐6” and “Math” or any other name that describes the scores included in that tier.
Up to Twenty Five Tiers of ten scores may be defined. Simply enter the name desired into the Tier Name Column for each Tier. The names will take effect the next time the Other Assessments Project is run. Once processed, end users will see these names in the online Pulse System. For example, "ACT" will be displayed instead of "Tier1" when selecting tiers from Pull-‐Down Selection boxes. If no tier names are defined, the tiers will be named Tier1-‐Tier25 by the Other Assessments model. See the example below.
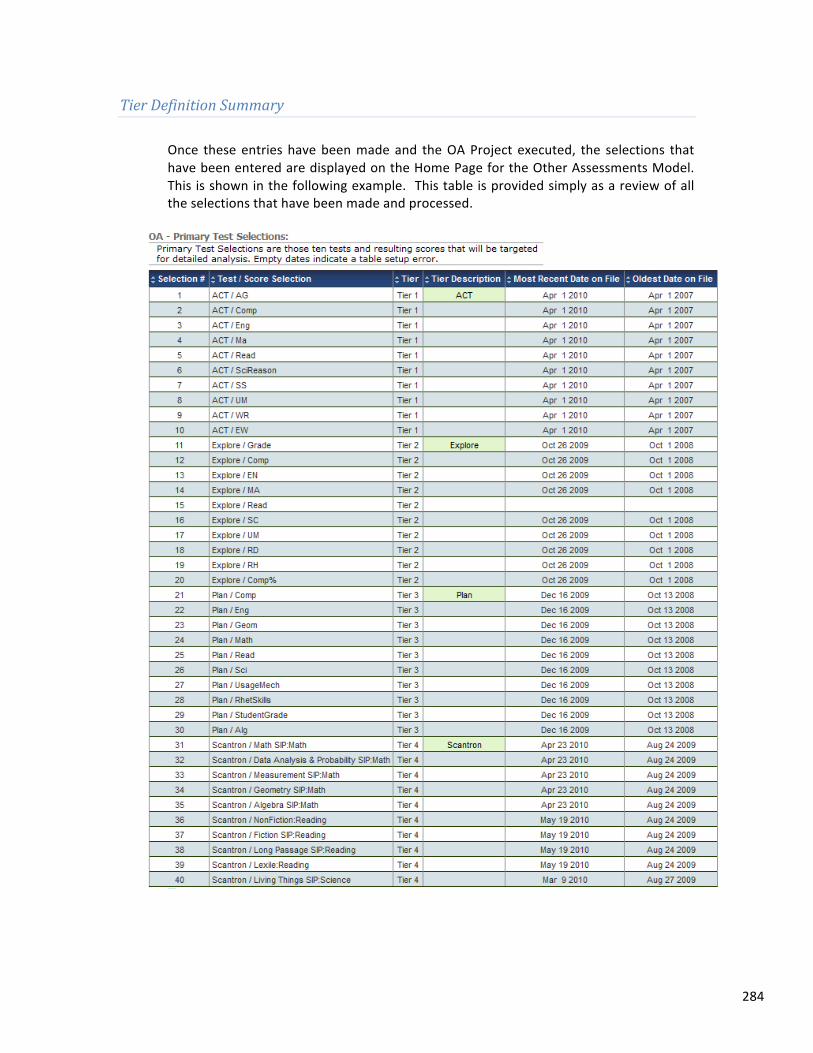
284
Tier Definition Summary Once these entries have been made and the OA Project executed, the selections that have been entered are displayed on the Home Page for the Other Assessments Model. This is shown in the following example. This table is provided simply as a review of all the selections that have been made and processed.
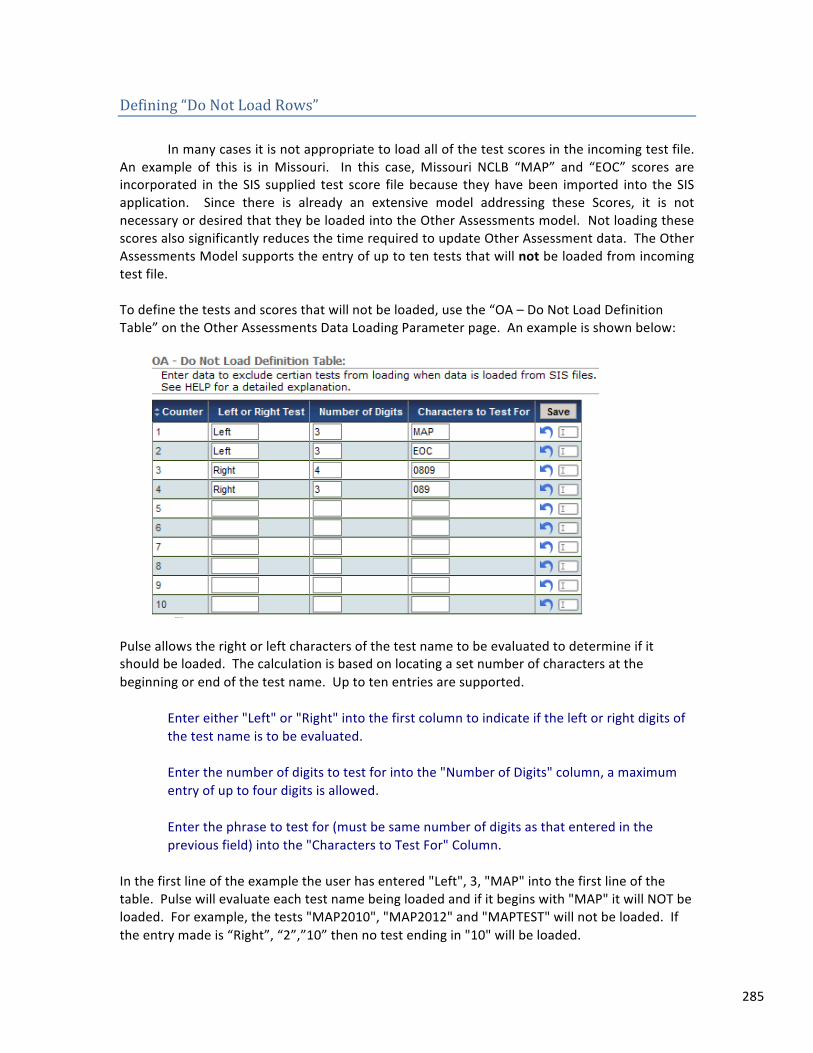
285
Defining “Do Not Load Rows”
In many cases it is not appropriate to load all of the test scores in the incoming test file. An example of this is in Missouri. In this case, Missouri NCLB “MAP” and “EOC” scores are incorporated in the SIS supplied test score file because they have been imported into the SIS application. Since there is already an extensive model addressing these Scores, it is not necessary or desired that they be loaded into the Other Assessments model. Not loading these scores also significantly reduces the time required to update Other Assessment data. The Other Assessments Model supports the entry of up to ten tests that will not be loaded from incoming test file. To define the tests and scores that will not be loaded, use the “OA – Do Not Load Definition Table” on the Other Assessments Data Loading Parameter page. An example is shown below:
Pulse allows the right or left characters of the test name to be evaluated to determine if it should be loaded. The calculation is based on locating a set number of characters at the beginning or end of the test name. Up to ten entries are supported.
Enter either "Left" or "Right" into the first column to indicate if the left or right digits of the test name is to be evaluated.
Enter the number of digits to test for into the "Number of Digits" column, a maximum entry of up to four digits is allowed.
Enter the phrase to test for (must be same number of digits as that entered in the previous field) into the "Characters to Test For" Column.
In the first line of the example the user has entered "Left", 3, "MAP" into the first line of the table. Pulse will evaluate each test name being loaded and if it begins with "MAP" it will NOT be loaded. For example, the tests "MAP2010", "MAP2012" and "MAPTEST" will not be loaded. If the entry made is “Right”, “2”,”10” then no test ending in "10" will be loaded.
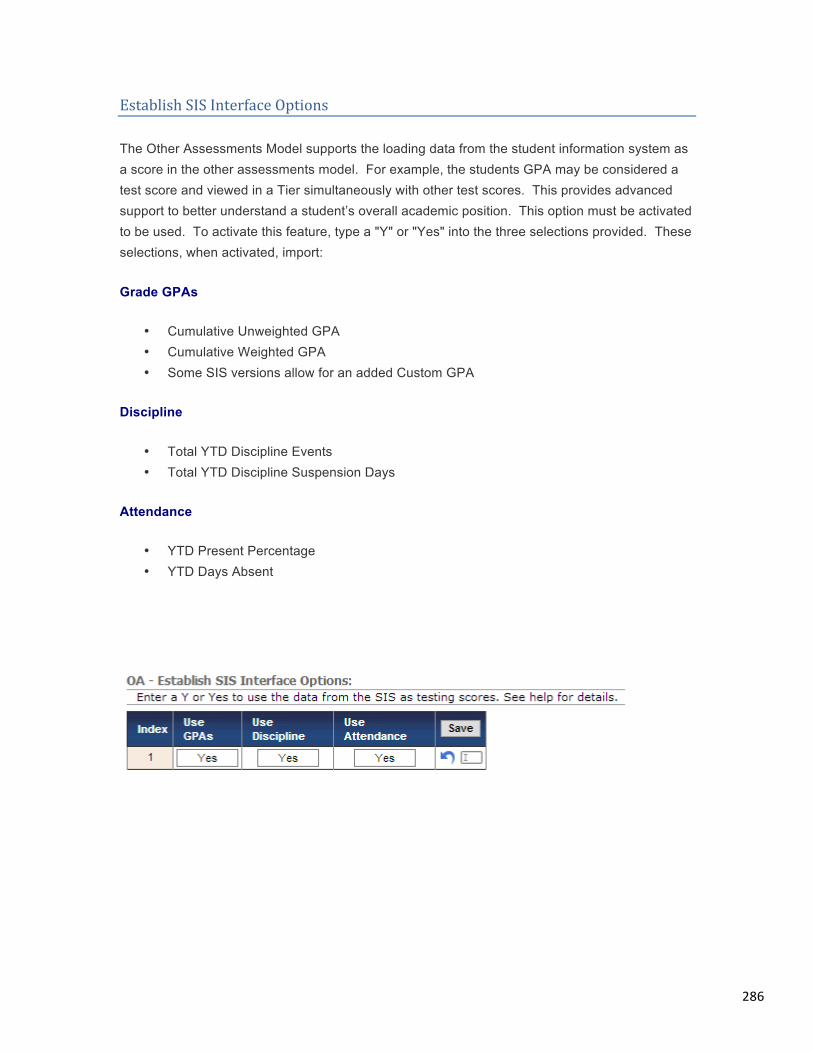
286
Establish SIS Interface Options
The Other Assessments Model supports the loading data from the student information system as a score in the other assessments model. For example, the students GPA may be considered a test score and viewed in a Tier simultaneously with other test scores. This provides advanced support to better understand a student’s overall academic position. This option must be activated to be used. To activate this feature, type a "Y" or "Yes" into the three selections provided. These selections, when activated, import:
Grade GPAs
• Cumulative Unweighted GPA • Cumulative Weighted GPA • Some SIS versions allow for an added Custom GPA
Discipline
• Total YTD Discipline Events • Total YTD Discipline Suspension Days
Attendance
• YTD Present Percentage • YTD Days Absent
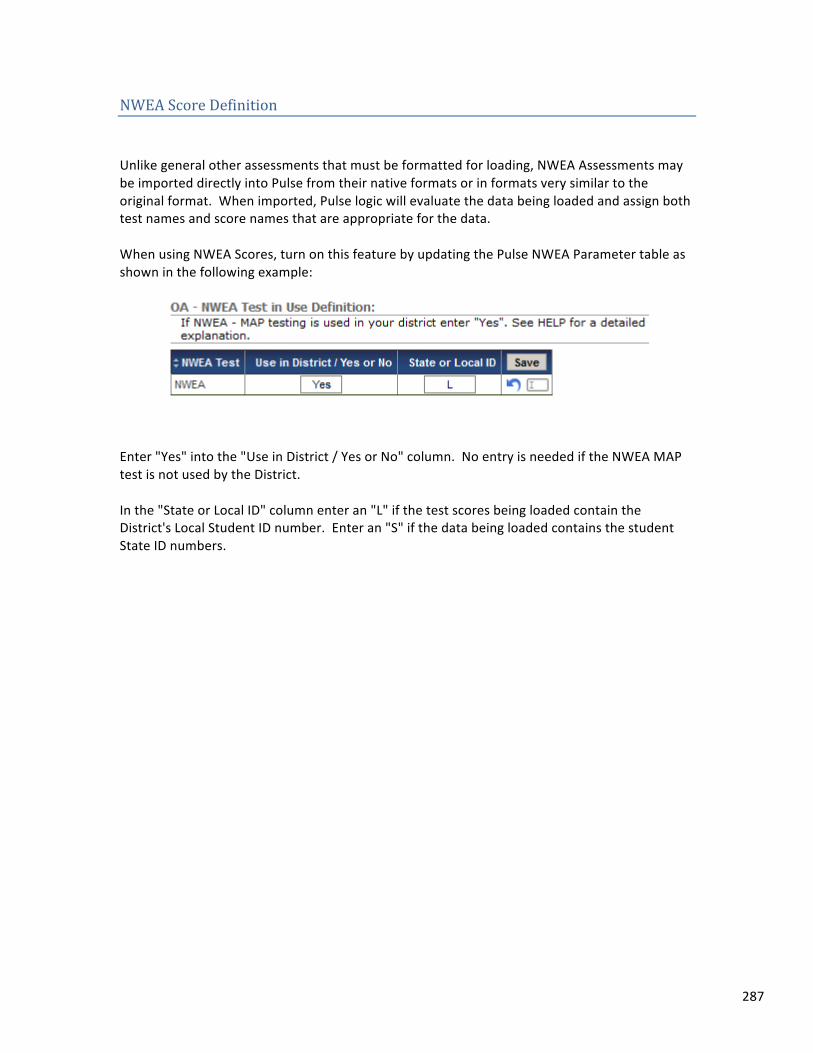
287
NWEA Score Definition
Unlike general other assessments that must be formatted for loading, NWEA Assessments may be imported directly into Pulse from their native formats or in formats very similar to the original format. When imported, Pulse logic will evaluate the data being loaded and assign both test names and score names that are appropriate for the data. When using NWEA Scores, turn on this feature by updating the Pulse NWEA Parameter table as shown in the following example:
Enter "Yes" into the "Use in District / Yes or No" column. No entry is needed if the NWEA MAP test is not used by the District. In the "State or Local ID" column enter an "L" if the test scores being loaded contain the District's Local Student ID number. Enter an "S" if the data being loaded contains the student State ID numbers.
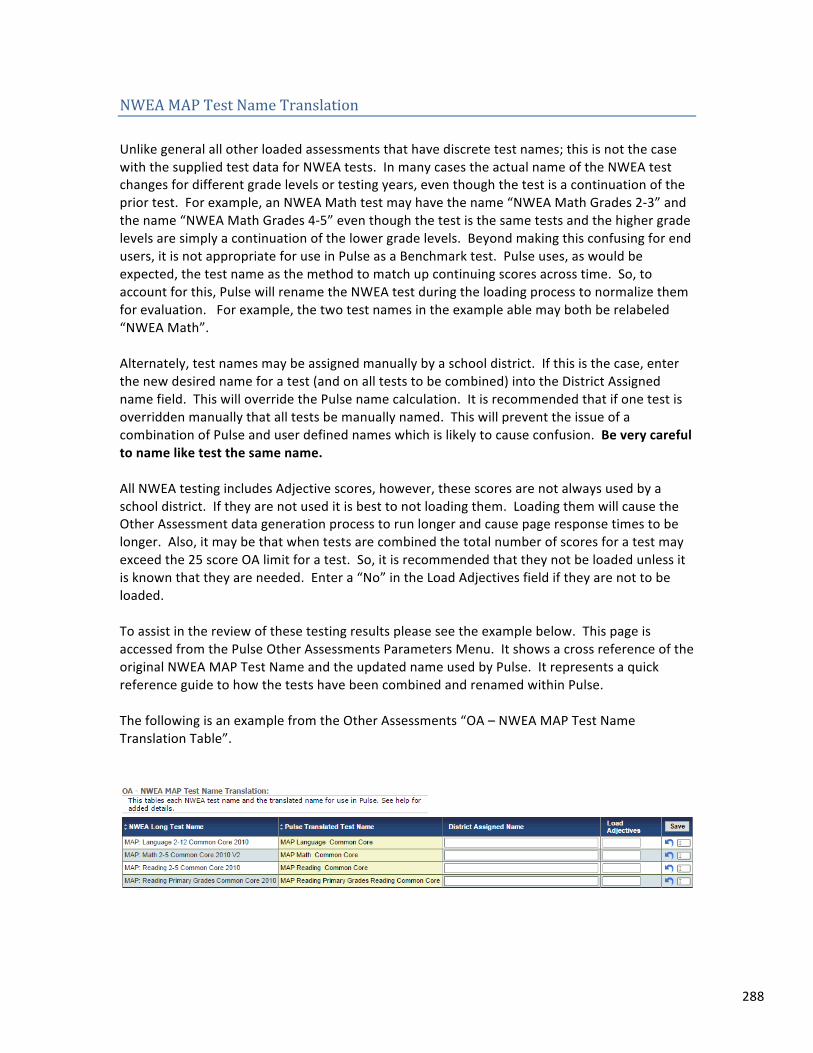
288
NWEA MAP Test Name Translation Unlike general all other loaded assessments that have discrete test names; this is not the case with the supplied test data for NWEA tests. In many cases the actual name of the NWEA test changes for different grade levels or testing years, even though the test is a continuation of the prior test. For example, an NWEA Math test may have the name “NWEA Math Grades 2-‐3” and the name “NWEA Math Grades 4-‐5” even though the test is the same tests and the higher grade levels are simply a continuation of the lower grade levels. Beyond making this confusing for end users, it is not appropriate for use in Pulse as a Benchmark test. Pulse uses, as would be expected, the test name as the method to match up continuing scores across time. So, to account for this, Pulse will rename the NWEA test during the loading process to normalize them for evaluation. For example, the two test names in the example able may both be relabeled “NWEA Math”. Alternately, test names may be assigned manually by a school district. If this is the case, enter the new desired name for a test (and on all tests to be combined) into the District Assigned name field. This will override the Pulse name calculation. It is recommended that if one test is overridden manually that all tests be manually named. This will prevent the issue of a combination of Pulse and user defined names which is likely to cause confusion. Be very careful to name like test the same name. All NWEA testing includes Adjective scores, however, these scores are not always used by a school district. If they are not used it is best to not loading them. Loading them will cause the Other Assessment data generation process to run longer and cause page response times to be longer. Also, it may be that when tests are combined the total number of scores for a test may exceed the 25 score OA limit for a test. So, it is recommended that they not be loaded unless it is known that they are needed. Enter a “No” in the Load Adjectives field if they are not to be loaded. To assist in the review of these testing results please see the example below. This page is accessed from the Pulse Other Assessments Parameters Menu. It shows a cross reference of the original NWEA MAP Test Name and the updated name used by Pulse. It represents a quick reference guide to how the tests have been combined and renamed within Pulse. The following is an example from the Other Assessments “OA – NWEA MAP Test Name Translation Table”.
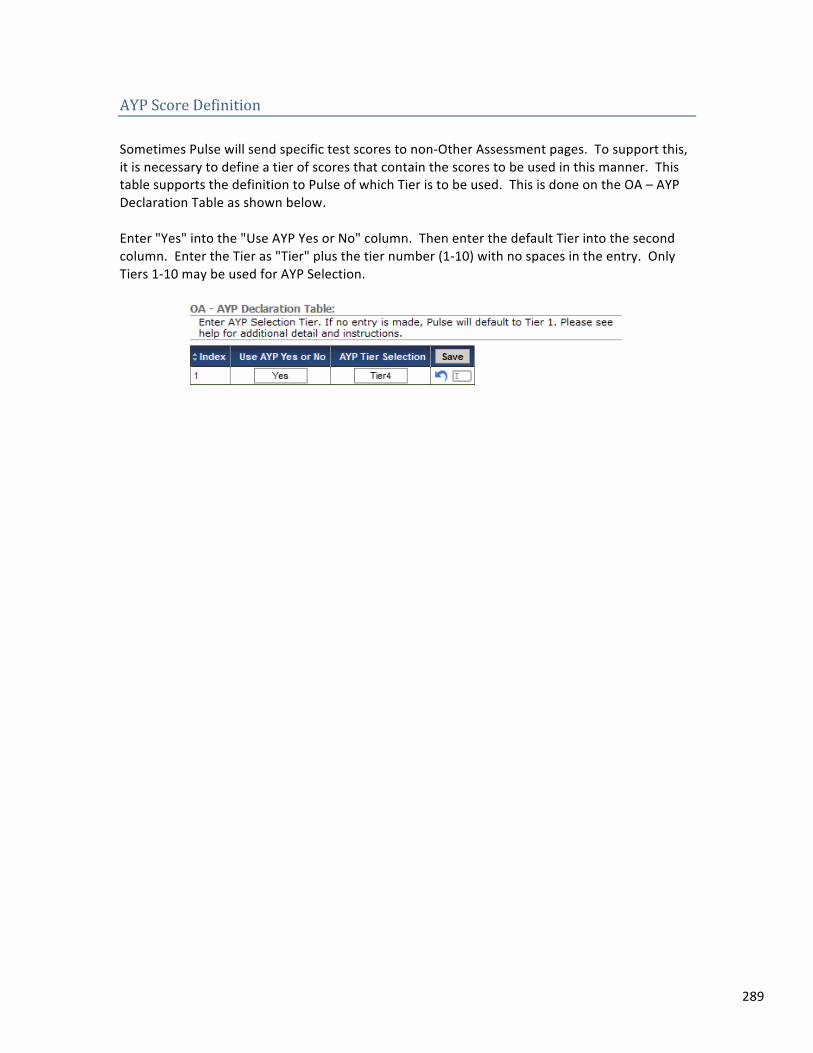
289
AYP Score Definition Sometimes Pulse will send specific test scores to non-‐Other Assessment pages. To support this, it is necessary to define a tier of scores that contain the scores to be used in this manner. This table supports the definition to Pulse of which Tier is to be used. This is done on the OA – AYP Declaration Table as shown below. Enter "Yes" into the "Use AYP Yes or No" column. Then enter the default Tier into the second column. Enter the Tier as "Tier" plus the tier number (1-‐10) with no spaces in the entry. Only Tiers 1-‐10 may be used for AYP Selection.
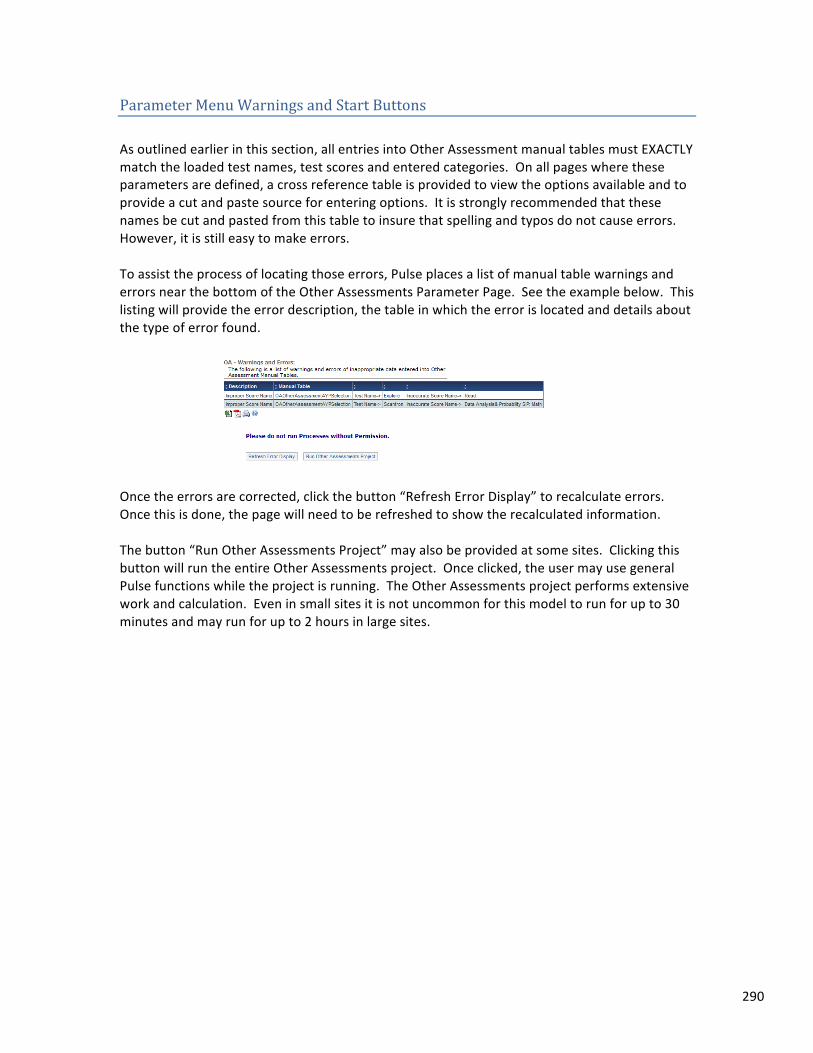
290
Parameter Menu Warnings and Start Buttons As outlined earlier in this section, all entries into Other Assessment manual tables must EXACTLY match the loaded test names, test scores and entered categories. On all pages where these parameters are defined, a cross reference table is provided to view the options available and to provide a cut and paste source for entering options. It is strongly recommended that these names be cut and pasted from this table to insure that spelling and typos do not cause errors. However, it is still easy to make errors. To assist the process of locating those errors, Pulse places a list of manual table warnings and errors near the bottom of the Other Assessments Parameter Page. See the example below. This listing will provide the error description, the table in which the error is located and details about the type of error found.
Once the errors are corrected, click the button “Refresh Error Display” to recalculate errors. Once this is done, the page will need to be refreshed to show the recalculated information. The button “Run Other Assessments Project” may also be provided at some sites. Clicking this button will run the entire Other Assessments project. Once clicked, the user may use general Pulse functions while the project is running. The Other Assessments project performs extensive work and calculation. Even in small sites it is not uncommon for this model to run for up to 30 minutes and may run for up to 2 hours in large sites.
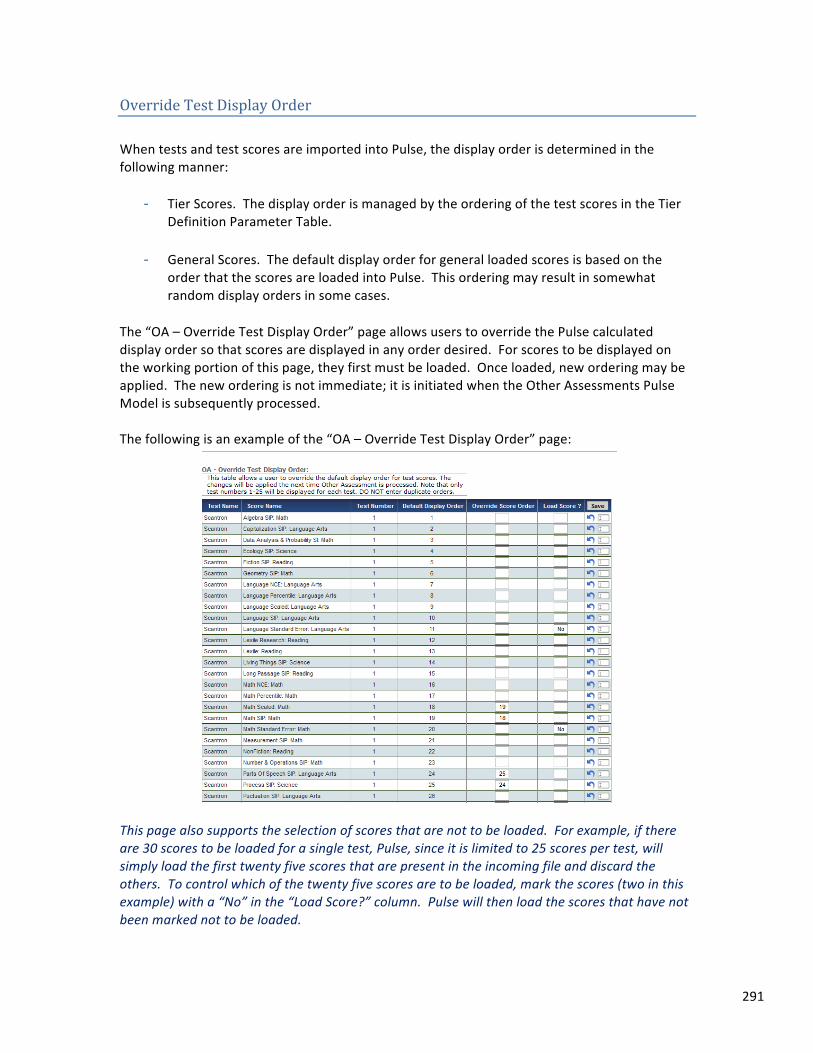
291
Override Test Display Order When tests and test scores are imported into Pulse, the display order is determined in the following manner:
-‐ Tier Scores. The display order is managed by the ordering of the test scores in the Tier Definition Parameter Table.
-‐ General Scores. The default display order for general loaded scores is based on the order that the scores are loaded into Pulse. This ordering may result in somewhat random display orders in some cases.
The “OA – Override Test Display Order” page allows users to override the Pulse calculated display order so that scores are displayed in any order desired. For scores to be displayed on the working portion of this page, they first must be loaded. Once loaded, new ordering may be applied. The new ordering is not immediate; it is initiated when the Other Assessments Pulse Model is subsequently processed. The following is an example of the “OA – Override Test Display Order” page:
This page also supports the selection of scores that are not to be loaded. For example, if there are 30 scores to be loaded for a single test, Pulse, since it is limited to 25 scores per test, will simply load the first twenty five scores that are present in the incoming file and discard the others. To control which of the twenty five scores are to be loaded, mark the scores (two in this example) with a “No” in the “Load Score?” column. Pulse will then load the scores that have not been marked not to be loaded.
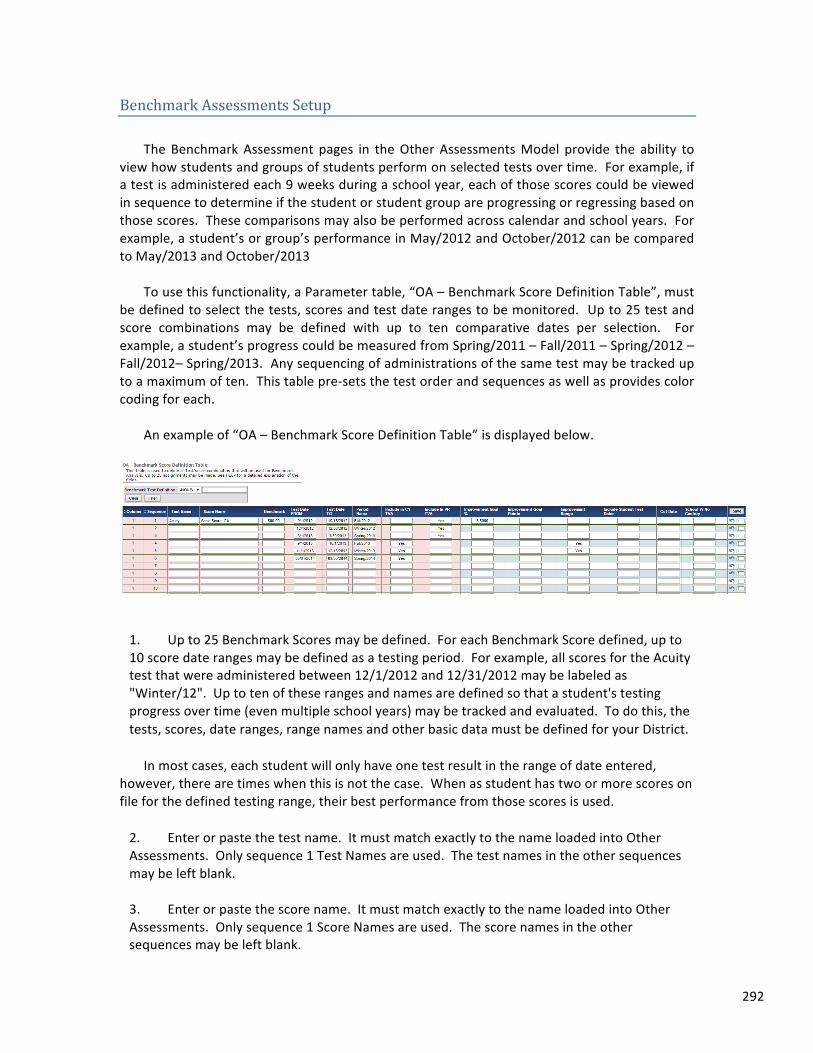
292
Benchmark Assessments Setup The Benchmark Assessment pages in the Other Assessments Model provide the ability to
view how students and groups of students perform on selected tests over time. For example, if a test is administered each 9 weeks during a school year, each of those scores could be viewed in sequence to determine if the student or student group are progressing or regressing based on those scores. These comparisons may also be performed across calendar and school years. For example, a student’s or group’s performance in May/2012 and October/2012 can be compared to May/2013 and October/2013
To use this functionality, a Parameter table, “OA – Benchmark Score Definition Table”, must
be defined to select the tests, scores and test date ranges to be monitored. Up to 25 test and score combinations may be defined with up to ten comparative dates per selection. For example, a student’s progress could be measured from Spring/2011 – Fall/2011 – Spring/2012 – Fall/2012– Spring/2013. Any sequencing of administrations of the same test may be tracked up to a maximum of ten. This table pre-‐sets the test order and sequences as well as provides color coding for each.
An example of “OA – Benchmark Score Definition Table” is displayed below.
1. Up to 25 Benchmark Scores may be defined. For each Benchmark Score defined, up to 10 score date ranges may be defined as a testing period. For example, all scores for the Acuity test that were administered between 12/1/2012 and 12/31/2012 may be labeled as "Winter/12". Up to ten of these ranges and names are defined so that a student's testing progress over time (even multiple school years) may be tracked and evaluated. To do this, the tests, scores, date ranges, range names and other basic data must be defined for your District.
In most cases, each student will only have one test result in the range of date entered, however, there are times when this is not the case. When as student has two or more scores on file for the defined testing range, their best performance from those scores is used.
2. Enter or paste the test name. It must match exactly to the name loaded into Other Assessments. Only sequence 1 Test Names are used. The test names in the other sequences may be left blank.
3. Enter or paste the score name. It must match exactly to the name loaded into Other Assessments. Only sequence 1 Score Names are used. The score names in the other sequences may be left blank.
293
4. Optionally enter a Benchmark Score (numeric up to 2 decimals). This is the Cut Score that determines proficiency for this test. If there is a single cut score for all grade levels, enter that score here. If the score varies by grade level or by testing date, enter those scores on the "Competency Level Definitions" table. All entries on that table will override a "stray" entry on this table. Only sequence 1 Benchmark Entries are used. The cut off entries in the other sequences may be left blank.
5. Enter the beginning date for the testing date range in MM/DD/YYYY format. The date must be a valid date so be careful of typos. 6. Enter the ending date for the testing date range. 7. Pulse provides a comprehensive Teacher Value Added model to track the value that teachers are contributing to their classroom. This evaluation uses the progress that students make on these benchmark tests. If the teacher value added model is being used, it is necessary to define which date ranges and scores are used in their evaluation. NOTE, the short answer would be the scores for students in the CURRENT SCHOOL YEAR. Also, this evaluation determines student’s performance in prior years so that a teacher may be fairly reviewed. So the short answer here is to determine the last score a student got prior to entering the teacher’s classroom in the current year. 8. Type Yes into the "Include in CY TVA" column if the date range is in the current school year. 9. Type Yes into the "Include in PR TVA" column for the date range of the last score in the previous school year. 10. Entering a No is not necessary but will not hurt anything. Do not enter a Y, enter a full "Yes" in the two previous fields. 11. NOTE, each test / score name combination may have UP TO ten entries. If there are not ten historical scores for a particular score/test, enter only what is available and leave the other columns empty.
12. Each benchmark test definition supports the entry of an Improvement Goal on the first line of the benchmark definition for each test. Note that only the first line is used for this purpose and entries into any other lines will be ignored by Pulse. The Improvement Goal is used to measure each student’s progress on the most recent two test offerings and report if they have met or not met this goal.
The goal may be expressed as a percentage gain or as a point gain, however, only one of these options are used in Pulse calculations. The percentage gain takes precedence over the point gain so if both are entered, only the percentage gain is used. Enter the percentage gain as a whole number, for example five percent is entered as 5.0, NOT as .05. Also enter a “Yes” in at least two of the testing periods in the Improvement Range field. Pulse will use this entry to determine the beginning and ending testing period (range of test dates)
294
to calculate the goal compliance. For example, the range for the entered goal may be the last two testing periods, the first and last testing period in the current year, the last testing period from last year to the current testing period or any range desired. If a student has not taken the specified test on one or both of these dates/range selections, then no calculation will be performed for that student.
In summary, goals are compared to the student’s prior two testing periods to determine if a goal has been met. Improvement Goals are determined using one of four different methods. The OA model determines the goal based on the following formulas:
• Goals may be imported from files in a similar way that test scores are imported. Some assessment vendors will provide files containing these goals for this purpose. If the scores are imported, this method will trump all other methods described below.
• On the Benchmark Setup page there are columns to define a global point improvement goal or a percentage improvement goal for each individual test. If a percentage goal is defined, then the goal for each student will be determined by taking that percentage (for example 5.0%) of the most recent test result (for example 100) to determine a goal (in this example 5.0 points). A raw goal may be entered which will be the same for each student, regardless of their previous score. If both types are entered, then the percentage option will be used and the raw score entry will be ignored.
• If none of the options listed above are used, then Pulse will generate a target improvement. It is generally accepted that the student should outperform their projected score (See explanations of Pulse projected score calculations) to be on an upward track. Based on this, Pulse will determine the difference between the last student score on file and the projected score calculated before that test was taken. If the result is negative, then the target improvement is considered to be zero improvement. The projected score may actually be lower than the last student score when there are a series of results on various tests where the student scored much lower than the most recent score.
The model displays the goal target, the actual improvement and a Yes/No column showing if the score target was met. NOTE -‐ when calculating scores it is necessary that the student has a score in the most recent score column. If this is not the case, no target score will be generated.
13. Include Student Test Dates. Enter “Yes” in this column if student test dates are to be included in the benchmark testing student detail display page. When this is set, the actual date that a student took the test in the testing cycle range will be listed on the page. Note that while this may be needed in some Districts, it does add additional width to the display line.
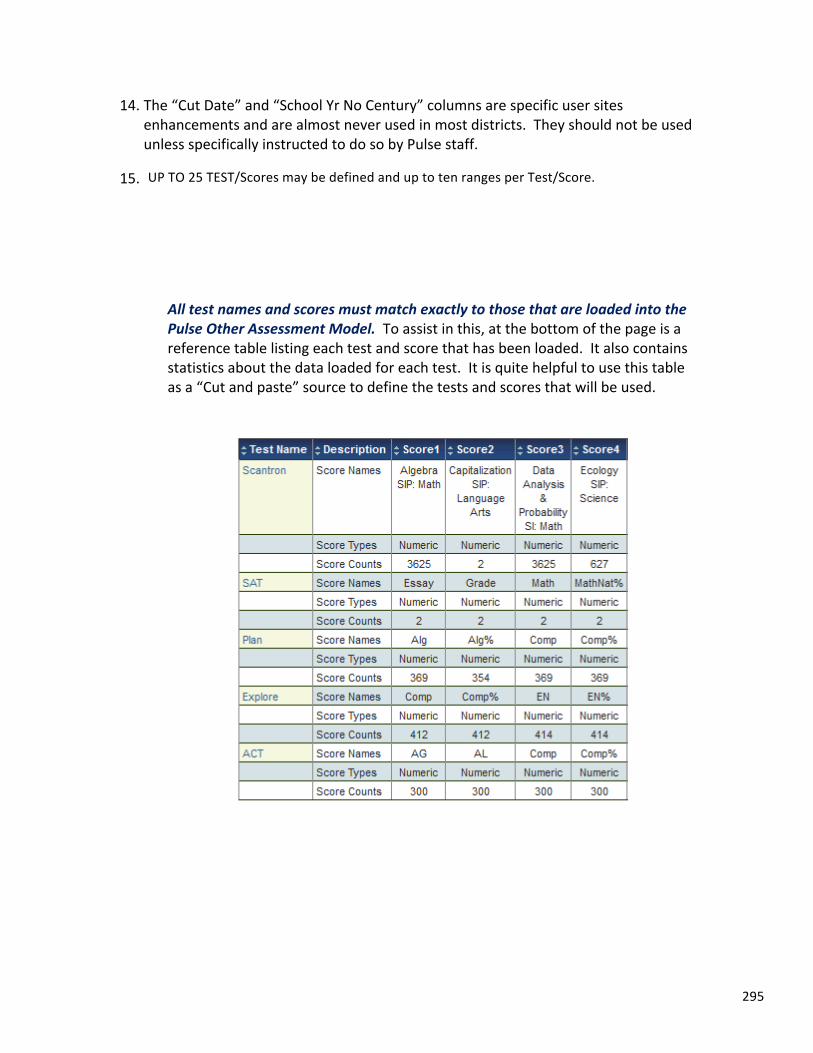
295
14. The “Cut Date” and “School Yr No Century” columns are specific user sites enhancements and are almost never used in most districts. They should not be used unless specifically instructed to do so by Pulse staff.
15. UP TO 25 TEST/Scores may be defined and up to ten ranges per Test/Score.
All test names and scores must match exactly to those that are loaded into the Pulse Other Assessment Model. To assist in this, at the bottom of the page is a reference table listing each test and score that has been loaded. It also contains statistics about the data loaded for each test. It is quite helpful to use this table as a “Cut and paste” source to define the tests and scores that will be used.
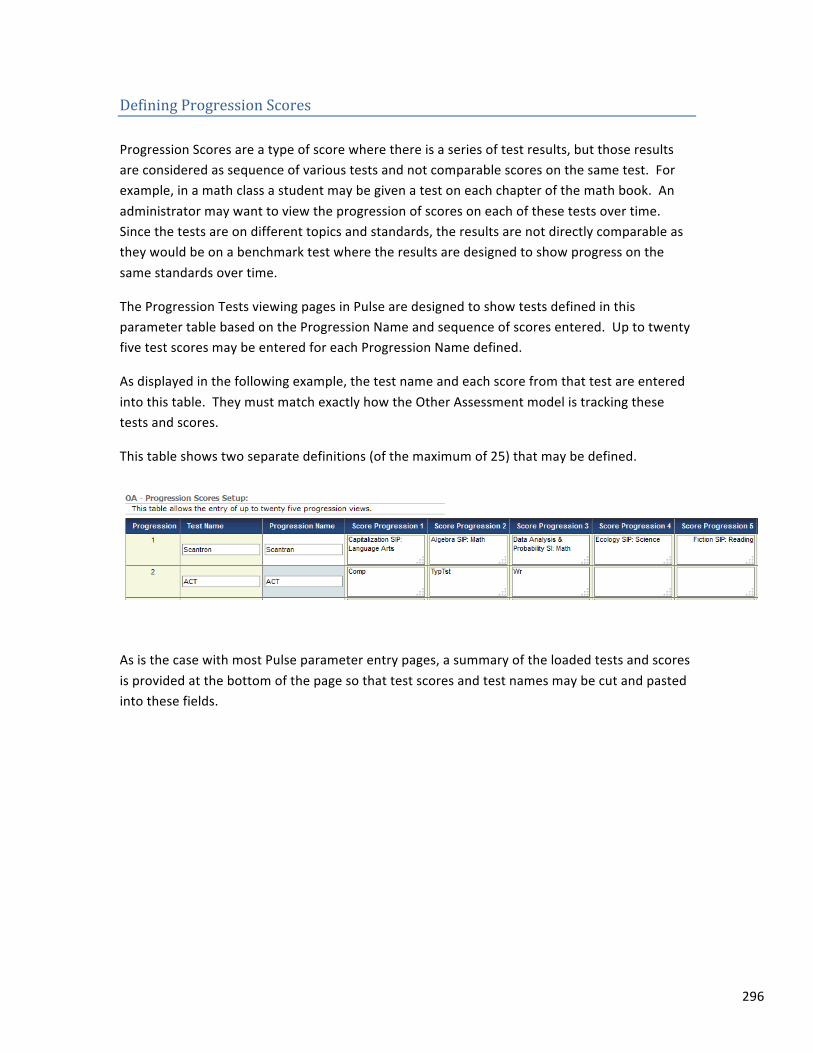
296
Defining Progression Scores
Progression Scores are a type of score where there is a series of test results, but those results are considered as sequence of various tests and not comparable scores on the same test. For example, in a math class a student may be given a test on each chapter of the math book. An administrator may want to view the progression of scores on each of these tests over time. Since the tests are on different topics and standards, the results are not directly comparable as they would be on a benchmark test where the results are designed to show progress on the same standards over time.
The Progression Tests viewing pages in Pulse are designed to show tests defined in this parameter table based on the Progression Name and sequence of scores entered. Up to twenty five test scores may be entered for each Progression Name defined.
As displayed in the following example, the test name and each score from that test are entered into this table. They must match exactly how the Other Assessment model is tracking these tests and scores.
This table shows two separate definitions (of the maximum of 25) that may be defined.
As is the case with most Pulse parameter entry pages, a summary of the loaded tests and scores is provided at the bottom of the page so that test scores and test names may be cut and pasted into these fields.
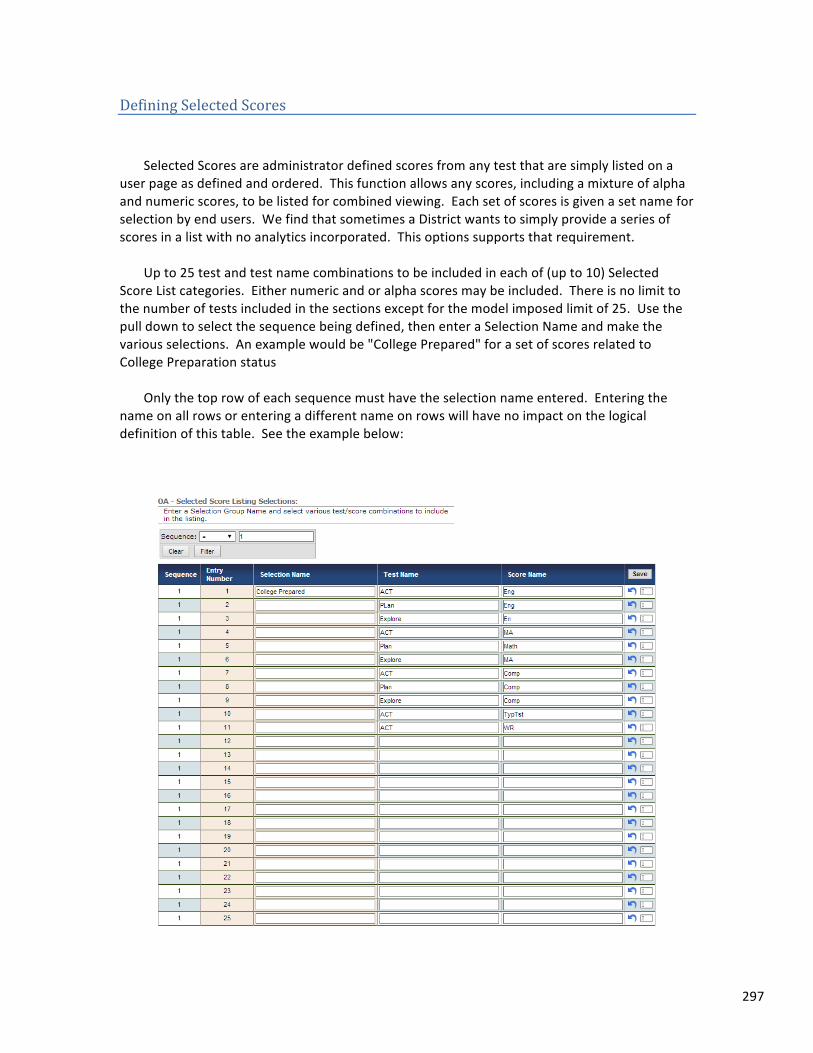
297
Defining Selected Scores Selected Scores are administrator defined scores from any test that are simply listed on a
user page as defined and ordered. This function allows any scores, including a mixture of alpha and numeric scores, to be listed for combined viewing. Each set of scores is given a set name for selection by end users. We find that sometimes a District wants to simply provide a series of scores in a list with no analytics incorporated. This options supports that requirement.
Up to 25 test and test name combinations to be included in each of (up to 10) Selected
Score List categories. Either numeric and or alpha scores may be included. There is no limit to the number of tests included in the sections except for the model imposed limit of 25. Use the pull down to select the sequence being defined, then enter a Selection Name and make the various selections. An example would be "College Prepared" for a set of scores related to College Preparation status
Only the top row of each sequence must have the selection name entered. Entering the
name on all rows or entering a different name on rows will have no impact on the logical definition of this table. See the example below:
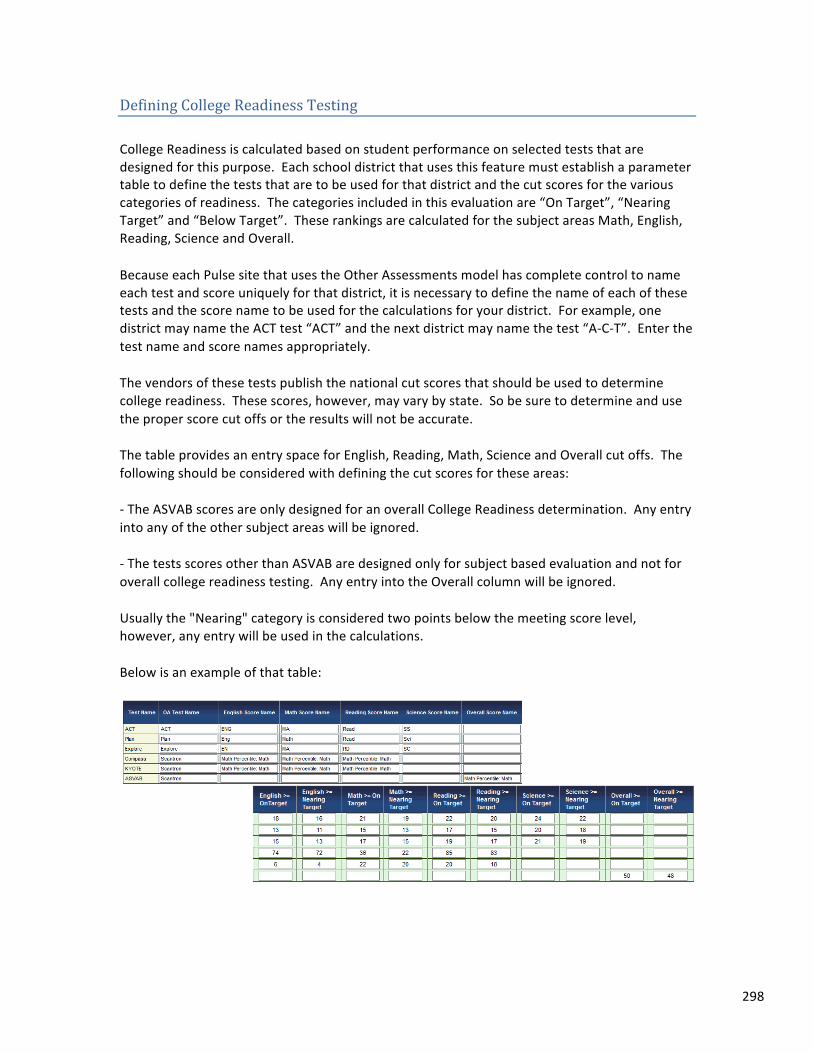
298
Defining College Readiness Testing
College Readiness is calculated based on student performance on selected tests that are designed for this purpose. Each school district that uses this feature must establish a parameter table to define the tests that are to be used for that district and the cut scores for the various categories of readiness. The categories included in this evaluation are “On Target”, “Nearing Target” and “Below Target”. These rankings are calculated for the subject areas Math, English, Reading, Science and Overall.
Because each Pulse site that uses the Other Assessments model has complete control to name each test and score uniquely for that district, it is necessary to define the name of each of these tests and the score name to be used for the calculations for your district. For example, one district may name the ACT test “ACT” and the next district may name the test “A-‐C-‐T”. Enter the test name and score names appropriately.
The vendors of these tests publish the national cut scores that should be used to determine college readiness. These scores, however, may vary by state. So be sure to determine and use the proper score cut offs or the results will not be accurate.
The table provides an entry space for English, Reading, Math, Science and Overall cut offs. The following should be considered with defining the cut scores for these areas:
-‐ The ASVAB scores are only designed for an overall College Readiness determination. Any entry into any of the other subject areas will be ignored.
-‐ The tests scores other than ASVAB are designed only for subject based evaluation and not for overall college readiness testing. Any entry into the Overall column will be ignored.
Usually the "Nearing" category is considered two points below the meeting score level, however, any entry will be used in the calculations.
Below is an example of that table:
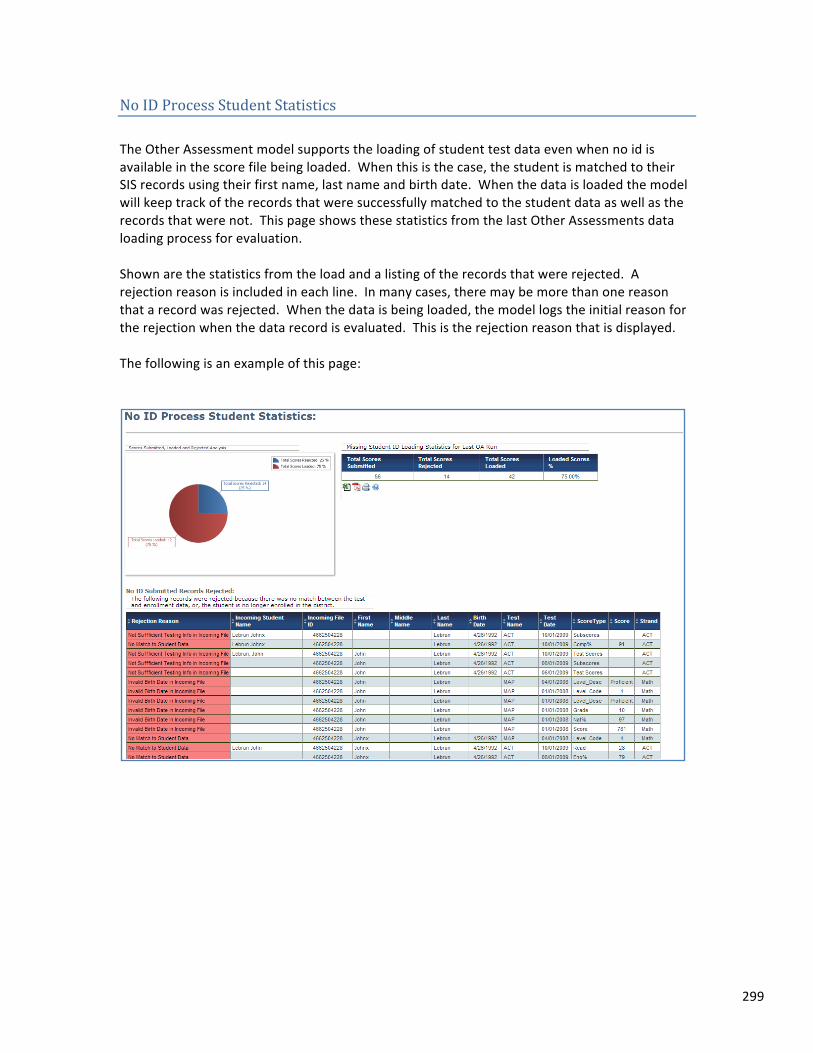
299
No ID Process Student Statistics The Other Assessment model supports the loading of student test data even when no id is available in the score file being loaded. When this is the case, the student is matched to their SIS records using their first name, last name and birth date. When the data is loaded the model will keep track of the records that were successfully matched to the student data as well as the records that were not. This page shows these statistics from the last Other Assessments data loading process for evaluation. Shown are the statistics from the load and a listing of the records that were rejected. A rejection reason is included in each line. In many cases, there may be more than one reason that a record was rejected. When the data is being loaded, the model logs the initial reason for the rejection when the data record is evaluated. This is the rejection reason that is displayed. The following is an example of this page:
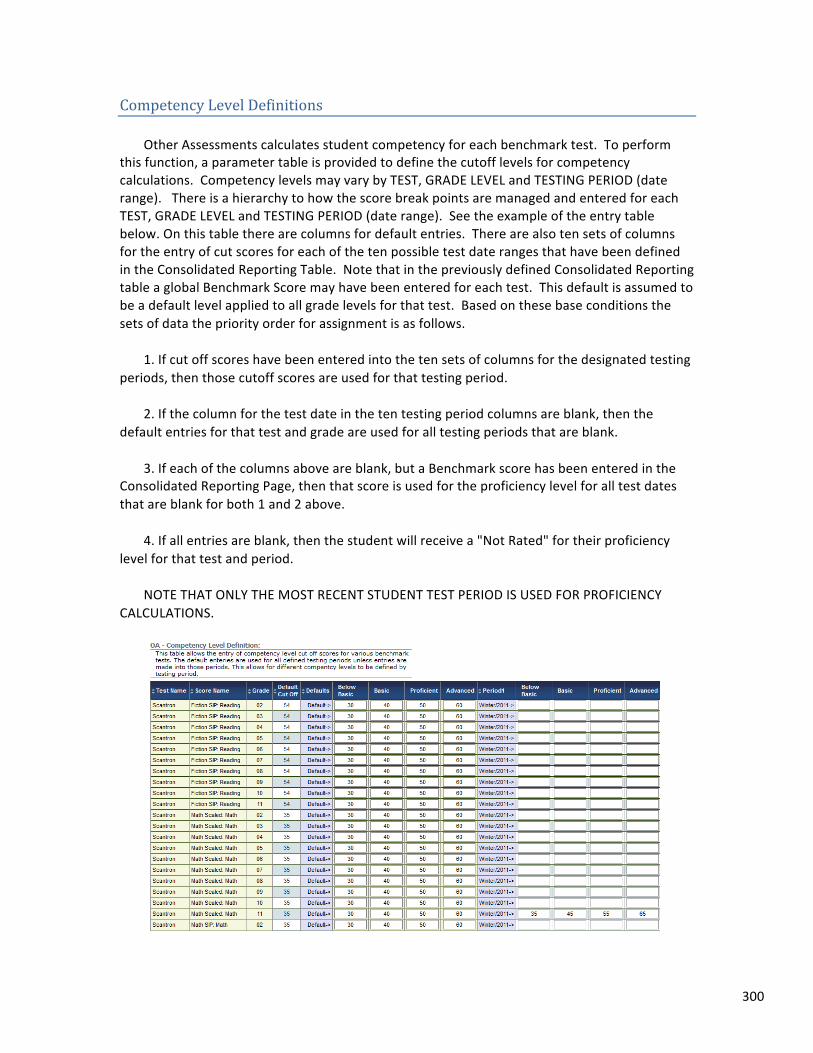
300
Competency Level Definitions
Other Assessments calculates student competency for each benchmark test. To perform this function, a parameter table is provided to define the cutoff levels for competency calculations. Competency levels may vary by TEST, GRADE LEVEL and TESTING PERIOD (date range). There is a hierarchy to how the score break points are managed and entered for each TEST, GRADE LEVEL and TESTING PERIOD (date range). See the example of the entry table below. On this table there are columns for default entries. There are also ten sets of columns for the entry of cut scores for each of the ten possible test date ranges that have been defined in the Consolidated Reporting Table. Note that in the previously defined Consolidated Reporting table a global Benchmark Score may have been entered for each test. This default is assumed to be a default level applied to all grade levels for that test. Based on these base conditions the sets of data the priority order for assignment is as follows.
1. If cut off scores have been entered into the ten sets of columns for the designated testing periods, then those cutoff scores are used for that testing period.
2. If the column for the test date in the ten testing period columns are blank, then the default entries for that test and grade are used for all testing periods that are blank.
3. If each of the columns above are blank, but a Benchmark score has been entered in the Consolidated Reporting Page, then that score is used for the proficiency level for all test dates that are blank for both 1 and 2 above.
4. If all entries are blank, then the student will receive a "Not Rated" for their proficiency level for that test and period.
NOTE THAT ONLY THE MOST RECENT STUDENT TEST PERIOD IS USED FOR PROFICIENCY CALCULATIONS.
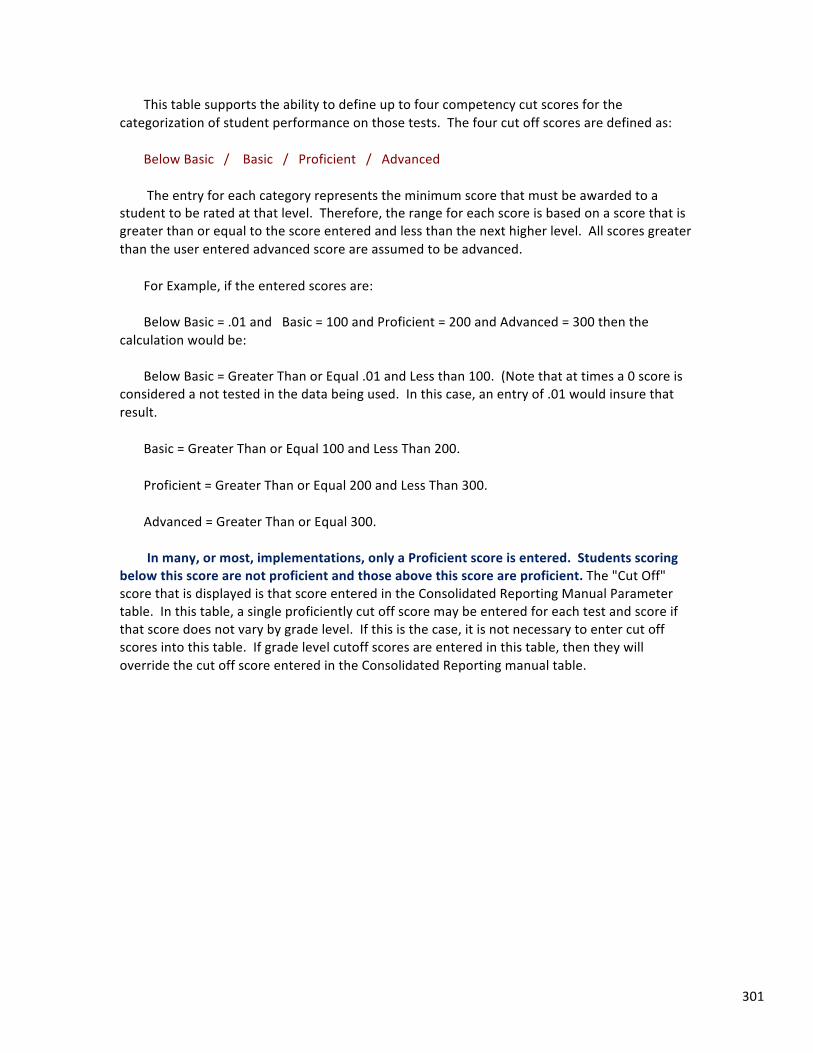
301
This table supports the ability to define up to four competency cut scores for the categorization of student performance on those tests. The four cut off scores are defined as:
Below Basic / Basic / Proficient / Advanced
The entry for each category represents the minimum score that must be awarded to a student to be rated at that level. Therefore, the range for each score is based on a score that is greater than or equal to the score entered and less than the next higher level. All scores greater than the user entered advanced score are assumed to be advanced.
For Example, if the entered scores are:
Below Basic = .01 and Basic = 100 and Proficient = 200 and Advanced = 300 then the calculation would be:
Below Basic = Greater Than or Equal .01 and Less than 100. (Note that at times a 0 score is considered a not tested in the data being used. In this case, an entry of .01 would insure that result.
Basic = Greater Than or Equal 100 and Less Than 200.
Proficient = Greater Than or Equal 200 and Less Than 300.
Advanced = Greater Than or Equal 300.
In many, or most, implementations, only a Proficient score is entered. Students scoring below this score are not proficient and those above this score are proficient. The "Cut Off" score that is displayed is that score entered in the Consolidated Reporting Manual Parameter table. In this table, a single proficiently cut off score may be entered for each test and score if that score does not vary by grade level. If this is the case, it is not necessary to enter cut off scores into this table. If grade level cutoff scores are entered in this table, then they will override the cut off score entered in the Consolidated Reporting manual table.
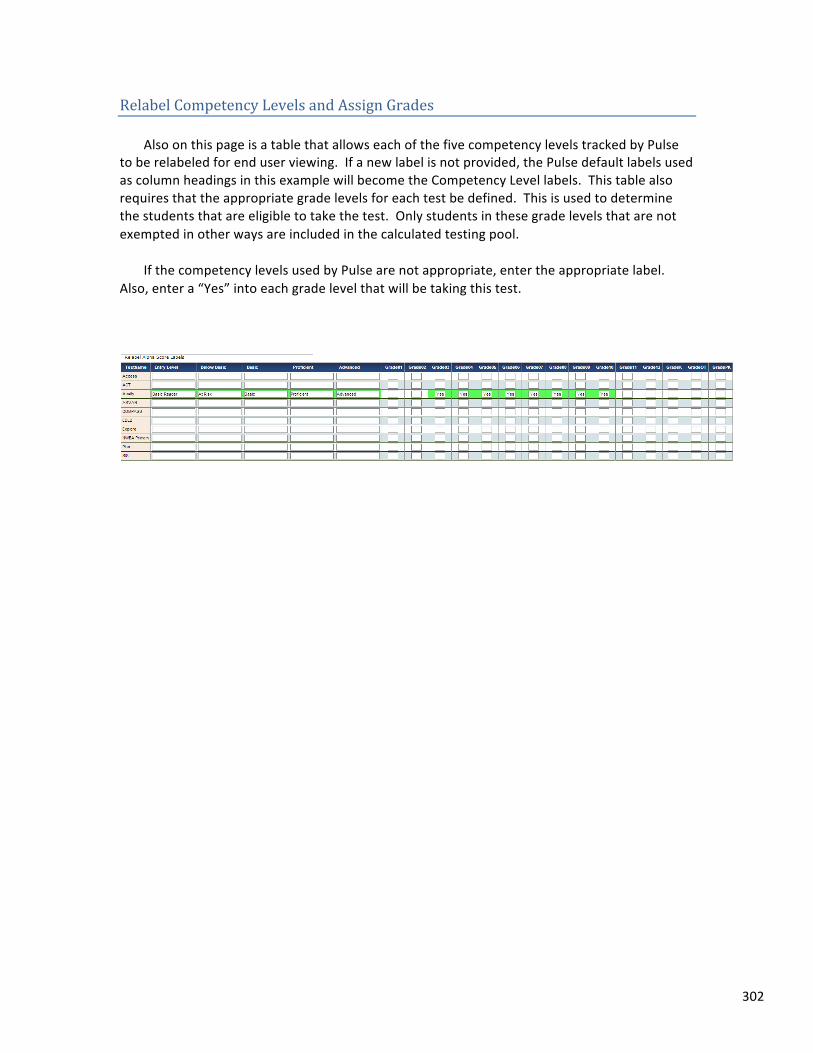
302
Relabel Competency Levels and Assign Grades
Also on this page is a table that allows each of the five competency levels tracked by Pulse to be relabeled for end user viewing. If a new label is not provided, the Pulse default labels used as column headings in this example will become the Competency Level labels. This table also requires that the appropriate grade levels for each test be defined. This is used to determine the students that are eligible to take the test. Only students in these grade levels that are not exempted in other ways are included in the calculated testing pool.
If the competency levels used by Pulse are not appropriate, enter the appropriate label. Also, enter a “Yes” into each grade level that will be taking this test.
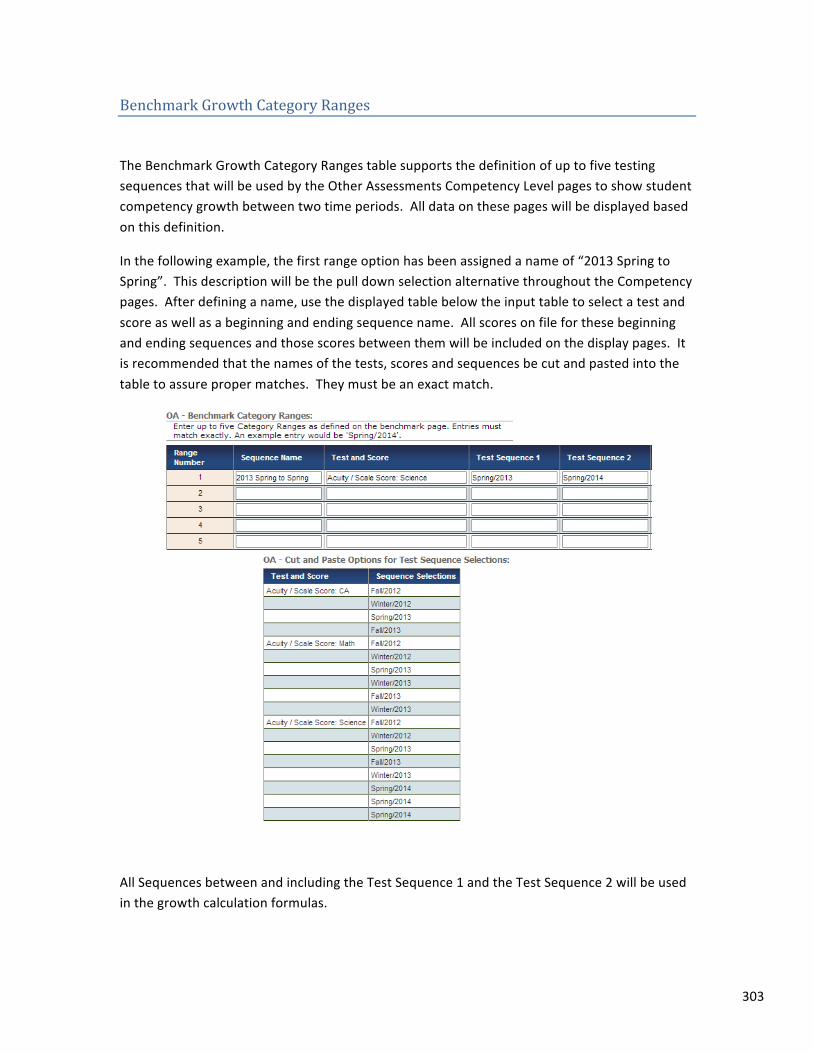
303
Benchmark Growth Category Ranges
The Benchmark Growth Category Ranges table supports the definition of up to five testing sequences that will be used by the Other Assessments Competency Level pages to show student competency growth between two time periods. All data on these pages will be displayed based on this definition.
In the following example, the first range option has been assigned a name of “2013 Spring to Spring”. This description will be the pull down selection alternative throughout the Competency pages. After defining a name, use the displayed table below the input table to select a test and score as well as a beginning and ending sequence name. All scores on file for these beginning and ending sequences and those scores between them will be included on the display pages. It is recommended that the names of the tests, scores and sequences be cut and pasted into the table to assure proper matches. They must be an exact match.
All Sequences between and including the Test Sequence 1 and the Test Sequence 2 will be used in the growth calculation formulas.
304
Detail Test Analysis Goals
NOTE, this table is not for establishing test improvement goals as are described in another section above. Other Assessments will calculate how students in the district are performing when meeting district wide goals on specific tests. While this functionality may be used for any test desired, in most cases, this evaluation is being performed as part of a state published option to use alternative tests for annual progress calculations instead of the standard state NCLB testing. So, this functionality is designed to both support general evaluation of student results and support for this state/federal mandate. We normally see the ACT as the most used test for this function. The end result of this process will be to report how the district is performing on the selected tests using the established goals. Note that these goals are most often published by a State department of education. Evaluation areas included in the reporting are:
1. Total Students Enrolled in the district or for the grade level selected
2. Total Students Participating in the Test
3. The Participation Target Percentage established by the district
4. The Actual Percentage of Enrolled Students Participating in the Test
5. The variance between target and actual participation
6. The student average score on the test
7. The target average score for the test established by the district
8. The variance between the target average and the actual average
9. The total students enrolled
10. The total students participating in the test
11. The number of students meeting or exceeding the target score
12. The percent of participating students meeting the target score
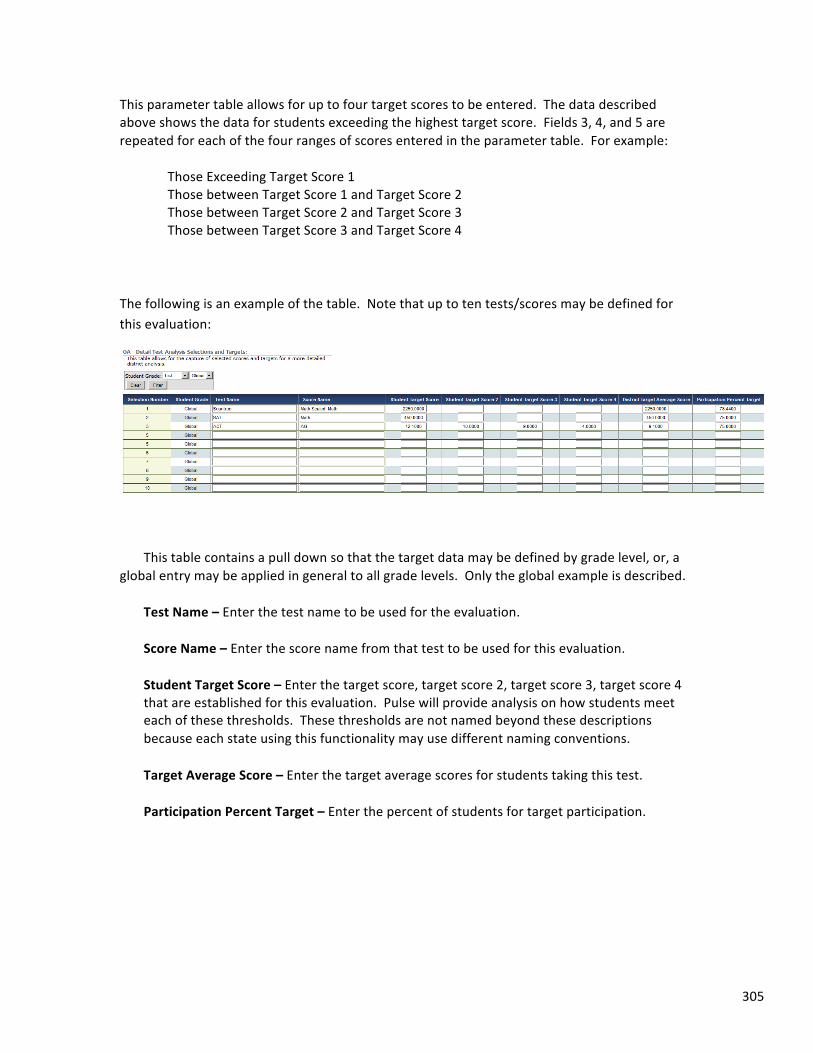
305
This parameter table allows for up to four target scores to be entered. The data described above shows the data for students exceeding the highest target score. Fields 3, 4, and 5 are repeated for each of the four ranges of scores entered in the parameter table. For example:
Those Exceeding Target Score 1 Those between Target Score 1 and Target Score 2 Those between Target Score 2 and Target Score 3 Those between Target Score 3 and Target Score 4
The following is an example of the table. Note that up to ten tests/scores may be defined for this evaluation:
This table contains a pull down so that the target data may be defined by grade level, or, a global entry may be applied in general to all grade levels. Only the global example is described.
Test Name – Enter the test name to be used for the evaluation.
Score Name – Enter the score name from that test to be used for this evaluation.
Student Target Score – Enter the target score, target score 2, target score 3, target score 4 that are established for this evaluation. Pulse will provide analysis on how students meet each of these thresholds. These thresholds are not named beyond these descriptions because each state using this functionality may use different naming conventions.
Target Average Score – Enter the target average scores for students taking this test.
Participation Percent Target – Enter the percent of students for target participation.
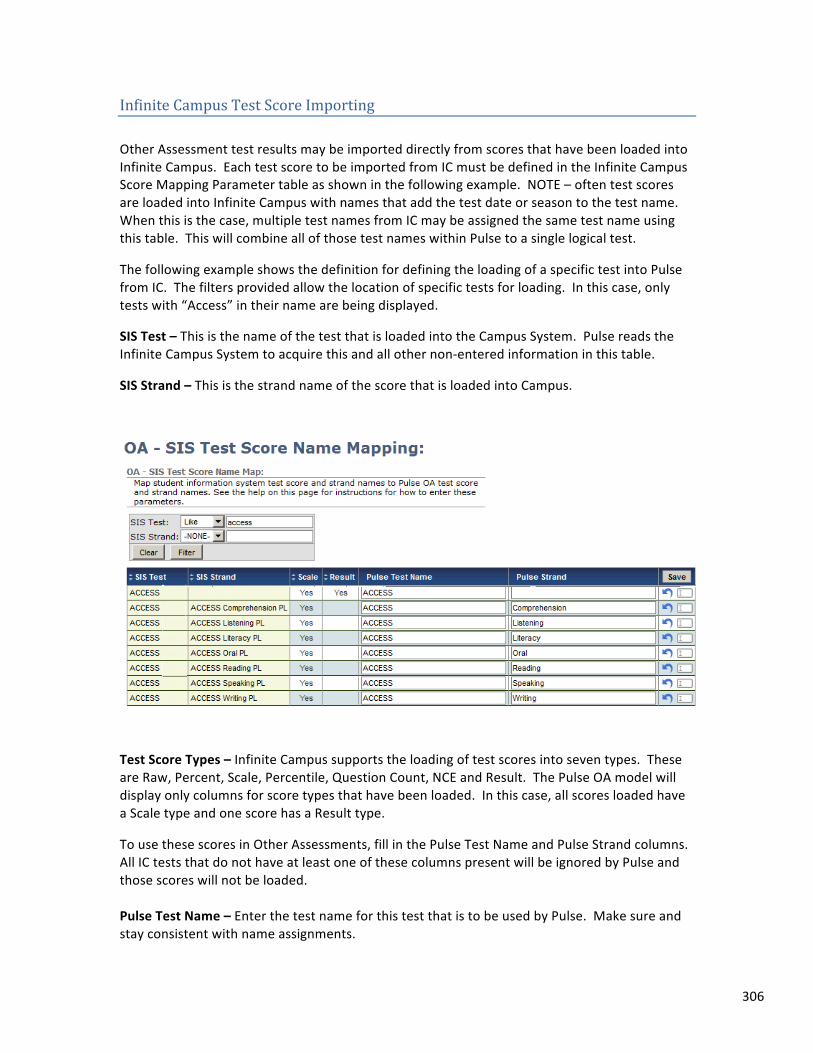
306
Infinite Campus Test Score Importing
Other Assessment test results may be imported directly from scores that have been loaded into Infinite Campus. Each test score to be imported from IC must be defined in the Infinite Campus Score Mapping Parameter table as shown in the following example. NOTE – often test scores are loaded into Infinite Campus with names that add the test date or season to the test name. When this is the case, multiple test names from IC may be assigned the same test name using this table. This will combine all of those test names within Pulse to a single logical test.
The following example shows the definition for defining the loading of a specific test into Pulse from IC. The filters provided allow the location of specific tests for loading. In this case, only tests with “Access” in their name are being displayed.
SIS Test – This is the name of the test that is loaded into the Campus System. Pulse reads the Infinite Campus System to acquire this and all other non-‐entered information in this table.
SIS Strand – This is the strand name of the score that is loaded into Campus.
Test Score Types – Infinite Campus supports the loading of test scores into seven types. These are Raw, Percent, Scale, Percentile, Question Count, NCE and Result. The Pulse OA model will display only columns for score types that have been loaded. In this case, all scores loaded have a Scale type and one score has a Result type.
To use these scores in Other Assessments, fill in the Pulse Test Name and Pulse Strand columns. All IC tests that do not have at least one of these columns present will be ignored by Pulse and those scores will not be loaded. Pulse Test Name – Enter the test name for this test that is to be used by Pulse. Make sure and stay consistent with name assignments.

307
Pulse Strand – Enter the score strand name that will be used by Pulse. To clarify, for each score imported into Other Assessments, the score in named using a combination of the Test Name, Score Type and Stand. So, for the above definition, the score names will become:
Access / Result Access / Scale Access / Scale: Comprehension Access / Scale: Literacy Access / Scale: Listening
The test name will use the Pulse entered name. The score name will default to the IC score type of Raw, Percent, Scale, Percentile, Question Count, NCE or Result and the stand will use the Pulse Strand Entry or default to the IC SIS Strand if that column has not been entered. Further Clarifications
The displayed table lists each test, score name and type of score (Raw, Scale, Percent, Percentile, etc.) that is on file in the Infinite Campus database. In the IC database it is likely that the same logical test will have different names. These names need to be normalized for loading into Pulse. Pulse uses the date of each score to determine the sequence of the student sittings for each test. So, when the same test in IC has different names, this page is to tell Pulse that these various names are the same test.
For example, a test labeled "Benchmark" may be labeled as follow in Infinite Campus:
1st Grade Benchmark 2nd Grade Benchmark 3rd Grade Benchmark, etc. -‐or as-‐ 2013 Benchmark 2012 Benchmark 2011 Benchmark, etc.
This is the case when in reality they are simply different date based instances of the same test. So, the action of renaming each of these Tests 'Benchmark" will result in the test being loaded into Pulse and the date of the tests being used to determine the sequence for all display and calculations in Pulse.
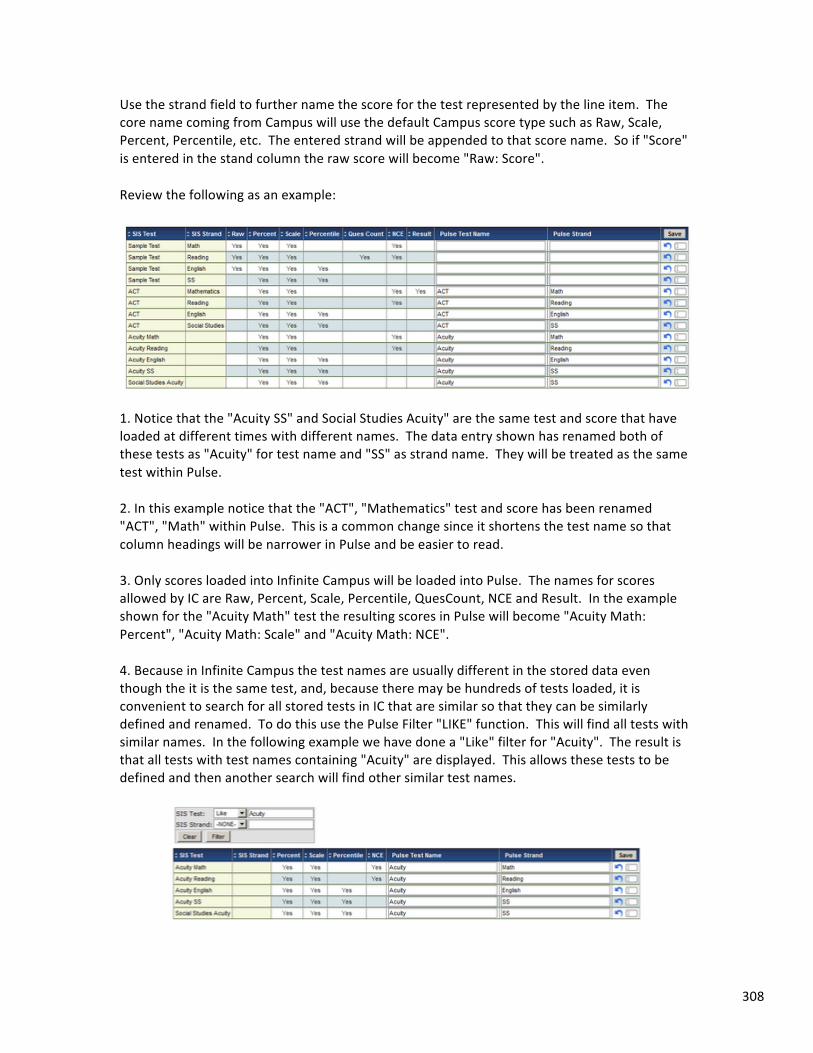
308
Use the strand field to further name the score for the test represented by the line item. The core name coming from Campus will use the default Campus score type such as Raw, Scale, Percent, Percentile, etc. The entered strand will be appended to that score name. So if "Score" is entered in the stand column the raw score will become "Raw: Score".
Review the following as an example:
1. Notice that the "Acuity SS" and Social Studies Acuity" are the same test and score that have loaded at different times with different names. The data entry shown has renamed both of these tests as "Acuity" for test name and "SS" as strand name. They will be treated as the same test within Pulse.
2. In this example notice that the "ACT", "Mathematics" test and score has been renamed "ACT", "Math" within Pulse. This is a common change since it shortens the test name so that column headings will be narrower in Pulse and be easier to read.
3. Only scores loaded into Infinite Campus will be loaded into Pulse. The names for scores allowed by IC are Raw, Percent, Scale, Percentile, QuesCount, NCE and Result. In the example shown for the "Acuity Math" test the resulting scores in Pulse will become "Acuity Math: Percent", "Acuity Math: Scale" and "Acuity Math: NCE".
4. Because in Infinite Campus the test names are usually different in the stored data even though the it is the same test, and, because there may be hundreds of tests loaded, it is convenient to search for all stored tests in IC that are similar so that they can be similarly defined and renamed. To do this use the Pulse Filter "LIKE" function. This will find all tests with similar names. In the following example we have done a "Like" filter for "Acuity". The result is that all tests with test names containing "Acuity" are displayed. This allows these tests to be defined and then another search will find other similar test names.
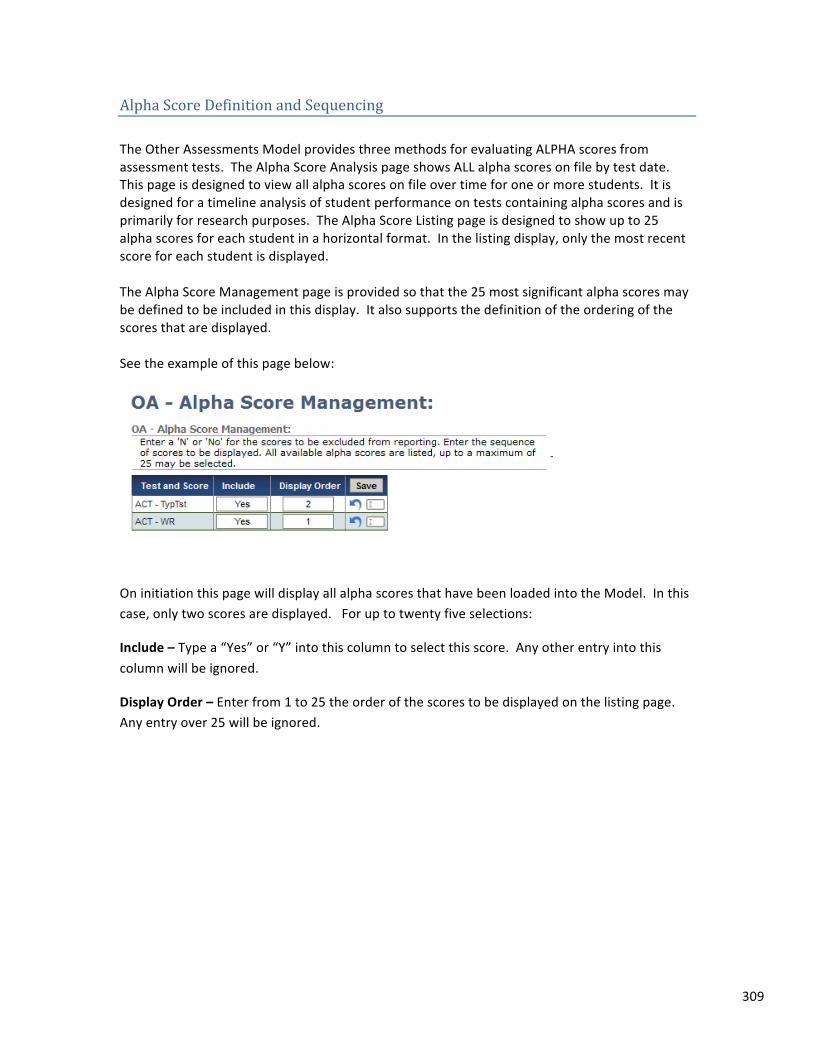
309
Alpha Score Definition and Sequencing The Other Assessments Model provides three methods for evaluating ALPHA scores from assessment tests. The Alpha Score Analysis page shows ALL alpha scores on file by test date. This page is designed to view all alpha scores on file over time for one or more students. It is designed for a timeline analysis of student performance on tests containing alpha scores and is primarily for research purposes. The Alpha Score Listing page is designed to show up to 25 alpha scores for each student in a horizontal format. In the listing display, only the most recent score for each student is displayed. The Alpha Score Management page is provided so that the 25 most significant alpha scores may be defined to be included in this display. It also supports the definition of the ordering of the scores that are displayed. See the example of this page below:
On initiation this page will display all alpha scores that have been loaded into the Model. In this case, only two scores are displayed. For up to twenty five selections:
Include – Type a “Yes” or “Y” into this column to select this score. Any other entry into this column will be ignored.
Display Order – Enter from 1 to 25 the order of the scores to be displayed on the listing page. Any entry over 25 will be ignored.
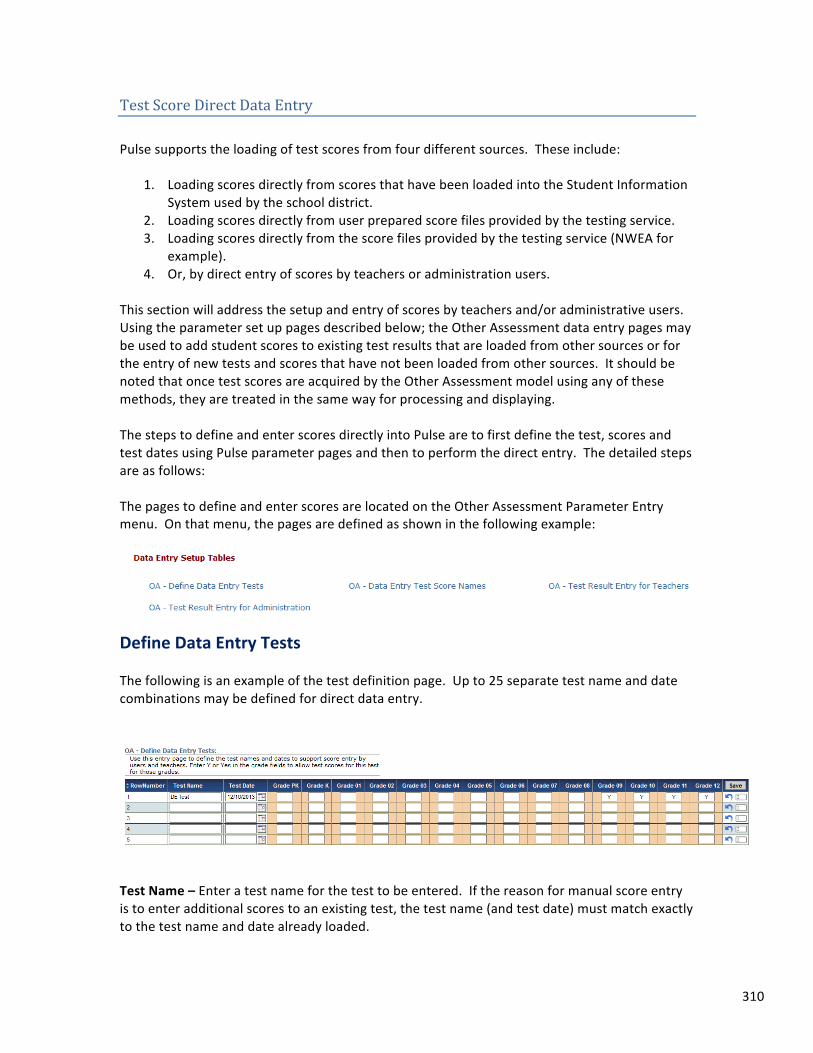
310
Test Score Direct Data Entry
Pulse supports the loading of test scores from four different sources. These include:
1. Loading scores directly from scores that have been loaded into the Student Information System used by the school district.
2. Loading scores directly from user prepared score files provided by the testing service. 3. Loading scores directly from the score files provided by the testing service (NWEA for
example). 4. Or, by direct entry of scores by teachers or administration users.
This section will address the setup and entry of scores by teachers and/or administrative users. Using the parameter set up pages described below; the Other Assessment data entry pages may be used to add student scores to existing test results that are loaded from other sources or for the entry of new tests and scores that have not been loaded from other sources. It should be noted that once test scores are acquired by the Other Assessment model using any of these methods, they are treated in the same way for processing and displaying. The steps to define and enter scores directly into Pulse are to first define the test, scores and test dates using Pulse parameter pages and then to perform the direct entry. The detailed steps are as follows: The pages to define and enter scores are located on the Other Assessment Parameter Entry menu. On that menu, the pages are defined as shown in the following example:
Define Data Entry Tests The following is an example of the test definition page. Up to 25 separate test name and date combinations may be defined for direct data entry.
Test Name – Enter a test name for the test to be entered. If the reason for manual score entry is to enter additional scores to an existing test, the test name (and test date) must match exactly to the test name and date already loaded.
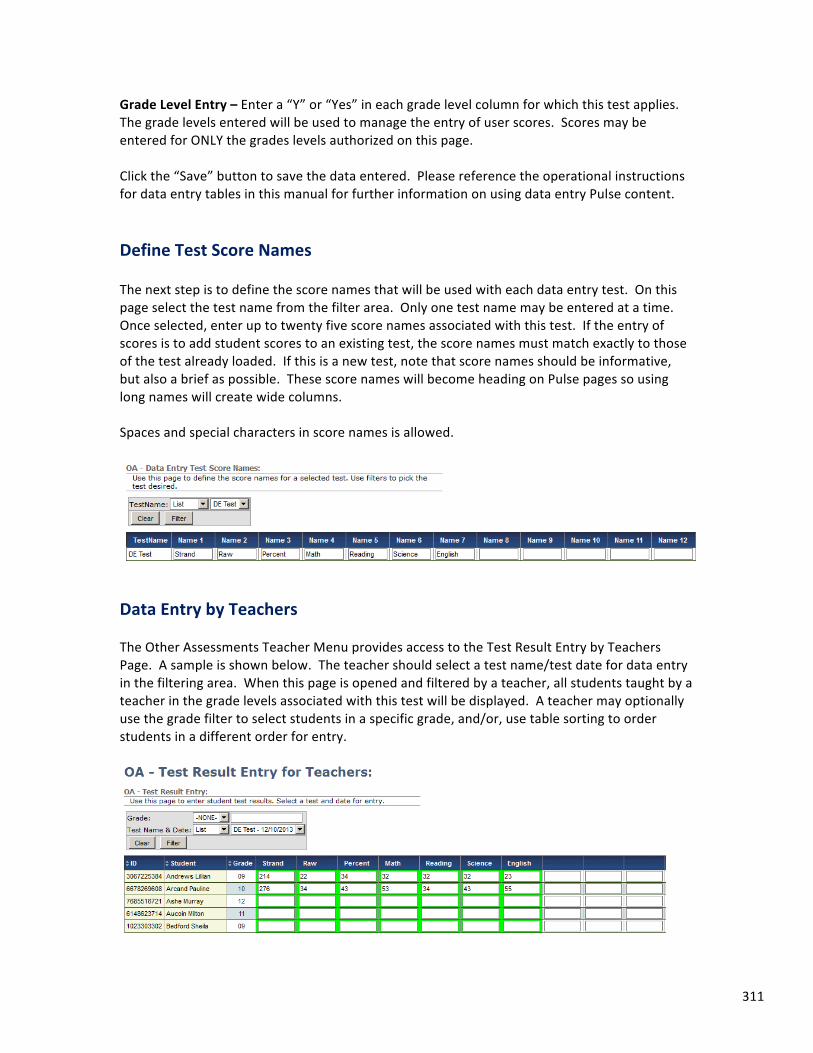
311
Grade Level Entry – Enter a “Y” or “Yes” in each grade level column for which this test applies. The grade levels entered will be used to manage the entry of user scores. Scores may be entered for ONLY the grades levels authorized on this page. Click the “Save” button to save the data entered. Please reference the operational instructions for data entry tables in this manual for further information on using data entry Pulse content. Define Test Score Names The next step is to define the score names that will be used with each data entry test. On this page select the test name from the filter area. Only one test name may be entered at a time. Once selected, enter up to twenty five score names associated with this test. If the entry of scores is to add student scores to an existing test, the score names must match exactly to those of the test already loaded. If this is a new test, note that score names should be informative, but also a brief as possible. These score names will become heading on Pulse pages so using long names will create wide columns. Spaces and special characters in score names is allowed.
Data Entry by Teachers The Other Assessments Teacher Menu provides access to the Test Result Entry by Teachers Page. A sample is shown below. The teacher should select a test name/test date for data entry in the filtering area. When this page is opened and filtered by a teacher, all students taught by a teacher in the grade levels associated with this test will be displayed. A teacher may optionally use the grade filter to select students in a specific grade, and/or, use table sorting to order students in a different order for entry.
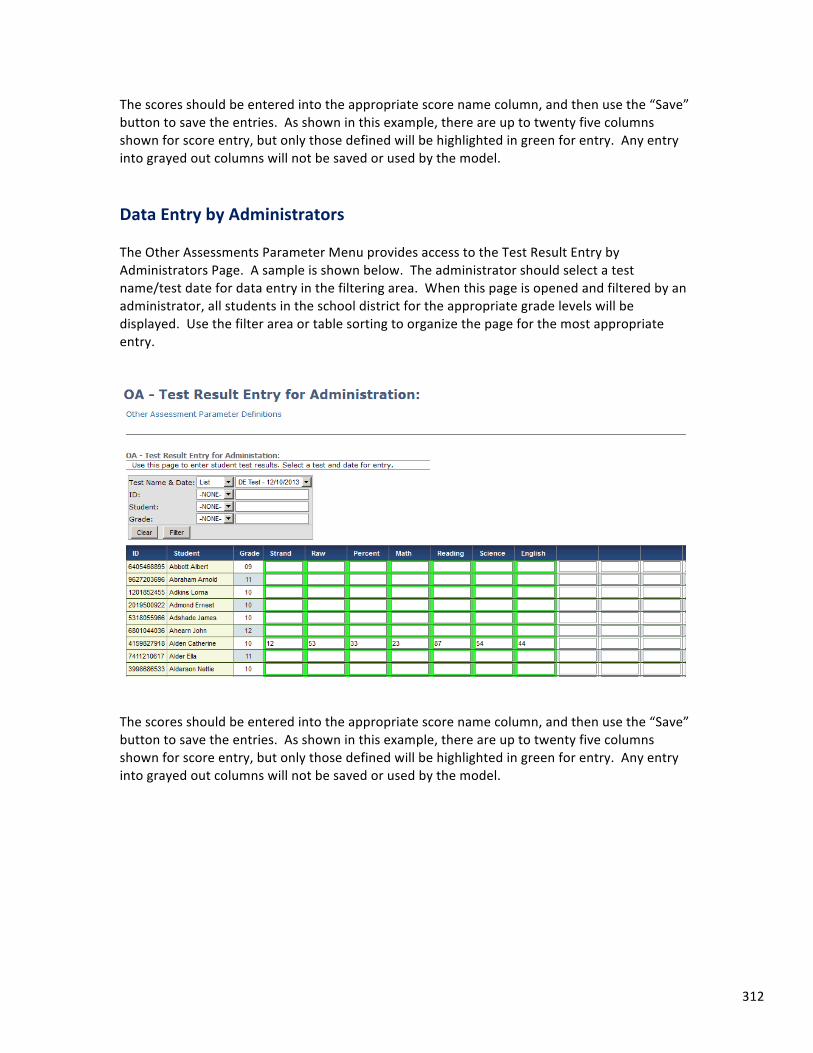
312
The scores should be entered into the appropriate score name column, and then use the “Save” button to save the entries. As shown in this example, there are up to twenty five columns shown for score entry, but only those defined will be highlighted in green for entry. Any entry into grayed out columns will not be saved or used by the model. Data Entry by Administrators The Other Assessments Parameter Menu provides access to the Test Result Entry by Administrators Page. A sample is shown below. The administrator should select a test name/test date for data entry in the filtering area. When this page is opened and filtered by an administrator, all students in the school district for the appropriate grade levels will be displayed. Use the filter area or table sorting to organize the page for the most appropriate entry.
The scores should be entered into the appropriate score name column, and then use the “Save” button to save the entries. As shown in this example, there are up to twenty five columns shown for score entry, but only those defined will be highlighted in green for entry. Any entry into grayed out columns will not be saved or used by the model.
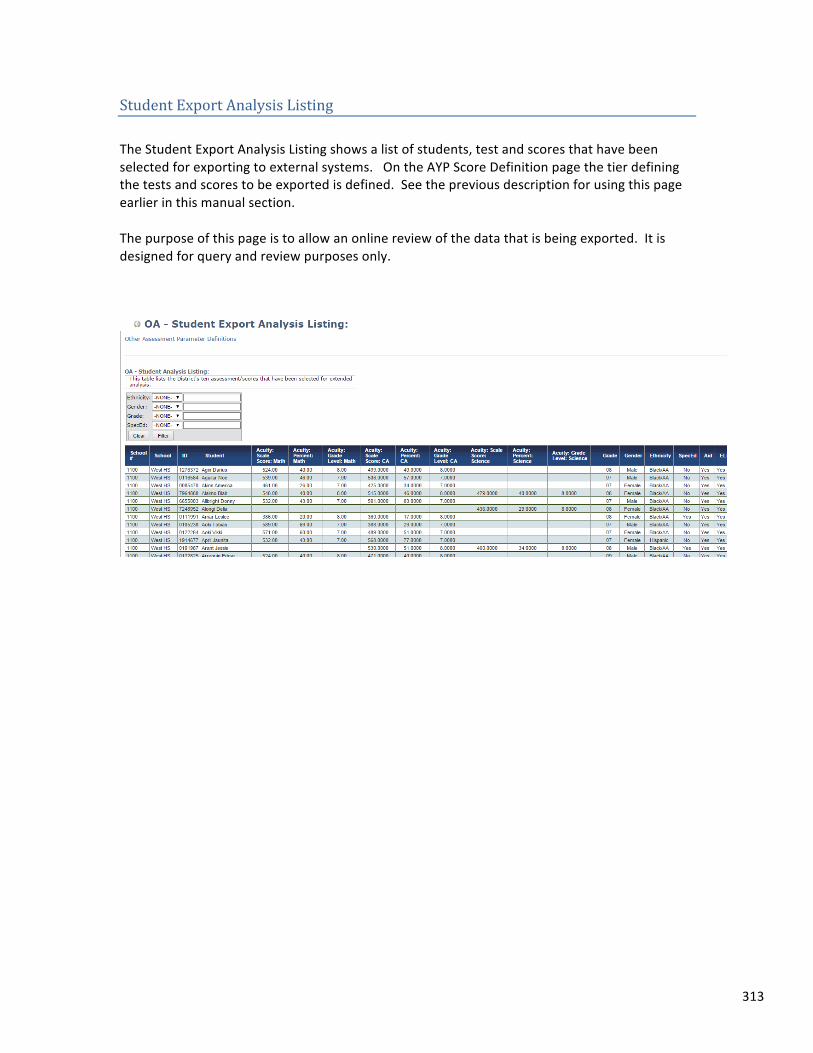
313
Student Export Analysis Listing
The Student Export Analysis Listing shows a list of students, test and scores that have been selected for exporting to external systems. On the AYP Score Definition page the tier defining the tests and scores to be exported is defined. See the previous description for using this page earlier in this manual section. The purpose of this page is to allow an online review of the data that is being exported. It is designed for query and review purposes only.
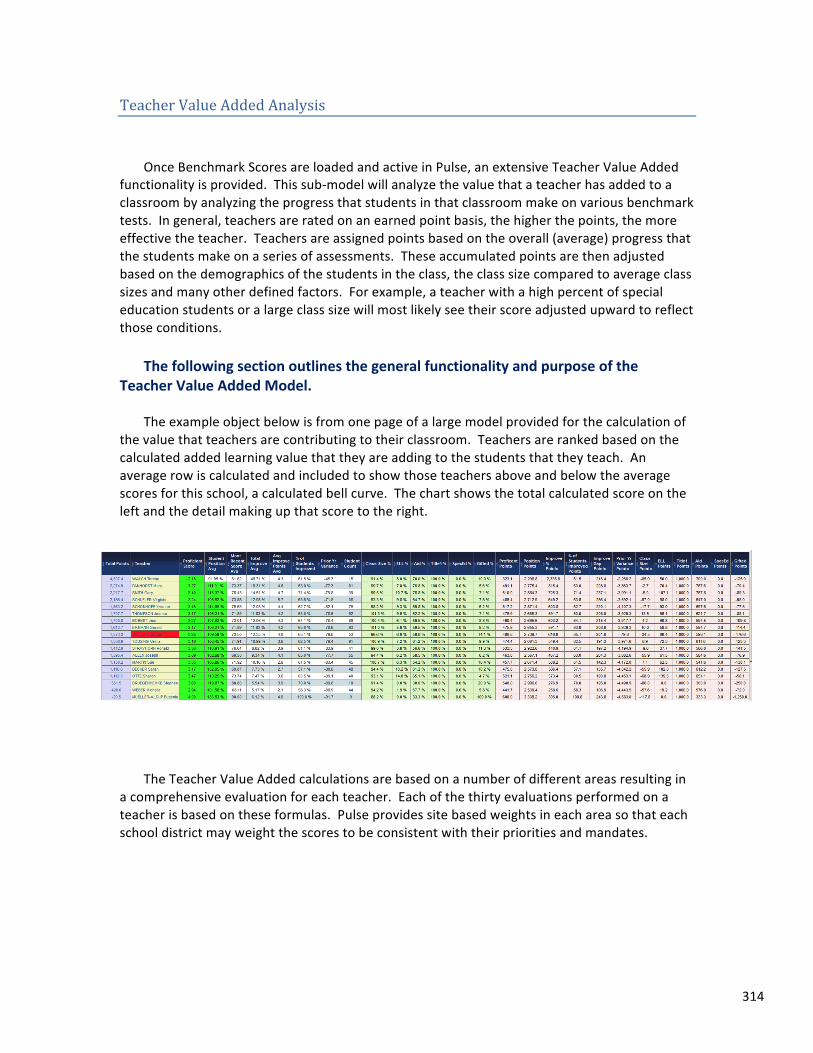
314
Teacher Value Added Analysis
Once Benchmark Scores are loaded and active in Pulse, an extensive Teacher Value Added functionality is provided. This sub-‐model will analyze the value that a teacher has added to a classroom by analyzing the progress that students in that classroom make on various benchmark tests. In general, teachers are rated on an earned point basis, the higher the points, the more effective the teacher. Teachers are assigned points based on the overall (average) progress that the students make on a series of assessments. These accumulated points are then adjusted based on the demographics of the students in the class, the class size compared to average class sizes and many other defined factors. For example, a teacher with a high percent of special education students or a large class size will most likely see their score adjusted upward to reflect those conditions.
The following section outlines the general functionality and purpose of the
Teacher Value Added Model. The example object below is from one page of a large model provided for the calculation of
the value that teachers are contributing to their classroom. Teachers are ranked based on the calculated added learning value that they are adding to the students that they teach. An average row is calculated and included to show those teachers above and below the average scores for this school, a calculated bell curve. The chart shows the total calculated score on the left and the detail making up that score to the right.
The calculations making up this evaluation are quite comprehensive. In reviewing this
example, note that Pulse provides this level of calculation on twenty five different assessment The Teacher Value Added calculations are based on a number of different areas resulting in
a comprehensive evaluation for each teacher. Each of the thirty evaluations performed on a teacher is based on these formulas. Pulse provides site based weights in each area so that each school district may weight the scores to be consistent with their priorities and mandates.
315
Formula Components 1. Pulse calculates the average improvement for a teacher’s students on any specified test.
Each test is assumed to have a baseline exam and up to nine additional scores taken over a school year. The baseline exam may be in the same school year or can be an exit exam from the prior school year. Pulse calculates the average percentile improvement for each student being taught by a teacher. For example, a teacher with a classroom improving the average score for students by 25% will receive a higher score than a teacher with a classroom improving by 20%.
The resulting calculation is adjusted by the District’s weighting to calculate a score for average percentile improvement. Students in a teacher’s class or group that have not taken the test a sufficient number of times or who entered the teacher’s classroom during the school year are automatically excluded from the calculation. This is the case for each evaluation area except for class size and demographic adjustments that are described below.
2. Based on the same criteria described above, Pulse calculates the average number of
point improvement on the test for each student in the classroom. The average point and percentile improvement can vary due to the percentile at which each student tests. For example, students in low percentiles improving 5 points will improve by higher percentages than students improving 5 points in higher percentiles. The approach of using both percentage and points gains in the formulas will level this abnormality. The same exclusions and weights are applied as outlined above.
3. Pulse calculates the average proficiency of the classroom based on proficiency cutoffs
unique to each grade level. A point value is calculated based on the testing proficiency level of the classroom. For example, a classroom with students averaging 75% proficient will score higher than a classroom with 50% if the students scoring proficient.
4. Pulse determines the percentage of students taught by each teacher that have
improved their scores over the course of the year or testing period. This value is used in the same manner as described above to calculate a weighted score. For example, a teacher with 80% of their students improving on test scores will be weighted higher than a teacher with 70% of their students improving.
5. One of the more advanced parts of the Teacher Value Add ratings is the ability to
compare student advances over multiple years. In this evaluation area Pulse calculates the average improvement of all of the students taught by a teacher in the current year with that same group of student’s performance in the prior school year. In this case, those students may have been taught last year by a variety of teachers. The improvement in that year is then compared to the current year. A score is calculated based on the current year rate (owned by the current teacher) and the prior year rate (owned by a variety of teachers on the same students). This approach normalizes the scoring based on the expected improvement levels for this specific group of students and results in a much more fair and comprehensive evaluation. The same weighting and student inclusion formulas are used as are described above.
316
6. Pulse evaluates the average age of the students taught by a teacher. This age calculation is based on the expected age of students at their grade level. It has been shown in studies that the age of students is likely the most significant factor in how (in large groups) they will scores on tests. Therefore, if one teacher is teaching students that are on average four months younger than those of another teacher, an adjustment should be made to account for this variance. Without this adjustment, a fair comparison of teacher performance is not possible.
7. Pulse calculates a Risk Position for each student in a school district. This rating is based
on a formula that calculates how well a student is adjusted to school life. For teacher evaluations, Pulse also calculates an average risk position for each teacher’s students. If the average ranking (on a percentage scale) for one teacher’s students is 50% and for a second teacher’s students is 10%, then an adjustment is mandated to achieve accurate and fair results. In this case, the first teacher is spending far more time than the second teacher managing discipline, attendance and other school related issues and less time teaching.
8. Once each of these steps is completed, Pulse further provides for adjustments to the
scores based on classroom size and demographic considerations. For example, two teachers being compared may have different numbers of students. One teacher may teach 25 students while the other is teaching 21. So, the net effect is that the first teacher is spread thinner over more students. To be fair, an adjustment should be made to account for this inconsistency. Also, in one teacher’s class there may be 60% ELL students while in another teacher’s class there are 7.5% ELL students. Again, a direct comparison is difficult and unfair without an adjustment accounting for the more difficult student group in the teacher with the most ELL students.
So, Pulse allows for automatic adjustments to be made in these areas. Each adjustment is made based on the Pulse calculation of these comparatives from the school master schedule. Also, the weights managed by each school district are also applied to the calculation. The following calculations are made:
-‐ Class Size. Pulse calculates the average class size for each school. Then,
Pulse calculates the percentage of the average class size for each teacher in relation to the school average class size. The variance in the percent is used for this calculation.
-‐ ELL Count. The percentage of ELL students taught by each teacher is
calculated and then used as an adjustment on this factor.
-‐ Special Ed Count. The percentage of Special Ed students taught by each teacher is calculated and then used as an adjustment on this factor.
-‐ Aid Count. The percentage of students qualified for free and reduced lunch
taught by each teacher is calculated and then used as an adjustment on this factor.
317
-‐ Title1 Count. The percentage of Title1 students taught by each teacher is calculated and then used as an adjustment on this factor.
-‐ Gifted Count. The percentage of gifted students taught by each teacher is
calculated and then used as an adjustment on this factor.
So, in summary Pulse is performing hundreds of thousands of individual calculations across dozens of evaluation areas to generate a highly specialized value add ranking for each teacher. This is then performed 30 separate times across multiple scores and subject areas to produce a composite ranking for each teacher.
The 30 areas of evaluation are made up of:
-‐ One Evaluation Score for each of the 25 Benchmark Test/Scores that are defined.
-‐ A blended score for each of the benchmark scores associated with Math, Reading, Science and Social Studies
-‐ A total or blended score based on the averages of all of the 25 scores.
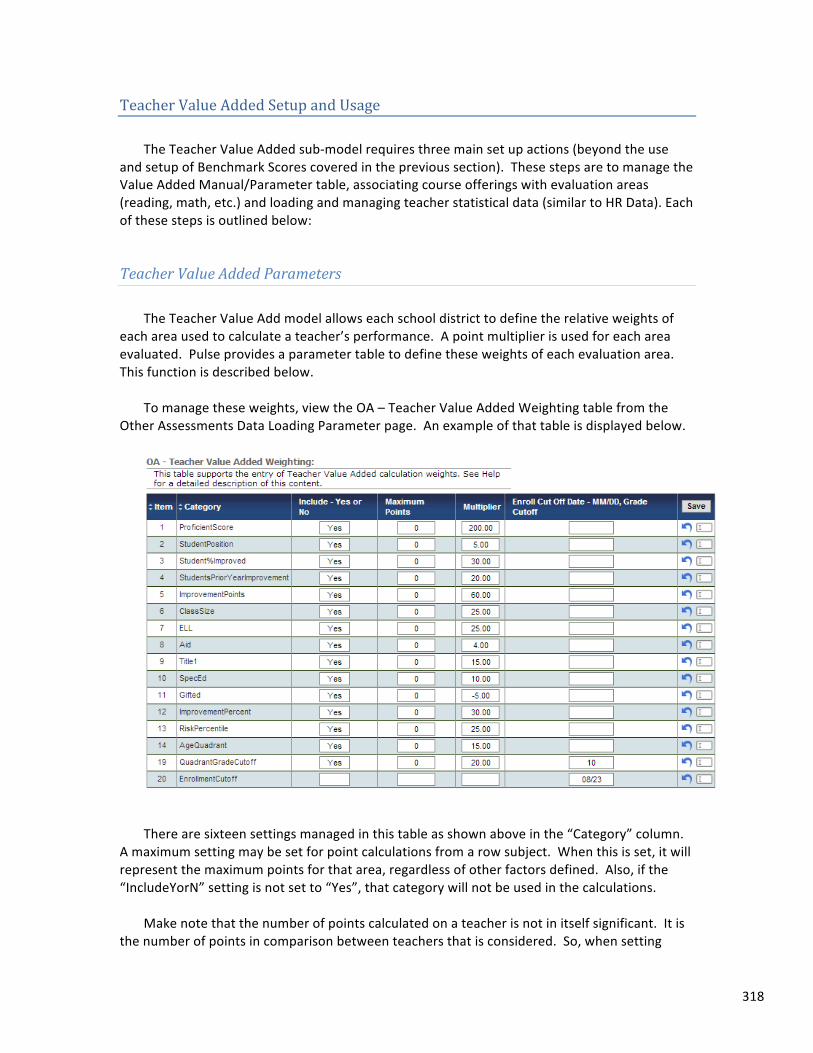
318
Teacher Value Added Setup and Usage The Teacher Value Added sub-‐model requires three main set up actions (beyond the use
and setup of Benchmark Scores covered in the previous section). These steps are to manage the Value Added Manual/Parameter table, associating course offerings with evaluation areas (reading, math, etc.) and loading and managing teacher statistical data (similar to HR Data). Each of these steps is outlined below:
Teacher Value Added Parameters The Teacher Value Add model allows each school district to define the relative weights of
each area used to calculate a teacher’s performance. A point multiplier is used for each area evaluated. Pulse provides a parameter table to define these weights of each evaluation area. This function is described below.
To manage these weights, view the OA – Teacher Value Added Weighting table from the
Other Assessments Data Loading Parameter page. An example of that table is displayed below.
There are sixteen settings managed in this table as shown above in the “Category” column.
A maximum setting may be set for point calculations from a row subject. When this is set, it will represent the maximum points for that area, regardless of other factors defined. Also, if the “IncludeYorN” setting is not set to “Yes”, that category will not be used in the calculations.
Make note that the number of points calculated on a teacher is not in itself significant. It is
the number of points in comparison between teachers that is considered. So, when setting
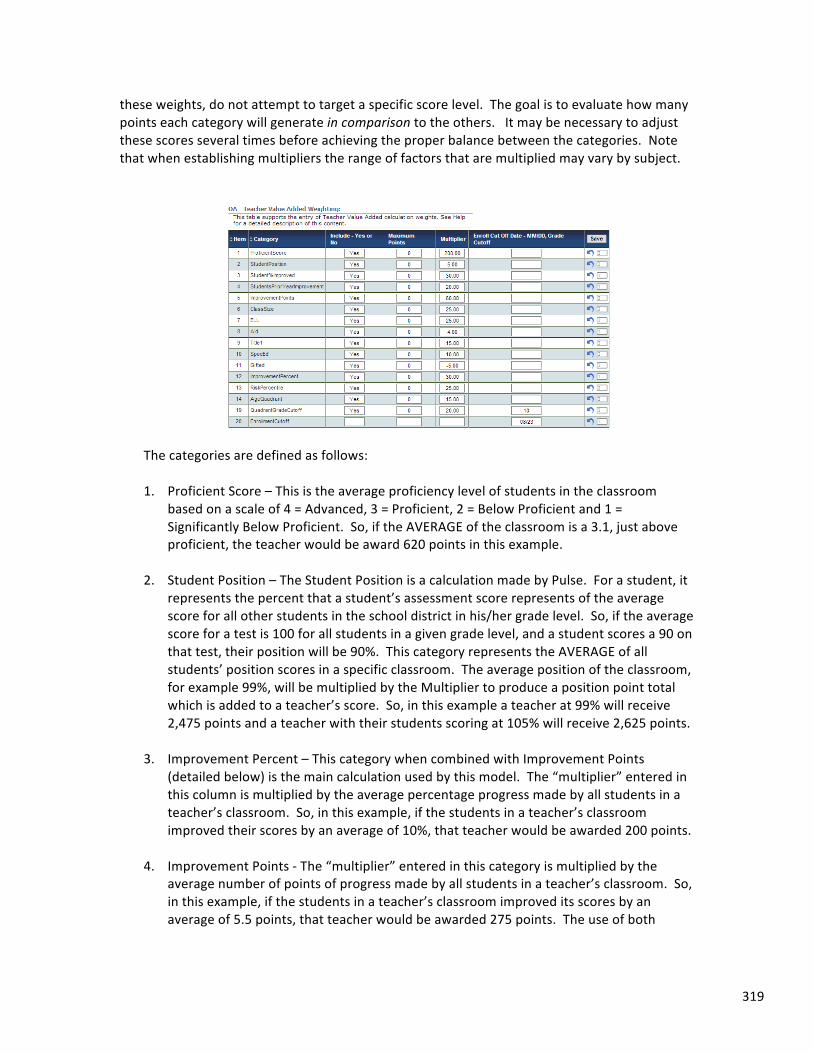
319
these weights, do not attempt to target a specific score level. The goal is to evaluate how many points each category will generate in comparison to the others. It may be necessary to adjust these scores several times before achieving the proper balance between the categories. Note that when establishing multipliers the range of factors that are multiplied may vary by subject.
The categories are defined as follows: 1. Proficient Score – This is the average proficiency level of students in the classroom
based on a scale of 4 = Advanced, 3 = Proficient, 2 = Below Proficient and 1 = Significantly Below Proficient. So, if the AVERAGE of the classroom is a 3.1, just above proficient, the teacher would be award 620 points in this example.
2. Student Position – The Student Position is a calculation made by Pulse. For a student, it
represents the percent that a student’s assessment score represents of the average score for all other students in the school district in his/her grade level. So, if the average score for a test is 100 for all students in a given grade level, and a student scores a 90 on that test, their position will be 90%. This category represents the AVERAGE of all students’ position scores in a specific classroom. The average position of the classroom, for example 99%, will be multiplied by the Multiplier to produce a position point total which is added to a teacher’s score. So, in this example a teacher at 99% will receive 2,475 points and a teacher with their students scoring at 105% will receive 2,625 points.
3. Improvement Percent – This category when combined with Improvement Points
(detailed below) is the main calculation used by this model. The “multiplier” entered in this column is multiplied by the average percentage progress made by all students in a teacher’s classroom. So, in this example, if the students in a teacher’s classroom improved their scores by an average of 10%, that teacher would be awarded 200 points.
4. Improvement Points -‐ The “multiplier” entered in this category is multiplied by the
average number of points of progress made by all students in a teacher’s classroom. So, in this example, if the students in a teacher’s classroom improved its scores by an average of 5.5 points, that teacher would be awarded 275 points. The use of both

320
percentage gains and point gains in a classroom normalizes the situation where students improving from very low scores show higher percentage gains for the same point gains.
5. Prior Year Improvement – The Prior Year Improvement is the percentage improvement
that a current teacher’s students made in the prior year. The teacher’s student’s prior year improvement is subtracted from the current year improvements to determine if that group of students made more or less progress in the current year than with prior year teachers. This is a very good leveling consideration. It allows for the determination that the group of students taught by a teacher traditionally lags or exceeds learning averages across multiple years. Once determined, an adjustment may be made in the teacher value added rankings. The “multiplier” in this column is multiplied by the difference in the prior year and current year average for the students taught by the teacher.
6. ELL, Aid, Title1, SpecEd, Gifted – Each of these categories are calculated in the same
manner. Pulse calculates the percentage of students taught by each teacher in each of these categories. For example, if 10% of the students taught by a teacher were special education students, the Multiplier of 10 times the 10% would increase that teacher’s score by 100 points. In this example, it is assumed that students in these categories are expected to improve their scores at a slower pace than students not in these categories.
Note in the example above Gifted Students are given a negative value. This will result in gifted students taught by a teacher reducing the points since gifted students are expected to improve test scores at a faster rate from a higher starting point.
7. Class Size – The class size setting will increase or decrease a teacher’s calculated points
based on their average class size. Pulse calculates the average class size for each school in which a teacher teachers. The average class size for each teacher is also calculated. By comparing these calculations each teacher is determined to be a percentage above or below the school average. This category will multiply the multiplier by the percentage that the teacher is above or below the average. This adjustment is made because is it expected that teacher’s with large classrooms will spend less time with each individual student compared to teachers with smaller rooms. When calculating the average class size in a school, Pulse ignores all classes with fewer than ten students. This allows “special” classes to be excluded from the calculation to achieve a better overall class size average.
8. Enrollment Cutoff – The Enrollment Cutoff is a date that is used to determine if a
student that enrolled in a teacher’s classroom after the start of a school year should be considered in the teacher’s TVA calculations. If a teacher has generally not taught a student for a full school year, it may not be fair to include that student’s results in the teachers scoring. Any student that enrolled after this date will not be included in the calculation, however, they will be included in class count and demographic calculations.
9. Risk Percentile – Risk Percentile is defined as a ranking (generally on a percentage scale)
of how well a student is adjusted to school life. For each teacher, an average risk percentile rating is calculated for the students that they teach. So, teachers with students having higher risk percentiles (based on attendance, discipline, etc.) should
321
have adjustments made when being compared to teachers with students having a lower risk percentile.
10. Age Quadrant – Most studies have shown that for large groups of students, the number
one variable determining test results is the relative age of the students. Because the students in each classroom may vary in age by one year (more if there are holdbacks or students starting school early), it is not uncommon to see the average age of one teacher’s student vary by three months or more from another teacher’s students. The teacher with the younger students is at a severe disadvantage when making direct comparisons. So, it is appropriate to make adjustments based on the average age of each teacher’s students.
11. Age Cutoff – While the age variation described above is very pronounced at lower grade
levels, it is diluted at higher grade levels. It is appropriate to define a grade level cut off for this calculation. If a 10 is entered in this setting then students in K-‐9 will have this calculations performed and students in grades 10-‐12 will not have this adjustment performed.
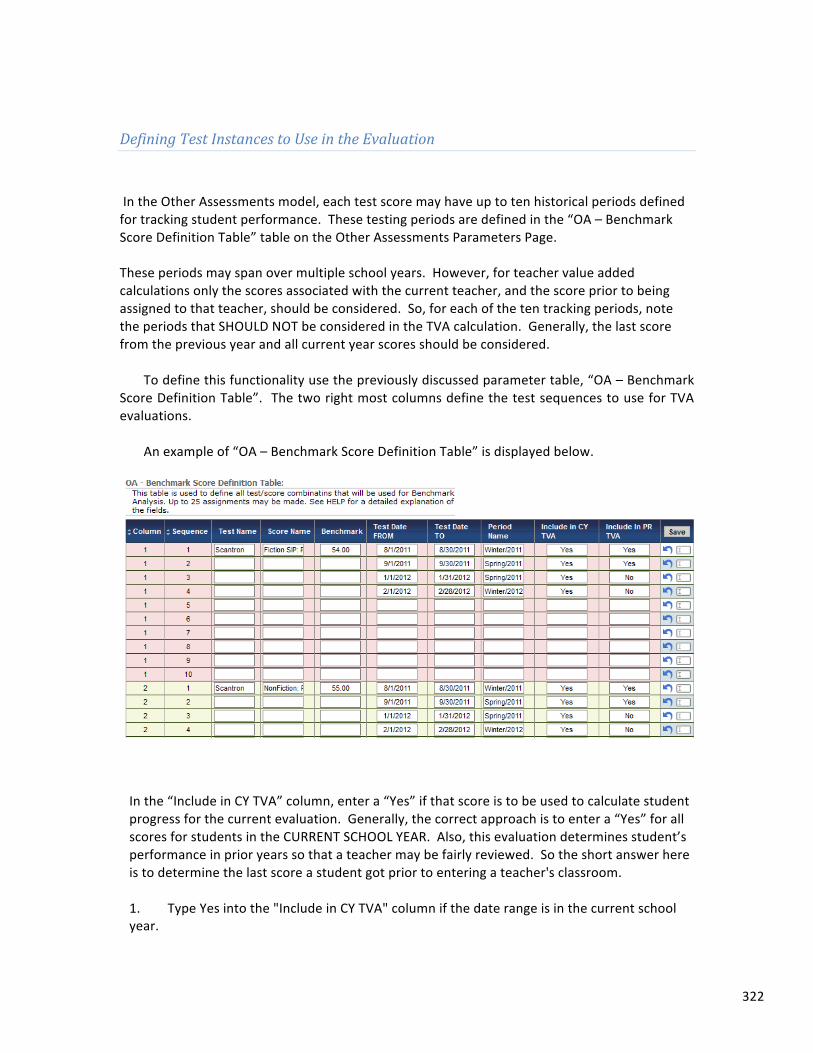
322
Defining Test Instances to Use in the Evaluation In the Other Assessments model, each test score may have up to ten historical periods defined for tracking student performance. These testing periods are defined in the “OA – Benchmark Score Definition Table” table on the Other Assessments Parameters Page. These periods may span over multiple school years. However, for teacher value added calculations only the scores associated with the current teacher, and the score prior to being assigned to that teacher, should be considered. So, for each of the ten tracking periods, note the periods that SHOULD NOT be considered in the TVA calculation. Generally, the last score from the previous year and all current year scores should be considered.
To define this functionality use the previously discussed parameter table, “OA – Benchmark
Score Definition Table”. The two right most columns define the test sequences to use for TVA evaluations.
An example of “OA – Benchmark Score Definition Table” is displayed below.
In the “Include in CY TVA” column, enter a “Yes” if that score is to be used to calculate student progress for the current evaluation. Generally, the correct approach is to enter a “Yes” for all scores for students in the CURRENT SCHOOL YEAR. Also, this evaluation determines student’s performance in prior years so that a teacher may be fairly reviewed. So the short answer here is to determine the last score a student got prior to entering a teacher's classroom. 1. Type Yes into the "Include in CY TVA" column if the date range is in the current school year.
323
2. Type Yes into the "Include in PR TVA" column for the date range of the last score in the previous school year. Entering a No is not necessary but will not hurt anything. Do not enter a Y, enter a full "Yes" in the two previous fields. NOTE, each test / score name combination may have UP TO ten entries. If there are not ten historical scores for a particular score/test, enter only what is available and leave the other columns empty.
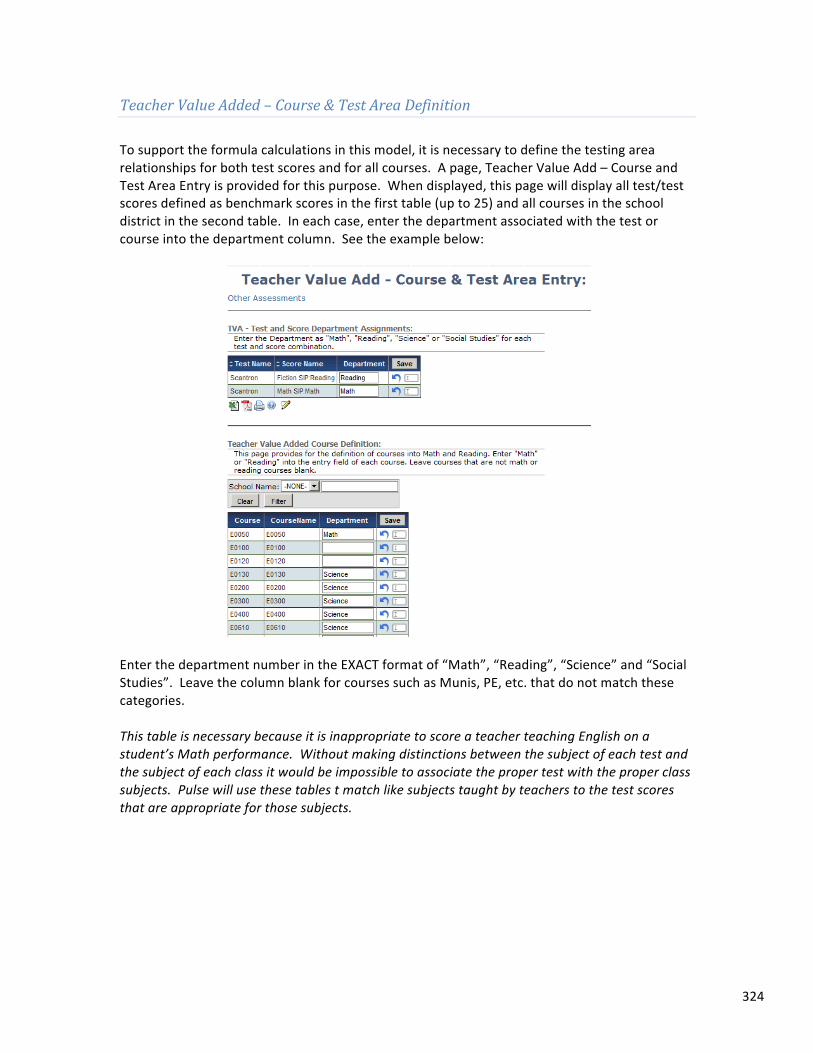
324
Teacher Value Added – Course & Test Area Definition
To support the formula calculations in this model, it is necessary to define the testing area relationships for both test scores and for all courses. A page, Teacher Value Add – Course and Test Area Entry is provided for this purpose. When displayed, this page will display all test/test scores defined as benchmark scores in the first table (up to 25) and all courses in the school district in the second table. In each case, enter the department associated with the test or course into the department column. See the example below:
Enter the department number in the EXACT format of “Math”, “Reading”, “Science” and “Social Studies”. Leave the column blank for courses such as Munis, PE, etc. that do not match these categories. This table is necessary because it is inappropriate to score a teacher teaching English on a student’s Math performance. Without making distinctions between the subject of each test and the subject of each class it would be impossible to associate the proper test with the proper class subjects. Pulse will use these tables t match like subjects taught by teachers to the test scores that are appropriate for those subjects.
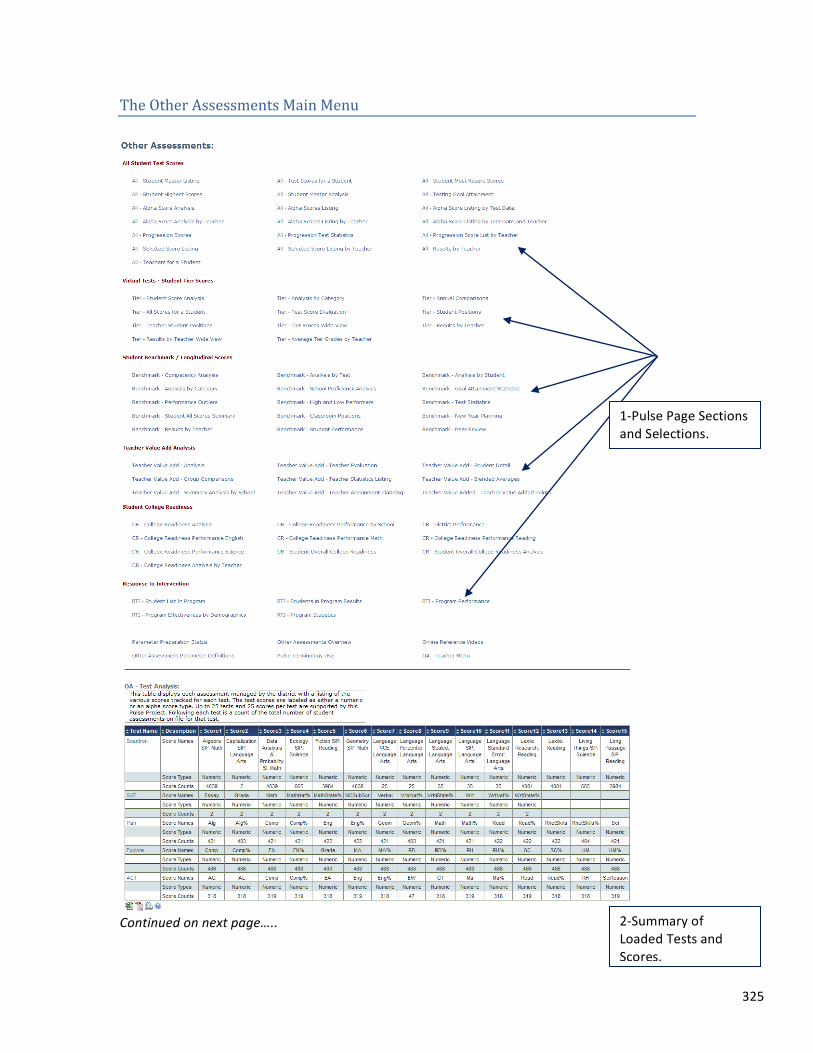
325
The Other Assessments Main Menu
Continued on next page…..
1-‐Pulse Page Sections and Selections.
2-‐Summary of Loaded Tests and Scores.
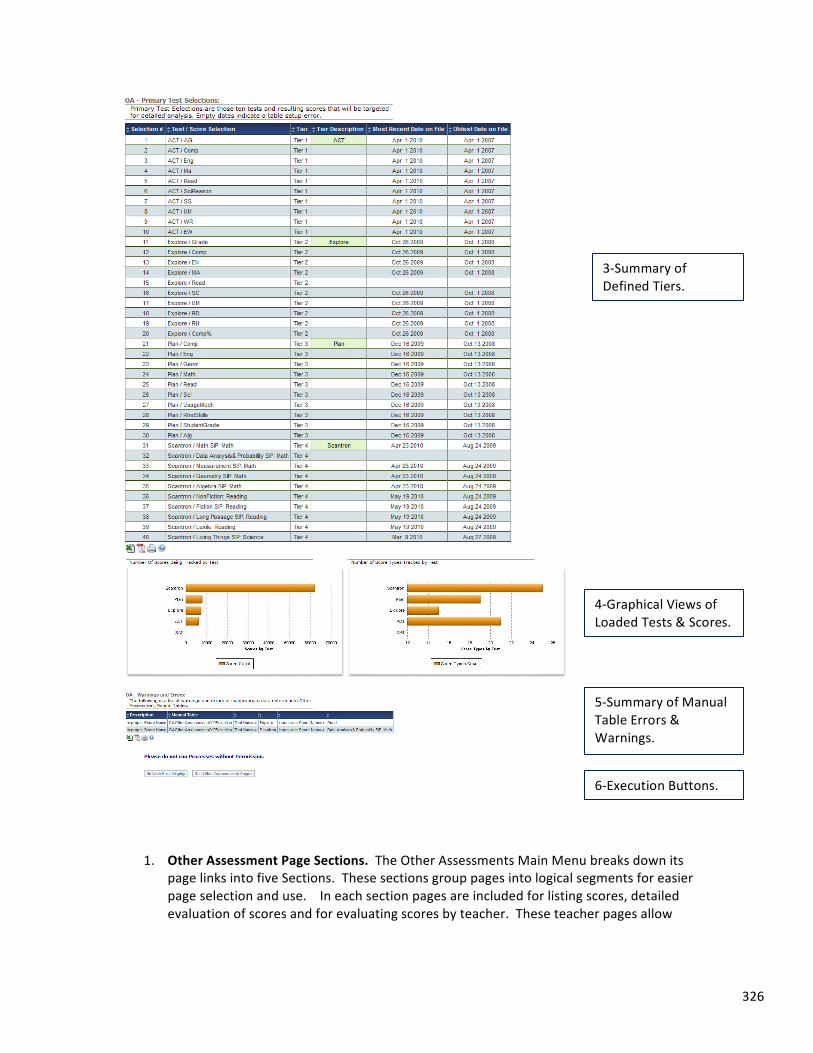
326
1. Other Assessment Page Sections. The Other Assessments Main Menu breaks down its page links into five Sections. These sections group pages into logical segments for easier page selection and use. In each section pages are included for listing scores, detailed evaluation of scores and for evaluating scores by teacher. These teacher pages allow
3-‐Summary of Defined Tiers.
4-‐Graphical Views of Loaded Tests & Scores.
5-‐Summary of Manual Table Errors & Warnings.
6-‐Execution Buttons.
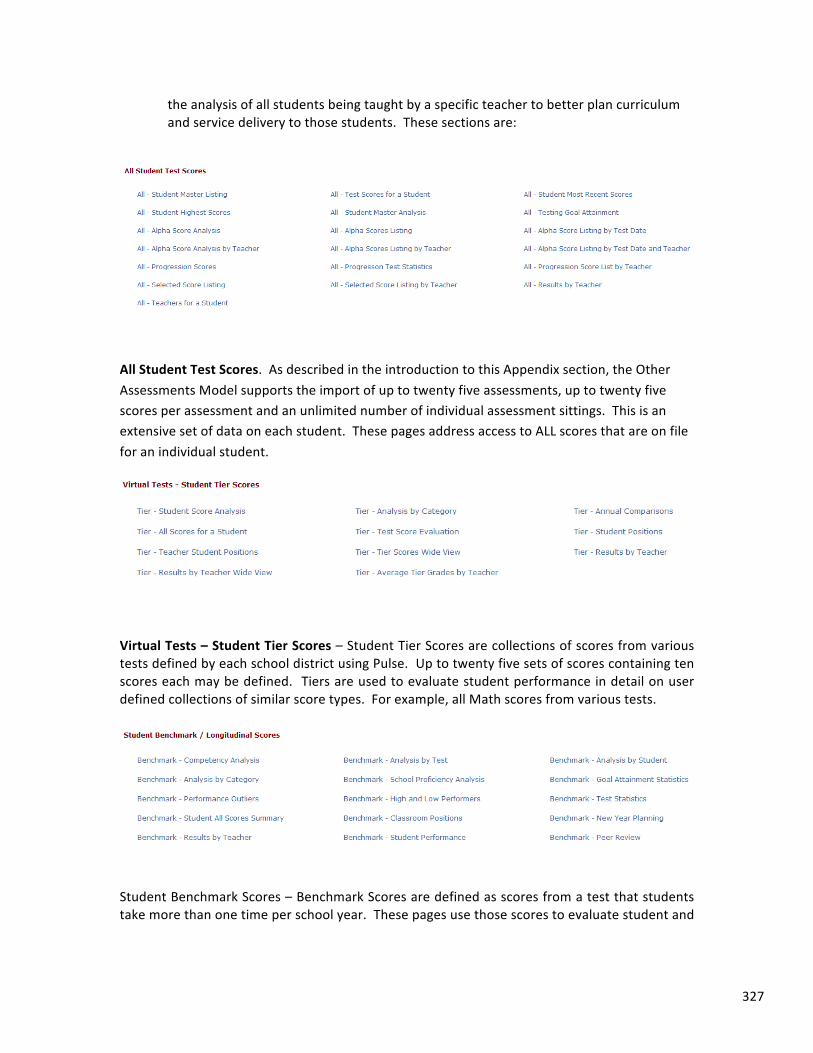
327
the analysis of all students being taught by a specific teacher to better plan curriculum and service delivery to those students. These sections are:
All Student Test Scores. As described in the introduction to this Appendix section, the Other Assessments Model supports the import of up to twenty five assessments, up to twenty five scores per assessment and an unlimited number of individual assessment sittings. This is an extensive set of data on each student. These pages address access to ALL scores that are on file for an individual student.
Virtual Tests – Student Tier Scores – Student Tier Scores are collections of scores from various tests defined by each school district using Pulse. Up to twenty five sets of scores containing ten scores each may be defined. Tiers are used to evaluate student performance in detail on user defined collections of similar score types. For example, all Math scores from various tests.
Student Benchmark Scores – Benchmark Scores are defined as scores from a test that students take more than one time per school year. These pages use those scores to evaluate student and
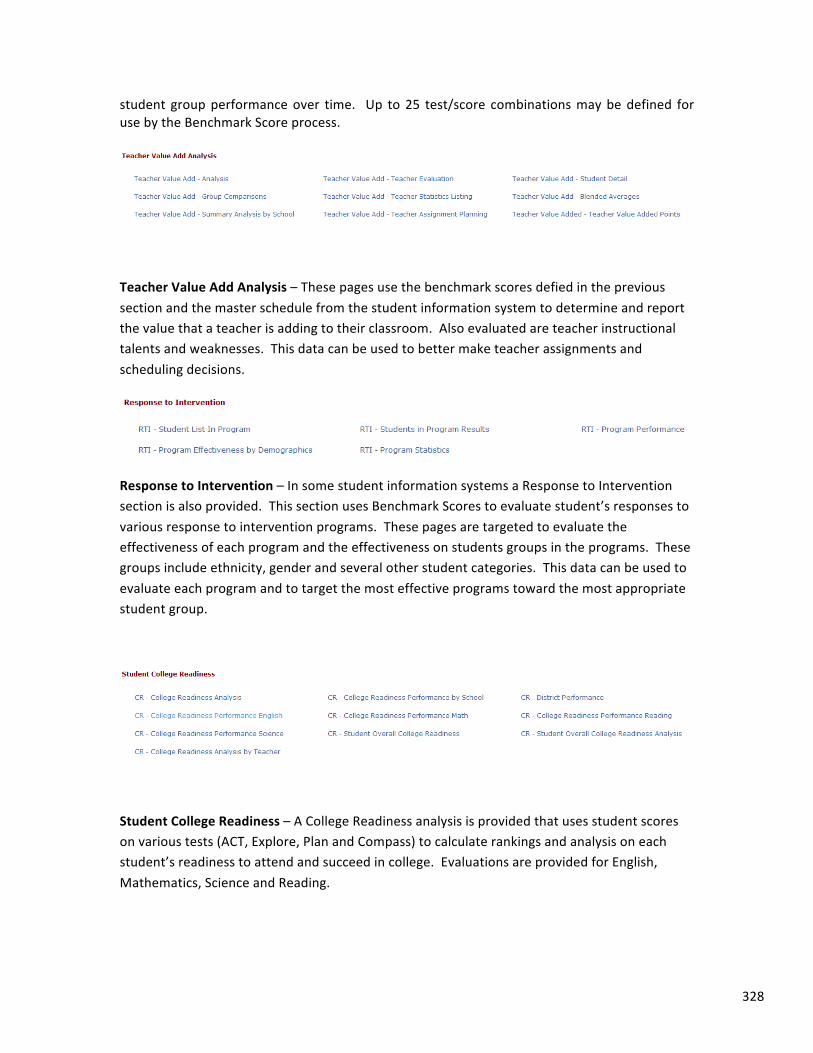
328
student group performance over time. Up to 25 test/score combinations may be defined for use by the Benchmark Score process.
Teacher Value Add Analysis – These pages use the benchmark scores defied in the previous section and the master schedule from the student information system to determine and report the value that a teacher is adding to their classroom. Also evaluated are teacher instructional talents and weaknesses. This data can be used to better make teacher assignments and scheduling decisions.
Response to Intervention – In some student information systems a Response to Intervention section is also provided. This section uses Benchmark Scores to evaluate student’s responses to various response to intervention programs. These pages are targeted to evaluate the effectiveness of each program and the effectiveness on students groups in the programs. These groups include ethnicity, gender and several other student categories. This data can be used to evaluate each program and to target the most effective programs toward the most appropriate student group.
Student College Readiness – A College Readiness analysis is provided that uses student scores on various tests (ACT, Explore, Plan and Compass) to calculate rankings and analysis on each student’s readiness to attend and succeed in college. Evaluations are provided for English, Mathematics, Science and Reading.
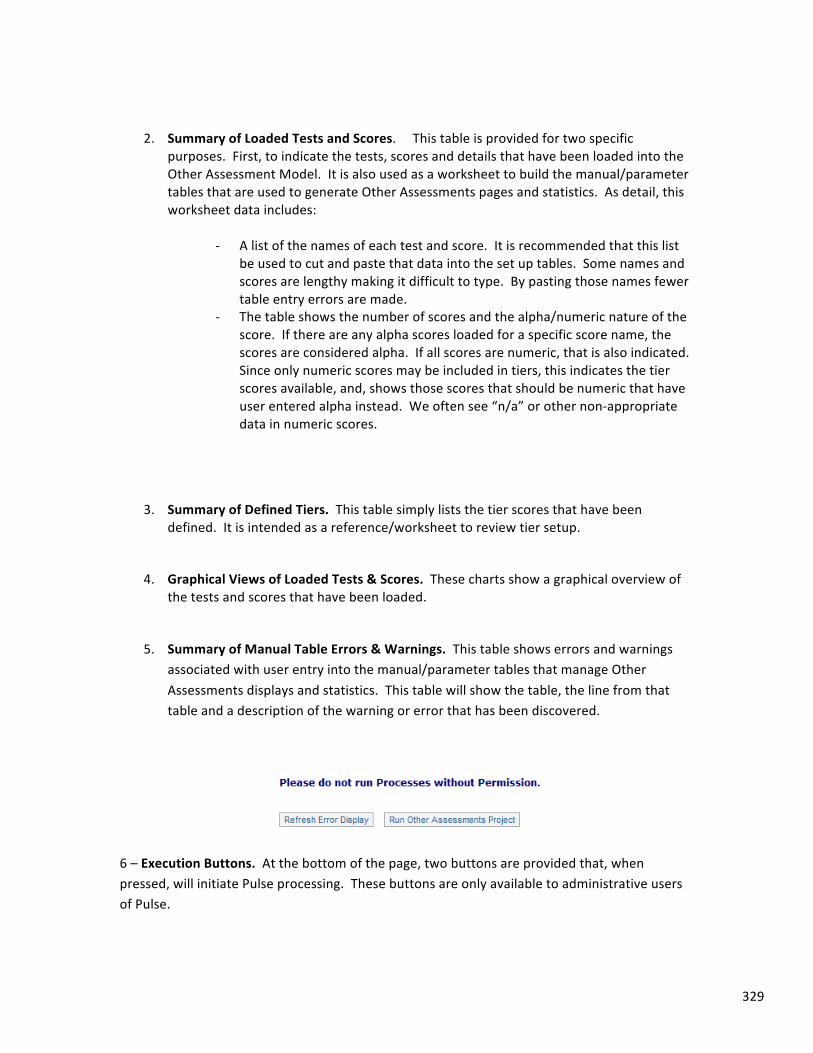
329
2. Summary of Loaded Tests and Scores. This table is provided for two specific purposes. First, to indicate the tests, scores and details that have been loaded into the Other Assessment Model. It is also used as a worksheet to build the manual/parameter tables that are used to generate Other Assessments pages and statistics. As detail, this worksheet data includes:
-‐ A list of the names of each test and score. It is recommended that this list
be used to cut and paste that data into the set up tables. Some names and scores are lengthy making it difficult to type. By pasting those names fewer table entry errors are made.
-‐ The table shows the number of scores and the alpha/numeric nature of the score. If there are any alpha scores loaded for a specific score name, the scores are considered alpha. If all scores are numeric, that is also indicated. Since only numeric scores may be included in tiers, this indicates the tier scores available, and, shows those scores that should be numeric that have user entered alpha instead. We often see “n/a” or other non-‐appropriate data in numeric scores.
3. Summary of Defined Tiers. This table simply lists the tier scores that have been defined. It is intended as a reference/worksheet to review tier setup.
4. Graphical Views of Loaded Tests & Scores. These charts show a graphical overview of the tests and scores that have been loaded.
5. Summary of Manual Table Errors & Warnings. This table shows errors and warnings associated with user entry into the manual/parameter tables that manage Other Assessments displays and statistics. This table will show the table, the line from that table and a description of the warning or error that has been discovered.
6 – Execution Buttons. At the bottom of the page, two buttons are provided that, when pressed, will initiate Pulse processing. These buttons are only available to administrative users of Pulse.
330
-‐ Refresh Error Display. If errors are present in the previous table, once corrected manually that table may be recalculated by pressing this button. Once processed, the browser page will need to be refreshed to view the results.
-‐ Run Other Assessments Project. We the entire Other Assessments project is ready to be run, clicking this button will run that project. Once started, this project will run for 15 minutes (small districts) up to two hours (large districts). While running, the user may perform other Pulse functions since it runs in the background. No indication of completion is provided, the entries from the process are being written into the Pulse Log.
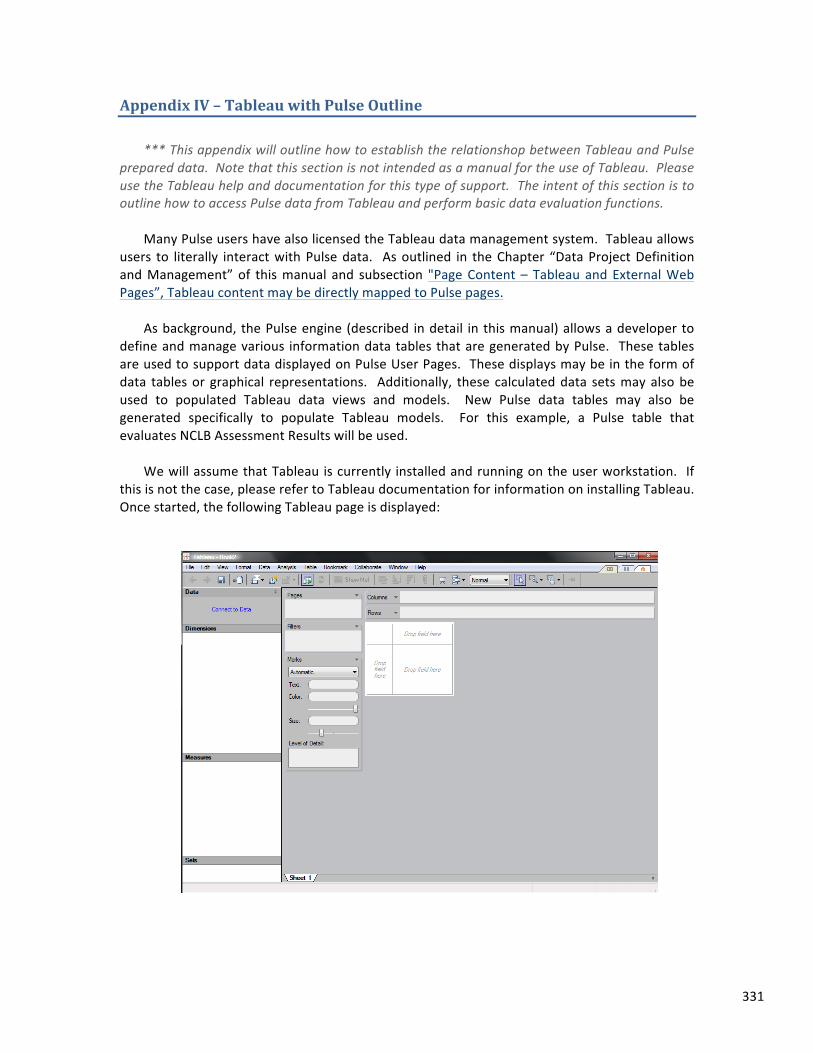
331
Appendix IV – Tableau with Pulse Outline *** This appendix will outline how to establish the relationshop between Tableau and Pulse
prepared data. Note that this section is not intended as a manual for the use of Tableau. Please use the Tableau help and documentation for this type of support. The intent of this section is to outline how to access Pulse data from Tableau and perform basic data evaluation functions.
Many Pulse users have also licensed the Tableau data management system. Tableau allows
users to literally interact with Pulse data. As outlined in the Chapter “Data Project Definition and Management” of this manual and subsection "Page Content – Tableau and External Web Pages”, Tableau content may be directly mapped to Pulse pages.
As background, the Pulse engine (described in detail in this manual) allows a developer to
define and manage various information data tables that are generated by Pulse. These tables are used to support data displayed on Pulse User Pages. These displays may be in the form of data tables or graphical representations. Additionally, these calculated data sets may also be used to populated Tableau data views and models. New Pulse data tables may also be generated specifically to populate Tableau models. For this example, a Pulse table that evaluates NCLB Assessment Results will be used.
We will assume that Tableau is currently installed and running on the user workstation. If
this is not the case, please refer to Tableau documentation for information on installing Tableau. Once started, the following Tableau page is displayed:
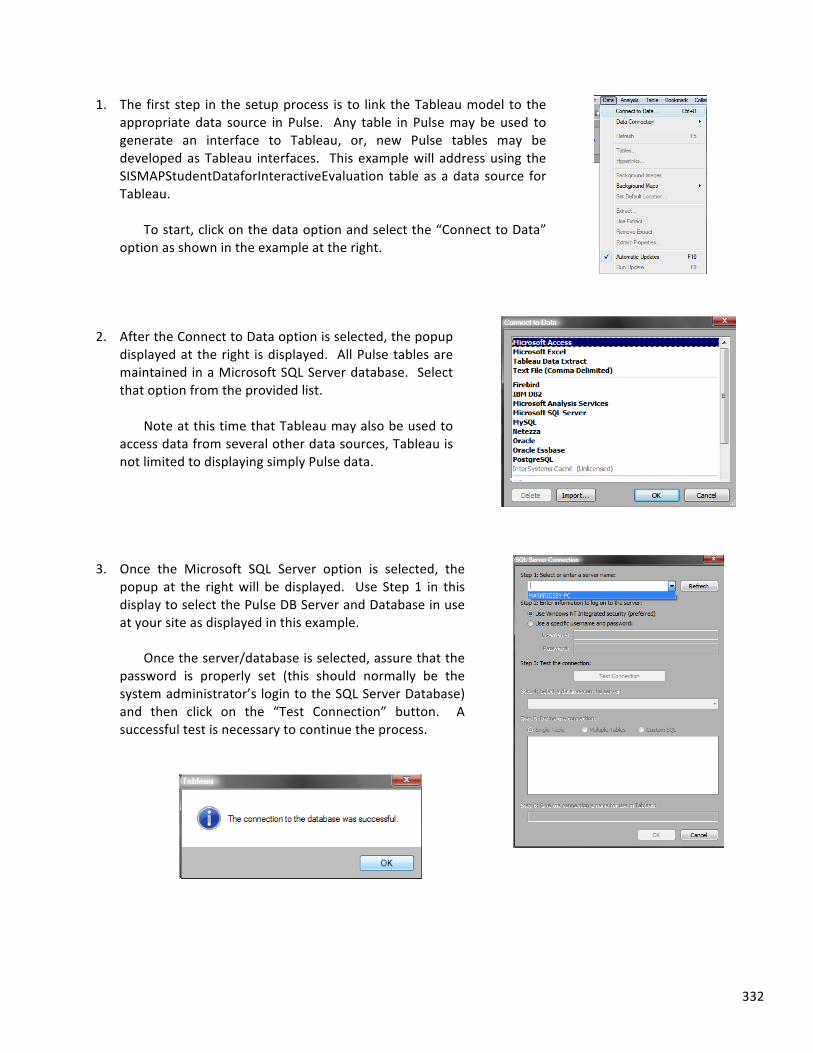
332
1. The first step in the setup process is to link the Tableau model to the appropriate data source in Pulse. Any table in Pulse may be used to generate an interface to Tableau, or, new Pulse tables may be developed as Tableau interfaces. This example will address using the SISMAPStudentDataforInteractiveEvaluation table as a data source for Tableau.
To start, click on the data option and select the “Connect to Data”
option as shown in the example at the right.
2. After the Connect to Data option is selected, the popup displayed at the right is displayed. All Pulse tables are maintained in a Microsoft SQL Server database. Select that option from the provided list.
Note at this time that Tableau may also be used to
access data from several other data sources, Tableau is not limited to displaying simply Pulse data.
3. Once the Microsoft SQL Server option is selected, the popup at the right will be displayed. Use Step 1 in this display to select the Pulse DB Server and Database in use at your site as displayed in this example.
Once the server/database is selected, assure that the
password is properly set (this should normally be the system administrator’s login to the SQL Server Database) and then click on the “Test Connection” button. A successful test is necessary to continue the process.
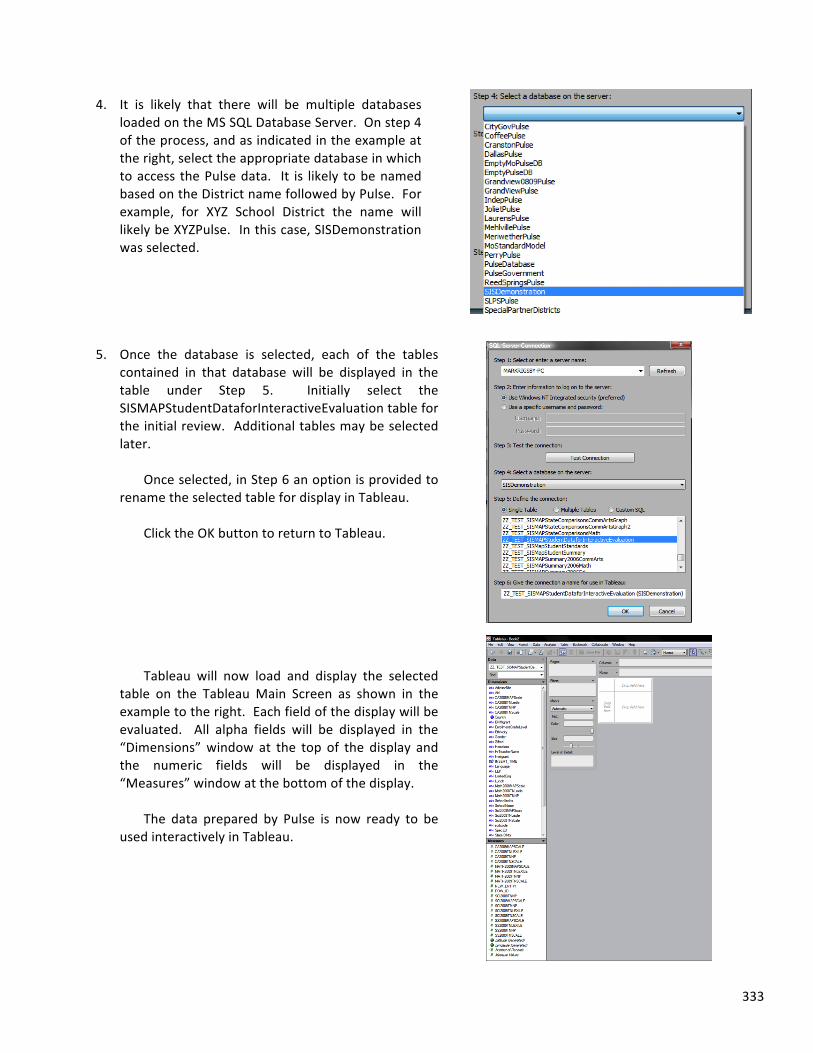
333
4. It is likely that there will be multiple databases loaded on the MS SQL Database Server. On step 4 of the process, and as indicated in the example at the right, select the appropriate database in which to access the Pulse data. It is likely to be named based on the District name followed by Pulse. For example, for XYZ School District the name will likely be XYZPulse. In this case, SISDemonstration was selected.
5. Once the database is selected, each of the tables contained in that database will be displayed in the table under Step 5. Initially select the SISMAPStudentDataforInteractiveEvaluation table for the initial review. Additional tables may be selected later.
Once selected, in Step 6 an option is provided to
rename the selected table for display in Tableau. Click the OK button to return to Tableau. Tableau will now load and display the selected
table on the Tableau Main Screen as shown in the example to the right. Each field of the display will be evaluated. All alpha fields will be displayed in the “Dimensions” window at the top of the display and the numeric fields will be displayed in the “Measures” window at the bottom of the display.
The data prepared by Pulse is now ready to be
used interactively in Tableau.
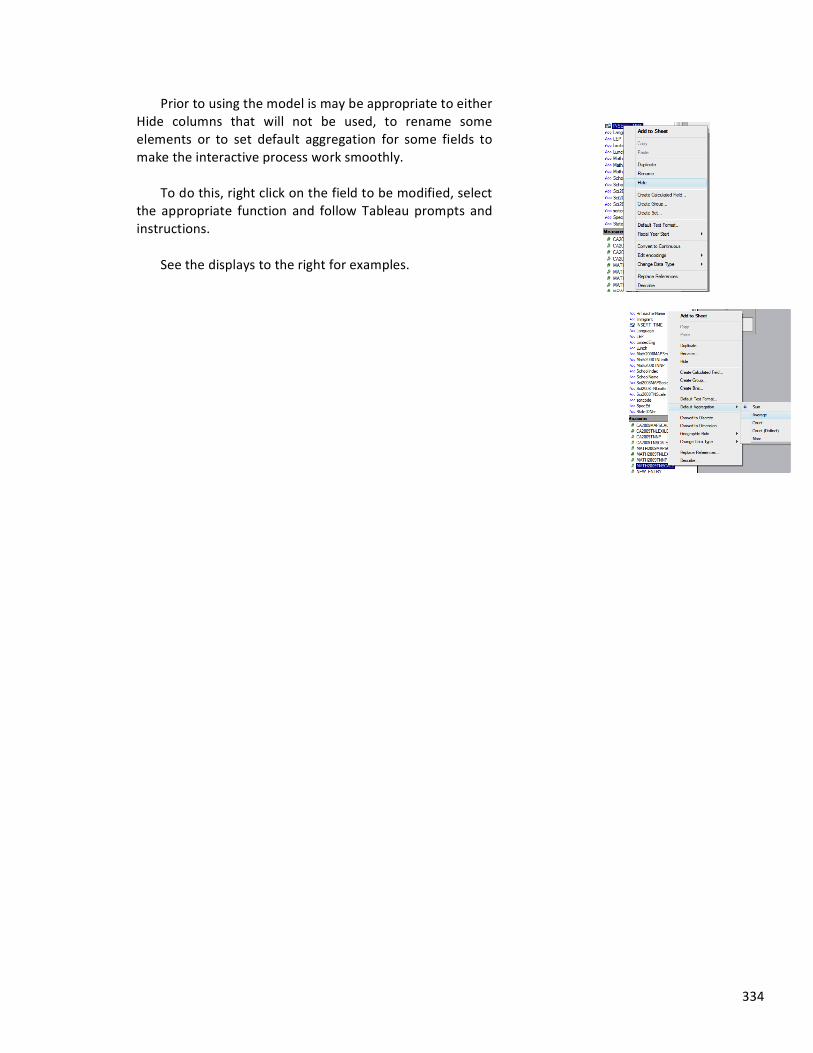
334
Prior to using the model is may be appropriate to either Hide columns that will not be used, to rename some elements or to set default aggregation for some fields to make the interactive process work smoothly.
To do this, right click on the field to be modified, select
the appropriate function and follow Tableau prompts and instructions.
See the displays to the right for examples.
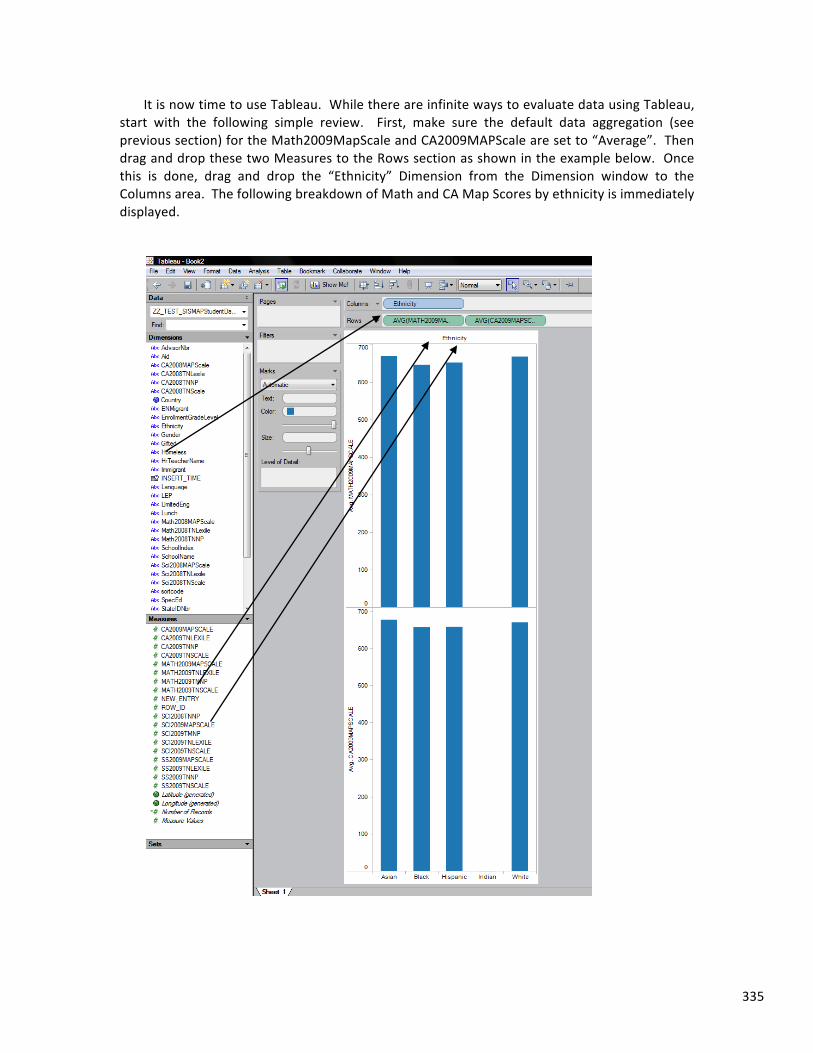
335
It is now time to use Tableau. While there are infinite ways to evaluate data using Tableau, start with the following simple review. First, make sure the default data aggregation (see previous section) for the Math2009MapScale and CA2009MAPScale are set to “Average”. Then drag and drop these two Measures to the Rows section as shown in the example below. Once this is done, drag and drop the “Ethnicity” Dimension from the Dimension window to the Columns area. The following breakdown of Math and CA Map Scores by ethnicity is immediately displayed.
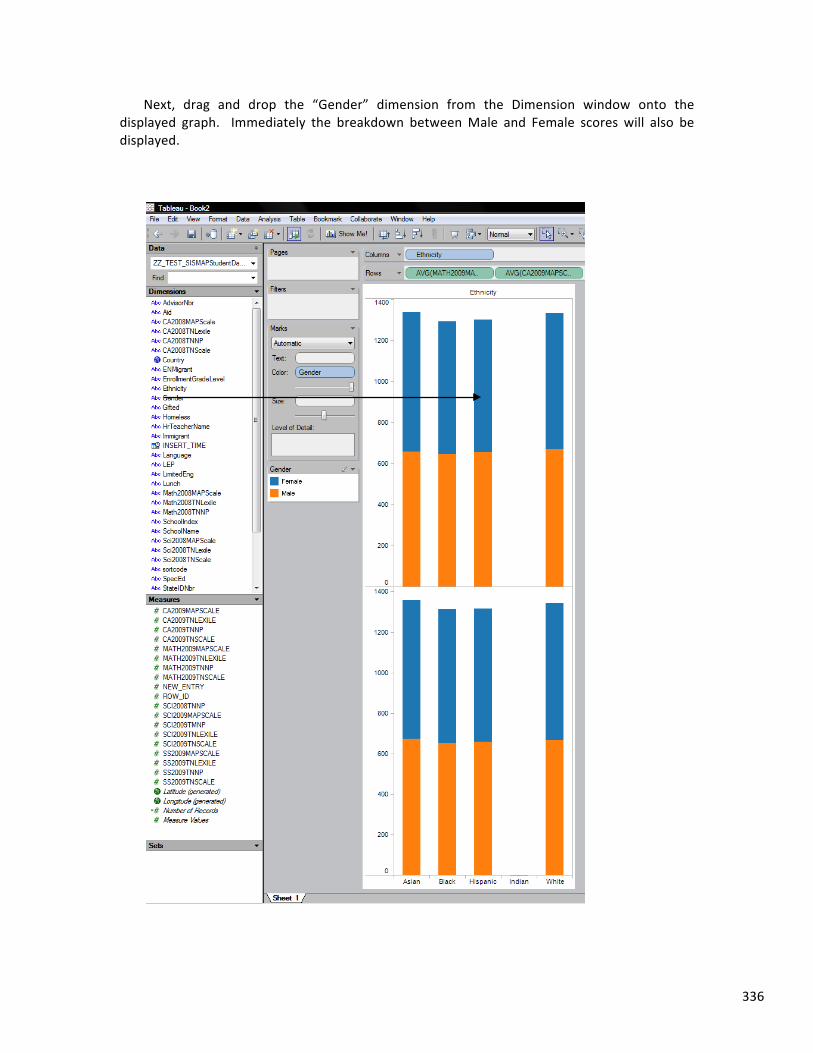
336
Next, drag and drop the “Gender” dimension from the Dimension window onto the displayed graph. Immediately the breakdown between Male and Female scores will also be displayed.
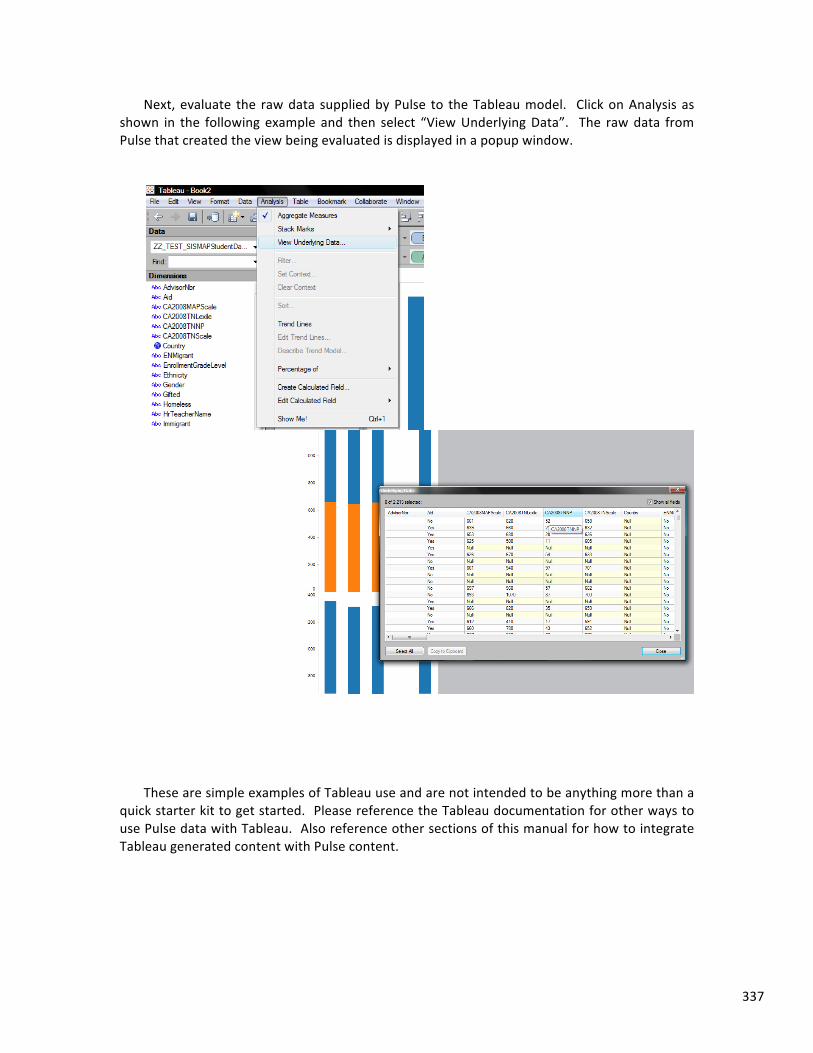
337
Next, evaluate the raw data supplied by Pulse to the Tableau model. Click on Analysis as shown in the following example and then select “View Underlying Data”. The raw data from Pulse that created the view being evaluated is displayed in a popup window.
These are simple examples of Tableau use and are not intended to be anything more than a quick starter kit to get started. Please reference the Tableau documentation for other ways to use Pulse data with Tableau. Also reference other sections of this manual for how to integrate Tableau generated content with Pulse content.
338
Appendix V – Risk Analysis – Setup Instructions The Tyler Pulse Risk Analysis sub-‐model provides a broad view of student risk based
weighted rankings from model data from throughout Pulse. This approach provides a broadly inclusive and detailed view of a student’s risk to succeed. The Pulse Risk model is highly configurable so the unique needs of each district may be easily integrated into its calculations. The approach used is to calculate risk points from each data area (such as grades, attendance, etc.) and then to summarize those points as an overall risk rating. While this model is commonly used to forecast a student risk of dropping out of school that is not its primary purpose. The overall approach is to calculate ratings of how well a student is adjusted to school life. Making this assumption, a risk (school life) ranking may be calculated on students at any grade level. This approach is designed to isolate students of all grade levels that are silently or loudly asking for help in their school life.
Note that this model will vary somewhat from SIS to SIS that is supported by Pulse. So, it is
not uncommon to see a field/column described in this documentation missing when the specific SIS in use does not support the data to generate that column/field. This appendix section should be considered an overview of Risk and not a detailed instruction set because on these variations.
The Tyler Risk model is not study base, but study inspired from many different studies that
have been evaluated in its development. It is designed so that the findings of any risk study may be integrated via parameter setup and management. And, the opinions and needs of each implementing school district may also be integrated into these parameters. As such, this model raises above various study based risk programs by providing the ability to indirectly support any of them, or even hybrid combination of them. Tyler has used its experience and expertise in this marketplace, and the results of various studies, to develop a starting point for each parameter. These default settings have been vetted through various studies and adjusted to create a generic but effective starting approach to calculations. These setting/weights may then be changed as appropriate by each implementing school district.
So, when Pulse is implemented, Pulse staff will set up risk category weightings to these
default levels. Each district using this model should then amend these risk weightings to be consistent with that District’s priorities and needs. This is done using Pulse Manual Tables, essentially a parameter table. For example, one district may feel that low grades are a greater risk factor than poor attendance, and another district may take the opposite approach. Each risk category may be separately rated and scored in the overall calculation.
It is also important to note that the risk score calculated is not significant until compared to
that of other students. Risk scores are used to determine the students with the highest to the least risk in a school. Since all of the score ranges are user managed, no specific score is deemed a threshold to a student being at risk.
The following table shows an example of the Risk Analysis main page in Pulse. Note that
there are several columns calculating a student’s risk score in specific areas. Each of these individual scores is combined into an overall Risk Factor score. In some cases a calculated point total may be displayed as a negative number. In these cases, that category is reducing the student’s overall risk rating. For example, a gifted student is scored less at risk than other

339
students. A student with a high GPA or high test scores will see their risk reduced while students with low GPA or test scores will receive a higher risk rating.
On the Risk Table, two separate risk ratings are displayed, a Risk Factor (points) and a Risk
Percentile. The Risk Factor is the sum of each of the individually calculated risk areas. The higher the pints, the higher the calculated risk. This is the best way to calculate Risk for a specific school. However, when comparing risk between schools, this is a poor comparative because different schools have different staffs and implementation of district policy, students with high or low risk may have point totals that vary significantly. For example, in one school, discipline may be maintained very strictly while in another it is a bit lax. Both schools follow policy, they just implement it differently.
To normalize the risk ratings across a school district the model also calculates a risk
percentile. This score is the percentage that the student’s risk becomes a percentage of the maximum risk for all students in that school. So, if a student has a risk rating of 50%, they have risk points that are 50% of the maximum risk for a student in that school. This is a comparative used throughout Pulse as a quick risk snapshot for each student.
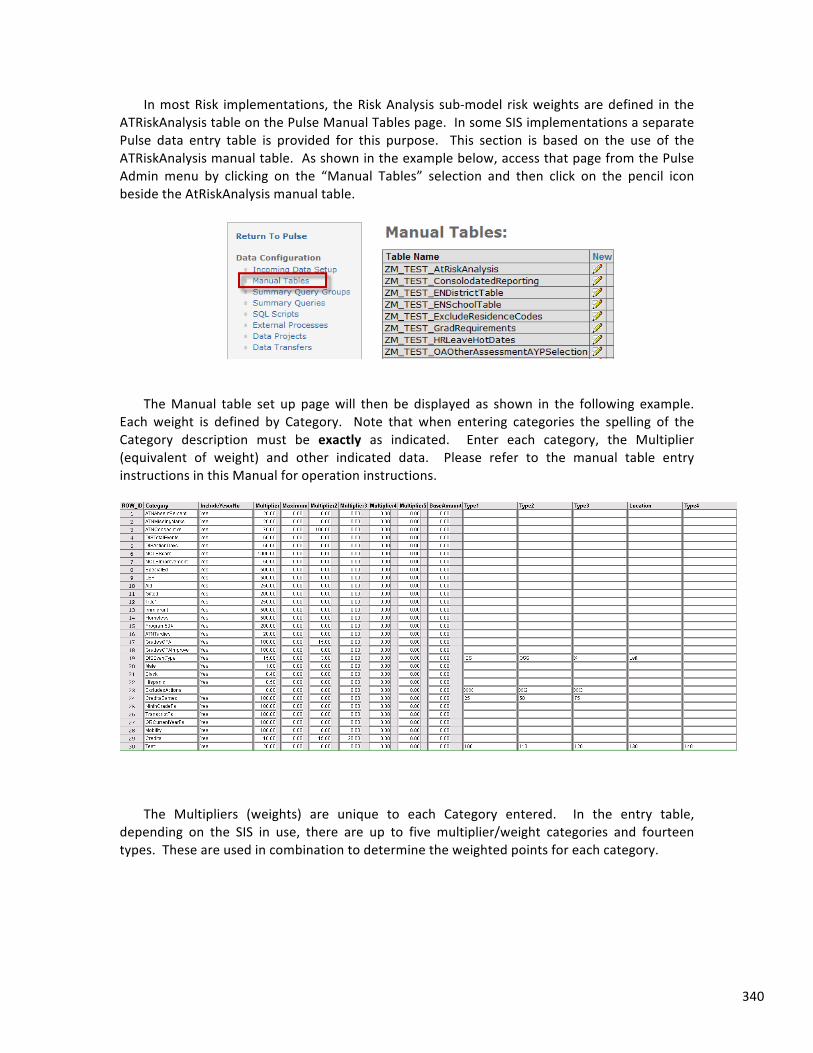
340
In most Risk implementations, the Risk Analysis sub-‐model risk weights are defined in the ATRiskAnalysis table on the Pulse Manual Tables page. In some SIS implementations a separate Pulse data entry table is provided for this purpose. This section is based on the use of the ATRiskAnalysis manual table. As shown in the example below, access that page from the Pulse Admin menu by clicking on the “Manual Tables” selection and then click on the pencil icon beside the AtRiskAnalysis manual table.
The Manual table set up page will then be displayed as shown in the following example.
Each weight is defined by Category. Note that when entering categories the spelling of the Category description must be exactly as indicated. Enter each category, the Multiplier (equivalent of weight) and other indicated data. Please refer to the manual table entry instructions in this Manual for operation instructions.
The Multipliers (weights) are unique to each Category entered. In the entry table,
depending on the SIS in use, there are up to five multiplier/weight categories and fourteen types. These are used in combination to determine the weighted points for each category.
341
Refer to the following overview of each category before changing or entering weights. NOTE THAT THE TOTAL RISK SCORE CALCULATED WILL BE THE TOTAL OF THE CALCULATED POINTS FOR EACH CATEGORY. IT IS CRITICAL TO CONSIDER THE SCORE THAT WILL RESULT FROM THE MULTIPLIER (WEIGHT) ON EACH CATEGORY. Multiplier or Weights (used as interchangeable terms in this section) are simply the number that the value of each category is multiplied by to calculate the points for that category. For example, if a student has 10 tardies and the tardy weight is 15, the points calculated will be 150. So, the weight/multiplier is not a direct weight but is conditioned on the multipliers assigned to all other categories. Changing a weight/multiplier in one category will affect the overall distribution across all categories.
IncludeYesorNo Column – This column allows for a category to be included (Yes) or not
included (No) in the risk calculation for a specific school district. When a column is marked as No, no points are calculated and the column is not displayed on the Risk evaluation page.
Maximum Score – A maximum score may be set for each category. A setting of zero in this
column will result in no maximum score being enforced. When a maximum score is defined, the actual calculation will be used unless it exceeds the maximum score. When this is the case, the maximum score is used as the point total for the category.
Multiplier – This is the relative weight of the category. The category number will be
multiplied by this factor to determine the risk for that area. The multiplier is NOT a direct weight. Because each category is different and may have a different range, careful consideration should be used in the multiplier assignment. For example, attendance ranges from 0 to 100% absent while suspension days may range from 0 to the maximum length of the school year (for example 180 days). However, both factors are usually toward the bottom of this range for most students. Consider these variations and how they contribute to the overall total before making assignments. Discussed at the end of this section is the ability to review how each section is manifesting itself in the overall calculation, in other words the calculated weight of each category. Review this data to determine if further changes in the weights need to be made to achieve a desired result. Weights may be changed as often as desired. In some cases, the multiplier is a fixed number of points, such as 500 points if the student is an ELL student.
Additional Multipliers – In some cases, different multipliers are used for different data
conditions. For example, if student tests on a state assessment as Advanced, the multiplier assignment may be minus 1000 points, if they test as proficient minus 500 points and if they test below expectations positive 500 points. Each of these conditions are described in the appropriate risk area below.
Types 1-‐14 – Types are used to set certain conditions for which risk will be calculated.
Depending on the SIS, there may be from three to fourteen types in the table. For example, the type columns may be used to designate different values by grade level, to define on certain discipline codes to include or exclude in a calculation. The types are used on only a few risk categories. The definition of each of the categories types are used is described below.
342
Location – In some cases, when types are used, Pulse provides the ability to check either the left or the right characters of the description to match up the type data entered. Left is assumed unless right is entered. For example, if, as in the example on the previous page, the Location is set to Left, and the Type is set to OSS, discipline codes of “OSS”, “OSS1”, “OSS2”, “OSSMajor” will all be selected since each has “OSS” as the left three characters of the discipline code.
Risk Settings
ATNAbsentPercent – This category is based on the percentage of absenteeism for the
student. Student absenteeism may range from 0-‐100%. If the multiplier in this section is set to 20 and the student has been absent 10% of the time, the point calculation will be 200.
ATNMissingMarks – Depending on the SIS, this category is either the percentage of
absenteeism that is unexcused or the total number of absence marks on file for the student where there is no contact from the parent about why the student was absent. For daily attendance schools these marks are taken once per day and for period attendance schools they are taken once per period. The number of Marks or Unexcused Absences (depending on the SIS) will be multiplied by the weight.
ATNConsecutive – This category is based on the number of days that a student has been
consecutively absent on the date of the calculation. The ATNConsecutive factor ranges from 0 to 10 for Multiplier 1. So, if the student has between 2 and 10 consecutive absences, the number of consecutive absences is multiplied by multiplier 1. If the student has greater than 10 consecutive absences, the consecutive absences is multiplied by Multiplier 2. The number of consecutive absences may be checked on the Consecutive Absences page on the Attendance Menu. In all SIS Models, there is a maximum of calculated consecutive absences. Usually it is 10 or 15. When a student is above the maximum number, the model shows 10+ or 15+ consecutive absences. These are the cases where the second multiplier is used.
So, in the example where Multiplier 1 is set to 10 and Multiplier 2 is set to 20, and a student has 10 consecutive absences, the calculated points will be 100. When a student has 10+ consecutive absences the calculated points will be 200.
Tardies – This category is based on the total number of tardies on file for each student. The
total tardies will be multiplied by the weight entered. It can range from 0 to an unlimited number based on the student’s attendance activities.
DISTotalEvents – This category is based on the total number of discipline events on file in
the current year for each student. The total number of events on file for a student will be multiplied by the weight. In some SIS systems, there is also a category (described below) to indicate discipline event types that are to be excluded. An example would be to exclude positive discipline events (an award for example) or events associated with attendance. When defined, these indicated events will be excluded from the event count.
343
DISActionDays – This category is based on the total number of days that a student has been
suspended. Both in school and out of school suspensions are combined. In the SISk12 SIS the number of action days may be reduced by action type codes entered into the type columns. For example, if some suspension days were for attendance, they could optionally be removed from the totals and no points calculated for them. The number of action days is multiplies by the weight.
DisEventType – This category is based on the total number of discipline events that match
the user entered discipline types entered in the first five type columns. This function allows specific event types to have additional points calculated in addition to the points calculated in the DISTotalEvents category discussed above. The total number of events on file that match these event types are multiplied by the weight. For example, it may be desired to calculate extra points for out of school suspension event types. Remember when setting this weight that the points calculate are IN ADDITION to those points calculated in the DISTotalEvents category.
NCLBScore – This category is based on the results for each student on the NCLB testing in
the state where the district is located. While the descriptions may be different, four levels are defined. If the student result is “Below Basic”, the actual value in Multiplier 1 is used to add to that student’s risk. If the student result is “Basic” then the actual value in Multiplier2 is used to add to that student’s risk. If the result is “Proficient” then the actual value in Multiplier3 is used to add to that student’s risk. If the student result is “Advanced” then the actual value in Multiplier4 is used add to that student’s risk. The NCLB Score range is based on the user’s entries. Note that the values entered may be positive or negative number. For example, if a -‐1000 is entered in the Advanced weight column, then the student’s risk total will be reduced by 1000 points.
NCLBImprovement – This category is based on the improvement or loss in the total score a
student receives on the NCLB test (both Math and Communication Arts are combined) from the current and past year. If a student’s combined scores show a reduction, then the percentage of the reduction is multiplied by the weight and the risk points increase. If the student improves her/his score, then the percent of improvement is multiplied by the weight and the risk points are reduced. So, for example, if a student has improved their Math score by 5% but has fallen back on their Communication Arts (reading or other descriptions may be used in some states) by 1%, then this category will multiple 4 by the multiplier.
GradesGPA – This option is based on how a student’s GPA compares to that of their peers,
defined as other students in the same school. The average GPA for ALL students in the school is calculated. Then, for each student above the average, the GPA percentage difference above the average is multiplied by the Multiplier and that number reduces the Risk total since these students are above the average. For students below the average, the same calculation is made but the total increases Risk total.
GradesGPAImprovement – This option calculates the student improvement in GPA for the
previous two terms. The improvement or loss percentage is then multiplied by the weight. So, when a student has an improving GPA, their risk is reduced and when the GPA if falling, the risk is increased. This function is used beginning in the second term and only for schools/grades that are calculating GPAs.
344
FsCurrentYear – This option determines how many term Fs a student has been awarded in
the current school year. All term Fs are included, so for a 6 term school with 6 periods up to 36 Fs are possible. The total number of current year Fs is then multiplied by the weight. See the Term Grades page on the Grade Menu in your SIS Pulse model for more information. For each student, the total number of Fs displayed on that page for a given student is used for this calculation.
TranscriptFs – This option determines how many Fs the student has in his/her transcript
historical record. The number of transcript Fs is then multiplied by the weight. It is then automatically adjusted based on the grade level of the student so that higher grade levels are not overstated.
NinthGradeFs – This option determines the number of Fs the student was awarded in the
ninth grade. The student transcript record is used for this calculation. Studies have shown that students failing classes in ninth grade are at HIGH risk of becoming dropouts. It is suggested that a relatively high number be applied to the multiplier for this category. Note specifically that Ninth Grade Fs are also being counted as Transcript Fs above. So, the weight assigned to Ninth Grade Fs is incremental to that assigned for Transcript Fs.
Credits – This option determines the number of credits earned compared to credits
required for graduation by reading the manual table “GradRequirements” to acquire the total credits needed for graduation. If this table is not created, no calculation is made. The total credits to be on track for graduation are computed to determine the +/-‐ credit status for a student based on their grade and current year semester. The student’s percentage above or below this calculation is then multiplied by the weight. So, for example, if 25 credits are needed to graduate, then a 10th Grader at the beginning of the year would be expected to have 25% of those credits or a total or 6.25. In the second semester that same 10 grade student should have 9.375 credits if they are on track to graduate on time. If a student is ahead of this graduation curve, then the risk is reduced by the number of extra credits times the weight. If they are behind this curve, then the number credits behind is multiplied by the weight and added to the risk total.
Test Scores (Test1 – Test10) – In the other Assessments module, a specific tier of up to ten
test scores may be designated to be forward to the risk model. This allows these ten scores to be individually used to calculate risk. Enter the multiplier as the weight for each score in separate rows Test1 to Test10. Also entered are target scores in all fourteen type columns. Grades 1-‐12 are represented by Types 1-‐12. Type 13 is used for Grade PK students and Type 14 is used for Grade K students. A target score for each test is entered into these fields. This target score represents the expected score or proficiency cut score for students at that grade level for this specific test score. The model will calculate the variance of the student from this target score. That variance (either a positive or negative variance) will then be multiplied by the weight and applied to the student risk. For example, if a selected test has a range of 1-‐100, then for Grade 1 students the target score may be 10, for Grade 2 students the target score may be 20 and so on. So, for a Grade 1 student scoring a 15, the score variation would be calculated as 5, the score of 15 minus the target of 10. The resulting 5 would then by multiplied by the multiplier.

345
For test where the better scores are the lower scores, enter the multiplier as a negative number. Note: For Infinite Campus implementations there will also be a Type 15 in the manual table. This is used to designate the number of the test tier to be used from the student assessment score list that is displayed on the Student Pulse page. For the first listed test choose 1, for the second 2 and so on from this list. So, for example, in the example below if Discovery Scales were to be used enter a 2 in the Type15 field.
Various Demographic Types – Included are demographic analysis for LEP/ELL, Aid (Free &
Reduced Lunch, Gifted, Title 1, Immigrant, Homeless and 504 Participation and possibly others in various SIS Systems. Each of these options assigns points (or reduces points in the case of Gifted) if that condition is present on the student record. The number of points indicated for each option will be added. In the event the student is not assigned to that particular demographic area, no points will be added.
Male – This option allows males to be assigned a higher risk rating than females. This would
be the case in a situation where a district believes that males have a higher risk of dropout, even after other considerations are factored. The calculation of risk points for this category differs from those previously defined above. For this option, enter a decimal to indicate the percent to raise or lower the overall risk factor for Males. For example, entering a .01 will raise the overall Male risk totals by 1% after all other areas have been considered.
Ethnicity – In most risk studies, African-‐American (Black) and Hispanic students have shown
to have higher dropout rates. In most cases, these tendencies will show up in the detailed ratings that have been discussed above. However, if a district believes that an added weight for students in these ethnic categories should be calculated, it is supported in this category. If an added weight for a specific ethnicity is desired, enter a line and the percent (for example .01) to raise the scores for those students. Make sure and use the exact ethnicity description used in the SIS for this category. For example, if the Hispanic ethnicity has a description of “Hispanic Decent” then used that exact description as this category label. This entry differs from those previously defined above. For this option, enter a decimal to indicate the percent to raise or lower the overall risk factor for ethnic areas. For example, entering a .01 will raise the overall ethnic risk totals by 1% after all other areas have been considered.
Excluded Actions – In some SISs an excluded action definition is supported. This option
allows up to three specific types of discipline actions to be excluded when computing Action Days. For example, an action type may contain an action day for eating lunch alone. It may be
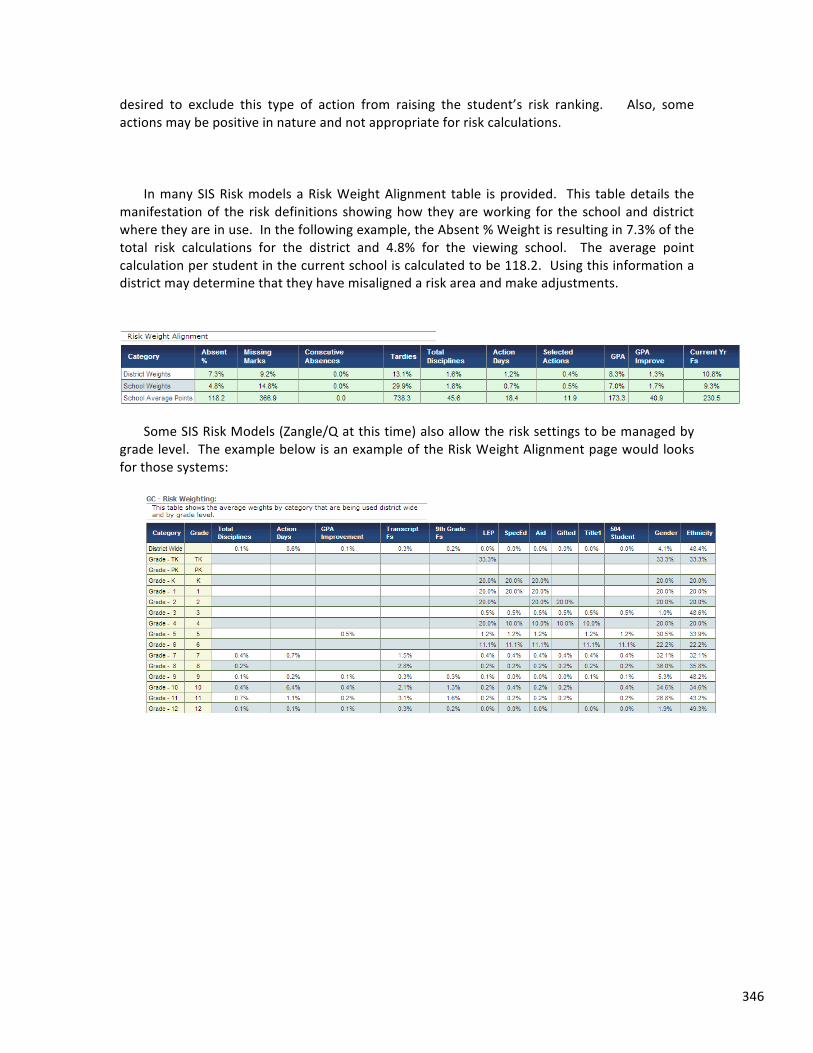
346
desired to exclude this type of action from raising the student’s risk ranking. Also, some actions may be positive in nature and not appropriate for risk calculations.
In many SIS Risk models a Risk Weight Alignment table is provided. This table details the
manifestation of the risk definitions showing how they are working for the school and district where they are in use. In the following example, the Absent % Weight is resulting in 7.3% of the total risk calculations for the district and 4.8% for the viewing school. The average point calculation per student in the current school is calculated to be 118.2. Using this information a district may determine that they have misaligned a risk area and make adjustments.
Some SIS Risk Models (Zangle/Q at this time) also allow the risk settings to be managed by
grade level. The example below is an example of the Risk Weight Alignment page would looks for those systems:
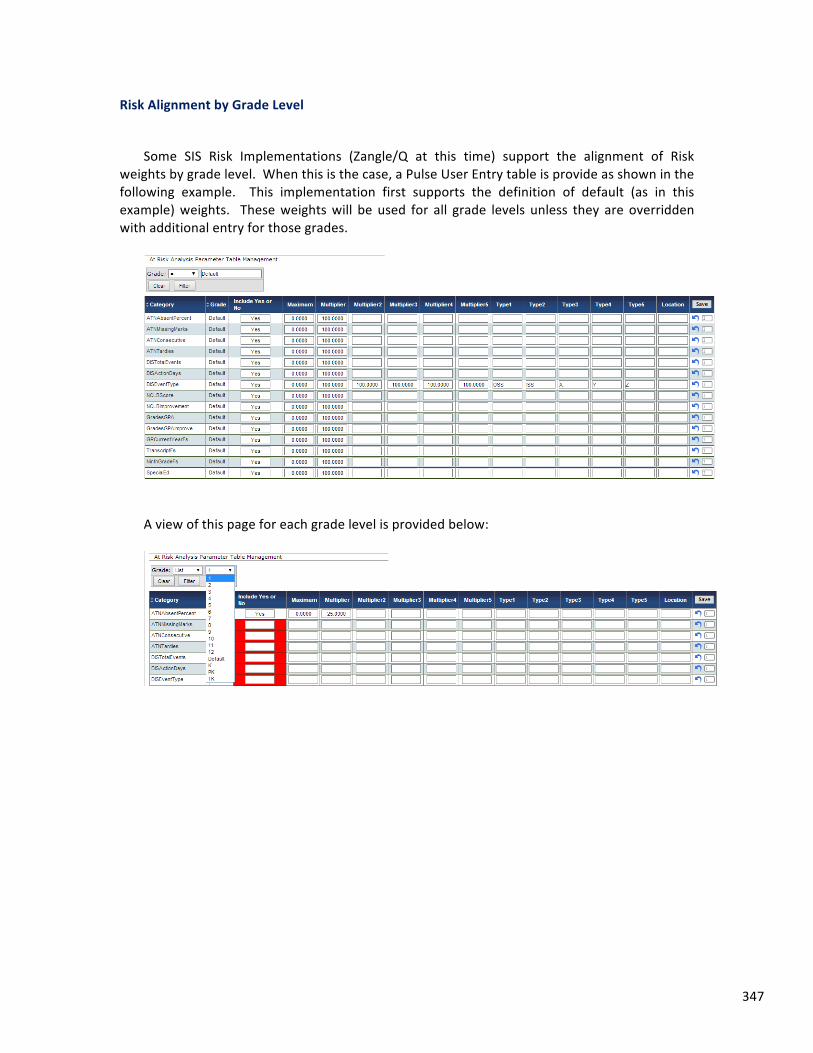
347
Risk Alignment by Grade Level
Some SIS Risk Implementations (Zangle/Q at this time) support the alignment of Risk
weights by grade level. When this is the case, a Pulse User Entry table is provide as shown in the following example. This implementation first supports the definition of default (as in this example) weights. These weights will be used for all grade levels unless they are overridden with additional entry for those grades.
A view of this page for each grade level is provided below:
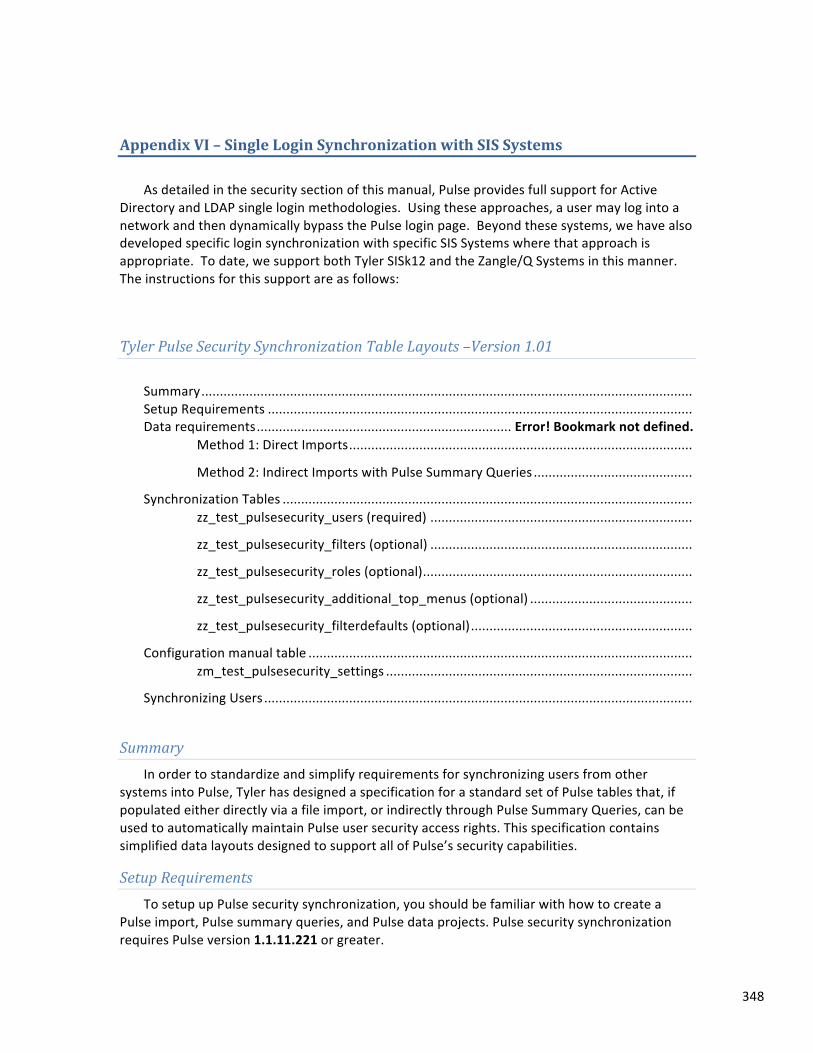
348
Appendix VI – Single Login Synchronization with SIS Systems As detailed in the security section of this manual, Pulse provides full support for Active
Directory and LDAP single login methodologies. Using these approaches, a user may log into a network and then dynamically bypass the Pulse login page. Beyond these systems, we have also developed specific login synchronization with specific SIS Systems where that approach is appropriate. To date, we support both Tyler SISk12 and the Zangle/Q Systems in this manner. The instructions for this support are as follows:
Tyler Pulse Security Synchronization Table Layouts –Version 1.01 Summary ..................................................................................................................................... Setup Requirements ................................................................................................................... Data requirements ..................................................................... Error! Bookmark not defined.
Method 1: Direct Imports .............................................................................................
Method 2: Indirect Imports with Pulse Summary Queries ...........................................
Synchronization Tables ............................................................................................................... zz_test_pulsesecurity_users (required) .......................................................................
zz_test_pulsesecurity_filters (optional) .......................................................................
zz_test_pulsesecurity_roles (optional) .........................................................................
zz_test_pulsesecurity_additional_top_menus (optional) ............................................
zz_test_pulsesecurity_filterdefaults (optional) ............................................................
Configuration manual table ........................................................................................................ zm_test_pulsesecurity_settings ...................................................................................
Synchronizing Users ....................................................................................................................
Summary In order to standardize and simplify requirements for synchronizing users from other
systems into Pulse, Tyler has designed a specification for a standard set of Pulse tables that, if populated either directly via a file import, or indirectly through Pulse Summary Queries, can be used to automatically maintain Pulse user security access rights. This specification contains simplified data layouts designed to support all of Pulse’s security capabilities.
Setup Requirements To setup up Pulse security synchronization, you should be familiar with how to create a
Pulse import, Pulse summary queries, and Pulse data projects. Pulse security synchronization requires Pulse version 1.1.11.221 or greater.
349
Revision History Version 1.0 – Original version
Version 1.01 – Corrected zz_test_pulsesecurity_users table field name “LDAPName” (was incorrectly stated as “LDAP User Name”).
Added new pulsesecurity_settings option: PasswordEncryptionType. Version 1.02 – Added new pulsesecurity_settings option InactivateUsersDuringSync.
Data requirements This document describes a series of pulse standard name table layouts (see the
Synchronization Tables section) required for synchronizing user names and user attributes into Pulse from other sources. Customers can chose one of two methods to integrate security records into Pulse:
Method 1: Direct Imports Customers can design comma or tab delimited files containing all of the data specified in the
synchronization tables below, and directly import that data to the specified table names. This import can then be added to a regularly scheduled Pulse project and synchronization can be included in nightly or weekly Parser runs.
Method 2: Indirect Imports with Pulse Summary Queries Customers can design comma or tab delimited files or use Remote SQL queries to obtain all
the necessary data, though not in the precisely required format. This data, once imported into Pulse, can be further reformed using Pulse Summary Queries into the final specified layouts.
Synchronization Tables This section described the required table layouts and names to be used for either file
imports or pulse summary queries. Table names use standard pulse naming requirements. In the examples below, we show a
file name in the format of zz_test_[TableName]. Pulse automatically supplies the prefix “zz” + the prefix of the customer abbreviation (in our example belows, we’re using a site with a customer abbreviation called “test”).
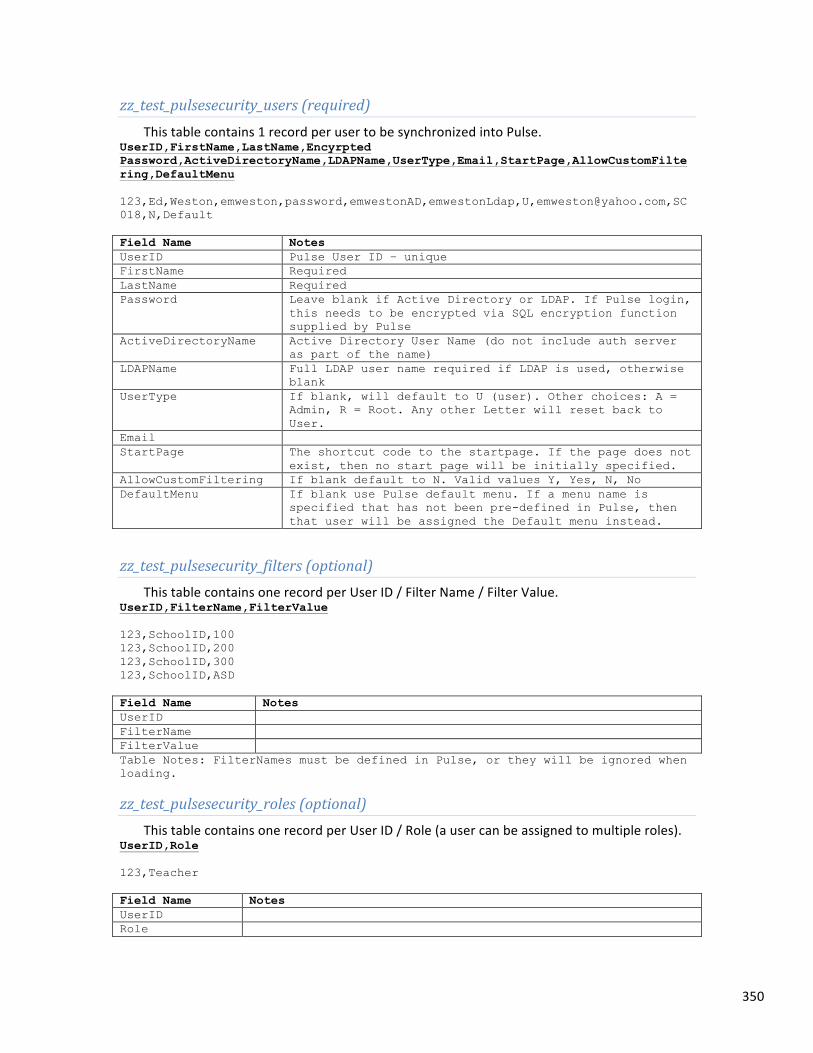
350
zz_test_pulsesecurity_users (required) This table contains 1 record per user to be synchronized into Pulse.
UserID,FirstName,LastName,Encyrpted Password,ActiveDirectoryName,LDAPName,UserType,Email,StartPage,AllowCustomFiltering,DefaultMenu 123,Ed,Weston,emweston,password,emwestonAD,emwestonLdap,U,[email protected],SC018,N,Default Field Name Notes UserID Pulse User ID – unique FirstName Required LastName Required Password Leave blank if Active Directory or LDAP. If Pulse login,
this needs to be encrypted via SQL encryption function supplied by Pulse
ActiveDirectoryName Active Directory User Name (do not include auth server as part of the name)
LDAPName Full LDAP user name required if LDAP is used, otherwise blank
UserType If blank, will default to U (user). Other choices: A = Admin, R = Root. Any other Letter will reset back to User.
Email StartPage The shortcut code to the startpage. If the page does not
exist, then no start page will be initially specified. AllowCustomFiltering If blank default to N. Valid values Y, Yes, N, No DefaultMenu If blank use Pulse default menu. If a menu name is
specified that has not been pre-defined in Pulse, then that user will be assigned the Default menu instead.
zz_test_pulsesecurity_filters (optional) This table contains one record per User ID / Filter Name / Filter Value.
UserID,FilterName,FilterValue 123,SchoolID,100 123,SchoolID,200 123,SchoolID,300 123,SchoolID,ASD Field Name Notes UserID FilterName FilterValue Table Notes: FilterNames must be defined in Pulse, or they will be ignored when loading.
zz_test_pulsesecurity_roles (optional) This table contains one record per User ID / Role (a user can be assigned to multiple roles).
UserID,Role 123,Teacher Field Name Notes UserID Role
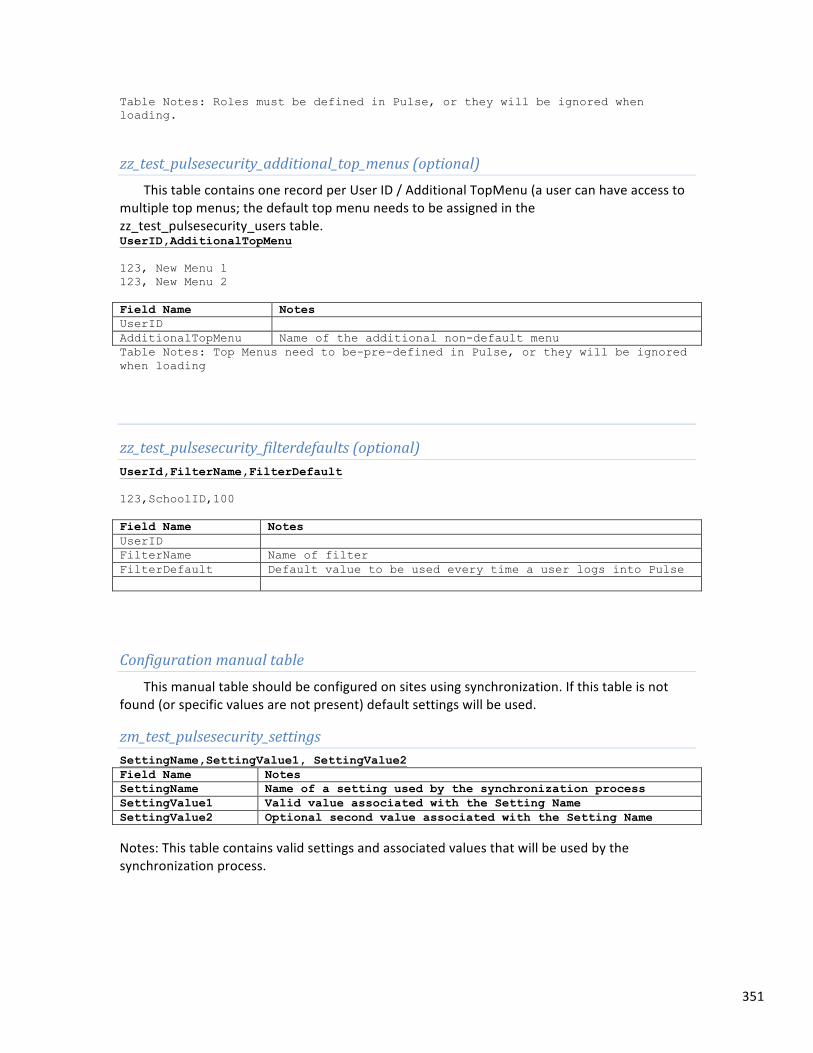
351
Table Notes: Roles must be defined in Pulse, or they will be ignored when loading.
zz_test_pulsesecurity_additional_top_menus (optional) This table contains one record per User ID / Additional TopMenu (a user can have access to
multiple top menus; the default top menu needs to be assigned in the zz_test_pulsesecurity_users table. UserID,AdditionalTopMenu 123, New Menu 1 123, New Menu 2 Field Name Notes UserID AdditionalTopMenu Name of the additional non-default menu Table Notes: Top Menus need to be-pre-defined in Pulse, or they will be ignored when loading
zz_test_pulsesecurity_filterdefaults (optional) UserId,FilterName,FilterDefault 123,SchoolID,100 Field Name Notes UserID FilterName Name of filter FilterDefault Default value to be used every time a user logs into Pulse
Configuration manual table This manual table should be configured on sites using synchronization. If this table is not
found (or specific values are not present) default settings will be used.
zm_test_pulsesecurity_settings SettingName,SettingValue1, SettingValue2 Field Name Notes SettingName Name of a setting used by the synchronization process SettingValue1 Valid value associated with the Setting Name SettingValue2 Optional second value associated with the Setting Name
Notes: This table contains valid settings and associated values that will be used by the synchronization process.
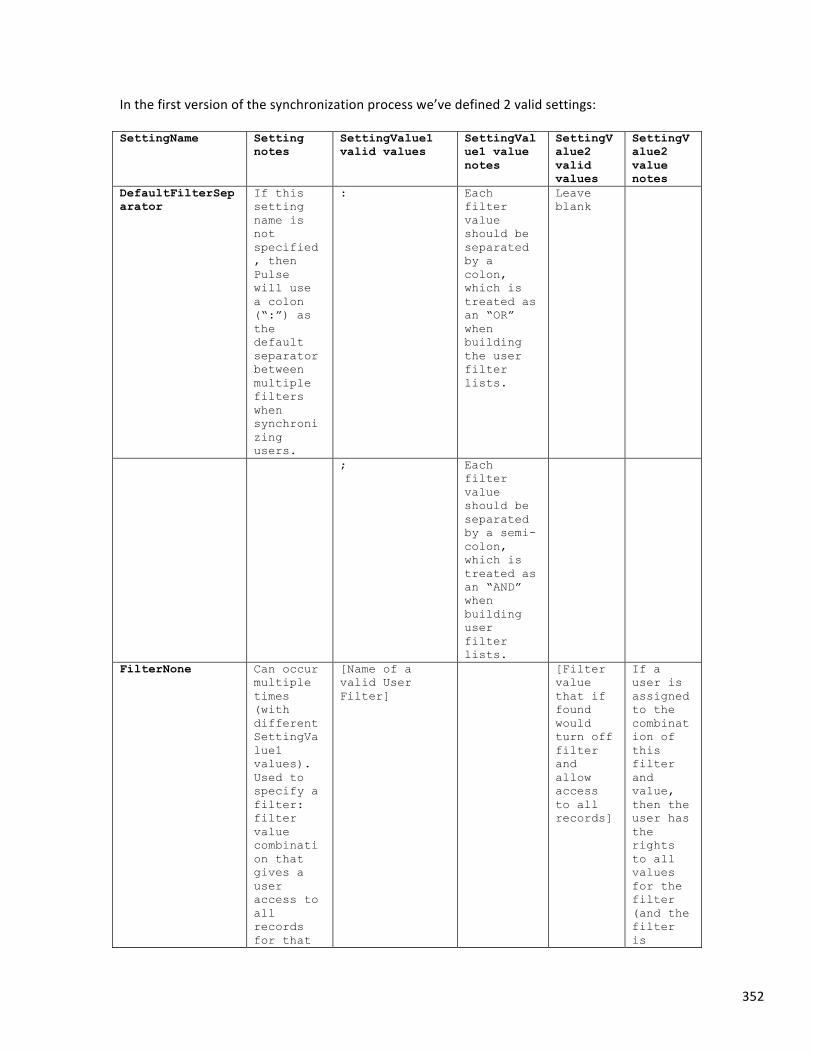
352
In the first version of the synchronization process we’ve defined 2 valid settings: SettingName Setting
notes SettingValue1 valid values
SettingValue1 value notes
SettingValue2 valid values
SettingValue2 value notes
DefaultFilterSeparator
If this setting name is not specified, then Pulse will use a colon (“:”) as the default separator between multiple filters when synchronizing users.
: Each filter value should be separated by a colon, which is treated as an “OR” when building the user filter lists.
Leave blank
; Each filter value should be separated by a semi-colon, which is treated as an “AND” when building user filter lists.
FilterNone
Can occur multiple times (with different SettingValue1 values). Used to specify a filter: filter value combination that gives a user access to all records for that
[Name of a valid User Filter]
[Filter value that if found would turn off filter and allow access to all records]
If a user is assigned to the combination of this filter and value, then the user has the rights to all values for the filter (and the filter is
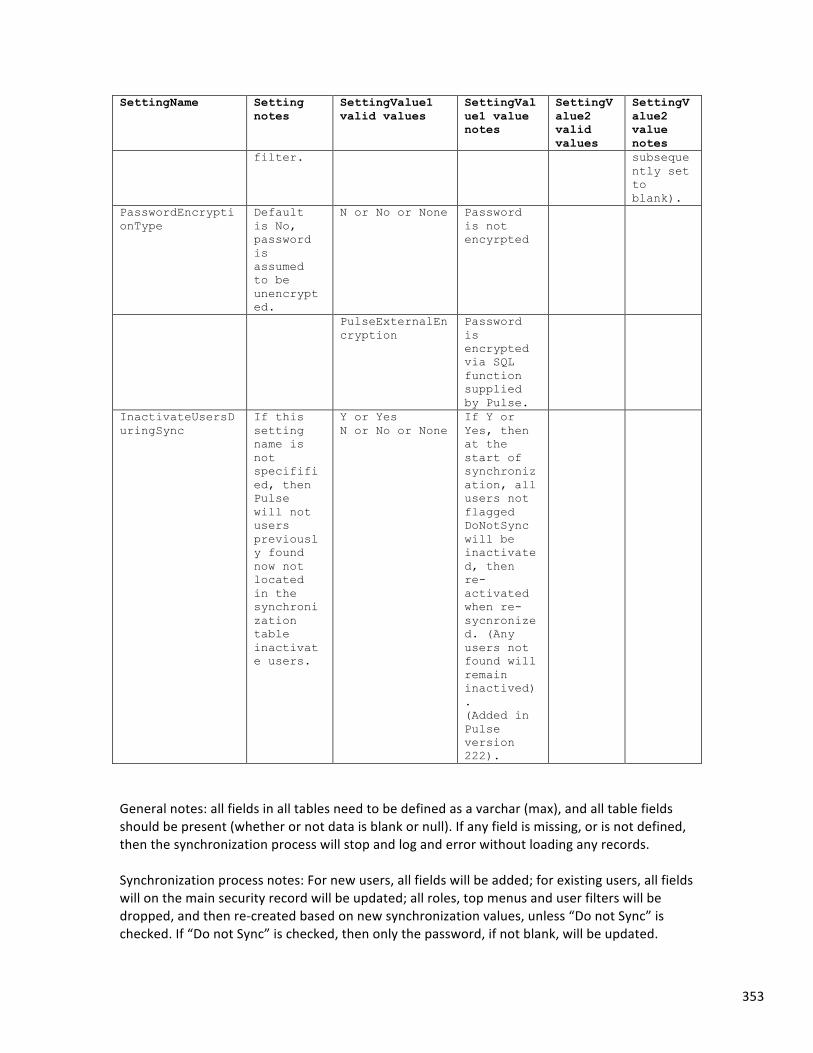
353
SettingName Setting notes
SettingValue1 valid values
SettingValue1 value notes
SettingValue2 valid values
SettingValue2 value notes
filter. subsequently set to blank).
PasswordEncryptionType
Default is No, password is assumed to be unencrypted.
N or No or None Password is not encyrpted
PulseExternalEncryption
Password is encrypted via SQL function supplied by Pulse.
InactivateUsersDuringSync
If this setting name is not specifified, then Pulse will not users previously found now not located in the synchronization table inactivate users.
Y or Yes N or No or None
If Y or Yes, then at the start of synchronization, all users not flagged DoNotSync will be inactivated, then re-activated when re-sycnronized. (Any users not found will remain inactived). (Added in Pulse version 222).
General notes: all fields in all tables need to be defined as a varchar (max), and all table fields should be present (whether or not data is blank or null). If any field is missing, or is not defined, then the synchronization process will stop and log and error without loading any records. Synchronization process notes: For new users, all fields will be added; for existing users, all fields will on the main security record will be updated; all roles, top menus and user filters will be dropped, and then re-‐created based on new synchronization values, unless “Do not Sync” is checked. If “Do not Sync” is checked, then only the password, if not blank, will be updated.
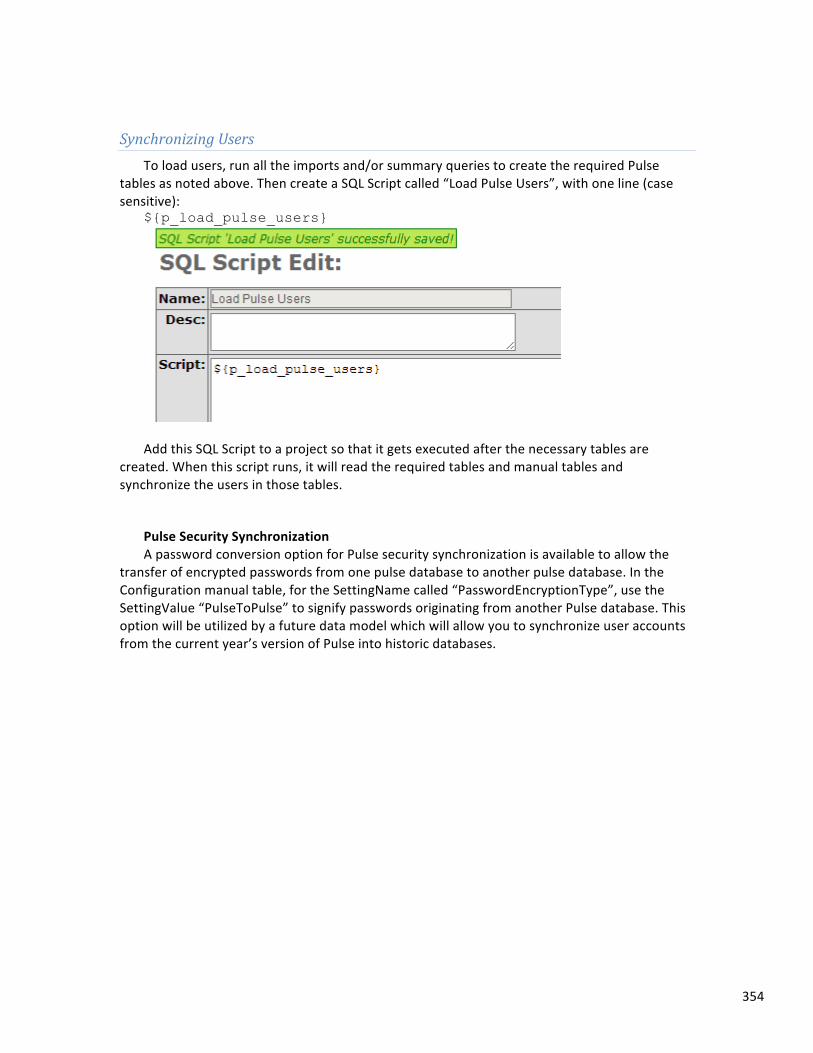
354
Synchronizing Users To load users, run all the imports and/or summary queries to create the required Pulse
tables as noted above. Then create a SQL Script called “Load Pulse Users”, with one line (case sensitive):
${p_load_pulse_users}
Add this SQL Script to a project so that it gets executed after the necessary tables are
created. When this script runs, it will read the required tables and manual tables and synchronize the users in those tables.
Pulse Security Synchronization A password conversion option for Pulse security synchronization is available to allow the
transfer of encrypted passwords from one pulse database to another pulse database. In the Configuration manual table, for the SettingName called “PasswordEncryptionType”, use the SettingValue “PulseToPulse” to signify passwords originating from another Pulse database. This option will be utilized by a future data model which will allow you to synchronize user accounts from the current year’s version of Pulse into historic databases.
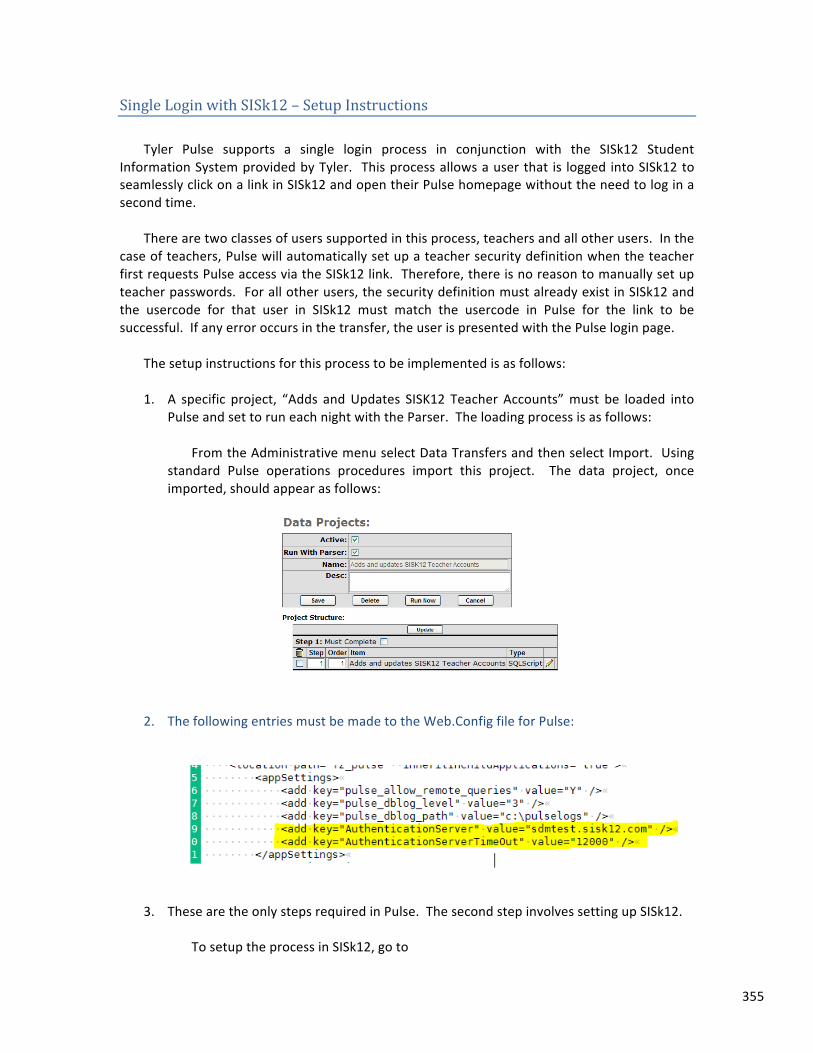
355
Single Login with SISk12 – Setup Instructions Tyler Pulse supports a single login process in conjunction with the SISk12 Student
Information System provided by Tyler. This process allows a user that is logged into SISk12 to seamlessly click on a link in SISk12 and open their Pulse homepage without the need to log in a second time.
There are two classes of users supported in this process, teachers and all other users. In the
case of teachers, Pulse will automatically set up a teacher security definition when the teacher first requests Pulse access via the SISk12 link. Therefore, there is no reason to manually set up teacher passwords. For all other users, the security definition must already exist in SISk12 and the usercode for that user in SISk12 must match the usercode in Pulse for the link to be successful. If any error occurs in the transfer, the user is presented with the Pulse login page.
The setup instructions for this process to be implemented is as follows: 1. A specific project, “Adds and Updates SISK12 Teacher Accounts” must be loaded into
Pulse and set to run each night with the Parser. The loading process is as follows:
From the Administrative menu select Data Transfers and then select Import. Using standard Pulse operations procedures import this project. The data project, once imported, should appear as follows:
2. The following entries must be made to the Web.Config file for Pulse:
3. These are the only steps required in Pulse. The second step involves setting up SISk12.
To setup the process in SISk12, go to
356
Management > District Level > District / Site / Year Setup > District Settings
On the Main tab, enter the Pulse URL (the URL used at your district to logon to Pulse).
Each user will then need to take the following steps On the Home Page, select Actions > Favorites. From Available Favorites on the right, select Pulse, then click
Add. Click Done. Pulse will then display both on the Home Page Favorites panel as well as in the Favorites drop-‐downlist at the top of the screen.
When the Pulse Favorite is selected, auto login to pulse will be initiated with the
user’s SIS username. The user must be already setup in Pulse. This uses a secure method that only passes user identity info through a secure web service.

357
Zangle SIS User Account Auto Login Pulse supports Zangle SIS user account auto. To enable the auto login functionality, add a
new connection string called ZangleAuthDB to the Pulse web.config file that points to the Zangle database that contains the Zangle loginparms table. An example and the syntax of that string is as follows:
On a Pulse Zangle site, to update user accounts into Pulse, first import the standard Zangle
data files into the Zangle Pulse model. This is the same process as the normal Pulse setup. After this load, all records from the imported Zangle table ZZ…SISTeachersAllData can then be loaded into pulse as teachers by creating then running the following Pulse SQL Script:
The script requires only 1 line, but it must be entered precisely:
${p_loadzangleusers} This script may be added to the Pulse nightly process so that Zangle user accounts are
regularly updated. Running this script will read all records in ZZ…SISTeachersAllData and create Pulse teacher
login accounts. If, after importing records for the first time, you want to change an imported user type from Teacher to some other kind of pulse user, make those account changes, and then check the “Do Not Sync Account” on that user’s Account Setup form:
Subsequently, only that user’s password will be updated from Zangle during the “Load
Zangle Users” process; all other changed settings will not be touched.
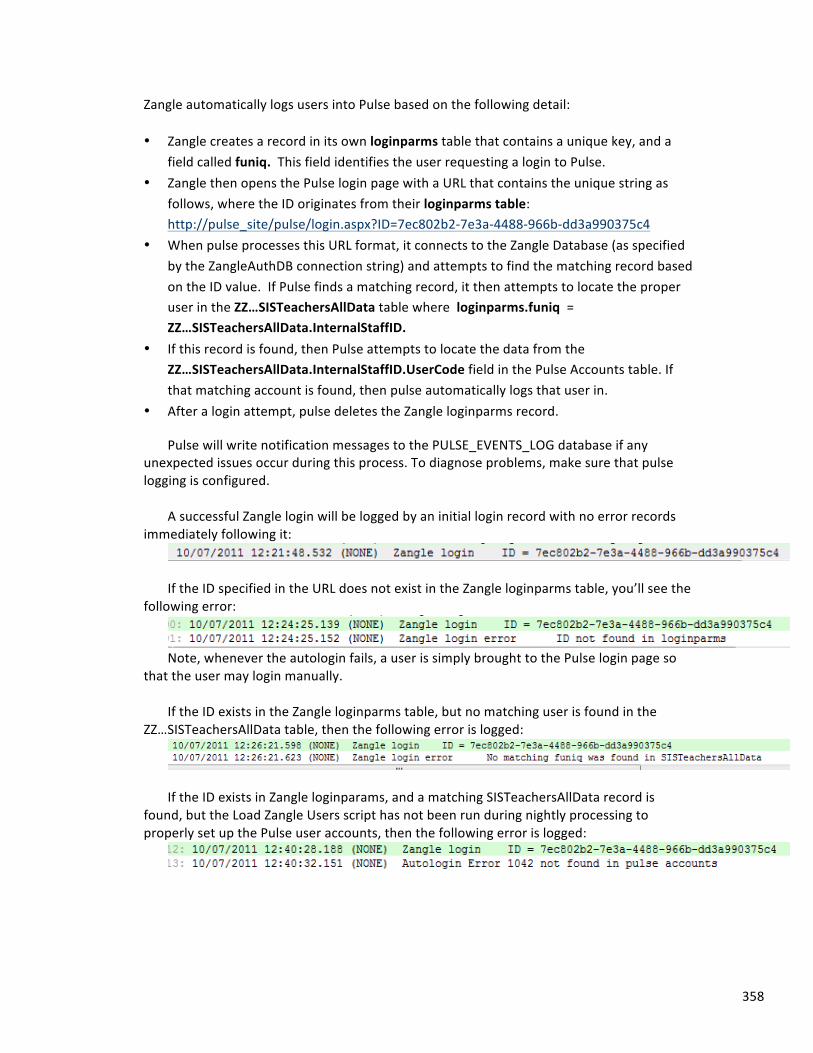
358
Zangle automatically logs users into Pulse based on the following detail: • Zangle creates a record in its own loginparms table that contains a unique key, and a
field called funiq. This field identifies the user requesting a login to Pulse. • Zangle then opens the Pulse login page with a URL that contains the unique string as
follows, where the ID originates from their loginparms table: http://pulse_site/pulse/login.aspx?ID=7ec802b2-‐7e3a-‐4488-‐966b-‐dd3a990375c4
• When pulse processes this URL format, it connects to the Zangle Database (as specified by the ZangleAuthDB connection string) and attempts to find the matching record based on the ID value. If Pulse finds a matching record, it then attempts to locate the proper user in the ZZ…SISTeachersAllData table where loginparms.funiq = ZZ…SISTeachersAllData.InternalStaffID.
• If this record is found, then Pulse attempts to locate the data from the ZZ…SISTeachersAllData.InternalStaffID.UserCode field in the Pulse Accounts table. If that matching account is found, then pulse automatically logs that user in.
• After a login attempt, pulse deletes the Zangle loginparms record.
Pulse will write notification messages to the PULSE_EVENTS_LOG database if any unexpected issues occur during this process. To diagnose problems, make sure that pulse logging is configured.
A successful Zangle login will be logged by an initial login record with no error records
immediately following it:
If the ID specified in the URL does not exist in the Zangle loginparms table, you’ll see the
following error:
Note, whenever the autologin fails, a user is simply brought to the Pulse login page so
that the user may login manually. If the ID exists in the Zangle loginparms table, but no matching user is found in the
ZZ…SISTeachersAllData table, then the following error is logged:
If the ID exists in Zangle loginparams, and a matching SISTeachersAllData record is
found, but the Load Zangle Users script has not been run during nightly processing to properly set up the Pulse user accounts, then the following error is logged:
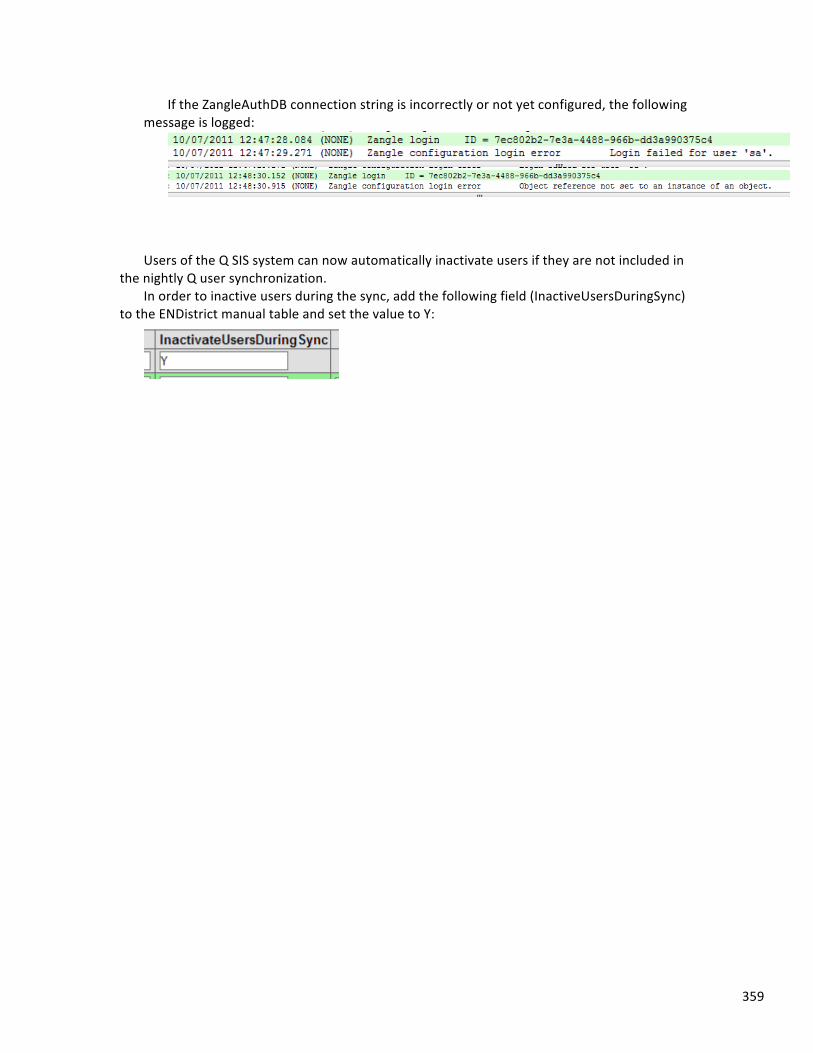
359
If the ZangleAuthDB connection string is incorrectly or not yet configured, the following message is logged:
Users of the Q SIS system can now automatically inactivate users if they are not included in
the nightly Q user synchronization. In order to inactive users during the sync, add the following field (InactiveUsersDuringSync)
to the ENDistrict manual table and set the value to Y:
360
Appendix VII – Manual Table / Customer Responsibilities The models that have been created and provided to customers to support various US states
and various application systems use Pulse Manual Tables (Parameter Tables) for managing and storing various parameters that control Pulse processing. In all cases, Pulse technical staff will initially populate these tables using data/information provided by each customer when Pulse is first implemented. After the initial implementation, it is each customer’s responsibility to keep these tables populated with current information.
There are two triggers that should be noted to know when a manual table needs to be
updated.
1. When key information changes. For example, a school is closed or opened; when processing rules change or other key actions need to be taken the tables need to be updated to reflect these changes.
2. Several tables are school year based. At the beginning of each school year several data fields need to be updated. For example, the date ranges for each term of the school year.
When reviewing changes that need to be maintained for your Pulse implementation, please contact Pulse Support if you have any questions.
Please reference the “Manual Tables” section of this manual under the “Other
Administrative Functions” chapter for instructions on how to use Pulse Manual Tables.
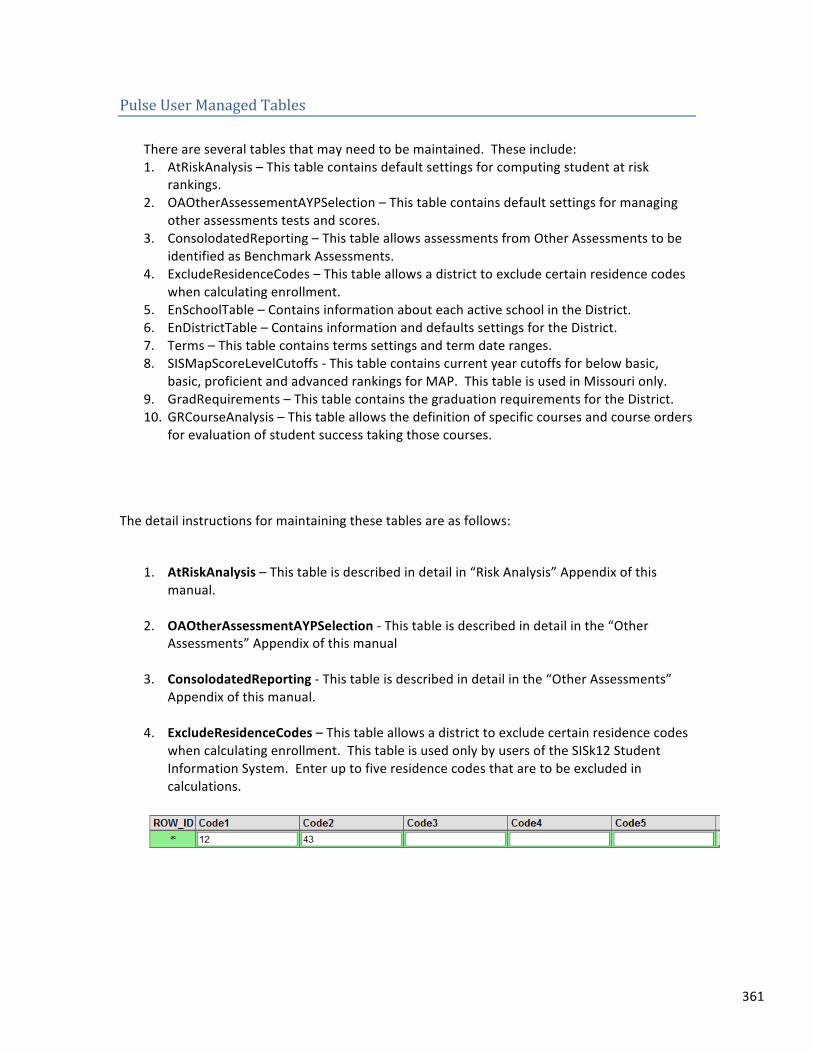
361
Pulse User Managed Tables There are several tables that may need to be maintained. These include: 1. AtRiskAnalysis – This table contains default settings for computing student at risk
rankings. 2. OAOtherAssessementAYPSelection – This table contains default settings for managing
other assessments tests and scores. 3. ConsolodatedReporting – This table allows assessments from Other Assessments to be
identified as Benchmark Assessments. 4. ExcludeResidenceCodes – This table allows a district to exclude certain residence codes
when calculating enrollment. 5. EnSchoolTable – Contains information about each active school in the District. 6. EnDistrictTable – Contains information and defaults settings for the District. 7. Terms – This table contains terms settings and term date ranges. 8. SISMapScoreLevelCutoffs -‐ This table contains current year cutoffs for below basic,
basic, proficient and advanced rankings for MAP. This table is used in Missouri only. 9. GradRequirements – This table contains the graduation requirements for the District. 10. GRCourseAnalysis – This table allows the definition of specific courses and course orders
for evaluation of student success taking those courses.
The detail instructions for maintaining these tables are as follows:
1. AtRiskAnalysis – This table is described in detail in “Risk Analysis” Appendix of this
manual. 2. OAOtherAssessmentAYPSelection -‐ This table is described in detail in the “Other
Assessments” Appendix of this manual
3. ConsolodatedReporting -‐ This table is described in detail in the “Other Assessments” Appendix of this manual.
4. ExcludeResidenceCodes – This table allows a district to exclude certain residence codes
when calculating enrollment. This table is used only by users of the SISk12 Student Information System. Enter up to five residence codes that are to be excluded in calculations.
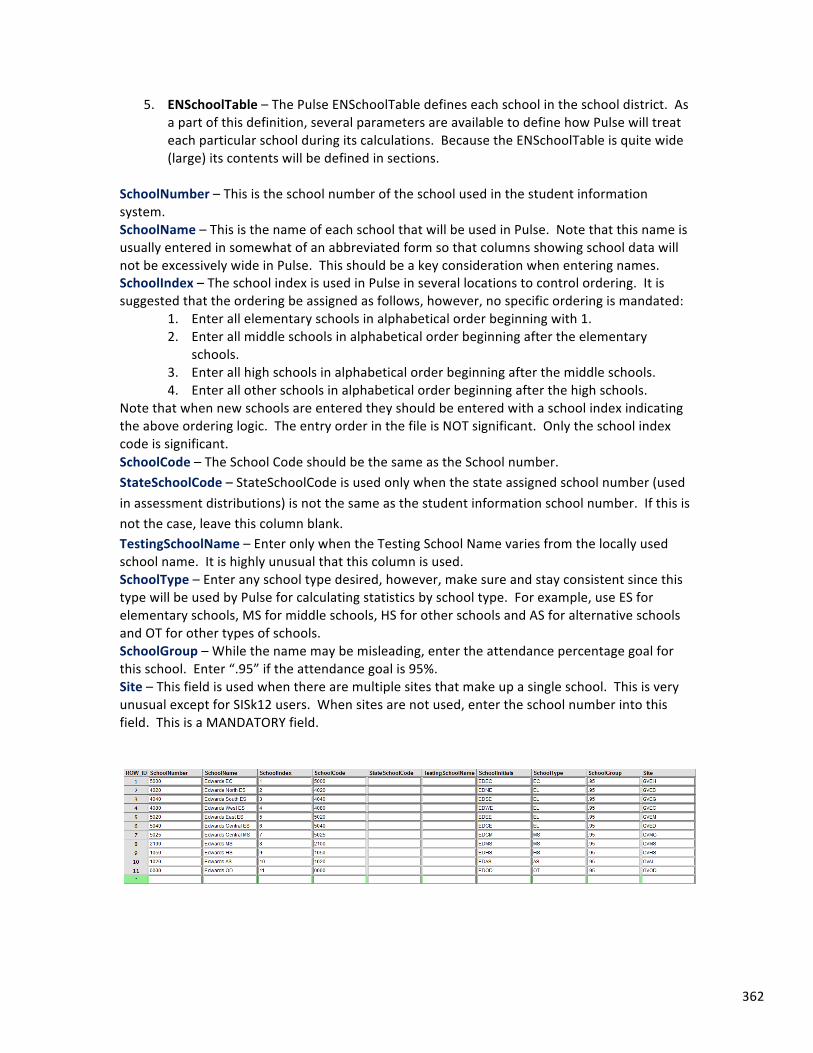
362
5. ENSchoolTable – The Pulse ENSchoolTable defines each school in the school district. As a part of this definition, several parameters are available to define how Pulse will treat each particular school during its calculations. Because the ENSchoolTable is quite wide (large) its contents will be defined in sections.
SchoolNumber – This is the school number of the school used in the student information system. SchoolName – This is the name of each school that will be used in Pulse. Note that this name is usually entered in somewhat of an abbreviated form so that columns showing school data will not be excessively wide in Pulse. This should be a key consideration when entering names. SchoolIndex – The school index is used in Pulse in several locations to control ordering. It is suggested that the ordering be assigned as follows, however, no specific ordering is mandated:
1. Enter all elementary schools in alphabetical order beginning with 1. 2. Enter all middle schools in alphabetical order beginning after the elementary
schools. 3. Enter all high schools in alphabetical order beginning after the middle schools. 4. Enter all other schools in alphabetical order beginning after the high schools.
Note that when new schools are entered they should be entered with a school index indicating the above ordering logic. The entry order in the file is NOT significant. Only the school index code is significant. SchoolCode – The School Code should be the same as the School number. StateSchoolCode – StateSchoolCode is used only when the state assigned school number (used in assessment distributions) is not the same as the student information school number. If this is not the case, leave this column blank. TestingSchoolName – Enter only when the Testing School Name varies from the locally used school name. It is highly unusual that this column is used. SchoolType – Enter any school type desired, however, make sure and stay consistent since this type will be used by Pulse for calculating statistics by school type. For example, use ES for elementary schools, MS for middle schools, HS for other schools and AS for alternative schools and OT for other types of schools. SchoolGroup – While the name may be misleading, enter the attendance percentage goal for this school. Enter “.95” if the attendance goal is 95%. Site – This field is used when there are multiple sites that make up a single school. This is very unusual except for SISk12 users. When sites are not used, enter the school number into this field. This is a MANDATORY field.
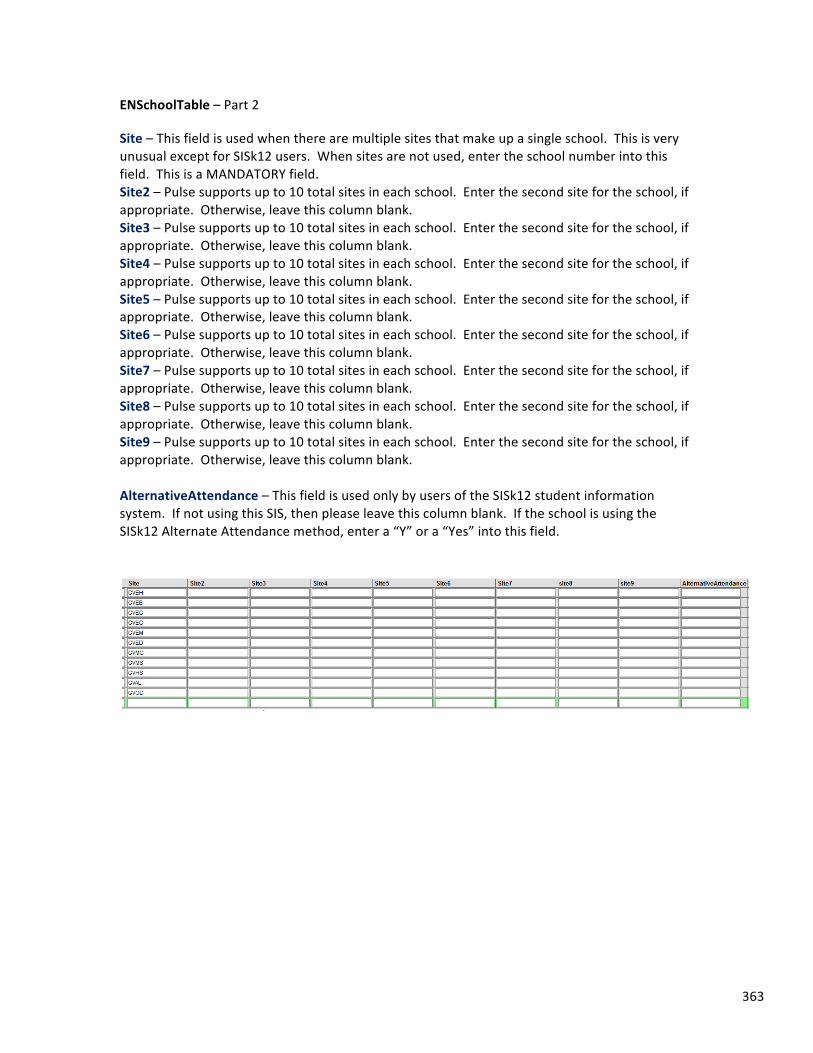
363
ENSchoolTable – Part 2
Site – This field is used when there are multiple sites that make up a single school. This is very unusual except for SISk12 users. When sites are not used, enter the school number into this field. This is a MANDATORY field. Site2 – Pulse supports up to 10 total sites in each school. Enter the second site for the school, if appropriate. Otherwise, leave this column blank. Site3 – Pulse supports up to 10 total sites in each school. Enter the second site for the school, if appropriate. Otherwise, leave this column blank. Site4 – Pulse supports up to 10 total sites in each school. Enter the second site for the school, if appropriate. Otherwise, leave this column blank. Site5 – Pulse supports up to 10 total sites in each school. Enter the second site for the school, if appropriate. Otherwise, leave this column blank. Site6 – Pulse supports up to 10 total sites in each school. Enter the second site for the school, if appropriate. Otherwise, leave this column blank. Site7 – Pulse supports up to 10 total sites in each school. Enter the second site for the school, if appropriate. Otherwise, leave this column blank. Site8 – Pulse supports up to 10 total sites in each school. Enter the second site for the school, if appropriate. Otherwise, leave this column blank. Site9 – Pulse supports up to 10 total sites in each school. Enter the second site for the school, if appropriate. Otherwise, leave this column blank. AlternativeAttendance – This field is used only by users of the SISk12 student information system. If not using this SIS, then please leave this column blank. If the school is using the SISk12 Alternate Attendance method, enter a “Y” or a “Yes” into this field.
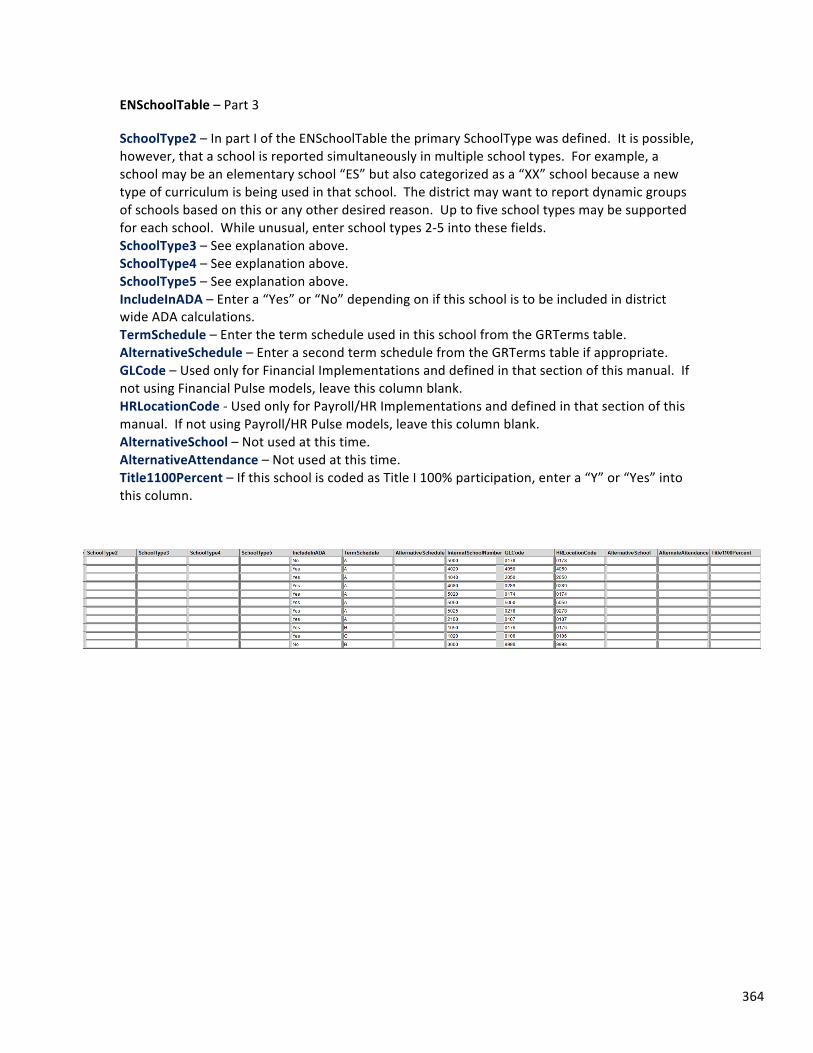
364
ENSchoolTable – Part 3
SchoolType2 – In part I of the ENSchoolTable the primary SchoolType was defined. It is possible, however, that a school is reported simultaneously in multiple school types. For example, a school may be an elementary school “ES” but also categorized as a “XX” school because a new type of curriculum is being used in that school. The district may want to report dynamic groups of schools based on this or any other desired reason. Up to five school types may be supported for each school. While unusual, enter school types 2-‐5 into these fields. SchoolType3 – See explanation above. SchoolType4 – See explanation above. SchoolType5 – See explanation above. IncludeInADA – Enter a “Yes” or “No” depending on if this school is to be included in district wide ADA calculations. TermSchedule – Enter the term schedule used in this school from the GRTerms table. AlternativeSchedule – Enter a second term schedule from the GRTerms table if appropriate. GLCode – Used only for Financial Implementations and defined in that section of this manual. If not using Financial Pulse models, leave this column blank. HRLocationCode -‐ Used only for Payroll/HR Implementations and defined in that section of this manual. If not using Payroll/HR Pulse models, leave this column blank. AlternativeSchool – Not used at this time. AlternativeAttendance – Not used at this time. Title1100Percent – If this school is coded as Title I 100% participation, enter a “Y” or “Yes” into this column.
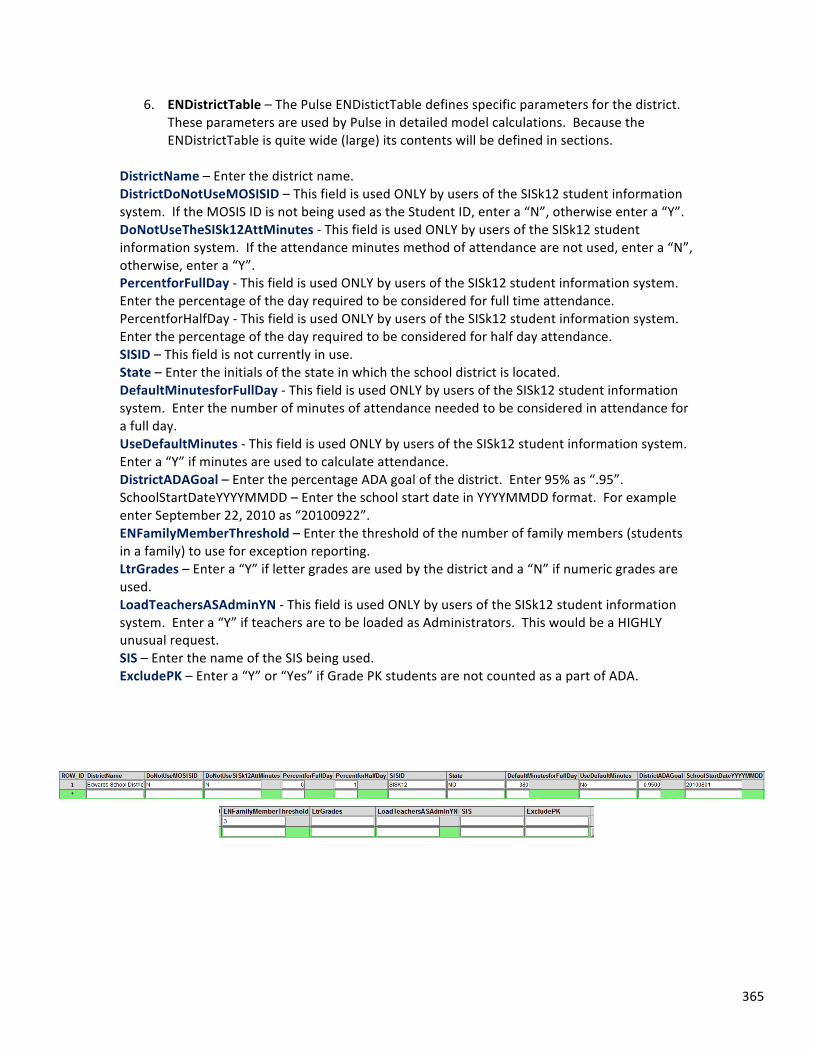
365
6. ENDistrictTable – The Pulse ENDistictTable defines specific parameters for the district. These parameters are used by Pulse in detailed model calculations. Because the ENDistrictTable is quite wide (large) its contents will be defined in sections.
DistrictName – Enter the district name. DistrictDoNotUseMOSISID – This field is used ONLY by users of the SISk12 student information system. If the MOSIS ID is not being used as the Student ID, enter a “N”, otherwise enter a “Y”. DoNotUseTheSISk12AttMinutes -‐ This field is used ONLY by users of the SISk12 student information system. If the attendance minutes method of attendance are not used, enter a “N”, otherwise, enter a “Y”. PercentforFullDay -‐ This field is used ONLY by users of the SISk12 student information system. Enter the percentage of the day required to be considered for full time attendance. PercentforHalfDay -‐ This field is used ONLY by users of the SISk12 student information system. Enter the percentage of the day required to be considered for half day attendance. SISID – This field is not currently in use. State – Enter the initials of the state in which the school district is located. DefaultMinutesforFullDay -‐ This field is used ONLY by users of the SISk12 student information system. Enter the number of minutes of attendance needed to be considered in attendance for a full day. UseDefaultMinutes -‐ This field is used ONLY by users of the SISk12 student information system. Enter a “Y” if minutes are used to calculate attendance. DistrictADAGoal – Enter the percentage ADA goal of the district. Enter 95% as “.95”. SchoolStartDateYYYYMMDD – Enter the school start date in YYYYMMDD format. For example enter September 22, 2010 as “20100922”. ENFamilyMemberThreshold – Enter the threshold of the number of family members (students in a family) to use for exception reporting. LtrGrades – Enter a “Y” if letter grades are used by the district and a “N” if numeric grades are used. LoadTeachersASAdminYN -‐ This field is used ONLY by users of the SISk12 student information system. Enter a “Y” if teachers are to be loaded as Administrators. This would be a HIGHLY unusual request. SIS – Enter the name of the SIS being used. ExcludePK – Enter a “Y” or “Yes” if Grade PK students are not counted as a part of ADA.
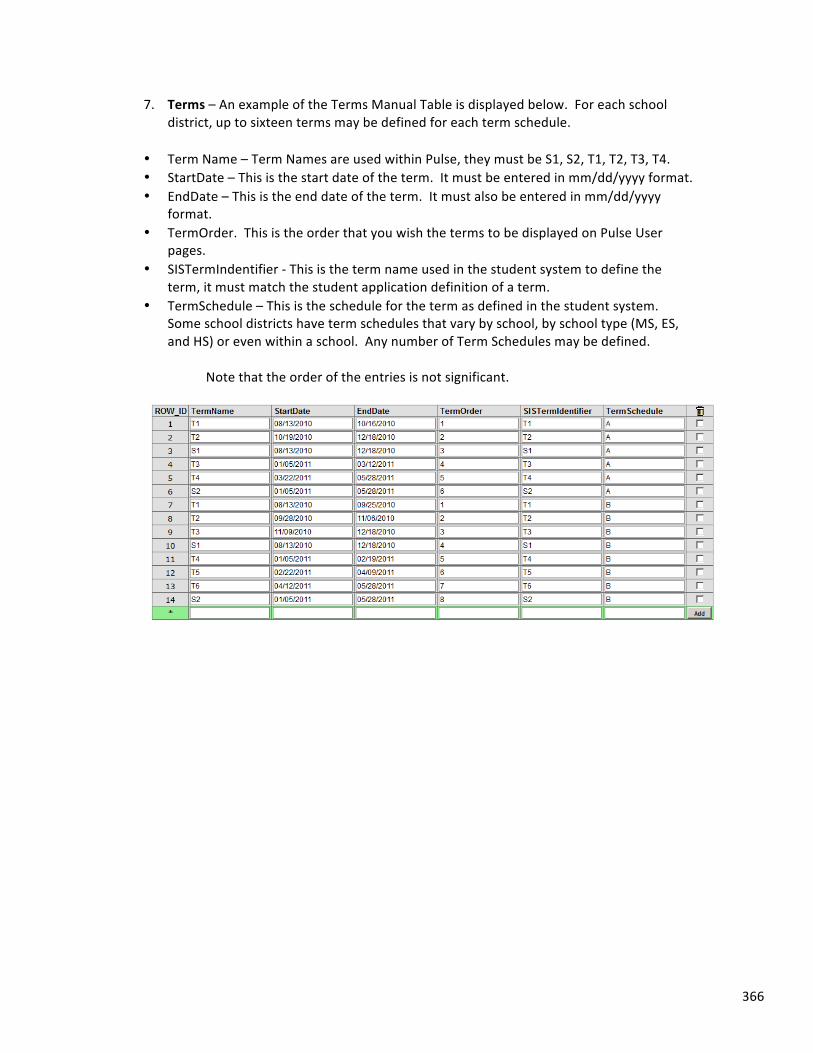
366
7. Terms – An example of the Terms Manual Table is displayed below. For each school district, up to sixteen terms may be defined for each term schedule.
• Term Name – Term Names are used within Pulse, they must be S1, S2, T1, T2, T3, T4. • StartDate – This is the start date of the term. It must be entered in mm/dd/yyyy format. • EndDate – This is the end date of the term. It must also be entered in mm/dd/yyyy
format. • TermOrder. This is the order that you wish the terms to be displayed on Pulse User
pages. • SISTermIndentifier -‐ This is the term name used in the student system to define the
term, it must match the student application definition of a term. • TermSchedule – This is the schedule for the term as defined in the student system.
Some school districts have term schedules that vary by school, by school type (MS, ES, and HS) or even within a school. Any number of Term Schedules may be defined.
Note that the order of the entries is not significant.
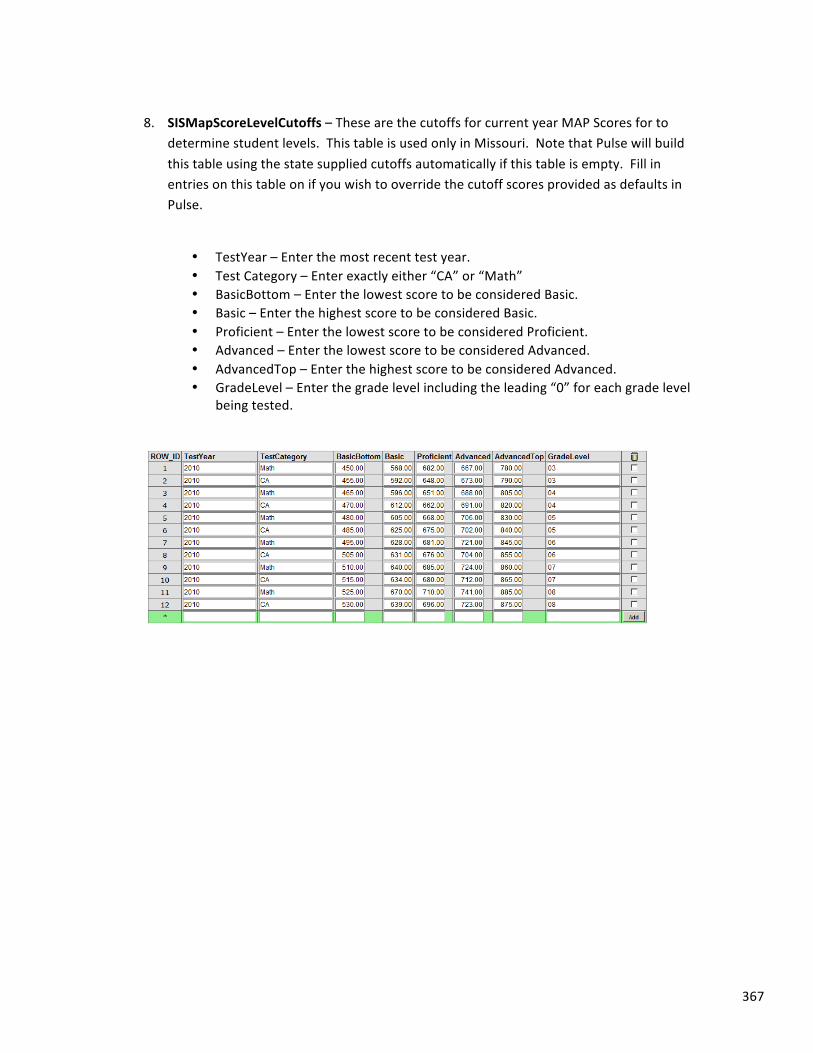
367
8. SISMapScoreLevelCutoffs – These are the cutoffs for current year MAP Scores for to
determine student levels. This table is used only in Missouri. Note that Pulse will build this table using the state supplied cutoffs automatically if this table is empty. Fill in entries on this table on if you wish to override the cutoff scores provided as defaults in Pulse.
• TestYear – Enter the most recent test year. • Test Category – Enter exactly either “CA” or “Math” • BasicBottom – Enter the lowest score to be considered Basic. • Basic – Enter the highest score to be considered Basic. • Proficient – Enter the lowest score to be considered Proficient. • Advanced – Enter the lowest score to be considered Advanced. • AdvancedTop – Enter the highest score to be considered Advanced. • GradeLevel – Enter the grade level including the leading “0” for each grade level
being tested.
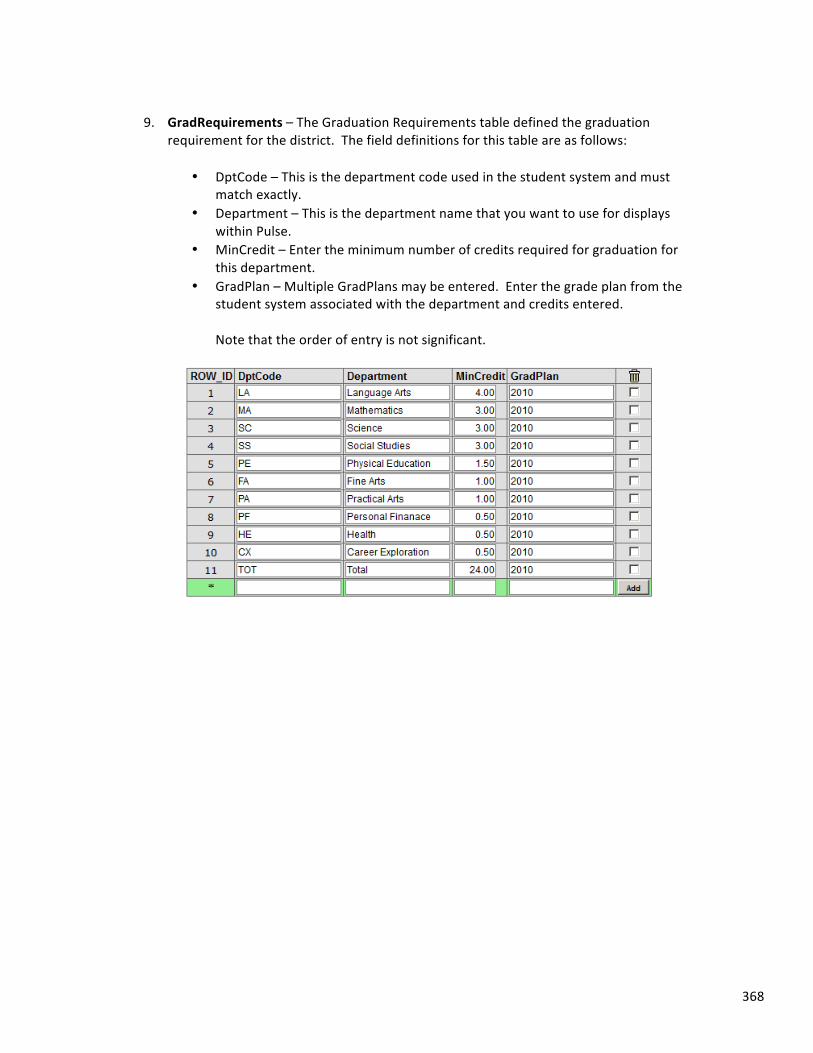
368
9. GradRequirements – The Graduation Requirements table defined the graduation
requirement for the district. The field definitions for this table are as follows:
• DptCode – This is the department code used in the student system and must match exactly.
• Department – This is the department name that you want to use for displays within Pulse.
• MinCredit – Enter the minimum number of credits required for graduation for this department.
• GradPlan – Multiple GradPlans may be entered. Enter the grade plan from the student system associated with the department and credits entered.
Note that the order of entry is not significant.
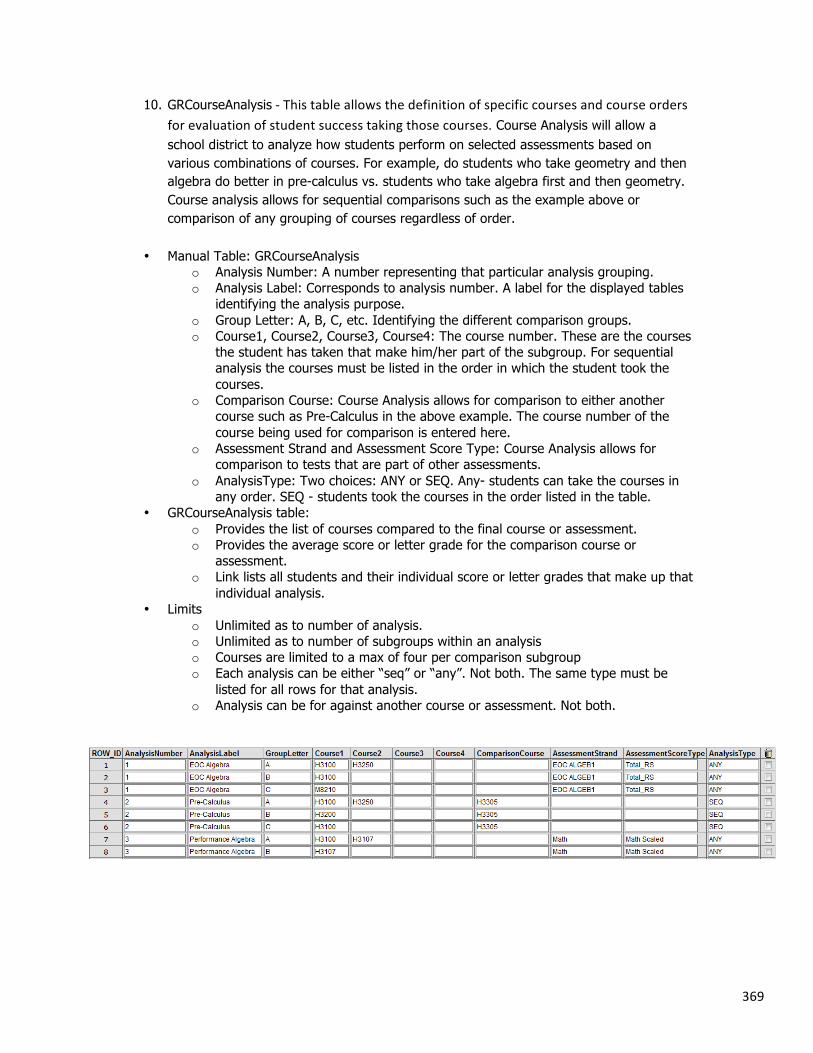
369
10. GRCourseAnalysis -‐ This table allows the definition of specific courses and course orders for evaluation of student success taking those courses. Course Analysis will allow a school district to analyze how students perform on selected assessments based on various combinations of courses. For example, do students who take geometry and then algebra do better in pre-calculus vs. students who take algebra first and then geometry. Course analysis allows for sequential comparisons such as the example above or comparison of any grouping of courses regardless of order.
• Manual Table: GRCourseAnalysis o Analysis Number: A number representing that particular analysis grouping. o Analysis Label: Corresponds to analysis number. A label for the displayed tables
identifying the analysis purpose. o Group Letter: A, B, C, etc. Identifying the different comparison groups. o Course1, Course2, Course3, Course4: The course number. These are the courses
the student has taken that make him/her part of the subgroup. For sequential analysis the courses must be listed in the order in which the student took the courses.
o Comparison Course: Course Analysis allows for comparison to either another course such as Pre-Calculus in the above example. The course number of the course being used for comparison is entered here.
o Assessment Strand and Assessment Score Type: Course Analysis allows for comparison to tests that are part of other assessments.
o AnalysisType: Two choices: ANY or SEQ. Any- students can take the courses in any order. SEQ - students took the courses in the order listed in the table.
• GRCourseAnalysis table: o Provides the list of courses compared to the final course or assessment. o Provides the average score or letter grade for the comparison course or
assessment. o Link lists all students and their individual score or letter grades that make up that
individual analysis. • Limits
o Unlimited as to number of analysis. o Unlimited as to number of subgroups within an analysis o Courses are limited to a max of four per comparison subgroup o Each analysis can be either “seq” or “any”. Not both. The same type must be
listed for all rows for that analysis. o Analysis can be for against another course or assessment. Not both.
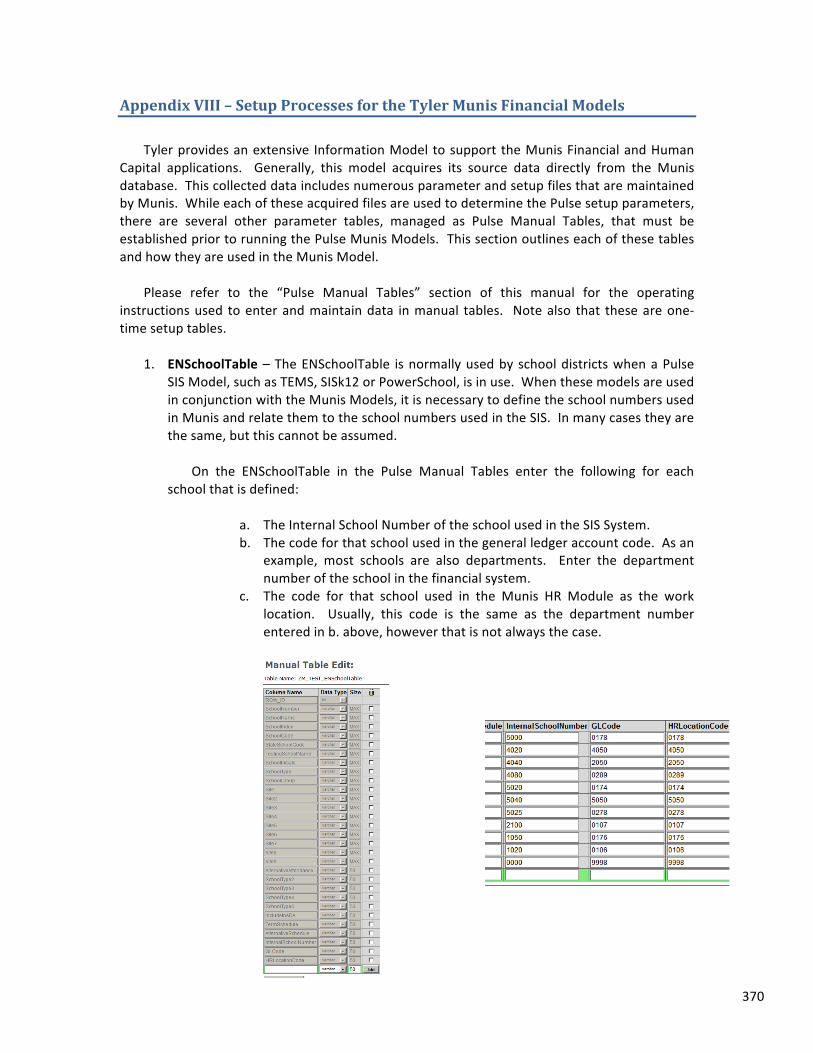
370
Appendix VIII – Setup Processes for the Tyler Munis Financial Models Tyler provides an extensive Information Model to support the Munis Financial and Human
Capital applications. Generally, this model acquires its source data directly from the Munis database. This collected data includes numerous parameter and setup files that are maintained by Munis. While each of these acquired files are used to determine the Pulse setup parameters, there are several other parameter tables, managed as Pulse Manual Tables, that must be established prior to running the Pulse Munis Models. This section outlines each of these tables and how they are used in the Munis Model.
Please refer to the “Pulse Manual Tables” section of this manual for the operating
instructions used to enter and maintain data in manual tables. Note also that these are one-‐time setup tables.
1. ENSchoolTable – The ENSchoolTable is normally used by school districts when a Pulse
SIS Model, such as TEMS, SISk12 or PowerSchool, is in use. When these models are used in conjunction with the Munis Models, it is necessary to define the school numbers used in Munis and relate them to the school numbers used in the SIS. In many cases they are the same, but this cannot be assumed.
On the ENSchoolTable in the Pulse Manual Tables enter the following for each
school that is defined:
a. The Internal School Number of the school used in the SIS System. b. The code for that school used in the general ledger account code. As an
example, most schools are also departments. Enter the department number of the school in the financial system.
c. The code for that school used in the Munis HR Module as the work location. Usually, this code is the same as the department number entered in b. above, however that is not always the case.
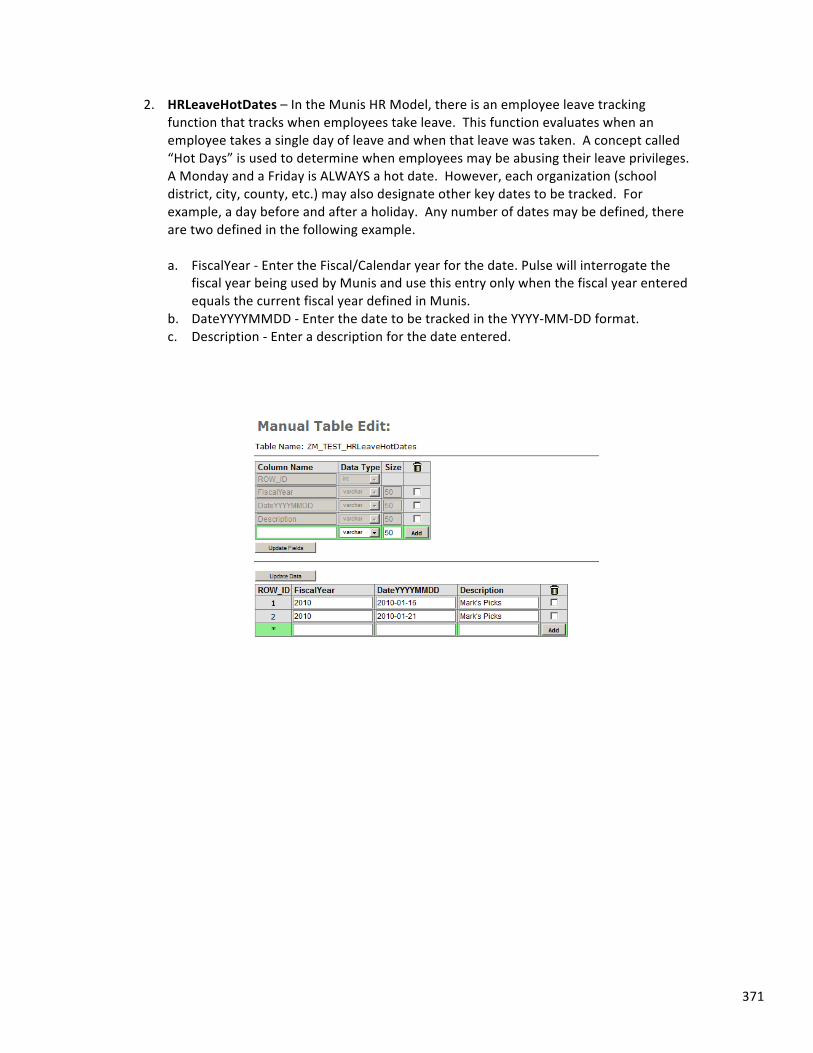
371
2. HRLeaveHotDates – In the Munis HR Model, there is an employee leave tracking function that tracks when employees take leave. This function evaluates when an employee takes a single day of leave and when that leave was taken. A concept called “Hot Days” is used to determine when employees may be abusing their leave privileges. A Monday and a Friday is ALWAYS a hot date. However, each organization (school district, city, county, etc.) may also designate other key dates to be tracked. For example, a day before and after a holiday. Any number of dates may be defined, there are two defined in the following example.
a. FiscalYear -‐ Enter the Fiscal/Calendar year for the date. Pulse will interrogate the
fiscal year being used by Munis and use this entry only when the fiscal year entered equals the current fiscal year defined in Munis.
b. DateYYYYMMDD -‐ Enter the date to be tracked in the YYYY-‐MM-‐DD format. c. Description -‐ Enter a description for the date entered.
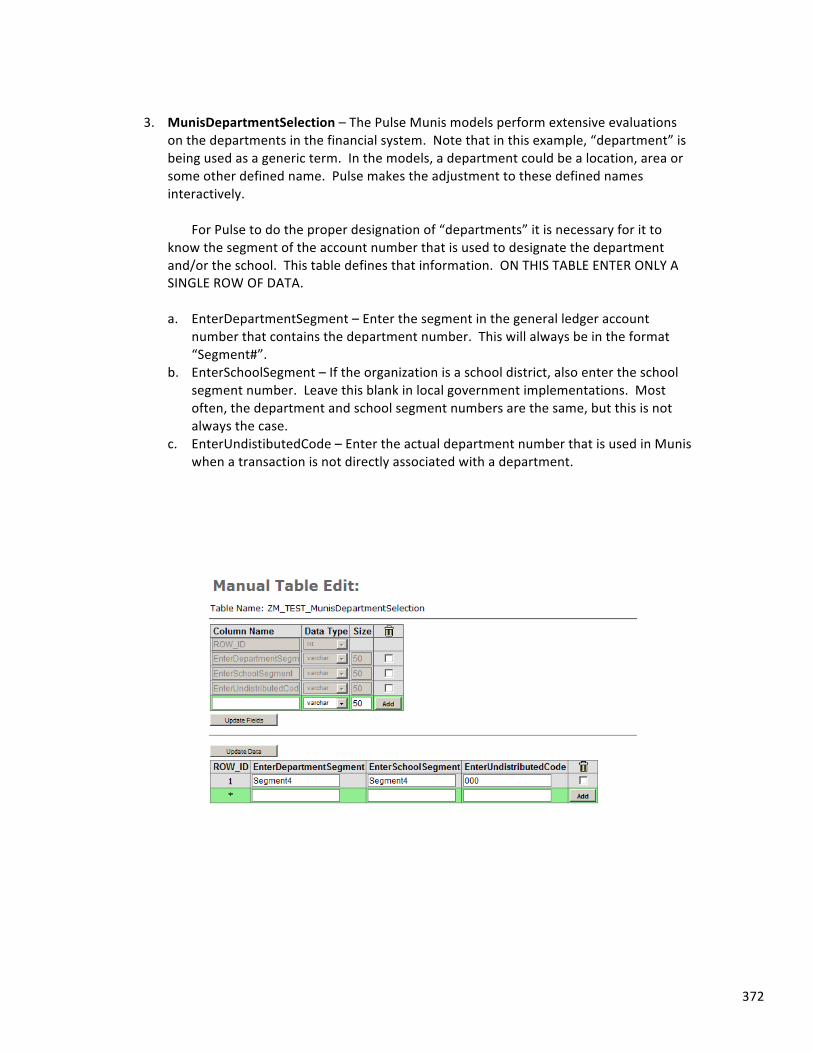
372
3. MunisDepartmentSelection – The Pulse Munis models perform extensive evaluations
on the departments in the financial system. Note that in this example, “department” is being used as a generic term. In the models, a department could be a location, area or some other defined name. Pulse makes the adjustment to these defined names interactively.
For Pulse to do the proper designation of “departments” it is necessary for it to
know the segment of the account number that is used to designate the department and/or the school. This table defines that information. ON THIS TABLE ENTER ONLY A SINGLE ROW OF DATA.
a. EnterDepartmentSegment – Enter the segment in the general ledger account
number that contains the department number. This will always be in the format “Segment#”.
b. EnterSchoolSegment – If the organization is a school district, also enter the school segment number. Leave this blank in local government implementations. Most often, the department and school segment numbers are the same, but this is not always the case.
c. EnterUndistibutedCode – Enter the actual department number that is used in Munis when a transaction is not directly associated with a department.
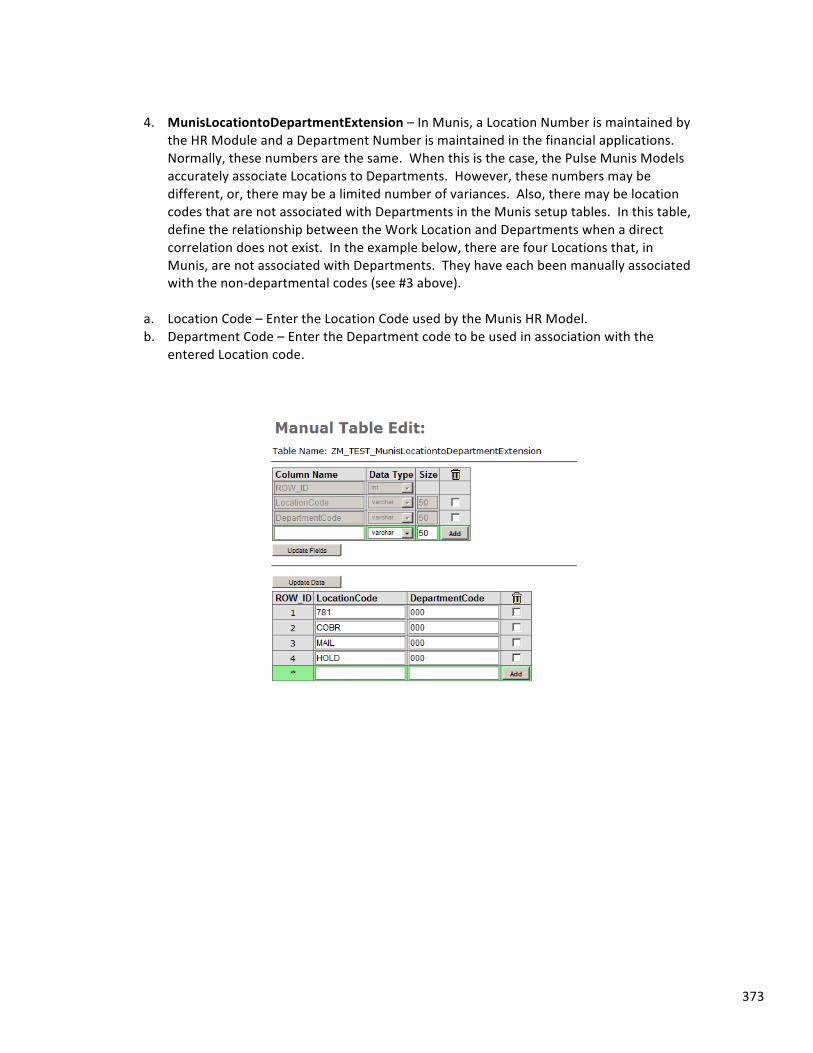
373
4. MunisLocationtoDepartmentExtension – In Munis, a Location Number is maintained by
the HR Module and a Department Number is maintained in the financial applications. Normally, these numbers are the same. When this is the case, the Pulse Munis Models accurately associate Locations to Departments. However, these numbers may be different, or, there may be a limited number of variances. Also, there may be location codes that are not associated with Departments in the Munis setup tables. In this table, define the relationship between the Work Location and Departments when a direct correlation does not exist. In the example below, there are four Locations that, in Munis, are not associated with Departments. They have each been manually associated with the non-‐departmental codes (see #3 above).
a. Location Code – Enter the Location Code used by the Munis HR Model. b. Department Code – Enter the Department code to be used in association with the
entered Location code.
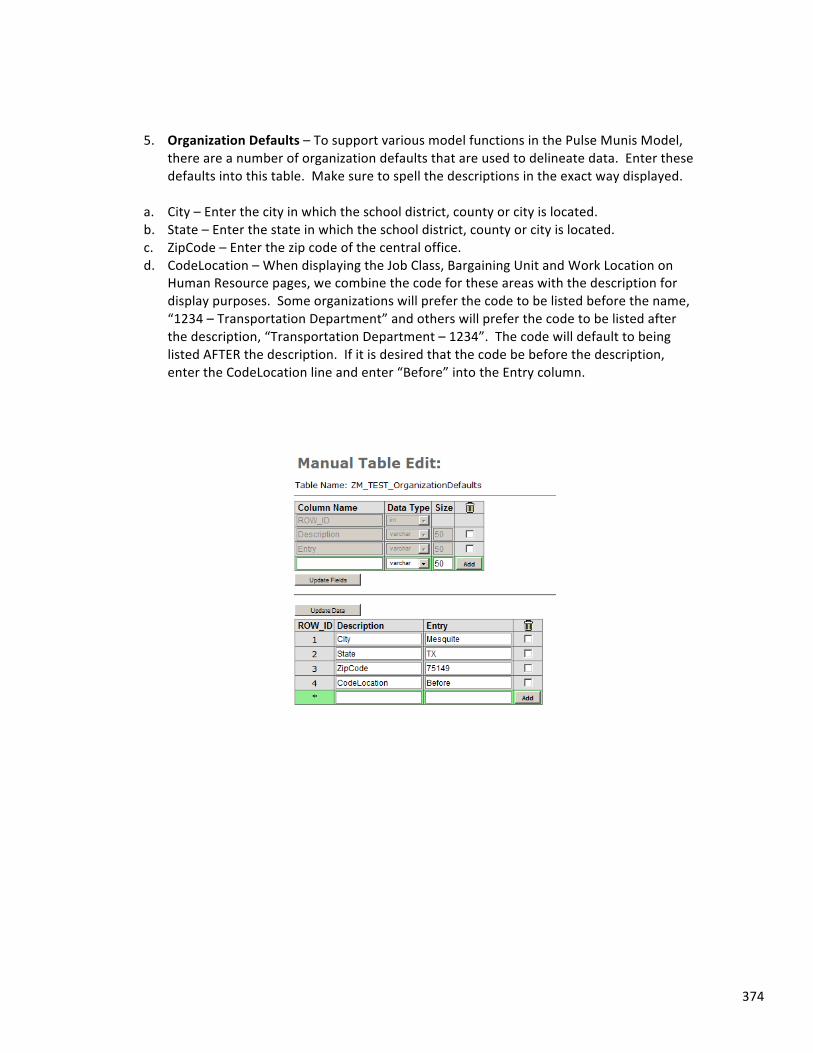
374
5. Organization Defaults – To support various model functions in the Pulse Munis Model,
there are a number of organization defaults that are used to delineate data. Enter these defaults into this table. Make sure to spell the descriptions in the exact way displayed.
a. City – Enter the city in which the school district, county or city is located. b. State – Enter the state in which the school district, county or city is located. c. ZipCode – Enter the zip code of the central office. d. CodeLocation – When displaying the Job Class, Bargaining Unit and Work Location on
Human Resource pages, we combine the code for these areas with the description for display purposes. Some organizations will prefer the code to be listed before the name, “1234 – Transportation Department” and others will prefer the code to be listed after the description, “Transportation Department – 1234”. The code will default to being listed AFTER the description. If it is desired that the code be before the description, enter the CodeLocation line and enter “Before” into the Entry column.

375
6. TrackingAccounts – In the Munis Financial Model, we provide a function that allows a
manager to track the GL activity into a GL Account or GL Object code in great detail. For example, a manager may want to “get a handle” on expenditures for consulting activities. If so, the object(s) or account code(s) representing consulting activities could be entering into the TrackingAccounts Manual Table. Pages in the Pulse models then provide extended information in these areas.
a. Category – Enter a category for the tracking to be performed. This is a key field that
usually indicates then individual manager or group of managers tracking the entered information.
b. AccountCode – Enter a specific Account Code to be tracked. The entry must match exactly the account codes being used in Munis.
c. ObjectCode – Enter an object code to be tracked. When an object code is entered all account codes containing that object code are tracked in summary.
DO NOT ENTER AN ACCOUNT CODE AND OBJECT CODE ON THE SAME LINE.
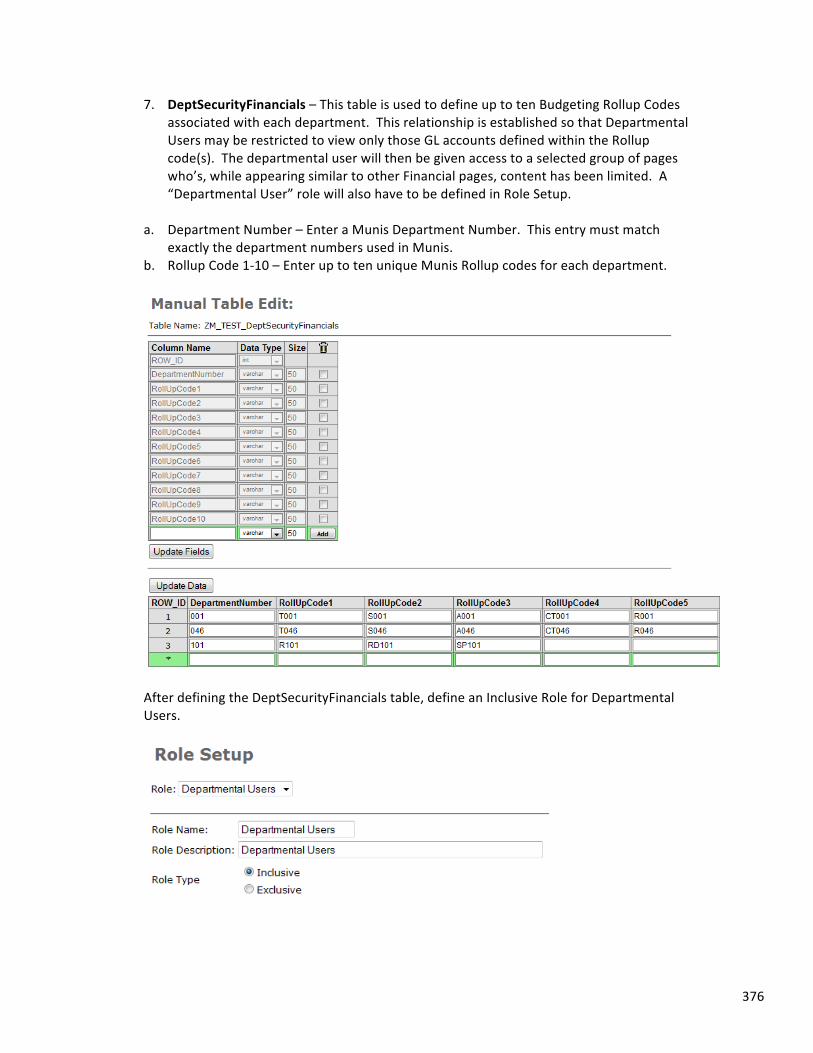
376
7. DeptSecurityFinancials – This table is used to define up to ten Budgeting Rollup Codes associated with each department. This relationship is established so that Departmental Users may be restricted to view only those GL accounts defined within the Rollup code(s). The departmental user will then be given access to a selected group of pages who’s, while appearing similar to other Financial pages, content has been limited. A “Departmental User” role will also have to be defined in Role Setup.
a. Department Number – Enter a Munis Department Number. This entry must match
exactly the department numbers used in Munis. b. Rollup Code 1-‐10 – Enter up to ten unique Munis Rollup codes for each department.
After defining the DeptSecurityFinancials table, define an Inclusive Role for Departmental Users.
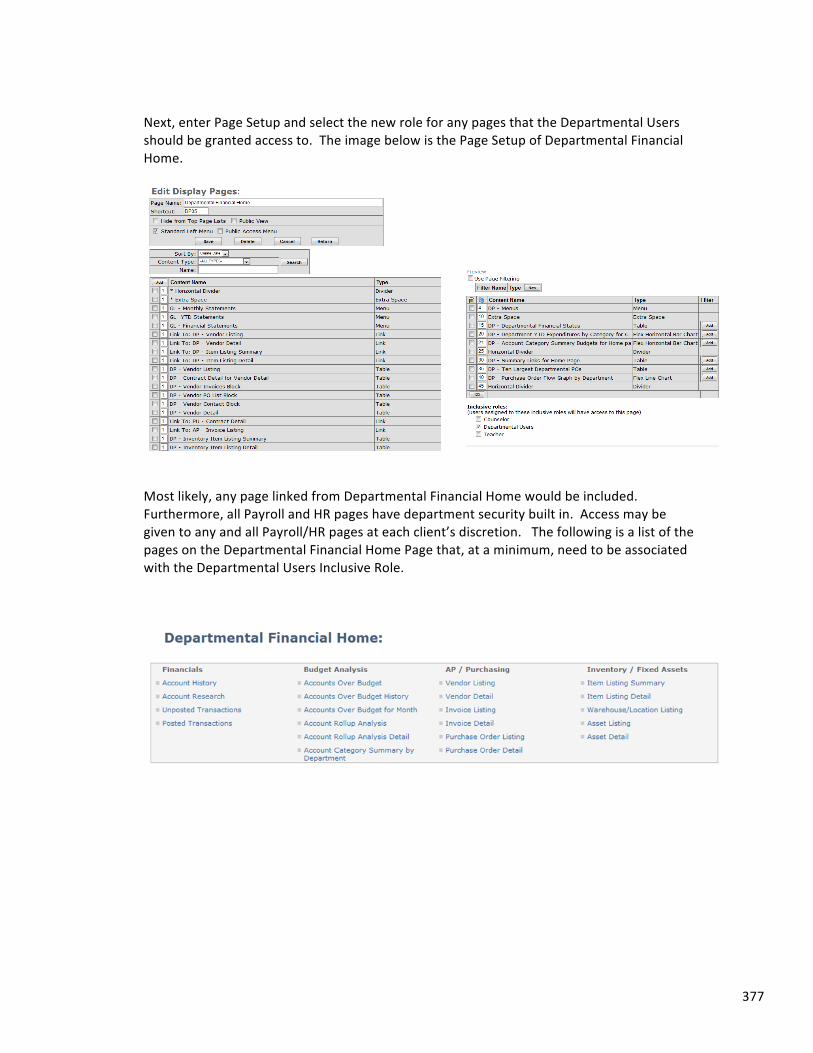
377
Next, enter Page Setup and select the new role for any pages that the Departmental Users should be granted access to. The image below is the Page Setup of Departmental Financial Home.
Most likely, any page linked from Departmental Financial Home would be included. Furthermore, all Payroll and HR pages have department security built in. Access may be given to any and all Payroll/HR pages at each client’s discretion. The following is a list of the pages on the Departmental Financial Home Page that, at a minimum, need to be associated with the Departmental Users Inclusive Role.
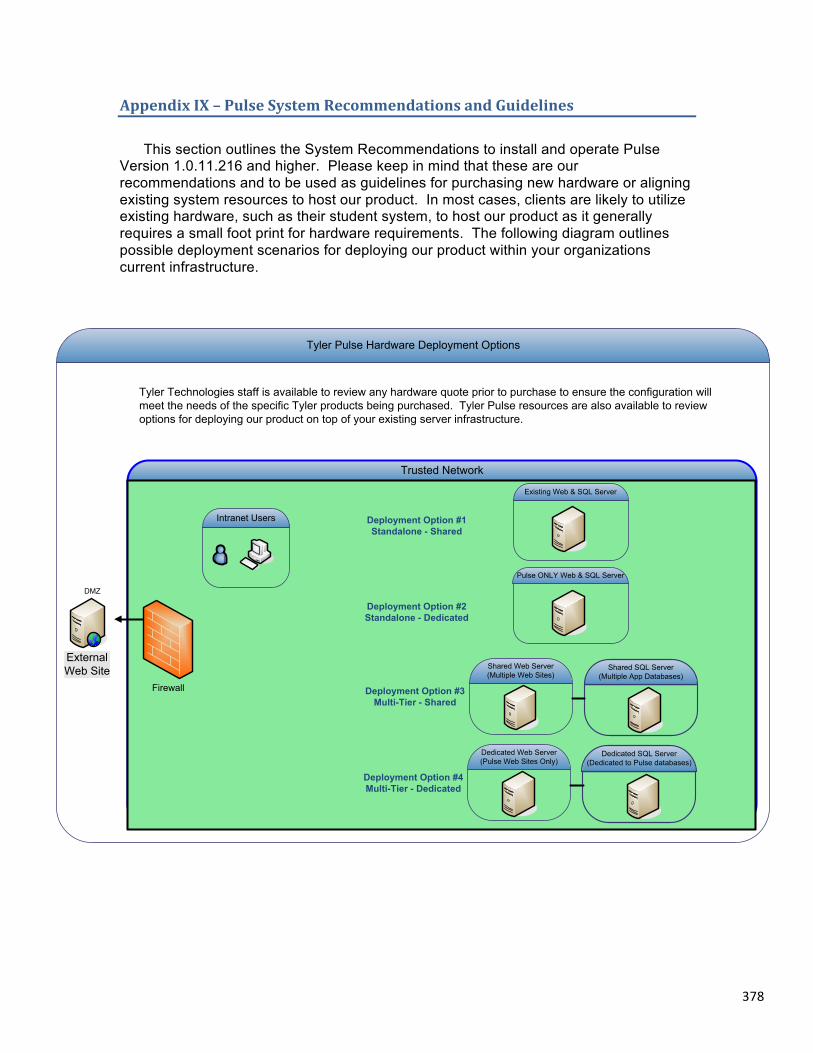
378
Appendix IX – Pulse System Recommendations and Guidelines This section outlines the System Recommendations to install and operate Pulse
Version 1.0.11.216 and higher. Please keep in mind that these are our recommendations and to be used as guidelines for purchasing new hardware or aligning existing system resources to host our product. In most cases, clients are likely to utilize existing hardware, such as their student system, to host our product as it generally requires a small foot print for hardware requirements. The following diagram outlines possible deployment scenarios for deploying our product within your organizations current infrastructure.
Trusted Network
Tyler Pulse Hardware Deployment Options
Firewall
ExternalWeb Site
Tyler Technologies staff is available to review any hardware quote prior to purchase to ensure the configuration will meet the needs of the specific Tyler products being purchased. Tyler Pulse resources are also available to review options for deploying our product on top of your existing server infrastructure.
DMZ
`
Intranet Users
Existing Web & SQL Server
Deployment Option #1Standalone - Shared
Deployment Option #2Standalone - Dedicated
Shared Web Server (Multiple Web Sites)
Shared SQL Server(Multiple App Databases)
Deployment Option #3Multi-Tier - Shared
Dedicated Web Server (Pulse Web Sites Only)
Dedicated SQL Server(Dedicated to Pulse databases)
Deployment Option #4Multi-Tier - Dedicated
Pulse ONLY Web & SQL Server
379
Tyler Pulse System Recommendations In general, Tyler Technologies will support Tyler Pulse running on versions of
Operating Systems and Databases that are supported by their manufacturer. If a specific OS or Database version has been discontinued, installation services and support on the particular platform will be limited. The following Operating Systems and Databases are supported for the Tyler Pulse product. If there are any questions regarding your current OS version, please contact your onsite I.T. staff for further review of your server’s system specifications.
Tyler Technologies currently recommends Windows Server 2008 R2 and SQL 2008
R2. Supported Operating Systems • 64 bit - Microsoft Windows Server 2008 R2 Standard & Enterprise • 32 and 64 bit - Microsoft Windows Server 2008 Standard & Enterprise • 32 bit - Microsoft Windows Server 2003 & 2005 R2 Standard & Enterprise • 32 bit - Microsoft Windows Server 2003 & 2005 Standard & Enterprise
Supported Databases • 32 and 64 bit – Microsoft SQL Server 2008 R2 Standard & Enterprise • 32 and 64 bit - Microsoft SQL Server 2008 Standard & Enterprise • 32 and 64 bit - Microsoft SQL Server 2005 Standard & Enterprise
Supported PC Web Browsers
Generally, any marketplace browser may be used with Pulse. Currently, the supported browsers for the Pulse product are listed below:
• Microsoft Internet Explorer • Mozilla Firefox • Chrome • Safari & Safari for the iPod or iPad
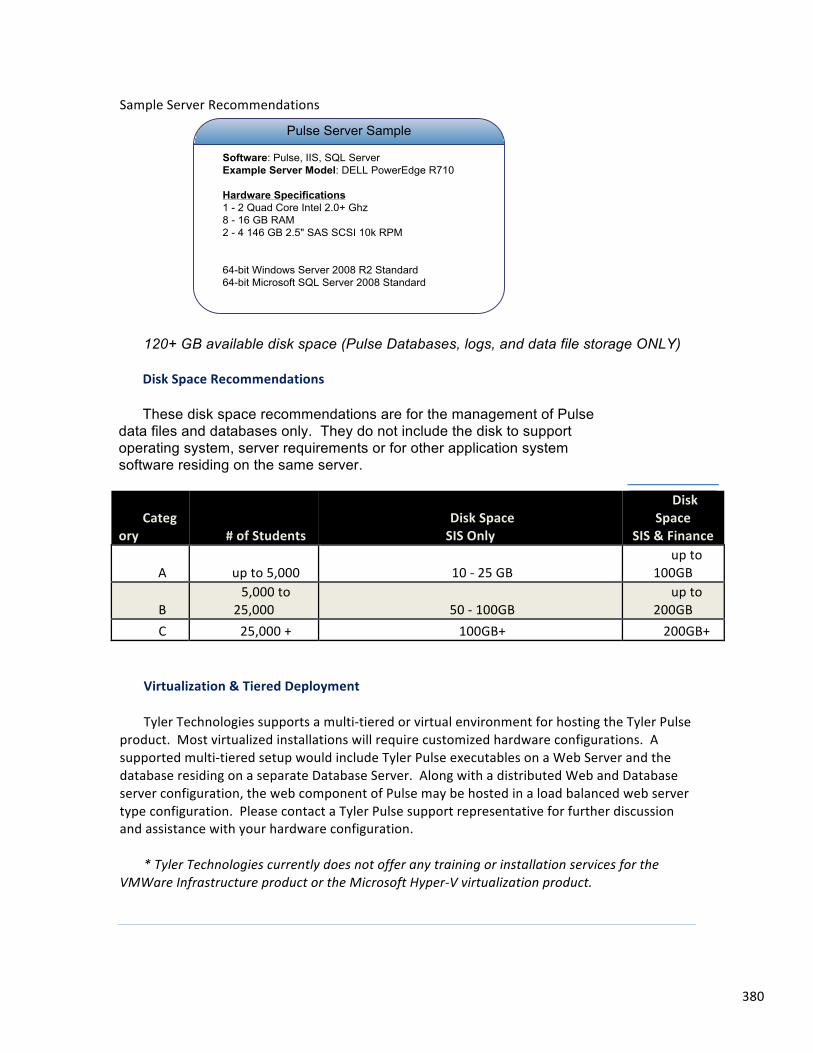
380
Sample Server Recommendations
Pulse Server Sample
Software: Pulse, IIS, SQL ServerExample Server Model: DELL PowerEdge R710
Hardware Specifications1 - 2 Quad Core Intel 2.0+ Ghz 8 - 16 GB RAM2 - 4 146 GB 2.5" SAS SCSI 10k RPM
64-bit Windows Server 2008 R2 Standard64-bit Microsoft SQL Server 2008 Standard
120+ GB available disk space (Pulse Databases, logs, and data file storage ONLY)
Disk Space Recommendations These disk space recommendations are for the management of Pulse
data files and databases only. They do not include the disk to support operating system, server requirements or for other application system software residing on the same server.
Category # of Students
Disk Space SIS Only
Disk Space
SIS & Finance
A up to 5,000 10 -‐ 25 GB up to
100GB
B 5,000 to
25,000 50 -‐ 100GB up to
200GB C 25,000 + 100GB+ 200GB+
Virtualization & Tiered Deployment Tyler Technologies supports a multi-‐tiered or virtual environment for hosting the Tyler Pulse
product. Most virtualized installations will require customized hardware configurations. A supported multi-‐tiered setup would include Tyler Pulse executables on a Web Server and the database residing on a separate Database Server. Along with a distributed Web and Database server configuration, the web component of Pulse may be hosted in a load balanced web server type configuration. Please contact a Tyler Pulse support representative for further discussion and assistance with your hardware configuration.
* Tyler Technologies currently does not offer any training or installation services for the
VMWare Infrastructure product or the Microsoft Hyper-‐V virtualization product.
381
Deployment Considerations Key considerations to be aware of when planning Tyler Pulses hardware
implementations include: 1. Public Access: If the District plans to include making Tyler Pulses content
available to users outside of the District’s network (via https Internet access), the security of the student data managed by Tyler Pulses should be considered. While running Tyler Pulse and its database on one server is supported, configuring Tyler Pulses on a web server accessing the data on a second server behind a firewall should be considered. This is also a consideration for non-Internet implementations.
2. Server Support: To provide adequate support levels, Tyler Staff requires remote desktop access to all Pulse servers at each customer site.
The hardware requirements for the Tyler Pulse product are quite flexible and are
significantly less than what would normally be expected by traditional data/information warehouse systems. This is predominately based on the following:
-‐ Tyler Pulses generally acquires raw data from supporting systems (Student Information and State NCLB Testing at a minimum) during non-working hours.
-‐ Virtually all information (user statistics and displayed data) calculated by Tyler Pulses is generated at the time of data acquisition for subsequent customer use during the following day.
-‐ During daily processing, most of the significant processing work has already performed during off hours. During online processing, processor and memory loads are significantly minimized.
Shared Servers with Other Applications Many Tyler Pulse sites will choose to implement Pulse on servers that are in existing
use with other application systems. Assuming that sufficient resources are available on those shared web and/or database servers, this is often a good option. Because Pulse is designed to organize and prepare data during off-business hours, it uses significant resources during those off hours when those resources are readily available. During business hours, when resource availability is at a premium, Pulse uses significantly less computer resources because its data has been organized the previous evening.
Users of Tyler Student Information Systems and Tyler Financial Systems usually find
sharing severs a good option. Users of other systems may also find sharing servers an option, however, in both cases the availability of resources must be closely evaluated prior to this decision. If this is an option being considered, please contact Tyler Pulse support staff. We will work with your technical staff to assure that the planned configuration is appropriate for implementing Pulse at your facilities.
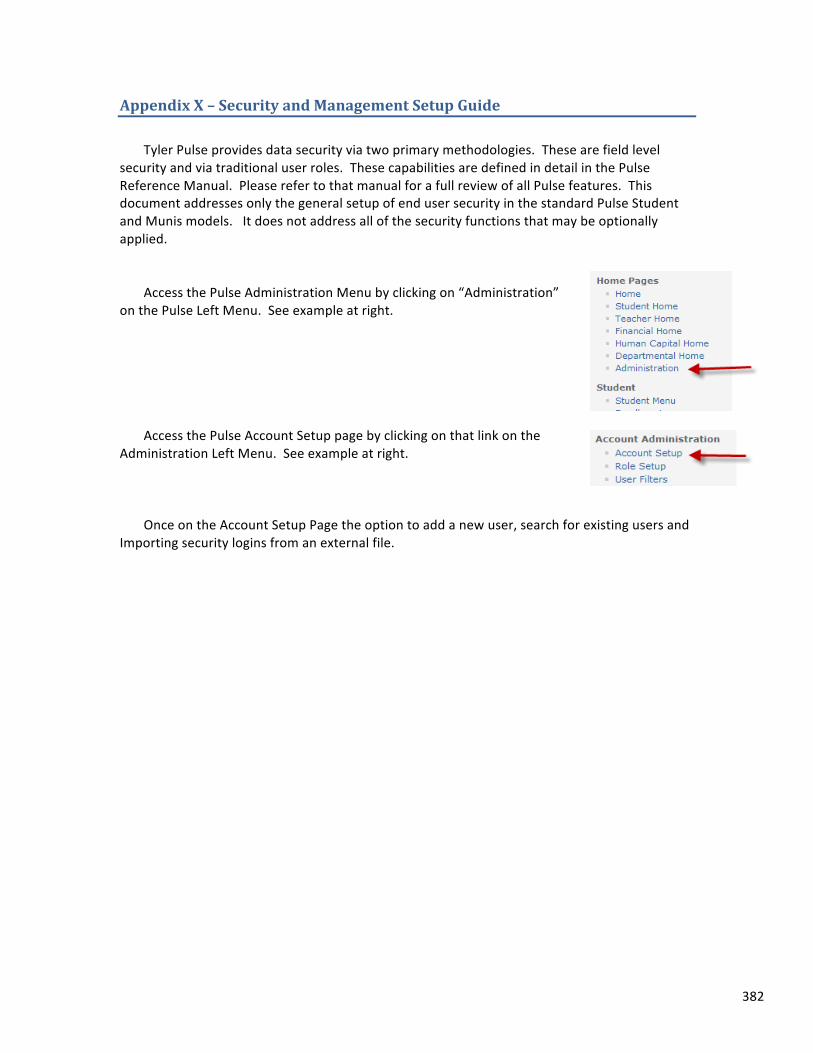
382
Appendix X – Security and Management Setup Guide Tyler Pulse provides data security via two primary methodologies. These are field level
security and via traditional user roles. These capabilities are defined in detail in the Pulse Reference Manual. Please refer to that manual for a full review of all Pulse features. This document addresses only the general setup of end user security in the standard Pulse Student and Munis models. It does not address all of the security functions that may be optionally applied.
Access the Pulse Administration Menu by clicking on “Administration”
on the Pulse Left Menu. See example at right. Access the Pulse Account Setup page by clicking on that link on the
Administration Left Menu. See example at right. Once on the Account Setup Page the option to add a new user, search for existing users and
Importing security logins from an external file.
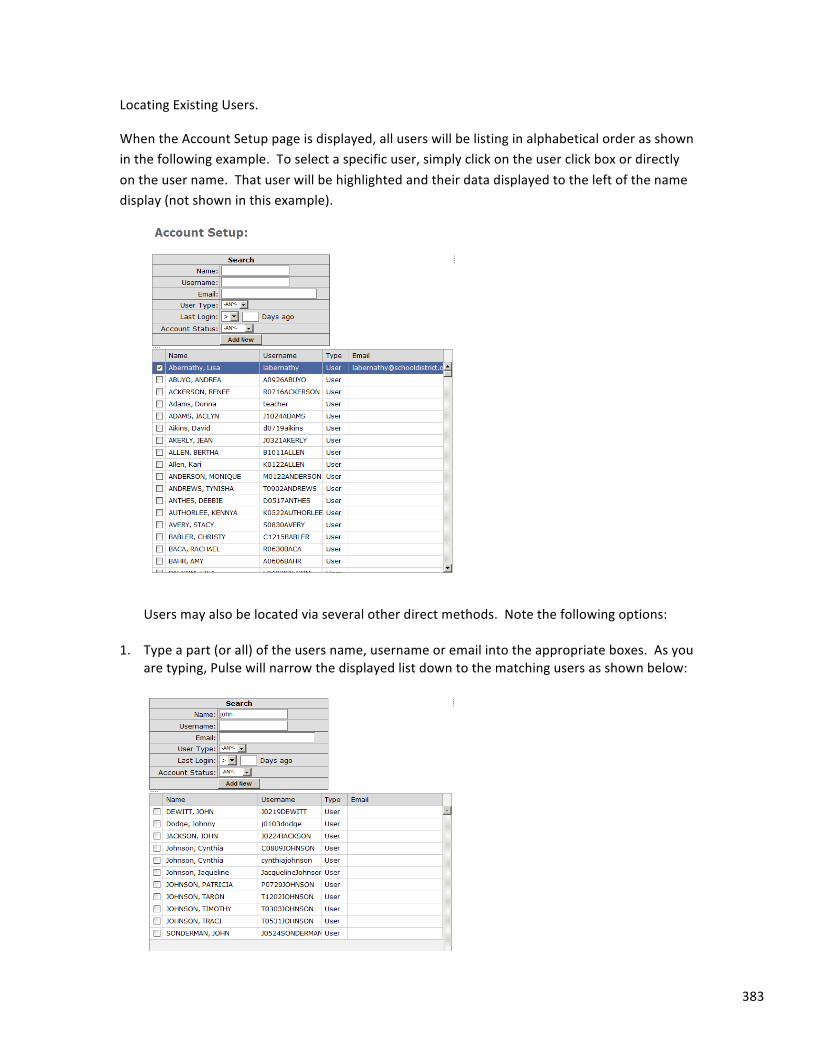
383
Locating Existing Users.
When the Account Setup page is displayed, all users will be listing in alphabetical order as shown in the following example. To select a specific user, simply click on the user click box or directly on the user name. That user will be highlighted and their data displayed to the left of the name display (not shown in this example).
Users may also be located via several other direct methods. Note the following options:
1. Type a part (or all) of the users name, username or email into the appropriate boxes. As you are typing, Pulse will narrow the displayed list down to the matching users as shown below:

384
2. Also supported are searching for users by: o User Type (User, Admin, Root) o Last Login, fill in the number of days to support the search o Account Status (Enabled or Disabled)
Once a user is selected, the following dialog will be displayed to the right of the selection:
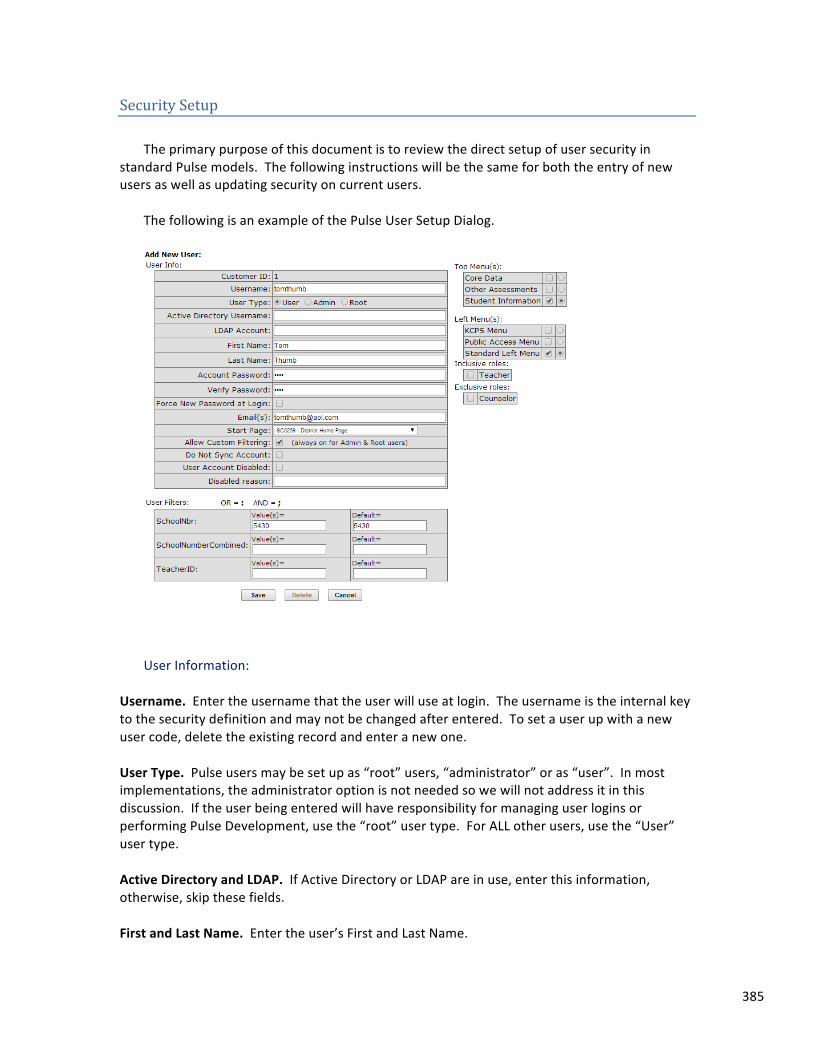
385
Security Setup The primary purpose of this document is to review the direct setup of user security in
standard Pulse models. The following instructions will be the same for both the entry of new users as well as updating security on current users.
The following is an example of the Pulse User Setup Dialog.
User Information:
Username. Enter the username that the user will use at login. The username is the internal key to the security definition and may not be changed after entered. To set a user up with a new user code, delete the existing record and enter a new one.
User Type. Pulse users may be set up as “root” users, “administrator” or as “user”. In most implementations, the administrator option is not needed so we will not address it in this discussion. If the user being entered will have responsibility for managing user logins or performing Pulse Development, use the “root” user type. For ALL other users, use the “User” user type.
Active Directory and LDAP. If Active Directory or LDAP are in use, enter this information, otherwise, skip these fields.
First and Last Name. Enter the user’s First and Last Name.
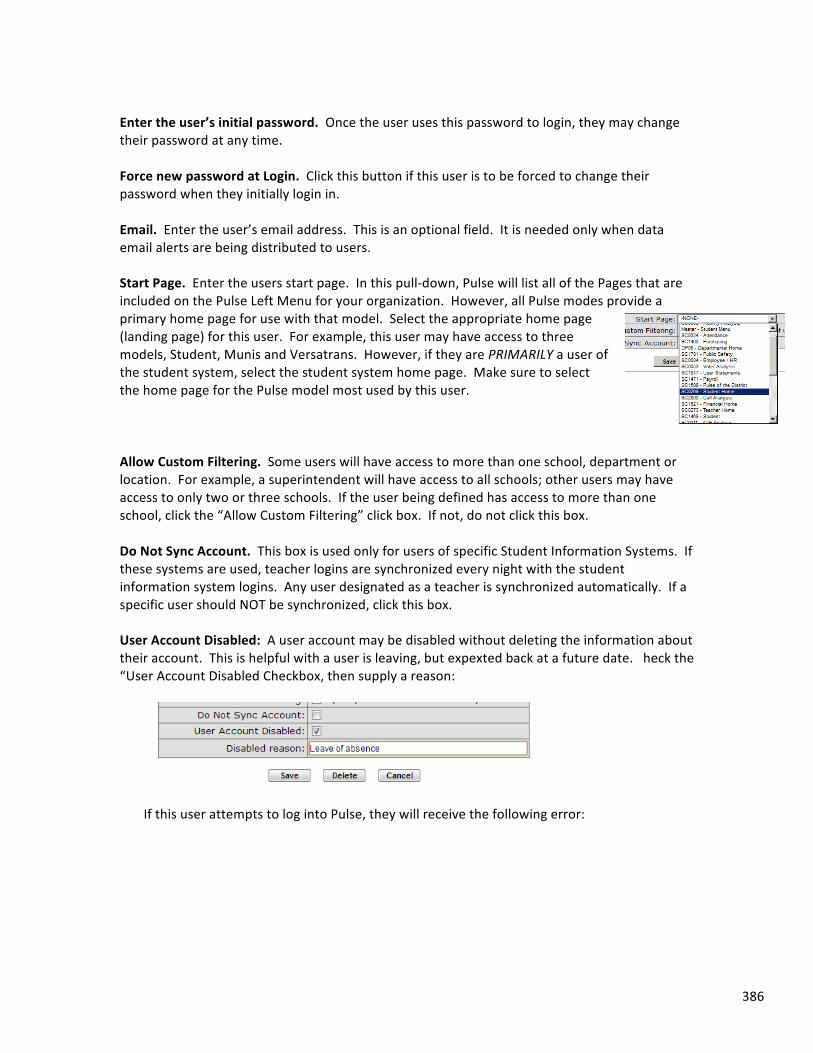
386
Enter the user’s initial password. Once the user uses this password to login, they may change their password at any time.
Force new password at Login. Click this button if this user is to be forced to change their password when they initially login in.
Email. Enter the user’s email address. This is an optional field. It is needed only when data email alerts are being distributed to users.
Start Page. Enter the users start page. In this pull-‐down, Pulse will list all of the Pages that are included on the Pulse Left Menu for your organization. However, all Pulse modes provide a primary home page for use with that model. Select the appropriate home page (landing page) for this user. For example, this user may have access to three models, Student, Munis and Versatrans. However, if they are PRIMARILY a user of the student system, select the student system home page. Make sure to select the home page for the Pulse model most used by this user.
Allow Custom Filtering. Some users will have access to more than one school, department or location. For example, a superintendent will have access to all schools; other users may have access to only two or three schools. If the user being defined has access to more than one school, click the “Allow Custom Filtering” click box. If not, do not click this box.
Do Not Sync Account. This box is used only for users of specific Student Information Systems. If these systems are used, teacher logins are synchronized every night with the student information system logins. Any user designated as a teacher is synchronized automatically. If a specific user should NOT be synchronized, click this box. User Account Disabled: A user account may be disabled without deleting the information about their account. This is helpful with a user is leaving, but expexted back at a future date. heck the “User Account Disabled Checkbox, then supply a reason:
If this user attempts to log into Pulse, they will receive the following error:
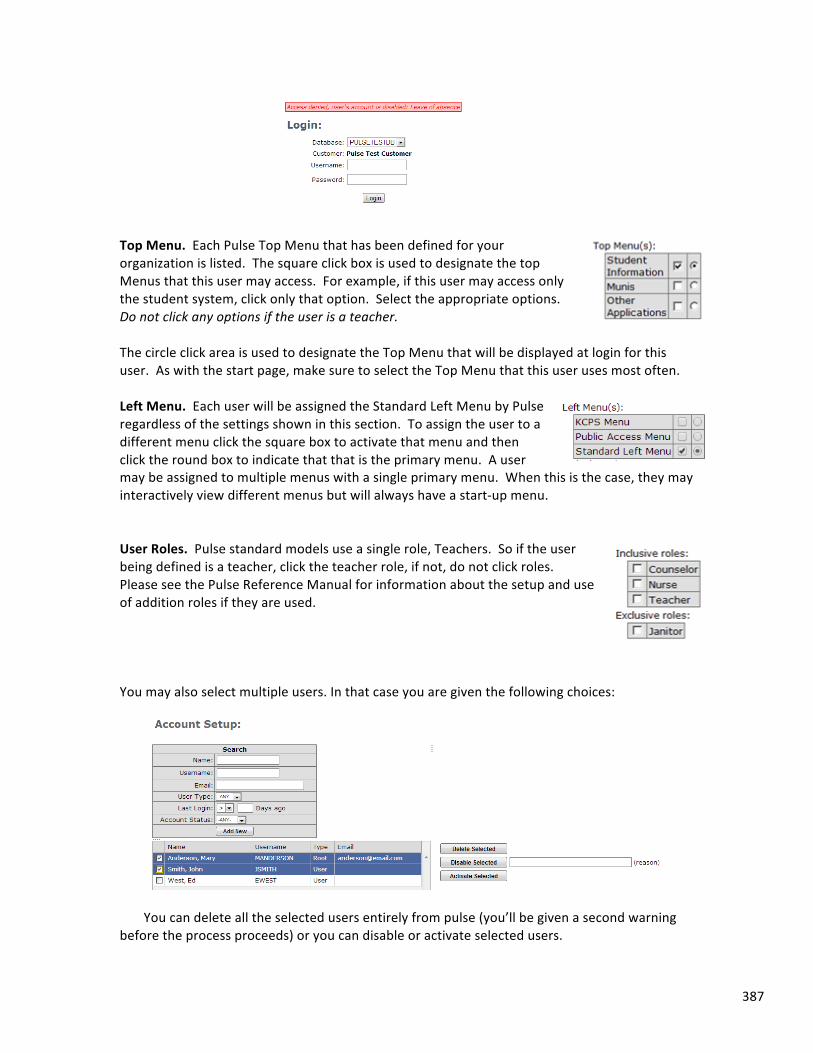
387
Top Menu. Each Pulse Top Menu that has been defined for your organization is listed. The square click box is used to designate the top Menus that this user may access. For example, if this user may access only the student system, click only that option. Select the appropriate options. Do not click any options if the user is a teacher.
The circle click area is used to designate the Top Menu that will be displayed at login for this user. As with the start page, make sure to select the Top Menu that this user uses most often.
Left Menu. Each user will be assigned the Standard Left Menu by Pulse regardless of the settings shown in this section. To assign the user to a different menu click the square box to activate that menu and then click the round box to indicate that that is the primary menu. A user may be assigned to multiple menus with a single primary menu. When this is the case, they may interactively view different menus but will always have a start-‐up menu. User Roles. Pulse standard models use a single role, Teachers. So if the user being defined is a teacher, click the teacher role, if not, do not click roles. Please see the Pulse Reference Manual for information about the setup and use of addition roles if they are used.
You may also select multiple users. In that case you are given the following choices:
You can delete all the selected users entirely from pulse (you’ll be given a second warning
before the process proceeds) or you can disable or activate selected users.
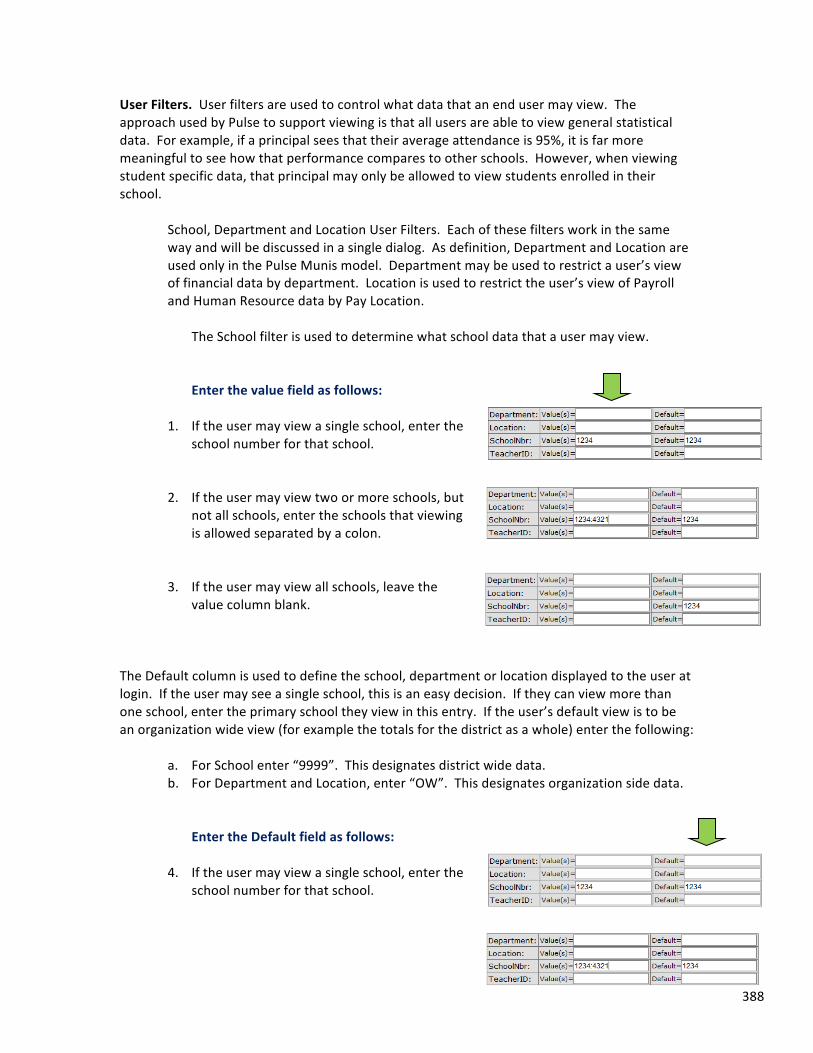
388
User Filters. User filters are used to control what data that an end user may view. The approach used by Pulse to support viewing is that all users are able to view general statistical data. For example, if a principal sees that their average attendance is 95%, it is far more meaningful to see how that performance compares to other schools. However, when viewing student specific data, that principal may only be allowed to view students enrolled in their school.
School, Department and Location User Filters. Each of these filters work in the same way and will be discussed in a single dialog. As definition, Department and Location are used only in the Pulse Munis model. Department may be used to restrict a user’s view of financial data by department. Location is used to restrict the user’s view of Payroll and Human Resource data by Pay Location.
The School filter is used to determine what school data that a user may view. Enter the value field as follows:
1. If the user may view a single school, enter the school number for that school.
2. If the user may view two or more schools, but not all schools, enter the schools that viewing is allowed separated by a colon.
3. If the user may view all schools, leave the value column blank.
The Default column is used to define the school, department or location displayed to the user at login. If the user may see a single school, this is an easy decision. If they can view more than one school, enter the primary school they view in this entry. If the user’s default view is to be an organization wide view (for example the totals for the district as a whole) enter the following:
a. For School enter “9999”. This designates district wide data. b. For Department and Location, enter “OW”. This designates organization side data.
Enter the Default field as follows:
4. If the user may view a single school, enter the school number for that school.
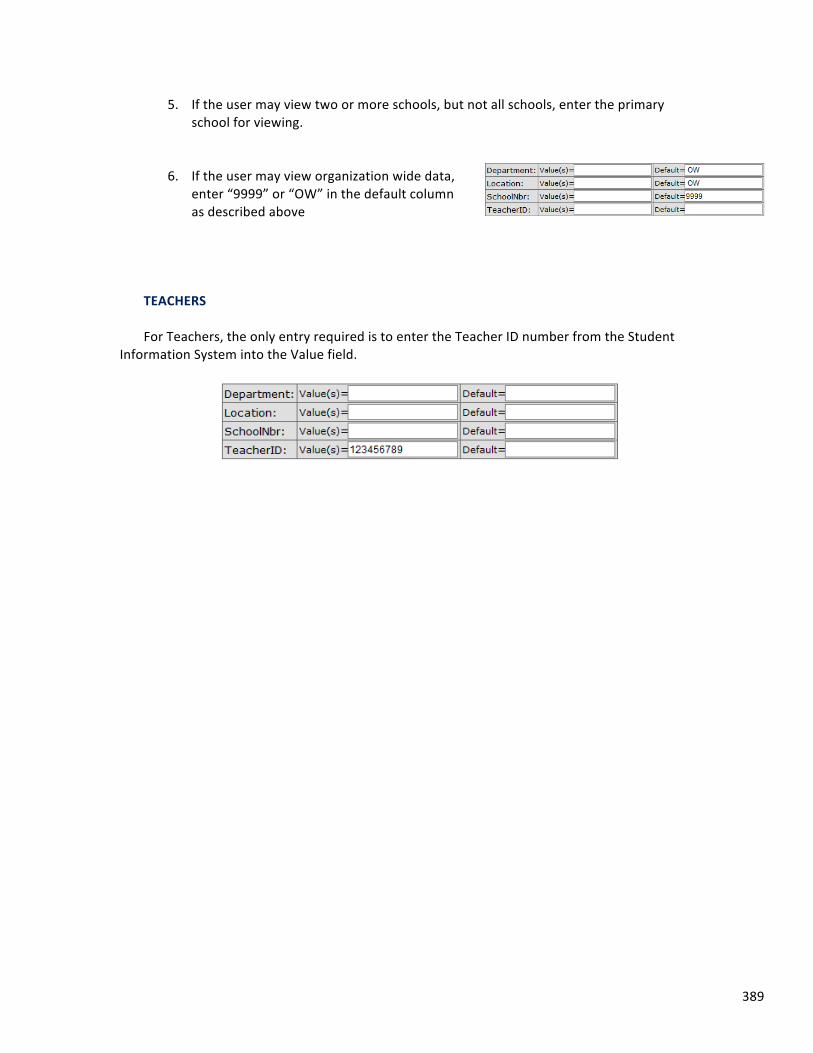
389
5. If the user may view two or more schools, but not all schools, enter the primary school for viewing.
6. If the user may view organization wide data, enter “9999” or “OW” in the default column as described above
TEACHERS For Teachers, the only entry required is to enter the Teacher ID number from the Student
Information System into the Value field.
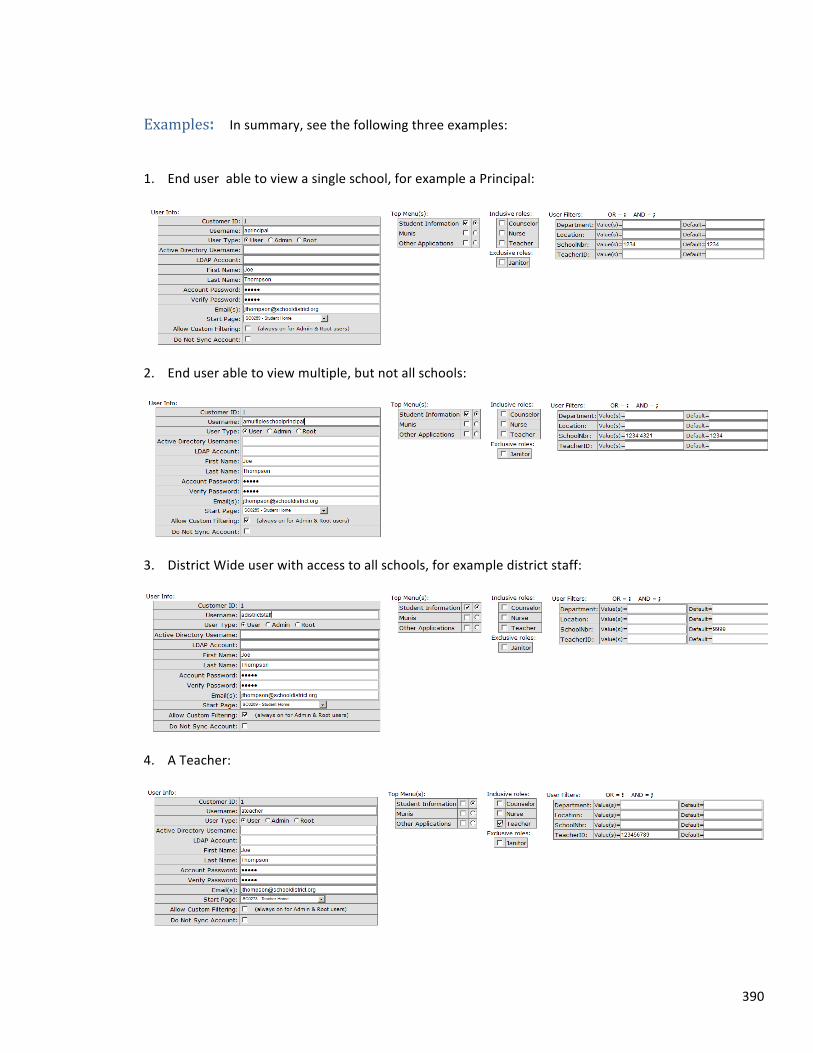
390
Examples: In summary, see the following three examples: 1. End user able to view a single school, for example a Principal:
2. End user able to view multiple, but not all schools:
3. District Wide user with access to all schools, for example district staff:
4. A Teacher:

391
Appendix XI – Grades Model Setup
This documentation for grade model management and setup is a generic description of the process for setting up the grades model for various SIS Models within Pulse. Note that these processes may vary by SIS, contact Pulse Support if you have questions or need further information in this area.
Pulse grades has three sections: Current Grades, Grades, and Transcript Grades. Current Grades: These are extracted from the SIS system’s grade book each night. At a
minimum the extract needs to contain grades for the current term. We don’t receive this from all of our SIS systems.
Grades: These are the grades posted to the report cards for the current school year. The key
to this working correctly is to make sure the first query GRSchoolYear correctly identifies the School Year as extracted from the SIS system.
Transcript Grades: These are the grades for the high school transcripts and include grades
from previous years for high school students. Ideally the extract from the SIS system will only flag actual high school transcript grades but we do have some system that bring across all grade history and flag them as transcript. The flag column is transcript and the query looks for a “Y” or “Yes”. Sometimes you have to modify the first query GRTRGrades to only include grades earned in grade levels 9, 10, 11, and 12.
Manual Tables: ENDistrictTable:
• LtrGrades: Enter Y or N if we receive letter grades in the grades file. • Include Numeric Grades: Enter Y or N if we receive numeric grades (percentages) in the
grades file. • SISID: Indicate the SIS system. The queries currently check for SISK12, TEMS,
SchoolMaster, IC, SMAX and Q) Caution: Somewhere along the lines another column SIS was added to this table. Make sure you use the column SISID.
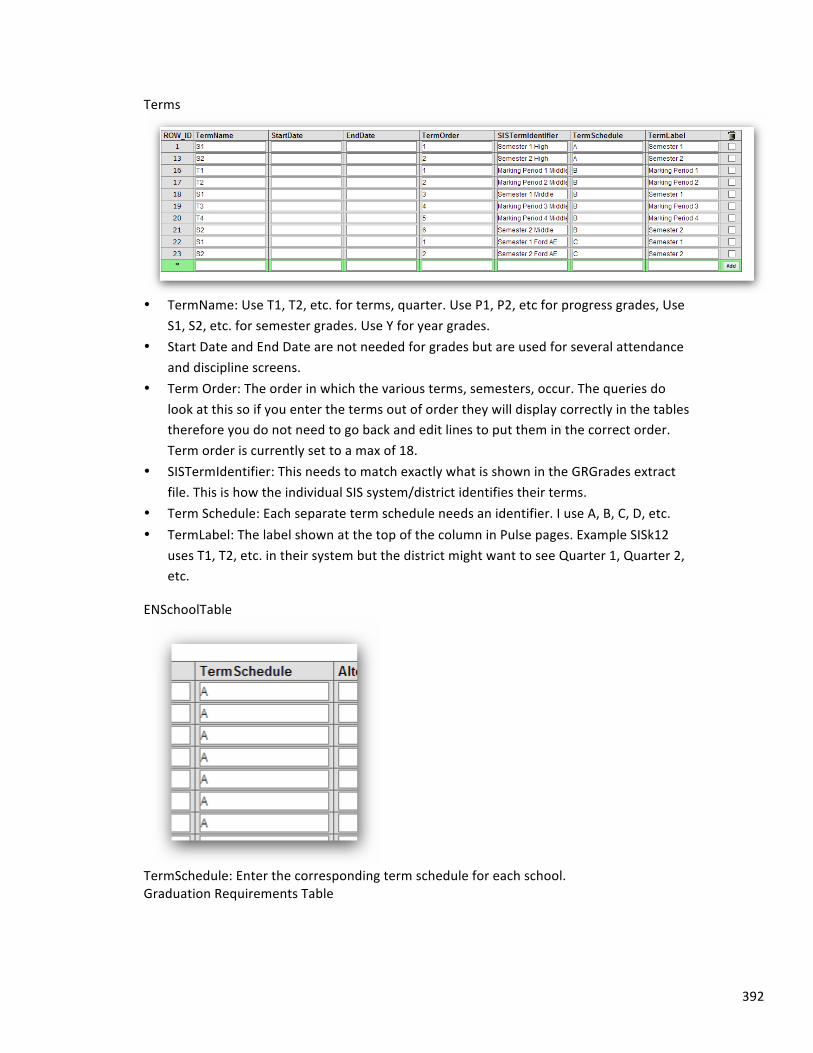
392
Terms
• TermName: Use T1, T2, etc. for terms, quarter. Use P1, P2, etc for progress grades, Use
S1, S2, etc. for semester grades. Use Y for year grades. • Start Date and End Date are not needed for grades but are used for several attendance
and discipline screens. • Term Order: The order in which the various terms, semesters, occur. The queries do
look at this so if you enter the terms out of order they will display correctly in the tables therefore you do not need to go back and edit lines to put them in the correct order. Term order is currently set to a max of 18.
• SISTermIdentifier: This needs to match exactly what is shown in the GRGrades extract file. This is how the individual SIS system/district identifies their terms.
• Term Schedule: Each separate term schedule needs an identifier. I use A, B, C, D, etc. • TermLabel: The label shown at the top of the column in Pulse pages. Example SISk12
uses T1, T2, etc. in their system but the district might want to see Quarter 1, Quarter 2, etc.
ENSchoolTable
TermSchedule: Enter the corresponding term schedule for each school. Graduation Requirements Table
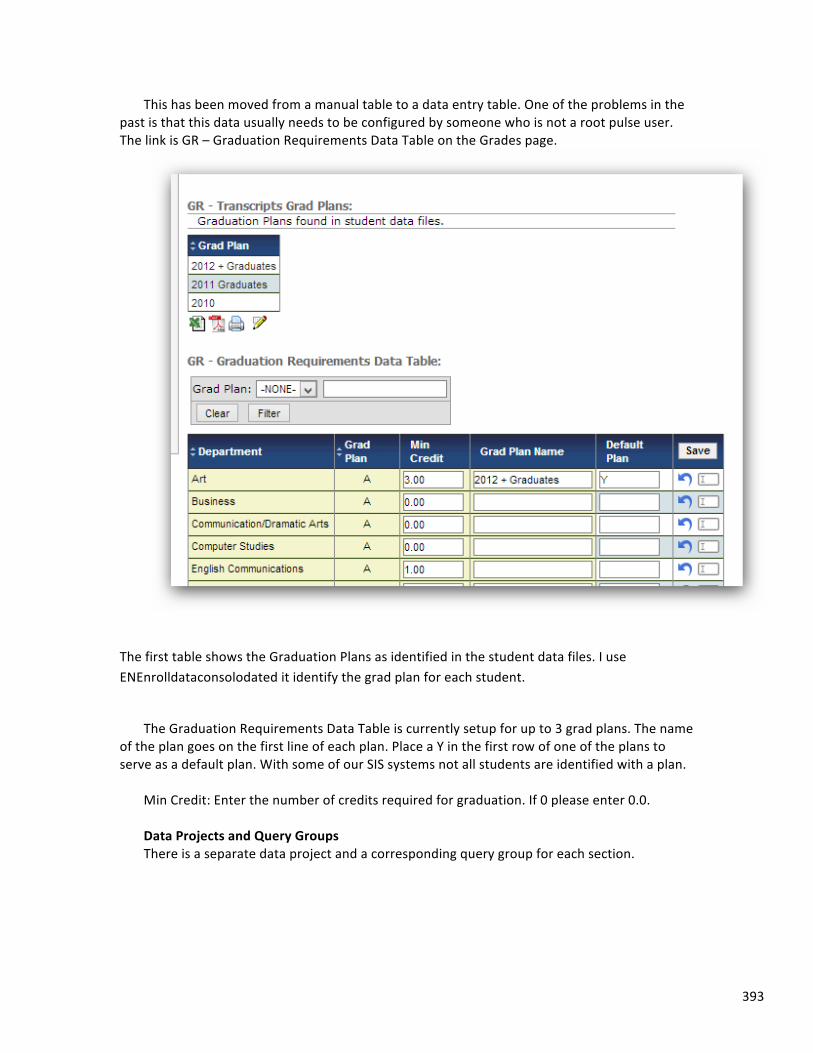
393
This has been moved from a manual table to a data entry table. One of the problems in the past is that this data usually needs to be configured by someone who is not a root pulse user. The link is GR – Graduation Requirements Data Table on the Grades page.
The first table shows the Graduation Plans as identified in the student data files. I use ENEnrolldataconsolodated it identify the grad plan for each student.
The Graduation Requirements Data Table is currently setup for up to 3 grad plans. The name
of the plan goes on the first line of each plan. Place a Y in the first row of one of the plans to serve as a default plan. With some of our SIS systems not all students are identified with a plan.
Min Credit: Enter the number of credits required for graduation. If 0 please enter 0.0. Data Projects and Query Groups There is a separate data project and a corresponding query group for each section.
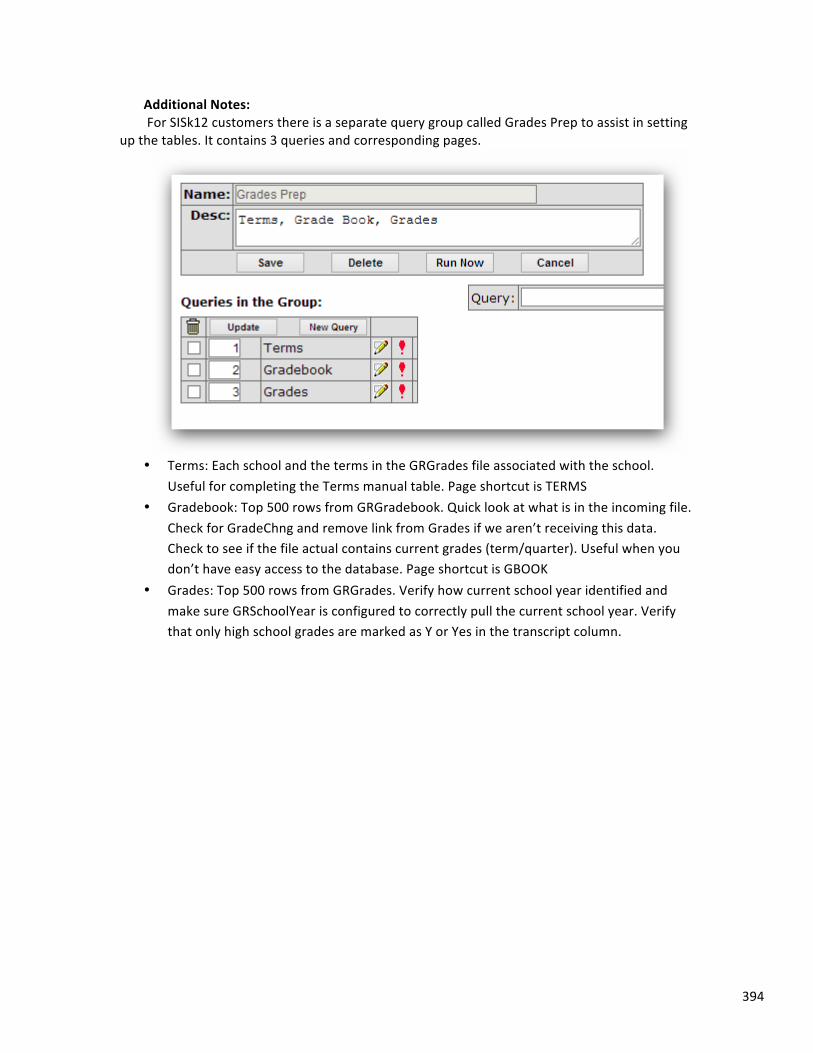
394
Additional Notes: For SISk12 customers there is a separate query group called Grades Prep to assist in setting
up the tables. It contains 3 queries and corresponding pages.
• Terms: Each school and the terms in the GRGrades file associated with the school.
Useful for completing the Terms manual table. Page shortcut is TERMS • Gradebook: Top 500 rows from GRGradebook. Quick look at what is in the incoming file.
Check for GradeChng and remove link from Grades if we aren’t receiving this data. Check to see if the file actual contains current grades (term/quarter). Useful when you don’t have easy access to the database. Page shortcut is GBOOK
• Grades: Top 500 rows from GRGrades. Verify how current school year identified and make sure GRSchoolYear is configured to correctly pull the current school year. Verify that only high school grades are marked as Y or Yes in the transcript column.
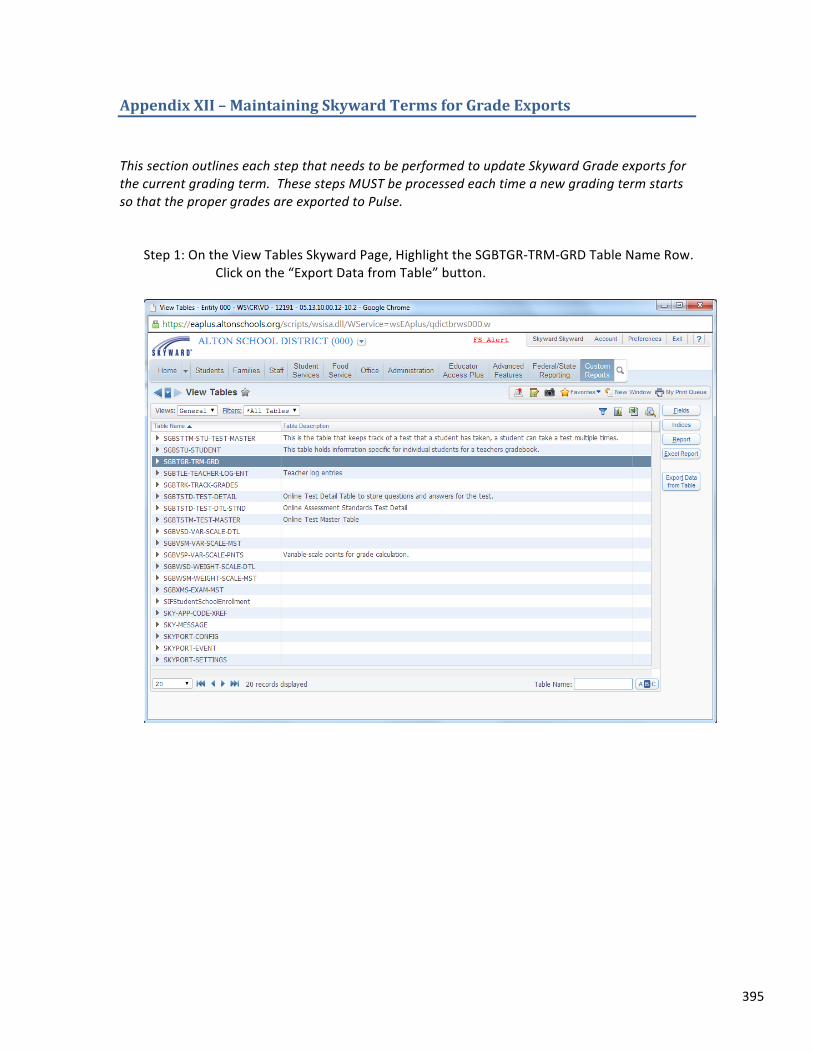
395
Appendix XII – Maintaining Skyward Terms for Grade Exports
This section outlines each step that needs to be performed to update Skyward Grade exports for the current grading term. These steps MUST be processed each time a new grading term starts so that the proper grades are exported to Pulse.
Step 1: On the View Tables Skyward Page, Highlight the SGBTGR-‐TRM-‐GRD Table Name Row. Click on the “Export Data from Table” button.
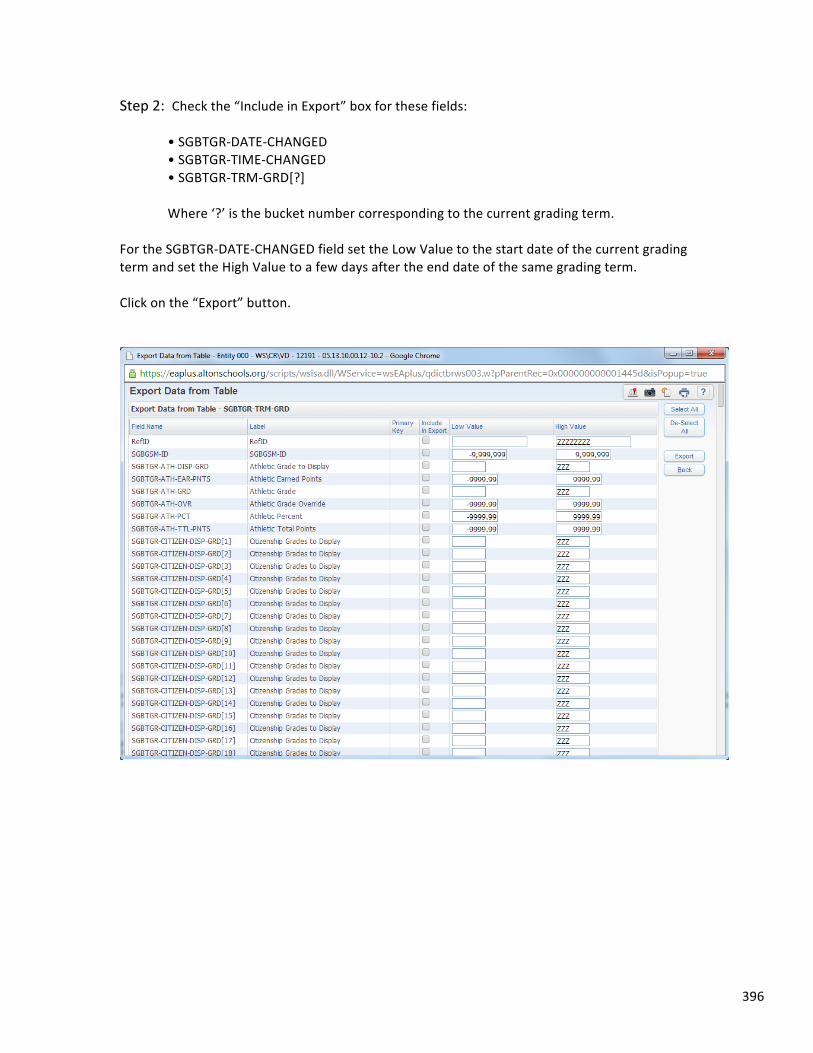
396
Step 2: Check the “Include in Export” box for these fields:
• SGBTGR-‐DATE-‐CHANGED • SGBTGR-‐TIME-‐CHANGED • SGBTGR-‐TRM-‐GRD[?] Where ‘?’ is the bucket number corresponding to the current grading term. For the SGBTGR-‐DATE-‐CHANGED field set the Low Value to the start date of the current grading term and set the High Value to a few days after the end date of the same grading term. Click on the “Export” button.
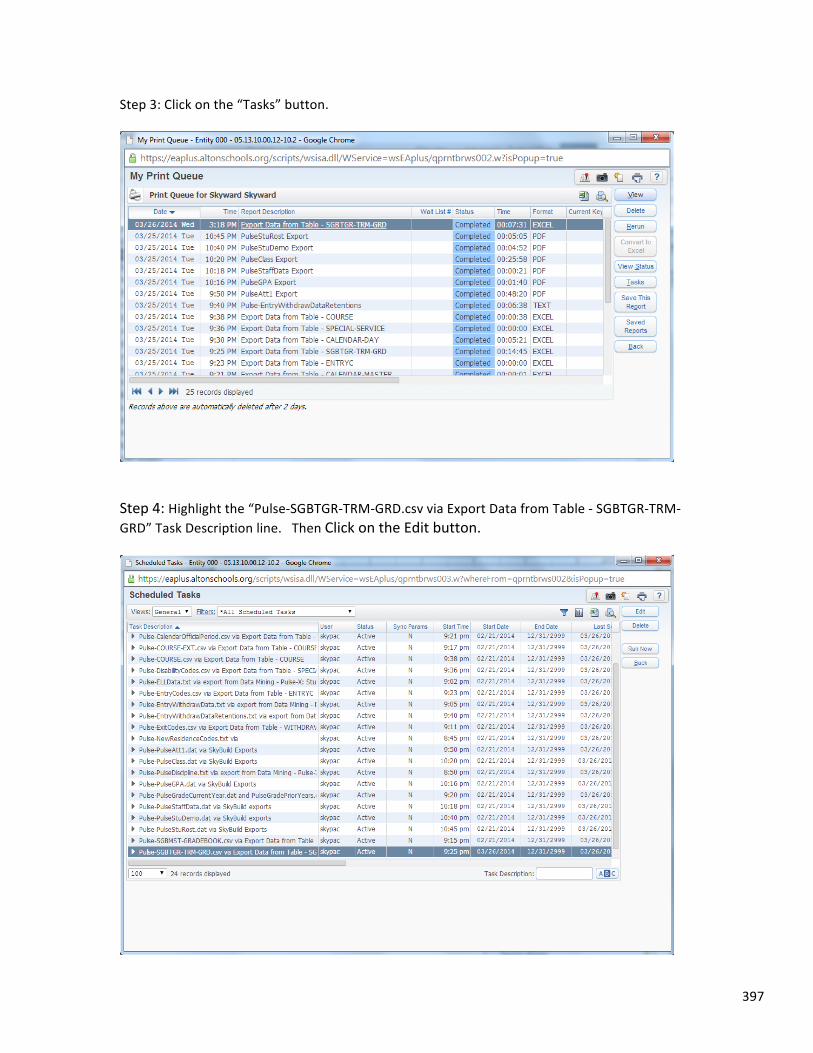
397
Step 3: Click on the “Tasks” button.
Step 4: Highlight the “Pulse-‐SGBTGR-‐TRM-‐GRD.csv via Export Data from Table -‐ SGBTGR-‐TRM-‐GRD” Task Description line. Then Click on the Edit button.
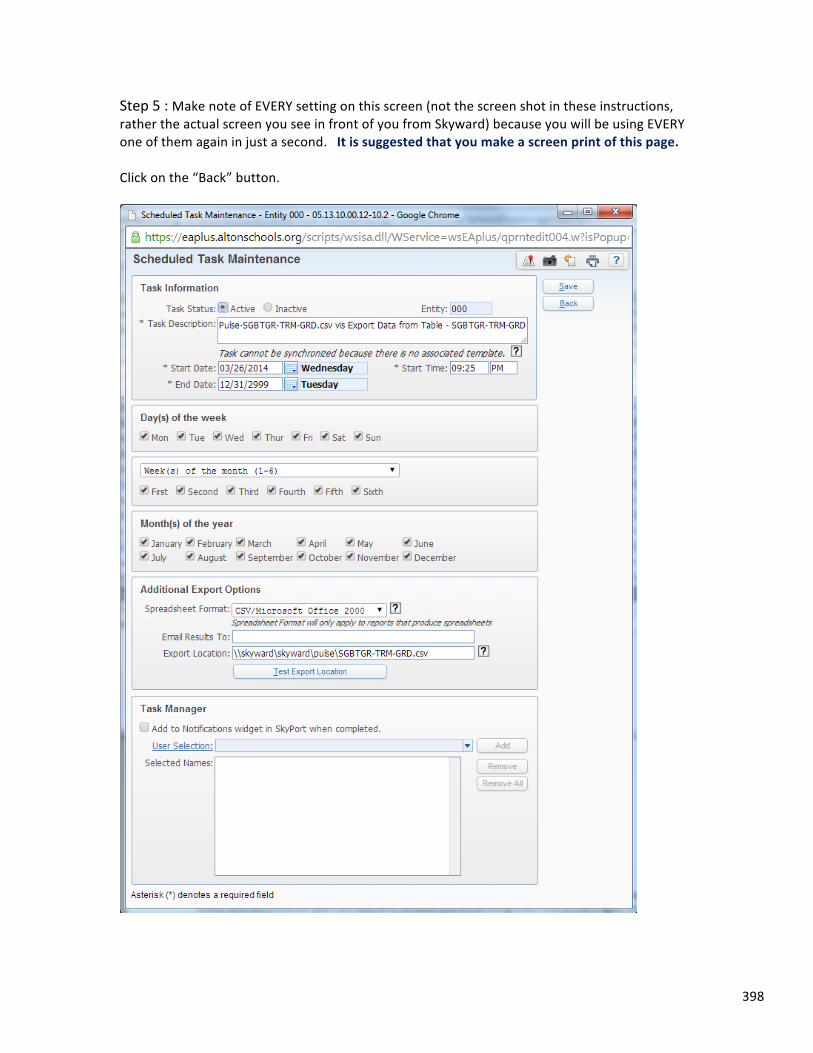
398
Step 5 : Make note of EVERY setting on this screen (not the screen shot in these instructions, rather the actual screen you see in front of you from Skyward) because you will be using EVERY one of them again in just a second. It is suggested that you make a screen print of this page. Click on the “Back” button.
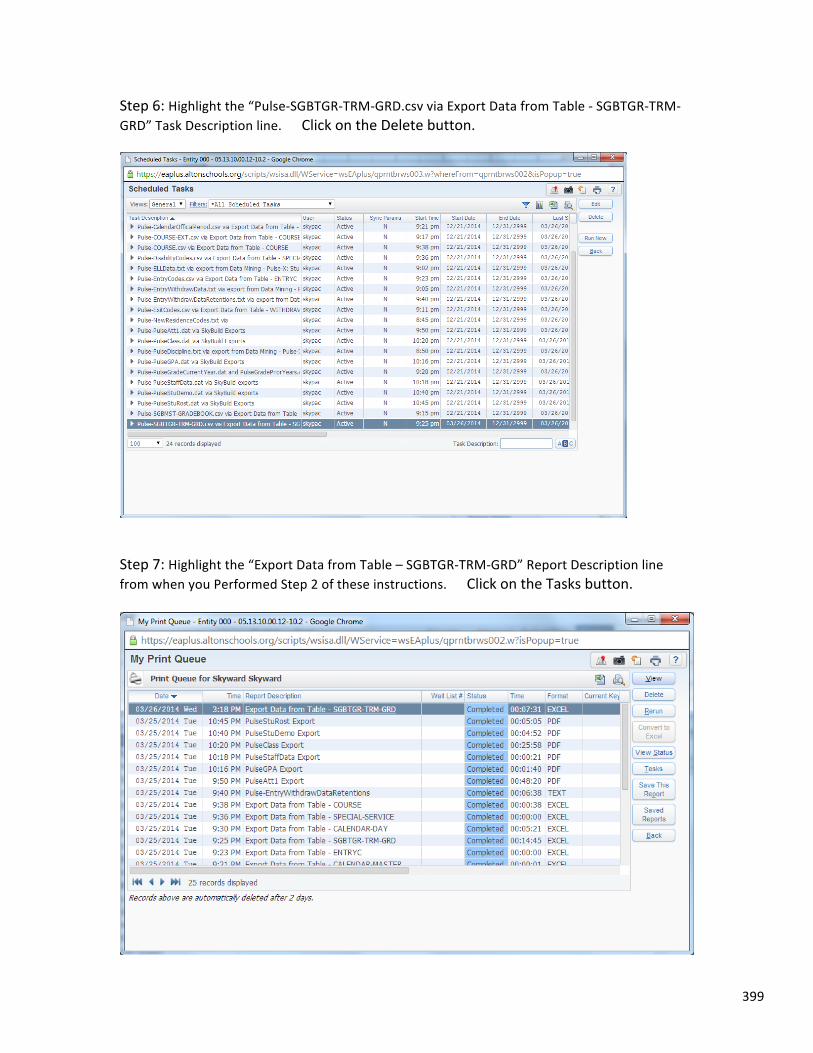
399
Step 6: Highlight the “Pulse-‐SGBTGR-‐TRM-‐GRD.csv via Export Data from Table -‐ SGBTGR-‐TRM-‐GRD” Task Description line. Click on the Delete button.
Step 7: Highlight the “Export Data from Table – SGBTGR-‐TRM-‐GRD” Report Description line from when you Performed Step 2 of these instructions. Click on the Tasks button.
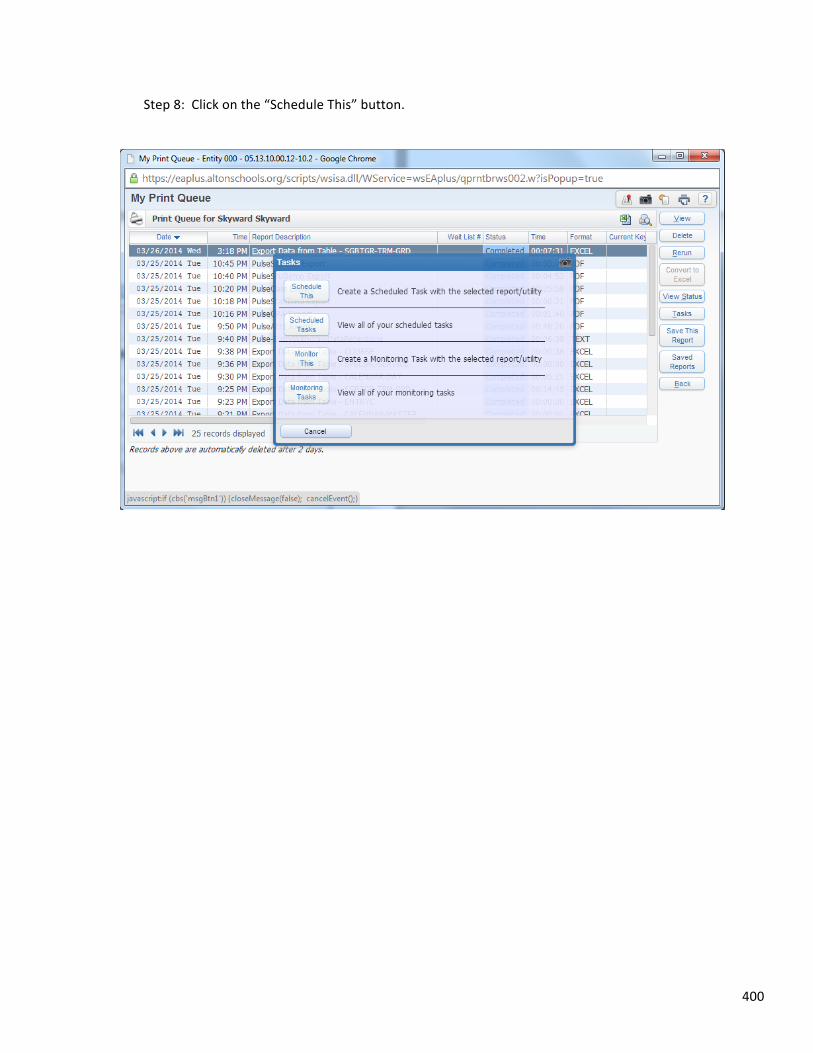
400
Step 8: Click on the “Schedule This” button.
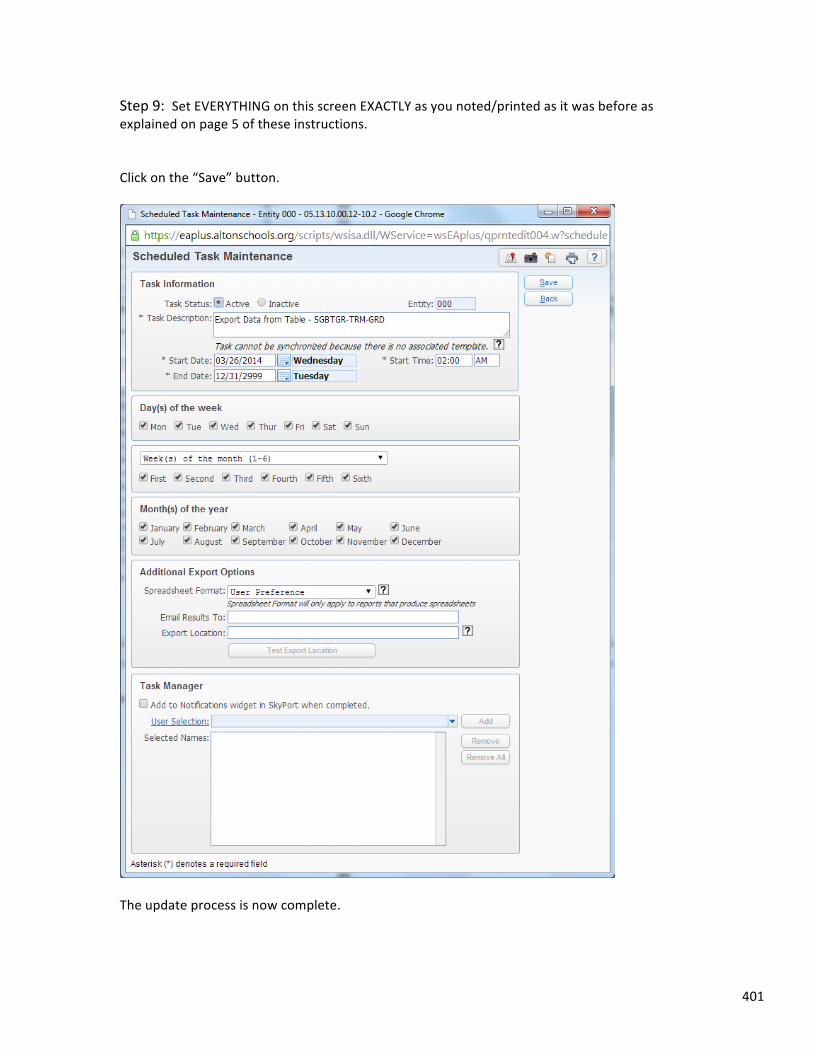
401
Step 9: Set EVERYTHING on this screen EXACTLY as you noted/printed as it was before as explained on page 5 of these instructions. Click on the “Save” button.
The update process is now complete.