PUBLICATIONS OF THE INSTITUTE OF ... - Intermagnet
67
INSTITUTE OF GEOPHYSICS POLISH ACADEMY OF SCIENCES PUBLICATIONS OF THE INSTITUTE OF GEOPHYSICS POLISH ACADEMY OF SCIENCES C-105 (415) RESULTS OF GEOMAGNETIC OBSERVATIONS BELSK, HEL, HORNSUND 2011 WARSZAWA 2012
-
Upload
khangminh22 -
Category
Documents
-
view
2 -
download
0
Transcript of PUBLICATIONS OF THE INSTITUTE OF ... - Intermagnet

INSTITUTE OF GEOPHYSICS POLISH ACADEMY OF SCIENCES
PUBLICATIONS
OF THE INSTITUTE OF GEOPHYSICS
POLISH ACADEMY OF SCIENCES
C-105 (415)
RESULTS OF GEOMAGNETIC OBSERVATIONS BELSK, HEL, HORNSUND
2011
WARSZAWA 2012
INSTITUTE OF GEOPHYSICS POLISH ACADEMY OF SCIENCES
PUBLICATIONS
OF THE INSTITUTE OF GEOPHYSICS
POLISH ACADEMY OF SCIENCES
C-105 (415)
RESULTS OF GEOMAGNETIC OBSERVATIONS BELSK, HEL, HORNSUND
2011
Editorial note
The Publications of the Institute of Geophysics are now mainly an internet free-access journal. Since 2010, the former Monographic Volumes are part of the
GeoPlanet Series, issued by the consortium GeoPlanet (Earth and Planetary Research Centre)
WARSZAWA 2012

Editor-in-Chief
Roman TEISSEYRE
Editorial Advisory Board Tomasz ERNST, Maria JELEŃSKA, Andrzej KIJKO (University of Pretoria, South Africa),
Zbigniew KŁOS (Space Research Center, Polish Academy of Sciences, Warsaw, Poland), Jan KOZAK (Geophysical Institute, Prague, Czech Rep.), Antonio MELONI (Instituto Nazionale di Geofisica, Rome, Italy), Hiroyuki NAGAHAMA (Tohoku University, Sendai, Japan), Kaja
PIETSCH (AGH University of Science and Technology, Cracow, Poland), Zbigniew W. SORBJAN (Marquette University, Milwaukee, USA), Steve WALLIS (Heriot Watt
University, Edinburgh, UK), Wacław M. ZUBEREK (University of Silesia, Sosnowiec, Poland)
Editors Janusz BORKOWSKI (Atmospheric Sciences), Jerzy JANKOWSKI (Geomagnetism), Paweł
M. ROWIŃSKI (Hydrology), Anna DZIEMBOWSKA (Managing Editor)
Editorial Office Instytut Geofizyki Polskiej Akademii Nauk
ul. Księcia Janusza 64, 01-452 Warszawa, Poland
© Copyright by Instytut Geofizyki Polskiej Akademii Nauk, Warszawa 2012
Internet Edition
ISBN 978-83-88765-89-6

"Publications of the Institute of Geophysics, Polish Academy of Sciences" has been issued in the following series: A – Physics of the Earth's Interior B – Seismology C – Geomagnetism D – Physics of the Atmosphere E – Hydrology (formerly Water Resources) M – Miscellanea Since 2010, we are mostly restricted to Internet Editions.

PUBLICATIONS OF THE INSTITUTE OF GEOPHYSICS POLISH ACADEMY OF SCIENCES
C. Geomagnetism
List of latest issues.
C-99 (398) Monographic Volume: XII IAGA Workshop on Geomagnetic Observatory Instruments, Data Acquisition and Processing, Belsk, 19-24 June 2006. C-100 (402) Results of geomagnetic observations, Belsk, Hel, Hornsund, 2006. C-101 (408) Results of geomagnetic observations, Belsk, Hel, Hornsund, 2007. C-102 (409) Results of geomagnetic observations, Belsk, Hel, Hornsund, 2008. C-103 (413) (Internet Edition) Results of geomagnetic observations, Belsk, Hel, Hornsund, 2009 C-104 (414) (Internet Edition) Results of geomagnetic observations, Belsk, Hel, Hornsund, 2010 ISBN 978-83-88765-89-6 Full texts of all the papers, with color versions of the figures, are available on the Institute’s homepage.


1
PUBLS. INST. GEOPHYS. POL. ACAD. SC., C-105 (415) (2012)
Results of Geomagnetic Observations Belsk, Hel, Hornsund,
2011
Mariusz NESKA, Jan REDA and Stanisław WÓJCIK
Institute of Geophysics, Polish Academy of Sciences ul. Księcia Janusza 64, 01-452 Warszawa, Poland
1. INTRODUCTION
This publication contains basic information on geomagnetic observations carried out in 2011 in three Polish geophysical observatories: Belsk (BEL), Hel (HLP), and Hornsund (HRN). All these observatories belong to the Institute of Geophysics, Polish Academy of Sciences. Observatories Belsk and Hel are located on the territory of Poland, while Hornsund is in Spitsbergen archipelago, governed by Norway.
In 2011, like in the previous years, the Belsk, Hel and Hornsund observatories have kept a close collaboration with the world network of geomagnetic observatories INTERMAGNET. The Belsk Observatory joined INTERMAGNET in 1992, Hel in 1999, and Hornsund in 2002. 2. DESCRIPTION OF OBSERVATORIES
The location of observatories is shown in Fig. 1 and Table 1. The geomagnetic coordinates in Table 1 were calculated in relation to the geomagnetic pole located at 83.2oN, 118.3oW on the basis of model IGRF-11 from epoch 2010.
The methodology of geomagnetic observations in all the three observatories was very similar, based on the “Guide for Magnetic Measurements and Observatory Practice” (Jankowski and Sucksdorff 1996). The instruments were similar too. Absolute measurements were made with the use of DI-flux magnetometers and proton magnetometers. The magnetic field variations were measured with the use of PSM magnetometers equipped in Bobrov’s quartz variometers. The spare sets are equipped in PSM magnetometers or LEMI flux-gate magnetometers.

2
Fig. 1. Location of the Belsk, Hel and Hornsund observatories.
Table 1 Coordinates of the Polish observatories
Observatory Geographic coordinates Geomagnetic coordinates Elevation Latitude Longitude Latitude Longitude [m]
Belsk (BEL) 51o 50.2′ N 20o 47.3′ E 49.9o N 105.1o E 180
Hel (HLP) 54o 36.5′ N 18o 49.0′ E 53.1o N 104.6o E 1
Hornsund (HRN) 77o 0.0′ N 15o 33.0′ E 73.9o N 125.3o E 15
Continuous recording has been made by means of digital loggers type NDL. Owing to the
recording system we use and the fact that we strictly obey the procedures relating to the so-called magnetic service, the gaps in one-minute data from Belsk and Hel are practically absent.
It is worth mentioning that in 2011 the Belsk and Hornsund Observatories have been continuing the permanent observation of the Schumann resonance. Two horizontal magnetic components and the vertical component of the electric field have been recorded at a frequency of 100 Hz. This recording was initiated in both observatories in 2004 (Neska and Satori 2006).

3
2.1 Central Geophysical Observatory at Belsk, Central Poland
The Observatory at Belsk began continuous observations of the Earth magnetic field in 1965 (Jankowski and Marianiuk 2007). It continued the activity of the first Polish magnetic Observatory at Świder near Warsaw, working incessantly through the years 1920-1975. The magnetic observations were transferred from Świder to Belsk because of a strong increase of artificial noise from the Warsaw agglomeration, in particular due to the electric railroad passing nearby the Świder Observatory.
The Belsk Observatory is located at a distance of about 50 km south of Warsaw and about 2 km northwest of the village Belsk Duży. The premises of the Observatory, about 10 ha in area, is at the edge of the forest reserve Modrzewina, far away of people’s settlements and automobile traffic. The Observatory is surrounded by typically agricultural regions (with fertile soil, mostly apple orchards), so the direct neighborhood is deprived of sources of major artificial geomagnetic field disturbances. It is only the electric railroad (DC powered) situated some 14 km away of the Observatory to the north that produces some small artificial magnetic disturbances, whose average level usually does not exceed 1 nT.
More information about the region in which the Observatory is located can be found, in English, Polish and German, on the internet pages of Grójec district (http://www.grojec.pl) to which the village Belsk Duży belongs. Relevant information about Belsk Observatory can be found at page http://www.igf.edu.pl/en/obserwatoria/cog_belsk. 2.2 Geophysical Observatory at Hel, Northern Poland
The Observatory at Hel began continuous observations of the earth magnetic field in 1932 (Jankowski and Marianiuk 2007). The observations were stopped in 1939, after the outbreak of World War II. During the war, the Observatory as well as its equipment and data were completely destroyed. After reconstruction, continuous observations at Hel were resumed in 1957.
The Hel Observatory is located in a small resort town at the end of Hel Peninsula by the Bay of Gdańsk. It is the area of Seaside Landscape Park (Nadmorski Park Krajobrazowy), weakly industrialized and urbanized. The region, surrounded by water from three sides, lacks any major artificial noise and is a good place for continuous magnetic observations.
The observatory premises, about 4.5 ha in area, is surrounded by mixed forest (mainly pine and birch trees). Pavilions with measurement and recording instruments are located at small clearings.
More information about the town of Hel where the Observatory is located can be found at the address: http://www.hel-miasto.pl/. 2.3 Hornsund, Spitsbergen
The Polish Polar Station Hornsund (PSP Hornsund) is situated on the White Bear Bay (Isbjørnhamna) in Hornsund Fiord, Spitsbergen Island, Svalbard archipelago. More information on the Svalbard Archipelago can be found at the address: http://svalbard.com The Hornsund station is the northernmost Polish scientific facility carrying out year-round activity. The Hornsund region is situated in a zone of strong magnetic field activity, much stronger than on the magnetic pole. Therefore, it is a very interesting place for magnetic observations.
Polish geomagnetic observations in the Arctic were initiated during the II Polar Year; a magnetic station was then established by S. Siedlecki and C. Centkiewicz on the Bear Island. In the years 1932/33, they had carried out continuous recording of magnetic field and

4
performed absolute measurements. Unfortunately, all data were destroyed during the war. In the years 1957/58, in the framework of the International Geophysical Year, measurements of magnetic declination and inclination were made by J. Kowalczuk and K. Karaczun in five sites in the Hornsund Fiord region.
Since the beginning of October 1978, continuous magnetic field recording has been put into operation, and systematic absolute measurements have been implemented (Jankowski and Marianiuk 2007). Since then, PSP Hornsund has begun to fulfill all the requirements for geomagnetic observatory.
Since 1993, PSP Hornsund has been participating in the IMAGE (International Monitor for Auroral Geomagnetic Effects) project. In the framework of this project, Hornsund data are being sent to Finnish Meteorological Institute once a month on the average and available on http://www.geo.fmi.fi/image/request.html. Since 2002, PSP Hornsund is included into the global near-real-time magnetic observatory network INTERMAGNET, sending the results, via Internet, to the GIN (Geomagnetic Information Nodes) centers in Edinburgh and Paris. 3. INSTRUMENTATION 3.1 Absolute measurements
In all the three Polish observatories, the absolute measurements used for determination of bases of the recordings are performed by means of DI-flux and proton magnetometers. Di-flux magnetometers measure the absolute values of the angles of declination D and inclination I, while the proton magnetometers measure the absolute values of the total magnetic field vector F. From the measured values of F, D, and I, we can calculate all the remaining magnetic field components, H, X, Y, and Z.
The results of absolute measurements are determined by means of a special computer package ABS (author: M. Neska), which calculates the base values on the basis of data from the measurement protocol.
The instruments for absolute measurements are listed in Table 2, and the basic parameters of the instruments in Table 3.
Table 2 Instruments for absolute measurements
Belsk Hel Hornsund
DI-fluxgate (fluxgate, theodolite)
ELSEC 810, THEO-10B sn: 002208
FLUX-9408 THEO-10B sn: 160334
FLUX-9408 THEO-10B sn: 160326
PMP-8 sn: 13/1998
PMP-5 sn: 160
PMP-5 sn: 115
Proton magnetometer
Frequency of 6 per week 3 per week 2 per week
measurements
5
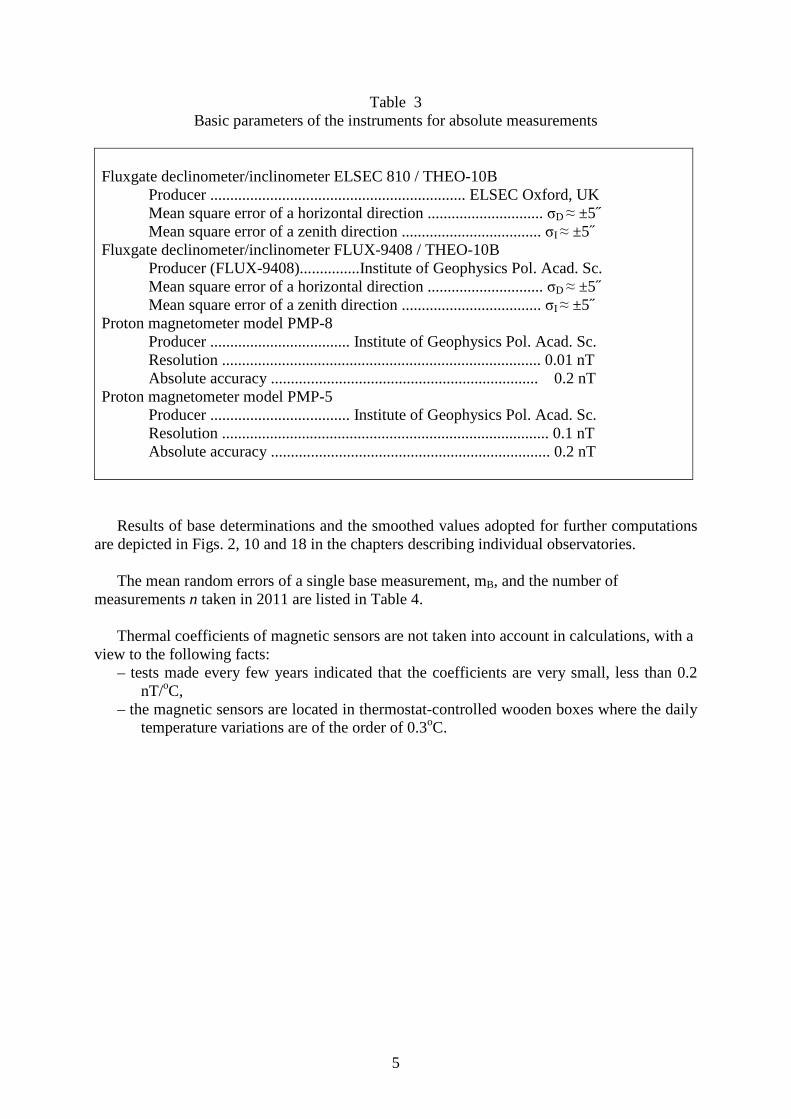
Table 3
Basic parameters of the instruments for absolute measurements Fluxgate declinometer/inclinometer ELSEC 810 / THEO-10B
Producer ................................................................ ELSEC Oxford, UK Mean square error of a horizontal direction ............................. σD ≈ ±5˝ Mean square error of a zenith direction ................................... σI ≈ ±5˝
Fluxgate declinometer/inclinometer FLUX-9408 / THEO-10B Producer (FLUX-9408)...............Institute of Geophysics Pol. Acad. Sc. Mean square error of a horizontal direction ............................. σD ≈ ±5˝ Mean square error of a zenith direction ................................... σI ≈ ±5˝
Proton magnetometer model PMP-8 Producer ................................... Institute of Geophysics Pol. Acad. Sc. Resolution ................................................................................ 0.01 nT Absolute accuracy ................................................................... 0.2 nT
Proton magnetometer model PMP-5 Producer ................................... Institute of Geophysics Pol. Acad. Sc. Resolution .................................................................................. 0.1 nT Absolute accuracy ...................................................................... 0.2 nT
Results of base determinations and the smoothed values adopted for further computations are depicted in Figs. 2, 10 and 18 in the chapters describing individual observatories.
The mean random errors of a single base measurement, mB, and the number of measurements n taken in 2011 are listed in Table 4.
Thermal coefficients of magnetic sensors are not taken into account in calculations, with a view to the following facts:
– tests made every few years indicated that the coefficients are very small, less than 0.2 nT/oC,
– the magnetic sensors are located in thermostat-controlled wooden boxes where the daily temperature variations are of the order of 0.3oC.

6
Table 4 Mean errors of measurements of BX, BY and BZ in 2011
Observatory Element
Number of
measurements
n
Mean error
mB
[nT]
Belsk
BX 304 0.6
BY 307 0.6
BZ 306 0.3
Hel
BX 142 0.3
BY 148 0.4
BZ 148 0.2
Hornsund
BX 197 0.7
BY 197 1.1
BZ 197 0.7
3.3 Recording of geomagnetic field variations
As we already mentioned, the continuous digital recordings of geomagnetic field variations in all the Polish observatories are performed by means of magnetometers PSM and digital loggers NDL In spare sets, we use magnetometers PSM or LEMI. Both the main and spare sets record the components in the rectangular coordinate system X, Y, Z. At Belsk and Hel, continuous recording of the total magnetic field modulus F is performed as well. The basic parameters of the recording systems are listed in Table 5.
Magnetometers PSM
Magnetometers PSM were designed at the Institute of Geophysics PAS with the use of torsion quartz variometers of V. N. Bobrov system (Marianiuk 1977, Jankowski et al. 1984). In these magnetometers, the magnet‘s deflections in response to the magnetic field changes are transformed by means of photoelectric converters into the electric current changes. Owing to a strong negative feedback, the voltage changes on the output of the converter are in linear proportion to the magnetic field changes. The magnetometers PSM are characterized by good stability, of about 3-5 nT/year, and small noise, below 10 pT.
Magnetometers LEMI
Magnetometers LEMI were designed at the Lviv Centre of the Institute of Space Research (Ukraine). They employ flux-gate sensors. These magnetometers have been successfully used as auxiliary sets. Their stability is not much less than that of PSM’s, and they are also characterized by good orthogonality of sensors and relatively small self noise.

7
Table 5 Basic instruments for the magnetic field variations recording
Belsk Hel Hornsund
Name of magnetometer PSM PSM PSM
Kind of sensor Bobrov Bobrov Bobrov
Type PSM-8511-01P PSM 8511-02P PSM-8911-05P
1
Sensor’s orientation XYZ XYZ XYZ
Range +/– 850 nT +/– 850 nT +/– 5000 nT
SE
T
Magnetometer’s producer Institute of Geophysics PAS
Institute of Geophysics PAS
Institute of Geophysics PAS
Digital recorder NDL NDL NDL
Producer TUS Electronics TUS Electronics TUS Electronics
Sampling interval 1 s 1 s 1 s
Name of magnetometer PSM PSM LEMI
Kind of sensor Bobrov Bobrov fluxgate
Type PSM-8511-01P PSM 8511-03P LEMI-003/95
2
Sensor’s orientation XYZ XYZ XYZ
Range +/– 820 nT +/– 820 nT +/– 10,000 nT
SE
T
Magnetometer’s producer Institute of Geophysics PAS
Institute of Geophysics PAS
Institute of Geophysics PAS
Digital recorder NDL NDL NDL
Producer TUS Electronics TUS Electronics TUS Electronics
Sampling interval 1 s 1 s 1 s
field
Name of magnetometer PMP-8 PMP-8 –
Producer Institute of Geophysics PAS
Institute of Geophysics PAS –
To
tal
Sampling interval 30 s 30 s –
Proton magnetometers PMP-5 and PMP-8
Magnetometers PMP-5 and PMP-8 were designed at the Institute of Geophysics PAS.
These are classical proton magnetometers, in which the precession signal is forced in a cycle of proton polarization by means of direct current. The resolution of magnetometers PMP-5 is 0.1nT, that of PMP-8 being 0.01nT. The stability of both magnetometers is better than 0.3 nT/year. More information about PMP-8 magnetometer can be found on the page:
http://www.igf.edu.pl/pl/zaklady_naukowe/konstrukcji_aparatury/aparatura
Digital loggers NDL
The NDL data logger is designed for recording of analog signals, mainly coming from geophysical phenomena detectors. The instrument is equipped with six independent measuring channels; the analog-to-digital conversion is realized using 24 bit sigma-delta converters. The GPS receiver ensures high time accuracy of recorded signals. The NDL is equipped with ftp server; this allows easy access to NDL via Internet.

8
3.4 Calibration of magnetic sensors
The verification of scale values of recording systems in all the three observatories was made by the classical electromagnetic method: electric currents were passed through calibration coils woven over variometers. The currents induce the magnetic field of precisely known intensity. The measurements are made at least few times a year.
The scale values of magnetometers PSM and LEMI, parameters of calibration coils of PSMs, and mutual orthogonality of sensors in PSMs and LEMIs is checked every few years in large calibration coils installed at the Belsk Observatory. Adopted scale values are listed in Table 6.
Table 6 Scale values adopted for computations in 2011
Observatory Period Scale values X [nT/bit] Y [nT/bit] Z [nT/bit
Belsk Jan01-Dec31 0.00000607 0.00000605 0.00000609
Hel Jan01-Dec31 0.00000603 0.00000605 0.00000593
Hornsund Jan01-Dec31 0.0000356 0.0000367 0.0000360
3.5 Data processing
In processing the results of digital recordings we used the software packet developed for the needs of an observatory operating in the INTERMAGNET network. This software makes it possible to perform, among other things, the following operations:
• conversion of magnetic data into the INTERMAGNET text format IMFV1.22 and creation in this format of daily files containing one-minute means of X, Y, Z and F (author: M. Neska),
• automatic transmission of data, via the Internet, to the Institute of Geophysics PAS in Warsaw and data centers in Paris and Edinburgh (author: M. Neska),
• archiving of data and plotting of magnetograms (authors: J. Reda, M. Neska, S.Wójcik),
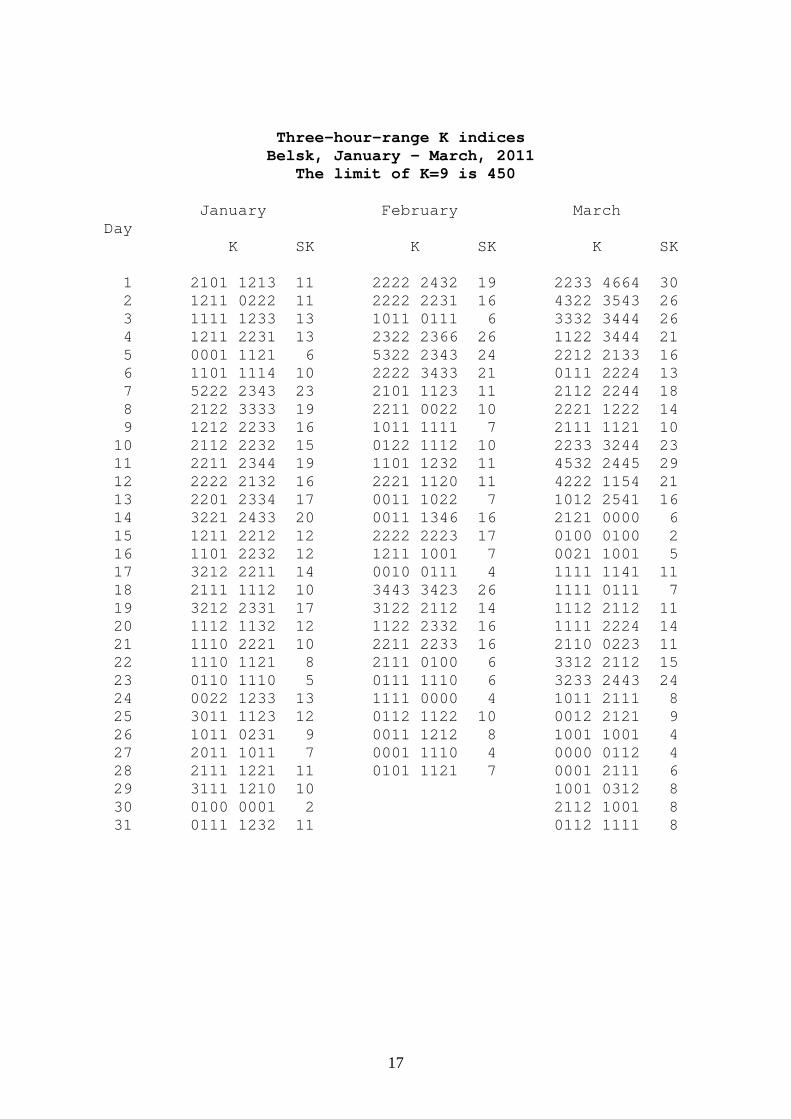
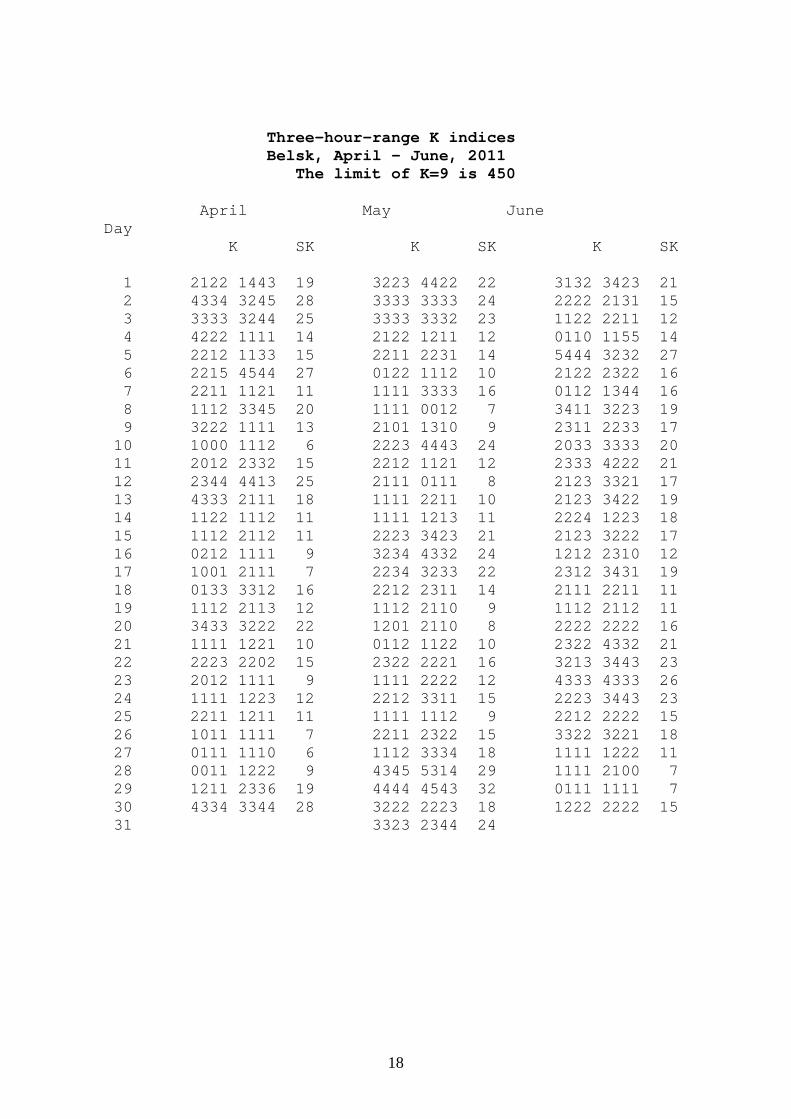
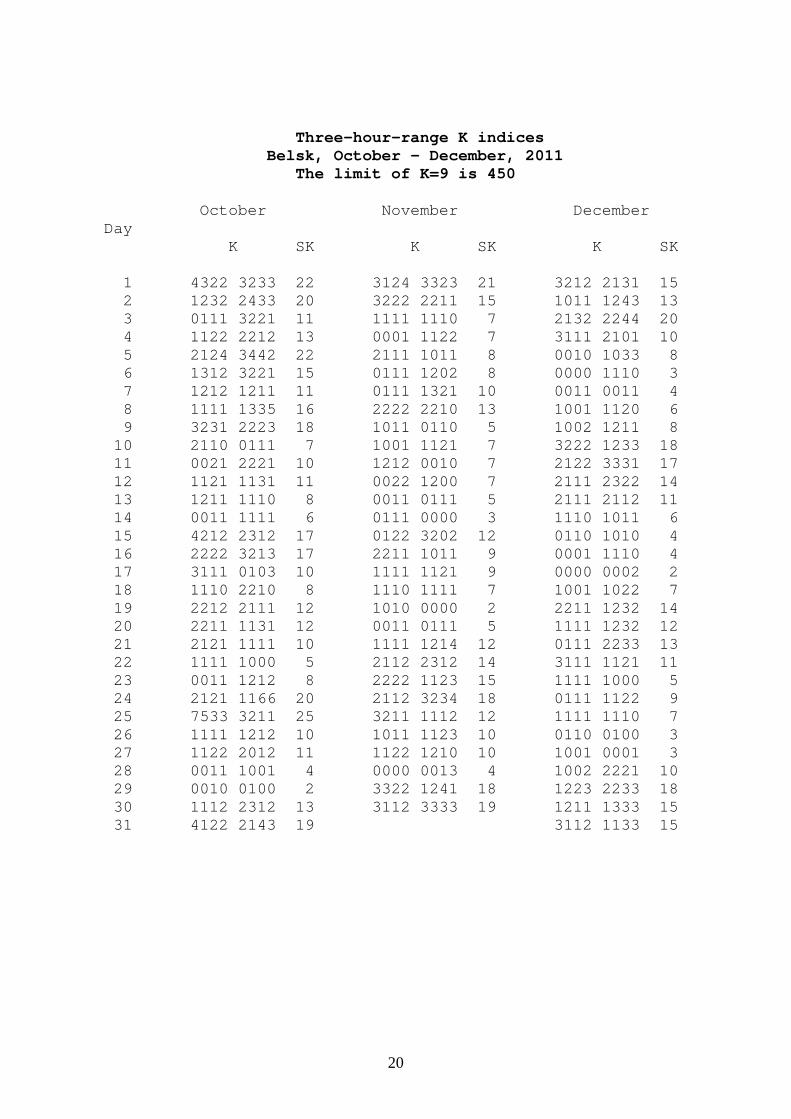
• calculation of results of absolute measurements (author: M. Neska), • automatic calculation of geomagnetic indices K (Nowożyński et al. 1991). The indices
are calculated with the use of ASm (Adaptive Smoothed) method, developed at the Institute of Geophysics PAS, and recommended by IAGA in 1991. The currently used program calculates the indices from one-minute means in the INTERMAGNET CD-ROM Data Format or in the IMFV1.22 format. The program for calculation of indices may be taken from the INTERMAGNET page: http://www.intermagnet.org/Software_e.php
• test printouts to check various parameters of recording adopted for calculation and a possibility of looking over current and past data curves or tables.
The diagrams illustrating the annual variations of X, Y, and Z, monthly variations of X, Y,
Z and F, bases of recording sets as well as plots of K indices for 2011 were prepared with the use of programs imcdview.jar and imagplot.exe provided to us by INTERMAGNET. The diagrams prepared by means of imagplot.exe and other diagrams related to 2011 data are shown in Figs 8 .. 24.
9
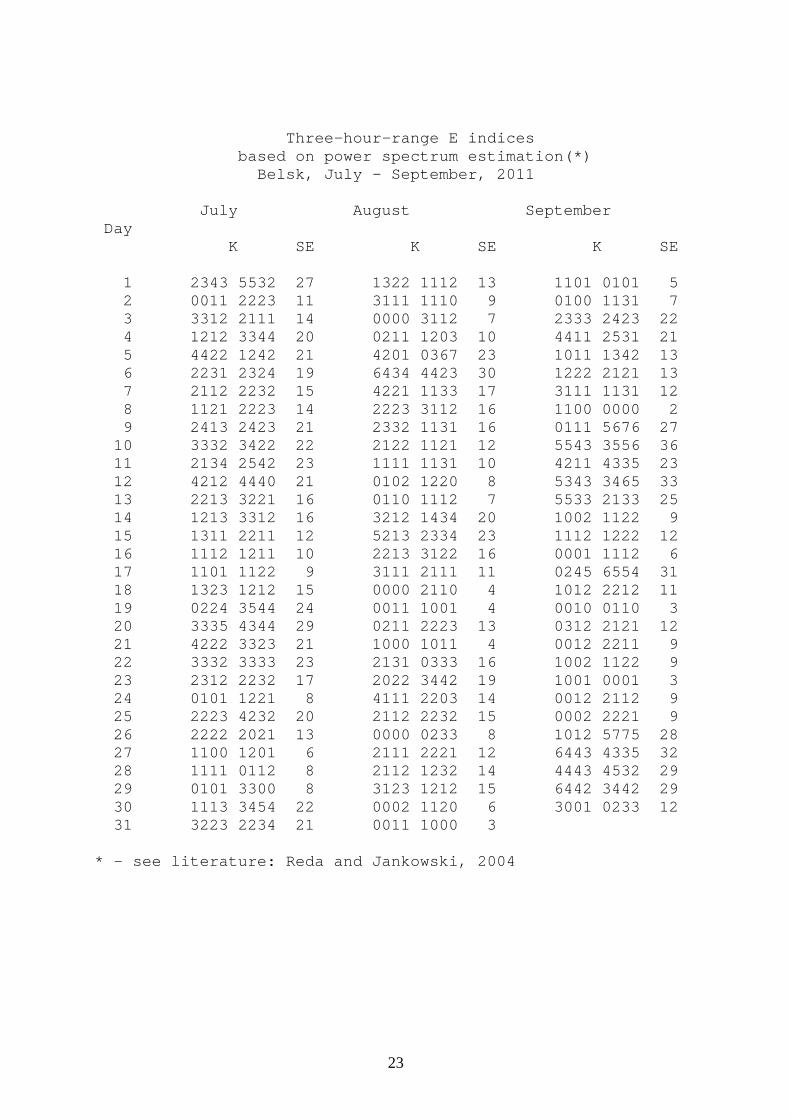
In the present yearbook, as in previous years, we include the E indices calculated for Belsk observatory. The E indices, unlike the K indices, are calculated on the basis of energy analysis. They have been described in detail by Reda and Jankowski (2004). 3.6 Data availability
The newest data from Belsk, Hel and Hornsund observatories can be viewed in graphic form through the WEB application
http://rtbel.igf.edu.pl described by Nowożyński and Reda (2007).
On this page, the Belsk and Hel data appear with one-hour delay, while the delay for Hornsund is few hours. The page makes it possible to view the archival data from any observatory belonging to the INTERMAGNET network (in the form of curves on the screen). It offers also a possibility of calculating the K indices according to the ASm method (Nowożyński et al. 1991) and E indices (Reda and Jankowski 2004).
The current data (of status REPORTED) from all the three observatories can be found in INTERMAGNET at the Internet address:
http://www.intermagnet.org/apps/dl_data_prel_e.php
Data from Belsk, Hel and Hornsund are also available from the WDCs. Addresses of some WDC pages with magnetic data are the following:
WDC for Geomagnetism, Edinburgh http://www.wdc.bgs.ac.uk/catalog/master.html
WDC for Geomagnetism, Kyoto http://swdc234.kugi.kyoto-u.ac.jp/
All the three observatories have in their archives the original data, whose sampling periods are listed in Table 5. For those interested, these data can be made available on request. 4 CONTACT PERSONS, POSTAL ADDRESSES, CONTACT DETAILS 4.1 Belsk Observatory
Jan Reda, Mariusz Neska Central Geophysical Observatory 05-622 Belsk Poland Tel.: +48 486610830 Fax: +48 486610840 Email: [email protected] (J.Reda), [email protected] (M.Neska) http://www.igf.edu.pl/en/obserwatoria/cog_belsk
4.2 Hel Observatory
Stanisław Wójcik Geophysical Observatory ul. Sosnowa 1 84-150 Hel POLAND Tel./Fax +48 58 6750480 Email: [email protected]

10
http://www.igf.edu.pl/en/obserwatoria/hel 4.3 Hornsund
Mariusz Neska Central Geophysical Observatory 05-622 Belsk POLAND Tel.: +48 486610833 Fax: +48 486610840 Email: [email protected] http://hornsund.igf.edu.pl/index_en.php http://www.igf.edu.pl/en/zaklady_naukowe/zaklad_badan_polarnych/obserwatoria
5 PERSONNEL TAKING PART IN THE WORK OF BELSK, HEL AND
HORNSUND OBSERVATORIES IN 2011 5.1 Belsk
– Jan Reda (project leader of geomagnetic observations in Belsk, Hel, Hornsund) – Mariusz Neska (data processing) – Paweł Czubak (data processing) – Michał Sawicki (apparatus service) – Krzysztof Kucharski (observer) – Halina Suska (data processing, observer) – Józef Skowroński (observer)
5.2 Hel
– Stanisław Wójcik (head of Geophysical Observatory) – Anna Wójcik (observer) – Mariusz Neska (data processing) – Jan Reda (data processing)
5.3 Hornsund
– Mariusz Neska (head of geomagnetic observations) – Michał Sawicki (observer in 1-st half-year) – Jacek Renkas (observer in 2-nd half-year) – Jan Reda (data processing)
L i t e r a t u r e Jankowski, J., and C. Sucksdorff (1996), Guide for Magnetic Measurements and Observatory
Practice, IAGA, Warsaw, 235 pp. Jankowski, J., J. Marianiuk, A. Ruta, C. Sucksdorff, and M. Kivinen (1984), Long-term
stability of a torque-balance variometer with photoelectric converters in observatory practice, Geophys. Surv. 6, 3/4, 367-380.
11
Jankowski, J., and J. Marianiuk (2007), Past and present of Polish geomagnetic observatories, Publs. Inst. Geophys. Pol. Acad. Sc. C-99 (398), 20-31.
Marianiuk, J. (1977), Photoelectric converter for recording the geomagnetic field elements:
construction and principle of operation, Publs. Inst. Geophys. Pol. Acad. Sc. C-4 (114), 57-73.
Neska, M., and G. Satori (2006), Schumann resonance observation at Polish Polar Station at
Spitsbergen and in Central Geophysical Observatory in Belsk, Poland, Przegl. Geofiz. 3-4, 189-198, (in Polish).
Nowożyński, K., T. Ernst and J. Jankowski (1991), Adaptive smoothing method for computer
derivation of K-indices, Geophys. J. Int. 104, 85-93. Nowożyński, K., and J. Reda (2007), Comparison of observatory data in quasi-real time,
Publs. Inst. Geophys. Pol. Acad. Sc. C-99 (398), 123-127. Reda, J., and M. Neska (2007), Measurement Session during the XII IAGA Workshop at
Belsk, Publs. Inst. Geophys. Pol. Acad. Sc. C-99 (398), 7-19. Reda, J., and J. Jankowski (2004), Three hour activity index based on power spectra estim
tion, Geophys. J. Int. 157, 141-146. Reda, J. (editor) (2007), XII IAGA Workshop on Geomagnetic Observatory Instruments, Data
Acquisition and Processing, Belsk, 19-24 June 2006, Monographic Volume, Publs. Inst. Geophys. Pol. Acad. Sc. C-99 (398), 397 pp.
Technical data of PMP-8: http://www.igf.edu.pl/pl/zaklady_naukowe/konstrukcji_aparatury/aparatura
Received May 10, 2012
Accepted November21, 2012

12
6. TABLES AND PLOTS FOR BELSK OBSERVATORY

13
Fig. 2. Base values of set 1, Belsk 2011.

14
Annual mean values of magnetic elements in Belsk Observatory
No Year D
[ o ‘ ] H
[ nT ] Z
[ nT ] X
[ nT ] Y
[ nT ] I
[ o ‘ ] F
[ nT ] 1 1966 2 04.2 18901.2 45023.3 18888.9 682.8 67 13.6’ 48829.8 2 1967 2 05.6 18906.2 45047.7 18893.6 690.7 67 14.0 48854.3 3 1968 2 06.2 18917.8 45071.3 18905.5 694.6 67 13.8 48880.5 4 1969 2 06.3 18935.7 45093.5 18922.9 695.6 6713.3 48907.9 5 1970 2 06.6 18953.0 45123.1 18940.2 697.7 67 13.0 48941.9 6 1971 2 06.6 18975.5 45146.4 18962.6 698.8 67 12.2 48972.1 7 1972 2 08.0 18991.6 45176.3 18978.4 706.7 67 11.9 49005.9 8 1973 2 10.2 19004.6 45210.8 18991.0 719.4 67 12.0 49042.8 9 1974 2 13.3 19016.3 45245.6 19002.0 737.1 67 12.2 49079.3 10 1975 2 16.4 19035.2 45273.5 19020.2 754.9 67 11.7 49112.4 11 1976 2 18.5 19049.7 45306.9 19034.3 767.3 67 11.7 49148.8 12 1977 2 22.0 19062.1 45336.6 19045.8 787.4 67 11.7 49181.0 13 1978 2 27.4 19058.6 45375.7 19041.1 817.1 67 13.0 49215.7 14 1979 2 32.3 19061.4 45401.4 19042.7 844.2 67 13.5 49240.5 15 1980 2 37.2 19063.2 45418.4 19043.3 871.2 67 13.9 49256.8 16 1981 2 42.9 19047.1 45448.9 19025.7 902.0 67 15.7 49278.7 17 1982 2 48.3 19034.8 45478.8 19012.0 931.3 67 17.3 49301.6 18 1983 2 52.4 19032.6 45498.8 19008.7 953.8 67 18.0 49319.2 19 1984 2 56.9 19022.8 45519.8 18997.6 978.4 67 19.2 49334.8 20 1985 3 00.8 19015.2 45542.0 18988.9 999.5 67 20.3 49352.3 21 1986 3 05.1 19003.3 45570.4 18975.8 1022.8 67 21.8 49373.9 22 1987 3 08.5 18999.1 45592.7 18970.6 1041.2 67 22.7 49392.9 23 1988 3 12.4 18983.0 45626.4 18953.3 1062.0 67 24.6 49417.8 24 1989 3 15.9 18966.2 45662.1 18935.4 1080.3 67 26.6 49444.3 25 1990 3 18.8 18961.5 45684.3 18929.8 1095.9 67 27.5 49463.1 26 1991 3 22.2 18950.8 45709.3 18918.0 1114.1 67 28.8 49482.0 27 1992 3 25.3 18954.8 45726.1 18921.0 1131.2 67 29.1 49499.1 28 1993 3 29.8 18956.4 45743.7 18921.1 1156.0 67 29.4 49516.0 29 1994 3 34.8 18953.6 45772.4 18916.6 1183.3 67 30.4 49541.4 30 1995 3 39.8 18959.3 45796.8 18920.6 1211.5 67 30.7 49566.2 31 1996 3 45.0 18965.7 45821.9 18925.1 1240.6 67 30.9 49591.8 32 1997 3 50.9 18962.8 45856.9 18920.0 1272.7 67 32.0 49623.0 33 1998 3 57.3 18955.8 45897.1 18910.6 1307.6 67 33.6 49657.5 34 1999 4 02.5 18957.8 45930.6 18910.6 1336.4 67 34.3 49689.2 35 2000 4 07.8 18955.4 45968.7 18906.2 1365.4 67 35.5 49723.5 36 2001 4 13.0 18962.4 46004.8 18911.1 1394.2 67 36.0 49759.6 37 2002 4 18.4 18969.2 46043.6 18915.6 1424.4 67 36.6 49798.0 38 2003 4 24.2 18970.2 46089.6 18914.2 1456.7 67 37.7 49840.9 39 2004 4 29.4 18980.3 46121.0 18922.0 1486.0 67 37.9 49873.8 40 2005 4 34.7 18984.3 46154.6 18923.7 1515.5 67 38.5 49906.4 41 2006 4 39.8 18996.7 46177.2 18933.8 1544.3 67 38.3 49932.0 42 2007 4 45.8 19007.4 46206.7 18941.8 1578.4 67 38.4 49963.4 43 2008 4 52.5 19014.0 46236.3 18945.2 1615.9 67 38.7 49993.3 44 2009 4 59.7 19022.2 46264.5 18949.9 1656.4 67 39.0 50022.5 45 2010 5 08.0 19017.6 46301.3 18941.4 1701.4 67 40.2 50054.7 46 2011 5 16.1 19015.0 46338.0 18934.7 1745.7 67 41.3 50087.7
15
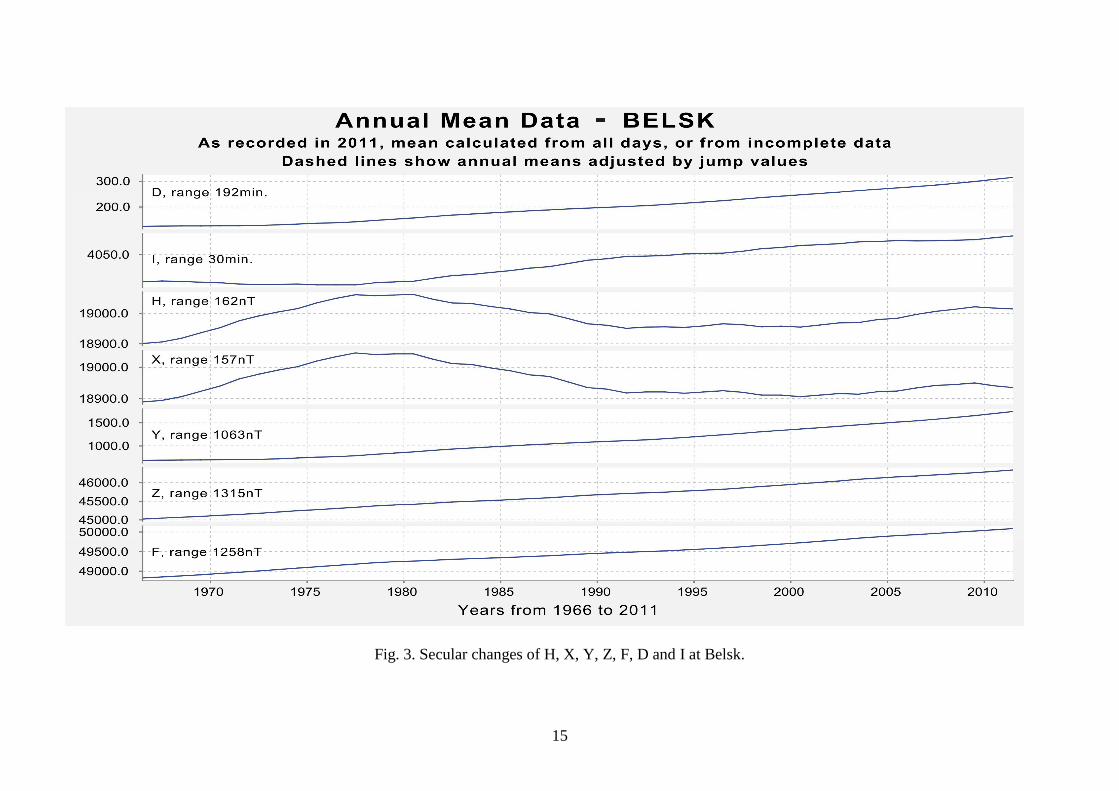
Fig. 3. Secular changes of H, X, Y, Z, F, D and I at Belsk.
16
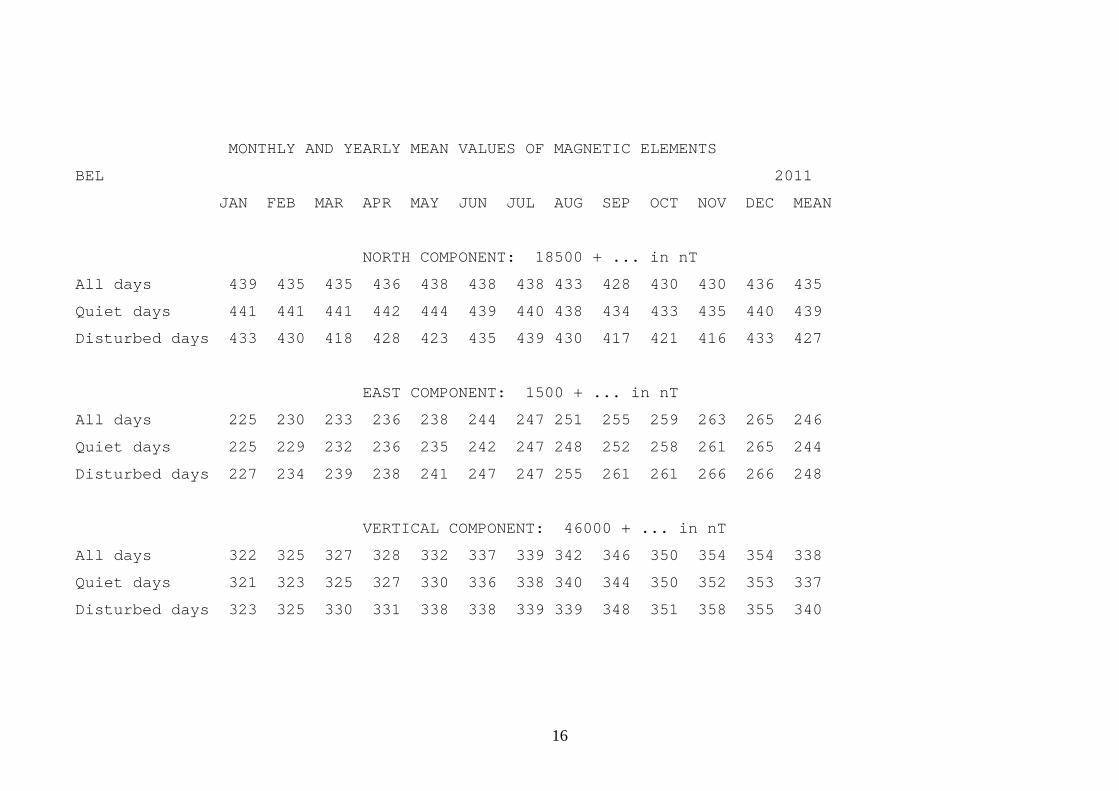
MONTHLY AND YEARLY MEAN VALUES OF M AGNETIC ELEMENTS
BEL 2011
JAN FEB MAR APR MAY JUN JUL A UG SEP OCT NOV DEC MEAN
NORTH COMPONENT: 185 00 + ... in nT
All days 439 435 435 436 438 438 438 4 33 428 430 430 436 435
Quiet days 441 441 441 442 444 439 440 4 38 434 433 435 440 439
Disturbed days 433 430 418 428 423 435 439 4 30 417 421 416 433 427
EAST COMPONENT: 1500 + ... in nT
All days 225 230 233 236 238 244 247 2 51 255 259 263 265 246
Quiet days 225 229 232 236 235 242 247 2 48 252 258 261 265 244
Disturbed days 227 234 239 238 241 247 247 2 55 261 261 266 266 248
VERTICAL COMPONENT: 46000 + ... in nT
All days 322 325 327 328 332 337 339 3 42 346 350 354 354 338
Quiet days 321 323 325 327 330 336 338 3 40 344 350 352 353 337
Disturbed days 323 325 330 331 338 338 339 3 39 348 351 358 355 340
17
Three-hour-range K indices Belsk, January - March, 2011 The limit of K=9 is 450 January February M arch Day K SK K SK K SK 1 2101 1213 11 2222 2432 19 223 3 4664 30 2 1211 0222 11 2222 2231 16 432 2 3543 26 3 1111 1233 13 1011 0111 6 333 2 3444 26 4 1211 2231 13 2322 2366 26 112 2 3444 21 5 0001 1121 6 5322 2343 24 221 2 2133 16 6 1101 1114 10 2222 3433 21 011 1 2224 13 7 5222 2343 23 2101 1123 11 211 2 2244 18 8 2122 3333 19 2211 0022 10 222 1 1222 14 9 1212 2233 16 1011 1111 7 211 1 1121 10 10 2112 2232 15 0122 1112 10 223 3 3244 23 11 2211 2344 19 1101 1232 11 453 2 2445 29 12 2222 2132 16 2221 1120 11 422 2 1154 21 13 2201 2334 17 0011 1022 7 101 2 2541 16 14 3221 2433 20 0011 1346 16 212 1 0000 6 15 1211 2212 12 2222 2223 17 010 0 0100 2 16 1101 2232 12 1211 1001 7 002 1 1001 5 17 3212 2211 14 0010 0111 4 111 1 1141 11 18 2111 1112 10 3443 3423 26 111 1 0111 7 19 3212 2331 17 3122 2112 14 111 2 2112 11 20 1112 1132 12 1122 2332 16 111 1 2224 14 21 1110 2221 10 2211 2233 16 211 0 0223 11 22 1110 1121 8 2111 0100 6 331 2 2112 15 23 0110 1110 5 0111 1110 6 323 3 2443 24 24 0022 1233 13 1111 0000 4 101 1 2111 8 25 3011 1123 12 0112 1122 10 001 2 2121 9 26 1011 0231 9 0011 1212 8 100 1 1001 4 27 2011 1011 7 0001 1110 4 000 0 0112 4 28 2111 1221 11 0101 1121 7 000 1 2111 6 29 3111 1210 10 100 1 0312 8 30 0100 0001 2 211 2 1001 8 31 0111 1232 11 011 2 1111 8
18
Three-hour-range K indices Belsk, April - June, 2011 The limit of K=9 is 450 April May June Day K SK K SK K SK 1 2122 1443 19 3223 4422 22 313 2 3423 21 2 4334 3245 28 3333 3333 24 222 2 2131 15 3 3333 3244 25 3333 3332 23 112 2 2211 12 4 4222 1111 14 2122 1211 12 011 0 1155 14 5 2212 1133 15 2211 2231 14 544 4 3232 27 6 2215 4544 27 0122 1112 10 212 2 2322 16 7 2211 1121 11 1111 3333 16 011 2 1344 16 8 1112 3345 20 1111 0012 7 341 1 3223 19 9 3222 1111 13 2101 1310 9 231 1 2233 17 10 1000 1112 6 2223 4443 24 203 3 3333 20 11 2012 2332 15 2212 1121 12 233 3 4222 21 12 2344 4413 25 2111 0111 8 212 3 3321 17 13 4333 2111 18 1111 2211 10 212 3 3422 19 14 1122 1112 11 1111 1213 11 222 4 1223 18 15 1112 2112 11 2223 3423 21 212 3 3222 17 16 0212 1111 9 3234 4332 24 121 2 2310 12 17 1001 2111 7 2234 3233 22 231 2 3431 19 18 0133 3312 16 2212 2311 14 211 1 2211 11 19 1112 2113 12 1112 2110 9 111 2 2112 11 20 3433 3222 22 1201 2110 8 222 2 2222 16 21 1111 1221 10 0112 1122 10 232 2 4332 21 22 2223 2202 15 2322 2221 16 321 3 3443 23 23 2012 1111 9 1111 2222 12 433 3 4333 26 24 1111 1223 12 2212 3311 15 222 3 3443 23 25 2211 1211 11 1111 1112 9 221 2 2222 15 26 1011 1111 7 2211 2322 15 332 2 3221 18 27 0111 1110 6 1112 3334 18 111 1 1222 11 28 0011 1222 9 4345 5314 29 111 1 2100 7 29 1211 2336 19 4444 4543 32 011 1 1111 7 30 4334 3344 28 3222 2223 18 122 2 2222 15 31 3323 2344 24

19
Three-hour-range K indices Belsk, July - September, 2011 The limit of K=9 is 450 July August Septem ber Day K SK K SK K SK 1 2333 4432 24 2322 2112 15 110 1 1101 6 2 0011 2223 11 2111 2111 10 111 1 1131 10 3 2312 2221 15 1111 2212 11 233 3 2333 22 4 1312 3344 21 0211 1213 11 331 2 2431 19 5 4322 1232 19 3211 1376 24 111 1 2342 15 6 2232 2323 19 5434 4423 29 122 2 2221 14 7 2112 2232 15 4221 1232 17 311 2 1121 12 8 1122 2223 15 2222 3122 16 121 1 1111 9 9 2313 2323 19 2332 1232 18 011 2 5565 25 10 2322 3322 19 2222 2121 14 543 3 3545 32 11 2234 2432 22 1211 1132 12 321 1 3324 19 12 3212 3331 18 1112 1220 10 433 3 3454 29 13 3213 3221 17 1101 2112 9 443 3 2133 23 14 2223 3322 19 2222 2434 21 111 2 2122 12 15 1211 2211 11 4223 2333 22 111 2 2222 13 16 1112 1221 11 2222 3112 15 011 1 1112 8 17 1111 1222 11 3212 2221 15 124 4 5553 29 18 1323 2212 16 1111 2110 8 211 2 2212 13 19 1224 3443 23 0011 1112 7 002 1 1120 7 20 3224 4334 25 1211 2223 14 021 2 2122 12 21 3223 3323 21 1111 1121 9 011 2 2212 11 22 3232 3332 21 2131 1232 15 100 2 1122 9 23 2212 2222 15 2122 3342 19 111 1 1111 8 24 0111 2222 11 4212 2213 17 001 2 2112 9 25 2223 4332 21 2112 2232 15 111 2 2221 12 26 2222 2121 14 0011 1223 10 111 2 4665 26 27 1111 1212 10 2111 2221 12 544 3 3335 30 28 1112 0111 8 2122 1232 15 343 2 4422 24 29 0102 3310 10 3133 2222 18 543 2 3442 27 30 1113 3444 21 1001 1121 7 311 1 1233 15 31 3223 2333 21 1011 1100 5
20
Three-hour-range K indices Belsk, October - December, 2011 The limit of K=9 is 450 October November D ecember Day K SK K SK K SK 1 4322 3233 22 3124 3323 21 321 2 2131 15 2 1232 2433 20 3222 2211 15 101 1 1243 13 3 0111 3221 11 1111 1110 7 213 2 2244 20 4 1122 2212 13 0001 1122 7 311 1 2101 10 5 2124 3442 22 2111 1011 8 001 0 1033 8 6 1312 3221 15 0111 1202 8 000 0 1110 3 7 1212 1211 11 0111 1321 10 001 1 0011 4 8 1111 1335 16 2222 2210 13 100 1 1120 6 9 3231 2223 18 1011 0110 5 100 2 1211 8 10 2110 0111 7 1001 1121 7 322 2 1233 18 11 0021 2221 10 1212 0010 7 212 2 3331 17 12 1121 1131 11 0022 1200 7 211 1 2322 14 13 1211 1110 8 0011 0111 5 211 1 2112 11 14 0011 1111 6 0111 0000 3 111 0 1011 6 15 4212 2312 17 0122 3202 12 011 0 1010 4 16 2222 3213 17 2211 1011 9 000 1 1110 4 17 3111 0103 10 1111 1121 9 000 0 0002 2 18 1110 2210 8 1110 1111 7 100 1 1022 7 19 2212 2111 12 1010 0000 2 221 1 1232 14 20 2211 1131 12 0011 0111 5 111 1 1232 12 21 2121 1111 10 1111 1214 12 011 1 2233 13 22 1111 1000 5 2112 2312 14 311 1 1121 11 23 0011 1212 8 2222 1123 15 111 1 1000 5 24 2121 1166 20 2112 3234 18 011 1 1122 9 25 7533 3211 25 3211 1112 12 111 1 1110 7 26 1111 1212 10 1011 1123 10 011 0 0100 3 27 1122 2012 11 1122 1210 10 100 1 0001 3 28 0011 1001 4 0000 0013 4 100 2 2221 10 29 0010 0100 2 3322 1241 18 122 3 2233 18 30 1112 2312 13 3112 3333 19 121 1 1333 15 31 4122 2143 19 311 2 1133 15

21
Three-hour-range E indices based on power spectrum estimation(* ) Belsk, January - March, 2011 January February M arch Day K SE K SE K SE 1 2100 1213 10 2211 2432 17 323 3 4655 31 2 1111 0222 10 2121 2231 14 532 2 4543 28 3 1001 1233 11 0000 0010 1 333 2 3555 29 4 1211 1341 14 1422 2377 28 112 3 3554 24 5 0001 1121 6 5422 1344 25 121 2 1233 15 6 1000 0115 8 2123 3533 22 010 1 1215 11 7 5222 2454 26 1100 1123 9 221 2 2254 20 8 2112 3233 17 2301 0022 10 222 1 1222 14 9 1211 1343 16 0001 0110 3 211 1 1021 9 10 2111 2142 14 0112 1012 8 223 4 3255 26 11 2101 2454 19 1101 1242 12 554 2 2446 32 12 2222 1132 15 2220 1130 11 422 2 1155 22 13 2101 1344 16 0010 0012 4 000 3 2541 15 14 3222 2444 23 0000 0347 14 111 1 0000 4 15 1211 2111 10 2111 2223 14 000 0 0000 0 16 1100 2232 11 0211 0000 4 001 0 0000 1 17 3212 2121 14 0000 0110 2 011 0 1141 9 18 2111 0112 9 3354 3423 27 101 1 0000 3 19 3212 3331 18 3112 3111 13 101 2 2101 8 20 0011 1141 9 1132 2343 19 111 1 2224 14 21 1000 1221 7 2312 2244 20 200 0 0224 10 22 1110 1021 7 2001 0000 3 331 2 2102 14 23 0010 0100 2 0010 1010 3 322 3 1554 25 24 0011 0144 11 0101 0000 2 101 2 1010 6 25 3011 1124 13 0001 1122 7 001 1 2111 7 26 2000 0140 7 0001 1112 6 000 1 0000 1 27 2001 1010 5 0001 0110 3 000 0 0112 4 28 2110 0321 10 0101 0011 4 000 2 2011 6 29 4101 1200 9 000 0 0212 5 30 0000 0000 0 210 1 1000 5 31 0100 0333 10 001 2 1211 8 * - see literature: Reda and Jankowski, 2004

22
Three-hour-range E indices based on power spectrum estimation(* ) Belsk, April – June, 2011 April May June Day K SE K SE K SE 1 2023 1354 20 4333 4533 28 313 2 3424 22 2 5334 2155 28 4343 3444 29 223 2 2231 17 3 4333 3355 29 3423 3343 25 111 1 2200 8 4 4322 1101 14 2121 1211 11 001 0 1146 13 5 1112 0043 12 1211 3130 12 544 3 3332 27 6 2215 6645 31 0111 1102 7 212 1 2321 14 7 2211 0121 10 1001 3333 14 001 1 1244 13 8 1012 3345 19 1000 0012 4 441 1 4223 21 9 4221 1101 12 2001 1310 8 331 1 2233 18 10 1000 1212 7 1123 3443 21 202 3 3333 19 11 3002 2431 15 1201 1120 8 234 3 4222 22 12 1355 5414 28 2010 0111 6 212 3 3321 17 13 4333 1101 16 1011 1210 7 321 3 3432 21 14 0121 0003 7 1100 1212 8 322 4 1113 17 15 1112 2112 11 2213 3423 20 212 2 2212 14 16 0112 1101 7 3234 4342 25 111 1 2400 10 17 0001 2111 6 1233 3223 19 231 1 3431 18 18 0033 4312 16 1211 1311 11 211 1 1101 8 19 1111 1112 9 1011 2000 5 101 1 2012 8 20 4543 3111 22 0100 1100 3 222 2 2122 15 21 1111 1111 8 0011 1122 8 232 1 4442 22 22 2213 2102 13 2311 1210 11 321 2 3444 23 23 2012 0100 6 0101 2222 10 433 3 4334 27 24 0111 1224 12 3112 3211 14 222 2 3553 24 25 1210 1110 7 2101 0102 7 121 2 1323 15 26 0001 1011 4 2110 2312 12 241 1 2331 17 27 0011 1110 5 1122 3444 21 111 1 1112 9 28 0000 0222 6 5355 6324 33 111 1 2000 6 29 1211 1346 19 5544 4554 36 010 1 1100 4 30 4335 3355 31 3122 2233 18 122 2 1222 14 31 3333 2444 26 * - see literature: Reda and Jankowski, 2004
23
Three-hour-range E indices based on power spectrum estimation(* ) Belsk, July - September, 2011 July August Septem ber Day K SE K SE K SE 1 2343 5532 27 1322 1112 13 110 1 0101 5 2 0011 2223 11 3111 1110 9 010 0 1131 7 3 3312 2111 14 0000 3112 7 233 3 2423 22 4 1212 3344 20 0211 1203 10 441 1 2531 21 5 4422 1242 21 4201 0367 23 101 1 1342 13 6 2231 2324 19 6434 4423 30 122 2 2121 13 7 2112 2232 15 4221 1133 17 311 1 1131 12 8 1121 2223 14 2223 3112 16 110 0 0000 2 9 2413 2423 21 2332 1131 16 011 1 5676 27 10 3332 3422 22 2122 1121 12 554 3 3556 36 11 2134 2542 23 1111 1131 10 421 1 4335 23 12 4212 4440 21 0102 1220 8 534 3 3465 33 13 2213 3221 16 0110 1112 7 553 3 2133 25 14 1213 3312 16 3212 1434 20 100 2 1122 9 15 1311 2211 12 5213 2334 23 111 2 1222 12 16 1112 1211 10 2213 3122 16 000 1 1112 6 17 1101 1122 9 3111 2111 11 024 5 6554 31 18 1323 1212 15 0000 2110 4 101 2 2212 11 19 0224 3544 24 0011 1001 4 001 0 0110 3 20 3335 4344 29 0211 2223 13 031 2 2121 12 21 4222 3323 21 1000 1011 4 001 2 2211 9 22 3332 3333 23 2131 0333 16 100 2 1122 9 23 2312 2232 17 2022 3442 19 100 1 0001 3 24 0101 1221 8 4111 2203 14 001 2 2112 9 25 2223 4232 20 2112 2232 15 000 2 2221 9 26 2222 2021 13 0000 0233 8 101 2 5775 28 27 1100 1201 6 2111 2221 12 644 3 4335 32 28 1111 0112 8 2112 1232 14 444 3 4532 29 29 0101 3300 8 3123 1212 15 644 2 3442 29 30 1113 3454 22 0002 1120 6 300 1 0233 12 31 3223 2234 21 0011 1000 3 * - see literature: Reda and Jankowski, 2004

24
Three-hour-range E indices based on power spectrum estimation(* ) Belsk, October - December, 2011 October November D ecember Day K SE K SE K SE 1 5423 3244 27 4124 4423 24 421 2 1031 14 2 2233 3524 24 2222 3211 15 101 1 0143 11 3 0012 3221 11 1111 0210 7 202 2 2244 18 4 1022 1312 12 0001 1122 7 311 1 1101 9 5 2124 3532 22 2110 0010 5 001 0 0013 5 6 0312 2221 13 0001 1201 5 000 0 1110 3 7 0112 1211 9 0011 0211 6 000 0 0011 2 8 1111 0345 16 2221 2310 13 000 0 0020 2 9 4231 2224 20 0000 0000 0 000 1 1301 6 10 1110 0100 4 0001 0122 6 422 2 1134 19 11 0010 2221 8 0112 0010 5 212 1 3331 16 12 0120 1131 9 0012 1200 6 311 1 1322 14 13 1201 1000 5 0011 0000 2 211 1 2112 11 14 0011 1000 3 0100 0000 1 110 0 0010 3 15 5202 2311 16 0012 3202 10 010 0 0000 1 16 2212 4114 17 2211 0011 8 000 0 0000 0 17 3111 0003 9 1111 0121 8 000 0 0002 2 18 1110 1210 7 0110 1001 4 000 1 0011 3 19 2213 2001 11 0000 0000 0 211 1 1232 13 20 2211 0130 10 0000 0011 2 111 2 0142 12 21 3110 1010 7 0011 1215 11 010 1 2243 13 22 1111 1000 5 2112 2412 15 210 1 0111 7 23 0001 1112 6 2321 1133 16 110 1 0000 3 24 2021 0166 18 2111 3244 18 001 1 1022 7 25 7643 3210 26 3210 0002 8 111 1 0000 4 26 0110 0112 6 1011 1113 9 001 0 0000 1 27 0112 2002 8 1122 1310 11 000 0 0000 0 28 0001 0000 1 0000 0014 5 000 2 2221 9 29 0000 0000 0 4321 1251 19 122 3 1233 17 30 1013 2413 15 3013 4443 22 121 1 1233 14 31 5012 2154 20 301 2 0032 11 * - see literature: Reda and Jankowski, 2004

25
Fig. 4. K-indices in graphical form, Belsk 2011.

26
Fig. 5. Daily mean data plot for Belsk 2011.

27
Fig. 6. Hourly mean data plot of X component for Belsk 2011.

28
Fig. 7. Hourly mean data plot of Y component for Belsk 2011.
29
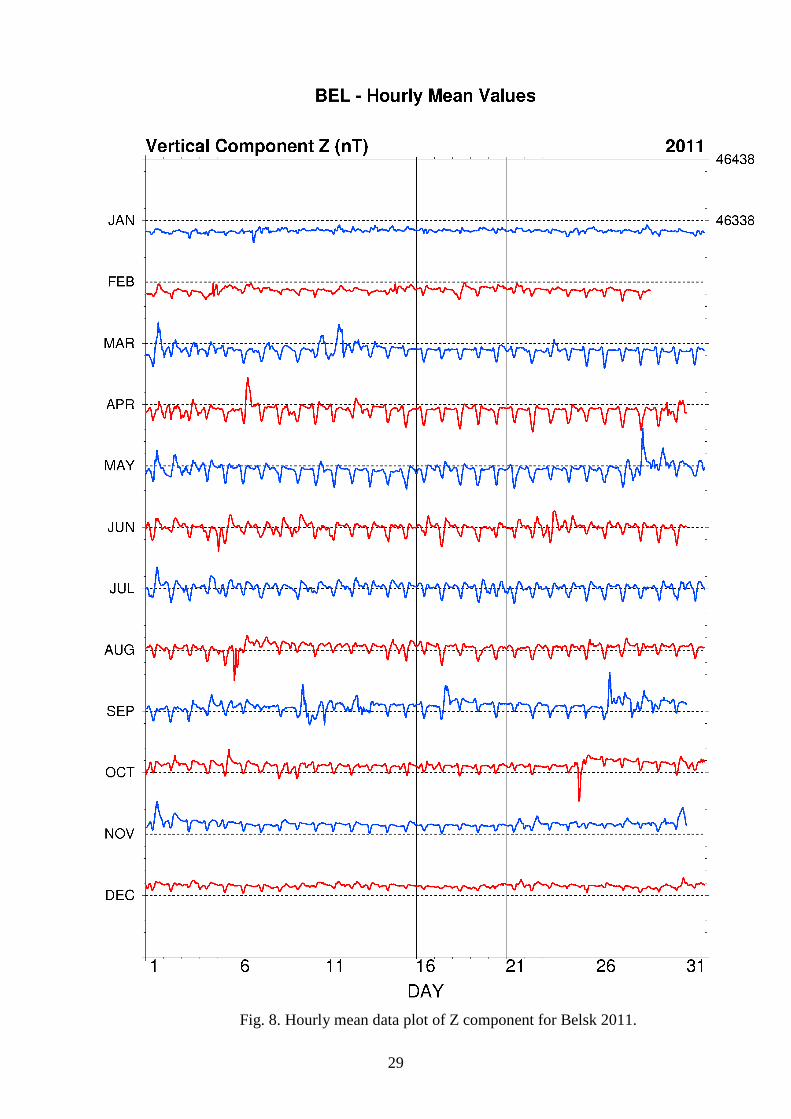
Fig. 8. Hourly mean data plot of Z component for Belsk 2011.

30
Fig. 9. Hourly mean data plot of F component for Belsk 2011.

31
7. TABLES AND PLOTS FOR HEL OBSERVATORY
32
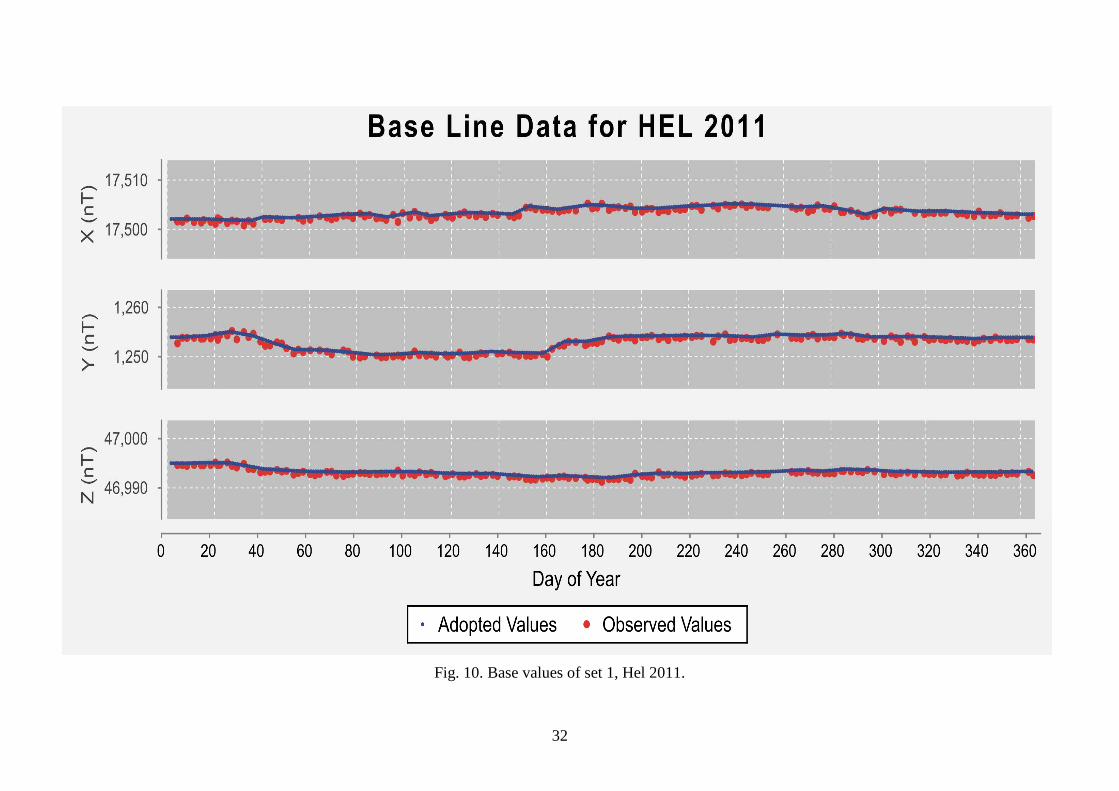
Fig. 10. Base values of set 1, Hel 2011.

33
Annual mean values of magnetic elements in Hel Observatory
No Year D
[ o ‘ ] H
[ nT ] Z
[ nT ] X
[ nT ] Y
[ nT ] I
[ o ‘ ] F
[ nT ] 1 1953 -0 14.5 17388 45327 17388 -73 69 00.8 48548
2 1954 -0 10.0 17394 45374 17394 -51 69 01.5 48594
3 1955 -0 04.2 17379 45430 17379 -21 69 03.9 48640
4 1956 0 03.9 17371 45450 17371 20 69 05.0 48656
5 1957 0 05.7 17372 45475 17372 29 69 05.5 48680
6 1958 0 10.2 17380 45535 17380 52 69 06.5 48739
7 1959 0 14.7 17390 45565 17390 74 69 06.6 48771
8 1960 0 17.6 17402 45602 17402 89 69 06.8 48810
9 1961 0 19.8 17422 45625 17422 100 69 06.0 48838
10 1962 0 22.7 17438 45647 17438 115 69 05.5 48864
11 1963 0 26.5 17449 45663 17448 134 69 05.2 48883
12 1964 0 28.6 17464 45676 17463 145 69 04.6 48901
13 1965 0 30.0 17476 45692 17475 152 69 04.2 48920
14 1966 0 31.6 17485 45710 17484 161 69 04.0 48940
15 1967 0 33.3 17492 45743 17491 169 69 04.4 48973
16 1968 0 34.4 17502 45769 17501 175 69 04.4 49001
17 1969 0 34.3 17524 45792 17523 175 69 03.5 49030
18 1970 0 34.8 17542 45824 17541 178 69 03.2 49067
19 1971 0 35.7 17565 45849 17564 182 69 02.3 49098
20 1972 0 36.1 17579 45880 17578 184 69 02.1 49132
21 1973 0 38.5 17595 45912 17594 197 69 01.9 49168
22 1974 0 41.9 17606 45951 17605 215 69 02.2 49208
23 1975 0 45.0 17625 45984 17623 231 69 01.7 49246
24 1976 0 49.6 17639 46015 17637 254 69 01.6 49280
25 1977 0 55.0 17651 46045 17649 282 69 01.5 49312
26 1978 1 00.2 17646 46085 17643 309 69 02.9 49349
27 1979 1 05.1 17651 46112 17648 334 69 03.2 49375
28 1980 1 11.5 17653 46127 17649 367 69 03.5 49390
29 1981 1 17.5 17637 46156 17632 398 69 05.2 49411
30 1982 1 23.4 17620 46184 17615 427 69 07.1 49431
31 1983 1 28.6 17614 46200 17608 454 69 07.8 49444
32 1984 1 33.5 17602 46219 17596 479 69 09.1 49457
33 1985 1 37.9 17591 46239 17584 501 69 10.3 49472

34
34 1986 1 42.7 17579 46263 17571 525 69 11.6 49490
35 1987 1 46.3 17572 46285 17564 543 69 12.6 49508
36 1988 1 51.0 17555 46318 17546 567 69 14.6 49533
37 1989 1 55.5 17535 46352 17525 589 69 16.7 49558
38 1990 1 58.4 17527 46374 17516 604 69 17.8 49575
39 1991 2 00.6 17513 46398 17502 614 69 19.3 49593
40 1992 2 03.9 17515 46416 17504 631 69 19.6 49611
41 1993 2 10.0 17516 46428 17503 662 69 19.8 49622
42 1994 2 15.9 17512 46456 17498 692 69 20.7 49647
43 1995 2 21.3 17518 46481 17503 720 69 21.0 49672
44 1996 2 26.6 17523 46506 17507 747 69 21.2 49698
45 1997 2 32.9 17519 46539 17502 779 69 22.3 49727
46 1998 2 39.8 17512 46581 17493 814 69 23.8 49764
47 1999 2 45.4 17511 46615 17491 842 69 24.7 49796
48 2000 2 51.9 17507 46657 17485 875 69 25.9 49833
49 2001 2 57.7 17515 46692 17492 905 69 26.2 49869
50 2002 3 03.7 17520 46730 17495 936 69 26.9 49906
51 2003 3 10.8 17519 46777 17492 972 69 28.1 49950
52 2004 3 16.6 17529 46809 17500 1002 69 28.2 49983
53 2005 3 22.3 17531 46843 17501 1031 69 28.9 50016
J 2006.0 0 -1.5 -2 9 -2 -8 0 0.6 7
54 2006 3 29.9 17550 46859 17517 1071 69 28.1 50038
55 2007 3 36.7 17559 46887 17524 1106 69 28.2 50067
56 2008 3 43.8 17564 46917 17527 1143 69 28.5 50097
57 2009 3 51.3 17571 46945 17531 1181 69 28.8 50126
58 2010 4 00.5 17568 46980 17525 1228 69 29.8 50157
59 2011 4 09.2 17564 47014 17518 1272 69 30.9 50188
Note: Since 2006 the observatory has stopped introducing the so-called historical corrections.
The corrections were related, among other things, with the variable location of the
instruments for absolute measurements. In the 2006.0 line we include the jump value J
relating to the neglect of historical corrections. The jump values are defined as follows:
jump value J = old site value - new site value

35
Fig. 11. Secular changes of H, X, Y, Z, F, D and I at Hel.

36
MONTHLY AND YEARLY MEAN VALUES OF M AGNETIC ELEMENTS
HLP 2011
JAN FEB MAR APR MAY JUN JUL A UG SEP OCT NOV DEC MEAN
NORTH COMPONENT: 170 00 + ... in nT
All days 521 518 519 519 522 523 522 5 17 511 512 512 518 518
Quiet days 523 523 524 524 526 524 524 5 21 516 515 517 521 522
Disturbed days 516 513 501 512 508 520 523 5 14 501 504 500 515 511
EAST COMPONENT: 1000 + ... in nT
All days 252 255 258 261 263 270 274 2 79 283 287 290 292 272
Quiet days 252 253 256 261 260 269 274 2 76 280 286 288 292 271
Disturbed days 254 260 263 263 265 273 274 2 83 290 289 293 293 275
VERTICAL COMPONENT: 46500 + ... in nT
All days 499 501 502 504 508 512 514 5 18 523 527 532 531 514
Quiet days 499 499 501 503 506 511 514 5 17 521 528 529 530 513
Disturbed days 500 501 505 507 513 512 514 5 14 523 527 537 532 516

37
Three-hour-range K indices Hel, January - March, 2011 The limit of K=9 is 550
January February M arch Day K SK K SK K SK 1 2100 1113 9 2222 1332 17 222 3 4654 28 2 1211 0122 10 2112 1221 12 422 2 3443 24 3 1101 1233 12 0010 0010 2 233 2 3444 25 4 1101 1231 10 2322 2266 25 112 3 3444 22 5 0001 1121 6 5321 1243 21 121 2 2133 15 6 1100 0114 8 2122 3432 19 011 1 2224 13 7 4222 2343 22 2101 0112 8 211 2 2243 17 8 2122 3333 19 1201 0012 7 212 1 1122 12 9 1212 1233 15 1001 0111 5 112 1 1121 10 10 2112 2132 14 0112 1012 8 213 3 3243 21 11 2101 1344 16 1101 0232 10 443 2 2345 27 12 2212 1132 14 1210 1120 8 322 2 1144 19 13 2111 1344 17 0000 0022 4 001 3 1441 14 14 2222 2333 19 0010 1346 15 211 1 0000 5 15 0211 2111 9 2222 2222 16 000 0 0000 0 16 1101 2232 12 1111 1001 6 002 1 1001 5 17 3112 2211 13 0010 0111 4 111 1 1131 10 18 211- --12 -- 3443 3322 24 101 1 0000 3 19 3212 2331 17 3111 2112 12 101 2 2101 8 20 1011 1131 9 1122 2232 15 111 1 2214 13 21 0100 2221 8 2211 2233 16 201 0 0113 8 22 1110 1121 8 2110 0000 4 331 2 3002 14 23 0000 0100 1 0010 1010 3 323 3 2343 23 24 0022 1133 12 0101 0000 2 101 1 2110 7 25 3012 1123 13 0012 1122 9 001 2 2111 8 26 1000 0131 6 0001 1112 6 100 0 0000 1 27 1010 0010 3 0001 1110 4 000 0 0012 3 28 2101 0221 9 0011 1011 5 000 1 1111 5 29 3111 1100 8 000 1 1312 8 30 0000 0000 0 310 2 1000 7 31 0101 0232 9 011 3 1111 9

38
Three-hour-range K indices Hel, April - June, 2011 The limit of K=9 is 550
April May J une Day K SK K SK K SK 1 1023 2443 19 3233 4422 23 312 2 3423 20 2 4333 3244 26 3333 3333 24 222 2 2231 16 3 3323 3234 23 3334 3332 24 112 2 2101 10 4 3222 1111 13 2112 1201 10 001 0 1155 13 5 2112 0133 13 1212 2221 13 544 4 3232 27 6 2214 4543 25 0012 1102 7 212 2 2221 14 7 2111 1121 10 1001 3332 13 001 1 2243 13 8 1012 3334 17 1000 0012 4 331 1 3222 17 9 3212 1111 12 2001 1200 6 231 2 2122 15 10 1000 1112 6 2113 4433 21 203 3 3323 19 11 2012 3432 17 2211 1110 9 233 3 4222 21 12 2344 4413 25 1110 0111 6 212 3 3321 17 13 3333 2101 16 1111 2211 10 211 3 3422 18 14 1122 1002 9 1100 1212 8 222 3 2212 16 15 1112 2112 11 2223 3422 20 212 3 3211 15 16 0113 1111 9 3224 4332 23 121 2 2300 11 17 0001 2111 6 2224 3232 20 321 2 3431 19 18 0023 4312 15 1212 3311 14 211 1 2211 11 19 1111 1113 10 1111 2100 7 111 2 2111 10 20 3433 3212 21 0101 1110 5 222 2 2221 15 21 1111 1221 10 0111 1112 8 222 2 4332 20 22 2223 2202 15 2211 2210 11 321 2 3433 21 23 2012 1111 9 0101 2222 10 332 3 4333 24 24 1112 2223 14 2112 3311 14 222 2 3443 22 25 1211 1211 10 1101 1111 7 221 2 2223 16 26 0011 1111 6 2111 3312 14 331 2 2221 16 27 0011 1110 5 1223 3334 21 111 1 1112 9 28 0001 1212 7 4344 6214 28 110 1 2100 6 29 1111 1235 15 4444 4543 32 010 1 1111 6 30 4334 4344 29 2232 2222 17 121 1 2221 12 31 3223 2334 22
39
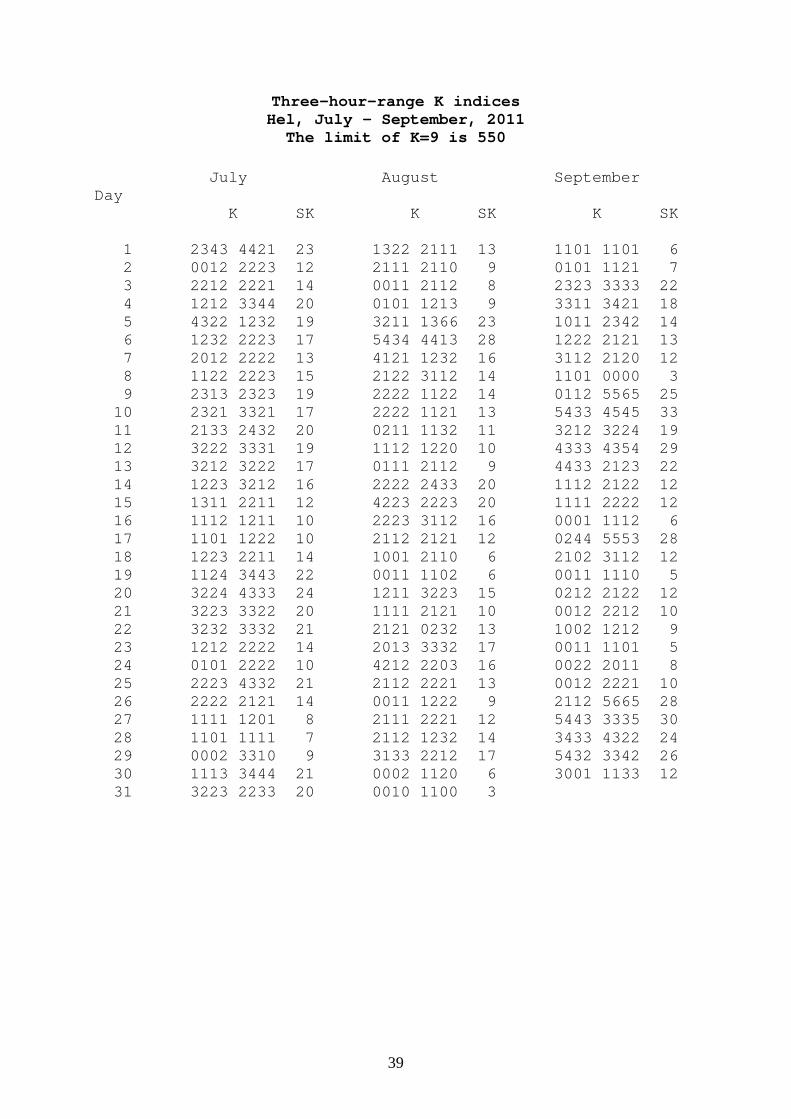
Three-hour-range K indices Hel, July - September, 2011
The limit of K=9 is 550 July August Sep tember Day K SK K SK K SK 1 2343 4421 23 1322 2111 13 110 1 1101 6 2 0012 2223 12 2111 2110 9 010 1 1121 7 3 2212 2221 14 0011 2112 8 232 3 3333 22 4 1212 3344 20 0101 1213 9 331 1 3421 18 5 4322 1232 19 3211 1366 23 101 1 2342 14 6 1232 2223 17 5434 4413 28 122 2 2121 13 7 2012 2222 13 4121 1232 16 311 2 2120 12 8 1122 2223 15 2122 3112 14 110 1 0000 3 9 2313 2323 19 2222 1122 14 011 2 5565 25 10 2321 3321 17 2222 1121 13 543 3 4545 33 11 2133 2432 20 0211 1132 11 321 2 3224 19 12 3222 3331 19 1112 1220 10 433 3 4354 29 13 3212 3222 17 0111 2112 9 443 3 2123 22 14 1223 3212 16 2222 2433 20 111 2 2122 12 15 1311 2211 12 4223 2223 20 111 1 2222 12 16 1112 1211 10 2223 3112 16 000 1 1112 6 17 1101 1222 10 2112 2121 12 024 4 5553 28 18 1223 2211 14 1001 2110 6 210 2 3112 12 19 1124 3443 22 0011 1102 6 001 1 1110 5 20 3224 4333 24 1211 3223 15 021 2 2122 12 21 3223 3322 20 1111 2121 10 001 2 2212 10 22 3232 3332 21 2121 0232 13 100 2 1212 9 23 1212 2222 14 2013 3332 17 001 1 1101 5 24 0101 2222 10 4212 2203 16 002 2 2011 8 25 2223 4332 21 2112 2221 13 001 2 2221 10 26 2222 2121 14 0011 1222 9 211 2 5665 28 27 1111 1201 8 2111 2221 12 544 3 3335 30 28 1101 1111 7 2112 1232 14 343 3 4322 24 29 0002 3310 9 3133 2212 17 543 2 3342 26 30 1113 3444 21 0002 1120 6 300 1 1133 12 31 3223 2233 20 0010 1100 3

40
Three-hour-range K indices
Hel, October - December, 2011 The limit of K=9 is 550
October November Dec ember Day K SK K SK K SK 1 4322 3233 22 3124 3323 21 311 2 1031 12 2 1232 2434 21 3222 2211 15 101 1 1243 13 3 0111 2221 10 1010 0110 4 212 2 1243 17 4 1022 2212 12 0001 1122 7 311 1 1100 8 5 2133 3432 21 2101 0011 6 000 0 0022 4 6 1212 3221 14 0001 1202 6 000 0 1110 3 7 1112 1211 10 0111 0221 8 000 0 0011 2 8 1111 1334 15 2212 2210 12 000 0 0020 2 9 3231 2223 18 0000 0000 0 000 1 1201 5 10 2110 0110 6 0000 1121 5 312 2 1123 15 11 0020 2211 8 0212 0010 6 211 2 2331 15 12 1121 1121 10 0022 1200 7 211 1 1222 12 13 1211 1000 6 0011 0001 3 211 1 2112 11 14 0001 1111 5 0001 0000 1 111 0 0010 4 15 3212 2311 15 0012 2202 9 000 0 0000 0 16 2222 3113 16 2211 0011 8 000 0 0000 0 17 2111 0102 8 1111 2121 10 000 0 0002 2 18 1110 1210 7 1001 1101 5 000 1 0021 4 19 2112 2011 10 0000 0000 0 221 1 1232 14 20 2211 1120 10 0011 0111 5 111 1 0132 10 21 2110 1011 7 0001 1214 9 010 1 2233 12 22 1000 1000 2 2012 2312 13 311 1 0111 9 23 0001 1202 6 2221 1123 14 100 1 0000 2 24 1111 1155 16 2102 3234 17 001 1 0021 5 25 7533 3210 24 2210 0012 8 111 1 0000 4 26 1111 1211 9 1011 1122 9 010 0 0000 1 27 0111 2011 7 1122 1210 10 000 0 0000 0 28 0001 0000 1 0000 0013 4 000 1 2221 8 29 0000 0000 0 3321 1241 17 112 3 1233 16 30 1002 2312 11 3103 3333 19 121 1 1233 14 31 4023 2143 19 311 2 0022 11
41
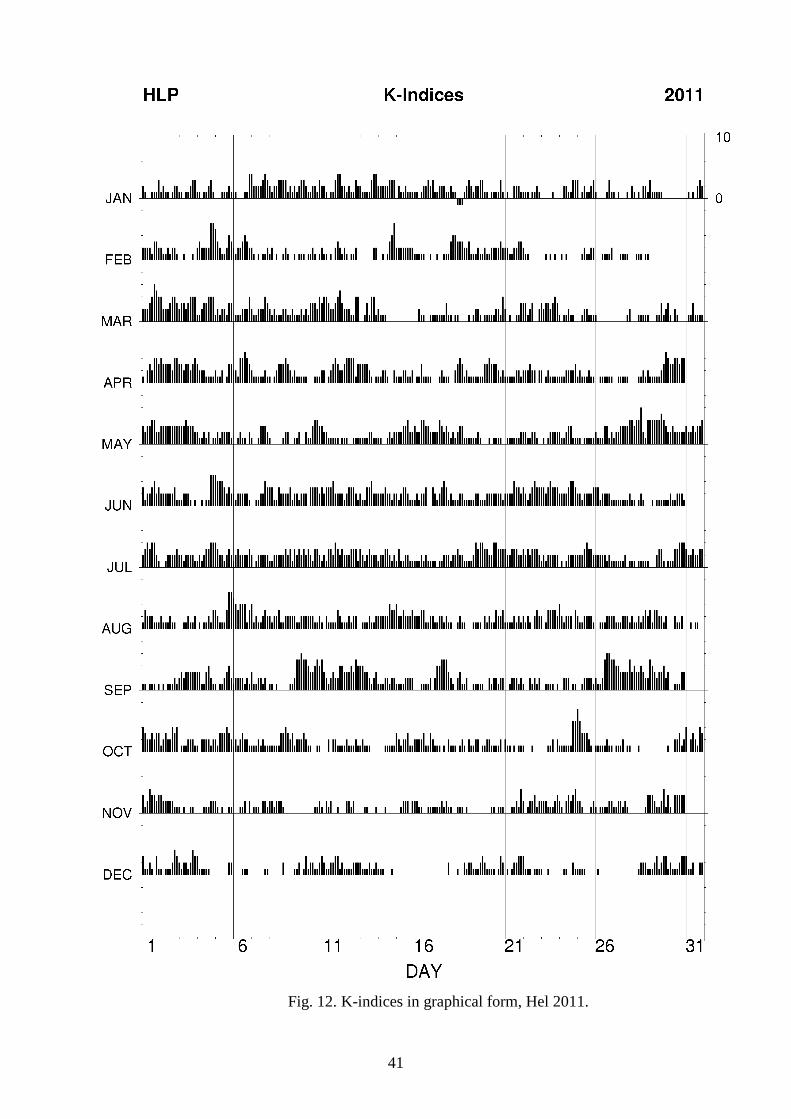
Fig. 12. K-indices in graphical form, Hel 2011.
42
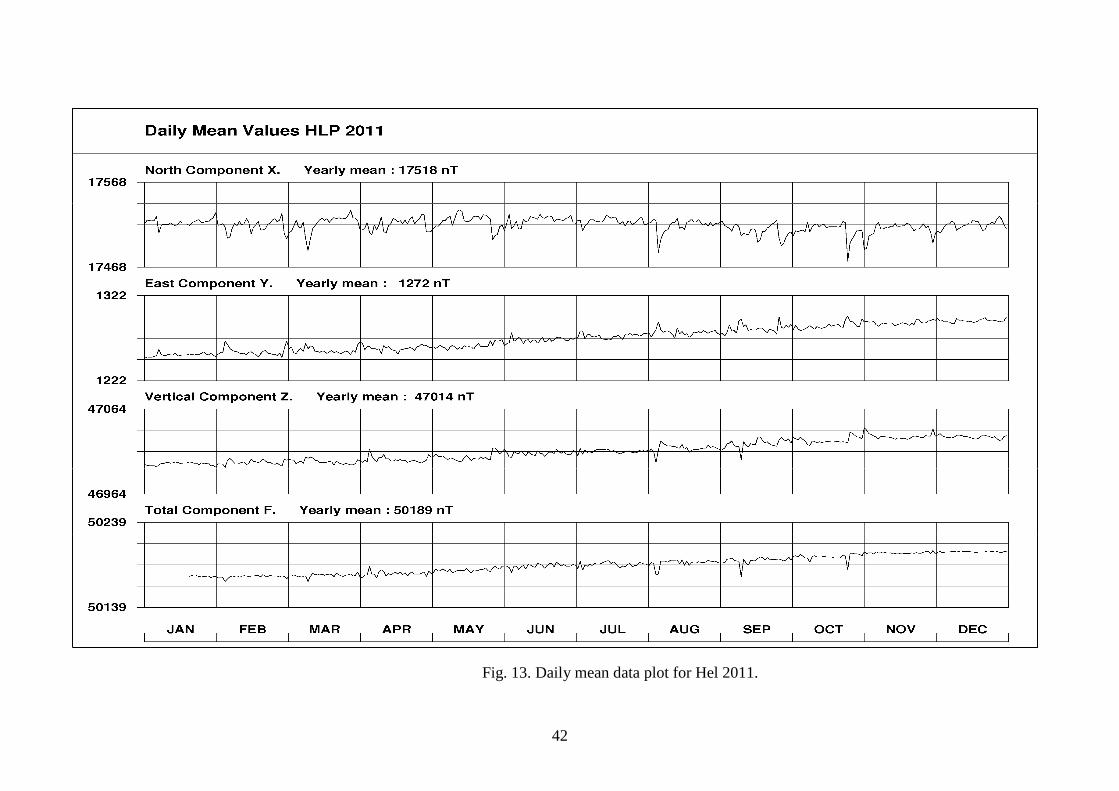
Fig. 13. Daily mean data plot for Hel 2011.

43
Fig. 14. Hourly mean data plot of X component for Hel 2011.
44
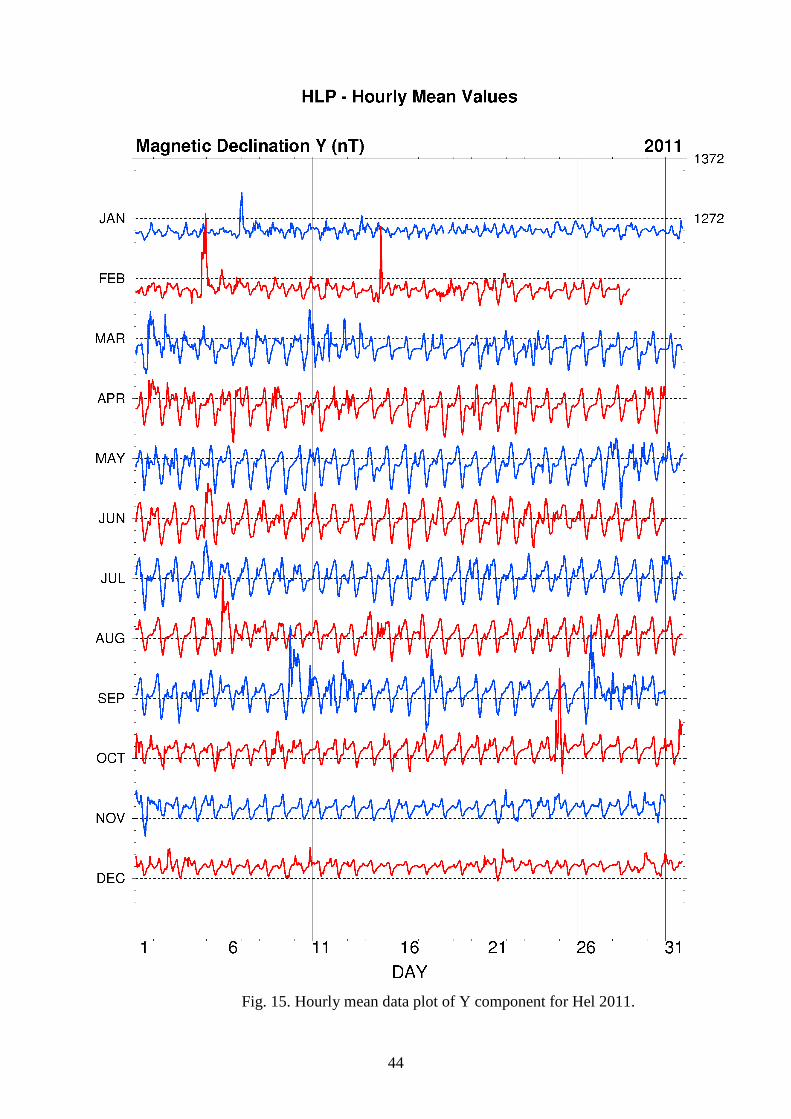
Fig. 15. Hourly mean data plot of Y component for Hel 2011.
45
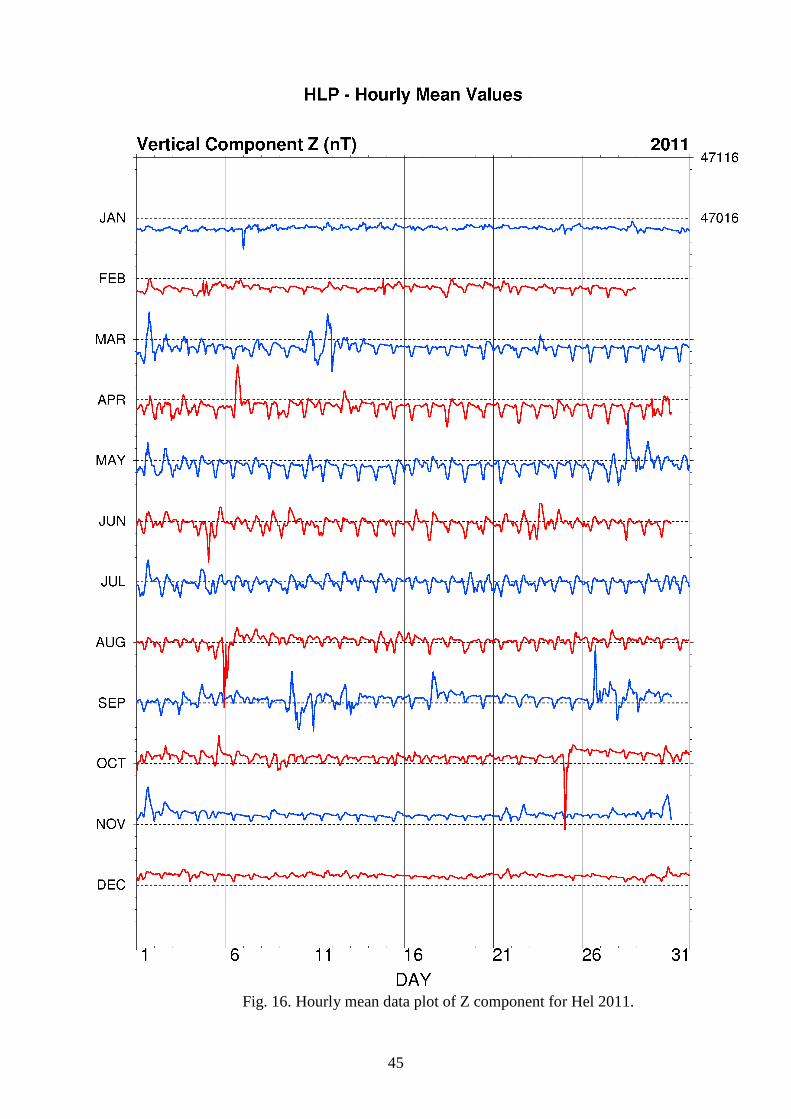
Fig. 16. Hourly mean data plot of Z component for Hel 2011.

46
Fig. 17. Hourly mean data plot of F component for Hel 2011.

47
8. TABLES AND PLOTS FOR HORNSUND OBSERVATORY
48
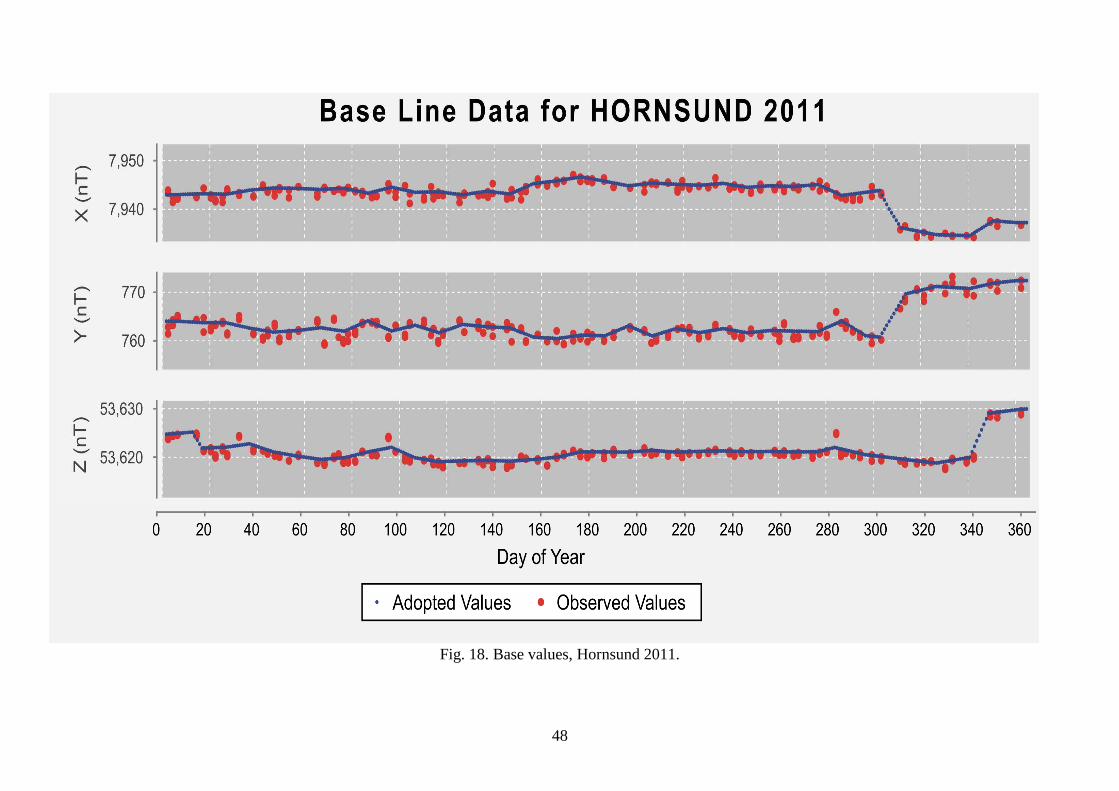
Fig. 18. Base values, Hornsund 2011.
49
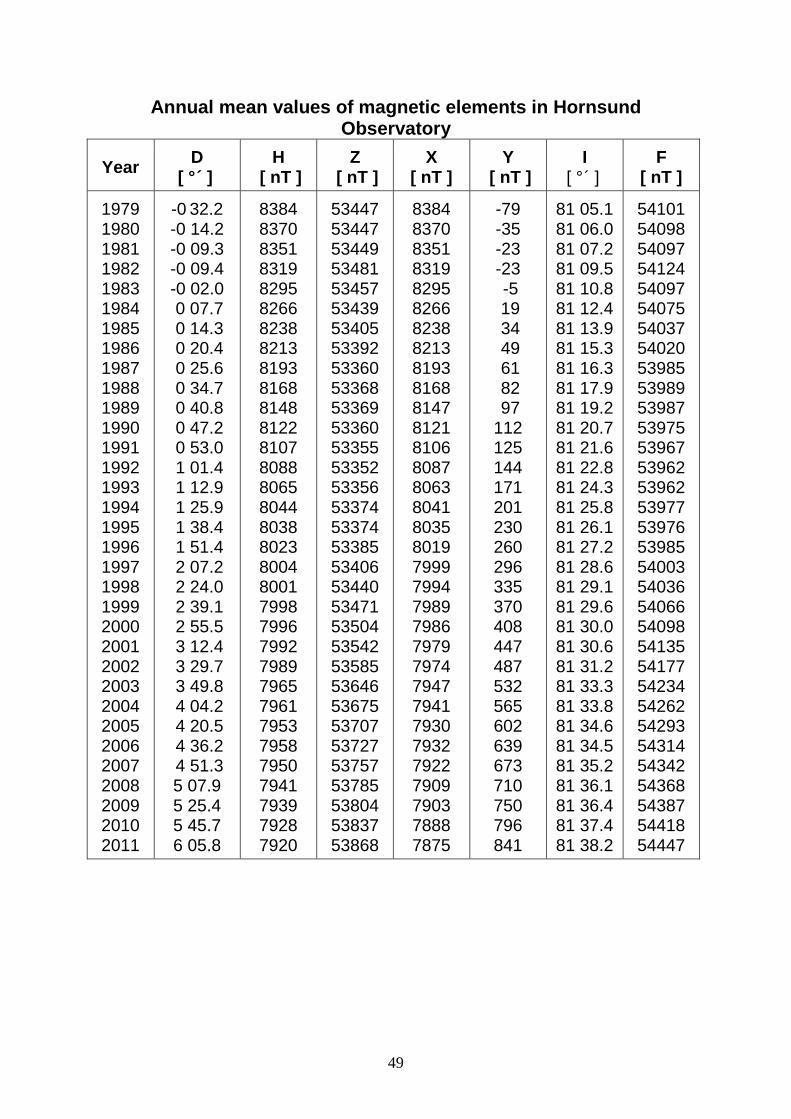
Annual mean values of magnetic elements in Hornsund
Observatory
Year D [ ° ´ ]
H [ nT ]
Z [ nT ]
X [ nT ]
Y [ nT ]
I [ ° ´ ]
F [ nT ]
1979 1980 1981 1982 1983 1984 1985 1986 1987 1988 1989 1990 1991 1992 1993 1994 1995 1996 1997 1998 1999 2000 2001 2002 2003 2004 2005 2006 2007 2008 2009 2010 2011
-0 32.2 -0 14.2 -0 09.3 -0 09.4 -0 02.0 0 07.7 0 14.3 0 20.4 0 25.6 0 34.7 0 40.8 0 47.2 0 53.0 1 01.4 1 12.9 1 25.9 1 38.4 1 51.4 2 07.2 2 24.0 2 39.1 2 55.5 3 12.4 3 29.7 3 49.8 4 04.2 4 20.5 4 36.2 4 51.3 5 07.9 5 25.4 5 45.7 6 05.8
8384 8370 8351 8319 8295 8266 8238 8213 8193 8168 8148 8122 8107 8088 8065 8044 8038 8023 8004 8001 7998 7996 7992 7989 7965 7961 7953 7958 7950 7941 7939 7928 7920
53447 53447 53449 53481 53457 53439 53405 53392 53360 53368 53369 53360 53355 53352 53356 53374 53374 53385 53406 53440 53471 53504 53542 53585 53646 53675 53707 53727 53757 53785 53804 53837 53868
8384 8370 8351 8319 8295 8266 8238 8213 8193 8168 8147 8121 8106 8087 8063 8041 8035 8019 7999 7994 7989 7986 7979 7974 7947 7941 7930 7932 7922 7909 7903 7888 7875
-79 -35 -23 -23 -5 19 34 49 61 82 97 112 125 144 171 201 230 260 296 335 370 408 447 487 532 565 602 639 673 710 750 796 841
81 05.1 81 06.0 81 07.2 81 09.5 81 10.8 81 12.4 81 13.9 81 15.3 81 16.3 81 17.9 81 19.2 81 20.7 81 21.6 81 22.8 81 24.3 81 25.8 81 26.1 81 27.2 81 28.6 81 29.1 81 29.6 81 30.0 81 30.6 81 31.2 81 33.3 81 33.8 81 34.6 81 34.5 81 35.2 81 36.1 81 36.4 81 37.4 81 38.2
54101 54098 54097 54124 54097 54075 54037 54020 53985 53989 53987 53975 53967 53962 53962 53977 53976 53985 54003 54036 54066 54098 54135 54177 54234 54262 54293 54314 54342 54368 54387 54418 54447

50
Fig. 19. Secular changes of H, X, Y, Z, F, D and I at Hornsund.

51
MONTHLY AND YEARLY MEAN VALUES OF M AGNETIC ELEMENTS
HRN 2011
JAN FEB MAR APR MAY JUN JUL A UG SEP OCT NOV DEC MEAN
NORTH COMPONENT: 750 0 + ... in nT
All days 370 368 373 380 388 394 387 3 79 370 366 361 360 375
Quiet days 378 378 381 389 392 390 386 3 78 372 370 367 365 379
Disturbed days 355 340 334 354 353 382 386 3 63 343 361 348 350 356
EAST COMPONENT: 500 + ... in nT
All days 322 325 326 330 332 333 340 3 47 352 359 360 364 341
Quiet days 322 324 328 325 331 339 340 3 46 353 358 361 365 341
Disturbed days 323 325 330 336 352 333 340 3 46 357 365 358 364 344
VERTICAL COMPONENT: 53500 + ... in nT
All days 353 359 366 365 358 360 366 3 69 379 382 378 378 368
Quiet days 346 352 361 355 362 358 364 3 62 372 373 374 374 363
Disturbed days 360 374 382 363 368 351 354 3 78 403 391 387 375 374

52
Three-hour-range K indices Hornsund, January - March, 2011 The limit of K=9 is 2500 January February M arch Day K SK K SK K SK 1 2211 2213 14 1222 2321 15 233 4 3352 25 2 2222 1113 14 1222 1122 13 634 4 4463 34 3 1112 1143 14 0112 0012 7 234 3 3544 28 4 1222 2144 18 2542 2265 28 224 3 3554 28 5 0010 1144 11 4422 2265 27 232 3 2144 21 6 1221 0115 13 3333 2644 28 022 1 2104 12 7 6232 2366 30 3222 2114 17 323 2 2124 19 8 2344 3235 26 3322 0024 16 223 2 2223 18 9 1233 3344 23 2111 2133 14 212 2 2142 16 10 2323 3133 20 0223 2014 14 144 4 2232 22 11 4222 1355 24 2221 1143 16 323 2 2555 27 12 2333 2023 18 1322 2142 17 533 3 2163 26 13 2222 2242 18 0111 1011 6 221 3 2441 19 14 1333 3555 28 0000 1226 11 132 3 1000 10 15 1322 3143 19 0231 1234 16 021 1 1000 5 16 2122 2243 18 2332 1003 14 002 1 1000 4 17 3332 3124 21 1231 1120 11 022 1 1051 12 18 3232 2013 16 2444 2221 21 111 1 1111 8 19 2333 2241 20 2323 3233 21 112 3 2001 10 20 1232 2043 17 4234 2353 26 122 1 2213 14 21 1211 2233 15 2122 2223 16 222 1 1125 16 22 1211 2144 16 3221 1112 13 332 2 2002 14 23 2212 1121 12 1221 1113 12 223 3 3453 25 24 0132 1024 13 0311 1000 6 111 2 2101 9 25 3222 1124 17 0112 1022 9 002 2 2111 9 26 2022 1051 13 0111 2122 10 111 1 0000 4 27 2111 1020 8 0101 1111 6 001 0 0011 3 28 3311 1210 12 0010 1000 2 120 1 2121 10 29 4221 0122 14 000 1 1221 7 30 0100 0000 1 220 1 1001 7 31 0100 0113 6 011 2 2210 9

53
Three-hour-range K indices Hornsund, April - June, 2011 The limit of K=9 is 2500 April May June Day K SK K SK K SK 1 1123 3255 22 2333 4553 28 323 3 3335 25 2 5333 3166 30 4344 3654 33 224 4 2332 22 3 5433 3365 32 3434 3342 26 222 2 3111 14 4 4332 2122 19 1333 3322 20 112 0 1124 12 5 3331 0024 16 2322 3241 19 644 4 4442 32 6 2325 4535 29 1113 2102 11 233 3 4222 21 7 1222 1123 14 1112 3323 16 132 2 2154 20 8 0123 3554 23 2111 1012 9 333 2 4324 24 9 3343 2210 18 1201 2100 7 442 2 3322 22 10 2231 3321 17 2223 3234 21 303 4 3233 21 11 2123 3221 16 2222 2111 13 235 3 4232 24 12 2245 4314 25 2221 0111 10 223 4 3222 20 13 3344 3311 22 1223 2201 13 322 4 5233 24 14 1222 1002 10 1210 1201 8 324 4 2223 22 15 1222 3111 13 2224 3322 20 333 4 3213 22 16 0333 2112 15 2354 4232 25 121 2 3321 15 17 1002 1111 7 2244 3224 23 332 2 4432 23 18 0133 4212 16 2333 3331 21 223 2 2211 15 19 1222 2111 12 1223 3211 15 222 3 3022 16 20 2553 3101 20 1211 2110 9 233 3 3122 19 21 1212 2111 11 1222 2231 15 243 3 4342 25 22 3323 2323 21 2321 2111 13 323 3 3342 23 23 2223 2110 13 1222 2232 16 443 3 4344 29 24 0112 3324 16 3323 3222 20 344 3 4554 32 25 2221 2231 15 2211 1112 11 333 3 3332 23 26 1222 2111 12 2322 2222 17 353 3 3332 25 27 1121 1120 9 1333 3343 23 231 2 2103 14 28 0120 1242 12 3353 5313 26 120 1 1110 7 29 1222 2225 18 4464 4553 35 110 1 0101 5 30 4345 4245 31 4344 2334 27 232 2 2221 16 31 3544 3355 32

54
Three-hour-range K indices Hornsund, July - September, 2011 The limit of K=9 is 2500 July August Septem ber Day K SK K SK K SK 1 1363 3422 24 3343 3101 18 010 1 0001 3 2 1222 2112 13 3332 1132 18 121 2 2221 13 3 2533 2111 18 1121 2113 12 223 4 3321 20 4 3223 3323 21 0112 3213 13 333 2 3521 22 5 4233 2143 22 4321 2257 26 122 2 3342 19 6 2342 3224 22 6555 4323 33 223 3 3331 20 7 3223 3244 23 3232 3234 22 124 3 2152 20 8 2222 2232 17 2333 4222 21 121 1 2102 10 9 2523 3344 26 3442 2242 23 032 2 4545 25 10 3333 3222 21 2333 2223 20 644 5 2343 31 11 3346 4343 30 1322 2134 18 233 2 3335 24 12 4333 3452 27 2323 3231 19 444 4 4453 32 13 3433 3221 21 1312 3042 16 354 4 3113 24 14 2233 3333 22 2322 2333 20 122 3 2122 15 15 2421 1122 15 3332 2232 20 123 2 2223 17 16 2232 2121 15 1333 3231 19 122 2 2104 14 17 1222 2222 15 1313 3102 14 144 3 3354 27 18 1333 2222 18 1112 3021 11 111 3 3321 15 19 2233 3334 23 0011 2101 6 012 0 1100 5 20 2444 3235 27 1322 2132 16 133 3 2123 18 21 4343 3232 24 1111 1112 9 021 2 2201 10 22 3343 2233 23 3222 1222 16 111 1 2131 11 23 1432 3353 24 2122 3242 18 011 0 0002 4 24 2222 2232 17 3223 2204 18 102 1 2021 9 25 2333 4232 22 2232 3332 20 010 2 2211 9 26 3332 3133 21 0130 1144 14 222 3 4573 28 27 2211 0101 8 2222 3311 16 434 2 4224 25 28 2112 1002 9 1333 1131 16 333 3 2544 27 29 1112 2311 12 3333 3112 19 764 3 4331 31 30 2223 3453 24 2112 3142 16 321 1 2212 14 31 4334 2243 25 1021 1000 5
55
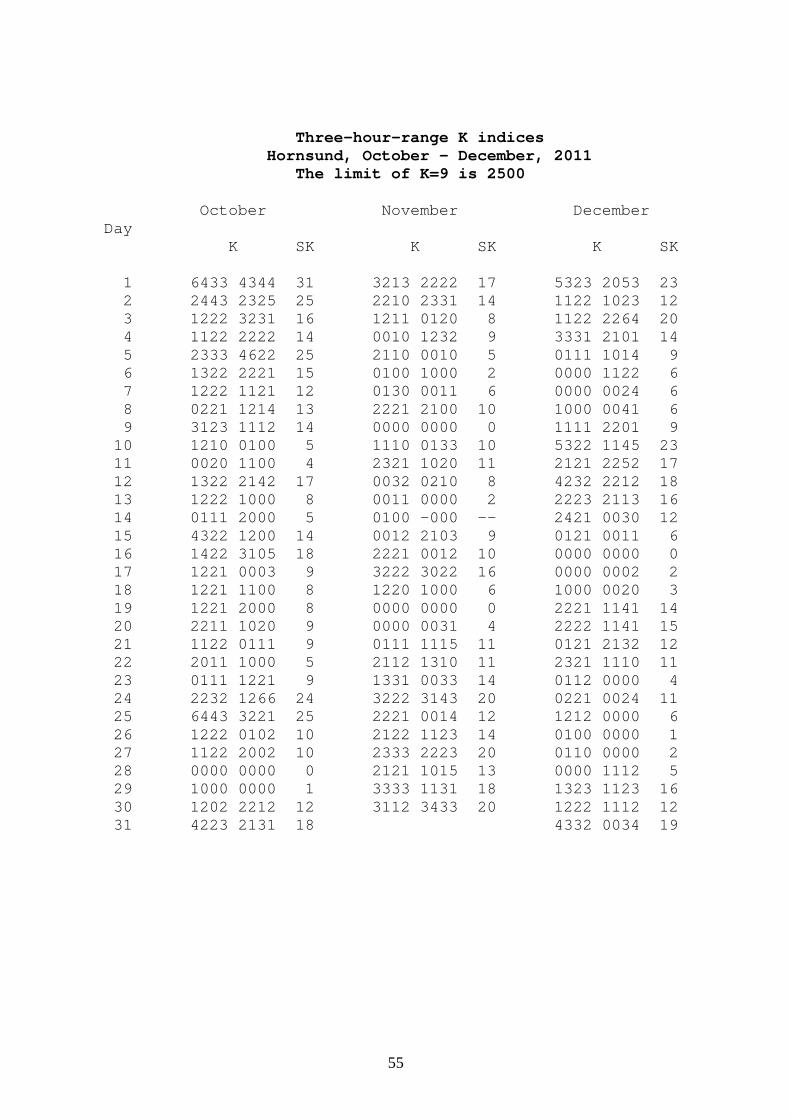
Three-hour-range K indices Hornsund, October - December, 2011 The limit of K=9 is 2500 October November D ecember Day K SK K SK K SK 1 6433 4344 31 3213 2222 17 532 3 2053 23 2 2443 2325 25 2210 2331 14 112 2 1023 12 3 1222 3231 16 1211 0120 8 112 2 2264 20 4 1122 2222 14 0010 1232 9 333 1 2101 14 5 2333 4622 25 2110 0010 5 011 1 1014 9 6 1322 2221 15 0100 1000 2 000 0 1122 6 7 1222 1121 12 0130 0011 6 000 0 0024 6 8 0221 1214 13 2221 2100 10 100 0 0041 6 9 3123 1112 14 0000 0000 0 111 1 2201 9 10 1210 0100 5 1110 0133 10 532 2 1145 23 11 0020 1100 4 2321 1020 11 212 1 2252 17 12 1322 2142 17 0032 0210 8 423 2 2212 18 13 1222 1000 8 0011 0000 2 222 3 2113 16 14 0111 2000 5 0100 -000 -- 242 1 0030 12 15 4322 1200 14 0012 2103 9 012 1 0011 6 16 1422 3105 18 2221 0012 10 000 0 0000 0 17 1221 0003 9 3222 3022 16 000 0 0002 2 18 1221 1100 8 1220 1000 6 100 0 0020 3 19 1221 2000 8 0000 0000 0 222 1 1141 14 20 2211 1020 9 0000 0031 4 222 2 1141 15 21 1122 0111 9 0111 1115 11 012 1 2132 12 22 2011 1000 5 2112 1310 11 232 1 1110 11 23 0111 1221 9 1331 0033 14 011 2 0000 4 24 2232 1266 24 3222 3143 20 022 1 0024 11 25 6443 3221 25 2221 0014 12 121 2 0000 6 26 1222 0102 10 2122 1123 14 010 0 0000 1 27 1122 2002 10 2333 2223 20 011 0 0000 2 28 0000 0000 0 2121 1015 13 000 0 1112 5 29 1000 0000 1 3333 1131 18 132 3 1123 16 30 1202 2212 12 3112 3433 20 122 2 1112 12 31 4223 2131 18 433 2 0034 19

56
Fig. 20. K-indices in graphical form, Hornsund 2011.

57
Fig. 21. Daily mean data plot for Hornsund 2011.
58
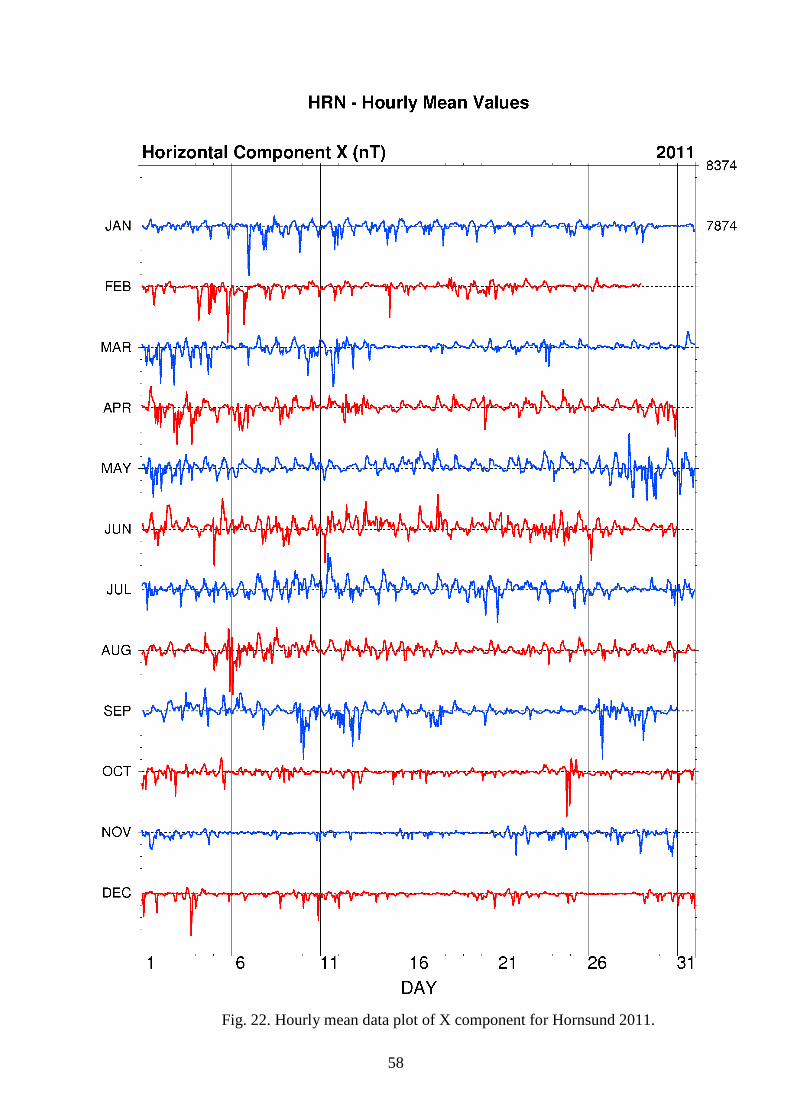
Fig. 22. Hourly mean data plot of X component for Hornsund 2011.
59
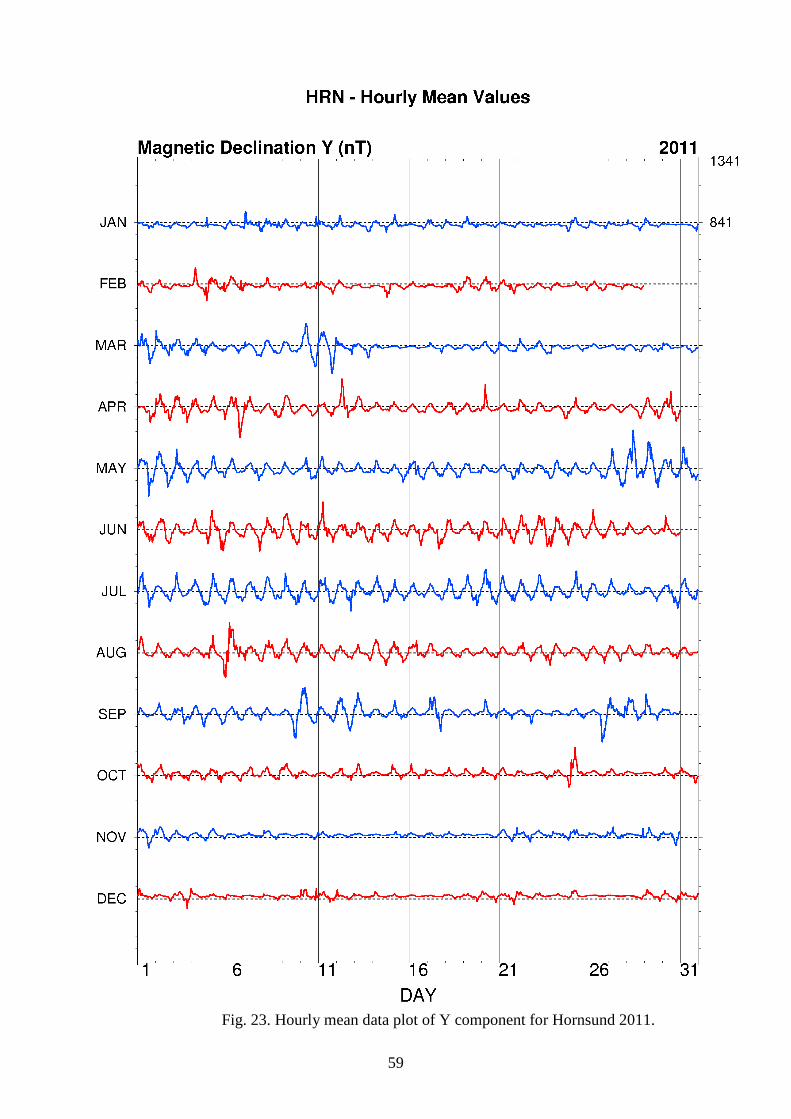
Fig. 23. Hourly mean data plot of Y component for Hornsund 2011.

60
Fig. 24. Hourly mean data plot of Z component for Hornsund 2011.
61
C O N T E N T S
Results of Geomagnetic Observations Belsk, Hel, Hornsund, 2011 …………………... 1
Tables and plots for Belsk Observatory ………………………………………………... 12
Tables and plots for Hel Observatory ……………………………………...................... 31
Tables and plots for Hornsund Observatory …………………………………………… 47