PUBLIC SERVICE COMPANY OF OKLAHQMA - OCC Imaging
263
PUB L I C SE R VI CE C O MPANY O F O KL A HQ MA Integrated Resource Pla n Spring 200 5 ncluding an Addendum Reflect i ng Continuin g Analysis as Represented in Cause No . 200500516
-
Upload
khangminh22 -
Category
Documents
-
view
0 -
download
0
Transcript of PUBLIC SERVICE COMPANY OF OKLAHQMA - OCC Imaging

PUBLIC SERVICE COMPANY OFOKLAHQMA
Integrated Resource Plan
Spring 200 5
ncluding an Addendum ReflectingContinuing
Analysis as Represented inCause No . 200500516

TABLE OF CONTENT S
SUBJECT PAGE
SECTION A -- NARRATIVE . . . . . . . . . . . . . . . . . . . . . . . . . . . . . . . . . . . . . . . . . . . . . . . . . . . . . . . . . . . . . . . . . . . . . . . . . . . . . . . . . . . . . . . . . . . . . . . . . . 41 .0 IRP Process Overview . . . . . . . . . . . . . . . . . . . . . . . . . . . . . . . . . . . . . . . . -- . . . . . . . . . . . . . . . . . . . . . . . . . . . . . . . . . . . . . . . . . . . . . . . . . . . . . . . . . . . . . . 4
1 .1 Introductian . . . . . . . . . . . . . . . . . . . . . . . . . . . . . . . . . . . . . . . . . . . . . . . . . . . . . . . . . . . . . . . . . . . . . . . . . . . . . . . . . . . . . . . . . . . . . . . . . . . . . . . . . . . . . . . . . . . 412 Planning Objective . . . . . . . . . . . . . . . . . . . . . . . . . . . .1 .3 Fundamental Steps and Planning Considerations . . . . . . . . . . . . . . . . . . . . . . . . . . . . . . . . . . . . . . . . . . . . . . . . . . . . . . . . 51 .4 Planning Horizon . . . . . . . . . . . . . . . . . . . . . . . . . . . . . . . . . . . . . . . . . . . . . . . . . . . . . . . . . . . . . . . . . . . . . . . . . . . . . . . . . . . . . 9
2 .0 Demonstration of Need . . . . . . . . . . . . . . . . . . . . . . . . . . . . . . . . . . . . . . . . . . . . . . . . . . . . . . . . . . . . . . . . . . . . . . . . . . . . . . . . . . . . . . . . . . . . . . . . . . . . . . . 92 .1 Load and Demand Forecast . . . . . . . . . . . . . . . . . . . . . . . . . . . . . . . . . . . . . . . . . . . . . . . . . . . . . . . . . . . . . . . . . . . . . . . . . . . . . . . . . . . . . . . . . .9
2 .1 .1 (Peak) Demand Forecast . . . . . . . . . . . . . . . . . . . . . . . . . . . . . . . . . . . . . . . . . . . . . . . . . . . . . . . . . . . . . . . . . . . . . . . . . . . . . . . . . . . . 112 .2 Demand Side Management (DSM) . . . . . . . . . . . . . . . . . . . . . . . . . . . . . . . . . . . . . . . . . . . . . . . . . . . . . . . . . . . . . . . . . . . . . . . . . . . . . 1 2
2 .2.1 Current DSM Offerings . . . . . . . . . . . . . . . . . . . . . . . . . . . . . . . . . . . . . . . . . . . . . . . . . . . . . . . . . . . . . . . . . . . . . . . . . . . . . . . . . . . . . 122 .2.2 Potential Future DSM . . . . . . . . . . . . . . . . . . . . . . . . . . . . . . . . . . . . . . . . . . . . . . . . . . . . . . . . . . . . . . . . . . . . . . . . . . . . . . . . . . . . . . . . 13
2 .3 Current Owned Capacity Portfolio . . . . . . . . . . . . . . . . . . . . . . . . . . . . . . . . . . . . . . . . . . . . . . . . . . . . . . . . . . . . . . . . . . . . . . . . . . . . . 142 .4 Unit Disposition . . . . . . . . . . . . . . . . . . . . . . . . . . . . . . . . . . . . . . . . . . . . . . . . . . . . . . . . . . . . . . . . . . . . . . . . . . . . . . . . . . . . . . . . . . . . . . . . . . . . . . . . . . 142 .5 Capacity and Reserve Margin Requirement . . . . . . . . . . . . . . . . . . . . . . . . . . . . . . . . . . . . . . . . . . . . . . . . . . . . . . . . . . . . . . . 152 .6 Projected Capacity / Reserve Margin Deficiencies . . . . . . . . . . . . . . . . . . . . . . . . . . . . . . . . . . . . . . . . . . . . . . . . . . . . 152 .7 Operating Agreements . . . . . . . . . . . . . . . . . . . . . . . . . . . . . . . . . . . . . . . . . . . . . . . . . . . . . . . . . . . . . . . . . . . . . . . . . . . . . . . . . . . . . . . . . . . . . . . 1 6
3 .0 Capacity Resource Planning -- Short Term Needs . . . . . . . . . . . . . . . . . . . . . . . . . . . . . . . . . . . . . . . . . . . . . . . . . . . . . . . . . . . 173 . 1 Recent RFP Solicitations . . . . . . . . . . . . . . . . . . . . . . . . . . . . . . . . . . . . . . . . . . . . . . . . . . . . . . . . . . . . . . . . . . . . . . . . . . . . . . . . . . . . . . . . . . . . 1 73 .2 Transmission Limitations Impacting Short-Term Requirements . . . . . . . . . . . . . . . . . . . . . . . . . . . . . . 1 8
4 .0 Capacity Resource Planning - Long-Term Needs . . . . . . . . . . . . . . . . . . . . . . . . . . . . . . . . . . . . . . . . . . . . . . . . . . . . . . . . . . . . 194.1 Resource Planning Assumption & Issues . . . . . . . . . . . . . . . . . . . . . . . . . . . . . . . . . . . . . . . . . . . . . . . . . . . . . . . . . . . . . . . . . . . 19
4 . 1 .1 Commodity Prices -- Gas &Energy . . . . . . . . . . . . . . . . . . . . .. 194 .1 .2 Transmission Constraints Modeled . . . . . . . . . . . . . . . . . . . . . . . . . . . . . . . . . . . . . . . . . . . . . . . . . . . . . . . . . . . . . . . . . . . . 20
4 .1 .2 .1 ERCOT - SPP Ties . . . . . . . . . . . . . . . . . . . . . . . . . . . . . . . . . . . . . . . . . . . . . . . . . . . . . . . . . . . . . . . . . . . . . . . . . . . . . . . . . . . 204.1 .2.2 Unique Design Implications . . . . . . . . . . . . . . . . . . . . . . . . . . . . . . . . . . . . . . 20
4 . 1 .3 Commodity Prices - Capacity . . . . . . . . . . . . . . . . . . . . . . . . . . . . . . . . . . . . . . . . . . . . . . . . . . . . . . . . . . . . . . . . . . . . . . . . . . . 214.1 .4 Capacity "Mix" Considerations . . . . . . . . . . . . . . . . . . . . . . . . . . . . . . . . . . . . . . . . . . . . . . . . . . . . . . . . . . . . . . . . . . . . . . . . . 22
4.2 Least-Cost Resource Planning Modeling Options . . . . . . . . . . . . . . . . . . . . . . . . . . . . . . . . . . . . . . . . . . . . . . . . . . . . . 234.2 .1 Modeling Objective . . . . . . . . . . . . . . . . . . . . . . . . . . . . . . . . . . . . . . . . . . . . . . . . . . . . . . . . . . . . . . . . . . . . . . . . . . . . . . . . . . . . . . . . . . 234.2 .2 Capacity Supply (Build) Modeling Options . . . . . . . . . . . . . . . . . . . . . . . . . . . . . . . . . . . . . . . . . . . . . . . 234.2.3 Technology Option Screening . . . . . . . . . . . . . . . . . . . . . . . . . . . . . . . . . . . . . . . . . . . . . . . . . . . . . - . . . . . . . . . . . . . . . . . . . . . 234.2.4 Modeling Approach -- The Strategist Model . . . . . . . . . . . . . . . . . . . . . . . . . . . . . . . . . . . . . . . . . . . . . . . . . . . . 254.2.5 Modeling Contraints . . . . . . . . . . . . . . . . . . . . . . . . . . . . . . . . . . . . . . . . . . 264.2.6 Primary Modeling Framework & Drivers . . . . . . . . . . . . . . . . . . . . . . . . . . . . . . . . . . . . . . . . . . . . . . . . . . . . . . . . . 27
5.0 Review of Modeling Results . . . . . . . . . . . . . . . . . . . . . . . . . . . . . . . . . . . . . . . . . . . . . . . . . . . . . . . . . . . . . . . . . . . . . . . . . . . . . . . . . . . . . . . . . . . . . 275 .1 Results Based on Gas Price Scenarios . . . . . . . . . . . . . . . . . . . . . . . . . . . . . . . . . . . . . . . . . . . . . . . . . . . . . . . . . . . . . . . . . . . . . . . . 275 .2 Build Plans - Analysis Discussion Points . . . . . . . . . . . . . . . . . . . . . . . . . . . . . . . . . . . . . . . . . . . . . . . . . . . . . . . . . . . . . . . . . . 285.3 Risk Assessment . . . . .-- . . . . . . . . . . . . . . . . . . . . . . . . . . . . . . . . . . . . . . . . . . . . . . . . . . . . . . . . . . . . . . . . . . . . . . . . 3 1
5 .3 .1 Risk Profile Results . . . . . . . . . . . . . . . . . . . . . . . . . . . . . . . . . . . . . . . . . . . . . . . . . . . . . . . . . . . . . . . . . . .. 316.0 Conclusions . . . . . . . . . . . . . . . . . . . . . . . . . . . . . . . . . . . . . . . . . . . . . . . . . . . . . . . . . . . . . . . . . . . . . . . . . . . . . . . . . . . . . . . . . . . . . . . . . . . . . . . . . . . . . . . . . . . . . . . 347 .0 PSO - Action Plan . . . . . . . . . . . . . . . . . . . . . . . . . . . . . . . . . . . . . . . . . . . . . . . . . . . . . . . . . . . . . . . . . . . . . . . . . . . . . . . . . . . . . . . . . . . . . . . . . . . . . . . . . . . . 3 5
SECTION B - CAPABILITY, DEMAND AND RESERVES . . . . . . . . . . . . . . . . . . . . . . . . . . . . . . . . . . . . . . . . . . . . . . . . . 36SECTION C - ENERGY SUPPLY PLAN . . . . . . . . . . . . . . . . . . . . . . . . . . . . . . . . . . . . . . . . . . . . . . . . . . . . . . . . . . . . . . . . . . . . . . . . . . . . . . . 38

Addenduyn . . . . . . . . . . . . . . . . . . . . . . . . . . . . . . . . . . . . . . . . . . . . . . . . . . . . . . . . . . . . . . . . . . . . . . . . . . . . . . . . . . . . . . . . . . . . . . . . . . . .4 2SECTION A -- NARRATIVE (ADDENDUM)1 .0-A IRP Process Overview
1 .1 -A Introduction . . . . . . . . . . . . . . . . . . . . . . . . . . . . . . . . . . . . . . . . . . . . . . . . . . . . . . . . . . . . . . . . . . . . . . . . . . . . . .41I .3-A Fundamental Steps and Planning Considerations . . . . . . . . . . . . . . . . . . . . . . . . . . . . . . . . . . .41
2 .0-A Demonstation of Need2.1-A Load and Demand Forecast . . . . . . . . . . . . . . . . . . . . . . . . . . . . . . . . . . . . . . . . . . . . . . . . . . . . . . . . . . . . .42
2.1 .1-A (Peak) Demand Forecast . . . . . . . . . . . . . . . . . . . . . . . . . . . . . . . . . . . . . . . . . . . . . . . . . . . .432.4-A Unit Dispostion . . . . . . . . . . . . . . . . . . . . . . . . . . . . . . . . . . . . . . . . . . . . . . . . . . . . . . . . . . . . . . . . . . . . . . . . . .442.6-A Projected Capacity / Reserve Margin Deficiences . . . . . . . . . . . . . . . . . . . . . . . . . . . . . . . . .452.7-A Operating Agreements . . . . . . . . . . . . . . . . . . . . . . . . . . . . . . . . . . . . . . . . . . . . . . . . . . . . . . . . . . . . . . . . . .45
3 .0-A Capacity Resource Planning -- Short Term Need s3 .1-A Recent RFP Solicitations . . . . . . . . . . . . . . . . . . . . . . . . . . . . . . . . . . . . . . . . . . . . . . . . . . . . . . . . . . . . . . 46
4.0-A Capacity Resource Planning -- Long-Term Need s4.1-A Resource Planning Assumption & Issue s
4 .1 .1-A Commodity Prices -- Gas & Energy . . . . . . . . . . . . . . . . . . . . . . . . . . . . . . . . . . . . . . .474 .1 .3-A Commodity Prices -- Capacsty . . . . . . . . . . . . . . . . . . . . . . . . . . . . . . . . . . . . . . . . . . . . .50
4.2-A Least-Cost Resource Planning Modeling Options4.2.2-A Capacity Supply (Build) Modeling Options . . . . . . . . . . . . . . . . . . . . . . . . . . . . . .51
5.0-A Review of Modeling Results5 .1-A Results Based on Gas Price Scenarios . . . . . . . . . . . . . . . . . . . . . . . . . . . . . . . . . . . . . . . . . . . . . . . .53
6 .0-A Conclusions . . . . . . . . . . . . . . . . . . . . . . . . . . . . . . . . . . . . . . . . . . . . . . . . . . . . . . . . . . . . . . . . . . . . . . . . . . . . . . . . . . . . . . • 567 .0-A PSO -- Action Plan . . . . . . . . . . . . . . . . . . . . . . . . . . . . . . . . . . . . . . . . . . . . . . . . . . . . . . . . . . . . . . . . . . . . . . . . . . . . . . . .57SECTION B -- CAPABILITY, DEMAND AND RESERVES (ADDENDUM . . . . . . . . . . . . . . . . . .59
3

SECTION A -- NARRATIVE
1 .0 IRP Process Overv iew
1 .1 Introduction - Public Service Company of Oklahoma (PSO ) is a wholly-owned subsidiary of American
Electric Power Corporation (AEP) . The total AEP System comprises eleven operating companies, operating in
eleven states, and in, primarily, two different Regional Transmission Organizations (RTO's), as follow :
AEP West Zone - SPP :
* Public Service Oklahoma (PSO), serving port ions of Oklahom a
• Southwestern Electric Power (SWEPCO), serving portions of Arkansas, Louisiana, and Texa s
Note : In addition, Texas North Company (T'NC) serves portions of Texas within the SPP RTO . The TNC load
and peak demand in the SPP zone is minimal (demand estimated at approximately 30 MW or, comparatively,
well less than 1% of either the PSO or SWEPCO peak demand) and TNC owns no generation capability that is
located in the SPP zone, instead relying on purchase transfers from ERCOT via DC ties . Therefore, TNC is not
detailed in the planning analysis as described in this report.
AEP East Zone - PJM.-
• Appalachian Power (APCo), serving portions of Virginia and West Virginia
• Columbus Southern Power (CSP), serving portions of Ohi o
• Indiana Michigan Power {I&M}, serving portions of Indiana and Michigan
• Kentucky Power (KP), serving portions of Kentucky
• Ohio Power (OPCo), serving portions of Ohio
• Kingsport Power (KgP), serving portions of Tennessee
• Wheeling Power (WP), serving portions of West Virgini a
Note : KgP and WP are affiliated, non-generating distribution companies . As such, neither would be considered
for capacity resource ownership but, rather, each would continue to incur costs as part of its FERC wholesale
cost-of-service tariff with its affiliated operating company - APCo and OPCo, respectively .
The operating companies in AEP's western zone located in the Southwest Power Pool ("SPP Companies")
collectively serve a population of about 3 .7 million (0 .9 million retail customers) in a 36,000 square-mile area of
Arkansas, Louisiana, Oklahoma, and Texas . AEP-SPP recently experienced its all-time peak internal demand of
8,480 MW on August 2 6 , 2005 (SWEPCO recently established and a)1-time time demand of 4,724 on August, 23,
2005, and PSO likewise recently establishing an all-time demand of 4,047 MW on July 22, 2005) .
4

1.2 Planning Objective - This report presents the results of an Integrated Resource Plan (IRP) analysis for the
SPP Companies covering the period 2005-2014 . The information presented with this IRP ("Plan") includes
descriptions of assumptions, study parameters, methodologies, and results including the integration of supply-sid e
resources and demand-side management approaches .
The objective of this planning process was to set forth a plan that would provide the AEP operating companies
with capacity resources that will maintain the companies' long-term reliability and low cost profile to its
customers, ensuring the flexibility necessary to promptly respond to the changes occurring in the electric utility
industry . In that regard, assum tions and plans are continually reviewed and rnodi ie d as new in ornaation
becomes avarlable . Such continuous analysis is required to ensure that changing markets, market structures,
technical parameters, reliability and environmental requirements are constantly re-assessed .
1 .3 Fundamental Steps and Planning Considerations - With the additional supply-side resources reflected in
the Plan, SWEPCO and PSO, individually, are expected to have adequate reso urces to serve customers'
requirements throughout the ten (10)-year (2005-2014) IRP period, while at the same time being positioned to be
in compliance with known or anticipated economic/market conditions, technology advancements, changes in
governing statutes/rules, including environmental requirements, all at the lowest reasonable cost to customers .
The resource planning process includes the following basic steps :
1 . Load Forecasting (Energy and Demand) Development of energy and peak demand forecast for
native load, an estimation of demand side management opportunities, as well as an estimation of
wholesale customer load and demand profiles . The latter intended to optimize the utilization of the
available generating resources .
2. Review /Assessment of Current Resources - Evaluation of physical and economic factors -
including environmental compliance requirements - that may affect the continued operation of any
of the system's current generation resources .
3 . Reliabality Analysis / Reserve Criteria - Consideration of RTO andlor zonal requirements
concerning sufficiency of capacity planning reserves .
4. Determination ofAdequacy of Current Resources /Need fortldditional Resources - Matching
existing and currently planned resources against total requirements (load plus reserve
requirements), to determine projected future capacity shortfalls / needs .
Ident f cation of Capaci ty Resource Options - Cons iderat ion of v arious classes of potentialresources : market purchases of firm capac ity vs . generating unit additions vs . purchase of existinggenerating assets ; available technology options ; etc . Determination of the relevant assumptions foreach of these options, as well as system-w ide appl ication assumptions .
6. Determination of Optimal Resource Mix and Timing - Consideration of the analytically optimal
resource mix and timing of new capacity resources within the planning period under various
modeling assumptions and risk factors .
7. Implementation Considerations - Consideration of technical and physical ability to implement ,
local (state/operating company) legal entity bidding andlor ownership issues and requirements, a s
well as siting and other practical technical and regulatory issues .

Further, the planning process includes the following process considerations discussed more fully below :
1 . "Obligation to Serve" Load Requirements
2. Environmental Regulation s
3 . Existing Generating Unit Operating Considerations
4. Commodity Pricing Assessment
5 . Supply Options : Build/Own vs . Buy
6. Transmission and RTO impacts
7. Optimal Resource Mi x
8. Generation Technology Assessment
9 . Risk Analysis
Obligation to Serve Load Requirements : Electric utility service in the four states the SPP Companies operate is
fully regulated, with the exception Texas . As such, the long-term obligation to generate, transmit and distribut e
reliable power and energy is one of the chief considerations of the IRP process .
Environmental ReguLations : Environmental regulatory uncertainty has been analyzed under various scenarios,
including the guidelines recently established under the U .S. Environmental Protection Agency (EPA) Clean Ai r
Interstate Rules (CAIR) and Clean Air Mercury Rules (CAMR) .
Note: Given both the generation mix and technology of the existing fleet of the SPP Companies
(significant gas generation as well as either low-sulfur, Powder River Basin [PRB]-sourced coal andlor
coal units with scrubbers), the relative impacts of CAIR and CAMR are limited . Further, certain states
such as Oklahoma are generally not directly impacted by the requirements of CAIR .
Existing Generation Unit Operating Considerations : Planning necessitates the analysis of not only new
generation resources to meet prospective load and demand growth, but also the analysis of the continued
operation or potential retirement and/or re-powering of existing resources . Such analyses center on the economi c
viability of generating units within the context of the available capacity market "build versus buy" opportunities .
Viability may also be impacted by decisions surrounding any plans to meet mandated emission regulations .
However, other factors such as a unit's ability to alleviate local reliability constraints may impact day-to-day
operational planning . In some situations, re-powering can be a viable alternative to retirement, but that decision
depends heavily on site-specific considerations . The SPP Companies participation in the SPP RTO - and the
processes and procedures that are then invoked -- also play a role in unit disposition decisions .
6

Commodity Pricing Assessment: : Any detemination of supply-side capacity and energy options must take into
consideration the anticipated value of various commodity prices that have a direct bearing on generation assets -
whether those assets are existing assets or are "new-build" assets being contemplated as part of the IRP process .
Such commodity prices include natural gas, energy, delivered coal (by-type), emission allowances that ar e
currently transacted within liquid markets, namely, SO 2 , NOx and, to a lesser extent, CO2. In addition,
regional/RTO requirements surrounding capacity obligations have set forth the assessment of capacity prices as
an important element within the capacity planning process . Clearly, such regional capacity availability and
attendant pricing play a role in the fundamental "make versus buy" construct within capacity resource planning .
However, recent volatility in the natural gas market has further focused specific attention on that commodity as
being perhaps the most critical commodity element in this long-term process .
Supply Options : Build/Own vs. Buy: Load serving utilities typically have the option of building/supplying their
own resources or buying energy and capacity from the wholesale market to meet future needs . Issues impacting
these options that should ultimately be considered include but are not limited to :
Investor credit-worthiness and ultimate impact on required cost of capital ;
Exposure to market risk and, with that, consideration of price certainty ; and
Regulatory/legal requirements that may dictate consideration of such option s
To expand upon the final issue, utilities may be directed or encouraged by regulators to pursue more open
procurement processes . The rules governing competitive procurement are not uniform as exemplified in the four
state jurisdictions of the SPP Companies . For instance, certain rules may require states' utilities to initiate a
formal Request for Proposal (R-FP) process, and may provide for independent review of the utility's bid
evaluation process . Even in cases where regulators allow utility self-build, they must frequently provide detailed
information on the costs of any self-build options versus alternatives before approval . Further, FERC policies can
also influence this build/own vs, buy decision . For example, "market power" considerations may limit the
aggregate amount of generation resources a utility may own in a zone, thus limiting its ability to build and own
additional resources itself or acquisition of competitive (e .g . IPP) resources .
The SPP Companies are developing sei£ build options as each has a regulatory "obligation to serve ." These
options will also serve as a backstop should market solicitations being established as part of the IRP
implementation process not produce supply options that are lower cost or that are less robust than self-build
options .
Transmission and RTO Impacts : Overall resource planning typically considers all resources, including
transmission . In certain cases, transmission investment may be warranted purely for reliability purposes .
Transmission can also enhance available generation resources when it opens access to nearby zones that may hav e
generation capability deficiencies . In other cases, transmission is required to deliver the energy from new
generation projects to loads, or to make local resources more economic through off-system saies or integration
with more remote zones . Transmission considerations will also affect potential siting of new resources . Both the
transmission system's ability to integrate a new resource, and specific interconnection requirements must be
considered. Moreover, an RTO may have interconnection protocols, sometimes quite detailed, that must becomplied with .
7

Utility memberships with RTOs have implications for the addition of generation resources to the transmission
system . In the past, addition of regulated generation to ones' own transmission facilities involved limited
coordination with neighboring systems . However, membership in an RTO now requires development of specific
coordinated transmission plans, with the related potential cost responsibility to mitigate transmission impacts on
neighboring systems resulting from the new generation . In addition, the proposed generation resources must be
studied by the RTO to assess reliability consequences, connection requirements and cost responsibilities . The
length of the SPP generation interconnection study process is not as well defined, but it could take as much as one
year .
Optimal Resources Mix: The plan must contemplate the optimal mix of generating asset types necessary to meet
future load obligations. The comparison of different resources involves tradeoffs between available technologies
with different generating profiles . In general, generating technologies with high fixed costs and low variable
costs, such as most solid-fuel (coal, lignite) technologies, tend to be more economic when operated at high
capacity factors . Technologies with low fixed, but high variable costs, such as gas-fired simple-cycle combustion
turbines, are more economic at low capacity factors .
As discussed later in this report, incremental resources for the SPP Companies were considered reflecting a
reasonable "mix" of generation types that comport to the inherent typical load shapes of the SPP Companies ,
Generation Technology Assessment : Given the necessary long time horizons of most resource planning
exercises, the capacity planning process must consider new or constantly evolving generating technologies, some
of which may have potentially uncertain or unproven performance and cost parameters . Therefore, the modeling
assessment of such generating technologies for the SPP Companies as part of this Plan considered an array of
sources for such cost and performance estimates . Such sources included commonly cited public information,
consortiums where AEP is actively engaged, vendor relationships, as well as AEP's own experience and
expertise .
Risk Analysis : The future is inherently uncertain, and the "optimal" plan for one set of assumptions may not be
optimal for a different set of assumptions . Different approaches to planning account for uncertainty in different
ways. At a minimum, virtually all resource plans model several discrete scenarios that vary key drivers such as
fuel prices, load growth, capacity build costs, and environmental regulation . More computationally intensive
modeling processes characterize the distributions governing these drivers and their correlations, using sampling
techniques to model wide ranges of possible scenarios, As described above, and for purposes of this Plan, the
primary risk driver was considered to be the long-term r ip ce o natural gas .

1 .4 Planning Horizon - Given the significant time period typically encompassed by the capacity planning
process, both from the perspective of the ultimate cost exposure of these long-lived assets as well as from the
perspective of the in-service "lead-time" requirement, the evaluations to be discussed in this document were
performed over a 2005-2020 ' detailed capacity resource "planning" period . As a result, in order to recognize the
ultimate cost-based end-effects of any capacity option established in the latter years of that planning period, the
economics were extended an additional ten (10) years, resulting in an overall 2005-2030 economic "study"
period .
The optimal capacity resource plans identified in this document were performed utilizing the proprietary
Strategist 2 resource optimization tool and were based on a traditional revenue requirements basis . In all
scenarios the model seeks, as its ultimate objective function, to establish a least-cost (revenue requirement)
Cumulative Present Worth (CPW) solution over the defined study period .
2.0 Demonstration of Need
2.1 Load and Demand Forecast - Internal load and peak demand forecasts were based on the AEP Economic
Forecasting group's January, 2005 update to the approved 2005 AEP load forecast that was completed in the
summer of 2004 .
The eiectrie energy and demand forecast is the accumulation of five specific forecast model processes as reflected
in the chart below . The first two processes model the consumption of electricity at the aggregated customer level .
These aggregated levels are the FERC revenue classifications of residential, commercial, industrial, other, and
municipals and cooperatives . The first model process is the monthly short-term sales models and the second is
the annual long-term sales models . The third process estimates energy losses in terms of transmission and
distribution losses from the source to the customer premise . The fourth process blends short and long term
results, aggregates the revenue class sales, and adds energy losses . This culminates in what is generally called net
internal energy requirements . Net internal energy requirements are projected here in the units of monthly
electricity production at the source . The final model process also distributes the monthly net internal energy
requirements across the hours of the month resulting in the hourly demand forecast .
1 A lthough the long-term modeling to be described as ses sed capacity need s thrflu g h 2020 , given the fact that the
capacit y resource planning eval uation for all "out-years" will be continually cycled going-forward and cons i dering
that th e over all corporate l ong-term financial pl anning ho rizon i s typica lly lim i ted to te n years, the IRP results inthis
renort r epre sent a v i ew of the AEP ca~aci ty res ourc e r e quirements throu~ theyear 2014 .
z) A s di scussed in g r e ater detail later in this document , Strategist is a long-term resource optimization to o l widely use dover t he past two decades in the utility inciu s try for resource planning acti vity . Thi s propri etar y application is underl ease to AEP from New Energy Associate d (NEA), Atlanta, GA .
9

1 . Short - Term Sales 2. Long - T erm S ales
Forecast (b y FERC Revenue F orecast (by F ERC Revenu e
3 . Energy
4 . Net Internal
Energy
5 . D emandForecast
The long-term forecasts are developed utilizing annual econometric models . The process starts with an economic
forecast provided by Ecorzonzy.com for the United States as a whole, each state, and regions within each state .
These forecasts include forecasts of employment, population, and other demographic and financial variables, The
long-term forecast incorporates the economic forecast and other inputs to produce a forecast of annual KWh sales .
Other inputs include regional and national economic and demographic conditions {some of which are presented in
the following table), energy prices, weather data, and customer-specific information .
CPI GDP (2000 $) PPI
Urban Consumer - Al lltems , (Index 1982- 2000 $ Index = 1982 , United
States84=100 )
1980 82 .4 5 , 161 .7 79 . 1
1985 107 .6 6,053 .8 111 . 6
1990 130 ,7 7 , 1 1 2 . 5 1 1 7 . 61995 152 . 4 8,031 .7 130 . 92000 172 .2 9 , 816 . 9 1 30 . 7
Actual Data 2003 184 . 0 10,398 .0 141 .1
Forecast Data 2004 188.0 1 0 , 888 .9 143 . 32005 1 90 .2 11 ,268 . 9 145 .52010 212 .1 13 , 30 1 .0 150 .02015 236 .7 15 , 122 .2 159 . 0
2020 264 . 2 1 6 , 899 .2 169 . 32025 294 .9 18 ,683 .1 1 80 2
AEP uses processes that take advantage of the relative strengths of each method . The regression models typically
used in the shorter-term modeling use the latest available sales and weather information to represent the variation
in sales on a monthly basis for short-term applications . While these models produce extremely accurate forecasts
in the short run, without specific ties to economic factors, they are less capable of capturing the structural trend s
- in the electricity catisumptian that are important for the longer term p)anning . The Jong-2erm process, with itsexplicit ties to economic and demographic factors, is appropriate for longer term decisions and the establishment
10
of the most likely or "base"load and demand outcome over the forecast period .
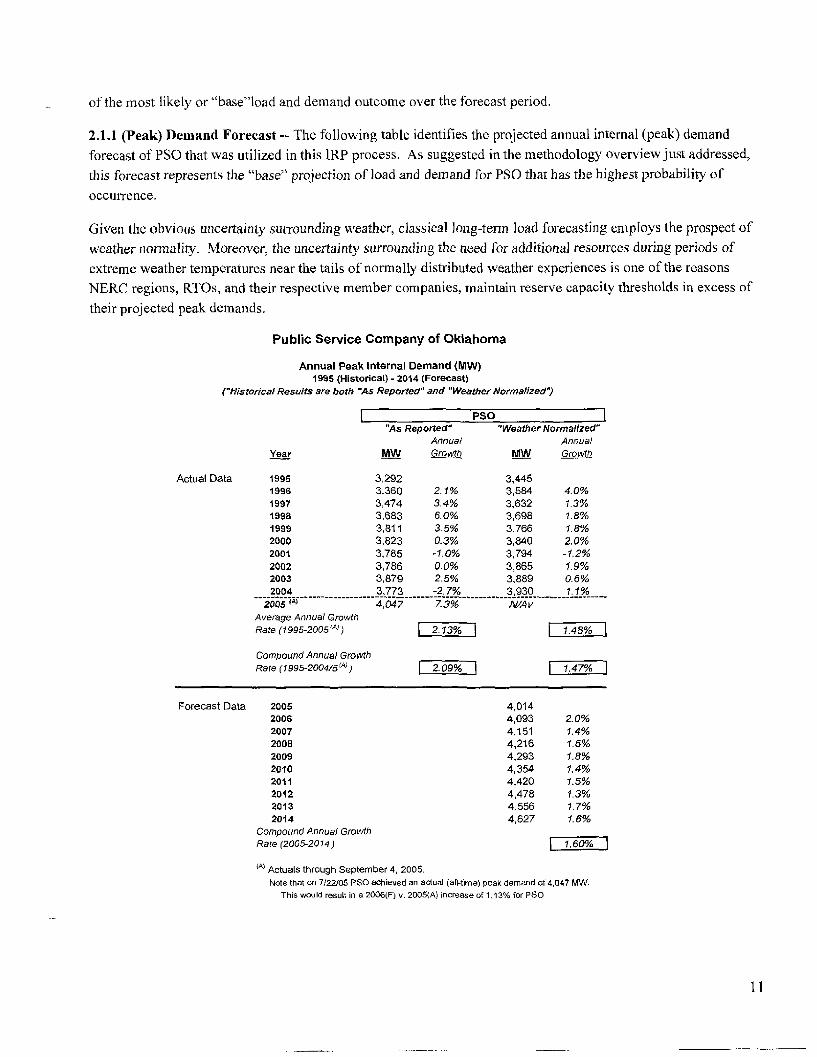
2.1 .1 (Peak) Demand Forecast -- The following table identifies the projected annual internal (peak) demand
forecast of PSO that was utilized in this IRP process . As suggested in the methodology overview just addressed,
this forecast represents the "base" projection of load and demand for PSO that has the highest probability of
occurrence .
Given the obvious uncertainty surrounding weather, classical long-term load forecasting employs the prospect of
weather normality . Moreover, the uncertainty surrounding the need for additional resources during periods of
extreme weather temperatures near the tails of normally distributed weather experiences is one of the reasons
NERC regions, RTOs, and their respective member companies, maintain reserve capacity thresholds in excess of
their projected peak demands .
Public Service Company of Oklahoma
Annual Peak Internal Demand (MW)1995 (Hi st orical) - 2014 ( F orecast)
( "Nistorical Results are both AS Repnrted" and "Weather Normalized")
PSO"A s Reparted" " Weath erlYO rmalized"
Annuai AnnualYear MW Growfh MW Growth
Actual Data 1995 3 ,292 3,4451996 3 , 360 2 .1% 3 ,584 4 . 0%1997 3 ,474 3 .4% 3,632 1 . 3%1998 3 ,683 6 .0% 3 ,698 1 . 8%1999 3,811 3 .5% 3,766 1 . 8%2000 3 ,823 0 .3% 3,840 2 . 0°/a200 1 3 , 785 -1 . 0 % 3 , 794 -1 .2%2002 3,786 0 .0% 3 ,865 1 . 9%2003 3 ,879 2.5% 3,889 0. 6%2004 3 ,773 -2 .7% 3 , 930 1 . 1 %---------------------------------------------~-------°-----°-----------------------
20R3 { a) 4,047 7 3ib N/,9vAverage Annual G rowthRate (1995-2005 rA) }
Compound Annual GrowthRate (1995-2004/5 '") }
2. 13 %
2- 09%
4 ,01 44,0934 , 1 514,2164,2934,3544 , 4204 ,4784,5564,627
Forec a st Data 20 052006200720082009
201020112012
2013201 4
Compound Annual Gro wth
Rate (2005-2014)
1 . 47 %
2.0%1 . 4%
1 . 8%1 .4%1 . 5%1 . 3%1 . 7%1 .6%
E1 . 6Q~
Actual s th rough September 4, 20 05 .Note that on 7122105 P50 ach ieved an actual ( all-time) peak demand of 4,047 MtN.
This wo uld result in a 2006(F) v . 2005 (A3 increase of 1 . 13% for PSO
I 1

Note that this table also offers a comparative view of these forecasted demand levels versus a comparable (] 0 -
year) historical period . Jt would suggest that the projection of peak demand as reflected over the forecast period
compares favorably to recent historicai results, particular when those historical results are adjusted for norma l
weather . Specifically for PSQ, it would suggest that the forecasted compound annual growth rate for the 10-yea r
period of 1 .60% is slightly above the weather normalized 1 D-year historical level of 1 .47% .
2.2 Demand Side Management (DSM) - The economic purpose of a demand side management (DSM) program
is to reduce customer load (peak demand, energy, or both) at less cost than would be incurred to serve that load .
DSM programs' availability, economics, the utility's avoided energy and capacity costs, the allocation of the
programs' costs and benefits, and the effect on customers are factors considered in DSM program analysis ,
2 .2 .1 Current DSM Offerings - Following is a summary of the current DSM programs :
"MarketChoice" (aka "ValueChaice") offers real-time pricing (RTP) options for participating
customers . As represented on the table below and in Section B (CDR for PSO), based on historical
responses, it is anticipated that 32 MW of demand would be shifted annually during peak hours. In
addition, PSO has two special contract industrial customer tariffs applicable to Weyerhauser and
Elkem for which 1 6 MW has been reflected in the PSO CDR for such anticipated annual load
reductions .
The amount of DSM currently reflected in the IRP for PSO is as follows :
Public Service Company of Oklahoma
Annual Impact of Demand Side Managementon Forecasted Peak Demand (MW )
2005-201 4
PSOInterruptibl e
Year Active DSM {Al TarifFs (") Sum
2005200620072008200920102011ZO?Z201 32014
(32)(32)(32)(32)(32)(32)(32)(32)(32)(32)
(16 )
{~s)(16)(16)(16){16}(~~)(16)(16)
(48)(48)(48)(48)(48)(48)(48)(48)(48)(48)
t'°) "MarketChoice (aka ValueChoice) program(8) Two spec ia l i nterrup ti b l e contracts w ith Weyerhasuer an d E iicem
12

2.2.2 Potential Future DSM - Over the past decade, low regional price levels of market energy and capacity have
limited the opportunities for cost-effective DSM . However, it would be anticipated that capacity prices would
begin to rise in coming years in conjunction with expected regional capacity addition requirements . Some DSM
measures could prove cost-effective in this future environment . DSM implementation can require significant lead
time (just as the implementation of supply resources), and such opportunities must be identified and acted o n
sufficiently in advance .
Given these circumstances, AEP recognizes the need to enhance its DSM pianning process, and has begun initial
steps to do so . The initial objectives are :
~ Develop a comprehensive DSM planning approach that will enable AEP and its operating company
subsidiaries to fully implement any cost-effective DSM measures that may be identified in a timely
manner, and
~ Develop an initial "order of magnitude" estimate of the amount of DSM that may ultimately prove to be
cost effective, and the timing thereof. This estimate will be continually refined .
Further steps in AEP's enhanced DSM planning process over the relatively near-tenn will involve :
1 . A continual review of the assumptions made regarding possib le DSM measures identified as potentia lly
cost-effective .
2 . lnclusion of such DSM measures in combined supply / demand-side resource optimization profiles .
3 . Inclusion of jurisdiction-specifc DSM information and a "roadmap" of AEP's enhanced DSM
planning process in regulatory TRP reports and getting feedback thereon ,
4. Addition of a DSM participant analysis to assure that a reasonable sharing of DSM benefits can be
arranged between participating customers and the system, looking at customer specifc tariffs, etc .
AEP has performed a series of preliminary, high-level economic screenings of various non-RTP-type DSM
measures involving equipment at the customer premise . The following table offers a non-exhaustive listing of
such measures for both residentia l and commercial appication . Based on estimates associated with the cost to
implement such unique measures, the measures' effective potential load/demand impact, as well as potential
customer saturation and sign-up percentages, it was determined that there was negligible opportunity to cost
effectively initiate such DSM measureslprogxams over the next several years . However, by later this decade, the
company believes there will be greater opportunity for certain of these measures -incliding combinations of
measures aggregated into programs - to achieve a Rate Impact Measure ("RIM") or benefit-to-cost ratio greater
than or equal to 1 .0 . These preliminary screenings suggest that based on today's technologies such potential
demand reduction at peak for the combined SPP Companies would be approximately 10 MW by around 20 10 .
However, as technologies advance and competition among DSM equipment/service providers grows, suc h
benefits could escalate .
13

Sample Listing of DSM TechnologiesInvolving Customer Premise Equipment (CPE)
Residentia l
Ceiling Insulation (> R30)Compact Fluorescent Lamps (CFL)Direct Load Control AC CyclingEnergy Efficient BallastsEnergy Efficient Central ACFloor/Basement InsulationGeothermal Heat PumpInduction Cookto pLoad Control AC & WHLoad Control Water HeatLow Flow FixturesProgrammable ThermostatRemove 2nd RefrigeratorSolar Water HeatingTank/Pipe Wrap
Commercia l
CFLIBallast-ReplacementCFL-NewEnergy Efficient A CEnergy Efficient Condensing HeatingEnergy Efficient Conv. HeatersEnergy Efficient Heat Pum pExit Signs-RetrofitTa LightingT8 LightingVariable Speed Drive MotorsWindow Fil m
2.3 Current Owned Capacity Portfolio - The following figures offer a summary of supply resources for the
SPP Companies . Specifically, the current profile of supply sourced from owned generation facilities consists of
Coal / Lignite 1,018 MW
Gas 1 Diesel 3,079 MW
Total AEP 4,097 MW
2.4 Unit Disposition -A review of selected PSO units was performed as part of the IRP evaluation process .
That review revealed the following units were candidates for further study .
+ Southwestern Units l& 2 ; and
• Tulsa Unit 3 (currently not operable, in stand-by status )
Although the review identified the above units for further examination, in general, economic viability of the
existing AEP-SPP fleet of gas-fired generating units - and the decision to mothball or retire such units - can be
simply stated as the net present value of the ongoing (largely fixed) costs to maintain the unit for reliable
operation versus the replacement capacity cost of the unit . As will be described later, since PSOis projected to be
substantially capacity-short over the planning period, and, thus, additional generating capacity is indicated, no
unit can be taken out of service without a commensurate capacity replacement .
Following the premise that capacity replacement value is the primary metric of economic viability from a
(capacity) resource planning perspective, the existing gas-fired generating units were evaluated against a proxy
14

for capacity replacement cost based on a forecasted pure market capacity price used throughout this TRP process .
When considering the removal from operation of multiple units, potentially constituting hundreds of megawatts,
the market capacity price may become less indicative of the replacement cost, as the ability for the AEP-S PP
control area to rely on incremental purchases becomes constrained, and other factors such as transmission network
upgrade costs and new build options must ultimately be factored into the indicative replacement value .
Each unit previously identified was evaluated individually against its market capacity replacement cost . Given
PSO's dependence on market purchases through 2007 (as will be set forth later in this document), as well as
known transmission constraint issues removing anyl unit from service prior to that point would not be prudent .
Even though continued operation of all but one of the units can be justified solely on their replacement capacity
value, additional qualitative factors were considered including : (1) energy contribution, (2) operational history,
(3) repowering opportunities, and (4) infrastructure impacts such as Reliability Must Run status, environmental,
and safety issues . With the exception of Tulsa 3, all PSO units scored satisfactorily on these additional
quantitative and qualitative factors .
The following represent the findings and recommendations of this unit disposition review process :
• No unit retirements or mothballing over the ten-year IRP period .
• Make necessary capital re-investment and perform necessary maintenance for Tulsa Unit 3 so as to ensureits safe and reliable start-up and operation by the 2006 summer season .
• Develop specific recommendations for any potential repowering of steam units that may be candidates .
• Continue the policy of frequent periodic review of the ongoing expected capital and O&M dollarsnecessary to maintain reliable and safe operation versus the capacity replacement cost of the units .
2 .5 Capacity and Reserve Margin Requirement .. A 13 .6% planning reserve margin (as a percent of annual
peak demand, 12 .0% as a percent of capacity) requirement as set forth by SPP has been used over the entire
planning period . PSO and SWEPCO are assumed to meet this minimum requirement separately under the
assumption that the inter-company available Transfer Capability (ATC) is insufficient to support large capacity
commitments . Specifically, prior operational experience and internal assessments of company transmission
capabilities suggest that, when considering a single contingency event, the present transfer limit is 200 MW for
firm capability . Recognizing that loadings will increase over the planning period, this inter-company transfer limit
was assumed to be zero for modeling purposes . However, as discussed later in this document, this constraint was
relaxed in forming the final recommended resource plan to consider limited (up to 200 MW) of reserve sharing .
2.6 Projected Capacity / Reserve Margin Deficiencies - The chart below presents the MW capacity (reserve
margin) deficiencies under the long-term forecast of peak demand and the current capacity supply portfolio for
PSO .
15

PUBLJC SERVICE CQNFA NY OF OKLAHOMA
Projected Capacity Deficiency{ Res u lting from a 13.6% S PP Reserve Ma rg in Requ i rement }
20p5 - 20 1 4
~
a
aM0
Assumes . . .o January, 2005 Update to 2005 Load Forecast (estab)ished, Summar 'D4)
1000 o No New-Build Generation or Unit Retirements (i e . current PSO Supply Portfolio)o No Market Capacity Purch ases b eyond 20 0 5
(however, includes Wind Purchases in 2 006)o AEP-Fast -to- AEP-West capacity transfer through 2006 only
860
600
20 05 2006 2 007 2008 ~ 2609 2010 2011
lPSO i_ 36 966 _J 359 433 519 587 _682
400. . , a
_ ' _ ', ., r' d.~̀ _✓, ~~;
.}?
2 00 ~~ =F y ~ µ
- i K F
O
2012
726
2013 I 2014
894 894
As suggested above, PSO is anticipated to require 433 MW of capacity resources to achieve a 13 .6% reserve
margin requirement by 2 008 . That date is critical in that it demonstrates that the respective capacity needs at that
time may far outweigh the ability to import potentially available (market) capacity due to known and anticipated
transmission constraints to be discussed further in this report . That 2008 timeframe is also critical in that it
represents the earliest summer season in which, as will also be discussed, new build capacity resources in the
form of "peaking" capacity could be in-service .
2 .7 Operat i ng Agreements - The ultimate determination of the unique PSO and SWEPCO capacity
requirements are also impacted by :
• The FERC-approved 1997 Restated and Amended Operating Agreement among Central Power and LightCompany (aka Texas Central Company (TCC)), West Texas Utilities Company (aka Texas NorthCompany (TNC), PSO, SWEPCO, and Central and Southwest Services, Inc . (CSW) ("CSW OperatingAgreement") .
• The 1998 System Integration Agreement among American Electric Power Service Corporation (AEPSC),as agent for eastern operating companies, and CSW, as agent for western operating companies ("SIA") .The SIA is designed to function as an umbrella agreement in addition to the CSW Operating Agreement
and the 1951 AEP Interconnection Agreement that likewise governs the sharing of capacity, energy, andcosts among the eastern operating companies .
Among other things, the CSW Operating Agreement sets fort h requirements by which each operating company
must seek to maintain adequate annual planning reserve margins in the form of a Planning Reserve Level of
capacity. As discussed, in this Plan the Planning Reserve Level within the SPP Companies' region is 13 .6%
when expressed as a function of its forecasted Company Load Responsibility (as defined in Section 2 .12 of the
CSW Operating Agreement) .
Note: Subsequent to the 1997 CSW Operating Agreement, events i n the state of Texas tied pr i marily to legislatio n
16

req u irin g electr i c uti lity restru cturi ng and c ustom e r choice, have resulted in nearly all of the generati ng capability
p reviou sly ow n e d by TCC and TNC and resid i ng w ithin th e ERCOT region bei n g d ivested, mothballed or retir e d in
th e interi m . G iven thi s, th e focus of this IRP in AEP 's western region was limited to the PSO and SWEPCO
operating companies (SWEPCO being inc lusive of a portion of i ts service terr itory located i n th e Texas that is a part
of the SPP region .) .
The SIA provides for the integration and coordination of AEP's East and West companies zone . Among other
things, the SIA provides for the transfer of power and energy between AEP West zone and AEP East zone under
certain conditions . AEP has continued to reserve 2S0 MW of transmission capacity between the AEP East zone
and AEP West zone . With that, this Plan continues to reflect the East -to- West transfer/purchase of 250 MW of
capacity through the 2 006 summer season since the AEP Eastern (PJM) zone is anticipated to have more than
enough installed capacity ("ICAP") in the summer of 2 006 to cover this transfer and be in keeping with the
capacity reliabilitylreserve requirements of PJM . However, that position is anticipated to change beginning in
2007, whereby the continued transfer of capacity from AEP's East -to- West zones could then place the AEP-PJM
zone in a capacity deficit position . Therefore, additional studies will need to occur going-forward to assess
whether the continued transfer of capacity beyond 20 06 is merited based on the SIA provisions .
3 .0 Capac ity Resource Plann ing -- Sh or t Term Needs
3.1 Recent RFP Solicitations - Recognizing requisite "new-build" capacity addition lead-times of -1$-34
months (peaking) ; -30-42 months (intermediate) ; -60+ months (baseload) ; the following are summarizations of
recent Request for Proposals (RFPs) that have been solicited to meet the nearer-term incremental capacity and
energy needs of the SPP Companies :
2005 through 2009 Capacity Bid Solicitaions
✓ On December 14, 2004, an RFP was issued on behalf of PSO and SWEPCO for the purchase ofpeaking capacity for the summer of 2005 (PSO and SWEPCO) and 200 6 (PSO only) . As a resultof that bid process, 150 MW of 2005 capacity purchases were awarded . This amount is reflectedwithin this Plan .
✓ On April 15, 2005, an RFP was issued on behalf of PSO (250 MW) and SWEPCO (100 MW) fo rthe purchase of peaking capacity for the years 2006 through 2009 . Responses were received fromthree (3) bidders for the 240 6 requirements only, with ultimate negotiations with two of thos erespondents leading to bids that included 2007 requirements . Currently these bids are beingevaluated including the determination as to whether each would be qualified by SPP to receiv efirm network transmission capability . Therefore, such potential 2006 and 2007 capacity purchas eamounts have not yet been reflected - by specific counterparty - within this IRP, but rather areclassified within the capability category "Unknown Wholesale Purchases" line of the CDR tha twill be discussed later .
(Note that RFPs for additional capacity will likely be solicited to meet remaining 2007summer capacity requirements for the SPP Companies as well as, potentially, anyincrementa12008 and 2009 requirments that may be established subsequent to theidentification of any new-build capacity plans for those years .)
1 7

Renewable Capacity & Energy Bid Solicitaion s
✓ On November 1, 2004, an RFP was issued on behalf of PSO and SWEPCO for the purchase o f
up to 250 MW (nameplate) of renewable energy generation facilties that would be placed int o
service by December 31, 2005 . (Note: Such bid pro posals could include either wind, solar,
hydroelectric, geothermal, biomass, and biomass-based waster products, including landfill gas
generation technologies .) This RFP culminated in a purchase agreement for PSO with a non -
affiliate to purchase a total of 40 MW of wind nameplate capacity and energy from an extensio n
of the Weatherford project .
(Note that an additional 151 MW of nameplate wind energy is being purchased by PSOas a result of on-going bilateral negotiations with another non-affiliate . This IRPincorporates these purchases although the amount of capacity assumed to be applicable tomeet planning reserve requirements is limited to approximately 8% of nameplate, inrecognition of SPP critieria and, fundamentaEly, the intermittent nature of this resource . )
3.2 Transmiss ion L im i tations Impacting S hort-Term Requirements - As discussed, ATC constraints limit
the ability to exercise inter-company capacity transfers between the SPP Campanies . Further, the ability to
schedule firm transmission with SPP due to capacity import limitations further constrains the level and timing by
which a market solution can be utilized within the capacity resource plan. To reiterate a previous point from
Section 3 .1, above, P S 0 and SWEPCO received an initiai response of three (3) offers from only 3 bidders - for
2006 only - for its April, 2005 bid solicitation for 2006 though 2009 capacity . This, in spite of the fact that, as will
be reflected on the following table, the anticipated overall SPP reserve margin as reflected in that region's 2005
EIA-411 report, is anticipated to be as high as 29 .7% -to- 23 .6% over that same timeframe. Further, the responses
to this most recent RFP for 2006 market capacity fe l l well short of the number of bids -- 20 offers (from 10
bidding entities) and 35 offers (from 8 bidders) - that were received from comparable market capacity RFPs made
as recently as late-2003 and 2004, for the years 2004 and 2005, respectively .
SOUTHWEST POWER POOL PROJECTED CAPACITY AN D DEMAND
As Show n in 2005 SPP. EI A-411 , Item 3 .1, Susnmer(in MW unless note d)
NetOperable
Capacit y
2005
2006
2007
2008
2009
2010
2011
2012
2013
2014
53,52553,52553,52553,52553,52553,52553,52553,52553,52553,525
NetInterna lDeman d
40,45141,26241,95342,49943,30644,27144,57444,98845,83546,650
Re s erveCapac ity
13,07412,26311,57211,02610,2199,2548,9518,5377,6906,875
Reser vesAbove Mi n
Requi re m ent
7,5586,6375,8515,2314,3143,2172,8732,4021,440514
Margin(% of Ne tlnfemal
D emand)
32.3%29 . 7%
27.6%
25 . 9%
23,6%
20.9%
20.1%
19.0%
16 . 8%
14 . 7%
Margin(% o f N etOperabl eCapacity )
24.4%22.9%2 1 .6%20.6%19 .1%17.3%1 6 .7%15 .9%14.4%12.8%
1g

4.0 Capacity Resource Planning - Long-Term Need s
4 .1 Resource Planning Assumption & Iss ues
4.1 . 1 Commodity Prices -- Gas & Energy - One of the more critical commodity assumptions in the
development of the IRP for the SPP Companies is the forecast of natural gas prices .
The natural gas prices are a forecast of cash prices (not NYMEX-based futures), based on a fundamental analysis
of the natural gas market . In these long-term projections, it has been assumed that the underlying fundamental
price movements of crude oil cause much of the price volatility in refined petroleum products with the balance of
the refined product pricing then being a function of the product's unique anticipated supply/demand and inventory
condition. Refined products in the form of residual (No . 6) and distillate (No . 2) oil have some direct
substitutability with natural gas both in the short-term and the long-term . Additionatly, the petroleum and natural
gas markets behave in a directionally correlated manner when viewed over longer time periods . The initial
forecasted price is for the Henry Hub geographical location, which is then translated into zonal forecasts . These
zonal forecasts use fuel and variable costs for unconstrained transportation areas, and historical relationships for
constrained areas. Historical shapes are used to determine monthly price factors, with a check to ensure adequate
summer / winter spreads as an incentive to refill gas storage each year .
Market energy prices are strongly influenced by gas-fired generation which is on the margin during peak hours
and seasons and, therefore, is closely coupled (via implied market heat rates) to natural gas prices . In order to
achieve consistent commodity pricing between the gas and electricity, long-term energy prices employed for
resource planning modeling represent the product of forecasted gas prices and the AEP Fundamental Analysis
group's estimate of such implied (marginal) market heat rates .
The following represents the long-term forecast of average annual natural gas prices - including a High and Low
range which was intended to proxy a +/- 2 standard deviation (90% probability range) - and energy prices,
respectively, as established by the AEP Fundamental Analysis group in its February, 2005 forecast, and that were
utilized in the IRP modeling of the SPP Companies .
19

4.1 .2 Transmission Constraints Modeled - As previously suggested when reviewing the SPP Companies
recent attempts to solicit bids for short-term capacity needs, an overall region such as the Southwest Power Pool
may have sufficient capacity to cover its load responsibility with adequare reserve margins and still have
participating entities/companies with specific resource need . Although the region may have capacity to serve its
overall load, it may not be possible to get power from that capacity into certain areas due to transmissio n
limitations . Such areas are defined as being -`transmission constrained" .
Although there are a number of unique contingency situations which may produce transmission constraints, an
area is generally considered to be transmission constrained if the load in the area exceeds the sum of the
generation available in the area plus the transmission import capability into the area . Solutions to such constraints
may be to build additional transmission into the area, reduce the load in the area, or construct some type of
additional generating capacity in the area .
Therefore, significant issues exist within the SPP region in terms of the ability to obtain firm transmission service
for purchase of market capacity . The ability of either PSO or SWEPCO to rely on firm capacity purchases to
achieve nearer-term (pre-2010) reserve requirements has increasingly become a greater concern . As a result, the
capacity resource modeling was constrained to assume that a long-term (vs . short-term) option would be
necessary by 2008 based on :
. AEP capacity purchases and, with that, attendant firm transmission requirements may be limited to a s
little as 200-300 MW in the relative near term summer seasons, an d
. Anticipated lead-time to acquire long-term resources, specifically combustion turbines, suggests 2008 to
be the earliest potential summer season to address a long-term solution for any such capacity deficiencies
that would exceed that 200-300 MW firm transmission threshold .
4 .1 .2 .1 ERCOT - SPP Ties
The interface between AEP-SPP and ERCOT consists of two HVDC ties, the North DC Tie (Oklaunion)
in northern Texas connecting ERCOT to PSO and the East DC Tie (Welch) in northeastern Texas
connecting ERCOT to SWEPCO. Since there are no synchronous connections between the Eastern
Interconnection and ERCOT, the impacts of loop flows within the Eastern Interconnection are isolated
from ERCOT, and vice versa . However, the impact of the real power flows through the 600 MW East
DC Tie can have a dramatic effect upon voltage perforcnance in the AEP-SPP (SWEPCo) Transmission
System .
4 .1 .2 .2 Un ique Design Imp lications
The number of interconnections between the AEP-SPP Companies and neighboring systems, as well as
the topology of the A EP-SPP Transmission System can significantly influence its performance of the
latter. Facility outages, generation dispatch or load changes internal to AEP as well as on neighboring
companies' systems, in combination with power transactions across the interconnected network, can have
a significant effect on the power flows on the AEP-SPP transmission facilities .
Further, the generation in the AEP-SPP zone was planned primarily to meet individual operating
company needs and located near load centers . The full deliverability of ge nerat ion throughout the AEP-
SPP zone was not a key driver in the planning of the generation or the transmission system . Over time,
20

. . this has resulted in a transmission system in the AEP-SPP zone that is constrained when generation is
dispatched in a manner inconsistent with the or i ginal design of utilizing local generat ion to serve local
load .
Therefore, the AEP-SPP import capability would be constrained by the loading of the most limiting
element in the transmission network . In addition, firm import capability is typically calculated on the
basis of one contingency (any one network element out of service) and considers transmissio n
reservations already in place throughout the region . These factors could severely reduce the AEP-SPP
import capability, to the point that studies of individual transactions must be undertaken by SPP and may
result in a finding that firm transmission service for significant import is either severely constrained or not
available .
4 .1 .3 Commodity Prices - Capacity - Based on those SPP EIA-411 projections below, the fundamentals might
initially suggests capacity reserve margins - inclusive of even anticipated merchant (IPP) capacity projects - point
to generation asset "build" levels within the next 5 to 10 years in the AEP-SPP zone . However, as previously
discussed in Section 3 .2, in the AEP-SPP zone, long-term (supply) options may be required to be significantly
accelerated, relative to overall SPP capacity needs, due to locational transmission constraint issues .
SOUTHWEST POWER POOL PROJECTED CA PAC ITY AND DEMAND
As Shown in 2005 SPP E TA-411, Item 3. 1, Summer(i n MW unless noted)
NetOperableCapacit y
2005
2006
2007
2008
2009
2010
2011
2012
2013
2014
53,52533,52553,52553,52553,52553,52553,52553,52553,52553,525
Net
Interna l
Demand
40,45141,26241 , 95342,49943,30644,27144,57444,98845 ,83546,650
Re s erveC ap a c ity
13,074
12,263
11,572
11,0261 0,2 1 99,254
8,951
8, 537
7,690
6,875
ReservesAbove Min
Requirement
7,5586,6375,8515,2314,3143,2172,8732,4021,440514
Reserv e
Margin(% of Net
Internal
Demand)
32 .3%
29.7%
27.6%
25 .9%
23.6%
20.9%
20.1%
I9 .0° o
1b .8%
I4.7°
CapacityMargin(% of NetOperableCapacity)
24 . 4%22.9%21 . 6%20 . 6%19 . 1%17 .3%16 .7%15,9%14 .4%12 . 8%
Based on that capability trending information, as well as known, potentially overriding AEP-SPP regional
transmission constraints, the following table represents the long-term forecast of SPP zonal capacity prices as
established by the AEP Fundamental Analysis group and utilized within the capacity resource modeling for the
SPP Companies .
21

4.1 .4 Capacity "Mix" Cuusiderations - The following charts provide historical and projected (2010) load
shapes for PSO . These curves were then overlayered against the current typical "stack" of currently available
native generation sources . These overlays reflect "shaped" optical supply/deinand relationships for PSO .
Note that, in addition to the ideDtification of potential "peaking" req u irements for both companies going-forward,
the fact that relative higher heat-rate gas (steam) u n its make up such a large portion of the supply stack for bot h
companies would suggests lower-cost "base load" capacity is required for PSO .
Public Service Company of Oklahom aHistorical I Projected Load Duration Curve vs . (Native) Supply Stac k
OCaal . . - - ~ ~ Gas t1 0 Hf2 ~
=Gas1O-11 HR ~G as i1 , 1 2H R5,000 - ~ G as 112 HR ^^20 10 Est Load Resp + Rsv ---
~""200 4 Load ^^2003 L oa dPotent i al 2010 ---•zoaz loaa__ 2001 Loa d. . Peaking " a , snn - -~_ -- - -- - -
Needs(typically, < 5% 4,000 - - ---- --- __ -_ - -- - --.-70%ofhours)
3,000
Currenf ( Fte m a i n i ng ) Lo ad -Fo{l ow ing !2,500 eaking Capacity (as required)
Potential 201 0"Baseload
" 2,000and
"Intermedia te "Need
s 1,500
1 , 000
Current Baseload an d500 (Primary) Load-Fo (lowing Current Baseload
(Intermediate) Capacity Capacity
1 50 1 1001 1501 200 1 2501 3001 35 0 1 4001 4501 5001 6501 6001 6501 700 1 7501 604 11 8501Not e, o Current sup pl y-siack excVud e s (economic) en ergylcapaci ty purchases__ . assumes OAS - 0 .06 FOF
❑ Est 20 1 0 demand curve reftect s 1 3 .6% reserve requirement Hours 22
4 .2 Least-Cost Resource Plann ing Model i ng Options
4.2 .1 Modeling Objective - The objective of the IRP modeling effort was to recommend an optimum mix of
incremental resources, not only from a least-cost perspective but also from the perspectives of risk, achievability,
and affordability .
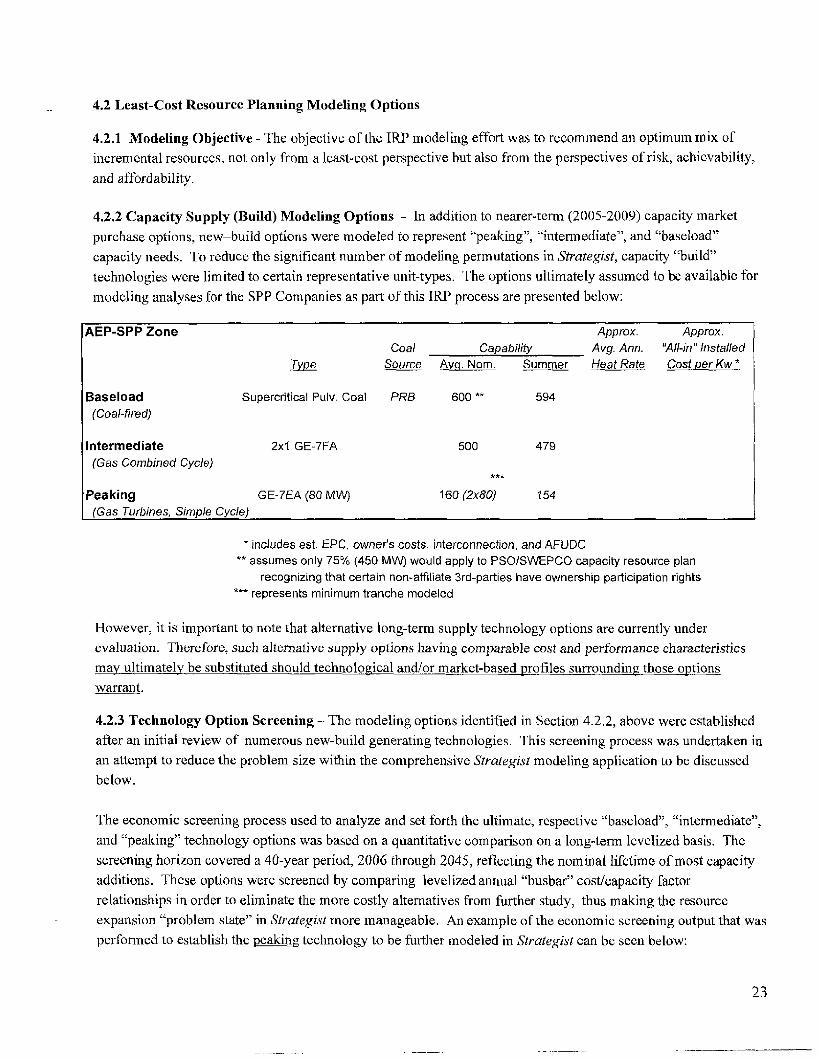
4 .2 .2 Capacity Supply (Build) Modeling Options - In addition to nearer-term (2005-2009) capacity market
purchase options, new-buitd options were modeled to represent "peaking", "intermediate", and "baseload"
capacity needs . To reduce the significant number of modeling permutations in Strategist, capacity "build"
technologies were limited to certain representative unit-types . The options ultimately assumed to be available for
modeling analyses for the SPP Companies as part of this IRP process are presented below :
Approx
Coal Capab ility Avg . Ann .
Approx .
"Al!-in" Installed7vpe Source AVq " Nom . Summer Heat Rate Cost per Kw *
Baseload(Coa!-fired)
Intermediate(Gas Combined Cycle )
Peaking(Gas Turbines,
Supercritical Pul v . Coal PRB
2x1 GE-7FA
GE-7EA (80 NPW)
600 ** 594
500 479
160 (2x80) 4 5 4
~ includes est . EPC , owner's costs , interconnection, and AF UD Cassumes only 75% (450 M1N) would apply to PSOISWEPCO capacity resource plan
recognizing that ce rtain non-affi liate 3rd-pa rt ies have ownership participation right s.*` represents minimum tranche modele d
However, it is important to note that alternative long-term supply technology options are currently under
evaluation. Therefore, such alternative supply options having comparable cost and performance characteristics
may ultimatel,y be substituted should technological andlor market-based profiles surrounding those options
warrant .
4.2 .3 Technology Option Screening - The modeling options identified in Section 4 .2 .2, above were established
after an initial review of numerous new-build generating technologies . This screening process was undertaken in
an attempt to reduce the problem size within the comprehensive Strategist modeling application to be discussed
below .
The economic screening process used to analyze and set forth the ultimate, respective "baseload", "intermediate",
and "peaking" technology options was based on a quantitative comparison on a long-term levelized basis . The
screening horizon covered a 40-year period, 2006 through 2045, reflecting the nominal lifetime of most capacity
additions . These options were screened by comparing ievelized annual "busbar" cost/capacity factor
relationships in order to eliminate the more costly alternatives from further study, thus making the resource
expansion "problem state" in Strategist more manageable . An example of the economic screening output that was
performed to establish the p eaking technology to be further modeled in Strategist can be seen below :
23

Note that each peaking technology assessed is represented by a line that shows the relationship between its total
levelized annual cost per kW and an assumed annual capacity factor . The value at zero capacity factor represents
the fixed costs, including carrying charges and fixed O&M, which would be incurred even if the unit produces no
energy. The slope of the line reflects variable costs, including fuel, emissions, and variable O&M, which increase
in proportion to the energy produced. Specifically, this chart displays the economic screening "best-in-class" by
comparing the cost curves for various ("multiple-unit" combustion turbine and aero-derivative unit) eaki n
options . It reflects the cost relationships for various combustion turbine and aero-derivative (AD) peaking
machines. It suggests that the GE 7EA and 7FA turbines are generally more economical than the various AD
machines up to a capacity factor range of 20 to 30% . Given concerns over generation / emissions permitting
limitations such output levels could create, AD units were not considered for further modeling in Strategist.
Although the cost curves were very comparable, GE 7EA machines were screened ahead of GE 7FA models after
consideration of other factors not included in the screening exercise such as relative "quick-start" capability,
simplicity of design, potential broader availability, etc .
24

While the combination of these preliminary economic and technical screens served as the basis for the subsequent
detailed modeling, it is important to reiterate that the generation technologies utilized within the Strategist long-
term capacity resource modeling were intended to represent reasonable proxies for each technology "type"
(baseload, intermediate, peaking) . Subsequent substitution of specific technologies could occur in any ultimate
build plan based on emerging economic or non-economic factors not yet identifie d
4.2.4 Modeling Approach -- T he Strategist Mode1- The Strategist optimization model served as the
underpinning from which these (AEP-SPP) zonal and operating company-specific capacity requirement
perspectives were examined and, ultimately, recommendations made . As an objective function, Strategist
determines the regulatory "least-cost" resource mix for the system being assessed . The solution is bounded by a
user-defined set of resource technologies and prescribed sets of constraints and assumptions .
Note : Stra tegist also offers the capab i lity to address incremental tran s m ission ("T") options that may be tied toevaluat ion s of certain generating capacity r esources altern atives .
Strategist develops a discrete "macro" (PSO and SWEPCO-specific, as described above) least-cost resource mix
for a system by incorporating a wide variety of planning assumptions including :
• Characteristics (e .g. capital cost, construction period, life) of resource addition alternative s
• Operating parameters (e .g, capacity ratings, heat rates, outage rates, etc) of existing and new units
• Unit disposition (retirement / repowering )
• Delivered fuel prices
• Prices of external market energy and capacity as well as SO2 and NOX emission allowances
• Reliability constraints (in this study, minimum reserve margin targets )
• Emission limits and environmental compliance option s
These assumptions, and others, are considered to develop an integrated plan that best fits the utility . Note that
Strategist does not develop a full regulatory "cost of service" (COS) profile . Rather, it typically considers only
COS that change from plan-to-plan, not fixed "embedded" costs associated with existing asset costs that would
remain constant under any scenario . Likewise, transmission costs are included only to the extent that they are
associated with new generating capacity, or are linked to supply alternatives .
Specifically, Strategist includes and recognizes in its "incremental revenue requirement" output profile :
4 Fixed costs of capacity additions, i .e . carrying charges on new generating capacity additions and associated
transmission (based on a weighted average AEP system cost of capital) and fixed O& M
~ Fixed costs of any capacity purchase s
~ Variable costs associated with the entire fleet of added and existing generating units . This includes fuel,
purchased energy, market replacement cost of emission allowances, and variable O&M costs .
Market revenues from external energy transactions (e .g . off-system sales) are netted against these cost s
under this ratemaking/revenue requirement format .
As suggested, this is a holistic model in that existing units may operate differently under varying capacity addition
scenarios modeled . Therefore, the model ultimately determines and reflects such unique going-forward costs
2 5

from a system (i .e . AEP-SPP) operating perspective . Further, due to the "netting" of external energy transactions
against variable costs, dependina on the market spreads for energy, Strcrtegist outcomes may represent relative
"longer" or "shorter" (market) energy positions that can have bearing on the resulting net system cost .
In the PROVIEW module of Strategist, the least-cost expansion plan is empirically formulated from hundreds of
thousands of possible resource alternative combinations created by the module's chronological "dynamic
programming" algorithm . On an annual basis, each capacity resource alternative combination that satisfies its
least-cost objective function through various user-defined constraints (chief among them being a"minimucn" on-
going capacity reserve margin) is considered to b e a "feasible state" and is saved by the program for consideration
in following years . As the years progress, the previous years' feasible states are used as starting points for the
addition of more resources that can be used to meet the current year's minimum reserve requirement . As the need
for additional capacity on the system increases, the number of possible combinations as well as the number of
feasible states increase approximately exponentially with the number of resource alternatives being considered .
The following diagram offers a very simplisCic example of this a2goi-ithtri . In it, the model has the choice of two
capacity types (CT and CC) and must achieve its reserve requirement constraint through some combination of
three (3) of these units - one per year -- over a three- year period . As is reflected, six unique plans that could
meet such requirements are generated (and retained) by the model even after the elimination of one of the more
expensive paths .
Year I Year 2 Year 3
CT ($5)
CT ($3) CC ($6)CT ($1)
CC ($4) CT ($7)
CC ($8)CT ($5)
CC ( $ 3 )
CC ($6)CT ($9 )
CC ($10)
* Note : Path "CC (Yr, I )" - to -
"CT (Yr . .2)" path eliminated from
further consideration in Yr . 3 as its
cumulative cost ($5) is greater than
a similar plan . . . "CT (Yr . 1)" - to -
"CC (Yr. 2)" Eosring $4.
4.2.51'Vlodeling Contraints - As demonstrated in this example, the potential for creating such a vast number of
alternative combinations and feasible states can become an extremely large computational and data storage
problem, if not constrained in some manner . The Strategist mode l includes a number of input variables
specifically designed to allow the user to further limit or constrain the size of the problem the model is attempting
to solve . One of severa l of these variables focus on limiting the number of a particular resource alternative that
can be considered by the model during the planning period . There were numerous other known physical and
economic issues that needed to be considered and, effectively, "constrained" during the mode l ing of the long-term
capacity needs of the SPP Companies so as to reduce the problem size within the Strategist tool :
✓ SPP capacity purchases available in IOOMW segments, from 2005 through 2009, with a cap of 300 MWbeginning in 2008 .
✓ Peaking capacity was modeled as blocks of four (4), 80MW GE-7EA combustion turbine units . (summerrating of 77 MW x 4 = 308 MW), available beainning in 2010 .
✓ InteYrraedicale capacity was modeled as single natural gas Combined Cycle units, each rated 500 MW .(479 MW summer) available beginning in 2010 .
26

✓ Baselaad capacity was represented by 75% (450 MW) ownership shares of 600 MW Supercritical PC
units, available beginning in 2011, based on the assumption that certain non-affiliates would exercise
some portion of previously-established participation rights tied to the CSW Operating Company
construction of new generation .
✓ PSO-SWEPCO (inter-company) interconnection was set at 0 MW in Strategist for firm capacity, butallowed to approach -200 MW in the final ("Hybrid") plan (in either direction) as discussed later . Energy
transfers of up to 600 MW were al lowe d throughout the planning period to emulate current cond i tions .
✓ PSO and SWEPCO external interconnections were each constrained at 1 ,000 MW for non-firm energysales ; 600 MW for non-firm energy purchases .
f As d iscussed, given the limited East-West inter-company interconnection , Strategist modeled AEP East
(PJM) and West (SPP) zones separately . In addition, the AEP-SPP zone was modeled uniquely for both
PSO and SWEPCO due to the l imited AEP-SPP inter-company interchange capability . Results from theindependent PSO and SWEPCO model evaluations were , however, rolled-up into a final, overall AEP-SPP profile so as to reflect the inter-company energy transfer capabilities - and the attendant energy costbenefits that could be derived from such transfers - into a "final" set of PSO and SWEPCO CPW (total)
revenue requirement / cost profiles .
4.2 .6 Primary Modeling Framework & Drivers - As demonstrated earlier, recoanizing the volatility of gas
pricing, capacity plans were established optimizing around each level (Low, Base/Mid, High) of gas price range
identified .
As part of an initial effort to establish a relative risk profile tied to such gas price volatility, each optimal (build)
plan that was established for a certain level of gas price was locked-in and then "re-priced" in th e
model with the other (High-to-Low) gas prices, A matrix of resulting cost profiles was then established to
determine relative exposure to such propective shifts in natural gas prices . This, as well as additional simulation
analyses to be discussed, offers a validation to the notion that proforma assumptions around gas pricing play a
critical role in the development of the capacity resource plan for the SPP Companies .
5.0 Revievv of Modeling Result s
5.1 Results Based on Gas Price Scenarios - The following matrix for PSO facilitates a view of an "optimal" -
or least cost - capacity build plan as measured by that planning profiles' unique "Total Cumulative Present Worth
(CPW)" . These least-cost determinations made by Strategist over the modeling study period were based on an
"array" of natura! gas prices described earlier . This afforded a means to then compare the relative impacts that
natural gas pricing had on such build plans .
• Representing row results : the respective optimal generation build plans created under the assumption
that either the "Low ", "Mrd-Law "(aritlanaetic average offorecasted "Low " and "Base " gaspricing),"Base (Mid) ", "Mid-High ", or "High " gas prices would exist .
• Representing columnar results : the costs of these optimal baeild plans effectively "re priced " under the
notion that ultimate gas prices would deviate frorra that original plan/build view,
27

PS ONew Capacity Additions70-Year Full Period Low M id Low Base MidHigh High
(2 0 05-20 1 4) (2005-2020) Gas Gas Gas Gas Gas# MW # MW
L4w Gas Optimal Pla nCT 4 308 8 6 46 Total CPW-$B 8.19 10.40 11 21 1296CC 2 739 2 739 Levelized $Rb1Wh 43.26 53.18 56.78 64. 6 7PC 4 0 0 0 Var, NetCPW-$B 663 8.87 5. 68 1138
Levelrzed$ii41Y M 23.72 39J6 4342 51 02Total 1 ,047 1,355
CT 4 308CC i 260PC 1 446
Total 1 , 014
4 308 Tot al CPW-$B .- 9.261 260 2, evelized VA4Wh 48. 052 894 Var, Net CPW-$B 6 .8 3
[ evelixed $/MWh 30 . 631 , 458
101 0$1 . 83 •
7 . 6734. 4 1
brld Plancr 4 sQa 4 308 rotarePw-ge B44 ~:~ i2k~~ ,t~t~ •'~~,f~CC 1 '2e0 T 200 'Levelized~titkV~ 4 4I~388 , 5y, 8 7 ~€9 ~PC 1 446 2 890 Var, N et C P W40 , . '' lf;d$ 4 4°
At : ;T ota l 1 .a1 4 1 ;458
Base Gas Optimal PlanCT 4 308 4 308 Total CPW-$B 8 .46 1 .08 10 .73 41 .9 4CC 1 28 0 1 260 Lgvelized .YJM1Nb 44.46 5 1_75 54.67 60 . 08e; ; ~ ;`~~•.,2tPC 1 446 2 890 Var, Net CPW-$B 6 .00 7 .66 B .32 9 .4 7
LBVellzed VMWh 26.9 1 34.33 37.30 42 . 46Total 1 ,014 1 ,458
Mid-High Gas Optimal Plan CT 4 308 4 308 Totat CPW-$B 8 .46 10 68 10 73 11 .9 4
CC 1 260 1 2 60 Lgvelized$/MWh 44. 46 • 5175 54 .67 60. 08PC 1 446 2 890 Var , Net CPW-$B 6 . 7 .66 8 .32 947
2.evellzed$/l 4 Wh 26. 9 1 34.33 37 .30 42 .46Total 1 ,014 1 ,45 8
High Gas Optimal PlanCT 0 Q 0 0 TotafCPW-$B 853 1 0 . 20 1689 ii .8 8CC 2 739 2 739 Levelized$/R?Wh 44 . 76 52.29 55.35 59 . 80PC 1 446 2 890 Var, Net CPW-$9 5 .95 7 .6 6 8 .36 9. 24
Levellzatl $tjylWh 27. ?3 34 .37 37.48 41 . 6 6Total 1 ,185 1 ,629
E2cl a ti Nc f »>1):tc 1 on !:5" I ,~ Rl . ltiilf-f ) Iiuild 41I ' i a n s I r i scd on :i r:in oc of Gas P a• i ces
- LAA
Note : "Tota] CPW" represents cumulative present worth (CPW) over the full economic study period (2005-2030) of allgeneration "G"-related fixed costs (FOM & carrying charges) including incremental new build and enviranmentai retrofitcapital investment as well as market purchase of capacity PLUS : total (system) va riable "G" costs (fuel, VOM, replacement
emissions costs) NET OF; <revenues>lcosts associated with non-affiliated off-system sale/purchase projections from the
inherent energy profiling al so performed in Strategist .
"Var(iable ) CPW " repre sents cumulative pre sent wo rth over the s tudy period (1 2005-2030) of the tota l variable co sts, n e t asdescrib ed above ,
5.2 Build Plans - Analysis Discussion Points=> The optimal or least-cost build plan for PSO under each gas price scenario is that matrix cell highlighted in
yellow on the previous tables that aligns with that pricing assumption . For example, under the PSO "La w
•.- Gas (pricing) Scenario", the lowest cost plan is that listed as "Low Gas Optimal Plan", with a CPW total cost
of $8.19 billion over the full 26-year study period .
28

=> Looking across the gas scenarios for the PSO matrix results - the optimal plan costs of the A EP-SPP zone are
yM responsive to gas prices . This is largely a function of the large amount of existing gas-fired capacity .
• For example, looking across the row of the "Base Gas Optimal (Build) Plan" for PSO, study periodcosts range from $8 .46 billion under the Low gas scenario to $11 .94 b ill ion under the High gasscenar io (nearly 41 % cost spread), almost all of which represents attendant fuel cost differences .
~ However, the "Low Gas Optimal Plan" results suggest even wider-ranging costs across ultimatescenarios with, again for PSO, those figures ranging from $8 .19 billion -to- S12.96 billion over thestudy period (approaching a 58% spread)
~ This responsiveness to gas prices causes the "High Gas Optimal Plan" to be quite different for PSO,consisting of 890 MW of coal-fired capacity over the fu21 planning period ( 2 x 445 MIN'-summerunits) with 479 MW of combined cycle capacity (excluding the proposed Lawton PPA) .Contrastingly, the "Low Gas Optimal Plan" is an "all-gas" build plan with no solid-fuel units selectedby the model .
Note that for PSO, the same build profile/mix was established for the "Mid-High" and "Base Gas" optimal
plans . In an attempt to determine the approximate "trigger point" by which the model would optimally begi n
to select more gas generation versus coal, a "Mid-Low Optimal (Build) Plan" was introduced . As reflected o n
the PSO matrix, coal-fired generation continued to be selected by the model at that lowered gas pricing poin t
in nearly like amounts over the planning period . Thus, for the AEP-SPP zone, this (Mid-Low) gas price i s
still above that gas (and correlating energy) pricing point at which coal-fired capacity becomes the more
economical incremental buila chotce .=>
~ Lawton Cogeneration facility : Development of a proposed PURPA combined cycle facility at Lawton,
Oklahoma would result in PSO receiving firm capacity (260MW-summer rating) via a purchase power
agreement (PPA). A June, 2005, ruling by the Oklahoma Supreme Court remanded the PPA back to the OC C
on various issues including the issue of the appropriateness of the Avoided Energy Cost used in the PPA .
In conclusion, these results recognize :
1 . the significant build alternative sensitivity and resulting cost exposure in the AEP-SPP Zone that correlates
directly with gas prices;
2 . the fact that the modeled solid-fuel optimal build plan outcomes are essentially the same between the"High" (-+2 std .dev.) and even the "Mid-Low" (-- -1 std .dev .) LT gas pricing scenarios ;
3 . the fact that there is potential for limited planning reserve sharing between the companies ;
4 . Firm Transmission Limitations -- as discussed previously, the fact that significant issues exist within the
SPP region in terms of the ability to obtain firm network transmission service for purchases of market
capacity, leading to a determination that a long-term (vs . short-tern market) solution would be necessary
by 2008
5. Distressed Generatro.o - it is recognized that should opportunities arise in the near future for the
acquisition of any available (and technically/locationally-viable) "distressed" merchant generation assets,
such opportunities should be actively explored, particularly if the break-even cost of such acquisition (vis-
29

a-vis the cost any subsequent of greenfield construction as outlined in this Plan) is greater than the
potential purchase price .
The results and conclusions were compiled into an SPP Company view and a "Hybrid" Plan was set farth as the
optimal plan for purposes of further risk analysis as well as assessment of corporate financial and (state /
jurisdictional) regulatory recovery impacts . For PSO, this plan recommends the addition of: 1,198 MW (summer)
of total generating capacity consisting of 308 MW (4) CT units, 0 MW CC unit, and 890 MW (2) Pulverized
Coal units over theefull 2005-2020 planning period .
When viewed from the perspective of the nearer-term 10- ear fnancial l annin eriod, the PSO Plan
recommends 754 MW (summer) of long-term generating capacity* consisting of :
~
it
* ~ouri ~s ' ab~~i~'~assumed 2¢V
. WI~ .p£~u~urier Oap dbi tity
cogenetai~`~~~
The following chart provides a graphical profile of the annual progression of capacity mix as reflected
in the Hybrid Plan for PSO .
6,000
5,000
& 4 ,000
a,aU
3,Oa0
2,00 0
1 .000
2004 2005 2006 2007 20 08 2009 2 010 2011 2012 2013 20 1 4
PSO Generation Supply

5.3 Risk Assessment -- To quantify and understand the potential risks inherent in the selected capacity build 1
expansion plans, AEP chose to include additional risk analyses as part of the process over-and-above the discrete
gas price scenario modeling performed in Strategist and described earlier . The inclusion of risk in the evaluation
process provides a fuller understanding of the impacts of each proposed capacity resource plan . AEP engaged
Black & Veatch (B&V) to assist in this risk evaluation and to provide more rigorous risk profiling for the
expansion plans under consideration .
In summary, this risk analysis involved more robust simulation profiling . The simulation approach used by B&V
was built off of the output of selected optimal (build) scenarios from Strategist to evaluate the impacts from
changes in modeling variables determined to be "key risk factors" . The key risk factors evaluated and the
magnitude (distributions) of their variability in the simulations performed by B&V are as follows :
• Natural Gas (NG) Prices . . . with ranges generally averaging +/- -$2/MMBtu over the gperiod
• SO2 Allowance Prices . . . with ranges of +40%,- -20% by the end of the planning period as established
by B& V
• NOx A1lowancE Prices . . . with ranges of } 40%; -20% by the end of the planning period as established
by B& Y
• Capital Cost of New Generation . . . capital cost ranges established by B& V and used in simulatio n
profiles as follows :
neration Type LOW HIG H
Supercritical P CCombined Cycle (GE 2x1 7FA)Simple Cycle Combustion Turbine (GE 7
-15%-10%-1 0 %
+20%
+20%+15%
The simulation results were based on a B&V-developed Monte Carlo simulator program and was predicated upon
5,000 trials . For each trial, the simulator : 3 ) selects a value for each factor identified above from a probability
distribution assigned to it by a risk add-in program ; then 2) re-calculates the plan profile CPW based on the
relative change in the variables . Repeating the process for the desired number of trials, a probability distribution
is established at the completion of the process .
5 .3.1 Risk Profile Results - The following chart displays the comparable results of B&V's simulation analysis
for the AEP-SPP zone by offering the following probability distribution of CPW cost profiles for the build plans
tested :
3 1
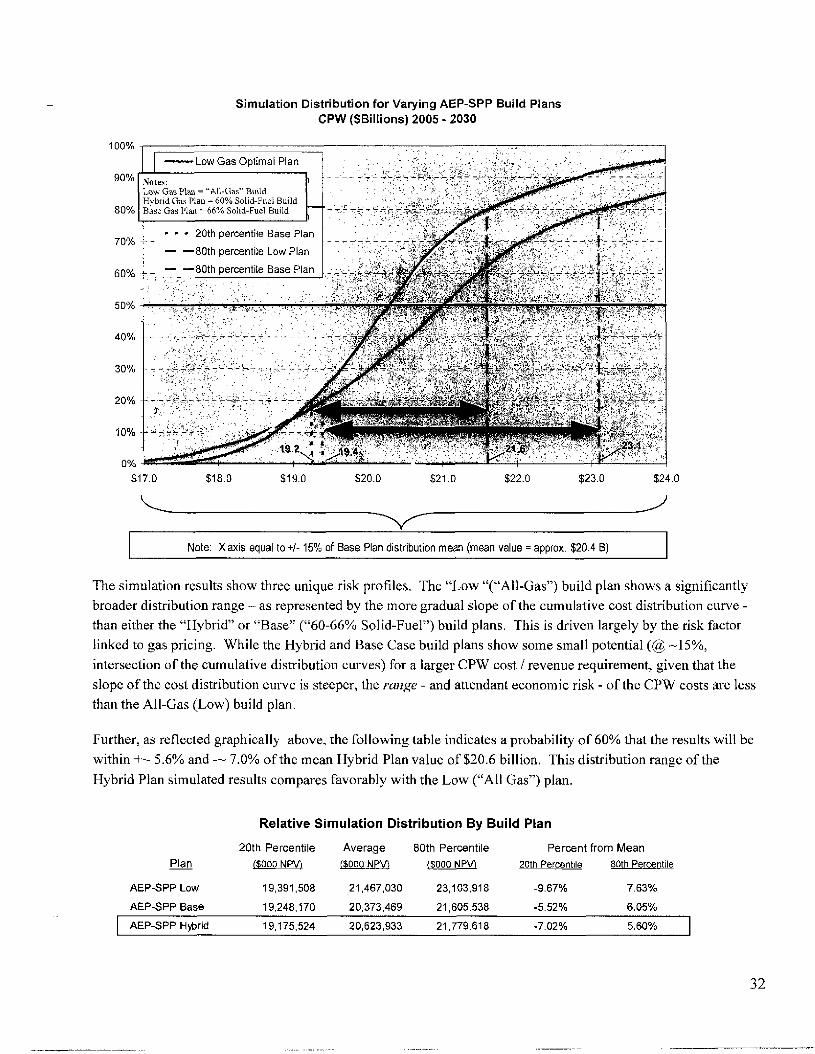
Simulation Distribution for Vary i ng A5P-SPP Build P lansCPW ($Billions) 2005 - 203 0
100%
9 0%
80%
70%
60%
50%
40%
30%
20%
10%
Note : Xaxis equal to+l- 15% of Base P lan distribution mean (mean value = approx . $20. 4 B)
The simulation results show three unique risk profiles . The "Low "("Ail-Gas") build plan shows a significantly
broader distribution range -- as represented by the more gradual slope of the cumulative cost distribution curve -
than either the "Hybrid" or "Base" ("60-66% Solid-Fuel") build plans . This is driven largely by the risk factor
linked to gas pricing . While the Hybrid and Base Case build plans show some small potential (@ -15% ,
intersection of the cumulative distribution curves) for a larger CPW cost / revenue requirement, given that the
slope of the cost distribution curve is steeper, the range - and attendant economic risk - of the CPW costs are less
than the All-Gas (Low) build plan .
Further, as reflected graphically above, the following table indicates a probability of 60% that the results will be
within +- 5 .6% and ---• 7 .0% of the mean Hybrid Plan value of $20 .6 billion . This distribution range of the
Hybrid Plan simulated results compares favorably with the Low ("All Gas") plan .
Relative Simulation Distribution By Build Plan
20 th Percentile Average 80th Percentile Percent from Mean
Plan I$OD0 NP)~ l $ 000 NPVI ($000 NPV) 20th Percentile 80th Percenti l e
AEP-SPP Low 19 , 391 ,508 21,467 ,030 23,103,91 8 -9 . 67% 7 .63%
A EP-SPP Base 19 , 248 ,170 2 0, 373 ,469 21,605 ,538 -5 .52% 6 . 05%
AEP-SPP Hybrid 19 , 175 ,524 2 0, 623 ,933 21,779 ,618 -7 .02% 5 . 60%
3 2
0%
$17 .0 $18.0 $19.0 $20 .0 $21 .0 $22 .0 $23 .0 $24 .0

This further serves to validate the conclusion drawn from the discrete Strategist profiling for AEP-SPP discussed
previously . In general, it would suggest that there is a tradeoff between the higher installed
(fixed) cost of coal-fired capacity and its mitigating effect an higher natural gas (variable) costs .
Finally, the tornado diagram that follows highlights the unique impacts of each variable on simulated CPW for the
AEP-SPP zone. It demonstrates the significant impact of natural gas prices, when comparing it to the relative
impacts on total CPW for the other risk variables analyzed .
.A 1a. P -S P11 Com pa nies13AS 1±." (Gas Price) B ui l d
PC +20%d-15 %Low Ca se
+20 %d-9 5 % Ba se
S02 Sa s e
■ S02-Low Case
GT s +15'
1
CC +20 %a
■
17.0 1 8 . 0
+ 1 S°/d-1 0% LOw Cas e
o/8as e
CC + 2 00/4-10%Low Cas e
19.0 20.0 21 0 22.0 23.0 24 0
NPV Utility Cost (2005 -2030) vs . Base Ca se ,
Note : X axis equal to+l-15% of Base Plan dist ri bution mean (mean value = approx . $20. 4 B)
In summary, these risk assessments indicate that such (gas price) risk tolerance is not suited to the pursuit of an
all-gas plan . (Recall also that these cost profiles do not reflect other cost factors that lie outside of traditional
cost-of-service such as local, socio-economic factors, political factors, etc .) Risk tolerance of the Plan to gas
price volatility would indicate preference to a generation capacity build plan that incorporates ample solid-fuel
generating sources goin~; forward .
33
The following statement was excerpted from B&V's engagement report :
"The risk tolerance of the region i ndicates an expansion plan that is not all natural gas is preferable. In
addition, the risk profile for the expansion plans with coal technology shows a preferred expected
revenue requirement CPW as well as greater certainty around the expected value when compared to the
no coal technology expansion plan . "
The report goes on to conclude and recommend the following :
"Current natural gas price forecasts suggest a mixture of coal and natural gas technologies . As natural
gas forecasts are influenced by current events, we recommend that the evaluation of expansion plans be
continued and updated on a semi-annual basis . The fi°equency of updates may be adjusted to annual onc e
the process is firmly established and key variable thresholds are defined. This will allow the
incorporation of the latest information into the planning process . As uncertainty around various
parameters is reduced, the change in risk can clearly be communicated.
Current results in the west show large uncertainty with the all gas plan . This level of uncertainty is
believed to be above the risk tolerance level for the region . In addition, the all gas plan has a less
desirable expected revenue requirement CPW . "
6.0 Conclusions
Several conclusions can be drawn from this capacity resource planning / IRP process for the PSO :
✓ PSO has reasonably determined its needs for additional capacity resources over the ten-year IRF period ;
✓ PSO has identified a reasonable approach for the further examination and inclusion, where warrante d
based on its economic cost-effectiveness, of additional DSM measures and programs ;
✓ PSO will continually assess the economic viability of its older-vintaged, higher-cost units in its generating
fleet ;
✓ PSO has undertaken efforts to address short-term capacity resource requirements by way of market bid
solicitation ;
✓ concurrently, PSO recognizes and will actively engage the SPP RTO to address the transmissio n
constraint issues impacting the ability to import capacity ;
✓ given this constraint, however, PSO has undertaken steps to establish a least-cost long-term capacity
resource planning process, including detailed analysis of key input parameters and, considering the
significant capital investment at stake, robust modeling of relevant risk ;
34

✓ based on those results PSO has set forth a reasonable IRP so as to ensure the reliable supply of generating
capacity for years to come at a cost that will both be economically/competitively-driven and will be less
subject to market volatilities ; and
✓ PSO will seek to implement this Plan utilizing any prescribed processes established for that purpose .
7.0 PSO - Action Plan
The PSO Action Plan summarized below provides an action item for decisions that need to be made within the
next 2 - 4 years . This decision window provides the necessary lead-time to implement necessarily long-lead time
resource solutions . Resource decisions outside this time frame will be re-evaluated in subsequent IRPs .
This Action Plan will ensure PSO will continue to meet its obligation serve in a low cost, reliable manner,
appropriately adapting to the changing industry environment .
Action Resource Type Timing Size ActionIte m
I Peaking Capacity Beginning Summer 320 MW Competitive soli c itat i on for peaking capacity and
2008 energy for an in service date of June 1, 2008 . File forused and useful determination under HB1910 .
2 B as eload Capacity Beginning Summer Up to 6 00 MW Com p etiti ve solicitati on for baseload capaci ty an d2011 energy for an in serv ice date of June 1, 2011 . File fo r
used and useful determination under HB1910 .
3 Transmission Summer 2007 n/a Complete Tulsa Area 345/138kV upgrad e
4 Existing Steam Generation 2 0 0 5 IRP (Fall n/a Continue iteration of disposition evaluations o f
Update) existing steam units including Southwestern I and 2as well as Tulsa 3 .
5 DSM 2005 I RP (Fall n/a Continue assessment of v iable, cost-effectiveUpdate) measures
6 Intermediate 2009 300 MW Develop contingency supply options for the Lawto nCogen plant for the event the COD is eithe raccelerated or deferred from the assumed 2009 .
7 Market Capaci ty Purchases 2006 -2008 Bid solicitations as requi red
35

SECTION B - CAPABILITY, DEMAND AND RESERVE S
OVERVIEW
The 2005 Capacity, Demand and Reserves (CDR) profile is a ten-year summary of the IRP for the PSO . All
figures included in the CDR are expressed in megawatts and is comprised of three major sections :
1 . A Capability section containing PSO's installed capacity less unavailable or derated capacity, less off-
system capacity sales without reserves plus all purchases of capacity without reserves .
2. A Demand section containing PSO's forecast of on-system peak demand plus off-system sales with
reserves less any purchases with reserves . Demand-side management (DSM) peak capacity impacts and
SPP Operating Company peak diversity are included as appropriate .
3 . A Reserves section details the amount that Capability exceeds Demand and the amount these reserve s
exceed the minimum required by the Southwest Power Pool (SPP) .
Notes to the CD R
Demand
o Based on the 2005 Revised Load Forecast, completed in January, 2005 .
o PSO interruptible load is Elkem Metals .
Ca aci
o No unit retirements .
o Tulsa 3 restarts in 2006 at 68MW .o The 250MW capacity transfer from the AEP-East Zone to the AEP-West Zone (per SIA)
extends through 2006.
o Initial unit ratings are per 12/2003 internal assessment . Northeastern Unit 1 rating per
8/26/03 letter from W. L. Sigmon to the AEP Generation Pool & System IntegrationAgreement Committees .
o Derating for Environmental Compliance modeling :
Oklaunion, 0 .4% in 2012 for FGD upgrade
o Capacity additions based on results of 2 005 Q1 (Spring'QS IRP) Strategist modeling (updated) .
o Lawton cogeneration PPA assumed in-sevice for summer 2009 .
o Due to build lead-time constraints, first CT capacity available in 20 0$; first salid-fuei units in2011 .
o 95MW purchase from Tenaska for 2005 Summer .
T ransactions
o Annual wholesale purchases and purchase from East are allocated on ratio of total purchasesneeded by each operating company ,
o Capacity purchases from the market through 2 00$.
36

PUBLlC SERVIC E OF OKLAHOMA rueuc
CAPABILITY , DEMAN D AND RE 5ERVES FORECAST COSERVICE
MPANY OF04 ACTUAL - 2014
OKLAHOMA
BASE (SPR I NG 200 5 IRP) PLANcapaBUIr r
N et P lant Capability it t 2 } 4 ,097 4 ,097 4, 765 4 ,165 4, 4 73 4,739 4 ,7 17 5,179 5 ,1 79 6,179 5,1 7 9
Off-System $ al~s Without Reserves
TRANSFHR TOSVJEPCO 49 97
TRANSFER TO TNC 5 5 5 8 6
TOTAL 0 d 0 0 0 49 5 5 5 6 i0 3
I ases Without Rese rv e s
AEP EA57 T O VJEST CAPACITY TRANSFER
TENASKA
RFP WI ND~_._ _ . .
TRAN SFE R F ROM SWEPC O
1NF.ATH ERFORD W IN D
OG DEN MARTIN C O GEN 20EN7E RGY KOCH 107
i1NKNOWN WHOLESALE PURCHASE
20 I 20
111101111 70T A L 12 7 319 340 40 5 17 1 46 ' 71 71 71 71 71
7otalCa pa6 i lit y { 3 - 4+51 4 ,2 24 4, 416 4 ,505 4 ,5 70 4, 644J
4 ,75 0 4,744 5 ,245 5, 245 5 ,244 ! 5, 147
DEMAND 0 , 005 2006 007 2008 009 010 2011 2012 2013 2014
A Peak D e mand Before Passive DS M 1 ,7 7 3 4,014 4, 093 4,761 4, 216 4 ,295 4,354 1,420 4 ,478 4,556 6 ,627
B Pass ive US M
NEW aSM PR OGRAMS
TO7AL 0 0 0 0 0 0 0 1 0 0 0 0
C P eaM D e mand { A , B) 3,773 4,014 4 ,091 4, 1 51 4 ,2 16 4,293 4 ,354 4, 420 4 ,478 4, 555 4,G2 7
VA LUECFfO ICE 32 32 32 32 32 32 32 32 32 32
INTERRUPTIBLE 18 18 1B 18 i 6 is IB i6 16 16
TOTAL 0 48 68 AB 46 48 48 48 45 48 OB
E Firm Dem antl ( C- D) 3,973 3,966 4 ,0 0.5 4,103 4 , 1 6E 4 .245 4,306 4,372 4.430 4 ,508 4,57 9
Native Loatl Respon sibi lity ( E . F ) 1 ,76 0 3 ,9 26 4,005 4 ,06 2 4,127 6,20 2 1 6, 262 4 ,32 8 4,385 4,462 4, 5 99
IIIIWIIII 70TAL 2 1 9 40 4 0 4 0 40 40 46 40 40 C O M
~1 Load Responsibility (7+ 8 - 9~ 5,5d1 3.886 3,965 4 ,022 4 ,067 4,1 62 4 ,2 22 4,289 4 ,345 4, 422 4 ,49 3
RESERVES 0 A C T 005 2006 007 21008 009 010 2011 2012 2013 2014
Raserve Capacity 111 683 530 640 648 667 568 677 9S7 90 6 82Y 65 4
X R rserve Ma rgin (( 1 V10 )• 70 0 ) 1 9 .3 t3.6 1 13 .6 17 .6 5 3 .6 ' t9 .6 ; 13.7 22.3 20.7 1 8 b
Se Ga pac q y Ma rgin ( t 71~ 8 J' 70G ~ 5 6 .2 52.0 1 2.0 1 1 2 .0 1 2.0 1 2 .0 12.0 18 .2 17.2 1 5 .7 1 2.9
Rese rvss Above M14fnimum 12% Capacity Margin 200 0 6 0 0 0 k 372 308 219 42
337
Adj us tmeM S to Pl a nt Capability
NEWCTS 308 300 306 309 308 308 306
TU LSA N 3 UNAVAILA9LE -BO -e a -12 -72 -12 -12 -12 -12 -12 -9 2 -12
NEW COAL 446 445 496 446
COMBINED CYCLE 260 250 290 280 . 26 0 29 0
Purchaaes With Reserve s
P50 - SWPA E NT ITLEMENT 40 40 40 i 40 ..~~ 4 6 .~~. 40..._... .. 4 0 1 40 40 4 0 40
AEP E AS T TO WEST CAPACITY TRANSFER i 79

SECTION C - ENERGY SUPPLY PLAN
OVERVIEW
The 2005 AEP-SPP Energy Supply Plan (ESP) is a ten-year production forecast performed in conjunction with
the IRP for the SPP Companies . The ESP was generated using the PROMOD IV Analytical Probabilistic
Dispatch (APD) module, a detailed production costing model produced by New Energy Associates . While
generation and fuel consumption projections in the ESP are subject to uncertainties such as fuel price, load
forecasts, and operational constraints, they were created using the most recent available data and assumptions .
The ESP was developed using a multi-area model representing the AEP-SPP System . Assumptions and
information sources represented in the ESP are listed below :
Fuel and Market Price s
• The natural gas, emission allowance, and power market price forecasts are provided by the AEP
Fundamental Analysis group .
• Solid fuel price forecasts are provided by the AEP Fuel, Emission and Logistics group, and are consistent
with contractual agreements and market forecasts .
Operational C haracteristics
• The generating unit capacities and equivalent unplanned unavailability rates are provided by the AEP
Generation Business Services group .
• Short-term planned maintenance outages and long-term outage cycles provided by the Asset and Outage
Planning Department .
Transactions
• Firm off-system transactions for each operating company are modeled to represent contractual
requirements .
+ The off-system economy forecast is based on the economic dispatch of AEP unit generation against a
forecast of market prices .
Load Forecast
• The peak and energy forecasts used in the ESP are consistent with the forecasts used to develop the 2005-
2014 CDR .
38

~ PuBLfCSERVICE 24D05 2006 2007 2008 2009 2010 2011 2012 2013 2014
COMR4HY OF Jul-DecOKLA NONL4
~ •
System LoadNet System Load ( Ind Losses) 10,005 19 ,1 0 0 19, 368 19 ,707 20, 01 8 20,302 20,602 20,911 21 ,228 21 ,556Off- System & Eco nomy S ales 2 07 1 , 11 8 806 1,04 1 1 ,627 2,097 2 ,7 25 3 ,038 2649 2,66 1Off-System & Ew nomy Purchas e s -3,461 -6,521 -6 ,540 -6,497 -5 , 775 .5,352 - 4 ,7 43 -4 ,023 - 4 ,2 86 -4, 435
GenerationRaquired 6,752 1 3 ,696 1 3,633 14 ,651 15.871 1 7,047 1 8, 585 19,926 19 ,5 92 1 9, 782
Natural Gas Total 2 ,976 6, 00 5 6 , 317 7, 236 8 , 0 55 9, 494 9,064 8 ,743 8 ,845 9, 037
Coal7ota7 3,776 7,691 7,316 7,4 16 7,785 7 ,553 9,521 1 1,1 e3 1 0,7 47 1 D ,744
GENFRATlONTOTAL 6.752 13 ,6 96 1 3,633 14 ,651 15,571 1 7 ,047 18,585 19 ,926 19,592 19,782
•'
C0M POSITECAPAClTYFAGTOR 3 7 .1% 37% 37 0% 367% 37.3 % 400% 39.9% 427% 42.1% 42 .5 %
- 111
MHIBTUX1000TOTAL 69, 270 1 40 ,952 1 37,fi93 145,953 15 4 ,394 163,911 179,025 7 91 ,5 1 1 167, 936 189 ,67 9
E 00070TAL 240,716 489, 027 4 75,9 1 5 495,612 53 9, 393 620 , 891 635, 108 647,260 689, 732 716,577
•
TatalSalesGWH 207 1 , 1 1 8 806 1,041 1, 627 2 ,0 9 7 2, 7 25 3 ,03 8 2,649 2 ,66 1
Total Sales $000 8,124 57 , 207 3 8 ,1 80 49 , 1 77 82 ,994 1 11 .511 1 41 ,517 953, 824 1 41 ,593 143 ,97 5
•
Total Purchased GWH 3, 461 6, 521 6, 54 0 6 , 0 97 5,775 5 ,352 4,743 4 ,02 3 4,286 4 ,43 5
TatafPurchase$ 000 1 39 ,628 246 ,1 75 2 41, 576 2 1 8 , 030 206 ,1 46 195 ,1 24 169,601 1 41 ,8 0 7 1 54, 2 69 163,62 0
• •
Em ission Fees & FuelAux. Co5is 12,832 20,4 58 19 ,8 7 2 22,009 • 29 ,091 37, 258 43, 245 48,6 8 0 51,023 55 ,92 5
~ ~~ •
NefAdfnl. Exp . &Revenue 1 2 ,2 03 2 5, 878 29 ,323 28,155 52 ,935 80 ,354 92,044 102,206 1 02,571 10 3 ,76 8
'~~ ~ • '. 11 1
TolalFuelErpenses 240 ,7 16 48 9, 027 475 ,915 495 ,61 2 539 ,393 62 0, 891 635, 1 08 64 7,260 689, 732 71 6,57 7
Emission Fees & Fuel Aux. Costs 12 ,8 32 20 ,458 19 ,872 22 ,009 29 ,091 37 ,258 43 ,245 48,680 51, 023 55,92 5
NelAdtnl. Frcp . 8. Rev. 1 2,2 03 2 5, 678 29 ,323 28,155 52 ,935 80,354 92 ,044 1 0 2.206 102,571 1 0 3,768
Off-System Sales Revenue -8 ,124 -57 ,20 7 -38 , 180 - 49 ,1 77 -82,994 -11 1, 511 -141 .517 -1 53,824 - 1 41 ,593 -143,975
O!f-SystemPurthaseExperese 1 3 9,628 246 ,1 75 24 1, 576 218,030 20 6, 146 195, 124 169, 601 1 41 ,801 154,269 1 63,62 DNetProBuefronCosl 397, 2E6 724 ,332 728, 506 7 1 4,629 744 ,565 822 , 11 7 798 ,481 786 ,123 85 6,0 03 895,916
39

(this page intentionally left blank)
40

PSO Spring 2005 IRP
Addendum
Subsequent to the development of the PS O Integrated Resource Plan in the Spring of 2005, certain planning
elements and factors previously described have evolved . While it is critical to emphasize that the ultimate PS OIRP has not changed from that which has been identifaed in the preceding portion of this document, any
reasonable planning process will continue to assess key variables that impact that process up to the point of plan
implementation .
In that regard, following are several factars-discussed in the process outline order (and numbering) reflected in
the priorpages-that have undergone such evalartion over the balance of2005 and into the year 2006. Each
factor is being addressed by exception, which is intended to emphasize that the information in this Addendum is
only intended to append, not replace, the formal PSO capacity resource planning set forlh in the preceding
Spring 2005 IRP documentation .
As will be ultimately discussed, such planning factor updates that have occurred in the period leading up to
PSD's implementation of its nearer-term capacity resource plan will serve to confirm and validate that
comrnitment,
SECTION A - NARRATIVE (ADDENDUM)
1 .0-A IRP Process Overview
1 .1-A Introduction - It is now anticipated that, by 2007, SWEPCO will be obligated to serve a relatively small
number of retail customers (-30 MW of demand, or well less than 1% of SWEPCO's peak demand) residing in
the SPP region of north Texas that have been the obligation of AEP affiliate, Texas North Company {TNC) .
1 .3-A Fundamental Steps and Planning Consideration s
Environmental Regulations:
On June 15, 2005, the USEPA finalized amendments to the July 1999 regional haze ru le. These amendments
apply to the provisions of that rule-known as the Clean Air Visibi l ity Rule (CAVR)-that require emission
controls known as best available retrofit technology, or BART, for industrial faci lities emitting air pollutants that
reduce visibility by causing or contributing to regional haze . The pol lutants that reduce visibility include fine
particulate matter {e .g . PM2.5), and compounds which contribute to PM2 .5 formation, such as NO,,, SO2 and,
under certain conditions, volatile organic compounds and ammonia . The requirements of CAVR are largely
location-driven and must be considered in addition to the regional and state-specific pollutant remediation
requirement impacts of CAIR and CAMR as previously discussed . Based on subsequent assessments, the
possibility now exists that PSO's Northeastern 3 and 4 coal-fired units could be required to install flue gas
desulfurization (FGD or "scrubbers") by the latter part (-2014) of this planning period .
41

2.0-A Demonstration of Nee d
2.1-A Load and Demand Forecast - Updates to the January 2005 load and demand forecasts utilized in the
determination of PSO's capacity resource plan have been performed .
With that, as identified in the following table, updates to various projected annual national economic indicators
used in the long-term econometric models previously described in Section 2 .1 have been modified from those
originally employed in the determination of the load and demand forecast update performed by AEP Economic
Forecasting in January, 2005 . However, the underlying long-term expected rate of growth of these indicator s
remains generally co n sistent .cp i G oP PPI
Consumer P ric eIndex (Urban Gross Domestic
Producer Pr iceIndex (AllYear Consumer - AI 1 Product(Bi1 .
2040 CommoditlES ,Items, Index 1982- $) Index = 1 982)
84=100 )
Actua l 1970 39 3,772 371980 82 5,162 901990 131 7 ,113 1162000 172 9,817 133200 1 177 9,891 1342002 iBa 1 0,049 1312003 184 10 ,321 13 8200 4 189 10,756 147
Forecast 2005 195 11 ,135 15720 06 202 11 ,529 1682007 208 11,875 172
2008 213 12 ,244 1742009 218 1 2, 632 178
2010 223 13 ,005 1 82
2011 228 13,368 185
2012 233 13,730 189
2013 239 14 , 077 193
2014 244 14,421 198
2015 249 1 4 ,763 202202 0 278 16 ,487 2252025 309 18,216 251
Co mpound G ro wth RatesHistoricaf 20-Yr ( 1 98 0 -2000 )N i storlcal 10-Yr (199 0 -2000)Farecastl0-Yr(20D5-20 1 5 )Forecast 10-Yr (2005-2015 )
3 .8% 3 . 3% 2.0%2 -8% 3 .3% 1 . 3%2 .5% 2.9% 2 .5%2 .3% 2-5% 2. 4 %
Moreover, the long-term load forecasting methodology utilized by AEP Economic Forecasting has undergone
some change in the interim period . That department subsequently incorporated Statistically Adjusted End-use
(SAE) models for forecasting long-term Residential and Commercial kWh energy sales and, with that, attendant
peak demand . SAE models are econometric models with features of end-use models included to specifically
account for energy efficiency impacts, such as those included in the Energy Policy Act of 2005 (EPAct 2005) .
SAE models start with the construction of structured end-use variables that embody end-use trends, including
equipment saturation levels and efficiency . Factors are also included to account for changes in energy prices,
household size, home size, income, and weather conditions . Regression models are still used, as before, to
estimate the relationship between observed customer usage and the structured end-use variables . The result is a
model that has implicit end-use structure, but is econometric in its model-fitting technique .
42

AEP Economic Forecasting's analysis would suggest that the SAE approach for residential and commercial load
profiles explicitly accounts for energy efficiency which, in turn has served to slightly lower the forecast of PSO
aemand and energy in the outer forecast horizon (t,e . generaXly, years beyound 2010) when such energ}, efficiency
intiatives-such as those being envisioned by EPAct 2005-could begin to manifest more aggressively .
2 .1 . 1-A (Peak) Demand Forecast - A review of the most recent PSO demand fo recast in the following table
would support that longer-term relative trending when comparing those SAE-influenced results to the prior long-
term PSO demand forecast that did not utilize SAE techniques {specificalfy, the January 2005 forecast update
utilized in PSO's Spring 2005 IRP profile) .Public Service Company of Oklahom a
Annual Peak knternal Demand ( MW) •- UPDATE
1996 (Hisroric ar) - 2o1a (Forec ast)
(Nistorical ResuBS a re both As Reported" and " Weather Nom+a'izer7')
PSO
"A s Report e d " "Weafher N ormalized "
Annual Annual
Year MW Growth MW Growth
Actual Data 1 996 3,360 2 .1% 3,584 4.0%
1 997 3,474 3.4% 3,632 1.3%1998 3,583 6. 0 Y6 3,698 1. 8°. 6
1999 3, 6 1 1 3 .5% 3,766 1 _8%2000 3,823 0_3% 3,840 2.0%
2001 3,785 -1 .0% 3 ,794 -1 .2 %
200 2 3,786 0.0% 3,865 1.9 %
2003 3,879 25% 3,889 0.6 %
200 4 3,773 -2-7% 3,930 1.1%200 5 4,047 7.3% 4,026 2.4 %
20 06( j
'10-Year Compound Annual GmwthRate (1895- 2006(A)) 2. J5°
`9-Year Compound Annual G ro wthRate (1996-2005) 2A9% i .30%
2605 "Q4" 12006 "Qi "Spring 2005 I RP 2006 Load Forecast Update tgy 2006 "02" Update
( Nov. 'O51Jan . '06 Update to( J,in'(; Update fo °2005" (^2006 " Load &Demand "2006" Fcst pe/formed Aug ( Mav os Upuate to "2006"Fcst pertwmed Aug. '04) Fcst pedormed A ug. 'OS) '05) Fcsf pWormed Aug 'oh]
Forecast Data 2006 4,093 1.7% 4,039 0.3°/n 4,D20 -0.2% 4,109 1 .9%2007 4,151 1 .4% 4,110 1 .8% 4,040 0.5% 4,169 1 .7%20 0 6 4,216 1.6% 4,161 1.2% 4,084 1.1% 4,216 1.9%20 0 9 4,293 1.8% 4,207 1 .1% 4,155 1.7% 4,27 4 1 . 4 %2010 4,354 1.4% 4 ,250 1.0% 4 ,224 1 .7% 4,333 1 .4%2 011 4,420 1.5% 4,295 1 .0% 4,289 1 .5% 4,388 1 .3%2012 4,478 1.3% 4,343 1 .1% 4,337 1 .1% 4, 4 4 6 1 .3%2013 4,556 1.7% 4,392 1.1% 4,386 1 .1% 4,495 9.1%2 01 4 4,627 1.8% 4,442 1. 1% 4,436 1, 1 % 4,544 1 . 1 %
'9 -Yea r' Co n7poun d Annual Growth
Rate (2005(R) - 2014)
Forecast Data 2 008
2007
2008
zaa9
2010
2011
201 2
2013
2014
2606 Load Forecast(54) -1 . 3%(41) - 1 . 0%(55) -1 .3%(86) -2 . 0 %
(104) -2. 4%(125) -2. 8%(135) -3 . 0%(164) -3. 6%(185) -4.0%
w' On 7 718f06 P SO achieved a(prel imi n ary) actual all-ti me peak demantl of 4,1 S fi MW
T h e initial update to t h e 2006 Load Faecas t was performed in Nove mb er, 2605, It wa s su 6squ e n tfy re- sftirmed in Janu ary, 2 0D6 .
For ca m paralive p urp os es, airludes potential n ew Fum (cost-based ) whol es ale loatl s (<5 OMW) retlected in PSO CDR.
" N lAd' = data no t Wra il ab le
1.5$% 1 .10% 1 .08% 1 . 35%
17 Annual VarianCes from "S rin '05" !Rp Forecast
2005 "04" 12006 „ Q1"Update(73) -1. 8%
(111) -2. 7%(132) -3. 1 %(138) -3. 2%(130) -3 .0%(131) -3 . 0%(141) -3. 2%(170) -3 .7%(191) -4 . 1%
2006 " 02" Update8 0 .2%18 0. 4%0 0. 0 %
(19) -0 .4 %(21) -0 . 5%(32) -0. 7%(32) -0 .7%(61) -1 .3%(83) -1 . 8%
43

The table reflects three subsequent forecast views of PSO peak demand that would ultimately indicate only mino r
changes from the January 2 005 forecast previously described and identified in the Spring 2005 IRP . The forecast
and forecast updates to the "2006" PSO load and demand forecast (established in the summer of 2005) were
performed by the AEP Economic Forecasting group in November 2 005, January 2006 (which re-affirmed the
November 2005 update), and May, 200 6 , respectively. It suggests that the most recent forecast for the updated 9-
year forecast period through 2014 now indicates a PSO peak demand compound annual growth rate (CAGR) of
J .35°10, versus the 1 .56% level for the same period reflected in the "Spring 2005" IRP forecast performed in
January, 2005. While that latest (May, 2006) update represents a slightly lower growth rate than that January,
2005 projection, it has increased from both the "20 06" PSO Load and demand forecast performed in the summer
of 2005, as well as the update performed as recently as January, 2006, which had indicated an even lower CAGR
for PSO over the same period of only 1,10% and 1 .08%, respectively . Further, this most recent update of the
forecasted CAGR for PSO of 1 .35% is slightly above the most recent available "weather normalized" actual 9-
year (1996-2005) CAGR demand growth for PSO of 1 .30%
AEP Economic Forecasting's analysis would suggest that the SAE approach to forecasting long-term load and
demand previously decribed explicitly accounts for shifts in energy efficiency assumptions which, in turn, has
served to contribute to the slightly lower forecast of PSO demand and energy in the outer forecast horizon (i .e .
generally years beyond 2010 when such energy efficiency intiatives-such as those being envisioned by EPAct
2005-could indeed begin to more signifcantly manifest .) A review of the most recent PSO demand forecast in
the table above would support that relative reduced out-year trending when comparing those SAE-influenced
results to the prior long-term PSO demand forecast that did not utilize SAE techniques (specifically, the January
2005 forecast update utilized in PSO's Spring 2005 tRP profile) .
Another driver of these recent PSO customer demand projection swings has been the aftermath of the September,
2005 hurricane events that impacted the Gulf Coast states . In the case of PSO there were, for instance, significant
pricing implications to its retail customers due to the relative short-term increases in natural gas pricing . Due to
PSO's particularly heavy reliance on natural gas-sourced power supply-both own generation and purchased
energy-such increases in natural gas prices were originally assumed to have a longer-term affect on regional
customer reten#ionlgrowth as well as through usage elasticity impacts . Subsequent stabilization has occurred in
those commodity markets, as reflected in a "quicker" return in PSO's long-term demand expectations to a level
nearer to the January 20 05 forecast level . As previously suggested, however, while such uncommon events that
occurred last year in the Gulf States are impossible to predict, uncertainties surrounding such occurrences-and
their aftermath-is something that the Company must contemplate when addressing risk as part of the capacity
resource planning process .
2 .4-A Unit Disposition -- At the time of the development of PSO's Spring 2005 IRP, Tulsa Unit 3 was not
operable and in a standby mode . The Company, however, was in the process of performing the necessary
upgrades and maintenance that would be required to ensure safe, reliable start-up and operation . With that, the
Plan assumed that this unit would become operational . Such upgrades and repairs to Tulsa Unit 3 were performed
and the unit is now able to achieve the 68 MW of generating capability that had been projected for purposes of
PSO's resource planning beginning in 20 06 .
44

2.6-A Projected Capacity I Reserve Margin Deficiencies - The following table reflects P SO's updated
projected capacity deficiencies assuming the most recent (May 2006) long-term forecast of peak demand and th e
current capacity supply portfolio . As defined in the legend text, these anticipated PSO capacity deficienc y
projections represent a"going-in" position in that no new capacity additions are reflected over-and-above known ,
firm capacity transactions .
e
~
Y
uCL
U
PUBLIC SERVICE COMPANY OF OKLAHOMA
Capaci ty Deficie n cy P rojection -• UPDATE{Resulfi n g from a 1 3.6°k S PP Re serve M argin Requirement)
1200 pssumes ..o AEP-6con . Fcsf May 'O6 Load & Demand Fcst Updateo No New-Build Generation or Unit Retirements (i. e . current PSO supply portfolio)
1000 o Excludes Lawton PPAo fnclu es AEP-East -to- AEP-West (SPP) Capacity 7Yansfer (total transfer @ 250 MW) thru 2007 only
o!ncludes 2 006 & 2007 ST Mkt Purch (P54 = 250 MW annual) from R rp ;r os Sr RFP
{Raflects re alloca8on of'06 8 '07 F1W Capacity Transfer between PSO and SWEPCO based on above)
8 00 :~ :r •~~ ' :'r~y - `
600
400 '~ 3 ,f.r n
200
6
. . , - ,
-2002006 2007
h p50 13 102
20D8 2009 2010 2011 2012 ~ . ry 2013
484__] 550 617 680 745 8~0
2014
870
As indicated within the updated table above, PSO is now anticipated to require 550 MW of capacity resources to
achieve a 13,6% reserve margin requirement by 2008 . That date is critical in that it demonstrates that the capacity
needs at that time may outweigh the ability to import potentially available (market) capacity due to known and
anticipated transmission constraints previously discussed in the Spring 2005 IRP . That 2008 timeframe is also
critical in that it represents the earliest summer season in which new build capacity resources in the form of
peaking capacity could be in-service . Note that the PSO capacity deficiency grows to 870 MW by the end of theIRP period . This would suggest that the rate of growth in the capacity deficiency of PSO is largely a function of
the 1 .35 percent (50-60 MW) compound annual growth rate in the most recent update of forecasted peak demand .
2 .7-A Operating Agreements - As identified, the AEP System Integration Agreement (SIA) provides for the
integration and coordination of AEP's East and West companies zone . Among other things, the SIA provides for
the transfer of power and energy between AEP West zone and AEP East zone under certain conditions . The Plan
has been updated to reflect the transfer/purchase of 250 MW of capacity from the 2006 summer season into the
2007 summer season since the AEP Eastern (PJM) zone is now anticipated to have enough installed capacity
("ICAP") in the summer of 2007 to cover a comparable reserve requirement within PJM . As identified in the
PSO capacity position chart above, that position, however, remains unknown beginning in 2008, as the continued
transfer of capacity from AEP's East to West zones could place the AEP-P .TM zone in a capacity deficit position .
45

3 .0-A Capacity Resource Plann ing -- Short Term Needs
3.1 -A Recen t RFP Solicitations
Previously, the 250 MW PSO assignment of the AEPSC purchases (from two counterparties) of 350 MW
of annual peaking capacity, and related energy for the years 2006 and 2007 that resulted from its April 15,
2005, soliciation was not yet assumed to have received firm network transmission service authorization
from the SPP. As such, the capacity assigned to PSO continued to be reflected implicity as an "Unknown
Wholesale Purchase" within the PSO Spring 2005 IRP Capacity, Demand, Reserve (CDR) profile .
Subsequently, these capacity purchases were evaluated by SPP to determine whether each would be
qualified to receive firm network transmission service . Such evaluations were completed and each of the
transactions has now been qualified by SPP for such firm network transmission service subject to the
potential re-dispatch of other generation . Therefore, these 2006 and 2007 capacity purchase amounts for
PSO have now been reflected-by specific amounts, by counterparty-and have been inelUded in both
the previous addended chart of the Company's long-term capacity deficiency position as well as within
the PSO CDR reflected in this IRP addendum .
• On December 8, 2005, AEPSC again as agent for PSO and SWEPCO-and in conjunction with the
overa112005 RFP solicitation for long-term PSO (and SWEPCO) capacity resources-issued an
additional RFP for "Short-Term" capacity and related energy . This soliciation was made for a total of up
to 200 MW for the year 2006 and up to 800 MW for each of the years 2007 through 2009 and that would
be shared among the two companies based on their relative capacity positions . Based on both the ultimate
anticipated need and the offers received, a determination was made to enter into negotiations for two
purchase transactions . The first being for 225 MW of capacity for each of the years 2007 through 2009 .
The second, with a separate counterparty, for 200 MW for the years 2008 and 2009 .
As with the case of previous short-term capacity purchases, the Company does not yet know whether
either transaction will quality for firm network transmission service by SPP . As a result, until such
evaluations are completed by the SPP, PSO's ultimate allocated share of these capacity resource amounts
for the years 2007 through 2009 have not yet been reflected as an offsetting capacity source in the
summary of its Capacity Deficiency Projection in the previous chart . In addition, such capacity purchase
amounts are reflected as part of the line item "Unknown Wholesale Purchase" within in the PSO CDR
included in this IRP addendum .
• Renewable (wind power) capacity and energy acquisitions by PSO that were incorporated into PSO's
Spring 2005 IRP had assumed that the MW that would be applicable to meet capacity planning reserve
requirements would be limited to approximately 8 to 9 percent of capacity nameplate . That limitation
was in recognition of the prior PSO experience that considered not only the SPP critieria surrounding the
"firmness" of wind power, but also the respective locations and interconnections of these intermittent
resources . Subsequently, it was determined by the SPP that the Blue Canyon I and IT projects would not
qualify for firm transmission capacity without fairly massive transmission interconnection upgrades . As
such, while the Company is receiving energy associated with the transaction, 14 MW of previousl y
assumed firm capacity is now not being reflected in PSO's capacity portfolio (CDR) .
46

4 .0-A Capacity Resource P lanning -- Long-Term Needs
4.1-A Reso urce Planning Assumption & Issues
4 .1 .1-A Commodity Prices -- Gas & Energy - The AEP Fundamental Analysis group has performed
continuous updates to its forecasts of commodity prices, including natural gas . The following table offers a
comparison of those updates of the average annual "Base" (or point-estimate) of projected Henry Hub natural gas
prices versus those Base values previously reflected in the modeling to support the Spring 2005 IRP ,
The three most recent AEP Fundamental Analysis updates of natural gas prices projections have incorporated the
impact of the September 2005 Gulf Coast hurricanes as a significant relative driver in the nearer-term period
(2006-2008), initially impacting average annual pricing by as much as $3-4 per MMBtu . Specifically, these near-
term projections assumed that the ramification of those events on both drilling and pipeline infrastructure could
cause supply pressures to exist, however, it was anticipated that those pressures will be largely mitigated by the
2008/2009 timeframe as indicated in each of these subsequent AEP Fundamental Analysis profles .
In terms of the relative impact such increased pricing volatility may have on PSO's long-term capacity planning
modeling, several points are evident . First, any upward pressure from the 2005 hurricane events inherently
incorporated into the latest projections of natural gas prices will be relatively short-lived from a capacity planning
perspective . In fact, annual pricing trends captured in the above table suggests that the "Base" natural gas prices
from these five chronologically-distinct forecast views will converge in the 201 0 timeframa-a period that
generally aligns with the assumed start of new-build generation needs in the region . Second, as previously
discussed with the projecting of future load and demand, is the notion that the potential to predict the timing of
long-term (natural gas and attendant energy) pricing volatility due to similar such naturally occurring events in the
future is impossible . That being said, it is reasonable to assume that such unpredictable events could periodically
47

re-emerge going-forward that would have the potential to cause periodic havoc on commodity pricing . Finally, it
is important to note that the nominal price of gas has been projected to remain above the $6 per MMBtu threshold
throughout the forecast period . This is in spite of the anticipated increasing receipt of liquified natural gas (LNG)
by over 2 Tcf per year by 2010 as well consideration of Alaskan pipeline deliveries from the north slope in the
mid-to-latter part of the next decade .
The following table offers a comparison of both "HIGH" and "LOW" projected natural gas bandwidths versus
those originally established in the February 2005 forecast and utilized in PSO's 2005 IRP . Further, this table
compares these projection bandwidths across the same set of forecast updates from AEP Fundamental Analysis .
48

The forecasted natural gas pricing bandwidths depicted above continue to confirm even greater pricing volatility
then that which was incorporated into the Spring 2005 IRP (February, 2005 projections) . Specifically-beginning
with the subsequent June, 2005 estimates and continuing with the November 2005 and, finally, affirmed in the
March and June, 2006 AEP Fundamental Analysis updates-these total natural gas pricing bandwidths continue
to exceed $5 per MMBtu and, as such, will likewise continue to validate PSO's approach in addressing such
potential price volatility when it establishes its justification for solid-fuel capacity going-forward .
Additional Natural Gas Price Forecast Validation :
To support the AEP Fundemenal Analysis projected view of this critical commodity pricing, the following chart
offers a recent view of projected average annual natural gas pricing from several industry sources .
The backwardation of nominal prices through the 2010 period as LNG imports begin to increase is the consensus
among the sources depicted above . From 2006 through 2010, AEP's projection of nominal prices at the
benchmark Henry Hub average $7.281MMBtu .
Beyond 2010, AEP's nominal price prajection averages $6 .33/MMBtu through 2020 considering Alaska pipeline
deliveries from the North Slope in 2018 and increasing LNG receipts all tempered by modest growth of lower 48
production and a possible reduction of net Canadian imports . Both EIA and (confidential and proprietary) Source
2 predict Alaska pipeline receipts by 2015 with less price impact than the AEP projection .
Ultimately, AEP Fundamental Analysis suggests the factor that will most likely shape the fundamentals of overall
gas demand will be the growth of gas consumption for electricity generation . Gas demand growth from the power
sector is inevitable as long as the economy grows and only a minimal amount of non-gas-fired generating capacity
comes online in the Eastern Interconnect by 2010 .
49

4.1 .3-A Commodity Prices - Capacity - The following chart offers the long-term forecast of SPP zonal
capacity prices as established by the AEP Fundamental Analysis group in its February 2005 forecast assumed for
the Spring 2005 IRP as well as the group's most recent profile of regional capacity pricing performed in June,
2006 .
Additional Capacity Price Forecast Validation :
To support the AEP Fundemenal Analysis projected view of market capacity price, the following chart compares
the same AEP Fundamental Analysis annual projections of SPP capacity values, as reflected above, with the
actual 2005-2009 bid responses to the short-term AEPSC market capacity solicitations made in December 2004 ,
Apri 1 2005, 4nd December 2005, that were previously described .
50

As reflected on the preceding chart, it would indicate that such recent market responses to these capacity RFP s
are, in the short-terrn, generally tracking at or above these fundamental projections . Given the relative smal l
amounts of capacity at issue (total AEP-SPP amounts of 150 MW in 2005, 350 MW in 2006, 575 MW (total) i n
2007, and 425 MW in 2008 and 2009) it might also suggest that the projected capacity valuation trend may b e
conservative given the potential for (capacity) market depth issues brought on by the anticipated firm transmissio n
constraints previously discussed ,
4.2-A Least-Cost Resource Planning Modeling Option s
4 . 2 .2 -A Capacity Supply (Build) Mode ling Options - As reflected i n the table below, updates were performed
to the original (February, 2005) technology-specific cost and performance estimates used in the Spring 2005 IRP
in both July 2005 and December 2005, respectively .
AEP-SPP Zone
TvAe
Baseload Ad v. Supercriti cal Pulv . Coal
Approx .
Coal Capability Avg . Ann.
Source Avq . Nom . Summer Heat Rate
PRB*.
600 594600 594600 594
Spring 2005 IRP (AEP New Gen .D evef ., 20 0 5 vl .2) Dated : 2 I2410 5
Update , 2005 v2 . 0 D a ted : 7 I5lO5
Lat e st Uodate . 2005 v3 .0 Dated , 1211l0 5
Intermediate 2x1 G E-7FA(Gas Combined Cycle )5pring 2005 IRP (AEP New Gen Deve L , 2005 vl .2) Dated: 2/24105
Update, 2005 v2A Da t ed . 715l05
Latest Update, 2 00 5 v3 .0 Dated; . 12HIa5
Peaking GE-7EA (80 MW)
5D0 479
500 479
500 479
***
160 (2x80) 154170 (2x85) 163160 (2x80) 1 63
Approx ." Akl-in" InstalledCost~
Excl , AFUDC inc l . AFUD C
Sp ri ng 2005 1RP (AEP New Gen . Devel ., 2005 v1 . 2) D ated : 21 24105
Update , 2005 v2 .0 D at ed : 715I0 5
Latest lJndate . 2 00 5 v3 . 6 Dated 1 2 11I0 5
* incl ud e s es t . EPC , o wner's costs, a nd (generic) inte rcon nettfon, p er C o r po rate Technology Development forec ast
assu mes only 75% (4 50MU1) woul d ap ply to P50 cap ac ity resource plan rec on g ni z fng that certa in n on-affi liate
3rd parties have ownershlp participation rights re : self-build option s
re p resents mini mu m peaker fran c he assume d
Focusing on those specific generating technology types originally modeled within the Strategist optimization in
the Spring 2005 IRP process-Advanced Supercritical Pulverized Coal (PC) (baseloac), Natural Gas Combined
Cycle (NGCC), 2xl GE-7FA (intemediate), and Natural Gas Combustion Turbine (NGCT), GE -7EA (peaking)-
the updated profiles suggest generally consistent (or even improved) performance estimates, but increases in
estimated installed costs .
51

Additional Generation Techology Installed Cost Increase Validation :
A major cost pressure impacting the installed costs of all generation types is the cost of various commodities,
including the cost of steel . The following chart depicts the recent trend in the indexed price of fabricated
structural steel . 2005 prices escalated by 8% over 2004 with, as suggested in the chart, most of that increase
occurring in the latter four months of the year-a period coinciding with the hurricane events previously
discussed. This trend is continuing in 2006, with indexed prices escalating another 3+% through YTD June .
i d u
Fabricated SteelRecent Index Prices
~~
175
C
17 0-{
0 1 035 0 3105 05105 0 7105 09105 11105 01106 03106 05106Mont h
Source : U .S . Department of Labor Statistics ; PPI for Fabricated Steel(B L S Index Code : WPI3 1 07405) ; Dated : June 200 6
Further, it is anticipated that the competing demands for various craft labor group s--e lectrician s, pipefitters,
welders, etc .-will also likely contribute to generation project cost pressures as more such new-build projects are
announced and undertaken . In terms of the affects of these generation technology type cost changes on PSO's
capacity resource plan, no impacts would be anticipated . As will be described, the relative mix and timing-the
latter being largely affirmed based on the updated profiles of PSO demand previously discussed-remains
unchanged from that of the Spring 2005 IRP .
52

5.0-A Review of Modeling Result s
5.1-A Results Sased on Gas Price Scenarios - An update to that model output matrix was performed in th e
fall of 2005 to reflect updates to certain modeling parameters previously described, namely :
➢ updated demand forecast from AEP Economic Forecasting's "2006" Load & Demand Forecast performe d
in August, 2005 ;
➢ updated long-term commodity price forecast from AEP Fundamental Analysis' June 2 005 Forecast
Update; and
➢ updated generation technology cost & performance parameters from AEP Generation Development' s
July, 2005 update .
As identified in the discrete modeling resul ts found in the following cost matrix, the "Hybrid" Plan for PSO
reflects the same amount and relative mix of Baseload, Intermediate (represented by the continued assumption of
a Lawton PPA) and Peaking capacity resources as had been reflected in the Spring 2005 IRP .Capacity Resource Modafing Results Based on an Array of Natural Gas Prices
(Update Pe rfomed Subsequent to the "Spring 2005" IRP)
PUBLIC SERVICE COMPANY OF OKLAHOMA
xdelrng Uptlale Reflects. .
o Updated Load & Demand Projections from AEP Economic Forecasting (qugust, 2005 Forecast)
o Updated Commodity Pricing Forecast from AEP Fundamental Analysis (June . 2005 Update)
o Updated New Generation Technology Cost & Performance Parameters Matnx (2005 v2A dated: 7)8/05}
o No change in unit disposition p roi le (from Spring'05 IRP) _ .
PSONaw Capacity Adtlition s
1 01 Year Fu1J Peqpd Low
( 2005- 2014) {2005-2020} Gas
# MW # MW
Low Gas Optimal PlanCT 8 648 12 972 Total C PW-$B 8 .52CC 1 260 1 260 Levetized gJM6a/h 46. 33PC 0 0 0 0 Var ., Net CPW-$B 6 . 8
Levelized $/MWh 31,01Tot al 968 1 ,23 2
MidLow Scenario Optimal PlanCT B 648 12 972 Total CPW-$B 8 .52C C 1 260 1 260 Cevef+zed 3/MWh 46. 31PC 0 0 0 0 Var ., Net CP1hF$B 6 . 8
Levelized $/MWh 31 . 00Total 908 1 ,232
CT 4 324 4 324 1CC 1 , 260 1 4W L. 0vrPC1 445 2 890
7otal 1,029 1 ,474 "
B ase Scenario Opt ima l Pl anCT 4 324 4CC 1 260 1PC 1 445 2
Total 1,029
M idH igh G as Opt imal P l anCT 4 324 4CC 1 260 1PC 1 44 5 2
Total 1,029
CT 4 324 4CC 1 260 1PC 1 44 5 2
Total 1 , 029
Gas Scenano Gas Gas
9 .53 10 74 12 .67 15 .6450.95 56.49 85.32 78.9 1
77 8 _9 10 .9 13.935.46 40.93 49. 79 63. 46
9 _53 10.74 12 .6 7 15 . 6 250.94 56 .48 6 5.31 78. 84
7,7 8 .9 1 0.9 13.&35. 46 40,93 4979 63 .4 0
$0s ', ~~qw
324Total
CPW-$B 8 ,88260 Level+zed $/MWh 48 .00890 Var., Net CP1N-$B 6 .2
Levelrzed W Wh 28 .241,47 4
324 7ocaf CPW-$8 8.88260 Leveliz ed .$~MWh 48.00890 Var., Net CPW-$B 6. 2
L e velized $/MWh 28. 241 ,474
324 Tot al C PW- $B 888260 LBVelizedS/MiNh 48.00890 Var ., Net C P W- $B 6 2
Levefized $/MWh 28 .241 ,47 4
9 .60 1 0 . 4851 .27 55.2 6
6.8 7.731 .30 35.24
9,60 104851 .27 55 .2 8
6 .8 7 .731,30 3524
9 .60 50 4851. 27 55 .2 868 7 .7
31.30 35. 24
12 .03 14 .4162 .38 73. 30
9.3 11.74236 53.37
1203 4 4 .d462.38 73. 3 09-3 11.7
42.3 6 53 .3 7
1203 14 ,4162,38 73. 30
9 .3 11 .742 .38 53. 37
53

Therefore, these capac ity resource madek in results identified in t_he cost ~natrix can continue to support theplann ing conclus ions and recarnmendat~ons as set forth in the PSO S~rin 2 0~_,OS IRP.
The only minor exception between this updated cost matrix and that which was originally established for the
PSO's Spring 2005 IRP, can be found under the "Mid-Low" and "Low" natural gas price forecast profile . The
discrete Strategist model updates performed in the fall of 2005 would opt to build additional peaking capacity
(CTs) in lieu of: a) baseload, pulvierized coal under the "Mid-Low" case, and b) intermediate combined cycle
capacity under the "Low" case . That being said, it is also important to point out that such a view of capacity
resource mix would continue to create very signifzcant ranges of CPW revenu e requirements . Specifwa))y,
whereas this updated Hybrid Plan result would create a potential CPW revenue requirement variation or "swing"
of as much as $5 .4 billion based on the potential gas price bandwidth ($14 .36 billion less $8 .93 billion) over the
full 30-year study period in that updated view, that potential revenue requirement exposure under that "Mid-Low"
optimal build plan would now be $7.1 billion ($15 .62 billion less $8 .52 billion), or as much as an 83 percent
potential swing . No further capacity resource optimization profiles were performed .
Additional Modeling Validation :
The subsequent culmination of the 2005 IRP implementation process-the awarding of long-term capacity
resource committments stemming from PSO's respective Peaking and Baseload Request for Proposals (RFP)-
established the following :
✓ Award for the construction of a total of four (4) Combustion Turbine peaking units at PSO's
Riverside and Southwestern Station facilities-for operation by June, 2008-based on offers received
from AEPSC, acting as agent for PSO ; and
✓ Award for the construction of an ultra-supercritical pulverized eoal unit by Oklahoma Gas Electric
(OG&E) at its Sooner Station site for operation by June, 2011 . It has been announced that this unit
to built and operated by OG&E-would be jointly owned with PSO taking a 50 percent interest.
Based on this, an additional modeling exercise was performed within Strategist to offer a final validation of the
2005 capacity resource plan . Specifically, the pricing and performance parameters for the baseload unit stemming
from the OG&E offer from the RFP process were used to replace the comparable "generic" or non-descriptlnon-
site specific data within the original (and updated) planning modeling . The capacity resource profile was then re-
run to reflect the relative impact of these offered cost and performance profiles on PSO's study period CPW . In
addition, an opposing view was also modeled that so ught to add a "generic" combined cycle unit (since no viable
combined cycle alternative resulted from PSO's RFP process) in lieu of that coal unit for in-service in 201 1 .
This evaluation did not constitute an updated optimization profile for long-term PSO capacity resources . Rather it
simply represented a method to compare the relative cost impact of the offered pulverized coal facility versus an
alternative technology type in the form of a combined cycle unit .
As summarized on the following table, the results of this Strategist analysis that sought to validate the offered
(OG&E) pulverized coal unit vis-a-vis a generic combined cycle unit, would suggest that under both an AEP
Fundamental Analysis "High" and "Mid-High" gas price scenario, the view with the OG&E-offered solid-fuel,
baseload unit in 201 1 resulted in a lower total CPW over a 40-year "life-cycle" (i .e . through the RFP-emulated
54

2051) analysis period than a generic CC build . Under an AEP FA "Base" gas view, however, the generic CC was
slightly (0 .7%) less expensive over the study period from a Total CPW perspective, but 6 .0% more expensive
when considering potentially volatile variable costs (largely fuel) only .Capacity Resource M odelirtg RasulLS 8ased or, an Array of Natura! Gas Pr ices
(Update P erfomed Subsequent to the "Spring 2405" IRP and Dec . ' 05 RFP Process )
"Base load Sub st itutio n Anal ys is "
O G&E Pulverized Coa l U nit in 201 1
"G e n e ri c" Combined Cycle in 201 1
% Variance(Generic) CC vs OGdE PC
Natural Gas Pri cin g So urce :AEP F undame n tal An alysis" Q1 ( Ma r .) 2006" Fore cast
8ase MidH'sgh HighGas Gas Gas
Scenari o
Total CPW,$B 13.35 1487 1607Levelized $/fVlWh 68.42 75.40 80 .91
Var ., Net CPW-$ B 9.66 11.00 12.1 7Levefized $iMWh 44 .21 50.37 55.7 1
Total CPW-$B 13. 25 1 4. 91Levefized $/MV✓h 87. 9 6 75. 56
Var., Net CPSNz$8 ~ D, 24 11 .72Levelized $/MWh 46 .89 53, 64
16 , 29
81 . 88
130559 . 72
Total CP1N , $B -0.7% 0. 2%Var. , Net CPW-SB 6.0% 6.5%
7_3 %
7. 2%
As an additional sensitivity on these RFP offer results for baseload resources, a view of forecasted natural gas
prices from the Energy Information Administration (EIA) was applied . EIA is the statistical agency of the U .S .
Department of Energy . EIA issues a wide range of weekly, monthly and annual reports on energy production,
stocks, demand, imports, exports, and prices, and prepares analyses and special reports on topics of current
interest . EIA's most recent (February 2006) long-term profiles of Henry Hub natural gas pricing are compared to
AEP FuPlamental na ysis - view as rerlected in e a e 15clow :
55

Utilizing those long-term natural gas pricing views from EIA, the following table offers a like-comparative
analysis (OG&E-offered supercritical pulverized coal unit versus a"generic" NG combined cycle unit in 201 1) .
Natural Gas Pricing Source :E I A
"Ge n e ri t" Combined Cycle in 201 1
P u ive
GasScenario
Total CPW-$B 13 .29Levellzed .8/AAh/h 68.16
Var., Net CPW-$B 9 .2 7Levelized $/MWh 42 .42
Total GPW4B 13 .26Levelized $IMWh 67.96
Var ., Net CPW-$B 9 .88Levelized $1MWh 45.24
Total CPW-$B -0.3 %1Jar., Net GPW4B 5.61
Gas
15 . 8679,9211 . 2351 .39
16 . 0780. 8812 . 1255.4 8
% Variance(Generic) CC vs OG&E PC
1.3%
N ot es :
o OG &E p ulverized co a [ unitdata saurued fro m RFP b id res p onse
o Both mews (PC and NGCC build) reflect
-- (Bi d ) CT a d ditions (324 M4N, su m me r) i n 2008La wto n FPA ( 286 MW, C C ) ef(ectire 201 0
n EIA"Base" and "High" gas prices per.
- B ase : R e p ort#: D OElE1Pr0383(20 0 6), released Fe brua ry, 2008
- H fgh: 'qnnua! En ergy0utloo k 2006 with Projections to 2030" Report, release d December, 200 5
In the EIA "High" natural gas price scenario, again, the view with the OG&E solid-fuel, baseload unit in 2011
resulted in a lower total CPW over a 40-year "life-cycle" (i .e . again, through 2051) study period than a generic
CC build. While under the EIA "Base" gas view, however, the generic CC was cost was nearly identical with the
generic NGCC unit being 0 .3% less expensive over the same study period from a Total CPW perspective but,
again, 6 .6% more expensive when considering only variable costs .
6.0-A Conclusions
In conclusion :
✓ From a "needs assessment" perspective, the subsequent analysis of PSO long-term load and demand
would suggest that the projected PSO MW obligation to serve remains as set forth in the 2005 IRP .✓ From a "cost-driver" perspective :
0
0
subsequent assessment of natural gas pricing-one of the key cost drivers in the
evaluation-would suggest that such longer-term pricing is consistent with that set forth
in the 2005 IRP, with (High-to-Low) pricing bandwidths-and with that, the attendant
exposure to natural gas pricing-being potentially broader ; and
subsequent assessment of new generation techology cost and performance parameters
have remained fairly consistent versus those set forth in the 2005 IRP with, however, cost
pressures tied to both matieral and labor anticipated to impact all technology types .
56

✓ From an analyticalJmodeling perspective, the optimum (least-cost) peaking and baseload alternatives
originally identified in the 2005 IRF were emuiated in an updated analysis that considered certain
modifications/updates to various modeling parameters . Moreover, the results from the final one-off
analysis decribed in this documentation would further suggest that this PS O capacity resource
planning outcome resulting from the recent PSO RFP process was itself validated as being reasonabl e
when compared to an "alternative" (but not offered via the RFP process) generation type a
"generic" natural gas combined cycle unit .
7.0-A PSO - Aetian P lan
The following PSO Action Plan reflected as part of the Spring 2005 IRP has now been augmented in the
following table :
Action Resource Type Timing Amount ActionItem
1 Peaking Capacity Beginning Summer Up to 320 Competitive RFP solicitation for peakin g2008 MW capacity and energy for an in service
date of June 1, 2408. Offers received,evaluated and awarded to AEPSC, asagent for PSO, for two sites (RiversideStation (1 60MW) and SouthwesternStation (1 60MW)) Filed for used an duseful determination under HB1910 .
2 Baseload Beginning Summer Up to 600 Competitive RFP solicitation forCapacity 2011 MW baseload capacity and energy for an i n
service date of June 1, 201 1 . Offer sreceived, evaluated and recently(7118/0 6) awarded /announced to OG&E,for a pulverized coal facility at SoonerStation site w/ PSO taking a 50 %interest . Contract negotiations for thi sjoint venture proceding . Filed for use dand useful determination under HB I9T0 .
3 Transmission Summer 2007 n/a Complete Tulsa Area 345/ 1 38kVupgrad e
4 Existing Steam 2005 IRP (Fall n/a Continue cycling of dispositionGeneration Update) evaluations of existing gas-steam units
including, among others, Southwestern Iand 2 as well as Tulsa 3 .
5 DSM 2005 IRP (Pa3I n/a Continue assessment of viable, cost-Update) effective measures
57

6 Intermediate 2010 (delayed from 300 MW Develop contingency supply option s for
2009 due to the Lawton Cogeneration plant for th euncertainty regarding event the COD is either accelerated ortiming of any final deferred from the assumed date of 2010 .OCC order)
7 Market Capacity 2006 - 2009 Up to 200 Competiti ve RFP solic itation for marketPurchases MW (2006) capacity and related energy for the year s(AEPSC , as to up to 800 2006-2009 . Offers received, evaluated ,agent, and on M W(2007, and term negotiations underway for thebehalf of PSOand 200 $ , and possible acquis it ion of 225 MW (tota lSWEPCO) 2009) - total PSO and SWEPCO) for 2007 and 42 5
PSO and MW (total) for 2008 and 2009 .SWEPCO Company allocations to be determ i ned .
58

SECTION B - CAPABILITY , DEMAND AND RESERVES
OVERVIEW (l4DDENDUMThe following 2005 Capacity, Demand and Reserves (CDR) profile represents a ► nodified view, of the ten-year
IRP for PSO based on the paraemeters reviewed in this Plan addendum . All figures included in the CDR ar e
expressed in megawatts .
caPastLrrr
PUBLI C SERV i CE OF OKLAHOMA =+wsucCAPAB I LITY , DEMAN D AND RESERVES FORECAST PnNr Of
05 ACTUAL - 20 14 °x~NOMA
BASE (SPRING 2005 IRP) PLAN -- UPDAT E
NEW CQAL I ' 44~ H6 , 446
TU LSAk5 l l ry,qVAILP.81E ~ -80 -i2 .12 12 -12 -12 - 12 -12 -12NE 38 4 F6p RE TROFi7 ~GOMBI NED C YCLE P P A Z60 26Q 2 C 20
T oT aL -84 -52 •1 2 312 St2 572 1 .01 e 1 ,01 8 1,01 1
ry etpWrrtC 40a6 i4 ty ( 1+21 4.097 4A65 4,165 4,489 4 ,489 4.749 6,1 95 5 ,196 5,79 5 5,180
OffSys6em Sales yYyqiout Reserves
G Pe ak D eo+and (A-B) 4,047 4,107 4,1 68 4 216 4,274 4 ,939 1,988 4,446 4 ,495 A,514
E Ffrm D;;Z4 ( C - D ) 4,047 4,060 1 ,918 4,1 65 1 ,223 4.282 4.397 4, 395 4,444 4,493
Ns~iv e La ad Responsi 6lli ty { E - P) 3,829 4p30 4,0 96 4, 142 4,7A0 4,259 4.976 4 ,371 4,420 4 ,46B
RESERVES ~ ~ ~ ~ IMI i WAW~Rexrve G ap~ny ( fi 10 ) 567 5 95 Sl3 658 6 97
L.958 9 02 S 6s 6"
%Re~ prgm ((1 0 0 1l 95.6 13 .6 11.6 15 .6 4 9.6 13S IZA 20.a 7 9 .5 75,q
XWpee" M,y4in ( N!(6~•f0oy 77.4 12A 12,0 12.6 7 2 .0 72.p 18 .5 1T.2 16.3 15,1
Rea e~ves A bove p~ inimum92%Cayarjfy Margv~ 64 0 0 0 0 6 3767
1 YSb 62
59
wf C aP~~ li(y (~ _ 6 . 51 4, 227 4,4 0 4, 524 4,653 4,727 4,794 5,293 51713 5,233 Sp94
D EMAND G5 ACT 1 2006 007 1 2008 00 i 0 i 2012 013 20
n peak D-ndgefor aPas sive ➢3 M I 4,a47 47o 7 4,1 68 4 ,216 4,274 4 ,333 4,98 8 4,446 i ,495 ~,i44
~ Load ResP4n q i6fldy (7+ 5-9) 3,6 60 3.926 3,806 4,102 4.760 1 ,2 19 4,274 4,337 4 ,380 4,428

This PSO 20 05 IRP "CDR-Addendum " Updated to Reflect Eff'ects ofo AEP Economic Forecasting May, 2 006 Forecast Update, incl . DSM updates (vs . Jan . '05 Fcst . Update)o PSO share of East-to-West Capacity Transfer through 2007 (vs . 2006 only)o Delay of Lawton PPA In-Service until 2010 (vs . 2009 in-service )a Reduction of 14 MW of Wind Projects (Blue Canyon) that can offer Firm Capabilityo With network transmission service authorization from SPP, PSO share of 350MW (PSO assignment
fixed @ 250MW) purchases in 2006 & 2007 now considered "Firm" (vs . "Unknown (Market)Wholesale Purchase" )
o PSO Northeastern Llnits 3&4 now assumed to incur derating of 15MW beginning in 2014 due toprojected FGD installation resulting from CAV R
0 2005 Actual data (vs . Forecast)
60

BEFORE THE CORPORATION COMMISSION OF THE STATE OF OKLA HOMA
APPLICATION OF ERNEST G . JOHNSON,DMECTQ~ OF THE, PUBLIC iJTILIT'YDIVISION, OKLAHOMA CORPORATIONCOMMISSION, TO REQUIRE PUBLICSERVICE COMPANY OF OKLAHOMA TOINFORM THE COMMISSION REGARDINGPLANNING OF ENERGY PROCUREMENTPRACTICES AND RISK MANAGEMENTSTRATEGIES AND FOR A DETERMINATIONAS TO APPROPRIATE METHODS TOLESSEN THE IMPACT OF ENERGY PRICEVOLATILITY UPON CONSUMERS .
CAUSE NO. PUD 200100096
MAY ~ 5 2006
COUR T CLERKS OFFICE - OKCCORPORAT0N CQM M lSSfON
OF OKLAHOMA
Public Service Companyof Oklahoma's 200 6
Fue l Supply Por t folioAnd . Risk Management Plan
May 1 5, 2006
Table of Contents
1 . TNTRODLTCTION . . . . . . . . . . . .. . . . . .. . . . . . . . . . . . . . . . . . . . . . . . .. . .. . . . . . . . . . . . . . . . . . . . . . . . .. .. .._. ._ ._ . . . . . .. . . . . . . . . . . . . . . . . . . . . . . . . . . . . . . . . . . . . .. .. . . . . . . . . . . . . 1
A. Fuel Plann ing Quaiifrcati ons . . . . . . . . . . . . . . . . . . . . . . .. . . . . . . . . . . . . . . . . . . . . . . . . . . . . . . . . . . .. . . . . . . . . . . . . . . . . . . . . . . . . . . . . . .. .. .. . . . . . . . . . . . . .. . . . . . . . . . . . . 1S. Fuel Planning CDbjectives . . . . . . . . . . . . . . . . . . . . . . . . . . . . .. . . . . . . . . . . . . . . . . . . . . . . . . . . . . . . . . . . .. . . . . .. . . . . . . . . . . . . . . . . . . . . . . . . .. . . .. . . . . . . . . . . . . . . . . . . . . . . . . . 3C . Prior Procurement P lan Feedbask . . . . . . . . . . . . .. . . . . . . . . . . . . . . . . . . . . . . . . . .. .. . . . . . .. .. .. .. . . .. . . . . . . . . . . . . . . . . . . . . . . . . . . . . . . . . . . . . . . . . . . . . . . . . . . . 7
CI. FORECAST ING . . . . . .. . . . . . . . . . . . . . . . . . . . . . . . . . . . . . . . . . . . . . . . . . .. . . . . . . . . . . . . . . . . . . . . . . . . . . . . . . . . . . .. . . . . . . . . . . . . . . . . . . . . . . . . . . . . . . . . .. .. . . . . .. . . . . .. . . . . . . . . . . . . . 8
A . Load and Demand Forecas# ing . . . . . . . . . . . . . . . . . . . . . . . . . . . . . . . . . . . . . . . . . . . . . . . .. . . . . . . . . . . . . . . . . . . . . . . . . . . . . . . . . . . . . . . . . . . . . . . . . . . . . . . . . . . . . . . . 9
B . Fuel Forecasting . .. .. .. .. .. .. . . . . . . . . . . . . . . . . . . . . . . . . . . . . . .. .. . . . . . . . . . . . . . . . . . . . . . . . . . . . . . . . . .. . . . . . . . . . . . . . . . . . . . . . . . . . . . . . . .. . . .. . . .. . . . . . . . . . . . . . . . . . . . . . 9C. Purchased Power F oreeasti ag . . . . . . . . . . . . . . . . . . . . . . . . . . . . . . . . . . . . . . . . . . . . . . . . . .. . . . . . . . . . . . . . . . . . . . . . . . . . . . . . . . . . . . .. .. .. .. .. .. .. .. .. .. . . . . . . . . . . . 1 0
I 11 . PSO GENERAfitNG RESOURCES AND SYSTEM CAPABrL d TlES . . . . . . . . . . . . . . . . . . . . . . . .. . . .. . . . . . . . . . . . . . . . . . . . . . . . . . . J3
IV . COMPARISON BETWE EN A VAILAS[ . E ALTERNATIV ES . . . . . . . . . . . . . . . . . . . . . . . . . . . . . . . . . . . .. . . . . . . . . . . . . . . . . . . . . . . . . . . . . . . 1 5
A. Methodology Discussion . . . . . . . . . . . . . . . . . . . . . . .. . . . . . . . . . . . . . . . . . . . . . . . . . . . .. . . . . . . . . . . . . . . . . . . . . . . . . . . . . . . . . . .. . . . . . . .. . . . . . . . . . . . . . . . . . . . . . . .. .. . . . . 1 5R . Scenarios Retevaace- Discusston . .. . . . . . . . . . . . . . . . . . . . . . . . . . . . . . . . . . . . . . . . . . . . . . . . . . . . . . . . . . . .. .. .. .. .. .. .. . . . . . .. . . . . . . . . . . . . . . . . . . . . . . . . . . . . . . 1 6
V. DISCUSS ION OF FUEL RESOURCE PL AN S ELECTED . . . . . . . . . . . . . . . . . . . . . . . . . . . . . . . . . . . . .. . . . . . . . . . . . . . . . . . . . . . . . . . . . . .. .. .. .. . 1 4
A. CoaI . . . . . . . . . . . . . . . . . . . . . . . . . . . . . . . . . . . . . . . . . . . . . . . . . . .. . . . . . . . . . . . . . . . . . . . . . . . . . . . . . . . . . . . . . . . . . . . . . . . . . . . . . . . . . . . . . . . . . .. . . .. . . . . . .. .. . . . . . . . . . . . . . . . . . . . . . . . .. .. .208 . Gas . . . . . . . . . . . . . . . . . . . . . . . . . . . . .. .. .. .. .. .. . . . . . .. .. . . . ... . . . . . . . . . . . . . . . . . . . . . . . . . . . . . . . . . . . . . . . . . . . . . . . . . . . . . . . . . . . . . . . . . . . . .. . . . . . . . . . . . . . . . . . . . . . . . . . . . . . . . . . .. . 20C. Fuel Oil . . . . . . . . . . . . . . . . . . . . . . . . . . . .. . . . . . . . . . . . . .. . . . . . . . . . . . . . . . . . . . . . . . . . . . . . . . . . .. . . . . . . . . . . . . . . . . . . . . . . . . . . . . . . . . . . . . . . . . . .. . . . . . . . . . . . . . . . . . . . . . . . . . . . . . . . . . .. .243 ) . Purchased Pnwer . . . . . . . . . . . . . . . . . . . . . . . . . . .. . . . . . . . . . . . . . . . . . . . . . . . . . . . . . . .. . . . . . . . . . . . . . . . . . . . . . . . . . . . . . . . . . . . . . . . . .. . . . . . . . . . . . . . . . . . . . . . . . . . . . . . . . . .. . 24E . Customer Programs . . . . . . . . . . . . . . . . . . . . . . . . . . . . . . . . . . . . . . . . . . . .. .. . . . . .. . . . . . . . . . . . . . . . . . . . . . . . . . . . . . . . . . . . . . . . . . .. . . . . . . . .. . . .. .. .. . . . . . . . . . . . . .. . . . . . . . . . . .. . 26
Vt. BILL PROJECTIONS AND COMPAR ISONS . . . . . . . . . . . . . . . . . . . . . . . . . . . . . . . . . . . . . . . . . .. . . . . . . . . . . . . . . . . . . . . . . . . . . . . . . . . . . . . . . . . . .. . . . . . . . . 26
VII . FINAL COMMENTS . . .. . . . . . . . . . . . . . . . . . . . . . . . . . . . . . . . . . . . . . . . . . . . . . . . . . . . . . . . . . . . . . . . . . . . . . . . . . . . . . .. . . . . . . . . . .. . . . . .. . . . . . . . . . . . . . . .. .. . . . . . . .. . . . . . . . . 27
VIII. CONTACT WFORMATION . . . . . . . . . . . . . . . . . . . . . .. .. . . . . . . . . 27

I . Introduction
As a public utility company, PSO has an obligation to serve its customers at all times at
all load levels, and those loads change on an instantaneous basis . To meet its constantl y
changing and uncertain load obligations, PSO uses al l available resources, regardless of
ownership, while taking into account fuel rnarkets, environmental constraints, and regulator y
requirements . This commitment is demonstrated, in part, by PSO's recent contracts, in 2004 an d
2005, to purchase wind energy that provides not only a reasonable economic price, but als o
provides fuel diversity and environmental benefits to PSO and its customers . PSO routinel y
displaces its own generation with economic purchases from the competitive market and ha s
established natural gas, coal , fue l oi l , and transportation procurement processes that use
competitive bidding and market offers .
PSO's fuel procurement and risk management plan has as its primary focus concerns for :
(1) reliability (to ensure fuel wi11 be available), (2) adequacy (in sufficient quantities), (3)
flexibility (to alter the portfolio to mee t changing needs), and (4) price (to ensure reliable fuel
supply at the lowest reasonable cost) . In other words, PSO's fuel procurement activity is first
and foremost focused on ensuring that all the electric power that its customers want is available
when they want it .
A. FueZ Planning Qualifcatzon s
PSO's fuel plaru3ing and the foundation of PSO's fuel costs for 2006 and 2 007 are base d
on existing fuel and fuel-related contracts and anticipated market prices for that fuel . While
western coal costs are anticipated to remain relatively stable, natural gas prices can vary based o n
supply and demand realities in the rzaturaJ gas maxket . PSO currently has 82,000 MMBtus per

day of annual base load natural gas, or approximately 38 percent of its annual natural gas suppl y
requirements (based on the prior year's generation), under contracts of one-year or longer havin g
staggered terms . Since most natura l gas suppliers are not wiffing to assume the market price risk,
the pricing under those contracts is generally based on market indices . Natural gas suppliers
typically demand a significant premium to assume the market price risk for fixed-price contract s
which would increase the cost of fuel to PSO's customers . PSO considers and evaluates fixed-
price natural gas contracts whenever market conditions indicate that such arrailgements ma y
provide an opportunity to minimize the overall fuel cost for PSO's customers without restrictin g
operational f[exibility for PSO's generating units . Presently, PSQ has approximately 21 percent
of its annual base load natural gas requirements secured under fixed-price con tracts to mitigate
price volatility .
For supply reliability, PSO acquires its natural gas under annual, seasonal, and monthl y
firm arrangements, while using daily purchases to meet the varied requirements of PSO's natura l
gas-fired generation. Illustration 1 shows PSO's 2005 natural gas purchases by transaction type .
Illustration l : PSO 2005 Natural Gas Purchases by Transaction Type
~ -----
- 500000~- --- -
y 400000
5 300000
200000
CO 100000
-- - -- --
~ ~ ~ ~ ~ ~ ~ ~ ~ LO U') Lno a o 0 0 0 o a o 0 C) c~a o 0 o n o 0 o o a o 0N N N ~ N N N N N N N N~ ' f" f r T t"` ~ T ~ = r
r CV M
It LI)C4 ~ CO _C:) ~ N
r r r
~M LT F irm ■ Seasonal 0 Mont hly 0 Daily B u rn
2
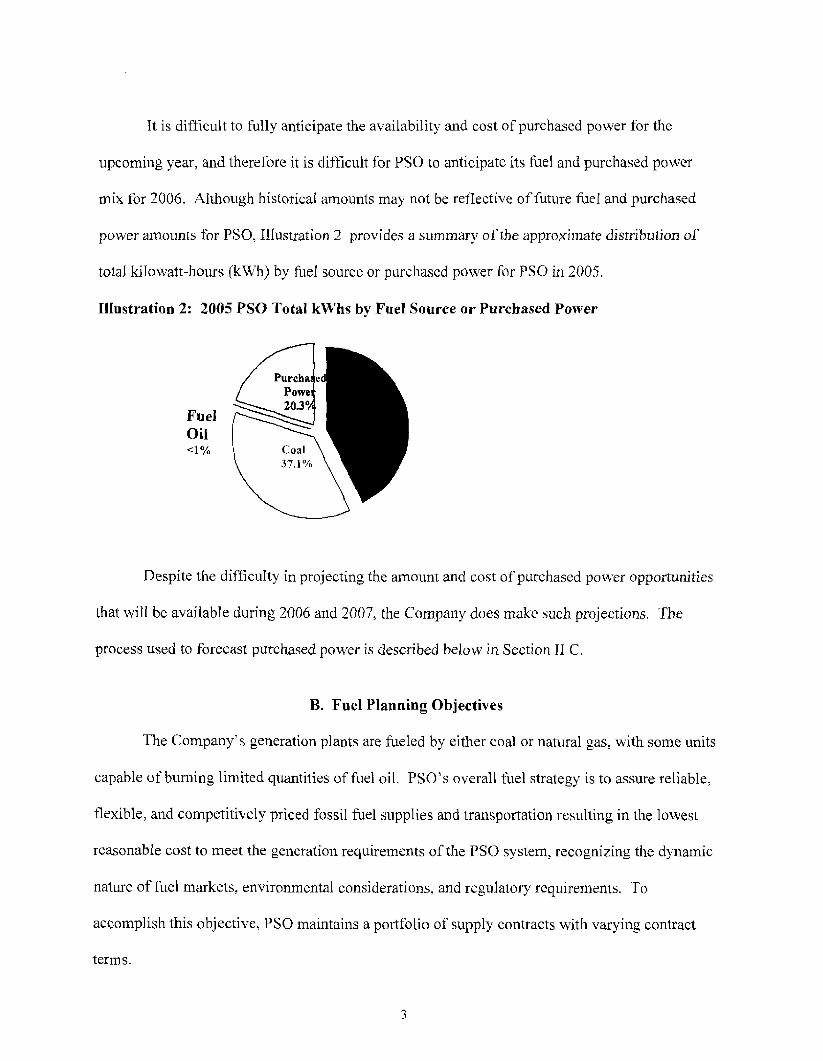
It is difficult to fully anticipate the availability and cost of purchased power for th e
upcoming year, and therefore it is difficult for PSO to anticipate its fuel and purchased powe r
mix for 2006 . Although histoxical amounts may not be reflective of future fuel and purchase d
power amounts for PSO, Illustration 2 provides a summary of the approximate distribution of
total kiJowatt-hours (kWh) by fuel source or purchased power for PSO in 2 005 .
Illustration 2 : 2005 PSO Total kWhs by Fuel Source or Purchased Power
Fuel
Oil< 1 %
Despite the difficulty in projecting the amount and cost of purchased power opportunitie s
that will be available during 2006 and 2007, the Company does make such projections . The
process used to forecast purchased power is described below in Section II C .
B . Fue l Plann ing Objectives
The Company's generation plants are fueled by either coal or natural gas, with some unit s
capable of burning limited quantities of fuel oil . PSO's overall fuel strategy is to assure reliable,
flexible, and competitively priced fossil fuel supplies and transportation resulting in the lowest
reasonable cost to meet the generation requirements of the PSO system, recognizing the dynamic
nature of fuel markets, environmental considerations, and regulatory requirements . To
acc;omplish this objective, PSO maintains a portfolio of supply contracts with varying contrac t
terms.

Typically, PSO meets its generation requirements by first using its lower-cost coal-fired
units (and generation from SWEPCO's coal and lignite-fired units when available to PSO) t o
achieve the overall lowest reasonab le fuel cost and by, nznning i ts Rel2ability-MusT-Run units
(RMR) for system reliability purposes . PSO maintains a coal inventory to be both proactive and
responsive to known and anticipated changes in operating, coal supply, and rail transportatio n
conditions . in addition, PSO's coal inventory mitigates risk and allows the Company to tak e
advantage of favorable and timely coal purchases .
Next, PSO's natural gas-fired units are compared to purchased power opportunities ,
based on each unit's efficiency, economics, and other relevant factors, to meet peak load
demands, to replace coal capacity during scheduled maintenance and forced outages, to follow
daily and hourly load swings, and for voltage support . Fuel oil is also burned in PSO's power
plants when appropriate, Illustration ; provides a graphical depiction of the hourly economi c
dispatch of available resources for a typical day .
4

Illustration 3 : Typica l Day Resource Econom ic Dispatch 2 005
9 , 0008,0007,0006 ,000
0: 5 ,0004,0003,0002,0001,000
0
Hour EndingF- ■ CoallLignite Generation D RMR Units Gas Generatio
n 0 Long Term Econ Purchases■ IPP Pre-Sched Purchase s
Purchases from AEP East il Hourly Purchase s
L ❑ Non-RMR Gas Generatio n
For 2006-2007, PSO also anticipates the delivery of wind energy which will generall y
displace energy from PSO's non-RMR natural gas-fired units .
Given PSO's combination of generation plants, PSO's average fuel cost from its ow n
generation will be a weighted average of the delivered cost of coal and natural gas . Illustration
4 provides a graphic representation of PSO's fuel costs from its own generation for 2005 show n
in $/MMBtu.
5
1 2 3 4 5 6 7 8 9 10 1 1 12 1 3 14 1 5 1 6 1 7 18 1 9 20 21 22 23 24

Illustration 4: 2005 PSO Fuel Costs from Owned Generat ion
t$12.0
0 $10. 00 --- - - - - - - - - - - - -- -- - -- ---- -
~$8.D0 - -- - ~ -- _ -
-- - --- ---~ -- - --- - - --_ - ------ - - - -- _ . _ ._ .._ __ _~ --$6.00
$4. 00 - -- ~- -- - -- - - - -~~~~~1~ ,_~~-~~~~~"~ -- -- - -- - --~_--i _ ._-----
- - - - - - - - - - __. _ ... . - -- -$2 . 00 -- - - - -- -- -
$- =--- - , . ..- . - ~ - - - - -- -- --, - - -- - --- ,- --- -~ - -- --, - --- ,~ -- - ;- -.-
Jan Feb Mar Apr May Jun Jul Aug Sep Oct Nov Dec
+Coal $ lMMB7U ~ -f-Gas $ IMMBTU Total $ IMMBTI J
Illustzation 5 shows PSO's total fuel costs, including the cost of purchased power, on a
$/MWH basis . Note that the cost of affiliate power purchases is lower than non-affiliat e
purchases . This is due to the purchase of energy from SWEPCO's low-cost coal and lignite-fired
units when they are available to PSO .
6

Illustration 5 : 2005 PSO Fuel Costs and Purchased Power from Owned Generatio n
$120.00 --
$110 .00 f-
$100.00
$90.00 ~
$80 .00 j-
$70.00 j
$60.00 - i
$50.00 ~-$40,00 ~
$30,00
$20.00 ~ .. -- -- -- -- - -- - .. _- -- --
$ 1 0. 00 I
$0 .00 ~ - - T ,, ---- -_ _ __ ; T - --; - ~ ---. ,_ - 1 - -- ---- ,--Jan Feb Mar Apr May Jun Jul Aug Sep Oct Nov Dec
- 0 Coa[ SfMWH --l--Gas $fMWH --A-°-Affi liate $/MWH
L --*---Non-A ffi 2iate $IMWH -~lE--Total Reso urces $/?VIW H
C. Prior Procurement Plan Feedbac k
The flexibility in PSO's fuel supply plan and the diversity of its generating fleet allow the
Company to optimize the dispatch of generation to take advantage of lower spot market fuel and
purchased power opportunities, while maintaining reliability of service to its customers . PSO's
diversifed gener•ation and balanced fuel supply portfolio is the foundation ofits risk
management plan and provides an effective physical hedge to mitigate fuel cost volatility of any
particular fuel cost component . By investing in and using generating plants with different fue l
sources, PSO has, in effect, created a flexible portfolio of coal, natural gas, fuel oil an d
purchased power resources, including wind, which helps in the management of overall variable
7

costs due to the potential price volatility of any one particular fuel source . PSO's ability to
mitigate the potential price volatility of its overall fuel cost has been primarily attributable t o
management of its fuel mix, through maximum use of its coal generation, increased flexibility i n
fuel supply and transportation contracts, periodic use of fuel oil, and the use of purchased energy .
As noted above, the effect of PSO's balanced fuel supply portfolio on its fuel cost during 2005 ,
excluding purchased power, is evidenced in Illustration 4 where the total $/MMBtu is the
resulting average of both natural gas and coal-related costs . Also, as shown abflve. Illustration 5
includes the impact of purchased power expense on PSO's total average fuel and purchase d
power cost .
In Cause No . PUD 2003007 6 , OCC Staff Witness Dr. Kenneth R. Zimmerman
recommended, " . . .that the Commission instruct PSO to work with Staff to identify annua l
average minimum gas burn as a first step toward acquiring at least a portion of this minimum gas
requirement through fixed price gas supply contracts ." In Cause No. PUD 200200754, OC C
Staff Witness Zimmerman stated that, " . . .PSO could conceivably lower its cost of gas, provid e
some physical mitigation of potential gas price volatility and improve the reliability of its ga s
supply by purchasing between 15% and 20% of its annual gas supply requirement under fixe d
price terms, rather than at index prices ." While fixed price contracts do not necessarily ensur e
lower fuel cost, PSO has responded to the Staff's suggestion and currently has approximately 2 1
percent of its annual base load natural gas required secured under fixed price contracts .
11, Forecasting
A summary of PSO's Load and Demand, Fuel, and Purchased Power forecasting proces s
is described below .

A. Load and Demand Forecastin g
PSO has historically used two distinct methods for forecasting its annual kWh and will
continue to do so for 2006, First, PSO uses regression models with time series error terms t o
forecast short-term M sales up to 18 months ahead . These mode ls use the most recen t
customer count, kWh sales data, weather data (in the form of degree days), and indicato r
variables where needed. The models used are estimated and evaluated in an iterative process_
Second, the Iong-term kWh forecast uses econometric models incorporating an economi c
forecast to produce a forecast of annual kWh sales . The long-term process starts with an
economic forecast provided by Economy .com for the United States as a whole, each state, an d
regions within each state . These forecasts include forecasts of employment, population, an d
income. Inputs such as regional and national economic and demographic conditions, energy
prices, weather data, customer-specific information and informed judgment are all used i n
producing these forecasts .
To forecast peak and hourly kW loads, PSO uses a series of algorithms for distributin g
the monthly kWh sales to hourly demand . The inputs into forecasting hourly demand are kW h
sales, transmission and distribution losses, weather, hourly load profiles, and calendar
information. The output from the model includes hourly ioads for PSO for the entire forecas t
period.
B. Fuel Forecasting
The fuel cost for each of PSO's generating plants is different and is based on the cost o f
fuel and related transportation costs to deliver the fuel to the plant . Coal prices are based upon

the contractual pricing provisions contained in the coal supply and transportation contracts, wit h
replacement and supplemental coal costs based on projected spot market prices for coal .
Natural gas projections are based upon the contractual pricing provisions contained in the
varied term supply and transportation contracts and the trading prices of natural gas future s
contracts from the New York Mercantile Exchange (NYMEX) for delivery at the Henry Hub,
adjusted for transportation basis differentials applicable to PSO's geographic region and delivery
points . PSO monitors the fuel markets daily and considers industry standard forecasts publishe d
by analysts such as Cambridge Energy Research Associates, Inc . (CERA), PIRA Energy Group ,
and the United States Energy Information Administration . Based on the Commission-approve d
settlement in PSO's most recent rate case, Case No . PUD 200300076, PSO's Fuel Adjustment
Clause is provided to the OCC Staff on an annual basis .
C . Purchased Power Forecasting
American Electric Power Service Corporation (AEPSC), acting as agent for PS O
forecasts hourly, daily, monthly, and annual loads for PSO . When making these forecasts ,
AEPSC uses historical load data for similar weather days in like seasons and adjusts the loa d
forecast for subsequent changes in the magnitude and type of load served and current specifi c
weather patterns . The load information and other data such as fuel prices, market power prices,
scheduled generating unit outages, etc . are used to develop projections of fuel burn and power
purchases for PSO . These projections are part of the day-ahead resource commitment process
used for PSO, which is presented below in Illustration 6 . While the day-ahead process must plan
to meet peak demand for the day, PSO also uses that process to purchase and schedule energy to
displace its own generation .
10

Illustration 6: Day-Ahead Resource Commitment Proces s
Obligations- load and reserve s
Unit Assessment- C45t, RMR,
availability, liabilitie s
Purchases / Sales- long-term- short-term- transmissionavailability
Next DayResourc e
CommitmentDecisions
Day-ahead Plan
Gas Purchases
Gas Burn Forecast
AEPSC uses a resource optimization program called GenTrader from Power Cost
Incorporated (PCI) for weekly and daily optimization studies . AEPSC has received training for
GenTrader from PCI during the installation and following any updates to the program. In
addition, AEPSC has participated in a user group meeting sponsored by PCI .
This program uses plant heat rate curves, fuel costs, emissions casts, and load forecast s
to predict an optimal hourly dispatch profile . By using the marginal cost output from thi s
program, AEPSC can compare the cost of generating a block of energy to the cost of purchasin g
the energy from the market . The PCI forecasting program, as well as other decision suppor t
tools, is augmented by AEPSC knowledge and activity in the market and the arrangement o f
hourly, daily, weekly, monthly, and longer-term sales and purchases of energy .
In the intra-day market (real time), AEPSC hourly marketers, and generation dispatcher s
work closely to optimize the PSO system by takina into consideration opportunities to purchas e
energy in the market . If AEPSC has an offer from a reliable source of energy capable of bein g
delivered to PSO's system at a price that is below the forecasted marginal generation (dispatch )
11

cost, AEPSC purchases this economic energy whenever possible . Such purchases are part of the
hourly and balance of day resource dispatch process outlined in Illustration 7 below ,
Illustration 7: Hourly and Balance of Day Resource Dispatch Proces s
Day-ahead Pla n
Gas Availabilityand Cost
Update -Unit Assessment
Update -Obliaations
TransmissionConstraints- TLR / Redispatch
Market Bids andOffers
Balance of Day /Hourly Dispatc h
Decisions
GasRequirements
Real TimeEconomicDispatch
As a result of the active purchasing practices by AEPSC, energy purchases constituted
20.3 percent of PSO's energy supply (kWh) for the year 20 05 . These energy purchases benefited
PSO customers because PSO was able to displace energy from its own higher cost natural gas-
fired units . As the forecasted time period decreases, long-term to near-term, so too does th e
potential variability of load and uncertainty in fuel prices . Consequently, hourly energy
purchases can be made with more certainty that they will be below PSO's marginal generatio n
cost than can longer-term purchases of energy . As the time frame into the future increases, a
wider range of load and fuel price projections must be taken into consideration when makin g
energy purchase decisions .
The structure of any long-term energy purvhases must be considered to continue to reflect
the dynamic nature of PSO's system, reliability requirements and PSO's continuously changin g
12

load requirements . Purchased power for the peak days of Monday through Friday, other tha n
hourly purchases, is typically under a flat schedule - offered and purchased on a standard 16-hour
time frame for some period (daily, weekly, monthly, etc .) . Also, variable weather leads to load
variability on a daily basis . Forecasting inaccuracies, including unanticipated load changes ,
unexpected generation outages, and abnormal weather patterns, may lead to drastically differen t
system costs over long periods of time, thereby increasing the possibility that energy cost
associated with longer-term periods could be above PSO's hourly marginal generation cost .
III. PSO Generating Resources and System Capabilitie s
PSO's generating fleet is composed of two coal-fired power plants and six natural gas-
fired power plants . These plants and their production capacity are as follows :
Power PlantComancheRiversideSouthwesternTulsaWe2eetkaNortheastern 1 & 2Northeastern 3 & 4OklaunionTotal
FuelTypeNatural GasNatural GasNatural GasNatural GasNatural GasNatural GasCoalCoal
Production Capacity(MW)2688934494091678909101094,094
In addition, certain generating units at Riverside, Northeastern and Southwestern can als o
use fuel oil to generate electricity, and PSO maintains a limi ted quantity of fuel oi l at these plants
as an emergency back-up fuel supply . PSO can also burn natural gas at Northeastern 3 and 4 in
the event of coal curtailments or coal-related equipment outages .
With the exception of Comanche and Weleetka, each of PSO's natural gas-fired plants i s
connected to at least two different pipeline systems, with Riverside being connected to thre e
13

pipelines. These multiple natural gas pipeline connections provide the Company with access to
reliable, flexible, and competitively priced natural gas supplies . The natural gas pipeline
interconnections to each of PSO's natural gas-fired plants are shown below in Illustration 8 .
Illustration 8: Existing Natura l Gas Pipeline Interconnections to PSO
GAS-FIRED POWER S TATIO N SP I P ELINESYSTEM S
ENOGEX INC .
OG7
ScissorTai l
* In cl udes gas for NE3 -4 shoul d it be n ee d ed .
Similarly, the Northeastern 3 and 4 coal units have access to two competing rail carrier s
for coal deliveries . The location of PSO's and SWEPCO's coal-fired generating plants relative
to the coal supply region and rail transportation routes is provided in Illustrat ion 9 .
Illustration 9 : Location of PSO & SWEPCO Coal Plants
PFB
-*Na rt h ea st ern *Ffinc C rc e ic
O kl aun io n _*
-k'1S e3s 6
Railroad
1S
Ii C' $
14

IV. Comparison Between Available Alternative s
A. Methodology Discussion
Some of the various supply options potentia l ly available to PSO are listed below. This
list is intended to be comprehensive, yet it is not exhaustive .
1 . Coal Procurement and Transpartation Alternatives
• PSO could purchase all of its coal through long-term supply contracts, through spot
market purchases, or through a combination of both .
• PSO's alternatives for coal transportation savings continue to include negotiatin g
more economically favorable coal transportation contracts, and arbitrating o r
litigating adverse coal transportation contracts to provide greater flexibility to tak e
advantage of lower priced base and spot coal .
2 . Natural Gas Procurement and Transportation Alternatives
• PSO could purchase all of its natural gas requirements through fixed-price suppl y
contracts for terms of one year or greater if there were suppliers willing to sell al l
volumes at a fixed price .
a PSO could purchase all of its natural gas requirements on the daily spot market if
ample supplies were available .
• PSO could purchase its natural gas under index-priced supply contracts if supplier s
were willing to commit to sales of natural gas, but not at a fixed price .
• PSO could purchase its natural gas requirements from a combination of fixed-pric e
supply contracts having a term of one year or greater and daily spot market purchases .
1 5

0 PSO could negotiate to have all its natural gas transportation requirements provide d
through firm service, which would guarantee that a ll of its requirements would be met
at all times, if sufficient firm transportation capacity were available .
• PSO could secure interruptible service to meet its entire transportation needs if
sufficient interruptible transportation capacity were available .
• PSO could purchase natural gas storage capacity if it were available in storage
facilities connected to pipelines capab le of delivery to PSO's generating plan ts .
* PSO could burn fuel oil as an alternative to natural gas in selected units, but woul d
probably experience reduced generation output and peaking capability .
Environmental issues may also arise if fuel oil is burned for an extensive period o f
time .
► PSO could co-fire the Northeastern 3 and 4 coal units with natural gas .
3 . Risk Management
; PSO could use a diverse generation portfolio .
• PSO could hedge natural gas prices (including purchasing at a fixed price) to mitigat e
price volatility. Hedging does not, however, ensure a lower fuel cost and may
increase the cost .
0 PSO could provide customer choices that allow varying payments and varying powe r
prices for customers .
B. Scenarios Relevance - Discussion
1 . Coal Procurement and Transportation
16

• Purchasing all of PSO's coal through long-term, fixed-price supply contracts could
result in suppliers demanding an economic premium, which could result in higher
prices for PSO's customers . It would also prohibit PSO from taking advantage of
coal spot market opportunities for any portion of its coal requirements .
• PSO could elect to purchase all of its coal on the spot market, but it would face the
risk and uncertainty of not knowing whether it would have coal available to fu lfil l its
commitment to provide adequate, reliable generation capacity to meet its customers '
requirements .
2 . Natural Gas Procurement and Transportatio n
0 Purchasing all of PSO's natural gas through fixed-price supply contracts could resu3 t
in suppliers demanding an economic premium to ensure a~ 'ixed price over a long
period due to uncertainty in the market . This could result in higher prices for PSO' s
customers. At this time, even though PSO has requested fixed-price bids, som e
natural gas suppliers will not offer fixed-price contracts . The suppliers who will offer
fixed prices require significant premiums for doing so . Also, because of changing
market conditions, weather patterns, unit outages, power purchase opportunities, etc . ,
it would be difficult for PSO to predict its long-term needs with precise accuracy . As
shown previously in Illustration 1, PSO has significant variability in its daily natura l
gas bums .
• PSO could elect to purchase all of its natural gas on the daily spot market, and thoug h
these prices could be lower than purchases made on a longer-term basis, PSO woul d
face the uncertainty of not knowing whether sufficient natural gas would be availabl e
17

to fulfill its commitment to provide adequate, reliable generation capability to mee t
its customers" requirements .
0 PSO could negotiate to have all its natural gas transportation requ irements pro`rided
through firm service, which would guarantee that all of its requirements would be me t
at all times, but the price for such firm service would be prohibitive .
; Alternatively, PSO could secure interruptible service to meet its entire natural gas
transportation needs, if sufficient transportation capacity were available . However,
service reliability could be severely impacted, as the transporter would be able to
curtail gas delivery to PSO at its discretion .
0 PS O could purchase natural gas storage, if available, to meet its natural gas peakin g
requirements . However, prior evaluations have indicated that, due to the difficulty i n
anticipating peak hourly and daily requirements, it would be difficult for PSO to
nominate its natural gas withdrawals in advance, and this has not evolved as a viabl e
operational or economic alternative . Storage injections and withdrawals must b e
accomplished at a steady flow rate and are not responsive to the peaking demands of
natural gas-fired e lectric generators .
• PSO could use fuel oil on a limited basis in some of its natural gas-fired generatin g
units. However, fuel oil is generally a higher-priced alternative to natural gas and
could decrease the flexibility and efficiency of plant operations . There are also
environmental issues that need to be considered when fuel oil is burned for a n
extended period .
* PSO's Northeastern 3 and 4 are coal-fired units that have natural gas burning
capability . PSO can co-fire with natural gas in these two units . However, in most, i f
18

not all, instances, burning natural gas instead of coal would result in higher fuel cost s
for PSO's customers .
3 . Risk Management
• PSO could and does use a diverse portfolio of generating assets, including economic
energy purchases, as an effective physical hedge to ensure the lowest, reasonable fue l
cost .
• PSO could use forward contracts and futures contracts (including fixed pric e
contracts, if available) to hedge the cost of natural gas . Hedging is not, however ,
expected to reduce the cost of natural gas and may increase the cost .
V. Discussion of Fuel Resource Plan Selecte d
PSO's generation portfolio includes coal-fired, natural gas-fired and fuel-oil generation ,
as well as economic energy purchases . Additionally, PSO has entered into long-term win d
energy purchases for fuel diversity and economic energy purposes . PSO optimizes available
generation resources by first dispatching its lower cost coal units (and solid fuel units fro m
SWEPCO when available to PSO), in addition to its Reliability-Must-Run units . PSO then use s
natural gas-fired generation, along with purchased energy, to meet any base-load requirement s
which exceed coal-fired generation capabilities, to meet peak electrical demands, to rep lace coal
capability during scheduled maintenance and forced outages, and to meet load-following an d
voltage-support requirements .
PSO (through AEPSC) forecasts hourly, daily, monthly, and annual loads to anticipat e
both its fuel and purchased power requirements . It then uses an algorithmic optimization mode l
called GenTrader which uses heat rate curves, fuel costs, and load forecasts to predict dispatc h
1 9

costs . The output from this model, along with market price projections, is then used to ❑ptimize
the PSO system and to identify opportunities in the purchased energy market .
A. Coal
PSO has an established coal and transportation procurement process that uses competitiv e
bidding and market offers . The majority of the coal used as boiler fuel on PSO's system i s
obtained through long-term supply and transportation contracts, with the remaining portion o f
PSO's coal requirements purchased in the spot market . As it has done in the past, PSO wil l
continue to evaluate its contracts and attempt to negotiate the most favorable terms wheneve r
possible .
PSO maintains a coal inventory to be both proactive and responsive to known an d
anticipated changes in operating, coal supply, and rail transportation conditions. In addition ,
PSO's coal inventory mitigates risk and allows the Company to take advantage of favorable an d
timely coal purchases .
To furthzr reduce coal costs, PSO will also continue to pursue effo rts to reduce its coal
transportation costs through its rail contract negotiations .
B . Natural Gas
PSO procures all of its natural gas supplies by competitive bids or competitive marke t
offers . PSO uses a combination of annual, seasonal, and monthly base load supply contracts, and
monthly and daily competitive bidding, to locate and optimize its natural gas purchas e
requirements . The types of natural gas purchases are identified in the table below .
20

OOS AnnualT e of Purchase erm id T e Re uiremen#Annual base-load ] year or greater Competitive Bid S°/a
Seasonal firm Greater than 1 month, Competitive Bid 9 %less than ] year
Mnthly~ base-Ioac~ 1 month Competitive Bid 21 °1~
Daily incremental Dakly Market Offer 32 %(next day, same dayand no-notice )
Actual weather, generating unit availability, and economic purchase power opportunities
will impact these percentages for 2006 . PSO's divexsity in the types of purchases it makes
reduces its exposure to potential daily price vo la ti2ity and secures a reliable supply of natura l gas .
PSO is active in the daily natural gas markets and stays abreast of current market changes ,
including any new potential natural gas suppliers that can be solicited .
PSO currently intends to purchase its annual base load natural gas requirements, or
approximately 38 percent of its natural gas (based on 2005 generation), under contracts having a
term of one year or greater and the remainder of its requirements, 62 percent, on spot suppl y
arrangements which would include seasonal, monthly base load, next-day, no-notice, and same-
day natural gas, as needed . The amount of base load natural gas was determined by taking the
average minimum daily burn (82,000 MMBtus/day) multiplied by 365 days (annual base loa d
requirements) and then dividing by the total annual burn for calendar year 2005 . PSO's natural
gas purchases by transaction type for 2005 were previously provided in Illustration 1 .
Historically, for the sunlmer peak period of June through August, PSO entered into som e
seasonal, base load supply contracts to ensure deliveries of natural gas as a hedge against a
shortage of supply rather than against a change in prices . For the summer of 2006, and i n
addition to its annual base load natural gas requirement of 82, 000 MMBtuslaay, PSO has
obtained seasonal base load supply of 70,000MMBtu/day for the summer months of June, July ,
21

and August . PSO also obtained 5,000 MMBtulday of short-term base load supply for the month s
of April, May, September, and October . PSO has historically obtained incremental daily cal l
natural gas for June through August to ensure supply availability on projected high vo l urz3e burn
days, however, due to pricing considerations, PSO has not entered into arrangements for
incremental call gas for the Plan Year (61240 6 thru 5120 07) , although it still could do so shoul d
prices become more favorable . The reservation fees and adders to index for daily call gas
proposals received from suppliers were excessive when compared to historical summer call gas
transactions and the adders PSO is currently realizing in the daily gas market . PSO expects to
secure less expensive gas supplies in the spot market.
PSO's plan for the winter of 2006-2007 is to start each month with a minimum of 82,000
MMBtus/day of annual base load natural gas and supplement that with monthly base load natural
gas purchases obtained by competitive bid to meet forecasted minimum monthly requirements .
PSO currently has approximately 21 percent of its annual base load natural gas requirement s
secured under fixed-price contracts to mitigate price volatility . Daily natural gas will be
purchased on a competitive basis to follow projected changes in daily load .
PSO typically uses pricing based on the following natural gas price ind2ces ;
Monthly : Inside FER C PEPLInsrde FERC ANRInside FERC OGT
Daily : Gas Daily PEPLGas Daily ANRGas Daily OGT
In general, PSO cannot purchase natural gas below the index price . The index price plus
the current market adder represents the market price for natural gas . PSO has seen a significant
increase in market adders since the storms that occurred during the 2005 hurricane season and
the increase of independent power producer natural gas use in Oklahoma, causing increased
competition for the available natural gas . On occasion, PSO might have an opportunity t o
22
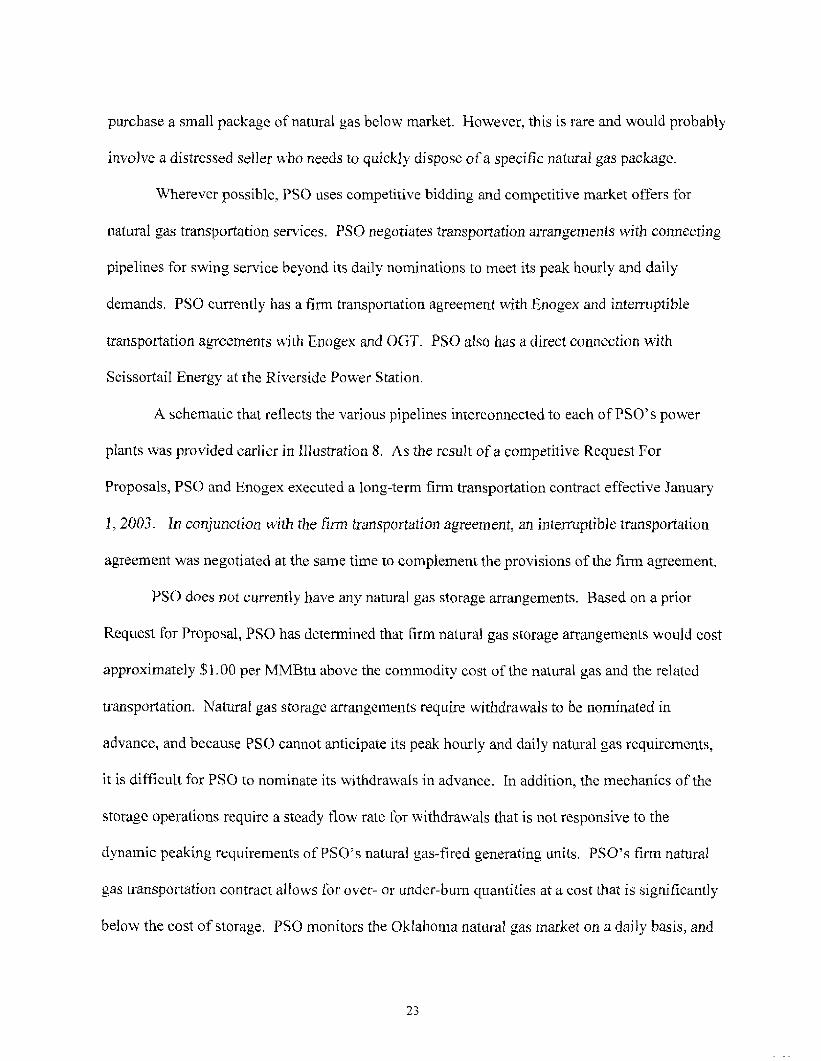
purchase a small package of natural gas below market . However, this is rare and would probabl y
involve a distressed sel ler who needs to quickly dispose of aspecifc natural gas package .
Wherever possible, PSO uses competitive bidding and competitive market offers fo r
natural gas transportation services . PSO negotiates transportation arrangements with connecting
pipelines for swing service beyond its daily nominations to meet its peak hourly and daily
demands . PSO currentiy has a firm transportation agreemerit with Enogex and interruptible
transportation agreements with Enogex and OGT. PSO also has a direct connection with
Scissortail Energy at the Riverside Power Station .
A schematic that reflects the various pipelines interconnected to each of PSO's powe r
plants was provided earlier in Illustration S . As the result of a competitive Request For
Proposals, PSO and Enogex executed a long-term firm transportation contract effective Januar y
1, 2003 . In conjunction with the frm transportation agreement, an interruptible transportatio n
agreement was negotiated at the same time to complement the provisions of the firm agreement .
PSO does not currently have any natural gas storage arrangements . Based on a prior
Request for Proposal, PSO has determined that firm natural gas storage arrangements would cost
approximately $1 . 00 per MM$tu above the commodity cost of the natural gas and the relate d
transportation. Natural gas storage arrangements require withdrawals to be nominated in
advance, and because PSO cannot anticipate its peak hourly and daily natural gas requirements ,
it is difficult for PSO to nominate its withdrawals in advance . In addition, the mechanics of th e
storage operations require a steady flow rate for withdrawals that is not responsive to th e
dynamic peaking requirements of PSO's natural gas-fired generating units . PSO's firm natura l
gas transportation contract allows for over- or under-burn quantities at a cost that is significantly
below the cost of storage . PSO monitors the Oklahoma natural gas market on a daily basis, and
23

will continue to monitor the storage issues and cost, especially if there are any indications o f
supply reliability issues . Through recent discussions with suppliers, PSQ has confirmed tha t
storage still does not represent an economical option for PSQ .
C. Fuel Oil
During periods of high volatility in natural gas prices, PS4 does daily comparison s
between natura] gas and fue l oi l prices to determine the most favorable fuel price option and
burns fuel oil when so indicated . Because fuel oi l is not used as a primary fuel supply for PSO' s
power plants, PSO will continue to purchase its fuel oil requirements on the spot market, b y
competitive bid, on an as-needed basis . PSO procures its fuel oil through requests for written
bids (or oral bids in emergency situations) from its fuel oil suppliers which are then reviewed an d
the lowest cost bid, with acceptable quality and delivery conditions, is selected .
PSO maintains fuel oil inventories at Riverside, Southwestern, and Northeastern fo r
reliability purposes . The target inventory levels are :
Riverside Units I & 2Southwestern Unit 3 :Northeastern Unit 2 :
80,000 barre l s or 3'/Z days supply at 60% load42,500 barrels or 3'/2days supply at 100% load23,500 barrels or 2'/2days supply at 100% loa d
The Riverside plant is also connected to a pipeline capable ofde~ ivering fuel oil .
D . Purchased En ergy
AEPSC, as agent for PSO, is engaged to trade with creditworthy energy companies that
buy and sell over-the-counter electricity in SPP . AEPSC's production optimization group an d
trading group contact and use market offers from other utilities in the area, independent powe r
24

producers, and marketing companies with generation assets in the region, and other marketin g
companies with a trading presence in the Midwest .
AEPSC has developed strong relationships with the SPP utilities, and has leveraged on
the relationships with other utilities in the eastern interconnect . These relationships provide
AEPSC and PSO with opportunities for commercial transactions that on occasion have provided
flexibility in the scheduling process .
AEPSC has a wide coverage of the Midwestern section of the eastern interconnect and
the Dectrrc Re)jabi ltty Council of Texas (ERCOT) market which allows for n umerous marke t
opportunities to purchase power . Illustration 10 provides the external control area ties to PSO .
Illustration 1 0 : PSO/SWEPCO Ex terna l Contro l Areas T ies
25

As previously discussed, as part of its day-ahead resource commitment process and it s
hourly and balance of the day resource dispatch process (lllustrations 6 and 7), PSO routinel y
purchases energy on an economic basis and displaces energy from its own natural gas-fire d
generation when it is able to economically and reliably able to do so .
E. Customer Program s
PSO has offered several programs to assist customers in managing their price volatility
risk, including an average monthly payment plan and its Real Time Pricing tariffs which provide
customers with choices in how to best use electric energy .
VI . Bill Projections and Comparison s
The tables below provide monthly bill projections for Summer 20 06, and Winter 2006 , as
well as the previous year's information .
Winter BillCu stomer Biil* Actua l Estimated Esfimated Projected %C lass and 2005 Price--O/kWh B ill * Price-~/kWh IncreaseUsa e 2005 2006 200G Per kWhResidential- $ 7S .12 7.02 $86.69 8.10 15.4%1070 kWhSmall $129.54 7.36 $148.73 8.45 14.8%t .̀ommercial -17b0 kWh___L
Summer BillCustomer Ml* Actual Estimated Estimated Projected %
Class and 2005 Pr ice--¢IkWh Bill* Price-¢/kWh IncreaseUsa e 2005 2006 2006 Per kWhResidential- $84.09 7.86 $96_83 9.05 15.1 %1070 kWhSmall $151 .42 8.60 $172.51 9.80 14%Cammercial -1760 kWh
26

* Actual and estimated bi l l amounts include Base Service Charge, Energy Charge, FAC, IRCARider, Merger Savings Credit Rider (discontinued on 12/31I05}, and Franchise Fee .
VYI . F inal Comm ents
As stated previously, any fuel procurement, and risk management plan must hav e
multiple concerns or considerations for. reliability, adequacy, flexibility, and price . The
foundation of PSp's risk management plan has been to have a diversified generatian and suppl y
portfolio, which includes coal-fired generation, natural gas-fired generation, fuel-oil generation,
and wholesale energy purchases . Each of these commodities is procured under a competitive
bidding and competitive market offer process . This includes energy purchases to displace energy
from PSO's own-generation when it is able to do so, both economically and reliably . PSO's fuel
supply plan and portfaiio are balanced, yet flexible, which allows PSO to appropriately respon d
to changes in the fuel supply and purchased energy markets, thereby ensuring a reliable fue l
supply at the lowest reasonable cost . As markets develop and change, PSO will review its fue l
procurement activities, and modify them as appropriate, to ensure that any fuel procurement an d
risk management plan continues to meet the standards of reliability, adequacy, flexibility, an d
reasonable cost,
VIIL Contact Information
For questions or additional information, please contact :
Alan W. DeckerRegulatory Services-aklahomaSuite 14001601 Northwest ExpresswayOklahoma City, OK 73118(405) 841-133 8(405) 841 - 1 345 (Facsimile)
27

The Southwest Power Pool ("SPP") has the responsibility for assessing theadequacy of the regional transmission system, and PSO's transmission planning stafffully participates with SPP in their transmission planning activities . The 2006 SPPRegional Expansion plan has not been published as of this date but the scope of the Planis described in Attachment A . The SPP 2006 plan applies to a ten-year planning horizon,from 2006 to 2016 .
The 2005 SPP Expansion plan is included as Attachment B . It covers the periodfrom 2005 through 2010, but does give consideration to conditions for a ten-year period .
In addition to the SPP regional planning process, PSO's transmission planninggroup independently assesses the transmission system and produces a report . The reportis confidential, contains market-sensitive information and is not publicly available . Thereport will be provided upon request under the terms of a protective order .
PSO's proposed transmission lines and substation projects for the years 2007through 2014 are listed in Attachment C . The locations of these facilities have been
redacted . The locations will be provided under the terms of a protective order .

ATTACHMENT A
Southwest Power Pool (S PP ) E xpansion Pl an2006 P roposed Scope
IntroductionThe ma in objective of the SPP RTO Expansion Plan is to create an effective long-rangeplan for the SPP footprint which identifies NERC, SPP and local planning criteriavialations and develops appropriate mitigation plans to meet the reliability needs of theSPP region . In addition, projects which may produce an economic benefit to thestakeholders in the SPP footprint are also evaluated . This process consists of thefollowing steps :
1 . Identification of the reliability based problems (NERC, SPP and local criteriaviolations )
2. Comprehensive assessment of known mitigation plans, an d3. Development of additional mitigation plans to meet the needs of the region and
maintain NERC, SPP and Local reliability/planning standards, and4. Identification of other projects that may provide economic benefit to the system .
The process is an open process and allows for stakeholder input . All study resultsthrough the planning process are being coordinated with other entities/regionsresponsible for transmission needs assessment/planning .
Expansion P lan ObjectivesReliability Planning
• SPP shall plan the SPP Transmission System to meet :o NERC Reliability Standard so SPP Criteriao Local Planning Criteria as requested by Transmission Owner(TO)
~ Address additional needs of the regio n~ Assess mitigation plans proposed by TO (Operating guides andlor new facilities)+ SPP shall track planned system upgrades to ensure reliability projects are built
in time to meet the needs of the system . This will be accomplished through theSPP Project Tracking process .
• SPP shall coordinate regional transmission plans with neighboring entities,regions and RTO's .
Market Need & Economic Benefit Screenin g~ SPP shall identify projects for potential system reinforcements that may provide
an economic benefit to the system .

Assumptions for Reliability Assessmen t
Load Flow Models• SPP shall use the SPP MDWG 2005 Series 2007 Summer Peak, 2007/8 Winter
Peak, 2011 Summer Peak, 2011/12 Winter Peak and 2016 Summer Peak caseswith updates from nearby regions and entities . The cases shall be modified asfollows to create the Base Cases for the Expansion Plan :
o Treatment of transmission owner -Initiafed Project s■ SPP shall remove transmission owner initiated projects within SPP that
have a start of construction date beyond January 1, 2008 . In the eventthat there is a question from the initiating transmission owner regardingthe January 1, 2008 cutoff date for removal of projects, SPP staff willapprove exceptions .
■ All Proposed and Exploratory projects shall be removed from themodels
o Treatment of previous SPP RTO Expansion Plan Projects■ SPP staff shall remove previous SPP RTO Expansion Plan projects
that have a start of construction date beyond January 1, 2008 . In theevent that there is a question regarding the January 1, 2008 cutoff datefor removal of projects, SPP staff will approve exceptions .
o Treatment of SPP Aggregate Study (Attachment Z) Project s■ SPP staff shall remove SPP Aggregate Study Projects that have a
required start of construction date beyond January 1, 2008 . In theevent that there is a question regarding the January 1, 2008 cutoff datefor removal of projects, SPP staff will approve exceptions .
■ SPP staff shall include all SPP Aggregate Study Projects that havesigned contracts and have an in-service date prior to January 1, 2008 .
Stability Models• SPP Staff shall use the SPP 2005 Series MDWG 2007 Winter Peak stability model .
o Remove Proposed and Exploratory project so Include all SPP Aggregate Study Projects that have signed contracts and have
a completion date prior to January 1, 2008 .
Methodology for Reliability Assessmen t
Steady State Analysi s• Monitoring of Facilitie s
o SPP staff shall monitor all facilities in the SPP footprint 69 kV and above .a With the exception of Entergy (EES) and Associated Ekectric (AECI), SPP staff
shall monitor all facilities in first tier control areas 230 kV and above . WithinEES and AECI, facilities shall be monitored at 100 kV and above .
• The 2007 Summer Peak case and 2007/8 Winter Peak case shall be used to helptime projects prior to 2011

Summer Peak Analysis - Contingency analysis shall be performed on the 2011Summer Peak case (including all transaction cases) and the 2016 Summer Peakcase (including all transaction cases) .
o All NERC Reliability Standard for transmission planning, Table 1 category Bcontingencies 69 kV and above in SPP will be evaluated . These contingenciesdo not include manual transfer of load or manual switching .
o All NERC Reliability Standard for transmission planning, Table I category Bcontingencies 100 kV and above in EES and AECI will be evaluated .
o For other first tier areas, all NERC Reliability Standard for transmissionplanning, Table 1 category B 230 kV and above contingencies will beevaluated .
o SPP will verify that all violations identified have reinforcement planso SPP will verify that all category A and B violations identified have
reinforcement plan sWinter Peak Analysis - Contingency analysis shall be performed on the 2011/12Winter Peak case (including all transaction case s
o All NERC Reliability Standard for transmission planning, Table 1 category Bcontingencies 69 kV and above in SPP will be evaluated . These contingenciesdo not include manual transfer of load or manual switching .
o All NERC Reliability Standard for transmission planning, Table I category Bcontingencies 100 kV and above in EES and AECI will be evaluated .
a For other first tier areas, all NERC Reliability Standards for transmissionplanning, Table 1 category B 230 kV and above contingencies will beevaluated .
o Within SPP, automatic bus outages for 345 kV and above buses (Bus sectionC-1) will be conducted TO will verify if the contingency is valid .
o Within SPP, automatic double lines outages from 345 kV buses (Breakerfailure C-2) will be conducted . TO will verify if the contingency is validcategory C and D contingency list which shall also include tower outages .
o SPP will verify that all category A, B and C violations identified havereinforcement plan s
Stabilitv Analysis• SPP staff shall provide a list of past studies to stakeholders to determine what
contingencies to evaluate .• Stakeholders shall provide SPP staff a priority list of category B, C and D
contingencies to evaluate .• Based on recommendations from stakeholders, SPP staff and TWG shall determine
the appropriate contingencies to evaluate .• The 2007108 Winter Peak stability case shall be used to evaluate the stability of the
system

Voltage Stability Analysi s• Stakeholders shall provide input to SPP staff regarding potential voltage stability
problems .• SPP staff will screen for stability problems by reviewing load flow results for low
voltage, non-converged cases, and voltage deviations of 5% .• SPP staff and TWG will determine what contingencies to evaluate using either a PV
or QV analysis .• SPP staff will perform a reactive margin/reserve stud y
o Use 2011 Summer Peak base case, and list VAR reserves in each contro larea .
o Use 2011 Summer Peak base case and produce additional cases by removin gthe largest unit in significant load areas .
o SPP staff will screen the above cases for potential voltage stability problem byrunning 230 kV and above contingencies for all facilities in the SPP footprint .
o SPP staff will identify generators that are at their var limits .o SPP staff will perform a P-V analysis on selected contingencies, as identified
by the screening analysis .
Use of Opera#inq Guides• The Steady State analysis will identify all violations without the use of operating
guides/directives .• Operating guides/directives may be used as alternatives to planned projects . Load
flow analysis will be performed to determine the effectiveness of the operating guidein alleviating the violation(s) .
• SPP staff will determine all reinforcements that are needed to eliminate operatingguides/directives used in alleviating violation(s) . A fist of reinforcements that are nolonger required due to operating guides will be included in the report .
Market Need & Economic Benefit Screen ing• Solicit stakeholder inpu t• Conduct preliminary screen of projects• Post results~ Additional investigation and study will be conducted once interest has been
expressed (willingness to build)

ATTACHMENT B
SPP RTO Expansion Plan 2005-201 0
QDDutbwestPower Pool
SPP RTOExpansion Plan
2005-20 1 0
Prepared by SPP StaffSPP Engineering Planning
As approved by TWG : September 14, 2005

SPP RTO Expansion Plan 2005-2010
Table of Contents
H isto ry . . . . . . . . . . . . . . . . . . . . . . . . . . . . . . . . . . . . . . . . . . . . . . . . . . . . . . . . . . . . .. . . . . . . . . . . . . . . . . . . . . . . . . . . . . . . . . . . . . . . . . . . . . . . . . . . . . . . . . . . . . . . . . . . . . . . . . . . . . . . . . . .. . . . . . . . . . 3
Executive SummarY . . . . . . . . . . . . . . . . . . . . . . . . . . . . . . . .. . . . . . . . . . . . . . . . . . . . . . . . . . . . . . . . . . . . . . . . . . . . . . . . . . . . . . . . . . . . . . . . . . . . . . . . . . . . . .. . . . . . . . . . . .. . . . . . .. . . 6
Phase 1 : Rel i ability . . . . . . . . . . . . . . . . . . . . . . . . . .. . . . . . .. . . . . . . . . . . . . . . . . . . . . . . . . . . . . . . . •• --- . . . . . . . . . . . . . . . . . . . . . . . . . . . . . . . . . . . . . . . . . . . . . .. . . . . . .. . . . . . . . . . 8
Introduction and Scope of Analysis . . . . . . . . . . . . . . . . . . . . . . . . . . . . . . . . . . . . . . . . . . . . . . . . . . . . . . . . . . . . . . . . . . . . . . . . . . . . . . . . . . . . . . . . . . . . . . . . . . . . . . . . . . 8. . . . . . . . . . . . . . . . . . . . . . . . . . . . . . . . . . . . . . . . . . . . . . . . . . .Introduction . . . . . . . . . . . . . . . . . . . . . . . . . . . . . . . . . . . . . . . . . . . . . . . . . . . . . . . . . . . . . . . . . . . . . . . . . . . . . . . . . . . . . . . . $
Scope . . . . . . . . . . . . . . . . . . . . . . . . . . . . . . . . . . . . . . . . . . . . . . . . . . . . . . . . . . . . . . . . . . . . . . . . . . . . . . . . . . . . . . . . . . . . . . . . . . . . . . . . . . . . . . . . . . . . . . . . . . . . . . . . . . . . . . . . . . . . . . . . . . . 9Contingency 5imulatians . . . . . . . . . . . . . . . . . . . . . . . . . . . . . . . . . . . . . . . . . . . . . . . . . . . . . . . . . . . . . . . . . . . . . . . . . . . . . . . . . . . . . . . . . . . . . . . . . . . . . . . . . . . . . . . . . . . . 10Stab i lity Simulations . . . . . . . . . . . . . . . . . . . . . . . . . . . . . . . . . . . . . . . . . . . . . . . . . . . . . . . . . . . . . . . . . . . . . . . . . . . . . . . . . . . . . . . . . . . . . . . . . . . . . . . . . . . . . . . . . . . . . . . . . . . 11Fault Study . . . . . . . . . . . . . . . . . . . . . . . . . . . . . . . . . . . . . . . . . . . . . . . . . . . . . . . . . . . . . . . . . . . . . . . . . . . . . . . . . . . . . . . . . . . . . . . . . . . . . . . . . . . . . . . . . . . . . . . . . . . . . . . . . . . . . . . . . 1 1
Findings . . . . . . . . . . . . . . . . . . . . . . . . . . . . . . . . . . . . . . . . . . . . . . . . . . . . . . . . . . . . . . . . . . . . . . . . . . . . . . . . . . . . . . . . . . . . . . . . . . . . . . . . . . . . . . . . . . . . . . . . . . . . . . . . . . . . . . . . . . . . . . . . . . 11Stability F i ndings . . . . . . . . . . . . . . . . . . . . . . . . . . . . . . . . . . . . . . . . . . . . . . . . . . . . . . . . . . . . . . . . . . . . . . . . . . . . . . . . . . . . . . . . . . . . . . . . . . . . . . . . . . . . . . . . . . . . . . . . . . .. . . . . . .Summa ry o f Load Flow F i ndings . . . . . . . . . . . . . . . . . . . . . . . . . . . . . . . . . . . . . . . . . . . . . . . . . . . . . . . . . . . . . . . . . . . . . . . . . . . . . . . . . . . . . . . . . . . . . . . . . . . . . . . . 1 1Violations and Ma jor Problem . . . . . . . . . . . . . . . . . . . . . . . . . . . . . . . . . . . . . . . . . . . . . . . . . . . . . . . . . . . . . . . . . . . . . . . . . . . . . . . . . . . . . . . . . . . . . . . . . . . . . . . . . . . . 15
Recommendat j ons . . . . . . . . . . . . . . . . . . . . . . . . . . . . . . . . . . . . . . . . . . . . . . . . . . . . . . . . . . . . . . . . . . . . . . . . . . . . . . . . . . . . . . . . . . . . . . . . . . . . . . . . . . . . . . . . . . . . . . . . . . . . . . . . . . 1 6Major Projacts. . . . . . . . . . . . . . . . . . . . . . . . . . . . . . . . . . . . . . . . . . . . . . . . . . . . . . . . . . . . . . . . . . . . . . . . . . . . . . . . . . . . . . . . . . . . . . . . . . . . . . . . . . . . . . . . . . . . . . . . . . . . . . . . . . . . . 16
. . . . . . . . . . . . . . . . . . . . . . . . . . . .Summary of Projects . . . . . . . . . . . . . . . . . . . . . . . . . . . . . . . . . . . . . . . . . . . . . . . . . . . . . . . . . . . . . . . . . . . . . . . . . . . . . . . . . . . . . . . . . . . . . . 32Complete Li st of Recommended Projects . . . . . . . . . . . . . . . . . . . . . . . . . . . . . . . . . . . . . . . . . . . . . . . . . . . . . . . . . . . . . . . . . . . . . . . . . . . . . . . . . . . . . . . . . . 34
Out of Cycle Projects - Project Tracking . . . . . . . . . . . . . . . . . . . . . . . . . . . . . . . . . . . . . . . . . . . . . . . . . . . . . . . . . . . . . . . . . . . . . . . . . . . . . . . . . . . . . . . . . . . . . . . . 35Operati ng GuideslD i rectives . . . . . . . . . . . . . . . . . . . . . . . . . . . . . . . . . . . . . . . . . . . . . . . . . . . . . . . . . . . . . . . . . . . . . . . . . . . . . . . . . . . . . . . . . . . . . . . . . . . . . . . . . . . . . . . . . . . 35
Phase II: Market Assessment . . . . . . . . . . . . . . . . . . . . . . . . . . . . . . . . . . . . . . . . . . . . . . . . . . . . . . . . . . . . . . . . . . . . . . . . . . . . . .. . . . . . . . . . . . . . . . . . . . . . . . . . . . . . . . . . . .37
Objective . . . . . . . . . . . . . . . . . . . . . . . . . . . . . . . . . . . . . . . . . . . . . . . . . . . . . . . . . . . . . . . . . . . . . . . . . . . . . . . . . . . . . . . . . . . . . . . . . . . . . . . . . . . . . . . . . . . . . . . . . . . . . . . . . . . . . . . . . . . . . . . . . 37Economic Plann i ng . . . . . . . . . . . . . . . . . . . . . . . . . . . . . . . . . . . . . . . . . . . . . . . . . . . . . . . . . . . . . . . . . . . . . . . . . . . . . . . . . . . . . . . . . . . . . . . . . . . . . . . . . . . . . . . . . . . . . . . . . . . . . . . . . 37
Economic Modeling Assumptions . . . . . . . . . . . . . . . . . . . . . . . . . . . . . . . . . . . . . . . . . . . . . . . . . . . . . . . . . . . . . . . . . . . . . . . . . . . . . . . . . . . . . . . . . . . . . . . . . . . . . . 38Project Screening . . . . . . . . . . . . . . . . . . . . . . . . . . . . . . . . . . . . . . . . . . . . . . . . . . . . . . . . . . . . . . . . . . . . . . . . . . . . . . . . . . . . . . . . . . . . . . . . . . . . . . . . . . . . . . . . . . . . . . . . . . . . . . . . . . . 40Detailed Analysis . . . . . . . . . . . . . . . . . . . . . . . . . . . . . . . . . . . . . . . . . . . . . . . . . . . . . . . . . . . . . . . . . . . . . . . . . . . . . . . . . . . . . . . . . . . . . . . . . . . . . . . . . . . . . . . . . . . . . . . . . . . . . . . . . . . . 4 1
Tulsa East Switching Stat i on . . . . . . . . . . . . . . . . . . . . . . . . . . . . . . . . . . . . . . . . . . . . . . . . . . . . . . . . . . . . . . . . . . . . . . . . . . . . . . . . . . . . . . . . . . . . . . . . . . . . . . . . . . . . . . 42Sooner-Cle veland 345 kV Line . . . . . . . . . . . . . . . . . . . . . . . . . . . . . . . . . . . . . . . . . . . . . . . . . . . . . . . . . . . . . . . . . . . . . . . . . . . . . . . . . . . . . . . . . . . . . . . . . . . . . . . . . . . 45Rose Hill-Sooner 345 kV L i ne . . . . . . . . . . . . . . . . . . . . . . . . . . . . . . . . . . . . . . . . . . . . . . . . . . . . . . . . . . . . . . . . . . . . . . . . . . . . . . . . . . . . . . . . . . . . . . . . . . . . . . . . . . . . 48Tolk-Potter 345 kV Line . . . . . . . . . . . . . . . . . . . . . . . . . . . . . . . . . . . . . . . . . . . . . . . . . . . . . . . . . . . . . . . . . . . . . . . . . . . . . . . . . . . . . . . . . . . . . . . . . . . . . . . . . . . . . . . . . . . . . . 51Project Comparison/Sensitivity Analysis . . . . . . . . . . . . . . . . . . . . . . . . . . . . . . . . . . . . . . . . . . . . . . . . . . . . . . . . . . . . . . . . . . . . . . . . . . . . . . . . . . . . . . . . . . . . 54
Economic Upgrades . . . . . . . . . . . . . . . . . . . . . . . . . . . . . . . . . . . . . . . . . . . . . . . . . . . . . . . . . . . . . . . . . . . . . . . . . . . . . . . . . . . . . . . . . . . . . . . . . . . . . . . . . . . . . . . . . . . . . . . . . . . . . . . 54
Next SPP RTO Planning Cycle . . . . . . . . . . . . . . . . . . . . . . . . . . . . . . . . . . . . . . . . . .. . . . . . . . . . . . . . . . . . . . . . • -•-----•--, . . . ., .---~ . . . . . . . . . . . . . . . . . . . . . . . . . . .56
Appendix A: List of Prajects . . . . . . . . . . . . . . . . . . .•--• . . . . . . . .. . . . . ---------•-------• . . . . . . . . . . . . . . . . . . . . . . . . . . . . . . . . . . . . . . . . . . . . . . . . . . . . . . . . . . . . . .58
Project Identification . . . . . . . . . . . . . . . . . . . . . . . . . . . . . . . . . . . . . . . . . . . . . . . . . . . . . . . . . . . . . . . . . . . . . . . . . . . . . . . . . . . . . . . . . . . . . . . . . . . . . . . . . . . . . . . . . . . . . . . . . . . . . . . 58Forms 1 - Transmission Lines and Transformers . . . . . . . . . . . . . . . . . . . . . . . . . . . . . . . . . . . . . . . . . . . . . . . . . . . . . . . . . . . . . . . . . . . . . . . . . . . . . . . . . . 59Forms 2 - Dev ices and Loads . . . . . . . . . . . . . . . . . . . . . . . . . . . . . . . . . . . . . . . . . . . . . . . . . . . . . . . . . . . . . . . . . . . . . . . . . . . . . . . . . . . . . . . . . . . . . . . . . . . . . . . . . . . . . . . . 67Forms 3 - Generators . . . . . . . . . . . . . . . . . . . . . . . . . . . . . . . . . . . . . . . . . . . . . . . . . . . . . . . . . . . . . . . . . . . . . . . . . . . . . . . . . . . . . . . . . . . . . . . . . . . . . . . . . . . . . . . . . . . . . . . . . . . . . 69
Append ix B : Maps with Crite ria Violat i ons above 1 00 kV. . . . . . . . . . . . . . . . . . . . . . . . . . . . . . . . . . . . . . . . . . . . . . . . . . . . . . . . . . . . . . . . . . . . .70
Appendix C : List of Screened Projects and Rank ing . . . . . . . . . . . . . . . . . . . . . . . . . . . . . . . . . . . . . . . . . . . . . . . . . . . . . . . . . . . . . . . . . . . . . . . . . .. . 8 7
2 Sep 2005

SPP RTO Expansion Plan 200 5 -2010
History
Southwest Power Pool, Inc . (SPP) has been involved in regional planning for decades . SPP didnot wait for Regional Transmission Organization (RTO) designation to formalize a morecomprehensive, open and transparent planning process to address transmission expansion needs
within the SPP footprint . The SPP Open Access Transmission Tariff (OATT) contains
procedures in Attachment 0 describing the coordinated planning process .
The Transmission Working Group (TWG) has been assigned primary responsibility for theregional planning process . The TWG consists of both transmission owning and non-transmissionowning members . Meetings are open and agendas are posted on the SPP web site(www.spp.org) . SPP stakeholders are encouraged to actively participate in the regional planningprocess to ensure that the recommended expansion plans are the best solutions in and around the
SPP footprint .
SPP, as a regional reliability council, has coordinated planning for many years . SPP staff hashistorically performed regional assessments of the transmission system and coordinated studiesfor SPP transmission owners . This process was included in the Tariff upon the addition of long-term transmission service on April 1, 1999 .
SPP has performed or participated in many recent regional expansion studies . During 2000, SPP
began a Bulk Extra High Voltage (EHV) Transmission Study. This study identified potential
upgrades to relieve known constraints in the SPP region . The Bulk EHV Transmission Study wascompleted in two phases during 2001 . SPP then followed up that study by participating in the
Midwest ISO Transmission Expansion Plan (MTEP) during 2002 and 2 003 . Up until the MISO-SPP merger termination in early 2003, SPP staff and resources in Little Rock provide dleadership and significant support to the MTEP effort . The initial MISO study was completed inJune of 2003 with SPP considered as a sub-region . SPP continues to support model buildingefforts and inter-regional studies with neighboring North American Energy Reliability Council(NERC) regions and other entities responsible for the planning and operations of the bulk electrictransmission system.
It is important to note that SPP's planning process has been effective in planning and expandingthe transmission system in the past several years . SPP has maintained a reliable transmissionsystem through active review and engineering assessment. SPP has upgraded 45 transmissionfacilities through the regional Tariff in the five years this process has been in place . A primeexample of the effectiveness in regional planning was SPP's ability to upgrade the LaCygne-Stilwell 345 kV line . In only 27 months, the project went from concept to completion and fu llcost-recovery without impact to retail or wholesale customers . This line was identified as one ofthe key constraints in the Eastern Interconnection in the Federal Energy Regulatory Commission
(FERC) 2001 : Electric Transmission Constraint Study, Division of Market Development .LaCygne-Stilwell was the only SPP facility identified as a limit in the study . SPP transmissionowners, through the regional planning process, reached agreement on benefit and cost support toupgrade this key limitation [FERC Docket ER03-547-000] . An innovative transmission upgrad e
Sep 2005

SPP RTO Expansion Plan 2005-201 0
approach was used, and construction was completed ahead of schedule, providing for increasedSPP reliability and transmission system capacity for 2003 and beyond . The LaCygne-Stilwellupgrade would not have occurred without a functioning regional planning process .
SPP as an RTO is responsible for planning and for directing or arrang ing necessary transmission
expansions, additions and upgrades that will enable it to provide efficient, reliable and non-discriminatory transmission service . It also coordinates such efforts with appropriate stateauthorities . SPP has been proactive in its transmission expansion planning efforts which continueto evolve over time . In November 2003, SPP formally kicked off its new, expanded process at
the first SPP Regional Planning Summit .
SPP, through the TWG, has designed a formal process for planning and expansion thatencourages open participation for market-motivated solutions to relieve congestion. SPP staff isresponsible for development of the SPP RTO Expansion Plan . SPP continues to work with stateregulatory agencies and legislators to ensure that the regional planning process addresses allneeds. With time, the Regional State Committee (RSC) is more involved in the transmissionexpansion planning process at SPP. The SPP planning and expansion process will be coordinated
and integrated with programs of existing regional transmission groups .
SPP has a history of coordination with existing regional transmission groups through its effortswith coordination agreements and information exchange, and SPP will continue these activitiesas an RTO. This coordination is demonstrated by SPP's past and continuing participation withthe MTEP as well as with Southeastern Electric Reliability Council's VST model buildingefforts. The SPP RTO Expansion Plan includes all transmission facility expansion in the regionand attempt to assess the combined effect on loop flows and reliability of all existing andplanned facilities .
In early 2004, SPP initiated a special study of transmission expansion plans for theKansas/Panhandle sub-region of SPP . SPP staff continues to evaluate the benefits of severalEHV transmission expansion projects to improve imports/exports for the Kansas/Panhandle sub-region which has significant potential to provide demand and energy from wind farmdevelopments . SPP is expanding its capabilities with the recent installation/training ofPawerWorld and Global Energy's MarketSym tools for evaluating the market and commercialbenefits of system expansion alternatives .
Much has happened recently regarding planning at SPP . In fact, FERC in their initial orderregarding SPP's RTO filing was supportive of SPP's planning efforts (Dockets RT04-1-00 andER04-48-00) . The FERC order in paragraph 185 states :
We commend SPP for its efforts in updating its transmission planning and expansionprocess . SPP is currently reviewing this function with an eye toward making the processmore open and partrcipatory and is evaluating a two year planning cycle with the firsiyear's focus on reliability and the second year's focus on market needs . The current draftof this cycle calls for approval of the transmission plan on September of the second year .
4 Sep 2005

SPP RTO Expansion Plan 2005-2010
We believe SPP's efforts here are a critical first step toward a regional assessment oftransmission needs and strongly support its proactive efforts.
The SPP RTO expansion planning process will continue to evolve as SPP moves forward as anRTO . SPP has created a dedicated webpage at h ttp://www.spp.org/Ob'ects/En g ineer .cfm to postnumerous public documents regarding the SPP RTO Expansion Plan and analysis results . Allstakeholders are required to fill out a stakeholder ID form, sign a confidentiality agreement andreturn the forms to SPP to obtain access to the regional planning models and project data that areshared on SPP's E-Room .
SPP management has stated that a key RTO objective is transmission expansion opportunities .System expansion that is needed to address reliability requirements, as well as provide economicbenefits, will be developed and implemented in an efficient and effective manner as a result ofthe SPP RTO Expansion Plan,
Sep 2005

SPP RTO Expansion Plan 2005-2010
Exec ut ive S um ma rySPP began the initial RTO expansion planning process in late 2003 . The SPP RTO expansionplanning process is open and collaborative using regional planning summits to present theprocess, discuss results and collect feedback . The regional planning summits were well attendedby a variety of attendees including : regulators, SPP transmission owners, transmission ownersfrom other regions, members of the Wind Coalition, load serving entities, consulting firms and
independent system operators .
Phase I of this report, titled SPP RTO Expansion Plan, SPP addressed reliability violations andrecommended projects to meet planning standards . The projects identified in Phase I spanOctober 2003 through December 2010, and the SPP system requires an investment totaling $552million. The estimated line mileage for new transmission lines for this period totaled 634 miles,while rebuilds/upgrades totaled 646 miles . The project types are illustrated in Figure 1 .
1 : Transmission Expansion Projects (October 2003 - December 201
Transmission Expansion Projects (October 2003- December 2010 )Total $552 Million
5% 7%
20%
! New Lines
❑ New Transformers
❑ Line RebuildlUpgrade so TransformerlSubstation Uqca r
46%
15%
■ New Caps/Reactors/Devices❑ New HVDC
The major 345 kV projects over the study period are as follows :• 105 mile Finney-Lamar 345 kV line and high voltage direct current (HVDC) tie -
December 2004
• Oklahoma Gas and Electric Company (OGE) Draper 345/138 kV transformer - June200 5
• American Electric Power (AEP) 14 mile Chamber Springs-Tontitown 345 kV line - June2007
• AEP 22 mile Flint Creek-East Centerton 345 kV line - June 201 0
Only 100 kV and above contingencies were evaluated ; as a result, the $552 million project costdoes not include al169 kV projects required to meet the planning standarcis . New or advancedprojects identified by the SPP RTO Expansion Plan process equal $172 million of the $552million .
6 Sep 2005

SPP RTO Expansion Plan 2005-2 0 1 0
A market assessment was conducted during Phase II of the SPP RTO Expansion Plan todetermine potential projects for system reinforcement . Potential projects were identified from avariety of resources including stakeholder feedback, review of past transmission line loadingrelief, refused long-term transmission reservations and suggestions from summit participantsduring the Planning Summit 111 . Thirty three projects were screened to determine the top fourprojects with the best cost to benefit ratio . These projects were further studied by doing completeseasonal economic runs for 2005 and 2010 . The top four projects are as follows ;
+ Tulsa East Switching Station
+ Sooner-Cleveland 345 kV line
• Rose Hill-Sooner 345 kV line
+ Tolk-1'otter 345 kV line
Detailed analysis of the four projects showed that the projects each have approximately 10-yearreturn on investment . The Sooner-Cleveland 345 kV line had the best cost to benefit ratio .Summit participants showed interest in all four projects . A proposed economic upgrade processwas presented at the Regional Planning Summit IV .
At Summit IV, it was recommended that an Economic Modeling and Methods Task Force beformed. This task force will review basic model assumptions, solution techniques, etc . and makerecommendations for improvements to future economic planning analyses .
SPP intends to publish the SPP RTO Expansion Plan after receiving approval from the Board ofDirectors during the fourth quarter of 2005 . Through the collaborative process, the TransmissionWorking Group (TWG) has overseen the development of the plan and will present a draft to theSPP Markets and Operations Policy Committee (MOPC) . After review by the MOPC, the planwill be presented to the Board for approval . The Board approved Phase I afthe SPP RT OExpansion Plan in April, 2005 .
After initial review of Phase I, SPP recommended changing the two year planning cycle to 18-months . Figure 50 shows the proposed 18-month SPP RTO planning cycle . Under the newprocess, the SPP Board would approve the reliability projects within one year from the studystart date . Another key item of the new 18-manth cycle is the first cycle will be in sync with theSPP Model Development Working Group (MDWG) model building effort, whereas the secondcycle will use Models on Demand (MOD) .
Appendix A of this report contains a list of all projects . The projects are divided into threecategories including Board approved projects (Phase 1- April 2005), approved out of cycleprojects and out of cycle projects pending evaluation . The project lists will be revised quarterlyto include project updates .
Sep 2005

SPP RTO Expansion Pla n
Ph ase 1 : Rel iab i lity
lntroduction and Scope of Anal sis
zoos-ZO i o
Introduction
SPP adopted a two-year planning cycle . The planning cycle and important milestones areillustrated on Figure 2 . SPP intends to shorten the planning cycle as the planning processmatures .
The SPP expansion planning process is open and participatory, and stakeholder inputs arewelcomed. The basic premise of the expansion planning process is to ensure transmission systemreliability through compliance with planning criteria while creating an effective long-range plan .
The long-range plan includes a comprehensive assessment of mitigation plans to maintainplanning standards .
The SPP RTO Expansion Plan is divided into two phases . Phase I of the SPP RTO ExpansionPlan focuses on reliability needs, and Phase IC weighs market needs related to an economicexpansion plan . All study results are being coordinated with other entities responsible fortransmission needs assessment and planning .
ure 2 : SPP RTO Expa nsion P lanning Process (2-Year Cyiyear _ 7 Year 0 Relvabd u y Assess menc
_ "'►
Nov ! - Dec.3l ]an 1-Fe6 10 Feb 12- May 1 9
PI anning SPP Plannsssg
8Wittitr Models SPP l dennfies !un 3Year I - 1 0
~RC lAIz
tffface &
1 SnL'c PoweeMiogation CLeview Plgnr,ing
San 1- Feb 10 1'ear LI OProblerta a
t SumrtutT.O
Sub-Regional &
Construct~on Regional L evel
For m Roll iln
I !
SI,v l - F eb 2 8
L
SPP MDW G
Ma del pevelopmeat
Nov 3
OASISposyi ng
May 3
OASIS
posting
Year 0 Year I- Myke[ Assessnunt
I ➢ec 1 Dec 2~ Jen I Jan 2-7an , 3
Sub-Regional PlanningPlanning Sumirnt OASI S
Sumrtrit H Feedback posting
Jua 1 ]un z_ 3un 30 Jul l- Aug. 31
R¢pjnnal Planning SPP Finalizes
Planning:1, ~ Sumr~t ExpansionPlali
5ununit Peedbaclc
Iun 4- Oa 1
Prelimirary
Sol utwn
Maz. 1 Mu 2- M ar 31 Apr 1 - May 1
Market Refi neSolutwq SPF Devwlops Draftsessnrnt Evaluate Smpe Expansion Pjan
Sep . I Sep 2 - Oa. 31
Budgering & Scoping~ ~~p P~ for Yeais 2-5 &
Out of Cyclc Projccts
Models and data created for the planning process are stored in SPP's non-public E-Room . SPPmembers are bound by SPP Bylaws, Membership Agreement and Code of Conduct . Non-
8 Sep 2005

SPP RTO Expansion Plan 2005-201 0
members are required to sign a Non-Disclosure Agreement to receive study models and results .Non-members are also required to fill out an identification form to access the data and models .
Scope
Phase 1 is intended to provide an independent assessment of expansion plans required by SPP in
order to meet NERC, regional and local planning standards . The study will review the summer
peak conditions for 2005 through 2010 . Major projects recommended through the reliabilityassessment are also being evaluated for 2013 summer peak conditions to verify the long-term
effectiveness of these projects .
Model updates are performed at the beginning of the planning process . SPP members providemodel updates through the SPP NIDWG model-building process . The SPP MDWG 2004 models(update two) were used as the starting load flow model . Outside regions provided model updates
to SPP . Updates were made to both the stability and load flow models . In addition to the basemodels for 2005 and 2010 summer peak, SPP created additional load flow models that includelong-term firm, confirmed reservations plus rollovers that are not usually modeled in the basemodels . If these transactions were scheduled they cause a bias across the SPP region . Many ofthese transactions cross the SPP interfaces. Three scenarios were created for each test year, firstbeing transaction case one (Ti) which simulates a west to east bias flow, second beingtransaction case two (T2) which simulates an east to west bias flow and third being transactioncase three (T3) which is a hybrid flow that consists of west to east bias and Southwestern PublicService (SPS) importing .
A consistent treatment of projects within the SPP footprint and neighboring systems wasrequired before performing a reliability needs assessment . Three project categories wereproposed by SPP staff- planned, proposed and exploratory .
Planned - A planned project is driven by system needs and is the recommended solutionamong all evaluated projects . Planned projects are commitments that have little, if any,outstanding issues that could delay implementation past the expected in-service date . Plannedprojects should be included in load flow as part of the baseline . Typically, planned projectswould not require pending approvals such as budget, permitting, site or regulatory . Inaddition, equipment procurement and installation are not of concern .
Proposed - A proposed project is one for which a need has been identified and is the best-known alternative but has not yet received adequate approvals . A proposed project would notbe included in the baseline load flow but would be cons idered when evaluating solutions toidentified problems . Such projects have been identified as preferred solut ions but have yet toreceive budgetary, siting, permitting, regulatory or other necessary approvals . Equipmentprocurement and installation are not a concern for proposed projects .
• Exploratory - An exploratory project is one for which a system need has been identified butalternatives and details have not been fully investigated . Exploratory projects would not b e
9 Sep 2005

SPP RTO Expansion Plan 2005-201 0
included in the baseline load flow but would be considered when evaluating solutions toidentified problems. Exploratory projects are conceptual in nature . They are typicallyvisionary EHV transmission projects for addressing potential system needs . These projectshave little, if any, approvals . Despite these unknowns, procurement and installation of theproject by the target need date should not cause concern .
All of the proposed and exploratory projects that were in the model and part of the model updateprocess were removed . This was done to test the system and determine the appropriatereinforcennent . The proposed and exploratory projects, as well as other projects recommended bystakeholders and SPP staff, provided a pool of possible solutions to the identified prohlems .Expected system reinforcements that met the definition of planned projects were incorporatedinto neighboring regions' MMWG models to create a consistent baseline topology for SPP'sreliability assessment .
Contingency Simulation sTransmission facilities in the SPP footprint along with first tier companies were tested usingNERC Table lA guidelines . Updates to the contingency list were received from SPP membersand first tier companies . NERC defines system outages in four different categories :
Category A :Category B :Category C :
Category D :
System intact, no disturbanceLoss of a single elementLoss of two or more elements (normal clearing, manual systemadjustments between events), bus fault, single line to ground (SLG) faultwith breaker failure, etc .Extreme events, loss of two or more elements, three-phase fault withbreaker failure, loss of tower with three ore more circuits, loss of allgeneration in a station, etc .
SPP uses the most restrictive criteria for contingency analysis . If a transmission owner has morerestrictive criteria than the SPP or NERC criteria, SPP will perform the analysis using thetransmission owner's criteria . For example, SPP's voltage criteria requires load serving bus
voltages to be in the range of ±10% of nominal voltage for Category B outages, while KansasCity Power and Light (KCPL) has requested SPP monitor KCPL's buses for ±5% of nominalvoltage for a Category B outage . However, Westar requested that SPP use the SPP criteria ratherthan Westar's more restrictive criteria because this was a regional study .
Contingency analyses were performed for facilities above 100 kV, all generators in SPP,Associated Electric Cooperative, Inc . (AECI) and Entergy. Contingency analyses were alsoperformed for facilities above 23 0 kV in SPP's first tier control areas as well as other first tiercompanies . Modeled facilities 69 kV and above were monitored for overloads and voltageviolations in SPP. SPP monitored Entergy and AECI facilities above 1 00 kV plus other first-tiercompanies with 230 kV and above .
10 Sep 2005

SPP RTO Expansion P lan
Stabil i ty S imulations
2005-201 0
SPP solicited input from stakeholders and transmission owners to list potential stabilitysimulations . Stability analyses were performed on the more severe Categories C and D outages .Knowing that stability analysis requires a great deal of time and resources, SPP staff requested
the help of SPP stakeholders at TWG meetings to prioritize the list of stability simulations .
Fault Study
A basic three-phase fault study was performed on locations where system improvements wereproposed. Results were shared with transmission owners to determine whether further fault
studies are required . It is important to note that breaker replacements, due to an increase in faultcurrents, have not been included in the final list of SPP expansion projects .
Find inqs
The results in this section reflect the findings discovered using 2 005 summer case and 2010summer case peak load simulations . No attempt was made to identify when reliability violationswould occur between 2005 and 2010, Project timing was determined in the solutions phase of theplanning process .
Stability FindingsSPP reviewed the list of past studies completed by transmission owners and other reliabilityorganizations . SPP also assessed the list of requested Categories C and D contingencies providedby stakeholders . After reviewing this information, SPP determined nine contingencies to beevaluated in more detail . Eight of the contingencies are to be evaluated for dynamics stability
and one for voltage stability . Six of the contingencies were NERC Category C events and threewere NERC Category D events . The stability simulations show that one of the Category C andone of the Category D contingencies would be unstable . It was determined that the unstableCategory C would be stable with the use of an operating procedure . For the unstable Category Dcontingency, it was determined that due to the low probability of the event occurring and the factthat it posed no regional security problem, no action was recommended .
Summary of Load Flow Fin d ingsSPP evaluated 7,775 contingencies in the load flow study . This study identified numerouscriteria violations . Figures 3-10 summarize the results of the contingency simulations . Note : forCategory A, facilities are monitored against Rate A while buses are monitored with voltagecriteria of 0 .95-1 .05 per unit. For Category B, C and D outages, facilities are monitored againstRate B whi le buses are monitored with voltage criteria of 0 .90-1 .10 per unit . Incrementaloverloads and voltage violations due to transaction cases are also summarized .
1 1 Sep 2005

SPP RTO Expansion Plan 2005 -2010
Fi wre 3 : NERC Category A Overload Summary - shows the number of NERC Category Aoverloads violation by voltage for the base and transaction cases .
NERC Catego ry A Overloac! SummaryOver 100% of Rate A (Normal Rating)
2 4-❑ 2005 S ummer Case
.2 2- 0 2610 Summer Case
Figure 4 : NERC Category A Vottaee Violations Summary --- shows t he NERC Category Avo l tage violations for the base case and transaction cases fo r 2005 and 20 1 0 summer cases .
NERC Category A Voltage Violations Summa ry
Below 95% of Nominal Voltage ~
1 2 Sep 2005

SPP RTO Expansion Plan 200 5-201 0
Fi ure 5 : NERC Cate o B Overload Summary - depicts the NE RC Category B ove rload
violations (n-1 contingencies) for the base case and transaction cases . As i llustrated in Figure 5,
the number of violations increases with time and the greatest number of violations occurs at the
69 kV voltage leve l .- - - - - --,~
NERC Category B Overload Summary
Over 100% of Rate B (Emergency Rat ing )
~e
05;
80
60
40
20
0
❑ 2005 Summer Case
■ 2010 Summer Case
Voltage
Fieure 6: NERC Cate2orv B Volfage Violations Summary - shows the NERC Category Bvoltage violations for 2005 summer case and 2010 summer case for the base case and transactioncases . More violations are identified in 2010 than in 2005 .
c0
0~
Figure 7 and Figure 8 show the number of NERC Categories A and B incremental violations thatwere identified by transaction cases not identified by the base cases . The x-axis identifies thecase and the NERC category . For example, 2005_A indicates it was 2 045 case and NERCCategory A . As expected, the transaction cases did increase the number of criteria violations ;however, the numbers of additional violations were not as great as anticipated . Several of theviolations identified simply advance the need for future projects .
13 Sep 2005
69 kV 115-16 1 kV 230-500 kV
NERC Category B Voltage Violations SummaryBelow 90% of Nominal Voltage

SPP RTO Expansion Plan
Figure 7 : NERC Categories A and $ Incremental Overlo ads
- NERC Categories A and B incremental OverloadsCaused by Transaction Cases
2
0 fi5
2005-20] 0
ro~ 0 - ; x"` - C7 69 k1/
'> - " ■ 115 -161 kV
■ 230 -500 kVJ
0 Amok"2005_A 2001 0 A 2D05_B 207a B
Case and NERC Catego ry
_ j
Figure 8 : NERC Categories A and B Incremental Voltage Violations
I NERC Categories A and B Incremental VoltageViolations Caused by Transaction Cases
1412
1 0o 8~
603 4
20
❑ 69 kV
■ i 4 5- 'i 61 kV
■ 230-500 kV ~
14 Sep 2005
2005_A 2010_A 2405_B 2010_B
Case and NERC Category

SPP RTO Exnansion Plan Zoas-zo 1 o
Figure 9 : NERC Categories C_ and D Overload Summary - dep icts the number of NERCCategories C and D conti ngency overloads for the base case and transaction cases . As ca n beseen by the graph, the majority of the v iolations wer e in the 1 l 5 kV to 1 61 kV range .
NERC Categories C and D Overloac! Summa ryOver '[ UO% of Rate B
60
50
~ 400
30
0 20
10
0
❑ 2005 Summer Case,
■ 2010 Summer Cas e
F igure 10 : NERC Ca tegories C and D Incremental Overloads - shows the incrementalNERC Categories C and D contingency overloads identified in the transaction cases .
Violations and Major Prob lem
The maps showing criteria violations above 100 kV within the SPP footprint can be found inAppendix B . Violations are grouped by state for map purposes . Contingencies are not discussedin this report due to security concerns .
15 Se p 2005
69 kV 115-161 kV 230-500 kV
Voltage
NERC Categories C and D Incremental OverloadsCaused by Transaction Cases
Over 100°/a of Rate B

SPP RTO Expansion Plan 2005-2010
Recommendations
Major ProjectsThe identified criteria violations were shared during Planning Summit II so SPP could solicitstakeholder suggestions for projects to address identified violations. A pool of solutions wascreated by using inputs received from stakeholders, proposed and exploratory projects providedby transmission owners and alternative solutions by SPP staff . SPP staff independently evaluatedthe alternatives and then makes recommendations from this pool of solutions . The solutions,identified in this report, correct all SPP violations identified with the exception of a few NERCCategory C and Category D type contingencies still under evaluation . In the next planning cycle,SPP staff will work with affected transmission owners to resolve any outstanding issuesregarding NERC Categories C and D .
The timing of projects was determined from the load flow results of the 2005 summer case and2010 summer case simulations . For the complete list of expansion projects and details regardingeach project, re fer to Appendix A . The projects are diviaed into three categories including Boardapproved projects (Phase 1- April 2005), approved out of cycle projects and out of cycl eprojects pending evaluation . The project lists will be revised quarterly to include project updates .
Figures 13-23 show the zone maps with the recommended projects of 100 kV and abovefacilities . For the purpose of this report, the SPP region was split into eleven zones . Figure 1 Ishows the complete SPP region, and Figure 12 shows how the region was divided into zones .Project descriptions along with estimated in-service dates for 100 kV and above projects areshown in the project description tables on page 18-20 .
1 6 Sep 2005

SPP RTO Expansion Pla n
Figure I l : SPP Region
Ikl O"! SPURIKA#~iA:~ .~ ., ,' ' , . . . . , .' , .
f { ,_
Ns
LOllISIANA
Figure 12 : Zones
2005-201 0
o
k17 Sep 200 5
- -.._._ .._ -- I -..~~. . .

SPP RTO Expansion Plan 200 5-201 0
EstimatedProject Description (100 kV and Above Proj ACts ) lnServic6
D ateZone 1
Install 5.5 miles of 161 kV line from Turner Road-Belton South Jun-04
Rebuild 15 .1 miles of 1 15 kV line from Kereford-NW Leavenworth Jun-04
Reconductor 5 .5 miles of 161 kV line from Avondale-Randolph-Hawthorn Jun-0 4
Convert 28.5 miles of 115 kV line to 230 kV original design from McDowell Creek-Morris Co. Jun-05
lnstall 230/115 kV 280/308 MVA transformer at McDowell Creek Jun-0 5
Install 50 Mvar 161 kV capacitor at Paola Jun-0 5
lnstall 8.5 miles of new 115 kV iine from Prairie-Lang Jun-0 5
Install 9 miles of 161 kV line from West Gardner-Cedar Niles Jun-0 5
Install new 2301115 kV 2801308 MVA transformer at Auburn Jun-05
Replace 4 .6 miles of double circuit 1 1 5 kV line with single circuit from Au b um-South Gage Jun-0 5
Install 4 miles of 161 kV line from Greenwood-Lone Jack Jun-06
Install 8 .8 miles of 161 kV line from Cedar Niles-Quarry Jun-0 6
Convert 36 miles 161 kV line to 115 kV from "fecumseh-Midland Jun-0 7
Install 2 miles of 161 kV line from CrosstoWn-Boulevard Jun-07
Install 50 Mvar 161 kV capacitor at Craig Jun-07
Reconductor 4 .5 miles of 1 61 kV line from Stilwell-Antioch Jun-07
Instafl 345/161 kV 4001440 MVA transformer atPaola Jun-08
Install 7 .6 miles of 161 kV line from Cedar Ni3es-]iillsdale Jun-08
Rebuild 6 .4 miles of 115 kV line from Jarbaio- 166 Street Jun-08
Reconductor 1 .7 miles of 161 kV line from North Kansas City to Northeast Jun-0 8
Install 12 miles of 161 kV line from Hitlsdale-Lackman Jun-09
Reconductor 5 mlles of 161 kV line from Greenwood-Merriam and replace line switches an dwavetrap at Merriam and Greenwood Jun-09
Replace a 161 kV wave trap at Blue Valley Jun-09
Replace circuit switcher at Lenexa on the Lenexa-Craig terminal Jun-09
Install 27 miles of 161 kV line from No rth Louisburg-Middle Creek-Paola Jun-1 0
Zone 2
Rebuild 6 .8 mil es of 1 61 kV line from Tontitown-Dyess A r-04
Convert 4 .4 miles 69 kV line to 1 61 kV from Lowell-Rogers Jun-0 4
Install 10.4 miles of 161 !cV line from Tontitown-Lowell Jun-0 4
Install 4 .7 miles of 161 kV line from Rogers-East Rogers Jun-04
Rebuild 25 miles of 138 kV line from Riverside-Okmulgee Jun-0 4
Increase current transformer at Five Tribes Substation on the Pecan Creek-Five Tribes 161 kV A r-0 5
Replace Ba rtlesville SEwavetrap May-05
Increase CTR to 2 000A at Muskogee . Ma -a5
Replace jumper and switch at South S rsn dale on the Dyess-S . 5 rin dale line .fun- 0 5
Upgrade CT and Wavetrap at Bristow, and line relays at Bristow, Rock Creek & Horseshoe Lake Jan-0 6
Install 19 miles of 161 kV line from Tahle uah-Stilwell May-0 6
Replace three switches at Tulsa SE on th e Tulsa SE-53 & Garnett N Tap 138 kV line Jun-06
Install 14 miles of 345 kV line from Chamber S ri n s-Tontitown May-07
Install 345/161 KV 675 MVA transformer at Tontitown May-0 7
install 7 .5 miles of 16 1 kV line from Siloam S rin s-Chamber S rin s May-0 7
Convert 12 miles of 69 kV line to 161 kV from Dyess-N Fa ettviUe-Fa etteviile-S Fayetteville Jun-07
Install 4 .2 miles of 161 kV line from Reinmiller-Ti ton Ford Jun-07
Rebuild 1 .5 miles of 161 icV Tontitown-Elm Springs REC line and replace switch and bus at El mS rin s REC Jun- 0 7
Replace Jumper, Switch, Brea ker at Dyess and replace switch at Elm S rin s REC Jun-0 8
Upgrade the main and transfer buses and bus work within bay at 5pringfield . Replace disconnectswitches at S rin field . Reconductor 2 miles 161 kV line from Brookline-S rin field Jun-0 8
18 Sep 2005

SPP RTO Expansion Plan 2005-2010
EstimatedProject Descri ption (100 kV and Above Projects) In-Service
Date
Install 15 miles of 161 kV line from Monett-Chesapeake Jun-0 9
Install 275 MW generator at S rin field SWPS2 Jun-09
Install 345I1 6 3 kV 675 MVA transformer at East Centerton Jun-10
Zone 3
Wavetrap and CT at Seminole Nov-04
Install 5 .5 miles of 161 kV line from Clarksville-Little S adra Dec-04
Install 28.4 Mvar 69 kV capacitorat Red Oak Jun-05
Install 45 Mvar 1 61 kV capacitor at Fort Smith Jun-0 5
Install 18 M var 69 kV capacitorat VBI Oct-05
Replace wavetraps, switches and reset relays at Valliant. Oct-05
Install 2 miles of 161 kV line from 3rd Street Tap-Massard Jun-06
Convertlrebuild 35 .5 miles of 69 kV line to 161 kV from Branch-Short Mountain-Razorback tap-IGO -Little Spadra Jun-1 0
Convert/rebuild 4 .7 miles of 69 kV line to 16 1 kV from Fitzhugh-Helberg Jun-1 0
Relay upgrade at Park Lane Jun-10
Re lace substation conductor at Ho e substation on the lia e-Fulton 161 kV line Jun-1 0
Zone 4
Remove wavetraps at Idalia and Asherville, also reconductor 22 miles of 161 kV line from lda4ia -Ashervitle .fun-D 9
Z one 5
Lone Star South replace CT on the Lone Star South-Pittsburg 138 kV line Dec-04
Rebuild 16 .4 miles of 138 kV line from Knox Lee-Rock Hill May-0 5
Rebuild 26 .3 miles of 138 kV line from IPC Jefferson-Lieberman May-0 5
Install 2 0 miles of 138 kV line from Pittsbur -Winnsboro Jun-06
Reconductor 9 .5 miles of 138 KV line from Rockhill-Carthage REC . This project was advanced fromthe original timing because a three terminal line contin enc was identified late in the study process . Jun- 0 6
Replace relay, wavetrap and switch at Knox Lee and switch at Oak Hill on the Knox Lee-Oak HiI I138 kV line Jun-06
Install 25 miles of 138 kV from Winnsboro-No rth Mineala Jun-07
Reconductor 2 .3 miles of 138 kV line from Carthage REC-Cartage Tap . This project was advance dfrom the original timing due to a three terminal line contingency not initially identified. Jun-07
Lone Star South replace CT on the Lone Star South-Wilkes 138 kV line Jun-09
Replace wavetrap at South Shreveport on the South Shreveport-SW Shreveport 138 kV line Jun-10
Z one 6
Reconductor 5 .9 miles of 138 kV line from Many-Fisher Oci-03
Install 22 MVAR 138 kV capacitor at Marksville Jun-04
Zone 7
Install three 10 lvlvar capacitors and 8 Mvar statcom at Plainville 115 kV Jun- 0 5
Install 11 miles of 138 kV line from Evans 5outh-17ih Street Jun-0 8
Install 20 Mvar 138 kV capacitor at Harper Jun-1 0
Zone S
Install 26 miles of 115 kV line from Pioneer-Nu aton-Walkeme er Dec-04Install 105 miles of 345 kV line from Lamar-Finney and 210 MW HDVC Station which provides a 3rdDC tie to WECC at Lamar Jan-05
Install t 15 kV 33 .2 Mvar Capacitorat East Liberal Jan-0 5
lnstall 1 2 M v ar 115 kV capacitor at Ruleton Dec-06
+1- 8 Mvar DVAR and 15 Mvar capacitor at Rhoades 115 kV Jun-07
Rebuild 25 miles of 115 kV line from Holcomb-PI Tap Jun-08
Rebuild 46 miles of 115 kV line from Scott Cit -Mannin ta -Df hton-Beeler-Ness City Jun-0 8
Instal[ +1- 8 Mvar Dvar and 15 Mvar capacitor at Mingo 115 kV Dec-08
19 Sep 2005

SPP RTO Expansion Pla n
Project Description (100 kV and Above Projects)
Zo ne 9
Install 23 .4 Mvar 138 kV capacitor at Sunnysid e
Raise 4 or 5 structures on Comanche tap-Duncan OMPA 13$ kV line to increase clearance
Install $ .5 miles of 138 kV line from Glenwood-N E Enid
Install 8 .5 miles of 138 kV line from Hayrr:aker - Piedmont
Insta l l two 25 Mvar 345 kV reactors at Arcadi a
Reconductor 1 .9 miles of 138 kV line from Stiliwater-McElray
Replace f re e standing metering CT at Elk City
Replace terminal equipment and wavetrap at Division Substation on the Division-Silver Lake 138 kVlin e
Increase CTR to 2000A at Sunnysid eReconductor 1 . 7 ini]es of 138 kV line from Memorial-Skyline and increase terminal equipment
Upgrade wavetrap at Franklin SW on the Franklin SW-Midwest Ta p
Install 10 Mvar 138 kV capacitor at Marietta
Install 345/138 kV 493 MVA transformer at Draper
Replace the Corn ville wavetra pRepla ce Southwestern Station wavetrap & Anardarko wavetrap
Install 18 Mvar 69 kV capacitor at Woodard District
Relocate 2 . 5 miles of 138 kV line from N F= 10th-Glendal new substation
Instaf16. 5 rrsifes t38 kV line from Gter swood-fiE EnidZone !0
Install two taps on the Nichols-Swisher 230 kV line and open between the taps . Install 5 . 5 miles ofdouble circuit 23 0 kV line from each line tap to the Amarillo South substation . Install new AmarilloSouth substation with 23011 i 5 kV 225/259 MVA transforme r
Upgrade transformer 1 and 2 at Nichols with two 230/115 kV 2251259 MVA transformers
Zo ne 1 1
Install 2 .9 miles of 230 kV line from Lubbock South-LP South Interchange
Install 28 .8 Mvar 115 kV capacitor at Seven River s
Install 2301115 kV 150 MVA transformer at Seven RiversInstall 24 .5 miles of 230 kV line from Eddy County-Seven Rivers
Install 6 mites of new 1 15 kV line from Amerada Hess-Doss
Install 14 . 4 Mvar 69 kV caoacitor at Dos s
Install 24. 5 miles of 115 kV line from Floyd-Floyd Tap
Install 26 miles of 115 kV line from Lubbock East-CrosbyInstall 6 miles of 115 kV line from Floyd-Cox
Install 2301 1 1 5 1 50 iUIVA transformer at Pecos
fnstaSl 31 .5 miles of 230 kV line from Seven Rivers-Pecos-Potash Junct ion
Install 230/115 kV 2521298 .8 MVA transformer #2 at Lubbock Sout h
20
In-ServiceDate
Jun-04
Jun-04
Dec-04
Dec-04
Jun- 05Jun-05
Jun-06Jun-06
Dec-1 0
Jun-04
Dec-0 4
Mar-05
Jun-05
J u n-0 5
DeC-05
2005-201 0
Sep 2005

SPP Expansion P lan
Ei ure 13 : Zone 1
Legend
~ WO kV & Ovar Trensmissan Lines ••••• New Tra nsmigcion Line
345 kV 7ransmigsipn Linas - fteconduCtoredlRsbu ilt Line, Ma}}~ IIIe' f'
~ 23 0 kV Transmission Lines - Votlage Comor sion715161 kV Trarrsmission Lines 0 Capaci[or Bank or Var D evice
I& Suhslat wn Modifica tion
New rranstormer Mid W$Y
EfOWn Co.- - `. 4~c Jaseph
KnobHill Smittyville 8aileyville
Clrcleuille #A~J
JEFFERY ENERG YCENTER Ho 1~ HTI ~ • . S~aerCr~
.M_
E .Man tlan711
Ma nna hn Keene ~nd JCf z, ,L,~ i-~-_-` 7'_" "
~° - MC I SOi1th AubU Gag a,~~ ~` ~,
Creek Alma
BUILCREEK'-~ `aare ~i~~i B~"Co.
Z Readi~ Prai~e f ~ .. ng PA
' La~ ,.,; .
g i
OLFCREEK-----°` .___ . . . .~~__~;- _ _~..... .. ; ~~
LACYG N ?
Vaugu ~,,-~-'Y
Maraf4n ~-k s~ NEVAD.P,,. , . \•, - Camp ~'lat--- s .1
21
2U~-zol o
hnswick_•.
- 5alis6'~~ryftichm3rd Cafrollt4 n
Saulh WavedyNo IN
° °~..,...
~ken6u .~ 'PA.FB Ceqetn/ J~, ~.___ ~J ~Sed~lia E
HDL DEN `~-',~edalla
~~Clinkon~.. . . ;
MONiROSE~ TRi1MRN
O~ceola /,J"
Sep 2005

SPP J Expansion Plan
Figure 14 : Zone 2
Le end
500 kV & Over Transmission Lines345 kV Transm i s s ion Lines230 kV Tran smissio n Lines
1 15- 1 61 kV Tran s miss io n L ines
••,,, New Transmission Line
-~. Reconduclored/Rebuilt Line
"'- Voltage Conversio n
A Capacitor Bank or Var Device
~ Substation Modification
Q New Transformer
2U,,,-2 01 0
_ `. ~'r• Balivai. 8umsiioga STOCKiO Morgan
Baker.~.~ _.
..._ ..~ .~hlartheasiPaws °Nf` ;MAC,.r----- ~ .
Mao1 ame h~ound SH0 8roo~l~e-,~°~,~~,9~l ~.~. Cib~rry =~}-~r '•~+,~^~busS~ -; ;.~ '`~ LA RUSSELL, _ . . . , STAT LlNE _..;L--t___RIVER sauTF~s
Dea[in ' ~. .; Far~la~d ~~ _ ~ ~~::~$j :g~ ,.,. Ho~ken+ilEe v.~rnm~ ~Monelf :..""C esapeake
Rluerdalej T o Fortl
$ ~*Me ,, ~, ...~ Auroraj/
;Wehb C' 44F. Pa
wh u $ i~a Dom L~ h Y"
N Pa4n~1: ~~~N BOSh6 \ o
,~;r-~--~-~v-Y-~-- --~~~Bartlesr~eSE~~ RoarkCr2~Y
iJ1m/fts ~ ~pAT1C ~~ ~IVIS ( '\ ~\ 1~ br_~
~ ~ ~,~r `~ F' r• / .~ Reeis ,rirg`~-~ --~~ -
Pawhuska Bamsdafl ; f rr Vinita % Gr°Ve No~~ TRBLER6CK ~~KBERCPfNSAC'OLA -~Wash6um qavaoaerCov~
F al!? Cmuskin O9B~~o .-'~ .eG,,
S~Hi~d1( ~~ --~---- ~ ~ 4~ lE
:-/ n,r..
.Clevelaid; E R G~een Fore ~ma"?,~laremare ~ -
aM'"
ad r~y~ua •~ey ; ' E.Ceflte dom~~~~S $Bffy4l~lB H2ffIS004'wSfFL 0 i L~1 G~~en Forest ~ Harrisontl . j t
aN1A _.
. rkr3iF:J ~ ~C
~~ I"I ~, . . ~•_~
lverC,ty ~ ~---. 412 ~m ~y ~eazYik Hardsoo SouthE ~
CAM r, Cha r-.o FORT TAle ue~lf, Sp~oKnl ~CuShln~Tak~ ~_, v~ ~ xm~ \ ~ ~LS S ~
FayeGIBSO N\~-`~~-" - - , ~kay~.-;:i •
:. .., - - ~(OG
..Fay~te~9e
\-. .0 561wel
_~..-Peca~Cr~4~
KeyWest Okmu ee ,-- BB~R$FAr TENKILL `~5 9
22 Sep 2005

SPP . J Expans ion Plan
Figure 15: Zone 3
Le en d
- 500 kV & Over Transmission Lines -- New Transmission Lin e
345 kV Transmsss ion Lines Reconductored l Rebuilt Line
230 kV Transmission Lines Voltage Conversio n
1 1 5-161 kV Transmission Lines Capacitor Bank or Var Device
~ Substation Moffcatio n
Q New Transformer
a1~7 ~
~~~saw ,- ~~~i•~~.~~~ ._. ~r ~% ,~ C t e~lah % il~er y
$EW .~rcm,
yr~~ -----~Mize
DR2w'~-~~
Russetl
P
T
XO
7
8
~ENiSDAY
6\02i QRM
4, Mapke
- --- " 4V BacneviGeNrn€h fu"oc ,
%RR
EETH E~IFAULANanna
a,A wFE P`JINTCarratliag 4~~~
~ Tenaska EMex TarbyOa S k P O~ ~-~----~ ~Mm~ ~. - ca~
~Retl oaK*SW Sawrra Lon2;
Pump~~J Nasho
Clayla~ ~'~_ .
Befhel
flan~in/Pr`1SawY
ning~an ° r~ ~~'~.-~OV fBn , ,~
$OW !
K P re
,---=~ MeRa
S.6'~e~ks Murf~asboro,~:
f ~; ~~sra'r~ LOCk2CSbp~/
D.,4shdown~Okau
e Nor#h
MGhlati~rfhFnrntnart'``t' ~-~
26,,,-201 0
23 Sep 2005

SPP . __ J Expans ion Plan 20~, - 201 0
F igure 16 : Zone 4
Leaen
500 kV & Over Transmission Lines -- New Transmission Line
345 kV Transmission Lines Reconductored/Rebuilt Line
~ 230 kV Transmission Lines Voltage Conversio n
115-161 kV Transmission Lines Q Capacitor Bank or Var Device
~ Substation Modificatio n
New Transformer
24 seP 2005

SPP RTO Expansion Plan 2005-20 1 0
17 : Zone 5
P- 500 kV &Over Transmission Lines
345 kV Tr an smiss lon L in e s
230 kV Transmission l ines
4 1 5- 161 kV 7ransmissian Ltnes
New Transmission Line
ReconductoredfRebuilt Line
Vnltage Conversion
Capaci{or 8ank or Var Devw
Su6station Motlificafion
NewTransTnrmer
25 Sep 2005

SPP RTO Expansion Plan 2005-201 0
ure 18 : Zone 6
Leaend
~ 500 kV 8 Dver Transmissipn Lines
345 kV Transmiss ion h nes
~ 230 kV Transmission Lines
115-181 kV Transmission Li nes
New Tran smiss ion Line
R econd ucto redlReb uil tL ine
Volta g e Con v ersi on
Capacitor Ban k or Var Dev ice
Subsiation M odfi catfo n
New Tra n sformer
26 Sep 2005

SPP RTO Expansion Plan 200 5-201 0
re 19 : Zone 7
eaend
+ 500 kV & Over Transmissio n ~in es
,~. 34 5 kV 7ra n smissio n Li ne s
rr 230 kV Tre nsmi ssion Lines
~ 1 15-1 61 kVTransmission Lines
New Transmiss ion Lin e
~, .. fteconducto redlRebudt Line
--' Valtage Conversion
Capacitor Bank or Var D ev ice
Subs#ation Modification
NewT ransfprmer
?hili. . . ._ _
CLlHbN,;j-'~ - , ,
(' 'LC{dla
Glen Elder ----~', Hot
Plairm~ ClayCsilli11\,N SASW21doAll ~
, B2mis 1 ENiva ,.);-------~ ------~._ ....~ ~, -
[ L,HAY$ !:~ , L`; ABI LENE) GCiham _. -.._Ru9Sdl
3ummi!l~Cm~s
Neru~e[ NekamaCo.Ri~
e9.laCr'o~ - _ ~ He~eC~ ~,. ,'-~,~a,;r. :~x•~. , ~~W.M~Ph2~,~ NlllshomMAN i -
~{ .. ~ r (,I LISSUIY I
E MhmanPaul fWfa J(
- Hu~~svlleSW 4aaBuzui f~ `- r'~bur~idge~jHU CHINS4N ~
' ------~ ~ asSer ce Davis I Haktaa
S~.~oh~ ~ ~__.~._.~-•
Edwat
.-_ .Greqs6urg,rv~
f~aso (,H I/' Fu6Ei ;.. Sua
Milaa~ OxiordGrasr~R
27 Sep 2005

SPP RTO Expansion Plan
Figure 20 : Zone 8
Leciend~ 50 0 kV 8 Over T r ansmission L ines New Tr ansm ission L, n e
~ 345 kV Transmiss fon Lines - • - Recon tl uctoredlRe6uilt Li n e
. 230 kV Transmiss +on Lines Vol tage Convers io n
~ 1151 6 1kVTransmissionLines CapaailorBankoNarDewce
Substat ion Modif ica tion
N ew Tra n sforme r
5t F rancis Bird Ciiy N . Afiwood .~~(~_~-
_ .__-~:r-- ~.~.Cree
k ~~ • AfwaadLawn Ridge
Aj Rulston Goodland COLBY
~------~ NorcaiurJohnso
n --------___~..-~--------N~ Brewster~ Haxie
~- _' City of GoaEland i --- ---°~ _:-- ~ _ •_f
Kanarado Mingo--,_ .---
Chase
Sharon 5prrgs
Pkiner MARIENTHAL .-jLeofi - "; ^
TfibuwJess
Selkirk cRrse~+~ se h an~~
Grinnefl
GDVE
Oighton
pll~.~ _. .
2005-201 0
Graham
Ross etck' Retlline
A~rp3ald Ransom
Beeler
#Ves~ City
I6a~sai
lam&r N . S yracuse ~ 3. Wi lfiamsan Fletche rirv~
cnRO c~T1.~'_ 14
00* . M . . r . . . r . . a w . . a . a r ...r' -
;a~ „ ...e.,-.. . ,
.;~
tonavy(2004)
Pfym~S ~tcl~ P~tced i~2
Pucker f~TO}.~ ~
P ianeer O ~_~ . . .. -~, .. ---.._._._. . Pion m Tap
(20a4)Hickok Mas kefl
Seward
~ (2004) •. ~Cim arrmH IJ C,~OtOfl d - -a
Walkemeyer ~'-o.,or. E. U~6e f21
28
Ao~ ~tt4~a~s x~ ~ E
LARGE.T~- -- -- ~
GRAY C6UNTY
.i' Cudahy
Sep 2005

SPP RTO Expansion Plan 2005-2010
Fieure 21 : Zone 9
~ so oi 34 J
~ 2 30
115-
29 Sep 2005
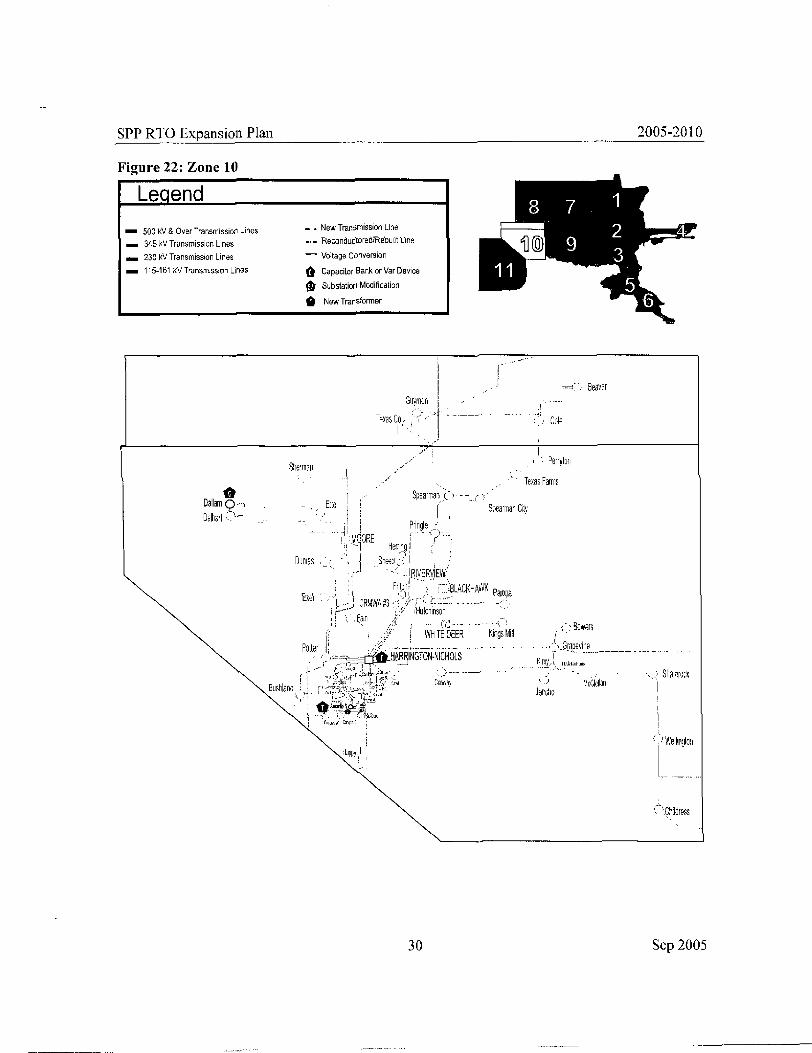
SPP RTO Expansion Pla n
Figure 22 : Zone 1 0
Leaend
- 500 kV & Over Transmission Lines
- 345 kV Transmiss ion L ine s
230 kV Transmission Line s~ 11 5-1 6 1 kV Transmiss ion Lines
. . . New Tran sm ission Line
. , _ Re c a n ducto red'I Reou ift Ltne
- Voltage Conversio n
Cap a ci to r Bank or Var Devi ce
S u 6station Modificat ion
New Transformer
baavarGuymarl ., .. ...
Texas
2005-201 0
Sherman ~ Prryto-n
Tezas Farm s
Dallam Q Ei:tef 5pearman Cll ~Dalhari
Pnngl eN ORE
:,, •Dumas Sneeay, ;
Frit; rh gLpCKHAVVK
CRM'oVA#3 "f . . -` .~r ~~ 1~4h1090 0
Fa nJ. ; t- ~, __f -_. .- ;~u .. . ._ . _-_ ., .~_, • ' ~ flW2fS
WNITE DEER NingsMiE l' 'r ' a apevinPottzi ( ' ;G
R INGTON NICHOL S~ Kiray, I rut P-- 9 • - - - 5ha~r~ack
6ushl8nd ~ ~ " "d Cr~ova' ~ McGle llan~.~:.• , J01'Of1
U'Jellmglao,daPD'1 ,
30
~~% .Cf1[~f255
Sep 2005

SPP RTO Expansion Plan
23 : Zone 11
31
2005-241 a
Sep 2005

SPP RTO Expansion P lan 2005-2010
Summary of ProjectsFigures 11-14 summarize the projects recommended for the SPP RTO Expansion Plan .Estimated line mileage for new transmission lines for October 2003 to December 20 10 totaled634 miles, and rebuilds/upgrades totaled 646 miles . Figure 28 shows the breakdown of projectsby type .
Figure 24: Estimated Cost of Transmission Line Project s
Estimated Cost of Transmission Line Project s
32 Sep 2005

SPP RTO Expansion Pla n
Figure 25: Estimated Line Mileage for Transmission Line Projects
Estimated Line Mileage for Transmission Line Project s
Figure 266: Estimated Cost of Transformer Project s
Estimated Cost of Transformer Projects
33
2005-2010
Sep 2005

SPP RTO Expansion Plan
Figure 277: Estimated Number of Transformer Projects
Estimated Number of Transformer Projects
12%
10
8
6E
y 4
2
02004 2005 2006 2007 2008 2009 201 0
Year
❑ New ■ Upgrade ]
2005-201 0
Figure 28 : Pro'ects by Typ e
Transmission Expansion Projects (Octobe r 2003 - December 2010)Total $552 M illio n
20%
46% I
■ New Lines❑ New Transformers
[7 Line RebuildlUpgrade s
0 Transformer/Substation Upgrades
■ New CapslReactorslDevice s
❑ New HV DC
15%
Complete List of Recommended ProjectsThe comp l e te list of recommended SPP RTO Expansion Plan projects can be found in AppendixA.
34 Sep 200 5
5% 7%
SPP RTO Expansion Plan 20 05-2010
Out of Cycle Proj ects - Project Trackin g"Out of Cycle" projects are those that have been announced or developed after the SPP RTOExpansion Plan . These projects may include new load service, new generator interconnections(signed interconnection agreement or firm commitment) or new transmission interconnections .The projects had unknown status at the time of the analysis for the SPP RTO Expansion Plan .Out of cycle projects can also include reliability projects that the transmission owner committedto build and may include site purchase only . The out of cycle projects also include projects thatmay be on the "fast track" for various reasons . New projects submitted through the MDWGmodel building process will be reviewed for potential out of cycle projects .
SPP expects that members will help support the plan and communicate any system changes . Toprovide data for a dynamically changing transmission system, the following is proposed :
• When a new project is announced, developed or studied by the transmission owner and itcan have a significant impact on the current models, the project should be reported to SPPas soon as discovered . The data will be reported using Forms 1-3 with an appropriateentry made for the project. The in-service data should be shown as well as any otherpertinent information. If the project is confidential to the transmission owner or thecustamer, a column is provided to flag it as "Customer Confidential ." SPP staff will notshare any details regarding "Customer Confidential" projects until authorized . SPP willtrack and report the number of "Customer Confidential" projects in routine postings .
• Data should be sent to SPP on a continuous basis throughout the year, not accumulatedand sent in a grouping. Studies require accurate models .
• On a quarterly, each entity responsible for a project would update the in-service dates onthe Forms 1-3 Updating should be done for all projects that entity has constructionresponsibility for.
• On an immediate basis, each entity should notify SPP if there is a change in projectschedule or in-service date that impacts the project construction around or of a flowgateelement or 230 kV or higher transmission project . This notification should occur as soonas the information is known, not on a quarterly basis .
Likewise, SPP will provide on the same basis to the construction entities information on anychanges in required construction because of transmission service sold . This notification allowsthe responsible entity to get the item on Formsl-3 and seek the approvals necessary for goingforward . The proposed process is for SPP to send out Forms 1-3 quarterly .
Over the year, the projects required for sold service should transfer to Forms 1 -3 along with thenecessary project information . The list of Out-Of-Cycle projects is included in Appendix A .
4 eratin Guides/Directive sOperating guides/directives have been used for many years in the SPP region to mitigate systemconstraints such as line overloads and low voltages . Operating guides/directives provide thesystem operator with actions that may alleviate the system problem during emergency situations .
35 Sep 2005

SPP RTO E xpansion Plan 2005-2010
Some companies within the SPP region use operating guides/directives to solve systemviolations identified in the planning process . Operating guides/directives were tested to seewhether the full implementation correct the problem . Checking of line overloads and voltageviolations were performed only before and after the implementation . Issues such as relay trippingand equipment failures during the implementation of the operating guides/directives were nottested. Transmission owners perform a more detailed analysis during the operating horizon .
SPP used operating guide/directive solutions recommended by the transmission owners . All
operating guides/directives used in the SPP RTO Expansion Plan were tested to ensure that fullimplementation of the guides/directives do correct the system problem. SPP staff was concernedthat some of the operating horizon recommendations could not be implemented in time due tohighly overloaded facilities. These facilities may trip before the operating guides/directives could
be fully implemented . To address this concern, additional testing was done on facilities loadedgreater than 110% of long term emergency rating post contingency. SPP staff gathered additionalinformation on short-term ratings for these facilities to make sure the facilities could withstandthe high overioads until the guidesfdixtctives were implemented .
Future SPP RTO Expansion Plan studies will not initially include operating guide/directives .System reinforcement will be determined for all violations . Operating guides/directives will beconsidered as alternatives to the reinforcements .
Figure 29 : Q eratin Guides/Directives Used Zacilities Above 100 k
A 1 q
502 Cleco Power LLC (CELE)
Grand River Dam Authority (GRDA)IAssociated523 Electric Cooperative, Inc . (AECI) 1
536 Westar (WERE) 7
541 KCPL 1
Total 9
CELE Dolet Hills Operating GuideGRDA/AECT Chouteau Operating GuideWERE (Directive 400) Outage of Jeffrey Energy Center-Hoyt 345 kV Line
(Directive 618) Outage of Auburn Road 230/115 kV Transformer(Directive 6 3 3) Outage of East Manhattan 230/115 kV Transforme r(Directive 803) Outage of Hoyt-Stranger 345 kV Lin e(Directive 900) Outage of Jeffrey Energy Center-East Manhattan 23 0 kV Lin e(Directive 1105) Outage of the Moundridge-Halstead or Gordon Evans-Halstea d
138 kV Line s(Directive 1205) Outage of Circle-Davis 1 1 5 kV Line(Directive 1213) Outage of the Circle to Hutchinson Energy Center 115 kV Lin e
KCPL Operating Letter #132 Close Sprint Bu s
36 Sep 2005

SPP RTO Expansion Plan
Phase II : Market Assessment
2005 -201 0
Obiective
Some transmission projects may be justified not for purely reliability reasons but rather on their
ability to improve the system in an economic manner . Phase II of the SPP RTO Expansion Plan
addressed potential transmission projects that may be justified based on the expected economicbenefits .
The market assessment is intended to provide an independent market evaluation of potentialtransmission expansion projects that offer the greatest return on investment .
Economic PlanningThe costs of congestion management and transmission construction are inversely proportional asdemonstrated by Figure 30 . SPP plans the system to meet planning standard ; as a result, SPP isbeyond the required planning standards requirement . SPP would like to have additiona ltransmission installed to achieve the most cost effective point of operation (i .e ., where the costsof transmission and congestion management intersect) .
Figure 30: Supply and Demand
~OU
Congestion Management Cost
-T ranSm iss Eon Ezpansion
~ In finite Bus~
37 Sep 2005
Amount of Transmission

SPP RTO Expansion Plan 2005-201 0
Economic Modeling AssumptionsSPP used the Global Energy Mar~.etSym package, which utilizes the PowerWorld load flowprogram, to perform detailed analysis of the transmission projects in Phase II .
• Henwood MarketSym
• Coordination of overall simulation process and case/data management
• ProSym is the engine for initial unit commitment and dispatch
• Multi-regional database for load/generatorlcast characteristics
• PowerWorld Simulato r
• Dispatch optimization using alternating current-optimal power flow (AC-OPF)
• Computes nodal prices and economic costs of constraint s
Key AssuT tions Used in the Economic ModelSPP region is modeled as 19 transmission areas encom assin the 17 tariff control areas
Public Service Company of Oklahoma (PSO) and Southwestern Electric Powe r Company
(SOEP) are dispatched as a single control area (AEPW)
Oklahoma Municipal Power Authority (OMPA) loads are distributed within Oklahoma Gas an d
Electric (OGE), PSO/AEPW and Western Farmers Electric Coop (WFEC) transmission areas
Arkansas Electric Cooperative Corporation loads are aggregated with other loads at buses withi n
Entergy, SOEP and SWPA system s
A portion of Grand River Dam Authority (GRDA) loads are embedded in the Associated E lectri cCooperative, Incorporated (AECI) system
Simulation of every other hour in a typical week to represent a month
Control area peak load forecast based on SPP Energy Information Administration (EIA) 4 1 1report and other information analyzed and documented by Henwood staff
Peak loads are modeled based on total internal demand as reported by utilities
Hourly load shapes are based on `typical year' representation derived by Henwood from multipl eyears of historical data
Interruptib le loads reported in EIA 411 are modeled as dispatchable resources in ProSym
More than 95% of total generation capacity of the optimal power flow (OPF) area is explicitl yidentified and mapped
Thermal generator forced outage rates and equivalent schedule outage rates are estimated fo r
classes of generators from NERC Generating Availability Data System (GADS) data reporte dthrough the year 1999
The ProSym `Converged Monte-Carlo' technique is used for forced outage rate
Natural gas price estimates are general ly tied to Henry Hub pric e
Fue l oil prices are generally tied to NYMEX future price s
Unit commitment/dispatch by ProSym
38 Sep 2005

SPP RTO Expansion Plan 2005-201 0
Unit commitment by control are a
Spinning reserve requ irement - 2% of load
Regulation and load following - 3% of loa d
Non-spinning requirement - 2% of load
Must-run units modeled in SPS
Additional must-run units w i ll be modeled as information becomes ava ilable
AC optimal power flow (AC is used to incorporate losses and VAR flows )
Calculates nodal pr ices
Monitor branches> 100 kV
Monitor all flowgates > 100%
Flowgate operating range for violation cost 0-2% ( Penalty of $45 per MW per hour)
Flowgate operating rang e for violation cost > 2% (Penalty of $90 per MW per hour)
Branches or transformers above normal rated capaci ty (Penal ty of $30 per MW per hour)
Hurdle rate s• Between SPP areas - $2• Between SPP and F irst Tier - $ 5
$4 added to offer c urves for independent power producers
For the evaluation of economic projects, SPP used an 8% discount rate and evaluated the benefitsover a 10-year period using a two-step process . The first step determines if the dispatch cost plusviolation cost savings over the studied period paid for the project . If the project is determined tobe of benefit to the OPF study area then the cost of the project was allocated to the beneficiaries .
The allocation of the project has two parts : direct and indirect . The direct costs are referred to asthe generator redispatch savings and the indirect impact is referred to as the load benefits .
Equations 1 and 2 show how the calculations are made . When benefits are calculated, there arewinners and losers . The objective is to levelize cost across the region. In the allocation processonly positive impacts are used . The indirect benefits portion is still being discussed . In thisreport, SPP used the allocation of 10% of unhedged indirect benefits and also without theindirect benefits (i .e, all the load is hedged) .
39 Sep 2005
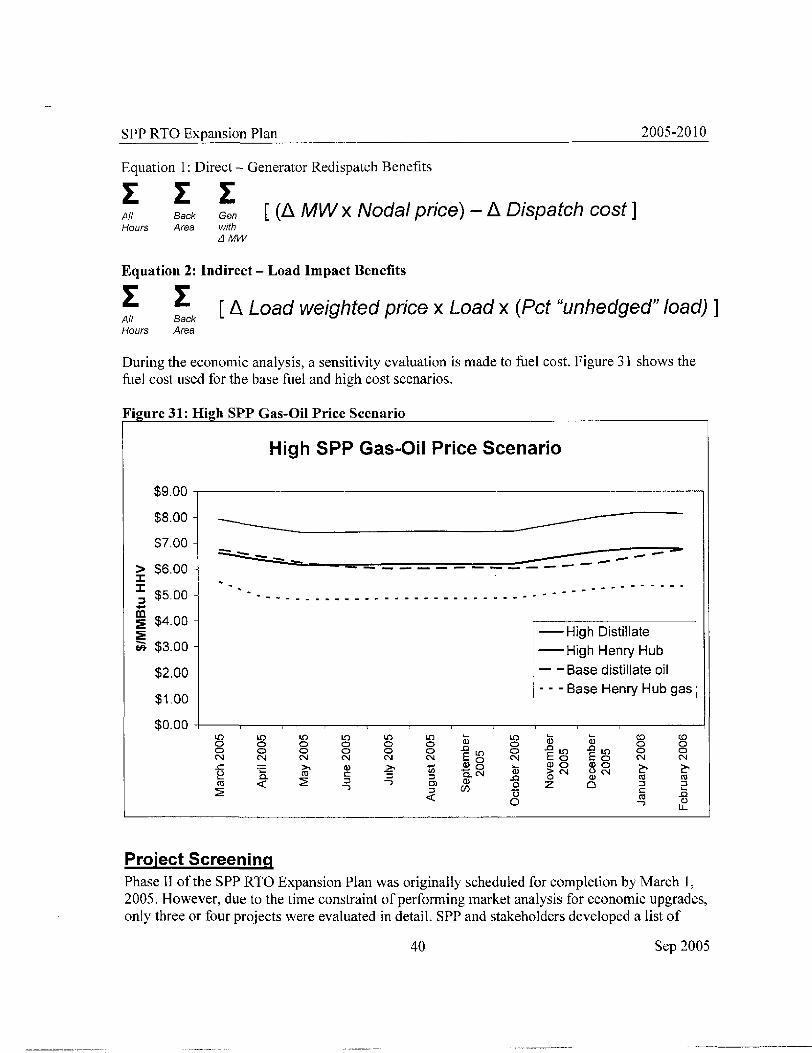
SPP RTO Expansion Plan
Equation 1 : Direct - Generator Redispatch Benefits
T. T. F.A„ Back Gen [(A MW x Nodal price) - A Dispatch cost ]Hours Area with
d MW
2005-201 0
Equation 2 : Indirect - Load Impact Ben efits
2: T. [ A Load weighted price x Load x (Pct "unhedged" load) ]All Ba ckHours Area
During the economic analysis, a sensitivity evaluation is made to fuel cost . Figure 31 shows the
fuel cost used for the base fuel and high cost scenarios .
31 : SYY iias-uil Yrice hcenario
High SPP Gas-Oil Price Scenario
$9 . 00
$8 . 00
$7.00
> $6 .00
$5 . 00
n $4.00
~ $3 . 00
$2.00
$1 . 00
$0,00
--------------------
-High Distillate
-High Henry Hub
- - Base distillate oil
--- Base Henry Hub gas ,
00 0 O 0 O O ~ ~ O ~ LO -0 LO O ON N N N N (V E p N E O E O N N
UU.
~ ~ _ ~ N ~ N U N
M Q ¢ My Oz 0 (1)
0 ~ ~O `° m
LL
Proiect Screenin gPhase 11 of the SPP RTO Expansion Plan was originally scheduled for completion by March 1,2005 . However, due to the time constraint of performing market analysis for economic upgrades,only three or four projects were evaluated in detail . SPP and stakeholders deve loped a list o f
40 Sep 2005

SPP RTO Expansion Plan 2005-201 0
potential transmission projects to be evaluated, and only 100 kV and above projects were
considered. The projects include proposed and exploratory transmission projects provided bytransmission owners and not used in Phase I, projects proposed by stakeholders, projects frombreakout groups at the Planning Summit III, projects developed after reviewing transmission lineloading relief history and projects after reviewing rejected transmission service . Thirty-threeprojects were included in the screening process .
The steps for the screening process include :1) Rank the list of potential transmission projects
2) Used a typical week from July 2005 to run ProSy m
3) Base MarketSym run made for 2005 with the OPF area including SPP and first tie r
companies4) Change case created for each project on the list of potential transmission projects
5) MarketSym run made for each change case6) Comparing the base case to the change case, the total dispatch savings (dispatch cost
plus violation cost) extracted7) 14-year savings estimated by calculating the savings over the summer period and
assuming the yearly savings is twice the summer saving s8) Present worth of the future savings over a 10-year period calculated using an eight
percent discount rat e
9) Estimated cost developed for each projec t10) Ratio number calculated by dividing the estimated dispatch savings by the cost of the
project11) Projects ranked by the ratio (Note : the ranking method used was solely for screening
purposes)12) List of projects presented in an open SPP TWG meeting for comments (List of
screened projects can be found in Appendix C }
Based on project ranking, SPP staff recommends the top four that yield the highest ratio . Thefour projects selected for detailed analysis are :
1) 345 kV Tulsa East switching station to tie PSO's Northeastern-Oneta and GRDA'sGRDA1-TulsaN line s
2) Rose Hill-Sooner 345 kV3) Sooner-Cleveland 345 kV4) Tolk-Potter 345 kV
Detailed Analysi sDetailed analyses were performed on the four selected projects . Seasonal MarketSym runs werecreated for 2005 and 2010. Each change case was compared to the base case. The productioncost savings (i .e . dispatch savings plus violations cost savings) was calculated for a i 0-yearperiod using seasonal data . The production was used to determine if savings over 10 years wouldpay for the project . Generation revenues and load savings were calculated to determine theallocation of the benefits .
4 1 Sep 2005

SPP RTO Expansion Plan 2005-2010
Tulsa East Switchi ng Station
By instal ling a switching station, the Tulsa East Switching Station project ties PSO'sNortheastern-Oneta 345 kV line and GRDA's GRDA 1-Tulsa North 345 kV lines . Figure 32shows the location of the Tulsa East Switching Station .
Figure 32: Tulsa East Switching Station
~ ~,, . ... . ,.... __.
~r .
~~~, •~. . , .
dh
'~~--1 7 RDA~, 412
A ( '
FORTG IBSON
Oka y
~a~ Creek~~.y ~ ; -r Ham~ ; ~t ~ . a~ ..
BBER FALLS, TENKILL
The estimated cost for the Tulsa East Switching Station is $8 million . The calculated economicsavings for this project over 10-years is approximately $8 million dollars using an eight percentdiscount rate, as shown in Figure 33 . The savings indicates that the project could be beneficial tointerested parties .
Figure 33 : Tulsa East Switching Station 10-Year Saving sDispatch Cost Savings + Violation Costs
Tulsa East Tulsa East2005 2010
Spring $230 ,268 $318,501Summer $580,340 $641,818Fall $181,508 $182,609Winter $62,592 $184, 83 8Total $1,054,708 $1,327,766Estimated 10-Year Savings $7,819,17 7
Figure 34 shows the annual generator dispatch benefits and load impacts/load benefits for theTulsa East Switching Station .
42 Sep 2005
-- --- ----- - --------
Ron CiY al~rai_4'- '1
PaWhuska Vl n lia Gmue
PENSACOLA ,.;unolucncrCou i sr''

SPP RTO Expansion Plan
Figure 34 : Tulsa East Switching Station Annual SaviYear 2005 Year 2005Generator 10% load Benefi t
Redispatch Savings 1Vormalize dCELE (485) 6,826EMDE 8,540 (52,204)GRRD 826 (41,285 )INDN 1,527 (1,292 )KACP 8,632 33,876KACY 615 4,628LAFA 145 (714 )LEPA 28 (274 )MlDW 0 (273 )MIPU 858 (11,748 )OKGE 3,256 195,648PSOK 88,217 297,795SOEP (20,932) (47,922 )SPPIPP 2,191 0SPRM 2,123 (31,868)SUNC (234) 1,355SWPA (83) 12, 709SWPS (277) 126,027WEPL 51 81 7WERE 10,724 (56,545)WFEC 1,885 46,304Subtotals 107,606 365,78 3
AECI 46,811 (27,250)IOWA 19,712 (10,332)MAINS 4,165 (126,623)NEBR (46) 7,725EES (3,075) (29,092 )EESIPP 5,021 0Su btota Is 72,587 185, 57 2
Totals 180,193 209,30 3
Annual Production Cost Savings for 2005
Violation CostsSavings 257,395Dispatch Savings 797,313
Dispatch + Violatio nSavings 1,054,70 8
43
for 2005 and 2 010Year 2q10Generato r
Redispatch Sav ings
4244 , 686
104
370
31
19
52
20
01,3793 ,462
69 , 870(2 , 085)
4 . 752
20
538
(306)5,7743,993
91 . 448
21 , 28915 , 57 1
122793
(4,326 )4 , 924
38,373
I
2005-201 0
Year 2010
1 0% load BenefitNormalized
(13,074)(32,156)
(16 .792 1
1
2( 5,401)178,047309,4391( 0,396 )
02( 1,776)
3,9901 9( , 693)124,975
3984( 0,534)41,433
428.673
24 , 35337,18502 . 474
0
172 . 01 5
Annual Production Cost Savings for 2010Violation CostsSavln s 572,217Dis a#chSa~in s 75~549
Dispatch + Violatio nSavings 1,327,766
Sep 2005

SPP RTO Expansion Plan 2005-201 0
Tulsa East Annual Savings
Figure 3 5 shows allocation of benefits for the Tulsa East Switching Station using only positivebenefits of both generation and load . Negative savings were not included in the allocation . The
allocation is shown using two scenarios : 1) generator redispatch savings plus 10% of the loadbenefits and 2) generator redispatch savings .
Figure 35 : Allocat ion Tulsa East Benefits Based on 10-Year Savings
Allocation GeneratorRedispatch Savings Allocation Generato r+ 10% Load Benefits Redispatch Saving s
CELE 0% 0%EMDE 1% 4%GRRD 0% 0%llVDN 0% 1 %KACP 1% 3%KACY 0% 0%LAFA 0% 0%LEPA 0% 0%MIDW 0% 0%MIPU 0% 1%OKGE 23% 2%PSOK 45% 45%SOEP 0% 0%SPPIPP 0% 2%SPRM 0% 1%SUNC 0% 0%SWPA 0% 0%SWPS 15% 0%WEPL 0% 0%WERE 1 % 5%WFEC 6% 2%
AECI 4% 20%IOWA 2% 10%MAINS 0% 1%NEBR 1 % 0%EES 0% 0%EESIPP 1% 3%
Totals 100% 100%
AEP announced a new $48 million project in the Tulsa area . This project completes the 345 kVloop from Wekiwa-Riverside by converting an existing 138 kV line . A sensitivity run was madeto determine the impact of this project . The sensitivity runs show that with the project in place,only half of the benefits of the Tulsa East Switching Station project would be realize d
44 Sep 2005
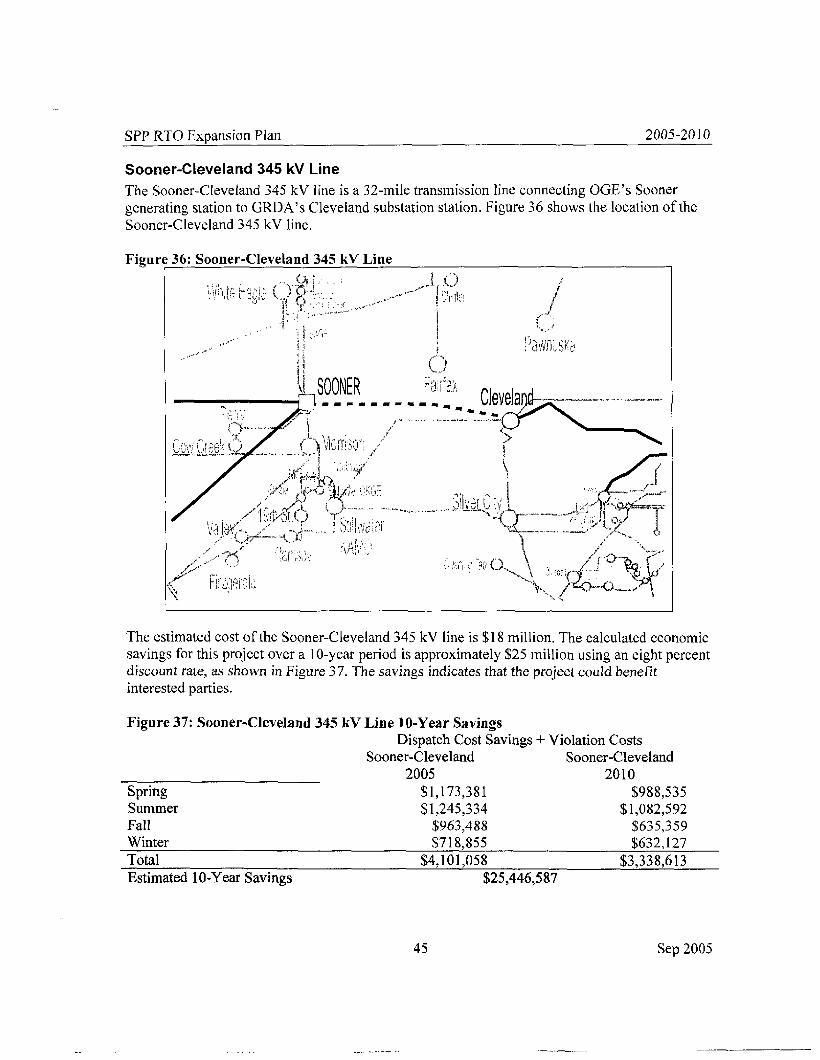
SPP RTO Expansion Plan 2005-201 0
Sooner-Cleveland 345 kV Lin e
The Sooner-Cievetand 345 kV line is a 32-mile transmission line connecting OGE's Soonergenerating station to GRDA's Cleveland substation station . Figure 36 shows the location of theSooner-Cleveland 345 kV line .
Figure 36 : Sooner-Cleveland 345 kV Line
eI 1C)
soaNE~ ~w~ : ~~~~
~,.
~-~~
r' i a1 NUi`
., !.U/ I.
~ ~~'.I ~~•.i ,)~I~, w
The estimated cost of the Sooner-Cleveland 345 kV line is $18 million . The calculated economicsavings for this project over a 10-year period is approximately $25 million using an eight percentdiscount rate, as shown in Figure 37 . The savings indicates that the project could benefi tinterested parties .
Figure 37: Sooner-C leve land 345 kV Line 10-Year SavingsDispatch Cost Savings + Violation Costs
Sooner-Cleveland Sooner-Cleveland2005 2010
Spring $1,173,381 $988,535Summer $1,245,334 $1,082,592Fall $963,488 $635,359Winter $718,855 $632,127Total $4,101,058 $3,338,613Estimated 10-Year Savings $25,446,587
45 Sep 2005

SPP RTO Expansion Plan 2005-201 0
Figure 38 shows the annual generator redispatch benefits and load impacts/load benefits for theSooner-Cleveland 345 kV line .
Figure 38 : Sooner-Cleveland 345 kV Line Annual Savings for 2005 and 2010Year2005 Year2005
Generator Red ispatch 10% load BenefitSavings Norma l ize d
CELE 7 ,380 57 , 355EMDE 15 , 156 (128,415 )GRRD 6 1 7,0$8INDN 13,611 42 , 528KACP 23 ,627 (686,442 )KACY 7,476 (105,794 )LAFA 54 13,227LEPA (1) 6 , 257MIDW 0 (36,186)MIPU 9 , 169 (261,019)OKGE 93 ,936 2 , 307 , 668PSOK 65 , 986 863,662SOEP 39 ,328 434 ,532SPPIPP 3 , 624 0SPRM 7,499 (107,293)SUNC 541 (23,043)SWPA 2 , 867 (42,112)SWPS 23 , 472 1,049,98 0WEPL (65) (96,976)WERE 203 ,690 2,012 , 380WFEC 62 , 137 515 , 698
Subtotals 579 ,493 1 , 689 ,1 03
AECI 15 , 008 (200,247 )IOWA 4 , 1 15 (421,972 )MAINS 5 ,454 (909,397 )NEBR 5 ,499 (544,109 )EES (47,030) 89 , 646EESIPP 1 0 , 169 0
Subtota l s (6,785) (1,986,080)
Totals 572 , 708 (296,976)
Annual Production Cost Savin s for 2005Violation Costs Savings 1,957,912Dis a tch Savin s 2,163,146Dispatch + ViolationSavings 4,121,058
Year 201 Q Year 201 010% load
Generator Redispatch Benefi tSavin s Normalized
1,468 23,66415, 1 84 (120,116)
(17) 29,7647,265 29,184
11,668 444,3485,537 (70,347)
(48) 3,45223 1,578
0 (20,931 )11,732 (198,955)89,677 1,560, 56558,557 539,37633,770 237,843
5,073 07,292 (106,216)
fi41 (3,314)2,209 (40,428)
26,408 891,198(227) (56,605)
102,845 (1,376,921 )44,963 329,443
422,739 1,089,99 1
12,507 169, 1 0 1(4,419) (229,930 )(1,962) (549,673 )
2,859 (413,769 )(33,443) (71,897 )
(108) 0
(24,565) 1,434,369)
398,174 344 379
Annual Production Cost Sa~in s for 2010Violation Cpsts Savings 948 , 046Di$' b-S aWi ngs 2 , 590 , 569Dispa tch + Violatio nSavings 3 , 338, 61 5
46 Sep 2005

SPP RTO Expansion Plan 2005-201 0
Figure 39 shows allocation of benefits for the Sooner-Cleveland 345 kV line . The allocation ofbenefits used only positive benefits of both generation and load . Negative savings were notincluded in the allocation. The allocation is shown using two scenarios: 1) generator redispatch
savings plus 10% of the load benefits and 2) generator redispatch savings .
Figure 39: Allocat ion Sooner-Cleveland 345 kV Based on 10-Year Savin s
Allocation Generato rRedispatch Savings + Allocation Generato r10% Load Benefits Redis atch Savings
CELE 1% 1 %EMDE 0% 3%
GRRD 0% 0%I N DN 0% 2 %
KACP 0% 3%KACY 0% 1 %LAFA 0% 0%l. E PA 0% 0%MIQW 0% 0%MiPU 0% 2%OKGE 41% 17%PSOK 15% 12%SOEP 8% 7%SPPIPP 0% 1%SPRM 0% 1 %SUIVC 0% 0%SWPA 0% 0%SWPS 20% 5%WEPL 0% 0%WERE 3% 30%WFEC 10% 10%
AECI 0% 3%IOWA 0% 0%MAINS 0% 1 %N EBR 0% 1%EES 1% 0 %EESIPP 0% 1 %
T0~81s 100% 100%
47 Sep 2005

SPP RTO Expansion Plan 2005-201 0
Rose Hill-Sooner 345 kV Lin eThe Rose Hill-Sooner 345 kV line is an 83-mile transmission line connecting Westar Energy'sRose Hill substation and OGE's Sooner generating station. Figure 40 shows the location of theRose Hill-Sooner 345 kV line .
Figure 40 : Rose Hill-Sooner 345 kV Line
,, .
A.: ~ .
SOONE R
The estimated construction cost of the Rose Hill-Sooner 345 kV line is $44 mill ion. Thecalculated economic savings for this project over a 10-year period is approximately $42 millionusing an eight percent discount rate, as shown in Figure 41 . The savings would indicate theproject could benefit interested parties who would request additional study ; however, thepayback period may exceed 10-years .
Figure 41 : Rose Hill-Sooner 345 kV Line 1 0-Year SavingsDispatch Cost Savings + Violation Costs
Rose Hill-Sooner Rose Hill-Sooner2005 2010
Spring $1,961,617 $1,630,577Summer $1,905,147 $1,705,158Fall $1,775,775 $1,187,216Winter $1,143,109 $904,225Total $6,785,648 $5,427,176Estimated 10-Year Savings $41,840,77 8
48 Sep 2005

SPP RTO Expansion Plan 2005-201 0
Figure 42 shows the annual generator redispatch benefits and load impacts or load benefits forthe Rose Hill-Sooner 345 kV line .
Fi2ure 42: Rose Hill-Sooner 345 kV Line Annual ~.Yea r 2005 Year 2D05Generator 10% load Benefi t
Redispatch Savings Norma l ize dCELE 13 , 822 110,432EMDE 17 , 670 (28,231 )GRRD (0) 1 46 ,1 95I N QN 28,572 66 , 1 1 7KACP 50 , 440 (986,490 )KACY 21,102 (161,633 )LAFA (39) 31,53 1LEPA 31 12 , 91 4MIDW 0 (53,106 )MIPU 26 , 049 (403,430 )OKGE 159 , 202 2,943,6D3PSOK 56 ,683 1 , 366 , 973SOEP 71 ,260 743 , 026SPPIPP 2 , 349 0SPRM 10 , 476 (62,056)SUNC 587 (47,009 )SWPA 2 ,636 17 , 543SWPS 52 ,183 1 , 432 , 390WEPL (828) (148,765)WERE 475 , 208 (3,291,564 )WFEC 149,851 642 , 156
Subtotals 1,137,252 2,163,275
AECI 17,878 114 , 962IOWA 7 , 221 (453,634)MAINS 7 ,467 9 , 017 , 51 6NEBR 8 ,77 5 (730,772)EES (79,011) 720 ,296EESIPP 5,001 0Subtotals (32,669) (1,596,587 )
Tota Is 1 ,104,583 566,688
n s for 2005 and 20 1 0Year 2p10 Year 201 0Generator 10% load Benefit
Redispatch Savings Normalized5,289 69,743
1 6 ,7473
13,82845,0251 6 , 358
115
0
028 , 505
163,54347 , 20052 , 2442 , 2756,497
244
252,411
80 .76 2
13,0421 , 0712 , 0283 , 805
33,393)1,802
1 1 . 645 ]
7
94,8185( 1,699 )
67( 1,235)1 1( 3,4g9)
17,34 08,149
2{ 7,309}(323,414)1,770,61 4
913,138465,385
0(40,276)10,405
1( q,325 )1,098,007
(73,178 )
374 , 022
1 . 337 . 703
100, 575)221,292)647,631)472,843)499,115
0
943,225)
Annua l Product i on Cost Savings fo r 2005 Annua l Production Cast Savings fo r 2010
Violation Costs Vi olati on Cast SSavings 2,664,830 Savin s 1 ,27$,927Dispatch Savings 4,120 ;817 D ~ s
Ich Savin s 4, 148 ,248
Dispatch + Violation ❑ ispafch + ' ViolationSavin s 6 , 785 , 647 Savings 5,427,175
49 Sep 2005

SPP RTO Expansion Plan 2005-2010
Figure 43 shows allocation of benefits for the Rose Hill-Sooner ')45 kV line . The allocation ofbenefits used only positive benefits of both generation and load . Negative savings were notincluded in the allocation. The allocation is shown using two scenarios: 1) generator redispatchsavings plus 10% of the load benefits and 2) generator redispatch savings .
Figure 43: Allocation Rose Hill-Sooner 345 kV Line Based on 10-Year SavingsAllocation Generato rRedispatch Savings Allocation Generato r+ 10% Load Benefits Redis atch Saving s
CELE 4% 3%EMDE 0% 2%GRRD 2% 0%IfVDN 0% 2%KACP 1% 5%KACY 0% 2%LArA 0% 0%LEPA 0% 0%MIDW 0% 0%MIPU 0% 3%OKGE 31% 20%PSOK 15% 6%SOEP 8% 6 %SPPIPP 0% 0%SPRM 0% 1 %SUNC 0% 0%SWPA 0% 0%SWPS 18% 5%WEPL 0% 0%WERE 4% 31 %Y Y r GC 7% 10%
AECI 0% 2%IOWA 0% 0%MAINS 0% 0%NEBR 0% 0%EES 8% 0%EESIPP 0% 0%
TotaIS 100% 100%
50 Sep 2005

SPP RTO Expansion Plan
Tolk-Potter 345 kV Line
2005-201 0
The Tolk-Potter 345 kV line is a 55-mile transmission line connecting the SPS Potter substationand SPS Tolk generating station . Figure 44 shows the location of the Tolk-Potter 345 kV line .
Figure 44 : Tolk-Potter 345 kV Lin e
The estimated construction cost of the Tolk-Potter 345 kV line is $30 million . The calculatedeconomic savings for this project over a 10-year period is approximately $35 million using aneight percent discount rate, as shown in Figure 45 . The savings indicates the project could bebeneficial to the interested parties who would request additional study .
Figure 45: Tolk-Potter 345 kV Line 10-Year SavingsDispatch Cost Savings + Violation Costs
Tolk-Potter Tolk-Potter2005 201 0
Spring $1,819,161 $1,818,469Summer $1,385,254 $1,034,012Fall $1,330,766 $1,329,091Winter $610,566 $1,019,690Total $5,145,747 $5,201,262Estimated 10-Year Savings $34,679,236
5 1 Sep 2005

SPP RTO Expansion Plan Zoos-ZOi a
Figure 46 shows the annual generator redispatch benefits and load impacts or load benefits for
the Tolk-Potter 345 kV line .
F igure 46: Talk-Patter 345 kV Line Ann ual Savings for 2005 and 201 0Year 2005 Yeat 2 005
Generator 10% load BenefitRedispatch 5av in s Normal ized
CELE 5 , 713 (4,821 )EMDE 1 , 92$ (16,131 )GRRD (15) 4 , 789INDN 4, 445 (12,202 )KACP 3,789 197 , 767KACY 1 ,620 34 , 294LAFA 49 1,020LEPA 18 124MIDW 0 109 ,426M IPU 3 , 404 (72,016)OKGE 13 , 233 361,315PSOK 621 69 , 708SOEP $ ,265 57 ,749SPPIPP 1,764 0SPRM 3 , 513 (12,947)SUNC 2 , 404 (359,375)SWPA 1 , 972 (6,799)SWPS 2 , 071 ,338 2 , 320 , 275WEPL (121) 306 , 876WERE 31 , 148 (702,684 )
WFEC 3 ,135 27 , 325Subtotals 2 , 158 ,223 1 , 006 , 968
AEC I 4 , 020 (32,594 )IOWA 4 ,921 44 , 164MAINS 1 , 976 (244,914)NEBR 4 ,227 201 , 064EES (17,978) 46 , 707EESIPP 5 , 202 0Subtota ls 2 ,369 14 , 428
Totals 2,180,592 1,021,396
Year 20 1 0 Year 201 0
Ge ne rato r Red i spatch 1 0% load BenefitSavings Normalize d
3 , 7 1 7 (36,997 )4 , 326 (33,049)_
79 (17,162 )2 , 240 (11,628 )4,922 (165,233)2 ,208 28 , 948282 9 , 399
1 (5,256 )0 (108,988)
3 ,925 67,9856 ,963 69 ,7221, 895 (75,645 )
1 8 , 551 (115,970 )602 0
2 , 335 (26,025)1 , 177 (341,000)1,820 (24,476)
1 , 888 ,549 2 , 389 , 33 166 305 , 386
23 , 728 (552,106 )
4 , 959 (27,690 )1 , 972 , 346 506 ,10 9
03 , 680 (61,409 )2 , 818 14,67 8
(1,896) (199,580)11 , 114 (81,543)
11 , 636 (466,367)1,753 05 , 832 (794,221 )
1,978,178 28$ 112
Annual Production Cost Savings for 2005 Annual Production Cost Savings for 2010Violation Costs Violation Cos t sSavings (1,733,704) Savings 2 ,Q01 ,377Dispatch Savin s 6,879,452 Q ES atch §Pvih 5 7,202,$32D ispatch + Vi n lation Dispatch + Violat i onSavin s 5 ,1 45,748 Savings 6, 241,262
52 Sep 2005

SPP RTO Expansion Plan 20 05 -201 0
Figure 47 shows allocation of benefits for the Tolk-Potter 345 kV line . The allocation of benefitsused only positive benefits of both generation and load . Negative savings were not included in
the allocation. The allocation is shown using two scenarios : 1) generator redispatch savings plus10% of the load benefits and 2) generator redispatch savings .
Figure 47: Allocation Tolk-Potter 345 kV Line Based on 10-Year Savin gsAllocation Generator Allocation Generato rRedispatch Savings + Redispatch Savings10% Load Benefits
CEL E 0% 0%EMDE 0% 0%
GRRD 0% 0%
INDN 0% 0 %KACP 0% 0%KACY 0% 0%
LAFA 0% 0%
LEPA 0% 0%MIDW 0% 0%MIPU 0% 0%OKG E 5% 1%
PSOK 1% 0%
SOEP 1 °/a 1 %SPPIPP 0% 0%SPRM 0% 0%SUNC 0% 0%$WPA 0% 0%SWPS $7% 95%WEPL 0% 0%WERE 1% 1 °/aWFEC 0% 0%
AECI 0% 0%IOWA 1% 0%MAINS 0% 0%NEBR 3% 0%EES 1% 0%EESIPP 0% 0 %
Totals 3 00% 100%
53 Sep 2005

SPP RTO Expansion Plan
Project Comparison/Sensitivity Analysis
zoos-Zai o
Figure 48 shows the cost benefit ratio for the four projects based on the calculated 10-yearsavings. The Sooner-Cleveland 345 kV line has the highest benefit cost ratio, followed by Tolk-Potter 345 kV line . The ratios for the other two projects were slightly less than 100% for a 10-year period . This does not conclude that they are not good economic projects . This analysis didnot consider other benefits that may even reduce the payback time to less than 10 years .
Figure 48 : Benefit Cost Ratio Based on 10-Year Savi ngsCost Millions 10-Year Savings Ratio
Tulsa East $8.0 $7,8 ] 9,177 98%Sooner-Cieveland $18.0 $25,446,587 141%Rose Hill-Sooner $43.5 $41,840,778 96%Tolk-Potter $29.5 $34,679,236 11 8%
A sensitivity analysis was conducted to determine how the cost benefit variance related to thesequence of the four project installations . The sensitivity runs revealed the order yielding the
greatest benefit is Sooner-Cleveland 345 kV line, Tolk-Potter 345 kV line, Tulsa East SwitchingStation and Rose Hill-Sooner 345 kV line . The sensitivity runs also show that the savings gainedby all projects stacked together were less than the savings realized by the four projects conductedindividually .
A sensitivity analysis was also made to study the impact of high fuel cost . The EconomicPlanning section of this report describes the high fuel scenario . High fuel scenario results :
• Tulsa East Switching Station - benefit increased 5%~ Sooner to Cleveland 345 kV Line - benefit increased 56 %~ Rose Hili-Sooner 345 kV Line - benefit increased 20%• Tolk-Potter 345 kV Line - benefit increased 23 %
Economic UpgradesFunding of economic projects is voluntary . The four economic projects were presented at SPPPlanning Summit IV . Participants have shown some initial interest in pursuing all four projects .
At the SPP Planning Summit IV, SPP presented a proposed flow chart that outlines theEconomic Upgrade Process . Few changes have been made to the flowchart since incorporatingcomments from stakeholders . Figure 49 shows the proposed flow chart for SPP economicupgrades .
54 Sep 2005

SPP RTO Expansion Pla n
Figure 49 : SPP RTO Economic Upgrade Process
Spec+ al
Studie s{ e .g ., Ka nsa sl
p anhandle)
SPP Staff
Evalu ate To pProjects Via Open Meeiing
Detai led Anelysis {Pla n nin g Summit)For SPP RT OE xpans io n Pla n
New Proposed ~f SPP SueensEconom ic Pfo]ects ~ 'I Projects
Y es
S kake ho ltlerl n put
Gro up En6 ty Eleds To
S ponsored Pay SP P For
S tu dy?
No
D eta iled St udy
Sig n Agreeme nt F-H Meet ing Of Projecttvr Rd d ih ona
l Spo n sorsStudies
/ Ye s Determin e Imp actFurther Stu d o n S PP RTO
Expansi on P lan
N o
Determin eB en efi cia r ies o f
Proje ct
Yes Constru ct ionConstruct? Ag re ement
N o
EN❑
Incorporate Proje ctInto SP P R T 0Expansion Plan
H
Con struchonProject CompletionRight-Of-Way &
H Proj ect Lead Project Owner(s)Permidmg
Al3 oc aie D e ferred,D ispla ced Or
4vofda p Ba s e PlanUpgrade Costs InAccordance With
SPP OATTAtt achment J
Cost Recovery
AllocateTransmission
Revenue CreditsIn A ccordance
With SPP OA T TAttachment Z
Stability,Inte rconneclion &
Short CircuitStudies
TWG Review
2005-2010
55 Sep 2005

SPP RTO Expansion Plan 2005-2010
Next SPP RTO Planning Cycl e
SPP held its fourth planning summit on June 1, 2005 in Dallas/Fort Worth. Results of the Phase
II assessment, along with approved Phase 1, were shared with summit participants . One of theoutcomes of Summit IV was the formation of the Economic Modeling and Methods Task Force .The task force will review the economic planning process used by SPP staff and offer proposalsfor the improvement of the process .
The task force will address the following :
• Determine the necessary data required to model, study and evaluate economicalternatives using MarketSym and PowerWori d
• Review the solution techniques used in the prior expansion plans and providerecommendations for improvement and/or alternatives
• Define as necessary any terms used in the economic planning process, data orassumptions that provides clear understandin g
• Review and revise as appropriate the economic assumptions to be used in thedevelopment of the economic phase of the expansion plan
• Review and modify if appropriate the methodologies for overall quantification and break-out of economic impact s
After initial review of Phase I, SPP recommended changing the two year planning cycle to 18-months . Figure 50 shows the proposed 18-month SPP RTO planning cycle . Under the newprocess, the SPP Board would approve the reliability projects within one year from the studystart date . Another key item of the new 18-month cycle is the first cycle will be in sync with theSPP MDWG model building effort, whereas the second cycle will use Model On Demand(MOD) .
Appendix A of the SPP RTO Expansion Plan contains a list of all projects . The projects aredivided into three categories including Board approved projects (Phase I - April 2005), approvedout of cycle projects and out of cycle projects pending evaluation. The project lists will berevised quarterly to include project updates .
56 Sep 2005

SPP RTO Expansion Pla n
Figure 50 : SPP RTO Expansion
Nov I - Dec 3 1 d an I - Feh 1 0
M{' 5PP Planning
Model s
Year 1 - I O
dan I -Peb, i ~
EonUp
Sap L -Ae 6 28
SPP MDWGMo de l Developmen t
Aug 2
OASIS
posting
Aug. lS
lanning Process (18 -Month 1
Feb. 12 - May I
SPP IdeRti fi esI n4¢ffaCe 8:
NERC ] A Bu lk P ower
MiGgation Review Problem s at
Year 1 -10 Su b-Regi oaal &
[teg iunal Leve l
A ag 16 - Aug 31
Pia nnmg
S umm it
Feedba ck
J an 2 San 15 ]an . 16 - d an , 31
OASIS PlaaningSumm~ t
posting Feedback
May 2 1
S ep 1 Sep l - O c t 31 \ ov I - N ov 30
7OASI3 Mazket Refi ne Solut ion;
p ostmg Assessment Evaluate Scope
Feb l - M ar 31
SPP Fi nal izes
Expansion Plan
Apr, I
SPP Approves
& Aosts Plan
57
2005-201 0
May 22 - Aug I
Prel~minary
Sol
u
tia a
Dec 1 - Dec 3 1
'P Develops Draft
Eaya n si on Pla n
Apr. 2 - Apr 30
Budgenng & Scop in g
for Years 2 - 5 &Out of Cycle P r ojects
Sep 2005

SPP RTO Expansion Plan 2005-201 0
Appendix A : L ist of Projects
Proiect Identificatio nForms 1 -3 contain a list of the projects addressed in the SPP Expansion Plan. Figure 51 showsthe area number identifying the owner building the project . SPP transmission owners conduct
future planning; and, consequently, many projects listed by SPP were already identified andplanned by the transmission owner .
Forms 1-3 identified projects using `PL,' `X' and 'OOC .' Projects planned by the transmissionowners are indicated with `PL .' An `X' indicates the project was identified through the SPP RTOExpansion Plan process and therefore not previously recognized or planned by a transmission
owner . `OOC' shows that the project is an out of cycle project .
The projects are also divided into three categories : projects approved by the Board (Phase 1,April 2005) ; out of cycle projects evaluated and being presented in this report; and out of cycleprojects still to be evaluated . Forms 1-3 do not contain all 69 kV and below projects, because thetotal 69 kV system was not evaluated . The transmission owners independently planned themajority of the 69 kV system .
Figure 51 : Owner Area Iden t ificationArea Number Owner Buildin th e Pro'ec t502 CELE Central Louisiana Electric Cam an , Incorporated503 LAFA City of Lafayette504 LEPA Louisiana Energy & Power Authority515 SWPA Southwestern Power Administratio n520 AEPW American Electric Power System West523 GRDA Grand River Dam Authority524 OKGE Oklahoma Gas and Electric Com an525 WFEC Western Farmers Electric Cooperative526 SWPS Southwestern Public Service Compan y527 OMPA Oklahoma Municipal Power Authori531 MIDW Midwest Energy, Incorporate d534 SUNC Sunflower Electric Power Corporation536 WERE Westar Energy, Incorporate d539 WEPL West Plains Energy540 MIPU Missouri Public Service Company541 KCPL Kansas City Power and Light Company542 KACY Board of Public Utilities, Kansas City, KS544 EMDE Empire District Electric Company545 INDN City Power & Li ht, Independence, Missour i546 SPRM City Utilities, S rin field Missour i
58 Sep 2005

SPP RTO Expansion Plan 2005-2010
Forms 1- Transmission Lines and Transformers
59 Sep 2005

N
cC~3
~i~
~
~
N
O~

SPP RTO Expansion Plan
61
2005-201 0
Sep 2005

SPP RTO Expansion Plan
62
2005-201 0
Sep 2005

SPP RTO Expansion Plan
63
2005-201 0
Sep 2005

SPP RTO Exnansion Plan 2005-2010
64 Sep 2005

SPP RTO Expansian Plan
65
2005-2Q1 0
Sep 2005

SPP RTO Expansion Plan 2005-201 0
66 Sep 2005

SPP RTO ExDansion Plan
Forms 2- Devices and Loads
67
Zaos-2o 1 a
Sep 2005

SPP RTO Expansion Plan 2005-2 0 1 0
69 Sep 2005

SPP RTO Expansion Pla n
Forms 3 - Generators
69
zaas-2o1 o
Sep 2005

SPP RTO Expansion Plan
Appendix B : Maps with Criteria Violations above 100 kV
Following are maps showing criteria violations above 100 kV within the SPP footprint . Violations are groupedby state for map purposes . Contingencies are not discussed in this report due to security concerns .
Map Legends :OS SP - 2005 Summer Peaki OSP - 2010 Summer PeakODR - Operating DirectiveLocation name highlighted indicates voltage violationLine highlighted between two locations indicates an overloaded lineYellow/Orange 2005 violation
Purple 201 0 violation
B - Base Case
T1 - .West to East transaction caseT2 -- East to West transaction caseT3 - Hybrid transaction case (West to East with SPS importing)ALL - Base Case, TI, T2, and T3Voltage violations are highlighted and do not identify the type of load flow case (base or transaction case )
Kansas
70 Sep 2005

SPP RTO Expansion Plan
.~ ~ KansasNERC Category A
Kno k i ryA ~-- ~~_ ~ Russella SSp L_
Arnald S. Fiay-.~. Ransom
~nc~oss
r N1~koma ~~~
NE75S ti`Ity S. GaGross-~L,`.~ HB~ZAf~ R
~
o Hh OaApe
Paiwn9+BOgSP
OS~'►~'° ~sp T 8t. Jot~n
N nslsy[~
Edwards;pearvi lle w ssp
KansasNERC Category B
,~~~ Otis
qHe-izerAEexa~nder S. ~ac REN R
iCe CU.
2nd &
osSP
Pawnee
N. KinsleyEdwards
4SSP OSSP
71
a5SPp Huntsville SW
St~John
Sep 2005

SPP RTO Expansion Plan
KansasNERC Category B
w/Operating Directives~ HiJlsboroLyottS Wheatlancl
vsSPR I2C/5
A Ark Va(
W. herson
E.McPherscioSP
i~~F~Iori0 1
as/=oSP
6ntOn
/Eaa -~- rcle
ODR =1*5
I n
Bu:rr en TCHlNSONH
Cities Service Davis
iosPODR iid5
GORDO
KansasNERC Category B
_ __-A-
;H erndon - ----- o 551, o 55P
4 S 5P ~~n •LOBP f084
NM~I[tt-455l'
latl 0 4S P 6 4 tiP IOSPof 5 P -
.'dw-
BY
- - ~_--. Mo rla nd ~ tr~am oSSP bSSP;f c r~ La o3SV t68P tOiP
-b-- ----- ~;., ~ jig9roS SQ o s S P I
uS 5P IABF ---~
o SSP tioW 9 55P
K krpgp IOSP
wCrinrtel ~ . ~~...- ~ aSSP os&P
oSSP oSS P zOw sowioBP
i
lAmal d i
~j} ._..~ .
. Ot--9 Rarssom 05 5 P ~ Ilow
~fllsworn,ux„~,w zOBP
72 Sep 2005

SPP RTO Expansion Plan
'Slf
• KansasNERC Category B
w/Operating Directivess~C1aP CI rGl9viil~~8, -ArZ
XFz3a/aLssJEFFFtEY ENERGY° sJ~90-SF
IaDaIt CFNTER ODlm 4404
r~utt~,~..1 ~l e r Oct' vrn.rr 1
w~ ~d~"-~,~• .. E. M nhattarid 4~ ♦ n,nw~~,~~~ seuws~ t} --~^ 33
(3r~i
J ~Sautn Atlna Kaeane 1"
GT
,-_- •• •• =-Y O Bll .
31i_r=N Cr~a ~tc~ [4S~ as/zo p w, .
T~ ODR,
o5t7. i ~.a„Adr~
4rris Co- ot 400~~~ ~e►I.~.
OJ .~ Readi r
boro L.angEmpoha . StreQ i
s. a+s lp WOLF
KansasNERC Category B
Circlevi~le o5I1 oSP T1
JEFFREY ENEaGY
~~ CENTER Hayt HTI vt
zoSP
South IRkrra i KOM
;[pSP
73 Sep 2005

SPP RTO ion Plan
KansasNERC Category B
w/Operating DirectivesforA ~
ODR 6i8 IAT p - -` Fh rOpALL
r • ~ A~~ K cy1 o5/~OSP Str n r I~. rwn?,_ .- k
Ja rL - • ~ . .-~:.:>~ .~, ~ E
'Y t,
~,~, io$~ f r/wrn1Y LYIB orqa FKNA H
y .
JCS JiG9.leT5UIWRENCE - ^ .r. •-' ~ '~ ~ Cltl aaa
, • i . _~ -~r ctL_. .' ~..~ ~ ~ 'Mk'~ ~ ~.
cant~n x~ CREEKI'~3orxas
Jcx onR6xs~ Hw~
~ ~nR ps~Sp~nn . nwa t-,
~ . ._. .- ..... ._--as/YaSp
QDR 6T8ALL
Rdr fan
0
~ re r~~ian,k~AbL7i._ `
Kansas/MissouriNERC Category B
1r late Cb
` KGf
T%NA1 ,
A . .A~ It Z-~C 1
NEAR1
IAI RENCEn . „w. .. . .' H . .~ ~
us~ ~q dm ~a - ~ ,~ra
lawer!n :•~ 4 Y"~~a'e R(1MeR y.""
L
BUt ..
GREE K Sprin~ H i lS. Fiichlarrd
74
1WiHOHN
o 6 BLUde~
~ .~ . _ .
ekw
HE
P Wsrri le
HOLDEN
Sep 2005

SPP RT4 Expansion Plan
Missouri
i _ . _ . . .. . . ., .~ . _, _ .. ~ _ _ .,..r.. .
I ~~ ss
r
___ _
i M issouriNERC Category B
IOSPA LL MAC
! Summ ftMarshfi
.1 ~ r~ e~i n 'Q
'Brook . Mltl~Dnmfia1
an
SC3UTHWESS RIVE R
rRive2al
Mentofi
c~'`~` e ~ P - ~...~C ~ v .~ .. D
75 Sep 2005

SPP RTO Ex pans i on P lan
MissouriNERC Category B
Leeper
rickson ~
Q en For
IoSPB,pT:ZI,3
Asherville
oplar Bluff
Richlanx9
Arkansas
Lutesvrl le
fu a~t r Pn o l ! A N ."',
_'_.. .. .._-___.----- _-_... ...... ._z_
. .. . . ___.
AH 0 .1
~
~_ .. . .. .~. ._.. _
~RI ~ ~7 - i. ~l~ ti S
~ ~.
\1 51; :1
76 Sep 2005

SPP RTO Expansion Plan
ArkansasNERC Category A
BEAVERDAM
Cawskin~ ALL E. Centerton
Jay Ro ag e rG EureDec urRa ers
l.l C
O EK Sprir
I lo.gown Lo
Rysss S. Springdale
Siloam S OSP T191'3Chamber Springs 9HIand
x A.LL~ Fatmingtorr S.E. Fayettevilfe
~ tzoos ► ~, FavP#tGavillA
ArkansasNERC Category B
BEAVER
Cov~skin6eC r
SPRogers Eureka
Ro %S/=~pfi ~ K ow ALLL
OS fiOSFS. Sprln9dale ALL
Sil :~ a 5 Spr ings
-- OS/3
.~/ Fa~rrgtan 0 S.E . Fayettev9le
sti e ~ FayettevilleOS/i4Sp
77 Sep 2005

SPP RTO Expansion Plan
Okay
1~McNab
o 5rp o5SP
Van s~~ '~$~g FITZHUGH GlarksWilleBure a'xo,
Hl itraus Oxide ~ S~I
"~
;EU(27)Litt fe Spadra
tiRazorback .a~ ~
~~`RKANSA ~- ~~• NUCLEAR
t ► o rt Mountain DARDAN LIN . Maga~ir►e DAM
Blue ~urtn .daE1W1 lle
North Huntington
ArkansasNERC Category E3
ArkansasNERC Category A
pe North Preseott J/'
FuLraNSugar HN
f°10~]@ N ` Emm ettSWHope
Hapa aslSWWBSt Mope East Camden N
E~i P B, T2
Camden P .
Patrrios ~ Lamartine ~te ph~
Lewisville West
H ARV MagCOUCH
78
Mag no{ia E.
~ gnolia So. ~
Sep 2005

SPP RTO Plan
Oklahoma
"8 ,`y Ht 6 x'e , r 'hp pP f Pnoi
,M~- .t` i
- . SlFr: ;:C,
__ . _ ..~
• .',5 :-„
j r.
;r- .,,.__ ..._ . . ._ . ~C }l ~,S :B3r"'
A° i
~ 5 ._ ~ . .
•
cta rksvills
ecan
SE R' f
ioSpTi
OklahomaNERC Category B
Tahlequah
\OkayF4RT GI ON
1iUKOGEEin
TENKlLLER
Salliore
79
f
Sep 2005

SPP RTO Expansion Plan
.~.
HiN
7r
N ' neI L 5berty Pharoah
ry ited C lav Gromwell ~
OklahomaNERC Category B
wlOperating Directives
Oklahomar NERC Category A
in Wewoka WetuP ink
aud OHazef T ~Fixco
4i *SP Ti H
SEIVI I IVOL E
80 Sep 2005
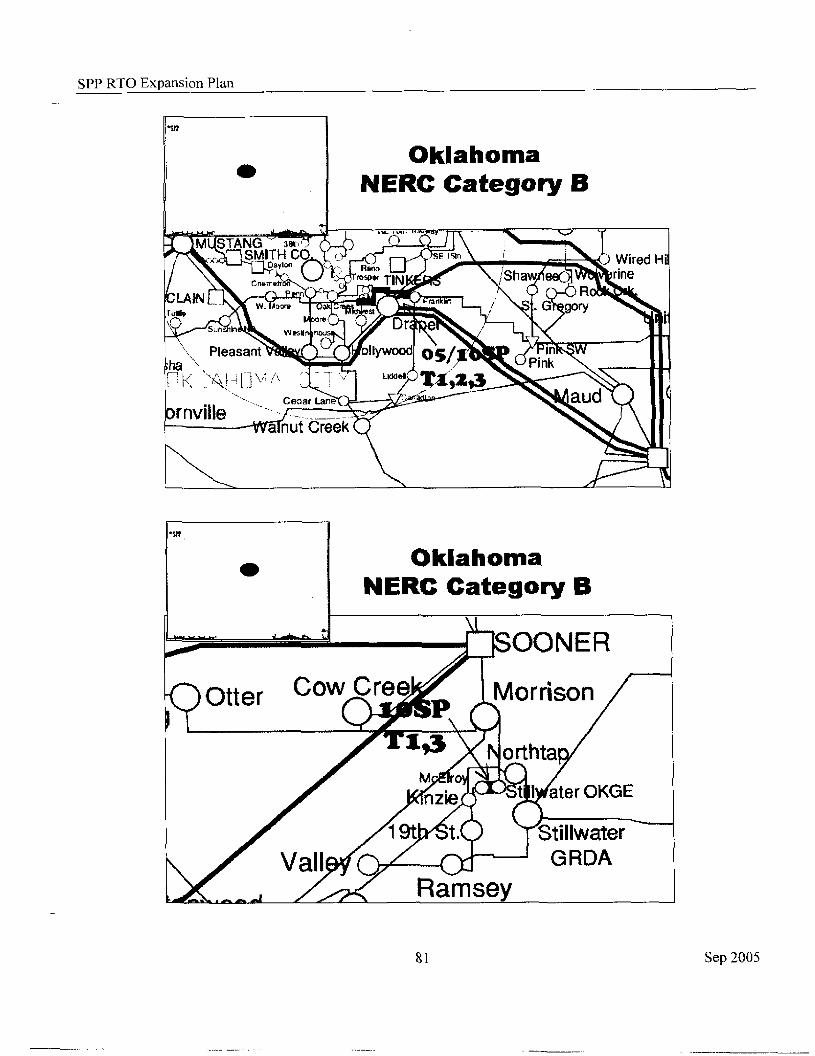
SPP RTO Expansion Plan
-x
Oklah omaNERC Category B
s( ►h f -) ~ ~.I co r sF,~~ ~ ' Wlred~" Renn
, ShaW e rine
w.
`.~ Pleasarrt altywoo~QS~
~ PinjPink
1 . '~r: 7 •v
L
~a~ ~~~
C
f nVl~~~a nut C reek
OklahomaNERC Category B
91 Sep 2005

SPP RTO Expansion Plan
40
. . . ..~ i, s~~s ~,.,ftusn Spr~ ,p
M ,~rO t~ N a[. G as
, FIBtGher 'C}untan Fast"
E[]utl Can
3 S/* B aseli ne'ALL E e ~A.
r Fto aurl
•
hoi lis0
Pralre Pt.
8ki e
AUn
Lane
µ~ u~ '~7aal Pelr. if..f'~ u~a~t GhiCkasaw Russe t E~/ } {alOK~n W oh Ln n e ~ ~~a UOn
Ringling i~~ RocKy P. fika sSe~L}10SP Cflney
_. .._ o
10 QSS
P
IAS~
Oklahoma/TexasNERC Category B
Snyder
14
~ PSO
oSSP 05SpzOSP =oSP
ioSP
82
OklahomaNERC Category B
Qklau nion
Sep 2005

SPP RTO Expansion Plan
North & East Texas
~~~,5y ir~hx•e .rFirqfr 1' n o l
Ape :;2 .1' 4
, . .t,
,. . . . . . . .'t ~ ~~ r~
viss
North Texas~ NERC Category B
Patter ,.j HARRiNCV7DW-
Cvnway
'~ ` ~LL CO. ~`/
Bu s h land naa uAmar~uo s ~. 05/=4SP TZr3
n W !o DuroCanyqr► E
Dawn
83
. . .~r. 5 1
_ . ,. , . . . . . . ~ .--, - 4
.~ ~
1I
~ . ~? ~ .z ._„~r•, ~ _.r ~ .'~~~
Sep 2005

SPP RTO Expansion Plan
East TexasNERC Category A
Glenn P ine
E xpiorer
Uroveo ;
TRINIDADI
•S , .
•
Tricorner
Tap
Pe
acxson "\
Canton1 OS►P 10:
zasp
foioSp
East TexasNERC Category B
''~,N_ MineolaC anto r► Tap ~-~
-~~ PerdusE x pio rer, ,yac kson
~M1 abanlc CanZc
OSSP 0~~p Barto nVlF ahan C~~
~5
_.r. _ r. A ens New
FREESTONE IKRGY CENTER
zz irlial'
141, Pi
ne Grove
zOSPBIG BROWN VOLTAGE
nrrsrrasuUa•r
84 Sep 2005

SPP RTO Expansion Plan
East TexasNERC Category B
•Jjj Le B rL
hape[
ak H i ll ~e
;witeh
NW Hend
L
Tatum
HARRISON SCO.
ioCkhil~S~~pri
~~ALL
~~- ~ IOSP1 / Carthaget1 Connection
85 Sep 2005
Louisiana

SPP RTO Plan
LouisianaNERC Category B
0 w/Operating Directive
Ring
Q5/Yd4< ~ BTz /B'-&1lR . Do1 t
acific
Man
LouisianaNERC Category B
86
Tex EasSta "E"
Hills
~rr If
LET H I LL
ne I Western fffaft
cky
OSP011 230/138Bfi2AMessick
arence
Sep 2005

SPP RTO Expansion Plan
Appendix C : List of Screened Pro jects and Rankin g
Rr ' . kl~a~?[~it~i~tP 'i l
PrQject „ ame~ „ 0i~.
Tulsa East 345 kV Switch in Sta'tions 8 . 0 . 9.4 1 1 7 . 5
Tolk-Potter 345 .kV 2915 25 .0 84. 7
Cleveiand-Sooner 345 kV 18. 0 14 .6 80 . 9
Tuco-Tolk-Potter345 kV 44 .5 25 .2 56 . 7
Rose HiII-Sooner 345 kV 43 . 5 19.7 45 . 2
SWPS-Battlefield 161 kV 3 .0 1 .0 34 . 9
Fair Port-Sibley345 kV 32 .0 9 .9 31 . 0
Potter-Clovis345 !cV 98 .5 27 .5 27 . 9
Su er X-P 1an 3451cV 493 .5 136 .9 27 . 7
Pauline-Knoll-5 earville-XF 345 kV 119 .0 32 .2 27 . 1Modified X-Plan 345 kV 449 .0 120 .0 26 . 7
Pauline-Knoll-S earv ifie 345 kV 114 .0 29 .7 26 . 1JEC-Swi svaJle 345 kV 27 .0 6 .3 23 . 3
Valliant Tie 138 kV 3 .3 0 . 7 21 . 6pri inal X-Plan 345 kV P1an-A 419 .0 84 .4 20 . 1Ori inal X-Plan 345 kV Plan-B 410 .0 81 .9 20 . 0Swisvaite-JEC -Maore 345 kV 86 .5 14 . 7 17 . 0
Flint Creek -ISES 345 !cV 126 .0 20 .7 16 . 4Tuco-Tolk 345 ! cV 17 .0 2 .5 14 . 8S . pierks-Murfressboro 138 kV 7 .3 0 .9 12 . 6S . Fa etteville-Osa e 161 kV 17 .3 1 .9 1 0 . 7JEC-Moore 345 kV 59 .5 5 . 9 9 . 9NWTexarkana-McNeil 345 kV 28.0 2 .7 9 . 6Chaves 230/145 kV Transformer 2 7 . 0 0 .7 9 . 5Wolf Creek-Lang 345 kV 22 .0 1 .3 6 . 0NW Texarkana-McNeil-Rolet Hills 345 kV 52 .3 3 .0 5 . 6
Lac away 345 kV 105 . 0 4 .0 3 . 8Moore-Pringle230 kV 20 . 0 0 .7 3 . 5SPS 115kV Lines & Transformers 35 . 0 0 .9 2 . 7
Potter-Northwest 345 kV 132 . 0 2 .0 1 . 5Muslco ee-VB13451cV 38 .3 0 .4 1 . 0
Dolet Hills 345 k!! Tie 24 .3 0 . 1 _0. 2HaleCoun -PlantX 23 0kV 27 .0 0 .0 0 . 1
87 Sep 2005
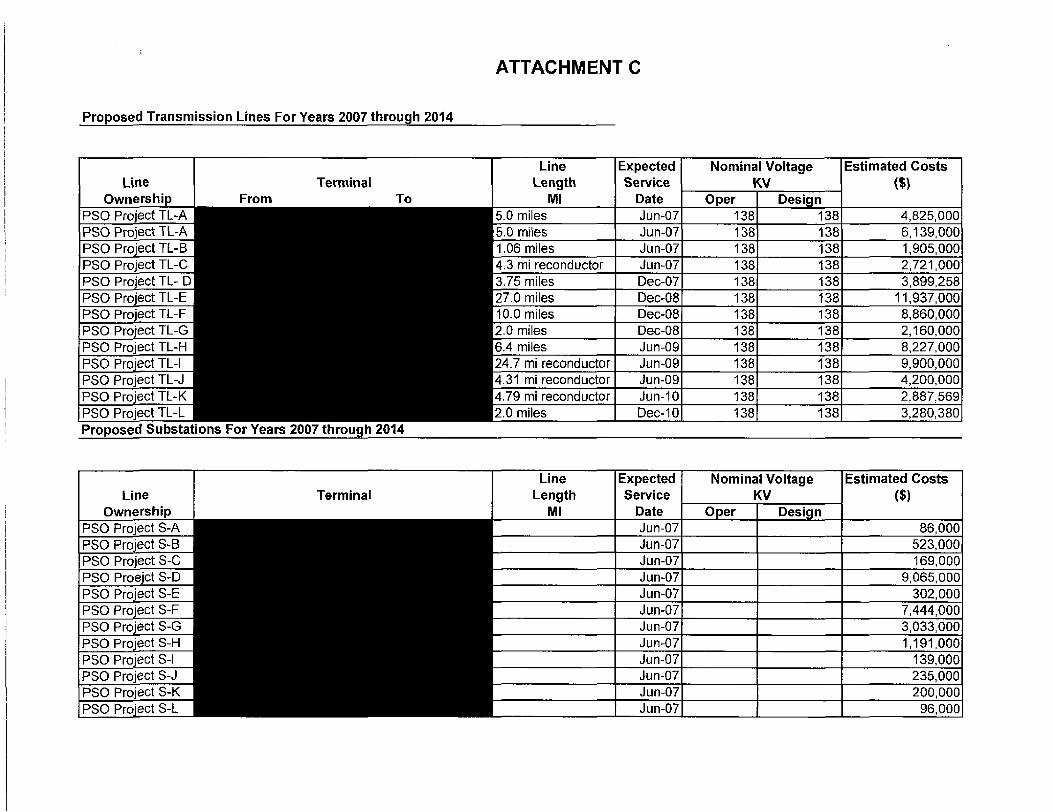
ATTAC HMENT C
Transmission Lines For Years 2007 throuqh 2014


Public Service Company of Oklahom a
Request For Proposa l
forPeaking Capacity and Energy Resources
November 2005
PUBLIC SERVICECOMPANY OFOKlAHOMA'A unit of American Electric Power
PSO RFP2005 RFP for Peaking Capacity and Energy Resource s
Table of Contents
SECTION 1 - GENERAL INFORMATION . . . . . . . . . . . . . . . . . . . . . . . . . . . . . . . . . . . . . . . . . . . . . . . . . . . . . . . . . . . . . . . . . . . . . . . . . . . . . . . . . . . . . . . . . . . . . . . . . . . . . . . . . . . . 'i
1 .1 INTR pDUCT I ON . . . . . . . . . . . . . . . . . . . . . . . . . . . . . . . . . . . . . . . . . . . . . . . . . . . . . . . . . . . . . . . . . . . . . . . . . . . . . . . . . . . . . . . . . . . . . . . . . . . . . . . . . . . . . . . . . . . . . . . . . . . . . . . . . . . . . 11 .2 INDEPEN D ENT MONITOR . . . . . . . . . . . . . . . . . . . . . . . . . . . . . . . . . . . . . . . . . . . . . . . . . . . . . . . . . . . . . . . . . . . . . . . . . . . . . . . . . . . . . . . . . . . . . . . . . . . . . . . . . . . . . . . . . . . . . . . 21 3 SELF_$UI L DPROCEDURES . . . . . . . . . . . . . . . . . . . . . . . . . . . . . . . . . . . . . . . . . . . . . . . . . . . . . . . . . . . . . . . . . . . . . . . . . . . . . . . . . . . . . . . . . . . . . . . . . . . . . . . . . . . . . . . . . . . 3
SECTIO N 2- SE CTIO N N OT USED . . . . . . . . . . . . . . . . . . . . . . . . . . . . . . . . . . . . . . . . . . . . . . . . . . . . . . . . . . . . . . . . . . . . . . . . . . . . . . . . . . . . . . . . . . . . . . . . . . . . . . . . . . . . . . . . . . . . 3
SECTION 3 - 2405 PEAKING R ESOURCES RFP . . . . . . . . . . . . . . . . . . . . . . . . . . . . . . . . . . . . . . . . . . . . . . . . . . . . . . . . . . . . . . . . . . . . . . . . . . . . . . . . . . . . . . . . . . . . . .3
3 .1 OVERVi EvtiroF RFP . . . . . . . . . . . . . . . . . . . . . . . . . . . . . . . . . . . . . . . . . . . . . . . . . . . . . . . . . . . . . . . . . . . . . . . . . . . . . . . . . . . . . . . . . . . . . . . . . . . . . . . . . . . . . . . . . . . . . . . . . . . . . .33 .2 BAS IC REQUIREMENTS F OR FI RM PEAK I NG CAPACITY AND ENERGY PROP OSALS . . . . . . . . . . . . . . . . . . . . . . . . . . . . . . . . . 4
3 .2 .1 Base Proposal . . . . . . . . . . . . . . . . . . . . . . . . . . . . . . . . . . . . . . . . . . . . . . . . . . . . . . . . . . . . . . . . . . . . . . . . . . . . . . . . . . . . . . . . . . .. . . . . . . . . . . . . . . . . . . . . . . . . . . . . . . _ . . . . . . . . . . . . . . . . . . . . . 5
3.2.2 AlternativeProposcrls . . . . . . . . . . . . . . . . . . . . . . .. . . . . . . . . . . . . . . . . . . . . . . . . . .. . . . . . . . . . . . . . . . . . . . . . . . . . . . . . . . . . . . . . . . . . . . . . . . . . . . . . . . . . . . . . . . . . . . . . . . . . . . . . . . .5
3.3 POWER PUR C HASE PROP O SALS . . . . . . . . . . . . . . . . . . . . . . . . . . . . . . . . . . . . . . . . . . . . . . . . . . . . . . . . . . . . . . . . . . . . . . . . . . . . . . . . . . . . . . . . . . . . . . . . . . . . . . . . . . 5
3 .3.1 System Products. . . . . . . . . . . . . . . . . . . . . . . . . . . . . . . . . . . . . . . . . . . . . . . . . . . . . . . . . . . . . . . . . . . . . . . . . . . . . . . . . . . . . . . . . . . . . . . . . . . . . . . . . . . . . . . . . . . . . . . . . . . . . . . . . . . . . . . . . . . . . . 63 .4 ASSET PURCHASE PR OP OSAL S . . . . . . . . . . . . . . . . . . . . . . . . . . . . . . . . . . . . . . . . . . . . . . . . . . . . . . . . . . . . . . . . . . . . . . . . . . . . . . . . . . . . . . . . . . . . . . . . . . . . . . . . . . . . 73 .5 FUEL CONSI DERAT lOf15 . . . . . . . . . . . . . . . . . . . . . . . . . . . . . . . . . . . . . . . . . . . . . . . . . . . . . . . . . . . . . . . . . . . . . . . . . . . . . . . . . . . . . . . . . . . . . . . . . . . . . . . . . . . . . . . . . . . . . . . 8
3.5,1 Power Purchase Qgreement . . . . . . . . . . . . . . . . . . . . . . . . . . . . . . . . . . . . . . . . . . . . . . . . . . . . . . . . . . . . . . . . . . . . . . . . . . . . . . . . . . . . . . . . . . . . . . . . . . . . . . . . . . . . . . . . . . . . . . . . . . 8
3 .5.2 Purchase of Existing Peaking Generation Facilities . . . . . . . . . . . . . . . . . . . . . . . . . . . . . . . . . . . . . . . . . . . . . . . . . . . . . . . . . . . . . . . . . . . . . . . . . . . . . . . . . . . . 9
3.6 RELIABLE DEZ IVE f2 Y . . . . . . . . . . . . . . . . . . . . . . . . . . . . . . . . . . . . . . . . . . . . . . . . . . . . . . . . . . . . . . . . . . . . . . . . . . . . . . . . . . . . . . . . . . . . . . . . . . . . . . . . . . . . . . . . . . . . . . . . . . . . . 9
SECTID IV 4- INSTi4 U CTIO NS TO 8 1D DERS . . . . . . . . . . . . . . . . . . . . . . . . . . . . . . . . . . . . . . . . . . . . . . . . . . . . . . . . . . . . . . . . . . . . . . . . . . . . . . . . . . . . . . . . . . . . . . . . . . . 10
41 PR OP05Al . SUBM ITTA L F EE S . . . . . . . . . . . . . . . . . . . . . . . . . . . . . . . . . . . . . . . . . . . . . . . . . . . . . . . . . . . . . . . . . . . . . . . . . . . . . . . . . . . . . . . . . . . . . . . . . . . . . . . . . . . . . .10
4 .2 CONFIDENTIAL 1NFD RMAT SON AN D CON F ID E NT IALIT I' AGREEMENTS . . . . . . . . . . . . . . . . . . . . . . . . . . . . . . . . . . . . . . . . . . . . . . . . . . . . 'I O
4 .3 R FP SCHEDULE . . . . . . . . . . . . . . . . . . . . . . . . . . . . . . . . . . . . . . . . . . . . . . . . . . . . . . . . . . . . . . . . . . . . . . . . . . . . . . . . . . . . . . . . . . . . . . . . . . . . . . . . . . . . . . . . . . . . . . . . . . . . . . . . 11
4 . 4 MODIFICATION OR C AN C ELLAT ION O F T HE RFP . . . . . . . . . . . . . . . . . . . . . . . . . . . . . . . . . . . . . . . . . . . . . . . . . . . . . . . . . . . . . . . . . . . . . . . . . . . . . . . . . . 114.5 QU E STIO N , C OMMENT AND RESPONSE PROC E SS . . . . . . . . . . . . . . . . . . . . . . . . . . . . . . . . . . . . . . . . . . . . . . . . . . . . . . . . . . . . . . . . . . . . . . . . . . . . . . 'I 'I4.6 TECH N ICAL CONFEREiVCE . . . . . . . . . . . . . . . . . . . . . . . . . . . . . . . . . . . . . . . . . . . . . . . . . . . . . . . . . . . . . . . . . . . . . . . . . . . . . . . . . . . . . . . . . . . . . . . . . . . . . . . . . . . . . . . . . .1 2
4 . 7 ADDITIONAL QU ESTIONS A N D COMMENT SUBMISSION . . . . . . . . . . . . . . . . . . . . . . . . . . . . . . . . . . . . . . . . . . . . . . . . . . . . . . . . . . . . . . . . . . . . . . . . 12
4.8 PR E-B IDC Q[V FEf2ENCE . . . . . . . . . . . . . . . . . . . . . . . . . . . . . . . . . . . . . . . . . . . . . . . . . . . . . . . . . . . . . . . . . . . . . . . . . . . . . . . . . . . . . . . . . . . . . . . . . . . . . . . . . . . . . . . . . . . . . . 134 .9 TR A N SMISS I O N CO NTACTS . . . . . . . . . . . . . . . . . . . . . . . . . . . . . . . . . . . . . . . . . . . . . . . . . . . . . . . . . . . . . . . . . . . . . . . . . . . . . . . . . . . . . . . . . . . . . . . . . . . . . . . . . . . . . . . . . 'I 3
4 . 10 NOTiC E OF INTENT TO SUBMIT PROPOSAL . . . . . . . .. . . . . . . . . . . . . . . . . . . . . . . . . . . . . . . . . . . . . . . . . . . . . . . . . . . . . . . . . . . . . . . . . . . . . . . . . . . . . . . . . . 1 3
4.11 JOINT PROPO SA LS . . . . . . . . . . . . . . . . . . . . . . . . . . . . . . . . . . . . . . . . . . . . . . . . . . . . . . . . . . . . . . . . . . . . . . . . . . . . . . . . . . . . . . . . . . . . . . . . . . . . . . . . . . . . . . . . . . . . . . . . . . . . .1 3
4 .12 SELF-BUILD O PrroN s . . . . . . . . . . . . . . . . . . . . . . . . . . . . . . . . . . . . . . . . . . . . . . . . . . . . . . . . . . . . . . . . . . . . . . . . . . . . . . . . . . . . . . . . . . . . . . . . . . . . . . . . . . . . . . . . . . . . . . . .134.13 S U B M1 55 10N OF PRO P OSALS . . . . . . . . . . . . . . . . . . . . . . . . . . . . . . . . . . . . . . . . . . . . . . . . . . . . . . . . . . . . . . . . . . . . . . . . . . . . . . . . . . . . . . . . . . . . . . . . . . . . . . . . . . . . . . 1 4
SECTION 5 - PROPOSA L EVALUATIO N . . . . . . . . . . . . . . . . . . . . . . . . . . . . . . . . . . . . . . . . . . . . . . . . . . . . . . . . . . . . . . . . . . . . . . . . . . . . . . . . . . . . . . . . . . . . . . . . . . . . . . . . . .15
5 . 1 RECEIPT AN D OPENING OF PROPOSA LS . . . . . . . . . . . . . . . . . . . . . . . . . . . . . . . . . . . . . . . . . . . . . . . . . . . . . . . . . . . . . . . . . . . . . . . . . . . . . . . . . . . . . . . . . . . . . 1 55 . 2 SCRE ENING FOR CONFORMANCE WITH RFP SU BMITiAL REQUIREMENTS . . . . . . . . . . . . . . . . . . . . . . . . . . . . . . . . . . . . . . . . . . . 1 55 . 3 D E SC RIPT I ON O F TH E EVALUATIO N PROCESS . . . . . . . . . . . . . . . . . . . . . . . . . . . . . . . . . . . . . . . . . . . . . . . . . . . . . . . . . . . . . . . . . . . . . . . . . . . . . . . . . . . . . T S
5.3.1 Eligibility Requirements and Threshold Requirements Screening . . . . . . . . . . . . . . . . . . . . . . . . . . . . . . . . . . . . . . . . . . . . . . . . . . . . . . . . . . . .175.3.2 Categoraze/Cluster Proposals . . . . . . . . . . . . . . . . . . . . . . . . . . . . . . . . . . . . . . . . . . . . . . . . . . . . . . . . . . . . . . . . . . . . . . . . . . . . . . _ .. . . . . . . . . . . . . . . . . . . . . . . . . . . . . . . . . 175.3, 3 Price and Non-Price Analysis . . . . . . . . . . . . . . . . . . . . . . . . . . . . . . . . . . . .. . . . . . . . . . . . . . . . . . . . . . . . . . . . . . . . . . . . . . . . . . . . . . . . . . . . . . . . . . . . . . . . . . . . . . . . . . . . . . . . . 175.3.4 Selection afihe Short I,is1 . . . . . . . . . . . . . . . . . . . . . . . . . . . . . . . . . . . . . . . . . . . . . . . . . . . . . . . . . . . . . . . . . . . . . . . . . . . . . . . . . . . . . . . . . . . . . . . . . . . . . . . . . . . . . . . . . . . . . . . . . . . . 1853.5 Partfalio Gvaluation . . . . . . . . . . . . . . . . . . . . . . . . . . . . . . . . . . . . . . . . . . . . . . . . . . . . . . . . . . . . . . . . . . . . . . . . . . . . . . . . . . . . . . . . . . . . . . . . . . . . . . . . . . . . . . . . . . . . . . . . . . . . . . . . . . . .185.3 .6 Award Group Selection ana`Contract Negotiations . . . . . . . . . . . . . . . . . . . . . . . . . . . . . . . . . . . . . . . . . .. . . . . . . . . . . . . . . . . . . . . . . . . . . . . . . . . . . . . . . . .18
5 . 4 THRESHOLD REQUIREM ENTS . . . . . . . . . . . . . . . . . . . . . . . . . . . . . . . . . . . . . . . . . . . . . . . . . . . . . . . . . . . . . . . . . . . . . . . . . . . . . . . . . . . . . . . . . . . . . . . . . . . . . . . . . . . . . 1954.1 Credit Threshold . . . . . . . . . . . . . . . . . . . . . . . .. . . . . . . . . . . . . . . . . . . . . . . . . . . . . . . . . . . . . . . . . . . . . . . . . . . . . . . . . . . . . . . . . . . . . . . . . . . . . . . . . . . . . . . . . . . . . . . . . . . . . . . . . . . . . . . . .1954.2 RrcountrngThreshold . . . . . . . . . . . . . . .. . . . . . . . . . . . . . . . . . . . . . . . . . . . . . . . . . . . . . . . . . . . . . . . . . . . . . . . . . . . . . . . . . . . . . . . . . . . . . . . . . . . . . . . . . . . . . . . . . . . . . . . . . . . . . .195.4.3 Sitirrg. .. . . . . . . . . . . . . . . . . . . . . . . . . . . . . . . . . . . . . . . . . . . . . . . . . . . . . .10. . . . . . . . . . . . . . . . . . . . . . . . . . . . . . . . . . . . . . . . . . . . . . . . . . . . . . . . . . . . . . . . . . . . . . . . . . . . . . . . . . . . . . . . . . . . . . . . . . . .
5 .5 DESCRIPTION OF N ON-PR l CE RELATE D EVALUAT4 0N CRIT ERIA . . . . . . . . . . . . . . . . . . . . . . . . . . . . . . . . . . . . . . . . . . . . . . . . . . . . . . . . . .20

PSO RFP2005 RFP for Peak i ng Capa city and Energy Resources
5.5 .1 Calexibiliry . . . . . . . . . . . . . . . . . . . . . . . . . . . . . . . . . . . . . . .. . . . . . . . . . . . . . . . . . . . . . . . . . . . . . . . . . . . . . . . . . . . . . . . . . . . . . . . . . . . . . . . . . . . . . . . . . . . .. . . . . .. . . . . . . . . . . . . . . . . . . . . . . .Z25.5 .2 Deve lopmentFeasibility. . . . . . . . . . . . . . . . . . . . . . . . . . . . . . . . . . . . . . . . . . . . . . . . . . . . . . . . . . . . . . . . . . . . . . . . . . . . . . . . . . . ____ . . . . . . . . . . . . . . . . . .. . . . . . . . . . . . .. . . .2?5.5 .3 Project Operational Viabiliry . . . . . . . . . . . . . . . . . . . . . . . . . . . . . . . . . . . . . . . . . . . . . . . . . . . . . . . . . . . . . . . . . . . . . . . . . . . . . . . . . . . . . . . . . . . . . . . . . . . . . . . . . . . . . . . . . . . . . . .?45.5.4 Quality ofC}utprrt . . .. . . . . . . . .. . . . . . . . . . . . . . . . ... . . . . . . . . . . . . . . . . . . . . . . .. . . . . . . . . . . . . . . . . . . . . . . . . . . . . . . . . . . . . . . . . . . . . . . . . . . . . . . . . . . . . . . . . . . . . . . . . . . . . . . . . . .285.5 .5 Model Contrncis . . . . . . . . . . . . . . . . . . . .. . . . . . . . . . . . . . . . . . . . . . . . . . . . . . . . . . . . . . . . . . . . . . . . . . . . . . . . . . . . . . . . . . . . . . . . . . . . . . . . . . . . . . . . . . . . . . . . . . . . . . . . . . . . . . . . . . . . . . .29
5.6 DESCR I PTION OF PRICE RELAT ~E Q EVALUATION CRITERIA . . . . . . . . . . . . . . . . . . . . . . . . . . . . . . . . . . . . . . . . . . . . . . . . . . . . . . . . . . . . . . . . . . .29.i.d. l Capacity Charge . . . . . . . . . . . . . . . . . . . . . . . . . .. 30. . . . . . . . . . . . . . . . . . . . . . . . . . . . . . . . . . . . . . . . . . . . . . . . . . . . . . . . . . . . . . . . . . . . . . . . . . . . . . . . . . . . . . . . . . . . . . . . . . . . . . .5.6.2 Faxed O & MC ha rge . . . . . . .. . . . . .. . . . . . . . . . . . .. . . . . . . . . . . . . . . . . . . . . . . . . . . . . . . . . . . . . . . . . . . . . . . . . . . . . . . . . . . . . . . . . . . . . . . . . . . . . . . . . . . . . . . . . . . . . . . . . . . . . . . . . . .30
5,63 Energy Charge . . . . . . . . . . . . . . . . . . . . . . . . . . . . . . . . . . . . . .. . . . . . . . . . . . . . . . . . . . . . . . . . . . . . . . . . . . . . . . . . . . . . . . . . . . . . . . . . . . . . . . . . . . . . . . . . . . . . . . . . . . . . . . . . . . . . . . . . . . . . . 305.6. 4 Fuel Transpartatiarr Charge . . . . . . . . . . . . . . . . . . . . . . . . . . . .. . . . . . . . . . . . . . . . . . . . . . . . .. . . . . . . . . . . . . . . . . . . . . . . . . . . . . . . . . . . . . . . . . . . . . . . . . . . . . . . . .. . . . . . . . . 305 .65 Variable O&M Cha rge . . . . . . . . . . . . . . . . . . . . . . . . .. . . . . . . . . . . . . . . . . . . . . . . . . . . . _ . . . . . . . . . . . . . . . . . . . . . ., . . . . . . . . . . . . . . . . . . . . . . . . . . . . . . . . . .. . . . . . . . . . . . . . . . . 315.6.6 Start- Up Charge . . . . . . . . . . . . . . . . . . . . . . . . . . . . . . . . . . . . . . . . . . . . .3I. . . . . . . . . . . . . . . . . . . . . . . . . . . . . . . . . . . . . . .. . . . . . . . . . . . . . . . . . . . . . . . . . . . . . . . . . . . . . . . . .5.6.7 Emissions Ch arges . . . . . . . . . . . . . . . . . . . . . . . . . . . . . . . . . . . . . . . . . . . . . . . . . . . . . . . . . . . . . . . . . . . . . . . . . . . . . . . . . . . . . . . . . . . . . . . . . . . . . . . . . . . . . . .. . . . . . . . . . . . . . . . . . . . . .3 15.68 An c illarySe r vices Charge . . . . . . . . . . . . . . . . . . . . . . . . . . . . . . . . . . . . . . . . . . . . . . . . . . . . . . . . . . . . . . . . . . . . . . . . . . . . . . . . . . . . . . . . . . . . . . . . . . . . . . . . . . . . . . . . . . . . . . . . . . . .32569 Tran smissio n System Impact . . . . . . . . . ._ . . . . . . . . . . . . . . . . . . . . . . . . . . . . . . . . . . . . . . . . . . . . . . . . . . . . . . . . . . . . . . . . . . . . . .. . . . . . . . . . . . . . . . . . . . . . . . . . . . . . . . . . . . . 325610 Deb t Fquivale nce . . . . . . . . . . . . . . . . . . . . . . . . . . . . . . . . . . . . . . . . . .. . . . . . . . . . . . . . . . . . . . . . . . . . . . . . . . . . . . . . . . . . . . . . . . . . . . . . . . . . . . . . . . . . . . . . . . . . . . . . . . . . . . . . . . . 32
5.7 N071FICRTION OF EVAL11A7lON RESULTS AND N EGOTIATIONS . . . . . . . . . . . . . . . . . . . . . . . . . . . . . . . . . . . . . . . . . . . . . . . . . . . . . . . . . . . . . 33
SECTION 6 - REGULATORY AAPROUA L S . . . . . . . . . . . . . . . . . . . . . . . . . . . . . . . . . . . . . . . . . . . . . . . . . . . . . . . . . . . . . . . . . . . . . . . . . . . . . . . . . . . . . . . . . . . . . . . . . . . . . 33
SECTION 7- RESERVATION OF RIGHTS . . . . . . . . . . . . . . . . . . . . . . . . . . . . . . . . . . . . . . . . . . . . . . . . . . . . . . . . . . . . . . . . . . . . . . . . . . . . . . . . . . . . . . . . . . . . . . . . . . . . . . 33
SECTION 8- GLOSSARY OF TERMS . . . . . . . . . . . . . . . . . . . . . . . . . . . . . . . . . . . . . . . . . . . . . . . . . . . . . . . . . . . . . . . . . . . . . . . . . . . . . . . . . . . . . . . . . . . . . . . . . . . . . . . . . . . . . 35
Appendix A
Appendix B
Appendix C
Appendix D
Appendix E
Appendix F
Appendix G
Appendix H
Appendix I
Appendix J
Appendix K
Independent Monitor Scope of Work
Confidentiality Agreement Form
Transmission Service Territory Map
Pre-Bid Conference Registration Form
RFP Response Packag e
Credit Evaluation Forms I thru 3
Notice of In#ent to Submit Proposal Form
Model Power Purchase Agreemen t
Model Purchase and Sale Agreement
List of Projections and Indices
RFP Procedures Manual

PSO RF P2005 RFP for Peaking Capacity and Energy Resource s
NOTICE
In the event that a B idder perceives a conf li ct between th isRFP and other posted informat i on (e .g ., answers to questions),this RFP document, as amended , shall prevai l .
If co rrect ions or clarificat i ons to the RFP documents arerequ i red , PSO w i ll issue a "RFP Amendment" on its RFPwebs ite located at :
www.PSOklahoma .com/go/rfp
Potential B i dders shou l d check th is RFP website regu larly. Itis the so le responsibility of the Bidder to keep up w ith any RFPdocument changes as d iscussed above .

PSO RFP2005 RFP for Peaking Capacity and Energy Resource s
SECTION '! - GENERAL INFORMATION
1 .1 Introduction
The purpose of this document is to prescribe the process by which Public ServiceCompany of Oklahoma ("PSO" or the "Company") will request and evaluate Proposalsthrough a competitive procurement process which Company deems, in its solediscretion, to provide the most reasonable cost and reliable resources to fulfill a portionof its suppty-side resource need consistent with Company's resource planningrequirements . The scope of this Request For Proposal ("RFP"), subject to thelimitations described herein, is focused on a supply-side resource capable of deliveringpeaking capacity and associated energy in or to the Company's transmission system(see Section 3 .6) and that is capable of fulfilling the planning reserve requirements ofthe Southwest Power Pool ("SPP") .
The Company is soliciting binding Proposals from bidders (Bidders) in the form ofPower Purchase Agreements (PPA) andlor the acquisition of existing generationfacilities for up to 500 megawatts (MW) of Peaking Resources with a CommercialOperation Date of June 1, 2008 ("COD") . The Company prefers to ultimately own andoperate the generation facilities providing the capacity and associated energy proposedunder the terms of this RFP, and, therefore, Bidders who propose a PPA will beencouraged to propose terms that allow the Company to acquire the generation facilityduring the contract term . The Company values the Bidcler's fiexibifify in terms ofadjusting the COD . Proposals sha4l be submitted by Bidders in the form of the RFPResponse Package attached as Appendix E ,
Proposals shall be binding upon the successful Bidder(s) until August 31, 2006 .
The general schedule for the RFP process is shown below . A more detailed schedulefollows in Section 4 .3 .
Draft RFP Issued 091 1 2/05Issue Final RFP 11/01/05Binding Peaking Proposals Due 1212 0105Selection of Award Group 031 1 6106Execute Final Contract(s) 051 1 5/06
The Company seeks Proposals from any B i dde r who is capable of meeting theconditions of th is RFP . B i dde rs should note that the Company and its agents w i ll beable to, and should be expected to , respond to th i s RFP . As described in more deta ilbelow, the Company h as put i n place prudent safeguards to avoid undue preference toits self-build Proposals . Any B i dder who has a quest ion with respect to such safeguardsis i ns tructed to contact the Independent Mon i tor ( [M ) as descr i bed i n Sect ion 1 . 2 below.
PSO, based in Tulsa, Oklahoma, is a wholly owned subsidiary of American ElectricPower Company, Inc . (AEP). PSO is an operating electric public utility engaged in thegeneration, transmission, distribution, purchase and sale of electric energy i n
Page 1

PSO RF P2005 RFP for Peaking Capacity and Energy Resource s
Oklahoma. PS4 provides wholesale and retail electric service to more than 509, 000customers in a service area covering approximately 30, 000 square miles . PSO's retailelectric rates and services are regulated by the Oklahoma Corporation Commission("OCC" or the "Commission") . PSO's wholesale power and transmission rates andservices are regulated by the Federal Energy Regulatory Commission ("FERC") .
PSO will be using its Affiliate, American Electric Power Service Corporation (AEPSC) asits agent for the RFP process .
For capitalized terms not defined in the main text of this RFP, please refer to Section 8,Glossary of Terms .
1 .2 Independent Monitor
PSO is committed to a fair solicitation process. The evaluation criteria and process aredesigned to ensure a fair solicitation process and to provide Bidders with information onhow the Proposals will be evaluated and what the Company deems as importantaspects of a Proposal . Merrimack Energv Group, Inc. will act as the IndependentMonitor for this so(icitation. The IM wi l l monitor the RFP process and will review andtrack the Company's conduct of the RFP to ascertain that no undue preference is givento PSO's self-build Proposals . This will include, to the extent necessary, reviewing thedraft RFP and the Company's evaluation of Proposals ; monitoring communications (andcommunications protocols) with market participants ; monitoring adherence to codes ofcanduct; validation of the models, input assumptions ; risk assessments ; and monitoringcontract negotiations .
A more detailed evaluatron of the 1M's Scope of Work is attached as Appendix A .Among other responsibilities noted in the Scope of Work, the 1M will address Bidders'questions, issues, and concerns during the RFP process, and, as needed, communicatethose issues and concerns to the appropriate parties, including PSO and QCG Staff .
Contact information for the IM is :
Wayne OliverMerrimack Energy Group, inc .727 Lafayette Roa dP O Bax 2955Seabrook, NH 03874Phone : (603) 474-3385CeIL 781-$56-0007Fax: 603-474-3384E-mail : wayne m oliverCcbaal.cam
Page 2

PSO RFP2005 RFP for Peaking Capacity and Energy Resources
1 .3 Self-Build Procedure s
Procedures for this RFP call for objective, arm's-length dealing with respect to agents ofthe Company who are developing self-build Proposals ("Self-Build Team") . Appropriateprocedures and a Code of Conduct are in place to safeguard against the Self-Build Teamreceiving undue preferential treatment and preferential access to information . Additionalprocedural provisions require PS O to protect the confidentiality of Proposals and Bidderinformation and to ensure such information is not improperly used by PSO or its Affiliates(see Procedures Manual in Appendix K) .
Specifcally prohibited is the communication, directly or indirectly, of material non-publicinformation about or derived from PSO selectively to the Self-Build Team, as well as anypreference by PSO expressed in any way whatsoever for self-build Proposals per se .Accordingly, in this RFP there is pre-estabiished operational independence between PSOand the Self-Build Team to ensure that any Proposals submitted by the Self-Build Teamwill not have any material advantage in the selection process versus Proposals submittedby third-party Bidders .
SECTION 2- SECTlON NOT USE D
SECTION 3- 2005 PEAKING RESOURCES RFP
3 . 1 Overview of RFP
The Company's Integrated Resource Plan ("IRP") has identified that additional capacitymust be added to the PSO system over the next 10 years in order for it to maintainadequate capacity reserves . The IRP process has shown that the most economic solutionfor meeting PSO's future capacity reserve needs is the addition of peaking capacity andassociated energy by the summer of 2 008 and baseload capacity and associated energyby the summer of 2011 .
In order to meet its future resource needs, PSO will issue two separate RFPs, this RFPfor peaking resources and a separate RFP for baseload resources . In this peakingresource RFP, PSO seeks Proposals for capacity and associated energy for up to 5 00MW of peaking resources with a COD of June 1, 2008 . PSO's baseload resource RFPwill seek Proposals for firm capacity and associated energy for up to 600 MW ofbaseload resources with a COD of June 1, 201 1 .
PSO is interested in Proposals that are in the form of PPAs andlor the acquisition ofexisting generation facilities (Asset Purchase Proposal or APP) . PSO prefers to own andoperate the generation facilities providing the peaking capacity and associated energyproposed under the terms of this RFP. Therefore, Bidders who submit PPA Proposals willbe requested to propose terms that give PSO the option to acquire the Bidder's interest inthe designated generation facility at various points during the contract term .
Page 3

PSO RFP2005 RFP for Peaking Capacity and Energy Resource s
Appendix H contains the Model Power Purchase and Sale Agreement ("Madel PPA') andAppendix I contains the Model Purchase and Sale Agreement ("Modei PSA") . The ModelPPA and Model PSA together are referred to as the Model Contracts .In addition to Proposals from third parties, it is anticipated that PSO will submit self-buildProposals .
PSO's objective for this RFP is to encourage a broad range of Proposals and to securethose resources that provide the greatest benefit to its customers . PSO reserves the dghtto reject any and all Proposals, in its sole discretion, if they are not in the best interest ofPSO. The level of flexibility and creativity offered by the Bidder in its Proposal will berecognized in the evaluation process . PSO is interested in Proposals that :
(i) provide flexibility in terms of the COD, including the ability to defer oraccelerate the COD by one year ;
(ii) offer other options which minimize risk and costs to PSO and its customers ;(iii) provide PSO with the ability to acquire the generation assets used to supply
the capacity and energy for a PPA Proposaf ;(iv) offer creative pricing and technical options either as part of its Base Proposal
or as an Alternative; and(v) offer tuel and fuel transportation flexibility .
3 ,2 Basic Requirements for Fi rm Peak ing Capacity and Enerqy Proposa ls
The Company is seeking Proposals for firm capacity and associated energy for aminimum of 320 MW and up to 500 MW of peakrrtg resources with a COD of June 1,2008 . Firm capacity will be defined as Net Dependable Summer Capability . Theminimum bid size is 40 MW of Net Dependable Summer Capability .
Bidders who propose PPAs are required to conform to a contract term of 20, 25 or 30years .
In addition to PPA Proposals, PSO will also consider Asset Purchase Proposals for theacquisition of a Bidder's existing generation facilities or interests therein . Asset PurchaseProposals must meet the same minimum size and COD that are defined for PPAProposals . Asset Purchase Proposals shall be for a fixed dollar amount, inclusive of allmonetary consideration for the generation asset . Any contractual obligations (e .g., fuelsupply and transportation, maintenance agreements, etc .) related to the generation assetproposed for sale should be clearly defined by the Bidder in its Proposal . PSO prefersProposals in which it will acquire the majority interest andlor the 4perational control of thegeneration facilities .
PSO prefers Proposals with points of deflvery tiec! directly to PSO's transmission system asshown in Appendix C . All Proposals, regardless of the location of the generation resource,will be judged based upon their impact on PSO's transmission facilities, incfuding the costof any required system upgrades, and to the extent they can be determined, onneighboring transmission systems .
Page 4
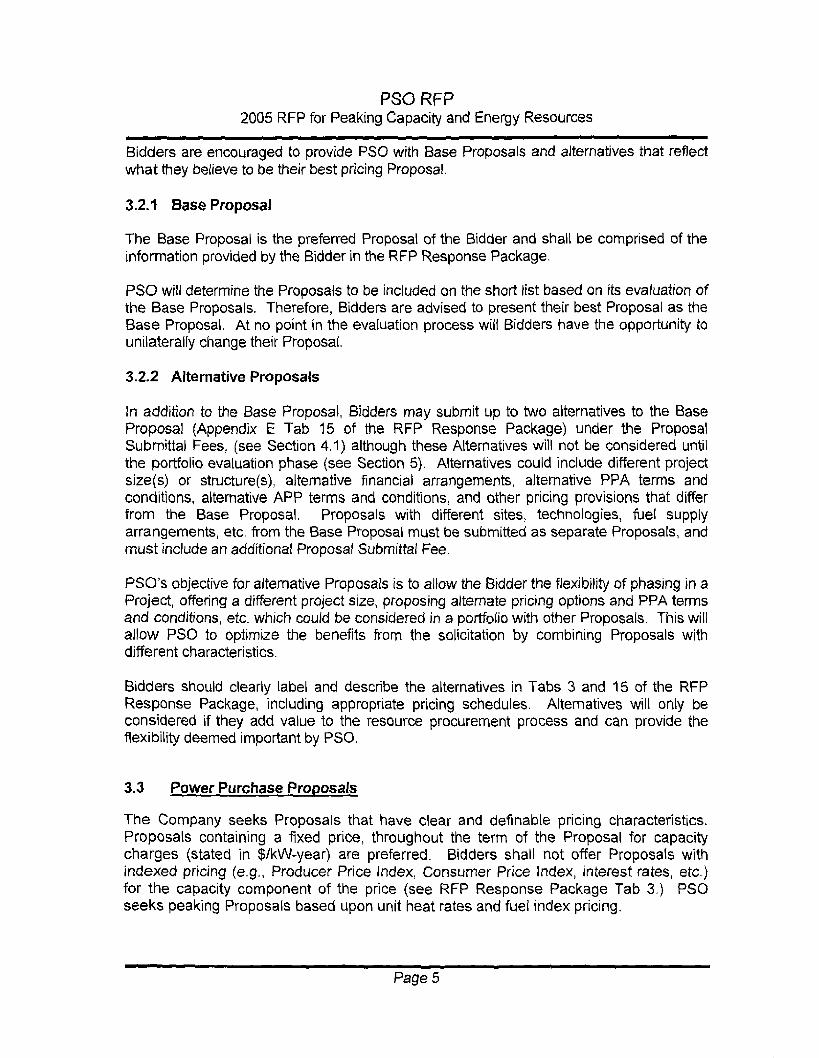
Pso RFP2005 RFP for Peaking Capac i ty and Energy Resource s
Bidders are encouraged to provide PSO with Base Proposals and alternatives that reflectwhat they believe to be their best pricing Proposal .
3 .2 . 1 Base Proposa l
The Base Proposal is the preferred Proposal of the Bidder and shall be comprised of theinformation provided by the Bidder in the RFP Response Package .
PSD will determine the Proposals to be included on the short list based on its evaluation ofthe Base Proposals . Therefore, Bidders are advised to present their best Proposal as theBase Proposal . At no point in the evaluation process will Bidders have the opportunity tounilaterally change their Proposal .
3 .2.2 Alternative Proposals
In addition to the Base Proposal, Bidders may submit up to two alternatives to the BaseProposal (Appendix E Tab 15 of the RFP Response Package) under the ProposalSubmittal Fees, (see Section 4 .1) although these Alternatives will not be considered untilthe portfolio evaluation phase (see Section 5) . Alternatives could include different projectsize(s) or structure(s), alternative financial arrangements, alternative PPA terms andconditions, alternative APP terms and conditions, and other pricing provisions that differfrom the Base Proposal . Proposals with different sites, technologies, fuel supplyarrangements, etc, from the Base Proposal must be submitted as separate Proposals, andmust include an additional Proposal Submittal Fee .
PSO's objective for alternative Proposals is to allow the Bidder the flexibility of phasing in aProject, offering a different project size, proposing alternate pricing options and PPA termsand conditions, etc. which could be considered in a portfolio with other Proposals . This willallow PSO to optimize the benefits from the solicitation by combining Proposals withdifferent characteristics .
Bidders should clearly label and describe the alternatives in Tabs 3 and 15 of the RFPResponse Package, including appropriate pricing schedules . Alternatives will only beconsidered if they add value to the resource procurement process and can provide theflexibility deemed important by PS O .
3 .3 Power Purchase Proposals
The Company seeks Proposals that have clear and definable pr icing characteristics .Proposals conta i n ing a f i xed pr i ce , throughout the term of the Proposal for capac itycharges (stated in $IkW-year ) are preferred . Bidders shall not offe r Proposals withindexed pr i c ing (e . g ., Prod uce r Pr ice Index, Consumer Price Inclex , interest rates , etc . )for the capacity component of the pr ice (see RFP Response Package Tab 3 .) PSOseeks peaking Proposals based upon unit heat rates and fue l index pr i c i ng .
Page 5

PSO RFP2005 RFP for Peaking Capacity and Energy Resource s
Bidders proposing PPA products are responsible for all costs to deliver those productsto PSO , including, but not limited to : costs of transmission service, upgrades and newconstruction of tra nsmiss ion facilities located outside o f the AEP SPP control area;costs of transmission congestion ; costs of ancillary services ; and any fees or taxes,present and future, over the term of the Proposal . This must be expressly confirmed inBidders' Proposals .
Bidder generation resources interconnected to PSD's transmission system within theAEP SPP control area near PSO's large load centers are preferred .
In addition, PSO is interested in Proposais giving it the option to purchase thegeneration assets that are used to supply the capacity and energy under the PPA .Bidders are encouraged to propose purchase pricing for those generation assets atvarious points during the contract term. (Appendix E Tab 3)
Peaking products should be proposed in quantity blocks ranging from a minimum size of40 MW to a maximum size of 500 MW .
PSO prefers products that provide scheduling 0exrbi irty commensurate with the operatingcharacteristics of the proposed generation assets . PSO reserves the right to dispatchthese products at any load level within the source generator's operating limits, and to startand stop as needed to serve PSO's operational needs .
Requirements of the PPA may be met through a slice of system, existing generationfacilities, or proposed new generating facilities .
3.3 .1 System Products
Company encourages the Bidder to submit RFP Proposals for Peaking products supportedby a single generating facility or by a system of generating facilities . Such slice-of-system("Sys#em") Proposals should meet the Peaking product criteria stated above andelsewhere in this RFP. Because the characteristics of a System are not defined byreference to the capabilities of a particular generating unit, the Bidder should specify withparticularity the capabilities of its System product. The Bidder should modify its RFPResponse Package to the extent necessary to include this information . The Bidder shouldinclude an overview of its System and information on the particular generating facilitiessupporting its System Proposal .
In order to assist Bidders wishing to propose System products, Company is providing the#atiawing non-exhaustive list of the capabilities that should be described in such Proposals .Where appropriate, Company has specified minimum standards that must be met by aSystem product .
(i) Quali : Company prefers System products that are Firm with liquidateddamages. The Bidder should specify the level of firmness of its Systemproduct and state any excuses from performance with particularity (i .e ., the
Page 6

PSO RFP2005 RFP for Peaking Capacity and Energy Resource s
number of un i ts or percentage of system that must be off-l i ne prior to anydim in i shment in System product service) .
(ii) Schedulinq : The Bidder should specify any minimum notice times prior t oscheduling and dispatch of the System product by Company . In particular, th eBidder should specify if its System product must be scheduled on a day-ahea dbasis, and the extent to which its System may be scheduled on an hour-ahea dor shorter basis . For a Peaking Product, Company should have rights t odispatch the unit on an hourly basis at a minimum .
(iii) Scheduling Limits : The Bidder should state any minimum or maxim um loadingconstraints, as well as the rate at which Company may change the loading ofthe System over a given time period .
(iv) Starts: The Bidder should state the number of "starts" - the scheduling of atleast minimum load after the System has been scheduled to zero - over agiven time, any mandatory downtime or uptime, and the cost, if any, of startingthe System .
(v) Delivery Paint: The Bidder should specify the Delivery Point for energy andancillary services from the System and, if more than one point, any informationnecessary to determine the allocation of energy and ancillary services amongthose points .
(vi) Ancillarv Services: The Bidder should specify the ancillary services thatCompany will have the right to utilize from the System and, if such ancillaryservices are not under the direct dispatch and control of Company, the mannerin which aggregate System revenues from those services will be determinedand allocated to Company .
3.4 Asset Purchase Proposals
Bidders may submit Proposals to sell existing generation assets that have a provenoperating history. In such case, a Bidder shall offer to sell (i) 100% of the ownership ofa generation asset having a minimum Net Dependable Summer Capability that matchesthe products outlined in Section 3 .3 or (ii) its ownership interest in a generation asset inwhich the Bidder's share of the output is no less than the minimum Net DependableSummer Capacity that matches the products outlined in Section 3 .3 . PSO prefersgeneration assets that do not have any restrictions or limitations imposed on them as aresult of other assets at that site .
Asset Purchase Proposals shall be priced at a fixed dollar amount inclusive of allmonetary consideration for the generation assets . APPs may include or exclude relatedarrangements for fuel commodities and transportation of them and the presence orabsence of this factor shall not adversely affect the conforming status of a Proposal .Any material contract obligations that are associated with the proposed asset saleshould be clearly defined (e .g ., fuel storage, fuel transportation) .
Page 7

PSO RFP2005 RFP for Peaking Capacity and Energy Resource s
Any and a ll costs that would be i ncurred by PSO fo r the del ive ry of power from ageneration asset , i nclud i ng , but not limited to costs of transmission se rvice , upgradesand new construction ; costs of transm i ssion congestion ; costs of ancilla ry services ; andany fees or taxes , present and future, over the term of the Proposa l, w i ll be cons ideredi n evaluating the Proposal .
All Asset Purchase Proposals shall prov ide the information requ i red i n the RFP ResponsePackage . Such i nformation shall not preclude the Company from conducting its own duediligence .
3.5 Fuel Considerations
3.5.1 Power Purchase Agreemen t
PPA Proposals shou ld have fuel supply and transportation f1exi b i l i ty commensurate withthe Proposal's operational and d ispatch flex i b i l ity . The Bidder shal l clearly describe theflex i b iiity of its fuei supply and transportation arrangements serving its generation units .The Company 's analysis w ill be weighted to reflect the va lue such fue l supply andtransportation flex i b il ity affords Company operations .
With respect to the energy and ancillar ies price component of PPA Proposals for naturalgas generat i ng fac i lities , Company's preference is for a heat rate p riced Proposa l tied tothe Gas Daily da i ly m i dpoint price i ndex , wh ich methodology is i ncluded in the Model PPA.If B i dder des i res to utikize a d ifferent energy and anc i llar ies pr i cing methodology , B i ddershould i nclude the description of any index used, whether the prici ng i s da i ly or monthly, aswell as any escalation factors or other costs to the Company wh i ch should be considered .
Regard l ess of the specific fuel used by the generat i ng facil it i es or system that Bidder relieson in i ts Proposal, Bidder shal l exp l ain its proposed fue l supply p l an in detai l (Appendix E ,Tab 5 ,) including its proposed primary fuel supp ly and transportation and its backupalternatives . The Bidder is encouraged to suggest as part of i ts Proposal terms andconditions for inclusion i n the PPA u nde r which Company would be able to lock-i n thevariable fue l p ri ce component of the energy and ancikla ries charges from t ime to ti meduring the term of the PPA ,
Preference will be given to Proposals that prov ide maximum fl exib ility and seconda rysource (s) of fuel supp l y and transportati on arrangements . B i dders sha l l clear ly identi fy anyfue l -related constra i nts andlar l i m i tations associated w ith the i r Proposals , i ncluding , but notl imited to , operational flex i bility or reliability of its fue l supp l y and lor transportation whichm ight affect the ab i lity to dispatch the generat i on andlar Company 's abi l ity to uti lize theresou rce for operating reserves.
In the event that a new fuel supply or tra nsportat i on arrangement is required to enableBidder to meet i ts del ivery obligati on to Company, all relevant informat i on wi th respect tosuch proposed arrangements should be provided as part of Bidder's Proposal in sufFcientdeta i l to allow its feas i bi l ity to be evaluated by the Company 's eval uation team .
Page 8

PSO RFP2005 RFP for Peaking Capacity and Energy Resource s
3.5.2 Purchase of Existing Peaking Generation Facilitie s
PSO requests Proposals for the purchase of existing peaking generation facilities whichaddress not only the Company's desire for peaking generation capacity, but also itsrequirements for dispatchable operations with maximum fuel and transportation flexibility .Such flexibility is an integral part of the evaluation of any such Proposal .
Bidders shall identify the any existing tuel supply and transportation agreements currentlyserving the generation facility being offered . They shall also identify the generalcommercial terms of such agreements, including, but not limited to, term, quantityobligation, pricing, any other applicable fees, or costs of such commitments, etc. Biddersshould also state whether such commitments are assignable under the terms of theexisting fuel supply and transportation agreements .
Should the disclosure of such information be subject to a confidentiality provision inBidder's existing contracts the Com pany is willing to enter into a confidentiality agreementto ensure that such information is used solely for the evaluation of the Proposal .
Bidders shall also identify any other naturai gas transporters within 10 miles of the subjectgeneration facility .
Preference will be given to Proposals that provide maximum flexibility and secondarysource of fuel supply and transportation arrangements . Bidders shall identify if thegenerattan facility is capable of operating on any alternative fuels, and if so, shall identifythe type and availability of such fuel, the existence of any long-term contracts for the supplyandlor transportation of such fuel, and the assignability of such contracts . Secondary fuelsupply andlnr transportation options are valuable considerations for any Proposal .
Proposals shall also clearly describe any fuel-related constraints associated with theProposal including, but not limited to, operational flexibility or reliability of its fuel supplyand/or transportation that might affect dispatch of the generation facility andlor theCompany's ability to utilize the resource for operating reserves .
The Company's analysis will be weighted to reflect the value that any such fuel andlortransportation flexibility provides to the Company's operation of the generation faciiity .
3 .6 Reliable Delive
Bidders are required to deliver firm capacity, energy and associated electric products tothe AEP SPP Control Area . PSO expects to use Network lntegrated TransmissionService under the SPP Open Access Transmission Tariff ("OATT") from resourceswithin the SPP RTO footprint . Approval of transmission service by SPP for requestswhere the resources are located on PSO's transmission system are expected to requirefewer transmission upgrades than resources located elsewhere .
Proposals for products originating outside the SPP RTO footprint shall specify theBidder's obligation to reserve, provide for, and pay for firm transmission service to the
Page 9

PSO RFP2005 RFP for Peaking Capacity and Energy Resaurces
SPP RTO footprint . Such Proposals shall specify all pertinent details of proposed firmtransmission paths, services and arrangemen ts and shall specify all-inclusive pricing tothe SPP RTO footprint, including all transmission costs and agreements in place todeliver such firm capacity, energy and associated electric products .
Each Bidder offering firm capacity, energy and associated electric products originatingoutside the SPP RTO footprint must provide the factual basis for its assumption that afirm transmission reservation can be obtained to deliver power into PSO's transmissionsystem.
Prior to short-listing Proposals, PSO will undertake its own analysis for delivery ofcapacity, energy and associated electrical products and use the results in the Proposalevaluation phase . A Bidder, at its sole option and liability, can contract with applicabletransmission provider(s) and pay for any studies it wishes to provide PSO prior toevaluation of Proposals .
Once Proposals are short-listed, PSO will perform more detailed studies at its ownexpense to estimate the cost of any required transmission upgrades . Thesetransmission studies will be done in a manner simikar to the transmission studiesrequired by SPP . Company will use the best available information and data to performthese studies, however, there is no expectation that the study results will preciselymatch studies that will be ultimately performed by SPP to approve PSO's request forNetwork Integration Transmission Service .
After the Award Group is de termined and negotiations are completed, Company willrequest Network Integration Transmission Service under the SPP OATT . Bidderssourcing their offer outside the SPP will be expected to make similar arrangements withtransmission providers outside the SPP at that time .
SECTI ON 4 - INSTRUCTIONS TO BIDDER S
4 . 1 Proposal Submittal Fees
Bidders shall pay a non-refundable $5,000 Proposal Submittal Fee per Proposal from asingle generation resource and a non-refundable Proposal Submittal Fee of $500 each forup to two alternatives as outlined in Section 3 .2.2 from that same generation resource .Checks for the Proposal Submittal Fees should be made payable to Public ServiceCompany of Oklahoma .
4 ,2 Confidential Information and Can#identiali Agreements
The Company, its agents, and the IM will treat as confidential all Proposals submitted byBidders . Bidders shall submit their Proposals, with the knowledge and understandingthat regardless of confidentiality any information submitted by them, such information issubject to disclosure to the Commission or any other governmental authority or judicialbody with jurisdiction relating to these matters and may be subject to legal discovery . Inthe event that the Company, in its sole judgment and discretion, determines thatinformation contained in any question, response, or other communication between it
Page 10

PSO RF P2005 RFP for Peaking Capacity and Energy Resource s
a nd a Bidder that is not conta i ned in the Bidder's Proposal, requires confidentialtreatment , a Confidentiality Agreement (Appendix B) will be subm itted to the B i dder .The Company w ill ensure that all Bidders have a ccess to the same information f rom theCompany and that no B i dder will have select i ve or otherwise preferen tial access tomarket sens i tive i nformat i on from the Company through th i s RFP .
4 .3 RFP Schedule
The schedule for the RFP is shown below . As circumstances warrant, the Company, inits sole judgment and discretion, may change this schedule, and in that event, PS O willinform all participants as far in advance as reasonably possible and the information willbe posted on the RFP website located at www .PSOklahoma .com/go/rfp . The Companywill consult with the IM prior to announcing any significant change to the scheduleshown below .
Draft RFP IssuedTechnical ConferencePosting Deadline for all QuestionsComments DueIssue Final RFPNotice of Intent to Submit Proposal Form DuePre-Bid Conference Registration Du ePre-Bid ConferenceSelf-8u ild Prapnsals DueProposals Du eShort List ldentrftedSelection of Award GroupExecute Final Contracts
4 .4 Modification or Cancellation of the RFP
09/12/051 0105/Q510/07/0510/21/0511/01/05'f '( I'[ 5/4511/16/0511/21/0512/19/0512/20/05q?l30I0603/16/0605/15/06
In addition to modifying the proposed schedule, PSO reserves the right, in its solejudgment and discretion, but subject to prior consultation with the 1M and Commission,to modify or cancel this RFP . PSO will post a notice on its RFP website and make areasonable attempt to notify directly all participants who have filed a timely Notice oflntent to Submit Proposai (Appendix G) of any such changes, cancellations, or schedulechanges. Notwithstanding, PSO shall not have responsibility for making any suchnotification .
4 .5 Question Comment and Res onse Process
All questions and comments submitted by Bidders, as well as PSO's responses to suchquestions, will be posted on the RFP website iocated at www .PSOktahoma .corrzlgafrfp .The official response to questions submitted by Bidders is the written response postedto the website . PSO's objective in posting these questions, comments and responses i s
Page 11

PSO RFP2005 RFP for Peaking Capacity and Energy Resource s
to ensure all Bi dders have equal access to i nformation that may be potent i al l y relevantto their Proposals .
Requests for access to the website Question and Answer section shou l d be sent v ia e-mail to PSOPeakRFP@AEP . com . Requests should inc lude : (1) contact name , (2)company , (3 ) ma iling address , (4) phone number, and (5 ) e-mail address . A user IDand password will be i ssued and commun icated through a return message to therequester 's e-ma il add ress .
Any Bidder who does not comply w i th the Not i ce of intent to Submit Proposa l in Section4 . 10 will l ose access to the Quest i on and Answer sect ion of the webpage .
Any unsolic i ted contact by Bidder w ith any P50 or i ts Aff i liates personnel conce rn ingth i s RFP is not pe rm i tted and may constitute grounds for disqualification .
4.6 Technical Conference
PSO w il l conduct a Techn i cal Conference for any pers on i nterested in this RFP , at 1 : 00p . m . CPT on October 5 , 2005 at the PSO headquarters l ocated at 2 1 2 E . 6 th Street,Tulsa , Oklahoma . The prima ry purpose of this conference will be to review the RFPand to afford i nterested persons the oppo rtun ity to ask questions and makesuggestions . Quest ions on the RFP website posted at leas t five days pr i or to theTechnica l Conference will be add ressed during the Conference . Potent i a l Bidde rs areencouraged , but not requ ired , to attend and actively pa rticipate . Fol l owing the Techn i ca lConference, PSO 's complete presentation at the conference will be posted on i ts RFPwebs i te .
4.7 Additional Questions and Comment Submission
Fol l ow i ng the Technical Conference , B i dders have until 5 ~ 00 p . m . CPT on October 7 ,2005 to subm i t final quest ions . The Company wil l respond to all questions by October15 , 2005 .
Comments on the RFP must be su bmi tted to the Com pany by 5 :00 p . m . CPT onOctober 21 , 2005 . Comments may be submitted through e-mail toPSOPeakRF P@AEP . com or by ma i l to the add ress speci fied in Secti on 4 .1 2 .
Fol l owing issuance of the F i na l RFP , B idders are encouraged to continue to sendquestions related to the substance of the RFP to the Company R FP website . Allquestions should be submi tted no l ater than 5 : 00 p .m . CPT December 2 , 2005 . Afterthat time , the website will be closed for further q uestions . Questions submi tted at leastfive days in advance of the Pre -b id Conference will be addressed du ring theConference . PSO will answer all questions subm itted to its RFP webs i te , and w il l postthe answers on the website by December 9 , 2005 .
Page 12

PSO RF P2005 RFP for Peaking Capac i ty and Energy Resources
4.8 Pre-Bid Conference
On November 21 , 2005 the Company will ho l d a Pre-B i d Conference at i ts headquarte rsi n Tulsa , Ok lahoma . Interested parties are requested to return a Pre-Bid ConferenceReg i stration Fo rm (Append ix D) . Comp l eted Forms should be sent vi a e-ma i l toPSOPeakRFP@AEP . com . Th e purpose of th is meeting w ill be to answe r anyremain ing technical and commerc i a l questions .
After the Pre-B i d Conference , if Bidders have any unresolved concerns or questi ons ,they may send them to the f M . Any and a ll addenda to the RFP w i ll be posted on theRFP website by December 9 , 2005 .
4.9 Transmission Contacts
Any i nqu i r i es related to PSO 's transm iss i on system o r serv ices must be directed to theSPP .
4 . 10 Notice of intent to Submit Proposa l
Bidders shall submit a Notice of Intent to Submit Proposal on the form attached asAppendix G no later than 5:00 p .m. CPT, November 15, 2005. Notices should besubmitted by e-mail to PSOPeakRFP@AEP .com . Confirmation of receipt by Companyshall be the responsibility of the prospective Bidder . Submitting a Notice of Intent toSubmit a Proposal does not commit a prospective Bidder to submit a Propasal,However, Bidders who do not submit a Notice of Intent to Submit Proposal will not besent any further notices regarding this RFP and will lose their access rights to theQuestion and Answer section of the RFP website .
4.11 Joint Proposals
No Bidder may act through a partnership, joint venture, consortium, or other associationor otherwise act in concert with any other person unless as part of its Proposal itprovides written notification to PSO and fully identifies all partners, joint venturers,members or other entities or persons thereof.
4 .12 Self-Build Options
Self-Build Proposals will submit information according the PPA new build requirements ofthe RFP and RFP Response Package .
Self-Build Proposals shall be submitted no later than 3 :00 p.m. CPT, December 1 9, 2005 .
Page 13
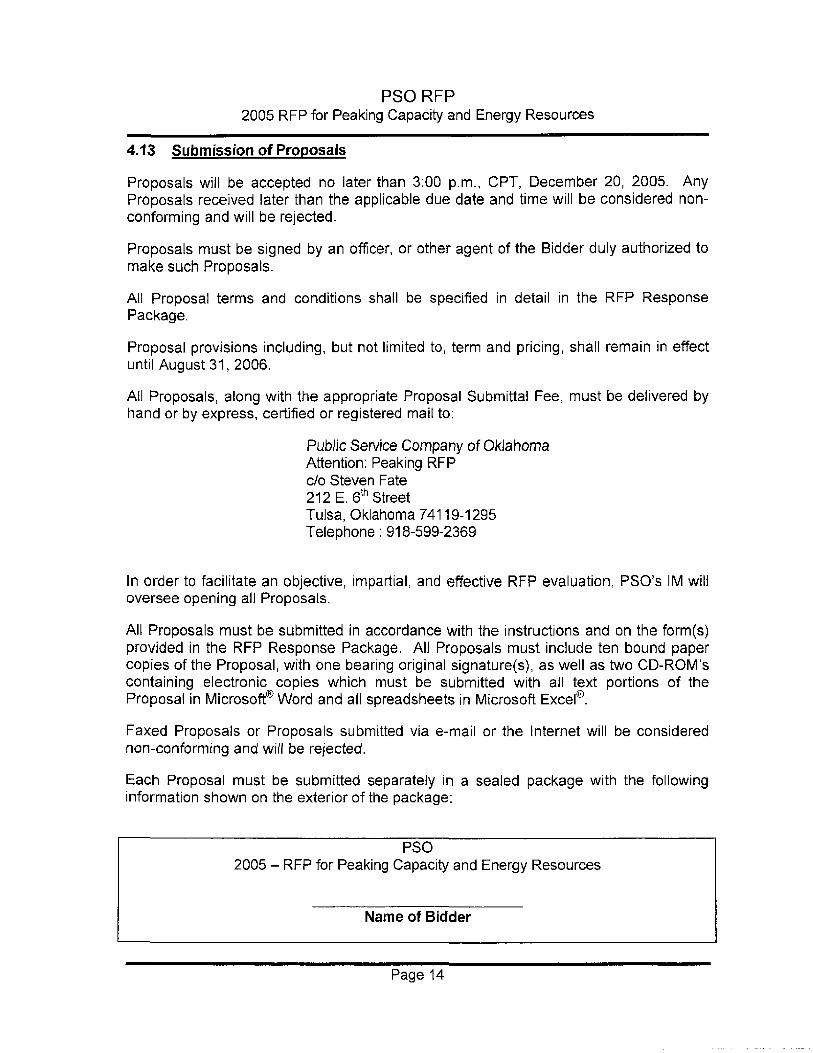
PSO RFP2005 RFP for Peaking Capacity and Energy Resources
4.13 Submission of Proposals
Proposals will be accepted no later than 3 :00 p .m ., CPT, December 20, 2005 . AnyProposals received later than the applicable due date and time will be considered non-conforming and will be rejected .
Proposals must be signed by an officer, or other agent of the Bidder duly authorized tomake such Proposals .
All Proposal terms and conditions shall be specified in detail in the RFP ResponsePackage .
Proposal provisions including, but not limited to, term and pricing, shall remain in effectuntil August 31, 2006 .
All Proposals, along with the appropriate Proposal Submittal Fee, must be delivered byhand or by express, certified or registered mail to :
Public Service Company of Ok lahomaAttention : Peaking RF Pclo Steven Fate212 E. 61h StreetTulsa, Oklahoma 741 1 9-1295Telephone : 918-599-2369
In order to facilitate an objective, impartial, and effective RFP evaluation, PSO's IM willoversee opening all Proposals .
All Proposals must be submitted in accordance with the instructions and on the form(s)provided in the RFP Response Package . All Proposals must include ten bound papercopies of the Proposal, with one bearing original signature(s), as well as two CD-ROM'scontaining electronic copies which must be submitted with all text portions of theProposal in Microsoft® Word and all spreadsheets in Microsoft Excel'o .
Faxed Proposals or Proposals submitted via e-mail or the Internet will be considerednon-conforming and will be rejected .
Each Proposal must be submitted separately in a sealed package with the followinginformation shown on the exterior of the package :
PSO2005 - RFP for Peaking Capacity and Energy Resources
Name of Bidder
Page 14

PSO RF P2005 RFP for Peaking Capacity and Energy Resource s
Proposals submitted i n response to this RFP w ill not be returned to B idders . At theconclusion of the RFP , all Proposals w ill be arch ived by PSO until a t least theconclusion of the RFP process and of any oth er re l ated regu l ato ry review and appro valperiods .
SECTION 5 - PROPOSAL EVALUATIO N
5 . 1 Receipt and Opening of Proposals
The IM and PSO's Designated Representative will document and monitor the process ofopening all Proposals, including the order in which they are opened, and will ensure thatall Proposal documents are housed in a secure location that is accessible only todesignated RFP personnel and the IM .
5 . 2 Screen ing for Conformance wi th RFP Submittal Requ i rements
The Company, subject to the oversight of the 1M, will thoroughly review and assess allProposals to ensure that each :
(i) is received on time with all forms completed in their entirety ;(ii) is signed by a duly authorized officer or agent of the Bidder ;(ii) includes Proposal Submittal Fees for each Proposal and alternative Proposafs ; and(iv) meets the informational requirements and other conditions specified in the RFP
Response Package .
Proposals that meet the requirements of the RFP shall be considered conforming .
Proposals may be deemed non-conforming if they do not meet the requirementsspecified in the RFP Response Package Appendix E . Except for Proposals notreceived on time, at PSO's sole judgment and discretion, in consultation with the IM,Proposals that are non-conforming may be given three business days to remedy theirnon-conformity . PSO reserves the right, in consultation with the IM, not to consider anyProposal that is non-conforming .
During the initial screening process, PSO reserves the right to contact Bidders to clarifyProposal terms or to request additional information . The IM shall monitor all suchcontacts .
5.3 Description of the Evaluation Process
The Company will use a multi-stage evaluation process to review Proposals and to selectthe preferred resources or portfolio of resources . To proceed through each stage of theevaluation process, a Proposal must meet certain threshold requirements and criteriarelative to other Proposals . Figure 5 .3 illustrates the Proposal evaluation processes fromreceipt of the Proposals to the selection of the Award Group and contract negotiations .
Page 15

PSO RF P2005 RFP for Peaking Capacity and Energy Resources
Figure 5 .3
~ Re-pt an d Ope n ingPipposa[s
Sc 2emn g for C onfor ma ncewith ftFP S uh m ~ttal
Requi rcnenls
M eets Noe fi cation afSuhm ~Ual ND N onLOnfoimance
R eq ui rament s
V e s
C VUSIe r P mposals
-pluetEon I
N onnc eP n ce Eva E val u ah o n
6 0 %4 0 %
Short-list SeEaction .
, Unsuccesstu lP m posal
Portfo lm Evaluah o n N o~i No h fi c a4on
Ye s
AwaN Gmup Select ion
Co ntrect Neganatio n s
The exact evaluation process followed will depend upon the number of Proposals receivedand changes in economic conditions that may have occurred from the time the Proposalswere submitted until the particular stage of the evaluation . For example, while PSO prefersto conduct a price and non-price evaluation of all Proposals based on a 60/40 weightingbetween price/non-price factors, if a large number of Proposals are received, PSO mayconduct an initial price screen prior to the non-price evaluation . Each phase of theevaluation process is described in more detail in subsequent sections .
Both the price and non-price characteristics of conforming Proposals will be evaluated bythe Company. Proposals will be evaluated relative to one another and relative to theirimpact on P50's system . The objective of the evaluation process is to select theProposal(s) that provides the highest value consistent with PSO's stated objectives andrequirements. The preferred Proposal(s) does not necessarily have to be the lowest costoption(s) or highest scoring Proposal(s) from a price and non-price perspective. PSO isinterested in Proposals which provide the most desirable combination of operationalflexibility and reliability, fuel supply and transportation diversity, limited risk and low cost .
Page 16

PSO RF P2005 RFP for Peaking Capacity and Energy Resource s
5.3.1 Eligibility Requirements and Threshold Requirements Screenin g
The first step in the evaluation process will be to review each Proposal to ensure that itsatisfies all of the applicable Eligibility Requirements specified in Section 5 .2 and ThresholdRequirements specified in Section 5.4. In this stage of the evaluation, PSO will determinewhether the Proposal meets the Eligibility Requirements specified, the Proposal isconsistent with all requirements outlined in the RFP and the Response Package and theProposal conforms to the Threshold Requirements .
Proposals that provide i naccurate or incomplete information w i l l be deemed to be non-conforming and may be rejected . The Company may , in its so le d i scre tion , prov i deBidders the opportunity to correct or c larify the i r Proposa l s to conform to the requirementsof the RFP provided the competitive positi on of P roposa l s is not affected . If the Companyseeks c l arifi cat i on , B i dders will be given three business days (or as otherwise stated by theCompany i n i ts request) to c larify the i r Proposal . Fa i lu re to t i mely conform to therequirements wi l l resu l t i n reject i on of the P roposal . Proposals that pass t h is i nit i al screenw i l l proceed to the next stage of the evaluat i on .
5 . 3 .2 Categorize lClus#er Proposals
Al l Proposals that meet the E l igib i l i ty and Threshold Requ i rements Sc reening w i l l becategor ized or clustered by type of Proposal (PPA or APP ), and resource type inpreparation fo r the pri ce and non-price analys is . Th i s process wi ll ensure that the h i ghestranking Proposa l s in each category can be d i stinguished and that a d i versity of opt i ons arecons idered throughout the eva l uation process . The Company reserves the right todeterm i ne , at its sole discreti on , appropr i a te clusters from the Proposa l s that it rece ivesand the placemen t of Proposa ls into cl usters .
5 . 3 .3 Price and Non -Price Analysi s
The third step of the evaluation process will include a price and non-price evaluation for allBase Proposals that pass the Eligibility and Threshold Screening . The result of the 60/40weighted price and non-price analysis will be a relative ranking and scoring of BaseProposals in each cluster. Base Proposals of the same type of contract and contract termwill be evaluated relative to similar Proposals at this stage of the evaluation .
The Company may, in its discretion, use screening curves andlor detailed production costanalysis to calculate the total cost impacts of each Proposal on PSO's system . Proposalswithin each cluster will be assigned price rankings based on their impact on PSO's totalsystem cost . Each Proposal will be evaluated using the price factors contained in theProposal. Where appropriate, generation expansion and production cost models will beused to determine and evaluate the impact on the net present worth of the Company'srevenue requirement .
Page 17

PSO RFP2005 RFP for Peaking Capacity and Energy Resources
5.3 .4 Select i on of the Short Lis t
PSO will select a short list of Proposals from the various clusters based on the results ofthe price and non-price analysis . The objective of the ranking system is to differentiateProposals relative to one another rather than selecting a fixed number of Proposals ormegawatts of capacity. The Company's objectives for selecting the short list are to select(i) an amount of capacity in excess of the Company's requirements to ensure a viablecompetitive process is followed ; and (ii) a diversity of options and contract types whichmeet PSO's RFP objectives and future generation needs while providing diversity andflexibility of its generation portfolio as well as it fuel supply and fuel transportationarrangements .
5 .3 .5 Portfol io Evaluation
In this stage of the evaluation process, short-listed Proposals from each cluster will becombined into various portfolios and compared and evaluated against each other. TheCompany may evaluate the Bidders' alternative Proposals that were submitted with theirBase Proposal . The Company will also consider the benefits of flexibility options proposedby the Bidder relative to its Base Proposal . The Company will evaluate in more detail theimpacts of other important PPA provisions .
In addition, the Company will assess the transmission impact of each Proposal todetermine what, if any, transmission system improvements must be made and theestimated cost of those improvements . The Company will assess the Proposal'stransmission system impact using SPP's reliability criteria and the SPP study methodology .Final transmission system impacts and related costs will be determined by SPP inaccordance with the SPP OATT .
In this phase of the evaluation, the Company will conduct sensitivity analysis of importantprice and economic assumptions to determine how robust the various Proposals andlorportfolios of Proposals are to various assumptions . The Company may develop high andlow fuel price cases as part of this portfolio evaluation process . Other sensitivities willinclude economic and environmental factors . The Company will also assess any uniquenon-price or flexibility provisions offered by Proposals or portfolio of Proposals that mayresult in a preferred porlfolia of resources .
5.3.6 Award Group Selection and Contract Negotiations
Based upon the portfolio evaluation results, the Company will select a group of Proposals(Award Group) for contract negotiations .
The Company will negotiate first with the highest ranking Proposals sufficient to fill theresource needs . If negotiations with higher ranked Bidders indicate that the Company isunlikely to negotiate acceptable terms with the Bidders, the Company may terminatenegotiations with those Bidders and commence negotiations with Bidders having lowerranked Proposals .
Page 1 8

PSO RFP2005 RFP for Peaking Capacity and Energy Resources
At this point in the process, an Award Group member may be required to provide evidenceof its ability to post Acceptable Credit Support as outlined in Section 5 .5.3 (ii) below. Suchevidence may include, but will not be limited to, unrestricted cash on the Bidder's or CreditSupport Provider's Balance Sheet, bank statements, existing credit facilities andlorexpected future credit facilities as confirmed by Bidder's or Credit Support Provider'slender. PSO reserves the right to determine precisely what is considered to constitutesufficient evidence at the time of contract negotiation .
The bas is for contract negotiat i ons wil l be to d iscuss requested modifications to therelevant Model Contract identified by the Bidder i n its Proposal . If no modificat i on to therelevant Model Contract has been requested as a part of the B i dde r' s Proposal , the Bidderwill be expected to execute a cont ract in substantia l ly the form of the relevant Mode lContract . B idders that request materi a l changes to the relevant Model Contract at thisstage of the e valuation process that were not reflected i n B i dders ' except ions to thecontract identified in the i r Proposal wi ll be subject to hav i ng the i r Proposa l re-ranked by theCompany . A B i dder's i nclusion i n the Award Group does not obl igate the Company toaccept any change to the re l evant Mode l Contract that has been proposed by the Bidder .Contracts may be subject to app rova l by the appropriate regulato ry agencies .
5 .4 Thres hold Requirements
5 . 4.1 Credit Threshold
Each Bidder must complete and submit with their Proposal the Bidder Profile Form(Appendix F Form 1) .
Each Bidder must also provide proof of a minimum tangible net worth of $500 million U .S .dollars, as reflected on the Bidder's most recent audited balance sheet, where tangible networth is defined as total assets less the sum of intangible assets, goodwill, and totalliabilities .
5 . 4 .2 Accounting Threshold
The Company is unwilling to be subject to accounting and tax treatment that results fromVariable Interest Entity treatment as set forth in Financial Accounting Standards Board(FASB) Interpretation No. 46 as issued and amended from time to time by FASB .
All PPA Proposals will be assessed by PSO for appropriate accounting andlor taxtreatment. Bidders shall be required to supply the Company with all the informationrequested in the RFP Response Package necessary to make such assessments .Moreover, each Bidder must also agree to make available at any point in the Proposaievaluation process any and all fnancial data associated with the Bidder, the generationresource and the PPA proposed that PSO requires to verify the expected treatment underFASB Interpretation No . 46 . Such information may include, but is not limited to, datasupporting the economic life (both initial and remaining), the fair market value, executor y
Page 19

PSO RFP2005 RFP for Peaking Capacity and Energy Resource s
costs, nonexecutory costs, and investment tax credits or other costs (including debtspecific to the asset being proposed) associated with the Bidder's Proposal .
5 .4 .3 Siting
For a generation facility to be constructed, or being constructed, for a PPA Proposal(Project), the Bidder shall have identified a site and shall have taken the appropriate stepsto acquire or secure use of the site by holding a purchase option or a binding letter of intentfrom the site owner(s) .
5 . 5 Description of Non-Price Related E valuation Criteri a
As noted , Company antici pates that all Proposals w il l be evaluated relat ive to non -priceand r i sk re l ated cr iteria deemed to be i mportant to Company . The Company i s interestedin PPA Proposa ls that offer operating flexib il ity and d i vers i ty and are l i kely to operateconsistent wi th PPA requirements throughout the term of the PPA . Company expects toconsider the non-pr i ce and r isk related a ttr i butes o f a Proposa l in the screen i ng phase anddetailed eva l uati on phase of the evaluation process . Th i s may be particularly i mportant i f apo rtfo l io of Proposals is selected and va rious po rtfo li os have sim i la r prices .
Page 20

PSO RFP2005 RFP for Peaking Capacity and Energy Resource s
Table 5.2 lists each of the Project non-price andlor risk-related criteria .
Table 5 .2Non-Pr i ce Criteri a
Griterion Wei htin *
Flexibility 5%(i) COD Flexibility(ii) Expansion Capability(iii) Contract Term
Development Feasibility 41 %(i) Siting Status(ii) Environmental Permitting(iii) Project Schedule(iv) Engineering and Technology
Maturity(iv) Fuel Supply and Transportation
Arrangements(vi) Project Management Experience(vii) Rights-of-Way Acquisitio n(viii) Water Supply/Resource Availability(ix) Non-Owned Transmission System
Empact
Project Operational Viability 27%(i) Operation and Maintenance Plan(ii) Financial Strength(iii) Environmental Compliance(iv) Environmental Impac t(v) Fuel Reliability and Flexibility
Quality of Output 19%(i) DispatchabilitylSchedufin g(ii) Coordination of Maintenance(iii) Operating ProfilelCharacteristics
Model Contracts(i) Model PPA(ii) Model PSA
8%
Represents the major non-pr i ce cri ter i a catego ry weightings wh i ch comb i ned represent40% of the overal l pri ce and non-price score .
Page 21

PSO RFP2005 RFP for Peaking Capacity and Energy Resource s
A detailed list and description of each non-price criteria for Proposals and Company'sobjectives relative to such criteria follows .
5 .5 .1 Flex ibility
The Company is interested in Proposals that provide flexibility in terms of the COD in itsacceleration option, Project size considerations, or the willingness of a Bidder to defer theCOD in its deferral option . Company will incorporate the values presented in its analysis aswell as qualitatively assess the level of flexibility offered by each Proposal . If Proposals aresimilarly ranked, the Proposal deemed to offer the greatest level of flexibility at the lowestcost will be preferred . Company views the following commitments to offer value toCompany .
(i) COD Flexibility This criterion is important for Company due to uncertaintyaround the regulatory approval process . Company values Proposals thatexpress a willingness to conform the COD at Company's request or canphase-in the Project to meet changes in the requirements .
(ii) . Expansion Capability PPA Proposals with the capability to expand at thesame site or offer volume and term flexibility will be viewed more favorably .
(iii) Contract Term When procuring resources to meet its identified needs, one ofthe Company's objectives for acquiring power resources is to achieve anappropriate portfolio mix of resources . The Company prefers longer termcontracts that best meet its need for reliability, price risk management andflexibility for dispatchable operations .
5 .5 .2 Development Feasibility
This category is designed to assess the likelihood of a Project coming into fruition based onvarious factors critical to successful project development . The status of development aswell as the likelihood for Project completion will be considered . The objectives of thecriteria within this category are to provide an indication of the feasibility of each Projectbeing developed as well as the likelihood of it being developed on schedule .
(i ) Siting Status This criterion considers the Project site l ocati on and physicala ttr i butes . It a l so eva l uates the Bidder's ab i l i ty to demonstrate ev i dence thatthe site i s comm itted for the fu l l term of the PPA .
(ii) Environmental Permittina This criterion considers the degree of certaintyoffered by the Bidder in securing the necessary environmental permits .Projects in the early stages of development will be evaluated based on th eBidder's plan for securing permits, the reasonableness of the Project schedul erelative to the proposed COD, prior experience, and BACT or LAE Rrequirements . Projects which exhibit a thorough understanding of th e
Page 22

PSO RF P2005 RFP for Peaking Capacity and Energy Resource s
env i ronmental permitting process (or have secured perm i ts ) and who presenta reasonable p lan wi ll be preferred . Projects which have made greate rp rogress i n environmental pe rmi tt ing o r wh i ch do not requ i re major perm its arepreferred . Projects with pe rm i ts i n p l ace are more highly valued .
Proposals should include a list of rer{uired permits to build and/or operate thesource. If permits are to be obtained in the future, it should include a timelinefor obtaining the permits .
(iii) Pro j ect Schedule This criterion requests Bidders to provide a detailed Projec tschedule (critical path including milestone dates) for the Project thatencompasses the period from the notice of selection of the Award Group t oCOD. The COD reflects the combination of a number of Project developmentfactors necessary for successful Project development . Company will reviewand evaluate the Project schedule and critical path to ensure the Bidder ha sdeveloped a reasonable schedule for meeting the proposed COD as outline din Section 3 .
(iv) Engineering and Technology Maturitv This criterion considers questionspertinent to the engineering design and project technology . Bidders shouldprovide information about the specific technology andlor equipment includingthe track record of the technology and equipment .
The electricity generation process proposed for the Project must have reacheda proven level of technological maturity and the strategic generat i on equipment(e . g ., turbine , generator) must be commercially ava i lable . The generalspecifications of the proposed equipment shall be provided .
Electri city generation processes are considered technologically mature if theyare in use in at least two generation facil i ties that ha ve been deliver i ngelectr i city on a commercial basis to a utility for at least two years . Generationfacilities still i n the demonstration phase for new generation processes will notbe considered . Strateg i c equipment used in generating e lectricity is notadmiss i ble for purposes of this RFP if i t is not commercially availab l e from aknown equipment manufacturer or if it re li es on a new operating principle or onone that has not yet been proven . This requiremen t is not meant to eliminateoffers us i ng equipment that constitutes an advanced version of provenequipment (e . g ., LMS100 combustion turb i ne, etc . ) .
The Company reserves the right to requ ire the B i dder to demonstrate t hat theproposed technology and strategic equipment used i n the generation of energyare proven . The Company further reserves the right to commission ani ndependent expe rt of its choice i n order to establish the techno l og i calmaturity .
Page 23

PSO RF P2005 RFP for Peaking Capacity and Energy Resource s
(v) Fuel Supply and Transportation Arranaements This criterion refers to thequality and availability of the fuel supply and transportation arrangements ofthe Project relative to the technology proposed . Company prefers Proposalswith fuel supply and transportation arrangements with reputable andcreditworthy suppliers for a term sufficient to conform to the requirements forproject financing . The Company also prefers fuel supply and transportationcontracts with fixed or index-based prices with provisions that minimize risk toCompany and its customers .
If the Project is in the early stages of development, Company requires a fuelsupply procurement plan that demonstrates that the fuel supply arrangementsadequately conform to the type and technology (e.g ., combustion turbine unit,combined cycle unit, etc.) of the Project proposed consistent with the securityand reliability required by Company . Company will evaluate the fuel supplyand transportation status of each Project relative to the type of Project andtechnology proposed .
(vi) Pra m ect Management Experience This criterion requires Bidders todemonstrate project experience and management capability to successfull ydevelop and operate the Project as proposed . PSO is particularly interested i na project team that has demonstrated success in at least one power project o fa similar nature, type, size and technology and can demonstrate an ability t oeffectively work together to bring the Project to COD .
(vii) Rights-of-Way Acquisitian Acquisition of rights-of-way and construction ofother facilities (such as water pipelines, rail spurs, etc .) can be importantelements of project development . Projects that do not require construction ofother facilities and rights-of-way acquisition are preferred .
(viii) Water Supply/Resource Availability This criterion considers the degree ofcertainty offered by the Bidder in securing the necessary water supply requiredby the Project . The evaluation will be based on the Bidder's plan for securingwater contracts/rights for the Project and the reasonableness of the planrelative to the Project type and schedule .
(ix) Non-Owned Transmission System fmpact This criterio n cons i ders thetransm i ssion upgrades that may be requ i red to transm i ssion systems otherthan those owned by PSO . Projects wh i ch do not require construction of newtransm i ssion and other fac i l i t i es are prefe rred .
5 . 5 .3 Project Operational Viability
Project opera ti onal viabi l i ty characteri sti cs prov ide a means of evaluat i ng whether Biddersw i ll provide reliable service to Company and its customers over the term of the PPA . Inaddit ion , th i s cri terion is designed to assu re that the Bidder w ill be ab l e to efficiently meetthe terms and conditions of the PPA. The following factors wi l l be considered :
Page 24

PSO RF P2 005 RFP for Peaking Capacity and Energy Resource s
(i) Operation a nd Maintenance Plan This factor evaluates the operation andmaintenance (O&M) plan of the Bidder, as to the reasonableness of themaintenance funding levels and arrangements, the willingness of a Bidder toexecute a long-term contract with a reputable operation and maintenanceprovider, and the previous experience of the Bidder in operating andmaintaining similar facilities . Company prefers Projects that demonstrate thatthe Bidder has developed a solid plan and adequate funding to properlymaintain the generation facility throughout the contract term . The plan shoulddemonstrate that NERC, SPP, and other applicable Regional ReliabilityCouncil guidelines for operating the generation facility are to be followed .
(ii) Financial Strength PSO will evaluate the ability of Bidders to perform underthe terms of their Proposals by reviewing credit ratings by Moody's andS&P, financial information as outlined in RFP Response Package and creditinformation published about Bidders (or their Credit Support Provider) bythird parties, which will include, but not be limited to :
Senior Unsecured, or Corporate credit ratings issued by Standard &Poor'sSenior Unsecured, or [ssuer credit rating(s) issued by Moody's ; andSEC form 1 0-K, form 10-Q, and form 8-K filings .
In addition, PSO will perform its own internal credit evaluation of Bidders (or their CreditSupport Providers) through the use on an internal credit scoring process, which willevaluate, at a minimum, the following factors :
(i) Revenue and earnings growth ;(ii) His#orical tangible net warth ;(iii) Historical measures of cash flow adequacy ;(iv) Historical measures of leverage and(v) Other credit risk and financial considerations, including, but not limited to, th e
status of ongoing court, regulatory, or other governmental processes o rproceedings or significant contract negotiations or renegotiations .
Unsecured Credit or credit supported by a Parent Guarantor will be issued atthe following limits, as listed in Table 5 .3, based on the lowest of S&P,Moody's Credit Rating or PSO internal credit rating for Bidder or Bidder'sCredit Support Provider. This shall be the aggregate unsecured credit limitextended to the Bidder, covering all contracts entered into between Bidder andPSO and its Affiliates .
Page 25

PSO RF P2005 RFP for Peaking Capacity and Energy Resources
Tabl e 5 .3 - Unsecured Credit Lim i ts
Credit Rating Dollar Cred it LimitAA- to AAA $75,000,000A+ and A $6 0,000 , 000A- $5 0,040 , 000BBB+ $35 , 000 , 000BBB $25 , 000 , 000BBB- $25,000,000BB+ and $0bel ow
As part of this process , PSO reserves the right to request further financia linformation from Bidders (or their Credit Suppor t Providers) and PSO willconsider entering into a Confidentiality Agreement with such Bidders toprotect such information , as appropriate . PSO may require successfulB i dder (or its Credit Support Provider) to post a form of Acceptable CreditSupport to ensure the Bidder 's performance under the terms of theProposal . The amount of Acceptable Credit Support , if required , will be inan amount determ ined by PSO's evaluation of the Bidder 's cred i t conditionin conj unction with a determination of the financial and performanceobl igations of the B i dder under the terms of the Proposal . In determin i ngthe financ ial and pe rformance obligations component of a long-term PPA,PSO will estimate the costs to replace such PPA . These costs will relate tocapacity and energy and w i ll cover an 18 month period , which is theminimum period that PSO estimates it will take to obtain and havegovernmental and regulatory appro val of an equivalent replacementcontract .
Credit Support related to capacity charges will be based on 50% of thevalue of the estimated future capacity cost, covering the aforementionedperiod of 1 8 months. Credit Support related to energy charges will bebased on the expected incremental replacement cost of such energy, giverta 50% market move, over the 18-month period . However, if Bidder'scapacity and/or energy prices exceed PSO's estimated market prices usedin the preceding calculation, then the Credit Support calculation will employBidder's price(s) instead of PSO's estimated price(s) and stil4 assume the50% market move described above .
Table 5 . 4 i l l ustrates the expected Credit Suppo rt Amounts for B i dderssubm i tt ing PPA Proposals based upon the Bidde rs ' ass i gned cred i t rati ng ,and submitted in $/kW form . Bidders wil l be expected to post secur i ty in anamount determined by their ( or the i r C r edit Support P rov i der's) credit ratingas represented in Table 5 .4 and the number of MW Proposed . For other
Page 26

PSO RFP2005 RFP for Peaking Capacity and Energy Resources
details regarding Credit Support posting requirements, refer to Article 8 ofthe Model PPA .
Further, Bidders should note that Company reserves the right to protect itselfagainst counterparty credit concentration risk, and as such, may require Bidderto post Acceptable Credit Support in the form of cash or an IrrevocableStandby Letter of Credit in amounts in excess of those amounts listed in Table5.4 to maintain compliance with AEP's credit policies .
Table 5 .4 - Cred it Support Amounts
PeakingCred it Rating IkWA ,AA -AA+ -AA -AA- -
A+ -A -A- -BBB+ -BBB -BBB- -BB+ $7 . 0 5BB $9 . 25BB - $ 13 . 95B+ $ 1 6 . 95B $19 . 40B- $21 . 95CCC $28 . 1 0
Bidders submitting an Asset Purchase Proposal will be subject to the samecreditworthiness scrutiny as described above . However, the amount ofCredit Support required will be based upon the Bidder's obligations andliabilities under an executed PSA .
(iii ) Environmental Com pl i ance This cri terion add resses the ability of gene rat ionfacil i ties supporting a PPA Proposal to remai n in environmental comp liance .Company will assess whether Proposa ls can demonstrate , through acred ible plan , the abi l ity to rema i n in compl i ance . Options to meetrequirements of developing regulations for i ncreased contro l of currentl yregulated a i r em i ss i ons and mercu ry should be considered . Also, the ab ili t yof a Bidder to secure the necessa ry Emiss i on Allowances for a Project ca ninfluence Project costs . B i dders are requ i red to p repare and subm it a planoutlin i ng its strategy for secur i ng the necessary Emission Allowances tomeet Project requ iremen ts .
Page 27
PSO RFP2005 RFP for Peaking Capacity and Energy Resource s
(iv) Environmenta l lmpact An important cr i terion for evaluati ng Proposa l s wil l bethe Project's environmental i mpacts . The Project 's overall plan to minimize a i rem iss i ons will be an impo rtant aspect of th i s review . In add it i on , site i mpactssuch as water use , land use , property value i ssues , and aesthet i cs will beconsidered in the Proposa l evaluation .
(v) Fue l Re l iabil i tv and F ' fexib i li~v This criter i on addresses the ab i lity of a Proposa lto prov i de flexib i l ity of fuel supp ly and fuel transpo rtation wh ile meet i ng thereliab il ity needs of Company . For example , hav i ng mu l tip le natura l gaspi pe lines or rai l roads serv i ng a generat i on faci l i ty wou l d be highly desirable .The ab i l i ty to convert to an alte rnate fuel (e . g . gas to fue l b i l , coal to gas ) wheneconom i cally o r operationally benefic i a l wou l d a l so be considered an a ttract iveoption .
Company prefers Proposals that can demonstrate that a reliable and securesupply of fuel and fuel transpartation resources will be available to th egenerating facil i ty . To assess reliability , the Companyaccess i bility to supply opt i ons , availability and firmness ofresources (e .g ., number and nature of pipeline systems or railhistory of pipeline operations i n the relevant area , tariff termsexperience with operational flow orders and curtailments , etcthe interests of the Company and its customers , and allodispatchability of the generation .
5.5 .4 Quality of Output
will cons i dertransportation
transportation),and conditi ons ,
which protectw for max i mum
Quality of output evaluation criteria are designed to evaluate the system impactsassociated with each Proposal relative to the level of operating flexibility and consistencywith Company's objectives regarding enhancement to system generation, reliability andoperations . Scheduling of generation facilities will be considered in the dispatching criteriaas noted below. While the factors considered may, to some degree, be incorporated intothe cost analysis and therefore influence the economics of each Proposal, it is not likelythat the cost implications capture the full benefit to Company. Therefore, it is important toincorporate these criteria separately as part of the non-price related criteria in the analysis .
(i) Dis atchabili ISchedulin This criterion refers to the extent to which th esubject generation facilities will be dispatchable and the flexibility offered i nscheduling energy . Dispatchability is defined as the ability of the Company t orequire delivery of power and energy at a Company determined level (includingno output) for a specified period. Generation facilities that are not full ydispatchable will be evaluated based on the level of operating flexibility an dcontrol offered to Company .
(ii) Coordination of Maintenance This criterion addresses the willingness andflexibility of a Bidder to coordinate the maintenance schedules of the subjectgeneration facilities in conjunction with Company's maintenance schedules forits own generation facilities .
Page 28

PSO RFP2005 RFP for Peaking Capacity and Energy Resource s
(iii) Operating Profile/Characteristics This criterion refers to the ability of th esubject generation facilities to meet load requirements (real and reactive)quickly and provide the operating flexibility deemed valuable to Company .Characteristics of importance include load following capability, minimum start-up capability, ability to cycle the unit, cold start time, ramping capability, an dvoltage support capability . Company will evaluate the operating profile of th esubject generation facilities relative to its implications to the PSO system .
5 .5 .5 Model Contracts
( E) Model PPA Appendix H contains the Model Power Purchase Agreement .Bidders submitting PPA Proposals are required to include with their Proposal ared-line version of the PPA which clearly identifies any proposed changes tothe Model PPA. Bidder's proposed changes to the Model PPA will be a part ofthe non-price evaluation of the Proposal .
(II) Model PSA Appendix I contains the Model Purchase and Sale Agreemen t(Model PSA) . Bidders submitting Asset Purchase Proposals are required t oinclude with their Proposal a red-lined version of the Model PSA which clearl yidentifies any proposed changes thereto . Bidders' proposed changes to theModel PSA will be considered by the Company in its evaluation of th eProposal .
5 .6 Description of Price Related Evaluation Criteri a
All Proposals wi l l be evaluated on the bas i s of thei r price and operational pe rformancefactors i n the price and portfolio eva lua ti on th rough the simulation of the i mpact of theProposa l on the o verall costs to the PSO system . Company will consider the impacts ofthe Proposal on PSO and i ts customers . Company will also i nclude other criter i a i n i tsanalys i s , includ i ng operationa l characterist ics and flexi b i lity p rovis i ons th at a l low Companyto min i m i ze risk and unce r ta i nty . Company 's objective i n selecting resources , therefore ,involves a combination of rate i mp licati ons and risk min i m i zati on options to arrive at theprefer red po rt fol i o of resources .
Company proposes to conduct a deta iled cost analysis that incorporates all of the costsatt ri buted to each Proposa l including, bu t not l imited to :
(i) Capacity Charge(ii) Fixed O&M Charg e(iii) Energy Charge(iv) Fuel Transportation Charg e(v) Variable O&M Charge(vi) Start-Up Charg e(vii) Emissions Charg e(viii) Ancillary Services Charge
Page 29

PSO RF P2005 RFP for Peaking Capacity and Energy Resource s
( i x) Transmission System Impact(x ) Debt Equ i va l ence
A description of each component i s presented below .
5.6.1 Capacity Charge
The Capacity Charge reflects the payment that Company will make to the Bidder for hav i ngthe generating capac i ty ava i lab le to Company to operate at the proposed committedcapaci ty level . All Proposals w i l l be eval uated at the target equ i va l ent ava i lab i lity spec i fiedby the B i dder unless the target equ i va lent ava il abi l ity is deemed to be unreal i stic for theproposed technology or fac ility des ign . Bidde rs may propose to bid a fixed pr ice o r fi xedescalation Capacity Charge arrangement a t the time of Proposal subm i ssion that locks inthe Capacity Charge from the COD for the term of the PPA . Bidders a re proh i bi ted fromsubmi tt ing a Proposal pr i ce that i nc ludes esca lation prov i sions tied to a va ri ab le anduncertain index (e . g ., inflation , interest rates , etc .) .
As noted in the Model PPA , the B i dder will be pa i d Capac i ty Charges based on the productof the Capaci ty Charge , Contract Capac i ty , an allocation factor for the applicab le month ofthe year and the ava i labi lity adjustment specified in the RFP and PPA.
5 .6.2 Fixed O&M Charge
The Fixed O&M Charge reflects the payments that Company would ma ke to the Bidder tocover the F i xed O&M cos ts associated with their Proposal . This may i nc l ude such items asfi xed labor or staff expenses , p rope rty taxes, insurance , fixed maintenance expenses andother fixed operat ing expenses . Fixed natural gas pipel i ne and other fue l transportationcharges , such as demand charges , shou ld be reflected as a separate Fix ed Fue lTransportation Charge . These payments will be calculated based on the i n itia l base peri odcharge and the esca l at i on rate selected by the B i dder.
As noted in the Mode l PPA, the B i dder w ill be pa id Fixed O&M Cha rge based on theproduct of the F i xed O&M Charge , Contrac t Capac ity , an allocation factor for theappl i cable month of the year and the ava i labil i ty adjustment specified in the RFP andPPA .
5.6.3 Energy Charge
This factor will account for the amount and cost of energy del i vered by the B idder . Such ananalysis requires the i ncorporati on of operating characteristics that influence thepe rformance of the subject generation facil i ties . This includes the level of dispatchab il ityproposed , the level of avai l ab il ity , and other operationa l const r a i nts .
5.6.4 Fuel Transportation Charge
Page 30

PSO RF P2005 RFP for Peaking Capacity and Energy Resource s
This Factor w il l account for the fixed and variable charges for recove ry of Bidders fueltransportation cost . Fixed fuel charges , such as demand charges or reservat i on payments ,shou ld be recovered through a F ixed Fuel Transportation Cha rge .
As noted in the Model PPA, the Bidder will be paid Fuel Transportation Charges subject tothe adjustment for the applicable month of the year and the ration of actual availability totarget availability within the perimeters in the RFP and PPA .
5 .6 .5 Variable O&M Charge
The Var i able O&M Charge reflects the payments that Company wou l d make to the B i dderto cover the Va riab le O&M costs assoc i ated with their Proposa l . The Variab l e O&MCharge may take i nto cons f derati on non-fue l variable expenses re l ated to ope ration of theB i dders generation faci l ity . Var i able natura l gas pi pe l ine and other fuel transportationcharges , such as transportation charges for natural gas actual l y delivered, shou ld bereflected as a separate Variable Fuel Transportation Charge . These payments wi l l becalculated based on the i n itia l base per i od charge and the escala tion i nd ices se lected bythe B i dder ,
5.6 .6 Start-Up Charge
The Start-Up Charge reflects the payments Company will make each time a generationfacility, which specifies such payments, successfully starts its generating facility whencalled upon by Company to operate . Costs to start-up the generation facility after plannedand unplanned maintenance or forced outages will not be included as Start-Up Charges .Company will estimate how many times it expects the generation facility to be required tostart-up, and will include the proposed Start-Up Charge in conducting the evaluation .Bidders are encouraged to describe any constraints or unique characteristics of theirProposals which could influence the Company's analysis .
5.6.7 Emissions Charges
Company will evaluate the implications of a Proposal on overall system emission levels toassess how it will impact Company's Emission Allowances and the impact it will have onCompany's position in the emission allowance market and any costs or savings associatedwith a particular Proposal . Company will estimate the S02, NOx, and mercury emissionsfrom its system as a result of each Proposal . To estimate the impacts associated witheach Proposal, Company will calculate the dollar impacts as the net emission impacts ofthe project times the estimated market value of the emission over the term of the PPA .
Page 31

PSO RFP2005 R FP for Peaking Capacity and Energy Resources
5.6.8 Ancillary Services Charg e
Ancillary Services that may be provided by generators are ,
(i) Reactive Supply and Voltage Control ;(ii) Regulation and Frequency Response ;(iii) Energy Imbalance ;(iv) Operating Reserves - Spinning ;(v) Operating Reserves - Supplemental .
Bidder shall identify in their Proposal any explicit ancillary service charges related todelivering power and energy to Company under their Proposal . In addition, Bidder needsto describe in detail the relationship between Bidder's Proposal generation facility,Company and SPP RTO market operations . The details shall include responsibilitiesassociated with scheduling, asset registration, resource bidding and ancillary serviceprovision .
5 .6.9 Transmission System Impac t
This criterion considers the upgrades and attendant costs that may be required to PSO'stransmission system . Company will use its computer modeling capability (e .g., power flowprogram) to verify and quantify the Transmission system impacts, based on the specificdata contained in Bidder's Proposal .
5 .6.10 Debt Equivalence
Evaluation of PPA Proposals will include the imputed cost (revenue requirement) ofcommon equity for any additianal amounts of common equity required to maintain theCompany's current debt-equity ratio . Should the PPA be determined to be treated as acapital lease under EITF 0 1-08 and SFAS 13, equity will be assumed to be added tomaintain the current total debt to equity ratio based on the amount of the debt or capitallease liability anticipated to consolidate onto the Company's balance sheet . Should thePPA be determined to be treated as an operating lease under EITF 01-08 and SFAS 13,equity will be assumed to be added to maintain the current total debt to equity ratio usingStandard and Poor's (S&P) published guidelines as a basis of the equity imputation and itscost. Key parameters for the calculations will include ROE (pre-tax) based on theCompany's authorized return and NPV discount factor and debt cost at the Company'sweighted average cost of debt . If the PPA is not a lease, sensitivities will be calculated at a30% and a 50% risk factor that will be applied to the fixed charge NPV to calculate theimputed debt . The cost of additional equity will be included as a revenue requirement to allapplicable PPA Proposals .
As stated in the Threshold Requirements, the Company will not accept any Proposals withcontract terms that would require balance sheet consolidation of a Variable Interest Entity(VIE) per FASB lnterpretation No. 46R. Through information gathered from Bidders, theCompany will determine whether it will be subject to VIE consolidation treatment at an y
Page 32

PSO RFP2005 RFP for Peaking Capacity and Energy Resource s
time during the contract period . Failure in this provision will be considered a disqualifica t ionof the Proposal .
5 .7 Notification of Evaluation Results and Negotiations
Upon completion of the screening to determine those Proposals that meet the CreditThreshold and Accounting Threshold, PSO will notify all Bidders on the status of theirProposal . Praposa[s meeting the thresholds will be separated and grouped as described inSection 5 .3 .2 . For Bidders whose Proposal fails the threshold screening, Company willprovide an explanation of the requirements that were not met.
Upon completion of Proposal evaluation, Bidders will be notified of the status of theirProposal and whether additional discussions or negotiations are warranted . Negotiationswill commence as soon as practicable after selected Bidders are notified .
Upon conclusion of negotiations, if successful, PSO will work with the Bidders to developdefinitive agreements for submission to the Commission . PSO will retain writtendocumentation of its decision-making process for Proposals that are selected or rejected,including the reasons for its decisions .
Upon selection of Proposals for negotiation, PSO will contact each Bidder to notify it of thestatus of its Proposal and whether additional discussions or negotiations are warranted .Negotiations will commence as soon as practicable after selected Bidders are notified .
SECTION 6 - REGULATORY APPROVALS
Generafiy, the results of the RFP will be subject to regulatory approvals . Anycontractual arrangements between PSO and prospective Bidders may be conditionedupon prior Commission authoriza tion that is satisfactory in form and substance to PSOin its sole judgment and discretion . The Company reserves the right to reject anyproposed contracts that result from the RFP if subsequently issued regulatory approvalsor authorizations are subject to conditions, including ratemaking treatments, w h i ch areunacceptable to PSO in its sole judgment and discretion .
Other than the prior authorization from the Commission, for which PSO shall apply, aBidder whose Proposal is selected will be solely responsible financially, legally andotherwise, as applicable, for acquiring and maintaining all necessary governmental (e .g .FERC), creditor, and other third party authorizations and consents necessary orappropriate to facilitate effectuation of the selected Proposal, including allauthorizations, permits, licenses, consents, and approvals associated with a selectedProposal, as well as compliance with any and all governmental rules and regulations forthe construction and operation of the Project identified in the Proposal .
SECTION 7 - RESERVATION OF RIGHTS
Bidder's Proposal will be deemed accepted only when PSO and the successful Bidderhave executed definitive agreements . Company has no obligation to accept any
Page 33

PSO RFP2005 RFP for Peaking Capacity and Energy Resource s
Proposal, whether or not the stated price in such Proposal is the lowest price offered,and PSO may reject any Proposal in its sole judgment and discretion and without anyobligation to disclose the reason or reasons for rejection .
BY PARTICIPATING IN THE RFP PROCESS , EACH BIDDER AGREES THAT(A) EXCEPT TO THE EXTENT OF ANY REPRESEN TATIONS AND WARRAN TIESCONTAINE D IN A DEFINITIVE AGREEMENT WITH THE COMPANY , ANY AND ALLINFORMATION FURNISHED BY OR ON BEHALF OF THE COMPANY INCONNECTION WITH THE RFP IS OR WILL BE PROVIDED WITHOUT ANYREPRESENTATION OR WARRANTY , EXPRESS OR IMPLIED, AS TO THEUSEFULNESS , ACCURACY , OR COMPLETENESS OF SUCH INFORMATION , AND( B ) EXCEPT AS OTHERWISE PROV IDED IN A DEFINITIVE AGREEMENT WITH THECOMPANY , NEITHER PSO , ITS AFFILIATES NOR ANY OF THEIR PERSONNEL ORREPRESENTATIVES SHALL HAVE ANY LIABILITY TO ANY BIDDER OR ITSPERSONNE L OR REPRESENTATiVES RELATING TO OR ARISING FROM THEUSE OF OR RELIANCE UP ON ANY SUCH INFORMATION OR ANY ERRORS OROMISSIONS THEREIN .
Each Bidder is solely responsible to pay any and all costs incurred by the Bidder in thepreparation of a Proposal in response to this RFP, or to contract for any products orservices proposed by any Bidder . PSO reserves the right to modify or withdraw thisRFP, to negotiate with any and all qualified Bidders to resolve any and all technical orcontractual issues, or to reject any or all Proposals and to terminate negotiations withany Bidder at any time . PSO reserves the right, at any time and from time to time,without prior notice and without specifying any reason and, within its sole judgment anddiscretion, to :
1 . Cancel, modify or withdraw this RFP, reject any and all responses, an dterminate negotiations at any time during the RFP process ;
2 . Discuss with a Bidder and its advisors the terms of any Proposal submittedby the Bidder and obtain clarification from the Bidder and its advisorsconcerning the Proposal ;
3 . Consider all Proposals to be the property of PSO, subject to the provisions ofthis RFP relating to confidentiality and any confidentiality agreement that ma ybe executed in connection with this RFP, and destroy or archive anyinformation or materials developed by or submitted to PSO in this RFP ;
4. Request from a Bidder information that is not explicitly detailed in this RFP ,but which may be useful for evaluation of that Bidder's Proposal ;
5. Determine which Proposals to accept, favor, pursue, or reject ;6 . Reject any Proposals that are not complete or contain irregularities, or waive
irregularities in any Proposal that is submitted ;7 . Accept Proposals that do not provide the lowest evaluated cost ;8 . Determine which Bidders to allow to participate in the RFP, including
disqualifying a Bidder due to a change in the qualifications of the Bidder or i nthe event that PSO determines that the Bidder's participation in the RFP ha sfailed to conform to the requirements of the RFP ;
Page 34

PSO RFP2005 RFP for Peaking Capacity and Energy Resource s
9 . Conduct negotiations with any o r al l B i dders or other persons or with noB i dders or other persons ; and
10 . Execute one or more defin i t ive agreements w i th any B idder that subm its aP roposal or w ith any other person or with no one .
If at any time the Company determines that there is a defect in the RFP process or adeviation from the requirements of the RFP or that collusive or fraudulent bidding hasoccurred or appears to have occurred, the Company, in consultation with the IM, maysuspend the RFP in whole or in part as to any Bidder or Bidders so involved .
Unde r all circumsta n ces , each Bidder i s responsib le fo r all costs and expenses it incursin connect ion w i th the RFP . Under no circumstances , i nclud ing the Company 'sterm ination of the RFP at any time, w il l the Company or any of its representatives berespons i ble for any costs or expenses of any Bidder i ncurred in connect i on w i th theRFP .
SECTION 8- GLOSSARY OF TERMS
1 .} Acceptable Credit Support . Acceptable Credit Support shall mean, but shal lnot be limited to, one or more of the following: (i) an irrevocable, transferabl estandby Letter of Credit issued by a U .S . commercial bank or a foreign ban kwith a U .S. branch with such bank have a credit rating of at least A- fro mS&P or A3 from Moody's in a form as outlined in Appendix F Form 3, or (ii) acash deposit.
2.) Affiliate : Is any person directly or indirectly controlling or controlled by o runder direct or indirect common control with such person or any person tha tdirectly or indirectly (through one or more intermediaries) controls or i scontrolled by or is under common control with the person . For purposes ofthis definition, "control" (including, with correlative meanings, the term s°controEling," "controlled by" and "under common control with"), as used wit hrespect to any person, shall mean the direct or indirect ownership or contro lof, or the possession, directly or indirectly, of the power to vote, five percen t(5%) or more of the outstanding voting securities of such person, or th epossession, directly or indirectly, of the power to direct or cause the directio nof the management or policies of such person, whether through theownership of voting securities, by agreement, or otherwise .
3 .) Commercial Operation Date : The date upon which the seller's deliveryobligations commence under a PPA
4.) Control Area : AE P SPP electric system bounded by interconnectionmetering and telemetry capable of controlling owned and contractedgeneration to maintain interchange schedules with other control areas . Inthis document, the term, "control area," is used interchangeably with theterm, "transmission system ."
Page 35

PSO RFP2005 RFP for Peaking Capacity and Energy Resource s
5.) Credit Support Provider: An entity that has issued a guaranty to cover theobligations of the Bidder .
6.) Net Dependable Summer Capabil~: The net demonstrated summercapability of a generating unit established in accordance with the testingprocedures defined in Section 12 of SPP Criteria--Electrical FacilityRatings .
7.) SPP RTO : The Southwest Power Pool Regional Transmissio nOrganization . Major services provided by the SPP RTO to membersinclude independent reliability coordination and tariff administration ,regional engineering model development, planning and operating studies ,reliability assessment studies, a computer-based telecommunication snetwork, and operating reserve sharing . SPP provides regional transactio nscheduling and is in the process of implementing market settlemen tfunctionality as required by FERC Order 2000 .
8 .) F'ea_kin~Capac t ty and Energy Resource : A firm generating resource that ca nbe placed on - l ine or be made avai la b le for d i spatch i n a re l at i ve ly sho rtper i od of t i me. From an econom i c perspective a pr i ma ry characteristic i s tha tthe resource ' s fi xed cost profile (capital recove ry and fixed operati on andmaintenance cost , e tc . ) wou l d be sufficiently low so as to a l low the asset tobe econom i ca l ly justifi ed to operate at potential l y ve ry low capacity factors .
Page 36
Public Service Company of Oklahom a
Request For Proposa l
for
Baseload Capacity and Energy Resources
December 2005
P ° GWR Ix `i = . ~~. '~~CEC0~~~~AI4I'" OF~~ ~~LA ~~M A'
A unit ofAmerican Electric Power

PSO RF P2005 RFP for Baseload Capacity and Energy Resource s
Table of Contents
SECTION 1 - GENERAL INF ORMATIO N . . . . . . . . . . . . . . . . . . . . . . . . . . . . . . . . . . . . . . . . . . . . . . . . . . . . . . . . . . . . . . . . . . . . . . . . . . . . . . . . . . . . . . . . . . . . . . . . . . . . .
1 . 1 IN7ROQl1CTION . . . . . . . . . . . . . . . . . . . . . . . . . . . . . . . . . . . . . . . . . . . . . . . . . . . . . . . . . . . . . . . . . . . . . . . . . . . . . . . . . . . . . . . . . . . . . . . . . . . . . . . . . . . . . . . . . . . . . . . . . . . . . . . . . . . . . 1
1 .2 IND EPENtiEN7 M ONETOR . . . . . . . . . . . . . . . . . . . . . . . . . . . . . . . . . . . . . . . . . . . . . . . . . . . . . . . . . . . . . . . . . . . . . . . . . . . . . . . . . . . . . . . . . . . . . . . . . . . . . . . . . . . . . . . . . . . . . . . 2
1 . 3 SELF-BUILD PR4CEDl1RES . . . . . . . . . . . . . . . . . . . . . . . . . . . . . . . . . . . . . . . . . . . . . . . . . . . . . . . . . . . . . . . . . . . . . . . . . . . . . . . . . . . . . . . . . . . . . . . . . . . . . . . . . . . . . . . . . . . 3
SECTION 2 - SECTI ON NOT USED . . . . . . . . . . . . . . . . . . . . . . . . . . . . . . . . . . . . . . . . . . . . . . . . . . . . . . . . . . . . . . . . . . . . . . . . . . . . . . . . . . . . . . . . . . . .. . . . . . . . . . . . . . . . . . . . . . . . 3
SECTION 3 - 2005 BASELOAD RESOURC ES RFP . . . . . . . . . . . . . . . . . . . . . . . . . . . . . . . . . . . . . . . . . . . . . . . . . . . . . . . . . . . . . . . . . . . . . . . . . . . . . . . . . . . . . . . . . . 3
3 . 13 .2
3.2.13.2.2
3 . 33. 3. 1
3 . 43 . 5
3. 5. 13. 5. 2
3 . 6
OVE RV IEW OF RFP . . . . . . . . . . . . . . . . . . . . . . . . . . . . . . . . . . . . . . . . . . . . . . . . . . . . . . . . . . . . . . . . . . . . . . . . . . . . . . . . . . . . . . . . . . . . . . . . . . . . . . . . . . . . . . . . . . . . . . . . . . . . . .3
BASIC REQUIREMENTS FOR FERM BASELOA D CAPACITYANp ENER GY PROPQSALS . . . . . . . . . . . . . . . . . . . . . . . . . . . . . . . 4Base Praposal . . . . . . . . . . . . . . . . . . . . . . . . . . . . . . . . . . . . . . .. . . . . . . . . . . . . . . . . . . . . . . . . . . . . . . . . . . . . . . . . . . . . . . . . . . . . . . . . . . . . . . . . .. . . . . . . . . . . . . . . . . . . . . . . . . . . . . . . . . . . . . . . . 5
Alternative Proposals . . . . . . . . . . . . . . . . . . . . . . . . . . . . . . . . . . . . . . . . . . . . . . . . . . . . . . . . . . . . . . . . . . . . . . . . . .. . . . . . . . . . . . . . . . . . . _ -- . .. . . . . . . . . . . . . . . . . . . . . . . . . . . . . . . . . . 5POWER PURCHASE PROPO SALS . . . . . . . . . . . . . . . . . . . . . . . . . . . . . . . . . . . . . . . . . . . . . . . . . . . . . . . . . . . . . . . . . . . . . . . . . . . . . . . . . .. . . . . . . . . . . . . . . . . . . . . . . . 5
S~stem Products . . . . . . . . . . . . . . . . . . . . . . . . . . . . . . . . . . . . . . . . . . . . . . . . . . . . . . . . . . . . . . . . . . . . . . . . . . . . . . . . . . . . . . . . . . . . . . . . . . . . . . .. . . . . . . . . . . . . . . . . . . . . . . . . . . . . . . . . . . . . . . fiASS ET PURCHASE PROP OSALS . . . . . . . . . . . . . . . . . . . . . . . . . . . . . . . . . . . . . . . . . . . . . . . . . . . . . . . . . . . . . . . . . . . . . . . . . . . . . . . . . . . . . . . . . . . . . . . . . . . . . . . . . . . . 7FUEL CONSIDERATIONS . . . . . . . . . . . . . . . . . . . . . . . . . . . . . . . . . . . . . . . . . . . . . . . . . . . . . . . . . . . . . . . . . . . . . . . . . . . . . . . . . . . . . . . . . . . . . . . . . . . . . . . . . . . . . . . . . . . . . . . 5
Power Purchase figreement . . . . . . . . . . . . . . . . . . . . . . . . . . . . . . . . . . . . . . . . . . . . . . . . . . . . . . . . . . . . . . . . . . . . . . . . . . . . . . . . . . . . . . . . . . . . . . . . . . . . . . . . . . . . . . .. . . . . . . . . . . . 8
Purchase nf Existing Baseload Generation Facilities . . . . . . . . . . . . . . . . . . . . . . . . . . . . . . . . . . . . . . . . . . . . . . . . . . . . . . . . . . . . . . . . . . . . . . . . . . . . . . . . . . 9
R EL IABLE DELIVERY . . . . . . . . . . . . . . . . . . . . . . . . . . . . . . . . . . . . . . . . . . . . . . . . . . . . . . . . . . . . . . . . . . . . . . . . . . . . . . . . . . . . . . . . . . . . . . . . . . . . . . . . . . . . . . . . . . . . . . . . g
SECTION 4 - INSTRUCTIONS TO BIDDERS . . . . . . . . . . . . . . . . . . . . . . . . . . . . . . . . . . . . . . . . . . . . . . . . . . . . . . . . . . . . . . . . . . . . . . . . . . . . . . . . . . . . . . . . . . . .. . . . . . . 1 0
4 . 14 . 24 .34 . 44 . 54 . 64 . 74.84 . 94 . 104 . 114 . 124 . 13
PROPOSAL SUBMITTAL FEES . . . . . . . . . . . . . . . . . . . . . . . . . . . . . . . . . . . .. . . . . . . . . . . . . . . . . . . . . . . . . . . . . . . . . . . . . . . . . . . . . . . . . . . . . . . . . . . . . . . . . . . . . . . . . .10CONFIDENTIAL INFORMATION AND CONFIDENTIALITY AGREEMENTS . . . . . . . . . . . . . . . . . . . . . . . . . . . . . . . . . . . . . . . . . . . . . . . . . . . .10RFP SCHEDULE . . . . . . . . . . . . . . . . . . . . . . . . . . . . . . . . . . . . . . . . . . . . . . . . . . . . . . . . . . . . . . . . . . . . . . . . . . . . . . . . . . . . . . . . . . . . . . . . . . . . . . . . . . . . . . . . . . . . . . . . . . . . . . . . 1 1
MOD IFICATION OR CANCELLATION OF THE RFP . . . . . . . . . . . . . . . . . . . . . . . . . . . . . . . . . . . . . . . . . . . . . . . . . . . . . . . . . . . . . . . . . . . . . . . . . . . . . . . . . . 11
QUESTION, COMMENT AND RESPONSE PROCESS . . . . . . . . . . . . . . . . . . . . . . . . . . . . . . . . . . . . . . . . . . . . . . . . . . . . . . . . . . . . . . . . . . . . . . . . . . . . . .'I j
TECHN I CAL CONFERENCE . . . . . . . . . . . . . . . . . . . . . . . . . . . . . . . . . . . . . . . . . . . . . . . . . . . . . . . . . . . . . . . . . . . . . . . . . . . . . . . . . . . . . . . . . . . . . . . . . . . . . . . . . . .. . . . . . . 12
ADDITIONAL QUESTIONS AND COMMENT SUBMI SS ION . . . . . . . . . . . . . . . . . . . . . . . . . . . . . . . . . . . . . . . . . . . . . . . . . . . . . . . . . . . . . . . . . . . . . . . . 12
PRE -BID CONFERENCE . . . . . . . . . . . . . . . . . . . . . . . . . . . . . . . . . . . . . . . . . . . . . . . . . . . . . . . . . . . . . . . . . . . . . . . . . . . . . . . . . . . . . . . . . . . . . . . . . . . . . . . . . . . . . . . . . . . . . . 12TRANSMISSION CONTACTS . . . . . . . . . . . . . . . . . . . . . . . . . . . . . . . . . . . . . . .. . . . . . . . . . . . . . . . . . . . . . . . . . . . . . . . . . . . . . . . . . . . . . . . . . . . . . . . . . . . . . . . . . . . . . . . . .'I3NOTICE OF INTENT TO SUBMIT PROP O SAL . . . . . . . . . . . . . . . . . . . . . . . . . . . . . . . . . . . . . . . . . . . . . . . . . . . . . . . . . . . . . . . . . . . . . . . . . . . . . . . . . . . . . . . . . . 'I 3
JOINT PROPOSALS . . . . . . . . . . . . . . . . . . . . . . . . . . . . . . . . . . . . . . . . . . . . . . . . . . .. . . . . . . . . . . . . . . . . . . . . . . . . . . . . . . . . . . . . . . . . . . . . . . . . . . . . . . . . . . . . . . . . . . . . . . . . .'I 3
SELF-BUILD OPTIONS . . . . . . . . . . . . . . . . . . . . . . . . . . . . . . . . . . . . . . . . . . . . . .. . . . . . . . . . . . . . . . . . . . . . . . . . . . . . . . . . . . . . . . . . . . . . . . . . . . . . . . . . . . . . . . . . . . . . . . . .'1 3SUBMI S SION OF PROPOSALS . . . . . . . . . . . . . . . . . . . . . . . . . . . . . . . . . . . . . . . . . . . . . . . . . . . . . . . . . . . . . . . . . . . . . . . . . . . . . . . . . . . . . . . . . . . . . . . . . . . . . . . . . . . . . .'I 3
SECTION 5 - PROPOSAL EVALUATION . . . . . . . . . . . . . . . . . . . . . . . . . . . . . . . . . . . . . . . . . . . . . . . . . . . . . . . . . . . . . . . . . . . . . . . . . . . . . . . . . . . . . . . . . . . . . . . . . . . . . . . . . . 1 5
5 . 15.25 .3
53. r5 .3 .25 . 3 . 35 .3 .45. 3 . 55.3 .6
5 . 45. 4. 15. 4. 25.4.3
5 . 5
RECE IP T AH D O PENING O F PRO POSAI.S . . . . . . . . . . . . . . . . . . . . . . . . . . . . . . . . . . . . . . . . . . . . . . . . . . . . . . . . . . . . . . . . . . . . . . . . . . . . . . . . . . . . . . . . . . . . .'I5SCREENING FOR CONFORMANCE WITH RFP SUBMITTAL REQUIREMENTS . . . . . . . . . . . . . . . . . . . . . . . . . . . . . . . . . . . . . . . . . . . "I5DESCRIPTION OF THE EVALUATION PROCESS . . . . . . . . . . . . . . . . . . . . . . . . . . . . . . . . . . . . . . . . . . . . . . . . . . . . . . . . . . . . . . . . . . . . . . . . . . . . . . . . . . . . 1 5
F,ligibiliry Requirements and Threshold Requirements Screening . . . . . . . . . . . . . . . . . . . . . . . . . . . . . . . . . . . . . . . . . . . . . . . . . . . . . . . . . . . .17Categnrize/Cluster Proposals . . . . . . . . . . . . . . . . . . . . . . . . . . . . . . . . . . . . . . . . . . . . . . . . . . . . . . . . . . . . . . . . . . . . . . . . . . . . . . . . . . . . . . . . . . . . . . . . . . . . . . . . . . . . . . . . . . . . . .17Price and Non-Price,4nalysis . . . . . . . . . . . . . . . . . . . .. . . . . . . . . . . . . . . . . . . . . . . . . . . . . . . . . . . . . . . . . . . . . . . . . . . . . . . . . . . . . . . . . . . . . . . . . . . . . . . . . . . . . . . . . . . . . . . . . .17Selection of the Short-list. . . . . . . . . . . . . . . . . . . . . . . . . . . .. . . . .. . . . . . . . . . . . . . . . . . . . . . . . . . . . . . . . . . . . . . . . . . . . . . . . . . . . . . . . . . . . . . . . . . . . . . . . . .. . . . . . . . . . . . . . . . . .18Fortfolio Evaluation . . . . . . . . . . . . . . . . . . . . . . . . . . .. . . . . . . . . . ____ . . . . . . . . . . . . . . . . . . . . . . . . . . . . . . . . . . . . . . . . . . . . . . . . . . . . . . . . . . . . . . . . . . . . . . . . . . . . . . . . . . . .Award Group Selection and Contract Negotiations . . . . . . . . . . . . . . . . . . . . . . . . . . . . . . . . . . . . . . . . . . . . . . . . . . . . . . . . . . .. . . . . . . . . . . . . . . . . . . . . . . .19
TH RESHOLD REQUIREMENTS . . . . . . . . . . . . . . . . . . . . . . . . . . . . . . . . . . . . . . . . . . . . . . . . . . . . . . . . . . . . . . . . . . . . . . . . . . . . . . . . . . . . . . . . . . . . . . . . . . . . . . . . . . . . . 19Credit Threshold. . . . . . . . . . . . . . . . . . . . . . . . . . . . . . . . . . . .. . . . . . . . . . . . . . . . . . . . . . . . . . . . . . . . . . . . . . . . . . . . . . . . . . . . . . . . . . . . . . . . . . . . . . . . . . . . . . . . . . . . . . . . . . . . . . . . . . . . .. .19Accounting Threshodd. . . . . . . . . . . . . . . . . . . . . . . . . . . . . . . . . . . . . . . . . . . . . . . . . . . . . . . . . . . . . . . . . . . . . . . . . . . . . . . . . . . . . . . . . . . . . . . . . . . . . . . . . . . . . . . . . . . . . . . . . . . . . . . . . . .19Siting . . . . . . . . . ._ . . . . . . . . . . . . . . . . . . . . . . . . . . . . . . . . . . . . . . . . . .. . . . . . . . . . . . . . . . . . . . ._ -- - . .. . . . . . . . . . . . . . . . . . . . . . . . . . . . . . . . . . . . . . . . . . . . . . . . . . . . . . . . . - _ - . . . . . . . . . . .2 0
DESCRIPTION OF NON-PRICE RELATED EVA LUATION CRITERIA . . . . . . . . . . . . . . . . . . . . . . . . . . . . . . . . . . . . . . . . . . . . . . . . . . . . . . . . . .ZO

PSO RFP2005 RFP for Baseload Capacity and Energy Resources
5 .5.1 Flexibility . . . . . . . . . . . . . . . . . . . . . . . . . .. . . . . . . . . . . .. . . . . . . . . . . . . . . . . . . . . . . . . . . . . . . . . . . . . . . . . . . . . . . . . . . . . . . . . . . . . . . . . . . . . . . . . . . . . . . . . . . . . . . . . . . . . . . . . . . . . . . . . . . . . . .22
5 .5.2 Development FeasibilitY . . .. . . . . . . . . . . .. . . . . . . . . . . . . . . . . . . . . . . . . . . . . . . . . . . . . . . . . . . . . . . . . . . . . . . . . . . . . . . . . . . . . . . . . . . . . . . . . . . . . . . . . . . . .. . . . . . . . . . . . . . . . . . .22
5 .5.3 YrojectOperational Yiahility . . . . . . . . . . . .. . . . . . . . . . . . . . . . . . . . . . . . . . . . . . . . . . . . . . . . .. . . . . . . . . . . . . . . . . . . . . . . . . . . . . . . . . . . . . . . . . . . . . . .. . . . . . . . . . . . . . . . . . .25
5 .5.4 Quality of Output . . . . . . . . . . . . .. . . . . . . . . . . . . . . . . .. . . . . . . . . . . . . . . . . . . . . . . . . . . . . . . . . . . . . . . . . . . . . . . . . . . . . . . . . . . . . . .. . . . . . . . . . . . . . . . . . . . . . . . . . . . . . . . . . . . . . . . . . . .2$
5.5.5 Model Contracts . . . . . . . . . . . . . . . . . . . . . . . . . . . . . . . . . . . . . . . . . . . . . . . . . . . . . . . . . . . . . . . . . . . .. . . . . . . . . . . . . . . . . . . . . . . . . . . . . . . . . . . . . . . . . . . . . . . . . . . . . . . . . . . . . . . . . . . . . . .29
5 .6 DESCRIPTION OF P RICE R E LATED EVALUATION C RITERIA . . . . . . . . . . . . . . . . . . . . . . . . . . . . . . . . . . . . . . . . . . . . . . . . . . . . . . . . . . . . . . . . . . .ZJ
5 .6.1 Capacity Charge . . . . . . . . . . . . . . . . . . . . . . . . . . . . . . . .. . . . . . . . . . . . . . . . . . . . . . . . . . . . . . . . . . . . . . . . .. . . . . . . . . . . . . . . . . . . . . . . . . . . . . . . . .. --- . . . . . . . . . . . . . . . . . . . . . . . . . . . . .305 .6.2 Fixed O&M Charge . . . . . . . . . . . . . . . . . . . . . . . . . . . .. . . . . . . . . . . . . . . . . . . . . . . . . . . . . . . . . . . . . . . .. . . . . . . . . . . . . . . . . . . . . . . . . . . . . . . .•- . . . . .___ . . . . . . . . . . . . - . . . . . 30
5 .6.3 Energy Charge . . . . . . . . . . . . . . . . . . . . . . . . . . . . . . . . . . . .. . . . . . . . . . . . . . . . . . . . . . . . . . . . . . . . . . . . . . . .- . . . . . . . . . . . . . . . . . . . . . . . . . . . . . . . . . . . . . .. . . . . . . . . . . . . . . . . . . . . . . . . . . 31
5 .6.4 Variable O&M Charge . . . . . . . . . . . . . . . . . . . . . . .. . . . . . .. . . . . . . . . . . . . . . . . . . . . . . . . . . . . . . . . . . . . . . . . . . . . . . . . . . . . . . . . . . . . . . . . . . . . . . . . . . . .. . . . . . . . . . . . . . . . . . . . . .31
5.6.5 Start-Up Charge . . . . . . . . . . . . . . . . . . . . . . . . . . . . . . . . . . . . . . . . . . . . . . . . . . . . . . . . . . . . . . . . . . . . . . . . . . . . . . . . . . . . . . . . . . . . . . . . . . . . . . . . . . . . . . . . . . . . . . . . . . . . . . . . . . . . . . . . . . .3I
5.6.6 Emissions Charges . . . . . . . . . . . . . . . . . . . . . .- -- . . . . . . . . . . . . . . . . . . . . . . .. . . . . . . . . . . . . . . . . . . . . . .---- . . . . . . . . . . . . . .. . . . . . . . . . . . . . . . . . . . . . . . . . . . . . . . . . . . . . . . . . . .31
5.67 Ancillary Services Charge. . . . . . . . . . . . . . . . . . . . . . . . . . . . . . . . . . . . . . . . . . . . . . . . . . . . . . . . . . . . . . . . . . . . . . . . . . . . . . . . . . . . . . . . . . . . . . . . . . . . . . . . . . . . . . . . . . . . . . . . . . . .32
5.6.8 Transmission System Impact . . . . . . . . . . . . .. . . . . . . . . . . . . . . . . . . . . . . . . . . . . . . . . . . . . . . . . . . . . . . . . . . . . . . . . . . . . . . . . . . . . . . . . . . . . . . . . . . . . . . . . . . . . . . . . . . . . . . . . . .325.6.9 De6fEquivulence . . . . . . . . . . . . . .. . . . . . . . . . . . . . . . .. . .. . . . . . . . . . . . . . . . . . . . . . . . . . . . . . . . . . . . . . . . . . . .. . . . . . . . . . . . . . . . . . . . . . . . . . .. . . . . . . . . . - . . . . . . . . . . . . . . . . . . . . . . 32
5 . 7 NOTIFICATION OF EVALUATIaN RESULTS AND NEGO T IATIONS . . . . . . . . . . . . . . . . . . . . . . . . . . . . . . .. . . . . . . . . . . . . . . . . . . . . . . . . . . . . . 33
SEC TI ON fi - REGULA TORY APPROVALS . . . . . . . . . . . . . . . . . . . . . . . . . . . . . . . . . . . . . . . . . . . . . . . . . . . . . . . . . . . . . . . . . . . . . . .. . . . . . . . . . . . . . . . . . . . . . . . . . . . . .33
SECTION 7- RESERVAT I ON OF RIGHTS . . . . . . . . . . . . . . . . . . . . . . . . . . . . . . . . . . . . . . . . . . . . . . . . . . . . . . . . . . . . . . . . . . . . . . . . . . . . . . . . . . . . . . . . . . . . . . . . . . . . . . 34
SECTION 8- GLOSSARY OF TERMS . . . . . . . . . . . . . . . . . . . . . . . . . . . . . . . . . . . . . . . . . . . . . . . . . . . . . . . . . . . . . . . . . . . . . . . . . . . . . . . . . . . . . . . . . . . . . .. . . . . . . . . . . . . . . 35
Appendix A
Appendix B
Appendix C
Appendix D
Appendix E
Appendix F
Appendix G
Appendix H
Appendix I
Appendix J
Appendix K
Independent Monitor Scope of Work
Confidentiality Agreement Form
Transmission Service Territory Map
Pre-Bid Conference Registration Form
RFP Response Packag e
Credit Evaluation Forms 1 thru 3
Notice of Intent to Submit Proposal Form
Model Power Purchase Agreemen t
Model Purchase and Sale Agreemen t
List of Projections and Indices
RFP Procedures Manual

PSO RF P2005 RFP for Baseload Capacity and Energy Resources
NOTIC E
In the event that a B idder perce ives a conflict between thisRFP and other posted i nformat i on (e . g ., answers to questions) ,this RFP document , as amended , shall prevail .
If correct ions or c larificat ions to the RFP d ocu ments arerequire d , PSO wil l iss ue a "RFP Am endment" on its RFPwe bsite located at :
www.PSOklahoma.com/go/rfp
Potential Bidders s hould check this RFP website reg u larly . Iti s the s ole res ponsibil ity of the Bidder to ke ep up w ith a ny RFPdocument changes as d iscussed above.

PSO RFP2005 RFP for Baseload Capacity and Energy Resources
SECTION I - GENERAL 1NFORMATiO N
1 .1 Introduction
The purpose of this document is to prescribe the process by which Public ServiceCompany of Oklahoma ("PS O" or the °Company") will request and evaluate Proposalsthrough a competitive procurement process which Company deems, in its solediscretion, to provide the most reasonable cost and reliable resources to fulfill a portionof its supply-side resource need consistent with Company's resource planningrequirements . The scope of this Request For Proposal ("UP"), subject to thelimitations described herein, is focused on a supply-side resource capable of deliveringbaseload capacity and associated energy in or to the Company's transmission system(see Section 3 .6) and that is capable of fulfilling the planning reserve requirements ofthe Southwest Power Pool ("SPP") .
The Company is soliciting binding Proposals from bidders ("Bidders") in the form ofPower Purchase Agreements ("PPA") and/or the acquisition of existing generationfacilities for up to 600 megawatts ("MW") of baseload resources with a CommercialOperation Date of June 1, 2011 ("COD") . The Company prefers to ultimately own andoperate the generation facilities providing the capacity and associated energy proposedunder the terms of this RFP and, therefore, Bidders who propose a PPA will beencouraged to propose terms that allow the Company to acquire the generation facilityduring the contract term . The Company values the Bidder's flexibility in terms ofadjusting the COD . Proposals shall be submitted by Bidders in the form of the RFPResponse Package attached as Appendix E .
Proposals shall be binding upon the successful Bidder until November 30, 2006 .
The general schedule for the RFP process is shown below . A more detailed schedulefollows in Section 4 .3 of this RFP .
Draft RFP Issued 10/10/05Issue Final RFP 12/04/05Binding Baseload Proposals Due 02/16/06Selection of Award Group 06112106Execute Final Contract(s) 08/31/0 6
The Company seeks Proposals from any Bidder who is capable of meeting theconditions of this RFP . Bidders should note that the Company and its agents will beable to, and should be expected to, respond to this RFP. As described in more detailbelow, the Company has put in place prudent safeguards to avoid undue preference toits self-build Proposals . Any Bidder who has a question with respect to such safeguardsis instructed to contact the Independent Monitor ("IM") as described in Section 1 .2below .
PSO , based in Tulsa , Oklahoma , is a wholly-owned subsidia ry of American ElectricPower Company , Inc . ("'AEP") . PSO is an operating electric public utility engaged in thegeneration , transmission , distribution, purchase and sale of electric energy i n
Page 1

PSO RFP2005 RFP for Baseload Capacity and Energy Resources
Oklahoma . PSO provides wholesale and retail electric service to more th an 509 , 000customers in a ser vice area covering approximately 30 , 000 square miles . PSO 's retailelectric rates and se rvices are regulated by the Oklahoma Corporation Commission("OGC ' or "the Commission " ) . PSO 's wholesale power and transmiss ion rates andservices are regulated by the Federa l Energy Regulatory Comm iss i on (" FERC ") .
PSO will be using its Affiliate , American Electric Power Service Corporation ( "AEPSC " ) ,as its agent for the RFP process .
For capitalized terms not defined in the main text of t h is RFP , please refer to Sect i on 8 ,Glossary of Terms .
1 .2 Independent Monito r
PSO is committed to a fair solicitation process . The evaluation criteria and process aredesigned to ensure a#air solicitation p rocess and to provide Bidders w i th information onhow the Proposals will be evaluated and what th e Company deems as i mportantaspects of a Proposal . Merrimack Energy Group , Inc . will act as the IM for thissolicitation . The IM will monitor the RFP p rocess and will review and track theCompany 's conduct of the RFP to asce rtain that no undue p reference i s given to PSO 'sself-build Proposals . This will i nclude , to the extent necessary , reviewing the draft RFPand the Company ' s evaluation of Proposals ; monitoring communicat ions (andcommunications protocols) with market pa rt icipants ; monitoring adherence to codes ofconduct ; validation of the models, input assumptions ; risk assessments ; and monitoringcontract negotiations .
A more detailed evaluation of the IM 's Scope of Work is attached as Appendix A .Among other responsibilities noted in the Scope of Work , the IM will address Bidders 'questions , issues , and concerns during the RF P process , and , as needed , communicatethose issues and concerns to the appropriate par ties , including PSO and OCC Staff.
Contact information for the IM is :
Wayne OliverMerrimack Energy Group , Inc .727 Lafayette Roa dP 0 Box 2955Seabrook , NH 03874Phone : (603) 474-3385Cell : 781-856-0007Fax : 603-474 -3384E -ma i l : wayrtejo l i ver(d-)aol .com
Page 2

PSO RFP2005 RFP for Baseload Capacity and Energy Resources
1 .3 Self-Build Procedures
Procedures for this RFP call for objective, arm's-length dealing with respect to agents ofthe Company who are developing self-build Proposals ("Self-Build Team") . Appropriateprocedures and a Code of Conduct are in place to safeguard against the Self-Build Teamreceiving undue preferential treatment and preferential access to information . Additionalprocedural provisions require PSO to protect the confidentiality of Proposals and Bidderinformation and to ensure such information is not improperly used by PSO or its Affiliates(see Procedures Manual in Appendix K) .
Specifically prohibited is the cammunica#ion, directly or indirectly, of material non-publicinformation about or derived from PSO selectively to the Self-Build Team, as well as anypreference by PSO expressed in any way whatsoever for self-build Proposals per se .Accordingly, in this RFP there is pre-established operational independence between PS Oand the Self-Build Team to ensure that any Proposals submitted by the Self-Build Teamwill not have any material advantage in the selection process versus Proposals submittedby third-party Bidders .
SECTION 2 - SECTION NOT USE D
SECTION 3 - 2005 BASELOAD RESOURCES RFP
3 . 1 Qverview of RF P
The Company's Integrated Resource Plan ("IRP") has identified that additional capacitymust be added to the PSO system over the next 10 years in order for it to maintainadequate capacity reserves . The I RP process has shown that the most economic solutionfor meeting PSO's future capacity reserve needs is the addition of peaking capacity andassociated energy by t he summer of 2008 and baseload capacity and associated energyby the summer of 2011 .
In order to meet its future resource needs, PSD issued an RF P for 500 MW of PeakingCapacity and Energy Resources on September 12, 2005 and is issuing this RFP forbaseload resources in which PSO seeks Proposals for firm capacity and associatedenergy for up to 600 MW of baseload resources with a COD of June 1, 2011 .
PSO is interested in Proposals that are in the form of PPAs andlor the acquisition ofexisting generation facilities ("Asset Purchase Proposal" or "APP") . PSO prefers to ownand operate the generation facilities providing the baseload capacity and associatedenergy proposed under the terms of this RFP . Therefore, Bidders who submit PPAProposals will be requested to propose terms that give PSO the option to acquire theBidder's interest in the designated generation facility at various points during the contractterm .
Appendix H contains the Model Power Purchase and Sale Agreement ( "Model PPA" ) andAppendix I contains the Model Purchase and Sale Agreement ( "Model PSA" ) . The Mode l
Page 3

PSO RFP2005 RFP for Baseload Capacity and Energy Resources
PPA and Model PSA together are referred to as the Model Contracts . In addition toProposals from thi rd-parties , it is ant ic i pated that PSO will submit self-build Proposals .
PSO 's objective for this RFP i s to encourage a broad range of Proposals and to securethose resources that provide the greatest benefit to its customers . f'SO reserves the rightto reject any and all Proposals , in its sole discretion, if they are not in the best interest ofPSO . The level of flexibility and creativ ity offered by the Bidder in its Proposal will berecogn ized in the evaluation process . PSO is interested in Proposals that:
(i) provide flexibility in terms of the COD, including the ability to defer oraccelerate the COD by one year ;
(ii) offer other options which minimize risk and costs to PSO and its customers ;(iii) provide PSO with the ability to acquire the generation assets used to supply
the capacity and energy for a PPA Proposal ;(iv) offer creative pricing and technical options either as part of its Base Proposal
or as an Alternative ; and(v) offer fuel and fuel transportation flexibility
3 .2 Basic Requirements for Firm Baseload Capacitv and Enerqv Proposal s
The Company is seeking Proposals for firm capacity and associated energy for aminimum of 450 MW and up to 60 0 MW of baseload resources with a COD of June 1,2011 . Firm capacity will be defined as Net Dependable Summer Capability . Theminimum bid size is 100 MW of Net Dependable Summer Capability .
Bidders who propose PPAs are required to conform to a contract term of 30 , 35 or 40years .
In addition to PPA Proposals , PSO w i ll also consider Asset Purchase Proposals for theacquisition of a Bidder's existing generation facilities or interests therei n . Asset PurchaseProposals must meet the same minimum size and C OD that are defined for PPAProposals . Asset Purchase Proposals shall be for a fixed dollar amount , inclusive of allmonetary consideration for the generation asset . Any contractual obligations (e .g ., fuelsupply a nd transportation , maintenance agreements , etc . ) related to the generation assetproposed for sale should be clearly defined by the B idder in its Proposal . P50 prefersProposals in which it will acquire the majority interest and lor the operat i onal control of thegeneration facilities .
PSO prefers Proposals with points of delivery connected directly to PSO 's transmissionsystem as shown in Appendix C . All Proposals, regardless of the location of the generationresource , will be judged based upon the i r impact on PSO 's transmission facilities, includ ingthe cost of any required system upgrades , and to the extent they can be determ ined , onneighboring transmission systems .
Bidders are encouraged to provide PSO with Base Proposals and Alternatives that reflectwhat they believe to be their best pricing Proposal .
Page 4

PSO RFP2005 RFP for Baseload Capacity and Energy Resource s
3 .2 . 1 Base Proposa l
The Base Proposal is the preferred Proposal of the Bidder and shall be comprised of thei nformation provided by the Bidder in t he RFP Response Package .
PSO will determine the Proposals to be included on the sho rt-list based o n its evaluation ofthe Base Proposals . Therefore, Bidders are ad vised to present their best Proposal as theBase Proposal . At no point in the eval uation process w i ll B i dders have the opportunity tounilaterally change their Proposal .
3 .2 .2 Alternative Proposals
In add ition to the Base Proposal , Bidders may submit up to two Alternatives to the BaseProposal (Append ix E Tab 15 of the RFP Response Package) under the ProposalSubmittal Fees , (see Section 4 . 1) although these Alternat ives wi l l not be considered untilthe portfolio evaluat i on phase (see Section 5) . Alternatives could include different projects ize(s) or structure(s), alternative financial arrangements , alternative PPA terms andconditions, alternat ive APP terms and conditions , and other pricing provisions that differfrom the Base Proposal . Proposals with different sites , technologies , fuel supplyarrangements, etc . from the Base Proposal must be submitted as separate Proposals andmust include an additional Proposal Submi ttal Fee .
PSO 's objective for Alternat ive Proposals i s to allow the Bidder the flexibility of phasing in aProject , offer i ng a different project size , proposing alternate pricing options and PPA termsand condit i ons , etc . wh ich could be considered in a portfolio with other Proposals . This willallow PSO to optimize the benefits from the sol i citation by comb i n i ng Proposals withd ifferent characteristics .
Bidders should clearly label and describe its Alternatives in Tabs 3 and 1 5 of the RFPResponse Package, including appropriate pricing schedules . Alternatives will only beconsidered if they add value to the resource procurement process and can provide theflexibility deemed important by PSO .
3 . 3 Power Purchase Proposals
The Company seeks Proposals that have clear and def i nab le pric i ng characteristics .Proposals containing a fixed price throughout the term of the Proposal for capacitycharges (stated i n $/kW-year) are preferred . PSO seeks Proposals with heat rateprici n g using an industry recogn ized index charge , such as Coal Daily , or fixed energypricing with an escalator based o n United States Department of Labor forecasts (seeRFP Response Package Schedule 3-4) . Proposals should also spec i fy fixed andvariable transportation costs for wh ich they are requesting recovery on Schedule 3-6 ofthe RFP Response Package .
In recognition that Bidders whose Proposals rely on Greenfield or Brownfieldconstruction may be experiencing historically high uncertainty for the cost of key
Page 5

PSO RF P2005 RFP for Baseload Capacity and Energy Resource s
commodities and construction labor, PSO will accept Proposals that index part of theconstruction cost via the Capacity Charge . In Schedule 3-1 C of the RFP ResponsePackage (Appendix E) the Bidder may specify which portion(s) of the Capacity Chargeas defined in Section 5 .6 .1 of this RFP are tied to approved indices contained inAppendix J . The labor and material indices may be used to escalate the actualCapacity Charge from June 1, 2006 to COD. Beyond COD, the Bidders shall not offerProposals with indexed pricing for the Capacity Charge . The Company prefersProposals that have clear and definable pricing characteristics and do not indexsignificant portions of the Capacity Charge .
Bidders proposing PPA products are responsible for all costs to deliver those productsto PSO including, but not limited to : costs of transmission service, upgrades and newconstruction of transmission facilities located outside of the SPP footprint, costs oftransmission cangestion ; costs of ancillary services, and any fees or taxes, present andfuture, over the term of the Proposal . This must be expressly confirmed in Bidder'sProposals .
Bidder generation resources interconnected to PSO's transmission system within theAEP SPP control area near PSO's large load centers are preferred .
In addition, PSO is interested in Proposals giving it the option to purchase thegeneration assets that are used to supply the capacity and energy under the PPA .Bidders are encouraged to propose purchase pricing for those generation assets atvarious points during the contract term . (Appendix E Tab 3 )
Baseload products should be proposed in quantity blocks ranging from a minimum sizeof 100 MW to a maximum size of 600 MW .
PSO prefers products that provide scheduling flexibility commensurate with the operatingcharacteristics of the proposed generation assets . PSO reserves the right to dispatchthese products at any load level within the source generator's operating limits, and to startand stop as needed to serve PSO's operational needs .
Requirements of the PPA may be met through a slice-of-system, existing generationfacilities or proposed new generating facilities .
3.3.1 System Products
Company encourages the Bidder to submit RFP Proposals for baseload productssupported by a single generating facility or by a system of generating facilities . Such slice-of-system ("System") Proposals should meet the baseload product criteria stated aboveand elsewhere in this RFP . Because the characteristics of a System are not defined byreference to the capabilities of a particular generating unit, the Bidder should specify withparticularity the capabilities of its System product. The Bidder should modify its RFPResponse Package to the extent necessary to include this information . The Bidder shouldinclude an overview of its System and infarmation on the particular generating facilitiessupporting its System Proposal .
Page 6

PSO RFP2005 RFP for Baseload Capacity and Energy Resources
In order to assist Bidders wishing to propose System products , Company is p rov iding thefollowing non-exhaustive list of the capabilities that should be described in such Proposals .Where appropriate , Company has specified minimum standards that must be met by aSystem product .
(i) QualitY : Company prefers System products that are F i rm with liquidateddamages . The Bidder should specify the level of firmness of its Systemproduct and state any excuses from performance with particularity (i . e ., thenumber of units or percentage of system that must be off-line pr i or to anydiminishment i n System product serv i ce) .
(ii) Scheduling : The Bidder should specify any min imum notice times prior toscheduling and dispatch of the System product by Company . In particular , theBidder should specify if its System product must be scheduled on a day-aheadbasis and th e extent to which its System may be scheduled on an hour-aheador sho rter basis .
( i ii) Scheduling Limits : The Bidder should state any minimum or maximum loadingconstra ints as well as the rate at which Company may change the loading ofthe System over a given time period .
(iv) Starts : The Bidder should state the number of "sta rts" - the scheduling of atleast minimum load after the System has been scheduled to zero - over agiven ti me , any mandato ry downtime or uptime, and the cost, if any , of start ingthe System .
(v) Delive ry Po i nt : The Bidder should specify the De l i ve ry Point for energy andancillary serv i ces from the System and , if more than one point , any informationnecessary to determine the allocat i on of energy and ancilla ry services amongthose points .
(v i ) Ancilfary Serv ices: The Bidder should specify the a nci lla ry services thatCompany wi l l have the right to utilize from the System and , if such ancilla ryservices are not under the direct dispatch and control of Company , the mannerin which aggregate System re venues from those services will be determinedand allocated to Company .
3 .4 Asset Purchase Proposals
Bidders may submit Proposals to sell existing generation assets that have a provenoperating history . In such case, a Bidder shall offer to sell (i) 100% of the ownership ofa generation asset having a minimum Net Dependable Summer Capability that matchesthe products outlined in Section 3 .3 of this RFP or (ii) its ownership interest in ageneration asset in which the Bidder's share of the output is no less than the minimumNet Dependable Summer Capacity that matches the products outlined in Section 3 .3 of
Page 7

PSO RFP2005 RFP for Baseload Capacity and Energy Resources
this RFP. PSQ prefers generation assets that do not have any restrictions or limitationsimposed on them as a result of other assets at that site .
Asset Purchase Proposals shall be priced at a fixed dollar amount inclusive of allmonetary consideration for the generation assets . APPs may include or exclude relatedarrangements for fuel commodities and transportation of them and the presence orabsence of this factor shall not adversely affect the conforming status of a Proposal .Any material contract obligations that are associated with the proposed asset saleshould be clearly defined (e .g., fuel storage, fuel transportation) .
Any and all costs that would be incurred by PSO for the delivery of power from ageneration asset including, but not limited to, costs of transmission service, upgradesand new construction, costs of transmission congestion, costs of ancillary services, andany fees or taxes, present and future, over the term of the Proposal, will be consideredin evaluating the Proposal .
All Asset Purchase Proposals shall provide the information required in the RFP ResponsePackage. Such information shall not preclude the Company from conducting its own duediligence .
3.5 Fuel Consideration s
3.5. 1 Power Purchase Agreement
PPA Proposals should have fuel supply and transportation flexibility commensurate withthe Proposal's operational and dispatch flexibility . The Bidder shall clearly describe theflexibility of its fuel supply and transportation arrangements serving its generation units .The Company's analysis will be weighted to reflect the value such fuel supply andtransportation flexibility affords Company's operations .
Regardless of the specific fuel used by the generating facilities or system that Bidder relieson in its Proposal, Bidder shafl explain its proposed fuel supply plan in detail (Appendix E,Tab 5) including its proposed primary fuel supply and transportation and its backupalternatives .
Preference will be given to Proposals that provide maximum flexibility and secondarysource(s) of fuel supply and transportation arrangements . Bidders shall clearly identify anyfuel-related constraints and/or limitations associated with their Proposals including, but notlimited to, operational flexibility or reliability of its fuel supply andlor transportation whichmight affect the ability to dispatch the generation andlar Company's ability to utilize theresource for operating reserves .
In the event that a new fuel supply or transportation arrangement is required to enableBidder to meet its delivery obligation to Company, all relevant information with respect tosuch proposed arrangements should be provided as part of Bidder's Propasal in sufficientdetail to allow its feasibility to be evaluated by the Company's RFP evaluation teams .
Page 8

PSO RFP2005 RFP for Baseload Capacity and Energy Resources
3.5.2 Purchase of Exist ing Baseload Generation Facilities
PSO requests Proposals for the purchase of existi ng baseload generat i on facil ities whichaddress not only the Co mpany 's desire for low-cost baseload generation capac i ty but alsoits requirements for dispatchable operations with maximum fuel and transportat ionflexibil ity . Such flexibility is an integral part of the evaluation of any such Proposal .
Bidders shall identify any existing fuel supply and transportation agreements currentlyserving the generation facility being offered . They shall also identify the generalcommercial terms of such agreements including , but not l i m i#ed to: term , quant ityobligation , pricing , any other applicable fees or costs of such comm itments , etc . Biddersshould also state whether such commitments are assignable under the terms of theexisting fuel supply and transportation agreements .
Shou ld the disclosure of such information be subject to a confidentiality provision inBidder's ex isting contracts , the Company is willing to enter into a confidentiality agreementto ensure that such informat i on is used solely for the evaluation of the Proposal .
Preference will be given to Proposals that provide maximum flexibil ity and seconda rysource of fuel supply and transpo rtation arrangements . Bidders shall identify if thegeneration facil ity is capable of operating on any alternative fuels and , if so , shall identifythe type and availability of such fuel , the existence of any long -term contracts for the supplyandlor transpo rtation of such fuel and the assignability of such contracts . Seconda ry fuelsupply andlor transpo rtat i on options are valuable considerations for any Proposal . Biddersshall also identify any other fuel supply and transportation options available to the Proposalgeneration facility .
Proposals shal l also clearly describe any fuel-related constraints associated with theProposa l including , but not limited to , operational flexibility or reliability of its fuel supplyandlor transportation that m i ght affect dispatch of the generat ion facility andlor theCompany 's ability to uti l i ze the resource for operating reserves ,
The Company 's analysis will be weighted to reflect the value that any such fue l andlortransportation flex i bi lity provides to the Company 's operation of the generation faci l ity.
3.6 Reliable Delivery
Bidders are required to deliver f i rm capac i ty , energy and associated electric products tothe AEP SPP Control A rea . PSO expects to use Network Integrated Transm i sionService under the SPP Open Access Transmission Tariff ("OATT") from resourceswithin the SPP RTO footprin t . Approval of transmission serv ice by SPP for requestswhere the resources are located on PS O's transm ission system are expected to requirefewer transmission upgrades tha n resources located elsewhere .
Proposals for products originating outside the SPP RTO footpri nt shall specify theBidder's obligation to reserve , provide for, and pay for firm transmission serv ice to theSPP RTO footprint . Such Proposals shall spec i fy all pe rt inent details of proposed firmtransmission paths , services and arrangements and shall specify all-inclusive pricing to
Page 9

PSO RFP2005 RFP for Baseload Capacity and Energy Resources
the SPP RTO footprint, including all transmission costs and agreements in p l ace todeliver such firm capacity , energy and associated electric products .
Each Bidder offering firm capacity , energy and associated electric products originat i ngoutside the SPP RTO footprint must provide the factual basis for its assumpt i on that afirm transmission reservation can be obta i ned to del iver power into PSO 's transmissionsystem .
Pr ior to sho rt-listing Proposals, PSO will undertake its own analysis for delivery ofcapacity , energy and associated electrical products and use the results in the Proposalevaluation phase . A B i dder, at its sole option and liability, can contract with applicabletransmission provider(s) and pay for any studies it wishes to p rovide PSO prior toevaluation of Proposals .
Once Proposals are short-listed , PSO will pe rform more detailed stud ies at its ownexpense to estimate the cost of any requ ired transmission upgrades . Thesetransmission studies will be done in a manner s i m ilar to the transmission studiesrequired by SPP . Company will use the best available information and data to performthese studies, however , there is no expectation t hat the study results will preciselymatch studies that will be ultimately performed by SPP to approve PSO's request forNetwork Integration Transmiss i on Service .
After the Award Group is determined and negotiat i ons are completed , Company willrequest Network Integration Transmission Service under the SPP OATT . Bidderssourcing their offer outside the SPP will be expected to make s imilar firm transmissionse rvice arrangements with tra nsmission providers outside the SPP at that t i me .
SECTION 4- INSTRUCTIONS TO BIDDER S
4.1 Proposal Submitta! Fees
Bidders shal l pay a non-refundable $5 , 000 Proposal Submittal Fee per Proposal from asingle generat ion resource and a non-refundable Proposal Submittal Fee of $500 each forup to two alternati ves as outlined i n Section 3 . 2 . 2 i f this RFP from that same generat i onresource . Checks for the Proposal Submi ttal Fees should be made payable to PublicServ i ce Company of Oklahoma .
4.2 Confidential Informat ion and Confidentiality Agreements
The Company , i ts agents , and the IM will treat as confidential all Proposals subm itted byB i dders . Bidders sha ll submit their Proposals with the knowledge and understand i ng thatregardless of confidentiality any information submitted by them is subject to d isclosure tothe Commission or any other governmental authority or judic i al body with jurisd i ctionrelat i ng to these ma tters and may be subject to legal discovery . In the event that theCompany, in its sole judgment and discretion , determ ines that informatio n contained in anyquestion, response , or other communicat i on between it and a Bidder that is not contained
Page 1 0
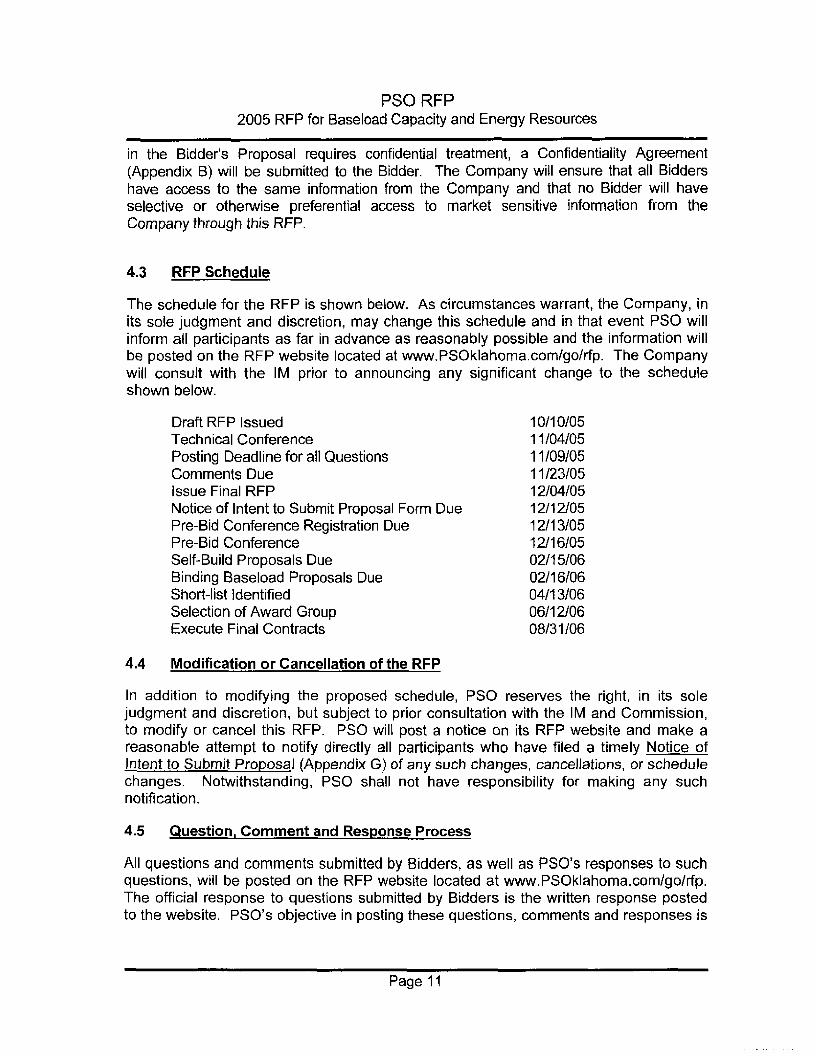
PSO RF P2005 RFP for Baseload Capacity and Energy Resource s
in the B i dder 's Proposal requires confident i al treatmen t , a Confidentiality Agreement(Appendix B) will be subm itted to the B id der. The Company will ensure that all Biddershave access to the same information from the Company and that no Bidder will haveselective or otherwise preferent i a l access to market sensit ive information from theCompany through th is RFP .
4 .3 RFP Schedule
The schedule for the RFP is shown below . As circumstances warrant, the Company, inits sole judgment and discretion, may change this schedule and in that event PSO willinform all participants as far in advance as reasonably possible and the information willbe posted on the RFP website located at www .PSOklahoma .com/go/rfp . The Companywill consult with the IM prior to announcing any significant change to the scheduleshown below .
Draft RFP IssuedTechnical ConferencePosting Deadline for all QuestionsComments DueIssue Final RFPNotice of Intent to Submit Proposal Form DuePre-Bid Conference Registration DuePre-Bid ConferenceSelf-Build Proposals DueBinding Baseload Proposals DueShort-list IdentifiedSelection of Award GroupExecute Final Contracts
4 . 4 Modification or Cancellation of the RFP
10/10/0511/04/0511/09/0511/23/0512/04/0512/12/0512/13/0512/16/0502/15/0602116I0604/13/0646I1210608/31/06
In addition to modify ing the proposed schedule , PSO reserves the right , in its solejudgment and discretion , but subject to prior consultation w ith the IM and Commiss ion ,to modify or cancel this RFP . PSO wil l post a notice on i ts RFP website and make areasonable attempt to notify directly all participa nts who ha ve filed a t i mely Notice ofIntent to Submit Proposal (Append ix G ) of any such changes , cancellat ians , or schedulechanges . Notwithstanding , PSO shall not have responsibility for making any suchnoti fication .
4 .5 Question, Comment and Response Process
All questions and comments submitted by Bidders , as well as PSO 's responses to suchquestions, will be posted on the RFP website located at www .PSOklahoma .com/go/rfp .The offic i al response to questions submitted by Bidders is the written response postedto the website . PSO 's objective in posting these questions , comments and responses is
Page 11

PSO RF P2005 RFP for Baseload Capacity and Energy Resource s
to ensure all Bidders have equal access to information that may be potentially relevantto their respective Proposals .
Requests for access to the website Question and Answer section should be sent v ia e-mail to PSOBaseloadRFP@AEP .com . Requests should include : (1) contact name , (2)company , (3) m ailing address , (4) phone number and (5) e-mail address . A user ID andpassword will be i ssued and communicated through a return message to the requester'se -mail address .
Any Bidder who does not comply with the Notice of Intent to Submit P ropo sa l discussedin Section 4 .10 of th is RFP will lose access to the Quest ion and Answer section of thewebpage .
Any unsolicited contact by Bidder with any PSO or i ts Affi liates personnel concerningthis RFP is not perm itted and may constitute grou nds for disqual ification .
4.6 Technical Conference
PSO conducted a Technical Conference for persons interested in this RFP onNovember 4 , 2005 at the PSO headquarters located at 2 1 2 E . 6 t`' Street , Tulsa ,Oklahoma . The prima ry purpose of this co nference was to rev i ew the RFP and to affordinterested persons the opportunity to ask questions and make suggestions . PotentialB idders were encouraged , but not required , to attend and actively part i cipate. Followingthe Technical Conference, PSO 's complete presentation and the Questions andAnswers were posted on its RFP website . The official response to questions submittedby Bidders is the wr itten response posted to the website .
4.7 Additional Questions and Comment Submission
Fol l owing the Techn i cal Conference , Bidders had untii 5 : 00 p .m . CPT on November 9 ,2005 to submit f i nal questions . The Company responded to all questions by Novem ber16,2005 .
Comments on the RFP were to be submitted to the Company by 5 : 00 p . m . CPT onNovember 23 , 2005 . No comments were received .
Following issuance of the F inal RFP , Bidders are encouraged to continue to sendquestions related to the substance of the RFP to the Company RFP website . Allquestions should be submitted no later than 5 : 00 p . m . CPT December 29 , 2005 . Afterthat time , the website will be closed for further questions . Questions submitted at leastfive days in advance of the Pre-bid Conference will be addressed during theConference . PSO will answer all questions submitted to its RFP website , and will postthe answers on the website by January 8 , 2006 .
4.8 Pre-Bid Conference
On December 16 , 2005 the Company wil l hold a Pre-Bid Conference viateleconference . lnterested pa rties are requested to return a Pre -Bid Conference
Page 12

PSO RFP2005 RFP for Baseload Capacity and Energy Resources
Registration Form (Appendix D). Completed Forms should be sent via e-mail toPSOBasefoadRFP@A E P.com. The purpose of this meeting will be to answer anyremaining technical and commercial questions . The dial-in information for theteleconference will be provided to Bidders via e-mail .
After the Pre-Bid Conference, if Bidders have any unresolved concerns or questions,they may send them to the IM . Any and all addenda to the RFP will be posted on theRFP website by January 8, 2006 .
4 . 9 Transm iss i on Contacts
Any inquiries related to PSO's transmission system or services must be directed to theSPP.
4 .10 Not ice of Intent to Submit Proposa l
Bidders shall subm it a Not i ce of Intent to Submit PrOqOSaI on the form attached asAppendix G no later than 5 :00 p . m . CPT , December 12 , 2005 . Notices should besubmitted by e-mail to PSOBaseloadRFP@AEP . com . Confirmation of receipt byCompany shall be the responsibility of the prospective Bidder . Submitting a Notice ofIntent to Submit a Proposal does not commit a prospect i ve Bidder to submit a Proposal .However, Bidders who do not submit a Not i ce of Intent to Submit Proposal will not besent any fu rther notices regarding this RFP and w ill lose the ir access rights to theQuestion and Answer section of the RFP website .
4 .11 Jo int Proposal s
No Bidder may act through a pa rtnership , joint venture , consortium , or other associationor otherw ise act in conce rt with any other person unless , as pa rt of its Proposal , itprovides written notification to PSO and fully identifies all partners , j oint venturers ,members or other entities or persons thereo f.
4.12 Self-Bu i ld Options
Self-Build Proposals will submit information according the PPA new build requirements ofthe RFP and RFP Response Package .
Self-build Proposals shall be s ubmitted no later than 3 : 00 p .m . CPT , Februa ry 15 , 2006 .
4.13 Submission of Proposals
Proposals will be accepted no later than 3 : 00 p . m ., CPT , February 16 , 2006 . AnyProposals received later than the appl i cable due date and time will be considered non -conforming and will be rejected .
Proposals must be signed by an off icer or other agent of the Bidder duly authorized tomake such Proposals by the Bidder 's board of d i rectors or similar governing body .
Page 13

PSO RFP2005 RFP for Baseload Capacity and Energy Resources
Proposals must certify in writing that all Proposal terms , includ i ng pricing , have beenapproved by the Bidder 's board of dir ectors or other governing authori ty .
All Proposal terms and conditions sha ll be specified in detail in the RFP ResponsePackage .
Proposal provisions i ncluding , but not lim i ted to , term and pricing , shall rema in in effectunti l November 30 , 2006 .
All Proposals, along with the appropriate Proposal Submittal Fee , must be delivered byhand or by express , certified or registered mail to :
Publ i c Serv i ce Company of OklahomaAttention : Baseload RF Pc/o Steve Fate21 2 E . 6 th StreetTulsa , Oklahoma 74119 -1295Telephone : 918-599-236 9
In order to facilitate an objective, impartial and effective RFP evaluation, PSO 's IM willoversee the opening of all Proposals .
All Proposals must be submitted in accordance with the instructions and on the form(s)provided in the RFP Response Package . All Proposals must include ten bound papercopies of the Proposal, with one bearing original signature(s), as well as two CD-ROM'scontaining electronic copies which must be submitted with all text portions of theProposal in Microsoft® Word and all spreadsheets in Microsoft Excel .
Faxed Proposals or Proposals submitted via e-mail or the Internet will be considerednon-conforming and will be rejected .
Each Proposal must be submitted separately in a sealed package with the followinginformation shown on the exterior of the package :
P502005 - RFP for Baseload Capacity and Energy Resource s
Name of Bidder
Proposals submitted in response to th is RFP will not be returned to Bidders . At theconclusion of the RFP , all Proposals will be arch ived by PSO un t il at least theconclusion of the RFP process and of any other related regulatory review and approvalperiods .
Page 14

PSO RFP2005 RFP for Baseload Capacity and Energy Resources
SECTION 5 - PROPOSAL EVALUATION
5.1 Receipt and Opening of Proposals
The IM and PSO's Designated Representative will document and monitor the process ofopening all Proposals, including the order in which they are opened, and will ensure thatall Proposal documents are housed in a secure location that is accessible only todesignated RFP evaluation team members and the IM .
5 . 2 Screening for Conformance with RFP Submi ttal Requirements
The Company , subject to the oversight of the IM , will thoroughly rev iew and assess allProposals to ensure that each :
(i) is received on time with all forms completed in their entirety ;(ii) is signed by a duly authorized officer or agent of the Bidder ;(iii) includes Proposal Submittal Fees for each Proposal and Alternative Proposals ; and(iv) meets the informational requirements and other conditions specified in the RFP
Response Package .
Proposals that meet the requirements of the RFP shall be considered conforming .
Proposals may be deemed non-conforming if they do not meet the requirementsspecified in the RFP Response Package, Appendix E. Except for Proposals notreceived on time, at PSO's sole judgment and discretion, in consultation with the IM,Proposals that are non-conforming may be given three business days to remedy theirnon-conformity . PSO reserves the right, in consultation with the IM, not to consider anyProposal that is non-conforming .
During the initial screen ing process, PSO rese rves the right to contact Bidder(s) toclarify Proposal terms or to request addit i onal informat ion . The IM shall monitor all suchcontacts .
5 .3 Description of the Evaluation Proces s
The Company will use a multi-stage evaluation process to review Proposals and to selectthe preferred resources or portfolio of resources . To proceed through each stage of theevaluation process, a Proposal must meet certain threshold requirements and criteriarelative to other Proposals . Figure 5 .3 illustrates the Proposal evaluation processes fromreceipt of the Proposals to the selection of the Award Group and contract negotiations .
Page 15

PSO RFP2005 RFP for Baseload Capacity and Energy Resources
Figure 5 .3
Rece ipt and O pen in gProp osal s
Sc re eningbr Can lov anc ewith RFP Su hmit lal
Req uirments
M~~s Not~F c a tion of ~S ubm ittai NO No n~on iomianc e {
Requireme~~s ~
Ye s
C lu s4e r Propoeal s
P~ ce ~valuat ion1 N on~nc e
BO%-~ Eva luatia naa~,
~ -- -- ~
L
Sh ort-li st S el ecti o .
" - fJnsucce~s~sfu l~P rop ILiH :I Mof cal ~o n
Ye s
Awa rdG iop5eie cl i~
r-..
Canlracl Negoe a~ian J~
~- -The exact evaluation process followed will depend upon the number of Proposals receive dand changes in economic conditions that may ha ve occurred from the time the Proposalswere submitted until the particular stage of the evaluation . For example , while PSO prefersto conduct a price and non-pr ice evaluation of all Proposals based on a 60/40 weightingbetween price/non-price factors , if a large number of Proposals are received, PSO mayconduct an initial price screen prior to the non-price evaluation . Each phase of t heevaluation p rocess is descr i bed in more detail in subsequent sections .
Both the price and non-price characteristics of conforming Proposals will be evaluated bythe Company. Proposals will be evaluated relative to one another and relative to theirimpact on PSO's system. The objective of the evaluation process is to select theProposal(s) that provides the highest value consistent with PSO's stated objectives andrequirements . The preferred Proposal(s) does not necessarily have to be the lowest costoption(s) or highest scoring Proposal(s) from a price and non-price perspective . PSO isinterested in Proposals which provide the most desirable combination of operationalflexibility and reliability, fuel supply and transportation diversity, limited risk and low cost .
Page 16

PSO RFP2005 RFP for Baseload Capacity and Energy Resources
5.3 .1 Eligibility Requirements and Threshold Requireme nts Screening
The fi rst step in the evaluation process will be to review each Proposal to ensure that itsatisfies a l l of the applicable Eligibility Requirements specified i n Section 5 . 2 of this RFPand Threshold Requirements spec ified in Section 5 . 4 of this RFP . I n this stage of theevaluation PSO will determine whether the Proposal meets the Eligibility Requirementsspecifieci , the Proposal is consistent with all requirements outlined in the RFP and theResponse Package and the Proposal conforms to the Threshold Requ i rements .
Proposals that p rov ide inaccurate or incomplete informat ion will be deemed to be non-conforming and may be rejected . The Company may , in its sole discretion , provideBidders the opportunity to correct or clarify their Proposals to conform to the requ i rementsof the RFP provided the competitive position of Proposals is not affected . If the Companyseeks clarification, B idders will be g iven three bus i ness days (or as otherwise stated by theCompany i n its request) to clarify their Proposal . Fa i lure to timely co nform to therequirements will resu lt in rejection of the Proposal . Proposals that pass this initial screenwill proceed to the next stage of the evaluation .
5.3.2 CategorizelCluster Proposals
All Proposals that meet th e Eligibility and Threshold Requirements Scree n ing will becategorized or clustered by type of Proposal (PPA or APP) and resource type inpreparation for the price and non - pri ce analysis . This process will ensure that the highestranking Proposals i n each catego ry can be distinguished and that a diversity of options isconsidered throughout the evaluation process . The Company reserves the r ight todetermine, at i ts sole discret i on , appropriate clusters from the Proposals that it receivesand the placement of Proposals into clusters .
5 .3 .3 Price and Non-Price Analysi s
The third step of the evaluation process will include a price and non-price evaluation for allBase Proposals that pass the Eligibility and Threshold Screening . The result of the 60140weighted price and non-price analysis will be a relative ranking and scoring of BaseProposals in each cluster . Base Proposals of the same type of contract and contract termwill be evaluated relative to similar Proposals at this stage of the evaluation .
The Company may, in its sole discretion, use screening curves andlor detailed productioncost analysis to calculate the total cost impacts of each Proposal on PSO's system .Proposals within each cluster will be assigned price rankings based on their impact onPSO's total system cost . Each Proposal will be evaluated using the price factors containedin the Proposal . Where appropriate, generation expansion and production cost models willbe used to determine and evaluate the impact on the Company's net present worth of therevenue requirement .
Page 17

PSO RF P2005 RFP for Baseload Capacity and Energy Resources
5 . 3 .4 Selection of the Short -lis t
PSO will select a short-list of Proposals from the various clusters based on the results ofthe price and non-price analysis . The objective of the ranking system is to differentiateProposals relative to one another rather than selecting a fixed number of Proposals ormegawatts of capacity. The Company's objectives for selecting the short-list are to select(i) an amount of capacity in excess of the Company's requirements to ensure a viablecompetitive process is followed and (ii) a diversity of options and contract types which meetPSO's RFP objectives and future generation needs while providing diversity and flexibilityof its generation portfolio as well as its fuel supply and fuel transportation arrangements .
At this point in the process , a short-list member may be requ i red to provide ev idence of itsability to post Acceptable Cred i t Suppo rt as outlined in Section 5 . 5 . 3 (ii) below. Suchevidence may include , but will not be limited to , unrestricted cash on the Bidder's or CreditSuppo rt Prov ider 's Balance Sheet, bank statements , availability of cred it under existingcred it fac i l ities and lor expected future credit faci lities as confirmed by Bidder's or CreditSupport Provider 's lender . PSO reserves the right to determ ine precisely what isconsidered to const itute sufficient ev idence and to evaluate the Bidder 's ability to postAcceptable Credit Support at the ti me the short-list is determined .
5.3 .5 Portfolio Evaluation
In this stage of the evaluation process short-listed Proposals from each cluster will becombined into various portfolios and compared and evaluated against each other. TheCompany may evaluate the Bidder's Alternative Proposals that were submitted with itsBase Proposal . The Company will also consider the benefits of flexibility options proposedby the Bidder relative to its Base Proposal . The Company will evaluate in more detail theimpacts of other important PPA provisions (e .g ., COD deferral and acceleration options)offered by the Proposal .
In addition , the Company will assess t he transmission i mpact of each Proposal todetermine what , if any, transmission system improvements must be made and theestimated cost of those improvements . The Company will assess the Proposal'stransm iss i on system impact using SPP ' s reliabil ity criteria and the SPP study methodology .Final transmission system impacts and related costs will be determined by the SPP inaccordance with the SPP OATT .
In this phase of the evaluation, the Company will conduct sensitivity analysis of importantprice and economic assumptions to determine how robust the various Proposals and/orportfolios of Proposals are to various assumptions . The Company may develop high andlow fuel price cases as part of this portfolio evaluation process . Other sensitivities willinclude economic and environmental factors . The Company will also assess any uniquenon-price or flexibility provisions offered by Proposals or portfolio of Proposals that mayresult in a preferred portfolio of resources .
Page 1 8

PSO RFP2005 RFP for Baseload Capacity and Energy Resources
5.3 .6 Award Group Selection and Contract Negotiation s
Based upon the portfolio evaluation resu lts , the Company w i ll select a group of Proposals(Award Gro up) for contract negotiat ions .
The Company will negotiate first w i th the highest rank i ng Proposals sufficient to fill theresource needs . If negotiations w ith higher ranked Bidder(s) i ndicate that the Company isunlikely to negotiate acceptable terms with the Bidder(s), the Company may terminatenegotiations with those Bidder(s) and commence negotiations with Bidders ha v i ng lowerranked Proposals .
The basis for contract negotiat ions will be to d i scuss requested modifications to therelevant Modei Contract identified by the Bidder i n its Proposal . If no modification to therelevant Model Contract has been requested as a part of the Bidder 's Proposal , the B idderwill be expected to execute a contract in substantially the form of the relevant ModelContract . B i dders that request materi al changes to the relevant Model Contract at th i sstage of the evaluation p rocess that were not reflected in Bidder 's exceptions to thecontract i dentified in its Proposal will be subject to hav ing its Proposal re-ranked by theCompany . A B i dder's inclusion in the Award Group does not obligate the Company toaccept any change to the relevant Model Contract that has been proposed by the Bidder .Contracts may be subject to approval by the appropriate regulato ry agencies .
5 .4 Threshold Requirements
5 .4 .1 Credit Threshold
Each Bidder must complete and submit with their Proposal the Bidder Profile Form(Appendix F, Form 1) . Each Bidder or Bidder's Credit Support Provider must also provideproof of a minimum tangible net worth of $500 million U.S. dollars, as reflected on theBidder's (or Bidder's Credit Support Provider's) most recent audited balance sheet, wheretangible net worth is defined as total assets less the sum of intangible assets, goodwill, andtotal liabilities .
5 .4 .2 Accounting Threshold
The Company is unwilling to be subject to accounting and tax treatment that results fromVariable Interest E ntity treatment as set forth in Financia l Accounting Standards Board(FASB) Interpretation No . 46 as issued and amended from time to ti me by FASB .
All PPA Proposals will be assessed by PSO for appropriate accounting andlar taxtreatment . Bidders shall be required to supply the Company with all the informationrequested in the RFP Response Package necessary to make such assessments .Moreover, each Bidder must also agree to make available at any point in the Proposalevaluation process any and all financial data associated with the Bidder, the generationresource and the PPA proposed that PSO requires to verify the expected treatment underFASB lnterpretation No . 46. Such information may include, but is not limited to, datasupporting the economic life (both initial and remaining), the fair market value, executor y
Page 19

PSO RFP2005 RFP for Baseload Capacity and Energy Resource s
costs, nonexecutory costs, and investment tax credits or other costs (including debtspecific to the asset being proposed) associated with the Bidder's Proposal .
5.4 .3 Siting
For a generation facility to be constructed, or being constructed, for a PPA Proposal(Project), the Bidder shall have identified a site and shall have taken the appropriate stepsto acquire or secure use of the site by holding a purchase option or a binding letter of intentfrom the site owner(s) .
5 .5 Description of Non-Price Related Evaluation Criter i a
As noted, Company anticipates that all Proposals wil l be evaluated relative to non-priceand risk related criteria deemed to be important to Company. The Company is interestedin PPA Proposals that offer operating flexibility and diversity and are likely to operateconsistent with PPA req uirements throughout the term of the PPA . Company expects toconsider the non-price and risk related attributes of a Proposal in the screening phase anddetailed evaluation phase of the evaluation process . This may be particularly important if aportfolio of Proposals is selected and various portfolios have similar prices .
Page 20

PSO RF P2005 RFP for Baseload Capacity and Energy Resources
Table 5 . 2 lists each of the Project non-pr i ce andlor risk-related criteria .
Table 5 . 2Non-Price Criteri a
Criterion
Flexibility(i) COD Flexibility(ii) Expansion Capability(iii) Contract Ter m(iv) Environmental Compliance
Development Feasibility(i) Siting Status(ii) Environmental Permitting(iii) Project Schedule(iv) Engineering and Technology Maturity(v) Fuel Supply and Transportation
Arrangements(vi) Project Management Experience(vii) Rights-of-Way Acquisitio n(viii) Water Supply/Resource Availability(ix) Non-DwnedTransmissiQn System
lmpact
Project Operationa l V iabil ity(i) Operation and Maintenance Plan(ii) Financial Strength(iii) Environmental Compliance(iv) Environmental Impact(v) Fuel Reliability and Flexibility
Quality of Outpu t(i) DispatchabilitylScheduling(ii) Coordination of Maintenance(iii) Operating Profile/Characteristics
Model Contracts(i) Model PPA(ii) Model PSA
Weighting WeightingFor PPA* For PSA*
10% 10%
43%
25%
41 %
25%
18% 17%
4% 7%
Represents the major non -price criteria catego ry we i ghtings which com bi ned represent40% of the overall price and non-price score.
Page 21

PSO RFP2005 RFP for Baseload Capacity and Energy Resources
A detailed list and description of each non-price criteria for Proposals and Company'sobjectives relative to such criteria follows .
5.5 .1 Flexi bility
The Company is interested in Proposa l s that prov ide flexibility in terms of the COD in itsacceleration option , Project size considerations , or the w i llingness of a Bidder to defer theCOD in its deferral option . Company will incorporate the values presented in its analysis aswell as qual i tat ively assess the level of flexib i lity offered by each Proposal . If Proposa l s aresimilarJy ranked , the Proposal deemed to offer the greatest level of flexibility at the lowestcost will be preferred . The Company views the following comm i tments to offer value toCompany .
(i) COD Flexibilitv . This criterion is important for Company due to uncertaintyaround the regulatory approval p rocess . Company values Proposals thatexpress a willingness to conform the COD at Company 's request or canphase-in the Project to meet changes in the requirements .
(ii) Expansion Capability . PPA P roposals with the capabil i ty to expand at thesame site or offer volume and term flexib i lity will be viewed more favorably .
(iv) Contract Term . When procuring resources to meet its identified needs, one ofthe Company's objectives for acquiring power resources is to achieve anappropriate portfolio mix of resources . The Company prefers longer termcontracts that best meet its need for reliability, price risk management andflexibility for dispatchable operations .
(v) Environmental Compliance . For Asset Purchase Proposals, the Compan yprefers Proposals that address the ability to meet potential future emissioncompliance requirements for CO2. Recognizing the increasing role that coa lwill play in meeting future electricity supply needs, advanced technologies thatutilize coal for power generation in a clean and efficient manner comprise akey element of a portfolio of technology options . International, national andstate policy activities all indicate the high likelihood of future legal requirement sto reduce greenhouse gas emissions, including CO2 . While the prospects forenactment of greenhouse gas control legislation in the United States are notimminent in the near term, there is growing evidence that emission contro lrequirements will be mandated within the next several years . While the timin gand substance of the regulations are uncertain, it is expected that th ecompliance regime will build on the emissions cap-and-trade market-base dsystems put in place for reducing SO2, NOx and Hg from fossil-fueled powe rplants. There is likely to be a market for CO2 emission allowances and a valu eassociated with CO2 emission reductions or offsets at power plants .
5 . 5 .2 Development Feasibility
Page 22

PSO RF P2005 RFP for Baseload Capacity and Energy Resource s
This category is designed to assess the likelihood of a Project coming into fruition based onvarious factors critical to successful project development . The status of development aswell as the likelihood for Project completion will be considered . The objectives of thecriteria within this category are to provide an indication of the feasibiiity of each Projectbeing developed as well as the likelihood of it being developed on schedule .
(i) Sitiw-Status . Th is cr iterion considers the Project site location and physicalattributes . It also evaluates the B i dder's ability to demonstrate evid ence thatthe site is comm itted for the full term of the PPA.
(ii) Env ironmental Permitting . This criterion considers the degree of certaintyoffered by the Bidder in securing the necessa ry environmental permits .Projects i n the early stages of development will be evaluated based on theBidder's plan for securing permits , the reasonableness of the Project schedulerelative to the proposed CO D, prior experience, and BACT or LAERrequirements . Projects which exhibit a tho rough understanding of theenvironmental permitting process (or have secured perm its) and who presenta reasonable plan will be preferred . Projects wh ich have made greaterprogress in environmental permitting or which do not require major permits arepreferred . Projects with perm its in place are more h i ghly valued .
Proposals should i nclude a list of required perm i ts to build andlor operate thesource. It perm its are to be obta ined i n the future, it should include a timel i nefor obtaining the permits .
(iii) Project Schedule . This criter i on requests Bidders to pro v ide a detailed Pro jectschedule (critical path including m ilestone dates) for the Project thatencompasses the period from the notice of selection of the Award Group t oCOD . The COD reflects the combination of a number of Project developmen tfactors necessa ry for successful Project development . Company will reviewand evaluate the Project schedule and critical path to ensure th e Bidder hasdeveloped a reasonable schedule for meet ing the proposed COD as outline din Section 3 of this RFP .
(iv) E...ngineerinc~ and Technology Maturity . This criterion cons i ders questionspertinent to the engineering des i gn and project technology . Bidders shouldprovide information about the specific technology andlor equipment includingthe track record of the technology and equipment .
The electr i c ity generat i on process proposed for the P roject must have reacheda proven level of technological maturity and the strategic generation equ ipment(e . g ., turb i ne , generator) must be commercially a vailable . The generalspecifications of the proposed equipment shall be provided .
Electricity generation processes are cons idered technologically mature if theyare in use in at least two generation facilities that have been deliveringelectricity on a commercial bas is to a utility for at least two consecuti ve years .
Page 23

PSO RFP2005 RFP for Baseload Capacity and Energy Resource s
Generation facilities still in the demonstration phase for new generationp rocesses will not be considered . Strategic equipment used in generatingelectricity is not admissible for purpos es of this R FP if it i s not commerciallyavailable from a known equipment manufacturer or if it relies on a newoperating principle or on one that has not yet been proven . Th i s requirementis not meant to eliminate offers using equipment that constitutes an advancedvers ion of proven equipment (e . g ., large scale CFB boiler design , advancedsupercritical steam cycles, etc. ) .
The Company reserves the right to require the Bidder to demonstrate that theproposed technology and strategic equipment used in the generation of energyare proven. The Company further reserves the right to commission anindependent expert of its choice in order to establish the technologicalmaturity .
(v) Fuel Supplv and Transqortation Arrangements . This criterion refers to thequality and availability of the fuel supply and transportation arrangements ofthe Project relative to the technology proposed . Company prefers Proposalswith fuel supply and transportation arrangements with reputable andcreditworthy suppliers for a term sufficient to conform to the requirements forproject financing. The Company also prefers fuel supply and transportationcontracts with fixed or index-based prices with provisions that minimize risk t oCompany and its customers .
If the Project is in the early stages of development , Company requires a fuelsupply procurement plan that demonstrates that the fuel supply arrangementsadequately conform to the type and tech n ology of the Project proposedconsistent w ith the security and reliability required by Company . Company willevaluate the fuel supply and transpo rtation status of each Project relati ve tothe type of Project and technology proposed .
(vi) Proiect Management Experience . This criterion requires Bidders todemonstrate project experience and manageme nt capability to successfullydevelop and operate the Project as proposed . PSO is particularly interested i na project team that has demonstrated success in at least one power project ofa similar nature , type , size and technology and can demonstrate an ability t oeffectively work together to bring the Project to COD .
(vii) Ri hts-of-Wa Ac uisition . Acquisition of rights-of-way and construction ofother facilities (such as water pipelines, rail spurs, etc .) can be importantelements of project development . Projects that do not require construction ofother facilities and rights-of-way acquisition are preferred .
(v i i i)Water SupplylResource Availabil ity . This criterion considers the degree ofcertainty offered by the Bidder in securing the necessa ry water supply requiredby the Project. The evaluat i on w i ll be based on the B id der's plan for securin g
Page 24

PSO RF P2005 RFP for Baseload Capacity and Energy Resource s
water contracts/rights for the Project and the reasonableness of the planrelative to the Project type and schedule .
(ix) Non-owned Transmiss i on System Impact . Th is criterion considers thetransmission upgrades that may be requ i red to transmission systems other thanthose owned by PSO. Project that do not requ i re constructio n of newtransmiss i on and other facilities are preferred .
5 .5 .3 Project Operational Viabi lity
Project operational viab i lity characterist i cs provide a means of evaluating whether B i dderswi ll prov ide reliable service to Company and its customers over the term of the PPA . Inaddition , th is criterion is designed to assure that the Bidder will be able to efficiently meetthe terms and condit ions of the PPA . The following factors will be considered :
(i) Operation and Maintenance Plan . This factor evaluates the operation an dmaintenance (O&M) plan of the Bidder as to the reasonableness of th emaintenance funding levels and arrangements, the willingness of a Bidder t oexecute a long-term contract with a reputable operation and maintenanc eprovider and the previous experience of the Bidder in operating an dmaintaining similar facilities . Company prefers Projects that demonstrate thatthe Bidder has developed a solid plan and adequate funding to properl ymaintain the generation facility throughout the contract term . The plan shoul ddemonstrate that N ERC, SPP, and other applicable Regional Reliabilit yCouncii guidelines for operating the generation facility are to be followed .
(ii) Financial Stren gth . PSO will evaluate the ability of Bidders to perform unde rthe terms of their Proposals by reviewing credit ratings by Moody's an dS&P, financial information as outlined in RFP Response Package and credi tinformation published about Bidder (or its Credit Support Provider) by third -parties which will include, but not be limited to (a) Senior Unsecured, o rCorporate credit ratings issued by Standard & Poor's, (b) Senior Unsecured ,or Issuer credit rating(s) issued by Moody's and (c) SEC Form 10-K, For m10-Q, and Form 8-K filings .
In addition, PSO will perform its own internal credit evaluation of Bidders (ortheir Credit Support Providers) through the use on an internal credit scoringprocess, which will evaluate, at a minimum, the following factors :
■ Revenue and earnings growth■ H istorical tangible net worth■ H istori cal measures of cash flow adequacy■ H istorical measures of leverage■ Other credit risk a nd financi a l considerations , including , but not l imited
to , the status of ongoing court, regulato ry, or other governmentalprocesses or proceedings or s i gn ificant contract negotiations orrenegotiations .
Page 25

PSO RF P2005 RFP for Baseload Capacity and Energy Resources
Unsecured Credit or credit supported by a Parent Guarantor (see Appendix F,Form 2 for the required Corporate Guaranty format) will be issued at thefollowing limits, as listed in Table 5 .3, based on the lowest of S&P, Moody's orPSO's internal Credit Rating for Bidder or Bidder's Credit Support Provider .This shall be the aggregate unsecured credit limit extended to the Bidder,covering all contracts entered into between Bidder and PSO and its Affiliates .
Table 5 .3 - Unsecured Cred it Limit
Credit Rating Dollar Credit LimitAA- to AAA $75 ,000, 000A+ and A $60,000,000A- $50 , 000,000BBB+ $35 ,000,000BBB $25 , 000,000BBB- $25,000,000BB+ and b e l ow $0
As part of this process, PSO reserves the right to request further financialinformation from Bidder(s) or its Credit Support Providers and PSO willconsider entering into a Confidentiality Agreement (Appendix B) with suchBidder to protect such information, as appropriate . PSO may requiresuccessful Bidder (or its Credit Support Provider) to post a form ofAcceptable Credit Support to ensure the Bidder's performance under theterms of the Proposal. The amount of Acceptable Credit Support, ifrequired, will be in an amount determined by PSO's evaluation of theBidder's credit condition in conjunction with a determination of the financialand performance obligations of the Bidder under the terms of the Proposal .In determining the financial and performance obligations component of along-term PPA, PS O will estimate the costs to replace such PPA . Thesecosts will relate to capacity and energy and will cover an 18-month period,which is the minimum period that PSO estimates it will take to obtain andhave governmental and regulatory approval of an equivalent replacementcontract.
Credit Support related to capacity charges will be based on 50% of thevalue of the estimated future capacity cost , covering the aforementionedperi od of 1 8 months . Credit Support related to energy charges w i ll bebased on the expected incrementa[ replacement cost of such energy gi vena 50% market move , over the 18-month period . However , if Bidder'scapacity andlor energy prices exceed PSO 's estimated market prices usedin the preceding calculation , then the Credit Suppo rt calculation will employ
Page 26
PSO RF P2005 RFP for Baseload Capacity and Energy Resource s
Bidder's price(s) instead of PSO's estimated price(s) and stifl assume the50% market move described above .
Table 5 .4 illustrates the expected Credit Support Amounts for Bidderssubmi tting PPA Proposals based upon the Bidders ' assigned cred it ratings ,in $/kW form . Bidders will be expected to post Acceptable Credit Supportin an amount determined by their (or the i r Credit Suppo rt Provider 's) creditrating as represented in Table 5 .4 and the number of MW proposed . Forother details regarding Credit Support posting requirements , refer to Article7 of the Model PPA .
Further, Bidders should note that Company reserves the right to protect itselfagainst counterparty credit concentration risk, and as such, may require Bidderto post Acceptable Credit Support in the form of cash or an IrrevocableStandby Letter of Credit in amounts in excess of those amounts listed in Tab le5.4 to maintain compliance with AEP's credit policies .
Table 5 .4 - Credit Sunport Amounts
$/kW
BB-
$ 46.15$ 60. 65$ 91 . 65$ 111 . 50$ 127 .60$ 144. 15$ 184 . 70
B i dders subm i tt i ng an Asset Purchase Proposal w i ll be subject to the samecreditworthiness scrutiny as described abo ve . Howeve r , the amount ofCredit Support required will be based upon the Bidder 's obligations andli a bilities under an executed Purch ase and Sale Agreement .
(iii) Environmental Compliance . This criterion addresses the ability ofgeneration facilities suppo rting a PPA Proposal to remain in env ironmentalcompliance . Company wi ll assess whether Proposals can demonstrate ,
Page 27

PSO RF P2005 RFP for Baseload Capacity and Energy Resources
through a credi b le plan , the ability to remain in compliance . Options to meetrequirements of developing regulations for increased control of currentlyregulated air emissions and mercury should be considered . Also , the abilityof a Bidder to secure the necessary Emission Allowances for a Project caninfluence Project costs . Bidders are requ ired to prepare and subm i t a planoutlining its strategy for securing the necessary Emission Allowances tomeet Project requirements .
(iv) Environmental Impact . An important criterion for evaluating Proposals will bethe Project's environmental impacts . The Project's overall plan to minimize airemissions will be an important aspect of this review . In addition, site impactssuch as water use, land use, property value issues, and aesthetics will beconsidered in the Proposal evaluation.
(v) Fuel Reliability and Flexibi lity . This criterion addresses the abil ity of a Proposa lto provide flexibility of fuel supply and fue l transportati on wh i le meeting thereliability needs of Company . For example , hav ing multiple natural ga spipel ines or railroads serving a generation facility would be highly des i rable .The ability to convert to an alternate fuel (e . g ., gas to fuel oil , coal to gas) wheneconomically or operationally benefic i a l would also be considered an attractiveoption .
Company prefers Proposals that can demonstrate that a reliable and securesupply of fuel and fuel transportation resources will be available to thegenerating facility . To assess reliability, the Company will consideraccessibility to supply options, availability and firmness of transportationresources (e .g., number and nature of pipeline systems or rail transportation),history of pipeline operations in the relevant area, tariff terms and conditions,experience with operational flow orders and curtailments, etc . which protectthe interests of the Company and its customers, and allow for maximumdispatchability of the generation .
5.5 .4 Qua lity of Outpu t
Quality of output evaluation criteria are designed to evaluate the system impactsassociated with each Proposal relative to the level of operating flexibility and consistencywith Company's objectives regarding enhancement to system generation, reliability andoperations . Scheduling of generation facilities will be considered in the dispatching criteriaas noted below. While the factors considered may to some degree be incorporated intothe cost analysis and therefore influence the economics of each Proposal, it is not likelythat the cost implications capture the full benefit to Company . Therefore, it is important toincorporate these criteria separately as part of the non-price related criteria in the analysis .
(i) Disqatchabi(itvlScheduling . This criterion refers to the extent to which thesubject generation facilities will be dispatchable and the flexibility offered inscheduling energy. Dispatchability is defined as the ability of the Company torequire delivery of power and energy at a Company determined level (including
Page 28

PSO RFP2005 RFP for Baseload Capacity and Energy Resource s
no output) for a specified period . Generation facilities that are not fullydispatchable will be evaluated based on the level of operating flexibility andcontrol offered to Company .
( ii) Coordination of Ma i ntenance . This criterion addresses the willingness andflexibility of a Bidder to coordinate the maintenance schedules of the subjectgeneration facilities in conjunction with Company's ma i ntenance schedules forits own generation facilities .
( i ii) Operating Profile/Characteristics . This criterion refers to the ability of th esubject generation faci lities to meet load requirements (real and reactive)quickly and provide the operating flex i b i lity deemed valuable to Company .Characteristics of importance include load following capability , min imum start-up capabil ity , ability to cycle the un it , cold start ti me , ramping capability , andvoltage support capability . Company will evaluate the operating profile of thesubject generat i on facilities relative to its implications to the PSO system .
5 .5 ,5 Model Contracts
(i ) Model PPA . Appendix H contains the Model PPA . B idders submitt ing PPAProposals are required to include with the i r Proposal a red-l ine vers ion of thePPA which clearly identifies any proposed changes to the Model PPA .Bidder's proposed changes to the Model PPA will be a part of the non-priceevaluation of the Proposal .
(ii) Model PSA . Appendix I contains the Model PSA . Bidders subm itting AssetPurchase Proposals are required to i nclude with their Proposal a red-l inedvers ion of the Model PSA wh ich clearly identifies any proposed changesthereto . Bidders ' proposed changes to the Model PSA will be cons i dered bythe Company in its eval uation of the Proposal .
5 .6 Descri tion of Price Related Evaluation Criteri a
All Proposals will be evaluated on the basis of price and operational pe rformance factors inthe price and portfolio evaluation through the simulation of the impact of the Proposal onthe overall costs to the PSO system . Company will cons ider the impacts of each Proposalon PSO and its customers . Company will also i nclude other criteria in its analysis ,including operational characteristics and flexibility provisions that allow Company tominimize risk and unce rtainty . Company 's object ive in select i ng resources , therefore ,involves a comb i nation of rate implications and risk minimization options to arrive at thepreferred po rtfolio of resources .
Page 29

PSO RFP2005 RFP for Baseload Capacity and Energy Resource s
Company proposes to conduct a detailed cost analysis that incorporates all of the costsattributed to each Proposal including, but not limited to :
■ Capacity Charg e■ Fixed O&M Charge■ Energy Charge■ Variable O&M Charge■ Start-Up Charge■ Emissions Charge■ Ancillary Services Charge• Transmission System Impact■ Debt Equivalence
A description of each component is presented below .
5 . 6.1 Capac ity Charge
The Capacity Charge reflects the payment that Company will make to the Bidder for havingthe generating capacity available to Company to operate at the proposed committedcapacity level . Al l Proposals will be evaluated at the target equivalent avai lability specifiedby the Bidder unless the target equivalent availability is deemed to be unrealistic for theproposed technology or facility design . Bidders may propose a fixed price or pre-specifiedescalation Capacity Charge arrangement at the time of Proposal submission that locks inthe Capacity Charge from the COD for the term of the PPA . Additionally, Bidders maypropose a Capacity Charge in which parts, as indicated in Schedule 3-1 of the RFPResponse Package, are indexed to known indices found in Appendix J . Capacity Chargepayments made by PSO during the contract term of the PPA will be based on the actualtotal Capacity Charge that is effective on the COD and these pre-specified escalation rates .
As noted in the Model PPA, the winning Bidder(s) will be paid Capacity Charges based onthe product of the Capacity Charge, Contract Capacity, an allocation factor for theapp licable month of the year and the availability adjus tment specified in the RFP and PPA .
5 . 6 .2 F ixed O&M Charge
The Fixed O&M Charge reflects the payments that Company would make to the Bidder tocover the Fixed O&M costs associated with their Proposal . This may include such items asfixed l abor or staff expenses, property taxes, insurance, fixed maintenance expenses andother fixed opera ting expenses . Fixed natural gas pipeline and other fuel transportationcharges, such as demand charges, should be reflected as a separate Fixed FuelTransportation Charge. These payments will be calculated based on the initial base periodcharge and the escalation rate selected by the Bidder .
As noted in the Model PPA, the Bidder will be paid Fixed O&M Charge based on theproduct of the Fixed O&M Charge, Contract Capacity, an allocation factor for the
Page 30

PSO RF P2005 RFP for Baseload Capacity and Energy Resource s
applicable month of the year and the availability adjustment specified in the RFP andPPA.
5 .6 .3 Energy Charge
This factor will account for the amount and cost of energy delivered by the Bidder . Such ananalysis requires the incorporation of operating characteristics that influence theperformance of the subject generation facilities. Bidders are ful ly responsible for all fuelrelated expenses, which should be accounted for as specified in Sections 3 .4.4 and 3 .4.6of the RFP Response Package .
5 .6 .4 Variable O&M Charge
The Variable O&M Charge reflects the payments that Company would make to the Bidderto cover the Variable O&M costs associated with their Proposal . The Variable O&MCharge may take into consideration non-fuel variab le expenses related to operat ion of theBidders generation facility . These payments will be calculated based on the in itial baseperiod charge and the escalation indices selected by the Bidder.
5 . 6 .5 Sta rt-Up Charge
The Sta rt-Up Charge reflects the payments Company w i ll make each time a generationfaci lity , which specifies such payments , successfully starts its generat i ng facility whencalled upon by Company to operate . Costs to start-up the generat i on facility after plannedand unplanned ma intenance or forced outages w i ll not be i ncluded as Start-Up Charges .Company will estimate how many times it expects the generation facility to be required tostart -up , and will i nclude the proposed Start-Up Charge in conducting the evaluation .Bidders are encouraged to describe any constraints or un i que character i stics of theirProposals which could influence th e Company's analysis .
5 .6.6 Emissions Charge s
Company will evaluate the implications of a Proposal on overall system emission levels toassess how it will impact Company 's Emission Allowances and the im pact it will have onCompany's position in the em i ssion allowance market and any costs or savings assoc iatedw i th a particular Proposal . Company wi ll estimate the SO2, NOx , and mercury emissionsfrom its system as a result of each Proposal . To estimate the impacts associated witheach Proposal, Company will calculate the dollar impacts as the net emission impacts ofthe project times the estimated market value of the emiss ion over the term of the PPA .
PSO previously reta i ned a third -party to provide a range of CO z prices reflecting possiblefuture C02 emission reduction scenarios . The range Of CO2 allowance prices reflect thepotent i al stringency and timing of possible future legislati on . The upper range of costs isassociated with plants that capture 90% of the CO2 emissions and then compress the gasand inject it into geolog i c formations near the plant _
Page 31

PSO RFP2005 RFP for Baseload Capacity and Energy Resource s
Proposal evaluations w i ll incorporate assumptions regarding the probabilities and futurecost, if any , associated w ith tax assessment(s) or other impositions based on the quantityof C02 em i ssions produced from the combust ion o f fuel by a Proposal generation facility . Ifa Bidder proposes an arrangement wherein a specific facility is not identified (such as maybe the case with a System PPA) , the resulting contract shall explicitly state that PSO shallnot be liable for any C02-related expenses , and the Bidder will be required to enter into anIndemnity Agreement which indemnifies Company from any incremental costs associatedwith or arising from any change in law related to CO2 emissions . For Proposals with aspecified facil i ty , the potential C02 related expenses are to be provided by the Bidder i naccordance with Tab 4 of the RFP Response Package . This data will be included in theCompany 's evaluation . The Praposa l evaluation p rocess will incorporate the assumptionthat the Bidder does not contractually absorb the l i ability associated w ith potential futureincremental costs assoc iated with or arisi ng from any change in law related to CO2emissions . As such , Bidders are directed to submit Proposals that i ncorporate theassumption that Bidders will pass through any costs associated with meeting future CO2emissions control requirements .
5 .6 .7 Ancilla ry Services Charge
Ancillary Services that may be provided by generators are :
■ Reactive Supply and Vaftage Control■ Regulation and Frequency Response■ Energy Imbalanc e■ Operating Reserves - Spinnin g■ Operating Reserves - Supplementa l
Bidder shall identify in their Proposal any explicit ancillary service charges related todelivering power and energy to Company under their Proposal . In addition, Bidder needsto describe in detail the relationship between Bidder's Proposal generation facility,Company and SPP RTO market operations . The details shall include responsibilitiesassociated with scheduling, asset registration, resource bidding and ancillary serviceprovision .
5 .6 .8 Transmission System Impac t
This criterion considers the upgrades and attendant costs that may be required to PSO'stransmission system, and to the extent they can be determined, on neighboringtransmission systems. Company will use its computer modeling capability (e .g., power flowprogram) to verify and quantify the transmission system impacts, based on the specificdata contained in Bidder's Proposal .
5 .6.9 Debt Equivalence
Evaluation of PPA Proposals will include the imputed cost (revenue requirement) for anyadditional common equity required to maintain the Company's current debt-equity ratio .Should the PPA be determined to be treated as a capital lease under EITF 01-08 an d
Page 32

PSO RF P2005 RFP for Baseload Capacity and Energy Resources
SFAS 13 , equity will be assumed to be added to mainta i n the current total debt to equityrat i o based on the amount of the debt or capita l lease liabi l ity anticipated to consolidateonto the Company 's balance sheet . Should the PPA be determined to be treated as anoperating lease under EITF 01-08 and SFAS 13 , equity will be assumed to be added toma intain the current total debt to equity ratio using Standard and Poor 's (S&P) publishedguidelines as a basis of the equity imputation and its cost . Key parameters for thecalculations will include ROE (pre-tax) based on the Company 's authorized return and netpresent value ("NPV") d i scount factor and debt cost at the Company 's weighted averagecost of debt . If the PPA is not a lease , sensitiv ities will be calculated at a 30% and a 50%risk factor that will be applied to the fixed charge NPV to calculate the imputed debt. Thecost of additional equ i ty will be included as pa rt of the revenue requirement to all applicablePPA Proposals .
As stated in the Threshold Requirements , the Company will not accept any Proposals withcontract terms that would require balance sheet consolidation of a Variable Interest Entity( "VfE ") per FASB Interpretation No . 46R . Through information gathered from Bidders , theCompany will determine whether it will be sub ject to V1E consolidation treatment at anytime during the contract period . Failure in this provision will be considered a disqual ificationof Proposal .
5.7 Notification of Evaluation Results and Negotiations
Upon completion of the screening to determine those Proposals that meet the CreditThreshold and Accoun ting Threshold, PSO will notify all Bidders on the status of theirProposal . Proposals meeting the th resholds will be separated and grouped as described inSection 5 . 3 . 2 . For Bidders whose Proposal fails the threshold screening , Company willprovide an explanation of the requirements that were not met . Upon completion ofProposal evaluation, Bidders will be notified of the status of the i r Proposal and whetheradditional d i scussions or negotiations are warranted . Negotiations will commence as soonas practicable after selected Bidders are notified .
Upon conclusion of negotiations , if successful , PSO will work with the B idders to developdefinitive agreements for submiss ion to the Commission . PSO will retain writtendocumentat i on of its decision-making p rocess for P roposals that are selected or rejected ,i ncludi ng the reasons for its decisions .
SECTION 6 - REGULATORY APPROVALS
Generally, the results of the RFP will be subject to regulatory approvals . Anycontractual arrangements between PSO and prospect i ve Bidders may be conditionedupon prior Commission authorization that is satisfacto ry in form and substance to PSOin its sole judgment and discretion . The Company reserves the right to reject anyproposed contracts that result from the RFP if su bsequent l y issued regulato ry approvalsor authorizations are subject to conditions , including ratemaking treatments , which areunacceptable to PSO in its sole judgment and discretion .
Page 33

PSO RF P2005 RFP for Baseload Capacity and Energy Resource s
Other than the prior authorization from the Commission for which P50 shall apply, aBidder whose Proposal is selected will be solely responsible financially, legally andotherwise, as applicable, for acquiring and maintaining all necessary governmental(e.g ., FERC), creditor, and other third-party authorizations and consents necessary orappropriate to facilitate effectuation of the selected Proposal, including allauthorizations, permits, licenses, consents, and approvals associated with a selectedProposal, as well as compliance with any and all governmental rules and regulations forthe construction and operation of the Project identified in the Proposal .
SECT ION 7 -- RESERVATION OF RIGHTS
A Bidder's Proposal will be deemed accepted only when PSO and the successful Bidderhave executed definitive agreements . Company has no obligation to accept anyProposal, whether or not the stated price in such Proposal is the lowest price offered,and PSO may reject any Proposal in its sole judgment and discretion and without anyobligation to disclose the reason or reasons for rejection .
BY PARTICIPATING IN THE RFP PROCESS, EACH B I DDER AGREES THAT(A) EXCEPT TO THE EXTENT OF ANY REPRESENTAT IONS AND WARRANTIESCONTA I NED IN A DE FINIT I VE AGREEMENT WITH T HE COMPANY, ANY AND ALLINFORMATION FURNI5HED BY OR ON BEHALF OF THE COMPANY INCONNECTION WITH THE RFP IS OR WILL BE PROVIDED W ITHOUT ANYREPRESENTATION OR WARRANTY, EXPRESS OR IMP LI ED, AS TO THEUSEFULNESS , ACCURACY, OR COMPLETENESS OF SUCH INFORMATION , AND(B) EXCEPT AS OTHERWISE PRO VIDED IN A DEFINITIVE AGREEMENT WITH THECOMPANY , NEITHER PSO , ITS AFFIL IATES NOR ANY OF THE IR PERSONNEL ORREPRESENTATIVES SHALL HAVE ANY LIABILITY TO ANY BIDDER OR ITSPERSONNEL OR REPRE SENTATIVES RELATI NG TO O R ARISING FROM THEUSE OF OR REL IANCE UPON ANY SUCH INFORMATION OR ANY ERRORS O ROM ISSIONS THEREIN .
Each Bidder is solely responsible to pay any and all costs incurred by the Bidder in thepreparation of a Proposal in response to this RFP, or to contract for any products orservices proposed by any Bidder . PSO reserves the right to modify or withdraw thisRFP, to negotiate with any and all qualified Bidders to resolve any and all technical orcontractual issues, or to reject any or all Proposals and to terminate negotiations withany Bidder at any time . PSO reserves the right, at any time and from time to time,without prior notice and without specifying any reason and, within its sole judgment anddiscretion, to :
Cancel, modify or withdraw this RFP, reject any and all responses, andterminate negotiations at any time during the RFP proces sDiscuss with a Bidder and its advisors the terms of any Proposal submittedby the Bidder and obtain clarification from the Bidder and its advisorsconcerning the Proposal .Consider all Proposals to be the property of PSO, subject to the provisions ofthis RFP relating to confidentiality and any confidentiality agreement that ma y
Page 34

PSO RFP2005 RFP for Baseload Capacity and Energy Resource s
be executed in connection with this RFP , and destroy or archive anyinformation or materials de veloped by or subm itted to PSO in this RFP .
■ Request from a B idder information that is not explicitly deta i led in th is RFP ,but which may be useful for evaluation of that Bidder 's Proposal .
• Determine wh ich Proposals to accept , favor , pursue or reject .• Reject any Proposals that are not complete or contain irregu l arities , or waive
i rregularities i n any Pro posal that is submi tted .■ Accept Proposals that do not provide the lowest evaluated cost .• Determ ine which Bidders to allow to participate in the RFP , including
disqualifying a Bidder due to a change in the qualifications of the Bidder or inthe event that PSO determines that th e B i dder's pa rt icipation i n the RFP hasfailed to conform to the requ i rements of the RFP .
■ Conduct negotiations with any or all Bidders or other persons or w ith noB i dders or other persons .
■ Execute one or more defin i tive agreements w ith any Bidder that submits aProposal or with any other person or with no one .
If at any time the Compa ny determines that there is a defect in the RFP process or adev iation from the requirements of the RFP or that collusive or fraudulent bidding hasoccurred or appears to have occurred , the Company , in consultation with the 1M , maysuspend the RFP in whole or in part as to any Bidder or Bidders so invol ved .
Under all circumstances , each Bidder i s responsible for all costs and expe nses it incursin connection with th e RFP . Under no circumstances , includ ing the Company'stermination of the RFP at any time , wi ll the Company or any of its representa tives beresponsible for any costs or expenses of any Bidder incurred in connection with theRFP .
SECTION 8- GLOSSARY OF T ERM S
1 . Acceptable Credit Support : Shall mean , but shall not be limited to , one or more ofthe following : (i ) an irrevocable , transferable sta ndby Letter of Credit issued by aU .S . commercial bank or a foreign bank with a U . S . branch with such bank have acredit rating of at least A - from S&P or A3 from Moody 's in a form as o u tlined i nAppendix F Form 3 , or (i i) a cash deposit .
2 . Affiliate : Is any person directly or indirectly controlling or controlled by or underdirect or indirect common control with such person or any person that directly orindirectly (through one or more intermediaries) controls or is controfied by or i sunder common control with the person . For purposes of this definition, "control "(including, with correlative meanings, the terms "controlling," "controlled by" an d"under common control with"), as used with respect to any person, shall mean th edirect or indirect ownership or control of, or the possession, directly or indirectly, o fthe power to vote, five percent (5%) or more of the outstanding voting securities o fsuch person, or the possession, directly or indirectly, of the power to direct or caus ethe direction of the management or policies of such person, whether through th eownership of voting securities, by agreement, or otherwise .
Page 35

PSO RFP2005 RFP for Baseload Capacity and Energy Resource s
3 . Commercial Operation Date : The date upon wh i ch the seller's d e li very obligationscommence under a PPA .
4 . Control Area : AEP SPP electric system bounded by interconnection metering andtelemet ry capable of contro l ling owned and contracted generat ion to ma intaininterchange schedules with other control areas . In th is document, the term , "controlarea ," is used i nterchangeably with the term , "transmission system" .
5 . Credit Support Provider : An entity that has issued a guaranty to cover theobligati ons of the Bidde r.
6 . Net Dependable Summer Ca abil i t : The net demonstrated summer capabil i tyof a generating unit established in accordance w ith the test i ng proceduresdefined in Section 12 of SPP Criteria --Electrical Facility Ratings .
7 . SPP RTO : The Southwest Power Pool Regional Transmission Organization .Major services provided by the SPP RTO to members include independentreliability coordination and tariff administration, regional engineering mode ldevelopment, planning and operating studies, reliability assessment studies, acomputer-based telecommunications network, and operating reserve sharing .SPP provides regional transaction scheduling and is in the process o fimplementing market settlement functionality as required by FERC Order 2000 .
8 . Baseload Ca acit and Ener Resource : A firm generating resource that iseconomically dispatched at a high capac ity factor . Prima ry characteristics are theresource 's high fixed cost profile (capital recovery and fixed operation andmaintenance cost , etc.) would be relatively high but is economica l ly justified due toits ve ry low variable and i ncremental operating cost .
Page 36