Public Disclosure Authorized - The World Bank Documents
151
zJ -- ;C 0~ _ .. rb~ ~ ^DP r-Y- q~~~~~~~~~~~~~ _S Public Disclosure Authorized Public Disclosure Authorized Public Disclosure Authorized closure Authorized
-
Upload
khangminh22 -
Category
Documents
-
view
1 -
download
0
Transcript of Public Disclosure Authorized - The World Bank Documents
zJ --;C
0~ _ . .
rb~ ~ ^DP
r-Y-
q~~~~~~~~~~~~~ _S
Pub
lic D
iscl
osur
e A
utho
rized
Pub
lic D
iscl
osur
e A
utho
rized
Pub
lic D
iscl
osur
e A
utho
rized
Pub
lic D
iscl
osur
e A
utho
rized
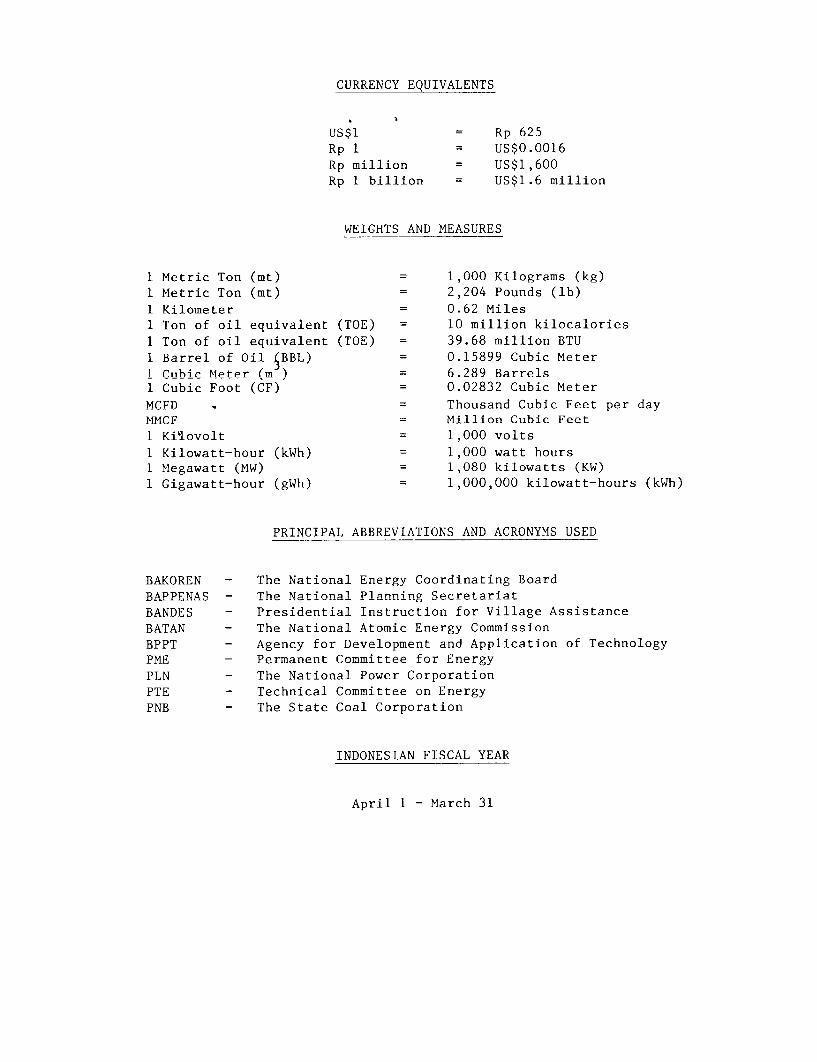
CURRENCY EQUIVALENTS
US$1 = Rp 625
Rp 1 = US$0.0016
Rp million = US$1,600
Rp 1 billion = US$1.6 million
WEIGHTS AND MEASURES
1 Metric Ton (mt) 1,000 Kilograms (kg)1 Metric Ton (mt) = 2,204 Pounds (lb)1 Kilometer = 0.62 Miles
1 Ton of oil equivalent (TOE) = 10 million kilocalories1 Ton of oil equivalent (TOE) 39.68 million BTU1 Barrel of Oil BBL) 0.15899 Cubic Meter1 C2ihir MteIr (m ) = 6.289 Barrels1 Cubic Foot (CF) = 0.02832 Cubic MeterMCFD . = Thousand Cubic Feet per dayMMCF = Million Cubic Feet
1 Ki'lovolt = 1,000 volts
1 Kilowatt-hour (kWh) = 1,000 watt hours1 Megawatt (MW) = 1,080 kilowatts (KW)1 Gigawatt-hour (gWh) = 1,000,000 kilowatt-hours (kWh)
PRINCIPAT. ARRRFVTATIONS AND ACRONYMS USED
BAKOREN - The National Energy Coordinating Board
BAPPENAS - The National Planning Serrptnrint
BANDES - Presidential Instruction for Village AssistanceBATAN - The Nati-nnal Atomicr Pnerau Commfissin
BPPT - Agency for Development and Application of TechnologyPME - Permanent Committee for EnergyPLN - The National Power CorporationPTE - Technical Committee o nEnrgy
PNB - The State Coal Corporation
TMNDONSCTAN FISCAL YEAR
April 1 - March 31
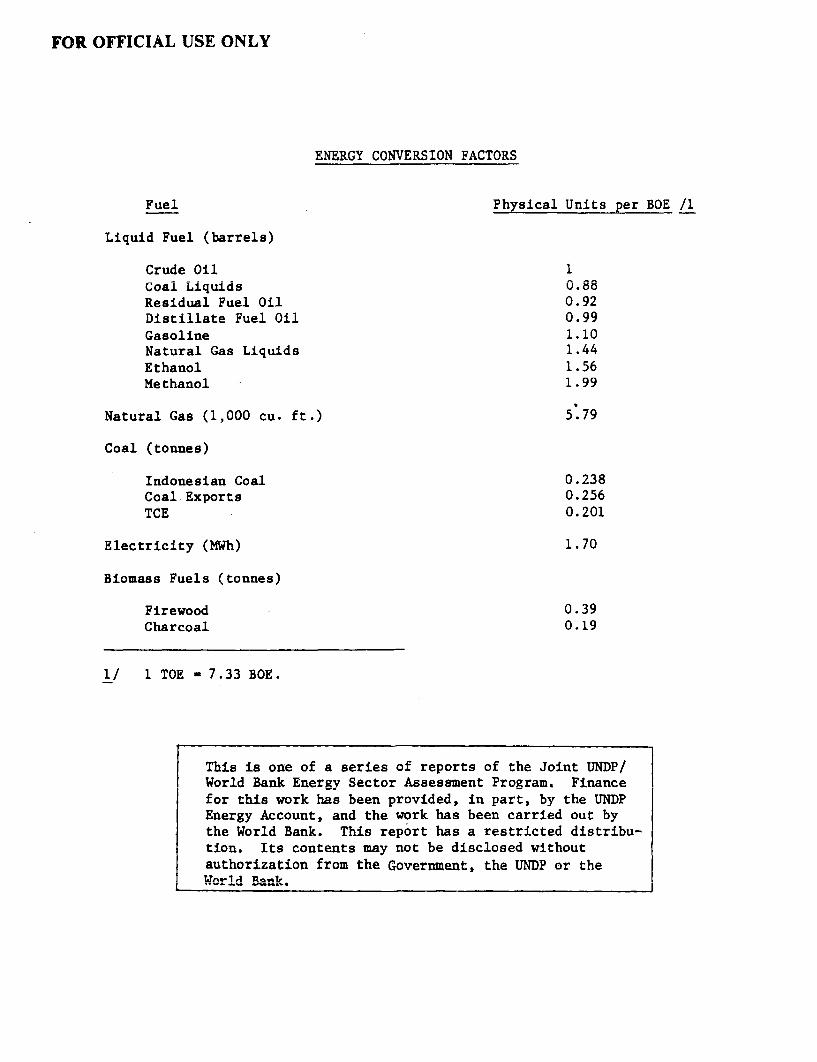
FOR OFFICIAL USE ONLY
VML7(0V r'AUN7VDCTniM VAr1'ADC
Fuel Physical Units per BOE /1
Liquid Fuel (barrels)
Crude Oil 1Coal Liquids 0.88Residual Fuel Oil 0.92Distillate Fuel Oil 0.99Gasoline 1.10Natural Gas Liquids 1.44Ethanol 1.56Methanol 1.99
Natural Gas (1,000 cu. ft.) 5.79
Coal (tonnes)
Indonesian Coal 0.238Coal Exports 0.256TCE 0.201
Electricity (MWh) 1.70
Biomass Fuels (tonnes)
Firewood 0.39ChArtnAl 0.19
1/ 1 TOE - 7.33 BOE.
This is one of a series of reports of the Joint UNDP/World Bank Energy Sector Assessment Program. Financefor this work has been provided, in part, by the UNDPEnergv Account. and the work has been carried out bythe World Bank. This report has a restricted distribu-tion. Tt-s c-o-nteintq may not he diRcloRed without
authorization from the Government, the UNDP or theWorl Ba1n Rk"

INDONESIA
ISSUES AND OPTIONS IN THE ENERGY SECTOR
TrAUTV Av 'nmirMTmC
.LINLR JUC,1 .LO . . . . . . . . . . . . . . . . . . . . . . . . . . . .v
TVQCTTlC' AXTT nDEl IEl.7TT1AqrT'%XPV 1 £).U.J BJ'41J0 il A£.I1WlJV1J.L2J.1IJ L.LSJJ10...V.....J.. .....
flt -- - - I - '.rlPlfl I r.n, TTnrlrrrnnT A ATf 'nnn ClT1y T' rflfl'TTn TflE A ITT 1Chapter 1: ENERGY tU ur.r±JxnI'V ±1u N UoDDlE PUOUSSIB F R r'LuND . . . . . .
Background . . . . . . . . . . . . . . . . . . . . . . . .
Petroleum Products . . . . . . . . . . . . . . . . . . 3,, ~~~~~~~~~~~~~~~~~~~~~~~~~~~~~~rKerosene j
Automotive Diesel ... . . . . . . . . . . . . . . . . 5Other Petroleum Products . . . . . . . . . . . . . . . 5
Coal. . . . . . . . . . . . . . . . . . . . . . . . . . 5Natural Gas ... . . . . . . . . . . . . . . . . . . . 6Electricity ... . . . . . . . . . . . . . . . . . . . 6Commercial Energy Balance FY79 . . . . . . . . . . . . 7
Likely Demand to FY89 .7.. . . . . . . . . . . . . .... . 7Background ... . . . . . . . . . . . . . . . . . . . 7The Domestic Demand for Petroleum . . . . . . . . . . . 7The Domestic Demand for Natural Gas . . . . . . . . . . 11The Domestic Demand for Coal . . . . . . . . . . . . . 11The-Domestic Demand for Electricity . . . . . . . . . . 12Commercial Energy Balance, FY89 . . . . . . . . . . . . 13The Outlook for FY99 ... . . . . . . . . . . . . . . 15
Chapter 2: THE SUPPLY OF PRIMARY ENERGY . . . . . . . . . . . . . . . 21
Overview . . . . . . . . . . . . . . . . . . . . . . . . . 21The Supply of Oil . . . . . . . . . . . . . . . . . . . . 21The Supply of Gas ... . . . . . . . . . . . . . . . . . 24The Supply of Coal ... . . . . . . . . . . . . . . . . . 26The Supply of Geothermal Energy . . . . . . . . . . . . . 28The Supply of Hydro ... . . . . . . . . . . . . . . . . 30Traditional Energy Resources . . . . . . . . . . . . . . . 31Other Biomass Resources ... . . . . . . . . . . . . . . 34Conclusion ... . . . . . . . . . . . . . . . . . . . . . 34
Chapter 3: ENERGY PRICING POLICY . . . . . . . . . . . . . . . . . . 35
Background ... . . . . . . . . . . . . . . . . . . . . . 35The Pricing of Energy Products . . . . . . . . . . . . . . 37
Petroleum . . . . . . . .. . . . . . . . . . . . . . . . 37Natural Gas ... . . . . . . . . . . . . . . . . . . . 41Coal ... . . . . . . . . . . . . . . . . . . . . . . 43Electricity ... . . . . . . . . . . . . . . . . . . . 44
Policy Issues ...................... 47
Page No.
Chapter 4: INTER-FUEL OPTIONS FOR MEETING FUTURE ENERGY NEEDS . . . . 48
The Household Sector .48Th e TInAustrilal Sector . 53 ..... .The Transport Sector .54The Electric Power Subsector . . . . . . . . . . . . . . . 54
Ch.-apter 5: ?TVD-RG TC'T1TLC ATr f'OPTIONS Th 'rKTY.E DITAT ADVA° I 59
Lnergy Lptlons 'or -le Lural Sector . . . . . . . . . . . 5J2i V~ ' .J L.AJ L . LU . LLII XU .. JO L.L'..
Patterns of Energy Use in the Rural Sector . . . . . . . . 60Households: J ava/ Ba.LL .O. . . . . . . . . . . . . . . UV
Households: Other Islands . . . . . . . . . . . . . . 62cIfRura'l E'Lectric'Lty 'Supp'Ly . . . . . . . . . . . . . . . . . o2
Agriculture ... . . . . . . . . . . . . . . . . . . . . 63Inadustry .... . . . . . . . . . . . . . . . . . . . . . 64
Fuels for Rural Industry . . . . . . . . . . . . . . . 66The Scope for Biomass Gasification . . . . . . . . . . 67
Institutional Considerations for Rural Energy Planning . . 68
Chapter 6: ENERGY SECTOR ORGANIZATION AND INSTITUTIONS . . . . . . . 70
Background .... . . . . . . ..... . . . . . . . . . 70The Ministry of Mines and Energy . .. . . . . . . . . . . 70The Oil and Gas Subsector ... . . . .... . . . . . . 73
PERTAMNA . .. . . . . . . . . . . . . . . . . . . . . 73
The Electric Power Subsector . . . . . . . . . . . . . . 74Perusahaan Umum Listrik Negara (PLN) . . . . . . . . . 74
Rural Electrification ... . . . . .... . . . . . . . 76The Coal Subsector ................. . 78Other Institutions ... . . . . . .... . . . . . . . . 80
BATAN . .. . . . . . . . . . . . . . . . . . . . . . . 80Energy Research and Development . . . . . . . . . . . . . 80
Ministry of Research and Technology . . . . . . . . . . 80Other Research Institutes . . . . . . . . . . . . . . . 81
Chapter 7: INVESTMENT IN THE ENERGY SECTOR . . . . . . . . . . . . . 85
ANNEX: ENERGY BALANCES AND PROJECTIONS . . . . . . . . . . . . .
Bibliography .... . . . . . . . . . . . . . . . . . . . . . . . . . 36Maps .... . . . . . . . . . . . . . . . . . . . . . . . . . . . . . 127
This report incorporates the findings of a series of missions toIndonesia between September 1980 and March 1981. The leader of the mainmission was Dr. N.B. Prasad (consultant), who prepared the report. Otherswho contributed to the report were Julian Bharier (leader of the preparatorymission), Ian Johnson, Ion Stancescu (consultant), Richard Berney, EricDaf fern, Amarquay Armar, Max Wilton (consultant), Eric Hassall (consultant},Izzet Zincir, Armeane Choksi, and Julia Tuzun (editor).
TABLES IN TEXT
Page No.
1.1 Energy Consumption, 1960-1978 . . . . . . . . . . . . . . . 21.9 WorArsne -Gonsumto
4n- -a Prr
4,es 196Q-7 A.. . 4
1.3 PLN Sales by Tariff Group, FY79 . . . . . . . . . . . . . . 61.4 Energy Balance, FY 79/80.............81.5 Projected Petroleum Product Consumption . . . . . . . . . . 91.6 Kerosene Consumption ProjectIon, FY79-FY89 .. . 91.7 Consumption of Petroleum Products in the Transport
Sector, FY709-F1Y,89 . . . ........... .......... ........... ........ . 1V1.8 Projected Domestic Consumption of Natural Gas,
FV70-VVQ 0X 1 J L 7 . . . . . . . . . . . . . . . . . . . . . . . . AIA
1.9 Projection of Electrical Energy Sales, FY79-FY2000 . . . . . 121.10 Forecast of Electricity Sales by E=Use... 13
1.11 Energy Balance, FY89/90 . . . . . . . . . . . . . . . . . . 141.12 Commercial Energy Consumption Growth Rates, FY79-FY89
and FY89-FY99 ... . . . . . . . . . . . . . . . . . . . 151.3Energy Balance, FrY99 /2000 (Senr' I)..... 16
1.14 Summary of Current and Projected End-Use CommercialEnergy Consumption ... . . . . . . . . . . . . . . . . . 18
1.15 Energy Balance, FY99-2000 (Scenario II) . . . . . . . . . . 191.16 S-ummary of Commercial Energy Demand Dy Sector,
FY99/2000. ....................... 20
2.1 Total Indonesia Crude Oil Supply . . . . . . . . . . . . . . 222.L indonesian Refineries ... 232.3 Supply Projection - Crude Oil . . . .. . . . . . . . . . . 242.4L Supply Projection - Coal .2.5 Estimated Geothermal Resources . . . .. . . . . . . . . . . 292.6 Supply Projections for Hydro Development . . . .. . . . . . 312.7 Distribution of Forest Land by Island . . . .. . . . . . . 32
3.1 Apparent Budgeting Subsidies/Taxes on PetroleumProducts ... . . . . . . . . . . . . . ..... . . . . 38
3.2 Retail Prices for Selected Petroleum Productsas of May 1980 . . . . . . . . . . . . . . ...... . . . 39
3.3 Composition of Subsidies on Petroleum Products, FY80 . . . . 403.4 Prices of Natural Gas ... . . . . . . . . . ..... . . 423.5 Domestic Coal Prices, 1980 . . . . . . . . . . . . . . . . . 433.6 Electricity Basic Tariff, 1980 . . . . . . . . . . . . . . . 46
4.1 Household Energy Demand, 1978 . . . . . . . . . . . . . . . 494.2 Comparative Lighting Fuel Costs . . . . . . . . . . . . . . 514.3 Comparative Cooking Fuel Costs . . . . . . . . . . . . . . . 524.4 PLN Installed Capacity - March 1980 . . . . . . . . . . . . 554.5 Growth of Captive Power in Indonesia . . . . . . . . . . . . 564.6 PLN's Investment Program (1980-1990),
Installed Capacity (MW) ............ .... 57
- iv -
P a; g e 1`
5.1 General Statistics on the Rural Sector . . . . . . . . . . . 605.2 Patterr, of Rerose Uses in Sample Villages
(West Java), 1977 . . . . . . . . . . . . . . . . . . . . 61J.J . UUmarLy o'. RU L dL LUII LJfi £LUI AZ L'.LLL
Surveys. . . . . . . . . . . 635.4 Consumption of Petroleum Fuels in Selected
Industries ... . . . . . . . . . . . . . . . . . . . . . 655.5 Relative Fuel Cost as Supplied 'Wholesale to Rural
Industries on Java, 1981 ... . . . . . . . . . . . . . . 67
6.1 Projected Need for Manpower, 1980-1990 . . . . . . . . . . . 81
Chart 1 Major Institutions in the Energy Sector . . . . . . . . . 83Chart 2 The Ministry of Mines and Energy . . . . . . . . . . . . 84
7.1 Indonesia: GDP and Energy Sector Investments . . . . . . . 86
INTRODUCTION
i. Indonesia is a major oil producer. Oil meets practically all the
commercial energy needs of the country while oil exports provide the revenues
f 4or most of its current an-d development expeen-ditures. However, the domnestic
demand for oil is accelerating while the oil available for export is declining.Th4o-ut* measures to offs-t this trend, Indonesia could soon find itself
short of the funds that are essential for supporting its economic and social
development. The Governent of Irndonesia (GOI) has already recognized theneed for action in the energy sector and has established an interministerial
group (BAKOREN), headed by the Minister of Mines and Energy, for developing anenergy policy, as well as an Energy Planning Unit for preparing energy plansLor the shILort, medium andu 'long term.
ii. in September 19080, the GOI 'nvited the WorLdU Banl to assess the
problems facing the energy sector; in particular to identify policy options,
analyze investment priorities, provide a framework for technical ass'stancein the energy sector and to advise them on institutional aspects. A recon-naissance misslon visiLteU Inuoesia iLn October/November 1780 anU left an
aide-memoire with the GOI. Following the GOI's response to this aide-memoire,
a follow-up mission visited indonesia in February/March 1981 to study theenergy subsectors and institutions in greater depth.
iii. During the course of this mission, discussions were held withofficials of the various Ministries of the GOT and the institutions/agencies
dealing with the different energy subsectors to ensure that the work of themission was directly focussed on the issues considered most urgent by the GOT.As a result, certain areas of the energy sector have received more attention
than others. The conclusions of the mission were discussed with the GO! in
October 1981, but there are still some areas in which recommendations will notbe possible until further studies are made. This does not in any measure
reflect on the importance or otherwise of the issues which have not beenstudied; it simply reflects the need for additional work. This report is,therefore, just one step in the continuing analysis of the multi-faceted
issues and options facing the energy policy makers in Indonesia.
iv. The major issues and recommendations of the mission are summarized
in the first part of the report. This begins with a statement of the energy
problem, followed by an overview of demand and supply. It concludes with adiscussion of energy pricing policies, the fuel options available to the
country, energy in the rural sector and energy sector institutions.
v. The body of the report starts by reviewing energy consumption trends,
particularly since 1970, and provides a tentative energy balance for FY79/80.Based on these trends and various assumptions about GDP growth, its sectoraldistribution and diversification of the energy base, preliminary indications
of likely future energy demand have been prepared for FY89/90 as well as forFY90/2000 using two scenarios. The first is based on a projection of thehistorical trends and the second on the likely impact of changes in policies
for demand management, conservation and energy export.

- vi -
v' L li r ep r t g s o toe ' u a t e 'L d O L- U -5 i -a - en L-- -- I -e - Ou r C -eV1. LILe LepuLL X gusui LU CVd1UdLt: £LIUU[IIt:id :: Cllt:Lgy L euuLCeS --
particularly oil and gas, coal, geothermal and hydro, and discusses futuresupply poi-cy issues. I't thIlen examies prLicing policy fLor oil prouucts,gas, coal and electricity and continues with a review of the options forinterfuel substitution and for providing enlergy in the rural areas, disLin-guishing between Java/Bali and the other islands. Institutions in the energysector are then discussed, focussing particularly on the need to strengtnensome of these. The final chapter of the report deals with the investmentrequired in the energy sector and the allocation of investment prioritiesamong the different subsectors.

- vii -
ISSUES AND RECOMMENDATIONS
I. The Energy Problem
i. Indonesia is a country richly endowed with energy resources and, as
is well known, a member of the Organization of Petroleum Exporting Countries,
but it is likely to face a severe energy problem in the near future comparable
to the problems faced in most oil-importing developing countries. The problem
arises because only one of its energy resources, oil, has been substantially
developed, and because oil plays such a vital role in the country's social and
economic development. Oil products meet over 80% of the country's commercial
energy needs. Net oil exports are financing practically all non-oil imports,
and oil revenues account for 70% of the Government's total revenues. Since
oil has been relatively cheap to develop, investment in energy has taken only
2% of the Gross Domestic Product which is low compared with other countries at
about the same level of GDP. Moreover, most of this investment has beencarried out by foreign private industry (with its associated technical and
administrative inputs) under production pricing contracts with the Government.
ii. As in most oil-exporting countries, there has, in addition, been a
Icheap oil' policy for domestic energy consumption. This has been implemented
largely by providing heavy subsidies on oil products, especially kerosene,diesel and fuel oil. Together with a GDP growth rate of 7.5%, this policy has
led to a very high growth of demand for oil products. Growth of domestic
demand for oil is now outpacing increases in oil production and oil exports
are showing a declining trend. If unchecked, this will continue to erode the
surplus of oil available for export and, even allowing for the expectedincreases in domestic production and world oil prices, will not only rapidlyreduce the contribution of oil to financing non-oil imports and Government
revenues but could also, within two decades, lead to Indonesia becoming a
substantial oil importer. Further, the subsidies on internally used oil
products, already accounting for 20% of the Government's budget, will increase
the burden. Thus, in a few years, the social and economic development objec-tives of the Government could be seriously jeopardized.
iii. Whereas the problem of most oil-importing developing countries is
to reduce oil imports, Indonesia's problem is how to ensure a continuationof netroleum exnort earnings. Although the problems differ the remedies in
both cases are remarkably similar in that a major part of the solution lies in
expanding oil nroduction and in develoning other indigenous energy sources in
order to substitute for the oil products used in the country. In the past, a
su1bstantial nart of the investment in the energv sector was devoted to meeting
the needs of the export market which accounted for nearly 62% of the totalenergy produced. Over the next twno decades, domestic energy needs will assume
increasing importance and a substantial part of anticipated investment in the
energy sector will be to meet these needs. While net energy exnort-s-can be
maintained at present levels (about 480 MBOE) during the current decade, witha decline in oil exports being compensated by increased exports of LNG, they
will almost certainly decline over the following decade. Indonesia is in the
early stages of it-s industrial development ar.d will require increasing amounts~aL ~L 0 La5
o 'JL LO .L±U UCUt ~ U V ~~jJUfl~LU aLLwJ~L
- viii -
of energy for meeting domestic needs. It wiii also continue to require theforeign exchange earnings that energy exports provide. Thus, the growth of
the energy sector is the key to tuture economic development. This, in itseif,implies that the level of investment in Indonesia's energy sector will have tobe increased substantially--fourfold in the next decade in real terms and a
further doubling in the following decade. Since much of this increase willhave to be carried out by the public sector, this further implies that majordecisions on national investment allocations will have to be made.
iv. Indonesia has many kinds of energy sources--oil, gas, hydro powersites, coal, geothermal resources and a large biomass potential, but except
for oil and gas, the exploitation of energy resources is in a relatively earlystage of exploration and development. The country has a multitude of options
available for energy development because of this diversified energy base.Indeed, it is the possibility of substitution among primary energy sources,and among individual energy products, that makes the task of the energy
planners in optimizing and achieving a balanced growth of the different energysubsectors a challenging one. Some of the interfuel substitutions can occurrapidly as, for example, a switch from kerosene to LPG in cooking. Otherchanges will occur more slowly as in the case of power generation where leadtimes are long. There are also other policy choices to be made regardingpricing strategies, for example, on the general level of energy prices, on the
relative prices of different fuels to stimulate interfuel substitution, on
prices to encourage production of specific indigenous resources, and on pricesto stimulate more efficient use of energy. There is also the need for conser-vation. For instance, nearly 17% of the energy produced is lost either intransformation or due to flaring; the value of gas flared in FY80 alone is
estimated at US$1.0 billion. These and other policy options need to becontinuously evaluated and appropriate institutional arrangements for nationalenergy planning as well as planning in the energy subsectors is essential.
v. In short, to alleviate its energy problem over the medium to long
term, Indonesia must soon embark on a series of important measures. Themission recognizes that with the country currently exporting substantialquantities of oil and not facing immediate balance of payments problems it maybe difficult to convince some decision-makers and the population at large ofthe need for these measures. However, as it will be several years beforethe necessary investments produce the various fuels in sufficient quantities,there is already an urgency to formulate and to begin to implement a national
energy plan. The mission therefore strongly endorses the recent establishmentof an interministerial group (BAKOREN) for developing an energy policy, and anEnergy Planning Unit for preparing energy plans for the short, medium, and
long term. Furthermore, the mission is impressed by the GOI's commitment, asexnressed in its recent statement of overall energy policy, to developing andimplementing plans to transform the country from an oil-based economy to onein which all Pnprgv rouiirnes are ontimally used in order to support Indonesia's
future economic and social development.
- ix -
II. Energy Demand
vi. Current per capita energy consumption is fairly low, although ithas grown rapidly over the last decade. It is estimated that the per capitaconsumption of total (commercial and non-commercial) energy is only about 2.2BOE, of which nearly 50% is from traditional fuels, namely fuelwood andagricultural wastes, and the rest from commercial energy sources. Oil and gasaccount for 98% of commercial energy consumption; the other 2% comes fromcoal. hvdronower and other resources.
vii. Per ranita ronsumntion of electricity is also low at 76 kWh (1980).Nearly 50% of the generation is in captive power plants, most of it in theindustrIal sector; and the other 50% is generated by the national Dowercorporation, PLN. Of the 57,000 villages in the country, only about 3,000 areplPrt-rified_ reflerting the total lack of access to electricity in most areas
of the country.
viii. The elasticity of commercial energy to GDP is high and was 1.59 forthe period l970-78. It is likely that this will not fall significantly overthe short and medium term, reflecting the growth in population of about 2.3%,the increased substitution of tradition-al fels byr commi a- al fls,l in the
household sector and the growing share of the industrial, transport andservice sectors in the economy. --- t4 14Coerral energy cntion is 1e1,oly tn
increase at an annual rate of about 12% up to 1990 and may increase at 10%subsequently. If so, the probable levels of future demand forn commercial
energy could be about 500 MBOE in 1990 and 1,300 MBOE in 2000, compared toa fi7gure or 1f . Vujr .n loan 16 MEIC.ese tent,at4ve estimates are baseda on currentL
consumption trends and therefore are firmer for 1990. The estimate for 2000£0 OpcLULativE, at-LIU, .Ln LO Lac may never maeLCLalieLCz UCeaUOC loln UCbefULG
demand rises to such a level, Indonesia would have become a net energy importer~LIU Lu[~e4UeI1iy w~y LUL UC a ULt: LU bUPPUL L CL high,1 CkeL1UEUWIUL UW LII La ~LCarldl consequently m1a-y Lr,ot be able to -upr -- hig economi grwt -rate.---
Because of this, the mission presents in Chapter 1 an alternative scenario for2000 which might be feasible if new policies Lor energy UdemandU management an,d
interfuel substitution are successfully implemented and if necessary organiza-t'Lonal an,d 'LnstiLtutLonal changes 'n the energy sector aLe madue. oth scenarios
underscore the need for action to improve energy supplies in the medium termthrough a rapid increase of iLnvestment irn the sector. The impact of demandillustrates the need to improve the data on energy consumption and to introduceformal demand analysis and projections. Indeed, this should be a prioritytask of the recently formed Energy Planning Unit. Chapter 1 provides anexplanation of the mission's tentative estimates and the ways in which thesecan be used to show the need for, and implications of, energy policy decisions.
-x-
III. Primary Energy Resource Development
ix. Indonesia appears to have substantial reserves of oil and gas in,
vast sedimentary basins yet to be explored, signficant deposits of coal with
inferred reserves in the billion of tonnes, and vast geothermal and hydro-
electric potential. In addition, it has a large biomass resource as nearly
64% of the land area is covered with forests. However, while substantialcompared to current levels of consumption, the energy resource base is rela-
tively small on a per capita basis and when compared to likely demand by the
end of the century. Moreover, most of the energy resources are located away
from the main population centers.
x. Before major decisions are made on the best way of moving away from
the massive dependence on oil for commercial energy, it is essential that much
more work be done to prove up the reserves of gas and coal and to firm-up the
potential of geothermal and hydro. Nevertheless, as the discussion in Chapter
2 shows, there are already some indications of the likely pattern of non-oil
primary energy resource development.
xi. Natural gas, though generally located away from the most populated
areas, can play a major role in meeting domestic energy demand not only as a
substitute for oil products, but also as a fuel for power generation. Most of
Indonesia-s natural gas reserves (85%) are not associated with oil production,
and exploitation for uses other than export has been constrained by low
producer prices and poor inter-institutional arrangements. The mission urges that
these policies be changed as they have led to the wasteful flaring of 30% of
the gas associated with oil production. In particular, the mission recom-
mends amendments to the petroleum production-sharing contracts to encourage
the use of gas which is now flared. With these changes the mission considers
that a doubling of production to 353 MBOE is possible by 1990. Inadequate
attention has been paid to natural gas liquids (NGL), which could increasefrom 32 to 80 MBOE by 1985 and there is a clear need for an evaluation of the
relative benefits of using these as a domestic extender for gasoline or as a
spike' for exported crude oil. Furthermore, LPG, which is currently produced
in the refineries and largely exported, and production of which could increase
fourfold by 1988 with the increase in investment in LNG trains, should be used
to replace kerosene in domestic uses because the future world price of LPG is
likely to fall relative to that of kerosene.
xii. Coal has been discovered over large areas in Sumatra and Kalimantan.
but more intensive geological surveys and delineation work is necessary to
upgrade the current figure of only 300 million tonnes for proven recoverable
reserves out of estimated reserves of over 10 billion tonnes. Very little
investment has one into coal expnloration and, given the magnitude of the
reserves likely to be established and the increasing role that coal is expected
to play in industry and power generation, there is a need to accelerate these
programs. While the mission supports the Government's policy of attracting
private industry into co-- exploration ar.d development, it recommends a
reduction in the time period allowed to potential developers either to make
their developmert commitments or to relinquish their concessions= It is
suggested that the Government consider financing the pre-development activities
itself andU tien put tLle areas up for bIs in order to speed up coal develoment
Even if this is done, however, the mission believes that there is likely to be
a shortfall in the domestic coal supply in relation to the future demand for
coal from industry and the electric power subsector.
- xi -
xiii. The mission also recommends that the work on proposals to develop
coal liquefaction and gasification projects be deferred as coal in the required
quantities is not lilkely to be available. Indeed, the mission considers that
not even preliminary studies on these proposals should currently be undertaken
as they will result in the diversion of scarce technical and administrative
manpower away from essential tasks in conventional energy development.
xiv. Geothermal potential is estimated at 10,000 MW but of this only
about 1, r Ml' 'as been i-4entified on a firm basis so far. Althouah a Volcan-
ological Institute has been set up in Bandung and some expertise has been
bult up in geothermal prospecting and evaluation at this Institute and at
PERTAMINA, adequate progress has not been made in prospect identification and
delineation due to irnadequate fundir.g and restrictive operating pr0cedures
Fortunately, over 50% of the potential is in Java, where it is needed most,Dut substantiLal drilling adiU expLoraLory work still has o be carried out to
firm-up the potential and estimate development costs. The mission also recom-
mends the establishment of a public sector agency under the control of the
Directorate-General of Power to encourage geothermal development, to oversee
private sector geothermal contracts, and to expLore for and develop LLLe geo-
thermal resources which do not attract private industry. The mission considers
that if these steps are taken, 400 M of geothermal power could be on stream
by 1990.
xv. The hydroelectric potential of Indonesia is estimated at 31,000
MW. However, only some 2,500 Mw is available on Java, and most of this has
been, or is being, developed. In the rest of the country, development of
hydro potential has received low priority due to the lack oi adequateLy
investigated projects, the long lead time required for construction of hydro
projects and the lack of a long term (15 to 20 years) plan for power uevelop-
ment. A separate hydro survey unit is being established within PLN to carry
out a study on Indonesia½s river basins, to evaluate the nydroelectric poten-
tial on a firmer basis and to build-up a shelf of projects. Once this is
completed it will be possible to assess the potential contribution of hydro
stations for both urban and rural electrification programs outside of Java.
xvi. None of the measures recommended above should detract from the con-
tinuing need to explore for, and develop, new sources of oil, both onshore
and offshore, or to ensure that the country s substantial biomass resources
(especially wood) are used in the most appropriate way. It appears that
recent oil production sharing contract terms have re-established the former
pace of oil exploration activity and should encourage further secondary
recovery activities. However, it is unlikely that annual oil production will
increase beyond about 700 million barrels unless massive new reserves are
discovered. In the areas outside Java/Bali, work is needed on the potential
use of logging and other agricultural residues for use as fuels and, especially,
on the means of transporting these wastes.
IV. Inter-fuel Options
xvii. The energy supply options open to Indonesia are discussed in Chapter
4 largely on the basis of the substitution possibilities of oil products
within the major energy consuming sectors. The key sectors are the household
sector (kerosene), the electric power sector (fuel oil and diesel), the
transport sector (gasoline, diesel and fuel oil), and the industrial sector
(kerosene, diesel and fuel oil).
- xii -
xvJiJ. Energy consumption in the household sector is basicall- for cookingand lighting. For cooking, fuelwood, kerosene and negligible quantities ofLPG are used arld f'or lighting, kerose,e and eLectriLiLty. Current household
use of kerosene is estimated at over 40 million barrels per annum and isexpected to rise rapidly as incomes rise. It is largely Lor this reason thatthe financial (and economic) subsidies on petroleum products have been growingso rapidly.
xix. Preparations should therefore be made, as a matter of urgency, forthe introduction of alternative fuels in the household sector. For cooking, astudy of LPG potential, including marketing and pricing, for replacing kerosenein urban areas and gradual market penetration throughout the whole of Java/Balishould be undertaken. This study should also review the technical and eco-nomic merits of substituting kerosene by methanol for cooking purposesas is being considered elsewhere. Whatever fuelwood is available from privatebackyards should continue to be used since this does not lead to deforestationand it has little or no economic cost. Charcoal is too expensive for useas a basic cooking fuel. For lighting, while LPG can be used in the short tomedium term to replace kerosene, the promotion of electrification of house-holds and specifically in Java/Bali, the longer term development of a nationalpower grid should be given consideration. Outside Java/Bali, while kerosenewould remain the major energy resource for lighting, use of LPG to replacekerosene should be considered as a longer term option.
xx. The industrial sector has three distinct categories of energy re-quirement: feedstock, motive power and heat. The largest use of hydrocarbonenergy in the industrial sector is as feedstock: petroleum products in re-fineries and petrochemicals, and natural gas in fertilizers, methanol andpetrochemicals production. Many of the existing plants in these industriesare not as energy efficient as the plants now being designed and there aresubstantial opportunities to increase energy efficiency by retrofitting. Inthe case of motive power, a vigorous effort is required by the Government toensure that reliable power is supplied by the national agency for power (PLN)and that the small diesel-based private generating plants on Java/Bali areretired. For heat requirements several alternative forms of energy are avail-able: oil products, primarily fuel oil, diesel and kerosene, gas, coal andfuelwood. The most obvious way of reducing the use of oil products in indus-try is the increased use of natural gas, although as long as domestic gasprices are far below the opportunity cost (as feedstock for LNG) there islittle incentive to promote production. As the pricing discrepancies areremedied over time, increased attention should be given to the developmentof a natural gas based industrial sector. This can only occur if gas trans-mission pipelines are developed to meet the needs of the large industrialplants, industrial estates and power stations. A corollary of this is thatattention should be given to locating industries within reasonable proximityof the energy resources used, especially natural gas. In some cases (suchas cement plants) the use of non-oil fuels (such as coal) could be made manda-tory. Attention should also be paid to developing the cogeneration potentialof lumber mills and large industrial plants on the other islands. Specialemphasis should be placed on reducing the diversion of kerosene into indus-trial use and one of the ways this can be achieved is by segregating kerosenemarketing from the marketing of other liquid fuels. In this regard, the Gov-ernment might consider as one option taxes on bulk transport and distributionof kerosene; together with distribution of kerosene only in 10 or 20 litercans for household purposes; this technique has worked well in other countries.
xxi. With the exception of negligible quantities of electricity used intLie ra'.lway subJsector, consufmptioni o0 enCergy 'n1 the transport sector is whollyconfined to petroleum products, principally gasoline and diesel, and some fueloil in inter-islanud shipping. Indeed, the transport sector is the Largestconsumer of oil products and is likely to continue to account for 30% of allcommercial energy consumption. The only possible alternatives to oil proUuctsare NGL, LPG and alcohol. With increasing production of natural gas, therewill be corresponding increases in the amounts of NGL, and, as noted abovethere is a need to assess the economic viability of using NGL as a substitutefor, or extender of, gasoline. LPG is a potential substitute for diesel aswell as for gasoline, but since it requires a spark-ignition engine it canonly be considered as a repiacement for diesei as part of a program forreplacing or adding to bus fleets with new engines. It is unlikely, given thepremium on land and the relatively high cost of producing ethanol, thatalcohol from biomass will prove to be a viable option as an extender of eithergasoline or diesel on a large scale in the near future. The mission considersthat there is no need to replace the fuel oil used in inter-island shippingand some industries, largely because this is probably the most effective wayof utilizing this product which is inevitably produced by the refineries andfor which it is desirable, on technical grounds, to maintain a reasonablelevel of demand. On a broader front, the longer term potential for energydemand management in transport, including widespread railway electrificationand urban public transport systems, as well as changes in transport modesparticularly on Java/Bali, needs to be analyzed. The automobile industry canbe encouraged to concentrate more on the production of fuel efficient vehicles.
xxii. The strategy for the development of the power sector is consistentwith the GOI's energy policy to diversify from oil-based generation and usegeothermal, natural gas, coal and hydro resources. Much emphasis is beingplaced on the development of domestic coal as a fuel for power generation,but, as already mentioned, unless a vigorous exploration effort is initiated,coal may not become the expected backbone of the electric power sector.Indeed, the uncertainties associated with coal development are such thatmulti-fuel-fired plants (coal/gas/oil) should be planned whenever possible.In line with this, feasibility studies should also be done on the alternativesof gas pipelines, coal transport, and electricity transmission from mine-headplants to load centers not only on Java and the other major islands butalso between islands, especially Sumatra and Java. Geothermal and hydrodevelopments have already been mentioned; in the short run the rapid develop-ment of geothermal resources on Java/Bali for base load appears to be essen-tial, while for peak load service hydroelectric power stations should beplanned after the necessary resource identification effort.
xxiii. BATAN, the national agency for atomic energy, had originally consi-dered commissioning a number of nuclear power stations, but given the potentialfor gas, coal, geothermal and hydro in the medium-term and the lower cost ofpower from these sources, the mission agrees that it would be prudent to defercommitment to a large program until more information is available on competingenergy resources. Plans can however be made for the installation of a singlecommercial-size nuclear power plant in order for the country to gain experiencein nuclear technology and have this option available for the longer term.
- xiv -
xxiv. For smaller power plants, especially on the other islands, greaterefforts at supplementing diesel-based generators will be required. Bothwood-based thermal (including gasification) and mini-hydro generators could bedeveloped; these would equally provide a basis for possible future connectionsto grid systems. On Java, where there is already an emerging grid, themission recommends that consideration be given to using this grid system toserve the rural areas in the longer term.
V. Energy in the Rural Sector
xxv. The mission recommends (in Chapter 5) that the special energy needsof the rural areas be met in different ways on different islands. In partic-ular, since it is increasingly difficult to distinguish between the urban andrural areas on the densely-populated islands of Java and Bali, provision ofenergy to rural areas on these islands should be an integral part of the supplysystem to urban areas. This is possible because there is already widespreadcommercialization of energy on Java/Bali, even for traditional fuels such aswood, although the availability of these traditional fuels appears to bediminishing rapidly. Thus, the recommendations made above on the fuel optionsfor households, industry, transport and electric power are appropriate forthe rural areas of Java and Bali. For rural, small-scale industry on theseislands (75% of total small-scale industry) the provision of energy is espe-cially important because, although it accounts for only a small proportion ofmanufacturing activity it represents a substantial proportion of employment.It is estimated that nearly 1.2 million small-scale enterprises are scatteredthroughout the rural areas of Indonesia, providing up to 80% of total employ-ment in the manufacturing sector, but contributing only 12% of gross outputand 14% of total value added to manufacturing. The productivity of theseenterprises could be improved greatly by providing them with easy access toelectricity.
xxvi. Very little commercial energy is being used in agriculture today, butthis is likely to change in the coming years as animate power is replaced bymechanical power in many farming operations for increasing agriculturalyields. While this has not been taken into consideration in the mission'stentative energy demand forecasts, it should certainly be a factor in theforecasting work of the Energy Planning Unit.
xxvii. On the other islands rural energy needs for household cooking andindustry can be largely met by fuelwood. or, possibly, by charcoal and/orgas produced from wood or rice husks. Where kerosene is currently used forlighting it may well continue to be the most economic option unless thetransport and distribution of LPG as a substitute proves to be competitive.It is especially important on the other islands to establish a strong organ-ization for planning and implementing rural energy programs. To this end, themission recommends that a Rural Energy Policy Coordinating Task Force beestablished within the Energy Planning Unit.
VI. Pricing and Subsidies
xxviii. The mission considers that current petroleum product pricing is amajor constraint to the Government's stated policy of replacing oil by otherindigenous energy resources. This pricing policy is characterized by massive

- xv -
financial (and economic) subsidies on almost all petroleum products
which, in addition to the fiscal strain on the Government's budget! is provid-
ing a clear disincentive to potential producers of non-oil resources and is
encouraging the ranidly growing use of netroleum products (sometimes wastefully)
rather than other fuels. The oil products subsidies are dominated by one
product, kerosene, accounting for about 50% of the economic subsidy. As
kerosene can be substituted for diesel in the transport sector and for fuel
oil in the industrial sector, these two fuelLs are also subsidized. Indeed,
if it were politically fea,sible to remove the subsidy on kerosene, many of the
other problems relating to energy product pricing would automatically be
solved.
xxix. The rationale fcor the subsidy on kerosene has been that it replaces
the fuelwood used for cooking and this prevents deforestation and heLps the
poorer households. This cibjective is of relevance only on Java/Bali because of
the ample supply of fuelwood elsewhere. In Tava/Bali, the kerosene subsidy
seems to have been effective in replacing the use of fuelwood except for thepreva'Lence of backyard wocUl.ots which is the most economic way of providin-
cooking fuel, even in comparison with subsidized kerosene. The removal of thekerosene subsidy, if accompanied by measures to further stimulate backyard
woodlots and alternate fuels (as discussed in Chapter 4) would be desirable,especially as the benefit of the present subsidy has gone more to the affluenthouseholds than to the poorer households. There is also evidence that kerosene
is being UdvertedU to industrial use, including thle cement indutry, as the
price differential between kerosene and fuel oil makes it profitable to do this.
xxx. The mission supports the Government's stated policy of eventually
withdrawing subsidies while recognizing the difficulties inherent in this
process. The discussion of energy pricing in Chapter 3 therefore takes into
consideration not only the opportunity costs of different energy ULorms but
also the possibility of lower market prices for some products, particularly
LPG which is a direct substitute for kerosene. If the segregation ofr kerosene
marketing, as suggested earlier, is achieved, there would be little need for
subsidies on other liquid fuels except those designed to help the poor, or
promote specific regions or industries. In such cases, subsidies should be
rearranged so as to ensure that they reach those for whom they are designed.
xxxi. With respect to natural gas, the mission recommends that in all
areas where non-associated gas exists, the producer price should be put at
its opportunity cost as LNG feedstock to stimulate the production of gas for
indigenous use. The government may in some cases consider that a lower
producer price may provide sufficient incentive and therefore tax the differ-
ence between the price and the opportunity cost. To promote the use of gas,
subsidies on the retail price of gas may be required until the subsidies on
competing fuels, especially fuel oil and coal, are removed, but efforts should
be made to shift the subsidies 'downstream' whenever possible (e.g., to the
retail price of fertilizer in the case of gas and the prices of inter-island
shipping in the case of fuel oil). Where gas is associated with oil produc-
tion, and especially where the gas is currently flared, use of the gas can be
encouraged by using a pricing formula based on its marginal cost of production,
transmission and distribution in petroleum production-sharing contracts.
- xvi -
xxx 1i i. In' ' L LILh respectL Lto coalL, the principle of priJc.ing on the bIasUis ofU th.Leopportunity cost of importing an equivalent fuel has been accepted by thegovernment andU the m'issiLon supports this principle.
Xxxiiti. Th1_e m'ssion a'so supports the recenLt adoption byILN feetiA.AAIIL. Lil UIL bLUI.LUb~LL L [Li LCCI UUPL.ULL uy ruN 01 t.!1LCLL1C1LY
tariffs reflecting long-run marginal costs, although regular revisions areessential as tnese costs chRange. Further cnanges are also required in thetariff structure, especially important are increases in the tariffs for mediumand high voltage users. Moreover, the policy of uniform tariffs across thecountry should be reconsidered once the long-run marginal costs of electricitysupplied outside Java can be estimated.
xxxiv. Energy prices and subsidies have to be viewed in the context of aneed for demand management and efficient interfuel choices in the long term.It has to be ensured that the present pricing policies do not distort futureconsumption and demand patterns and become counter-productive to energypolicies. As Indonesia diversifies its energy base, and as opportunities forinterfuel substitution become more and more possible, it is essential thatcomprehensive pricing policies be evolved and that they cover all of theenergy subsectors.
VII. Institutions
xxxv. The GOI has already recognized the need for developing and implement-ing a national energy policy to support Indonesia-s economic and socialdevelopment. As a first step, an Energy Planning Unit has been establishedin the Office of DG of Power. The GOI has also established an interministerialgroup, BAKOREN, headed by the Minister of Mines and Energy for developingan energy policy and ensuring its implementation. There is a need to strengthenthe planning unit and also to place it in the Office of the Minister of Energyand Mines so that it can effectively coordinate with all the Directoratesdealing with energy. Chapter 6 indicates the major terms of reference of thisunit.
xxxvi. Among the many studies recommended in this report, some should becarried out urgently to provide policy options to BAKOREN. These include:
(a) Developing (on the basis of planned GDP growth and its sectoraldistribution) energy demand forecasts and a series of alterna-tive plans over 5, 10 and 15 year periods for meeting this demand;
(b) the feasibility of using LPG to meet the cooking and lightingneeds of the household sector;
(c) alternative transport for energy, including coal shipments, elec-tricity transmission from mine-head plants and natural gas pipe-lines to planned and projected thermal power stations, especiallybetween Sumatra and West Java.
(d) the economics of the complete electrification of Java/Bali as alonger term substitute for kerosene in lighting taking into accountthe income e-lnt-icitv of kerosene in thiq case;
- xvi i -
(e) the feasibility of wood gasification plants on the other islandsto run stationary engines for power generation to meet isolatedloads; and
(f) a marketing strategy for kerosene, especially segregation of itsdistribution system from other petroleum products.
These studies are in addition to studies already proposed for (a) utilizationof flared gas; (b) city gas distribution systems; and (c) LPG marketing. Forthe medium term, studies to assess the potential of geothermal and hydro arerequired, while a similar effort is required for coal in addition to thepreparation of a rational coal policy.
xxxvii. The success of such an ambitious energy program will depend onthe strength of the relevant national agencies or institutions. These arePertamina in the case of oil and gas, PLN in the case of electricity, PNBatubara in the case of coal, and BATAN for nuclear power. The missionconsiders that geothermal development may proceed at a faster pace if aseparate agency is formed for it. Most of the institutions in the energysector still require strengthening, particularly PN Batubara. In view ofthe wide diversity of its operations, some structural changes may be desir-able in the case of Pertamina.
xxxviii. The major constraint for an ambitious energy program, however, isnot the institutions themselves, as the higher echelons of management of theseinstitutions are indeed very competent, but the availability of a cadre oftrained geologists, engineers and scientists for all these energy subsectors.These people are simply not available in sufficient numbers, and steps shouldbe taken to assess the trained manpower needs of the various energy organiza-tions and to increase the enrollment at the universities/technical institutesaccordingly. In the short term, it may be necessary to increase the scope oftechnical assistance schemes in all areas where such shortages are felt.
VIII. Investment
xxxix. The energy requirements of Indonesia will rise rapidly over thenext two decades and will require a maior increase in investment in all theenergy subsectors, most importantly in the power subsector. Public sectorinvestments are expected to rise from a current level of about US$1.25 billionto over US$10 billion by the turn of the century in 1980 prices. As a percent-age of GDP. these investments in the energy sector are expected to rise from2.1% in 1980 to 3.9% in the year 2000. On a cumulative basis, they couldamount to about USA38 billion in the current decade alone. The oil and gassector alone would account for nearly 50% of these investments, and the powersector for nearly 45%. While the mission recognizes that investment in theoil and gas sector should continue to have the highest priority, because oiland gas are exnected to meet most of the demand for commercial energv overthe next two decades, a crucial part of the investment program is the US$350mTillion reqaiire for siurveys and the delinestion of coal, hydro and geothermalresources.

CHAPTER 1
£~LlJ~1xu. L .AJ1AO.Uk1rl I £JN LiJUlu Er ) L.?ij) L~ r'u I r UI\ JEI±11'U4J
Background
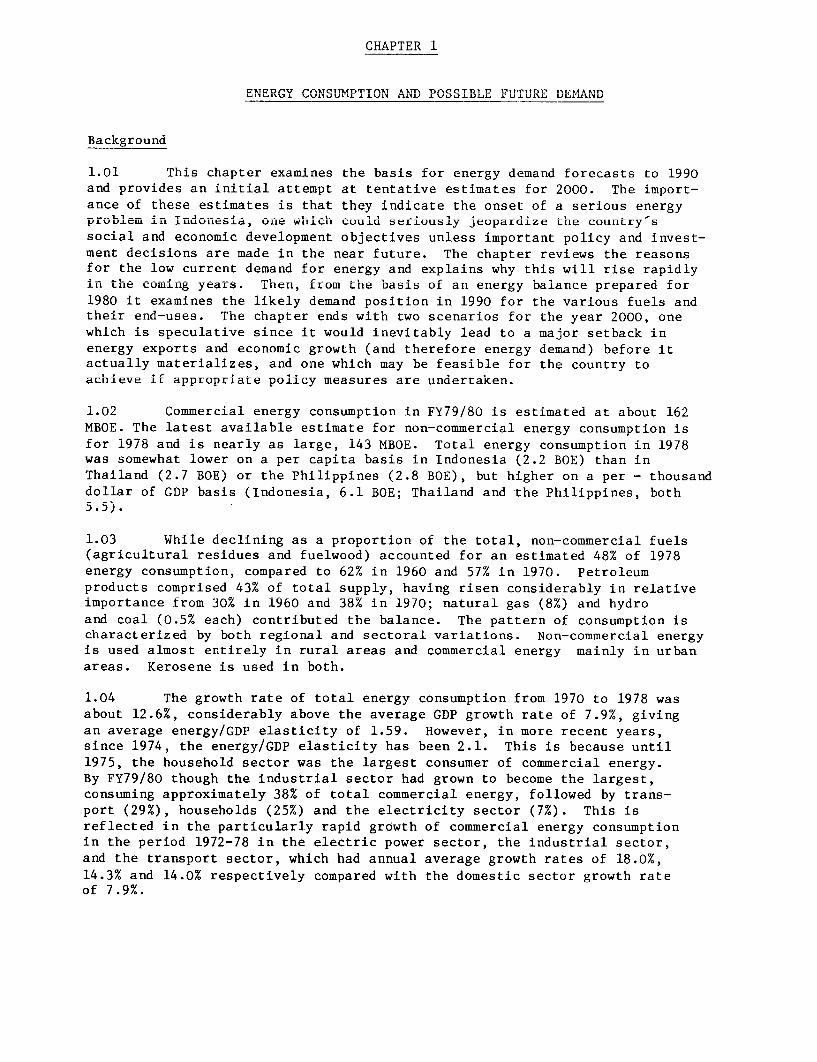
1.01 This chapter examines the basis for energy demand forecasts to 1990and provides an 'nitial attempt at tentative estimates for 2000. The import-ance of these estimates is that they indicate the onset of a serious energyproblem in IndonLesia, one which could seriously Jeopardize tne country ssocial and economic development objectives unless important policy and invest-ment decisions are made in the near future. The chapter reviews the reasonsfor the low current demand for energy and explains why this will rise rapidlyin the coming years. Then, from the basis of an energy baiance prepared for1980 it examines the likely demand position in 1990 for the various fuels andthleLr eIIU-uses. The chapter ends with two scenarios for the year 2uuu, onewhich is speculative since it would inevitably lead to a major setback inenergy exports and economic growth (and therefore energy demand) before itactually materializes, and one which may be feasible for the country toachieve if appropriate policy measures are undertaken.
1.02 Commercial energy consumption in FY79/80 is estimated at about 162MBOE. The latest available estimate for non-commercial energy consumption isfor 1978 and is nearly as large, 143 MBOE. Total energy consumption in 1978was somewhat lower on a per capita basis in Indonesia (2.2 BOE) than inThailand (2.7 BOE) or the Philippines (2.8 BOE), but higher on a per - thousanddollar of GDP basis (Indonesia, 6.1 BOE; Thailand and the Philippines, both5.5).
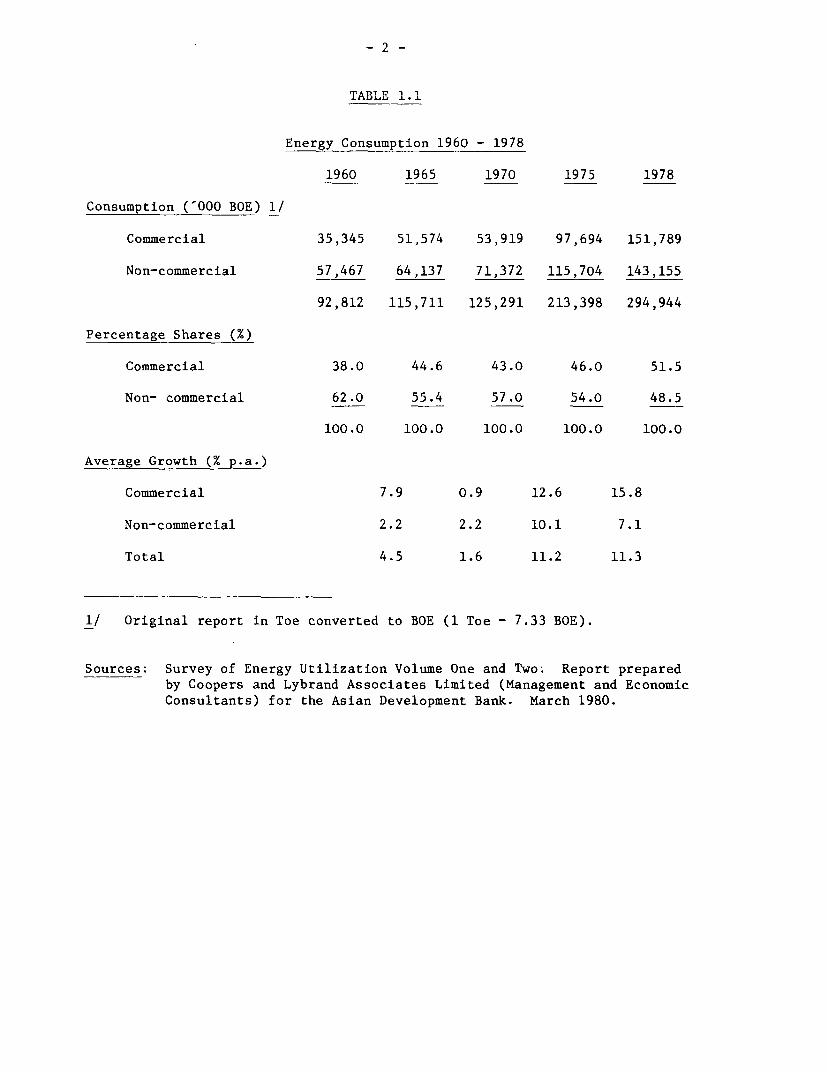
1.03 While declining as a proportion of the total, non-commercial fuels(agricultural residues and fuelwood) accounted for an estimated 48% of 1978energy consumption, compared to 62% in 1960 and 57% in 1970. Petroleumproducts comprised 43% of total supply, having risen considerably in relativeimportance trom 30% in 1960 and 38% in 1970; natural gas (8%) and hydroand coal (0.5% each) contributed the balance. The pattern of consumption ischaracterized by both regional and sectoral variations. Non-commercial energyis used almost entirely in rural areas and commercial energy mainly in urbanareas. Kerosene is used in both.
1.04 The growth rate of total energy consumption from 1970 to 1978 wasabout 12.6%, considerably above the average GDP growth rate of 7.9%, givingan average energy/GDP elasticity of 1.59. However, in more recent years,since 1974, the energy/GDP elasticity has been 2.1. This is because until1975, the household sector was the largest consumer of commercial energy.By FY79/80 though the industrial sector had grown to become the largest,consuming approximately 38% of total commercial energy, followed by trans-port (29%), households (25%) and the electricity sector (7%). This isreflected in the particularly rapid growth of commercial energy consumptionin the period 1972-78 in the electric power sector, the industrial sector,and the transport sector, which had annual average growth rates of 18.0%,14.3% and 14.0% respectively compared with the domestic sector growth rateof 7.9%.
-2 -
TABfLI I 1
Energy Consumption 1960 - 1978
1960 1965 1970 1975 1978
Consumption ('000 BOE) 1/
Commercial 35,345 51,574 53,919 97,694 151,789
Non-commercial 57,467 64,137 71,372 115,704 143,155
92,812 115,711 125,291 213,398 294,944
Percentage Shares (%)
Commercial 38.0 44.6 43.0 46.0 51.5
Non- commercial 62.0 55.4 57.0 54.0 48.5
100.0 100.0 100.0 100.0 100.0
Average Growth (% p.a.)
Commercial 7.9 0.9 12.6 15.8
Non-commercial 2.2 2.2 10.1 7.1
Total 4.5 1.6 11.2 11.3
1/ Original report in Toe converted to BOE (1 Toe - 7.33 BOE).
Sources: Survey of Energy Utilization Volume One and Two; Report prepared
by Coopers and Lybrand Associates Limited (Management and Economic
Consultants) for the Asian Development Bank. March 1980.
-3-
1.05 A further characteristic of the Dattern of commer^cial energy consnmp-tion has been the growing dependence on oil as the major commercial source ofenergy. The industrial e.ctor- whirh relied on oil for ahouit 5Q9 of its
commercial energy requirements in 1969 increased its reliance to 70% in 1977,while dependence on oil in the ele.tricity se.tor rose from ART to 86%L over
the same period. There were relatively small increases in installed hydro-Dower caDacitv. a decline in rnnl nrodnirtion nnd a marginal inc^rease in theconsumption of natural gas, from about 10.5% to 11.3%, which was used primarilyas feedstork for fhli fert-ili7r 4ndat-ruy.
1=06 While the general pattern of energy demand growth as sketchedabove is reasonably clear, the energy data available to the Government donnt nprmit a dAtailad ar.alysi of the high growth rate of commercial energyconsumption and the energy/GDP elasticities. Such an analysis is essentialfor constructing estImaates of future demand growth. Indeed, the missionconsiders that a priority task of the recently formed Energy Planning Unitshould be the establishment of a firm and consistent data base from whichanalysis and projections can be made.
Petroleum Products
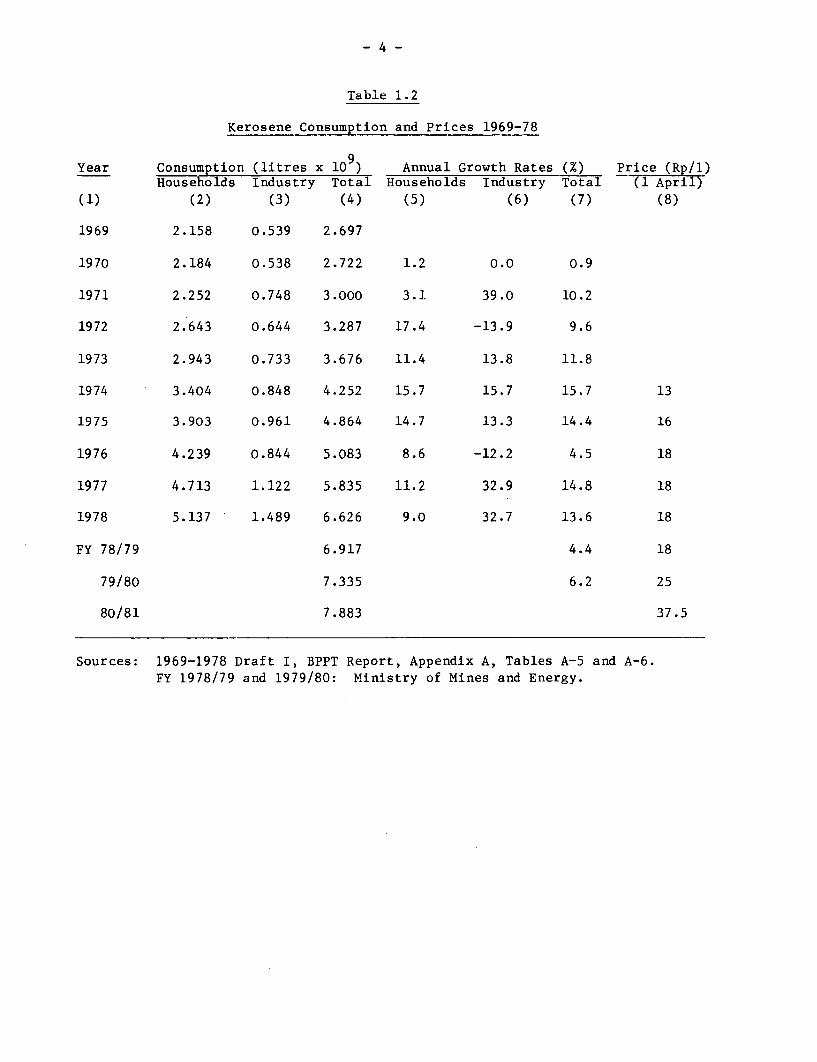
1.07 Between 1969 and 1979 consumption of petroleum products increasedat an annual average rate of 15.2%. Kerosene has remained the sirLgle largestcontributor although in relative terms it has decreased from 42% of totalconsumption in 1969 to 33%O in 1979. Automotive diesel (26%), gasoline (17%/),fuel oil (15%), industrial diesel oil (6%) and aviation fuel (3%) contributedthe balance in 1979. Automotive diesel fuel has shown the highest annualaverage growth rate (21.5%) followed by aviation fuel (16.0%). The growth inkwerosene consumptiOn halas, IhVWUVet, Vdaried UVe Llle perlod ana nas Deen cnarac-terized by lower than average growth rates in the past two years (Table 1.2).
- 4 -
Table i.2
Kerosene Consumption and Prices 1969-78
Year Consumption (litres x 10 ) Annual Growth Rates (%) Price (Rp/1)Households Industry Total Households Industry Total (1 April)
(1) (2) (3) (4) (5) (6) (7) (8)
1969 2.158 0.539 2.697
1970 2.184 0.538 2.722 1.2 0.0 0.9
1971 2.252 0.748 3.000 3.1 39.0 10.2
1972 2.643 0.644 3.287 17.4 -13.9 9.6
1973 2.943 0.733 3.676 11.4 13.8 11.8
1974 3.404 0.848 4.252 15.7 15.7 15.7 13
1975 3.903 0.961 4.864 14.7 13.3 14.4 16
1976 4.239 0.844 5.083 8.6 -12.2 4.5 18
1977 4.713 1.122 5.835 11.2 32.9 14.8 18
1978 5.137 1.489 6.626 9.0 32.7 13.6 18
FY 78/79 6.917 4.4 18
79/80 7.335 6.2 25
80/81 7.883 37.5
80ources: 1969=197t BPT Report, Ap p Adx A s A-5 -.A A-6.
FY 1978/79 and 1979/80: Ministry of Mines and Energy.
1.08 Kerosene: Although the household sector consumes most of the
kerosene, there is also apparently 1l a large and rapidly increasing level of
kerosene consumption in the industrial sector (see Table 1.2). For the period
1971-78, the average annual growth rate of kerosene consumption by households
was 13%, with industrial consumption increasing at a much higher rate in most
years. In-dustrial coLsumptiLon Lhas average approximately t001 of total consump-
tion. A comparison of growth trends and official wholesale prices suggests
that price increases reduce kerosene conusumption significantly-.
1.09 Automotive diesel accounted for approximately 26% of all domesti.
sales of petroleum products. Growth in demand for automotive diesel has
been even greater than kerosene. The high growth rate reflects, in part,
the substitution of gasoline in both the private trucking industry and the
private and public urban and inter-urban passenger transport sector. Of
course, the rapid increases in the consumption of both diesel and kerosene
have been encouraged by the very high subsidies on these commodities, whose
retail prices are currently about 20% to 30% of world prices.
1.10 Other petroleum products including gasoline, fuel oil, industrial
diesel and aviation fuel account for the other 41% of total petroleum productconsumption. Gasoline and aviation fuel are used exclusively in the trans-
port sector, fuel oil in the transport (42o%), industrial (33/o) and electricity(25%) sectors, and industrial diesel in the transport (18%), industrial (80%)
and electricity (2%) sectors.
1.11 The high growth rate in product demand has placed increasing strains
on the present operations of the domestic refinery sector, causing imbalances
which have resulted in the increased import of petroleum products, particularly
for the middle distillates such as kerosene. There are serious structural
problems in the refinery sector which require urgent attention. Due to the
quality of some of the crudes, capacity limitations and the lack of conver-
sion capacity, there is a very substantial imbalance between the domestic
demand for petroleum products and refinery output. In 1980/81, domestic
refineries, which have an effective capacity of 465,000 BPD, could supply only
215,000 BPD of petroleum products for domestic consumption. This is equiv-alent to 53% of total demand. On the other hand, a substantial proportion of
their output was in the form of heavy residues which had to be exported at a
relatively low price.
Coal
1.12 Consumption of coal declined steadily between 1940 and 1973 from
2 million tonnes per annum to 150,000 tonnes per annum. This was largely
due to the switch from coal consumption by the major sectoral consumers,
industry and power, to oil. In the past, low prices for oil products made
it uneconomic to use coal. Thus, by the mid 1970's coal accounted for a
negligible proportion of commercial energy demand. Current domestic consump-
tion of coal is estimated at 130,000 tonnes of which approximately 110,000 is
consumed in the industrial sector and the rest in the transport sector.
1/ The available data are not consistent with respect to kerosene consump-
tion. For example, MOME reports allocate all kerosene consumption to
the household sector, whereas BPPT and BPS (see bibliography) document
consumption in both the household and industrial sectors.
-6-
Naturall Gas
1.1,~~~ ~~~ Dmsi ,smtoof natural gas has been restricted to theL_ D~ tomestLct co)insumptLion'U naua a o,,I .sr~, ~ -O L..S L
industrial sector and in FY79 amounted to 132 billion SCF. The fertilizer and
stee.L L LIUustries were the largest consumers, cwn.Ain..smire RO bl fl u S -a.
34 billion SCF respectively. Use by local industries has grown at an averagean.-,ual rate ofL 22%1 since 19-75 Jrznd in FY-70 was 480 billi1on SCF.
Electricity
1.14 Per capita e'LectrlL.Cty corsumptLion in LInudonesia is amor,g th Ile 'lowestin Asia at 76 kWh (1980). Electricity consumption, as for all forms of energyconsumption in Indonesia, is fragmented, and regionally a,nd sectorally differ=-entiated with only 6% of total households having access to electricity. How-
ever, there are wide variations in the regional distriDution of eleCtriCity.
For example, about 10% of Java households have access to electricity compared
with Sumatra (4.3%), Kalimantan (5.0%) and Sulawesi (4.2%). Per capita con-sumption of electricity in the household sector is highest on Java (48 kWh)compared with Kalimantan (23 kWh), Sumatra (22 kWh) anrd Sulawesi (19 kWh).
Over 80% of total public supply is concentrated on Java. Electricity consump-tion has grown from a low base of about 20 kWh per capita in 1970 at a rapidrate of 11.3% per annum.
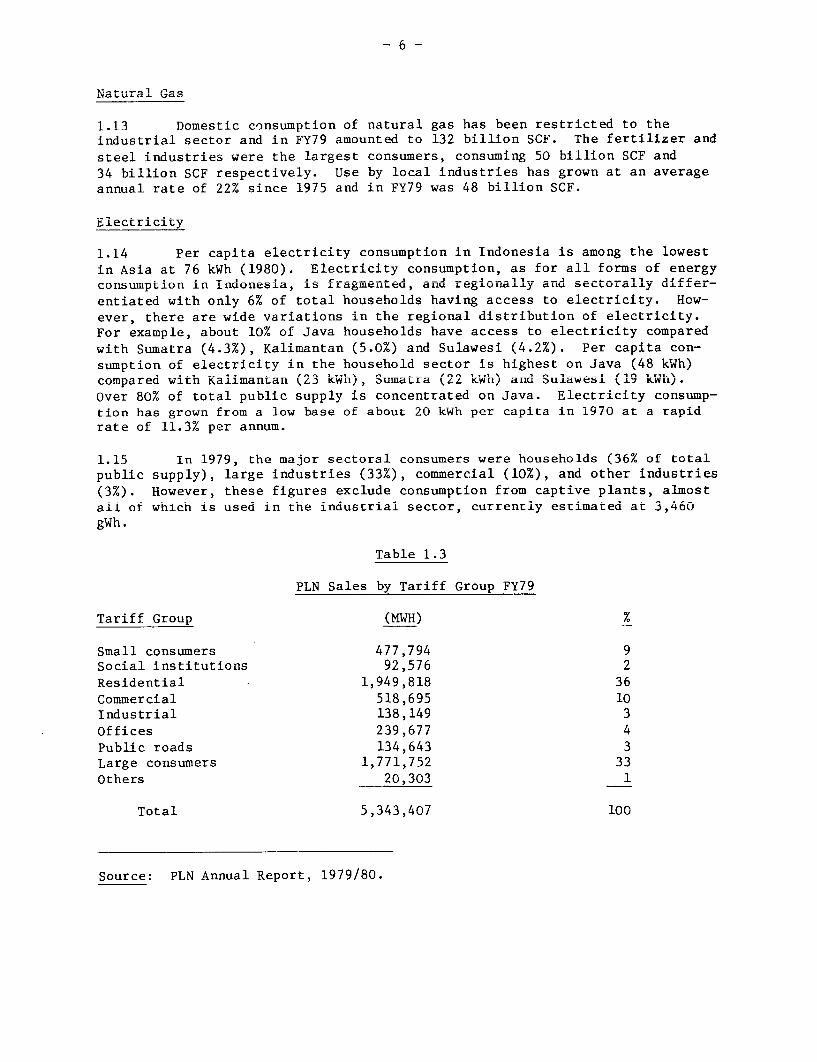
1.15 In 1979, the major sectoral consumers were households (36% of total
public supply), large industries (33%), commercial (10%), a-nd other industries
(3%). However, these figures exclude consumption from captive plants, almostall of which is used in the industrial sector, currently estimated at 3,460gWh.
Table 1.3
PLN Sales by Tariff Group FY79
Tariff Group (MWH) %
Small consumers 477,794 9Social institutions 92,576 2Residential 1,949,818 36
Commercial 518,695 10Industrial 138,149 3
Offices 239,677 4
Public roads 134,643 3Large consumers 1,771,752 33
Others 20,303 1
Total 5,343,407 100
Source: PLN Annual Report, 1979/80.
-7-
Commercial Energy Balance FY79
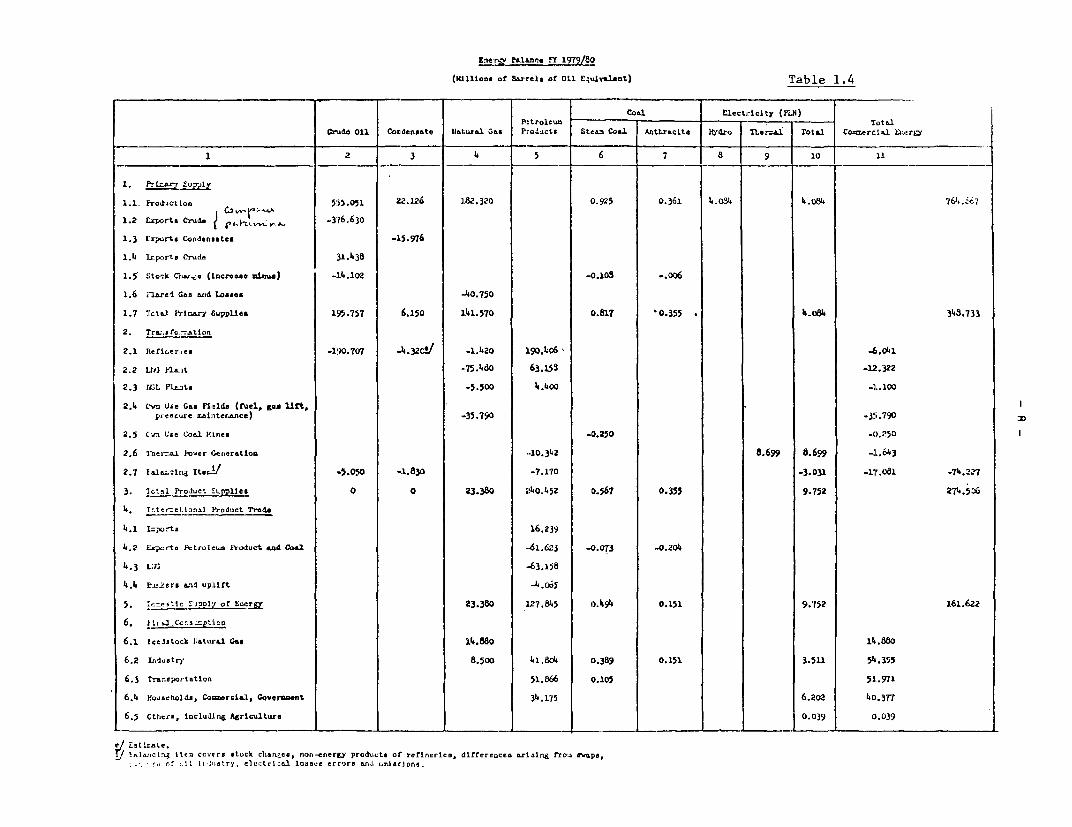
1.16 An energy balance has been prepared for FY79 (Table 1.4). Primaryenergy production for FY79/80 is estimated at 765 MBOE. Energy imports were48 MBOE and exports 522 MBOE (including crude oil, products, LNG and bunkers)with net energy exports at 474 MBOE. The remaining 291 MBOE was used in thedomestic economy: 162 MBOE for end use consumption, 74 MBOE for transformationlosses, 41 MBOE for flared gas and losses, and the other 14 MBOE for "stockchanges". Annex I gives a detailed breakdown of the energy balance togetherwith a commentary on the methodological approach used, the data problemsencountered and the assumptions made.
1.17 Net exports of primary energy supplies and products account for62% of gross energy production. Natural gas losses, flaring, transformationlosses and "unaccounted" account for 17%, leaving 21% (approximately 161MBOE) for domestic consumption. The final demand for energy shows thatindustry is the largest consuming sector (69 MBOE including feedstock) withtransport and households following (52 MBOE and 41 MBOE respectively). Theenergy balance for FY79 has been used as the base for tentative demand projec-tions to 1990 and two alternative and even more tentative projections to 2000.
Likely Demand to FY89
Background
1.18 The projections of commercial energy consumption in Indonesia forFY89 based on sectoral energy demands (which are explained in the Annex) imnlvan overall growth rate of almost 12% during the 1980's. The assumed averagereal GDP growth durinR this period is 8.2% giving a ratio of energy growth toGDP growth of 1.46. The rapid growth assumed in commercial energy consumptionis based on a number of factors: the increases, from low bases, in the growthof the industrial and electric power sectors; increasing demand in the trans-port sector, and, with rising incomes; the continued substitution of commer-cial for non-commercial energy. In these projections, the potential impact ondemand of changes in energy prices has not been taken into account-
The Domestic Demand for Petroleum
1.19 The demand for petroleum nroduicts is likely to grow at an annualrate of 10.9% during the 1980's, with particularly rapid growth in industrialsector consumption (12.9%).
E-neirV?& Lnne FY 1979/80
(4aLmlonm of B&rrels of 011 Equivrlatit) Table 1.4
F:troleur Coa L Elect]ricity (PAN)Petroleum- Total
Crudo Oil Condensatep tlatal c4s Pro4ucts Steac CoMA AntLtrcite iWrdro TLer-&i1 Total Coneercial 1L ,rgy
1 2 3 4 5 6 7 8 9 10 11
1. u;rply .
1.1. iro&ict Lon C.3 555.051 22.126 182.320 O 925 0.361 4.0S4 4.034 764._7
1.2 Ixports Crud. e t -376.630
1.3 Exports Condensates -15.976
1.4 ILrport Crude ii.1438
1.5' ito"k Chw.ue (Lncronoe Wmu -14.102 -0.108 -. 006
1.6 .laret Gas aid Losaes -40.750
1.7 lTct.l PnL ar 7 lpp1aes 195.757 6.150 1141.570 0.817 0.355 *.08i4 343.733
2. T- 1 Aratlon
2.1 RefrLerles -190.707 -4.32C!/ -1.420 L90.k06 .6.041
2.2 11U) k1wit -.75.460 63.153 -1!.322
2.3 lt PIzfts -5.500 14.400 -1. 100
2.4 Cvn Use Gas FlYild. (fuel, gaA Lift,prer u.re aainterance) -35.790 -35.790
2.5 Co.n Uce Coal MInes -0.250 -_.250
2.6 Tber-&l Icuer Gerneration -10.342 8.699 8.699 1.6143
2.7 EL&1"Tin Itce t *-5.050 -1.8330 -7.170 -3.031 -111.o8i -74.2Z7
3. iGtal Proluct ,r cpplleem 0 0 23.380 240.452 O.567 0.355 9.752 2714.536
4. lter-etloaal IProduct Trade
4.1 I=ports 16.239
4.2 Espcrts Btroluu Product &a4d Coal -61.623 -0.073 -o.204
4.3 L:r, .63.158
4.4 E,m>err e.id upLlt -4.065
5. I-cStlc !-jvlr of EnI_ 23.380 127.845 .1)4>94 0.151 9.752 161.622
6. jIr al cs .R.'oO
6.1 Itelutoch I:at.u-l Gas 14.880 lb.d80
6.2 Imm-stry 8.500 41.8oO4 o.389 0.151 3.5 i 54.355
6.3 rarnsportation 51.866 0.105 51.971
6.4 Y!ouseholdi, Cocrnercial, Goverument 34.175 6.202 40.377
6.5 Cthcra, Including Agriculture 0.039 0.039
e/ Lsticate.1/ 1.1-ucl., Item coo.rr itock chantes. non-energy products of refineiriea. differences arialng froo esaps,
.- r (.11 H ,r,mtry, clcctrleal loa.,ce error, anil onmlslono.
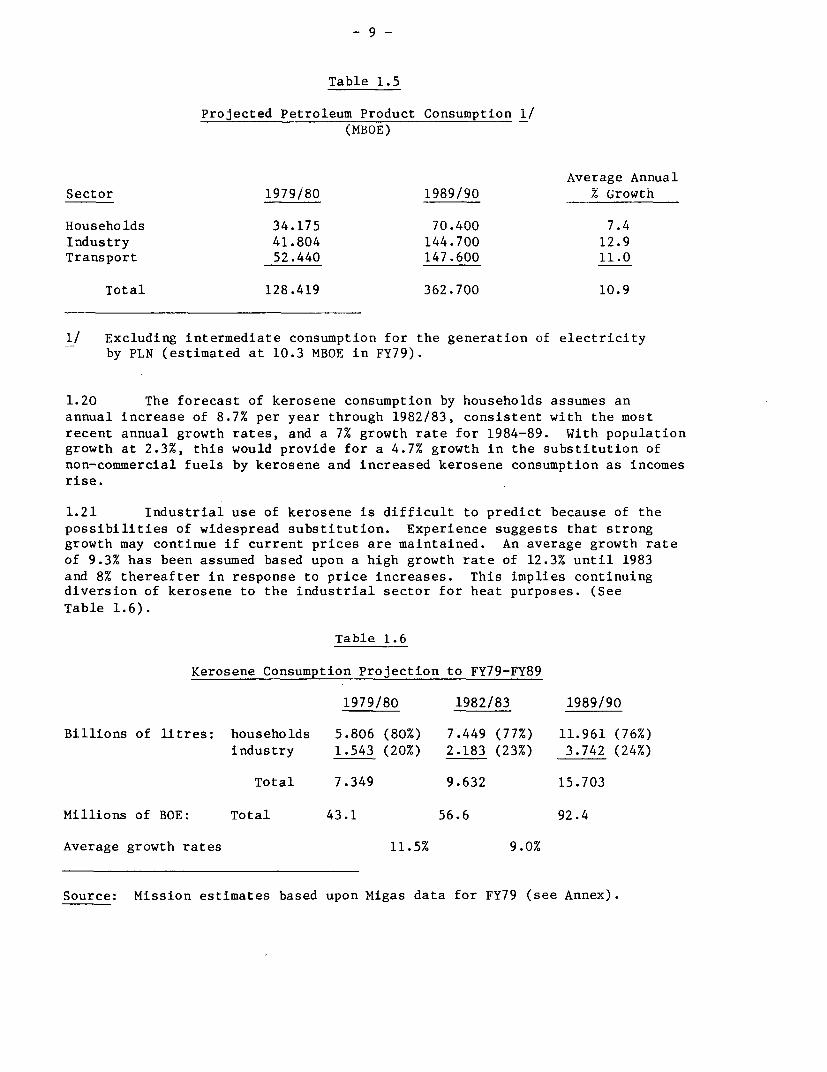
Table 1.5
Projected Petroleum Product Consumption _/(MBOE)
Average Annual
Sector 1979/80 1989/90 % Growth
Households 34.175 70.400 7.4
Industry 41.804 144.700 12.9Transport 52.440 147.600 11.0
Total 128.419 362.700 10.9
1/ Excluding intermediate consumption for the generation of electricityby PLN (estimated at 10.3 MBOE in FY79).
1.20 The forecast of kerosene consumption by households assumes an
annual increase of 8.7% per year through 1982/83, consistent with the most
recent annual growth rates, and a 7% growth rate for 1984-89. With populationgrowth at 2.3%, this would provide for a 4.7% growth in the substitution of
non-commercial fuels by kerosene and increased kerosene consumption as incomes
rise.
1.21 Industrial use of kerosene is difficult to predict because of the
possibilities of widespread substitution. Experience suggests that stronggrowth may continue if current prices are maintained. An average growth rate
of 9.3% has been assumed based upon a high growth rate of 12.3% until 1983
and 8% thereafter in response to price increases. This implies continuingdiversion of kerosene to the industrial sector for heat purposes. (See
Table 1.6).
Table 1.6
Kerosene Consumption Projection to FY79-FY89
1979/80 1982/83 1989/90
Billions of litres: households 5.806 (80%) 7.449 (77%) 11.961 (76%)
industry 1.543 (20%) 2.183 (23%) 3.742 (24%)
Total 7.349 9.632 15.703
Millions of BOE: Total 43.1 56.6 92.4
Average growth rates 11.5% 9.0%
Source: Mission estimates based upon Migas data for FY79 (see Annex).
- 10 -
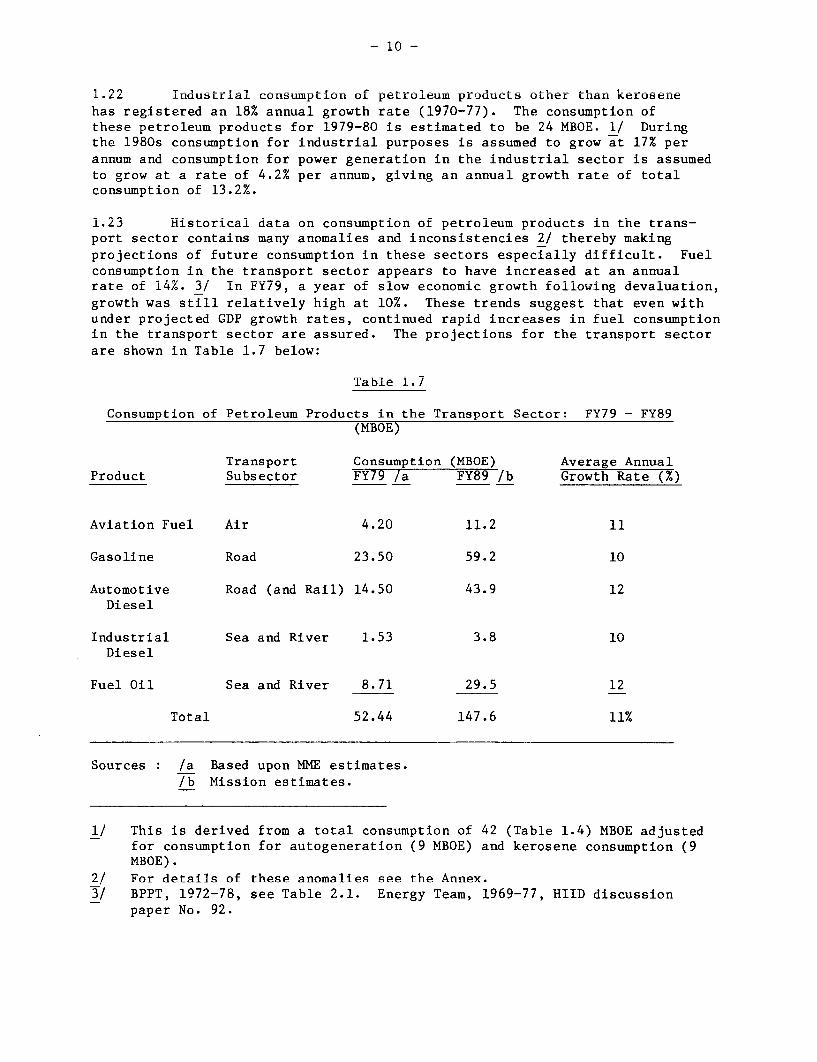
1.22 Industrial consumption o0 petroleum produucts othrer tnan Kerosenehas registered an 18% annual growth rate (1970-77). The consumption ofthese petroleum products for 1979-80 is estimated to be 24 MBOE. 1/ Duringthe 1980s consumption for industrial purposes is assumed to grow at 17% perannum and consumption for power generation in the industrial sector is assumedto grow at a rate of 4.2% per annum, giving an annual growth rate of totalconsumption of 13.l2/.
1.23 Historical data on consumption of petroleum products in the trans-port sector contains many anomalies and inconsistencies 2/ thereby makingprojections of future consumption in these sectors especially difficult. Fuelconsumption in the transport sector appears to have increased at an annualrate of 14%. 3/ In FY79, a year of slow economic growth following devaluation,growth was still relatively high at 10%. These trends suggest that even withunder projected GDP growth rates, continued rapid increases in fuel consumptionin the transport sector are assured. The projections for the transport sectorare shown in Table 1.7 below:
Table 1.7
Consumption of Petroleum Products in the Transport Sector: FY79 - FY89(MBOE)
Transport Consumption (MBOE) Average AnnualProduct Subsector FY79 /a FY89 /b Growth Rate (%)
Aviation Fuel Air 4.20 11.2 11
Gasoline Road 23.50 59.2 10
Automotive Road (and Rail) 14.50 43.9 12Diesel
Industrial Sea and River 1.53 3.8 10Diesel
Fuel Oil Sea and River 8.71 29.5 12
Total 52.44 147.6 11%
Sources : /a Based upon MME estimates./b Mission estimates.
1/ This is derived from a total consumption of 42 (Table 1.4) MBOE adjustedfor consumption for autogeneration (9 MBOE) and kerosene consumption (9MBOE).
2/ For details of these anomalies see the Annex.3/ BPPT, 1972-78, see Table 2.1. Energy Team, 1969-77, HIID discussion
paper No. 92.
- 11 -
Aviation fuel requirements are based upon a continued strong growth in airfreight. The forecast for road transport growth has been used as a proxy forestimating the road and rail subsector requirements since consumption by therail subsector is small. Projected gasoline consumption to FY89 at 10% issomewhat below the trend of automobile registration. The projected highergrowth of automotive diesel (12%) is due to the higher growth rates estimatedfor the registration of trucks and buses and allowances for the possiblefuture expansion of public transportation. The vital role of inter-islandshipping in the Indonesian economy suggests the continued expansion of petro-leum product consumption, particularly fuel oil.
The Domestic Demand for Natural Gas
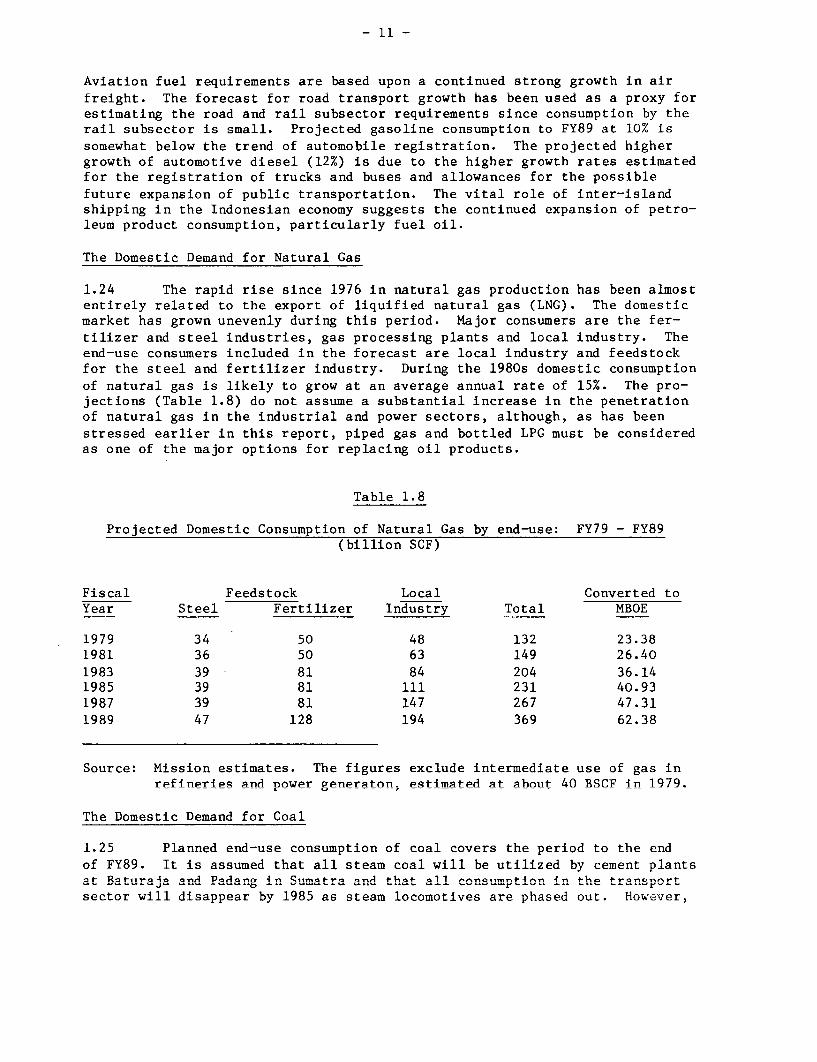
1.24 The rapid rise since 1976 in natural gas production has been almostentirely related to the export of liquified natural gas (LNG). The domesticmarket has grown unevenly during this period. Major consumers are the fer-tilizer and steel industries, gas processing plants and local industry. Theend-use consumers included in the forecast are local industry and feedstockfor the steel and fertilizer industry. During the 1980s domestic consumptionof natural gas is likely to grow at an average annual rate of 15%. The pro-jections (Table 1.8) do not assume a substantial increase in the penetrationof natural gas in the industrial and power sectors, although, as has beenstressed earlier in this report, piped gas and bottled LPG must be consideredas one of the major options for replacing oil products.
Table 1.8
Projected Domestic Consumption of Natural Gas by end-use: FY79 - FY89(billion SCF)
Fiscal Feedstock Local Converted toYear Steel Fertilizer Industry Total MBOE
1979 34 50 48 132 23.381981 36 50 63 149 26.401983 39 81 84 204 36.141985 39 81 111 231 40.931987 39 81 147 267 47.311989 47 128 194 369 62.38
Source: Mission estimates. The figures exclude intermediate use of gas inrefineries and nower generaton. estimated at about 40 BSCF in 1979.
The nnmpqtir Demnnd fnr Cnnl
1 25 Plannedi Pnd-iusP consuimption of rol covers the neriod to t-he endof FY89. It is assumed that all steam coal will be utilized by cement plantsat Baturaja anrd Padan.g 'ni Sumatra and that all consumption in the transportsector will disappear by 1985 as steam locomotives are phased out. However,
- 12 -
end-use consumption will be negligible compared with the intermediate duemanufor coal by the power sector. With the commissioning of the Suralaya powerplant in 9085, demand will iLncrease from 165,000 tonnes iC n 1i 9 o 2 mitonnes. By 1989, demand by the power sector will reach an estimated 7.5 mil-ilon tonnes per annum anld by thLe LndUustriLaL sector 0.5 million tonnes. Iin
addition, it is likely that up to 0.25 million tonnes could well be used inrural industry if a distribution system were developed.
The Domestic Demand for Electricity
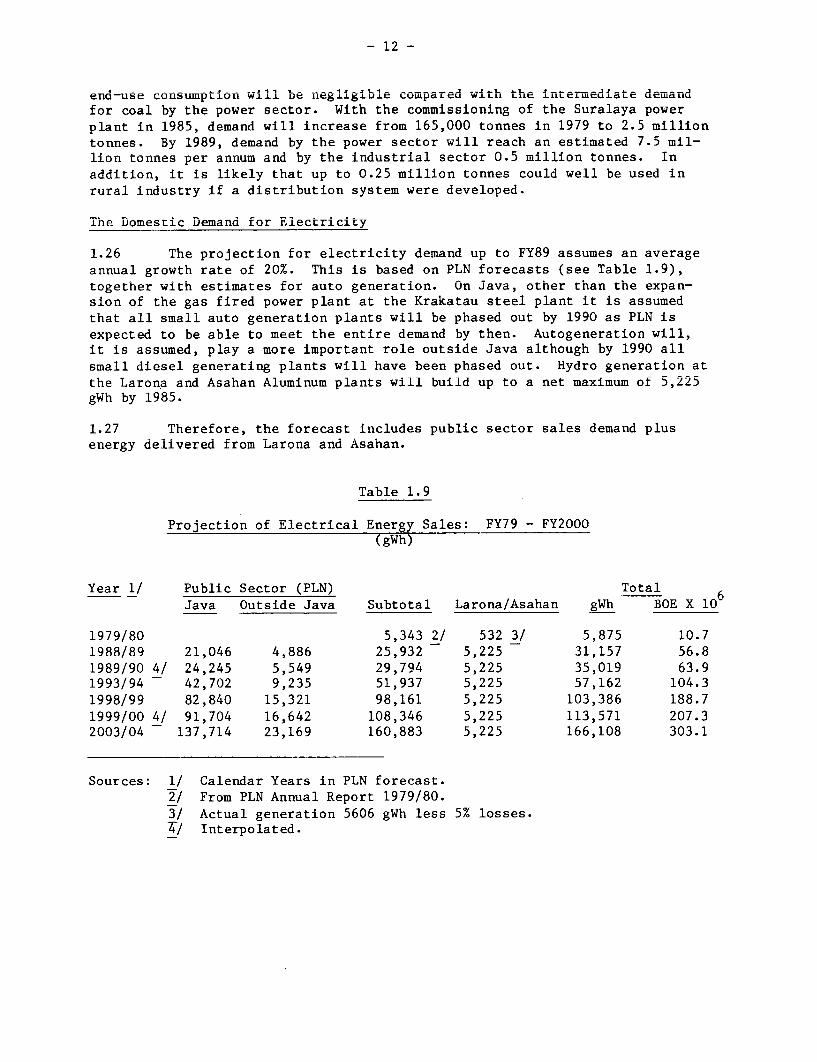
1.26 The projection for electricity demand up to FY89 assumes an averageannual growth rate of 20%. This is based on PLN forecasts (see Table 1.9),together with estimates for auto generation. On Java, other than the expan-sion of the gas fired power plant at the Krakatau steel plant it is assumedthat all small auto generation plants will be phased out by 1990 as PLN is
expected to be able to meet the entire demand by then. Autogeneration will,it is assumed, play a more important role outside Java although by i990 aiismall diesel generating plants will have been phased out. Hydro generation atthe Larona and Asahan Aluminum plants will build up to a net maximum of 5,225gWh by 1985.
1.27 Therefore, the forecast includes public sector sales demand plusenergy delivered trom Larona and Asahan.
Table 1.9
Projection of Electrical Energy Sales: FY79 - FY2000(gWh)
Year 1/ Public Sector (PLN) Total
Java Outside Java Subtotal Larona/Asahan gWh BOE X 10-
1979/80 5,343 2/ 532 3/ 5,875 10.71988/89 21,046 4,886 25,932 5,225 31,157 56.81989/90 4/ 24,245 5,549 29,794 5,225 35,019 63.91993/94 - 42,702 9,235 51,937 5,225 57,162 104.31998/99 82,840 15,321 98,161 5,225 103,386 188.71999/00 4/ 91,704 16,642 108,346 5,225 113,571 207.32003/04 - 137,714 23,169 160,883 5,225 166,108 303.1
Sources: 1/ Calendar Years in PLN forecast.2/ From PLN Annual Report 1979/80.3/ Actual Reneration 5606 RWh less 5% losses.4/ Interpolated.
- 13 -
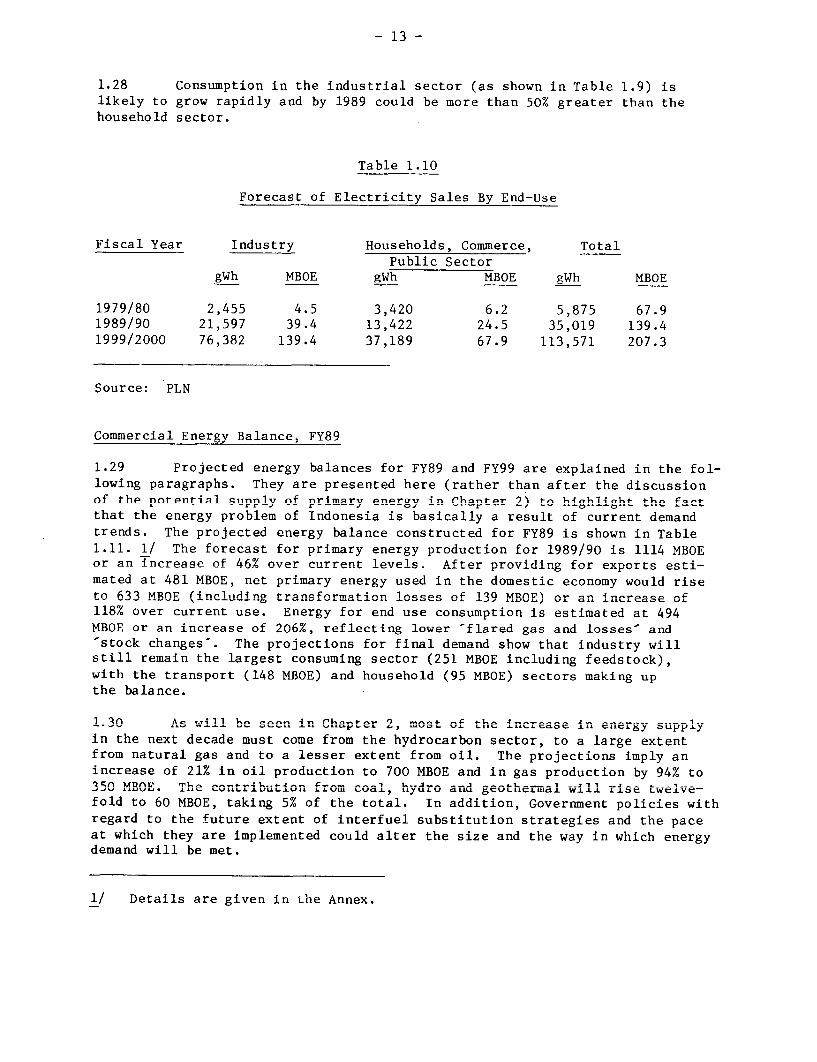
1.28 Consumption in the industrial sector (as shown in Table 1.9) islikely to grow rapidly and by 1989 could be more than 50% greater than thehousehold sector.
Table 1.10
Forecast of Electricity Sales By End-Use
Fiscal Year Industry Households, Commerce. TotalPublic Sector
gWh MBOE gWh MBOE RWh MBOE
1979/80 2,455 4.5 3,420 6.2 5;875 67.91989/90 21,597 39.4 13,422 24.5 35,019 139.41999/2000 76,382 139.4 37,189 67.9 113,571 207.3
Source: PLN
Commercial Energv Balance. FY89
1.29 Proiected energy balances for FY89 and FY99 are exnlainerd in the fol-lowing paragraphs. They are presented here (rather than after the discussionof the notential supply of nrimary energy in Chapter 2) to highlight the factthat the energy problem of Indonesia is basically a result of current demandtrends. The nroiected energy balance constructed for FY89 is shown in Table1.11. 1/ The forecast for primary energy production for 1989/90 is 1114 MBOEor an Increpae of 4L n over current levels. After providing for exports esti-mated at 481 MBOE, net primary energy used in the domestic economy would riseto 633 MBOE (including transformation losses of 139 MBOE) or an increase of118% over current use. Energy for end use consumption is estimated at 494MBOE or an increase of 206%, reflectin.g lower 'flared -- A I ----- a ndstock changes . The projections for final demand show that industry will
still remain the largest cnnsuRmina sector (251 MBOE Including feedstock),with the transport (148 MBOE) and household (95 MBOE) sectors making upthe baace
1 30 As will be seen in Chapter 2, most of thle increase ir. er,ergy suapp'lyin the next decade must come from the hydrocarbon sector, to a large extentfrom natural gas and t a lesser extent from oil. The projectionsimply anTincrease of 21% in oil production to 700 MBOE and in gas production by 94% to350 MBOE. The contribution from coal, lydAro a,,d geothermal w'ill rise twelve-.. ,~ ~Jt~iLit. L J LUUL.Li .L.LL LA.d Li7ULL) aLLU CLIiLid WJ. -L±. LWe±J.
fold to 60 MBOE, taking 5% of the total. In addition, Government policies withregard to ~tLe f-uture extent of iLnterfLuel subLstLtutLon strategi'es aDU the paceat which they are implemented could alter the size and the way in which energydemand will be met.
1/ Details are given ini the Annex.
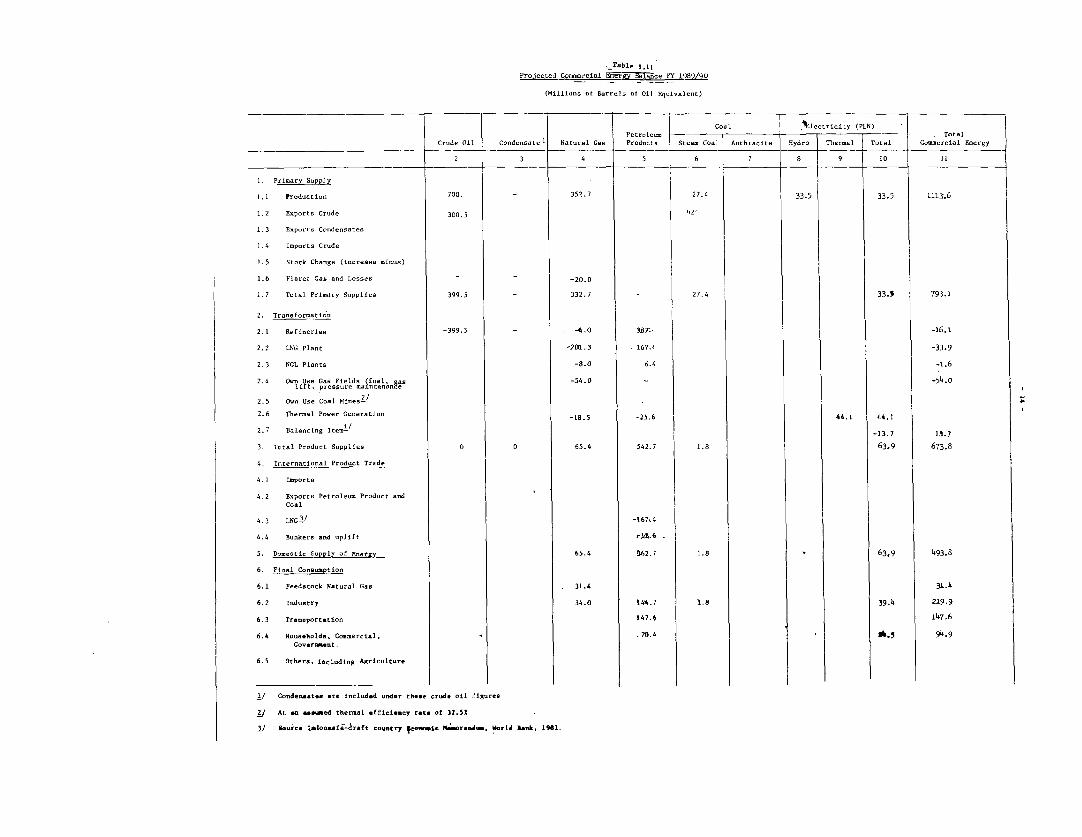
_ abile 1. 1Pro.jected Coumercial EiiF6 rice nT _1(89/9
(Mi].lione of 8arrelt of Oil Eriaiva1ent)
_ _ _ _ _ Petroleum -- -- %]. Tlioily (PLN)Crude Oil Condenste l Natural Gas Prod.cts Steae CoalA cie Hydrot The Total Comrcial E-ergy2 3 4 5 6 7 8 9 -10 11
1. Pri=ary 3ppY
1.1 Pruda:tion 700. _ 352.7 27.4 33.5 33.5 1113.61.2 Exports Crude 300.5 i2
1.3 Eportet Condensates
1.4 Iport.s Crude
1.5 Stock Chtnge (increase minus)
1.6 Flared Gas and L.osses - -20.0
1.7 Total Prinary Supplics 399.5 _ 332.7 _ 27.4 33.5 793.1
2. Transformation
2.1 Refieries -399.5 _ 4. O57. -1; .1
2.2 LNG Plant -201t.3 167.i
-33.92.3 NGL Plants
-8.0 6.4 -1.6
2.4 Ovn Use las Fieldn if-5el Rar -54.0
1 it, pressure 1e ntCnan-.
2.5 Ovn Use Coal Mines-
2.6 Thea-Il Poter Generatjon -18.5 -25.6 44.1 44.1
2.7 BalanlCng Ite.-/
-13.7 13.73. Toctal Product Supplien 0 I 65.4 542.7 1.8 63.9 673.84. Iriternationl Product Tr-de
4.1 Importa;
4.2 Enpurtts Petroleum Product and
4.3 LNG3/ -167,4
4.4 B.nker- .nd up.lift J.6
5. Domestic SUpply of Enary_ 65.4 562.7 1.8 63,9 493.86. finsl C.n.u ptios
6.1 Feedatock Natul- Gla. 31.4 31.4
6.2 Indu.try 34.0 14*.7 1.8 39.4 219.9
6.3 Tranep.rt.tion 147.6
147.66.4 R.u.ehalde. e C--trci.l.
70^.4 , 6k. 94.9Gov-rent.
6.5 Other,s iacluding Agri-altsre
1/ C-ndenate. -re included under th0-e crude nil figore.
2f At. mm pmmed theral flfinie-ey r-t. f 32.5S
3/ Slk.rec Iofan..ir-raft e.artry W-o1i N r.p l orld I..k, 1961.
- 15-
ihe OutLook for FY99
1.31 Any attempt at a demand forecast to the year 2000 is nignly specula-tive. The present data base is weak and contains several anomalies and dis-crepancies wnicn will require resolving berore more reliable demand projec-tions over a 20 year period can be made. The illustrative energy outlook forFY99 (Scenario I) is shown in Table 1.13. It is based on a slowing downof the growth rate of energy consumption to about 10% between FY89 and FY99along with a slowing down of the GDP growth rate to 6.5%. The growth rate orcommercial energy demand in the household sector is assumed to be 6.8%, in theindustrial sector 11.7% and in the transport sector 9% (Table 1.16). Theenergy/GDP elasticity would be 1.55. The electricity sector would still remain,at an average 12.5% per annum, the fastest growing sector (see Table 1.12).Total energy demand is projected at about 1,300 MBOE.
Table 1.12
Commercial Energy Consumption Growth Rates _/FY79 to FY89 and FY89 to FY99
(FY79-89) (FY89-99)Average Annual Average Annual
Product Growth Rate Growth Rate
Electricity 20 12.5Petroleum Products 11 9.5Natural Gas 11 10.5Coal 7 10.0
Total 12 10.0
1/ End use only.
1.32 Only a gra-dual decline in oil dependence seems possible. In FY79almost 80% of total commercial energy demand was derived from oil. This couldpossibly decline to about 73% by FY89 and to 70% by FY99. Coal, hydro andgeothermal would contribute about 250 MBOE, a fourfold increase from 1989/90and a supply larger, by nearly 50 percent, than total commercial energy con-sumption (162 MBOE) in the country in FY80. Table 1.14 summarizes currentand projected end use energy consumption for the three years. The FY99(Scenario I) projection implies a substantial import of oil by Indonesia (256MBOE). This is because, as will be seen in the next chapter. it is unlikelythat actual oil production will increase beyond 700 MBOE. This scenario hassevere implications for the balance of payments and the rate of economicgrowth and so a second scenario has been prepared.
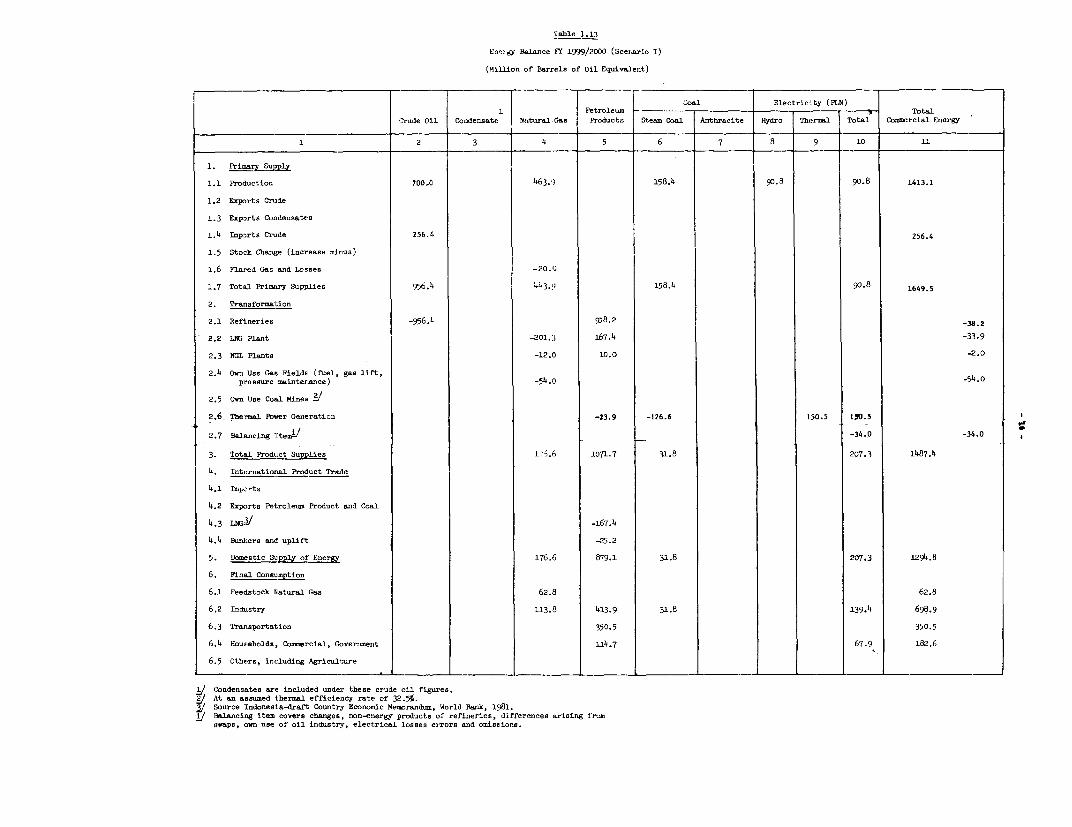
Gable 1.13
En-rgy EBlance FY 1999/20DO (Sce,ario I)
(Million of Barrels of Oil EquiraleuJt)
~~0&1 ~~Eiectrici.ty (PLSl)1 _ _ _ _ _ Petrole wn C - E le c TotalCrude Oi1. Condensate Natural GOas Products Steam Coal Anthracite Hydro Thermal Total Commercial Energy
1 2 3 4 5 6 7 8 9 10 U1
1. Primary Su1ply
1.1 Production 700.0 463.9 158.4 90.8 90.8 1413.1
1.2 Exports Cnlde
1.3 Exports Condensates
1.4 Imports Crnde 256.4 256.4
1.5 Stock Change (increase minus)
1.6 Flared Gas and Losses -20.0
1.7 Total Primary Supplies 956.4 443 . 158.4 90.8 1649.5
2. Transformation
2.1 RefLneries -956.4 918.2 -1.2
2.2 LDG Plant -201.3 167.4 -23.9
2.3 NGL Plants -12.0 10.0 .2.0
2.4 Own Use Gas FieldE (fuel, gas lift,pressure mainternance) -54.O 0- 4. O
2.5 Own Use Coal Mineg
2.6- Thermal Power Generation -23.9 -126.6 1'>0.5 150.5
2.7 Balancing Itemt-1
-34.0 -34.0 O
3. Total Product Suplies i .6 1071.7 31.8 207.3 1487.4
4. Internatioral. Product Trade
4.1 Iap:>.ts
4.2 Exports Petroleum Product and Coal
4.3 LdI3fI .-167.4
4.4 Bunkers and uplift -25.2
5. Domestic Supply of Energy 176.6 879.1 31.8 207.3 1294.8
6. FimLL Consumption
6.1 FeecLstock Datural Gas 62.8 62.8
6.2 Industry 1L3.8 413.9 31.8 139.4 698.9
6.3 Transportation 350.5 350.5
6.4 HouEieholds, Commercial, Government li4.7 67.9 182.6
6.5 Othetrs, including Agriculture
Condensates are included under these crude ciL figures.At an assumed thermal efficientcy rate of 32.5%.Source Indonesia-draft Country Economic Meincrandum, World Bank, 1981.B/ Balancing item covers changes, non-energy products of refineries, differences arising fromswaps, cwn use of oil industry, electrical losses errors and omisslions.
1.33 The alternative scenario (Scenario II) for 199'3 is shown in Table1~.T5 It 4S b-ase or,n reAucti4on ir. the overall er.ergy ;grow+-,- rate for 1989-99
to almost seven percent and in elasticity to close to one. The scenario assumesthat policies will be successfuLLy impl em entLedU 'Lo increase LL'Le subst iL LutLion ofL
coal for petroleum products in the industrial sector, and that a strong set ofcnisLervation measures, particularly in tne nousenuhl and transpUrt secLors,will be enacted. These policies are discussed in Chapters 3, 4 and 5. It isalso ass-umed that the recommendationbs or. organizat'o,al a-d insttutional changesiaade in Chapter 6 will be followed. A comparison of the demand projections forthe two tentative scenarios for FY99 is given in Table 1.16. Kerosene con-sumption is assumed to grow at 5% in Scenario I and at 2% in Scenario II. Inboth Scenarios it is assumed that kerosene cooking requirements wiil grow atthe same rate as the population and that the demand for kerosene for cooking isincome inelastic. In Scenario I, the additional kerosene consumption forlighting will be entirely income elastic. In both cases, the use of electricityfor lighting is assumed to grow at a much higher rate. in Scenario I1, it isalso assumed that by appropriate conservation and demand management measures,the sectoral elasticities for transport and industry can be reduced to 1.0 and1.2. The major differences on the supply side for the two scenarios are thatoil imports (of 256 MBOE) in Scenario I have been eliminated, that domestic oildemand still allows a surplus of about 141 MBOE for export and that there willbe a sizeable further increase in coal production.
1.34 Many alternative scenarios could have been prepared based on varioussectoral growth rates. Even so, it must be stressed that the scenariospresented here are solely for the purpose of indicating the urgency of policyand investment decisions in the energy sector and the priority areas foraction. These scenarios highlight the need for energy policies which providefor demand management, conservation and the faster development of otherindigenous energy resources. Such policies must also provide for a long-termenergy export strategy, at least to the end of the next decade, to provideforeign exchange to finance continued growth. A priority task for the EnergyPlanning Unit should be the elaboration of future energy balances based onalternative scenarios and policies.
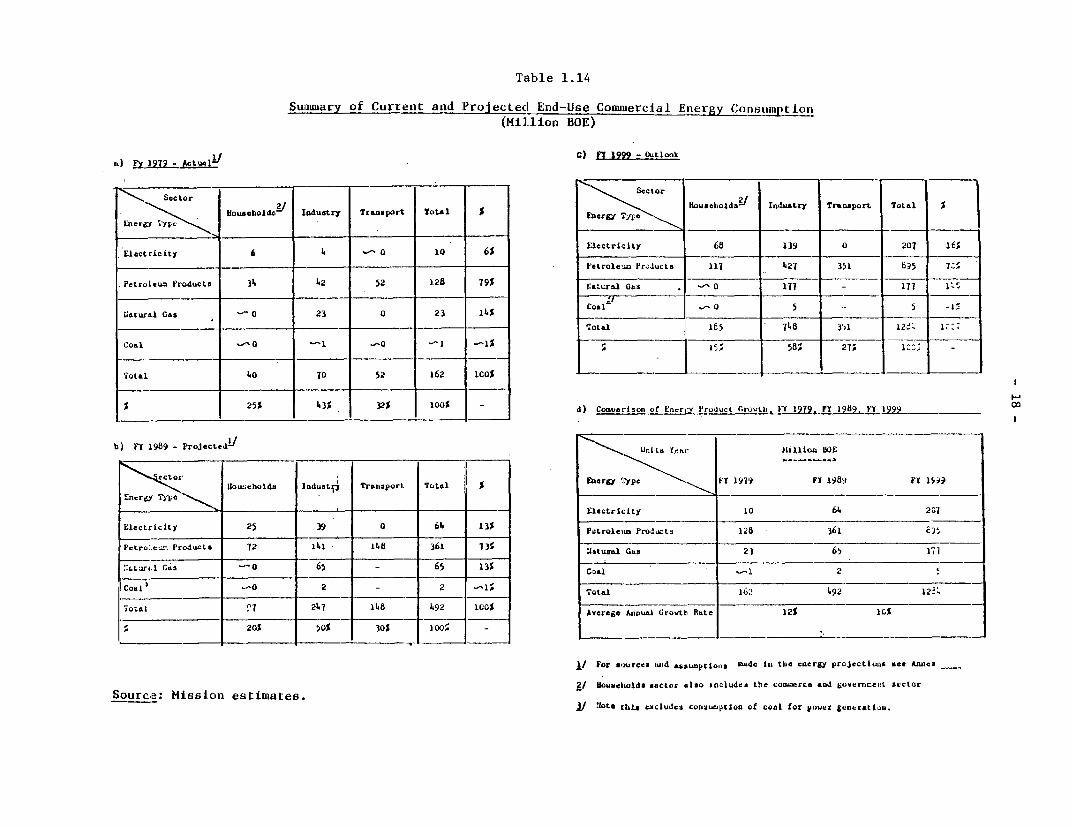
Table 1.14
Summary of Current and ProjctedL End-Use Commercial Energy Consumption(Killion BOE)
3 y 1979 - C) - Actoo-
Sector N.~~~~~~~~~~~~~~~~~~~~ ~SectorSecilor Trnsor Total_ _ _ _\ &co Household3v Indlu tryr Tr nsport Total S\Hou,se'bold Industry S rSer f
Energy 'ti- _ 2 _ _ _- ____ _
UEectricity- 6 4 _ 10 6S Electricity tit 139 iD 207 1Ss
_ _e_r_eu __od_t _ _r o __i'etrole Products 17 427 351 635 7
Petroleum Products 34 42 52 1.28 79S Iatuirodl GCs 11- 77 177 1'
;Gatural Cas _O 23 0 23 11.% Coal- _ O 5 5 5 _- _ _ _ _ _ _- - _--- --~'oteal lt5 '748 351 12'. 1z:
Coal - -1 -O -1 1 S5_ 58 t1 5 7
Total 40 70 52 162 bCuS _____
S 25% 1.3% 32% 100% d) Comuari sonof Uncrv yProduct Gro-th i'Y 1972. FT 1989. F' 1999 __ __t
b) FY 1989 - ProjectetL\ Units Yftr tLillioR DOE
Households InIdu3tp Transport Total | Energy 'ype FT 1979 VI 19861 FT 1S'9vEnr&r; Typae \_
£ner+y 'i'ype _.. _ _ - -__ ___ -______ _- Electricity 10 64 201
El=cticity 25 39 _ 64 13% Petroletun Products 1213 361 c35
P.trole-:, Products 72 141 1138 361 73S latural Gas 23 65 171'
|.LtUrgLl Gas __0 65 - 65 13% Coal | - 2
Coal8 .O 2 _ 2 -15 T 16' 1492 12'.
otal _ _ _ 2471 11.8 4.92 100% 'Isera4e Annual Grovth, Hate 12% IGS
20% 50% 30% 100 _ -
. For saurces iuid aumpctios tade Il the eneirgy projectiuna see Anne_x
Source: MILSSiConL eStimates. aouseiiolds sector also includes the conomrce and Scvtertenct asctor
i/ Uoto this exCludes conasunption of coal for power geneatLiju.
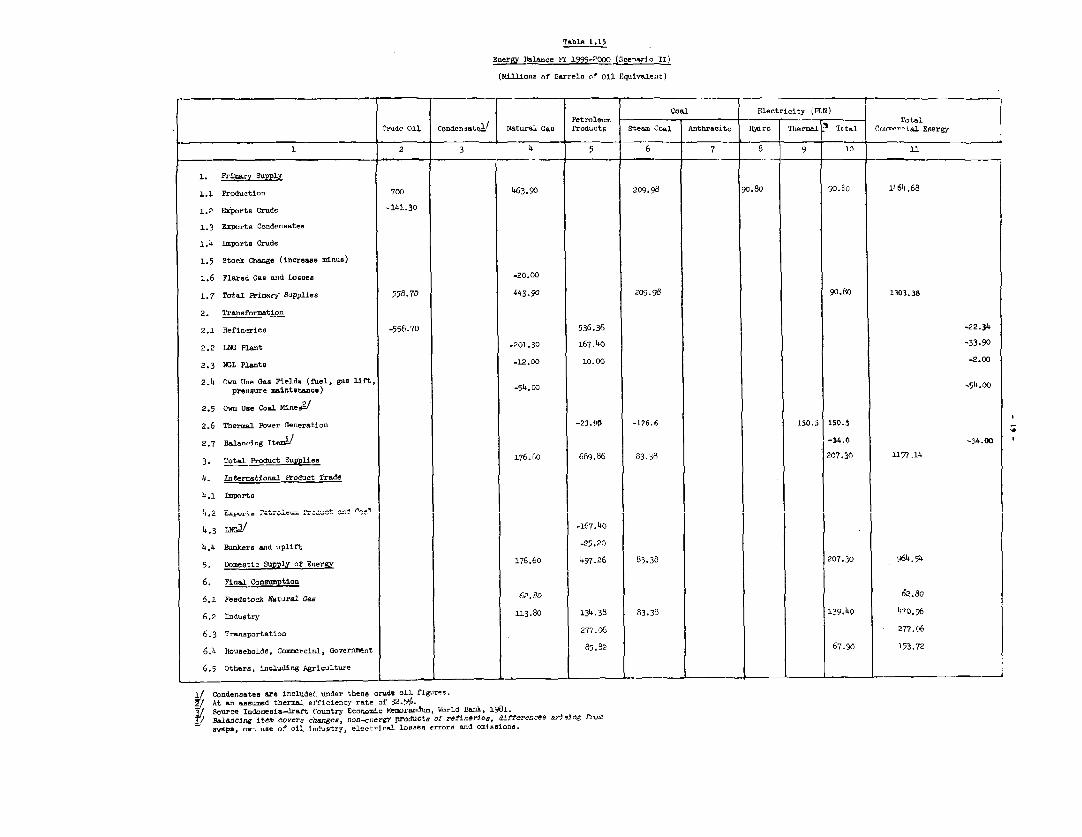
Table I.15
Energy Balance bY 1999-2000 (;cenario _I)(Millicons of Barrels Of Oil Equivalent)
Coal Electricity :wLN)Petrolenms- - -- Total
Crude oil Condensate2/ Natural Gas Products Steam Co)al Anthracite Hydro Therma To,tal Pno-nal Energ
1 2 3 4 . 6 7 8 9 in 11
1. Primary SuppJy
1.1 Produ,tion 700 463.90 209.98 90.80 gO.6ci 1464,68
1.2 Exports Crude -141.30
1.3 ExPorts Condeensates
1.4 Imports Crude
1.5 Stock Change (increase minus)
1.6 Flated Gas and Losses -20.00
1.7 Total Primary Supplies 558.70 443.90 209.96 90.80 1303,38
2. Transformatic,O
2.1 Refineries -55c1.70 536.36 -22.34
2.2 LNG Plant _201.30 167.40 -33.902.3 NGL Plants -12.DO 10.00 -2.00
2.4 Own Use Gas F'ields (fuel, gals lift,,pre ssure maintenance) -54. 054.00
2.5 Own Use Coal Mine/
2.6 Thermal Power Generation -23.90 -126.6 150.5 150.3
2.7 Balancing Ite.A/ -34.0 >o1.00
3. Total Product Supplies 176.60 689.86 83.38 207.30 1157.14
4. InterratIonal Product Trade
4.1 Imports
4.3 LNG-/ -167.40
4.4 Bunkers and uplift -25.20
5. Domestic Supply or Enlergy 176.60 497.26 83.38 207.3U 964.54
6. Final Consumption
6.1 Feedetocuc Natural Gei; C2 0 62.80
6.2 Industry 113.ciO 134.38 83.38 139.40 470.96
6.3 Transportation 277. 6 277.06
6.4 Householde, Commtercial, Goverrnent 85.32 67.95 153.726.5 Others, including Agriculture
IJ Condensates are included under thene crude oil figures.Y! At an "fased thermal effieiency rate of 32.5%(.
Source Indonesia-draft Country Economic Mesraldum, World Bank, 1981.Bd/ alfwlclng item covers ctanges, non_.ecrgf prodructs of refirneres, d2Lfltr'Ž & arislng taronswSps, own use oB nil industry, electri]cl lossen errors and ocissions.
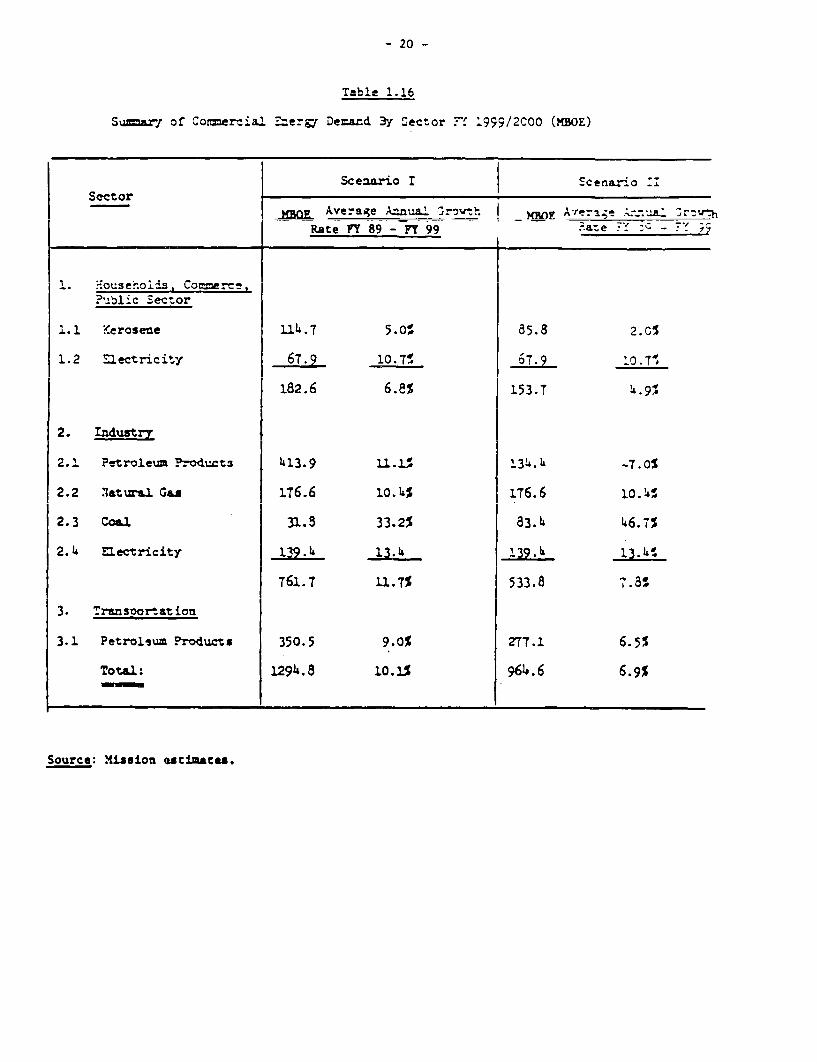
- 20 -
Table 1.16
Sun=mr of Cormrr^ia1 --ervr Dear-d 3v -7ector -' ;I2GOO (MRnBt
I l Scenario I Scenaro ;Sector _ u
MRop ~ ~ ~ __ Avrg =^ ;@* | Mo Av:e-i_e Arzu.a. Jrzi| . [ _ ~~~~~~~~~~~Rate FY 89 - n ~99 ' - 8e.Y--c_Y
H:ouse.ols, Coerce, I | ?--bl ~c Sector
1.1 Kerosene 114.7 5.0: | 85.S 2.G%
1.2 ¢ ectricity 67.9 10.7 | 67.9 _____7_
182.6 6.8% 153.T
I 2. Industry I I| 2.' Petroleum Product3 413.9 u.j |34- -7.0%
2.2 3atural Gas | 176.6 10.4% 1 176.6 10.14%
2.3 Coal 31.3 33.2% 83.4 46.TS
2.4 Electricity j 139.4 13.4 139.4 I3.4T 761.T 11.7% | 533.8 7.8a
|3. Transioortation
3.1 Petroleum Products 350.5 9.0% 277.1 6.5%
Total: 1294.8 10.1% | 964.6 6.9%
Source: Mission estimatas.
- 21 -
CHAPTER 2
THE SUPPLY OF PRIMARY ENERGY
Overview
2.01 Virtually all of Indonesia-s energy requirements are currently metfrom two sources of supply--indigenous oil, which accounts for about 45% ofthe total, and fuelwood and other agricultural wastes which account for another48%. There are good historical reasons for the predominance of these two prod-ucts, but for the reasons already given in Chapter 1, this almost exclusivedependence on oil and fuelwood will have to be reduced. Fortunately, Indonesiais also endowed with other energy sources which could be developed to substitutefor fuelwood and oil as the energy supply base is diversified. These includepotentially substantial reserves of natural gas, coal, hydroelectric powerand, to a lesser extent, geothermal energy. 1/
2.02 In this chapter the supply potential of these resources is examinedas well as the rate at which this notential is likely to be develoned underexisting Government policies and programs. In addition, the likely changes innolinies anei 1PeisQ1lation which wou,ld hp reniired to aceP1Pratp thair devuelopment
and the early diversification of the energy supply are identified. Embarkingon a program of oil substltution. howevur- {noq not in anv wav ls:p.n thrimportance attached to the supply of oil. Foreign exchange earnings from oilwill provide most of the rSoniirrcp renqiirpd for mnion investments in non-oilenergy sources and the level of these earnings depends largely on the continu-ation of Aomestc o4l production well in excess of the country:s own needs.
The Supply of 041
Reserves.
2.03 Firm data are not available on the various categories of oil reservesin Indonesia. In December 1980, remaining proven oil reserves were reported tobe 9.5 billifor. hbarrels whickh amountQ to about 16 years of production at thecurrent annual production rate of 575 million barrels. However, explorationof much of Indonesia is at an early stage and it is probable that considerableadditional reserves will be discovered. Estimates of undiscovered reservesvary widely from 10 billion to 40 billion barrels . Itn MIT world oil groupusing industry data put undiscovered recoverable reserves at 20 billionbarrels. Ever if tb.e lower figure of 10 billion barrels proves acrate,
the present production rate could be sustained for 35 years while the higherreser-ves fi gure wouldI 4mply that4 - proucio rate -twic as4 hi8h coudb~C~LV~C A...
5~a. W~ LLL .LLAIJ.LJ LLaL. L. F. WUU%LJ.~.LL L0L.L~ C.0 L A .JVU.LU U-_
sustained well into the next century. The assumption of 700 million barrelss .,_ _J ._ ._ _P __ 1n 0n /n n I _v_t '. _ rz ,_£___
01 iL.L prLUUUcLtUL UL 0o J707/7V X bIsUWIn 'Ll E d UJI ±*1JLL .LLLI LIdd Ll1ert Wlll
be considerable increases in exploration activity and a reasonable successratio. TIrnless further massive reser-ves are discovered, 't 's unliely th-atA~LL*U LL± 1 L.LLLI~1 0V L ULVVI. L±LV~'U L.L lb i.LN1 LILd
production will increase much beyond 700 million barrels.
1/ It is also considered that extensive peat deposits exist in Kalimantan.
- 22 -
Exploration Trends
2.04 The period 1969-75 saw a rapid increase in oil exploration anddevelopment. The number of exploratory wells increased from 40 in 1969 to180 in 1974. Development drilling grew fifteen-fold from 23 wells in 1969to 326 wells in 1975, a reflection of the high success ratio of exploratorydrilling in the early 1970s. Investment in oil exploration and developmentregistered a similar increase from $70 million in 1969 to $1.2 billion in 1975.However, this trend was temporarily reversed from late 1975 to 1977 because ofthe uncertainty resulting from the Government-s move to renegotiate the termsof the production sharing contracts to reflect the highest price of oil andto ensure US tax credits for Indonesian income tax payments. However, follow-ing the resolution of the contract uncertainty in 1978, exploration picked upand has since accelerated because of further sharp rises in world oil prices.
Production
2.05 Crude oil production in 1980 averaged 1.58 MBD. which placesIndonesia fourteenth among the world's crude oil producers. The level of oilnroduction in recent years has broadly followed the trends in exploration anddevelopment. Between 1970 and 1977 production more than doubled as the highlevel of private company exploration was rewarded with considerable success.However, the uncertainties of 1975-77 and the continued depletion of the giantMinas field resulted in a fall-off in production in 1977 which has only nowbeen arrested.
Table 2.1
Total Indonesia Crude Oil Supply(million barrels Der annum)
1969 1974 1975 1976 1977 1978 1979 1980
Production 27O09 501.8 476.9 550.3 615.1 596.8 580.4 (575.6)
Imports -0.2 2.7 2. 7.7 25.5 24.1 30.5 32.9
Total cupply 271.1 5.5A r4 A709. 5 t AI 5 64A. .a I a20. 60
2.06 The Indonesian refinery sector comprises six large refineries (ex-cludigl three small units producing primarily asphalt), all owned by PERTAMINA(Table 2.2). More than half the existing capacity predates the sixties andthe overall refinery configuration is very simple, with very little conver-sion capacity to upgrade heavier products into middle and light distillates.Total refining capacity is about 530,000 barrels per day (BPD) on a namepiatebasis, but the effective capacity figure is estimated at only 465,000 BPD dueto the age of some of the facilities. Relatively small changes could lead toa savings of 4% of the crude throughput of the existing refineries, equivalentto about i4,500 BPD or US$180 million per year at current worid prices. Theestimated cost per barrel of oil equivalent saved is estimated at US$7-10 for
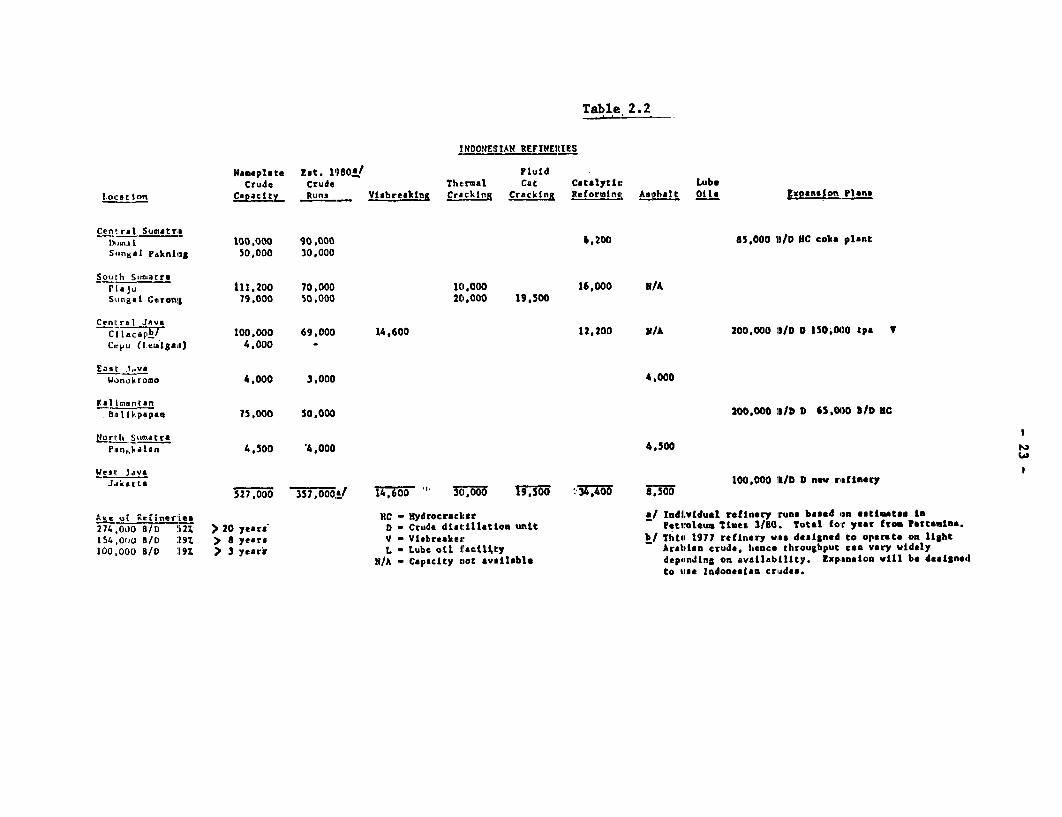
T'able 2.2
IND0NESIAN REFINEItIES
Ha-eplate tet. 1980!/ FluidCrude Crude Thermal Cat Catalytic Lubr
Loj atton Ca!pacitX _Runs Visbreaking CrAcking Crackint ReforutnsL Asphalt 0i('. Irpanejton Plans
Central Sumatrias im.1 L U100000 90.000 1,200 85,000 ll|D MC coke plantSlnial Paknlimg iO,000 3l0000
Souith SunatraPlaju 111.200 70.000 10.000 16,000 N/ASungs t Geronl 79,000 50.000 20.000 191,500
Crnltrat Java
Ci1acaFip 100.000 6.9.000 14,600 12,200 N/A 200.000 I5/D 0 150.000 tpe Vceipu (I lBj8dlI) 4,000 -
Easlt l..vaWanokromo 4,000 3.000 4.000
Ka imantanaI1uVpapeo 35,000 50,000 200.000 I5/ DD 3,000 b/D IC
tirhtl SlinatraPsn,1kalan 4,500 *4.000 4,500
Weil: Java C10 i/ nertieyJ.ak arta a ___ 100,000 ID D n refinery
5THo000 357,000.! W3i.ooo t 1 =50 so :W7 ii,500
At. r ineriea )IC - Hydrocrecker */ IndLvidual refinery rune based on estilteii In
274 000 T7W1 2z- > 20 rears D *D Crude distillatiom unit Petroleum Ties 3/C0. Total for yaee from Pbrttmina.154 ,0(o B/D 297 > 8 years V - Viabreakeer b/ Thisi 1977 refinery vite designed to operate on light100,000 BID 197 > 3 years L Lube oil feeilq Arabeian crude, heoce throuighput caa very widely
N/A - Capacity ciot availsble depending on availability. lxpaneionf vill be deaisnedto ose Indoneslan criadea.
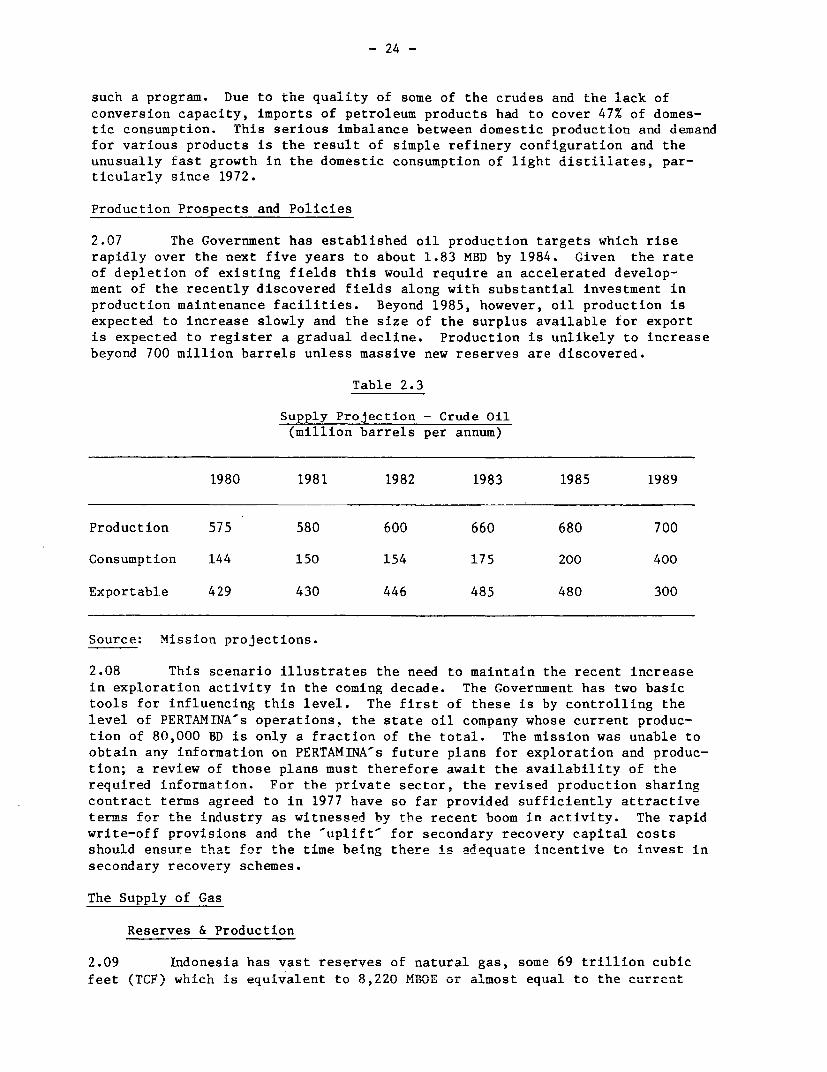
- 24 -
such a program. Due to the quality of some of the crudes and the lack of
conversion capacity, imports of petroleum products had to cover 47% of domes-
tic consumption. This serious imbalance between domestic production ana aemand
for various products is the result of simple refinery configuration and the
unusually fast growth in the domestic consumption of light distillates, par-
ticularly since 1972.
Production Prospects and Policies
2.07 The Government has established oil production targets which rise
rapidly over the next five years to about 1.83 MBD by 1984. Given the rate
of depletion of existing fields this would require an accelerated develop-
ment of the recently discovered fields along with substantial investment in
production maintenance facilities. Beyond 1985, however, oil production is
expected to increase slowly and the size of the surplus available for export
is expected to register a gradual decline. Production is unlikely to increase
beyond 700 million barrels unless massive new reserves are discovered.
Table 2.3
Supply Projection - Crude Oil(million barrels per annum)
1980 1981 1982 1983 1985 1989
Production 575 580 600 660 680 700
Consumption 144 150 154 175 200 400
Exportable 429 430 446 485 480 300
Source: Mission projections.
2.08 This scenario illustrates the need to maintain the recent increase
in exploration activity in the coming decade. The Government has two basic
tools for influencing this level. The first of these is by controlling the
level of PERTAMINA's operations, the state oil company whose current produc-
tion of 80,000 BD is only a fraction of the total. The mission was unable to
obtain any information on PERTAMINA's future plans for exploration and produc-
tion; a review of those plans must therefore await the availability of the
renuired information. For the nrivate sector, the revised production sharing
contract terms agreed to in 1977 have so far provided sufficiently attractive
terms for the industr- as witnessed bv the rpcent boom in activity. The rapid
write-off provisions and the 'uplift' for secondary recovery capital costsshould ensure that for the time being there is adeqnu2te incentive to invest in
secondary recovery schemes.
The Supply of Gas
Reserves & Production
2.09 Indonesia has vast reserves of natural gas, some 69 trillion cubic
feet (TCF) which is equivalent to 8,220 MBOE or almost equal to the currenrt
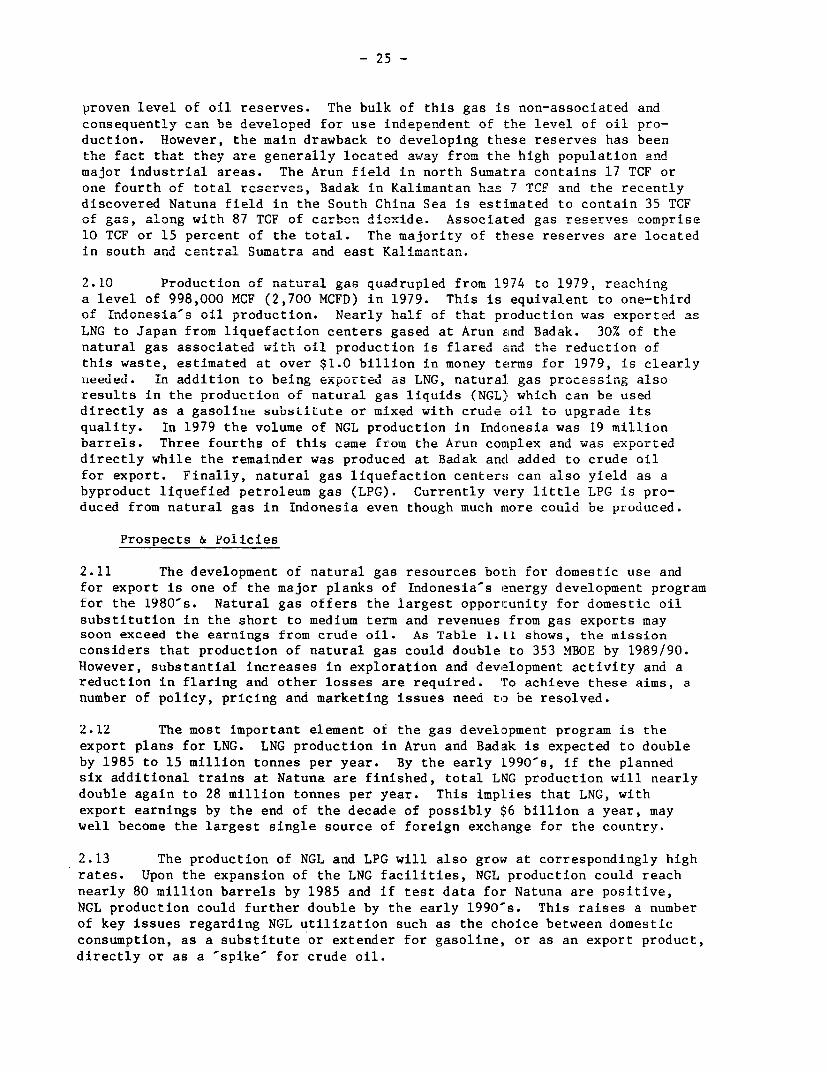
- 25 -
proven level of oil reserves. The bulk of this gas is non-associated and
consequently can be developed for use independent of the level of oil pro-duction. However, the main drawback to developing these reserves has been
the fact that they are generally located away from the high population anAmajor industrial areas. The Arun field in north Sumatra contains 17 TCF or
one fourth of total reserves, Badak in Kalimantan has 7 TCF and the recently
discovered Natuna field in the South China Sea is estimated to contain 35 TCFoffJ gas, along wi th. 87 TC.F of carbon dioxide. Associated -as reserves comprise
10 TCF or 15 percent of the total. The majority of these reserves are locateditn south and3 central Ou-mat"ra ar.d east Yalimantan.±11OU LLI CUU C La.L .3 ULJ LA a L.V %_ O4..~a,.a
2.i0 Proluction of natural gas quadrupledA from 1974- to 1070, reachingA* .L'. CA LUU L.J L , L.aL La. a 4 a~tLt L i IJt I.I - IS -. I -, L. -_ -rL.l1
a level of 998,000 MCF (2,700 MCFD) in 1979. This is equivalent to one-thirdof IdLLonesia's oill. pro dUcti on. Near'ly ha'lf of that ptoduction was exported as
LNG to Japan from liquefaction centers gased at Arun and Badak. 30% of the
natural gas associated wtitL oLil producton Ls larel and tie reduction of
this waste, estimated at over $1.0 billion in money tetrms for 1979, is clearly
needed. In addition to being exporteU as LNG, naturald. gas processLng also
results i.n the production of natural gas liquids (NGL) which can be used
directly as a gasoline substitute or mixed with crude oil to upgrade itsquality. In 1979 the volume of NGL production in Indonesia was 19 millionbarrels. Three fourths of this came from the Arun comiplex arnd was exported
directly while the remainder was produced at Badak and added to crude oil
for export. Finally, natural gas liquefaction centers can also yield as a
byproduct liquefied petroleum gas (LPG). Currently very little LPG is pro-
duced from natural gas in Indonesia even though much more could be produced.
Prospects & Policies
2.11 The development of natural gas resources bot:h for domestic use and
for export is one of the major planks of Indonesia's energy development program
for the 1980s. Natural gas offers the largest opportunity for domestic oil
substitution in the short to medium term and revenues from gas exports maysoon exceed the earnings from crude oil. As Table !.L[ shows, the mission
considers that production of natural gas could double to 353 MBOE by 1989/90.
However, substantial increases in exploration and development activity and areduction in flaring and other losses are required. ro achieve these aims, a
number of policy, pricing and marketing issues need to be resolved.
2.12 The most important element of the gas development program is the
export plans for LNG. LNG production in Arun and Badak is expected to double
by 1985 to 15 million tonnes per year. By the early l990's, if the planned
six additional trains at Natuna are finished, total LNG production will nearly
double again to 28 million tonnes per year. This implies that LNG, with
export earnings by the end of the decade of possibly $6 billion a year, may
well become the largest single source of foreign exchange for the country.
2.13 The production of NGL and LPG will also grow at correspondingly high
rates. Upon the expansion of the LNG facilities, NGL production could reach
nearly 80 million barrels by 1985 and if test data for Natuna are positive,
NGL production could further double by the early 1990's. This raises a number
of key issues regarding NGL utilization such as the choice between domestic
consumption, as a substitute or extender for gasoline, or as an export product,
directly or as a 'spike' for crude oil.
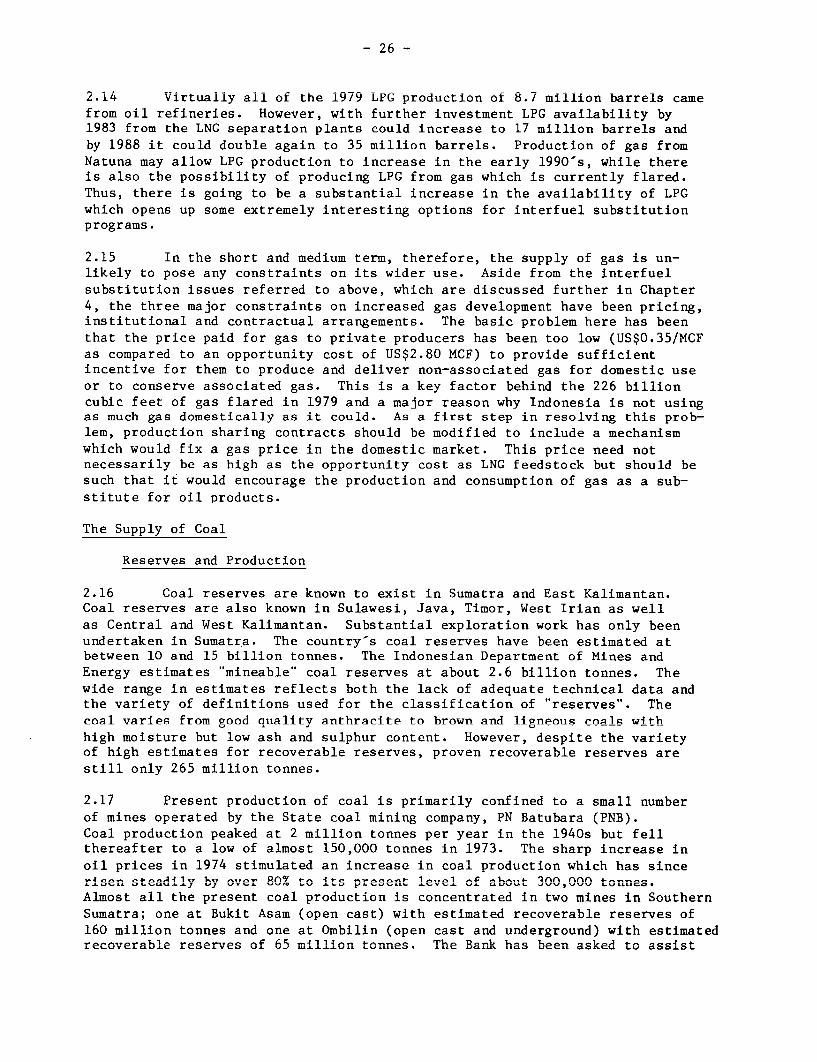
- 26 -
2.14 Virtually all of the 1979 LPG production ot 8.7 million barrels camefrom oil refineries. However, with further investment LPG availability by1983 from the LNG separation plants could increase to 17 million barrels andby 1988 it could double again to 35 million barrels. Production of gas fromNatuna may allow LPG production to increase in the early 1990's, while thereis also the possibility of producing LPG from gas which is currently flared.Thus, there is going to be a substantial increase in the availability of LPGwhich opens up some extremely interesting options for interfuel substitutionprograms.
2.15 In the short and medium term, therefore, the supply of gas is un-likely to pose any constraints on its wider use. Aside from the interfuelsubstitution issues referred to above, which are discussed further in Chapter4, the three major constraints on increased gas development have been pricing,institutional and contractual arrangements. The basic problem here has beenthat the price paid for gas to private producers has been too low (US$0.35/MCFas compared to an opportunity cost of US$2.80 MCF) to provide sufficientincentive for them to produce and deliver non-associated gas for domestic useor to conserve associated gas. This is a key factor behind the 226 billioncubic feet of gas flared in 1979 and a major reason why Indonesia is not usingas much gas domestically as it could. As a first step in resolving this prob-lem, production sharing contracts should be modified to include a mechanismwhich would fix a gas price in the domestic market. This price need notnecessarily be as high as the opportunity cost as LNG feedstock but should besuch that it would encourage the production and consumption of gas as a sub-stitute for oil products.
The Supply of Coal
Reserves and Production
2.16 Coal reserves are known to exist in Sumatra and East Kalimantan.Coal reserves are also known in Sulawesi, Java, Timor, West Irian as wellas Central and West Kalimantan. Substantial exploration work has only beenundertaken in Sumatra. The country's coal reserves have been estimated atbetween 10 and 15 billion tonnes. The Indonesian Department of Mines andEnergy estimates "mineable" coal reserves at about 2.6 billion tonnes. Thewide range in estimates reflects both the lack of adequate technical data andthe variety of definitions used for the classification of "reserves". Thecoal varies from good auialitv anthracite to brown and ligneous coals withhigh moisture but low ash and sulphur content. However, despite the varietyof high estimates for recoverable reserves, proven recoverable reserves arestill only 265 million tonnes.
2.17 Present production of coal is primarily confined to a small numberof mines operated by the State coal mining company, PN Batubara (PNB).Coal production peaked at 2 million tonnes per year in the 1940s but fellthereafter to a low of almost 150,000 tonnes in 1973. The sharp increase inoil prices in 1974 stimulated an increase in coal production which has sincerisen stea.dl1y by over 807 to its present level of about 30'0,0I0 tornes.
Almost all the present coal production is concentrated in two mines in SouthernSumatra; one at BIukit Asam /oper, cast) w4ith es-imae -reco--verable reserves of
160 million tonnes and one at Ombilin (open cast and underground) with estimatedrecoverable reserves of 65 million tonnes. The Bank has been asked to assist
- 27 -
in the rehabilitation and expansion of the Bukit Asam mine to increase produc-tion from about 200,000 to about 3 million tonnes per year. In 1974 ShellMijnbouw, under a production sharing agreement was granted rights to exploreIC 1 J 7 % A AAA d. the i-k, .1.4-1 tA,... fDTDA\for coaUl iLn a I70,00 sq. kmUL. concessi'on area aroundtU Le BukiL tAsam (PBAconcession area in South Sumatra, with the stipulation that Shell's share ofarny coaL prolucelu wouLU lUe fLor tLIe export market. .le Selel found extensivedeposits of lignite, it was unable to discover any conmercially exploitabledeposiLts ol export gLdue IardU coaL. tAs a resuL, the concessiLo,, was abua.-do.eUd
in 1978 and all data returned to the Government. The Bank is currently pre-paring a project for a detailed survey of potential reserves in a selecteanumbers of the relinquished areas which will lead to l:he preparation of aseries of feasibility and pre-feasibility studies for the optimum utilizationof South Sumatran coals. The Government is in the process of negotiating abilateral tecnnical assistance agreement with the Government of Germany toundertake detailed exploration studies for the Ombilin region and other sur-rounding potential areas in Central/West Sumatra. Coal from these areascould, in addition to continuing to supply local industry, presumably alsobe used for power generating facilities on Java.
2.18 The other area with undoubted coal producing potential is Kalimantanwhere eight major basins have been identified. Some boreholes have reportedlyintersected coal seams 20 to 50 meters thick. Recent exploration work,carried out primarily under a Colombo Plan technical assistance program hasidentified extensive reserves of open pit mineable coal. Though potentialreserves in Kalimantan could be in the billions of tonnes, detailed explorationhas only been done in one small area where reserves have been estimated at 140million tonnes of which 40 million tonnes are believed to be recoverable byopen pit mining. Further exploration and feasibility study preparation isrequired to quantify and classify the reserves and to identify recoverableopen pit and underground coal potential.
Prospects and Policies
2.19 It is now Government policy to encourage the developmant and utiliza-tion of coal for domestic consumption wherever feasible, and coal developmentin South Sumatra is a welcome step in diversifying the country's energy supplybase. During the 1980's the bulk of coal production will be used to generateelectric power. The Bukit Asam project will supply an 800 MW power plant atSuralaya and coal from Kalimantan could be used for t:hermal power generation.Under these circumstances it is particularly important to ensure that planningfor coal and electric power development proceed hand in hand. One source ofconcern in this regard is the likelihood that the supply of coal in both themid 1980's and by the end of the decade will fall short of the demand to begenerated by the coal fired thermal electricity deveLopment program, althoughestimates provided to the mission (shown in Table 2.4) appear to be optimistic,especially for 1990. The mission considers, however, that production in 1985could be higher if early action is take to develop tlae fields in East Kalimantan.In this respect, early preparation of a national coal policy is recommended.
2.20 A second issue which needs to be addressed is the appropriateinstitutional and contractual framework for future coal development. Giventhe fact that its own institutional and technical capabilities will have alreadybeen stretched during the implementation of the Bukit Asam project, theGovernment has wisely encouraged private operators to develop the resources ofKalimantan. However, the contracts currently under negotiation with nriuatp
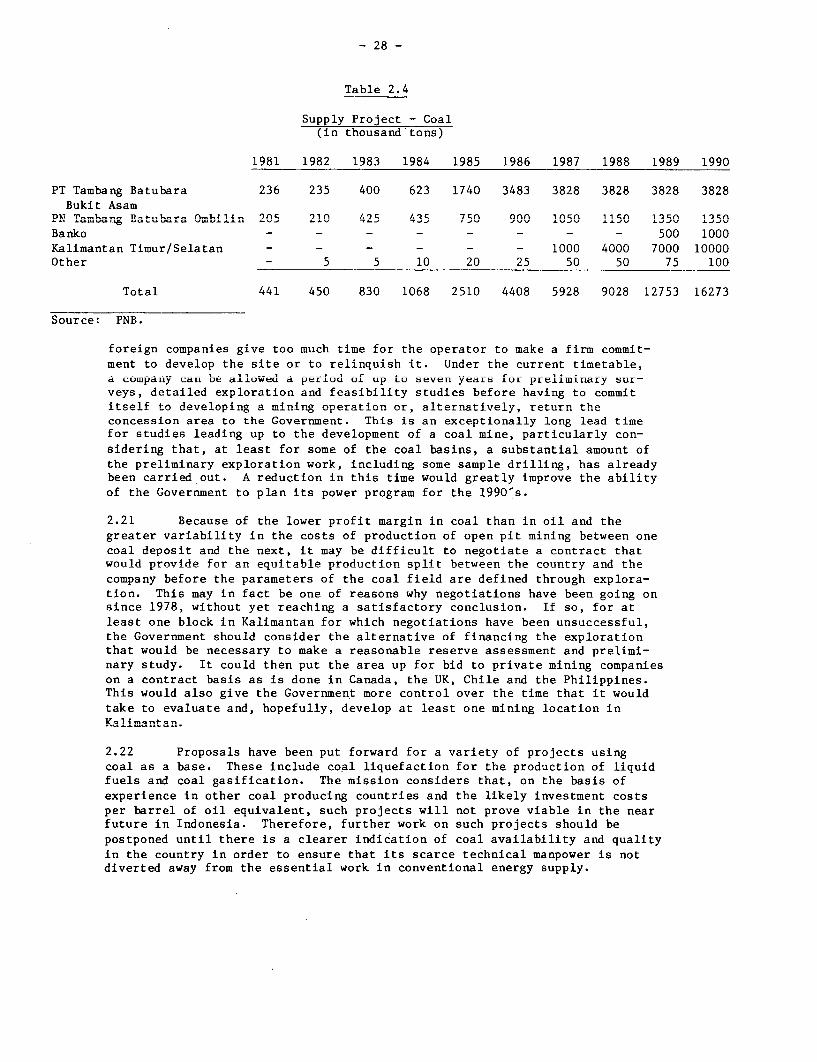
- 28 -
Table 2.4
Supply Project - Coal(in thousand tons)
1981 1982 1983 1984 1985 1986 1987 1988 1989 1990
PT Tambang Batubara 236 235 400 623 1740 3483 3828 3828 3828 3828Bukit Asam
PN Tamban Batu-ra Ombilin 205 210 425 435 750 900 1050 1150 1350 135r0Banko - - - - - - - - 500 1000Kalimantan Timur/Selatan - - - - - 1000 4000 7000 10000Other - 5 5 10 20 25 50 50 75 100
Total 441 450 830 1068 2510 4408 5928 9028 12753 16273
Source: PNB.
foreign companies give too much time for the operator to make a firm commit-ment to develop the site or to relinquish it. Under the current timetable,a company can be allowed a period of up to seven years for preliminary sur-veys, detailed exploration and feasibility studies before having to commititself to develoning a mining operation or, alternatively, return theconcession area to the Government. This is an exceptionally long lead timefor studies leading up to the development of a coal mine, particularly con-sidering that, at least for some of the coal basins, a substantial amount ofthe preliminary exploration work, including some sample drilling, has alreadybeen carried out. A reduction in this time would greatly improve the abilityof the Government to plan its power program for the 1990's.
2.21 Because of the lower profit margin in coal than in oil and thegreater variability iLn the costs ofU production ofU open piLt miniinng bUetween onecoal deposit and the next, it may be difficult to negotiate a contract thatwould nrovide for an Peqitahlet nrodnfurition snlit hetween t-he conintrv and the
company before the parameters of the coal field are defined through explora-tion. This may in fact be one of reasons why negotiations have been going onsince 1978, without yet reaching a satisfactory conclusion. If so, for atleast one block in Kalimantan for which negotiations have been unsuccessful,the Government should consider the alternative of financing the explorationthat would be necessary to make a reasonable reserve assessment and prelimi-nary study. It could then put the area up for bid to private mining companieson a contract basis as is done in Canada, the UK, Chile and the Philippines.1r 4s woull als g.1 t1 loe et mor conro over__ t_L t_m t'a 't . , wo_u" , ..
UiXD W1)U.U aLL VC D V ve LICUL IJLC LUIIL.UL uvCL LIIL. X IIdL L. wu.uU
take to evaluate and, hopefully, develop at least one mining location inKoalimantan.
2.22 ProDosals have been Dut forward for a variety of Droiects usingcoal as a base. These include coal liquefaction for the production of liquidfuels and coal gasification. The mission considers that, on the basis ofexperience in other coal producing countries and the likely investment costsper barrel of oil equivalent, such projects will not prove viable in the nearfuture in Indonesia. Therefore, further work on such projects should bepostponed until there is a clearer indication of coal availability and qualityin the country in order to ensure that its scarce technical manpower is notdiverted away from the essential work in conventional energy supply.
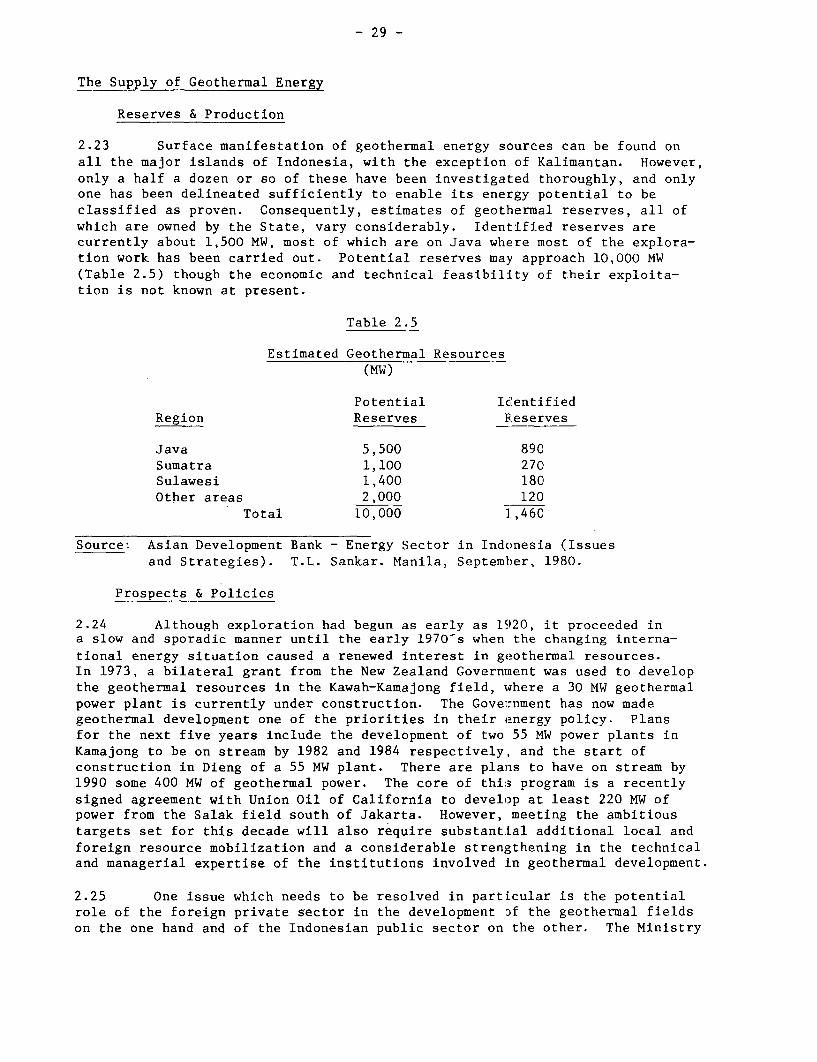
- 29 -
The Supply of Geothermal Energy
Reserves & Production
2.23 Surface manifestation of geothermal energy sources can be found onall the major islands of Indonesia, with the exception of Kalimantan. However,only a half a dozen or so of these have been investigated thoroughly, and onlyone has been delineated sufficiently to enable its energy potential to beclassified as proven. Consequently, estimates of geothermal reserves, all ofwhich are owned by the State, vary considerably. Identified reserves arecurrently about 1,500 MW, most of which are on Java where most of the explora-tion work has been carried out. Potential reserves may approach 10,000 MW(Table 2.5) though the economic and technical feasibility of their exploita-tion is not known at present.
Table 2.5
Estimated Geothermal Resources(MW)
Potential IcentifiedRegion Reserves Reserves
Java 5,500 890Sumatra 1,100 270Sulawesi 1,400 180Other areas 2,000 120
Total 10,000 1,460
Source: Asian Development Bank - Energy Sector in Indonesia (Issuesand Strategies). T.L. Sankar. Manila, September. 1980.
Prospects & Policies
2.24 Although exploration had begun as early as 1920, it proceeded ina slow and sporadic manner until the early 1970-s when the changing interna-tional energy situation caused a renewed interest in geothermal resources.In 1973, a bilateral grant from the New Zealand Government was used to developthe geothermal resources in the Kawah-Kamalong field, where a 30 MW geothermalpower plant is currently under construction. The Government has now madegeothermal development one of the priorities in their energy policy. Plansfor the next five years include the development of two 55 MW power plants inKamaiong to be on stream by 1982 and 1984 respectively, and the start ofconstruction in Dieng of a 55 MW plant. There are plans to have on stream by1990 some 400 MW of geothermal power. The core of this program is a recentlysigned agreement with Union Oil of California to develop at least 220 MW ofpower from the Salak field south of Jakarta. However, meeting the ambitioustargets set for this decade will also require substantial additional local andforeign reouirce mohilization and a ronideprab]p strengthening in the tpchniral
and managerial expertise of the institutions involved in geothermal development.
2.25 One issue which needs to be resolved in particular is the potentialrle of t-he fornicn privnte aantor 4n t-ha Adeveo1pment- -of the goPntherm_a1 fic-lds
on the one hand and of the Indonesian public sector on the other. The Ministry
- 30 -
of Energy and PERTANINA believe that a number of foreign groups are interestedin other potential fields on Java/Bali and will be able to develop them onsimilar terms as the joint operation contract between Union Oil and PERTAMINA.Further discussions with foreign groups should be actively pursued. It maybe difficult to attract foreign participation for the smaller geothermalprojects, especially on the other islands. Consequently, in some cases,public sector investment may be necessary.
2.26 In any event, geothermal development should be stimulated and theGovernment should consider the possibility of setting up a separate agencyto do this. This responsibility is now assigned to PERTAMINA but PERTAMINAcan (and should) make the best use of its limited operational and managerialresources by concentrating on petroleum production. While the new agencywould undoubtedly require strong technical assistance initially and mightwish to lease foreign drilling rigs, there is no doubt that it could effec-tively continue the development of the Kamajong/Darajat fields since consid-erable work has already been completed and the steam reserves have alreadybeen developed for the 30 MW power plant currently under construction.
The Supply of Hydro
Potential
2.27 The river systems of Indonesia offer great scope for hydropowerdevelopment. Government estimates indicate the theoretical potential of hydroat 31,000 MW of capacity and 155,000 gWh of annual energy. However, no com-prehensive field reconnaissance of the country's river systems has yet beenundertaken and even this figure may, in the medium to long term, prove to bean underestimate. In the case of Java, the potential is both better known andfurther developed. All the major hydro sites have been investigated and bythe end of the decade about 90% of the available potential will have beendeveloped.
2.28 The bulk of the identified potential, 127,000 gWh, lies outsideJava. Nearly half is located in Irian Jaya, where less than 1% of the popula-tion lives; 18% is in Kalimantan. 15% in Sulawesi, 12% in Sumatra and only Aton Java. There appears to be significant scope for small hydro development inthe country and this, in the longer term, could be an important and viablesource for promoting rural electrication on the islands.
Prospects & Policies
2.29 In March 1980 the total installed hydroelectric generating capacityin the country was 666 MW of whirh 462 MW was on Java, 176 MW in Sulawesi, 20MW in Kalimantan and 8 MW in Sumatra. Construction of a major hydroelectricproject has recentiv commenced at Asahan (600 MW) in Sumatra to supply powerto a large aluminum complex which will have a capacity of 225,000 tonnes ofaluminum per arn.rum. About 50 M,UT will be available for .D1N.s grid use. Thepossibility of increasing Asahan capacity by a further 300 MW is currentlyunder investiantion= Three further sites -at Sagulir.g ar.d Ciratz -in Wes t Tavaand______ - -. - -M-r iL CentVr Jv o 70 Meivand Mrica in Central Java for 700 MW, 200 MW and 180 MW capacities respectively
- 31 -
are now under consideration. All three are included in PLN-s developmentprogram and are expected to be completed by 1988. It is likely that they will
account for most of the available hydro resources on Java (see Table 2.6).
Table 2.6
Supply Projections for Hydro Development (1984/85-1988/89)
Annual EstimatedInstalled Energy Completion
Scheme Location Capacity(MW) Potential(GWh) Date
Saguling (Stage 1) Java 350 1,974 1985/86Saguling (Stage 2) Java 350 182 1986/87Cirata Java 500 1,370 1987/88Mrica Java 180 600 1987/88Maung Java 170 246 1987/88Kesamben Java 33 98 1984/85Maninjau Sumatra 68 270 1984/85Singkarak Sumatra 180 629 1987/88Tes Sumatra 16 101 1985/86Bandung Agung (Stage 1) Sumatra 4 - 1986/87Bandung Agung (Stage 2) Sumatra 16 - 1987/88Batu Tegi Sumatra 24 50 1986/87Pade Kembayung Kalimantan 30 235 1987/88Riam Kiwa Kalimantan 42 196 1988/89Tenggari (Stage 1) Sulawesi 16.6 90 1984/85Tenggari (Stage 2) Sulawesi 16.4 87 1987/88Sawangan Sulawesi 17.5 64 1988/89Bakaru (Stage 1) Sulawesi 124 970 1985/86Bakaru (Stage 2) Sulawesi 62 100 1988/89Sentani Irian Jaya 13 30 1987/88
Source: PLN
2.30 Extensive survey work should be carried out as a matter of urgency
to increase the number of hydro projects in the pipeline. Some survey workhas been undertaken, particularly on Java, however, because the lead ministry.the Ministry of Public Works, has had other legitimate priorities, such surveyshave not been carried out as rapidly as they might have been. This should beresolved within the next two years when, as part of a World Bank financedpower proiect (Power VI loan 1365), a separate hydro survey unit within PLNwill become fully operational.
Traditional Energy Resources
2.31 The natural ecosystem of the Indonesian archipelago, which receivesaverage annual rainfall levels of between 1000-5000 mm. consists nrimarilv ofequatorial rainforests, and tropical moist semi-deciduous forests. From anenergy perspective, both forest types have a relative]y large caparity forbiomass regeneration. The estimated annual rate of accumulation of fixed
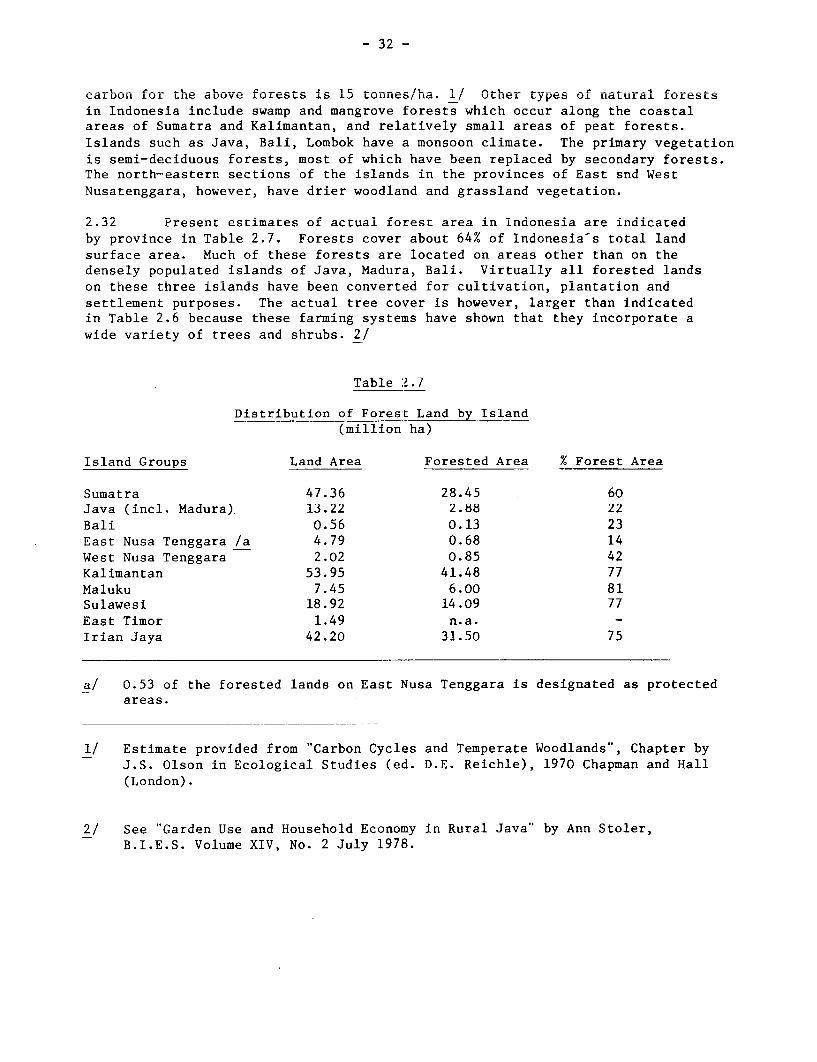
- 32 -
carbon for the above forests is 15 tonnes/ha. 1/ OIter types oi natural lorestsin Indonesia include swamp and mangrove forests which occur along the coastalareas of Sumatra and Kali-ar1ta[IL, anU relatLv ely a1 a l rCeas Uof peat forests.
Islands such as Java, Bali, Lombok have a monsoon climate. The primary vegetationis semi-deciduous forests, most of which have been replaced by secondary forests.The north-eastern sections of the islands in the provinces of East snd WestNusatenggara, however, have drier woodland and grassland vegetation.
2.32 Present estimates of actual forest area in Indonesia are indicatedby province in Table 2.7. Forests cover about 64% of Indonesia's total landsurface area. Much of these forests are located on areas other than on thedensely populated islands of Java, Madura, Bali. Virtually all forested landson these three islands have been converted for cuitivation, plantation andsettlement purposes. The actual tree cover is however, larger than indicatedin Table 2.6 because these farming systems have shown that they incorporate awide variety of trees and shrubs. 2/
Table 2.7
Distribution of Forest Land by Island(million ha)
Island Groups Land Area Forested Area % Forest Area
Sumatra 47.36 28.45 60Java (incl. Madura). 13.22 2.88 22Bali 0.56 0.13 23East Nusa Tenggara /a 4.79 0.68 14West Nusa Tenggara 2.02 0.85 42Kalimantan 53.95 41.48 77Maluku 7.45 6.00 81Sulawesi 18.92 14.09 77East Timor 1.49 n.a. -Irian Jaya 42.20 31.50 75
a/ 0.53 of the forested lands on East Nusa Tenggara is designated as protectedareas.
1/ Estimate provided from "Carbon Cycles and Temperate Woodlands", Chapter byJ.S. Olson in Ecological Studies (ed. D.E. Reichle), 1970 Chapman and Hall(London).
2/ See "Garden Use and Household Economy in Rural Java" by Ann Stoler,B.I.E.S. Volume XIV, No. 2 July 1978.
- 33 -
2.33 The extensive rain forests of Kalimantan, Su]lawesi, etc., areIndonesia's second largest source of export earnings. About 16 million tonnesof logs are exported annually. Eighty-five million hectares of Indonesia'sforests are maintained under permanent reserve. Between 6 - 10 million hec-tares are mantained as natural forest preservation and about 37 millionhectares are unreserved. Assuming an average annual increment of wood producedper hectare, the total forest biomass supply potential for Indonesia underpresent conditions could be about 650 million tonnes/year. 1/
2.34 Forests in Indonesia are continually being converted for cultivation,settlement and other purposes. Conservation estimates of the DirectorateGeneral of Forestry indicate an annual conversion rate of 400,000 hectares,most of which occur on the densely populated islands of Java and Bali. Thereis an increasing trend on Java towards the establishment of farms and settle-ments on mountain slopes. A major reforestation/affor-sstation program wasinitiated in the late 1960's to help reclaim large tracts of land to forestsand to tackle the immediate problem of topsoil erosion in watershed areas, andsiltation of rivers. An annual target of 1 million hectares was set for theprogram but this has yet to be achieved. The main target area is Java, wherein 1976, for example, 340,000 hectares of the total 465,000 hectares werereplanted. 700,000 hectares out of the annual target of a million hectaresare being organized as a "regreening" effort 2/ with the participation oflocal communities. The lack of any major progress with the program has beenattributed in part to the lack of interest and involvement by the rural communi-ties. This is, however, difficult to justify given the already widespreadindigenous practice of home garden (pekarangan) cultivation. Another cons-traint on the regreening program is the lack of extension support. Only about3,000 "greening" agents are being deployed for the program. This is inadequatefor comprehensive coverage of the severely affected areas.
2.35 There is some scope for improving the recovery and utilization ofresidues generated from commercial logging and milling operations. Thisties in closely with the requirements for the implementation of the recentlyenacted decree which stipulates a progressive increase in the proportion oflogs processed locally to 60% of total logging volume. Greater incentivesare being made available to logging companies to establish domestic millingoperations. Thus, the volume of domestically p5ocessed logs is expected toincrease from the present level to 35 million m by 1983. Residues from mill-ing operations (i.e., chippings, sawdust, etc.) will increase correspondingly.A more detailed assessment of the location of mills and notential markets forthe recovered energy is required. A special study component of the proposedIndonesia Forestry Proiect (to be financed in part by an TBRD loan) willexamine the feasibility of using milling residues for energy purposes.
1/ This assi,mes that the maximum rate of total wood consumption is equivalentto the sustainable yield of the forests (i.e., less than the mean annualincrement).
2/ This is an INPRES Forestry initiative. The remaining 300,000 hectares/annum are being replanted by D.G. Forestry Operations.
- 34 -
Discarded logs can be recovered, if need be, by carbonization on site using
simple earthen kiln methods. Results of field studies at transmigration sites,
carried out recently under the Transmigration Area Development Project 1/,
financed by a grant from the West German Agency for Technical Cooperation
(A.T.Z.), indicate that in addition to a gross income of US$2,900 - 10,700
which could be realized from commercially valuable timber, 15-54 tons of char-
coal could also be produced per hectare as an integral part of land clearing.
Other Biomass Resources (Agricultural Residues)
2.36 Agricultural residues are a very large but yet untapped source
of biomass energy in Indonesia. Vast amounts of agricultural residues are
generated on Java as a by-product of the intensive cropping practices. The
total amount of potentially available biomass is estimated at 91.1 million
green tonnes. In addition, home gardens and dryland farming systems make up
about 40% of the total cultivated land area on Java. The home gardens are
dominated by woody perennials including fruit and timber trees in the upper
tier. As a "harvestaeh1 forest" they nrovide the rural household with fire-wood, herbs, animal fodder and building materials. Surveys in parts of Java
indicate that some households obtain up to 70% of their fuelwood requirements
from home gardens. More effort should be made to examine the overall
contribution of home gardens, particularly as they relate to the stated
objectives of the regreening program. oth farming systems have the potential
of producing about 4A65-13.76 million m of fuelwood annually.
2.37 A major conntraint on the use of other agricultural residues for
energy on a larger scale is collection. The option becomes increasingly attrac-
tive wherever the cost of collect1on is tied to the existing system, as in
the case of rice husks and straws in Indonesia which are collected as an integral
part of rice harvesting; Thprp is litt-1e ise of rice straws for paner making but
all rice husks produced from milling onprations arp hllrnt.
Conclusion
2.38~L Fzmte di4scuss4or, in this chapter it i5 clear that while Indonesia
possesses a wide variety of energy resources besides oil, there is still insuffi-
cier.t know'ledge abo;ut the ext-ent- of ithese resources, their quality and the best
way of using them within the country's overall development strategy. Coal alone,
if estimated reserves are proven, could exceed oil and gas in terms of energy
content. There is therefore an immediate need to prove up the non-oil reserves.
In the short to medium term, however, oil and gas will provide the main sources of
energy for the country. Some of the choices among fuel uses are discussed in
Chapter 4, while the constraints on achieving the optimum use of all energy
resources are discussed in other chapters.
l/ Several reports have been published under the project: The TransmigrationArea Development Study: see especially "Indication of the Value of
Remaining Trees on Land designed for Transmigration in Pelita III in East
Kalimantan, by Ross, Saleh, Aliansyah, June 1979.
- 35 -
CHAPTER 3
ENERGY PRICING POLICY
Background
3.01 The current petroleum product pricing policy is a major constraintto achieving the Governmentls stated policy of replacing oil with otherindigenous energy resources. This pricing policy is based on large financial(and economic) subsidies on almost all petroleum produicts which, in additionto the fiscal strain on the Governments budget, provide a clear disincentiveto potential producers of non-oil resources and encourage the rapidly growinguse of petroleum products (sometimes wastefully) rather than other fuels onwhich there is little or no subsidy. The oil products subsidies are dominatedby one product, kerosene, which is priced at about one-third of its opportunitycost and accounts for about 50% of the economic subsidly. Both kerosene anddiesel are presently subsidized. As kerosene has been found to be a substitutefor diesel in both the transport and industrial sectors, removal of thesubsidy on diesel would encourage the use of kerosene. Hence, if it werepolitically feasible to remove the kerosene subsidy, miany of the other problemsrelating to petroleum product pricing would automatically be solved.
3.02 Three arguments have frequently been advanced in favor of low, sub-sidized kerosene prices:
(a) Subsidized kerosene prices help alleviate pc,verty and improveincome distribution. The current oil subsidies certainlyraise the real income of the lower income gIroups but by only asmall amount. They also worsen income dispaFrities. Accord-ing to 1976 expenditure survey data, about 20% of kerosene isconsumed by the poorest 40% of the population, implying thatevery Rp.100 of kerosene subsidy benefitting a member of thepoorest 40%, Rp.266 will benefit members of the upper 60%. Anincrease in the kerosene price to the world level (about threetimes the current domestic price) would impose a burden on thepoor. Therefore, careful thought should be given to the phasingof the price increases and to ways in which the budgetary savingsfrom reduced subsidies could be used to supplement the reducedincomes of the poor--such as subsidizing more efficient alter-native forms of energy, including rural electrification andbottled LPG.
(b) Higher domestic kerosene prices would result in further defores-tation and the erosion of watersheds. The cross-price elasti-city between kerosene and firewood is not known with anyconfidence, but it has been estimated that the subsidy servesto protect at most only about 20,000 ha. of land vulnerable toerosion. If this estimate is reasonably accurate, the budgetarycost of protection per hectare is approaching $100,000, roughlytwo hundred times the cost of replanting a hectare.
- 36 -
(c) Raising the prices of these three liquid fuels would cause anincrease in the rate of inflation because of cost-push factorsand also because fuel prices have an important psychologicalimpact on general wage and price movements. There are tworeasons why the effect on the overall price level of a reduc-tion in the oil subsidy would be small and possibly evennegative. First, the energy content of economic activityin Indonesia is still very low. Thus, even very substantialdomestic oil price increases would affect consumer prices onlymarginally. Second, the increased bugetary revenue (reducedsubsidy) would have an initial deflationary impact (on the demandside), and would reduce the need for converting oil revenues intorupiahs to finance Government development programs by the sameamount. The annual budget subsidy on oil products is currentlyequivalent to over 25% of the stock of money in circulation anddemand deposits. Given these relative magnitudes, domestic oilpricing in Indonesia could be used as a powerful tool of fiscalpolicy. If the Government should decide not to use all theincremental revenues resulting from a decrease in the oilsubsidy, the overall effect may in fact be to reduce inflation.
3.03 The Government has recently recognized the need to restructureits energy pricing policy and in early 1979 and 1980 raised the retail priceof petroleum products by 40% and 50%, respectively. Current prices are,however, still well below the opportunity costs of petroleum products.
3.04 Until 1974, Indonesia collected "taxes" on domestic consumptionof petroleum products. The Government considered as "tax receipts" anyexcess of PERTAMINA's total domestic sales revenues over PERTAMINA's costof producing and distributing the petroleum products. Until 1974, "taxes"collected in this manner accounted for between 5% and 8% of total tax reve-nues. However. it never subiected these Droducts to either the generalsales taxes or the special road user excise taxes. Instead, the prices ofrefined products were established by the Government through discussionsbetween BAPPENAS and the Ministries of Energy and Mines, and Finance. Theprices of natural gas and coal were also under Government control, but thesubsidies to PN Tambang Batubara (PNTB) were inconsequential given theminor ronl of onal in the total energv sunnlv. The electricity tariffstructure prior to the mid 1970s ensured that PLN had sufficient revenuesto more tlhan hreak even and Arhieuv Rome profit.
3._5 w.a_uar linrn 1976 teAstinfn from thiR Aiirrep haR derlined RtubRtan-tially, as controlled prices for petroleum products failed to keep pace with4nflation, and arapidly arowina subslidy emergedi (see Table 3=-1)= GasQ
pricing for bulk supply became more complex, as each increment of supply wasnegotiated separately. In the coal mining and electr4city scltors, theore was
little change in the financial position of the entities, PNTB and PLN.
3.06 The financial subsidy, which stood at $400 million in FY78, had.'rcreased to $ 4114bllon by -V and crt (-FY81) is estimated at
more than $2 billion. The present financial subsidy on fuel accounts for
20% of the Government's total routine budget. However, the economic cost ofthis subusid'y measured by- 1 the difenc bewe -wha -Irid -onesia could] receiveLLJ.L~~ ~UU~±U LLC UULLLULLiI- C UC LWCCLL WLLCLL ±L U%JLCL LUU 1.JLLV
for refined petroleum products when sold on the world market and what itreceives when these products are consumed domestically is 6ignificantly largerthan the financial cost. In FY80 the economic subsidy reached US$3.8 billion,equiva'lent to almost J30 of total estimated export earnings for tnat year.The present economic subsidy (FY81) will rise to over US$4 billion. If it isassumed that there are no nominal increases in domestic oil prices for thenext two years and only modest real increases in the following three years,the economic subsidy could reach US$12.0 billion by 1985. 1/
3.07 The GO! has a stated policy of eventually withdrawing subsidies.However, the mission recognizes the difficulties inherent in this process andthe following discussion of energy pricing therefore takes into considerationnot only the opportunity costs of different energy forms but also how marketprices may differ from these. Also considered are some ways of rearranging theexisting subsidies to ensure that they reach those for whom they are designedas well as some ways of ensuring that (even if prices cannot be raised or sub-sidies removed) there will be less diversion of producl:s--especially kerosene--into undesirable channels.
The Pricing of Energy Products
3.08 Petroleum. Since 1976, retail prices for pel:roleum products havebeen revised on three occasions, the most recent of which raised prices by anaverage of 50% in May 1980. During the period 1976-80., domestic prices ofpetroleum products doubled as compared to a tripling of the internationalprices of crude oil.
1/ See Table 3.3, Indonesia Development Prospects and Policy Options,World Bank, 1981.
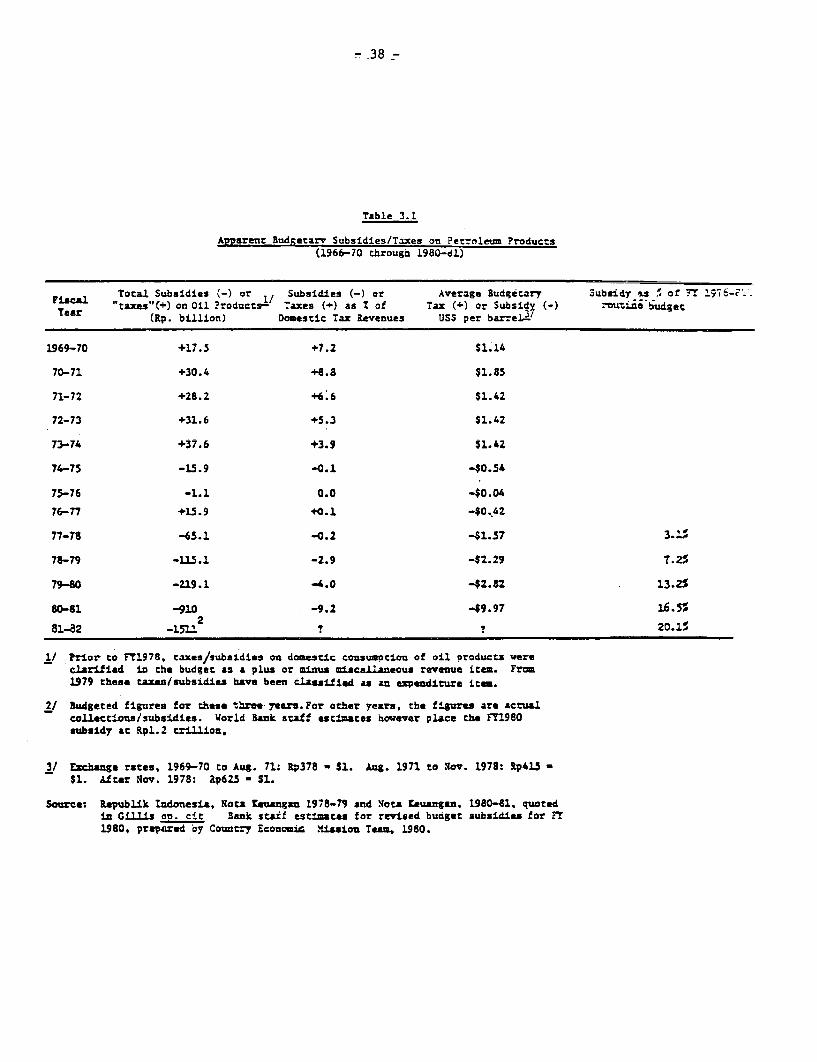
- 38
Table 3.1
Apparent Budgetarv Subsidies/Taxes on Pecrnleum Products(1966-70 chrougo 1980-8i)
Fiscal Total Subsidies (-) or 1/ Subsidies (-) or Average gudgetary Subsidy &s s of FTr 1.976-F` -Y .t fl taxes"(+) on Oil ?roducts- Taxes (+) as I of Tax (z) or Subsidy (-) ro tine budgec
(Rp. billion) Domestic Tax levenues US per barreJ4l!
1969-70 +17.5 r7.2 ; i.14
70-71 +30.4 +8.8 $1.85
71-72 +28.2 46.6 $1.42
72-73 +31.6 +5.3 $1.42
73-74 +37.6 +3.9 51.42
74-75 -15.9 -0.1 -80.54
75-76 -1.1 0.0 -$0.04
76-77 +L5.9 +0.1 -$0.42
77n" -e et. 1 -. *.5 7w
78-79 -L15.1 -2.9 -$2.29 T.2%
79-80 -219.1 -4.0 -42.82 13.2%
80-81 -910 -9.2 -$9.97 16.5%2
1/ Prior to FT1978. taxes/subsidies on domestic consumotion of oil oroducts wereclarified in the budget as a plus or minus miscellaneous revenue item. From1979 these taxes/subsidies have been classified as an expenditure item.
2J udgeted figures for these tbree years. For other years, the figures are actualcollectLous/subsidies. World Bank staf estimases however place the FY1980subsidy at Rpl.2 trillion.
3/ Excbange rates, 1969-70 to Aug. 71: R378 - Sl. Aug. 1971 to Nov. 1978: 1p415 -
$1. After Ncv. 1978: aZp6Z - S1.
Source: RepubLik Indonesia. Rota KeLangan 1978-79 and Nota Keuangan. 1980-81. quotedin Oill±s on. c±t Bank seaif estimates for revised buaget subsidies for FT1980, prepared by Country Economic Missaion Tea-- 1980.
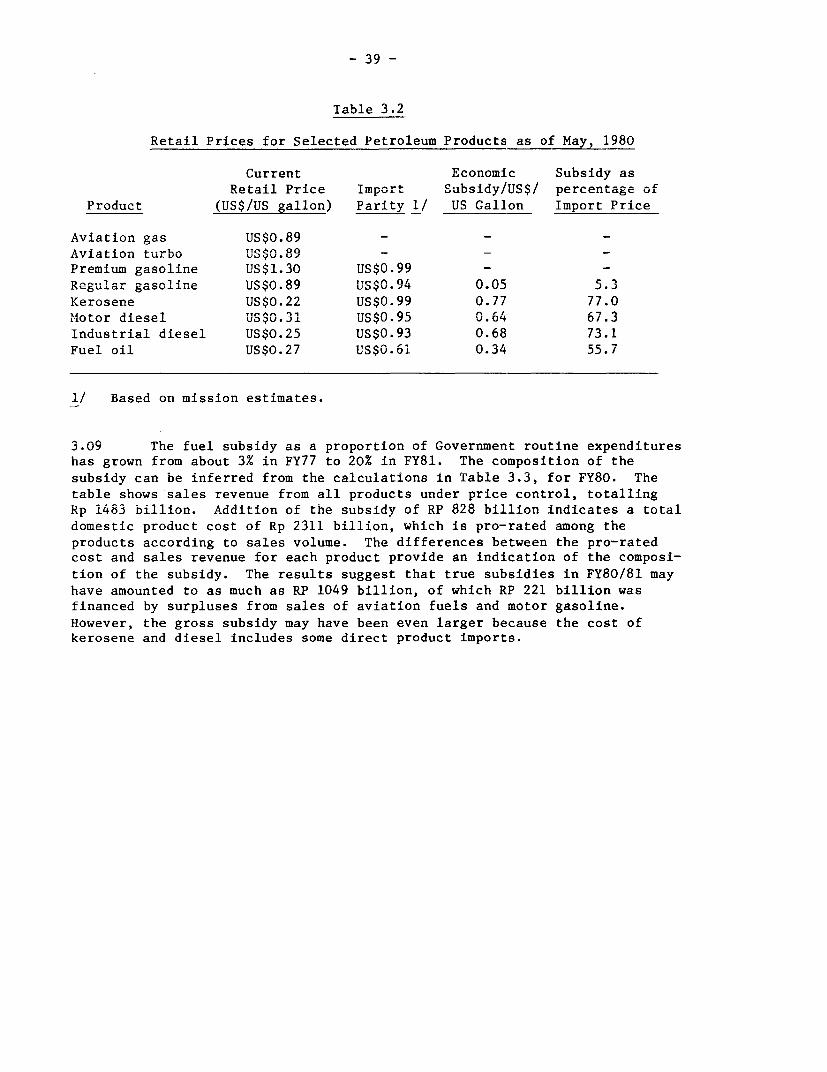
- 39 -
Table 3.2
Retail Prices for Selected Petroleum Products as of May, 1980
Current Economic Subsidy asRetail Price Tmport S ulbsidy/US$/ pecntg of
Product (US$/US gallon) Parity i/ US Gallon Import Price
Aviation gas US$0.89 - -Aviation t4urb- o US08 If - -
Premium gasoline US$1.30 US$0.99 _D 1 1 4 ~~~TTC'elf'% 0 TTCeFt *^. a/ AC C .D5egular gasoline UqJV.UV UO?V. 7t .VJ.J
Kerosene US$0.22 US$0.99 0.77 77.0U,.e-.. 2J~....-..1 r .r '3 1 usflAf Or AC0.z1 Motor diese'l uS$.31 US$0 -9v 0.4 06.3
Industrial diesel US$0.25 US$0.93 0.68 73.1ruel oil US$0.27 US$0.61 0.34 55.7
1/ Based on mission estimates.
3.09 The fuel subsidy as a proportion of Government routine expenditureshas grown from about 3% in FY77 to 20% in FY81. The composition of thesubsidy can be inferred from the calculations in Table 3.3, for FY80. Thetable shows sales revenue from all products under price control, totallingRp 1483 billion. Addition of the subsidy of RP 828 billion indicates a totaldomestic product cost of Rp 2311 billion, which is pro-rated among theproducts according to sales volume. The differences between the pro-ratedcost and sales revenue for each product provide an indication of the composi-tion of the subsidy. The results suggest that true subsidies in FY80/81 mayhave amounted to as much as RP 1049 billion, of which RP 221 billion wasfinanced by surpluses from sales of aviation fuels and motor gasoline.However, the gross subsidy may have been even larger because the cost ofkerosene and diesel includes some direct product imports.
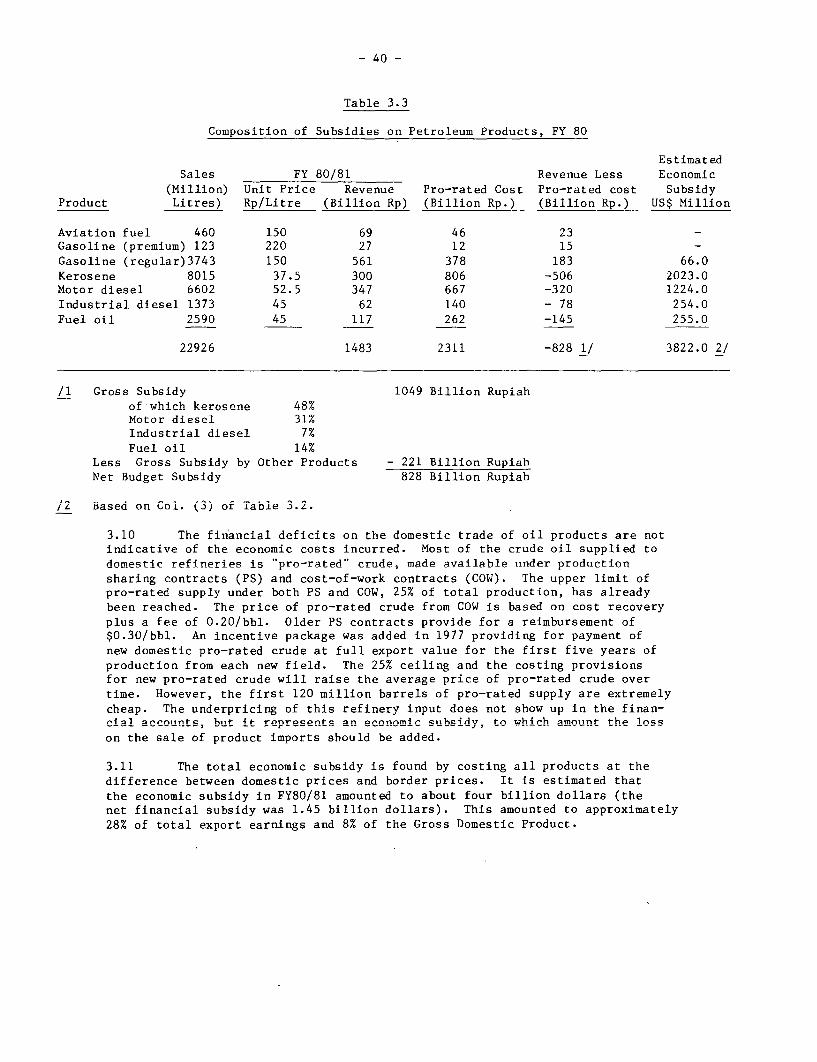
- 40 -
Table 3.3
Composition of Subsidies on Petroleum Products, FY 80
EstimatedSales FY 80/81 Revenue Less Economic
(rilffiLLon) unit Price Revenue Pro-rated Cost Pro-rated cost SubsidyProduct Litres) Rp/Litre (Billion Rp) (Billion Rp.) (Billion Rp.) US$ Million
Aviation fuel 460 150 69 46 23Gasoline (premium) 123 220 27 12 15 _Gasoline (regular)3743 150 561 378 183 66.0Kerosene 8015 37.5 300 806 -506 2023.0Motor diesel 6602 52.5 347 667 -320 1224.0Industrial diesel 1373 45 62 140 - 78 254.0Fuel oil 2590 45 117 262 -145 255.0
22926 1483 2311 -828 1/ 3822.0 2/
/1 Gross Subsidy 1049 Billion Rupiahnf whirh kerosene 48%L
Motor diesel 31%Industrial diesel 7%Fuel oil 14%
Less Gross Subsidy by Other Products - 221 Billion RupiahNet Budget Subsidy 828 Billion Rupiah
/2 Based on Col. (3) of Table 3.2.
J . L V 110 L- i 1e La- u. .L e Lts 1on LeO AmesIc L Ir CL o clu VLoViL pro duc L ts21 ar e noL C
indicative of the economic costs incurred. Most of the crude oil supplied todrmestir refineries iq "nro-rated" crude; made available tinder nrodurtionsharing contracts (PS) and cost-of-work contracts (COW). The upper limit ofpro-rated supply under both PS and COW, 25% of total production, has alreadybeen reached. The price of pro-rated crude from COW is based on cost recoveryplus a fee of 0.20/bbl. Older PS contracts provide for a reimbursement of$0.30/bbl. An incentive package was added in 1977 providing for payment ofnew domestic pro-rated crude at full export value for the first five years ofproduction from each new field. The 25% ceiling and the costing provisionsfor new pro-rated crude will raise the average price of pro-rated crude overtime. 'lowever, the first 120 million bVd.Lrels UL PLr-JLadLU supply aIr etrALLty1
cheap. The underpricing of this refinery input does not show up in the finan-cial accounts, but it renresents an economic subsidy, to which amonnt the loss
on the sale of product imports should be added.
3.11 The total economic subsidy is found by costing all products at thedifference between domestic prices and border prices. It is estimated thatthe economic subsidy in FY80/81 amounted to about four billion dollars (thenet financial subsidy was 1.45 billion dollars). This amounted to approximately28% of total export earnings and 8% of the Gross Domestic Product.
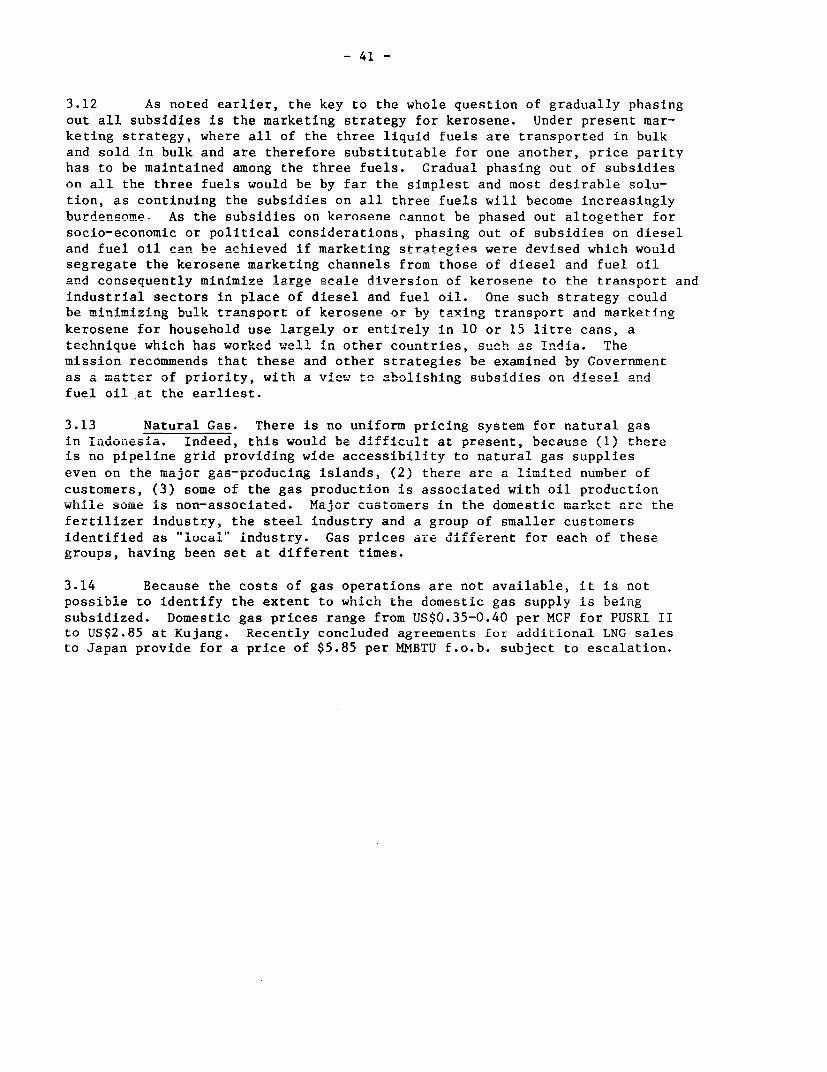
- 41 -
3.12 As noted earlier, the key to the whole question of gradually phasing
out all subsidies is the marketing strategy for kerosene. Under present mar-
keting strategy, where all of the three liquid fuels are transported in bulk
and sold in bulk and are therefore substitutable for one another, price parity
has to be maintained among the three fuels. Gradual phasing out of subsidies
on all the three fuels would be by far the simplest and most desirable solu-
tion, as continuing the subsidies on all three fuels will become increasingly
huirdensome. As the subsidies on kerosene cannot be phased out altogether forsocio-economic or political considerations, phasing out of subsidies on diesel
and fuel oil ca1n hb 2rhieved if marketing strategies were devised which wouldsegregate the kerosene marketing channels from those of diesel and fuel oil
and consequently minimize lare scrale diversion of kerosene to the transnort and
industrial sectors in place of diesel and fuel oil. One such strategy couldbe minimizing bulk transport of kerosene or bv taxing transnort and marketing
kerosene for household use largely or entirely in 10 or 15 litre cans, atechnique hIch. has worked well in other countries, such as India. Themission recommends that these and other strategies be examined by Government
as a matter of priority, with a view to abolishing subsidies on diesel andfuel oil at the earliest.
3.13 Natural Gas. There is no uniform pricing system for natural gas
iLn LLUUiIoeia. IndeeUd, this wouLd bDe UdfLicuL at present, because (1) there
is no pipeline grid providing wide accessibility to natural gas supplies
even on tie major gas=proluucLng islands, (2) there are a limited number of
customers, (3) some of the gas production is associated with oil productionwhile some Ls nonassociated. iJlor cusLomers Ln 'Lle domestic market are the
fertilizer industry., the steel industry and a group of smaller customers
identified as "local" industry. Gas prices are different for each of these
groups, having been set at different times.
3.14 Because the costs of gas operations are not available, it is not
possible to identify the extent to which the domestic gas supply is being
subsidized. Domestic gas prices range from US$0.35-0.40 per MCF for PUSRI IIto US$2.85 at Kujang. Recently concluded agreements for additional LNG salesto Japan provide for a price of $5.85 per MMBTU f.o.b. subject to escalation.
- 42 -
Table 3.4
Prices of Natural Gas
PriL esSupply Contract (US$/MCF) 1/
Fertilizer:
PUSRI I (S. Sumatra) est. 0.35-0.40PUSRI !I (S. cSumatral) est. 0.J3-0.4UPUSRI III (S. Sumatra) est. 0.65U IV (S. Sumatral est. O.uJ
Kujang (at Java) 0.65
Steel:
Krakatoa 0.65
Local Industry: 1.25-1.92
1/ For conversLoio to 'eat basis 1.0 MCF = i.O L'1BTU.
3.15 It appears that agreement has been reached in principle betweentLie 'GoverrmenLt an"' PERTAMiNA on a substantial increase in the price of =new=domestic gas contracts in order to stimulate the production of gas for domes-tic use. However, it is still not clear what policy will be adopted for theprice of competing fuel oil, currently standing at Rp 45.1 per liter (equiv-alent to $1.84 per MMBTU).
3.i6 In general, the low price for natural gas has discouraged the pro-duction of gas for indigenous use. On Java and Sumatra especially, but alsoin other areas where non-associated gas is available, the mission recommendsthat the price of gas received by producers be made equivalent to its oppor-tunity cost. Since, however, natural gas will compete with coal and fuel oil,the retail price of gas may have to be adjusted (by subsidies) until such timeas the subsidies on the competing products are removed.
3.17 It should be noted that for natural gas and fuel oil the subsidycan be shifted "downstream" relatively easily. For example, among the majorbeneficiaries of the very low price of natural gas (which has a subsidy of$12-20 per BOE) is the fertilizer industry. Since fertilizer in any event issubsidized between the manufacturer and the consumer, it would appear to berelatively simple to raise the price of gas delivered to the fertilizer plantsto its opportunity cost and to add the estimated "lost subsidy" directly tothe consumer price subsidy. Another example is the case of fuel oil (Bunker"C"), which is a major competitor of coal, gas, hydro, geothermal, etc., inelectricity generation. The main beneficiaries of the subsidy other than PLN
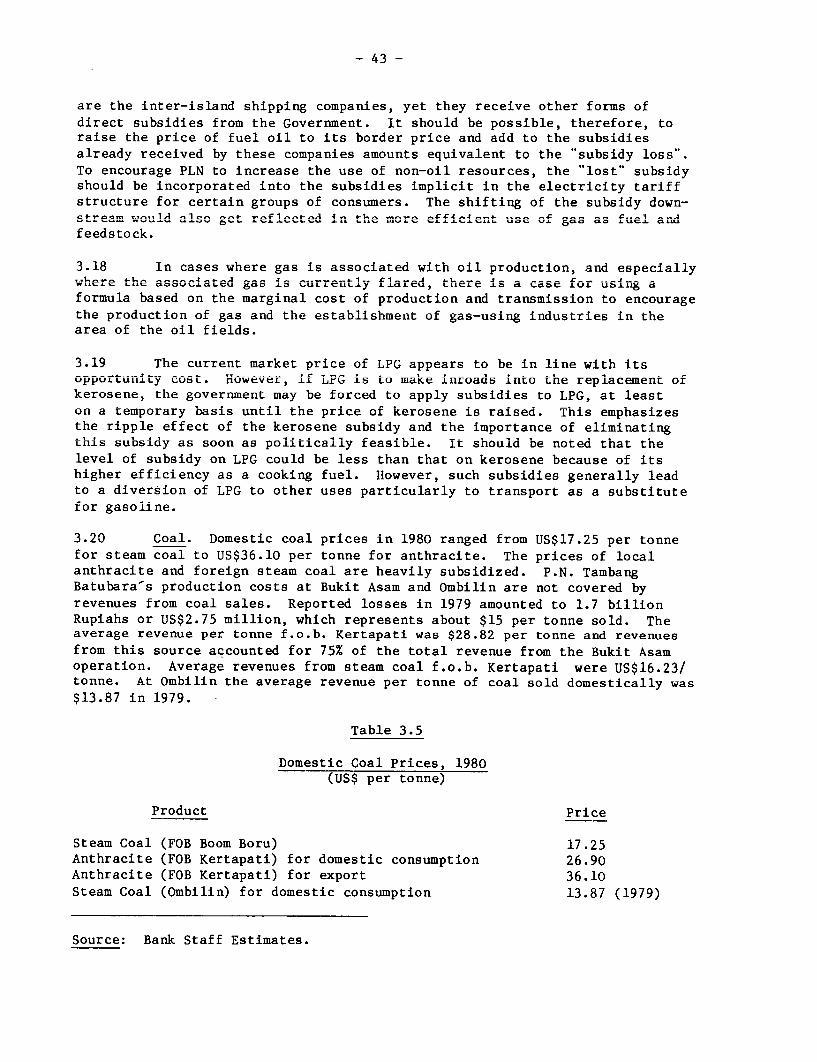
are the inter-island shipping companies, yet they receive other forms ofdirect siihidtiia a from tha Goniirnment ITt chniuld bh npcibhle, thoreforo, to
raise the price of fuel oil to its border price and add to the subsidiesalready receiuvd bu thoce companies amounts equivalent to the "subsidy loss"To encourage PLN to increase the use of non-oil resources, the "lost" subsidychmii1ue ho inpnr nv-toa 4-nt I-ho t a,,ha4A4=c 4 mn,1 4 r4tI- 4n I-h ol pf-tr4p4t-vy 4 FF
structure for certain groups of consumers. The shifting of the subsidy down-stream would --!so get reflected in the more efficient u-se of gas zs fuel_ -Ar
feedstock.
3.18 In cases where gas is associated with oil production, and especiallywhere the associated gas Is currently flared, there isa case for using aformula based on the marginal cost of production and transmission to encouragethe production Of gas ard the establishment of gas-using industries in tnearea of the oil fields.
3.19 The current market price of LPG appears to be in line with itsopportuni'ty cost. However, if LPG is to make inroads into the repilacement ofkerosene, the government may be forced to apply subsidies to LPG, at leaston a temporary basis until the price of kerosene is raised. This emphasizesthe ripple effect of the kerosene subsidy and the importance of eliminatingthis subsidy as soon as politically feasible. It should be noted that thelevel of subsidy on LPG could be less than that on kerosene because of itshigher efficiency as a cooking fuel. However, such subsidies generally leadto a diversion of LPG to other uses particularly to transport as a substitutefor gasoline.
3.20 Goal. Domestic coal prices in 1980 ranged from US$17.25 per tonnefor steam coal to US$36.10 per tonne for anthracite. The prices of localanthracite and foreign steam coal are heavily subsidized. P.N. TambangBatubara's production costs at Bukit Asam and Ombilin are not covered byrevenues from coal sales. Reported losses in 1979 amounted to 1.7 billionRupiahs or US$2.75 million, which represents about $15 per tonne sold. Theaverage revenue per tonne f.o.b. Kertapati was $28.82 per tonne and revenuesfrom this source accounted for 75% of the total revenue from the Bukit Asamoperation. Average revenues from steam coal f.o.b. Kertapati were US$16.23/tonne. At Ombilin the average revenue per tonne of coal sold domestically was$13.87 in 1979.
Table 3.5
Domestic Coal Prices, 1980(US$ per tonne)
Product Price
Steam Coal (FOB Boom Boru) 17.25Anthracite (FOB Kertapati) for domestic consumption 26.90Anthracite (FOB Kertapati) for export 36.10Steam Coal (Ombilin) for domestic consumption 13.87 (1979)
Source: Bank Staff Estimates.
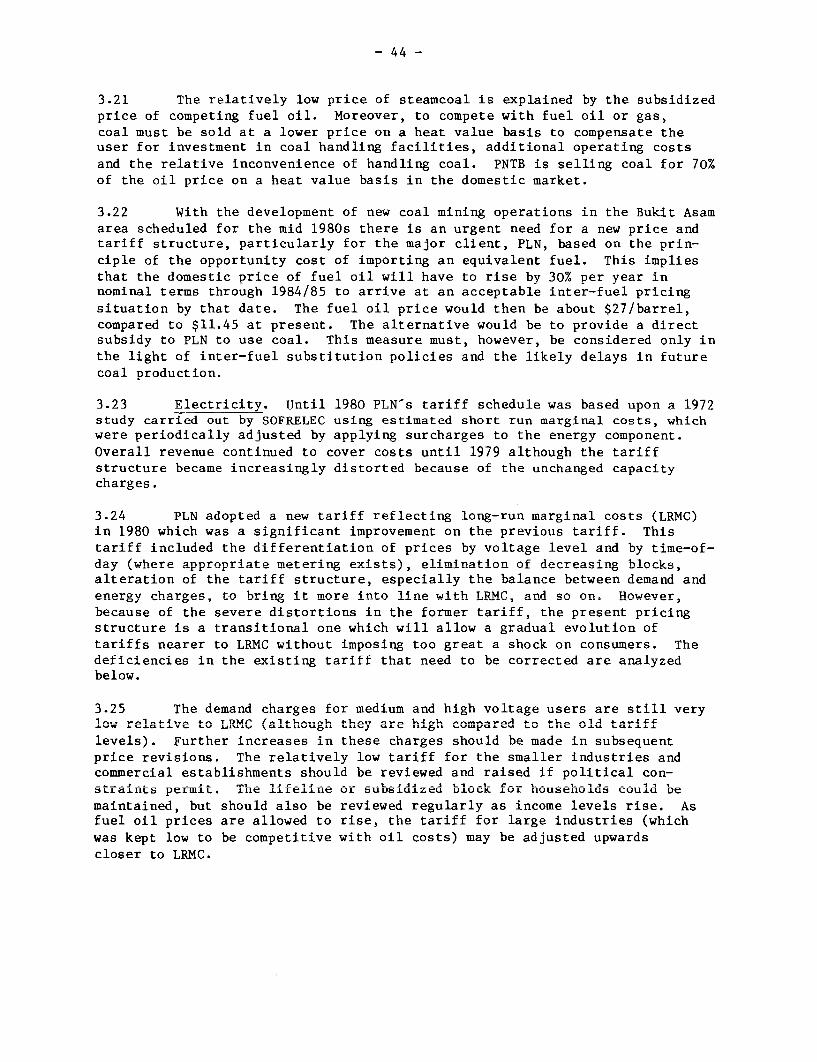
- 44 -
3.21 The relatively low price of steamcoal is explained by the subsidizedprice of competing fuel oil. Moreover, to compete with fuel oil or gas,coal must be sold at a lower price on a heat value basis to compensate theuser for investment in coal handling facilities, additional operating costsand the relative inconvenience of handling coal. PNTB is selling coal for 70%of the oil price on a heat value basis in the domestic market.
3.22 With the development of new coal mining operations in the Bukit Asamarea scheduled for the mid 1980s there is an urgent need for a new price andtariff structure, particularly for the major client, PLN, based on the prin-ciple of the opportunity cost of importing an equivalent fuel. This impliesthat the domestic price of fuel oil will have to rise by 30% per year innominal terms through 1984/85 to arrive at an acceptable inter-fuel pricingsituation by that date. The fuel oil price would then be about $27/barrel,compared to $11.45 at present. The alternative would be to provide a directsubsidy to PLN to use coal. This measure must, however, be considered only inthe light of inter-fuel substitution policies and the likely delays in futurecoal production.
3.23 Electricitv. Until 1980 PLN's tariff schedule was based unon a 1972study carried out by SOFRELEC using estimated short run marginal costs, whichwere periodically adjusted by applying surcharges to the energy component.Overall revenue continued to cover costs until 1979 although the tariffstructure became increasinalv distorted because of the unchanaed canacitvcharges.
3.24 PLN adopted a new tariff reflecting long-run marginal costs (LRMC)in 1980 which was a significant improvement on the nrevious tariff. Thistariff included the differentiation of prices by voltage level and by time-of-day (where appropriate metering exists), elimination of decreasina blocks,alteration of the tariff structure, especially the balance between demand andPneray rharaes to hrina, it mnrs intn line with .PMW and s on. n Powvuer
because of the severe distortions in the former tariff, the present pricingstructure is a transitional on.e whicrh wi11 allow agradal evolultion of
tariffs nearer to LRMC without imposing too great a shock on consumers. Thedeficiencies in the existing tariff that need to be corrected are abelow.
3.25 The demand charges for medium and high voltage users are still verylow rellative to LT -UC (a*ltlough they are hi4ghl compared to tUe old tar4ff
levels). Further increases in these charges should be made in subsequentprice revisions. The relati-vely low tariff for the smaller industries andcommercial establishments should be reviewed and raised if political con-straints perFmi1t. ThL[Ie Lifeline oLr s ubsidiJzedU Ulock for householdUs couLUd Demaintained, but should also be reviewed regularly as income levels rise. AsLuel oll priLces are al±ilUweu to riLse, L[t LdLiLor 'Large industries at:::i wniwas kept low to be competitive with oil costs) may be adjusted upwardscloser to LRMC.
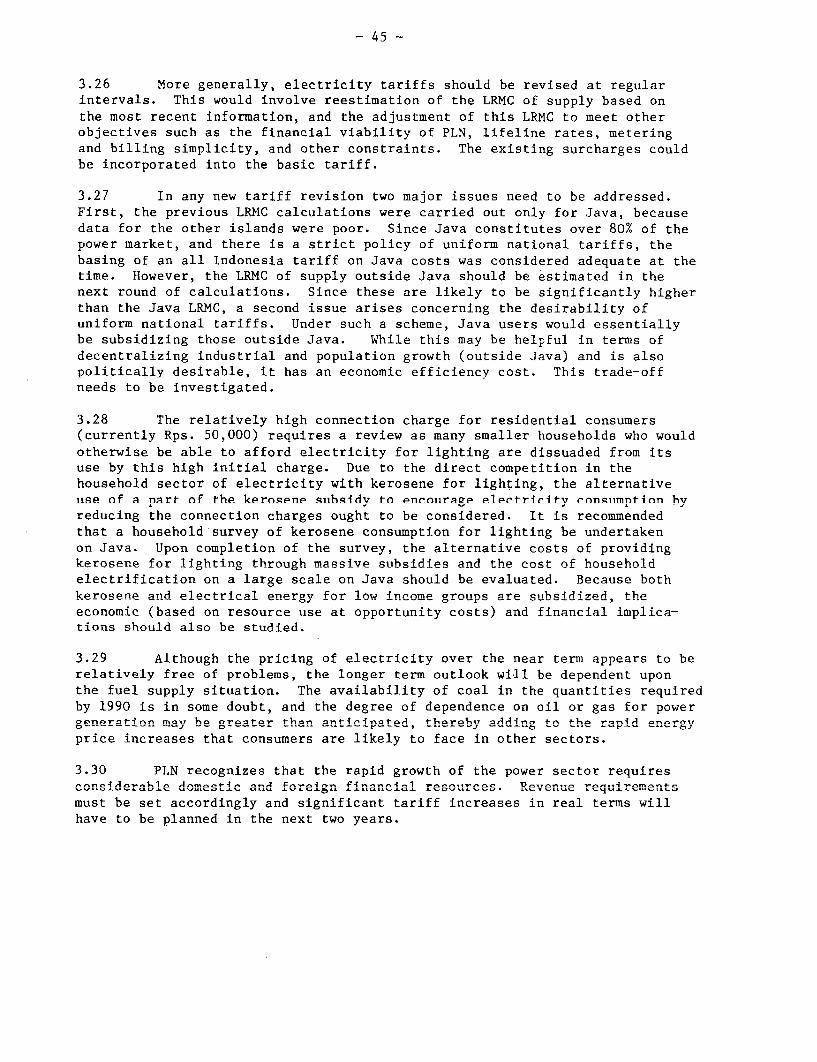
- 45 -
3.26 More generally, electricity tariffs should be revised at regularintervals. This would involve reestimation of the LRMC of supply based onthe most recent information, and the adjustment of this LRMC to meet otherobjectives such as the financial viability of PLN, lifeline rates, meteringand billing simplicity, and other constraints. The existing surcharges couldbe incorporated into the basic tariff.
3.27 In any new tariff revision two major issues need to be addressed.First, the previous LRMC calculations were carried out only for Java, becausedata for the other islands were poor. Since Java constitutes over 80% of thepower market, and there is a strict policy of uniform national tariffs, thebasing of an all Indonesia tariff on Java costs was considered adequate at thetime. However, the LRMC of supply outside Java should be estimated in thenext round of calculations. Since these are likely to be significantly higherthan the Java LRMC, a second issue arises concerning the desirability ofuniform national tariffs. Under such a scheme, Java users would essentiallybe subsidizing those outside Java. While this may be helpful in terms ofdecentralizing industrial and population growth (outside Java) and is alsopolitically desirable, it has an economic efficiency cost. This trade-offneeds to be investigated.
3.28 The relatively high connection charge for residential consumers(currently Rps. 50,000) requires a review as many smaller households who wouldotherwise be able to afford electricity for lighting are dissuaded from itsuse by this high initial charge. Due to the direct competition in thehousehold sector of electricity with kerosene for lighting, the alternativeuse of a nart of the kerosene subsidv to encourage electricity constumntion hvreducing the connection charges ought to be considered. It is recommendedthat a hoiisehold -,ilrvev of kprosene constumntion for lighting hp- iundprtqkpnon Java. Upon completion of the survey, the alternative costs of providingkerosene for lighting through mnssive subhqidiep and the cost of honusholdelectrification on a large scale on Java should be evaluated. Because bothkprospne and Plpctrical oneray for low in-ncmom roupsnc are suhbi7zed1 th1epeconomic (based on resource use at opportunity costs) and financial implica-ti ons shoul1d alsor- be stud(ied=i
3.29 Although the pricing of Plpetrityfv ovpr thp near term appears to berelatively free of problems, the longer term outlook will be dependent uponthe fulp supply situation. The availnhility of conl in tho quantities requiredby 1990 is in some doubt, and the degree of dependence on oil or gas for powergeneration may be areater than anticip.ated, thereb-y adeding to the raplid energy?
price increases that consumers are likely to face in other sectors.
3.30 PLN recognizes that the rapid growth of the power sector requiresconsiderable domestic and foreign f4nancial resources. Revenue requirementsmust be set accordingly and significant tariff increases in real terms will1-ahave t-o bu'e planned 4in tIChe next t.wo year7s.
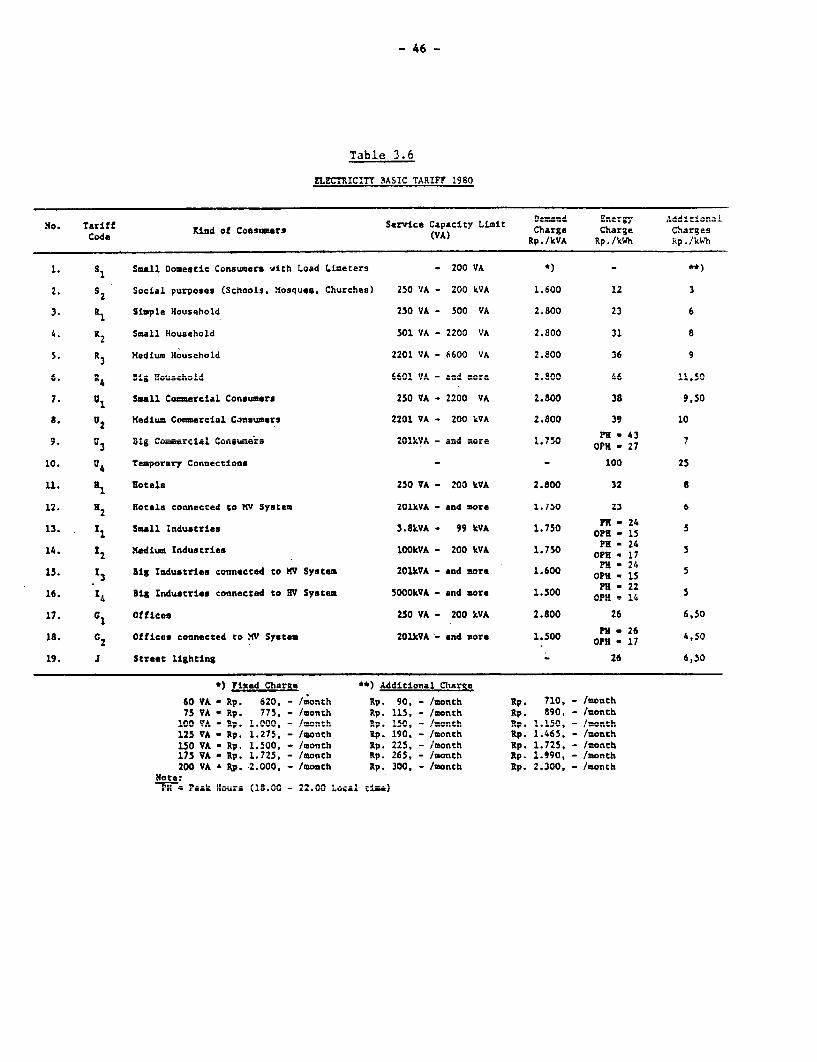
- 46 -
Table 3. 6
ELECTRICITY BASIC TARIFF 1980
Code SineofConumesCApai) I*it C1arg; Charge ChargesNo ri.f Codeid of Consumers (erv A)e CfpacSeytLLa Rp./kVA Rp./kwh Rp./kWh
1. 51 Small Domestic Consumers vith Load LLmeters - 200 VA -
2. S2 Social purposes (Schools, Mosques, Churches) 250 VA - 200 kVA 1.600 12 3
3. R1 Stmple Household 250 VA - 500 VA 2.800 23 6
4. R2 Small Household 501 VA - 2200 VA 2.800 31 8
5. R3 Medium Household 2201 VA - 6600 VA 2.800 36 9
& ousehold 6601 VAA a n dore 2.800 46 l,
7- . 1 Small Coiaercial Consumers 250 VA - 2200 VA 2.800 38 9,50
S. 2 Medium Comercial Consumers 2201 VA - 200 kVA 2.800 39 10
9. u Big Corm-arci Consu-mes 201kVA - --d Ie. PR - I27
10. U4 Temporary Connections - 100 25
11. YI Hotels 250 VA - 200 kVA 2.800 32 S
12. H2 8otals connected to Kv System 201kVA - and more 1.750 23 6
13. I Small Industries 3.8kVA - 99 kVA 1.750 PR - 2 15
14. 12 Medium Industries 1OOkVA - 200 kVA 1.750 PR 17 5OPI - 27
15. 13 Big Industries connected to MV System 201kVA - and more 1.600 (u -24 5
16. 1. Big Industries connected to RV System 50OOkVA - and more 1.500 FAR 14 5
17. C1 Offices 250 VA - 200 kVA 2.800 26 6,50
18. cG Offices connected to MV System 201kVA - and sore 1.500 oYn 17 4,50
19. J2 Street lishrlni - 26 6.50
) Sed Chargs e*) Additional Charee
60 VA - Rp. 620, - /month Rp. 90, - /month Rp. 710, - /month75 VA - Rp. 775, - /month Rp. 115, - /month Rp. 890, - /month
100 VA - RV. 1.000, - /-or.:h Rp. !50, -/c-or.h Rp. 1.150, - /_r.:h125 VA - Rp. 1.275, - /month Rp. 190, - /month Rp. 1.465. - /month150 VA R fp. 1.500. - /month fp. 225 - ;month Rp. 1.725, - /month175 VA -aR. 1.725' - /oth p. 265- /-..:th Rp. 1.990, - aoth200 VA ^ ftp. -2.000, - /month Rp. 300, - /month Rp. 2.300, - /onth
Note:rP a rPeak HOUrs (18.00 -22.00 Local tie,I
- 47
Policy Issues
3.31 The long-run costs and benefits of pricing energy supplies at theiropportunity costs have been addressed in a number of preceding Bank reports.The most recent Country Report "Development Prospects and Policy Options (No.3307-IND, March 10, 1981) merits particular attention because it traces themacro-economic effects of subsidized energy prices and illustrates how thegrowth prospects of the economy may be impaired or enhanced under alternativepricing scenarios.
3.32 The pricing of petroleum products is basic to the pricing structureof all other types of energy. As explained in para 3.12, to lay the groundworkfor future adjustments, strategies aimed at separating the kerosene marketfrom the marketing of other liquid fuels should be studied and implemented asa first priority. The stage would then be set for differential adjustments inthe prices of kerosene on the one hand and diesel and fuel oil on the other.
3.33 Simultaneously, domestic LPG marketing, distribution and consumeracceptance should be studied and tested on a pilot project basis. Dependingon the results of the pilot projects, the price increases should be accom-panied by larger LPG penetration of kerosene markets, especially on Java.
3.34 The level of fuel oil prices in 1985/86 is vital to the establishmentof a realistic initial price of Bukit Asam steamcoal delivered at Suralaya.The coal price escalation clauses in a PLN-PTBA contract should guarantee thatPTBA will generate sufficient funds internally to provide the Government withsome equity capital for the large scale expansion of the coal mining industrythat lies ahead.
3.35 Substitution of natural gas for fuel oil in the industrial sectoris a high priority. As recommended elsewhere in this renort; a study of anetwork of pipelines would serve to identify markets in relation to gas fieldsand pave the way for action.
3.36 Pricing of electricity has been resolved for the immediate futuireby the implementation of a new tariff in July 1980 and provisions for adjust-ments. However, serious problems may soon emerge as a result of a revisionof fuel prices. It- is, therefore, recommended that a study of PLN-s revenuerequirements to 1990 be undertaken, under various fuel pricing scenarios. Theresults would permit a timely appraisal of the likely effect of fuel pricingon growth rates and the tariff structure.
3.37 The pricing issues illustrate the need to (i) move towards pricingpolicies which encompass the entire energy sector and; (ii) review pricestructures on a more regular, possibly annual, basis. It is recommended thatthe Energy Planning Unit initiate long range studies that integrate the pricingof petroleum products, natural gas, coal and electricity. The coopneration ofPTE is indispensable for such an effort. Once a satisfactory mechanism isestablished, the results should be -resented periodically to BAVAODLE
- 48 -
CHAPTER 4
INTER-FUEL OPTIONS FOR MEETING FUTURE ENERGY NEEDS
4.01 Indonesia s energy problem arises because only one of its energyresources, oil, has been substantially developed, and because oil plays sucha vital role in the country's social and economic development. Oil productsmeet over 80% of the country's commercial energy needs and net oil exportsare financing practically all non-oil imports. There has also been a cheapoil policy for domestic energy consumption. As noted in Chapter 3, this hasbeen implemented largely by providing heavy subsidies on oil products, espe-cially kerosene, diesel and fuel oil. Together with a GDP growth rate of 7.5%,this policy has led to a very high growth of demand for oil products. Growthof domestic demand for oil is now outpacing increases in oil production andoil exports are showing a declining trend. As Chapter 1 shows, if unchecked,this will continue to reduce the oil available for export, and even allowingfor the expected increases in domestic production and world oil prices, willnot only rapidly reduce the contribution of oil to financing non-oil importsbut could, within two decades, lead to Indonesia becoming a substantial oilimporter. A major part of the remedy lies in developing other indigenousenergy sources in order to substitute for the oil products used in the country.Oil-product substitution has not been achieved because of the low prices foroil products and partly because the inter-fuel options available to thecountry have not been adequately evaluated.
4.02 The supply options have been examined in Chapter 2 and indicate thatthe supply of alternate energy forms is not likely to be a constraint in thelong run. The economically viable options are, however, limited by geographicconsiderations (Java and elsewhere, rural and urban) and by the technical sub-stitution possibilities within the major energy consuming sectors. Policieson energy pricing have been discussed in Chapter 3; this chapter examines theinter-fuel options open to the country. In this respect, the key sectors arethe household sector (kerosene), the industrial sector (kerosene, diesel andfuel oil), the transport sector (gasoline, diesel and fuel oil), and the elec-tric power sub-sector (fuel oil and diesel).
The Household Sector
4.03 Household demand for kerosene has been growing at over 13% annuallyin the past decade (see Table 4.1). This has resulted in Indonesia having toinvest heavily in hydrocracking capacity to meet middle-distillate demand.Indeed, Indonesia is currently installing the largest hydrocracking unit inthe world, 85,000 bbls/day.
4.04 Over 25 million households (92% of the total) have no access toelectricity, and therefore use kerosene for lighting. Based on an approxi-mate kerosene consumption for lighting of 111 liters per year per household,consumption by these households in 1978 for this purpose is estimated at48,700 bbls/day, or about 55% of household kerosene use.
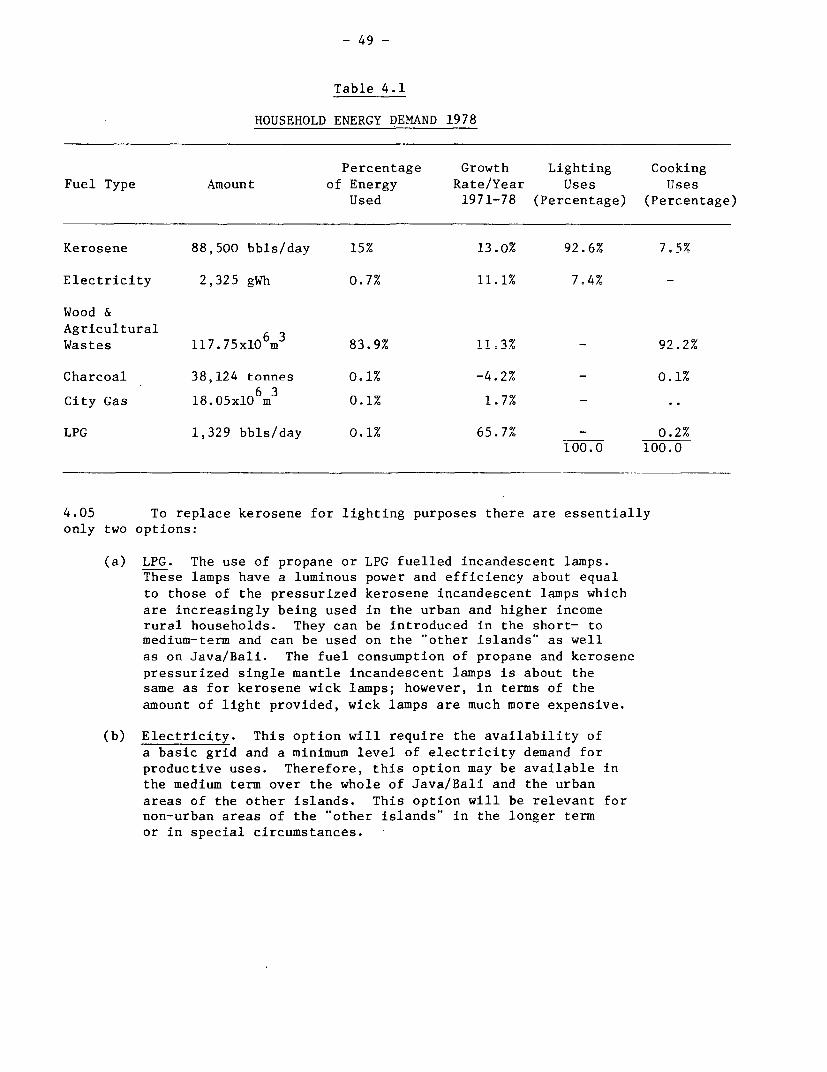
- 49 -
Table 4.1
HOUSEHOLD ENERGY DEMAND 1978
Percentage Growth Lighting CookingFuel Type Amount of Energy Rate/Year Uses Uses
Used 1971-78 (Percentage) (Percentage)
Kerosene 88,500 bbls/dav 15% 13.0% 92.6% 7.5%
Electricity 2,325 gWh 0.7% 11.1% 7.4%
Wood &Agricultural 6 3Wastes 117.75xlO m 83 9%_ 11.3% - 92.2%
Charcoal 38J124 tonnes (.1% -4t2% - 0.1%
City Gas 18.05xlO m 0.1% 1.7% -
LPG 1,329 bbls/day 0.1% 65.7% - 0.2%100.0 100.0
4.05 To replace kerosene for lighting purposes there are essentiallyonly two options:
(a) LPG. The use of propane or LPG fuelled incandescent lamps.These lamps have a luminous power and efficiency about equalto those of the pressurized kerosene incandescent lamps whichare increasingly being used in the urban and higher incomerural households. They can be introduced in the short- tomedium-term and can be used on the "other islands" as wellas on Java/Bali. The fuel consumption of propane and kerosenepressurized single mantle incandescent lamps is about thesame as for kerosene wick lamps; however, in terms of theamount of light provided, wick lamps are much more expensive.
(b) Electricity. This option will require the availability ofa basic grid and a minimum level of electricity demand forproductive uses. Therefore, this option may be available inthe medium term over the whole of Java/Bali and the urbanareas of the other islands. This option will be relevant fornon-urban areas of the "other islands" in the longer termor in special circumstances.
- 50 -
As Table 4.2 shows, electricity is likely to be the cheapest alternaLive forlighting where a transmission; distribution network exists.
4.o6 About 45% of household kerosene use is for cooking, although onlvabout 15% of the households cook with kerosene, largely because fuelwood andagricultural waste is still collected freely from areas near the household.As the efficiency of kerosene for cooking is higher than that of fuelwood,15% of the households consume only 7.5% of the energy uise fnr nnikina (Tahle4.1). Table 4.3 shows estimates of the cooking fuel costs per housebold perday on TJva uiina TPG, keprnosn, Plprtririt-,-v rhqrrksk1 and rnmmprrial firpwnntL
Since it is thought that most of the kerosene for cooking is used on Java/Bali,and since it is on these i lands that deforestation is most apparent (bnthbecause of the expanding agricultural area and the expanding needs for woodfuel),thlo kmaLin 4setAC 4o w At _U.O a tSre.A. b a e t . L, e a .e o
to discourage further deforestation and at an affordable cost for households.
4.07 The potential alternatives for kerosene as a cooking fuel on Java/
/a\ ,aroal imprted. 'ro__ t' ote 4._:1_LwrI.a UZ,lL L.ua . L Mp u .L IL Ull LCiL -lJli:L L±ad1Ulb e pb±sLi.y
Kalimantan, where forest resources are abundant. However,th e vi abil1-1t y of4 thi on JaaBl -per -- T--I -1-------very unlikelyLi,C V UL 0. L. L.~ L-IALO *.. IAJ VCILj aJ.A- C&JuJi~t C 0 AA&4~.
due to this fuel's high transport costs and bulky volume,thoughL it may be ar. appropriate subati.tute f-o fl ood
in many rural industries.
(b) Natural Gas: this would be for a limited number of urbanconsumers (htLI1e high LncoUme ones) auLu wuuld require inve6tmientin high pressure gas distribution systems for which feasibilitystudies Iave not yet Ueen madUe.
(c) LPG: The distribution and marketing costs of LPG across Java havee-en assumed to be about six times per bbl ($12/bbl) more costly
tnan kerosene. However, the economic fuel cost of cooking with LPG,after providing for the additional transport costs, is estimated tobe about 20% less tnan with kerosene. Since, in addition, interna-tional prices of LPG are expected to weaken over the next severalyears (doe to the enromous increase in supplies from the PersianGulf) relative to kerosene prices, there is a strong case forreplacing kerosene with LPG in both urban and rural areas in thenear future as well as in the longer term. However, a study isurgently needed to determine the investment required in transportand distribution facilities for LPG on Java/Bali and the potentialrole of the railroad for bulk transport of LPG.
(d) Fuelwood: A good part of the fuelwood being used for cooking onJava/Bali is from backyard woodlots. Whatever fuelwood isavailable from private backyards should continue to be usedsince this does not lead to deforestation and it has little orno economic cost. This could be supplemented by social foresteryto a limited extent and a study should be conducted on theviability of intensive woodlot farming.
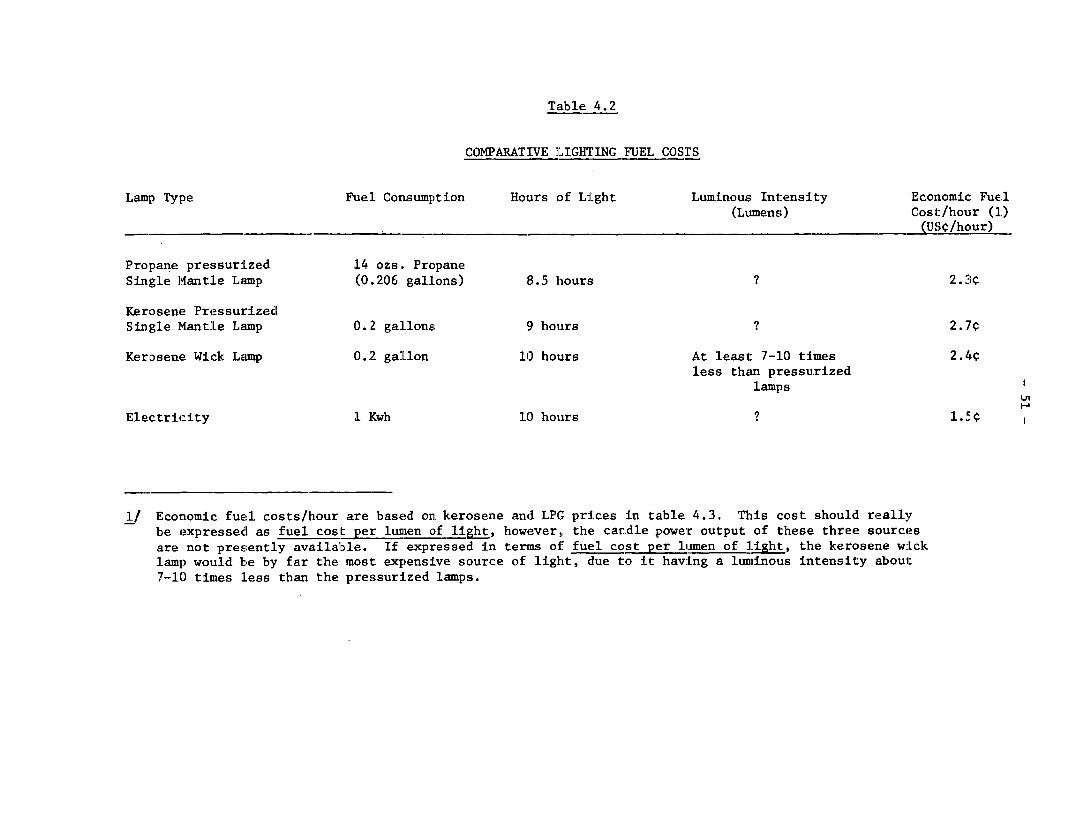
Table 4.2
COMPARATIVE LIGHTING FUEL COSTS
Lamp Type Fuel Consumption Hours of LiLght Luminous Intensity Economic: Fuel(Lumens) Cost/hour (1)
(U-,¢/hour)
Propane pressurized 14 ozs. PropaneSingle Mant:Le Lamp (0.206 gallons) B.5 hours ? 2.3q
Kerosene PressurizedSingle Mant:Le Lamp 0.2 ga:Llons 9 hours ? 2. 7¢
Kerosene Wick Lamp 0.2 gallon 10 hours At :Least: 7-1.0 times 2.4¢less than pressurized
lamps
Electricity 1 Kwh 10 hours ? l.54
1/ Economic fuel costs/hour are based on kerosenle and LPG prices in table 4.3. This cost should reaallybe expressed as fuel cost per lunmen cof light, however, the candle power output of these three sourcesare not presently availalble. If expressed in terms of fuel cost per lumen of light., the kerosene wicklamp would be by far the most: expensive source of light, dlue to it having a lunminous intensity about:7-l() times less than the pressurized lamps.
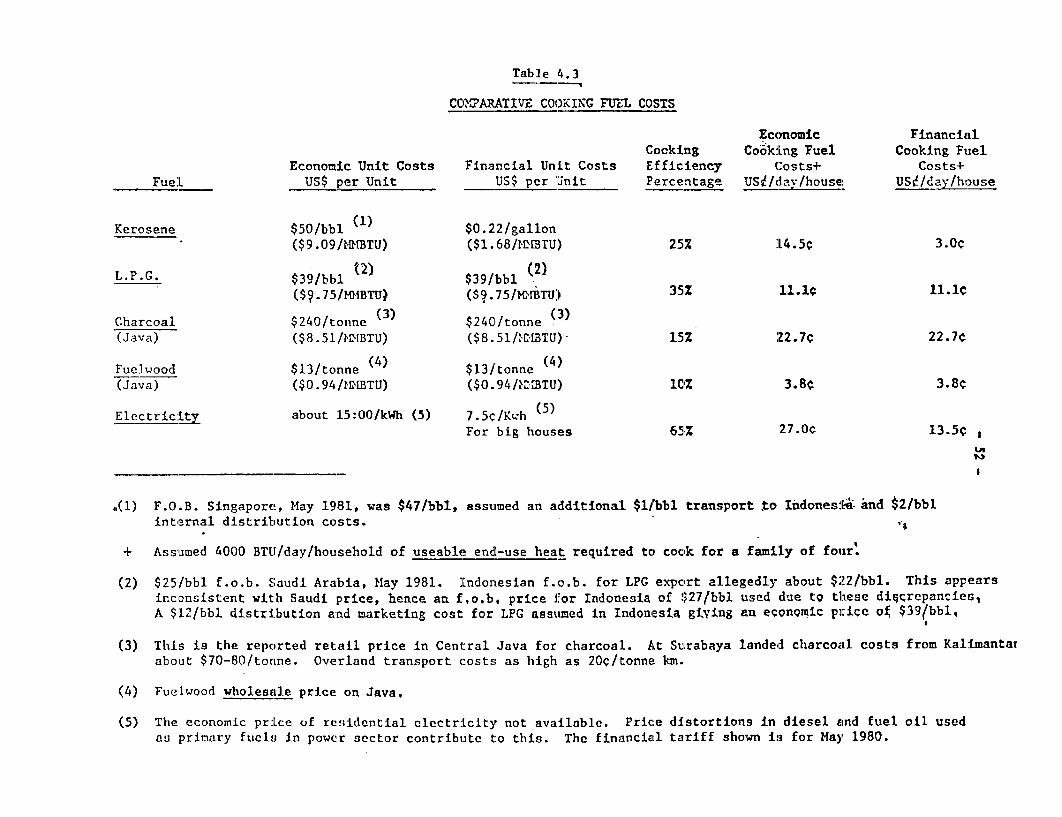
Table 4.3
CO|2ARATIVg COOKING FUTL COSTS
Eccmomic FinancialCocking Cooking Fuel Cooking Fuel
Economic Uinit Costs Financial Unit Costs Efficiency (osts+ Costs+Fuel US$ per lUnit US$ per linit Percentage US- /dav-/house USed/ay/house
Kerosene $50/bbl $0.22/gallon($9.09/NBtrU) ($1.68/IIMBTU) 25% 1l4.54: 3.Oc
L.P.IG. $39/bbl (2) $39/bbl (2)($S.75/MIOBTU) (S9.75/MViTU) 35% 11.1¢ 11.1e
Charcoal $240/tonne (3) $24tonne()(Java) ($8.51/loBrU) ($8.5l/I B1TU)- 15% 22.7C 22.7c
Fuelwood $13/tonne (4) $13/tonne (4)(Java) ($0.94/tDM1rU) ($0.94/X 3MTU) 10% 3.8c 3.8¢
Electric:Ltv about 15:00/kWh (5) 7.5c-/Kwh (5)For big houses 65% 27.0, 13.5¢
,,(1) F.O.B. Singapore, May 1981, was $47/bbl, assumed an additional $lfbbl transport to Indonesig. aknd l2./bblinterna:L distribution costs.
+ Assumed 4000 BTLI/day/household of useable end-use heat required to cook for a family of four'.
(2) $25/bbl f.o.b. 'Saudi Arabia, MIay 1981. Indornesian f.o.b. for LPG export allegedly about $22/bbl. This appearsinconsistent with Saudi price, hence an f,o.b, price for Indonesia of $27/bbl used due to these diqcrepantCes 1A $12/bbl diLstribution and marketing cost for LPG asstumed in Indoniesia giying an eronQmic price of $39(bbl,
(3) This is the reported retail price in Central Java. for charcoal. At Surabaya landeid charcoal costs from, Kalimantarabout $70-80/tonne. Overland transport costs as high as 20c/tonne kmt.
(4) Fuelwooti wholesatle price on Java.
(5) The economic priLce of residential electr:Lcity not availabl.c. Pric:e distortions in diesel eind fuel oil usedns primrary fuels in power sector contributc t:o this. The financiail tariff shown is for Mayt 1980.
The Industrial Sector
4.08 The industrial sector has three distinct categories of energyrequirement: motiJve power, h1-eat and1 feedstock. Th.e largest use olf. hUlydro-carbon energy in the industrial sector is as feedstock: petroleum productsin refineries andU petrochemicals, and1 natural gas in LLertiLJiLzers, meLthanoLand petrochemical production. Many of the existing plants in these indus-tries are not as energy efi'L".cIent as thike p'Lants now ILUeWLrng designed and tLiLereare substantial opportunities to increase energy efficiency by retrofitting.in Ltle case 0l' motiLve power 4 vigorous elLortL is required by tre Govern-entto ensure that reliable power from the grid is available on Java/Bali so thatthe small diesel generating plants will no longer be necessary. Tne presentplans of PLN to phase-out private generating plants except for cases whereconsumption is very large or where cogeneration is feasible (e.g., fertilizer,cement, aluminum, sugar industries) should be strengthened and energy pricesshould be set to ensure an incentive for industry to purchase public powersupplies. For heat requirements several alternative forms of energy areavailable: oil products, primarily fuel oil, diesel and kerosene, gas, coaland fuelwood. The most obvious way of displacing the use of fuel oil inindustry is the increased use of natural gas and coal, although as long asdomestic gas prices are far below the opportunity cost (as feedstock forLNG) there is little incentive to promote gas production for domestic sale.However, as the pricing discrepancies are remedied over time, increasingattention should be given to the use of natural-gas in the industrial sectorother than as a feedstock. This can only occur in the larger industrialplants and/or industrial estates where gas transmission pipelines can bedeveloped. A corollary of this is that increased attention should be givenin industrial planning to location and accessibility to energy resources,e.g. natural gas. Increased attention should also be given to developingthe cogeneration potential of lumber mills on the other islands. One majorproblem facing small scale rural industries on Java is the growing scarcityof fuelwood for process heating requirements. There is some scope for devel-oping heating fuel supplies from the forested areas of the other islands(i.e., from forest reclaiming operations, land clearing for transmigration,and possibly smallholder tree farming). The feasibility of charcoal produc-tion for the above market should be given further attention.
4.09 Despite the relatively low industrial base in Indonesia, there area number of possibilities for demand management activities. In particular,attention should be given to curtailing the high rates of growth in keroseneconsumption in the industrial sector. Further possibilities exist in thecement industry where the mandatory use of coal in new cement plants wouldcurtail industrial consumption of fuel oil. In addition to the above inter-fuel substitutions to reduce petroleum demand, overall energy requirementscan be reduced by promoting energy conservation measures in the major energyconsuming industries (e.g. steel, cement, paper, and fertilizer) by (a) improv-ing operating parameters. (b) installing heat recovery equipment, (c) replacingold and inefficient equipment and (d) retrofitting. The experience of othercountries suggests that savings of 15-20 percent of energy use can be achievedrelatively quickly with small additional investment.
- 54 -
The Transport Sector
4.10 With the exception of negligible quantities of electricity used inthe railway subsector, consumption of energy in the transport sector is whollyconfined to petroleum products, principally gasoline and diesel. Gasolineaccounted in 1979 for about 18% (70,000 bbls/day) of petroleum demand, althoughabout 44% of the petroleum products were consumed for transport. Demand forthis product is forecast to increase to over 160,000 bbls/day by 1989.Present plans appear to call for all of this growth to be met by refineryoutput. However, the economic benefits of meeting an increasing share of thisgasoline demand with natural gas liquids (NGL) obtained from field processingof natural gas, need to be analyzed and compared with its use as a spike forcrude. NGL production in 1979 was about 87,000 bbls/day, 75% of which camefrom Arun and was sold for export. The remainder was produced at Badak andwas added to crude oil for export. Upon expansion of the LNG facilities, NGLproduction is expected to double to nearly 175,000 bbls/day by 1985. It isunlikely, given the premium on land, and the relatively high cost of producingethanol, that alcohol from biomass is likely to make significant inroads intogasoline use in the near future except in remote locations.
4.11 Diesel oil represented in 1979, 25X of petroleum demand and nearlyhalf of this was used in the transport sector. A technical option availablefor substituting diesel oil used in the transport sector involves the useof LPG in urban bus fleets. A study of this needs to be undertaken. Theimplementation of such an option, if analysis confirms its viability, wouldneed to be undertaken in tandem with any planned normal replacement of exist-ing buses after their useful life since the LPG fuelled buses would have tohave spark ignition engines and not diesel engines. Residual fuel oil is alsomainly used (56% of it) in transport, essentially for inter-island shipping.Significant growth in this subsector for this product can be expected over thenext several years. However, no substitution of the fuel oil used in marinetransport is recommended because Indonesia will have to maintain a certainlevel of fuel oil demand in order to ensure that all products from the variousrefineries are fully utilized in the most economic way. DisDosal of residualfuel oil could present problems if, for example, its substitution by otherfuels was taken to such a degree that its demand only represented about 4-5Zof petroleum demand, while at the refinery level its yield represented some12-19! of the criide oil nrocessed. Thin in espriallv relevant given the Waxynature of Indonesian crudes and hence the residues derived therefrom.
4.12 On a broader front, the longer term potential for energy demandmanagement in transport, inrliidina widespread railway electrifjatjion andurban transport systems as well as changes in transport modes particularlyon-Java.Bai, needs to be analyzed. .The automobile industry can also beencouraged to concentrate more on the production of fuel-efficient vehicles.
The Electric Power Subsector
4.13 The electric power subsector consists mainly of PLN, the publicutility primarily respuosble LU all gueneatLon, traUsmissionu a and aistribu-tion of electricity in the country, captive plant installations primarily
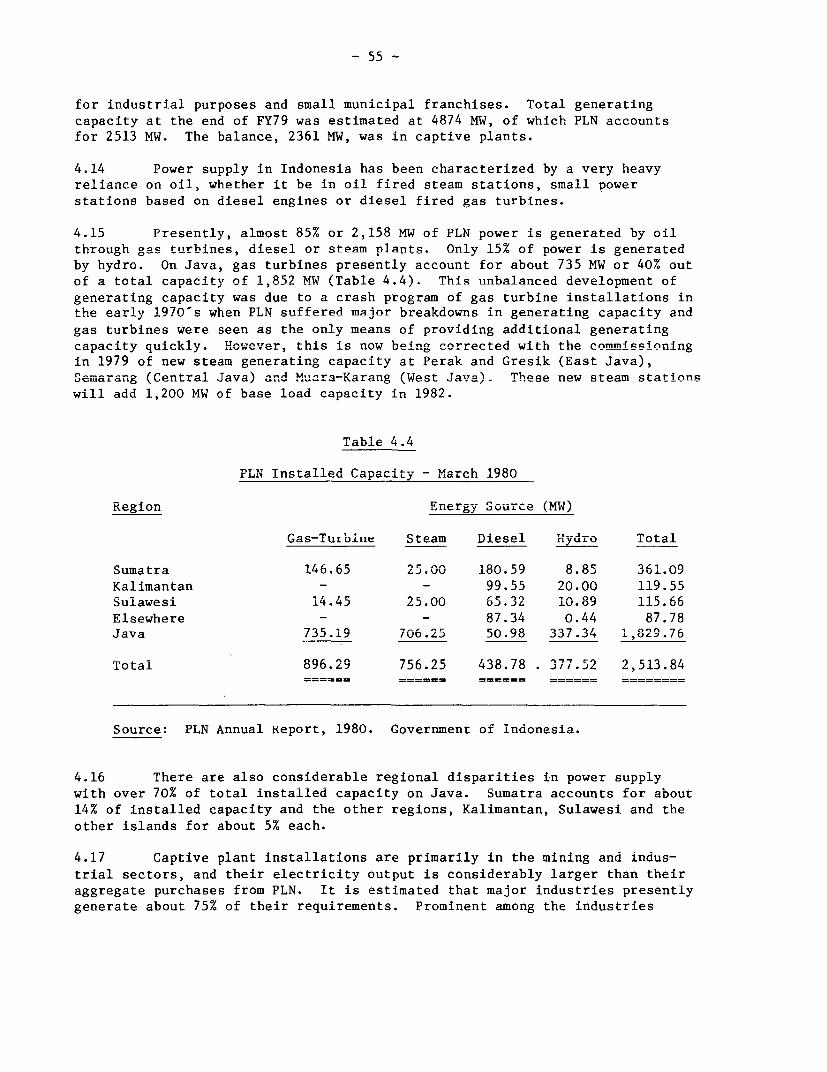
- 55 -
for industrial purposes and small municipal franchises. Total generating
capacity at the end of FY79 was estimated at 4874 MW, of which PLN accounts
for 2513 MW. The balance, 2361 MW, was in captive plants.
4.14 Power supply in Indonesia has been characterized by a very heavy
rlianc-e on oil, whether it be in oil fired steam stations, small power
stations based on diesel engines or diesel fired gas turbines.
4.15 Presently, almost 85% or 2,158 MW of PLN power is generated by oil
through gas turbines, diesel or steam plants. Only 15% of power is generatedby hydro. On Java, gas turbines presently account for about 735 MW or 40% out
of a total capacity of 1,8'2 Mw (Table 4.4). This unbalanced development of
generating capacity was due to a crash program of gas turbine installations inthe early 1970's when PLN suffered major breakdowns in generating capacity and
gas turbines were seen as the only means of providing additional generating
capacity quickly. However, this is now being corrected with the commissioninain 1979 of new steam generating capacity at Perak and Gresik (East Java),
SJemarang Cen*tral TJava and Muara-Karang. (Wp-e- Tnxy'a) These now ste-m stationn
will add 1,200 MW of base load capacity in 1982.
Iauble 4.4.
PNT I7Tnstalle Capaci ty -March 1980
Region Energy Source (MW..... )
Gas-Turbine Steam Diesel Hydro Total
Sumatra 146.65 25.00 180.59 8.85 361.09
Kalimantan - - 99.55 20.00 119.55
Sulawesi 14. 45 25.00 65 .32 10.89 115.66Elsewhere - - 87.34 0.44 87.78
Java 735.19 706.25 50.98 337.34 1,829.76
Total 896.29 756.25 438.78 . 377.52 2,513.84
Source: PLN Annual Report, 1980. Government of Indonesia.
4.16 There are also considerable regional disparities in power supply
with over 70% of total installed capacity on Java. Sumatra accounts for about
14% of installed capacity and the other regions, Kalimantan, Sulawesi and the
other islands for about 5% each.
4.17 Captive plant installations are primarily in the mining and indus-
trial sectors, and their electricity output is considerably larger than their
aggregate purchases from PLN. It is estimated that major industries presently
generate about 75% of their requirements. Prominent among the industries
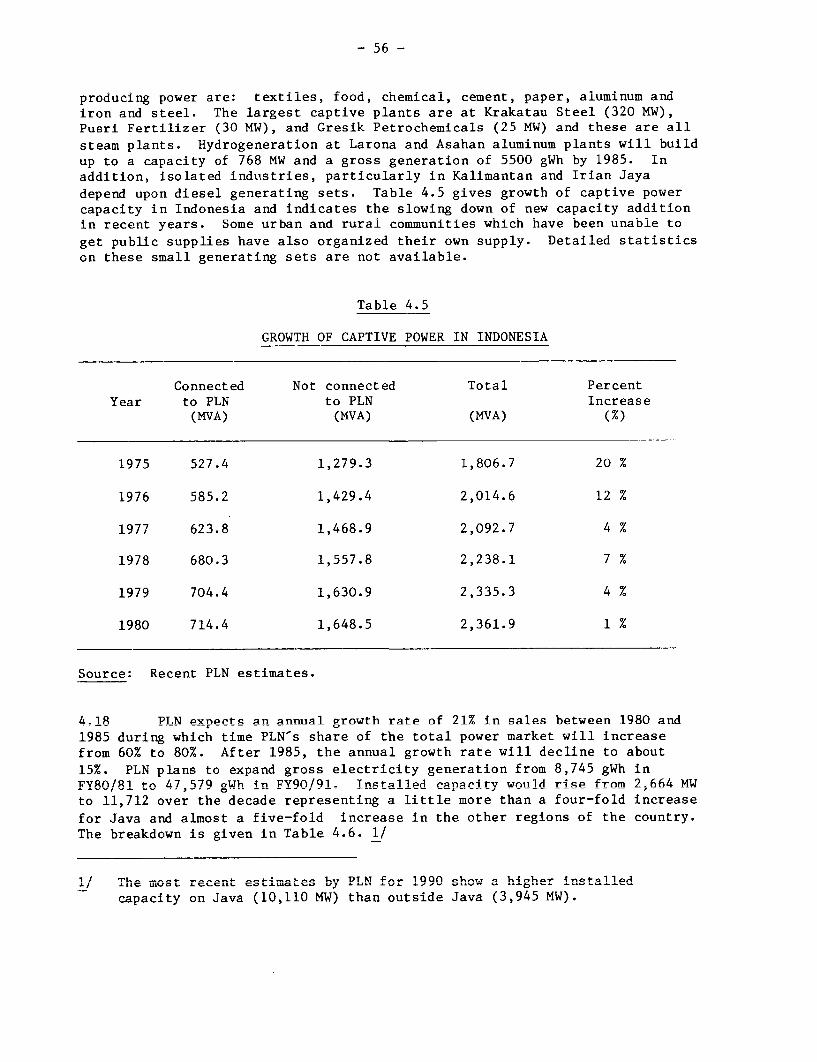
- 56 -
producing power are: textiles, food, chemical, cement, paper, aluminum andiron and steel. The largest captive plants are at Krakatau Steel (320 MW),Pusri Fertilizer (30 MW), and Gresik Petrochemicals (25 MW) and these are all
steam plants. Hydrogeneration at Larona and Asahan aluminum plants will buildup to a capacity of 768 M-W and a gross generation of 5500 gWh by i985. Inaddition, isolated industries, particularly in Kalimantan and Irian Jaya
depend upon diesel generating sets. Table 4.5 gives growth of captive powercapacity in Indonesia and indicates the slowing down of new capacity additionin recent years. Some urban and rural communities which have been unable to
get public supplies have also organized their own supply. Detailed statisticson these small generating sets are not available.
Table 4.5
GROWTH OF CAPTIVE POWER IN INDONESIA
Connected Not connected Total PercentYear to PLN to PLN Increase
(MVA) (MVA) (MVA) (%)
1975 527.4 1,279.3 1,806.7 20 %
1976 585.2 1,429.4 2,014.6 12 %
1977 623.8 1,468.9 2,092.7 4 %
1978 680.3 1,557.8 2,238.1 7 %
1979 704.4 1,630.9 2,335.3 4 %
1980 714.4 1,648.5 2,361.9 1 %
Source: Recent PLN estimates.
4.18 PT.N exnprts an annual growth rate of 21% in sales between 1980 and1985 during which time PLN's share of the total power market will increasefrnm, 60% t-n 80%. After 1985. the annual growth rate will decline to about
15%. PLN plans to expand gross electricity generation from 8,745 gWh inFY80/81 to 47,579 gWh in FY90/91- Tnqta11Pd ranaritv would rise from 2-664 MWto 11,712 over the decade representing a little more than a four-fold increase
for Java a-- almost a five-fold increase in the other re-ions of the country.The breakdown is given in Table 4.6. 1/
1/ TIhe most recent esma.tes by PL N for 1990 show a hi-her installedcapacity on Java (10,110 MW) than outside Java (3,945 MW).
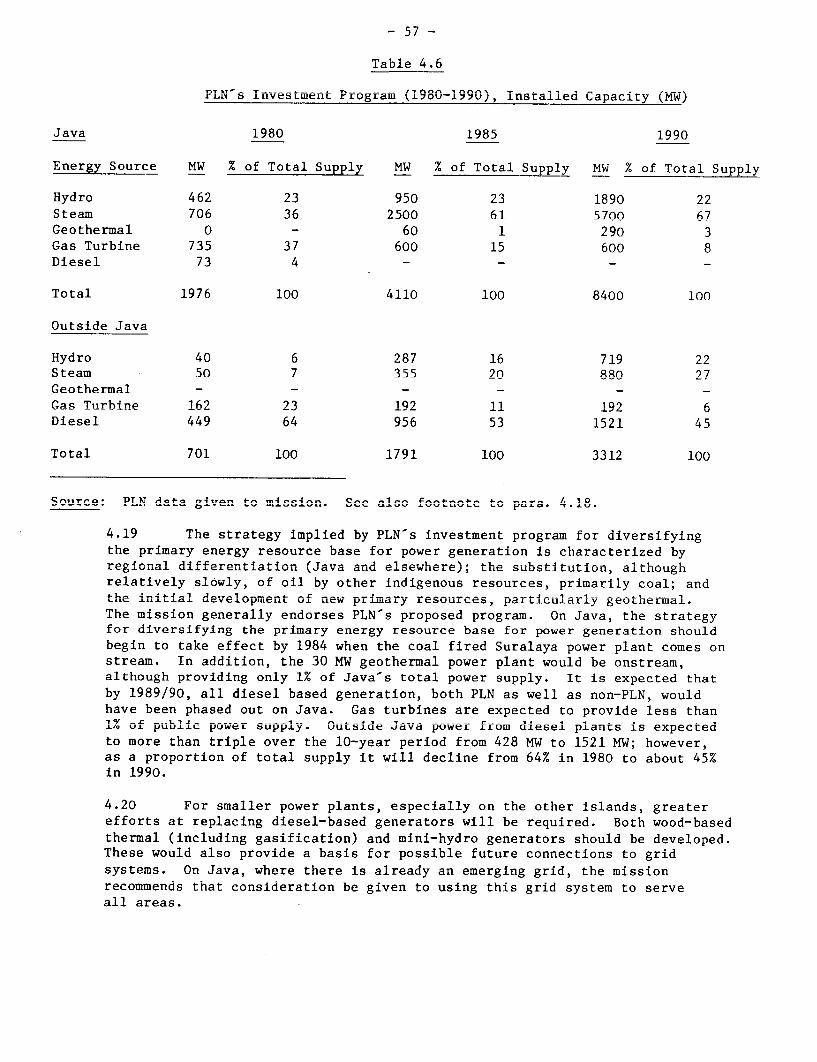
Table 4.6
PLrN s Investment Program (1980-1990), installed Capacity (M-W)
Java 1980 1985 1990
Energy Source MW % of Total Supply MW % of Total Supply MW % of Total Supply
Hydro 462 23 950 23 1890 22Steam 706 36 2500 61 5700 67Geothermal 0 - 60 1 290 3Gas Turbine 735 37 600 15 600 8Diesel 73 4 - -
Total 1976 100 4110 100 8400 100
Outside Java
Hydro 40 6 287 16 719 22Steam 50 7 355 20 880 27Geothermal - - - -
Gas Tuirhinp 162 23 192 11 192 6Diesel 449 64 956 53 1521 45
Total 701 100 1791 100 3312 100
Source: PLN data given to mission. See also footnote to para. 4.18.
4.19 The strategy implied by PLN s investment program for diversifyingthe primary energy resource base for power generation is characterized byr-egional differentiation T Java anA elsewlere); tLiLhe subustiLtutiLon, althoughrelatively slowly, of oil by other indigenous resources, primarily coal; andtLh iLitial AUeve 0U LInW pLLadry reboULC--, pdL6LCUrt LU ly geoLnerMai.
The mission generally endorses PLN's proposed program. On Java, the strategyfor diversifying the primary energy resource base for power generation shouldbegin to take effect by 1984 when the coal fired Suralaya power plant comes onstream. ITLn addition, the 3' 1.1 geother[al power p'Lant would be onstream,although providing only 1% of Java-s total power supply. It is expected that
lu L27/;VU d "es U eCSC UdasCU geLILeaLLULi, 'uLot PLdN as wei" as non-PLN, woulahave been phased out on Java. Gas turbines are expected to provide less than1% of publ'c power supply. Outside Java power from diesel plants is expectedto more than triple over the 10-year period from 428 MW to 1521 MW; however,as a proport'Lon o totaL supply it will decline from 64% in i980 to about 45%in 1990.
4.20 For smaller power plants, especially on the other islands, greaterefforts at replacing diesel-based generators will be required. Both wood-basedthermal (including gasification) and mini-hydro generators should be developed.These would also provide a basis for possibie ruture connections to gridsystems. On Java, where there is already an emerging grid, the missionrecommends that consideration be given to using this grid system to serveall areas.

- 58 -
4.21 BATAN, the national agency Lor atomic energy, naa originally consi-dered commissioning a number of nuclear power stations, but given the potentialfor gas, coal, geothermal and hydro in the medium-term and the lower cost ofpower from these sources, the mission agrees that it would be prudent to defercommitment to a large program until more information is available on competingenergy resources. By the end of this decade, Indonesia will be adding generat-ing capacity at a rate of 1UU0 Mw per annum ana at a somewnat nigner rateduring the nineties. As there is a degree of uncertainty regarding thepotential for coal, geothermal and hydro, Indonesia should keep the nuclearoption open for the longer term. The lead times for training and the type oftraining required suggests that plans be made for the installation of a singlecommercial-size nuclear power plant in order for the country to gain experiencewith nuclear technology.
4.22 The mission considers it unlikely that wind energy or 'frontier'technologies such as ocean thermal will be viable in Indonesia. In specialcircumstances or isolated areas, solar energy may eventually prove viable andwork on currently planned pilot projects should continue.
- 59 -
Chapter 5
ENERGY ISSUES AND OPTIONS IN THE RURAL AREAS
Energy Options for the Rural Sector
5.01 The general profile of energy use in the rural sector shows: (i) alarge dependence on traditional fuels such as fuelwood for both domestic andproductive heating needs; (ii) very limited access of households to electricity--about 8% of the villages and only 2% of the rural households are electrified;(iii) a large dependence on muscle power in agriculture and rural manufacturingenterprises; (iv) a large dependence on kerosene lamps for domestic lighting;and, (v) a shift in rural manufacturing industries and agriculture towards theuse of mechanical and electrical power.
5.02 Against this background is the overriding concern of the GOI topromote rural development programs with the aim of both upgrading the pro-ductivity of the rural economy and expanding rural employment opportunities.Rural energy options will therefore have to be developed within the broaderobjectives of the rural development strategy. With respect to employmentcreation. there will be major limitations on the extent to which agriculturalproductivity can be expanded under current labor intensive methods. A growingdenendence on non-farm enterprises for generating additional employment oppor-tunities is expected. In addition to efforts to reduce the effect of con-straints; such as lack of technical and marketing support, on rural industry.there is also the need to develop alternative economic and reliable sourcesof energy to stimulate manufacturing activity. In areas such as Java andBali, where rural industries are already facing fuelwood scarcities, a majorchallenge would be to develop new channels of sunnlv from other indigenoussourcdes of energy. In adopting this approach, however, it is assumed thatthe national energy nolicy obiective; which is to use fuels other than oilproducts, will be maintained.
5.03 The rural sector in Indonesia accounts for about 83% of an estimatedtotal nonulation of 147 million (1980 estimate). It comprises about 21 millionhouseholds and an estimated 58,000 villages (see Table 5.1). The distinctionbetween rural and urban settlements is relativelv easy on the other islands.However, in the densely populated regions of Java and Bali such distinctionsare blurred. From an energy viewpoint, therefore, Indonesia ran be dividedinto two broad sub-regions, namely Java/Bali where there is a strong case fortreating the rural energy problem as a part of the overall energy problem, and
the 'other islands'.
60 -
r Ilable .1
General Statistics on the Rural Sector
Total
Region Java/Bali Other Islands Indonesia
Total population (millions) 93.75 53.63 147.38
Land Area (sq. km) 137,748 1,781,695 1,919,443
Average Population density(Persons/sq. km) 681 30 2/ 77
Estimated Rural Population (%) 81.9 O2.5 82.1
No. of Rural villages 1/ 20,361 37,220 57,589
1/ This excludes urban villages. The estimated total number of peri-urban/villages (Kampongs) and rural villages (Desa) is 63,000.
2/ Average population density varies from about 3 persons/sq. km on Irian
Jaya to 80 persons/sq. km on Nusa Tenggara.
Patterns of Energy Use in the Rural Sector
Households: Java/Bali
5.04 On the very densely populated islands of Java and Bali, cultivation
is intensive, even around households in Kampongs where fruit and vegetable
home gardens are maintained. Recent surveys of areas outside the major cities
and towns of East and West Java indicate that wood shrubs and crop residues
are still the main cooking fuels for about 80% of the households (often sup-
plemented by kerosene). Household consumption is estimated at about 6 kg of
fuelwood equivalent per day, and it appears that although there is a growing
shortage of these fuels, most are still obtained within 1 km of the house-
holds, i.e., from homegardens and nearby dry agricultural fields. As the
shortage becomes more serious, there will be an inevitable shift towards
the increased use of kerosene.
5.05 Clay cooking stoves of various sizes are used throughout Java. The
two basic types of wood burning clay stoves are the large earthen platform
stoves and the smaller portable stoves. In some areas, particularly in
Kamnongs- the nortable clay stoves have been converted for kerosene use by
the insertion of kerosene burners. The portable stove with modifications to
the grate i6 also used as a charcoal stove. There has been some success in
parts of central Java with the distribution of more efficient clay stoves.
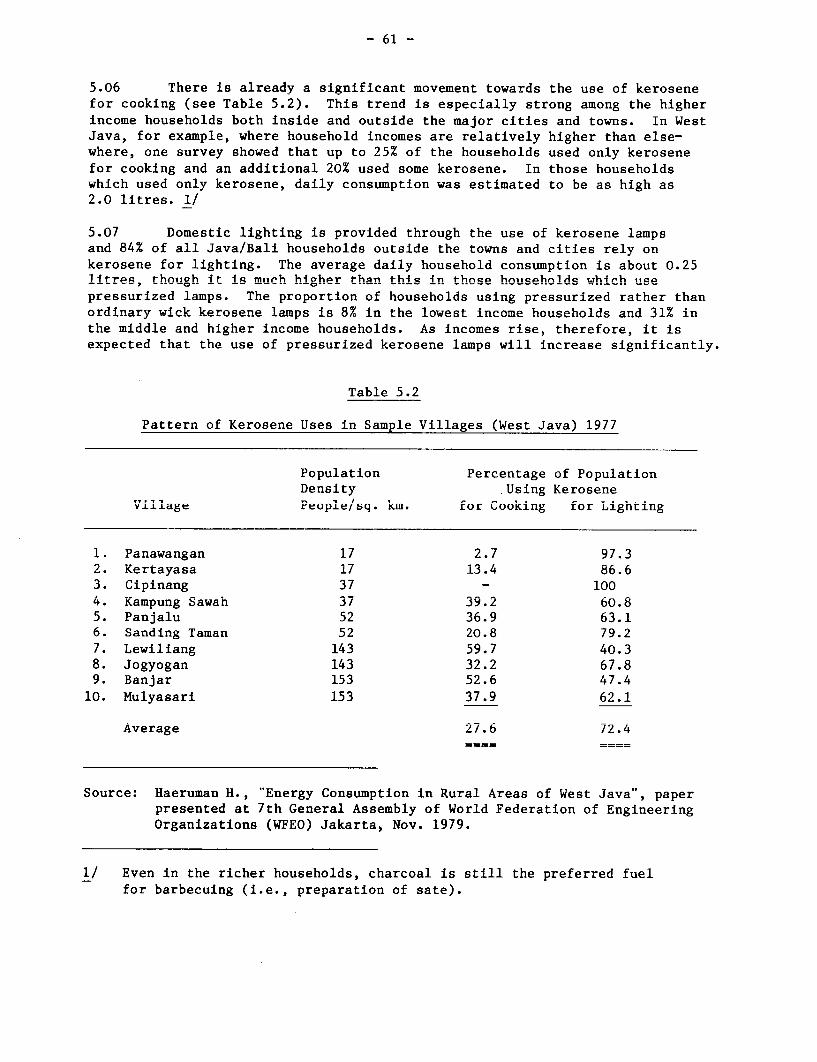
- 61 -
5.06 There is already a significant movement towards the use of kerosenefor cooking (see Table 5.2). This trend is especially strong among the higherincome households both inside and outside the maior cities and towns. In WestJava, for example, where household incomes are relatively higher than else-where, one survey showed that up to 25% of the households used only kerosenefor cooking and an additional 20% used some kerosene. In those householdswhich used only kerosene- daily consumption was estimated to hp as high as2.0 litres. 1/
5.07 Domestic lighting is provided through the use of kerosene lampsand R4% of all JavalBali houephn1ds noitsrip t-hp to-wns and cities rely on
kerosene for lighting. The average daily household consumption is about 0.25litre, thniiah it is murh higher than this in thnse houspholrsa which use
pressurized lamps. The proportion of households using pressurized rather thannrdinary wick kerosnen lamne s8 IT 4n the] lowest 4ncome hou--selds and 31% inthe middle and higher income households. As incomes rise, therefore, it isexpected that the use of pressurized kerosene lamps will increase significantly.
Table 5.2
Pattern of Kerosene Uses in Sample Villages (West Java) 1977
Population Percentage of PopulationDensity Using Kerosene
Village People/sq. km. for Cooking for Lighting
1. Panawangan 17 2.7 97.32. Kertayasa 17 13.4 86.63. Cipinang 37 - 1004. Kampung Sawah 37 39.2 60.85. Panjalu 52 36.9 63.16. Sanding Taman 52 20.8 79.27. Lewiliang 143 59.7 40.38. Jogyogan 143 32.2 67.89. Banjar 153 52.6 47.4
10. Mulyasari 153 37.9 62.1
Average 27.6 72.4
Source: Haeruman H., "Energy Consumption in Rural Areas of West Java", paperpresented at 7th General Assembly of World Federation of EngineeringOrganizations (WFEO) Jakarta, Nov. 1979.
1/ Even in the richer households, charcoal is still the preferred fuelfor barbecuing (i.e., preparation of sate).
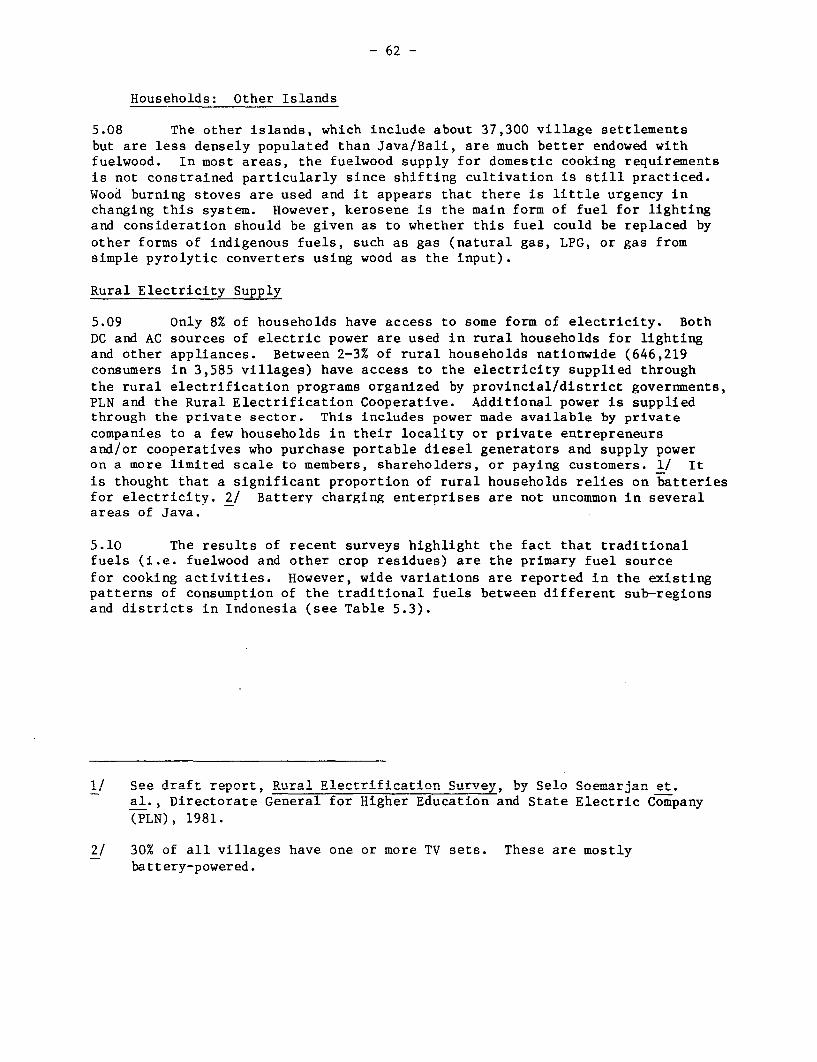
- 62 -
Households: Other Islands
5.08 The other islands, which include about 37,300 village settlementsbut are less densely populated than Java/Bali, are much better endowed withfuelwood. In most areas, the fuelwood supply for domestic cooking requirementsis not constrained particularly since shifting cultivation is still practiced.Wood burning stoves are used and it appears that there is little urgency inchanging this system. However, kerosene is the main form of fuel for lightingand consideration should be given as to whether this fuel could be replaced byother forms of indigenous fuels, such as gas (natural gas, LPG, or gas fromsimple pyrolytic converters using wood as the input).
Rural Electricity Supply
5.09 only 8% of households have access to some form of electricity. BothDC and AC sources of electric power are used in rural households for lightingand other appliances. Between 2-3% of rural households nationwide (646,219consumers in 3,585 villages) have access to the electricity supplied throughthe rural electrification programs organized by provincial/district governments,PLN and the Rural Electrification Cooperative. Additional power is suppliedthrough the private sector. This includes power made available by privatecompanies to a few households in their locality or private entrepreneursand/or cooperatives who purchase portable diesel generators and supply poweron a more limited scale to members, shareholders, or paying customers. 1/ Itis thought that a significant proportion of rural households relies on batteriesfor electricity. 2/ Battery charging enterprises are not uncommon in severalareas of Java.
5.10 The results of recent surveys highlight the fact that traditionalfuels (i.e. fuelwood and other crop residues) are the primary fuel sourcefor cooking activities. However, wide variations are reported in the existingpatterns of consumption of the traditional fuels between different sub-regionsand districts in Indonesia (see Table 5.3).
1/ See draft report, Rural Electrifieation Survey by Selo Soemar4an aet
al., Directorate General for Higher Education and State Electric Company(--), 1081.
, / 3fl0%0 of _al villages have one or more TV? sets. Thes. are mostlybattery-powered.
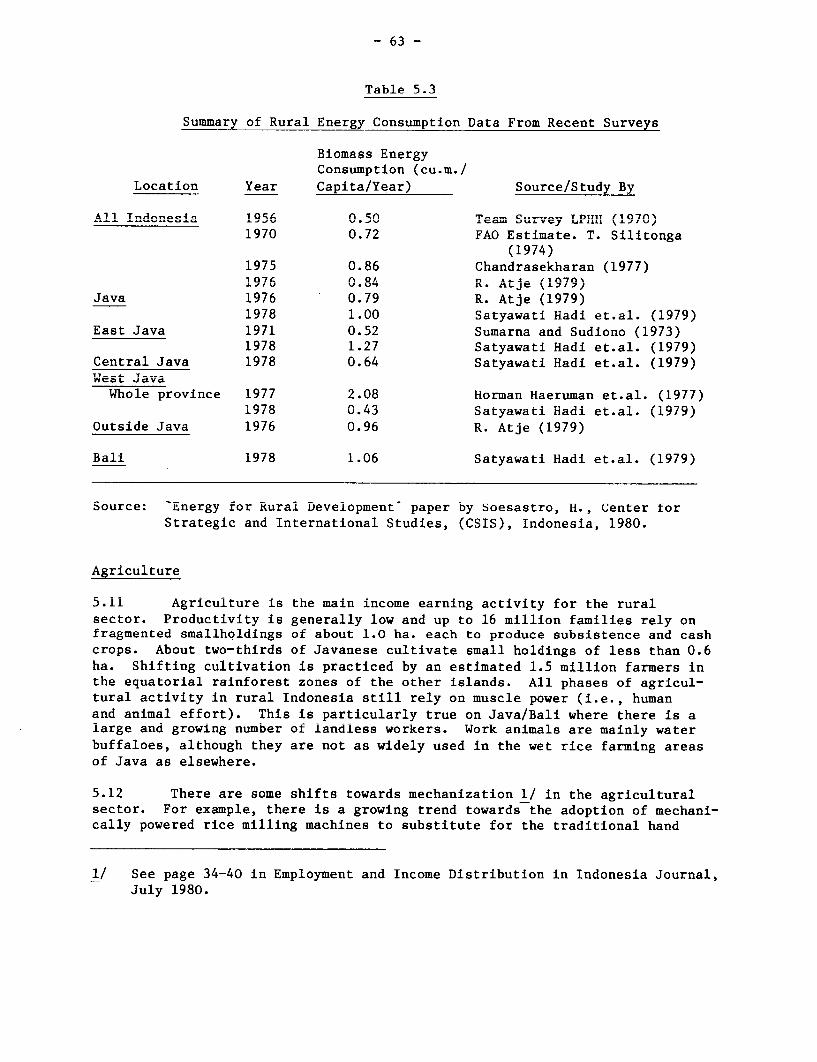
- 63 -
Table 5.3
Stimmarv nf Riirnl Rnprav Gonuitmntinn nata From PRecent Siirurve
RinTnnea Frnarau7-_ Ee0.gConsumption (cu.m./
Location Year ('pita/olVr)v Sour,,-,.c/Study By
All Indonesia 1956 0.50 TeM Survey LPHH (1970)1970 0.72 FAO Estimate. T. Silitonga
(19 07A )
1975 0.86 Chandrasekharan (1977)1074 Ai 0/. fl At. /1f7fl1976 V.8 R- i. A; je (1979)
Java 1976 0.79 R. Atje (1979)1 070 1 Art ,~1 / lfl7 N\1L978 L 1.00 SatyawatL 'nadu et.al. (1L79I)
East Java 1971 0.52 Sumarna and Sudiono (1973)1 070 1 fl'7 0 l A1 dfl7fl'xL197 I 1.27 Satyawat'L Hadi et.a'l. (1979)
Central Java 1978 0.64 Satyawati Hadi et.al. (1979)Wvest Jiava
Whole province 1977 2.08 Horman Haeruman et.al. (1977)1978 0.43 Satyawati Hadi et.al. (i979)
Outside Java 1976 0.96 R. Atje (1979)
Bali 1978 1.06 Satyawati Hadi et.al. (1979)
Source: Energy for Rural Development paper by Soesastro, H., Center forStrategic and International Studies, (CSIS), Indonesia, 1980.
Agriculture
5.i1 Agriculture is the main income earning activity for the ruralsector. Productivity is generally low and up to 16 million families rely onfragmented smaliholdings of about 1.0 ha. each to produce subsistence and cashcrops. About two-thirds of Javanese cultivate small holdings of less than 0.6ha. Shifting cultivation is practiced by an estimated 1.5 million farmers inthe equatorial rainforest zones of the other islands. All phases of agricul-tural activity in rural Indonesia still rely on muscle power (i.e., humanand animal effort). This is particularly true on Java/Bali where there is alarge and growing number of landless workers. Work animals are mainly waterbuffaloes, although they are not as widely used in the wet rice farming areasof Java as elsewhere.
5.12 There are some shifts towards mechanization 1/ in the agriculturalsector. For example, there is a growing trend towards the adoption of mechani-cally powered rice milling machines to substitute for the traditional hand
1/ See page 34-40 in Employment and Income Distribution in Indonesia Journal,July 1980.
- 64 -
pounding methods, and hand tractors and mini four-wheeled tractors are gainingpopularity in the more prosperous farming areas. At least 1700 hand tractorsand 300 mini four-wheeled tractors are reported to be in use throughout
Indonesia. 1/ The post-harvest drying operation (e.g., for paddy, etc.) isby sundrying. No reliable data are available on fuel consumption for agri-cultural operations, however, consumption for the above uses in the rural
areas is relatively small, though it may increase rapidly in the next decade
with changes in agricultural policy and methods.
Industry
5.13 At the time of the 1976 Industrial Survey, there were an estimated
1.2 million small scale enterprises scattered throughout the rural areas of
Indonesia. The majority of these enterprises (i.e., between 70-75%) arelocated on Java. Rural small scale enterprises in Indonesia comprise both
household and cottage industries with a few small industries. 2/ Productivity
in these enterprises is low. Although they provide up to 80% of total employ-
ment in the manufacturing sector, they contribute only 12% of gross output and
14% of total value added in manufacturing.
5.14 The most important energy requirement for rural industries is
heating fuel. It is the primary energy input for the majority of cottage and
household enterprises such as those engaged in the production of lime, floor
and roofing tiles, ceramics and food processing. Process heating requirements
are supplied predominantly from fuelwood. The preferred fuelwood species for
rural industry appear to be teak and old rubber trees. Total consumption of
fuelwood 3/ in rural industry was estimated at 8.7 million cu.m. (142 million
BOE) in 1976.
5.15 In some regions of Java and Bali, rural industries have had to
convert to using petroleum fuels due to the growing scarcities in the supply
of fuelwood. Wood has also had to be imported into Bali for those industries
requiring non-volatile fuels because of a local ban on tree cutting. However,
the overall extent to which petroleum fuels have replaced fuelwood in ruralindustries throughout Java and Bali is not known. Nevertheless, the statistics
for selected rural small-scale industries given in Table 5.4 show an estimated
consumption of petroleum fuels (excluding those for lubrication purposes) of
about 9.5 million BOE in 1978. It is likely that a significant proportion
of this fuel is consumed in operations other than for generating process heat
(e.g., mechanical shaft power in rice mills). Prior to 1974, no cottage and/or
1/ BPS Agricultural Statistics.
2/ See indonesia - Cottaae and Small Industrv in the National Economy.
IBRD Report No. 2490-IND, November. 1979.
3/ Forest Products Research Institute, (LPHH) Bogor.
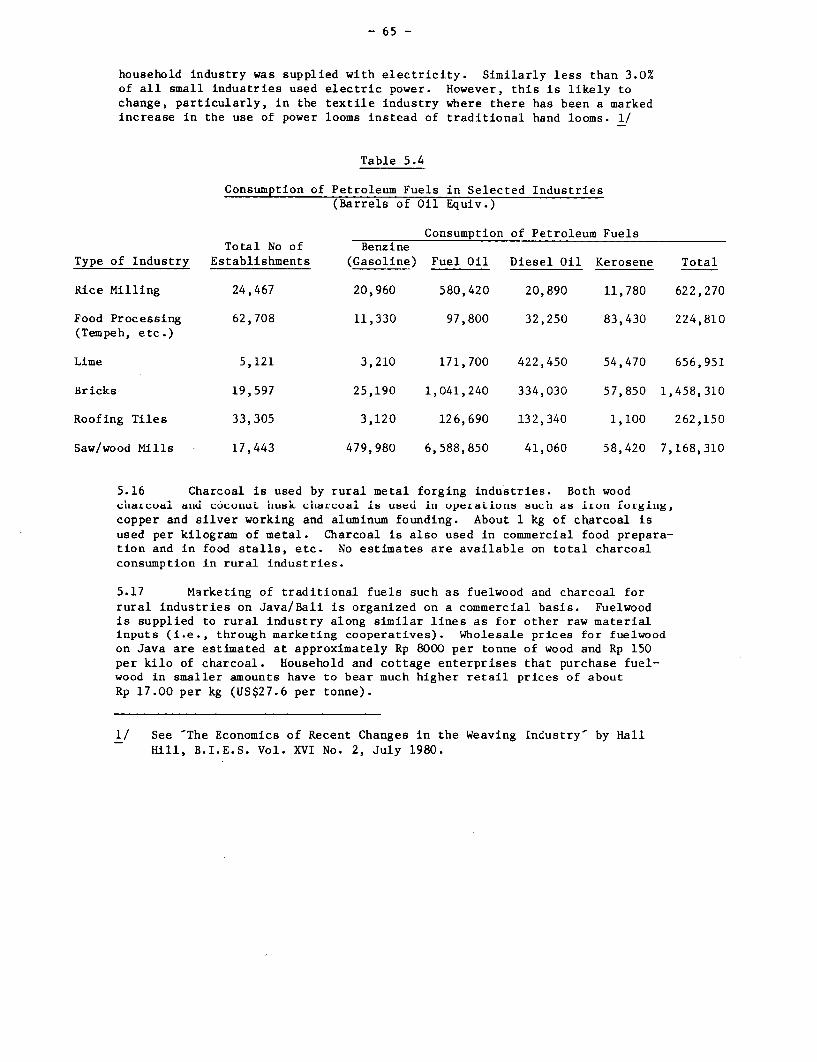
- 65 -
household industry was supplied with electricity. Similarly less than 3.0%of all small industries used electric power. However, this is likely tochange, particularly, in the textile industry where there has been a markedincrease in the use of power looms instead of traditional hand looms. 1/
Table 5.4
Consumption of Petroleum Fuels in Selected Industries(Barrels of Oil Equiv.)
Consumption of Petroleum FuelsTotal No of Benzine
Type of Industry Establishments (Gasoline) Fuel Oil Diesel Oil Kerosene Total
Rice Milling 24,467 20,960 580,420 20,890 11,780 622,270
Food Processing 62,708 11,330 97,800 32,250 83,430 224,810(Tempeh, etc.)
Lime 5,121 3,210 171,700 422,450 54,470 656,951
Bricks 19,597 25,190 1,041,240 334,030 57,850 1,458,310
Roofing Tiles 33,305 3,120 126,690 132,340 1,100 262,150
Saw/wood Mills 17,443 479,980 6,588,850 41,060 58,420 7,168,310
5.16 Charcoal is used by rural metal forging industries. Both woodcharcoal and coconut husk charcoal is used in operations such as iron forging,copper and silver working and aluminum founding. About 1 kg of charcoal isused per kilogram of metal. Charcoal is also used in commercial food prepara-tion and in food stalls, etc. No estimates are available on total charcoalconsumption in rural industries.
5.17 Marketing of traditional fuels such as fuelwood and charcoal forrural industries on Java/Bali is organized on a commercial basis. Fuelwoodis supplied to rural industry along similar lines as for other raw materialinputs (i.e., through marketing cooperatives). Wholesale prices for fuelwoodon Java are estimated at approximately Rp 8000 per tonne of wood and Rp 150per kilo of charcoal. Household and cottage enterprises that purchase fuel-wood in smaller amounts have to bear much higher retail prices of aboutRp 17.00 per b,,g (UTC$27. per tor..e)
1/ See 'The Economics of Recent Changes in the Weaving Industry' by HallHill, B.I.E.S. Vol. XVI No. 2, July 1980.
- 66 -
5.18 ~~Equivalent pr-ices for fuelwood on the other Islan.ds are considerabll.J* .u l jJ. VQL .L jA. ~ LJA I. U~L~S~ JL LLL U L. i A. .L LL~.~O L A.)itO±U L O
lower at about Rp 3000 per tonne (US$4.9/tonne). Deforestation in theseisJ.ona-ds is loess signifi.ant aA car. In part bhe attr.*ib.u+ted more tLo Aema-.A fromrural industry rather than for household requirements.
5.19 A major target group for rural energy programs is the householdsector especially on -Java/Bali Hoshl fue 4 for- cokrg rdlih-wlSeCLULt~~p .Lai±y CLJVCL/ DC&.I. . IUUZ)C1LU.LU iUC±IU.L LUL _Ur.LILLr diiU .L.~iJIW.L.LJ.
grow substantially with population trends and rising incomes, and the goalmust be to ensure that thLese are met witLL Low cosL iigenous energy sourcesother than kerosene, as well as to replace the existing use of kerosene. Themajor options appear to be gas (especially LPG Lor cookLng arid lightiLg) ana,
in the longer term, rural electricity for lighting. These options and thechoice between them need to be examined, and the mission recommends that thisbe done as a matter of priority. On the other islands, where the problem is.es s8evere, work snould De done on the potential use or wood or charcoalgasifiers 1/ and microhydro turbines to replace diesel-powered generators.Both can serve to supply tne smaii requirements or isoiated communities andalso to develop potential loads for future connection to emerging grid systems.
5.20 Fuels for Rural Industry: About 78% of all cottage and householdindustries, and 72% of small industries are located on Java and Bali. Amajority of these industries require energy in the form of process heat.Fuel for the above purpose has traditionally been supplied from fuelwood andcharcoal although there is increasing evidence of substitution with petroleumfuels, such as fuel oil, as wood supplies diminish.
5.21 At present wholesale fuel prices, tuelwood is still the cheapestalternative on an energy equivalent basis (see Table 5.5). However, itshould be noted that:
(a) fuelwood is not readily available in most areas of Javaand Bali. The felling of trees for fuel and buildingpurposes is banned in some areas;
(b) charcoal is a specialized fuel for metal working activities.The other fuels (e.g., wood, fuel oil) are not really sub-stitutes for these purposes. The only other major substituteis-coke which is also not readily available in most areas ofIndonesia;
(c) the prices of petroleum products incorporate fairly largesubsidies (Chapter 3). A reduction in these subsidieswould clearly lead to a greater incentive to use fuelwood orcharcoal; and,
(d) many of the rural industries do not have modified furnaces toensure the efficient use of fuel oil.
1/ Wood gasification presents some technical problems that limit its reli-ability for application in remote areas. The main problem which occurswhen wood gas is used to fuel engines is tar removal; hence charcoal isthe preferred fuel.
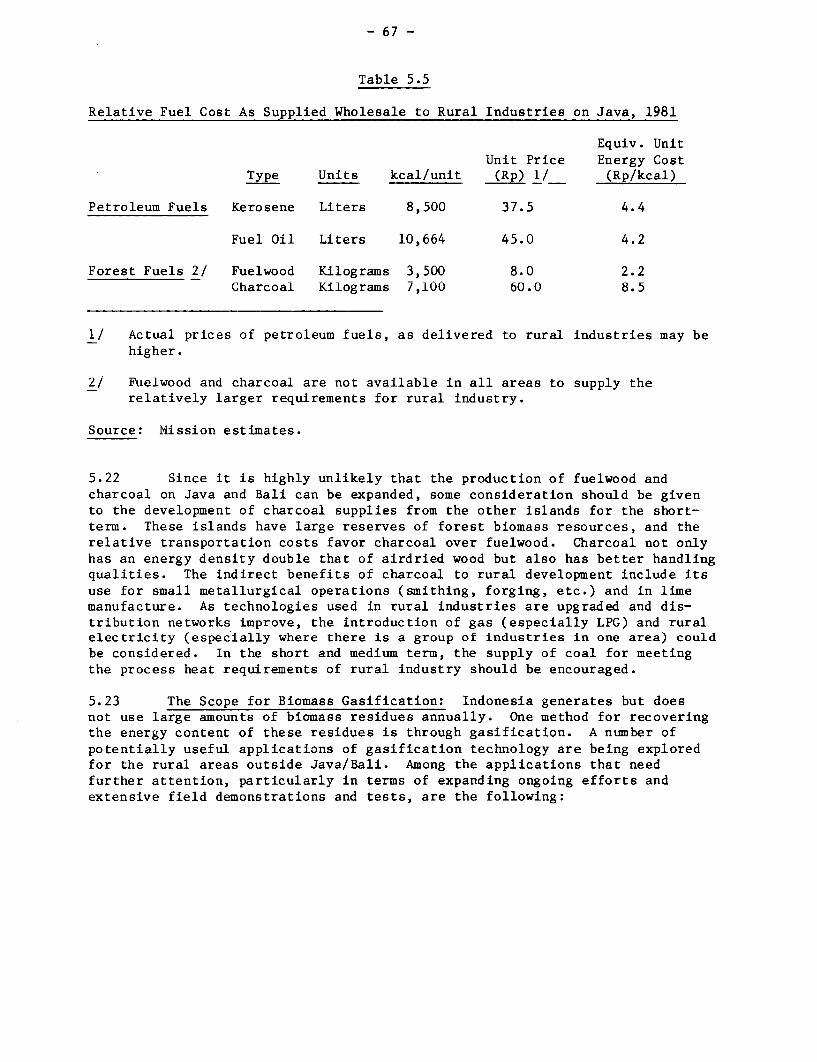
Table 5.5
Relative Fuel Cost As Supplied Wholesale to Rural Industries on Java, 1981
Equiv. UnitUnit Price Energy Cost
Type Units kcal/unit (Rp) 1/ (Rp/kcal)
Petroleum Fuels Kerosene Liters 8,500 37.5 4.4
Fuel Oil Liters 10,664 45.0 4.2
Forest Fuels 2/ Fuelwood Kilograms 3,500 8.0 2.2Charcoal Kilograms 7,100 60.0 8.5
1/ Actual prices of petroleum fuels, as delivered to rural industries may behigher.
2/ Fielwood and charcoal are not available in all areas to supply therelatively larger requirements for rural industry.
Source: Mission estimates.
5.22 Since it is highly unlikely that the production of fuelwood andcharcoal on Java and Bali can be expanded, some consideration should be givento the development of charcoal supplies from the other islands for the short-term. These islands have large reserves of forest biomass resources, and therelative transportation costs favor charcoal over fuelwood. Charcoal not onlyhas an energy density double that of airdried wood but also has better handlingqualities. The indirect benefits of charcoal to rural development include itsuse for small metallurgical operations (smithing, forging, etc.) and in limemanufacture. As technologies used in rural industries are upgraded and dis-tribution networks improve, the introduction of gas (especially LPG) and ruralelectricity (especially where there is a group of industries in one area) couldbe considered. In the short and medium term, the supply of coal for meetingthe process heat requirements of rural industry should be encouraged.
5.23 The Scope for Biomass Gasification: Indonesia generates but doesnot use large amounts of biomass residues annually. One method for recoveringthe energy content of these residues is through gasification. A number ofpotentially useful applications of gasification technology are being exploredfor the rural areas outside Java/Bali. Among the applications that needfurther attention, particularly in terms of expanding ongoing efforts andextensive field demonstrations and tests, are the following:
- 68 -
generation 1/ in IC engines. This approach has potentialboth in terms of stimulating the demand for electricity inremote areas but also in substituting for the use of smalldiesel engines for. battery ch.arging;
(b) cogeneration in wood processing mlls. hiS ton
that needs further examination within the context of theoveral-l 6organization of z±I m i perations 'n .L----lesia; and,
c) pyrolysis/improvement ol r'Lce husks to recover energy inthe form of charcoal, CO/H 2 fuel gas and some pyrolytic oil. 2/The Development Technology Center (DIB) hias made significantprogress in developing and testing a pyrolytic reactor. Twounlts Lhlave bieen produced, one of wnhcn nas Deen installea 3/for field demonstration at the Suskasari Rice Mill in ChiriangaWetbL Java. Fuel gas is suitable for smaii industriai uses(e.g., ceramics and pottery manufacturing) as a heat sourceand may be particularly useful on Java. It has also beensuccessfully tested as a diesel fuel extender in a 6hp Yanmargenerator. Tne market potential for rice husk charcoalbriquettes (fireballs) needs further investigation.
Institutional Considerations for Rural Energy Planning
5.24 The general paucity of data and information on the rural energysituation highlights the need for setting up a strong but flexible approachfor planning and implementing rural energy programs and strategies. Thisapproach should foster increasing cooperation between the Energy PlanningUnit in the DG of Power and the sectoral planning units working on programstargeted for the rural areas.
5.25 Many rural energy programs are being administered by directoratesand sub-directotates of the Ministries represented on the PTE. However, inorder not to lose sight of specific rural energy needs within the overallnational energy framework, it is recommened that a Rural Energy Policy Coor-dinating Task Force be established to work on similar lines as the PTE butwith special focus on identifying and defining policy instruments to promotecloser operational linkages between the different agencies with specific
1/ A pilot project is currently being implemented by the Agency forthe Development and Application of Technology (BPPT).
2/ About 400 kg,of charcoal (3,673 kcal/kg), 500 liters of pyrolysis gas(1560 kcal/mu), and 70 literes of pyrolytic oil is produced per tonne ofrice husk feed (14% moisture content).
3/ Total installation cost was Rp. 2.54 million (US$4,084) in 1979.
- 69 -
sectoral roles in the rural sector. This would facilitate the planning andimpleo-er.taio .6-_ts of transiating nation-ln eneprgv giidelines into nractiral
rural energy programs and projects that complement on-going programs. InaAAdition to representation from the Ager.cy for the Develonpmnt and Annlirationn
of Technology, those from other agencies including the Directorate General fort).._1 wWAt A_|) T_.~-,s
4_,4-s, vF
4x,e Qmol 1 < n o T,-A,Ictr nc~ and
RUCal Dv.LoCpmet Trnmgain Coo peratLX-es SmL a LX U2L- Scl industrieP Ws, s s...
Forestry should form the nucleus of the proposed policy task force.
5.26 Within the Energy Planning Unit, the role of the Rural Energy Plan-ning Sub-Unit would be to encourage and accelerate the development of suchenergy applications past the research phase. This calls for the formation of
smabll regiVLa.L.ly Udt~U LULbas.e CralLy g,rLUUpJ Lto carrL out U u Uvey ar.d analysis
of requirements of specific rural regions as they progress through differentpihases ofL de-velopment. The- Energ Plani. - Uni4-- tT -woul maitn - .oordiA4_-4piiae~ O U~ e.LpLuet. I MrLL=r L .aLCILLJALLL ULL.LL WLJU.U MIAaLLLCL~A..L a %ULJJLU.LL~ULaL.LL
role between the various regional groups. Among the specific tasks for theoub-'UniLt wou'ldU be:
(a) supervising the preparation of rural enery aLtionU plCnsfrom each of the two major regional planning areas (i.e.,
Java/'Bali anad other islands) andLL integratirlg the programs
into an overall national rural energy strategy; and,
(b) supervising the preparation and implementation of welldefined rural energy projects for particular regions. Inthe early phases of the program such projects could typicallybe pilot exercises that are designed to:
ki) test instliutional ana infrastructural requirementsat the village community level for regular energy
projects; and,
(ii) promote field testing and demonstration of promisingtechnical options.
- 70 -
CHAPTER 6
ENERGY SECTOR ORGANIZATION AND INSTITUTIONS
Background
6.01 In May 1978, the Ministry of Mines and Energy was created as part ofa general reorganization of Government departments to coordinate all activi-ties in the energy sector. At present, the only sub-sectors which are notpart of the Ministry are atomic energy, forestry, and some energy relatedresearch institutions. (See Chart One). Coordination and cooperation amongmajor energy producing and consuming sectors within the economy have beengiven added impetus by the creation through presidential decree in September1980 of a cabinet level interministerial coordinating body, BAKOREN. Themission strongly endorses these changes.
The Ministry of Mines and Energy
6.02 The Ministry of Mines and Energy has a broad range of responsibili-ties including energy policy and planning, resource delineation and development,oil and gas exploration, production and marketing, and development of thecoal, geothermal and power sectors. In addition, the Ministry has overallresponsibility for all mining activities, and geological surveys. The publicor quasi-public corporations 1/ dealing with mineral industries and the energysubsectors are also under the overall supervision of the Ministry. Thesecorporations have varying degrees of autonomy, with PERTAMINA (oil and gas)and PLN (power) retaining the most independence. Chart Two shows the Ministry'sstructure and distribution of functions.
6.03 Three bodies under the direction of the Ministrv are concerned withpolicy formulation in the energy sector:
(a) The National Energy Coordinating Board (BAKOREN) is arerentlv rtablihed cihinpt level nolicv hnard rhairpd
by the Minister of Mines and Energy and includes theMinisters of Ptiblir Works, Tntiustry TDPfpnse and Spririt,u
Communications, Agriculture, Research and Technology,Developnment and FnvironmPnt, and Administtrat-ivp Rinfnrm;
the Vice-Chairman of BAPPENAS; the Director General ofthe N-at4-1t Atomic Board; ar.d the President Direct'orof PERTAMINA.
L/ Tihe State EriterpriLses fLor tLin mini and othLer mu'ni-i1ii are, in effect,private corporations regulated and controlled by the Ministry.
- 71 -
(b) The Permanent Committee for Energy Studies (PME) is a committeeconnisting of th TJrPrtnrQ nf T.Pmigas, the Research Tnstitiite forMines, and the Research Institute for electric power, secretariesto the various Directorates of the Ministry, and the head ofplanning. The members of the PME have control over considerableresearGch act-ivity with-in th.e Mi-nistry. Thi,s committee .urrently.
acts as the Secretariat to BAKOREN.
(c) The Technical Committee on Energy Resources (PTE) was estab-L-L ILCU EL L." I 7 LLU Lb L.UWjJUbU UI.L Ll L U LL± b
and other organizations connected with energy affairs. ThePEL s major responsibilities nLow includue drafting energy policyproposals to BAKOREN and monitoring the implementationoL appr ovedu pol'L ces.
6.04 A smaii Energy Planning Unit operates witnin tne Directorate forEnergy Resources Development under the Director General of Power. However, inorder to translate the broad elements of the energy policy into a detailedenergy plan, this unit needs to be strengthened. It should have specificresponsibilities for:
(a) Compiling data on the production and consumption otall primary and secondary energy including the estab-lishment of data collection procedures and standards;
(b) Developing, on the basis ot planned GDP growth and itssectoral distribution, energy demand forecasts and a seriesof alternative plans over 5, 10 and 15 year periods formeeting this demand;
(c) Suggesting suitable measures for demand management andconservation;
(d) Analyzing energy pricing policies and the implicationsof these on supply and demand forecasts;
(e) Analyzing rural energy issues, in particular theconsumption of fuelwood and kerosene, and potentialrural electrification projects; and
(f) Monitoring the various agencies responsible for theimplementation of energy related programs.
6.05 The importance of rural energy issues and the fact that ruralenergy programs are currently being implemented under the auspices of severalgovernment and non-government agencies suggests the need for a Rural EnergyPlanning Sub-Unit within the Energy Planning Unit. The sub-unit could work as
- 72 -
a policy coordinating task force with representatives from other agenciesconcerned with rural energy issues through the Rural Energy Coordinating TaskForce. In particular, it would be responsible for identifying and definingpolicy instruments to promote closer operational linkages between the differentagencies.
6.06 Once strengthened, the Energy Planning Unit should be the Secretariatto BAKOREN. Since this Unit is concerned with all energy using and producingsectors and sub-sectors and not just electric power, it should be placed inthe office of the Minister of Mines and Energy for effective coordination withother Directorates. The PME would continue to coorindate all energy-relatedresearch and policy matters both within the Ministry and with other Ministriesincluding that financed from external aid programs.
6.07 The Technical Committee on Energy (PTE), which brings togetherrepresentatives from Ministries and other organizations connected with energyaffairs, is, and should be, the essential link between overall economic andsocial policy and energy policy. With a membershin of 27, some of whom areonly peripherally concerned with energy issues, the PTE could be made moreeffective by reducing its membership. These members should be at the samelevel--preferably Director Generals--and should include only those directlyconcerned with the energy producing and consuming sectors, as well as BAPPENAS.Thus, the PTE discussions would provide the major parameters for the EnergyPlanning Unit to use in producing an energy plan This plan would be suhmittedto BAKOREN, and then to the full Cabinet, for approval. The Energy PlanningUnit would then monitor the imnlementation of the ian., repnortinc to B.AJORENperiodically.
6.08 Line responsibility for the various energy organizations/institutionsfalls under three Dirpct-orate Generals in the Ministry of Mines and Energy.
(i) Directorate General of Oil and Gas covers oil and gasexploration and production, supervision and promotionof the oil and gas industry, and oil and gas researchthrough the Oil and Gas Technology Centre (LEMIGAS).
(ii) Directorate General of Mines covers the promotion andsupervision of the,. m-ir.ira industry, surveys and resourcedelineation, and research through the Geological Research-and Development Centre and tLhe Mineral Technology D-eve'lop-ment Centre. At present, no separate department hasresponsibilities for coal surveys and the coal industry.Coal is likely to play an increasingly important role inthLLe 4uture iin power generation anLd the contaiL ent ofLof domestic demand for oil products. The desirability ofcreatiLrg a Directorate of Coal under the DG of Mines should,therefore, be given serious consideration by the Ministry.
- 73 -
(iii) Directorate General of Power covers energy resourcedevelopment (essentially the Energy Planning Unitreferred to in para. 6.04) and promotion and supervisionof the power industry. With the increased emphasis onrural electricfication programs (REP), a separate cellfor planning and monitoring REP may be required. TheDirectorate General of Power should retain overallresponsibility for the development of geothermal andhydro resources where the irrigation component is small.The DG of Power should exercise the regulatory functionof licensing the private generating plants assigned to itby Regulation No. 36 of 1976 and not delegate it to PLN.The DG of Power should also be responsible for thecollection of data on generation from non-PLN sources.
6.09 The major energy corporations in the public sector, PERTAMINA, PLN,PTBA and PN BATUBARA are formally under the policy direction and guidanceof the Ministry and they enjoy varying degrees of autonomy in decisions oninvestment, planning and implementation. The flow of information requiredfor national energy planning purposes from these corporations is not adequateand suitable formats and procedures need to be devised.
The Oil and Gas Subsector
PERTAMINA
6=I1 P1RTAMTNA is the national agencv in the netroletim subsector havingoverall responsibility for the development of oil and gas in Indonesia. Itwas created as an amalgamation of three smaller nublic cornorations in 1968.Its basic charter was subsequently revised in 1971, when it received increasedresnonsibilities 1ncluding exnloration; exoloitation, refining and processing,transportation and marketing of oil and natural gas, and geothermal explora-ti4 ron aA develomemnt The PERTAM.N "crrsisis" fn on:rlu 1071i e',caAf 1 :: rcylu
by mismanagement and poor investment decisions within the institution, broughtabourt a further reorganization. A PrPesidentia1 Deprpp in lnte 1Q75 estab-lished tighter governmental control by subjecting PERTAMINA to periodicscrutiny (through a more nowerful Board of Directors and a ministerial levelCouncil of Government Commissioners) and limiting the scope of PERTAMINA'sactIvities tooil gas nnd eonthermal mAttcre onlyv Since 1Q75% PERTAMTNAhas placed increasing emphasis on simplifying its operations and improvingits overall efficiencr.c
6.11 PERTAMINA pla-s a unique and important role in the Indonesian econ-omy in that it has sole responsibility for all oil and gas sector activitiesait currently accountLs for appoximately 70% of total export earning.s. Ttemploys over 40,000 staff and exercises supervisory control over the opera-t-ions of more thlan 131 fore-ign oil1 contractors and over 200 service companies.
In addition, PERTAMINA is directly responsible for the production of approxi-mately J32 millior. -arls of c.rude oil pe a-- tnr.v (1e Ligures), equivaler.t to
5 per cent of total production.
- 74
6.12 A major issue with respect to PERTAMINA is whether its responsibi-lities for oil and gas exploration, for exports of oil products and LNG,for managing on behalf of the Government various contract arrangements, torrefineries, for domestic distribution of petroleum products and for geothermalare not too heavy for a single organization. The mission considers that sincesome areas such as the domestic distribution of petroleum products and, inparticular, natural gas and LPG, are likely to register substantial increasesin the future, the GOI should evaluate the possibility of subsidiary companiesbeing established by PERTAMINA for these activities. In addition, a separateagency is likely to prove useful for the rapid development of geothermalresources. Such an agency could participate in the Joint ventures beingset-up for the development of geothermal energy and, in time, could undertakedevelopment of some of the identified potential on its own. The trainedpersonnel available in PERTAMINA for geothermal activities could be transferredto the new agency.
The Electric Power Subsector
Perusahaan Umum Listrik Negara (PLN)
6.13 PLN, the public corporation for power, was created in 1961, whenthe Government nationalized three Dutch owned power utilities on Java. Until1971, PLN was a department of the Ministry of Public Works and Electric Power.In 1972, a Presidential Decree transformed PLN into an autonomous body and itis now under the control of the Minister of Mines and Energy. PLN is bound bystatute to have a President Director and at least two other directors and nowhas five directors in charge of the major departments of planning, operations,construction, finance and administration. In addition to the line departments,there are 16 regional (wilayah) offices with a total of about 150 branches.PLN's staff has increased consistently since 1972 and now totals about 31,000,of which 21,000 are on the permanent payroll.
6.14 Since the reorganization of 1972, PLN has grown in stature andcompetence and now appears to be developing into a strong service-orientedpublic utility. However, the structure of the power industry in Indonesiawill change substantially over the next decade. Large scale generating unitssuch as Suralaya will come on stream, capacity and investment will risesubstantially, and rural electrification may play a more imortant role.
6.15 To meet these new demands on PLN's administrative canacitv- themission considers that attention should be paid to strengthening the institu-tion in the following areas:
(a) Mannower nnd Training. Annrnximatelv 26% of PTLN-s stsff
are high school graduates or above (including 4% universitygraduates); and asteady imofovont in the proportlon ofgraduate and high school staff has occurred recently.However, difficulty is encountered in recruiting anadequate number of technical trained staff. Six trainingschnnlc havey hepn Petablisherid uy PLN t- nrnuide vocational
courses for staff (about 1,100 attend the various courseseach year). Staff membersc are csnt hbrond fnr adanced
training and counterpart training is provided in someforeign financed projects. HowevLer, the es t r aied-
- 75 -
and the courses given are not yet geared to provide adequatestaff in all the categories required by PLN.
(b) Accounting System. Accounting is based on a systemintroduced by consultants in the early 1970's and isgenerally well-operated. With the expansion of PLNsoperations and the proliferation of accounting units,the preparation of financial statements is increasinglydelayed by time-consuming procedures. Moreover, thetrend towards increased decentralization of managementpractices will call for some restricting of the systemso that adequate financial information is available tolocal managers in an orderly manner.
(c) Regional Offices Responsibility. In view of the sizeand archipelagic nature of the country the regionaloffices should have a greater involvement than they doat present in long-term planning, and increased respon-sibility for the achievement of PLN's operational goalsas well as improved capabilities in project implementationand analysis. PLN has initiated steps to train regionalstaff in overall planning and financial management which,when completed, will enable the regions to prepare longterm plans and financial forecasts, and have operationalresponsibilities for their regions. There is a need toaccelerate this process of decentralization. Much of thedecision making with regards to the day to day operationsof the regions is centralized at the corporate headquartersfor which it has little staff. This is made all the moredifficult given the lack of good communication between theregional offices and the headquarters. All such decisionmaking should be decentralized.
(d) Rural Electrification. PLN-s role in the rural electri-firation program is, frnm an instit1tinnnl viewpoint, not
yet clear. At present, the organizational framework forruiral electrification ic fragmentped. The noed to consonlidatet-
all-available expertise and resources from the existingoperations of the rural Pleptrificfatin d1iviszions of PIN
the Rural Electric Cooperatives and other autonomous bodiesic dsus in parrs A1R t-n 69.5.
(e) Electric Power Research Center (TMI). TMK was establishedin 1965 to undertake research, development and engineeringanalysis cerviceso for%- PLN. Its reanpnsia4ili4ti4 hv ben
expanded since 1975 to include implementation of researchand development, and ----nnering serv-ies in t- . f41ieA
of electric power in particular, and energy resources ingeneral. But these afdlded responrsibilities are not ade-quately reflected in the facilities available or in itsworlK program. TLM maintains an ElectricalLaotrya
WU~~~~IX1 L ,UL. -1L ".L Ls JL [ _ * Da* L *~ L |XwoUU L CZ LU JL Y , C_
Fuel, Gas and Chemical Laboratory, and a Hydropower Laboratory.LT;I s roLle extendUs also to Systems P"lanniLrIg andU OperatiLonsResearch and Field Surveys (i.e., geophysical and hydro
- 76 -
surveys). Here again, the involvement of LXX in PLN s
programs is minimal. Indonesia will be adding generatingcapacity at a rate of 1U00 -M-w per annum by the end of thedecade and should be able to sustain an electrical equipment
manufacturing industry. It should plan on manufacturing a
good part of the equipment required for transmission anddistribution in the future and LMK should enlarge its rolein the setting-up of standards and specifications for switch
gears, transmission and distribution lines, transformers,motors, motor control equipment etc. It should also act as
a testing facility for certification of indigenously manu-factured equipment and develop a master plan for the indi-genous manufacture of such equipment both in the public
as well as the private sectors, in consultation with theMinistry of Industry.
6.16 PLN should retain its overall national character and be the national
agency responsible for all aspects of power generation, transmission and dis-
tribution across the country. This should include monitoring and, where
necessary, supervising the other smaller agencies involved in the generationand distribution of electricity. In view of PLN-s diverse responsibilities,ranging from operating a large integrated network on Java to meeting the few
hundred kilowatt loads on the small island communities, some restructuring
seems necessary. As the Java grid spans the whole island with large gener-ating stations located on different parts of Java, the whole island should be
treated as one region for operational efficiencies. For the other islands, a
greater degree of decentralization may be desirable and it may, therefore, be
profitable to regroup their operations into a smaller number of regions.
6.17 There is a need to more closely integrate the operations of the
quasi-autonomous bodies, such as the Jatiluhur Authority Public Corporation
(JAPCOP) with those of PLN as a regional grid develops. This can be achieved
if PLN takes over all the distribution lines from these authorities, andenters into contracts for the bulk purchase of power from them.
Rural Electrification
6.18 Rural Electrification under PLN. PLN-s role in rural electrifica-tion is, from an institutional viewpoint, not yet clear. It maintains a Sub-directorate for Rural Electrification within its Directorate for Operations.
In addition, PLN-s Regional Directorates, the Principal Project Physical
and Sunnort Facilities, as well as the Electric Power Research Institute have
varying degrees of involvement in the development, installation and operation
of isolnted small diepepl and mic)ro hvdro nower systems. Overall- PLN's micro
hydro activity involves the operation of about 23 stations (30 units) withinstalled capacity of 5,900 kW. About 22 more micro hydro units are underconstruction. PLN's Rural Electrification Sub-Directorate is responsible for
implementna a pilot ---ogram of 7 large scale ru,ral electrification Qucstem to
serve 440 villages on Java, under a USAID project and also to electrifyvillages which are funded through the Government budget= Total villages to be
electrified by the end of Pelita III are 4867. PLN also operates a pilotrural electrification system serving 3 villages in the Vlaten province ofCentral Java.

- 77 -
6.19 Rural electrification is also covered by four other organizations:
(1) Directorate General for Cooperatives. A special officefor the development and support of rural electrificationcooneratives. known as IUP3LP. was established within theDGC in 1978. UP3LP's function is primarily to promotethe formation of rural electric cooperatives using themodel of the Philippines. It is also responsible forconrdinating terhnical assistance and training nrogramsfor its associated rural electric cooperatives.
(2) Dinas Listrik Pedesaan, Central Java (DLP). This autonomousruiral elertrification Rervfce was created by the aovernor
of the Central Java Province during the Pelita II period.It has since expanded into 28 separate systems servina over4,200 customers. DLP plans to further expand its systemsby purchasing bulk power, from the, PLN, Centra~l Java grldfor distribution. DLP works cooperatively with PLN. DLP-l ectri fi-- onif.l-, the iT- 1 1va-eC w.hi ch arn nrot l ellctri f; ied h' PT N
but if the PLN distribution line reaches the area, DLP turnsover th1-eir rural electrif4cation -in that" area to PLN.M
(3) Unit n Pelaksar.a T'ekLnis Pembangunan Klistrika Desa - aLs Java.
This is a special rural electrification unit established inn 7 7 uiLiae. a ProJviial Gove rn _ 4 A x Am.nt o 1 T oth aso
expanded its programs to 28 separate systems. There has been acooperatLion a [reement Detween PLTN, VPIEJDA LIthe egionLal goverrnmen)and ITS (the Institute for Technology in Surabaya), which doesthe imp'L te[IItUL1t I. PEMDII'A pLUVLUC tLhe L ULIUiir,. Tlhe UL-Lt alsbU
operates 5 isolated systems with diesel and mini hydro sets.
(4) Paket Kelistrikan Desa, Bali. The system, established byPLN, serves aDout 92 villages (4.5 percent of all villages) arid5400 households. PLN provides the services including installationfor a fee of Rp.60,000 per connection for a minimum of 250watts. The connection fee is payable by rural households overa ten moLthl period.
6.20 Financirg for these provincial systems is provided through severalchannels, including the Instruksi Presiden Bantuan Desa (Presidential Instruc-tion for Village Assistance) or BANDES. These programs are administered bythe Directorate General for Rural Development in the Ministry of Home Affairs.The progress of rural electrification projects that have received financialassistance from BANDES needs to be assessed.
6.21 There is an obvious need to coordinate all these various activitiesto ensure optimal utilization of resources. Rural electrification programsrequire more careful monitoring to ensure that: (1) the cost per householdand per village electrified is brought down significantly; (2) the cost-ben-efit ratios are fully analysed and steps are initiated to secure more produc-tion oriented loads in rural areas; (3) efforts are made to even out the loadcurves arising out of rural electrification programs; and (4) a steady flow of
funds is maintained on a long term basis.
- 78 -
6.22 It is suggested that a Rural Electrification body or Sub-Directoratebe established under the overall supervision of the DG of Power. It would,through a financing mechanism, monitor the planning and implementation otindividual programs and ensure that only those projects which met a minimumcriteria of economic viability would be taken up in the early years. It wouldthereby accelerate funding for rural electrification programs and would alsoact as a catalyst in conjunction with LMK or PLN in setting up reasonablestandards for all equipment used in rural electrification programs and wherenecessary to ensure bulk purchases of required equipment and materials. Itwould draw its funds from international financing institutions, such as theADB and the Bank, as well as from allocations from government budgets, includingtariffs or subsidies.
6.23 The primary responsibility for the programs in each region shouldrest with the regional PLN authorities who work on timetables agreed to withthe PLN central office and the rural electrification authority. After an areacomprising a group of villages had been electrified, some of the operationalaspects could be transferred to the Rural Electric Cooperatives, who would actas agents of PLN, distribute power within the area, and arrange to collectthe monthly bills. The rural electric cooperatives would also be responsiblefor promoting production-oriented loads. This would be the preferred patternon Java. On the other islands, it may be preferable for PLN regional orsub-regional offices to continue to be responsible for implementation of ruralelectrification programs, and for their operations.
The Coal Subsector
6.24 PNB is the state enterprise for coal mining and development. Thecoal industry has been nationalized since 1958, although some small open castmining in Kalimantan remains in the private sector. PNB was formed in 1970and presently operates two coal mines: the Ombilin mine in West Sumatra andthe Bukit Asam mine in South Sumatra. It is the smallest public sectorcorporation within the Ministry. PNB's past has been largely characterizedby limited budgetary allocations, unprofitable operations and excessiveministerial regulation.
6.25 The GOI will have to give serious consideration to strengtheningthe institutions responsible for the coal sector as plans to expand theindustry get underway. These plans include the World Bank assisted BukitAsam exnansion nrn-i#t whirh will increase nresent nrndiutinn levels bysixteen fold over the next 5 years. As part of this project, PNB's currentoneratina division at Bukit Asam will be converted into a new state ownedcommercial company, P.T. Bukit Asam (PTBA) which will have direct responsi-hilit-y for the pnripei't. TTnder the reorannizatinn, PNB will retnin rpQnnoni-bility for developing a second mine in Sumatra, and for managing the productionsharing conr.tracts (now under negottiattiorn) r fEas- VKl4-nta..
6.26 PNB s stated function is to promote the development of the coalindustry in Indonesia. It is apparent that this organization will not becapable in anIy meaningful sense of d-ev VlLJ0S1 the iudut wiAthin - th context
of the production requirements unless:
- 79 -
(a) it is strengthened by an injection of capable technicaland professional staff;
(b) it has a budget allocation which allows it to attractsuitably qualified geologists and mining engineers;
(c) it is provided with the equipment required for a modernopen-pit mining operation; and
(d) it is induced properly to undertake and supervise thenecessary exploration work required to establish asufficient geological data base to support a substantialcoal industry.
6.27 The strengthening of the organization controlling the coal industrycan only be undertaken over a long period. In the mean time it is apparentthat substantial foreign technical assistance will be needed both to iindertakethe necessary field work and to train Indonesian personnel. It is understoodthat the current assistance given by the British Gover-nment has proven satis-factory to DMR. This assistance consisted of equipment purchase and thesecondment of three experienced geologists from the institute of GeoloQicalSciences to work with Indonesian geologists, surveyors and technicians. Anextension of such technical assistance to PN Batubara is essential to thedevelopment of the coal industry. The resources allocated to the coal programwithin the Directorate of Mineral Resources (DMR) and the Mineral TechnologyDevelopment Center (MTDC) must also be strengthened.
6.28 Possible reorganization of the present system should be considered.Tt must be remembered that: (a) coal mining in Indonesia has never been alarge industry; and (b) its present development will be of strategic impor-tance to the country, probably for many years after the oil reserves havebeen exhausted. A strong, highly motivated and professional organization isrenuired to oversee development of this industry. Whether such a body isdeveloped out of the existing PN-Batubara organization or a new organizationis formed is immaterial so long as this body is totally responsible for over-seeing the development of coal resources and its marketing.
6.29 An appropriate organization might be to have PNB act as a holdingcompany with subsi4A4ries responsible for operation.s in varlous coalfieldareas as in Bukit Asam. The holding company could be responsible until a coalDirectorate is established Afor cor.trolling a.-d monitorUig foreign contractors,ensuring environmental protection and where appropriate entering into jointventure arrangements with fLoreiLgnI mIIi'LLiLg companles.
6.30 In view of the urgency attached to the development of coal, theGovernment should consider the employment of foreign technical expertise tour,dertake, with `Ior,esian counterparts, initial exploration and prefeasibil-ity studies. Such reports could be used as the basis for negotiating withinternational coal mining and civil engineering companies the development ofcoal production facilities on a non-production-sharing basis. This method ofexplo'tirg coal resources has been used successfully elsewhere.
- 80 -
0OthLuerTInstitutions
6.31 Energy relasted institutions outside the Ministry of Mine- and±11. 0 r LII.I LU ± -. J 1
Energy are limited to the nuclear and forest energy sub-sectors and variousresearch irnstitutior,s unAer the Minist-ry of Rlesearch ar.d TPechnology.
BATaN
6.32 .L -i8 te 'tate agency 'or .nuclear power. It operates as afully autonomous body under the auspices of the President's office. Coordina-tion with the ML-LL'Lstry oU Mines and Energy 'Ls limited to DA-R N Uf. which th
Chairman of BATAN is a member. BATAN's sphere of operation includes explora-tion for uranium in Sumatra and Kalimantan, the development (with bilateralassistance) of a feasibility study for a 600/1300 MW nuclear power plantand research related to atomic energy. Cllanges in tne present IIWLnLuLuIoia'
arrangements for nuclear energy will require reassessment in light of thedecisions, yet to be taken by the GOI, on the future role of nuclear powerin the country.
6.33 For the present, however, it would be desirable to leave the entireresponsibility, including the establishment of the first nuclear power stations,with BATAN. The current exploration program for uranium will have to beaccelerated in order to ascertain at an early date, if deposits of uranium,adequate to sustain a large program of nuclear power, can be located.
Energy Research and Development
6.34 Energy research is undertaken by several institutions that fallunder the direct supervision of either the Ministry of Mines and Energy, theMinistry of Research and Technology (MNRT), the Ministry of Education and theIndonesian Institute of Sciences (LIPI). An overview of ongoing activitiesand responsibilities is as follows:
1. Ministry of Research and Technology
6.35 This Ministry maintains an active and growing role in energy researchand development through its two affiliated institutions, the Agency for Develop-ment and Application of Technology (BPP Technology), and the National Centerfor Research in Science and Technology (PUSPITEK). Of these two institutions,
BPPT has ongoing pilot projects in the energy field. BPPT has a staff of 800professionals, 80% of whom have engineering backgrounds. The main focus ofits energy research program is on renewable energy and is divided into threesub-programs: utilization of biomass energy sources; utilization of alcohols(methanol and ethanol); and utilization of solar energy. Many of theseprojects have received foreign technical assistance. PUSPITEK will undertaketesting and demonstration of specific energy conversion hardware. Includedin the proposed list of technologies to be investigated within the PUSPITEKprogram are solar, desalination, biogasification, solar thermal and photo-voltaic electric power generation.
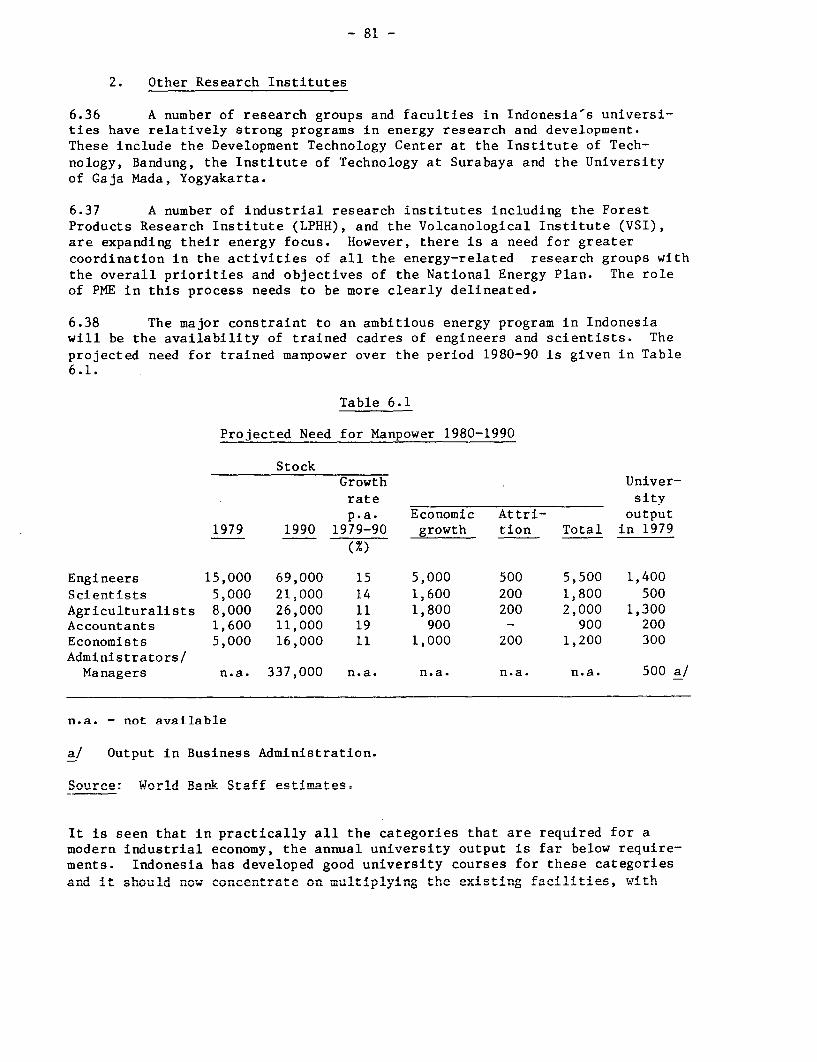
- 8i -
2. Other Research Institutes
6.36 A number of research groups and faculties in Indonesia's universi-ties have relatively strong programs in energy research and development.These include the Development Technology Center at the Institute of Tech-nology, Bandung, the Institute of Technology at Surabaya and the Universityof Gaja Mada, Yogyakarta.
6.37 A number of industrial research institutes including the ForestProducts Research Institute (LPHH), and the Volcanological Institute (VSI),are expanding their energy focus. However, there is a need for greatercoordination in the activities of all the energy-related research groups withthe overall priorities and objectives of the National Energy Plan. The roleof PME in this process needs to be more clearly delineated.
6.38 The major constraint to an ambitious energy program in Indonesiawill be the availability of trained cadres of engineers and scientists. Theprojected need for trained manpower over the period 1980-90 is given in Table6.1.
Table 6.1
Projected Need for Manpower 1980-1990
StockGrowth Univer-rate sityp.a. Economic Attri- output
1979 1990 1979-90 growth tion Total in 1979M~~~(%)
Engineers 15,000 69,000 15 5,000 500 5,500 1,400Scientist-s 5.000 211000 14 1,600 200 1,800 500Agriculturalists 8,000 26,000 11 1,800 200 2,000 1,300Accountants 1,600 11,000 19 900 - 900 200Economists 5,000 16,000 11 1,000 200 1,200 300Administrators!
Managers n.a. 337,000 n.a. n.a. n.a. n.a. 500 a/
n.a. - not available
_! Oitnlit in RiiBines Adminirtration.
Source, World Ba.nku Staff estim_ates~
It is seen that in practically all the categories that are required for amodern industrial economy, the annual university output i9 far below require-ments. Indonesia has developed good university courses for these categoriesa-A. i1t sho ul 1d4 now concen*tra e on mu'lt the exis tin facilities, with

- 82 -
appropriate bilateral and multilateral assistance where required. The Bankis already working on assessing the medium and long term needs of theMinistry of Mines and Energy for skilled manpower, but work in other areasand other agencies still needs to be done at an early date, otherwise many ofthe jobs that could be filled by Indonesians will have to be filled byexpatriates on a long term basis. In this context, priorities should bedrawn up in the R&D sector to ensure that available cadres of engineers andscientists are not drawn away from current energy programs to long term R&Dprograms.
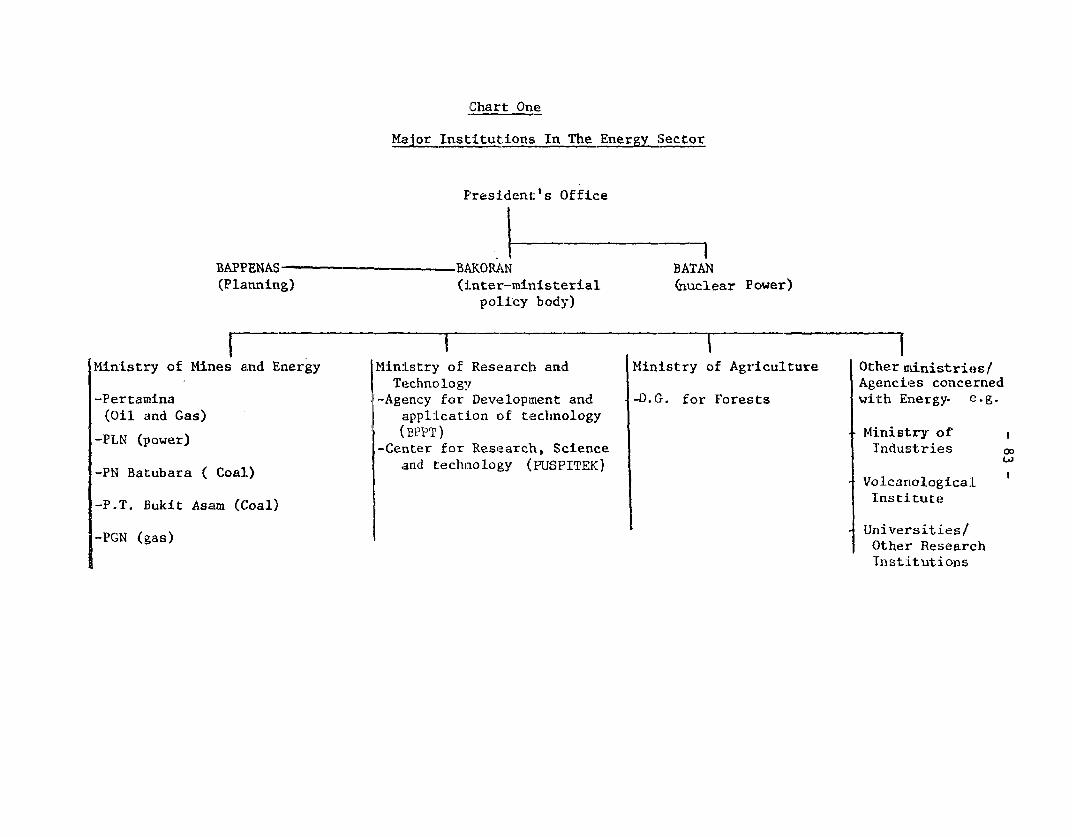
iChart One
Malor Institutions In The Energy ;ector
Presidentts Office
BAPPENAS- -BAORAN BATAN
(Planning) (inter-ministeriaL (nuclear Power)policy bod,y)
r- -- v- Ministry of Mines and Energy MiniLstry of Researclh and Ministry of Agriculture Other ministries/
Technology Agencies concerned
-Pertamina -Agency for Development and -D.G. for Forests wilth Einergy. e-g.
(Oil and Gas) appl-Lcat:Lon of technology
-PLN (power) (BPPT)Mistyo-Center for Research, Science Industries o
-PN Batubara ( Coal) and V nechnology PSPTE) ological
-P.T. Bukit Asam (Coal) Institute
-PGN ( gas ) Universitis ieit /aOther ResearchInstitut:ions
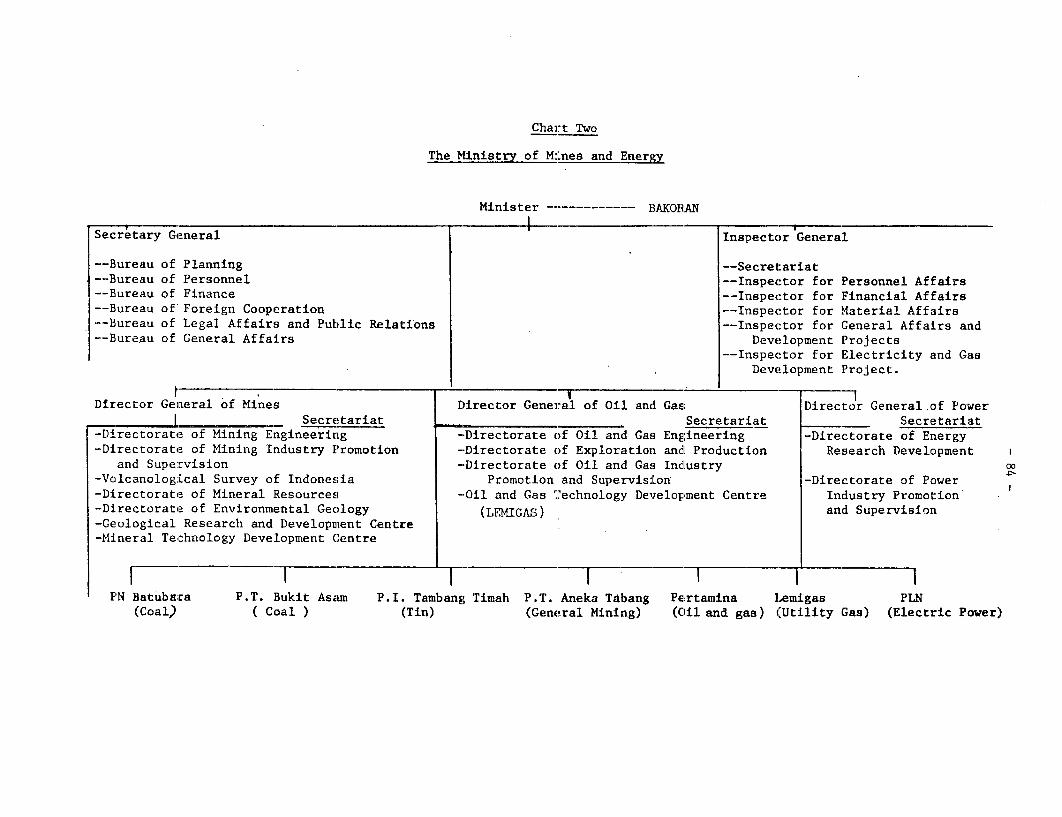
Chart Two
The Milnistry of MiLnes and Enerig
Minister ---- BAKORAN--- - - - I _ - - - -…_ Secretary General Inspector General
-- Bureau of Planning -- Secretariat-- Bureau of Personnel -- Inspector for Personnel Affairs-- Bureau of Finance -- Inspector for Financial. Affairs-- Bureau of Foreign Cooperat:Lon -- Inspector for Material Affairs-- Bureau of Legal Affairs and Public Relations -- Inspector for General Affairs and-- Bureau of Genetral Affairs Development Projects
-- Inspector for Electricity and GasDevelopment Project.
Director General of Mines Director Gener-al cif Oil and Gas Director General .of PowerSecretariat Secretariat Secretariat
-Directorate of Mining Engineering -Directorate of Oi.l and Gas Engineering -Directorate of Energy-Directorate of Mining Industry Promotion -Directorate of Exploration andL Production Research Development I
and Supervision -Directorate of Oil and Gas Indlustry m-Volcanological Survey of Indonesia Promotion and SupervisiLon -Directorate of Power 2
-Directorate of Mineral Resources -Oil and Gas Technology Devielopment Centre Industry Promotion-Directorate of Environmental Geology (LEMIGAS) and Supervision-Geological Research and Development Centre-Mineral Technology Development Centre
PN Batuba;ra P.T. Bukiit Asam P.I. Tambang Timah P.T. Aneka Tabang Pertamina Lemigas PLN(Coal) ( Coal ) (Tin) (General Mining) (Oil anad gas) (Utility Gas) (Electric Power)
- 85 -
CHAPTER-7
INVESTMENT IN THE ENERGY SECTOR
7.ol The increase in energy production needed to maintain energy exportsat almost current levels and meet expected increases in energy demand has beendiscussed in Chapter 2. It will require investments over the next two decades
which are substantially higher than in the past. These could double as a
proportion of GDP from 2% to 4% representing, in real terms, a tourfoldincrease for this decade and an eight-fold increase by 2000. However, as
explained in Chapter 1, more studies on likely energy demand are required
before the investment requirements for the following decade can be estimatedwith reasonable accuracy. Moreover, the energy investment requirements for
the coming decades quoted in this chapter assume the successful implementation
of policies for energy demand management, fuel supply options and energyexport which have been discussed in Chapters 3, 4 and 5, and the organizational
and institutional changes recommended in Chapter 6.
7.02 Domestic energy demand is expected to treble by 1990. The mission½sestimate for primary energy production in 1990 is 1114 MBOE or an increase of
46% over current levels. After allowing for exports at roughly current levels(481 MBOE), this would leave 494 MBOE for end use consumption or an increase
of 206%, providing that there is an elimination of current waste, especially
of flared gas and a reduction in transformation and other losses.
7.03 In the next decade, most of the increase in energy supply mustcome from the hydrocarbons sector, to a large extent from natural gas and toa lesser extent from oil. As discussed in Chapter 2, the mission considers
that an increase of 21% in oil production to 700 MBOE and in gas production by
94% to 350 MBOE will be possible. The contribution from coal, hydro andgeothermal could rise twelve-fold from 5 MBOE to 60 MBOE (5% of the total).
In addition to the investment required for increasing the production of primaryenergy, $350 million will be required for energy surveys and delineation ofwhich $100 million will be for geothermal and hydro surveys, and $250 million
for coal surveys.
7.04 In addition to the increase in oil production by 21 percent, allow-ances must be made for some decline in production from presently producing
fields. Additions from new fields to be discovered and developed and from
presently producing fields by enhanced recovery methods are expected to make
up the difference. Most of the refineries are old and based on designs which
are not energy efficient; their fuel consumption is very high particularlyconsidering that they have very limited conversion capacity. The mission
estimates that relatively small investments in energy efficiency measures can
lead to large savings. In addition, there is also a need for investment inthe refinery sector to add substantial new distillation and conversion capa-
city. The total investment is estimated at about $14 billion for oil explora-
tion, nroduction facilities and refineries.
- 86 -
7.05 Gas production could increase by 94 percent, but this will requireinvestment in further exploration, gas production facilities and a pipelinenetwork to the major domestic consumers. Additional investment will berequired in the proposed LNG plants. The total investment in the gas sectoris estimated at US$5.5 billion.
7.06 Furthermore, substantial investments will be required in the electricpower subsector. Installed electric power capacity in 1990 is expectedto be 13,860 MW, including PLN on and outside Java and captive generation.The additional capacity required will be more than the difference betweenpresent and projected installed capacities as a good part of diesel generationis expected to be phased out. The net addition to capacity is estimated at10,690 MW and will include coal and oil fired steam, hydro, geothermal andgas turbines. The cost of these additions to capacity is estimated at $8.5billion. The transmission and distribution network will also have to beexpanded and strengthened and is estimated to cost an additional $8.5 billion,so that total investment required in the power sector is US$17 billion.
7.07 Public sector investment in the energy sector in 1980 was aboutUS$1.3 billion -- or rather less than the financial subsidv on petroleumproducts in that year. Cumulative investment requirements in the energysector by 1990 are estimated at $38 billion. Some investment will come fromforeign contractors in the oil, gas and coal sectors, but a substantial part,amounting up to 75 percent of total investment in the energy sector, may haveto be met by the GOI. A summary statement giving projected GDP and publicinvestment in the energy sector over the next two decades in eiven in Table7.1 below:
Table 7.1
INDONESIA: GDP AND ENERGY SECTOR INVESTMENTS(sat- 198R nripes - TTj illinn)
1980 1985 1990 2000
C-DP 60.0 8. ! 176s! 227_Energy Investments 1.27 2.66 4.83 10.38
Percent of GDP 2.1 3.0 3.7 3.9
(The IBRD Report on Energy in the Developing Countries dated August 1980LUdiLtCa Ltbla energy i. ve s tmenL requirement-s VAf WtUl A L L IM V '
their GNP in 1980 and 3.2% in 1990 - p. 8).
1/ Growth rate = 7.5% p.a.
LI LLrowIth rate 8.2% p.a.
- 87 -
7.08 Estimates for investment in the various energy subsectors for
the period 1990-2000 are not attempted here, but annual investments are likelyto riLse rom about T/4.8 bli i 4,, 4n 1990 to (A JS$n* billion for thp vyar
LU LLD~ LLULA ~U PUL .J, - -- ---- L - Y _ I - -- j
2000. Investment in energy as a percentage of GDP' is expected to rise from2..V percent '£n 1980, which iLs 'Low. in comparisnL wt IL.
the same level of GDP, to 3.9 percent in the year 2000, which is roughly inLine witi whlat comparable countrLes are now investing.
7.09 At this stage the projected investments in the energy sector seem tobe feasible in the macro-economic context, although these must be reconsideredin light of national economic and social development goals. Oome of the in-vestments, particularly in the oil sector are contingent on a continuedsuccess ratio in exploratory drilling. In the past, a substant'al partof the investment in the energy sector was devoted to meeting the needs ofthe export market, but domestic energy needs will assume increasing importance.The priority areas for investment would be in the power sector, particularly
coal, hydro and geothermal. Among them, the highest priority would need tobe assigned to resource surveys and delineation so that the base for a rapidlyexpanding power sector is firmly established. Given the shortage of trainedmanpower, particularly in the professional categories and the need for exter-nal technical assistance to complete these surveys early, aid available on abilateral basis from other countries should also be increasingly utilized forthis purpose in the short and medium term rather than R&D programs and pilotdemonstration projects which would have an impact only over the long term.
- 88 -ANNF.Y 1
Page 1 of 35
ENERC-Y BnALAUNCES ANn PROJECTIONS
The purpose of this Annex is to describe the methodology behind
the produuc-tiLon 0f TI.donesla's er.ergy u.lance for 1070/80 a dthe I,.-,t4-
made for producing energy balances for 1989/90 and 1999/2000. Particular
a t tL e 4ntion is given to th.ose areas for which reliable tn a not avaial
and where, therefore, surrogate information has been used. It must be stressed
tha te e.ergy alances presented in thi L 'Ls report are preliminary a-A tatthere are many ways in which they could be improved as better data become
available Fo fLr examUi LIL-pl th lanalcsLLAbI prCesented hLere include natursalla
liquids with crude oil. LPG is included with natural gas although it would
[lave U'CIe Ues ELr au 'Le LV trL e Ua' uLi of L ILCes prL U C s r l DSimilAvar ly E
price elasticities of energy demand have not been taken into account.
A. Evolution of Demand 1971-1978
Table A-1 presents sectoral growth rates for the period 1972-78,in conjunction with rea'l GDP growtl over the same periodu. The enLergy sector
data were calculated from the draft report by BPPT, where 1978 is the last
year of the time series. The compilation illustrates some of the data problems
facing energy planners in Indonesia. Comparison of annual growth rates of
real GDP and total energy consumption (Cols. 2 and 3) do not suggest an-y
systematic relationship that could be interpreted as "crude elasticity"having an economic content. Irregularities ini Ltle HenLegy data aLe pLroUably
a contributing factor. For example, the data on industrial consumption for
1976 and 1977 and transport consumption for 1975 and 1978, are suspect.
The growth rates for eiectricity consumption difrer, because Coi.
(7) shows fuel inputs and Col. (8) gives actual generation. The difference
between average annual growth rates (18% and 13.1% respectively) is indicative
of the growing predominance of thermal power generation and the consequenttransformation losses which are higher compared to hydro.
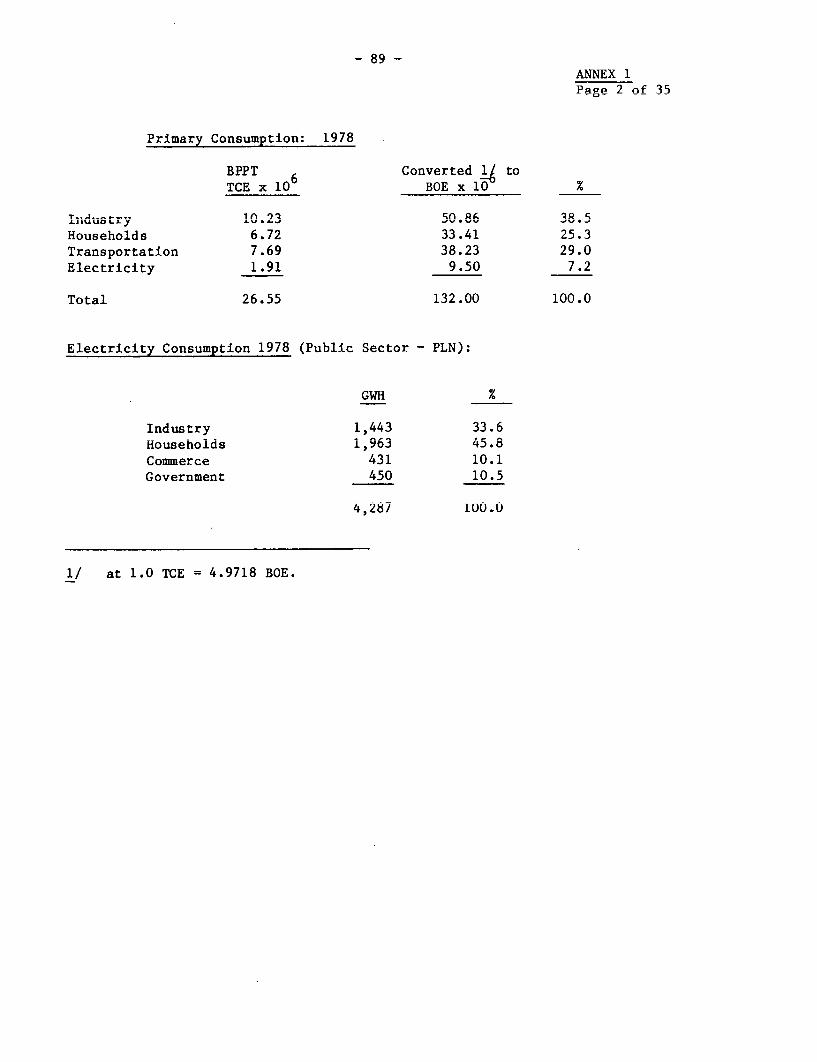
- 895 -
ANNEX 1PAa'p 2 of 35
Primary Consumption: 1978
BPPT Converted lu to1VrVx lf6 1n0 l %
Tiidustry 10.23 50.86 38.5Households 6.72 33.41 25.3
"I '~~~~~~7 tO 1Q') ) ATLrarsportation 7.69 32.0
Electricity 1.91 9.50 7.2
Total 26.55 132.00 100.0
Electricity Consumption 1978 (PUDbiC Sector - PLN):
GWH %
Industry 1,443 33.6Households i,963 45.8Commerce 431 10.1Government 450 10.5
4,287 100.0
1/ at 1.0 TCE = 4.9718 BOE.
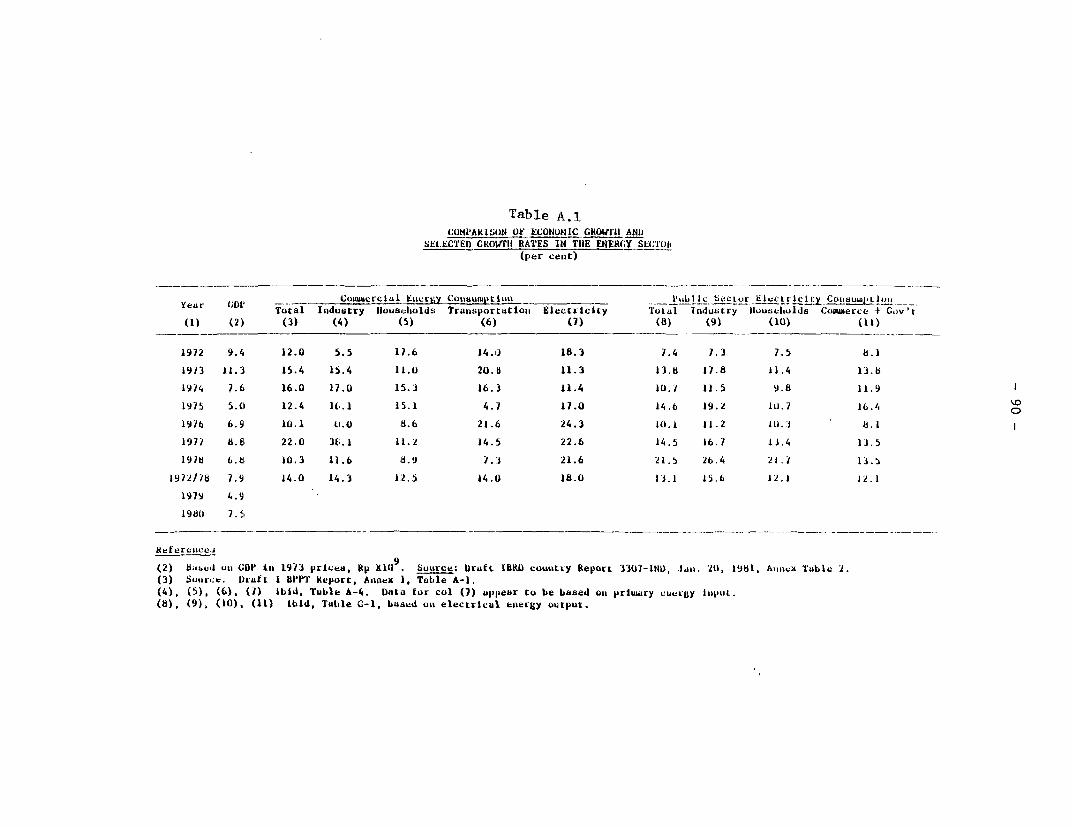
Table A.1COMIPAKISON OF ECONOtI1C CIROWrII ANI)
SEILECTED CROW4TII RATES IN TIIE ENERCY SECII'i0(tier cent)
Year K,Dp _ Coaercia rjy Cot wuuaiation _ ______ SectIc 'CLtr EleCLriclt ICo aiucLtio.ll_.1
Total Industry IHouseholds Transportatiotn Electricity lotal Inductry Hluusellaolds Comajerce t COvaL
(1) (2) (3) (4) (5) (6) (7) (8) (9) (10) (11)
1972 9.4 12.0 5.5 11.6 14.0 18.3 7.4 7.3 7.5 8.1
1973 11.3 15.4 15.4 II.O 20.8 11.3 13.8 17.8 11.4 13.8
1974 7.6 16.0 17.0 15.3 16.3 11.4 10.7 11.5 9.8 11.9
1975 5.(1 12.4 16.1 15.1 4.7 17.0 14.6 19.2 10.7 16.4
1976 6.9 10.1 0I. 0 8.6 21.6 24.3 10.1 11.2 10.3 8.1
1977 8. 8 22.0 38.1 11.2 J4.5 22.6 14.5 16.7 1J.4 13.5
197c 6.E8 10.3 11.6 8.'J 7.3 21.6 21.5 26.4 21.7 13.
1972/78 7.9 14.0 14,.3 12.5 14.0 18.0 13.1 15.6 12.1 J2.1
1979 4.91
1980 7.5
Refere scea
(2) babed ou CGD i' 1973 pricae, Bp XIO . SOurce; Oruti IBiI) coautly Report 3307-180, lao. 21, 12981, Aaaoex Table 3.(3) Source. Draft I 6i1PLr KepOrt. Aninex 1, Table A-).
(4), (5), (6), (7) ibil. Table A-4. Data fur col (7) appear t:o be based oii prluLry cuerIgy lilput.
(8), (9), (10). (11) ibid, Tat,le C-1, baused ou electrical enelrgy output.
- 91 -
ANNEX 1Paee 4 of 35
2. Energy Balance 1979/80
The data problems are most apparent when an energy balance ofsuppl- and demanrd for one year is attempted. A.2 which presents such a
balance for FY79/80, is accompanied by notes concerning the reconciliationof available information.
ItL will a - Jor task of LCthe El Plar.ning Unit ton+ -..A -he
available data base, to reconcile anomalies and discrepancies and to streamline.Luture Uata Lcl bUy Uevisir.g appropriate reportiJLng procedJures. ThLe gapsin the present data base appear serious enough to hamper proper energy planning.
The final demand of 161.1 million BOE (Table A.2) is less thanindicated by some other studies. The differences are caused, in part, by thetreatment of the fuel requirements of PLN and the NGL plants as intermediate-demand, and the output of electrical energy and LNG as final demand. Wherethis is not done, the corresponding transformation losses end up as finaldemand.
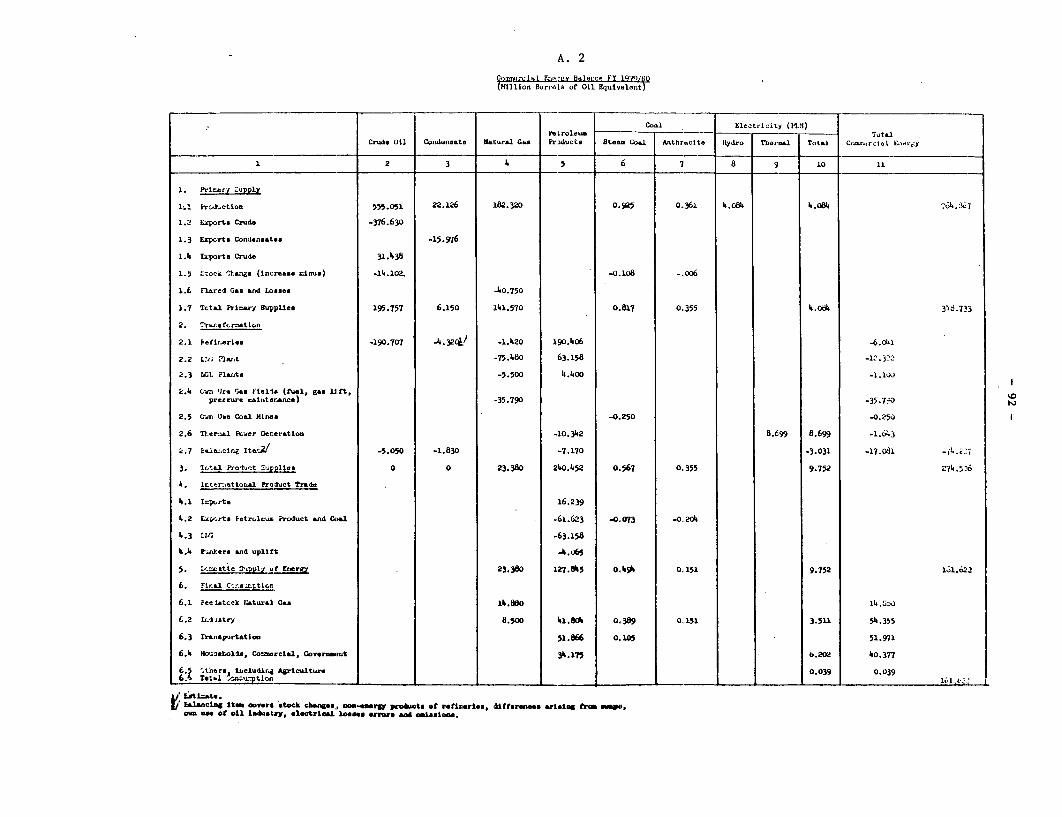
A. 2
gIIJul4 Elig-rpv Blfl FY 1979/ U0Wnioirn BCrre0l q or Oil Equival.rit)
Co,al Electricity (?t4)
Crude 0Li Cond.nsate flaorals Gra Products steam Coal Anthrci-te |lydro Ts-l.) Totel. Co.r-ial Lo.,y
1 2 3 4 5 6 7 8 9 10 11
1. Prllor Zupply
1.1 I 'r,duction 555.051 22.126 182.320 0.925 0.361 4.084 4.084
1.2 E,ports Crud. -376.633
1.3 E?ports Condensates .15.976
1.4 Exaports Clude 31.493
1.5 ELock Cang.e (increase =Luum) -14.101. -0.108 -.O06
1.6 Flared Gee ard Losses -40.750
1.7 Tr tal Pria.-jr Suylite 195.757 6.150 141.570 0.817 0.355 4 .0t4 3037383
2. rc.r.sfrnation
2.1 EF.Mertes -190.707 .41.3F0!/ -1.420 190.406 -6.041
2.2 L:,; ilt .75.4.80 63.158 -1'.322
2.3 14L PiWtis -5.500 4.400 -1.1Od
2.4 (r4n 'Ire G-e 11,1e. (fuel, gas Iift,prec rura, aei tor. nce) -35.790 -35.790
2.5 Crto Use Coal Hlne -0.250 -0.250
2.6 Tlerel FctM-er Generation -10.34.2 8.t99 13.699 -i.6143
c.7 l.w.clne IterL/ -5.050 -1.830 -7.170 -3.031 -17.031
3. Tto-a1 ?rotljt Z, Pies 0 0 23.380 21.0.452 o.567 0.355 9.752 274.55t;
h1. Iri,r-.tiousl Product ?r%de
1.1 ExI-rts 16.239
4.2 E? Vrte a ltroleun. Product end Coal -61.623 -0.073 -0,204
4.3 Lili -63.158
11.4 -.,kers end uplift 4.L*3
5. J:.rotic :h,pplil of t r 23.380 127.81.5 0.1.914 0.151 9.752 lol.62
6. Fl, sl Ct-.tc;tIcn
6.1 itr itcck Nlatural Gas 14.886 1
6.2 L.stry 8.500 41.804 0.389 0.151 3.511 54. 355
6.3 Transportation 51.866 0. 105 51.971
6.4 Ho;oe?olla,, Co=rcial, Governmeut 34L.175 6.20 4o0.377
6 trare 1zlc1udir.d Agriculture 0.039 0.0396 S >k1 u,A.ntlon
& hiucng It overs stock cbanges,, mo-eerg pes&.ct n of refleeries. Altrerwame sising frm owwo,am uot of 1il Ldusstry, el*ctricel losses roe " om iseloos.
- 93 -kAI x '
Page 6 of 35
1. Footn.otes to En ergy Balance 1970/80
Co'±. (2 SUoLucb; es ULInLly RACPOLrt rULLJULm CU -LL-L A ura.1 Gas
Industry of Indonesia", MIGAS' and PERTAMINA.Stock ckLange fLrom Miristry ofi Li±Lnes ar.d Energy.
Col. (3) Sources: Same as Col. (2). No separate number forstock change available. It is probably included inCol. (2), line 1.5, because conduensate 'Ls treated ascrude in some statistics.
Col. (4) Sources: MIGAS Monthly Reports. Lines 2.3, 6.1 and 6.2estimated, based on calendar year i979. For detailedbreakdown see Table A.5.
Col. (5) Source for lines 2.1, 2.2, 4.1-4.3: MIGAS; line 2.3 isestimated, line 2.6 from PLN statistics i979/80.
Source for lines 4.4, 5 and 6: Ministry of Mines andEnergy. Final consumption (in barrels of oil equivalent)exceeds reported sales by MIGAS. Industry use on line
6.2 includes fuel used for autogeneration. For detailedbreakdowns see Tables A.4, A.5, A.6 and A.7..
Col. (6) Source: PNTB data for 1979, used for FY79/80. Line 2.5includes coal used to generate electrical energy for internaluse. Line 6.3 is PJKA use for steam locomotives.
Col. (7) Source: See Col. (6).
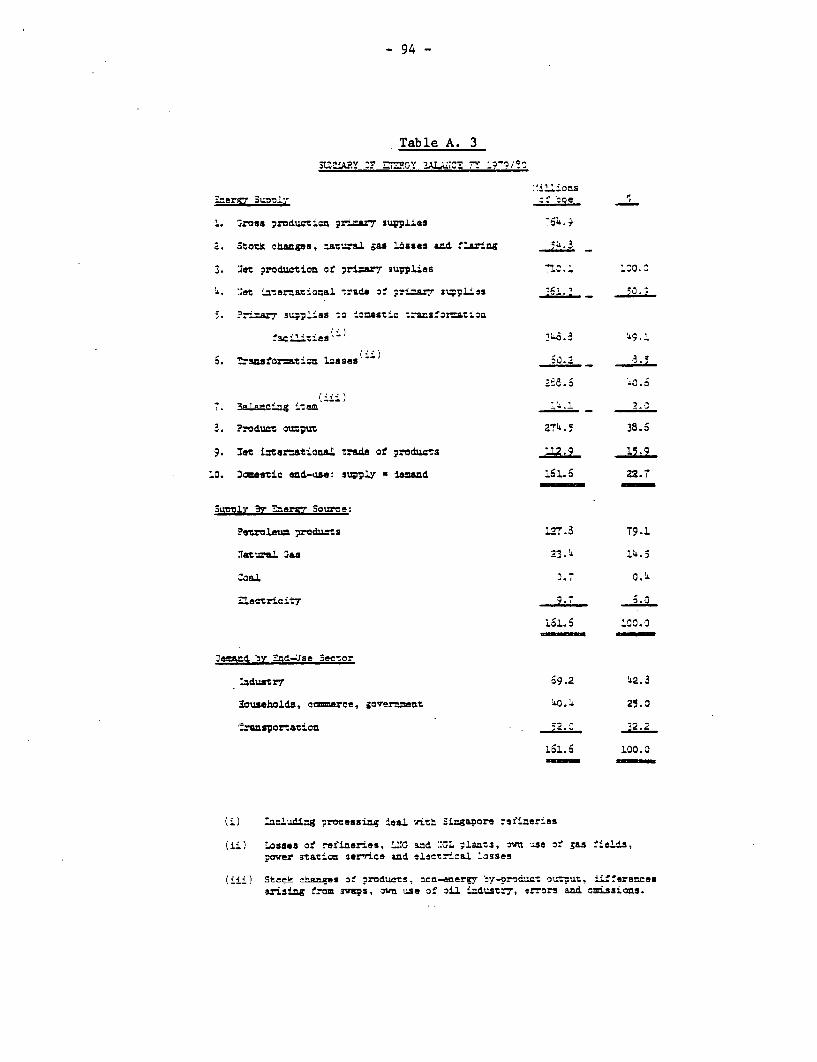
- 94 -
Table A. 3
13U.ARY 0 Z GY ' 9 3A/C * 0
'. wross roductlca priL sup.lies
2. 3Sotak Caes, zazsL gas losses aa'4 " 5 '4... 3
'toit ;roductiou of Pri=7 3u7Pieas 0._:0
w. :r.t ;=ierrational -aze :t :-4za.7 *t ;r s -i 'l0.s
'aci stioes' ) 733
6. fr faro 2iza Losses6
(:,.~~~~~~~~~~~~~~~~~~~2e -'.
3. ?oduct outp,xt Z74.5 38.5
i. :et itaer:=tionL3 -racen of procdu=s '2.9 15.9
LO. Daresiz end-uae: s3uily e-id 22. t
3i.o±y Br : ergy Sourc e
?P%oetrm1 mmdu±-.s .3 T9.1
.Tatural Gas 23.1.5
T -.
ect=ricit7 ,, . I
-nd. 'v nd-Uae See~3r
Zdustr7 59.2 '2.3
3auseho1dz, commerce, over=meut 40.'4 25.0
Transportation -5. 2 0
161. 6 100. 0
i) ±u± 8 rdcizug osasi s ,rLth Singa;pore refi8eLi:e
(ii) ,sses of refineries, '"ZG &s:d ::GL ,la303 vn _se of 3as fieds,power stavion serrice and electc4^al Losses
({'At ! ! nSt res z t o roduc-ts. onr-erxT Wy-orocruc: outmut. 4'erances&rising frou sVft, Use o oil. -dust7, errors az a3issions.
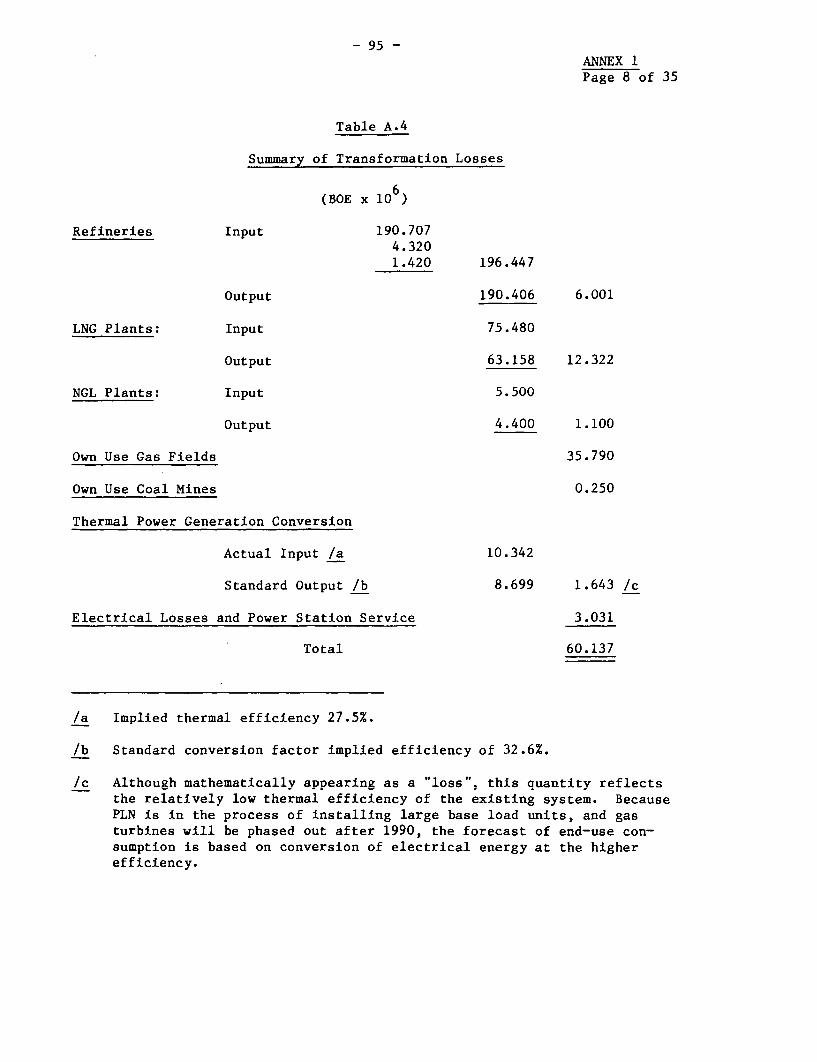
- 95 -AWThTLV 1
Page 8 of 35
Table A.4
Summary of Transformation Losses
(BOE x 10 )
Refineries Input 190.7074.3201.420 196.447
Output 190.406 6.001
LNG Plants: Input 75.480
Output 63.158 12.322
NGL Plants: Input 5.500
Output 4.400 1.100
Own Use Gas Fields 35.790
Own Use Coal Mines 0.250
Thermal Power Generation Conversion
Actual Input /a 10.342
Standard Output /b 8.699 1.643 /c
Electrical Losses and Power Station Service 3.031
Total 60.137
/a Implied thermal efficiency 27.5%.
/b Standard conversion factor implied efficiency of 32.6%.
/c Although mathematically appearing as a "loss". this quantity reflectsthe relatively low thermal efficiency of the existing system. BecausePLN is in the process of installing large base load units- and gasturbines will be phased out after 1990, the forecast of end-use con-sumption is based on conversion of electrical energv at the higherefficiency.
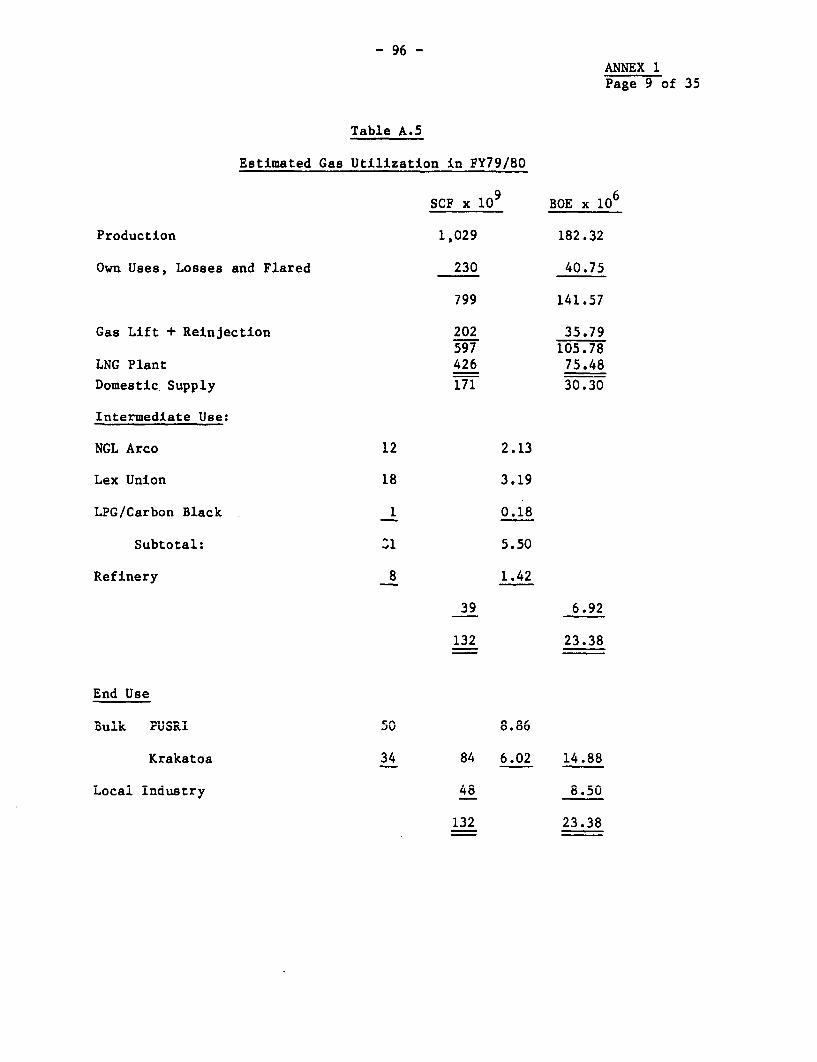
- 96 -ANNEX 1Page 9 of 35
Table A.5
Estimated Gas Utilization in FY79/80
SCF x 10 BOE x 106
Production 1,029 182.32
Own Uses, Losses and Flared 230 40.75
799 141.57
Gas Lift + Reinjection 202 35.79597 105.78
LNG Plant 426 75.48
Domestic Supply 171 30.30
Intermediate Use:
NGL Arco 12 2.13
Lex Union 18 3.19
LPG/Carbon Black 1 0.18
Subtotal: 31 5.50
Refinery 8 1.42
39 6.92
132 23.38
Elnd Use
Bulk PUSRI ± 5.86
Krakatoa 04 o.uz LQ.8O
Local Industry 48 8.50
132 23.38
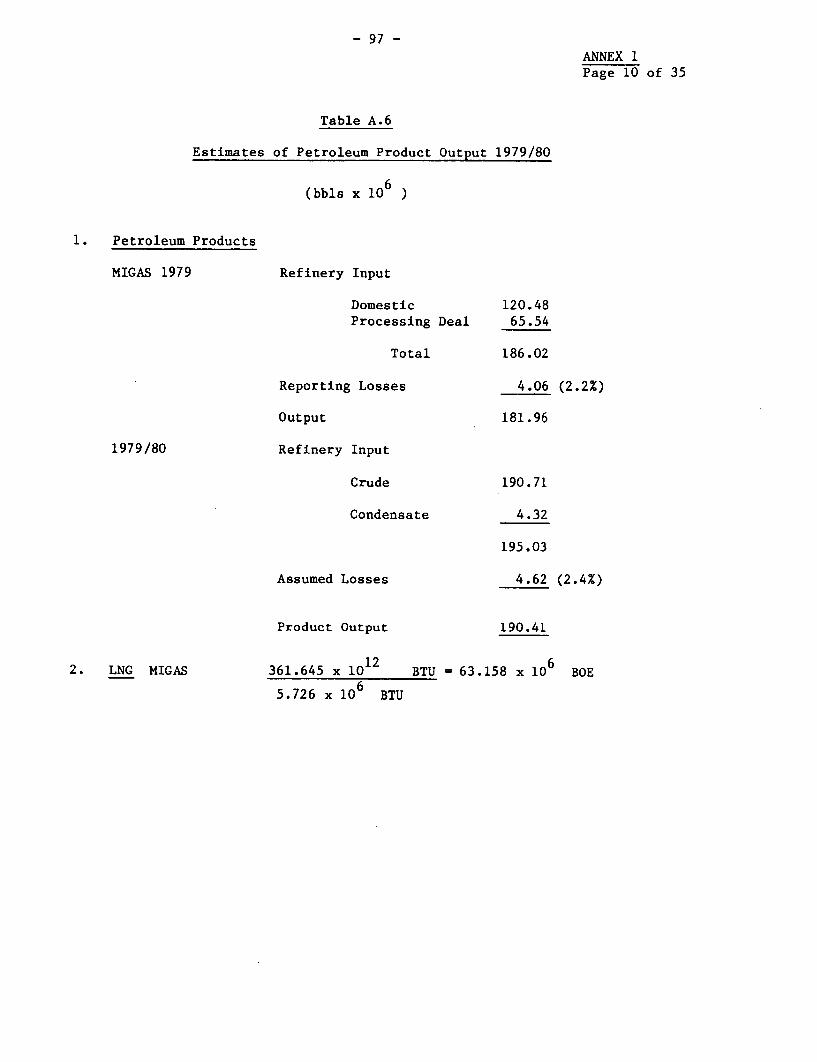
- 97 -ANNEX 1Page 10 of 35
Table A.6
Estimates of Petroleum Product Outnut 1979/80
6(bbls x 10 )
1. Petroleum Products
MIGAS 1979 Refinery Input
Domestic 120.48Processing Deal 65.54
Total 186.02
Reporting Losses 4.06 (2.2%)
Output 181.96
1979/80 Refinery Input
Crude 190.71
Condensate 4.32
195.03
Assumed Losses 4.62 (2.4%)
Prnduct O19t0t CmA.41
2. LNG MIGAS 361.645 x 10 BTU - 63.158 x 10 BOE
-).7o X IV J BTU
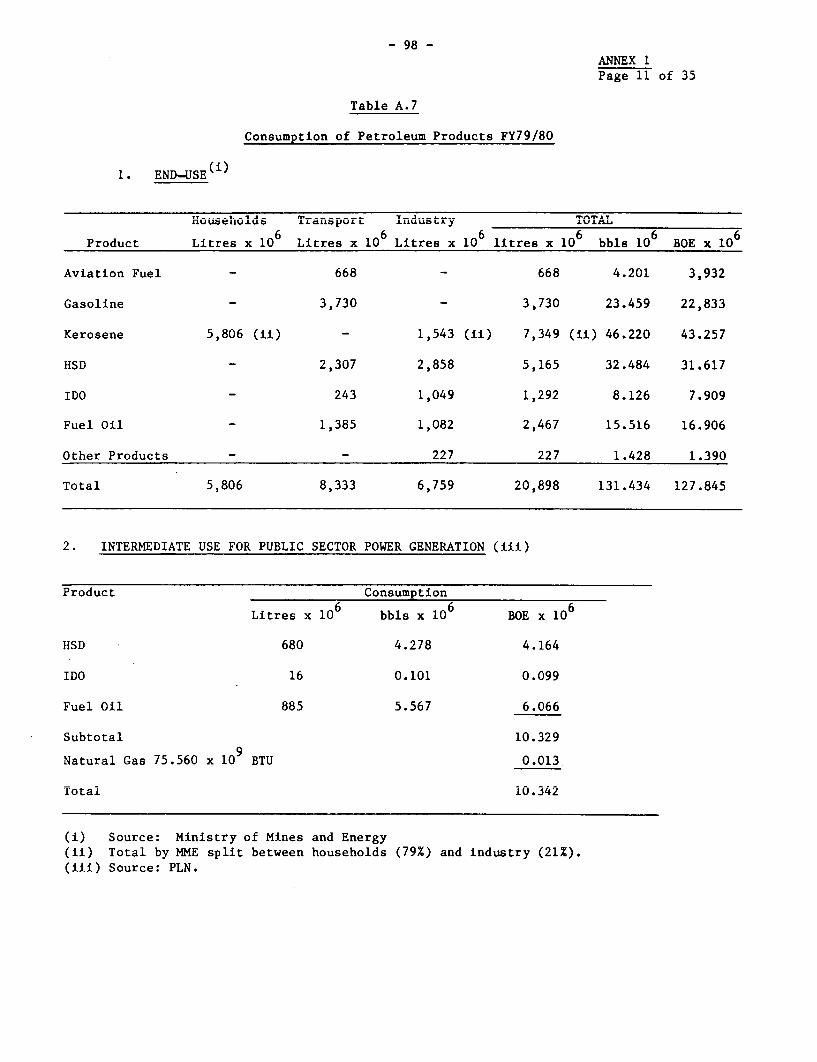
-98 --9-ANNEX 1Page 11 of 35
Table A.7
Consumption of Petroleum Products FY79/80
1. END-USE(i)
noruseholor s xransport 1nUus6ry6 TOT^
Product Litres x 10 Litres x 10 Litres x 10 litres x 10 6 bbls 10 BOE x 10
Aviation Fuel - 668 - 668 4.201 3,932
Gasoline - 3,730 - 3,730 23.459 22,833
Kerosene 5,806 (ii) - 1,543 (ii) 7,349 (ii) 46.220 43.257
HSD - 2,307 2,858 5,165 32.484 31.617
IDO - 243 1,049 1,292 8.126 7.909
Fuel Oil - 1,385 1,082 2,467 15.516 16.906
Other Products - - 227 227 1.428 1.390
Total 5,806 8,333 6,759 20,898 131.434 127.845
2. INTERMEDIATE USE FOR PUBLIC SECTOR POWER GENERATION (iii)
Product Consumption
Litres x 106 bbls x 106 BOE x 106
HSD 680 4.278 4.164
IDO 16 0.101 0.099
Fuel Oil 885 5.567 6.066
Subtotal 10.329--9
Natural Gas 75.560 x 10 BTU 0.013-
Total 10.342
(i) Source: Ministry of Mines and Energy(ii) Total by ME split between households (/79X) and industry (21%).(iii) Source: PLN.
- 99 -ANTNEX 1
Page 12 of 35
B. EnLergy Forecast 1for 1989/90 and 199L9/0uuu
Macro-economic Aspects
The growth scenario underlying the energy Lorecast is one of con-tinuing strong growth of real GDP at an average annual rate of 8% per annumtnrougn 19891i990 and of somewnat reduced growtn at an average annual rate of6.5% in the decade 1989/1990 to 1999/2000. The optimistic outlook for thenext ten years appears warranted because both the beneficial effects ofthe November 1978 devaluation and rising oil and gas revenues have alreadyproduced a marked acceleration of economic growth from 4.3/5 in l979 to 7.5h
in 1980. of course, domestic inflation exceeding that of Indonesia-s majortrading partners or sub-optimal use of the current resource surplus coulderode the basis for future growth. Since these aspects are closely relatedto energy policy, the assumed GDP growth rate is a working hypothesis thatwill require periodic reexamination along the lines of the Country ReportDevelopment Prospects and Policy Options" (No. 3307-IND, March 10, 1981).
Alternatively, one can conceive of an underlying long-term averagegrowth rate of 6.5% annually, as suggested by BAPPENAS for the preparationof Repelita III in 1979. The lower growth rate is considered a variantfrom the basic scenario of high growth over the period to 1989/90. Theeffect on planning decisions is most easily seen in terms of time lags.Consumption projected under the high-growth assumption would materializesomewhat later under the low-growth assumption. The time lag is one to twoyears for the second half of the 1980's and two and a half years for the1990 s. These lags are immaterial for long-term strategy.
The high growth scenario assumes that the period 1972-1978 forwhich an actual average annual growth of 7.9% was recorded, provides a reason-able statistical basis for sectoral analysis of energy consumption.
Official projections of recent years have employed the regressionof energy use on real GDP (on a per capita basis) for the period 1970-77.Although this method has produced some useful insights for other countries,the application to -the available data base in Indonesia gives rise to somedoubts about the reliability of the results, and the energy data may containsubstantial errors.
Forecasting Technique
The statistics on past consumption are usually grouped under theheadings households, transportation, industry and electric power. Consumptionby commerce and public sector agencies are included in either householdsor industry. Commercial energy consumption by agriculture is still too smallto be identified as a separate sector.
- 100 -A WrTMVV I
Page 13 of 35
The forecast distinguishes three end-use sectors:
(i) households, commerce and public sector agencies;
(ii) transportation; and
(iii) industry.
Electrical energy statistics are broken down by the same categories,
with separate identifications of commercial and government consumption.Separate forecasts are made for the consumption of petroleum products, naturalgas, coal and electricity by each of the end-use sectors.
The inter-dependency of demand, pricing, and resource development
implies that both the magnitude and the composition of projected end-use
consumption in this report can be only a first approximation. The resultsmay be considered a fair indication for the near term, in which pricing andsupply patterns are fixed. As the time horizon is extended, the number ofpolicy options increases and the main value of the longer term forecast isthe provision of a framework for identification of such options.
The forecast is restricted to the demand for commercial energy.
There is a link between consumption thus defined, and the consumption oftraditional fuels such as agricultural wastes and firewood. However, thelimited studies on. consumption and production of non-traditional fuels arenot considered a sound basis for the formal treatment of this subject on anaggregated basis. Where applicable, qualitative observations on'the possiblesubstitution effects are given in the discussion of sectoral energy demand.
End-use demand must be translated into derived demand for primaryforms of energy. Electrical energy demand results in demand for hydroelectricenergy. fuel oil. natural gas and coal. Transformation losses must be addedto assess primary energy requirements. These supply-related estimates can beestablished only approximately, based on fuel options.
C. Proiection of Domestic ConsumDtion to 1989/90 and Outlook to 1999/2000
At this time it does not appear nossihbe to incornorate fuel nricingin an energy forecast in a formal manner. The projection of end-use consumptionis developed separately for petroleum products, natural g, coal anl eleatrtc-ity, as if the existing choices of fuels would continue in future. Thecomparison of the projected requirements and the ava i lability of resourceswill indicate in which areas substitution should be promoted by deliberateplanning -__ _ A 4_ - I -1A. - 4-4- A A14-.
j9.LsLLLLU6 s U&Ue LLLU ULML1C5=MUZ&LL. v C, J ; . G*L j6 ... ...M 65
LLhe pricin.g assumption. is most relevant to kerosene consumption
and a projected high growth rate for the next two years takes implicit accounto0 tne possible effect of1 the short=;erm prjiciLng policy. WI th Ler luemandA compo-nents are assumed to be less sensitive to price changes and their projectedgrowth rates reflect experience since 1971 more than anything else.
- 101 -
ANNEX 1Page 14 of 35
The Household Sector
General Observations. Kerosene accounted for about 31% of alldomestic sales of liquid petroleum products in FY79/80. Most reports allocateall kerosene consumption to the household sector. Actually, substantialnuantities are consumed by industry. The Biro Pusat Statistik (BPS) publishedannual data on fuel consumption by industry, 1/ but these surveys do notapnpar rnomn1ptp
The draft BPPT RAnnrt aiups a hrpnkdown of hnioushnld and indiuRtrinl
kerosene consumption since 1969, reproduced in Table B.1. The sources arenot -et documented, oand the numbers sug-est that in 1969 and in the perilod
1972-1975 total consumption was split between households and industry inthe p -h p-- -- o4--- 4- I - 1the-last the year v ry,
and the total consumption in 1978 is in good agreement with total consumption-in FY78/ 70 azs reported bAy rrut. Tberefore, despite c.ertaln wealnesses, tbe
BPPT Report data appear to provide a better basis for a preliminary analysis
'..UIM. l J.UII US. tL / I CLL L UWLII L.A.CLIUD W.LL.1 UL .LAL.t |.L WllU iL b4OC
prices suggests that higher prices do influence consumption significantly.Total consumption in FY79/80 is only 6.2% higher than. in FY78/79, followinga price increase from Rp 18 to Rp 25 per litre. It should be noted, however,that 1979 was a year of slow growth in the wake of the devaluation and reducedindustrial consumption may have contributed disproportionately to the lowergrowth rate. Prices were raised again in FY79/80 to Rp. 37.5 per litre.Total consumption in 1980 (preliminary) when compared to 1978, indicates anaverage growth rate of 8.4% over two years, during which time the nominalprice doubled. This is in contrast to the two year period of a fixed price(1976-i978), when total consumption rose at an average rate of 15.2% per year.
At the starting point of the forecast, FY 79/80 consumption, asreported by the Ministry of Mines and Energy, is assumed to be split 79/21between households and industry (in billions of litres):
Households 5.806Industry 1.543
Total 7.349
Projection of Kerosene Consumption
Regardless of pricing considerations, the question that arises is,"why did household kerosene consumption grow at annual rates of 8-15% in aperiod when population growth was in the 2.1 - 2.4% range". Market penetrationmay have influenced growth in earlier years, but all densely populated areasappear to have been serviced by an efficient distribution system for a numberof years.
1/ Statistik Industri - Survey of Manufacturing Industries. See forexample 1978 Survey, Volume II, Table 3 a.
- 102 -
ANNEX 1Page 15 of 35
A more important factor explaining the rapid growth may be theincrease in consumption per household with incomes rising over time. In1976 the Biro Pusat Statistik undertook a socio-economic survey includingan examination of household consumption of electricity, kerosene and charcoal.The result 1/ shows a significant income elasticity of kerosene consumption.For the rural areas 2/ on both Java and the other islands fuel consumptionhas a virtually constant elasticity over the range of household expenditureclasses. In the urban areas there is a much higher elasticity in low incomegroups and a tapering off in the higher range. The survey appears to confirm:
(i) that kerosene is used in rural areas mainly for lighting andthat consumption rises with income over a wide range! as thequantity and quality of lighting is upgraded;
(ii) that kerosene is used in urban areas for both lighting andcooking, with a relatively inelastic demand for cooking explainingthe decrease of overall elasticity with income.
Without time series it is not possible to translate the surveyresults into quantities on an aggregate basis. However, the trends forhouseholds would explain a large part of the overall growth of consumptionas arising from higher incomes, princiDallv in urban areas.
The average nnnisumntionn in litres npr hoiuehold per month, estimatedin the 1976 survey, is as follows:
Urban Rural Weighted Average
Java-Madura 37.0 10.6 14.9Other Islands 22.4 8.8 11.1Indonesia 31.9 10.0 13.6
.1/I Socio-Economic Survey 1976, Table 5.
2/ The interpretation of the results should take into account that "rural"areas in the BPS definition comprise all populated areas with theexception of Jakarta, provincial capitals and capitals of subdivisionsof the provinces called Kabupatens. Therefore, "rural" includes manyurbanized areas.
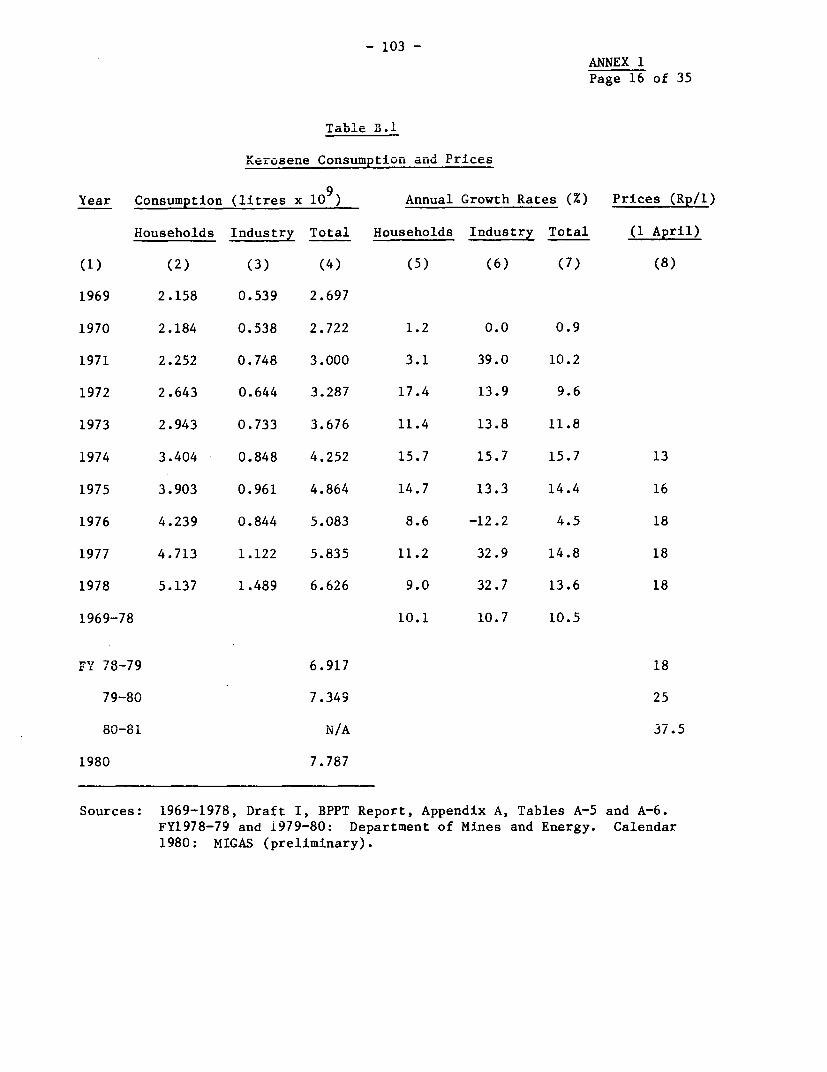
- 103 -A)T VV 1A NEX IPage 16 of 35
TabU.L e B.1
Nerosene Consumption adLU Pr'Lces
Year Consumption (litres x 10') Annual Growth Rates (%) Prices (Rp/1)
Households Industry Total Households Industry Total (1 April)
(1) (2) (3) (4) (5) (6) (7) (8)
1969 2.158 0.539 2.697
1970 2.184 0.538 2.722 1.2 0.0 0.9
1971 2.252 0.748 3.000 3.1 39.0 10.2
1972 2.643 0.644 3.287 17.4 13.9 9.6
1973 2.943 0.733 3.676 11.4 13.8 11.8
1974 3.404 0.848 4.252 15.7 15.7 15.7 13
1975 3.903 0.961 4.864 14.7 13.3 14.4 16
1976 4.239 0.844 5.083 8.6 -12.2 4.5 18
1977 4.713 1.122 5.835 11.2 32.9 14.8 18
1978 5.137 1.489 6.626 9.0 32.7 13.6 18
1969-78 10.1 10.7 10.5
FY 78-79 6.917 18
79-80 7.349 25
80-81 N /A 37.5
1980 7.787
Sources: 1969-1978, Draft I, BPPT Report, Appendix A, Tables A-5 and A-6.FY1978-79 and 1979-80: Department of Mines and Energy. Calendar1980: MIGAS (preliminary).
- 104 -
1UNIM1N.A I.
Page 17 of 35
Calculations based on the estimated number of households in 1980with these unit consumptions of kerosene resulted in a theoretical consumption
of 4.32 billion litres. The estimated actual consumption for 19i9/80 is 5.080
billion, or 34% higher. This implies that unit consumption may have increasedsignificantly since 1976. Interviews by the Mission in uroan and rural areasseem to confirm that unit consumption per household tends to be much higher
than indicated by the 1976 Survey. Of course, the crude check on consumptionwith the aid of a population model takes no account of the fact that not every
household uses kerosene. Therefore, actual use per household could even be
more than 1.34 times the 1976 level.
In view of the large share of kerosene in the total consumptionof petroleum products, an updated household survey is recommended. Theassociated subsidies are so large, that an in-depth investigation is a pre-requisite for any policy decisions regarding future subsidies or alternativesto subsidies.
For the purpose of this report the forecast of future keroseneconsumption is based on past growth rates, with the recognition that decliningsubstitution of kerosene for wood fuels (in rural areas) and reduced income
elasticity of consumption for cooking in urban areas may result in lowergrowth rates in the future.
The forecast of kerosene consumption by household assumes annualincreases of 7.0% to 1980/81 and of 9.5% per year through 1982/83, consistentwith the high growth rate experienced during a previous price freeze. From1982/83 to 1989/90 a 7% growth rate is adopted on the hypothesis that signi-ficant price adjustments will be forthcoming. The outlook from 1990/91 to1999/2000 is based on 5% per year growth, under the assumption that bothprice adjustments and market penetration will have run their course.
This scenario would produce the following trend in consumption:
1979/80 1982/83 1989/90 1999/2000
Billions of litres 5.806 7.449 11.961 19.484
Millions of BOE 34.2 43.8 70.4 114.7
The Industrial Sector
Projection of Kerosene Consumption
Industrial use of kerosene is difficult to predict because of thesubstitution possibilities The exnerience of 1977 and 1978 (see Table B-1)
suggests that strong growth is in the offing as long as the economy maintains
its momentum. Assumed annual increases are 7% to 1980/81 and 15% through
1982/83, thereafter 8% through 1989/90 in response to price adjustments.For the longer run it is assmed that more moderate economic growth and
possibly policy measures would reduce the growth rate to 4% annually.
- 105 -ANNEX 1Page 18 of 35
Consumption wonil dvelonn as fol1owa:
1979/80 1982/83 1989/90 1999/2000
Billions of ltres 1.543 2.183 3.742 5.539
Millions of BOE 9.1 12.8 22.0 32.6
Policy measures recommenAdeAd in this reor -ol -rdc -lower* ~ ~ ~a * ~L1~L~.L A1L.LIUJ. &. IJU.J. L LAU.LLA P.LVUUL;= ±UW-_L
consumption, accompanied by a switch from kerosene to fuel oil. However, theoverall industrial demand for petroleum products over the short to medium termis not likely to be materially affected.
Uses of Other Oil Products
Statistics on use of all commercial energy by industry are brokendown by fuel in the BrrT Report. 1/ The time series for oil products otherthan kerosene (1968-1978) shows some definite anomalies in 1969 and 1978.For this reason the following analysis is confined to the years 1970 through1977, reproduced in Table B.2 (Cols. 2 and 3). Average annual growth in thisperiod was 16.5%.
The recorded consumption is assumed to include fuel used for auto-generation which, according to the BPPT estimates, may. have expanded ata rate of 12.1%. The implication is that oil product consumption for heatand industrial processes has grown faster than 16.5%, which is a most impor-tant factor in future projections that assume a gradual phasing out of auto-generation by small plants. The calculation in Table B.2 shows that con-sumption of oil products (excluding kerosene) for purely industrial use mayhave grown at a rate of over 18% per year.
The consumption at the starting point of the forecast, being FY 79/80,is estimated as follows (in BOE x 10 ):
1/ Draft BPPT Report Table A-5.
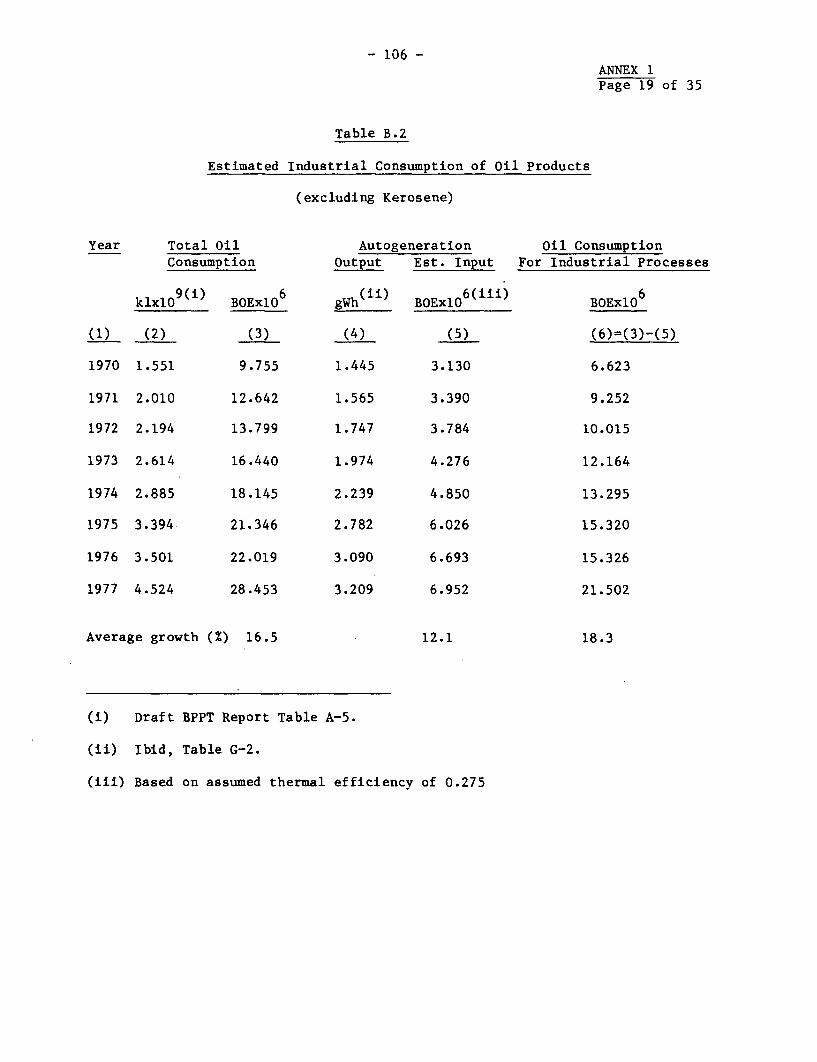
- 106 -
ANNEX 1Page 19 of 35
Table B.2
Estimated Industrial Consumption of Oil Products
(excluding Kerosene)
Year Total Oil Autogeneration Oil ConsumptionConsumption Output Est. Input For Industrial Processes
klxlO 9 (i) BOEx1O6 gWh(ii) BOExlO6(iii) BOExlO6
(1) (2) (3) (4) (5) (6)=(3)-(5)
1970 1.551 9.755 1.445 3.130 6.623
1971 2.010 12.642 1.565 3.390 9.252
1972 2.194 13.799 1.747 3.784 10.015
1973 2.614 16.440 1.974 4.276 12.164
1974 2.885 18.145 2.239 4.850 13.295
1975 3.394 21.346 2.782 6.026 15.320
1976 3.501 22.019 3.090 6.693 15.326
1977 4.524 28.453 3.209 6.952 21.502
Average growth (%) 16.5 12.1 18.3
(i) Draft BPPT Report Table A-5.
(ii) Ibid, Table G-2.
(iii) Based on assumed thermal efficiency of 0.275
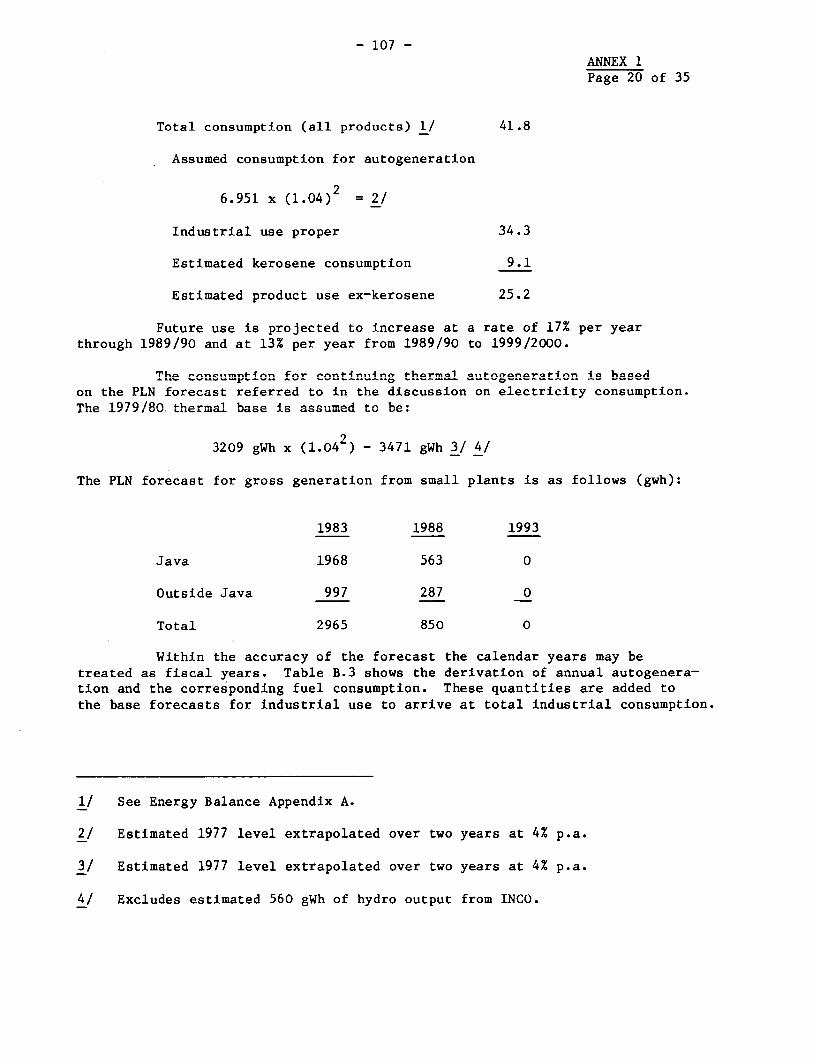
- 107 -A^X&VV 1
Page 20 of 35
Total consumption (all products) 1/ 41.8
Assumed consumption for autogeneration
6.951 x (1.04)2 = 2/
Industrial use proper 34.3
Estimated kerosene consumption 9.1
Estimated product use ex-kerosene 25.2
Future use is projected to increase at a rate of 17% per yearthrough 1989!90 and at 13% per year frnm I 18RQI to 1999/2n=00
The consumption for continuing thermal autogeneration is basedon the PLN forecast referred to in the discussion on electricity consumption.711 1Q7o /Qn% +-,- bs_el 4As asfsumedl t be:.
3209 gWh x (1.04 ) - 3471 gWh 3/ 4/
The PLN forecast for gross generation from small plants is as follows (gwh):
1983 1988 1993
Java 1968 563 0
Outside Java 997 287 0
Total 2965 850 0
Within the accuracy of the forecast the calendar years may betreated as fiscal years. Table B.3 shows the derivation of annual autogenera-tion and the corresponding fuel consumption. These quantities are added tothe base forecasts for industrial use to arrive at total industrial consumption.
1/ See Energy Balance Appendix A.
2/ Estimated 1977 level extrapolated over two years at 4% p.a.
3/ Estimated 1977 level extrapolated over two years at 4% p.a.
4/ Excludes estimated 560 gWh of hydro output from INCO.
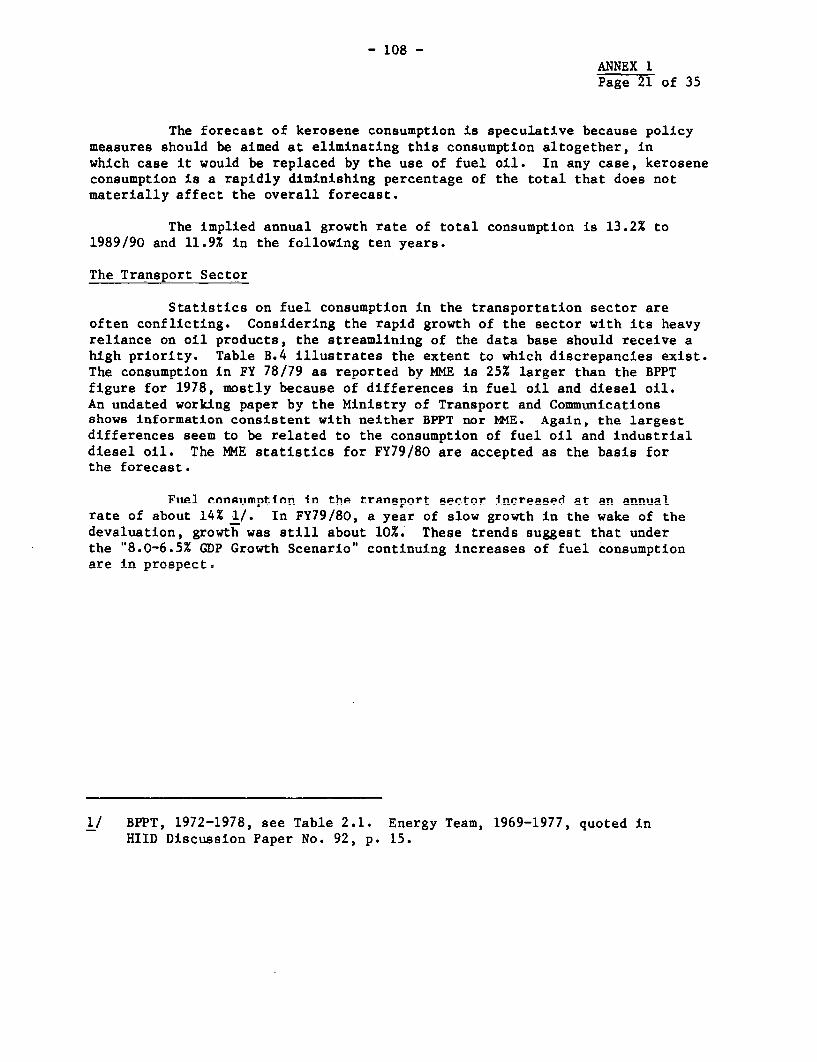
- 108 -ANNEX 1Page 21 of 35
The forecast of kerosene consumption is speculative because policymeasures should be aimed at eliminating this consumption altogether, inwhich case it would be replaced by the use of fuel oil. In any case, keroseneconsumption is a rapidly diminishing percentage of the total that does notmaterially affect the overall forecast.
The implied annual growth rate of total consumption is 13.2% to1989/90 and 11.9% in the following ten years.
The Transport Sector
Statistics on fuel consumption in the transportation sector areoften conflicting. Considering the rapid growth of the sector with its heavyreliance on oil products, the streamlining of the data base should receive ahigh priority. Table B.4 illustrates the extent to which discrepancies exist.The consumption in FY 78/79 as reported by MME is 25% larger than the BPPTfigure for 1978, mostly because of differences in fuel oil and diesel oil.An undated workin2 paner bv the Ministrv of Transnort and Communicationsshows information consistent with neither BPPT nor MME. Again, the largestdifferences seem to be related to the consumption of fuel oil and industrialdiesel oil. The MME statistics for FY79/80 are accepted as the basis forthe forecast.
Fuel consumntion in tha transnort Rector increased at an annualrate of about 14% 1/. In FY79/80, a year of slow growth in the wake of thedpvaliat1inn growth wan still abhnit lo!%- These trends suggest that underthe "8.0-6.5% GDP Growth Scenario" continuing increases of fuel consumptionare in prospet
jI BrPT, i972-i978, see Table 2.i. Energy Team, 1969-i977, quoted inHIID Discussion Paper No. 92, p. 15.
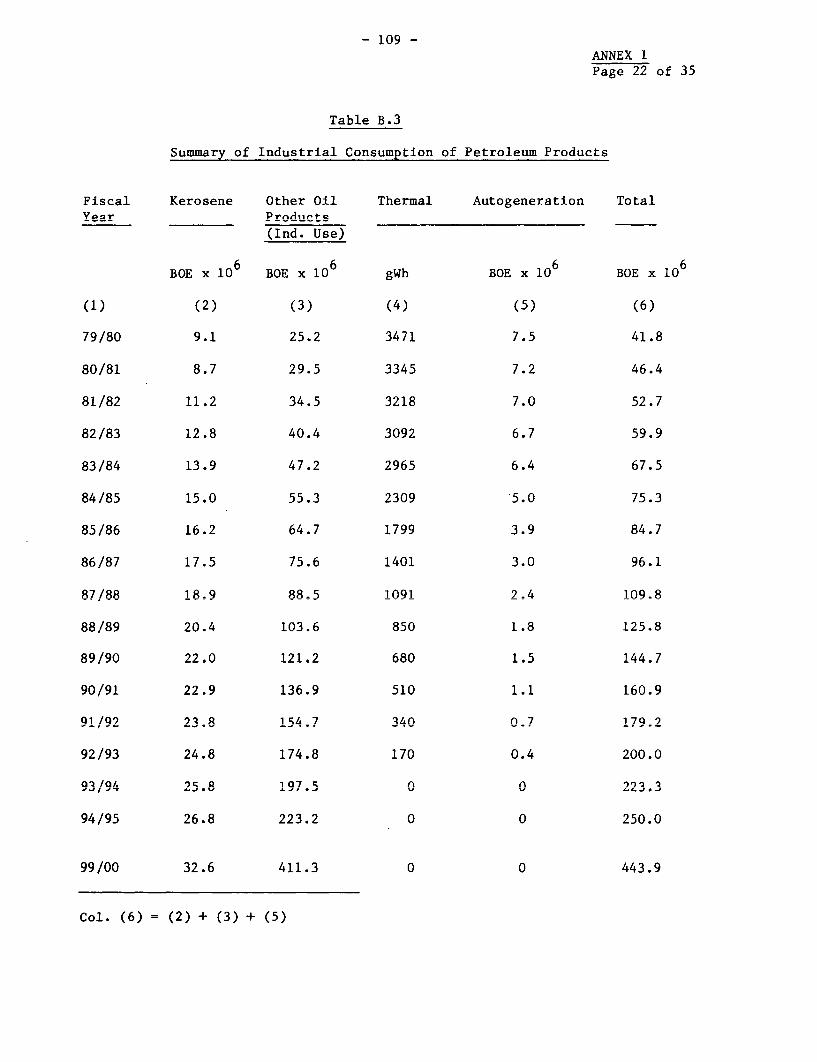
- 109 -
ANNEX 1Page 22 of 35
Table B.3
Summarv of Industrial Consumption of Petroleum Products
Fiscal Kerosene Other Oil Thermal Autogeneration TotalYear Producits~
(Ind. Use)
BOE x 10 BOE x 10 gWh BOE x 10 BOE x 10
(1) (2) (3) (4) (5) (6)
79/80 9.1 25.2 3471 7.5 41.8
80/81 8.7 29.5 3345 7.2 46.4
81/82 11.2 34.5 3218 7.0 52.7
82/83 12.8 40.4 3092 6.7 59.9
83/84 13.9 47.2 2965 6.4 67.5
84/85 15.0 55.3 2309 5.0 75.3
85/86 16.2 64.7 1799 3.9 84.7
86/87 17.5 75.6 1401 3.0 96.1
87/88 18.9 RRS. 1091 2.4 109.8
88/89 20=4 1i=6 850 1-8 125.8
89/90 22.0 121.2 680 K 5 144.7
90/91 22.9 136.9 510 1=1 160=9
91/92 23.8 154.7 340 0.7 179.2
92/93 24.8 174.8 170 0.4 200.0
93/94025.8 107.5 0 0 2
f/. /or. 2 0 0)) ') A 2 5)0. A
99/00 32.6 411.3 0 0 443.9
Col. (6) = (2) + (3) + (5)
- 110 -
ANNEX 1Page 23 of 35
The projection in this report is based on the following growthrates:
1979/80-1989/90 1989/90-1999-2000Air Transport
Aviation Fuel 11% 8%
Road and Rail Transnort
Gasolino 10% 8ZAutomotive Diesel 12% 10%
Sea and River Transport
Industrial Diesel 10% 8%FLuel Oil '1 4. . I_ L f
Aviation fuel requirements are based on strong growth in air freight,V OFFset OVG s AL.eLL LUJ ani aoOLLIUssu rLat'Lve s'owUUw-L LL1l - LL a.L L.L V.
with increasing fuel prices.
Road and rail transport requirements are effectively a forecastfor road transport, sinee diesel fuel for rail transport is a small fractionof the total. Projected gasoline consumption to 1989/90 at 10% is somewhatbelow the trend of registration of automobiles and motorcyciles. The higherforecast for automotive diesel gives weight to higher rates of registra-tion of trucks and buses and possible expansion of public transport in thefuture. Considering the vital role of inter-island shipping in the Indonesianeconomy, continued strong expansion is projected, especially in industrialdiesel and fuel oil-consumption.
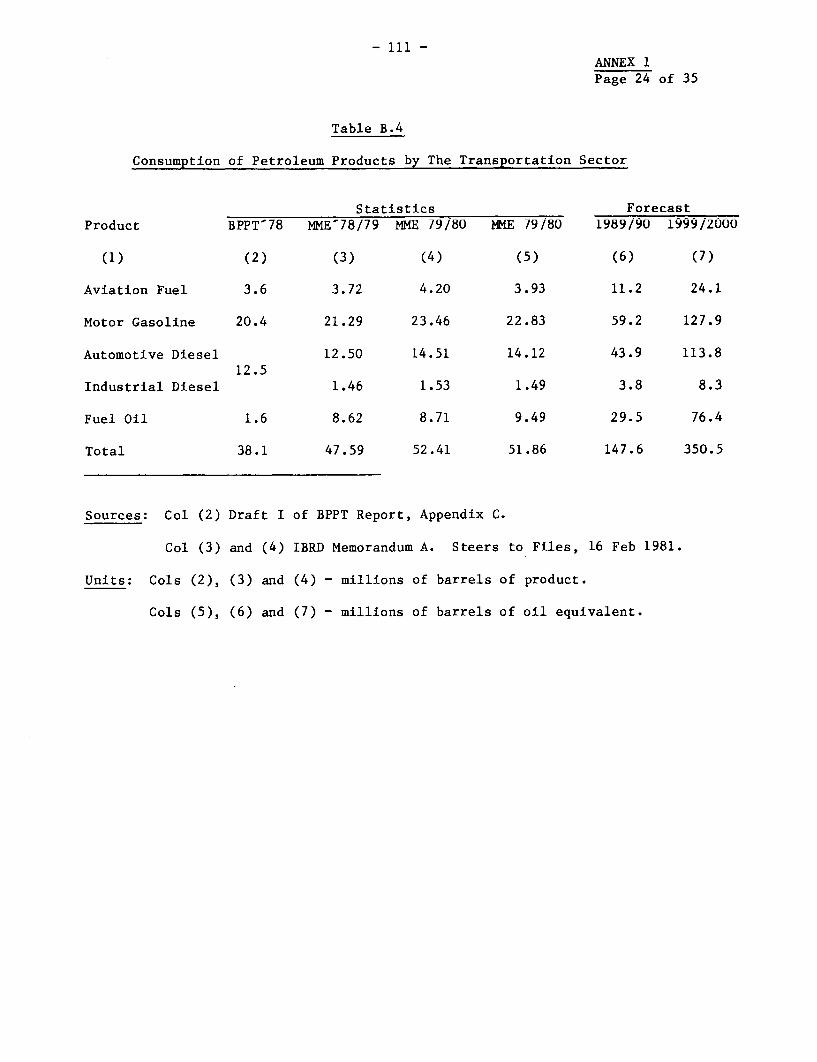
- 111 -A V.XJTnV I
Page 24 of 35
Table B.4
Consumption of Petroleum Products by The Transportation Sector
Statistics ForecastProduct BPPT-78 MME-78/79 MME 79/80 MME 79/80 1989/90 1999/2000
(1) (2) (3) (4) (5) (6) (7)
Aviation Fuel 3.6 3.72 4.20 3.93 11.2 24.1
Motor Gasoline 20.4 21.29 23.46 22.83 59.2 127.9
Automotive Diesel 12.50 14.51 14.12 43.9 113.812.5
Industrial Diesel 1.46 1.53 1.49 3.8 8.3
Fuel Oil 1.6 8.62 8.71 9.49 29.5 76.4
Total 38.1 47.59 52.41 51.86 147.6 350.5
Sources: Col (2) Draft I of BPPT Report, Appendix C.
Col (3) and (4) IBRD Memorandum A. Steers to Files, 16 Feb 1981.
Units: Cols (2), (3) and (4) - millions of barrels of product.
Cols (5), (6) and (7) - millions of barrels of oil equivalent.
- 112 -ANNEX 1Page 25 of 35
The total transportation sector forecast is presented in Cols(6) and (7) of Table B.4. The growth rates implied by the overall totalsare 11% from FY 79/80 to FY89/90 and 9% from FY 89/90 to FY 99/00.
The Electric Sub-sector
The projection is based on the PLN forecast described in thisreport. Sales and generation are developed for successive Repelitas endingin calendar years 1983, 1988, 1993, 1998 and 2003. For the purpose of thisreport, the load levels in these years are assumed for the nearest fiscalyear, i.e., 1988 which is interpreted as FY88/89, etc. The loads in the"benchmark" years 1989/90 and 1999/2000 are found by interpolation. For thepurpose of this report the load levels in these years are assumed as for thenearest fiscal year, i.e. 1988 is interpreted as FY88/89 etc. The loads inthe "benchmark" years 1989/90 and 1999/2000 are found by interpolation.
Besides demands on the public sector (on Java and outside Java),the PLN forecast shows expected auto-generation, broken down into the follow-ing categories:
Java (i) Small plants - phased out by 1990. The correspondingfuel requirements are included in the industrialforecast. (Table 2-5, Cols. 5)
(ii) Krakatau and future expansion of the steel industry.This generation is assumed to be gas-based and thecorresponding energy requirements are included inthe forecast of domestic gas consumption (Table 2-9)
Outstide Java (iii) Small plants, phased out by 19qq. TrePteP as (i) above(Table 2-5, Col. 2)
(iv) Gross hydro generation of Larona and Asahan, buildingun to a maximlim of S,500 gWh by 1Q85. On the asz1imntion
of 2% losses and station service, the correspondingenergy cor.sumption i8 5225 gWh.
(v) AAAd4dfi4na1 uto generation, buil g 1A4 p prom f zero in
1988 to 9,638 gWh in 2003. This is industrial demandthat is ass, med to be1 supplied from therma 1
- ar,/ orhydroelectric generation. As it is not clear whetherth-is woul 1b e thermal or hydro based, this compor,entLL.L WVU.LU Ji LILU1J A .. LL U. Ua.P LLI.Lb UIJL~L
is not included in the forecast. The omission of thisenergy dema.d iLn the Lorecast 'lowers L.Le totaL co,sump-
tion in the years 1989/90 - 1990/2000 by 3-5% relativeto tLhe rL --N feast.
Therefore, the total projection in this forecast comprises publicsector sales demand plus energy delivered from Larona and Asahan as givenin Table B.5.
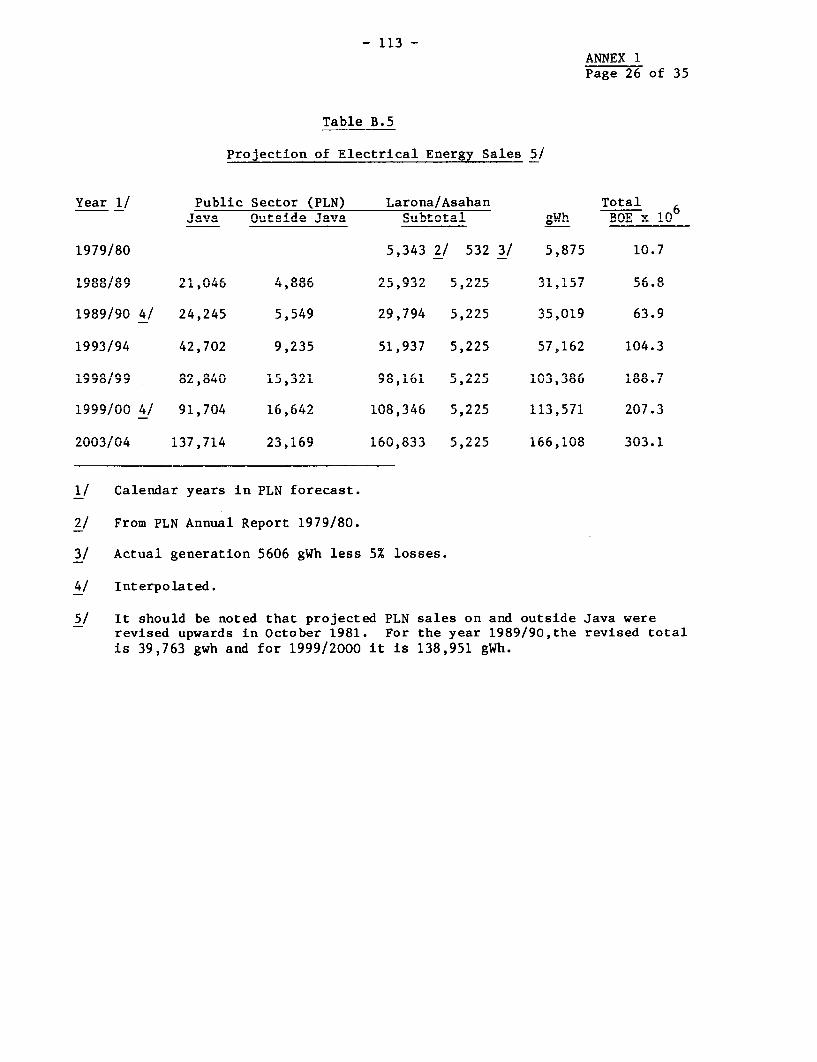
- 113 -ANNEX 1Page 26 of 35
Table B-5
Pro4ection nf Electriral E-nerav Sales RI
Year 1/ Public Sector (PLN) Larona/Asahan TotalTJava Outside Java Subtotal Cyh BOE x 10
10 70 /OA 2 12 9q/ C29 2 / C Q7. 1 n 7.1.J v J.' VV~ S , _5J ~{ .JJÆ Si SJ > S SV.
inoo/on II %A/ I. oo0 oc n9n c 9nc 51 1 C7 C: 07 O OI/O7 L tt'uv L VJ, 7 J L J , L L J J± IL Ji .J-UU.U
1989/an 1. 90/. I. 24 ,.20 50 70/. 5 ,2 25 Al3 0 63. 01.993/ 9i It.tIJ .I 9,235 I 5 9 5,225 5,162 14.3
I0l In)j/n. 1. 9 '7f% I A 99ir C I 9J7 r ItE 7 14 9 lI . 93
1998/99 82,840 15,321 98,161 5,225 103,386 188.7
199900 Io/L 91,704. 1664 108,34 5,225 113,-71 207.3man /n Ia , S ,. A 1 ,fl r am*n I 0 -
2003/04 137,i7i4 23,169 160,833 5,225 i66,100 3V0.1
1/ Calendar years in PLN forecast.
2/ From PLN Annual Report 1979/80.
3/ Actual generation 5606 gWh less 5% losses.
4/ Interpolated.
5/ It should be noted that projected PLN sales on and outside Java wererevised upwards in October 1981. For the year 1989/90,the revised totaiis 39,763 gwh and for 1999/2000 it is 138,951 gWh.
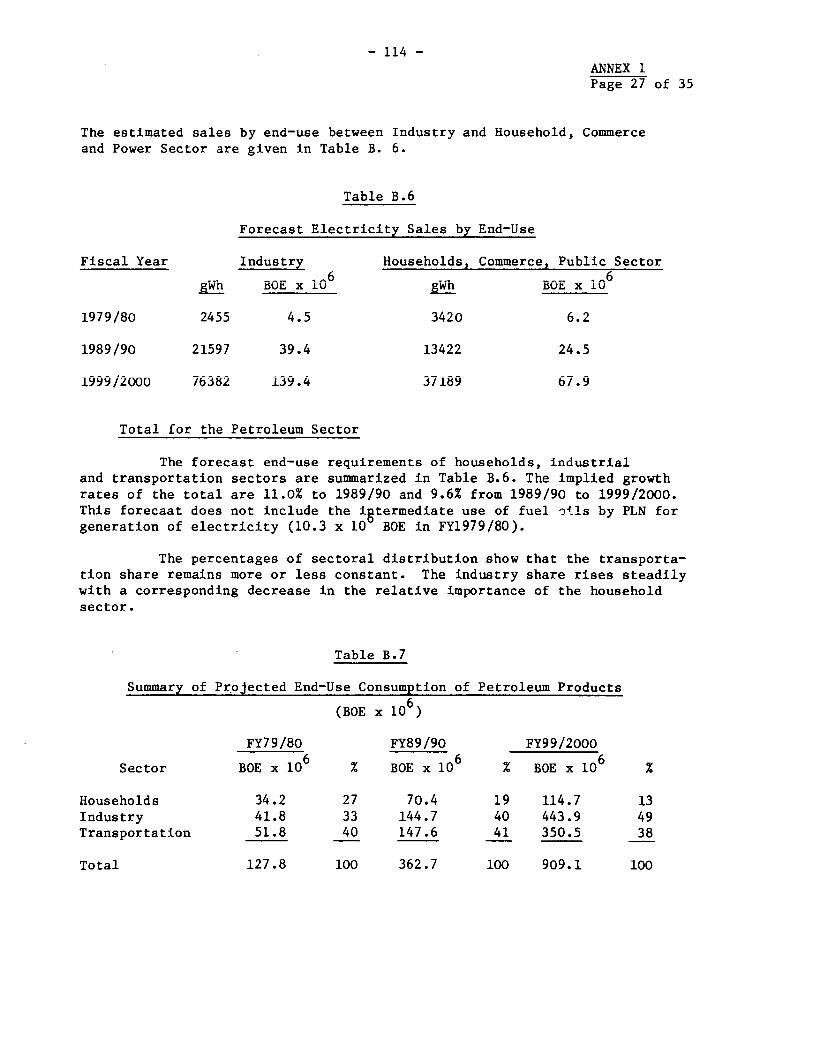
- 114 -ANNEX 1Page 27 of 35
The estimated sales by end-use between Industry and Household, Commerceand Power Sector are given in Table B. 6.
Table B.6
Forecast Electricity Sales by End-Use
Fiscal Year Industry Households, Commerce, Public Sector
__n BOE x iO ROE x iOgWh ROE xlv _____B_E '
1979/80 2455 4.5 3420 6.2
1989/90 21597 39.4 13422 24.5
1999/2000 76382 139.4 37189 67.9
Total for the Petroleum Sector
The forecast end-use requirements of households, industrialand transportation sectors are summarized in Table B.6. The implied growthrates of the total are 11.0% to 1989/90 and 9.6% from 1989/90 to 1999/2000.This forecaat does not include the iotermediate use of fuel oils by PLN forgeneration of electricity (10.3 x 10 BOE in FY1979/80).
The percentages of sectoral distribution show that the transporta-tion share remains more or less constant. The industry share rises steadilywith a corresponding decrease in the relative importance of the householdsector.
Table B.7
Summary of Projected End-Use Consumption of Petroleum Products
(BOE x 106)
FY79/80 FY89/90 FY99/2000
Sector BOE x lO % BOE xlO 6 % BOE x 10 6
Households 34.2 27 70.4 19 114.7 13Industry 41=8 33 144=7 40 443.9 49Transportation 51.8 40 147.6 41 350.5 38
Total 127.8 100 362.7 100 909.1 100
- 115 -ANNFX 1
Page 28 of 35
Domestic Natural C-as Con-.-m-- 4-n
Recent statistics on natural gas production and domestic consumptionare compiled in Table B.8. The rapid rise in production since 1976 is almost
entirelJyU rel atA. tAo.tLLexp.rt.oU LaL.ULJ.i.L ntag. ThLLLe dUomsti market
has expanded at the same time in a rather irregular pattern. The main cate-goriIes ofJ consumption are bulk suppjly of 'LeeU'stock to thle fertilizer andUsteel industries, in addition to feedstock to gas processing plants and localJLIuusLry. FeedUsoCK LU gas process'ing plants i._s ignorea in tne forecast,because practically all LPG is exported at this time. Other uses shown inTable 2-8, such as fuel for refineries, are considered intermediate use. Tneend use categories in the forecast are local industry and feedstock for thesteel and fertilizer industry.
Use by local industry has grown at an average annual rate of 22%since 1975. This average is based on the high side because of a 50% increasein 1977 alone, followed by growth in the next two years ot less than 10%.
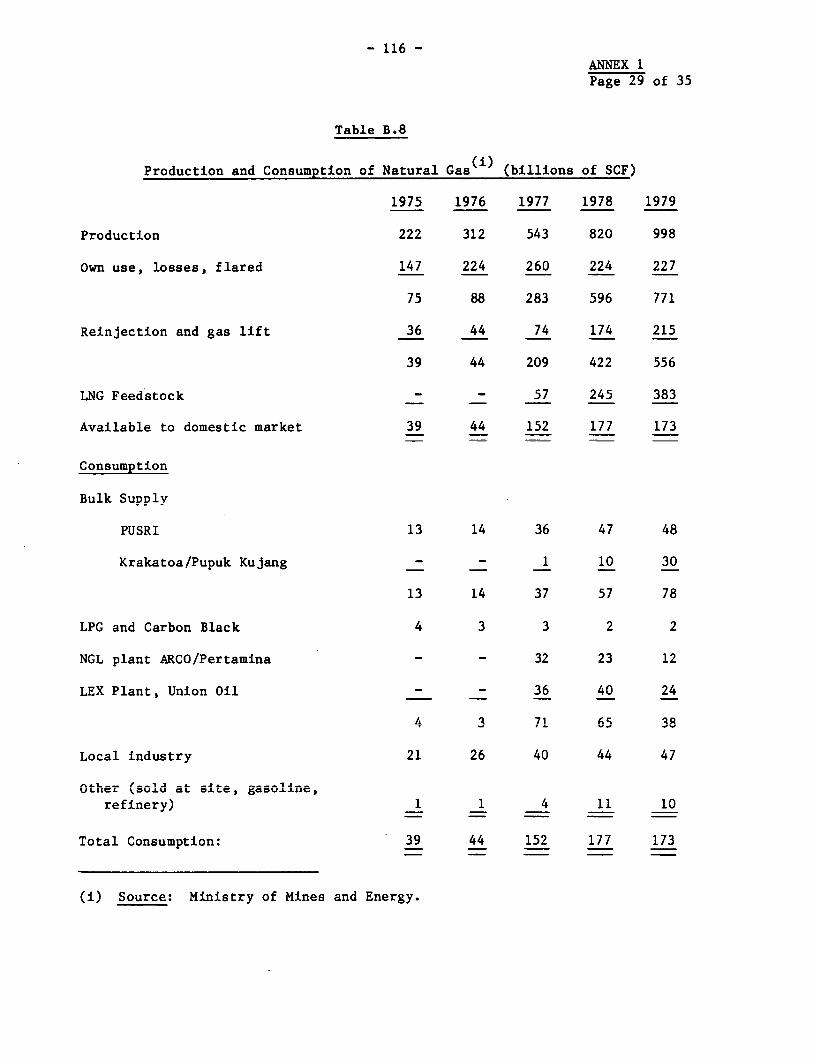
- 116 -
ANN-EX 1Page 29 of 35
Table B.8
Production and Consumption of Natural Gas(i) (billions of SCF)
1975 1976 1977 1978 1979
Production 222 312 543 820 998
Own use, losses, flared 147 224 260 224 227
75 88 283 596 771
Reinjection and gas lift 36 44 74 174 215
39 44 209 422 556
LNG Feedstock - - 57 245 383
Available to domestic market 39 44 152 177 173
Consumption
Bulk Supply
PUSRI 13 14 36 47 48
Krakatoa/Pupuk Kuiang - - 1 10 30
13 14 37 57 78
LPG and Grorhn RIlnPk 4 3 3 2 2
NGL plant ARC0/Pertamina - - 32 23 12
TYX Plant, Union Oil - - 6 4n 9a
4 3 71 65 38
Tocal -indu -stry 21 An AA 44A7
Vtbler (soLU at site, gasoline,refinery) 1 1 4 11 10
Total Consumption: 39 44 152 177 173
(i) Source: Ministry of Mines and Energy.
- 117 -AMMTk' 1
Page 30 of 35
Future requLremerits are proJected to increase at a rate of 15% per year to1989/90 and 12% thereafter. The future requirements of the steel and fer-tilizer industriLes are projected in accordance with estimates of the BPPTReport (Table 4-17) and 4-21, respectively).
Total requirements are summarized in Table B.9. They show that forthe assumed growth rates of local industry consumption, this category wouldbegin to exceed feedstock requirements as of 1988/89 (169 billion SCF forlocal industry versus (47 + 119 = 166) billion SCF for the steel and fertilizerindustry). The forecast does not take into account the possibility of a muchlarger penetration of natural gas in the industrial sector. Similar to otherfuel substitution problems, this question must be considered as part of thefuture energy supply strategy.
Domestic Coal Consumption
Currently planned end-use consumption of coal covers only the nearterm, to fiscal year 1987/88. Most steam coal will be used by cement plantsat Baturaja and Padang on Sumatra. All transportation use is expected todisappear by 1984/85, as steam locomotives are phased out. For the sakeof simplicity all end-use consumption of coal is classified as industrial.
The tonnages associated with end-use are minute compared to thefuture requirements of the electric power sector. Therefore, Table B.10,summarizing domestic final consumption, is in no way representative of thefuture of the coal mining industry.
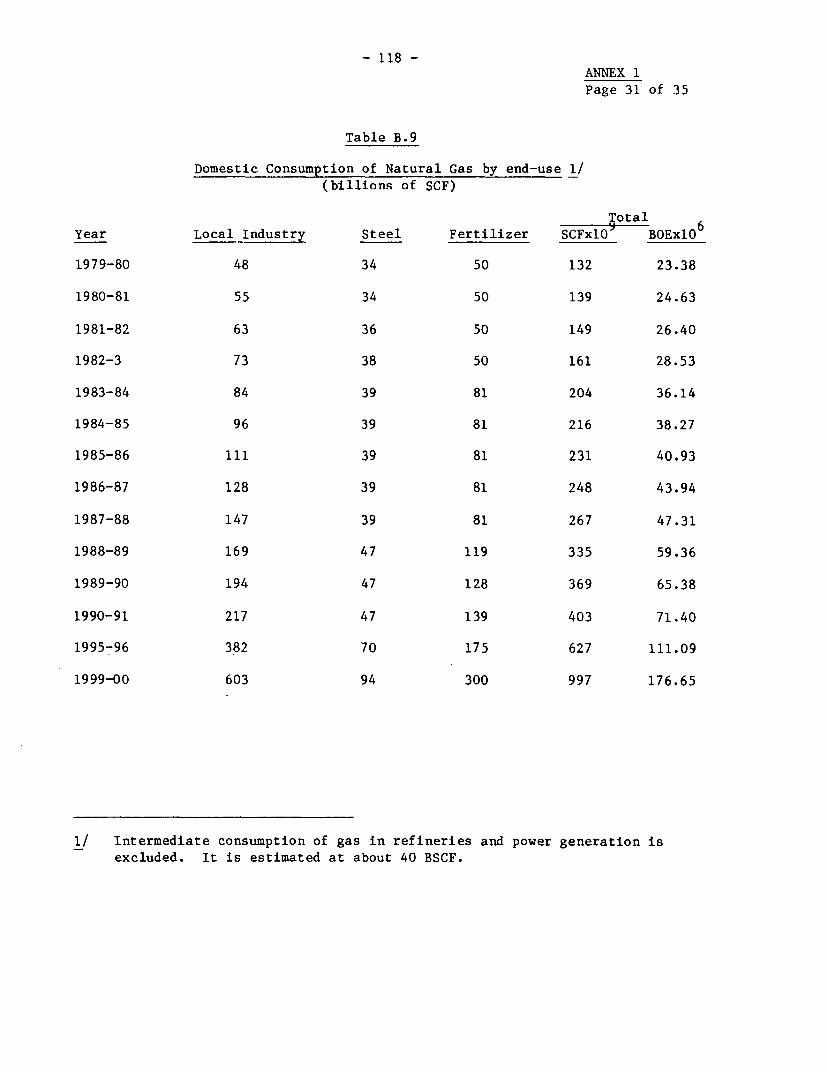
- 118 -ANNEX 1
Page 31 of 35
Table B.9
Domestic Consumption of Natural Gas by end-use 1/
(billions of SCF)
Total
Year Local Industry Steel Fertilizer SCFxIO BOEx1O
1979-80 48 34 50 132 23.38
1980-81 55 34 50 139 24.63
1981-82 63 36 50 149 26.40
1982-3 73 38 50 161 28.53
1983-84 84 39 81 204 36.14
1984-85 96 39 81 216 38.27
1985-86 111 39 81 231 40.93
1986-87 128 39 81 248 43.94
1987-88 147 39 81 267 47.31
1988-89 169 47 119 335 59.36
1989-90 194 47 128 369 65.38
1990-91 217 47 139 403 71.40
1995-96 382 70 175 627 111.09
1999-00 603 94 300 997 176.65
1/ Intermediate consumption of gas in refineries and power generation is
excluded. It is estimated at about 40 BSCF.
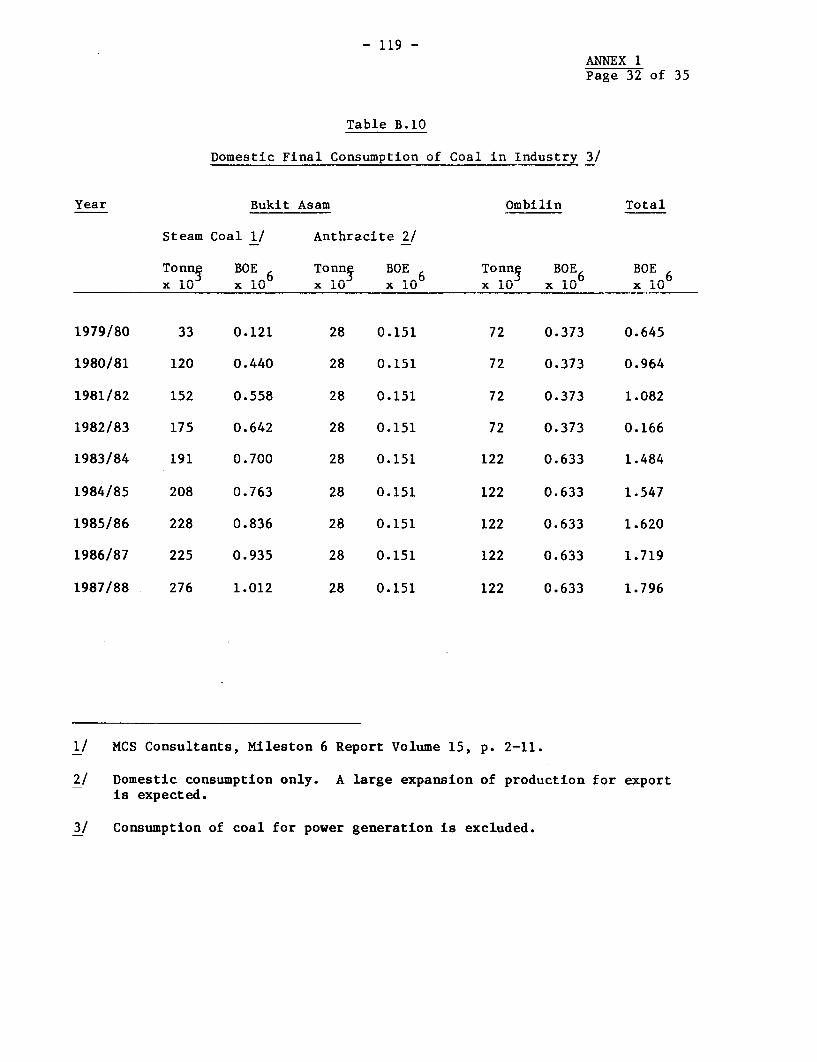
- 119 -AIUNEX 1
Page 32 of 35
TrablD1-e B.10Ow
DUomest-ibLc Final Consumption o01 Coal i1n Industry dl
Year Bukit Asam Ombilin Total
Steam Coal 1/ Anthracite 2/
Tonn BOE Tonne BOE Tonne BOE BOExiO x .6 x iO x 106 xiO xIO x 1
6
1979/80 33 0.121 28 0.151 72 0.373 0.645
1980/81 120 0.440 28 0.151 72 0.373 0.964
1981/82 152 0.558 28 0.151 72 0.373 1.082
1982/83 175 0.642 28 0.151 72 0.373 0.166
1983/84 191 0.700 28 0.151 122 0.633 1.484
1984/85 208 0.763 28 0.151 122 0.633 1.547
1985/86 228 0.836 28 0.151 122 0.633 1.620
1986/87 225 0.935 28 0.151 122 0.633 1.719
1987/88 276 1.012 28 0.151 122 0.633 1.796
1/ MCS Consultants, Mileston 6 Report Volume 15, p. 2-11.
2/ Domestic consumption only. A large expansion of production for exportis expected.
3/ Consumption of coal for power generation is excluded.
- 120 -ANNEX 1Page 33 of 35
Total Commercial Energy Demand
Table B.11 summarizes the final demand for all sectors. The composi-tion of sectoral demand by types of energy is based on extrapolation of presentsupply patterns. Large shifts are conceivable due to substitution that maycome about as a result of development strategy. The implied growth rates ofthe totals are 11.8% p.a. for 1979/80 to 1989/90 and 10.1% p.a. for 1989/90 to1999/2000. The assumed average real GDP growth in these periods is 8.0% and6.5%, respectively.
The ratios of energy growth to GDP growth are 1.46 for the firstdecade and 1.55 for the second one. The weak data base and the peculiaritiesof the Indonesian energy scene suggest that not too much significance shouldbe attached to these "elasticities".
The end-use consumption is re-grouped by sources of energy in TableB.12. The demand for primary forms of energy depends on future energy supplyno]iciesj of which energv RubRtitution and nlannina of electricitv sunnlvare major aspects. Furthermore allowances for transformation losses must beadded to end-use cnonsumntion.
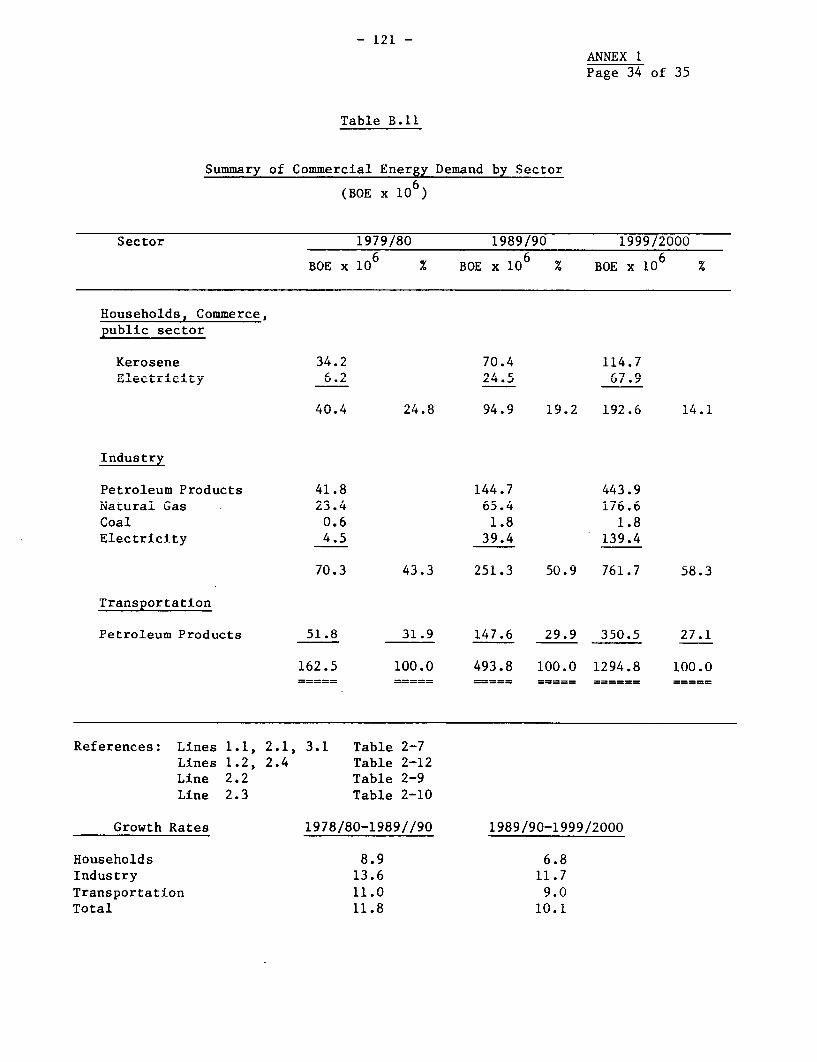
- 121 -ANNEX 1Page 34 of 35
Table B.11
Summary of Commercial Energy Demand by SectorA
(BOE x 10)
Sector 1979/80 1989/90 1999/2000
BOE x 10 % BOE x 10 % BOE x 10 %
Househllwds, Comerce,
public sector
Kerosene 34.2 70.4 114.7Electricity £ 24 6.
l.a I. 'il. 0 a,. a in~ -n A 40.4 24.8 947'.9 19.2 192.6U 14.1
Industry
Petroleum Products 41.8 144.7 443.9Natural Gas 23.4 65.4 176.6Coal 0.6 1.8 1.8Electricity 4.5 39.4 139.4
70.3 43.3 251.3 50.9 761.7 58.3
Transportation
Petroleum Products 51.8 31.9 147.6 29.9 350.5 27.1
162.5 100.0 493.8 100.0 1294.8 100.0
References: Lines 1.1, 2.1, 3.1 Table 2-7Lines 1.2, 2.4 Table 2-12Line 2.2 Table 2-9Line 2.3 Table 2-10
Growth Rates 1978/80-1989//90 1989/90-1999/2000
Households 8.9 6.8Industry 13.6 11.7Transportation 11.0 9.0Total 11.8 10.1
- 122 -ANN^X i
Page 35 of 35
Table B.12
Summary of Commercial Energy Demand by Source
FY 79/80 FY 89/90 FY 99/2000
Energy Source BOE x 6 % BOEx10 6 BOE x 6
Petroleum Products 127.8 78.6 362.7 73.5 909.1 70.2
Natural Gas 23.4 14.4 65.4 13.2 176.6 13.7
Coal 0.6 0.4 1.8 0.4 1.8 0.1
Electricity 10.7 6.6 63.9 12.9 207.3 16.0
Total 162.5 100.0 493.8 100.0 1294.8 100.0
1/ Addressed in the assessment by Gillis, HIID Discussion Paper No. 92,p. 37.
- 123 -
B I B L I O G R A P H Y
A. INDONESIA GENERAL
World Bank. Report No. 2026-IND. Recent Developments, Short-TermProspects and Development Issues, April 26, 1978.
World Bank. ReDort No. 2093-IND. Indonesia Growth Patterns,Social Progress and Development Prospects, February 20,1979.
World Bank. Report No. 2788-IND. Indonesia: Lone-Run DeveloDmentand Short-Run Adjustment, February 20, 1980.
World Bank. Report No. 2927-IND. Indonesia Transport Sector Review,Marc'h 28, 1980.
World Bank. Report No. 2490-IND. InQdnnesi Grttaeo and RmTnll
Industry in the National Economy, November 1979.
C. Fisher, South-East Asia: A Social Economic and Political GeographyLondon: Methuen and Co. Ltd., 1964.
TnCJT Tndustr4al Dlevelopment 4n South rast1- A sian Countr4es:
Small and Medium Scale Industries in Indonesia, Surveyly T T. 1.. .X _ 1 n_ 1 I cTreport uy Jnternat'ona' 'Veve'Lpment Center os Japan
(IDCJ); 1977/78.
B. GENERAL ENERGY SECTOR
World Bank. Bahman Abadian. Indonesia, The Energy Sector Issues,June 7, 1977.
WorlU DdBK. LLUU1Unba ARUenWabl ZnLergy Profile prepared for theRenewable Energy Task Force, February, 1980.
Asian Development Bank. Survey of Energy Utilization. Vols. 1 and2, March, i980.
Asian Development Bank. Energy Sector in Indonesia (Issues andStrategies), September 1980.
BPPT/Bechtel National Inc. Energy Planning Study for Indonesia,1981.
C. THE POWER SECTOR
PLN. The Public Power Sector in Indonesia, Background Paper onInvestment Planning No. 3, 1974.
- 124 -
Electrowatt Eng. Services Ltd./PLN. East Java Steam Power PlantFeasibility Study, Februarv 1981.
PLNa Annual Report 1979/80.
PLN. The Diversification of Enerav in the Power Sector, reportprepared for World Energy Conference, Jakarta 1980.
NIRA/PLN/BATAN. Feasibility Study for the first Nuclear PowerPlant in Indonpsia, 1980.
PL ,N/D.G r 4 -t - Education. Rural Electrification Survey, draft
report by Selo Soemarjan et. al. 1980/81.
2D.C. Electricity for Small Villages and Village Energy from BiomassTechInical Progress- Report (Phase I) TTSATn/RPPT, December 1980.
IBRD. InduonesiLa - Saguling Hydroelectric Project -Power Project Brief.
IBRD. M. Munasinghe, Indonesia PLN Power Tariff Study, Final
Report, May L197.
IBDfJ. B. Abaudia, InA Power Development Strategy,
December 7, 1978.
M. Notodihardjo, Hydro Power Resources of Indonesia, August 1975.
D. COAL SECTOR
World Bank. Report No. P-2213-IND, The Bukit Asam Coal Mining and
Transportation E,-gineeriLnLg ProJect, April 2. , 19A7
Canadian International Development Agency. A Plan to Increase theAnnual Output of the Ombilin Coal Mines prepared by
H.S. Hasiam and Associates, Ltd., Vancouver, February1975.
K. Wardell, Report on Coal Sector Development, Indonesia, October
1979.
IBRD. Indonesia Coal Sector Report, by E.R. Hassal (consultant),Energy Mission, April 1981.
GOI. Towards Asian Cooperation in Coal, report to Asian meetingon coal by Indonesian Delegation.
E. PETROLEUM AND NATURAL GAS
U.S. Embassy, Jakarta. Indonesia's Petroleum Sector 1979, May 1979.
- 125 -
Robert F. Ichord, Jr., Oil Export Dependence and Political SystemResponse: The Case of Indonesia, February 25, 1980.
"Indonesia Growing Problems Downstream", Petroleum Economist,
Vol. XLVI No. 11, November 1979.
"Pertamina" OPEC Bulletin Supplement', March 3, 1980.
PERTAMINA. Annual Reports, 1977 and 1978.
SRITUA AREIF Association. Financial Analysis of the IndonesianPetroleum Industry, 1977.
F. RURAL ENERGY GENERAL
1. 'Basic Energy Budgets of Rural Households in Indonesia' bySoesastro, H. Indonesian Quarterly, Vol. VIII, No. 1, January 1980.
2. 'Energy Consumption in Rural Areas of West Java' by Haeruman, H.Paper presented at 7th General Assembly of World Federation of
Engineering Organizations (WFEO), Jakarta, November 1979.
3. 'Methodology of Fuelwood Surveys with Reference to Indonesian data'
by K.F. Wiersum, paper presented at FAO meeting on Forestry forLocal Community Development, Rome, May 1979.
4. 'Peranan Energi Di Sektor Industri Pedesaan Jawa Barat' by Hadi
Soesastro.. CSISP. August 1980.
5 'The Stuidv f Rural Energy Needs in Indonesia' by Hadi Soesastro,
CSIS, 1980.
6. 'International Cooperation for the Development of New and RenewableEnergy Resources Appropriate for Rural Utilization and thpir Tm-lica-tions for Environment, paper presented by Indonesian Delegation for
the 28th Consultative Meeting of Colombo Plan, Jakarta, November 1980.
7. 'Energy Problems of the Developing Countries with Snerial reference
to the firewood dilemma in Indonesia' by Kadir, A. and Arismunander,
A paper presented at lith World Energy Conference, 1980a
8. 'The Impact of Energy Development on the Ervironment in Rural Areas'
by Haeruman, H., paper presented at International Conference onEnergy anlu EnvironmentA, Y-4l1, Tanuary 1981.
B.I.E.S. Vol. XIV, No. 2, July 1978.
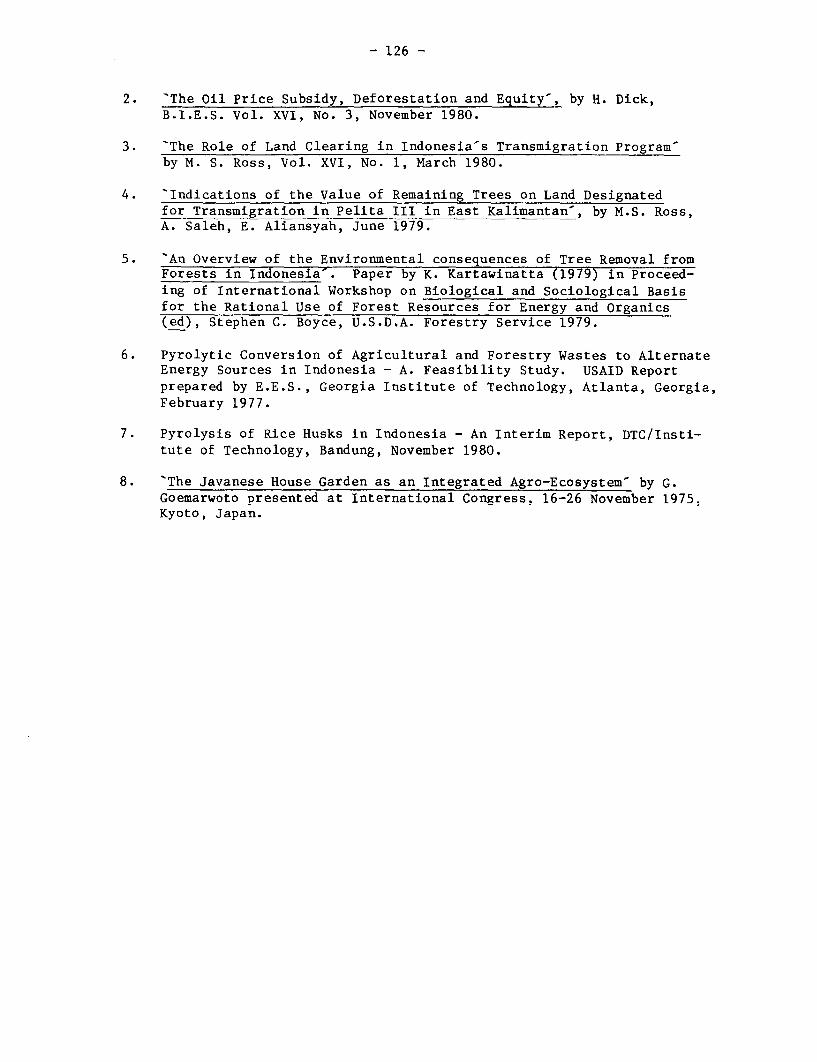
- 126 -
2. .The Oil Price Subsidy, Deforestation and Equity-, by H. Dick,B.I.E.S. Vol. XVI, No. 3, November 1980.
3. -The Role of Land Clearing in Indonesia-s Transmigration Program'by M. S. Ross, Vol. XVI, No. 1, March 1980.
4. -Indications of the Value of Remaining Trees on Land Designatedfor Transmigration in Pelita III in East Kalimantan, by M.S. Ross,A. Saleh, E. Aliansyah, June 1979.
5. -An Overview of the Environmental consequences of Tree Removal fromForests in Indonesia-. Paper by K. Kartawinatta (1979) in Proceed-ing of International Workshop on Biological and Sociological Basisfor the Rational Use of Forest Resources for Energy and Organics(ed), Stephen C. Boyce, U.S.D.A. Forestry Service 1979.
6. Pyrolytic Conversion of Agricultural and Forestry Wastes to AlternateEnergy Sources in Indonesia - A. Feasibility Study. USAID Reportprepared by E.E.S., Georgia Institute of Technology, Atlanta, Georgia,February 1977.
7. Pyrolysis of Rice Husks in Indonesia - An Interim Report, DTC/Insti-tute of Technology, Bandung, November 1980.
8. 'The Javanese House Garden as an Integrated Agro-Ecosystem by G.Goemarwoto presented at International Conrress. 16-26 November 1975.Kyoto, Japan.
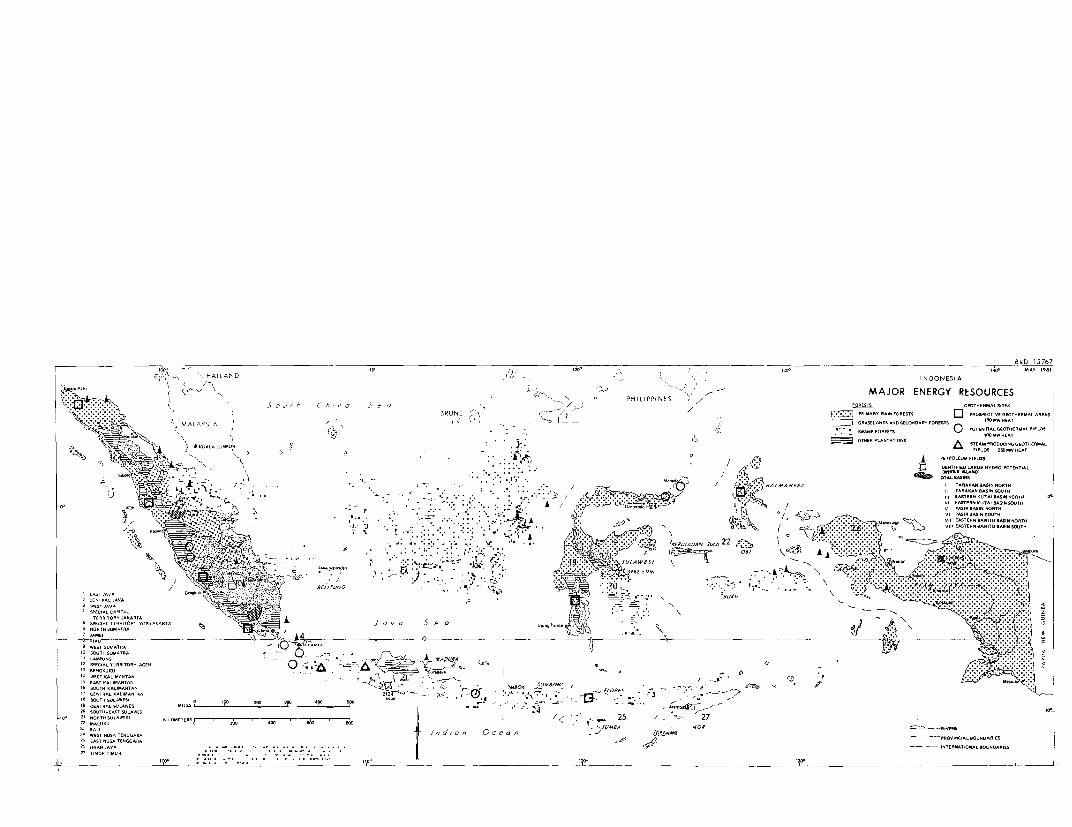
BRD 15767T THAILAND > - INDONESIA
A-0 Wf-vv R D PHILIPPINES ' / MAJOR ENERGY RESOURCES
BRUNEI ~ ~ ~ ~ ~ P!LPINS ,
t<E* 5 .MA LA Y S IA A C / 2aL - FOREST S+t~~~~~~~~~~~~~~~~~~~~~~~~~~~ I GRSLAD AN A- ES R F OTESTS OPDTESTOAGEOTNERMALTIELGS
;K ) t @ KUA LA LUMP ? - _ * . - - OTHER PLANTATIONS
6 ML~~~~~~~~~~~~~~~~~~~~~~~~~~~~~~~~~~~~~~Le~~~~~~~~~~~~~~~~~~~~~~~h @,~ it\ %tt PS TTlLS A E 2 IE LOS
SUIA.fS, ... I~~~~~~~~~~~~~~2jA50I.AA
S YECIAL TERRITORY YOG<hKARTA >>CI 2 17 V 7 5 e o~~~~~~~~~~~~~~~~~~~~~~~~~~~~~~~ SWt ADPE
--- ^ RIAU ~~~~~~~~~~~ {O +zK= A ' -Q _ UNngPsadellg 3 .g- ..i~~~~~~~~~~~~~~~~~~/ O ODEN 0 T S P
WSST 5/W S EGTRA U RS NN-T |
T5 SOUTH (2LIMANTAN <e~~~~~ | ̂ ~~ t-, A r DA ~1,T0/' ASFEPDOSIASA/ _ITRi 2 Da rSNTA
2~~~~~~~~~~~~~~~~~~~~~~~~~~~~~~~~~~~~~~~~~~1 /OT-ES S LAES POI EAI SWFT
D 2TAVA ^ v = = INTERNATIOUAL DOUNOARIES~~~~~~~~~~~~~~~~~~~~~~~~~~~~~~~~~~~~~Aoo v'
'o 101 f A"a * ~ ; o T T
.......... A""' ~ ~ ~ ~ ~ ~ ~ ~ ~ ~ ~ EAAAIAY* %ENIE-L ~ ~ ~ ~ ~ ~ ~ ~ ~ ~ ~ ~ ~ ~ ~ ~ ~ ~ ~ ~ ~ ~ ~ ~ ~ ~ ~ ~~~- -Go6O - -A-A
7~~~~~~~~~~Jv Seaf~~~~~~~~~~~~~~~~~~~~~~~~~~~~~~~~~~~~~~~~~~~~~~~~~~~~~~~~~~~~~~~
-1- -.- AT-D-AL /--R -SDEAOIAYDFITROS DOT/
A' MY.Etl IA

0060 - i S)@tWe aS.r tCS ohIOt ett
9tl , 90tI |t9Ct gIr
0-00IS1X_ A0000, 0000000a*o0 z lti l 01001 111111 ZLSt a 11101 It, O 1 1 SOI' 000 10011 t9'P 000001 5000 1 7000100000010000M 01'400s_2 IIl50 000w50 _005 _051 10 _0001
015 t90 StIe O 10 Zt 0 1001 O 1101 000O 110 15 tC 0 0 0 9 o0. et 31010100 N1IW000 1000011 0010505 i /00 010 tE tt0 SIYV 909 0 13
010000001100 00.00100000100 0000l0004 'e0IIl000a.0 000 r r0.01o se t\,o ee 0 - It toe 1530011oco 00o001090N3t 1M11
'~~~~~~~~~~~~~~~~-~ cP! eo sew°n IIX 005 -l' 00 't0 10108011
t~~~~~~~~~~~~~~~~~~~~~~~~~~~~~~~~~~~~~~~~~~~~~~~~~~~00 501. , 9 5001 , 00 0050 0000 0010
OOL 009 O9S wt Wt W9 wOI 0 SY3130118 9'f 2 / , <s -W ,_ ez > -- X 380dt/9NISS weta,, SOl 0950 0000 10¢g01 0>X/~ ~ ~~~~~~~~~~~~~~~~~~e 005 SOl SOo tr-, lOSO1SN )OL \10 '~ I ) 00005 t 000111
_ 5318t0nO9 lol;vnusom - - b 0t ~ ~ ~ w-lulL-7 -111111000 005000010 0000
7 t~~~~~~~~~~~~~~~~---~~~~~~~~~~~~~~~~ go~~~~~~~~~9e V7 ; ,
td3tWnN~~ ~ ~ L0AV0I/
S.oIl ''1 -3nS0 3 S ° U/y 9 y/0u g9 __
00.3NO(lNI 0x - 0 r 0 0 -00 d
½)~~~~~~~~~~~~~~~~~~~~~~<irl 6 wIi 001
-9Z51 0 N 33 I QA0i'A coolt / .0o1100 10ttlAl001 00101010 00010
SMIIIDV~~~~~~~ ONINIJ3M wmio&~~~~~~~~~~~~~d (INV NOII'VdgN~~~~~~~~~~~~~9 :)iiun8 S3NIddlllHd N,~~~~~~~~~~~~~~~,0VArfN/AS f gNOJ\/J74TS
jNo mWL99M (891~ ~ ~ ~ ~ ~ ~ ~ ~ ~ ~ ~ ~ ~ ~ ~ ~~~~~~~~~>
IL N/