PSC REF#:204700
234
For Official Use Only Imagine the result Phase 2: Evaluation of Long-Term Water Supply Alternatives, Town of Jackson West Shore Pipe Line Company January 2013 PSC REF#:204700 Public Service Commission of Wisconsin RECEIVED: 05/20/14, 10:41:14 AM
-
Upload
khangminh22 -
Category
Documents
-
view
1 -
download
0
Transcript of PSC REF#:204700

For Official Use Only
Imagine the result
Phase 2: Evaluation of Long-Term Water Supply Alternatives, Town of Jackson
West Shore Pipe Line Company
January 2013
PSC REF#:204700Public Service Commission of Wisconsin
RECEIVED: 05/20/14, 10:41:14 AM

Phase 2: Evaluation of Long-Term Water Supply Alternatives, Town of Jackson
West Shore Pipe Line Company
James P. Cooper, PE Staff Water Resources Engineer
Robert L. McNutt, PE Senior Water Resources Engineer
Edmund A. Buc, PEProject Manager
Prepared for:
West Shore Pipe Line Company
Prepared by:
ARCADIS U.S., Inc. 126 North Jefferson Street Suite 400 Milwaukee Wisconsin 53202 Tel 414 276 7742 Fax 414 276 7603
Our Ref.:
WI001304.0002
Date:
January 2013
This document is intended only for the use of the individual or entity for which it was prepared and may contain information that is privileged, confidential and exempt from disclosure under applicable law. Any dissemination, distribution or copying of this document is strictly prohibited.
For Official Use Only i
g:\aproject\buckeye\wi1304\jackson\reports\phase ii\phase2_report_20121227.docx
Phase 2: Evaluation of Long-Term Water Supply Alternatives, Town of Jackson
West Shore Pipe Line Company
Abbreviations vii
Executive Summary E-1
1. Introduction 1-1
1.1 Purpose of Evaluation 1-1
1.2 Key Assumptions 1-1
1.3 Anticipated Future Phases 1-3
2. Site Background and Current Conditions 2-1
2.1 Phase 1 Alternatives Evaluation Summary 2-1
2.2 Community Engagement 2-3
2.3 Impacted Wells 2-3
2.4 Determination of Proposed Services 2-4
2.5 Proposed Services Water Consumption 2-5
2.5.1 Residential Demands 2-5
2.5.2 Agricultural Demands 2-6
2.6 Geology and Hydrogeology 2-6
2.6.1 Regional Geology 2-7
2.6.2 Regional Hydrogeology 2-8
2.6.3 Local Geology 2-9
2.6.4 Local Hydrogeology 2-10
3. Phase 2 Alternatives Development 3-1
3.1 Identification of Alternatives 3-1
3.1.1 Alternative 2 – Village PWS 3-1
3.1.2 Alternative 3 – Town of Jackson SD 3-1
3.1.3 Alternative 4 – New Private Water Supply Wells 3-2
4. Phase 2 Alternatives Evaluation 4-1
4.1 Alternative 2 – Village of Jackson PWS 4-1

For Official Use Only ii
g:\aproject\buckeye\wi1304\jackson\reports\phase ii\phase2_report_20121227.docx
Phase 2: Evaluation of Long-Term Water Supply Alternatives, Town of Jackson
West Shore Pipe Line Company
4.1.1 Distribution System Hydraulic Assessment 4-1
4.1.1.1 Previous System Analysis 4-2
4.1.1.2 Current System Conditions 4-2
4.1.1.3 Current System Assessment 4-3
4.1.2 Border or Supply Agreements 4-4
4.1.3 Regulatory Considerations 4-4
4.1.4 Additional Considerations 4-5
4.2 Alternative 3 – Town of Jackson SD 4-5
4.2.1 Water Supply Source 4-6
4.2.1.1 Village PWS 4-6
4.2.1.2 Town Wells 4-7
4.2.2 Facilities and Staffing 4-8
4.2.2.1 Interconnection Facility and BPS 4-9
4.2.2.2 SD Water Treatment Facility 4-9
4.2.3 Regulatory Considerations 4-9
4.2.4 Additional Considerations 4-10
4.3 Alternative 4 – New Private Water Supply Wells 4-12
4.3.1 Desktop Geologic Study 4-12
4.3.1.1 Regional Geology 4-12
4.3.1.2 Regional Hydrogeology 4-15
4.3.1.3 Groundwater Location, Movement, and Recharge 4-16
4.3.1.4 Hydraulic Conductivity 4-17
4.3.2 Desktop Geologic Study Results 4-18
4.3.2.1 Communication between Aquifers 4-18
4.3.2.2 Water Quality 4-20
4.3.2.3 Water Quantity 4-24

For Official Use Only iii
g:\aproject\buckeye\wi1304\jackson\reports\phase ii\phase2_report_20121227.docx
Phase 2: Evaluation of Long-Term Water Supply Alternatives, Town of Jackson
West Shore Pipe Line Company
4.3.3 Well Drilling Requirements 4-26
4.3.4 Regulatory Considerations 4-27
4.3.5 Additional Considerations 4-28
5. Phase 2 Alternatives Comparative Analysis 5-1
5.1 Evaluation Criteria 5-1
5.1.1 Long-Term Susceptibility 5-2
5.1.2 Technical Feasibility 5-2
5.1.3 Quantity of Water 5-2
5.1.4 Quality of Water 5-2
5.1.5 Operations, Maintenance and Replacement 5-3
5.1.6 Legal and Regulatory Complexity 5-3
5.1.7 Monitoring, Reporting and Compliance 5-3
5.1.8 Timing to Implement 5-3
5.1.9 System Redundancy 5-4
5.1.10 Anticipated Community Acceptance 5-4
5.1.11 Capital Cost 5-4
5.2 Evaluation Results 5-4
5.2.1 Implementation Schedule Comparison 5-5
5.2.2 Conceptual Level Capital and O&M Cost Opinions 5-6
5.2.3 Alternative Results Summary 5-8
5.2.3.1 Alternative 2 5-8
5.2.3.2 Alternative 3A 5-9
5.2.3.3 Alternative 3G 5-9
5.2.3.4 Alternative 4 5-9
6. Selection and Recommendation of Alternatives 6-1
6.1 Basis of Recommendation 6-1

For Official Use Only iv
g:\aproject\buckeye\wi1304\jackson\reports\phase ii\phase2_report_20121227.docx
Phase 2: Evaluation of Long-Term Water Supply Alternatives, Town of Jackson
West Shore Pipe Line Company
6.2 Conceptual Design 6-2
6.3 Anticipated Implementation Schedule 6-3
7. References 7-1
Tables
2-1 Phase 1 Alternatives Comparison Scorecard
2-2 Well Detections Summary
2-3 Estimated Proposed Services Water Consumption
2-4 Summary of Geologic Units
4-1 Summary of Water Quality Data
4-2 Summary of Water Quantity Data
5-1 Evaluation Criteria Weighting
5-2 Phase 2 Alternatives Comparison Scorecard
5-3 Anticipated Alternative Costs
6-1 Alternative 2 Preliminary Implementation Schedule
Figures
1-1 Site Location Map
2-1 7.5-Minute Quadrangle Map
2-2 Remediation and Monitoring Well Locations
2-3 Impacted Well Properties
2-4 Phase 2 Proposed Services
3-1 Alternative 2 - Preliminary Water Infrastructure
3-2 Alternative 3A - Preliminary Water Infrastructure
3-3 Alternative 3G - Preliminary Water Infrastructure

For Official Use Only v
g:\aproject\buckeye\wi1304\jackson\reports\phase ii\phase2_report_20121227.docx
Phase 2: Evaluation of Long-Term Water Supply Alternatives, Town of Jackson
West Shore Pipe Line Company
3-4 Alternative 4 - Preliminary Water Infrastructure
4-1 Alternative 2 – Maximum Day Demands Model Simulated Pressures
4-2 Alternative 3A – Interconnection Facility Layout
4-3 Alternative 3G – Municipal Well Section
4-4 Alternative 3G – Treatment Facility Flow Schematic
4-5 Location of Geologic Cross Sections
4-6 Geologic Cross Section A-A’
4-7 Geologic Cross Section of B-B’
4-8 Regional Bedrock Topography
4-9 Niagara Aquifer, Arsenic Concentrations
4-10 Niagara Aquifer, Presence of Coliform Bacteria
4-11 Niagara Aquifer, Total Hardness
4-12 Niagara Aquifer, Iron Concentrations
4-13 Niagara Aquifer, Manganese Concentrations
4-14 All Aquifers, Nitrate Concentrations
4-15 Sandstone Aquifer, Arsenic Concentrations
4-16 Sandstone Aquifer, Presence of Coliform Bacteria
4-17 Sandstone Aquifer, Total Hardness
4-18 Sandstone Aquifer, Iron Concentration
4-19 Sandstone Aquifer, Manganese Concentration
4-20 Niagara Aquifer, Specific Capacity
4-21 Sandstone Aquifer, Specific Capacity
4-22 Niagara Aquifer, Pumping Rate
4-23 Sandstone Aquifer, Pumping Rate
4-24 Alternative 4 – Private Well Section

For Official Use Only vi
g:\aproject\buckeye\wi1304\jackson\reports\phase ii\phase2_report_20121227.docx
Phase 2: Evaluation of Long-Term Water Supply Alternatives, Town of Jackson
West Shore Pipe Line Company
5-1 Implementation Schedule Comparison
6-1 Recommended Alternative Infrastructure
Appendices
A Workshop and Meeting Minutes
B Drinking Water Fact Sheets
C Soil Boring Logs and Well Construction Reports
D Water Quality and Quantity Databases
E Cost Estimates

For Official Use Only vii
g:\aproject\buckeye\wi1304\jackson\reports\phase ii\phase2_report_20121227.docx
Phase 2: Evaluation of Long-Term Water Supply Alternatives, Town of Jackson
West Shore Pipe Line Company
Abbreviations
AACE Association for Advancement of Cost Engineering
BPS Booster Pumping Station
EOPCC Engineer’s Opinion of Probable Construction Cost
ES Enforcement Standard
ft feet
ft bgs feet below ground surface
ft/d feet per day
gpapd gallons per animal per day
gpm gallons per minute
gpm/ft gallons per minute per foot
GRN Groundwater Retrieval Network
HGL Hydraulic Grade Line
MCL Maximum Contaminant Level
MG Million Gallons
MGD Million Gallons per Day
mg/L Milligrams per Liter
NR Natural Resources
OM&R Operation, Maintenance, and Replacement
PAL Preventive Action Limit
POET Point of Entry Treatment
PSC Public Service Commission
PSI Pounds per Square Inch
PWS Public Water System
For Official Use Only viii
g:\aproject\buckeye\wi1304\jackson\reports\phase ii\phase2_report_20121227.docx
Phase 2: Evaluation of Long-Term Water Supply Alternatives, Town of Jackson
West Shore Pipe Line Company
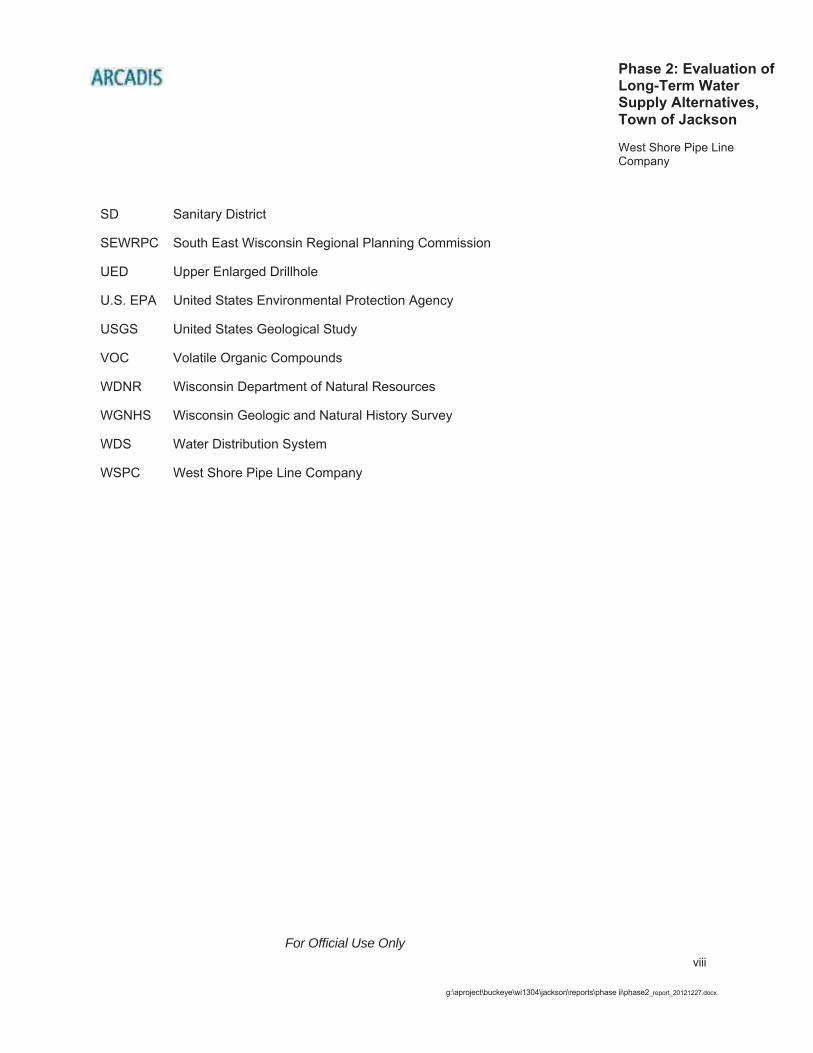
SD Sanitary District
SEWRPC South East Wisconsin Regional Planning Commission
UED Upper Enlarged Drillhole
U.S. EPA United States Environmental Protection Agency
USGS United States Geological Study
VOC Volatile Organic Compounds
WDNR Wisconsin Department of Natural Resources
WGNHS Wisconsin Geologic and Natural History Survey
WDS Water Distribution System
WSPC West Shore Pipe Line Company

For Official Use Only
g:\aproject\buckeye\wi1304\jackson\reports\phase ii\phase2_report_20121227.docx
Phase 2: Evaluation of Long-Term Water Supply Alternatives, Town of Jackson
West Shore Pipe Line Company
1E-1
Executive Summary
ARCADIS was retained by West Shore Pipe Line Company (WSPC) to complete a Phase 2 Evaluation of long-term water supply alternatives associated with response actions in the Town of Jackson, Wisconsin (Town). On July 17, 2012, an underground pipeline owned by WSPC released approximately 1,300 barrels of gasoline into the ground in the Town. The pipeline was shut down less than three minutes after the release occurred, and no injuries were sustained in the process. After successfully testing the integrity of the system and receiving regulatory approval for repairs, WSPC operators safely restarted the pipeline on July 21, 2012 and resumed normal operations.
The release occurred in the Town in an area largely occupied by farmsteads and residences. These properties obtain water from individual private water supply wells. The Village of Jackson (Village) is located to the northwest of the release site and operates a public water system (PWS). Concurrent with repair activities, WSPC mobilized staff and contractors to the area to respond to the release. Efforts included sampling nearly 300 private water supply wells, installing over 70 point of entry treatment (POET) systems, and providing bottled water. Remediation efforts are ongoing.
As of November 26, 2012, 13 water supply wells (on 11 properties) contained benzene at concentrations above the Natural Resources (NR) 140 Enforcement Standard (ES) of 5 micrograms per liter. The Wisconsin Department of Natural Resources (WDNR) views the use of POET systems as a short-term solution to provide water to property owners and has requested that WSPC restore potable water supply to affected property owners without the use of POET systems.
A Phase 1 Alternatives Evaluation of long-term water supply alternatives was conducted between August and October 2012 to identify potentially feasible long-term water supply options. The Phase 1 Alternatives Evaluation identified six water supply alternatives and provided conceptual-level information for comparison of the alternatives:
Alternative 1 – Maintain existing private wells with POET systems.
Alternative 2 – Connect properties to the Village PWS as direct customers.

For Official Use Only
g:\aproject\buckeye\wi1304\jackson\reports\phase ii\phase2_report_20121227.docx
Phase 2: Evaluation of Long-Term Water Supply Alternatives, Town of Jackson
West Shore Pipe Line Company
2E-2
Alternative 3 – Establish a Town sanitary district (SD). Seven alternative sources of water were identified for the SD.
Alternative 4 – Abandon affected private water supply wells and replace with deeper wells. Based on input from Town residents and the Town Board, two sub-alternatives were identified: a) Replacement of each individual well, and b) Cluster wells, where deep wells would be installed to serve groups of six properties or less.
Alternative 5 – Establish a privately-owned water supply system.
Alternative 6 – A combined approach using elements of the other five alternatives.
Based on results of the Phase 1 Alternatives Evaluation and stakeholder feedback, three alternatives were selected for Phase 2 Evaluation:
Alternative 2 – Connect properties to the Village PWS as direct customers.
Alternative 3 – Town SD, with source water provided by either: Consecutive system to Village, or Include installation of PWS wells and a water treatment plant for treatment of
potential naturally-occurring contaminants.
Alternative 4 – Abandon affected private water supply wells and replace with deeper wells, with either a) replacement of each individual well, or b) Cluster wells, where deep wells would be installed to serve groups of six properties or less.
As part of this Phase 2 Evaluation, ARCADIS collected additional information to conduct further evaluations of the three selected alternatives and to define the area of proposed services. The conceptual infrastructure layout generally considers a service area near the region bounded by Maple Road, Division Road, Mill Road and Western Avenue and the subdivisions that include Wildflower, Mockingbird and Hummingbird Drives. Phase 2 proposed services within this region are defined as all properties with a related well detection of benzene and all immediately adjacent properties.
ARCADIS met with representatives of the Village, Town, and WDNR to confirm that each alternative was viewed as potentially feasible and to clarify engineering requirements for implementing each alternative. Field surveying was initiated to identify potential water main routes and easement considerations. A desktop study was completed to evaluate geologic and hydrogeologic conditions and assess the quantity

For Official Use Only
g:\aproject\buckeye\wi1304\jackson\reports\phase ii\phase2_report_20121227.docx
Phase 2: Evaluation of Long-Term Water Supply Alternatives, Town of Jackson
West Shore Pipe Line Company
3E-3
and quality of water available for supply wells. This information was used to develop conceptual layout figures for each alternative. Eleven selection criteria were then used to evaluate each alternative to determine which would be the most feasible for providing a safe and reliable long-term water supply for proposed services within a reasonable period of time.
Based on evaluation results, the recommended long-term water supply is Alternative 2 – Connect properties to Village PWS. Alternative 2 is further defined as extension of the existing Village water distribution system with direct hydraulic connection to properties with detectable benzene in water supply wells and the opportunity for connection of adjacent properties. This alternative will have sufficient capacity to add additional properties if the affected area changes and to support limited growth.
This report presents the project background and current conditions, the Phase 2 Evaluation process, and results of the Phase 2 Evaluation. Assumptions, findings and recommendations in this report are based on data available at the time of the evaluation.

For Official Use Only
g:\aproject\buckeye\wi1304\jackson\reports\phase ii\phase2_report_20121227.docx
Phase 2: Evaluation of Long-Term Water Supply Alternatives, Town of Jackson
West Shore Pipe Line Company
1-1
1. Introduction
ARCADIS was retained by West Shore Pipe Line Company (WSPC) to complete a Phase 2 Evaluation of long-term water supply alternatives associated with response actions in the Town of Jackson (Town), Wisconsin. On July 17, 2012, an underground pipeline owned by WSPC released approximately 1,300 barrels of gasoline into the ground in the Town. The pipeline was shut down less than three minutes after the release occurred, and no injuries were sustained in the process. After successfully testing the integrity of the system and receiving regulatory approval for repairs, WSPC operators safely restarted the pipeline on July 21, 2012 and resumed normal operations. The release site is depicted on Figure 1-1.
The repair occurred in the Town, in an area largely occupied by farmsteads and residences. Figure 1-1 is an aerial photograph that depicts land use in the area. These properties obtain water from individual private water supply wells. The Village of Jackson (Village) is located to the northwest of the release site and operates a public water system (PWS). Concurrent with repair activities, WSPC mobilized staff and contractors to the area to respond to the release. Efforts included sampling nearly 300 private water supply wells, installing over 70 point of entry treatment (POET) systems, and providing bottled water. Remediation efforts are ongoing. Locations of private water supply wells in the area are also depicted on Figure 1-1.
As of November 26, 2012, 13 water supply wells (on 11 properties) contained benzene at concentrations above the Natural Resources (NR) 140 Enforcement Standard (ES) of 5 micrograms per liter. The Wisconsin Department of Natural Resources (WDNR) views the use of POET systems as a short-term solution to provide water to property owners and has requested that WSPC restore potable water supply to affected property owners without use of POET systems.
1.1 Purpose of Evaluation
The purpose of the Phase 2 Alternatives Evaluation is to identify a feasible alternative for providing a safe and reliable long-term water supply for the proposed services in a reasonable period of time.
1.2 Key Assumptions
Throughout the evaluation process, several key assumptions were applied to develop and further evaluate each alternative. Assumptions include, but are not limited, to:

For Official Use Only
g:\aproject\buckeye\wi1304\jackson\reports\phase ii\phase2_report_20121227.docx
Phase 2: Evaluation of Long-Term Water Supply Alternatives, Town of Jackson
West Shore Pipe Line Company
1-2
1. The long-term water supply solution shall: a) Provide a safe, reliable water supply for a minimum 20-year planning period.
Any alternative that is not considered viable for at least 20 years shall be deemed non-feasible and eliminated from further consideration.
b) Replace the water supply that existed at the time of the spill without intending to improve water quantity or provide for growth through development or lot splits.
c) Be flexible so if the affected area migrates, the solution can be altered to provide safe, reliable water.
d) Not require additional treatment by property owners to meet drinking water standards.
2. The intent is to replace what was lost, not upgrade or improve on the previous system. Therefore, improvements such as fire protection, if provided, are considered an additional benefit.
3. New wells must be drilled below the impacted Niagara Aquifer through the Maquoketa Shale layer to prevent migration of gasoline to unaffected aquifers.
4. Agricultural uses are intended to remain on existing wells with POET systems and be physically disconnected from the potable water solution provided. Separation of water systems must be approved by regulatory agencies and verified through inspections. During the first year of POET installation, adsorption media in the POET systems is anticipated to be replaced monthly and is included in the construction cost opinions. After the first year of media replacements, media is anticipated to be replaced quarterly, or four times per year, and is included in the annual operations, maintenance and replacement (OM&R) costs.
5. New municipal wells would be sized for 100 gallons per minute (gpm) peak rate. Two wells would be provided, one for backup to provide a reliable and redundant system.
6. Capital, operating and maintenance costs to be developed will be Class 5, conceptual level cost opinions as defined by the Association for Advancement of Cost Engineering (AACE).

For Official Use Only
g:\aproject\buckeye\wi1304\jackson\reports\phase ii\phase2_report_20121227.docx
Phase 2: Evaluation of Long-Term Water Supply Alternatives, Town of Jackson
West Shore Pipe Line Company
1-3
1.3 Anticipated Future Phases
The Phase 2 Evaluation is complete and documented in this report. Subsequent phases of work required to implement a safe and reliable long-term water supply are:
Phase 3 – Management of Negotiations for Long-Term Water Supply, including: agreement negotiations, cost sharing, modification and finalization of selected alternative, OM&R negotiations, contracts, and technical negotiations. Complete the preliminary design for selected and agreed upon option.
Phase 4 – Engineering for Long-Term Water Supply, including design, bidding support, construction engineering services and Resident Project Representative.

For Official Use Only
g:\aproject\buckeye\wi1304\jackson\reports\phase ii\phase2_report_20121227.docx
Phase 2: Evaluation of Long-Term Water Supply Alternatives, Town of Jackson
West Shore Pipe Line Company
2-1 2-1
2. Site Background and Current Conditions
The release occurred on July 17, 2012. After successfully testing the system’s integrity and receiving regulatory approval for repairs, WSPC operators safely restarted the pipeline on July 21, 2012 and resumed normal operations. The repair area is located approximately 1,150 feet north of Western Avenue in the Town and in the Southwest quarter of the Southeast quarter of Section 28, Township 10 North, Range 20 East, in Washington County. A United States Geologic Survey (USGS) 7.5-Minute quadrangle map of the area is presented as Figure 2-1.
Remediation efforts are ongoing and are being documented by others. In summary, approximately 7,270 tons of soil containing gasoline were excavated and transported off-site for disposal during repair activities. Five groundwater recovery wells were installed around the perimeter of the repair to recover light nonaqueous phase liquid and groundwater. Extracted groundwater is being treated by an interim groundwater remediation system and treated water is discharged in accordance with a Wisconsin Pollutant Discharge Elimination System permit. Extraction activities were initiated on August 22, 2012 and are ongoing. A network of vapor extraction wells was installed around the perimeter of the repair area to recover petroleum vapors.
A groundwater monitoring program was implemented immediately after the repair. As of November 26, 2012, groundwater samples had been collected from 298 water supply wells on 286 properties. In addition, 78 monitoring wells were installed to further evaluate groundwater conditions. Remediation and monitoring well locations are depicted on Figure 2-2.
2.1 Phase 1 Alternatives Evaluation Summary
ARCADIS was initially retained by WSPC to complete a Phase 1 Alternatives Evaluation of potential long-term water supply alternatives. During the first part of the Phase 1 Alternatives Evaluation, potential water supply alternatives were identified. ARCADIS solicited input during the community engagement process and from stakeholders such as the WDNR, WSPC, and officials with the Town and Village. These potential long-term water supply alternatives were identified:
Alternative 1 – Maintain existing private wells with POET systems.
Alternative 2 – Connect properties to Village PWS as direct customers.

For Official Use Only
g:\aproject\buckeye\wi1304\jackson\reports\phase ii\phase2_report_20121227.docx
Phase 2: Evaluation of Long-Term Water Supply Alternatives, Town of Jackson
West Shore Pipe Line Company
2-2 2-2
Alternative 3 – Establish a Town sanitary district (SD). Seven alternative sources of water were identified for the SD.
Alternative 4 – Abandon affected private water supply wells and replace with deeper wells. Based on input from Town residents and the Town Board, two sub-alternatives were identified: a) replacement of each individual well, and b) Cluster wells, where deep wells would be installed to serve groups of six properties or less.
Alternative 5 – Establish a privately-owned water supply system.
Alternative 6 – A combined approach using elements of the other five alternatives.
In summary, six alternatives were identified. Alternative 3 included seven alternate sources of water, and Alternative 4 included two alternate sources of water, creating 13 potential alternatives.
Following a review of multiple parameters, each alternative was scored based on 11 equally-weighted criteria. All criteria were scored a 1 (comparatively unfavorable) to a 5 (comparatively favorable) with a total possible score of 55. Scores and criteria are identified on the Phase 1 Alternatives Comparison Scorecard (Scorecard) presented in Table 2-1, which considered available data through September 24, 2012. Alternatives 1, 2 and 3A scored highest based on engineering evaluations completed at the time of the Phase 1 Alternatives Evaluation. Specific stakeholder preferences for long-term water supply affect which alternatives are ultimately retained for Phase 2 evaluations. As such, this additional input was considered:
WDNR stated that Alternative 1 cannot be used for a long-term water supply solution, though it was among the highest-scoring alternatives identified.
Town Board input indicated a preference for replacement of existing private wells with deeper wells, potentially in a cluster well configuration (Alternative 4).
Based on results of the Phase 1 Alternatives Evaluation and feedback from the WDNR and Town Board, these alternatives were selected for inclusion in the Phase 2 Evaluation:
Alternative 2 – Connect properties to Village PWS as direct customers.

For Official Use Only
g:\aproject\buckeye\wi1304\jackson\reports\phase ii\phase2_report_20121227.docx
Phase 2: Evaluation of Long-Term Water Supply Alternatives, Town of Jackson
West Shore Pipe Line Company
2-3 2-3
Alternative 3 – Town SD, with source water provided by either: Alternative 3A – Consecutive system to Village, or Alternative 3G – Installation of new PWS wells and water treatment plant for
treatment of potential naturally-occurring contaminants.
Alternative 4 – Abandon affected private water supply wells and replace with deeper wells. Based on input from Town residents and the Town Board, two sub-alternatives were identified: a) Replacement of each individual well, and b) Cluster wells, where deep wells would be installed to serve groups of six properties or less.
2.2 Community Engagement
Shortly after the repair was completed, the WDNR began to approach stakeholders to initiate discussions regarding implementing a long-term water supply solution for the affected area. Discussions were held with officials from the Town and Village. The WDNR hosted a public meeting on September 18, 2012. The Town sent a survey to residents in the affected area on September 20, 2012 to solicit input regarding long-term water supply alternatives. As part of the Phase 2 Evaluation, ARCADIS met with representatives of the Village and Town to collect information for the evaluation. Copies of workshop and meeting minutes are included in Appendix A. ARCADIS, WSPC and WDNR have also participated in several Town Board meetings to present information regarding potential long-term water supply alternatives.
2.3 Impacted Wells
As indicated above, a groundwater monitoring program was implemented to evaluate groundwater quality in the affected area. As of November 26, 2012, groundwater samples had been collected from 298 water supply wells on 286 properties and from 83 remediation/monitoring wells. Groundwater samples are analyzed for volatile organic compounds (VOCs) using United States Environmental Protection Agency (U.S. EPA) Method 524.2. For this Alternatives Evaluation, benzene is being used as an indicator of petroleum constituents to evaluate groundwater quality.
Groundwater quality criteria in Wisconsin are set forth in Chapter NR 140, Wis. Admin. Code. For each regulated constituent, two standards are established in NR 140: an ES and a preventive action limit (PAL). The PAL is lower than the ES and was developed as a ‘trigger’ standard. If a constituent concentration is below the ES but exceeds the PAL, NR 140 establishes a list of potential response actions which generally are associated with continued evaluation or monitoring. The ES represents the minimum

For Official Use Only
g:\aproject\buckeye\wi1304\jackson\reports\phase ii\phase2_report_20121227.docx
Phase 2: Evaluation of Long-Term Water Supply Alternatives, Town of Jackson
West Shore Pipe Line Company
2-4 2-4
concentration at which a constituent poses a potential risk to human health. The NR 140 ESs are equivalent to or lower than the U.S. EPA’s Maximum Contaminant Levels (MCLs). If an ES is exceeded, NR 140 establishes a list of potential responses, which are more aggressive than those for PAL exceedances, and range from further investigation to implementation of remediation.
The number of water supply wells that have demonstrated detectable benzene and exceedances of the NR 140 ES for benzene has fluctuated, but has been generally decreasing over time. An overview of detection changes over time (WSPC, 2012) is shown below in Table 2-2.
Table 2-2 Well Detections Summary
Date
Number of Wells with Benzene
Detections
Number of Wells with Benzene Detections
above NR 140 ES 8/11/2012 23 18 9/11/2012 15 12 10/12/2012 13 12 11/12/2012 17 13 11/26/2012 15 13 12/17/2012 14 13
Locations of properties with water supply wells demonstrating detectable benzene during at least one sampling event are shown on Figure 2-3.
2.4 Determination of Proposed Services
The Town Board and WDNR requested that each alternative be expandable in the event the area of impacted wells migrated. The conceptual infrastructure layout generally considers a service area near the region bounded by Maple Road, Division Road, Mill Road and Western Avenue and the subdivisions that include Wildflower, Mockingbird and Hummingbird Drives. Therefore, the alternatives are expandable to reasonably supply water should an increase in the number of well detections occur. The alternatives are not intended to support future growth/demands that may be created by subdividing parcels into developments. Future developers would be responsible for infrastructure necessary to support development. The system is designed to allow minimal growth; however, a balance must be achieved between designing a system for current demands only versus designing a system to sustain all

For Official Use Only
g:\aproject\buckeye\wi1304\jackson\reports\phase ii\phase2_report_20121227.docx
Phase 2: Evaluation of Long-Term Water Supply Alternatives, Town of Jackson
West Shore Pipe Line Company
2-5 2-5
land being converted to subdivisions and significant growth. This underscores the necessity to define proposed services for this Phase 2 Evaluation.
Phase 2 proposed services are defined based on WDNR’s recommendation that all properties with a well detection at any time and all immediately adjacent properties be included in proposed services. A property may not be required to connect to the replacement water supply; however, each alternative was developed as if it were serving all proposed services. Proposed services include 40 households with impacted wells or adjacent to impacted wells as indicated on Figure 2-4.
2.5 Proposed Services Water Consumption
The Phase 1 Alternatives Evaluation considered replacement water supply to all parcels within the Flush Only Advisory area that existed at the time of the Evaluation. A total of 64 homes were considered. The sizing of water infrastructure for each alternative continues to be based on the ability to serve the entire Phase 1 Evaluation area. Based on further delineation of the proposed services reflective of data available at the time of this Phase 2 Alternatives Evaluation, a total of 40 homes are now considered. Private well users typically do not retain well usage data; therefore water usage for residential and agricultural users was estimated.
2.5.1 Residential Demands
Multiple sources applicable for estimating residential water usage exist. Per Section 11.243.b of the Recommended Standards for Wastewater Facilities (GLUMRB, 2004), a proposed normal flow for planning purposes is 100 gallons per capita per day (gpcd). Per Table 6 of the Water Use in Wisconsin domestic water use is 56.1 gpcd (USGS, 2005). According to data obtained from the 2010 U.S. Census for Washington County, Wisconsin, an average of 2.51 occupants per household exists countywide, with 2.47 occupants per household within the Village. Water usage varies, and distribution systems are generally most economical when sources are designed to supply at up to the average rate of demand on the maximum day with demands in excess of this rate supplied from distribution storage.
A summary of estimated historical water usage and water infrastructure design usage for the 40 proposed services is provided in Table 2-3.

For Official Use Only
g:\aproject\buckeye\wi1304\jackson\reports\phase ii\phase2_report_20121227.docx
Phase 2: Evaluation of Long-Term Water Supply Alternatives, Town of Jackson
West Shore Pipe Line Company
2-6 2-6
Table 2-3 Estimated Proposed Services Water Consumption
System Demand Scenario
Historical Usage(1)
TotalDesign Demand
(gpd) Demand
Ratio
PerHousehold
(gpd) Total (gpd)
Average Day 141 5,700 10,000 - -
Maximum Day 226 9,100 16,000 1.6
Peak Hour 451 18,200 32,000 3.2(1) Based on USGS and U.S. Census data
As indicated in Table 2-3, water infrastructure is designed to provide water supply of 10,000 gpd on average. This amount is in excess of the 5,700 gpd estimated usage by the 40 proposed services, allowing flexibility for serving additional proposed services if required.
2.5.2 Agricultural Demands
Four properties located within the proposed services have water usage considered agricultural, as shown on Figure 2-3. WSPC provided bulk water deliveries to agricultural properties between August and November 2012. Per Table 10 of the Water Use in Wisconsin (USGS, 2005), dairy cows use 35 gallons per animal per day (gpapd) and horses use 10 gpapd. However, mixed agricultural usage within the area could not be estimated based on animal counts. Agricultural water usage within the proposed services will be supplied via existing wells with POET systems. Usage includes a nursery, raspberry farm and crop farms and is not intended for human consumption. Agricultural use properties will still be included in the long-term water supply solution for their residential usage.
2.6 Geology and Hydrogeology
ARCADIS conducted a desktop geologic study as part of this Phase 2 Alternatives Evaluation. A detailed discussion of the desktop geologic study and associated results is presented in Section 4.3. An overview of regional and local geology and hydrogeology is presented below.

For Official Use Only
g:\aproject\buckeye\wi1304\jackson\reports\phase ii\phase2_report_20121227.docx
Phase 2: Evaluation of Long-Term Water Supply Alternatives, Town of Jackson
West Shore Pipe Line Company
2-7 2-7
2.6.1 Regional Geology
Washington County’s regional geology is characterized by a series of geologic units consisting of unconsolidated deposits underlain by a sequence of bedrock units: limestone/dolomite; shale, dolomite, and sandstone; sandstone; and crystalline bedrock. The various geologic units from youngest to oldest are summarized in Table 2-4 below (WGNHS, 1980).
Table 2-4 Summary of Geologic Units
Period Lithology/Formation Description
Quaternary UnconsolidatedDeposits
Poorly sorted sand and gravel deposited by end and ground moraines. Clay and silt tills are also
present.
Silurian Limestone/Dolomite Very light to light gray, fossiliferous, medium to
coarse grained limestone with thin to thick beds. Discontinuous fractures are present in the upper
part of the unit.
Ordovician
Maquoketa Shale Greenish gray to purplish with interbedded dolomite and shale in the upper part and uniform shale in the
lower part of the unit.
Galena Dolomite, Decorah Formation, Platteville Formation
Light-gray to blue-gray, shaley dolomite.
St. Peter Sandstone White to light gray, fine to medium grained.
Prairie du Chien Group White to gray dolomite with some sandstone.
Cambrian
Trempealeau Formation Light gray, very fine to medium grained sandstone with interbedded siltstone.
Franconia Formation Very fine to medium grained sandstone with siltstone and dolomite beds.
Galesville Sandstone Light gray fine to medium grained sandstone.
Eau Claire Sandstone Light gray to light pink, fine to medium grained sandstone.
Mount Simon Sandstone
White to light gray, fine to coarse grained sandstone with interbedded dolomite and shale.
Precambrian Crystalline rock Crystalline rock.

For Official Use Only
g:\aproject\buckeye\wi1304\jackson\reports\phase ii\phase2_report_20121227.docx
Phase 2: Evaluation of Long-Term Water Supply Alternatives, Town of Jackson
West Shore Pipe Line Company
2-8 2-8
2.6.2 Regional Hydrogeology
Groundwater is used as potable water for Washington County (WCLWR, 2005). Over 12 million gallons per day (MGD) of water are withdrawn from groundwater in Washington County. There are three aquifers in Washington County, discussed below (USGS, 1992), and fact sheets on drinking water from private wells and public water systems from regulatory agencies are provided in Appendix B. Water from each aquifer has the potential to contain naturally occurring or regional contaminants that can affect potable water quality. These water quality parameters include arsenic, iron, manganese, hardness, bacteria and nitrate.
Unconsolidated Sand and Gravel Aquifer: The sand and gravel aquifer is the shallowest and youngest aquifer with its origins from glacial and alluvial deposits. Because the sand and gravel aquifer is shallow, it is directly connected to surface water and can be readily recharged through precipitation.
Niagara Aquifer: The Niagara Aquifer includes the Silurian limestone/dolomite found directly beneath the unconsolidated glacial and alluvial deposits and above the Maquoketa Shale. The Niagara is a primary aquifer used in Washington County for drinking water where the unconsolidated deposits are thin or not present.
In Washington County, groundwater is generally located 25 feet or less below ground surface (ft bgs) (WCLWR, 2005). Groundwater in the Niagara Aquifer flows to the southeast. The potentiometric surface is located between 800 and 900 feet above mean sea level (ft msl). Because groundwater is shallow, recharge to the Niagara Aquifer is provided predominantly by precipitation (SEWRPC, 2005).
Wells in the Niagara Aquifer have a sufficient yield to support supplying water for domestic, municipal, industrial, and irrigation purposes (WGNHS, 1980). The horizontal hydraulic conductivity for the Silurian limestone/dolomite is estimated at 1 to 4 feet per day (ft/d), and the vertical hydraulic conductivity is estimated at 0.001 to 0.1 ft/d.
Sandstone Aquifer: The Sandstone Aquifer, confined by the Maquoketa Shale, includes the Ordovician Galena-Platteville Dolomite, St. Peter Sandstone and Prairie du Chien Group sandstone formations (WGNHS, 1980). The potentiometric surface rises above the Maquoketa Shale and is below the potentiometric surface in the Niagara Aquifer in wells cased below the Maquoketa Shale. The potentiometric surface

For Official Use Only
g:\aproject\buckeye\wi1304\jackson\reports\phase ii\phase2_report_20121227.docx
Phase 2: Evaluation of Long-Term Water Supply Alternatives, Town of Jackson
West Shore Pipe Line Company
2-9 2-9
is approximately 100 to 200 feet below the groundwater elevation in the Niagara Aquifer, indicating a downward gradient exists.
Groundwater in the Sandstone Aquifer flows to the southeast. Recharge to the Sandstone Aquifer is predominantly where the Maquoketa Shale is absent, in the western third of Washington County. The Sandstone Aquifer has a sufficient well yield to support supplying water for domestic, municipal, industrial, and irrigation purposes (WGNHS, 1980). The horizontal hydraulic conductivity for the Galena-Platteville Formation and the St. Peter Sandstone Formation are estimated at 0.04 to 0.3 ft/d and 1.2 to 6 ft/d, respectively (SEWRPC, 2005). The vertical hydraulic conductivity for the Galena-Platteville Formation and the St. Peter Sandstone Formation show little variability, with estimated values at 0.0005 to 0.01 ft/d and 0.0004 to 0.04 ft/d, respectively.
Maquoketa Shale: The Maquoketa Shale is an aquitard located between the Niagara and Sandstone Aquifers. The shale exhibits geologic heterogeneity with bedding plane fractures where interbedded shale and dolomite facies are present in the upper part, compared to the lower part that has a uniform shale lithology (WGNHS, 2001).The horizontal conductivity is estimated at 0.0003 to 0.3 ft/d and the vertical hydraulic conductivity is estimated at 0.000005 to 0.001 ft/d (SEWRPC, 2005). As indicated above, the Maquoketa Shale is absent in the western third of Washington County.
2.6.3 Local Geology
Local geology in the immediate area of the pipeline repair consists of unconsolidated Quaternary deposits overlying a local bedrock high. Quaternary deposits consist mostly of clay, but are variable and can include sand and gravel. Quaternary deposits range in thickness from 3 to 27 feet with thickening to the north, south, east, and west away from the bedrock high.
Bedrock underlying the Quaternary deposits consists of Silurian limestone/dolomite. Depth to bedrock ranges from 3 to 27 ft bgs in the area of the bedrock high and deepens to 300-500 ft bgs approximately 2 miles to the west of the area due to a north-south trending erosional valley in the bedrock surface. Based on Village municipal wells, thickness of the limestone/dolomite in the affected area ranges from 120 to 225 feet. The limestone/dolomite is very vuggy (i.e., small cavity in a rock or vein often lined with crystals) and often highly fractured with soft zones and vugs reported during drilling.

For Official Use Only
g:\aproject\buckeye\wi1304\jackson\reports\phase ii\phase2_report_20121227.docx
Phase 2: Evaluation of Long-Term Water Supply Alternatives, Town of Jackson
West Shore Pipe Line Company
2-10 2-10
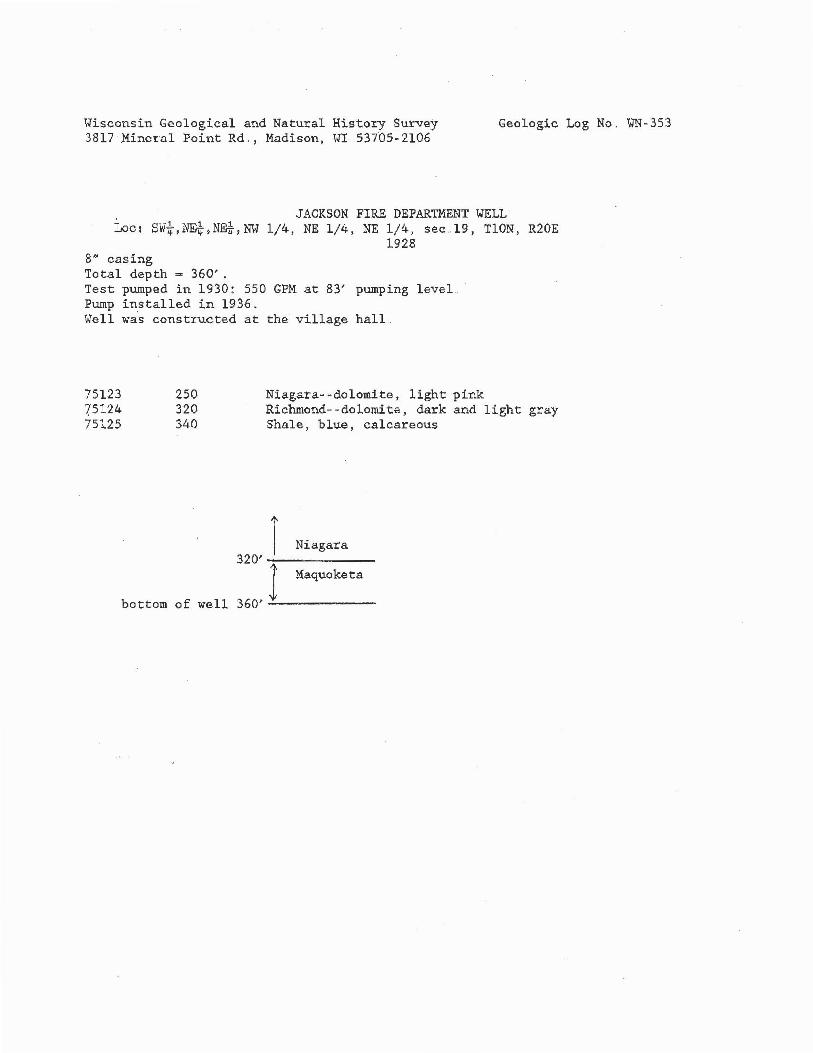
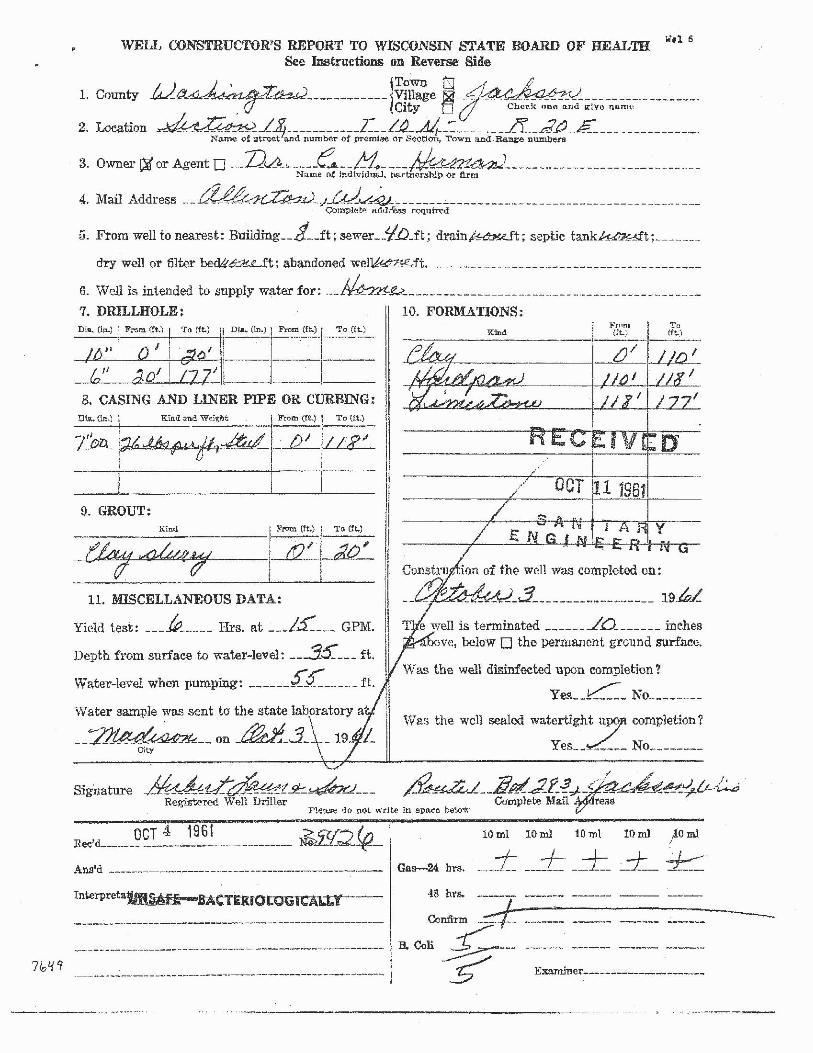
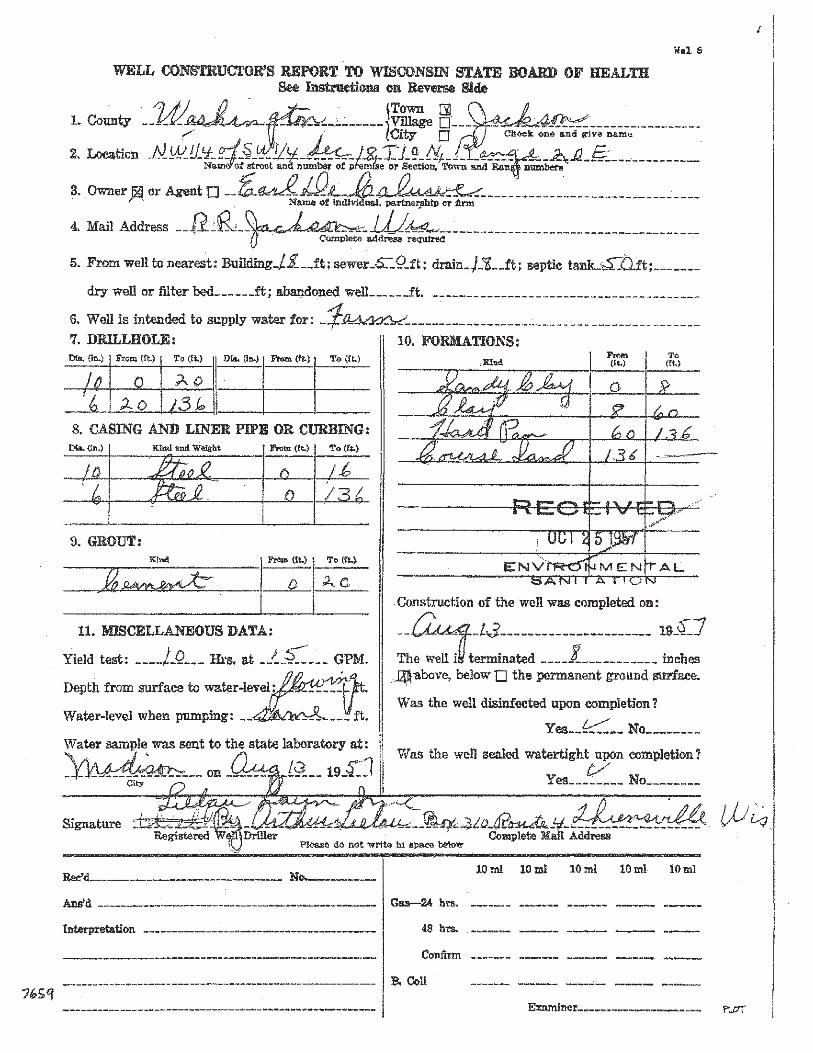
The Ordovician Period Maquoketa Shale underlies the Silurian limestone/dolomite. Several Village municipal wells penetrate the top of the shale at depths ranging from 280 to 320 ft bgs. The shale has been described as greenish to blue-gray, dolomitic, and somewhat hard, with traces of fossils and pyrite. The upper part of the shale is often interlayered with and gradational to dolomite. The thickness of the Maquoketa Shale, where completely penetrated by municipal wells in the Village and the city of Cedarburg, is approximately 200 feet.
The Maquoketa Shale is underlain by Ordovician Period dolomite of the Sinnipee Group that includes the Galena, Decorah, and Platteville Formations. The top of the Galena Formation was found at 480 ft bgs in one Village municipal well and ranges from 680 to 745 ft bgs in several city of Cedarburg municipal wells. The Ordovician dolomites are light gray and brown, dense, with traces of pyrite, white chert, red speckling, and some interbedded shale. The thickness of the Ordovician dolomites where completely penetrated by municipal wells in the city of Cedarburg is approximately 200 feet.
The Ordovician Period St. Peter sandstone is beneath the Ordovician dolomites. The St. Peter sandstone is not penetrated in the affected area but is found in several municipal wells in the city of Cedarburg to the east. Where encountered, the depth to the top of the St. Peter sandstone ranges from 920 to 1,035 ft bgs. The sandstone is light yellowish gray, very fine to coarse grain, with a trace of dolomitic cementing. The St. Peter sandstone is the deepest formation encountered in the area and not completely penetrated, except for one well where the thickness was 205 feet.
None of the private water supply wells in the affected area penetrate the Silurian limestone/dolomite. As a result, little information is available regarding the depth or thicknesses of the underlying bedrock formations in the immediate area of the pipeline repair, including the continuity of the Maquoketa Shale.
2.6.4 Local Hydrogeology
The Niagara Aquifer, where the water table is present, is the major water supply in the affected area. All the area residential wells and a majority of the Village municipal wells produce water from this unit. The static water level reported in the residential wells at the time of installation ranged from 45 to 125 ft bgs. Water levels reported from monitoring and extraction wells installed in the affected area ranged from approximately 95 to125 ft bgs or 855 to 832 ft msl.

For Official Use Only
g:\aproject\buckeye\wi1304\jackson\reports\phase ii\phase2_report_20121227.docx
Phase 2: Evaluation of Long-Term Water Supply Alternatives, Town of Jackson
West Shore Pipe Line Company
2-11 2-11
Groundwater flows primarily to the east; however, due to the bedrock high in the affected area, some radial flow to the north, west and south may also be expected. In addition, fractures in the Niagara limestone affect groundwater flow.
Residential wells in the affected area ranged in depth from 45 to 125 ft bgs. The depth to water during pumping tests performed during historic private water well installations ranged from 63 to 150 ft bgs. Sustained flow rates during pumping tests conducted after historic private water well construction ranged from 8 to 25 gpm, and flow rates of 15 to 20 gpm were common. Residential wells were generally completed with a 6-inch open hole, with surface casing installed to depths ranging from 27 to 166 ft bgs.
For Official Use Only
g:\aproject\buckeye\wi1304\jackson\reports\phase ii\phase2_report_20121227.docx
Phase 2: Evaluation of Long-Term Water Supply Alternatives, Town of Jackson
West Shore Pipe Line Company
3-1 3-1
3. Phase 2 Alternatives Development
Alternatives 2, 3A, 3G and 4 were selected for further comparison and evaluation. The following sections present an overview of each of these alternatives.
3.1 Identification of Alternatives
Due to the dynamic nature of site conditions and the overall project, identification and refinement of the selected alternatives is based on information available at the time of this Evaluation.
3.1.1 Alternative 2 – Village PWS
Alternative 2 would extend the Village PWS to the proposed services with service connections from the water main to each user as shown on Figure 3-1. Users would be long-term water customers of the Village’s Water Utility. Improvements necessary to adequately serve the users were identified and included in this Evaluation. This alternative will have sufficient capacity to add additional properties if the affected area changes and to support limited growth.
Locations of existing Village water mains and planned future water mains are shown on Figure 3-1. The long-term water supply must be reliable and redundant; therefore portions of 12-inch diameter mains are included in this alternative in accordance with the Village’s master plan to provide service in the 2030 Village Limits. All water mains directly serving users are assumed as 8-inch diameter.
The Village’s master plan also identifies a need for a future elevated tank in the proposed services’ vicinity; however, the Village does not own property in the area for an elevated tank. WSPC may consider negotiating acquisition of property for a tank site.
3.1.2 Alternative 3 – Town of Jackson SD
Alternative 3 would be a Town-maintained SD providing a public water supply to the proposed services. This alternative is further divided into two sub-alternatives, as included in Phase 1, based on the SD’s water source.
Alternative 3A would establish a SD that provides water from the Village PWS. The SD would be considered a consecutive system, purchasing bulk water from the Village. All
For Official Use Only
g:\aproject\buckeye\wi1304\jackson\reports\phase ii\phase2_report_20121227.docx
Phase 2: Evaluation of Long-Term Water Supply Alternatives, Town of Jackson
West Shore Pipe Line Company
3-2 3-2
water infrastructure and customers beyond the master meter would be the responsibility of the Town SD. Water infrastructure required to develop the SD is identified on Figure 3-2. Water main routes are similar to Alternative 2, with the exception that an additional structure is shown at the future elevated tank site. An Interconnection Facility would contain the master meter, backflow prevention, booster pumps and space for future booster chlorination equipment. Provisions would be included to allow booster chlorination if warranted in the future; however, based on discussion with Village representatives, it is not anticipated that booster chlorination would be required at this time. Space for a hydro-pneumatic tank would also be planned into this building.
Alternative 3G establishes a SD that provides water via new, SD-owned pubic water system wells. Wells would be drilled on Town Hall property located at 3146 Division Road, which is the closest potential site to the release that could be utilized and is owned by the Town. There is an assumption that sufficient quantity and quality of water could be found at this area. Public water system treatment would also need to occur on the property, where the water distribution system would distribute treated water from wells at the Town Hall property to the proposed services. Water infrastructure locations are identified on Figure 3-3. To provide a reliable and redundant long-term water supply, two wells are included, with each well of adequate capacity to supply the system demands. The SD in this alternative would be physically separate and not reliant on the Village PWS.
3.1.3 Alternative 4 – New Private Water Supply Wells
Alternative 4 would provide water supply to the proposed services through private individual or cluster wells. This alternative did not score well in comparison to other alternatives in the Phase I Alternatives Evaluation; however, the Town requested that it be considered further. Where feasible, up to six households would share a single private well without the design or reporting requirements of a public water system. Due to the rural nature of the area, some households would be provided with an individual well where cluster wells would not be geographically feasible. However, cluster (or individual) wells must be capable of providing long-term water supply that meets public drinking water standards. As a result, treatment of well water for naturally occurring contaminants (i.e., arsenic, radionuclides, iron, manganese, hardness) or contaminants associated with regional land use (i.e., nitrate from agriculture) may be necessary. Preliminary water infrastructure locations for this alternative and service connections from each cluster well to the proposed services are shown on Figure 3-4.

For Official Use Only
g:\aproject\buckeye\wi1304\jackson\reports\phase ii\phase2_report_20121227.docx
Phase 2: Evaluation of Long-Term Water Supply Alternatives, Town of Jackson
West Shore Pipe Line Company
4-1 4-1
4. Phase 2 Alternatives Evaluation
Each alternative was evaluated as a viable, long-term, safe and reliable drinking water supply for the proposed services. Each evaluation includes technical, regulatory, economic and additional considerations. A comparison of the evaluation results for each alternative is presented in Section 5. Results of the alternative comparison and final recommendations for the long-term water supply solution are reviewed and discussed in Section 6.
4.1 Alternative 2 – Village of Jackson PWS
The Village Water Utility owns and maintains a water distribution network with water mains in the southeastern portion of the Village approximately one mile from the proposed services. As the nearest PWS, it is a feasible source for long-term water supply of the proposed services. However, the Village system must have adequate capacity to sustain the additional water usage. Alternative 2 considers extending the Village system to the proposed services, and users would be direct customers of the Village Water Utility. This extension of the water system beyond the current and 2030 Village Limits would require a revision or supplement to the existing Village of Jackson Revenue Sharing Agreement and Cooperative Boundary Plan (Border Agreement). Regulatory, negotiations and additional considerations applicable to this alternative were also evaluated.
4.1.1 Distribution System Hydraulic Assessment
The Village provided a copy of their latest water distribution system hydraulic model to assist in evaluating their system for purposes of this work. The model was last calibrated by Bonestroo (now Stantec) in June 2011 and is assumed to reasonably reflect current system conditions and operations. A complete system analysis considers the following: high head loss, high and low pressures, fire flow capacity, distribution storage and turnover, reliability and redundancy, operations and maintenance and water quality. The model provided by the Village does not appear to be developed to perform calibrated extended period analyses. A steady-state model simulation was completed to evaluate portions of the system reliability and redundancy, hydraulic grade line (HGL), pressures and fire flow capacity.
For Official Use Only
g:\aproject\buckeye\wi1304\jackson\reports\phase ii\phase2_report_20121227.docx
Phase 2: Evaluation of Long-Term Water Supply Alternatives, Town of Jackson
West Shore Pipe Line Company
4-2 4-2
4.1.1.1 Previous System Analysis
A summary of the Water Analysis Report dated October 20, 2006 and prepared by Bonestroo (now Stantec) is set forth below:
1) Water infrastructure consists of five wells, two elevated tanks (0.2 million gallons [MG] Central Tank and 0.5 MG West Tank), each with an overflow HGL at elevation 1,065 feet, USGS Datum, one booster pumping station and one hydro-pneumatic tank.
2) The low pressure zone serves customers at ground elevations ranging from 840 to 965 feet.
3) The booster pumping station zone serves customers at ground elevations of 990 to 1,054 feet.
4) Village wells have a firm capacity (capacity with largest pump out of service) of 3.4 MGD.
5) Maximum day demand in 2006 of 1.34 MGD projected to increase to 1.77 MGD by 2009 and 1.92 MGD by 2010.
6) Maximum day demand to average day demand ratio of 1.86.
7) Recommended to add 12-inch diameter mains to loop southeastern area of the system.
8) Recommended to add elevated tank in southeastern portion of system in 2009 and add elevated tank in northern portion of system in 2010, contingent on system demands increasing as projected.
Analysis recommendations are revisited in this report, as appropriate, and based on actual system demands from January 2010 through June 2012.
4.1.1.2 Current System Conditions
As stated in the system analysis summary above, maximum day water demands were projected to increase to 1.77 MGD by 2009 and 1.92 MGD by 2010, warranting a new elevated tank in the low pressure zone in 2009 and a new elevated tank in the north

For Official Use Only
g:\aproject\buckeye\wi1304\jackson\reports\phase ii\phase2_report_20121227.docx
Phase 2: Evaluation of Long-Term Water Supply Alternatives, Town of Jackson
West Shore Pipe Line Company
4-3 4-3
zone in 2010, respectively. Following 2006 demand projections, the Village has experienced attenuated growth of water demands, similar to many other public water systems.
Data provided by the Village indicates annual maximum day demands of 1.171 MGD in 2010 (versus projected demand of 1.92 MGD), 1.238 MGD in 2011 and 1.115 MGD in 2012 (to date of data acquisition) or an average of 1.18 MGD maximum day demand over this 2-year period.
4.1.1.3 Current System Assessment
The water source for the Village PWS is a series of wells providing a firm capacity of 3.4 MGD. Current maximum day demands of 1.18 MGD are within the firm well capacity. Including a maximum day water usage projection of 16,000 gpd for the affected parcels would increase system demand by approximately 1.4 percent to 1.196 MGD. Based on maximum day demands totaling 1.196 MGD, the firm well capacity of 3.4 MGD is adequate to supply existing system and projected design demands from the proposed services.
The distribution system is generally well reinforced; however, the southeastern portion is in need of improvements to ensure system reliability and redundancy. Currently, the Twin Creeks subdivision is supplied water via a single 8-inch diameter main, and the Oakland Drive/Hickory Lane/Sherman Parc area is supplied water via a single 12-inch diameter main. A 12-inch diameter main along Sherman Road and Jackson Drive from Hickory Lane to Twin Creeks Road would provide reliability and redundancy for existing Village customers and for the additional 40 proposed services. This 12-inch diameter water main is included in the Alternative 2 water infrastructure improvements and will be included in remaining distribution system evaluations.
The proposed water infrastructure for Alternative 2 was added to the existing system hydraulic model for analysis. Model junctions were included at all pipe intersections and at high and low elevations along the water main routes. Results of the simulated distribution system pressures are presented in Figure 4-1. As shown on Figure 4-1, the proposed Alternative 2 distribution system would be served with adequate pressures greater than 45 pounds per square inch (psi) during maximum day demand conditions. Addition of an elevated tank or booster pumping station is not warranted due to system pressures in Alternative 2.

For Official Use Only
g:\aproject\buckeye\wi1304\jackson\reports\phase ii\phase2_report_20121227.docx
Phase 2: Evaluation of Long-Term Water Supply Alternatives, Town of Jackson
West Shore Pipe Line Company
4-4 4-4
The proposed location of a future elevated tank is also shown on Figure 4-1. A system analysis completed in 2006 by Bonestroo identified a need for additional system storage when warranted by increased system demands. Due to the existing system and affected user maximum day demands totaling 1.196 MGD, which is below the 1.77 MGD rate projected for implementing an elevated tank in the southeastern portion of the system, an elevated tank is not required based on system demands.
4.1.2 Border or Supply Agreements
The need for a long-term water supply is driven by the emergency nature of the release. While the Border Agreement provides the best protection for the Village Water Utility, it is recommended that a separate water supply agreement be entered into for extending water to the proposed services. Town developers cannot simply extend the water distribution system (WDS) network or connect to the WDS network and develop a subdivision without Village approval. It is recommended that any future development activities in this area require modification of the Border Agreement, as is the nature and intent of the existing Border Agreement and cooperative working relationship between the Village and Town.
4.1.3 Regulatory Considerations
Chapters NR 809 (Safe Drinking Water), NR 810 (Requirements for the Operation and Maintenance of Public Water Systems), NR 811 (Requirements for the Operation and Design of Community Water Systems) and NR 812 (Well Construction and Pump Installation) regulate various aspects of public water systems. These requirements are currently being met by the Village PWS and would extend to the proposed services. Failure to do so would result in a violation of State and Federal laws.
The Public Service Commission (PSC) of Wisconsin regulates public water utilities including major capital improvements and utility rates and requires various annual reports and financial statements from utilities be filed. The PSC also reviews new public wells and treatment, and approves or denies them based on potential water supplies and sources in an area.
Section NR 812.26, Wis. Admin. Code requires that water supply wells taken out of service be abandoned (i.e., sealed). For properties where connection to the PWS will occur, the existing water supply well would be decommissioned by removing the pump to prevent cross-connections or use of the Niagara Aquifer. In the long term, it is assumed that each of the decommissioned water supply wells would be sealed in

For Official Use Only
g:\aproject\buckeye\wi1304\jackson\reports\phase ii\phase2_report_20121227.docx
Phase 2: Evaluation of Long-Term Water Supply Alternatives, Town of Jackson
West Shore Pipe Line Company
4-5 4-5
accordance with Chapter NR 812, Wis. Admin. Code. In the near term, WDNR may request that decommissioned water supply wells be maintained for collection of groundwater samples to monitor groundwater quality in the Niagara Aquifer as remediation progresses. For a few properties, the existing well and POET system will be transitioned into an agricultural well, completely disconnecting potable water in the home from remaining agricultural uses.
4.1.4 Additional Considerations
A key negotiation issue is for permission to install water service laterals onto each property and connect to the new system. Size of water mains, fire protection and new elevated water storage tank are all considered negotiable under this alternative. Although a rural water network utilizing 4-inch diameter mains would be adequate to provide water in quantity and quality similar to what previously existed, Village standards set the minimum acceptable water main at 8-inch diameter. Further, hydrants may be required by state regulations.
While the Village’s 2030 master plan proposes a water storage tank in this area when justified by higher demands, at this time, construction of this proposed tank is not recommended. However, consideration may be given to secure a site for a future tank as part of this overall plan.
Extending the Village PWS service area to provide long-term, safe water supply to the proposed services would be fairly straightforward. The Village PWS is in the business of providing water, is knowledgeable, is currently under the jurisdiction of regulators, and is appropriately staffed. This alternative provides the least concerns for operations, maintenance and long-term viability.
4.2 Alternative 3 – Town of Jackson SD
Alternative 3 would construct a water distribution system within the affected area, and laterals would be extended to the proposed services. Each affected water supply well would be decommissioned in accordance with Chapter NR 812, Wis. Admin. Code. The SD would obtain water from one of two sources, from the Village PWS or from public water supply wells installed as part of the overall SD’s water system.
A SD is a quasi-governmental entity with taxing authority, similar to a town or village. SDs are established under Wisconsin Statutes, Chapter 60 – Towns, Subchapter IX – Town SD. These districts provide water and/or sanitary sewer service to protect the

For Official Use Only
g:\aproject\buckeye\wi1304\jackson\reports\phase ii\phase2_report_20121227.docx
Phase 2: Evaluation of Long-Term Water Supply Alternatives, Town of Jackson
West Shore Pipe Line Company
4-6 4-6
public health of an area where a water or sanitary sewer utility cannot provide service and where private systems are not considered feasible. When required, the WDNR can force establishment of a SD to protect public health.
A SD has the ability to own, operate, manage and maintain water and sewer utilities. Once created, they are treated basically the same as any other public water or sanitary sewer utility. As such, administration, operation and maintenance of a SD are regulated by the Wisconsin Administrative Code, Wisconsin Statutes and Annotations, WDNR, and PCS. The utility would need to establish an income stream appropriate to operate, manage, and maintain the utility system in accordance with the appropriate Wisconsin Administrative Code. This alternative assumes creating a SD for the purpose of providing long-term, safe and reliable water supply for the proposed services.
4.2.1 Water Supply Source
The SD would be required to obtain a safe supply of water and distribute this safe, reliable water to the proposed services. Two options for a water source were evaluated as part of this Phase 2 Alternatives Evaluation. Alternative 3A considers the Village PWS as a water source, and Alternative 3G considers new wells drilled specifically for the SD.
4.2.1.1 Village PWS
The Village PWS is considered the most viable source of public water supply in the area. The Village has sufficient quantity and quality of water to serve the needs of the SD. Water would be transported to the point of connection where the Town would purchase the water through a master water meter connection.
A distribution system hydraulic assessment, identical to the assessment performed for Alternative 2, was also performed for this alternative. By adding a master meter, backflow prevention, and other appurtenances, an additional 10 to 15 psi pressure loss at the point of connection from the Village PWS to the Town SD will result. This will require addition of a Booster Pumping Station (BPS) to maintain adequate system pressure within the SD. A 1,500 gallon hydro-pneumatic tank would also be added to maintain system pressures and attenuate surges during periods of peak demand. A preliminary layout for an Interconnection Facility, including the BPS, is presented as Figure 4-2.

For Official Use Only
g:\aproject\buckeye\wi1304\jackson\reports\phase ii\phase2_report_20121227.docx
Phase 2: Evaluation of Long-Term Water Supply Alternatives, Town of Jackson
West Shore Pipe Line Company
4-7 4-7
The master meter, BPS and tank would be owned and maintained by the Town SD. The proposed site for these facilities and a portion of the district’s distribution system downstream of these facilities would be constructed within the 2030 Village Limits (Figure 3-2). Easements and property transfers would be required to allow for operation and maintenance of District facilities and water mains.
4.2.1.2 Town Wells
The Town Board could also install its own municipal well fields and treatment facilities to produce sufficient water to serve the needs of the SD. New municipal wells would be developed as a water source. Developing a groundwater source would be in accordance with Chapter NR 811, Wis. Admin. Code, and well construction and pump installation would be in accordance with Chapter NR 812, Wis. Admin. Code. A proposed municipal well section is shown on Figure 4-3.
Two wells would be constructed for redundancy. Both well pumps would be sized to handle system demands independently of the other. Each well site would require a lot or parcel of land with minimum dimensions of 100 feet by 100 feet. A well site investigation report would be prepared for each well site and submitted before or concurrent with a request for approval of a test well or permanent well. Proposed well sites are recommended at the Town property where the Town Hall and community sports fields are located (Figure 3-3). If there are existing septic systems on the property, wells would need to maintain a minimum separation distance of 400 feet.
Section NR 811.12(5), Wis. Admin. Code states that water supply wells must be located at least 1,200 feet from known contamination sites. The affected area is located more than 1,200 feet from the Town Hall property. It is anticipated that WDNR will establish additional standards for well construction to safeguard against migration from the affected area. This alternative assumes that the Town wells would be installed to depth through the Maquoketa shale layer and into the Sandstone Aquifer.
A water quality analysis for wells that are in operation drawing from the Sandstone Aquifer was performed on existing data from wells throughout Washington and surrounding counties. Based on results of that analysis, this alternative assumes that along with disinfection requirements, the SD would also provide treatment for iron, manganese and arsenic that may be above NR 140 ESs. If this alternative is selected, it is recommended that a test well be constructed at one of the permanent well sites to confirm water quality before detailed design of treatment facilities. Also, treatment of arsenic would require a pilot study prior to approval for implementation.

For Official Use Only
g:\aproject\buckeye\wi1304\jackson\reports\phase ii\phase2_report_20121227.docx
Phase 2: Evaluation of Long-Term Water Supply Alternatives, Town of Jackson
West Shore Pipe Line Company
4-8 4-8
Upon reviewing acceptable treatment methods described in Chapter NR 811, Wis. Admin. Code, all three contaminants listed above would be treated with an oxidation and filtration unit process along with adsorption media technology. Well pumps would pump through pressure filters with chlorine feed pre-filtration for oxidation of the contaminants and another chlorine feed point post-filtration for disinfection. The filtered water would then be re-pumped into a 4,000 gallon hydro-pneumatic tank to maintain system pressures, provide for backwash water, and attenuate surges during periods of peak demand. A preliminary flow schematic for the treatment facility is shown on Figure 4-4.
As stated above, arsenic is present as a naturally occurring contaminant. Chapter NR 811, Wis. Admin. Code requires pilot testing for any unit process being proposed for the treatment of arsenic. Detailed design of such a process would be based on information from a pilot study. For purposes of this Phase 2 Alternatives Evaluation, a three month pilot study was assumed, following a projected nine month review and approval process by PSC, for a 12 month total regulatory review period.
Finally, the waste stream from the treatment process must be appropriately handled. Ideally, the filter backwash wastewater would be discharged directly to a sanitary sewer system. Because the Village’s sanitary system is approximately 1.6 miles away, a sanitary pumping station and force main would be needed. However, for the conceptual design phase, it is recommended that a backwash waste recycling system be chosen with zero wastewater discharge and only a sludge load-out connection. This method is more cost effective due to lack of a nearby sanitary sewer collection system.
4.2.2 Facilities and Staffing
The most significant operating cost for a utility is typically personnel, including administrative support, customer service, licensed operators, equipment operators, service technicians, and meter readers. Emergency responders for main breaks and major equipment malfunctions would also be required. Some of this staffing could be provided through current Town staff, if available. In accordance with Chapter NR 810, Wis. Admin. Code the District is required to employ a certified operator to oversee water quality monitoring and preparation and submittal of monthly reports to WDNR. None of these positions justify full-time employment. The SD could also consider subcontracting these duties out to a public entity, such as the Village, or a private business, who already has trained personnel in the area that could be responsible for the monitoring, reporting, billings, financials and maintenance responsibilities needed by the SD.

For Official Use Only
g:\aproject\buckeye\wi1304\jackson\reports\phase ii\phase2_report_20121227.docx
Phase 2: Evaluation of Long-Term Water Supply Alternatives, Town of Jackson
West Shore Pipe Line Company
4-9 4-9
Regardless of the supply water source, it is anticipated that the SD would need a facility somewhere within the Town for storing spare parts and materials. It is assumed for purposes of this study that existing Town maintenance facilities would be used, thus no additional buildings are included. The SD would need to maintain this storehouse, ensure that the necessary items are available for repairs, operation and maintenance of the SD’s BPS and distribution system. It is also expected that the SD would need to purchase a service vehicle to assist with day-to-day operations.
4.2.2.1 Interconnection Facility and BPS
Facility components for Alternative 3 include the check valve, master meter, BPS and hydro-pneumatic tank. It is recommended that all of these components be incorporated into one Interconnection Facilities Building (Figure 4-2).
4.2.2.2 SD Water Treatment Facility
Facility components for this alternative include well fields and well pumps. A building near the well fields to house the water treatment unit processes would need to be constructed and sized to house pressure filters, chlorine storage and chemical feed equipment, filtered water pumps, and hydro-pneumatic tank. In addition, the wastewater treatment tanks, recirculation and sludge load-out equipment would be housed in this building (Figure 4-4).
4.2.3 Regulatory Considerations
Regulatory considerations are two-fold for this alternative: 1) Establishing a water utility capable of serving the proposed services, and 2) establishing a SD. Utilization of wells is regulated via Section NR 811.12(5), Wis. Admin. Code. It establishes siting requirements for wells used as part of a community water system. Section NR 811.12(5) states that water supply wells must be located at least 1,200 feet from solid waste facilities and other known sources of contamination. In addition, treatment for arsenic requires pilot testing per Section NR 811, Wis. Admin. Code, as discussed in Section 4.2.1.2.
The PSC of Wisconsin regulates public water utilities (Section 4.1.3 above). As stated, they regulate, review and require reporting. For a new water system, reviews are expected to require between six and nine months and include additional time for public meetings and comments. The PSC contacted ARCADIS regarding this evaluation and indicated that establishment of small SDs such as Alternative 3 is generally

For Official Use Only
g:\aproject\buckeye\wi1304\jackson\reports\phase ii\phase2_report_20121227.docx
Phase 2: Evaluation of Long-Term Water Supply Alternatives, Town of Jackson
West Shore Pipe Line Company
4-10 4-10
discouraged because utilities this small frequently encounter management, operational, or financial difficulties that can adversely affect users.
Establishing the SD would need to comply with Chapter 60, Subchapter IX, of the Wisconsin Statutes; however, it also could be established at the order of WDNR. This process would begin with WDNR giving the Town Board 30 days notice that they wish to hold a public hearing, and the Board then would be responsible for publishing a hearing notice. After the hearing, and upon receipt of notice from WDNR, the Town Board would be ordered to establish a Town SD. If the Town Board did not establish a SD within 45 days of the notice from WDNR, WDNR has the authority to issue orders establishing boundaries of the SD, declaring the District organized, and giving the District a corporate name.
Section NR 812.26, Wis. Admin. Code requires that water supply wells taken out of service be abandoned (i.e., sealed). For properties where connection to the SD will occur, the existing water supply well would be decommissioned as presented above in Section 4.1.3.
4.2.4 Additional Considerations
The water source supply would be the main factor to consider in negotiations. Supply from Village PWS would require the most significant negotiations, whereas developing SD wells would be fairly straightforward.
For a well water supply owned by the Town, the key negotiation issue is for permission to install water service laterals onto each property and connect to the new system. The SD would have to decide on distribution system piping diameter and whether or not to provide fire hydrants. Although a rural water network utilizing 4-inch diameter mains would be adequate to provide water in quantity and quality similar to what existed previously, if fire hydrants are desired or required, a minimum 6-inch diameter or recommended 8-inch diameter, main would be necessary.
A well site must be acquired, test wells drilled and sampled and final design for wells and necessary treatment completed. Acquisition of a well site would require negotiation if the Town Hall property were not used.
As mentioned above, negotiating agreements for a water supply source from the Village would be more involved. The first issue is whether the Border Agreement would require update, or whether a separate water supply agreement would suffice. The latter

For Official Use Only
g:\aproject\buckeye\wi1304\jackson\reports\phase ii\phase2_report_20121227.docx
Phase 2: Evaluation of Long-Term Water Supply Alternatives, Town of Jackson
West Shore Pipe Line Company
4-11 4-11
is recommended, and such a supply agreement should resolve issues regarding size of water mains to be attached, average and maximum flow rates desired at the point of connection, impact fees to be collected, quality of water delivered at the point of master meter, rates charged for water, term of agreement, and how to modify the agreement over time for growth of the SD’s water network.
Property acquisition for the water treatment facility would be needed if the Town Hall property was not used. Any special requirements for the building’s architectural features, zoning, any site fencing needed, etc. should be considered. Also, internal components (pumps, storage tank, office space or not, and other considerations) as well as possible need for sanitary sewer on the site should be considered.
Other operational issues with either supply source could be included in the water supply agreement, such as possible desire to subcontract with the Village for operations, maintenance and management (customer service, meter reading, billings, etc.). Emergency repairs could also be contracted as part of such an agreement.
Through use, deeper wells could draw contaminant vertically if there are unknown fissures, cracks, or crevices in the Maquoketa Shale resulting in a newly impacted well. This could impair the new well, thus reversing the situation and creating a need for new wells. Also, construction activities could result in similar contaminant migration vertically. Water quality at deeper strata at the actual well site could significantly affect treatment infrastructure and associated costs.
Additional operations, maintenance and management activities are required with operating a water utility and are compounded by addition of wells and water treatment. The more complexities introduced to a utility, the higher the OM&R expenses and initial design and construction. Given the relatively small size of the system needed for the proposed services, the long-term cost per user could be significant.
The list of regulated contaminants continues to be evaluated by U.S. EPA and continues to grow. Over time SD operations could be increased, and more treatment for additional, currently unregulated contaminants could be required. This also increases costs to end users.
Time frame to set up a SD and get agreements in place prior to providing water to residents will be longer than the other alternatives. Inter-government relationships, procedures, and public meetings could pose significant time delays in final implementation of this alternative. Plan reviews for design can be expedited for the

For Official Use Only
g:\aproject\buckeye\wi1304\jackson\reports\phase ii\phase2_report_20121227.docx
Phase 2: Evaluation of Long-Term Water Supply Alternatives, Town of Jackson
West Shore Pipe Line Company
4-12 4-12
piping system. However, timing for pilot studies for arsenic treatment (if needed) could delay final implementation and water supply to the proposed services
4.3 Alternative 4 – New Private Water Supply Wells
Under Alternative 4 each existing private water supply well would be decommissioned by removing the well pump, and a new water supply well would be installed to provide potable water. Decommissioned wells would either be maintained as monitoring wells to continue evaluating the extent of affected groundwater or sealed in accordance with Chapter NR 812.26, Wis. Admin. Code.
During the Phase 1 Alternatives Evaluation, several concerns were raised regarding installation of replacement water supply wells. The goal of this process is to provide affected properties with a long-term, safe and reliable source of potable water. If replacement wells were installed in a lower portion of the Niagara Aquifer or the upper portion of the Sandstone Aquifer, the combined effect of multiple operating water supply wells has the potential to draw contaminants further downward into previously unaffected aquifers. In addition, water quality parameters associated with naturally occurring conditions such as hardness and iron often increase in concentration with depth.
The Town Board requested that installation of replacement wells be retained as an alternative. It was also suggested that a variation of this alternative be included in the Phase 2 Alternatives Evaluation. To reduce the number of replacement water supply wells, the Town Board suggested that consideration be given to installing water supply wells that would service groups of properties, clustering properties in close proximity with one another to provide water from a common well. This variation was also reviewed as part of the Phase 2 Alternatives Evaluation.
4.3.1 Desktop Geologic Study
ARCADIS completed a desktop geologic study to evaluate hydrogeologic conditions in the area and determine whether Alternative 4 would be feasible for providing affected properties with a long-term, safe and reliable source of potable water.
4.3.1.1 Regional Geology
Washington County’s regional geology is characterized by a series of geologic units consisting of unconsolidated deposits underlain by a sequence of bedrock units:

For Official Use Only
g:\aproject\buckeye\wi1304\jackson\reports\phase ii\phase2_report_20121227.docx
Phase 2: Evaluation of Long-Term Water Supply Alternatives, Town of Jackson
West Shore Pipe Line Company
4-13 4-13
limestone/dolomite; shale, dolomite, and sandstone; sandstone; and crystalline bedrock. Bedrock cross sections were prepared to depict subsurface conditions, and locations of geologic cross sections are depicted on Figure 4-5. Cross sections A-A’ and B-B’ are presented on Figures 4-6 and 4-7, respectively. Boring logs and well construction reports reviewed in the desktop geologic study are included in Appendix C. A summary of the various geologic units from youngest to oldest is presented below.
Unconsolidated Deposits: In Washington County unconsolidated deposits were formed during the Quaternary Period, which started approximately 1.6 million years ago. As the Laurentide Ice Sheet advanced from central and eastern Canada into Wisconsin, several distinct lobes were formed including the Green Bay and Lake Michigan Lobes (WGNHS, 1997). These lobes transected Washington County from northeast to southwest. The Lake Michigan Lobe was located where the Village is currently located. As the two lobes retreated, melt water flowed south under and above the ice sheet and deposited massive amounts of sand and gravel, along with clay and silt.
Unconsolidated deposits in the southeast quarter of Washington County were formed from end and ground moraine (WGNHS, 1983). Thickness of deposits range from zero (where the underlying dolomite bedrock outcrops at the surface) up to approximately 50 feet. Deposits belong to the Waubeka Member of the Holy Hill Formation that contains sand, gravel, and diamicton. Diamicton refers to poorly sorted sediment with a wide range of grain sizes. Unconsolidated deposits in the Waubeka Member consist of gray to brown, clayey till and silt till, with limited amounts of sand (WGNHS, 1997).
Bedrock: Bedrock in Washington County (WGNHS, 1980), from youngest to oldest, includes these geologic units:
Silurian limestone/dolomitic bedrock;
Ordovician shale, dolomite and sandstone;
Cambrian sandstones; and
Precambrian basement crystalline rock.
Topography of the top of the bedrock surface in the region is depicted on Figure 4-8. Additional information regarding each unit is presented below.

For Official Use Only
g:\aproject\buckeye\wi1304\jackson\reports\phase ii\phase2_report_20121227.docx
Phase 2: Evaluation of Long-Term Water Supply Alternatives, Town of Jackson
West Shore Pipe Line Company
4-14 4-14
Silurian Age Bedrock: Underlying the unconsolidated deposits is a Silurian Period limestone/dolomite (WGNHS, 1980). The Silurian Period was approximately 419 to 440 million years ago, and the Silurian limestone/dolomite belongs to the Racine Formation (WGNHS, 2004). The Racine Formation is very light to light gray, medium to coarse grained, with thin to thick beds, and is fossiliferous. Significant discontinuous fractures are present in the upper limestone/dolomite that is referred to as the Niagara Aquifer and is a predominant aquifer used for drinking water. Thickness of the Silurian limestone/dolomite increases from zero in parts of Washington County to approximately 150 feet below land surface along the Lake Michigan shoreline.
Ordovician Age Bedrock: Underlying the Silurian limestone/dolomite is Ordovician Period shale, sandstone, and dolomite (WGNHS, 1980). The Ordovician Period was approximately 440 to 485 million years ago. Multiple formations were formed during this Period including the Maquoketa shale; a dolomite-shaley dolomite, referred to as the Galena dolomite, Decorah Formation, and Platteville Formation; St. Peter Sandstone; and the dolomite-sandy dolomite Prairie du Chien Group. Much of the Prairie du Chien Group was eroded before the St. Peter Sandstone was deposited.
The Maquoketa Shale is greenish gray to purplish, with limited tan, argillaceous dolomite (WGHNS, 2004). The Galena, Decorah, and Platteville formations are light-gray to blue-gray and are also known to be shaley (WGNHS, 1980). The St. Peter Sandstone is white to light gray, fine to medium grained. The Prairie du Chien Group is white to gray dolomite with some sandstone. The Galena-Platteville unit surface is located approximately 750 feet above sea level west of Hartford to more than 150 feet below sea level along the Lake Michigan shoreline. The elevation of the Ordovician bedrock ranges from 750 feet above sea level west of Hartford to more than 150 feet below sea level along the Lake Michigan shoreline.
There is a bedrock valley trending from northeast to southwest that transects Washington County (WGHNS, 2004), and this valley is located west of the Village (Figure 4-8). The valley was formed as the Silurian dolomite/limestone was eroded down to the Maquoketa Shale, and unconsolidated sand and gravel has filled the buried bedrock valley.
Cambrian Age Bedrock: Underlying the Ordovician Period bedrock, sandstone was formed during the Cambrian Period approximately 485 to 540 million years

For Official Use Only
g:\aproject\buckeye\wi1304\jackson\reports\phase ii\phase2_report_20121227.docx
Phase 2: Evaluation of Long-Term Water Supply Alternatives, Town of Jackson
West Shore Pipe Line Company
4-15 4-15
ago. This sandstone is subdivided into five formations including, from youngest to oldest: the Trempealeau, Franconia, Galesville, Eau Claire, and Mount Simon. These sandstones generally represent a fining-up-sequence that grades from fine to coarse sand in the Mount Simon Formation to very fine to medium sand in the Trempealeau Formation. Siltstone beds are present in the Trempealeau Formation, while dolomitic and shale beds are present in Eau Claire and Mount Simon Formations. Thickness of the Cambrian sandstones increases from zero in the Hartford area to several hundred feet along the Lake Michigan shoreline.
Precambrian Age Bedrock: Underlying the Cambrian Period sandstone is crystalline bedrock that was formed during the Precambrian Period that ended approximately 540 million years ago. Crystalline bedrock underlies the Cambrian Age sandstone and slopes to the east. The surface of the crystalline bedrock ranges from approximately 500 feet above sea level near Hartford to approximately 1,200 feet below sea level along the Lake Michigan shoreline. The thickness of the crystalline bedrock is unknown.
4.3.1.2 Regional Hydrogeology
Groundwater is used as potable and process water for Washington County (WCLWR, 2005) with more than 12 MGD withdrawn from groundwater in Washington County. A summary of the regional hydrogeology based on reports prepared by the USGS, Wisconsin Geologic and Natural History Survey (WGNHS), and the Southeast Regional Planning Commission (SEWRPC) is below.
There are three aquifers in Washington County (USGS, 1992):
Unconsolidated Sand and Gravel Aquifer: The sand and gravel aquifer is the shallowest and youngest aquifer with sand and gravel originating from glacial and alluvial deposits. Unconsolidated deposits are typically 50 feet or less thick. Complex stratigraphy (variable grain sizes) and depositional environments, combined with variable thickness of deposits and hummocky topography, contribute to the low to medium permeability of the aquifer. However, since the sand and gravel aquifer is shallow, it is directly connected to surface water and can be readily recharged through precipitation.
Niagara Aquifer: The Niagara Aquifer includes the Silurian limestone/dolomite found directly beneath the unconsolidated glacial and alluvial deposits, but above the Maquoketa Shale. This is the primary aquifer used in Washington County for

For Official Use Only
g:\aproject\buckeye\wi1304\jackson\reports\phase ii\phase2_report_20121227.docx
Phase 2: Evaluation of Long-Term Water Supply Alternatives, Town of Jackson
West Shore Pipe Line Company
4-16 4-16
drinking water, where unconsolidated deposits are thin or not present. Drinking water in the affected area is supplied from private wells installed in the Niagara Aquifer.
Sandstone Aquifer: The Sandstone Aquifer includes the Ordovician Galena-Platteville Dolomite, St. Peter Sandstone and Prairie du Chien Group sandstone formations. The aquifer is located beneath the Maquoketa Shale. The Ordovician age Maquoketa Shale is a relatively impermeable formation that separates the Niagara and Sandstone aquifers and confines the water in the Sandstone Aquifer (WGNHS, 1980).
4.3.1.3 Groundwater Location, Movement, and Recharge
A summary of the depths to groundwater, flow direction, and recharge information for the Niagara and Sandstone aquifers is below.
Niagara Aquifer: In Washington County groundwater is located 25 feet or less below land surface (WCLWR, 2005). Groundwater in the Niagara Aquifer flows to the southeast (SEWRPC, 2005). The potentiometric surface is located between 800 and 900 feet above mean sea level and coincides directly with the topography and location of surface water bodies. There has been negligible change in the potentiometric surface and flow direction in Washington County between predevelopment and current development.
Since groundwater is shallow, recharge to the unconsolidated sand and gravel aquifer and Niagara Aquifer is provided predominantly by precipitation and discharge from surface water bodies like streams, lakes, and springs (SEWRPC, 2005). Washington County receives an average of 15 to 25 inches of rainfall annually (USGS, 2012). The recharge rate in southeast Washington County is approximately two to three inches per year (SEWRPC, 2005).
Sandstone Aquifer: The Sandstone Aquifer is confined by the Maquoketa Shale. In wells cased below the Maquoketa Shale, the potentiometric surface rises above the Shale and below the potentiometric surface of the Niagara Aquifer located approximately 700 feet below land surface. This is approximately 100 to 200 feet below the groundwater elevation in the Niagara Aquifer, indicating a downward gradient exists.
For Official Use Only
g:\aproject\buckeye\wi1304\jackson\reports\phase ii\phase2_report_20121227.docx
Phase 2: Evaluation of Long-Term Water Supply Alternatives, Town of Jackson
West Shore Pipe Line Company
4-17 4-17
Prior to development of Washington County, groundwater flow was to the east towards Lake Michigan. However, as pumping rates in Milwaukee and Waukesha counties increased with development, the cone of depression in southeast Wisconsin expanded, and today groundwater flow in the Sandstone Aquifer (predominantly in the St. Peter Sandstone) is to the southeast. Recharge to the Sandstone Aquifer is predominantly where the Maquoketa Shale is absent, in the western third of Washington County.
4.3.1.4 Hydraulic Conductivity
Both the Niagara and Sandstone Aquifers are important sources of water for Washington County. The Maquoketa Shale is a confining unit that separates the two aquifers. A discussion of the hydraulic conductivities of the two aquifers and confining unit is below.
Niagara Aquifer: Wells in the Niagara Aquifer have a sufficient well yield to support supplying water for domestic, municipal, industrial, and irrigation purposes (WGNHS, 1980). The Niagara Aquifer includes the Devonian and the Silurian dolomite. The Devonian dolomite was eroded by the last glaciation in Washington County. The horizontal hydraulic conductivity for the Silurian dolomite/limestone is estimated at 1 to 4 feet per day (ft/d) and the vertical hydraulic conductivity is estimated at 0.001 to 0.1 ft/d.
Maquoketa Shale: The Maquoketa Shale is an aquitard located between the Niagara and Sandstone Aquifers. The shale exhibits geologic heterogeneity with bedding plane fractures where interbedded shale and dolomite facies are present in the upper part, compared to the lower part that has a uniform shale lithology (WGNHS, 2001). Fractures in the upper part of the shale have resulted in a higher bulk hydraulic conductivity in the upper part of the formation than compared to the lower half. The horizontal conductivity is estimated at 0.0003 to 0.3 ft/d and the vertical hydraulic conductivity is estimated at 0.000005 to 0.001 ft/d (SEWRPC, 2005).
Sandstone Aquifer: Like the Niagara Aquifer, wells in the Sandstone Aquifer have a sufficient well yield to support supplying water for domestic, municipal, industrial, and irrigation purposes (WGNHS, 1980). However, the Sandstone Aquifer is generally not utilized for domestic purposes since the Niagara Aquifer provides a sufficient quantity of water, and constructing wells in the Sandstone Aquifer would be more costly.
The Sandstone Aquifer includes the Galena-Platteville Formation and the St. Peter Sandstone Formation. The St. Peter Sandstone is more conductive than the Galena-

For Official Use Only
g:\aproject\buckeye\wi1304\jackson\reports\phase ii\phase2_report_20121227.docx
Phase 2: Evaluation of Long-Term Water Supply Alternatives, Town of Jackson
West Shore Pipe Line Company
4-18 4-18
Platteville Formation (SEWRPC, 2005). The horizontal hydraulic conductivity for the Galena-Platteville Formation and the St. Peter Sandstone Formation are estimated at 0.04 to 0.3 ft/d and 1.2 to 6 ft/d, respectively. The vertical hydraulic conductivity for the Galena-Platteville Formation and the St. Peter Sandstone Formation show little variability with estimated values at 0.0005 to 0.01 ft/d and 0.0004 to 0.04 ft/day, respectively.
4.3.2 Desktop Geologic Study Results
The feasibility of Alternative 4 is driven by geologic and hydrogeologic conditions in the area. To be feasible, it must be possible to install replacement wells that provide affected properties with a long-term, safe and reliable source of potable water. For this to occur, there must be 1) no potential for water to become impacted with constituents from the affected area over time; 2) the source water must be similar in quality to the water being replaced; and 3) the source must be capable of providing sufficient yield of water to ensure the quantity of available water is comparable to the source water being replaced.
4.3.2.1 Communication between Aquifers
Based on conversations with the WDNR, private water supply wells installed in the affected area would have to be installed so water is being drawn from the Sandstone Aquifer, with the well casing secured within the Maquoketa Shale. The Maquoketa Shale is a regional confining unit located between the Niagara and Sandstone Aquifers in southeast Wisconsin (WGNHS, 2001). Characterization of the Maquoketa Shale as an aquitard is a central component to regional groundwater flow models, which are used to understand and adjust regional groundwater use and develop wellhead protection plans.
The ability of the Maquoketa Shale to serve as an aquitard is critical for the feasibility of this alternative. If the Maquoketa Shale is not a sufficient aquitard, there is potential that the newly installed private water supply wells could create a downward gradient, drawing contaminants into previously unaffected aquifers. ARCADIS reviewed available information regarding the potential for communication between the Niagara and Sandstone Aquifers and key observations follow:
High capacity wells for industrial and municipal use in the region are installed above and below the Maquoketa Shale. Water levels in wells cased below the Maquoketa Shale in the Sandstone Aquifer are located below the water levels for
For Official Use Only
g:\aproject\buckeye\wi1304\jackson\reports\phase ii\phase2_report_20121227.docx
Phase 2: Evaluation of Long-Term Water Supply Alternatives, Town of Jackson
West Shore Pipe Line Company
4-19 4-19
wells cased above the Maquoketa Shale in the Niagara Aquifer, indicating there is a downward gradient. This downward gradient increases the potential for leakage across the confining unit.
The Maquoketa Shale is approximately 200 feet thick in southeast Washington County; however, there is a bedrock valley trending from northeast to southwest that transects Washington County (WGHNS, 2004). This valley is located approximately 2 miles west of the Village. The valley was formed as the Silurian limestone/dolomite was eroded down to the Maquoketa Shale, and unconsolidated sand and gravel has filled the buried bedrock valley. The presence of this valley indicates there is a potential for localized communication between the two aquifers due to thinning or absence of the Maquoketa Shale.
Drawdown was observed in wells cased in the Maquoketa Shale at various depths when pumping was initiated in the Niagara Aquifer. This connectivity led to further characterization of the Shale as an aquitard. Geologic heterogeneity exists in the upper two-thirds of the formation where bedding plane fractures are observed at the shale and dolomite facies, compared to the lower part of the formation. The drawdown observed in the shale formation was attributed to higher bulk conductivity in the upper formation where local interconnections between bedding plane and vertical fractures are present.
The horizontal conductivity is estimated at 0.0003 to 0.3 ft/day and the vertical hydraulic conductivity is estimated at 0.000005 to 0.001 ft/day (SEWRPC, 2005). These results indicate that the upper portion of the Maquoketa Shale would not serve as an aquitard.
Tritium concentrations in groundwater are often used to evaluate groundwater movement. Tritium is present in groundwater as a result of atmospheric nuclear testing conducted in the 1960s. Tritium in precipitation subsequently entered groundwater through recharge and serves as a tracer. The isotropic results for tritium were negative in the Maquoketa Shale (WGNHS, 2001). Elevated tritium values would be expected if leakage were occurring through the Maquoketa Shale. The lack of tritium may be an indication of the formation acting as a regional confining unit or aquitard.
Based on the drawdown observed in wells installed above and below the Maquoketa Shale and the higher bulk conductivity observed in the upper two-thirds of the formation where bedding plane and vertical fractures are present, there is potential,

For Official Use Only
g:\aproject\buckeye\wi1304\jackson\reports\phase ii\phase2_report_20121227.docx
Phase 2: Evaluation of Long-Term Water Supply Alternatives, Town of Jackson
West Shore Pipe Line Company
4-20 4-20
although low, for leakage through the Maquoketa Shale. A test well installed in the lower one-third of the Maquoketa Shale to evaluate the geologic heterogeneity of the formation and assist with design and installation methodology and identification of construction materials for a replacement potable well would be advisable if this alternative were selected.
4.3.2.2 Water Quality
ARCADIS obtained an analytical database for private and high capacity wells from the WDNR online Groundwater Retrieval Network (GRN) on December 4, 2012. The data ranges from November 1993 to March 2012. Specific water quality parameters from this database (total arsenic, hardness, nitrate, bacteria as coliform, total iron and total manganese) were reviewed for the Niagara Aquifer and underlying Sandstone Aquifer. These parameters were selected because they provide an indicator of these water quality issues:
Aesthetic properties that affect water use. These parameters include hardness, iron and manganese, which can cause scaling and staining.
The presence of naturally occurring or manmade contaminants that can cause health issues. These parameters include arsenic, bacteria and nitrate.
Other parameters including radium and hydrogen sulfide were considered, but insufficient data were available. Fact sheets from regulatory agencies for the constituents evaluated by this Phase 2 Alternatives Evaluation are included in Appendix B.
ARCADIS reviewed the database to determine minimum, maximum, and average values for these water quality parameters for wells located within the Niagara Aquifer and Sandstone Aquifer (Table 4-1). Water quality data was then mapped to evaluate spatial distribution of the data relative to the affected area. For each water quality parameter except nitrate, separate figures (Figures 4-9 through 4-19) were prepared for the Niagara Aquifer (Figures 4-9 through 4-13) and Sandstone Aquifer (Figures 4-15 through 4-19). Based on the limited number of samples containing nitrate, all data for this water quality parameter were placed on a single figure (Figure 4-14). Data from the WDNR GRN database used for this analysis are included in Appendix D. Data was reviewed to evaluate whether the Sandstone Aquifer is capable of providing a sufficient quality of water for new private water supply wells. Water quality data was also

For Official Use Only
g:\aproject\buckeye\wi1304\jackson\reports\phase ii\phase2_report_20121227.docx
Phase 2: Evaluation of Long-Term Water Supply Alternatives, Town of Jackson
West Shore Pipe Line Company
4-21 4-21
reviewed for the Niagara Aquifer, as this aquifer is currently in use in the affected area and results serve as a baseline.
Niagara Aquifer: Groundwater database results were evaluated for the Niagara Aquifer. Based on available literature, water from the Niagara Aquifer is very hard and locally contains high concentrations of iron and manganese (WGNHS, 1980).
Total arsenic was detected in 179 analytical samples out of 308. The average detection for total arsenic was 0.011 milligrams per liter (mg/L). Of the 179 detections, 120 were greater than or equal to the NR 140 PAL of 0.001 mg/L and less than the NR 140 ES of 0.10 mg/L, and 38 detections were greater than the ES. ES limits are local required treatment standards and are equal to or more stringent than the U.S. EPA MCLs requiring treatment per the Safe Drinking Water Act. A summary of results is shown in Table 4-1 and depicted on Figure 4-9. In general, higher arsenic concentrations were present in wells to the west and north.
Bacteria, as Coliform, was detected in 37 analytical samples out of 1,107. The NR 140 PAL and ES is zero (i.e., no bacteria present). A summary of these results is shown in Table 4-1 and depicted on Figure 4-10. Several exceedances were located near the affected area.
Hardness was detected in 72 analytical samples out of 74. The average detection for hardness was 340 mg/L, an indication of hard water. Of the 72 detections, 61 were greater than or equal to a hardness of 100 mg/L, indicating moderately hard water. No NR 140 ES or PAL has been established for hardness. A summary of these results is shown in Table 4-1 and depicted on Figure 4-11.
Total iron was detected in 66 analytical samples out of 103. The average detection for iron was 1.256 mg/L. Of the 66 detections, six were greater than or equal to the NR 140 PAL of 0.15 mg/L and less than the NR 140 ES of 0.30 mg/L, and 38 detections were greater than the ES. NR 140 water quality criteria exceedances for iron were located in all directions from the affected area. A summary of these results is shown in Table 4-1 and depicted on Figure 4-12.
Total manganese was detected in 74 analytical samples out of 98. The average detection for manganese was 1.38 mg/L. Of the 74 detections, 15 were greater than or equal to the PAL of 0.025 mg/L and less than the ES of 0.05 mg/L, and 14 detections were greater than the ES. NR 140 water quality criteria exceedances for manganese

For Official Use Only
g:\aproject\buckeye\wi1304\jackson\reports\phase ii\phase2_report_20121227.docx
Phase 2: Evaluation of Long-Term Water Supply Alternatives, Town of Jackson
West Shore Pipe Line Company
4-22 4-22
were located in all directions from the affected area. A summary of these results is shown in Table 4-1 and depicted on Figure 4-13.
Nitrate was detected in 30 analytical samples out of 32. The average detection for nitrate was 1.186 mg/L. Of the 30 detections, 3 were greater than or equal to the PAL of 2.0 mg/L and less than the ES of 10 mg/L, and no detections were greater than the ES. All available nitrate data was collected from the Cedarburg-Grafton area to the east. A summary of these results is shown in Table 4-1 and depicted on Figure 4-14.
Sandstone Aquifer: Groundwater database results were evaluated for the Sandstone Aquifer. Based on available literature, water from the Sandstone Aquifer has the potential to contain concentrations of water quality parameters that affect potable water aesthetics (WGNHS, 1980).
Total arsenic was detected in 22 analytical samples out of 51. The average detection for total arsenic was 0.003 mg/L. Of the 22 detections, 14 were greater than or equal to the NR 140 PAL of 0.001 mg/L and less than the NR 140 ES of 0.10 mg/L, and no detections were greater than the ES. NR 140 groundwater quality criteria exceedances were generally found to the north and east. A summary of these results is shown in Table 4-1 and depicted on Figure 4-15.
Bacteria, as Coliform, was detected in 2 analytical samples out of 308, indicating limited exceedances of the NR 140 groundwater quality criteria for this parameter. A summary of these results is shown in Table 4-1 and depicted on Figure 4-16.
Hardness was detected in 20 analytical samples out of 20. The average detection for hardness was 321.45 mg/L, indicating hard water. Of the 20 detections, 19 were greater than or equal a hardness of 100 mg/L, indicating moderately hard water throughout the area. A summary of these results is shown in Table 4-1 and depicted on Figure 4-17.
Total iron was detected in 16 analytical samples out of 18. The average detection for iron was 0.438 mg/L. Of the 16 detections, 1 was greater than or equal to the PAL of 0.15 mg/L and less than the ES of 0.30 mg/L, and 11 detections were greater than the ES. NR 140 water quality criteria exceedances for iron were located in all directions from the affected area. A summary of these results is shown in Table 4-1 and depicted on Figure 4-18.
For Official Use Only
g:\aproject\buckeye\wi1304\jackson\reports\phase ii\phase2_report_20121227.docx
Phase 2: Evaluation of Long-Term Water Supply Alternatives, Town of Jackson
West Shore Pipe Line Company
4-23 4-23
Total manganese was detected in 17 analytical samples out of 18. The average detection for manganese was 0.039 mg/L. Of the 17 detections, 5 were greater than or equal to the NR 140 PAL of 0.025 mg/L and less than the ES of 0.05 mg/L, and 7 detections were greater than the NR 140 ES. Exceedances of the NR 140 groundwater quality criteria were found to the north, west and south. A summary of these results is shown in Table 4-1 and depicted on Figure 4-19.
Nitrate was detected in 13 analytical samples out of 16. The average detection for nitrate was 0.841 mg/L. Of the 13 detections, none were greater than or equal to the PAL of 2.0 mg/L or the ES of 10 mg/L. A summary of these results is shown in Table 4-1 and depicted on Figure 4-14.
Summary: The quality of groundwater in wells completed in the Niagara and Sandstone Aquifers throughout Washington and Ozaukee Counties is generally good; however, some characteristics make it objectionable or unsuitable for some uses (WGNHS, 1980). Water from each aquifer contains iron and manganese concentrations that commonly exceed the NR 140 ES for potable wells, the water is also moderately hard, exceeding 100 mg/L throughout the area and averaging more than 300 mg/L in both aquifers in some areas.
Average concentrations of total arsenic, iron and manganese in the Niagara Aquifer exceed the NR 140 ESs. The average concentration for iron was the only parameter that exceeded the ES for the Sandstone Aquifer, but the maximum concentration for iron and manganese was greater than the ES for each parameter.
As indicated in Table 4-2, it appears the water quality in the Sandstone Aquifer is better than or equal to that from the Niagara Aquifer, based on the average concentrations of water quality parameters; however, construction of some of the wells completed into the Sandstone aquifer consist of open boreholes completed across multiple geologic units (discussed below). This, along with a limited dataset from the Sandstone Aquifer creates uncertainty in the comparison of water quality between the two aquifers. To provide confirmation of the water quality data collected for this study, a test well is recommended, if this alternative is selected. If a test well is utilized, it is recommended that depth-specific sampling be performed to identify the best screening intervals for water quality. Confirmation of arsenic concentrations would be of primary concern given the low regulatory standard for this parameter and the need for water treatment if the regulatory standard is exceeded.

For Official Use Only
g:\aproject\buckeye\wi1304\jackson\reports\phase ii\phase2_report_20121227.docx
Phase 2: Evaluation of Long-Term Water Supply Alternatives, Town of Jackson
West Shore Pipe Line Company
4-24 4-24
4.3.2.3 Water Quantity
ARCADIS obtained a database from the WGNHS (WGNHS, 2012) that provided hydrologic information including normal pumping rates and specific capacity on high-capacity wells in Washington and Ozaukee Counties. ARCADIS reviewed the database to determine minimum, maximum, and average values for pumping rate and specific capacity for wells located within the Niagara Aquifer and Sandstone Aquifer. Results of this review for each aquifer are presented in Table 4-2. Average specific capacity for area water supply wells located within the Niagara Aquifer and Sandstone Aquifer are presented in Figures 4-20 and 4-21, respectively, to depict the spatial distribution of wells and specific capacity. Average pumping rates for area water supply wells located within the Niagara Aquifer and Sandstone Aquifer are presented in Figures 4-22 and 4-23, respectively, to depict the spatial distribution of wells and pumping rates. Data from the WGNHS databases used for this analysis are included in Appendix D.
The data was reviewed to evaluate whether the Sandstone Aquifer is capable of providing a sufficient quantity of water for new private water supply wells. Water quantity data was also reviewed for the Niagara Aquifer because this aquifer is currently in use in the affected area and results serve as a baseline.
Niagara Aquifer: The Niagara Aquifer includes Devonian and Silurian dolomite. Based on available literature, wells completed in this aquifer have sufficient yield to support water supply wells for domestic, municipal, industrial, and irrigation purposes (WGNHS, 1980). Furthermore, this unit currently provides water for the affected area since all of the private water supply wells in the affected area are installed in the Niagara Aquifer. Local water shortages associated with this formation in the affected area have not been reported, although shortages were reported in the city of Cedarburg to the east in 2012.
Forty-six wells identified and mapped in the WGNHS database search are completed within the Niagara aquifer (Figure 4-20). The average specific capacity is 21.5 gallons per minute per foot (gpm/ft) of drawdown. The maximum specific capacity is 550 gpm/ft (located approximately 2.5 miles south of the affected area), and the minimum is 0.3 gpm/ft (located approximately 11.5 miles north of the affected area). Wells with higher specific capacity were generally located to the south and east. The wells completed in the Niagara Aquifer (Figure 4-21) have an average pumping rate of 174 gpm. The wells completed in this aquifer range in depth from 64.5 to 127.9 feet and casing diameters range in size from 6 to 20 inches. Wells with higher pumping rates were
For Official Use Only
g:\aproject\buckeye\wi1304\jackson\reports\phase ii\phase2_report_20121227.docx
Phase 2: Evaluation of Long-Term Water Supply Alternatives, Town of Jackson
West Shore Pipe Line Company
4-25 4-25
located to the east, south and west and corresponded to municipal wells in areas with higher populations. These results support the literature conclusion that the Niagara Aquifer has sufficient water for current development.
Sandstone Aquifer: The Sandstone Aquifer includes the Ordovician Galena-Platteville Dolomite, St. Peter Sandstone and Prairie du Chien Group sandstone formations and is located beneath the Maquoketa Shale. Based on available literature, wells that are completed in the Sandstone Aquifer have sufficient yield to support water supply wells for domestic, municipal, industrial, and irrigation purposes (WGNHS, 1980). This aquifer is generally not used for domestic purposes because the overlying Niagara Aquifer provides sufficient quantity, and Sandstone Aquifer wells are more costly to install. As noted above, local water shortages were reported in the city of Cedarburg to the east in 2012; the city of Cedarburg’s municipal water system includes wells that draw water from the Sandstone Aquifer.
Twelve wells identified in the WGNHS database search are completed within the Sandstone Aquifer (Figure 4-22). The average specific capacity of these wells is 4.1 gpm/ft of drawdown. The maximum specific capacity is 13.6 gpm/ft (located approximately 7 miles to the east, in Cedarburg), and the minimum is 1.3 gpm/ft (located approximately 18 miles northwest). The wells completed in the Sandstone aquifer (Figure 4-23) have an average pumping rate of 271 gpm and range in depth from 190 to 1,401 feet with casing diameters ranging in size from 6 to 24 inches. Wells with higher specific capacity and pumping rates were generally located to the south and east.
Summary: Results of the desktop geologic study and associated WGNHS database review suggest that the Sandstone Aquifer is capable of providing a sufficient quantity of water for replacement water supply wells. However, as noted above, there is a potential for water shortages evidenced by the nearby city of Cedarburg experiencing water shortages in 2012. In addition, a review of the database indicated that many of the existing water supply wells constructed within the Sandstone Aquifer are constructed across several geologic units. For example, a nearby well in the city of Cedarburg (BG643) has a drilled depth of 1,210 feet. Another nearby well in the Village of Germantown (BH247) has a drilled depth of 1,271 feet. Well construction information indicates that these wells are completed across the Galena and Plattville formations. If this alternative is selected, a test well and pumping test may be needed to confirm that the portion of the Sandstone Aquifer targeted for use by new private water supply wells is capable of providing sufficient quantity of water, aquifer yield and well capacity.

For Official Use Only
g:\aproject\buckeye\wi1304\jackson\reports\phase ii\phase2_report_20121227.docx
Phase 2: Evaluation of Long-Term Water Supply Alternatives, Town of Jackson
West Shore Pipe Line Company
4-26 4-26
Water quantity in both the limestone layer and sandstone layer below the shale appear to be adequate for proposed services, and the peak pumping rate of 100 gpm desired for the municipal wells required in Alternative 3G. (See Table 4-2 and Figures 4-20 through 4-23 for a summary of water quantity in the region.)
4.3.3 Well Drilling Requirements
Minimum standards for private water supply well construction are established in NR 812, Wis. Admin. Code. WDNR has the regulatory authority to establish additional standards to protect human health and the environment. ARCADIS contacted the WDNR to determine if more stringent construction requirements would be established for private water supply wells constructed within the affected area.
WDNR indicated that additional well construction requirements would need to be met for private water supply wells installed within the affected area. A proposed private well section is shown in Figure 4-24. An overview of required construction methods follows:
A 12-inch upper enlarged drillhole (UED) extending from the ground surface to 10 to 20 feet into the Maquoketa Shale using mud rotary drilling techniques.
An 8-inch steel casing cement-grouted into the UED.
A borehole drilled through the Maquoketa Shale and into the lower dolomite or sandstone. This second borehole could be drilled using either air or mud rotary techniques.
A 6-inch casing cement-grouted into place using the Bradenhead technique.
The lower drillhole would be constructed as needed to supply water.
As noted in the regional geology discussion, the upper portion of the Maquoketa Shale exhibits geologic heterogeneity with bedding plane fractures and interbedded shale and dolomite facies. It is recommended that the construction methods described above be modified to require construction of the UED and 8-inch casing into the lower portion of the Maquoketa Shale.
If private water supply wells are replaced outside the affected area, WDNR indicated that alternate well construction techniques beyond the minimum requirements in NR 812 Wis. Admin. Code would also be required. They would not, however, be as
For Official Use Only
g:\aproject\buckeye\wi1304\jackson\reports\phase ii\phase2_report_20121227.docx
Phase 2: Evaluation of Long-Term Water Supply Alternatives, Town of Jackson
West Shore Pipe Line Company
4-27 4-27
stringent as those required for private water supply well construction within the affected area. For the purpose of this Alternatives Evaluation, all proposed private wells are located within the affected area.
4.3.4 Regulatory Considerations
Regulations for the construction of private water supply wells are established in Chapter NR 812, Wis. Admin. Code, and establishes a minimum standard. The WDNR provided a more stringent construction methodology for water supply wells within the affected area.
Water supply wells and the associated distribution system serving seven or more single family homes are considered community water systems, regulated under Chapter NR 811, Wis. Admin. Code. Regulations for water supply wells used to serve groups of six single family homes or fewer are limited to those applicable to individual private water supply wells (i.e., NR 812) and associated with plumbing connections (Chapter SPS 382).
There is no state or Town regulatory requirement for sampling a private water supply well or a water supply well serving up to six single family homes. However, Section NR 700, Wis. Admin. Code gives the WDNR authority to require investigation and remediation activities to address a release. Such activities can include implementation of a groundwater monitoring program under Chapters NR 716 or NR 724, Wis. Admin. Code. As stated earlier in this report, a groundwater monitoring program to evaluate groundwater quality has been implemented in the affected area. WDNR may require sampling of the newly installed water supply wells to confirm the absence of contaminants associated with the release.
Section NR 812.26, Wis. Admin. Code requires that water supply wells taken out of service be abandoned (i.e., sealed). For properties where a replacement water supply well is installed, the existing water supply well would be decommissioned by removing the pump to prevent cross-connections or use of the Niagara Aquifer. In the long term, it is assumed that each of the decommissioned water supply wells would be sealed in accordance with Chapter NR 812, Wis. Admin. Code. In the near term, WDNR may request that decommissioned water supply wells be maintained for collection of groundwater samples to monitor groundwater quality in the Niagara Aquifer as remediation progresses.
For Official Use Only
g:\aproject\buckeye\wi1304\jackson\reports\phase ii\phase2_report_20121227.docx
Phase 2: Evaluation of Long-Term Water Supply Alternatives, Town of Jackson
West Shore Pipe Line Company
4-28 4-28
4.3.5 Additional Considerations
If this alternative were selected, negotiations for implementation would be held directly with individual property owners or, in the case of cluster well usage, groups of property owners. The Village and Town would not be included in these negotiations except as it relates to permitting required for well construction and infrastructure associated with water lines from cluster wells. ARCADIS does not envision any specific water-related issues related to negotiations for this alternative.
Additional negotiations would be necessary to implement cluster wells as an alternative. The affected area would be divided into groups of six or less single family homes and a decision would then need to be made on where each water supply well would be constructed. Property deeds would require updating, placing easements across neighboring properties for operations, maintenance and/or replacement of wells, piping, etc. This could prove to be difficult and tenuous, resulting in strained neighbor relations and delays in implementing the alternative.
The use of cluster wells would require that the homes being grouped onto a single water supply well cooperate in initially establishing an agreed-upon location for the shared well and easement rights for future well maintenance. There are no legal requirements or oversight from WDNR, Town or Washington County Health Department to force “cluster homes” to work amicably together to operate and maintain wells. It is not uncommon for relationships among the property owners to become strained as individual properties are sold and new owners enter into the arrangement/easement relationship. As a result, there is a potential for future claims by individual property owners if a well fails and the parties cannot agree on upgrades or replacement.
The WDNR developed specifications for construction of replacement water supply wells within the affected area. Construction methods include installation of a casing from the ground surface to the Maquoketa Shale and sealing the casing within the shale. Protection of the Sandstone Aquifer would rely on the successful well construction and continued integrity of the casing and seal. A construction deficiency or seal failure could result in migration of contaminants to the Sandstone Aquifer.
The use of the Maquoketa Shale as an aquitard assumes that the unit is continuous across the entire affected area. The desktop geologic study did not identify a well or boring in the affected area that extends to the Maquoketa Shale, so its presence in the affected area is being inferred from boring log information from neighboring

For Official Use Only
g:\aproject\buckeye\wi1304\jackson\reports\phase ii\phase2_report_20121227.docx
Phase 2: Evaluation of Long-Term Water Supply Alternatives, Town of Jackson
West Shore Pipe Line Company
4-29 4-29
communities. A bedrock valley is located two miles west of the affected area, indicating there may be some localized discontinuity of this unit.
There are no specific monitoring requirements for private water supply wells. In the absence of a monitoring program, there would be no mechanism to identify whether contaminants from the affected area have migrated to a replacement well due to drawdown, failed casing, or failed seal within the Maquoketa Shale.
Based on these additional considerations, this approach may not be viable for the 20- year planning period of the Phase 2 Alternatives Evaluation.

For Official Use Only
g:\aproject\buckeye\wi1304\jackson\reports\phase ii\phase2_report_20121227.docx
Phase 2: Evaluation of Long-Term Water Supply Alternatives, Town of Jackson
West Shore Pipe Line Company
5-1 5-1
5. Phase 2 Alternatives Comparative Analysis
Each alternative was evaluated separately to better define and identify key aspects. Each alternative was also compared to the remaining alternatives, to defensibly compare options and provide a single recommendation. The comparative analysis includes multiple criteria and an economic and timeline comparison.
5.1 Evaluation Criteria
A series of 11 evaluation criteria were considered for the Phase 2 Alternatives Evaluation. The criteria match those used in the Phase 1 Alternatives Evaluation. Because additional information was obtained during Phase 2, each of the 11 criteria was assigned a weighting percentage totaling 100 percent. All criteria were scored a 1 (comparatively unfavorable) to a 5 (comparatively favorable), and each score was factored by the criteria weight. The resultant overall alternative evaluation score was presented out of a total possible score of 5.0.
Three main categories were considered for the criteria weighting percentage. The categories and corresponding percentages are shown in Table 5-1 below.
Table 5-1 Evaluation Criteria Weighting
Category Percentage Criteria
Efficiency to
Implement
15 Technical Feasibility
15 Schedule
15 Cost
Long Term Viability
10 Water Quality
10 Water Quantity
10 Long Term Susceptibility
DailyOperations
5 Operation and Maintenance
5 Legal and Regulatory Complexities
5 Monitoring and Reporting Compliance
5 System Redundancy
5 Anticipated Public Acceptance
Total 100

For Official Use Only
g:\aproject\buckeye\wi1304\jackson\reports\phase ii\phase2_report_20121227.docx
Phase 2: Evaluation of Long-Term Water Supply Alternatives, Town of Jackson
West Shore Pipe Line Company
5-2 5-2
5.1.1 Long-Term Susceptibility
Each alternative was compared on its susceptibility as a long-term replacement water supply. The evaluation considered factors such as maintaining an adequate source, potential for long-term use and ability for adapting to long-term changes in property ownership. A public water system would be comparatively favorable due to its established resources and maintenance procedures and its ongoing regulatory sampling and reporting requirements. Private cluster wells scored comparatively unfavorable due to unknown operations, maintenance and replacement agreements among homeowners and complications with long-term changing property ownership.
5.1.2 Technical Feasibility
Each alternative was compared on its technical feasibility as a long-term replacement water supply. The evaluation considered factors such as ability to meet the defined assumptions, best available technology for treatment and possibility of technical complications. Alternatives were also compared based on type and amount of water infrastructure required. A supply requiring additional treatment, booster pumping or hydro-pneumatic storage was comparatively unfavorable to a supply not requiring treatment, pumping or storage.
5.1.3 Quantity of Water
Each alternative was compared on the quantity of water available to be supplied to the proposed services. The evaluation considered factors such as available capacity for a public water system and volume of water available in the specific aquifer strata for drilling new deep wells. Alternatives with known available capacities would be comparatively favorable to alternatives with unknown specific available capacities from a well or public water system.
5.1.4 Quality of Water
Each alternative was compared on the quality of water provided to the proposed services. The evaluation considered factors such as data available to determine water quality, untreated water quality of source and ability to maintain adequate water quality delivered to each user. Alternatives with historically adequate water quality data, ability to flush areas with high water age and ability to maintain quality water at customer taps would be comparatively favorable to alternatives with poor or little historical water quality data and lack of control to maintain water quality at customer taps.

For Official Use Only
g:\aproject\buckeye\wi1304\jackson\reports\phase ii\phase2_report_20121227.docx
Phase 2: Evaluation of Long-Term Water Supply Alternatives, Town of Jackson
West Shore Pipe Line Company
5-3 5-3
5.1.5 Operations, Maintenance and Replacement
Each alternative was compared for its complexity and ability for the infrastructure owner(s) to operate, maintain and replace. The evaluation considered factors such as treatment equipment complexity, infrastructure useful life and ability for future replacement. Alternatives with minimal equipment, infrastructure with a high useful life and treatment equipment that could be easily removed and replaced were comparatively favorable to alternatives with complex or buried infrastructure, treatment requiring chemical addition and treatment resulting in conveyance or additional treatment of large quantities or high concentrations of process waste streams.
5.1.6 Legal and Regulatory Complexity
Each alternative was compared for its legal and regulatory complexity, considering alternative implementation as well as long-term operation. The evaluation considered factors such as infrastructure ownership, necessity to revise or supplement the existing Town/Village Border Agreement and additional regulations applicable to the infrastructure within each alternative. Alternatives that were an extension of existing infrastructure or with minimal legal requirements were comparatively favorable to alternatives that developed a new public water entity or alternatives that may require multiple property owner easements.
5.1.7 Monitoring, Reporting and Compliance
Each alternative was compared on its monitoring and reporting complexity and its long-term ability to maintain monitoring and reporting compliance. The evaluation considered factors such as assumed sampling frequency, technical expertise required of the personnel responsible for the infrastructure and past monitoring and reporting compliance. Alternatives considering private water supply were comparatively favorable to alternatives potentially requiring long-term raw water, treatment and distribution sampling and compliance.
5.1.8 Timing to Implement
Each alternative was compared on its estimated implementation schedule, from detailed design to water at the users’ tap. The evaluation considered factors such as schedule estimates for design, regulatory and local approvals; pilot testing; plan reviews; capacity assurance plans; construction, startup and testing. Alternatives with

For Official Use Only
g:\aproject\buckeye\wi1304\jackson\reports\phase ii\phase2_report_20121227.docx
Phase 2: Evaluation of Long-Term Water Supply Alternatives, Town of Jackson
West Shore Pipe Line Company
5-4 5-4
the least time estimated to full implementation were comparatively favorable to alternatives with the longest estimated time to full implementation.
5.1.9 System Redundancy
Each alternative was compared on its reliability to continuously provide a long-term water supply through infrastructure redundancy. The evaluation considered backup from the water supply source, extent of looping within a distribution system, duplicate treatment or distribution equipment and power facilities. Alternatives with multiple redundancies within the source and distribution were comparatively favorable to alternatives with little or no source or distribution redundancy.
5.1.10 Anticipated Community Acceptance
Each alternative was compared on its anticipated community acceptance as a long-term water supply for the users. The evaluation weighed public perception of having a safe and reliable water supply from a public water system with the perception of no user cost for private well supply. Generalized preliminary results of the Town’s affected user survey were considered as short-term community acceptance along with anticipated long-term community acceptance.
5.1.11 Capital Cost
Each alternative was compared on its estimated capital cost. Alternatives with lowest capital cost estimate were comparatively favorable to alternatives with the highest capital cost estimate. Cost was evaluated with the 10 other specific criteria to provide an overall evaluation score encompassing all significant aspects of each alternative.
5.2 Evaluation Results
Results of the comparative analysis are summarized in Table 5-2. An overall comparative evaluation score is provided as an overall rank of alternatives based on the criteria defined within Section 5.1. Due to the criticality of the project timeline, additional comparison and evaluation of implementation schedule is provided. Further supporting information and assumptions in developing anticipated project costs and operation and maintenance costs is also provided within the evaluation results. A brief summary of the comparative analysis results for each alternative is also provided.

For Official Use Only
g:\aproject\buckeye\wi1304\jackson\reports\phase ii\phase2_report_20121227.docx
Phase 2: Evaluation of Long-Term Water Supply Alternatives, Town of Jackson
West Shore Pipe Line Company
5-5 5-5
5.2.1 Implementation Schedule Comparison
The estimated implementation schedule is shown in Figure 5-1.
The schedule considers multiple steps to alternative implementation ranging from detailed design through water at the users’ tap. The evaluation considers factors such as schedule estimates for design, regulatory and local approvals; pilot testing; plan reviews; capacity assurance plans; construction, startup and testing. Many of the specific requirements such as approval and testing are based on possible requirements that may or may not be imposed by regulatory agencies. Therefore, the following assumptions were considered in the implementation schedule estimate:
1) Alternatives for design and approval do not include any time needed for negotiations among various stakeholders.
Figure 5-1: Implementation Schedule Comparison
Implementation Time (months)
0 2 4 6 8 10 12 14 16 18 20 22 24 26 28 30
Alte
rnat
ives
4
3G
3A
2
DesignApproval
Construction

For Official Use Only
g:\aproject\buckeye\wi1304\jackson\reports\phase ii\phase2_report_20121227.docx
Phase 2: Evaluation of Long-Term Water Supply Alternatives, Town of Jackson
West Shore Pipe Line Company
5-6 5-6
2) Alternative 2 Negotiations: a) Village and Town to extend water into Town. b) WSPC and property owners to permit access to private property to install
services and disconnect wells. c) WSPC and Paloroma Farms to extend water mains across their property and
consider acquiring tank site. d) Construction time for a new elevated tank is significantly longer but not
required in the short-term to make this alternative viable.
3) Alternative 3A Negotiations: a) Same as Alternative 2. b) Village and Town for Water Supply Agreement. c) WDNR and Town to establish SD. d) SD to establish utility ordinances, standards and codes.
4) Alternative 3G Negotiations: a) WSPC and property owners to permit access to private property to install
services and disconnect wells. b) Town and WDNR for pilot testing and approval of treatment. c) WDNR and Town to establish SD. d) SD to establish utility ordinances, standards and codes.
5) Alternative 4 Negotiations: a) WSPC and property owners to drill new wells and install connections. b) Property owners with each other to create easements and operations,
maintenance and expense sharing agreements and to file new easements or agreements with County recorder.
5.2.2 Conceptual Level Capital and O&M Cost Opinions
Cost opinions are Class 5, conceptual level cost opinions as defined by the AACE. These cost opinions were developed by ARCADIS’ in-house Chief Estimator based on similar construction project bids and contracts as well as through Means Cost Estimating guides. Further, budgetary costs were provided by manufacturers for specialty equipment as determined necessary for the various alternatives. For well drilling, contractor input was also solicited and considered herein.
These costs are conceptual in nature, with unknowns regarding treatment for potential municipal wells and resulting waste streams in Alternative 3G. Thus, the cost opinions

For Official Use Only
g:\aproject\buckeye\wi1304\jackson\reports\phase ii\phase2_report_20121227.docx
Phase 2: Evaluation of Long-Term Water Supply Alternatives, Town of Jackson
West Shore Pipe Line Company
5-7 5-7
for Alternative 3G have specifically been increased to account for potential unknowns. However, the piping networks and associated infrastructure (Alternatives 2 and 3A) and private wells (Alternative 4) are much better defined. Therefore a 15 percent contingency was added onto all engineer’s opinions of costs as a uniform contingency rate.
Capital costs for setting up the long-term water supply solution are the most significant portion of the overall cost opinions. For most alternatives, water distribution system piping, valves, hydrants, and service connections are included. This portion of the capital cost comprises the largest percentage of the engineer’s opinion of probable construction cost (EOPCC). Water storage tanks, pumps, water treatment equipment, and buildings represent a smaller portion of the overall costs. Finally, well installation cost within the proposed services, and specifically within the affected area, are significantly higher than outside the affected area. Wells must comply with WDNR requirements for this area, including significantly deeper wells, double casing and specialized drilling and construction methods.
Conversely, annual operating costs are relatively minor compared to the capital costs for developing a new water utility. Operating costs include personnel, utilities, chemicals, facilities’ needs, postage, consumables, etc. The most significant operating cost is typically personnel, including administrative support, customer service, licensed operators, equipment operators, service technicians, and meter readers. The relative size of such a utility will dictate annual and monthly operating costs that must be borne by utility customers (rate payers). The expense for compliance with all local, state and federal drinking water requirements is considered in this item as well, including water system flushing, valve exercising, sampling, laboratory analyses, and reporting.
Maintenance and replacement costs are considered to be very low during the first five years and also over the 20-year planning period of this Phase 2 Alternatives Evaluation. The utility infrastructure will be new. Specialty equipment should not need much initial maintenance work, and tends to have a design life of at least 20 years. The consumable media from treatment is considered an operating expense, as discussed above. Finally, the most significant portion of the capital cost is for piping infrastructure that has a minimum design life of 50 years.
As with any utility, rates charged to users of the utility must be sufficient to cover operations, maintenance, and replacements of the infrastructure. A utility fund is an enterprise fund and is expected to be self-sufficient, not requiring outside taxes or general operating funds to support the utility.

For Official Use Only
g:\aproject\buckeye\wi1304\jackson\reports\phase ii\phase2_report_20121227.docx
Phase 2: Evaluation of Long-Term Water Supply Alternatives, Town of Jackson
West Shore Pipe Line Company
5-8 5-8
Table 5-3 shows a summary of the anticipated capital and OM&R cost for each alternative. The EOPCC tables are included in Appendix E for each alternative. For Alternatives 2, 3A, and 3G, four of the existing private water supply wells would be maintained for agricultural water use and would be disconnected from the potable water supply. The first year’s anticipated cost for media was considered in the up-front capital cost, then quarterly replacement thereafter. All other wells are anticipated to be abandoned.
From Table 5-3 it is noteworthy that the EOPCC for Alternatives 2, 3A and 3G at $3.79 Million, $3.82 Million, and $3.99 Million, respectively, are all within 5 percent of one other. At this level of engineering judgment, these are all considered equivalent. Additional factors must be considered to make a comparison among these alternatives. The POET systems with agricultural wells are identical for these three alternatives. The annual operating costs, however, increase significantly for Alternatives 3A and 3G due to the small number of proposed services being tasked with the cost of operating a SD. Alternative 2 overall seems to represent the least cost opinion per user for both capital and operations. Alternative 4 at $5.18 Million is the highest cost alternative primarily due to the significant cost to drill and develop each well for the proposed services.
5.2.3 Alternative Results Summary
Each of the alternatives selected in the Phase 1 Alternatives Evaluation has been further defined, evaluated and compared. A brief summary of the Phase 2 Alternatives Evaluation results is provided herein, including the evaluation score for each alternative (Table 5-1).
5.2.3.1 Alternative 2
Alternative 2 would extend the Village PWS to supply water to the proposed services defined herein. Comparative analysis results indicate an evaluation score of 4.7 out of 5.0. The alternative ranked favorably due to its established resources, maintenance and reporting requirements; available data and ability to meet the defined assumptions; adequacy of water quality and quantity, and short implementation timeline. Potential extension of the Village PWS has been anticipated, studied, modeled and included in the current Border Agreement between the Village and Town. The system has a plan for maintaining a well-reinforced transmission grid as the water utility develops and expands.

For Official Use Only
g:\aproject\buckeye\wi1304\jackson\reports\phase ii\phase2_report_20121227.docx
Phase 2: Evaluation of Long-Term Water Supply Alternatives, Town of Jackson
West Shore Pipe Line Company
5-9 5-9
5.2.3.2 Alternative 3A
Alternative 3A would establish a SD with a water distribution system supplied by the Village PWS. Comparative analysis results indicate an evaluation score of 3.8 out of 5.0. The alternative ranked favorably due to the Village PWS water supply having adequate quality and quantity. The alternative ranked unfavorably because of the additional legal and regulatory complexity, lack of proven maintenance and necessity to develop a new water utility, and the additional implementation time and complexity of operating and maintaining a booster pumping station. The SD start-up as a new utility would present challenges and complexities that would likely result in increased time required for implementation.
5.2.3.3 Alternative 3G
Alternative 3G would establish a SD with a water distribution system supplied by new Town wells and water treatment facility. Comparative analysis results indicate an evaluation score of 2.7 out of 5.0. The alternative ranked unfavorably due to the various unknowns of siting and drilling new municipal wells and probable need for development of a water treatment facility based on results of possible test well and pilot studies. The alternative scored the lowest for facilities operation and maintenance and timing to implement the wells, treatment and distribution facilities. Similar to Alternative 3A, the SD start-up as a new utility would present challenges and complexities that would likely result in increased time required for implementation.
5.2.3.4 Alternative 4
Alternative 4 would construct new cluster or individual private wells. Similar to Alternative 3G, comparative analysis results indicate an evaluation score of 2.4 out of 5.0. Alternative 4 is the least involved alternative from the Town’s perspective and the Village’s perspective. The alternative ranked unfavorably due to the various unknowns and risks of drilling multiple wells through the confining Maquoketa Shale; the lack of system redundancy; and the long-term legal and regulatory complexity of establishing easements, access rights and ownership of water supply equipment for cluster wells. Through evaluation of defining a recommended long-term water supply, Alternative 4 has the lowest ability to provide a safe and reliable long-term water supply. Further, drilling multiple new wells through the regional aquitard that protects an aquifer that provides water to many nearby communities adds inherent risk to regional groundwater resources. These penetrations could provide conduits for contaminants to migrate into the Sandstone Aquifer. Lastly, the need for private well owner treatment in this area

For Official Use Only
g:\aproject\buckeye\wi1304\jackson\reports\phase ii\phase2_report_20121227.docx
Phase 2: Evaluation of Long-Term Water Supply Alternatives, Town of Jackson
West Shore Pipe Line Company
5-10 5-10
due to arsenic, iron and manganese, voids this alternative from further consideration. WDNR has stated that an alternative that requires private treatment systems would not be considered a long-term solution as long as other viable options are available.

For Official Use Only
g:\aproject\buckeye\wi1304\jackson\reports\phase ii\phase2_report_20121227.docx
Phase 2: Evaluation of Long-Term Water Supply Alternatives, Town of Jackson
West Shore Pipe Line Company
6-1 6-1
6. Selection and Recommendation of Alternatives
Through completion of the Phase 1 Alternatives Evaluation, multiple alternatives were considered to select potentially feasible options for providing long-term water supply to the affected area. A more detailed review of the alternatives selected in Phase 1 was conducted in this Phase 2 Alternatives Evaluation. Through the specific evaluation of alternatives and their multi-parameter comparative analysis, a recommendation for the preferred alternative for a long-term water supply is provided herein.
6.1 Basis of Recommendation
Alternative 4, private individual and cluster wells, is excluded from further consideration because POET systems for treating inorganic, naturally occurring contaminants in the strata required for new wells would be required. In addition, Alternative 4 would require multiple penetration of a regional aquitard that protects an aquifer that provides water to many nearby communities. These penetrations could provide conduits for contaminants to migrate into the Sandstone Aquifer.
Alternative 3G, SD with new public wells, is excluded from further consideration due to comments received from the PSC, the time needed for regulatory reviews including pilot testing treatment options for arsenic, time required for a new start-up, and relatively higher operations, maintenance and replacement costs for the additional required treatment. Further, the cost per customer for treatment and distribution systems over the long term, including changing regulations and resulting increases in costs, is not sustainable for such a small number of customer connections (40 connections).
Alternatives 2 and 3A include the Village as the source water and a new distribution system along Mill Road, Maple Road, Western Avenue, Division Road, and corresponding subdivisions. Considering the differences between these two alternatives, a direct Village supply, and operations, maintenance and ownership provides for a solution that can be implemented in a more expeditious timeframe and should require less effort and time for negotiations. It is ARCADIS’ opinion that the additional time needed to establish a SD and adequately develop and staff a new water utility would delay implementation of the long term water solution well into 2014. In addition, the PSC has indicated that establishment of a utility as small as the one being considered for Alternative 3A is generally discouraged.

For Official Use Only
g:\aproject\buckeye\wi1304\jackson\reports\phase ii\phase2_report_20121227.docx
Phase 2: Evaluation of Long-Term Water Supply Alternatives, Town of Jackson
West Shore Pipe Line Company
6-2 6-2
Based on the analysis summarized in this report, ARCADIS recommends Alternative 2 as the recommended long-term water supply solution for the proposed services included in this Alternatives Evaluation.
6.2 Conceptual Design
A proposed layout for Alternative 2 is shown on Figure 6-1. This alternative includes approximately 32,000 lineal feet of water main along Maple, Mill, Division, Western, Crosswinds and connected subdivisions, and develops a significant portion of the proposed Village 2030 master plan in the southeastern portion of the Village WDS.
A total of 36 private wells would be decommissioned. However, in the interest of maintaining the existing groundwater monitoring network, these wells may not be completely abandoned for the next few years. The four wells to be converted for agricultural purposes would be individually evaluated for sizing the POET systems. The POET systems would be modified as soon as practical, but no later than at the time of the final connection of the replacement potable water system.
Fire hydrants could be installed periodically throughout the WDS network for fire protection and for WDS maintenance and flushing. The recommendation is to not provide hydrants at urban densities within the general service area. There are long stretches of water main with few, if any, customers; fire protection there would be superfluous. In addition, too many hydrants could pose a challenge to farming activities resulting in increased maintenance, while providing no additional benefit. Likewise, isolation valves are included at a more sparse density than would be recommended in an urban setting.
An elevated water tank could be constructed within the Paloroma Farms subdivision in the future. The property could be secured and ownership transferred to the Village for water utility purposes.
Homes that have had an occurrence of benzene in their well samples and/or are immediately adjacent to such a home would be connected into the water system. If contaminants migrate and further wells are found to be contaminated over time, those homes would also be connected as soon as possible after verifying presence of benzene from the release.
No sanitary sewers or other facilities other than what is included above will be considered as part of this long-term water supply solution. Providing water via this
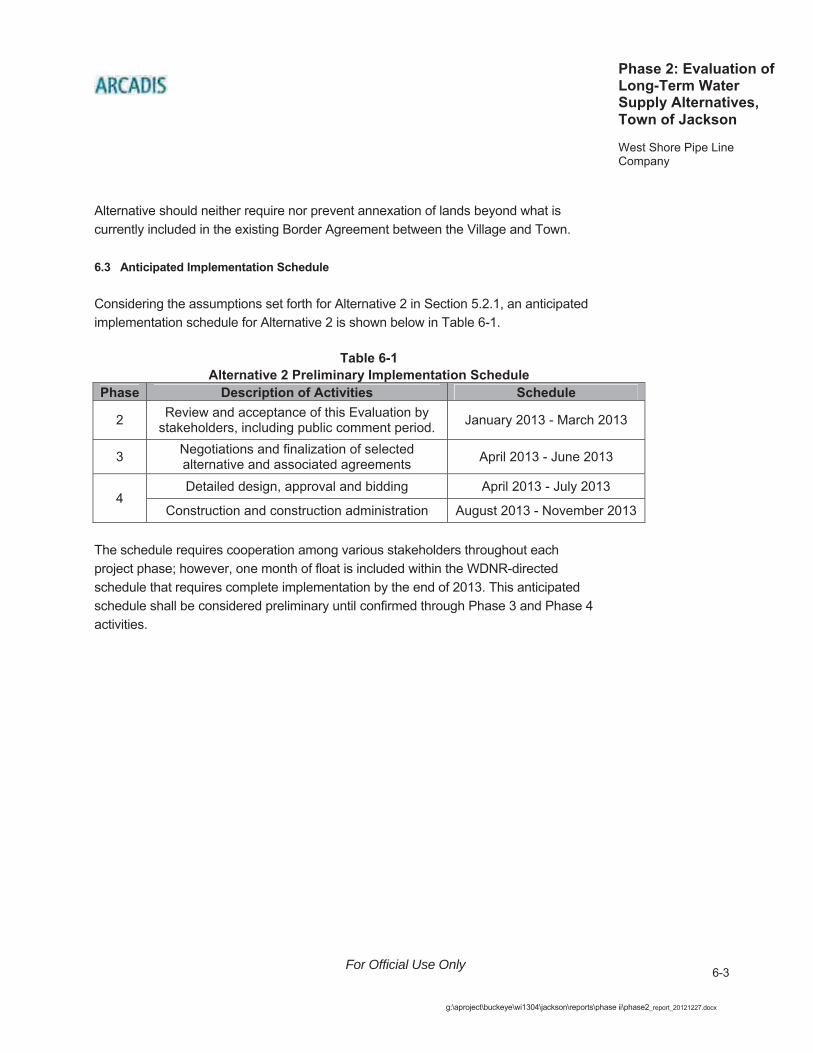
For Official Use Only
g:\aproject\buckeye\wi1304\jackson\reports\phase ii\phase2_report_20121227.docx
Phase 2: Evaluation of Long-Term Water Supply Alternatives, Town of Jackson
West Shore Pipe Line Company
6-3 6-3
Alternative should neither require nor prevent annexation of lands beyond what is currently included in the existing Border Agreement between the Village and Town.
6.3 Anticipated Implementation Schedule
Considering the assumptions set forth for Alternative 2 in Section 5.2.1, an anticipated implementation schedule for Alternative 2 is shown below in Table 6-1.
Table 6-1 Alternative 2 Preliminary Implementation Schedule
Phase Description of Activities Schedule
2 Review and acceptance of this Evaluation by stakeholders, including public comment period. January 2013 - March 2013
3 Negotiations and finalization of selected alternative and associated agreements April 2013 - June 2013
4Detailed design, approval and bidding April 2013 - July 2013
Construction and construction administration August 2013 - November 2013
The schedule requires cooperation among various stakeholders throughout each project phase; however, one month of float is included within the WDNR-directed schedule that requires complete implementation by the end of 2013. This anticipated schedule shall be considered preliminary until confirmed through Phase 3 and Phase 4 activities.

For Official Use Only
g:\aproject\buckeye\wi1304\jackson\reports\phase ii\phase2_report_20121227.docx
Phase 2: Evaluation of Long-Term Water Supply Alternatives, Town of Jackson
West Shore Pipe Line Company
7-1 7-1
7. References
Bonestroo. 2006. Village of Jackson Water Analysis Report. 20 October 2006.
Bonestroo. 2011. Village of Jackson Model Calibration and Fire Flow Evaluation Memo. 15 June 2011.
Donohue & Associates, Inc. 1987. Report on Remedial Action for VOC Contamination at Well No. 3 and Well No. 5, Cedarburg, Wisconsin.
Great Lakes-Upper Mississippi River Board. 2004. Recommended Standards for Wastewater Facilities, 2004 Edition.
Microsoft Corporation. 2010. Bing Maps Aerial. Licensed for use through ESRI Map Service. http://www.arcgis.com/home/item.html?id=8651e4d585654f6b955564efe44d04e5.Accessed 27 December 2012.
National Geographic Society. 2011. USA Topo Maps representing United States Geological Society paper topographic maps. ESRI Map Service. http://goto.arcgisonline.com/maps/USA_Topo_Maps. Accessed 27 December 2012.
Southeastern Wisconsin Regional Planning Commission. 2005. A Regional Aquifer Simulation Model for Southeast Wisconsin Technical Report Number 41.
United States Geologic Survey. 1983. Quaternary Geologic Map of the Chicago 40 x 60 Quadrangle, United States. Quaternary Geologic Atlas of the United States.
United States Geologic Survey. 1992. Ground Water Atlas of the United States Iowa, Michigan, Minnesota, Wisconsin, HA 730-J.
United States Geologic Survey. 2004. The Value of Long-Term Monitoring in the Development of Ground-Water-Flow Models Fact Sheet 116-03.
United States Geological Survey. 2005. Water Use in Wisconsin. Open-File Report 2009-1076, Versions 1.1, November 2011.
Village of Jackson. 2008. Design and Drafting Handbook, Utility Specifications and Exhibits. Revised 28 March 2008.

For Official Use Only
g:\aproject\buckeye\wi1304\jackson\reports\phase ii\phase2_report_20121227.docx
Phase 2: Evaluation of Long-Term Water Supply Alternatives, Town of Jackson
West Shore Pipe Line Company
7-2 7-2
Village of Jackson and Town of Jackson. 2008. Village of Jackson and Town of Jackson Revenue Sharing Agreement and Cooperative Boundary Plan. Amended February 2008. Maps Revised March 2009.
Washington County, Wisconsin Geographic Information Systems. 2007. Washington County 2007 Digital Contour Mapping. Spatial Reference: Horizontal Coordinate System State Plane Zone 4803; Geodetic Model North American Datum 1927; Vertical Coordinate System National Geodetic Vertical Datum 1929. Contour data as of 18 December 2006.
Washington County Land and Water Conservation Committee. 2005. Washington County Land and Water Resource Management Plan (1st Revision 2006-2010).
West Shore Pipe Line Company. 2012. http://www.jacksonwisconsinresponse.com/ Accessed. November 26, 2012.
Wisconsin Department of Natural Resources. 2012. Website: http://dnr.wi.gov/topic/Groundwater/data.html Accessed December 3, 2012.
Wisconsin Department of Natural Resources. 2012. Website: http://prodoasext.dnr.wi.gov/inter1/hicap$.startup. Accessed December 4, 2012.
Wisconsin Geological and Natural History Survey. 1980. Ground-Water Resources and Geology of Washington and Ozaukee Counties, Wisconsin Information Circular Number 38. 1980.
Wisconsin Geological and Natural History Survey. 1983. Thickness of Unconsolidated Material in Wisconsin. 1983.
Wisconsin Geological and Natural History Survey. 1997. Quaternary Geology of Ozaukee and Washington Counties, Wisconsin Bulletin 91.
Wisconsin Geological and Natural History Survey. 2000. Appendix B Hydraulic Conductivity and Specific Storage of the Maquoketa Shale, Open-file Report 2000-01.
Wisconsin Geological and Natural History Survey. 2001. Appendix C Verification and Characterization of a Fracture Network Within the Maquoketa Shale Confining Unit, Southeast Wisconsin Open-file Report 2001-04.

For Official Use Only
g:\aproject\buckeye\wi1304\jackson\reports\phase ii\phase2_report_20121227.docx
Phase 2: Evaluation of Long-Term Water Supply Alternatives, Town of Jackson
West Shore Pipe Line Company
7-3 7-3
Wisconsin Geological and Natural History Survey. 2001. Appendix C Verification and Characterization of a Fracture Network Within the Maquoketa Shale Confining Unit, Southeast Wisconsin Open-file Report 2001-04.
Wisconsin Geological and Natural History Survey. 2004. Preliminary bedrock geologic map of Washington County, Wisconsin Open File Report 2004-17A.
Wisconsin Geological and Natural History Survey. 2004. Preliminary depth to bedrock map of Washington County, Wisconsin. Open-File Report 2004-17C.
Wisconsin Geological and Natural History Survey. 2011. Glaciation of Wisconsin Educational Series 36 Fourth Edition.
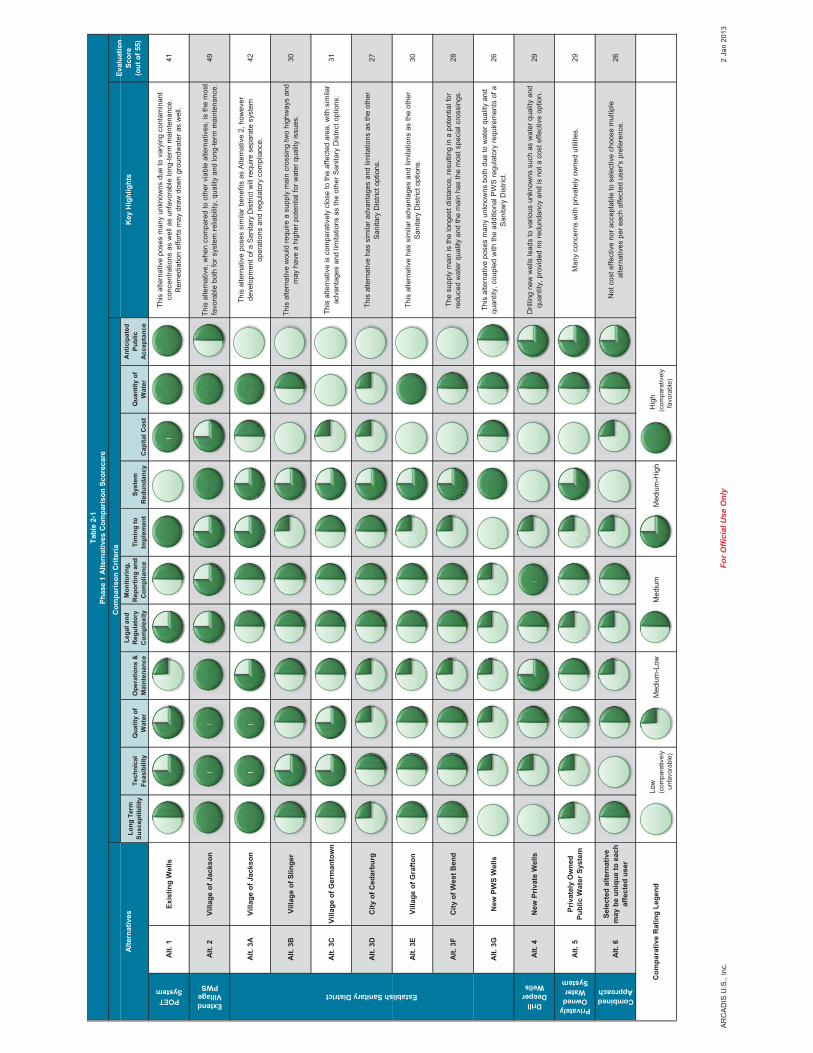
Long
Ter
m
Susc
eptib
ility
Tech
nica
l Fe
asib
ility
Qua
lity
of
Wat
erO
pera
tions
&
Mai
nten
ance
Lega
l and
Re
gula
tory
Co
mpl
exity
Mon
itorin
g,
Repo
rtin
g an
d Co
mpl
ianc
eTi
min
g to
Im
plem
ent
Syst
em
Redu
ndan
cyCa
pita
l Cos
tQ
uant
ity o
f W
ater
Antic
ipat
ed
Publ
ic
Acce
ptan
ce
POET System
Alt.
1Ex
istin
g W
ells
34
42
43
51
55
5Th
is a
ltern
ativ
e po
ses
man
y un
know
ns d
ue to
var
ying
con
tam
inan
t co
ncen
tratio
ns a
s w
ell a
s un
favo
rabl
e lo
ng-te
rm m
aint
enan
ce.
Rem
edia
tion
effo
rts m
ay d
raw
dow
n gr
ound
wat
er a
s w
ell.
41
Extend Village PWS
Alt.
2Vi
llage
of J
acks
on5
55
54
44
54
53
This
alte
rnat
ive,
whe
n co
mpa
red
to o
ther
via
ble
alte
rnat
ives
, is
the
mos
t fa
vora
ble
both
for s
yste
m re
liabi
lity,
qua
lity
and
long
-term
mai
nten
ance
.49
Alt.
3AVi
llage
of J
acks
on5
55
43
34
43
51
This
alte
rnat
ive
pose
s si
mila
r ben
efits
as
Alte
rnat
ive
2, h
owev
er
deve
lopm
ent o
f a S
anita
ry D
istri
ct w
ill re
quire
sep
arat
e sy
stem
op
erat
ions
and
regu
lato
ry c
ompl
ianc
e.42
Alt.
3BVi
llage
of S
linge
r3
43
33
32
41
31
This
alte
rnat
ive
wou
ld re
quire
a s
uppl
y m
ain
cros
sing
two
high
way
s an
d m
ay h
ave
a hi
gher
pot
entia
l for
wat
er q
ualit
y is
sues
.30
Alt.
3CVi
llage
of G
erm
anto
wn
34
43
33
34
21
1Th
is a
ltern
ativ
e is
com
para
tivel
y cl
ose
to th
e af
fect
ed a
rea,
with
sim
ilar
adva
ntag
es a
nd li
mita
tions
as
the
othe
r San
itary
Dis
trict
opt
ions
.31
Alt.
3DC
ity o
f Ced
arbu
rg2
32
23
33
42
21
This
alte
rnat
ive
has
sim
ilar a
dvan
tage
s an
d lim
itatio
ns a
s th
e ot
her
Sani
tary
Dis
trict
opt
ions
.27
Alt.
3EVi
llage
of G
rafto
n3
33
23
32
41
51
This
alte
rnat
ive
has
sim
ilar a
dvan
tage
s an
d lim
itatio
ns a
s th
e ot
her
Sani
tary
Dis
trict
opt
ions
.30
Alt.
3FCi
ty o
f Wes
t Ben
d3
33
23
32
41
31
The
supp
ly m
ain
is th
e lo
nges
t dis
tanc
e, re
sulti
ng in
a p
oten
tial f
or
redu
ced
wat
er q
ualit
y an
d th
e m
ain
has
the
mos
t spe
cial
cro
ssin
gs.
28
Alt.
3GN
ew P
WS
Wel
ls1
22
22
21
53
33
This
alte
rnat
ive
pose
s m
any
unkn
owns
bot
h du
e to
wat
er q
ualit
y an
d qu
antit
y, c
oupl
ed w
ith th
e ad
ditio
nal P
WS
regu
lato
ry re
quire
men
ts o
f a
Sani
tary
Dis
trict
.26
Drill Deeper Wells
Alt.
4N
ew P
rivat
e W
ells
12
34
35
21
13
4D
rillin
g ne
w w
ells
lead
s to
var
ious
unk
now
ns s
uch
as w
ater
qua
lity
and
quan
tity,
pro
vide
d no
redu
ndan
cy a
nd is
not
a c
ost e
ffect
ive
optio
n.29
Privately Owned Water
System
Alt.
5Pr
ivat
ely
Ow
ned
Publ
ic W
ater
Sys
tem
22
33
23
24
13
4M
any
conc
erns
with
priv
atel
y ow
ned
utilit
ies.
29
Combined Approach
Alt.
6Se
lect
ed a
ltern
ativ
e m
ay b
e un
ique
to e
ach
affe
cted
use
r3
13
22
32
12
34
Not
cos
t effe
ctiv
e no
r acc
epta
ble
to s
elec
tive
choo
se m
ultip
le
alte
rnat
ives
per
eac
h af
fect
ed u
ser's
pre
fere
nce.
26
Low
(com
para
tivel
y u
nfav
orab
le)
Med
ium
-Low
Med
ium
Med
ium
-Hig
h H
igh
(c
ompa
rativ
ely
fav
orab
le)
Eval
uatio
nSc
ore
(out
of 5
5)
Tabl
e 2-
1Ph
ase
1 Al
tern
ativ
es C
ompa
rison
Sco
reca
re
Com
para
tive
Ratin
g Le
gend
Establish Sanitary District
Alte
rnat
ives
Key
Hig
hlig
hts
Com
paris
on C
riter
ia
5555
5555555
5555
5555
555
55555
55
55555555
55
555555 55
ARC
ADIS
U.S
., In
c.Fo
r Offi
cial
Use
Onl
y 2
Jan
201
3

Mid
dle
95%
Mid
dle
95%
Ave
rage
Con
cent
ratio
n(m
g/L)
Max
imum
Con
cent
ratio
n(m
g/L)
Max
imum
Con
cent
ratio
n(m
g/L)
Arse
nic
0.00
10.
0130
80.
011
0.00
790.
474
0.04
610.
0005
442
%H
ardn
ess
NS
NS
7434
0.12
341.
8462
158
51.
23%
Nitr
ate
210
321.
186
1.07
85.
22.
20.
216%
Bact
eria
, As
Col
iform
*0
01,
107
N/A
N/A
Pres
ent
N/A
097
%Iro
n0.
150.
310
31.
261.
2099
6.7
6.6
0.00
1235
%M
anga
nese
0.02
50.
0598
1.38
0.03
1810
00.
186
0.00
0624
%
Mid
dle
95%
Mid
dle
95%
Ave
rage
Con
cent
ratio
n(m
g/L)
Max
imum
Con
cent
ratio
n(m
g/L)
Arse
nic
0.00
10.
0151
0.00
310.
0029
0.00
920.
0087
0.00
051
57%
Har
dnes
sN
SN
S20
321.
4531
6.53
415
410
820%
Nitr
ate
210
160.
8412
0.77
81.
61.
60.
056
19%
Bact
eria
, As
Col
iform
*0
030
8N
/AN
/APr
esen
tN
/A0
99%
Iron
0.15
0.3
180.
440.
394
1.1
0.91
0.01
411
%M
anga
nese
0.02
50.
0518
0.03
90.
0371
0.07
20.
068
0.00
025%
Bol
dC
once
ntra
tion
Exce
eds
the
NR
140
Pre
vent
ive
Actio
n Li
mit
(PAL
). Ex
pres
sed
as m
illigr
ams
per l
iter (
mg/
L) u
nles
s ot
herw
ise
note
d.B
old
Con
cent
ratio
n Ex
ceed
s th
e N
R 1
40 E
nfor
cem
ent S
tand
ard
(ES)
. Ex
pres
sed
as m
g/L
unle
ss o
ther
wis
enot
ed.
NS
No
stan
dard
.Ba
cter
ia, A
s C
olifo
rm*
This
par
amet
er is
repo
rted
as p
rese
nt o
r abs
ent,
not a
s m
g/L.
Tabl
e 4.
1. S
umm
ary
of W
ater
Qua
lity
Dat
a, P
hase
2 A
ltern
ativ
es E
valu
atio
n, J
acks
on, W
isco
nsin
.
Ave
rage
Con
cent
ratio
n(m
g/L)
Min
imum
Con
cent
ratio
n(m
g/L)
Ave
rage
Con
cent
ratio
n(m
g/L)
Max
imum
Con
cent
ratio
n(m
g/L)
Min
imum
Con
cent
ratio
n(m
g/L)
Nia
gara
Aqu
ifer
Con
stitu
ent
Con
stitu
ent
Sand
ston
e A
quife
r
NR
140
ES (m
g/L)
NR
140
PA
L (m
g/L)
Num
ber
ofSa
mpl
es
Perc
ent
Non
dete
ct
NR
140
PA
L (m
g/L)
NR
140
ES (m
g/L)
Num
ber
ofSa
mpl
es
Perc
ent
Non
dete
ct
For O
ffici
al U
se O
nly
G:\A
proj
ect\B
ucke
ye\W
I130
4\Ja
ckso
n\ta
bles
\wat
er q
ualit
y qu
antit
y ta
bles
.xls
x (q
ualit
y)

Ave
rage
Mid
dle
95%
A
vera
geM
axim
umM
iddl
e 95
%
Max
imum
Min
imum
Num
ber o
f Sa
mpl
es
Spec
ific
Cap
acity
(gpm
/ft)
21.5
178
055
044
.40.
346
Nor
mal
Pum
ping
Rat
e (g
pm)
174.
4616
082
567
20.
6946
Ave
rage
Mid
dle
95%
A
vera
geM
axim
umM
iddl
e 95
%
Max
imum
Min
imum
Num
ber o
f Sa
mpl
esSp
ecifi
c C
apac
ity (g
pm/ft
)4.
093.
213
.67.
61.
312
Nor
mal
Pum
ping
Rat
e (g
pm)
270.
6319
01,
000
300
34.7
212
gpd/
ft
gal
lons
per
min
ute
(gpm
) per
foot
.
Nia
gra
Aqu
ifer
Sand
ston
e A
quife
r
Tabl
e 4.
2. S
umm
ary
of W
ater
Qua
ntity
Dat
a, P
hase
2 A
ltern
ativ
es E
valu
atio
n, J
acks
on, W
isco
nsin
.
For O
ffici
al U
se O
nly
G:\A
proj
ect\B
ucke
ye\W
I130
4\Ja
ckso
n\ta
bles
\wat
er q
ualit
y qu
antit
y ta
bles
.xls
x (q
uant
ity)

Crit
eria
Long
Ter
m
Susc
eptib
ility
Tech
nica
l Fe
asib
ility
Qua
ntity
of
Wat
erQ
ualit
y of
W
ater
Ope
ratio
ns &
M
aint
enan
ce
Lega
l and
R
egul
ator
y C
ompl
exity
Mon
itorin
g,
Rep
ortin
g an
d C
ompl
ianc
e
Tim
ing
to
Impl
emen
tSy
stem
R
edun
danc
y
Antic
ipat
ed
Publ
ic
Acce
ptan
ceC
apita
l Cos
t
Wei
ght
1015
1010
55
515
55
15
Alt.
25
55
55
44
55
34
4.7
Alt.
3A4
45
54
33
34
14
3.8
Alt.
3G3
33
32
22
14
24
2.7
Alt.
41
13
34
25
41
41
2.4
Low
(com
para
tivel
y u
nfav
orab
le)
Med
ium
-Low
Med
ium
Med
ium
-Hig
h H
igh
(c
ompa
rativ
ely
fav
orab
le)
Com
para
tive
Rat
ing
Lege
nd
Tabl
e 5-
2Ph
ase
2 Al
tern
ativ
es C
ompa
rison
Sco
reca
rd
Alte
rnat
ives
Eval
uatio
nSc
ore
(out
of 5
.0)
Exte
nd V
illag
e of
Ja
ckso
n Sy
stem
Sani
tary
Dis
tric
t w
ith V
illag
e of
Ja
ckso
n W
ater
So
urce
Sani
tary
Dis
tric
t w
ith N
ew P
WS
Wel
ls
New
Priv
ate
Wel
ls
Com
paris
on C
riter
ia a
nd W
eigh
ting
Perc
enta
ge
5555
55 55
55 55
55
55
5555
ARC
ADIS
U.S
., In
c.Fo
r Offi
cial
Use
Onl
y 2
Jan
201
3

Tota
lPe
r Ser
vice
WD
S N
etw
ork
40$3
,761
,940
$94,
048.
50$2
9.55
$95,
821.
50
POET
Sys
tem
s fo
r Agr
. Site
s4
$28,
060
$7,0
15.0
0$1
,600
.00
$32,
615.
00
Tota
l Con
stru
ctio
n C
ost
- -$3
,790
,000
WD
S N
etw
ork
& Sa
n D
istri
ct40
$3,7
91,9
40$9
4,79
8.50
$72.
00$9
9,11
8.50
POET
Sys
tem
s fo
r Agr
. Site
s4
$28,
060
$7,0
15.0
0$1
,600
.00
$32,
615.
00
Tota
l Con
stru
ctio
n C
ost
- -$3
,820
,000
WD
S N
etw
ork
& Sa
n D
istri
ct40
$3,9
61,9
40$9
9,04
8.50
$87.
00$1
04,2
68.5
0
POET
Sys
tem
s fo
r Agr
. Site
s4
$28,
060
$7,0
15.0
0$1
,600
.00
$32,
615.
00
Tota
l Con
stru
ctio
n C
ost
- -$3
,990
,000
Priv
ate
Wel
ls40
$5,1
80,0
00$1
29,5
00.0
0$2
2.00
$130
,820
.00
Tota
l Con
stru
ctio
n C
ost
- -$5
,180
,000
Tabl
e 5-
3An
ticip
ated
Alte
rnat
ive
Cos
ts(1
)
Com
pone
nt
(2) E
OPC
C -
engi
neer
s op
inio
n of
pro
babl
e co
nstru
ctio
n co
sts
(3) C
ost i
nclu
des
supp
lies,
pow
er, c
hem
ical
s, tr
eatm
ent,
etc
as w
ell a
s m
onth
ly w
ater
bills
bas
ed o
n av
erag
e cu
stom
er u
sage
(4) C
ost i
nclu
des
EOPC
C a
nd 5
yea
rs o
f fix
ed O
&M c
osts
.
EOPC
C(2
)
(1) L
egal
cha
lleng
es, r
emed
iatio
n co
sts,
and
cos
ts o
utsi
de th
is re
port
are
not i
nclu
ded.
No.
of
Serv
ices
Alte
rnat
ive
Alte
rnat
ive
4N
ew P
rivat
e W
ells
Mon
thly
O
M&
R(3
)5
Yr. C
ost
Per S
ervi
ce(4
)
Alte
rnat
ive
2Ex
tend
Vill
age
of J
acks
on
Syst
em
Alte
rnat
ive
3ASa
nita
ry D
istr
ict w
ith V
illag
e of
Jac
kson
Wat
er S
ourc
e
Alte
rnat
ive
3GSa
nita
ry D
istr
ict w
ith N
ew
PWS
Wel
ls
ARC
ADIS
U.S
., In
c.Fo
r Offi
cial
Use
Onl
y 2
Jan
201
3

JACKSON
SHER
MA
N
MAPLE
HICKORY
CR
OSSWIND
RIVERVIE
W
DIVISION
CTY TK
T
HU
MM
ING
BIR
D
EL CAMINO
FIESTA
SHER
MA
N
SPRING VALLEY
CREEKWOODSHER
MA
N PA
RC
WILDFLOWERMOCKINGBIRD
MONTIC
ELLO
DIVISION
MAPLE
JACKSON
WESTER
N
DIVISION
MAPLE
CENTER
SPRIN
G VA
LLEY
MILL
WESTER
N
SHER
MA
N
OA
KLAND
STONEHEDGE
SHER
MA
N PA
RC
JACKSON
JACKSON
TWIN CREEKS
FENCELINE
CENTER
CROSSWINDB
ROO
KS ID
E
BR
OO
KSID
E
1-1WI001304.0002
J. Cooper
2 Jan 2013 Site Location Map
ARCADIS U.S., Inc.126 N. Jefferson St., Suite 400Milwaukee, WI 53202Tel 414 276 7742 Fax 414 276 7603www.arcadis-us.com
PROJECT NUMBER
DATE
DRAWN BY SHEET TITLE
CLIENT/PROJECT FIGURE
For Official Use Only
01,400
2,800700
Feet
Release
Site
User: JCooper Date: 12/27/2012 Path: G:\PROJECTS\WI001304.0001\Water\Figures\GIS\Fig1-1_SiteLocationMap.mxd
Germ
antown
Jackson
MAPLE
DIVISIONC
TY TK
T
CHURCHPIO
NEER
CENTER
CHURCH
CTY TK P
CE NTER
HY 45 HY 45
LocationM
ap
The information presented originates from
various sources. It shall be considered for preliminary reference purposes only and shall not be considered final.
West Shore Pipe Line Company - Jackson, WI
Phase 2 Long-TermWater Supply Eval.
LegendPrivate Wells
Road

ReleaseSite
ARCADIS U.S., Inc.126 N. Jefferson St., Suite 400Milwaukee, WI 53202Tel 414 276 7742 Fax 414 276 7603www.arcadis-us.com
2-1WI001304.0002
J. Cooper
2 Jan 2013
7.5-MinuteQuadrangle Map
WSPC - Jackson, WI
Phase 2 Long-TermWater Supply Eval.
SHEET TITLE
FIGUREPROJECT NUMBER
DATE
DRAWN BY
CLIENT/PROJECT
0 1,750 3,500875Feet
Use
r: JC
oope
r D
ate:
12/
27/2
012
P
ath:
G:\P
RO
JEC
TS\W
I001
304.
0001
\Wat
er\F
igur
es\G
IS\F
ig2-
1_U
SG
SQ
uadM
ap.m
xd
For O
ffici
al U
se O
nly
The information presented originates from various sources. It shall be considered for preliminary reference purposes only and shall not be considered final.

1880W
ESTERN
AVE
1930W
ESTERN
AVE
WESTER
NAVE
1836W
ESTERN
AVE
1891 WM
ILL RD
MILL R
D
1964W
ESTERN
AVE
1969 WM
ILL RD
1859M
ILL RD
1824W
ESTERN
AVE
MILL R
D
DU
229
SJ467
TL785
930
940
950
960
960
940
950
960
950
950
960
960
950
950
MW
-1
MW
-2
MW
-3
MW
-4M
W-4D
MW
-5
MW
-6
MW
-6D
MW
-7M
W-7D
MW
-8MW
-8D
MW
-9MW
-9D
MW
-10M
W-10D
MW
-11M
W-11D
MW
-12M
W-12D
MW
-13M
W-13D
MW
-14M
W-14D
MW
-15M
W-15D
MW
-16M
W-16D
RW-1
RW-2
RW-3
RW-4
RW-5
LegendMonitoring & Extraction W
ells
Private Wells
Parcels
Contours
2-2WI001304.0002
J. Cooper
2 Jan 2013
Remediation andMonitoring Well Locations
ARCADIS U.S., Inc.126 N. Jefferson St., Suite 400Milwaukee, WI 53202Tel 414 276 7742 Fax 414 276 7603www.arcadis-us.com
PROJECT NUMBER
DATE
DRAWN BY SHEET TITLE
CLIENT/PROJECT FIGURE
For Official Use Only
0200
400100
Feet
Release
Site
User: JCooper Date: 12/27/2012 Path: G:\PROJECTS\WI001304.0001\Water\Figures\GIS\Phase2\Fig2-2_RemediationMonitoringWells.mxd
MAPLE
DIVISIONM
ILL
SHER
MA
N
WESTER
N
SPRING
VALLEY
Location Map
The information presented originates from
various sources. It shall be considered for preliminary reference purposes only and shall not be considered final.
West Shore Pipe Line Company - Jackson, WI
Phase 2 Long-TermWater Supply Eval.

2002
2135
3279
20302780 2812
32473252
3075
32622263
2362
32863048
1860
31273128
31343133
31513152
3159
2913
2926 2938 2948
2945 2961
2459
2985
1982
1915
1885
1894
1985
2014
1969
1983
1790
1760
1770
1880
2771
3073
20352043 2042
1930
3053
2418
2266 2244
2255
224922392339
2327
2288 2280
3146
3144
3188
3162
3170
31143220
31063228
3167
3124
31003105
3236
32443086
2243
2235
22132229
30643055
30562242
2234
3047
1870
1682
1998
1710
1732
1752
1782
1796
18181876
194
194194
194194
160
194
160
160
160
193 193160
160160
2840
1639
2818
28602762
2881
2025
2015
2005
1971
1961
2869
2857
2026
2864
1990
1974
19601957
1995
2007
2019
2031
2807
2305
2245
2771
2343
2321
2165
3255
3223
3209
2979
2315
3215
3207
1736
2963
1730
1780
1836
1891
2955
2060
2090
2097
20452011
3252
3037
1740
1750
1708
1595
1555
3265
1629
1645
1665
32043282
3296
1683
3146
3191317131113123
2976
2950
1676
1666
3186
3174
3166
1605
3060
3375
3217 3249
1964
2004
2018
1986
1930
1646
2992
1997
1969
2039
3071
2250
1859
2933
1824
2971
29852987
3020
3115
1987
1845
31153116
2430
31653166
ST ONE H
EDGE
HICKORYSH
ERM
AN
C ROSSWIND
EAST
GATE
DIVISION
MAPLE
EAST GATE
OAKLAND
WESTER
N
GO
LDEN
HA
RVEST
HU
MM
ING
BIR
D
SHERM
AN
PARC
WILDFLOWER
MOCKINGBIRD
MAPLE
DIVISION
CTY TK
T
MAPLE
MILL
WESTER
N
SHER
MA
N PA
RC
FENCELINE
CROSSWIND
930
910
890
920
880
860
960
940
910
880
870
930
910
900
930
920
930
900
930
900
900
930
900
960
910
920
900
910
930
900
900
900
960
910
960
840
940
870
920
890
900
890
910
930
940
880
850
870
910
870
870
890
930
890
890
890
930
890
930
890
930
960
910
890
900
910
860
920
910
920
960
920
900
850
910
930
920
950
900
920
890
910
890
900
950960
880
920
900
900
900
910
920
940
900
950
LegendPrivate W
ellsR
esidential Usage
Agricultural Usage
ParcelsWell Im
pacted
Well N
ot Impacted
Contours
2-3WI001304.0002
J. Cooper
2 Jan 2013Impacted Well
Properties
West Shore Pipe Line Company - Jackson, WI
Phase 2 Long-TermWater Supply Eval.
ARCADIS U.S., Inc.126 N. Jefferson St., Suite 400Milwaukee, WI 53202Tel 414 276 7742 Fax 414 276 7603www.arcadis-us.com
PROJECT NUMBER
DATE
DRAWN BY SHEET TITLE
CLIENT/PROJECT FIGURE
For Official Use Only
01,000
2,000500
Feet
Release
Site
Note: Background data as of N
ov. 2012
User: JCooper Date: 12/27/2012 Path: G:\PROJECTS\WI001304.0001\Water\Figures\GIS\Phase2\Fig2-3_AffectedUserParcels.mxd
The information presented originates from
various sources. It shall be considered for preliminary reference purposes only and shall not be considered final.

2002
2135
3279
20302780 2812
32473252
3075
32622263
2362
32863048
1860
31273128
31343133
31513152
3159
2913
2926 2938 2948
2945 2961
2459
2985
1982
1915
1885
1894
1985
2014
1969
1983
1790
1760
1770
1880
2771
3073
20352043 2042
1930
3053
2418
2266 2244
2255
224922392339
2327
2288 2280
3146
3144
3188
3162
3170
31143220
31063228
3167
3124
31003105
3236
32443086
2243
2235
22132229
30643055
30562242
2234
3047
1870
1682
1998
1710
1732
1752
1782
1796
18181876
194
194194
194194
160
194
160
160
160
193 193160
160160
2840
1639
2818
28602762
2881
2025
2015
2005
1971
1961
2869
2857
2026
2864
1990
1974
19601957
1995
2007
2019
2031
2807
2305
2245
2771
2343
2321
2165
3255
3223
3209
2979
2315
3215
3207
1736
2963
1730
1780
1836
1891
2955
2060
2090
2097
20452011
3252
3037
1740
1750
1708
1595
1555
3265
1629
1645
1665
32043282
3296
1683
3146
3191317131113123
2976
2950
1676
1666
3186
3174
3166
1605
3060
3375
3217 3249
1964
2004
2018
1986
1930
1646
2992
1997
1969
2039
3071
2250
1859
2933
1824
2971
29852987
3020
3115
1987
1845
31153116
2430
31653166
ST ONE H
EDGE
HICKORYSH
ERM
AN
C ROSSWIND
EAST
GATE
DIVISION
MAPLE
EAST GATE
OAKLAND
WESTER
N
GO
LDEN
HA
RVEST
HU
MM
ING
BIR
D
SHERM
AN
PARC
WILDFLOWER
MOCKINGBIRD
MAPLE
DIVISION
CTY TK
T
MAPLE
MILL
WESTER
N
SHER
MA
N PA
RC
FENCELINE
CROSSWIND
930
910
890
920
880
860
960
940
910
880
870
930
910
900
930
920
930
900
930
900
900
930
900
960
910
920
900
910
930
900
900
900
960
910
960
840
940
870
920
890
900
890
910
930
940
880
850
870
910
870
870
890
930
890
890
890
930
890
930
890
930
960
910
890
900
910
860
920
910
920
960
920
900
850
910
930
920
950
900
920
890
910
890
900
950960
880
920
900
900
900
910
920
940
900
950
LegendPrivate W
ellsR
esidential Usage
Agricultural Usage
ParcelsProposed Service (Well Im
pacted)
Proposed Service (Adjacent to Impacted W
ell)
Well N
ot Impacted
Contours
2-4WI001304.0002
J. Cooper
2 Jan 2013Phase 2
Proposed Services
West Shore Pipe Line Company - Jackson, WI
Phase 2 Long-TermWater Supply Eval.
ARCADIS U.S., Inc.126 N. Jefferson St., Suite 400Milwaukee, WI 53202Tel 414 276 7742 Fax 414 276 7603www.arcadis-us.com
PROJECT NUMBER
DATE
DRAWN BY SHEET TITLE
CLIENT/PROJECT FIGURE
For Official Use Only
01,000
2,000500
Feet
Release
Site
Note: Background data as of N
ov. 2012
User: JCooper Date: 12/27/2012 Path: G:\PROJECTS\WI001304.0001\Water\Figures\GIS\Phase2\Fig2-4_Ph2PropSvcs.mxd
The information presented originates from
various sources. It shall be considered for preliminary reference purposes only and shall not be considered final.

2002
2135
3279
20302780 2812
32473252
3075
32622263
2362
2400
3026
2420
3080
3130
2435
2423
2415
2407
2426
2418
2408
32863048
1860
31273128
31343133
31513152
3159
2473
2913
2926 2938 2948
2945 2961
2459
2985
1982
1915
18851894
1985
2014
1969
1983
1790
1760
1770
1880
2771
3073
20352043 20421930
3053
2418
2266
2244
2255
2249
2239
2398
2339
2327
2358
2366
2288
2280
3146
3144
3188
3162
3170
3114
3220
31063228
3167
3124
31003105
3236
32443086
2243
2235
2213
2229
30643055
3056
2242
2234
3047
1870
2333
3207
3195
3189
31833177
3138
3142
3160
3172 3180
3291
3275
3253
3274
3260
3252
3244
2239
2247
2257
2267
2275
2283
2293
2305
2238
2246
2256
2266
2274
2284
2298
2306
2314 2320 2328
2342
3044
325332473239
3229
3219 325032443236
2430
2420
2410
2400
2384
2370
2364
2358
2350
2431
2421
2411
2401
2385
2373
3226
1682
1998
17101732
17521782
1796
18181876
194
194194
194
160
160
160193
160160
2406160
28402818
2860
2762
2881
2025
2015
2005
1971
1961
2869
2857
2026
2864
1990
1974
19601957
1995
2007
2019
2031
2807
2305
2245
2771
2343
2321
2401
2788
2450
2165
3255
3223
3209
2979
2315
2409
3215
3207
1736
2963
1730
1780
1836
1891
2955
2060
2090
2097
20452011
3252
3037
1740
1750
1708
3204 3282
3296
16833146
29762950
3186
31743166
3060
1964
2004
2018
1986
1930
2992
1997
1969
2039
2250
1859
2933
1824
2971
29852987
3020
3115
1987
1845
31153116
2466
2430
31653166
HICKORY
JACKSON
SHER
MA
N
CTY
TK T
DIVISION
CROSSWIND
MAPLE
OAKLAND
CROSSWIND
TWIN CREEKS
EAST G
ATE
EAST GATE
GO
LDEN H
AR
VEST
HU
MM
ING
BIR
D
JACKSON
TWIN CREEKS
CREEKWOODSHER
MA
N PARC
WILDFLOWER
MOCKINGBIRD
MAPLE
WESTER
N
MAPLE
MILL
WESTER
N
S HER
MA
N PA
RC
FENCELINE
FENCELINE
CROSSWINDBRO
OK
SI DE
BR
OO
KSID
E
DIVISION
930
910 890
960
940
910
930
910
860
930900
890
850
900
890
870
850
930
900
910
930
960
860
900
900
960
910
960
910
920
920
890
900
890
910
930
940
870
910
870
930
870
890
890
850
930
890
840
930
890
930
870
960
910
900
910
920
890
920
900
960
930
920
950
920
870880
900
950
960
880
920
900
920
940
900
860
950
LegendVillage W
ater Mains
8" - Existing
12" - Existing
8" - Future
12" - Future
Private Wells
Residential U
sage
Agricultural Usage
Proposed Water M
ains
Service Connections
2030 Village Limits
ParcelsProposed Service (Well Im
pacted)
Proposed Service (Adjacent to Impacted W
ell)
Well N
ot Impacted
3-1WI001304.0002
J. Cooper
2 Jan 2013
Alternative 2Preliminary Water
Infrastructure
West Shore Pipe Line Company - Jackson, WI
Phase 2 Long-TermWater Supply Eval.
ARCADIS U.S., Inc.126 N. Jefferson St., Suite 400Milwaukee, WI 53202Tel 414 276 7742 Fax 414 276 7603www.arcadis-us.com
PROJECT NUMBER
DATE
DRAWN BY SHEET TITLE
CLIENT/PROJECT FIGURE
For Official Use Only
01,000
2,000500
Feet
Release
Site
Future VillageElev. Tank Site
8"
12"
8"
8"
8"
8"
8"
12"
8"
8"8"
12"12"
Note: Background data as of N
ov. 2012
User: JCooper Date: 12/27/2012 Path: G:\PROJECTS\WI001304.0001\Water\Figures\GIS\Phase2\Fig3-1_Alt2PrelimInfrastructure.mxd
The information presented originates from
various sources. It shall be considered for preliminary reference purposes only and shall not be considered final.
8"
8"
8"

HICKORY
JACKSON
SHER
MA
N
CTY
TK T
DIVISION
CROSSWIND
MAPLE
OAKLAND
CROSSWIND
TWIN CREEKS
EAST G
ATE
EAST GATE
GO
LDEN H
AR
VEST
HU
MM
ING
BIR
D
JACKSON
TWIN CREEKS
CREEKWOODSHER
MA
N PARC
WILDFLOWER
MOCKINGBIRD
MAPLE
WESTER
N
MAPLE
MILL
WESTER
N
S HER
MA
N PA
RC
FENCELINE
FENCELINE
CROSSWINDBRO
OK
SI DE
BR
OO
KSID
E
DIVISION
2002
2135
3279
20302780 2812
32473252
3075
32622263
2362
2400
3026
2420
3080
3130
2435
2423
2415
2407
2426
2418
2408
32863048
1860
31273128
31343133
31513152
3159
2473
2913
2926 2938 2948
2945 2961
2459
2985
1982
1915
18851894
1985
2014
1969
1983
1790
1760
1770
1880
2771
3073
20352043 20421930
3053
2418
2266
2244
2255
2249
2239
2398
2339
2327
2358
2366
2288
2280
3146
3144
3188
3162
3170
3114
3220
31063228
3167
3124
31003105
3236
32443086
2243
2235
2213
2229
30643055
3056
2242
2234
3047
1870
2333
3207
3195
3189
31833177
3138
3142
3160
3172 3180
3291
3275
3253
3274
3260
3252
3244
2239
2247
2257
2267
2275
2283
2293
2305
2238
2246
2256
2266
2274
2284
2298
2306
2314 2320 2328
2342
3044
325332473239
3229
3219 325032443236
2430
2420
2410
2400
2384
2370
2364
2358
2350
2431
2421
2411
2401
2385
2373
3226
1682
1998
17101732
17521782
1796
18181876
194
194194
194
160
160
160193
160160
2406160
28402818
2860
2762
2881
2025
2015
2005
1971
1961
2869
2857
2026
2864
1990
1974
19601957
1995
2007
2019
2031
2807
2305
2245
2771
2343
2321
2401
2788
2450
2165
3255
3223
3209
2979
2315
2409
3215
3207
1736
2963
1730
1780
1836
1891
2955
2060
2090
2097
20452011
3252
3037
1740
1750
1708
3204 3282
3296
16833146
29762950
3186
31743166
3060
1964
2004
2018
1986
1930
2992
1997
1969
2039
2250
1859
2933
1824
2971
29852987
3020
3115
1987
1845
31153116
2466
2430
31653166
930
910 890
960
940
910
930
910
860
930900
890
850
900
890
870
850
930
900
910
930
960
860
900
900
960
910
960
910
920
920
890
900
890
910
930
940
870
910
870
930
870
890
890
850
930
890
840
930
890
930
870
960
910
900
910
920
890
920
900
960
930
920
950
920
870880
900
950
960
880
920
900
920
940
900
860
950
LegendVillage W
ater Mains
8" - Existing
12" - Existing
8" - Future
12" - Future
Private Wells
Residential U
sage
Agricultural Usage
Proposed Water M
ains
Service Connections
2030 Village Limits
ParcelsProposed Service (W
ell Impacted)
Proposed Service (A
djacent to Impacted W
ell)
Well N
ot Impacted
3-2WI001304.0002
J. Cooper
2 Jan 2013
Alternative 3APreliminary Water
Infrastructure
West Shore Pipe Line Company - Jackson, WI
Phase 2 Long-TermWater Supply Eval.
ARCADIS U.S., Inc.126 N. Jefferson St., Suite 400Milwaukee, WI 53202Tel 414 276 7742 Fax 414 276 7603www.arcadis-us.com
PROJECT NUMBER
DATE
DRAWN BY SHEET TITLE
CLIENT/PROJECT FIGURE
For Official Use Only
01,000
2,000500
Feet
Release
Site
Future VillageElev. Tank &Structure Site
8"
12"
8"
8"
8"
8"
8"
12"
8"
8"8"
12"12"
Note: Background data as of N
ov. 2012
User: JCooper Date: 12/27/2012 Path: G:\PROJECTS\WI001304.0001\Water\Figures\GIS\Phase2\Fig3-2_Alt3APrelimInfrastructure.mxd
The information presented originates from
various sources. It shall be considered for preliminary reference purposes only and shall not be considered final.
8"
8"
8"
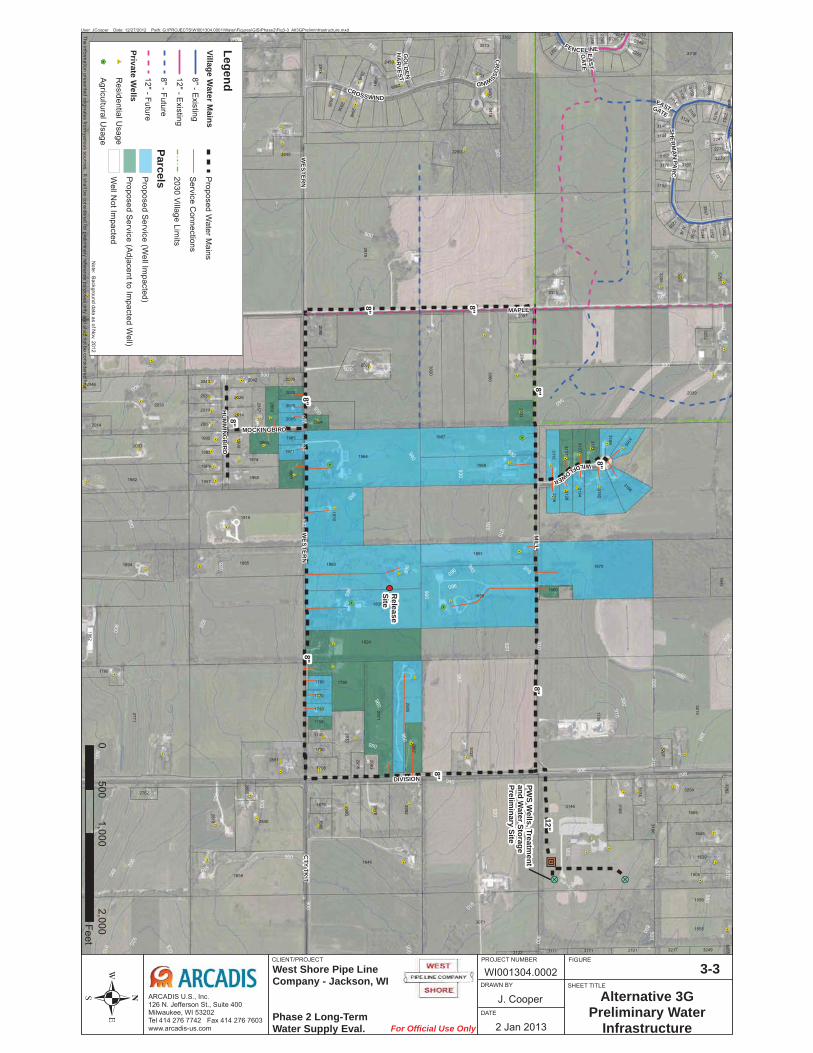
CROSSWIND
EAST
GATE
EAST GATE
GO
LDEN
HA
RVEST
SHER
MA
N
PARC
HU
MM
ING
BIR
D
WESTER
N
WILDFLOWER
MOCKINGBIRD
CTY TK
T
DIVISION
MAPLEMAPLE
MILL
WESTER
N
FENCELINE
SHER
MA
N PA
RC
CROSSWIND
2014
2002
2030
2780 2812
32473252
3075
32622263
2362
1790
1860
31273128
31343133
31513152
3159
2913
2926 2938 2948
2945 2961
2459
2985
1982
1915
18851894
1985
2014
1969
1983
1790
1760
1770
1880
2771
3073
2761
20352043 2042
1862
1930
3053
2418
22662244
2255
2249
22392339
2327
2288
2280
3146
3144
3188
3162
3170
3114
3220
31063228
3167
31243100
31053236
32443086
2243
2235
2213
2229
30642242
1870
2046
2840
1639
2818
28602762
2881
2025
2015
2005
1971
2726
1961
2869
2857
2026
2864
1990
1974
19601957
1995
2007
2019
2031
2807
2305
2245
2771
2757
2723
2343
2321
3255
3223
3209
2979
2315
3215
3207
1736
2963
1730
1780
1836
1891
2955
2060
2090
2097
20452011
3252
3037
1740
1750
1708
1595
1555
3265
1629
1645
1665
3204
3282
3146
3191317131113123
2976
2950
1676
1666
3186
3174
3166
1605
3060
3217 3249
1964
2004
1646
2992
1969
2039
3071
2250
1859
2933
1824
2971
29852987
3020
3115
1987
1845
31153116
2430
3165
3166
960
940
910
930
910
930
900
910
890
880
900
900
880
930
890
910
880
900
930
900
960
910
920
910
910900
930
920
900
900
960
960
880
940
920
920
900
900900
890
930
940
870
910870
930
890
930
890
900
930
890
930
920
960
910
910
920
890
850
920
960
890
910
930
920
950
920
910
860
900
950
960
920
900
890
900
910
920
940
900
900
950
LegendVillage W
ater Mains
8" - Existing
12" - Existing
8" - Future
12" - Future
Private Wells
Residential U
sage
Agricultural Usage
Proposed Water M
ains
Service Connections
2030 Village Limits
ParcelsProposed Service (Well Im
pacted)
Proposed Service (Adjacent to Impacted W
ell)
Well N
ot Impacted
3-3WI001304.0002
J. Cooper
2 Jan 2013
West Shore Pipe Line Company - Jackson, WI
Phase 2 Long-TermWater Supply Eval.
ARCADIS U.S., Inc.126 N. Jefferson St., Suite 400Milwaukee, WI 53202Tel 414 276 7742 Fax 414 276 7603www.arcadis-us.com
PROJECT NUMBER
DATE
DRAWN BY SHEET TITLE
CLIENT/PROJECT FIGURE
For Official Use Only
01,000
2,000500
Feet
Release
Site
PWS W
ells, Treatment
and Water Storage
Preliminary Site
8"
8"
8"
8"
8"8"
Note: Background data as of N
ov. 2012
User: JCooper Date: 12/27/2012 Path: G:\PROJECTS\WI001304.0001\Water\Figures\GIS\Phase2\Fig3-3_Alt3GPrelimInfrastructure.mxd
The information presented originates from
various sources. It shall be considered for preliminary reference purposes only and shall not be considered final.
8"
8"
8"
Alternative 3GPreliminary Water
Infrastructure
12"

HU
MM
ING
BIR
D
CTY TK
T
WILDFLOWER
MOCKINGBIRD
MAPLE
DIVISION
MAPLE
WESTER
N
MILL
WESTER
N
20022030
2780
2812
1860
31273128
31343133
3151
3152
3159
1982
1915
1885
1985
2014
1969
1983
1790
1760
1770
1880
2771
20352043
2042
1930
31883220
1870
2840
1639
2818
2860
2881
2025
2015
2005
1971
1961
2869
2857
2026
2864
1990
1974
19601957
1995
2007
2019
2031
2807
3209
2979
32153207
1736
2963
1730
1780
1836
1891
2955
2060
2090
2097
20452011
3037
1740
1750
1708
16653204
3146
2976
2950
1676
1666
3186
3174
3166
3060
1964
2004
1646
29921969
2039
2250
1859
2933
1824
2971
2985
2987
3020
3115
1987
31153116
3165
3166
960
940
910
930
930
890
930
920
960
910
930
890
880
890
900
900
910
960
910
960
940
920
930
930
940
900
900
930
920
930
930
890
930
910
960
960
960
960
900
910
910
920920
960
960
900
910
930
920
910
950
920
910
930
910
950
960
900
900
940
900
950
LegendProposed W
ellsC
luster
Individual
Cluster W
ell Service Connections
Private Wells
Residential U
sage
Agricultural Usage
ParcelsProposed Service (W
ell Impacted)
Proposed Service (A
djacent to Impacted W
ell)
Well N
ot Impacted
2030 Village Limits
3-4WI001304.0002
J. Cooper
2 Jan 2013
West Shore Pipe Line Company - Jackson, WI
Phase 2 Long-TermWater Supply Eval.
ARCADIS U.S., Inc.126 N. Jefferson St., Suite 400Milwaukee, WI 53202Tel 414 276 7742 Fax 414 276 7603www.arcadis-us.com
PROJECT NUMBER
DATE
DRAWN BY SHEET TITLE
CLIENT/PROJECT FIGURE
For Official Use Only
0500
1,000250
Feet
Release
Site
Note: Background data as of N
ov. 2012
User: JCooper Date: 12/27/2012 Path: G:\PROJECTS\WI001304.0001\Water\Figures\GIS\Phase2\Fig3-4_Alt4PrelimInfrastructure.mxd
The information presented originates from
various sources. It shall be considered for preliminary reference purposes only and shall not be considered final.
Alternative 4Preliminary Water
Infrastructure

HICKORY
JACKSON
SHER
MA
N
CTY
TK T
DIVISION
CROSSWIND
MAPLE
OAKLAND
CROSSWIND
TWIN CREEKS
EAST G
ATE
EAST GATE
GO
LDEN H
AR
VEST
HU
MM
ING
BIR
D
JACKSON
TWIN CREEKS
CREEKWOODSHER
MA
N PARC
WILDFLOWER
MOCKINGBIRD
MAPLE
WESTER
N
MAPLE
MILL
WESTER
N
S HER
MA
N PA
RC
FENCELINE
FENCELINE
CROSSWINDBRO
OK
SI DE
BR
OO
KSID
E
DIVISION
2002
2135
3279
20302780 2812
32473252
3075
32622263
2362
2400
3026
2420
3080
3130
2435
2423
2415
2407
2426
2418
2408
32863048
1860
31273128
31343133
31513152
3159
2473
2913
2926 2938 2948
2945 2961
2459
2985
1982
1915
18851894
1985
2014
1969
1983
1790
1760
1770
1880
2771
3073
20352043 20421930
3053
2418
2266
2244
2255
2249
2239
2398
2339
2327
2358
2366
2288
2280
3146
3144
3188
3162
3170
3114
3220
31063228
3167
3124
31003105
3236
32443086
2243
2235
2213
2229
30643055
3056
2242
2234
3047
1870
2333
3207
3195
3189
31833177
3138
3142
3160
3172 3180
3291
3275
3253
3274
3260
3252
3244
2239
2247
2257
2267
2275
2283
2293
2305
2238
2246
2256
2266
2274
2284
2298
2306
2314 2320 2328
2342
3044
325332473239
3229
3219 325032443236
2430
2420
2410
2400
2384
2370
2364
2358
2350
2431
2421
2411
2401
2385
2373
3226
1682
1998
17101732
17521782
1796
18181876
194
194194
194
160
160
160193
160160
2406160
28402818
2860
2762
2881
2025
2015
2005
1971
1961
2869
2857
2026
2864
1990
1974
19601957
1995
2007
2019
2031
2807
2305
2245
2771
2343
2321
2401
2788
2450
2165
3255
3223
3209
2979
2315
2409
3215
3207
1736
2963
1730
1780
1836
1891
2955
2060
2090
2097
20452011
3252
3037
1740
1750
1708
3204 3282
3296
16833146
29762950
3186
31743166
3060
1964
2004
2018
1986
1930
2992
1997
1969
2039
2250
1859
2933
1824
2971
29852987
3020
3115
1987
1845
31153116
2466
2430
31653166
930
910 890
960
940
910
930
910
860
930900
890
850
900
890
870
850
930
900
910
930
960
860
900
900
960
910
960
910
920
920
890
900
890
910
930
940
870
910
870
930
870
890
890
850
930
890
840
930
890
930
870
960
910
900
910
920
890
920
900
960
930
920
950
920
870880
900
950
960
880
920
900
920
940
900
860
950
LegendM
odel Nodes (by pressure)
< 45 psi
45 - 50 psi
50 - 60 psi
65 - 80 psi
> 80 psi
Village Water M
ains8" - Existing
12" - Existing
8" - Future
12" - Future
Private Wells
Residential U
sage
Agricultural Usage
Proposed Water M
ains
2030 Village Limits
ParcelsProposed Service (Well Im
pacted)
Proposed Service (Adjacent to Impacted W
ell)
Well N
ot Impacted
4-1WI001304.0002
J. Cooper
2 Jan 2013
Alternative 2Maximum Day Demands
Model Simulated Pressures
West Shore Pipe Line Company - Jackson, WI
Phase 2 Long-TermWater Supply Eval.
ARCADIS U.S., Inc.126 N. Jefferson St., Suite 400Milwaukee, WI 53202Tel 414 276 7742 Fax 414 276 7603www.arcadis-us.com
PROJECT NUMBER
DATE
DRAWN BY SHEET TITLE
CLIENT/PROJECT FIGURE
For Official Use Only
01,000
2,000500
Feet
Release
Site
Future VillageElev. Tank Site
8"
12"
8"
8"
8"
8"
8"
12"
8"
8"8"
12"12"
Note: Background data as of N
ov. 2012
User: JCooper Date: 12/27/2012 Path: G:\PROJECTS\WI001304.0001\Water\Figures\GIS\Phase2\Fig4-1_SvcAreaPressures.mxd
The information presented originates from
various sources. It shall be considered for preliminary reference purposes only and shall not be considered final.
8"
8"
8"


A
A'
BB'
TP470
GC
223
SC4
61
DE6
52
HD
960
MG
503
DM
958
IC424
AA06
1
LU728
RN
761
KZ194
HI507
LE715
RP6
32
OT0
86
GM
176
SQ072
RH
871
CD
229
EQ433
KM104
DU
998
IC389
FI531
HP6
23
LY346
FO6
64
RV1
05
QW
674
SJ464
FO3
38
HI573
RK9
98
FO6
33
EN8
16
FO6
67
IG39
9
SI952
NM
754
CX7
81
TU19
7
CU
358
FK711
GG
105
HP6
16
HO
632
HU
639
VB33
7
AF211
MN
439
EN0
08
AD9
31
WO
787
UM
851
TH82
7
TH25
7
VD6
26
UC
251
FV248
RQ
901
RH
684
VH8
52
ON
339SC4
88
RC
217
MG
684
SJ227
QO
153
SQ046
QW
477
DQ
173
TP057
NU
754
KZ134
CD
120
FI296
DA6
37
607
LY338
ON
313
IG38
4
RV5
54
SI953
MK
107
SJ213
NP3
49
LT702
WH
774
FI516
MW
592
GE
895
IF012
SN0
88
NA8
87
SL307
LL174
QJ937
LT289
QN
765
OH
304
QV
075
KO916
HP6
12
NJ322
RP6
30
FQ3
51
LA201
FO3
46
EN8
95
LU397
KO985
QV
094
FV241
LT228
UP8
41
DA6
64
GJ917
WG
395
OC
048
UB8
73
RN
776
TL473
TL759
TH24
1
TF094
SL323
RL430
WI047
VB32
5
US3
73
UO
640
UM
860
WO
224
UP8
18
MW
551
VL794
VB34
7
TJ151
US3
48
SJ208
LU380
SN0
89
HD
938
KU6
24
GE
469
KZ980
RU
826
QP
356
LT157
FI530
LA193
RV8
64
SQ412
LT664
VC8
17
QX
086
RP6
66
SK18
5
RN
157
MG
697
QV
078
EJ375
GE
884
CZ53
2
RH
874
HX4
33
SC4
97
OQ
617
RU
900
LD584
LI590
IG36
3
LT720
GK
666
OT8
62
FV824
GI58
2
SN0
73
QW
691
RM
710
OS
972
CD
174
KU6
18
DM
828
SJ281
FO6
78
KO813
UP8
16
WG
236
FL993
IN031
NV7
01
LT179
NA8
49
FT652
TR78
0
NG
839
IC420
US3
46
LT146
MP
522
CW
583
NX6
37
RA5
83
LT218
SV83
4
WL
372
US7
28
SS01
0
RH
899
UQ
073
UY5
58
KZ133
UV4
44
HY2
01RH
695
FO1
91
SQ477
OC
079
HL982
QL78
9
TE293
ON
346
CU
581
LU413
SL338
SS03
0
SL393
OJ734
CY4
82
HY2
04
SI383
QW
459
RN
746
OC
058
FO6
93
OJ741
MZ
121
HJ903
RH
815
JE550
HD
910
DO
389
DE6
37
KB14
5
SJ429
SR7
94
RP6
58
QO
175
MZ
150
KZ185
HO
669
RH
531
MZ
555
SL305
AZ640
GM
318
TI946
DN
492
SU6
55
RP3
181
DC
298
MN
727
NA7
35
OT8
63
SE21
6
TW118
SL309
FU60
4
KB13
5
SK15
8
MH
3382
GM
177
BO725
ON
829
QW
628
MO
423
NE4
16
GE
821
DM
817
TQ1
00
RV1
09
SQ070
OC
898
NL109
GZ7
59
646
GM
221
HO
664
OT8
38
LL792
GJ163
IG39
5
RV1
29
RV1
37
MW
582
IA567
FO1
87
RM
718
AJ294
KO989
KR6
13
CY7
63
NW
908
RN
784
DE6
42
FP645
FV737
GG
189
LL796
LU414
NJ343
LT685
LT213
QX
060
QV
058
II680
AT891
HC
800
UP8
37
CT95
7
SJ216
LL766
TL756
UE0
92
TI975
UQ
546
UL254
TN39
9
SV89
2
TH82
0
WG
237
WL
338
VC9
59
WG
752
UB8
82
OC
071
WJ
052
FY616
DA5
45
KZ128
DF44
2
RN
750
MK
133
NL137
LU529
RN
730
HS9
44
QX
781
KZ123
KB78
6
IF115
CO
462
IN045
IE873
EJ402
OR
084
EQ542
IL288
HU
686
LT212
HY2
09
GM
311
DR
245
DU
243
RS0
55
ID310
BO722
MF
026
OT8
49
LL787
OS
778
FX730
ET678
SN1
71
LT657
TN38
3
UQ
085
TK569
WJ
780
SJ462
TU80
8
WI028
WK
951
VJ989
TC25
7
IB785
UE8
77
DA6
21
HT40
3
SJ475
SA93
4
RK7
12
MJ48
6
DA6
44
644
KL891
TL369
DE6
45
ON
310
RH
895
MO
391
RV1
04
OG
965
SY38
1
QO
176
SI125
FO3
00
AA07
6
SS04
9
TQ4
11
GE
898
MW
598
SG042
CT43
7
QW
614
ST177
AG295
SJ445
RC
222
SV80
1
OC
02
KO970
GC
138
OC
003
LW6
81
AK55
4
OT8
22
FO2
24
IG37
3
MQ
152
RP6
61
DA6
66
GE
902
TL534
SW0
32
SL316
UE8
77
UP6
93
UP6
65
WL
329
TI303
TK050
OS
994
OS
786
SY39
3
CU
550
DR
226
OU
567
LI442
HI553
RM
734
HD
973
LH768
LT132
GC
228
SU6
72
GG
129
TH86
6
CO
940
625
MJ63
5
DM
816
TL782
KP27
2
RH
820
KC8
81
SV89
7
MZ
140
SJ278
EJ460
OJ751
HU
624
MP
583
EM373
YE89
7
MG
683
RR
384
RM
076
EJ373
OT8
66
KA44
4
QO
157
KO991
TC56
0
MG
543
HU
087
QV
079
HP6
51
CI463
HS9
30
RS6
43
GE
894
SJ224
LI480
GE
832
SL311
MH
122
HC
798
RP6
65
SJ463
SZ259
SE22
0
UN
477
VC8
04
TL361
SB37
4
EP93
5
OQ
687
RS0
35
EN8
26
630
SK19
0
FY016
HX8
13
EQ966
TG9
93
EN1
25
AC4
03
FO6
24
DU
965
HR
500
TC53
3
NF77
8
RV5
29
JE547
AU6
94
DN
673
CY7
88
DN
693
GE
809
LW6
74
FY850
GG
191
FU62
0
CE1
58
GH
029
QW
643
AU7
00
SJ256
OC
080
KP25
3
DM
810
SN1
60
HR
244
HS9
12
SS10
0
SJ296
SV82
8
FY852
GZ5
60
FP811
SD6
29
HI583
LL752
KS411
SW0
13
EO805
TC54
8
QW
631
MC
491
HC
711
OT8
42
DQ
181
DP3
80
DE6
69
NM
760
RV5
45
KO938
OT8
70
SM173
GL06
9
QV
014
MC
491
UM
871
TW10
0
TE660
US3
59
US3
38
TL452
TX888
HS4
57
HO
672
FW85
5
EJ396
MZ
525
UC
293
QX
049
QS
548
GC
497
KO906
QN
784
MC
497
SA31
9
NL129
QT7
03
DU
947
FQ3
27
IG65
7
RK9
65
GC
146
SO007
KM085
FW84
8
QW
651
NV7
45
GE
870
NG
205
LL736
IG39
3
FO2
81
DO
353
KO990
QI36
2
NM
242
AT879
MG
542
ID399
KZ173
QX
790
RB3
91
FY908
OT8
30
RN
778
CU
512
DR
243
CY7
64
MK
128
TL767
CZ51
6
MW
375
KM085
QX
065
IB762
GE
907
LE120
632
NG
844
EN0
06
RV1
33
KR7
14
GG
104
LT190
IG40
5
CT38
1
SS04
3
SQ032
UK9
39
WL
530
UD
661
TC57
4
WJ
394
UQ
074
UL297
UB9
57
US0
71
TI965
UN
450
DN
494
WJ
028
UC
217
GE
842
AY305
MW
576
DU
973
LU719
NJ352
SI033
CU
575
DC
071
SJ470
KY52
5
GE
824
LY983
ON
400
AS96
9
KZ988
DC
540
QX
062
OR
062
OK
666
LU596
KZ131
GE
663
AE36
4
RH
517
RM
746
LK184
QW
635
HU
678
MF
099
HJ107
MK
122
TM869
HR
497
TV386
HV7
78
IL209
LL718
WL
894
NA8
81
LT415
RQ
946
HD
932
LI584
TH85
0
SL365
UB8
57
TH82
6
UY5
60
WM
333
KO918
NC
866
KZ925
NE4
13
CW
573
RY8
61
FW86
8
KP29
2
DQ
158
GG
176
FI299
SR7
72
GE
698
US3
57
RB5
28
LI598
MC
499
OJ764
QW
641
SL376
KP28
0
NJ362
CY7
99
NI312
EN8
66
FI549
SJ455
GE
922
RK9
84
MC
414
RC
279
HI506
NM
787
EN8
36
EN1
22
FY061
EP22
7
NT42
4
TS633
GE
825
SE25
3
DC
926
FK250
NB3
73
KO116
RV1
45
SJ222
RU
838
TH87
4
UC
293
WJ
489
UX5
68
VB92
4
VC9
54
UU
733
TU44
8
SL376
FY617
RE1
72 FV795
FI275
HO
667
SL377
CI960
MW
327
LT153
HY2
73
RK9
66
HS9
28
GH
031
RP6
67
RS8
96
CW
577
SP62
3
WM
031
WL
416
AK52
8
GE
889
GH
045
MM
119
KO904
OT8
17
OO
976
SV62
4
FV733FV
740
WM
031
LT317
OJ758
NM
761
NJ335
GH
042
SJ277
AU5
29
DU
289
MW
418
EQ949
GK
846
LL710
SJ461
RM
709
UD
673
TK040
TL454
UP8
31
TL336
US3
39
WP
715
KC0
45
QW
669
GF6
75
MG
665
HY6
34
WI994
LU432
LU431
MV
547
CY7
65
HI545
HX8
14
SM179
TH86
2
TH83
8
EJ378
AF618
AF498
HO
633
FI501
HP6
69
FQ8
09
DU
989
TU44
6
FQ2
54
SL400
RP7
00
UP6
71
ID326
LL722
MV
277
OJ757
MW
577
GG
126
SS00
2
ES90
6
KP22
3
DU
988
SV41
5
HP6
09
OC
063
KM538
RS6
39
OC
072
EP92
7
KP25
1
UC
209
UD
655
VC8
13
FT798
FK727
ID308
FY622
OT8
65
RA1
55
NJ368
HD
949
SM118
BH2
63
LL756
FY848
AU11
7
TD58
6
GI58
3
VD6
30
DP3
89
AF465
RN
164
ML8
55
RK9
76
AH1
65
NY4
54
NM
271
HU
681
DN
692
KU6
16
SL330
IC418H
W8
59
HO
744
DC
947
KP23
1
ID387
RV5
64
AB46
1
TH85
6
ON
317
OS
780
HO
609
HJ957
NF78
9
FU98
8
KC7
47
MW
399
DQ
166
UP8
43
LH826
OR
067
QO
975
QN
735
NM
761
SQ028
TJ161
TH83
6
SW0
21
WO
858
WN
339
WM
891
UP8
08
UK6
39
SN1
94
QW
634
OC
054
LV107
RH
683
KY54
7
AP34
2
FI281
DE2
05
KP29
1
RN
792
EP44
4
CY7
71
QW
697
RK9
76
EJ372
FT646
SJ249
KP211
IG38
5
GE
868
MG
688
IC383
SV81
5
HT48
7
DC
935
RS6
04
DE2
00
DU
997
LH748
SE54
0
NL171
HY2
27
OT8
65
TL479 SJ2
01
KO737
AG279
MJ66
6
OQ
643
ID387
SJ202
SJ276
TL774
VD6
32
GC
134
SI356
VC8
15
DU
934
SD7
62
KW5
22
RN
137
KM815
LU466
HI562
AY843
LD616
HY2
86
SQ034
QV
085
EN8
00
SJ469
GI04
1
HN
978
RM
728
MF
079
SL328
LH811
NL136
CN
712
GE
700
SE25
2
EQ972
ES18
7
SL310
HN
992
GZ7
48
AJ335
LL755
UN
654
SL328
QW
626
TF208
OL63
6
SL341
SO635
KA44
3
WL
878
WM
911
TI987
WO
721
TI986
SS07
9
TE296
TF202
QW
482
KC4
83
FU98
1
CY7
91
GG
153
MZ
107
NM
219
MJ45
5
EN8
99
HN
910
SW0
10
SB39
0
TS604
NL189
DQ
879
QI37
1
RN
793
FO3
44
CY7
84
HP6
88
NM
774
IE912
ME
266
MK
454
HR
410
FT789
QW
486
DF43
8
DR
799
SJ420
GG
110
RP3
63
EJ394
FU98
9
RK9
67
TH86
4
CD
211
FV741
OT1
63
KB45
0
RN
729
EN8
09
TL338
NG
830
EJ397
ET675
LT323
RV1
48
OG
190
IL371
DA5
52
GC
637
EN0
12
SQ028
TH84
3
SJ212
GL06
0
TL500
SJ269
SZ292
UY5
56
UN
675
WL
889
UP8
21
DU
906
TW13
2
SR7
01
MK
127
HI695
QI92
6
CU
368
DA7
02
DE2
02
MG
517
RL469
GE
856
SJ460
LT695
FY634
LA222
DR
936
LU435
NY4
18
HV5
64
RY1
64
SL303
FI297
MG
689
LT712
MY
466
KB46
0
LU417
RC
258
SJ290
MD
959
DA6
19
RM
713
KO653
DE2
07
MG
689
SJ465
DA5
58
SN0
98
LI595
DR
214
LT712
HJ558
IC406
SE24
1
KM079
MK
147
DE2
01
LU381
RM
744
FW86
1
FY913
RV1
50
OT8
73
SJ242
KU6
02
TR76
9
II673
MW
377
LD594
OS
760
LT300
DB2
97
HS9
43
TE992
VC9
98
EN8
17
ID329
AA06
8
MW
403
LK319
SV61
8
DR
786
CB5
81
AF491
CZ35
0
MG
610
IJ291
FY632
SI373
KC4
93
RC
251
CX6
25
EQ330
SW4
06
SS40
6
OS
960
MW
618
KY51
3
DD
742
FI267
IE893
GI59
6
RK9
61
SU6
58
FU47
8
MH
367
HO
665
GE
658
ON
331
GE
908
GC
140
KB80
2
UQ
562
UO
614
UB8
88
TU43
8
UT20
4
WO
746
WL
403
SL312
WG
734
KO936
EN0
26
MK
184
SB89
2
DR
782
ON
392
FY010
CL044
ON
350
FO6
28
FO2
85
LJ486
OS
996
RL489
IN004
HY6
67
MJ80
5
RP3
83
DM
956
RM
077
NB7
74
DA6
29
AF149
AU6
07
DV0
26
MW
550
RV1
24
SD6
34
QX
045
MM
769
SS40
7
GE
666
AG684
LI481
KC4
88
KY52
6
GG
113
GK
653
HI637
QI36
2
FI542
SM146
LU548
SJ467
UA9
01TL7
87
OH
550
AY310
FT649
FT651
NA5
21
OG
953
WJ
910
TG9
92
UL300
TF239
JE535
TP056
TE146
WN
354
KQ063
OC
012
FW78
1
LT288
EN8
88
MG
628
KX85
3HI556
SU5
38
RK1
37
CP8
70
EJ387
OO
715
ID309
635
LL157
SL326
MV
520
AG724
GV
804
SJ239
627
SL302
DR
215
SU5
21
WG
249
QW
487
DD
860
CW
584
AU5
55
KA91
3
MZ
520
OC
091
HO
635
EQ959
OR
075
CZ51
7
SJ250
AZ646
OC
064
QX
792
QV
050WG
248
GC
247
RK1
84
GK
656
UZ67
9
TL785
TG9
53
VJ973
TI919
UB8
84
TC52
7
TC55
0
GG
154
BH2
13
UX9
09
VL980
TE290
SL394
HI528
DB9
64
OC
099
LT671
DF43
9
HY2
11
NL132
NJ395
DU
266
MO
402
EQ960
HU
665
NA7
02
CD
213
LM5
60
CU
573
KA60
8
RN
169
IQ92
7
CW
789
HI694
RM
701
NY4
99
HR
445
LE719
NJ318
MK
120
KR6
62
LL748
NR
362
UX9
14
QS
525
FO4
50
SL372
FO7
00
HO
606
CU
522
LT251
EN1
37
UD
640
US3
29
TC57
5
UK9
20
WM
906
SL334
NA8
19
SM181
HP1
65
KY54
9
DN
662
RY8
35
FO2
80
647
AJ547
NL183
HY2
14
CD
150
OS
965
LT302
RU
894
DA5
53
KM108
KB23
1
NL105
KP21
0
SL399
AG276
TQ4
21LL772
IF009 N
J375
OJ952
DV1
63
MG
696
LT682
DE2
72
HX8
03
FG6
84
OS
256
NQ
584
VA277
DR
789
SL318
DC
937
CZ34
9
FW86
4
CY4
92
RN
753
RW2
79
WM
739
CZ53
1
GO
783
LL714
IC386
EJ392
MD
433
ON
308
FO2
01
Q686
UM
808
UN
451
LT199
OJ726
LT147
LU416
FV739
SZ290
GE
677
HI534
SC1
00
EP95
1
OC
065
SQ033
LU416
ON
323
FG7
06
HI554
OC
092
LI591
FI259
SK16
2
OJ904
FT642
LT128
LK052
LT164
EM367
MK
185
HO
655
UP8
20
SL371
YE66
7
UN
673
UO
650
UM
873
US0
79
TC54
6
UK9
10
EQ549
Cedarburg
Germ
antown
Grafton
Hartford
Jackson
Mequon
New
burg
PortW
ashingtonSaukville
Slinger
Thiensville
West
Bend
57
145
57
32
59181
60
167
144
57
57
57
57
14332
144
167 175
K
145
Kilbourn
Main
Eastern
Mequon
Granville
Swan
Ulao
18th18th
River
Range Line
C
Pione er Chestnut
1st
Dec orahP
Wauwatosa
Lake Shore
Main
164
Ll
P
Highl and
O
45
4545
41
43
43
43
BH
272
BG
643
WQ
162
BH
264
BH
277
BH
270
FM494
BH
258
JA248
BG
646
HN
169
BG
647
BH
269
GM
798
BH
265
BH
263
BH
274
BG
655
GU
105EM
272
BH
257
BH
271
BG
652
BG
651
BH
268
BH
245
BA
139
BH
266
BG
653
BH
246
BG
654
WJ284
BG
645
WO
060
CS308
TQ324
BH
273
BG
650
WJ910
SA189
BH
255
BH
252
BH
253B
H254
BH
256
BH
250
LegendHigh C
apacity Wells
Private Wells
Cities or Villages
County Boundaries
Cross SectionsA-A'
B-B'
4-5WI001304.0002
J. Cooper
2 Jan 2013Location of Geologic
Cross Sections
West Shore Pipe Line Company - Jackson, WI
Phase 2 Long-TermWater Supply Eval.
ARCADIS U.S., Inc.126 N. Jefferson St., Suite 400Milwaukee, WI 53202Tel 414 276 7742 Fax 414 276 7603www.arcadis-us.com
PROJECT NUMBER
DATE
DRAWN BY SHEET TITLE
CLIENT/PROJECT FIGURE
For Official Use Only
02
41
Miles
Release
Site
User: JCooper Date: 12/27/2012 Path: G:\PROJECTS\WI001304.0001\Water\Figures\GIS\Phase2\Fig4-5_LocationCrossSections.mxd
The information presented originates from
various sources. It shall be considered for preliminary reference purposes only and shall not be considered final.

KZ194
LE715
FO6
64
RV1
05
AD9
31
RQ
901
RH
684
RC
217
QO
153
KO992
WH
774
KU0
77
LT289
QN
765
QV
075
HP6
12
FO3
46
FV241
LT228
DA6
64
OC
048
UB8
73
TH24
1
TF094
WI047
QW
672
HD
938
VC8
17
HX4
33
SN0
73
QW
691
RM
710
UP8
16
WG
236
FL993
IN031
NV7
01
LT179
NA8
49
NG
839
IC420
US3
46
NX6
37
LT218
US7
28
QL78
9
SL338
SL393
DO
389
DC
298
TW118
BO725
QW
628
TQ1
00
646
NA8
40
LL796
LT213
II680
UP8
37
LL766
KZ128
QX
781
CO
462
IE873
OT8
49
LL787
OS
778
FX730
ET678
WI028
KL891
SS04
9
QW
614
OC
003
LW6
81
FO2
24
RP6
61
DA6
66
TK050
LI442
HD
973
LT132
TL782
KC8
81
MP
583
EM373
HU
087
SJ224
SL311
SJ463
SE22
0
RS0
35
SK19
0
HR
500
FO6
65
CE1
58
GH
029
OC
080
DM
810
HI583
QW
631
MC
491
HC
711
DU
229
DE6
69
NM
760
RV5
45
KO938
OT8
70
MC
491
TL452
QS
548
QW
651
NV7
45
GE
907
NG
844
GG
104
SQ032
UK9
39
DN
494
MW
576
DC
071
SJ470
DC
540
OR
062
RM
746
LK184
QW
635
LL718
WL
894
HD
932
LI584
TH85
0
NC
866
NE4
13
RB5
28
GE
922
RK9
84
RC
279
EN8
36
FK250
NB3
73
RV1
45
VC9
54
SL376
OT8
17
LT317
OJ758
NM
761
DU
289
MW
418
EQ949
SJ461
RM
709
UD
673
UP8
31TL3
36
KC0
45
MV
277
OJ757
MW
577
GG
126
OT8
65
NJ368
RN
164
NY4
54
ID387
HO
609
NF78
9
MW
399
DQ
166
UP8
43
NM
761
SQ028
TJ161
QW
634
RN
792
QW
697
SJ249 LH
748
OT8
65
TL479
AG279
ID387
GC
134
RN
137
SJ469
MF
079
AJ335
SL341
WL
878
SS07
9
TF202
MJ45
5
NM
774
MK
454
RP3
63
FU98
9
TL338
NG
830
EJ397
ET675
LT323
RV1
48
OG
190
DA5
52
EN0
12
SQ028
TH84
3
SJ212
SZ292
WL
889
UP8
21
HV5
64
RY1
64
RC
258
DA6
19
RM
744
FW86
1
HS5
48
OT8
73
SJ242
KU6
02
TR76
9
II673
LD594
LT300
HS9
43
FU47
8
GE
658
SL312
FY010
LJ486
AF149
QX
045M
M7
69
LI481
LU548
SJ467
UA9
01
OH
550
OG
953
UL300
TP056
TE146
SL326
EQ959
AZ646
WG
248
RK1
84
GK
656
TL785
TI919
TC55
0
TE290
SL394
SL372
FO7
00
UD
640
SL334
CI475
DA5
53
KM108
GO
783
MD
433
ON
308
FO2
01
Q686
ON
323
FG7
06
FI259
FT642
LT128
LT164
EM367
SL371
Germ
antown
Jackson
West
Bend
4-6WI001304.0002
J. Cooper
2 Jan 2013Geologic
Cross Section A-A'
West Shore Pipe Line Company - Jackson, WI
Phase 2 Long-TermWater Supply Eval.
ARCADIS U.S., Inc.126 N. Jefferson St., Suite 400Milwaukee, WI 53202Tel 414 276 7742 Fax 414 276 7603www.arcadis-us.com
PROJECT NUMBER
DATE
DRAWN BY SHEET TITLE
CLIENT/PROJECT FIGURE
For Official Use Only
07,500
15,0003,750
Feet
Release
Site
User: JCooper Date: 12/27/2012 Path: G:\PROJECTS\WI001304.0001\Water\Figures\GIS\Phase2\Fig4-6_CrossSectionA-A.mxd
The information presented originates from
various sources. It shall be considered for preliminary reference purposes only and shall not be considered final.
A
A'
LegendHigh C
apacity Wells
Private Wells
Cross S
ection A-A'
Cities or Villages
County Boundaries

B
B'
DM
958
KZ194
LE715
IC389
QW
674
NM
754
AD9
31
UM
851
UC
251
MG
684
SJ227
KO992
WH
774
SN0
88
KU0
77
NA8
87
QJ937
LT289
HP6
12
FQ3
51
FO3
46
EN8
95
KO985
QV
094
FV241
WG
395
OC
048
UB8
73
TH24
1
UM
860
US3
48
SJ208
VC8
17
MG
697
HX4
33
OQ
617
RM
710
WG
236
LT146
MP
522
CW
583
NX6
37
RA5
83
LT218
US7
28
UY5
58
QL78
9
HO
669
SE21
6
TW118
SL309
646
OT8
38M
W58
2
NA8
40
CY7
63
LL796
QV
058
HC
800
UP8
37
CT95
7
SJ216
LL766
WG
237
WL
338
WJ
052
IL288
MF
026
SN1
71
LT657
MJ48
6
DA6
44
ON
310
QO
176
KO970
IG37
3
MQ
152
SL316
WL
329
TK050
OS
786
LI442
HD
973
LT132
MP
583
KO991
HU
087
HC
798
RP6
65
SJ463
RS0
35
EN8
26
630
TG9
93
EN1
25
NF77
8
GH
029
MC
491
HC
711
OT8
42
DQ
181
DP3
80
GL06
9
QV
014
MC
491
US3
38
TL452
HO
672
EJ396
GC
497
KO906
FQ3
27
IG65
7
LL736
KO990
ID399
RB3
91
IG40
5
CT38
1
SQ032
UK9
39
UD
661
TI965
UC
217
DU
973
SJ470
RM
746
LK184
QW
635
IL209
LI584
TH85
0
UP8
49
WM
333
NC
866
KZ925
FW86
8
MC
499
MC
414
RC
279
EN8
36
SE25
3
KO116
SJ222
RU
838
VC9
54
TU44
8
SL376
RE1
72
FI275
CI960
HY2
73
GH
031
NM
761
GK
846
LL710
KO116
SJ461
RM
709
TL454
TL336
US3
39
TH86
2
MV
277
OJ757
KP25
1
FY622
HD
949
LL756
HO
744
DC
947
ID387
HJ957
NF78
9
LH826
OR
067
QO
975
QN
735
NM
761
SQ028
TJ161
WO
858
WN
339
QW
634
RN
792
SJ249
DC
935
LH748
TL479 SJ2
01
MJ66
6
OQ
643
ID387
SJ202
SJ276
GC
134
RN
137
CN
712
GE
700
AJ335
UN
654
KA44
3
TI987
WO
721
TI986
TF202
MJ45
5
NM
774
IE912
MK
454
DR
799
RP3
63G
C637
SQ028
TH84
3
SJ212
GL06
0
SZ292
UN
675
WL
889
CU
368
LU435
HV5
64
LU417
RC
258
SN0
98
IC406
SE24
1
FW86
1
FY913
RV1
50
LK319
CB5
81
FY632
HO
665
GC
140
KB80
2
UO
614
WL
403
FY010
ON
350
LJ486
OS
996
IN004
RM
077
QX
045
MM
769
LI481
SJ467
NA5
21
TP056
TE146
OC
012
EN8
88
HI556
RK1
37
EJ387
SL326
SJ239
WG
249
QX
792
QV
050
UZ67
9
TL785
VJ973
TC55
0
VL980
TE290
SL394
NA7
02
KR6
62
NR
362
UX9
14
EN1
37
UD
640
SL334
NQ
584
Q686
UM
808
OJ726
LU416
SZ290
LU416
HI554
OC
092
MK
185
HO
655
UP8
20
SL371
YE66
7
UO
650
Cedarburg
Germ
antown
Grafton
Jackson
Mequon
Slinger
4-7WI001304.0002
J. Cooper
2 Jan 2013Geologic
Cross Section B-B'
West Shore Pipe Line Company - Jackson, WI
Phase 2 Long-TermWater Supply Eval.
ARCADIS U.S., Inc.126 N. Jefferson St., Suite 400Milwaukee, WI 53202Tel 414 276 7742 Fax 414 276 7603www.arcadis-us.com
PROJECT NUMBER
DATE
DRAWN BY SHEET TITLE
CLIENT/PROJECT FIGURE
For Official Use Only
07,500
15,0003,750
Feet
Release
Site
User: JCooper Date: 12/27/2012 Path: G:\PROJECTS\WI001304.0001\Water\Figures\GIS\Phase2\Fig4-7_CrossSectionB-B.mxd
The information presented originates from
various sources. It shall be considered for preliminary reference purposes only and shall not be considered final.
LegendHigh C
apacity Wells
Private Wells
Cross S
ection B-B'
Cities or Villages
County Boundaries

Germ
antown
Hartford
Jackson
Slinger
West
Bend
60
83
145
83
144143
167
175
K
S
145
State
Prospect
Lincoln
Monro e
Lin coln
Forest
83 MainMain
Cedar
83
Pio neer
164
MainPP
45
4545
41
LegendHigh C
apacity Wells
Private Wells
Cities or Villages
4-8WI001304.0002
J. Cooper
2 Jan 2013
RegionalBedrock Topography
West Shore Pipe Line Company - Jackson, WI
Phase 2 Long-TermWater Supply Eval.
ARCADIS U.S., Inc.126 N. Jefferson St., Suite 400Milwaukee, WI 53202Tel 414 276 7742 Fax 414 276 7603www.arcadis-us.com
PROJECT NUMBER
DATE
DRAWN BY SHEET TITLE
CLIENT/PROJECT FIGURE
For Official Use Only
01.5
30.75
Miles
User: JCooper Date: 12/27/2012 Path: G:\PROJECTS\WI001304.0001\Water\Figures\GIS\Phase2\Fig4-8_RegionalBedrockTopo.mxd
Release
Site
The information presented originates from
various sources. It shall be considered for preliminary reference purposes only and shall not be considered final.

Release Site
LegendTotal A
rsenic, milligram
s per liter (mg/L)
less than 0.001 mg/L
0.001 - 0.009 mg/L
greater than or equal to 0.01 mg/L
Counties
Urban Areas
4-9WI001304.0002
B. Webb
2 Jan 2013
Niagara Aquifer Arsenic Concentrations
PROJECT NUMBER
DATE
DRAWN BY SHEET TITLE
CLIENT/PROJECT FIGURE
For Official Use Only
013,200
26,400Feet
ARCADIS U.S., Inc.126 N. Jefferson St., Suite 400Milwaukee, WI 53202Tel 414 276 7742 Fax 414 276 7603www.arcadis-us.com
West Shore Pipe Line Company - Jackson, WI
Phase 2 Long-TermWater Supply Eval.
Points shown reflect data filtered from
WD
NR
database for Washington and O
zaukee County w
hich includes data from private potable,
municipal, non-transient non-com
munity, transient non-com
munity, and unspecified non-com
munity w
ells.
User: JCooper Date: 12/27/2012 Path: G:\PROJECTS\WI001304.0001\Water\Figures\GIS_BrianWebb\mxd\Fig4-9_niagara_arsenic.mxd
The information presented originates from
various sources. It shall be considered for preliminary reference purposes only and shall not be considered final.

Release Site
LegendC
oliform B
acteriaPresent/Postive
Absent/Negative
Counties
Urban A
reas
4-10WI001304.0002
B. Webb
2 Jan 2013
Niagara AquiferPresence of Coliform Bacteria
PROJECT NUMBER
DATE
DRAWN BY SHEET TITLE
CLIENT/PROJECT FIGURE
For Official Use Only
013,200
26,400Feet
ARCADIS U.S., Inc.126 N. Jefferson St., Suite 400Milwaukee, WI 53202Tel 414 276 7742 Fax 414 276 7603www.arcadis-us.com
West Shore Pipe Line Company - Jackson, WI
Phase 2 Long-TermWater Supply Eval.
Points shown reflect data filtered from
WD
NR
database for Washington and O
zaukee County w
hich includes data from private potable,
municipal, non-transient non-com
munity, transient non-com
munity, and unspecified non-com
munity w
ells.
User: JCooper Date: 12/27/2012 Path: G:\PROJECTS\WI001304.0001\Water\Figures\GIS_BrianWebb\mxd\Fig4-10_niagra_bacteria.mxd
The information presented originates from
various sources. It shall be considered for preliminary reference purposes only and shall not be considered final.

Release Site
LegendTotal H
ardness, milligram
s per liter (mg/L)
less than 100 mg/L
greater than or equal to 100 mg/L
Counties
Urban Areas
4-11WI001304.0002
B. Webb
2 Jan 2013
Niagara Aquifer Total Hardness
PROJECT NUMBER
DATE
DRAWN BY SHEET TITLE
CLIENT/PROJECT FIGURE
For Official Use Only
013,200
26,400Feet
ARCADIS U.S., Inc.126 N. Jefferson St., Suite 400Milwaukee, WI 53202Tel 414 276 7742 Fax 414 276 7603www.arcadis-us.com
West Shore Pipe Line Company - Jackson, WI
Phase 2 Long-TermWater Supply Eval.
Points shown reflect data filtered from
WD
NR
database for Washington and O
zaukee County w
hich includes data from private potable,
municipal, non-transient non-com
munity, transient non-com
munity, and unspecified non-com
munity w
ells.
User: JCooper Date: 12/27/2012 Path: G:\PROJECTS\WI001304.0001\Water\Figures\GIS_BrianWebb\mxd\Fig4-11_niagra_hardness.mxd
The information presented originates from
various sources. It shall be considered for preliminary reference purposes only and shall not be considered final.

Release Site
4-12WI001304.0002
B. Webb
2 Jan 2013
Niagara Aquifer Iron Concentrations
PROJECT NUMBER
DATE
DRAWN BY SHEET TITLE
CLIENT/PROJECT FIGURE
For Official Use Only
013,200
26,400Feet
ARCADIS U.S., Inc.126 N. Jefferson St., Suite 400Milwaukee, WI 53202Tel 414 276 7742 Fax 414 276 7603www.arcadis-us.com
West Shore Pipe Line Company - Jackson, WI
Phase 2 Long-TermWater Supply Eval.
Points shown reflect data filtered from
WD
NR
database for Washington and O
zaukee County w
hich includes data from private potable,
municipal, non-transient non-com
munity, transient non-com
munity, and unspecified non-com
munity w
ells.
User: JCooper Date: 12/27/2012 Path: G:\PROJECTS\WI001304.0001\Water\Figures\GIS_BrianWebb\mxd\Fig4-12_niagra_iron.mxd
The information presented originates from
various sources. It shall be considered for preliminary reference purposes only and shall not be considered final.
LegendTotal Iron, m
illigrams per liter (m
g/L)N
D or less than 0.15 m
g/L0.15 - 0.29 m
g/Lgreater than or equal to 0.3 m
g/LC
ountiesU
rban Areas
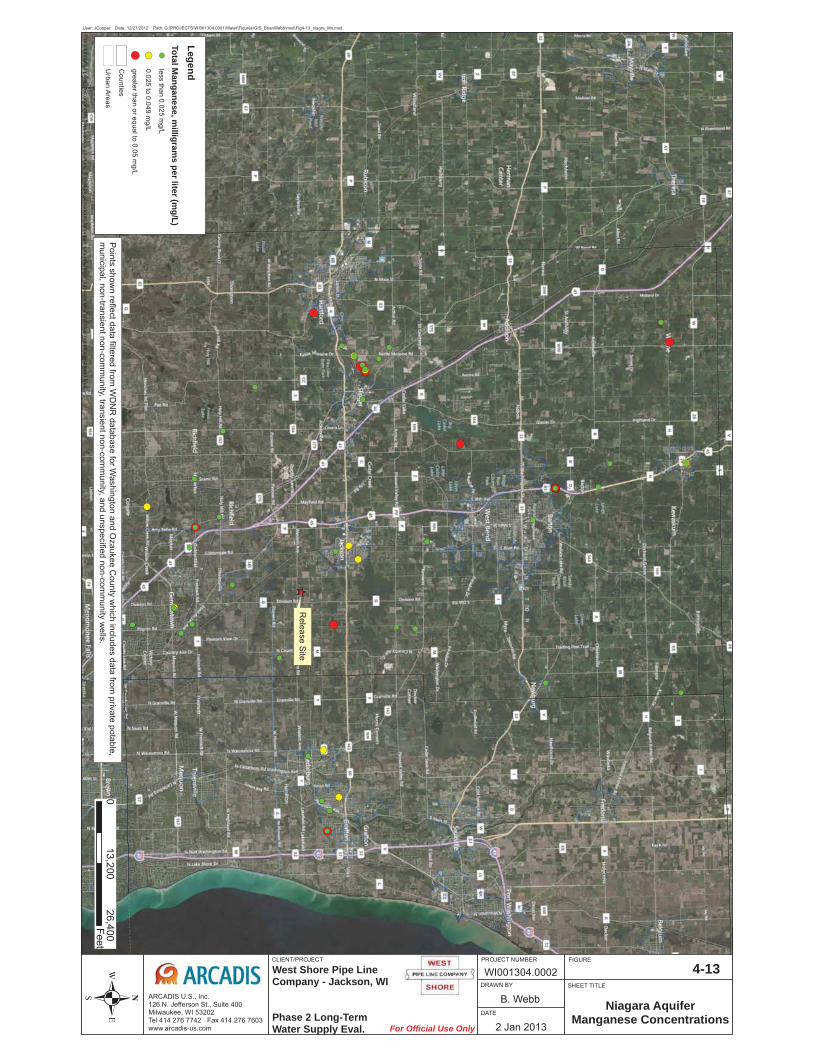
Release Site
LegendTotal M
anganese, milligram
s per liter (mg/L)
less than 0.025 mg/L
0.025 to 0.049 mg/L
greater than or equal to 0.05 mg/L
Counties
Urban Areas
4-13WI001304.0002
B. Webb
2 Jan 2013
Niagara AquiferManganese Concentrations
PROJECT NUMBER
DATE
DRAWN BY SHEET TITLE
CLIENT/PROJECT FIGURE
For Official Use Only
013,200
26,400Feet
ARCADIS U.S., Inc.126 N. Jefferson St., Suite 400Milwaukee, WI 53202Tel 414 276 7742 Fax 414 276 7603www.arcadis-us.com
West Shore Pipe Line Company - Jackson, WI
Phase 2 Long-TermWater Supply Eval.
Points shown reflect data filtered from
WD
NR
database for Washington and O
zaukee County w
hich includes data from private potable,
municipal, non-transient non-com
munity, transient non-com
munity, and unspecified non-com
munity w
ells.
User: JCooper Date: 12/27/2012 Path: G:\PROJECTS\WI001304.0001\Water\Figures\GIS_BrianWebb\mxd\Fig4-13_niagra_Mn.mxd
The information presented originates from
various sources. It shall be considered for preliminary reference purposes only and shall not be considered final.

Release Site
LegendTotal N
itrate (mg/L)
greater than or equal to 2.0 mg/L
less than 2.0 mg/L
Counties
Urban A
reas
4-14WI001304.0002
B. Webb
2 Jan 2013
All AquifersNitrate Concentrations
PROJECT NUMBER
DATE
DRAWN BY SHEET TITLE
CLIENT/PROJECT FIGURE
For Official Use Only
013,200
26,400Feet
ARCADIS U.S., Inc.126 N. Jefferson St., Suite 400Milwaukee, WI 53202Tel 414 276 7742 Fax 414 276 7603www.arcadis-us.com
West Shore Pipe Line Company - Jackson, WI
Phase 2 Long-TermWater Supply Eval.
Points shown reflect data filtered from
WD
NR
database for Washington and O
zaukee County w
hich includes data from private potable,
municipal, non-transient non-com
munity, transient non-com
munity, and unspecified non-com
munity w
ells.
User: JCooper Date: 12/27/2012 Path: G:\PROJECTS\WI001304.0001\Water\Figures\GIS_BrianWebb\mxd\Fig4-14_nitrate.mxd
The information presented originates from
various sources. It shall be considered for preliminary reference purposes only and shall not be considered final.

Release Site
LegendTotal A
rsenic, milligram
s per liter (mg/L)
ND
or less than 0.001 mg/L
0.001 to 0.01 mg/L
Counties
Urban Areas
4-15WI001304.0002
B. Webb
2 Jan 2013
Sandstone AquiferArsenic Concentrations
PROJECT NUMBER
DATE
DRAWN BY SHEET TITLE
CLIENT/PROJECT FIGURE
For Official Use Only
013,200
26,400Feet
ARCADIS U.S., Inc.126 N. Jefferson St., Suite 400Milwaukee, WI 53202Tel 414 276 7742 Fax 414 276 7603www.arcadis-us.com
West Shore Pipe Line Company - Jackson, WI
Phase 2 Long-TermWater Supply Eval.
Points shown reflect data filtered from
WD
NR
database for Washington and O
zaukee County w
hich includes data from private potable,
municipal, non-transient non-com
munity, transient non-com
munity, and unspecified non-com
munity w
ells.
User: JCooper Date: 12/27/2012 Path: G:\PROJECTS\WI001304.0001\Water\Figures\GIS_BrianWebb\mxd\Fig4-15_SS_arsenic.mxd
The information presented originates from
various sources. It shall be considered for preliminary reference purposes only and shall not be considered final.

Release Site
LegendC
oliform B
acteriaPresent/Positive
Absent/Negative
Counties
Urban Areas
4-16WI001304.0002
B. Webb
2 Jan 2013
Sandstone AquiferPresence of Coliform Bacteria
PROJECT NUMBER
DATE
DRAWN BY SHEET TITLE
CLIENT/PROJECT FIGURE
For Official Use Only
013,200
26,400Feet
ARCADIS U.S., Inc.126 N. Jefferson St., Suite 400Milwaukee, WI 53202Tel 414 276 7742 Fax 414 276 7603www.arcadis-us.com
West Shore Pipe Line Company - Jackson, WI
Phase 2 Long-TermWater Supply Eval.
Points shown reflect data filtered from
WD
NR
database for Washington and O
zaukee County w
hich includes data from private potable,
municipal, non-transient non-com
munity, transient non-com
munity, and unspecified non-com
munity w
ells.
User: JCooper Date: 12/27/2012 Path: G:\PROJECTS\WI001304.0001\Water\Figures\GIS_BrianWebb\mxd\Fig4-16_SS_bacteria.mxd
The information presented originates from
various sources. It shall be considered for preliminary reference purposes only and shall not be considered final.

Release Site
LegendTotal H
ardness, milligram
s per liter (mg/L)
Less than 100 mg/L
Greater than or equal to 100 m
g/L
Counties
Urban Areas
4-17WI001304.0002
B. Webb
2 Jan 2013
Sandstone AquiferTotal Hardness
PROJECT NUMBER
DATE
DRAWN BY SHEET TITLE
CLIENT/PROJECT FIGURE
For Official Use Only
013,200
26,400Feet
ARCADIS U.S., Inc.126 N. Jefferson St., Suite 400Milwaukee, WI 53202Tel 414 276 7742 Fax 414 276 7603www.arcadis-us.com
West Shore Pipe Line Company - Jackson, WI
Phase 2 Long-TermWater Supply Eval.
Points shown reflect data filtered from
WD
NR
database for Washington and O
zaukee County w
hich includes data from private potable,
municipal, non-transient non-com
munity, transient non-com
munity, and unspecified non-com
munity w
ells.
User: JCooper Date: 12/27/2012 Path: G:\PROJECTS\WI001304.0001\Water\Figures\GIS_BrianWebb\mxd\Fig4-17_SS_hardness.mxd
The information presented originates from
various sources. It shall be considered for preliminary reference purposes only and shall not be considered final.

Release Site
LegendTotal Iron, m
illigrams per liter (m
g/L)N
D or less than 0.15 m
g/L
0.15 to 0.29 mg/L
Greater than or equal to 0.3 m
g/L
Counties
Urban Areas
4-18WI001304.0002
B. Webb
2 Jan 2013
Sandstone AquiferIron Concentrations
PROJECT NUMBER
DATE
DRAWN BY SHEET TITLE
CLIENT/PROJECT FIGURE
For Official Use Only
013,200
26,400Feet
ARCADIS U.S., Inc.126 N. Jefferson St., Suite 400Milwaukee, WI 53202Tel 414 276 7742 Fax 414 276 7603www.arcadis-us.com
West Shore Pipe Line Company - Jackson, WI
Phase 2 Long-TermWater Supply Eval.
Points shown reflect data filtered from
WD
NR
database for Washington and O
zaukee County w
hich includes data from private potable,
municipal, non-transient non-com
munity, transient non-com
munity, and unspecified non-com
munity w
ells.
User: JCooper Date: 12/27/2012 Path: G:\PROJECTS\WI001304.0001\Water\Figures\GIS_BrianWebb\mxd\Fig4-18_SS_iron.mxd
The information presented originates from
various sources. It shall be considered for preliminary reference purposes only and shall not be considered final.

Release Site
LegendTotal M
anganese, milligram
s per liter (mg/L)
ND
to less than 0.025 mg/L
0.025 to 0.049 mg/L
greater than or equal to 0.05 mg/L
Counties
Urban Areas
4-19WI001304.0002
B. Webb
2 Jan 2013
Sandstone AquiferManganese Concentrations
PROJECT NUMBER
DATE
DRAWN BY SHEET TITLE
CLIENT/PROJECT FIGURE
For Official Use Only
013,200
26,400Feet
ARCADIS U.S., Inc.126 N. Jefferson St., Suite 400Milwaukee, WI 53202Tel 414 276 7742 Fax 414 276 7603www.arcadis-us.com
West Shore Pipe Line Company - Jackson, WI
Phase 2 Long-TermWater Supply Eval.
Points shown reflect data filtered from
WD
NR
database for Washington and O
zaukee County w
hich includes data from private potable,
municipal, non-transient non-com
munity, transient non-com
munity, and unspecified non-com
munity w
ells.
User: JCooper Date: 12/27/2012 Path: G:\PROJECTS\WI001304.0001\Water\Figures\GIS_BrianWebb\mxd\Fig4-19_SS_Mn.mxd
The information presented originates from
various sources. It shall be considered for preliminary reference purposes only and shall not be considered final.

Release Site
550 gpm/ft
0.3 gpm/ft
LegendSpecific C
apacity, gallons per minute per foot (gpm
/ft)less than or equal to 10 gpm
/ft
12 - 50 gpm/ft
550 gpm/ft
Counties
Urban Areas
4-20WI001304.0002
B. Webb
2 Jan 2013
Niagara AquiferSpecific Capacity
PROJECT NUMBER
DATE
DRAWN BY SHEET TITLE
CLIENT/PROJECT FIGURE
For Official Use Only
013,200
26,400Feet
ARCADIS U.S., Inc.126 N. Jefferson St., Suite 400Milwaukee, WI 53202Tel 414 276 7742 Fax 414 276 7603www.arcadis-us.com
West Shore Pipe Line Company - Jackson, WI
Phase 2 Long-TermWater Supply Eval.
Points shown reflect data filtered from
WD
NR
database for Washington and O
zaukee County w
hich includes data from private potable,
municipal, non-transient non-com
munity, transient non-com
munity, and unspecified non-com
munity w
ells.
User: JCooper Date: 12/27/2012 Path: G:\PROJECTS\WI001304.0001\Water\Figures\GIS_BrianWebb\mxd\Fig4-20_niagra_quantity.mxd
The information presented originates from
various sources. It shall be considered for preliminary reference purposes only and shall not be considered final.

Release Site
1.3 gpm/ft
13.6 gpm/ft
LegendSpecific C
apacity, gallons per minute per foot (gpm
/ft)less than 10 gpm
/ft
13.6 gpm/ft
Counties
Urban Areas
4-21WI001304.0002
B. Webb
2 Jan 2013
Sandstone AquiferSpecific Capacity
PROJECT NUMBER
DATE
DRAWN BY SHEET TITLE
CLIENT/PROJECT FIGURE
For Official Use Only
013,200
26,400Feet
ARCADIS U.S., Inc.126 N. Jefferson St., Suite 400Milwaukee, WI 53202Tel 414 276 7742 Fax 414 276 7603www.arcadis-us.com
West Shore Pipe Line Company - Jackson, WI
Phase 2 Long-TermWater Supply Eval.
Points shown reflect data filtered from
WD
NR
database for Washington and O
zaukee County w
hich includes data from private potable,
municipal, non-transient non-com
munity, transient non-com
munity, and unspecified non-com
munity w
ells.
User: JCooper Date: 12/27/2012 Path: G:\PROJECTS\WI001304.0001\Water\Figures\GIS_BrianWebb\mxd\Fig4-21_SS_quantity.mxd
The information presented originates from
various sources. It shall be considered for preliminary reference purposes only and shall not be considered final.

Release Site
LegendPum
ping Rate, gallons per m
inute (gpm)
less than 100 gpm
100 to 500 gpm
greater than 500 gpm
Counties
Urban Areas
4-22WI001304.0002
B. Webb
2 Jan 2013
Niagara AquiferPumping Rate
PROJECT NUMBER
DATE
DRAWN BY SHEET TITLE
CLIENT/PROJECT FIGURE
For Official Use Only
013,200
26,400Feet
ARCADIS U.S., Inc.126 N. Jefferson St., Suite 400Milwaukee, WI 53202Tel 414 276 7742 Fax 414 276 7603www.arcadis-us.com
West Shore Pipe Line Company - Jackson, WI
Phase 2 Long-TermWater Supply Eval.
Points shown reflect data filtered from
WD
NR
database for Washington and O
zaukee County w
hich includes data from private potable,
municipal, non-transient non-com
munity, transient non-com
munity, and unspecified non-com
munity w
ells.
User: JCooper Date: 12/27/2012 Path: G:\PROJECTS\WI001304.0001\Water\Figures\GIS_BrianWebb\mxd\Fig4-22_niagra_quantity_gpm.mxd
The information presented originates from
various sources. It shall be considered for preliminary reference purposes only and shall not be considered final.

Release Site
BH
247
BG
643
LegendPum
ping Rate, gallons per m
inute (gpm)
less than 100 gpm
100 to 500 gpm
1000 gpm
Counties
Urban Areas
4-23WI001304.0002
B. Webb
2 Jan 2013Sandstone Aquifer
Pumping Rate
PROJECT NUMBER
DATE
DRAWN BY SHEET TITLE
CLIENT/PROJECT FIGURE
For Official Use Only
013,200
26,400Feet
ARCADIS U.S., Inc.126 N. Jefferson St., Suite 400Milwaukee, WI 53202Tel 414 276 7742 Fax 414 276 7603www.arcadis-us.com
West Shore Pipe Line Company - Jackson, WI
Phase 2 Long-TermWater Supply Eval.
Points shown reflect data filtered from
WD
NR
database for Washington and O
zaukee County w
hich includes data from private potable,
municipal, non-transient non-com
munity, transient non-com
munity, and unspecified non-com
munity w
ells.
User: JCooper Date: 12/27/2012 Path: G:\PROJECTS\WI001304.0001\Water\Figures\GIS_BrianWebb\mxd\Fig4-23_SS_quantity_gpm.mxd
The information presented originates from
various sources. It shall be considered for preliminary reference purposes only and shall not be considered final.
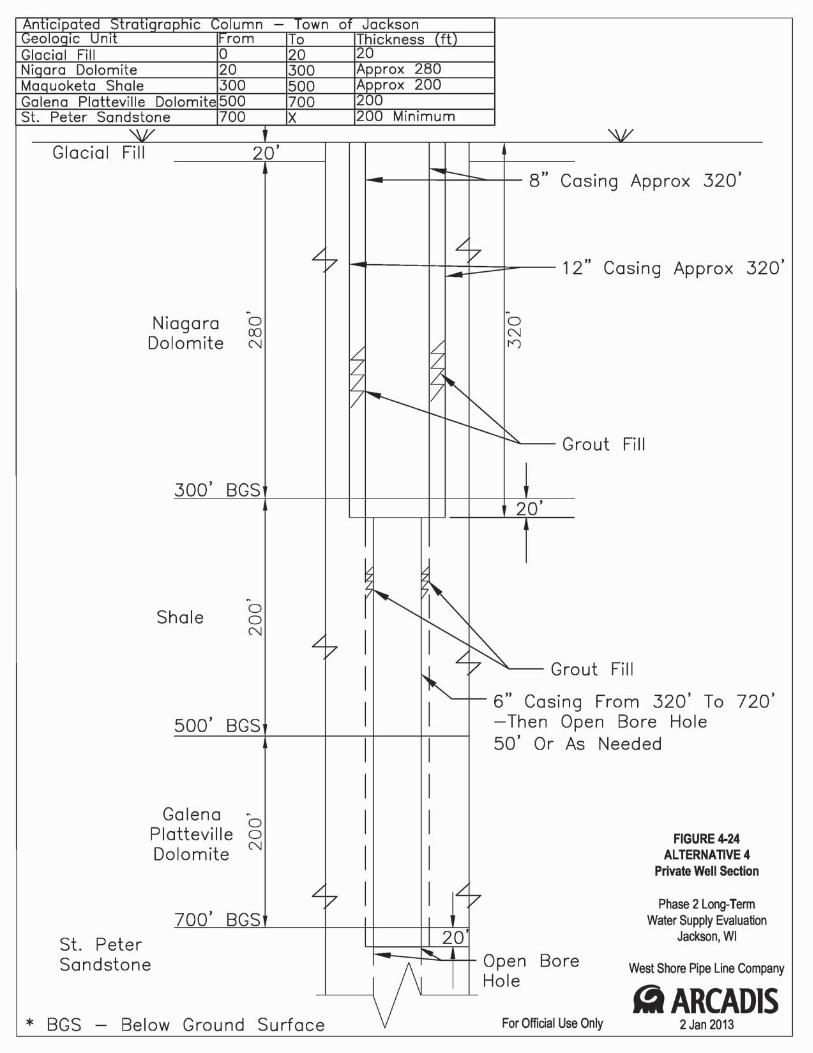

2002
2135
3279
20302780 2812
32473252
3075
32622263
2362
2400
3026
2420
3080
3130
2435
2423
2415
2407
2426
2418
2408
32863048
1860
31273128
31343133
31513152
3159
2473
2913
2926 2938 2948
2945 2961
2459
2985
1982
1915
18851894
1985
2014
1969
1983
1790
1760
1770
1880
2771
3073
20352043 20421930
3053
2418
2266
2244
2255
2249
2239
2398
2339
2327
2358
2366
2288
2280
3146
3144
3188
3162
3170
3114
3220
31063228
3167
3124
31003105
3236
32443086
2243
2235
2213
2229
30643055
3056
2242
2234
3047
1870
2333
3207
3195
3189
31833177
3138
3142
3160
3172 3180
3291
3275
3253
3274
3260
3252
3244
2239
2247
2257
2267
2275
2283
2293
2305
2238
2246
2256
2266
2274
2284
2298
2306
2314 2320 2328
2342
3044
325332473239
3229
3219 325032443236
2430
2420
2410
2400
2384
2370
2364
2358
2350
2431
2421
2411
2401
2385
2373
3226
1682
1998
17101732
17521782
1796
18181876
194
194194
194
160
160
160193
160160
2406160
28402818
2860
2762
2881
2025
2015
2005
1971
1961
2869
2857
2026
2864
1990
1974
19601957
1995
2007
2019
2031
2807
2305
2245
2771
2343
2321
2401
2788
2450
2165
3255
3223
3209
2979
2315
2409
3215
3207
1736
2963
1730
1780
1836
1891
2955
2060
2090
2097
20452011
3252
3037
1740
1750
1708
3204 3282
3296
16833146
29762950
3186
31743166
3060
1964
2004
2018
1986
1930
2992
1997
1969
2039
2250
1859
2933
1824
2971
29852987
3020
3115
1987
1845
31153116
2466
2430
31653166
HICKORY
JACKSON
SHER
MA
N
CTY
TK T
DIVISION
CROSSWIND
MAPLE
OAKLAND
CROSSWIND
TWIN CREEKS
EAST G
ATE
EAST GATE
GO
LDEN H
AR
VEST
HU
MM
ING
BIR
D
JACKSON
TWIN CREEKS
CREEKWOODSHER
MA
N PARC
WILDFLOWER
MOCKINGBIRD
MAPLE
WESTER
N
MAPLE
MILL
WESTER
N
S HER
MA
N PA
RC
FENCELINE
FENCELINE
CROSSWINDBRO
OK
SI DE
BR
OO
KSID
E
DIVISION
930
910 890
960
940
910
930
910
860
930900
890
850
900
890
870
850
930
900
910
930
960
860
900
900
960
910
960
910
920
920
890
900
890
910
930
940
870
910
870
930
870
890
890
850
930
890
840
930
890
930
870
960
910
900
910
920
890
920
900
960
930
920
950
920
870880
900
950
960
880
920
900
920
940
900
860
950
LegendVillage W
ater Mains
8" - Existing
12" - Existing
8" - Future
12" - Future
Private Wells
Residential U
sage
Agricultural Usage
Proposed Water M
ains
Service Connections
2030 Village Limits
ParcelsProposed Service (Well Im
pacted)
Proposed Service (Adjacent to Impacted W
ell)
Well N
ot Impacted
6-1WI001304.0002
J. Cooper
2 Jan 2013
RecommendedAlternative
Infrastructure
West Shore Pipe Line Company - Jackson, WI
Phase 2 Long-TermWater Supply Eval.
ARCADIS U.S., Inc.126 N. Jefferson St., Suite 400Milwaukee, WI 53202Tel 414 276 7742 Fax 414 276 7603www.arcadis-us.com
PROJECT NUMBER
DATE
DRAWN BY SHEET TITLE
CLIENT/PROJECT FIGURE
For Official Use Only
01,000
2,000500
Feet
Release
Site
Future VillageElev. Tank Site
8"
12"
8"
8"
8"
8"
8"
12"
8"
8"8"
12"12"
Note: Background data as of N
ov. 2012
User: JCooper Date: 12/27/2012 Path: G:\PROJECTS\WI001304.0001\Water\Figures\GIS\Phase2\Fig6-1_RecommendedInfrastructure.mxd
The information presented originates from
various sources. It shall be considered for preliminary reference purposes only and shall not be considered final.
8"
8"
8"

Appendix A
For Official Use Only
Workshop and Meeting Minutes

Page:
1/3
October 19, 2012WSPC – Phase 2 Long Term Water Supply Alternatives Evaluation
Conference Call with Wisconsin Department of Natural Resources (WDNR), West Shore Pipe
Line Company, ARCADIS
A G E N D A
Telephone Conference Call: Friday, October 19, 2012
Time Item
11:30 Agenda outline for call was provided by Steve Ales of WDNR, and is presented below. Discussion notes in italics/underline
Future Water Options for Town of Jackson Gas Spill Area
1. Private wells: Pros/Consa. Geology of the areab. Upper aquifer in area of spill likely unusable due to gasc. Evaluate lower aquifer for use.
i. Depth of lower aquiferii. Water quality of lower aquifer – Lower aquifer appears to
be widely used suggesting water quality will be acceptable for potable use. However, water quality will be different and potentially more mineralized than the shallow aquifer.Perception of residents may be that lower aquifer is of poorer quality than the shallower aquifer. Can be determined from regional studies and water quality sampling at the site. Per WDNR – local water quantity may be limited.
iii. Due to depth will a 6” well work? Are there commercially available pumps that will lift water from that depth? GouldsPumps have a lot of well pumps, check catalog. Actual pump sizing will need to be made to determine this.Diameter is not influenced by flow rate as much as by pump hydraulics. If larger pump is needed – well casingwill need to be larger.-Spoke to a residential well driller that has experience completing wells to these type of depths and to a pump supplier. Both indicated that there are numerous off-theshelf pump models that will lift water from these types of depths. The pumps can be found in standard 4-inchdiameter sizes, such that larger well diameters would not be needed.
iv. If 6” wells won’t work and 8” wells are needed, what type of pump (hp, 3 phase, cost of operation) are needed to lift water from great depth – Horsepower and voltage would need to be greater to achieve the greater lifts. Perhaps

Page:
2/3
from the standard ½ to ¾ horsepower shallow well pump to about a 3 horsepower (depends on head conditions).Could still use single phase pump. There would be greater electrical costs associated with the stronger pumps, which can be calculated. Additional costs probably not excessive because of the pumps short actual run time, but calculations would confirm.
d. Evaluate upper aquifer but outside plume. Will higher/concentrated pumping draw contamination into that well? –Possible, but generally water usage from residential wells is small enough that it does not have a large influence on water levels or flow directions/gradients. Influence of can be determined with a groundwater flow model calibrated to site water level measurements and/or pumping test Can you use monitoring wells around extraction system as a pump test? - Yes, provided that the flow rate in the extraction well can be precisely controlled (and turned off for a period of time) and monitoring wells are appropriately spaced and screened at the appropriate depth.Can be determined by review of the monitoring system and calculations with pumping rate and assumed hydraulic parameters. Must also consider where to discharge contaminated water during the test.- All remediation wells, monitoring wells and residential wells are located within the upper aquifer. To obtain representative results, a test well would need to be installed within the aquifer that would be used for replacement wells. ARCADIS suggested a desktop geologic study to obtain information on regional geology and hydrogeology in lieu of a pump test.
2. Public Water Systema. What geographic area should be covered by the distribution
system?b. Other Than Municipal Systems – multiple to cover geographic
areasc. Source of water
i. Purchase from Jackson. Pros/Consii. Purchase from some other municipality. Pros/Cons – The
major drawbacks with providing municipal water fromother sources are the large expenses associated with running a raw water line greater distances.
iii. New source wells. Pros/Cons – Major drawbacks are expense associated with raw water line, new production wells, testing/engineering, and permitting. Increased regulation, operator qualifications, testing, O&M costs associated with these type of systems….unless surrounding municipality willing to take over operation of system. Advantage would be ability to site well/wells closer to affected area (i.e. less transmission line). Will need to demonstrate quantity is sufficient, quality is acceptable, and no impacts to surrounding water users through testing and potentially modeling. Also, larger

Page:
3/3
draw of water may impact movement of plume.Placement of well must take well-head protection into account, time of travel from any potential contaminant plume, etc. This will take more time to evaluate and more cost for preliminary engineering.
1. Test well into lower aquifer.a. Needs prior approval from public water
programb. Design so that it could be used as part of a
public water systemc. Determine testing protocol once well is
completed. This testing will also answer viability of lower aquifer for private wells
d. Location – place where it could be part of a future public water system
d. Cost of operation including pumping and treatment of any public water system
Additional conference call discussions:
WDNR: Can’t force Village to extend water distribution system (WDS). Must
have an agreement with them to do so. Can force Town to establish a Sanitary District for water service.
Village – supply water to a WDS that either they operate or to a consecutive system. Source eliminates a lot of uncertainty.
Border Agreement – looks like parties can extend the Agreement further. Developer – can’t annex just because tie in to water. Erick Nitchke does not incorporate annexation for water & sewer. Some
areas are included for specific annexation (NE area) Lower dolomitic limestone, not much water producer. Time frame can extend as needed for test wells, report work, etc. – just
don’t have long lag times for moving forward. DNR may permit lack of profile view for this design. WDNR needs to put
this in writing. If Village Source – Village or Town may not permit lack of profiles. Need to confirm with each party.
Can ARCADIS start working with Village? – WDNR says yes – ARCADIScan talk with Village and with Town directly. Prior to specific alternative, need to provide more details to public. No final decision until privatewells data has been worked out. Washington County GIS – Eric (person) very good. Margaret Anderson, Katie can provide some contact. Any special crossings – show profile.
Trying to keep ahead of weather, therefore preliminary investigation work & surveying.
For a consecutive system may need chemical boosting? Above ground building? BPS? Etc.

g:\aproject\buckeye\wi1304\jackson\working\villagemtgminutes_20121114.docxPage:
1/3
November 14, 2012WSPC – Phase 2 Long Term Water Supply Alternatives Evaluation
Jackson Village HallN168 W20733 Main St
Jackson, WI 53037
A G E N D A
Alternative 2 – Direct Connections to Village of Jackson
Time Item
1:30 Data Needs from the Village of Jackson
1. Border Agreement (BA) and understandinga. Area of concern is outside the Border Agreement.b. BA should be updated for the land area to be included. Concern is
how to manage growth, subdivisions, etc – benefitting from Village services without Village taxes and ROI.
2. WDS Hydraulic Modela. Stantec currently has Village Modelb. WDS model will be made available to ARCADISc. ARCADIS will assume that model is updated – due to recalibration
efforts in 2011. ARCADIS will analyze hydraulics for proper sizing ofinfrastructure.
3. Copy of a typical water bill (showing all fees)a. Village to provide copy to ARCADIS. Also, village will provide most
recent rate study.4. Connection and Service fees per account
a. Connection fee $820 per Residential Equivalent User (REU)b. Village will provide example bill.
Planning Area
1. Identify Service Areaa. Long Term service area to be determined by Town, if outside current
Border Agreementb. Alternative 2B Figure is appropriate for the immediate impacted area
of concern. This area will be used for sizing infrastructure unless appropriate direction provided.
2. Access, Land Ownership: Future tank site, ROW or easementsa. Village does not own site for future tank.b. Village does not own easements for potential cross-country routes
Geology
1. Knowledge of rock elevations along Sherman, Maple, Mill, Western, etc.a. No additional data is known, beyond ARCADIS current knowledge of
area
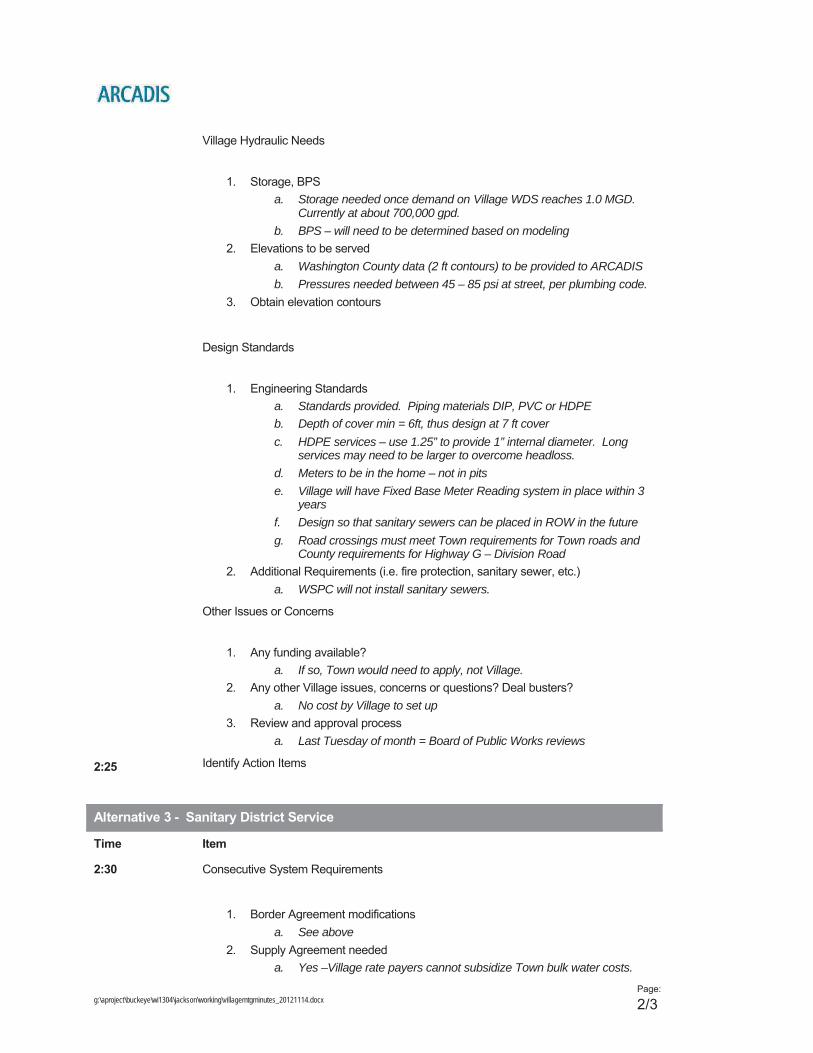
g:\aproject\buckeye\wi1304\jackson\working\villagemtgminutes_20121114.docxPage:
2/3
Village Hydraulic Needs
1. Storage, BPSa. Storage needed once demand on Village WDS reaches 1.0 MGD.
Currently at about 700,000 gpd.b. BPS – will need to be determined based on modeling
2. Elevations to be serveda. Washington County data (2 ft contours) to be provided to ARCADISb. Pressures needed between 45 – 85 psi at street, per plumbing code.
3. Obtain elevation contours
Design Standards
1. Engineering Standardsa. Standards provided. Piping materials DIP, PVC or HDPEb. Depth of cover min = 6ft, thus design at 7 ft coverc. HDPE services – use 1.25” to provide 1” internal diameter. Long
services may need to be larger to overcome headloss.d. Meters to be in the home – not in pitse. Village will have Fixed Base Meter Reading system in place within 3
yearsf. Design so that sanitary sewers can be placed in ROW in the futureg. Road crossings must meet Town requirements for Town roads and
County requirements for Highway G – Division Road2. Additional Requirements (i.e. fire protection, sanitary sewer, etc.)
a. WSPC will not install sanitary sewers.
Other Issues or Concerns
1. Any funding available?a. If so, Town would need to apply, not Village.
2. Any other Village issues, concerns or questions? Deal busters?a. No cost by Village to set up
3. Review and approval processa. Last Tuesday of month = Board of Public Works reviews
2:25 Identify Action Items
Alternative 3 - Sanitary District Service
Time Item
2:30 Consecutive System Requirements
1. Border Agreement modificationsa. See above
2. Supply Agreement neededa. Yes –Village rate payers cannot subsidize Town bulk water costs.

g:\aproject\buckeye\wi1304\jackson\working\villagemtgminutes_20121114.docxPage:
3/3
b. Terms of sale, costs, etc to be included.3. Emergency Interconnection – site and type
a. If Town has 2 wells (one for backup) would not need Village as an emergency backup.
b. Could use Village, but same type of Agreement and terms & conditions would be needed.
4. Ability for Town to contract WDS operations and management servicesa. Village would be willing to accommodate as appropriate – not against
the idea.
Town Well Source1. Source Water Protection Plan, well locations (N/A)2. Pumping, treatment and storage needs (N/A)3. Emergency Interconnection – mutual benefit
a. Village would not want this - no need to have Town provide water to Village.
b. Town would need a check valve to prevent Town water from re-entering the Village WDS.
Other Issues or Concerns1. Any Village concerns as a source for a consecutive system
a. Can’t have Village rate payers subsidize Town customers.b. Timing for updating the Border Agreement and/or executing a Water
Supply Agreement with Town.2. Any Village concerns as a source for an emergency interconnection
a. Same as above.3. Any Town concerns to accepting Village as source or emergency connection
(N/A)4. Any Town concerns to establishing a Sanitary District (N/A)
2:55 Identify Action Items

g:\projects\wi001304.0001\docs\meeting agendas & minutes\townmtgminutes_20121127.docxPage:
1/3
November 27, 2012WSPC – Phase 2 Long Term Water SupplyAlternatives Evaluation
Jackson Town Hall
Jackson, WI 53037
A G E N D A
Telephone Conference Call: Tuesday November 20, 2012 (email 11/16/12)
Time Item
10:30Engineering Design Standards
Follow the Village of Jackson standards basically for WDS network materials, pipes,valves, hydrants, etc. PVC and HDPE pipe materials are very common.
Street crossings for pipe can be open cut, but backfilled with slurry. Water servicelaterals must be bored across the streets. County Highway G (Division Road)improvements must be approved by Washington County. Street crossings do not need tobe in casing pipe, unless County requires it..
Reviews required by WDNR, inspections by Village, no zoning or building departmentreviews by Town, no Board of Planning or such entity either. Engineering reviews will berequired though.
No review or consideration as of yet for property needs, facilities, etc. Town Board willneed to address such issues.
Border Agreement, Service Area, Misc:
Property owner surveys are confidential – and as such, specifics cannot be released.
Town is willing to move forward, as directed by the Town Board.
Town sees this situation as an emergency. This is not a plan for expansion ordevelopment but rather emergency to fix problems from the accidental release ofgasoline.
Town Board is not in favor of reopening the Border Agreement or updating to address theemergency spill zone needs.
Town Board desires a separate water supply agreement to address this area, concernsfor routine splitting of a lot, for usual growth, but not to permit new subdivisions orsignificant growth.
Town Board will have to address the issue of fire protection, fire hydrants, etc.
Annexation and/or reopening the Border Agreement for this would be considered a “dealbreaker”.
Potential long term service area to be determined. However, hard to make decisionswithout knowing why pipe failed. What is potential of failure of pipe anywhere else alongthe pipe?
Staffing for a Sanitary District would need Town Board action, but previous thought givento subcontracting back to Village or other entity.
No current plans to force residents to connect to any water mains, unless forced due toimpacted well – by WDNR.

g:\projects\wi001304.0001\docs\meeting agendas & minutes\townmtgminutes_20121127.docxPage:
2/3
Strong desire to consider agricultural usage separate from domestic usage.
For Alternative 4 – desire cluster wells, no governmental oversight. Home owners wouldbe on their own to work out costs, etc, but Town would not be involved.
Other Issues or Concerns
1. Any funding available?
None known. Town is not in a position to apply for such funding (noexperience).
2. Any other Town issues, concerns or questions? Deal busters?
Reopening the Border Agreement = deal breaker
Forced annexation = deal breaker
3. Capacity in infrastructure design
Would like to see Report identify available capacity for improvements, beyondneeded capacity for immediate area impacted.
Would like to see Report state flexibility and options for growing therecommended infrastructure should plume movement require adding moreproperties.
Has WDNR set the base line service area to be included yet? If so, where?
Town Meeting – November 27, 2012Questions to Town Board for consideration:
1. Fire Protection issues:
WDNR codes require?) Hydrants per Town Engineers. Town may request avariance from this rule if desired to provide rural water use only – without fireprotection, matching the current system conditions.
Spacing typically between 350 to 600 feet, with average of 400 ft spacing.Could request a variance and permit further apart. Would need ability to flushthe WDS network for water quality purposes.
2. Service Area: Intended = impacted area noted in Phase I.
Town sees this situation as an emergency. This is not a plan for expansion ordevelopment but rather emergency to fix problems from the accidental releaseof gasoline.
Sizing of infrastructure is a point of concern.
i. Water main (WM) should be large enough to accommodate the currentand potential total customers impacted by the plume.
ii. WM should be large enough to permit modest growth on existing lands(for example parent splitting off a lot or two for their children to buildhomes).
iii. WM should be small enough not to impact water quality and not toencourage subdivision type growth.
iv. Report should state the design capacity, initial expected demand andavailable capacity for growth, including number of homes that could beadded.
3. Sanitary District Alternative
Properties or sites for consideration
i. Town Hall property may have land for facilities

g:\projects\wi001304.0001\docs\meeting agendas & minutes\townmtgminutes_20121127.docxPage:
3/3
ii. Town has property along Route 60, but may be too small
iii. Location of future municipal wells will be as directed by WDNR
iv. Town property at Transfer Station approximately 1.5 miles north of theimpacted area.
v. Depending on needs, additional land may be required.
Village Source Concerns?
i. Border Agreement issues – see below
Well Water Source
i. Concern – will WDNR permit drilling in contaminated plume area?
ii. How far away from plume will WDNR draw any “no-drill” boundary forprivate wells?
iii. How could this affect future drilling of currently unaffected parcels?
iv. How far away from plume will WDNR permit drilling a new municipalwell for use as a Town Source?
v. Can the Town be provided this information ASAP in order to continuemaking decisions?
vi. If using cluster wells, how will the clusters be set up to permit someexpansion of the system for lot splits and new services?
4. Border Agreement modifications
No reference to accommodate this type of emergency situation
Any future properties “desiring” to be served – vs. required to be served, wouldneed to continue falling under the Border Agreement requirements.
This emergency service needs to be treated separately via a Supply Agreementinstead of modifying the Border Agreement.
5. Supply Agreement needed
Town Board believes that a separate agreement will be required instead ofreopening the border agreement.
6. Long term water supply concerns or issues?
Any Town concerns to accepting Village as source or emergency connection?
i. No change to Border Agreement
ii. No annexation
Any Town concerns to establishing a Sanitary District
i. What is the future financial impact on the tax payers for O,M & R of thewater facilities and infrastructure? What is the 50 year design life costimpact on the Town?
ii. Will tax payers from rest of Town be required to pay for this watersystem, long term, that 1) was forced upon them and 2) serves sofew?
Time: Item
7:00 Identify Action ItemsARCADIS to call WDNR and further request information as well as clarificationregarding well related questions.

Appendix B
For Official Use Only
Drinking Water Fact Sheets
PRINTED ONRECYCLEDPAPER
YOU & YOUR WELLWISCONSIN DEPARTMENT OF NATURAL RESOURCES
The Wisconsin Department of Natural Resources provides equal opportunity in its employment, programs, services, and functions under an Affi rmative Action Plan. If you have any questions, please write to Equal Opportunity Offi ce, Department of Interior, Washington, D.C. 20240.This publication is available in alternative format (large print, Braille, audio tape, etc) upon request. Please call 608-266-0821 for more information.
For more information, request the following brochures: Well Abandonment (PUB-DG-016), Bacteriological Contamination of Drinking Water (PUB-DG 003), Driven-Point (Sand-Point) Wells (PUB-DG-022 92)
PUB-DG-002 2007

Is there a new well in your future? Perhaps you are building a new home, or are simply considering replacing or upgrading an existing water supply. Whatever the case, here is some information that can help you.
Who regulates water wells?
Wisconsin has had well regulations since 1936, and today is recognized as a national leader in well protection. NR 812, (formerly NR 112), Wis. Adm. Code, is administered by the Department of Natural Resources (DNR). The Well Code is based on the sound premise that if a well and water system is properly located, constructed, installed and maintained the well should provide safe water continuously without the need for treatment. Most county zoning and public health offi ces have a copy of the Well Code. For information about the code, contact a DNR regional water supply staff person or a licensed well driller or pump installer. Consult with licensed individuals or neighbors for background information on water quality.
When is an approval required prior to construction?
A DNR Notifi cation Number is required prior to construction. You may obtain a DNR Noti-fi cation Number online at: dnr.wi.gov. Under “Online Services” click on Well Construc-tion Notifi cation and answer the questions. Be sure to print a copy for your records. A second option is that you may also visit one of the 1500 locations throughout Wisconsin where hunting & fi shing licenses are sold. You will receive a receipt for your records which displays a DNR Notifi cation Number. Also, some DNR approved county ordinances require that a “well permit” be obtained prior to construction. Check with your county health department or zoning offi ce.
State statutes require that any owner who constructs and/or operates a well or combina-tion of wells on one property that are capable of producing 70 or more gallons per minute, in aggregate, must obtain an approval from the DNR prior to construction.
Approvals are also required for constructing school water systems, wastewater treatment plant water systems and community water systems governed under chapter NR 811 and for the installation of some types of water treatment.
Who can construct wells?Who can install pumps?
Well Driller—Only those persons holding a current well drilling license from the Depart-ment of Natural Resources may construct or reconstruct (deepen or install a liner or screen) potable wells.
Pump Installer—Only those persons hold-ing a current pump installer license from the
Department of Natural Resources may install and replace pumps, pitless adapters and acces-sory piping and pressure tanks on both drilled and driven point potable wells.
Exceptions—A well drilling license is not required for constructing driven point wells.
A license is not required for a person con-structing a well or installing a pump on property owned and occupied by him or her. State law requires, however, that no matter who does the work, it must comply with the State Private Well Code (ch. NR 812), and a Well Construction Report must be submitted to DNR.
A license is not required for an individual constructing a nonpotable well or installing a pump in a nonpotable well, however the instal-lation must comply with the well code.
What are the responsibilities of a well constructor to the owner?
The well must be constructed or reconstructed in compliance with ch. NR 812, and upon completion of a well construction or recon-struction, a well driller or point driver is required to:
1. Test pump and fl ush the well.
2. Disinfect the well.
3. Collect a water sample for a bacteriologi-cal test; submit the sample to a laboratory certifi ed for bacteriological testing; and provide a report of the results to the owner within 10 days of receiving the water test results. (The DNR recommends that the water also be tested for nitrates.)
4. Provide the owner or his agent with a copy of a Well Construction Report, that describes how the well was constructed, within 30 days of completion of the well. The report assigns a unique number to the well.
The water sample test results and well construction report must also be sent to the Department.
What are the responsibilities of a pump installer to the owner?
A pump installer must install the pump, the pitless adapter, pressure tank and sample faucet in compliance with the Well Code, disinfect the
pump and distribution system after installation, fl ush it, take a water sample for bacteriological analysis (as described in #3 above) and report the results to the owner.
The pump installer may delegate the sample collection to the owner or another agent, by leaving the sample bottle, instructions and form, but the pump installer is still responsible for the sample collection.
Some private well location requirements (from NR 812)
Always ensure that your well is located upslope and as far as possible from potential sources of contamination, but at least:
◆ 8 feet from an approved gravity building sewer pipe or 25 feet from building sewers made of other non-approved materials or a pressurized building sewer.
◆ 8 feet from a swimming pool.
◆ 100 feet from any buried petroleum tank, except that only 25 feet of separation is required for a buried fuel oil tank if the tank is used only for private residential heating.
◆ 25 feet from a septic or holding tank, or from a laundry or wastewater sump.
◆ 25 feet from the high water mark of a lake, pond or stream.
◆ 50 feet from a privy, dry well, soil absorp-tion system (“drainfield”) or mound system.
◆ 50 feet from a municipal collector sewer.
◆ 50 feet from an animal yard or animal shelter
◆ 250 feet from a sludge disposal area, a salvage yard or a salt storage area.
◆ 250 feet from an absorption, storage, retention or treatment pond; ridge and furrow system; or spray irrigation waste disposal site.
◆ 1,200 feet from any existing, proposed or abandoned landfi ll site.
NOTE: This list is not complete. Consult NR 812 or the DNR for specifi c requirements. Figures A and B show well location require-ments.
Figure A Common separation distances on residential lots Figure B Common separation distances
on farms
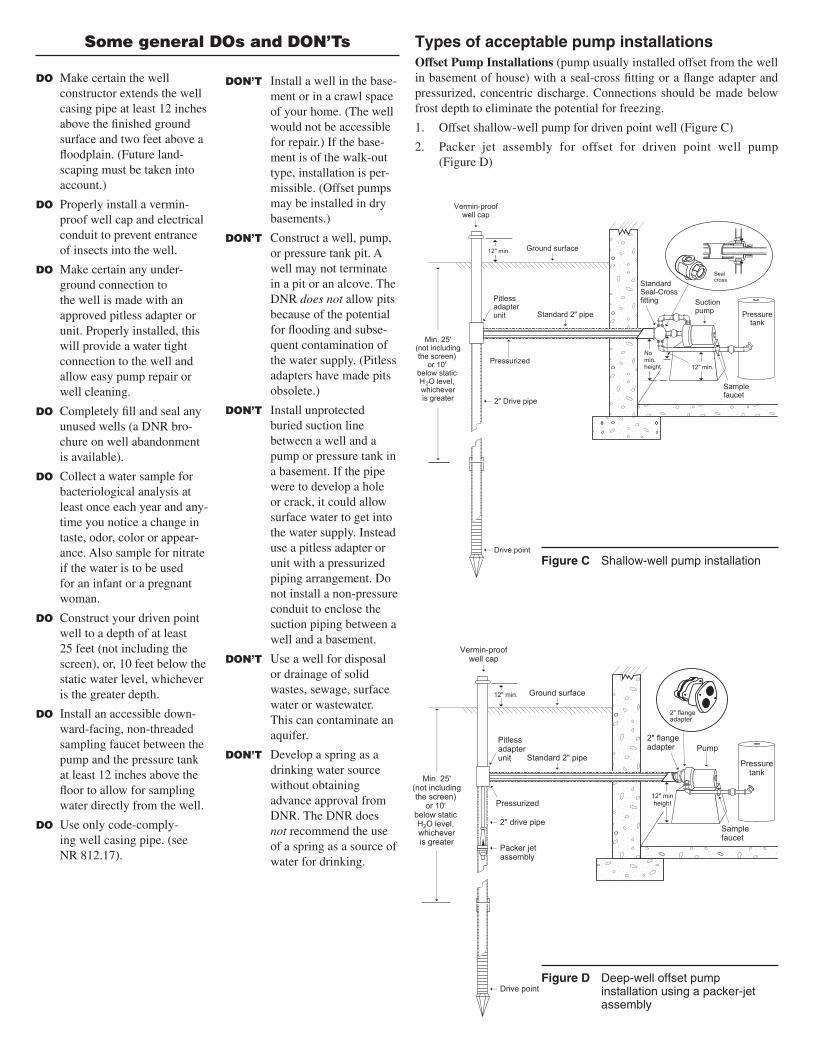
���������
��������������
Figure D Deep-well offset pump installation using a packer-jet assembly
Figure C Shallow-well pump installation
Some general DOs and DON’Ts
DON’T Install a well in the base-ment or in a crawl space of your home. (The well would not be accessible for repair.) If the base-ment is of the walk-out type, installation is per-missible. (Offset pumps may be installed in dry basements.)
DON’T Construct a well, pump, or pressure tank pit. A well may not terminate in a pit or an alcove. The DNR does not allow pits because of the potential for fl ooding and subse-quent contamination of the water supply. (Pitless adapters have made pits obsolete.)
DON’T Install unprotected buried suction line between a well and a pump or pressure tank in a basement. If the pipe were to develop a hole or crack, it could allow surface water to get into the water supply. Instead use a pitless adapter or unit with a pressurized piping arrangement. Do not install a non-pressure conduit to enclose the suction piping between a well and a basement.
DON’T Use a well for disposal or drainage of solid wastes, sewage, surface water or wastewater. This can contaminate an aquifer.
DON’T Develop a spring as a drinking water source without obtaining advance approval from DNR. The DNR does not recommend the use of a spring as a source of water for drinking.
DO Make certain the well constructor extends the well casing pipe at least 12 inches above the fi nished ground surface and two feet above a fl oodplain. (Future land-scaping must be taken into account.)
DO Properly install a vermin-proof well cap and electrical conduit to prevent entrance of insects into the well.
DO Make certain any under-ground connection to the well is made with an approved pitless adapter or unit. Properly installed, this will provide a water tight connection to the well and allow easy pump repair or well cleaning.
DO Completely fi ll and seal any unused wells (a DNR bro-chure on well abandonment is available).
DO Collect a water sample for bacteriological analysis at least once each year and any-time you notice a change in taste, odor, color or appear-ance. Also sample for nitrate if the water is to be used for an infant or a pregnant woman.
DO Construct your driven point well to a depth of at least 25 feet (not including the screen), or, 10 feet below the static water level, whichever is the greater depth.
DO Install an accessible down-ward-facing, non-threaded sampling faucet between the pump and the pressure tank at least 12 inches above the fl oor to allow for sampling water directly from the well.
DO Use only code-comply-ing well casing pipe. (see NR 812.17).
Types of acceptable pump installations
Offset Pump Installations (pump usually installed offset from the well in basement of house) with a seal-cross fi tting or a fl ange adapter and pressurized, concentric discharge. Connections should be made below frost depth to eliminate the potential for freezing.
1. Offset shallow-well pump for driven point well (Figure C)
2. Packer jet assembly for offset for driven point well pump(Figure D)

��������
������������
���
���������
��
�����
�������
7/02 LP
NORTHEAST
NORTHERN
SOUTHEAST
WEST CENTRAL
SOUTH CENTRAL
Region Offices
Green Bay
Spooner Rhinelander
Milwaukee
Eau Claire
Madison
Well Code requirements have been simplifi ed for this pamphlet.
For specifi c details on the Wisconsin Well Code (NR 812), look on our website at: dnr.wi.gov/
org/water/dwg/code.htm. If you have questions on the specifi cs of NR 812, please contact staff at one of the following offi ces.
Figure F Approved above-ground discharge unit
Figure HSubmersible pump with pitless receiver tank
Figure E Submersible pump with above-ground discharge in pumphouse
Figure G Submersible pump with below-ground discharge
Figure I Example of a vermin-proof cap
Northern Region810 W. Maple StreetSpooner, WI 54801(715) 635-2101or107 Sutliff AvenueRhinelander, WI 54501(715) 365-8900
South Central Region3911 Fish Hatchery RoadFitchburg, WI 53711(608) 275-3266
West Central Region1300 W. ClairemontPO Box 4001Eau Claire, WI 54702-4001(715) 839-3700
Southeast Region2300 N. Dr. Martin Luther King, Jr. DriveMilwaukee, WI 53212(414) 263-8500
Northeast Region2984 Shawano AvenueP.O. Box 10448Green Bay, WI 54307-0448(920)662-5100
Central Offi ce101 S. WebsterP.O. Box 7921Madison, WI 53707-7921(608) 266-0821
Submersible Pumps installed within well, below water level with:1. An above-ground discharge
pipe enclosed in a heated shelter (Figure E); or
2. Approved above-ground dis-charge unit, directed to an inside pressure tank (Figure F); or
3. A below-ground discharge with approved pitless adapter or pitless unit (Figure G); or
4. A buried pitless receiver tank (Figure H).
Drinking Water FromHousehold Wells
Cover photo courtesy of Charlene E. Shaw, U.S. Environmental Protection Agency

Table of Contents
Introduction .............................................................. 1
What Is Ground Water andHow Can It Be Polluted? ........................................... 2
Where Do Ground WaterPollutants Come From? ............................................. 4
What Are Some NaturallyOccurring Sources of Pollution? ............................ 5
What Human Activities CanPollute My Ground Water? .................................... 5
Should I Be Concerned? ............................................ 8
How Much Risk Can I Expect? .............................. 8
What Should I Do? .................................................... 8
Six Steps to Well Water Safety .............................. 8
Protecting Your Ground Water Supply .................. 9
Find Out More – Sources ofInformation on Well Water ................................. 16
Definitions – Common TermsAbout Wells and Ground Water ............................... 18
EPA 816-K-02-003 January 2002

Introduction
If your family gets drinking water from your ownwell, do you know if your water is safe to drink? Whathealth risks could you and your family face? Wherecan you go for help or advice?
This pamphlet helps answer these questions. It givesyou general information about drinking water fromhome wells (also considered private drinking watersources). It describes types of activities in your areathat can create threats to your water supply. It alsodescribes problems to look for and offers maintenancesuggestions. Sources for more information and helpare also listed.
All of us need clean water to drink. We can go forweeks without food, but only days without water.Contaminated water can be a threat to anyone’shealth, but especially to young children.
About 15 percent of Americans have their own sourcesof drinking water, such as wells, cisterns, and springs.Unlike public drinking water systems serving manypeople, they do not have experts regularly checkingthe water’s source and its quality before it is sentthrough pipes to the community.
To help protect families with their own wells, almost allstates license or register water-well installers. Most alsohave construction standards for home wells. In addition,some city and county health departments have localrules and permitting. All this helps make sure the well isbuilt properly. But what about checking to see that it isworking correctly and the water is always healthy todrink? That is the job of the well owner, and it takessome work and some knowledge.
1
Drinking Water From Household Wells

Drinking Water From Household Wells
What Is Ground Water AndHow Can It Be Polluted?
Ground water is a resource found underthe earth’s surface. Most ground watercomes from rain and melting snowsoaking into the ground. Water fills thespaces between rocks and soils, makingan “aquifer”. (See Watershed Graphic.)About half of our nation’s drinkingwater comes from ground water. Most issupplied through public drinking watersystems. But many families rely onprivate, household wells and use groundwater as their source of fresh water.
Ground water — its depth from thesurface, quality for drinking water, andchance of being polluted — varies fromplace to place. Generally, the deeperthe well, the better the ground water.The amount of new water flowing intothe area also affects ground waterquality.
Ground water may contain somenatural impurities or contaminants,even with no human activity or pollu-tion. Natural contaminants can comefrom many conditions in the watershedor in the ground. Water movingthrough underground rocks and soilsmay pick up magnesium, calcium andchlorides. Some ground water naturallycontains dissolved elements such asarsenic, boron, selenium, or radon, agas formed by the natural breakdownof radioactive uranium in soil. Whetherthese natural contaminants are healthproblems depends on the amount ofthe substance present.
In addition to natural contaminants,ground water is often polluted byhuman activities such as
• Improper use of fertilizers, animalmanures, herbicides, insecticides,and pesticides
2
A “watershed” is the landarea where water soaksthrough the earth fillingan underground watersupply or aquifer. It isalso called a rechargearea. The “water table” isthe line below which theground is saturated orfilled with water andavailable for pumping.The water table will fallduring dry seasons. Awell can pump waterfrom either the saturatedzone or an aquifer. Wellsmust be deep enough toremain in the saturatedzone.
Impermeable Rock
Aquifer
Ocean
Precipitation
Recharge AreaWaterTable

Drinking Water From Household Wells
• Improperly built or poorly locatedand/or maintained septic systemsfor household wastewater
• Leaking or abandoned undergroundstorage tanks and piping
• Storm-water drains that dischargechemicals to ground water
• Improper disposal or storage ofwastes
• Chemical spills at local industrialsites
These problems are discussed ingreater detail later in this brochure.
Suburban growth is bringing busi-nesses, factories and industry (andpotential sources of pollution) intoonce rural areas where families oftenrely on household wells. Growth is alsopushing new home developments ontothe edge of rural and agriculturalareas. Often municipal water and
sewer lines do not extend to theseareas. Many new houses rely on wellsand septic tanks. But the people buyingthem may not have any experienceusing these systems.
Most U.S. ground water is safe forhuman use. However, ground watercontamination has been found in all 50states, so well owners have reason tobe vigilant in protecting their watersupplies. Well owners need to be awareof potential health problems. Theyneed to test their water regularly andmaintain their wells to safeguard theirfamilies’ drinking water.
3
The hydrologic cycle isthe natural process ofrain and snow falling toearth and evaporatingback to form clouds andfall again. The waterfalling to earth flows intostreams, rivers, lakes andinto the soil collecting toform groundwater.
Groundwater Flow
Evaporation
Sleet, Snow, or Rain

Drinking Water From Household Wells
Quick Reference List of Noticeable Problems
Visible• Scale or scum from calcium or magnesium salts in water• Unclear/turbid water from dirt, clay salts, silt or rust in water• Green stains on sinks or faucets caused by high acidity• Brown-red stains on sinks, dishwasher, or clothes in wash points to
dissolved iron in water• Cloudy water that clears upon standing may have air bubbles from poorly
working pump or problem with filters.
Tastes• Salty or brackish taste from high sodium content in water• Alkali/soapy taste from dissolved alkaline minerals in water• Metallic taste from acidity or high iron content in water• Chemical taste from industrial chemicals or pesticides
Smell• A rotten egg odor can be from dissolved hydrogen sulfide gas or certain
bacteria in your water. If the smell only comes with hot water it is likelyfrom a part in your hot water heater.
• A detergent odor and water that foams when drawn could be seepagefrom septic tanks into your ground water well.
• A gasoline or oil smell indicates fuel oil or gasoline likely seeping from atank into the water supply
• Methane gas or musty/earthy smell from decaying organic matter in water• Chlorine smell from excessive chlorination.
Note: Many serious problems (bacteria, heavy metals, nitrates, radon, andmany chemicals) can only be found by laboratory testing of water.
Where Do Ground WaterPollutants Come From?
Understanding and spotting possiblepollution sources is important. It’s thefirst step to safeguard drinking waterfor you and your family. Some threatscome from nature. Naturally occurringcontaminants such as minerals canpresent a health risk. Other potentialsources come from past or presenthuman activity — things that we do,
4
make, and use — such as mining,farming and using chemicals. Some ofthese activities may result in thepollution of the water we drink.
Several sources of pollution are easy tospot by sight, taste, or smell. (See “QuickReference List.), however many seriousproblems can only be found by testingyour water. Knowing the possible threatsin your area will help you decide on thekind of tests you need.

Drinking Water From Household Wells
What are Some Naturally
Occurring Sources of Pollution?
Microorganisms: Bacteria, viruses,parasites and other microorganismsare sometimes found in water. Shallowwells — those with water close toground level — are at most risk.Runoff, or water flowing over the landsurface, may pick up these pollutantsfrom wildlife and soils. This is oftenthe case after flooding. Some of theseorganisms can cause a variety ofillnesses. Symptoms include nauseaand diarrhea. These can occur shortlyafter drinking contaminated water. Theeffects could be short-term yet severe(similar to food poisoning) or mightrecur frequently or develop slowly overa long time.
Radionuclides: Radionuclides areradioactive elements such as uraniumand radium. They may be present inunderlying rock and ground water.Radon — a gas that is a naturalproduct of the breakdown of uraniumin the soil — can also pose a threat.Radon is most dangerous when in-haled and contributes to lung cancer.Although soil is the primary source,using household water containingRadon contributes to elevated indoorRadon levels. Radon is less dangerouswhen consumed in water, but remainsa risk to health.
Nitrates and Nitrites: Althoughhigh nitrate levels are usually due tohuman activities (see below), they maybe found naturally in ground water.They come from the breakdown ofnitrogen compounds in the soil.Flowing ground water picks them upfrom the soil. Drinking large amounts
of nitrates and nitrites is particularlythreatening to infants (for example,when mixed in formula).
Heavy Metals: Underground rocksand soils may contain arsenic, cad-mium, chromium, lead, and selenium.However, these contaminants are notoften found in household wells atdangerous levels from natural sources.
Fluoride: Fluoride is helpful in dentalhealth, so many water systems addsmall amounts to drinking water.However, excessive consumption ofnaturally occurring fluoride candamage bone tissue. High levels offluoride occur naturally in some areas.It may discolor teeth, but this is not ahealth risk.
What Human Activities Can
Pollute Ground water?
Bacteria and Nitrates: Thesepollutants are found in human andanimal wastes. Septic tanks can causebacterial and nitrate pollution. So canlarge numbers of farm animals. Bothseptic systems and animal manuresmust be carefully managed to preventpollution. Sanitary landfills andgarbage dumps are also sources.Children and some adults are at extrarisk when exposed to water-bornbacteria. These include the elderly andpeople whose immune systems areweak due to AIDS or treatments forcancer. Fertilizers can add to nitrateproblems. Nitrates cause a healththreat in very young infants called“blue baby” syndrome. This conditiondisrupts oxygen flow in the blood.
5

Drinking Water From Household Wells
Concentrated Animal FeedingOperations (CAFOs): The numberof CAFOs, often called “factory farms,”is growing. On these farms thousandsof animals are raised in a small space.The large amounts of animal wastes/manures from these farms can threatenwater supplies. Strict and carefulmanure management is needed toprevent pathogen and nutrient prob-lems. Salts from high levels of manurescan also pollute groundwater.
Heavy Metals: Activities such asmining and construction can releaselarge amounts of heavy metals intonearby ground water sources. Someolder fruit orchards may contain highlevels of arsenic, once used as apesticide. At high levels, these metalspose a health risk.
Fertilizers and Pesticides: Farmersuse fertilizers and pesticides to pro-mote growth and reduce insect dam-age. These products are also used ongolf courses and suburban lawns andgardens. The chemicals in theseproducts may end up in ground water.Such pollution depends on the typesand amounts of chemicals used andhow they are applied. Local environ-mental conditions (soil types, seasonalsnow and rainfall) also affect thispollution. Many fertilizers containforms of nitrogen that can break downinto harmful nitrates. This could add toother sources of nitrates mentionedabove. Some underground agriculturaldrainage systems collect fertilizers andpesticides. This polluted water canpose problems to ground water andlocal streams and rivers. In addition,chemicals used to treat buildings andhomes for termites or other pests mayalso pose a threat. Again, the possibility
of problems depends on the amountand kind of chemicals. The types of soiland the amount of water movingthrough the soil also play a role.
Industrial Products and Wastes:Many harmful chemicals are usedwidely in local business and industry.These can become drinking waterpollutants if not well managed. Themost common sources of such prob-lems are:
• Local Businesses: These includenearby factories, industrial plants,and even small businesses such asgas stations and dry cleaners. Allhandle a variety of hazardouschemicals that need careful manage-ment. Spills and improper disposalof these chemicals or of industrialwastes can threaten ground watersupplies.
• Leaking Underground Tanks & Piping:Petroleum products, chemicals, andwastes stored in undergroundstorage tanks and pipes may end upin the ground water. Tanks andpiping leak if they are constructed orinstalled improperly. Steel tanks andpiping corrode with age. Tanks areoften found on farms. The possibilityof leaking tanks is great on old,abandoned farm sites. Farm tanksare exempt from the EPA rules forpetroleum and chemical tanks.
• Landfills and Waste Dumps: Modernlandfills are designed to contain anyleaking liquids. But floods can carrythem over the barriers. Olderdumpsites may have a wide variety
6

Drinking Water From Household Wells
of pollutants that can seep intoground water.
Household Wastes: Improperdisposal of many common products canpollute ground water. These includecleaning solvents, used motor oil,paints, and paint thinners. Even soapsand detergents can harm drinkingwater. These are often a problem fromfaulty septic tanks and septic leachingfields.
Lead & Copper: Household plumb-ing materials are the most commonsource of lead and copper in homedrinking water. Corrosive water maycause metals in pipes or soldered jointsto leach into your tap water. Yourwater’s acidity or alkalinity (oftenmeasured as pH) greatly affectscorrosion. Temperature and mineralcontent also affect how corrosive it is.
They are often used in pipes, solder, orplumbing fixtures. Lead can causeserious damage to the brain, kidneys,nervous system, and red blood cells.The age of plumbing materials — inparticular, copper pipes soldered withlead — is also important. Even inrelatively low amounts these metalscan be harmful. EPA rules under theSafe Drinking Water Act limit lead indrinking water to 15 parts per billion.Since 1988 the Act only allows “leadfree” pipe, solder, and flux in drinkingwater systems. The law covers bothnew installations and repairs ofplumbing. For more information onavoiding lead in drinking water, visitthe EPA Website at www.epa.gov/safewater/Pubs/lead1.html
Water Treatment Chemicals:Improper handling or storage of water-well treatment chemicals (disinfec-tants, corrosion inhibitors, etc.) closeto your well can cause problems.
7
LocalIndustry
HouseholdWastes
Landfills
Pesticides and Fertilizers
LivestockWastes
SepticTank
UndergroundStorage Tanks
Septic tanks are deignedto have a “leach field”around them — an areawhere wastewater flowsout of the tank. Thiswastewater can alsomove into the groundwater

Drinking Water From Household Wells
Should I Be Concerned?
You should be aware because the SafeDrinking Water Act does not protectprivate wells. EPA’s rules only apply to“public drinking water systems” —government or privately run companiessupplying water to 25 people or 15service connections. While most statesregulate private household wells, mosthave limited rules. Individual wellowners have primary responsibility forthe safety of the water drawn fromtheir wells. They do not benefit fromthe government’s health protections forwater systems serving many families.These must comply with federal andstate regulations for frequent analysis,testing, and reporting of results.
Instead, household well owners shouldrely on help from local health depart-ments. They may help you with yearlytesting for bacteria and nitrates. Theymay also oversee the placement andconstruction of new wells to meet stateand local regulations. Most have rulesabout locating drinking water wellsnear septic tanks, drain fields, andlivestock. But remember, the finalresponsibility for constructing yourwell correctly, protecting it frompollution, and maintaining it falls onyou, the well owner.
How Much Risk Can I Expect?
The risk of having problems dependson how good your well is — how wellit was built and located, and how wellyou maintain it. It also depends onyour local environment. That includesthe quality of the aquifer from whichyou draw your water and the humanactivities going on in your area that canaffect your well water.
Some questions to consider in protect-ing your drinking water and maintain-ing your well are:
• What distance should my well befrom sources of human wastes suchas septic systems?
• How far should it be from animalfeedlots or manure spreading?
• What are the types of soil andunderlying rocks? Does water floweasily or collect on the surface?
• How deep must a well be dug toavoid seasonal changes in groundwater supply?
• What activities in my area (farming,mining, industry) might affect mywell?
• What is the age of my well, itspump, and other parts?
• Is my water distribution systemprotected from cross connectionsand backflow problems?
What Should I Do?
Listed below are the six basic steps youshould take to maintain the safety ofyour drinking water. After the list you’llfind “how to” suggestions for eachpoint to help you protect your well andyour drinking water.
1. Identify potential problem sources2. Talk with ”local experts”3. Have your water tested periodically.4. Have the test results interpreted and
explained clearly.5. Set a regular maintenance schedule
for your well, do the scheduledmaintenance and keep accurate,up-to-date records.
6. Remedy any problems.
8

Drinking Water From Household Wells
9
Protecting Your Ground Water Supply
When Building, Modifying Or Closing A Well
• Hire a certified well driller for any new well construction or modification• Slope well area so surface runoff drains away• When closing a well:
– Do not cut off the well casing below the land surface– Hire a certified well contractor to fill or seal the well
Preventing Problems
• Install a locking well cap or sanitary seal to prevent unauthorized use of,or entry into, the well
• Do not mix or use pesticides, fertilizers, herbicides, degreasers, fuels, andother pollutants near the well
• Never dispose of wastes in dry wells or in abandoned wells• Pump and inspect septic systems as often as recommended by your local
health department• Never dispose of hazardous materials in a septic system• Take care in working or mowing around your well
Maintaining Your Well
• Each month check visible parts of your system for problems such as:– Cracking or corrosion,– Broken or missing well cap,– Settling and cracking of surface seals
• Have the well tested once a year for coliform bacteria, nitrates, and othercontaminants
• Keep accurate records in a safe place, including:– Construction contract or report– Maintenance records, such as disinfection or sediment removal– Any use of chemicals in the well– Water testing results
After A Flood — Concerns And Advisories
• Stay away from the well pump while flooded to avoid electric shock• Do not drink or wash from the flooded well to avoid becoming sick• Get assistance from a well or pump contractor to clean and turn on the
pump• After the pump is turned back on, pump the well until the water runs clear
to rid the well of flood water• If the water does not run clear, get advice from the county or state health
department or extension service• For additional information go to http://www.epa.gov/safewater/consumer/
whatdo.htm

Drinking Water From Household Wells
1. How Can I Spot Potential
Problems?
The potential for pollution enteringyour well is affected by its placementand construction — how close is yourwell to potential sources of pollution?Local agricultural and industrialactivities, your area’s geology andclimate also matter. This documentincludes a checklist to help you findpotential problems with your well.Take time to review it in the boxlabeled “Protecting Your Ground waterSupply.” Because ground water con-tamination is usually localized, the bestway to identify potential contaminantsis to consult a local expert. For ex-ample, talk with a geologist at a localcollege or someone from a nearbypublic water system. They’ll knowabout conditions in your area. (Seeitem # 5)
2. Have Your Well Water Tested
Test your water every year for totalcoliform bacteria, nitrates, totaldissolved solids, and pH levels. If yoususpect other contaminants, test forthese also. Chemical tests can beexpensive. Limit them to possibleproblems specific to your situation.Again, local experts can tell you aboutpossible impurities in your area.
Often county health departments dotests for bacteria and nitrates. For othersubstances, health departments,environmental offices, or countygovernments should have a list of statecertified laboratories. Your StateLaboratory Certification Officer canalso provide one. Call EPA’s SafeDrinking Water Hotline, (800) 426-4791, for the name and phone numberof your state’s certification officer.
Before taking a sample, contact the labthat will perform your tests. Ask forinstructions and sampling bottles.Follow the instructions carefully so youwill get correct results. The first step isgetting a good water sample. It is alsoimportant to follow advice aboutstoring the samples. Ask how soon theymust be taken to the lab for testing.These instructions can be very differentfor each substance being tested.
Remember to test your water afterreplacing or repairing any part of thewell system (piping, pump, or the wellitself.) Also test if you notice a changein your water’s look, taste, or smell.The chart below (“Reasons to Test YourWater”) will help you spot problems.The last five problems listed are not animmediate health concern, but theycan make your water taste bad, mayindicate problems, and could affectyour system long term.
10

Drinking Water From Household Wells
Reasons to Test Your Water
Conditions or Nearby Activities: Test for:
Recurring gastro-intestinal illness Coliform bacteria
Household plumbing contains lead pH, lead, copper
Radon in indoor air or region Radonis radon rich
Corrosion of pipes, plumbing Corrosion, pH, lead
Nearby areas of intensive agriculture Nitrate, pesticides, coliform bacteria
Coal or other mining Metals, pH, corrosionoperations nearby
Gas drilling operations nearby Chloride, sodium, barium, strontium
Dump, junkyard, landfill, factory, Volatile organic compounds, totalgas station, or dry- cleaning dissolved solids, pH, sulfate,operation nearby chloride, metals
Odor of gasoline or fuel oil, and Volatile organic compoundsnear gas staion or buried fuel tanks
Objectionable taste or smell Hydrogen sulfide, corrosion, metals
Stained plumbing fixtures, laundry Iron, copper, manganese
Salty taste and seawater, or a Chloride, total dissolved solids,heavily salted roadway nearby sodium
Scaly residues, soaps don’t lather Hardness
Rapid wear of water pH, corrosiontreatment equipment
Water softener needed to Manganese, irontreat hardness
Water appears cloudy, frothy, Color, detergentsor colored
11

Drinking Water From Household Wells
3. Understanding Your Test
Results
Have your well water tested for anypossible contaminants in your area.Use a state-approved testing lab. (Seebelow for sources of approved labora-tories.) Do not be surprised if a lot ofsubstances are found and reported toyou.
The amount of risk from a drinkingwater contaminant depends on thespecific substance and the amount inthe water. The health of the person alsomatters. Some contaminant causeimmediate and severe effects. It maytake only one bacterium or virus tomake a weak person sick. Anotherperson may not be affected. For veryyoung children, taking in high levels ofnitrate over a relatively short period oftime can be very dangerous. Manyother contaminants pose a long-term orchronic threat to your health — a littlebit consumed regularly over a longtime could cause health problems suchas trouble having children and othereffects.
EPA drinking water rules for publicwater systems aim to protect peoplefrom both short and long term healthhazards. The amounts of contaminantsallowed are based on protecting peopleover a lifetime of drinking water. Publicwater systems are required to test theirwater regularly before delivery. Theyalso treat it so that it meets drinkingwater standards, notify customers ifwater does not meet standards andprovide annual water quality reports.
Compare your well’s test results tofederal and state drinking waterstandards. (You can find these stan-dards at www.epa.gov/safewater/mcl.html or call the Safe DrinkingWater Hotline 800-426-4791.) In somecases, the laboratory will give a veryhelpful explanation. But you may haveto rely on other experts to aid you inunderstanding the results.
The following organizations may beable to help:
• The state agency that licenses water-well contractors can help youunderstand your test results. It willalso provide information on wellconstruction and protection of yourwater supply. The agency is usuallylocated in the state capital or othermajor city. It is often part of thedepartment of health or environ-mental protection. Check the blue“government pages” of your localphone book or call the AmericanGround Water Trust at (614) 761-2215 or the EPA Hotline at (800)426-4791 for your licensing agency’sphone number.
• The local health department andagricultural agents can help youunderstand the test results. Theywill have information on any knownthreats to drinking water in yourarea. They can also give you sugges-tions about how to protect your wellwater.
• The state drinking water programcan also help. You can compare yourwell’s water to the state’s standardsfor public water systems. Stateprograms are usually located in thestate capital or another major city.They are often part of the depart-ment of health or environmental
12

Drinking Water From Household Wells
regulation. Again, consult the blue“government pages” in your localphone book for the address andphone number or call or the EPAHotline — (800) 426-4791.
• The Safe Drinking Water Hotline at(800) 426-4791, mentioned above— can help in many ways. TheHotline can provide a listing ofcontaminants public water systemsmust test for. EPA also has copies ofhealth advisories prepared forspecific drinking water contami-nants. The EPA Hotline staff canexplain the federal regulations thatapply to public water systems. Theycompare your lab results to thefederal standards. In addition, theycan give you the phone number andaddress of your state drinking waterprogram, and of your state labora-tory certification officer. That officercan send you a list of approved labsin your area.
4. Well Construction and
Maintenance
Proper well construction and continuedmaintenance are keys to the safety ofyour water supply. Your state water-well contractor licensing agency, localhealth department, or local watersystem professional can provideinformation on well construction. (Seethe two graphics below. One showsthree types of well locations and howsurface water drains. The other lists thedistances from the well to guardagainst possible sources of pollution.)
Water-well drillers and pump-wellinstallers are listed in your localphone directory. The contractorshould be bonded and insured. Makecertain your ground water contractoris registered or licensed in your state,if required. If your state does nothave a licensing/registration programcontact the National Ground WaterAssociation. They have a voluntary
13
GOOD FAIR POOR The well should belocated so rainwaterflows away from it.Rainwater can pick upharmful bacteria andchemicals on the land’ssurface. If this waterpools near your well, itcan seep into it, poten-tially causing healthproblems.
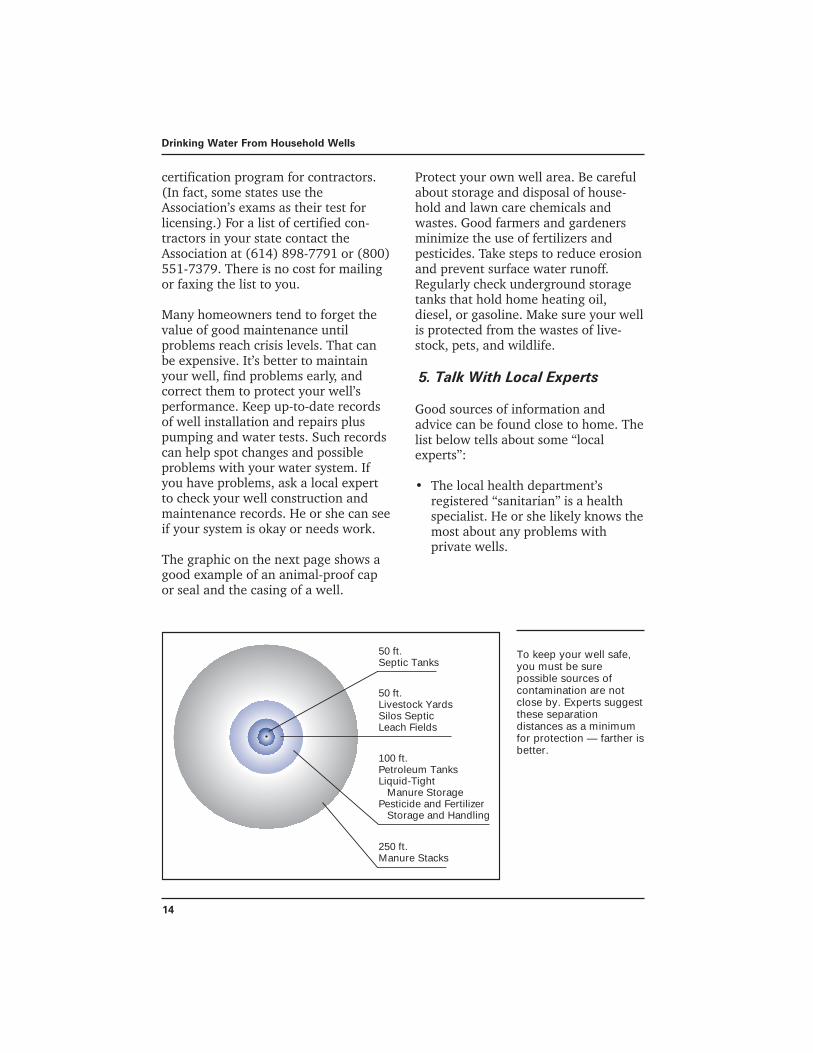
Drinking Water From Household Wells
14
certification program for contractors.(In fact, some states use theAssociation’s exams as their test forlicensing.) For a list of certified con-tractors in your state contact theAssociation at (614) 898-7791 or (800)551-7379. There is no cost for mailingor faxing the list to you.
Many homeowners tend to forget thevalue of good maintenance untilproblems reach crisis levels. That canbe expensive. It’s better to maintainyour well, find problems early, andcorrect them to protect your well’sperformance. Keep up-to-date recordsof well installation and repairs pluspumping and water tests. Such recordscan help spot changes and possibleproblems with your water system. Ifyou have problems, ask a local expertto check your well construction andmaintenance records. He or she can seeif your system is okay or needs work.
The graphic on the next page shows agood example of an animal-proof capor seal and the casing of a well.
Protect your own well area. Be carefulabout storage and disposal of house-hold and lawn care chemicals andwastes. Good farmers and gardenersminimize the use of fertilizers andpesticides. Take steps to reduce erosionand prevent surface water runoff.Regularly check underground storagetanks that hold home heating oil,diesel, or gasoline. Make sure your wellis protected from the wastes of live-stock, pets, and wildlife.
5. Talk With Local Experts
Good sources of information andadvice can be found close to home. Thelist below tells about some “localexperts”:
• The local health department’sregistered “sanitarian” is a healthspecialist. He or she likely knows themost about any problems withprivate wells.
50 ft.Septic Tanks
50 ft.Livestock YardsSilos Septic Leach Fields
100 ft.Petroleum TanksLiquid-Tight Manure StoragePesticide and Fertilizer Storage and Handling
250 ft.Manure Stacks
To keep your well safe,you must be surepossible sources ofcontamination are notclose by. Experts suggestthese separationdistances as a minimumfor protection — farther isbetter.

Drinking Water From Household Wells
15
• Local water-well contractors can tellyou about well drilling and construc-tion. They are also familiar withlocal geology and water conditions.Look in the yellow pages of yourphone book or contact the agency inyour state that licenses water wellcontractors. Call the NationalGround Water Association (NGWA)at (614) 898-7791 or (800) 551-7379 to find NGWA-certified water-well contractors in your area.
• Officials at the nearest public watersystem may explain any threats tolocal drinking water and may bedeveloping plans to address poten-tial threats. They may advise you ontaking samples and understandingtests done on your water. Ask thelocal health department or look inyour phone book for the name andaddress of the closest system.
• Local county extension agents willknow about local farming andforestry activities that can affectyour water. They may also haveinformation about water testing.
• The Natural Resources ConservationService (NRCS) replaced the oldU.S. Soil Conservation Service. It ispart of the U.S. Department ofAgriculture. The NRCS and the U.S.Geological Survey have informationabout local soils and ground water.They can tell you where a localwater supply is located and how it isrecharged or replenished. Theywould know of any pollution threatsand if radon is a problem in thearea. Look for both in the blue pagesof your local phone book.
• Local or county planning commis-sions can be good sources. Theyknow about past and present landuses in your area that affect water.
• Your public library may also haverecords and maps that can provideuseful information. Nearby collegesand universities have research armsthat can provide facts and expertise.They may also have a testing lab.
ScreenedVent
Vermin-ProofCap or Seal
18-inches
An animal or verminproof cap preventsrodents from enteringyour well, being trappedand dying. Paving aroundyour well will preventpolluted runoff fromseeping into your watersupply.

Drinking Water From Household Wells
16
6. Fix Problems Immediately
If you find that your well water ispolluted, fix the problem as soon aspossible. You may need to disinfectyour water, have a new well drilled,replumb or repair your system. Con-sider hooking into a nearby communitywater system (if one is available). Ifyou have a new well drilled or connectto a community water system, the oldwell must be closed properly. Consult“local experts” for help. You mightconsider installing a water treatmentdevice to remove impurities. Informa-tion about treatment devices can beobtained from the following sources:
Water Quality AssociationP.O. Box 6064151 Naperville RoadLisle, IL 60532www.wqa.org
National Sanitation FoundationP.O. Box 130140789 N Dixboro RoadAnn Arbor, MI 48113-0140(734) 769-8010, (800) NSF-MARKwww.nsf.org
U.S. Environmental Protection Agency(to visit in person)Office of Water Resource Center1200 Pennsylvania Avenue, NWAriel Rios BuildingWashington, DC 20460Phone: (202) 260-7786
Monday through Friday,except federal holidays,8:30AM – 4:30PM ET
E-mail address:[email protected]
There are many home water treatmentdevices. Different types remove differentpollutants or impurities. No onedevice does it all. Also, you mustcarefully maintain your home treatmentdevice so your water stays safe. For moreinformation, get a copy of EPA’s pam-phlet, “Home Water Treatment Units”from the U.S. EPA Resource Center orcall the Hotline at (800) 426-4791.
Find Out More
To find out more about your watershedand its ground water visit “Surf YourWatershed” at www.epa.gov/surf. Alsolook at the “Index of WatershedIndicators” at www.epa.gov/iwi. Thesewebsites can also tell you possiblesources of problems. Companies withpermits to release their wastewaters inyour area are listed. You can see if theymeet pollution control laws. You canalso learn how your watershed com-pares to others in the country.
The U.S. Department of Agricultureand EPA support a program to helpfarmers, ranchers and ruralhomeowners. Called Farm*A*Syst orHome*A*Syst, it helps identify andsolve environmental problems, includ-ing protecting drinking water. Obtain acopy of the Home*A*Syst question-naire/checklist that can help you findpossible threats to your water supplyfrom:
National Farm*A*Syst/Home*A*SystProgram303 Hiram Smith Hall1545 Observatory DriveMadison, WI 53706

Drinking Water From Household Wells
17
Ph: 608.262.0024, Fax: [email protected]
For more information on current andfuture federal drinking water standardsand for general information on drinkingwater topics and issues, contact the EP Aat www.epa.gov/safewater or at:
U .S. Environmental Protection AgencyOffice of Ground Water andDrinking Water1200 Pennsylvania Avenue, NWWashington, DC 20460
Or call:
The Safe Drinking Water Hotline(800) 426-4791The hotline operates from 9:00 AM to5:30 PM (EST)The hotline can be accessedon the Internet atwww.epa.gov/safewater/drinklink.html
You can get a list of Federal drinkingwater standards from the EPA website.In addition, the EPA Office of GroundWater and Drinking Water giveschemical and health risk informationfor a number of drinking water prob-lems through its Safe Drinking WaterHotline (800) 426-4791. This informa-tion is also on the internet atwww.epa.gov/safewater. If you do nothave a computer, most public librariesoffer internet access. Even thoughfederal standards do not apply tohousehold wells, you can use them as aguide to potential problems in yourwater. Be aware that many states havetheir own drinking water standards.Some are stricter than the federalrules. To get your state standards,contact your state drinking waterprogram or local health department.
Other sources of information include:
Ground Water Protection Councilhttp://gwpc.site.net
American Water WorksAssociationwww.awwa.org
National Rural WaterAssociationwww.nrwa.org
National Drinking WaterClearinghousewww.estd. wvu.edu/ndwc
Rural CommunityAssistance Programwww.rcap.org
U.S. Geological Surveywater.usgs.gov
U.S. Department of AgricultureNatural ResourcesConservation Servicewww.nrcs.usda.gov
Water Systems Councilwww.watersystemscouncil.org

Drinking Water From Household Wells
18
Definitions
Aquifer – An underground formationor group of formations in rocks andsoils containing enough groundwater to supply wells and springs.
Backflow – A reverse flow in waterpipes. A difference in water pres-sures pulls water from sources otherthan the well into a home’s watersystem, for example waste water orflood water. Also called backsiphonage.
Bacteria – Microscopic livingorganisms; some are helpful andsome are harmful. “Good” bacteriaaid in pollution control by consum-ing and breaking down organicmatter and other pollutants in septicsystems, sewage, oil spills, and soils.However, “bad” bacteria in soil,water, or air can cause human,animal, and plant health problems.
Confining layer – Layer of rock thatkeeps the ground water in theaquifer below it under pressure.This pressure creates springs andhelps supply water to wells.
Contaminant – Anything found inwater (including microorganisms,minerals, chemicals, radionuclides,etc.) which may be harmful tohuman health.
Cross-connection – Any actual orpotential connection between adrinking (potable) water supply anda source of contamination.
Heavy metals – Metallic elementswith high atomic weights, such as,mercury chromium cadmium,arsenic, and lead. Even at low levelsthese metals can damage livingthings. They do not break down ordecompose and tend to build up inplants, animals, and people causinghealth concerns.
Leaching field – The entire areawhere many materials (includingcontaminants) dissolve in rain,snowmelt, or irrigation water andare filtered through the soil.
Microorganisms – Also calledmicrobes. Very tiny life forms suchas bacteria, algae, diatoms, para-sites, plankton, and fungi. Some cancause disease.
Nitrates – Plant nutrient andfertilizer that enters water supplysources from fertilizers, animal feedlots, manures, sewage, septicsystems, industrial wastewaters,sanitary landfills, and garbagedumps.
Protozoa – One-celled animals,usually microscopic, that are largerand more complex than bacteria.May cause disease.

Drinking Water From Household Wells
19
Radon – A colorless, odorlessnaturally occurring radioactive gasformed by the breakdown or decayof radium or uranium in soil orrocks like granite. Radon is fairlysoluble in water, so well water maycontain radon.
Radionuclides – Distinct radioactiveparticles coming from both naturalsources and human activities. Canbe very long lasting as soil or waterpollutants.
Recharge area – The land areathrough or over which rainwaterand other surface water soaksthrough the earth to replenish anaquifer, lake, stream, river, or marsh.Also called a watershed.
Saturated zone – The undergroundarea below the water table where allopen spaces are filled with water. Awell placed in this zone will be ableto pump ground water.
Unsaturated zone – The area abovethe ground water level or watertable where soil pores are not fullysaturated, although some water maybe present.
Viruses – Submicroscopic disease-causing organisms that grow onlyinside living cells.
Watershed – The land area thatcatches rain or snow and drains itinto a local water body (such as ariver, stream, lake, marsh, oraquifer) and affects its flow, and thelocal water level. Also called arecharge area.
Water table – The upper level of thesaturated zone. This level variesgreatly in different parts of thecountry and also varies seasonallydepending on the amount of rainand snowmelt.
Well cap – A tight-fitting, vermin-proof seal designed to preventcontaminants from flowing downinside of the well casing.
Well casing – The tubular lining of awell. Also a steel or plastic pipeinstalled during construction toprevent collapse of the well hole.
Wellhead – The top-of a structurebuilt over a well. Term also used forthe source of a well or stream.


WATER ON TAPwhat you need to know
Office of Water (4601)EPA 816-K-09-002www.epa.gov/safewaterDecember 2009 Printed on Recycled Paper
Table of Contents
Chapter Page No.
1. A Consumer’s Guide To The Nation’s Drinking Water . . . . . . . . . . . . . . . . . . . . . . . . .1
2. How Safe Is My Drinking Water? . . . . . . . . . . . . . . . . . . . . . . . . . . . . . . . . . . . . . . . . .2
3. Where Does My Drinking Water Come From And How Is It Treated? . . . . . . . . . . . . .7
4. How Do We Use Drinking Water In Our Homes? . . . . . . . . . . . . . . . . . . . . . . . . . . . .10
5. What’s Being Done To Improve Water Security? . . . . . . . . . . . . . . . . . . . . . . . . . . . . .13
6. What Can I Do If There Is A Problem With My Drinking Water? . . . . . . . . . . . . . . . .15
7. How Safe Is The Drinking Water In My Household Well? . . . . . . . . . . . . . . . . . . . . .18
8. What You Can Do To Protect Your Drinking Water . . . . . . . . . . . . . . . . . . . . . . . . . . .21
Appendix A: National Primary Drinking Water Standards as of 10/03 . . . . . . . . . . . . . . . . . . . . . . .23
Appendix B: References . . . . . . . . . . . . . . . . . . . . . . . . . . . . . . . . . . . . . . . . . . . . . . . . . . . . . . . . . . .28
Appendix C: Sources of Additional Information . . . . . . . . . . . . . . . . . . . . . . . . . . . . . . . . . . . . . . . .29
Appendix D: Glossary . . . . . . . . . . . . . . . . . . . . . . . . . . . . . . . . . . . . . . . . . . . . . . . . . . . . . . . . . . . . .31

The United States enjoys one of the best supplies of drinking water in the world. Nevertheless, many of us who once gave little or no thought to the water that comes from our taps are now asking the ques-tion: “Is my water safe to drink?” While tap water that meets federal and state standards is generally safe to drink, threats to drinking water are increasing. Short-term disease outbreaks and water restrictions during droughts have demonstrated that we can no longer take our drinking water for granted.
Consumers have many questions about their drinking water. How safe is my drinking water? What is being done to improve security of public water systems? Where does my drinking water come from, and how is it treated? Do private wells receive the same pro-tection as public water systems? What can I do to help protect my drinking water?
1. A Consumer’s Guide To The Nation’s Drinking Water
Sensitive Subpopulations
Some people may be more vulnerable to con-taminants in drinking water than the general population. People undergoing chemotherapy or living with HIV/AIDS, transplant patients, children and infants, the frail elderly, and preg-nant women and their fetuses can be particu-larly at risk for infections.
If you have special health care needs, con-sider taking additional precautions with your drinking water, and seek advice from your health care provider. For more information, see www.epa.gov/safewater/healthcare/special.html.
You will find information on bottled water and home water treatment units on page 16 of this booklet. You may also contact NSF International, Underwriter’s Laboratory, or the Water Quality Association. Contact information is located in Appendix C.
This booklet provides the answers to these and other frequently asked questions.
This booklet also directs you to more detailed sources of information. Often, you will be directed to a page on the EPA website. Additionally, the Safe Drinking Water Hotline is available to answer your questions. Please also see Appendix C for more resources. Refer to the Glossary (Appendix D) for definitions of words in bold font.
1
www.epa.gov/safewater Safe Drinking Water Hotline: 800-426-4791
What you need to know to protect your family

2
www.epa.gov/safewater Safe Drinking Water Hotline: 800-426-4791
What Law Keeps My Drinking Water Safe?
Congress passed the Safe Drinking Water Act (SDWA) in 1974 to protect public health by regulat-ing the nation’s public drinking water supply and protecting sources of drinking water. SDWA is administered by the U.S. Environmental Protection Agency (EPA) and its state partners.
What Is A Public Water System?
The Safe Drinking Water Act (SDWA) defines a public water system (PWS) as one that serves piped water to at least 25 persons or 15 service connections for at least 60 days each year. There are approxi-mately 161,000 public water systems in the United States.1 Such systems may be publicly or privately owned. Community water systems (CWSs) are public water systems that serve people year-round in their homes. Most people in the U.S. (268 million) get their water from a community water system. EPA also regulates other kinds of public water systems,
2. How Safe Is My Drinking Water?
Highlights of the Safe Drinking Water Act
Authorizes EPA to set enforceable health stan-dards for contaminants in drinking water
violations and annual reports (Consumer Confidence Reports) to customers on con-taminants found in their drinking water - www.epa.gov/safewater/ccr
-lation enforcement
protect underground sources of drinking water - www.epa.gov/safewater/uic
except those with pristine, protected sources
-ing loan fund for water system upgrades - www.epa.gov/safewater/dwsrf
all drinking water sources to contamination - www.epa.gov/safewater/protect
— Drinking Water: Past, Present, and Future EPA-816-F-00-002
Public Water Systems
Community Water System (54,000 systems)—A public water system that serves the same people year-round. Most residences are served by Community Water Systems.
Non-Community Water System ( approximately 108,000 systems)—A public water system that does not serve the same people year-round. There are two types of non-community systems:
System (almost 19,000 systems)—A non-community water system that serves the same people more than six months of the year, but not year-round. For example, a school with its own water supply is consid-ered a non-transient system.
(more than 89,000 systems)—A non- community water system that serves the public but not the same individuals for more than six months. For example, a rest area or a campground may be considered a transient system.

3
www.epa.gov/safewater Safe Drinking Water Hotline: 800-426-4791
such as those at schools, campgrounds, factories, and restaurants. Private water supplies, such as household wells that serve one or a few homes, are not regulated by EPA. For information on household wells, see “How Safe Is The Drinking Water In My Household Well?” on page 18 of this booklet.
Funding In The Future?
Nationwide, drinking water systems have spent hun-dreds of billions of dollars to build drinking water treatment and distribution systems. From 1995 to 2000, more than $50 billion was spent on capital investments to fund water quality improvements.2
With the aging of the nation’s infrastructure, the clean water and drinking water industries face a signifi-cant challenge to sustain and advance their achieve-ments in protecting public health. EPA’s Clean Water & Drinking Water Infrastructure Gap Analysis3
has found that if present levels of spending do not increase, there will be a significant funding gap by the year 2019.
Where Can I Find Information About My Local Water System?
Since 1999, water suppliers have been required to provide annual Consumer Confidence Reports to their customers. These reports are due by July 1 each year, and contain information on contaminants found
in the drinking water, possible health effects, and the water’s source. Some Consumer Confidence Reports are available at www.epa.gov/safewater/dwinfo.htm.
Water suppliers must promptly inform you if your water has become contaminated by something that can cause immediate illness. Water suppliers have 24 hours to inform their customers of violations of EPA standards “that have the potential to have seri-ous adverse effects on human health as a result of short-term exposure.” If such a violation occurs, the water system will announce it through the media, and must provide information about the potential adverse effects on human health, steps the system is taking to correct the violation, and the need to use alternative water supplies (such as boiled or bottled water) until the problem is corrected.
Systems will inform customers about violations of less immediate concern in the first water bill sent after the violation, in a Consumer Confidence Report, or by mail within a year. In 1998, states began com-piling information on individual systems, so you can evaluate the overall quality of drinking water in your state. Additionally, EPA must compile and summarize the state reports into an annual report on the condi-tion of the nation’s drinking water. To view the most recent annual report, see www.epa.gov/safewater/annual.
How Often Is My Water Supply Tested?
EPA has established pollutant-specific minimum test-ing schedules for public water systems. To find out how frequently your drinking water is tested, contact your water system or the agency in your state in charge of drinking water.
If a problem is detected, immediate retesting require-ments go into effect along with strict instructions about how the system informs the public. Until the system can reliably demonstrate that it is free of problems, the retesting is continued.
In 2001, one out of every four community water systems did not conduct testing or report the results for all of the monitoring required to verify the safety
Cost of Making Water Safe Continues to Rise
Much of the existing water infrastructure (underground pipes, treatment plants, and other facilities) was built many years ago. In 1999, EPA conducted the second Drinking Water Infrastructure Needs Survey, and found that drinking water systems will need to invest $150 billion over a 20-year period to ensure clean and safe drinking water.

4
www.epa.gov/safewater Safe Drinking Water Hotline: 800-426-4791
of their drinking water.4 Although failure to monitor does not necessar-ily suggest safety problems, conduct-ing the required reporting is crucial to ensure that problems will be detected. Consumers can help make sure certain monitoring and reporting requirements are met by first contacting their state drinking water agency to determine if their water supplier is in compliance. If the water system is not meeting the requirements, consumers can work with local and state officials and the water supplier to make sure the required mon-itoring and reporting occurs.
A network of government agencies monitor tap water suppliers and enforce drinking water standards to ensure the safety of public water supplies. These agencies include EPA, state depart-ments of health and environment, and local public health departments. Nevertheless, problems with local drinking water can,
and do, occur.
What Problems Can Occur?
Actual events of drinking water contamination are rare, and typically do not occur at levels likely to pose health concerns. However, as development in our modern society increases, there are growing numbers of activities that can contaminate our drink-ing water. Improperly disposed-of chemicals, animal and human wastes, wastes injected underground, and naturally occurring substances have the potential to contaminate drinking water. Likewise, drinking water that is not properly treated or disinfected, or that travels through an improperly maintained distribution system, may also pose a health risk. Greater vigilance by you, your water supplier, and your government can help prevent such events in your water supply.
Contaminants can enter water supplies either as a result of human and animal activities, or because they occur naturally in the environment. Threats to your drinking water may exist in your neighborhood, or may occur many miles away. For more information on drinking water threats, see www.epa.gov/safewater/
District ofColumbia
0% - 6% of Systems 6% - 11% of Systems 11+% of Systems
Reported Community Water Systems Violating Maximum Contaminant Levels or Treatment
Standards in FY 2002
Common Sources of Pollution
Naturally Occurring: microorganisms (wild-life and soils), radionuclides (under lying rock), nitrates and nitrites (nitrogen compounds in the soil), heavy metals (underground rocks containing arsenic, cadmium, chromium, lead, and selenium), fluoride.
Human Activities: bacteria and nitrates (human and animal wastes—septic tanks and large farms), heavy metals (mining construc-tion, older fruit orchards), fertilizers and pes-ticides (used by you and others (anywhere crops or lawns are maintained)), industrial products and wastes (local factories, indus-trial plants, gas stations, dry cleaners, leak-ing underground storage tanks, landfills, and waste dumps), household wastes (cleaning solvents, used motor oil, paint, paint thinner), lead and copper (household plumbing materi-als), water treatment chemicals (waste water treatment plants).

5
www.epa.gov/safewater Safe Drinking Water Hotline: 800-426-4791
publicoutreach/landscapeposter.html. Some typical examples are microbial contamination, chemical con-tamination from fertilizers, and lead contamination.
Microbial Contamination:
The potential for health problems from microbial-contaminated drinking water is demonstrated by localized outbreaks of waterborne disease. Many of these outbreaks have been linked to contamination by bacteria or viruses, probably from human or animal wastes. For example, in 1999 and 2000, there were 39 reported disease outbreaks associated with drinking water, some of which were linked to public drinking water supplies.5
Certain pathogens (disease-causing microorgan-isms), such as Cryptosporidium, may occasionally pass through water filtration and disinfection process-es in numbers high enough to cause health problems, particularly in vulnerable members of the population. Cryptosporidium causes the gastrointestinal disease, cryptosporidiosis, and can cause serious, some-times fatal, symptoms, especially among sensitive members of the population. (See box on Sensitive Subpopulations on page 1.) A serious outbreak of cryptosporidiosis occurred in 1993 in Milwaukee, Wisconsin, causing more than 400,000 persons to be infected with the disease, and resulting in at least 50 deaths. This was the largest recorded outbreak of waterborne disease in United States history.6
Chemical Contamination From Fertilizers:
Nitrate, a chemical most commonly used as a fertil-izer, poses an immediate threat to infants when it is found in drinking water at levels above the national standard. Nitrates are converted to nitrites in the intestines. Once absorbed into the bloodstream, nitrites prevent hemoglobin from transporting oxy-gen. (Older children have an enzyme that restores hemoglobin.) Excessive levels can cause “blue baby syndrome,” which can be fatal without immediate medical attention. Infants most at risk for blue baby syndrome are those who are already sick, and while they are sick, consume food that is high in nitrates or drink water or formula mixed with water that is high in nitrates. Avoid using water with high nitrate levels for drinking. This is especially important for infants and young children, nursing mothers, pregnant women and certain elderly people.
Boil Water Notices for Microbial Contaminants
When microorganisms such as those that indicate fecal contami-
nation are found in drinking water, water suppliers
water for one minute kills the microorganisms that cause disease. Therefore, these notices serve as a precaution to the public. www.epa.gov/safewater/
l
Nitrates: Do NOT Boil
Do NOT boil water to attempt to reduce nitrates.
Boiling water contaminated with nitrates increases its concentration and potential risk. If you are concerned about nitrates, talk to your health care provider about alternatives to boiling water for baby formula.
Excessive levels of nitrates can cause
“blue baby syndrome,” which can be fatal
without immediate
medical attention.

6
www.epa.gov/safewater Safe Drinking Water Hotline: 800-426-4791
Lead Contamination:
Lead, a metal found in natural deposits, is commonly used in household plumbing materials and water service lines. The greatest exposure to lead is swal-lowing lead paint chips or breathing in lead dust. But lead in drinking water can also cause a variety of adverse health effects. In babies and children, exposure to lead in drinking water above the action level of lead (0.015 milligram per liter) can result in delays in physi-cal and mental development, along with slight deficits in attention span and learn-ing abilities. Adults who drink this water over many years could develop kidney problems or high blood pres-sure. Lead is rarely found in source water, but enters tap water through corrosion of plumbing materials. Very old and poorly maintained homes may be more likely to have lead pipes, joints, and solder. However, new homes are also at risk: pipes legally considered to be “lead-free” may contain up to eight percent lead. These pipes can leach signifi-cant amounts of lead in the water for the first several months after their installation. For more information on lead contamination, see www.epa.gov/safewater/con-taminants/dw_contamfs/lead.html.
For more information on drinking water contaminants that are regulated by EPA, see Appendix A, or visit www.epa.gov/safewater/mcl.html.
Where Can I Find More Information About My Drinking Water?
Drinking water varies from place to place, depending on the water’s source and the treatment it receives. If your drinking water comes from a community water system, the system will deliver to its customers annual drinking water quality reports (or Consumer Confidence Reports). These reports will tell consumers what contaminants have been detected in their drinking water, how these detection levels compare to drink-ing water standards, and where their water comes from. The reports must be provided annually before July 1, and, in most cases, are mailed directly to customers’ homes. Contact your water suppli-er to get a copy of your report, or see if your report is posted online
at www.epa.gov/safewater/dwinfo.htm. Your state’s department of health or environment can also be a valuable source of information. For help in locating these agencies, call the Safe Drinking Water Hotline. Further resources can be found in Appendix C. Information on testing household wells is on page 19.
1 Factoids: Drinking Water & Ground Water Statistics for 2002, 2003.
2 Community Water Systems Survey 2000, Volume I, 2001.3 The Clean Water and Drinking Water Infrastructure Gap
Analysis, EPA 816-R-02-020.4 Factoids: Drinking Water and Ground Water Statistics for
2001, EPA 816-K-02-004.5 Morbidity and Mortality Weekly Report: Surveillance for
Waterborne Disease Outbreaks, United States 1999-2000, 2002.
6 25 Years of the Safe Drinking Water Act, 1999.
Lead: Do NOT Boil
Do NOT boil water to attempt to reduce lead. Boiling water increases lead concentration.
Always use water from the cold tap for pre-paring baby formula, cooking, and drinking. Flush pipes first by running the water before using it. Allow the water to run until it’s cold. If you have high lead levels in your tap water, talk to your health care provider about alter-natives to using boiled water in baby formula.

7
www.epa.gov/safewater Safe Drinking Water Hotline: 800-426-4791
Your drinking water comes from surface water or ground water. The water that systems pump and treat from sources open to the atmosphere, such as rivers, lakes, and reservoirs is known as surface water. Water pumped from wells drilled into under-ground aquifers, geologic formations containing water, is called ground water. The quantity of water produced by a well depends on the nature of the rock, sand, or soil in the aquifer from which the water is drawn. Drinking water wells may be shallow (50 feet or less) or deep (more than 1,000 feet). More water systems have ground water than surface water as a source (approx. 147,000 v. 14,500), but more people drink from a surface water system (195 million v. 101,400). Large-scale water supply systems tend to rely on surface water resources, while smaller water systems tend to use ground water. Your water utility or public works department can tell you the source of your public water supply.
How Does Water Get To My Faucet?
An underground network of pipes typically delivers drinking water to the homes and businesses served by the water system. Small systems serving just a hand-ful of households may be relatively simple, while large metropolitan systems can be extremely com-plex—sometimes consisting of thousands of miles of pipes serving millions of people. Drinking water must meet required health standards when it leaves the treatment plant. After treated water leaves the plant, it is monitored within the distribution system to identify and remedy any problems such as water main breaks, pressure variations, or growth of microorganisms.
How Is My Water Treated To Make It Safe?
Water utilities treat nearly 34 billion gallons of water every day.1 The amount and type of treatment applied varies with the source and quality of the water. Generally, surface water systems require more treat-ment than ground water systems because they are directly exposed to the atmosphere and runoff from rain and melting snow.
Water suppliers use a variety of treatment processes to remove contaminants from drinking water. These individual processes can be arranged in a “treatment train” (a series of processes applied in a sequence). The most commonly used processes include coagu-lation (flocculation and sedimentation), filtration, and disinfection. Some water systems also use ion exchange and adsorption. Water utilities select the treatment combination most appropriate to treat the contaminants found in the source water of that par-ticular system.
Coagulation (Flocculation & Sedimentation):
Flocculation: This step removes dirt and other par-ticles suspended in the water. Alum and iron salts or synthetic organic polymers are added to the water to form tiny sticky particles called “floc,” which attract the dirt particles.
3. Where Does My Drinking Water Come From And How Is It Treated?
All sources of drinking water contain some naturally occurring contaminants. At low levels, these contaminants generally are not harmful in our drinking water. Removing all contaminants would be extremely expensive, and in most cases, would not provide increased protection of public health. A few naturally occurring min-erals may actually improve the taste of drinking water and may even have nutritional value at low levels.

8
www.epa.gov/safewater Safe Drinking Water Hotline: 800-426-4791
Sedimentation: The flocculated particles then settle naturally out of the water.
Filtration:
Many water treatment facilities use filtration to remove all particles from the water. Those particles
include clays and silts, natural organic matter, precip-itates from other treatment processes in the facility, iron and manganese, and microorganisms. Filtration clarifies the water and enhances the effectiveness of disinfection.
Storage: Water is placed in a closed tank or reservoir for disinfection to take place. The water then flows through pipes to homes and businesses in the community.
Source: AWWA Drinking Water Week Blue Thumb Kit
Filtration: The water passes through filters, some made of layers of sand, gravel, and charcoal that help remove even smaller particles.
Sedimentation: The heavy particles (floc) settle to the bottom and the clear water moves to filtration.
Disinfection: A small amount of chlorine is added or some other disinfection method is used to kill any bacteria or microorganisms that may be in the water.
Coagulation removes dirt and other particles suspended in water. Alum and other chemicals are added to water to form tiny sticky particles called “floc” which attract the dirt particles. The combined weight of the dirt and the alum (floc) become heavy enough to sink to the bottom during sedimentation.
Lake or Reservoir
Water Treatment Plant
Follow a drop of water from the source through the treatment process. Water may be treated differently

9
www.epa.gov/safewater Safe Drinking Water Hotline: 800-426-4791
Disinfection Byproducts
Disinfection of drinking water is one of the major public health advances of the 20th century. However, sometimes the disinfec-tants themselves can react with naturally occurring materials in the water to form unintended byproducts, which may pose health risks. EPA recognizes the importance of removing microbial contaminants while simultaneously protecting the public from disinfection byproducts, and has developed regulations to limit the presence of these byproducts. For more information, see www.epa.gov/safewater/mdbp.html.
Disinfection:
Disinfection of drinking water is considered to be one of the major public health advances of the 20th century. Water is often disinfected before it enters the distribution system to ensure that dangerous micro-bial contaminants are killed. Chlorine, chlorinates, or chlorine dioxides are most often used because they are very effective disinfectants, and residual concen-trations can be maintained in the water system.
Why Is My Water Bill Rising?
The cost of drinking water is rising as suppliers meet the needs of aging infrastructure, comply with pub-lic health standards, and expand service areas. In most cases, these increasing costs have caused water suppliers to raise their rates. However, despite rate increases, water is generally still a bargain compared to other utilities, such as electricity and phone ser-vice. In fact, in the United States, combined water and sewer bills average only about 0.5 percent of household income.2
1 Protect Your Drinking Water, 2002.2 Congressional Budget Office Study: Future Investment in
Drinking Water & Wastewater Infrastructure, 2002.
Water System Filtration Tank
Water passes through charcoal, sand, and gravel layers in a water system’s filtration tank.
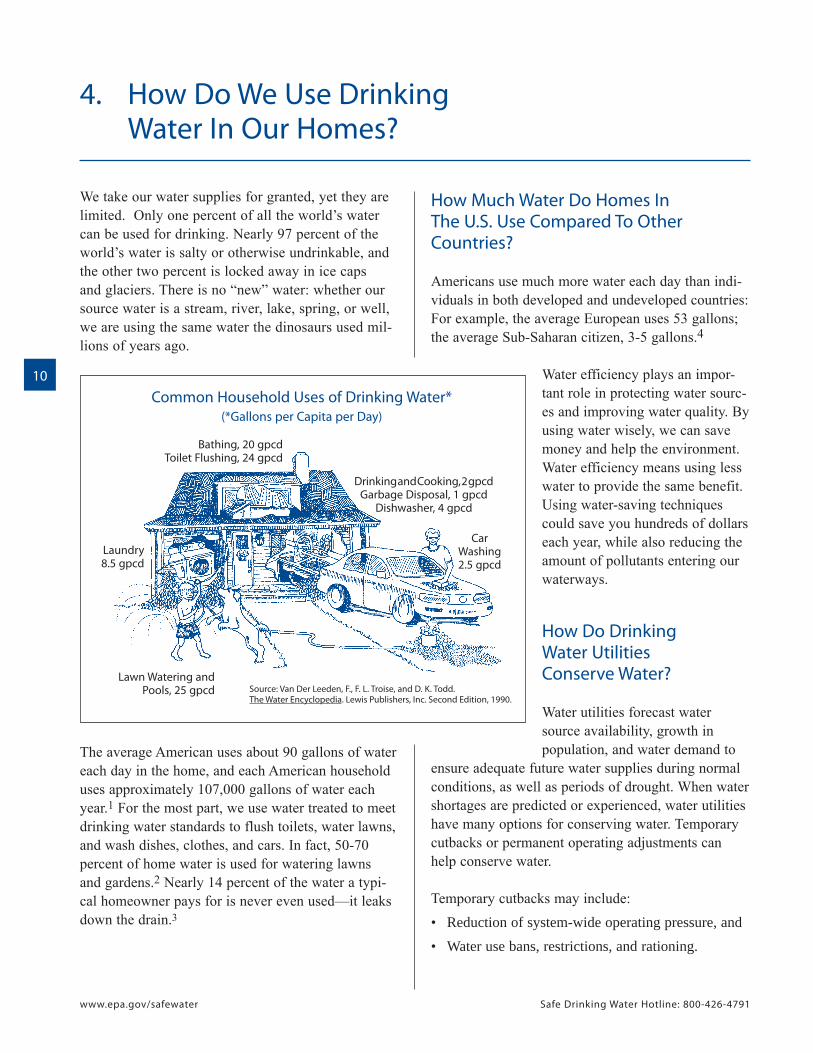
10
www.epa.gov/safewater Safe Drinking Water Hotline: 800-426-4791
We take our water supplies for granted, yet they are limited. Only one percent of all the world’s water can be used for drinking. Nearly 97 percent of the world’s water is salty or otherwise undrinkable, and the other two percent is locked away in ice caps and glaciers. There is no “new” water: whether our source water is a stream, river, lake, spring, or well, we are using the same water the dinosaurs used mil-lions of years ago.
The average American uses about 90 gallons of water each day in the home, and each American household uses approximately 107,000 gallons of water each year.1 For the most part, we use water treated to meet drinking water standards to flush toilets, water lawns, and wash dishes, clothes, and cars. In fact, 50-70 percent of home water is used for watering lawns and gardens.2 Nearly 14 percent of the water a typi-cal homeowner pays for is never even used—it leaks down the drain.3
How Much Water Do Homes In The U.S. Use Compared To Other Countries?
Americans use much more water each day than indi-viduals in both developed and undeveloped countries: For example, the average European uses 53 gallons; the average Sub-Saharan citizen, 3-5 gallons.4
Water efficiency plays an impor-tant role in protecting water sourc-es and improving water quality. By using water wisely, we can save money and help the environment. Water efficiency means using less water to provide the same benefit. Using water-saving techniques could save you hundreds of dollars each year, while also reducing the amount of pollutants entering our waterways.
How Do Drinking Water Utilities Conserve Water?
Water utilities forecast water source availability, growth in population, and water demand to
ensure adequate future water supplies during normal conditions, as well as periods of drought. When water shortages are predicted or experienced, water utilities have many options for conserving water. Temporary cutbacks or permanent operating adjustments can help conserve water.
Temporary cutbacks may include:• Reduction of system-wide operating pressure, and• Water use bans, restrictions, and rationing.
4. How Do We Use Drinking Water In Our Homes?
Common Household Uses of Drinking Water* (*Gallons per Capita per Day)
Bathing, 20 gpcdToilet Flushing, 24 gpcd
Laundry8.5 gpcd
Drinking and Cooking, 2 gpcdGarbage Disposal, 1 gpcd
Dishwasher, 4 gpcd
CarWashing2.5 gpcd
Lawn Watering and Pools, 25 gpcd Source: Van Der Leeden, F., F. L. Troise, and D. K. Todd.
The Water Encyclopedia. Lewis Publishers, Inc. Second Edition, 1990.
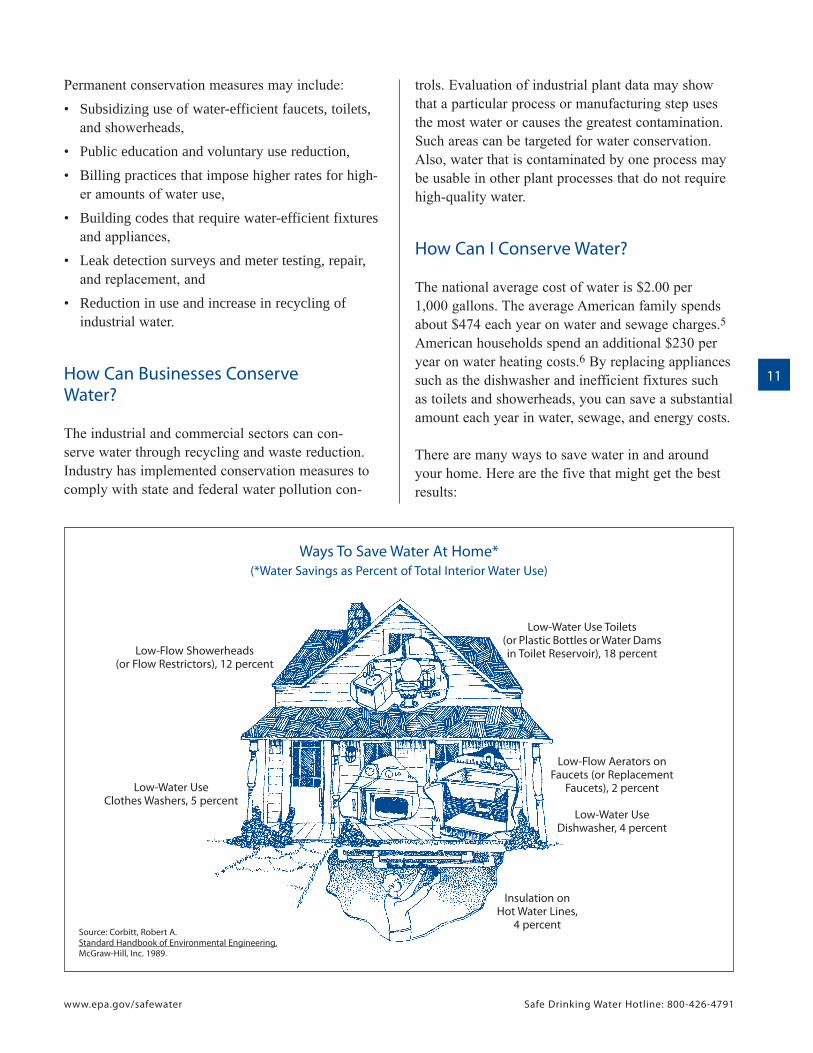
11
www.epa.gov/safewater Safe Drinking Water Hotline: 800-426-4791
Permanent conservation measures may include:• Subsidizing use of water-efficient faucets, toilets,
and showerheads,• Public education and voluntary use reduction,• Billing practices that impose higher rates for high-
er amounts of water use,• Building codes that require water-efficient fixtures
and appliances,• Leak detection surveys and meter testing, repair,
and replacement, and• Reduction in use and increase in recycling of
industrial water.
How Can Businesses Conserve Water?
The industrial and commercial sectors can con-serve water through recycling and waste reduction. Industry has implemented conservation measures to comply with state and federal water pollution con-
trols. Evaluation of industrial plant data may show that a particular process or manufacturing step uses the most water or causes the greatest contamination. Such areas can be targeted for water conservation. Also, water that is contaminated by one process may be usable in other plant processes that do not require high-quality water.
How Can I Conserve Water?
The national average cost of water is $2.00 per 1,000 gallons. The average American family spends about $474 each year on water and sewage charges.5American households spend an additional $230 per year on water heating costs.6 By replacing appliances such as the dishwasher and inefficient fixtures such as toilets and showerheads, you can save a substantial amount each year in water, sewage, and energy costs.
There are many ways to save water in and around your home. Here are the five that might get the best results:
Ways To Save Water At Home* (*Water Savings as Percent of Total Interior Water Use)
Low-Flow Showerheads(or Flow Restrictors), 12 percent
Source: Corbitt, Robert A.Standard Handbook of Environmental Engineering.McGraw-Hill, Inc. 1989.
Low-Water UseClothes Washers, 5 percent
Low-Water Use Toilets(or Plastic Bottles or Water Dams in Toilet Reservoir), 18 percent
Low-Flow Aerators on Faucets (or Replacement
Faucets), 2 percent
Low-Water UseDishwasher, 4 percent
Insulation onHot Water Lines,
4 percent

12
www.epa.gov/safewater Safe Drinking Water Hotline: 800-426-4791
• Stop Leaks.• Replace Old Toilets with models that use 1.6
gallons or less per flush.• Replace Old Clothes Washers with EPA Energy
Star certified models.• Plant the Right Kind of Garden that requires less
water.• Provide Only the Water Plants Need.
For more information on ways to conserve water in the home, see www.epa.gov/water/waterefficiency.html or www.h2ouse.org.
1 Water Trivia Facts, EPA 80-F-95-001.2 AWWA Stats on Tap.3 Using Water Wisely in the Home, 2002.4 The Use of Water Today, World Water Council.5 Investing in America’s Water Infrastructure, 2002.6 Using Water Wisely in the Home, 2002.
Nearly 14 percent of the water a typical homeowner pays for is never even used—it leaks down the drain.
Using Water Wisely in the Home, 2002
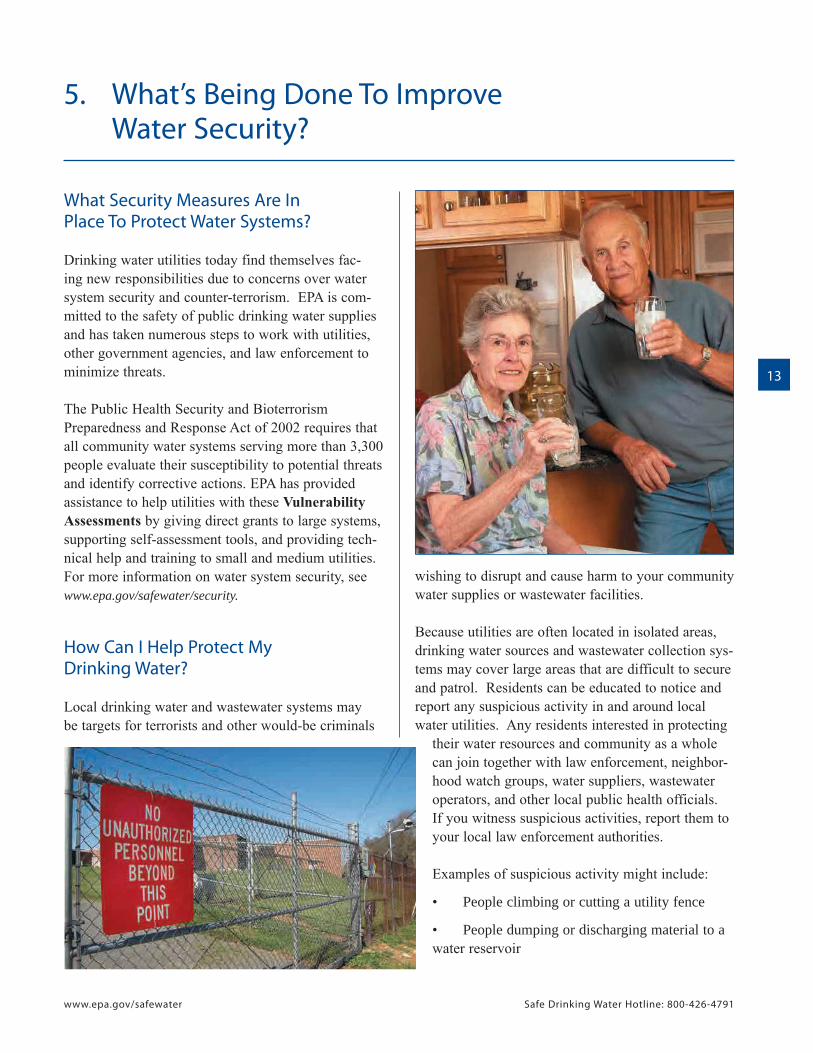
13
www.epa.gov/safewater Safe Drinking Water Hotline: 800-426-4791
What Security Measures Are In Place To Protect Water Systems?
Drinking water utilities today find themselves fac-ing new responsibilities due to concerns over water system security and counter-terrorism. EPA is com-mitted to the safety of public drinking water supplies and has taken numerous steps to work with utilities, other government agencies, and law enforcement to minimize threats.
The Public Health Security and Bioterrorism Preparedness and Response Act of 2002 requires that all community water systems serving more than 3,300 people evaluate their susceptibility to potential threats and identify corrective actions. EPA has provided assistance to help utilities with these Vulnerability Assessments by giving direct grants to large systems, supporting self-assessment tools, and providing tech-nical help and training to small and medium utilities. For more information on water system security, see www.epa.gov/safewater/security.
How Can I Help Protect My Drinking Water?
Local drinking water and wastewater systems may be targets for terrorists and other would-be criminals
wishing to disrupt and cause harm to your community water supplies or wastewater facilities.
Because utilities are often located in isolated areas, drinking water sources and wastewater collection sys-tems may cover large areas that are difficult to secure and patrol. Residents can be educated to notice and report any suspicious activity in and around local water utilities. Any residents interested in protecting
their water resources and community as a whole can join together with law enforcement, neighbor-hood watch groups, water suppliers, wastewater operators, and other local public health officials. If you witness suspicious activities, report them to your local law enforcement authorities.
Examples of suspicious activity might include:
• People climbing or cutting a utility fence
• People dumping or discharging material to a water reservoir
5. What’s Being Done To Improve Water Security?

14
www.epa.gov/safewater Safe Drinking Water Hotline: 800-426-4791
Do not confront strangers. Instead report suspicious activities to local authorities.
When reporting an incident:
• State the nature of the incident
• Identify yourself and your location
• Identify location of activity
• Describe any vehicle involved (color, make, model, plate number)
• Describe the participants (how many, sex, race, color of hair, height, weight, clothing)
For more information on water security, visit: www.epa.gov/safewater/security
• Unidentified truck or car parked or loitering near waterway or facilities for no apparent reason
• Suspicious opening or tampering with manhole covers, fire hydrants, buildings, or equipment
• People climbing or on top of water tanks
• People photographing or videotaping utility facilities, structures or equipment
• Strangers hanging around locks or gates
Report suspicious activity to local
authorities
For emergencies, dial 9-1-1 or other local emergency response numbers.
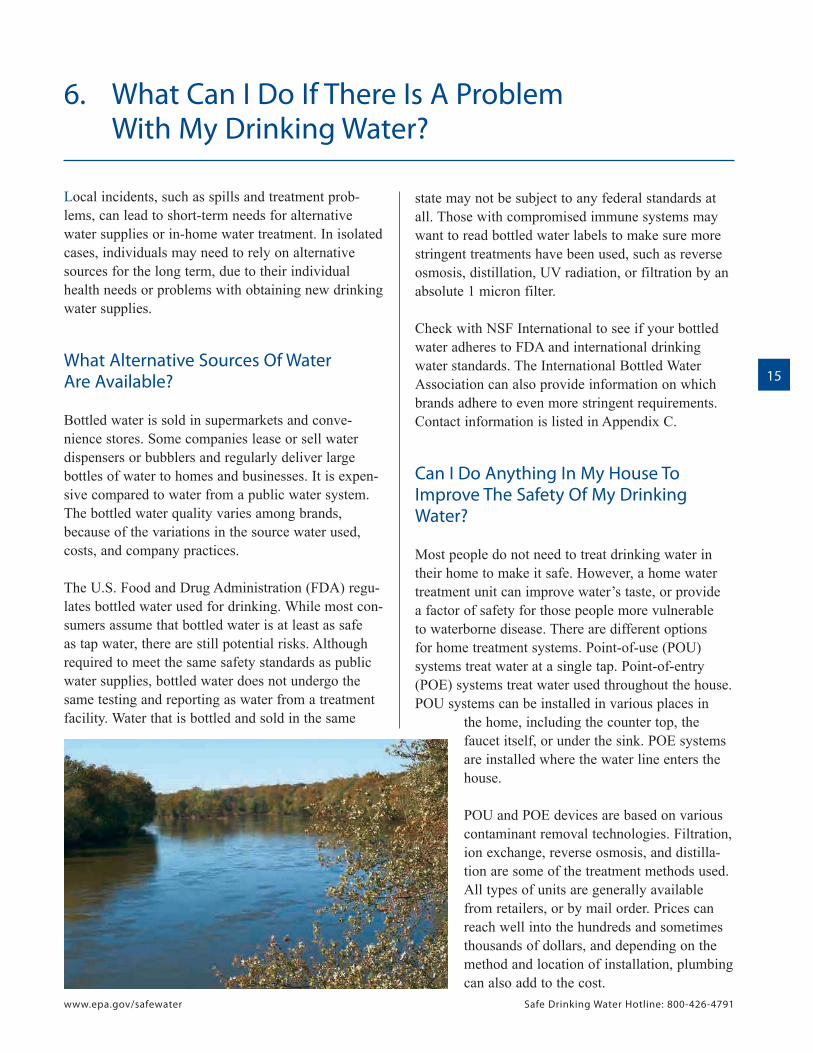
15
www.epa.gov/safewater Safe Drinking Water Hotline: 800-426-4791
Local incidents, such as spills and treatment prob-lems, can lead to short-term needs for alternative water supplies or in-home water treatment. In isolated cases, individuals may need to rely on alternative sources for the long term, due to their individual health needs or problems with obtaining new drinking water supplies.
What Alternative Sources Of Water Are Available?
Bottled water is sold in supermarkets and conve-nience stores. Some companies lease or sell water dispensers or bubblers and regularly deliver large bottles of water to homes and businesses. It is expen-sive compared to water from a public water system. The bottled water quality varies among brands, because of the variations in the source water used, costs, and company practices.
The U.S. Food and Drug Administration (FDA) regu-lates bottled water used for drinking. While most con-sumers assume that bottled water is at least as safe as tap water, there are still potential risks. Although required to meet the same safety standards as public water supplies, bottled water does not undergo the same testing and reporting as water from a treatment facility. Water that is bottled and sold in the same
state may not be subject to any federal standards at all. Those with compromised immune systems may want to read bottled water labels to make sure more stringent treatments have been used, such as reverse osmosis, distillation, UV radiation, or filtration by an absolute 1 micron filter.
Check with NSF International to see if your bottled water adheres to FDA and international drinking water standards. The International Bottled Water Association can also provide information on which brands adhere to even more stringent requirements. Contact information is listed in Appendix C.
Can I Do Anything In My House To Improve The Safety Of My Drinking Water?
Most people do not need to treat drinking water in their home to make it safe. However, a home water treatment unit can improve water’s taste, or provide a factor of safety for those people more vulnerable to waterborne disease. There are different options for home treatment systems. Point-of-use (POU) systems treat water at a single tap. Point-of-entry (POE) systems treat water used throughout the house. POU systems can be installed in various places in
the home, including the counter top, the faucet itself, or under the sink. POE systems are installed where the water line enters the house.
POU and POE devices are based on various contaminant removal technologies. Filtration, ion exchange, reverse osmosis, and distilla-tion are some of the treatment methods used. All types of units are generally available from retailers, or by mail order. Prices can reach well into the hundreds and sometimes thousands of dollars, and depending on the method and location of installation, plumbing can also add to the cost.
6. What Can I Do If There Is A Problem With My Drinking Water?

16
www.epa.gov/safewater Safe Drinking Water Hotline: 800-426-4791
Activated carbon filters adsorb organic contami-nants that cause taste and odor problems. Depending on their design, some units can remove chlorination byproducts, some cleaning solvents, and pesticides. To maintain the effectiveness of these units, the car-bon canisters must be replaced periodically. Activated carbon filters are efficient in removing metals such as lead and copper if they are designed to absorb or remove lead.
Because ion exchange units can be used to remove minerals from your water, particularly calcium and magnesium, they are sold for water softening. Some ion exchange softening units remove radium and bar-ium from water. Ion exchange systems that employ activated alumina are used to remove fluoride and
arsenate from water. These units must be regenerated periodically with salt.
Reverse osmosis treatment units generally remove a more diverse list of contaminants than other systems. They can remove nitrates, sodium, other dissolved inorganics, and organic compounds.
Distillation units boil water and condense the result-ing steam to create distilled water. Depending on their design, some of these units may allow vaporized organic contaminants to condense back into the prod-uct water, thus minimizing the removal of organics.
You may choose to boil your water to remove micro-bial contaminants. Keep in mind that boiling reduces
TREATMENT DEVICE WHAT IT DOES TO WATER TREATMENT LIMITATIONS
Activated Carbon Filter
(includes mixed media that remove heavy metals)
Adsorbs organic contaminants that cause taste and odor problems.
Somedesigns remove chlorination byproducts;
Some types remove cleaning solvents and pesticides
Is efficient in removing metals such as lead and copper
Does not remove nitrate, bacteria or dissolved minerals
Ion Exchange Unit
(with activated alumina)
Removes minerals, particularly calcium
Some designs remove radium and barium
Removes fluoride
If water has oxidized iron or iron bacteria, the ion-exchange resin will become coated or clogged and lose its softening ability
Reverse Osmosis Unit (with carbon)
Removes nitrates, sodium, other dissolved inorganics and organic compounds
Removes foul tastes, smells or colors
May also reduce the level of some pesticides, dioxins and chloroform and petrochemicals
Does not remove all inorganic and organic contaminants
Distillation Unit Removes nitrates, bacteria, sodium, hardness, dissolved solids, most organic compounds, heavy metals, and radionucleides
Kills bacteria
Does not remove some volatile organic contaminants, certain pesti-cides and volatile solvents
Bacteria may recolonize on the cool-ing coils during inactive periods

17
www.epa.gov/safewater Safe Drinking Water Hotline: 800-426-4791
the volume of water by about 20 percent, thus con-centrating those contaminants not affected by the temperature of boiling water, such as nitrates and
Maintaining Treatment Devices
All POU and POE treatment units need main-tenance to operate effectively. If they are not maintained properly, contaminants may accu-mulate in the units and actually make your water worse. In addition, some vendors may make claims about their effectiveness that have no merit. Units are tested for their safety and effectiveness by two organizations, NSF International and Underwriters Laboratory. In addition, the Water Quality Association represents the household, commercial, indus-trial and small community treatment industry and can help you locate a professional that meets their code of ethics. EPA does not test or certify these treatment units.
pesticides. For more information on boiling water, see page 5 of this booklet.
No one unit can remove everything. Have your water tested by a certified laboratory prior to purchasing any device. Do not rely on the tests conducted by salespeople that want to sell you their product.
Where Can I Learn More About Home Treatment Systems?
Your local library has articles, such as those found in consumer magazines, on the effectiveness of these devices.
The U.S. General Accounting Office published a booklet called Drinking Water: Inadequate Regulation of Home Treatment Units Leaves Consumers At Risk (December 1991). To read this booklet, visit www.gao.gov and search for documentnumber RCED-92-34, or call (202) 512-6000.
This treatment device is for point of use (POU).
For more information on different types of devices contact
NSF International, Underwriters Laboratory, or the
Water Quality Association See Appendix C for
contact information.

18
www.epa.gov/safewater Safe Drinking Water Hotline: 800-426-4791
EPA regulates public water systems; it does not have the authority to regulate private wells. Approximately 15 percent of Americans rely on their own pri-vate drinking water supplies (Drinking Water from Household Wells, 2002), and these supplies are not subject to EPA standards. Unlike public drinking water systems serving many people, they do not have experts regularly checking the water’s source and its quality before it is sent to the tap. These households must take special precautions to ensure the protection and maintenance of their drinking water supplies.
Drinking Water from Household Wells is an EPA publication available to specifically address special concerns of a private drinking water supply. To learn more, or to obtain a copy, visit www.epa.gov/safewater/privatewells, or call the Safe Drinking Water Hotline.
How Much Risk Can I Expect?
The risk of having problems depends on how good your well is—how well it was built and located, and how well you maintain it. It also depends on your local environment. That includes the quality of the aqui-fer from which your water is drawn and the human activities going on in your area that can affect your well.
Several sources of pollution are easy to spot by sight, taste, or smell. However, many serious problems can be found only by testing your water. Knowing the possible threats in your area will help you decide the kind of tests you may need.
What Should I Do?
There are six basic steps you can take to help protect your private drinking water supply:
1. Identify potential problem sources.
2. Talk with local experts.
3. Have your water tested periodically.
4. Have the test results interpreted and explained clearly.
5. Set and follow a regular maintenance schedule for your well, and keep up-to-date records.
6. Immediately remedy any problems.
Identify Potential Problem Sources
Understanding and spotting possible pollution sources is the first step to safeguarding your drinking water. If your drinking water comes from a well, you may also have a septic system. Septic systems and other
on-site wastewater disposal sys-tems are major potential sources of contamination of private water supplies if they are poorly main-tained or located improperly, or if they are used for disposal of toxic chemicals. Information on septic systems is available from local health departments, state agen-cies, and the National Small Flows Clearinghouse (www.epa.gov/owm/mab/smcomm/nsfc.htm) at (800) 624-8301. A septic system design manual and guidance on system
maintenance are available from EPA (www.epa.gov/OW-OWM.html/mtb/decent/homeowner.htm).
7. How Safe Is The Drinking Water In My Household Well?

19
www.epa.gov/safewater Safe Drinking Water Hotline: 800-426-4791
Talk With Local Experts
Ground water conditions vary greatly from place to place, and local experts can give you the best infor-mation about your drinking water supply. Some examples are your health department’s “sanitarian,” local water-well contractors, public water system officials, county extension agents of the Natural Resources Conservation Service (NRCS), local or county planning commissions, and your local library.
Have Your Water Tested Periodically
Test your water every year for total coliform bacteria,nitrates, total dissolved solids, and pH levels. If you suspect other contaminants, test for these as well. As the tests can be expensive, limit them to possible problems specific to your situation. Local experts can help you identify these contaminants. You should also test your water after replacing or repairing any part of the system, or if you notice any change in your water’s look, taste, or smell.
Often, county health departments perform tests for bacteria and nitrates. For other substances, health departments, environmental offices, or county gov-ernments should have a list of state-certified labora-tories. Your State Laboratory Certification Officer can also provide you with this list. Call the Safe Drinking Water Hotline for the name and number of your state’s certification officer. Any laboratory you use should be certified to do drinking water testing.
Have Your Test Results Interpreted And Explained Clearly
Compare your well’s test results to federal and state drinking water standards (see Appendix A, or visit www.epa.gov/safewater/mcl.html or call the Safe Drinking Water Hotline). You may need to consult experts to aid you in understanding your results, such as the state agency that licenses water well contrac-tors, your local health department, or your state’s drinking water program.
Protecting Your Ground Water Supply
well for problems such as:
- Cracked, corroded, or damaged well casing
- Broken or missing well cap
- Settling and cracking of surface seals.
-face runoff away from the well.
unauthorized use of, or entry into, the well.
per year with bleach or hypochlorite gran-ules, according to the manufacturer’s direc-tions.
-form bacteria, nitrates, and other constitu-ents of concern.
-tenance, such as disinfection or sediment
-icals in the well.
construction, modification, or abandon-ment and closure.
herbicides, degreasers, fuels, and other pollutants near the well.
abandoned wells.
land surface.
as recommended by your local health department.
septic system.

20
www.epa.gov/safewater Safe Drinking Water Hotline: 800-426-4791
Set A Regular Maintenance Schedule For Your Well And Your Septic System
Proper well and septic system construction and con-tinued maintenance are keys to the safety of your water supply. Your state water well and septic system contractor licensing agency, local health department, or local public water system professional can provide information on well construction. Make certain your contractors are licensed by the state, if required, or certified by the National Ground Water Association.
Maintain your well, fixing problems before they reach crisis levels, and keep up-to-date records of well installation and repairs, as well as plumbing and water costs. Protect your own well area from contamination.
Immediately Remedy Any Problems
If you find that your well water is con-taminated, fix the problem as soon as possible. Consider connecting into a nearby community water system, if one is available. You may want to install a water treatment device to remove impurities. Information on these devices is provided
on page 16. If you connect to a public water system, remember to close your well properly.
After A Flood-Concerns And Advisories
• Stay away from well pump to avoid electric shock.
• Do not drink or wash from a flooded well.
• Pump the well until water runs clear.
• If water does not run clear, contact the county or state health department or extension service for advice.
Animal wastecan
contaminateyour
water supply

21
www.epa.gov/safewater Safe Drinking Water Hotline: 800-426-4791
Drinking water protection is a shared responsibility. Many actions are underway to protect our nation’s drinking water, and there are many opportunities for citizens to become involved.
Be Involved!
EPA activities to protect drinking water include set-ting drinking water standards and overseeing the work of states that enforce federal standards—or stricter ones set by the individual state. EPA holds many public meetings on issues ranging from pro-posed drinking water standards to the development of databases. You can also comment on proposed drafts of other upcoming EPA documents. A list of public meetings and regulations open for comment can be found at www.epa.gov/safewater/pubinput/html.
Be Informed!
• Read the annual Consumer Confidence Report provided by your water supplier. Some Consumer Confidence Reports are available at www.epa.gov/safewater/dwinfo.htm.
• Use information from your state’s Source Water Assessment to learn about potential threats to your water source.
• If you are one of the 15 percent of Americans who uses a private source of drinking water—such as a well, cistern, or spring—find out what activi-ties are taking place in your watershed that may impact your drinking water; talk to local experts/test your water periodically; and maintain your well properly.
• Find out if the Clean Water Act standards for your drinking water source are intended to protect water for drinking, in addition to fishing and swimming.
Be Observant!
• Look around your watershed and look for announcements in the local media about activities that may pollute your drinking water.
• Form and operate a citizens watch network with-in your community to communicate regularly with law enforcement, your public water supplier and wastewater operator. Communication is key to a safer community!
• Be alert. Get to know your water/wastewater utili-ties, their vehicles, routines and their personnel.
• Become aware of your surroundings. This will help you to recognize suspicious activity as opposed to normal daily activities.
Other Ways To Get Involved
-tion, storm water permitting, and town planning.
asking to see their environmental impact statements.
affect your water source.
water system as they make funding deci-sions.
-ticipate in your community’s contaminant monitoring activities.
their job.
8. What You Can Do To Protect Your Drinking Water

22
www.epa.gov/safewater Safe Drinking Water Hotline: 800-426-4791
• If you see any suspicious activities in or around your water supply, please notify local authorities or call 9-1-1 immediately to report the incident.
Don’t Contaminate!
• Reduce paved areas: use permeable surfaces that allow rain to soak through, not run off.
• Reduce or eliminate pesticide application: test your soil before applying chemicals, and use plants that require little or no water, pesti-cides, or fertilizers.
• Reduce the amount of trash you create: reuse and recycle.
• Recycle used oil: 1 quart of oil can contaminate 2 million gallons
of drinking water—take your used oil and anti-freeze to a service station or recycling center.
• Take the bus instead of your car one day a week: you could prevent 33 pounds of carbon dioxide emissions each day.
• Keep pollutants away from boat marinas and waterways: keep boat motors well-tuned to prevent leaks, select nontoxic cleaning products and use a drop cloth, and clean and maintain boats away from the water.
For more information on how you can help pro-tect your local drinking water source, call the Safe Drinking Water Hotline, or check www.epa.gov/safewater/publicoutreach. Additional resources are listed in Appendix C.
Stormwater runoff threatens our sources of drinking water. As this water washes over roofs, pavement, farms and grassy areas, it picks up fertilizers, pesticides and litter, and deposits them in surface water and ground water. Here are some other threats to our drinking water:
Every year:
that contain toxic and harmful chemicals to our lawns.
municipal solid water—approximately five pounds of trash or garbage per person per day—that contain bacteria, nitrates, virus-es, synthetic detergents, and household chemicals.
and houseboats and 10,000 boat marinas release solvents, gasoline, detergents, and raw sewage directly into our rivers, lakes and streams.

23
www.epa.gov/safewater Safe Drinking Water Hotline: 800-426-4791
Contaminant MCL or Potential health effects from Common sources of contaminant Public Health TT1 (mg/L)2 long-term3 exposure above the MCL in drinking water Goal (mg/L)2
Acrylamide TT4 Nervous system or blood problems; Added to water during sewage/ zeroincreased risk of cancer wastewater treatment
Alachlor 0.002 Eye, liver, kidney or spleen problems; Runoff from herbicide zeroanemia; increased risk of cancer used on row crops
Alpha/photon emitters 15 picocuries Increased risk of cancer Erosion of natural deposits of certain zeroper Liter minerals that are radioactive and(pCi/L) may emit a form of radiation known
as alpha radiation
Antimony 0.006 Increase in blood cholesterol; decrease Discharge from petroleum refineries; 0.006 in blood sugar fire retardants; ceramics; electronics;
solder
Arsenic 0.010 Skin damage or problems with circulatory Erosion of natural deposits; runoff 0systems, and may have increased from orchards; runoff from glass &risk of getting cancer electronics production wastes
Asbestos (fibers >10 7 million Increased risk of developing benign Decay of asbestos cement in water 7 MFL micrometers) fibers per intestinal polyps mains; erosion of natural deposits
Liter (MFL)
Atrazine 0.003 Cardiovascular system or reproductive Runoff from herbicide used on row 0.003problems crops
Barium 2 Increase in blood pressure Discharge of drilling wastes; discharge 2 from metal refineries; erosion
of natural deposits
Benzene 0.005 Anemia; decrease in blood platelets; Discharge from factories; leaching zero increased risk of cancer from gas storage tanks and landfills
Benzo(a)pyrene 0.0002 Reproductive difficulties; increased risk Leaching from linings of water storage zero(PAHs) of cancer tanks and distribution lines
Beryllium 0.004 Intestinal lesions Discharge from metal refineries and 0.004coal-burning factories; dischargefrom electrical, aerospace, anddefense industries
Beta photon emitters 4 millirems Increased risk of cancer Decay of natural and man-made zeroper year deposits of certain minerals that are
radioactive and may emit forms ofradiation known as photons and betaradiation
Bromate 0.010 Increased risk of cancer Byproduct of drinking water disinfection zero
Cadmium 0.005 Kidney damage Corrosion of galvanized pipes; erosion 0.005of natural deposits; discharge
from metal refineries; runoff fromwaste batteries and paints
Carbofuran 0.04 Problems with blood, nervous system, or Leaching of soil fumigant used on rice 0.04reproductive system and alfalfa
Carbon tetrachloride 0.005 Liver problems; increased risk of cancer Discharge from chemical plants and zeroother industrial activities
Chloramines (as Cl2) MRDL=4.01 Eye/nose irritation; stomach discomfort; Water additive used to control MRDLG=41anemia microbes
Chlordane 0.002 Liver or nervous system problems; Residue of banned termiticide zeroincreased risk of cancer
Chlorine (as Cl2) MRDL=4.01 Eye/nose irritation; stomach discomfort Water additive used to control MRDLG=41microbes
Chlorine dioxide MRDL=0.81 Anemia; infants, young children, and fetuses of Water additive used to control MRDLG=0.81(as ClO2) pregnant women: nervous system effects microbes
Chlorite 1.0 Anemia; infants, young children, and fetuses of Byproduct of drinking water 0.8pregnant women: nervous system effects disinfection
Chlorobenzene 0.1 Liver or kidney problems Discharge from chemical and agricultural 0.1chemical factories
Chromium (total) 0.1 Allergic dermatitis Discharge from steel and pulp mills; 0.1erosion of natural deposits
Copper TT5; Short-term exposure: Gastrointestinal Corrosion of household plumbing 1.3Action distress. Long-term exposure: Liver or systems; erosion of natural depositsLevel = kidney damage. People with Wilson’s
1.3 Disease should consult their personaldoctor if the amount of copper in theirwater exceeds the action level
Cryptosporidium TT7 Short-term exposure: Gastrointestinal illness Human and animal fecal waste zero(e.g., diarrhea, vomiting, cramps)
National Primary Drinking Water Regulations
OC
OC
OC
OC
OC
OC
OC
OC
OC
R
R
D
D
D
IOC
IOC
IOC
IOC
IOC
IOC
IOC
IOC
M
DBP
DBP
LEGEND
D IOC OCDisinfectant Inorganic Chemical Organic ChemicalRMDBP Disinfection Byproduct Microorganism Radionuclides

24
www.epa.gov/safewater Safe Drinking Water Hotline: 800-426-4791
Contaminant MCL or Potential health effects from Common sources of contaminant Public Health TT1 (mg/L)2 long-term3 exposure above the MCL in drinking water Goal (mg/L)2
Cyanide 0.2 Nerve damage or thyroid problems Discharge from steel/metal factories; 0.2(as free cyanide) discharge from plastic and fertilizer
factories
2,4-D 0.07 Kidney, liver, or adrenal gland problems Runoff from herbicide used on row 0.07crops
Dalapon 0.2 Minor kidney changes Runoff from herbicide used on rights 0.2of way
1,2-Dibromo-3- 0.0002 Reproductive difficulties; increased risk Runoff/leaching from soil fumigant zerochloropropane of cancer used on soybeans, cotton, pineapples,(DBCP) and orchards
o-Dichlorobenzene 0.6 Liver, kidney, or circulatory system Discharge from industrial chemical 0.6problems factories
p-Dichlorobenzene 0.075 Anemia; liver, kidney or spleen damage; Discharge from industrial chemical 0.075changes in blood factories
1,2-Dichloroethane 0.005 Increased risk of cancer Discharge from industrial chemical zerofactories
1,1-Dichloroethylene 0.007 Liver problems Discharge from industrial chemical 0.007factories
cis-1,2-Dichloroethylene 0.07 Liver problems Discharge from industrial chemical 0.07factories
trans-1,2- 0.1 Liver problems Discharge from industrial chemical 0.1Dichloroethylene factories
Dichloromethane 0.005 Liver problems; increased risk of cancer Discharge from drug and chemical zerofactories
1,2-Dichloropropane 0.005 Increased risk of cancer Discharge from industrial chemical zerofactories
Di(2-ethylhexyl) adipate 0.4 Weight loss, liver problems, or possible Discharge from chemical factories 0.4 reproductive difficulties
Di(2-ethylhexyl) 0.006 Reproductive difficulties; liver problems; Discharge from rubber and chemical zerophthalate increased risk of cancer factories
Dinoseb 0.007 Reproductive difficulties Runoff from herbicide used on soybeans 0.007and vegetables
Dioxin (2,3,7,8-TCDD) 0.00000003 Reproductive difficulties; increased risk Emissions from waste incineration zeroof cancer and other combustion; discharge
from chemical factories
Diquat 0.02 Cataracts Runoff from herbicide use 0.02
Endothall 0.1 Stomach and intestinal problems Runoff from herbicide use 0.1
Endrin 0.002 Liver problems Residue of banned insecticide 0.002
Epichlorohydrin TT4 Increased cancer risk; stomach problems Discharge from industrial chemical zerofactories; an impurity of some watertreatment chemicals
Ethylbenzene 0.7 Liver or kidney problems Discharge from petroleum refineries 0.7
Ethylene dibromide 0.00005 Problems with liver, stomach, reproductive Discharge from petroleum refineries zerosystem, or kidneys; increased risk of cancer
Fecal coliform and MCL6 Fecal coliforms and E. coli are bacteria whose Human and animal fecal waste zero6E. coli presence indicates that the water may be contaminated
with human or animal wastes. Microbes in these wastes may cause short term effects, such as diarrhea, cramps,nausea, headaches, or other symptoms. They may pose aspecial health risk for infants, young children, and peoplewith severely compromised immune systems.
Fluoride 4.0 Bone disease (pain and tenderness of Water additive which promotes 4.0the bones); children may get mottled strong teeth; erosion of naturalteeth deposits; discharge from fertilizer
and aluminum factories
Giardia lamblia TT7 Short-term exposure: Gastrointestinal illness Human and animal fecal waste zero(e.g., diarrhea, vomiting, cramps)
Glyphosate 0.7 Kidney problems; reproductive Runoff from herbicide use 0.7 difficulties
Haloacetic acids 0.060 Increased risk of cancer Byproduct of drinking water n/a9(HAA5) disinfection
Heptachlor 0.0004 Liver damage; increased risk of cancer Residue of banned termiticide zero
Heptachlor epoxide 0.0002 Liver damage; increased risk of cancer Breakdown of heptachlor zero
Heterotrophic plate TT7 HPC has no health effects; it is an HPC measures a range of bacteria n/acount (HPC) analytic method used to measure the that are naturally present in the
variety of bacteria that are common in environmentwater. The lower the concentration ofbacteria in drinking water, the bettermaintained the water system is.
OC
OC
OC
OC
OC
OC
OC
OC
OC
OC
OC
OC
OC
OC
OC
OCOCOCOC
OC
IOC
LEGEND
D IOC OCDisinfectant Inorganic Chemical Organic ChemicalRMDBP Disinfection Byproduct Microorganism Radionuclides
M
IOC
OC
M
OC
OCOC
DBP
M

25
www.epa.gov/safewater Safe Drinking Water Hotline: 800-426-4791
LEGEND
D IOC OCDisinfectant Inorganic Chemical Organic ChemicalRMDBP Disinfection Byproduct Microorganism Radionuclides
Contaminant MCL or Potential health effects from Common sources of contaminant Public Health TT1 (mg/L)2 long-term3 exposure above the MCL in drinking water Goal (mg/L)2
Hexachlorobenzene 0.001 Liver or kidney problems; reproductive Discharge from metal refineries and zero difficulties; increased risk of cancer agricultural chemical factories
Hexachlorocyclopentadiene 0.05 Kidney or stomach problems Discharge from chemical factories 0.05
Lead TT5; Infants and children: Delays in physical or Corrosion of household plumbing zeroAction or mental development; children could systems; erosion of natural deposits
Level=0.015 show slight deficits in attention spanand learning abilities; Adults: Kidneyproblems; high blood pressure
Legionella TT7 Legionnaire’s Disease, a type of Found naturally in water; multiplies in zeropneumonia heating systems
Lindane 0.0002 Liver or kidney problems Runoff/leaching from insecticide used 0.0002on cattle, lumber, gardens
Mercury (inorganic) 0.002 Kidney damage Erosion of natural deposits; discharge 0.002 from refineries and factories; runoff from landfills and croplands
Methoxychlor 0.04 Reproductive difficulties Runoff/leaching from insecticide used 0.04on fruits, vegetables, alfalfa, livestock
Nitrate (measured as 10 Infants below the age of six months who Runoff from fertilizer use; leaching 10Nitrogen) drink water containing nitrate in excess from septic tanks, sewage; erosion of
of the MCL could become seriously ill natural depositsand, if untreated, may die. Symptomsinclude shortness of breath and blue-babysyndrome.
Nitrite (measured as 1 Infants below the age of six months who Runoff from fertilizer use; leaching 1Nitrogen) drink water containing nitrite in excess from septic tanks, sewage; erosion of
of the MCL could become seriously ill natural depositsand, if untreated, may die. Symptomsinclude shortness of breath and blue-babysyndrome.
Oxamyl (Vydate) 0.2 Slight nervous system effects Runoff/leaching from insecticide used 0.2on apples, potatoes, and tomatoes
Pentachlorophenol 0.001 Liver or kidney problems; increased Discharge from wood-preserving zerocancer risk factories
Picloram 0.5 Liver problems Herbicide runoff 0.5
Polychlorinated biphenyls 0.0005 Skin changes; thymus gland problems; Runoff from landfills; discharge of zero (PCBs) immune deficiencies; reproductive or waste chemicals nervous system difficulties; increased
risk of cancer
Radium 226 and 5 pCi/L Increased risk of cancer Erosion of natural deposits zeroRadium 228 (combined)
Selenium 0.05 Hair or fingernail loss; numbness in fingers Discharge from petroleum and metal refineries; 0.05or toes; circulatory problems erosion of natural deposits; discharge
from mines
Simazine 0.004 Problems with blood Herbicide runoff 0.004
Styrene 0.1 Liver, kidney, or circulatory system problems Discharge from rubber and plastic 0.1 factories; leaching from landfills
Tetrachloroethylene 0.005 Liver problems; increased risk of cancer Discharge from factories and dry cleaners zero
Thallium 0.002 Hair loss; changes in blood; kidney, intestine, Leaching from ore-processing sites; 0.0005or liver problems discharge from electronics, glass,
and drug factories
Toluene 1 Nervous system, kidney, or liver problems Discharge from petroleum factories 1
Total Coliforms 5.0 Coliforms are bacteria that indicate that other, Naturally present in the environment zeropercent8 potentially harmful bacteria may be present.
See fecal coliforms and E. coli
Total Trihalomethanes 0.080 Liver, kidney or central nervous system problems; Byproduct of drinking water disinfection n/a9(TTHMs) increased risk of cancer
Toxaphene 0.003 Kidney, liver, or thyroid problems; Runoff/leaching from insecticide used zeroincreased risk of cancer on cotton and cattle
2,4,5-TP (Silvex) 0.05 Liver problems Residue of banned herbicide 0.05
1,2,4-Trichlorobenzene 0.07 Changes in adrenal glands Discharge from textile finishing 0.07factories
1,1,1-Trichloroethane 0.2 Liver, nervous system, or circulatory Discharge from metal degreasing 0.2problems sites and other factories
1,1,2-Trichloroethane 0.005 Liver, kidney, or immune system Discharge from industrial chemical 0.003problems factories
Trichloroethylene 0.005 Liver problems; increased risk of cancer Discharge from metal degreasing zerosites and other factories
OC
OC
OC
OC
OC
OC
OCOC
OC
OC
OC
OC
OCOC
OC
OC
OC
OC
R
IOC
IOC
IOC
IOC
IOC
IOC
DBP
M
M

26
www.epa.gov/safewater Safe Drinking Water Hotline: 800-426-4791
M
LEGEND
D IOC OCDisinfectant Inorganic Chemical Organic ChemicalRMDBP Disinfection Byproduct Microorganism Radionuclides
Contaminant MCL or Potential health effects from Common sources of contaminant Public Health TT1 (mg/L)2 long-term3 exposure above the MCL in drinking water Goal (mg/L)2
Turbidity TT7 Turbidity is a measure of the cloudiness of water. Soil runoff n/a It is used to indicate water quality and filtration
effectiveness (e.g., whether disease-causing organismsare present). Higher turbidity levels are often associatedwith higher levels of disease-causing microorganismssuch as viruses, parasites and some bacteria. Theseorganisms can cause short term symptoms such asnausea, cramps, diarrhea, and associated headaches.
Uranium 30μg/L Increased risk of cancer, kidney toxicity Erosion of natural deposits zero
Vinyl chloride 0.002 Increased risk of cancer Leaching from PVC pipes; discharge zerofrom plastic factories
Viruses (enteric) TT7 Short-term exposure: Gastrointestinal illness Human and animal fecal waste zero(e.g., diarrhea, vomiting, cramps)
Xylenes (total) 10 Nervous system damage Discharge from petroleum factories; 10discharge from chemical factories
OC
OC
R
M
27
www.epa.gov/safewater Safe Drinking Water Hotline: 800-426-4791
NOTES1 Definitions • Maximum Contaminant Level Goal (MCLG)—The level of a contaminant in drinking water below
which there is no known or expected risk to health. MCLGs allow for a margin of safety and are non-enforceable public health goals. • Maximum Contaminant Level (MCL)—The highest level of a contaminant that is allowed in drinking water. MCLs are set as close to MCLGs as feasible using the best available treatment technology and taking cost into consideration. MCLs are enforceable standards. • Maximum Residual Disinfectant Level Goal (MRDLG)—The level of a drinking water disinfectant
below which there is no known or expected risk to health. MRDLGs do not reflect the benefits of the use of disinfectants to control microbial contaminants.
• Maximum Residual Disinfectant Level (MRDL)—The highest level of a disinfectant allowed in drinking water. There is convincing evidence that addition of a disinfectant is necessary for control of microbial contaminants. • Treatment Technique (TT)—A required process intended to reduce the level of a contaminant in drinking water.2 Units are in milligrams per liter (mg/L) unless otherwise noted. Milligrams per liter are equivalent
to parts per million (ppm).3 Health effects are from long-term exposure unless specified as short-term exposure.4 Each water system must certify annually, in writing, to the state (using third-party or manufacturers
certification) that when it uses acrylamide and/or epichlorohydrin to treat water, the combination (orproduct) of dose and monomer level does not exceed the levels specified, as follows: Acrylamide = 0.05 percent dosed at 1 mg/L (or equivalent); Epichlorohydrin = 0.01 percent dosed at 20 mg/L (or equivalent).
5 Lead and copper are regulated by a Treatment Technique that requires systems to control thecorrosiveness of their water. If more than 10 percent of tap water samples exceed the action level,water systems must take additional steps. For copper, the action level is 1.3 mg/L, and for lead is 0.015 mg/L.
6 A routine sample that is fecal coliform-positive or E. coli-positive triggers repeat samples--if anyrepeat sample is total coliform-positive, the system has an acute MCL violation. A routine samplethat is total coliform-positive and fecal coliform-negative or E. coli-negative triggers repeat samples--ifany repeat sample is fecal coliform-positive or E. coli-positive, the system has an acute MCL violation.See also Total Coliforms.
7 EPA’s surface water treatment rules require systems using surface water or ground water under the direct influence of surface water to (1) disinfect their water, and (2) filter their water or meetcriteria for avoiding filtration so that the following contaminants are controlled at the following levels:
• Cryptosporidium: 99 percent removal for systems that filter. Unfiltered systems are required to include Cryptosporidium in their existing watershed control provisions. • Giardia lamblia: 99.9 percent removal/inactivation
• Viruses: 99.99 percent removal/inactivation • Legionella: No limit, but EPA believes that if Giardia and viruses are removed/inactivated according
to the treatment techniques in the surface water treatment rule, Legionella will also be controlled.• Turbidity: For systems that use conventional or direct filtration, at no time can turbidity (cloudiness of
water) go higher than 1 nephelolometric turbidity unit (NTU), and samples for turbidity must beless than or equal to 0.3 NTU in at least 95 percent of the samples in any month. Systems that usefiltration other than conventional or direct filtration must follow state limits, which must include turbidity
at no time exceeding 5 NTU. • HPC: No more than 500 bacterial colonies per milliliter • Long Term 1 Enhanced Surface Water Treatment; Surface water systems or ground water systems under the direct influence of surface water serving fewer than 10,000 people must comply with the
applicable Long Term 1 Enhanced Surface Water Treatment Rule provisions (e.g. turbidity standards, individual filter monitoring, Cryptosporidium removal requirements, updated watershed control requirements for unfiltered systems). • Long Term 2 Enhanced Surface Water Treatment; This rule applies to all surface water systems or ground water systems under the direct influence of surface water. The rule targets additional
Cryptosporidium treatment requirements for higher risk systems and includes provisions to reducerisks from uncovered finished water storages facilities and to ensure that the systems maintain microbial
protection as they take steps to reduce the formation of disinfection byproducts. (Monitoring start dates are staggered by system size. The largest systems (serving at least 100,000 people) will begin monitoring in October 2006 and the smallest systems (serving fewer than 10,000 people) will not begin monitoring until October 2008. After completing monitoring and
determining their treatment bin, systems generally have three years to comply with any additional treatment requirements.) • Filter Backwash Recycling: The Filter Backwash Recycling Rule requires systems that recycle to return specific recycle flows through all processes of the system’s existing conventional or direct filtration system or at an alternate location approved by the state.8 No more than 5.0 percent samples total coliform-positive in a month. (For water systems that collect
fewer than 40 routine samples per month, no more than one sample can be total coliform-positive per month.) Every sample that has total coliform must be analyzed for either fecal coliforms orE. coli. If two consecutive TC-positive samples, and one is also positive for E. coli or fecal coliforms,system has an acute MCL violation.
9 Although there is no collective MCLG for this contaminant group, there are individual MCLGs for some of the individual contaminants:
• Haloacetic acids: dichloroacetic acid (zero); trichloroacetic acid (0.3 mg/L) • Trihalomethanes: bromodichloromethane (zero); bromoform (zero); dibromochloromethane (0.06 mg/L)

28
www.epa.gov/safewater Safe Drinking Water Hotline: 800-426-4791
Environmental Education:

29
www.epa.gov/safewater Safe Drinking Water Hotline: 800-426-4791
American Water Works Association
www.awwa.org
Association of Metropolitan Water Agencies
www.amwa.net
Association of State Drinking Water Administrators
www.asdwa.org
Clean Water Action
www.cleanwater.org
Consumer Federation of America
www.consumerfed.org
The Groundwater Foundation
www.groundwater.org
The Ground Water Protection Council
www.gwpc.org
International Bottled Water Association
National Association of Regulatory Utility Commissioners
www.naruc.org
National Association of Water Companies
www.nawc.org
National Drinking Water Clearinghouse
www.ndwc.wvu.edu
National Ground Water Association
www.ngwa.org
National Rural Water Association
www.nrwa.org
Natural Resources Defense Council
www.nrdc.org

30
www.epa.gov/safewater Safe Drinking Water Hotline: 800-426-4791
NSF International
www.nsf.org
Rural Community Assistance Program
www.rcap.org
Underwriters LaboratoriesCorporate Headquarters
www.ul.com
Water Quality Association
www.wqa.org
U.S. Environmental Protection Agency Water Resource Center
www.epa.gov/safewater
Water Systems CouncilNational Programs Office
www.watersystems council.org
EPA Region 1
EPA Region 2
EPA Region 3
EPA Region 4
EPA Region 5
EPA Region 6
EPA Region 7
EPA Region 8
EPA Region 9
EPA Region 10

31
www.epa.gov/safewater Safe Drinking Water Hotline: 800-426-4791
Action Level
The level of lead and copper which, if exceeded,
water system must follow.
A natural underground layer, often of sand or gravel, that contains water
Coliform
A group of related bacteria whose presence in drinking water may indicate contamination by disease-causing microorganisms
Community Water System (CWS)
A water system that supplies drinking water to 25 people or more year-round in their residences
Contaminant
Anything found in water (including microorgan-isms, radionuclides, chemicals, minerals, etc.) which may be harmful to human health
Cryptosporidium
Microorganism found commonly in lakes and rivers which is highly resistant to disinfection.
Disinfectant
A chemical (commonly chlorine, chloramines, or ozone) or physical process (e.g., ultraviolet light) that kills microorganisms such as viruses, bacteria, and protozoa
Distribution System
A network of pipes leading from a treatment plant to customers’ plumbing systems
Ground Water
Inorganic Contaminants
Mineral-based compounds such as metals, nitrates, and asbestos; naturally occurring in some water, but can also enter water through human activities
Maximum Contaminant Level
The highest level of a contaminant that EPA allows in drinking water (legally enforceable standard)
Maximum Contaminant Level Goal
The level of a contaminant at which there would be no risk to human health (not a legally enforceable standard)
Microorganisms
Tiny living organisms that can be seen only under a microscope; some can cause acute health prob-lems when consumed in drinking water
Non-Transient Non-Community Water System
A non-community water system that serves the same people more than six months of the year, but not year-round
Organic Contaminants
Carbon-based chemicals, such as solvents and pes-ticides, which enter water through cropland runoff or discharge from factories
Pathogen
Disease-causing organism

32
www.epa.gov/safewater Safe Drinking Water Hotline: 800-426-4791
Public Water System (PWS)
A water system which supplies drinking water to at least 25 people, at least 60 days each year
Sensitive Subpopulation
People who may be more vulnerable to drinking water contamination, such as infants, children, some elderly, and people with severely compro-mised immune systems
Septic System
Used to treat sanitary waste; can be a significant
Source Water
Water in its natural state, prior to any treatment for drinking (i.e., lakes, streams, ground water)
Surface Water
Water that is pumped and treated from sources open to the atmosphere, such as rivers, lakes, and reservoirs
Transient Non-Community Water System
A non-community water system that serves the public but not the same individuals for more than six months
Violation
Failure to meet any state or federal drinking water regulation
Vulnerability Assessment
its vulnerability to contamination by pathogens and toxic chemicals
Watershed
The land area from which water drains into a stream, river, or reservoir
Well
A bored, drilled or driven shaft whose depth is greater than the largest surface dimension, a dug hole whose depth is greater than the largest surface dimension, an improved sinkhole, or a sub-surface fluid distribution system


34
www.epa.gov/safewater Safe Drinking Water Hotline: 800-426-4791

Dep
art
men
t o
f N
atu
ral
Res
ou
rces
Off
ices
Th
e D
NR
has
mor
e in
form
atio
n ab
out
dri
nkin
gw
ater
and
gro
und
wat
er p
rote
ctio
n on
its
web
site
at
dn
r.w
i.go
v. C
hoo
se “
Dri
nkin
g W
ater
& G
roun
dw
ater
” fr
om t
he
dro
p-d
own
pro
gram
men
u an
d s
elec
t fr
om a
var
iety
of l
iste
d t
opic
s.
NORT
HEAS
TW
EST C
ENTR
AL
SOUT
H CE
NTRA
LSO
UTHE
AST
NORT
HERN
Stat
e of W
iscon
sin
Depa
rtmen
t of N
atur
al Re
sour
ces
The
Wis
cons
in D
epar
tmen
t of N
atur
al R
esou
rces
Bur
eau
of D
rink
ing
Wat
er &
Gro
undw
ater
wou
ld li
ke to
than
k th
eG
roun
dwat
er C
oord
inat
ing
Cou
ncil
(G
CC
) E
duca
tion
Sub-
Com
mit
tee
for
thei
r pa
rt i
n th
e de
velo
pmen
t and
edit
ing
of th
is p
ubli
cati
on. F
or m
ore
info
rmat
ion
on th
eG
CC
, it’s
mem
ber
orga
niza
tion
s an
d pr
ogra
mm
ing,
plea
se v
isit
ww
w.w
isco
nsin
.gov
. Cho
ose
“Gov
ernm
ent,”
“Sta
te A
genc
ies,
” fo
llow
ed b
y “L
ist o
f Age
ncie
s” th
ense
lect
“G
roun
dwat
er C
oord
inat
ing
Cou
ncil
.”
The
Wis
cons
in D
epar
tmen
t of N
atur
al R
esou
rces
pro
vide
seq
ual o
ppor
tuni
ty i
n it
s em
ploy
men
t, pr
ogra
ms,
ser
vice
s an
dfu
ncti
ons
unde
r an
Aff
irm
ativ
e A
ctio
n Pl
an. I
f you
hav
e an
yqu
esti
ons,
ple
ase
wri
te to
: Equ
al O
ppor
tuni
ty O
ffic
e,D
epar
tmen
t of t
he In
teri
or, W
ashi
ngto
n, D
.C. 2
0240
.
Thi
s pu
blic
atio
n is
ava
ilab
le i
n al
tern
ativ
e fo
rmat
(lar
ge p
rint
, Bra
ille
, aud
iota
pe, e
tc)
upon
req
uest
.Pl
ease
cal
l (60
8) 2
66-0
821
for
mor
e in
form
atio
n.
PUB
-DG
-062
200
6 P
RIN
TE
D O
N
RE
CY
CLE
DP
AP
ER
Ars
enic
has
been
dete
cted
inev
ery
coun
tyin
the
Stat
e of
Wis
cons
in. T
he s
hade
d co
untie
s on
the
map
rep
rese
nt a
reas
with
wat
er w
ells
that
had
arse
nic
leve
ls e
xcee
ding
the
new
arse
nic
drin
king
wat
er s
tand
ard
of 1
0 pa
rts
per
billi
on (
ppb)
. Ser
ious
pro
blem
s w
ithar
seni
c ar
e ho
wev
er c
once
ntra
ted
insp
ecifi
c re
gion
s w
ithin
thes
e co
untie
s.
Wis
cons
in D
epar
tmen
t of
Nat
ural
Res
ourc
esB
urea
u of
Dri
nkin
g W
ater
& G
roun
dw
ater
Ars
enic
in Dri
nki
ng
Wat
erD
rin
kin
g W
ater
Wel
lste
sted
wit
h A
rsen
icLe
vels
Gre
ater
than
10
pp
b.
North
east
Reg
ion
Cent
ral O
ffice
Ca
n w
ate
r tr
eatm
ent
syst
ems
rem
ove
ars
enic
?
Yes,
sp
ecia
ltr
eatm
ent
syst
ems
can
rem
ove
arse
nic
from
wel
l wat
er.
How
ever
, be
awar
eth
at c
omm
ontr
eatm
ent
syst
ems
like
wat
erso
ften
ers,
car
bon
filt
ers
and
sed
imen
tfi
lter
s d
o no
tad
equa
tely
rem
ove
arse
nic
from
wat
er.
Do
not
pur
chas
e a
trea
tmen
t sy
stem
unl
ess
you
hav
e fi
rst
chec
ked
wit
h t
he
Dep
artm
ent
of C
omm
erce
’s a
pp
rove
dtr
eatm
ent
dev
ice
list.
(w
ebsi
te b
elow
und
erD
epar
tmen
t of
Com
mer
ce)
Th
ere
are
two
typ
es o
f tre
atm
ent
syst
ems
curr
entl
y av
aila
ble
for
arse
nic
rem
oval
. Th
ese
trea
tmen
t sy
stem
s ar
e “p
oint
-of-u
se”
and
“p
oint
-of
-ent
ry”
syst
ems.
Poi
nt-o
f-use
sys
tem
sge
nera
lly o
nly
trea
t on
e fa
ucet
th
at is
use
d fo
rd
rink
ing
and
coo
king
. Poi
nt-o
f-ent
ry s
yste
ms
trea
t al
l th
e w
ater
ent
erin
g th
e h
ouse
. New
trea
tmen
t te
chno
logi
es t
hat
will
red
uce
arse
nic
in y
our
wat
er s
upp
ly a
re p
rese
ntly
bei
ngd
evel
oped
. Onc
e yo
u h
ave
det
erm
ined
wh
ich
trea
tmen
t op
tion
is c
orre
ct fo
r yo
ur w
ater
sup
ply
, it
is r
ecom
men
ded
th
at y
ou u
se a
licen
sed
plu
mb
er fo
r in
stal
lati
on. A
fter
inst
alla
tion
, fol
low
th
e m
aint
enan
cein
stru
ctio
ns p
rovi
ded
by
the
man
ufac
ture
r ve
rycl
osel
y to
mak
e su
re t
he
syst
em c
onti
nues
to
oper
ate
as a
via
ble
ars
enic
red
ucti
on w
ater
trea
tmen
t sy
stem
.
Dri
lling
a n
ew w
ell m
ay b
e ne
cess
ary
for
extr
emel
y h
igh
leve
ls o
f ars
enic
. Tal
k to
you
rw
ell d
rille
r or
you
r d
rink
ing
wat
er &
grou
ndw
ater
sp
ecia
list
at y
our
DN
R r
egio
nal
offic
e ab
out
spec
ial w
ell c
onst
ruct
ion
guid
elin
es.
Wh
ere
can
I g
et m
ore
in
form
ati
on
?
Hea
lth
Dep
artm
ents
Th
e D
epar
tmen
t of
Hea
lth
& F
amily
Serv
ices
has
mor
e in
form
atio
n on
the
hea
lth
eff
ects
of a
rsen
ic e
xpos
ure
atd
hfs
.wis
con
sin
.gov
/eh
/Wat
er/i
nd
ex.h
tm
Stat
e D
epar
tmen
t of
Hea
lth
and
Fam
ily S
ervi
ces,
Div
isio
n of
Pub
lic H
ealt
h...
......
......
..60
8-26
6-74
80
Bro
wn
Co.
Hea
lth
Dep
t....
......
......
.....
920-
448-
6400
Out
agam
ie C
o. H
ealt
h D
ept.
......
......
920-
832-
5100
Win
neb
ago
Co.
Hea
lth
Dep
t....
......
..92
0-23
2-30
00
Dep
artm
ent
of C
omm
erce
Th
e D
epar
tmen
t of
Com
mer
ce m
aint
ains
a li
stof
tre
atm
ent
dev
ices
ap
pro
ved
for
rem
ovin
gar
seni
c at
com
mer
ce.s
tate
.wi.
us/
SB/S
B-
Pu
bsP
lum
bin
gPro
du
ctsR
egis
ter.
htm
l.
Safe
ty a
nd B
uild
ing
Div
isio
nP
lum
bin
g P
rod
uct
Rev
iew
PO
Box
716
2, M
adis
on, W
I 537
07-7
162
(608
) 26
7-14
01
Dep
artm
ent
of N
atu
ral
Res
ourc
esT
he
DN
R m
aint
ains
th
e fo
llow
ing
pag
es w
ith
info
rmat
ion
rela
ting
to
lab
s, w
ater
qua
lity
and
arse
nic
rese
arch
.
Wis
con
sin
’s A
rsen
ic I
nfo
rmat
ion
Pag
eV
isit
th
e D
NR
Web
sit
e fo
r ar
seni
c in
form
atio
nre
late
d t
o w
ell d
rilli
ng, w
ater
tre
atm
ent
opti
ons,
rece
nt n
ews
arti
cles
, res
earc
h p
aper
s an
d m
ore!
Go
to t
he
DN
R W
eb s
ite
at d
nr.
wi.
gov/
org/
wat
er/d
wg/
arse
nic
/in
dex
.htm
Cer
tifi
ed L
abor
ator
ies
A li
st o
f cer
tifie
d la
bs is
ava
ilabl
e fr
om t
he D
NR
or
onlin
e at
: dn
r.w
i.gov
/org
/es/
scie
nce
/lc/
INFO
/La
bli
sts.
htm
or
chec
k yo
ur lo
cal y
ello
w p
ages
and
ask
if th
ey a
re s
tate
cer
tifie
d to
tes
t fo
r ar
seni
c.
Con
sum
er C
onfi
den
ce R
epor
tsYo
ur lo
cal w
ater
sup
plie
r p
rint
s a
spec
ial r
epor
ton
th
e q
ualit
y of
you
r p
ublic
wat
er s
yste
m’s
dri
nkin
g w
ater
. Con
tact
you
r lo
cal w
ater
sup
plie
r or
find
you
r sy
stem
’s la
test
rep
ort
onth
e W
eb! G
o to
th
e D
NR
Web
sit
e at
pro
dm
tex0
0.d
nr.
stat
e.w
i.u
s/p
ls/i
nte
r1/
pw
s2$.
star
tup
. A q
uery
, or
sear
ch, c
anth
en b
e m
ade
by
city
or
ind
ivid
ual s
yste
m.
North
ern
Regi
on
OR Sout
h Ce
ntra
l Reg
ion
Wes
t Cen
tral R
egio
n
Sout
heas
t Reg
ion

Wh
at
is a
rsen
ic?
Ars
enic
is a
n el
emen
t th
atoc
curs
nat
ural
ly in
soi
l and
bed
rock
form
atio
ns. T
race
s of
arse
nic
are
also
foun
d in
grou
ndw
ater
, lak
es, r
iver
s an
doc
ean
wat
er. F
ood
s lik
e fr
uits
,ve
geta
ble
s, a
nd s
eafo
od c
anal
so c
onta
in a
rsen
ic. S
ome
frui
ts a
nd v
eget
able
sab
sorb
tra
ces
of a
rsen
ic fr
om t
he
soil
they
gro
win
. Oce
an fi
sh a
nd s
eafo
ods
natu
rally
hav
e h
igh
leve
ls o
f an
orga
nic
non-
toxi
c fo
rm o
f ars
enic
.
Hig
h le
vels
of i
norg
anic
ars
enic
, th
e m
ost
toxi
cfo
rm, h
ave
bee
n fo
und
in o
ver
1,20
0 p
riva
ted
rink
ing
wat
er w
ells
in W
isco
nsin
. Man
y of
the
impa
cted
wel
ls a
re lo
cate
d in
Out
agam
ie,
Win
neba
go a
nd B
row
n C
ount
ies
whe
re b
edro
ck is
natu
rally
hig
h in
ars
enic
. The
map
on
the
cove
rsh
ows
coun
ties
whe
re w
ells
hav
e be
en t
este
dan
d fo
und
to c
onta
in a
rsen
ic a
bove
10
ppb.
Ho
w c
an
I b
e ex
po
sed
to
ars
enic
?
Sinc
e ar
seni
c is
a n
atur
al p
art
of o
ur e
nvir
onm
ent,
ever
yone
is e
xpos
ed t
o sm
all a
mou
nts.
The
maj
orso
urce
of a
rsen
ic e
xpos
ure
is d
rink
ing
wat
er t
hat
cont
ains
ele
vate
d le
vels
of a
rsen
ic. O
ther
sou
rces
of a
rsen
ic e
xpos
ure
incl
ude:
food
s co
ntai
ning
tra
ces
of a
rsen
ic
smok
e fr
om w
ood
, coa
l, to
bac
co p
rod
ucts
dus
t fr
om s
ome
ind
ustr
ial p
roce
sses
pes
tici
des
anti
-par
asit
ic v
eter
inar
y m
edic
ines
folk
rem
edie
s
som
e tr
eate
d lu
mb
er
Peo
ple
wh
o ar
e ex
pos
ed t
o ar
seni
c ov
er a
per
iod
of y
ears
can
exp
erie
nce
a va
riet
y of
hea
lth
pro
ble
ms.
Ars
enic
can
be
easi
lyab
sorb
ed in
to t
he
hum
an s
yste
m b
y d
rink
ing
cont
amin
ated
wat
er o
r b
y b
reat
hin
g ai
rbor
nep
arti
cula
tes.
In m
ost
case
s, it
is s
afe
to u
sew
ater
th
at c
onta
ins
arse
nic
to b
ath
e an
d fo
rh
ouse
hol
d c
hor
es. A
rsen
ic is
not
eas
ilyab
sorb
ed t
hro
ugh
th
e sk
in a
nd d
oes
not
evap
orat
e fr
om t
he
wat
er in
to t
he
air.
Ho
w d
oes
ars
enic
get
in
to a
dri
nki
ng
wa
ter
sup
ply
?
Mos
t of
th
e ar
seni
c fo
und
inW
isco
nsin
gro
und
wat
er is
natu
rally
occ
urri
ng,
dep
osit
ed in
th
e so
il an
db
edro
ck la
yers
ove
rm
illio
ns o
f yea
rs.
Ars
enic
is t
ied
up
insu
lfid
e m
iner
als,
wh
ich
are
com
mon
in b
edro
ckfo
rmat
ions
and
in s
ome
glac
ial d
epos
its.
Ars
enic
can
be
rele
ased
from
soi
l and
rock
into
th
egr
ound
wat
er a
ndd
raw
n in
to w
ells
.
Scie
ntis
ts w
ho
hav
e st
udie
d t
his
pro
ble
m b
elie
ve a
rsen
ic is
bei
ngre
leas
ed in
to g
roun
dw
ater
at
elev
ated
leve
ls in
the
Out
agam
ie, W
inne
bag
o an
d B
row
n C
ount
yar
ea a
t le
ast
par
tly
bec
ause
peo
ple
are
now
usin
g m
ore
wat
er t
han
eve
r b
efor
e d
ue t
o ra
pid
sub
urb
an d
evel
opm
ent.
Dur
ing
the
pas
t te
nye
ars,
ab
out
10,0
00 n
ew w
ells
hav
e b
een
cons
truc
ted
in t
his
are
a. W
ater
qua
lity
pro
ble
ms
hav
e in
crea
sed
as
mor
e ne
w w
ells
are
bei
ng d
rille
d a
nd d
eman
ds
on g
roun
dw
ater
cont
inue
to
incr
ease
.
Stu
die
s h
ave
sho
wn
th
at in
crea
sed
wat
erd
eman
ds
hav
e lo
wer
ed t
he
wat
er t
able
in t
his
area
. Th
is h
as a
llow
ed o
xyge
n t
o g
et in
to t
he
bed
rock
aq
uif
ers,
cre
atin
g ch
emic
al r
eact
ion
sth
at r
elea
se a
rsen
ic in
to t
he
wat
er. I
n o
ther
area
s o
f th
e St
ate,
dif
fere
nt
typ
es o
f rea
ctio
ns
can
rel
ease
ars
enic
th
at m
ove
d in
to W
isco
nsi
n,
in t
he
geo
logi
c p
ast,
fro
m o
ther
geo
grap
hic
sou
rces
. Sci
enti
sts
are
stu
dyi
ng
thes
e an
do
ther
po
ssib
le fa
cto
rs t
o d
eter
min
e th
e b
est
way
s to
avo
id a
rsen
ic p
rob
lem
s. T
he
Dep
artm
ent
of N
atu
ral R
eso
urc
es s
taff
co
nti
nu
eto
stu
dy
arse
nic
co
nta
min
atio
n p
rob
lem
sth
rou
gho
ut
the
Stat
e to
det
erm
ine
its
geo
grap
hic
al e
xten
t an
d s
ever
ity.
Ho
w c
an
ars
enic
aff
ect
my
hea
lth
?
Con
sum
pti
on o
f ars
enic
-co
ntam
inat
ed w
ater
has
bee
nas
soci
ated
wit
h t
he
follo
win
gp
ossi
ble
hea
lth
eff
ects
:
Skin
can
cer
Inte
rnal
can
cers
(b
lad
der
,p
rost
ate,
lung
and
oth
er s
ites
)
Th
ick,
rou
gh s
kin
on h
and
s an
d fe
et
Unu
sual
ski
n p
igm
enta
tion
(d
app
ling
ofd
ark
bro
wn
or w
hit
e sp
lotc
hes
)
Num
bne
ss in
th
e h
and
s an
d fe
et
Cir
cula
tory
dis
ord
ers
Tre
mor
s
Stom
ach
pai
n, n
ause
a, d
iarr
hea
Dia
bet
es
Dep
ress
ion
Ars
enic
con
tam
inat
ion
of d
rink
ing
wat
er is
ase
riou
s h
ealt
h c
once
rn. I
f you
th
ink
you
orso
meo
ne in
you
r fa
mily
has
sym
pto
ms
from
arse
nic
exp
osur
e ta
lk t
o yo
ur d
octo
r an
d h
ave
your
wat
er t
este
d fo
r ar
seni
c.
Ho
w c
an
I f
ind
ou
t if
my
wa
ter
isco
nta
min
ate
d w
ith
ars
enic
?
You
cann
ot s
mel
l, ta
ste
or s
ee a
rsen
ic in
you
rd
rink
ing
wat
er. T
he
only
way
to
know
if y
our
wat
er c
onta
ins
arse
nic
is t
o h
ave
a w
ater
sam
ple
from
you
r p
riva
te w
ell t
este
d b
y a
cert
ified
lab
orat
ory.
A li
st o
f cer
tifie
d la
bs
is a
vaila
ble
from
th
e D
NR
or
onlin
e at
: dn
r.w
i.go
v/or
g/es
/sc
ien
ce/l
c/IN
FO/L
abli
sts.
htm
If yo
u us
e w
ater
from
a p
ublic
wat
er s
yste
m,
chec
k th
e w
ater
sys
tem
’s C
onsu
mer
Con
fiden
ceR
epor
t (C
CR
). P
ublic
wat
er s
yste
ms
dist
ribu
teco
pies
of t
heir
CC
R t
o sy
stem
use
rs e
ach
sum
mer
.T
he s
ecti
on t
itle
d “W
here
can
I ge
t m
ore
info
rma-
tion
”, fo
und
in t
his
broc
hure
con
tain
s in
stru
c-ti
ons
to h
elp
you
find
your
CC
R o
n th
e w
ebsi
te.
If t
he
arse
nic
leve
l in
your
wat
er is
ab
ove
the
dri
nkin
g w
ater
sta
ndar
d o
f 10
pp
b, s
top
dri
nkin
g yo
ur w
ater
. Ob
tain
wat
er fr
om a
kno
wn
safe
sou
rce
for
dri
nkin
g an
d p
rep
arat
ion
ofb
ever
ages
or
for
food
s lik
e b
aby
form
ula,
sou
p,
and
cof
fee.
Unl
ess
your
ars
enic
leve
l exc
eed
s10
0 p
pb
, it
is s
afe
to b
ath
e in
th
e w
ater
and
use
it fo
r h
ouse
hol
d p
urp
oses
. If a
rsen
ic le
vels
exce
ed 1
00 p
pb
, you
sh
ould
con
sult
you
r lo
cal
or C
ount
y h
ealt
h d
epar
tmen
t.
If t
he
arse
nic
leve
l in
your
wat
er is
just
und
er 1
0p
pb
and
you
con
sum
e 2
liter
s (a
bou
t 68
oun
ces)
or m
ore
of d
rink
ing
wat
er fr
om t
his
sou
rce
per
day
, you
may
wis
h t
o tr
y to
red
uce
your
exp
osur
e to
ars
enic
. Con
tact
you
r h
ealt
h c
are
pro
vid
er o
r lo
cal h
ealt
h d
epar
tmen
t to
det
erm
ine
your
sp
ecif
ic n
eed
s.
New
wel
l con
stru
ctio
n or
rec
onst
ruct
ions
hav
eb
een
succ
essf
ul a
t re
duc
ing
the
arse
nic
conc
entr
atio
ns in
wat
er s
upp
ly s
yste
ms.
For
leve
ls o
f ars
enic
con
tam
inat
ion
exce
edin
g50
pp
b, D
epar
tmen
t of
Nat
ural
Res
ourc
esW
ell C
ompe
nsat
ion
Prog
ram
fund
s m
ay b
eav
aila
ble
for
rep
lace
men
t w
ater
sys
tem
s fo
rin
com
e-el
igib
le p
riva
te w
ell o
wne
rs o
r le
ssee
s.
Ever
yone
sh
ould
sam
ple
th
eir
wel
l for
ars
enic
at le
ast
once
eve
ry fi
ve y
ears
. If y
ou a
re in
th
e“S
peci
al W
ell C
asin
g D
epth
Are
a” (
Out
agam
iean
d W
inne
bag
o C
ount
ies)
or
an a
rea
wh
ere
arse
nic
has
bee
n d
etec
ted
, th
e D
epar
tmen
t of
Nat
ural
Res
ourc
es r
ecom
men
ds
you
rete
st y
our
wel
l wat
er e
ach
yea
r, r
egar
dle
ss o
f pre
viou
s te
stre
sult
s b
ecau
se c
once
ntra
tion
s of
ars
enic
can
chan
ge o
ver
tim
e. (
See
the
map
on
the
fron
t of
this
bro
chur
e fo
r co
unti
es in
Wis
cons
in w
her
ear
seni
c le
vels
are
kno
wn
to h
ave
exce
eded
10p
pb
.) In
a s
mal
l per
cent
age
of w
ells
th
atp
rod
uce
wat
er w
ith
hig
h le
vels
of a
rsen
ic, t
he
wat
er is
ver
y ac
id a
nd c
an c
orro
de
plu
mb
ing
pip
es a
nd fi
xtur
es.
Con
vers
ely,
if y
ou h
ave
corr
osiv
e w
ater
, i.e
. you
r p
ipes
and
fixt
ures
are
cor
rod
ing,
ther
e is
a g
reat
er c
han
ce y
ouh
ave
an a
rsen
ic p
rob
lem
.


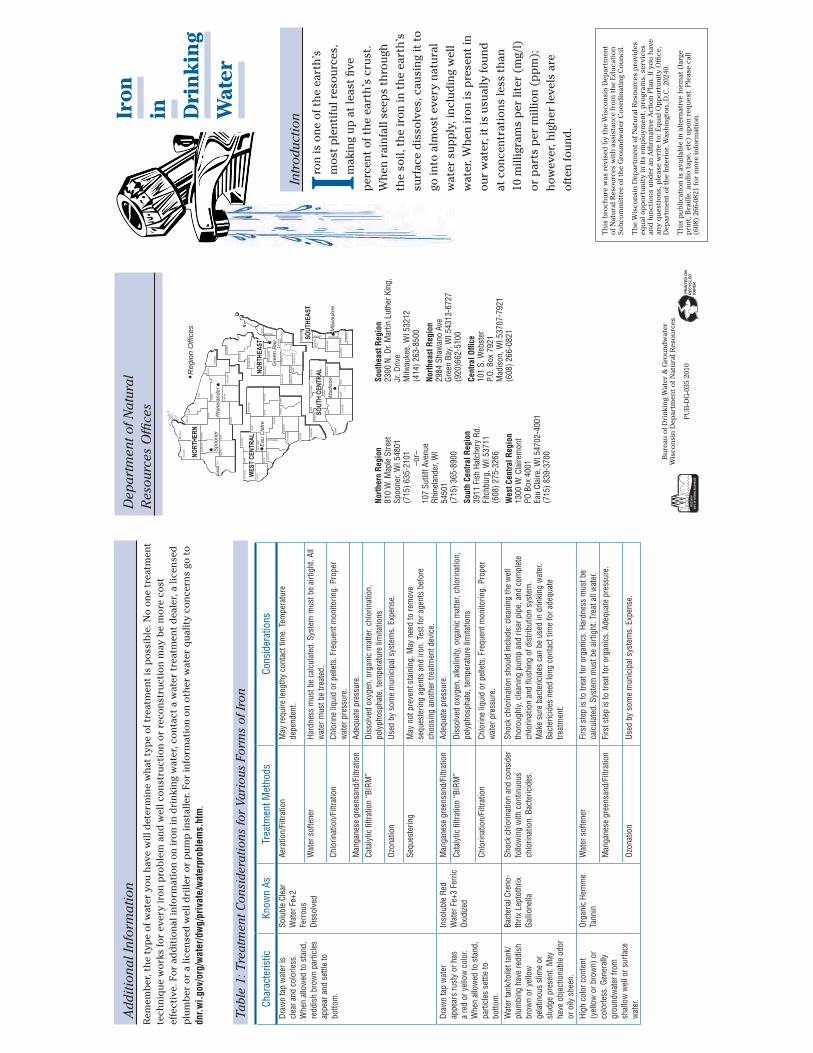
PR
INTE
D O
NR
ECYC
LED
PAPE
R
7/02
LP
NORT
HEAS
T
NORT
HERN
SOUT
HEAS
T
WES
T CEN
TRAL
SOUT
H CE
NTRA
LReg
ion
Offi
ces
Gre
en B
ay
Spo
oner
Rhi
nela
nder
Milw
auke
e
Eau
Cla
ire
Mad
ison
Iron
in Dri
nki
ng
Wat
er
Bur
eau
of D
rink
ing
Wat
er &
Gro
und
wat
er
Wis
cons
in D
epar
tmen
t of
Nat
ural
Res
ourc
es
PU
B-D
G-0
35 2
010
Intr
oduc
tion
Iron
is o
ne o
f th
e ea
rth
’s
mos
t p
lent
iful r
esou
rces
, m
akin
g up
at
leas
t fiv
e p
erce
nt o
f th
e ea
rth
’s c
rust
. W
hen
rai
nfal
l see
ps
thro
ugh
th
e so
il, t
he
iron
in t
he
eart
h’s
su
rfac
e d
isso
lves
, cau
sing
it t
o go
into
alm
ost
ever
y na
tura
l w
ater
sup
ply
, inc
lud
ing
wel
l w
ater
. Wh
en ir
on is
pre
sent
in
our
wat
er, i
t is
usu
ally
foun
d
at c
once
ntra
tion
s le
ss t
han
10
mill
igra
ms
per
lite
r (m
g/l)
or
par
ts p
er m
illio
n (p
pm
);
how
ever
, hig
her
leve
ls a
re
ofte
n fo
und
.
Add
ition
al In
form
atio
nR
emem
ber
, th
e ty
pe
of w
ater
you
hav
e w
ill d
eter
min
e w
hat
typ
e of
tre
atm
ent
is p
ossi
ble
. No
one
trea
tmen
t te
chni
que
wor
ks fo
r ev
ery
iron
pro
ble
m a
nd w
ell c
onst
ruct
ion
or r
econ
stru
ctio
n m
ay b
e m
ore
cost
ef
fect
ive.
For
ad
dit
iona
l inf
orm
atio
n on
iron
in d
rink
ing
wat
er, c
onta
ct a
wat
er t
reat
men
t d
eale
r, a
licen
sed
p
lum
ber
or
a lic
ense
d w
ell d
rille
r or
pum
p in
stal
ler.
For
info
rmat
ion
on o
ther
wat
er q
ualit
y co
ncer
ns g
o to
dn
r.wi.g
ov/o
rg/w
ater
/dw
g/pr
ivat
e/w
ater
prob
lem
s.ht
m.
Th
is b
roch
ure
was
rev
ised
by
the
Wis
cons
in D
epar
tmen
t of
Nat
ural
Res
ourc
es w
ith
ass
ista
nce
from
th
e Ed
ucat
ion
Sub
com
mit
tee
of t
he
Gro
und
wat
er C
oord
inat
ing
Cou
ncil.
Th
e W
isco
nsin
Dep
artm
ent
of N
atur
al R
esou
rces
pro
vid
es
equa
l op
por
tuni
ty in
its
emp
loym
ent,
pro
gram
s, s
ervi
ces
and
func
tion
s un
der
an
Affi
rmat
ive
Act
ion
Pla
n. If
you
hav
e an
y q
uest
ions
, ple
ase
wri
te t
o: E
qua
l Op
por
tuni
ty O
ffice
, D
epar
tmen
t of
th
e In
teri
or, W
ash
ingt
on, D
.C. 2
0240
.
Th
is p
ublic
atio
n is
ava
ilab
le in
alt
erna
tive
form
at (
larg
e p
rint
, Bra
ille,
aud
io t
ape,
etc
) up
on r
eque
st. P
leas
e ca
ll (6
08)
266-
0821
for
mor
e in
form
atio
n.
Char
acte
ristic
Know
n As
Trea
tmen
t Met
hods
Cons
ider
atio
nsDr
awn
tap
wat
er is
cl
ear a
nd c
olor
less
. W
hen
allo
wed
to s
tand
, re
ddis
h br
own
parti
cles
ap
pear
and
set
tle to
bo
ttom
.
Solu
ble
Clea
r W
ater
Fe+
2 Fe
rrou
s Di
ssol
ved
Aera
tion/
Filtr
atio
nM
ay re
quire
leng
thy
cont
act t
ime.
Tem
pera
ture
de
pend
ent.
Wat
er s
ofte
ner
Hard
ness
mus
t be
calc
ulat
ed. S
yste
m m
ust b
e ai
rtigh
t. Al
l w
ater
mus
t be
treat
ed.
Chlo
rinat
ion/
Filtr
atio
nCh
lorin
e liq
uid
or p
elle
ts. F
requ
ent m
onito
ring.
Pro
per
wat
er p
ress
ure.
Man
gane
se g
reen
sand
/Filt
ratio
nAd
equa
te p
ress
ure.
Cata
lytic
filtr
atio
n “B
IRM
”Di
ssol
ved
oxyg
en, o
rgan
ic m
atte
r, ch
lorin
atio
n,
poly
phos
phat
e, te
mpe
ratu
re li
mita
tions
Ozon
atio
nUs
ed b
y so
me
mun
icip
al s
yste
ms.
Exp
ense
.
Sequ
este
ring
May
not
pre
vent
sta
inin
g. M
ay n
eed
to re
mov
e se
ques
terin
g ag
ents
and
iron
. Tes
t for
age
nts
befo
re
choo
sing
ano
ther
trea
tmen
t dev
ice.
Draw
n ta
p w
ater
ap
pear
s ru
sty
or h
as
a re
d or
yel
low
col
or.
Whe
n al
low
ed to
sta
nd,
parti
cles
set
tle to
bo
ttom
.
Inso
lubl
e Re
d W
ater
Fe+
3 Fe
rric
Ox
idize
d
Man
gane
se g
reen
sand
/Filt
ratio
nAd
equa
te p
ress
ure.
Cata
lytic
filtr
atio
n “B
IRM
”Di
ssol
ved
oxyg
en, a
lkal
inity
, org
anic
mat
ter,
chlo
rinat
ion,
po
lyph
osph
ate,
tem
pera
ture
lim
itatio
ns
Chlo
rinat
ion/
Filtr
atio
nCh
lorin
e liq
uid
or p
elle
ts. F
requ
ent m
onito
ring.
Pro
per
wat
er p
ress
ure.
Wat
er ta
nk/to
ilet t
ank/
plum
bing
hav
e re
ddis
h br
own
or y
ello
w
gela
tinou
s sl
ime
or
slud
ge p
rese
nt. M
ay
have
obj
ectio
nabl
e od
or
or o
ily s
heen
.
Bact
eria
l Cre
no-
thrix
Lep
toth
rix
Galli
onel
la
Shoc
k ch
lorin
atio
n an
d co
nsid
er
follo
win
g w
ith c
ontin
uous
ch
lorin
atio
n. B
acte
ricid
es.
Shoc
k ch
lorin
atio
n sh
ould
incl
ude:
cle
anin
g th
e w
ell
thor
ough
ly, c
lean
ing
pum
p an
d ris
er p
ipe,
and
com
plet
e ch
lorin
atio
n an
d flu
shin
g of
dis
tribu
tion
syst
em.
Mak
e su
re b
acte
ricid
es c
an b
e us
ed in
drin
king
wat
er.
Bact
eric
ides
nee
d lo
ng c
onta
ct ti
me
for a
dequ
ate
treat
men
t.
High
col
or c
onte
nt
(yel
low
or b
row
n) o
r co
lorle
ss. G
ener
ally
gr
ound
wat
er fr
om
shal
low
wel
l or s
urfa
ce
wat
er.
Orga
nic
Hem
me
Tann
inW
ater
sof
tene
rFi
rst s
tep
is to
trea
t for
org
anic
s. H
ardn
ess
mus
t be
calc
ulat
ed. S
yste
m m
ust b
e ai
rtigh
t. Tr
eat a
ll w
ater
.M
anga
nese
gre
ensa
nd/F
iltra
tion
Firs
t ste
p is
to tr
eat f
or o
rgan
ics.
Ade
quat
e pr
essu
re.
Ozon
atio
nUs
ed b
y so
me
mun
icip
al s
yste
ms.
Exp
ense
.
Tabl
e 1:
Tre
atm
ent C
onsi
dera
tions
for
Vari
ous
Form
s of
Iron
North
ern
Regi
on
810
W. M
aple
Stre
et
Spoo
ner,
WI 5
4801
(7
15) 6
35-2
101
–or–
107
Sutli
ff Av
enue
Rh
inel
ande
r, W
I 54
501
(715
) 365
-890
0
Sout
h Ce
ntra
l Reg
ion
3911
Fis
h Ha
tche
ry R
d.Fi
tchb
urg,
WI 5
3711
(608
) 275
-326
6
Wes
t Cen
tral R
egio
n13
00 W
. Cla
irem
ont
PO B
ox 4
001
Eau
Clai
re, W
I 547
02-4
001
(715
) 839
-370
0
Sout
heas
t Reg
ion
2300
N. D
r. M
artin
Lut
her K
ing,
Jr
. Driv
eM
ilwau
kee,
WI 5
3212
(414
) 263
-850
0
North
east
Reg
ion
2984
Sha
wan
o Av
eGr
een
Bay,
WI 5
4313
-672
7(9
20)6
62-5
100
Cent
ral O
ffice
101
S. W
ebst
erP.
O. B
ox 7
921
Mad
ison
, WI 5
3707
-792
1(6
08) 2
66-0
821
Dep
artm
ent o
f Nat
ural
R
esou
rces
Offi
ces

Hea
lth a
nd W
ater
Qua
lity
Iron
is n
ot c
onsi
der
ed h
azar
dou
s to
hea
lth
. In
fact
, iro
n is
ess
enti
al fo
r go
od h
ealt
h b
ecau
se it
tr
ansp
orts
oxy
gen
in y
our
blo
od. I
n th
e U
nite
d
Stat
es, m
ost
tap
wat
er p
rob
ably
sup
plie
s le
ss
than
5 p
erce
nt o
f th
e d
ieta
ry r
equi
rem
ent
for
iron
.
Und
er D
epar
tmen
t of
Nat
ural
Res
ourc
es
(DN
R)
rule
s, ir
on is
con
sid
ered
a s
econ
dar
y or
“ae
sth
etic
” co
ntam
inan
t. T
he
pre
sent
re
com
men
ded
lim
it fo
r ir
on in
wat
er, 0
.3 m
g/l
(pp
m),
is b
ased
on
tast
e an
d a
pp
eara
nce
rath
er t
han
on
any
det
rim
enta
l hea
lth
eff
ect.
P
riva
te w
ater
sup
plie
s ar
e no
t su
bje
ct t
o th
e ru
les,
but
th
e gu
idel
ines
can
be
used
to
eval
uate
wat
er q
ualit
y.
For
inst
ance
, wh
en t
he
leve
l of i
ron
in w
ater
ex
ceed
s th
e 0.
3 m
g/l l
imit
, we
exp
erie
nce
red
, bro
wn,
or
yello
w s
tain
ing
of la
und
ry,
glas
swar
e, d
ish
es, a
nd h
ouse
hol
d fi
xtur
es s
uch
as
bat
htu
bs
and
sin
ks. T
he
wat
er m
ay a
lso
hav
e a
met
allic
tas
te a
nd a
n of
fens
ive
odor
. W
ater
sys
tem
pip
ing
and
fixt
ures
can
als
o b
ecom
e re
stri
cted
or
clog
ged
.
Typ
es o
f Iro
nIr
on is
gen
eral
ly d
ivid
ed in
to tw
o m
ain
cate
gori
es: 1
) so
lub
le o
r fe
rrou
s an
d 2)
in
solu
ble
or
ferr
ic ir
on. S
olub
le ir
on, o
r “c
lear
w
ater
” ir
on, i
s th
e ty
pe o
f iro
n fo
und
in o
ur
grou
ndw
ater
and
oxi
dize
s to
inso
lubl
e or
red
ir
on in
the
pres
ence
of o
xyge
n ei
ther
in th
e w
ell
or in
you
r ho
me.
Thi
s ty
pe o
f iro
n is
iden
tifie
d
afte
r yo
u’ve
pou
red
a gl
ass
of c
old
clea
r w
ater
. If
allo
wed
to s
tand
in th
e pr
esen
ce o
f air,
red
dish
br
own
part
icle
s w
ill a
ppea
r in
the
glas
s an
d
even
tual
ly s
ettl
e to
the
bott
om.
Wh
en in
solu
ble
iron
, or
“red
wat
er”
iron
is
pou
red
into
a g
lass
, it
app
ears
rus
ty o
r h
as a
re
d o
r ye
llow
col
or. I
nsol
uble
iron
can
cre
ate
seri
ous
tast
e an
d a
pp
eara
nce
pro
ble
ms
for
the
wat
er u
ser.
Iron
, wh
ich
com
bin
es w
ith
diff
eren
t na
tura
lly-
occu
rrin
g or
gani
c ac
ids
or t
anni
ns, m
ay a
lso
exis
t as
an
org
anic
com
ple
x. A
com
bin
atio
n of
aci
d a
nd ir
on,
or o
rgan
ic i
ron
, can
be
foun
d a
nyw
her
e; h
owev
er, i
t is
mor
e co
mm
on in
sh
allo
w w
ells
and
sur
face
wat
er.
Alt
hou
gh t
his
kin
d o
f iro
n ca
n b
e co
lorl
ess,
it is
us
ually
yel
low
or
bro
wn.
Fina
lly, w
hen
iron
exi
sts
alon
g w
ith
cer
tain
kin
ds
of b
acte
ria,
pro
ble
ms
can
bec
ome
even
wor
se. T
he
bac
teri
a co
nsum
e ir
on t
o su
rviv
e an
d le
ave
a re
dd
ish
b
row
n or
yel
low
slim
e th
at c
an c
log
plu
mb
ing
and
ca
use
an o
ffen
sive
od
or. Y
ou m
ay n
otic
e th
is s
lime
or
slud
ge in
you
r to
ilet
tank
wh
en y
ou r
emov
e th
e lid
. Fo
r m
ore
info
rmat
ion
on ir
on b
acte
ria,
find
th
e D
NR
p
ublic
atio
n, Ir
on B
acte
ria
Pro
ble
ms
in W
ells
on
the
inte
rnet
at
dnr.w
i.gov
/org
/wat
er/d
wg/
feba
ct.h
tm. O
nce
you
det
erm
ine
wh
eth
er y
ou h
ave
“cle
ar w
ater
,” “
red
w
ater
,” “
orga
nic”
or
“bac
teri
al”
iron
in y
our
wat
er,
you
can
take
ste
ps
to c
orre
ct t
he
pro
ble
m. K
eep
in
min
d t
hat
no
one
trea
tmen
t m
eth
od w
ill w
ork
for
ever
y ty
pe
of ir
on p
rob
lem
.
Test
You
r W
ater
Bef
ore
you
atte
mp
t to
rem
ove
anyt
hin
g th
at a
pp
ears
to
be
iron
-rel
ated
, it
is im
por
tant
to
hav
e yo
ur w
ater
te
sted
. A c
omp
lete
wat
er t
est
to d
eter
min
e th
e ex
tent
of y
our
iron
pro
ble
m a
nd p
ossi
ble
tre
atm
ent
solu
tion
s sh
ould
incl
ude
test
s fo
r ir
on c
once
ntra
tion
, ir
on b
acte
ria,
pH
, alk
alin
ity,
and
har
dne
ss. C
hec
k th
e b
usin
ess
pag
es o
f th
e p
hon
e b
ook
und
er
“Lab
orat
orie
s-Te
stin
g” t
o fin
d a
wat
er t
esti
ng la
b o
r ca
ll a
licen
sed
pro
fess
iona
l for
ass
ista
nce.
Cer
tifie
d
lab
orat
orie
s ca
n al
so b
e fo
und
at
dnr.w
i.gov
/org
/es/
scie
nce/
lc/P
W/L
ablis
ts.h
tm.
If yo
u re
ceiv
e yo
ur w
ater
from
a p
ublic
wat
er s
yste
m
and
exp
erie
nce
red
wat
er p
rob
lem
s, it
is im
por
tant
to
con
tact
a u
tilit
y of
ficia
l to
det
erm
ine
wh
eth
er t
he
red
wat
er is
from
th
e p
ublic
sys
tem
or
your
hom
e’s
plu
mb
ing
or p
ipin
g.
Wel
l Con
stru
ctio
n/R
econ
stru
ctio
nH
igh
iron
leve
ls m
ay b
e av
oid
ed in
som
e ca
ses
by
chan
ging
th
e sc
reen
or
casi
ng d
epth
of t
he
wel
l as
long
as
the
min
imum
cas
ing
dep
th r
equi
rem
ents
ar
e st
ill m
et. T
alki
ng t
o yo
ur n
eigh
bor
s ab
out
thei
r w
ell d
epth
s an
d ir
on le
vels
will
giv
e yo
u so
me
idea
of
wh
at w
ell d
epth
wou
ld p
ump
th
e lo
wes
t am
ount
of
iron
. It
is a
lso
hel
pfu
l to
talk
to
a w
ell d
rille
r or
p
ump
inst
alle
r ab
out
loca
l con
dit
ions
and
th
e co
st
of d
rilli
ng a
new
wel
l in
your
are
a. T
he
cost
of w
ell
wor
k sh
ould
be
com
par
ed t
o th
e lo
ng t
erm
(p
erh
aps
twen
ty y
ears
) co
st o
f tre
atin
g th
e w
ater
for
any
iron
re
late
d p
rob
lem
s.
Tre
atm
ent
Tab
le 1
list
s tr
eatm
ent
cons
ider
atio
ns fo
r th
e va
riou
s fo
rms
of ir
on. F
or a
dd
itio
nal
info
rmat
ion
on w
ater
tre
atm
ent
syst
ems,
co
ntac
t yo
ur C
ount
y Ex
tens
ion
Offi
ce o
r Ex
tens
ion
Pub
licat
ions
, Rm
. 245
, 30
N.
Mur
ray
Stre
et, M
adis
on, W
I 537
15 a
nd a
sk
for
pub
licat
ion
G35
58-5
, Ch
oosi
ng a
Wat
er
Tre
atm
ent
Dev
ice
or y
ou c
ould
con
tact
a
licen
sed
plu
mb
er. A
list
of i
ron
trea
tmen
t d
evic
es a
pp
rove
d fo
r us
e in
Wis
cons
in c
an
be
foun
d a
t co
mm
erce
.wi.g
ov/p
hp/s
b-pp
alop
p/co
ntam
_alp
ha_l
ist.p
hp.
Wh
en c
hoo
sing
a w
ater
tre
atm
ent
met
hod
or
dev
ice,
mak
e su
re y
ou h
ave
answ
ers
to t
he
follo
win
g fiv
e q
uest
ions
:
1.
Wh
at fo
rm o
f iro
n d
o I h
ave
in m
y w
ater
sy
stem
?
2.
Will
th
e w
ater
tre
atm
ent
unit
rem
ove
the
tota
l iro
n co
ncen
trat
ion
(det
erm
ined
by
the
wat
er t
est)
in m
y w
ater
sup
ply
? (T
otal
ir
on r
efer
s to
bot
h s
olub
le a
nd in
solu
ble
ir
on c
omb
ined
).
3.
Will
th
e tr
eatm
ent
unit
tre
at t
he
wat
er
at t
he
flow
rat
e re
qui
red
for
my
wat
er
syst
em?
4.
Con
sid
erin
g th
e re
sult
s of
my
wat
er t
est,
w
ill t
his
met
hod
eff
ecti
vely
rem
ove
iron
? (F
or e
xam
ple
, pH
may
nee
d t
o b
e ad
just
ed
bef
ore
beg
inni
ng a
par
ticu
lar
trea
tmen
t).
5.
Wou
ld w
ell c
onst
ruct
ion
or r
econ
stru
ctio
n b
e m
ore
cost
eff
ecti
ve t
han
a lo
ng t
erm
ir
on r
emov
al t
reat
men
t p
roce
ss?
Iron
Tre
atm
ent T
erm
s
Aera
tion:
Intro
duci
ng o
xyge
n to
the
wat
er s
ourc
e to
co
nver
t sol
uble
iron
to it
s in
solu
ble
form
.
Filtr
atio
n: M
edia
use
d to
ent
rap
and
scre
en o
ut o
xidi
zed
parti
cles
of i
ron.
Usu
ally
requ
ires
back
was
hing
to re
mov
e ac
cum
ulat
ed ir
on.
Wat
er S
ofte
ning
: Rem
oval
of s
olub
le ir
on b
y io
n ex
chan
ge.
Man
gane
se G
reen
sand
: An
ion
exch
ange
san
d m
ater
ial
whi
ch is
cap
able
of r
emov
ing
iron.
Ads
orbs
dis
solv
ed ir
on
and
requ
ires
chem
ical
rege
nera
tion.
Cata
lytic
Filt
ratio
n “B
IRM
”: A
gra
nula
r filte
r med
ium
that
en
hanc
es th
e re
actio
n be
twee
n ox
ygen
and
iron
and
then
fil
ters
the
inso
lubl
e iro
n.
Ozo
natio
n: A
spe
cial
ized
form
of a
erat
ion
usin
g oz
one
to
conv
ert s
olub
le ir
on to
inso
lubl
e iro
n.
Ion
Exch
ange
: Sub
stitu
ting
an a
ccep
tabl
e io
n (s
uch
as
sodi
um) f
or s
olub
le ir
on.
Sequ
este
ring
: Add
ing
chem
ical
age
nts
to w
ater
to k
eep
met
als
like
iron
in s
olut
ion
to p
reve
nt c
hara
cter
istic
red
stai
ns.
Chlo
rina
tion:
Che
mic
al o
xidi
zer u
sed
to c
onve
rt s
olub
le
iron
to a
n in
solu
ble,
filte
rabl
e fo
rm.

7/02
LP
NORT
HEAS
T
NORT
HERN
SOUT
HEAS
T
WES
T CEN
TRAL
SOUT
H CE
NTRA
LReg
ion
Offi
ces
Gre
en B
ay
Spo
oner
Rhi
nela
nder
Milw
auke
e
Eau
Cla
ire
Mad
ison
Bact
erio
logic
al Co
nta
min
atio
n
of D
rinkin
g W
ate
r W
ells
Wisc
onsin
Dep
artme
nt of
Natur
al Re
sourc
es, B
ureau
of D
rinkin
g Wate
r and
Grou
ndwa
ter
PUB-D
G-003
-2009
Regi
on O
ffi ce
s
North
ern
Regio
n81
0 W.
Map
le St
reet
Spoo
ner, W
I 548
01(7
15) 6
35-21
01OR 10
7 Su
tliff A
venu
eRh
inelan
der, W
I 545
01(7
15) 3
65-89
00
West
Cent
ral R
egion
1300
Wes
t Clai
remon
tP.O
.Box
400
1Ea
u Clai
re, W
I 547
02-40
01(7
15) 8
39-37
00
Prin
ted
on R
ecyc
led
Pape
r
This
bro
chur
e w
as re
vise
d by
the
Wis
cons
in D
epar
tmen
t of
Nat
ural
Res
ourc
es w
ith a
ssis
tanc
e fro
m th
e Ed
ucat
ion
Subc
omm
ittee
of t
he G
roun
dwat
er C
oord
inat
ing
Cou
ncil.
The
Wis
cons
in D
epar
tmen
t of N
atur
al R
esou
rces
pro
vide
s eq
ual o
ppor
tuni
ty in
its
empl
oym
ent,
prog
ram
s, s
ervi
ces
and
func
tions
und
er a
n A
ffi rm
ativ
e A
ctio
n Pl
an. I
f you
hav
e an
y qu
estio
ns, p
leas
e w
rite
to E
qual
Opp
ortu
nity
Offi
ce,
Dep
artm
ent o
f the
Inte
rior,
Was
hing
ton,
D.C
. 202
40
This
pub
licat
ion
is a
vaila
ble
in a
ltern
ativ
e fo
rmat
(la
rge
prin
t, Br
aille
, aud
iota
pe, e
tc) u
pon
requ
est.
Plea
se c
all (
608)
266
-082
1 fo
r mor
e in
form
atio
n.
North
east
Regio
n29
84 S
hawa
no Av
enue
Gr
een B
ay, W
I 543
13-67
27(9
20) 6
62-51
00So
uthe
ast R
egion
2300
N. D
r. Mart
in Lu
ther K
ing Jr
. Driv
eMi
lwau
kee,
WI 5
3212
(414
) 263
-8500
Sout
h Ce
ntra
l Reg
ion39
11 Fi
sh H
atche
ry Ro
adFit
chbu
rg, W
I 537
11(6
08) 2
75-32
66
Cent
ral O
ffi ce
101
S. W
ebste
r St.,
P.O.
Box
792
1Ma
dison
, WI 5
3707
-7921
(608
) 266
-0821
Mos
t priv
ate
wel
ls pr
ovid
e a
safe
and
unc
onta
min
ated
sou
rce
of
drin
king
wat
er. S
ome
wel
ls do
how
ever
bec
ome
cont
amin
ated
with
ba
cter
ia. F
ortu
nate
ly c
ertifi
ed
labs
can
eas
ily te
st w
ater
for c
olifo
rm
bact
eria
, a c
omm
on in
dica
tor o
f bac
teria
l con
tam
inat
ion
in w
ells.
To
ensu
re y
our w
ell i
s no
t con
tam
inat
ed, i
t is
a go
od id
ea to
regu
larly
test
your
wat
er. Y
ou s
houl
d ha
ve y
our w
ater
teste
d at
leas
t ann
ually
and
w
hene
ver y
ou n
otic
e a
chan
ge in
the
taste
, odo
r or c
olor
of t
he w
ater
.
Mos
t bac
teria
ent
erin
g th
e gr
ound
sur
face
alo
ng w
ith ra
inw
ater
or
sno
wm
elt a
re fi
ltere
d ou
t as
the
wat
er s
eeps
thro
ugh
the
soil.
Se
vera
l stra
ins
of b
acte
ria c
an s
urvi
ve a
long
tim
e an
d fi n
d th
eir
way
into
the
grou
ndw
ater
by
mov
ing
thro
ugh
coar
se s
oils,
sha
llow
fra
ctur
ed b
edro
ck, q
uarr
ies,
sin
khol
es, i
nade
quat
ely
grou
ted
wel
ls or
cra
cks
in th
e w
ell c
asin
g. In
sect
s or
sm
all r
oden
ts ca
n al
so c
arry
bac
teria
into
wel
ls w
ith in
adeq
uate
cap
s or
sea
ls.
Col
iform
bac
teria
are
nat
ural
ly o
ccur
ring
in s
oil a
nd a
re
foun
d on
veg
etat
ion
and
in s
urfa
ce w
ater
s. W
ater
from
a w
ell
prop
erly
loca
ted
and
cons
truct
ed s
houl
d be
free
of c
olifo
rm
bact
eria
. Whi
le c
olifo
rm b
acte
ria d
o no
t cau
se il
lnes
s in
hea
lthy
indi
vidu
als,
thei
r pre
senc
e in
wel
l wat
er in
dica
tes
the
wat
er
syste
m is
at r
isk
to m
ore
serio
us fo
rms
of c
onta
min
atio
n.
The
pres
ence
of a
noth
er ty
pe o
f bac
teria
, Esc
heric
hia
coli
(E. c
oli),
in
dica
tes
feca
l con
tam
inat
ion
of th
e w
ater
. Fec
al c
olifo
rm b
acte
ria in
habi
t th
e in
testi
nes
of w
arm
-blo
oded
ani
mal
s an
d ar
e ty
pica
lly fo
und
in th
eir
feca
l mat
ter.
Path
ogen
ic b
acte
ria, v
iruse
s an
d pa
rasi
tes
ofte
n pr
esen
t in
feca
l mat
ter c
an c
ause
illn
esse
s, s
ome
havi
ng fl
u-lik
e sy
mpt
oms
such
as
nau
sea,
vom
iting
, fev
er a
nd d
iarr
hea.
In s
ome
case
s, s
ympt
oms
can
be m
ore
seve
re. M
any
labs
now
rout
inel
y te
st fo
r E. c
oli b
acte
ria a
long
w
ith to
tal c
olifo
rm. T
he p
rese
nce
of E
. col
i bac
teria
in w
ater
repr
esen
ts a
serio
us p
robl
em. I
f you
r wat
er s
ampl
e is
pos
itive
for E
. col
i, it
is im
porta
nt
you
stop
cons
umin
g yo
ur w
ater
and
dea
l with
this
pro
blem
imm
edia
tely.
Bact
eria
are
onl
y on
e of
sev
eral
con
tam
inan
ts th
at c
an a
ffect
you
r wel
l w
ater
. It i
s go
od n
ews
if th
e re
sults
of b
oth
the
tota
l col
iform
and
E. c
oli
bact
eria
tests
are
neg
ativ
e, b
ecau
se th
is m
eans
ther
e ar
e no
bac
teria
l co
ntam
inan
ts in
the
wat
er. H
owev
er, t
hese
neg
ativ
e re
sults
do
not
nece
ssar
ily m
ean
your
wat
er is
free
of c
hem
ical
con
tam
inat
ion,
like
nitr
ate
or p
estic
ides
. For
info
rmat
ion
rega
rdin
g ch
emic
al c
onta
min
atio
n of
you
r w
ell w
ater
you
can
refe
r to
othe
r ava
ilabl
e de
partm
ent b
roch
ures
.
Vo
lum
e of
Ble
ach
A
ppro
xim
ate
To
Wat
er
Chl
orin
e
Mix
Rat
io
Con
cent
ratio
n
3 /
4 qu
art b
leac
h pe
r
100
gallo
ns w
ater
10
0 pp
m
11
/2 q
uarts
ble
ach
per
10
0 ga
llons
wat
er
200
ppm
2
quar
ts bl
each
per
10
0 ga
llons
wat
er
300
ppm
3. U
sing
wat
er fr
om a
kno
wn
safe
and
un
cont
amin
ated
sou
rce,
add
a v
olum
e of
w
ater
– a
t lea
st as
gre
at a
s th
e vo
lum
e of
wat
er
stand
ing
in th
e w
ell –
into
cle
an n
ew g
arba
ge
cans
or o
ther
com
para
ble
cont
aine
rs.
4. U
sing
the
tabl
e be
low
cal
cula
te th
e vo
lum
e of
bl
each
(sod
ium
hyp
ochl
orite
) nec
essa
ry to
pro
duce
th
e de
sire
d ch
lorin
e co
ncen
tratio
n to
dis
infe
ct th
e w
ell a
nd w
ater
sys
tem
. Gen
eral
ly, fo
r mos
t wat
er
syste
ms,
a c
once
ntra
tion
of a
nyw
here
from
100
to
300
parts
per
mill
ion
(ppm
) will
be
adeq
uate
to
disi
nfec
t the
wel
l and
the
plum
bing
sys
tem
. (M
ost
hous
ehol
d bl
each
es c
onta
in b
etw
een
5% a
nd 6
%
avai
labl
e ch
lorin
e.) T
he b
leac
h m
ust b
e fre
e of
ad
ditiv
es li
ke ‘f
resh
sce
nt,’
alga
ecid
es o
r thi
cken
ing
agen
ts th
at c
an c
hem
ical
ly c
onta
min
ate
your
wel
l.
Note
: For
sev
ere
bact
eria
l inf
esta
tions
per
haps
in
volv
ing
a bi
ofi lm
, lik
e an
iron
or s
ulfa
te re
duci
ng
bact
eria
l slim
e, m
ore
aggr
essi
ve a
ppro
ache
s m
ay b
e ne
cess
ary.
The
se a
ppro
ache
s in
clud
e a
mor
e co
ncen
trate
d ch
lorin
e so
lutio
n, m
easu
res
to c
ontro
l the
pH
of t
he s
olut
ion,
or t
he a
dditi
on
of s
alt (
NaC
l) or
oth
er d
epar
tmen
t app
rove
d pr
oduc
ts. S
omet
imes
it is
also
nec
essa
ry to
scr
ub
the
insi
de o
f the
wel
l with
a c
him
ney
brus
h to
hel
p re
mov
e sli
me
or m
iner
al b
uild
up th
at c
an h
arbo
r th
e ba
cter
ia. C
onta
ct a
Lic
ense
d W
ell D
rille
r or
Pum
p In
stalle
r for
thes
e m
ore
diffi
cult
situ
atio
ns.
5. U
sing
this
wat
er a
nd th
e ca
lcul
ated
vol
ume
of
blea
ch, p
repa
re a
chl
orin
e so
lutio
n th
at e
qual
s or
exc
eeds
the
volu
me
of w
ater
sta
ndin
g w
ithin
th
e w
ell.
Add
the
blea
ch to
the
wat
er-fi
lled
cont
aine
rs a
t a s
ite u
pwin
d an
d cl
ose
to th
e w
ell
so y
ou a
re le
ss li
kely
to b
reat
he th
e fu
mes
and
so
you
won
’t ha
ve to
car
ry th
e so
lutio
n to
o fa
r.6.
Rem
ove
your
wel
l cap
or s
eal a
nd a
dd a
bout
a
half-
cup
to a
cup
of D
epar
tmen
t-app
rove
d ch
lorin
e gr
anul
es o
r tab
lets
(cal
cium
hyp
ochl
orite
) dow
n th
e w
ell.
(The
se p
rodu
cts
mus
t also
be
free
of
addi
tives
.) Th
e gr
anul
es w
ill d
isin
fect
the
colu
mn
of
wat
er s
tand
ing
with
in th
e w
ell a
nd p
reve
nt b
acte
ria
from
bei
ng fo
rced
out
into
the
aqui
fer w
hen
you
add
the
larg
e vo
lum
e of
liqu
id c
hlor
ine
solu
tion.
(C
aution: D
o no
t use
gra
nula
r or t
able
t chl
orin
e pr
oduc
ts in
the
arse
nic
prob
lem
are
as o
f no
rthea
stern
Wis
cons
in.)
7. T
urn
off t
he e
lect
rical
pow
er a
nd, w
hile
wea
ring
eye
prot
ectio
n, ru
bber
glo
ves
and
rubb
er-so
led
shoe
s, re
mov
e th
e w
ell c
ap. M
ake
sure
you
ex
amin
e pu
mp
wire
s fo
r cha
fed
insu
latio
n or
m
issi
ng w
ire n
uts.
Hav
e an
y ne
cess
ary
repa
irs
mad
e to
the
elec
trica
l sys
tem
.8.
Pou
r or s
ipho
n th
e ch
lorin
e so
lutio
n do
wn
the
wel
l, as
rapi
dly
as p
ossi
ble,
in o
ne c
ontin
uous
pou
r.9.
Con
nect
a n
ew c
lean
hos
e to
a n
earb
y ho
se b
ib
(fauc
et) a
nd tu
rn th
e el
ectri
cal p
ower
bac
k on
. Tu
rn th
e w
ater
on
and
reci
rcul
ate
the
chlo
rinat
ed
solu
tion
thro
ugh
the
hose
and
bac
k to
the
wel
l m
akin
g su
re y
ou ri
nse
the
entir
e in
side
sur
face
of
the
casi
ng, a
ll th
e w
ay d
own
to th
e w
ater
tabl
e.
10. A
gain
turn
off
the
elec
trica
l pow
er a
nd d
rain
bot
h th
e pr
essu
re ta
nk a
nd w
ater
hea
ter.
(Doi
ng th
is w
ill
subs
eque
ntly
allo
w th
e w
ater
from
thes
e ta
nks
to
be to
tally
repl
aced
by
the
chlo
rinat
ed s
olut
ion.
)11
. Tur
n th
e el
ectri
cal p
ower
to th
e pu
mp
back
on
and
let t
he w
ell w
ater
refi l
l the
pr
essu
re ta
nk a
nd w
ater
hea
ter.
12. O
pen
ever
y on
e of
you
r wat
er fa
ucet
s th
roug
hout
yo
ur p
lum
bing
sys
tem
, bot
h in
side
and
out
side
, unt
il yo
u ca
n sm
ell t
he c
hlor
ine
solu
tion
at e
ach
one.
N
ote
: For
car
tridg
e w
ater
fi lte
rs, r
epla
ce th
e ca
rtrid
ge a
fter y
ou h
ave
com
plet
ed th
e ch
lorin
atio
n pr
oces
s an
d co
mpl
etel
y fl u
shed
the
syste
m. T
o di
sinf
ect y
our w
ater
sof
tene
r, af
ter c
ompl
etio
n of
the
chlo
rinat
ion
proc
edur
e, a
dd a
bout
1/4
to
1 /2
cup
of b
leac
h to
the
fi ll t
ube
in th
e br
ine
tank
an
d se
t the
sof
tene
r to
man
ually
rech
arge
.13
. Tur
n al
l wat
er ta
ps o
ff co
mpl
etel
y an
d al
low
the
chlo
rine
solu
tion
to re
mai
n in
you
r wel
l and
plu
mbi
ng
syste
m a
t lea
st ov
erni
ght,
but p
refe
rabl
y fo
r 24
hour
s.14
. Flu
sh th
e ch
lorin
e so
lutio
n fro
m th
e en
tire
wat
er
syste
m b
y us
ing
a ho
se c
onne
cted
to o
ne o
f you
r ou
tside
fauc
ets.
Run
the
solu
tion
to a
loca
tion
away
from
you
r law
n an
d la
ndsc
apin
g be
caus
e it
can
dam
age
them
. Also
mak
e su
re th
e ch
lorin
e
solu
tion
does
not
get
into
a s
tream
, riv
er o
r lak
e.
Chl
orin
e, e
ven
in s
mal
l dos
es, c
an k
ill a
quat
ic li
fe.
Do
not r
un th
e ch
lorin
ated
sol
utio
n in
to y
our s
eptic
sy
stem
bec
ause
it m
ay k
ill th
e ba
cter
ia th
at b
iolo
gica
lly
brea
kdow
n th
e w
aste
. The
ext
ra v
olum
e of
the
solu
tion
can
also
hyd
raul
ical
ly o
verlo
ad th
e sy
stem
. Th
e fl u
shin
g pr
oces
s ca
n ta
ke a
long
tim
e. K
eep
runn
ing
the
wat
er u
ntil
you
can
no lo
nger
not
ice
a sm
ell o
f chl
orin
e fro
m a
ny o
f you
r fau
cets
or ta
ps.
15. A
fter t
he c
hlor
ine
solu
tion
has
been
com
plet
ely
fl ush
ed
from
the
syste
m, w
ait a
bout
a w
eek
and
resa
mpl
e yo
ur
wat
er to
mak
e su
re it
is b
acte
riolo
gica
lly s
afe
to d
rink.
Some
Gen
eral
DO’s
and D
ON’T
sD
O c
heck
chl
orin
e pr
oduc
ts be
fore
you
use
them
. C
hlor
ine
conc
entra
tions
var
y fro
m m
anuf
actu
rer t
o m
anuf
actu
rer a
nd d
ecre
ase
in c
once
ntra
tion
with
ag
e. S
ome
prod
ucts
cont
ain
inap
prop
riate
add
itive
s.
It is
also
a g
ood
idea
to c
onfi r
m th
e co
ncen
tratio
n of
th
e ch
lorin
e in
the
wel
l usi
ng a
test
kit.
This
pro
cess
w
ill a
ssur
e th
at y
ou a
re a
ddin
g en
ough
, but
not
too
muc
h, b
leac
h so
lutio
n in
to th
e w
ell.
You
may
wis
h to
co
nfi rm
the
pH o
f the
chl
orin
e so
lutio
n in
you
r wel
l w
ith te
st pa
per.
The
pH s
houl
d no
t exc
eed
abou
t 7.5
.
DO
con
tact
a L
icen
sed
Wel
l Dril
ler o
r Pum
p In
stalle
r fo
r gui
danc
e if
you
do n
ot fe
el c
onfi d
ent y
ou c
an
safe
ly u
nder
take
this
pro
cedu
re o
r for
a s
ituat
ion
invo
lvin
g a
mor
e di
ffi cu
lt ca
se o
f bac
teria
l inf
esta
tion
or/o
r slim
e bu
ildup
. The
pro
fess
iona
l con
tract
or
may
wis
h to
opt
imiz
e th
e ch
lorin
e so
lutio
n w
ith p
H
cont
rol o
r by
addi
ng s
alt i
n or
der t
o ob
tain
pea
k ge
rmic
idal
act
ion
from
the
chlo
rinat
ion
proc
ess.
DO
sam
ple
your
wel
l wat
er a
bout
a w
eek
follo
win
g th
e ch
lorin
atio
n pr
oced
ure
and
have
it te
sted
for
colif
orm
bac
teria
at a
cer
tifi e
d la
b. If
the
sam
ple
is “
safe
”, s
ampl
e yo
ur w
ater
yea
rly th
erea
fter,
durin
g ea
rly s
prin
g or
late
sum
mer
/ear
ly fa
ll.
DO
NO
T ch
lorin
ate
your
wel
l and
wat
er s
yste
m a
s pa
rt of
regu
lar m
aint
enan
ce p
roto
col u
nles
s yo
u ha
ve
recu
rrin
g or
per
siste
nt p
robl
ems.
Doi
ng s
o ca
n, in
som
e ca
ses,
plu
g up
the
pum
p w
ith s
edim
ent o
r dam
age
the
pum
p or
com
pone
nts
of th
e w
ater
sys
tem
.
DO
NO
T us
e m
ore
blea
ch th
an n
eces
sary
for t
he
disi
nfec
tion
proc
edur
e. D
oing
so
can
rais
e th
e pH
of
the
solu
tion
to a
poi
nt w
here
the
effe
ctiv
enes
s of
th
e ch
lorin
atio
n pr
oces
s is
sig
nifi c
antly
redu
ced.
DO
NO
T us
e dr
y ca
lciu
m h
ypoc
hlor
ite p
rodu
cts
(gra
nule
s or
pel
lets)
with
in th
e ar
seni
c co
ntam
inat
ion
area
s of
no
rthea
stern
Wis
cons
in. W
hen
usin
g a
liqui
d bl
each
/w
ater
dis
infe
ctio
n so
lutio
n in
thes
e ar
seni
c pr
oble
m
area
s, d
o n
ot
use
a ch
lorin
e co
ncen
tratio
n gr
eate
r th
an 1
00 p
pm o
r allo
w th
e so
lutio
n to
rem
ain
in th
e w
ell f
or m
ore
than
30
min
utes
. Doi
ng s
o ca
n tri
gger
ge
oche
mic
al re
actio
ns w
ithin
the
bedr
ock
aqui
fers
th
at c
an re
leas
e ar
seni
c in
to y
our w
ell w
ater
.

Poss
ible
sou
rces
of w
ell c
onta
min
atio
n
‘Volu
me
fact
ors
’ -
base
d o
n w
ell d
iam
eter
:
• 2
-inch
dia
met
er
= 3
/4 q
uart
wat
er fo
r eac
h fo
ot o
f wat
er s
tand
ing
in th
e w
ell.
• 4
-inch
dia
met
er
= 1
/2 g
allo
n w
ater
for e
ach
foot
of w
ater
sta
ndin
g in
the
wel
l. •
5-in
ch d
iam
eter
=
1 g
allo
n w
ater
for e
ach
foot
of w
ater
sta
ndin
g in
the
wel
l.•
6-in
ch d
iam
eter
=
11 /
2 ga
llons
wat
er fo
r eac
h fo
ot o
f wat
er s
tand
ing
in th
e w
ell.
• 8
-inch
dia
met
er
= 2
1 /2
gallo
ns w
ater
for e
ach
foot
of w
ater
sta
ndin
g in
the
wel
l.•
10-in
ch d
iam
eter
=
4 g
allo
ns w
ater
for e
ach
foot
of w
ater
sta
ndin
g in
the
wel
l.
How
can
my w
ell be
come
cont
amina
ted?
Your
wat
er s
uppl
y m
ay b
ecom
e ba
cter
iolo
gica
lly
cont
amin
ated
bec
ause
of o
ne o
r mor
e of
the
follo
win
g re
ason
s:
1. T
here
is a
sou
rce
of c
onta
min
atio
n to
o cl
ose
to
the
wel
l and
the
casi
ng d
oes
not e
xten
d de
ep
enou
gh to
ass
ure
bact
eria
hav
e be
en a
dequ
atel
y fi l
tere
d ou
t of r
echa
rge
wat
er to
the
aqui
fer.
2 Th
e w
ell m
ay h
ave
been
con
struc
ted
usin
g po
or s
anita
ry
prac
tices
. Wel
ls ca
n be
com
e co
ntam
inat
ed d
urin
g th
e dr
illin
g pr
oces
s by
the
impr
oper
use
of c
onta
min
ated
dr
ill to
ols,
cas
ing
pipe
or d
rillin
g w
ater
. The
insta
llatio
n of
the
pum
p, it
s di
scha
rge
pipi
ng, o
r any
oth
er p
ump
or p
ress
ure
syste
m c
ompo
nent
can
also
be
the
caus
e of
co
ntam
inat
ion
if th
ey a
re n
ot a
ssem
bled
and
insta
lled
in a
san
itary
man
ner p
rior t
o th
eir u
se. T
he S
tate
Priv
ate
Wel
l Cod
e (N
R 81
2) re
quire
s di
sinf
ectio
n of
any
new
w
ell,
the
pum
p, p
ump
disc
harg
e pi
ping
and
the
pres
sure
ta
nk, p
rior t
o be
ing
plac
ed in
ser
vice
.3.
Con
tam
inat
ed s
urfa
ce o
r nea
r-sur
face
wat
er c
an e
nter
a
subs
tand
ard
or im
prop
erly
con
struc
ted
wel
l in
any
of
the
follo
win
g w
ays:
• D
ug w
ells
lined
with
poo
rly s
eale
d br
ick,
sto
ne o
r til
e cu
rbin
g, o
r hav
ing
unse
aled
cov
ers,
can
allo
w
unfi l
tere
d w
ater
to g
et in
to th
e w
ell.*
• C
asin
g im
prop
erly
sea
led
thro
ugh
a sh
allo
w
unco
nsol
idat
ed o
r bed
rock
geo
logi
cal f
orm
atio
n m
ay
allo
w c
onta
min
ated
wat
er to
mig
rate
dow
nwar
d in
to
the
aqui
fer.*
• Su
rface
wat
er c
an e
nter
the
top
of th
e w
ell c
asin
g if
the
casi
ng d
oes
not e
xten
d fa
r eno
ugh
abov
e th
e gr
ound
sur
face
.•
The
wel
l cas
ing
may
term
inat
e in
a b
asem
ent,
pit o
r al
cove
sub
ject
to fl
oodi
ng o
r see
page
of w
ater
.•
An
old
wel
l cas
ing
may
bec
ome
badl
y co
rrod
ed
and
allo
w w
ater
to s
eep
into
the
wel
l thr
ough
hol
es
in th
e ca
sing
.*•
A w
ell w
ith a
non
com
plyi
ng c
asin
g de
pth
setti
ng
can
allo
w c
onta
min
ated
nea
r-sur
face
wat
er to
ent
er
the
wel
l.*•
A w
ell h
avin
g ol
d, s
ubsta
ndar
d ‘s
tove
-pip
e’ c
asin
g ca
n al
low
nea
r sur
face
wat
er to
ent
er th
e w
ell.*
*
Note
: A
wel
l with
the
defe
cts
indi
cate
d w
ith a
n as
teris
k ca
nnot
be
easi
ly re
paire
d an
d ty
pica
lly n
eed
to b
e re
plac
ed w
ith a
new
cod
e-co
mpl
ying
wel
l.4
The
aqui
fer m
ay b
e a
high
ly fr
actu
red
bedr
ock
form
atio
n or
a c
oars
e gr
avel
dep
osit
that
doe
s no
t ade
quat
ely
fi lte
r rec
harg
e w
ater
per
cola
ting
dow
n fro
m th
e gr
ound
sur
face
into
the
aqui
fer.
5. T
he w
ell c
ap m
ay b
e lo
ose
or p
oorly
insta
lled
allo
win
g in
sect
s, s
pide
rs o
r sm
all a
nim
als
to e
nter
the
wel
l.6
Ther
e m
ay b
e a
‘cro
ss-c
onne
ctio
n’ b
etw
een
the
wel
l or
plum
bing
sys
tem
and
the
sept
ic o
r sew
erag
e sy
stem
.
When
shou
ld I t
est m
y well
for
bacte
riolog
ical c
onta
mina
tion?
The
Stat
e W
ell C
ode
requ
ires
all n
ew w
ells
to b
e te
sted
for
bact
erio
logi
cal q
ualit
y. W
ells
mus
t also
be
teste
d fo
llow
ing
the
insta
llatio
n or
rein
stalla
tion
of a
pum
p, o
r any
time
a w
ell i
s en
tere
d fo
r rep
airin
g or
rein
stalli
ng e
quip
men
t w
ithin
the
wel
l. Ex
istin
g w
ells
shou
ld b
e te
sted
annu
ally,
af
ter m
odify
ing
the
wel
l in
any
way
, or w
hene
ver t
here
is
any
chan
ge in
the
taste
, odo
r or a
ppea
ranc
e of
the
wat
er.
The
best
times
of t
he y
ear t
o te
st yo
ur w
ell w
ater
are
whe
n it
is m
ost l
ikel
y to
be
unsa
fe. S
tatis
tical
ly th
ese
times
occ
ur
follo
win
g a
perio
d of
hea
vy s
now
mel
t in
early
spr
ing
or
durin
g th
e ho
t sta
gnan
t tim
e of
late
sum
mer
and
ear
ly fa
ll.
Wher
e can
I ob
tain
a wat
er-sa
mplin
g kit
for b
acter
iolog
ical t
estin
g?A
test
kit (
incl
udin
g sa
mpl
ing
instr
uctio
ns) m
ay b
e ob
tain
ed fr
om a
ny la
bora
tory
cer
tifi e
d to
test
wat
er fo
r ba
cter
iolo
gica
l con
tam
inat
ion.
For
priv
ate
wel
l ow
ners
, ce
rtifi e
d ba
cter
ia la
bs c
an b
e fo
und
onlin
e at
dnr.
wi.g
ov/
org
/wate
r/dw
g/w
ells
.htm
. Whe
n co
llect
ing
a w
ater
sam
ple
mak
e su
re y
ou c
aref
ully
fo
llow
all
instr
uctio
ns fo
r sam
plin
g an
d ha
ndlin
g.
If a
Wis
cons
in U
niqu
e W
ell N
umbe
r (W
UW
N) h
as b
een
assi
gned
to y
our w
ell,
you
may
cho
ose
to h
ave
a co
py o
f yo
ur te
st re
sults
sav
ed in
a p
erm
anen
t fi le
for y
our w
ell b
y w
ritin
g th
e W
UW
N o
n th
e la
b fo
rm a
nd c
heck
ing
the
box
“sen
d co
py o
f res
ults
to D
NR.
”
Resu
lts o
f wat
er q
ualit
y te
sts d
one
by th
e St
ate
Labo
rato
ry
of H
ygie
ne a
re a
utom
atic
ally
repo
rted
to D
NR
for fi
ling
and
ar
e en
tere
d in
to th
e de
partm
ent’s
wat
er s
ampl
e da
ta s
yste
m
if th
e W
UW
N is
incl
uded
on
the
sam
ple
colle
ctio
n fo
rm.
Your
WU
WN
may
be
foun
d on
a s
ticke
r tag
atta
ched
to
the
wat
er p
ipe
ente
ring
the
build
ing
from
the
wel
l, of
ten
near
the
sam
plin
g fa
ucet
. You
may
also
fi nd
a c
ompa
nion
sti
cker
on
the
mai
n el
ectri
cal f
use
or c
ircui
t bre
aker
box
.
What
do th
e tes
t res
ults t
ell m
e?Ba
cter
iolo
gica
l ana
lyse
s of
wat
er s
ampl
es a
re c
ompl
eted
to
dete
rmin
e th
e sa
fety
of t
he w
ater
for d
rinki
ng a
nd p
repa
ratio
n of
food
. If a
sam
ple
was
col
lect
ed a
ccor
ding
to d
irect
ions
in
clud
ed w
ith th
e ki
t and
the
lab
subs
eque
ntly
repo
rts th
e sa
mpl
e as
bac
terio
logi
cally
“sa
fe,”
then
“to
tal c
olifo
rm
bact
eria
” w
ere
not f
ound
in th
e w
ater
. You
can
then
be
reas
onab
ly s
ure
the
wat
er is
bac
terio
logi
cally
saf
e to
drin
k.
On
the
othe
r han
d, w
hen
the
lab
repo
rts th
e sa
mpl
e as
eith
er
bact
erio
logi
cally
“at
risk
” or
“un
safe
,” th
en to
tal c
olifo
rm
and/
or E
. col
i bac
teria
wer
e fo
und
in th
e sa
mpl
e an
d yo
u sh
ould
not
drin
k th
e w
ater
. Tot
al c
olifo
rm b
acte
ria a
re o
nly
an in
dica
tor b
acte
ria a
nd a
re n
ot, b
y th
emse
lves
, usu
ally
a
heal
th c
once
rn fo
r hea
lthy
indi
vidu
als.
But
thei
r pre
senc
e in
wel
l wat
er in
dica
tes
an in
crea
sed
risk
that
pat
hoge
nic
(dise
ase-
caus
ing)
bac
teria
are
also
pre
sent
in th
e w
ater
.
Wel
l wat
er re
porte
d by
the
lab
as b
eing
“at
risk
” or
“un
safe
” sh
ould
not
be
cons
umed
or u
sed
for p
repa
ratio
n of
food
un
less
it is
fi rs
t boi
led
for a
t lea
st on
e m
inut
e, a
t a ro
lling
bo
il. If
you
nee
d ad
ditio
nal h
elp
in in
terp
retin
g th
e re
sults
of
your
wat
er a
naly
sis, c
onta
ct y
our l
abor
ator
y.
(Not
e: B
oilin
g w
ater
for a
long
tim
e re
duce
s th
e vo
lum
e of
w
ater
and
can
incr
ease
the
conc
entra
tion
of a
ny n
itrat
e th
at
may
be
pres
ent i
n th
e w
ater
. Thi
s ca
n m
ake
the
wat
er m
ore
haza
rdou
s fo
r inf
ants.
)
What
shou
ld I d
o if m
y well
wat
er is
ba
cterio
logica
lly u
nsaf
e?1.
Firs
t res
ampl
e yo
ur w
ell.
Col
lect
ano
ther
wat
er s
ampl
e an
d ha
ve it
ana
lyze
d to
con
fi rm
you
r fi rs
t “at
risk
” or
“u
nsaf
e” re
sult.
Be
sure
to u
se th
e pr
oper
sam
plin
g pr
oced
ure
whe
n yo
u co
llect
the
sam
ple.
Thi
s w
ill h
elp
you
dete
rmin
e if
your
orig
inal
sam
ple
resu
lt co
uld
have
si
mpl
y be
en a
resu
lt of
an
impr
oper
sam
plin
g te
chni
que.
2. I
f the
sec
ond
sam
ple
resu
lt is
also
repo
rted
as b
eing
“a
t ris
k” o
r “un
safe
”, d
o not
cons
ume
the
wat
er u
nles
s yo
u bo
il it,
at a
rolli
ng b
oil,
for a
t lea
st 1
min
ute.
3. I
f you
fi nd
no
obvi
ous
sour
ces
of c
onta
min
atio
n of
you
r wel
l or w
ater
sys
tem
, you
sho
uld
have
yo
ur e
ntire
sys
tem
insp
ecte
d an
d di
sinf
ecte
d by
a
repu
tabl
e Lic
ense
d W
ell D
rille
r or P
ump
Insta
ller.
You
can
disi
nfec
t you
r wel
l you
rsel
f if y
ou fo
llow
the
prec
autio
ns a
nd d
irect
ions
at t
he e
nd o
f thi
s br
ochu
re.
4. I
f you
r wel
l doe
s no
t hav
e a
Dep
artm
ent-a
ppro
ved
verm
in-p
roof
wel
l cap
or s
eal,
have
one
insta
lled
by y
our L
icen
sed
Wel
l Dril
ler o
r Pum
p In
stalle
r.
To fi
nd a
Lic
ense
d W
ell D
rille
r or P
ump
Insta
ller,
look
in th
e ba
ck o
f you
r pho
ne b
ook
unde
r “W
ater
Wel
l Dril
ling
& S
ervi
ce,”
“Pu
mp
Serv
ice
& R
epai
r” o
r “W
ater
Sup
ply
Syste
ms.
”
How
can
I fi n
d pos
sible
sour
ces o
f my
well c
onta
mina
tion?
If yo
ur w
ater
is u
nsaf
e an
d yo
u ha
ve ru
led
out s
ampl
ing
proc
edur
al e
rror
s, th
en c
heck
the
area
sur
roun
ding
you
r w
ell f
or p
ossi
ble
sour
ces
of c
onta
min
atio
n, in
clud
ing
anim
al y
ards
, sep
tic s
yste
ms,
sew
ers,
impr
oper
ly
aban
done
d w
ells,
land
fi lls,
sin
khol
es, q
uarr
ies,
bed
rock
ou
tcro
ppin
gs, e
tc.
Oth
er p
ossi
ble
caus
es o
f an
unsa
fe w
ater
con
ditio
n in
clud
e in
appr
opria
te o
peni
ngs
in th
e w
ell h
ead,
a d
amag
ed o
r co
rrod
ed c
asin
g, a
n in
adeq
uate
cas
ing
dept
h se
tting
, fau
lty
insta
llatio
n of
a p
itles
s ad
apte
r or a
ny o
ther
com
pone
nt
of th
e pu
mp
insta
llatio
n. If
any
of t
hese
item
s se
ems
to b
e a
likel
y ca
use
of y
our w
ell c
onta
min
atio
n, th
e ne
cess
ary
repa
irs s
houl
d be
mad
e to
you
r wat
er s
yste
m. Y
ou c
an a
sk
a Lic
ense
d W
ell D
rille
r, Pu
mp
Insta
ller o
r Cou
nty
Sani
taria
n (if
ava
ilabl
e in
you
r Cou
nty)
to a
ssis
t you
in in
spec
ting
your
w
ell a
nd w
ater
sys
tem
and
to re
com
men
d w
heth
er o
r not
yo
ur s
yste
m s
houl
d be
mod
ifi ed
, upg
rade
d or
repl
aced
.
How
can
I disi
nfec
t my w
ater
syste
m?Sa
fety
: Bef
ore
you
begi
n, c
onsi
der s
afet
y is
sues
, fi r
st an
d fo
rem
ost.
You
may
dis
infe
ct y
ou w
ater
sys
tem
you
rsel
f, bu
t if
you
choo
se to
do
so it
is v
ery
impo
rtant
you
fi rs
t he
ed th
e fo
llow
ing
impo
rtant
saf
ety
prec
autio
ns:
Elec
tric
al:
If yo
u un
derta
ke th
is p
roce
dure
you
will
be
wor
king
with
bot
h w
ater
and
dan
gero
us v
olta
ges
of e
lect
ricity
, a p
oten
tially
leth
al c
ombi
natio
n. U
se
extre
me
caut
ion
to p
rote
ct y
ours
elf a
nd o
ther
s fro
m e
lect
rical
sho
ck. I
f you
are
not
fam
iliar
with
el
ectri
cal s
yste
ms,
see
k he
lp fr
om a
lice
nsed
pr
ofes
sion
al. I
f you
hav
e th
e ne
cess
ary
know
ledg
e an
d ex
perie
nce,
use
the
follo
win
g pr
ecau
tions
be
fore
and
dur
ing
a di
sinf
ectio
n pr
oced
ure:
• Tu
rn o
ff th
e el
ectri
cal p
ower
to th
e pu
mp
at th
e ci
rcui
t bre
aker
bef
ore
rem
ovin
g th
e w
ell c
ap.
• W
ear r
ubbe
r glo
ves
and
rubb
er-so
led
foot
wea
r.•
Afte
r rem
ovin
g th
e w
ell c
ap o
r sea
l, ex
amin
e th
e w
ires
and
conn
ectio
ns fo
r po
tent
ial e
lect
rical
saf
ety
haza
rds.
Hav
e an
y da
mag
ed fe
atur
es re
paire
d or
repl
aced
.•
Keep
the
pow
er o
ff w
hen
addi
ng th
e ch
lorin
ated
sol
utio
n in
to th
e w
ell.
Chem
ical:
The
use
of c
hlor
ine
prod
ucts
invo
lves
the
risk
of c
hlor
ine
gas,
whi
ch is
ver
y da
mag
ing
to th
e ey
es a
nd lu
ngs
and
can
be d
eadl
y in
ext
rem
e ca
ses.
Ta
ke th
e fo
llow
ing
prec
autio
ns to
pro
tect
you
rsel
f:
• W
ear p
rote
ctiv
e go
ggle
s or
a fa
ce s
hiel
d w
hen
usin
g a
chlo
rine
prod
uct.
• N
ever
mix
chl
orin
e an
d am
mon
ia p
rodu
cts.
A
mix
ture
of t
hese
two
prod
ucts
will
cr
eate
a c
once
ntra
ted
chlo
rine
gas.
• St
ay u
pwin
d of
you
r mix
ing
cont
aine
rs a
nd th
e w
ell.
• D
o no
t mix
or u
se a
chl
orin
e pr
oduc
t in
an e
nclo
sed
spac
e lik
e a
pum
phou
se, a
lcov
e or
wel
l pit.
(In
fact
, do
not e
nter
a p
it fo
r any
reas
on b
ecau
se
ther
e ca
n be
a lo
w o
xyge
n le
vel o
r a b
uild
up
of o
ther
har
mfu
l gas
es in
a p
it.) I
f you
r wel
l is
in a
pit,
an
alco
ve o
r in
your
bas
emen
t, hi
re a
lic
ense
d pr
ofes
sion
al to
chl
orin
ate
the
wel
l.•
Do
not u
se m
ore
blea
ch fo
r the
chl
orin
e so
lutio
n th
an th
e vo
lum
es re
com
men
ded
belo
w.
• D
o no
t drin
k he
avily
chl
orin
ated
wat
er o
r bat
he
or s
how
er in
it. D
oing
so
can
dam
age
skin
and
oth
er ti
ssue
.•
Do
not l
eave
or s
tore
ble
ach
prod
ucts
whe
re c
hild
ren
can
get t
o th
em.
Disin
fecti
on P
roce
dure
New
wel
ls an
d w
ells
that
pro
duce
bac
terio
logi
cally
un
safe
wat
er s
houl
d be
dis
infe
cted
acc
ordi
ng to
the
follo
win
g in
struc
tions
:
1. C
lose
gat
e va
lves
so
the
chlo
rine
solu
tion
will
byp
ass
your
wat
er s
ofte
ner a
nd a
ny o
ther
wat
er tr
eatm
ent
equi
pmen
t. A
stro
ng c
hlor
ine
solu
tion
can
dam
age
this
equi
pmen
t. Yo
u ca
n di
sinfe
ct th
ese
devi
ces
sepa
rate
ly u
sing
the
man
ufac
ture
r’s in
struc
tions
.
Exam
ple
: Cal
cula
te th
e vo
lum
e of
wat
er s
tand
ing
with
in a
6-in
ch d
iam
eter
wel
l, 80
feet
dee
p w
ith a
sta
tic w
ater
le
vel o
f 15
feet
.
Firs
t the
re a
re (8
0’- 1
5’) =
65
feet
of w
ater
sta
ndin
g w
ithin
the
wel
l. Th
e vo
lum
e of
the
wat
er s
tand
ing
with
in th
is w
ell w
ill th
en b
e:[‘V
olum
e fa
ctor
’ X (8
0’ –
15’
) [1
.5 g
al./
ft. X
65
ft.] =
97.
5 ga
llons
of w
ater
sta
ndin
g w
ithin
wel
l.
2. C
alcu
late
the
volu
me
of w
ater
sta
ndin
g w
ithin
yo
ur w
ell a
ccor
ding
to th
e fo
llow
ing:
Vo
lum
e of
wat
er s
tand
ing
with
in a
wel
l =
Leng
th o
f wat
er c
olum
n m
ultip
lied
by th
e ‘V
olum
e fa
ctor
’ for
you
r wel
l. (‘V
olum
e fa
ctor
s’
are
liste
d be
low
for g
iven
wel
l dia
met
ers)
.
Note
: Le
ngth
of s
tand
ing
wat
er c
olum
n =
Tota
l w
ell d
epth
min
us d
epth
to th
e sta
tic w
ater
leve
l.

Wh
ere
can
I g
et m
ore
in
form
ati
on
?
Lice
nsed
wel
l dri
llers
can
hel
p y
ou d
eter
min
e w
het
her
dri
lling
a w
ell w
ith
mor
e ca
sing
ca
n re
duc
e th
e ni
trat
e le
vels
in y
our
wat
er. C
hec
k yo
ur lo
cal p
hon
e d
irec
tory
un
der
“W
ater
Wel
l Dri
lling
& S
ervi
ce.”
Th
e W
isco
nsin
Dep
artm
ent
of H
ealt
h S
ervi
ces
(DH
S), D
ivis
ion
of P
ublic
Hea
lth
can
giv
e yo
u m
ore
info
rmat
ion
on t
he
pot
enti
al h
ealt
h e
ffec
ts
of n
itra
te e
xpos
ure.
Cal
l (60
8) 2
66-0
923
or v
isit
th
e D
HS
web
site
at
dh
s.w
isco
nsi
n.g
ov/e
h/w
ater
.
Th
e W
isco
nsin
Dep
artm
ent
of A
gric
ultu
re, T
rad
e an
d C
onsu
mer
Pro
tect
ion
(DAT
CP
) ca
n gi
ve
you
mor
e in
form
atio
n on
loca
ting
p
oten
tial
nit
rate
sou
rces
. Cal
l (6
08)
224-
4502
or
visi
t th
e D
ATC
P
web
site
at
dat
cp.s
tate
.wi.
us
A li
st o
f cer
tifi e
d la
bs
is a
vaila
ble
from
DN
R
onlin
e at
dn
r.w
i.go
v/or
g/es
/sci
ence
/lc/
und
er
the
cate
gory
“C
erti
fi ed
Lab
Lis
ts.”
You
may
al
so fi
nd la
bor
ator
ies
liste
d in
you
r lo
cal
tele
ph
one
boo
k un
der
“La
bor
ator
ies-
Test
ing.
”
DN
R h
as m
ore
info
rmat
ion
abou
t d
rink
ing
wat
er o
n it
s w
ebsi
te a
t d
nr.
wi.
gov.
Ch
oose
“D
rink
ing
Wat
er
& G
r oun
dw
ater
” fr
om t
he
dro
p-d
own
pro
gram
m
enu,
and
sel
ect
from
a v
arie
ty o
f lis
ted
top
ics.
Fi
nd o
ut h
ow t
o d
eal w
ith
wat
er q
ualit
y p
r ob
lem
s b
y se
arch
ing
for
“Wh
at’s
Wro
ng w
ith
My
Wat
er”
on
the
DN
R w
ebsi
te.
The
Uni
vers
ity
of W
isco
nsin
-Coo
pera
tive
Ext
ensi
on
has
man
y pu
blic
atio
ns r
elat
ed t
o dr
inki
ng w
ater
an
d w
ater
qua
lity
avai
labl
e on
its
web
site
. Go
to
lear
nin
gsto
re.u
wex
.ed
u/D
rin
kin
g-W
ater
-C12
0.as
px.
The
Dep
artm
ent o
f Com
mer
ce h
as in
form
atio
n on
w
ater
trea
tmen
t dev
ices
and
app
rova
ls o
n it
s w
ebsi
te.
• co
mm
erce
.wi.
gov/
SB/S
B-P
lum
bin
gWat
Tre
atR
evQ
A.h
tml
• co
mm
erce
.wi.
gov/
SB/d
ocs/
SB-P
lum
bin
gPro
dR
evC
omm
Info
0310
.pd
f
• co
mm
erce
.wi.
gov/
SB/d
ocs/
SB-P
lum
bin
gWtr
Trt
Req
List
.pd
f
The
Wis
cons
in D
epar
tmen
t of N
atur
al R
esou
rces
Bur
eau
of D
rink
ing
Wat
er a
nd G
roun
dwat
er w
ould
like
to th
ank
the
Gro
undw
ater
Coo
rdin
atin
g C
ounc
il (G
CC
) Ed
ucat
ion
Sub-
Com
mitt
ee fo
r its
par
t in
the
deve
lopm
ent a
nd
editi
ng o
f thi
s pu
blic
atio
n. F
or m
ore
info
rmat
ion
on
the
GC
C, i
t’s m
embe
r or
gani
zatio
ns a
nd p
rogr
amm
ing,
pl
ease
vis
it w
isco
nsi
n.g
ov.
Cho
ose
“Gov
ernm
ent,”
“S
tate
Age
ncie
s,”
follo
wed
by
“Lis
t of A
genc
ies”
th
en s
elec
t “G
roun
dwat
er C
oord
inat
ing
Cou
ncil.
”
Sout
h Ce
ntra
l
North
east
Wes
t Cen
tral
North
ern
Sout
heas
t
Th
e W
isco
nsin
Dep
artm
ent
of N
atur
al R
esou
rces
pro
vid
es
equa
l op
por
tuni
ty in
its
emp
loym
ent,
pro
gram
s, s
ervi
ces
and
func
tion
s un
der
an
Affi
rmat
ive
Act
ion
Pla
n. If
you
hav
e an
y q
uest
ions
, ple
ase
wri
te t
o: E
qua
l Op
por
tuni
ty O
ffi ce
, D
epar
tmen
t of
th
e In
teri
or, W
ash
ingt
on, D
.C. 2
0240
.
Th
is p
ublic
atio
n is
ava
ilab
le in
alt
erna
tive
form
at
(lar
ge p
rint
, Bra
ille,
aud
iota
pe,
etc
) up
on r
eque
st.
Ple
ase
call
(608
) 26
6-08
21 fo
r m
ore
info
rmat
ion.
DNR
Cent
ral O
ffi ce
101
S. W
ebst
er
P.O
. Box
792
1 M
adis
on, W
I 537
07-7
921
(608
) 266
-082
1
Nort
hern
Reg
ion
810
W. M
aple
Stre
et
Spoo
ner,
WI 5
4801
(7
15) 6
35-2
101
107
Sutli
ff Av
enue
R
hine
land
er, W
I 545
01
(715
) 365
-890
0
Nort
heas
t Reg
ion
2984
Sha
wan
o Av
enue
Gre
en B
ay, W
I 543
13-6
727
(920
)662
-510
0
Sout
heas
t Reg
ion
2300
N. D
r. M
artin
Lut
her K
ing,
Jr.
Driv
eM
ilwau
kee,
WI 5
3212
(4
14) 2
63-8
500
Wes
t Cen
tral R
egio
n 13
00 W
. Cla
irem
ont
P.O
. Box
400
1 Ea
u C
laire
, WI 5
4702
-400
1 (7
15) 8
39-3
700
Sout
h Ce
ntra
l Reg
ion
3911
Fis
h H
atch
ery
Roa
d Fi
tchb
urg,
WI 5
3711
(6
08) 2
75-3
266
Dep
art
men
t o
f N
atu
ral
Res
ou
rces
Offi
ces
Wis
cons
in D
epar
tmen
t of
Nat
ural
Res
ourc
es
Bur
eau
of D
rink
ing
Wat
er &
Gro
und
wat
er
Th
is b
roch
ure
exp
lain
s h
ow
nitr
ate
can
ente
r d
rink
ing
wat
er s
upp
lies,
th
e h
ealt
h
effe
cts
of n
itra
te e
xpos
ure,
w
hen
to
test
a p
riva
te w
ell,
and
th
ings
you
can
do
to
red
uce
the
nitr
ate
leve
l in
your
dri
nkin
g w
ater
. Th
e b
roch
ure
also
pro
vid
es
sour
ces
of in
form
atio
n an
d
assi
stan
ce t
hat
may
be
usef
ul
to p
riva
te w
ell o
wne
rs.
Nit
rate
In Dri
nki
ng
Wat
er
PU
B-D
G-0
01 2
010
Res
ults
of w
ater
qua
lity
test
s d
one
by
the
Stat
e La
bor
ator
y of
Hyg
iene
are
aut
omat
ical
ly
rep
orte
d t
o D
NR
for
fi lin
g. Y
ou c
an fi
nd y
our
Uni
que
Wel
l Num
ber
clo
se t
o th
e sa
mp
ling
fauc
et
on t
he
wat
er p
ipe
ente
ring
th
e b
uild
ing
from
th
e w
ell o
r on
th
e m
ain
elec
tric
al fu
se b
ox.
Wh
at
sho
uld
I d
o i
f m
y w
ate
r is
h
igh
in
nit
rate
?
If th
e ni
trat
e-ni
trog
en c
once
ntra
tion
of y
our
wat
er e
xcee
ds
the
10-m
illig
ram
per
lite
r st
and
ard
, th
e fo
llow
ing
acti
ons
are
reco
mm
end
ed:
A
void
dri
nkin
g th
e w
ater
dur
ing
pre
gnan
cy
and
do
not
give
th
e w
ater
to
infa
nts
less
th
an 6
mon
ths
of a
ge o
r us
e th
e w
ater
to
pre
par
e in
fant
form
ula.
T
he
Wis
cons
in D
ivis
ion
of P
ublic
Hea
lth
re
com
men
ds
that
peo
ple
of a
ll ag
es a
void
lo
ng-t
erm
con
sum
pti
on o
f wat
er t
hat
has
a
nitr
ate
leve
l gre
ater
th
an 1
0 p
pm
.
D
o no
t at
tem
pt
to r
emov
e th
e ni
trat
e b
y b
oilin
g th
e w
ater
. Th
is w
ill o
nly
incr
ease
th
e ni
trat
e co
ncen
trat
ion.
Se
ek m
edic
al h
elp
imm
edia
tely
if t
he
skin
co
lor
of a
n in
fant
ap
pea
rs b
luis
h o
r gr
ay.
Som
etim
es c
olor
ch
ange
is fi
rst
noti
ced
ar
ound
th
e m
outh
, or
on t
he
han
ds
and
feet
.
P
rote
ct y
our
wat
er s
upp
ly fr
om n
itra
te
cont
amin
atio
n b
y re
duc
ing
fert
ilize
r yo
u us
e, im
pro
ving
man
ure-
han
dlin
g m
eth
ods,
m
aint
aini
ng y
our
sep
tic
syst
em a
nd p
ump
ing
sep
tic
tank
s re
gula
rly
to p
reve
nt o
verfl
ow
.
A
saf
er, l
onge
r-te
rm r
emed
y m
ay b
e to
dri
ll a
new
wel
l.
T
reat
men
t de
vice
s ap
prov
ed b
y th
e D
epar
tmen
t of
Com
mer
ce.

Ho
w d
o I
kn
ow
if
my
wa
ter
is s
afe
to
dri
nk?
Pu
bli
c W
ater
Sys
tem
sA
ll p
ublic
wat
er s
yste
ms
are
req
uire
d t
o no
tify
co
nsum
ers
if an
y re
gula
ted
con
tam
inan
t, in
clud
ing
nitr
ate,
exc
eed
s th
e m
axim
um c
onta
min
ant
leve
l (M
CL)
th
at is
set
by
the
fed
eral
Saf
e D
rink
ing
Wat
er A
ct. M
unic
ipal
sys
tem
s (s
uch
as
city
, tow
n,
or s
anit
ary
dis
tric
ts)
and
Oth
er-T
han
-Mun
icip
al
(OT
M)
syst
ems
(suc
h a
s m
obile
hom
e p
arks
or
con
dom
iniu
m a
ssoc
iati
ons)
are
req
uire
d t
o re
por
t an
y d
etec
tion
of a
reg
ulat
ed c
onta
min
ant
that
occ
urre
d in
th
e p
revi
ous
year
in t
hei
r an
nual
C
onsu
mer
Con
fi den
ce R
epor
t (C
CR
). If
you
wou
ld
like
to v
iew
you
r co
mm
unit
y’s
CC
R, c
onta
ct
your
loca
l wat
er s
upp
lier
or v
isit
th
e W
isco
nsin
D
epar
tmen
t of
Nat
ural
Res
ourc
es (
DN
R)
web
site
at
dn
r.w
i.go
v. C
hoo
se “
Dri
nkin
g W
ater
& G
roun
dw
ater
” fr
om t
he
dro
p-d
own
“Pro
gram
” m
enu.
Ch
oose
“W
ater
Q
ualit
y D
atab
ases
” in
th
e le
ft-h
and
col
umn.
Nex
t ch
oose
“P
ublic
Wat
er S
yste
ms”
und
er t
he
‘Dri
nkin
g an
d G
r oun
dw
ater
Sys
tem
’ hea
din
g. A
sea
rch
can
th
en b
e m
ade
by
city
or
ind
ivid
ual s
yste
m.
Tre
atm
ent
met
hod
s ar
e av
aila
ble
th
at c
an
red
uce
the
leve
ls o
f nit
rate
in t
he
dri
nkin
g w
ater
sup
ply
, but
som
e m
eth
ods
may
be
mor
e ap
pro
pri
ate
or c
ost-
effe
ctiv
e th
an
oth
ers.
In m
any
case
s th
e b
est
opti
on
for
a co
mm
unit
y is
to
dri
ll a
new
wel
l.
Res
iden
tial
Wel
l O
wn
ers
The
onl
y w
ay t
o kn
ow if
you
r dr
inki
ng w
ater
co
ntai
ns n
itra
te is
to
have
a w
ater
sam
ple
from
you
r pr
ivat
e w
ell t
este
d by
a c
erti
fi ed
labo
rato
ry. A
list
of
cer
tifi e
d la
bs is
ava
ilabl
e fr
om t
he D
epar
tmen
t of
N
atur
al R
esou
rces
(D
NR
) or
onl
ine
at d
nr.
wi.g
ov/
org/
es/s
cien
ce/l
c. A
nit
rate
tes
t is
rec
omm
ende
d
for
all n
ewly
con
stru
cted
pri
vate
wel
ls a
nd w
ells
th
at h
ave
not
been
tes
ted
duri
ng t
he p
ast
5 ye
ars.
Te
stin
g is
als
o re
com
men
ded
for
wel
l wat
er u
sed
by
pr e
gnan
t w
omen
and
is e
ssen
tial
for
a w
ell
that
ser
ves
infa
nts
unde
r 6
mon
ths
of a
ge. W
ells
w
ith
nitr
ate
conc
entr
atio
ns b
etw
een
5 an
d 10
m
illig
ram
s pe
r lit
er s
houl
d be
tes
ted
annu
ally
. A
ddit
iona
l tes
ting
may
als
o be
use
ful i
f the
re a
re
any
know
n so
urce
s of
nit
rate
or
if hi
gh n
itra
te
conc
entr
atio
ns a
re fo
und
in n
eigh
bori
ng w
ells
.
Wh
at
is n
itra
te?
Nit
rate
(N
O3- )
is a
com
pou
nd m
ade
up o
f nit
roge
n an
d o
xyge
n. It
is fo
rmed
wh
en n
itro
gen
from
am
mon
ia o
r ot
her
sou
rces
com
bin
es w
ith
oxy
gen
in w
ater
. Nit
rate
is n
atur
ally
foun
d in
pla
nts
and
in
vege
tab
les
at v
aryi
ng c
once
ntra
tion
s. It
is o
ften
in
grou
ndw
ater
dep
end
ing
on t
he
amou
nt o
f fer
tiliz
er
and
man
ure
app
lied
to
crop
fi el
ds.
Acc
ord
ing
to t
he
U.S
. Env
iron
men
tal P
rote
ctio
n A
genc
y, m
ost
adul
ts
wh
o ar
e ea
ting
a b
alan
ced
die
t m
ay c
onsu
me
10-2
5 m
illig
ram
s of
nit
rate
-nit
roge
n p
er d
ay in
th
eir
food
. M
ost
of t
his
nit
rate
com
es fr
om le
afy
vege
tab
les
like
lett
uce,
cab
bag
e, c
eler
y, s
pin
ach
, and
cur
ed m
eats
. A
dd
itio
nal e
xpos
ure
to n
itra
te fr
om c
onta
min
ated
d
rink
ing
wat
er m
ay p
ose
a si
gnifi
cant
hea
lth
ris
k.
Ho
w d
oes
nit
rate
en
ter
gro
un
dw
ate
r?
In n
atur
e, w
ater
usu
ally
con
tain
s le
ss
than
1 m
illig
ram
of n
itra
te-n
itro
gen
per
lite
r an
d is
not
con
sid
ered
a
hea
lth
con
cern
. Sig
nifi c
antl
y h
igh
er
nitr
ate
conc
entr
atio
ns c
an in
dic
ate
that
th
e d
rink
ing
wat
er h
as b
een
cont
amin
ated
and
may
pos
e a
seri
ous
hea
lth
con
cern
. Com
mon
so
urce
s of
nit
rate
incl
ude
nitr
ogen
fert
ilize
rs, m
anur
e,
sep
tic
syst
ems,
mun
icip
al
sew
age
trea
tmen
t sy
stem
s,
and
dec
ayin
g p
lant
deb
ris.
N
itra
te d
isso
lves
eas
ily in
w
ater
and
doe
s no
t ad
sorb
ont
o th
e so
il. It
can
ea
sily
be
carr
ied
into
th
e gr
ound
wat
er b
y ra
inw
ater
an
d m
elti
ng s
now
as
they
per
cola
te t
hro
ugh
th
e so
il an
d b
edro
ck in
to t
he
und
erly
ing
aqui
fer.
Is m
y w
ell
at
risk
?
Th
e on
ly w
ay t
o kn
ow if
you
r d
rink
ing
wat
er
cont
ains
exc
essi
ve n
itra
te is
to
hav
e a
wat
er s
amp
le
anal
yzed
by
a ce
rtifi
ed la
bor
ator
y. T
her
e ar
e al
so
seve
ral t
hin
gs y
ou c
an c
hec
k to
det
erm
ine
your
w
ell’s
vul
nera
bili
ty t
o ni
trat
e co
ntam
inat
ion.
W
ell L
ocat
ion.
Nit
rate
-con
tam
inat
ed w
ells
ar
e of
ten
loca
ted
nea
r fa
rm fi
eld
s, b
arny
ard
s,
feed
lots
, sep
tic
tank
s, m
unic
ipal
was
tew
ater
tr
eatm
ent
syst
ems
or “
slud
ge”
spre
adin
g si
tes.
W
ell c
asin
g d
epth
and
con
stru
ctio
n.
Sinc
e ni
trat
e en
ters
th
e aq
uife
r fr
om
the
grou
nd s
urfa
ce, w
ells
th
at h
ave
shal
low
cas
ing
are
mor
e lik
ely
to b
e af
fect
ed t
han
dee
per
cas
ed w
ells
.
G
eolo
gy. A
reas
wit
h h
igh
ly p
orou
s, s
and
y so
ils, f
ract
ured
bed
rock
, nat
ural
cav
es a
nd
sink
hol
es, a
nd s
hal
low
dep
ths
to g
roun
dw
ater
ar
e es
pec
ially
vul
nera
ble
to
cont
amin
atio
n.
Are
as w
ith
hig
hly
exp
osed
cre
vice
d b
edro
ck
or s
pec
ifi c
geol
ogic
con
dit
ions
kno
wn
as
“kar
st”
limes
tone
geo
logy
, pre
sent
in m
uch
of
Doo
r C
ount
y fo
r ex
amp
le, m
ay a
lso
be
vuln
erab
le t
o ni
trat
e co
ntam
inat
ion.
Wh
at
are
th
e h
ealt
h r
isks
of
con
sum
ing
wa
ter
wit
h h
igh
co
nce
ntr
ati
on
s o
f n
itra
te?
Stat
e an
d F
eder
al la
ws
set
the
max
imu
m a
llow
able
le
vel o
f nit
rate
-nit
roge
n in
pu
blic
dri
nki
ng
wat
er a
t 10
mill
igra
ms
per
lite
r (1
0 p
arts
per
m
illio
n).
Th
e W
isco
nsi
n D
ivis
ion
of P
ub
lic H
ealt
h
reco
mm
end
s th
at p
eop
le o
f all
ages
avo
id lo
ng-
term
co
nsu
mp
tio
n o
f wat
er t
hat
has
a n
itra
te le
vel
grea
ter
than
10
pp
m.
Nit
rate
-con
tam
inat
ed w
ater
sh
ould
nev
er b
e fe
d t
o an
infa
nt u
nder
6 m
onth
s of
age
. In
youn
g in
fant
s,
inge
stio
n of
nit
rate
can
red
uce
the
blo
od’s
ab
ility
to
car
ry o
xyge
n. In
sev
ere
case
s it
can
cau
se a
co
ndit
ion
that
doc
tors
cal
l met
hem
oglo
bin
emia
. T
he
cond
itio
n is
als
o ca
lled
“b
lue
bab
y sy
ndro
me”
bec
ause
th
e in
fant
’s s
kin
app
ears
b
lue-
gray
or
lave
nder
in c
olor
. T
his
ski
n co
lor
chan
ge is
cau
sed
b
y a
lack
of o
xyge
n in
th
e b
lood
.
All
infa
nts
less
th
an 6
mon
ths
of
age
are
at r
isk
of n
itra
te t
oxic
ity,
b
ut p
rem
atur
e b
abie
s an
d b
abie
s w
ith
oth
er h
ealt
h p
rob
lem
s ar
e m
ore
sens
itiv
e th
an h
ealt
hy
infa
nts.
A
n i
nfa
nt
suff
erin
g fr
om “
blu
e b
aby
syn
dro
me”
nee
ds
imm
edia
te m
edic
al
care
bec
ause
th
e co
nd
itio
n c
an l
ead
to
com
a an
d d
eath
if
it i
s n
ot t
reat
ed p
rom
ptl
y.
Wh
en n
ursi
ng m
oth
ers
inge
st w
ater
con
tain
ing
elev
ated
con
cent
rati
ons
of n
itra
te, t
he
amou
nt
of n
itra
te in
bre
ast
milk
may
incr
ease
slig
htl
y.
Alt
hou
gh n
o co
nfi r
med
cas
es o
f “b
lue
bab
y sy
ndro
me”
hav
e b
een
asso
ciat
ed w
ith
nit
rate
in
bre
ast
milk
, it
may
be
advi
sab
le fo
r nu
rsin
g w
omen
to
avoi
d d
rink
ing
wat
er t
hat
con
tain
s m
ore
than
10
mill
igra
ms
of n
itra
te p
er li
ter
of w
ater
.
Som
e sc
ient
ifi c
stud
ies
hav
e al
so fo
und
evi
den
ce
sugg
esti
ng t
hat
wom
en w
ho
dri
nk n
itra
te-
cont
amin
ated
wat
er d
urin
g p
regn
ancy
are
mor
e lik
ely
to h
ave
bab
ies
wit
h b
irth
def
ects
. Th
is m
ay
be
bec
ause
nit
rate
inge
sted
by
the
mot
her
may
als
o lo
wer
th
e am
ount
of o
xyge
n av
aila
ble
to
the
fetu
s.
Som
e re
sear
cher
s su
spec
t th
at c
onsu
min
g ni
trat
e-co
ntam
inat
ed w
ater
may
in
crea
se t
he
risk
of t
hyr
oid
d
isea
se, d
iab
etes
, and
ce
rtai
n ty
pes
of c
ance
r. P
eop
le w
ho
hav
e h
eart
or
lung
dis
ease
, cer
tain
in
her
ited
enz
yme
def
ects
or
can
cer
may
be
mor
e se
nsit
ive
to t
he
toxi
c ef
fect
s of
nit
rate
th
an h
ealt
hy
ind
ivid
uals
.
Wel
ls c
onta
min
ated
wit
h h
igh
nit
rate
leve
ls
are
mor
e lik
ely
to b
e co
ntam
inat
ed w
ith
ag
ricu
ltur
al p
esti
cid
es. I
f you
r w
ater
is
cont
amin
ated
wit
h n
itra
te, y
ou m
ay w
ant
to h
ave
the
wat
er t
este
d fo
r p
esti
cid
es,
esp
ecia
lly if
you
r w
ell i
s ne
ar fa
rm fi
eld
s.

Interpreting Drinking Water Test Resultsby Chris Mechenich and Elaine Andrews
Musty odors, red-brown stains on plumbing fixtures, bathtubrings—all these are unpleasant signs of water qualityproblems, but usually not of harmful contaminants in the
water. Contaminants that may threaten our health are usually notdiscernible by the senses. Drinking water can contain nitrate,bacteria, and pesticides at levels which cannot be tasted or smelled,but which can be hazardous to health.
If your drinking water comes from a private well, you should testyour water once a year even if you do not observe any smells, stainsor changes in water quality. Only analysis by a certified laboratorycan determine if the water is free of harmful contaminants. Thispublication provides information about how to interpret thelaboratory results for a basic set of tests conducted as part of theUniversity of Wisconsin–Extension water testing program and thatare recommended for all private wells.
The tests described in this publication are also conducted on publicwater supplies. If you are using water from a public water utility,consider having the water tested if your home plumbing systemcontains lead or copper pipes or lead solder, if you are installing awater treatment device, or if you have concerns about the water. SeeEvaluating the Condition of Your Public Water Supply (G3558-3), formore information.
The Initial Set of Water TestsAnyone buying a home with a private well, installing a new well orsimply having their well water tested for the first time should runthe basic set of tests described here. These tests give a good overallpicture of current water quality, indicate possible problems, andprovide a “baseline” for comparing future test results. Each test isdescribed in more detail in this publication.
Always have a certified laboratory conduct the tests. Labs certified bythe Department of Natural Resources or Department of Agriculture,Trade and Consumer Protection must meet standards for accuracy. Alist of certified labs is available from county Extension offices andDepartment of Natural Resources (DNR) regional offices.
This fact sheet is part of a seriesdesigned to help you determinethe quality of your home drinkingwater and to show you techniquesavailable for improving it. To makethe best use of these publications,include them in a household filecontaining well information andwater test results.
Other fact sheets in the series are:
Keeping Your Home WaterSupply Safe (G3558-1)
Evaluating the Condition ofYour Private Water Supply(G3558-2)
Evaluating the Condition ofYour Public Water Supply(G3558-3)
Choosing a WaterTreatment Device (G3558-5)
The Extension bulletin MaintainingYour Home Well Water System(G3399), can be used with thesepublications.
This series was developed by theUniversity of WisconsinCooperative Extension incooperation with the WisconsinDepartment of Natural Resourcesand the Wisconsin Department ofCommerce.
HOME WATER SAFETY
G3558-4
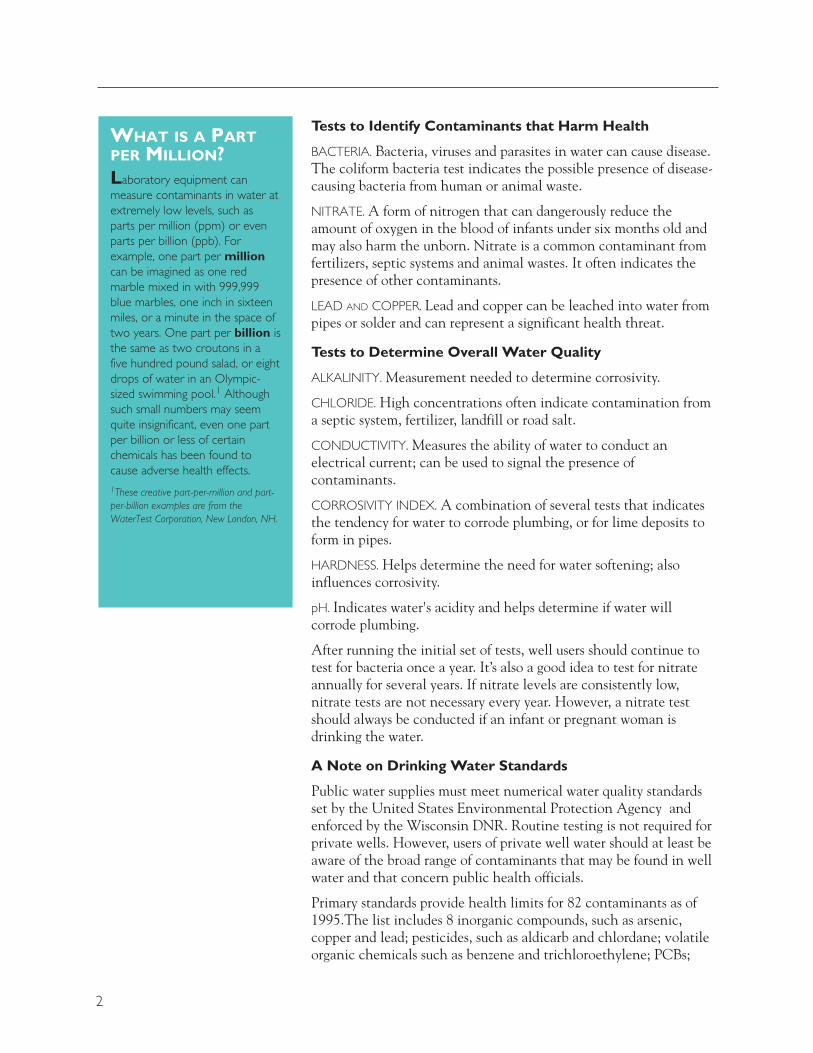
Tests to Identify Contaminants that Harm Health
BACTERIA. Bacteria, viruses and parasites in water can cause disease.The coliform bacteria test indicates the possible presence of disease-causing bacteria from human or animal waste.
NITRATE. A form of nitrogen that can dangerously reduce theamount of oxygen in the blood of infants under six months old andmay also harm the unborn. Nitrate is a common contaminant fromfertilizers, septic systems and animal wastes. It often indicates thepresence of other contaminants.
LEAD AND COPPER. Lead and copper can be leached into water frompipes or solder and can represent a significant health threat.
Tests to Determine Overall Water Quality
ALKALINITY. Measurement needed to determine corrosivity.
CHLORIDE. High concentrations often indicate contamination froma septic system, fertilizer, landfill or road salt.
CONDUCTIVITY. Measures the ability of water to conduct anelectrical current; can be used to signal the presence ofcontaminants.
CORROSIVITY INDEX. A combination of several tests that indicatesthe tendency for water to corrode plumbing, or for lime deposits toform in pipes.
HARDNESS. Helps determine the need for water softening; alsoinfluences corrosivity.
pH. Indicates water's acidity and helps determine if water willcorrode plumbing.
After running the initial set of tests, well users should continue totest for bacteria once a year. It’s also a good idea to test for nitrateannually for several years. If nitrate levels are consistently low,nitrate tests are not necessary every year. However, a nitrate testshould always be conducted if an infant or pregnant woman isdrinking the water.
A Note on Drinking Water Standards
Public water supplies must meet numerical water quality standardsset by the United States Environmental Protection Agency andenforced by the Wisconsin DNR. Routine testing is not required forprivate wells. However, users of private well water should at least beaware of the broad range of contaminants that may be found in wellwater and that concern public health officials.
Primary standards provide health limits for 82 contaminants as of1995.The list includes 8 inorganic compounds, such as arsenic,copper and lead; pesticides, such as aldicarb and chlordane; volatileorganic chemicals such as benzene and trichloroethylene; PCBs;
2
WHAT IS A PARTPER MILLION?Laboratory equipment canmeasure contaminants in water atextremely low levels, such asparts per million (ppm) or evenparts per billion (ppb). Forexample, one part per millioncan be imagined as one redmarble mixed in with 999,999blue marbles, one inch in sixteenmiles, or a minute in the space oftwo years. One part per billion isthe same as two croutons in afive hundred pound salad, or eightdrops of water in an Olympic-sized swimming pool.1 Althoughsuch small numbers may seemquite insignificant, even one partper billion or less of certainchemicals has been found tocause adverse health effects.1These creative part-per-million and part-per-billion examples are from theWaterTest Corporation, New London, NH.
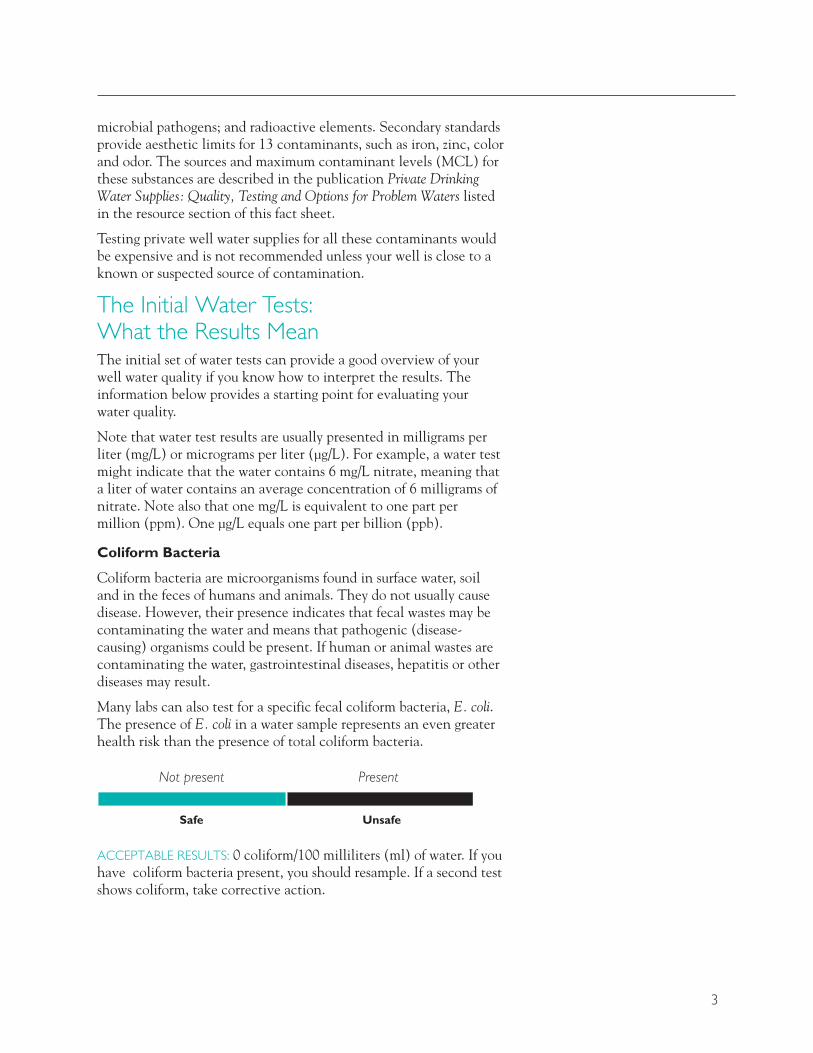
microbial pathogens; and radioactive elements. Secondary standardsprovide aesthetic limits for 13 contaminants, such as iron, zinc, colorand odor. The sources and maximum contaminant levels (MCL) forthese substances are described in the publication Private DrinkingWater Supplies: Quality, Testing and Options for Problem Waters listedin the resource section of this fact sheet.
Testing private well water supplies for all these contaminants wouldbe expensive and is not recommended unless your well is close to aknown or suspected source of contamination.
The Initial Water Tests:What the Results MeanThe initial set of water tests can provide a good overview of yourwell water quality if you know how to interpret the results. Theinformation below provides a starting point for evaluating yourwater quality.
Note that water test results are usually presented in milligrams perliter (mg/L) or micrograms per liter (μg/L). For example, a water testmight indicate that the water contains 6 mg/L nitrate, meaning thata liter of water contains an average concentration of 6 milligrams ofnitrate. Note also that one mg/L is equivalent to one part permillion (ppm). One μg/L equals one part per billion (ppb).
Coliform Bacteria
Coliform bacteria are microorganisms found in surface water, soiland in the feces of humans and animals. They do not usually causedisease. However, their presence indicates that fecal wastes may becontaminating the water and means that pathogenic (disease-causing) organisms could be present. If human or animal wastes arecontaminating the water, gastrointestinal diseases, hepatitis or otherdiseases may result.
Many labs can also test for a specific fecal coliform bacteria, E. coli.The presence of E. coli in a water sample represents an even greaterhealth risk than the presence of total coliform bacteria.
ACCEPTABLE RESULTS: 0 coliform/100 milliliters (ml) of water. If youhave coliform bacteria present, you should resample. If a second testshows coliform, take corrective action.
3
Not present
Safe Unsafe
Present

CORRECTIVE ACTIONS: Coliform bacteria in groundwater indicatethat contaminated surface water is entering groundwater withoutthe filtering effect that soils usually provide. In areas where thebedrock is fractured and close to the surface, or in areas with coarsesand and gravel soils, contaminated surface water can naturally findits way into the groundwater. More often, detection of coliformbacteria in well water is an indication that contaminated surfacewater is entering a well because of defects in well construction ormaintenance.
If coliform bacteria are detected in the water sample, have anothersample tested. Carefully follow the sampling steps suggested by thelaboratory to ensure that your sampling procedure itself is notcontaminating the water. If the second test shows bacterialcontamination, check the well for defects. Some defects are easilyviewed; others might require excavating around the well. Followthis checklist as you look for obvious defects:
✓ Is the cap or seal on tightly? Is the well vented? The well capshould fit tightly to keep out surface water and vermin. On adrilled well, the screened vent that allows air to enter the wellmust be securely connected to the cap or seal.
✓ Is all wiring in conduit (tubing that connects the well with theelectrical box)?
✓ Is the casing at least 12 inches above the ground? (The casing isthe steel or plastic pipe installed in the bore hole duringconstruction.) Also, if there are visible holes or cracks in thecasing, or if you can move it, there might be a problem.
✓ Is the well in a pit or basement? If so, it may not meet staterequirements and might be unsafe.
After correcting visible defects, disinfect the well with chlorinebleach and have another sample tested after all traces of chlorinehave dissipated. Test again one month later to ensure that thecontamination source has been eliminated. See the DNRpublication Bacteriological Contamination of Drinking Water and theExtension publication Evaluating the Condition of Your Private WaterSupply (G3558-2) for more information.
Nitrate
Nitrate nitrogen is a commonly used lawn and agricultural fertilizer.It is also a chemical formed in the decomposition of waste materials.If infants under six months of age drink water (or formula madewith water) that contains more than 10 mg/L nitrate-nitrogen, theyare susceptible to methemoglobinemia, a disease which interfereswith oxygen transport in the blood. Pregnant women should alsoavoid drinking water high in nitrate. Recent studies suggestconnections between high-nitrate water and birth defects ormiscarriages.
4

High nitrate levels also suggest that other contaminants may bepresent. The natural level of nitrate in Wisconsin’s groundwater isless than 0.2 mg/L. Nitrite is an unstable form of nitrogen which maybe found in small amounts along with nitrate. Sometimes results ofnitrate and nitrite are reported together.
ACCEPTABLE RESULTS: Labs report nitrate results either as nitratenitrogen or as nitrate. When reported as nitrate nitrogen (NO -
3-N)or nitrate and nitrite nitrogen (NO -
2 + NO - 3-N) the acceptable
level is less than 10 mg/L (less than 2 mg/L is preferred). Whenreported simply as nitrate (NO -
3), the acceptable level is less than45 mg/L.
SOURCES: Fertilizer, septic system effluent and animal wastes can allcontribute to elevated nitrate levels. In most cases, elevated nitratelevels indicate general contamination of the aquifer (water-bearingformation) at the depth of the well.
CORRECTIVE ACTIONS:✓ Deepen or replace the well. Nitrate is more commonly found in
shallow wells. Drilling to a deeper part of the aquifer might helpreduce nitrate levels.
✓ Eliminate contamination sources. If the source of the nitrate canbe identified (such as a nearby barnyard or septic system) thebest solution might be to clean up or remove the contaminationsource. However, it could take years for the nitrate to return tosafe levels in the well.
✓ Carry or buy water, especially for infants and pregnant women.
✓ Treat the water. Some home water treatment devices can removenitrate from drinking water. See fact sheet Choosing a WaterTreatment Device (G3558-5) for more information.
Lead and copper
Lead is a metal once used in solder, pipes and plumbing fixtures inmany Wisconsin homes. High lead levels in the body can damagemany body organs and systems. Lead can be especially dangerous toyoung children, infants and the unborn.
Copper is the metal commonly used to manufacture water pipes.Too much copper in drinking water may cause vomiting, stomachcramps, diarrhea and nausea. Some cases of “formula intolerance” ininfants may be caused by high copper levels in water. Loss of copperfrom pipes into the drinking water may also eventually lead to leaksin the pipes.
5
0 0.2 2 5 10
Natural level
Nitrate-nitrogen mg/L
Human influence on waterquality
Unsafe

ACCEPTABLE RESULTS: less than 15 μg/L (parts per billion) lead. Less than 1.3 mg/L (parts per million) copper
SOURCES: lead and copper in pipes, solder and plumbing fixtures.
CORRECTIVE ACTIONS :✓ Before using water for cooking or drinking, flush the cold water
faucet by allowing the water to run until it is as cold as it will get(usually 2-3 minutes). Do not use water from the hot water tapfor drinking or cooking because hot water dissolves metals in theplumbing system more quickly than cold water. For moreinformation see the DNR publication Lead in Drinking Water andCopper in Drinking Water.
✓ Replace copper or lead pipes with plastic pipes.
✓ Avoid drinking water treated by a water softener. Soft waterprevents a protective coating from forming on pipes and mayallow metals to leach into the water. If water is naturally too soft,see “Corrective Action for Corrosivity” for steps to harden water.
Chloride
In most areas of Wisconsin, chloride in groundwater is naturally lessthan 10 mg/L. Some higher concentrations in limestone andsandstone aquifers in eastern Wisconsin may also be natural. Higherconcentrations usually indicate contamination by septic systems,road salt, fertilizer, animal or other wastes. Chloride is not toxic, butsome people can detect a salty taste at 250 mg/L. Water with highchloride may also have a high sodium content. High chloride mayalso speed up corrosion in plumbing (just as road salt does to yourcar).
6
0 10 250
Natural level
mg/L Chloride
Human-influencedlevels
Salty taste,corrosion
0 5 10 15
Acceptable
μg/L Lead
Unsafe
0 1.3
Acceptable
mg/L Copper
Unsafe

ACCEPTABLE RESULTS: There is no health standard. Levels less than10 mg/L are desirable. Levels more than 250 mg/L may cause a saltytaste.
SOURCES: Septic systems, road salt, fertilizer, animal or other wastes.
CORRECTIVE ACTIONS: None required specifically for chloride. Ifelevated chloride levels are found in combination with high nitratelevels, take corrective actions indicated for nitrate.
Conductivity
Conductivity (specific conductance) is a measure of water’s ability toconduct an electrical current. It is related to the amount of dissolvedminerals in water, but it does not give an indication of whichminerals are present. Conductivity (measured in μmho/cm at 25˚C)is about twice the hardness (mg CaCO3/L) in most uncontaminatedwaters in Wisconsin. If it is much greater than two times thehardness, it may indicate the presence of contaminants such assodium, chloride, nitrate, or sulfate, which may occur naturally or beinfluenced by human activity. Changes in conductivity over timemay indicate changing water quality.
ACCEPTABLE RESULTS: There is no health standard. A normalconductivity value is roughly twice the hardness in unsoftenedwater.
SOURCES: Natural and human-made dissolved substances in thewater.
CORRECTIVE ACTIONS: None specifically required for conductivity.
pH
The measure of the hydrogen ion (acid) concentration in water iscalled pH. A pH of 7 is neutral. Values above 7 are alkaline or basic;those below 7 are acidic. A change of 1 pH unit is a tenfold changein acid level. Acidic water is often corrosive (see Corrosivity Index).Iron may also be found at problem levels in acid water. LaboratorypH values are often slightly higher than would be found in a freshwater sample from your well.
ACCEPTABLE RESULTS: There is no health standard. Values from 6.5to 8.5 pH units occur in most natural waters. Ideal values range from7.5 to 8.3. The lower the pH, the more corrosive the water will be.
7
0 1 2 3 4 5 6 7 7.5 8 9 10 11 12 13 14
Idealrange
pH
Acidic Neutral Basic
May corrode pipes May corrode pipes
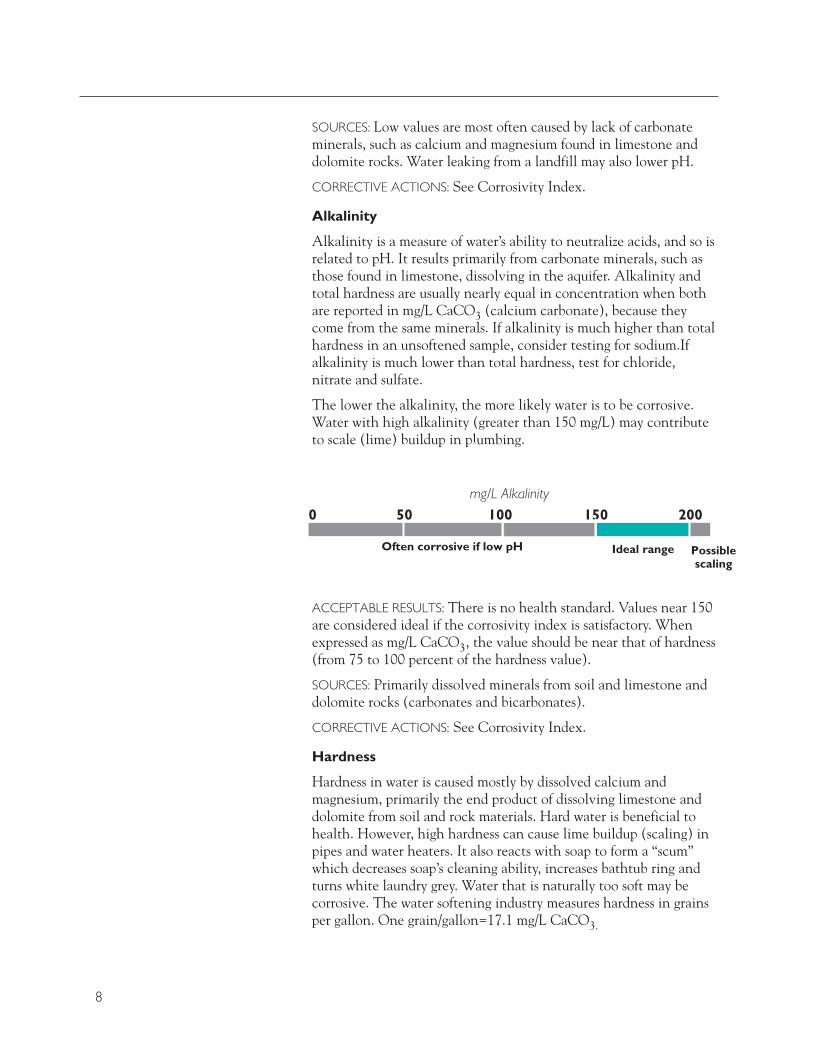
8
SOURCES: Low values are most often caused by lack of carbonateminerals, such as calcium and magnesium found in limestone anddolomite rocks. Water leaking from a landfill may also lower pH.
CORRECTIVE ACTIONS: See Corrosivity Index.
Alkalinity
Alkalinity is a measure of water’s ability to neutralize acids, and so isrelated to pH. It results primarily from carbonate minerals, such asthose found in limestone, dissolving in the aquifer. Alkalinity andtotal hardness are usually nearly equal in concentration when bothare reported in mg/L CaCO3 (calcium carbonate), because theycome from the same minerals. If alkalinity is much higher than totalhardness in an unsoftened sample, consider testing for sodium.Ifalkalinity is much lower than total hardness, test for chloride,nitrate and sulfate.
The lower the alkalinity, the more likely water is to be corrosive.Water with high alkalinity (greater than 150 mg/L) may contributeto scale (lime) buildup in plumbing.
ACCEPTABLE RESULTS: There is no health standard. Values near 150are considered ideal if the corrosivity index is satisfactory. Whenexpressed as mg/L CaCO33, the value should be near that of hardness(from 75 to 100 percent of the hardness value).
SOURCES: Primarily dissolved minerals from soil and limestone anddolomite rocks (carbonates and bicarbonates).
CORRECTIVE ACTIONS: See Corrosivity Index.
Hardness
Hardness in water is caused mostly by dissolved calcium andmagnesium, primarily the end product of dissolving limestone anddolomite from soil and rock materials. Hard water is beneficial tohealth. However, high hardness can cause lime buildup (scaling) inpipes and water heaters. It also reacts with soap to form a “scum”which decreases soap’s cleaning ability, increases bathtub ring andturns white laundry grey. Water that is naturally too soft may becorrosive. The water softening industry measures hardness in grainsper gallon. One grain/gallon=17.1 mg/L CaCO3.
0 50 100 150 200
Often corrosive if low pH
mg/L Alkalinity
Ideal range Possiblescaling
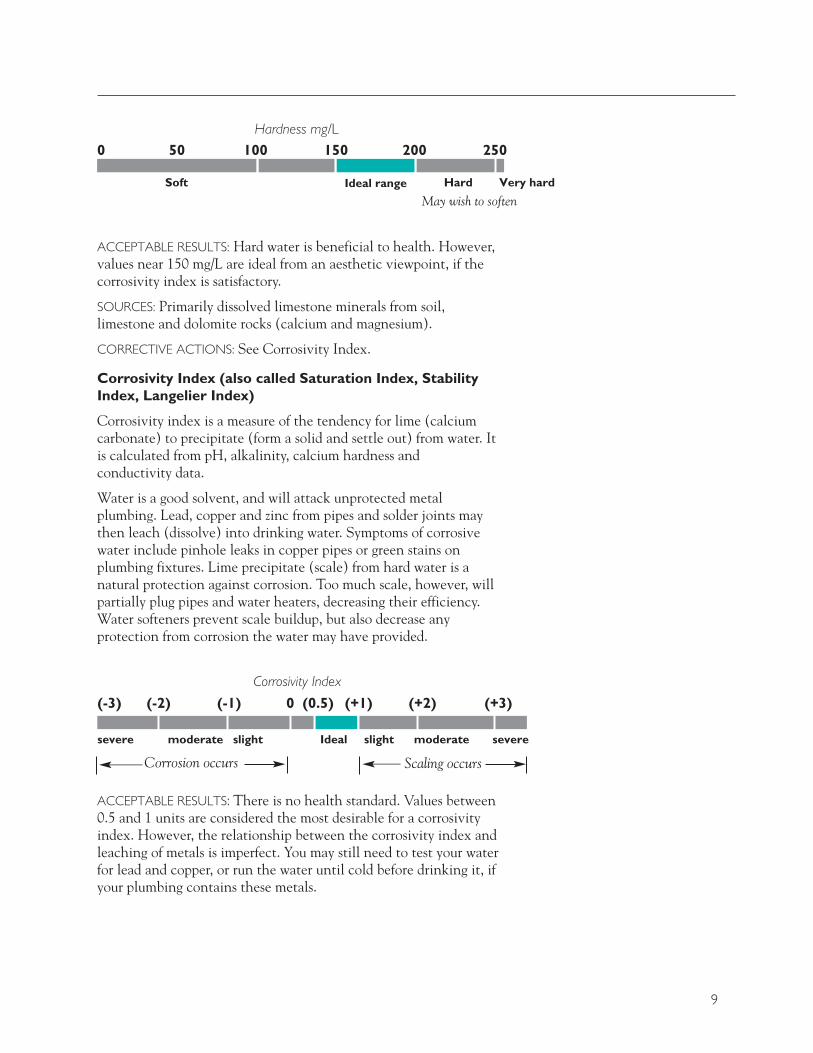
ACCEPTABLE RESULTS: Hard water is beneficial to health. However,values near 150 mg/L are ideal from an aesthetic viewpoint, if thecorrosivity index is satisfactory.
SOURCES: Primarily dissolved limestone minerals from soil,limestone and dolomite rocks (calcium and magnesium).
CORRECTIVE ACTIONS: See Corrosivity Index.
Corrosivity Index (also called Saturation Index, StabilityIndex, Langelier Index)
Corrosivity index is a measure of the tendency for lime (calciumcarbonate) to precipitate (form a solid and settle out) from water. Itis calculated from pH, alkalinity, calcium hardness and conductivity data.
Water is a good solvent, and will attack unprotected metalplumbing. Lead, copper and zinc from pipes and solder joints maythen leach (dissolve) into drinking water. Symptoms of corrosivewater include pinhole leaks in copper pipes or green stains onplumbing fixtures. Lime precipitate (scale) from hard water is anatural protection against corrosion. Too much scale, however, willpartially plug pipes and water heaters, decreasing their efficiency.Water softeners prevent scale buildup, but also decrease anyprotection from corrosion the water may have provided.
ACCEPTABLE RESULTS: There is no health standard. Values between0.5 and 1 units are considered the most desirable for a corrosivityindex. However, the relationship between the corrosivity index andleaching of metals is imperfect. You may still need to test your waterfor lead and copper, or run the water until cold before drinking it, ifyour plumbing contains these metals.
9
0 50 100 150 200 250
Soft
Hardness mg/L
Ideal range Hard Very hard
May wish to soften
(-3) (-2) (-1) 0 (0.5) (+1) (+2) (+3)
severe moderate slight Ideal slight moderate severe
Corrosivity Index
Scaling occursCorrosion occurs

SOURCES: Low values may be caused by natural lack of carbonateminerals in the aquifer and/or high nitrate levels. High valuesnormally relate to high water hardness and alkalinity.
CORRECTIVE ACTIONS FOR CORROSIVITY, HARDNESS, ALKALINITYOR pH: If values are too low, indicating a corrosion problem, youshould consider:
✓ Deepening the well.
✓ Increasing the hardness and/or alkalinity of the water with awater treatment device (see the Extension publication Choosing aWater Treatment Device (G3558-5)).
✓ Running water for several minutes before using it for drinking orcooking if the plumbing includes copper pipes, lead pipes or leadsolder. Replacing all plumbing with plastic would be also be asolution.
If hardness or corrosivity values are too high, indicating a scalingproblem:
✓ Soften water (except a cold water tap for drinking water). Softened water prevents protective scale formation and alsocontains sodium.
If alkalinity or pH values are too high, contact a water testinterpretation specialist (see page 12).
When You Should ConsiderAdditional TestsIn addition to the initial set of tests and once-a-year checks forbacteria and nitrate, you should consider additional testing of yourprivate water supply in the following circumstances:
If you are installing a water treatment deviceTEST FOR: Any contaminants you are concerned about removing.You will need to know the levels of contaminants present to choosethe best treatment device.
If you have copper pipes soldered with lead solder or lead pipesTEST FOR: Lead and copper.
If there is an infant or pregnant woman in the homeTEST FOR: Nitrate, copper, lead and coliform bacteria before theinfant begins drinking the water.
If there is a family illness that could be related to drinking water(such as gastrointestinal illness)TEST FOR: Coliform bacteria and copper. (Consult a physician formedical advice.)
If there are noticeable changes in livestock or poultry performanceTEST FOR: Compounds measured in the initial water test.
10
SHOULD I WORRYABOUT CHANGESIN MY WATER?Sudden changes in water qualitymay be a sign of seriouscontamination problems whichmay harm health. If there is aproblem with the construction ofyour private well, you areespecially likely to observesudden changes in taste, odor orclarity in the spring or after heavyrain. Such changes should beinvestigated immediately withlaboratory testing for coliformbacteria and nitrate. The watermay be used for washing andbathing but should not beconsumed until the laboratoryresults show that your water issafe.
You may find that some changesyou observe are natural. If yourwater quality changes routinely ata certain time of year, you maywant to make that the time atwhich you do your routineannual testing. Ultimately,sampling frequency is a personaldecision which should be basedon your own judgment, level ofconcern, and previouscontamination levels.

If your neighbors find one or more contaminants when they testtheir wellTEST FOR: The same contaminants found in the neighbors’ well.
If agricultural chemicals or petroleum products have been spillednear your well, or you suspect an accident might have back-siphoned these products into the wellTEST FOR: The suspected volatile organic chemicals (VOCs) orpesticides.
If pesticides or fertilizers are applied to fields within 100 feet ofyour wellTEST FOR: Nitrate and pesticides with a scan that includes thepesticides used on the fields. If corn is grown, consider screening foratrazine, a common corn herbicide.
If there is an old underground fuel storage tank nearbyTEST FOR: Oil, gasoline and volatile organic chemicals.
If indoor air testing reveals radon concentrations higher than 4picocuries/liter in kitchen and bathroom areas (Radon is anaturally occurring radioactive substance in geological materialsin some areas; in well water, radon can contribute to elevatedindoor air radon levels.)TEST FOR: Radon. Contact the DNR water systems specialist forhelp.
If you notice rust stains on bathroom or kitchen fixtures,laundered clothes, cooking utensilsTEST FOR: Iron.
If you live near an active or abandoned solid waste landfillTEST FOR: Volatile organic chemicals, chloride, and chemical oxygendemand.
11

Sources of InformationPublications
University of Wisconsin-Extension:Do Deeper Wells Mean Better Water?(G3652)Improving Your Drinking WaterQuality (G3378)Maintaining Your Home Well WaterSystem (G3399)Available from: Extension countyoffices or from ExtensionPublications, Rm. 170, 630 W.Mifflin St., Madison, WI 53715608/262-3346; fax 608/265-8052
DNR:Bacterial Contamination of DrinkingWater PUBL-WS-003 97 REVCopper in Drinking Water PUBL-WS-027 92Iron Bacteria Problems in WellsPUBL-WS-004 89 REVLead in Drinking Water PUBL-WS-015 94 REV.Nitrate in Drinking Water PUBL-WS-001 95 REV.Pesticides in Drinking Water PUBL-WS-007 93 REV.Private Well Construction in GraniteFormations PUBL-WS-017 91 REV.Radium in Drinking Water PUBL-WS-008 90 REV.Sulfur Bacteria Problems in WellsPUBL-WS-005 95 REV
You and Your Well PUBL-WS-00295 REV.Available from: DNR, 101 S.Webster St., Madison, WI 53707 orDNR regional offices.
Northeast RegionalAgricultural EngineeringService:Private Drinking Water Supplies:Quality, Testing, and Options forProblem Waters NRAES-47
Available from: Northeast RegionalAgricultural Engineering Service,152 Riley-Robb Hall, CooperativeExtension, Ithaca, NY 14853-5701
Sources of AssistanceWater testing: A list of certifiedlaboratories is available from countyExtension offices and DNR regionaloffices. The Wisconsin StateLaboratory of Hygiene providesinexpensive nitrate and bacteriatesting. For information, contact theState Laboratory, 465 Henry Mall,Madison, WI 53706, 608/262-6303. In addition, the lab provides aninexpensive scan for atrazine (a common agricultural herbicide).For information call 1/800/334-1641.
Water test interpretation:County Extension offices, DNRregional offices, county healthdepartments.
Well constructors report:Available from the WisconsinGeological and Natural HistorySurvey (WGNHS), 608/262-7430and from DNR regional offices.
Well inspection: Licensed welldrillers and pump installers.
Well compensation fund: Insome circumstances the state willhelp pay for the cost of installing anew well or reconstructing anexisting well. Contact DNR regionaloffices for more information.
Toxicity of watercontaminants: WisconsinDepartment of Health and FamilyServices: 608/266-0923 or 608/266-7480.
EPA Safe Drinking Waterhotline: 1/800-426-4791
DNR regional drinking waterofficesNortheast Region 414/492-5800Northern Region—Rhinelander715/365-8900
Northern Region—Spooner715/635-2101
South Central Region 608/275-3266Southeast Region 414/263-8500West Central Region 715/839-3700
Copyright © 2004 by the Board of Regents of the University of Wisconsin System doing business as the division of Cooperative Extensionof the University of Wisconsin–Extension. All rights reserved. Send copyright inquiries to Cooperative Extension Publishing, Rm. 103, 432 N. Lake St., Madison, WI 53706.
Authors: Christine Mechenich was formerly a groundwater education specialist with the Central Wisconsin Groundwater Center,College of Natural Resources, University of Wisconsin–Stevens Point and the University of Wisconsin–Extension, Cooperative Extension.Elaine Andrews is an environmental education specialist with the Environmental Resources Center, University of Wisconsin–Madison andthe University of Wisconsin–Extension, Cooperative Extension.
Produced by Cooperative Extension Publishing, University of Wisconsin–Extension.
An EEO/AA employer, the University of Wisconsin–Extension, Cooperative Extension provides equal opportunities in employment andprogramming, including Title IX and Americans with Disabilities (ADA) requirements.
This publication is available from your Wisconsin county Extension office or from Cooperative Extension Publishing. To order, call toll-free: 1-877-WIS-PUBS (947-7827) or visit our web site: cecommerce.uwex.edu.
Home Water Safety: Interpreting Drinking Water Test Results (G3558-4) RP/09-2004

Appendix C
For Official Use Only
Soil Boring Logs and Well Construction Reports