Interaction of divalent cations with peptide fragments from Parkinsons disease genes
Upload
uomustansiryahCategory
view
0download
0
J Solution Chem (2012) 41:793–803DOI 10.1007/s10953-012-9830-7
Protonation Equilibria of Carminic Acid and StabilityConstants of Its Complexes with Some Divalent MetalIons in Aqueous Solution
Hasan Atabey · Hayati Sari · Faisal N. Al-Obaidi
Received: 26 April 2011 / Accepted: 25 August 2011 / Published online: 28 April 2012© Springer Science+Business Media, LLC 2012
Abstract The dissociation constants of carminic acid (7-D-glucopyronosyl-3,5,6,8-tetra-hydroxy-1-methyl-9,10-dioxo-anthracene-2-carboxylic acid) (CA), together with the stabil-ity constants of its Cu(II), Zn(II), Ni(II), Co(II) and Hg(II) complexes, were studied potentio-metrically in aqueous medium at 25.0 (1) °C, and at the ionic background of 0.1 mol·dm−3
of NaCl, and determined with the SUPERQUAD computer program. It has been observedthat carminic acid has five dissociation constants, and for H5L their values are 3.39 (7),5.78 (7), 8.35 (7), 10.27 (7), and 11.51 (7). This ligand behaves as a bi-dentate ligand, andthe carboxyl and the ortho hydroxy groups of the ligand coordinate to the metal ions. Vari-ous metal complexes were produced in solution under the experimental conditions, for eachmetal ion used, including hydrolyzed species. The species distribution curves of the com-plexes formed in the solution were calculated and reviewed. The stability of the complexeswas found to follow the order: Cu(II) > Zn(II) > Ni(II) > Co(II) > Hg(II).
Keywords Carminic acid · Potentiometric titration · Stability constant · Protonationconstant · SUPERQUAD
1 Introduction
Carminic acid is produced naturally by a scale insect called cochineal (Doctylopius coccuscosta); this insect is native to the tropical and subtropical parts of South America and Mex-ico. Carminic acid (CA, see Fig. 1) can be extracted from the insect’s dried body and eggs,which is used to produce carmine dye through the addition of aluminum or calcium [1].Carmine is widely used as a natural coloring food additive, which has been approved by theFood and Agriculture Organization (FAO) and World Health Organisation (WHO) expert’s
H. Atabey · H. Sari (�)Science and Arts Faculty, Chemistry Department, Gaziosmanpasa University, 60250, Tokat, Turkeye-mail: [email protected]
F.N. Al-ObaidiDepartment of Chemistry, College of Science, The University of Mustansiriya, Baghdad, Iran

794 J Solution Chem (2012) 41:793–803
Fig. 1 Chemical structures ofCA
committee [2], as well as being used in drugs and cosmetics [3]. Several techniques havebeen used to monitor and identify the amount of (CA) in foodstuff [4–6]. It has been re-cently found that (CA) posses antitumor properties [7, 8], which reflects the importance ofthis compound. Other applications have been found for (CA) such as an indicator in acid–base titrations and the spectrophotometric determination of certain transition metal ions [9,10], lanthanides metal ions [11], gallium(III) [12], and boron [13], and it has other analyt-ical applications [14–17]. (CA) complexes also have applications in medicinal chemistry[18–20].
The aim of this work is to investigate the coordination properties and determine the dis-sociation constants of carminic acid, as well as the stability constants of its complexes withCu(II), Ni(II), Zn(II), Co(II) and Hg(II), using the SUPERQUAD computer program [21].Two sets of constants were obtained which represent the dissociation constants of the ligandand its stability constants with these divalent ions in aqueous solution at 25.0 (1) °C. Severalcomplex species are formed in the solutions under the experimental conditions used, and arediscussed in detail through species distribution curves created from the experimental data.
2 Experimental
2.1 Apparatus and Materials
All of the transition metal salts and NaCl used in this research were purchased from Merck,potassium hydrogen phthalate (KHP) from Fluka, CA (≥ 96 %), and 0.1 mol·dm−3 NaOHand 0.1 mol·dm−3 HCl as standard from Aldrich. All reagents were of analytical quality andwere used without further purification. Solutions of metals ions (2 × 10⁻³ mol·dm−3) wereprepared from CuCl2, ZnCl2, NiCl2·6H2O, CoCl2 and HgCl2 and then standardized withethylenediaminetetraacetic acid (EDTA) [22].
A 0.05 mol·kg−1 potassium hydrogen phthalate (KHP) was prepared for calibration ofthe electrode. A 2 × 10⁻³ mol·dm−3 solution of CA in water was prepared and used in theexperiments. The NaOH solution was standardized with primary standard KHP solution bypH-metric titration. The solution in the cell was purged with nitrogen (99.9 %) to main-tain an inert atmosphere. A 1.0 mol·dm−3 NaCl stock solution was prepared and dilutedto 0.1 mol·dm−3, which was used as ionic background to maintain constant ionic strength.CO2-free double-distilled deionized water was used throughout all the experiments; it hadbeen prepared using an aqua MAXTM-Ultra water purification system (Young Lin Inst.); itsresistivity was 18.2 M�·cm−1. pH-metric titrations were performed using the Molspin pHmeterTM with an Orion 8102BNUWP ROSS ultra combination pH electrode.
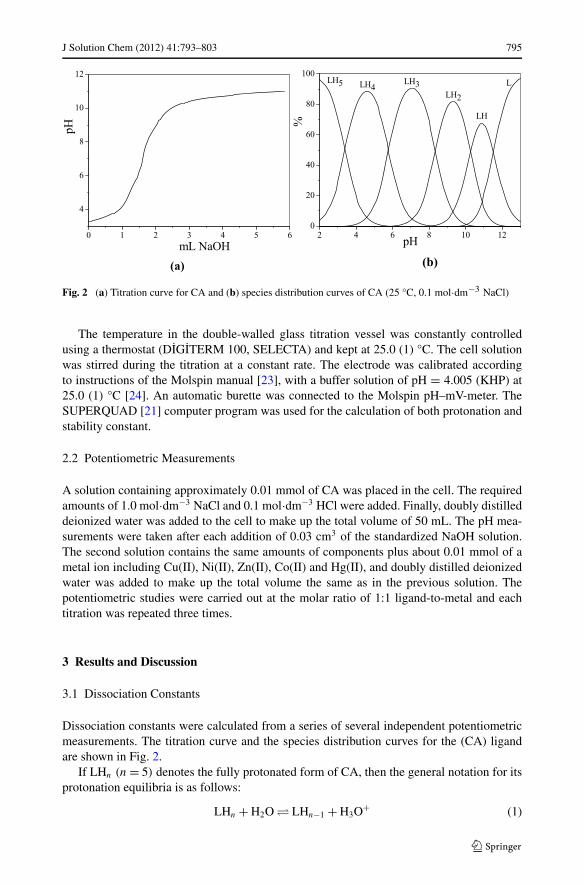
J Solution Chem (2012) 41:793–803 795
Fig. 2 (a) Titration curve for CA and (b) species distribution curves of CA (25 °C, 0.1 mol·dm−3 NaCl)
The temperature in the double-walled glass titration vessel was constantly controlledusing a thermostat (DIGITERM 100, SELECTA) and kept at 25.0 (1) °C. The cell solutionwas stirred during the titration at a constant rate. The electrode was calibrated accordingto instructions of the Molspin manual [23], with a buffer solution of pH = 4.005 (KHP) at25.0 (1) °C [24]. An automatic burette was connected to the Molspin pH–mV-meter. TheSUPERQUAD [21] computer program was used for the calculation of both protonation andstability constant.
2.2 Potentiometric Measurements
A solution containing approximately 0.01 mmol of CA was placed in the cell. The requiredamounts of 1.0 mol·dm−3 NaCl and 0.1 mol·dm−3 HCl were added. Finally, doubly distilleddeionized water was added to the cell to make up the total volume of 50 mL. The pH mea-surements were taken after each addition of 0.03 cm3 of the standardized NaOH solution.The second solution contains the same amounts of components plus about 0.01 mmol of ametal ion including Cu(II), Ni(II), Zn(II), Co(II) and Hg(II), and doubly distilled deionizedwater was added to make up the total volume the same as in the previous solution. Thepotentiometric studies were carried out at the molar ratio of 1:1 ligand-to-metal and eachtitration was repeated three times.
3 Results and Discussion
3.1 Dissociation Constants
Dissociation constants were calculated from a series of several independent potentiometricmeasurements. The titration curve and the species distribution curves for the (CA) ligandare shown in Fig. 2.
If LHn (n = 5) denotes the fully protonated form of CA, then the general notation for itsprotonation equilibria is as follows:
LHn + H2O � LHn−1 + H3O+ (1)
796 J Solution Chem (2012) 41:793–803
Table 1 Dissociation constants of CA in the literature and this work (25 °C, 0.1 mol·dm−3 NaCl)
pKa1 pKa2 pKa3 pKa4 pKa5 References
2.91 5.62 8.3 [24]
2.81 5.43 8.1 [25]
2.9 5.31 8.85 ∼ 12.37 [23]
3.39 (7) 5.78 (7) 8.35 (7) 10.27 (7) 11.51 (7) This work
Table 2 Charges of oxygenatoms in different positions Atom Charge (Hückel)
(Carboxyl group in 2 position) O −0.1553
(Hydroxyl group in 5 position) O −0.3556
(Hydroxyl group in 6 position) O −0.3612
(Hydroxyl group in 8 position) O −0.3671
(Hydroxyl group in 3 position) O −0.3682
In each stage, one proton dissociates. The dissociation constants (Kn; n = 1–5) are given by
Kn = [LHn−1][H3O][LHn] (2)
Potentiometric titrations of the ligand indicate five deprotonation steps, which are repre-sented by five dissociation constants {see Table 1 and Fig. 2(a)}, the measured pKa values inthis paper are in accordance with literature values [25–27] (see Table 1), and the dissociationconstants of similar ligands are shown in Table 3 for the sake of comparison.
The ChemBio3D ultra computer program was used to calculate the charge on the oxygenatoms (carboxyl group and hydroxy groups) (see Table 2).
This calculation will assist in understanding the dissociation sequence of the ionizablegroups in the ligand molecule, and also to assess the coordination sites, as oxygen atomshaving a higher charge are more favorable for coordination with a metal ion. The partialcharge reflects the extent of basicity of the oxygen atom in the group. The ligand containsone acidic carboxyl group and four ionizable hydroxy groups in positions 3, 5, 6 and 8, andthe enhancement of carboxylic acidity is due to the inductive effect of the neighboring hy-droxy group [27]. The oxygen atom of the hydroxy group located in position 3 is more basicthan the rest of the ionizable hydroxy groups (see Table 1). This information is essential incomplying with the IUPAC technical report [28] about the proton and metal ion stabilityconstants of the ortho-hydroxy-carboxylic acid complexes. So clearly, in the free ligand, thehydroxyl group in position 3 will dissociate last (with pKa5 = 11.51). The second dissoci-ation step, after the dissociation of the carboxylic group, is the hydroxy group in position5 with pKa2 = 5.78, followed by the dissociation of the hydroxy group in position 6 withpKa3 = 8.35, and pKa4 represents the dissociation constant of the hydroxy group in position8 and it has the value 10.27.
Accordingly, it can be assumed that the coordination of (CA) with the metal ion occursvia the carboxylic group and the hydroxy group in position 3 to form complexes. Intra-hydrogen bonding between the hydrogen of the carboxylic group and the oxygen of thehydroxy group in position 3 is expected to take place within the ligand molecule in solution.The low dissociation constant of the carboxylic group in the (CA) will encourage intra-hydrogen bonding, but it is not expected that such bonding will cause significant obstruction
J Solution Chem (2012) 41:793–803 797
Table 3 pKa values of similar ligands that include –COOH and –OH in similar positions
Ligands pKa values
–COOH –OH –OH
a TPAT [29] pKa1 = 2.65 pKa6 = 9.30
pKa2 = 3.36 pKa7 = 10.42
pKa3 = 4.08 pKa8 = 10.53
pKa4 = 5.43
Gallic acid [29] pKa1 = 4.55 pKa2 = 8.80 pKa3 = 10.44
Protocatechuic acid [30] pKa1 = 4.62 pKa2 = 8.90 pKa3 = 10.73
a TPAT: 1,4,5,8-tetrahydroxy-9-oxo-10-pentyl-9,10-dihydro-acridine-2,3,6,7-tetracarboxylic acid
to the coordination of the ligand with the metal ion. Rather, this is due to the weakness ofthis bonding (50 kJ·mol−1 or less) [31]. Ligands possessing carboxylic and hydroxy groupsare included in Table 3 for the sake of comparison [29].
3.2 Stability Constants
The stability constants of binary complexes of carminic acid with some divalent metal ionsin aqueous solution were determined by use of the SUPERQUAD computer program.
The cumulative stability constants (βmlh) are defined by Eqs. 3 and 4:
mM + lL + hH � MmLlHh (3)
βmlh = [MmLlHh][M]m[L]l[H]h (4)
where M denotes the metal ion, L the ligand, H the proton and m, l and h are the respec-tive stoichiometric coefficients. Figure 3 represents the metal–ligand titration curves for theCu(II), Ni(II), Zn(II), Co(II) and Hg(II) complexes. Comparing the titration curve of thefree ligand (Fig. 2) with those of the complexed ligand shows that addition of the metal ionto the free ligand solution of the complexes shifts the curve to lower pHs. In other words,the curves of the complexes are situated at lower pHs than the free ligand curve as theyrequired more alkali to have the same pH as the free ligand. This can be explained simplyas a result of proton release from the coordinated ligand, which implies complex formation.The amount of protons released depends of the strength on the metal–ligand bond. In otherwords, the extent of variation in the pH of the complex titration curve, compared to the freeligand titration curve, depends on the individual metal ion. There is a resemblance in shapebetween the protonation curve and complex titration curves but they differ in the pH span.
The coordination of (CA) to the metal ion was assumed to occur through the carboxylicgroup and the nearby hydroxy group. This is based on the implication that the hydroxygroup in position 3 is more basic than the others, in addition to enhancing coordination viathe carboxylic group, where the ligand acts as a bi-dentate. Coordination through hydroxygroups in position 5 and 6 is less likely due to the weak basicity of these hydroxy groupsin comparison with hydroxy group in position 3, and because of steric hindrance introducedby the D-glucopyronosyl group. Coordination through the hydroxy group in position 8 turnsthe (CA) into a mono-dentate ligand, and this is unlikely to happen as long as (CA) canbehave as a bi-dentate ligand through other coordination sites within the molecule.
Generally, the complexes that have been identified in solution are MH5L, MH4L, MH3L,MH2L, MHL, ML and M(OH)L, where H5L represents the neutral ligand. Other species

798 J Solution Chem (2012) 41:793–803
Fig. 3 Titration curves of CAwith Cu(II), Ni(II), Zn(II), Co(II)and Hg(II) (25 °C, 0.1 mol·dm−3
NaCl)
Fig. 4 Species distributiondiagram for Cu(II)–CAcomplexes (25 °C, 0.1 mol·dm−3
NaCl)
with H less than 5 are de-protonated species of the (CA) ligand, and M represents one of thefollowing metal ions Zn(II), Cu(II), Ni(II), Co(II) and Hg(II), bearing in mind that not all ofthese metal ions are capable of forming all of the above complex species.
Figure 4 shows all the species that exist in the Cu(II)–CA system; between pH < 4 topH just above 8 the main complexes existing in solution are MH3L, MH2L, and MHL. Atabout pH = 7.5, approximately 85 % of the Cu(II) occurs as MHL which forms the mainconstituent of the complex species. MH3L forms about 40 % of the total Cu(II), and itsmaximum concentration occurs at pH ∼ 5, while the maximum occurrence of MH2L (justless than 70 %) is at pH ∼ 6. In more basic solutions and at a pH just above 8, the speciesML starts to form and reaches its maximum occurrence at a pH ∼ 9.25 (forming nearly 60 %of the total Cu(II)). The final species that occurs in the Cu(II)–CA system is the complexM(OH)L (hydrolyzed species), which occurs in appreciable amounts at pHs above 9.5, asa result of the dissociation of water molecules in the inner sphere of the Cu(II) metal ion.This hydrolyzed species becomes a major complex just above pH = 10. Cu(II)L is morestable than the other M(II)L complexes considered in this research, and this (see Table 4) is

J Solution Chem (2012) 41:793–803 799
Table 4 Overall stability constants in the M(II)–CA system (25 °C, 0.1 mol·dm−3 NaCl)
Metal m h l log10 β
Cu2+ 1 0 1 15.80 (3)
1 1 1 24.55 (4)
1 2 1 31.22 (4)
1 3 1 36.44 (4)
1 4 1 40.46(6)
1 −1 1 6.10 (7)
Ni2+ 1 0 1 14.65 (6)
1 1 1 24.13 (5)
1 2 1 31.09 (5)
1 3 1 36.85 (4)
Zn2+ 1 0 1 15.17 (5)
1 1 1 24.74 (3)
1 2 1 31.72 (5)
1 3 1 37.75 (5)
1 4 1 41.11 (6)
Co2+ 1 0 1 13.98 (8)
1 1 1 23.01 (2)
1 2 1 30.15 (3)
1 3 1 36.69 (3)
1 4 1 42.07 (4)
1 5 1 45.35 (5)
1 −1 1 3.52 (3)
Hg2+ 1 0 1 13.76 (5)
1 1 1 22.67 (4)
1 2 1 31.97 (1)
1 3 1 40.18 (3)
1 4 1 45.99 (4)
1 5 1 49.37 (6)
1 −1 1 3.43 (4)
in accordance with the Irving–William series [32]. Strong metal–ligand bonding can resultin the dissociation and formation of the above hydrolyzed species, as such coordinationenhances dissociation via electron withdrawing towards the coordination center, therebyreleasing protons from the partially complexed metal ion [32, 33].
A variety of Ni(II)–CA complexes are formed in solution over a wide range of pH (seeFig. 5). Four different species exist within the pH span of pH = 3.75 up to pH just above10. Ni(II)H3L is almost the only complex species formed at early stages and up to pH = 5,where it reaches a maximum occurrence of about 70 %, and it persists over the whole acidicregion up to pH = 6.5. The other species present in addition to the above mentioned oneis Ni(II)H2L, which forms at about 65 % at pH = 6.25. In basic solutions and at pH = 7,Ni(II)HL starts to form to a considerable degree and it is the only significant species present

800 J Solution Chem (2012) 41:793–803
Fig. 5 Species distributiondiagram for Ni(II)–CAcomplexes (25 °C, 0.1 mol·dm−3
NaCl)
Fig. 6 Species distributiondiagram for Zn(II)–CAcomplexes (25 °C, 0.1 mol·dm−3
NaCl)
between pH = 7.5 to 8.5 and reaches its maximum availability at pH = 8.25 where it isforms about 85 % of the complexes. The Ni(II)L is the final species that forms above pH = 9and it is dominant in the solution at pH just above 10.
Zn(II)–CA complexes exist in solution in different forms, as in the case of the previousmetal complexes (see Fig. 6). Complexes start to form at even lower pHs than for the Ni(II)and Cu(II) systems. A small amount of Zn(II)H4L forms in the solutions with a maximumamount of about 25 % at pH = 3.25, while at this pH the other species Zn(II)H3L occurs atalmost the same percentage. The amount of the latter species increases rapidly and reachesup to 85 % at pH = 4.75, but disappears at just below pH = 7. The Zn(II)H2L complexexists in both acidic and basic media from pH = 5.5 to pH = 7.5 and occurs at about 60 %of the total metal ion concentration at pH = 6.5. About 90 % of the Zn(II) ion is in the formof Zn(II)HL at pH = 8.5.
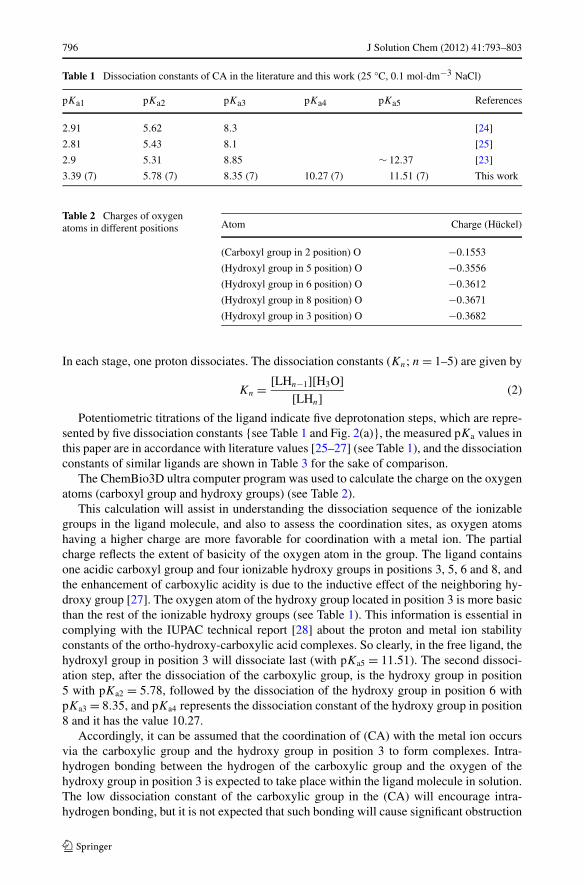
Co(II) ion is capable forming all of the possible species which might be expected asa result of coordination and dissociation processes between CA and the metal ion (seeFig. 7). Coordination with the ligand starts at a relatively low pHs, as low as pH = 2, to
J Solution Chem (2012) 41:793–803 801
Fig. 7 Species distributiondiagram for Co(II)–CAcomplexes (25 °C, 0.1 mol·dm−3
NaCl)
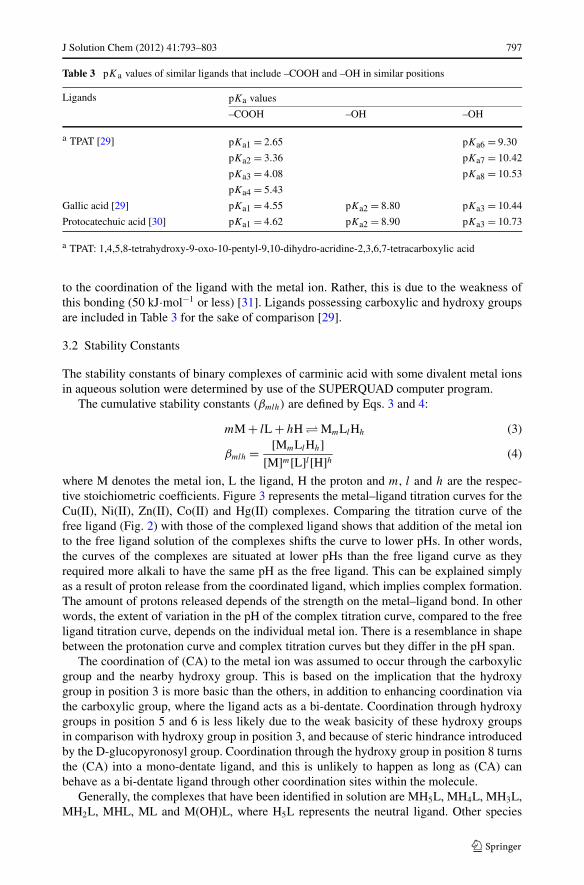
Fig. 8 Species distributiondiagram for Hg(II)–CAcomplexes (25 °C, 0.1 mol·dm−3
NaCl)
form Co(II)H5L which then disappears at pH = 4; this complex is stable and present inan appreciable amount over a narrow pH range. Co(II)H5L forms at higher pHs and, asa result of dissociation of the proton of the carboxylic and/or hydroxy groups, forms theCo(II)H4L and Co(II)H3L complexes. All three complexes indicated above, together withthe Co(II)H2L complex, coexist in the acidic pH range with maximum availability of 75 %at pH just above 2, 75 % at pH = 4.25, approximately 60 % at pH = 6, and 50 % at pH justless than 7, for Co(II)H5L, Co(II)H4L, Co(II)H3L and Co(II)H2L, respectively. The mainspecies in the solution from pH = 3.5 to pH = 5.25 is Co(II)H4L. Turning to basic condi-tions, another two species form in considerable amounts from pHs just above 7 to pH = 10.5,and these are Co(II)HL (with a maximum occurrence of 80 % at pH = 8.25) and Co(II)L(with a maximum occurrence of 70 % at pH = 9.75). The Co(II)(OH)L species forms atsignificantly higher pHs (above 10.5). Formation of this hydrolyzed species is due to disso-ciation of water molecules attached to partially complexed metal ions in basic medium, as aresult of the tendency of the hydrated metal ion towards dissociation [32, 33].

802 J Solution Chem (2012) 41:793–803
The Hg(II)–CA complex was considered in this study to reveal the full extent of thecoordination properties of the (CA) ligand (see Fig. 8). The (CA) ligand, as a hard base[33], is not expected to fully interact with the soft acid Hg(II) [34]. The fact is that Hg(II)forms reasonably stable diverse complexes with the (CA) ligand. A variety of species startto appear in the solution at a very low pH, as low as just above pH = 2. The Hg(II)H5L andHg(II)H4L species form in the acidic region, and their formation spans pHs just above 2 upto pH just above 6, with a maximum formation of about 90 % at pH = 2 for the first, and atthe same percentage with a pH = 4.5 for the second complex. The other species Hg(II)H3Lforms between pH = 5 and pH = 9, and its maximum formation of 90 % occurs in theneutral region of pH = 7. Thus this species initially forms in acidic medium and persistsup to the relatively high pH = 9. The other four species form in basic medium from pHjust above 7 to pH < 12. The Hg(II)H2L species start to form at pH = 7 and decreases atpH = 10 with a maximum occurrence of 60 % at pH = 8.75. The Hg(II)HL species existsin very low concentrations and presents its maximum amount of less than 20 % at pH = 9.The Hg(II)L species forms between pH = 9.25 and 11 with its highest percentage of 65 %at pH = 9.75. Hydrolyzed species develop in solution at pH = 10 and reach their highestlevel above pH = 11.5.
4 Conclusion
In the present paper, dissociation and stability constants of the complexes of (CA) formedwith the divalent metal ions Cu(II), Ni(II), Zn(II), Co(II) and Hg(II) have been studied poten-tiometrically in aqueous solution at 0.1 mol·dm−3 ionic strength and at 25.0±0.1 °C, using aglass electrode. The dissociation constants and overall stability constants were calculated us-ing SUPERQUAD. Dissociation constants of (CA) were determined to be pKa1 = 3.39 (7),pKa2 = 5.78 (7), pKa3 = 8.35 (7), pKa4 = 10.27 (7), and pKa5 = 11.51 (7). These pKa val-ues are similar to values found in the literature. The dissociation constants and overall stabil-ity of their metal complexes were calculated through computer refinement of the pH-titrationversus volume data and the results are presented in Tables 1–4. The stability of the ML com-plexes of the divalent metal ions follows the order Cu2+ > Zn2+ > Ni2+ > Co2+ > Hg2+.
Acknowledgements The authors gratefully acknowledge the financial support of this work by ScientificResearch Council of Gaziosmanpasa University.
References
1. Meloan, S.N., Valentine, L.S., Puchtler, H.: On the structure of carminic acid and carmine. Histochemie27, 87–95 (1971)
2. Twenty first report of the joint FAO/WHO expert committee on food additives. World Health Organiza-tion Technical Report Series No. 617 (1977)
3. Panadero, S., Gomez-Hens, A., Perez-Bendito, D., Fresenius, J.: Kinetic determination of carminic acidby its inhibition of lanthanide-sensitized luminescence. Anal. Chem. 357, 80–83 (1997)
4. Carvelho, P.R.N., Collins, C.H.: HPLC determination of carminic acid in foodstuffs and beverages usingdiode array and fluorescence detection. Chromatographia 45, 63–66 (1997)
5. Lech, K., Jarosz, M.: Novel methodology for the extraction and identification of natural dyestuffs inhistorical textiles by HPLC–UV–Vis–ESI MS. Anal. Bioanal. Chem. 399, 3241–3251 (2011)
6. Rosenberg, E.: Characterisation of historical organic dyestuffs by liquid chromatography–mass spec-trometry. Anal. Bioanal. Chem. 391, 33–57 (2008)
7. Mihail, N., Craciun, C.: Effect of cochenille on Jensen tumors. Naturwessenschaften 57, 500–506 (1970)8. Harada, M.: Survey of Compounds which Have Been Tested for Carcinogenic Activity, 2nd edn., pp. 18–
136. U.S. Department of Health and Human Services (1951), cited by Hartwell

J Solution Chem (2012) 41:793–803 803
9. Tutem, E.: The complex forming ability of carminic acid with Fe2+, Fe3+ and Mn2+ ions. PhD Thesis,Istanbul University, Engineering Faculty, Istanbul, Turkey (1985)
10. Kirkbright, G.F., West, T.S., Woodward, C.: Carminic acid as a reagent for the spectrofluorimetric deter-mination of molybdenum and tungsten—I. Development of procedures. Talanta 13, 1637–1644 (1966)
11. López-Martinez, L., Guzman-Mar, J.L., Lopez-de Alba, P.L.: Simultaneous determination of ura-nium(VI) and thorium(IV) ions with carminic acid by bivariate calibration. J. Radioanal. Nucl. Chem.247, 413–417 (2001)
12. Filik, H., Tutem, E., Apak, R., Ercag, E.: Spectrophotometric determination of gallium(III) with carminicacid and hexadecylpyridinium chloride. Mikrochim. Acta 129, 57–63 (1998)
13. Callicoat, D.L., Wolszon, J.D.: Carminic acid procedure for determination of boron. Anal. Chem. 31,1434–1437 (1959)
14. El-Mosellhya, M.M., Senguptab, A.K., Smith, R.: Carminic acid modified anion exchanger for the re-moval and preconcentration of Mo(VI) from wastewater. J. Hazard. Mater. 185, 442–446 (2011)
15. Samaria, F., Hemmateenejada, B., Shamsipur, M.: Spectrophotometric determination of carminic acid inhuman plasma and fruit juices by second order calibration of the absorbance spectra—pH data matricescoupled with standard addition method. Anal. Chim. Acta 667, 49–56 (2010)
16. Nagaraj, P., Prakash, J.S., Shivakumar, A., Shrestha, A.K.: Sensitive spectrophotometric methods for theassessment of nitrite in water sample. Environ. Monit. Assess. 147, 235–241 (2008)
17. Manzoori, J.L., Sorouraddin, M.H., Amjadi, M.: Spectrophotometric determination of osmium based onits catalytic effect on the oxidation of carminic acid by hydrogen peroxide. Talanta 53, 61–68 (2000)
18. Jamison, J.M., Flowers, D.G., Jamison, E., Kitareewan, S., Krabill, K., Rosenthal, K.S., Tsai, L.: En-hancement of the antiviral and interferon-inducing activities of poly r(A-U) by carminic acid. Life Sci.42, 1477–1483 (1988)
19. Loprienoa, G., Boncistiania, G., Lopienoa, N.: Genotoxicity studies in vitro and in vivo on carminic acid(natural red 4). Food Chem. Toxicol. 30, 759–764 (1992)
20. Tutem, E., Apak, R., Sozgen, K.: Spectrophotometric investigation of the interaction of carminic acidand mitoxantrone with the iron(II, III) and copper(I, II) redox couples. J. Inorg. Biochem. 61, 79–96(1996)
21. Gans, P., Sabatini, A., Vacca, A.: SUPERQUAD: an improved general program for computation of for-mation constants from potentiometric data. J. Chem. Soc., Dalton Trans. 6, 1195–1200 (1985)
22. Jeffery, G.H., Bassett, J., Mendham, J., Denney, R.C.: Vogel’s Textbook of Quantitative Chemical Anal-ysis, 5th edn. Longman, London (1989)
23. Pettit, L.D.: Academic Software, Sourby Farm, Timble, Otley, LS21 2PW, UK (1992)24. IUPAC recommendations measurement of pH definition, standards, and procedures. Pure Appl. Chem.
74, 2169–2200 (2002)25. Schwing-Weil, M.J., Wechsler, S.: Spectrophotometric study of carminic acid in solution. Analusis 14,
290–295 (1986)26. Jorgensein, K., Skibsted, L.H.: Light sensitivity of cochineal. Quantum yields for photodegradation of
carminic acid and conjugate bases in aqueous solution. Food Chem. 40, 25–34 (1991)27. Favaro, G., Milliani, C., Romania, A., Bagnini, M.: Role of protolytic interactions in photo-aging pro-
cesses of carminic acid and carminic lake in solution and painted layers. J. Chem. Soc. 2, 192–197(2002)
28. Lajunen, L.H., Portonova, R., Piispanen, J., Tolazzi, M.: Stability constants for alpha-hydrocarboxylicacid complexes with protons and metal Ions and the accompanying enthalpy changes. Part I—Aromaticortho-hydrocarboxylica acids. Pure Appl. Chem. 69, 329–381 (1997)
29. Ibaoglu, K., Sari, H., Tuzen, M., Mendil, D., Soylak, M.: Potentiometric determination of pKa val-ues of 1,4,5,8-tetrahydroxy-9-oxo-10-pentyl-9,10-dihydroacridine-2,3,6,7-tetracarboxylic acid (TPAT)extracted from Laurus nobilis. Chem. Anal. (Warsaw) 49, 635–642 (2004)
30. Beltran, J.L., Sanli, N., Fonrodona, G., Barron, D., Özkan, G., Barbosa, J.: Spectrophotometric, poten-tiometric and chromatographic pKa values of polyphenolic substances in water and acetonitrile–watermedia. Anal. Chim. Acta 484, 253–264 (2003)
31. Huheey, J.E., Keiter, E.A., Keiter, R.L.: Inorganic Chemistry, Principles of Structure and Reactivity,4th edn. Harper Collins College, New York (1993)
32. Irving, H., Williams, R.J.P.: The stability of transition-metal complexes. J. Chem. Soc. 156, 3192–3210(1953)
33. Burgess, J.: Metal Ion in Solution. Horwood/Wiley, Chichester (1978)34. Al-Obaidi, F.N., Sari, H., Macit, M.: Potentiometric study of the coordination tendency of 1,2-bis(4-
benzylpiperidine)glyoxime toward some transition metal ions. J. Chem. Eng. Data 55, 5576–5580(2010)
Copyright © 2022 FDOKUMEN