Postmitotic Specification of Drosophila Insulinergic Neurons from Pioneer Neurons
Upload
independentCategory
view
1download
0
Jami et al. BMC Neuroscience 2014, 15:93http://www.biomedcentral.com/1471-2202/15/93
RESEARCH ARTICLE Open Access
Proteome analysis reveals roles of L-DOPA inresponse to oxidative stress in neuronsMohammad-Saeid Jami1,4, Ramavati Pal1, Esthelle Hoedt2, Thomas A Neubert2, Jan Petter Larsen3
and Simon Geir Møller1,3*
Abstract
Background: Parkinson’s disease (PD) is the second most common neurodegenerative movement disorder, causedby preferential dopaminergic neuronal cell death in the substantia nigra, a process also influenced by oxidativestress. L-3,4-dihydroxyphenylalanine (L-DOPA) represents the main treatment route for motor symptoms associatedwith PD however, its exact mode of action remains unclear. A spectrum of conflicting data suggests that L-DOPAmay damage dopaminergic neurons due to oxidative stress whilst other data suggest that L-DOPA itself may inducelow levels of oxidative stress, which in turn stimulates endogenous antioxidant mechanisms and neuroprotection.
Results: In this study we performed a two-dimensional gel electrophoresis (2DE)-based proteomic study to gainfurther insight into the mechanism by which L-DOPA can influence the toxic effects of H2O2 in neuronal cells. Weobserved that oxidative stress affects metabolic pathways as well as cytoskeletal integrity and that neuronal cellsrespond to oxidative conditions by enhancing numerous survival pathways. Our study underlines the complexnature of L-DOPA in PD and sheds light on the interplay between oxidative stress and L-DOPA.
Conclusions: Oxidative stress changes neuronal metabolic routes and affects cytoskeletal integrity. Further, L-DOPAappears to reverse some H2O2-mediated effects evident at both the proteome and cellular level.
Keywords: Parkinson’s disease, Oxidative stress, Dopamine, Proteomics
BackgroundParkinson’s disease (PD) is the second most common neu-rodegenerative movement disorder, affecting approxi-mately 1% of individuals older than 60 years [1]. Theoccurrence of PD will most likely double within the nexttwo decades due to an increase in the aging population[2]. PD is caused by preferential dopaminergic neuronalcell death in the substantia nigra, resulting in a reducedlevel of dopamine in the striatum. By the time of clinicaldiagnosis this region of the brain has irreversibly lost 50–70% of its neurons compared to unaffected individuals [3].Despite PD being a complex and multifactorial disease,oxidative stress and mitochondrial dysfunction arethought to be major causes of neurodegeneration in PD[4]. In both idiopathic and genetic PD, oxidative stress isthought to be a common denominator and the substantia
* Correspondence: [email protected] of Biological Sciences, St John’s University, New York, NY, USA3The Norwegian Centre for Movement Disorders, Stavanger UniversityHospital, Stavanger, NorwayFull list of author information is available at the end of the article
© 2014 Jami et al.; licensee BioMed Central LtCommons Attribution License (http://creativecreproduction in any medium, provided the orDedication waiver (http://creativecommons.orunless otherwise stated.
nigra of PD subjects exhibit increased levels of oxidizedlipids [5], proteins and DNA [6] and decreased levels ofreduced glutathione (GSH) [7].L-3,4-dihydroxyphenylalanine (L-DOPA) remains the
most common PD medication as it is converted into dopa-mine in dopaminergic neurons temporarily relieving motorsymptoms. Despite its widespread use there is clear contro-versy in the field. Pre-clinical in vivo studies have shownthat L-DOPA can damage dopaminergic neurons due tooxidative stress and perhaps through other mechanisms[8,9]. Studies have shown that direct intraniagral infusion ofL-DOPA in rats results in reduced dopaminergic neuronnumbers [10] whilst other studies have demonstrated thatL-DOPA increases the levels of nitric oxide in the substan-tia nigra and striatum [11,12]. In contrast, many in vitrostudies have shown that L-DOPA may be neuroprotectivethrough decreased lipid peroxidation [13,14]. Furthermore,studies have indicated that L-DOPA can act as a neuropro-tective agent reducing toxicity evoked by stronger oxidants[15]. Indeed, whether L-DOPA is neurotoxic, or has little to
d. This is an Open Access article distributed under the terms of the Creativeommons.org/licenses/by/2.0), which permits unrestricted use, distribution, andiginal work is properly credited. The Creative Commons Public Domaing/publicdomain/zero/1.0/) applies to the data made available in this article,
Jami et al. BMC Neuroscience 2014, 15:93 Page 2 of 11http://www.biomedcentral.com/1471-2202/15/93
no effect on dopaminergic neuron survival, still remainsunanswered [16].Despite numerous studies, the molecular interplay be-
tween oxidative stress and L-DOPA remains fragmented.In this study we have performed a two-dimensional gelelectrophoresis (2DE)-based proteomic study to gain fur-ther insight into the effects of L-DOPA in response toH2O2-mediated oxidative stress in SH-SY5Y neuronalcells. We show that L-DOPA influences proteome changesin response to oxidative stress leading to a lowering of re-active oxygen species (ROS) and increased cell survival in-dicative of a role in neuronal cell protection.
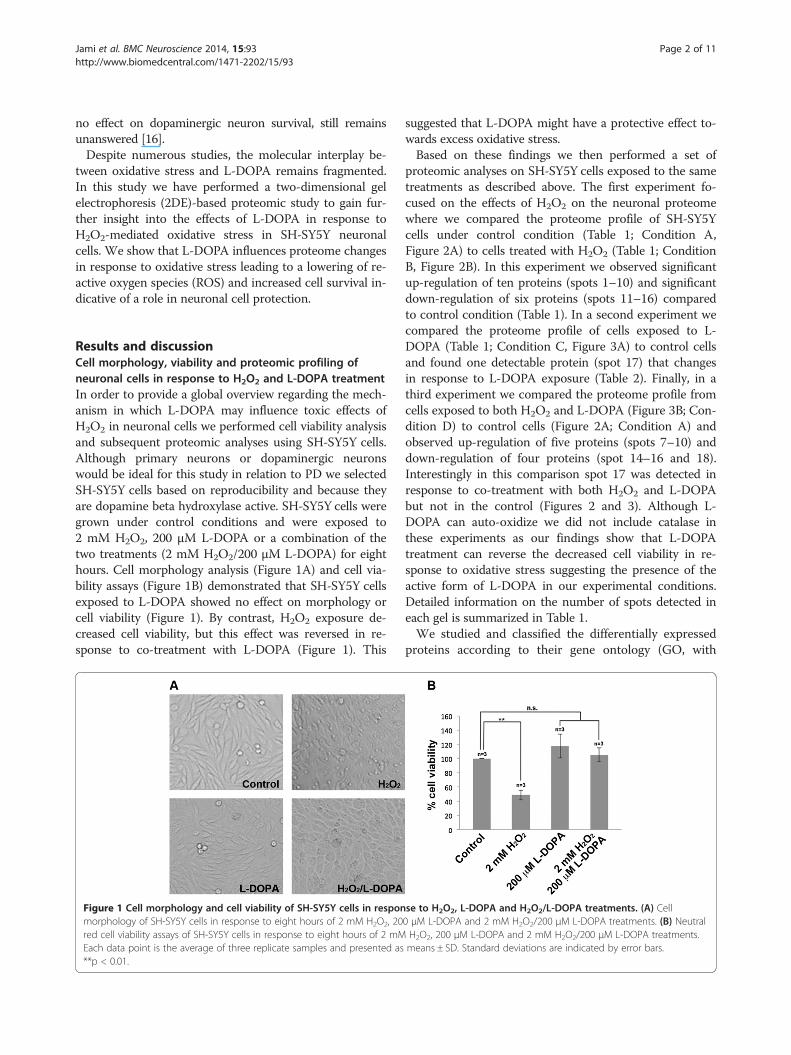
Results and discussionCell morphology, viability and proteomic profiling ofneuronal cells in response to H2O2 and L-DOPA treatmentIn order to provide a global overview regarding the mech-anism in which L-DOPA may influence toxic effects ofH2O2 in neuronal cells we performed cell viability analysisand subsequent proteomic analyses using SH-SY5Y cells.Although primary neurons or dopaminergic neuronswould be ideal for this study in relation to PD we selectedSH-SY5Y cells based on reproducibility and because theyare dopamine beta hydroxylase active. SH-SY5Y cells weregrown under control conditions and were exposed to2 mM H2O2, 200 μM L-DOPA or a combination of thetwo treatments (2 mM H2O2/200 μM L-DOPA) for eighthours. Cell morphology analysis (Figure 1A) and cell via-bility assays (Figure 1B) demonstrated that SH-SY5Y cellsexposed to L-DOPA showed no effect on morphology orcell viability (Figure 1). By contrast, H2O2 exposure de-creased cell viability, but this effect was reversed in re-sponse to co-treatment with L-DOPA (Figure 1). This
Figure 1 Cell morphology and cell viability of SH-SY5Y cells in responmorphology of SH-SY5Y cells in response to eight hours of 2 mM H2O2, 20red cell viability assays of SH-SY5Y cells in response to eight hours of 2 mMEach data point is the average of three replicate samples and presented as**p < 0.01.
suggested that L-DOPA might have a protective effect to-wards excess oxidative stress.Based on these findings we then performed a set of
proteomic analyses on SH-SY5Y cells exposed to the sametreatments as described above. The first experiment fo-cused on the effects of H2O2 on the neuronal proteomewhere we compared the proteome profile of SH-SY5Ycells under control condition (Table 1; Condition A,Figure 2A) to cells treated with H2O2 (Table 1; ConditionB, Figure 2B). In this experiment we observed significantup-regulation of ten proteins (spots 1–10) and significantdown-regulation of six proteins (spots 11–16) comparedto control condition (Table 1). In a second experiment wecompared the proteome profile of cells exposed to L-DOPA (Table 1; Condition C, Figure 3A) to control cellsand found one detectable protein (spot 17) that changesin response to L-DOPA exposure (Table 2). Finally, in athird experiment we compared the proteome profile fromcells exposed to both H2O2 and L-DOPA (Figure 3B; Con-dition D) to control cells (Figure 2A; Condition A) andobserved up-regulation of five proteins (spots 7–10) anddown-regulation of four proteins (spot 14–16 and 18).Interestingly in this comparison spot 17 was detected inresponse to co-treatment with both H2O2 and L-DOPAbut not in the control (Figures 2 and 3). Although L-DOPA can auto-oxidize we did not include catalase inthese experiments as our findings show that L-DOPAtreatment can reverse the decreased cell viability in re-sponse to oxidative stress suggesting the presence of theactive form of L-DOPA in our experimental conditions.Detailed information on the number of spots detected ineach gel is summarized in Table 1.We studied and classified the differentially expressed
proteins according to their gene ontology (GO, with
se to H2O2, L-DOPA and H2O2/L-DOPA treatments. (A) Cell0 μM L-DOPA and 2 mM H2O2/200 μM L-DOPA treatments. (B) NeutralH2O2, 200 μM L-DOPA and 2 mM H2O2/200 μM L-DOPA treatments.means ± SD. Standard deviations are indicated by error bars.

Table 1 Treatment conditions of the SH-SY5Y neuronal cells
Condition Treatment regime Number of spots detectedin three gels
Spots matchedto replicates
Spots matchedto control
Figureno.
A Control 1252, 1326, 1277 1212 - 2A
B 2 mM H2O2 - 8 hours 1287, 1202, 1219 1184 1033 2B
C 200 μM L-DOPA - 8 hours 1314, 1280, 1334 1257 1191 3A
D Co-treatment with 200 μM L-DOPA and 2 mM H2O2 - 8 hours 1285, 1274, 1239 1215 1082 3B
Jami et al. BMC Neuroscience 2014, 15:93 Page 3 of 11http://www.biomedcentral.com/1471-2202/15/93
focus on biological process) through Uniprot (proteinknowledge website: http://www.uniprot.org/) and QuickGO(http://www.ebi.ac.uk/QuickGO/). Several biological pro-cesses and pathways were affected due to the treatmentconditions. For instance the majority of protein changes inresponse to oxidative stress belong to the “cell motion(GO:0006928)” category, most of which were reversed byL-DOPA co-treatment. More detailed information regard-ing the differentially expressed proteins are illustrated inFigure 4, summarized in Table 2 and discussed below.
Oxidative stress changes metabolic routesGlutathione is one of the main cellular antioxidants whichprevents damage caused by ROS [17]. The reduced formof glutathione is oxidized during the conversion of re-active H2O2 into H2O by glutathione peroxidase and theoxidized form can be reduced back to its original state viaNADPH and glutathione reductase. The main source ofNADPH in cells is through the pentose phosphate path-way (PPP, also called the phosphogluconate pathway).
Figure 2 Comparison of the proteomes of SH-SY5Y cells with or withproteomes of SH-SY5Y cells grown for 8 hours in the (A) absence or (B) proverrepresented in each condition whereas lowercase letters are used for snumbered and correspond to the proteins listed in Table 2.
We observed a dramatic decrease in the expression ofglyceraldehyde 3-phosphate dehydrogenase (GAPDH) inall conditions treated with H2O2 (spot 14 with an aver-age of 0.22 fold change compared to the control)(Table 2). GAPDH catalyzes the conversion of glyceral-dehyde 3-phosphate to D-glycerate 1,3-bisphosphate aspart of glycolysis. GAPDH also acts as reversible meta-bolic switch under oxidative stress conditions wherecells require excessive amounts of the antioxidant cofac-tor NADPH [18]. Indeed, it has been shown that oxida-tive stress causes an inactivation of GAPDH which re-routes the metabolic flux from glycolysis to the PPP[19]. This phenomenon in turn allows cells to producehigher levels of NADPH to overcome the oxidative con-ditions. Combined with our findings showing H2O2-me-diated down-regulation of GAPDH, GAPDH modulationmay have neuroprotective potential [20].Unlike GAPDH, lactate dehydrogenase (LDH, spot 7,
4.52 fold change) is up-regulated in response to H2O2
exposure (Table 2). This cytosolic enzyme, involved inoxidation-reduction, can catalyze the conversion of
out H2O2. Representative 2-DE gels (n = 3 for each treatment) of theesence of 2 mM H2O2. The uppercase letters are used for those spotspots underrepresented. The spots differentially represented are

Figure 3 Proteomes of SH-SY5Y cells exposed to L-DOPA with or without H2O2. Representative 2-DE gels (n = 3 for each treatment) of theproteomes of SHSY5Y cells grown in media containing 200 μM L-DOPA for 8 hours in the (A) absence or (B) presence of 2 mM H2O2. Theuppercase letters are used for those spots overrepresented in each condition whereas lowercase letters are used for spots underrepresented.The spots differentially represented are numbered and correspond to the proteins listed in Table 2.
Jami et al. BMC Neuroscience 2014, 15:93 Page 4 of 11http://www.biomedcentral.com/1471-2202/15/93
pyruvate to lactate in the absence of oxygen [21]. How-ever, LDH can also perform the reverse reaction in oxi-dative conditions and generate NADH.Similar to the cytosolic routes, oxidative stress impacts
the tricarboxylic acid (TCA) cycle as well as beta-oxidation of fatty acids in mitochondria. We detectedsubstantial up-regulation of fumarate hydratase (spot 1,8.27 fold increase) in response to H2O2, a member of theTCA cycle that catalyzes the reversible hydration/dehydra-tion of fumarate to malate (Table 2). The TCA cycle gen-erates NADH, which can either be used in respiration orbe converted to NADPH via nicotinamide nucleotidetranshydrogenase (NNT). Interestingly, the alteration ofmitochondrial nucleoside-diphosphate kinase (spot 6, 2.7fold increase), that catalyzes the exchange of phosphategroups between different nucleoside diphosphates, alsosupports the involvement of the TCA cycle in the oxida-tive stress response in neurons (Table 2).Our analysis also showed up-regulation of 3-Hydroxyacyl
CoA dehydrogenase (spot 2, 4.81 fold change), an oxidore-ductase enzyme involved in beta-oxidation of fatty acidscatalyzing oxidation of L-3-hydroxyacyl CoA by NAD+thus generating NADH in response to oxidative stress(Table 2).
Neurons respond to oxidative conditions by enhancingcell survival mechanismsIn the oxidative stress conditions tested we observed up-regulation of proteins involved in cell survival such asAnnexin A1, Peroxiredoxin-6 and PARK7/DJ-1 (Table 2).
Annexin A1 (spot 8, 1.88 fold) is known to be a cal-cium/phospholipid-binding protein that promotes mem-brane fusion [22]. This membrane-associated proteincan regulate proliferation and apoptosis via the NF-κBsignal transduction pathway [23,24]. Annexin A1 canalso directly improve cell survival by limiting excessivelevels of ROS during oxidative stress in plant cells. It hasbeen demonstrated that Annexin A1 from Arabidopsisthaliana (AnnAt1) is a redox sensor and displays perox-idase activity [25]. Moreover Rhee and co-workers haveshown that, Annexin I serves as a stress protein in HeLacells and that Annexins may constitute a new class ofstress proteins [26].Similarly, Peroxiredoxin-6, involved in redox regula-
tion of the cell, is highly up-regulated (spot 10, 12.7fold) in response to H2O2 exposure (Table 2). Peroxire-doxins represent antioxidants with the capacity to medi-ate signal transduction in mammalian cells [27]. Indeed,peroxiredoxin-6 can reduce H2O2 and short chain fattyacid, and phospholipid hydroperoxides [28]. Moreover,it has been reported that retinal ganglion cells over-expressing Peroxiredoxin-6 gain resistance againsthypoxia-evoked generation of ROS and ROS-inducedcellular insults by negatively regulating NF-κB-mediateddeath signaling [29].The substantial up-regulation of PARK7/DJ-1 (spot 9,
8.58 fold), involved in protecting cells against oxidativestress and cell death, is not entirely surprising (Table 2).PARK7/DJ-1 has numerous reported functions, includinganti-oxidative stress reactions, transcriptional regulation,

Table 2 Detailed information of spots up-regulated or down-regulated in each treatment condition
SpotID
ProteinID
Description Mass PI Score Proteincoverage
AVG foldchange
p-value q-value GO (Biological Process)
1 P07954 Fumarate hydratase,mitochondrial
54714 8.85 408 27.2 8.27 2.10E-03 4.68E-04 GO:0009056 ~ catabolic process, GO:0042592 ~ homeostaticprocess
2 Q16836 Hydroxyacyl-coenzyme Adehydrogenase
34613 8.76 118 21.5 4.81 3.22E-04 1.38E-03 GO:0055114 ~ oxidation reduction
3 Q9Y281 Cofilin-2 18764 7.66 113 33.1 7.4 2.75E-05 1.75E-03 GO:0030042 ~ actin filament depolymerization
4 P60981 Destrin 18852 8.14 147 26.1 5.08 1.62E-04 1.75E-03 GO:0006928 ~ cell motion, GO:0043243 ~ positive regulation ofprotein complex disassembly
5 P23528 Cofilin-1 18776 8.22 192 50.6 4.1 3.15E-03 1.99E-03 GO:0006928 ~ cell motion, GO:0043243 ~ positive regulation ofprotein complex disassembly
6 O00746 Nucleoside diphosphatekinase
17469 7.77 1024 41.4 2.7 3.71E-03 2.34E-03 GO:0009116 ~ nucleoside metabolic process
7 Q9BYZ2 L-lactate dehydrogenase A-like 6B
36817 7.62 244 29.6 4.52 1.02E-02 4.48E-03 GO:0055114 ~ oxidation reduction, GO:0006096 ~ glycolysis
8 P04083 Annexin A1 38816 6.57 142 6.62 1.88 3.49E-03 4.48E-03 GO:00070301 ~ cellular response to hydrogen peroxide,GO:0006954 ~ inflammatory response
9 Q99497 Protein DJ-1 20064 6.33 501 21.2 8.58 4.11E-04 4.48E-03 GO:0006979 ~ response to oxidative stress, GO:0042592 ~homeostatic process
10 P30041 Peroxiredoxin-6 25109 5.74 348 35.7 12.7 5.85E-04 5.26E-03 GO:0009056 ~ catabolic process, GO:0055114 ~ oxidationreduction
11 P08670 Vimentin 53754 5.06 1536 62.2 0.08 2.21E-03 5.26E-03 GO:0006928 ~ cell motion
12 P67936 Tropomyosin alpha-4 chain 28620 4.65 138 23.8 0.07 2.47E-02 5.26E-03 GO:0006928 ~ cell motion
13 P09493 Tropomyosin alpha-1 chain 32746 4.69 405 33.1 0.12 2.37E-03 6.41E-03 GO:0006979 ~ response to oxidative stress, GO:0006928 ~ cellmotion, GO:0046907 ~ intracellular transport
14 O14556 Glyceraldehyde-3-phosphate dehydrogenase
35953 8.49 1165 48.6 0.22 9.05E-03 1.04E-02 GO:0055114 ~ oxidation reduction, GO:0006096 ~ glycolysis,GO:0006928 ~ cell motion
15 Q9UBR2 Cathepsin Z 34658 6.13 308 15.7 0.18 4.90E-03 1.04E-02 GO:0006508 ~ proteolysis
16 Q08752 Peptidyl-prolyl cis-transisomerase D
20436 6.77 139 8.88 0.12 9.20E-03 1.08E-02 GO:0043065 ~ positive regulation ofapoptotic process
17 Q9Y4L1 Hypoxia up-regulatedprotein 1
1E + 05 5.09 192 27 N/A N/A N/A GO:0042221 ~ response to chemical stimulus,GO:0006950 ~ response to stress
18 P10809 60 kDa heat shock protein 61105 5.72 289 29.6 4.77 8.26E-04 2.47E-02 GO:0032943 ~ mononuclear cell proliferation
Jamiet
al.BMCNeuroscience
2014,15:93Page
5of
11http://w
ww.biom
edcentral.com/1471-2202/15/93
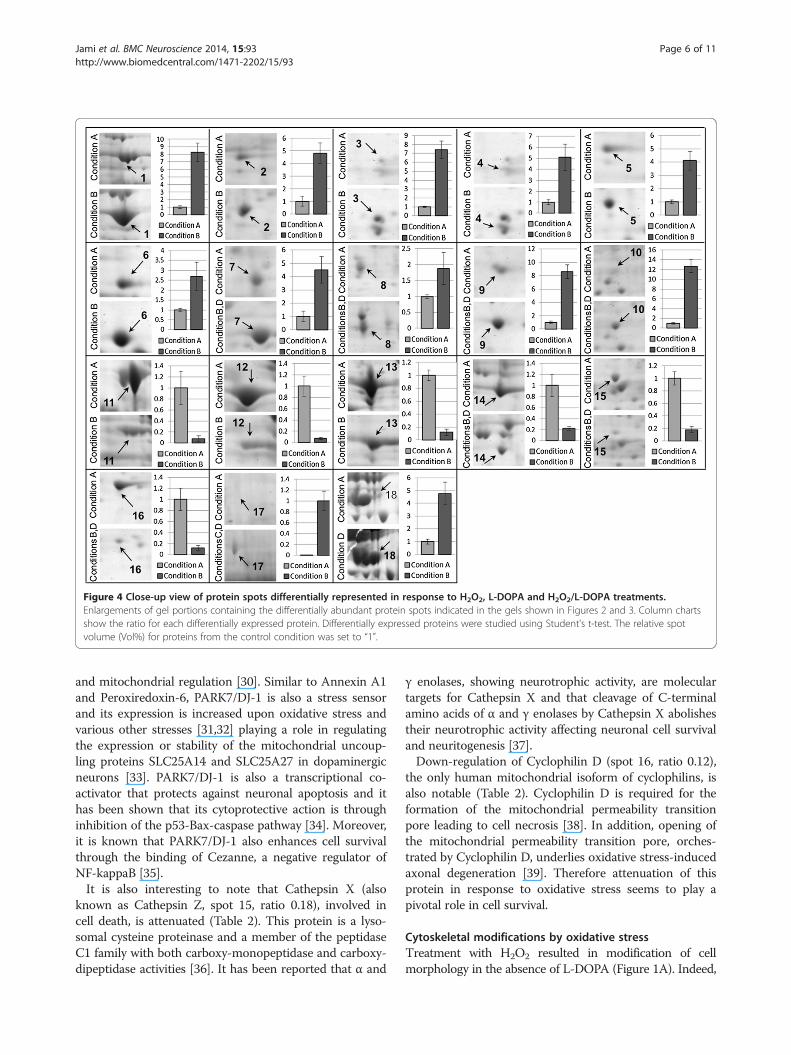
Figure 4 Close-up view of protein spots differentially represented in response to H2O2, L-DOPA and H2O2/L-DOPA treatments.Enlargements of gel portions containing the differentially abundant protein spots indicated in the gels shown in Figures 2 and 3. Column chartsshow the ratio for each differentially expressed protein. Differentially expressed proteins were studied using Student's t-test. The relative spotvolume (Vol%) for proteins from the control condition was set to “1”.
Jami et al. BMC Neuroscience 2014, 15:93 Page 6 of 11http://www.biomedcentral.com/1471-2202/15/93
and mitochondrial regulation [30]. Similar to Annexin A1and Peroxiredoxin-6, PARK7/DJ-1 is also a stress sensorand its expression is increased upon oxidative stress andvarious other stresses [31,32] playing a role in regulatingthe expression or stability of the mitochondrial uncoup-ling proteins SLC25A14 and SLC25A27 in dopaminergicneurons [33]. PARK7/DJ-1 is also a transcriptional co-activator that protects against neuronal apoptosis and ithas been shown that its cytoprotective action is throughinhibition of the p53-Bax-caspase pathway [34]. Moreover,it is known that PARK7/DJ-1 also enhances cell survivalthrough the binding of Cezanne, a negative regulator ofNF-kappaB [35].It is also interesting to note that Cathepsin X (also
known as Cathepsin Z, spot 15, ratio 0.18), involved incell death, is attenuated (Table 2). This protein is a lyso-somal cysteine proteinase and a member of the peptidaseC1 family with both carboxy-monopeptidase and carboxy-dipeptidase activities [36]. It has been reported that α and
γ enolases, showing neurotrophic activity, are moleculartargets for Cathepsin X and that cleavage of C-terminalamino acids of α and γ enolases by Cathepsin X abolishestheir neurotrophic activity affecting neuronal cell survivaland neuritogenesis [37].Down-regulation of Cyclophilin D (spot 16, ratio 0.12),
the only human mitochondrial isoform of cyclophilins, isalso notable (Table 2). Cyclophilin D is required for theformation of the mitochondrial permeability transitionpore leading to cell necrosis [38]. In addition, opening ofthe mitochondrial permeability transition pore, orches-trated by Cyclophilin D, underlies oxidative stress-inducedaxonal degeneration [39]. Therefore attenuation of thisprotein in response to oxidative stress seems to play apivotal role in cell survival.
Cytoskeletal modifications by oxidative stressTreatment with H2O2 resulted in modification of cellmorphology in the absence of L-DOPA (Figure 1A). Indeed,

Figure 5 Quantitative ROS measurements in response to H2O2,L-DOPA and H2O2/L-DOPA treatments. Quantification of ROSproduction in SH-SY5Y cells in response to eight hours of 2 mMH2O2, 200 μM L-DOPA and 2 mM H2O2/200 μM L-DOPA treatmentsas determined by DCF fluorescence intensity. Each data point is theaverage of 12 replicate samples and presented as means ± SD.Standard deviations are indicated by error bars. ***p < 0.001.
Jami et al. BMC Neuroscience 2014, 15:93 Page 7 of 11http://www.biomedcentral.com/1471-2202/15/93
the alteration of several structural proteins, in response tooxidative stress, indicates a rearrangement of the cytoskel-eton. We observed up-regulation of all three members ofthe ADF/cofilin family including Cofilin-1 (spot 5, 4.1 fold),Cofilin-2 (spot 3, 7.4 fold) and Destrin, also known as ADFor actin depolymerizing factor (spot 4, 5.08 fold) (Table 2).Cofilins control actin polymerization/depolymerization in apH-sensitive manner where they bind to actin filaments(F actin) and regulate actin cytoskeleton dynamics playing acritical role in the regulation of cytoskeletal organizationand cell morphology [40].Conversely, other actin binding proteins, such as Tropo-
myosin alpha-4 chain (spot 12, ratio 0.07) and Tropomy-osin alpha-1 chain (spot 13, ratio 0.12) are down-regulated(Table 2). These proteins bind to actin filaments in muscleand non-muscle cells and play a central role in muscle con-traction and in stabilizing cytoskeleton actin filaments innon-muscle cells [41].The down-regulation of Vimentin (spot 11, ratio 0.08)
under oxidative conditions is also remarkable (Table 2).Vimentin is attached to the endoplasmic reticulum,mitochondria and nucleus either laterally or terminally[42]. This cytoskeletal component plays an importantrole in anchoring organelles in the cytosol and is respon-sible for maintaining cell shape, cytoplasmic integrity,and stabilization of cytoskeletal interactions [43]. Cellsdeficient in Vimentin are therefore extremely delicate[43] suggesting that the observed change in neuronal cellmorphology in response to H2O2 may be due to the ob-served attenuation of Vimentin (Table 2).
L-DOPA promotes reversal of oxidative stress responsesAn interesting phenomenon that was observed in our treat-ments is the ability of L-DOPA to reverse the effects ofH2O2 on cellular morphology and cell viability (Figure 1).This reversal was also observed in terms of ROS where L-DOPA exposure reduced ROS levels, in the presence ofH2O2, down to levels observed in control cells (Figure 5).Indeed, all the H2O2-induced protein alterations, affectingthe cytoskeleton, were restored to baseline by supplement-ing the H2O2-containing media with L-DOPA (spots 3, 4, 5,11, 12 and 13) (Figures 3B, Table 2). Furthermore, theinduction of mitochondrial enzymes under oxidativestress condition (fumarate hydratase (spot 1), nucleoside-diphosphate kinase (spot 6) and 3-Hydroxyacyl CoA de-hydrogenase (spot 2) was abolished in response toL-DOPA exposure (Table 2).
Effects of L-DOPAOnly cells exposed to L-DOPA under oxidative stress con-ditions show significantly elevated expression of a 60-kDaheat shock protein (also known as HSP-60, spot 18, 4.77fold overexpressed), a mitochondrial protein with cytopro-tective functions [44]. This observation suggests that L-
DOPA can mediate mitochondrial associated cell survivalmechanisms as has been previously reported when expos-ing postnatal mesencephalic cultures, grown on gliamonolayers, to L-DOPA in excess of 100 μM [45]. Thisheat shock protein contributes to the anti-apoptoticHsp60/procaspase-3 complex and enhances cell survival[46]. It has been observed that mild Hsp60 deficiency pri-marily affects neuronal and/or glia cells, whereas more se-vere Hsp60 deficiency affects all tissues [47].In addition to its effects on the cytoskeleton and mito-
chondria, L-DOPA seems to participate in a cell survivalmechanism triggered by oxygen deprivation through induc-tion of the hypoxia up-regulated protein 1 (ORP150, spot17), a chaperone involved in protein folding [48]. We ob-served detectable levels of this protein only in the presenceof L-DOPA regardless of the oxidative stress conditions(Table 2) suggesting that L-DOPA may aid hypoxia condi-tion in cells. It has been shown in rat astrocytes thatORP150 is induced by hypoxia within 24 hours, augmentedfurther during early re-oxygenation, and thereafter decreas-ing to baseline levels by 24 hours in normoxia [49]. Fur-thermore, the hypoxia-mediated induction of ORP150appears specific as stress conditions such as heat shock,H2O2, cobalt chloride, 2-deoxyglucose, or tunicamycin doesnot affect ORP150 levels [49]. Interestingly, exposure todopamine has similar ORP induction effects as hypoxia inPC12 cells [50]. In the catecholamine synthesis pathwaydopamine is the first catecholamine synthesized from L-DOPA where norepinephrine and epinephrine are formedby further metabolic dopamine modifications (Figure 6).
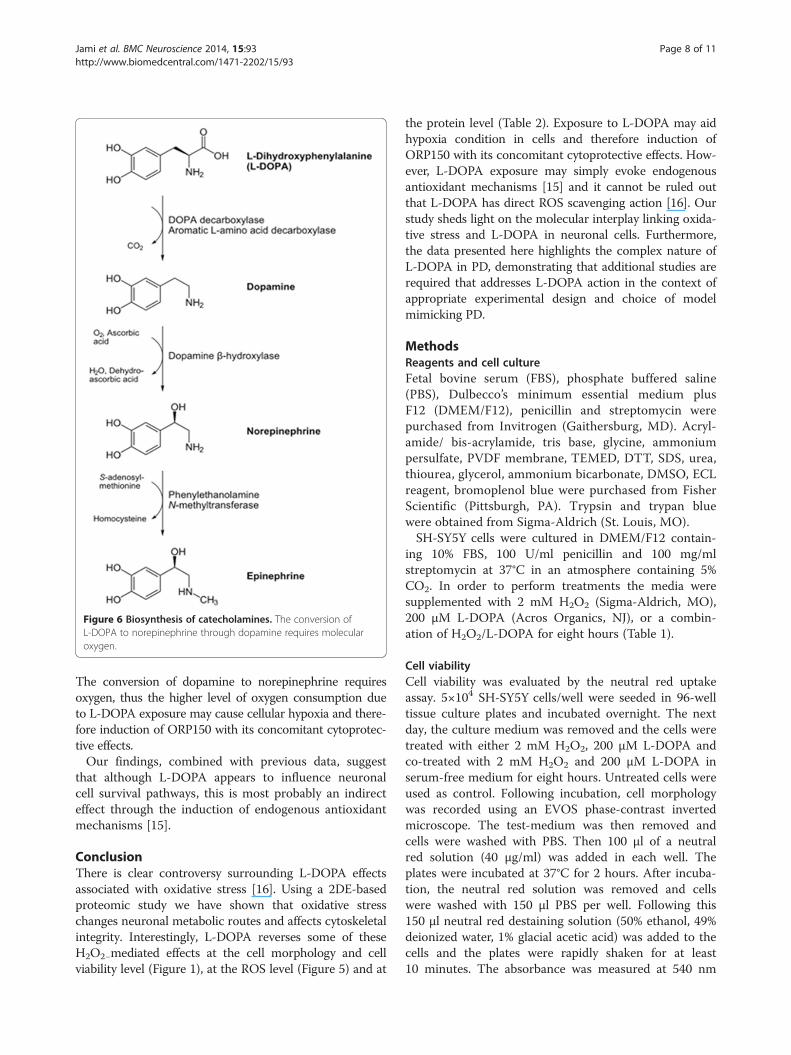
Figure 6 Biosynthesis of catecholamines. The conversion ofL-DOPA to norepinephrine through dopamine requires molecularoxygen.
Jami et al. BMC Neuroscience 2014, 15:93 Page 8 of 11http://www.biomedcentral.com/1471-2202/15/93
The conversion of dopamine to norepinephrine requiresoxygen, thus the higher level of oxygen consumption dueto L-DOPA exposure may cause cellular hypoxia and there-fore induction of ORP150 with its concomitant cytoprotec-tive effects.Our findings, combined with previous data, suggest
that although L-DOPA appears to influence neuronalcell survival pathways, this is most probably an indirecteffect through the induction of endogenous antioxidantmechanisms [15].
ConclusionThere is clear controversy surrounding L-DOPA effectsassociated with oxidative stress [16]. Using a 2DE-basedproteomic study we have shown that oxidative stresschanges neuronal metabolic routes and affects cytoskeletalintegrity. Interestingly, L-DOPA reverses some of theseH2O2−mediated effects at the cell morphology and cellviability level (Figure 1), at the ROS level (Figure 5) and at
the protein level (Table 2). Exposure to L-DOPA may aidhypoxia condition in cells and therefore induction ofORP150 with its concomitant cytoprotective effects. How-ever, L-DOPA exposure may simply evoke endogenousantioxidant mechanisms [15] and it cannot be ruled outthat L-DOPA has direct ROS scavenging action [16]. Ourstudy sheds light on the molecular interplay linking oxida-tive stress and L-DOPA in neuronal cells. Furthermore,the data presented here highlights the complex nature ofL-DOPA in PD, demonstrating that additional studies arerequired that addresses L-DOPA action in the context ofappropriate experimental design and choice of modelmimicking PD.
MethodsReagents and cell cultureFetal bovine serum (FBS), phosphate buffered saline(PBS), Dulbecco’s minimum essential medium plusF12 (DMEM/F12), penicillin and streptomycin werepurchased from Invitrogen (Gaithersburg, MD). Acryl-amide/ bis-acrylamide, tris base, glycine, ammoniumpersulfate, PVDF membrane, TEMED, DTT, SDS, urea,thiourea, glycerol, ammonium bicarbonate, DMSO, ECLreagent, bromoplenol blue were purchased from FisherScientific (Pittsburgh, PA). Trypsin and trypan bluewere obtained from Sigma-Aldrich (St. Louis, MO).SH-SY5Y cells were cultured in DMEM/F12 contain-
ing 10% FBS, 100 U/ml penicillin and 100 mg/mlstreptomycin at 37°C in an atmosphere containing 5%CO2. In order to perform treatments the media weresupplemented with 2 mM H2O2 (Sigma-Aldrich, MO),200 μM L-DOPA (Acros Organics, NJ), or a combin-ation of H2O2/L-DOPA for eight hours (Table 1).
Cell viabilityCell viability was evaluated by the neutral red uptakeassay. 5×10⁴ SH-SY5Y cells/well were seeded in 96-welltissue culture plates and incubated overnight. The nextday, the culture medium was removed and the cells weretreated with either 2 mM H2O2, 200 μM L-DOPA andco-treated with 2 mM H2O2 and 200 μM L-DOPA inserum-free medium for eight hours. Untreated cells wereused as control. Following incubation, cell morphologywas recorded using an EVOS phase-contrast invertedmicroscope. The test-medium was then removed andcells were washed with PBS. Then 100 μl of a neutralred solution (40 μg/ml) was added in each well. Theplates were incubated at 37°C for 2 hours. After incuba-tion, the neutral red solution was removed and cellswere washed with 150 μl PBS per well. Following this150 μl neutral red destaining solution (50% ethanol, 49%deionized water, 1% glacial acetic acid) was added to thecells and the plates were rapidly shaken for at least10 minutes. The absorbance was measured at 540 nm
Jami et al. BMC Neuroscience 2014, 15:93 Page 9 of 11http://www.biomedcentral.com/1471-2202/15/93
using an Epoch microplate spectrophotometer (BioTeck,VT). The results were reported as a percentage com-pared to control cells (considered as 100% viable).
Detection of ROS formationIntracellular ROS levels were detected by measuring theoxidation of the cell-permeable dye 2′, 7′-dichlorofluor-escent diacetate (DCF-DA; Sigma-Aldrich, MO) to fluor-escent DCF. To quantify intracellular ROS levels, 5×10⁴
SH-SY5Y cells/well were seeded in black 96-well plates.The next day, the culture medium was removed and thecells were incubated for 45 minutes with 200 μl of DCF-DA (final concentration 25 μmol)/well. After incubationcells were washed with PBS and exposed to 2 mMH2O2, 200 μM L-DOPA and 2 mM H2O2/200 μM L-DOPA in serum-free medium for eight hours as de-scribed above. The medium was then removed and cellswere washed again with PBS. Relative fluorescence wasmeasured using a GloMax®-Multi Detection Systemfluorescence plate reader (Promega, WI) at 485 nm exci-tation and 528 nm emission wavelengths.
Protein sample preparation and 2-D gel electrophoresisTriplicate batches of SH-SY5Y cells were seeded at 20–30%confluence and harvested when cell density reached 90%.After three washes with PBS, healthy cells were harvestedfrom the plates and solubilized in 500 μl of lysis buffer: 8 Murea, 4% (w/v) 3-[(3-cholamidopropyl)dimethylammonio]-1-propanesulfonate (CHAPS), 0.5% (v/v) ampholytes (IPGbuffer, GE Healthcare), 25 mM DTT and 0.002% bromo-phenol blue) and stored at −80°C. The insoluble fractionwas discarded after centrifugation at 13,200 rpm for 5 min.The supernatant was collected and the protein concentra-tion was determined according to the Bradford method,which showed a high reproducibility for this protein extrac-tion protocol.A solution containing 850 μg of soluble proteins in the
sample buffer (same as lysis buffer but containing 2%CHAPS), was loaded onto 24-cm IPG strips (GE Health-care), with non-linear (NL) pH 3–11 gradients. Focusingof proteins (using BioRad IEF instrument), equilibrationof the focused IPG strips and the 12.5% SDS-PAGE forthe second dimension (carried out in an Ettan Dalt Sixapparatus (GE Healthcare)) were performed as previ-ously described [51]. Briefly, proteins were focused at20°C according to the following program: 1 h, 0 V and12 h, 30 V (rehydration); 30-min gradient to 10,000 V;up to 9 h, 10,000 V until 85 kV-h. Focused IPG stripswere equilibrated twice for 15 min in a buffer containing50 mM Tris–HCl (pH 8.8), 6 M urea, 30% (v/v) glycerol,2% (w/v) SDS, 0.002% bromphenol blue, and 1% (w/v)DTT. For the second equilibration step, DTT was re-placed by 4.0% (w/v) iodoacetamide. In the second di-mension 12.5% polyacrylamide SDS-PAGE gels were run
in an Ettan Dalt Six apparatus (GE Healthcare) for45 min at 3 watts/gel and then for 4 h at 18 watts/gel.Gels were stained with Colloidal Coomassie (CC) follow-ing the “blue silver” staining method (28), using 0.12%Coomassie Blue G-250 (Sigma), 10% ammonium sulfate,10% phosphoric acid, and 20% methanol [52,53].
Analysis of differential protein abundanceTwo-dimensional images were captured by scanningstained gels using an ImageScanner II (GE Healthcare)previously calibrated by using a grayscale marker (East-man Kodak Co.), digitalized with Labscan 5.00 (v1.0.8)software (GE Healthcare), and analyzed with the Image-MasterTM 2D Platinum V7.0 software (GE Healthcare).Three gels for each condition, obtained from three inde-pendent cultures (biological replicates), were analysed toguarantee representative results. After automated spotdetection, spots were checked manually to eliminate anypossible artefacts, such as streaks or background noise.The patterns of each sample were overlapped andmatched, using landmark features, to detect differentiallyexpressed proteins. Variability in the number of proteinspots detected among biological replicates was less than10%, which may be due to experimental variability. Spotnormalization (internal calibration to make the data in-dependent from experimental variations between gels)was made using relative volumes to quantify the gelspots. Relative spot volume (Vol%) corresponds to thevolume of each spot divided by the total volume of allthe spots in the gel. Analysis of each differentiallyexpressed protein between conditions was performedusing Student's t-test and p < 0.05 was considered statis-tically significant [51,54,55]. False discovery rate (FDR)correction for multiple hypothesis testing was performedaccording to Storey’s method (q-value <0.05) [56]. Dif-ferentially expressed proteins were studied further whenthe ratio of the relative mean volume for one specificspot (in three biological replicates) was higher than 1.5fold (the relative spot volume (Vol%) for proteins fromthe control condition was set to “1”).
Protein identification by mass spectrometryThe protein spots of interest were manually excisedfrom the gel and washed three times with ammoniumbicarbonate/acetonitrile 1:1 (vol/vol) solution. Polyacryl-amide fragments were dehydrated in acetonitrile anddried with a vacuum concentrator. Protein reductionand alkylation were performed by reswelling polyacryl-amide fragments in 25 mM ammonium carbonate solu-tion containing 0.15 mg/ml DTT at 56°C. This solutionwas replaced by a 25 mM ammonium bicarbonate solu-tion containing 10 mg/ml 2-iodoacetamide (Bio-Rad) for45 min at room temperature and in the dark. Fragmentswere dried as described above and tryptic cleavage was
Jami et al. BMC Neuroscience 2014, 15:93 Page 10 of 11http://www.biomedcentral.com/1471-2202/15/93
initiated by reswelling the gel in 25 mM ammonium bicar-bonate solution containing 0.1 μg trypsin per gel slice(Promega, WI, USA) for 20 min on ice. The solution wasthen replaced by 25 mM ammonium carbonate solutionand digestion carried out overnight at 37°C. Tryptic pep-tides were extracted at 37°C for 15 min with a 50% (vol/vol) acetonitrile and 10% (vol/vol) acetic acid solution. Asecond extraction was performed under the same conditions.A third extraction was performed at room temperature for15 min with 100% acetonitrile. The pooled solution wasdried under vacuum and resuspended in 10 μl 0.1% (vol/vol)formic acid solution.Five microliters of each sample were loaded onto a
75 μm × 12 cm column self-packed with 3 μm ReproSil-Pur C18-AQ beads (Dr. Maisch), eluted with a gradient of0–40% acetonitrile in 0.1% formic acid over 18 min at300 nl/min using an Exigent nanoflow HPLC coupled dir-ectly to an LTQ-Orbitrap mass spectrometer (Thermo FisherScientific). Mass spectra were acquired in data-dependentanalysis mode with one 60 000 resolution MS survey scanby the Orbitrap and up to eight concurrent MS/MS scansin the LTQ for the eight most intense peaks selected fromeach survey scan. Automatic gain control was set to 2 000000 for Orbitrap survey scans and 5 000 for LTQ MS/MSscans. Survey scans were acquired in profile mode andMS/MS scans were acquired in centroid mode. Mascotgeneric format files were generated from the raw datausing DTASuperCharge (version 1.01) for databasesearching. Mascot Generic Files combining MS and MS/MS spectra were automatically created for protein identifi-cation, and used to interrogate a nonredundant proteindatabase using a local license of Mascot v 2.2 from MatrixScience through the Protein Global Server (GPS) v 3.6(Applied Biosystems). The search parameters were set asfollows: (i) NCBInr (2011.11.21) sequence database wasused; (ii) taxonomy: All entries (16245521 sequences;5585386883 residues); (iii) fixed and variable modificationswere considered (Cys as S carbamidomethyl derivative andMet as oxidized methionine); (iv) one missed cleavage sitewas allowed; (v) precursor tolerance was 100 ppm andMS/MS fragment tolerance was 0.3 Da; (vi) peptidecharge: 1+; and (vii) the algorithm was set to use trypsinas the enzyme. Additional criteria for confident identifica-tion were that the protein match should have at least 15%sequence coverage; for a lower coverage, only thoseproteins with a Mascot ions score above 54 and at leasttwo peptides identified in the tandem MS analysis (with asignificance level of p < 0.05), were considered valid.
Competing interestsThe authors declare that they have no competing interests.
Authors’ contributionsMSJ, RP, and SGM designed the research; MSJ carried out the cell culture,treatment optimization, 2-DE and gel analysis. RP performed the cell viabilityand ROS measurements. MSJ and EH carried out the protein identification.
MSJ carried out the data analysis and interpretation of proteomic results.SGM, TAN, and JPL led the research; MSJ, RP, and SGM wrote the paper. Allof the authors have been involved in revising the manuscript and have givenfinal approval of the version to be published.
AcknowledgementsThis work was supported by the Norwegian Research Council (SGM), TheWestern Norway Regional Health Authority (SGM), The Norwegian Centre forMovement Disorders (JPL), NIH NINDS grant P30 NS050276 (TAN) and 100Women in Hedge Funds Grant (TAN). We thank Steven Blais for advice onmass spectrometry.
Author details1Department of Biological Sciences, St John’s University, New York, NY, USA.2Kimmel Center for Biology and Medicine at the Skirball Institute andDepartment of Biochemistry and Molecular Pharmacology, New YorkUniversity School of Medicine, New York, NY, USA. 3The Norwegian Centrefor Movement Disorders, Stavanger University Hospital, Stavanger, Norway.4Cellular and Molecular Research Center, School of Medicine, ShahrekordUniversity of Medical Sciences, Shahrekord, Iran.
Received: 14 January 2014 Accepted: 23 July 2014Published: 31 July 2014
References1. De Lau LML, Breteler MMB: Epidemiology of Parkinson’s disease.
Lancet Neurol 2006, 5:525–535.2. Dorsey ER, Constantinescu R, Thompson JP, Biglan KM, Holloway RG,
Kieburtz K, Marshall FJ, Ravina BM, Schifitto G, Siderowf A, Tanner CM:Projected number of people with Parkinson disease in the mostpopulous nations, 2005 through 2030. Neurology 2007, 68:384–386.
3. Davie CA: A review of Parkinson’s disease. Br Med Bull 2008, 86:109–127.4. Dawson TM, Ko HS, Dawson VL: Genetic animal models of Parkinson’s
disease. Neuron 2010, 66:646–661.5. Bosco DA, Fowler DM, Zhang Q, Nieva J, Powers ET, Wentworth P, Lerner
RA, Kelly JW: Elevated levels of oxidized cholesterol metabolites in Lewybody disease brains accelerate alpha-synuclein fibrilization.Nat Chem Biol 2006, 2:249–253.
6. Nakabeppu Y, Tsuchimoto D, Yamaguchi H, Sakumi K: Oxidative damage innucleic acids and Parkinson’s disease. J Neurosci Res 2007, 85:919–934.
7. Zeevalk GD, Razmpour R, Bernard LP: Glutathione and Parkinson’s disease:is this the elephant in the room? Biomed Pharmacother 2008, 62:236–249.
8. Mena MA, Casarejos MJ, Solano RM, de Yébenes JG: Half a century of L-DOPA. Curr Top Med Chem 2009, 9:880–893.
9. Blessing H, Bareiss M, Zettlmeisl H, Schwarz J, Storch A: Catechol-O-methyltransferase inhibition protects against 3,4-dihydroxyphenylalanine(DOPA) toxicity in primary mesencephalic cultures: new insights intolevodopa toxicity. Neurochem Int 2003, 42:139–151.
10. Reksidler AB, Lima MMS, Dombrowski PA, Barnabé GF, Andersen ML, Tufik S,Vital MABF: Distinct effects of intranigral L-DOPA infusion in the MPTP ratmodel of Parkinson’s disease. J Neural Transm Suppl 2009, 73:259–268.
11. Gołembiowska K, Dziubina A, Kowalska M, Kamińska K: Paradoxical effectsof adenosine receptor ligands on hydroxyl radical generation by L-DOPAin the rat striatum. Pharmacol Rep 2008, 60:319–330.
12. Itokawa K, Ohkuma A, Araki N, Tamura N, Shimazu K: Effect of L-DOPA onnitric oxide production in striatum of freely mobile mice. Neurosci Lett2006, 402:142–144.
13. Li CL, Werner P, Cohen G: Lipid peroxidation in brain: interactions of L-DOPA/dopamine with ascorbate and iron. Neurodegeneration 1995,4:147–153.
14. Spencer JP, Jenner A, Butler J, Aruoma OI, Dexter DT, Jenner P, Halliwell B:Evaluation of the pro-oxidant and antioxidant actions of L-DOPA anddopamine in vitro: implications for Parkinson’s disease. Free Radic Res1996, 24:95–105.
15. Han SK, Mytilineou C, Cohen G: L-DOPA up-regulates glutathione andprotects mesencephalic cultures against oxidative stress. J Neurochem1996, 66:501–510.
16. Lipski J, Nistico R, Berretta N, Guatteo E, Bernardi G, Mercuri NB: L-DOPA: ascapegoat for accelerated neurodegeneration in Parkinson’s disease?Prog Neurobiol 2011, 94:389–407.
Jami et al. BMC Neuroscience 2014, 15:93 Page 11 of 11http://www.biomedcentral.com/1471-2202/15/93
17. Pompella A, Visvikis A, Paolicchi A, De Tata V, Casini AF: The changing facesof glutathione, a cellular protagonist. Biochem Pharmacol 2003,66:1499–1503.
18. Agarwal AR, Zhao L, Sancheti H, Sundar IK, Rahman I, Cadenas E: Short-term cigarette smoke exposure induces reversible changes in energymetabolism and cellular redox status independent of inflammatoryresponses in mouse lungs. Am J Physiol Lung Cell Mol Physiol 2012,303:L889–L898.
19. Ralser M, Wamelink MM, Kowald A, Gerisch B, Heeren G, Struys EA, Klipp E,Jakobs C, Breitenbach M, Lehrach H, Krobitsch S: Dynamic rerouting of thecarbohydrate flux is key to counteracting oxidative stress. J Biol 2007,6:10.
20. Hara MR, Thomas B, Cascio MB, Bae B-I, Hester LD, Dawson VL, Dawson TM,Sawa A, Snyder SH: Neuroprotection by pharmacologic blockade of theGAPDH death cascade. Proc Natl Acad Sci U S A 2006, 103:3887–3889.
21. Markert CL: Lactate dehydrogenase. Biochemistry and function of lactatedehydrogenase. Cell Biochem Funct 1984, 2:131–134.
22. McNeil AK, Rescher U, Gerke V, McNeil PL: Requirement for annexin A1 inplasma membrane repair. J Biol Chem 2006, 281:35202–35207.
23. Varticovski L, Chahwala SB, Whitman M, Cantley L, Schindler D, Chow EP,Sinclair LK, Pepinsky RB: Location of sites in human lipocortin I that arephosphorylated by protein tyrosine kinases and protein kinases A and C.Biochemistry 1988, 27:3682–3690.
24. Zhang Z, Huang L, Zhao W, Rigas B: Annexin 1 induced by anti-inflammatory drugs binds to NF-kappaB and inhibits its activation: anti-cancer effects in vitro and in vivo. Cancer Res 2010, 70:2379–2388.
25. Gorecka KM, Konopka-Postupolska D, Hennig J, Buchet R, Pikula S:Peroxidase activity of annexin 1 from Arabidopsis thaliana.Biochem Biophys Res Commun 2005, 336:868–875.
26. Rhee HJ, Kim GY, Huh JW, Kim SW, Na DS: Annexin I is a stress proteininduced by heat, oxidative stress and a sulfhydryl-reactive agent.Eur J Biochem 2000, 267:3220–3225.
27. Rhee SG, Chae HZ, Kim K: Peroxiredoxins: a historical overview andspeculative preview of novel mechanisms and emerging concepts in cellsignaling. Free Radic Biol Med 2005, 38:1543–1552.
28. Fisher AB: Peroxiredoxin 6: a bifunctional enzyme with glutathioneperoxidase and phospholipase A₂ activities. Antioxid Redox Signal 2011,15:831–844.
29. Tulsawani R, Kelly LS, Fatma N, Chhunchha B, Kubo E, Kumar A, Singh DP:Neuroprotective effect of peroxiredoxin 6 against hypoxia-inducedretinal ganglion cell damage. BMC Neurosci 2010, 11:125.
30. Ariga H, Takahashi-Niki K, Kato I, Maita H, Niki T, Iguchi-Ariga SMM:Neuroprotective function of DJ-1 in Parkinson’s disease. Oxid Med CellLongev 2013, 2013:683920.
31. Shendelman S, Jonason A, Martinat C, Leete T, Abeliovich A: DJ-1 is aredox-dependent molecular chaperone that inhibits alpha-synucleinaggregate formation. PLoS Biol 2004, 2:e362.
32. Yokota T, Sugawara K, Ito K, Takahashi R, Ariga H, Mizusawa H: Downregulation of DJ-1 enhances cell death by oxidative stress, ER stress, andproteasome inhibition. Biochem Biophys Res Commun 2003, 312:1342–1348.
33. Guzman JN, Sanchez-Padilla J, Wokosin D, Kondapalli J, Ilijic E, SchumackerPT, Surmeier DJ: Oxidant stress evoked by pacemaking in dopaminergicneurons is attenuated by DJ-1. Nature 2010, 468:696–700.
34. Fan J, Ren H, Jia N, Fei E, Zhou T, Jiang P, Wu M, Wang G: DJ-1 decreasesBax expression through repressing p53 transcriptional activity. J BiolChem 2008, 283:4022–4030.
35. McNally RS, Davis BK, Clements CM, Accavitti-Loper MA, Mak TW, Ting JP-Y:DJ-1 enhances cell survival through the binding of Cezanne, a negativeregulator of NF-kappaB. J Biol Chem 2011, 286:4098–4106.
36. Klemencic I, Carmona AK, Cezari MH, Juliano MA, Juliano L, Guncar G, TurkD, Krizaj I, Turk V, Turk B: Biochemical characterization of humancathepsin X revealed that the enzyme is an exopeptidase, acting ascarboxymonopeptidase or carboxydipeptidase. Eur J Biochem 2000,267:5404–5412.
37. Kos J, Jevnikar Z, Obermajer N: The role of cathepsin X in cell signaling.Cell Adhes Migr 2009, 3:164–166.
38. Linard D, Kandlbinder A, Degand H, Morsomme P, Dietz K-J, Knoops B:Redox characterization of human cyclophilin D: identification of a newmammalian mitochondrial redox sensor? Arch Biochem Biophys 2009,491:39–45.
39. López-Erauskin J, Ferrer I, Galea E, Pujol A: Cyclophilin D as a potentialtarget for antioxidants in neurodegeneration: the X-ALD case. Biol Chem2013, 394:621–629.
40. Bravo-Cordero JJ, Magalhaes MAO, Eddy RJ, Hodgson L, Condeelis J:Functions of cofilin in cell locomotion and invasion. Nat Rev Mol Cell Biol2013, 14:405–415.
41. Lin JJ-C, Eppinga RD, Warren KS, McCrae KR: Human tropomyosin isoformsin the regulation of cytoskeleton functions. Adv Exp Med Biol 2008,644:201–222.
42. Katsumoto T, Mitsushima A, Kurimura T: The role of the vimentinintermediate filaments in rat 3Y1 cells elucidated by immunoelectronmicroscopy and computer-graphic reconstruction. Biol Cell 1990,68:139–146.
43. Goldman RD, Khuon S, Chou YH, Opal P, Steinert PM: The function ofintermediate filaments in cell shape and cytoskeletal integrity. J Cell Biol1996, 134:971–983.
44. Takada M, Otaka M, Takahashi T, Izumi Y, Tamaki K, Shibuya T, Sakamoto N,Osada T, Yamamoto S, Ishida R, Odashima M, Itoh H, Watanabe S:Overexpression of a 60-kDa heat shock protein enhances cytoprotectivefunction of small intestinal epithelial cells. Life Sci 2010, 86:499–504.
45. Mena MA, Davila V, Sulzer D: Neurotrophic effects of L-DOPA in postnatalmidbrain dopamine neuron/cortical astrocyte cocultures. J Neurochem1997, 69:1398–1408.
46. Campanella C, Bucchieri F, Ardizzone NM, Marino Gammazza A, MontalbanoA, Ribbene A, Di Felice V, Bellafiore M, David S, Rappa F, Marasà M, Peri G,Farina F, Czarnecka AM, Conway de Macario E, Macario AJL, Zummo G,Cappello F: Upon oxidative stress, the antiapoptotic Hsp60/procaspase-3complex persists in mucoepidermoid carcinoma cells. Eur J Histochem2008, 52:221–228.
47. Bross P, Magnoni R, Bie AS: Molecular chaperone disorders: defectiveHsp60 in neurodegeneration. Curr Top Med Chem 2012, 12:2491–2503.
48. Ozawa K: 150-kDa Oxygen-regulated Protein (ORP150) SuppressesHypoxia-induced Apoptotic Cell Death. J Biol Chem 1999, 274:6397–6404.
49. Matsumoto M: Purification and Characterization of a Novel Stress Protein,the 150-kDa Oxygen-regulated Protein (ORP150), from Cultured RatAstrocytes and Its Expression in Ischemic Mouse Brain. J Biol Chem 1996,271:5025–5032.
50. Dukes AA, Van Laar VS, Cascio M, Hastings TG: Changes in endoplasmicreticulum stress proteins and aldolase A in cells exposed to dopamine.J Neurochem 2008, 106:333–346.
51. Jami M-S, Barreiro C, García-Estrada C, Martín J-F: Proteome analysis of thepenicillin producer Penicillium chrysogenum: characterization of proteinchanges during the industrial strain improvement. Mol Cell Proteomics2010, 9:1182–1198.
52. Candiano G, Bruschi M, Musante L, Santucci L, Ghiggeri GM, Carnemolla B,Orecchia P, Zardi L, Righetti PG: Blue silver: a very sensitive colloidalCoomassie G-250 staining for proteome analysis. Electrophoresis 2004,25:1327–1333.
53. Kosalková K, García-Estrada C, Barreiro C, Flórez MG, Jami MS, Paniagua MA,Martín JF: Casein phosphopeptides drastically increase the secretion ofextracellular proteins in Aspergillus awamori. Proteomics studies revealchanges in the secretory pathway. Microb Cell Factories 2012, 11:5.
54. García-Estrada C, Barreiro C, Jami M-S, Martín-González J, Martín J-F: Theinducers 1,3-diaminopropane and spermidine cause the reprogrammingof metabolism in Penicillium chrysogenum, leading to multiple vesiclesand penicillin overproduction. J Proteome 2013, 85:129–159.
55. Jami M-S, García-Estrada C, Barreiro C, Cuadrado A-A, Salehi-Najafabadi Z,Martín J-F: The Penicillium chrysogenum extracellular proteome.Conversion from a food-rotting strain to a versatile cell factory for whitebiotechnology. Mol Cell Proteomics 2010, 9:2729–2744.
56. Storey JD: A direct approach to false discovery rates. J R Stat Soc Series BStat Methodol 2002, 64:479–498.
doi:10.1186/1471-2202-15-93Cite this article as: Jami et al.: Proteome analysis reveals roles ofL-DOPA in response to oxidative stress in neurons. BMC Neuroscience2014 15:93.
Copyright © 2022 FDOKUMEN