Proteoglycans: Systems-Level Insight into Their Expression in ...
20
Citation: Oravecz, O.; Balogh, A.; Romero, R.; Xu, Y.; Juhasz, K.; Gelencser, Zs.; Xu, Z.; Bhatti, G.; Pique-Regi, R.; Peterfia, B.; et al. Proteoglycans: Systems-Level Insight into Their Expression in Healthy and Diseased Placentas. Int. J. Mol. Sci. 2022, 23, 5798. https://doi.org/ 10.3390/ijms23105798 Academic Editor: Guillaume Martinez Received: 26 April 2022 Accepted: 15 May 2022 Published: 21 May 2022 Publisher’s Note: MDPI stays neutral with regard to jurisdictional claims in published maps and institutional affil- iations. Copyright: © 2022 by the authors. Licensee MDPI, Basel, Switzerland. This article is an open access article distributed under the terms and conditions of the Creative Commons Attribution (CC BY) license (https:// creativecommons.org/licenses/by/ 4.0/). International Journal of Molecular Sciences Review Proteoglycans: Systems-Level Insight into Their Expression in Healthy and Diseased Placentas Orsolya Oravecz 1,2 , Andrea Balogh 1 , Roberto Romero 3,4,5,6,7 , Yi Xu 3,8 , Kata Juhasz 1 , Zsolt Gelencser 1 , Zhonghui Xu 3 , Gaurav Bhatti 3,8 , Roger Pique-Regi 3,6,8 , Balint Peterfia 1 , Petronella Hupuczi 9 , Ilona Kovalszky 10 , Padma Murthi 11,12 , Adi L. Tarca 3,8,13 , Zoltan Papp 9 , Janos Matko 1 and Nandor Gabor Than 1,9,10, * 1 Systems Biology of Reproduction Research Group, Institute of Enzymology, Research Centre for Natural Sciences, H-1117 Budapest, Hungary; [email protected] (O.O.); [email protected] (A.B.); [email protected] (K.J.); [email protected] (Zs.G.); peterfi[email protected] (B.P.); [email protected] (J.M.) 2 Doctoral School of Biology, Institute of Biology, ELTE Eötvös Loránd University, H-1117 Budapest, Hungary 3 Perinatology Research Branch, Division of Obstetrics and Maternal-Fetal Medicine, Division of Intramural Research, Eunice Kennedy Shriver National Institute of Child Health and Human Development, National Institutes of Health, U.S. Department of Health and Human Services (NICHD/NIH/DHHS), Bethesda, MD 20892, and Detroit, MI 48201, USA; [email protected] (R.R.); [email protected] (Y.X.); [email protected] (Z.X.); [email protected] (G.B.); [email protected] (R.P.-R.); [email protected] (A.L.T.) 4 Department of Obstetrics and Gynecology, University of Michigan, Ann Arbor, MI 48109, USA 5 Department of Epidemiology and Biostatistics, Michigan State University, East Lansing, MI 48824, USA 6 Center for Molecular Medicine and Genetics, Wayne State University, Detroit, MI 48201, USA 7 Detroit Medical Center, Detroit, MI 48201, USA 8 Department of Obstetrics and Gynecology, Wayne State University, Detroit, MI 48201, USA 9 Maternity Private Clinic, H-1126 Budapest, Hungary; [email protected] (P.H.); [email protected] (Z.P.) 10 First Department of Pathology and Experimental Cancer Research, Semmelweis University, H-1085 Budapest, Hungary; [email protected] 11 Department of Pharmacology, Monash Biomedicine Discovery Institute, Clayton, VIC 3800, Australia; [email protected] 12 Department of Obstetrics and Gynaecology, University of Melbourne, Royal Women’s Hospital, Parkville, VIC 3502, Australia 13 Department of Computer Science, Wayne State University College of Engineering, Detroit, MI 48202, USA * Correspondence: [email protected]; Tel.: +36-(1)-382-6788 Abstract: Proteoglycan macromolecules play key roles in several physiological processes (e.g., adhe- sion, proliferation, migration, invasion, angiogenesis, and apoptosis), all of which are important for placentation and healthy pregnancy. However, their precise roles in human reproduction have not been clarified. To fill this gap, herein, we provide an overview of the proteoglycans’ expression and role in the placenta, in trophoblast development, and in pregnancy complications (pre-eclampsia, fetal growth restriction), highlighting one of the most important members of this family, syndecan-1 (SDC1). Microarray data analysis showed that of 34 placentally expressed proteoglycans, SDC1 production is markedly the highest in the placenta and that SDC1 is the most upregulated gene dur- ing trophoblast differentiation into the syncytiotrophoblast. Furthermore, placental transcriptomic data identified dysregulated proteoglycan genes in pre-eclampsia and in fetal growth restriction, including SDC1, which is supported by the lower concentration of syndecan-1 in maternal blood in these syndromes. Overall, our clinical and in vitro studies, data analyses, and literature search pointed out that proteoglycans, as important components of the placenta, may regulate various stages of placental development and participate in the maintenance of a healthy pregnancy. Moreover, syndecan-1 may serve as a useful marker of syncytialization and a prognostic marker of adverse pregnancy outcomes. Further studies are warranted to explore the role of proteoglycans in healthy and complicated pregnancies, which may help in diagnostic or therapeutic developments. Int. J. Mol. Sci. 2022, 23, 5798. https://doi.org/10.3390/ijms23105798 https://www.mdpi.com/journal/ijms
-
Upload
khangminh22 -
Category
Documents
-
view
1 -
download
0
Transcript of Proteoglycans: Systems-Level Insight into Their Expression in ...

Citation: Oravecz, O.; Balogh, A.;
Romero, R.; Xu, Y.; Juhasz, K.;
Gelencser, Zs.; Xu, Z.; Bhatti, G.;
Pique-Regi, R.; Peterfia, B.; et al.
Proteoglycans: Systems-Level Insight
into Their Expression in Healthy and
Diseased Placentas. Int. J. Mol. Sci.
2022, 23, 5798. https://doi.org/
10.3390/ijms23105798
Academic Editor: Guillaume
Martinez
Received: 26 April 2022
Accepted: 15 May 2022
Published: 21 May 2022
Publisher’s Note: MDPI stays neutral
with regard to jurisdictional claims in
published maps and institutional affil-
iations.
Copyright: © 2022 by the authors.
Licensee MDPI, Basel, Switzerland.
This article is an open access article
distributed under the terms and
conditions of the Creative Commons
Attribution (CC BY) license (https://
creativecommons.org/licenses/by/
4.0/).
International Journal of
Molecular Sciences
Review
Proteoglycans: Systems-Level Insight into Their Expression inHealthy and Diseased PlacentasOrsolya Oravecz 1,2 , Andrea Balogh 1 , Roberto Romero 3,4,5,6,7 , Yi Xu 3,8, Kata Juhasz 1, Zsolt Gelencser 1,Zhonghui Xu 3 , Gaurav Bhatti 3,8 , Roger Pique-Regi 3,6,8 , Balint Peterfia 1, Petronella Hupuczi 9 ,Ilona Kovalszky 10 , Padma Murthi 11,12 , Adi L. Tarca 3,8,13 , Zoltan Papp 9 , Janos Matko 1
and Nandor Gabor Than 1,9,10,*
1 Systems Biology of Reproduction Research Group, Institute of Enzymology,Research Centre for Natural Sciences, H-1117 Budapest, Hungary; [email protected] (O.O.);[email protected] (A.B.); [email protected] (K.J.); [email protected] (Zs.G.);[email protected] (B.P.); [email protected] (J.M.)
2 Doctoral School of Biology, Institute of Biology, ELTE Eötvös Loránd University, H-1117 Budapest, Hungary3 Perinatology Research Branch, Division of Obstetrics and Maternal-Fetal Medicine,
Division of Intramural Research, Eunice Kennedy Shriver National Institute of Child Health andHuman Development, National Institutes of Health, U.S. Department of Health and HumanServices (NICHD/NIH/DHHS), Bethesda, MD 20892, and Detroit, MI 48201, USA;[email protected] (R.R.); [email protected] (Y.X.); [email protected] (Z.X.);[email protected] (G.B.); [email protected] (R.P.-R.); [email protected] (A.L.T.)
4 Department of Obstetrics and Gynecology, University of Michigan, Ann Arbor, MI 48109, USA5 Department of Epidemiology and Biostatistics, Michigan State University, East Lansing, MI 48824, USA6 Center for Molecular Medicine and Genetics, Wayne State University, Detroit, MI 48201, USA7 Detroit Medical Center, Detroit, MI 48201, USA8 Department of Obstetrics and Gynecology, Wayne State University, Detroit, MI 48201, USA9 Maternity Private Clinic, H-1126 Budapest, Hungary; [email protected] (P.H.);
[email protected] (Z.P.)10 First Department of Pathology and Experimental Cancer Research, Semmelweis University,
H-1085 Budapest, Hungary; [email protected] Department of Pharmacology, Monash Biomedicine Discovery Institute, Clayton, VIC 3800, Australia;
[email protected] Department of Obstetrics and Gynaecology, University of Melbourne, Royal Women’s Hospital,
Parkville, VIC 3502, Australia13 Department of Computer Science, Wayne State University College of Engineering, Detroit, MI 48202, USA* Correspondence: [email protected]; Tel.: +36-(1)-382-6788
Abstract: Proteoglycan macromolecules play key roles in several physiological processes (e.g., adhe-sion, proliferation, migration, invasion, angiogenesis, and apoptosis), all of which are important forplacentation and healthy pregnancy. However, their precise roles in human reproduction have notbeen clarified. To fill this gap, herein, we provide an overview of the proteoglycans’ expression androle in the placenta, in trophoblast development, and in pregnancy complications (pre-eclampsia,fetal growth restriction), highlighting one of the most important members of this family, syndecan-1(SDC1). Microarray data analysis showed that of 34 placentally expressed proteoglycans, SDC1production is markedly the highest in the placenta and that SDC1 is the most upregulated gene dur-ing trophoblast differentiation into the syncytiotrophoblast. Furthermore, placental transcriptomicdata identified dysregulated proteoglycan genes in pre-eclampsia and in fetal growth restriction,including SDC1, which is supported by the lower concentration of syndecan-1 in maternal bloodin these syndromes. Overall, our clinical and in vitro studies, data analyses, and literature searchpointed out that proteoglycans, as important components of the placenta, may regulate various stagesof placental development and participate in the maintenance of a healthy pregnancy. Moreover,syndecan-1 may serve as a useful marker of syncytialization and a prognostic marker of adversepregnancy outcomes. Further studies are warranted to explore the role of proteoglycans in healthyand complicated pregnancies, which may help in diagnostic or therapeutic developments.
Int. J. Mol. Sci. 2022, 23, 5798. https://doi.org/10.3390/ijms23105798 https://www.mdpi.com/journal/ijms
Int. J. Mol. Sci. 2022, 23, 5798 2 of 20
Keywords: fetal growth restriction; placenta development; pre-eclampsia; pregnancy; proteoglycans;trophoblast differentiation; trophoblast invasion; syndecans
1. Introduction
Proteoglycans are macromolecules consisting of a protein core to which glycosamino-glycan (GAG) side chains are covalently attached [1]. Most proteoglycans are importantcomponents of the extracellular matrix; however, some of them are localized to the cellsurface, and serglycin is one with intracellular localization [2]. Proteoglycans regulatevarious cellular functions (e.g., adhesion, proliferation, migration, invasion, angiogenesis,and apoptosis) in several ways, such as by binding cytokines, growth factors, or other com-ponents of the extracellular matrix or by modulating the activation of signaling receptorsmostly via interaction with GAG chains [3–11].
Emerging data at the RNA and protein levels have shown that more than a dozenof the nearly 50 proteoglycan core proteins [1,12] are expressed by the human placenta(Table S1). They are produced by trophoblasts (syndecans, glypican-3) and other placentalcell types or decidualized stromal cells (a cell surface chondroitin-sulfate proteoglycan(CD44) and decorin) [6,13]. Placental proteoglycans are reported to be involved in differentphysiological functions of the placenta, such as maintenance of blood flow by anticoag-ulation, regulation of trophoblast migration and proliferation, and angiogenic processesas well as the regulation of inflammation [14–18]. Each of these functions is necessary forproper placental development and the maintenance of pregnancy. Indeed, altered placentalexpression of proteoglycans (e.g., syndecan-1; endocan, glypican-3) was reported in ob-stetrical syndromes, such as pre-eclampsia [19–21], fetal growth restriction [22–24], andgestational diabetes mellitus [25,26], pointing to their potential roles in the developmentof these syndromes. Furthermore, proteoglycan-attached GAGs are critical mediatorsof differentiation, migration, tissue morphogenesis, and organogenesis during embry-onic development since embryos lacking specific GAG-modifying enzymes have distinctdevelopmental defects [27].
Of note, the extremely rapid development of the placenta highly resembles the forma-tion of malignant tumors. Indeed, among the properties shared by placental trophoblastcells and cancer cells are the capabilities to invade healthy tissues, form new vessels,and promote an environment that is protected from the immune system [28]. Since pro-teoglycans are strongly involved in various processes during tumorigenesis, which wasreviewed by several workgroups [29–48], they may have similar key roles in these processesduring placentation.
However, only a few studies attempted to determine the proteoglycans’ diverse rolesin the placenta, and a systematic effort to provide a global view on placental proteoglycanshas not been carried out. Therefore, herein we performed a systems-level analysis onproteoglycan expression in the placenta in normal and complicated pregnancies, focus-ing on syndecan-1 as one of the most important members of the proteoglycan family inthe placenta.
2. Results and Discussion2.1. Expression of Proteoglycans by the Placenta
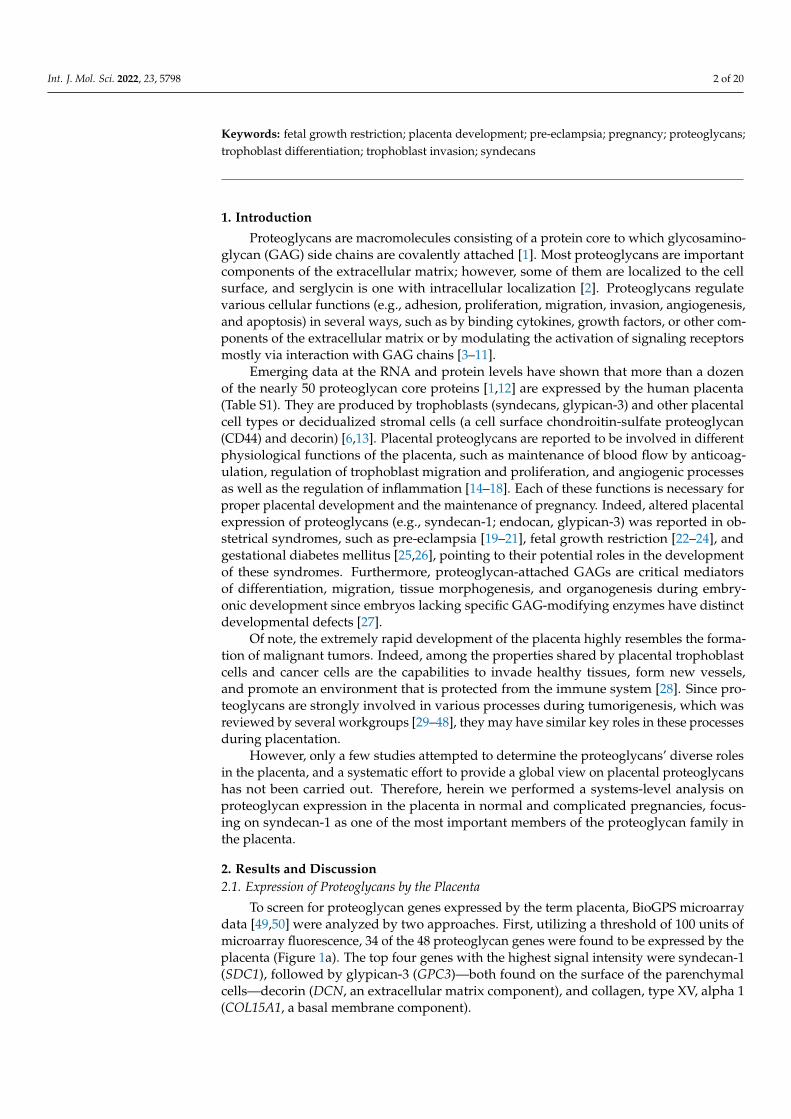
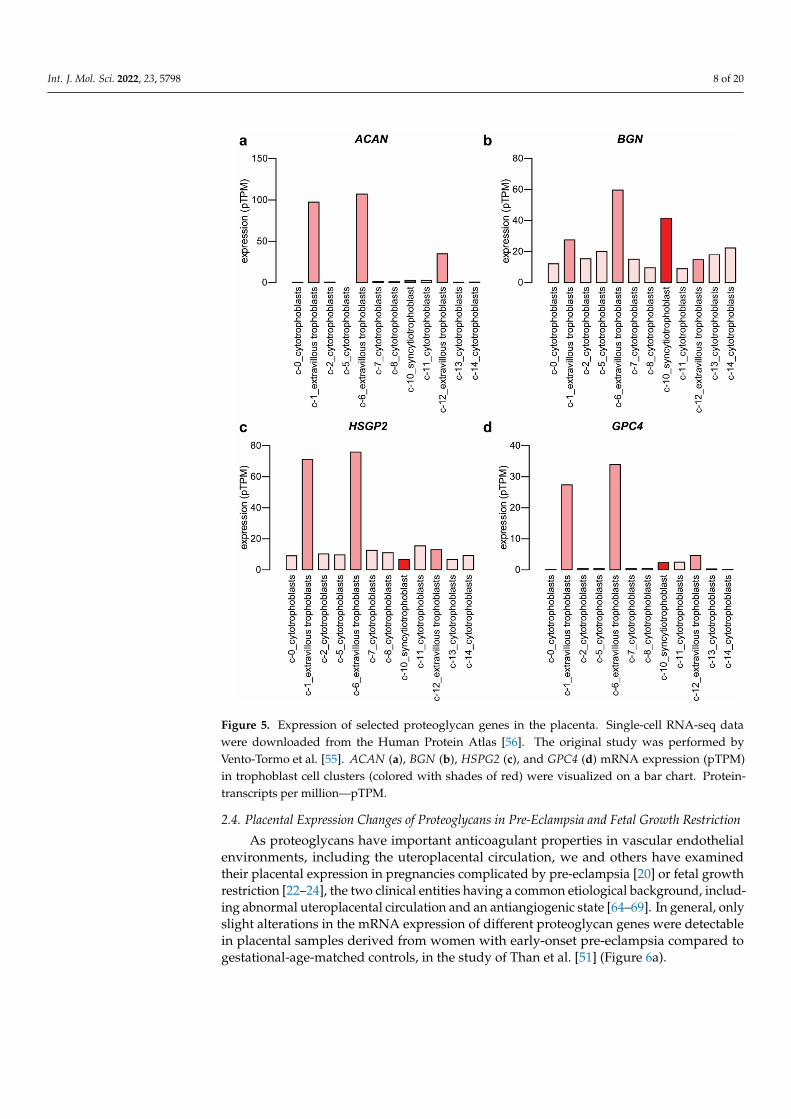
To screen for proteoglycan genes expressed by the term placenta, BioGPS microarraydata [49,50] were analyzed by two approaches. First, utilizing a threshold of 100 units ofmicroarray fluorescence, 34 of the 48 proteoglycan genes were found to be expressed by theplacenta (Figure 1a). The top four genes with the highest signal intensity were syndecan-1(SDC1), followed by glypican-3 (GPC3)—both found on the surface of the parenchymalcells—decorin (DCN, an extracellular matrix component), and collagen, type XV, alpha 1(COL15A1, a basal membrane component).
Int. J. Mol. Sci. 2022, 23, 5798 3 of 20Int. J. Mol. Sci. 2022, 23, x FOR PEER REVIEW 3 of 20
Figure 1. Placental expression of proteoglycan genes. (a) Absolute microarray gene expression values in the BioGPS database [49,50] were visualized on a heatmap. Color code depicts log2 gene expression levels. Bold letter: expression above threshold 100. Grey color: no data were available. (b) Placental expression of proteoglycan genes was compared to the median expression of 78 other tissues or cells. Differential expression of proteoglycan genes in the placenta was visualized on a heatmap. Color code depicts log2 gene expression ratios. Grey color: no data were available. (c) Real-time quantitative reverse transcription PCR (qRT-PCR) validation of BioGPS data on SDC1 expression in human tissues (n = 3) was visualized on the diagram as the percentage of placental expression. SDC1 mRNA expression values were normalized to RPLP0. Unpaired t-test was used for the analysis of SDC1 expression profiling with the Human Major Tissue qPCR Array. (* p < 0.05). Ribosomal Protein Lateral Stalk Subunit P0—RPLP0; syndecan-1—SDC1.
Figure 1. Placental expression of proteoglycan genes. (a) Absolute microarray gene expression valuesin the BioGPS database [49,50] were visualized on a heatmap. Color code depicts log2 gene expressionlevels. Bold letter: expression above threshold 100. Grey color: no data were available. (b) Placentalexpression of proteoglycan genes was compared to the median expression of 78 other tissues orcells. Differential expression of proteoglycan genes in the placenta was visualized on a heatmap.Color code depicts log2 gene expression ratios. Grey color: no data were available. (c) Real-timequantitative reverse transcription PCR (qRT-PCR) validation of BioGPS data on SDC1 expression inhuman tissues (n = 3) was visualized on the diagram as the percentage of placental expression. SDC1mRNA expression values were normalized to RPLP0. Unpaired t-test was used for the analysis ofSDC1 expression profiling with the Human Major Tissue qPCR Array. (* p < 0.05). Ribosomal ProteinLateral Stalk Subunit P0—RPLP0; syndecan-1—SDC1.

Int. J. Mol. Sci. 2022, 23, 5798 4 of 20
As a second approach, the placental expression for each gene was transformed asa ratio relative to the median expression in other tissues (Figure 1b). Nine proteoglycangenes had at least six times higher expression in the placenta than the median of othertissues. The top three genes—GPC3, SDC1, and COL15A1—had relative expression ordersof magnitude: 441-fold, 390-fold, and 198-fold higher expression in the placenta than themedian of other tissues, respectively. Among these genes, GPC3 and SDC1 also met anadditional criterion, being predominantly expressed in the placenta, previously defined inpapers by Than et al. and Szilagyi et al. [51,52]. Of note, a recent plasma proteome studyreported the highest (26-fold) increase in the concentrations of glypican-3, amongst proteinswith significant change, in the maternal circulation with advancing gestation [53].
To validate BioGPS microarray data, syndecan-1 expression results were quantified byqRT-PCR, using a TaqMan Assay and a human 48-tissue cDNA panel (Figure 1c). SDC1mRNA expression patterns from the qRT-PCR data were consistent with the microarraydata. The highest expression was observed in the placenta, representing an approximatelythree-fold increase over the second-highest expression in the liver, while it has low expres-sion in other tissues. These data suggest that proteoglycans, including SDC1, are importantstructural and molecular components of the placenta.
2.2. Expression Changes of Proteoglycans during Syncytiotrophoblast Differentiation
Since one of the most important processes in placental development is the differen-tiation of cytotrophoblast cells into the syncytiotrophoblast, change in the expression ofproteoglycan genes was investigated in an in vitro trophoblast differentiation model system.The basic experiment involved the spontaneous syncytial differentiation of isolated primarycytotrophoblast cells [52]. The gene expression pattern of these cells was measured daily bymicroarray for seven days. The maximal difference in the expression of proteoglycan genescompared to the baseline day 0 was ascertained. SDC1 showed the highest difference inthe course of syncytial trophoblast differentiation with a 10.9-fold increase in expressionon day 2 (Figure 2a). Of note, CD44 and transforming growth factor-beta receptor III(TGFBR3) were also upregulated with a 2.1-fold and 2.6-fold increase, respectively, whileleprecan-1—also known as prolyl 3-hydroxylase 1 (P3H1)—(3.4-fold) and serglycin (SRGN)(−3.5-fold)—was downregulated. To validate the microarray results, the expression ofSDC1 mRNA was measured by qRT-PCR in cell lysates, and the protein level was monitoredin cell culture supernatants by ELISA. The maximum mRNA expression of syndecan-1was detected in the cells on day 2 after seeding with an approximately 120-fold increase inexpression (Figure 2b). The protein expression in the supernatant, correspondingly, showedthe same time dependence (Figure 2c).
Cuffdiff analysis of RNA-seq data of Azar et al. found that DCN, lumican (LUM),and P3H1 were downregulated in the syncytiotrophoblast, while edgeR analysis of thesame dataset revealed the downregulation of collagen type XII alpha 1 chain (COL12A1),P3H1, syndecan-4 (SDC4), and structural maintenance of chromosomes 3 (SMC3) as wellas the upregulation of GPC3 [54]. In addition, single-cell RNA-seq data derived fromthe Human Protein Atlas also supports that the syncytiotrophoblast (isolated from first-trimester placentas) has the highest SDC1 expression compared to other trophoblast typesin the placenta (Figure 3a) [55,56]. At term, expression of SDC1 remains the highest inthe syncytiotrophoblast, as evidenced by a recent single-cell RNA-seq study searching forsingle-cell transcriptional signatures of the human placenta in term and preterm parturition(Figure 3b) [57].

Int. J. Mol. Sci. 2022, 23, 5798 5 of 20Int. J. Mol. Sci. 2022, 23, x FOR PEER REVIEW 5 of 20
Figure 2. Changes in proteoglycan gene expression during villous trophoblast differentiation. (a) Microarray data were obtained from primary villous trophoblast cells isolated from third-trimester normal placentas (n = 3) during a seven-day differentiation period. The largest differences in gene expression compared to day 0 were visualized on a heatmap. Color code depicts log2 gene expression ratios. Grey color: no data were available. The original study was published by Szilagyi et al. [52]. (b) SDC1 expression was monitored during villous trophoblast differentiation. qRT-PCR data were obtained from an extended set of primary villous trophoblast cells isolated from third-trimester normal placentas (n = 5) during a seven-day differentiation period. Relative expression of SDC1, normalized to RPLP0, was visualized on the diagraph. (c) Changes in syndecan-1 protein concentration in cell culture supernatants (n = 5) were examined throughout spontaneous syncytial differentiation of primary villous trophoblast cells. One-Way ANOVA with Dunnett’s post-hoc test was used for the analysis of qRT-PCR and ELISA results (* p < 0.05, ** p < 0.01, *** p < 0.001). Ribosomal Protein Lateral Stalk Subunit P0—RPLP0; syndecan-1—SDC1.
Cuffdiff analysis of RNA-seq data of Azar et al. found that DCN, lumican (LUM), and P3H1 were downregulated in the syncytiotrophoblast, while edgeR analysis of the same dataset revealed the downregulation of collagen type XII alpha 1 chain (COL12A1), P3H1, syndecan-4 (SDC4), and structural maintenance of chromosomes 3 (SMC3) as well as the upregulation of GPC3 [54]. In addition, single-cell RNA-seq data derived from the Human Protein Atlas also supports that the syncytiotrophoblast (isolated from first-trimester placentas) has the highest SDC1 expression compared to other trophoblast types in the placenta (Figure 3a) [55,56]. At term, expression of SDC1 remains the highest in the syncytiotrophoblast, as evidenced by a recent single-cell RNA-seq study searching for single-cell transcriptional signatures of the human placenta in term and preterm parturition (Figure 3b) [57].
Figure 2. Changes in proteoglycan gene expression during villous trophoblast differentiation. (a) Mi-croarray data were obtained from primary villous trophoblast cells isolated from third-trimesternormal placentas (n = 3) during a seven-day differentiation period. The largest differences in geneexpression compared to day 0 were visualized on a heatmap. Color code depicts log2 gene expressionratios. Grey color: no data were available. The original study was published by Szilagyi et al. [52].(b) SDC1 expression was monitored during villous trophoblast differentiation. qRT-PCR data wereobtained from an extended set of primary villous trophoblast cells isolated from third-trimesternormal placentas (n = 5) during a seven-day differentiation period. Relative expression of SDC1, nor-malized to RPLP0, was visualized on the diagraph. (c) Changes in syndecan-1 protein concentrationin cell culture supernatants (n = 5) were examined throughout spontaneous syncytial differentiationof primary villous trophoblast cells. One-Way ANOVA with Dunnett’s post-hoc test was used forthe analysis of qRT-PCR and ELISA results (* p < 0.05, ** p < 0.01, *** p < 0.001). Ribosomal ProteinLateral Stalk Subunit P0—RPLP0; syndecan-1—SDC1.
At the protein level, syndecan-1 was also primarily detected in the syncytiotrophoblast,a multinucleated cell layer of the human placenta. In the syncytiotrophoblast, syndecan-1was localized to the cytoplasm and the apical cell surface. Immunohistochemical examina-tions showed negative staining for other cell types of the placenta, e.g., villous trophoblastsand stromal cells of chorionic villi [4,21]. In a recent publication revealing the pivotalrole of the transcriptional co-activator yes-associated protein in trophoblast stemness ofthe developing human placenta, syndecan-1 was even used as a cell fusion marker [58].Furthermore, during a healthy pregnancy, serum concentrations of syndecan-1 increasesteadily with gestational age, in line with the growing placenta and syncytiotrophoblastvolume [59–61].

Int. J. Mol. Sci. 2022, 23, 5798 6 of 20Int. J. Mol. Sci. 2022, 23, x FOR PEER REVIEW 6 of 20
Figure 3. SDC1 expression in the placenta. (a) Single-cell RNA-seq data, derived from first-trimester placentas, were downloaded from the Human Protein Atlas [56]. The original study was performed by Vento-Tormo et al. [55]. SDC1 mRNA expression (pTPM) in trophoblast cell clusters (colored with shades of red) was visualized on a bar chart. (b) Single-cell RNA-seq data, derived from term placentas, were downloaded from http://genome.grid.wayne.edu/sclabor/ (accessed on 5 April 2022). The study was performed by Pique-Regi et al. [57]. SDC1 mRNA expression (normalized log2 count data) in cell clusters in three placental compartments (basal plate, placenta villi, and chorioamniotic membranes) was visualized on a histogram chart. Non-proliferative interstitial—npi; protein-transcripts per million—pTPM.
At the protein level, syndecan-1 was also primarily detected in the syncytiotrophoblast, a multinucleated cell layer of the human placenta. In the
Figure 3. SDC1 expression in the placenta. (a) Single-cell RNA-seq data, derived from first-trimesterplacentas, were downloaded from the Human Protein Atlas [56]. The original study was performedby Vento-Tormo et al. [55]. SDC1 mRNA expression (pTPM) in trophoblast cell clusters (coloredwith shades of red) was visualized on a bar chart. (b) Single-cell RNA-seq data, derived from termplacentas, were downloaded from http://genome.grid.wayne.edu/sclabor/ (accessed on 5 April2022). The study was performed by Pique-Regi et al. [57]. SDC1 mRNA expression (normalizedlog2 count data) in cell clusters in three placental compartments (basal plate, placenta villi, andchorioamniotic membranes) was visualized on a histogram chart. Non-proliferative interstitial—npi;protein-transcripts per million—pTPM.

Int. J. Mol. Sci. 2022, 23, 5798 7 of 20
2.3. Expression Changes of Proteoglycans during Extravillous Trophoblast Differentiation
Cytotrophoblast stem cells also differentiate into extravillous trophoblasts [62], whichfacilitate critical tissue connection in the developing placental-uterine interface. Therefore,two independent datasets from Gene Expression Omnibus (GEO) and ArrayExpress wereused for the analysis to identify proteoglycan expression patterns associated with extrav-illous trophoblast differentiation. In both studies, mRNA signatures of purified villoustrophoblasts (poor invasiveness) and extravillous trophoblasts (high invasiveness), isolatedfrom first-trimester human placentas, were compared by using GeneChip analyses [13,63].We focused on those genes whose expression was found to be altered in the same direc-tion in both datasets and which attained statistical significance at least in one dataset.Four genes, aggrecan (ACAN), biglycan (BGN), GPC3, and heparan sulfate proteoglycan 2(HSPG2), showed higher expression in extravillous trophoblasts in both datasets (Figure 4).
Int. J. Mol. Sci. 2022, 23, x FOR PEER REVIEW 7 of 20
syncytiotrophoblast, syndecan-1 was localized to the cytoplasm and the apical cell surface. Immunohistochemical examinations showed negative staining for other cell types of the placenta, e.g., villous trophoblasts and stromal cells of chorionic villi [4,21]. In a recent publication revealing the pivotal role of the transcriptional co-activator yes-associated protein in trophoblast stemness of the developing human placenta, syndecan-1 was even used as a cell fusion marker [58]. Furthermore, during a healthy pregnancy, serum concentrations of syndecan-1 increase steadily with gestational age, in line with the growing placenta and syncytiotrophoblast volume [59–61].
2.3. Expression Changes of Proteoglycans during Extravillous Trophoblast Differentiation Cytotrophoblast stem cells also differentiate into extravillous trophoblasts [62],
which facilitate critical tissue connection in the developing placental-uterine interface. Therefore, two independent datasets from Gene Expression Omnibus (GEO) and ArrayExpress were used for the analysis to identify proteoglycan expression patterns associated with extravillous trophoblast differentiation. In both studies, mRNA signatures of purified villous trophoblasts (poor invasiveness) and extravillous trophoblasts (high invasiveness), isolated from first-trimester human placentas, were compared by using GeneChip analyses [13,63]. We focused on those genes whose expression was found to be altered in the same direction in both datasets and which attained statistical significance at least in one dataset. Four genes, aggrecan (ACAN), biglycan (BGN), GPC3, and heparan sulfate proteoglycan 2 (HSPG2), showed higher expression in extravillous trophoblasts in both datasets (Figure 4).
Figure 4. Differentially expressed proteoglycan genes in invasive extravillous trophoblast cells compared to villous cytotrophoblast cells. Microarray data from two independent GEO (study #1) [63] or ArrayExpress (study #2) [13] datasets were reanalyzed. Color code depicts log2 gene expression ratios. Red indicates higher gene expression in extravillous trophoblasts, while blue depicts higher gene expression in villous cytotrophoblasts. Stars show significant differences.
Figure 4. Differentially expressed proteoglycan genes in invasive extravillous trophoblast cellscompared to villous cytotrophoblast cells. Microarray data from two independent GEO (study #1) [63]or ArrayExpress (study #2) [13] datasets were reanalyzed. Color code depicts log2 gene expressionratios. Red indicates higher gene expression in extravillous trophoblasts, while blue depicts highergene expression in villous cytotrophoblasts. Stars show significant differences.
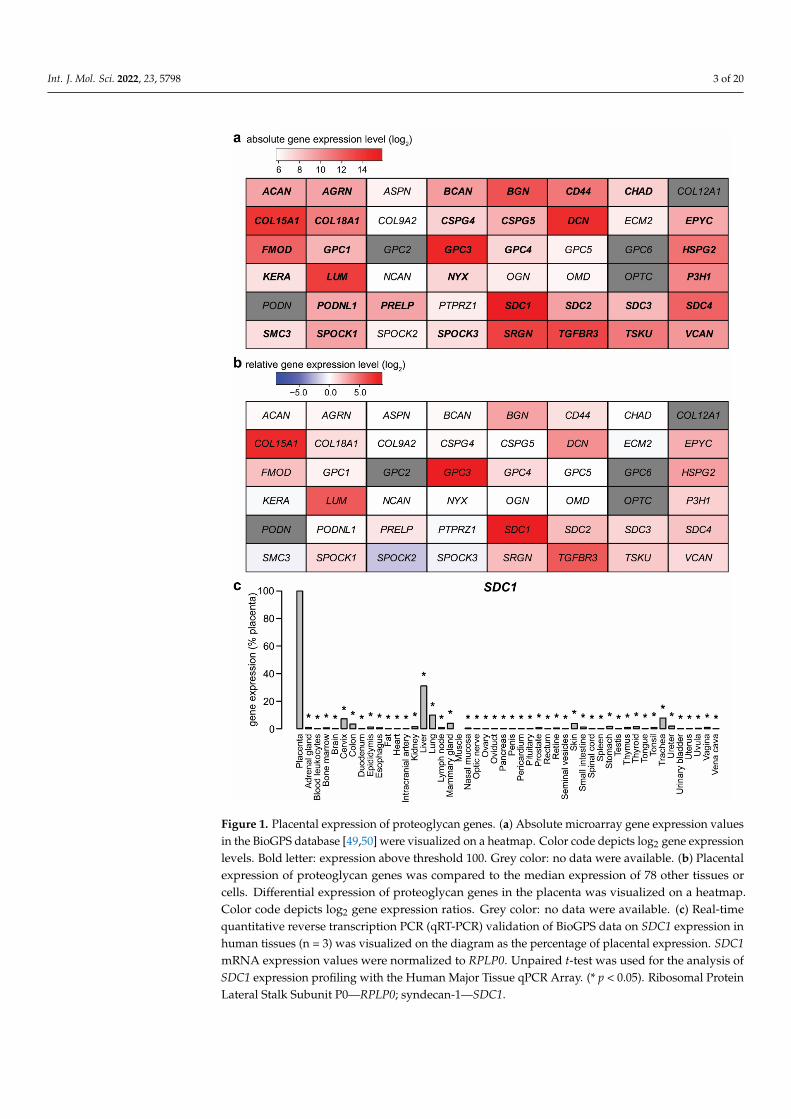
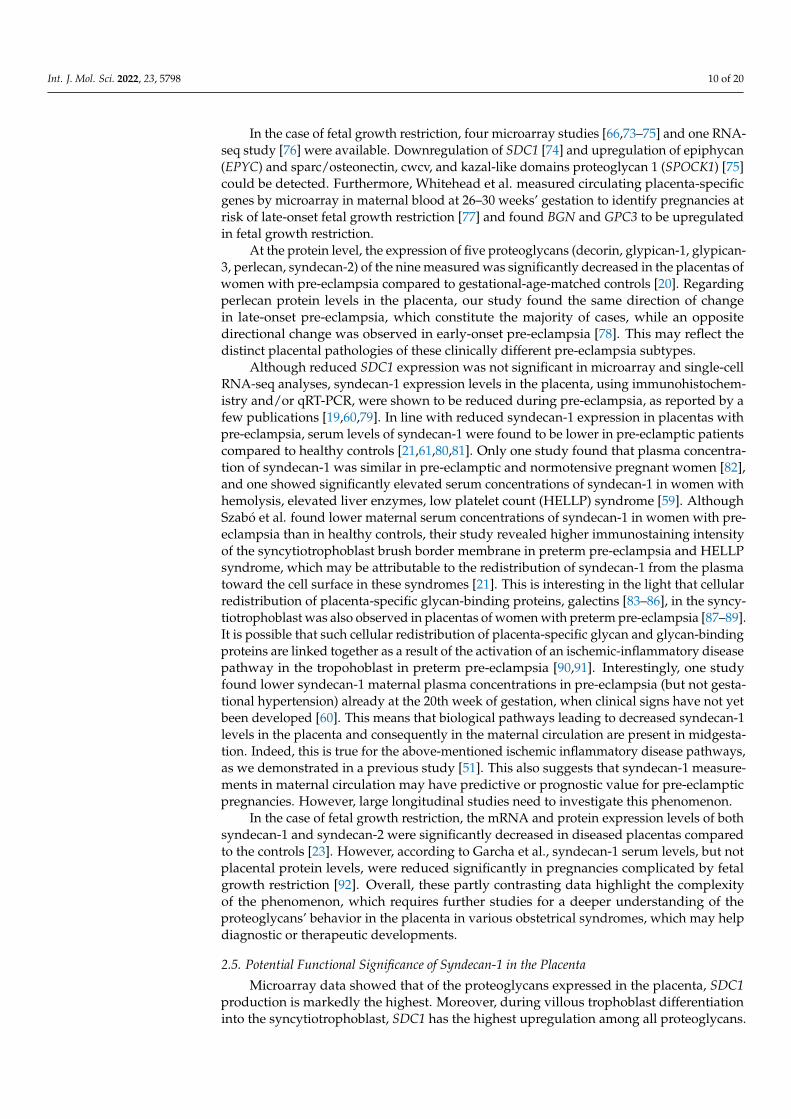
Upregulated expression of ACAN, BGN, and HSPG2 was also supported by single-cellRNA-seq data relative to other trophoblast cell clusters (Figure 5a–c) retrieved from theHuman Protein Atlas [56]. Single-cell RNA-seq data of glypican-4 (GPC4) (Figure 5d) andSDC1 (Figure 3) expression rather supports the microarray study of Apps et al. [13].
Int. J. Mol. Sci. 2022, 23, 5798 8 of 20
Int. J. Mol. Sci. 2022, 23, x FOR PEER REVIEW 8 of 20
Upregulated expression of ACAN, BGN, and HSPG2 was also supported by single-cell RNA-seq data relative to other trophoblast cell clusters (Figure 5a–c) retrieved from the Human Protein Atlas [56]. Single-cell RNA-seq data of glypican-4 (GPC4) (Figure 5d) and SDC1 (Figure 3) expression rather supports the microarray study of Apps et al. [13].
Figure 5. Expression of selected proteoglycan genes in the placenta. Single-cell RNA-seq data were downloaded from the Human Protein Atlas [56]. The original study was performed by Vento-Tormo et al. [55]. ACAN (a), BGN (b), HSPG2 (c), and GPC4 (d) mRNA expression (pTPM) in trophoblast cell clusters (colored with shades of red) were visualized on a bar chart. Protein-transcripts per million—pTPM.
2.4. Placental Expression Changes of Proteoglycans in Pre-Eclampsia and Fetal Growth Restriction
As proteoglycans have important anticoagulant properties in vascular endothelial environments, including the uteroplacental circulation, we and others have examined their placental expression in pregnancies complicated by pre-eclampsia [20] or fetal growth restriction [22–24], the two clinical entities having a common etiological background, including abnormal uteroplacental circulation and an antiangiogenic state [64–69]. In general, only slight alterations in the mRNA expression of different
Figure 5. Expression of selected proteoglycan genes in the placenta. Single-cell RNA-seq datawere downloaded from the Human Protein Atlas [56]. The original study was performed byVento-Tormo et al. [55]. ACAN (a), BGN (b), HSPG2 (c), and GPC4 (d) mRNA expression (pTPM)in trophoblast cell clusters (colored with shades of red) were visualized on a bar chart. Protein-transcripts per million—pTPM.
2.4. Placental Expression Changes of Proteoglycans in Pre-Eclampsia and Fetal Growth Restriction
As proteoglycans have important anticoagulant properties in vascular endothelialenvironments, including the uteroplacental circulation, we and others have examinedtheir placental expression in pregnancies complicated by pre-eclampsia [20] or fetal growthrestriction [22–24], the two clinical entities having a common etiological background, includ-ing abnormal uteroplacental circulation and an antiangiogenic state [64–69]. In general, onlyslight alterations in the mRNA expression of different proteoglycan genes were detectablein placental samples derived from women with early-onset pre-eclampsia compared togestational-age-matched controls, in the study of Than et al. [51] (Figure 6a).

Int. J. Mol. Sci. 2022, 23, 5798 9 of 20
Int. J. Mol. Sci. 2022, 23, x FOR PEER REVIEW 9 of 20
proteoglycan genes were detectable in placental samples derived from women with early-onset pre-eclampsia compared to gestational-age-matched controls, in the study of Than et al. [51] (Figure 6a).
Figure 6. Placental proteoglycan gene expression in pre-eclampsia. (a) Placental microarray data from women with early-onset pre-eclampsia (n = 12) and preterm controls (n = 5) were published by Than et al. [51]. Color code depicts log2 gene expression ratios between cases and controls. Red indicates higher gene expression, while blue depicts lower gene expression in pre-eclampsia. Stars show significant differences. (b) Single-cell RNA-seq data from women with early-onset pre-eclampsia and preterm controls were published by Zhang et al. [70]. Differentially expressed genes in villous cytotrophoblasts (VCT), in the syncytiotrophoblast (SCT), and in extravillous trophoblasts (EVT) were visualized on a heatmap. Red indicates higher gene expression, blue depicts lower gene expression in pre-eclampsia (log2 fold change, q-value < 0.05), and grey depicts non-differentially expressed genes.
The greatest changes were detected for sparc/osteonectin, cwcv, and kazal-like domains proteoglycan 2 (SPOCK2), SDC1, brevican (BCAN), transforming growth factor-beta receptor III (TGFBR3), versican (VCAN), and agrin (AGRN) with 2.4-, −2.2-, 1.7-, −1.6-, 1.5-, and 1.5-fold changes, respectively (Figure 6a). However, only AGRN and TGFBR3 had a significant change in expression in early-onset pre-eclampsia.
A comprehensive analysis of high-quality RNA-seq data also found TGFBR3 as the most downregulated gene in pre-eclampsia, while SPOCK2, glypican-5 (GPC5), and chondroitin sulfate proteoglycan 4 (CSPG4) were significantly upregulated [71]. In addition, expression changes in the placenta, obtained from women with preterm pre-eclampsia and from healthy controls, were also revealed in a small single-cell RNA-seq study [70]. DCN and SRGN were upregulated in villous cytotrophoblasts; GPC3 and SRGN were downregulated, while DCN, LUM, SDC4, and SMC3 were upregulated in the syncytiotrophoblast; HSPG2 and syndecan-2 (SDC2) were downregulated, and SRGN was upregulated in extravillous trophoblasts (Figure 6b). When comparing the results of these studies, it transpires that gene expression patterns were similar in the bulk placenta to that of the syncytiotrophoblast at the level of some proteoglycans, probably due to their predominant expression in that cell compartment. Herein, we did not perform a meta-
Figure 6. Placental proteoglycan gene expression in pre-eclampsia. (a) Placental microarray datafrom women with early-onset pre-eclampsia (n = 12) and preterm controls (n = 5) were publishedby Than et al. [51]. Color code depicts log2 gene expression ratios between cases and controls.Red indicates higher gene expression, while blue depicts lower gene expression in pre-eclampsia.Stars show significant differences. (b) Single-cell RNA-seq data from women with early-onset pre-eclampsia and preterm controls were published by Zhang et al. [70]. Differentially expressed genesin villous cytotrophoblasts (VCT), in the syncytiotrophoblast (SCT), and in extravillous trophoblasts(EVT) were visualized on a heatmap. Red indicates higher gene expression, blue depicts lower geneexpression in pre-eclampsia (log2 fold change, q-value < 0.05), and grey depicts non-differentiallyexpressed genes.
The greatest changes were detected for sparc/osteonectin, cwcv, and kazal-like do-mains proteoglycan 2 (SPOCK2), SDC1, brevican (BCAN), transforming growth factor-betareceptor III (TGFBR3), versican (VCAN), and agrin (AGRN) with 2.4-, −2.2-, 1.7-, −1.6-, 1.5-,and 1.5-fold changes, respectively (Figure 6a). However, only AGRN and TGFBR3 had asignificant change in expression in early-onset pre-eclampsia.
A comprehensive analysis of high-quality RNA-seq data also found TGFBR3 as themost downregulated gene in pre-eclampsia, while SPOCK2, glypican-5 (GPC5), and chon-droitin sulfate proteoglycan 4 (CSPG4) were significantly upregulated [71]. In addition,expression changes in the placenta, obtained from women with preterm pre-eclampsiaand from healthy controls, were also revealed in a small single-cell RNA-seq study [70].DCN and SRGN were upregulated in villous cytotrophoblasts; GPC3 and SRGN weredownregulated, while DCN, LUM, SDC4, and SMC3 were upregulated in the syncytiotro-phoblast; HSPG2 and syndecan-2 (SDC2) were downregulated, and SRGN was upregulatedin extravillous trophoblasts (Figure 6b). When comparing the results of these studies, ittranspires that gene expression patterns were similar in the bulk placenta to that of thesyncytiotrophoblast at the level of some proteoglycans, probably due to their predominantexpression in that cell compartment. Herein, we did not perform a meta-analysis sincedifferent patient groups, and different basic methods limit the comparability of numerousstudies. However, we investigated transcriptomic changes in pre-eclampsia in a recentpublication [72].
Int. J. Mol. Sci. 2022, 23, 5798 10 of 20
In the case of fetal growth restriction, four microarray studies [66,73–75] and one RNA-seq study [76] were available. Downregulation of SDC1 [74] and upregulation of epiphycan(EPYC) and sparc/osteonectin, cwcv, and kazal-like domains proteoglycan 1 (SPOCK1) [75]could be detected. Furthermore, Whitehead et al. measured circulating placenta-specificgenes by microarray in maternal blood at 26–30 weeks’ gestation to identify pregnancies atrisk of late-onset fetal growth restriction [77] and found BGN and GPC3 to be upregulatedin fetal growth restriction.
At the protein level, the expression of five proteoglycans (decorin, glypican-1, glypican-3, perlecan, syndecan-2) of the nine measured was significantly decreased in the placentas ofwomen with pre-eclampsia compared to gestational-age-matched controls [20]. Regardingperlecan protein levels in the placenta, our study found the same direction of changein late-onset pre-eclampsia, which constitute the majority of cases, while an oppositedirectional change was observed in early-onset pre-eclampsia [78]. This may reflect thedistinct placental pathologies of these clinically different pre-eclampsia subtypes.
Although reduced SDC1 expression was not significant in microarray and single-cellRNA-seq analyses, syndecan-1 expression levels in the placenta, using immunohistochem-istry and/or qRT-PCR, were shown to be reduced during pre-eclampsia, as reported by afew publications [19,60,79]. In line with reduced syndecan-1 expression in placentas withpre-eclampsia, serum levels of syndecan-1 were found to be lower in pre-eclamptic patientscompared to healthy controls [21,61,80,81]. Only one study found that plasma concentra-tion of syndecan-1 was similar in pre-eclamptic and normotensive pregnant women [82],and one showed significantly elevated serum concentrations of syndecan-1 in women withhemolysis, elevated liver enzymes, low platelet count (HELLP) syndrome [59]. AlthoughSzabó et al. found lower maternal serum concentrations of syndecan-1 in women with pre-eclampsia than in healthy controls, their study revealed higher immunostaining intensityof the syncytiotrophoblast brush border membrane in preterm pre-eclampsia and HELLPsyndrome, which may be attributable to the redistribution of syndecan-1 from the plasmatoward the cell surface in these syndromes [21]. This is interesting in the light that cellularredistribution of placenta-specific glycan-binding proteins, galectins [83–86], in the syncy-tiotrophoblast was also observed in placentas of women with preterm pre-eclampsia [87–89].It is possible that such cellular redistribution of placenta-specific glycan and glycan-bindingproteins are linked together as a result of the activation of an ischemic-inflammatory diseasepathway in the tropohoblast in preterm pre-eclampsia [90,91]. Interestingly, one studyfound lower syndecan-1 maternal plasma concentrations in pre-eclampsia (but not gesta-tional hypertension) already at the 20th week of gestation, when clinical signs have not yetbeen developed [60]. This means that biological pathways leading to decreased syndecan-1levels in the placenta and consequently in the maternal circulation are present in midgesta-tion. Indeed, this is true for the above-mentioned ischemic inflammatory disease pathways,as we demonstrated in a previous study [51]. This also suggests that syndecan-1 measure-ments in maternal circulation may have predictive or prognostic value for pre-eclampticpregnancies. However, large longitudinal studies need to investigate this phenomenon.
In the case of fetal growth restriction, the mRNA and protein expression levels of bothsyndecan-1 and syndecan-2 were significantly decreased in diseased placentas comparedto the controls [23]. However, according to Garcha et al., syndecan-1 serum levels, but notplacental protein levels, were reduced significantly in pregnancies complicated by fetalgrowth restriction [92]. Overall, these partly contrasting data highlight the complexityof the phenomenon, which requires further studies for a deeper understanding of theproteoglycans’ behavior in the placenta in various obstetrical syndromes, which may helpdiagnostic or therapeutic developments.
2.5. Potential Functional Significance of Syndecan-1 in the Placenta
Microarray data showed that of the proteoglycans expressed in the placenta, SDC1production is markedly the highest. Moreover, during villous trophoblast differentiationinto the syncytiotrophoblast, SDC1 has the highest upregulation among all proteoglycans.

Int. J. Mol. Sci. 2022, 23, 5798 11 of 20
Furthermore, SDC1 gene expression (microarray and RNA-seq data), although not alwayssignificantly, is found to be downregulated in pre-eclampsia and fetal growth restriction,which corroborates with a significantly lower concentration of syndecan-1 protein in thematernal blood in these obstetrical syndromes. These findings, along with data on the roleof syndecan-1 in regulating cytoskeleton remodeling, cell adhesion, growth factor signaling,anchorage-dependent growth, and invasiveness in different cell systems [3,93,94], suggestthat it may play important roles in the maternal-fetal interface.
On the fetal side of the placenta, the critical involvement of syndecan-1 in trophoblastsyncytialization [58] has been reported by a few studies. Prakash et al. found that syndecan-1silencing led to a decrease in cell fusion and even human chorionic gonadotropin (hCG)production in trophoblast-like BeWo choriocarcinoma cells. Their explanation was that theimpairment in the establishment of cell-to-cell contact is essential for the morphologicaldifferentiation leading to cell fusion. The possible ways through which syndecans, e.g.,syndecan-1, regulate the cellular function may include supporting cell adhesion via thebinding of adhesion molecules such as fibronectins, collagens, and thrombospondin [94]or may help to establish feto-maternal communication through binding with growth fac-tors [4]. In addition, syndecans have been found to serve as primary attachment receptorsfor a disintegrin and metalloproteinase 12 (ADAM12) in various human and mouse car-cinoma and fibroblast cell lines [95], but the same stands for other cells as well. In thecase of trophoblasts, ADAM12 is able to shed the ectodomain of E-cadherin and potentiatetrophoblast fusion [96]. The importance of syndecan-1 has been revealed in the main-tenance of intestinal barrier function [97,98]. In this context, Moore et al. found thatsyncytialization caused a marked change in syndecans, matching observations of placentalextracellular matrices. Furthermore, the barrier function of the extracellular matrix, asmeasured by electric cell-substrate impedance sensing, increased significantly during andafter syncytialization [98].
Interestingly, the role of syndecan-1 also emerges in trophoblast invasion in associationwith ADAM12. ADAM12, upregulated during extravillous trophoblast differentiation,was suggested to exert its promigratory function in extravillous trophoblasts by inducingintegrin beta 1-mediated cellular spreading [99]. As syndecans are key receptors forADAM12, they may support the spreading.
On the maternal side of the placenta, it was demonstrated by the workgroup ofHess that syndecan-1 is involved in the control of apoptosis both in human endometrialepithelial [100] and in stromal cells [101]. SDC1 knockdown in endometrial epithelialcells resulted in the decreased expression of several anti-apoptotic proteins, a cellularinhibitor of apoptosis (cIAP)-1 and -2, X-linked inhibitor of apoptosis (XIAP), survivin,clusterin, heme oxygenase (HO-2), and heat shock proteins HSP27 and -70. Correspond-ingly, active caspase-3 was increased more severely in knockdown cells after treatmentwith implantation-related stimuli [100]. In endometrial stromal cells, active caspase-3 wasalso increased in knockdown cells after treatment with implantation-related stimuli [101].Pro-apoptotic BCL2-associated agonist of cell death (Bad) and Fas receptor increased inaccordance with decidualization, and SDC1 knockdown further increased Bad expression.On the contrary, anti-apoptotic Livin decreased due to decidualization and knockdownof SDC1. Implantation stimuli provoked an increase of abundant proteins in all differentcell types (stromal cell, SDC1 knockdown stromal cells, decidualized stromal cells, anddecidualized SDC1 knockdown stromal cells) in varying degrees. Bad was upregulated inall four cell types, whereas anti-apoptotic cIAP-1 and XIAP were downregulated only inknockdown cells [101]. Altogether, these findings suggest that syndecan-1 may affect thefine-tuning of apoptosis in the endometrium, regulating the embryo’s invasion depth as acrucial step for regular implantation followed by successful pregnancy [100,101].
Of note, the same workgroup found that SDC1 knockdown led to significant changesin cytokine, chemokine, growth factors, and angiogenic factor (e.g., C-X-C motif chemokineligand 1 (CXCL1), CXCL8, C-C motif chemokine ligand 2 (CCL2), hepatocyte growthfactor (HGF)) expression profiles of human endometrial stromal cells [102]. Incubation

Int. J. Mol. Sci. 2022, 23, 5798 12 of 20
with IL-1β altered the expression patterns of chemokines and angiogenic factors towardinflammatory-associated molecules and factors involved in extracellular matrix regulation.Therefore, syndecan-1 appears to play an important role as a co-receptor and storage factorfor many cytokines, chemokines, growth factors, and angiogenic molecules during thedecidualization and implantation period, supporting proper implantation and angiogenesisby regulation of chemokine and angiogenic factor secretion in favor of the implantingembryo (Figure 7) [102].
Int. J. Mol. Sci. 2022, 23, x FOR PEER REVIEW 12 of 20
knockdown cells [101]. Altogether, these findings suggest that syndecan-1 may affect the fine-tuning of apoptosis in the endometrium, regulating the embryo’s invasion depth as a crucial step for regular implantation followed by successful pregnancy [100,101].
Of note, the same workgroup found that SDC1 knockdown led to significant changes in cytokine, chemokine, growth factors, and angiogenic factor (e.g., C-X-C motif chemokine ligand 1 (CXCL1), CXCL8, C-C motif chemokine ligand 2 (CCL2), hepatocyte growth factor (HGF)) expression profiles of human endometrial stromal cells [102]. Incubation with IL-1β altered the expression patterns of chemokines and angiogenic factors toward inflammatory-associated molecules and factors involved in extracellular matrix regulation. Therefore, syndecan-1 appears to play an important role as a co-receptor and storage factor for many cytokines, chemokines, growth factors, and angiogenic molecules during the decidualization and implantation period, supporting proper implantation and angiogenesis by regulation of chemokine and angiogenic factor secretion in favor of the implanting embryo (Figure 7) [102].
Figure 7. Physiological aspects of syndecan-1 at the maternal-fetal interface. The figure represents multiple roles of syndecan-1 in implantation, angiogenesis, maternal-fetal immune tolerance, and trophoblast invasion. (a) Embryo implantation. (b) Formation of primary villi by proliferative cytotrophoblasts and syncytialization. (c) Formation of tertiary villi, placental angiogenesis, extravillous trophoblast invasion, and spiral artery remodeling. Amniotic epithelium, AE; cell column trophoblast, CCT; dendritic cell, DC; decidual fibroblast, DF; embryoblast, EB; endothelial cell, EC; extracellular matrix, ECM; extraembryonic mesoderm, EM; endovascular cytotrophoblast, eCTB; giant cell, GC; inner cell mass, ICM; interstitial cytotrophoblast, iCTB; luminal uterine epithelium, LUE; lacunae, L; matrix metalloproteinase, MMP; natural killer, NK; placental fibroblast, pF; primitive syncytium, PS; placental vessel, pV; spiral artery, SA; syncytium, S; smooth
Figure 7. Physiological aspects of syndecan-1 at the maternal-fetal interface. The figure representsmultiple roles of syndecan-1 in implantation, angiogenesis, maternal-fetal immune tolerance, andtrophoblast invasion. (a) Embryo implantation. (b) Formation of primary villi by proliferative cytotro-phoblasts and syncytialization. (c) Formation of tertiary villi, placental angiogenesis, extravilloustrophoblast invasion, and spiral artery remodeling. Amniotic epithelium, AE; cell column trophoblast,CCT; dendritic cell, DC; decidual fibroblast, DF; embryoblast, EB; endothelial cell, EC; extracellularmatrix, ECM; extraembryonic mesoderm, EM; endovascular cytotrophoblast, eCTB; giant cell, GC;inner cell mass, ICM; interstitial cytotrophoblast, iCTB; luminal uterine epithelium, LUE; lacunae,L; matrix metalloproteinase, MMP; natural killer, NK; placental fibroblast, pF; primitive syncytium,PS; placental vessel, pV; spiral artery, SA; syncytium, S; smooth muscle cell, SMC; trophectoderm,TE; uterine gland, UG; uterine NK cell, uNK; uterine vessel, UV; villous cytotrophoblast, vCTB.Cartoons are adapted from Knöfler and Pollheimer [103] under the terms of the Creative CommonsAttribution License.
Of importance, the syndecan-1 ectodomain can be shed by various matrix metallopro-teinases in a highly regulated fashion, and soluble syndecan-1 can compete with the intactone for extracellular ligands. The multiple roles of syndecan shedding, including inflamma-tion, wound healing, and tumor progression, were reviewed by Manon-Jensen et al. [104].

Int. J. Mol. Sci. 2022, 23, 5798 13 of 20
It would be important to reveal the regulation of syndecan shedding and functions of shedsyndecans in pregnancy as well.
3. Summary and Conclusions
In this review, we aimed to characterize the expression and potential functions ofall proteoglycans at the maternal-fetal interface in healthy and diseased pregnancies. Im-portantly, we detected SDC1 to be primarily expressed by the placenta among all humantissues and primarily in the syncytiotrophoblast within the placenta, where it is localizedto the cytoplasm and the apical cell surface, the largest interface between the maternal andfetal compartments. Microarray data showed that of 34 proteoglycans expressed in theplacenta, SDC1 production is markedly the highest. Moreover, during villous trophoblastdifferentiation into the syncytiotrophoblast, SDC1 has the highest upregulation amongall proteoglycans. We also analyzed transcriptomic data of the placenta from variousobstetrical syndromes and identified SDC1, among other dysregulated proteoglycan genes,in pre-eclampsia and fetal growth restriction. In line with these findings, syndecan-1concentrations are decreased in the maternal blood in these syndromes, where placentaldevelopment and malfunction are at the center of the disease. Since syndecan-1 supportsproper implantation and angiogenesis by the regulation of chemokine and angiogenic factorsecretion in favor of the implanting embryo, it may have a key role in the development ofplacental dysfunction in obstetrical syndromes, where these functions are severely affected.
In conclusion, proteoglycans are important components of the placenta and regulatevarious steps of placental development as well as participate in the maintenance of healthypregnancy. Syndecan-1, with the highest expression among proteoglycans, may serve asa useful marker of syncytialization and may also be a diagnostic/prognostic marker ofadverse pregnancy outcomes, such as pre-eclampsia and fetal growth restriction. Furtherstudies are warranted to explore the role of proteoglycans, including syndecan-1, in healthypregnancies and in pregnancies with adverse outcomes to better characterize molecularsignaling pathways and to reveal potential therapeutic targets.
4. Materials and Methods4.1. Placental Expression of Proteoglycan Coding Genes
We downloaded the human U133A/GNF1H microarray data on 79 human tissues fromthe BioGPS database [105]. In the case of absolute mRNA expression, the threshold wasset to 100. To demonstrate gene expression in the placenta on a relative scale, in comparisonto other kinds of tissues, the relative placental expression was calculated relative to themedian Q50 value of all other tissues.
Microarray data of trophoblast differentiation into the syncytiotrophoblast were down-loaded from GEO (Acc. No.: GSE130339) [52]. Microarray data of extravillous trophoblastdifferentiation were downloaded from GEO (Acc. No.: GSE9773) [63] and the ArrayExpressmicroarray data repository (Acc. No.: E-MTAB-429) [13]. Microarray data of placentasobtained from women with preterm pre-eclampsia with or without HELLP syndrome(n = 12), as well as gestational-age-matched controls (n = 5), were downloaded from GEO(Acc. No.: GSE66273) [51,106].
Single-cell RNA-seq data (pTPM) were downloaded from the Human Protein At-las [107]. The 19 cell clusters were narrowed down to the 12 trophoblast clusters, excludingfibroblasts, endothelial cells, and Hofbauer cells. The original study was executed byVento-Tormo et al. [55].
4.2. Isolation of Primary Trophoblasts and Cell Culturing
Placentas (n = 6) were collected prospectively from normal pregnant women at term,delivered by cesarean section, at Hutzel Women’s Hospital of the Detroit Medical Cen-ter (Detroit, MI, USA), and were then processed at the Perinatology Research Branch,NICHD/NIH/DHHS, for in vitro trophoblast experiments. For cytotrophoblast isolation,we used the modified method of Kliman et al. [108]. One hundred grams of villous tro-

Int. J. Mol. Sci. 2022, 23, 5798 14 of 20
phoblast were cut from the placenta, then washed with PBS. The placenta pieces weresequentially digested with 60 U/mL Dnase I (Sigma-Aldrich, St. Louis, MI, USA) and 0.25%(Thermo Fisher Scientific, Waltham, MA, USA) trypsin for 90 min at 37 ◦C, then the digestedcells were filtered through 100 µm Falcon nylon mesh cell strainers (BD Biosciences, SanJose, CA, USA) and the erythrocytes were lysed using 5 mL NH4Cl solution (Stemcell Tech-nologies, Vancouver, BC, Canada). The cells were then washed and resuspended, layeredover 20–50% Percoll gradients, and centrifuged at 1200× g for 20 min. Negative selectionwas used to collect trophoblast-containing bands and to exclude non-trophoblastic cells,using anti-CD14 (20 µg/mL) and anti-CD9 (20 µg/mL) mouse monoclonal antibodies (R&DSystems, Minneapolis, MN, USA), MACS anti-mouse IgG microbeads, and MS columns(Miltenyi Biotec, Auburn, CA, USA). Next, the primary trophoblast cells were plated on acollagen-coated 12-well plate (BD Biosciences) in Iscove’s modified Dulbecco’s medium(IMDM, Thermo Fisher Scientific) and completed with 1% penicillin/streptomycin and10% fetal bovine serum (FBS). Primary trophoblasts were kept in IMDM containing 1%penicillin/streptomycin and 5% non-pregnant human serum (SeraCare, Milford, MA, USA)to test the effect of trophoblast differentiation on selected genes’ expression. Every 24 h, themedium was replenished, and all 24 h cells were harvested for total RNA between days 1and 7.
4.3. Total RNA Isolation, cDNA Generation, and RT-qPCR
Total RNA was isolated from cells in 12-well plates each day with RNeasy Mini Kit andRNase-Free DNase Set (Qiagen, Valencia, CA, USA). RNA concentrations were measuredwith a NanoDrop1000 Spectrophotometer (Thermo Fisher Scientific). Total RNA (500 ng)was reverse-transcribed with SuperScript III First-Strand Synthesis Kit (Invitrogen-ThermoFisher Scientific). TaqMan Assays (Applied Biosystems-Thermo Fisher Scientific) for SDC1(Hs00896423_m1) and RPLP0 (large ribosomal protein; Endogenous Control; 4326314E)were used for gene expression profiling on an ABI 7500 Fast Real-Time PCR System(Applied Biosystems-Thermo Fisher Scientific). All experiments were run in triplicate.
4.4. Human 48-Tissue cDNA Panel Expression Profiling
The same TaqMan Assays for SDC1 and RPLP0 were also used for gene expressionprofiling on Human Major Tissue qPCR Arrays containing first-strand cDNAs from 48different pooled tissues (n = 3), OriGene Technologies, Inc., Rockville, MD, USA) on anABI 7500 Fast Real-Time PCR System (Applied Biosystems-Thermo Fisher Scientific). Allexperiments were run in triplicate.
4.5. Syndecan-1 Immunoassay
Syndecan-1 concentrations in supernatants of primary trophoblast cell cultures (n = 5)were measured with a human syndecan-1 sandwich ELISA Kit (Cell Sciences, Canton,MA, USA), according to the manufacturer’s instructions. The sensitivity of the assay was<2.56 ng/mL, and the coefficients of intra-assay variation and inter-assay variation were7.6% and 6.8%, respectively. All experiments were run in triplicate.
4.6. Statistical Analysis
Statistical analysis was performed using GraphPad Prism 5.0 (GraphPad Software,San Diego, CA, USA). Unpaired t-test was used for the analysis of SDC1 expression profilingwith the Human Major Tissue qPCR Array. One-Way ANOVA test with Dunnett’s post-hoctest was used for the analysis of qRT-PCR and ELISA results. Results were consideredstatistically significant at * p < 0.05, ** p < 0.01, and *** p < 0.001.
Supplementary Materials: The following supporting information can be downloaded at: https://www.mdpi.com/article/10.3390/ijms23105798/s1.
Author Contributions: Conceptualization, N.G.T.; methodology, Y.X., Zs.G., Z.X., G.B., B.P., A.L.T.and N.G.T.; validation, O.O., A.B., Y.X., K.J., Zs.G., Z.X., G.B., P.M., A.L.T. and N.G.T.; formal analysis,

Int. J. Mol. Sci. 2022, 23, 5798 15 of 20
O.O., A.B., Y.X., K.J., Zs.G., Z.X., G.B., B.P., A.L.T. and N.G.T.; resources, R.R., Z.P. and N.G.T.; datacuration, A.B., P.H., I.K., J.M. and N.G.T.; writing—original draft preparation, O.O., A.B., K.J., Zs.G.,B.P., J.M., P.M. and N.G.T.; writing—review and editing, all authors; visualization, A.B., Zs.G., Z.X.,G.B. and R.P.-R.; supervision, R.R., I.K., Z.P., J.M. and N.G.T.; project administration, N.G.T.; fundingacquisition, A.B., R.R. and N.G.T. Current address of B.P. is the Faculty of Information Technologyand Bionics, Pázmány Péter Catholic University, Budapest, Hungary. R.R. contributed to this work aspart of his official duties as an employee of the United States Federal Government. All authors haveread and agreed to the published version of the manuscript.
Funding: This research was funded, in part, by the Perinatology Research Branch, Division ofObstetrics and Maternal-Fetal Medicine, Division of Intramural Research, Eunice Kennedy ShriverNational Institute of Child Health and Human Development, National Institutes of Health, USADepartment of Health and Human Services (NICHD/NIH/DHHS); in part, with Federal fundsfrom NICHD/NIH/DHHS under Contract No. HHSN275201300006C (R.R.); by the HungarianAcademy of Sciences (Momentum Grant No LP2014-7/2014 (N.G.T.) and Premium Postdoc_2019-436Grant (A.B.)); by the Ministry of Innovation and Technology of Hungary from the National Research,Development Innovation Fund financed under the OTKA K124862 (N.G.T.) and FIEK_16-1-2016-0005 (N.G.T.) funding schemes; and by the Hungarian Ministry For National Economy, Grant NoVEKOP-2.3.3-15-2017-0014 (N.G.T.).
Institutional Review Board Statement: The study was conducted in accordance with the Declarationof Helsinki, and approved by the Institutional Review Boards of Wayne State University (approvalnumber: #110605MP4F dated 10 March 2006) and the Eunice Kennedy Shriver National Institute ofChild Health and Human Development, National Institutes of Health, U.S. Department of Healthand Human Services (approval number: OH97-CH-N067, dated 4 December 1997).
Informed Consent Statement: All participants provided written informed consent prior to thecollection of samples for research purposes.
Data Availability Statement: Not applicable.
Acknowledgments: We thank Judit Baunoch, Andor Jelinek, Katalin Karaszi, Szilvia Szabo (ResearchCentre for Natural Sciences), Po Jen Chiang, Russ Price, Theodore Price, Rona Wang (PerinatologyResearch Branch), Matthew Hess, Susan Land, Daniel Lott, Tara Reinholz (Wayne State University)for their assistance, and Maureen McGerty (Wayne State University) for her critical reading of themanuscript. We also thank Krisztian Papp for the generation of heatmaps and processing of fetalgrowth restriction microarray and single-cell RNA-seq data.
Conflicts of Interest: The authors declare no conflict of interest. The funders had no role in the designof the study; in the collection, analyses, or interpretation of data; in the writing of the manuscript, orin the decision to publish the results.
References1. Iozzo, R.V.; Schaefer, L. Proteoglycan form and function: A comprehensive nomenclature of proteoglycans. Matrix Biol. 2015, 42,
11–55. [CrossRef] [PubMed]2. Niemann, C.U.; Cowland, J.B.; Klausen, P.; Askaa, J.; Calafat, J.; Borregaard, N. Localization of serglycin in human neutrophil
granulocytes and their precursors. J. Leukoc. Biol. 2004, 76, 406–415. [CrossRef] [PubMed]3. Couchman, J.R.; Woods, A. Syndecans, signaling, and cell adhesion. J. Cell. Biochem. 1996, 61, 578–584. [CrossRef]4. Jokimaa, V.; Inki, P.; Kujari, H.; Hirvonen, O.; Ekholm, E.; Anttila, L. Expression of syndecan-1 in human placenta and decidua.
Placenta 1998, 19, 157–163. [CrossRef]5. Crescimanno, C.; Marzioni, D.; Paradinas, F.J.; Schrurs, B.; Muhlhauser, J.; Todros, T.; Newlands, E.; David, G.; Castellucci, M.
Expression pattern alterations of syndecans and glypican-1 in normal and pathological trophoblast. J. Pathol. 1999, 189, 600–608.[CrossRef]
6. Marzioni, D.; Crescimanno, C.; Zaccheo, D.; Coppari, R.; Underhill, C.B.; Castellucci, M. Hyaluronate and CD44 expressionpatterns in the human placenta throughout pregnancy. Eur. J. Histochem. 2001, 45, 131–140. [CrossRef]
7. Khan, S.; Blackburn, M.; Mao, D.L.; Huber, R.; Schlessinger, D.; Fant, M. Glypican-3 (GPC3) expression in human placenta:Localization to the differentiated syncytiotrophoblast. Histol. Histopathol. 2001, 16, 71–78. [CrossRef]
8. Van Sinderen, M.; Cuman, C.; Winship, A.; Menkhorst, E.; Dimitriadis, E. The chrondroitin sulfate proteoglycan (CSPG4) regulateshuman trophoblast function. Placenta 2013, 34, 907–912. [CrossRef]
9. Afratis, N.A.; Nikitovic, D.; Multhaupt, H.A.; Theocharis, A.D.; Couchman, J.R.; Karamanos, N.K. Syndecans-key regulators ofcell signaling and biological functions. FEBS J. 2017, 284, 27–41. [CrossRef]

Int. J. Mol. Sci. 2022, 23, 5798 16 of 20
10. Jeyarajah, M.J.; Jaju Bhattad, G.; Kops, B.F.; Renaud, S.J. Syndecan-4 regulates extravillous trophoblast migration by coordinatingprotein kinase C activation. Sci. Rep. 2019, 9, 10175. [CrossRef]
11. Goryszewska-Szczurek, E.; Baryla, M.; Kaczynski, P.; Waclawik, A. Prokineticin 1-prokineticin receptor 1 signaling in trophoblastpromotes embryo implantation and placenta development. Sci. Rep. 2021, 11, 13715. [CrossRef] [PubMed]
12. Halari, C.D.; Zheng, M.; Lala, P.K. Roles of two small leucine-rich proteoglycans decorin and biglycan in pregnancy andpregnancy-associated diseases. Int. J. Mol. Sci. 2021, 22, 10584. [CrossRef] [PubMed]
13. Apps, R.; Sharkey, A.; Gardner, L.; Male, V.; Trotter, M.; Miller, N.; North, R.; Founds, S.; Moffett, A. Genome-wide expressionprofile of first trimester villous and extravillous human trophoblast cells. Placenta 2011, 32, 33–43. [CrossRef] [PubMed]
14. Xu, G.; Guimond, M.J.; Chakraborty, C.; Lala, P.K. Control of proliferation, migration, and invasiveness of human extravilloustrophoblast by decorin, a decidual product. Biol. Reprod. 2002, 67, 681–689. [CrossRef] [PubMed]
15. Ball, M.; Carmody, M.; Wynne, F.; Dockery, P.; Aigner, A.; Cameron, I.; Higgins, J.; Smith, S.D.; Aplin, J.D.; Moore, T. Expressionof pleiotrophin and its receptors in human placenta suggests roles in trophoblast life cycle and angiogenesis. Placenta 2009, 30,649–653. [CrossRef]
16. Lala, N.; Girish, G.V.; Cloutier-Bosworth, A.; Lala, P.K. Mechanisms in decorin regulation of vascular endothelial growthfactor-induced human trophoblast migration and acquisition of endothelial phenotype. Biol. Reprod. 2012, 87, 59. [CrossRef]
17. Hayashida, K.; Parks, W.C.; Park, P.W. Syndecan-1 shedding facilitates the resolution of neutrophilic inflammation by removingsequestered CXC chemokines. Blood 2009, 114, 3033–3043. [CrossRef]
18. Teng, Y.H.; Aquino, R.S.; Park, P.W. Molecular functions of syndecan-1 in disease. Matrix Biol. 2012, 31, 3–16. [CrossRef]19. Jokimaa, V.I.; Kujari, H.P.; Ekholm, E.M.; Inki, P.L.; Anttila, L. Placental expression of syndecan 1 is diminished in preeclampsia.
Am. J. Obstet. Gynecol. 2000, 183, 1495–1498. [CrossRef]20. Chui, A.; Murthi, P.; Brennecke, S.P.; Ignjatovic, V.; Monagle, P.T.; Said, J.M. The expression of placental proteoglycans in
pre-eclampsia. Gynecol. Obstet. Investig. 2012, 73, 277–284. [CrossRef]21. Szabo, S.; Xu, Y.; Romero, R.; Fule, T.; Karaszi, K.; Bhatti, G.; Varkonyi, T.; Varkonyi, I.; Krenacs, T.; Dong, Z.; et al. Changes of
placental syndecan-1 expression in preeclampsia and HELLP syndrome. Virchows Arch. 2013, 463, 445–458. [CrossRef] [PubMed]22. Ogawa, M.; Yanoma, S.; Nagashima, Y.; Okamoto, N.; Ishikawa, H.; Haruki, A.; Miyagi, E.; Takahashi, T.; Hirahara, F.; Miyagi, Y.
Paradoxical discrepancy between the serum level and the placental intensity of PP5/TFPI-2 in preeclampsia and/or intrauterinegrowth restriction: Possible interaction and correlation with glypican-3 hold the key. Placenta 2007, 28, 224–232. [CrossRef][PubMed]
23. Chui, A.; Zainuddin, N.; Rajaraman, G.; Murthi, P.; Brennecke, S.P.; Ignjatovic, V.; Monagle, P.T.; Said, J.M. Placental syndecanexpression is altered in human idiopathic fetal growth restriction. Am. J. Pathol. 2012, 180, 693–702. [CrossRef] [PubMed]
24. Gunatillake, T.; Chui, A.; Fitzpatrick, E.; Ignjatovic, V.; Monagle, P.; Whitelock, J.; Zanten, D.; Eijsink, J.; Borg, A.; Stevenson, J.;et al. Decreased placental glypican expression is associated with human fetal growth restriction. Placenta 2019, 76, 6–9. [CrossRef]
25. Chen, C.P.; Chang, S.C.; Vivian Yang, W.C. High glucose alters proteoglycan expression and the glycosaminoglycan compositionin placentas of women with gestational diabetes mellitus and in cultured trophoblasts. Placenta 2007, 28, 97–106. [CrossRef]
26. Murthi, P.; van Zanten, D.E.; Eijsink, J.J.; Borg, A.J.; Stevenson, J.L.; Kalionis, B.; Chui, A.K.; Said, J.M.; Brennecke, S.P.; Erwich, J.J.Decorin expression is decreased in first trimester placental tissue from pregnancies with small for gestation age infants at birth.Placenta 2016, 45, 58–62. [CrossRef]
27. Kramer, K.L. Specific sides to multifaceted glycosaminoglycans are observed in embryonic development. Semin. Cell Dev. Biol.2010, 21, 631–637. [CrossRef]
28. Costanzo, V.; Bardelli, A.; Siena, S.; Abrignani, S. Exploring the links between cancer and placenta development. Open Biol. 2018,8, 180081. [CrossRef]
29. Sanderson, R.D. Heparan sulfate proteoglycans in invasion and metastasis. Semin. Cell Dev. Biol. 2001, 12, 89–98. [CrossRef]30. Timar, J.; Lapis, K.; Dudas, J.; Sebestyen, A.; Kopper, L.; Kovalszky, I. Proteoglycans and tumor progression: Janus-faced molecules
with contradictory functions in cancer. Semin. Cancer Biol. 2002, 12, 173–186. [CrossRef]31. Edwards, I.J. Proteoglycans in prostate cancer. Nat. Rev. Urol. 2012, 9, 196–206. [CrossRef] [PubMed]32. Theocharis, A.D.; Skandalis, S.S.; Neill, T.; Multhaupt, H.A.; Hubo, M.; Frey, H.; Gopal, S.; Gomes, A.; Afratis, N.; Lim, H.C.; et al.
Insights into the key roles of proteoglycans in breast cancer biology and translational medicine. Biochim. Biophys. Acta 2015, 1855,276–300. [CrossRef] [PubMed]
33. Szatmari, T.; Otvos, R.; Hjerpe, A.; Dobra, K. Syndecan-1 in cancer: Implications for cell signaling, differentiation, and prognosti-cation. Dis. Mark. 2015, 2015, 796052. [CrossRef] [PubMed]
34. Baghy, K.; Tatrai, P.; Regos, E.; Kovalszky, I. Proteoglycans in liver cancer. World J. Gastroenterol. 2016, 22, 379–393. [CrossRef][PubMed]
35. Schaefer, L.; Tredup, C.; Gubbiotti, M.A.; Iozzo, R.V. Proteoglycan neofunctions: Regulation of inflammation and autophagy incancer biology. FEBS J. 2017, 284, 10–26. [CrossRef]
36. Tanaka, Y.; Tateishi, R.; Koike, K. Proteoglycans are attractive biomarkers and therapeutictargets in hepatocellular carcinoma. Int.J. Mol. Sci. 2018, 19, 3070. [CrossRef]
37. Xu, L.; Tang, L.; Zhang, L. Proteoglycans as miscommunication biomarkers for cancer diagnosis. Prog. Mol. Biol. Transl. Sci. 2019,162, 59–92. [CrossRef]
Int. J. Mol. Sci. 2022, 23, 5798 17 of 20
38. Rigoglio, N.N.; Rabelo, A.C.S.; Borghesi, J.; de Sa Schiavo Matias, G.; Fratini, P.; Prazeres, P.; Pimentel, C.; Birbrair, A.; Miglino,M.A. The tumor microenvironment: Focus on extracellular matrix. Adv. Exp. Med. Biol. 2020, 1245, 1–38. [CrossRef]
39. Teixeira, F.; Gotte, M. Involvement of syndecan-1 and heparanase in cancer and inflammation. Adv. Exp. Med. Biol. 2020, 1221,97–135. [CrossRef]
40. Reszegi, A.; Horvath, Z.; Feher, H.; Wichmann, B.; Tatrai, P.; Kovalszky, I.; Baghy, K. Protective role of decorin in primaryhepatocellular carcinoma. Front. Oncol. 2020, 10, 645. [CrossRef]
41. Gubbiotti, M.A.; Buraschi, S.; Kapoor, A.; Iozzo, R.V. Proteoglycan signaling in tumor angiogenesis and endothelial cell autophagy.Semin. Cancer Biol. 2020, 62, 1–8. [CrossRef] [PubMed]
42. Espinoza-Sanchez, N.A.; Gotte, M. Role of cell surface proteoglycans in cancer immunotherapy. Semin. Cancer Biol. 2020, 62,48–67. [CrossRef] [PubMed]
43. Reszegi, A.; Horvath, Z.; Karaszi, K.; Regos, E.; Postnikova, V.; Tatrai, P.; Kiss, A.; Schaff, Z.; Kovalszky, I.; Baghy, K. The protectiverole of decorin in hepatic metastasis of colorectal carcinoma. Biomolecules 2020, 10, 1199. [CrossRef] [PubMed]
44. Wei, J.; Hu, M.; Huang, K.; Lin, S.; Du, H. Roles of proteoglycans and glycosaminoglycans in cancer development and progression.Int. J. Mol. Sci. 2020, 21, 5983. [CrossRef]
45. De Pasquale, V.; Pavone, L.M. Heparan sulfate proteoglycan signaling in tumor microenvironment. Int. J. Mol. Sci. 2020, 21, 6588.[CrossRef]
46. Hollosi, P.; Vancza, L.; Karaszi, K.; Dobos, K.; Peterfia, B.; Tatrai, E.; Tatrai, P.; Szarvas, T.; Paku, S.; Szilak, L.; et al. Syndecan-1promotes hepatocyte-like differentiation of hepatoma cells targeting Ets-1 and AP-1. Biomolecules 2020, 10, 1356. [CrossRef]
47. Li, N.; Spetz, M.R.; Ho, M. The role of glypicans in cancer progression and therapy. J. Histochem. Cytochem. 2020, 68, 841–862.[CrossRef]
48. Vancza, L.; Karaszi, K.; Peterfia, B.; Turiak, L.; Dezso, K.; Sebestyen, A.; Reszegi, A.; Petovari, G.; Kiss, A.; Schaff, Z.; et al. SPOCK1promotes the development of hepatocellular carcinoma. Front. Oncol. 2022, 12, 819883. [CrossRef]
49. Su, A.I.; Wiltshire, T.; Batalov, S.; Lapp, H.; Ching, K.A.; Block, D.; Zhang, J.; Soden, R.; Hayakawa, M.; Kreiman, G.; et al. A geneatlas of the mouse and human protein-encoding transcriptomes. Proc. Natl. Acad. Sci. USA 2004, 101, 6062–6067. [CrossRef]
50. Wu, C.; Orozco, C.; Boyer, J.; Leglise, M.; Goodale, J.; Batalov, S.; Hodge, C.L.; Haase, J.; Janes, J.; Huss, J.W., 3rd; et al. BioGPS:An extensible and customizable portal for querying and organizing gene annotation resources. Genome Biol. 2009, 10, R130.[CrossRef]
51. Than, N.G.; Romero, R.; Tarca, A.L.; Kekesi, K.A.; Xu, Y.; Xu, Z.; Juhasz, K.; Bhatti, G.; Leavitt, R.J.; Gelencser, Z.; et al. Integratedsystems biology approach identifies novel maternal and placental pathways of preeclampsia. Front. Immunol. 2018, 9, 1661.[CrossRef] [PubMed]
52. Szilagyi, A.; Gelencser, Z.; Romero, R.; Xu, Y.; Kiraly, P.; Demeter, A.; Palhalmi, J.; Gyorffy, B.A.; Juhasz, K.; Hupuczi, P.; et al.Placenta-specific genes, their regulation during villous trophoblast differentiation and dysregulation in preterm preeclampsia.Int. J. Mol. Sci. 2020, 21, 628. [CrossRef] [PubMed]
53. Romero, R.; Erez, O.; Maymon, E.; Chaemsaithong, P.; Xu, Z.; Pacora, P.; Chaiworapongsa, T.; Done, B.; Hassan, S.S.; Tarca, A.L.The maternal plasma proteome changes as a function of gestational age in normal pregnancy: A longitudinal study. Am. J. Obstet.Gynecol. 2017, 217, 67.e1–67.e21. [CrossRef] [PubMed]
54. Azar, C.; Valentine, M.; Trausch-Azar, J.; Druley, T.; Nelson, D.M.; Schwartz, A.L. RNA-Seq identifies genes whose proteins aretransformative in the differentiation of cytotrophoblast to syncytiotrophoblast, in human primary villous and BeWo trophoblasts.Sci. Rep. 2018, 8, 5142. [CrossRef]
55. Vento-Tormo, R.; Efremova, M.; Botting, R.A.; Turco, M.Y.; Vento-Tormo, M.; Meyer, K.B.; Park, J.E.; Stephenson, E.; Polanski,K.; Goncalves, A.; et al. Single-cell reconstruction of the early maternal-fetal interface in humans. Nature 2018, 563, 347–353.[CrossRef]
56. Karlsson, M.; Zhang, C.; Mear, L.; Zhong, W.; Digre, A.; Katona, B.; Sjostedt, E.; Butler, L.; Odeberg, J.; Dusart, P.; et al. Asingle-cell type transcriptomics map of human tissues. Sci. Adv. 2021, 7, eabh2169. [CrossRef]
57. Pique-Regi, R.; Romero, R.; Tarca, A.L.; Sendler, E.D.; Xu, Y.; Garcia-Flores, V.; Leng, Y.; Luca, F.; Hassan, S.S.; Gomez-Lopez, N.Single cell transcriptional signatures of the human placenta in term and preterm parturition. Elife 2019, 8, e52004. [CrossRef]
58. Meinhardt, G.; Haider, S.; Kunihs, V.; Saleh, L.; Pollheimer, J.; Fiala, C.; Hetey, S.; Feher, Z.; Szilagyi, A.; Than, N.G.; et al. Pivotalrole of the transcriptional co-activator YAP in trophoblast stemness of the developing human placenta. Proc. Natl. Acad. Sci. USA2020, 117, 13562–13570. [CrossRef]
59. Hofmann-Kiefer, K.F.; Knabl, J.; Martinoff, N.; Schiessl, B.; Conzen, P.; Rehm, M.; Becker, B.F.; Chappell, D. Increased serumconcentrations of circulating glycocalyx components in HELLP syndrome compared to healthy pregnancy: An observationalstudy. Reprod. Sci 2013, 20, 318–325. [CrossRef]
60. Gandley, R.E.; Althouse, A.; Jeyabalan, A.; Bregand-White, J.M.; McGonigal, S.; Myerski, A.C.; Gallaher, M.; Powers, R.W.; Hubel,C.A. Low soluble syndecan-1 precedes preeclampsia. PLoS ONE 2016, 11, e0157608. [CrossRef]
61. Kuessel, L.; Husslein, H.; Montanari, E.; Kundi, M.; Himmler, G.; Binder, J.; Schiefer, J.; Zeisler, H. Dynamics of soluble syndecan-1in maternal serum during and after pregnancies complicated by preeclampsia: A nested case control study. Clin. Chem. Lab. Med.2019, 58, 50–58. [CrossRef] [PubMed]
62. Pollheimer, J.; Vondra, S.; Baltayeva, J.; Beristain, A.G.; Knofler, M. Regulation of placental extravillous trophoblasts by thematernal uterine environment. Front. Immunol. 2018, 9, 2597. [CrossRef] [PubMed]

Int. J. Mol. Sci. 2022, 23, 5798 18 of 20
63. Bilban, M.; Haslinger, P.; Prast, J.; Klinglmuller, F.; Woelfel, T.; Haider, S.; Sachs, A.; Otterbein, L.E.; Desoye, G.; Hiden, U.; et al.Identification of novel trophoblast invasion-related genes: Heme oxygenase-1 controls motility via peroxisome proliferator-activated receptor gamma. Endocrinology 2009, 150, 1000–1013. [CrossRef] [PubMed]
64. Espinoza, J.; Romero, R.; Mee Kim, Y.; Kusanovic, J.P.; Hassan, S.; Erez, O.; Gotsch, F.; Than, N.G.; Papp, Z.; Jai Kim, C. Normaland abnormal transformation of the spiral arteries during pregnancy. J. Perinat. Med. 2006, 34, 447–458. [CrossRef]
65. Brosens, I.; Pijnenborg, R.; Vercruysse, L.; Romero, R. The “Great Obstetrical Syndromes” are associated with disorders of deepplacentation. Am. J. Obstet. Gynecol. 2011, 204, 193–201. [CrossRef] [PubMed]
66. Nishizawa, H.; Ota, S.; Suzuki, M.; Kato, T.; Sekiya, T.; Kurahashi, H.; Udagawa, Y. Comparative gene expression profiling ofplacentas from patients with severe pre-eclampsia and unexplained fetal growth restriction. Reprod. Biol. Endocrinol. 2011, 9, 107.[CrossRef] [PubMed]
67. Chaiworapongsa, T.; Chaemsaithong, P.; Yeo, L.; Romero, R. Pre-eclampsia part 1: Current understanding of its pathophysiology.Nat. Rev. Nephrol. 2014, 10, 466–480. [CrossRef]
68. Szalai, G.; Xu, Y.; Romero, R.; Chaiworapongsa, T.; Xu, Z.; Chiang, P.J.; Ahn, H.; Sundell, B.; Plazyo, O.; Jiang, Y.; et al. In vivoexperiments reveal the good, the bad and the ugly faces of sFlt-1 in pregnancy. PLoS ONE 2014, 9, e110867. [CrossRef]
69. Szalai, G.; Romero, R.; Chaiworapongsa, T.; Xu, Y.; Wang, B.; Ahn, H.; Xu, Z.; Chiang, P.J.; Sundell, B.; Wang, R.; et al. Full-lengthhuman placental sFlt-1-e15a isoform induces distinct maternal phenotypes of preeclampsia in mice. PLoS ONE 2015, 10, e0119547.[CrossRef]
70. Zhang, T.; Bian, Q.; Chen, Y.; Wang, X.; Yu, S.; Liu, S.; Ji, P.; Li, L.; Shrestha, M.; Dong, S.; et al. Dissecting human trophoblastcell transcriptional heterogeneity in preeclampsia using single-cell RNA sequencing. Mol. Genet. Genom. Med. 2021, 9, e1730.[CrossRef]
71. Gong, S.; Gaccioli, F.; Dopierala, J.; Sovio, U.; Cook, E.; Volders, P.J.; Martens, L.; Kirk, P.D.W.; Richardson, S.; Smith, G.C.S.; et al.The RNA landscape of the human placenta in health and disease. Nat. Commun. 2021, 12, 2639. [CrossRef] [PubMed]
72. Than, N.G.; Posta, M.; Gyorffy, D.; Orosz, L.; Orosz, G.; Rossi, S.W.; Ambrus-Aikelin, G.; Szilagyi, A.; Nagy, S.; Hupuczi, P.; et al.Early pathways, biomarkers, and four distinct molecular subclasses of preeclampsia: The intersection of clinical, pathological,and high-dimensional biology studies. Placenta 2022, in press. [CrossRef] [PubMed]
73. Sitras, V.; Paulssen, R.; Leirvik, J.; Vartun, A.; Acharya, G. Placental gene expression profile in intrauterine growth restriction dueto placental insufficiency. Reprod. Sci. 2009, 16, 701–711. [CrossRef] [PubMed]
74. Guo, L.; Tsai, S.Q.; Hardison, N.E.; James, A.H.; Motsinger-Reif, A.A.; Thames, B.; Stone, E.A.; Deng, C.; Piedrahita, J.A.Differentially expressed microRNAs and affected biological pathways revealed by modulated modularity clustering (MMC)analysis of human preeclamptic and IUGR placentas. Placenta 2013, 34, 599–605. [CrossRef] [PubMed]
75. Medina-Bastidas, D.; Guzman-Huerta, M.; Borboa-Olivares, H.; Ruiz-Cruz, C.; Parra-Hernandez, S.; Flores-Pliego, A.; Salido-Guadarrama, I.; Camargo-Marin, L.; Arambula-Meraz, E.; Estrada-Gutierrez, G. Placental microarray profiling reveals commonmRNA and lncRNA expression patterns in preeclampsia and intrauterine growth restriction. Int. J. Mol. Sci. 2020, 21, 3597.[CrossRef]
76. Majewska, M.; Lipka, A.; Paukszto, L.; Jastrzebski, J.P.; Szeszko, K.; Gowkielewicz, M.; Lepiarczyk, E.; Jozwik, M.; Majewski, M.K.Placenta transcriptome profiling in intrauterine growth restriction (IUGR). Int. J. Mol. Sci. 2019, 20, 1510. [CrossRef] [PubMed]
77. Whitehead, C.L.; McNamara, H.; Walker, S.P.; Alexiadis, M.; Fuller, P.J.; Vickers, D.K.; Hannan, N.J.; Hastie, R.; Tuohey, L.;Kaitu’u-Lino, T.J.; et al. Identifying late-onset fetal growth restriction by measuring circulating placental RNA in the maternalblood at 28 weeks’ gestation. Am. J. Obstet. Gynecol. 2016, 214, 521.e521–521.e528. [CrossRef]
78. Szenasi, N.L.; Toth, E.; Balogh, A.; Juhasz, K.; Karaszi, K.; Ozohanics, O.; Gelencser, Z.; Kiraly, P.; Hargitai, B.; Drahos, L.; et al.Proteomic identification of membrane-associated placental protein 4 (MP4) as perlecan and characterization of its placentalexpression in normal and pathologic pregnancies. PeerJ 2019, 7, e6982. [CrossRef]
79. Heyer-Chauhan, N.; Ovbude, I.J.; Hills, A.A.; Sullivan, M.H.; Hills, F.A. Placental syndecan-1 and sulphated glycosaminoglycansare decreased in preeclampsia. J. Perinat. Med. 2014, 42, 329–338. [CrossRef]
80. Alici Davutoglu, E.; Akkaya Firat, A.; Ozel, A.; Yilmaz, N.; Uzun, I.; Temel Yuksel, I.; Madazli, R. Evaluation of maternal serumhypoxia inducible factor-1alpha, progranulin and syndecan-1 levels in pregnancies with early- and late-onset preeclampsia. J.Matern. Fetal. Neonatal. Med. 2018, 31, 1976–1982. [CrossRef]
81. Kornacki, J.; Wirstlein, P.; Wender-Ozegowska, E. Levels of syndecan-1 and hyaluronan in early- and late-onset preeclampsia.Pregnancy Hypertens 2019, 18, 108–111. [CrossRef] [PubMed]
82. Hassani Lahsinoui, H.; Amraoui, F.; Spijkers, L.J.A.; Veenboer, G.J.M.; Peters, S.L.M.; van Vlies, N.; Vogt, L.; Ris-Stalpers, C.; vanden Born, B.J.H.; Afink, G.B. Soluble syndecan-1 and glycosaminoglycans in preeclamptic and normotensive pregnancies. Sci.Rep. 2021, 11, 4387. [CrossRef] [PubMed]
83. Than, N.G.; Romero, R.; Goodman, M.; Weckle, A.; Xing, J.; Dong, Z.; Xu, Y.; Tarquini, F.; Szilagyi, A.; Gal, P.; et al. A primatesubfamily of galectins expressed at the maternal-fetal interface that promote immune cell death. Proc. Natl. Acad. Sci. USA 2009,106, 9731–9736. [CrossRef] [PubMed]
84. Than, N.G.; Romero, R.; Meiri, H.; Erez, O.; Xu, Y.; Tarquini, F.; Barna, L.; Szilagyi, A.; Ackerman, R.; Sammar, M.; et al. PP13,maternal ABO blood groups and the risk assessment of pregnancy complications. PLoS ONE 2011, 6, e21564. [CrossRef] [PubMed]

Int. J. Mol. Sci. 2022, 23, 5798 19 of 20
85. Than, N.G.; Balogh, A.; Romero, R.; Karpati, E.; Erez, O.; Szilagyi, A.; Kovalszky, I.; Sammar, M.; Gizurarson, S.; Matko, J.;et al. Placental Protein 13 (PP13)—A placental immunoregulatory galectin protecting pregnancy. Front. Immunol. 2014, 5, 348.[CrossRef] [PubMed]
86. Than, N.G.; Romero, R.; Balogh, A.; Karpati, E.; Mastrolia, S.A.; Staretz-Chacham, O.; Hahn, S.; Erez, O.; Papp, Z.; Kim, C.J.Galectins: Double-edged swords in the cross-roads of pregnancy complications and female reproductive tract inflammation andneoplasia. J. Pathol. Transl. Med. 2015, 49, 181–208. [CrossRef]
87. Than, N.G.; Abdul Rahman, O.; Magenheim, R.; Nagy, B.; Fule, T.; Hargitai, B.; Sammar, M.; Hupuczi, P.; Tarca, A.L.; Szabo,G.; et al. Placental protein 13 (galectin-13) has decreased placental expression but increased shedding and maternal serumconcentrations in patients presenting with preterm pre-eclampsia and HELLP syndrome. Virchows Arch. 2008, 453, 387–400.[CrossRef]
88. Balogh, A.; Pozsgay, J.; Matko, J.; Dong, Z.; Kim, C.J.; Varkonyi, T.; Sammar, M.; Rigo, J., Jr.; Meiri, H.; Romero, R.; et al. Placentalprotein 13 (PP13/galectin-13) undergoes lipid raft-associated subcellular redistribution in the syncytiotrophoblast in pretermpreeclampsia and HELLP syndrome. Am. J. Obstet. Gynecol. 2011, 205, 156.e1–156.e14. [CrossRef]
89. Than, N.G.; Romero, R.; Xu, Y.; Erez, O.; Xu, Z.; Bhatti, G.; Leavitt, R.; Chung, T.H.; El-Azzamy, H.; LaJeunesse, C.; et al. Evolu-tionary origins of the placental expression of chromosome 19 cluster galectins and their complex dysregulation in preeclampsia.Placenta 2014, 35, 855–865. [CrossRef]
90. Burton, G.J.; Jauniaux, E. Placental oxidative stress: From miscarriage to preeclampsia. J. Soc. Gynecol. Investig. 2004, 11, 342–352.[CrossRef]
91. Szabo, S.; Mody, M.; Romero, R.; Xu, Y.; Karaszi, K.; Mihalik, N.; Xu, Z.; Bhatti, G.; Fule, T.; Hupuczi, P.; et al. Activation of villoustrophoblastic p38 and ERK1/2 signaling pathways in preterm preeclampsia and HELLP syndrome. Pathol. Oncol. Res. 2015, 21,659–668. [CrossRef] [PubMed]
92. Garcha, D.; Walker, S.P.; MacDonald, T.M.; Hyett, J.; Jellins, J.; Myers, J.; Illanes, S.E.; Nien, J.K.; Schepeler, M.; Keenan, E.; et al.Circulating syndecan-1 is reduced in pregnancies with poor fetal growth and its secretion regulated by matrix metalloproteinasesand the mitochondria. Sci. Rep. 2021, 11, 16595. [CrossRef] [PubMed]
93. Bernfield, M.; Gotte, M.; Park, P.W.; Reizes, O.; Fitzgerald, M.L.; Lincecum, J.; Zako, M. Functions of cell surface heparan sulfateproteoglycans. Annu. Rev. Biochem. 1999, 68, 729–777. [CrossRef] [PubMed]
94. Prakash, G.J.; Suman, P.; Gupta, S.K. Relevance of syndecan-1 in the trophoblastic BeWo cell syncytialization. Am. J. Reprod.Immunol. 2011, 66, 385–393. [CrossRef]
95. Iba, K.; Albrechtsen, R.; Gilpin, B.; Frohlich, C.; Loechel, F.; Zolkiewska, A.; Ishiguro, K.; Kojima, T.; Liu, W.; Langford, J.K.; et al.The cysteine-rich domain of human ADAM 12 supports cell adhesion through syndecans and triggers signaling events that leadto beta1 integrin-dependent cell spreading. J. Cell Biol. 2000, 149, 1143–1156. [CrossRef]
96. Aghababaei, M.; Hogg, K.; Perdu, S.; Robinson, W.P.; Beristain, A.G. ADAM12-directed ectodomain shedding of E-cadherinpotentiates trophoblast fusion. Cell Death Differ. 2015, 22, 1970–1984. [CrossRef]
97. Wang, Z.; Li, R.; Tan, J.; Peng, L.; Wang, P.; Liu, J.; Xiong, H.; Jiang, B.; Chen, Y. Syndecan-1 acts in synergy with tight junctionthrough Stat3 signaling to maintain intestinal mucosal barrier and prevent bacterial translocation. Inflamm. Bowel Dis. 2015, 21,1894–1907. [CrossRef]
98. Moore, K.H.; Murphy, H.A.; Chapman, H.; George, E.M. Syncytialization alters the extracellular matrix and barrier function ofplacental trophoblasts. Am. J. Physiol. Cell Physiol. 2021, 321, C694–C703. [CrossRef]
99. Biadasiewicz, K.; Fock, V.; Dekan, S.; Proestling, K.; Velicky, P.; Haider, S.; Knofler, M.; Frohlich, C.; Pollheimer, J. Extravilloustrophoblast-associated ADAM12 exerts pro-invasive properties, including induction of integrin beta 1-mediated cellular spreading.Biol. Reprod. 2014, 90, 101. [CrossRef]
100. Boeddeker, S.J.; Baston-Buest, D.M.; Altergot-Ahmad, O.; Kruessel, J.S.; Hess, A.P. Syndecan-1 knockdown in endometrialepithelial cells alters their apoptotic protein profile and enhances the inducibility of apoptosis. Mol. Hum. Reprod. 2014, 20,567–578. [CrossRef]
101. Boeddeker, S.J.; Baston-Buest, D.M.; Fehm, T.; Kruessel, J.; Hess, A. Decidualization and syndecan-1 knock down sensitizeendometrial stromal cells to apoptosis induced by embryonic stimuli. PLoS ONE 2015, 10, e0121103. [CrossRef] [PubMed]
102. Baston-Bust, D.M.; Gotte, M.; Janni, W.; Krussel, J.S.; Hess, A.P. Syndecan-1 knock-down in decidualized human endometrialstromal cells leads to significant changes in cytokine and angiogenic factor expression patterns. Reprod. Biol. Endocrinol. 2010,8, 133. [CrossRef] [PubMed]
103. Knofler, M.; Pollheimer, J. Human placental trophoblast invasion and differentiation: A particular focus on Wnt signaling. Front.Genet. 2013, 4, 190. [CrossRef] [PubMed]
104. Manon-Jensen, T.; Itoh, Y.; Couchman, J.R. Proteoglycans in health and disease: The multiple roles of syndecan shedding. FEBS J.2010, 277, 3876–3889. [CrossRef]
105. Daglar, K.; Kirbas, A.; Timur, H.; Ozturk Inal, Z.; Danisman, N. Placental levels of total oxidative and anti-oxidative status,ADAMTS-12 and decorin in early- and late-onset severe preeclampsia. J. Matern. Fetal. Neonatal. Med. 2016, 29, 4059–4064.[CrossRef]
106. Varkonyi, T.; Nagy, B.; Fule, T.; Tarca, A.L.; Karaszi, K.; Schonleber, J.; Hupuczi, P.; Mihalik, N.; Kovalszky, I.; Rigo, J., Jr.; et al.Microarray profiling reveals that placental transcriptomes of early-onset HELLP syndrome and preeclampsia are similar. Placenta2011, 32, S21–S29. [CrossRef]

Int. J. Mol. Sci. 2022, 23, 5798 20 of 20
107. Sjostedt, E.; Zhong, W.; Fagerberg, L.; Karlsson, M.; Mitsios, N.; Adori, C.; Oksvold, P.; Edfors, F.; Limiszewska, A.; Hikmet, F.;et al. An atlas of the protein-coding genes in the human, pig, and mouse brain. Science 2020, 367, eaay5947. [CrossRef]
108. Kliman, H.J.; Nestler, J.E.; Sermasi, E.; Sanger, J.M.; Strauss, J.F., 3rd. Purification, characterization, and in vitro differentiation ofcytotrophoblasts from human term placentae. Endocrinology 1986, 118, 1567–1582. [CrossRef]