Protein gels and emulsions from mixtures of Cape-hake and pea proteins
10
Research Article Received: 2 January 2014 Revised: 24 April 2014 Accepted article published: 30 April 2014 Published online in Wiley Online Library: (wileyonlinelibrary.com) DOI 10.1002/jsfa.6717 Protein gels and emulsions from mixtures of Cape hake and pea proteins Ana Sofia Tomé, a Carla Pires, b* Irineu Batista, b Isabel Sousa a and Anabela Raymundo a Abstract BACKGROUND: Portioning of frozen fish generates by-products such as fish ‘sawdust’ and cut-offs which can be further processed into protein concentrates and isolates. The objective of the present work was to produce gels and emulsions using recovered Cape hake protein powder (HPP). In previous works, the structures of the gels produced by HPP were found to be strong, with a high rubbery character. In this work, the addition of commercial pea proteins (PPC) to HPP gels and emulsions was studied. RESULTS: Physical properties of gels and emulsions prepared with different proportions of mixtures of PPC and HPP were evaluated. In general, gels and emulsions showed high values for whiteness and, as expected, the higher content of HPP in the protein mixtures led to higher firmness values of the gels. The gel network was rapidly formed upon heating due to the fish protein macromolecules and further reinforced by the pea protein macromolecules when cooled to 5 ∘ C. Both visco-elastic parameters, storage and loss moduli, of the produced gels increased with the HPP proportion in the protein mixtures, corresponding to more structured systems. For the emulsions, two different pH environments were studied: 3.8 and 7.0. At neutral pH a synergy was found between the vegetable and fish protein, which is not so strong when pH is lowered to 3.8, near the isoelectric point of pea proteins (pI = 4.5). This evidence was supported by the results from the texture measurements, viscosity and visco-elastic parameters. CONCLUSIONS: Gels made from Cape hake proteins showed a softer texture and were less rubbery with the addition of pea proteins. Emulsions stabilised by these mixtures showed slightly different behaviour when produced at pH 7.0 or pH 3.8. © 2014 Society of Chemical Industry Keywords: Cape hake by-products; recovered proteins; pea proteins; gels and emulsions; texture and rheological properties INTRODUCTION Fish proteins from by-products and under-utilised species are tra- ditionally used in the production of fish meal and silage but other alternatives with added value, such as the production of protein isolates by acid or alkaline solubilisation, have also been investigated. 1 Fish proteins can be used as an excellent dietary supplement to provide a highly healthy source of easily digestible proteins. 2 The high gelation capacity of fish proteins is well recognised 3 and this capacity is very important in forming desired textures in many seafood products. Protein gelation can be viewed as a process during which proteins interact to establish a net- work of molecules structured (e.g. kamaboko). These interactions include protein–water, protein–fat and protein–protein. 4 They are influenced by several factors as protein concentration, temper- ature, pH, ionic strength, additives, endogenous and exogenous enzymes and processing factors. Therefore, these factors can affect protein gelation, as well as the type and the properties of gels. The emulsifying capacity of fish proteins have also been studied by sev- eral authors. 5,6 Similarly, fish protein powder prepared by different methods also showed good gelation and emulsifying capacity. 7 – 10 Concentrate or isolate plant proteins are also widely employed in many foodstuffs due to their nutritional quality and contribution to food texture. Pea protein isolates (PPC) have gained increasing importance in recent years. They present a balanced amino acid composition, good nutritional value and have been used as a sub- stitute for meat protein or as a functional additive. 11 Several studies have reported the gelation ability of PPC. 4,12,13 The use of plant proteins to stabilise oil/water emulsions was extensively studied by several authors. 14 – 16 Those studies showed that pea proteins had high surface active properties at the oil – water interface. The capacity of PPC to stabilise food emulsions was optimised and the main operating conditions were studied by Raymundo et al. 17 Proteins from different sources have been used to modify the rheological properties of surimi or other fish protein gels. Thus, the addition of soy protein isolate affected the gel properties and modori phenomena of Alaska pollock surimi as reported by Furukawa and Ohta. 18 Chang-Lee et al. 19 also evaluated the effect of egg white, whey protein and soy protein isolate as protein ∗ Correspondence to: Carla Pires, IPMA, IP, Instituto Português do Mar e da Atmosfera, DMRM/DivAV, Av. Brasília, 1449–006 Lisbon, Portugal. E-mail: [email protected] a CEER – Biosystems Engineering, Instituto Superior de Agronomia/Technical University of Lisbon, Tapada da Ajuda, 1349-017 Lisbon, Portugal b IPMA, IP, Instituto Português do Mar e da Atmosfera, DMRM/DivAV, Av. Brasília, 1449-006 Lisbon, Portugal J Sci Food Agric (2014) www.soci.org © 2014 Society of Chemical Industry
Transcript of Protein gels and emulsions from mixtures of Cape-hake and pea proteins

Research ArticleReceived: 2 January 2014 Revised: 24 April 2014 Accepted article published: 30 April 2014 Published online in Wiley Online Library:
(wileyonlinelibrary.com) DOI 10.1002/jsfa.6717
Protein gels and emulsions frommixturesof Cape hake and pea proteinsAna Sofia Tomé,a Carla Pires,b* Irineu Batista,b Isabel Sousaa and AnabelaRaymundoa
Abstract
BACKGROUND: Portioning of frozen fish generates by-products such as fish ‘sawdust’ and cut-offs which can be furtherprocessed into protein concentrates and isolates. The objective of the present work was to produce gels and emulsions usingrecovered Cape hake protein powder (HPP). In previous works, the structures of the gels produced by HPP were found to bestrong, with a high rubbery character. In this work, the addition of commercial pea proteins (PPC) to HPP gels and emulsionswas studied.
RESULTS: Physical properties of gels and emulsions prepared with different proportions of mixtures of PPC and HPP wereevaluated. In general, gels and emulsions showed high values for whiteness and, as expected, the higher content of HPPin the protein mixtures led to higher firmness values of the gels. The gel network was rapidly formed upon heating dueto the fish protein macromolecules and further reinforced by the pea protein macromolecules when cooled to 5 ∘C. Bothvisco-elastic parameters, storage and loss moduli, of the produced gels increased with the HPP proportion in the proteinmixtures, corresponding to more structured systems. For the emulsions, two different pH environments were studied: 3.8 and7.0. At neutral pH a synergywas foundbetween the vegetable and fish protein, which is not so strongwhenpH is lowered to 3.8,near the isoelectric point of pea proteins (pI= 4.5). This evidencewas supported by the results from the texturemeasurements,viscosity and visco-elastic parameters.
CONCLUSIONS: Gels made from Cape hake proteins showed a softer texture and were less rubbery with the addition of peaproteins. Emulsions stabilised by thesemixtures showed slightly different behaviour when produced at pH7.0 or pH3.8.© 2014 Society of Chemical Industry
Keywords: Cape hake by-products; recovered proteins; pea proteins; gels and emulsions; texture and rheological properties
INTRODUCTIONFish proteins from by-products and under-utilised species are tra-ditionally used in the production of fish meal and silage butother alternatives with added value, such as the production ofprotein isolates by acid or alkaline solubilisation, have also beeninvestigated.1 Fish proteins can be used as an excellent dietarysupplement to provide a highly healthy source of easily digestibleproteins.2 The high gelation capacity of fish proteins is wellrecognised3 and this capacity is very important in forming desiredtextures inmany seafoodproducts. Protein gelation canbe viewedas a process during which proteins interact to establish a net-work of molecules structured (e.g. kamaboko). These interactionsinclude protein–water, protein–fat and protein–protein.4 Theyare influenced by several factors as protein concentration, temper-ature, pH, ionic strength, additives, endogenous and exogenousenzymes andprocessing factors. Therefore, these factors can affectprotein gelation, as well as the type and the properties of gels. Theemulsifying capacity of fishproteins have alsobeen studiedby sev-eral authors.5,6 Similarly, fish protein powder prepared by differentmethods also showedgoodgelationandemulsifying capacity.7–10
Concentrate or isolate plant proteins are also widely employed inmany foodstuffs due to their nutritional quality and contributionto food texture. Pea protein isolates (PPC) have gained increasingimportance in recent years. They present a balanced amino acid
composition, good nutritional value and have been used as a sub-stitute formeatproteinor as a functional additive.11 Several studieshave reported the gelation ability of PPC.4,12,13 The use of plantproteins to stabilise oil/water emulsions was extensively studiedby several authors.14–16 Those studies showed that pea proteinshad high surface active properties at the oil–water interface. Thecapacity of PPC to stabilise food emulsions was optimised and themain operating conditions were studied by Raymundo et al.17
Proteins from different sources have been used to modify therheological properties of surimi or other fish protein gels. Thus,the addition of soy protein isolate affected the gel propertiesand modori phenomena of Alaska pollock surimi as reported byFurukawa and Ohta.18 Chang-Lee et al.19 also evaluated the effectof egg white, whey protein and soy protein isolate as protein
∗ Correspondence to: Carla Pires, IPMA, IP, Instituto Português do Mar e daAtmosfera, DMRM/DivAV, Av. Brasília, 1449–006 Lisbon, Portugal. E-mail:[email protected]
a CEER – Biosystems Engineering, Instituto Superior de Agronomia/TechnicalUniversity of Lisbon, Tapada da Ajuda, 1349-017 Lisbon, Portugal
b IPMA, IP, Instituto Português doMar e da Atmosfera, DMRM/DivAV, Av. Brasília,1449-006 Lisbon, Portugal
J Sci Food Agric (2014) www.soci.org © 2014 Society of Chemical Industry

www.soci.org A S Tomé et al.
additives to heat-set fish gels. Egg white produced superior gelfirmness and elasticity, while soy protein isolate produced nosignificant alteration in texture properties of the gels produced.Similarly, the addition of soy protein isolate influenced the gelproperties of Alaska pollock, common carp and silver carp surimiand their effect was dependent on the setting conditions andsurimi quality.20,21 The effect of added vegetable proteins on thesurimi gels open a wide range of possibilities to prepare newsurimi-based products. However, information is required concern-ing the effect of these proteins, particularly pea proteins, on surimigel properties.The objective of the present work was to study the rheological,
texture and colour properties of gels and emulsions preparedwithprotein powder obtained from Cape hake by-products and peaproteins.
MATERIAL ANDMETHODSMaterialFrozen Cape hake (Merluccius capensis) by-products resulting fromthe fish portioning (fish ‘sawdust’ and cut-offs) in a fish process-ing plant (Gelpeixe, Portugal) were used as rawmaterial to prepareprotein powders (HPP) as described by Pires et al.10 Pea proteins(PPC) Pisane® HD was supplied by Cosucra, S.A. (Warcoing, Bel-gium). Commercial vegetable oil used in the preparation of emul-sions and spices was purchased in the local market.
MethodsProximate chemical compositionTheashandmoistureweredeterminesbygravimetry, lipid contentwas evaluated by the Soxhlet method and total protein content ofHPP and PPC samples was determined by the Kjeldahl method, asdescribed by the AOAC.22
Preparation of gelsThe formulations were prepared based on different protein per-centages of HPP (0, 20, 50, 80 and 100%) and PPC (100, 80, 50,20 and 0%). The total protein content in each formulation was200 g kg−1, according to the results obtained in preliminary stud-ies (unpublished data). The formulations tested were designatedby 100PPC, 80PPC+ 20HPP, 50PPC+ 50HPP, 20PPC+ 80HPP and100HPP. To prepare the protein gels, the HPP and PPCwere initiallyrehydrated with distilled water (775 g kg−1) and sodium chloridewas added (25 g kg−1). The pH of suspensions was adjusted to 7.0with sodium bicarbonate and suspensions were placed in 0.025mdiameter and 0.045m height glass flasks and heated at 90 ∘C for30min, to ensure sufficient protein unfolding to build a good net-work on cooling and form a well-structured gel.23 Gels were keptat 5 ∘C overnight before performing the texture measurements.For rheological measurements, the protein suspensions were
immediately poured into the rheometermeasuring system (beforethe heating process) to promote gelation in situ and following theheating and cooling process.
Preparation of emulsionsOil-in-water emulsions were prepared with 650 g kg−1 vegetableoil, 320 g kg−1 water and a total protein content of 30 g kg−1. Thedifferent protein mixtures used had the same protein proportionsas those used in the gel preparation. The protein mixtures weredispersed in distilled water with magnetic stirring for 30min,at room temperature (20–22 ∘C), followed by pH adjustment to
Table 1. Proximate chemical composition of hake proteinpowder and pea protein isolate
Sample Protein (%) Moisture (%) Fat (%) Ash (%)
HPP 92.80± 1.22b 6.2± 0.04a 3.12± 0.21b 1.03± 0.05b
PPC 80.87± 1.25c 8.6± 0.03b 2.00± 0.59a 4.47± 0.02d
Values are means± standard deviation.Means with the same letter in each column are not significantly different(P<= 0.05).
Table 2. L*, a* and b* colour values and whiteness of gelsprepared with different hake protein powder (HPP) and com-mercial pea protein (PPC) mixtures at pH 7
Colour values
Sample L* a* b* Whiteness
100PPC 61.40± 1.74d 1.72± 0.15d 14.46± 0.75c 58.73± 1.48d
80PPC+ 20HPP 62.24± 0.97d 1.21± 0.15c 13.56± 0.15c 59.86± 0.91d
50PPC+ 50HPP 55.75± 3.83b −0.14± 0.71a 9.77± 2.84a 54.55± 3.22b
20PPC+ 80HPP 53.26± 2.86a 0.34± 0.74b 10.68± 1.15b 52.03± 2.81a
100HPP 58.40± 2.37c 1.12± 0.18c 13.94± 0.92c 56.08± 1.99c
Values are means± standard deviation.Means with the same letter in each column are not significantly different(P<= 0.05).
a a
b
c
d
0
2
4
6
8
100PPC 80PPC+20HPP 50PPC+50HPP 20PPC+80HPP 100HPP
Fir
mn
ess
(N)
Figure 1. Firmness of gels obtained with the mixtures of PPC and HPP.Different letters indicate statistically different averages (P <= 0.05).
7.0 or 3.8, since food emulsions, such as mayonnaise and saladdressings, have an acidic pH (around 3.8). The vegetable oil wasadded and emulsification was carried out at 13 500 rpm for 5minwith an Ultra Turrax T-25 rotor–stator homogeniser (Ika, Staufen,Germany), as previously studied for a similar system by Francoet al.24 The emulsions were stored in cylindrical glass flasks of0.06mdiameter and0.045mheight andpreserved at 5 ∘C, for 24 h,to reach equilibrium. The textural and rheological properties of theemulsions were subsequently evaluated at 20 ∘C.
Colour measurementsThe colour of gel and emulsion samples was measured using acolorimeter CR-300 (Minolta, Osaka, Japan) with standard illumi-nant D65 and a visual angle of 2∘. Tri-stimulus colour coordinates(CIELAB system)were used tomeasure the degree of lightness (L*),redness (a*) and yellowness (b*). For the assessment of colour, thecoordinates were combined to obtain the whiteness (W) parame-ter calculated by:
W = 100 −[(100 − L∗)2 + a*2 + b*2
]1∕2(1)
wileyonlinelibrary.com/jsfa © 2014 Society of Chemical Industry J Sci Food Agric (2014)

Cape hake and pea protein gels and emulsions www.soci.org
Figure 2. Heating curves (20–90 ∘C, 1 ∘Cmin−1) of PPC and HPP gels.
TexturemeasurementsTexture evaluation of gels and emulsions was performed by atexture profile analysis carried out in a texturometer TA-XT2iPlus(Stable Micro Systems, Surrey, UK). Penetration tests were per-formed with a Perspex cylindrical probe (0.010m and 0.038m ofdiameter for gels and emulsions, respectively) with a load cellof 5 kg and 0.002m s−1 of cross-head speed. From the force ver-sus time texturograms, firmness was calculated. It was consideredas the maximum resistance to the penetration of a cylinder at0.005m depth. This is recorded as themaximum force. All of thesemeasurements were conducted at 20 ∘C and replicated at leastthree times.
Rheological measurementsThe rheological behaviourof gels andemulsionspreparedwithdif-ferent formulations was analysed in a controlled-stress rheometer(RS-300; Haake, Karlsruhe, Germany). The samples were coveredwith paraffin oil to prevent moisture loss and all tests were repli-cated at least three times.Gels were characterised by small-amplitude oscillatory shear
measurements, using serrated plate–plate geometry (0.020mdiameter). Protein suspensions were placed on the rheometermeasuring device at 20 ∘C and heated to 90 ∘C at 1 ∘Cmin−1,kept at 90 ∘C for 30min and further cooled from 90 ∘C to 5 ∘C at1 ∘Cmin−1. Time sweep tests were conducted at 5 ∘C for 600min(frequencyof 1 Hz), to ensure that gel equilibriumwas reached, fol-lowedby frequency sweep tests (0.001592–23.87Hz). Subsequentheating (5–90 ∘C) and cooling (90 ∘C to 5 ∘C)were applied to studygels thermo-reversibility. A constant shear stress within the linearvisco-elastic region was used in all tests.Emulsions were also characterised by small-amplitude oscilla-
tory shear and steady state flow behaviour, at 20 ∘C tempera-ture. Frequency sweep tests were performed using a cone andplate sensor system (0.035m diameter, 2∘ angle) in a frequencyrange 0.01–100Hz, at a constant shear stress within the linearvisco-elastic region of each emulsion. For steady-state flow mea-surements a serrated parallel plate sensor system (0.020m diam-eter) was used in order to overcome the slip effect.25 Viscosityversus shear rate curves were obtained through a logarithmicramp of stresses increasing from 0.01 to 1000 Pa. The comparisonof the flow curves resulted from the adjustment of the Carreau
model (2):
� =�0[
1 +(
� ·
� ·c
)2]s (2)
where �0 is the zero-shear rate limiting-viscosity, � ·c is the criticalshear rate for the onset of the shear-thinning behaviour and s is aparameter related to the slope of this region.
Statistical analysisA general linear model – one-way ANOVA – was used to deter-mine significant differences (P≤ 0.05) between samples, followedby the post-hoc Tukey HSD test. All statistical treatments weredone with the software STATISTICA© from StatSoft, Inc. (Tulsa, OK,USA), version 6.1, 2003.
RESULTS ANDDISCUSSIONProximate chemical compositionThe proximate chemical composition of HPP and PPC used forpreparation of gels and emulsions are given in table 1. The pro-tein content of HPP was significantly higher (P≤ 0.05) than thatof PPC and its ash content was significantly lower (P≤ 0.05). Thelower protein content PPC may result from the presence of carbo-hydrates or fibre in this protein concentrate. The low ash contentof HPP indicated that the salts were mostly removed during theprotein recovery previously described by Pires et al.10
GelsColourThe colour parameters of gels prepared with the HPP and PPCmixtures (Table 2) show that the gel with 20PPC+ 80HPP wasthe darkest (P≤ 0.05), with L* value of 53.26 and whiteness of52.03. All gels were light yellowish, as indicated by the b* values.Gels prepared with 50PPC+ 50HPP presented significantly lower(P≤ 0.05) a* and b* values. The higher lightness and whiteness ofthe 100PPC gel compared with the 100HPP gel results from thehigher lightness of pea proteins (L*= 84.39, a*= 0.33, b*= 11.4for PPC and L*= 76.78; a*=−0.86, b*= 10.89 for HPP), whichis an advantage in terms of consumer preference. Luo et al.20
and Jafarpour et al.26 observed a decrease in whiteness of Alaska
J Sci Food Agric (2014) © 2014 Society of Chemical Industry wileyonlinelibrary.com/jsfa

www.soci.org A S Tomé et al.
Figure 3. Cooling curves (90∘ to 5 ∘C at 0.5 ∘Cmin−1) (A), and maturation curves (600min at 5 ∘C) of the PPC and HPP mixtures (B).
pollock and commoncarp surimi gels, respectively,with increasinglevels of soy protein isolate (0–40%). However, in this study anytrend was observed between the increasing levels of PPC and thecolour parameters of gels. The decrease of whiteness recorded bythe above authors was mainly due to the predominantly yellowcolour of the soy protein isolate used. The water released duringthe gelation process depends on the interactions between theproteins. As a consequence the gels had a different final watercontent, which influences the colour parameters as reported byReppond and Babbitt.27 Thus, the differences in colour parametersrecorded in the gels prepared with HPP and PPC may be relatedwith the water released during gelation.
Texture parametersFirmness values obtained for gelswithdifferent proportions of PPCand HPP are shown in Fig. 1. For the gel systems, only firmnessexhibits a coherent variation with protein composition, i.e. witha defined trend and low standard deviations values associated.The gel firmness increased as the proportion of HPP increasedin mixtures and the gels prepared with only hake proteins arethe firmest (6.68N). However, the firmness of the gels prepared
with 100PPC and 80PPC+ 20HPP are not significantly different(P> 0.05), i.e. the gel structure reinforcement effect from the HPPproteins is only noticed above a certain content.The HPP formed a strong protein network which is charac-
terised by the highest firmness values. An exponential decay ofthe gel firmness with the increase of PPC was found: the correla-tion coefficient was rather high (R2 = 0.98) and the fitted equation[ln(Firmness)= ln6.057− 0.02PPC] was adequate to describe thecorrelation between the amount of PPC and the gel firmness. Thepresence of PPC within the fish protein network contributes toa less firm gel. As reported by Sun and Arntfield28 the denatura-tion temperature of PPC is above the temperature used for gelformationwhich limited the interaction between fish and pea pro-teins. Thus, it was necessary to denaturate pea proteins at tem-peratures higher than 95 ∘C to enhance the interactions betweenthese two proteins. Similar results on pea protein denaturationwere described by Sousa et al.29
Rheological characterisationIn Fig. 2 the heating curves of five mixtures of proteins studied arerepresented, where the evolution of storage and loss moduli (G′
wileyonlinelibrary.com/jsfa © 2014 Society of Chemical Industry J Sci Food Agric (2014)
Cape hake and pea protein gels and emulsions www.soci.org
Figure 4. Frequency sweep tests of gels obtained with PPC and HPP mixtures at 5 ∘C and pH 7.0, within the linear visco-elastic range.
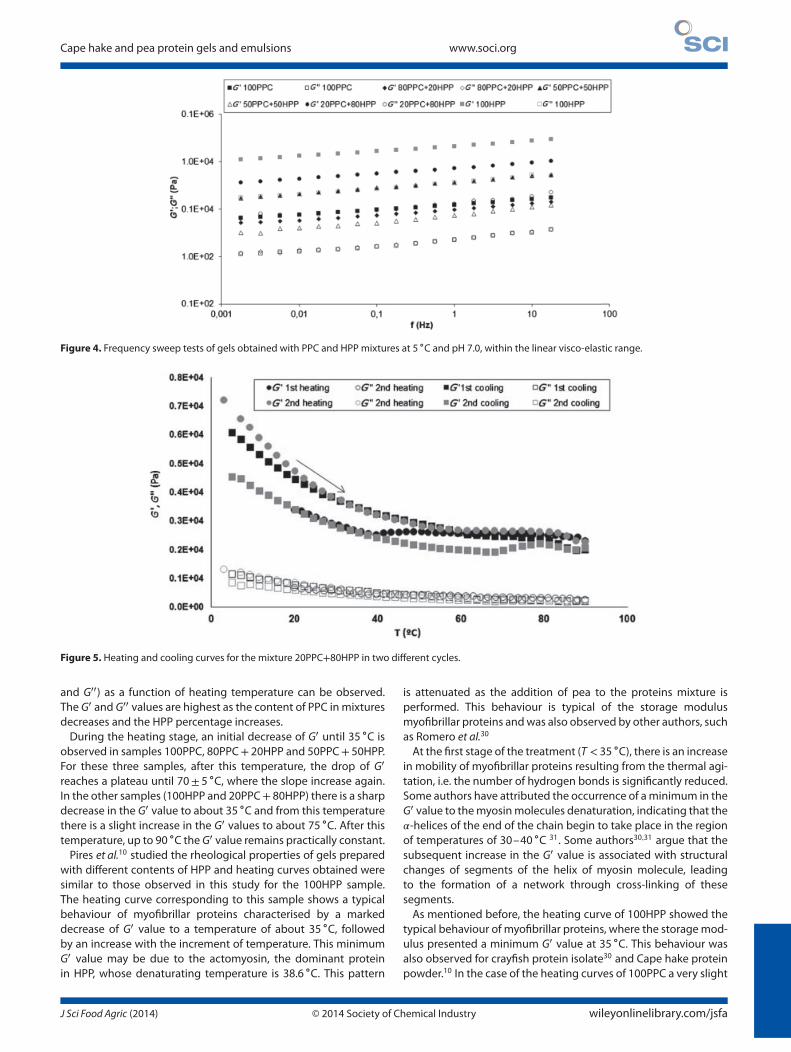
Figure 5. Heating and cooling curves for the mixture 20PPC+80HPP in two different cycles.
and G′′) as a function of heating temperature can be observed.The G′ and G′′ values are highest as the content of PPC inmixturesdecreases and the HPP percentage increases.During the heating stage, an initial decrease of G′ until 35 ∘C is
observed in samples 100PPC, 80PPC+ 20HPP and 50PPC+ 50HPP.For these three samples, after this temperature, the drop of G′
reaches a plateau until 70± 5 ∘C, where the slope increase again.In the other samples (100HPP and 20PPC+ 80HPP) there is a sharpdecrease in the G′ value to about 35 ∘C and from this temperaturethere is a slight increase in the G′ values to about 75 ∘C. After thistemperature, up to 90 ∘C theG′ value remains practically constant.Pires et al.10 studied the rheological properties of gels prepared
with different contents of HPP and heating curves obtained weresimilar to those observed in this study for the 100HPP sample.The heating curve corresponding to this sample shows a typicalbehaviour of myofibrillar proteins characterised by a markeddecrease of G′ value to a temperature of about 35 ∘C, followedby an increase with the increment of temperature. This minimumG′ value may be due to the actomyosin, the dominant proteinin HPP, whose denaturating temperature is 38.6 ∘C. This pattern
is attenuated as the addition of pea to the proteins mixture isperformed. This behaviour is typical of the storage modulusmyofibrillar proteins andwas also observed by other authors, suchas Romero et al.30
At the first stage of the treatment (T < 35 ∘C), there is an increasein mobility of myofibrillar proteins resulting from the thermal agi-tation, i.e. the number of hydrogen bonds is significantly reduced.Some authors have attributed the occurrence of aminimum in theG′ value to themyosinmolecules denaturation, indicating that the�-helices of the end of the chain begin to take place in the regionof temperatures of 30–40 ∘C 31. Some authors30,31 argue that thesubsequent increase in the G′ value is associated with structuralchanges of segments of the helix of myosin molecule, leadingto the formation of a network through cross-linking of thesesegments.As mentioned before, the heating curve of 100HPP showed the
typical behaviour of myofibrillar proteins, where the storagemod-ulus presented a minimum G′ value at 35 ∘C. This behaviour wasalso observed for crayfish protein isolate30 and Cape hake proteinpowder.10 In the case of the heating curves of 100PPC a very slight
J Sci Food Agric (2014) © 2014 Society of Chemical Industry wileyonlinelibrary.com/jsfa

www.soci.org A S Tomé et al.
Table 3. L*, a* and b* colour values and whiteness of emulsions prepared with different commercial pea protein (PPC) and hake protein powder(HPP) mixtures at pH 3.8 and 7.0
Colour values
L* a* b* Whiteness
Mixture pH 3.8 pH 7.0 pH 3.8 pH 7.0 pH 3.8 pH 7.0 pH 3.8 pH 7.0
100PPC 81.53± 0.46Ab 88.21± 0.57Bc −0.37± 0.12Ac −0.42± 0.20Ac 10.89± 0.36dB 7.88± 0.23Ad 78.56± 0.49Ab 85.81± 0.58Bab
80PPC+ 20HPP 76.02± 0.68Aa 86.81± 0.20Bab −0.55± 0.05Ab 0.35± 0.03Bd 10.55± 0.31dB 7.26± 0.03cA 73.79± 0.61Aa 84.94± 0.17Ba
50PPC+ 50HPP 82.39± 0.20Ac 87.74± 0.30Bbc −0.63± 0.08Ab −0.55± 0.06Ab 9.44± 0.18cD 6.50± 0.06Aab 80.01± 0.20Ac 86.11± 0.30Bb
20PPC+ 80HPP 84.89± 0.70Ad 88.12± 0.12Bc −0.87± 0.05Aa −0.96± 0.02Aa 8.69± 0.29bD 6.18± 0.01Aa 82.55± 0.74Ad 86.57± 0.13Bb
100HPP 84.53± 1.22Ad 86.72± 0.18Ba −0.95± 0.12aA −1.01± 0.06Aa 7.90± 0.19aB 6.64± 0.10Ab 82.59± 1.04Ad 85.12± 0.20Ba
Values are means± standard deviation.The same letters indicate mean values are not significantly different (P> 0.05).Lowercase letters compare the means in each column and uppercase letters compare the means between columns for each parameter.
Figure 6. Firmness values of the emulsions prepared with the different mixtures of PPC and HPP. Different letters mean statistically different values (P <=0.05).
initial decrease in the G′ value is observed until 35 ∘C, a plateauuntil 75 ∘C and again a slight slope for higher temperatures. Thiscorresponded to the first increase on mobility of the system fol-lowed by denaturation of the protein molecules, but no interac-tions between them are established at this point. This behaviourwas also observed for pea protein isolate by Nunes et al.32 Theseresults suggest that pea proteins hindered the gelation process offish proteins, since a decrease of G′ and G′′ values as the contentof PPC increases in the mixtures.The protein denaturation process proceeds at 90 ∘C for 30min.
The proteins were almost denatured after 10min at 90 ∘C, sincethe five samples presentG′ andG′′ values practically constant untilthe end of this step (results not shown). Therefore, it appears thatthe major protein denaturation occurred during the increase oftemperature heating process, where there is a greater change inthe G′ value.In Fig. 3A and B the cooling curves (from 90 ∘C to 5 ∘C) and mat-
uration curves (for 600min at 5 ∘C) are presented, respectively, forthe different proportions of PPC and HPP. From the cooling curves(Fig. 3A) it is observed that, for all gel formulations, a gradual
increase of both visco-elastic moduli occurs, from 90 ∘C to 5 ∘Cand G′ is greater than G′′. This increase in visco-elastic functionresults from the development of physical interactions, and hydro-gen bonds, on the gel formation process. These hydrogen bondsbetween amino acids andwatermolecules aremainly formed dur-ing cooling and are very important in stabilising protein systems.Furthermore, these connections also contribute to immobilisingthe water in the network of protein molecules.3
The shape of the cooling curves obtained for 100HPP and for100PPC was similar to that obtained by Pires et al.10 for hakeprotein gels and by Nunes et al.13 for pea protein gels, respec-tively, as expected. In both cases there was a gradual increase invisco-elastic moduli with decreasing temperature. This increaseresults from a reinforcement of the gel structure as interactionsprotein–protein were strengthened.10,33
From the gel maturation curves (Fig. 3B) it was observed thatall G′ values remained practically constant over the 600min ofmaturation at 5 ∘C. It can be stated that the gel structures werepractically formed at the beginning of thematuration stage. As theamount of PPC decreased, the G′ value increased, as a result of a
wileyonlinelibrary.com/jsfa © 2014 Society of Chemical Industry J Sci Food Agric (2014)

Cape hake and pea protein gels and emulsions www.soci.org
Figure 7. Frequency sweep tests of emulsions prepared at pH 7.0 (A) and pH 3.8 (B).
more structured gel due to the formation of a stronger networkof actin andmyosin. Very similar maturation curves were reportedby Pires et al.10 for Cape hake protein powders. Other authors34
reported G′ values within the range found in this study.The relative stability of the storagemodulus (varying from12 000
to 12 500 Pa) of 100PPC gels during the maturation process isanother evidence that the gel network was already formed. Thisbehaviour was not found by Nunes et al.32 in gels prepared with16% of pea proteins (concentration close to critical gel concentra-tion), where a rapid rise of storage modulus occurred in the firsthours, followed by a slower evolution. This difference may be dueto the higher percentage of pea protein (20%) in 100PPC in thepresent study.Figure 4 shows the frequency sweep tests obtained at 5 ∘C for
the five samples under study. The G′ value is always higher thanG′′, in the frequency range studied, andbothmoduli are frequencydependent, which is a characteristic behaviour of a weak gel.This behaviour was also observed by other authors.10,13,30 As the
amount of PPC decreases in gel formulations, G′ and G′′ valuesincreased, indicating that the higher proportion of HPP in mixtureinduced a stronger gel structure.After the application of a successive heating and cooling cycle
the recoverability of gels prepared with different proportions ofpea and hake protein was also evaluated. It was found that forall conditions studied, thermo-reversible gels were obtained. Anexample of this behaviour is represented in Fig. 5 for the gelprepared with 80% HPP and 20% PPC.
EmulsionsColourResults for colour parameters of the emulsions containing the dif-ferent proportions of PPC and HPP are listed in Table 3. The emul-sion prepared with 100PPC was more yellow than that preparedwith 100HPP, and had also a significantly higher (P<= 0.05) a*value at both pH values. The highest a* and b* values for the100PPC emulsion may result from the natural colour of the PPC
J Sci Food Agric (2014) © 2014 Society of Chemical Industry wileyonlinelibrary.com/jsfa

www.soci.org A S Tomé et al.
Figure 8. Flow curves of emulsions prepared at pH 7.0 (A), and 3.8 (B).
powder. In general, lightness andwhiteness of emulsionspreparedat pH 3.8 decreased with increasing levels of PPC in protein mix-tures. Conversely, a* and b* values increased with increasing lev-els of PPC in emulsions prepared at pH 3.8. In the case of emul-sions prepared at pH 7.0 only the a* value increased with increas-ing levels of PPC in protein mixtures. The emulsions prepared atpH 7.0 were significantly lighter, whiter and less yellow (P<= 0.05)than those obtained at pH 3.8. The difference of colour param-eters of emulsions prepared at the two different pH values mayresult from the stronger hydrophobic interactions between pro-teins and oil at pH 3.8. These results were similar to those reportedby Sathivel et al.7 for ‘mayonnaises’ preparedwith protein powdersrecovered from arrowtooth flounder. The emulsions obtained bythese authors were more yellow, had similar lightness but slightlylower a* values.
Texture parametersFirmness of o/w emulsions prepared with different proportionsof PPC and HPP are represented in Fig. 6. Emulsions preparedat pH 3.8 showed that the addition of PPC reduces the firmnessvalues, probably due to their lower solubility at this pH value.Moreover, at this pH HPP showed high solubility which allowprotein molecules to migrate to the surface of the oil droplets.35
At pH 7.0 a different behaviour was found. There is a maximumat the firmness versus mixture proportions in 50PPC+ 50HPPand 20PPC+ 80HPP mixtures, which unveils a synergetic effectbetween pea and hake proteins. This pH is far from the peaprotein pI and then stronger protein–protein interactionswith fishproteins may occur resulting in a reinforcement of the emulsionstructure. This behaviour, characterised by a better performanceof the protein mixtures than the individual proteins, has been
wileyonlinelibrary.com/jsfa © 2014 Society of Chemical Industry J Sci Food Agric (2014)

Cape hake and pea protein gels and emulsions www.soci.org
Figure 9. Zero-shear rate limiting-viscosity for emulsions obtained with different proportions of PPC and HPP proteins at pH 7.0 and pH 3.8.
also verified by other authors for emulsions stabilised by multipleproteins.36
Rheological characterisationThe frequency sweep tests (G′ andG′′ versus oscillatory frequency)of the five emulsions prepared at pH 7.0 and pH3.8 are shown inFig. 7A and B. For all emulsions, G′ was higher than G′′ for thewhole range of frequency studied, i.e. all emulsions are consistentwith structured systems, showing solid like behaviour. All thesesystems exhibit frequency sweep tests typical of protein-stabilisedemulsions in which a protein network was developed due to theoccurrence of an extensive flocculation process.24 Similar resultswere obtained by Raymundo et al.17 in a study on the rheologi-cal and texture properties of emulsions prepared with pea pro-tein;G′ values were always higher thanG′′ values, andG′ exhibiteda tendency for the development of a plateau region. The emul-sions of mixtures 20PPC+ 80HPP and 50PPC+ 50HPP preparedat pH 7.0 had the highest G′ and G′′ values, a result which indi-cates more structured systems. Moreover, these two emulsionsalso showed greater firmness. This should result from a synergis-tic effect of the two proteins at these proportions, which led to ahigher level of stabilisation of the oil–water emulsion structure. Itwas also noticed that the emulsionpreparedwith 100%of PPC cor-responded to the less structured system.At pH 3.8 (Fig. 7B) the emulsions prepared with 20PPC+ 80HPP
also presented the highest G′ and G′′ values. However, the syner-gistic effect between both proteins was not as evident as at pH 7.0,since 100HPP emulsion had higher G′ than 50PPC+ 50HPP emul-sion. This pHvalue is closer to the isoelectric point of bothproteins,therefore they are less soluble. This may reduce the possibility ofinteraction between PPC and HPP, since the proteins have a weaknet charge at this pH value.The flow curves of all emulsions (Fig. 8) show a plateau region
at low shear rates, a Newtonian zone (�0), followed by a regionwhere the viscosity decreases with increasing shear rate, showinga shear-thinning behaviour.The zero-shear rate-limiting viscosity values (�0) obtained from
the fitted parameters of the Carreau equation are presented inFig. 9. It was observed that �0 clearly depends on the emulsioncomposition and a tendency of �0 to increase with HPP content
can be noticed for the binary systems. At pH 7.0, higher valuesof �0 are obtained for the mixed systems, 50PPC+ 50HPP and20PPC+ 80HPP. This behaviour reinforces the view of a syner-getic effect between pea and hake proteins in stabilisation of theoil–water emulsions. These results are in agreement with the tex-ture characterisation of these emulsion systems (Fig. 6), wherehigher values for firmness were obtained for the emulsions pre-pared at pH 7.0.
CONCLUSIONSThe addition of pea proteins induces a decrease of gel firmness,reflecting a different gel structure. Nevertheless, this change in geltexture can be regarded as a positive impact on acceptance oftheseproducts, sinceHPPgels are highly structuredwith a rubberycharacter.With respect to oil–water emulsions, the two proteins studied
showed a synergistic effect on the structure stabilisation, espe-cially important at pH 7.0. Furthermore, at pH values commonlyused in commercial applications of this type of emulsions (pH 3.8)the existence of incompatibilities between the two proteins wasnot observed and the frequency sweep tests of the emulsionsobtained with binary systems are typical of structured and stablesystems. This is a positive stability indicator for the use of the sys-tems as salad dressings and mayonnaise-like products.
REFERENCES1 Pires C, Batista I, Fradinho P and Costa S, Utilization of
alkaline-recovered proteins from Cape Hake by-products in thepreparation of Frankfurter-type fish sausages. J Aquat Food ProdTechnol 18:170–190 (2009).
2 Tahergorabi R, Hosseini SV and Jaczynski J, Seafood proteins, in Hand-book of Food Proteins, ed. by Phillips JO andWilliams PA. WoodheadPublishing, Oxford, pp. 116–149 (2011).
3 Lanier TC, Carvajal P and Yongsawatdigul J, Surimi gelation chemistry,in Surimi and Surimi Seafood, ed by Park JW. Taylor & Francis Group,Boca Raton, FL, pp. 436–489 (2005).
4 O’Kane FE, Vereijken JM, Gruppen H and Van Boekel MAJS, Gelationbehavior of protein isolates extracted from 5 cultivars of Pisumsativum L. J Food Sci 70:132–137 (2005).
5 Xiong, YL and Blancnchard SP, Dynamic gelling properties of myofib-rillar protein from skeletal muscles of different chicken parts. J AgricFood Chem 42:670–674 (1994).
J Sci Food Agric (2014) © 2014 Society of Chemical Industry wileyonlinelibrary.com/jsfa

www.soci.org A S Tomé et al.
6 Kristinsson HG and Rasco BA, Fish protein hydrolysates: Produc-tion, biochemical and functional properties. Crit Rev Food Sci Nutr40:43–81 (2000).
7 Sathivel S, Bechtel PJ, Babbitt JK, Prinyawiwatkul W and Patterson M,Functional, nutritional, and rheological properties of protein pow-ders from arrowtooth flounder and their application inmayonnaise.J Food Sci 70:57–63 (2005).
8 Sathivel S, YinH, Bechtel PJ andKing, JM, Physical andnutritional prop-erties of catfish roe spray dried protein powder and its applicationin an emulsion system. J Food Eng 95:76–81 (2009).
9 Shaviklo GR, Thorkelsson G, Arason S and Sveinsdottir K, Character-istics of freeze-dried fish protein isolated from saithe (Pollachiusvirens). J Food Sci Technol 49:309–318 (2012).
10 Pires C, Costa S, Batista AP, NunesMC, Raymundo A and Batista I, Prop-erties of protein powder prepared from Cape Hake by-products. JFood Eng 108:268–275 (2012).
11 Sun XD and Arntfield SD, Gelation properties of salt-extracted peaprotein induced by heat treatment. Food Res Int 43:509–515 (2010).
12 Bora PS, Brekke CJ and Powers JR, Heat induced gelation of pea(Pisum sativum L.) mixed globulins, vicilin and legumin. J Food Sci59:594–596 (1994).
13 Nunes MC, Raymundo A and Sousa I, Rheological behaviour andmicrostructure of pea protein/kappa-carrageenan/starch gels withdifferent setting conditions. Food Hydrocolloids 20:106–113 (2006).
14 Raymundo A, Franco JM, Parta P, Sousa I and Gallegos C, Effect of thelupin protein/surfactant ratio on linear viscoelasticity properties ofoil-in-water emulsions. J Surfact Deterg AOCS 2, 4:545–551 (1999).
15 Raymundo A, Empis J, Sousa I, Gallegos C and Franco JM, Effect of thelupin protein surfactant ratio on the flow and textural properties ofoil-in-water emulsions. Grasas Aceites 52:3–4 (2001).
16 Ducel V, Popineau Y and Boury F, Adsorption kinetics and rheologicalinterfacial properties of plant proteins at the oil–water interface.Biomacromolecules 5:2088–2093 (2004).
17 Raymundo A, Gouveia I, Batista AP, Empis J and Sousa I, Fat mimeticcapacity of Chlorella vulgaris biomass in oil-in-water food emulsionsstabilised by pea protein. Food Res Int 38:961–965 (2005).
18 Furukawa T and Ohta S, Mechanical and water-holding properties ofheat-induced soy protein gels as related to their structural aspect. JTexture Stud 13:59–69 (1982).
19 Chang-LeeMV, Lampila LE and Crawford DL, Yield and composition ofsurimi from Pacific whiting (Merluccius productus) and the effect ofvarious protein additives on gel strength. J Food Sci 5:83–86 (1990).
20 Luo Y, Kuwahara R, Kaneniwa M, Murata Y and Yokoyama M, Effectof soy protein isolate on gel properties of Alaska pollock andcommon carp surimi at different setting conditions. J Sci Food Agric84:663–671 (2004).
21 Luo Y, ShenH, PanD and BuG, Gel properties of surimi from silver carp(Hypophthalmichthysmolitrix) as affectedbyheat treatment and soyprotein isolate. Food Hydrocolloids 22:1513–1519 (2008).
22 Association of Official Analytical Chemists,OfficialMethods of Analysis,15th edition. AOAC, Arlington, VA, p. 684 (1990).
23 Nunes C, Batista AP, Raymundo A, Alves MM and Sousa I, Vegetableproteins and milk puddings. Food Colloids, Biopolymers Materials(Special Issue) 31:1–4 (2003).
24 Franco J, Raymundo A, Sousa I and Gallegos C, Influence of process-ing variables on the rheological and textural properties of lupinprotein-stabilized emulsions. J Agric Food Chem 46:3109–3115(1998).
25 Franco JM, Gallegos C and Barnes HA, On slip effects in steady-stateflow measurements of oil-in-water food emulsions. J Food Eng36:89–102 (1998).
26 Jafarpour A, Hajiduon H-A and Rez aie M, A comparative study oneffect of egg white, soy protein isolate and potato starch on func-tional properties of common carp (Cyprinus carpio) surimi gel. J FoodProcess Technol 3:190 (2012).
27 Reppond KD and Babbitt JK, Gel properties of surimi from various fishspecies as affected bymoisture content. J Food Sci 62:33–36 (1997).
28 Sun XD and Arntfield SD, Gelation properties of myofibrillar/peaprotein mixtures induced by transglutaminase crosslinking. FoodHydrocolloids 27:394–400 (2012).
29 Sousa I, Mitchell J, Ledward D, Hill S and Beirão-da-Costa ML,Differential scanning calorimetry of lupin and soy proteins. ZLebensm-Unters-Forsch 200:44–46 (1995).
30 Romero A, Cordobés F, Puppo MC, Villanueva A, Pedroche J and Guer-rero A, Linear viscoelasticity and microstructure of heat-inducedcrayfish protein isolate gels. Food Hydrocolloids 23:964–972 (2009).
31 Kim BY, Park JW and Yoon WB, Rheology and texture properties ofsurimi gels, in Surimi and Surimi Sea Food, ed. by Park JW. Taylor &Francis Group, Boca Raton, FL, pp. 491–582 (2005).
32 Nunes MC, Raymundo A and Sousa I, Gelled vegetable desserts con-taining pea protein, �-carrageenan and starch. Eur Food Res Technol222:622–628 (2006).
33 Ziegler GR and Foegreding EA, The gelation of proteins. Adv Food NutrRes 34:203–298 (1990).
34 Yongsawatdigul J and Park JW, Effects of alkali and acid solubilisationon gelation characteristics of rockfish muscle proteins. J Food Sci69:499–505 (2004).
35 Sikorski Z, Functional properties of proteins in food systems, in Chem-ical & Functional Properties of Food Proteins, ed. by Sikorski Z. Tech-nomic Publishing, Lancaster, pp. 113–132 (2001).
36 Damodaran S, Protein stabilization of emulsions and foams. J Food Sci70:54–66 (2005).
wileyonlinelibrary.com/jsfa © 2014 Society of Chemical Industry J Sci Food Agric (2014)