Monte Carlo analysis of heterogeneity and core decoupling ...
Upload
independentCategory
view
0download
0
Prospects for Decoupling in Asia’s Growth Model
Montague Lord
2011
www.montaguelord.com

Prospects for Decoupling in Asia’s Growth Model Page ii
Table of Contents
List of Acronyms and Abbreviations iii
List of Tables and Figures iv
Executive Summary v
I. Introduction 1
A. Background 1
B. Coverage and Delimitation 2
II. Linkages to the US and EU Economies in the Asian Growth Model 3
A. Sources of Asian Growth 3
B. Globalization and Synchronization of Business Cycles 4
III. Can Asia Decouple in the Near Future? 9
A. Trade Linkages 9
B. Intra-Regional Trade and Global Production Networks 11
C. FDI Flows within Asian Region 12
D. Globalization of Financial Markets 13
E. International Currency Linkages 14
F. Implications for Asia’s Decoupling 17
IV. Forward Looking Policy Implications 20
A. Redefining the Asian Growth Model 20
B. Liberalization Trade and Investment Policy Regimes 20
C. Liberalizing Exchange Rate Regimes 21
D. Regional Collaboration in a New International Financial Architecture 21
Annex: Technical Notes 23
References 25
Prospects for Decoupling in Asia’s Growth Model Page iii
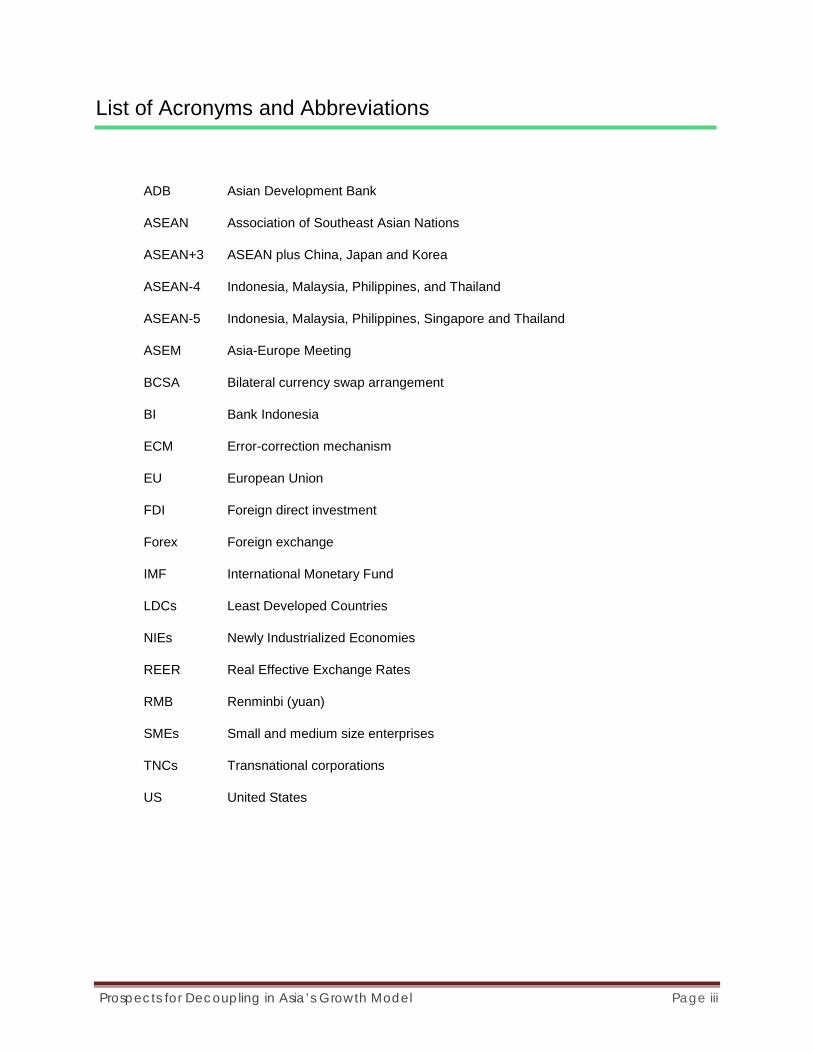
List of Acronyms and Abbreviations
ADB Asian Development Bank
ASEAN Association of Southeast Asian Nations
ASEAN+3 ASEAN plus China, Japan and Korea
ASEAN-4 Indonesia, Malaysia, Philippines, and Thailand
ASEAN-5 Indonesia, Malaysia, Philippines, Singapore and Thailand
ASEM Asia-Europe Meeting
BCSA Bilateral currency swap arrangement
BI Bank Indonesia
ECM Error-correction mechanism
EU European Union
FDI Foreign direct investment
Forex Foreign exchange
IMF International Monetary Fund
LDCs Least Developed Countries
NIEs Newly Industrialized Economies
REER Real Effective Exchange Rates
RMB Renminbi (yuan)
SMEs Small and medium size enterprises
TNCs Transnational corporations
US United States

Prospects for Decoupling in Asia’s Growth Model Page iv
List of Tables and Figures
List of Tables
Table 2.1: Correlation between Economic Activities of ASEM Member Countries, 1980-2008 5
Table 2.2: Correlation between Economic Activity of ASEM Member Countries and US/EU, 1980-2008 6
Table 2.3: US and EU Recessions and ASEM Member Country Growth, 1982-2009 7
Table 2.4: Foreign Income Elasticities 7
Table 3.1: ASEM Member Country Exports as Percent of GDP 9
Table 3.2: Changing Trade Exposure of ASEM Economies to the US and EU Economies 10
Table 3.3: Foreign Income, Financial Indicator and World Trade Elasticities of Asian Economies 10
Table 3.4: Top Export Product Categories of ASEAN Countries, 2007 12
Table 3.5: Main Sources of Foreign Direct Investment Inflow to ASEAN Region, 2006-2008 13
Table 3.6: Asia, US and EU Stock Market Developments, 2000 to mid-2009 13
Table 3.7: ASEM Countries’ Nominal Exchange Rates (local currency per US dollar), 1980-2008 14
Table 3.8: ASEAN-5 Real Effective Exchange Rates (REER) by Region, 1980-2008 15
Table 3.9: Asian De Facto Classification of Exchange Rate Regimes, 2008 16
Table 3.10: ASEAN-5 Region's Foreign Income, Financial Indicator, World Trade, and Real Effective Exchange Rate Elasticities 17
List of Figures
Figure 3.1: ASEAN Intra-Regional Trade, Share of Total Exports to World, 1990-2007 12
Prospects for Decoupling in Asia’s Growth Model Page v
EXECUTIVE SUMMARY
Asia’s success in developing an outward-looking export-oriented growth strategy is largely based on the region’s rapid assimilation into the global economy. Within this framework, however, there has emerged a large and persistent global imbalance in which Asia accounts for the bulk of the global current account surplus and the United States accounts for most of that deficit. That situation has produced a mutual dependence whereby the United States depends on Asia to finance its external deficit, and Asia depends on the United States to help drive the demand for its exports. Whether or not the global imbalance was at the root cause of, or at least contributed to, the current financial crisis, there is nonetheless widespread concern about the sustainability of the global imbalance. If another global crisis is to be averted then a new Asian growth strategy will need to emerge that involves rebalancing the region’s growth towards both domestic and intraregional demand-driven absorption of the region’s continued rapid output expansion. For that shift is to occur raises the question about whether Asia can decouple from the United States as well as other extra-regional markets like that of the European Union.
Proponents of the decoupling view argue that Asian economies now have more diversified export markets, and they also point to more robust domestic and intra-regional growth drivers that are independent of the US and other developed economies. China in particular has the potential to drive that intra-regional growth, a phenomenon that has already by exemplified by the emergence of its large trade and investments with East and Southeast Asia. There are, nonetheless, a large number of opponents to this view. Those who argue that decoupling is unlikely to occur point to the fact that intra-regional and extra-regional trade flows in Asia are largely made up of parts and components that eventually supply the United States and other developed economies. Reversing that pattern in Asia, they argue, would be neither feasible nor desirable.
The present study examines the empirical evidence underlying these arguments as a means of establishing some forwarding looking views about what options are available to the Asian economies. First, it demonstrates that the strong linkages both within Asia and between Asia and the United States and Europe have not waned in the last 25 years. However, the transmission channels have become more complex as new sources of those spillovers arise in terms of portfolio flows, stock market volatility, and integrated production networks. As a consequence, it is unlikely that Asia’s business-cycle co-movements with the US and European economies will diminish in the near to medium term.
Second, the study finds that there are significant downside risks for the recovery of growth in the United States and Europe. Over the medium term, US and EU consumer spending are expected to be sluggish relative to economies like China where earlier high savings rates are expected to fall significantly as the government introduces stimulus packages centered on expenditures. If Asia leads the recovery with China at its center, the policy focus should be on mechanisms to shift trade as well as investment from slow growth markets to the more dynamic economies. That shift could support a structural change in Asia’s trading patterns over the medium term.
Thirdly, the types of goods produced in Asia as outsourcing for large enterprises is likely to incorporate more second-generation technology that could increasingly promote intra-regional production networks. Nonetheless, multinationals will probably continue to be dominated by US, EU and, to a lesser extent, Japanese firms, since it is unlikely that, as a group, the shares of these top-ranked companies will be eroded in the future. For the Asian countries to develop

Prospects for Decoupling in Asia’s Growth Model Page vi
their own cross-national production networks and compete in the global market they will need to implement more aggressive domestic investment and technological development programs. One effective channel that has been successfully pursued by some counties is to encourage investment by foreign transnationals as a means of attracting technology and production know-how. Another has been the implementation of sub-regional cooperation schemes aimed at developing scale economies and private capital investment of the magnitude needed for effective competition at the global level. However, schemes like the ASEAN Investment Area (AIA) have to date had limited success because of the large number of exceptions that create disincentives among private investors. Moreover, while shorter distance between Asian countries facilitates bilateral FDI flows, low sovereign risk, a transparent and predictable regulatory environment and small corporate tax rates in the host countries are also important determinant that so far have been deterrents to cross-border investments in many Asia countries.
Another finding of the study is that stock market indicators in Asia are highly correlated with the major financial centers in the United States and Europe. The extent of these co-movements is much greater now than they were before in the 1980s and 1990s, and Asia’s major stock market linkages to the major US and EU financial centers will likely continue to increase. De-coupling in the financial markets could negatively alter the growing share of portfolio flows in the region’s overall private capital flows.
Finally, pegged and managed exchange rates will likely continue to form part of the policy tools used in most Asian economies, notwithstanding the lessons from the Asian financial crisis. Recent changes in the international competitiveness of the region’s countries have been unfavorable to some countries. The resulting appreciation of some currencies in terms of their real effective exchange rates relative to other Asian economies and major US and European markets could push policymakers to adopt the types of exchange rate policies that were introduced after the Asian financial crisis but have since then been abandoned by most countries. Otherwise the continued management of exchange rates could have a considerable impact on competitive adjustments that could, in turn, undermine the recovery in the global economy through a much-needed rebalancing of the global current account.
A number of forwarding looking policy implications can be derived from these findings. First, the current downturn in economic activity throughout Asia highlights the inherent unsustainability of an economic growth model dependent on foreign demand. This situation has given rise to widespread suggestions by policymakers in the Asian economies to take concrete actions to rebalance their economies in such a way that will ensure greater sustainability in the medium to long run. Yet the fundamental question facing those policymakers is how to rebalance growth in a manner that reduces the region’s dependence on the continued global current account imbalance. Policies promoting greater domestic consumption are generally favored over those encouraging investment since Asia’s widening current account surplus has been driven by high savings rates. Moreover, there is stronger evidence of over-saving than under-investment in the region, and stronger evidence of over-investment prior to the 1997 Asian crisis than underinvestment after the Asian crisis. This phenomenon suggests that the key to rebalancing Asian growth toward domestic sources lies in promoting consumption rather than investment.
There is also considerable scope for deepening trade liberalization within the ASEAN countries and broadening the coverage to other Asian countries as a means of strengthening the so-called ‘domestic’ regional economy. A larger regional bloc would promote scale economies and specialization in differentiated products that would expand intra-industry trade in Asia. Progress in moving from a free trade area to a customs union in ASEAN could also yield substantial producer and consumer welfare benefits to the region. The resulting expansion in production and domestic demand in individual Asian economies could stimulate cross-border production

Prospects for Decoupling in Asia’s Growth Model Page vii
activities to target the increased demand for final goods and thereby increase the relative importance of final goods in intraregional trade. In addition to the progress being made among the ASEAN+3 countries, there is now growing interest in expanding trade between Southeast Asia and South Asia.
Finally, there are also opportunities for countries to adopt more flexible exchange rate regimes that would enable Asian countries to adopt policies that promote a rebalancing based on the reallocation of resources from the production of tradables to nontradables. The prescription could become all the more appropriate if there were to occur a further US dollar depreciation, as part of the reversal of the global current account imbalance. In that case, many Asian currencies would likely experience a significant nominal and real exchange rate appreciation. Lower relative prices would help to shift resources toward production for domestic use, raise household incomes and stimulate consumption. Although in the short run it is unlikely that policymakers will embrace these expenditure switching measures that shift demand between domestic goods and imports, it could become a long-term strategy in the context of rebalancing growth towards domestic sources.
At the regional level, the US dollar’s chronic instability and Asia’s growing influence over how the region develops could produce a new monetary order in which either a new or existing regional currency would serve as the vehicle for international trade transactions. One mechanism has been proposed by China to introduce an International Monetary Fund (IMF) asset that would decouple international transactions from the US dollar. In the interim, some countries like Indonesia have introduced bilateral currency swap arrangements (BCSAs) as a means of reducing their dependence on the US dollar. Another mechanism for reducing transactions risks is the example of the euro’s dominance as a settlement currency within its regional domain. A similar vehicle within East Asia might be possible, given the region’s large economic size and far-reaching trade connections. Countries pegging softly to a key international currency within the region would be more likely to use it as their main intervention currency as well as a reserve currency. While the dollar would dominate reserve holdings within the dollar area and the euro within the euro area, an East Asian currency could become the settlement currency in that regional domain. In that way, efficiency gains of a limited number of international currencies would be maintained and transactions risks would be reduced.

Prospects for Decoupling in Asia’s Growth Model Page 1
I. INTRODUCTION
A. Background Asia’s exceptional success in developing an outward-looking export-oriented growth strategy is largely based on the region’s rapid assimilation into the global economy. While industrial growth and transformation have been the driving force behind that growth, its handmaiden has been the dynamic global trade expansion, as well as large inflows of direct and portfolio investments associated with global production and market growth. However, the emergence of large and persistent current account surpluses since the 1997 Asian crisis has created a global imbalance in which Asia accounts for the bulk of the global current account surplus and the United States accounts for most of that deficit. That situation has produced a mutual dependence whereby the United States depends on Asia to finance its external deficit, and Asia depends on the United States to help drive the demand for its exports. While that global imbalance has enabled the global market to absorb the expansion of global supplies resulting from China and India’s entry into the world economy, there have been suggestions that the so-called global savings glut contributed to the current global financial crisis.1 The argument is that the shift in GDP from the lower-saving industrialized countries to the higher-saving developing countries has raised the global supply of savings, suppressed long term real interest rates and caused the current account deficits in the industrialized countries.2
Whether or not the global imbalance was at the root cause of, or at least contributed to, the current financial crisis, there is nonetheless widespread concern about the sustainability of the current account imbalances. If another global crisis is to be averted then a new Asian growth strategy will need to emerge that involves rebalancing the region’s growth towards both domestic and intraregional demand-driven absorption of the region’s continued rapid output expansion. If such a shift is to occur, then it raises the question about whether Asia can decouple from the United States as well as other extra-regional markets like that of the European Union. Proponents of the decoupling view argue that Asian economies now have more diversified export markets, and they also point to more robust domestic and intra-regional growth drivers that are independent of the US and other developed economies. With a consumer market of 1.3 billion, China has the potential to drive that intra-regional growth, a phenomenon that has already by exemplified by the emergence of its large trade and investments with East and Southeast Asia.
There are, nonetheless, a large number of opponents to this view. Those who argue that decoupling is unlikely to occur point to the fact that intra-regional and extra-regional trade flows in Asia are largely made up of parts and components that eventually supply the United States and other developed economies. Reversing that pattern in Asia would be neither feasible nor desirable. For decoupling to occur in the medium to long-term, Asia would need to fundamentally diversify its export markets and shift a significant portion of its production to domestic markets. While the share of Asia’s exports to the G3 (US, EU and Japan) has indeed been on the decline in recent years, the United States remains one of the largest export markets 1 The hypothesis has been put forward by the present Chairman of the US Federal Reserve, Ben Bernanke in “The Global Saving Glut and the U.S. Current Account Deficit”, Sandridge Lecture, Virginia Association of Economics, Richmond, Virginia, Federal Reserve Board, March 2005. 2 Often-cited evidence is the fact that China’s national savings rate was 54 percent in 2007, while that of the United States has been near zero.

Prospects for Decoupling in Asia’s Growth Model Page 2
for most Asian economies. And while Asia’s trade appears to have diversified into other intra-regional and other extra-regional markets, the fact remains that much of that trade is in the form of intermediate goods that are processed within the region for export to large markets like those of the United States and Europe. For that reason, a recent study by the Monetary Authority of Singapore concludes that there is little evidence of structural decoupling in the long run.3 Similarly, the ADB’s Asian Development Outlook report for 2007 stated that, “Despite the emergence of the PRC economy and the increase in the Asian region’s share in global production and trade, [the evidence indicates] that the rise in intra-Asian economic interdependence through investment and trade is being driven by the globalization process.”4 A subsequent study by the ADB underscores the importance of Asia’s global links and concludes that Asia’s intra-regional and extra-regional relationships have reinforce each other since, among other, the recent surge in intraregional trade in parts and components has been largely driven by global final goods exports.5
B. Coverage and Delimitations of the Study The present study examines the empirical evidence underlying these arguments as a means of establishing some forwarding looking views about what options are available to the Asian economies. The paper is structured as follows: After this introductory section, Section II discusses the Asian growth model and the international transmission of business cycles. The first part of that section sets out the major views about sources of growth and the new globalization process. The second part addresses that globalization process in the context of synchronization of business cycle synchronization within Asia and between Asia and the United States and Europe. It covers both the degree and magnitude of those transmissions and the dynamics underlying their transmissions to the Asian economies.
Section III addresses the issue of Asia’s decoupling in the context of sources of spillovers to the region, namely, trade linkages, financial channels, and commodity prices. Based on the empirical findings, the final part of the section examines the prospect for Asia’s decoupling from the United States and the European Union in terms of trade and financial channels that include foreign direct investment (FDI), portfolio flows and use of international currency linkages affecting the region’s international competitiveness. Section IV examines the policy implications of the findings in terms of the Asian growth model, shifting to inward looking markets, trade and investment policy regimes as well as the exchange rate regimes, and the implementation of a new international financial architecture.
The country coverage of this report consists of members of the Asia-Europe Meeting (ASEM), which comprises the 13 members of ASEAN Plus Three (Brunei Darussalam, Cambodia, Indonesia, Laos, Malaysia, Myanmar, Philippines, Singapore, Thailand and Vietnam, plus China, Japan, and South Korea) India, Mongolia and Pakistan.
3 Monetary Authority of Singapore, “Revisiting the US-Asia Decoupling Hypothesis”. Special Feature B. Economic Policy Department. Macroeconomic Review, October 2007. 4 Asian Development Bank, “Asian Development Outlook 2007”. Manila, 2007. 5 Asian Development Bank, “Emerging Asian Regionalism: A Partnership for Shared Prosperity”. Manila, 2008.
Prospects for Decoupling in Asia’s Growth Model Page 3
II. LINKAGES TO THE US AND EU ECONOMIES IN THE ASIAN GROWTH MODEL
A. Sources of Asian Growth 1. Main Sources of Growth
There are three widely recognized explanations of economic growth in Asia. The first focuses on supply growth in the region to explain the ‘Asian Miracle’ associated with capital accumulation, the absorption or assimilation of increasingly modern technology and the change in industrial structures.6 Whether driven by capital accumulation or by its productive assimilation, the growth process was accompanied by major changes in the structure of the East Asian economies.7 Notwithstanding the severe economic and financial crisis that hit all the countries in late 1997 and 1998, the view holds that the factors determining supply growth are largely intact and will undoubtedly continue to influence the region under a favorable policy environment.
A closely related but more recent explanation is the fundamentalist view that structural factors have explained, first, the long-term growth of the Southeast Asian economies until mid-1997 and, second, the crisis in late 1997 and 1998. During the stellar years of the ‘miracle’ economies the dominant factors producing an outward-oriented, export-led growth were high domestic savings, human capital development, sound macro management and limited price distortions combined with careful policy interventions. During the 1997-98 crisis, structural factors also dominated events, but this time in the form of weak financial systems that were undermined by large capital flows and exchange rate misalignments. One explanation of these misalignments is the widespread use of relatively fixed exchange rate regimes. These regimes eventually needed to be reversed through the process of nominal and real deprecations of currencies that took place beginning in the latter part of 1997.8 An alternative explanation is that the cyclical variations in the real dollar-yen rate created the misalignment and impacted on trade, investment and capital flows of the Southeast Asian countries, rather than exchange rate
6 See Kim, J.I. and L.J. Lau, “The Sources of Economic Growth in the East Asian Newly Industrialized Countries”. Journal of Japanese and International Economics. 8: 235-71, 1994; Stiglitz, J., “The Role of International Financial Institutions in the Current Global Economy”. Address to the Chicago Council on Foreign Relations. Chicago (27 February), 1997; World Bank, The Asian Miracle: Economic Growth and Public Policy. Oxford: Oxford University Press for the World Bank, 1993; and Young, A., “The Tyranny of Numbers: Confronting the Statistical Realities of the East Asian Growth Experience”. Quarterly Journal of Economics. 110: 64 l-680, 1995. 7 Nelson, R.R., and H. Pack (), “The Asian Miracle and Modern Growth Theory”. Economic Journal 109, July, 1999. 8 The other major explanation of the 1997-98 crisis focuses on the possible impact of expectations in the asset market as they affected the recent financial crisis in Asia (Sachs, 1997, and Stiglitz, 1997). These negative expectations reflected a lack of confidence in the asset market that led to panic liquidation in all the Southeast Asian stock markets. The liquidation, in turn, instigated large movements of funds offshore that reversed capital flows and drained official reserves. The resulting downward pressure on exchange rates was essentially domestically induced, although there were spillovers that gave rise to contagion and the pervasiveness of the Asian financial crisis. Since in this study we are concerned with real international product and financial linkages of the ASEAN-5, this interpretation of events during 1997-98 will not be examined here. See Krugman, P., “What Happened to Asia?” Cambridge: Department of Economics, Massachusetts Institute of Technology, 1998. Available: http://web.mit.edu/krugman/www/ disinter.html; Goldstein, The Asian Financial Crisis: Causes, Cures, and Systemic Implications. Policy Analyses in International Economics 55. Washington, DC: Institute for International Economics, 1998; Corsetti, G., P. Pesenti, and N. Roubini, “What Caused the Asian Currency and Financial Crisis?” New York: Stern School of Business. New York University, 1998.

Prospects for Decoupling in Asia’s Growth Model Page 4
mismanagement on the part of these countries.9 Dollar-yen rate variations are believed to have affected the region’s international competitiveness, FDI flows, and short-term foreign currency indebtedness well before the crisis, and to have had a pervasive influence on the pattern of trade and investment in throughout the region.
The third explanation of economic growth in Asia focuses on the rapid assimilation of the region in the global economy. While recognizing that industrial growth and transformation have been the driving force behind the economic growth of Southeast Asia, that process has been supported by the large growth of international trade and direct and portfolio investment generated by the rapid expansion of global production and markets. For most Asian economies the systemic changes in the world economy have generated large volumes of international capital inflows and transactions in goods and services, as well as generating a widespread diffusion of production, transportation, and communication technologies from corporate contracting arrangements. The introduction of new technologies through cross-border production networks and the dissemination of new skills in the workforce have now become as important to the specialization of production activities in the Asian economies as their capital, labor and natural resource endowments.
This new globalization process emphasizes demand-led growth and the policy environment as a critical determinant of that growth. Until roughly the mid-1980s many of the region's countries relied on exports as the main engine for economic growth, which implied a liberalization of trade and an emphasis on the facilitating role of the government. The shift from an export-driven growth strategy by many Asian countries to a growth strategy targeting global production and market networks was largely driven by efforts to exploit the worldwide growth of cross-border production and international capital movements. While the earlier outward-oriented strategy promoted economic growth in a number of Asian economies through the introduction of high value-added products into their economies, the new strategy has targeted the broad-based transmission of domestic learning and knowledge accumulation as a means of sustaining high economic growth rates.
B. Globalization and Synchronization of Business Cycles 1. Synchronization in the Global Economy
Growing openness of economies and increasing globalization of production processes that has driven growth in the Asian economies have contributed to the international transmission of business cycles. Recent studies suggest that the industrialized countries of North America and Western Europe are increasingly coinciding with one another because of the linkages the key macroeconomic and financial variables related to business and financial cycles in these countries. Claessens, Kose, and Terrones (2008), for example, found that one-half of the industrialized countries experienced a synchronization of their recessions in the 1990s and early 2000s. Another recent study by Kose, Otrok and Prasad (2008) showed that the coincidence of those cycles have been much greater when investment changes generate those movements than when they are caused by consumption changes. In Asia, however, Hong, Lee, and Tang (2009) found that, with the exception of the 1997 Asian financial crisis, there is generally less synchronization of business cycles than in the industrialized countries.
9 See McKinnon, R., “The East Asian Dollar Standard, Life After Death?”. Presented to the Workshop on “Rethinking the East Asian Miracle”. The Asia Foundation, San Francisco, California, 16-17 February, 1999; and Ohno, K., “Exchange Rate Management in Developing Asia: A Reassessment of the Pre-crisis Soft Dollar Zone”. ADBI Working Paper 1. Asian Development Bank, Tokyo, 1999.

Prospects for Decoupling in Asia’s Growth Model Page 5
Table 2.1: Correlation between Economic Activities of ASEM Member Countries, 1980-2008
ASEAN
China, Japan, Korea
India, Mongolia, Pakistan
All ASEM
Brunei 0.94 0.79 0.81 0.88 Cambodia 0.95 0.83 0.78 0.89 Indonesia 0.93 0.83 0.76 0.88 Lao PDR 0.93 0.78 0.78 0.87 Malaysia 0.94 0.87 0.74 0.89 Myanmar 0.76 0.57 0.78 0.73 Philippines 0.93 0.86 0.74 0.88 Singapore 0.91 0.89 0.69 0.87 Thailand 0.90 0.89 0.68 0.85 Vietnam 0.85 0.66 0.76 0.80 China 0.94 0.69 0.79 0.88 Japan 0.62 0.71 0.36 0.58 South Korea 0.83 0.82 0.60 0.78 India 0.94 0.83 0.70 0.89 Mongolia 0.37 0.06 0.35 0.30 Pakistan 0.95 0.87 0.63 0.89
Note: Economic activity is measured by real GDP. Source of data: IMF, World Economic Outlook (WEO) database, April 2009.
1.1. Synchronization of Business Cycles in Asia Before analyzing linkages between the Asian and US and EU economies, we need to examine whether economic downturns and expansionary movements have coincided among the Asian economies themselves. If there has been synchronization of those movements within the region, then we can make generalizations about movements in key macroeconomic and financial variables for Asia as a whole relative to global shocks originating in the United States and the European Union. Otherwise, it will be necessary to approach the issue of dependency linkages for the Asian countries from a more disaggregated point of view.
Table 2.1 shows the average correlation coefficient between pairs of Asian countries based on annual time series data for 1980-2008. The average for all countries is 0.8, but it is higher for the ASEAN-5 (Indonesia, Malaysia, Philippines, Singapore and Thailand) at 0.93 with other ASEAN member countries than for the other ASEAN member countries (0.89).10 The “Plus 3” members of ASEAN China, Japan and Korea) have a correlation coefficient of 0.75 between their economic activity and that of all ASEM member countries, although China’s correlation with ASEAN member countries is high (0.94). Among the new members of ASEM (India, Mongolia and Pakistan) the correlation coefficient between their economic activity and ASEM countries is relatively high for India and Pakistan (both 0.89) but it is low for Mongolia (0.3). By way of comparison, the correlation coefficient between economic activity in the United States and the European Union is 0.998.
1.2. Synchronization of Asia and US/EU Business Cycles The lack of a strong interrelationship of business cycles among all Asian countries, except for those of most ASEAN members as well as China and India, suggests the need for caution about generalizations and points to the need to examine business cycle synchronizations at the country level. Table 2.2 reports the correlation coefficients between ASEM member countries and the United States and European Union, both concurrently and with a one-period lead by the United States and European Union.11 The results support the existence of a same period synchronization off business cycles, with relatively weaker linkages for Brunei Darussalam, Myanmar and Mongolia. It is not surprising to find that Asia’s synchronization of business cycles are equally strong for the United States as for the European Union since the correlation coefficient between economic activity in the United States and the European Union is near unity.
We also tested the extent of Asia’s business cycle synchronization with the United States and
10 Correlations of 0.9 or more are highlighted in bold. 11 In comparing concurrent and one-period leads of US and EU business cycles, higher ASEM member country correlations are highlighted in bold.

Prospects for Decoupling in Asia’s Growth Model Page 6
Table 2.2: Correlation between Economic Activity of ASEM Member Countries and US/EU, 1980-2008
US EU US + EU
US (+1)
EU (+1)
US + EU (+1)
Brunei 0.80 0.78 0.79 0.81 0.80 0.80 Cambodia 0.97 0.98 0.98 0.96 0.97 0.96 Indonesia 0.97 0.97 0.97 0.97 0.97 0.97 Lao PDR 0.97 0.97 0.97 0.96 0.96 0.96 Malaysia 0.99 0.99 0.99 0.98 0.98 0.98 Myanmar 0.88 0.90 0.89 0.86 0.87 0.87 Philippines 0.95 0.96 0.96 0.94 0.95 0.94 Singapore 0.99 0.99 0.99 0.98 0.99 0.99 Thailand 0.98 0.98 0.98 0.97 0.97 0.97 Vietnam 0.97 0.97 0.97 0.96 0.96 0.96 China 0.95 0.96 0.95 0.94 0.94 0.94 Japan 0.94 0.94 0.94 0.95 0.94 0.95 Korea 0.99 0.99 1.00 0.99 0.99 0.99 India 0.96 0.97 0.97 0.95 0.95 0.95 Mongolia 0.86 0.88 0.87 0.83 0.85 0.84 Pakistan 0.98 0.99 0.98 0.97 0.97 0.97 ASEAN 0.99 0.99 0.99 0.98 0.98 0.98 ASEAN+3 0.99 0.99 0.99 0.98 0.99 0.99 ASEM 0.99 0.99 0.99 0.99 0.99 0.99
Note 1: Economic activity is measured by real GDP. Note 2: (+1) refers to one-period ahead GDP of
corresponding country (US and/or EU). Source of data: IMF, World Economic Outlook (WEO) database, April 2009.
the European Union over time. The results show that business cycle movements coincide as much in the current decade as they did in the 1990s.12 The extent of synchronization was somewhat lower in the 1990s because of the 1997 Asian financial crisis, whose spread to the United States and Western Europe was limited to a mini-crash in the stock market percentage loss was relatively small compared to some other notable crashes.
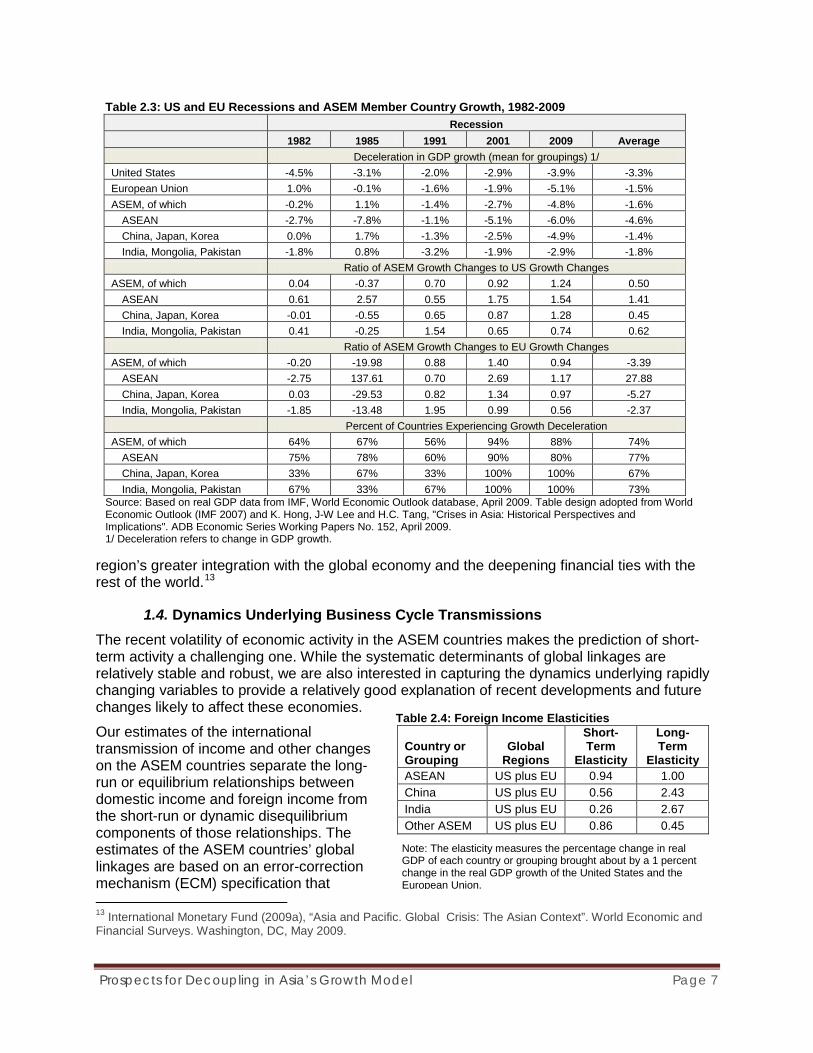
1.3. Magnitude of Business Cycle Transmissions The consequences of US and EU business cycle spillovers on the Asia economies are particularly visible during the recession periods. Nonetheless, there has been considerable variation in the extent to which US and EU economic downturns have impacted the region, and there is no clear trend as to whether the magnitude of those transmissions has decreased or intensified (Table 2.3). In the ASEAN region, a deceleration in US and EU economic growth has, on average, led to a more-that-proportional slowdown of growth in the ASEAN region. In fact, for every one percent deceleration in the United States, economic growth in the ASEAN region has slowed by 1.5 percent. In contrast, economic growth changes in the other ASEM countries (China, India, Japan, Mongolia, Pakistan and South Korea) have had a less-than-proportional response to a US deceleration in growth. These results reflect averages, however, and among the non-ASEAN countries there have been considerable variations.
Underlying causes of the US and EU economic downturns explain variations in their impact on the Asian economies. The 1982 US recession brought about by credit tightening and the accompanying increase in interest rates created large output contractions in developing Asia. The stock market crash on October 1987 followed by the 1990 Gulf War combined to produce the 1991 US recession, but its spread to Asia was mitigate by more moderate downturns in Europe and Japan. In contrast, the 2001 “dot-com bubble” combined with the September 11 attacks in the United States had a profound effect on East Asia in the aftermath of the 1997 Asia financial crisis. The December 2007 collapse of the housing market that spread to bank collapses in the United States and Europe caused an enormous liquidity and solvency crises because of the sharp reduction in the amount of available credit. The recession spread to Asia rapidly and affected much of the region to a far greater extent that the earlier externally originating recessions. Both trade and financial contractions have now spread throughout the region. Japan’s exports to the United States and Europe have fallen sharply, South Korea’s exports have also contracted, and foreign exchange reserves of Pakistan have suffered from mounting debt obligations. In the ASEAN member countries, the International Monetary Fund attributes the attributes the speed and intensity of the spillover from the global crisis to both the
12 The correlation coefficient between the ASEM region and US+EU is 0.99 in both the 1990s and 2000s.
Prospects for Decoupling in Asia’s Growth Model Page 7
Table 2.4: Foreign Income Elasticities
Country or Grouping
Global Regions
Short-Term
Elasticity
Long-Term
Elasticity ASEAN US plus EU 0.94 1.00 China US plus EU 0.56 2.43 India US plus EU 0.26 2.67 Other ASEM US plus EU 0.86 0.45
Note: The elasticity measures the percentage change in real GDP of each country or grouping brought about by a 1 percent change in the real GDP growth of the United States and the European Union.
region’s greater integration with the global economy and the deepening financial ties with the rest of the world.13
1.4. Dynamics Underlying Business Cycle Transmissions The recent volatility of economic activity in the ASEM countries makes the prediction of short-term activity a challenging one. While the systematic determinants of global linkages are relatively stable and robust, we are also interested in capturing the dynamics underlying rapidly changing variables to provide a relatively good explanation of recent developments and future changes likely to affect these economies.
Our estimates of the international transmission of income and other changes on the ASEM countries separate the long-run or equilibrium relationships between domestic income and foreign income from the short-run or dynamic disequilibrium components of those relationships. The estimates of the ASEM countries’ global linkages are based on an error-correction mechanism (ECM) specification that 13 International Monetary Fund (2009a), “Asia and Pacific. Global Crisis: The Asian Context”. World Economic and Financial Surveys. Washington, DC, May 2009.
Table 2.3: US and EU Recessions and ASEM Member Country Growth, 1982-2009 Recession 1982 1985 1991 2001 2009 Average Deceleration in GDP growth (mean for groupings) 1/ United States -4.5% -3.1% -2.0% -2.9% -3.9% -3.3% European Union 1.0% -0.1% -1.6% -1.9% -5.1% -1.5% ASEM, of which -0.2% 1.1% -1.4% -2.7% -4.8% -1.6%
ASEAN -2.7% -7.8% -1.1% -5.1% -6.0% -4.6% China, Japan, Korea 0.0% 1.7% -1.3% -2.5% -4.9% -1.4% India, Mongolia, Pakistan -1.8% 0.8% -3.2% -1.9% -2.9% -1.8%
Ratio of ASEM Growth Changes to US Growth Changes ASEM, of which 0.04 -0.37 0.70 0.92 1.24 0.50
ASEAN 0.61 2.57 0.55 1.75 1.54 1.41 China, Japan, Korea -0.01 -0.55 0.65 0.87 1.28 0.45 India, Mongolia, Pakistan 0.41 -0.25 1.54 0.65 0.74 0.62
Ratio of ASEM Growth Changes to EU Growth Changes ASEM, of which -0.20 -19.98 0.88 1.40 0.94 -3.39
ASEAN -2.75 137.61 0.70 2.69 1.17 27.88 China, Japan, Korea 0.03 -29.53 0.82 1.34 0.97 -5.27 India, Mongolia, Pakistan -1.85 -13.48 1.95 0.99 0.56 -2.37
Percent of Countries Experiencing Growth Deceleration ASEM, of which 64% 67% 56% 94% 88% 74%
ASEAN 75% 78% 60% 90% 80% 77% China, Japan, Korea 33% 67% 33% 100% 100% 67% India, Mongolia, Pakistan 67% 33% 67% 100% 100% 73%
Source: Based on real GDP data from IMF, World Economic Outlook database, April 2009. Table design adopted from World Economic Outlook (IMF 2007) and K. Hong, J-W Lee and H.C. Tang, "Crises in Asia: Historical Perspectives and Implications". ADB Economic Series Working Papers No. 152, April 2009. 1/ Deceleration refers to change in GDP growth.
Prospects for Decoupling in Asia’s Growth Model Page 8
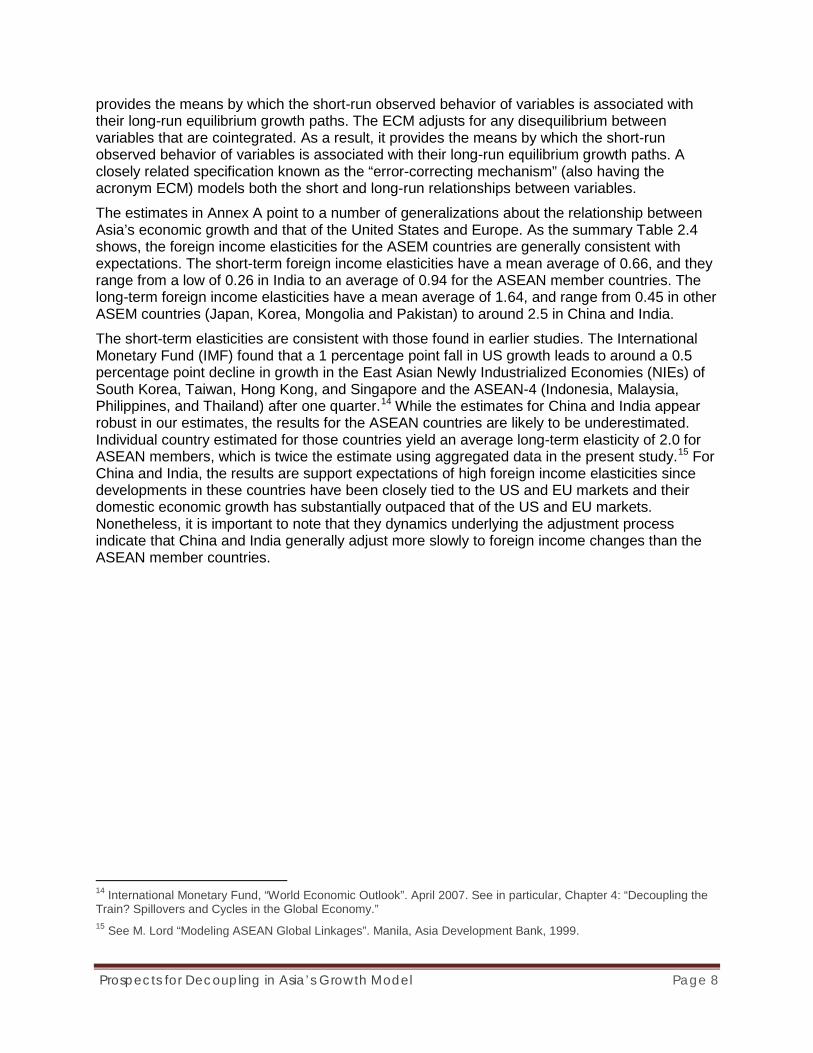
provides the means by which the short-run observed behavior of variables is associated with their long-run equilibrium growth paths. The ECM adjusts for any disequilibrium between variables that are cointegrated. As a result, it provides the means by which the short-run observed behavior of variables is associated with their long-run equilibrium growth paths. A closely related specification known as the “error-correcting mechanism” (also having the acronym ECM) models both the short and long-run relationships between variables.
The estimates in Annex A point to a number of generalizations about the relationship between Asia’s economic growth and that of the United States and Europe. As the summary Table 2.4 shows, the foreign income elasticities for the ASEM countries are generally consistent with expectations. The short-term foreign income elasticities have a mean average of 0.66, and they range from a low of 0.26 in India to an average of 0.94 for the ASEAN member countries. The long-term foreign income elasticities have a mean average of 1.64, and range from 0.45 in other ASEM countries (Japan, Korea, Mongolia and Pakistan) to around 2.5 in China and India.
The short-term elasticities are consistent with those found in earlier studies. The International Monetary Fund (IMF) found that a 1 percentage point fall in US growth leads to around a 0.5 percentage point decline in growth in the East Asian Newly Industrialized Economies (NIEs) of South Korea, Taiwan, Hong Kong, and Singapore and the ASEAN-4 (Indonesia, Malaysia, Philippines, and Thailand) after one quarter.14 While the estimates for China and India appear robust in our estimates, the results for the ASEAN countries are likely to be underestimated. Individual country estimated for those countries yield an average long-term elasticity of 2.0 for ASEAN members, which is twice the estimate using aggregated data in the present study.15 For China and India, the results are support expectations of high foreign income elasticities since developments in these countries have been closely tied to the US and EU markets and their domestic economic growth has substantially outpaced that of the US and EU markets. Nonetheless, it is important to note that they dynamics underlying the adjustment process indicate that China and India generally adjust more slowly to foreign income changes than the ASEAN member countries.
14 International Monetary Fund, “World Economic Outlook”. April 2007. See in particular, Chapter 4: “Decoupling the Train? Spillovers and Cycles in the Global Economy.” 15 See M. Lord “Modeling ASEAN Global Linkages”. Manila, Asia Development Bank, 1999.

Prospects for Decoupling in Asia’s Growth Model Page 9
III. CAN ASIA DECOUPLE IN THE NEAR FUTURE?
A. Trade Linkages 1. Growing External Exposure of Asian Economies
The rapidity with which ASEM member countries have opened their economies in the last 15 years is impressive (Table 3.1). Although all of the Southeast Asian economies initially embarked on import-substituting industrialization, over time they shifted to export-oriented industrialization policies, starting with Singapore in the late 1960s, followed by Malaysia, the Philippines, and Thailand in the 1970s, and finally Indonesia in the mid-1980s. Export-oriented industrialization led to an opening of the economies to more markets, and the promotion of foreign direct investment (FDI) as a means of upgrading the industrial structures through the transfer and diffusion of advanced industrial technologies. As a result, the exposure of the economies to foreign trade in now large, nowhere more so that in Malaysia and Singapore. In terms of changes over the last two decades, however, Cambodia has experience the largest change in its openness to trade. Other economies now having experienced a dramatic growth in the exposures to trade are India, Thailand, Vietnam and China. In contrast, the exposures of Brunei Darussalam, Indonesia and Pakistan have changed little, if any, from what they were two decades ago.
2. Exposure to US and EU Markets Notwithstanding the growing openness of the Asian economies, most countries have succeeded in reducing their dependence on the US and EU markets (Table 3.2). However, the sharp reductions that occurred in 2008 relative to 2007 raise some questions about the validity of the recent data. The data should therefore be interpreted with caution. The ASEAN member countries have lowered their reliance on the US market from 16 to 11 percent between 1980 and 2008, while the share of exports to the EU market fell more moderately from 13 to 11 percent. In contrast, China has increased its share to the US and EU market from 5 to 18 percent and from 15 to 20 percent respectively.
Table 3.1: ASEM Member Country Exports as Percent of GDP 1990 1995 1996 1997 1998 1999 2000 2001 2002 2003 2004 2005 2006 2007 Brunei 61.8 59.7 59.9 57.2 50.5 55.8 67.4 69.5 67.1 69.3 68.8 70.2 71.8 67.7 Cambodia 2.4 31.2 25.4 33.7 31.8 37.2 49.9 52.7 55.4 56.5 63.6 64.1 68.6 65.3 Indonesia 25.3 26.3 25.8 27.9 53 35.5 41 38.2 32.7 30.5 32.2 34.1 31 29.4 Lao PDR na na na na na na na na na na na na na na Malaysia 74.5 94.1 91.6 93.3 115.7 121.3 119.8 110.4 108.3 106.9 115.4 117.5 116.7 110.2 Myanmar 1.9 0.8 0.7 0.6 0.4 0.3 0.5 0.5 0.4 0.2 0.2 na na na Philippines 27.5 36.4 40.5 49 52.2 51.5 55.4 49.2 50.2 49.6 50.9 47.6 47.3 42.6 Singapore 183.2 187 181.6 175.2 172.7 183.9 195.6 191.6 192.3 212.5 225.4 238.5 246.2 230.9 Thailand 34.1 41.8 39.3 48 58.9 58.3 66.8 65.9 64.2 65.7 70.7 73.4 73.5 73.2 Vietnam 36 32.8 40.9 43.1 44.8 50 55 54.6 56.8 59.3 65.7 69.4 73.6 76.8 China 19.0 20.2 20.1 21.8 20.3 20.4 23.3 22.6 25.1 29.6 34.0 37.3 39.9 40.7 Japan 10.4 9.2 9.8 10.9 10.9 10.3 11.0 10.6 11.4 12.0 13.3 14.3 16.1 17.6 Korea 28.0 28.8 27.9 32.4 46.2 39.1 40.8 37.8 35.3 37.9 44.0 42.3 43.0 45.6 India 7.1 11.0 10.5 10.8 11.2 11.7 13.2 12.8 14.5 14.8 18.1 19.9 22.1 21.2 Mongolia na na na na na na na na na 57.7 66.7 64.3 65.3 na Pakistan 14.8 16.7 16.9 16.1 16.5 15.4 13.4 14.7 15.2 16.7 15.7 15.7 15.3 13.9 ASEAN avg 49.6 56.7 56.2 58.7 64.4 66.0 72.4 70.3 69.7 72.3 77.0 89.4 91.1 87.0 ASEM avg 37.6 42.6 42.2 44.3 48.9 49.3 53.8 52.2 52.1 54.6 59.0 64.9 66.5 64.2 Source: Asian Development Bank, Key Economic Indicators for Asia and the Pacific 2008. Manila, August 2008.

Prospects for Decoupling in Asia’s Growth Model Page 10
3. Dynamics of Trade Linkage Movements in both trade volumes and world market prices for traded commodities have impacted on the foreign demand for ASEM country exports in various degrees. The importance of foreign firms in the export sector is well-documented and there is ample evidence that export-orientation is one of the most important determinants of FDI flows (see, for example, Singh and Jun, 1995 and references therein). Moreover, the terms-of-trade shocks that hit Southeast Asia in 1997 had major repercussions on corporate earnings expectations. Stock markets in those countries contracted sharply, particularly in Thailand, Malaysia and the Philippines, and both foreign and domestic investors began to move funds offshore (Noland et al., 1998). At the same time, the growing openness of the Asian economies has deepened the close link of economic growth to the rapidly changing global economy, and produced rapid advances in all areas of globalization covering trade, cross-border investments and international financial activities.
To gauge the magnitude of Asia’s trade dependence, especially with the United States and the European Union, we used world market prices for primary non-fuel commodities relative to Table 3.3: Foreign Income, Financial Indicator and World Trade Elasticities of Asian Economies
Country or Grouping
Global Regions
Foreign Income Elasticity
Commodity Terms of Trade
Foreign (US-EU) Import Demand
Asian Private Capital Flows
Short-Term
Long-Term
Short-Term
Long-Term
Short-Term
Long-Term
Short-Term
Long-Term
ASEAN US plus EU 0.40 1.00 0.11 0.28 0.39 0.63 0.40 1.25 China US plus EU 0.18 1.41 0.15 0.83 - - 0.01 0.05 Other ASEM US plus EU 0.12 1.00 0.09 0.33 0.16 0.17 0.01 0.08 Notes: 1. Foreign Income Elasticity: Measures the percentage change in real GDP of each country or grouping brought about by a 1
percent change in the real GDP growth of the United States and the European Union. 2. Commodity Terms of Trade: Measures the percentage change in brought about by a 1 percent change in the relative prices of
non-fuel commodities to manufactures. 3. Foreign Import Demand Elasticity: Measures the percentage change in real GDP of each country or grouping brought about by
a 1 percent change in the volume of imports of the United States and the European Union. 4. Asia Private Capital Flows Elasticity: Measures the percentage change in real GDP of each country or grouping brought about
by a 1 percent change in the net private capital flows of the developing Asian economies. Net private capital flows comprise net direct investment, net portfolio flows, and other long- and short-term net investment flows including official and private borrowing.
Table 3.2: Changing Trade Exposure of ASEM Economies to the US and EU Economies a/ United States European Union 1980 1990 2000 2007 2008 1980 1990 2000 2007 2008 Brunei 8.6% 3.4% 12.0% 5.5% 1.1% 0.0% 0.2% 3.6% 1.2% 0.2% Cambodia na 0.0% 65.9% 58.1% 53.9% na 5.0% 20.6% 20.9% 22.5% Indonesia 19.6% 13.1% 13.7% 10.2% 9.8% 6.7% 12.2% 14.3% 11.6% 11.5% Lao PDR na 0.1% 2.3% 1.4% 2.5% na 9.4% 26.2% 12.2% 10.9% Malaysia 16.3% 16.9% 20.5% 15.6% 13.0% 18.3% 15.5% 14.0% 12.8% 10.7% Myanmar 0.5% 2.3% 22.4% 0.0% 0.0% 12.8% 6.9% 16.7% 6.9% 3.7% Philippines 27.5% 37.9% 29.8% 17.0% 12.8% 18.0% 18.5% 18.1% 17.0% 10.9% Singapore 12.3% 21.2% 17.3% 8.9% 7.1% 13.3% 15.5% 14.0% 10.7% 10.3% Thailand 12.7% 22.7% 21.3% 12.6% 11.4% 26.6% 23.3% 16.3% 13.8% 12.8% Vietnam na 0.0% 5.1% 20.8% 20.7% na 7.9% 20.5% 18.5% 18.5% China 5.4% 8.5% 20.9% 19.1% 18.4% 14.8% 10.2% 16.4% 19.9% 20.1% Japan 24.4% 31.6% 30.1% 20.4% 17.8% 15.6% 20.7% 16.8% 14.7% 14.0% South Korea 26.5% 28.6% 21.9% 12.3% 10.8% 16.9% 15.0% 14.3% 14.7% 12.4% India 11.5% 15.1% 21.3% 14.9% 13.1% 24.7% 28.5% 24.3% 21.4% 20.7% Mongolia na 2.0% 24.3% 4.8% 2.6% na 25.6% 7.7% 6.1% 4.6% Pakistan 5.3% 12.4% 25.2% 18.0% 16.0% 21.9% 36.7% 27.9% 22.2% 22.1% Sub-Total ASEAN 16.2% 19.4% 19.0% 12.4% 10.7% 12.9% 16.0% 15.0% 12.6% 11.4% Total ASEM 20.2% 25.1% 23.7% 16.7% 15.2% 15.2% 18.1% 16.1% 16.4% 15.8% a/ Trade exposure is measured as the exports to the United States or the European Union relative to total exports to all destinations. Source: International Monetary Fund (IMF), Direction of Trade database (July 2009).

Prospects for Decoupling in Asia’s Growth Model Page 11
those of manufactures, as well as the volume of total US and EU imports of goods.16 To measure the effect of foreign direct investment and portfolio flows, we used the broad measure of developing Asia net private capital flows, available from the International Monetary Fund.17 The estimates of the relationship for the ASEAN member countries, China and other ASEM countries are detailed in Annex A and summarized in Table 3.3.
As expected, US and EU import volumes and world commodity market prices relative to those of manufactures are significant in explaining changes in the ASEAN and other ASEM countries’ real GDP. Although US and EU import volumes were not statistically significant in determining GDP movements, overall world trade volumes were found to be an important determinant of GDP, suggesting that China’s economy is not as open as most other Asian countries and that there is somewhat less concentration in the US and EU markets. The average of the estimated US and EU import elasticities equals for the ASEAN countries (0.6) is substantially higher than that of the other ASEM countries (0.2). In the case of the global terms of trade, the average elasticity is higher in China that in the rest of the Asian country groupings. For private capital flows, the elasticity is much higher in the ASEAN member countries that in the rest of Asia. These flows refer to private capital flows comprise net direct investment, net portfolio flows, and other long- and short-term net investment flows including official and private borrowing. They reflect both the existence of large foreign direct investment into the region and the rising importance of portfolio flows in the ASEAN economies.18
B. Intra-Regional Trade and Global Production Networks
Asia’s declining share of trade with the United States and the European Union is partly due to the considerable expansion of trade within the region. In the ASEAN area, for example, the combined value of total exports of member countries has grown by five percentage points since the early 1990s (Figure 3.1). It would be misleading, however, to suggest that this trend reflects a growing decoupling of the region from the US and EU business cycle. Indeed, many of the products traded between the ASEAN countries has grown from the globalization of production
16 Commodity exports of the ASEM countries encompass a fairly broad range of products such as rubber, palm oil, tin, sugar, coconut oil, maize, and other agricultural and mineral commodities. We used the IMF’s broad-based price series for primary commodities, which is an index covering 31 agricultural, mineral and metal commodities. For manufactures, we used the World Bank’s Manufactured Unit Value (MUV) index, which is a composite index of prices for manufactured exports from the five major (G-5) industrial countries (France, Germany, Japan, the United Kingdom, and the United States) to low- and middle-income economies, valued in U.S. dollars. The MUV index covers products in Standard International Trade Classification (SITC) groups 5–8 and is constructed using trade-weighted unit value indexes for each country. 17 Based on data available from International Monetary Fund (IMF), International Financial Statistics database, June 2009. 18 In a more detailed study of international trade linkages for the ASEAN member countries, Lord (1999) examined interest rate differentials and investment risks effects on capital markets. He used four alternative measures: (a) the ratio of the Japanese yen LIBOR three-month rate to the US dollar LIBOR rate, (b) the ratio of the Japanese yen lending rate to the US dollar LIBOR rate, (c) ratio of the nominal lending rates in each ASEAN-5 country to the Japanese yen LIBOR three-month rate, and (d) ratio of the nominal lending rates in each ASEAN-5 country to the US dollar LIBOR rate. To measure investment risk effects, the study he uncovered interest parity relationship, an investor will be indifferent between borrowing abroad or at home if the following relationship holds: it = ift + Δse
t + γt, where i is the domestic loan rate, if is the foreign loan rate, γ is the risk premium from the risk differential of the foreign and domestic loans, and the term Δse
t = (Set+k – St)/St is the expected change in the real exchange rate.18 Since γt = (it -
ift) - Δset, the expectation of a devaluation of the domestic currency will increase the risk premium for foreign loans,
while the expectation of an appreciation will lower the risk premium. If Δγt > 0 domestic intermediaries will reduce foreign borrowing, as well as domestic loans for asset purchases. Alternatively, if Δγt < 0 domestic intermediaries will increase foreign borrowing and domestic loans for asset purchases.

Prospects for Decoupling in Asia’s Growth Model Page 12
activities and the associated expansion of intra-industry trade in processing and assembly products as part of cross-border supply chains (Table 3.4). Asian economies are therefore increasingly specializing in the intermediate stages of the production chain, with the final assembly into final goods done in China. These final goods are then shipped to their destination markets within and outside the region, including the United States and the European Union. With China providing the final assembly stage, most Asian economies now ship fewer goods to the US directly, although intra-regional shipments of intermediate goods continue to rise. However, the ADB has estimated that, after tracking the ultimate destination of trade of intermediate goods, as much as 60 percent of East Asia’s exports are ultimately destined for the US, EU and Japanese markets.19
International outsourcing by large enterprises depend on borderless manufacturing and procurement activities involving multiple enterprises, suppliers, manufacturers and retailers. Not only have value chains become one of the principal driving forces behind private sector development throughout Asia, but governments in the region are increasingly supporting programs to enhance international networking capabilities and international development agencies like the World Banka and the Asian Development Bank are providing technical assistance and loans that provide support to value chain systems as a means of boosting exports and encouraging the commercial development of small and medium size enterprises (SMEs).20
C. FDI Flows within Asian Region The traditional model of globalization focused almost exclusively on the US-EU-Japan triad. In Asia the pattern of FDI and cross-border equity flows with the triad reflected changes that were brought on by currency realignments between the mid-1980s and 1990s. When the US dollar fell against East Asian currencies between 1987 and 1996, exports from the region shifted from the United States and Europe to Japan as relative price movements induced a gradual depreciation of the real effective exchange rates of many of the developing East Asian economies. 21 As the yen began to appreciate in both nominal and real terms, Japanese firms 19 Asian Development Bank, “Asian Development Outlook 2007”. Manila, 2007 20 See, for example, World Bank, “Building Export Competitiveness in Laos”. Background Report. East Asia PREM. November 2006; Foreign Investment Advisory Service, “Moving Towards Competitiveness: A Value Chain Approach”. Foreign Investment Advisory Service (FIAS), World Bank, 2007; Asian Development Bank, “South Asia Strategic Framework for Aid for Trade Road Map”. March 2009; and Asian Development Bank, “Country Strategy and Program Update 2007-2010: Viet Nam, Socialist Republic of”, 2009. 21 For a description of the shift in East Asia's exports from the United States and other industrialized countries to markets within the region following the currency realignment of 1986, see Robertson (1994).
Figure 3.1: ASEAN Intra-Regional Trade, Share of Total Exports to World, 1990-2007
Data source: WTO Secretariate, Statistical database.
Table 3.4: Top Export Product Categories of ASEAN Countries, 2007
HS Code Description
Percent of Total Exports Intra-
ASEAN Extra-
ASEAN
85 Electric machinery, equipment and parts 24.8% 23.8%
84 Machinery and mechanical appliances 15.2% 14.6%
27 Mineral fuels, mineral oils & products 19.3% 11.1%
Sub-Total of All Exports 59.3% 49.5%
Prospects for Decoupling in Asia’s Growth Model Page 13
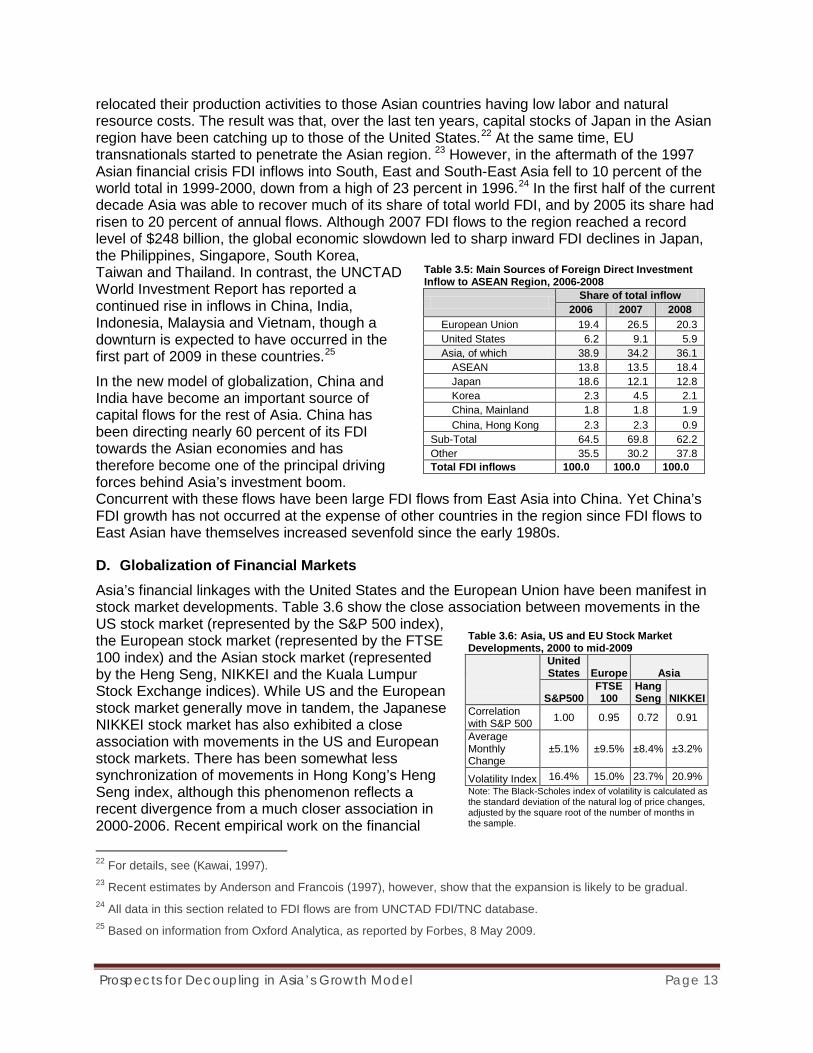
Table 3.5: Main Sources of Foreign Direct Investment Inflow to ASEAN Region, 2006-2008
Share of total inflow
2006 2007 2008 European Union 19.4 26.5 20.3 United States 6.2 9.1 5.9 Asia, of which 38.9 34.2 36.1
ASEAN 13.8 13.5 18.4 Japan 18.6 12.1 12.8 Korea 2.3 4.5 2.1 China, Mainland 1.8 1.8 1.9 China, Hong Kong 2.3 2.3 0.9
Sub-Total 64.5 69.8 62.2 Other 35.5 30.2 37.8 Total FDI inflows 100.0 100.0 100.0
relocated their production activities to those Asian countries having low labor and natural resource costs. The result was that, over the last ten years, capital stocks of Japan in the Asian region have been catching up to those of the United States.22 At the same time, EU transnationals started to penetrate the Asian region. 23 However, in the aftermath of the 1997 Asian financial crisis FDI inflows into South, East and South-East Asia fell to 10 percent of the world total in 1999-2000, down from a high of 23 percent in 1996.24 In the first half of the current decade Asia was able to recover much of its share of total world FDI, and by 2005 its share had risen to 20 percent of annual flows. Although 2007 FDI flows to the region reached a record level of $248 billion, the global economic slowdown led to sharp inward FDI declines in Japan, the Philippines, Singapore, South Korea, Taiwan and Thailand. In contrast, the UNCTAD World Investment Report has reported a continued rise in inflows in China, India, Indonesia, Malaysia and Vietnam, though a downturn is expected to have occurred in the first part of 2009 in these countries.25
In the new model of globalization, China and India have become an important source of capital flows for the rest of Asia. China has been directing nearly 60 percent of its FDI towards the Asian economies and has therefore become one of the principal driving forces behind Asia’s investment boom. Concurrent with these flows have been large FDI flows from East Asia into China. Yet China’s FDI growth has not occurred at the expense of other countries in the region since FDI flows to East Asian have themselves increased sevenfold since the early 1980s.
D. Globalization of Financial Markets Asia’s financial linkages with the United States and the European Union have been manifest in stock market developments. Table 3.6 show the close association between movements in the US stock market (represented by the S&P 500 index), the European stock market (represented by the FTSE 100 index) and the Asian stock market (represented by the Heng Seng, NIKKEI and the Kuala Lumpur Stock Exchange indices). While US and the European stock market generally move in tandem, the Japanese NIKKEI stock market has also exhibited a close association with movements in the US and European stock markets. There has been somewhat less synchronization of movements in Hong Kong’s Heng Seng index, although this phenomenon reflects a recent divergence from a much closer association in 2000-2006. Recent empirical work on the financial 22 For details, see (Kawai, 1997). 23 Recent estimates by Anderson and Francois (1997), however, show that the expansion is likely to be gradual. 24 All data in this section related to FDI flows are from UNCTAD FDI/TNC database. 25 Based on information from Oxford Analytica, as reported by Forbes, 8 May 2009.
Table 3.6: Asia, US and EU Stock Market Developments, 2000 to mid-2009
United States Europe Asia
S&P500 FTSE 100
Hang Seng NIKKEI
Correlation with S&P 500 1.00 0.95 0.72 0.91
Average Monthly Change
±5.1% ±9.5% ±8.4% ±3.2%
Volatility Index 16.4% 15.0% 23.7% 20.9% Note: The Black-Scholes index of volatility is calculated as the standard deviation of the natural log of price changes, adjusted by the square root of the number of months in the sample.

Prospects for Decoupling in Asia’s Growth Model Page 14
linkages between emerging market stock markets and those in the major US and European financial centers supports the view that these markets are highly correlated and that the extent of co-movements among these markets has grown to such an extent in recent years that de-coupling these financial markets is unlikely to occur.26
E. International Currency Linkages 1. Exchange Rate Misalignments
Since the middle of the last century the dollar’s dominance as the international numeraire and exchange medium to trade across multiple currencies has been supported by five drivers: the United States’ large economic size, political stability and well-developed financial system, confidence in the currency’s value, and its so-called network externality whereby the currency has become more valuable as more people use it.
The dollar’s volatility has had mixed effects on the ASEM countries, largely depending on conditions dictated by their exchange rate regimes (Table 3.7). Most countries have informally pegged their currencies to the dollar, while retaining the official policy of free-floating regimes. For example, China maintains a de facto peg to the dollar (adjusted in June 2008), and Malaysia keeps the ringgit within a narrow range relative to the dollar. Despite these efforts, however, in 2008 countries like Korea, Pakistan and India experienced substantial nominal devaluations of their currencies, notwithstanding the weakening of the US dollar, while others like Japan, China and Singapore experienced large appreciations in their currencies. These large movements reflect the longer term volatility in exchange rate movements, especially for Indonesia, the Philippines, South Korea, and Japan. Moreover, in some of the Least Developed Countries (LDCs), notably Cambodia and Laos, the economies remain partly dollarized, making them particularly susceptible to the dollar’s instability.
1.1. Misalignments and International Competitiveness How currency exchange movements impact on the competitiveness of the Asian economies depends on their real effective exchange rates (REERs), and their transmission mechanism within the economies.27 To illustrate their impact on the Asian economies, we focus the
26 N. Frank and H. Hesse, “Financial Spillovers to Emerging Markets during the Global Financial Crisis”. International Monetary Fund, IMF Working Paper WP/09/104, May 2009. 27 The real exchange rate is defined as er
t = (entPf
t)/Pt, where en is the nominal exchange rate, Pf is the foreign currency price of goods purchased abroad, and P is the domestic price level. A fall in er represents a real revaluation under a fixed exchange rate system, and an appreciation under a flexible exchange rate system. The fall is associated with either a rise in the nominal exchange rate en or a rise in relative prices of domestic goods (equivalent to a fall in relative prices of foreign goods). Conversely, a rise in er represents a real devaluation in a fixed exchange rate system, and a depreciation in a flexible exchange rate system.
Table 3.7: ASEM Countries’ Nominal Exchange Rates (local currency per US dollar), 1980-2008
Average Annual
Change Volatility
2000-2008 2008
1980-2008
Brunei -1.9% -6.0% 4.3% Cambodia 0.7% 0.0% 23.8% Indonesia 2.8% 6.1% 24.8% Lao PDR 4.1% 0.0% 31.0% Malaysia -1.4% -3.0% 7.3% Myanmar -1.5% -3.1% 5.4% Philippines 1.8% -3.6% 11.7% Singapore -1.9% -6.1% 4.3% Thailand -1.2% -3.5% 8.2% Vietnam 1.8% 1.2% 12.5% China -1.9% -8.7% 10.6% Japan -0.8% -12.2% 10.7% Korea -0.4% 18.6% 11.1% India 0.2% 5.2% 7.0% Mongolia 1.5% -0.4% 12.4% Pakistan 4.2% 15.9% 5.7%
Data source: International Monetary Fund database. Note: The Black-Scholes index of volatility is calculated as the standard deviation of the natural log of exchange rate changes.

Prospects for Decoupling in Asia’s Growth Model Page 15
Table 3.8: ASEAN-5 Real Effective Exchange Rates (REER) by Region, 1980-2008 (2000=100) Indonesia Malaysia
World US EU China Japan Other
ASEAN World US EU China Japan Other
ASEAN 1990 62.4 57.2 80.3 65.1 51.7 67.7 83.3 76.4 107.2 86.9 69.0 98.8 1991 63.2 57.7 78.5 58.5 55.6 69.1 84.9 77.5 105.5 78.6 74.7 101.4 1992 65.2 57.6 82.8 58.2 58.2 73.9 80.1 70.6 101.6 71.4 71.4 96.4 1993 63.2 55.6 71.9 59.9 62.9 71.1 80.7 71.0 91.9 76.5 80.4 97.8 1994 63.4 54.4 71.1 47.4 65.7 72.5 83.4 71.6 93.6 62.4 86.5 103.3 1995 65.4 53.2 76.1 54.5 67.8 75.1 83.8 68.1 97.5 69.7 86.8 103.1 1996 61.3 53.3 73.9 57.7 57.1 76.0 78.2 68.0 94.4 73.6 72.9 103.9 1997 69.1 63.8 77.1 69.6 61.2 81.7 82.2 75.8 91.7 82.7 72.8 101.8 1998 142.0 141.0 167.0 150.5 124.0 144.3 102.7 102.0 120.7 108.8 89.6 97.4 1999 97.0 93.6 109.7 96.4 92.3 99.7 101.7 98.2 115.1 101.1 96.8 105.8 2000 100.0 100.0 100.0 100.0 100.0 100.0 100.0 100.0 100.0 100.0 100.0 100.0 2001 106.5 112.3 108.3 110.1 96.2 104.6 96.1 101.4 97.7 99.3 86.8 92.0 2002 87.9 92.6 94.8 88.7 75.0 86.4 96.0 101.2 103.5 96.8 81.9 96.7 2003 81.5 81.8 100.0 77.4 69.8 76.1 102.1 102.4 125.2 96.9 87.4 101.6 2004 84.9 82.5 110.3 79.0 73.5 77.5 106.6 103.7 138.6 99.3 92.4 103.9 2005 85.0 83.8 111.0 79.9 70.7 79.8 105.1 103.6 137.3 98.8 87.4 104.6 2006 72.7 72.2 95.4 69.5 56.1 72.9 100.7 100.0 132.2 96.3 77.7 110.6 2007 72.1 69.9 100.1 71.8 52.1 76.1 97.5 94.5 135.4 97.1 70.5 111.6 2008 76.2 70.1 107.3 80.4 58.2 81.7 98.1 90.3 138.2 103.6 75.0 112.4
Philippines Singapore
World US EU China Japan Other
ASEAN World US EU China Japan Other
ASEAN 1990 104.8 96.0 134.8 109.2 86.7 130.6 103.3 94.6 132.9 107.7 85.5 128.4 1991 104.6 95.5 130.0 96.8 92.0 130.7 99.6 90.9 123.7 92.2 87.6 123.2 1992 95.0 83.9 120.7 84.8 84.7 119.1 97.9 86.4 124.3 87.3 87.3 123.4 1993 97.0 85.3 110.4 92.0 96.6 122.6 98.1 86.2 111.6 92.9 97.7 124.2 1994 91.2 78.2 102.3 68.2 94.5 115.2 94.6 81.1 106.1 70.7 98.0 120.4 1995 88.8 72.1 103.3 73.9 92.0 110.8 93.7 76.1 108.9 77.9 97.1 118.2 1996 79.8 69.4 96.3 75.2 74.5 106.6 88.4 76.8 106.6 83.2 82.4 120.7 1997 81.8 75.4 91.2 82.3 72.4 101.2 88.0 81.2 98.2 88.5 77.9 110.8 1998 97.6 96.9 114.7 103.4 85.2 91.3 93.8 93.2 110.3 99.4 81.9 86.8 1999 92.1 89.0 104.2 91.6 87.7 93.5 99.8 96.4 112.9 99.2 95.0 103.4 2000 100.0 100.0 100.0 100.0 100.0 100.0 100.0 100.0 100.0 100.0 100.0 100.0 2001 105.2 111.0 107.0 108.8 95.1 103.1 100.3 105.8 102.0 103.7 90.6 97.1 2002 105.2 110.9 113.5 106.1 89.8 108.4 102.3 107.8 110.3 103.2 87.3 104.7 2003 114.9 115.2 140.8 109.0 98.3 117.4 106.5 106.8 130.6 101.1 91.2 107.1 2004 118.7 115.4 154.3 110.5 102.8 118.4 107.6 104.6 139.9 100.2 93.2 105.1 2005 110.4 108.9 144.2 103.8 91.9 111.2 107.5 106.0 140.4 101.0 89.4 107.6 2006 99.3 98.6 130.3 94.9 76.6 108.7 104.2 103.5 136.8 99.6 80.4 115.3 2007 91.5 88.7 127.1 91.1 66.2 103.2 102.0 98.9 141.6 101.6 73.7 117.9 2008 88.2 81.2 124.2 93.1 67.4 98.5 98.3 90.5 138.4 103.8 75.1 112.7
Thailand ASEAN-5
World US EU China Japan Other
ASEAN World US EU China Japan Other
ASEAN 1990 82.2 75.3 105.7 85.7 68.0 97.0 79.0 73.8 96.7 81.6 68.3 90.7 1991 81.1 74.0 100.7 75.1 71.3 95.7 78.7 73.3 93.8 74.1 71.2 90.6 1992 82.6 72.9 104.9 73.7 73.7 100.3 78.1 70.8 94.8 71.4 71.4 91.3 1993 82.4 72.4 93.8 78.1 82.0 100.3 77.6 70.2 86.0 74.4 77.3 90.8 1994 81.9 70.3 91.9 61.2 84.9 100.9 77.3 68.7 84.7 62.0 79.5 91.3 1995 83.3 67.6 96.9 69.3 86.3 102.3 78.2 66.6 88.3 67.8 80.5 92.0 1996 76.9 66.9 92.8 72.4 71.8 101.8 73.0 65.4 84.9 69.6 69.1 91.3 1997 87.0 80.3 97.1 87.5 77.1 109.2 78.7 73.9 86.0 79.2 71.6 93.5 1998 100.1 99.4 117.7 106.1 87.4 94.3 115.4 114.8 132.5 121.2 103.1 110.9 1999 95.9 92.6 108.5 95.4 91.3 98.3 98.1 95.4 108.3 97.7 94.3 100.4 2000 100.0 100.0 100.0 100.0 100.0 100.0 100.0 100.0 100.0 100.0 100.0 100.0 2001 106.2 112.0 108.0 109.8 96.0 104.3 103.0 107.6 104.4 105.8 95.0 100.8 2002 103.7 109.3 111.9 104.7 88.6 106.5 95.9 100.0 101.9 96.6 84.9 97.0 2003 105.8 106.1 129.7 100.4 90.6 106.2 96.5 96.7 113.7 92.7 85.6 95.9 2004 105.7 102.8 137.5 98.5 91.6 102.8 99.2 97.1 122.6 93.9 88.8 96.6 2005 103.0 101.6 134.6 96.8 85.7 102.1 98.0 97.0 121.4 93.5 85.2 97.1 2006 95.1 94.4 124.8 90.9 73.4 103.1 90.1 89.7 111.6 87.1 74.5 95.4 2007 89.3 86.6 124.0 89.0 64.6 100.2 87.5 85.5 113.2 87.2 69.2 95.5 2008 89.4 82.2 125.8 94.3 68.3 100.1 88.1 82.6 115.8 91.8 72.0 96.2

Prospects for Decoupling in Asia’s Growth Model Page 16
empirical analysis on the ASEAN-5 (Indonesia, Malaysia, Philippines, Singapore and Thailand). Not surprisingly, the results show that as a group these countries have gradually reduced their international competitiveness in the global economy during this decade, particularly in the US, Chinese and Japanese markets, but also the EU market in more recent years.
Table 3.8 shows the results of the REER calculations for the world as well as specific export markets. In the first half of the 1990s, the ASEAN-5’s REER remained almost unchanged as devaluations of the currencies of some countries were offset by appreciations in those of others. Exports of all countries nevertheless surged during this period, particularly in Malaysia, Thailand and Singapore. In 1996 all ASEAN-5 currencies appreciated in real terms and, with the exception of Singapore, they all devalued sharply in 1997-98. Since then, most currencies have appreciated in real terms, particularly that of Indonesia. However, these movements differ across markets. The average real effective exchange rate of the ASEAN-5 appreciated more against the Japanese yen than against other major markets between 200 and 2008. In contrast, most of the countries experienced real exchange rate devaluations against the euro between in the first half of this decade and have since then appreciated (Indonesia, Philippines, Thailand) or remained relatively unchanged against the euro (Malaysia and Singapore). All countries have experienced real exchange rate appreciations against the US dollar between 2005 and 2008.
Volatility in the exchange rates of the Asian countries are generally considered to be unfavorable to their economies and most governments have adopted managed floats in their currencies that allows them to fluctuate within a limited range over time (Table 3.9). Nearly all countries manage or peg their currencies to adjust in value in foreign exchange (forex) markets as long as their currencies do not exceed some defined values that could affect foreign currency, inflation limit or monetary policy limits. The notable exception is the Philippines, which until March 2008 allowed its currency to float freely in forex markets. There have nonetheless occurred considerable competitive adjustments among most exchange rates throughout Asia that have affected the international competitiveness of most countries, as exemplified by the real exchange rate movements that have occurred in these countries (Table 3.8).
1.2. Measuring the Magnitude of Transmissions For the ASEAN-5 countries (Indonesia, Malaysia, Philippines, Singapore and Thailand), we measured the effects of the following variables:
Foreign income in the form of real GDP growth of the United States and the European Union.
Table 3.9: ASEM Countries De Facto Classification of Exchange Rate Regimes, 2008
Exchange Rate Arrangement Exchange Rate
Anchor
Managed Float
Fixed Peg Floating
Currency Board
US dollar Composite
Inflation Targeting
Monetary Policy
Brunei X Cambodia X X Indonesia X X Lao PDR X X Malaysia X X Myanmar X X Philippines X X Singapore X X Thailand X X Vietnam X China X Japan X X Korea X X India X X Mongolia X X Pakistan X X Source: De Facto Classification of Exchange Rate Regimes and Monetary Policy Frameworks, as of April 13, 2008. Washington, DC, April 2009.

Prospects for Decoupling in Asia’s Growth Model Page 17
Exchange rates in the form of the real effective exchange rate of the ASEAN-5 countries;
International prices in the form of the terms of world market prices for primary commodities relative to those of manufactures;
Foreign import demand in the form of the volume of US and EU imports.
Capital inflows in the form of the net private capital flows of the developing Asian economies, where net private capital flows comprise net direct investment, net portfolio flows, and other long- and short-term net investment flows including official and private borrowing.
The estimated equation is presented in the Annex and the estimated elasticities are summarized in Table 3.10. The results generally indicate that changes in these foreign income, trade and financial variables lead to a more-that-proportional change in the economic growth of the ASEAN member countries as a group. However, the level of statistical significance is higher for capital flows and real exchange rates than it is for trade, as measured by the US and EU import demand. Commodity prices, measured through the terms of trade of primary commodities relative to manufactures, were not found to be statistically significant in explaining GDP movements, which is explained by the fact that some ASEAN countries are net importers of primary commodities while others are net exporters. F. Implications for Asia’s Decoupling The empirical evidence in this chapter as well as the previous one provides the basis for some forward looking views about Asia’s prospects for decoupling as a means of mitigating adverse external effects from cyclical downturns and better insulating the region’s economies from external shocks.
1. Business-cycle co-movements with the US and European economies are unlikely to diminish in the near to medium term.
There are strong linkages both within Asia and between Asia and the United States and Europe, and the magnitude of international transmissions have not waned in the last 25 years. However, the transmission channels have become more complex as new sources of those spillovers arise in terms of portfolio flows, stock market volatility, and integrated production networks.
2. Traditional channels of international transmissions in the form of trade linkages with the US and EU economies are likely to weaken as shifts occur towards greater trade with intra-Asia markets as well as the Middle East and Central Asia.
The ASEM countries’ combined exports to the United States fell from 25 to 15 percent between 1990 and 2008, while those directed to the European Union fell more modestly, from 18 to 16 percent during the same period. There are significant downside risks for the recovery of growth in the United States and Europe. Over the medium term, US and EU consumer spending are
Table 3.10: ASEAN-5 Region's Foreign Income, Financial Indicator, World Trade, and Real Effective Exchange Rate Elasticities
Short-Term
Long-Term
Foreign Income Elasticity 0.35 1.33 Foreign (US-EU) Import Demand 0.12 1.11 Asian Private Capital Flows 0.02 1.17 Real Effective Exchange Rate 0.07 1.39
Notes: 1. Foreign Income Elasticity: Measures the percentage change in real GDP of each country or grouping brought about by a 1 percent change in the real GDP growth of the United States and the European Union. 2. Foreign Import Demand Elasticity: Measures the percentage change in real GDP of each country or grouping brought about by a 1 percent change in the volume of imports of the United States and the European Union. 3. Asia Private Capital Flows Elasticity: Measures the percentage change in real GDP of each country or grouping brought about by a 1 percent change in the net private capital flows of the developing Asian economies. 4. Real Effective Exchange Rate (REER) Elasticity: Measures the percentage change in real GDP of ASEAN group brought about by a 1 percent change in the REER for those countries.

Prospects for Decoupling in Asia’s Growth Model Page 18
expected to be sluggish relative to economies like China where earlier high savings rates are expected to fall significantly as the government introduces stimulus packages centered on expenditures. If Asia leads the recovery with China at its center, the policy focus should be on mechanisms to shift trade as well as investment from slow growth markets to the more dynamic economies. That shift could support a structural change in Asia’s trading patterns over the medium term.
3. The types of goods produced as outsourcing for large enterprises is likely to incorporate more second-generation technology and it could increasingly shift to intra-regional production networks.
In the near term multinationals will continue to be dominated by US, EU and, to a lesser extent, Japanese firms. In 2006, the top 50 transnational corporations (TNCs) accounted for about one-eighth of the estimated assets, sales and employment of all TNCs in the world. Of these TNCs, nine have parent companies in the United States, four are from Japan, and the remaining 37 are European.28 It is unlikely that, as a group, the shares of these top-ranked companies will be significantly eroded in the near to medium term. For the Asian countries to develop their own cross-national production networks and compete in the global market they will need to implement domestic investment and technological development programs. Managerial, technological, financial, and know-how requirements continue to be prohibitively high for many sectors in Asia. Consequently, it is difficult for these countries to emerge and compete with firms in the industrialized economies. One effective channel has been successfully pursued by Malaysia and Thailand that encourages investment by foreign transnationals as a means of attracting technology and production know-how through complementary relationships with those firms. Another would be sub-regional cooperation schemes aimed at developing scale economies and private capital investment of the type of magnitude needed for effective competition at the global level. However, schemes like the ASEAN Investment Area (AIA) were established a decade ago to promote such cross-border investments but have been underutilized. Although the AIA provides for (a) the elimination of investment barriers, (b) liberalized investment rules and policies, and (c) grants national treatment to member countries, there are a large number of exceptions that create disincentives among private investors. There is some hope, nevertheless, that cross-border investments among the larger countries will be occur based on a recent decision to combine the AIA with the ASEAN Agreement on the Promotion and Protection of Investments into a single ASEAN Comprehensive Investment Agreement (ACIA) in support of the development of an ASEAN Economic Community (AEC)
4. Foreign direct investment (FDI) sources are increasingly shifting toward Asia. Although intra-Asian FDI flows have grown substantially in the last ten years, the medium and long-term sustainability of those flows is likely to depend on the recovery of trade, investment and financial capital flows within the region. While shorter distance between Asian countries facilitates bilateral FDI flows, low sovereign risk, a transparent and predictable regulatory environment and small corporate tax rates in the host countries are also important determinant.29 Technological developments affecting manufacturing and service industries, especially those in information technology, biotechnology, and new materials, will nonetheless continue to be concentrated in the industrialized countries, and the comparative advantage of the Asian economies will be in their ability and willingness to participate in globally integrated production system. Foreign direct investments that exploit the dynamics of globalization will 28 UNCTAD database on FDI/TNC and cross-border M&As. 29 R. Hattari, R.S. Rajan, and S. Thangavelu, “Understanding Intra-Asean FDI Flows: Trends and Determinants and the Role of China and India.” January 2008. Available: http://www.freewebs.com/rrajan1/OFDIASEAN.pdf

Prospects for Decoupling in Asia’s Growth Model Page 19
likely continue to characterize the Asian growth model.
5. Asia’s major stock market linkages to the major US and EU financial centers will likely continue to increase.
Stock market indicators in Asia are highly correlated with the major financial centers in the United States and Europe. The extent of these co-movements is much greater now than they were before in the 1980s and 1990s. De-coupling in the financial markets could negatively alter the growing share of portfolio flows in the region’s overall private capital flows.
6. Pegged and managed exchange rates will continue to form part of the policy tools used in most Asian economies notwithstanding the lessons from the Asian financial crisis.
Most governments are likely to maintain either pegged or managed float of their currencies in an effort to reduce volatility in their exchange rates. Recent changes in the international competitiveness of the region’s countries have been unfavorable to some countries, especially those that have informally pegged their currencies to the US dollar. The resulting appreciation of some currencies in terms of their real effective exchange rates relative to other Asian economies and major US and European markets could push policymakers to adopt the types of exchange rate policies that were introduced after the Asian financial crisis but have since then been abandoned by most countries. Otherwise the continued management of exchange rates could have a considerable impact on competitive adjustments that could, in turn, create considerable downsize risks to the recovery in the global economy through a much-needed rebalancing of the global current accounts.

Prospects for Decoupling in Asia’s Growth Model Page 20
IV. FORWARD LOOKING POLICY IMPLICATIONS A. Redefining the Asian Growth Model The current downturn in economic activity throughout Asia highlights the inherent unsustainability of an economic growth model dependent on foreign demand. This situation has given rise to widespread suggestions by policymakers in the Asian economies to take concrete actions to rebalance their economies in such a way that will ensure greater sustainability in the medium to long run. Yet the fundamental question facing those policymakers is how to rebalance growth in such a way as to reduce the region’s dependence on the continued global current account imbalance. According to the recent Asian Development Outlook, even though the optimal policy mix for rebalancing will necessarily differ across countries, some of the key areas involving supply and demand-side policies to strength domestic demand and alter the production structure of the economies.30
Policies promoting greater domestic consumption are generally favored over those encouraging investment since Asia’s widening current account surplus has been driven by high savings rates. In support of this policy prescription, a recent study by Park and Shin found stronger evidence of over-saving than under-investment in the region, and stronger evidence of over-investment prior to the 1997 Asian crisis than underinvestment after the Asian crisis. Those results suggest that the key to rebalancing Asian growth toward domestic sources lies in promoting consumption rather than investment.31
Specific policies that would encourage increased domestic consumption include (a) initiatives that help shift corporate savings to household savings; (b) greater state provision of health care, education, and pension benefits to help mitigate the household risk and uncertainty and reduce precautionary savings; and (c) enhancing the regulatory climate for investment and expansionary fiscal policies that in the short run involve lower takes and greater government spending. On the supply side, policies that would promote a better balance include (a) providing access to the types of finance that more closely align production to domestic demand; and (b) move away from tightly managed exchange rate regimes toward a more flexible approach. At the regional level, there is also considerable scope for ameliorating external shocks and broadening regional arrangements to promote wider and more diversified intra-regional trade. That regional process could help to promote scale economies and greater specialization in all activities of the value chain.
B. Liberalizing Trade and Investment Policy Regimes There is considerable scope for deepening trade liberalization within the ASEAN countries and broadening the coverage to other Asian countries as a means of strengthening the so-called ‘domestic’ regional economy. A larger regional bloc would promote scale economies and specialization in differentiated products that would expand intra-industry trade in Asia. Progress in moving from a free trade area to a customs union in ASEAN could also yield substantial
30 Asian Development Bank, “Asian Development Outlook 2009”. Manila, 2009. See also C. Adams and D. Park, “Causes and Consequences of Global Imbalances: Perspective from Developing Asia”. ADB Economics Working Paper Series No. 157, April 2009. 31 D. Park and K. Shin, “Saving, Investment, and Current Account Surplus in Developing Asia”. ADB Economics Working Paper Series No. 158, April 2009.
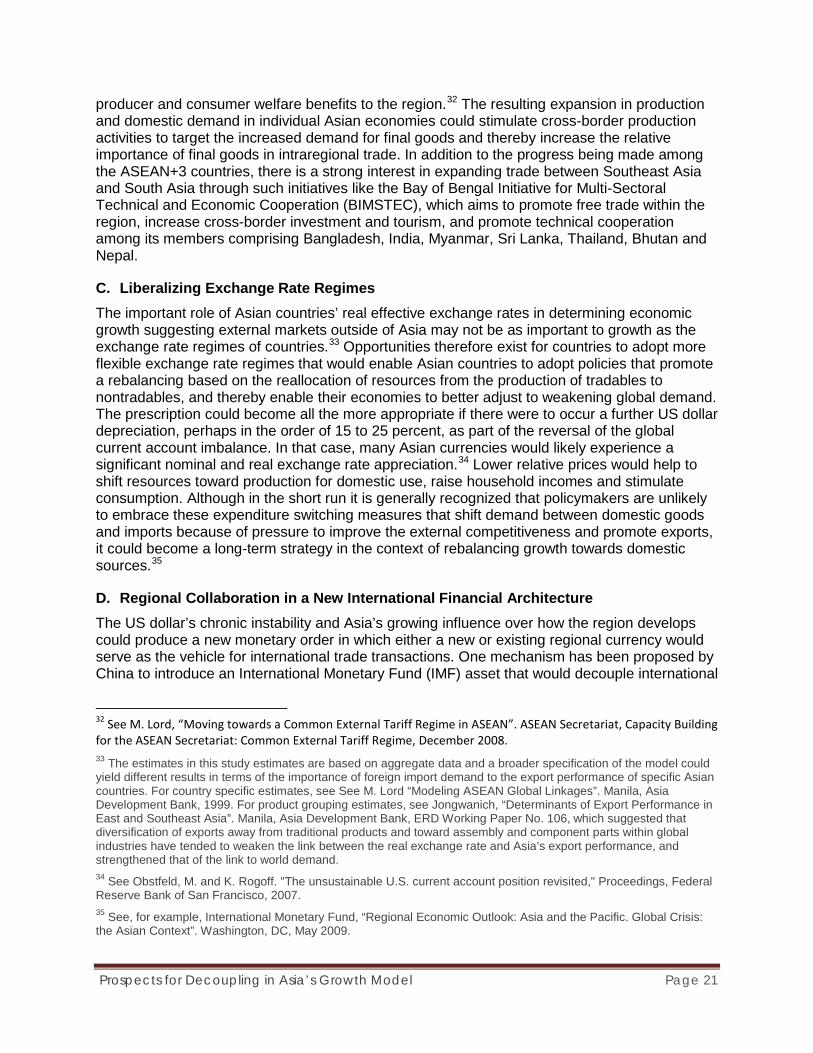
Prospects for Decoupling in Asia’s Growth Model Page 21
producer and consumer welfare benefits to the region.32 The resulting expansion in production and domestic demand in individual Asian economies could stimulate cross-border production activities to target the increased demand for final goods and thereby increase the relative importance of final goods in intraregional trade. In addition to the progress being made among the ASEAN+3 countries, there is a strong interest in expanding trade between Southeast Asia and South Asia through such initiatives like the Bay of Bengal Initiative for Multi-Sectoral Technical and Economic Cooperation (BIMSTEC), which aims to promote free trade within the region, increase cross-border investment and tourism, and promote technical cooperation among its members comprising Bangladesh, India, Myanmar, Sri Lanka, Thailand, Bhutan and Nepal.
C. Liberalizing Exchange Rate Regimes The important role of Asian countries’ real effective exchange rates in determining economic growth suggesting external markets outside of Asia may not be as important to growth as the exchange rate regimes of countries.33 Opportunities therefore exist for countries to adopt more flexible exchange rate regimes that would enable Asian countries to adopt policies that promote a rebalancing based on the reallocation of resources from the production of tradables to nontradables, and thereby enable their economies to better adjust to weakening global demand. The prescription could become all the more appropriate if there were to occur a further US dollar depreciation, perhaps in the order of 15 to 25 percent, as part of the reversal of the global current account imbalance. In that case, many Asian currencies would likely experience a significant nominal and real exchange rate appreciation.34 Lower relative prices would help to shift resources toward production for domestic use, raise household incomes and stimulate consumption. Although in the short run it is generally recognized that policymakers are unlikely to embrace these expenditure switching measures that shift demand between domestic goods and imports because of pressure to improve the external competitiveness and promote exports, it could become a long-term strategy in the context of rebalancing growth towards domestic sources.35
D. Regional Collaboration in a New International Financial Architecture The US dollar’s chronic instability and Asia’s growing influence over how the region develops could produce a new monetary order in which either a new or existing regional currency would serve as the vehicle for international trade transactions. One mechanism has been proposed by China to introduce an International Monetary Fund (IMF) asset that would decouple international
32 See M. Lord, “Moving towards a Common External Tariff Regime in ASEAN”. ASEAN Secretariat, Capacity Building for the ASEAN Secretariat: Common External Tariff Regime, December 2008. 33 The estimates in this study estimates are based on aggregate data and a broader specification of the model could yield different results in terms of the importance of foreign import demand to the export performance of specific Asian countries. For country specific estimates, see See M. Lord “Modeling ASEAN Global Linkages”. Manila, Asia Development Bank, 1999. For product grouping estimates, see Jongwanich, “Determinants of Export Performance in East and Southeast Asia”. Manila, Asia Development Bank, ERD Working Paper No. 106, which suggested that diversification of exports away from traditional products and toward assembly and component parts within global industries have tended to weaken the link between the real exchange rate and Asia’s export performance, and strengthened that of the link to world demand. 34 See Obstfeld, M. and K. Rogoff. "The unsustainable U.S. current account position revisited," Proceedings, Federal Reserve Bank of San Francisco, 2007. 35 See, for example, International Monetary Fund, “Regional Economic Outlook: Asia and the Pacific. Global Crisis: the Asian Context”. Washington, DC, May 2009.
Prospects for Decoupling in Asia’s Growth Model Page 22
transactions from the US dollar. In the interim, some countries like Indonesia have introduced bilateral currency swap arrangements (BCSAs) as a means of reducing their dependence on the US dollar. In March 2009 Indonesia signed a three-year BCSA with China allowing it to use the Chinese RMB to pay off transactions between the two countries without having to use the US dollar. This procedure could be extended to other countries in the region to promote trade and investment and provide short-term liquidity to the financial markets.
Another mechanism for reducing transactions risks is the example of the euro’s dominance as a settlement currency within its regional domain. A similar vehicle within East Asia might be possible, given the region’s large economic size and far-reaching trade connections. Countries pegging softly to a key international currency within the region would be more likely to use it as their main intervention currency as well as a reserve currency. While the dollar would dominate reserve holdings within the dollar area and the euro within the euro area, an East Asian currency could become the settlement currency in that regional domain. Efficiency gains of a limited number of international currencies would be maintained and transactions risks would be reduced. There are nonetheless efficiency gains in limiting the number of vehicle or transactions currencies, first, because it requires fewer foreign exchange markets and, second, because fewer exchange markets lowers transaction costs.
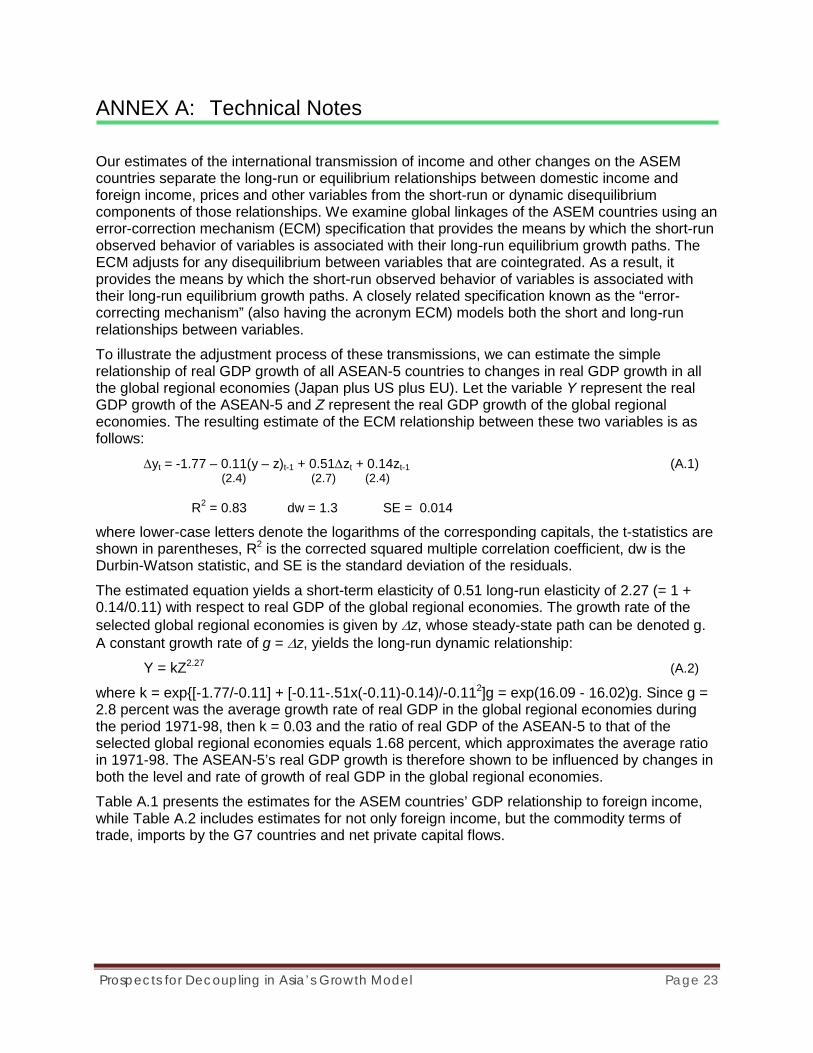
Prospects for Decoupling in Asia’s Growth Model Page 23
ANNEX A: Technical Notes
Our estimates of the international transmission of income and other changes on the ASEM countries separate the long-run or equilibrium relationships between domestic income and foreign income, prices and other variables from the short-run or dynamic disequilibrium components of those relationships. We examine global linkages of the ASEM countries using an error-correction mechanism (ECM) specification that provides the means by which the short-run observed behavior of variables is associated with their long-run equilibrium growth paths. The ECM adjusts for any disequilibrium between variables that are cointegrated. As a result, it provides the means by which the short-run observed behavior of variables is associated with their long-run equilibrium growth paths. A closely related specification known as the “error-correcting mechanism” (also having the acronym ECM) models both the short and long-run relationships between variables.
To illustrate the adjustment process of these transmissions, we can estimate the simple relationship of real GDP growth of all ASEAN-5 countries to changes in real GDP growth in all the global regional economies (Japan plus US plus EU). Let the variable Y represent the real GDP growth of the ASEAN-5 and Z represent the real GDP growth of the global regional economies. The resulting estimate of the ECM relationship between these two variables is as follows:
∆yt = -1.77 – 0.11(y – z)t-1 + 0.51∆zt + 0.14zt-1 (A.1) (2.4) (2.7) (2.4) R2 = 0.83 dw = 1.3 SE = 0.014
where lower-case letters denote the logarithms of the corresponding capitals, the t-statistics are shown in parentheses, R2 is the corrected squared multiple correlation coefficient, dw is the Durbin-Watson statistic, and SE is the standard deviation of the residuals.
The estimated equation yields a short-term elasticity of 0.51 long-run elasticity of 2.27 (= 1 + 0.14/0.11) with respect to real GDP of the global regional economies. The growth rate of the selected global regional economies is given by ∆z, whose steady-state path can be denoted g. A constant growth rate of g = ∆z, yields the long-run dynamic relationship:
Y = kZ2.27 (A.2)
where k = exp{[-1.77/-0.11] + [-0.11-.51x(-0.11)-0.14)/-0.112]g = exp(16.09 - 16.02)g. Since g = 2.8 percent was the average growth rate of real GDP in the global regional economies during the period 1971-98, then k = 0.03 and the ratio of real GDP of the ASEAN-5 to that of the selected global regional economies equals 1.68 percent, which approximates the average ratio in 1971-98. The ASEAN-5’s real GDP growth is therefore shown to be influenced by changes in both the level and rate of growth of real GDP in the global regional economies.
Table A.1 presents the estimates for the ASEM countries’ GDP relationship to foreign income, while Table A.2 includes estimates for not only foreign income, but the commodity terms of trade, imports by the G7 countries and net private capital flows.

Prospects for Decoupling in Asia’s Growth Model Page 24
The final estimate is for the ASEAN-5 countries (Indonesia, Malaysia, Philippines, Singapore and Thailand) with the real effective exchange rate included in the relationship. The results are as follow:
∆yt = -1.28 - 0.18(y – z)t-1 + 0.35∆zt + 0.06z-1 – 0.07r-1 + 0.02∆dt (2.7) (1.8) (1.8) (2.6) (7.8)
+ 0.03d-1 + 0.12∆qt + 0.02q-1+ vt (A.3) (7.7) (4.9) (1.6)
R2 = 0.99 dw = 2.7 SE = 0.004
Where Y = Domestic GDP, Z = Foreign GDP of US and EU, W = Commodity terms of trade (i.e., non-fuel commodity price index relative to manufactured unit value index), Q = Import volume of G7 industrialized countries, D = Developing Asia net private capital flows, and R = Real effective exchange rate of the ASEAN-5 countries, trade weighted by their respective GDP shares.
Table A.1: Regression Results of ASEM Members' GDP Relationships to Foreign Income Δyt = ao + a1(y – z)t-1 + a2Δzt + a3z-1 + vt Summary Statistics
Country or Grouping
Global Regions ln(Y/Z)t-1 Δln(Z)t lnZt-1 Const R2 dw SE dof
ASEAN a/ c/ US plus EU
-0.06 0.94 -0.19 0.86 1.40 0.02 16 (2.1) (3.6) China US plus
EU -0.07 0.56 0.10 1.14 0.30 1.42 0.03 17 (1.8) (1.7) (1.5)
India d/ US plus EU
-0.06 0.26 0.10 -0.99 0.57 1.25 0.01 24 (1.8) (1.7) (1.5) OTHER ASEM a/
US plus EU
-0.22 0.86 -0.12 0.9 0.82 1.53 0.01 20 -2.9 (4.7) (4.3) Notations (lower-case letters denote logarithms of upper-case letters): Y = Domestic GDP Z = Foreign GDP a/ Includes a binary variable for 1998 (1 in 1998; 0 otherwise). b/ Includes a binary variable for 1999 (1 in 1999; 0 otherwise). c/ Includes a binary variable for 1991 (1 in 1991; 0 otherwise). d/ Includes a binary variable for 2000 (1 in 2000; 0 otherwise). Notes: R2 is the adjusted R2; figures in parentheses below the coefficients are t-statistics. Table A.2: Regression Results of ASEM Members' GDP Relationships to Foreign Income, Commodity Prices,
G7 Imports, and Private Capital Flows Δyt = ao + a1(y – z)t-1 + a2Δzt + a3z-1 + + α6∆wt + α7w-1 + α8∆qt + α9q-1+ α10∆dt + α11d-1+ α12∆kt + α13k-
1 + vt Summary Statistics Country or Grouping
Global Regions ln(Y/Z)t-1 Dln(Z)t lnZt-1 Dln(W)t lnWt-1 Dln(Q)t lnQt-1 Dln(D)t lnDt-1 Const R2 dw SE dof
ASEAN US plus EU
-0.4 0.11 0.39 0.25 0.4 0.5 -2.4 0.95 2.30 0.01 16 (2.9) (1.7) (3.4) (2.4) (10.9) (9.2)
China US plus EU
-0.18 0.07 0.15 0.01 -1.98 0.68 1.63 0.01 12 (1.7) (1.8) (2.2) (2.2)
India d/ US plus EU
-0.06 0.26 0.10 -0.99 0.57 1.25 0.01 24 (1.8) (1.7) (1.5) OTHER ASEM a/
US plus EU
-0.12 0.09 0.04 0.16 0.02 0.009 0.009 -0.73 0.83 1.5 0.01 13 (3.7) (1.9) (2.0) (1.9) (2.8) (2.8) (1.8)
Notations (lower-case letters denote logarithms of upper-case letters): Y = Domestic GDP Z = Foreign GDP of US and EU W = Commodity terms of trade (i.e., non-fuel commodity price index relative to manufactured unit value index) Q = Import volume of G7 industrialized countries D = Developing Asia net private capital flows Notes: R2 is the adjusted R2; figures in parentheses below the coefficients are t-statistics.

Prospects for Decoupling in Asia’s Growth Model Page 25
REFERENCES Adams, C., and D. Park, “Causes and Consequences of Global Imbalances: Perspective from
Developing Asia”. Manila. Asian Development Bank. ADB Economics Working Paper Series No. 157, April 2009.
Asian Development Bank, “Asian Development Outlook 2009”. Manila, 2009.
Asian Development Bank, “Asian Development Outlook 2007”. Manila, 2007.
Asian Development Bank, “Emerging Asian Regionalism: A Partnership for Shared Prosperity”. Manila, 2008.
Bénassy-Quéré, A., “Exchange Rate Regimes and Policies in Asia”. CEPII, document de travail No. 96-07, 1996.
Borensztein, E., A. Berg, C.-M. Milesi-Ferretti, and C. Pattillo, “Anticipating Balance of Payments Crises---The Role of Early Warning Systems,” IMF Occasional Paper, 1999.
Chen, J-A., “Japanese Firms with Direct Investments in China and Their Local Management” in S. Tunaga, ed., Japan's foreign investment and Asian economic interdependence: Production, trade, and financial systems. Tyo: University of Tyo Press, 1994.
Chuhan, P., G. Perez-Quiros, and H. Popper, “International Capital Flows: Do Short-Term Investment and Direct Investment Differ?” Policy Research Working Papers. Washington, DC: World Bank, International Economics Division, 1996.
Claessens, S.; A. Kose; and M. Terrones. What Happens During Recessions, Crunches and Busts? IMF Working Paper WP/08/274, International Monetary Fund, Washington, DC. 2008.
Corsetti, G., P. Pesenti, and N. Roubini, “What Caused the Asian Currency and Financial Crisis?” New York: Stern School of Business. New York University, 1998.
Dahman, C. and L. Westphal, “The Transfer of Technology”. Finance and Development 20(4): 6-9.
Davidson et al., “Econometric Modelling of the Aggregate Time-Series Relationship Between Consumers’ Expenditure and Income in the United Kingdom”, Economic Journal 88: 661-92 1978.
Diwan and Hoeckman, “Competition, Complementarity and Contagion in East Asia”. Centre for Economic Policy Research. CEPR Discussion Paper No. 2112, 1999.
Dollar, D., “Outward-Oriented Developing Economies Really Do Grow More Rapidly: Evidence from 95 LDCs, 1976-1985”. Economic Development and Cultural Change 40(3): 523-44, 1992.
Easterly, W., “How Much Do Distortions Affect Growth?” Journal of Monetary Economics 32(2): 187-212, 1993.
Edwards, S., “Openness, Trade Liberalization, and Growth in Developing Countries”. Journal of Economic Literature 31(3): 1358-1393, 1993.
Engle, R. and C.W.J. Granger, “Co-Integration and Error Correction: Representation, Estimation, and Testing”, Econometrica 55(2): 251-276, 1987.
Fischer, S., “Growth, Macroeconomics, and Development”, in O.J. Blanchard and S. Fischer

Prospects for Decoupling in Asia’s Growth Model Page 26
(eds), NBER Macroeconomics Annual 1991. Cambridge, MA: MIT Press, 1991.
Fischer, S., “The Role of Macroeconomic Factors in Growth,” Journal of Monetary Economics. 32: 485-5 12, 1993.
Fry, M.J., S. Claessens, P. Burridge, and M-C. Blanchet, “Foreign Direct Investment, Other Capital Flows, and Current Account Deficits: What Causes What?” Policy Research Working Papers. Washington, DC: World Bank, International Economics Division, 1997.
Goldstein, The Asian Financial Crisis: Causes, Cures, and Systemic Implications. Policy Analyses in International Economics 55. Washington, DC: Institute for International Economics, 1998.
Granger, C.W.J., and A.A. Weiss, “Time Series Analysis of Error-Correcting Models”, in S. Karlin, T. Amemiya, and L.A. Goodman (eds), Studies in Econometrics, Time Series, and Multivariate Statistics. New York: Academic Press, 1983.
Hallwood, C.P., and R. MacDonald, International Money and Finance. Oxford: Blackwell Publishers Ltd, 1994.
Harrison, A., “Openness and Growth: A Time-Series, Cross-Country Analysis for Developing Countries”. Journal of Development Economics 48(2): 419-447, 1996.
Hattari, R., R.S. Rajan, and S. Thangavelu, “Understanding Intra-Asean FDI Flows: Trends and Determinants and the Role of China and India.” January 2008. Available: http://www.freewebs.com/rrajan1/OFDIASEAN.pdf
Hong, Kiseok; Jong-Wha Lee; and Hsiao Chink Tang (2009), “Crises in Asia: Historical Perspectives and Implications”. ADB Economics Working Paper Series No. 152. Manila: Asian Development Bank, April 2009.
Huh, C. and K. Kasa, “A Dynamic Model of Export Competition, Policy Coordination, and Simultaneous Currency Collapse”. Pacific Basin Working Paper Series No. PB97-08. San Francisco, DA: Federal Reserve Bank, CA: Federal Reserve Bank of San Francisco, 1997.
International Monetary Fund, “Thailand: Statistical Appendix”. Country Staff Report No. 98/119, 1998.
International Monetary Fund, “Asia and Pacific. Global Crisis: The Asian Context”. World Economic and Financial Surveys. Washington, DC, May 2009a.
International Monetary Fund, “Asia and Pacific. Global Crisis: The Asian Context”. Regional Economic Outlook. Asia and Pacific Global Crisis: The Asian Context. World Economic and Financial Surveys. May 2009b.
Kim, J.I. and L.J. Lau, “The Sources of Economic Growth in the East Asian Newly Industrialized Countries”. Journal of Japanese and International Economics. 8: 235-71, 1994.
Krugman, P., “What Happened to Asia?” Cambridge: Department of Economics, Massachusetts Institute of Technology, 1998. Available: http://web.mit.edu/krugman/www/ disinter.html
Krugman, P., “Balance Sheets, the Transfer Problem, and Financial Crises". Cambridge: Department of Economics, Massachusetts Institute of Technology, 1999. Available: http://web.mit.edu/krugman/www/flood.pdf
Kwan, C.H., “The Yen, the Yuan and the Asian Currency Crisis: Changing Fortune between

Prospects for Decoupling in Asia’s Growth Model Page 27
Japan and China”. Nomura Research Institute, 1998.
Levis, M., "Does Political Instability in Developing Countries Affect Foreign Investment Flow? An Empirical examination". Management International Review 19: 59-68, 1979.
Lim, L.Y. and P.E. Fong, Foreign Direct Investment and Industrialization in Malaysia, Singapore, Taiwan and Thailand. Paris: Development Centre of the Organization for Economic Cooperation and Development, 1991
Little, I.M.D., R.N. Cooper, W.M. Corden, and S. Rajapatirana, Boom, Crisis, and Adjustment: The Macroeconomic Experience of Developing Countries. Oxford: Oxford University Press for the World Bank, 1993.
Lopez-Mejia, A., “Large Capital Flows: A Survey of the Causes, Consequences, and Policy Responses”. IMF Working Paper P/99/17. Washington, DC: International Monetary Fund, 1999.
Lord, Montague, “Moving towards a Common External Tariff Regime in ASEAN”. ASEAN Secretariat, Capacity Building for the ASEAN Secretariat: Common External Tariff Regime, December 2008.
Lord, Montague, “Modeling ASEAN Global Linkages”. Manila, Asia Development Bank, 1999.
Lucas, R., "On the Determinants of Direct Foreign Investment: Evidence from East and Southeast Asia." World Development 21(3): 391-406, 1993.
MacDonald, R. and T.S. Torrance, “Expectations Formation and Risk in Four Foreign Exchange Markets”. Oxford Economic Papers 42: 544-561, 1990.
Maddison, A., Phases of Capitalist Development. Oxford: Oxford University Press, 1982.
Makin, J., Two New Paradigms. Washington: American Enterprise Institute, 1997.
McKibbin, R., “The Crisis in Asia: An Empirical Assessment”. Working Paper. Washington, DC: Broings Institution, 1998.
McKinnon, R., “The East Asian Dollar Standard, Life After Death?”. Presented to the Workshop on “Rethinking the East Asian Miracle”. The Asia Foundation, San Francisco, California, 16-17 February, 1999.
McKinnon, R. and K. Ohno, Dollar and Yen: Resolving Economic Conflict Between the United States and Japan. Cambridge, MA: MIT Press, 1997.
McKinnon, R. and K. Ohno, “The Exchange Rate Origins of Japan’s Economic Slump in the 1990s”. The World Economy, 1998.
Monetary Authority of Singapore, “Revisiting the US-Asia Decoupling Hypothesis”. Special Feature B. Economic Policy Department. Macroeconomic Review, October 2007.
Monteforte, L., “Aggregation bias in macro models: Does it matter for the euro area?”. Economic Modelling. Volume 24, Issue 2, March 2007.
Nelson, R.R., and H. Pack (), “The Asian Miracle and Modern Growth Theory”. Economic Journal 109, July, 1999.
Noland, M., L-G Liu, S. Robinson, and Z. Wang, Global Economic Effects of the Asian Currency Devaluations. Policy Analyses in International Economics 56. Washington, DC: Institute for International Economics, 1998.
Obstfeld, M., and K. Rogoff, Foundations of International Macroeconomics. Cambridge, MA:

Prospects for Decoupling in Asia’s Growth Model Page 28
MIT Press, 1998.
Ohno, K., “Exchange Rate Management in Developing Asia: A Reassessment of the Pre-crisis Soft Dollar Zone”. ADBI Working Paper 1. Asian Development Bank, Tokyo, 1999.
Park, D., and K. Shin, “Saving, Investment, and Current Account Surplus in Developing Asia”. ADB Economics Working Paper Series No. 158, April 2009.
Sachs, J. D., “Personal View”. Financial Times, 30 July 1997.
Sachs, J. D., and A. M. Warner, “Economic Reform and the Process of Global Integration”. Broings Papers on Economic Activity. 1: 1-118, 1995.
Singh, H. and K.W. Jun, “Some New Evidence on Determinants of Foreign Direct Investment in Developing Countries”. Policy Research Working Papers. Washington, DC: World Bank, International Economics Division, 1995.
Stiglitz, J., “The Role of International Financial Institutions in the Current Global Economy”. Address to the Chicago Council on Foreign Relations. Chicago (27 February), 1997.
Thee, K.W., “Export-Oriented Industrialisation and Foreign Direct Investment in the ASEAN countries”, 1999. Available: http://www.unu.edu/hq/ academic/Pg_area4/Thee.html
World Bank, The Asian Miracle: Economic Growth and Public Policy. Oxford: Oxford University Press for the World Bank, 1993.
World Bank, Private Capital Flows to Developing Countries: The Road to Financial Integration. Oxford: Oxford University Press for the World Bank, 1997.
Young, A., “The Tyranny of Numbers: Confronting the Statistical Realities of the East Asian Growth Experience”. Quarterly Journal of Economics. 110: 64 l-680, 1995.
Copyright © 2022 FDOKUMEN