reported case laws and/or previous litigation experience of ...
lable at ScienceDirect
ARTICLE IN PRESS
Clinical Nutrition xxx (2009) 1–8
YCLNU1533_proof � 7 September 2009 � 1/8
1
2
3
4
5
6
7
8
9
10
11
12
13
14
15
16
17
18
19
20
21
22
23
24
25
26
27
28
29
30
31
32
33
34
35
36
37
38
39
40
41
42
43
44
45
46
47
48
49
50
51
52
53
54
Contents lists avai
Clinical Nutrition
journal homepage: ht tp: / /www.elsevier .com/locate/c lnu
55
56
57
58
59
60
61
62
63
64
65
66
67
68
69
OOF
Original Article
Prospective study of self-reported usual snacking and weight gainin a Mediterranean cohort: The SUN project
Maira Bes-Rastrollo a,*, Almudena Sanchez-Villegas a,b, Francisco J. Basterra-Gortari a,c,Jorge M. Nunez-Cordoba a, Estefanıa Toledo a,d, Manuel Serrano-Martinez a
a Dept. of Preventive Medicine and Public Health, Medical School-Clinica Universitaria, University of Navarra, Pamplona, Spainb Dept. of Clinical Sciences, University of Las Palmas de Gran Canaria, Las Palmas de Gran Canaria, Spainc Dept. of Endocrinology, Hospital of Navarra. Pamplona, Spaind Dept. of Preventive Medicine and Quality Management, Hospital Virgen del Camino, Pamplona, Spain
70
71
72
73
74
75
76
77
78
79
80
a r t i c l e i n f o
Article history:Received 12 January 2009Accepted 26 August 2009
Keywords:Eating frequencyDietObesitySnacksLongitudinalCohort
U
* Corresponding author. Dept. Preventive Medicineof Navarra, C/Irunlarrea 1, Ed. Investigacion, 31008Tel.: þ34 948425600x6602; fax: þ34 948425649.
E-mail address: [email protected] (M. Bes-Rastrollo).
0261-5614/$ – see front matter � 2009 Elsevier Ltd adoi:10.1016/j.clnu.2009.08.017
Please cite this article in press as: Bes-RastroClinical Nutrition (2009), doi:10.1016/j.clnu.
81
82
83
84
85
86
87
88
RECTEDPRs u m m a r yBackground & aims: It has been hypothesized that snacking could be a major factor in the development ofobesity. However, the relationship between snacking and the increment in body weight remainscontroversial. Moreover, longitudinal studies about this issue are scarce. Thus, our objective was toprospectively assess the relationship between snacking and weight gain and obesity in a middle-agedfree-living population.Methods: Longitudinal prospective Spanish dynamic cohort (10,162 university graduates; mean age:39 years) followed-up for an average of 4.6 years. Dietary habits were ascertained through a validated136-item food-frequency questionnaire. Usual snackers were defined as those participants whoanswered affirmatively when asked in the baseline assessment if they usually eat between meals.Validated self-reported weight and body mass index were collected at baseline and during follow-up.Results: After adjusting for potential confounders, self-reported between-meal snacking was significantlyassociated with a higher risk of substantial weight gain (�3 kg/year; p< 0.001;� 5 kg/year,p< 0.001;� 10% baseline weight, p< 0.001). Among participants with a baseline body mass index lowerthan 30 kg/m2 (n: 9709) we observed 258 new cases of obesity. Usual snackers presented an adjusted66% higher risk of becoming obese during follow-up (Hazard Ratio: 1.69; 95% confidence interval:1.30–2.20).Conclusion: Our results support the hypothesis that self-reported between-meal snacking can bea potential risk factor for obesity.
� 2009 Elsevier Ltd and European Society for Clinical Nutrition and Metabolism.
8990
91
R92
93
94
95
96
97
98
99
100
101
NCO1. Introduction
Obesity has become an important Public Health problemworldwide. The number of obese people has increased over theyears. By 2025, according to the World Health Organization, it isexpected that 2.3 billion adults will be overweight and more than700 million will be obese around the world, with all the adversehealth and economic consequences associated with being over-weight and obese.1
and Public Health, UniversityPamplona (Navarra), Spain.
nd European Society for Clinical N
llo M, et al., Prospective study2009.08.017
102
103
104
105
106
107
108
Since the prevalence of obesity has increased more rapidly thanthe human genotype has changed, it is unlikely that the obesityepidemic could be explained entirely through genetic influencesEnvironmental conditions are probably the main factor responsiblefor the increased prevalence of obesity. Thus, it has been hypoth-esized that a major factor in the development of obesity2 could belifestyle pattern changes with increased snacking and decreasedstructured meals. This explanation can also be applicable even incountries undergoing the nutrition transition.3 The prevalence ofobesity has risen at the same time that snacking habits haveincreased. Snack food makes up a large proportion of the averagediet in developed countries. Adults in the USA consumed 17.7% oftheir daily total energy intake from snacks, which were approxi-mately equivalent to 350 kcal/day.4 Snacking has become increas-ingly popular even in countries in the Mediterranean area. In thelast 5 years, snack sales have gone up by 57% in Italy and 58% in
utrition and Metabolism.
of self-reported usual snacking and weight gain in a Mediterranean...,
109
110
E
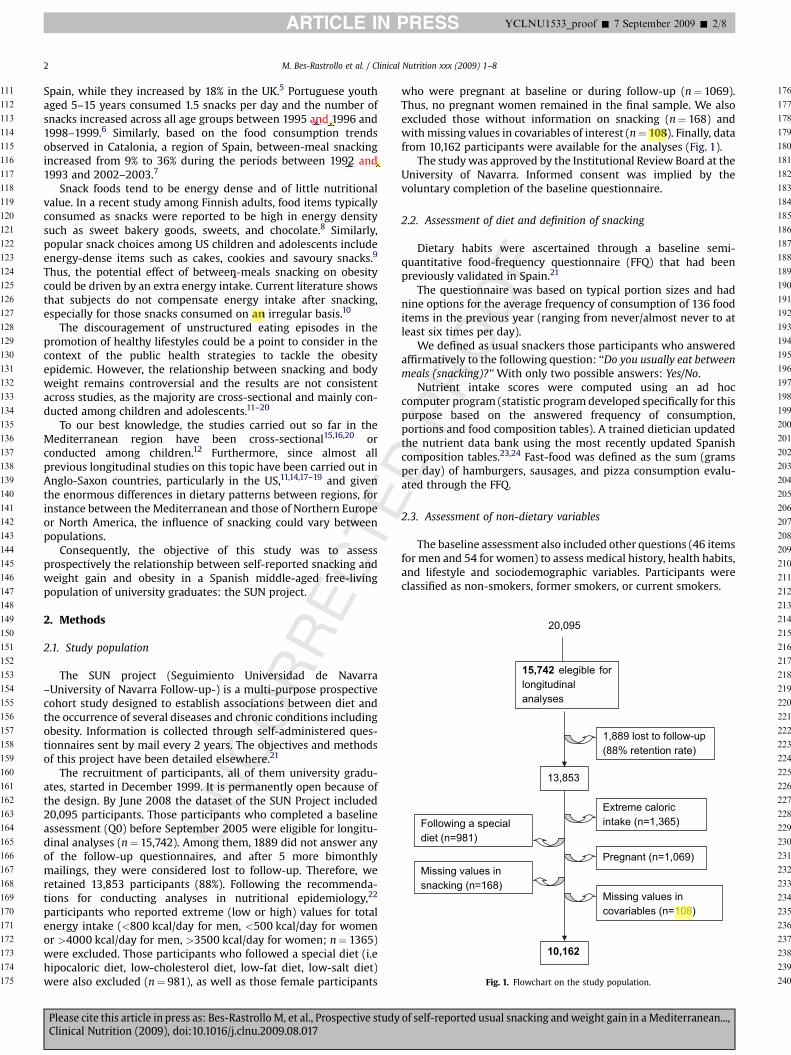
20,095
1,889 lost to follow-up(88% retention rate)
13,853
Extreme caloric intake (n=1,365)Following a special
diet (n=981)
Pregnant (n=1,069)Missing values in snacking (n=168)
Missing values in covariables (n=108)
10,162
15,742 elegible for longitudinalanalyses
Fig. 1. Flowchart on the study population.
M. Bes-Rastrollo et al. / Clinical Nutrition xxx (2009) 1–82
ARTICLE IN PRESS YCLNU1533_proof � 7 September 2009 � 2/8
111
112
113
114
115
116
117
118
119
120
121
122
123
124
125
126
127
128
129
130
131
132
133
134
135
136
137
138
139
140
141
142
143
144
145
146
147
148
149
150
151
152
153
154
155
156
157
158
159
160
161
162
163
164
165
166
167
168
169
170
171
172
173
174
175
176
177
178
179
180
181
182
183
184
185
186
187
188
189
190
191
192
193
194
195
196
197
198
199
200
201
202
203
204
205
206
207
208
209
210
211
212
213
214
215
216
217
218
219
220
221
222
223
224
225
226
227
228
229
230
231
232
233
234
235
236
237
238
239
240
UNCORRECT
Spain, while they increased by 18% in the UK.5 Portuguese youthaged 5–15 years consumed 1.5 snacks per day and the number ofsnacks increased across all age groups between 1995 and 1996 and1998–1999.6 Similarly, based on the food consumption trendsobserved in Catalonia, a region of Spain, between-meal snackingincreased from 9% to 36% during the periods between 1992 and1993 and 2002–2003.7
Snack foods tend to be energy dense and of little nutritionalvalue. In a recent study among Finnish adults, food items typicallyconsumed as snacks were reported to be high in energy densitysuch as sweet bakery goods, sweets, and chocolate.8 Similarly,popular snack choices among US children and adolescents includeenergy-dense items such as cakes, cookies and savoury snacks.9
Thus, the potential effect of between-meals snacking on obesitycould be driven by an extra energy intake. Current literature showsthat subjects do not compensate energy intake after snacking,especially for those snacks consumed on an irregular basis.10
The discouragement of unstructured eating episodes in thepromotion of healthy lifestyles could be a point to consider in thecontext of the public health strategies to tackle the obesityepidemic. However, the relationship between snacking and bodyweight remains controversial and the results are not consistentacross studies, as the majority are cross-sectional and mainly con-ducted among children and adolescents.11–20
To our best knowledge, the studies carried out so far in theMediterranean region have been cross-sectional15,16,20 orconducted among children.12 Furthermore, since almost allprevious longitudinal studies on this topic have been carried out inAnglo-Saxon countries, particularly in the US,11,14,17–19 and giventhe enormous differences in dietary patterns between regions, forinstance between the Mediterranean and those of Northern Europeor North America, the influence of snacking could vary betweenpopulations.
Consequently, the objective of this study was to assessprospectively the relationship between self-reported snacking andweight gain and obesity in a Spanish middle-aged free-livingpopulation of university graduates: the SUN project.
2. Methods
2.1. Study population
The SUN project (Seguimiento Universidad de Navarra–University of Navarra Follow-up-) is a multi-purpose prospectivecohort study designed to establish associations between diet andthe occurrence of several diseases and chronic conditions includingobesity. Information is collected through self-administered ques-tionnaires sent by mail every 2 years. The objectives and methodsof this project have been detailed elsewhere.21
The recruitment of participants, all of them university gradu-ates, started in December 1999. It is permanently open because ofthe design. By June 2008 the dataset of the SUN Project included20,095 participants. Those participants who completed a baselineassessment (Q0) before September 2005 were eligible for longitu-dinal analyses (n¼ 15,742). Among them, 1889 did not answer anyof the follow-up questionnaires, and after 5 more bimonthlymailings, they were considered lost to follow-up. Therefore, weretained 13,853 participants (88%). Following the recommenda-tions for conducting analyses in nutritional epidemiology,22
participants who reported extreme (low or high) values for totalenergy intake (<800 kcal/day for men, <500 kcal/day for womenor >4000 kcal/day for men, >3500 kcal/day for women; n¼ 1365)were excluded. Those participants who followed a special diet (i.ehipocaloric diet, low-cholesterol diet, low-fat diet, low-salt diet)were also excluded (n¼ 981), as well as those female participants
Please cite this article in press as: Bes-Rastrollo M, et al., Prospective studyClinical Nutrition (2009), doi:10.1016/j.clnu.2009.08.017
DPROOF
who were pregnant at baseline or during follow-up (n¼ 1069).Thus, no pregnant women remained in the final sample. We alsoexcluded those without information on snacking (n¼ 168) andwith missing values in covariables of interest (n¼ 108). Finally, datafrom 10,162 participants were available for the analyses (Fig. 1).
The study was approved by the Institutional Review Board at theUniversity of Navarra. Informed consent was implied by thevoluntary completion of the baseline questionnaire.
2.2. Assessment of diet and definition of snacking
Dietary habits were ascertained through a baseline semi-quantitative food-frequency questionnaire (FFQ) that had beenpreviously validated in Spain.21
The questionnaire was based on typical portion sizes and hadnine options for the average frequency of consumption of 136 fooditems in the previous year (ranging from never/almost never to atleast six times per day).
We defined as usual snackers those participants who answeredaffirmatively to the following question: ‘‘Do you usually eat betweenmeals (snacking)?’’ With only two possible answers: Yes/No.
Nutrient intake scores were computed using an ad hoccomputer program (statistic program developed specifically for thispurpose based on the answered frequency of consumption,portions and food composition tables). A trained dietician updatedthe nutrient data bank using the most recently updated Spanishcomposition tables.23,24 Fast-food was defined as the sum (gramsper day) of hamburgers, sausages, and pizza consumption evalu-ated through the FFQ.
2.3. Assessment of non-dietary variables
The baseline assessment also included other questions (46 itemsfor men and 54 for women) to assess medical history, health habits,and lifestyle and sociodemographic variables. Participants wereclassified as non-smokers, former smokers, or current smokers.
of self-reported usual snacking and weight gain in a Mediterranean...,
E
M. Bes-Rastrollo et al. / Clinical Nutrition xxx (2009) 1–8 3
ARTICLE IN PRESS YCLNU1533_proof � 7 September 2009 � 3/8
241
242
243
244
245
246
247
248
249
250
251
252
253
254
255
256
257
258
259
260
261
262
263
264
265
266
267
268
269
270
271
272
273
274
275
276
277
278
279
280
281
282
283
284
285
286
287
288
289
290
291
292
293
294
295
296
297
298
299
300
301
302
303
304
305
306
307
308
309
310
311
312
313
314
315
316
317
318
319
320
321
322
323
324
325
326
327
328
329
330
331
332
333
334
335
336
337
338
339
340
341
342
343
344
345
346
347
348
349
350
351
RRECT
Physical activity was ascertained through a baseline question-naire. The metabolic equivalent (MET) index per week wascomputed using the time spent engaging in 17 activities multi-plying by the MET score specific for each activity. A MET score of anactivity is defined as the ratio of the metabolic rate associated withthis activity divided by the resting metabolic rate (sitting quietly).25
The MET-hours for all activities were combined to obtain a value oftotal weekly MET-hours, which adequately correlated with energyexpenditure measured by a triaxial accelerometer in a validationsubsample of the cohort.21
2.4. Assessment of the outcome
Participants’ weight was recorded at baseline and every twoyears during follow-up. The reliability and validity of self-reportedweight was previously assessed in a subsample of the cohort beinghighly correlated with directly measured weight (r¼ 0.99) andwith a mean relative error in self-reported weight of �1.45%.21
Body mass index (BMI), defined as weight (in kg) divided by thesquare of the height (in meters) was ascertained in the baselinequestionnaire and during follow-up carrying forward the heightvalue obtained in the baseline questionnaire.
The outcomes were 1) change in body weight per year asa continuous variable, 2) substantial weight gain defined as anincrement of at least 3 kg per year during follow-up, and 3) incidentobesity (participants who had a BMI value< 30 kg/m2 at baselineand achieved a BMI� 30 kg/m2 during follow-up).
2.5. Statistical analyses
Least-squares regression models were used to evaluate theassociation between snacking and weight change per year duringfollow-up. We used analyses of covariance to adjust the subsequentaverage weight change per year for potential confounders. Ina second analysis, non-conditional logistic regression models werefit to assess the relationship between snacking and an increment ofweight of at least 3 kg per year. We repeated the analyses using anincrement of at least 5 kg per year or an increment of 10% of baselineweight as the outcomes. Odds Ratios (OR) and their 95% confidenceintervals (CI) were calculated considering non-snacker participantsas the reference category. We also conducted the analyses stratifyingby baseline BMI categories (underweight<18.5 kg/m2, normal weight:18.5 –<25 kg/m2, overweight: 25–<30, and obese: �30 kg/m2).
We conducted multivariate Cox’s regression analyses to assessthe association between snacking and the risk of incident obesity(BMI� 30 kg/m2) after excluding obese participants at baseline
UNCO
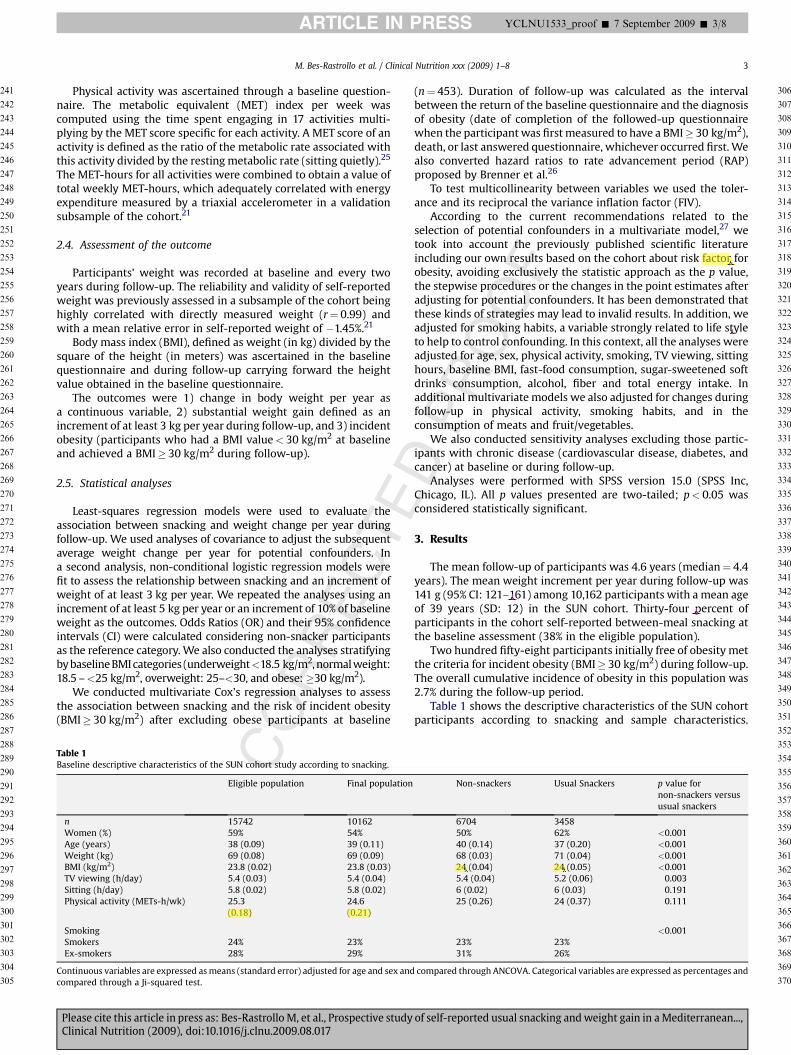
Table 1Baseline descriptive characteristics of the SUN cohort study according to snacking.
Eligible population Final population
n 15742 10162Women (%) 59% 54%Age (years) 38 (0.09) 39 (0.11)Weight (kg) 69 (0.08) 69 (0.09)BMI (kg/m2) 23.8 (0.02) 23.8 (0.03)TV viewing (h/day) 5.4 (0.03) 5.4 (0.04)Sitting (h/day) 5.8 (0.02) 5.8 (0.02)Physical activity (METs-h/wk) 25.3
(0.18)24.6(0.21)
SmokingSmokers 24% 23%Ex-smokers 28% 29%
Continuous variables are expressed as means (standard error) adjusted for age and sex andcompared through a Ji-squared test.
Please cite this article in press as: Bes-Rastrollo M, et al., Prospective studyClinical Nutrition (2009), doi:10.1016/j.clnu.2009.08.017
DPROOF
(n¼ 453). Duration of follow-up was calculated as the intervalbetween the return of the baseline questionnaire and the diagnosisof obesity (date of completion of the followed-up questionnairewhen the participant was first measured to have a BMI� 30 kg/m2),death, or last answered questionnaire, whichever occurred first. Wealso converted hazard ratios to rate advancement period (RAP)proposed by Brenner et al.26
To test multicollinearity between variables we used the toler-ance and its reciprocal the variance inflation factor (FIV).
According to the current recommendations related to theselection of potential confounders in a multivariate model,27 wetook into account the previously published scientific literatureincluding our own results based on the cohort about risk factor forobesity, avoiding exclusively the statistic approach as the p value,the stepwise procedures or the changes in the point estimates afteradjusting for potential confounders. It has been demonstrated thatthese kinds of strategies may lead to invalid results. In addition, weadjusted for smoking habits, a variable strongly related to life styleto help to control confounding. In this context, all the analyses wereadjusted for age, sex, physical activity, smoking, TV viewing, sittinghours, baseline BMI, fast-food consumption, sugar-sweetened softdrinks consumption, alcohol, fiber and total energy intake. Inadditional multivariate models we also adjusted for changes duringfollow-up in physical activity, smoking habits, and in theconsumption of meats and fruit/vegetables.
We also conducted sensitivity analyses excluding those partic-ipants with chronic disease (cardiovascular disease, diabetes, andcancer) at baseline or during follow-up.
Analyses were performed with SPSS version 15.0 (SPSS Inc,Chicago, IL). All p values presented are two-tailed; p< 0.05 wasconsidered statistically significant.
3. Results
The mean follow-up of participants was 4.6 years (median¼ 4.4years). The mean weight increment per year during follow-up was141 g (95% CI: 121–161) among 10,162 participants with a mean ageof 39 years (SD: 12) in the SUN cohort. Thirty-four percent ofparticipants in the cohort self-reported between-meal snacking atthe baseline assessment (38% in the eligible population).
Two hundred fifty-eight participants initially free of obesity metthe criteria for incident obesity (BMI� 30 kg/m2) during follow-up.The overall cumulative incidence of obesity in this population was2.7% during the follow-up period.
Table 1 shows the descriptive characteristics of the SUN cohortparticipants according to snacking and sample characteristics.
Non-snackers Usual Snackers p value fornon-snackers versususual snackers
6704 345850% 62% <0.00140 (0.14) 37 (0.20) <0.00168 (0.03) 71 (0.04) <0.00124 (0.04) 24 (0.05) <0.0015.4 (0.04) 5.2 (0.06) 0.0036 (0.02) 6 (0.03) 0.19125 (0.26) 24 (0.37) 0.111
<0.00123% 23%31% 26%
compared through ANCOVA. Categorical variables are expressed as percentages and
of self-reported usual snacking and weight gain in a Mediterranean...,
352
353
354
355
356
357
358
359
360
361
362
363
364
365
366
367
368
369
370
EDPROOF
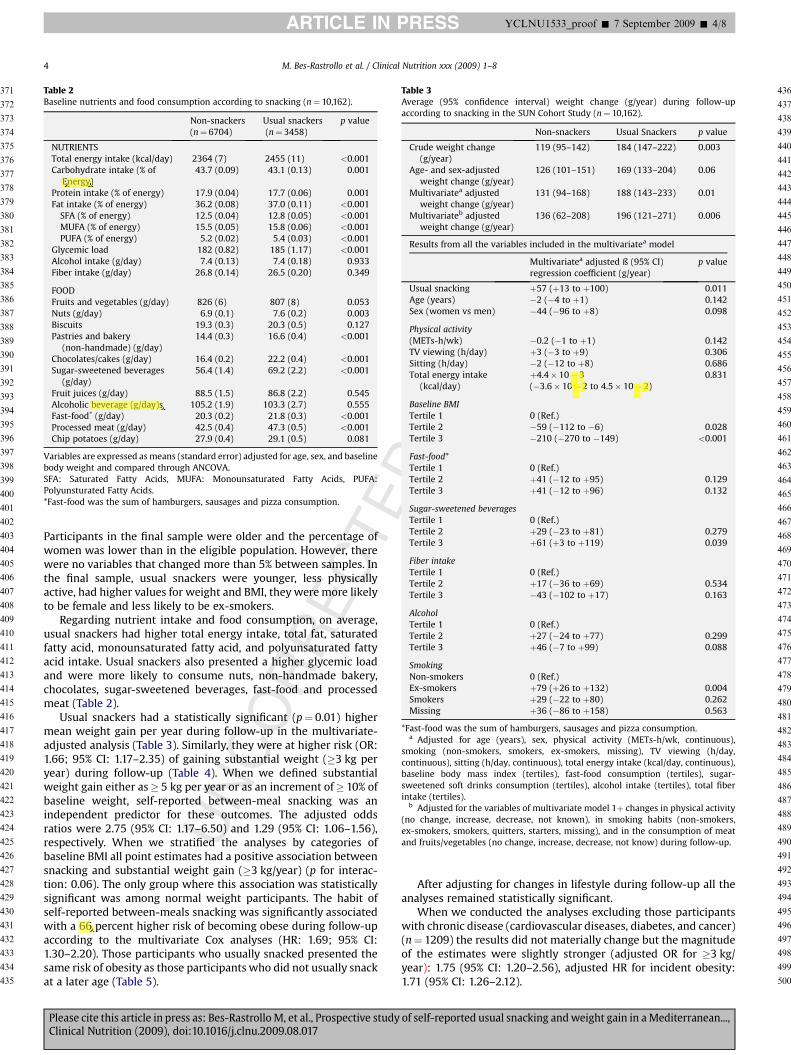
Table 2Baseline nutrients and food consumption according to snacking (n¼ 10,162).
Non-snackers(n¼ 6704)
Usual snackers(n¼ 3458)
p value
NUTRIENTSTotal energy intake (kcal/day) 2364 (7) 2455 (11) <0.001Carbohydrate intake (% of
Energy)43.7 (0.09) 43.1 (0.13) 0.001
Protein intake (% of energy) 17.9 (0.04) 17.7 (0.06) 0.001Fat intake (% of energy) 36.2 (0.08) 37.0 (0.11) <0.001
SFA (% of energy) 12.5 (0.04) 12.8 (0.05) <0.001MUFA (% of energy) 15.5 (0.05) 15.8 (0.06) <0.001PUFA (% of energy) 5.2 (0.02) 5.4 (0.03) <0.001
Glycemic load 182 (0.82) 185 (1.17) <0.001Alcohol intake (g/day) 7.4 (0.13) 7.4 (0.18) 0.933Fiber intake (g/day) 26.8 (0.14) 26.5 (0.20) 0.349
FOODFruits and vegetables (g/day) 826 (6) 807 (8) 0.053Nuts (g/day) 6.9 (0.1) 7.6 (0.2) 0.003Biscuits 19.3 (0.3) 20.3 (0.5) 0.127Pastries and bakery
(non-handmade) (g/day)14.4 (0.3) 16.6 (0.4) <0.001
Chocolates/cakes (g/day) 16.4 (0.2) 22.2 (0.4) <0.001Sugar-sweetened beverages
(g/day)56.4 (1.4) 69.2 (2.2) <0.001
Fruit juices (g/day) 88.5 (1.5) 86.8 (2.2) 0.545Alcoholic beverage (g/day)s 105.2 (1.9) 103.3 (2.7) 0.555Fast-food* (g/day) 20.3 (0.2) 21.8 (0.3) <0.001Processed meat (g/day) 42.5 (0.4) 47.3 (0.5) <0.001Chip potatoes (g/day) 27.9 (0.4) 29.1 (0.5) 0.081
Variables are expressed as means (standard error) adjusted for age, sex, and baselinebody weight and compared through ANCOVA.SFA: Saturated Fatty Acids, MUFA: Monounsaturated Fatty Acids, PUFA:Polyunsturated Fatty Acids.*Fast-food was the sum of hamburgers, sausages and pizza consumption.
Table 3Average (95% confidence interval) weight change (g/year) during follow-upaccording to snacking in the SUN Cohort Study (n¼ 10,162).
Non-snackers Usual Snackers p value
Crude weight change(g/year)
119 (95–142) 184 (147–222) 0.003
Age- and sex-adjustedweight change (g/year)
126 (101–151) 169 (133–204) 0.06
Multivariatea adjustedweight change (g/year)
131 (94–168) 188 (143–233) 0.01
Multivariateb adjustedweight change (g/year)
136 (62–208) 196 (121–271) 0.006
Results from all the variables included in the multivariatea model
Multivariatea adjusted ß (95% CI)regression coefficient (g/year)
p value
Usual snacking þ57 (þ13 to þ100) 0.011Age (years) �2 (�4 to þ1) 0.142Sex (women vs men) �44 (�96 to þ8) 0.098
Physical activity(METs-h/wk) �0.2 (�1 to þ1) 0.142TV viewing (h/day) þ3 (�3 to þ9) 0.306Sitting (h/day) �2 (�12 to þ8) 0.686Total energy intake
(kcal/day)þ4.4� 10� 3(�3.6� 10� 2 to 4.5� 10� 2)
0.831
Baseline BMITertile 1 0 (Ref.)Tertile 2 �59 (�112 to �6) 0.028Tertile 3 �210 (�270 to �149) <0.001
Fast-food*Tertile 1 0 (Ref.)Tertile 2 þ41 (�12 to þ95) 0.129Tertile 3 þ41 (�12 to þ96) 0.132
Sugar-sweetened beveragesTertile 1 0 (Ref.)Tertile 2 þ29 (�23 to þ81) 0.279Tertile 3 þ61 (þ3 to þ119) 0.039
Fiber intakeTertile 1 0 (Ref.)Tertile 2 þ17 (�36 to þ69) 0.534Tertile 3 �43 (�102 to þ17) 0.163
AlcoholTertile 1 0 (Ref.)Tertile 2 þ27 (�24 to þ77) 0.299Tertile 3 þ46 (�7 to þ99) 0.088
SmokingNon-smokers 0 (Ref.)Ex-smokers þ79 (þ26 to þ132) 0.004Smokers þ29 (�22 to þ80) 0.262Missing þ36 (�86 to þ158) 0.563
*Fast-food was the sum of hamburgers, sausages and pizza consumption.a Adjusted for age (years), sex, physical activity (METs-h/wk, continuous),
smoking (non-smokers, smokers, ex-smokers, missing), TV viewing (h/day,continuous), sitting (h/day, continuous), total energy intake (kcal/day, continuous),baseline body mass index (tertiles), fast-food consumption (tertiles), sugar-sweetened soft drinks consumption (tertiles), alcohol intake (tertiles), total fiberintake (tertiles).
b Adjusted for the variables of multivariate model 1þ changes in physical activity(no change, increase, decrease, not known), in smoking habits (non-smokers,ex-smokers, smokers, quitters, starters, missing), and in the consumption of meatand fruits/vegetables (no change, increase, decrease, not know) during follow-up.
M. Bes-Rastrollo et al. / Clinical Nutrition xxx (2009) 1–84
ARTICLE IN PRESS YCLNU1533_proof � 7 September 2009 � 4/8
371
372
373
374
375
376
377
378
379
380
381
382
383
384
385
386
387
388
389
390
391
392
393
394
395
396
397
398
399
400
401
402
403
404
405
406
407
408
409
410
411
412
413
414
415
416
417
418
419
420
421
422
423
424
425
426
427
428
429
430
431
432
433
434
435
436
437
438
439
440
441
442
443
444
445
446
447
448
449
450
451
452
453
454
455
456
457
458
459
460
461
462
463
464
465
466
467
468
469
470
471
472
473
474
475
476
477
478
479
480
481
482
483
484
485
486
487
488
489
490
491
492
493
494
495
496
497
498
499
500
UNCORRECTParticipants in the final sample were older and the percentage of
women was lower than in the eligible population. However, therewere no variables that changed more than 5% between samples. Inthe final sample, usual snackers were younger, less physicallyactive, had higher values for weight and BMI, they were more likelyto be female and less likely to be ex-smokers.
Regarding nutrient intake and food consumption, on average,usual snackers had higher total energy intake, total fat, saturatedfatty acid, monounsaturated fatty acid, and polyunsaturated fattyacid intake. Usual snackers also presented a higher glycemic loadand were more likely to consume nuts, non-handmade bakery,chocolates, sugar-sweetened beverages, fast-food and processedmeat (Table 2).
Usual snackers had a statistically significant (p¼ 0.01) highermean weight gain per year during follow-up in the multivariate-adjusted analysis (Table 3). Similarly, they were at higher risk (OR:1.66; 95% CI: 1.17–2.35) of gaining substantial weight (�3 kg peryear) during follow-up (Table 4). When we defined substantialweight gain either as� 5 kg per year or as an increment of� 10% ofbaseline weight, self-reported between-meal snacking was anindependent predictor for these outcomes. The adjusted oddsratios were 2.75 (95% CI: 1.17–6.50) and 1.29 (95% CI: 1.06–1.56),respectively. When we stratified the analyses by categories ofbaseline BMI all point estimates had a positive association betweensnacking and substantial weight gain (�3 kg/year) (p for interac-tion: 0.06). The only group where this association was statisticallysignificant was among normal weight participants. The habit ofself-reported between-meals snacking was significantly associatedwith a 66 percent higher risk of becoming obese during follow-upaccording to the multivariate Cox analyses (HR: 1.69; 95% CI:1.30–2.20). Those participants who usually snacked presented thesame risk of obesity as those participants who did not usually snackat a later age (Table 5).
Please cite this article in press as: Bes-Rastrollo M, et al., Prospective studyClinical Nutrition (2009), doi:10.1016/j.clnu.2009.08.017
After adjusting for changes in lifestyle during follow-up all theanalyses remained statistically significant.
When we conducted the analyses excluding those participantswith chronic disease (cardiovascular diseases, diabetes, and cancer)(n¼ 1209) the results did not materially change but the magnitudeof the estimates were slightly stronger (adjusted OR for �3 kg/year): 1.75 (95% CI: 1.20–2.56), adjusted HR for incident obesity:1.71 (95% CI: 1.26–2.12).
of self-reported usual snacking and weight gain in a Mediterranean...,

UNCORRECTE
OOF
Table 4Odds Ratios (ORs) and 95% confidence intervals (CI) of substantial weight gain(�3kg/year) during follow-up according to snacking in the SUN Cohort Study(n¼ 10,162).
Non-snackers(n¼ 6704)
Usual snackers(n¼ 3458)
WEIGHT GAIN (�3 kg per year)Incident cases (%) 70 (1%) 70 (2%)Crude OR (95% CI) 1 (Ref.) 1.96 (1.40–2.73)Age- and sex-adjusted OR
(95% CI)1 (Ref.) 1.88 (1.34–2.65)
Multivariatea adjusted OR95% CI)
1 (Ref.) 1.66 (1.17–2.35)
Multivariateb adjusted OR(95% CI)
1 (Ref.) 1.50 (1.05–2.14)
STRATIFYING BY BASELINE BMIUnderweight (BMI< 18.5 kg/m2) (n¼ 347)
n 204 143Incident cases (%) 3 (1.5%) 3 (2.1%)Multivariatec adjusted OR(95% CI)
1 (Ref.) 3.25 (0.49–21.67)
Normal weight (18.5 kg/m2� BMI< 25 kg/m2) (n¼ 6676)n 4467 2209Incident cases (%) 34 (0.8%) 34 (1.5%)Multivariatec adjusted OR(95% CI)
1 (Ref.) 1.94 (1.18–3.18)
Overweight (25 kg/m2� BMI <30 kg/m2) (n¼ 2686)n 1795 891Incident cases (%) 27 (1.5%) 21 (2.4%)Multivariatec adjusted OR(95% CI)
1 (Ref.) 1.18 (0.64–2.19)
Obese (BMI� 30 kg/m2) (n¼ 453)n 238 215Incident cases (%) 6 (2.5%) 12 (5.6%)Multivariatec adjusted OR(95% CI)
1 (Ref.) 1.88 (0.63–5.58)
Results from all the variables included in the multivariatea model
Multivariatea OR(95% CI)
p value
Usual snacking 1.65 (1.17–2.34) 0.005Age (years) 0.98 (0.96–0.99) 0.013Sex (women vs men) 1.23 (0.81–1.86) 0.336
Physical activity(METs-h/wk) 0.99 (0.99–1.01) 0.675TV viewing (h/day) 0.98 (0.83–1.04) 0.557Sitting (h/day) 0.97 (0.89–1.06) 0.675Total energy intake
(kcal/day)1.00 (0.99–1.00) 0.264
Baseline BMITertile 1 1 (Ref.)Tertile 2 2.34 (1.39–3.92) 0.001Tertile 3 4.42 (2.59–7.52) <0.001
Fast-food*Tertile 1 1 (Ref.)Tertile 2 1.00 (0.62–1.63) 0.991Tertile 3 1.31 (0.83–2.07) 0.245
Sugar-sweetened beveragesTertile 1 1 (Ref.)Tertile 2 1.01 (0.63–1.62) 0.978Tertile 3 1.26 (0.77–2.06) 0.362
Fiber intakeTertile 1 1 (Ref.)Tertile 2 1.13 (0.75–1.72) 0.556Tertile 3 0.94 (0.56–1.56) 0.802
AlcoholTertile 1 1 (Ref.)Tertile 2 0.91 (0.60–1.38) 0.639Tertile 3 0.85 (0.54–1.32) 0.462
Table 4 (continued)
Non-snackers(n¼ 6704)
Usual snackers(n¼ 3458)
SmokingNon-smokers 1 (Ref.)Ex-smokers 1.15 (0.75–1.75) 0.523Smokers 1.05 (0.68–1.61) 0.828Missing 0.25 (0.03–1.81) 0.169
*Fast-food was the sum of hamburgers, sausages and pizza consumption.a Adjusted for age (years), sex, physical activity (METs-h/wk, continuous),
smoking (non-smokers, smokers, ex-smokers, missing), TV viewing (h/day,continuous), sitting (h/day, continuous), total energy intake (kcal/day, continuous),baseline body mass index (tertiles), fast-food consumption (tertiles), sugar-sweet-ened soft drinks consumption (tertiles), alcohol intake (tertiles), total fiber intake(tertiles).
b Adjusted for the variables of multivariate model 1þ changes in physical activity(no change, increase, decrease, not known), in smoking habits (non-smokers,ex-smokers, smokers, quitters, starters, missing), and in the consumption of meatand fruits/vegetables (no change, increase, decrease, not know) during follow-up.
c Adjusted for the variables of multivariate model 1 except for baseline body massindex.
M. Bes-Rastrollo et al. / Clinical Nutrition xxx (2009) 1–8 5
ARTICLE IN PRESS YCLNU1533_proof � 7 September 2009 � 5/8
Please cite this article in press as: Bes-Rastrollo M, et al., Prospective studyClinical Nutrition (2009), doi:10.1016/j.clnu.2009.08.017
501
502
503
504
505
506
507
508
509
510
511
512
513
514
515
516
517
518
519
520
521
522
523
524
525
526
527
528
529
530
531
532
533
534
535
536
537
538
539
540
541
542
543
544
545
546
547
548
549
550
551
552
553
554
555
556
557
558
559
560
561
562
563
564
565
566
567
568
569
570
571
572
573
574
575
576
577
578
579
580
581
582
583
584
585
586
587
588
589
590
591
PRNone of the covariates included in the multivariate model pre-sented problems of collinearity according to the tolerance value (orvariance inflation factor: VIF). The covariate with less tolerance (orhigh VIF) was for the highest tertile of fiber intake with a value of0.51 (or VIF: 1.97).
592
593
594
595
596
597
598
599
600
601
602
603
604
605
606
607
608
609
610
611
612
613
614
615
616
617
618
619
620
621
622
623
624
625
626
627
628
629
630
D4. Discussion
In this prospective study, self-reported between-meal snackingwas associated with a higher body weight gain and higher risk ofbecoming obese during an average of 4.6-year follow-up in healthymiddle-aged Spanish university graduates. To our best knowledge,it is the first time that a prospective study has found this positiveassociation among an adult free-living population in a Mediterra-nean country.
Our longitudinal results from a large prospective cohort of morethan 45,000 person-years support and extend in another pop-ulation previous findings on this topic. Francis et al.11 reported thatsnacking was a risk factor for the development of overweight ina longitudinal study of 173 non-Hispanic white girls from centralPennsylvania followed-up for 4 years. A lower frequency ofsnacking was one of the characteristics presented by the successfulgroup of 72 adolescents who maintained their weight loss ina follow-up study 1 and 2 years after the end of a weight-reductionprogram in a French medical center.12 A cross-sectional Swedishstudy found that obese people consumed snacks more frequentlythan their normal counterparts.13 Similarly, in anothercross-sectional study from the Continuing Survey of Food Intakesby Individuals in the USA, a higher eating frequency was associatedwith a higher BMI.14 Previous cross-sectional results from ourcohort showed that between-meal snacking increased the proba-bility of weight gain in the last 5 years before answering thebaseline questionnaire.15 Recently, Marin-Guerrero et al. found thatsnacking (eating smaller-sized meals per day) was associated withobesity among women based on a cross-sectional analysis ofa representative sample of Spanish population in 1999.16 Even incountries undergoing the nutrition transition, the adherence toa snacking pattern was positively associated with children beingoverweight.3
In contrast with these previous findings, however, there areother contradictory results in the literature: a 7-year follow-uplongitudinal study among 196 non-obese girls from Massachusettsdid not find any relationship between the consumption of energy-
of self-reported usual snacking and weight gain in a Mediterranean...,

CORRECTE
Table 5Hazard Ratios (HRs) and 95% confidence intervals (CI) of becoming obese duringfollow-up in 9709* participants according to snacking in the SUN Cohort study.
Non-snackers
Usualsnackers
RAPa
(years)
Person-years 30,197 15,009Incident cases (%) 145 (2.2%) 113 (3.5%)
Crude HR (95% CI) 1 (Ref.) 1.58 (1.23–2.02)Age- and sex-adjusted HR (95% CI) 1 (Ref.) 2.01 (1.56–2.58) þ5.67Multivariateb adjusted HR (95% CI) 1 (Ref.) 1.69 (1.30–2.20) þ12.83Multivariatec adjusted HR (95% CI) 1 (Ref.) 1.63 (1.26–2.12) þ13.29
Results from all the variables included in the multivariateb model
HR (95% CI) p value
Usual snacking 1.69 (1.30–2.20) <0.001Age (years) 1.04 (0.97–1.18) 0.250Sex (women vs men) 1.22 (0.90–1.66) 0.199Physical activity (METs-h/wk) 0.99 (0.99–1.00) 0.164TV viewing (h/day) 1.01 (0.97–1.04) 0.779Sitting (h/day) 1.05 (0.98–1.12) 0.186Total energy intake (kcal/day) 1.00 (1.00001–1.00002) 0.029
Fast-food**Tertile 1 1 (Ref.)Tertile 2 0.96 (0.68–1.35) 0.811Tertile 3 1.11 (0.80–1.55) 0.541
Sugar-sweetened beveragesTertile 1 1 (Ref.)Tertile 2 0.83 (0.60–1.14) 0.252Tertile 3 1.11 (0.78–1.56) 0.563
Fiber intakeTertile 1 1 (Ref.)Tertile 2 0.97 (0.72–1.32) 0.882Tertile 3 0.74 (0.50–1.09) 0.134
AlcoholTertile 1 1 (Ref.)Tertile 2 1.10 (0.78–1.55) 0.577Tertile 3 1.07 (0.76–1.50) 0.716
SmokingNon-smokers 1 (Ref.)Ex-smokers 1.38 (1.01–1.89) 0.043Smokers 1.10 (0.81–1.50) 0.545Missing 0.85 (0.39–1.83) 0.673
*After excluding 453 baseline obese participants (10,162� 453¼ 9709).**Fast-food was the sum of hamburgers, sausages and pizza consumption.
a RAP: Rate Advancement Period (26).b Adjusted for age (years), sex, physical activity (METs-h/wk, continuous),
smoking (non-smokers, smokers, ex-smokers, missing), TV viewing (h/day,continuous), sitting (h/day, continuous), total energy intake (kcal/day, continuous),baseline body mass index (tertiles), fast-food consumption (tertiles), sugar-sweetened soft drinks consumption (tertiles), alcohol intake (tertiles), total fiberintake (tertiles). A quadratic term for age to account for departure of linearity wasalso added.
c Adjusted for the variables of multivariate model 1þ changes in physical activity(no change, increase, decrease, not known), in smoking habits (non-smokers,ex-smokers, smokers, quitters, starters, missing), and in the consumption of meatand fruits/vegetables (no change, increase, decrease, not know) during follow-up.
M. Bes-Rastrollo et al. / Clinical Nutrition xxx (2009) 1–86
ARTICLE IN PRESS YCLNU1533_proof � 7 September 2009 � 6/8
631
632
633
634
635
636
637
638
639
640
641
642
643
644
645
646
647
648
649
650
651
652
653
654
655
656
657
658
659
660
661
662
663
664
665
666
667
668
669
670
671
672
673
674
675
676
677
678
679
680
681
682
683
684
685
686
687
688
689
690
691
692
693
694
695
696
697
698
699
700
701
702
703
704
705
706
707
708
709
710
711
712
713
714
715
716
717
718
719
720
721
722
723
724
725
726
727
728
729
730
731
732
733
734
735
736
737
738
739
740
741
742
743
744
745
746
747
748
749
750
751
752
753
754
755
756
757
758
759
760
UNdense snacks and weight gain.17 A prospective study of 8203 girls
and 6774 boys in the US suggested that although snack foods mayhave low nutritional value, they were not an important determi-nant of weight gain among children and adolescents.18 Similarly,Hampl et al19 did not find any association between snacking andBMI, despite observing a greater energy intake among thoseconsuming snacks. Yet their study did not take into account phys-ical activity.
Most research seems to indicate that snacking results in a higherenergy intake.10 However, other research concludes that dividingthe food intake over more than the regular three daily meals resultsin a readjustment of the number of calories eaten at meals times.28
Still, other research suggests a reduction of total energy intake with
Please cite this article in press as: Bes-Rastrollo M, et al., Prospective studyClinical Nutrition (2009), doi:10.1016/j.clnu.2009.08.017
DPROOF
an increased eating frequency.5 Probably, the key point is thedifferentiation between a small meal and a snack. The contradic-tory results may be a consequence of the complexity in the defi-nition of ‘‘snacking’’. A differentiation is needed between mainmeals or ‘‘structured meals’’ (breakfast, lunch and dinner) andsnacks (generally smaller and unstructured eating events betweenmeals).8 In Spain, the regular schedule in which meals are usuallyconsumed, with lunch between 2pm and 3pm and dinner between9pm and 10pm, contributes to the fact that there is a greatproportion of the population having midmorning and mid-afternoon snacks. Actually, the Spanish Society of CommunityNutrition (SENC)29 recommends eating five times a day, andconsiders the midmorning and midafternoon snacks as part of theregular daily intake. As a consequence of this, when we evaluatedthe meaning of the between-meal snacking question amonga subsample of the cohort (n¼ 53), 89% of them did not includea typical and scheduled midafternoon meal in their concept ofsnacking and 85% of them considered snacking as an unstructuredeating event. All of them defined snacking as small bites of choc-olates, candies, savoury snacks, bakery products, nuts, and pro-cessed meat (‘‘embutidos’’) eaten at any irregular time between themain meals.
Indeed, those SUN participants who snacked between meals inthe cohort had higher total energy intake, and higher consumptionof meat and processed meat products, chocolate, industrialbakery, and carbonated-sweetened-soft drinks than their coun-terparts (p< 0.001). Except for soft drinks, all of them are highenergy-dense food items. Therefore, the obtained results are notsurprising, given that a higher dietary energy density has beenassociated with higher risk of weight gain.30 In reference tosugar-sweetened soft drinks, as liquids do not have a high-energydensity by themselves, and because they are consumed instead ofwater, they contribute to the extra energy intake at the end of theday, and they are one of the known risk factors for obesity.31
Therefore, the promotion of structured eating habits may bea useful strategy to prevent weight gain in preventive health care.
Moreover, snack foods may be consumed in addition to, notinstead of, regular meals. Snack food may contribute to daily energyintake as much as 140–300 calories per item, thus the consumptionof several snacks per day would result in a nontrivial addition ofenergy. At the same time, researchers have reported that peoplewho snack do not compensate for the excess energy intake of thesnack with less energy intake in the main meals10 Marmonier et al.showed that snacks between meals do not generate extra signals ofsatiety.32 Finally, there are some data to suggest that the intake ofhigh-glycemic load foods, such as cookies and candies consumed assnacks, produce substantial increases in blood glucose and insulinlevels after ingestion. Within a few hours after their consumption,blood glucose levels begin to decline rapidly due to an exaggeratedincrease in insulin secretion and a state of hunger is created,leading to over consumption in the next meal. Thus, the continuedintake of high-glycemic load items is associated with an increasedrisk of obesity.33
We have to take into account that our study is not exempt ofpotential limitations. As we mentioned before, cultural differencesbetween countries with regards to the definition of what consti-tutes a usual snack compared with a main meal can contribute tothe results.
In our study, snacking is based on self-reported participants’answers. Therefore, it might be a differential under-reporting ofsnacking among obese compared with non-obese participants.34
Since overweight and obese participants are more prone to gainsubstantial body weight and overweight participants are morelikely to become obese, this differential report might bias theresults for incident substantial weight gain and obesity. Some
of self-reported usual snacking and weight gain in a Mediterranean...,

E
M. Bes-Rastrollo et al. / Clinical Nutrition xxx (2009) 1–8 7
ARTICLE IN PRESS YCLNU1533_proof � 7 September 2009 � 7/8
761
762
763
764
765
766
767
768
769
770
771
772
773
774
775
776
777
778
779
780
781
782
783
784
785
786
787
788
789
790
791
792
793
794
795
796
797
798
799
800
801
802
803
804
805
806
807
808
809
810
811
812
813
814
815
816
817
818
819
820
821
822
823
824
825
826
827
828
829
830
831
832
833
834
835
836
837
838
839
840
841
842
843
844
845
846
847
848
849
850
851
852
853
854
855
856
857
858
859
860
861
862
863
864
865
866
867
868
869
870
871
872
873
874
875
876
877
878
879
880
881
882
883
884
885
886
887
888
889
890
UNCORRECT
authors have suggested this point as the reason for the lack ofassociation observed in some previous studies.14 Despite thispotential limitation, we have found a statistically significant asso-ciation between self-reported snacking and obesity.
We should point out the differences in the number of participantsbetween the eligible population (n¼ 15,742) for longitudinal anal-yses and the final number of participants included in the analyses(n¼ 10,162), acknowledging the possible existence of a potentialselection bias. However, both populations were fairly homogeneousin terms of demographic characteristics and baseline exposure.
Unfortunately, since we measured ‘‘usual snack’’ once at base-line, we were not able to assess changes in snacking as a predictorfactor for weight gain and obesity. Moreover, the exposure wasevaluated dichotomously comparing between those self-reportedas usual snackers and those that self-reported occasionally/infre-quently snacking. This does not allow the possibility of evaluatinga dose-response relationship.
The methods used in nutritional epidemiology and theirinherent problems to ascertain a usual diet have been subjected tosome criticism35 and remain one of the major challenges in nutri-tional epidemiology. In any case, in our study a simple questionrelated to snacking had the ability to capture participants withhigher total energy intake, higher glycemic load and less fiberintake. Therefore, our results suggest that including a questionabout snacking might be a useful tool to assess healthy or unhealthyattitudes towards nutrition and a potential independent predictorof weight gain.
An important strength of our study is its prospective design withthe inclusion of a large number of participants followed-up fora median of 4.4 years, taking into account potential confounderssuch as TV viewing in the analyses. Changes in lifestyle factors canalso contribute to weight gain. For this reason, we have adjusted forchanges in lifestyle during follow-up and the associations remainedstatistically significant. Nonetheless, this is an observational study,and the possibility of residual confounding or collinearity amongvariables may limit the strength of causal inferences. However, theevidence derived from our results may clarify the role of snacking inthe obesity epidemic.
In conclusion, between-meal snacking has been associated witha subsequent higher body weight and with an increase in the risk ofbecoming obese in a free-living cohort of healthy middle-agedSpanish university graduates. Thus, this dietary trend of unstruc-tured eating episodes with food of low nutritional value isa potential risk factor to be discouraged in the promotion of healthylifestyles to tackle the obesity epidemic. At least, the promotion ofalternative nutritious snacks (eg. nuts, fresh fruit and vegetables)should be considered from a Public Health perspective.
Conflict of interestThe authors declared no conflict of interest.
Acknowledgments
We thank all members of the SUN Study Group for adminis-trative, technical and material support, especially Dr. Miguel AngelMartinez-Gonzalez founding principal investigator of the SUNProject. We thank participants of the SUN Study for continuedcooperation and participation. The SUN Study has received fundingfrom the Spanish Ministry of Health (Grants PI030678, PI040233,PI070240, PI081943, RD06/0045), the Navarra Regional Govern-ment (projects 41/2005 and 36/2008) and the University ofNavarra.
MB-R and MS-M were responsible for study concept and design.MB-R and AS-V were responsible for acquisition and analysis of thedata. MB-R and FJB-G were responsible for drafting of the
Please cite this article in press as: Bes-Rastrollo M, et al., Prospective studyClinical Nutrition (2009), doi:10.1016/j.clnu.2009.08.017
DPROOF
manuscript. MB-R, AS-V, FJB-G, JMN-C, ET, MS-M were responsiblefor critical revision of the manuscript for important intellectualcontent. MS-M was responsible for obtaining funding. All authorsread and approved the final manuscript.
References
1. World Health Organization. Obesity and overweight. Fact sheet N�311, http://www.who.int/mediacentre/factsheets/fs311/en/print.html; September 2006[accessed January 07.01.09].
2. Zizza C, Siega Riz AM, Popkin BM. Significant increase in young adults’ snackingbetween 1977–1978 and 1994–1996 represents a cause for concern! Prev Med2001;32:303–10.
3. McDonald CM, Baylin A, Arsenault JE, Mora-Plazas M, Villamor E. Overweight ismore prevalent than stunting and is associated with socioeconomic status,maternal obesity, and a snacking dietary pattern in school children fromBogota, Colombia. J Nutr 2008 [Epub ahead of print].
4. Nielsen SJ, Siega-Riz AM, Popkin BM. Trends in energy intake in U.S. between1977 and 1996: similar shifts seen across age groups. Obes Res 2002;10:370–8.
5. Astrup A, Bovy MW, Nackenhorst K, Popova AE. Food for thought or thought forfood?-A stakeholder dialogue around the role of the snacking industry inaddressing the obesity epidemic. Obes Rev 2006;7:303–12.
6. Maques-Vidal P, Ravasco P, Dias CM, Camilo ME. Trends of food intake inPortugal, 1987–1999: results from the National Health Surveys. Eur J Clin Nutr2006;60:1414–22.
7. Ribas-Barba L, Serra-Majem L, Salvador G, Castell C, Cabezas C, Salleras L, et al.Trends in dietary habits and food consumption in Catalonia, Spain (1992–2003).Public Health Nutr 2007;10:1340–53.
8. Ovaskainen ML, Reinivuo H, Tapanainen H, Hannila ML, Korhonen T, Pakkala H.Snacks as an element of energy intake and food consumption. Eur J Clin Nutr2006;60:494–501.
9. Cross AT, Babicz D, Cushman LF. Snacking patterns among 1800 adults andchildren. J Am Diet Assoc 1994;94:1398–403.
10. De Graaf C. Effects of snacks on energy intake: an evolutionary perspective.Appetite 2006;47:18–23.
11. Francis LA, Lee Y, Birch LL. Parental weight status and girls’ television viewing,snacking, and body mass indexes. Obes Res 2003;11:143–51.
12. Peneau s, Thibault H, Meless D, Soulie D, Carbonel P, Roinsol D, et al. Anthro-pometric and behavioural patterns associated with weight maintenance afterand obesity treatment in adolescents. J Pediatr 2008;152:678–84.
13. Berteus Forslund H, Torgerson JS, Sjostrom L, Lindroos AK. Snacking frequencyin relation to energy intake and food choices in obese men and womencompared to a reference population. Int J Obes (Lond) 2005;29:711–9.
14. Howarth NC, Huang TT-K, Roberts SB, Lin BH, McCrory MA. Eating patterns anddietary composition in relation to BMI in younger and older adults. Int J Obes(Lond) 2007;31:675–84.
15. Sanchez-Villegas A, Martinez-Gonzalez MA, Toledo E, de Irala J, Martinez JA.Influencia del sedentarismo y el habito de comer entre horas sobre la gananciade peso. [Relative role of physical inactivity and snacking between meals inweight gain]. Med Clin (Barc) 2002;119:46–52.
16. Marin-Guerrero AC, Gutierrez-Fisac Jl, Guallar-Castillon P, Banegas JR, Rodri-guez-Artalejo F. Eating behaviours and obesity in the adult population of Spain.Br J Nutr 2008;100:1142–8.
17. Phillips SM, Bandini LG, Naumova EN, Cyr H, Colclough S, Dietz WH, et al.Energy-dense snack food intake in adolescence: longitudinal relationship toweight and fatness. Obes Res 2004;12:461–72.
18. Field AE, Austin SB, Gillman MW, Rosner B, Rockett HR, Colditz GA. Snack foodintake does not predict weight change among children and adolescents. Int JObes Relat Metab Disord 2004;28:1210–6.
19. Hampl JS, Heaton CLB, Taylor CA. Snacking patterns influence energy andnutrient intakes but not body mass index. J Hum Nutr Diet 2003;16:3–11.
20. Lioret S, Touvier M, Lafay L, Volatier JL, Maire B. Dietary and physical activitypatterns in French children are related to overweight and socioeconomicstatus. J Nutr 2008;138:101–7.
21. Segui-Gomez M, de la Fuente C, Vaquez Z, de Irala J, Martinez-Gonzalez MA.Cohort profile: the ‘‘Seguimiento Universidad de Navarra’’ (SUN) study. Int JEpidemiol 2006;35:1417–22.
22. Willett WC. Issues in analysis and presentation of dietary data. In: Willett WC,editor. Nutritional epidemiology. 2nd ed. New York: Oxford University Press;1998. p. 321–46. New.
23. Moreiras O, Carvajal A, Cabrera L. Tablas de composicion de alimentos. [Foodcomposition tables]. 9th ed. Madrid: Piramide; 2005.
24. Mataix Verdu J, Manas Almendros M. Tabla de composicion de alimentos. [Foodcomposition tables]. 4th ed. Granada: Universidad de Granada; 2003.
25. Ainsworth BE, Haskell WL, Whitt MC, Irwin ML, Swartz AM, Strath SJ, et al.Compendium of physical activities: an update of activity codes and METintensities. Med Sci Sports Excer 2000;32:S492–504.
26. Brenner H, Gefeller O, Greenland S. Risk and rate advancement periods asmeasures of exposure impact on the occurrence of chronic diseases. Epidemi-ology 1993;4:229–36.
27. Hernan MA, Hernandez-Diaz S, Werler MM, Mitchell AA. Causal knowledge asa prerequisite for confounding evaluation. Am J Epidemiol 2002;155:176–84.
28. Parks EJ, McCrory MA. When to eat and how often? Am J Clin Nutr 2005;81:3–4.
of self-reported usual snacking and weight gain in a Mediterranean...,

M. Bes-Rastrollo et al. / Clinical Nutrition xxx (2009) 1–88
ARTICLE IN PRESS YCLNU1533_proof � 7 September 2009 � 8/8
891
892
893
894
895
896
897
898
899
900
901
902
903
904
905
906
29. Dapcich V, Salvador G, Ribas L, Perez Rodrigo C, Aranceta J, Serra-Majem L. Guıa dela alimentacion saludable. [Guide of the healthy diet]. Madrid: SENC-Everest; 2005.
30. Bes-Rastrollo M, van Dam RM, Martinez-Gonzalez MA, Li TY, Sampson LL,Hu FB. Prospective study of dietary energy density and weight gain in women.Am J Clin Nutr 2008;88:769–77.
31. Bes-Rastrollo M, Sanchez-Villegas A, Gomez-Gracia E, Martinez JA, Pajares RM,Martinez-Gonzalez MA. Predictors of weight gain in a Mediterranean cohort:the Seguimiento Universidad de Navarra Study. Am J Clin Nutr 2006;83:362–70.
32. Marmonier C, Chapelot D, Fantino M, Louis-Sylvestre J. Snack consumed ina non-hungry state have poor satiating efficiency: influence of snack
UNCORRECTE
Please cite this article in press as: Bes-Rastrollo M, et al., Prospective studyClinical Nutrition (2009), doi:10.1016/j.clnu.2009.08.017
composition on substrate utilization and hunger. Am J Clin Nutr2002;76:518–28.
33. Thomas DE, Elliot EJ, Baur L. Low glycaemic index or low glycaemic loaddiets for overweight and obesity. CD005105. Cochrane Database Syst Rev2007;3.
34. Huang TT-K, Roberts SB, Howarth NC, McCrory MA. Effect of screening outimplausible energy intake reports on relationships between diet and BMI. ObesRes 2005;13:1205–17.
35. Kristal AR, Peters U, Potter JD. Is it time to abandon the food frequency ques-tionnaire? Cancer Epidemiol Biomarkers Prev 2005;14:2826–8.
DPROOF
of self-reported usual snacking and weight gain in a Mediterranean...,
Copyright © 2022 FDOKUMEN