Proposed Budget - Medford School District
180
18 19 PROPOSED BUDGET
-
Upload
khangminh22 -
Category
Documents
-
view
0 -
download
0
Transcript of Proposed Budget - Medford School District

1819
PROPOSED BUDGETMEDFORD SCHOOL DISTRICT 549C

Fiscal Year 2018-19
Successful Students Today ~ Successful Citizens Tomorrow
Fiscal Year 2018-19 Proposed Budget
BUDGET COMMITTEE School Board Members Lilia Caballero Michael Campbell (Vice Chair) Jim Horner Jeff Kinsella Suzanne Messer Karen Starchvick (Chair) Cynthia Wright Community Members Ilex Brandenberger Sara Collins Chris Dufour Maggie Keesee-Eklund Glen Gann Kevin Husted Casey Stine Administration Dr. Brian Shumate, Superintendent Michelle Cummings, Chief Academic Officer Kevin Campbell, Director of Secondary Student Achievement Jeanne Grazioli, Director of Elementary Student Achievement Tania Tong, Director of Special Education and Student Services Debbie Simons, Director of Human Resources Brad Earl, Chief Operations Officer Amy Tiger, District Athletic Director/Safety Coordinator Terri Dahl, Supervisor of Federal Programs and School Improvement

Fiscal Year 2018-19 Table of Contents
Introduction Message from the Superintendent .......................................................................................................................................... i Organization District Overview ................................................................................................................................................................ 1 School Board Strategic Governance ..................................................................................................................................... 2 Budget Presentation and Process .......................................................................................................................................... 4 District Leadership ................................................................................................................................................................ 5 Financial .............................................................................................................................................................................. 6 Key Metrics/Graphs ............................................................................................................................................................. 7 All District Funds ................................................................................................................................................................ 10 General Fund Fund Balance Projection ....................................................................................................................................... 11 Resources and Requirements Summary ............................................................................................................... 12 Resource Summary ............................................................................................................................................... 13 Source Detail – Local, Intermediate and State ....................................................................................... 14 Resident Average Daily Membership (ADMr) ...................................................................................... 16 Source Detail – Federal and Other ......................................................................................................... 17 Source Detail - Beginning Fund Balance ............................................................................................... 18 Expenditures Summary, Salary and Wage Summary ........................................................................................... 19 Staffing Summary ................................................................................................................................................. 21 Staffing by Function ............................................................................................................................................. 22 Expenditures Summaries – Benefits, Purhcased Svcs, Supplies, Capital Outlay ................................................. 23 Expenditures by Classification and Student Instruction ....................................................................................... 27 Special Education Spending Summary .................................................................................................. 29 Music Programs Spending Summary ..................................................................................................... 30 Function Detail ................................................................................................................................................. 31 Special Revenue Fund Summary............................................................................................................................................................. 100 Federal Programs .................................................................................................................................. 101 State and Local Programs ..................................................................................................................... 104 PERS Reserves ..................................................................................................................................... 105 PEEK Grant .......................................................................................................................................... 106 Secondary Athletic Fund ...................................................................................................................... 107 Food Service Fund ............................................................................................................................... 108 Seismic Upgrades Grant ....................................................................................................................... 109 Project Reserve Fund – Capital, NTS, Curriculum .............................................................................. 110 Measure 98 ........................................................................................................................................... 119 Measure 99 ........................................................................................................................................... 120 Other Funds Summary............................................................................................................................................................. 121 Debt Service Fund – General Obligation Bonds .................................................................................. 122 Debt Service Fund – Pension Obligation Bonds .................................................................................. 123 Capital Projects Fund ........................................................................................................................... 124 Health Insurance Fund.......................................................................................................................... 125 Student Scholarships Fund ................................................................................................................... 126 Student Body Fund ............................................................................................................................... 127 Information Revenue Sources ............................................................................................................................................................... 128 Glossary ............................................................................................................................................................................ 130 Appendix Publications Vision 2020

Introduction

i
Brian T. Shumate, Ph.D. Superintendent of Schools
ph 541-842-5002 fax 541-842-1087
April 16, 2018 To the Medford School District 549c Budget Committee: I am pleased to present my budget message for the 2018-19 school year. I am honored to serve you and the community of Medford in my fourth year as the Superintendent of the Medford School District. I am convinced that the Medford School District is built on the solid foundations of the past, is currently responding well to the current trends in society and education, and is poised and becoming a leader in educational practice, innovation, and results for students in the state of Oregon and the nation. I would like to express my appreciation to the members of the Medford School District Board of Education and the members of the Medford School District Budget Committee for their service, support, thoughtful analysis, dialogue, and consideration of this proposed budget. In this document, I am presenting a balanced budget for your consideration. Prior to presenting the details of the proposed budget, I will outline what the District has implemented and accomplished over the past three years to improve results for students. The subsequent priorities outlined in this budget are a continuation of a comprehensive plan that was set in motion upon my arrival in 2014. I have outlined this plan in each of my previous budget messages and we remain committed to this blueprint for the coming year. The general strategies are:
1. Increase quality student-teacher contact time 2. Expand Career Pathways 3. Expand dual and articulated credit offerings 4. Improve education effectiveness and efficiency 5. Educate the whole child
We believe the recent improvements in student achievement and outcomes within the Medford School District are directly attributed to the hard work of Medford’s educators and support staff and the implementation of these strategies. To measure the District’s effectiveness and to ensure that we remain on a positive trajectory, we consider four specific metrics as key indicators to know if our plan is working:
1. Four-year Graduation Rate 2. Smarter Balanced Assessment Scores 3. Daily Attendance Rate 4. 3rd Grade Reading Scores

ii
Realizing Results Graduation Rate: The District’s graduation rate increased ten (10) percentage points from 2014 to 2015, rose another two (2) percentage points from 2015 to 2016 to a rate of 77.15% and rose again in 2017 to a rate of 78.07%. This was accomplished first by ensuring that at least 80% of our high school teachers were teaching at least six (6) periods a day, which effectively reduced class sizes in our high schools and increased instructional options for all students. Second, by tracking every student’s acquisition of course credits from their first day of high school to their last day of high school to ensure that each student is on track to graduate on time. Initial analysis of this data showed us many high school students who did not graduate in four years had fallen behind during their freshmen year. Using our current credit acquisition tracking system, students who now fall behind at any time in their high school career are provided with personalized interventions that include tutoring, intensive academic interventions, access to opportunities for credit recovery including online options, extended day options and summer school. The District simultaneously set in motion the development and expansion of focused Career Pathways to ensure that every student finds his/her place in our schools based on each student’s interests. We believe that students are most successful when they affiliate with a chosen pathway, where they make connections, find meaning, and ultimately create understanding in their daily school lives. We want all students to be in environments where they have a common mission, are connected with like-minded students, are surrounded by caring adults, and participate in co-curricular activities that they look forward to after school, on weekends and during breaks. We believe the Career Pathways strategy is a long-term strategy that will result in graduation rate gains that will push the graduation beyond the 80% threshold established by the board. However, if the District is to reach a 90% graduation rate, we must design our school day, credit acquisition opportunities, and credit delivery modalities in innovative and modular ways. The District is currently developing an online component that will allow students to complete course work remotely at times of their choice. The District is also pursuing college options, both on our campuses and on college campuses, during the school day and in the evenings and weekends. Additionally, the District is attempting to expand its Career and Technical Education (CTE) options in the construction fields.
61.59%64.12% 63.91%
67.32% 65.21%
74.95%77.15%
78.07%
63.06%64.13%
67.13%68.73%
71.57%
71.43%
80.04% 82.49%
60%
65%
70%
75%
80%
85%
2010 2011 2012 2013 2014 2015 2016 2017
Graduation Rates
4 Year Cohort 5 Year Cohort

iii
Assessment Results: We believe regular assessments are an important way to measure student progress as well as help students prepare for assessments they will face as they pursue advanced education and career opportunities. By placing emphasis on periodic common assessments throughout the school year and on state and national annual assessments, we have seen appreciable growth in the number of students participating in the assessments, as well as individual student progress on the assessments. On the Smarter Balanced Assessments, the District proficiency rates have now moved ahead of the Oregon state averages in all tested areas (i.e., English Language Arts, Mathematics, Science). Note – this data represents all grades combined. We attribute this growth to more coherent districtwide curriculum alignment and pacing, better usage of common assessment and data, and more prescriptive tiered interventions to address the needs of a variety of learners. We also give credit to the excellent work in our teacher led Professional Learning Communities (PLCs). These small groups of teachers work in their PLCs to identify specific learning targets, monitor progress toward meeting those targets, and make timely decisions for students who are not meeting targets and those who are meeting targets.
51.60%
37.20%
69.30%
56.50%
39.70%
71.30%
53.60%
40.80%
61.40%
55.50%
41.50%
68.80%
0% 10% 20% 30% 40% 50% 60% 70% 80%
English Language Arts
Math
Science
Smarter Balanced Proficiency Assessment2016-17 Results
2016-17 549c 2016-17 State Average 2015-16 549c 2014-15 549c

iv
Student Attendance: Monitoring student attendance trends assist the District to better assess the culture of student engagement in the learning process. Higher attendance and reduced attrition rates signal that students are finding relevance and meaningful experiences and are present and more engaged in the learning process. We attribute improvement in attendance and retention to enhanced communications to the community regarding our improved results, expanded programs at all levels (e.g., full day kindergarten, middle school engineering program, greater variety of pathway and course offerings and activities for students, expanded Advanced Placement courses) and a sense of caring for every student.
3rd Grade Reading: We know that students who are reading on grade level at the end of the 3rd grade have more likelihood of successful progression through our K-12 system and remain on track for graduation. The District invested in a coherent English Language Arts curriculum, more coherent teacher professional development, and a systematic reading assessment, i-Ready. The i-Ready assessment is administered three times per year for all grades 3-8. The i-Ready assessment is a very accurate predictor of Smarter Balanced proficiency and we are closely monitoring mid-year assessment results and are predicting that the Smarter Balanced 3rd grade reading scores will increase this spring.
90.2
7%
92.1
4%
92.8
2%
93.2
5%
93.2
0%
93.1
3%
92.9
7%
91.7
2%
90.0
9%
89.7
1%
88.1
0%
88.0
4%
82.9
1%
92.4
7% 93.6
6%
94.2
7%
94.6
2%
94.8
3%
94.2
1%
94.0
2%
93.2
4%
92.7
4%
90.8
2%
89.9
4%
88.8
2%
84.8
5%
93.3
4%
93.9
1%
94.3
1%
94.4
7%
94.5
1%
94.7
5%
94.5
1%
93.9
4%
92.9
8%
91.8
7%
90.0
4%
89.0
7%
85.4
5%
93.4
3% 94.3
1%
94.5
6%
94.8
4%
94.7
3%
94.2
8%
94.6
5%
94.0
8%
94.1
2%
92.3
1%
91.4
6%
89.6
2%
87.3
7%
K G 1 S T 2 N D 3 R D 4 T H 5 T H 6 T H 7 T H 8 T H 9 T H 1 0 T H 1 1 T H 1 2 T H
ATTENDANCE BY GRADE LEVEL ANDFISCAL YEAR
2013-14 2014-15 2015-16 2016-17
41.147.9
45.1
36 38 40 42 44 46 48 50
All 3rd Grade Students
All 3rd Grade StudentsStudent Group 2016-17 %
Proficient 45.1
Student Group 2015-16 %Proficient 47.9
Student Group 2014-15 %Proficient 41.1
3rd Grade ELA Smarter Balanced Results

v
Budget Priorities I have outlined this plan in each of my previous budget messages and we remain committed to this blueprint for the coming year. The general strategies are:
1. Increase quality student-teacher contact time: a. Maintain lower class sizes at the elementary level b. Have more high school teachers teaching 6 classes c. Maintain a full day kindergarten program (4th year) d. Expand summer school opportunities e. Implement 6th Grade Academies at both middle schools f. Implement a co-teaching model with SPED and regular education teachers g. Create a Staff Development/Curriculum Coordinator position
2. Expand Career Pathways: a. Expand Pathways for all high school students in these areas: Academic, Artistic, Career
and Technical Education, and in Pre-Professional Pathways b. Create a Pathways Coordinator position c. Create an Online Program Coordinator position d. Add additional Pathways in:
i. Computer programming ii. Level II Pre-education
iii. Level II Pre-Law iv. Level III Project Lead the way Pre-engineering v. Beginning a Healthcare pathway to include an EMT program of study
vi. Construction Trades (i.e., plumbing, electrical, HVAC, carpentry)
3. Expand dual and articulated credit offerings: a. Pay student tuition for RCC and SOU classes b. Expand access to Advanced Placement courses and exams c. Provide free ACT exams to all juniors d. Expand the Bulldogs to Raiders program to South, North, and Hedrick e. Add staff for comprehensive guidance and counseling services f. Create coherent and systematic guidance and counseling services
4. Improve education effectiveness and efficiency: a. Guaranteed curriculum:
i. Align and refine learning targets and common assessments in all grade levels and subject areas
ii. Invest in high quality curriculum aligned to state standards b. Technology in the Classroom:
i. Increase student access to technology for learning in classrooms grades 2-12 by deploying Chromebooks
ii. Expand professional development in technology integration through hiring a Tech Integration Coach
iii. Create Online Programs for credit recovery, initial credit, and homeschool outreach
c. Teacher and Administrator Evaluation System i. Refine regular feedback systems using TeachBoost

vi
d. Assessment System i. Implement i-Ready reading and math assessments grades 3 through high school
5. Educating the Whole Child:
a. Reduce barriers for students, including financial support for fees, fines, college tuition, musical instruments, unified sports, et.al.
b. Enhance support to reduce disruptive student behaviors c. Increase mental health support for students during the school day d. Expand mentorship programs with peer and adult support e. Implement systematic crisis and suicide prevention measures led by the new Crisis
Prevention Contractor f. Maintain the fresh fruits and vegetables and elementary physical education grants g. Provide all District staff training in Adverse Childhood Experiences (ACEs) and
Trauma Informed Practices (TIPs) h. Provide quality elementary after school programs
Funding Outlook and a Balanced Budget Our District anticipates beginning the new fiscal year with an estimated $0.24 million annual surplus in the General Fund carrying over from the amended 2017-18 budget. In other words, the District expects to receive more revenue this year than it will expend year-end. In addition to the beginning surplus, our District is assuming it will receive an overall increase of $1.48 million in revenue next year and will have an overall increase of $1.72 million in total spending and transfers out to other funds in the General Fund resulting in a projected balanced budget for 2018-19. Impact on 2018-19 funding from using Extended Enrollment in 2017-18 In 2017-18, the District’s poverty rate dropped 6.53% points from 24.29% in 2016-17 to 17.77% in 2017-18. The impact of the drop in the poverty rate decreased enrollment weightings and thus funding by approximately $1.7 million from what the District has originally expected to receive in 2017-18. The net result from the reduction in poverty weightings reduced the 2017-18 weighted enrollment (ADMw) below 2016-17 ADMw. Oregon Statue 327.013 allows districts to use of either the current year ADMw or the prior year ADMw, whichever is higher. By using the higher of the two (2016-17 enrollment), the District was able to increase revenue approximately $1.0 million in 2017-18 to offset more than half of the $1.7 million reduction in funding from the drop in poverty weightings. The challenge for the District in 2018-19 is the District will no longer be able to use 2016-17 ADMw. The resulting impact is a drop in ADMw for 2018-19 as compared to the extended enrollment the District was funded on in 2017-18. The financial impact of this reduction in enrollment weightings for the District in 2018-19 is a reduction in funding of approximately $1.0 million. The Oregon Department of Revenue uses the US Census Small Area Income and Poverty Estimates (SAIPE) report to assign changes in poverty weightings across the state. Unfortunately, the SAIPE data that is used to assign year over year changes in poverty is not available until the middle of fiscal year, therefore there may or may not be changes in our poverty rate/poverty weightings in the coming year.

vii
The Second Year of a Biennium Our District is in the second year of the 2017-19 biennium, whereby the state passed an $8.2 billion two year K-12 budget. Half of the funds (50%) were scheduled to be distributed to school districts in the first year of the biennium and the other half (50%) in the second year of the biennium. In recent years, the state held back some biennial funding in the first year to help offset rising expenses for school districts in the second year. For example, it was common for the state to distribute 49% of the funds in the first year of a biennium and 51% of the funds in the second year. This change in distribution method in this biennium means our District’s General Fund, State School Funding Total Formula Revenue, which includes Local Property Tax, State Common School Fund, and a 70% reimbursement for transportation, will be the same next year at $133.8 million as it was this year – assuming all other factors, such as enrollment, remain equal. Our District does expect some additional revenue next year because the State Fiscal Controller estimated on March 1, 2018 that there will be an increase in state funding of $11/ADMw due primarily to a higher forecast for the levy and collection of statewide property taxes that will generate an increase of $0.2 million in funding for our District. While there are many variables in the state school funding formula, the variable that is most likely to change and affect our funding is student enrollment. We are anticipating a total of 117 more students generating approximately $0.9 million more funding. Of the 117 increase in students, we anticipate 67 more Charter students and 50 more non-charter students. The non-charter student increase next year is primarily from expanding open enrollment at our two high schools, North and South Medford. The Charter school enrollment increase is primarily driven by and estimated increase of 50 students at Kids Unlimited Academy (KUA). The majority of additional Charter school revenue is passed through to the charter schools per state statutes. Our relationship with the Southern Oregon Education Service District (SOESD) continues to evolve as we reduce or entirely shift select services previously performed by SOESD to our District. We have received a preliminary, high-level estimate of cash in lieu of services from SOESD and it shows an increase of $1.09 million for non-SPED services, but this estimate may change. The additional funds from SOESD will be partially offset by an additional $0.26 million spending for 3.0 FTE including: one Staff Development Coordinator, one Electrician and one Warehouse Worker in the General Fund to perform similar duties in house. The District also plans to reduce the transfer of funds from the General Fund to other funds by $2.93 million. We are reducing transfers to the PERS reserve by $1.84 million and transfers to project reserves by $1.19 million partially offset by an increase to the Physical Education Expansion (PEEK) Grant of $0.1 million. The PERS reserve is often funded by one time revenue true ups from the state each year and at this time we have not included an estimate for any such true up on the 2018-19 budget. The primary reason we are reducing transfers to project reserves this year is because last year we transferred $2.2 million to fund new classrooms at Griffin Creek Elementary School, which has been completed. We are increasing transfers to the PEEK grant, because State funds for the PEEK grant are anticipated to decrease $0.1 million as competition for these funds from other school districts grows. This continues the trend from 2017-18 when funding for this grant decreased $0.15 million. Over two years, funding for the PEEK grant has decreased $0.25 million or 50%. Based on recent developments, other districts that have shown reductions in the SAIPE report (mentioned above) have typically experienced reductions in Title funding in the following federal fiscal year. We believe Special Revenue Funding for Title programs may see an overall decrease in 2018-19, however since the federal fiscal year that runs October 2018 – September 2019, we don’t have any firm estimates of what funding adjustments might occur. If there are funding reductions, we

viii
plan to offset these reductions by utilizing carry over funds, where possible, and by reducing title services in areas with the least possible impact on students. The federal funding numbers are not typically finalized until August or September, just prior to the start of the federal fiscal year in October. The Measure 98 High School Success Initiative, was approved by voters in the November 2016 election to enhance Career Technical Education (CTE), College and Career Readiness, and Dropout Prevention for grades 8-12. The state legislature approved the Measure at $170 million (56.6% funding) which resulted in an additional $1.7 million funding in 2017-18 and $1.8 million funding in 2018-19 to the District. This represents a 49%/51% split over the two year biennium. With this additional funding, the district has created a comprehensive plan to expand in each of the aforementioned program areas. The District will fund new plumbing and electrical programs, online school software platform, additional support for AVID (a college readiness curriculum) and additional positions for: pathways development, online school coordination, mental health and behavior supports and alternative school programming at North and South Medford High Schools. As we look at our overall cost trend, costs to maintain currently existing programs and staff of 1,270 FTE continue to increase. The proposed budget for the General Fund includes projected increases in medical plan costs $0.8 million, contractual employee pay for step raises $1.5 million, and cost of living adjustments (COLA) raises of $1.0 million. These increases will be partially offset by a cost reduction estimated at $0.9 million for lower average compensation for approximately 30 positions where new employees will be hired at the lower end of the pay scale to replace retirees that were previously paid at the top of the pay scale. In summary, this plan includes investing 2.5 million for a 33.72 FTE increase in staffing to support the five previously listed budget priorities. Of the 33.72 FTE increase, 16.17 FTE or $1.1 million is being invested in Instruction, 11.55 FTE or $0.9 million is being invested in Direct Instruction Support and 6.0 FTE or $0.5 million is being invested in General Support. In Special Education, there will be a 18.5 FTE increase in staffing primarily focused on supporting Educating the Whole Child. These positions will primarily be focused on supporting early childhood intervention, student behavior support, student mental health support and students with special needs. In Non-SPED areas there will be a 15.22 FTE increase. We will be adding 6.28 FTE to support Increasing Quality Student-Teacher Contact Time: with 4.0 FTE focused on implementing sixth grade academy, 2.03 FTE maintaining lower class sizes in elementary, 1.0 FTE supporting enrollment growth, 1.0 FTE Staff Development Coordinator to enhance staff education and 0.25 FTE focusing on improvement of instruction. These increases are partially offset by the reduction of 2.0 FTE educational support assistants transferring to SPED. There will be an additional 3.94 FTE in Measure 98 focused on Expanding Career Pathways with the addition of 1.0 FTE Pathways Director, 1.0 FTE Online School Developer, 1.0 FTE Pathways/Online School administrative assistant and 1.0 FTE Programmer partially offset by the reduction of .06 FTE for educational assistants. Finally, we will be adding 5.0 FTE to Improve Education Effectiveness and Efficiency. The addition of 2.0 FTE in Network Technology will supporting increasing technology in the classroom including supporting the rollout of over 11,500 Chromebooks in grades 2-12 over the last four years. The addition of 2.0 FTE in Maintenance will take on duties insourced from SOESD. One Licensed Registered Nurse (RN) retirement will be replaced with 2.0 FTE Classified Licensed Practical Nurses (LPN), for a total of a 1.0 additional FTE addition in nursing.

ix
In a $140 million budget with as many different functions and variables that exist, there are many offsetting $0.1 million variations that occur each year. To balance the remainder of budget, we have made adjustments in our budget that net to a cut of approximately $0.2 million. This proposed budget projects a 5.72% end fund balance in the General Fund, maintaining the 5% minimum threshold set forth by board policy. Looking to the Near Future In prior budget messages, I mentioned the eventual need for additional community support. Our District implemented a plan to get to an 80% graduation rate and has demonstrated the ability to approach that goal within the next year. The next ten (10) percentage point gain, to get to a 90% four year graduation rate, will require a greater commitment by the District as well as the community. We believe that by creating alternative programming utilizing online options, college options and by expanding the District’s CTE options, we will be able to engage and retain more of our current students as well as attract new and underserved students to our schools. With increased enrollment, we believe the District can continue to maintain lower elementary class sizes, continue to partially fund the mandated future increase in physical education instructional minutes, and continue to enhance our after school programs for disadvantaged students. At the middle school level, the District could expand the Pathways concepts in the arts, the fields of engineering, health care, pre-law, education, and offer pre-advanced placement courses. At the high school level, the District could pursue the concept of building additional technical high school programs in the career and technical education fields as well as continue to enhance offerings in all of the high school Pathways. To accomplish the ambitious four-year graduation rate of 90% will require innovative programming, futuristic thinking and subsequent budgetary support. Our student enrollment has continued to grow slightly, partly due to renewed parent confidence in our schools and partly due to population growth in the region. However, the charter school enrollment increases are outpacing the District enrollment increases. A recently commissioned demographic study indicates our student enrollment will continue to grow, albeit at a slightly lower rate than was indicated in a previous projection. Currently, the District is utilizing more classrooms due to the hiring of additional teachers in order to create and maintain lower elementary school class sizes. Our existing facilities are in great shape and well managed and we continue to seek ways to maximize classroom space within our current infrastructure. We anticipate the need for additional classroom space at both the elementary and middle school levels within the next three to five years. This could be accomplished by renovating the current Central Medford High School site (the old South Medford High School) and/or building a new elementary or new middle school. The District has demonstrated excellent stewardship of our current facilities in which the community invested in generously in 2006-2007 and we look forward to continued partnership with the community. While still in the early planning process, we have begun to consider what our infrastructure needs will be in order to provide quality education services for the families of Medford. Respectfully, Brian T. Shumate, Ph.D. Superintendent
Organization

Fiscal Year 2018-19 Organization
Successful Students Today ~ Successful Citizens Tomorrow 1
Jackson County School District No. 549C, also known as the Medford School District (The District), is the eighth largest in Oregon. Serving approximately 14,000 students, the District enrolls approximately two percent of the total K-12 student population within the state. The District, formed in 1959, is located in Jackson County and includes most of the City of Medford, the City of Jacksonville, portions of the City of Central Point, and unincorporated areas of the county. Situated in the Rogue River Valley, the District extends beyond the City of Medford’s urban growth boundary and encompasses approximately 361 square miles. The District operates two comprehensive high schools, two middle schools, 14 elementary schools, one alternative high school, and four charter schools. Historical and projected enrollments are shown below:
The City of Medford, City of Jacksonville, Ruch, and Jackson County are key partners with the Medford School District. These communities embrace their schools. Businesses, parents and other volunteers generously offer their time and resources to help students. Parks, recreation, after-school and summer programs are provided for children. In addition, citizens of all ages have access to libraries, community centers, parks, educational, social and recreational opportunities. Professionally advanced police and fire departments provide comprehensive emergency response services to residents. The District has a close and unique partnership with the Medford Police Department, which provides security, training, and consultation to all campuses.
10,000
11,000
12,000
13,000
14,000
15,000
Num
ber
of S
tude
nts
District Enrollment: September 2008 - 2019*
*Projected
District Overview

Fiscal Year 2018-19 Organization
Successful Students Today ~ Successful Citizens Tomorrow 2
The Medford School Board recognizes that it has a unique and important role to play in assuring that the school system achieves the results expected by the community and deserved by students. In addition, the board and staff understand the significance of fiscal integrity and accountability. The board accepts the challenge to perform its own duties with the same degree of excellence expected of the Superintendent and all staff members.
District Mission To foster the talents and interests of a community of life-long learners through a meaningful education
that challenges students to reach their unlimited potential. Medford School Board Goals for 2016-17 and beyond
1. Extend student learning beyond proficiency by encouraging ALL students to attain mastery of all Oregon State Academic Standards. We want our students not only to meet academic standards, but also to grow beyond minimum levels of proficiency.
2. Promote a school environment of equity in which ALL students find connections, meaning,
and understanding in their daily school experiences. Secondary students will be affiliated and connected to school pathways (sequences of courses, programs, co-curricular activities, post-secondary connections) of their choosing, in which they express interest and find relevance.
3. Ensure that each elementary student reads at grade level by the end of the 3rd grade. Beginning in Kindergarten, all students will be assessed in reading and will be provided with any and all necessary instruction and interventions to ensure each student reads at grade level by the end of the 3rd grade.
4. Accelerate the learning for ALL students who perform below grade level, bringing them up to grade level by the end of the school year. ALL struggling students will be afforded the opportunity to receive specific, focused, and individualized interventions to ensure they perform at grade level in all academic areas by the end of the school year.
5. Increase the graduation rate. A high school diploma is a foundational credential. We want our students to complete a rigorous and focused academic program of studies, earn a credentialed diploma whereby each student can earn dual credit, articulated credit, or an industry certification, and have a credible working plan for their growth and training at the post-secondary level. We expect an annual district graduation rate of 80% by 2017, 90% by 2020, and 100% by 2025.
School Board Strategic Governance
Fiscal Year 2018-19 Organization
Successful Students Today ~ Successful Citizens Tomorrow 3
School system performance is monitored regularly to assure that reasonable progress is being made toward achieving these goals. This budget attends to these goals as well as all federal and state requirements for public schools.
School Board Strategic Governance (continued)

Fiscal Year 2018-19 Organization
Successful Students Today ~ Successful Citizens Tomorrow 4
Each year, the District prepares a budget according to Oregon budget law and school board policy. At the center of budget development are the school board mission, values, goals, and guiding principles. The primary objective is to present budget information in a manner that provides a clear and accurate account of the District’s financial position, educational programs, and services for the coming fiscal year. The budget acts as a business and operating plan for the fiscal year, and is revised as necessary. Budgets are presented on the modified accrual basis of accounting for all governmental funds. This is consistent with Generally Accepted Accounting Principles (GAAP). A balanced budget by fund is required. Unencumbered annual appropriations lapse at the end of each fiscal year. The budget is designed to help ensure fiscal transparency, efficiency, effectiveness and integrity. The Business Department and administration continually monitor all budgeted accounts and establish internal controls over all expenditures. The budget is adopted by the School Board, appropriations are made, and the tax levy is declared no later than June 30. The process includes planning, feedback, preparation, approval (by the Budget Committee), adoption (by the Board), implementation, evaluation and monitoring, and finally, auditing at the conclusion of the budget cycle.
FY18-19 Budget Calendar
March 23, 2018 Publish 1st notice of Budget Committee Meeting April 2, 2018 Budget Committee Orientation – Committee reviews roles, responsibilities
and budget process. Staff update on current year. April 6, 2018 Publish 2nd notice of Budget Committee Meeting April 16, 2018 1st Budget Committee Meeting – Committee elects officers, Superintendent
delivers budget message and committee receives budget document. April 30, 2018 2nd Budget Committee Meeting – Public comment, committee discusses and
approves Proposed Budget. May 11, 2018 Public notice of Budget Hearing and Budget Summary May 14, 2018 3rd Budget Committee Meeting (if needed) May 21, 2018 Board Meeting. Public Budget Hearing on FY18-19 Budget* -
Deliberate on budget approved by budget committee and considers additional public comment.
June 4, 2018 Board Meeting; Budget Adoption* - Board enacts resolutions adopting the budget, makes appropriations, imposes and categorizes tax levy.
July 13, 2018 District submits required budget documents to County Assessor, Department
of Education, and Southern Oregon Education Service District by July 13, 2018.
*Budget Committee members are invited but not required to attend
Budget Presentation and Process

Fiscal Year 2018-19 Organization
Successful Students Today ~ Successful Citizens Tomorrow 5
District Administrators
Dr. Brian Shumate Superintendent Michelle Zundel Chief Academics Officer Kevin Campbell Director of Secondary Student Achievement Jeanne Grazioli Director of Elementary Student Achievement Deborah Simons Director of Human Resources
Brad Earl Chief Operations Officer Tania Tong Director of Special Education and Student Services Amy Tiger Director of Athletics and School Safety Terri Dahl Supervisor of Federal Programs / Grants
School Principals
Amy Herbst Central Medford High School Dan Smith North Medford High School
Donnie Frazier South Medford High School Beth Anderson Hedrick Middle School Linda White McLoughlin Middle School
Megan Young Abraham Lincoln Elementary Louis Dix Griffin Creek Elementary
Lynn Cataldo Hoover Elementary Javier del Rio Howard Elementary Kelly Soter Jackson Elementary
Fred Kondziela Jacksonville Elementary Shelly Inman Jefferson Elementary
Tom Ettel Kennedy Elementary Gerry Flock Lone Pine Elementary Liz Landon Oak Grove Elementary
Kristi Anderson Roosevelt Elementary Julie Barry Ruch Elementary
Sallie Johnson Washington Elementary Aaron Luksich Wilson Elementary
District Managers
Jeff Bales Network Telecommunications
Heather Bothern Information Technology Ron Havniear Facilities and Grounds John Petach Finance Controller
District Leadership

Financial
Successful Students Today ~ Successful Citizens Tomorrow 6
Financial
NOTE: As with any budget, the development of this budget involves making assumptions. Ultimately, the District understands that some of these assumptions are required to be collectively bargained, and as such the District understands some of these assumptions may change.

Financial
Successful Students Today ~ Successful Citizens Tomorrow 7
Oregon has some of the most rigorous diploma requirements in the nation. Students must earn 24 credits (many states require 20 or 22 credits). Oregon students must also demonstrate proficiency in essential skills. In Medford, students must also complete a technology course and a senior project. Even with such rigorous standards, Medford School District has had another year of improved graduation rates.
78.07% of the Class of 2017 graduated from high school in four years. Across the state, 77% of students graduated in four years. This is also the third year that the Medford School District has exceeded the state average in this area.
Key Metrics
While this is tremendous growth, because we value equity, it’s particularly important to celebrate the graduation results for diverse student groups. Graduation rates for students with disabilities, Latino students, English Language Learners, and economically disadvantaged students have all improved in recent years.
Financial
Successful Students Today ~ Successful Citizens Tomorrow 8
Key Metrics
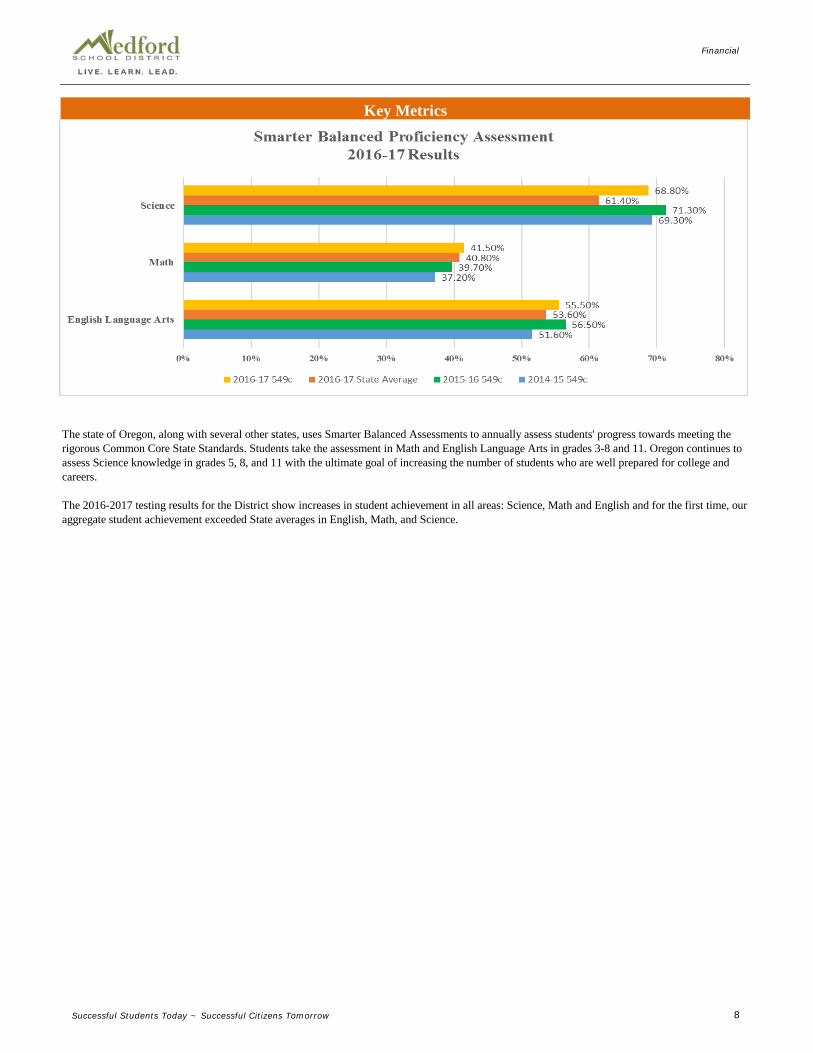
The state of Oregon, along with several other states, uses Smarter Balanced Assessments to annually assess students' progress towards meeting the rigorous Common Core State Standards. Students take the assessment in Math and English Language Arts in grades 3-8 and 11. Oregon continues to assess Science knowledge in grades 5, 8, and 11 with the ultimate goal of increasing the number of students who are well prepared for college and careers.
The 2016-2017 testing results for the District show increases in student achievement in all areas: Science, Math and English and for the first time, our aggregate student achievement exceeded State averages in English, Math, and Science.

Financial
Successful Students Today ~ Successful Citizens Tomorrow 9
At the Medford School District we are supporting student achievement and developing career skills. One key aspect of that is attendance. As the Achievement Institute reminds us, "We are on a mission to improve student achievement. Research has proven it, common sense tells us it’s true: student achievement is inextricably linked to attendance." The District implemented the Attention2Attendance (A2A) program as a tool to track attendance in the 2014-15 fiscal year and the District as a whole has increased its emphasis on the importance of student attendance to improve student achievement. The graph above demonstrates improvement at all grade levels (except 3rd and 4th) over the past two years.
Key Metrics

Financial
Successful Students Today ~ Successful Citizens Tomorrow 10
Special Revenue Funds: Other Funds:Federal Programs Debt Service - General Obligation BondsState and Local Programs Debt Service - Pension Obligation BondsPERS Reserves Capital Projects FundPhysical Education Expansion (PEEK) Grant Health Insurance FundSecondary Athletics Student Scholarship FundFood Service Operations Student Body FundsSeismic UpgradesProject ReservesMeasure 98 High School SuccessMeasure 99 Outdoor School
The General Fund is increasingly the primary funding source for operational spending in the District. In the FY18-19 Budget, the General Fund represents 67.3% of all resources versus 66.0% in the FY17-18 Budget. Total resources across all functions for FY18-19 is $222.7M vs $224.15M in the FY17-18 amended budget, which is $1.4 M, or 0.6% lower. This is due to a $1.78M increase in General Fund Resources (page 13), a $3.8M decrease in Special Revenue resources (page 99) and a $0.57M increase in other funds (page 120).
General Fund
All District Funds
General Fund67.3%
Special Revenue Funds13.5%
Other Funds19.2%
Financial
Successful Students Today ~ Successful Citizens Tomorrow 11
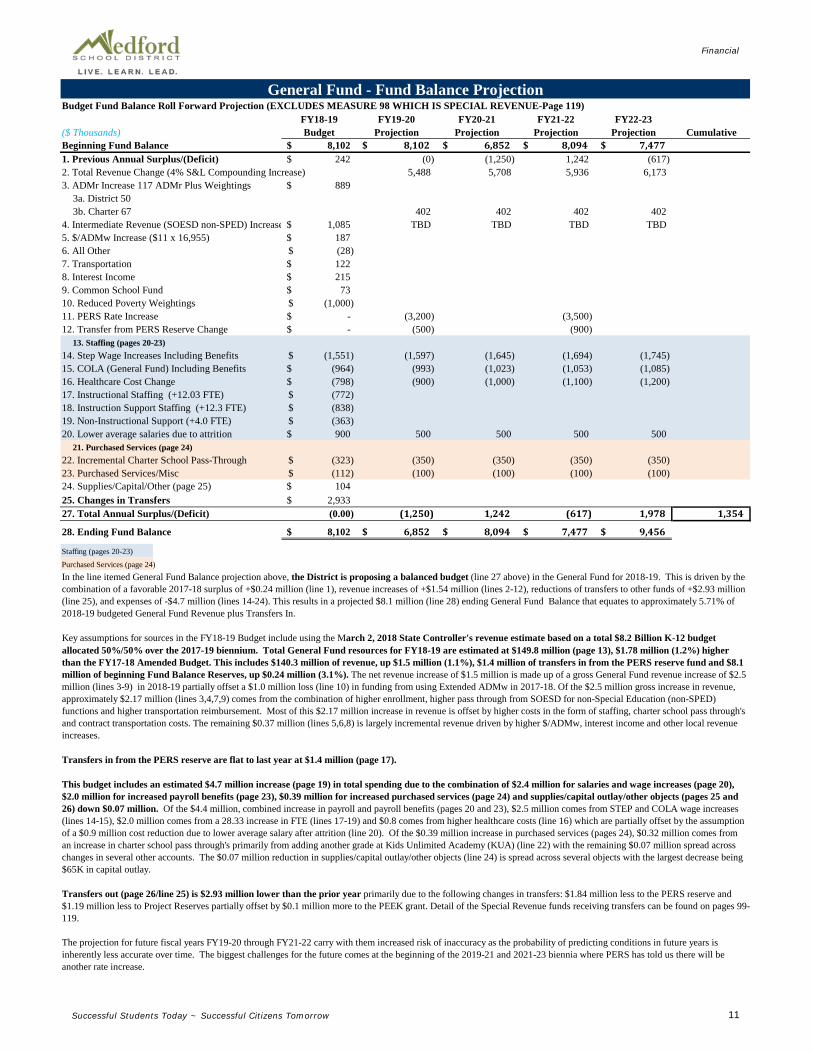
Budget Fund Balance Roll Forward Projection (EXCLUDES MEASURE 98 WHICH IS SPECIAL REVENUE-Page 119)FY18-19 FY19-20 FY20-21 FY21-22 FY22-23
($ Thousands) Budget Projection Projection Projection Projection CumulativeBeginning Fund Balance 8,102$ 8,102$ 6,852$ 8,094$ 7,477$ 1. Previous Annual Surplus/(Deficit) 242$ (0) (1,250) 1,242 (617) 2. Total Revenue Change (4% S&L Compounding Increase) 5,488 5,708 5,936 6,173 3. ADMr Increase 117 ADMr Plus Weightings 889$
3a. District 503b. Charter 67 402 402 402 402
4. Intermediate Revenue (SOESD non-SPED) Increase 1,085$ TBD TBD TBD TBD5. $/ADMw Increase ($11 x 16,955) 187$ 6. All Other (28)$ 7. Transportation 122$ 8. Interest Income 215$ 9. Common School Fund 73$ 10. Reduced Poverty Weightings (1,000)$ 11. PERS Rate Increase -$ (3,200) (3,500) 12. Transfer from PERS Reserve Change -$ (500) (900)
13. Staffing (pages 20-23)14. Step Wage Increases Including Benefits (1,551)$ (1,597) (1,645) (1,694) (1,745) 15. COLA (General Fund) Including Benefits (964)$ (993) (1,023) (1,053) (1,085) 16. Healthcare Cost Change (798)$ (900) (1,000) (1,100) (1,200) 17. Instructional Staffing (+12.03 FTE) (772)$ 18. Instruction Support Staffing (+12.3 FTE) (838)$ 19. Non-Instructional Support (+4.0 FTE) (363)$ 20. Lower average salaries due to attrition 900$ 500 500 500 500
21. Purchased Services (page 24)22. Incremental Charter School Pass-Through (323)$ (350) (350) (350) (350) 23. Purchased Services/Misc (112)$ (100) (100) (100) (100) 24. Supplies/Capital/Other (page 25) 104$ 25. Changes in Transfers 2,933$ 27. Total Annual Surplus/(Deficit) (0.00) (1,250) 1,242 (617) 1,978 1,354
28. Ending Fund Balance 8,102$ 6,852$ 8,094$ 7,477$ 9,456$
Staffing (pages 20-23)Purchased Services (page 24)In the line itemed General Fund Balance projection above, the District is proposing a balanced budget (line 27 above) in the General Fund for 2018-19. This is driven by the combination of a favorable 2017-18 surplus of +$0.24 million (line 1), revenue increases of +$1.54 million (lines 2-12), reductions of transfers to other funds of +$2.93 million (line 25), and expenses of -$4.7 million (lines 14-24). This results in a projected $8.1 million (line 28) ending General Fund Balance that equates to approximately 5.71% of 2018-19 budgeted General Fund Revenue plus Transfers In.
Key assumptions for sources in the FY18-19 Budget include using the March 2, 2018 State Controller's revenue estimate based on a total $8.2 Billion K-12 budget allocated 50%/50% over the 2017-19 biennium. Total General Fund resources for FY18-19 are estimated at $149.8 million (page 13), $1.78 million (1.2%) higher than the FY17-18 Amended Budget. This includes $140.3 million of revenue, up $1.5 million (1.1%), $1.4 million of transfers in from the PERS reserve fund and $8.1 million of beginning Fund Balance Reserves, up $0.24 million (3.1%). The net revenue increase of $1.5 million is made up of a gross General Fund revenue increase of $2.5 million (lines 3-9) in 2018-19 partially offset a $1.0 million loss (line 10) in funding from using Extended ADMw in 2017-18. Of the $2.5 million gross increase in revenue, approximately $2.17 million (lines 3,4,7,9) comes from the combination of higher enrollment, higher pass through from SOESD for non-Special Education (non-SPED) functions and higher transportation reimbursement. Most of this $2.17 million increase in revenue is offset by higher costs in the form of staffing, charter school pass through's and contract transportation costs. The remaining $0.37 million (lines 5,6,8) is largely incremental revenue driven by higher $/ADMw, interest income and other local revenue increases.
Transfers in from the PERS reserve are flat to last year at $1.4 million (page 17).
This budget includes an estimated $4.7 million increase (page 19) in total spending due to the combination of $2.4 million for salaries and wage increases (page 20), $2.0 million for increased payroll benefits (page 23), $0.39 million for increased purchased services (page 24) and supplies/capital outlay/other objects (pages 25 and 26) down $0.07 million. Of the $4.4 million, combined increase in payroll and payroll benefits (pages 20 and 23), $2.5 million comes from STEP and COLA wage increases (lines 14-15), $2.0 million comes from a 28.33 increase in FTE (lines 17-19) and $0.8 comes from higher healthcare costs (line 16) which are partially offset by the assumption of a $0.9 million cost reduction due to lower average salary after attrition (line 20). Of the $0.39 million increase in purchased services (pages 24), $0.32 million comes from an increase in charter school pass through's primarily from adding another grade at Kids Unlimited Academy (KUA) (line 22) with the remaining $0.07 million spread across changes in several other accounts. The $0.07 million reduction in supplies/capital outlay/other objects (line 24) is spread across several objects with the largest decrease being $65K in capital outlay.
Transfers out (page 26/line 25) is $2.93 million lower than the prior year primarily due to the following changes in transfers: $1.84 million less to the PERS reserve and $1.19 million less to Project Reserves partially offset by $0.1 million more to the PEEK grant. Detail of the Special Revenue funds receiving transfers can be found on pages 99-119.
The projection for future fiscal years FY19-20 through FY21-22 carry with them increased risk of inaccuracy as the probability of predicting conditions in future years is inherently less accurate over time. The biggest challenges for the future comes at the beginning of the 2019-21 and 2021-23 biennia where PERS has told us there will be another rate increase.
General Fund - Fund Balance Projection
Financial
Successful Students Today ~ Successful Citizens Tomorrow 12
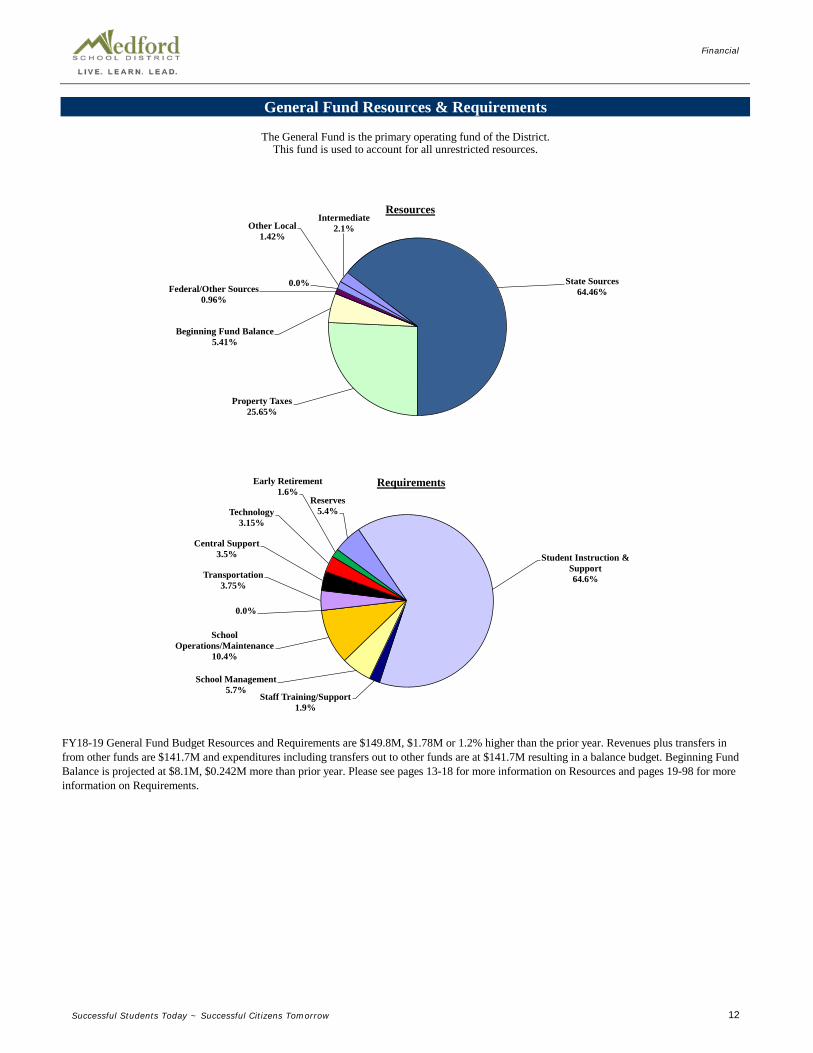
This fund is used to account for all unrestricted resources.
General Fund Resources & Requirements
FY18-19 General Fund Budget Resources and Requirements are $149.8M, $1.78M or 1.2% higher than the prior year. Revenues plus transfers in from other funds are $141.7M and expenditures including transfers out to other funds are at $141.7M resulting in a balance budget. Beginning Fund Balance is projected at $8.1M, $0.242M more than prior year. Please see pages 13-18 for more information on Resources and pages 19-98 for more information on Requirements.
The General Fund is the primary operating fund of the District.
Student Instruction & Support64.6%
Staff Training/Support1.9%
School Management5.7%
School Operations/Maintenance
10.4%
0.0%
Transportation3.75%
Central Support3.5%
Technology3.15%
Early Retirement1.6%
Reserves5.4%
Requirements
State Sources64.46%
Property Taxes25.65%
Beginning Fund Balance5.41%
Federal/Other Sources0.96%
0.0%
Other Local1.42%
Intermediate2.1%
Resources

Financial
Successful Students Today ~ Successful Citizens Tomorrow 13
2015-16 2016-17 2017-18 2018-19 2018-19 2018-19Total General Fund Resources Actual Actual Budget Proposed Approved AdoptedLocal 34,512,470 35,794,685 38,218,345 40,583,163 - - Intermediate 1,755,427 2,292,668 2,070,000 3,155,110 - - State 86,290,094 91,033,690 98,525,269 96,617,258 - - Federal 223,800 125,323 30,000 30,000 - - Other - - 1,401,100 1,401,100 - - Beginning Fund Balance 10,876,146 6,669,841 7,860,084 8,101,748 - - TOTAL RESOURCES 133,657,937 135,916,206 148,104,797 149,888,379 - -
-
Total General Fund Resources for FY18-19 are estimated at $149.8M, $1.78M (1.2%) higher than the FY17-18 Budget. This includes $140.3M of revenue, up $1.5M (1.11%) from prior year, $1.4M of transfers in from the PERS reserve fund and $8.1M of beginning fund balance, up $0.24M (3.1%) from the FY17-18 Amended Budget. The revenue increase is due to a combination of $2.36M higher local revenue, primarily property tax, and $1.08M in higher intermediate revenue, which is partially offset by $1.9M lower state revenues. More details of resource changes can be found on pages 14-18.
Our District is in the second year of the 2017-19 biennium, whereby the state passed an $8.2 billion two year K-12 budget. Half of the funds (50%) were scheduled to be distributed to school districts in the first year of the biennium and the other half (50%) in the second year of the biennium. In recent years, the state held back some biennial funding in the first year to help offset rising expenses for school districts in the second year. For example, it was common for the state to distribute 49% of the funds in the first year of a biennium and 51% of the funds in the second year. This change in distribution method in this biennium means our District’s General Fund, State School Funding Total Formula Revenue, which includes Local Property Tax, State Common School Fund, and a 70% reimbursement for transportation, will be the same next year at $133.8 million as it was this year – assuming all other factors, such as enrollment, remain equal. Our District does expect some additional revenue next year because the State Fiscal Controller estimated on March 2, 2018 that there will be an increase in state funding of $11/ADMw due primarily to a higher forecast for the levy and collection of statewide property taxes that will generate an increase of $0.2 million in funding for our District.
General Fund Resource Summary
133,657,937 135,916,206 148,104,797 149,888,379
-
20,000,000
40,000,000
60,000,000
80,000,000
100,000,000
120,000,000
140,000,000
160,000,000
2015-16A 2016-17A 2017-18B 2018-19B
Total General Fund Resources
Local Sources27.08%
Intermediate2.1%
State/Intermediate Sources64.46%
Federal/Other Sources0.95%
Contingency5.41%

Financial
Successful Students Today ~ Successful Citizens Tomorrow 14
2015-16 2016-17 2017-18 2018-19 2018-19 2018-19Local Sources Actual Actual Budget Proposed Approved AdoptedCurrent Year Taxes 32,183,118 33,269,548 35,629,825 37,722,480 Prior Years' Taxes 804,341 965,708 727,520 727,520 Tuition From Individuals - - - - Tuition From Other Districts - 3,545 10,000 10,000 Summer School Tuition - - - - Interest on Investments 240,407 384,493 700,000 915,163 Pre-School Fees 74,592 76,641 40,000 40,000 Other Revenue - Local Sources - - - - Rentals 173,885 177,795 200,000 200,000 Contributions - - 30,000 - Services Provided Other Charter Schools 41,739 43,366 40,000 40,000 Textbook Sales 5,250 - - - Recovery of Expenditures - - 5,000 5,000 Services Provided Other Funds - - 5,000 5,000 Fees Charges to Grants 462,540 472,488 605,000 642,000 Miscellaneous Revenue 3,166 50,109 5,000 35,000 Payroll Reimbursement 55,500 110,843 35,000 35,000 Field Trip Reimbursement 36,045 39,305 15,000 15,000 P-Card Rebate 133,891 98,838 130,000 130,000 Music Instrument Rentals 5,520 9,777 8,000 8,000 Self-Pay Health Ins Reimbursement 292,477 - - - E-Rate Reimbursement - 92,229 33,000 53,000 County School Fund - - - - LOCAL SOURCES 34,512,470 35,794,685 38,218,345 40,583,163 - -
Local sources for FY18-19 are budgeted to come in at $40.5M, up $2.36M (6.2%) from the FY17-18 Amended Budget of $38.2M. Local revenue sources are primarily property taxes, which make up 95% of the local sources. For the FY18-19 Budget, property taxes are projected to come in at $38.4M, which is $2M (5.87%) higher than the FY17-18 Budget. Interest on investments are projected to increase $0.2 million or 30% to $0.915 million as interest rates continue to increase at the State Local Group Investment Pool (LGIP).
General Fund Resources
34,512,470 35,794,685 38,218,345
40,583,163
-
5,000,000
10,000,000
15,000,000
20,000,000
25,000,000
30,000,000
35,000,000
40,000,000
45,000,000
2015-16A 2016-17A 2017-18B 2018-19B
Local Sources

Financial
Successful Students Today ~ Successful Citizens Tomorrow 15
2015-16 2016-17 2017-18 2018-19 2018-19 2018-19Intermediate Sources Actual Actual Budget Proposed Approved AdoptedPass-Through from SOESD 1,755,427 2,292,668 1,961,000 3,046,110 Jackson County Juvenile Detention Grant - - 109,000 109,000 INTERMEDIATE SOURCES 1,755,427 2,292,668 2,070,000 3,155,110 - -
2015-16 2016-17 2017-18 2018-19 2018-19 2018-19State Sources Actual Actual Budget Proposed Approved AdoptedState School Fund 84,556,891 89,234,066 96,961,467 94,970,831 Common School Fund 1,556,290 1,628,357 1,353,802 1,426,427 Juvenile Detention Grant 153,349 151,307 180,000 190,000 Teen Parent Grant 23,564 19,960 30,000 30,000 Side Account - - - - Miscellaneous Revenue - - - - STATE SOURCES 86,290,094 91,033,690 98,525,269 96,617,258 - -
Intermediate sources for 2018-19 are estimated at $3.1M, up $1.08M (52.4%) from FY17-18. The majority of the $3.1M of Intermediate revenue is coming from the Southern Oregon Education Service District (SOESD) as a pass-through in lieu of Special Education (SPED) non-SPED services provided. The increase is primarily due to insourcing non-SPED services previously provided by SOESD. This additional funding is helping to source the increase of 1.0 FTE Journeyman Electrician, 1.0 FTE Warehouse Worker, and 1.0 FTE Staff Development Coordinator to perform services previously performed by SOESD. The $109K FY18-19 other Restricted Grant in aid is a for a grant coming from Jackson County Juvenile Department, focused on improving juvenile attendance. The offsetting attendance spending can be found in function 2112, Attendance found on page 56.
State sources are estimated at $96.6M for FY18-19, down -$1.9M (-1.94%), primarily due to a small increase in State funding being more than offset by the increase in local property tax revenue which is deducted from State Funding as part of the State School Fund (SSF) funding formula.
General Fund Resources
88,045,521 93,326,358
100,595,269 99,772,368
-
20,000,000
40,000,000
60,000,000
80,000,000
100,000,000
120,000,000
2015-16A 2016-17A 2017-18B 2018-19B
Intermediate and State Sources

Financial
Successful Students Today ~ Successful Citizens Tomorrow 16
2018-19 Budget The projected ADMr for 2018-19 is up 117 or 0.84% from the 2017-18 year-end projection of 14,250. Of the 117 ADMr increase, 67 are from charter schools primarily driven by an additional grade a Kids Unlimited Academy and 50 are across all District schools primarily driven by an estimated increase from open enrollment.
Long Term TrendConsolidated ADMr: District consolidated enrollment is estimated to increase approximately 2,576 or 21.8% in the decade from FY08-09A to FY18-19B. This equates to a Compound Annual Growth Rate of 2.01% over the decade.
Charter School ADMrCharter schools started in the District in FY07-08 and ADMr has grown 1,675 from 71 in FY08-09 to an estimated 1,746 or approximately 12.25% of ADMr in FY18-19B. The district passes through the majority of state revenue it receives for this enrollment back to the charter schools.
Non-Charter ADMrDistrict non-charter schools enrollment has grown 901 or 7.7% over the decade, which equates to a 0.75% compound annual growth rate over the decade.

Financial
Successful Students Today ~ Successful Citizens Tomorrow 17
2015-16 2016-17 2017-18 2018-19 2018-19 2018-19Federal Sources Actual Actual Budget Proposed Approved AdoptedChild Care Block Grant 17,954 55,968 30,000 30,000 Other Restricted Grant-in-Aid - - - - TAG - - - - Other Federal - SFSF - - - - Federal Forest Fees 205,847 69,355 - - FEDERAL SOURCES 223,800 125,323 30,000 30,000 - -
2015-16 2016-17 2017-18 2018-19 2018-19 2018-19Other Sources Actual Actual Budget Proposed Approved AdoptedTransfers From Other Funds - - 1,401,100 1,401,100 Sale of Fixed Assets - - - - OTHER SOURCES - - 1,401,100 1,401,100 - -
Federal sources and other sources are budgeted at $0.03M, which is flat to the prior year budget.
Transfers in are budgeted at $1.4M, flat to the prior year. This transfer is coming from the PERS reserve fund to cover approximately half of the annual projected $2.8M cost increase due to rate increases in the 2017-19 biennium versus rates for the prior 2015-17 biennium. Please see page 105 for more detail regarding the PERS reserve fund.
General Fund Resources
223,800 125,323
1,431,100 1,431,100
-
200,000
400,000
600,000
800,000
1,000,000
1,200,000
1,400,000
1,600,000
2015-16A 2016-17A 2017-18B 2018-19B
Federal and Other Sources

Financial
Successful Students Today ~ Successful Citizens Tomorrow 18
2015-16 2016-17 2017-18 2018-19 2018-19 2018-19Beginning Fund Balance Actual Actual Budget Proposed Approved AdoptedBeginning Fund Balance 10,876,146 6,669,841 7,860,084 8,101,748 BEGINNING FUND BALANCE 10,876,146 6,669,841 7,860,084 8,101,748 - -
6,669,840.82 1,431,907.59
The FY18-19 beginning fund balance is $8.1M, which is $0.24M (3.1%) higher than FY17-18. While the beginning balance is higher in dollars it is relatively flat as a percentage of revenue as compared to FY17-18 at 5.8%. See page 11 for additional detail on fund balance change drivers.
General Fund Resources
10,876,146
6,669,841
7,860,084 8,101,748
-
2,000,000
4,000,000
6,000,000
8,000,000
10,000,000
12,000,000
2015-16A 2016-17A 2017-18B 2018-19B
Beginning Fund Balance

Financial
Successful Students Today ~ Successful Citizens Tomorrow 19
TOTAL 2015-16 2016-17 2017-18 2018-19 2018-19 2018-19General Fund Actual Actual Budget Proposed Approved AdoptedSalaries and Wages 60,218,183 62,231,021 62,437,200 64,864,439 - - Benefits 34,632,791 34,881,770 38,714,164 40,716,997 - - Purchased Services 19,921,876 20,926,930 25,929,019 26,319,180 - - Supplies and Materials 4,665,597 5,081,295 5,216,245 5,208,059 - - Capital Outlay 64,865 109,392 125,000 60,000 - - Other Objects 726,223 840,716 890,421 859,893 - - Transfers 6,758,561 3,985,000 6,691,000 3,758,063 - - Contingency - - 8,101,748 8,101,748 - - Unappropriated Fund Balance 6,669,841 7,860,084 - - - - TOTAL General Fund 133,657,937 135,916,206 148,104,798 149,888,379 - -
#REF! -
General Fund uses are up $1.7M or 1.2%. Of the $1.7M increase, spending is up $4.7M (3.5%) to $138.0M, transfers out are down $2.9M (43.8%) and Contingency is flat (see page 11 for breakdown).
The graph above details spending by object for the General Fund. Individual changes by object and function are described in the following pages of this budget document. The chart above shows the allocation of requirements by object including contingency. When fund balance reserves, contingency and charter school pass-through payments are excluded, the ratios for percentage of total General Fund spending are: salaries and wages 49.96%, payroll benefit cost 31.36%, services/supplies/capital outlay 15.12%, and other objects/transfers 3.56%. This again demonstrates that most of the District spending for ongoing operations is in personnel costs with 81.32% of ongoing operational spending going towards salaries and benefits.
General Fund EXPENDITURES -By Object
133,657,937 135,916,206
148,104,798 149,888,379
-
20,000,000
40,000,000
60,000,000
80,000,000
100,000,000
120,000,000
140,000,000
160,000,000
2015-16A 2016-17A 2017-18B 2018-19B
Total General Fund
Salaries and Wages43.3%
Payroll Benefit Costs27.2%
Services/Supplies/ Capital Outlay21.0%
Other Objects/Transfers3.1%
Contingency5.4%

Financial
Successful Students Today ~ Successful Citizens Tomorrow 20
2015-16 2016-17 2017-18 2018-19 2018-19 2018-19Object Description Actual Actual Budget Proposed Approved AdoptedLicensed 36,710,757 37,970,325 38,132,377 39,631,109 - - Classified 13,548,369 13,935,376 15,383,049 16,179,235 - - Administrative 3,976,817 4,066,685 4,062,369 4,237,294 - - Classified Managers 509,936 539,031 566,602 568,326 - - Early Retirement Stipends 1,022,157 846,200 1,071,700 1,174,800 - - Licensed Substitutes 1,286,208 1,421,751 34,428 28,961 - - Classified Substitutes 507,656 503,186 97,771 61,263 - - Licensed Temporary 487,345 594,516 574,900 472,105 - - Classified Temporary 481,574 600,648 873,525 770,897 - - Classified Overtime 217,692 284,261 209,349 210,892 - - Extra Duty Compensation 1,278,518 1,279,699 1,283,384 1,311,079 - - Home Instruction 26,274 39,332 35,000 55,023 - - Insurance Opt Out 164,880 150,009 112,746 163,457 - - SALARIES & WAGES 60,218,183 62,231,021 62,437,200 64,864,439 - -
#REF! 3,157,430
1250
General Fund Expenditures - Salary & Wages Summary
General Fund Salaries and Wages are $64.86M for the FY18-19 Budget, up $2.4M (3.9%) from the FY17-18 Amended Budget of $62.4M. The increase is mainly driven by the combination of $1.2M more for step wage increases, $0.7M more for a cost of living increase (COLA), and $1.3M more to fund a 28.33 GF FTE increase (pages 21-22). These increases are partially offset by -$0.5M of expected lower average salaries from attrition and -$0.2M reduction in temporary labor. See pages 21 and 22 for more information on staffing.
General Fund Staffing is projected to increase 28.33 FTE in the General Fund with 12.03 additional FTE in Instruction (pages 31-54) and 16.3 additional FTE in General Fund Support Services (pages 55-92). Of the proposed 16.3 FTE increase in support services 12.3 FTE are in Instruction Support (pages 55-70) and 4.0 FTE are in General Support functions (pages 71-92).
The 12.03 proposed FTE increase in the General Fund instruction is made up of 9.03 FTE licensed positions and 3.0 FTE non-licensed positions. This consists of: increasing elementary (1111) Certificated staffing +2.03 FTE (+.03 FTE is for music and +2.0 FTE for reduced student teacher ratios), +3.5 FTE to support the new 6th grade academy in middle schools, +1.0 Certificated FTE in high school to support additional ADMr from open enrollment, a decrease of -1.0 FTE Behavior Specialist moving to Direct Instruction Support, +2.0 FTE increase in ERC Resource Rooms (2 Certificated), +2.5 increase in Early Intervention Childhood, and +2.0 FTE in Early Intervening.
The proposed 12.3 FTE increase in Instruction Support is made up of +6.3 FTE Certificated positions and +6.0 FTE Classified. This consists of a +0.5 FTE increase at Hedrick for a Dean, a decrease of -2.0 FTE Educational Support Staff (ESS) that will be moved to Early Intervention Childhood, a +2.8 FTE increase in Behavior Specialists and +7 FTE ESS increase in Psychological Services, +1.0 FTE Speech & Language Pathologist, a +1.0 FTE Staff Development Coordinator, a reduction of -1.0 FTE through the attrition of an Registered Nurse in 2134 and the addition of +2.0 FTE Licensed Practical nurses for a net increase of +1.0 FTE and a +1 FTE increase in Student Support Services for a TOSA. The +9.8 FTE increase in Psychological Services is to insource work that was previously performed by Family Solutions. Total SPED support in the General Fund is up +15.3 FTE, or an addition of $1.2 million. This is partially offset by reductions of $585K in contracts with Family Solutions and the Douglas ESD and FTE being charged to the IDEA grant.
The proposed 4.0 FTE increase in General Support is made up of +1.0 FTE Electrician and +1.0 FTE Warehouse Worker in Maintenance, and +2.0 FTE System Administrators in Network Telecom Services. The two positions in maintenance and the Staff Development Coordinator in Instruction Support are being insourced from work previously performed by SOESD and will be funded by incremental pass through funds from SOESD. The District has added over 11,500 Chromebooks in the last four years while only adding one incremental support person. The two System Administrators will help support the growing technology workload.
The $0.7 million Cost Of Living Adjustment (COLA) for FY18-19 was negotiated in collective bargaining and is as follows: OSEA, Supervisors, Managers and Confidential employees are expected to receive a 2% raise, MEA, Administrators and Directors are expected to receive a 1% raise.
In FY17-18 substitute labor was moved to an outside company, Source 4 Teachers. This move has been met with high praise, as 98% of our absences are filled with a substitute in a timely manner, which is consistent to how it was before this duty was outsourced. This move is reflected in the move from substitute labor dollars from Licensed and Classified Substitutes to purchased services objects Other Licensed and Other Classified Subs found on page 24.
60,218,183 62,231,021 62,437,200 64,864,439
-
10,000,000
20,000,000
30,000,000
40,000,000
50,000,000
60,000,000
70,000,000
2015-16A 2016-17A 2017-18B 2018-19B
Salaries & Wages
Financial
Successful Students Today ~ Successful Citizens Tomorrow 21
Full Time Equivalent (FTE) FY18-19 FY17-18 FY17-18 FY16-17 Change from Change fromProposed Budget Amended Budget Adopted Budget Adopted Budget Amended Budget Adopted Budget
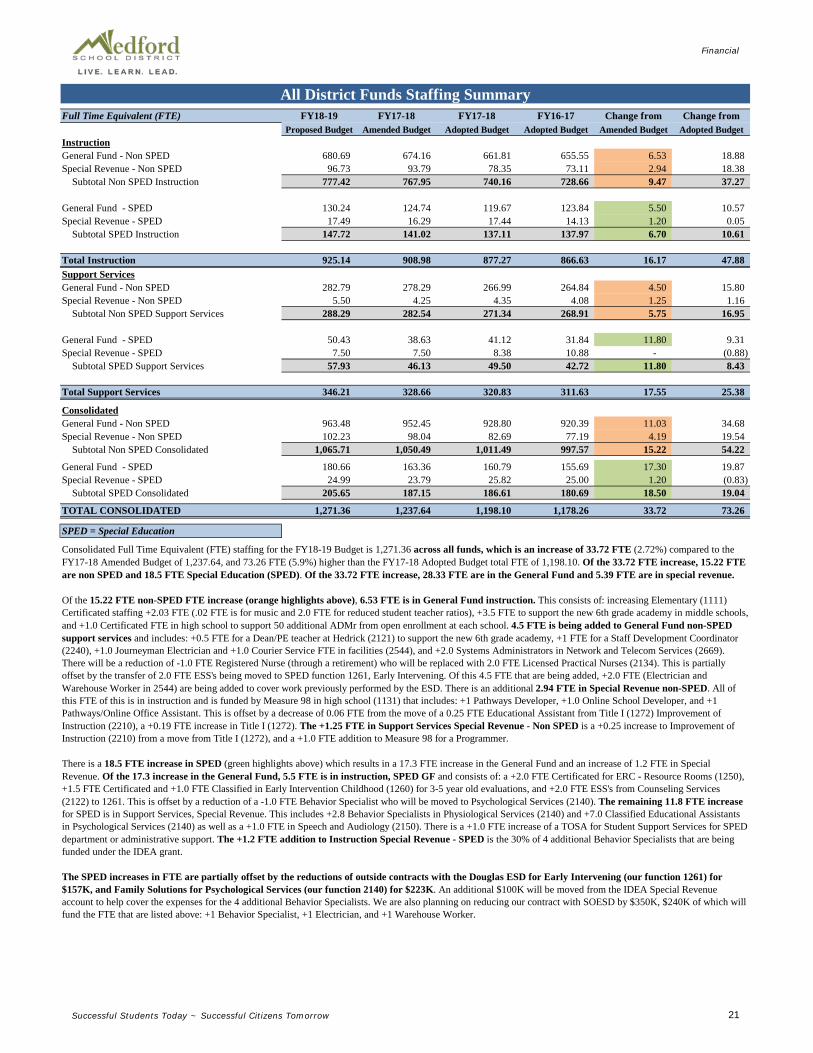
InstructionGeneral Fund - Non SPED 680.69 674.16 661.81 655.55 6.53 18.88 Special Revenue - Non SPED 96.73 93.79 78.35 73.11 2.94 18.38 Subtotal Non SPED Instruction 777.42 767.95 740.16 728.66 9.47 37.27 General Fund - SPED 130.24 124.74 119.67 123.84 5.50 10.57 Special Revenue - SPED 17.49 16.29 17.44 14.13 1.20 0.05 Subtotal SPED Instruction 147.72 141.02 137.11 137.97 6.70 10.61 Total Instruction 925.14 908.98 877.27 866.63 16.17 47.88 Support ServicesGeneral Fund - Non SPED 282.79 278.29 266.99 264.84 4.50 15.80 Special Revenue - Non SPED 5.50 4.25 4.35 4.08 1.25 1.16 Subtotal Non SPED Support Services 288.29 282.54 271.34 268.91 5.75 16.95 General Fund - SPED 50.43 38.63 41.12 31.84 11.80 9.31 Special Revenue - SPED 7.50 7.50 8.38 10.88 - (0.88) Subtotal SPED Support Services 57.93 46.13 49.50 42.72 11.80 8.43 Total Support Services 346.21 328.66 320.83 311.63 17.55 25.38 ConsolidatedGeneral Fund - Non SPED 963.48 952.45 928.80 920.39 11.03 34.68 Special Revenue - Non SPED 102.23 98.04 82.69 77.19 4.19 19.54 Subtotal Non SPED Consolidated 1,065.71 1,050.49 1,011.49 997.57 15.22 54.22 General Fund - SPED 180.66 163.36 160.79 155.69 17.30 19.87 Special Revenue - SPED 24.99 23.79 25.82 25.00 1.20 (0.83) Subtotal SPED Consolidated 205.65 187.15 186.61 180.69 18.50 19.04 TOTAL CONSOLIDATED 1,271.36 1,237.64 1,198.10 1,178.26 33.72 73.26
SPED = Special Education
Consolidated Full Time Equivalent (FTE) staffing for the FY18-19 Budget is 1,271.36 across all funds, which is an increase of 33.72 FTE (2.72%) compared to the FY17-18 Amended Budget of 1,237.64, and 73.26 FTE (5.9%) higher than the FY17-18 Adopted Budget total FTE of 1,198.10. Of the 33.72 FTE increase, 15.22 FTE are non SPED and 18.5 FTE Special Education (SPED). Of the 33.72 FTE increase, 28.33 FTE are in the General Fund and 5.39 FTE are in special revenue.
Of the 15.22 FTE non-SPED FTE increase (orange highlights above), 6.53 FTE is in General Fund instruction. This consists of: increasing Elementary (1111) Certificated staffing +2.03 FTE (.02 FTE is for music and 2.0 FTE for reduced student teacher ratios), +3.5 FTE to support the new 6th grade academy in middle schools, and +1.0 Certificated FTE in high school to support 50 additional ADMr from open enrollment at each school. 4.5 FTE is being added to General Fund non-SPED support services and includes: +0.5 FTE for a Dean/PE teacher at Hedrick (2121) to support the new 6th grade academy, +1 FTE for a Staff Development Coordinator (2240), +1.0 Journeyman Electrician and +1.0 Courier Service FTE in facilities (2544), and +2.0 Systems Administrators in Network and Telecom Services (2669). There will be a reduction of -1.0 FTE Registered Nurse (through a retirement) who will be replaced with 2.0 FTE Licensed Practical Nurses (2134). This is partially offset by the transfer of 2.0 FTE ESS's being moved to SPED function 1261, Early Intervening. Of this 4.5 FTE that are being added, +2.0 FTE (Electrician and Warehouse Worker in 2544) are being added to cover work previously performed by the ESD. There is an additional 2.94 FTE in Special Revenue non-SPED. All of this FTE of this is in instruction and is funded by Measure 98 in high school (1131) that includes: +1 Pathways Developer, +1.0 Online School Developer, and +1 Pathways/Online Office Assistant. This is offset by a decrease of 0.06 FTE from the move of a 0.25 FTE Educational Assistant from Title I (1272) Improvement of Instruction (2210), a +0.19 FTE increase in Title I (1272). The +1.25 FTE in Support Services Special Revenue - Non SPED is a +0.25 increase to Improvement of Instruction (2210) from a move from Title I (1272), and a +1.0 FTE addition to Measure 98 for a Programmer.
There is a 18.5 FTE increase in SPED (green highlights above) which results in a 17.3 FTE increase in the General Fund and an increase of 1.2 FTE in Special Revenue. Of the 17.3 increase in the General Fund, 5.5 FTE is in instruction, SPED GF and consists of: a +2.0 FTE Certificated for ERC - Resource Rooms (1250), +1.5 FTE Certificated and +1.0 FTE Classified in Early Intervention Childhood (1260) for 3-5 year old evaluations, and +2.0 FTE ESS's from Counseling Services (2122) to 1261. This is offset by a reduction of a -1.0 FTE Behavior Specialist who will be moved to Psychological Services (2140). The remaining 11.8 FTE increase for SPED is in Support Services, Special Revenue. This includes +2.8 Behavior Specialists in Physiological Services (2140) and +7.0 Classified Educational Assistants in Psychological Services (2140) as well as a +1.0 FTE in Speech and Audiology (2150). There is a +1.0 FTE increase of a TOSA for Student Support Services for SPED department or administrative support. The +1.2 FTE addition to Instruction Special Revenue - SPED is the 30% of 4 additional Behavior Specialists that are being funded under the IDEA grant.
The SPED increases in FTE are partially offset by the reductions of outside contracts with the Douglas ESD for Early Intervening (our function 1261) for $157K, and Family Solutions for Psychological Services (our function 2140) for $223K. An additional $100K will be moved from the IDEA Special Revenue account to help cover the expenses for the 4 additional Behavior Specialists. We are also planning on reducing our contract with SOESD by $350K, $240K of which will fund the FTE that are listed above: +1 Behavior Specialist, +1 Electrician, and +1 Warehouse Worker.
All District Funds Staffing Summary

Financial
Successful Students Today ~ Successful Citizens Tomorrow 22
This is the same staffing data as on page 21 of this book but is summarized into more detail by function. Detailed changes by job description are described in each functional narrative. Consolidated Full Time Equivalent (FTE) staffing for the FY18-19 Budget is 1,271.36 across all funds, which is an increase of 33.72 FTE (2.72%) compared to the FY17-18 Amended Budget of 1,237.64, and 73.26 FTE (5.9%) higher than the FY17-18 Adopted Budget total FTE of 1,198.10. Of the 33.72 FTE increase, 15.22 FTE are non SPED and 18.5 FTE Special Education (SPED). Of the projected 33.72 FTE increase, 28.33 FTE are in the General Fund and 5.39 are in the Special Revenue Fund. In addition to the changes and additions above, there will be 5.0 FTE moving from elementary 1111 to middle school 1121 for the 6th grade academy.
All District Funds Staffing By Function
Function Function Description
FY18-19 Proposed
Budget
FY17-18 Amended
Budget Variance Drivers of Variances to Current Staffing FY17-18 Adopted
Budget 1111 Elementary - Primary 378.08 376.05 2.03 +2 for class sizes, +.03 music 368.00
1121 Middle-Except Co-Curr 90.43 86.93 3.50 +2 for 6th grade academy, +1 music, +.5 PE for 6th grade academy 84.77
1131 High School-Except Co-Curr 184.11 180.11 4.00
+1 for open enrollment (General Fund), Measure98 (Special Revenue): +1 Pathways Developer, +1 IT Programmer, +1 Online School Developer, +1 Pathways/Online Office Assistant, -1 Mentor
169.93 1210 Talented and Gifted 0.62 0.62 - 0.54 1220/1240 SPED: Maps and Focus 71.38 72.38 (1.00) -1 FTE Certificated moved to 2140 76.84 1250 ERC - Resource Rooms 63.49 61.49 2.00 + 2 Certificated 53.11
1260 Early Intervention Childhood 2.50 - 2.50
+1.5 Certificated for 3-5 year old evaluations-Offset by expense budget, +1 Secretary
1261 Early Intervening 10.36 7.16 3.20
+2 FTE ESS's from 2122, +1.2 Behavior Specialists IDEA funding (2.8 FTE being charged to 2140) 7.16
1272 Title I 69.07 69.13 (0.06) -.25 move to 2210, +.19 FTE ESS increase 65.98 1283 District Alternative Programs 4.38 4.38 (0.00) 4.38 1291 English Language Learners 42.96 42.96 0.00 38.80 1292 Teen Parent 7.51 7.51 0.00 7.51 1297 At Risk 0.25 0.25 - 0.25
TOTAL INSTRUCTION 925.14 908.98 16.17 877.27 2112 Attendance 2.00 2.00 - 1.00 2121 Dean's Office 5.00 4.50 0.50 +.5 Hedrick Dean 4.00 2122 Counseling Services 12.00 14.00 (2.00) -2.0 FTE ESS's moved to 1261 12.00 2134 Nurse Services 7.00 6.00 1.00 -1 RN, +2 LPN's 6.00
2140 Psychological Services 27.49 17.69 9.80 +2.8 Behavior Specialists (1.2 FTE being charged to 1261), +7 Classified ESS 19.44
2150 Speech and Audiology 17.00 16.00 1.00 +1 Speech & Language Pathologist 18.38 2160 Occupational Th/Autism Spc 2.00 2.00 - 2.00 2190 Student Support Services 11.44 10.44 1.00 +1 TOSA - SPED Dept Support or Admin 9.69 2210 Improvement of Instruction 3.50 3.25 0.25 +.25 teacher (moved from 1272) 3.55 2211 Improvement of Instruction 1.00 1.00 - 1.00 2213 Curriculum Development 1.00 1.00 - 1.00 2221 Instructional Media Center 1.00 1.00 - 1.00 2222 School Libraries 22.35 22.35 - 22.35
2240 Instruct'nl Staff Devlpmnt 3.00 2.00 1.00 +1 Staff Development Coordinator (SOESD) 1.00 2321 Superintendent Services 6.75 6.75 - 6.75 2325 Elementary Director 2.00 2.00 - 2.00 2326 Secondary Director 2.00 2.00 - 2.00 2410 Office of the Principal 80.00 80.00 - 79.00 2521 Business Services 6.55 6.55 - 6.55 2542 Custodial 66.00 66.00 - 63.00
2544 Maintenance 30.47 28.47 2.00 +1 Journeyman Electrician, +1 Warehouse Worker II (SOESD) 26.47
2572 Purchasing/Warehouse Svcs 2.00 2.00 - 2.00 2574 Printing and Publishing Services 2.00 2.00 - 2.00 2640 Human Resources 8.20 8.20 - 7.20 2661 Information Technology 6.47 5.47 1.00 +1 Computer Programmer (Measure98) 5.00
2669 Network and Telecommunication Services 18.00 16.00 2.00 +2 Systems Administrators to support 11,500 chromebooks 16.47
TOTAL SUPPORT SERVICES 346.21 328.66 17.55 320.83 GRAND TOTAL 1,271.36 1,237.64 33.72 1,198.10

Financial
Successful Students Today ~ Successful Citizens Tomorrow 23
2015-16 2016-17 2017-18 2018-19 2018-19 2018-19Object Description Actual Actual Budget Proposed Approved AdoptedPERS 13,839,414 14,337,139 17,166,180 17,967,036 - - Social Security 3,649,072 3,767,517 3,841,756 4,154,683 - - Medicare 855,484 883,097 893,797 971,660 - - Workers Compensation 427,419 311,520 284,797 309,581 - - Unemployment 80,075 61,857 61,640 66,937 - - Health Insurance 14,714,679 14,401,343 14,968,273 15,766,047 - - Life Insurance 21,699 17,614 12,921 18,177 - - TSA Exec ER Paid 479,899 469,924 668,131 516,219 - - Long Term Disability 97,364 112,104 111,239 129,548 - - FSA/HSA 225,365 267,278 453,584 538,198 - - TSA Classified ER Paid Health Insurance Option 242,322 252,378 251,847 278,912 - - BENEFITS 34,632,791 34,881,770 38,714,164 40,716,997 - -
General Fund Expenditures - Payroll Benefits Summary
The FY18-19 Budget for Payroll Benefits is $40.7M, up $2.0M (5.17%) over the FY17-18 Budget, primarily driven by PERS/Social Security/Medicare/Workers Compensation increase of $1.2M (from salary increase, not due to rate increases) and a healthcare increase of $0.8M as projected by Mercer based on recent and historical expense trends. All other payroll benefit changes net to -$16K.
The most recent changes to the Districts proportionate share of the unfunded statewide PERS unfunded pension liability are shown below.
34,632,791 34,881,770
38,714,164 40,716,997
-
5,000,000
10,000,000
15,000,000
20,000,000
25,000,000
30,000,000
35,000,000
40,000,000
45,000,000
2015-16A 2016-17A 2017-18B 2018-19B
Payroll Benefits

Financial
Successful Students Today ~ Successful Citizens Tomorrow 24
2015-16 2016-17 2017-18 2018-19 2018-19 2018-19Object Description Actual Actual Budget Proposed Approved AdoptedProgram Improvement 54,203 - 10,000 27,500 - - Management Services 33,550 36,719 28,000 40,000 - - Professional Growth 70,985 56,275 89,500 89,250 - - Pro/Tech Service - Instructional 1,495,453 1,633,056 1,854,248 1,616,648 - - Cleaning Service 1,546 2,891 - - - - Repair and Maintenance 630,043 580,969 667,500 690,200 - - Rental 468,676 399,495 398,000 406,000 - - Electricity 1,333,123 1,327,278 1,350,000 1,400,000 - - Natural Gas 260,328 280,439 275,000 350,000 - - Water/Sewer 395,525 416,929 415,000 465,000 - - Garbage 172,941 174,041 220,000 220,000 - - Other Property Services 13,256 18,333 17,000 17,000 - - Pupil Transportation 4,414,107 4,641,068 5,416,066 5,564,400 - - Pupil Transportation - Other 52,801 31,432 44,900 71,000 - - Travel - In District 19,200 12,804 18,580 17,730 - - Travel - Out of District 125,099 107,740 157,300 150,770 - - Telephone 223,226 201,694 200,000 200,000 - - Postage 74,365 67,945 56,025 56,020 - - Advertising 21,194 36,601 27,000 27,500 - - Printing 7,477 2,752 8,900 6,000 - - Charter School Payments 9,186,083 10,028,859 11,633,690 11,956,392 - - Tuition 32,262 16,700 67,500 67,500 - - Audit Services 33,150 35,200 36,500 36,500 - - Legal 133,361 127,338 135,000 90,000 - - Architect/Engineering Services 24,346 49,479 20,000 20,000 - - Negotiations 13,951 1,824 15,000 12,500 - - Elections - 20,954 18,000 10,000 - - Professional Services - Tech/Non-Instr 631,626 618,114 571,186 554,700 - - Other Licensed Subs 1,917,396 1,952,795 - - Other Classified Subs 261,728 203,776 - - PURCHASED SERVICES 19,921,876 20,926,930 25,929,019 26,319,180 - -
#REF! 5,372,185
General Fund Expenditures - Purchased Services Summary
In the FY18-19 Budget, Purchased Services are budgeted at $26.3M, up $0.39M (1.5%) from the FY17-18 Budget. Spending is higher by $0.39M chiefly due to the increase of charter school pass-through of $0.32M and $0.174M for transportation increases.
Excluding the change in Charter School pass-through and transportation, all other changes net to a -$0.1M reduction and include:, $17K for Program Improvement for Junior Achievement and CIS training, $12K in Management Services for Human Resources new hire screenings, an increase of $23K in Repair and Maintenance and Rentals for vehicle maintenance, and $0.175M increase in utilities based on projected rate increases for water and garbage. Spending increases are partially offset by a -$.238M reduction in Professional Technical Services - Instructional. This reduction is mainly due to reducing the contract with Family Solutions for Psychological Services. In FY18-19 we plan to hire 3.0 FTE Behavior Specialists and 7.0 FTE Classified Assistants to cover the role that was previously being filled by Family Solutions, and 1.0 FTE Speech & Language Pathologist, which will reduce the contract with Presence Learning by $105K. Spending will also be reduced by $45K in Legal fees and $22K in Substitutes. Professional Services, Non-Instructional will go through some changes in FY18-19, which affect these object codes. There will be a reduction of $25K in Network Telecommunication Services, which will be using more of the ESD services. The Community Service Budget will increase by $.15M to cover one officer ($.14M) and the depreciation of one police car ($.01M). There will be a reduction of -$.157M from the Douglas ESD, which is offset in labor. We will be hiring +1.5 FTE Certificated and +1.0 FTE Classified in Early Childhood Intervening to replace these previously contracted services for the evaluation of 3-5 year olds.
In FY17-18 we moved our substitute labor from in-house to an outside company, Source 4 Teachers. This move has been met with high praise, as 98% of our absences are filled with a substitute in a timely manner. This move is reflected in the move from substitute labor dollars (page 20) to purchased services objects Other Licensed and Other Classified Subs. In the beginning part of FY17-18 Custodial function 2542 used Source 4 Teachers for substitute custodians but switched back to in-house management part way through the fiscal year. See page 82 for more details on the Custodial function.
19,921,876 20,926,930
25,929,019 26,319,180
-
5,000,000
10,000,000
15,000,000
20,000,000
25,000,000
30,000,000
2015-16A 2016-17A 2017-18B 2018-19B
Purchased Services

Financial
Successful Students Today ~ Successful Citizens Tomorrow 25
2015-16 2016-17 2017-18 2018-19 2018-19 2018-19Object Description - Supplies Actual Actual Budget Proposed Approved AdoptedSupplies and Materials 1,625,049 1,894,310 2,153,567 2,171,729 - - Textbooks 140,504 107,288 107,200 144,100 - - Library Books 89,378 97,464 97,830 100,726 - - Accelerated Reader Books - - - - - - Periodicals 39,102 42,685 35,760 35,610 - - Non-Consumables 665,479 576,395 639,550 701,538 - - Software 1,044,993 995,347 1,309,900 1,138,857 - - Accelerated Reader Software 40,908 66,450 72,218 77,381 - - Hardware Under $5000 1,020,185 1,301,354 800,220 838,119 - - SUPPLIES 4,665,597 5,081,295 5,216,245 5,208,059 - -
2015-16 2016-17 2017-18 2018-19 2018-19 2018-19Object Description - Capital Outlay Actual Actual Budget Proposed Approved AdoptedBldg. Acquisition/Improvement 5,311 2,804 - - - - Site Improvement 90 - - - - - Equipment - New 196 81,387 50,000 30,000 - - Equipment - Replacement 59,267 25,201 75,000 30,000 - - Equipment - Technology - - - - - - CAPITAL OUTLAY 64,865 109,392 125,000 60,000 - -
#REF! (10,000)
General Fund Expenditures - Supplies & Capital Outlay Summaries
These objects carry a range of goods that are used by the entire district, including, but not limited to, supplies and materials for our schools and district offices, textbooks, custodial and maintenance supplies, and software. The FY18-19 Budget for Supplies is $5.2M, which is flat to the FY17-18 Budget. Software includes programs for our district staff as well as software that is used in every school by our students. This contains the Kronos, our time-keeping system, Willamette ESD data warehousing contract, Cengage, a company which supplies e-pins for computer skills courses, iReady math diagnostic and intervention software, and much more. In FY18-19 the PLATO contract for $100K (software) was replaced with Edgenuity and will be moved to Special Revenue Funds Measure 98 for online schooling (page 119).
4,730,463 5,190,687 5,341,245 5,268,059
-
1,000,000
2,000,000
3,000,000
4,000,000
5,000,000
6,000,000
2015-16A 2016-17A 2017-18B 2018-19B
Supplies and Capital Outlay

Financial
Successful Students Today ~ Successful Citizens Tomorrow 26
2015-16 2016-17 2017-18 2018-19 2018-19 2018-19Object Description - Other Objects Actual Actual Budget Proposed Approved AdoptedRedemption of Principal - - - - - - Interest Payments - - - - - - Dues/Fees/Memberships 126,504 215,851 225,421 219,893 - - Liability Insurance 344,924 352,480 375,000 360,000 - - Fidelity Bond - - - - - - Property Insurance 249,764 262,855 265,000 270,000 - - Judgments Against District 5,031 5,000 25,000 10,000 - - Grant Indirect Charges - 4,530 - - - - OTHER OBJECTS 726,223 840,716 890,421 859,893 - -
2015-16 2016-17 2017-18 2018-19 2018-19 2018-19Object Description - Transfers Actual Actual Budget Proposed Approved AdoptedInterfund Transfers - - - - - - Other Transfers 6,758,561 3,985,000 6,691,000 3,758,063 - - TRANSFERS 6,758,561 3,985,000 6,691,000 3,758,063 - -
2015-16 2016-17 2017-18 2018-19 2018-19 2018-19Object Description - Other Uses of Funds Actual Actual Budget Proposed Approved AdoptedContingency - 8,101,748 8,101,748 - - Unappropriated Fund Balance 6,669,841 7,860,084 - - - OTHER USES 6,669,841 7,860,084 8,101,748 8,101,748 - -
- - TOTAL OTHER 14,154,624 12,685,799 15,683,169 12,719,704 - -
General Fund Expenditures - Other Objects & Transfers Summary
Other objects in the FY18-19 budget are down $30K, which is relatively flat to the prior year.
Transfers out are budgeted at $3.758M, down $2.93M from the prior year primarily due to the following changes in transfers: $1.84 million less to the PERS reserve and $1.19 million less to Project Reserves (17-18 Griffin Creek Project) partially offset by $0.1 million more to the PEEK grant. Detail of the Special Revenue funds receiving transfers can be found on pages 99-120.
Contingency is budgeted at $8.1M, which is flat FY17-18 Amended Budget due to expenditures being balanced to revenues.
14,154,624
12,685,799
15,683,169
12,719,704
-
2,000,000
4,000,000
6,000,000
8,000,000
10,000,000
12,000,000
14,000,000
16,000,000
18,000,000
2015-16A 2016-17A 2017-18B 2018-19B
Other Objects/Transfers/Other Uses

Financial
Successful Students Today ~ Successful Citizens Tomorrow 27
2015-16 2016-17 2017-18 2018-19 2018-19 2018-19Total General Fund Actual Actual Budget Proposed Approved AdoptedInstruction* 77,176,694 80,357,095 86,162,745 88,585,923 - - Support Services* 43,052,841 43,714,028 47,149,305 49,442,646 - - Community* - - - - - - Facilities* - - - - - - Debt & Transfers* 6,758,561 3,985,000 6,691,000 3,758,063 - - Contingency* 6,669,841 7,860,084 8,101,748 8,101,748 - - Fund Balance 0 0 0 0 0 0TOTAL General Fund Uses 133,657,937 135,916,206 148,104,798 149,888,379 0 0 *Appropriation Level - - 0.00 0.00
General Fund Expenditures by Classification
The FY18-19 General Fund Budget includes $149.8M of requirements consisting of $138M of spending, $3.758M of transfers, and $8.1M of year end Contingency/Reserves. Staffing for General Fund is proposed to increase 28.33 FTE with General Fund non-SPED FTE up 11.03 FTE and General Fund SPED FTE up 17.3. Total uses are up $1.7M (1.2%) from the FY17-18 Budget driven primarily by increased spending up $4.7M in Instruction and Support, and partially offset by -$2.97M lower transfers out. The $4.7M increase in spending is mostly made up of: $2.4 million for increased salaries and wages (page 20), $2.0 million for increased payroll benefits (page 23), $0.39 million for increased purchased services (page 24) and supplies/capital outlay/other objects (pages 25 and 26) down $0.07 million. Of the $4.4 million combined increase in payroll and payroll benefits (pages 20 and 23), $2.5 million comes from step and COLA wage increases, $2.0 million comes from a 28.33 increase in FTE, and $0.8 comes from higher healthcare costs, which are partially offset by the assumption of a $0.9 million cost reduction due to lower average salaries after attrition. See the Fund Balance explanation on page 11 for more detail.
On a year-to-year basis, the District analyzes the General Fund spending as a percentage of total requirements on a relative basis by function compared to the prior year Adopted budget. The FY18-19 Budget for Instruction spending is 59.1% of total spending, a .79% increase to the FY17-18 Budget level of 59.9%. Support Services percentage of spending is 33.0%, down 0.8% from the FY17-18 Budget level of 33.8%, Contingency is up 0.3 % to 5.4% and Debt & Transfers out up 0.11% to 2.51%.
133,657,937 135,916,206 148,104,798 149,888,379
-
20,000,000
40,000,000
60,000,000
80,000,000
100,000,000
120,000,000
140,000,000
160,000,000
2015-16A 2016-17A 2017-18B 2018-19B
Total General Fund
Instruction59.1%
Support Services33.0%
Contingency5.4%
Debt & Transfers2.51%

Financial
Successful Students Today ~ Successful Citizens Tomorrow 28
2015-16 2016-17 2017-18 2018-19 2018-19 2018-19Student Instruction Actual Actual Budget Proposed Approved AdoptedElementary Programs (K-6) 30,494,913 31,081,579 32,635,481 33,432,123 - - Middle School Programs (7-8) 8,162,284 8,219,667 8,880,683 9,215,928 - - Middle School Co-Curricular 273,274 277,492 294,481 301,016 - - High School Programs (9-12) 16,772,660 17,354,594 18,192,314 18,560,148 - - High School Co-Curricular 711,353 696,645 745,099 755,624 - - Talented & Gifted Programs 35,417 48,119 74,139 97,947 - - Special Programs 3,933,536 4,325,157 4,596,299 4,747,918 - - Extended School Year - 83 - - - - Resource Rooms 3,579,441 3,985,258 4,433,919 4,692,514 - - Early Intervention Programs 150,000 167,780 189,000 288,775 - - Alternative Education 359,682 416,592 442,283 471,331 - - Charter Schools 9,186,083 10,028,622 11,633,690 11,956,392 - - English Language Learners 2,940,615 3,093,352 3,356,300 3,352,369 - - Teen Parent Program 302,897 348,769 369,372 378,533 - - Homebound Program 42,112 47,353 47,261 75,053 - - At-Risk Program 42,592 46,338 57,280 46,588 - - Summer School - High School 189,836 219,695 215,142 213,663 - - STUDENT INSTRUCTION 77,176,694 80,357,095 86,162,745 88,585,923 - -
Medford School District 549C has 19 non-charter schools and 4 charter schools and is projected to serve approximately 14,250 students next year. Total FY18-19 Budget spending for Student Instruction is nearly $88.6M, up $2.4M (2.8%) from the FY17-18 Budget of $86.2M. The increase in spending is primarily driven by an increase of 12.03 FTE, contractual compensation changes, higher health insurance and benefits and increased pass-through to Charter Schools.
The increase in this area is from the 12.03 FTE is for both SPED and non-SPED functions. A brief summary of these increase are as follows: in function 1111, Elementary, there was a 2.03 FTE increase to reduce class sizes, in 1121, Middle School, there was a 3.5 FTE increase to support the launch of the 6th grade academy, in 1131, High School, there was a 1.0 FTE increase for open enrollment, in 1240, SPED Maps and Focus, there was a 1.0 FTE decrease for a transfer to Psychological Services (2140), in 1250, ERC-Resource Rooms, there was a 2.0 increase for certificated employees, in 1260 Early Intervention Childhood there was a 2.5 FTE increase (1.5 certificated and 1.0 classified), and in 1261, Early Intervening, there was a 2.0 FTE increase for Educational Assistants.
For more information on FTE changes, please see pages 21 and 22.
General Fund Expenditures Student Instruction Functions
77,176,694 80,357,095 86,162,745 88,585,923
-
10,000,000
20,000,000
30,000,000
40,000,000
50,000,000
60,000,000
70,000,000
80,000,000
90,000,000
100,000,000
2015-16A 2016-17A 2017-18B 2018-19B
Student Instruction

Financial
Successful Students Today ~ Successful Citizens Tomorrow 29
Excludes services provided to approximately 31 students by SOESD and SPED interpreter services provided by SOESD
(Excludes District Transportation) FY18-19 FY17-18 FY16-17 FY15-16 Change from Change fromBudget Budget Actual Actual FY17-18 Budget FY16-17 Actual
General FundSelf Contained Programs (1220, 1240) 4,747,918 4,596,299 4,325,157 3,933,536 151,619 422,761 Extended School Year (1227) - - 83 - - (83) ERT/Resource Rooms (1250) 4,692,514 4,433,919 3,985,258 3,579,441 258,595 707,256 Early Intervention Programs (1260, 1261) 288,775 189,000 167,780 150,000 99,775 120,995 Psychological Services (2140) 2,697,691 2,147,574 1,813,365 1,874,678 550,117 884,326 Speech and Audiology (2150) 2,105,076 2,042,289 1,871,913 1,709,426 62,787 233,163 Student Support Services (2190) 691,678 618,808 510,967 465,934 72,870 180,711 Total General Fund 15,223,652 14,027,888 12,674,525 11,713,015 1,195,765 2,549,127
Special Revenue FundsIDEA Part B 2,169,030 2,169,030 2,139,346 2,204,294 - 29,684 IDEA Enhancement 12,731 12,731 12,731 12,731 - - IDEA Extended Assessment 2,198 2,198 3,600 3,600 - (1,402) IDEA 619 Funds - - 50,889 7,028 - (50,889) System Performance Review & Improvement (SPRI) 11,550 11,550 7,458 7,059 - 4,092 Juvenile Detention Education Program (JDEP) - - 8,591 829 - (8,591) Total Special Revenue Funds 2,195,509 2,195,509 2,222,616 2,235,541 - (27,107)
TOTAL SPED SPENDING 17,419,161 16,223,396 14,897,140 13,948,556 1,195,765 2,522,020
FY18-19 FY17-18 FY16-17 FY15-16 Change from Change fromBudget Budget Actual Actual FY17-18 Budget FY16-17 Actual
Total General Fund 180.66 163.36 162.05 144.69 17.30 18.61 Special Revenue Funds 24.99 23.78 25.81 25.00 1.20 (0.82) TOTAL SPED STAFFING 205.65 187.14 187.86 169.69 18.50 17.79
Staffing Job Description FY18-19 Budget FY17-18 Budget VarianceMaps and Focus (1220,1240) 71.38 72.38 (1.00)
ERC - Resource Rooms (1250) 63.49 61.49 2.00
Learning Disabilities (1260, 1261) 12.86 7.16 5.70
Psychological Services (2140) 27.49 17.69 9.80
Speech and Audiology Services (2150) 17.00 16.00 1.00 Occupational Therapy/Autism (2160) 2.00 2.00 -
Support Services (2190) 11.44 10.44 1.00 205.65 187.16 18.50
Consolidated Special Education (SPED) Spending Summary
STAFFING: FTE
+2 FTE for Resource Room
Total FTE
Primary Driver
TOTAL SPENDING
1 FTE moved to 2140
In 2017-18 the District served a total 1,957 Special Education Students including 1,278 student in Education Resource Centers across all schools, 1,157 students in Speech-Language Therapy, 707 students in Assessment and Evaluation, 498 students in Behavior-Social Support, 320 students in Self-contained Classes (MAPS and FOCUS - at (12) schools), 121 students in Occupational Therapy and 16 students in STEPS classes operated by SOESD at two District schools and other schools in other Districts.
Total Spending for Special Education (SPED) excluding transportation in the FY18-19 Budget is $17.4M, $1.2M (7.4%) higher than the FY17-18 Budget and $2.5M (15.5%) higher than FY16-17 Actual spending. Total staffing FTE's for the FY18-19 Budget is 205.65, which is 18.5 FTE higher than current staffing, due to the combination of: a decrease of 1.0 FTE Behavior Specialist move to function 2140, Psychological Services, the increase of 2.0 FTE in 1250, ERC - Resource Rooms, the increase of 2.5 FTE in 1260, Early Intervention Childhood, the increase of 2.0 FTE in 1261, Early Intervening, the increase of 1.2 FTE Behavior Specialists in Special Revenue (of which $100K will be funded by the IDEA grant), the increase of 9.8 FTE in 2140, Psychological Services, an increase of 1.0 FTE in 2150, Speech & Audiology, and an increase of 1.0 FTE in 2190, Student Support Services.
A more detailed explanation of each functional area is explained in the following narrative pages in each functional area. The majority of the spending increase is due to: $0.81M for new employees, COLA $0.125M and $0.225M for step wage increases. In FY18-19 the District preliminary estimate is to receive $1.955M passed-through from the SOESD for Special Education, flat to last year. The final Choice and Equity plan for SOESD should be completed in late April.
+1 Speech & Language Pathologist
+1 TOSA - SPED Dept. Support or Admin
+1.5 for 3-5 year old evaluations, +1 Secretary, +2 ESS's from 2122, +1.2 Behavior Specialist funding+2.8 Behavior Specialists, +7 Classified ESS
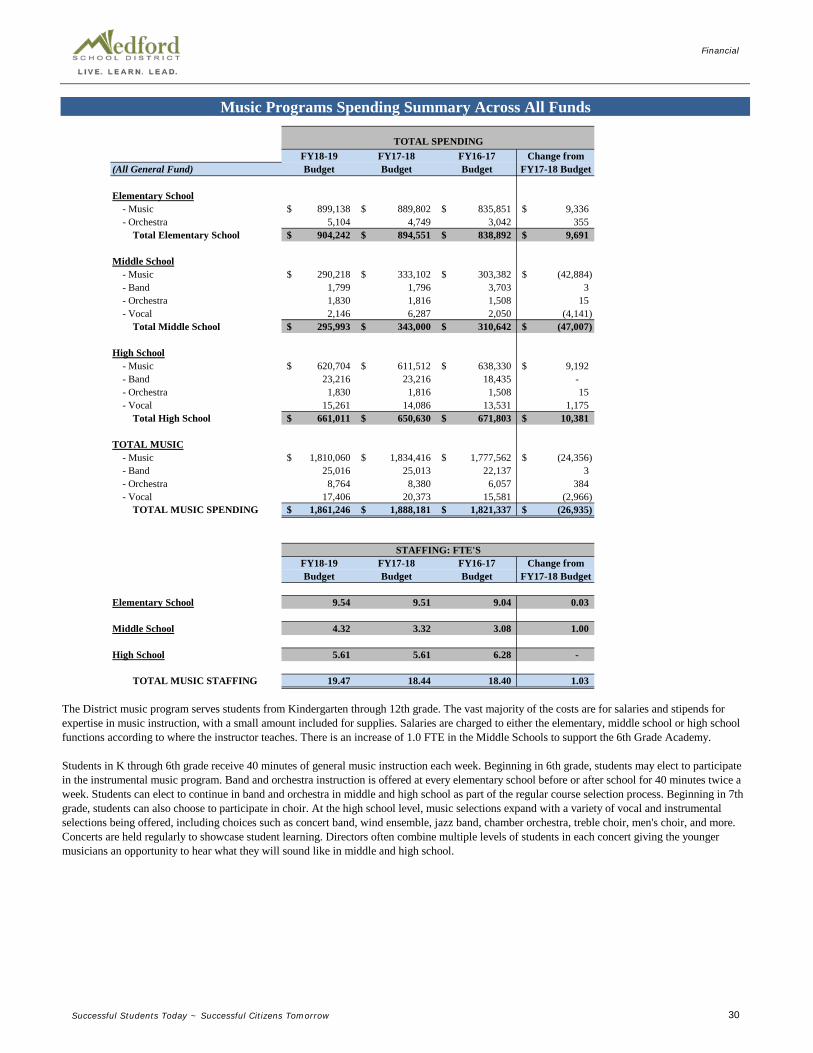
Financial
Successful Students Today ~ Successful Citizens Tomorrow 30
FY18-19 FY17-18 FY16-17 Change from(All General Fund) Budget Budget Budget FY17-18 Budget
Elementary School - Music 899,138$ 889,802$ 835,851$ 9,336$ - Orchestra 5,104 4,749 3,042 355 Total Elementary School 904,242$ 894,551$ 838,892$ 9,691$
Middle School - Music 290,218$ 333,102$ 303,382$ (42,884)$ - Band 1,799 1,796 3,703 3 - Orchestra 1,830 1,816 1,508 15 - Vocal 2,146 6,287 2,050 (4,141) Total Middle School 295,993$ 343,000$ 310,642$ (47,007)$
High School - Music 620,704$ 611,512$ 638,330$ 9,192$ - Band 23,216 23,216 18,435 - - Orchestra 1,830 1,816 1,508 15 - Vocal 15,261 14,086 13,531 1,175 Total High School 661,011$ 650,630$ 671,803$ 10,381$
TOTAL MUSIC - Music 1,810,060$ 1,834,416$ 1,777,562$ (24,356)$ - Band 25,016 25,013 22,137 3 - Orchestra 8,764 8,380 6,057 384 - Vocal 17,406 20,373 15,581 (2,966) TOTAL MUSIC SPENDING 1,861,246$ 1,888,181$ 1,821,337$ (26,935)$
FY18-19 FY17-18 FY16-17 Change fromBudget Budget Budget FY17-18 Budget
Elementary School 9.54 9.51 9.04 0.03
Middle School 4.32 3.32 3.08 1.00
High School 5.61 5.61 6.28 -
TOTAL MUSIC STAFFING 19.47 18.44 18.40 1.03
Music Programs Spending Summary Across All Funds
TOTAL SPENDING
The District music program serves students from Kindergarten through 12th grade. The vast majority of the costs are for salaries and stipends for expertise in music instruction, with a small amount included for supplies. Salaries are charged to either the elementary, middle school or high school functions according to where the instructor teaches. There is an increase of 1.0 FTE in the Middle Schools to support the 6th Grade Academy.
Students in K through 6th grade receive 40 minutes of general music instruction each week. Beginning in 6th grade, students may elect to participate in the instrumental music program. Band and orchestra instruction is offered at every elementary school before or after school for 40 minutes twice a week. Students can elect to continue in band and orchestra in middle and high school as part of the regular course selection process. Beginning in 7th grade, students can also choose to participate in choir. At the high school level, music selections expand with a variety of vocal and instrumental selections being offered, including choices such as concert band, wind ensemble, jazz band, chamber orchestra, treble choir, men's choir, and more. Concerts are held regularly to showcase student learning. Directors often combine multiple levels of students in each concert giving the younger musicians an opportunity to hear what they will sound like in middle and high school.
STAFFING: FTE'S

Financial
Successful Students Today ~ Successful Citizens Tomorrow 31
2015-16 2016-17 2017-18 2018-19 2018-19 2018-19Object Description Actual Actual Budget Proposed Approved AdoptedLicensed 15,781,570 16,333,717 16,697,851 16,832,456 - - Classified 2,023,668 1,969,780 2,204,796 2,280,573 - - Licensed Substitutes 695,686 724,039 11,962 12,000 - - Classified Substitutes 169,903 126,005 0 - - - Licensed Temporary 75,944 132,927 83,509 83,509 - - Classified Temporary 69,083 133,552 42,441 56,016 - - Classified Overtime 3,366 6,868 2,239 2,239 - - Extra Duty Compensation 43,480 43,993 43,899 46,537 - - Home Instruction - - - - - - Insurance Opt Out 57,980 58,016 37,928 59,321 - - SALARIES & WAGES 18,920,681 19,528,898 19,124,623 19,372,650 - - PERS 4,665,280 4,850,729 5,465,525 5,814,148 - - Social Security 1,167,493 1,205,406 1,163,557 1,271,675 - - Medicare 273,043 281,909 272,122 297,408 - - Workers Compensation 136,544 104,361 86,704 94,760 - - Unemployment 26,206 20,023 18,767 20,437 - - Health Insurance 4,127,186 4,024,616 4,195,068 4,293,669 - - Life Insurance 5,787 4,306 3,803 4,598 - - TSA Exec ER Paid 153,290 150,729 228,339 160,168 - - Long Term Disability 31,017 35,434 33,826 39,471 - - FSA/HSA 63,356 71,932 119,557 132,057 - - TSA Classified ER Paid Health Insurance Option 36,915 41,160 32,592 33,792 - - BENEFITS 10,686,117 10,790,605 11,619,861 12,162,183 - - Professional Growth 5,425 - - - - - Professional Instr. Services 336,745 256,721 178,000 125,000 - - Repair/Maintenance/Rentals 610 2,485 2,500 2,000 - - Rental Expense 32,046 - - - - - Pupil Transportation 357 1,587 - - - - Transportation 543 1,229 - - - - Travel - In District 184 651 300 300 - - Travel - Out of District 24 3,146 - - - - Postage/Advertising/Printing - 27 - - - - Advertising 317 - - - - - Professional Services - Tech 6,499 6,078 - - - - Other Licensed Subs - - 1,048,847 1,047,830 - - Other Classified Subs - - 90,071 90,400 - - PURCHASED SERVICES 382,749 271,925 1,319,718 1,265,530 - - Supplies and Materials 304,189 345,674 390,171 384,543 - - Textbooks 40,475 9,720 14,350 10,900 - - Library Books 31 208 - - - - Periodicals 26,089 28,367 22,400 22,350 - - Food - - - - - - Non-Consumables 18,114 25,954 17,300 17,150 - - Software 112,133 75,852 119,150 185,907 - - Accelerated Reader Software - - - - - - Hardware/Equipment 3,608 1,280 6,300 5,600 - - SUPPLIES 504,640 487,056 569,671 626,450 - - CAPITAL OUTLAY - - - - - - Dues/Fees/Memberships 726 3,095 1,609 5,309 - - OTHER OBJECTS 726 3,095 1,609 5,309 - - PRIMARY PROGRAMS (K-3) 30,494,913 31,081,579 32,635,481 33,432,123 - -
- 2,902,616.25
General Fund - 1111 Elementary Programs (K-6)

Financial
Successful Students Today ~ Successful Citizens Tomorrow 32
1111 Primary Programs (K-6) Continued
General Fund - 1111 Elementary Programs (K-6)
Medford School District 549C has 14 non-charter elementary schools and 3 charter schools serving approximately 8,050 elementary (K-6) students with 7,000 students in non charter schools and 1,050 students in charter schools. The Elementary Primary K-6 FY18-19 Budget is $33.4M, an increase of $0.796M (2.4%) from the FY17-18 Budget, driven primarily by contractual wage increases as well as PERS and healthcare increases. Professional Instructional Services contains $100K for the MAS/KU after school program and $25k for Writer's Workshop, Teacher's College. Software is budgeted at a total of $186k, up $67k for the FY18-19 school year. $173K of this cost is due to the purchase of a 2 year agreement instead of an annual agreement with Curriculum Associates (iReady) in order to save costs over time. Included in this cost is our district common diagnostic assessment for reading and math, professional development and additional instructional licenses to support teachers who teach blended grade classrooms. The software budget also includes supplemental Science curriculum ($13K) for all elementary schools.
Total General Fund staffing for the FY18-19 budget is 2.03 FTE higher than the amended budget at 378.08 FTE across all funds. A 2.0 FTE increase is to reduce student teacher ratios and the music staff will increase by .03 FTE. In FY18-19 there will be a move of 5.0 FTE from the elementary function 1111 to middle school 1121 in order to accommodate the 200 6th graders for the 6th grade acacemy. This will have a $0 financial impact. The FY18-19 Budget is designed to sustain a staffing ratio as close to the 2017-2018 school year as possible, and maintain class sizes within an established range. The ranges are as follows: Kindergarten and 1st grade: 21-25; 2nd and 3rd grade: 26-30; and 4th through 6th grade: 31-35. The goal is to keep all classrooms in the mid to lower range when possible, and additional assistant time is provided for classrooms that fall in the upper range.
Some of the financial considerations or challenges continue to include the need for added support staff and additional space to assist with higher enrollment at some schools. We anticipate that the 6th Grade Academy will alleviate some of the space issues.
Elementary After School Programs:The Medford After School/Kid’s Unlimited Partnership Program (MAS/KU) is an extended day program currently operating in three of our elementary schools: Howard, Roosevelt and Washington. The MAS/KU program is focused on helping students make academic progress as well as to participate in enrichment activities and gain positive school connections.
The District has earmarked $160,000 in the 2018-19 budget for the MAS/KU program, including $60,000 from the Title I grant and $100,000 from the General Fund, Elementary function 1111 under Professional Instr. Services. The $100,000 allocated in the General fund in 2018-19 will support the three schools mentioned above (Howard, Roosevelt and Washington).
There are also after school programs at Jackson, Oak Grove and Wilson currently served by Kids Unlimited. The District’s Title I grant supports the academic portion the program at $20,000 per school, for a total of $60,000.
In summary, Title I dollars will supplement all six Title I schools served by Kids Unlimited in 2018-19 for a total of $120,000 ($20,000 per school). This is in addition to the $100,000 from the General Fund for the three MAS/KU schools, bringing total funding to $220,000 across all funds. Funding for the 2017-18 school year was also $220,000. For comparison purposes, funding was $250,000, or $30,000 higher for the 2016-2017 school year. For more narrative about Title I programs, see pages 101-103.
30,494,913 31,081,579 32,635,481 33,432,123
-
5,000,000
10,000,000
15,000,000
20,000,000
25,000,000
30,000,000
35,000,000
40,000,000
2015-16A 2016-17A 2017-18B 2018-19B
Elementary Programs (K-6)

Financial
Successful Students Today ~ Successful Citizens Tomorrow 33
2015-16 2016-17 2017-18 2018-19 2018-19 2018-19Object Description Actual Actual Budget Proposed Approved AdoptedLicensed 4,480,374 4,517,824 4,523,164 4,837,226 - - Classified 308,959 322,053 470,499 353,347 - - Licensed Substitutes 182,036 183,819 10,000 - - - Classified Substitutes 7,183 9,343 11,763 12,000 - - Licensed Temporary 21,164 26,997 21,121 23,325 - - Classified Temporary 13,633 7,945 12,221 14,349 - - Classified Overtime 12,956 2,222 6,565 6,565 - - Extra Duty Compensation 84,889 84,232 83,502 83,564 - - Insurance Opt Out 12,500 10,200 8,041 14,682 - - SALARIES & WAGES 5,123,694 5,164,635 5,146,875 5,345,057 - - PERS 1,270,417 1,312,053 1,529,617 1,571,077 - - Social Security 308,947 310,253 306,460 344,308 - - Medicare 72,254 72,559 71,672 80,524 - - Workers Compensation 37,651 25,405 22,836 25,657 - - Unemployment 6,716 5,166 4,943 5,553 - - Health Insurance 1,079,529 1,066,401 1,184,062 1,206,043 - - Life Insurance 1,522 1,067 1,033 1,235 - - TSA Exec ER Paid 34,350 33,161 39,090 34,470 - - Long Term Disability 9,599 9,063 9,544 10,956 - - FSA/HSA 12,684 11,988 44,514 22,914 - - TSA Classified ER Paid Health Insurance Option 6,592 7,054 4,726 6,226 - - BENEFITS 2,840,261 2,854,171 3,218,496 3,308,963 - - Instr'l Program Improvement Svcs 3,221 - - 15,000 - - Professional Instr. Services 7,248 15,178 49,000 49,000 - - Repair/Maintenance 1,618 405 4,800 10,200 - - Pupil Transportation 542 907 - 400 - - Travel - In District 969 656 1,200 1,000 - - Travel - Out of District 2,547 4,596 2,500 1,500 - - Postage - 744 - - - - Professional Services 1,270 5,487 8,861 9,100 - - Other Licensed Subs - - 195,000 205,704 - - Other Classified Subs - - 2,628 2,600 - - PURCHASED SERVICES 17,414 27,974 263,989 294,504 - - Supplies and Materials 97,621 121,336 181,622 148,104 - - Textbooks 1,794 8,361 22,500 33,000 - - Library Books 110 - - - - - Periodicals 3,839 5,953 4,000 4,000 - - Non-Consumables 21,514 6,947 5,500 5,500 - - Software 28,641 8,284 17,000 26,000 - - Hardware /Equipment 11,071 11,616 10,500 40,500 - - SUPPLIES 164,590 162,497 241,122 257,104 - - CAPITAL OUTLAY - - - - - - Dues/Fees/Memberships 16,324 10,389 10,200 10,300 - - OTHER OBJECTS 16,324 10,389 10,200 10,300 - - MIDDLE SCHOOL-EXCEPT CO-CURR. 8,162,284 8,219,667 8,880,683 9,215,928 - -
57,382.67 1,015,726.22
General Fund - 1121 Middle School (Except Co-Curricular)

Financial
Successful Students Today ~ Successful Citizens Tomorrow 34
1121 Middle School Except Co-Curricular Continued
General Fund - 1121 Middle School (Except Co-Curricular)
Medford School District 549C serves approximately 2,200 middle school students, with two non-charter middle schools serving approximately 1,900 students, three charter middle schools, and one K-8 school with middle school students serving an additional 300 students. The FY18-19 Budget is roughly $9.2M, $0.3M (3.8%) higher than the FY17-18 Budget. Salaries & Wages are higher due to 3.5 additional FTE to support the launch of 6th grade academy, and is comprised of 2.0 Licensed employees, 1.0 Music teacher and 0.5 PE teacher. In the FY18-19 school year there will be a trial of 200 6th grade students attending McLoughlin and Hedrick Middle schools. 6th grade parents were given the option of applying for their child to participate in the academy experience. There will be a 5.0 FTE move from 1111, elementary to 1121, middle school to accommodate the increase of student for the 6th grade academy, with a $0 financial impact.
Instructional Program Improvement Services is up $15K due to funding for Junior Achievement Finance Park. This is a program for middle school students to gain experience in the business community. Professional Instructional Services includes iReady Math diagnostic and intervention curriculum. Supplies and Materials is down due to realigning this object with current actual spending. Software is up slightly due to a contract with Cengage, a company which supplies e-pins for the computer skills courses. Hardware is up $60k due to the purchase of six additional Chromebook carts for the incoming of 200 6th graders for the 6th grade academy.
The FY18-19 year reflects a student to licensed staff ratio to students of 1 to 27. Total FTE for FY18-19 is 90.43, which is 3.5 FTE higher than current staffing. This increase is due to the 6th grade academy increase of 200 students.
8,162,284 8,219,667 8,880,683
9,215,928
-
1,000,000
2,000,000
3,000,000
4,000,000
5,000,000
6,000,000
7,000,000
8,000,000
9,000,000
10,000,000
2015-16A 2016-17A 2017-18B 2018-19B
Middle School Except Co-Curricular

Financial
Successful Students Today ~ Successful Citizens Tomorrow 35
2015-16 2016-17 2017-18 2018-19 2018-19 2018-19Object Description Actual Actual Budget Proposed Approved AdoptedLicensed Substitutes 3,166 6,492 4,803 5,961 - - Extra Duty Compensation 201,912 206,530 211,246 217,798 - - SALARIES & WAGES 205,078 213,022 216,049 223,759 - - PERS 50,039 44,665 55,139 52,600 - - Social Security 12,439 12,950 13,097 14,226 - - Medicare 2,909 3,029 3,063 3,327 - - Workers Compensation 1,393 954 976 1,060 - - Unemployment 260 212 211 229 - - Health Insurance 2 - - - - - Life Insurance (0) - - 14 - - TSA Exec ER Paid 961 934 (10) - - - Long Term Disability - 1,489 - 116 - - TSA Classified ER Paid Health Insurance Option 192 238 210 - - - BENEFITS 68,196 64,470 72,687 71,572 - - Other Licensed Subs - - 5,746 5,685 - - PURCHASED SERVICES - - 5,746 5,685 - - CAPITAL OUTLAY - - - - - - OTHER OBJECTS - - - - - MIDDLE SCHOOL - CO-CURRICULAR 273,274 277,492 294,481 301,016 - -
4,218 39,043
General Fund Detail Budget - 1122 Middle School (Co-Curricular)
This function represents expenditures for stipends for middle school sports programs. Stipends for the FY18-19 Budget is relatively flat when compared to the FY17-18.
273,274 277,492 294,481 301,016
-
50,000
100,000
150,000
200,000
250,000
300,000
350,000
2015-16A 2016-17A 2017-18B 2018-19B
Middle School Co-Curricular

Financial
Successful Students Today ~ Successful Citizens Tomorrow 36
Notes Page

Financial
Successful Students Today ~ Successful Citizens Tomorrow 37
2015-16 2016-17 2017-18 2018-19 2018-19 2018-19Object Description Actual Actual Budget Proposed Approved AdoptedLicensed 9,250,846 9,531,088 9,320,321 9,630,857 - - Classified 510,611 533,276 664,849 550,754 - - Licensed Substitutes 361,520 447,541 7,663 11,000 - - Classified Substitutes 10,130 10,461 - - - - Licensed Temporary 61,062 71,364 74,338 54,338 - - Classified Temporary 35,519 35,637 39,720 39,720 - - Classified Overtime 2,728 2,851 3,474 3,474 - - Extra Duty Compensation 168,713 167,394 157,414 157,361 - - Insurance Opt Out 19,674 14,700 12,850 14,850 - - SALARIES & WAGES 10,420,802 10,814,313 10,280,628 10,462,354 - - PERS 2,534,286 2,648,876 3,118,586 3,207,075 - - Social Security 628,412 652,063 651,047 687,311 - - Medicare 146,969 152,498 147,584 160,742 - - Workers Compensation 69,211 49,031 47,023 51,216 - - Unemployment 13,919 10,818 10,178 11,086 - - Health Insurance 2,222,983 2,156,317 2,250,742 2,320,413 - - Life Insurance 3,359 2,452 2,194 2,479 - - TSA Exec ER Paid 59,498 58,281 46,836 55,908 - - Long Term Disability 17,871 18,715 19,997 22,382 - - FSA/HSA 39,781 41,535 95,003 60,003 - - TSA Classified ER Paid Health Insurance Option 8,087 8,405 7,688 8,289 - - BENEFITS 5,744,376 5,798,992 6,396,879 6,586,903 - - Instr'l Program Improvement Svcs 50,082 - - 2,500 - - Professional Growth 25 567 1,500 1,500 - - Professional Instr. Services 3,584 42,805 41,500 75,000 - - Cleaning Services 1,546 2,891 - - - - Repair and Maintenance 13,708 19,022 12,200 17,000 - - Rental Expense 658 - - - - - Pupil Transportation 6,463 9,929 16,000 14,000 - - Pupil Transportation OTHTS 4,422 2,033 3,500 4,000 - - Travel - In District 1,439 1,501 5,250 4,550 - - Travel - Out of District 17,874 7,071 27,500 11,000 - - Travel - Out of District - 36 - - - - Advertising 558 - - - - - Printing - - 500 500 - - Tuition 31,500 15,321 35,000 35,000 - - Professional Services - Other 64,838 6,700 5,850 3,850 - - Other Licensed Subs - - 608,437 615,372 - - Other Classified Subs - - 7,596 7,930 - - PURCHASED SERVICES 196,696 107,876 764,833 792,202 - - Supplies and Materials 222,019 284,570 346,925 408,651 - - Textbooks 86,451 54,059 59,350 89,200 - - Library Books 208 741 600 300 - - Periodicals 95 - 500 500 - - Food - - - - - Non-Consumables 12,845 19,891 34,000 25,688 - - Software 41,385 96,193 190,000 71,250 - - Hardware/Equipment 39,335 65,087 43,500 51,000 - - SUPPLIES 402,338 520,541 674,875 646,589 - - CAPITAL OUTLAY - - - - - - Dues/Fees/Memberships 8,448 112,873 75,100 72,100 - - OTHER OBJECTS 8,448 112,873 75,100 72,100 - - HIGH SCHOOL-EXCEPT CO-CURR 16,772,660 17,354,594 18,192,314 18,560,148 - -
581,933 2,012,002
General Fund Detail Budget - 1131 High School (Except Co-Curricular)

Financial
Successful Students Today ~ Successful Citizens Tomorrow 38
1131 High School Except Co-Curricular Continued
General Fund Detail Budget - 1131 High School (Except Co-Curricular)
Medford School District 549C serves approximately 4,000 high school students, with three non-charter high schools serving approximately 3,700 students and one charter high school with approximately 300 high school students. Expenditures in the FY18-19 Budget are $18.5M, which is $0.37M (2%) higher than the FY17-18 Budget. Licensed staffing for FY18-19 is up 4.0 FTE at 184.11 FTE versus current staffing at 180.10 across all funds. Of the 4.0 additional FTE, 1.0 FTE has been added to the General Fund due to open enrollment and an expected increase in student body for the Pathways Program. Another 3.0 FTE have been added for Measure 98. See Special Revenue page 119 for this narrative.
This function includes discretionary funds at each high school, which is determined and approved by the principal at each school. Professional Instructional Services is up $33.5k due to the TDG contract being moved in this function from the elementary function. Supplies and materials are up due to the additional services of iReady Math diagnostic and intervention curriculum. The software budget includes a contract with Cengage, a company which supplies e-pins for computer skills courses in the schools. Software expenses are lower due to a reduction of $100K contract with PLATO and the additional of a contract with Edgenuity, which will be paid for out of the Measure 98, Special Revenues grant for online schooling.
The FY18-19 Budget reflects a student to licensed staff ratio to students of 1 to 23. This ratio includes General Fund programs of Math, English, Science, Social Science, CTE, PE, Arts, Library, and ESS and excludes SPED and ELL.
16,772,660 17,354,594 18,192,314 18,560,148
-
2,000,000
4,000,000
6,000,000
8,000,000
10,000,000
12,000,000
14,000,000
16,000,000
18,000,000
20,000,000
2015-16A 2016-17A 2017-18B 2018-19B
High School Except Co-Curricular

Financial
Successful Students Today ~ Successful Citizens Tomorrow 39
2015-16 2016-17 2017-18 2018-19 2018-19 2018-19Object Description Actual Actual Budget Proposed Approved AdoptedLicensed Substitutes 7,439 - - - - - Licensed Temporary - 2,119 - - - - Classified Temporary 19 884 - - - - Extra Duty Compensation 568,552 559,732 579,573 579,572 - - Insurance Opt Out - - - - - - SALARIES & WAGES 576,010 562,735 579,573 579,572 - - PERS 83,019 84,109 116,724 127,315 - - Social Security 35,055 34,330 35,934 35,933 - - Medicare 8,238 8,029 8,404 8,404 - - Workers Compensation 3,942 4,393 2,678 2,678 - - Unemployment 762 562 580 580 - - Health Insurance 1,932 - - - - - Life Insurance 3 - - - - - TSA Exec ER Paid 1,174 1,495 1,192 900 - - Long Term Disability - 325 16 243 - - TSA Classified ER Paid Health Insurance Option 536 667 - - - - BENEFITS 134,661 133,910 165,526 176,052 - - Repair/Maintenance 374 - - - - - Travel - Out of District 308 - - - - - PURCHASED SERVICES 682 - - - - - SUPPLIES - - - - - - CAPITAL OUTLAY - - - - - - OTHER OBJECTS - - - - - - HIGH SCHOOL-CO-CURRICULAR 711,353 696,645 745,099 755,624 - -
(14,708) 8,444
General Fund Detail Budget - 1132 High School (Co-Curricular)
The FY18-19 Budget of $0.75M reflects expenditures for stipends for high school sports programs, which is relatively flat from the FY17-18 Budget. Medford enjoys popular and competitive high school sports. Athletic expenses outside of these coaching stipend costs are identified in the Special Revenue Secondary Athletics Fund, found on page 107 of this document. This co-curricular function maintains all positions and stipends for coaches for baseball, basketball, football, volleyball, golf, wrestling, softball, swimming, cross country, soccer, and track.
711,353 696,645 745,099 755,624
-
100,000
200,000
300,000
400,000
500,000
600,000
700,000
800,000
2015-16A 2016-17A 2017-18B 2018-19B
High School Co-Curricular

Financial
Successful Students Today ~ Successful Citizens Tomorrow 40
2015-16 2016-17 2017-18 2018-19 2018-19 2018-19Object Description Actual Actual Budget Proposed Approved AdoptedClassified 4,837 5,329 19,155 18,793 - - Licensed Substitutes - 175 - - - - Licensed Temporary 17,093 17,760 10,587 10,587 - - Classified Temporary - 204 - - - - Insurance Opt Out 333 466 253 253 - - SALARIES & WAGES 22,264 23,935 29,995 29,633 - - PERS 5,571 6,043 3,907 7,506 - - Social Security 1,353 1,462 1,602 1,879 - - Medicare 317 342 375 439 - - Workers Compensation 148 108 119 140 - - Unemployment 38 24 26 30 - - Health Insurance 13 3 6,490 11,903 - - Life Insurance 6 5 5 9 - - TSA Exec ER Paid 325 260 1,794 198 - - Long Term Disability - 23 22 41 - - FSA/HSA - - 149 - - - TSA Classified ER Paid Health Insurance Option 178 200 255 200 - - BENEFITS 7,948 8,470 14,744 22,346 - - Pupil Transportation - 32 - - - - Pupil Transportation OTHTS 45 471 - - - - Travel - In District - 548 - - - - Travel - Out of District 1,331 652 500 500 - - Other Licensed Subs - - - 669 - - PURCHASED SERVICES 1,376 1,703 500 1,169 - - Supplies and Materials 1,899 2,283 22,100 32,000 - - Textbooks 625 90 - - - - Non-Consumables 280 11,467 5,000 10,000 - - Software 205 - - - - - SUPPLIES 3,009 13,840 27,100 42,000 - - CAPITAL OUTLAY - - - - - Dues/Fees/Memberships 821 171 1,800 2,800 - - OTHER OBJECTS 821 171 1,800 2,800 - - TALENTED AND GIFTED 35,417 48,119 74,139 97,947 - -
12,702.23 60,142.53
The Talented and Gifted function funds support costs for this program and is anticipated to serve approximately 916 students in FY18-19 versus 790 students in FY17-18. Licensed temp labor is for migrant TAG support staff for approximately 10 weeks during the summer. The slight increase in supplies and materials and non-consumables in FY18-19 is due to the increase of 126 students in this program. This function has 0.62 FTE, which remains flat to current staffing.
General Fund Detail Budget - 1210 Talented and Gifted
35,417
48,119
74,139
97,947
-
20,000
40,000
60,000
80,000
100,000
120,000
2015-16A 2016-17A 2017-18B 2018-19B
Talented and Gifted

Financial
Successful Students Today ~ Successful Citizens Tomorrow 41
2015-16 2016-17 2017-18 2018-19 2018-19 2018-19Object Description Actual Actual Budget Proposed Approved AdoptedLicensed 1,231,637 1,354,077 1,324,200 1,360,702 - - Classified 1,013,518 1,126,028 1,192,264 1,237,403 - - Classified Substitutes 75,920 94,150 2,908 3,000 - - Licensed Temporary 2,873 9,469 4,322 4,322 - - Classified Temporary 604 18,979 407 407 - - Classified Overtime 2,640 4,107 3,404 3,404 - - Extra Duty Compensation 38,840 40,167 35,206 55,036 - - Insurance Opt Out 19,600 17,191 12,744 19,110 - - SALARIES & WAGES 2,385,631 2,664,168 2,575,455 2,683,383 - - PERS 508,460 539,822 716,844 735,462 - - Social Security 144,145 159,870 162,140 172,877 - - Medicare 33,711 37,389 37,920 40,431 - - Workers Compensation 16,875 14,441 12,098 12,882 - - Unemployment 3,129 2,664 2,615 2,788 - - Health Insurance 732,504 812,244 814,086 847,389 - - Life Insurance 1,142 995 777 1,018 - - TSA Exec ER Paid 28,819 29,804 58,328 22,045 - - Long Term Disability 3,898 5,072 4,845 5,557 - - FSA/HSA 20,461 24,145 39,511 39,511 - - TSA Classified ER Paid Health Insurance Option 16,057 18,232 14,027 14,027 - - BENEFITS 1,509,202 1,644,678 1,863,189 1,893,987 - - Professional Instr. Services 3,000 - 4,000 4,000 - - Repair/Maintenance - 365 - - - - Professional Services - 32 - - - - Other Licensed Subs - - 25,920 39,993 - - Other Classified Subs - - 66,134 64,955 - - PURCHASED SERVICES 3,000 397 96,054 108,948 - - Supplies and Materials 5,481 1,761 10,200 10,200 - - Non-Consumables 24,688 6,879 27,600 27,600 - - Software 630 4,567 14,000 14,000 - - Hardware Under $5000 4,904 - 9,800 9,800 - - SUPPLIES 35,703 13,206 61,600 61,600 - - Building Improvements - 2,708 - - - - CAPITAL OUTLAY - 2,708 - - - - OTHER OBJECTS - - - - - - SPECIAL EDUCATION 3,933,536 4,325,157 4,596,299 4,747,918 - -
391,620.45 180,343.71
General Fund Detail Budget - 1220/1240 SPED Self Contained Programs & Other Specialized Supports

Financial
Successful Students Today ~ Successful Citizens Tomorrow 42
1220/1240 Special Education Self-Contained Programs & Other Specialized Supports Continued
For a comprehensive picture of the changes to consolidated Special Education spending and staffing across all functions and funds, please see the year-over-year SPED budget comparison on page 29.
This function provides funding for direct program support and instruction for approximately 320 students at twelve school sites. The District also purchases specialized services from the Southern Oregon Education Service District (SOESD) for approximately 16 District students in the STEPS programs, and 15 students in PDHH (Program for the Deaf and Hard of Hearing).
The FY18-19 Budget is funded at $4.7M up $0.15M (3.3%) from FY17-18 Budget. This is mainly due to contractual wage increases and associated benefits. Staffing for the FY18-19 Budget for these functions across all funds is 71.38, which is 1.0 FTE less than current staffing due to this FTE transferring of 1.0 FTE to function 2140, Psychological Services.
General Fund Detail Budget - 1220/1240 SPED Self Contained Programs & Other Specialized Supports
3,933,536
4,325,157 4,596,299 4,747,918
-
1,000,000
2,000,000
3,000,000
4,000,000
5,000,000
2015-16A 2016-17A 2017-18B 2018-19B
Special Education Self Contained Programs & Other Specialized Supports
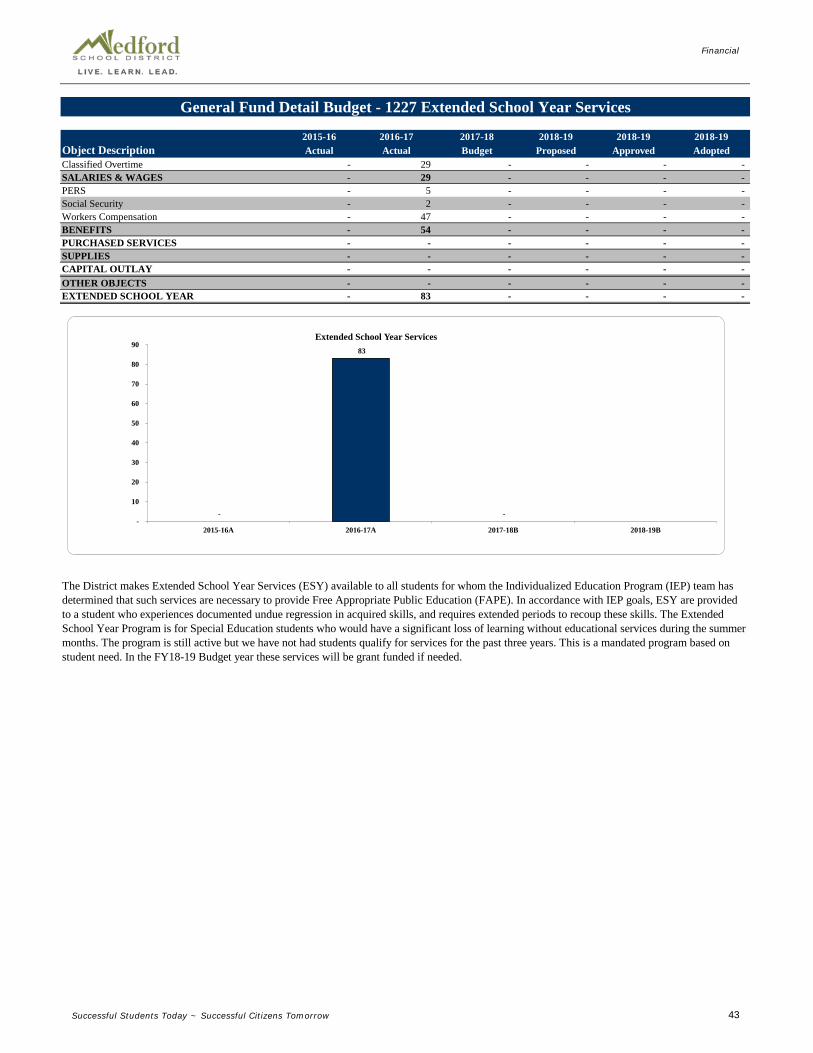
Financial
Successful Students Today ~ Successful Citizens Tomorrow 43
2015-16 2016-17 2017-18 2018-19 2018-19 2018-19Object Description Actual Actual Budget Proposed Approved AdoptedClassified Overtime - 29 - - - - SALARIES & WAGES - 29 - - - - PERS - 5 - - - - Social Security - 2 - - - - Workers Compensation - 47 - - - - BENEFITS - 54 - - - - PURCHASED SERVICES - - - - - - SUPPLIES - - - - - - CAPITAL OUTLAY - - - - - - OTHER OBJECTS - - - - - - EXTENDED SCHOOL YEAR - 83 - - - -
83 -
The District makes Extended School Year Services (ESY) available to all students for whom the Individualized Education Program (IEP) team has determined that such services are necessary to provide Free Appropriate Public Education (FAPE). In accordance with IEP goals, ESY are provided to a student who experiences documented undue regression in acquired skills, and requires extended periods to recoup these skills. The Extended School Year Program is for Special Education students who would have a significant loss of learning without educational services during the summer months. The program is still active but we have not had students qualify for services for the past three years. This is a mandated program based on student need. In the FY18-19 Budget year these services will be grant funded if needed.
General Fund Detail Budget - 1227 Extended School Year Services
-
83
- -
10
20
30
40
50
60
70
80
90
2015-16A 2016-17A 2017-18B 2018-19B
Extended School Year Services

Financial
Successful Students Today ~ Successful Citizens Tomorrow 44
2015-16 2016-17 2017-18 2018-19 2018-19 2018-19Object Description Actual Actual Budget Proposed Approved AdoptedLicensed 1,514,278 1,765,202 1,818,280 1,895,174 - - Classified 589,945 651,812 772,260 779,722 - - Licensed Substitutes 174 - - - - - Licensed Temporary 3,704 5,086 4,400 4,400 - - Classified Temporary 2,743 8,868 3,658 3,658 - - Classified Overtime 323 1,351 291 291 - - Extra Duty Compensation 47,277 59,841 47,480 47,445 - - Insurance Opt Out 10,800 3,400 8,192 11,291 - - SALARIES & WAGES 2,169,243 2,495,560 2,654,561 2,741,981 - - PERS 492,473 572,795 694,730 767,267 - - Social Security 129,756 149,672 147,019 170,127 - - Medicare 30,346 35,004 34,383 39,788 - - Workers Compensation 14,553 11,236 10,955 12,677 - - Unemployment 2,873 2,497 2,371 2,744 - - Health Insurance 649,625 672,035 700,093 761,779 - - Life Insurance 965 795 588 882 - - TSA Exec ER Paid 20,942 19,987 42,635 22,610 - - Long Term Disability 4,048 4,423 4,389 5,690 - - FSA/HSA 10,744 11,689 15,399 28,785 - - TSA Classified ER Paid Health Insurance Option 11,558 9,567 10,480 15,186 - - BENEFITS 1,367,883 1,489,699 1,663,042 1,827,533 - - Professional Instr. Services 26,774 - 100,000 100,000 - - Other Licensed Subs - - 315 - - - Other Classified Subs - - - 2,000 - - PURCHASED SERVICES 26,774 - 100,315 102,000 - - Software 15,541 - 16,000 16,000 - - Hardware Under $5000 - - - 5,000 - - SUPPLIES 15,541 - 16,000 21,000 - - CAPITAL OUTLAY - - - - - - OTHER OBJECTS - - - - - - ERC / RESOURCE ROOMS 3,579,441 3,985,258 4,433,919 4,692,514 - -
405,817.73 566,073.37
The Education Resource Centers (ERC) - Resource Room function provides special education services to approximately 1,278 students across the District. The FY18-19 Budget of nearly $4.7M is $0.26M (5.8%) higher than the FY17-18 Budget of $4.4M. This is mostly due to COLA and step wage increases. Staffing for FY18-19 is 63.49 FTE, which is up 2.0 FTE Licensed employees from current staffing.
General Fund Detail Budget - 1250 ERC - Resource Rooms
3,579,441
3,985,258
4,433,919 4,692,514
-
500,000
1,000,000
1,500,000
2,000,000
2,500,000
3,000,000
3,500,000
4,000,000
4,500,000
5,000,000
2015-16A 2016-17A 2017-18B 2018-19B
ERC - Resource Rooms

Financial
Successful Students Today ~ Successful Citizens Tomorrow 45
2015-16 2016-17 2017-18 2018-19 2018-19 2018-19Object Description Actual Actual Budget Proposed Approved AdoptedLicensed - 1,000 - 70,470 - - Classified - - - 88,079 - - Classified Temporary - 2,750 - - - - SALARIES & WAGES - 3,750 - 158,549 - - PERS Tiers I & II - 726 - 27,409 - - Social Security - 233 - 9,830 - - Medicare - 54 - 2,299 - - Workers Compensation - 13 - 732 - - Unemployment - 4 - 159 - - Health Insurance - - - 54,576 - - Life Insurance - - - 71 - - TSA Exec ER Paid - - - 1,602 - - Long Term Disability - - - 349 - - TSA Classified ER Paid Health Insurance Option - - - 1,200 - - BENEFITS - 1,030 - 98,227 - - Professional Services 150,000 163,000 189,000 32,000 - - PURCHASED SERVICES 150,000 163,000 189,000 32,000 - - SUPPLIES - - - - - - CAPITAL OUTLAY - - - - - - OTHER OBJECTS - - - - - - EARLY INTERVENTION 150,000 167,780 189,000 288,775 - -
125,775
General Fund Detail Budget - 1260/ 1261 Early Intervening
This page represents two functions 1260 and 1261. 1260, Early Intervention Childhood, provides evaluation services for approximately 490 Medford School District early childhood students younger than five years old. Function 1261, Early Intervening Services, provides preventative academic and behavioral support to school age students not elibigle for special education. These functions have been contracted solely with the Douglas ESD for evaluations in the past, but we are moving some staffing in house for FY18-19. In FY18-19 there will be an increase of 2.5 FTE in 1260, Early Intervention Childhood for 1.5 Licensed employees for 3-5 year old evaluations, and the addition of 1.0 FTE Secretary. These additional expenses will be partially offset by the reduction of $157K from the Douglas ESD contract. There will be an increase of 2.0 FTE's in function 1261, Early Intervening for Educational Assistants. An additional 1.2 FTE is in function 1261 in the Special Revenue fund. Across all funds, these two functions have a total of 12.86 FTE, which is 5.7 FTE higher than the current staffing. Of this 5.7 FTE, 4.5 are in the General Fund (explained above) and 1.2 are in the Special Revenue fund.
150,000 167,780
189,000
288,775
-
50,000
100,000
150,000
200,000
250,000
300,000
350,000
2015-16A 2016-17A 2017-18B 2018-19B
Early Intervention

Financial
Successful Students Today ~ Successful Citizens Tomorrow 46
2015-16 2016-17 2017-18 2018-19 2018-19 2018-19Actual Actual Budget Proposed Approved Adopted
Licensed 161,099 180,967 177,894 193,887 - - Classified 37,305 46,570 47,798 48,406 - - Licensed Substitutes 967 - - - - - Classified Substitutes 326 - - - - - Licensed Temporary 15,810 21,826 23,986 23,986 - - Classified Temporary 522 1,276 415 415 - - Classified Overtime 428 368 338 338 - - SALARIES & WAGES 216,457 251,006 250,430 267,032 - - PERS 56,212 68,366 75,968 80,966 - - Social Security 12,760 14,750 15,645 16,680 - - Medicare 2,984 3,450 3,660 3,901 - - Workers Compensation 1,505 1,163 1,166 1,243 - - Unemployment 668 251 252 269 - - Health Insurance 58,290 65,588 82,236 88,471 - - Life Insurance 158 138 62 71 - - TSA Exec ER Paid 1,350 1,951 1,954 1,950 - - Long Term Disability 613 701 501 533 - - FSA/HSA 3,134 1,408 1,416 2,416 - - TSA Classified ER Paid Health Insurance Option 450 900 845 900 - - BENEFITS 138,124 158,666 183,706 197,399 - - Travel - In District 14 - - - - - Postage/Printing - 11 - - - - Other Licensed Subs - - 1,755 2,000 - - Other Classified Subs - - 592 - - - PURCHASED SERVICES 14 11 2,347 2,000 - - Supplies and Materials 4,950 1,785 5,300 4,400 - - Library Books 137 424 500 500 - - Periodicals - 170 - - - - SUPPLIES 5,087 2,379 5,800 4,900 - - CAPITAL OUTLAY - - - - - - Grant Indirect Charges - 4,530 - - - - OTHER OBJECTS - 4,530 - - - - ALTERNATIVE EDUCATION 359,682 416,592 442,283 471,331 - -
56,910 59,964
Object Description
Alternative Education is the title given to programs outside of our traditional schools. The FY18-19 Budget of $0.47M is $29K (6.6%) higher than FY17-18 Budget, driven primarily by contractual compensation increase and associated benefits. The District has worked with multiple alternative education programs for years, and the trend is increasing for online and charter school programs. This function changed significantly in recent years from a Special Education function to Alternative Education programs and includes the Options, Options Jr., Juvenile Detention Program (JDEP), and Medford Opportunity School (MOS). Staffing is flat at 4.38 FTE.
General Fund Detail Budget - 1283 Alternative Education
359,682
416,592 442,283
471,331
-
50,000
100,000
150,000
200,000
250,000
300,000
350,000
400,000
450,000
500,000
2015-16A 2016-17A 2017-18B 2018-19B
Alternative Education

Financial
Successful Students Today ~ Successful Citizens Tomorrow 47
2015-16 2016-17 2017-18 2018-19 2018-19 2018-19Actual Actual Budget Proposed Approved Adopted
SALARIES & WAGES - - - - - - BENEFITS - - - - - - Charter School Payments 9,186,083 10,028,622 11,633,690 11,956,392 - - PURCHASED SERVICES 9,186,083 10,028,622 11,633,690 11,956,392 - - SUPPLIES - - - - - - CAPITAL OUTLAY - - - - - - OTHER OBJECTS - - - - - - CHARTER SCHOOLS 9,186,083 10,028,622 11,633,690 11,956,392 - -
842,539 2,240,870
Object Description
General Fund Detail Budget - 1288 Charter Schools
The Charter School function provides for the pass-through of the majority of the state funding received for charter school enrollment to District sponsored charter schools. The Madrone Trail Public Charter School, Logos Public Charter School, Kids Unlimited Academy Public Charter School and The Valley School of Southern Oregon are the four District-sponsored charter schools budgeted. Charter schools started in the District in FY07-08 and ADMr has grown 1,675 from 71 in FY08-09 to an estimated 1,746 or approximately 12.25% of ADMr in FY18-19B. The FY18-19 Budget of $12.0M is $0.3M (2.8%) higher than the FY17-18 Amended Budget. Charter School enrollment is anticipated to increase 67 students primarily due to an increase of 50 students at Kids Unlimited Academy from adding another grade.
9,186,083 10,028,622
11,633,690 11,956,392
-
2,000,000
4,000,000
6,000,000
8,000,000
10,000,000
12,000,000
14,000,000
2015-16A 2016-17A 2017-18B 2018-19B
Charter Schools

Financial
Successful Students Today ~ Successful Citizens Tomorrow 48
Notes Page

Financial
Successful Students Today ~ Successful Citizens Tomorrow 49
2015-16 2016-17 2017-18 2018-19 2018-19 2018-19Actual Actual Budget Proposed Approved Adopted
Licensed 1,248,551 1,289,434 1,333,022 1,311,129 - - Classified 489,269 493,340 554,824 564,092 - - Licensed Substitutes 87 14,124 - - - - Classified Substitutes 473 199 (0) - - - Licensed Temporary 17,587 8,918 18,309 18,309 - - Classified Temporary 20,485 24,712 17,009 19,427 - - Classified Overtime 6,305 5,889 3,341 3,341 - - Insurance Opt Out 7,377 9,292 4,801 7,377 - - SALARIES & WAGES 1,790,135 1,845,909 1,931,307 1,923,677 - - PERS 445,529 462,239 549,398 567,899 - - Social Security 106,912 110,363 115,910 119,296 - - Medicare 25,003 25,801 27,088 27,900 - - Workers Compensation 11,941 8,281 8,631 8,889 - - Unemployment 2,383 1,846 1,870 1,924 - - Health Insurance 379,512 398,200 449,457 454,522 - - Life Insurance 652 1,286 415 486 - - TSA Exec ER Paid 16,313 15,639 33,711 13,464 - - Long Term Disability 2,822 3,251 3,366 3,864 - - FSA/HSA 5,631 9,724 9,394 19,894 - - TSA Classified ER Paid Health Insurance Option 6,260 5,750 3,803 3,803 - - BENEFITS 1,002,958 1,042,380 1,203,042 1,221,942 - - Professional Instr. Services 15,510 17,475 10,000 5,000 - - Pupil Transp 587 108 400 - - - Pupil Transp - O.T.H.T.S. 706 - - - - - Travel - In District 3,018 2,363 700 700 - - Travel - Out of District 692 12,941 4,000 4,000 - - Tuition - - 30,000 30,000 - - Professional Services 3,116 3,269 8,000 8,000 - - Other Licensed Subs - - - 200 - - Other Classified Subs - - 251 250 - - PURCHASED SERVICES 23,628 36,156 53,351 48,150 - - Supplies and Materials 16,415 18,225 55,000 45,000 - - Textbooks 10,910 34,071 10,000 10,000 - - Periodicals 374 474 400 400 - - Non-Consumables 2,867 1,185 9,000 9,000 - - Software 92,673 114,953 90,000 90,000 - - Hardware Under $5,000 482 - 4,000 4,000 - - SUPPLIES 123,720 168,908 168,400 158,400 - - CAPITAL OUTLAY - - - - - - Dues/Fees/Memberships 174 - 200 200 - - OTHER OBJECTS 174 - 200 200 - - ENGLISH LANGUAGE LEARNERS 2,940,615 3,093,352 3,356,300 3,352,369 - -
152,737.74 271,655
Object Description
General Fund Detail Budget - 1291 English Language Learners

Financial
Successful Students Today ~ Successful Citizens Tomorrow 50
1291 English Language Learners Continued
Across all funds the FTE for FY18-19 is 42.96, which remains flat to current staffing. In summary, the District’s English as a Second Language (ESL) program is described in the following few sentences, and represents FTE across all funds. English for Speakers of Other Languages (ESOL) endorsed teachers (22.2 FTE) are assigned to all elementary, middle, and high school locations based on the number of students at each location. Staff are focused on instructing students, using the English Language Development Curriculum and other supplementary materials, with the goal of English language acquisition for every student. ESL Assistants (13.83 FTE) are used within the program to assist students in language acquisition and to provide student support within core curriculum areas. The staff’s time and location are based on student need, so some locations are assigned more ESL assistant and teacher time than others. Student need may include orientation for a new non-English speaking student. In this scenario, an assistant would spend one-on-one time with the student to help the student acquire the basic language skills necessary to navigate throughout a school. Assistants may also supervise students in a computer lab using English language computer software. The ESL program receives additional support from a Teacher on Special Assignment (1.07 FTE) who supports the program in terms of language acquisition and program fidelity, staff training and support, and data analysis. Finally, the program employs Success Specialists (3.14 FTE) who provide direct support for students in the program and by helping them succeed in school. They also provide a much needed connection to the families of ESL students, which help support the work of the school by assisting parents at home with common school expectations. The District is working proactively to hire additional dual language employees in its school locations, primarily seeking individuals with English and Spanish as their dual languages. The District also has 2.47 FTE Translators and 0.25 FTE Federal Programs Secretary.
The FY18-19 Budget of $3.3M is essentially flat to last year.
General Fund Detail Budget - 1291 English Language Learners
2,940,615 3,093,352
3,356,300 3,352,369
-
500,000
1,000,000
1,500,000
2,000,000
2,500,000
3,000,000
3,500,000
4,000,000
2015-16A 2016-17A 2017-18B 2018-19B
English Language Learners

Financial
Successful Students Today ~ Successful Citizens Tomorrow 51
2015-16 2016-17 2017-18 2018-19 2018-19 2018-19Actual Actual Budget Proposed Approved Adopted
Licensed - 12,393 12,406 9,090 - - Classified 183,742 189,722 202,324 207,141 - - Classified Substitutes 2,683 10,845 (0) - - - Classified Temporary - 2,788 - - - - Classified Overtime 240 133 364 364 - - Insurance Opt Out 2,200 200 1,517 2,217 - - SALARIES & WAGES 188,865 216,081 216,611 218,813 - - PERS 36,928 41,675 51,650 55,867 - - Social Security 11,477 13,055 13,430 13,659 - - Medicare 2,684 3,053 3,160 3,195 - - Workers Compensation 1,375 980 1,007 1,018 - - Unemployment 258 216 217 220 - - Health Insurance 52,748 63,202 65,748 68,386 - - Life Insurance 77 62 73 92 - - TSA Exec ER Paid 2,400 3,750 7,031 4,100 - - Long Term Disability 340 384 360 389 - - FSA/HSA 673 739 1,157 3,657 - - TSA Classified ER Paid Health Insurance Option 2,206 3,898 4,419 4,419 - - BENEFITS 111,165 131,014 148,250 155,000 - - Travel - In District - 254 120 120 - - Travel - Out of District 1,455 (306) 600 600 - - Other Classified Subs - - 1,540 1,500 - - PURCHASED SERVICES 1,455 (53) 2,260 2,220 - - Supplies and Materials - 20 1,250 1,500 - - Non-Consumables 704 340 500 500 - - Software 200 - - - - - SUPPLIES 904 360 1,750 2,000 - - CAPITAL OUTLAY - - - - - - Dues/Fees/Memberships 508 1,367 500 500 - - OTHER OBJECTS 508 1,367 500 500 - - TEEN PARENT 302,897 348,769 369,372 378,533 - -
45,872 31,355
The Pregnant and Parenting Teen (PPT) program located at the North Medford High School Child Development Center (CDC) serves approximately 15-35 students and 15-35 babies a year (12.41 ADMr as of March, 2018). The PPT program serves students from school districts across Southern Oregon and helps achieve multiple objectives including 1) helping pregnant students graduate or obtain a GED, 2) helping students take college articulated coursework, 3) providing childcare services both for students with children and the community at large, 4) teaching healthy life styles and parenting skills, and 5) educating high school students on child development.
There are Federal block grants, State Department of Human Services support payments and local Preschool user fees to help fund the PPT program. The annual required operating expenses in the General Fund FY18-19 Budget is $0.38M, which is flat to FY17-18 due primarily to 3 new employees replacing employees who had slightly higher wages. Total FTE is 7.51.
General Fund Detail Budget - 1292 Teen Parent
Object Description
302,897
348,769 369,372 378,533
-
50,000
100,000
150,000
200,000
250,000
300,000
350,000
400,000
2015-16A 2016-17A 2017-18B 2018-19B
Teen Parent
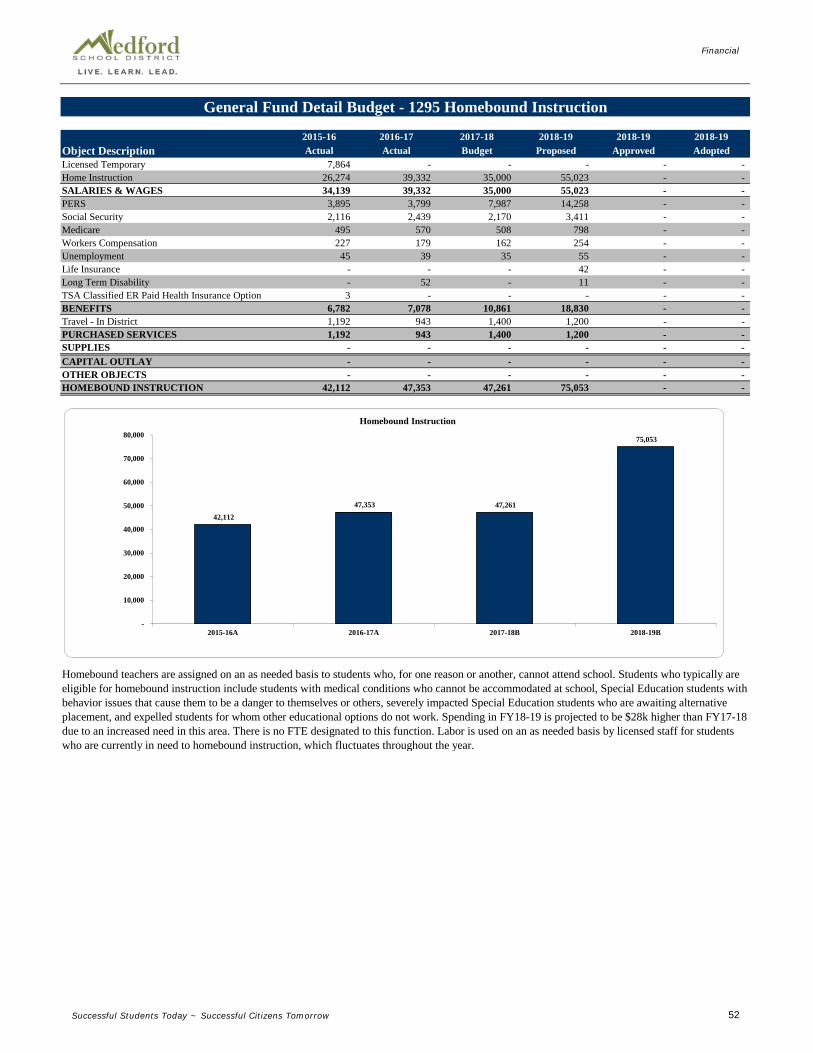
Financial
Successful Students Today ~ Successful Citizens Tomorrow 52
2015-16 2016-17 2017-18 2018-19 2018-19 2018-19Actual Actual Budget Proposed Approved Adopted
Licensed Temporary 7,864 - - - - - Home Instruction 26,274 39,332 35,000 55,023 - - SALARIES & WAGES 34,139 39,332 35,000 55,023 - - PERS 3,895 3,799 7,987 14,258 - - Social Security 2,116 2,439 2,170 3,411 - - Medicare 495 570 508 798 - - Workers Compensation 227 179 162 254 - - Unemployment 45 39 35 55 - - Life Insurance - - - 42 - - Long Term Disability - 52 - 11 - - TSA Classified ER Paid Health Insurance Option 3 - - - - - BENEFITS 6,782 7,078 10,861 18,830 - - Travel - In District 1,192 943 1,400 1,200 - - PURCHASED SERVICES 1,192 943 1,400 1,200 - - SUPPLIES - - - - - - CAPITAL OUTLAY - - - - - - OTHER OBJECTS - - - - - - HOMEBOUND INSTRUCTION 42,112 47,353 47,261 75,053 - -
#REF! 29,361
General Fund Detail Budget - 1295 Homebound Instruction
Homebound teachers are assigned on an as needed basis to students who, for one reason or another, cannot attend school. Students who typically are eligible for homebound instruction include students with medical conditions who cannot be accommodated at school, Special Education students with behavior issues that cause them to be a danger to themselves or others, severely impacted Special Education students who are awaiting alternative placement, and expelled students for whom other educational options do not work. Spending in FY18-19 is projected to be $28k higher than FY17-18 due to an increased need in this area. There is no FTE designated to this function. Labor is used on an as needed basis by licensed staff for students who are currently in need to homebound instruction, which fluctuates throughout the year.
Object Description
42,112 47,353 47,261
75,053
-
10,000
20,000
30,000
40,000
50,000
60,000
70,000
80,000
2015-16A 2016-17A 2017-18B 2018-19B
Homebound Instruction

Financial
Successful Students Today ~ Successful Citizens Tomorrow 53
2015-16 2016-17 2017-18 2018-19 2018-19 2018-19Actual Actual Budget Proposed Approved Adopted
Classified 6,343 7,362 7,567 7,713 - - Licensed Temporary 4,357 8,712 6,465 6,465 - - SALARIES & WAGES 10,700 16,074 14,032 14,178 - - PERS 2,318 2,604 3,288 3,379 - - Social Security 638 973 870 879 - - Medicare 149 228 203 206 - - Workers Compensation 81 123 65 66 - - Unemployment 13 16 14 14 - - Health Insurance 3,170 2,984 3,594 2,400 - - Life Insurance 5 3 4 - - - TSA Exec ER Paid 165 183 - 150 - - Long Term Disability - 30 17 17 - - FSA/HSA - - 50 - - - TSA Classified ER Paid Health Insurance Option 75 150 143 300 - - BENEFITS 6,614 7,294 8,248 7,410 - - Pupil Transportation OTHTS 71 108 - - - - Travel - In District 128 - - - - - Professional Services 25,080 22,862 35,000 25,000 - - PURCHASED SERVICES 25,279 22,970 35,000 25,000 - - SUPPLIES - - - - - - CAPITAL OUTLAY - - - - - - OTHER OBJECTS - - - - - - AT-RISK 42,592 46,338 57,280 46,588 - -
3,745 (8,926)
The At Risk function provides instruction activities designed to assist students with risk factors that affect the learning process. This function includes Professional Services for the Maslow Project, which provides food, services, and clothing to an increasing number of homeless students in the community. FY18-19 spending is slightly lower to align better with prior year's actual spending. Staffing also remains flat in FY18-19 at 0.25 FTE.
General Fund Detail Budget - 1297 At-Risk
Object Description
42,592 46,338
57,280
46,588
-
10,000
20,000
30,000
40,000
50,000
60,000
70,000
2015-16A 2016-17A 2017-18B 2018-19B
At - Risk

Financial
Successful Students Today ~ Successful Citizens Tomorrow 54
2015-16 2016-17 2017-18 2018-19 2018-19 2018-19Actual Actual Budget Proposed Approved Adopted
Classified 426 2,745 - - - - Licensed Substitutes 14,283 - (0) - - - Licensed Temporary 97,951 121,649 119,871 119,871 - - Classified Temporary 33,542 42,200 40,901 40,901 - - Classified Overtime 100 - - - - - SALARIES & WAGES 146,302 166,594 160,772 160,772 - - PERS 30,188 38,285 39,161 36,688 - - Social Security 9,038 10,276 9,968 9,968 - - Medicare 2,114 2,403 2,331 2,331 - - Workers Compensation 1,296 1,181 743 743 - - Unemployment 146 166 161 161 - - TSA Exec ER Paid 126 95 7 - - - Long Term Disability - 270 - - - - TSA Classified ER Paid Health Insurance Option 146 26 - - - - BENEFITS 43,053 52,702 52,370 49,891 - - Pupil Transportation OTHTS 212 - 1,000 2,000 - - Other Licensed Subs - - - - - - PURCHASED SERVICES 212 - 1,000 2,000 - - Supplies and Materials 269 399 1,000 1,000 - - SUPPLIES 269 399 1,000 1,000 - - CAPITAL OUTLAY - - - - - - OTHER OBJECTS - - - - - - SUMMER SCHOOL-HIGH SCHOOL 189,836 219,695 215,142 213,663 - -
29,859 (22,199)
The budget for summer school for FY18-19 is essentially flat to last year at $213K, down $1.5K (0.69%). The summer school program provides critical additional support for students who are credit deficient, in need of additional support, or to complete graduation requirements. Prior to the summer of 2014, the summer school program has focused mainly on high school credit recovery. The expansion of the summer school program provides significant increases in order to meet individual student needs at the middle school level as well as high school. Panther and Tornado camp is a 2 week period provided for incoming freshman students who are in need of academic confidence and support. Students will continue to have access to credit recovery options and targeted interventions based on each student's specific needs. Students can use this option to graduate on time with their class cohort.
Highly qualified licensed staff deliver instruction based on student needs, preparing students for regular school year courses and developing much needed study skills. There is no FTE in this function, but is staffed with existing employees who also choose to work during the summer. There will be administrative presence during the summer programs on all sites as well as classified support staff. During the summer sessions, schools will be open for four to five hours each day. The District's objective is to benefit between 500-800 students in this program while filling content skill gaps for students.
As previously noted, one of the focuses of summer school is to assist students in the completion of graduation requirements. In 2017-18 summer school there were 15 students who graduated, and in 2016-17 summer school there were 41 students who completed their graduation requirements.
Object Description
General Fund Detail Budget - 1430 Summer School - High School
189,836
219,695 215,142 213,663
-
50,000
100,000
150,000
200,000
250,000
2015-16A 2016-17A 2017-18B 2018-19B
Summer School - High School

Financial
Successful Students Today ~ Successful Citizens Tomorrow 55
DIRECT 2015-16 2016-17 2017-18 2018-19 2018-19 2018-19INSTRUCTION SUPPORT Actual Actual Budget Proposed Approved AdoptedAttendance 66,166 75,640 133,961 120,530 - - Student Resource Officers 44,056 55,202 70,000 220,000 - - Office of the Dean 501,401 487,432 493,044 617,417 - - Counseling 1,080,786 1,098,945 1,143,072 1,144,487 - - Nursing 549,391 632,168 626,157 706,648 - - Psychological Services 1,874,678 1,813,365 2,147,574 2,697,691 - - Speech & Audiology 1,709,426 1,871,913 2,042,289 2,105,076 - - General Student Support 465,934 510,967 618,808 691,678 - - DIRECT INSTRUCTION SUPPORT 6,291,838 6,545,631 7,274,903 8,303,527 - -
DIRECT 2015-16 2016-17 2017-18 2018-19 2018-19 2018-19STAFF SUPPORT Actual Actual Budget Proposed Approved AdoptedImprovement of Instruction - Media 114,339 123,368 125,156 129,120 - - Instructional Development 41,942 41,118 47,000 47,000 - - Curriculum Development 372,489 341,596 552,737 374,788 - - Instructional Media Services 167,947 151,737 161,078 173,846 - - School Libraries 1,618,740 1,695,186 1,791,075 1,809,723 - - Audiovisual Services 14,670 14,163 14,400 15,169 - - Instructional Staff Development 217,511 262,039 238,668 319,089 - - DIRECT STAFF SUPPORT 2,547,639 2,629,207 2,930,114 2,868,735 - -
TOTAL DIRECT INSTRUCTION SUPPORT 8,839,477 9,174,839 10,205,017 11,172,262 - -
General Fund Expenditures - Student and Staff Support Functions
Spending for the Student and Staff Support functions are budgeted at $11.1M for the FY18-19 Budget, up $0.967M (9.5%) from the FY17-18 Budget. Across all funding sources, staffing for the FY17-18 Budget is 115.78 FTE, a 12.55 FTE increase from current staffing. This is due to the following changes: the addition of .5 FTE at Hedrick for a Dean, a reduction of 2.0 FTE for ESS's moving to function 1260, Early Intervention Childhood, the addition of 2.0 FTE Licensed Practical Nurses replacing the attrition of 1.0 FTE Registered Nurse, the addition of 2.8 FTE Behavior Specialists (partially funded by the IDEA grant) and 7 FTE Classified ESS's in function 2140, Psychological Services, 1.0 FTE additional Speech & Language Pathologist, an addition of 1.0 FTE TOSA in function 2190, Student Support Services, a 1.0 FTE increase for 2240, Instructional Staff Development for a Staff Development Coordinator (funded by the reduction of services paid for to the SOESD), and a 0.25 FTE increase in 2210, Improvement of Instruction in the Special Revenue fund for a Licensed employee who is moving from 1272, Title I.
Student Resource Officers (SRO), function 2115, is up $150K to cover one contracting with Medford police department for one additional officer and the depreciation of one police car for one year. Spending changes for FY18-19 are detailed in the narratives for each function.
8,839,477 9,174,839
10,205,017
11,172,262
-
2,000,000
4,000,000
6,000,000
8,000,000
10,000,000
12,000,000
2015-16A 2016-17A 2017-18B 2018-19B
Student and Staff Support

Financial
Successful Students Today ~ Successful Citizens Tomorrow 56
2015-16 2016-17 2017-18 2018-19 2018-19 2018-19Actual Actual Budget Proposed Approved Adopted
Classified - - 57,457 48,561 - - Classified Temporary - - 14,049 14,049 - - SALARIES & WAGES - - 71,506 62,610 - - PERS - - 5,800 12,947 - - Social Security - - 3,090 3,882 - - Medicare - - 723 908 - - Workers Compensation (0) - 230 289 - - Unemployment - - 50 63 - - Health Insurance - - 15,269 2,400 - - Life Insurance - - 14 28 - - TSA Exec ER Paid - - 492 550 - - Long Term Disability - 67 79 53 - - TSA Classified ER Paid Health Insurance Option - - 508 600 - - BENEFITS (0) 67 26,255 21,720 - - Professional Instr. Services 66,166 75,573 - - - - Professional Services - - 36,200 36,200 - - PURCHASED SERVICES 66,166 75,573 36,200 36,200 - - SUPPLIES - - - - - - CAPITAL OUTLAY - - - - - - OTHER OBJECTS - - - - - - ATTENDANCE 66,166 75,640 133,961 120,530 - -
#REF! 58,530
General Fund Detail Budget - 2112 Attendance
Object Description
The District formerly contracted with SOESD for a secondary attendance specialist, but in FY17-18 this function was moved to the Medford School District at 2.0 FTE. These attendance specialists make visits to truant students' homes and may serve citations as needed. This function also has $36K for the A2A, or Attention to Attendance program. This function is decreasing by $13K in order to better align with actual dollars spent in the prior year. In 2017-19 years the Medford School District will receive a pass-through grant from Jackson County Juvenile Department in the amount of $109K each year for the following program which is delivered by this function: "The Truancy Reduction Program utilizing referrals from teachers in two middle schools and three high schools of the Medford School District will provide wraparound and case management services for youth that are chronically truant and assess as medium or high risk by the Juvenile Crime Prevention (JCP) assessment."
66,166 75,640
133,961 120,530
-
20,000
40,000
60,000
80,000
100,000
120,000
140,000
160,000
2015-16A 2016-17A 2017-18B 2018-19B
Attendance

Financial
Successful Students Today ~ Successful Citizens Tomorrow 57
2015-16 2016-17 2017-18 2018-19 2018-19 2018-19Actual Actual Budget Proposed Approved Adopted
SALARIES & WAGES - - - - - - BENEFITS - - - - - - Professional Services 44,056 55,202 70,000 220,000 - - PURCHASED SERVICES 44,056 55,202 70,000 220,000 - - SUPPLIES - - - - - - CAPITAL OUTLAY - - - - - - OTHER OBJECTS - - - - - - COMMUNITY SERVICE OFFICERS 44,056 55,202 70,000 220,000 - -
11,146 145,000
Object Description
General Fund Detail Budget - 2115 Student Resource Officers
This function provides law enforcement support for enhancing student safety in partnership with the Medford Police Department (MPD) Student Resource Officers (SROs). Spending for the FY18-19 year is $150K higher than prior years due to the addition of one officer at $140K (with benefits) and the depreciation of one police car at $10K for one year. In the past, the District reimbursed the City of Medford for approximately $70K per year to partially offset the costs of four (4) full time officers. With the additional of one officer in FY18-19 the District will have a total of five (5) full time SRO's.
One SRO will be assigned to each high school and middle school and each of the officers will be assigned two or three nearby elementary schools as well, with an anticipated increase in physical presence at every Medford school location. The District also works closely with the Jacksonville Police Department, Jackson County Sherriff’s Office and State Police Office to serve the schools located outside of the Medford Police Department service area. Each of the local emergency service agencies noted above, as well as the local fire departments, work together with the District for all types of emergency preparedness.
44,056 55,202
70,000
220,000
-
50,000
100,000
150,000
200,000
250,000
2015-16A 2016-17A 2017-18B 2018-19B
Student Resource Officers

Financial
Successful Students Today ~ Successful Citizens Tomorrow 58
2015-16 2016-17 2017-18 2018-19 2018-19 2018-19Actual Actual Budget Proposed Approved Adopted
Licensed 271,242 273,798 257,096 348,854 - - Licensed Temporary 72 859 109 109 - - Classified Temporary - 333 - - - - Extra Duty Compensation 41,705 40,672 40,672 40,696 - - SALARIES & WAGES 313,019 315,661 297,876 389,659 - - PERS 80,299 77,179 96,739 105,150 - - Social Security 18,771 19,085 19,708 24,159 - - Medicare 4,390 4,464 4,609 5,650 - - Workers Compensation 2,003 1,356 1,469 1,800 - - Unemployment 413 316 318 390 - - Health Insurance 79,974 63,942 69,468 85,697 - - Life Insurance 60 58 57 64 - - TSA Exec ER Paid 1,198 923 857 2,250 - - Long Term Disability 563 582 610 797 - - FSA/HSA 711 1,019 1,333 1,500 - - TSA Classified ER Paid Health Insurance Option - 2,846 - 300 - - BENEFITS 188,382 171,770 195,167 227,758 - - PURCHASED SERVICES - - - - - - SUPPLIES - - - - - - CAPITAL OUTLAY - - - - - - OTHER OBJECTS - - - - - - OFFICE OF THE DEAN 501,401 487,432 493,044 617,417 - -
(13,969) 101,524
Object Description
The budget for Office of the Dean is $617K, an increase of $124K (25.2%) due to an increase of 0.5 FTE Dean at Hedrick Middle School to support the 6th Grade Academy, as well as for contractual increases and the associated benefits. During the critical developmental stages in middle school, highly qualified student deans are utilized to maintain a safe and orderly educational environment. Deans (roughly two per middle school) are involved in student interventions and provide communication links to the home. They also provide much needed supervision during school and after-hours at school events. Staffing FTE is 0.5 FTE higher at 5.0 FTE.
General Fund Detail Budget - 2121 Office of the Dean
501,401 487,432 493,044
617,417
-
100,000
200,000
300,000
400,000
500,000
600,000
700,000
2015-16A 2016-17A 2017-18B 2018-19B
Office of the Dean
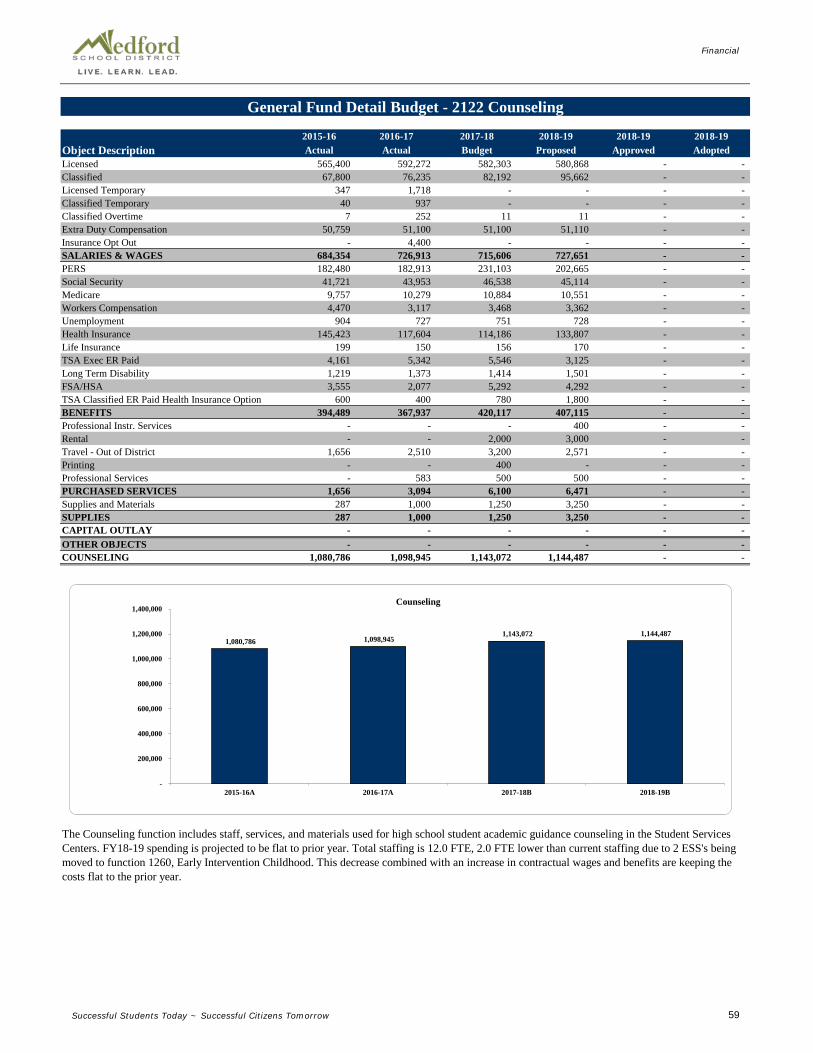
Financial
Successful Students Today ~ Successful Citizens Tomorrow 59
2015-16 2016-17 2017-18 2018-19 2018-19 2018-19Actual Actual Budget Proposed Approved Adopted
Licensed 565,400 592,272 582,303 580,868 - - Classified 67,800 76,235 82,192 95,662 - - Licensed Temporary 347 1,718 - - - - Classified Temporary 40 937 - - - - Classified Overtime 7 252 11 11 - - Extra Duty Compensation 50,759 51,100 51,100 51,110 - - Insurance Opt Out - 4,400 - - - - SALARIES & WAGES 684,354 726,913 715,606 727,651 - - PERS 182,480 182,913 231,103 202,665 - - Social Security 41,721 43,953 46,538 45,114 - - Medicare 9,757 10,279 10,884 10,551 - - Workers Compensation 4,470 3,117 3,468 3,362 - - Unemployment 904 727 751 728 - - Health Insurance 145,423 117,604 114,186 133,807 - - Life Insurance 199 150 156 170 - - TSA Exec ER Paid 4,161 5,342 5,546 3,125 - - Long Term Disability 1,219 1,373 1,414 1,501 - - FSA/HSA 3,555 2,077 5,292 4,292 - - TSA Classified ER Paid Health Insurance Option 600 400 780 1,800 - - BENEFITS 394,489 367,937 420,117 407,115 - - Professional Instr. Services - - - 400 - - Rental - - 2,000 3,000 - - Travel - Out of District 1,656 2,510 3,200 2,571 - - Printing - - 400 - - - Professional Services - 583 500 500 - - PURCHASED SERVICES 1,656 3,094 6,100 6,471 - - Supplies and Materials 287 1,000 1,250 3,250 - - SUPPLIES 287 1,000 1,250 3,250 - - CAPITAL OUTLAY - - - - - - OTHER OBJECTS - - - - - - COUNSELING 1,080,786 1,098,945 1,143,072 1,144,487 - -
18,158 43,444
General Fund Detail Budget - 2122 Counseling
Object Description
The Counseling function includes staff, services, and materials used for high school student academic guidance counseling in the Student Services Centers. FY18-19 spending is projected to be flat to prior year. Total staffing is 12.0 FTE, 2.0 FTE lower than current staffing due to 2 ESS's being moved to function 1260, Early Intervention Childhood. This decrease combined with an increase in contractual wages and benefits are keeping the costs flat to the prior year.
1,080,786 1,098,945 1,143,072 1,144,487
-
200,000
400,000
600,000
800,000
1,000,000
1,200,000
1,400,000
2015-16A 2016-17A 2017-18B 2018-19B
Counseling

Financial
Successful Students Today ~ Successful Citizens Tomorrow 60
2015-16 2016-17 2017-18 2018-19 2018-19 2018-19Actual Actual Budget Proposed Approved Adopted
Licensed 350,510 426,971 413,464 366,348 - - Classified 28,341 4,680 - 83,520 - - Licensed Temporary 24 245 - - - - Insurance Opt Out 2,200 200 1,517 2,199 - - SALARIES & WAGES 381,075 432,096 414,981 452,067 - - PERS 73,447 96,809 97,772 118,877 - - Social Security 23,330 26,165 25,729 28,028 - - Medicare 5,456 6,119 6,017 6,555 - - Workers Compensation 2,493 1,878 1,917 2,089 - - Unemployment 505 432 415 452 - - Health Insurance 48,147 55,768 63,009 76,330 - - Life Insurance 95 86 71 102 - - TSA Exec ER Paid 900 600 250 3,507 - - Long Term Disability 219 747 777 990 - - FSA/HSA 1,211 519 530 1,600 - - TSA Classified ER Paid Health Insurance Option 599 - - - - - BENEFITS 156,402 189,125 196,486 238,530 - - Travel - In District 2,163 2,264 1,500 2,200 - - PURCHASED SERVICES 2,163 2,264 1,500 2,200 - - Supplies and Materials 9,472 8,161 11,140 11,800 - - Non-Consumables - 144 1,750 1,750 - - SUPPLIES 9,472 8,305 12,890 13,550 - - CAPITAL OUTLAY - - - - - - Dues/Fees/Memberships 279 379 300 300 - - OTHER OBJECTS 279 379 300 300 - - NURSING 549,391 632,168 626,157 706,648 - -
82,777 89,858
General Fund Detail Budget - 2134 Nursing
Object Description
The FY18-19 Budget includes spending of $0.7M, $80K (12.85%) higher than the FY17-18 Budget primarily due to contractual wage increases and associated benefits. This function is for nursing activities which are non-instructional, such as health inspections and treatment of minor injuries. FTE for FY18-19 will be 7.0 FTE, which is 1.0 additional FTE to current staffing. The increase is due to the attrition of 1.0 FTE Registered Nurse being replaced with 2.0 FTE Licensed Practical Nurses.
549,391
632,168 626,157
706,648
-
100,000
200,000
300,000
400,000
500,000
600,000
700,000
800,000
2015-16A 2016-17A 2017-18B 2018-19B
Nursing

Financial
Successful Students Today ~ Successful Citizens Tomorrow 61
2015-16 2016-17 2017-18 2018-19 2018-19 2018-19Actual Actual Budget Proposed Approved Adopted
Licensed 820,543 721,248 698,623 1,019,986 - - Classified 21,964 51,390 111,458 270,434 - - Licensed Temporary 814 1,444 636 636 - - Classified Temporary 5,676 2,000 6,056 6,056 - - Classified Overtime - 10 - - - - Extra Duty Compensation 13,584 11,961 19,499 19,499 - - Insurance Opt Out 6,600 4,000 4,551 6,599 - - SALARIES & WAGES 869,180 792,054 840,823 1,323,210 - - PERS 238,020 208,465 312,416 331,171 - - Social Security 53,034 47,594 64,654 82,039 - - Medicare 12,403 11,131 15,121 19,187 - - Workers Compensation 5,585 3,288 4,818 6,103 - - Unemployment 1,150 792 1,043 1,323 - - Health Insurance 111,875 112,991 152,369 288,040 - - Life Insurance 239 171 185 365 - - TSA Exec ER Paid 4,627 4,479 5,796 15,090 - - Long Term Disability 1,124 1,644 1,903 2,849 - - FSA/HSA 1,422 3,619 6,707 8,207 - - TSA Classified ER Paid Health Insurance Option 890 900 1,092 2,460 - - BENEFITS 430,369 395,075 566,103 756,833 - - Professional Instr. Services 570,963 626,236 740,648 617,648 - - PURCHASED SERVICES 570,963 626,088 740,648 617,648 - - Supplies and Materials 1,607 148 - - - - Non-Consumables 2,288 - - - - - Hardware Under $5000 270 - - - - - SUPPLIES 4,165 148 - - - - CAPITAL OUTLAY - - - - - - OTHER OBJECTS - - - - - - PSYCHOLOGICAL SERVICES 1,874,678 1,813,365 2,147,574 2,697,691 - -
(61,313) 686,844
Object Description
General Fund Detail Budget - 2140 Psychological Services
The Psychological Services function provides services to students eligible for Special Education across the District. Responsibilities include activities related to testing, interpreting results, and providing psychological services to students. This function also includes staff, services, travel and supplies.
The FY18-19 Budget of $2.69M is $0.55M (25.6%) higher than the FY17-18 Budget primarily driven by the addition of 9.8 FTE. In FY18-19, the Medford School District will be insourcing some services that were previously contracted to Family Solutions. There will be an addition of 4.0 FTE for Behavior Specialists added into this function with 70% or 2.8 FTE funded by the General Fund and 30% or 1.2 FTE (approximately $100K) funded from the IDEA grant in function 1261. Another 7.0 FTE will be added for Classified Educational Support Staff. The total General Fund staffing increase (minus the $100K from the IDEA grant) of $467K will be slightly offset by $223K from the decreased contract with Family Solutions. Professional Instructional Services also includes $100K for behavior training for staff members.
Across all funds, the FTE is a total of 27.49.
1,874,678 1,813,365
2,147,574
2,697,691
-
500,000
1,000,000
1,500,000
2,000,000
2,500,000
3,000,000
2015-16A 2016-17A 2017-18B 2018-19B
Psychological Services

Financial
Successful Students Today ~ Successful Citizens Tomorrow 62
2015-16 2016-17 2017-18 2018-19 2018-19 2018-19Actual Actual Budget Proposed Approved Adopted
Licensed 576,628 490,194 484,994 575,862 - - Classified 236,886 307,131 324,790 328,354 - - Licensed Temporary 527 589 472 472 - - Classified Temporary - 2,972 - - - - Classified Overtime - 12 - - - - Extra Duty Compensation 15,734 12,464 10,850 10,849 - - SALARIES & WAGES 829,775 813,363 821,106 915,537 - - PERS 194,099 194,553 219,672 254,435 - - Social Security 49,947 48,745 57,531 56,763 - - Medicare 11,681 11,400 13,455 13,275 - - Workers Compensation 5,440 3,379 4,287 4,230 - - Unemployment 1,136 813 928 916 - - Health Insurance 169,431 209,787 222,954 238,277 - - Life Insurance 286 233 232 241 - - TSA Exec ER Paid 7,419 7,781 9,247 8,650 - - Long Term Disability 1,147 1,507 1,776 1,805 - - FSA/HSA 1,229 3,436 6,547 10,547 - - TSA Classified ER Paid Health Insurance Option 5,006 4,800 4,553 5,400 - - BENEFITS 446,821 486,434 541,183 594,539 - - Professional Instr. Services 432,830 572,117 680,000 595,000 - - PURCHASED SERVICES 432,830 572,117 680,000 595,000 - - SUPPLIES - - - - - - CAPITAL OUTLAY - - - - - - OTHER OBJECTS - - - - - - SPEECH AND AUDIOLOGY 1,709,426 1,871,913 2,042,289 2,105,076 - -
162,487 301,453
General Fund Detail Budget - 2150 Speech and Audiology
The Speech and Audiology function provides support services to Special Education students across the District, including the identification, assessment, and treatment of students with speech, hearing, and language impairments. The District contracts with Presence Learning for online speech and language services. The FY18-19 Budget of $2.1M is $62K (3.0%) higher than the FY17-18 Budget primarily driven by contractual wage increases. There is an addition of 1.0 FTE Speech and Language Pathologist offset by a corresponding reduction in contract services with Presence Learning. Staffing for FY18-19 is 17.0 FTE across all funds, and increase of 1.0 FTE for a Speech and Language Pathologist.
Object Description
1,709,426 1,871,913
2,042,289 2,105,076
-
500,000
1,000,000
1,500,000
2,000,000
2,500,000
2015-16A 2016-17A 2017-18B 2018-19B
Speech and Audiology

Financial
Successful Students Today ~ Successful Citizens Tomorrow 63
2015-16 2016-17 2017-18 2018-19 2018-19 2018-19Actual Actual Budget Proposed Approved Adopted
Licensed 66,019 69,639 74,976 142,116 - - Classified 48,980 85,162 134,031 146,379 - - Administrators Salaries 120,235 123,100 124,279 125,470 - - Licensed Temporary 24 - 10,036 36 - - Classified Temporary 6,319 1,537 9,587 9,587 - - Classified Overtime - 96 - - - - Extra Duty Compensation 1,631 1,614 1,614 1,614 - - Insurance Opt Out - 1,558 - - - - SALARIES & WAGES 243,209 282,706 354,523 425,203 - - PERS 61,083 67,739 115,644 108,914 - - Social Security 14,613 16,997 19,717 26,363 - - Medicare 3,458 3,976 4,611 6,165 - - Workers Compensation 1,685 1,866 1,469 1,964 - - Unemployment 323 286 318 425 - - Health Insurance 69,010 67,342 90,020 90,207 - - Life Insurance 135 125 60 178 - - TSA Exec ER Paid 8,450 8,592 11,760 2,968 - - Long Term Disability 223 443 555 856 - - FSA/HSA 192 2,299 2,446 3,446 - - TSA Classified ER Paid Health Insurance Option 1,800 2,807 1,589 8,894 - - BENEFITS 160,971 172,472 248,190 250,381 - - Professional Instr. Services 11,152 100 - - - - Rental 120 - 5,000 5,000 - - Travel - In District 1,000 2 - - - - Travel - Out of District - 1,349 - - - - Legal 14,374 47,817 10,000 10,000 - - Professional Services - 250 - - - - PURCHASED SERVICES 26,646 49,518 15,000 15,000 - - Supplies and Materials 249 2,503 - - - - Periodicals - 500 500 500 - - Non-Consumables - 2,674 - - - - Software 9,146 - - - - - Hardware Under $5000 25,119 - - - - - SUPPLIES 34,514 5,677 500 500 - - CAPITAL OUTLAY - - - - - - Dues/Fees/Memberships 595 595 595 595 - - OTHER OBJECTS 595 595 595 595 - - STUDENT SUPPORT SERVICES 465,934 510,967 618,808 691,678 - -
45,033 249,177
General Fund Detail Budget - 2190 Student Support Services
This function provides Special Education support services across the District. Activities include the direction and management of all student service programs, including Special Education, Nursing, Section 504, and other At-Risk programs. The FY18-19 budget of $0.69M is $73K (11.8%) higher than the FY17-18 budget, resulting primarily from the addition of 1.0 FTE for administration support and contractual wage increases. Total staffing is 11.44 for FY18-19.
Object Description
465,934 510,967
618,808 691,678
-
100,000
200,000
300,000
400,000
500,000
600,000
700,000
800,000
2015-16A 2016-17A 2017-18B 2018-19B
Student Support Services

Financial
Successful Students Today ~ Successful Citizens Tomorrow 64
2015-16 2016-17 2017-18 2018-19 2018-19 2018-19Actual Actual Budget Proposed Approved Adopted
Licensed - 3,750 - - - - Classified 17,460 18,206 19,148 19,989 - - Administrators Salaries 55,868 57,531 58,086 58,346 - - Classified Temporary 142 2,924 - - - - SALARIES & WAGES 73,470 82,411 77,233 78,335 - - PERS 16,314 18,276 21,346 21,445 - - Social Security 4,374 4,701 4,788 4,857 - - Medicare 1,023 1,152 1,120 1,136 - - Workers Compensation 499 364 357 362 - - Unemployment 97 82 77 78 - - Health Insurance 13,412 12,461 13,527 14,971 - - Life Insurance 56 45 14 93 - - TSA Exec ER Paid 300 300 152 900 - - Long Term Disability 142 163 170 172 - - FSA/HSA 690 628 1,490 1,490 - - TSA Classified ER Paid Health Insurance Option 876 880 748 748 - - BENEFITS 37,782 39,052 43,789 46,251 - - Travel - In District 14 25 - 50 - - Travel - Out of District (153) 32 - 250 - - Professional Services 153 - - 100 - - PURCHASED SERVICES 14 56 - 400 - - Supplies and Materials 1,857 23 2,000 2,000 - - Textbooks - 837 1,000 1,000 - - Non-Consumables 244 55 - - - - Software - - 200 200 - - SUPPLIES 2,101 915 3,200 3,200 - - CAPITAL OUTLAY - - - - - - Dues/Fees/Memberships 973 934 934 934 - - OTHER OBJECTS 973 934 934 934 - - IMPROV. OF INSTRUCTION 114,339 123,368 125,156 129,120 - -
9,029 10,936
General Fund Detail Budget - 2211 Improvement of Instruction
This function is for activities associated with directing and managing the instructional staff in planning, developing, and evaluating the process providing learning experiences for students. Staffing in the General Fund for the Improvement of Instruction function is flat to current levels. The budget is $129K, or $4K higher in FY18-19 compared to FY17-18.
Direct Administration – Includes 0.5 FTE of Federal Program’s Supervisor salary plus benefits.
Administrative Support – Includes 0.5 FTE of Federal Program’s Office Assistant salary plus benefits.
Object Description
114,339 123,368 125,156 129,120
-
20,000
40,000
60,000
80,000
100,000
120,000
140,000
2015-16A 2016-17A 2017-18B 2018-19B
Improvement of Instruction

Financial
Successful Students Today ~ Successful Citizens Tomorrow 65
2015-16 2016-17 2017-18 2018-19 2018-19 2018-19Actual Actual Budget Proposed Approved Adopted
SALARIES & WAGES - - - - - - BENEFITS - - - - - - Professional Growth 31,942 31,118 35,000 35,000 - - Professional Instr. Services 10,001 10,000 12,000 12,000 - - PURCHASED SERVICES 41,942 41,118 47,000 47,000 - - SUPPLIES - - - - - - CAPITAL OUTLAY - - - - - - OTHER OBJECTS - - - - - - INSTRUCTIONAL DEVELOPMENT 41,942 41,118 47,000 47,000 - -
(825) -
This function is for activities to assist teachers and administrators for the effective use of adopted curriculum materials. Per the Medford Education Association (MEA) Collective Bargaining Agreement, all bargaining unit members are allocated $50 for in-service use each contract year. Additionally, MEA bargaining unit members may also access tuition reimbursement for a portion of the tuition fee for courses directly related to the employee's instructional assignment. Spending is expected to be flat to the current year. There is no FTE in this function.
General Fund Detail Budget - 2212 Instructional Development
Object Description
41,942 41,118
47,000 47,000
-
5,000
10,000
15,000
20,000
25,000
30,000
35,000
40,000
45,000
50,000
2015-16A 2016-17A 2017-18B 2018-19B
Instructional Development

Financial
Successful Students Today ~ Successful Citizens Tomorrow 66
2015-16 2016-17 2017-18 2018-19 2018-19 2018-19Actual Actual Budget Proposed Approved Adopted
Classified 38,863 47,970 48,209 51,867 - - Licensed Temporary 106,501 97,646 150,000 75,000 - - Classified Temporary 60,123 36,134 86,361 86,361 - - Classified Overtime 765 2,272 1,160 1,160 - - SALARIES & WAGES 206,253 184,022 285,731 214,389 - - PERS 40,745 43,084 41,010 33,932 - - Social Security 12,516 11,067 17,715 13,292 - - Medicare 2,927 2,588 4,143 3,109 - - Workers Compensation 1,441 1,627 1,320 990 - - Unemployment 273 182 286 214 - - Health Insurance 19,179 19,890 22,812 22,533 - - Life Insurance 19 16 14 14 - - TSA Exec ER Paid 1,133 1,143 600 600 - - Long Term Disability 294 577 106 114 - - FSA/HSA - - - 1,600 - - TSA Classified ER Paid Health Insurance Option 881 642 600 600 - - BENEFITS 79,408 80,816 88,606 77,000 - - Instr'l Program Improvement Svcs 900 - 10,000 10,000 - - Professional Instr. Services 2,899 614 - - - - Travel - In District 39 - 1,000 1,000 - - Travel - Out of District 978 9,572 10,000 10,000 - - Tuition (840) - - - - - Professional Services 14,015 2,431 5,000 1,000 - - PURCHASED SERVICES 17,992 12,618 26,000 22,000 - - Supplies and Materials 8,817 11,192 16,500 5,500 - - Textbooks - 164 - - - - Non-Consumables - 221 100 100 - - Software 59,570 51,200 130,000 50,000 - - Accelerated Reader - - - - - - Hardware - 920 5,000 5,000 - - SUPPLIES 68,386 63,697 151,600 60,600 - -
CAPITAL OUTLAY - - - - - - Dues/Fees/Memberships 451 444 800 800 - -
OTHER OBJECTS 451 444 800 800 - -
CURRICULUM DEVELOPMENT 372,489 341,596 552,737 374,788 - -
(30,893) (175,442)
General Fund Detail Budget - 2213 Curriculum Development
Object Description
This function supports District initiatives for the improvement of instruction through ongoing curriculum development. FY18-19 spending is $0.37M, a -$0.18M (-32.2%) decrease over FY17-18 Budget. This is due to the reduction of a $100K contract with PLATO Software expenses, which will be replaced by Edgenuity and funded by the Measure 98 grant (see page 119). There was also a reduction of $75K in Licensed Temporary dollars to better align with actual spending from prior years. This function contains a $50K hosting fee with Houghton Mifflin Harcourt (HMH). Staffing for FY18-19 remains flat to current staffing at 1.0 FTE.
372,489 341,596
552,737
374,788
-
100,000
200,000
300,000
400,000
500,000
600,000
2015-16A 2016-17A 2017-18B 2018-19B
Curriculum Development
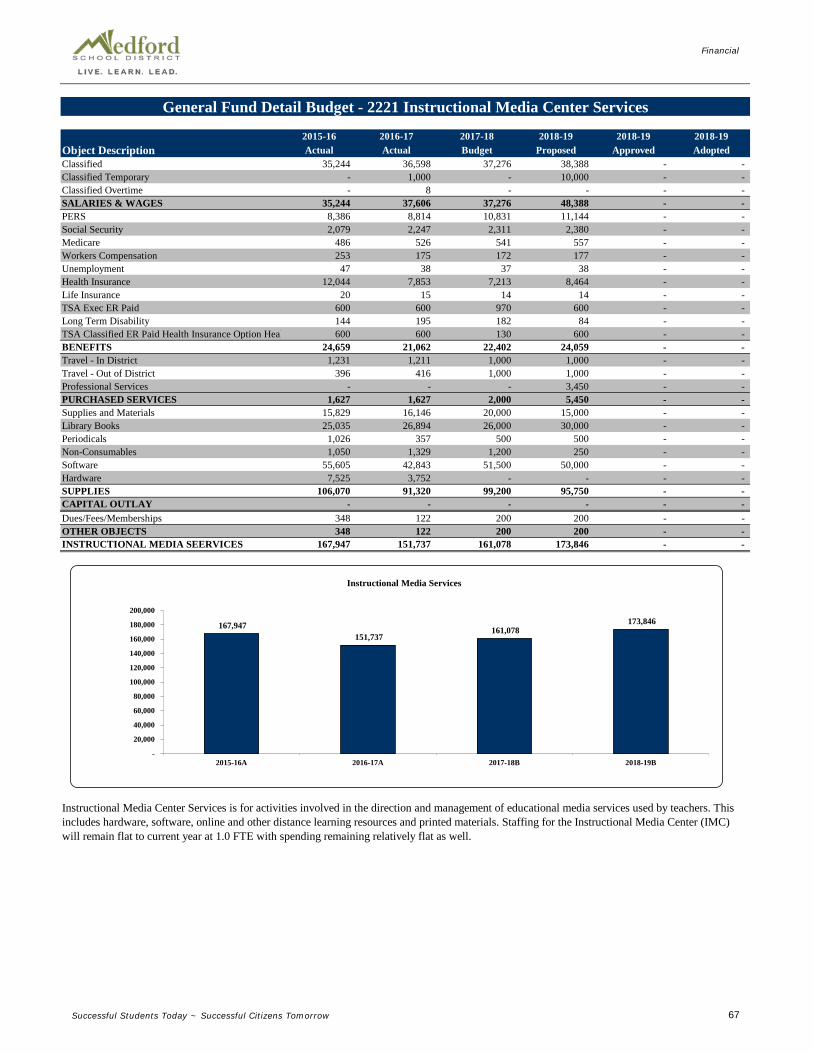
Financial
Successful Students Today ~ Successful Citizens Tomorrow 67
2015-16 2016-17 2017-18 2018-19 2018-19 2018-19Actual Actual Budget Proposed Approved Adopted
Classified 35,244 36,598 37,276 38,388 - - Classified Temporary - 1,000 - 10,000 - - Classified Overtime - 8 - - - - SALARIES & WAGES 35,244 37,606 37,276 48,388 - - PERS 8,386 8,814 10,831 11,144 - - Social Security 2,079 2,247 2,311 2,380 - - Medicare 486 526 541 557 - - Workers Compensation 253 175 172 177 - - Unemployment 47 38 37 38 - - Health Insurance 12,044 7,853 7,213 8,464 - - Life Insurance 20 15 14 14 - - TSA Exec ER Paid 600 600 970 600 - - Long Term Disability 144 195 182 84 - - TSA Classified ER Paid Health Insurance Option Heal 600 600 130 600 - - BENEFITS 24,659 21,062 22,402 24,059 - - Travel - In District 1,231 1,211 1,000 1,000 - - Travel - Out of District 396 416 1,000 1,000 - - Professional Services - - - 3,450 - - PURCHASED SERVICES 1,627 1,627 2,000 5,450 - - Supplies and Materials 15,829 16,146 20,000 15,000 - - Library Books 25,035 26,894 26,000 30,000 - - Periodicals 1,026 357 500 500 - - Non-Consumables 1,050 1,329 1,200 250 - - Software 55,605 42,843 51,500 50,000 - - Hardware 7,525 3,752 - - - - SUPPLIES 106,070 91,320 99,200 95,750 - - CAPITAL OUTLAY - - - - - - Dues/Fees/Memberships 348 122 200 200 - - OTHER OBJECTS 348 122 200 200 - - INSTRUCTIONAL MEDIA SEERVICES 167,947 151,737 161,078 173,846 - -
(16,210) 18,060
Object Description
Instructional Media Center Services is for activities involved in the direction and management of educational media services used by teachers. This includes hardware, software, online and other distance learning resources and printed materials. Staffing for the Instructional Media Center (IMC) will remain flat to current year at 1.0 FTE with spending remaining relatively flat as well.
General Fund Detail Budget - 2221 Instructional Media Center Services
167,947 151,737
161,078 173,846
-
20,000
40,000
60,000
80,000
100,000
120,000
140,000
160,000
180,000
200,000
2015-16A 2016-17A 2017-18B 2018-19B
Instructional Media Services
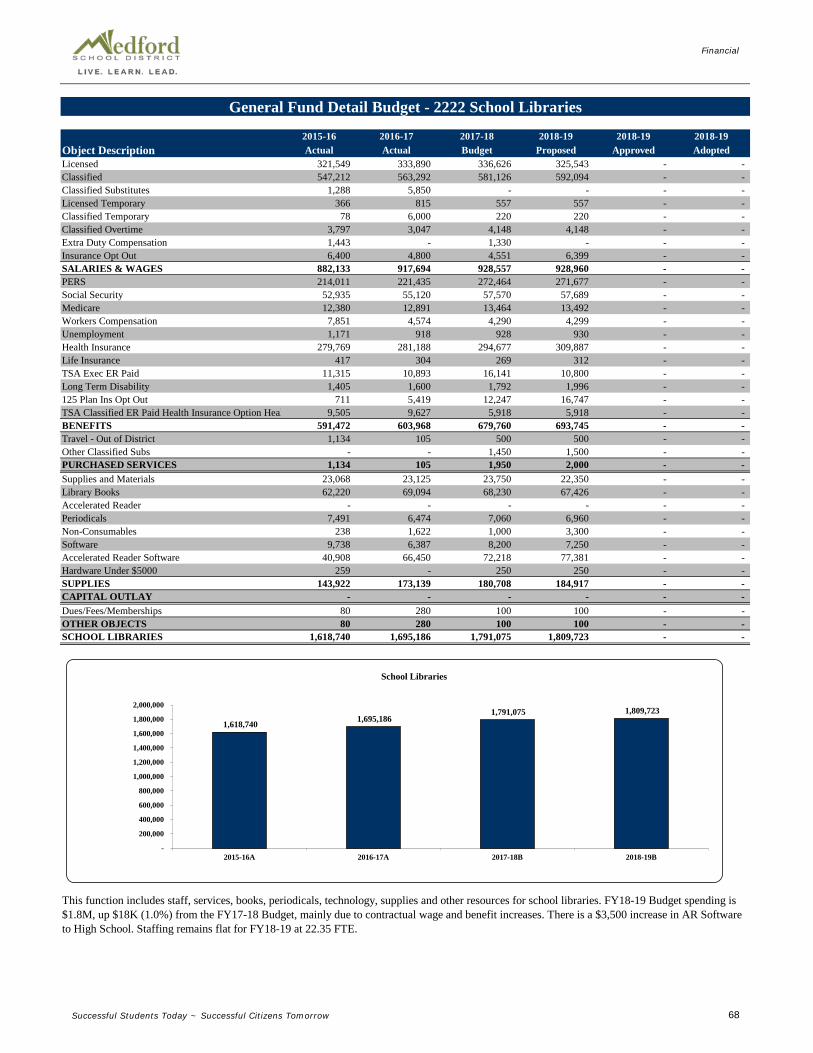
Financial
Successful Students Today ~ Successful Citizens Tomorrow 68
2015-16 2016-17 2017-18 2018-19 2018-19 2018-19Actual Actual Budget Proposed Approved Adopted
Licensed 321,549 333,890 336,626 325,543 - - Classified 547,212 563,292 581,126 592,094 - - Classified Substitutes 1,288 5,850 - - - - Licensed Temporary 366 815 557 557 - - Classified Temporary 78 6,000 220 220 - - Classified Overtime 3,797 3,047 4,148 4,148 - - Extra Duty Compensation 1,443 - 1,330 - - - Insurance Opt Out 6,400 4,800 4,551 6,399 - - SALARIES & WAGES 882,133 917,694 928,557 928,960 - - PERS 214,011 221,435 272,464 271,677 - - Social Security 52,935 55,120 57,570 57,689 - - Medicare 12,380 12,891 13,464 13,492 - - Workers Compensation 7,851 4,574 4,290 4,299 - - Unemployment 1,171 918 928 930 - - Health Insurance 279,769 281,188 294,677 309,887 - - Life Insurance 417 304 269 312 - - TSA Exec ER Paid 11,315 10,893 16,141 10,800 - - Long Term Disability 1,405 1,600 1,792 1,996 - - 125 Plan Ins Opt Out 711 5,419 12,247 16,747 - - TSA Classified ER Paid Health Insurance Option Heal 9,505 9,627 5,918 5,918 - - BENEFITS 591,472 603,968 679,760 693,745 - - Travel - Out of District 1,134 105 500 500 - - Other Classified Subs - - 1,450 1,500 - - PURCHASED SERVICES 1,134 105 1,950 2,000 - - Supplies and Materials 23,068 23,125 23,750 22,350 - - Library Books 62,220 69,094 68,230 67,426 - - Accelerated Reader - - - - - - Periodicals 7,491 6,474 7,060 6,960 - - Non-Consumables 238 1,622 1,000 3,300 - - Software 9,738 6,387 8,200 7,250 - - Accelerated Reader Software 40,908 66,450 72,218 77,381 - - Hardware Under $5000 259 - 250 250 - - SUPPLIES 143,922 173,139 180,708 184,917 - - CAPITAL OUTLAY - - - - - - Dues/Fees/Memberships 80 280 100 100 - - OTHER OBJECTS 80 280 100 100 - - SCHOOL LIBRARIES 1,618,740 1,695,186 1,791,075 1,809,723 - -
76,446 120,696
This function includes staff, services, books, periodicals, technology, supplies and other resources for school libraries. FY18-19 Budget spending is $1.8M, up $18K (1.0%) from the FY17-18 Budget, mainly due to contractual wage and benefit increases. There is a $3,500 increase in AR Software to High School. Staffing remains flat for FY18-19 at 22.35 FTE.
Object Description
General Fund Detail Budget - 2222 School Libraries
1,618,740 1,695,186 1,791,075 1,809,723
-
200,000
400,000
600,000
800,000
1,000,000
1,200,000
1,400,000
1,600,000
1,800,000
2,000,000
2015-16A 2016-17A 2017-18B 2018-19B
School Libraries

Financial
Successful Students Today ~ Successful Citizens Tomorrow 69
2015-16 2016-17 2017-18 2018-19 2018-19 2018-19Actual Actual Budget Proposed Approved Adopted
SALARIES & WAGES - - - - - - BENEFITS - - - - - - PURCHASED SERVICES - - - - - - Supplies and Materials 5,227 5,884 5,800 5,800 - - Non-Consumables 1,259 5,461 3,900 3,400 - - Hardware Under $5000 8,185 2,818 4,700 5,969 - - SUPPLIES 14,670 14,163 14,400 15,169 - - CAPITAL OUTLAY - - - - - - OTHER OBJECTS - - - - - - AUDIOVISUAL 14,670 14,163 14,400 15,169 - -
(507) (3,131)
General Fund Detail Budget - 2223 Audiovisual
Object Description
This function includes materials, supplies, and equipment for multimedia services used by instructional and administrative staff. Expenditures are relatively flat to FY18-19.
14,670 14,163 14,400 15,169
-
2,000
4,000
6,000
8,000
10,000
12,000
14,000
16,000
2015-16A 2016-17A 2017-18B 2018-19B
Audiovisual

Financial
Successful Students Today ~ Successful Citizens Tomorrow 70
2015-16 2016-17 2017-18 2018-19 2018-19 2018-19Actual Actual Budget Proposed Approved Adopted
Licensed 70,510 72,862 77,158 130,540 - - Classified - 67 - - - - Licensed Substitutes 20,504 43,424 (0) - - - Classified Substitutes 1,657 2,229 (0) - - - Licensed Temporary 52,192 62,106 46,074 46,074 - - Classified Temporary 1,246 1,131 808 808 - - Classified Overtime 389 - 227 227 - - SALARIES & WAGES 146,497 181,820 124,267 177,649 - - PERS 29,481 30,044 31,477 36,359 - - Social Security 8,879 11,081 7,705 13,141 - - Medicare 2,076 2,591 1,802 3,073 - - Workers Compensation 990 742 574 979 - - Unemployment 218 181 124 212 - - Health Insurance 12,200 11,924 13,580 28,767 - - Life Insurance 20 15 14 28 - - TSA Exec ER Paid 104 64 - 1,601 - - Long Term Disability 141 318 161 278 - - FSA/HSA - 13 13 - - - TSA Classified ER Paid Health Insurance Option Heal 11 3 - - - - BENEFITS 54,119 56,976 55,449 84,439 - - Professional Instr. Services 3,515 11,922 12,000 12,000 - - Pupil Transportation 333 - - - - - Travel - In District 518 151 200 200 - - Travel - Out of District 1,783 554 1,000 1,000 - - Professional Services 2,057 6,918 2,000 2,000 - - Other Licensed Subs - - 31,376 33,000 - - Other Classified Subs - - 1,275 1,300 - - PURCHASED SERVICES 8,206 19,545 47,851 49,500 - - Supplies and Materials 7,618 2,744 10,000 6,000 - - SUPPLIES 7,618 2,744 10,000 6,000 - - CAPITAL OUTLAY - - - - - - Dues/Fees/Memberships 1,070 955 1,100 1,500 - - OTHER OBJECTS 1,070 955 1,100 1,500 - - INSTR. STAFF DEVELOPMENT 217,511 262,039 238,668 319,089 - -
44,529 66,556
This function supports activities designed to train licensed and non-licensed staff in the use of District curriculum materials to increase the understanding of best teaching practices and to support other strategies to improve instruction. The FY18-19 Budget of $0.32M is up $80K (33.7%) due primarily to the addition of 1.0 additional FTE for a Staff Development Coordinator due to insourcing duties previously performed by SOESD. Staffing for FY18-19 is a total of 3.0 FTE, an increase of 1.0 FTE that will be funded by incremental revenue passed through from SOESD.
Object Description
General Fund Detail Budget - 2240 Instructional Staff Development
217,511
262,039 238,668
319,089
-
50,000
100,000
150,000
200,000
250,000
300,000
350,000
2015-16A 2016-17A 2017-18B 2018-19B
Instructional Staff Development

Financial
Successful Students Today ~ Successful Citizens Tomorrow 71
2015-16 2016-17 2017-18 2018-19 2018-19 2018-19Actual Actual Budget Proposed Approved Adopted
Board of Education 573,691 530,426 616,500 537,000 - - Office of Superintendent 1,162,758 1,196,960 1,338,159 1,350,954 - - Office of the Educational Director 709,636 828,843 676,467 694,395 - - Secondary Athletics 40,766 4,400 - - - - Office of the Principal 7,635,286 7,814,802 8,275,961 8,512,484 - - Office of the Business Services Director - - - - - - Business Services 656,501 633,265 655,421 770,616 - - Other Fiscal Services 98,760 110,897 29,531 37,531 - - Custodial 4,352,604 4,357,426 4,885,760 4,961,142 - - Maintenance Services 5,680,845 5,890,969 6,288,995 6,712,205 - - Vehicle Maintenance 92,571 135,425 100,000 110,000 - - Building Security 51,845 65,198 57,000 57,000 - - Student Transportation 4,456,327 4,661,664 5,447,566 5,622,500 - - Purchasing and Distribution 678,866 616,770 616,601 630,219 - - Printing and Publishing 197,992 231,783 235,883 244,935 - - Human Resources 924,115 818,040 899,918 1,002,686 - - Information Technology 678,057 673,704 971,953 917,034 - - Network and Telecommunications 3,664,594 3,859,076 3,569,429 3,773,650 - - Early Retirement 2,558,150 2,109,540 2,279,144 2,336,032 - - GENERAL SUPPORT 34,213,364 34,539,189 36,944,288 38,270,384 - -
The FY18-19 Budget for the General Support functions is $38.2M, up $1.3M (3.59%) from the FY17-18 Budget. Staffing across all funds for the FY18-19 is 230.44, which is up 5.0 FTE from the current staffing of 225.44. The increased FTE are as follows: an increase of 2.0 FTE in 2544, Maintenance for a +1.0 Journeyman Electrician and a +1.0 Warehouse Worker, a +1.0 FTE increase for a computer programmer in Information Technology (funded by Special Revenue), and a +2.0 FTE in 2669, Network and Telecommunications for two System Administrators. Spending variances compared to FY18-19 Budget for each function are described in the following pages.
Object Description
General Fund Expenditures - General Support Functions
34,213,364 34,539,189 36,944,288 38,270,384
-
5,000,000
10,000,000
15,000,000
20,000,000
25,000,000
30,000,000
35,000,000
40,000,000
45,000,000
2015-16A 2016-17A 2017-18B 2018-19B
General Support

Financial
Successful Students Today ~ Successful Citizens Tomorrow 72
2015-16 2016-17 2017-18 2018-19 2018-19 2018-19Actual Actual Budget Proposed Approved Adopted
SALARIES & WAGES - - - - - - BENEFITS - - - - - - Travel - In District 5,592 1,382 2,500 1,500 - - Travel - Out of District 16,092 12,644 15,000 15,000 - - Advertising - 86 - - - - Audit 33,150 35,200 36,500 36,500 - - Legal 118,988 57,537 100,000 60,000 - - Negotiations 13,780 1,824 10,000 7,500 - - Elections - 20,954 18,000 10,000 - - Professional Services 6,323 1,615 2,500 2,500 - - PURCHASED SERVICES 193,924 131,241 184,500 133,000 - - Supplies and Materials 3,893 7,901 5,000 7,000 - - SUPPLIES 3,893 7,901 5,000 7,000 - - CAPITAL OUTLAY - - - - - - Dues/Fees/Memberships 25,918 33,804 27,000 27,000 - - Liability Insurance 344,924 352,480 375,000 360,000 - - Legal Settlements 5,031 5,000 25,000 10,000 - - OTHER OBJECTS 375,873 391,284 427,000 397,000 - - BOARD OF EDUCATION SERVICES 573,691 530,426 616,500 537,000 - -
General Fund Detail Budget - 2310 Board of Education Services
This function includes expenses for policy development, audits, legal services, elections, dues, liability insurance and other responsibilities of the governing body. FY18-19 spending is $0.5M, down $79.5K (12.9%) from the FY17-18 Budget, chiefly due to lower projected legal fees.
Object Description
573,691 530,426
616,500
537,000
-
100,000.00
200,000.00
300,000.00
400,000.00
500,000.00
600,000.00
700,000.00
2015-16A 2016-17A 2017-18B 2018-19B
Board of Education Services

Financial
Successful Students Today ~ Successful Citizens Tomorrow 73
2015-16 2016-17 2017-18 2018-19 2018-19 2018-19Actual Actual Budget Proposed Approved Adopted
Classified 144,260 159,572 165,676 178,611 - - Administrators Salaries 601,309 603,672 619,088 631,992 - - Classified Substitutes 7,146 632 - - - - Classified Temporary 2,704 5,246 29,102 4,102 - - Classified Overtime 510 1,789 672 672 - - SALARIES & WAGES 755,929 770,911 814,538 815,377 - - PERS 153,490 152,912 198,477 206,328 - - Social Security 39,781 39,173 48,951 51,297 - - Medicare 10,814 11,018 11,448 11,997 - - Workers Compensation 5,271 3,431 3,648 3,822 - - Unemployment 996 771 790 827 - - Health Insurance 100,365 114,096 127,533 140,160 - - Life Insurance 410 361 96 358 - - TSA-Employer Paid 13,596 13,961 9,430 3,740 - - Long Term Disability 458 1,280 1,726 1,783 - - FSA/HSA 2,307 2,615 2,667 2,667 - - TSA Classified ER Paid Health Insurance Option Heal 2,431 3,740 6,196 6,196 - - BENEFITS 329,919 343,359 410,962 429,177 - - Professional Growth 370 - - - - - Professional Instr. Services 4,706 - - - - - Travel - In District 609 129 650 1,500 - - Travel - Out of District 23,424 13,109 20,000 20,000 - - Postage 16,756 9,029 10,000 10,000 - - Advertising 342 3,355 2,000 2,000 - - Legal - 21,984 25,000 20,000 - - Professional Services 14,172 14,002 25,000 25,000 - - Other Classified Subs - - 11,609 12,000 - - PURCHASED SERVICES 60,379 61,608 94,259 90,500 - - Supplies and Materials 6,028 15,546 7,000 8,000 - - Periodicals 105 391 400 400 - - Software - 10 - - - - Hardware - - 1,000 1,000 - - SUPPLIES 6,133 15,947 8,400 9,400 - - CAPITAL OUTLAY - - - - - - Dues/Fees/Memberships 10,398 5,135 10,000 6,500 - - OTHER OBJECTS 10,398 5,135 10,000 6,500 - - SUPERINTENDENT'S OFFICE 1,162,758 1,196,960 1,338,159 1,350,954 - -
34,202 143,602
Object Description
This function includes services, supplies, travel, postage, materials and staff to support the Superintendent's office. The FY18-19 budgeted spending is $1.3M, $13K (0.96%) higher than the FY17-18 budget. Staffing remains flat at 6.75 FTE.
General Fund Detail Budget - 2321 Office of the Superintendent
1,162,758 1,196,960 1,338,159 1,350,954
-
200,000
400,000
600,000
800,000
1,000,000
1,200,000
1,400,000
1,600,000
2015-16A 2016-17A 2017-18B 2018-19B
Office of the Superintendent

Financial
Successful Students Today ~ Successful Citizens Tomorrow 74
2015-16 2016-17 2017-18 2018-19 2018-19 2018-19Actual Actual Budget Proposed Approved Adopted
Classified 112,742 139,996 108,454 117,014 - - Administrators Salaries 231,372 236,460 247,885 250,817 - - Licensed Temporary - 86 - - - - Classified Temporary - 250 - - - - Classified Overtime - 5,992 - - - - Insurance Opt Out 2,236 2,400 2,179 2,179 - - SALARIES & WAGES 346,350 385,183 358,518 370,010 - - PERS 82,871 87,795 102,529 105,283 - - Social Security 20,303 23,612 22,228 22,941 - - Medicare 4,881 5,544 5,198 5,365 - - Workers Compensation 2,449 3,675 1,656 1,709 - - Unemployment 458 385 359 370 - - Health Insurance 52,338 56,129 51,171 52,341 - - Life Insurance 229 203 42 186 - - TSA - ER Paid 11,308 12,402 9,506 1,200 - - Long Term Disability 725 666 657 809 - - FSA/HSA 2,018 2,005 1,898 1,800 - - TSA Classified ER Paid Health Insurance Option Heal 2,496 1,740 780 780 - - BENEFITS 180,075 194,156 196,024 192,785 - - Professional Growth - 748 1,500 - - - Professional Instr. Services - 4,150 27,000 21,600 - - Travel - Out of District 3,747 1,338 5,500 4,800 - - Postage 57,609 57,778 45,000 45,000 - - Professional Services - Tech & Instructional 117,183 175,915 36,275 51,000 - - PURCHASED SERVICES 178,540 239,930 115,275 122,400 - - Supplies and Materials 2,191 6,570 2,800 4,750 - - Textbooks - - - - - - Non-Consumables 805 - 1,000 1,600 - - Software - 349 - - - - SUPPLIES 2,996 6,919 3,800 6,350 - - CAPITAL OUTLAY - - - - - - Dues/Fees/Memberships 1,675 2,654 2,850 2,850 - - OTHER OBJECTS 1,675 2,654 2,850 2,850 - - EDUCATIONAL DIRECTORS 709,636 828,843 676,467 694,395 - -
119,207 (22,310)
This function provides the direction and management for all elementary and secondary education, instruction, and operations. It includes staff, services, travel and supplies. The FY18-19 Budget of $0.69M is $17K (2.65%) higher than the FY17-18 Budget driven mostly by COLA increases. This function includes $21K for Youth Truth, a student survey to give administrators a rating of the culture, climate and academics of the school, expanding to elementary schools, and $36K for College Dreams. Staffing remains flat at 4.0 FTE.
General Fund Detail Budget - 2325/2326 Office of the Educational Directors
Object Description
709,636
828,843
676,467 694,395
-
100,000
200,000
300,000
400,000
500,000
600,000
700,000
800,000
900,000
2015-16A 2016-17A 2017-18B 2018-19B
Office of the Educational Directors

Financial
Successful Students Today ~ Successful Citizens Tomorrow 75
2015-16 2016-17 2017-18 2018-19 2018-19 2018-19Actual Actual Budget Proposed Approved Adopted
Classified 20,901 - - - - - Classified Temporary 103 3,270 - - - - Classified Overtime 909 - - - - - SALARIES & WAGES 21,913 3,270 - - - - PERS 5,042 - - - - - Social Security 1,331 203 - - - - Medicare 311 47 - - - - Workers Compensation 162 17 - - - - Unemployment 30 3 - - - - Health Insurance 6,462 39 - - - - Life Insurance 17 - - - - - Long Term Disability 39 778 - - - - BENEFITS 13,394 1,087 - - - - PURCHASED SERVICES - - - - - - Supplies and Materials - 43 - - - - Non-Consumables 5,458 - - - - - SUPPLIES 5,458 43 - - - - CAPITAL OUTLAY - - - - - - OTHER OBJECTS - - - - - - SECONDARY ATHLETICS 40,766 4,400 - - - -
(36,366) (29,141)
In the past this function was used for Secondary Athletics, but now these jobs are exclusively being charged to the Special Revenue fund (page 107) for functions 1122 and 1132 as needed for game management.
Object Description
General Fund Detail Budget - 2329 Secondary Athletics
40,766
4,400 - -
-
5,000
10,000
15,000
20,000
25,000
30,000
35,000
40,000
45,000
2015-16A 2016-17A 2017-18B 2018-19B
Secondary Athletics

Financial
Successful Students Today ~ Successful Citizens Tomorrow 76
Notes Page

Financial
Successful Students Today ~ Successful Citizens Tomorrow 77
2015-16 2016-17 2017-18 2018-19 2018-19 2018-19Actual Actual Budget Proposed Approved Adopted
Classified 1,844,054 1,841,593 1,910,961 1,955,130 - - Administrators Salaries 2,767,234 2,930,499 2,912,873 3,013,693 - - Licensed Substitutes 348 2,136 - - - - Classified Substitutes 24,332 22,922 (0) - - - Licensed Temporary 973 2,181 - - - - Classified Temporary 66,892 56,154 64,701 64,701 - - Classified Overtime 27,677 31,208 22,620 22,620 - - Insurance Opt Out 6,000 6,400 4,551 6,051 - - SALARIES & WAGES 4,737,509 4,893,094 4,915,706 5,062,195 - - PERS 1,043,701 1,052,881 1,406,010 1,350,639 - - Social Security/Medicare 285,610 294,379 300,744 314,878 - - Medicare 66,796 68,847 70,335 73,641 - - Workers Compensation 32,504 23,319 22,410 23,463 - - Unemployment 6,264 4,893 4,851 5,079 - - Health Insurance 1,209,911 1,228,052 1,268,546 1,313,630 - - Life Insurance 3,314 2,781 1,062 2,944 - - TSA - ER Paid 34,201 31,215 34,717 65,950 - - Long Term Disability 9,063 8,733 10,007 10,931 - - FSA/HSA 25,353 26,977 28,500 70,500 - - TSA Classified ER Paid Health Insurance Option Heal 59,005 60,125 67,989 70,489 - - BENEFITS 2,775,722 2,802,201 3,215,171 3,302,144 - - Professional Growth 13,408 15,326 36,500 36,750 - - Professional Instr. Services 362 87 100 - - - Repair/Maintenance/Rentals - 510 - - - - Rental Expense 152 1,106 - - - - Pupil Transportation 126 - - - - - Pupil Transportation OTHTS 1,429 - - - - - Travel - In District 236 260 160 160 - - Travel - Out of District 28,257 13,180 16,000 17,049 - - Printing 3,363 - - - - - Charter School - 237 - - - - Professional Services 1,176 2,206 2,000 2,000 - - Other Licensed Subs - - - 2,341 - - Other Classified Subs - - 9,742 14,140 - - PURCHASED SERVICES 48,510 32,911 64,502 72,440 - - Supplies and Materials 35,316 52,752 44,179 44,550 - - Textbooks 250 - - - - - Periodicals 83 - - - - - Non-Consumables 7,025 6,873 5,500 5,000 - - Software - - 350 250 - - Hardware 3,320 3,442 7,920 5,500 - - SUPPLIES 45,994 63,067 57,949 55,300 - - CAPITAL OUTLAY - - - - - - Dues/Fees/Memberships 27,551 23,530 22,633 20,405 - - OTHER OBJECTS 27,551 23,530 22,633 20,405 - - OFFICE OF THE PRINCIPAL 7,635,286 7,814,802 8,275,961 8,512,484 - -
179,517 766,563
Object Description
General Fund Detail Budget - 2410 Office of the Principal

Financial
Successful Students Today ~ Successful Citizens Tomorrow 78
Office of the Principal Continued
General Fund Detail Budget - 2410 Office of the Principal
The Office of the Principal function includes services, supplies, materials, and staff to support the principals and assistant principals at all 19 Medford schools. Spending for the FY18-19 Budget is $8.5M, which is $236K (2.86%) higher than the FY17-18 Budget. This is driven primarily by contractual wage increases and associated benefits. Staffing for FY18-19 is 80.0 FTE, flat to current staffing levels.
7,635,286 7,814,802 8,275,961 8,512,484
-
1,000,000
2,000,000
3,000,000
4,000,000
5,000,000
6,000,000
7,000,000
8,000,000
9,000,000
2015-16A 2016-17A 2017-18B 2018-19B
Office of the Principal

Financial
Successful Students Today ~ Successful Citizens Tomorrow 79
Notes Page

Financial
Successful Students Today ~ Successful Citizens Tomorrow 80
2015-16 2016-17 2017-18 2018-19 2018-19 2018-19Actual Actual Budget Proposed Approved Adopted
Classified 236,097 231,025 230,109 252,532 - - Classified Managers 194,771 176,507 180,504 218,524 - - Classified Temporary - 1,000 - - - - Classified Overtime 1,899 3,384 1,545 1,545 - - Insurance Opt Out 4,036 2,600 2,179 4,036 - - SALARIES & WAGES 436,803 414,516 414,337 476,637 - - PERS 84,176 74,272 96,520 114,780 - - Social Security/Medicare 26,420 24,801 25,689 29,552 - - Medicare 6,179 5,800 6,008 6,911 - - Workers Compensation 3,131 2,029 1,914 2,202 - - Unemployment 572 415 414 477 - - Health Insurance 78,338 87,910 85,107 96,677 - - Life Insurance 117 100 79 99 - - TSA - ER Paid 2,400 2,400 3,679 5,945 - - Long Term Disability 994 825 776 1,036 - - FSA/HSA 1,345 1,315 5,239 9,239 - - TSA Classified ER Paid Health Insurance Option 6,325 6,000 5,383 17,040 - - BENEFITS 209,999 205,868 230,809 283,958 - - Travel - In District 74 90 - - - - Travel - Out of District 3,677 5,537 6,000 6,000 - - Postage - 6 25 20 - - PURCHASED SERVICES 3,751 5,633 6,025 6,020 - - Supplies and Materials 4,897 4,362 2,750 2,500 - - Non-Consumables - 991 - - - - SUPPLIES 4,897 5,353 2,750 2,500 - - CAPITAL OUTLAY - - - - - - Dues/Fees/Memberships 1,051 1,895 1,500 1,500 - - OTHER OBJECTS 1,051 1,895 1,500 1,500 - - BUSINESS SERVICES 656,501 633,265 655,421 770,616 - -
(23,235) 151,935
Object Description
This function provides the direction, management and oversight for all District fiscal services, including accounting, audits, payroll, and budgeting. This function includes services, supplies and staff to support the Financial Controller. FY18-19 spending of $0.77M is up $.1M (17.6%) to FY17-18 Budget, mainly due to contractual compensation increases and associated benefits. FTE for FY18-19 is 6.55 FTE, which remains flat to current staffing.
General Fund Detail Budget - 2521 Business Services
656,501 633,265 655,421
770,616
-
100,000
200,000
300,000
400,000
500,000
600,000
700,000
800,000
900,000
2015-16A 2016-17A 2017-18B 2018-19B
Business Services

Financial
Successful Students Today ~ Successful Citizens Tomorrow 81
2015-16 2016-17 2017-18 2018-19 2018-19 2018-19Actual Actual Budget Proposed Approved Adopted
SALARIES & WAGES - - - - - - Long Term Disability - 335 - - - - BENEFITS - 335 - - - - Advertising - 1,415 - - - - Professional Services 75,940 94,407 20,000 28,000 - - PURCHASED SERVICES 75,940 95,822 20,000 28,000 - - Supplies and Materials - 1,187 331 331 - - Non-Consumables 3,722 1,234 200 200 - - Software - 1,464 - - - - SUPPLIES 3,722 3,885 531 531 - - CAPITAL OUTLAY - - - - - - Dues/Fees/Memberships 19,098 10,855 9,000 9,000 - - OTHER OBJECTS 19,098 10,855 9,000 9,000 - - OTHER FISCAL SERVICES 98,760 110,897 29,531 37,531 - -
12,137 (49,470)
General Fund Detail Budget - 2529 Other Fiscal Services
This function includes services, supplies and bank fees. Expenses are primarily for services for SunGard Business Plus Software maintenance and ad hoc support consulting, administrative expenses related to Section 125 flexible spending, GASB 73 and GASB 74 Other Post Employment Benefit actuarial work, and ad hoc benefits consulting such as consulting for compensation and benefits analysis. Spending for FY18-19 is slightly higher to the FY17-18 Budget.
Object Description
98,760
110,897
29,531 37,531
-
20,000
40,000
60,000
80,000
100,000
120,000
2015-16A 2016-17A 2017-18B 2018-19B
Other Fiscal Services
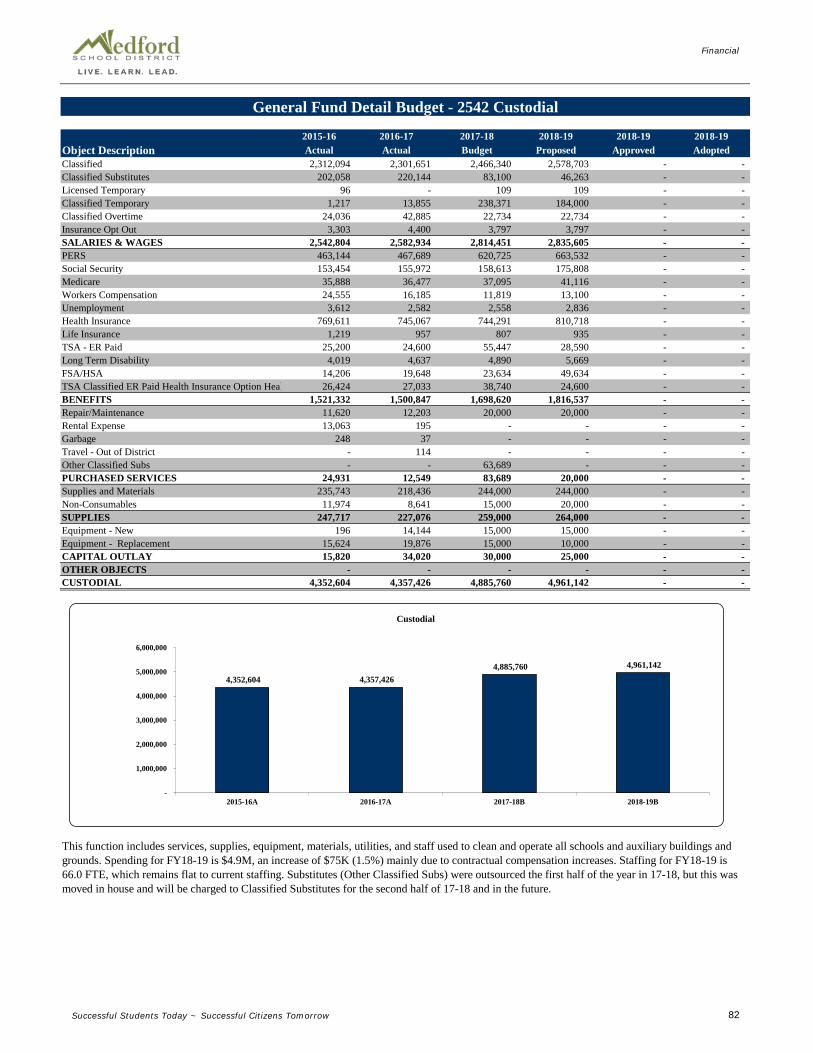
Financial
Successful Students Today ~ Successful Citizens Tomorrow 82
2015-16 2016-17 2017-18 2018-19 2018-19 2018-19Actual Actual Budget Proposed Approved Adopted
Classified 2,312,094 2,301,651 2,466,340 2,578,703 - - Classified Substitutes 202,058 220,144 83,100 46,263 - - Licensed Temporary 96 - 109 109 - - Classified Temporary 1,217 13,855 238,371 184,000 - - Classified Overtime 24,036 42,885 22,734 22,734 - - Insurance Opt Out 3,303 4,400 3,797 3,797 - - SALARIES & WAGES 2,542,804 2,582,934 2,814,451 2,835,605 - - PERS 463,144 467,689 620,725 663,532 - - Social Security 153,454 155,972 158,613 175,808 - - Medicare 35,888 36,477 37,095 41,116 - - Workers Compensation 24,555 16,185 11,819 13,100 - - Unemployment 3,612 2,582 2,558 2,836 - - Health Insurance 769,611 745,067 744,291 810,718 - - Life Insurance 1,219 957 807 935 - - TSA - ER Paid 25,200 24,600 55,447 28,590 - - Long Term Disability 4,019 4,637 4,890 5,669 - - FSA/HSA 14,206 19,648 23,634 49,634 - - TSA Classified ER Paid Health Insurance Option Heal 26,424 27,033 38,740 24,600 - - BENEFITS 1,521,332 1,500,847 1,698,620 1,816,537 - - Repair/Maintenance 11,620 12,203 20,000 20,000 - - Rental Expense 13,063 195 - - - - Garbage 248 37 - - - - Travel - Out of District - 114 - - - - Other Classified Subs - - 63,689 - - - PURCHASED SERVICES 24,931 12,549 83,689 20,000 - - Supplies and Materials 235,743 218,436 244,000 244,000 - - Non-Consumables 11,974 8,641 15,000 20,000 - - SUPPLIES 247,717 227,076 259,000 264,000 - - Equipment - New 196 14,144 15,000 15,000 - - Equipment - Replacement 15,624 19,876 15,000 10,000 - - CAPITAL OUTLAY 15,820 34,020 30,000 25,000 - - OTHER OBJECTS - - - - - - CUSTODIAL 4,352,604 4,357,426 4,885,760 4,961,142 - -
4,823 440,119
This function includes services, supplies, equipment, materials, utilities, and staff used to clean and operate all schools and auxiliary buildings and grounds. Spending for FY18-19 is $4.9M, an increase of $75K (1.5%) mainly due to contractual compensation increases. Staffing for FY18-19 is 66.0 FTE, which remains flat to current staffing. Substitutes (Other Classified Subs) were outsourced the first half of the year in 17-18, but this was moved in house and will be charged to Classified Substitutes for the second half of 17-18 and in the future.
Object Description
General Fund Detail Budget - 2542 Custodial
4,352,604 4,357,426 4,885,760 4,961,142
-
1,000,000
2,000,000
3,000,000
4,000,000
5,000,000
6,000,000
2015-16A 2016-17A 2017-18B 2018-19B
Custodial
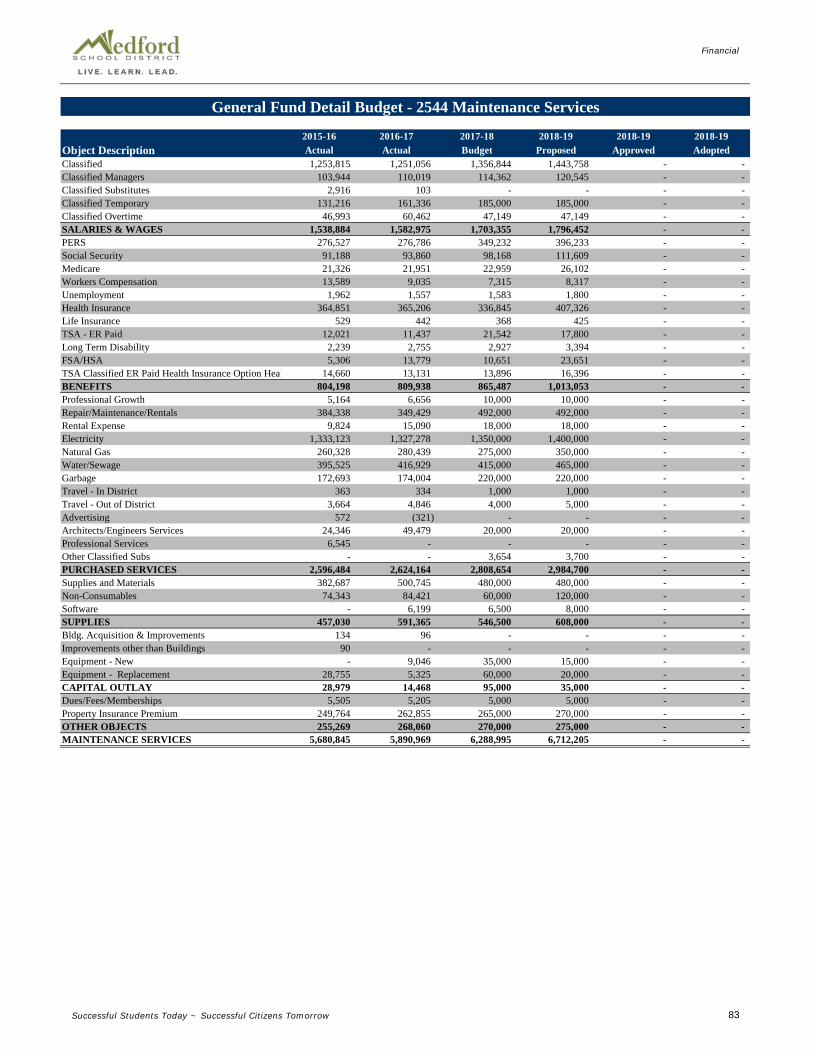
Financial
Successful Students Today ~ Successful Citizens Tomorrow 83
2015-16 2016-17 2017-18 2018-19 2018-19 2018-19Actual Actual Budget Proposed Approved Adopted
Classified 1,253,815 1,251,056 1,356,844 1,443,758 - - Classified Managers 103,944 110,019 114,362 120,545 - - Classified Substitutes 2,916 103 - - - - Classified Temporary 131,216 161,336 185,000 185,000 - - Classified Overtime 46,993 60,462 47,149 47,149 - - SALARIES & WAGES 1,538,884 1,582,975 1,703,355 1,796,452 - - PERS 276,527 276,786 349,232 396,233 - - Social Security 91,188 93,860 98,168 111,609 - - Medicare 21,326 21,951 22,959 26,102 - - Workers Compensation 13,589 9,035 7,315 8,317 - - Unemployment 1,962 1,557 1,583 1,800 - - Health Insurance 364,851 365,206 336,845 407,326 - - Life Insurance 529 442 368 425 - - TSA - ER Paid 12,021 11,437 21,542 17,800 - - Long Term Disability 2,239 2,755 2,927 3,394 - - FSA/HSA 5,306 13,779 10,651 23,651 - - TSA Classified ER Paid Health Insurance Option Heal 14,660 13,131 13,896 16,396 - - BENEFITS 804,198 809,938 865,487 1,013,053 - - Professional Growth 5,164 6,656 10,000 10,000 - - Repair/Maintenance/Rentals 384,338 349,429 492,000 492,000 - - Rental Expense 9,824 15,090 18,000 18,000 - - Electricity 1,333,123 1,327,278 1,350,000 1,400,000 - - Natural Gas 260,328 280,439 275,000 350,000 - - Water/Sewage 395,525 416,929 415,000 465,000 - - Garbage 172,693 174,004 220,000 220,000 - - Travel - In District 363 334 1,000 1,000 - - Travel - Out of District 3,664 4,846 4,000 5,000 - - Advertising 572 (321) - - - - Architects/Engineers Services 24,346 49,479 20,000 20,000 - - Professional Services 6,545 - - - - - Other Classified Subs - - 3,654 3,700 - - PURCHASED SERVICES 2,596,484 2,624,164 2,808,654 2,984,700 - - Supplies and Materials 382,687 500,745 480,000 480,000 - - Non-Consumables 74,343 84,421 60,000 120,000 - - Software - 6,199 6,500 8,000 - - SUPPLIES 457,030 591,365 546,500 608,000 - - Bldg. Acquisition & Improvements 134 96 - - - - Improvements other than Buildings 90 - - - - - Equipment - New - 9,046 35,000 15,000 - - Equipment - Replacement 28,755 5,325 60,000 20,000 - - CAPITAL OUTLAY 28,979 14,468 95,000 35,000 - - Dues/Fees/Memberships 5,505 5,205 5,000 5,000 - - Property Insurance Premium 249,764 262,855 265,000 270,000 - - OTHER OBJECTS 255,269 268,060 270,000 275,000 - - MAINTENANCE SERVICES 5,680,845 5,890,969 6,288,995 6,712,205 - -
General Fund Detail Budget - 2544 Maintenance Services
Object Description
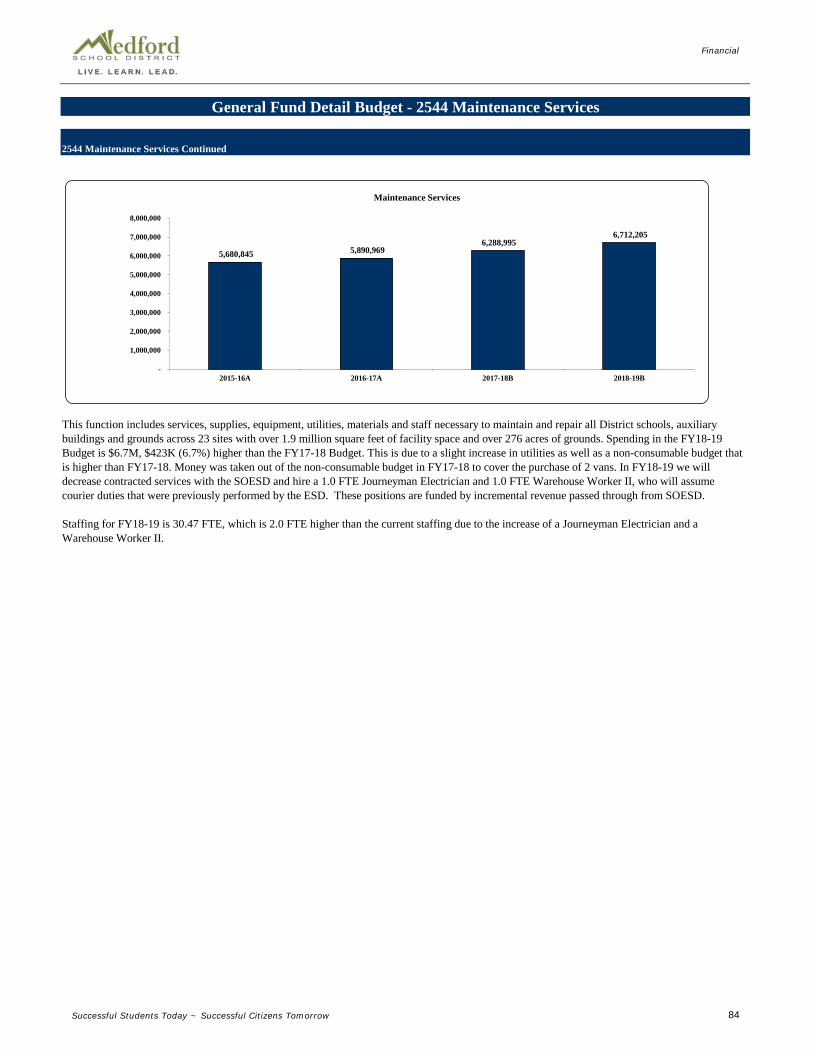
Financial
Successful Students Today ~ Successful Citizens Tomorrow 84
2544 Maintenance Services Continued
General Fund Detail Budget - 2544 Maintenance Services
This function includes services, supplies, equipment, utilities, materials and staff necessary to maintain and repair all District schools, auxiliary buildings and grounds across 23 sites with over 1.9 million square feet of facility space and over 276 acres of grounds. Spending in the FY18-19 Budget is $6.7M, $423K (6.7%) higher than the FY17-18 Budget. This is due to a slight increase in utilities as well as a non-consumable budget that is higher than FY17-18. Money was taken out of the non-consumable budget in FY17-18 to cover the purchase of 2 vans. In FY18-19 we will decrease contracted services with the SOESD and hire a 1.0 FTE Journeyman Electrician and 1.0 FTE Warehouse Worker II, who will assume courier duties that were previously performed by the ESD. These positions are funded by incremental revenue passed through from SOESD. Staffing for FY18-19 is 30.47 FTE, which is 2.0 FTE higher than the current staffing due to the increase of a Journeyman Electrician and a Warehouse Worker II.
5,680,845 5,890,969 6,288,995
6,712,205
-
1,000,000
2,000,000
3,000,000
4,000,000
5,000,000
6,000,000
7,000,000
8,000,000
2015-16A 2016-17A 2017-18B 2018-19B
Maintenance Services

Financial
Successful Students Today ~ Successful Citizens Tomorrow 85
2015-16 2016-17 2017-18 2018-19 2018-19 2018-19Actual Actual Budget Proposed Approved Adopted
SALARIES & WAGES - - - - - - BENEFITS - - - - - - Repair/Maintenance 54,269 59,770 50,000 60,000 - - Professional Services 5,976 - - - - - PURCHASED SERVICES 60,246 59,770 50,000 60,000 - - Supplies and Materials 32,583 17,458 50,000 50,000 - - SUPPLIES 32,583 17,458 50,000 50,000 - - Equipment - New - 58,197 - - - - CAPITAL OUTLAY - 58,197 - - - - OTHER OBJECTS (258) - - - - - VEHICLE MAINTENANCE 92,571 135,425 100,000 110,000 - -
42,854 10,000
This function includes services, supplies and equipment needed to maintain all District owned vehicles. The FY18-19 Budgeted spending will be relatively flat to the current year.
General Fund Detail Budget - 2545 Vehicle Maintenance
Object Description
92,571
135,425
100,000 110,000
-
20,000
40,000
60,000
80,000
100,000
120,000
140,000
160,000
2015-16A 2016-17A 2017-18B 2018-19B
Vehicle Maintenance

Financial
Successful Students Today ~ Successful Citizens Tomorrow 86
2015-16 2016-17 2017-18 2018-19 2018-19 2018-19Actual Actual Budget Proposed Approved Adopted
SALARIES & WAGES - - - - - - BENEFITS - - - - - - Repair/Maintenance 38,346 46,865 40,000 40,000 - - Other Property Services 13,326 18,333 17,000 17,000 - - Professional Services 174 - - - - - PURCHASED SERVICES 51,845 65,198 57,000 57,000 - - SUPPLIES - - - - - - CAPITAL OUTLAY - - - - - - OTHER OBJECTS - - - - - - SECURITY SERVICES 51,845 65,198 57,000 57,000 - -
13,353 5,000
This function includes a service contract with Sonitrol to provide security and safety for all District property, as well as repairs and maintenance expense for fire alarm certification. FY18-19 budgeted spending is anticipated to remain flat to the current year.
General Fund Detail Budget - 2546 Security Services
Object Description
51,845
65,198
57,000 57,000
-
10,000
20,000
30,000
40,000
50,000
60,000
70,000
2015-16A 2016-17A 2017-18B 2018-19B
Security Services

Financial
Successful Students Today ~ Successful Citizens Tomorrow 87
2015-16 2016-17 2017-18 2018-19 2018-19 2018-19Actual Actual Budget Proposed Approved Adopted
SALARIES & WAGES - - - - - - BENEFITS - - - - - - Pupil Transportation 4,405,700 4,628,504 5,399,666 5,550,000 - - Pupil Transportation - O.T.H.T.S. 45,374 27,591 40,400 65,000 - - Advertising 5,253 5,568 7,500 7,500 - - PURCHASED SERVICES 4,456,327 4,661,664 5,447,566 5,622,500 - - SUPPLIES - - - - - - CAPITAL OUTLAY - - - - - - OTHER OBJECTS - - - - - - STUDENT TRANSPORTATION SVC 4,456,327 4,661,664 5,447,566 5,622,500 - -
205,337 980,603
Object Description
General Fund Detail Budget - 2550 Student Transportation Services
This function includes a service agreement with First Student to provide all home-to-school transportation activity, as well as non-charter athletic transportation services. This is the gross expense for the District. The state revenue allocation includes a 70% transportation grant reimbursement for home-to-school transportation activity, as well as curriculum related travel. The FY18-19 Budget of $5.6M, up $0.175M (3.2%).
4,456,327 4,661,664
5,447,566 5,622,500
-
1,000,000
2,000,000
3,000,000
4,000,000
5,000,000
6,000,000
2015-16A 2016-17A 2017-18B 2018-19B
Student Transportation Services
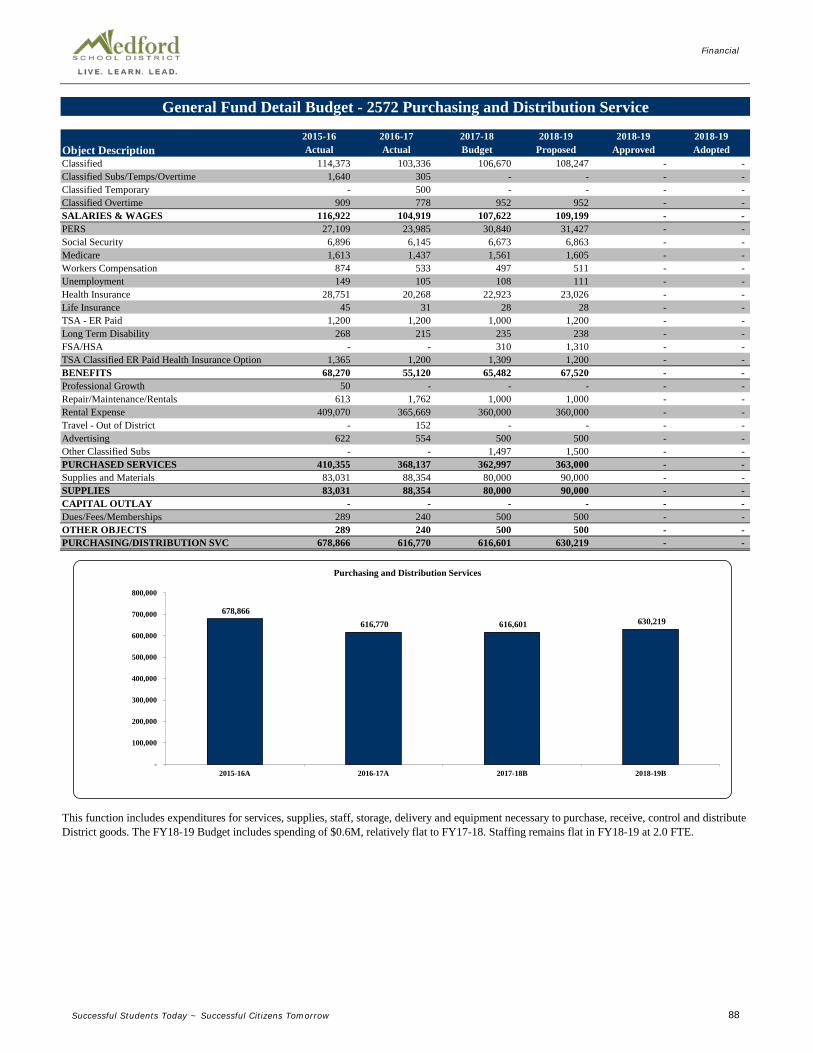
Financial
Successful Students Today ~ Successful Citizens Tomorrow 88
2015-16 2016-17 2017-18 2018-19 2018-19 2018-19Actual Actual Budget Proposed Approved Adopted
Classified 114,373 103,336 106,670 108,247 - - Classified Subs/Temps/Overtime 1,640 305 - - - - Classified Temporary - 500 - - - - Classified Overtime 909 778 952 952 - - SALARIES & WAGES 116,922 104,919 107,622 109,199 - - PERS 27,109 23,985 30,840 31,427 - - Social Security 6,896 6,145 6,673 6,863 - - Medicare 1,613 1,437 1,561 1,605 - - Workers Compensation 874 533 497 511 - - Unemployment 149 105 108 111 - - Health Insurance 28,751 20,268 22,923 23,026 - - Life Insurance 45 31 28 28 - - TSA - ER Paid 1,200 1,200 1,000 1,200 - - Long Term Disability 268 215 235 238 - - FSA/HSA - - 310 1,310 - - TSA Classified ER Paid Health Insurance Option 1,365 1,200 1,309 1,200 - - BENEFITS 68,270 55,120 65,482 67,520 - - Professional Growth 50 - - - - - Repair/Maintenance/Rentals 613 1,762 1,000 1,000 - - Rental Expense 409,070 365,669 360,000 360,000 - - Travel - Out of District - 152 - - - - Advertising 622 554 500 500 - - Other Classified Subs - - 1,497 1,500 - - PURCHASED SERVICES 410,355 368,137 362,997 363,000 - - Supplies and Materials 83,031 88,354 80,000 90,000 - - SUPPLIES 83,031 88,354 80,000 90,000 - - CAPITAL OUTLAY - - - - - - Dues/Fees/Memberships 289 240 500 500 - - OTHER OBJECTS 289 240 500 500 - - PURCHASING/DISTRIBUTION SVC 678,866 616,770 616,601 630,219 - -
(62,096) 18,699
Object Description
General Fund Detail Budget - 2572 Purchasing and Distribution Service
This function includes expenditures for services, supplies, staff, storage, delivery and equipment necessary to purchase, receive, control and distribute District goods. The FY18-19 Budget includes spending of $0.6M, relatively flat to FY17-18. Staffing remains flat in FY18-19 at 2.0 FTE.
678,866 616,770 616,601 630,219
-
100,000
200,000
300,000
400,000
500,000
600,000
700,000
800,000
2015-16A 2016-17A 2017-18B 2018-19B
Purchasing and Distribution Services

Financial
Successful Students Today ~ Successful Citizens Tomorrow 89
2015-16 2016-17 2017-18 2018-19 2018-19 2018-19Actual Actual Budget Proposed Approved Adopted
Classified 80,736 75,769 77,056 79,389 - - Classified Temporary 2,799 750 4,246 4,246 - - Classified Overtime 4,997 15,527 5,832 5,832 - - Insurance Opt Out 1,400 400 910 910 - - SALARIES & WAGES 89,933 92,446 88,044 90,377 - - PERS 20,427 21,091 24,044 24,277 - - Social Security 5,476 5,640 5,459 5,603 - - Medicare 1,281 1,319 1,277 1,310 - - Workers Compensation 671 465 407 418 - - Unemployment 121 92 88 90 - - Health Insurance 16,439 26,047 29,285 30,874 - - Life Insurance 33 35 28 28 - - TSA - ER Paid 600 1,200 1,000 600 - - Long Term Disability 164 166 170 175 - - FSA/HSA/HC Opt Out 1,680 1,482 2,482 - - TSA Classified ER Paid Health Insurance Option Heal 710 600 1,600 1,200 - - BENEFITS 45,923 58,336 64,839 67,058 - - Rental Expense 3,741 17,435 13,000 20,000 - - Printing 2,021 - 5,000 2,500 - - PURCHASED SERVICES 5,763 17,435 18,000 22,500 - - Supplies and Materials 56,374 63,566 65,000 65,000 - - SUPPLIES 56,374 63,566 65,000 65,000 - - CAPITAL OUTLAY - - - - - - OTHER OBJECTS - - - - - - PRINTING/PUBLISHING SVCS. 197,992 231,783 235,883 244,935 - -
33,791 29,051
Object Description
This function includes supplies, equipment, and staff used to print and publish District reports and instructional materials. Expenditures for FY18-19 are expected to be $0.24M, which is $9K (3.84%) higher than the FY17-18 Budget. This is due to contractual wage increases and the corresponding benefits. Staffing for FY18-19 remains flat at 2.0 FTE.
General Fund Detail Budget - 2574 Printing and Publishing Services
197,992
231,783 235,883 244,935
-
50,000
100,000
150,000
200,000
250,000
300,000
2015-16A 2016-17A 2017-18B 2018-19B
Printing and Publishing Services

Financial
Successful Students Today ~ Successful Citizens Tomorrow 90
2015-16 2016-17 2017-18 2018-19 2018-19 2018-19Actual Actual Budget Proposed Approved Adopted
Classified 301,837 316,040 392,909 400,133 - - Administrators Salaries 200,799 115,423 100,159 156,977 - - Temporary - Classified Salary - 1,069 - - - - Overtime Classified 2,879 1,417 4,242 4,242 - - Insurance Opt Out - 2,200 - - - - SALARIES & WAGES 505,515 436,149 497,310 561,352 - - PERS Tiers I & II 104,011 89,994 103,706 117,497 - - Social Security 28,791 25,890 29,469 34,804 - - Medicare 7,058 6,055 6,892 8,140 - - Workers Compensation 3,051 1,989 2,196 2,593 - - Unemployment 642 436 475 561 - - Health Insurance 94,756 77,484 82,855 87,617 - - Life Insurance 198 81 74 243 - - TSA - Employer Paid 10,454 5,520 4,840 6,390 - - Long Term Disability 689 833 837 1,175 - - FSA/HSA 1,477 2,207 2,252 1,652 - - TSA Classified ER Paid Health Insurance Option 5,340 5,790 7,013 8,513 - - BENEFITS 256,467 216,280 240,608 269,184 - - Management Services 33,550 36,719 28,000 40,000 - - Professional Growth 6,621 1,861 5,000 5,000 - - Travel - In District - 38 500 150 - - Travel - Out of District 11,859 10,245 20,000 20,000 - - Advertising 13,530 25,944 17,000 17,500 - - Negotiations 171 - 5,000 5,000 - - Professional Services 56,915 11,067 10,000 5,000 - - PURCHASED SERVICES 122,646 85,874 85,500 92,650 - - Supplies and Materials 36,836 43,672 36,000 36,000 - - Non-Consumables - 913 1,000 500 - - Software 698 35,112 37,000 40,000 - - Hardware - - 1,000 500 - - SUPPLIES 37,534 79,697 75,000 77,000 - - Dues/Fees/Memberships 1,953 40 1,500 2,500 - - OTHER OBJECTS 1,953 40 1,500 2,500 - - HUMAN RESOURCES/EMP. SVCS. 924,115 818,040 899,918 1,002,686 - -
(106,075) 160,878
The Human Resources function is for the direction and management of all personnel and employee services. This includes services, supplies, advertising, software, and staff necessary for the recruitment, monitoring, placement and pay assignment of all employees. It also includes bargaining, administrative assistance, and contract management. The FY18-19 Budget of $1.0M is $103K (11.4%) higher than the current year budget and is driven by contractual wage increases. Staffing for FY18-19 is 8.2 FTE, which is flat to current staffing.
General Fund Detail Budget - 2640 Human Resources and Employee Services
Object Description
924,115
818,040 899,918
1,002,686
-
200,000
400,000
600,000
800,000
1,000,000
1,200,000
2015-16A 2016-17A 2017-18B 2018-19B
Human Resources and Employee Services

Financial
Successful Students Today ~ Successful Citizens Tomorrow 91
2015-16 2016-17 2017-18 2018-19 2018-19 2018-19Actual Actual Budget Proposed Approved Adopted
Classified 277,958 252,911 261,458 306,717 - - Classified Managers 107,816 146,132 164,352 118,806 - - Classified Temporary - 500 30,914 - - - Classified Overtime 1,459 2,309 1,457 3,000 - - Insurance Opt Out - 385 - - - - SALARIES & WAGES 387,234 402,237 458,180 428,523 - - PERS 85,197 70,439 96,347 108,802 - - Social Security 22,945 23,750 26,888 26,568 - - Medicare 5,366 5,618 6,288 6,214 - - Workers Compensation 2,732 1,840 2,004 1,980 - - Unemployment 509 402 434 429 - - Health Insurance 70,082 55,169 65,153 68,234 - - Life Insurance 100 66 71 71 - - TSA - ER Paid 1,800 1,200 4,700 3,382 - - Long Term Disability 714 851 951 895 - - FSA/HSA 4,363 3,208 2,747 4,247 - - TSA Classified ER Paid Health Insurance Option 4,200 3,200 4,590 5,590 - - BENEFITS 198,009 165,743 210,173 226,411 - - Professional Instr. Services - 77 - - - - Repair/Maintenance 3,383 11,121 - - - - Travel - In District - 3 100 100 - - Travel - Out of District - 3,738 5,000 15,000 - - Postage - - - - - - Printing 2,093 2,752 3,000 3,000 - - Tuition 592 - 500 500 - - Professional Services 2,244 3,267 10,000 10,000 - - PURCHASED SERVICES 8,311 20,957 18,600 28,600 - - Supplies and Materials 3,577 3,338 2,500 2,500 - - Software 60,860 80,839 230,000 180,000 - - Hardware Under $5000 - - 2,500 1,000 - - SUPPLIES 64,437 84,177 235,000 183,500 - - Building Acq & Improvement 5,177 - - - - - Equipment - Replacement 14,889 - - - - - CAPITAL OUTLAY 20,066 - - - - - Dues/Fees/Memberships - 590 50,000 50,000 - - OTHER OBJECTS - 590 50,000 50,000 - - INFORMATION TECHNOLOGY 678,057 673,704 971,953 917,034 - -
(4,353) 159,928
General Fund Detail Budget - 2661 Information Technology
Object Description
The Information Technology function includes costs associated with ongoing computing, programming and data processing services. Kronos and a custom internally developed student information system are maintained by this department. Some key examples of costs incurred include hardware maintenance for Kronos and the NCS Scanner, software maintenance for Kronos, and the .net third-party tools. The District contracts out for mailing services, special forms, confidential document destruction and a database administrator. FY18-19 spending of $0.9M is nearly $55K less than the FY17-18 Budget. There was an expense of $50K that should have been accrued to 2016-17 but was not caught in time and was paid for in 2017-18. There is also a $30K reduction in Classified Temporary labor that is not needed in the future. Staffing across all funds for FY18-19 is 6.47 FTE, which is 1.0 FTE higher than current staffing due to the increase of 1.0 Computer Programmer, funded by Special Revenue Measure 98 (page 119).
678,057 673,704
971,953 917,034
-
200,000
400,000
600,000
800,000
1,000,000
1,200,000
2015-16A 2016-17A 2017-18B 2018-19B
Information Technology

Financial
Successful Students Today ~ Successful Citizens Tomorrow 92
2015-16 2016-17 2017-18 2018-19 2018-19 2018-19Actual Actual Budget Proposed Approved Adopted
Classified 638,128 723,681 774,550 947,729 - - Classified Managers 103,405 106,374 107,384 110,451 - - Classified Temps/Overtime 26,871 21,953 47,337 26,871 - - Classified Overtime 71,379 88,993 76,585 76,585 - - Insurance Opt Out 2,240 2,800 2,185 2,185 - - SALARIES & WAGES 842,022 943,800 1,008,040 1,163,821 - - PERS 170,740 193,195 252,952 270,606 - - Social Security 50,872 56,775 64,017 72,157 - - Medicare 11,897 13,278 14,972 16,875 - - Workers Compensation 6,089 4,426 4,770 5,377 - - Unemployment 1,106 944 1,033 1,164 - - Health Insurance 199,797 205,241 234,274 261,754 - - Life Insurance 266 229 212 255 - - TSA - ER Paid 7,200 7,800 9,552 13,217 - - Long Term Disability 1,162 1,585 1,759 2,328 - - FSA/HSA 2,807 1,655 11,349 12,349 - - TSA Classified ER Paid Health Insurance Option 9,343 10,067 9,248 11,248 - - BENEFITS 461,278 495,195 604,139 667,330 - - Professional Growth 7,980 - - 1,000 - - Repair/Maintenance/Rentals 121,164 77,032 45,000 48,000 - - Travel - In District 348 - 1,000 1,000 - - Travel - Out of District 4,354 348 15,000 15,000 - - Telephone 223,226 201,694 200,000 200,000 - - Postage - 313 1,000 1,000 - - Tuition 1,010 1,379 2,000 2,000 - - Pro Services - Tech / Non-instructional 33,894 42,823 105,000 90,000 - - PURCHASED SERVICES 391,976 323,589 369,000 358,000 - - Supplies and Materials 15,016 23,400 30,000 30,000 - - Library Books 1,636 103 2,500 2,500 - - Non-Consumables 476,062 389,154 450,000 450,000 - - Software 557,970 471,095 400,000 400,000 - - Hardware 916,107 1,212,440 703,750 700,000 - - SUPPLIES 1,966,791 2,096,192 1,586,250 1,582,500 - - Dues/Fees/Memberships 2,527 300 2,000 2,000 - - OTHER OBJECTS 2,527 300 2,000 2,000 - - NETWORK TELECOM SERVICES 3,664,594 3,859,076 3,569,429 3,773,650 - -
194,482 370,016
Object Description
This function includes services, supplies, equipment, software, and staff necessary to design, install and maintain District network, telecommunication and security systems. Expenditures in the FY18-19 Budget for the Network Telecom Services (NTS) function is up $204K (5.7%) versus the FY17-18 Budget due primarily to the increase of 2.0 FTE. Staffing is 2.0 FTE higher for FY18-19 at 18.0 FTE, which includes additional technical support for networks Chromebooks.
Chromebooks were first purchased at the end of the FY13-14 fiscal year for High School students. Over the last four years, the total number of Chromebooks has increased significantly as this technology has been rolled out to all students grades 2-12 . The District currently has over 11,500 Chromebook for students, but has only increased NTS staffing by 1.0 FTE from 2013 through 2018 to support this large increase in technology in the classroom. In FY18-19, we are proposing increasing staffing 2.0 FTE to meet the demands of Chromebook and the increased amount of staffing needed for day-to-day support.
General Fund Detail Budget - 2669 Network and Telecommunication Services
3,664,594 3,859,076
3,569,429 3,773,650
-
500,000
1,000,000
1,500,000
2,000,000
2,500,000
3,000,000
3,500,000
4,000,000
4,500,000
2015-16A 2016-17A 2017-18B 2018-19B
Network and Telecommunication Services

Financial
Successful Students Today ~ Successful Citizens Tomorrow 93
2015-16 2016-17 2017-18 2018-19 2018-19 2018-19Actual Actual Budget Proposed Approved Adopted
Early Retirement Stipends 1,022,157 846,200 1,071,700 1,174,800 - - SALARIES & WAGES 1,022,157 846,200 1,071,700 1,174,800 - - Social Security 63,264 52,464 88,951 72,838 - - Medicare 14,818 12,270 20,803 17,035 - - Workers Compensation 2,891 313 6,628 5,428 - - Unemployment - 0 1,435 1,175 - - Health Insurance 1,455,021 1,198,292 1,089,627 1,064,758 - - BENEFITS 1,535,993 1,263,340 1,207,444 1,161,232 - - PURCHASED SERVICES - - - - - - SUPPLIES - - - - - - CAPITAL OUTLAY - - - - - - OTHER OBJECTS - - - - - - EARLY RETIREMENT 2,558,150 2,109,540 2,279,144 2,336,032 - -
(448,610) (443,169)
The Early Retirement function includes costs for one time stipends and healthcare associated with the District supplemental early retirement program provided to qualified District retirees. These benefits are in addition to the state Public Employees Retirement System (PERS) benefits. Expenditures for FY18-19 are projected to be $2.3M. Approximately $1.27M, including fringe benefits, is budgeted for the one-time early retirement stipend program and $1.0M for healthcare (see paragraph below for details). How much is spent in total in this function and how much is spent in each of these areas (stipends vs. healthcare) could vary higher or lower significantly based on the timing of when employees choose to retire and whether they choose a one-time stipend or health insurance.
The early retirement healthcare benefit has been sunsetted for all employees who started after 2006. There are different levels of benefits depending on the bargaining group for those who started before 2006. For healthcare, the maximum benefit in years declines each year by one year. For the coming fiscal year, the maximum benefit for healthcare is 3 years. The maximum healthcare benefit for those retiring in 2019-20 is 2 years and 2020-21 is the last year for healthcare eligibility and the maximum benefit for retirees in that year will be 1 year in length. For those who do qualify and choose a one-time stipend instead of healthcare, there is a stipend based on years of service at June 30, 2012. The maximum one-time stipend is $56,000 per retiree. As the maximum benefit in years available for healthcare declines, it is anticipated more eligible employees will choose the one-time stipend payout. The amounts and terms vary by employee group.
Object Description
General Fund Detail Budget - 2700 Early Retirement
2,558,150
2,109,540 2,279,144 2,336,032
-
500,000
1,000,000
1,500,000
2,000,000
2,500,000
3,000,000
2015-16A 2016-17A 2017-18B 2018-19B
Early Retirement

Financial
Successful Students Today ~ Successful Citizens Tomorrow 94
2015-16 2016-17 2017-18 2018-19 2018-19 2018-19COMMUNITY Actual Actual Budget Proposed Approved AdoptedSchool Lunch Match - - - - - - COMMUNITY SERVICES - - - - - -
- - 2015-16 2016-17 2017-18 2018-19 2018-19 2018-19
FACILITIES Actual Actual Budget Proposed Approved AdoptedAcquisition & Construction - - - - - - Improvement - - - - - - FACILITIES - - - - - -
- - 2015-16 2016-17 2017-18 2018-19 2018-19 2018-19
DEBT & TRANSFERS Actual Actual Budget Proposed Approved AdoptedLong Term Debt - - - - - - Transfer of Funds 6,758,561 3,985,000 6,691,000 3,758,063 - - DEBT & TRANSFERS 6,758,561 3,985,000 6,691,000 3,758,063 - -
3,985,000 926,787
General Fund Expenditures- Community/Facilities/Debt & Transfer Functions
The General Fund is budgeting to transfer a total of $3.758M, which will be distributed as follows: $3.108M to the Project Reserve Fund to fund Maintenance and Repairs, Technology Hardware, and Curriculum, $375K to Special Revenue Secondary Athletics, $250K to partially fund the Physical Education Expansion (PEEK) and $25K for State and Local Programs. Narratives for the Special Revenue funds receiving these transfers start on page 99.
6,758,561
3,985,000
6,691,000
3,758,063
-
1,000,000
2,000,000
3,000,000
4,000,000
5,000,000
6,000,000
7,000,000
8,000,000
2015-16A 2016-17A 2017-18B 2018-19B
Community/Facilities/Debt/Transfers

Financial
Successful Students Today ~ Successful Citizens Tomorrow 95
2015-16 2016-17 2017-18 2018-19 2018-19 2018-19Actual Actual Budget Proposed Approved Adopted
SALARIES & WAGES - - - - - - BENEFITS - - - - - - PURCHASED SERVICES - - - - - - SUPPLIES - - - - - - CAPITAL OUTLAY - - - - - - OTHER OBJECTS - - - - - - SCHOOL LUNCH MATCH - - - - - -
- -
Object Description
General Fund Detail Budget - 3120 School Lunch Match
In order to qualify for The School Lunch Match Program, the State requires a revenue transfer from the General Fund BSSF-Basic School Support Fund to the Food Service BSSF-State School Lunch Match Fund. The intent is for this revenue to cover some costs associated with Food Service. We have consistently complied with this requirement. However, no expense is actually charged to the General Fund School Lunch Match since it is budgeted as a reduction in revenue in the General Fund and an increase in revenue in the Food Service Operations Fund. The match for 2016-17 was $52K and for 2017-18 it was $53K, so we expect next year's match to be about the same amount in 2018-19.

Financial
Successful Students Today ~ Successful Citizens Tomorrow 96
2015-16 2016-17 2017-18 2018-19 2018-19 2018-19Actual Actual Budget Proposed Approved Adopted
SALARIES & WAGES - - - - - - BENEFITS - - - - - - PURCHASED SERVICES - - - - - - SUPPLIES - - - - - - CAPITAL OUTLAY - - - - - - OTHER OBJECTS - - - - - - FACILITIES ACQUISITION/CONST. - - - - - -
- (49,000)
This function is now funded through the Project Reserves Fund found on pages 110-118 of this document.
General Fund Detail Budget - 4150 Facilities Acquisition and Construction
Object Description

Financial
Successful Students Today ~ Successful Citizens Tomorrow 97
2015-16 2016-17 2017-18 2018-19 2018-19 2018-19Actual Actual Budget Proposed Approved Adopted
SALARIES & WAGES - - - - - - BENEFITS - - - - - - PURCHASED SERVICES - - - - - - SUPPLIES - - - - - - CAPITAL OUTLAY - - - - - - Other Transfers 6,758,561 3,985,000 6,691,000 3,758,063 - - OTHER OBJECTS 6,758,561 3,985,000 6,691,000 3,758,063 - - TRANSFER OF FUNDS 6,758,561 3,985,000 6,691,000 3,758,063 - -
General Fund Detail Budget - 5201 Transfer of Funds
The General Fund is budgeting to transfer $3.758M out to other funds in FY18-19, which is 43.83% lower than FY17-18. These funds are transferred to State and Local Programs $0.025M, Secondary Athletics $0.375M, PEEK Grant $0.250M and Project Reserves $3.108M. Narratives for the Special Revenue Funds receiving these transfers start on page 99.
Object Description
6,758,561
3,985,000
6,691,000
3,758,063
-
1,000,000
2,000,000
3,000,000
4,000,000
5,000,000
6,000,000
7,000,000
8,000,000
2015-16A 2016-17A 2017-18B 2018-19B
Transfer of Funds

Financial
Successful Students Today ~ Successful Citizens Tomorrow 98
2015-16 2016-17 2017-18 2018-19 2018-19 2018-19Actual Actual Budget Proposed Approved Adopted
Contingency 6,669,841 7,860,084 8,101,748 8,101,748 - - CONTINGENCY 6,669,841 7,860,084 8,101,748 8,101,748 - -
2015-16 2016-17 2017-18 2018-19 2018-19 2018-19FUND BALANCE Actual Actual Budget Proposed Approved AdoptedUnappropriated Balance 0 0 0 0 0 0 FUND BALANCE 0 0 0 0 0 0
Contingency is $8.1M, which is flat compared to 2017-18.
General Fund Expenditures - Contingency and Fund Balance Functions
6,669,841
7,860,084 8,101,748 8,101,748
-
1,000,000
2,000,000
3,000,000
4,000,000
5,000,000
6,000,000
7,000,000
8,000,000
9,000,000
2015-16A 2016-17A 2017-18B 2018-19B
Contingency and Fund Balance

Financial
Successful Students Today ~ Successful Citizens Tomorrow 99
Special Revenue and Other Funds

Financial
Successful Students Today ~ Successful Citizens Tomorrow 100
2015-16 2016-17 2017-18 2018-19 2018-19 2018-19Requirements by Appropriation Level Actual Actual Budget Proposed Approved AdoptedInstruction* 7,646,354 9,622,553 10,888,776 12,254,491 - - Support Services* 2,438,238 1,622,908 3,201,098 3,015,019 - - Community Services* 5,271,725 5,547,255 6,265,640 6,351,865 - - Facilities Acquisition* 4,879,285 2,008,009 5,905,047 2,970,300 - - Transfers* - 150,000 1,851,100 1,551,100 - - Contingency* - 7,464,995 5,565,200 3,680,396 - - Fund Balance/Unappropriated Fund Balance 6,046,355 - 187,515 232,515 - - Total Expenditures/Appropriations 26,281,957 26,415,720 33,864,376 30,055,687 - - *Appropriation Level 26,281,956 26,415,721 30,055,687 - -
2015-16 2016-17 2017-18 2018-19 2018-19 2018-19Requirements by Program Actual Actual Budget Proposed Approved AdoptedFederal Programs 7,245,834 7,633,125 8,021,561 8,021,561 - - State and Local Programs 1,207,119 1,347,471 1,753,551 1,312,150 - - PERS Reserve 2,257,200 2,777,200 4,618,200 3,217,100 - - Physical Education Expansion (PEEK) 483,110 528,137 500,000 500,000 - - Secondary Athletics 608,911 626,459 639,353 642,250 - - Food Service Operations 6,590,254 7,107,236 7,226,165 6,853,695 - - Project Reserves 7,889,529 6,230,203 7,934,500 4,992,228 - - Seismic Upgrades - 165,889 2,191,747 1,500,000 - - Measure 98 - High School Success - - 904,298 2,741,702 - - Measure 99 Outdoor School - - 75,000 275,000 - - Total Requirements by Fund 26,281,957 26,415,720 33,864,375 30,055,687 - - (1) (0)
Secondary Athletics
Special Revenue funds account for the proceeds of specific revenue sources (other than
Federal Programs Food Service OperationsProject ReservesState and Local Programs
Special Revenue Funds
trusts, debt service, or capital projects) that are legally restricted to expenditure for specified purposes.
PERS ReserveMeasure 99 - Outdoor School
Seismic Upgrades
Special Revenue Resources/Appropriations are projected at $30M for FY18-19, down $3.8M (-11.25%) from the FY17-18 Budget. The reduction in Requirements is due primarily to $2.9M less spending in project reserves due primarily to the $2.2M Griffin Creek Construction project in 2017-18. Other significant reductions in Requirements include $1.4M less in the PERS reserve as it was transferred to the General Fund to offset higher PERS costs in 2017-18, $0.7 Million less in Seismic Upgrades as the Ruch project was completed in 2017-18 and the three new Seismic upgrade projects are in their earliest phases in 2018-19, $0.4M less in Food Service as the Reserves were partially spent down in 2017-18 to fund capital projects including replacing the main food service freezer ($0.25M) and $0.4M less across several smaller State and Local grants that were spent down in 2017-18. These decreases are partially offset by increases in High School Success $1.8M and Outdoor School $ 0.2M grants as they ramp up in their second year.
Measure 98 - High School SuccessPhysical Education Expansion (PEEK)
Federal Programs, $8,021,561
State and Local Programs, $1,312,150
Secondary Athletics, $642,250
Food Service, $6,853,695
Project Reserves, $4,992,228
Measure 98 Funds, $2,741,702
PEEK Grant, $500,000
PERS Reserve, $3,217,100 Seismic Upgrades,
$1,500,000
Measure 99 Funds, $275,000

Financial
Successful Students Today ~ Successful Citizens Tomorrow 101
2015-16 2016-17 2017-18 2018-19 2018-19 2018-19Object Description Actual Actual Budget Proposed Approved AdoptedRESOURCES By Grant Including CarryoverTitle I 4,028,263 4,271,632 4,507,500 4,507,500 IDEA 2,235,541 2,215,158 2,169,030 2,169,030 Title IIA - Improving Teacher Quality 536,878 545,724 439,561 439,561 Other Federal Grants/Carryover 62,770 168,237 528,470 528,470 Fruit and Vegetable Grants 219,386 236,066 185,000 185,000 Title III - English Language Acquisition 124,563 131,475 132,000 132,000 McKinney Homeless Education 38,433 64,834 60,000 60,000 TOTAL RESOURCES 7,245,834 7,633,125 8,021,561 8,021,561 - -
REQUIREMENTSInstruction 5,729,753 6,264,893 6,877,978 6,583,702 Support Services 1,388,410 1,067,567 960,763 1,121,894 Community Services 127,672 300,665 182,820 315,965 TOTAL REQUIREMENTS 7,245,834 7,633,125 8,021,561 8,021,561 - -
Program/Service Students ServedEducational Resource Centers (provided at all schools) 1,278Self-contained Classes - MAPS and FOCUS programs at twelve (12) schools 320STEPS Classes (operated by SOESD) at two (2) schools 16Speech-Language Therapy 1,157Assessment & Evaluation Teams 707Occupational Therapy 121Behavior-Social Support 498
Total 4,097
The following Special Education services and programs are offered in the Medford School District: (Note: This is not the same as the total child count above because some students can be in more than one of the programs below.)
Special Revenue Funds - Federal Programs
Federal Program grants revenues are projected at $8M in the FY18-19 Budget, which is flat to the FY17-18 Budget. Over 80% of the grant monies are awarded in two areas: IDEA and Title I. A description of the District's two major Federal Programs are described as follows:
IDEA - Under the Individuals with Disabilities Education Act (IDEA), federal Special Education funds are distributed by the state through three grant programs. Part B of the law, the main program, authorizes grants to state and local education agencies to offset part of the costs of the education needs of children with disabilities 5-21 years of age. The purpose of special education is to provide a Free Appropriate Public Education (FAPE) to eligible students at public expense, under public supervision and direction, at no cost to the parents, and in conformity with an Individualized Education Program (IEP). Special Education services include specially designed instruction, related services, and supplementary aides designed to meet the unique needs of a child with a disability. The District's Special Education Child Count as of December 1, 2017 was 1,957 students.
7,245,834 7,633,125
8,021,561 8,021,561
-
1,000,000
2,000,000
3,000,000
4,000,000
5,000,000
6,000,000
7,000,000
8,000,000
9,000,000
2015-16B 2016-17A 2017-18B 2018-19B
Federal Programs
Financial
Successful Students Today ~ Successful Citizens Tomorrow 102
Federal Programs Narratives ContinuedFEDERAL TITLE PROGRAMS IN THE ELEMENTARY AND SECONDARY EDUCATION ACT
School-Wide Programs are present in: Jackson, Jefferson, Kennedy, Oak Grove, Roosevelt, Washington, Wilson, Central, and McLoughlin.
Title I: Part A – Improving Basic Programs Part C – Migrant Education Part D – Neglected and Delinquent or At-Risk Children -Title IIA – Teacher Quality -Title III – English Learners and Immigrant Youth -Title X – McKinney-Vento Act or Homeless Education
The purpose of Title IA funding is to ensure that all children have a fair and equitable opportunity to learn and achieve. Title IA funding is a supplement to District and school resources to ensure our economically disadvantaged students receive a high quality education. It may not be used to supplant General Fund dollars.
A portion of this funding is allocated directly to each qualifying Title I school. The remaining portion is set-aside to ensure District support for all qualifying students and proper oversight of expenditures. The school funds are expended in accordance with the school-level Title I plan. The District funds are expended as authorized or required by federal and state law. Below is a narrative describing the purposes of the District set-aside funds and a brief summary of the planned expenditures.
District Title IA Set-Aside Description and Expenditure Category Summary1. Description: Administration and Leadership. This set-aside is used to support District administration of the Title IA program. Administration – Staff, supplies, and materials to support the administration of Title IA. Direct Administration – Includes 0.5 FTE of the Federal Program’s Supervisor’s salary plus benefits. Administrative Support – Includes 0.5 FTE of the Federal Program’s Office Assistant’s salary.
2. Description: Homeless. This is a required set-aside to support services for homeless students in all District facilities. The District provides academic support to homeless students in non-Title I buildings from this required set aside.
Required Expenditure Category:• Homeless - Provides services for homeless students in all District buildings, regardless if the students qualify for Title I or not.
3. Description: Parent Involvement. This is a required set-aside to implement effective Parent/Family Involvement (A 1% set-aside is required for Districts with allocations of more than $500 K.)
Required Expenditure Category: Parent Involvement- This set-aside goes back to Title IA schools. Equitable services for Sacred Heart private school are also reflected in this expenditure category as required by law.
4. Description: Professional Development. This is a required set-aside to support the improvement of instruction. As of 2006-07, paraprofessionals hired must be “highly qualified” as defined in federal and state law. The District must also provide services for qualifying private school students residing within the District.
Required Expenditure Category:• Eleven Title I Coordinators provide ongoing professional development for teachers and support staff. This includes guiding model lessons involving reading, math, and writing in the general education classroom. It also includes providing interventions for students and managing building Title I budgets and programs. The school-wide Title I schools are Howard, Jackson, Jefferson, Kennedy, Oak Grove, Roosevelt, Washington, Wilson, McLoughlin, Central High School and Kids Unlimited Academy.
• Sacred Heart, Rogue Valley Adventist and Grace Christian private schools receive 1.4% of this set-aside amount for professional development and direct interventions for reading and math instruction in the targeted assisted setting.
5. Description: Extended Time for Learning. This is a required set-aside for extending academic learning time. It includes before and after school, extended Kindergarten and summer school programs.
Special Revenue Funds - Federal Programs

Financial
Successful Students Today ~ Successful Citizens Tomorrow 103
Federal Title Programs Narratives Continued
Special Revenue Funds - Federal Programs
Required Expenditure Category:• Early Reading Intervention Support Staff -25 classified instructional support staff provide early reading intervention for Kindergarten. • Migrant Summer School- migrant summer school expenditures in combination with SOESD Title IC consortium funds for migrant and English Language Learners (ELL). • After School Program- after school program for English language learners at Title I schools.-Title I dollars will supplement six Title I Elementary schools in 2018-19 at $20,000 per school, for a total of $120,000. This is in addition to the $100,000 from the General Fund for three MAS/KU schools, bringing the total to $220,000 across all funds. See page 32 for more narrative about the after school program.• Extended Day Interventions- Extended day intervention provided by Kids Unlimited certified teachers to deliver instruction in the areas of reading and math.
6. Description: District Improvement. This is a required set-aside for professional development provided to meet the identified needs of the instructional staff serving the District. The required set-aside must be at least 10% of the Title I-A grant amount.
Required Expenditure Category:• Title I and Title IIA Set Asides for Professional Development Only
• Reading and math Professional Development
• Math Coaches K-6 in all schools. Coaches provide Math Studio support, model best practice lessons, work with PLCs & support school-wide data teams.
• 2.0 FTE Content Area Instructional Coach for NMHS and SMHS through Title IIA. This person or people will provide professional development for all secondary language arts departments, work with PLCs and provide support for building data teams. This decreased by 1.0 FTE from the 2015-2016 school year.
• 1.0 FTE School Improvement Coach Title IA and 2.0 FTE out of Title IIA Coaches provide reading and writing professional development training for both Title and non-Title elementary buildings in the District. They also work with grade level PLCs and provide data support for both building and District teams.
• 0.5 FTE Reading Intervention Specialist for Title buildings - work with students implementing literacy interventions, support staff with job imbedded, ongoing professional development.
• Set Aside for Homeless Children- This set-aside provides wrap around support services for homeless students and their families.
7. Description: Neglected Children. This is a required set-aside for services provided to students identified as neglected through the neglected child census.
Required Expenditure Category:• Funds for Neglected Children are used at Options and On Track to provide services for academic support. FTE support is provided for 1.0 FTE licensed staff.
• Positive attendance support through .8 FTE classified position.
8. Description: Other Required Set-Asides
Required Expenditure Category:• 0.75 FTE classified salary for a School Attendance and Success Service Advocate to make sure students are receiving wraparound services for support. The advocate helps facilitate the McKinney-Vento criteria for homeless students staying at their school of origin and helps facilitate transportation services. The advocate also works with mental health agencies, medical and dental providers, and District personnel from within and outside the District to ensure student success and regular school attendance.
Title IVA: Student Support and Academic Enrichment (SSAE)The purpose of the SSAE grant program is to improve students' academic achievement by increasing the capacity of states, LEAs, schools, and local communities to:•Provide all students with access to a well-rounded education•Improve school conditions for student learning, and •Improve the use of technology in order to improve the academic achievement and digital literacy of all students.

Financial
Successful Students Today ~ Successful Citizens Tomorrow 104
2015-16 2016-17 2017-18 2018-19 2018-19 2018-19Object Description Actual Actual Budget Proposed Approved AdoptedRESOURCES Local Sources 434,937 499,513 350,175 350,000 Intermediate Sources - 121,800 122,000 State Sources 172,017 119,003 141,701 Federal Sources - - 15,225 15,500 Transfers 25,000 175,000 475,000 175,000 Beginning Fund Balance 575,165 553,955 649,650 649,650 TOTAL RESOURCES 1,207,119 1,347,471 1,753,551 1,312,150 - -
REQUIREMENTSInstruction 407,910 412,817 252,500 252,500 Support Services 205,253 245,004 203,000 203,000 Community Services 15,000 15,000 450,000 150,000 Facilities Acquisition 25,000 25,000 20,300 20,300 Transfers - - - Contingency 649,650 802,751 636,350 - Unappropriated Fund Balance 553,955 - 25,000 50,000 TOTAL REQUIREMENTS 1,207,119 1,347,471 1,753,551 1,312,150 - -
The FY18-19 Budget for State and Local Programs includes the Food Service Capital Reserve and several smaller, mostly local grants, including but not limited to: Oregon Community Foundation, Medford Schools Foundation, Aspire, Project Dove, Anna May, Fred Meyer, West Foundation etc. In the past the PEEK grant was budgeted in this area, but has been moved to page 106 in the FY17-18 budget for more explanation. The PERS reserve funds also used to be budgeted on this page as well and have been moved to page 105. The FY18-19 Budget for State and Local Programs is down $.4M compared to the prior year due to a freezer purchase in FY17-18 for Food Service.
The $175K transfer in is $25K from the General Fund and $150K from the Food Service Operations Fund to the Food Service Guarantee Fund which pays for Food Service related capital needs.
Special Revenue Funds - State and Local Programs
1,207,119 1,347,471
1,753,551
1,312,150
-
200,000
400,000
600,000
800,000
1,000,000
1,200,000
1,400,000
1,600,000
1,800,000
2,000,000
2015-16A 2016-17A 2017-18B 2018-19B
State and Local Programs

Financial
Successful Students Today ~ Successful Citizens Tomorrow 105
2015-16 2016-17 2017-18 2018-19 2018-19 2018-19Object Description Actual Actual Budget Proposed Approved AdoptedRESOURCES Transfers In to PERS 2,257,200 520,000 1,841,000 Beginning Fund Balance 2,257,200 2,777,200 3,217,100 TOTAL RESOURCES 2,257,200 2,777,200 4,618,200 3,217,100 - -
REQUIREMENTSTransfers 1,401,100 1,401,100 Contingency 2,777,200 3,217,100 1,816,000 - - Unappropriated Fund Balance 2,257,200 - - - - TOTAL REQUIREMENTS 2,257,200 2,777,200 4,618,200 3,217,100 - -
Special Revenue Funds - PERS Reserves
This fund represents the PERS reserve that was setup to partially offset large rate increases in the PERS rate over the 2017-19 biennium and beyond. The original reserve had $2.8M at the end of Fiscal 16-17. The District employer contributions increased $2.8M per year ($5.6 M total over the biennium) in the 2017-19 biennium due to rate increases. About $1.4M of the original $2.8M reserve was used in 2017-18 offset about half of the annual PERS increase for 2017-18. Another $1.4M will be used in 2018-19. PERS has notified all its employers that, absent substantial reforms, there will be similar or larger increases for the next two biennium's (2017-19 and 2019-21) at a minimum. The graph below demonstrates the long term nature of the PERS challenge showing the expected Tier I/II PERS benefit payments peaking around 2037. The District made an additional $1.8M contribution to the reserve in 2017-18 so there should be $1.8M left at the end of 2018-19 to help offset a portion of the PERS increases in the 2019-21 biennium.
2,257,200
2,777,200
4,618,200
3,217,100
-
500,000
1,000,000
1,500,000
2,000,000
2,500,000
3,000,000
3,500,000
4,000,000
4,500,000
5,000,000
2015-16A 2016-17A 2017-18B 2018-19B
PERS Reserves

Financial
Successful Students Today ~ Successful Citizens Tomorrow 106
2015-16 2016-17 2017-18 2018-19 2018-19 2018-19Object Description Actual Actual Budget Proposed Approved AdoptedRESOURCES State Sources 483,110 528,137 350,000 250,000 Transfers 150,000 250,000 Beginning Fund BalanceTOTAL RESOURCES 483,110 528,137 500,000 500,000 - -
REQUIREMENTSInstruction 483,110 528,137 500,000 500,000 TOTAL REQUIREMENTS 483,110 528,137 500,000 500,000 - -
This page shows the Physical Education Expansion (PEEK) Grant. At this time, it is unclear how much the District will receive for the PEEK grant in the 2018-19 school year. If this grant is not awarded to the District or if it is awarded at a lower amount, the District will have to reevaluate how Physical Education instruction is delivered to elementary students. The District is expecting that this amount will slowly decrease to $0 in the upcoming years. This expected reduction is reflected in the budget for 2018-19, lowering the grant estimate to $250K from $350K.
BackgroundThe source of statewide funding for the PEEK grant has been $370,000 (for the 15-17 biennium) from the state legislature and $4,000,000 (for the 2015-17 biennium) from the big tobacco settlement monies that were allocated to Oregon.
• The tobacco settlement money is allocated by a separate committee, which consists of some very influential nonprofit groups that continue to advocate for kid related spending, i.e. keeping kids active and helping them make healthy decisions. • This grant is competitive and was intended to be seed money to get Districts up and running with the idea that the District (over time) would take over funding of their own PE programs. In the first couple of years, there were so few applications for grants that all grant requests were funded. Last year, for the first time, the committee had enough grant applications to cause a true competitive process, which led to us to predict that we will be receiving less per school than in the prior year. • It is anticipated that the tobacco settlement money will continue in the next biennium (although there is less certainty about the $370k noted above, but, as you can see, the state portion is less than 1% of the total). • It is anticipated that the PE minutes mandate is not going to be softened. It is also anticipated that more school Districts will apply for grants in the next biennium, based on the current trend and the need to get to the required number of minutes of PE instruction by 2019. It is not known if the committee will simply decrease the dollars per grant or start to attempt to wean some of us off of the grant. In either scenario, we are predicting getting less money next year and the year after. Thus far, the Medford School District has by far received the most funds from this grant.
Special Revenue Funds - Physical Education Expansion (PEEK) Grant
483,110 528,137
500,000 500,000
-
100,000
200,000
300,000
400,000
500,000
600,000
2015-16A 2016-17A 2017-18B 2018-19B
Physical Education Expansion (PEEK) Grant

Financial
Successful Students Today ~ Successful Citizens Tomorrow 107
2015-16 2016-17 2017-18 2018-19 2018-19 2018-19Object Description Actual Actual Budget Proposed Approved AdoptedRESOURCESAdmissions 147,644 115,669 115,000 115,000 Participation Fees 108,409 148,366 115,000 121,897 Other Local Sources - - State Sources - OSSA 31,899 17,912 30,000 30,000 Interfund Transfer 310,000 340,000 375,000 375,000 Beginning Fund Balance 10,959 4,512 4,353 353 TOTAL RESOURCES 608,911 626,459 639,353 642,250 - -
REQUIREMENTSInstruction - Middle School Co-Curricular:Salaries and Wages 539 1,031 600 600 Employee Benefits 142 291 150 150 Purchased Services 44,601 51,572 42,250 42,500 Supplies and Materials 32,977 29,403 30,000 30,000 Capital Outlay - - 8,000 6,000 Other Objects 800 400 1,000 1,000 Total Middle School 79,060 82,698 82,000 80,250 - - Instruction - High School Co-CurricularSalaries and Wages 56,872 56,323 60,000 60,000 Employee Benefits 11,834 11,861 12,000 15,000 Purchased Services 328,842 286,996 340,000 340,000 Supplies and Materials 98,837 145,552 90,000 90,000 Capital Outlay 7,733 - 30,000 32,000 Other Objects 21,222 38,676 25,000 25,000 Total High School 525,339 539,408 557,000 562,000 - - Contingency 4,353 353 (0) - - Fund Balance 4,512 TOTAL REQUIREMENTS 608,911 626,459 639,353 642,250 - -
Special Revenue Funds - Secondary Athletics
Secondary Athletics includes revenues and expenses other than the coaching stipends that are paid for by the General Fund (GF) in function 1122 and 1132. In 2018-19, the GF will transfer $375K to help support this fund. Revenue was affected by the wildfires in the fall of 2017 when home football games were moved. Athletic participation fees stayed the same but not to the original amounts that were previously charged, and we currently have the lowest fees in the Southwest Conference. Fees are currently $100 for high school and $50 for middle schools with a limit of paying for 2 sports. Costs for referees and transportation have continued to increase. The OSAA realignment of leagues for the next four year period and statewide scheduling for football will increase travel. Charter buses are used for longer trips to keep students in classrooms longer and get them home sooner. Cheerleading now uses district transportation and costs have been added in. Expenses also continue to climb for increased game management and supervision. This is a safety issue for spectators, players, coaches and venues. The benefits associated with these positions are increasing by over $3,000 assuming the same hours and rates of pay. This budget keeps the capital money set aside for baseball and softball fields in the athletic budget. There are a total of seven district fields and Harry and David Field is rented to make eight. Yearly additions for soil and other mixes for the seven fields are needed to maintain safe and quality playing conditions. Other capital projects include a rotation of football equipment for all levels so purchases will not hit all in one year.
608,911 626,459 639,353 642,250
-
100,000
200,000
300,000
400,000
500,000
600,000
700,000
2015-16A 2016-17A 2017-18B 2018-19B
Secondary Athletics

Financial
Successful Students Today ~ Successful Citizens Tomorrow 108
2015-16 2016-17 2017-18 2018-19 2018-19 2018-19Object Description Actual Actual Budget Proposed Approved AdoptedRESOURCESDaily Sales - School Lunch Program 587,213 606,353 637,500 650,250 Other Local Sources 500 - 1,020 - Federal Sources - School Lunch 4,514,533 4,635,226 4,607,000 4,800,000 Other Sources 379,660 404,456 255,000 260,100 TransferBeginning Fund Balance 1,108,349 1,461,201 1,725,645 1,143,345 TOTAL RESOURCES 6,590,254 7,107,236 7,226,165 6,853,695 - -
REQUIREMENTSCommunity Services:Salaries/Wages/Benefits 11,075 Purchased Services 4,966,335 5,029,561 5,228,800 5,428,800 Supplies and Materials 26,276 55,355 154,020 157,100 Other (Indirect Overhead to General Fund) 136,443 135,599 250,000 300,000 Capital Outlay - Total Community Services 5,129,054 5,231,590 5,632,820 5,885,900 - - Transfers 150,000 450,000 150,000 Contingency 1,725,645 1,143,345 817,795 - - Fund Balance 1,461,201 - - - - - TOTAL REQUIREMENTS 6,590,254 7,107,236 7,226,165 6,853,695 - -
Special Revenue Funds - Food Service Operations
Food services are provided for the students of the Medford School District by Sodexo, Inc. The majority of the anticipated requirements or expenditures are reflected in Purchased Services, which is primarily comprised of Sodexo’s fee to the District for providing the individual meals. The remainder of the expenditures is in Supplies and Materials, which is used primarily for commodities. This is required to be accounted for separately and the value is reimbursed to the District by Sodexo as received, and in Capital Outlay, which is primarily used for anticipated replacement of kitchen hardware. The $150K transfer out goes to the Food Service Guarantee in State and Local funds to fund capital equipment and repairs.
Sodexo serves approximately 1,600,000 meals and equivalent meals per year to students across all 20 school locations. Meals are calculated on the following contractual basis, set by ODE: Lunch and Supper = 1/1, Breakfast = 3/1, Afterschool Snacks = 4/1, Equivalent meals = $3.3125/1.
At this time costs are offset by federal sources and daily sales. The Federal Sources are from the USDA National School Lunch, Supper and Afterschool Snack Programs. If additional resources were needed to cover costs, those resources would come from a transfer from the General Fund.
6,590,254 7,107,236 7,226,165
6,853,695
-
1,000,000
2,000,000
3,000,000
4,000,000
5,000,000
6,000,000
7,000,000
8,000,000
2015-16A 2016-17A 2017-18B 2018-19B
Food Service Operations

Financial
Successful Students Today ~ Successful Citizens Tomorrow 109
2015-16 2016-17 2017-18 2018-19 2018-19 2018-19Object Description Actual Actual Budget Proposed Approved AdoptedRESOURCESState Sources 165,889 2,202,100 1,500,000 Beginning Fund Balance (10,353) - - - TOTAL RESOURCES - 165,889 2,191,747 1,500,000 - -
REQUIREMENTSTransfer from General Fund - - Capital Outlay 176,242 2,191,747 1,500,000 Contingency (10,353) - - TOTAL REQUIREMENTS 165,889 2,191,747 1,500,000 - -
The Medford School District has been awarded several grants through the State’s Seismic Rehabilitation Grant Program (SRGP) to seismically upgrade areas of four schools in need of structural reinforcement. Currently, we have completed seismic upgrades at Ruch bringing the site up to life safety standards and the gym up to immediate occupancy standards with a fully reimbursed project cost of ~$1.4M. We will complete seismic upgrades at Griffin Creek and Howard during the summer of 2018 with expected spending and reimbursement of ~$1.498M per project. Areas of Hoover elementary will be seismically upgraded during the summer of 2019 with an expected project cost and reimbursement of ~$1.5 million. The District will continue to pursue additional opportunities to seismically upgrade other sites based on the district wide seismic assessment. The Medford School District fronts the project cost which is then paid back in a timely manner by the State of Oregon Business Development Department—Infrastructure Finance Authority (IFA).
In the FY18-19 Budget we have projected to spend an estimated $1.5M to start upgrade projects on the three remaining schools (Griffin Creek, Howard and Hoover). These projects are expected to be completed in August of FY19-20.
Special Revenue Funds - Seismic Upgrades Grant
-165,889
2,191,747
1,500,000
-
500,000
1,000,000
1,500,000
2,000,000
2,500,000
2015-16A 2016-17A 2017-18B 2018-19B
Seismic Upgrades Grant
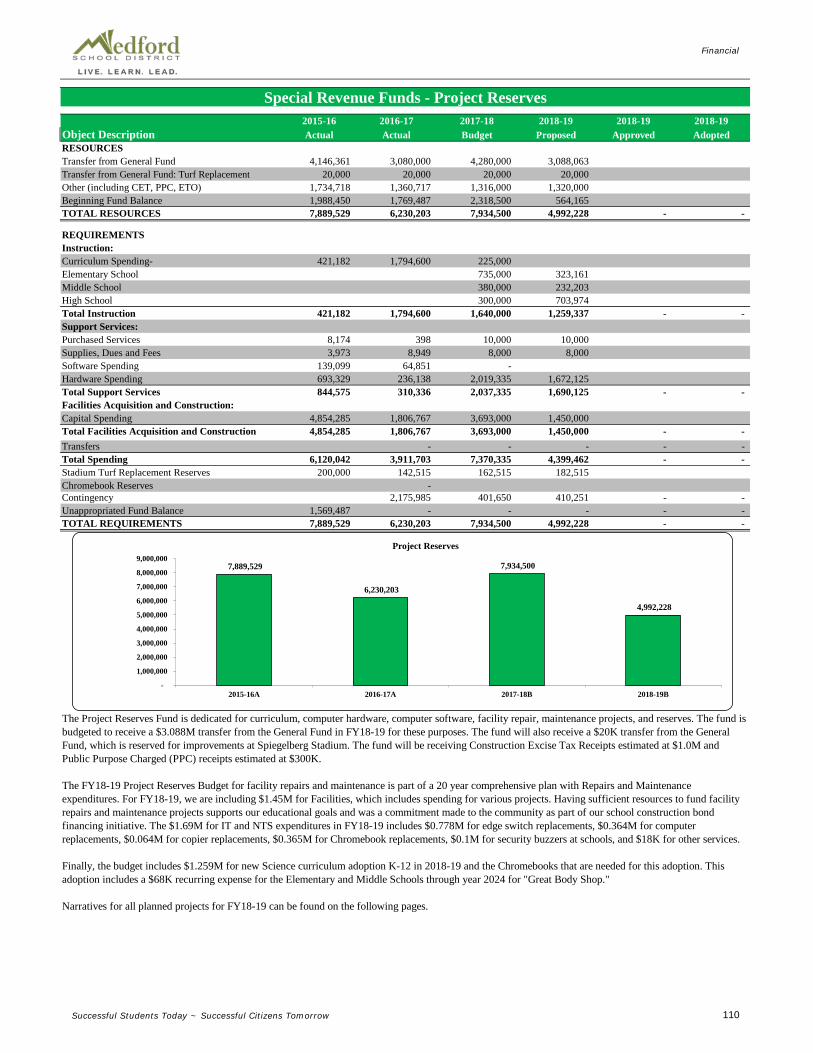
Financial
Successful Students Today ~ Successful Citizens Tomorrow 110
2015-16 2016-17 2017-18 2018-19 2018-19 2018-19Object Description Actual Actual Budget Proposed Approved AdoptedRESOURCESTransfer from General Fund 4,146,361 3,080,000 4,280,000 3,088,063 Transfer from General Fund: Turf Replacement 20,000 20,000 20,000 20,000 Other (including CET, PPC, ETO) 1,734,718 1,360,717 1,316,000 1,320,000 Beginning Fund Balance 1,988,450 1,769,487 2,318,500 564,165 TOTAL RESOURCES 7,889,529 6,230,203 7,934,500 4,992,228 - -
REQUIREMENTSInstruction:Curriculum Spending- 421,182 1,794,600 225,000 Elementary School 735,000 323,161 Middle School 380,000 232,203 High School 300,000 703,974 Total Instruction 421,182 1,794,600 1,640,000 1,259,337 - - Support Services:Purchased Services 8,174 398 10,000 10,000 Supplies, Dues and Fees 3,973 8,949 8,000 8,000 Software Spending 139,099 64,851 - Hardware Spending 693,329 236,138 2,019,335 1,672,125 Total Support Services 844,575 310,336 2,037,335 1,690,125 - - Facilities Acquisition and Construction:Capital Spending 4,854,285 1,806,767 3,693,000 1,450,000 Total Facilities Acquisition and Construction 4,854,285 1,806,767 3,693,000 1,450,000 - - Transfers - - - - - Total Spending 6,120,042 3,911,703 7,370,335 4,399,462 - - Stadium Turf Replacement Reserves 200,000 142,515 162,515 182,515 Chromebook Reserves - Contingency 2,175,985 401,650 410,251 - - Unappropriated Fund Balance 1,569,487 - - - - - TOTAL REQUIREMENTS 7,889,529 6,230,203 7,934,500 4,992,228 - -
-
Special Revenue Funds - Project Reserves
The Project Reserves Fund is dedicated for curriculum, computer hardware, computer software, facility repair, maintenance projects, and reserves. The fund is budgeted to receive a $3.088M transfer from the General Fund in FY18-19 for these purposes. The fund will also receive a $20K transfer from the General Fund, which is reserved for improvements at Spiegelberg Stadium. The fund will be receiving Construction Excise Tax Receipts estimated at $1.0M and Public Purpose Charged (PPC) receipts estimated at $300K.
The FY18-19 Project Reserves Budget for facility repairs and maintenance is part of a 20 year comprehensive plan with Repairs and Maintenance expenditures. For FY18-19, we are including $1.45M for Facilities, which includes spending for various projects. Having sufficient resources to fund facility repairs and maintenance projects supports our educational goals and was a commitment made to the community as part of our school construction bond financing initiative. The $1.69M for IT and NTS expenditures in FY18-19 includes $0.778M for edge switch replacements, $0.364M for computer replacements, $0.064M for copier replacements, $0.365M for Chromebook replacements, $0.1M for security buzzers at schools, and $18K for other services.
Finally, the budget includes $1.259M for new Science curriculum adoption K-12 in 2018-19 and the Chromebooks that are needed for this adoption. This adoption includes a $68K recurring expense for the Elementary and Middle Schools through year 2024 for "Great Body Shop."
Narratives for all planned projects for FY18-19 can be found on the following pages.
7,889,529
6,230,203
7,934,500
4,992,228
-
1,000,000
2,000,000
3,000,000
4,000,000
5,000,000
6,000,000
7,000,000
8,000,000
9,000,000
2015-16A 2016-17A 2017-18B 2018-19B
Project Reserves
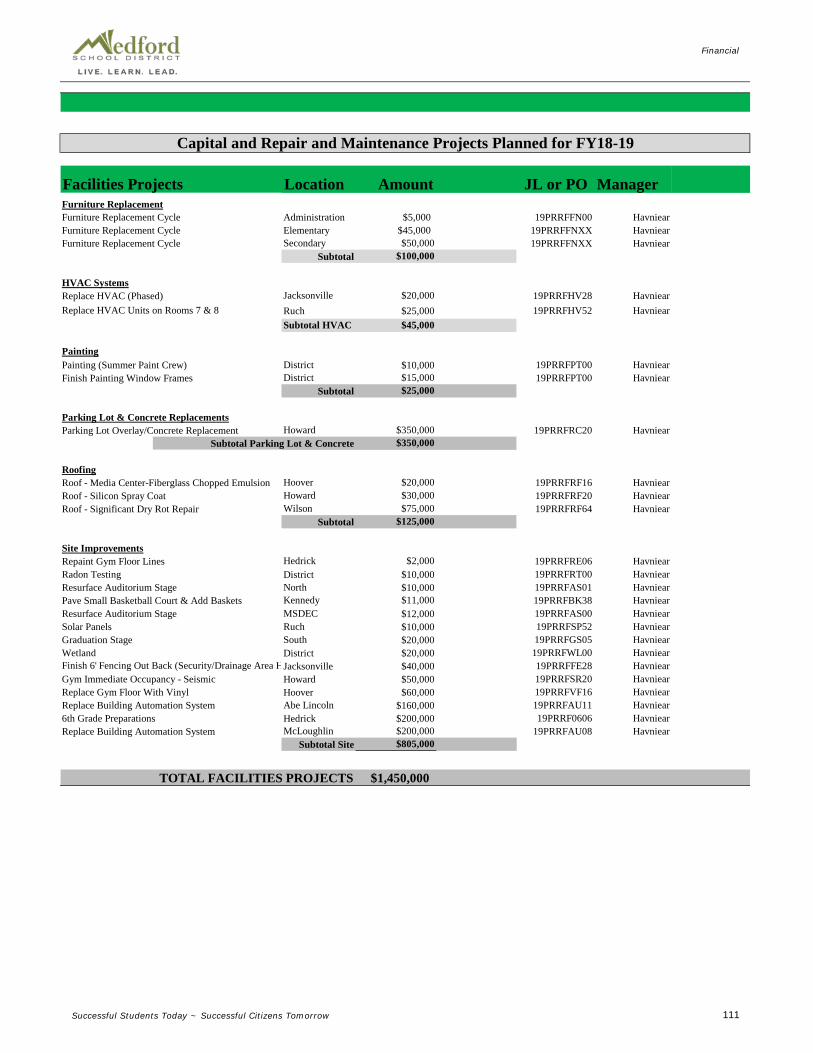
Financial
Successful Students Today ~ Successful Citizens Tomorrow 111
Facilities Projects Location Amount JL or PO Manager
Furniture Replacement Cycle Administration $5,000 19PRRFFN00 HavniearFurniture Replacement Cycle Elementary $45,000 19PRRFFNXX HavniearFurniture Replacement Cycle Secondary $50,000 19PRRFFNXX Havniear
$100,000
Jacksonville $20,000 19PRRFHV28 HavniearRuch $25,000 19PRRFHV52 HavniearSubtotal HVAC $45,000
PaintingPainting (Summer Paint Crew) District $10,000 19PRRFPT00 Havniear
District $15,000 19PRRFPT00 Havniear$25,000
Parking Lot Overlay/Concrete Replacement Howard $350,000 19PRRFRC20 Havniear$350,000
Roof - Media Center-Fiberglass Chopped Emulsion Hoover $20,000 19PRRFRF16 HavniearRoof - Silicon Spray Coat Howard $30,000 19PRRFRF20 HavniearRoof - Significant Dry Rot Repair Wilson $75,000 19PRRFRF64 Havniear
$125,000
Repaint Gym Floor Lines Hedrick $2,000 19PRRFRE06 HavniearRadon Testing District $10,000 19PRRFRT00 HavniearResurface Auditorium Stage North $10,000 19PRRFAS01 HavniearPave Small Basketball Court & Add Baskets Kennedy $11,000 19PRRFBK38 HavniearResurface Auditorium Stage MSDEC $12,000 19PRRFAS00 HavniearSolar Panels Ruch $10,000 19PRRFSP52 HavniearGraduation Stage South $20,000 19PRRFGS05 Havniear
District $20,000 19PRRFWL00 HavniearFinish 6' Fencing Out Back (Security/Drainage Area H Jacksonville $40,000 19PRRFFE28 HavniearGym Immediate Occupancy - Seismic Howard $50,000 19PRRFSR20 HavniearReplace Gym Floor With Vinyl Hoover $60,000 19PRRFVF16 HavniearReplace Building Automation System Abe Lincoln $160,000 19PRRFAU11 Havniear6th Grade Preparations Hedrick $200,000 19PRRF0606 HavniearReplace Building Automation System McLoughlin $200,000 19PRRFAU08 Havniear
$805,000
TOTAL FACILITIES PROJECTS $1,450,000
Parking Lot & Concrete Replacements
Furniture Replacement
Capital and Repair and Maintenance Projects Planned for FY18-19
Roofing
Site Improvements
Subtotal Site
Subtotal
Subtotal
Subtotal Parking Lot & Concrete
Subtotal
Replace HVAC (Phased)Replace HVAC Units on Rooms 7 & 8
HVAC Systems
Finish Painting Window Frames
Wetland
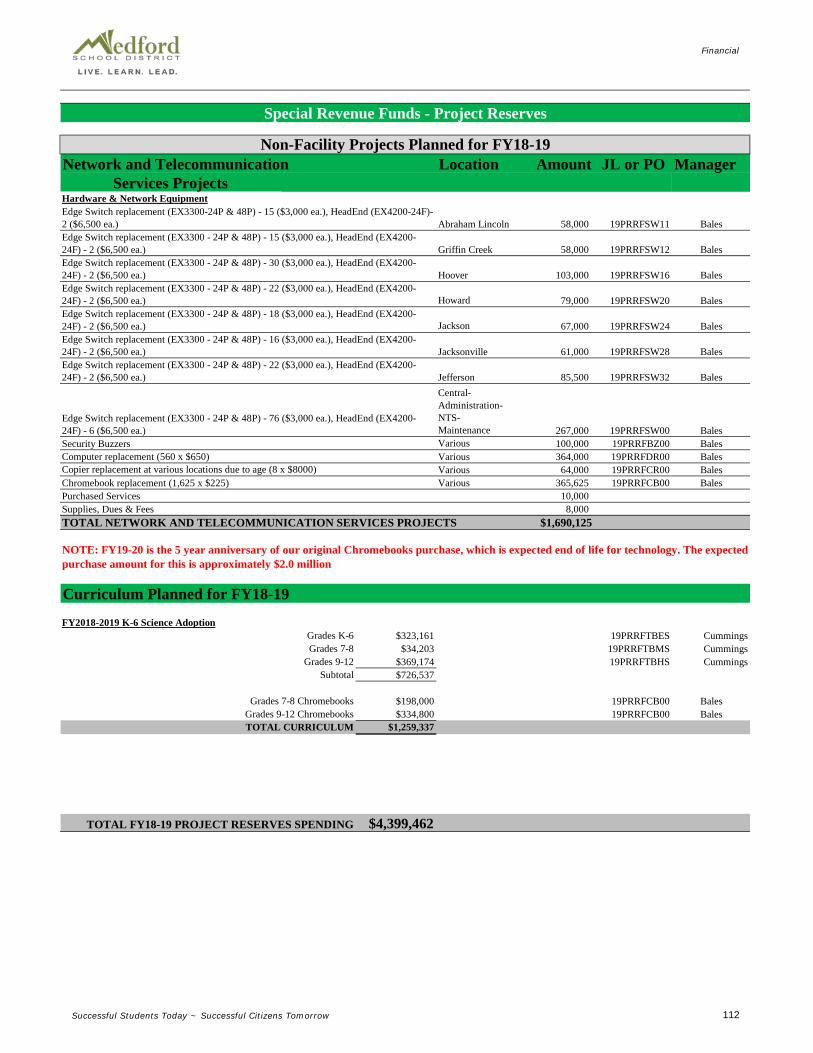
Financial
Successful Students Today ~ Successful Citizens Tomorrow 112
Network and Telecommunication Location Amount JL or PO ManagerServices Projects
Abraham Lincoln 58,000 19PRRFSW11 Bales
Griffin Creek 58,000 19PRRFSW12 Bales
Hoover 103,000 19PRRFSW16 Bales
Howard 79,000 19PRRFSW20 Bales
Jackson 67,000 19PRRFSW24 Bales
Jacksonville 61,000 19PRRFSW28 Bales
Jefferson 85,500 19PRRFSW32 BalesCentral-Administration-NTS-Maintenance 267,000 19PRRFSW00 BalesVarious 100,000 19PRRFBZ00 BalesVarious 364,000 19PRRFDR00 BalesVarious 64,000 19PRRFCR00 Bales
Chromebook replacement (1,625 x $225) Various 365,625 19PRRFCB00 BalesPurchased Services 10,000 Supplies, Dues & Fees 8,000 TOTAL NETWORK AND TELECOMMUNICATION SERVICES PROJECTS $1,690,125
Curriculum Planned for FY18-19
Grades K-6 $323,161 19PRRFTBES CummingsGrades 7-8 $34,203 19PRRFTBMS Cummings
Grades 9-12 $369,174 19PRRFTBHS CummingsSubtotal $726,537
Grades 7-8 Chromebooks $198,000 19PRRFCB00 BalesGrades 9-12 Chromebooks $334,800 19PRRFCB00 BalesTOTAL CURRICULUM $1,259,337
$4,399,462
Edge Switch replacement (EX3300-24P & 48P) - 15 ($3,000 ea.), HeadEnd (EX4200-24F)- 2 ($6,500 ea.)Edge Switch replacement (EX3300 - 24P & 48P) - 15 ($3,000 ea.), HeadEnd (EX4200-24F) - 2 ($6,500 ea.)Edge Switch replacement (EX3300 - 24P & 48P) - 30 ($3,000 ea.), HeadEnd (EX4200-24F) - 2 ($6,500 ea.)Edge Switch replacement (EX3300 - 24P & 48P) - 22 ($3,000 ea.), HeadEnd (EX4200-24F) - 2 ($6,500 ea.)
Computer replacement (560 x $650)
Special Revenue Funds - Project Reserves
Non-Facility Projects Planned for FY18-19
Security Buzzers
Hardware & Network Equipment
FY2018-2019 K-6 Science Adoption
Edge Switch replacement (EX3300 - 24P & 48P) - 18 ($3,000 ea.), HeadEnd (EX4200-24F) - 2 ($6,500 ea.)Edge Switch replacement (EX3300 - 24P & 48P) - 16 ($3,000 ea.), HeadEnd (EX4200-24F) - 2 ($6,500 ea.)Edge Switch replacement (EX3300 - 24P & 48P) - 22 ($3,000 ea.), HeadEnd (EX4200-24F) - 2 ($6,500 ea.)
Edge Switch replacement (EX3300 - 24P & 48P) - 76 ($3,000 ea.), HeadEnd (EX4200-24F) - 6 ($6,500 ea.)
Copier replacement at various locations due to age (8 x $8000)
NOTE: FY19-20 is the 5 year anniversary of our original Chromebooks purchase, which is expected end of life for technology. The expected purchase amount for this is approximately $2.0 million
TOTAL FY18-19 PROJECT RESERVES SPENDING

Financial
Successful Students Today ~ Successful Citizens Tomorrow 113
Capital Repairs Fund Narratives
Furniture Replacement Cycle – Administration - $5,000Furniture replacement cycle funds for administration.
Furniture Replacement Cycle – Elementary - $45,000Furniture replacement cycle funds for elementary.
Furniture Replacement Cycle – Secondary - $50,000Furniture replacement cycle funds for secondary.
Replace HVAC (Phased) - Jacksonville - $20,000
Replace HVAC Units on Rooms 7 & 8 - Ruch - $25,000
Painting (Summer Paint Crew) - District $10,000
Finish Painting Window Frames - District $15,000
Parking Lot Overlay/Concrete Replacement - Howard - $350,000
Roof - Media Center - Fiberglass Chopped Emulsion - Hoover - $20,000
Roof - Silicon Spray Coat - Howard - $30,000
Roof - Significant Dry Rot Repair - Wilson - $75,000
This roof is a built-up roof (BUR) where the cap sheet is starting to wear significantly, and we are seeing an increase in the number of leaks. There is a limited window of time to deal with wear and tear of this nature, before having to replace the roof completely. For the built up roofs, we recommend a monolithic, spray applied, reinforced roofing/top coat with an aluminum emulsion surface for reflectivity. This application consists of two coats. The base coat is a mix of chopped fiberglass. The top coat is a different color that increases reflectivity and helps determine wear and tear. This extends the life of the roof under warranty for an additional 10 years. The application can be repeated and/or tied into by section when needed. This procedure is effective, less invasive, less costly, takes less times, and is better for the environment in terms of roofing material disposal and energy conservation.
This roof is a built-up roof (BUR) with old gravel stop type flashing. This flashing is causing the water to build up and wick up the roof toward the ridgeline, resulting in areas with significant dry rot. This project will allow the areas of concern to be repaired with new wood, built up roofing, and a coating. For the built up roofs, we recommend a monolithic, spray applied, reinforced roofing/top coat with an aluminum emulsion surface for reflectivity. This application consists of two coats. The base coat is a mix of chopped fiberglass. The top coat is a different color that increases reflectivity and helps determine wear and tear. This extends the life of the roof under warranty for an additional 10 years. The application can be repeated and/or tied into by section when needed. This procedure is effective, less invasive, less costly, takes less times, and is better for the environment in terms of roofing material disposal and energy conservation.
FurnitureCapital and Repair and Maintenance Projects Planned for FY18-19
The paint and window frames at the MSDEC site have been slowly deteriorating over the years. Over the last three years, we have been fixing the frames and painting them across the site via a phased approach. This project will allow us to complete the effort this summer.
We replaced the east Howard parking lot in 2014 and the city recently replaced the west side near the park access. The front parking lot and concrete of Howard remains in poor condition. This project will allow for the front asphalt to be replaced, installation of a required water retention system, and replacement of a significant amount of deteriorated concrete. It will also widen the drop off lane near the front entrance of the school and reinforce the asphalt more adequately for bus traffic.
Roofing
These HVAC units are failing frequently and requiring extensive maintenance attention to keep operational. We have been replacing the units in a phased approach.
HVAC
Special Revenue Funds - Project Reserves
This roof is a built-up roof (BUR) where the cap sheet is starting to wear significantly, and we are seeing an increase in the number of leaks. There is a limited window of time to deal with wear and tear of this nature, before having to replace the roof completely. For the built up roofs, we recommend a monolithic, spray applied, reinforced roofing/top coat with an aluminum emulsion surface for reflectivity. This application consists of two coats. The base coat is a mix of chopped fiberglass. The top coat is a different color that increases reflectivity and helps determine wear and tear. This extends the life of the roof under warranty for an additional 10 years. The application can be repeated and/or tied into by section when needed. This procedure is effective, less invasive, less costly, takes less times, and is better for the environment in terms of roofing material disposal and energy conservation.
Parking Lot & Concrete Replacements
PAINTING
These HVAC units are failing frequently and requiring extensive maintenance attention to keep operational. We have been replacing the units in a phased approach.
As part of the district's preventative maintenance plan, we rotate paint crews through all schools over summer break. This allows us to work and refresh areas that cannot be accessed during the school year.

Financial
Successful Students Today ~ Successful Citizens Tomorrow 114
Capital Repairs Fund Narratives Site ImprovementsRepaint Gym Floor Lines - Hedrick - $2,000
Radon Testing - District - $10,000
Resurface Auditorium Stage - North - $10,000
Pave Small Basketball Court & Add Baskets - Kennedy - $11,000
Resurface Auditorium Stage - MSDEC - $12,000
Solar Panels - Ruch - $10,000
Graduation Stage - South - $20,000
Wetland - District - $20,000
Finish 6' Fencing Out Back (Security/Drainage Area Hazard Concerns) - Jacksonville - $40,000
Gym Immediate Occupancy - Seismic - Howard $50,000
Replace Gym Floor with Vinyl - Hoover - $60,000
Jacksonville school currently has a 4' fence across the back of the site. This project will improve the security of the school by replacing the existing fence with a 6' fence. There is also a drainage ditch at the back of the school that holds water during the wet season and poses a hazard to the school. The 6' fence will significantly reduce the risk of a student gaining access to the drainage ditch.
The Hoover gym floor is failing. The floor and the subsurface were damaged during a kitchen fire with water. It has been problematic ever since due to the moisture that remained. This project will allow for a new vinyl gym floor.
During the seismic projects, specified areas of the schools are brought up to life safety standards. When possible, common areas such as gyms are brought up to immediate occupancy standards so that they can serve as a community resource for shelters or command posts. Bringing Howard's gym up to immediate occupancy standards is beyond the capacity of the State grant. Once the construction crews are mobilized, it is a good time for the MSD to take advantage of upgrading this facility to immediate occupancy standards; however, the cost is in addition to what is covered by the grant. For future projects, the state grants will include immediate occupancy for gyms and be moved from $1.5 million to $2.5 million in terms of funding. This project will allow us to bring Howard's gym up to immediate occupancy standards in conjunction with this summer's state grant funded seismic work.
Currently, Kennedy elementary school does not have a paved surface for the playground on the North side. In this area of the school, the paved surface is within a quad surrounded by classrooms and is problematic due to its location and the sound disruptions. Kennedy has been fundraising to install an asphalt surface with basketball poles outside of the building area footprint. They have raised $10,500 in their effort with a target amount of ~$16,000. This project will help Kennedy improve the functionality of their play space and reduce the noise disruption that they currently experience with it being in-between the buildings.
The MSDEC auditorium stage has become worn through steady use over the years. The surface is damaged and the paint is coming off during performances. This project will allow the stage to be resurfaced and prolong the life of the stage.
Ruch school has aspired to install solar panels for several years. In an effort to make this a reality, we submitted and were awarded a Blue Sky grant valued at $24,337. Ruch school raised $9,000 with the help of a donor and in contributing their energy incentive money. The district committed to paying ~ $14,000. This project will enable the district to take the first steps in moving toward green energy technology (GET) at the Ruch site. It will also allow for Ruch to utilize the solar technology as an instructional tool for the students.
All schools are required to be tested for radon non linear threshold (NLT) 2021. We will test 4-5 schools per year in order to have them completed prior to 2021. This project also includes some funds in the event we need to conduct mitigation at a site.
As part of the Bond work during the construction of South, we were required to develop 20 acres of wetland to meet our wetland mitigation obligation. We have a 20.74 acre piece of land out near White City that we are responsible for developing known as the Whetstone Wetland Mitigation site. We do not own this property; it belongs to what is known as a "Wet Land Bank" which holds properties such as this for wetland mitigation purposes. We have been maintaining this site for ~ 11 years. We need to have a restored and enhanced wetland with 70% native cover and adequate hydrology. Pre-2014, we had made significant progress and were sitting at ~ 60% native ground cover. After the 2014 drought conditions, the site dropped to ~30% and currently we are at ~ 40-50%. Maintenance of the site consists primarily of spraying undesirables and seeding desirables. Currently, we are trending positive in terms of hydrology and negative in terms of native plant count. We work with a scientist at PBS Engineering and Environmental, the U.S. Army Corps of Engineers, and the Oregon Department of State Lands to develop an action plan and work toward achieving the desired end state at which point the MSD will be relieved of its obligation to maintain this site because the wetland will be self-sustaining and functioning as a wetland. Until then, we have to continue to dedicate resources to this site.
The North auditorium stage has become worn through steady use over the years. The surface is damaged and has an inconsistent smoothness. This project will allow the stage to be resurfaced and prolong the life of the stage.
The upper gym floor was resurfaced in 2014, however, the lines are too close to the walls and do not allow space for spectators. Therefore, all games have been re-located to MSDEC requiring busing and the additional costs associated with busing. Gym space is in heavy demand throughout the district. By moving these lines in and making room for spectators, Hedrick will be able to hold games on site saving time and money and freeing up gym space for others to use.
Special Revenue Funds - Project Reserves
South's graduation stage is falling apart and requires extensive repair every year. This purchase will provide a new graduation stage equivalent to North's. South will pay $10,000 toward the cost of this project.

Financial
Successful Students Today ~ Successful Citizens Tomorrow 115
Capital Repairs Fund Narratives
6th Grade Preparations - Hedrick - $200,000
Girls Locker Room (Total Need is 130 Additional Lockers)- Currently 70 lockers short- Need 60 additional for 6th grade
Boy's Locker Room (Total need is 160 additional lockers)- Currently 100 lockers short- Need 60 additional for 6th grade
Cost Estimate- Build Walls ($5,000)- Electrical ($5,000)- HVAC ($50,000)- NTS ($5,000)- Upstairs 150 Lockers ($18,238)- Downstairs 362 Lockers ($77,583)- Book Storage Cabinet ($1,000)- Ceiling Grid ($10,000)- Furniture ($10,000)- Misc. ($18,179)
Total: $200,000
In preparation for 120 six graders being brought into both middle schools, Hedrick needs additional space. This project will split two large classrooms to make four classrooms. As part of the renovation, two walls will be built, the HVAC and electrical will be split, current work stations will be removed and extra lockers will be installed throughout the school.
Room 106- Build wall (Frame/Gypsum/Finish)- Split HVAC- Split electrical and add data/electrical to new wall- Intercom- Fire- Furniture- Re-arrange Shelves- Remove existing science work stations- Carpet
Special Revenue Funds - Project Reserves
Room 102- Build wall (Frame/Gypsum/Finish)- Split HVAC- Split electrical and add data/electrical to new wall- Intercom- Fire- Furniture- Re-arrange Shelves
Down Stairs Hallway - Remove existing lockers and sell - Install set of ~120 top/bottom lockers in 6th grade wing from the boys/girls locker rooms (MSD Labor/Minimal Material Cost)
Upstairs Hallway- Install ~150 top bottom lockers in hallway outside room 210 ($25,000)- Electrical (plugs and ERB relocated)
Large Group Room- Add Bookshelves (We will build before school is out with MSD labor plus material cost)

Financial
Successful Students Today ~ Successful Citizens Tomorrow 116
Capital Repairs Fund Narratives Replace Building Automation System - Abe Lincoln - $160,000
Replace Building Automation System - McLoughlin - $200,000
Total Capital Repair and Maintenance Projects for FY18-19: $1,450,000
Abe Lincoln, McLoughlin, and Hedrick have building automation systems (BAS) that rely on communications between the controls and the site through a modem at a baud rate of ~9,600. The modem based system is antiquated and ineffective and results frequently in inconsistent temperatures at the site. Some parts are obsolete and can only be rebuilt, not replaced. Without the effective communication link facilities staff are unable to monitor temperatures at the sites and cannot remote in to address issues when they do arise. This project will update the BAS system to the site and improve the consistency of temperatures all around.
Abe Lincoln, McLoughlin, and Hedrick have building automation systems (BAS) that rely on communications between the controls and the site through a modem at a baud rate of ~9,600. The modem based system is antiquated and ineffective and results frequently in inconsistent temperatures at the site. Some parts are obsolete and can only be rebuilt, not replaced. Without the effective communication link facilities staff are unable to monitor temperatures at the sites and cannot remote in to address issues when they do arise. This project will update the BAS system to the site and improve the consistency of temperatures all around.
Special Revenue Funds - Project Reserves - Capital Repair and Maintenance

Financial
Successful Students Today ~ Successful Citizens Tomorrow 117
NTS Fund Narratives Edge Switch Replacements - $778,500
Computer Replacement - $364,000We are projecting to replace 560 computers in the schools (mainly for teachers) for $650 each.
Security Buzzers - $100,000
Copier Replacement - $64,000
Chromebook Replacement - $365,500
Support Services - $18,000
Next year we will be outfitting some schools with front door buzzers and cameras for security purposes.
We are projecting to replace 500 Chromebook throughout the District.
A switch is a device that allows computers and services to communication on a network. Most of the time switches are located in wiring closet so they are not typically seen by the end user. Medford School District has a little over 500 switches in our network and most have been in service for at least 8 years. The typical switch replacement cycle is 5-6 years.
Several of our copiers need to be replaced across all District sites. 8 copiers are projected to be replaced at $8,000 each.
Total Network & Telecommunication Services Projects FY18-19: $1,690,125
Network and Telecommunication Services Projects

Financial
Successful Students Today ~ Successful Citizens Tomorrow 118
K-12 Science Adoption- $726,537 (Details below)Grades 7-12 Chromebook Purchase - $532,800Total Curriculum Spending FY18-19: $1,259,337
** Note: Great Body Shop for Elementary and Middle School requires a commitment of $68,405 each year until 2023-2024.
Curriculum is aligned, reviewed, and updated on a seven year cycle. During the school year, prior to reviewing instructional materials, the District K-12 teams align standards and learning targets. As part of the process, teams also review open source materials and integrated technology needs. Professional development is provided to all teachers in the content area when new materials are adopted. The state allows districts three options: adopt new materials from the state-approved list, maintain current materials, or complete an independent adoption.
FY2018-2019
Curriculum Spending Planned FY18-19

Financial
Successful Students Today ~ Successful Citizens Tomorrow 119
2015-16 2016-17 2017-18 2018-19 2018-19 2018-19Object Description Actual Actual Budget Proposed Approved AdoptedRESOURCESState Sources - 904,298 2,741,702 Beginning Fund Balance - - - TOTAL RESOURCES - - 904,298 2,741,702 - -
REQUIREMENTSInstruction:CTE - 254,298 861,226 - - College and Career Readiness 290,000 844,226 Dropout Prevention - 360,000 1,036,250 - - Total Instruction - - 904,298 2,741,702 - -
Support Services:CTE - College and Career ReadinessDropout Prevention - - - - Total Support Services - - - - - -
Pass-through to Charter Schools - - Unappropriated Fund Balance - - - - - TOTAL REQUIREMENTS - - 904,298 2,741,702 - -
Oregon voters supported Measure 98 to increase funding to programs targeted at improving student success in grades 8-12. The key programs targeted address Drop Out prevention, Career Technical Education (CTE), and College and Career Readiness. This grant will is funded for the 2017-19 biennium. In FY18-19 we plan to spend $2.7M, an increase of $1.8M over FY17-18 due primarily to funds carried over from FY17-18.
In the Medford School District, Measure 98 funds:• Enhanced mental health support for students,• Expanded CTE programs including computer science, plumbing and electrical, • Covered college tuition for students,• Increased staffing and professional development for comprehensive guidance and counseling,• Provided college entrance assessments for all 11th graders.
Special Revenue Funds - Measure 98 High School Success
- -
904,298
2,741,702
-
500,000
1,000,000
1,500,000
2,000,000
2,500,000
3,000,000
2015-16A 2016-17A 2017-18B 2018-19B
Measure 98 Funds

Financial
Successful Students Today ~ Successful Citizens Tomorrow 120
2015-16 2016-17 2017-18 2018-19 2018-19 2018-19Object Description Actual Actual Budget Proposed Approved AdoptedRESOURCESState Sources - 75,000 275,000 - Beginning Fund Balance - - - TOTAL RESOURCES - - 75,000 275,000 - -
REQUIREMENTSInstruction - 75,000 275,000 - Total Instruction - - 75,000 275,000 - -
Pass-through to Charter Schools - - Unappropriated Fund Balance - - - - - TOTAL REQUIREMENTS - - 75,000 275,000 - -
Special Revenue Funds - Measure 99 Outdoor School
Initiative DesignMeasure 99 created an Outdoor School Education Fund from Oregon State Lottery Funds. The measure required that withdrawals from the State Lottery Fund cannot reduce lottery proceeds dedicated to the restoration and preservation of parks, beaches, watersheds, and native fish and wildlife. The Outdoor School Education Fund was designed to provide Oregon fifth- and sixth-grade students with an outdoor school program. The Oregon State University Extension Service was intended to administer the fund.
During the 2017-2018 school year, Medford School District applied for funding to support sixth graders in 11 out of our 17 schools (including charter schools). We were approved to spend a total of $75K to fund these programs and will receive reimbursements after the final reporting period in June 2018. Each school received funding for what they requested. These funds cover the cost of the program and can be provided by the school staff or by an external provider. This includes transportation, fees for admission, and/or any associated costs (meals, etc.) related to the program. The program requires schools to participate in a three consecutive day experience, but does not have to include overnights.
This year, some of the challenges have been planning for three consecutive days, competing with other schools during the same weeks in the spring for transportation, and finding enough volunteers for schools who chose to plan for overnight experiences.
Funding will be available for the 2018-19 school year upon satisfactory completion of a detailed final report due in June. After learning more of the planning process, the programs available in our area during the 2017-2018 school year, all of our elementary schools feel more prepared to participate during the 2018-2019 school year.
- -
75,000
275,000
-
50,000
100,000
150,000
200,000
250,000
300,000
2015-16A 2016-17A 2017-18B 2018-19B
Measure 99 Funds

Financial
Successful Students Today ~ Successful Citizens Tomorrow 121
2015-16 2016-17 2017-18 2018-19 2018-19 2018-19Other Funds Summary Actual Actual Budget Proposed Approved AdoptedDebt Service - General Obligation School Bonds 13,190,204 13,789,170 13,607,741 13,604,528 - - Debt Service - Pension Obligation Bonds 4,186,972 4,191,182 4,276,242 4,199,767 - - Capital Projects Fund 141,566 172,116 185,996 199,996 - - Health Insurance Fund 19,314,088 18,325,257 20,114,604 20,681,604 - - Trust and Agency Funds - Student Scholarships 660,811 716,210 721,934 723,766 - - Trust and Agency Funds -Student Body Funds 3,123,936 3,283,795 3,274,497 3,350,807 - - Total Appropriations 40,617,577 40,477,730 42,181,014 42,760,468 - -
Capital Projects Fund
Debt Service - General Obligation School Bonds
Trust and Agency Funds -Student Body Funds
Other Funds
Other funds are up $0.58M (1.37%) due primarily to a $0.56M increase in the Healthcare Self Insurance Fund. Excluding the increase in the Healthcare Self Insurance fund, other funds are up a cumulative $12K (0.03%).
Debt Service - Pension Obligation Bonds
Health Insurance Fund
Trust and Agency Funds - Student ScholarshipsTrust and Agency Funds - Hull Memorial
General Obligation Debt Service, $13,604,528
Pension Obligation Debt Service, $4,199,767
Capital Projects, $199,996
Health Insurance, $20,681,604
Trust and Agency Funds, $4,074,573
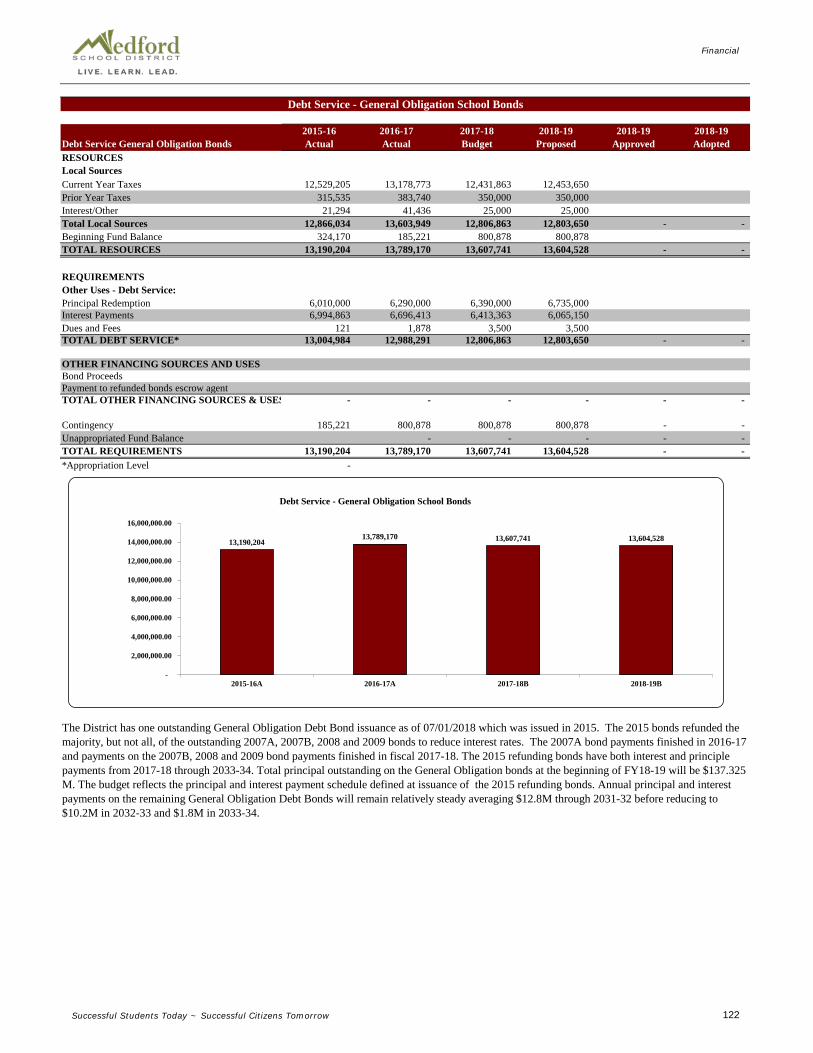
Financial
Successful Students Today ~ Successful Citizens Tomorrow 122
2015-16 2016-17 2017-18 2018-19 2018-19 2018-19Debt Service General Obligation Bonds Actual Actual Budget Proposed Approved AdoptedRESOURCESLocal SourcesCurrent Year Taxes 12,529,205 13,178,773 12,431,863 12,453,650 Prior Year Taxes 315,535 383,740 350,000 350,000 Interest/Other 21,294 41,436 25,000 25,000 Total Local Sources 12,866,034 13,603,949 12,806,863 12,803,650 - - Beginning Fund Balance 324,170 185,221 800,878 800,878 TOTAL RESOURCES 13,190,204 13,789,170 13,607,741 13,604,528 - -
REQUIREMENTSOther Uses - Debt Service:Principal Redemption 6,010,000 6,290,000 6,390,000 6,735,000 Interest Payments 6,994,863 6,696,413 6,413,363 6,065,150 Dues and Fees 121 1,878 3,500 3,500 TOTAL DEBT SERVICE* 13,004,984 12,988,291 12,806,863 12,803,650 - -
OTHER FINANCING SOURCES AND USESBond ProceedsPayment to refunded bonds escrow agentTOTAL OTHER FINANCING SOURCES & USES - - - - - -
Contingency 185,221 800,878 800,878 800,878 - - Unappropriated Fund Balance - - - - - TOTAL REQUIREMENTS 13,190,204 13,789,170 13,607,741 13,604,528 - - *Appropriation Level -
The District has one outstanding General Obligation Debt Bond issuance as of 07/01/2018 which was issued in 2015. The 2015 bonds refunded the majority, but not all, of the outstanding 2007A, 2007B, 2008 and 2009 bonds to reduce interest rates. The 2007A bond payments finished in 2016-17 and payments on the 2007B, 2008 and 2009 bond payments finished in fiscal 2017-18. The 2015 refunding bonds have both interest and principle payments from 2017-18 through 2033-34. Total principal outstanding on the General Obligation bonds at the beginning of FY18-19 will be $137.325 M. The budget reflects the principal and interest payment schedule defined at issuance of the 2015 refunding bonds. Annual principal and interest payments on the remaining General Obligation Debt Bonds will remain relatively steady averaging $12.8M through 2031-32 before reducing to $10.2M in 2032-33 and $1.8M in 2033-34.
Debt Service - General Obligation School Bonds
13,190,20413,789,170 13,607,741 13,604,528
-
2,000,000.00
4,000,000.00
6,000,000.00
8,000,000.00
10,000,000.00
12,000,000.00
14,000,000.00
16,000,000.00
2015-16A 2016-17A 2017-18B 2018-19B
Debt Service - General Obligation School Bonds

Financial
Successful Students Today ~ Successful Citizens Tomorrow 123
2015-16 2016-17 2017-18 2018-19 2018-19 2018-19Debt Service Pension Bonds Actual Actual Budget Proposed Approved AdoptedRESOURCESLocal Sources:Services provided by other funds 3,566,293 3,361,125 3,600,000 3,600,000 Other Sources:Interest/Other 13 - - - - - Beginning Fund Balance 620,667 830,057 676,242 599,767 TOTAL RESOURCES 4,186,972 4,191,182 4,276,242 4,199,767 - -
REQUIREMENTSOther Uses - Debt Service:Principal Redemption 1,325,000 1,555,000 1,800,000 2,070,000 Interest Payments 2,031,415 1,959,440 1,874,974 1,772,842 Dues and Fees 500 500 1,501 1,500 UAL lump sum payment to PERS - - - - - Total Debt Service* 3,356,915 3,514,940 3,676,475 3,844,342 - - Contingency 830,057 676,242 599,767 355,425 - - Unappropriated Fund Balance - - - - - TOTAL REQUIREMENTS 4,186,972 4,191,182 4,276,242 4,199,767 - - *Appropriation Level
In 2007, the District issued $40.2 M of Pension Obligation Bonds, the proceeds of which went directly to the Oregon Public Employee Retirement System (PERS) as a pre-payment on future District pension obligations for the purpose of reducing the District's annual PERS contribution rates. The budget reflects the principal and interest payments schedule defined at the issuance of the bonds. Revenue for payments on these bonds is funded through withholding as a percentage of gross payroll for PERS. At the beginning of FY18-19 there will be $31.245M in principle due on the Pension Obligation Bonds.
In FY18-19, the fund projects to generate approximately $3.6M in revenue and have debt service expense of $3.8M resulting in $0.2M deficit spending. Revenue for this fund is generated by withholding 5.8% of gross payroll. The most recent Milliman actuarial report (November 2017) shows the PERS side account earning 4.60%, so effectively the District is losing 1.2% on these bonds for this year. If gross payroll gets reduced and/or total debt service in this fund grows faster than gross payroll, there is a risk that the PERS withholding rate as a percentage of payroll will need to grow to fund these payments. Total principal and interest payments on the Pension Obligation bonds is scheduled to steadily increase each year from $3.8M this year to $5.4M in 2026-27. For the next five years, this payment is scheduled at FY18-19 $3.842 or 4.6% year-over-year growth, FY 19-20 $4.015M or 4.5% year-over-year growth, FY 20-21 $4.196 M or 4.5% year over year growth, FY21-22 $4.379 M 4.4% year over year growth and FY 22-23 $4.573 M 4.4% year over year growth.
Debt Service - Pension Obligation Bonds
4,186,972 4,191,182 4,276,242 4,199,767
-
500,000.00
1,000,000.00
1,500,000.00
2,000,000.00
2,500,000.00
3,000,000.00
3,500,000.00
4,000,000.00
4,500,000.00
2015-16A 2016-17A 2017-18B 2018-19B
Debt Service - Pension Obligation Bonds

Financial
Successful Students Today ~ Successful Citizens Tomorrow 124
2015-16 2016-17 2017-18 2018-19 2018-19 2018-19Capital Projects Actual Actual Budget Proposed Approved AdoptedRESOURCESLocal Sources:Taxes - - - - - Interest 17,276 14,320 14,000 14,000 Other local sources 21,528 16,350 - - Total Local Sources 38,804 30,670 14,000 14,000 - - State Sources:Energy Tax Credit and Rebates - - - - - Total State Sources - - - - - - Other Sources:Transfers In - - - - Beginning Fund Balance 102,762 141,446 171,996 185,996 TOTAL RESOURCES 141,566 172,116 185,996 199,996 - -
REQUIREMENTSFacilities Acquisition:Salaries and Wages - - - - - Employee Benefits - - - - - Purchased Services - - - - - Supplies and Materials - - - - - Capital Outlay - - - - - Other OBJECTS 120 120 - 120 - - Total Facilities and Acquisition* 120 120 - 120 - - Other Uses:Contingency 141,446 171,996 185,996 199,876 - - Unappropriated Fund Balance - - - - TOTAL REQUIREMENTS 141,566 172,116 185,996 199,996 - - *Appropriation Level
Bond funded construction was completed in FY12-13. This fund does hold a note receivable from Madrone Trail Charter School for the West Side School sale because bond funds were used to make improvements at West Side School prior to the sale to Madrone Trail. The note receivable started in 2010 and has a twenty year term that runs through 2030. The balance receivable at the beginning of 2017-18 is approximately $318K. The budget includes the collection of interest on the note.
Capital Projects Fund
141,566
172,116 185,996
199,996
-
50,000
100,000
150,000
200,000
250,000
2015-16A 2016-17A 2017-18B 2018-19B
Capital Projects Fund
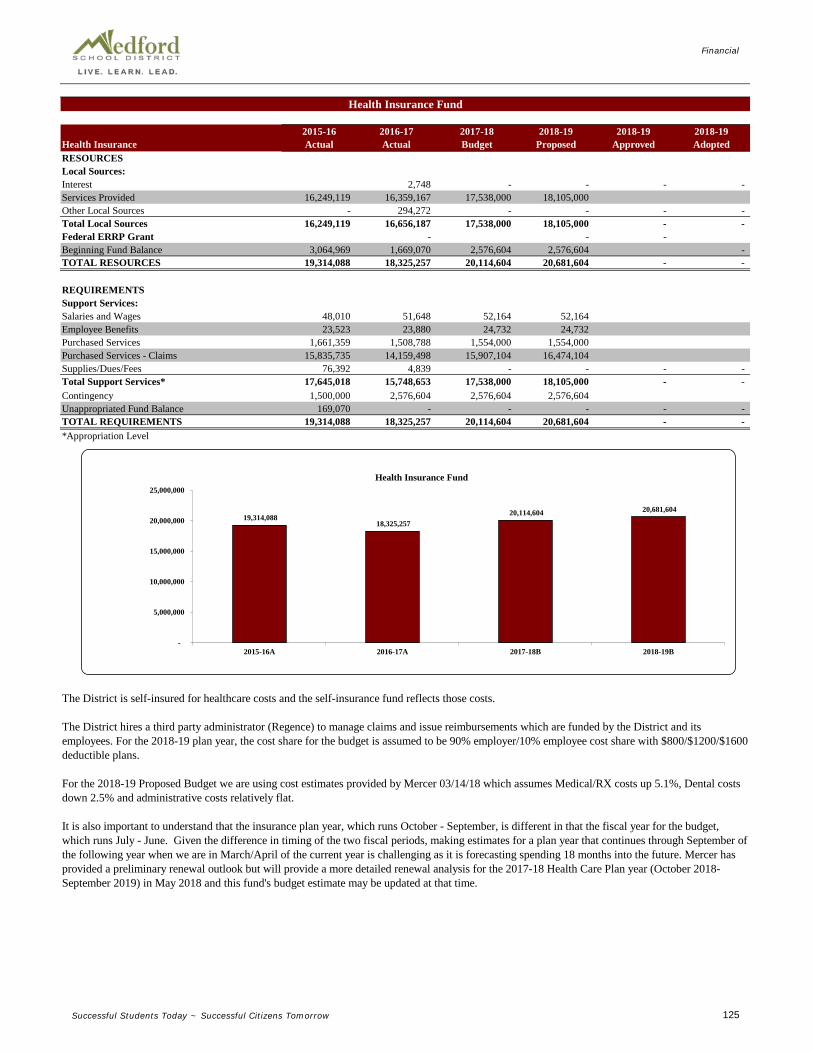
Financial
Successful Students Today ~ Successful Citizens Tomorrow 125
2015-16 2016-17 2017-18 2018-19 2018-19 2018-19Health Insurance Actual Actual Budget Proposed Approved AdoptedRESOURCESLocal Sources:Interest 2,748 - - - - Services Provided 16,249,119 16,359,167 17,538,000 18,105,000 Other Local Sources - 294,272 - - - - Total Local Sources 16,249,119 16,656,187 17,538,000 18,105,000 - - Federal ERRP Grant - - - Beginning Fund Balance 3,064,969 1,669,070 2,576,604 2,576,604 - TOTAL RESOURCES 19,314,088 18,325,257 20,114,604 20,681,604 - -
REQUIREMENTSSupport Services:Salaries and Wages 48,010 51,648 52,164 52,164 Employee Benefits 23,523 23,880 24,732 24,732 Purchased Services 1,661,359 1,508,788 1,554,000 1,554,000 Purchased Services - Claims 15,835,735 14,159,498 15,907,104 16,474,104 Supplies/Dues/Fees 76,392 4,839 - - - - Total Support Services* 17,645,018 15,748,653 17,538,000 18,105,000 - - Contingency 1,500,000 2,576,604 2,576,604 2,576,604 Unappropriated Fund Balance 169,070 - - - - - TOTAL REQUIREMENTS 19,314,088 18,325,257 20,114,604 20,681,604 - - *Appropriation Level
Health Insurance Fund
The District is self-insured for healthcare costs and the self-insurance fund reflects those costs.
The District hires a third party administrator (Regence) to manage claims and issue reimbursements which are funded by the District and its employees. For the 2018-19 plan year, the cost share for the budget is assumed to be 90% employer/10% employee cost share with $800/$1200/$1600 deductible plans.
For the 2018-19 Proposed Budget we are using cost estimates provided by Mercer 03/14/18 which assumes Medical/RX costs up 5.1%, Dental costs down 2.5% and administrative costs relatively flat.
It is also important to understand that the insurance plan year, which runs October - September, is different in that the fiscal year for the budget, which runs July - June. Given the difference in timing of the two fiscal periods, making estimates for a plan year that continues through September of the following year when we are in March/April of the current year is challenging as it is forecasting spending 18 months into the future. Mercer has provided a preliminary renewal outlook but will provide a more detailed renewal analysis for the 2017-18 Health Care Plan year (October 2018-September 2019) in May 2018 and this fund's budget estimate may be updated at that time.
19,314,088 18,325,257
20,114,604 20,681,604
-
5,000,000
10,000,000
15,000,000
20,000,000
25,000,000
2015-16A 2016-17A 2017-18B 2018-19B
Health Insurance Fund

Financial
Successful Students Today ~ Successful Citizens Tomorrow 126
2015-16 2016-17 2017-18 2018-19 2018-19 2018-19Scholarships Actual Actual Budget Proposed Approved AdoptedRESOURCESLocal Sources:Interest 1,184 6,894 1,515 1,530 Contributions 171,828 236,664 181,800 183,618 Other Local Sources - - - - - Total Local Sources 173,013 243,558 183,315 185,148 - - Beginning Fund Balance 487,798 472,652 538,619 538,618 TOTAL RESOURCES 660,811 716,210 721,934 723,766 - -
REQUIREMENTSInstruction:Instruction - Tuition paid* 188,158 183,672 183,316 185,509 Other - Transfers Out 6,081 Other Uses: - - - - - Contingency 472,652 538,619 538,618 538,258 - - Unappropriated Fund Balance - - - - - TOTAL REQUIREMENTS 660,811 716,210 721,934 723,766 - - *Appropriation Level
The District has three scholarship funds for graduating seniors. These funds are donated by outside agencies such as the Touvelle Foundation, Kiwanis, Medford Rotary, and Carpenter Foundation. Some scholarships have been set up in memory of past students and teachers. The donors normally set the amount per award and the specific criteria, which can be financial need, GPA, post-secondary field of study, etc. These funds are administered by District employees and the student scholarship applications are reviewed by a committee at each school.
Trust and Agency Funds - Student Scholarships
660,811 716,210 721,934 723,766
-
100,000
200,000
300,000
400,000
500,000
600,000
700,000
800,000
2015-16A 2016-17A 2017-18B 2018-19B
Student Scholarships

Financial
Successful Students Today ~ Successful Citizens Tomorrow 127
2015-16 2016-17 2017-18 2018-19 2018-19 2018-19Student Body Actual Actual Budget Proposed Approved AdoptedRESOURCESLocal Sources:Interest 6,799 11,768 1,515 11,885 Extra-Curricular Activities 2,058,523 2,165,287 2,121,000 2,186,939 Total Local Sources 2,065,322 2,177,054 2,122,515 2,198,825 - - Beginning Balance 1,058,614 1,106,741 1,151,982 1,151,982 TOTAL RESOURCES 3,123,936 3,283,795 3,274,497 3,350,807 - -
REQUIREMENTSInstruction:Elementary Extra-Curricular 356,508 322,312 309,211 332,444 Middle School Extra-Curricular 271,451 286,884 353,385 295,902 High School Extra-Curricular 1,389,236 1,522,617 1,459,919 1,570,479 Total Instruction 2,017,195 2,131,813 2,122,515 2,198,825 - - ContingencyDue to Students 1,106,741 1,151,982 1,151,982 1,151,982 - - TOTAL REQUIREMENTS 3,123,936 3,283,795 3,274,497 3,350,807 - -
The purpose of Student Body Fund is to account for monies raised by the school's students and/or parents to be used for student needs. These funds are controlled by the student body and not the District. The District performs an Agency oversight role for these funds. Student body monies must be expended for the purpose for which they were raised. Student body monies have historically been accounted for by the school's office manager or bookkeeper, under the supervision of the school administrator and District Staff. The majority of accounting and banking functions for schools were transferred to the District in FY15-16. During the transfer of the majority of accounting and banking functions to the District office, some non-student accounts were noted and transferred out of this fund. A few school student body funds are audited each year as part of the annual financial audit.
Trust and Agency Funds - Student Body
3,123,936 3,283,795 3,274,497 3,350,807
-
500,000
1,000,000
1,500,000
2,000,000
2,500,000
3,000,000
3,500,000
4,000,000
2015-16A 2016-17A 2017-18B 2018-19B
Student Body

Supplemental Information

Fiscal Year 2018-19 Information __________________________________________________________________
Successful Students Today ~ Successful Citizens Tomorrow 128
The District receives revenue from two primary sources: State aid and ad valorem taxes. Approximately 70 percent of the District’s General Fund is provided by the state and about 25 percent is generated from tax collections. The balance of General Fund revenues are from fees, interest earnings, grants, and other miscellaneous sources. Property Taxes Most local governments, including Medford School District, have permanent authority to levy taxes for operations. Public school system taxes are limited to $5 per $1,000 of the taxable Real Market Value of property. The District’s permanent tax rate is $4.4123 per $1,000 of assessed valuation. The law allows districts to increase tax revenue through a voter approved Local Option Levy; however, Medford School District has never made such a request of its voters. In addition, districts are allowed to seek voter authorization to issue general obligation bonds for the purpose of funding capital construction projects. In November 2006, voters authorized the District to issue $188.9 million in general obligation bonds.
District Property Tax Rates (Rates per $1,000 of Assessed Value)
Fiscal Year
General Tax Permanent Rate
($5 Limit)
Local
Option
General Obligation Debt Service Bonds
Total District
Tax Rate 2018 4.4123 - 1.5691 5.9814 2017 4.4123 - 1.6858 6.0981 2016 4.4123 - 1.6836 6.0959 2015 4.4123 - 1.8590 6.2713 2014 4.4123 - 1.9528 6.3651 2013 4.4123 - 1.9004 6.3127 2012 4.4123 - 2.0540 6.4663 2011 4.4123 - 2.0623 6.4746 2010 4.4123 - 2.0759 6.4882 2009 4.4123 - 2.1427 6.5550
- 1.0 2.0 3.0 4.0 5.0 6.0 7.0
2005 2006 2007 2008 2009 2010 2011 2012 2013 2014 2015 2016 2017 2018
District Tax Rates($ per $1,000
Permanent Rate Debt Service Bonds
Revenue Sources

Fiscal Year 2018-19 Information __________________________________________________________________
Successful Students Today ~ Successful Citizens Tomorrow 129
State School Fund The State School Fund was created to distribute state aid to Oregon school districts. The objective was to provide equal funding for all districts. Local property tax collections are included in the formula. The grant allocated to each district is comprised primarily of a general purpose grant and a transportation grant. The transportation grant provides a 70 percent reimbursement for home-to-school and instructional field trip transportation costs. The Oregon Department of Education (ODE) provides estimates of state appropriations beginning in March prior to the beginning of a new fiscal year (July 1). Apportionments are re-estimated throughout the year and finalized in May of the following fiscal year.
Fiscal Year
General Purpose
Grant
Transportation
Grant
Total
2019 130,587,258 3,885,000 134,472,258 2018 130,313,369 3,780,000 134,093,369 2017 120,872,618 3,248,000 124,120,618 2016 115,711,809 3,042,796 118,754,605 2015 108,667,261 2,979,643 111,646,904 2014 101,053,229 2,940,000 103,993,229 2013 91,730,374 2,838,255 94,568,629 2012 86,889,960 2,753,013 89,642,973 2011 82,297,130 2,624,861 84,921,991 2010 82,613,270 2,540,029 85,153,299 2009 82,207,838 2,635,186 84,843,025 2008 85,486,252 2,554,423 88,040,675 2007 80,461,344 2,281,158 82,742,502 2006 77,028,384 2,217,998 79,246,382
70,000 75,000 80,000 85,000 90,000 95,000
100,000 105,000 110,000 115,000 120,000 125,000 130,000 135,000 140,000
2006 2007 2008 2009 2010 2011 2012 2013 2014 2015 2016 2017 2018 2019
Millions $ State School Fund Grants
General Purpose Transportation
Revenue Sources

Fiscal Year 2018-19 Information
Successful Students Today ~ Successful Citizens Tomorrow 130
STUDENT INSTRUCTION
1111 Elementary Programs (K-6) All regular elementary school instructional programs for kindergarten through grade six. Includes staff, services, classroom supplies, and equipment.
1121 Middle School Programs (7-8) All regular middle school instructional programs for students in grades seven through eight. Includes staff, services, classroom supplies, and equipment.
1122 Middle School Co-Curricular (7-8) Advisor and coaching stipends, supplies, and equipment for extracurricular activities.
1131 High School Programs (9-12)
All regular high school instructional programs for students in grades nine through twelve. Includes staff, services, classroom supplies, and equipment.
1132 High School Co-Curricular (9-12)
Advisor and coaching stipends, supplies, and equipment for extracurricular activities.
1210 Talented and Gifted (TAG) Programs Program services and supplies for students identified as talented or gifted.
1220 Special Education Self-Contained Programs & Other Specialized Supports: Multi-
Age Positive Support (MAPS) Provides instructional and direct services for students with disabilities who spend one-half or more of their time in a special education setting. Specialized supports are also provided to students with sensory impairments.
1221 Southern Oregon Education Service District Provides specialized services and service providers, such as Braillists, Sign-Language Interpreters, Autism Consultants and STEPS classrooms for students with disabilities.
1227 Extended School Year Services Services are provided to students who experience documented, undue regression in acquired skills, based on IEP goals, and require extended periods to recoup the skills.
1240 Special Education Self-Contained Programs & Other Specialized Supports: Focus on Choosing Useful Skills (FOCUS) Provides instructional and direct services for students with disabilities who spend one-half or more of their time in a special education setting. Specialized supports are also provided to students with social, emotional and behavior impairments.
Function Glossary – Medford School District 549C

Fiscal Year 2018-19 Information
Successful Students Today ~ Successful Citizens Tomorrow 131
1250 ERC - Resource Rooms
Learning experiences outside the regular classroom for students with disabilities. Students receive specialized remedial instruction within these resource rooms.
1260 Early Intervention Childhood
Provides evaluation services for early childhood students younger than five years old. 1261 Early Intervening Services
Provides preventative academic and behavioral support to school age students not eligible for special education.
1283 Alternative Education Programs Learning experiences for students who may be more successful in a non-traditional classroom setting. Includes instructional programs designed to meet the needs of students at risk of dropping out of school. District programs include the Juvenile Detention Center.
1288 Charter Schools
Contracted learning experiences for students attending the District sponsored Madrone Trail, Logos, and Vibes.
1291 English Language Learners (ELL) Instructional activities designed to assist students who speak English as a second language. Includes staff, services, and classroom supplies.
1292 Teen Parent Program Instructional program designed to accommodate the needs of teen parents. This program is located on the campus of North Medford High School. Includes staff, services, and classroom supplies.
1295 Homebound Program
Instructional program designed to assist students who are unable to attend a regular school setting. These students receive instruction at home, typically on a temporary basis.
1297 At-Risk Program
Instruction activities designed to assist students with risk factors that often affect the learning process.
1430 Summer School Program – High School (9-12)
Includes staff, supplies, and materials to operate summer school for high school students.
Function Glossary – Medford School District 549C

Fiscal Year 2018-19 Information
Successful Students Today ~ Successful Citizens Tomorrow 132
DIRECT STUDENT SUPPORT SERVICES
2112 Attendance Services Attendance monitoring and record keeping.
2115 Community Service Officers
Activities associated with enhancing student safety. The District contracts with the City of Medford to provide Community Service Officers.
2121 Offices of the Deans (7-8)
Activities associated with directing and managing guidance services at middle schools.
2122 Counseling (9-12) Includes staff, services, and materials used in counseling centers. Each traditional high school is assigned four counselors. Central Medford High School is staffed with one full-time counselor.
2126 School to Work Program Includes career counseling, placement and referral services for students.
2134 Nursing
Nursing activities which are not instruction, such as health inspection, treatment of minor injuries and referrals for other health services.
2139 Long Term Care and Treatment
Includes activities concerned with testing, interpreting results, and providing psychological services to students. Includes staff, services, travel and supplies.
2140 Psychological Services Includes activities concerned with testing, interpreting results, and providing psychological services to students. Includes staff, services, travel and supplies.
2148 Family Solutions Includes a continuum of mental health services for students from early intervention to intensive residential treatment. Supports are provided in the community, school, home and treatment settings.
2150 Speech and Audiology Services Includes the identification, assessment, and treatment of students with impairments for speech, hearing and language.
2190 General Student Support Services
Direction and management of all student service programs, including special education, ELL and other at-risk programs.
Function Glossary – Medford School District 549C
Fiscal Year 2018-19 Information
Successful Students Today ~ Successful Citizens Tomorrow 133
DIRECT STAFF SUPPORT SERVICES
2210 Improvement of Instruction - Coaches Professional development activities provided by instructional coaches and mentors to assist teachers to improve instructional practices.
2211 Improvement of Instruction - Media
This function is for activities providing direction and management of educational media services used by teachers. Designed to assist instructional staff plan, develop, and evaluate the process of providing effective learning experiences for students.
2212 Instructional Development
Activities designed to assist teachers and administrators to effectively use adopted curriculum materials.
2221 Instructional Media Services
Direction and management of educational media services used by teachers. This includes hardware, software, printed materials, on-line and other distance learning resources.
2222 School Libraries Includes staff, services, books, periodicals, technology, supplies and other resources for school media centers.
2223 Audiovisual Services
Includes materials, supplies, and equipment for multimedia services used by instructional and administrative staff.
2240 Instructional Staff Development Activities designed to assist licensed and non-licensed staff in preparing and using district curriculum materials, the understanding of best teaching practices, and other strategies to improve instruction.
GENERAL SUPPORT SERVICES 2310 Board of Education
Includes expenses for policy development, audits, legal services, elections, dues, liability insurance and other responsibilities of the governing body.
2320 Executive Administration
This function was previously used to record costs associated with bond preparation and planning.
Function Glossary – Medford School District 549C

Fiscal Year 2018-19 Information
Successful Students Today ~ Successful Citizens Tomorrow 134
2321 Office of the Superintendent Includes services, supplies, travel, postage, materials and staff to support the Superintendent’s office.
2325 Offices of the Educational Directors
Direction and management of all elementary and secondary education, instruction, and operations. Includes staff, services, travel and supplies.
2329 Secondary Athletics
Direction and management of all secondary athletic programs.
2410 Offices of the Principals Includes services, supplies, materials and staff to support the Principals and Assistant Principals at each school.
2510 Office of the Business Services Director
Direction and management of district business and operation services. Includes services, supplies and staff to support the Chief Financial Officer.
2521 Business Services Direction, management and oversight for all district fiscal services, including accounting, audits, payroll, and budgets. Includes services, supplies, and staff to support the Fiscal Controller.
2529 Other Fiscal Services Includes services, supplies and bank fees.
2542 Custodial Includes services, supplies, equipment, materials, utilities and staff used to clean and operate all schools and auxiliary buildings.
2544 Maintenance Services
Includes services, supplies, equipment, materials, and staff necessary to maintain and repair all district schools, auxiliary buildings and grounds.
2545 Vehicle Maintenance Includes services, supplies, and equipment needed to maintain all district-owned vehicles.
2546 Security Services
Includes a service contract with Sonitrol to provide security and safety of all district property.
Function Glossary – Medford School District 549C

Fiscal Year 2018-19 Information
Successful Students Today ~ Successful Citizens Tomorrow 135
2548 Classroom Furniture
Includes costs of new and replacement classroom furniture. Beginning in 2008-09 this expense has been recorded in a separate capital reserve fund.
2550 Student Transportation Includes a service agreement with First Student to provide all home-to-school activity, and athletic transportation services.
2572 Purchasing/Distribution Services
Includes costs of services, supplies, staff, storage, delivery and equipment necessary to purchase, receive, control and distribute district goods.
2574 Printing and Publishing Services
Includes supplies, equipment, and staff used to print and publish district reports and instructional materials.
2630 Information Services
Includes activities, services, supplies, postage, and materials necessary to prepare, write, and communicate district information to the community, parents, staff and students.
2633 Public Information Includes the costs associated with organizing, duplicating and monitoring public document information.
2640 Human Resource/Employee Services Direction and management of all personnel and employee services. Includes services, supplies, advertising, software, and staff necessary for the recruitment, monitoring, placement and pay assignment of all employees. It also includes bargaining, administrative assistance, and contract management.
2661 Information Technology Includes costs associated with computing, programming and data processing services.
2669 Network and Telecommunication Services Includes services, supplies, equipment, software and staff necessary to design, install and maintain district network and telecommunication systems.
2700 Early Retirement Program
Includes costs associated with the supplemental early retirement program provided to qualified retirees.
Function Glossary – Medford School District 549C

Fiscal Year 2018-19 Information
Successful Students Today ~ Successful Citizens Tomorrow 136
OTHER SERVICES/FUNCTIONS
3120 School Lunch Match
Required expenditures to qualify as district support necessary to participate in the National School Lunch program.
4150 Building Acquisition and Construction
Includes professional services, supplies, equipment and staff necessary for the purchase or construction of new facilities or building improvements.
4190 Other Facility Services Costs for improvements to other district assets, such as grounds.
5110 Long-term Debt Service Includes fees associated with the issuance of debt lasting more than 12 months. 5201 Transfer of Funds
Transactions with withdraw resources from one fund and place it into another fund for a specific purpose.
6110 Operating Contingency
Portion of budget not designated for a specific use, but appropriated for unforeseen and unanticipated needs.
7700 Unappropriated Fund Balance
An estimate of funds needed to maintain operations of the district from July 1 of the ensuing fiscal year and the time when sufficient new revenue becomes available. No expenditure shall be made from the unappropriated fund balance in which it is budgeted. It is reserved for use in the subsequent year.
Function Glossary – Medford School District 549C
Appendix

Publications

Legal Announcements MEDFORD SCHOOl.
DISTRICT 649C Mo!lfonl, Oreg9n
NGTICE OF BUDGET COMMITIEE MEETING
A publlo meeting of the 8udget Committee. or the Me<lford School Dls11icti Jac;kson Go11nly, State 9 Oregon. on the budg'el for the fiscal ye:Qr Jvly t. 2018 to June 3Q, 2019, wfll be held et lhe Medford School District 8-oardroom, 815 S. Oakdafo Ave., Medford, OR, This budg'et commll loe orlentallon meeting will take plaoe at 6:00 pm, on Monday, Arri! 2, 2018. The purpose o the meeting ls l oreview commltlae fotas, responslb:llilles and tile budget p rocess. Ttie next bu_dg_et meellng w i ll tak'e place o n Wed"asday, AprH 16, 2016 at 6!00 pm. 'Thi's is a public meetrng where the, Budget, eommmee wlll de,lver Iha budget mesaajJ&, elec,I emcers end receive tt)e cudgel document. T.hfs meeting will lake public c.omment.
Brian T. Shumate S,uperfntendenl
March 22, 2018
This notice was also posted on our website at https://www.medford.k12.or.us/site/default.aspx?PageID=2818

MEDFORD SCHOOL DISTRICT 549C
Medford!. Oregon NOTICE Ot' BUDGET
COMMITTEE MEETING
A. publlc meeting of theBudget Committee of the Medford School Olstrlcl. Ji1c1<son County, State or Oregon, on the budget for the fiscal year July 1, 2018 lo June 30, 2019, will be held at the Medford Scl\ool District Boardroom, 815 s. Oakdale Ave., Medford. OR. This budget meetlng will lake piece at 6:00 Pill, on Monday, Aprll 16, 2.018. In tills ITl&ellng the Superintendent WIii read the budget message and a cory of the budget book wit be dlstribuled. The next budget meeting will teke place on Monday, Aprfl 30, 2()18 111 8:00 prn.
Brian T, Shumale Superintendent
April 6, 2018 :
This notice was also posted on our website at https://www.medford.k12.or.us/site/default.aspx?PageID=2818

Strategic Plan


CONTENTSSuperintendent’s Message, Vision, and Mission .............................1
Values ...................................................2
Academic Mastery .................................4
Equity for All ..........................................5
3rd Grade Reading ................................7
Accelerate Learning ...............................8
High School Graduation ........................10
High-Tech Learning ...............................12
About the Medford School District ...13
Elementary Schools ..............................14
Middle Schools .....................................19
High Schools ........................................20
Our Commitment to Vision 2020, Meet the Board Members ...................21

1 INTRODUCTION
SUPERINTENDENT’S MESSAGE
We are a premier school district that inspires remarkable achievement, and empowers students to succeed and contribute in a changing world.
To foster the talents and interests of a community of life-long learners through a meaningful education that challenges students to reach their unlimited potential.
OUR VISION
OUR MISSION
Dear Medford Community:
This Vision 2020 document represents the high expectations we share and the unwavering belief we have in our students as we strive to become a premier school district in Oregon. Your input, gathered over many months from a variety of stakeholder groups, shaped the mission and vision and the bold goals outlined in this document.
I am grateful for your participation in the creation of this plan. It is ambitious, but I believe that is what our students deserve. We have laid out goals and strategies that will set us on a course to improve achievement, reduce opportunity gaps for students, and to transform the Medford School District for generations to come.
Thank you for committing to this work and ensuring that our schools foster the talents and interests of a community of life-long learners through a meaningful education that challenges students to reach their unlimited potential.
Sincerely, Brian Shumate Superintendent

OUR VALUES
2OUR VALUES
CONNECTIONSWe value collaboration and teamwork that connects students, parents, teachers and the greater community to the learning process so that students may find connections, meaning and understanding in their daily school experiences.
EQUITYWe value opportunities for all, so that each student may explore different paths to their future. We recognize the diversity of our students, allowing all students to participate and demonstrate their knowledge, skills, and abilities. All students will experience equal access to all course work, co-curricular activities, and experiences. And, all courses, co-curricular activities and experiential groups will reflect the diversity of the entire school community.
LEARNINGWe value and are inspired by the acquisition of academic content, new ideas and new ways of thinking.
The Medford School District will be a Learning Organization which will honor the lessons of the past, embrace the foundations of diverse academic pursuits and optimistically embrace the future.
PERSEVERANCEWe value hard work, resilience, and determination in our students and in the Medford School District as a whole. The Medford School District is committed to instilling the growth mindset in our students where students learn to grapple with and master complex ideas and tasks.
RESPECTWe value each other, through empathy and kindness with an open mind and heart. We care for our schools, our community, and our world.
SERVICEWe, the staff, students and families, value meaningful service to the mission, to each other, and to the greater community.

3 OUR VALUES

Extend student learning beyond proficiency by encouraging ALL students to attain MASTERY of all Oregon State Academic Standards.
We want our students to not only meet academic standards, but also to grow beyond minimum levels of proficiency.
WE WILL…Improve student attendance by…• implementing the Attention2Attendance
(A2A) program.
• implementing coherent attendance program with student and family friendly interventions.
Improve academic skills by…• teaching study and organizational skills in
grades 7-9.
• aligning learning targets across grade levels and content areas.
• providing effective intervention and re-teaching opportunities.
• ensuring student learning through evidence based assessments.
Create a culture of engagement by…• recognizing and celebrating excellence.
• encouraging and reinforcing a growth mindset.
Create a standards based elementary report card by fall of 2017.
WE WILL MEASURE OUR PERFORMANCE BY…• reviewing grade distribution data
in grades 7-12.
• reviewing credit acquisition data for grades 9-12.
• reviewing published learning targets by grade level and content.
• reviewing Smarter Balanced data grades 3-11.
• reviewing PLC meeting minutes.
ACADEMIC MASTERY
4ACADEMIC MASTERY

Promote a school environment of EQUITY in which ALL students find connections, meaning, and understanding in their daily school experiences.
All students will become affiliated and engaged with the educational process through connections to caring adults, like-minded peers, meaningful curriculum and coursework and ultimately their own learning.
WE WILL…Implement Pathways by…• identifying and publishing Pathways,
course sequences, clubs and activities available at each high school.
• analyzing student enrollment in each Pathway.
• establishing industry certifications and dual credit classes with RCC, SOU, and industry partners.
• working with Junior Achievement and Rogue Workforce Partnership to establish business and community partners for each Pathway.
Recruit and retain a diverse staff by…• submitting a federal grant to recruit
bi-lingual teachers.
• collaborating with current staff to support and retain diverse staff.
• strategically attending recruitment fairs and posting openings widely.
• recruiting current support staff and students into the teacher education program and current teachers into the administrative program.
Reduce bias in student management by…• expanding restorative practices.
• reviewing discipline data to monitor for disproportionality.
• acknowledging Adverse Childhood Experiences (ACEs) and trauma informed practices.
Improve site based decision making by…• training principals and site councils on best
practices for engaging diverse voices.
EQUITY FOR ALL
5 EQUITY FOR ALL

Diversify participation of students by…• reviewing demographic participation data
for activities, athletics, and Advanced Placement (AP) classes.
• exposing all students to multiple opportunities at an early age.
• encouraging all students to participate in at least one co-curricular activity.
• implementing Unified Sports League.
• providing peer mentoring to students.
Promote family outreach by…• providing opportunities for families to
participate and engage with their school.
• increasing participation in parent-teacher conferences.
• encouraging parent participation on school-based site councils.
• leading parent outreach meetings and trainings.
Provide meaningful professional development by…• conducting implicit bias training and
feedback during school visits and classroom observations.
• piloting the implementation of Advancement Via Individual Determination (AVID) program.
• conducting Sheltered Instruction Observation Protocol (SIOP) and Constructing Meaning workshops.
• conducting Co-Teaching and Universal Design for Learning training.
6EQUITY FOR ALL
WE WILL MEASURE OUR PERFORMANCE BY…• comparing staff demographics to
student demographics.
• reviewing student demographics in all athletics, activities, and courses.
• tracking each high school student’s pathway choice and progress.
• analyzing dropout and graduation rates for all student groups.

WE WILL MEASURE OUR PERFORMANCE BY…• reviewing 3rd grade Smarter
Balanced Assessment (SBA) data.
• reviewing I-Ready reading periodic assessment data.
• reviewing K-2 student English Language Arts (ELA) performance data.
Ensure that each elementary student READS at grade level by the end of the 3rd grade.
Beginning in kindergarten, all students will be assessed in reading and will be provided with any and all necessary instruction and interventions to ensure each student reads at grade level by the end of the 3rd grade.
WE WILL…Implement new K-6 English Language Arts (ELA) curriculum by…• ordering and distributing curriculum.
• providing professional development for teachers.
• conducting classroom walk-throughs to observe the use of the curriculum.
• supporting Professional Learning Communities (PLCs) to make best use of the new materials.
Provide meaningful interventions by…• reviewing student performance and providing
tiered intervention strategies.
• providing Special Education, Title I-A, and English Language Development (ELD) support.
Utilize effective assessments by…• aligning learning targets.
• aligning sequence and pacing of content delivery.
• working with Professional Learning Communities (PLCs) to design periodic common assessments.
• expanding Keeping Learning on Track (KLT) groups.
3RD GRADE READING
7 3RD GRADE READING

ACCELERATE the learning for ALL students who perform below grade level, bringing them up to grade level by the end of the school year.
ALL struggling students will be afforded the opportunity to receive specific, focused, and individualized interventions to ensure they perform at grade level in all academic areas by the end of the school year. Further, we expect Special Education students to meet all Individual Education Program (IEP) goals each year. We expect English Language Learners (ELL) to make at least a year’s growth in language acquisition and exit the ELL program in, at most, five years. We expect ELL students who exit the ELL program at the end of 7th grade to graduate from high school in four years.
ACCELERATE LEARNINGWE WILL…Identify students performing below grade level by…• reviewing Smarter Balanced Assessment
(SBA), credit acquisition, and other related student academic data.
• developing plans to provide accelerated learning.
Provide meaningful interventions by…• reviewing student performance and utilizing
instructional grouping.
• supporting Special Education, Title I-A, and English Language Development (ELD) support.
Track student growth by…• reviewing student progress through school
data teams.
Address the needs of diverse populations by…• reducing mobility so families can remain at
their home school.
Improve transitions from elementary to middle to high school by…• passing a bond to build additional schools
so that school feeder patterns are more predictable.
Increase student connections to school by…• expanding and marketing athletics
and activities.
• maintaining consistent cohorts and improved transition programs at each school.
• Implementing high school pathways.
8ACCELERATE LEARNING

9 ACCELERATE LEARNING
WE WILL MEASURE OUR PERFORMANCE BY…• tracking all IEP progress data and
ELL Annual Measurable Achievement Objectives (AMOA) data.
• tracking the number of ELL students who make at least one year’s growth in language acquisition each year.
• tracking the number of ELL students who exit the ELL program in 5 years.
• tracking the number of ELL students, who exit ELL services by the end of the 7th grade, who graduate on time upon entering high school.
• tracking the number of interventions being offered for all regular education, special education and English language learners.
• tracking the number of credits being earned in out of school time (i.e., after school, evenings, weekends, summer).
• tracking attendance data.
• monitoring student progress data.
• monitoring summer school and extended day results.

Increase the GRADUATION rate to 90% by June 2020.
A high school diploma is a foundational credential. We want our students to complete a rigorous and focused academic program of studies, earn a credentialed diploma whereby each student can earn dual credit, articulated credit, or an industry certification, and have a credible working plan for their growth and training at the post-secondary level. We expect an annual district graduation rate of 80% by 2017, 90% by 2020 and 100% by 2025.
WE WILL…Enlist each high school student to engage in a focused pathway (4 course sequence) of his or her choosing in one of the following: Academic, Artistic, Career and Technical Education, Pre-Professional.
Enhance credit acquisition and recovery by…• reviewing student transcripts and assigning
proper courses.
• monitoring credit acquisition quarterly.
Improve student attendance by…• implementing Attention2Attendance (A2A).
• implementing coherent attendance program with interventions.
Implement Freshman Academy at North Medford High School.Implement Freshman Advisory by…• convening a task force to develop curriculum
and guideline for Freshman Advisory.
• providing staff development for 9th grade advisors.
Align learning targets in content areas by…• gathering teachers in grades 6–12 for district
committees in ELA, Math, Science, Social Studies, and Health.
• creating an annual calendar for monthly meetings.
• publishing a district alignment document.
HIGH SCHOOL GRADUATION
10HIGH SCHOOL GRADUATION

11 HIGH SCHOOL GRADUATION
Review data quarterly on attendance, student performance, credit acquisition and create intervention plans by…• identifying participants in school data teams.
• working with Information Technology (IT) to establish specific quarterly reports to publish to schools.
• establishing a quarterly meeting calendar for data teams.
• school teams publishing their data analysis and intervention plans.
Provide math and literacy interventions by…• reviewing student proficiency in math and
reading and assigning interventions.
• implementing scheduled interactions.
Furnish mentoring programs for students with disabilities by…• developing mentoring programs with
teachers, parents, students, and community groups.
Collaborate with Big Idea partners by…• developing a success plan for the
Class of 2020.
• convening follow up meetings with Big Idea and district.
Increase inclusive and co-teaching opportunities by…• developing a plan for professional
development for teachers at participating schools.
• establishing a structure for co-teaching at all schools.
Enhance family outreach regarding college and career opportunities by…• working with high school counselors and site
councils to create a family outreach plan.
Establish systematic and personalized college and career advising for students by…• convening a summit with high school
counselors, College Dreams, TRiO and students to develop a plan of action.
• continuing development of Career Inventory Systems for grades 7-12.
• developing a Junior/Senior seminar system at the high school level.
WE WILL MEASURE OUR PERFORMANCE BY…• tracking graduation rate data.
• tracking quarterly passing rate.
• tracking overall credit acquisition by grade.
• monitoring students on-track by credit accrual and essential skills.

Integrate instructional TECHNOLOGY to improve student achievement and prepare students to navigate an ever-changing world.
Students should have access to high quality technology at all times to enhance the teaching and learning process.
WE WILL…Increase student access to technology by…• purchasing and deploying Chromebooks.
• exploring options for economically disadvantaged families to check out devices and hot spots.
• providing access to accessible instructional materials.
Provide professional development for technology enhanced teaching by…• creating a professional development plan.
• collaborating with outside organizations technology specialists to provide regional support.
• identifying a tech specialist in each building.
Establish clear grade level expectations by…• developing a K-12 scope and sequence
for integrated technology.
Provide a budget to support the use of technology.
HIGH-TECH LEARNING
12HIGH-TECH LEARNING
WE WILL MEASURE OUR PERFORMANCE BY…• reviewing student-to-computer ratios.
• providing a calendar of professional development offerings.
• publication of K12 Scope and Sequence.
• improved student performance overall.
• reviewing student survey data.

“A Place for Every Kid”
The Medford School District strives to be a place where every student finds connections, meaning and understanding with their daily school experience, with their teachers, and with their peers. Every student should be affiliated and known for his or her strengths, aptitudes and interests so that the entire school experience is meaningful and has relevance to each student.
The district offers a wide-variety of both educational and extra-curricular programs for all students including opportunities to explore advanced areas of core-content classes, visual and performing arts, career and technical education and pre-professional opportunities.
The MSD is experiencing growth in graduation rates, statewide student assessment results, attendance, and enrollment.
The MSD is a premiere district in
Oregon, encompassing 361 square
miles in the heart of Southern Oregon’s
beautiful Rogue River Valley. We
serve 14,000 students in 14 elementary
schools, two middle schools, three high
schools and four charter schools.
ABOUT THE MEDFORD SCHOOL DISTRICT
13 A PLACE FOR EVERY KID

14ELEMENTARY SCHOOLS
“Our mission is to create a passion for life-long learning. Through a climate of dedication, love, and respect, our school community nurtures children to become productive and responsible citizens.”
Abraham Lincoln Elementary School opened in September of 1997, serving city and rural lands in northeast Medford. The school is sited on a twenty-acre parcel of elevated land, giving students a panoramic view of the City and the Bear Creek Valley.
The 63,500 square foot school was designed as a prototype for future elementary schools. The south end houses the office, media center, computer lab, gymnasium, music room/stage/little theatre complex, gymnasium, and conference rooms. These were designed to allow for community use, as well as to close off the north end of the building for security.
Griffin Creek Elementary School has a long and rich history; the school was built on a 9-acre site in 1902. In 2007 the district significantly renovated the school; adding a new roof, HVAC systems, flooring, exterior paint, and interior refurbishing.
“At Griffin Creek we nurture, respect and inspire everyone to achieve their greatest potential.”
Griffin Creek Elementary serves students in the southwest portion of Medford and surrounding foothills, a largely rural area. Griffin Creek boasts large playfields, beautiful landscaping and is one of the more tranquil settings in the district.
Hoover Elementary School was constructed on Siskiyou Boulevard in 1958, but the district built several additions in the early 1980’s. A three million dollar remodel began in the summer of 2007 which included asbestos abatement; new heating ventilation and air conditioning; upgraded lighting; painting inside and out; new flooring and much more. Hoover received another upgrade in 2013 to enhance the security and safety.
“Our mission is to help students learn, do their best, and strive to be safe, respectful and responsible.”
ABRAHAM LINCOLN ELEMENTARY
HOOVER ELEMENTARY
GRIFFIN CREEK ELEMENTARY

15 ELEMENTARY SCHOOLS
Howard Elementary is named after James Sullivan Howard who was officially elected as the mayor of the city of Medford in 1887. As a surveyor, merchant, postmaster, real estate agent and notary, Mr. J. S. Howard is often referred to as the “father of Medford.” Howard Elementary School was established in 1912 and has long been a fixture between northern Medford and Central Point.
“Engaged - Inspired - Valued - Empowered”
The district opened a new Howard Elementary School building in 1983 and renovated it in 2008 and 2009. Security updates were added in 2011.
Located in the historic mining town of Jacksonville, the original school opened in 1854, making Jacksonville Elementary School the first school in Southern Oregon. The district built a $2.2 million structure on Huener Lane in 1982 and remodeled the original, combining the two into one school. The school received major renovations in 2008. The modern, spacious building now houses a gymnasium large enough for community use and a full size theatrical stage that is home to many school productions.
“Our mission is to provide a positive environment which promotes responsible, resourceful, respectful individuals inspired with a life-long love of learning.”
“We believe students will succeed in a learning environment that is free from distractions and is emotionally and physically safe; values and builds on their background, language, and culture; and accelerates students to high levels of school success.”
Built in 1911, Jackson Elementary is one of the oldest school locations in the district. Major remodeling from 1996 to 1998 provided a new library-media center and cafeteria facilities, as well as additional classroom space. The current main building and gym were built in 2009, combining the character of the previous building with many modern features that support effective student learning: excellent lighting, clean and inviting classrooms and learning pods.
HOWARD ELEMENTARY
JACKSONVILLE ELEMENTARY
JACKSON ELEMENTARY

16ELEMENTARY SCHOOLS
KENNEDY ELEMENTARY
“Our mission is to provide opportunities for our students to develop strong academic skills, the ability to work well with others, and the confidence to achieve their potential. We do this in a safe, caring, enriched environment, in partnership with parents and community.”
Jefferson Elementary School was built in 1955 and expanded twice to accommodate a growing population. The Medford School District completely renovated the school in 2007 as a part of the Medford School District construction bond. Jefferson has provided generations of families in Southwest Oregon with years of exceptional education experiences.
John F. Kennedy Elementary School was constructed to keep up with a rapidly growing northeast Medford. Kennedy was completed in 1982 after being built in phases beginning in the mid-1970’s.
“Kennedy School is a partnership of staff, parents, and community members dedicated to providing each child with the skills to become a safe, respectful and responsible lifelong learner.”
In 1997 the district realigned attendance area boundaries and opened Abraham Lincoln Elementary, relieving crowding at Kennedy. The school received major renovations in 2007 and increased campus security in 2009 and 2013.
Lone Pine Elementary is one of the district’s larger schools and the grounds double as a city park with adjacent acreage offering a spray park for the community to enjoy.
From 1857 until 1959, Lone Pine District #10 was an independent district and housed the Red Top School built in 1887. Additions to Lone Pine Elementary came in stages, starting in 1926. The district made renovations to the spacious hexagon media center in 1982 and constructed two new buildings in 2009.
“We are dedicated to creating and building upon a successful, educational foundation, while encouraging students to become safe, responsible, and respectful.”
JEFFERSON ELEMENTARY
LONE PINE ELEMENTARY

Roosevelt Elementary School was built in 1911, when it was surrounded by farms. The school received a new library-media center, a multipurpose room, and new locker rooms in 1983. A new cafeteria was added in 1997 and the former cafeteria was remodeled to create a storage room, staff room and additional classrooms. The district re-constructed the main building and gym in 2009 and renovated the media center and cafeteria.
“We believe all students learn at their own rate and in different ways. Our school is a positive environment which focuses on success for all students and when academics are engaging, it ensures success.”
“Ruch Community School is committed to creating and maintaining a learning environment that provides opportunity to excel academically, socially, physically, and emotionally.”
Ruch Community School still includes the original 1913 building, and houses many more rooms as well as a modern gymnasium. The district added classrooms and other facilities as the school population grew.
The partially wooded site is about 11 acres and serves students in kindergarten through eighth grade. The attendance area extends to the California border, mostly consisting of sparsely populated mountains and homes along the Applegate River and other streams.
ROOSEVELT ELEMENTARY
RUCH COMMUNITY SCHOOL (K-8)
17 ELEMENTARY SCHOOLS

WILSON ELEMENTARY
“A learning community dedicated to high learning standards by recognizing students’ unique needs and strengths through success, opportunity, accountability, and respect.”
Washington Elementary School is registered as a historic building. Constructed in 1931, the 6.5-acre site is a central in the attendance area.
The mounted brass bell in front is from the original Washington Elementary, Medford’s first brick school. The district added a library-media center in 1988, new classrooms and a computer room in 1996-97. The building was significantly renovated in 2007 to include a new cafeteria.
Wilson Elementary School was built in 1958 with separate classroom wings tied together and covered walkways. All the roofs are broad and slightly peaked.
“Wilson School will proudly create a positive, supportive, educational environment that encourages responsible, productive, lifelong learners.”
Wilson Elementary School sits on a 9-acre site in central Medford, part of which was developed into a city park. The district renovated and expanded Wilson’s cafeteria in 2015 to serve the growing student body.
WASHINGTON ELEMENTARY
Oak Grove Elementary School’s original two-story structure was made of brick in 1908. The district remodeled and added several new additions over the years, most recently in 2009. The school site is approximately 12 acres and is almost exactly centered in its attendance area, combining urban and rural neighborhoods.
“All students have the right and the ability to learn in a safe, caring, and high quality learning environment.”
Our school is a safe, positive, welcoming community that is conducive to and committed to life-long learning and student success.
OAK GROVE ELEMENTARY
18ELEMENTARY SCHOOLS

Hedrick Middle School is one of two schools for Medford students in grades seven and eight. The district constructed the school on East Jackson Street in 1955 and named it for E. H. Hedrick, district superintendent from 1925 to 1955. Hedrick was extensively remodeled and received new additions between 1996 and 1998 to meet the educational needs of slightly under 1000 middle school students. Elementary feeder schools are Abraham Lincoln, Hoover, Kennedy, Lone Pine, Roosevelt, and Wilson.
“Hedrick is a community where each member is unique and shares the joy of learning.”
“McLoughlin is a learning community dedicated to: success, opportunity, accountability, and respect.”
McLoughlin Middle School is located on West 2nd Street and began as the district’s high school in 1926. The school was named for John McLoughlin, the leading figure in early 19th century Oregon Territory history. The district converted McLoughlin to a junior high school in 1931 and it became a middle school in 1995.
The district accomplished extensive remodeling and built new additions to the school between 1996 and 1998 to meet the educational requirements of slightly under 1000 middle school students. In 2013, security upgrades improved access to the office entry.
HEDRICK MIDDLE SCHOOL
MCLOUGHLIN MIDDLE SCHOOL
19 MIDDLE SCHOOLS

20HIGH SCHOOLS
NORTH MEDFORD HIGH SCHOOL
Central Medford High School is an alternative setting serving students grades 10 through 12 in a variety of programs. The school is focused on building relationships with students, fostering an environment of respect, and connecting academics to real life experiences and skills.
Constructed on South Oakdale in 1931, the school was once Medford Senior High. Central Medford High School moved to the location in 2010. The building houses the Medford School District Education Center where district educational and operational offices are located. Central High sits on 20 acres and is home of Spiegelberg Stadium, Medford’s football arena.
North Medford High School sits on a 60-acre campus with the atmosphere of a small college. The school opened in 1967. The facility became North Medford High School in 1986 and major renovations were completed in 2011 to improve safety.
North Medford has 78 classrooms, a gymnasium with a seating capacity of 3,000, and an auditorium that seats 800. A 100-seat planetarium is used for astronomy courses and to present the stars to the community.
In 2016, the district launched its Pathways Program in which freshman choose a four course sequence to pursue, similar to a college major.
South Medford’s modern 2010 campus includes a 255,000 sq. ft. building with a competition gym, auxiliary gym and theater. The campus also includes athletic fields with a track, tennis courts, baseball field, two softball fields, soccer field, and artificial turf at the football field.
The facility has eight computer labs, a professional performing arts facility, and two state of the art culinary arts centers. The beautiful school is energy efficient and situated on 38 acres.
In 2016, the district launched its Pathways Program in which freshman choose a four course sequence to pursue, similar to a college major.
CENTRAL MEDFORD HIGH SCHOOL
SOUTH MEDFORD HIGH SCHOOL

21 OUR COMMITMENT
The Vision 2020 Strategic Plan is an expression of our community’s belief in our students. To realize the goals outlined in this plan, we must commit, long-term, to its implementation. We will not only work to achieve our goals in a timely manner, but regularly report our progress to stakeholders, and celebrate the work of our students and staff in accomplishing these goals. With this plan, we reaffirm our commitment to becoming a premiere school district that inspires remarkable achievement and empowers student to succeed and contribute in a changing world. We look forward to partnering with you in fostering the talents and interests of a community of life-longer learners through a meaningful education that challenges students to reach their unlimited potential.
Karen Starchvick School Board Chair [email protected]
Michael Campbell School Board Vice Chair [email protected]
Lilia Caballero School Board Member [email protected]
Cynthia Wright School Board Member [email protected]
James Horner School Board Member [email protected]
Jeff Kinsella School Board Member [email protected]
Suzanne Messer School Board Member [email protected]
OUR COMMITMENT TO VISION 2020
MEET THE BOARD MEMBERS

/medfordschooldistrict549cwww.medford.k12.or.us
@msd549c(541) 842-3636
CONNECT WITH US WE’RE SOCIAL