PROMOTION FACTORS FOR ENLISTED INFANTRY MARINES
123
NAVAL POSTGRADUATE SCHOOL MONTEREY, CALIFORNIA THESIS Approved for public release. Distribution is unlimited. PROMOTION FACTORS FOR ENLISTED INFANTRY MARINES by Micah A. Steinpfad June 2017 Thesis Advisor: Robert Koyak Second Reader: Chad Seagren
-
Upload
khangminh22 -
Category
Documents
-
view
2 -
download
0
Transcript of PROMOTION FACTORS FOR ENLISTED INFANTRY MARINES
NAVAL POSTGRADUATE
SCHOOL
MONTEREY, CALIFORNIA
THESIS
Approved for public release. Distribution is unlimited.
PROMOTION FACTORS FOR ENLISTED INFANTRY MARINES
by
Micah A. Steinpfad
June 2017
Thesis Advisor: Robert Koyak Second Reader: Chad Seagren

THIS PAGE INTENTIONALLY LEFT BLANK

i
REPORT DOCUMENTATION PAGE Form Approved OMB No. 0704-0188
Public reporting burden for this collection of information is estimated to average 1 hour per response, including the time for reviewing instruction, searching existing data sources, gathering and maintaining the data needed, and completing and reviewing the collection of information. Send comments regarding this burden estimate or any other aspect of this collection of information, including suggestions for reducing this burden, to Washington headquarters Services, Directorate for Information Operations and Reports, 1215 Jefferson Davis Highway, Suite 1204, Arlington, VA 22202-4302, and to the Office of Management and Budget, Paperwork Reduction Project (0704-0188) Washington, DC 20503. 1. AGENCY USE ONLY (Leave blank)
2. REPORT DATE June 2017
3. REPORT TYPE AND DATES COVERED Master’s thesis
4. TITLE AND SUBTITLE PROMOTION FACTORS FOR ENLISTED INFANTRY MARINES
5. FUNDING NUMBERS
6. AUTHOR(S) Micah A. Steinpfad
7. PERFORMING ORGANIZATION NAME(S) AND ADDRESS(ES) Naval Postgraduate School Monterey, CA 93943-5000
8. PERFORMING ORGANIZATION REPORT NUMBER
9. SPONSORING /MONITORING AGENCY NAME(S) AND ADDRESS(ES)
N/A
10. SPONSORING / MONITORING AGENCY REPORT NUMBER
11. SUPPLEMENTARY NOTES The views expressed in this thesis are those of the author and do not reflect the official policy or position of the Department of Defense or the U.S. Government. IRB number NPS. 2017.00011-IR-EP5-A. 12a. DISTRIBUTION / AVAILABILITY STATEMENT Approved for public release. Distribution is unlimited.
12b. DISTRIBUTION CODE
13. ABSTRACT (maximum 200 words)
The Marine Corps dedicates itself to ensuring quality retention and promotion. To accomplish this, we must analyze the effects of policy and the quality of Marines currently serving. This thesis considers data from 97,013 enlisted infantry Marines who entered the Marine Corps from 2001 to 2016 to determine which factors contribute toward promotion for the ranks of lance corporal, corporal, sergeant and staff sergeant. To assess which ranks proportionally promote more high-quality Marines, we compare two performance evaluation methods: proficiency and conduct marks and reporting senior and reviewing officer values.
Our analysis of the data shows that the most important factors for promotion are conduct scores, reporting senior relative values, the number of deployments, combat fitness test (CFT) and physical fitness test (PFT) scores and zero adverse fitness reports. From the two performance evaluation methods we find that the Marine Corps promotes proportionally more high-quality Marines as reflected in fitness reports than with proficiency and conduct marks.
Promoting and retaining the highest-performing Marines will ensure they are fully prepared to meet current and future challenges to national security. We must develop new methods for retaining more top-quality Marines to ensure their greatest probability of success.
14. SUBJECT TERMS Marine Corps, enlisted, promotion, infantry, predictors, performance, fitness reports, rpart, trees, classification and regression tree, proportion, probability, quality, proficiency, conduct, reporting senior, reviewing officer
15. NUMBER OF PAGES
123 16. PRICE CODE
17. SECURITY CLASSIFICATION OF REPORT
Unclassified
18. SECURITY CLASSIFICATION OF THIS PAGE
Unclassified
19. SECURITY CLASSIFICATION OF ABSTRACT
Unclassified
20. LIMITATION OF ABSTRACT
UU NSN 7540-01-280-5500 Standard Form 298 (Rev. 2-89)
Prescribed by ANSI Std. 239-18

ii
THIS PAGE INTENTIONALLY LEFT BLANK
iii
Approved for public release. Distribution is unlimited.
PROMOTION FACTORS FOR ENLISTED INFANTRY MARINES
Micah A. Steinpfad Major, United States Marine Corps
B.S., United States Naval Academy, 2005
Submitted in partial fulfillment of the requirements for the degree of
MASTER OF SCIENCE IN OPERATIONS RESEARCH
from the
NAVAL POSTGRADUATE SCHOOL June 2017
Approved by: Robert Koyak Thesis Advisor
Chad Seagren Second Reader
Patricia A. Jacobs Chair, Department of Operations Research

iv
THIS PAGE INTENTIONALLY LEFT BLANK

v
ABSTRACT
The Marine Corps dedicates itself to ensuring quality retention and promotion. To
accomplish this, we must analyze the effects of policy and the quality of Marines
currently serving. This thesis considers data from 97,013 enlisted infantry Marines who
entered the Marine Corps from 2001 to 2016 to determine which factors contribute
toward promotion for the ranks of lance corporal, corporal, sergeant and staff sergeant.
To assess which ranks proportionally promote more high-quality Marines, we compare
two performance evaluation methods: proficiency and conduct marks and reporting
senior and reviewing officer values.
Our analysis of the data shows that the most important factors for promotion are
conduct scores, reporting senior relative values, the number of deployments, combat
fitness test (CFT) and physical fitness test (PFT) scores and zero adverse fitness reports.
From the two performance evaluation methods we find that the Marine Corps promotes
proportionally more high-quality Marines as reflected in fitness reports than with
proficiency and conduct marks.
Promoting and retaining the highest-performing Marines will ensure they are fully
prepared to meet current and future challenges to national security. We must develop new
methods for retaining more top-quality Marines to ensure their greatest probability of
success.

vi
THIS PAGE INTENTIONALLY LEFT BLANK

vii
TABLE OF CONTENTS
I. INTRODUCTION..................................................................................................1 A. BACKGROUND ........................................................................................1
1. Backbone of the Marine Corps .....................................................1 2. Ranks Associated with Proficiency and Conduct Marking .......1 3. Proficiency and Conduct Marking ...............................................2 4. Ranks Associated with the Fitness Report Assessment ..............4 5. Fitness Report Evaluation Process ...............................................5 6. Master Brief Sheet and its Use on a Promotion Board ...............7
B. PURPOSE OF THE THESIS ...................................................................7 C. RESEARCH QUESTIONS .......................................................................8
1. Primary Research Question ..........................................................8 2. Secondary Research Questions .....................................................8
D. SCOPE AND LIMITATIONS ..................................................................8 1. Scope................................................................................................8 2. Limitations ......................................................................................9
E. ORGANIZATION OF THE THESIS ......................................................9
II. LITERATURE REVIEW ...................................................................................11 A. INTRODUCTION....................................................................................11 B. CENTER FOR NAVAL ANALYSES STUDY .....................................11 C. GARZA STUDY.......................................................................................11 D. HOFFMAN STUDY ................................................................................12 E. LARGER STUDY ....................................................................................12 F. SUMMARY ..............................................................................................12
III. DATA DESCRIPTION .......................................................................................15 A. DATA COLLECTION PROCESS .........................................................15 B. DATA COMPOSITION ..........................................................................15 C. DATA DEVELOPMENT PROCESS ....................................................16 D. GENERAL RESTRICTIONS APPLIED TO EACH DATA SET ......16 E. PREDICTOR VARIABLE DEVELOPMENT .....................................17 F. METHOD .................................................................................................29
1. Interpreting the Tree Diagram ...................................................30 2. Classification Rate .......................................................................31 3. Method Overview .........................................................................32
IV. RESULTS .............................................................................................................33

viii
A. LANCE CORPORALS (WITH PEBD 2001 TO 2011) ........................33 1. Classification and Regression Tree Prediction with All
Variables .......................................................................................33 2. Classification and Regression Tree without Performance
Variables .......................................................................................35 3. Proportion of Lance Corporals Promoted by
Performance Quadrant ...............................................................37 B. CORPORAL (WITH PEBD 2001 TO 2010) .........................................40
1. Classification and Regression Tree Prediction with All Variables .......................................................................................40
2. Classification and Regression Tree without Performance Variables .......................................................................................42
3. Proportion of Corporals Promoted by Performance Quadrant .......................................................................................44
C. SERGEANT (WITH PEBD 2001 TO 2007) ..........................................46 1. Classification and Regression Tree Prediction with All
Variables .......................................................................................46 2. Classification and Regression Tree without Performance
Variables .......................................................................................48 3. Proportion of Sergeants Promoted by Performance
Quadrant .......................................................................................50 D. STAFF SERGEANT (WITH PEBD 2001 TO 2004) ............................52
1. Classification and Regression Tree Prediction with All Variables .......................................................................................52
2. Classification and Regression Tree without Performance Variables .......................................................................................53
3. Proportion of Staff Sergeants Promoted by Performance Quadrant .......................................................................................55
E. RESULTS SUMMARY ...........................................................................57
V. CONCLUSIONS ..................................................................................................59 A. OVERVIEW .............................................................................................59 B. CONCLUSIONS ......................................................................................59
1. Research Objectives .....................................................................60 2. Research Questions ......................................................................60
C. RECOMMENDATIONS .........................................................................61 D. FUTURE WORK .....................................................................................62
APPENDIX A. MARINE CORPS FITNESS REPORT TEMPLATE .......................63
APPENDIX B. MASTER BRIEF SHEET EXAMPLE ...............................................69

ix
APPENDIX C. REPORTING SENIOR RELATIVE VALUE CHART ....................71
APPENDIX D. ADDITIONAL CLASSIFICATION TREES .....................................73
APPENDIX E. PROMOTION TABLES BY RANK ...................................................89
LIST OF REFERENCES ................................................................................................93
INITIAL DISTRIBUTION LIST ...................................................................................97

x
THIS PAGE INTENTIONALLY LEFT BLANK
xi
LIST OF FIGURES
Figure 1. Reviewing Officer “Christmas Tree.” Source: USMC (2000). ...................6
Figure 2. Histograms of Enlisted Infantry Marines’ PFT Scores ..............................20
Figure 3. Histograms of Enlisted Infantry Marines’ CFT Scores .............................21
Figure 4. Histograms of Proficiency and Conduct Scores by Rank ..........................22
Figure 5. Histograms of Reporting Senior and Reviewing Officer Values ...............23
Figure 6. Histograms of General Technical Scores by Rank ....................................24
Figure 7. Histograms of Rifle Scores by Rank ..........................................................25
Figure 8. Histograms of Total Deployments by Rank ...............................................26
Figure 9. Histograms of Negative and Neutral Waivers by Rank .............................27
Figure 10. Histograms of Body Mass Index for Sergeants and Staff Sergeants .........28
Figure 11. Example Classification and Regression Tree ............................................31
Figure 12. Classification and Regression Tree with All Predictors Included for Promotion from Lance Corporal to Corporal (2001 to 2011) ....................34
Figure 13. Classification and Regression Tree with Proficiency and Conduct Scores Removed as Predictors for Promotion from Lance Corporal to Corporal (2001 to 2011) ........................................................................36
Figure 14. Lance Corporal Promotion Proportion by Proficiency Quadrant ..............39
Figure 15. Classification and Regression Tree with All Predictors Included for Promotion from Corporal to Sergeant (2001 to 2010) ...............................41
Figure 16. Classification and Regression Tree with Proficiency and Conduct Scores Removed as Predictors for Promotion from Corporal to Sergeant (2001 to 2010) .............................................................................43
Figure 17. Corporal Promotion Proportion Proficiency Trends by Quadrant and Year ............................................................................................................45
Figure 18. Classification and Regression Tree with All Predictors Included for Promotion from Sergeant to Staff Sergeant (2001 to 2007) ......................47

xii
Figure 19. Classification and Regression Tree with Reporting Senior and Reviewing Officer Values Removed as Predictors for Promotion from Sergeant to Staff Sergeant (2001 to 2007) ........................................49
Figure 20. Sergeant Promotion Proportion Trends by Reporting Senior Quadrants ...................................................................................................51
Figure 21. Sergeant Promotion Proportions Trends by Reviewing Officer Quadrants ...................................................................................................51
Figure 22. Classification and Regression Tree with All Predictors Included for Promotion from Staff Sergeant to Gunnery Sergeant (2001 to 2004) .......53
Figure 23. Classification and Regression Tree with Reporting Senior and Reviewing Officer Values Removed as Predictors for Promotion from Staff Sergeant to Gunnery Sergeant (2001 to 2004) .........................54
Figure 24. Staff Sergeant Promotion Trends by Reporting Senior Quadrants ............56
Figure 25. Staff Sergeant Promotion Trends by Reviewing Officer Quadrants .........56
Figure 26. USMC Promotion Proportions by Performance and Rank ........................58
Figure 27. Marine Corps Fitness Report Template. Source: USMC (2015a). ............67
Figure 28. Marine Corps Master Brief Sheet Example. Source: USMC (2013). ........69
Figure 29. Relative Value Chart. Source: USMC (2015a). .........................................71
Figure 30. CART for Lance Corporals with All Predictors ........................................73
Figure 31. CART for Lance Corporals without Performance Evaluation Predictors ...................................................................................................74
Figure 32. CART for Lance Corporals without Performance or Deployment Predictors ...................................................................................................75
Figure 33. CART for Lance Corporals without CFT Scores ......................................76
Figure 34. CART for Corporals with All Predictors ...................................................77
Figure 35. CART for Corporals without Performance Evaluation Predictors ............78
Figure 36. CART for Corporals without Performance or Deployment Predictors .....79
Figure 37. CART for Corporals without CFT Predictors ............................................80
Figure 38. CART for Sergeants with All Predictors ...................................................81

xiii
Figure 39. CART for Sergeants without Performance Evaluation Predictors ............82
Figure 40. CART for Sergeants without Performance Evaluation or Deployment Predictors...............................................................................83
Figure 41. CART for Sergeants without CFT Predictors ............................................84
Figure 42. CART for Staff Sergeants with All Predictors ..........................................85
Figure 43. CART for Sergeants without Performance Evaluation Predictors ............86
Figure 44. CART for Staff Sergeants without Performance Evaluation or Deployment Predictors...............................................................................87
Figure 45. CART for Staff Sergeants without CFT Predictors ...................................88

xiv
THIS PAGE INTENTIONALLY LEFT BLANK

xv
LIST OF TABLES
Table 1. Standards of Proficiency. Source: USMC (2000). .......................................3
Table 2. Standards of Conduct. Source: USMC (2000). ............................................4
Table 3. USMC Enlisted Grade Structure. Source: USMC (2000). ..........................5
Table 4. Variables Used for Preparing Predictor Categories ...................................15
Table 5. Analyses Data Composition by PEBD and Rank ......................................17
Table 6. Five Categories of Awards Used for Classification ...................................18
Table 7. Enlisted Infantry Award Categories by Rank ............................................19
Table 8. Weight Control for Lance Corporals and Corporals ..................................27
Table 9. Binary Response Variable for Promotion Beyond Current Rank ..............28
Table 10. Analyses Variables Used to Predict Promotion .........................................29
Table 11. Test Set Estimated Correct Classification for Lance Corporal Retention and Promotion ...........................................................................37
Table 12. Proportion of Lance Corporals Promoted Annually by Quadrant .............38
Table 13. Test Set Estimated Correct Classification for Corporal Retention and Promotion ...................................................................................................44
Table 14. Proportion of Corporals Promoted Annually by Quadrant ........................45
Table 15. Test Set Estimated Correct Classification for Sergeant Retention and Promotion ...................................................................................................50
Table 16. Proportion of Sergeants Promoted Annually by Quadrant ........................50
Table 17. Test Set Estimated Correct Classification for Staff Sergeant Retention and Promotion ...........................................................................55
Table 18. Staff Sergeant Promotion Proportions by Quadrant ..................................55
Table 19. Important Factors for Marines that Promote and Fail to Promote by Rank ...........................................................................................................57
Table 20. Lance Corporal Proficiency and Conduct Range Proportions by PEBD Year.................................................................................................89

xvi
Table 21. Corporal Proficiency and Conduct Range Proportions by PEBD Year .....90
Table 22. Sergeant Reporting Senior and Reviewing Officer Value Proportions by PEBD Year............................................................................................91
Table 23. Staff Sergeant Reporting Senior and Reviewing Officer Value Proportions by PEBD Year ........................................................................92
xvii
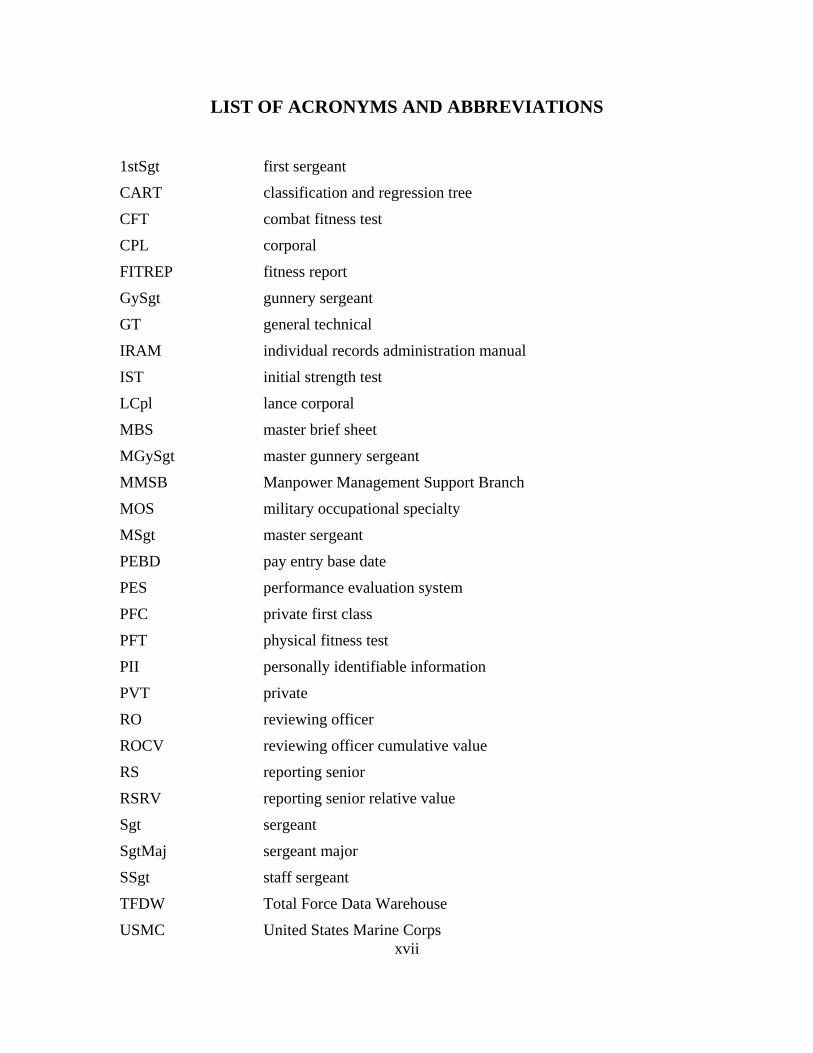
LIST OF ACRONYMS AND ABBREVIATIONS
1stSgt first sergeant
CART classification and regression tree
CFT combat fitness test
CPL corporal
FITREP fitness report
GySgt gunnery sergeant
GT general technical
IRAM individual records administration manual
IST initial strength test
LCpl lance corporal
MBS master brief sheet
MGySgt master gunnery sergeant
MMSB Manpower Management Support Branch
MOS military occupational specialty
MSgt master sergeant
PEBD pay entry base date
PES performance evaluation system
PFC private first class
PFT physical fitness test
PII personally identifiable information
PVT private
RO reviewing officer
ROCV reviewing officer cumulative value
RS reporting senior
RSRV reporting senior relative value
Sgt sergeant
SgtMaj sergeant major
SSgt staff sergeant
TFDW Total Force Data Warehouse
USMC United States Marine Corps

xviii
THIS PAGE INTENTIONALLY LEFT BLANK

xix
EXECUTIVE SUMMARY
Promoting and retaining high-quality Marines is a priority for the Marine Corps.
However, due to periods of growth during two major conflicts, quality has given way to
quantity to fulfill the needs of the Marine Corps. As conflicts draw down, the Marine Corps
shifts from promoting and retaining quantity to high-quality Marines. Throughout this
thesis, we use classification trees to determine which factors influence probabilities of
promotion for enlisted infantry Marines across four ranks: lance corporal to corporal,
corporal to sergeant, sergeant to staff sergeant, and staff sergeant to gunnery sergeant. We
then identify the proportion of Marines promoted by performance levels (quadrants) and
the probability of promoting from each quadrant. Finally, the thesis compares two
performance evaluation methods (proficiency and conduct marks vs. fitness report values)
to determine which method proportionally results in the promotion of more top performing
Marines.
From Table ES-1, we observe the three important factors that influence
probabilities for Marines promoting and not promoting (indicated by the level at which
the factor splits into two groups or branches). The dominant categories are performance
evaluation (proficiency and conduct marks, reporting senior and reviewing officer
values), the number of deployments, physical fitness (combat fitness test [CFT] and
physical fitness test [PFT] scores), adverse fitness reports and the number of personal
awards. For the ranks of lance corporal and staff sergeant, we observe median conduct
marks and reporting senior relative values, respectively, to be the most important factors
throughout the classification trees. While for corporals and sergeants, we observe that the
number of deployments are the most important factors. Across all of the ranks we
observe median CFT scores branch between 283 and 290 while median PFT scores
branch from 239 to 265. For the ranks of lance corporal and corporal, the median
proficiency and conduct scores both branch at the 4.3 mark. For sergeant and staff
sergeant fitness reports, we observe that the median reporting senior relative values
branch at 90 (in a range from 80 to 100) and median reviewing officer cumulative values
branch at values between .17 and 0.44 (range -5 to 4). Both of these indicate below-

xx
average and above-average groups. We also observe that adverse fitness reports
significantly decrease probabilities for promotion.
Table ES-1. Important Factors that Contribute to Promotion by Rank
We then group each Marine by rank into four performance levels (quadrants) by
using proficiency, conduct, reporting senior relative values and reviewing officer
cumulative values. From these we calculate the proportion of Marines promoted from each
performance quadrant. As observed in Figure ES-2, we note that the Marine Corps
promotes a low proportion of enlisted infantry Marines from the top performing quadrants
when using proficiency and conduct for performance evaluation. Conversely, the Marine
Corps promotes proportionally more top-performing Marines when using reporting senior
relative values and reviewing officer cumulative values for performance evaluation.
Figure ES-2. Proportions of Enlisted Infantry Marines Promoted
Rank (# Marines)
Lance Corporal (31312)
Corporal (26840)
Sergeant (7893)
Staff Sergeant(773)
81% Conduct > 4.3 49% Deployment > .5 43% Deployments > .5 62% RSRV > 9086% PFT > 240 95% Conduct > 4.3 58% RSRV > 90 69% CFT > 29096% Deployments > .5 62% Adverse < .5 78% Deployments > 453% Conduct < 4.3 24% Deployments < .5 3% Deployments < .5 18% RSRV < 9036% Conduct < 4.2 15% Conduct <4.5 21% RSRV < 90 8% CFT < 29220% PFT < 263 11% PFT < 265 5% Adverse > .5 2% Adverse >.5
Greatest Probability for
Promoting
Least Probability for
Promoting
Conclusions: Most Important Factors for Promotion

xxi
Next we calculate estimated probabilities from our models to classify each Marine
as either a promoting or not promoting for each rank. We first randomly select 10% of
Marines (the test set) and save them for later. We then run the classification model with
the 90% of Marines (training set) to create the model. Then we determine a threshold
between the Marines that promote and do not promote. We then compute truth tables
using our test set to determine the level at which our model accurately classified the
Marines in the test set. We do this with two models for each rank (with performance and
without performance factors) to determine the necessity of having performance included.
A. RECOMMENDATIONS
To ensure the Marine Corps retains and promotes the highest-quality Marines, it
is necessary to identify them from among the top-performing quadrants. We observe that
the proportion of top-performing Marines getting out of the Marine Corps is higher than
reasonably expected. We believe that a reasonable proportional split for quality retention
and promotion is achieved through a quadrant breakdown of 50%, 30%, 18% and 2% of
Marines from high, mid-high, mid-low and low- performing quadrants respectively.
Putting 80% of Marines above average and allowing 20% to retain and promote from the
below-average Marines. Through our analysis, we discover that it is not possible to split
the data evenly into quadrants, indicating that the range of 0 to 5 is not being utilized
fully and that precise guidance will create more usable and distinguishable performance
categories.
From the models, we observe important branching from the year of entry as a
result of wartime structure growth. This indicates probabilistic dominance created from
widening the promotions zones (a result of degrading every factor for all Marines in favor
of increasing the number of eligible Marines). We believe that a better method of
retention is to identify top-performing Marines and incrementally influencing their
retention options when needed. Further, we believe that the Marine Corps should identify
Marines that require less oversight (by using lifetime data for each Marine) to retain and
promote those that consistently demonstrate the ability to self-develop.

xxii
THIS PAGE INTENTIONALLY LEFT BLANK

xxiii
ACKNOWLEDGMENTS
My deepest gratitude goes to my wife and children for their patience and support
while working on this thesis. Secondly, I would like to thank my mother for her
consistent hand in guiding me through life. I am eternally grateful to the Marine Corps
for allowing me the opportunity to come to Monterey and develop a new mindset and
different worldview. To the enlisted Marines that I have served, thank you for all your
hard work. For her diligent effort and assistance in getting the IRB approval, I would like
to thank Rikki Nguyen. To Captain Taylor Williams, Captain William Wathen and
Captain Emily Monaghan, thank you for helping me get started and pointed in the right
direction. I would also like to thank Mr. Tim Johnson and Mr. Chris Blais from the Total
Force Data Warehouse and Ms. Doreen Marucci from the Performance Evaluation
Section for supplying the data needed to conduct this thesis.
I would also like to thank my advisor, Professor Koyak, and second reader, Major
Chad Seagren, for their guidance, steady tempo and considerable patience during this
process. A special thanks also goes to the Naval Postgraduate School staff for their
education and development in preparing me for continued support to the United States
Marine Corps.
Lastly I would like to thank my cohort for their consistent and reliable help
throughout my time at NPS and in compiling my thesis. Tony, your selflessness and
moral foundation have helped keep me focused on what matters (Marines). Phil, your
example as an outstanding father, Marine and human being will carry with me throughout
life. Bobby, thank you for being a reliable friend, study partner and sounding board for
my work here. Sam, you literally got me through my refresher quarter and you are my
operations research sounding board. Scott, your teamwork and mission accomplishment
approach have been a godsend. Elle, thank you for never being too busy to help with
computer programing, debugging or new program in R. Kat. Zach and Jimmy, you have
all shown considerable patience over the last two years and I thank you for all your help;
I consider you all great friends. Dare, your selfless contribution to our cohort will always
be remembered. To the rest of the cohort, thank you for all your help.

xxiv
THIS PAGE INTENTIONALLY LEFT BLANK

1
I. INTRODUCTION
Marines have historically possessed an innate drive to succeed, to excel in all that they do, including winning in combat. We will sustain this trait and ensure this drive to succeed, excel, and win continues to define our Corps by maintaining a force of the highest quality, which is smart, resilient, fit, disciplined, and able to overcome adversity. Recruiting and retaining quality men and women of character in today’s Corps is our friendly center of gravity and our highest priority.
—Robert B. Neller (2016)
A. BACKGROUND
1. Backbone of the Marine Corps
The backbone of the United States Marine Corps (USMC) is the infantry
battalion. The primary mission of the infantry battalion is “to locate, close with, and
destroy the enemy by fire and maneuver or to repel his assault by fire and close combat”
(United States Marine Corps [USMC] 2000). An infantry battalion is composed primarily
of enlisted infantry Marines. Within an infantry battalion there are five companies: a
Headquarters and Service Company, a Weapons Company and three Infantry Line
Companies. Within each line company there are about 176 enlisted Marines ranging in
ranks from private (PVT) to first sergeant (1stSgt). Each enlisted Marine’s performance
is evaluated routinely and recorded. In addition to performance evaluations Marines
complete training in accordance with their military occupational specialty (MOS). Within
the infantry there are multiple MOSs. During initial training an infantry Marine holds the
0300 MOS (basic infantryman). Upon completion of the relevant initial training, a
Marine will check into his first infantry battalion and possess one of the following MOSs:
0311-infantryman, 0317-scout sniper, 0331-machinegunner, 0341-mortarman, 0351-
infantry assaultmen, or 0352 antitank missilemen.
2. Ranks Associated with Proficiency and Conduct Marking
In the USMC each enlisted Marine has both a rank and a paygrade. The ranks
range from private to sergeant major. An enlisted Marine first enters the Marine Corps at
the rank of private and after attending boot camp a Marine will typically promote to

2
private first class (PFC). Within their first year in an infantry battalion a Marine will
likely be promoted to the rank of lance corporal (LCpl). With a minimum time in grade
of twelve months a lance corporal can promote to corporal (Cpl). Ideally a Marine will
have deployed at least one time within a battalion before their first enlistment has
expired.
An enlistment is the contractual period for which a person signs with the Marine
Corps committing him or her to service. A typical first enlistment period is four to six
years depending on the needs of the Marine Corps. Within a year of the enlistment period
expiring a Marine is eligible to submit a reenlistment package to request a second
enlistment.
During the entirety of the first enlistment, but prior to promoting to sergeant (Sgt),
a Marine receives a proficiency and conduct assessment. Once a Marine meets minimum
time in service of at least 24 months and time in grade as a corporal of at least 12 months,
the Marine is eligible for promotion to the rank of sergeant.
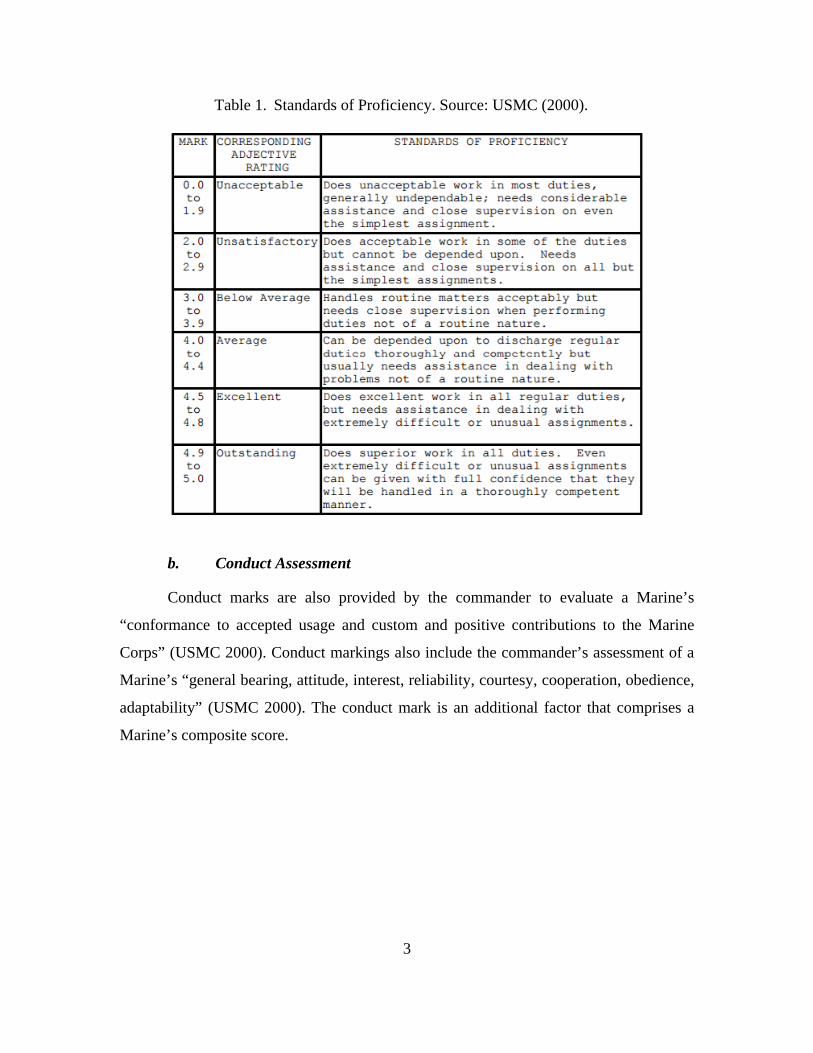
3. Proficiency and Conduct Marking
An enlisted Marine from the rank of private through corporal receives a
proficiency and conduct assessment semi-annually on 31 January and 31 July. Each
assessment score ranges from 0.0 to 5.0 in accordance with Tables 1 and 2 taken from the
Individual Records Administration Manual (IRAM) (USMC 2000).
a. Proficiency Assessment
Proficiency marks are provided by the commander to evaluate “the whole Marine
concept” which includes attributes such as “mission accomplishment, leadership, intellect
and wisdom, individual character, physical fitness, personal appearance and completion
of professional military education” (USMC 2000). The proficiency mark is a portion of
the evaluation score that factors into a Marine’s composite score for the ranks lance
corporal and corporal. A Marine receives a percentage of points based on his or her
proficiency score, with higher scores indicating better performance.
3
Table 1. Standards of Proficiency. Source: USMC (2000).
b. Conduct Assessment
Conduct marks are also provided by the commander to evaluate a Marine’s
“conformance to accepted usage and custom and positive contributions to the Marine
Corps” (USMC 2000). Conduct markings also include the commander’s assessment of a
Marine’s “general bearing, attitude, interest, reliability, courtesy, cooperation, obedience,
adaptability” (USMC 2000). The conduct mark is an additional factor that comprises a
Marine’s composite score.

4
Table 2. Standards of Conduct. Source: USMC (2000).
4. Ranks Associated with the Fitness Report Assessment
Once a Marine promotes to the rank of sergeant, that Marine is subject to the
performance evaluation system (PES) which uses the fitness report (FITREP) for
performance evaluation. To achieve the rank of sergeant a Marine typically has at least
four years-time in service, two deployments and is the early stages of their second

5
enlistment. In an infantry battalion a sergeant generally holds the billet of squad leader
and is in charge of the daily mentoring, development, and leadership of the thirteen
Marines in his squad. The next opportunity for promotion is to the rank of staff sergeant
(SSgt). A staff sergeant typically has eight to twelve years of experience in the Marines
Corps and holds the billet of platoon sergeant, who advises the platoon commander and
supervises the development of approximately 40 Marines within the infantry platoon.
After about two deployments in an infantry battalion a staff sergeant will receive
professional military education at a formal school house and be ready to promote to the
rank of gunnery sergeant (GySgt). Typically, a gunnery sergeant has twelve to sixteen
years of service and advises the company commander on the tactical employment of unit.
The next opportunity to promote is to either master sergeant (MSgt) or first sergeant
(1stSgt). The highest ranks in an infantry battalion are a master gunnery sergeant
(MGySgt) promoted from master sergeant or a sergeant major (SgtMaj) promoted from
the first sergeant rank. For the ranks of sergeant and above performance is evaluated
using fitness reports in the performance evaluation system (PES). From Table 3 we
observe the full rank structure in seniority descending order.
Table 3. USMC Enlisted Grade Structure. Source: USMC (2000).
5. Fitness Report Evaluation Process
The fitness report is a performance evaluation that each Marine above the rank of
sergeant receives annually or during periods of significant change. Typically, a Marine
will receive an observed fitness report for periods greater than three months by their

6
immediate supervisor, referred to as the reporting senior (RS). In addition to the RS
evaluation, each Marine also receives evaluation on the same fitness report from a
reviewing officer (RO). For example, a sergeant whose billet is that of squad leader will
have an RS that is the platoon commander and an RO who is the company commander. If
either the RS or RO have insufficient observation time (less than three months) the fitness
report will still be completed but marked as not observed due to insufficient observation
time for that evaluator.
The fitness report is composed of the following sections: administrative, billet
description, billet accomplishments, mission accomplishment, individual character,
leadership, intellect and wisdom, fulfillment of evaluation, RS directed comments,
certification, RO comments and an RO ordinal tree “Christmas Tree” assessment. In
addition to the directed comments from the RS and RO each fitness report creates an RS
relative cumulative value (RSRV) and an RO cumulative value (ROCV). The RSRV
ranges from 80 to 100. It is broken into thirds on the master brief sheet (MBS) to show
across all reports where each Marine falls out against their peers as being above, with, or
below others in standing. The ROCV uses the RO “Christmas Tree” which has values
one to eight with one being unsatisfactory and eight being eminently qualified. Figure 1
shows a blank RO “Christmas Tree” used for computing the ROCV. A Marine’s overall
ROCV will also break into thirds; above, with or below their peers. The ideal Marine is
above peers from his or her RS and above peers from his or her RO.
Figure 1. Reviewing Officer “Christmas Tree.” Source: USMC (2000).

7
6. Master Brief Sheet and its Use on a Promotion Board
The master brief sheet is a document that captures each Marine’s performance
profile and includes all fitness reports, RSRV, ROCV and how each Marine compares to
his or her peers. The breakdown of where a Marine falls out against their peers allows
members of the promotion board to quickly brief the Marine’s performance in the two-
minute window allocated for each Marine. Additional information that will briefed is
combat fitness test (CFT) score, physical fitness test (PFT) score, number of awards,
number of deployments, leadership billets, rifle qualification, primary military education
completed, additional schools attended, adverse information, and any additional material
the Marine may have submitted to the board. Ultimately the master brief sheet allows a
member of a promotion board to quickly assess the performance of a Marine by
categorizing their performance quickly.
B. PURPOSE OF THE THESIS
An enlisted Marine is evaluated under two different performance evaluation
systems. Although the performance evaluation system is necessary and efficient it is
important for individual Marines to know and fully understand what their chances of
promoting are prior to a promotion board. For the first few years Marines are evaluated
by receiving proficiency and conduct marks which contribute toward a composite score.
After promoting to sergeant a Marine receives fitness reports in accordance with the
performance evaluation system and when eligible will be briefed on a promotion board.
The Marine Corps tracks information on each Marine for promotion and retention
purposes.
The purpose of this thesis is to provide the Marine Corps an alternate perspective
for viewing quality (i.e., the proportion of quality Marines from each of four quadrants).
We also seek to provide enlisted infantry Marines and their leadership an understanding
of how individual factors affect the likelihood of retention and promotion. Classification
and regression trees can identify important factors and their associated levels that
contribute to increasing probabilities of promotion for each rank. Gaining a deeper
understanding of factor influence will show the results that policy has developed.

8
Understanding factor importance will also provide enlisted infantry Marines with the
information they should know about what the Marine Corps requires of them in order to
promote at each rank.
C. RESEARCH QUESTIONS
1. Primary Research Question
What variables are important factors in predicting promotion for enlisted infantry
Marines to corporal, sergeant, staff sergeant and gunnery sergeant?
2. Secondary Research Questions
What proportion of Marines does the Marine Corps promote from the bottom,
lower-middle, upper-middle and top fourths by rank and year with respect to proficiency
and conduct scores and reporting senior relative values and reviewing officer cumulative
values?
How do proficiency and conduct evaluations compare to the reporting senior
relative values and reviewing officer cumulative values as predictors for retention and
promotion.
D. SCOPE AND LIMITATIONS
1. Scope
The scope of this research includes a review of existing performance and
promotion directives, a statistical review of the data from the Total Force Data
Warehouse (TFDW) and the Manpower Management Support Branch (MMSB), a
detailed description of the data handling method used, the method used for factor
prediction, the results of the classification trees and recommendations based off the
results. We use four ranks for the base of the study; lance corporal, corporal, sergeant and
staff sergeant. The outcome variable is promotion to subsequent rank.

9
2. Limitations
The period of research spans the years 2001 to 2016 and during that time some
policies have changed; namely the CFT was initiated en masse in 2009. Since half of the
data collected has missing values for the dates prior to 2009 the method for interpretation
uses tree analysis. Existing regression models do not handle missing data very well, due
to this limitation some observations were discarded.
E. ORGANIZATION OF THE THESIS
This thesis is organized into five chapters. Chapter I provides a background
overview and the purpose of this thesis. Chapter II is a literature review which focuses on
methods used for classifying promotions using performance measures. Chapter III
discusses the data collection and cleaning process and the analysis methods used
throughout the study. Chapter IV details the results from the study by rank. Chapter V
outlines conclusions, recommendations and future work.

10
THIS PAGE INTENTIONALLY LEFT BLANK

11
II. LITERATURE REVIEW
A. INTRODUCTION
While a number of papers have been written about officer promotion predictors
and retention in the United States Marine Corps, few have been done for the enlisted side.
A Center for Naval Analyses (CNA) study (Clemens et al. 2012) takes a wide view of
officer retention and their associated significant prediction factors toward promotion.
Garza (2014) identifies individual factors that become significant predictors during the
career designation boards for junior officers. Hoffman (2008) specifically looks at
predictors for promotion of field grade officers. Larger (2016) provides a succinct
overview of promotion methods used across the military and through industry which lays
a foundation for viewing proportional performance promotions. We discuss each of these
studies separately in the following sections. It should be noted that none of these studies
have considered analysis for the USMC enlisted community.
B. CENTER FOR NAVAL ANALYSES STUDY
The study of Clemens et al. (2012) on the Marine Corps’ officer fitness report
system analyzes the fitness report system to answer questions about fitness report
inflation, changes to the process due to experience, the significance of the reporting
senior and reviewing officer values over time, verbal and numeric marking comparisons
and processes for improvement. The report finds that the individual fitness report marks
and verbal comments are consistent to one another. It also concludes that those promoted
are generally consistent with higher reporting senior and reviewing officer marks.
C. GARZA STUDY
Garza (2014) applies a probit regression model to predict the probability of a
Marine being career designated. He finds that a Marine’s reviewing officer relative value
average is consistently the most significant predictor of career designation. He also finds
that the number of combat deployments did not produce significant prediction results
toward career designation. His analysis considers 6,732 officers from the 2010 career

12
designation board. The prediction model used 96 explanatory variables pulled from three
separate Marine Corps databases.
D. HOFFMAN STUDY
Hoffman’s (2008) thesis considers factors that predict an officer’s probability for
promotion to major, lieutenant colonel, and colonel in the Marine Corps. The author uses
data from the Total Force Data Warehouse (TFDW) and the Manpower Management
Support Branch (MMSB) which results in 56 prediction variables across three ranks. The
author analyzes data from 1,435 officers that were ready for promotion (“in zone”) during
fiscal year 2008. Hoffman finds that the results vary among the three ranks. For major the
significant predictors for promotion are marital status, PFT, water qualification, reporting
senior value, reviewing officer value, personal awards and billet assignments. Significant
predictors for lieutenant colonel promotion include the same predictors for promotion to
major as well as commissioning source. For promotion to colonel duration of time as a
major, commissioning program, reporting senior relative value average, reviewing officer
average and standard deviation and billet assignment proved significant.
E. LARGER STUDY
Lager’s (2016) study of junior enlisted Marines has an interesting literature
review that covers multiple promotion methods. His review considers internal labor
markets with “Firm-Specific Human Capital” (specifically “limited entry and exit points”
and “wage allocation”) and identifies a promotion method used for corporate
organizations known as the “tournament model.” This model promotes individuals on a
competitive premise from amongst performance tiers. While the “tournament model”
appeals to an objective performance based promotion process it can also reduce
cooperation amongst individuals. This particular model reflects the promotion process
observed in the Marine Corps. For a full survey of this literature see Larger 2016.
F. SUMMARY
While there has been substantial work on identifying prediction variables for
Marine Corps officer promotion, analyses of promotion of enlisted Marines are sparse.

13
Binary regression models are commonly used for identifying significant factors toward
promotion. The common significant predictors from the above mentioned studies are
fitness report scores, combat fitness test scores, physical fitness test scores, number of
combat deployments, type of billet assignments and awards. Analysis across multiple
cohorts has been conducted for officer ranks but not for those of the enlisted community.
We combine the efforts and methods used in predicting officer promotion to analyze
similar conditions for the enlisted infantry community. We then compare proportional
performance promotions using a tournament style model.

14
THIS PAGE INTENTIONALLY LEFT BLANK

15
III. DATA DESCRIPTION
A. DATA COLLECTION PROCESS
We retrieved the data for the thesis research from the Total Force Data
Warehouse (TFDW) and Manpower Management Support Branch (MMSB). The data
retrieval process required approval from the Naval Postgraduate School’s Institutional
Review Board and the USMC Institutional Review Board to preserve personally
identifiable information (PII). To further protect each Marine’s identity TFDW generated
an individual randomized number, which is used to synchronize the two data sources. We
protect the data on a secure network with limited access.
B. DATA COMPOSITION
We use data from only enlisted infantry Marines entering the Marine Corps from
2001 to 2016. The data consists of records from 97,013 male Marines (historically an all-
male force) and contains 172 variables. We segment the data by rank with a focus on
promotion from lance corporal to corporal, corporal to sergeant, sergeant to staff sergeant
and staff sergeant to gunnery sergeant. Table 4 lists the predictor variable that are used in
this study.
Table 4. Variables Used for Preparing Predictor Categories
Variables Brief Description of VariablesID Randomly generated identification number used to combine data from two systemsCurrent Rank Ranks used for analyses (Lance Corporal, Corporal, Sergeant, Staff Sergeant)Pay Entry Base Date Date a Marine began enlistment into USMCNext Rank Next rank a Marine earnedNext Rank Date Date the Marine picked up the next rankProficiency Value Semi annual Proficiency grade for Marines below rank of SergeantConduct Value Semi annual Conduct grade for Marines below rank of SergeantReporting Senior Relative Value Marines FITREP Value from their immediate SupervisorReviewing Officer Cumulative Value Marines FITREP Value from their secondary SupervisorPhysical Fitness Test Scores Annual physical test: 3 mile run, pull-ups, and sit-ups in two minutesCombat Fitness Test Score Annual physical test: Manuever Under Fire, Movement to Contact, Ammo Can LiftRifle Qualification Score Annual rifle qualification (Marksman, Sharpshooter, Expert, UNK)End of Active Service (EAS) date Date a Marine terminated contract with the Marine CorpsAwards Type and Number of Awards a Marine has earnedWaivers Waivers required for each Marine upon entry into USMCDeployment The number of deployments a Marine has participated inGT scores General Technical score from the ASVAB

16
C. DATA DEVELOPMENT PROCESS
To prepare the data for use in estimating classification models we create four data
sets, aligned to the four promotion steps of interest, with each Marine represented as one
record. Because each Marine has multiple values for some factors it is necessary to
consolidate them into a single value. For instance, each Marine has multiple PFT scores
because it is an annually graded event.
With performance and physical fitness values across multiple occasions the
median is used to summarize a Marine’s overall value. The median is often preferred to
the mean as it is less prone to the effects of outliers. For example, if a Marine has a series
of strong fitness reports and one negative report, the median is less affected by the
negative report than the mean. This method is applied to the performance and fitness
values of all Marines.
D. GENERAL RESTRICTIONS APPLIED TO EACH DATA SET
For each rank considered (lance corporal, corporal, sergeant and staff sergeant)
we study only those Marines that have been in the Marine Corps long enough to be a
candidate for promotion. For instance, a sergeant with only one year in grade has not had
enough time to be eligible for promotion. To prevent these Marines from skewing the
data we exclude them from the analysis. A result of this process is that the lance corporal
data set includes those Marines that entered the Marine Corps from 2001 to 2011,
corporals from 2001 to 2010, sergeants from 2001 to 2007 and staff sergeants from 2001
to 2004.
It also is necessary to ensure that data inclusion is restricted to events that led up
to each promotion board but not future information. We do this to prevent entries such as
fitness reports values from a Marine’s time as a staff sergeant from being included in the
prediction model for promotion to sergeant. With the data partitioned by rank, and only
applicable entries included for those with enough time in grade, we then prepare the
variables for use in our classification model.

17
E. PREDICTOR VARIABLE DEVELOPMENT
All predictor variables are calculated using software from the R statistical
programing language (R Core Team 2016) and we use the following R packages for data
cleaning: plyr (Wickham 2011), dplyr (Wickham et al. 2016), and tidyr (Wickham
2011). We use these three packages for data cleaning purposes, specifically removing
duplicate data entries, and for providing median outputs from multiple observations.
We extract the year of entry from each Marines Pay Entry Base Date (PEBD) and
we use it as a variable to account for force structure changes in the Marine Corps from
2001 to 2011. Table 5 shows the number of enlisted Marines by rank and year using their
PEBD. Table 5 shows a decreasing trend in the number of Marines by rank. This is a
result of the data collection process which includes only Marines joining the Marine
Corps after 2001. The final years listed by rank are a sample vice the entire rank
population due to data trimming in the later years to ensure that each Marine has had the
opportunity to be eligible to promote. We exclude analysis from Marines that entered
after 2011 as a result of promotion ineligibility.
Table 5. Analyses Data Composition by PEBD and Rank
PEBD Year LCPL CPL SGT SSGT2001 2446 2976 1207 3642002 4081 3890 1592 2692003 4572 3930 1872 1192004 3758 3508 1796 452005 3398 2910 9822006 1912 2060 3082007 2835 2798 1102008 3281 28392009 3019 15302010 1668 3552011 341
Total Marines in Analyses by PEBD Year and Rank

18
Next we consolidate the awards variable from more than 40 types of awards into
five categories. We create five individual category variables according to whether a
Marine received a purple heart, high personal award, personal award, combat
distinguishing device, or combat action ribbon. A purple heart is typically received for
being wounded in combat. The high personal award category is the composition of all
awards at the level of bronze star and above. Personal awards are mostly those awards at
commendation and achievement level. Table 6 shows the breakdown of each of these
awards. The combat distinguishing device is earned typically for valorous action and the
combat action ribbon is earned for executing duties during a period of physical combat.
It is possible for a Marine to receive more than one of these awards. Each of the
five category variables records the number of the respective awards received. For
example, a Marine with two personal awards receives a value of “2” under the P_AWD
variable.
Table 6. Five Categories of Awards Used for Classification

19
A quick statistical analysis of the number of awards earned by rank, as detailed in
Table 7, reveals an interesting finding at the rank of lance corporal. When comparing the
number of personal awards against the number of purple hearts received we find that the
ratio for lance corporal is 23% vice the 4% for staff sergeant. While purple hearts become
less frequent with increasing rank, personal awards become more frequent. We also
observe that staff sergeant “High Personal Awards” are received four times more often
than for any other rank.
Table 7. Enlisted Infantry Award Categories by Rank
The initial strength test (IST) score is derived from the IST test taken by each
candidate recruit upon enlistment into the Marine Corps. It is composed of a 1.5 mile
timed run portion, timed sit-ups and the number of pull-ups conducted. Scoring is
different for male and female recruits but this study uses purely male standards as only
male Marines were allowed in the infantry until 2016. In the absence of an IST score
system the PFT scoring method is used. To get 100 points on the male PFT for the run
portion a Marine must run at a pace of six minutes per mile for three miles. To achieve a
maximum score in sit-ups a Marine must do 100 sit-ups in two minutes. To get a perfect
score for pull-ups a male Marine must complete 20 pull-ups (USMC 2008a). From these
standards and in the absence of an IST score calculator, each Marines score is normalized
by penalizing run times over six minutes per mile. This is done by giving each Marine
candidate a score of 100 for the run, subtracting total seconds over six minutes and
multiplying by one third (three seconds per point), similar to the PFT run time reduction
of six seconds per point over 18 minutes for three miles. Each pull-up is scored five
(Total Marines in Data Set)Award Category Number Percent Number Percent Number Percent Number PercentPurple Heart 4904 16% 3572 13% 324 4% 38 5%Personal Award 21214 68% 19521 73% 5520 70% 948 123%High Personal Award 322 1% 316 1% 110 1% 33 4%Combat Distguishinig Device 4942 16% 4511 17% 1161 15% 159 21%Combat Action Ribbon 40636 130% 28794 107% 1855 24% 203 26%Purple Heart / Personal Award
Lance Corporal (31312) Corporal (26840) Sergeant (7893) Staff Sergeant(773)
Enlisted Infantry Awards by Rank
23% 18% 6% 4%

20
points with a maximum score of 100 and each sit-up is scored one point with a maximum
score of 100 points.
In our analysis the PFT variable is taken to be the median of all PFT scores for
each Marine conducted prior to the next rank. The individual scores consist of a 3-mile
run, maximum pull-ups and maximum sit-ups in two minutes. Each Marine is required to
conduct a scored PFT annually. Figure 2 shows histograms of PFT scores for male
Marines by rank. Each histogram reflects a left-skewed distribution, likely a result of the
maximum score cut off at 300 points.
Figure 2. Histograms of Enlisted Infantry Marines’ PFT Scores

21
The Combat Fitness Test variable is taken to be the median of all CFT scores
conducted prior to promoting to the next rank. The purpose of the CFT is to assess
overall ability to execute combat related tasks. It is “designed to evaluate strength,
stamina, agility and coordination as well as overall anaerobic capacity” (USMC 2009).
The test consists of three portions: maneuver under fire, movement to contact, and an
ammo can lift. The maximum number of points for the CFT is 300. Each Marine is
required to conduct a scored CFT annually. Because the CFT was implemented in July
2009 nearly half of the Marines in the data set (all entering from 2001 to 2009) do not
have CFT scores prior to that date. Figure 3 shows four histograms of CFT scores by
rank. The long left tail indicates that high CFT scores are frequent across every rank. This
also indicates that the maximum score cut off at 300 points is masking the capabilities of
those Marines with additional combat fitness capacity.
Figure 3. Histograms of Enlisted Infantry Marines’ CFT Scores

22
The performance variables for the ranks of lance corporal and corporal consist of
the median values of all proficiency marks and conduct marks that a Marine had received
prior to the next promotion rank. As a lance corporal and corporal, each Marine receives
a proficiency and conduct mark from their chain of command. Figure 4 shows the
discrete nature of the proficiency and conduct marks. We also observe a shift in the
averages to the right between the ranks of lance corporal and corporal. We further note
that there is a visual similarity between the proficiency and conduct marks for each rank.
Figure 4. Histograms of Proficiency and Conduct Scores by Rank
At the sergeant and higher ranks a Marine receives a fitness report annually from
their reporting senior (immediate commander) and no longer receives proficiency and
conduct marks. The Median_RSRV variable is the median reporting senior relative value
that we calculate for each Marine prior to their next promotion date or upon departure
from the Marine Corps. Additionally, each Marine receives a performance evaluation

23
from their reviewing officer (RO) who is the reporting senior’s immediate commander.
The Median_ROCV variable is the median calculation of all reviewing officer
cumulative values that we calculate for each Marine prior to their next promotion rank or
upon departure from the Marine Corps. From the top portion of Figure 5 we observe
relative normality (except in the tails) using Median_RSRV for the ranks of sergeant and
staff sergeant. From the lower plots of the Median_ROCV we note long left tails,
indicating the RO marking very low when low marks are provided. This would indicate a
tendency for the reviewing officer to keep a tight profile centered on their average vice
using the full scale allotted as used in the RSRV.
Figure 5. Histograms of Reporting Senior and Reviewing Officer Values
24
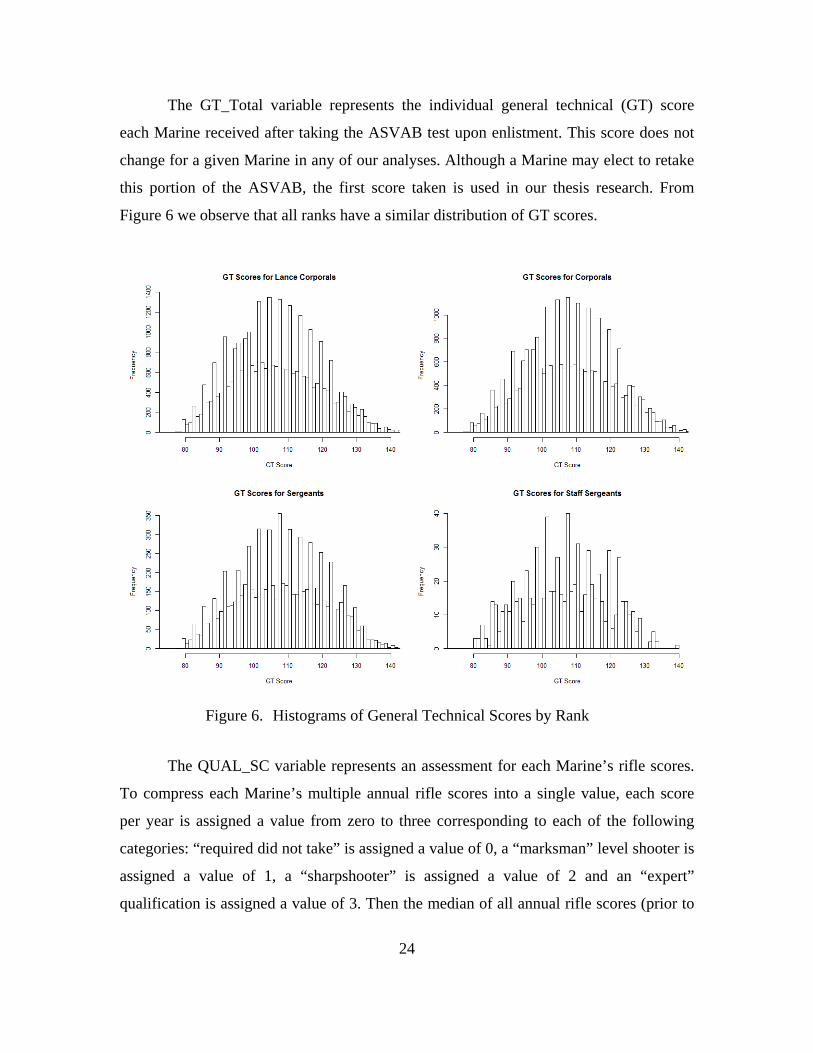
The GT_Total variable represents the individual general technical (GT) score
each Marine received after taking the ASVAB test upon enlistment. This score does not
change for a given Marine in any of our analyses. Although a Marine may elect to retake
this portion of the ASVAB, the first score taken is used in our thesis research. From
Figure 6 we observe that all ranks have a similar distribution of GT scores.
Figure 6. Histograms of General Technical Scores by Rank
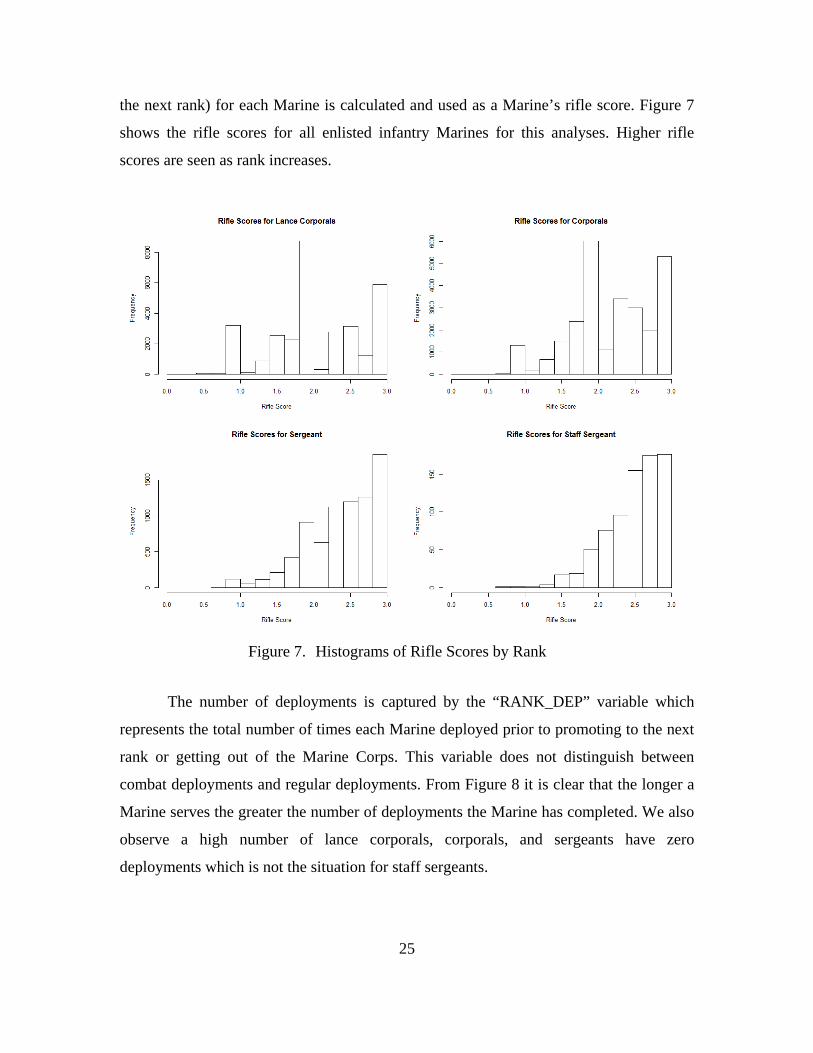
The QUAL_SC variable represents an assessment for each Marine’s rifle scores.
To compress each Marine’s multiple annual rifle scores into a single value, each score
per year is assigned a value from zero to three corresponding to each of the following
categories: “required did not take” is assigned a value of 0, a “marksman” level shooter is
assigned a value of 1, a “sharpshooter” is assigned a value of 2 and an “expert”
qualification is assigned a value of 3. Then the median of all annual rifle scores (prior to
25
the next rank) for each Marine is calculated and used as a Marine’s rifle score. Figure 7
shows the rifle scores for all enlisted infantry Marines for this analyses. Higher rifle
scores are seen as rank increases.
Figure 7. Histograms of Rifle Scores by Rank
The number of deployments is captured by the “RANK_DEP” variable which
represents the total number of times each Marine deployed prior to promoting to the next
rank or getting out of the Marine Corps. This variable does not distinguish between
combat deployments and regular deployments. From Figure 8 it is clear that the longer a
Marine serves the greater the number of deployments the Marine has completed. We also
observe a high number of lance corporals, corporals, and sergeants have zero
deployments which is not the situation for staff sergeants.

26
Figure 8. Histograms of Total Deployments by Rank
The waiver variables are consolidated from 11 categories into two count
variables: negative waivers (Neg_Waivers) and neutral waivers (Neut_Waivers).
Neg_Waivers includes those related to drugs, mental, law, hostile country of origin,
education, medical and the number of dependents. Neut_Waivers includes those related
to administrative reasons, age, and prior service. These variables are determined at the
point of enlistment and remain constant throughout a Marine’s career. From Figure 9 we
observe that the presence of negative and neutral waivers received upon entry into the
Marine Corps decreases as Marines promote to higher ranks.

27
Figure 9. Histograms of Negative and Neutral Waivers by Rank
The weight control variable (WC) represents the number of times a Marine is
officially entered into the weight control program. If a Marine has ever been on weight
control that individual is given a value of one; otherwise, a value of zero. Entries were
controlled across the rank subsets by including only weight control entries prior to
promotion to the next rank date or departure date from the Marine Corps. From Table 8
we observe that the number of Marines on weight control decreases by half when
comparing lance corporals to corporals.
Table 8. Weight Control for Lance Corporals and Corporals
For the ranks of sergeant and staff sergeant, who receive fitness reports which
contain height and weight parameters, we calculate each male Marine’s body mass index
(BMI) with the following formula (Hartley 2017):
2( ) / ( ) *703.BodyMassIndex Weight pounds Height inches=
We then take the median of all BMI scores in rank to obtain an overall BMI score. From
Figure 10 we observe that the BMI shifts slightly to the right indicating an increase in

28
body mass with age and rank. We also find the mean BMI for sergeant is 25.6 while staff
sergeant is 25.9.
Figure 10. Histograms of Body Mass Index for Sergeants and Staff Sergeants
We now turn attention to the response variable which is a binary response on
whether a Marine promotes beyond a given rank. We define this variable to isolate the
question of who was retained and then promoted. From Table 9 we observe the response
variable by rank, the total number of Marines further broken down by promoted and did
not promote, and the associated percent of Marines that promoted. It is interesting that the
staff sergeant sample shows a 51% promotion rate compared to a 29% promotion rate for
sergeants. With the response variable computed we collect all factors that will be used for
each analyses into Table 11. We note that there are 21 prediction variables available for
our response variable and the classification model.
Table 9. Binary Response Variable for Promotion Beyond Current Rank
Promoted Beyond 0: (Did Not Promote) 1: (Did Promote) % PromoteLance Corporal (31312 Marines) 9,692 21,620 69%Corporal (26840 Marines) 16,622 10,218 38%Sergeant (7893) 5,601 2,292 29%Staff Sergeant (773) 382 391 51%
Binary Response Variable: Promotion by Rank

29
Table 10. Analyses Variables Used to Predict Promotion
F. METHOD
We use Classification and Regression Trees (CART), as implemented by the
rpart package from R (Therneau et al. 2015), to develop models to predict promotion
based on attributes of a Marine. This method is adapted from Sam Buttrey’s lecture titled
“Advanced Data Analysis Part II: Trees” in August 2016 at the Naval Postgraduate
School, Monterey California. It is used because of its resilience to outliers, ability to
process missing values, resilience to monotonic transformation of variables, and ease of
understanding.
The objective of the CART modeling process is to predict the values of a response
variable from a collection of predictor variables. We also aim to gain insight into the
influence of the individual predictor variables. For a classification tree, the response
variable has categorical values, and for a regression tree the response variable has
continuous values (Rao 2013). CART uses a series of yes/no questions based on splits on
a single predictor variable at a time to build up a decision tree structure. For the purposes
of preventing overfitting and improving readability, the resulting trees typically are
pruned using a local minimum cross validation error criterion (e.g., variance between
groups).
Original Attribute Analysis Variables Brief Description of VariablesID ID Randomly generated identification number used to combine data from two systemsProm_FR Promote From Response variable signifying whether a Marine promoted or executed EASPEBD Pay Entry Base Date Date a Marine began enlistment into USMCRANK_PROFIC Proficiency Value Semi annual proficiency grade for Marines below rank of sergeantRANK_CONDUCT Conduct Value Semi annual conduct grade for Marines below rank of sergeantMedian_RSRV Reporting Senior Relative Value Marine's fitness report value from their immediate supervisorMedian_ROCV Reviewing Officer Cumulative Value Marines fitness report value from their secondary supervisorPFT_Median Physical Fitness Test Scores Annual physical test: 3 mile run, pull-ups, and sit-ups in two minutesCFT_Median Combat Fitness Test Score Annual physical test: Manuever Under Fire, Movement to Contact, Ammo Can LiftQUAL_SC Rifle Qualification Score Annual rifle qualification (Marksman, Sharpshooter, Expert, UNK)P_Award Personal Award Acheivement, Commendation, Meritorious Service MedalsHP_Award High Personal Award Awards Bronze Star and abovePH Purple Heart Awarded for wounded or killed in actionV Combat Distinguishing Device Awarded for valorous action, accomondates other awardsCAR Combat Action Ribbon Awarded for executing ones duty in a combat environmentNeg_Waiver Negative Waivers Drugs, mental, law, hostile country origin, education, medical and # of dependentsNeut_Waiver Neutral Waivers Waivers required for each Marine upon entry into USMCRANK_DEP Deployment The number of deployments a Marine has participated inRANK_ADV Adverse The number of adverse fitness reports recievedWC Weight Control Number of times a lance corporal and corporal are put on the weight control programBMI Body Mass Index Weight normalization for sergeant and staff sergeant using height and weight GT_scores GT scores General Technical score from the ASVAB
Final Variables Used for the Analyses

30
We also seek to determine a measure of the quality of Marines that are promoted.
First, we separate the Marines in a given rank into four performance groups of
approximately equal size. For the ranks of lance corporal and corporal the performance
groups are based on cut points using proficiency and conduct values. By taking the
resulting number from each group and dividing by the total population size we get the
proportion belonging to each group given that they were promoted. It is important to note
that promoted is defined as Marines with a next rank promote date and rank listed in the
TFDW data base. We do not investigate individual promotion board timelines, offers for
reenlistment, or extenuating situations. Rather we gain general understanding from the
effect of the promotion process by observing only the proportion of those Marines the
Marine Corps retains, stay in the Marine Corps and actually promote. These proportions
are further broken down by year to analyze the effects of upsizing and downsizing the
Marine Corps over the years studied.
1. Interpreting the Tree Diagram
We illustrate the interpretation of a CART prediction tree diagram using
Figure 11, which is obtained by applying functions from the RColorBrewer (Neuwirth
2014) and Rattle (Williams 2011) packages in R to the CART output. Observe that each
split in the tree states the proportion of Marines that promote, and the number and
percentage of Marines in each node determined by the splitting variable. Beginning at the
top of the tree, approximately half (.50) of the total sample of 681 staff sergeants (100%
of sample) promote. The first split uses the median reporting senior relative values
(Median_RSRV) which divides the sample into two groups: those that are less than 90
(branching left) and those that are greater than or equal to 90 (branching right). For the
191 Marines in the “yes” branch, which comprises 28% of all staff sergeants in the
analysis, approximately 18% promote to gunnery sergeant. Following the right branch
from Median_RSRV we note: combat fitness scores (CFT_Median) above 290, number
of deployments for a staff sergeant (SSGT_DEP) or greater than 3.5 (four deployment or
more) and adverse report (SSGT_ADV) less than .5 (a Marine has never received an
adverse fitness report) all give the staff sergeant rank the highest probability for

31
promoting (83%). This classification applies to 242 (36%) of staff sergeants promoted in
the classification tree.
The proportions of promotion in each node are the numbers on the first line in each box. The numbers and percentages of observations in each node are shown on the second line in each box.
Figure 11. Example Classification and Regression Tree
2. Classification Rate
The next step is to evaluate the prediction success of the model using a confusion
matrix. For this analysis we randomly select approximately 10% of Marines from the data
and set them aside as a test set. We fit a CART model using the remaining 90% of the
data and measure how well it classifies the test set. The predict function applied to the

32
output of this model is a vector of estimated probabilities of promotion for all
observations in the data set. A Marine is classified as promoted if the estimated
probability is greater than or equal to a preset threshold, and is classified as not promoted
otherwise. The classification accuracy of a threshold is given by two proportions: of those
who do promote, the proportion that are predicted to promote; and of those who do not
promote, the proportion that are predicted to not promote. We take the minimum of these
two proportions as a measure of the accuracy of the classification rule using a particular
threshold, and we seek to maximize this measure through the choice of a threshold. We
consider threshold values in the range of zero to one in increments of .01 for this
optimization.
3. Method Overview
After we create and interpret the classification tree for each rank we remove the
performance variables and create another classification tree. We then compare the two
trees (with performance and without performance variables) and the classification rates
for both trees. Based off the classification rate comparisons we assess which model
correctly classifies a higher proportion of Marines as either promote or not and we do this
for each by rank. We then assess the value gained through the inclusion of performance
evaluation.
33
IV. RESULTS
The purpose of this thesis is to analyze the effects that the prediction variables
have on Marines that are retained by the Marine Corps, continue to serve and actually
promote. We use classification and regression trees to visually show the effect that
certain factors have toward those that promote and do not promote. This chapter
summarizes the result from the analyses, and it describes how much the performance
evaluation process contributes to predicting promotion. Each analysis is interpreted
initially by rank and the evaluation system used and then by comparison across all ranks.
We conclude with a summary analysis from all four ranks.
A. LANCE CORPORALS (WITH PEBD 2001 TO 2011)
1. Classification and Regression Tree Prediction with All Variables
Using 90% of the lance corporal data as a training set we construct the
classification and regression tree presented in Figure 12 which reflects either being
promoted and retained or not. From this tree we note a 69% promotion rate for the rank
of lance corporal to corporal for Marines with PEBD years from 2001 to 2011. Starting at
the top of the tree, observe that the first split occurs at LCPL_CONDUCT: values less
than 4.3 break to the left and values greater than or equal to 4.3 break to the right. Those
with conduct scores less than 4.3 have an overall promotion rate of 53% and those with
conduct scores at or above 4.3 have an overall promotion rate of 81%. We find that for an
infantry lance corporal to have the greatest chance of promotion he would need a
PFT_Median score greater than 240, proficiency and conduct median scores above 4.3,
CFT_Median scores above 284, PEBD from 2005 to 2009 and to have had at least one
deployment. Figure 12 also shows that Marines with conduct marks below 4.2 and a high
PFT or CFT score still have greater than a 24% probability of promoting while a PFT
score split above 236 accounts for half the lance corporal sample. To have the greatest
probability for promotion a lance corporal needs to have a conduct score average above
4.3, a median PFT score above 240, and accessed during a period of force increase (e.g.

34
2005 to 2009). The lowest probability on the tree is 24% indicating a one if four chance
of promoting for the worst performers.
Pruned tree for prediction of promotion for the rank of lance corporal with all predictor values included indicating important predictor splits. Tree branches occur at conduct (LCPL_CONDUCT), PFT scores (PFT_Median), and PEBD.
Figure 12. Classification and Regression Tree with All Predictors Included for Promotion from Lance Corporal to Corporal (2001 to 2011)
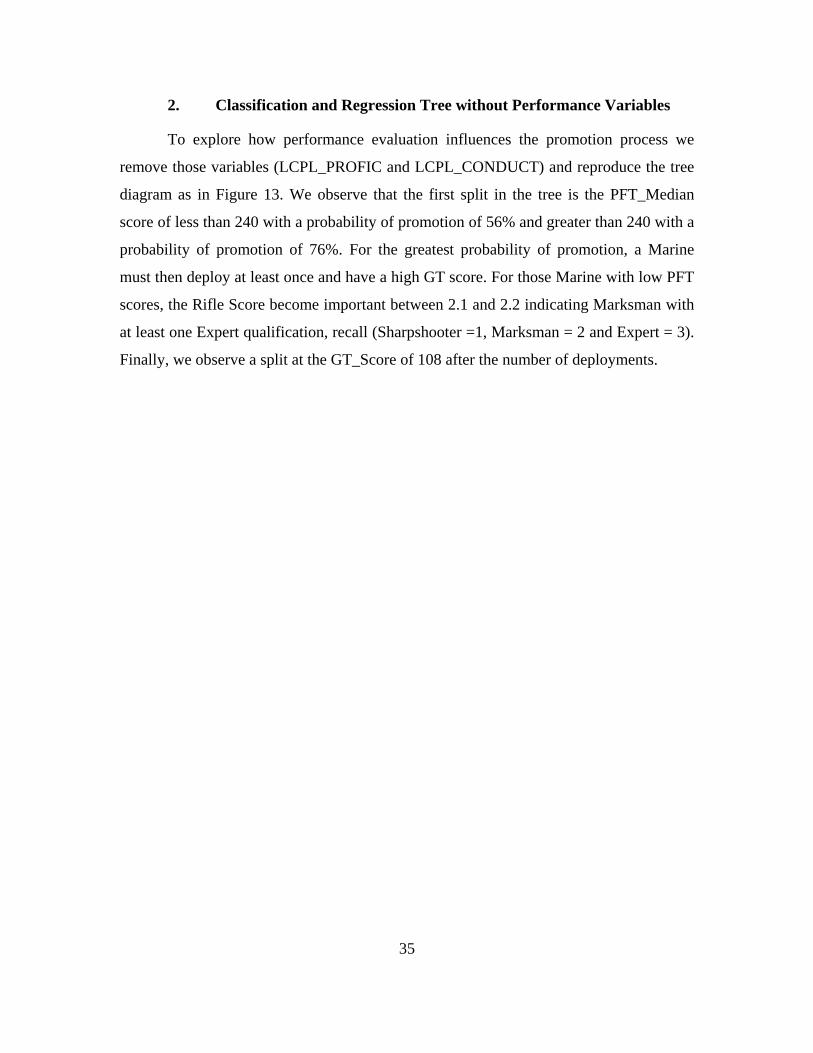
35
2. Classification and Regression Tree without Performance Variables
To explore how performance evaluation influences the promotion process we
remove those variables (LCPL_PROFIC and LCPL_CONDUCT) and reproduce the tree
diagram as in Figure 13. We observe that the first split in the tree is the PFT_Median
score of less than 240 with a probability of promotion of 56% and greater than 240 with a
probability of promotion of 76%. For the greatest probability of promotion, a Marine
must then deploy at least once and have a high GT score. For those Marine with low PFT
scores, the Rifle Score become important between 2.1 and 2.2 indicating Marksman with
at least one Expert qualification, recall (Sharpshooter =1, Marksman = 2 and Expert = 3).
Finally, we observe a split at the GT_Score of 108 after the number of deployments.
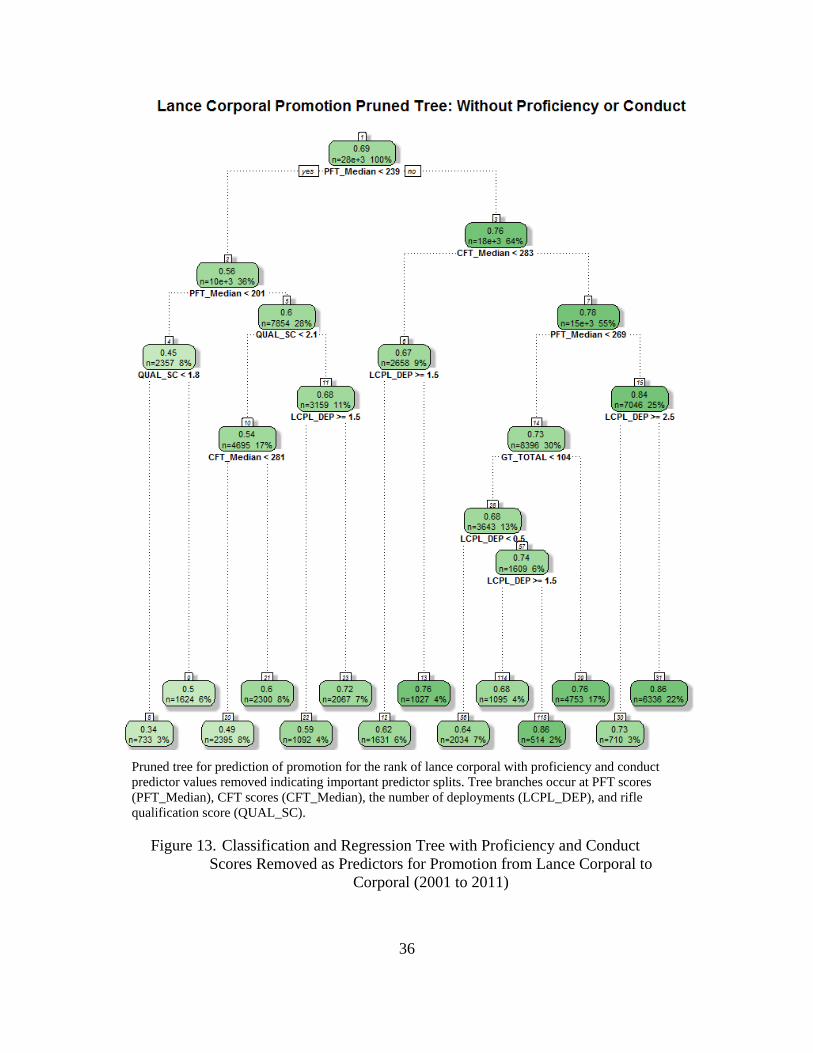
36
Pruned tree for prediction of promotion for the rank of lance corporal with proficiency and conduct predictor values removed indicating important predictor splits. Tree branches occur at PFT scores (PFT_Median), CFT scores (CFT_Median), the number of deployments (LCPL_DEP), and rifle qualification score (QUAL_SC).
Figure 13. Classification and Regression Tree with Proficiency and Conduct Scores Removed as Predictors for Promotion from Lance Corporal to
Corporal (2001 to 2011)

37
Next we determine the effectiveness of the two different classification trees to
assess the importance of including performance variables. The classification trees are
produced using 90% of the lance corporal data with 10% held in reserve to determine
how well the model accurately predicts promotion. Using the estimated probabilities, a
threshold for classification into promoted and not-promoted groups is determined to
maximize the smaller of the two correct classification rates (for those that promote and
for those that do not promote). We then calculate estimated correct classification
probabilities using data from the test set. From Table 11 we observe that the estimated
correct classification probabilities are 66% for Marines that promote and 64% for
Marines that do not promote. After we remove the performance we find that the model
accurately classifies Marines that promote with a probability of 70% and Marines that did
not promote with a probability of 50%. We then compare the two model classification
rates and note that the exclusion of proficiency and conduct marks reduces the correct
classification rate of those who do not promote to a substantial degree.
Table 11. Test Set Estimated Correct Classification for Lance Corporal Retention and Promotion
3. Proportion of Lance Corporals Promoted by Performance Quadrant
Are the highest performing Lance Corporals advancing to the next rank? To
answer this question, we first take the sample of lance corporals and split them by their
performance scores (proficiency and conduct) into four categories (quadrants) of
approximately equal size and determine the proportion of Marines that promote from
each of the four quadrants. Recall that we only consider Marines that remain in the
Marine Corps long enough to promote to the next rank.
We next observe what proportion of lance corporals are promoted by quadrant for
the years 2001 to 2011. From Table 12 we observe the average proficiency quadrant
Promote Not Promote Promote Not PromoteOptimal Threshold Value > .7 ≤ .7 > .68 ≤ .68Estimated Correct Prediction Probability 0.66 0.64 0.70 0.50
Lance Corporal (E-3): Proficiency and Conduct SystemAll Predictors Proficiency/Conduct Removed

38
promotion rates across all years. The proportion of Marines promoted from the LOW
performer quadrant is 12%, MID-LOW 38%, MID-HIGH 27%, and 23% of Marines
promoted come from the HIGH performers. We note the quadrant splits for low
performing Marines have median proficiency and conduct scores between 0 and 4.29 and
account for 11% to 17% of lance corporals. The next quadrant (MID-LOW) performers
have proficiency and conduct values from 4.29 to 4.35 and represent 28% to 43% of
lance corporals. MID-HIGH performing Marines are those with median proficiency and
conduct scores between 4.35 and 4.40 and consist of 24% to 30% of lance corporals. The
top (HIGH) performing Marines have scores from 4.4 to 5.0 and account for 17% to 28%
of the population. We note that the marginal separation between the top three quadrants
spans 4.29 to 5.0.
Table 12. Proportion of Lance Corporals Promoted Annually by Quadrant
For the Marine Corps to promote and retain as many high quality Marines as
possible we expect to see the greatest proportion from the HIGH performers and less
from each subsequent quadrant. We would expect to see 50%, 30%, 18%, and 2% as a
reasonable estimate for the proportion of Marines promoted HIGH performance
quadrants and down. But it appears that performance evaluation include is viewed as
coming from the top three quadrants with policy restricting only the lowest performing
Marines.
Quadrant Conduct Range 2001 2002 2003 2004 2005 2006 2007 2008 2009 2010 2011 AverageLOW 0.00 to 4.29 0.13 0.11 0.12 0.14 0.12 0.12 0.14 0.14 0.16 0.17 0.17 14%
MID-LOW 4.29 to 4.35 0.32 0.28 0.34 0.36 0.39 0.35 0.36 0.41 0.43 0.39 0.36 36%MID-HIGH 4.35 to 4.40 0.28 0.27 0.26 0.26 0.25 0.28 0.29 0.25 0.24 0.27 0.26 27%
HIGH 4.40 to 5.00 0.27 0.34 0.28 0.24 0.24 0.25 0.20 0.20 0.17 0.17 0.20 23%
Quadrant Proficiency Range 2001 2002 2003 2004 2005 2006 2007 2008 2009 2010 2011 AverageLOW 0.00 to 4.29 0.10 0.08 0.10 0.11 0.12 0.10 0.12 0.13 0.17 0.15 0.15 12%
MID-LOW 4.29 to 4.35 0.33 0.30 0.36 0.38 0.39 0.39 0.31 0.41 0.44 0.43 0.41 38%MID-HIGH 4.35 to 4.40 0.30 0.28 0.26 0.26 0.27 0.27 0.27 0.26 0.24 0.25 0.25 27%
HIGH 4.40 to 5.00 0.26 0.33 0.27 0.25 0.22 0.24 0.20 0.19 0.15 0.17 0.19 23%
Lance Corporal Conduct Range P(Quadrant|Prom) by Year
Lance Corporal Proficiency Range P(Quadrant|Prom) by Year

39
To better visualize the proportion of lance corporals promoted by performance
quadrant and year we plot the data. From Figure 14 we see that there are trends over time
for each quadrant. The LOW performance quadrants have an increasing trend over time
while the HIGH performing quadrants have a decreasing trend over time. Instead of
observing a reasonable estimate (50, 30, 18, 2 breakdown), we observe of a 20, 25, 35, 10
breakdown which trends to a 17, 25, 43, 15 breakdown of high to low performance
retention and promotion model. These results indicate a model that is losing a large
proportion of its top performing and above average Marines.
Figure 14. Lance Corporal Promotion Proportion by Proficiency Quadrant
0.00
0.05
0.10
0.15
0.20
0.25
0.30
0.35
0.40
0.45
0.50
LOW (0.00 to 4.29) MID-LOW (4.29 to 4.35) MID-HIGH (4.35 to 4.40) HIGH (4.40 to 5.00)
Prop
ortio
n of
Mar
ines
Pro
mot
ed
Quadrants Scores by Year
Lance Corporal Promotion Proportion Trends by Proficiency Quadrants
2001 2002 2003 2004 2005 2006 2007 2008 2009 2010 2011
40
B. CORPORAL (WITH PEBD 2001 TO 2010)
1. Classification and Regression Tree Prediction with All Variables
For the corporal rank we estimate the probability of being promoted to be 19,601
divided by 28,312 or 38% during the time frame of our study. From the top of the tree in
Figure 15 we see that the number of CPL_DEP (deployments) is the most important
predictor of promotion. Corporals with no deployments encompass roughly 45% of this
group and have a 24% estimated probability of promotion. The best chance that a
corporal with no deployments can achieve is 60% and requires a CPL_CONDUCT score
above 4.5 and a PFT_Median score above 249. Those corporals with at least one
deployment (55% of corporals) split to the right and have a probability of promoting of
50% but can increase their chances of promotion up to 94% by having entered the Marine
Corps in 2005 and having a CPL_CONDUCT score greater than 4.3. Those with at least
one deployment, PEBD of 2001 to 2004 and a CFT above 288 have a 71% estimated
probability of promoting.
From observation we generalize that PFT scores above 249, CFT_Median scores
above 280, P_AWD (achievement or commendation medal) of at least one, with a
median QUAL_SC (rifle score) above the marksman level increase a Marine’s overall
probability of promotion. For the lance corporal rank LCPL_CONDUCT is at the top of
the tree while for corporals the CPL_DEP (number of deployments) is the first split.

41
Pruned tree for prediction of promotion for the rank of corporal with all predictor values included indicating important predictor splits. Tree branches occur at the number of deployments (CPL_DEP), PEBD, conduct values (CPL_CONDUCT), PFT scores (PFT_Median), rifle qualification score (QUAL_SC), and the number of personal awards (P_AWD).
Figure 15. Classification and Regression Tree with All Predictors Included for Promotion from Corporal to Sergeant (2001 to 2010)
42
2. Classification and Regression Tree without Performance Variables
From Figure 16 we observe that after removing the performance related
prediction variables (CPL_PROFIC and CPL_CONDUCT) that CPL_DEP
(deployments) remain the initial split. Those without a deployment have a 24% chance of
promoting which increases if their PFT_Median is greater than 266, have a QUAL_SC
(rifle scores) above 2.2, a PEBD of 2001 or 2005, and at least one P_AWD can get their
probability of promotion up to 61%. When we observe the effect of having an award for
the rank of corporal, we note a 13–16% probabilistic difference for Marines promoting. A
high CFT and PFT score improves the probability of promotion in almost all cases.
Finally, as observed with the lance corporal rank the GT score split at 108 indicates some
necessity for general technical skill at that level. For those Marines with at least one
deployment we observe that the greatest probability, 95%, comes from a PEBD of 2005
and a PFT_Median score above 222.
With PEBD appearing frequently in the classification tree, it is clear that policies
of the Marine Corps taken over time should be taken into account for predicting
promotion. What those policies would be in the future cannot be foreseen which suggest
that the model should be re-estimated periodically over time.

43
Pruned tree for prediction of promotion for the rank of corporal tree with proficiency and conduct predictor values removed indicating important predictor splits. Tree branches occur at the number of deployments (CPL_DEP), PEBD, PFT scores (PFT_Median), CFT scores (CFT_Median), rifle qualification score (QUAL_SC), and the number of personal awards (P_AWD).
Figure 16. Classification and Regression Tree with Proficiency and Conduct Scores Removed as Predictors for Promotion from Corporal to
Sergeant (2001 to 2010)

44
We next compare the prediction skill of the two classification trees using the test
set for corporals. We use the predict command in R to estimate the probabilities of being
promoted from the training set using a classification tree. Using the estimated
probabilities and threshold for classification as in Table 13 we calculate the estimated
correct classification probabilities using the test set. For the full model (with performance
variables) we estimate a 60% correct classification probability for those that promote and
a 79% correct classification probability for those that do not promote. For the model
without performance variables we estimate a correct classification rate of 59% for those
that promote and a 77% correct classification rate for those that do not promote. From
this we note that the inclusion of proficiency and conduct improves variable classification
accuracy but only slightly.
Table 13. Test Set Estimated Correct Classification for Corporal Retention and Promotion
3. Proportion of Corporals Promoted by Performance Quadrant
Next we ask what proportion of high performing corporals promote and advance
to the next rank? From Table 14 we note that the estimated probabilities are similar to
those for the lance corporals. For HIGH performance we notice a decrease in the
proportion of corporals promoted while the LOW performer quadrant appears to be
steadily increasing with time. This indicates that during the years the Marine Corps
needed more Marines the proficiency and conduct marks had less value toward
promotion. We make a mental note that corporals promoting to sergeant have roughly a
20, 35, 35, 10 proportional breakdown from high to low performance. We observe that
over time there is a slight trend effect so we plot the data for corporals to pronounce the
effect.
Promote Not Promote Promote Not PromoteOptimal Threshold Value >.34 ≤.34 > .31 ≤.31Estimated Correct Prediction Probability 0.60 0.79 0.59 0.77
All PredictorsCorporal (E-4): Proficiency and Conduct System
Proficiency/Conduct Removed

45
Table 14. Proportion of Corporals Promoted Annually by Quadrant
From Figure 17 we note the data appears to be proportional large in the middle
two quadrants. The notable drop in proportion of Marines promoted from the bottom
quadrant in 2010 indicates a significant push toward retaining and promoting top
performing Marines. This (25, 40, 32, 3) breakdown while a better then and previous
rank, does not achieve the reasonable estimate (50, 30, 18, 2) high to low performance
breakdown.
Figure 17. Corporal Promotion Proportion Proficiency Trends by Quadrant and Year
Quadrant Conduct Range 2001 2002 2003 2004 2005 2006 2007 2008 2009 2010 AverageLOW 0.00 to 4.29 0.12 0.09 0.11 0.13 0.15 0.14 0.14 0.18 0.13 0.07 13%
MID-LOW 4.29 to 4.35 0.27 0.24 0.31 0.33 0.36 0.35 0.39 0.38 0.38 0.34 34%MID-HIGH 4.35 to 4.40 0.36 0.37 0.37 0.37 0.36 0.34 0.37 0.31 0.35 0.34 35%
HIGH 4.40 to 5.00 0.26 0.30 0.21 0.16 0.13 0.17 0.10 0.13 0.14 0.25 19%
Quadrant Proficiency Range 2001 2002 2003 2004 2005 2006 2007 2008 2009 2010 AverageLOW 0.00 to 4.29 0.10 0.08 0.09 0.12 0.14 0.12 0.12 0.17 0.13 0.03 11%
MID-LOW 4.29 to 4.35 0.25 0.26 0.31 0.34 0.39 0.36 0.40 0.38 0.37 0.32 34%MID-HIGH 4.35 to 4.40 0.30 0.38 0.39 0.38 0.33 0.36 0.36 0.32 0.36 0.40 36%
HIGH 4.40 to 5.00 0.25 0.28 0.21 0.16 0.14 0.16 0.12 0.13 0.14 0.25 18%
Corporal Conduct Range P(Quadrant|Prom) by Year
Corporal Proficiency Range P(Quadrant|Prom) by Year
46
C. SERGEANT (WITH PEBD 2001 TO 2007)
1. Classification and Regression Tree Prediction with All Variables
We now observe the impact of fitness reports on enlisted infantry promotions for
the rank of sergeant. From the CART we see that from the 7,057 sergeants observed that
2,059 promote, which is roughly 29% of the total. From Figure 18 we observe the first
split for sergeants at SGT_DEP (number of deployments) corresponding to a zero and
one or more. From the 36% of sergeants that did not deploy only 3% promoted. For those
that did deploy their Median_RSRV (reporting senior) values split at 90%, indicating
above or below average Marines. Those with above-average Median_RSRVs are able to
increase their probability of promoting to 58% while those below average scores decrease
to 22%. We note that 5% of all Sergeants are both ranked above average by their
reporting senior and get adverse fitness reports and 8% of all sergeants get both below
average marks and receive at least one adverse fitness report. We also note that
CFT_Median scores above 285 will increase probabilities of promotion. PEBD has an
important effect throughout especially on those that entered service from 2001 to 2002,
(81% of whom promoted). The greatest probability of promotion combination comes
from a sergeant with at least one deployment, median_ RSRV above 90, no adverse
fitness reports, and PEBD between 2001 to 2002.

47
Pruned tree for prediction of promotion for the rank of sergeant with all predictor values included indicating important predictor splits. Tree branches occur at the number of deployments (SGT_DEP), reporting senior values (Median_RSRV), adverse fitness reports (SGT_ADV), PEBD, CFT scores (CFT_Median), PFT scores (PFT_Median), and reviewing officer values (Median_ROCV).
Figure 18. Classification and Regression Tree with All Predictors Included for Promotion from Sergeant to Staff Sergeant (2001 to 2007)
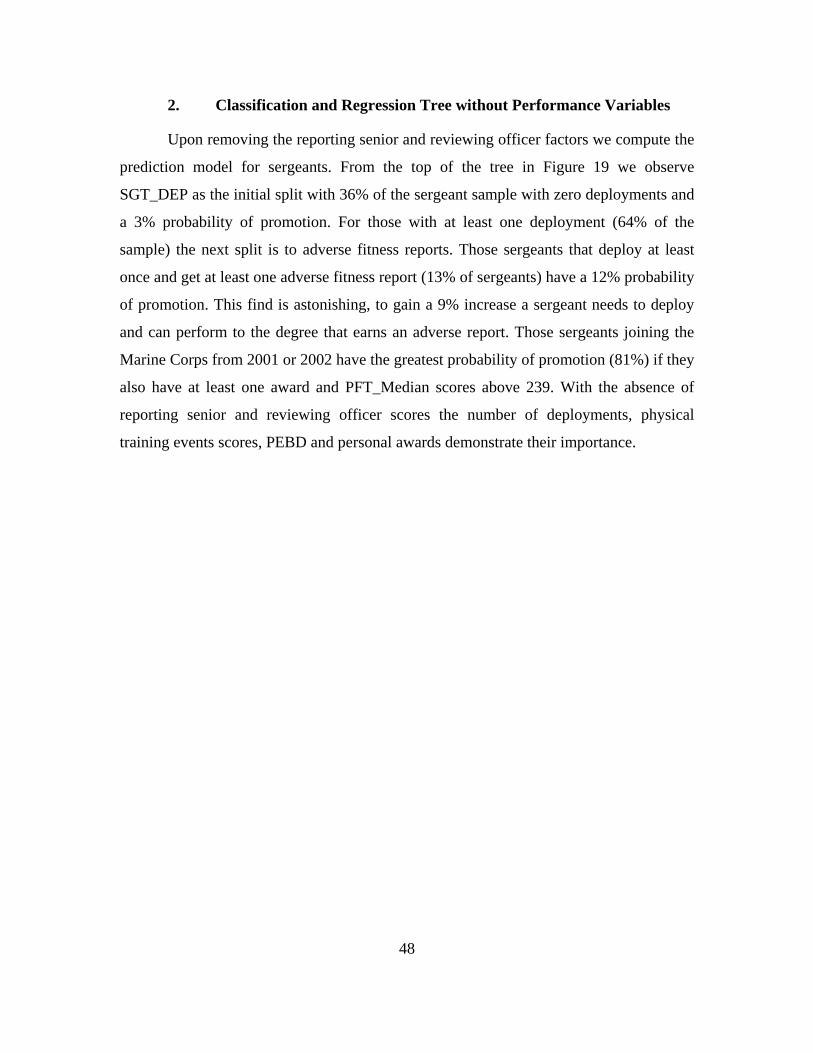
48
2. Classification and Regression Tree without Performance Variables
Upon removing the reporting senior and reviewing officer factors we compute the
prediction model for sergeants. From the top of the tree in Figure 19 we observe
SGT_DEP as the initial split with 36% of the sergeant sample with zero deployments and
a 3% probability of promotion. For those with at least one deployment (64% of the
sample) the next split is to adverse fitness reports. Those sergeants that deploy at least
once and get at least one adverse fitness report (13% of sergeants) have a 12% probability
of promotion. This find is astonishing, to gain a 9% increase a sergeant needs to deploy
and can perform to the degree that earns an adverse report. Those sergeants joining the
Marine Corps from 2001 or 2002 have the greatest probability of promotion (81%) if they
also have at least one award and PFT_Median scores above 239. With the absence of
reporting senior and reviewing officer scores the number of deployments, physical
training events scores, PEBD and personal awards demonstrate their importance.

49
Pruned tree for prediction of promotion for the rank of sergeant with reporting senior and reviewing officer values removed indicating important predictor splits. Tree branches occur at the number of deployments (SGT_DEP), adverse fitness reports (SGT_ADV), PEBD, PFT scores (PFT_Median), CFT scores (CFT_Median), and the number of personal awards (P_AWD).
Figure 19. Classification and Regression Tree with Reporting Senior and Reviewing Officer Values Removed as Predictors for Promotion from
Sergeant to Staff Sergeant (2001 to 2007)
Comparing the two models as in Table 15 we find that both have the same
classification probabilities. Both correctly classify those Marines that promote with a
probability of 80% and those that do not promote with a probability of 77%. From this
we conclude the inclusion of the reporting senior and reviewing officer values do not
improve the correct classification rate.
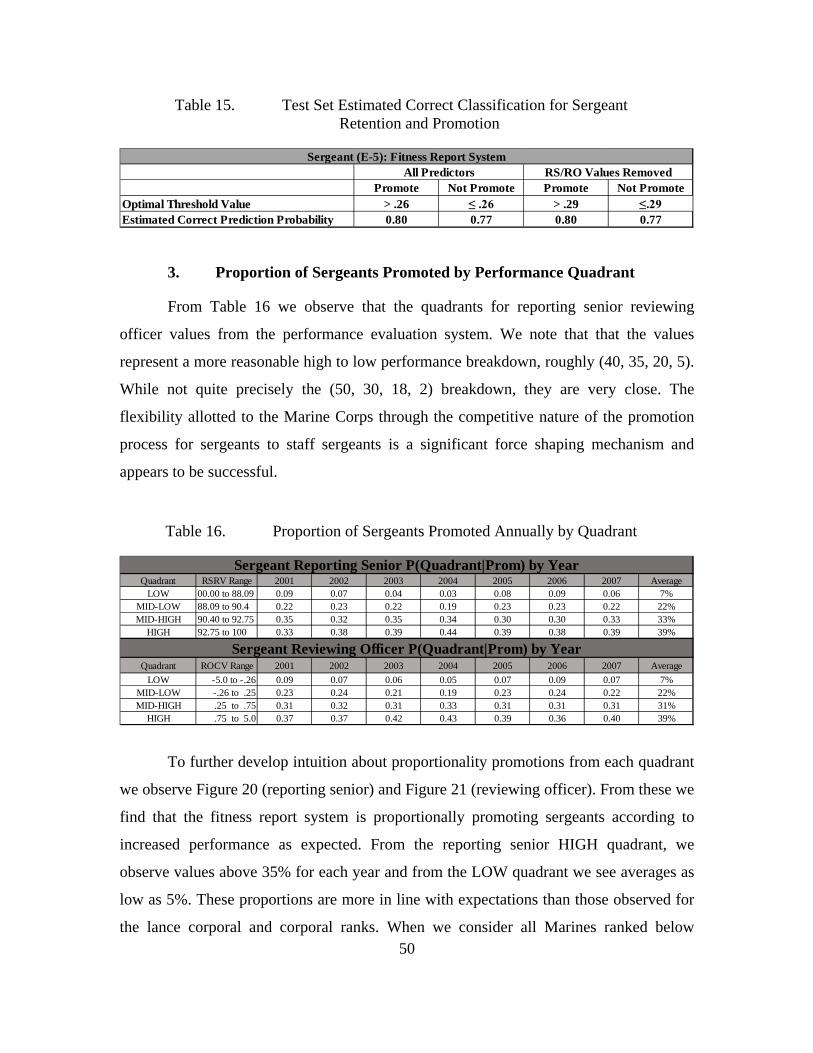
50
Table 15. Test Set Estimated Correct Classification for Sergeant Retention and Promotion
3. Proportion of Sergeants Promoted by Performance Quadrant
From Table 16 we observe that the quadrants for reporting senior reviewing
officer values from the performance evaluation system. We note that that the values
represent a more reasonable high to low performance breakdown, roughly (40, 35, 20, 5).
While not quite precisely the (50, 30, 18, 2) breakdown, they are very close. The
flexibility allotted to the Marine Corps through the competitive nature of the promotion
process for sergeants to staff sergeants is a significant force shaping mechanism and
appears to be successful.
Table 16. Proportion of Sergeants Promoted Annually by Quadrant
To further develop intuition about proportionality promotions from each quadrant
we observe Figure 20 (reporting senior) and Figure 21 (reviewing officer). From these we
find that the fitness report system is proportionally promoting sergeants according to
increased performance as expected. From the reporting senior HIGH quadrant, we
observe values above 35% for each year and from the LOW quadrant we see averages as
low as 5%. These proportions are more in line with expectations than those observed for
the lance corporal and corporal ranks. When we consider all Marines ranked below
Promote Not Promote Promote Not PromoteOptimal Threshold Value > .26 ≤ .26 > .29 ≤.29Estimated Correct Prediction Probability 0.80 0.77 0.80 0.77
Sergeant (E-5): Fitness Report SystemAll Predictors RS/RO Values Removed
Quadrant RSRV Range 2001 2002 2003 2004 2005 2006 2007 AverageLOW 00.00 to 88.09 0.09 0.07 0.04 0.03 0.08 0.09 0.06 7%
MID-LOW 88.09 to 90.4 0.22 0.23 0.22 0.19 0.23 0.23 0.22 22%MID-HIGH 90.40 to 92.75 0.35 0.32 0.35 0.34 0.30 0.30 0.33 33%
HIGH 92.75 to 100 0.33 0.38 0.39 0.44 0.39 0.38 0.39 39%
Quadrant ROCV Range 2001 2002 2003 2004 2005 2006 2007 AverageLOW -5.0 to -.26 0.09 0.07 0.06 0.05 0.07 0.09 0.07 7%
MID-LOW -.26 to .25 0.23 0.24 0.21 0.19 0.23 0.24 0.22 22%MID-HIGH .25 to .75 0.31 0.32 0.31 0.33 0.31 0.31 0.31 31%
HIGH .75 to 5.0 0.37 0.37 0.42 0.43 0.39 0.36 0.40 39%
Sergeant Reporting Senior P(Quadrant|Prom) by Year
Sergeant Reviewing Officer P(Quadrant|Prom) by Year

51
average by their reporting senior, we observe an overall proportion of 29% for sergeants
promoted. While the promotion system appears to be promoting quality better than the
corporal and below ranks, there is still 29% of proportional opportunity to promote from
the above average sergeants.
Figure 20. Sergeant Promotion Proportion Trends by Reporting Senior Quadrants
Figure 21. Sergeant Promotion Proportions Trends by Reviewing Officer Quadrants
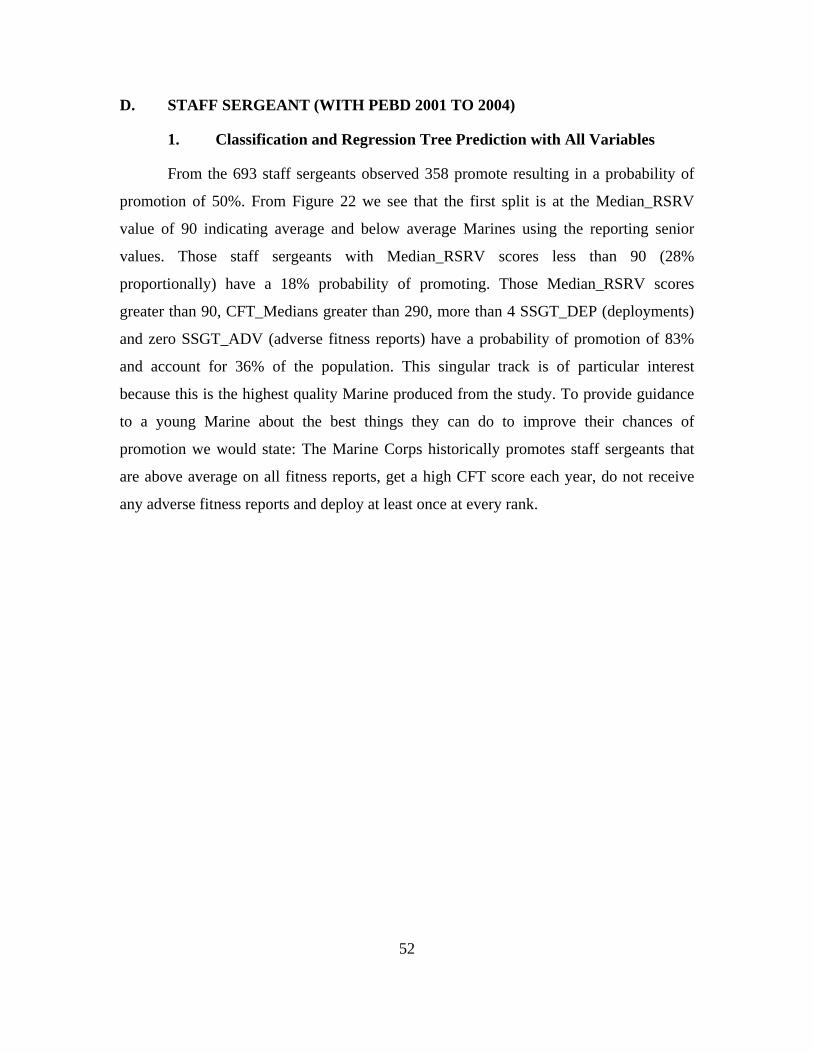
52
D. STAFF SERGEANT (WITH PEBD 2001 TO 2004)
1. Classification and Regression Tree Prediction with All Variables
From the 693 staff sergeants observed 358 promote resulting in a probability of
promotion of 50%. From Figure 22 we see that the first split is at the Median_RSRV
value of 90 indicating average and below average Marines using the reporting senior
values. Those staff sergeants with Median_RSRV scores less than 90 (28%
proportionally) have a 18% probability of promoting. Those Median_RSRV scores
greater than 90, CFT_Medians greater than 290, more than 4 SSGT_DEP (deployments)
and zero SSGT_ADV (adverse fitness reports) have a probability of promotion of 83%
and account for 36% of the population. This singular track is of particular interest
because this is the highest quality Marine produced from the study. To provide guidance
to a young Marine about the best things they can do to improve their chances of
promotion we would state: The Marine Corps historically promotes staff sergeants that
are above average on all fitness reports, get a high CFT score each year, do not receive
any adverse fitness reports and deploy at least once at every rank.
53
Staff Sergeant promotion tree with all predictors included indicating important promotion predictor splits. Notice the top predictors are reporting senior relative values, CFT scores, reviewing officer cumulative value, number of deployments and adverse fitness reports.
Figure 22. Classification and Regression Tree with All Predictors Included for Promotion from Staff Sergeant to Gunnery Sergeant (2001 to 2004)
2. Classification and Regression Tree without Performance Variables
To interpret the effect that performance variables have on predicting promotion
we remove them from the model and re-run the CART. From Figure 23 we observe that
the first split is on CFT_Median greater than or equal to 290. Those staff sergeants with
at less than a 290 CFT_Median and at least one adverse fitness reports (6%
proportionally) have 2% probability of promoting. Those Marines above a 290
CFT_Median, zero adverse fitness reports, four deployments, and two or more awards
comprise 37% of sergeants promoted and have an 80% probability of promotion.

54
Pruned tree for prediction of promotion for the rank of staff sergeant with reporting senior and reviewing officer values removed indicating important predictor splits. Tree branches occur at CFT scores (CFT_Median), adverse fitness reports (SGT_ADV), the number of deployments (SSGT_DEP), the number of personal awards (P_AWD), GT score (GT_TOTAL) and PFT scores (PFT_Median).
Figure 23. Classification and Regression Tree with Reporting Senior and Reviewing Officer Values Removed as Predictors for Promotion from
Staff Sergeant to Gunnery Sergeant (2001 to 2004)
When comparing the two prediction models for staff sergeants we find that
removing the performance variables improves the predictability of the model as observed
in Table 17. The model with reporting senior and reviewing officer values correctly
predicts promotion with a 63% probability while predicting those Marines that do not
promote with a 68% probability. Conversely after removing the performance variables
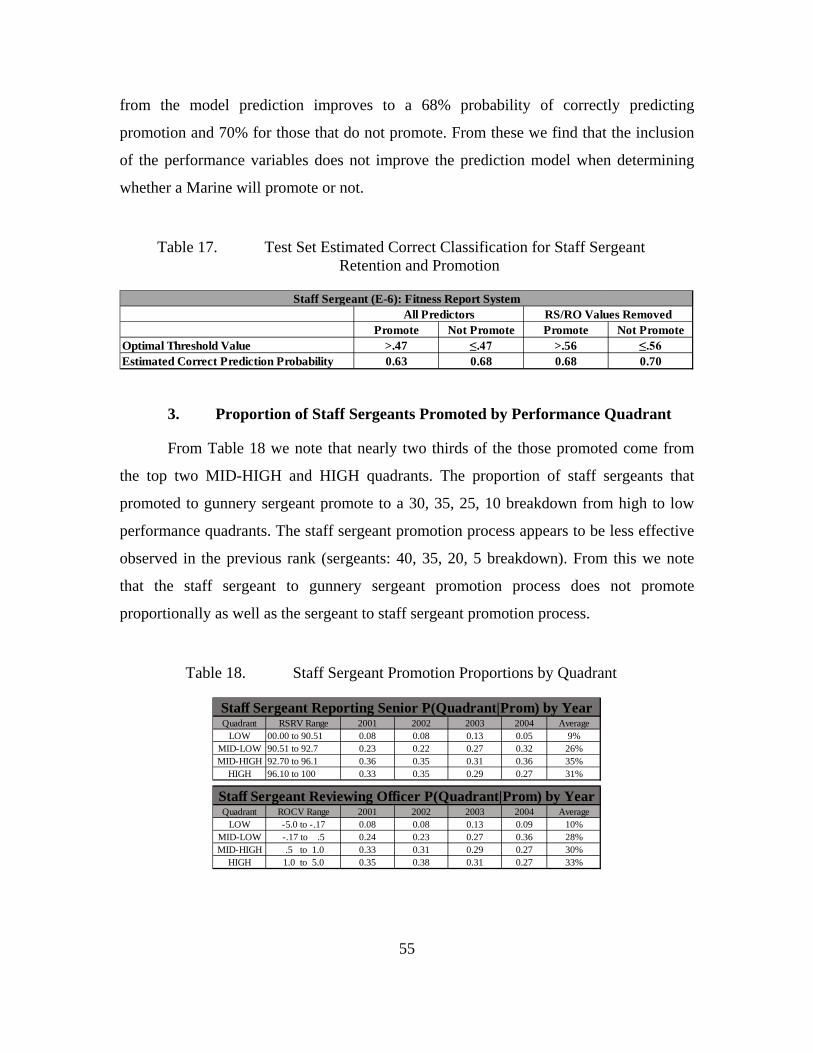
55
from the model prediction improves to a 68% probability of correctly predicting
promotion and 70% for those that do not promote. From these we find that the inclusion
of the performance variables does not improve the prediction model when determining
whether a Marine will promote or not.
Table 17. Test Set Estimated Correct Classification for Staff Sergeant Retention and Promotion
3. Proportion of Staff Sergeants Promoted by Performance Quadrant
From Table 18 we note that nearly two thirds of the those promoted come from
the top two MID-HIGH and HIGH quadrants. The proportion of staff sergeants that
promoted to gunnery sergeant promote to a 30, 35, 25, 10 breakdown from high to low
performance quadrants. The staff sergeant promotion process appears to be less effective
observed in the previous rank (sergeants: 40, 35, 20, 5 breakdown). From this we note
that the staff sergeant to gunnery sergeant promotion process does not promote
proportionally as well as the sergeant to staff sergeant promotion process.
Table 18. Staff Sergeant Promotion Proportions by Quadrant
Promote Not Promote Promote Not PromoteOptimal Threshold Value >.47 ≤.47 >.56 ≤.56Estimated Correct Prediction Probability 0.63 0.68 0.68 0.70
All Predictors RS/RO Values RemovedStaff Sergeant (E-6): Fitness Report System
Quadrant RSRV Range 2001 2002 2003 2004 AverageLOW 00.00 to 90.51 0.08 0.08 0.13 0.05 9%
MID-LOW 90.51 to 92.7 0.23 0.22 0.27 0.32 26%MID-HIGH 92.70 to 96.1 0.36 0.35 0.31 0.36 35%
HIGH 96.10 to 100 0.33 0.35 0.29 0.27 31%
Quadrant ROCV Range 2001 2002 2003 2004 AverageLOW -5.0 to -.17 0.08 0.08 0.13 0.09 10%
MID-LOW -.17 to .5 0.24 0.23 0.27 0.36 28%MID-HIGH .5 to 1.0 0.33 0.31 0.29 0.27 30%
HIGH 1.0 to 5.0 0.35 0.38 0.31 0.27 33%
Staff Sergeant Reporting Senior P(Quadrant|Prom) by Year
Staff Sergeant Reviewing Officer P(Quadrant|Prom) by Year

56
From Figures 24 and 25 we observe the proportions of staff sergeants promoted
from 2001 to 2004. From the LOW and MID-LOW quadrants, we note an increase over
time while the opposite is true for the MID-HIGH and HIGH performing quadrants. The
decreasing trend indicates a higher attrition of top performing Marines while more below
overage Marines promote.
Figure 24. Staff Sergeant Promotion Trends by Reporting Senior Quadrants
Figure 25. Staff Sergeant Promotion Trends by Reviewing Officer Quadrants

57
E. RESULTS SUMMARY
To gain an overall assessment for each rank we identify the greatest contributing
factors for the highest and lowest probabilities associated with retention and promotion.
From Table 19 we observe that most frequent factors across all ranks are performance
evaluation, deployments, negative paperwork and physical fitness. Next we summarize
the effect that policy is having for each rank. For lance corporals to have the highest
probabilities for retaining and promoting they should have conduct scores above 4.3, PFT
scores over 240 and at least one deployment. Corporals should have conduct scores above
4.3 and at least one deployment. Sergeants should have at least one deployment, above
average reporting senior values, and zero adverse fitness reports.
Table 19. Important Factors for Marines that Promote and Fail to Promote by Rank
We next summarize the performance quadrants by rank and the two performance
metrics from each performance system. From Figure 25 we note that the bottom quadrant
accounts for 6% to 13% of Marines across the ranks and evaluation systems, the lower-
middle performing Marines account for 22% to 36% of Marines, upper-middle 26% to
36% and top performing Marines account for 18% to 39% of Marines promoted. The
inconsistency of the above specified ranges indicates disparity between the two systems.
From the left side of the figure we observe more LOW and MID-LOW performance
while to the right we note more MID-HIGH and HIGH performance. Those ranks
associated with fitness reports proportionally promote 14% more from the top performing
Marines then those using proficiency and conduct system. This tells us that the proportion
of high quality Marines is better represented using fitness report scores than using
Rank (# Marines)
Lance Corporal (31312)
Corporal (26840)
Sergeant (7893)
Staff Sergeant(773)
81% Conduct > 4.3 49% Deployment > .5 43% Deployments > .5 62% RSRV > 9086% PFT > 240 95% Conduct > 4.3 58% RSRV > 90 69% CFT > 29096% Deployments > .5 62% Adverse < .5 78% Deployments > 453% Conduct < 4.3 24% Deployments < .5 3% Deployments < .5 18% RSRV < 9036% Conduct < 4.2 15% Conduct <4.5 21% RSRV < 90 8% CFT < 29220% PFT < 263 11% PFT < 265 5% Adverse > .5 2% Adverse >.5
Greatest Probability for
Promoting
Least Probability for
Promoting
Conclusions: Most Important Factors for Promotion

58
proficiency and conduct scores. From this we conclude that the Marine Corps relies
heavily on identifying quality from reporting senior and reviewing officer values and less
so for proficiency and conduct scores.
Figure 26. USMC Promotion Proportions by Performance and Rank
59
V. CONCLUSIONS
A. OVERVIEW
Our thesis identifies important factors that explain differences in the probabilities
of promotion for enlisted infantry Marines across four ranks: lance corporal to corporal,
corporal to sergeant, sergeant to staff sergeant, and staff sergeant to gunnery sergeant.
From the classification and regression trees we find that performance evaluation, number
of deployments, physical fitness, adverse fitness reports and awards play an important
role in determining the likelihood of retaining and promoting. We then remove
performance evaluation parameters and identify where the resulting prediction model
improves or degrades in the probability of correctly predicting promotion. It was found
that the performance evaluation parameters only improve lance corporal predictions.
From the data we determine the proportion of high quality Marines that promote
across four performance quadrants derived from proficiency and conduct values,
reporting senior relative values and reviewing officer cumulative values. From these we
consider trends for each quadrant by rank and performance metric and compare these to
what we expect them to be. We then compute the probability of promoting from each
performance quadrant by rank.
B. CONCLUSIONS
Throughout our comparison of the two methods used for performance evaluation
we find that proportionally more high quality Marines are promoted using fitness reports
and the promotion board process than the proficiency and conduct and composite score
process. The low proportions of high quality Marines promoted as a result of proficiency
and conduct process presents an issue. Neither the proficiency and conduct method or the
fitness report scores method for promoting result in retaining and promoting 100% from
the top two quadrants. Perhaps the goal for retention and promotion should fall closer to a
(50, 30, 18, 2) proportional high to low performance breakdown. The closest rank that
achieves the proportional split is sergeants.
60
1. Research Objectives
The main objective of this thesis is to develop an understanding about which
factors influence probabilities of promotion for enlisted infantry Marines. Additionally,
the thesis identifies the proportion of Marines promoted from performance quadrants and
the probability of promoting from each quadrant. Finally, the thesis compares the two
performance evaluation models and the results they proportionally produce across
performance quadrants.
2. Research Questions
In Chapter I a set of research questions are presented, which our findings address
as follows:
What factors influence the promotion process by rank? We find that the
primary prediction variables for each rank are the performance variables (proficiency and
conduct marks, and reporting senior, reviewing officer values) and physical fitness (CFT
and PFT scores). For the proficiency and conduct system scores we observe the value of
4.3 as a natural split. For CFT scores we observe splits between 283 to 290 across the
ranks while splits for PFT scores range mostly from 239 to 265 across the ranks. For
lance corporals and corporals, we observe that high rifle scores, the number of
deployments, GT scores and awards contribute toward promotion. For the ranks of
sergeant and staff sergeant we observe fitness reports, awards and deployments to be the
prevailing promotion prediction factors. Fitness reports generally split just above average
with reporting senior relative values splitting between median scores of 89 and 90 (range
80 to 100) and reviewing officer cumulative values splitting between .17 and 0.44 (range
-5 to 4). We observe adverse fitness reports decrease probabilities for promotion for both
ranks observed. The most important prediction factor for promotion to sergeant and staff
sergeant is having at least one deployment even with an adverse fitness report.
What proportion of Marines are promoted from the bottom, lower-middle,
upper-middle and top performance evaluation quadrants by rank? The Marine
Corps promotes 5% to 15% from the lowest performing quadrant of Marines across all
ranks. The opportunity to retain and promote more from the top 50% and top 25%
61
performance evaluated Marines from proficiency, conduct, reporting senior and
reviewing officer values exists.
How do the two performance evaluation systems compare? From proficiency/
conduct scores and reporting senior/reviewing officer scores, we observe that the
proficiency and conduct method promotes more bottom performing and less top
performing Marines then the reporting senior and reviewing officer scores. Despite this
the classification and regression trees reveal similarities across the two evaluation
methods, such as the number of deployments and the importance of the performance
evaluation variables. While the performance inclusion changes the ability to correctly
predict those that retain and promote or not by rank it is clear that performance
parameters are present in all classification and regression trees and therefore important.
C. RECOMMENDATIONS
Based on our conclusions we believe that the Marine Corps promotes a low
proportion of enlisted infantry Marines with above average proficiency and conduct
marks. Proportionally, the fitness report and board process promotes more high quality
Marines. Consider altering the proficiency and conduct system to achieve the effects that
the fitness report system has on proportional retention and promotion. While fitness
reports for 160 thousand Marines may be difficult for officers to complete, an approach
involving non-commissioned officers may provide relief. In order to achieve proportional
understanding it is necessary to first determine what proportion from each quadrant is
reasonable. A policy that promotes 50%, 30%, 18% and 2% of Marines from high, mid-
high, mid-low and low performing quadrants respectively does seem reasonable.
Comparing other military occupational specialties proportional levels will provide a solid
baseline. To get close to the aforementioned breakdown it is necessary to understand why
high quality junior enlisted infantry Marines get out of the Marine Corps and then to
focus retention efforts toward retaining these high quality Marines.
From the classification and regression trees we observe the effects that Marine
Corps policy has over time. This insight allows the Marine Corps to validate if the policy
is having the effect desired. Deployments identify as important factors for promotion

62
across the ranks. This may not be causation and requires further analysis to determine the
necessity that having at least one deployment has on promotions.
Throughout the analysis we identify interesting ways of interpreting each Marines
data. For personal awards we observe a proportionally low amount for the lower ranking
Marines while purple hearts are proportionally high. The Marines taking the risk should
be recognized the most. Policy governing awards should better reflect the outstanding
work and risk that junior Marines provide. For proficiency and conduct marks we note
the discrete nature of the values used which if expanded would allow better performance
classification for Marines. This could be accomplished through refined guidance in the
IRAM. We also note the effect of increasing promotion zones and the proportion of
Marines promoted based on the PEBD factor. Incentivizing higher quality Marines
through monetary means, quality of life measures, key desired billets, early moves, or
performance based rewards all provide alternate means for retaining and promoting more
high quality Marines and should be considered. Lastly we note the utility of using the
accumulated data method. By assessing a Marine based off all of their data we create a
more accurate representation of their quality. The whole Marine concept recognizes each
Marines self-development consistency, which could lead to less personal management
and should be integrated as necessary.
D. FUTURE WORK
The factors identified as important, should have their levels interpreted and
studied. The distribution of each factor needs to be analyzed for requirement validation to
ensure Marines are being evaluated in a manner that contributes to desired areas of
improvement. From these findings it is necessary to define quality and determine the
ideal proportion of quality desired and required. It should also include analysis for
determining better means for increasing force structure during times of war (vice
widening the zones for promotion and therefore reducing standards, a larger reserve pool,
or by influencing retention for high quality Marines).
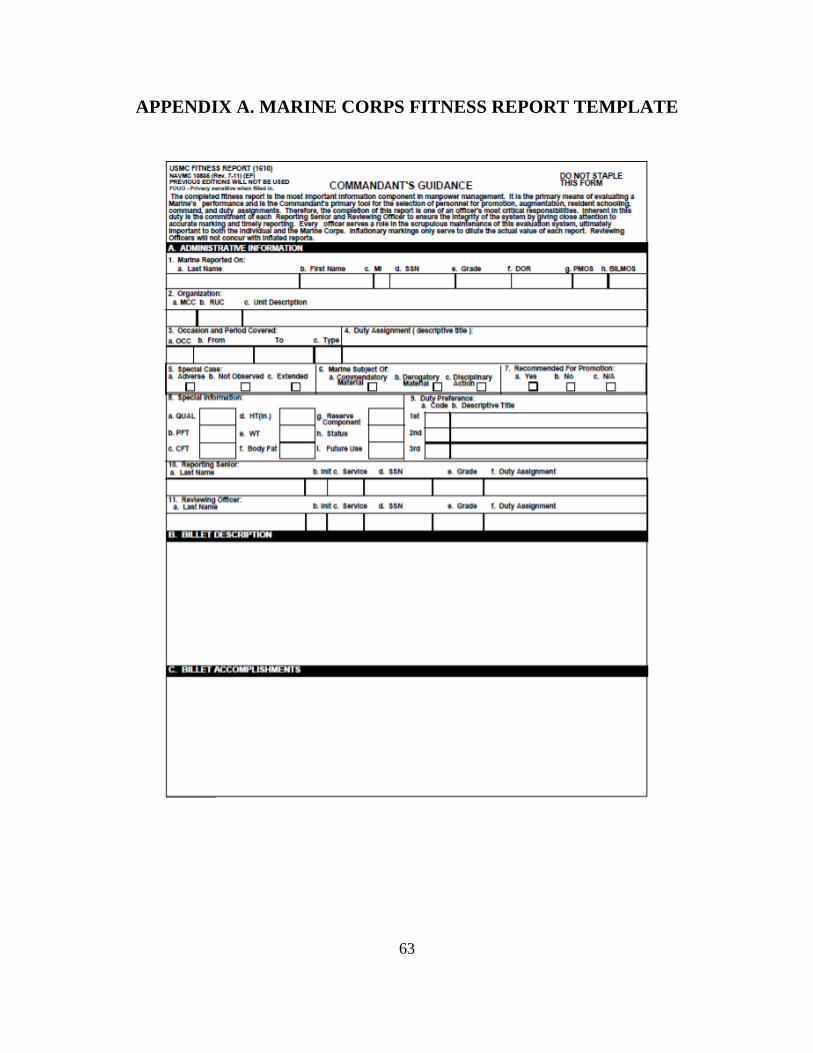
63
APPENDIX A. MARINE CORPS FITNESS REPORT TEMPLATE

64

65

66

67
Figure 27. Marine Corps Fitness Report Template. Source: USMC (2015a).

68
THIS PAGE INTENTIONALLY LEFT BLANK
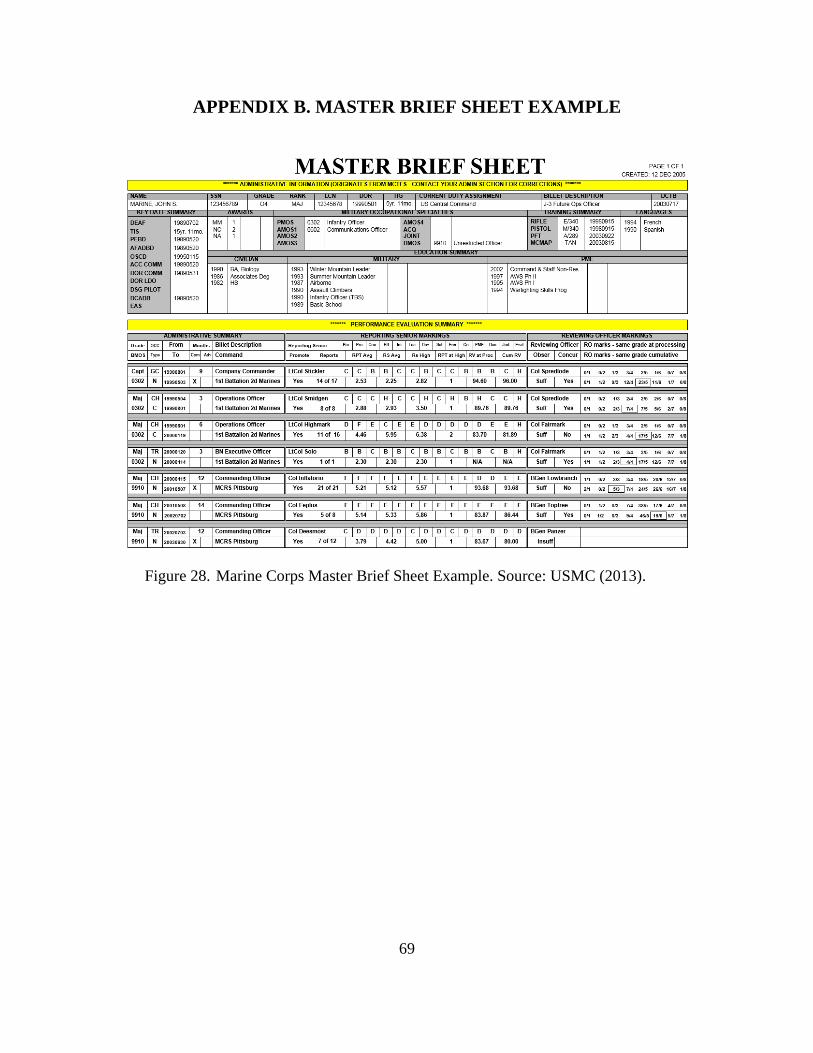
69
APPENDIX B. MASTER BRIEF SHEET EXAMPLE
Figure 28. Marine Corps Master Brief Sheet Example. Source: USMC (2013).

70
THIS PAGE INTENTIONALLY LEFT BLANK
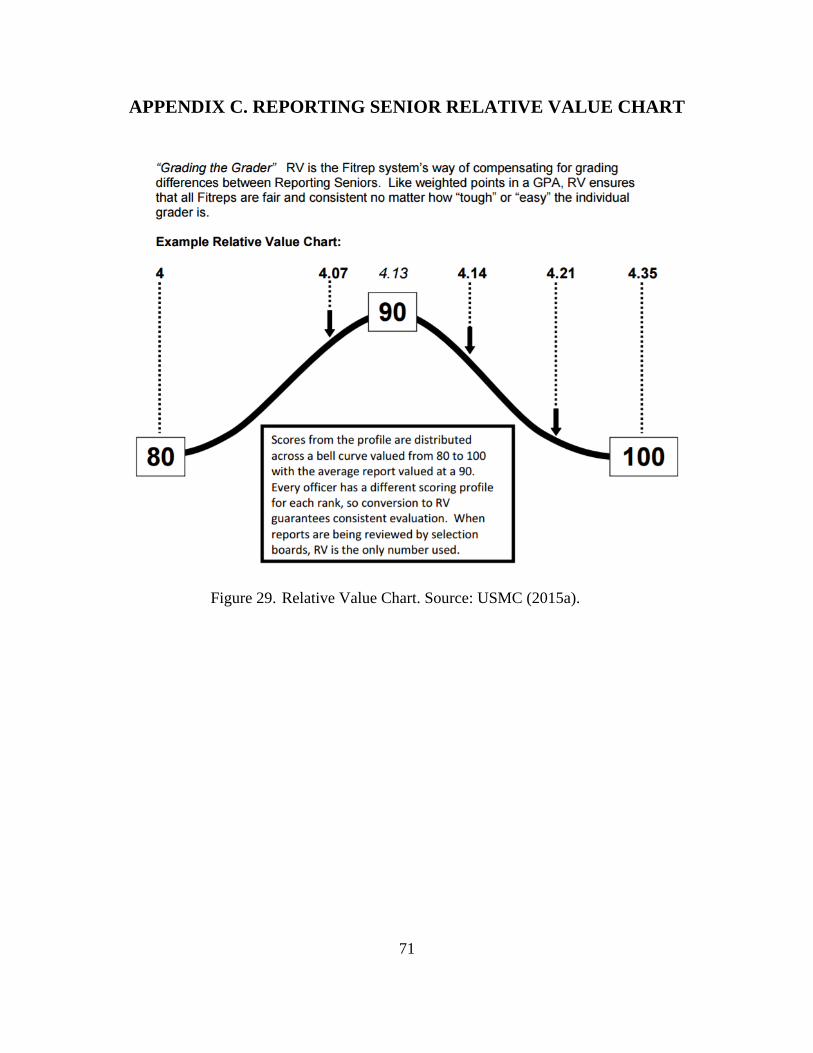
71
APPENDIX C. REPORTING SENIOR RELATIVE VALUE CHART
Figure 29. Relative Value Chart. Source: USMC (2015a).

72
THIS PAGE INTENTIONALLY LEFT BLANK

73
APPENDIX D. ADDITIONAL CLASSIFICATION TREES
Figure 30. CART for Lance Corporals with All Predictors

74
Figure 31. CART for Lance Corporals without Performance Evaluation Predictors
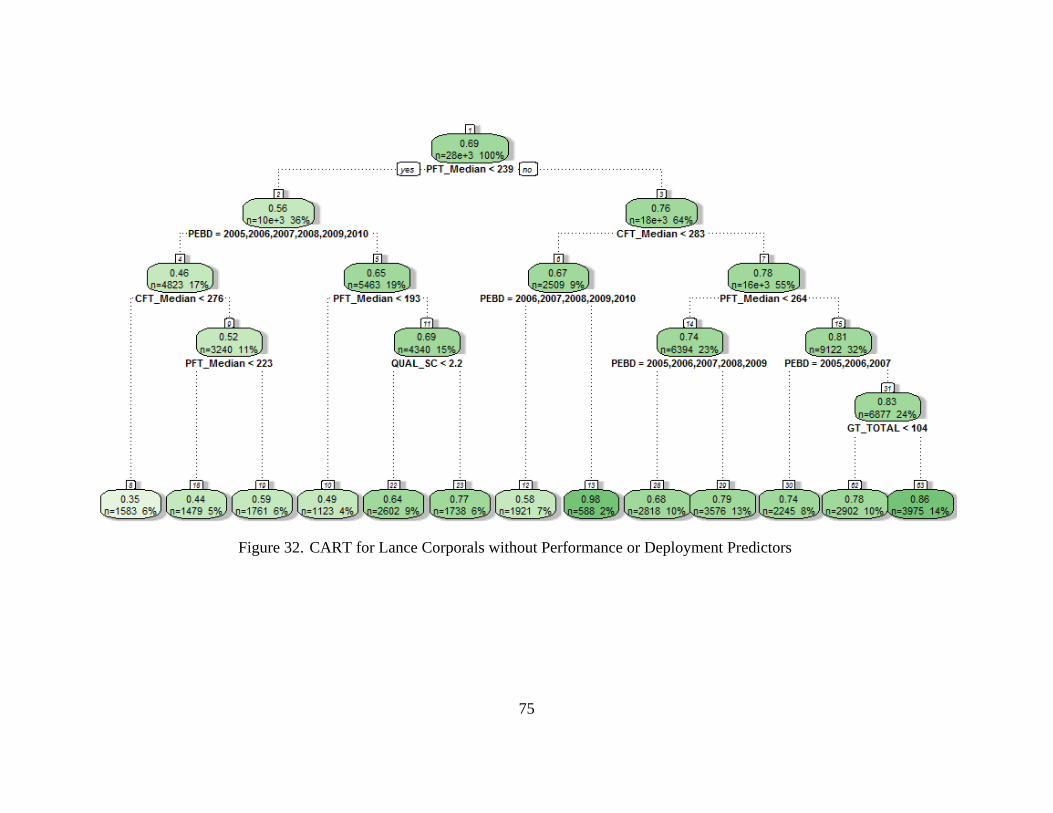
75
Figure 32. CART for Lance Corporals without Performance or Deployment Predictors
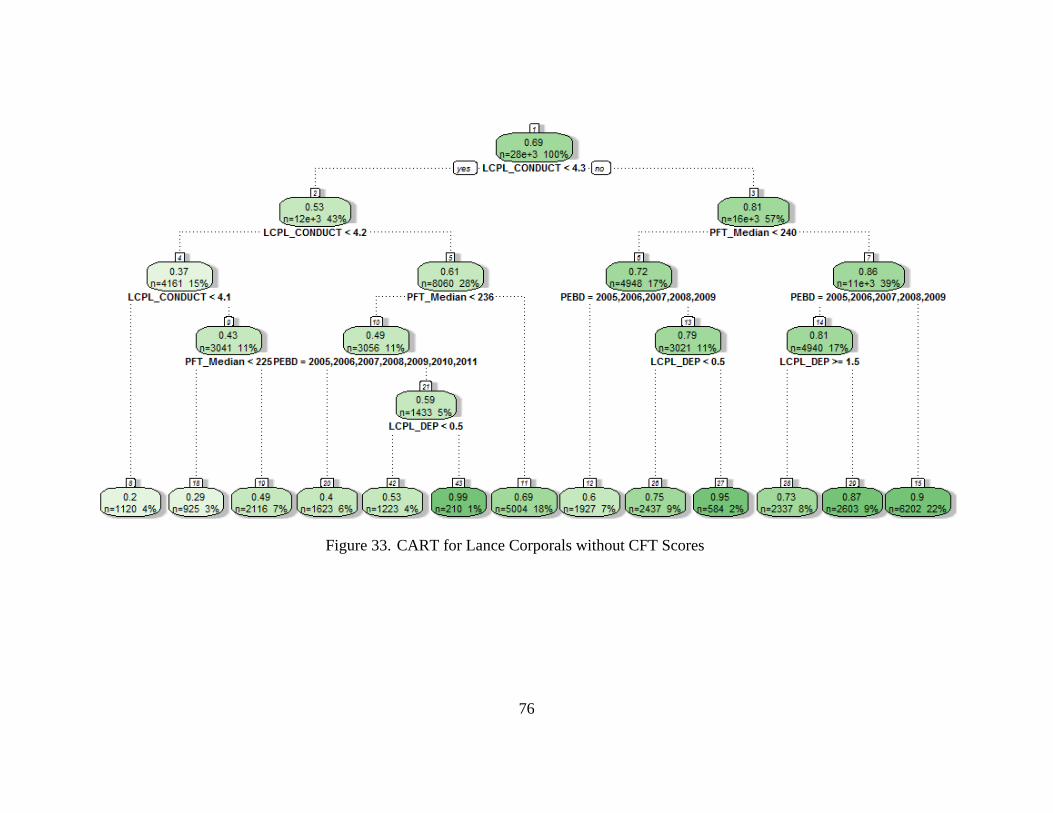
76
Figure 33. CART for Lance Corporals without CFT Scores
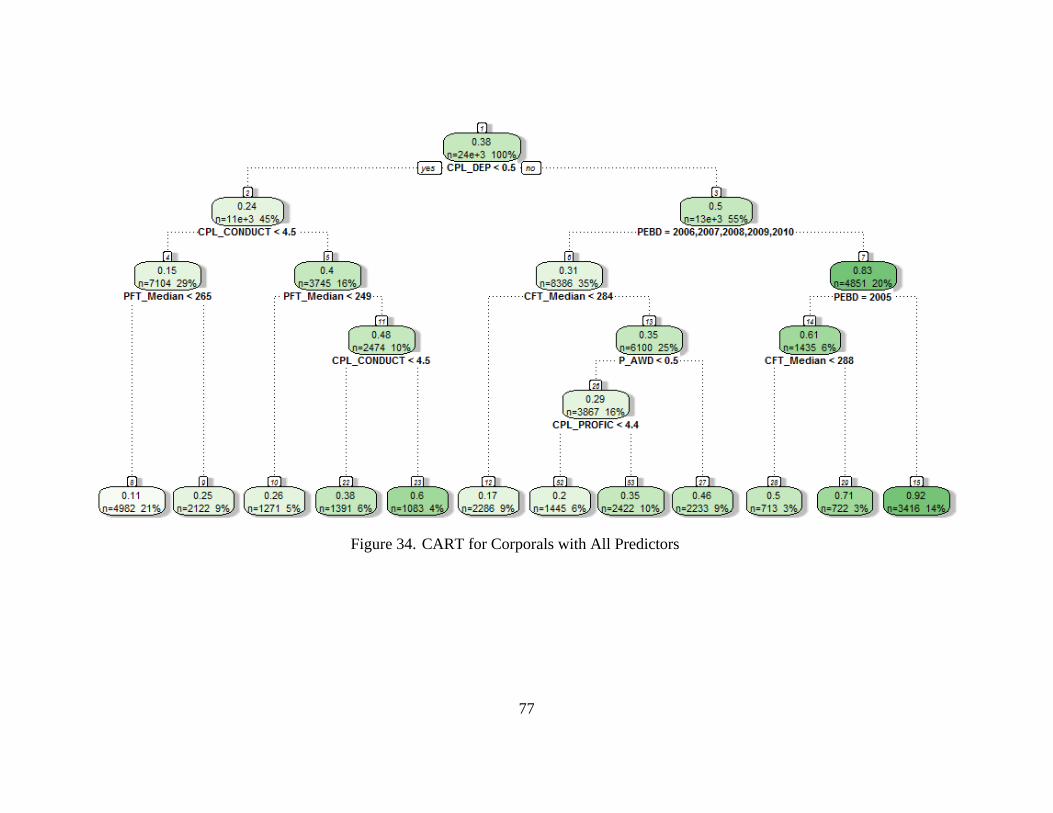
77
Figure 34. CART for Corporals with All Predictors

78
Figure 35. CART for Corporals without Performance Evaluation Predictors

79
Figure 36. CART for Corporals without Performance or Deployment Predictors

80
Figure 37. CART for Corporals without CFT Predictors
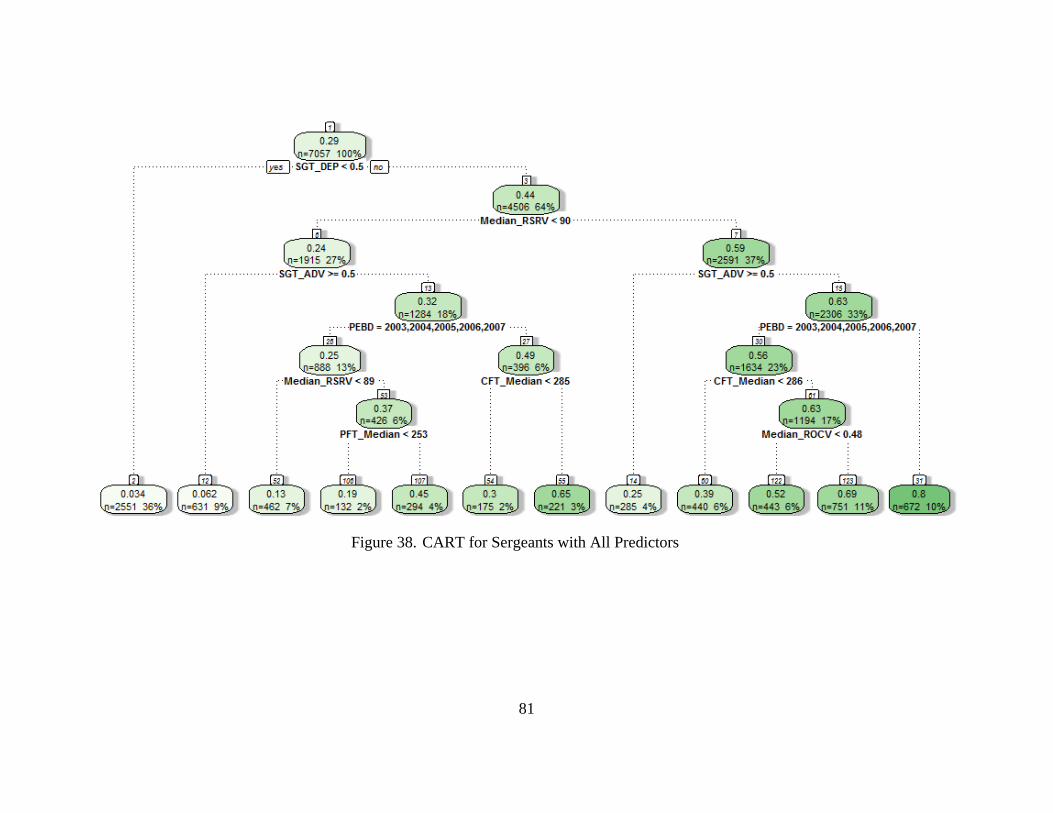
81
Figure 38. CART for Sergeants with All Predictors

82
Figure 39. CART for Sergeants without Performance Evaluation Predictors

83
Figure 40. CART for Sergeants without Performance Evaluation or Deployment Predictors
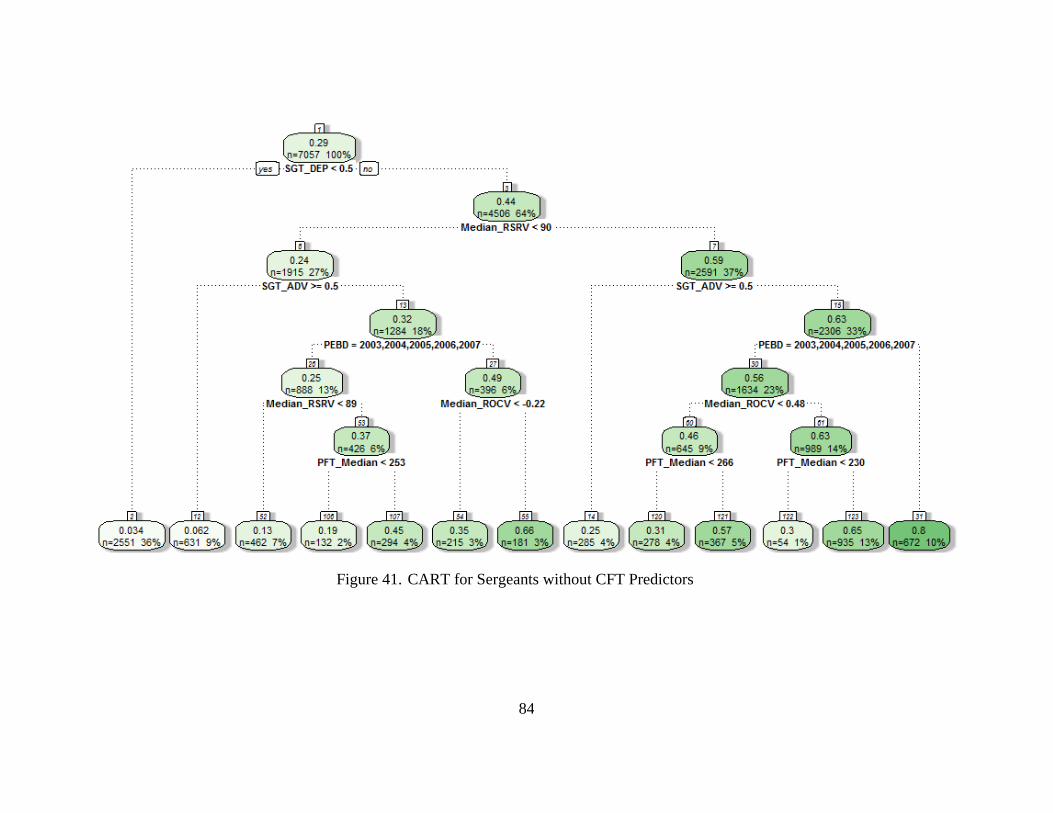
84
Figure 41. CART for Sergeants without CFT Predictors
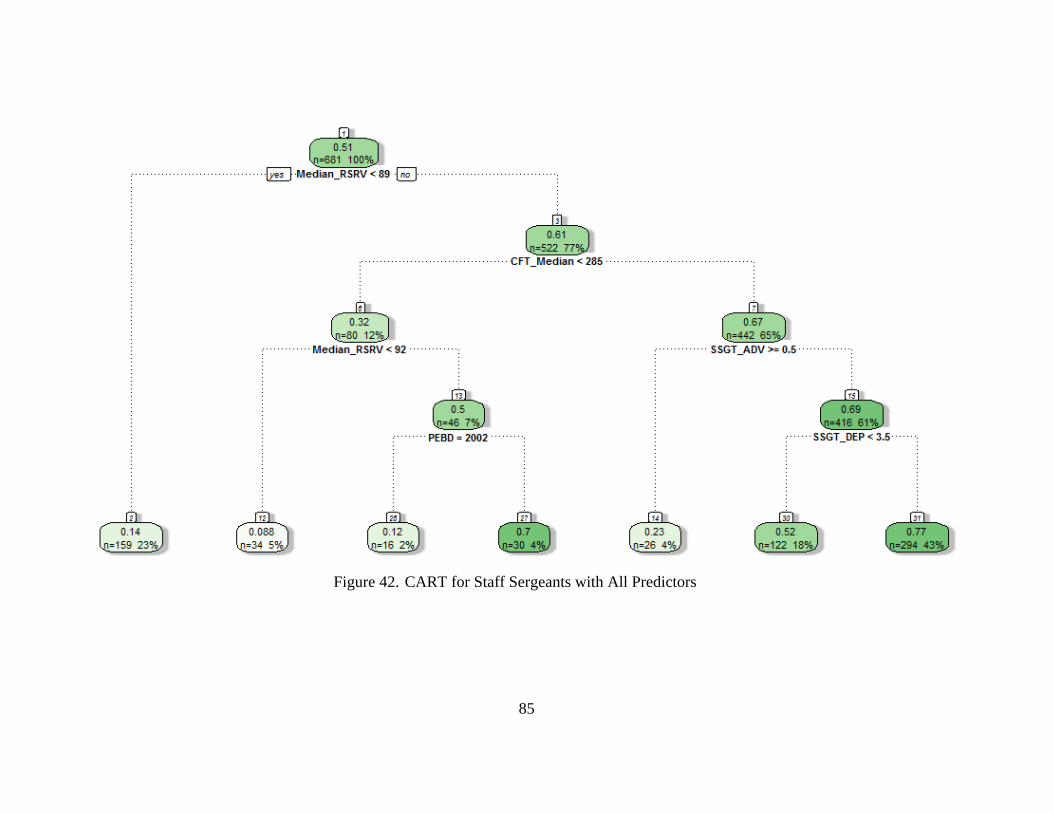
85
Figure 42. CART for Staff Sergeants with All Predictors
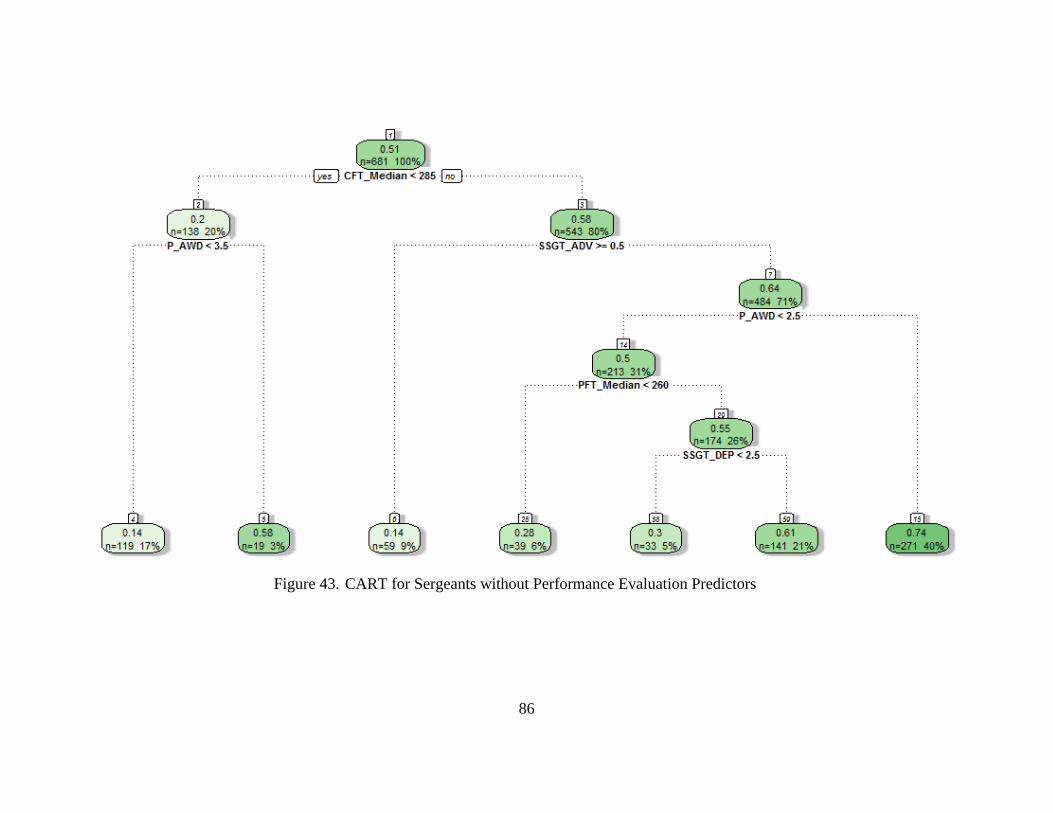
86
Figure 43. CART for Sergeants without Performance Evaluation Predictors

87
Figure 44. CART for Staff Sergeants without Performance Evaluation or Deployment Predictors
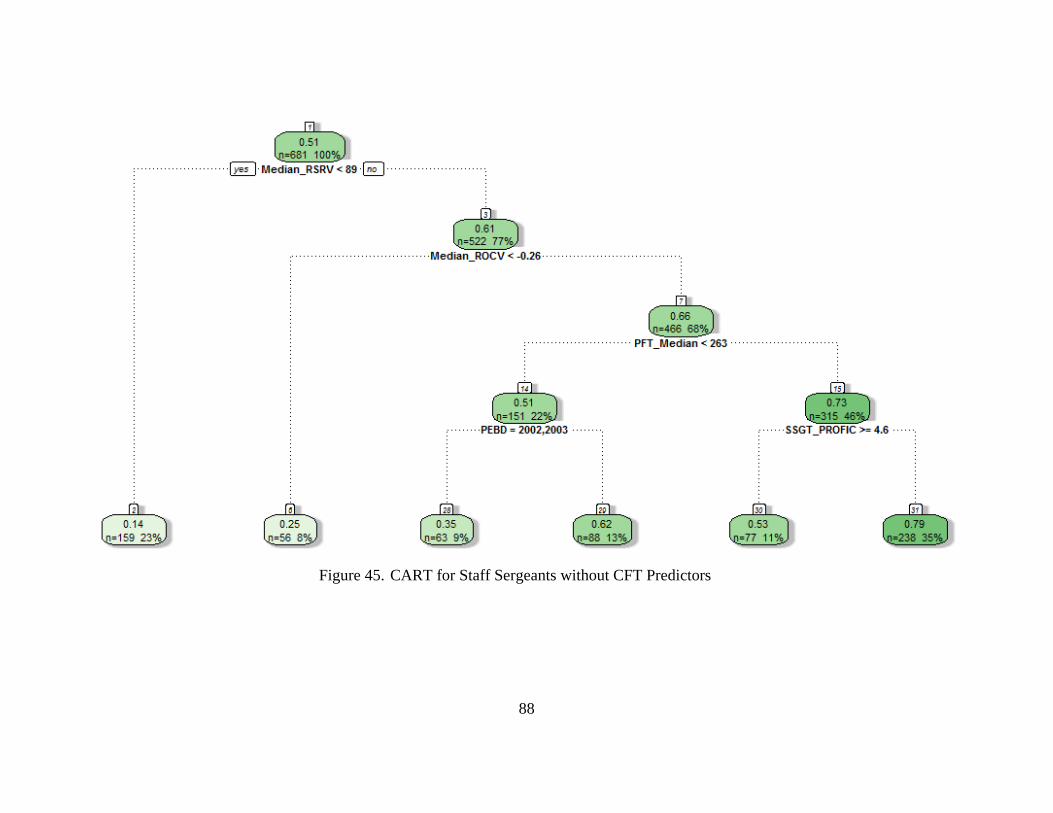
88
Figure 45. CART for Staff Sergeants without CFT Predictors
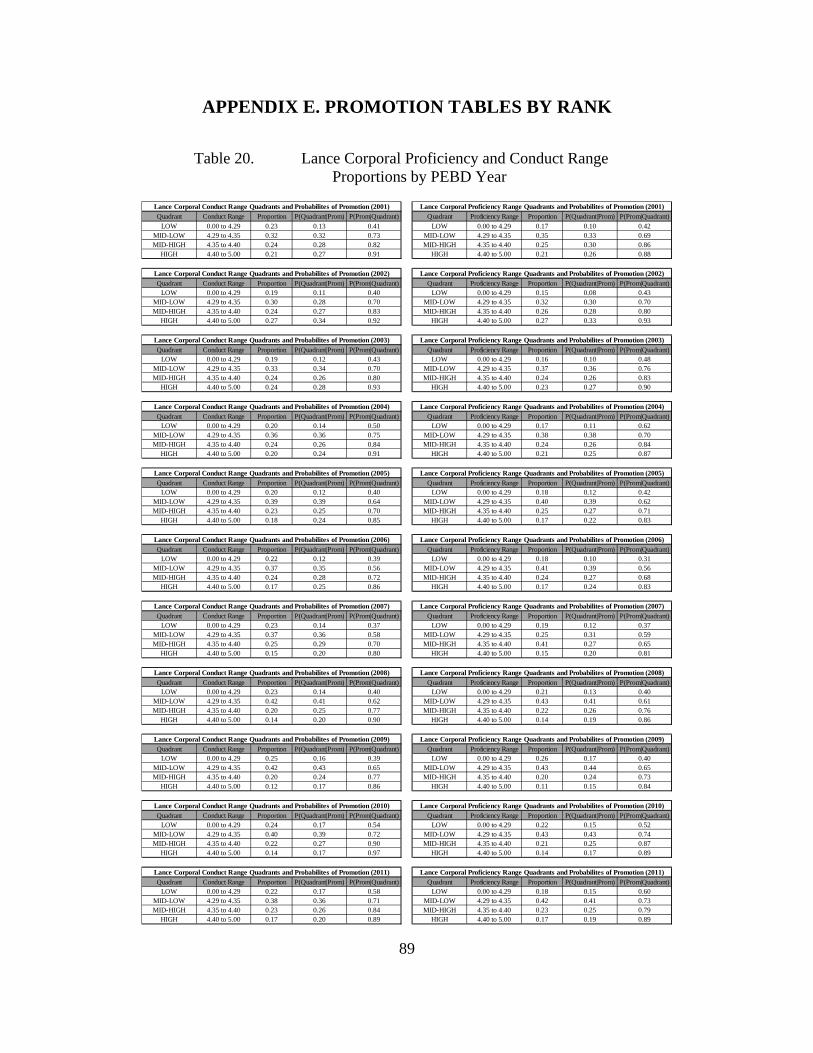
89
APPENDIX E. PROMOTION TABLES BY RANK
Table 20. Lance Corporal Proficiency and Conduct Range Proportions by PEBD Year
Quadrant Conduct Range Proportion P(Quadrant|Prom) P(Prom|Quadrant) Quadrant Proficiency Range Proportion P(Quadrant|Prom) P(Prom|Quadrant)LOW 0.00 to 4.29 0.23 0.13 0.41 LOW 0.00 to 4.29 0.17 0.10 0.42
MID-LOW 4.29 to 4.35 0.32 0.32 0.73 MID-LOW 4.29 to 4.35 0.35 0.33 0.69MID-HIGH 4.35 to 4.40 0.24 0.28 0.82 MID-HIGH 4.35 to 4.40 0.25 0.30 0.86
HIGH 4.40 to 5.00 0.21 0.27 0.91 HIGH 4.40 to 5.00 0.21 0.26 0.88
Quadrant Conduct Range Proportion P(Quadrant|Prom) P(Prom|Quadrant) Quadrant Proficiency Range Proportion P(Quadrant|Prom) P(Prom|Quadrant)LOW 0.00 to 4.29 0.19 0.11 0.40 LOW 0.00 to 4.29 0.15 0.08 0.43
MID-LOW 4.29 to 4.35 0.30 0.28 0.70 MID-LOW 4.29 to 4.35 0.32 0.30 0.70MID-HIGH 4.35 to 4.40 0.24 0.27 0.83 MID-HIGH 4.35 to 4.40 0.26 0.28 0.80
HIGH 4.40 to 5.00 0.27 0.34 0.92 HIGH 4.40 to 5.00 0.27 0.33 0.93
Quadrant Conduct Range Proportion P(Quadrant|Prom) P(Prom|Quadrant) Quadrant Proficiency Range Proportion P(Quadrant|Prom) P(Prom|Quadrant)LOW 0.00 to 4.29 0.19 0.12 0.43 LOW 0.00 to 4.29 0.16 0.10 0.48
MID-LOW 4.29 to 4.35 0.33 0.34 0.70 MID-LOW 4.29 to 4.35 0.37 0.36 0.76MID-HIGH 4.35 to 4.40 0.24 0.26 0.80 MID-HIGH 4.35 to 4.40 0.24 0.26 0.83
HIGH 4.40 to 5.00 0.24 0.28 0.93 HIGH 4.40 to 5.00 0.23 0.27 0.90
Quadrant Conduct Range Proportion P(Quadrant|Prom) P(Prom|Quadrant) Quadrant Proficiency Range Proportion P(Quadrant|Prom) P(Prom|Quadrant)LOW 0.00 to 4.29 0.20 0.14 0.50 LOW 0.00 to 4.29 0.17 0.11 0.62
MID-LOW 4.29 to 4.35 0.36 0.36 0.75 MID-LOW 4.29 to 4.35 0.38 0.38 0.70MID-HIGH 4.35 to 4.40 0.24 0.26 0.84 MID-HIGH 4.35 to 4.40 0.24 0.26 0.84
HIGH 4.40 to 5.00 0.20 0.24 0.91 HIGH 4.40 to 5.00 0.21 0.25 0.87
Quadrant Conduct Range Proportion P(Quadrant|Prom) P(Prom|Quadrant) Quadrant Proficiency Range Proportion P(Quadrant|Prom) P(Prom|Quadrant)LOW 0.00 to 4.29 0.20 0.12 0.40 LOW 0.00 to 4.29 0.18 0.12 0.42
MID-LOW 4.29 to 4.35 0.39 0.39 0.64 MID-LOW 4.29 to 4.35 0.40 0.39 0.62MID-HIGH 4.35 to 4.40 0.23 0.25 0.70 MID-HIGH 4.35 to 4.40 0.25 0.27 0.71
HIGH 4.40 to 5.00 0.18 0.24 0.85 HIGH 4.40 to 5.00 0.17 0.22 0.83
Quadrant Conduct Range Proportion P(Quadrant|Prom) P(Prom|Quadrant) Quadrant Proficiency Range Proportion P(Quadrant|Prom) P(Prom|Quadrant)LOW 0.00 to 4.29 0.22 0.12 0.39 LOW 0.00 to 4.29 0.18 0.10 0.31
MID-LOW 4.29 to 4.35 0.37 0.35 0.56 MID-LOW 4.29 to 4.35 0.41 0.39 0.56MID-HIGH 4.35 to 4.40 0.24 0.28 0.72 MID-HIGH 4.35 to 4.40 0.24 0.27 0.68
HIGH 4.40 to 5.00 0.17 0.25 0.86 HIGH 4.40 to 5.00 0.17 0.24 0.83
Quadrant Conduct Range Proportion P(Quadrant|Prom) P(Prom|Quadrant) Quadrant Proficiency Range Proportion P(Quadrant|Prom) P(Prom|Quadrant)LOW 0.00 to 4.29 0.23 0.14 0.37 LOW 0.00 to 4.29 0.19 0.12 0.37
MID-LOW 4.29 to 4.35 0.37 0.36 0.58 MID-LOW 4.29 to 4.35 0.25 0.31 0.59MID-HIGH 4.35 to 4.40 0.25 0.29 0.70 MID-HIGH 4.35 to 4.40 0.41 0.27 0.65
HIGH 4.40 to 5.00 0.15 0.20 0.80 HIGH 4.40 to 5.00 0.15 0.20 0.81
Quadrant Conduct Range Proportion P(Quadrant|Prom) P(Prom|Quadrant) Quadrant Proficiency Range Proportion P(Quadrant|Prom) P(Prom|Quadrant)LOW 0.00 to 4.29 0.23 0.14 0.40 LOW 0.00 to 4.29 0.21 0.13 0.40
MID-LOW 4.29 to 4.35 0.42 0.41 0.62 MID-LOW 4.29 to 4.35 0.43 0.41 0.61MID-HIGH 4.35 to 4.40 0.20 0.25 0.77 MID-HIGH 4.35 to 4.40 0.22 0.26 0.76
HIGH 4.40 to 5.00 0.14 0.20 0.90 HIGH 4.40 to 5.00 0.14 0.19 0.86
Quadrant Conduct Range Proportion P(Quadrant|Prom) P(Prom|Quadrant) Quadrant Proficiency Range Proportion P(Quadrant|Prom) P(Prom|Quadrant)LOW 0.00 to 4.29 0.25 0.16 0.39 LOW 0.00 to 4.29 0.26 0.17 0.40
MID-LOW 4.29 to 4.35 0.42 0.43 0.65 MID-LOW 4.29 to 4.35 0.43 0.44 0.65MID-HIGH 4.35 to 4.40 0.20 0.24 0.77 MID-HIGH 4.35 to 4.40 0.20 0.24 0.73
HIGH 4.40 to 5.00 0.12 0.17 0.86 HIGH 4.40 to 5.00 0.11 0.15 0.84
Quadrant Conduct Range Proportion P(Quadrant|Prom) P(Prom|Quadrant) Quadrant Proficiency Range Proportion P(Quadrant|Prom) P(Prom|Quadrant)LOW 0.00 to 4.29 0.24 0.17 0.54 LOW 0.00 to 4.29 0.22 0.15 0.52
MID-LOW 4.29 to 4.35 0.40 0.39 0.72 MID-LOW 4.29 to 4.35 0.43 0.43 0.74MID-HIGH 4.35 to 4.40 0.22 0.27 0.90 MID-HIGH 4.35 to 4.40 0.21 0.25 0.87
HIGH 4.40 to 5.00 0.14 0.17 0.97 HIGH 4.40 to 5.00 0.14 0.17 0.89
Quadrant Conduct Range Proportion P(Quadrant|Prom) P(Prom|Quadrant) Quadrant Proficiency Range Proportion P(Quadrant|Prom) P(Prom|Quadrant)LOW 0.00 to 4.29 0.22 0.17 0.58 LOW 0.00 to 4.29 0.18 0.15 0.60
MID-LOW 4.29 to 4.35 0.38 0.36 0.71 MID-LOW 4.29 to 4.35 0.42 0.41 0.73MID-HIGH 4.35 to 4.40 0.23 0.26 0.84 MID-HIGH 4.35 to 4.40 0.23 0.25 0.79
HIGH 4.40 to 5.00 0.17 0.20 0.89 HIGH 4.40 to 5.00 0.17 0.19 0.89
Lance Corporal Conduct Range Quadrants and Probabilites of Promotion (2010) Lance Corporal Proficiency Range Quadrants and Probabilites of Promotion (2010)
Lance Corporal Conduct Range Quadrants and Probabilites of Promotion (2007) Lance Corporal Proficiency Range Quadrants and Probabilites of Promotion (2007)
Lance Corporal Conduct Range Quadrants and Probabilites of Promotion (2008) Lance Corporal Proficiency Range Quadrants and Probabilites of Promotion (2008)
Lance Corporal Conduct Range Quadrants and Probabilites of Promotion (2009) Lance Corporal Proficiency Range Quadrants and Probabilites of Promotion (2009)
Lance Corporal Conduct Range Quadrants and Probabilites of Promotion (2001) Lance Corporal Proficiency Range Quadrants and Probabilites of Promotion (2001)
Lance Corporal Proficiency Range Quadrants and Probabilites of Promotion (2002)Lance Corporal Conduct Range Quadrants and Probabilites of Promotion (2002)
Lance Corporal Conduct Range Quadrants and Probabilites of Promotion (2005) Lance Corporal Proficiency Range Quadrants and Probabilites of Promotion (2005)
Lance Corporal Conduct Range Quadrants and Probabilites of Promotion (2011) Lance Corporal Proficiency Range Quadrants and Probabilites of Promotion (2011)
Lance Corporal Conduct Range Quadrants and Probabilites of Promotion (2003) Lance Corporal Proficiency Range Quadrants and Probabilites of Promotion (2003)
Lance Corporal Conduct Range Quadrants and Probabilites of Promotion (2004) Lance Corporal Proficiency Range Quadrants and Probabilites of Promotion (2004)
Lance Corporal Conduct Range Quadrants and Probabilites of Promotion (2006) Lance Corporal Proficiency Range Quadrants and Probabilites of Promotion (2006)
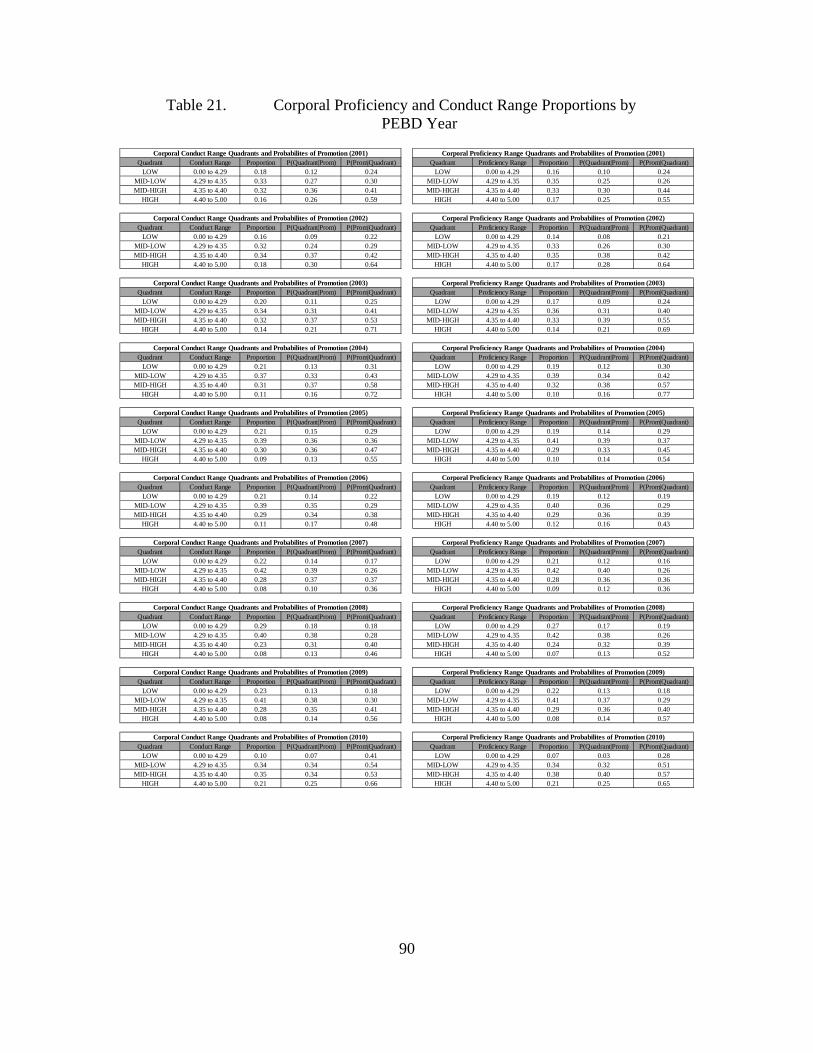
90
Table 21. Corporal Proficiency and Conduct Range Proportions by PEBD Year
Quadrant Conduct Range Proportion P(Quadrant|Prom) P(Prom|Quadrant) Quadrant Proficiency Range Proportion P(Quadrant|Prom) P(Prom|Quadrant)LOW 0.00 to 4.29 0.18 0.12 0.24 LOW 0.00 to 4.29 0.16 0.10 0.24
MID-LOW 4.29 to 4.35 0.33 0.27 0.30 MID-LOW 4.29 to 4.35 0.35 0.25 0.26MID-HIGH 4.35 to 4.40 0.32 0.36 0.41 MID-HIGH 4.35 to 4.40 0.33 0.30 0.44
HIGH 4.40 to 5.00 0.16 0.26 0.59 HIGH 4.40 to 5.00 0.17 0.25 0.55
Quadrant Conduct Range Proportion P(Quadrant|Prom) P(Prom|Quadrant) Quadrant Proficiency Range Proportion P(Quadrant|Prom) P(Prom|Quadrant)LOW 0.00 to 4.29 0.16 0.09 0.22 LOW 0.00 to 4.29 0.14 0.08 0.21
MID-LOW 4.29 to 4.35 0.32 0.24 0.29 MID-LOW 4.29 to 4.35 0.33 0.26 0.30MID-HIGH 4.35 to 4.40 0.34 0.37 0.42 MID-HIGH 4.35 to 4.40 0.35 0.38 0.42
HIGH 4.40 to 5.00 0.18 0.30 0.64 HIGH 4.40 to 5.00 0.17 0.28 0.64
Quadrant Conduct Range Proportion P(Quadrant|Prom) P(Prom|Quadrant) Quadrant Proficiency Range Proportion P(Quadrant|Prom) P(Prom|Quadrant)LOW 0.00 to 4.29 0.20 0.11 0.25 LOW 0.00 to 4.29 0.17 0.09 0.24
MID-LOW 4.29 to 4.35 0.34 0.31 0.41 MID-LOW 4.29 to 4.35 0.36 0.31 0.40MID-HIGH 4.35 to 4.40 0.32 0.37 0.53 MID-HIGH 4.35 to 4.40 0.33 0.39 0.55
HIGH 4.40 to 5.00 0.14 0.21 0.71 HIGH 4.40 to 5.00 0.14 0.21 0.69
Quadrant Conduct Range Proportion P(Quadrant|Prom) P(Prom|Quadrant) Quadrant Proficiency Range Proportion P(Quadrant|Prom) P(Prom|Quadrant)LOW 0.00 to 4.29 0.21 0.13 0.31 LOW 0.00 to 4.29 0.19 0.12 0.30
MID-LOW 4.29 to 4.35 0.37 0.33 0.43 MID-LOW 4.29 to 4.35 0.39 0.34 0.42MID-HIGH 4.35 to 4.40 0.31 0.37 0.58 MID-HIGH 4.35 to 4.40 0.32 0.38 0.57
HIGH 4.40 to 5.00 0.11 0.16 0.72 HIGH 4.40 to 5.00 0.10 0.16 0.77
Quadrant Conduct Range Proportion P(Quadrant|Prom) P(Prom|Quadrant) Quadrant Proficiency Range Proportion P(Quadrant|Prom) P(Prom|Quadrant)LOW 0.00 to 4.29 0.21 0.15 0.29 LOW 0.00 to 4.29 0.19 0.14 0.29
MID-LOW 4.29 to 4.35 0.39 0.36 0.36 MID-LOW 4.29 to 4.35 0.41 0.39 0.37MID-HIGH 4.35 to 4.40 0.30 0.36 0.47 MID-HIGH 4.35 to 4.40 0.29 0.33 0.45
HIGH 4.40 to 5.00 0.09 0.13 0.55 HIGH 4.40 to 5.00 0.10 0.14 0.54
Quadrant Conduct Range Proportion P(Quadrant|Prom) P(Prom|Quadrant) Quadrant Proficiency Range Proportion P(Quadrant|Prom) P(Prom|Quadrant)LOW 0.00 to 4.29 0.21 0.14 0.22 LOW 0.00 to 4.29 0.19 0.12 0.19
MID-LOW 4.29 to 4.35 0.39 0.35 0.29 MID-LOW 4.29 to 4.35 0.40 0.36 0.29MID-HIGH 4.35 to 4.40 0.29 0.34 0.38 MID-HIGH 4.35 to 4.40 0.29 0.36 0.39
HIGH 4.40 to 5.00 0.11 0.17 0.48 HIGH 4.40 to 5.00 0.12 0.16 0.43
Quadrant Conduct Range Proportion P(Quadrant|Prom) P(Prom|Quadrant) Quadrant Proficiency Range Proportion P(Quadrant|Prom) P(Prom|Quadrant)LOW 0.00 to 4.29 0.22 0.14 0.17 LOW 0.00 to 4.29 0.21 0.12 0.16
MID-LOW 4.29 to 4.35 0.42 0.39 0.26 MID-LOW 4.29 to 4.35 0.42 0.40 0.26MID-HIGH 4.35 to 4.40 0.28 0.37 0.37 MID-HIGH 4.35 to 4.40 0.28 0.36 0.36
HIGH 4.40 to 5.00 0.08 0.10 0.36 HIGH 4.40 to 5.00 0.09 0.12 0.36
Quadrant Conduct Range Proportion P(Quadrant|Prom) P(Prom|Quadrant) Quadrant Proficiency Range Proportion P(Quadrant|Prom) P(Prom|Quadrant)LOW 0.00 to 4.29 0.29 0.18 0.18 LOW 0.00 to 4.29 0.27 0.17 0.19
MID-LOW 4.29 to 4.35 0.40 0.38 0.28 MID-LOW 4.29 to 4.35 0.42 0.38 0.26MID-HIGH 4.35 to 4.40 0.23 0.31 0.40 MID-HIGH 4.35 to 4.40 0.24 0.32 0.39
HIGH 4.40 to 5.00 0.08 0.13 0.46 HIGH 4.40 to 5.00 0.07 0.13 0.52
Quadrant Conduct Range Proportion P(Quadrant|Prom) P(Prom|Quadrant) Quadrant Proficiency Range Proportion P(Quadrant|Prom) P(Prom|Quadrant)LOW 0.00 to 4.29 0.23 0.13 0.18 LOW 0.00 to 4.29 0.22 0.13 0.18
MID-LOW 4.29 to 4.35 0.41 0.38 0.30 MID-LOW 4.29 to 4.35 0.41 0.37 0.29MID-HIGH 4.35 to 4.40 0.28 0.35 0.41 MID-HIGH 4.35 to 4.40 0.29 0.36 0.40
HIGH 4.40 to 5.00 0.08 0.14 0.56 HIGH 4.40 to 5.00 0.08 0.14 0.57
Quadrant Conduct Range Proportion P(Quadrant|Prom) P(Prom|Quadrant) Quadrant Proficiency Range Proportion P(Quadrant|Prom) P(Prom|Quadrant)LOW 0.00 to 4.29 0.10 0.07 0.41 LOW 0.00 to 4.29 0.07 0.03 0.28
MID-LOW 4.29 to 4.35 0.34 0.34 0.54 MID-LOW 4.29 to 4.35 0.34 0.32 0.51MID-HIGH 4.35 to 4.40 0.35 0.34 0.53 MID-HIGH 4.35 to 4.40 0.38 0.40 0.57
HIGH 4.40 to 5.00 0.21 0.25 0.66 HIGH 4.40 to 5.00 0.21 0.25 0.65
Corporal Conduct Range Quadrants and Probabilites of Promotion (2010) Corporal Proficiency Range Quadrants and Probabilites of Promotion (2010)
Corporal Conduct Range Quadrants and Probabilites of Promotion (2007) Corporal Proficiency Range Quadrants and Probabilites of Promotion (2007)
Corporal Conduct Range Quadrants and Probabilites of Promotion (2008) Corporal Proficiency Range Quadrants and Probabilites of Promotion (2008)
Corporal Conduct Range Quadrants and Probabilites of Promotion (2009) Corporal Proficiency Range Quadrants and Probabilites of Promotion (2009)
Corporal Proficiency Range Quadrants and Probabilites of Promotion (2004)
Corporal Conduct Range Quadrants and Probabilites of Promotion (2005) Corporal Proficiency Range Quadrants and Probabilites of Promotion (2005)
Corporal Conduct Range Quadrants and Probabilites of Promotion (2006) Corporal Proficiency Range Quadrants and Probabilites of Promotion (2006)
Corporal Conduct Range Quadrants and Probabilites of Promotion (2004)
Corporal Conduct Range Quadrants and Probabilites of Promotion (2001) Corporal Proficiency Range Quadrants and Probabilites of Promotion (2001)
Corporal Conduct Range Quadrants and Probabilites of Promotion (2002) Corporal Proficiency Range Quadrants and Probabilites of Promotion (2002)
Corporal Conduct Range Quadrants and Probabilites of Promotion (2003) Corporal Proficiency Range Quadrants and Probabilites of Promotion (2003)

91
Table 22. Sergeant Reporting Senior and Reviewing Officer Value Proportions by PEBD Year
Quadrant Reporting Senior Proportion P(Quadrant|Prom) P(Prom|Quadrant) Quadrant Reviewing Officer Proportion P(Quadrant|Prom) P(Prom|Quadrant)
LOW 00.00 to 88.2 0.25 0.09 0.11 LOW -5.0 to -.45 0.25 0.09 0.13MID-LOW 88.20 to 90.55 0.25 0.22 0.34 MID-LOW -.45 to .1 0.25 0.23 0.35MID-HIGH 90.55 to 92.8 0.25 0.35 0.47 MID-HIGH .1 to .66 0.25 0.31 0.47
HIGH 92.80 to 100 0.25 0.33 0.60 HIGH .66 to 5.0 0.25 0.37 0.57
Quadrant Reporting Senior Proportion P(Quadrant|Prom) P(Prom|Quadrant) Quadrant Reviewing Officer Proportion P(Quadrant|Prom) P(Prom|Quadrant)LOW 00.00 to 88 0.25 0.07 0.09 LOW -5.0 to -.45 0.25 0.07 0.09
MID-LOW 88.00 to 90.55 0.25 0.23 0.28 MID-LOW -.45 to .1 0.25 0.24 0.29MID-HIGH 90.55 to 93 0.25 0.32 0.39 MID-HIGH .1 to .629 0.25 0.32 0.40
HIGH 93.00 to 100 0.25 0.38 0.46 HIGH .629 to 5.0 0.25 0.37 0.46
Quadrant Reporting Senior Proportion P(Quadrant|Prom) P(Prom|Quadrant) Quadrant Reviewing Officer Proportion P(Quadrant|Prom) P(Prom|Quadrant)LOW 00.00 to 88.34 0.25 0.04 0.04 LOW -5.0 to -.42 0.25 0.06 0.06
MID-LOW 88.34 to 90.65 0.25 0.22 0.22 MID-LOW -.42 to .14 0.25 0.21 0.21MID-HIGH 90.65 to 93.05 0.25 0.35 0.35 MID-HIGH .14 to .7 0.25 0.31 0.31
HIGH 93.05 to 100 0.25 0.39 0.39 HIGH .7 to 5.0 0.25 0.42 0.42
Quadrant Reporting Senior Proportion P(Quadrant|Prom) P(Prom|Quadrant) Quadrant Reviewing Officer Proportion P(Quadrant|Prom) P(Prom|Quadrant)LOW 00.00 to 88.09 0.25 0.03 0.03 LOW -5.0 to -.462 0.25 0.05 0.04
MID-LOW 88.09 to 90.4 0.25 0.19 0.17 MID-LOW -.462 to .128 0.25 0.19 0.17MID-HIGH 90.40 to 92.75 0.25 0.34 0.30 MID-HIGH .128 to .7 0.25 0.33 0.30
HIGH 92.75 to 100 0.25 0.44 0.39 HIGH .7 to 5.0 0.25 0.43 0.38
Quadrant Reporting Senior Proportion P(Quadrant|Prom) P(Prom|Quadrant) Quadrant Reviewing Officer Proportion P(Quadrant|Prom) P(Prom|Quadrant)LOW 00.00 to 89 0.25 0.08 0.10 LOW -5.0 to -.26 0.25 0.07 0.09
MID-LOW 89.00 to 91 0.25 0.23 0.30 MID-LOW -.26 to .25 0.25 0.23 0.30MID-HIGH 91.00 to 93.4 0.25 0.30 0.39 MID-HIGH .25 to .75 0.25 0.31 0.40
HIGH 93.40 to 100 0.25 0.39 0.50 HIGH .75 to 5.0 0.25 0.39 0.50
Quadrant Reporting Senior Proportion P(Quadrant|Prom) P(Prom|Quadrant) Quadrant Reviewing Officer Proportion P(Quadrant|Prom) P(Prom|Quadrant)LOW 00.00 to 89.3 0.25 0.09 0.14 LOW -5.0 to -.26 0.25 0.09 0.14
MID-LOW 89.30 to 91.55 0.25 0.23 0.37 MID-LOW -.26 to .36 0.25 0.24 0.38MID-HIGH 91.55 to 94.15 0.25 0.30 0.48 MID-HIGH .36 to .87 0.25 0.31 0.50
HIGH 94.15 to 100 0.25 0.38 0.60 HIGH .87 to 5.0 0.25 0.36 0.58
Quadrant Reporting Senior Proportion P(Quadrant|Prom) P(Prom|Quadrant) Quadrant Reviewing Officer Proportion P(Quadrant|Prom) P(Prom|Quadrant)LOW 00.00 to 88.35 0.25 0.06 0.08 LOW -5.0 to -.414 0.25 0.07 0.08
MID-LOW 88.35 to 90.66 0.25 0.22 0.25 MID-LOW -.414 to .16 0.25 0.22 0.26MID-HIGH 90.66 to 93.05 0.25 0.33 0.38 MID-HIGH .16 to .7 0.25 0.31 0.36
HIGH 93.05 to 100 0.25 0.39 0.45 HIGH .7 to 5.0 0.25 0.40 0.46
Sergeant Reporting Senior Quadrants and Probabilites of Promotion (2007) Sergeant Reviewing Officer Quadrants and Probabilites of Promotion (2007)
Sergeant Reporting Senior Quadrants and Probabilites of Promotion (2003) Sergeant Reviewing Officer Quadrants and Probabilites of Promotion (2003)
Sergeant Reporting Senior Quadrants and Probabilites of Promotion (2004) Sergeant Reviewing Officer Quadrants and Probabilites of Promotion (2004)
Sergeant Reporting Senior Quadrants and Probabilites of Promotion (2005) Sergeant Reviewing Officer Quadrants and Probabilites of Promotion (2005)
Sergeant Reporting Senior Quadrants and Probabilites of Promotion (2001) Sergeant Reviewing Officer Quadrants and Probabilites of Promotion (2001)
Sergeant Reporting Senior Quadrants and Probabilites of Promotion (2002) Sergeant Reviewing Officer Quadrants and Probabilites of Promotion (2002)
Sergeant Reporting Senior Quadrants and Probabilites of Promotion (2006) Sergeant Reviewing Officer Quadrants and Probabilites of Promotion (2006)
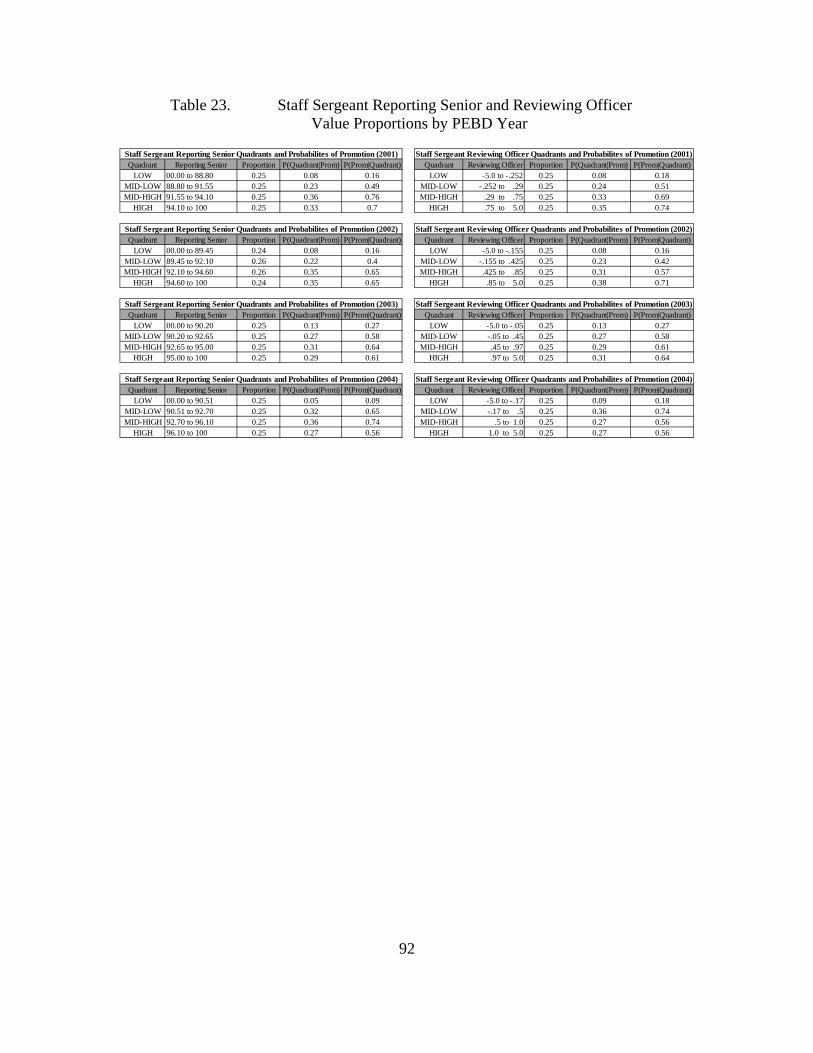
92
Table 23. Staff Sergeant Reporting Senior and Reviewing Officer Value Proportions by PEBD Year
Quadrant Reporting Senior Proportion P(Quadrant|Prom) P(Prom|Quadrant) Quadrant Reviewing Officer Proportion P(Quadrant|Prom) P(Prom|Quadrant)LOW 00.00 to 88.80 0.25 0.08 0.16 LOW -5.0 to -.252 0.25 0.08 0.18
MID-LOW 88.80 to 91.55 0.25 0.23 0.49 MID-LOW -.252 to .29 0.25 0.24 0.51MID-HIGH 91.55 to 94.10 0.25 0.36 0.76 MID-HIGH .29 to .75 0.25 0.33 0.69
HIGH 94.10 to 100 0.25 0.33 0.7 HIGH .75 to 5.0 0.25 0.35 0.74
Quadrant Reporting Senior Proportion P(Quadrant|Prom) P(Prom|Quadrant) Quadrant Reviewing Officer Proportion P(Quadrant|Prom) P(Prom|Quadrant)LOW 00.00 to 89.45 0.24 0.08 0.16 LOW -5.0 to -.155 0.25 0.08 0.16
MID-LOW 89.45 to 92.10 0.26 0.22 0.4 MID-LOW -.155 to .425 0.25 0.23 0.42MID-HIGH 92.10 to 94.60 0.26 0.35 0.65 MID-HIGH .425 to .85 0.25 0.31 0.57
HIGH 94.60 to 100 0.24 0.35 0.65 HIGH .85 to 5.0 0.25 0.38 0.71
Quadrant Reporting Senior Proportion P(Quadrant|Prom) P(Prom|Quadrant) Quadrant Reviewing Officer Proportion P(Quadrant|Prom) P(Prom|Quadrant)LOW 00.00 to 90.20 0.25 0.13 0.27 LOW -5.0 to -.05 0.25 0.13 0.27
MID-LOW 90.20 to 92.65 0.25 0.27 0.58 MID-LOW -.05 to .45 0.25 0.27 0.58MID-HIGH 92.65 to 95.00 0.25 0.31 0.64 MID-HIGH .45 to .97 0.25 0.29 0.61
HIGH 95.00 to 100 0.25 0.29 0.61 HIGH .97 to 5.0 0.25 0.31 0.64
Quadrant Reporting Senior Proportion P(Quadrant|Prom) P(Prom|Quadrant) Quadrant Reviewing Officer Proportion P(Quadrant|Prom) P(Prom|Quadrant)LOW 00.00 to 90.51 0.25 0.05 0.09 LOW -5.0 to -.17 0.25 0.09 0.18
MID-LOW 90.51 to 92.70 0.25 0.32 0.65 MID-LOW -.17 to .5 0.25 0.36 0.74MID-HIGH 92.70 to 96.10 0.25 0.36 0.74 MID-HIGH .5 to 1.0 0.25 0.27 0.56
HIGH 96.10 to 100 0.25 0.27 0.56 HIGH 1.0 to 5.0 0.25 0.27 0.56
Staff Sergeant Reporting Senior Quadrants and Probabilites of Promotion (2004) Staff Sergeant Reviewing Officer Quadrants and Probabilites of Promotion (2004)
Staff Sergeant Reporting Senior Quadrants and Probabilites of Promotion (2001) Staff Sergeant Reviewing Officer Quadrants and Probabilites of Promotion (2001)
Staff Sergeant Reporting Senior Quadrants and Probabilites of Promotion (2002) Staff Sergeant Reviewing Officer Quadrants and Probabilites of Promotion (2002)
Staff Sergeant Reporting Senior Quadrants and Probabilites of Promotion (2003) Staff Sergeant Reviewing Officer Quadrants and Probabilites of Promotion (2003)

93
LIST OF REFERENCES
Clemens, Adam, Lauren Malone, Shannon Phillips, Gary Lee, Cathy Hiatt, and Theresa Kimble, 2012. “An Evaluation of the Fitness Report System For Marine Officers.” CNA Study. DRM-2012-U-001003-Final. http://www.dtic.mil/docs/citations/AD1014581.
Friedman, Jerome, Trevor Hastie, and Rob Tibshirani, 2010. “Regularization Paths For Generalized Linear Models Via Coordinate Descent.” Journal of Statistical Software 33(1), 1–22. http://www.jstatsoft.org/v33/i01/.
Garza, Raul. 2014. “United States Marine Corps Career Designation Board: Significant Factors in Predicting Selection.” MBA professional report. http://calhoun.nps.edu/handle/10945/41381.
Gonzalez, Michael. 2011. “Analysis of Promotion Rates to Lieutenant Colonel and Selection for Command for USMC Aviation Supply and Maintenance Officers.” MBA professional report. http://oai.dtic.mil/oai/oai?verb=getRecord&metadataPrefix=html&identifier=ADA556263.
Hartley, Simon. 2017. “The BMI Formula.” What Health. http://www.whathealth.com/bmi/formula.html.
Hoffman, Joel. 2008. “Significant Factors in Predicting Promotion to Major, Lieutenant Colonel, and Colonel in the United States Marine Corps.” MBA professional report. http://oai.dtic.mil/oai/oai?verb=getRecord&metadataPrefix=html&identifier=ADA479928.
Hovey, Erik. 2005. “Fuzzy Math: Do Current Relative Values Tell An Accurate Story?” Contemporary issue paper. http://oai.dtic.mil/oai/oai?verb=getRecord&metadataPrefix=html&identifier=ADA505526.
Jobst, Mark and Jeffrey Palmer. 2005. “An Analysis of the USMC FITREP: Contemporary Or Inflexible?” (MBA professional report). http://calhoun.nps.edu/handle/10945/2210.
Larger, Richard. 2016. “Effectiveness of the Marine Corps’ Junior Enlisted Performance Evaluation System: An Evaluation of Proficiency and Conduct Marks.” MBA professional report. http://calhoun.nps.edu/handle/10945/53006.
Lazear, Edward, and Michael Gibbs. 2015. Personnel Economics in Practice (3rd ed.). Hoboken, NJ: John Wiley & Sons.
94
Neller, Robert. 2016. “37th Commandant of the Marine Corps: Commandant’s Planning Guidance.” United States Marine Corps. http://www.hqmc.marines.mil/Portals/142/Docs/CMC%20FRAGO%2001%2019JAN16.pdf.
Neuwirth, Erich. 2014. RColorBrewer: ColorBrewer Palettes. R package version 1.1-2. https://CRAN.R-project.org/package=RColorBrewer.
R Core Team 2016. R: A Language and Environment For Statistical Computing. R Foundation for Statistical Computing, Vienna, Austria. https://www.R-project.org/.
Rao, Venky. 2013. Introduction to Classification and Regression Trees (CART). Data Science Central. http://www.datasciencecentral.com/profiles/blogs/introduction-to-classification-regression-trees-cart.
Reynolds, Jacob. 2011. “Effect of being an aviator on promotion to O-5 in the USMC” MBA professional report. http://calhoun.nps.edu/handle/10945/5790.
Ripley, B. 2016. Tree: Classification and regression trees. R package version 1.0-37. https://CRAN.R-project.org/package=tree.pdf.
Therneau, Terry, Beth Atkinson, and Brian Ripley. 2015. Rpart: Recursive Partitioning and Regression Trees. R Package Version 4.1-10. https://CRAN.R-project.org/package=rpart.
United States Marine Corps. 2000. Marine Corps Individual Records Administration Manual (MCO P1070.12K w/ CH 1). Washington, DC: Department of the Navy. http://www.trngcmd.marines.mil/Portals/207/Docs/TBS/B3K4070%20Individual%20Records%20Administration%20Manual.pdf?ver=2015-03-26-102229-447.
United States Marine Corps. 2008a. Marine Corps Physical Fitness Program (MCO 6100.13 w/ CH 1). Washington, DC: Department of the Navy. http://www.marines.mil/Portals/59/Publications/MCO%206100.13%20W_CH%201.pdf.
United States Marine Corps. 2008b. “Proficiency, Conduct Marks and Composite Score Computation.” http://www.marines.mil/News/Messages/Messages-Display/Article/886712/proficiency-conduct-marks-and-composite-score-computation/.
United States Marine Corps. 2013. Infantry Training and Readiness Manual (NAVMC 3500.44B). Washington, DC: Department of the Navy.http://www.marines.mil/Portals/59/Publications/NAVMC%203500.44B.pdf.
United States Marine Corps. 2015a. Fitness Reports B3K3738 Student Handout. http://www.trngcmd.marines.mil/Portals/207/Docs/TBS/B3K3738%20Fitness%20Report.pdf?ver=2015-03-26-102052-153.
95
United States Marine Corps. 2015b. Organization of the United States Marine Corps (MCRP 5–12D). Washington, DC: United States Marine Corps. http://www.marines.mil/Portals/59/Publications/MCRP%205-12D.pdf.
United States Marine Corps. 2015c. Performance Evaluation System, MCO 1610.7. http://www.marines.mil/Portals/59/Publications/MCO%201610.7.pdf.
Wickham, Hadley. 2011. The Split-Apply-Combine Strategy For Data Analysis. Journal of Statistical Software, 40(1), 1–29. http://www.jstatsoft.org/v40/i01/.
Wickham, Hadley. 2016. tidyr: Easily tidy data with `spread()` and `gather()` functions. R package version 0.6.0. https://CRAN.R-project.org/package=tidyr.
Wickham, Hadley, and R Francois. 2016. dplyr: A Grammar of Data Manipulation. R package version 0.5.0. https://CRAN.R-project.org/package=dplyr.
Williams, Graham. 2011. Data Mining with Rattle and R: The Art of Excavating Data for Knowledge Discovery, use R!, Springer NY: Dordrecht Heidelberg London. https://books.google.com/books?hl=en&lr=&id=mDs7OXj03V0C&oi=fnd&pg=PR3&dq=Data+mining+with+Rattle+and+R:+The+art+of+excavating+data+for+knowledge+discovery&ots=m_V8lghS4k&sig=bDeOkjhKvN0nagWR8vkseU9H98Y#v=onepage&q=Data%20mining%20with%20Rattle%20and%20R%3A%20The%20art%20of%20excavating%20data%20for%20knowledge%20discovery&f=false.

96
THIS PAGE INTENTIONALLY LEFT BLANK
97
INITIAL DISTRIBUTION LIST
1. Defense Technical Information Center Ft. Belvoir, Virginia 2. Dudley Knox Library Naval Postgraduate School Monterey, California