Project Report " Research Methodology " " Impact of Subliminal Perceptual Embedding in...
30
A Project Report ON “Research Methodology” Topic On “Impact of Subliminal Perceptual Embedding in Advertisements” 1 | Page
Transcript of Project Report " Research Methodology " " Impact of Subliminal Perceptual Embedding in...

A
Project ReportON
“Research Methodology”Topic On
“Impact of Subliminal Perceptual
Embedding in Advertisements”
1 | P a g e

Declaration We hereby declare that the following
project report titled “Impact Of
Subliminal Perceptual Embedding In
Advertisements” is an authentic work done
by us. This is to declare that all work
indulged in the completion of this work
such as research, analysis of activities
of an organization is a profound and
honest work of ours.
2 | P a g e

ACKNOWLEDGEMENT We would like to express hearty
gratitude to our faculty guide, Miss.
………………… for giving us the opportunity
to prepare a project report on “Impact OfSubliminal Perceptual Embedding In
Advertisements” and for his valuable
3 | P a g e

guidance and sincere cooperation, which
helped us in completing this project.
4 | P a g e

Table of Contents
Sl.No. Topic Page Nos.
1
Introduction :§1.1 Subliminal Perception – A briefintroduction§1.2 Subliminal Perception and its usage inMarketing– A brief introduction
5 -8
2 Objectives 9-10
3. Methodology 11-14
4. Findings & Analysis 15-29
5. Conclusions 30-31
6. Recommendations & Suggestions 32-33
7. Bibliography 34-35
5 | P a g e

Introduction§1.1 Subliminal Perception – a brief introduction
Subliminal Perception occurs whenever stimuli presented belowthe threshold or limens for awareness are found to influencethrough feeling or actions. Stimuli that are too weak to beconsciously seen or heard may nevertheless be strong enough tobe perceived by one or more receptor cells. The process iscalled subliminal perception because the stimulus is beneaththe threshold or limens of conscious awareness, thoughobviously not beneath the absolute threshold of the receptorinvolved.
Here, the above graph shows that the SUBLIMINAL PERCEPTIONSlies between the limens (level of conscious awareness) andabsolute threshold
An advertising message presented below the threshold ofconsciousness. A visual or auditory message that is allegedlyperceived psychologically, but not consciously Subliminalmessages and perception are linked to the idea of mind control,and the roots of this are placed very far back in our history.Mind control is where an individual or group of individuals canbe controlled without their awareness. It is perception belowthe individual's/group's threshold. It is also the idea thatpeople can be made to do things they would not ordinarily do.
The concept of subliminal perception is of considerableinterest because it suggests that peoples' thoughts, feelings
6 | P a g e

and actions are influenced by stimuli that are perceivedwithout any awareness of perceiving. This interest wasreflected in some of the earliest psychological studiesconducted during the late 1800s and early 1900s. In these earlystudies, people were simply asked whether or not they wereaware of perceiving. For example, visual stimuli such asletters, digits, or geometric figures were presented at such adistance from observers that they claimed either not to seeanything at all or to see nothing more than blurred dots.Likewise, auditory stimuli such as the names of letters werewhispered so faintly that observers claimed that they wereunable to hear any sound whatsoever.
To test whether these visual or auditory stimuli may have beenperceived despite the statements to the contrary, the observerswere asked to make guesses regarding the stimuli. For example,if half the stimuli were letters and half the stimuli weredigits, the observers may have been asked to guess whether aletter or a digit had been presented. The consistent resultfound in these early studies was that the observers' guessesregarding the stimuli were more correct than would be expectedon the basis of chance guessing. In other words, despite theobservers' statements indicating that they were unaware ofperceiving the stimuli, their guesses indicated that they didin fact perceive sufficient information to make accurateguesses regarding the stimuli. Over the years, there have beenliterally hundreds of studies following a similar format. Takentogether, these studies show that considerable informationcapable of informing decisions and guiding actions is perceivedeven when observers do not experience any awareness ofperceiving.
7 | P a g e

8 | P a g e

§1.2 Subliminal Perception and its usage in Marketing
USES: Marketers use subliminal perception by showing hiddenmessages embedded in another signal design to pass below thenormal limit of human perception such as dynamic images of aproduct which compels attention.Subliminal messages (or subliminal stimuli) are sensory relatedstimuli below a person’s level of conscious perception. Here,the above picture shows ICE and creates a perceptions in theviewers, of thirst, which is a complete example of SubliminalPerception.The two most prominent types used by the marketers are visualstimuli and audio stimuli. Visual based subliminal messages areimages which are quickly flashed before the brain has time toprocess them, or are flashed and masked, which also interruptsprocessing by the brain. Audio subliminal stimuli may be played below audible volumes,or similarly masked by other sounds and noises, or recordedbackwards in a process called back masking.
9 | P a g e

OBJECTIVESTo understand SUBLIMINAL PERCEPTION and identify thecases of its usage in Food and Beverages. To study the impact of usages of Subliminal Perceptualembedding in advertisement of Food and Beverages amongthe students of APC, BCREC.
10 | P a g e

METHODOLOGY FOR DATA COLLECTION
The study will be partly qualitative and quantitativein nature and will be based on both PRIMARY andSECONDARY sources of data PRIMARY SOURCES:
The study will be based on a sample survey ofstudents pursuing the UG courses at APC, BCREC basedon the following sampling plan.Sample Size : 50 Sampling unit: he or she is a student of APC, BCREC. Sample technique: Systematic random sampling. Sampling Frame : College Roll Sheet Sampling instrument: Structured questionnaire.
SECONDARY SOURCES:
WebPages, Books, Journals and Periodicals
11 | P a g e

Structured Questionnaire for Survey on Subliminal Perceptionsand its effects
Q1.What do you feel about the Ad? a. Interesting. b. Not at all stimulating c. could not understand Q2. Do you feel like going and trying the productright now? a. Yes b. No
12 | P a g e

Methodology for data analysis
The data so collected was tabulated and analysed by usingstatistical tool like PIE CHART and CHI SQUARE TEST fordependence of attribute.
Chi-square is a statistical test commonly used to compareobserved data with data The chi-square test is always testing what scientists callthe null hypothesis (Ho), which states that there is nosignificant difference between the expected and observedresult. The formula for calculating chi-square (X2) is:X2= (o-e) 2/e
That is, chi-square is the sum of the squared differencebetween observed (o) and the expected (e) data (or thedeviation, d), divided by the expected data in all possiblecategories.Expected value is calculated by:E= RT*Ct/Gt where RT is row total
C t iscolumn total and Gt is grand total
Degree of freedom (dof) is calculated by the formula:(R-1)(C-1)
Where r is no. of row and c is no. ofcolumn.H0 (null hypothesis): Which means there is no correlationbetween two variables.H1: which means there is correlation between two variables. 5% of level of significance is taken and if
X2(tabulated)>X2
(calculated) Ho is accepted
13 | P a g e
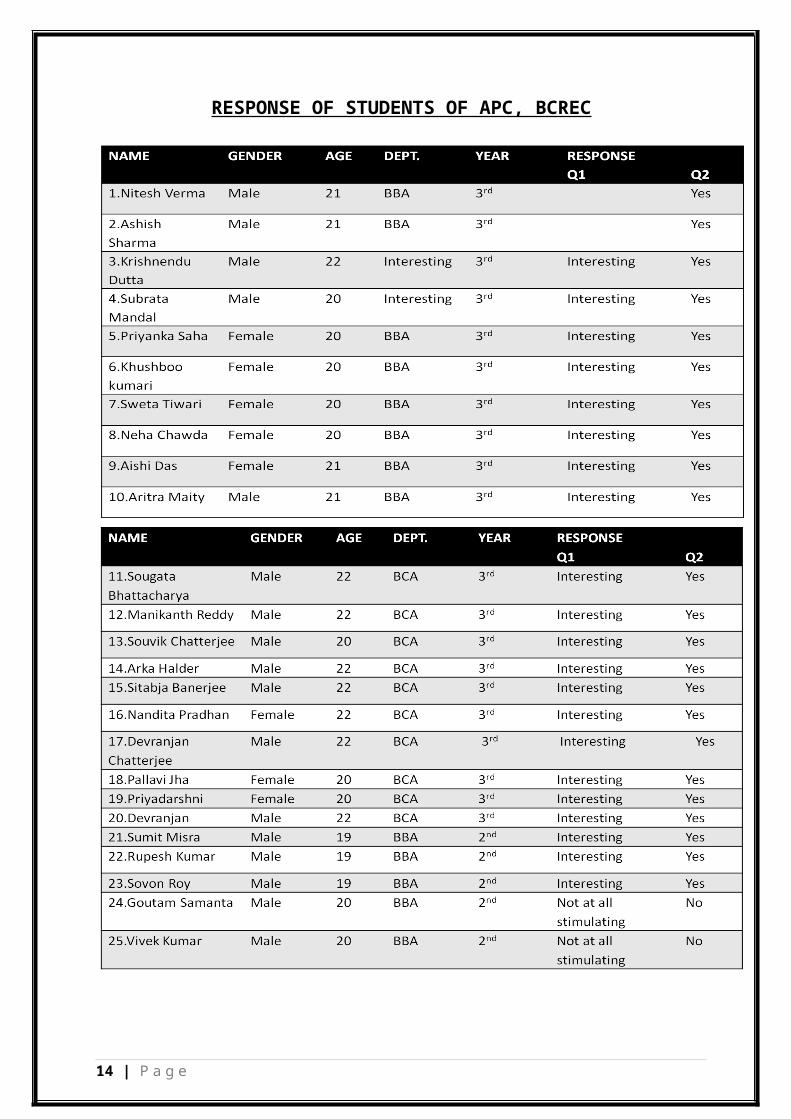
RESPONSE OF STUDENTS OF APC, BCREC
14 | P a g e

15 | P a g e

Overall response to the Ads (For the 1 st question).
In the above Pie Chart, we have shown the overallresponse of the students of APC, BCREC that what theyfeel about the product.Here, 4% of the students says (out of 50 students, 2says) that ads were not at all stimulating.5% of students says (out of 50 students, 5 says) thatthey couldn’t understand the ads.Whereas, 86% of students say (out of 50 students, 43says) that ads were interesting.
16 | P a g e

RESPONSE OF STUDENTS FROM DIFFERENT DEPARTMENTS
BBA Students
In the above Pie Chart, we have shown the response of the BBA(H) students of APC, BCREC towards the ads. 9% of BBA (H) students (out of 30 students, 3) say that theycouldn’t understand the ads.0% of BBA (H) students say that ads were not at all stimulatingWhereas, 91% of the BBA (H) students (out of 30 students, 27)says that ads were interesting.
BCA Students
In the above Pie Chart, we have shown the response of the BCAstudents of APC, BCREC towards the ads. 9% of BCA students (out of 21 students, 2) say that theycouldn’t understand the ads.0% of BCA students say that ads were not at all stimulating.Whereas, 91% of the BCA students (out of 21 students, 19) saysthat ads were interesting
17 | P a g e

RESPONSE OF STUDENTS FROM DIFFERENT YEARS1 st Year Students
Here, in the above Pie Chart, we have shown the response of the1st year students of towards the ads. 10% of 1st year students says (out of 20 students, 2 says) thatthey couldn’t understand the ads.0% of 1st year students say that ads were not at allstimulating.Whereas, 90% of the students says (out of 20 students, 18 says)that ads were interesting.
2 nd Year Students
Here, in the above Pie Chart, we have shown the responses of2nd year students towards the ads.20% of 2nd year students say (out of 15 students, 3 says) theycouldn’t understand the ads.13% of 2nd year students says (out of 15 students, 2 says) thatads were not at all stimulating.Whereas, 67% of 2nd year students says (out of 15 students, 10says) that ads were interesting
3 rd Year students
18 | P a g e
Here, in the above PieChart, we have shown theresponses of 3rd yearstudents towards the ads.
0% of 3rd year students saythat ads were not at allstimulating.
0% of 3rd year students saythat they couldn’tunderstand the ads.
100% of the students says

RESPONSE OF STUDENTS FROM DIFFERENT GENDERSMale Students
Here, in the above Pie Chart, we have shown the response ofmale students towards the ads.8% of male students say (out of 26 students, 2 says) theycouldn’t understand the ads.7% of male students says (out of 26 students, 2 says) that adswere not at all stimulating.Whereas, 85% of male students says (out of 26 students, 22says) that ads were interesting.
Female Students
Here, in the above Pie Chart, we have shown the responses offemale students towards the ads.12% of female students says (out of 25 students, 3 says) theycouldn’t understand the ads.0% of female students say that ads were not at all stimulating.Whereas, 88% of female students says (out of 25 students, 22says) that ads were interesting.
19 | P a g e
Here, in the above PieChart, we have shown theresponses of 3rd yearstudents towards the ads.
0% of 3rd year students saythat ads were not at allstimulating.
0% of 3rd year students saythat they couldn’tunderstand the ads.
100% of the students says

OVERALL RESPONSE TO THE ADS (For second question)
Here, in the above Pie Chart, we have shown the overallresponse of the students of APC, BCREC that whether they aregoing to try the product or not.21% of the students says (out of 50 students, 10 says), No,they are not going to try the products.Whereas, 79% of the students says (out of 50 students, 40says), Yes, they are going to try the products.
20 | P a g e

RESPONSE OF STUDENTS FROM DIFFERENT DEPARTMENT
BBA Students
Here, in the above Pie Chart, we have shown the response of thestudents of BBA (H) departments.23% of the students of BBA (H) says (out of 30 students,7says), No, they are not going to try the products.Whereas, 77% of the students of BBA (H) says (out of 30students, 23 says), Yes, they are going to try the products.
BCA Students
Here, in the above Pie Chart, we have shown the response of thestudents of BCA departments.23% of the students of BCA says (out of 21 students,3 says),No, they are not going to try the products.Whereas, 82% of the students of BBC says (out of 21 students,18 says), Yes, they are going to try the products.
21 | P a g e

RESPONSE OF STUDENTS FROM DIFFERENT YEAR
1 st Year Students
Here, in the above Pie Chart, we have shown the response of 1st
year students of APC, BCREC.29% of the students of 1st year says (out of 20 students, 6says), No, they are not going to try the products.Whereas, 71% of the students of 1st year says (out of 20students, 14 says), Yes, they are going to try the products.
2 nd Year Students
Here, in the above Pie Chart, we have shown the response of 2ndyear students of APC, BCREC.33% of the students of 2nd year says (out of 15 students,5says), No, they are not going to try the products.Whereas, 67% of the students of 2nd year says (out of 15students, 10 says), Yes, they are going to try the products.
22 | P a g e

3 rd Year Students
Here, in the above Pie Chart, we have shown the response of 3rdyear students of APC, BCREC.0% of the students of 3rd year say, No, they are not going totry the products.Whereas, 100% of the students of 3rd year says (out of 16students, 16 says), Yes, they are going to try the products.
23 | P a g e

RESPONSE OF STUDENTS FROM DIFFERENT GENDER
Male Students
Here, in the above Pie Chart, we have shown the response ofmale students of APC, BCREC.26% of the male students says (out of 26 students,7 says), No,they are not going to try the products.Whereas, 74% of the male student says (out of 26 students, 19says), Yes, they are going to try the products.
Female students
Here, in the above Pie Chart, we have shown the response offemale students of APC, BCREC.25% of the female students says (out of 25 students,6 says),No, they are not going to try the products. Whereas, 75% of thefemale student says (out of 25 students, 19 says), Yes, theyare going to try the products
24 | P a g e

Analysis for dependence of attributes usingChi-square tests
Gender Vs Response to AdLevel of significance α = 0.05
Variables
Degreesoffreedom
H0 (nullhypothesis)
Χ2
(cal)Χ2
(tab) Result Inference
GenderVsResponseto Ad
2Nocorrelation
2.181 5.99H0
accepted
There is nocorrelation betweenthe two variablesGender and Responseto Ads.
Here, In, Gender Vs Response, there is no correlation betweenthe two variables Gender and Response to ads which shows thatads are independent of Gender.
Year Vs Response to adsLevel of significance α = 0.05
Variables
Degreesoffreedom
H0 (nullhypothesis)
Χ2
(cal)Χ2
(tab) Result Inference
Year VsResponseto Ad
4Nocorrelation
9.01 9.49H0
accepted
There is nocorrelation betweenthe two variablesAge and Response toAds.
Here, In, Year Vs Response, there is no correlation between thetwo variables Year and Response to ads which shows that ads areindependent of Year or Age. Most of the people found ads to beinteresting.
Department Vs Response to adsLevel of significance α = 0.05
Variables
Degreesoffreedom
H0 (nullhypothesis)
Χ2
(cal)Χ2
(tab) Result Inference
Dept. VsResponseto Ad
2 Nocorrelation
1.48 5.99 H0
accepted
There is nocorrelation betweenthe two variablesDept. and Response
25 | P a g e

to Ads.
Here, In, Department Vs Response, there is no correlationbetween the two variables Dept. and Response to ads which showsthat ads are independent of Course one pursue or Dept. Most ofthe people found ads to be interesting.
Gender Vs Readiness To Try
Level of significance α = 0.05
Variables
Degreesoffreedom
H0 (nullhypothesis)
Χ2
(cal)Χ2
(tab) Result Inference
GenderVsReadiness to try
1Nocorrelation
0.91 3.84H0
accepted
There is nocorrelation betweenthe two variablesGender and Readinessto try.
Here, Ho accepted which means the readiness to try is notcorrelated with the indicators of Gender. Readiness to try isindependent of Gender.
Year of Course Vs Readiness to Try
Level of significance α = 0.05
Variables
Degreesoffreedom
H0 (nullhypothesis)
Χ2
(cal)Χ2
(tab) Result Inference
Year ofCourse VsReadiness to try
2Nocorrelation
6.47 5.99H0
rejected
There is correlationbetween the twovariables Year ofCourse and Readinessto try.
Here, Ho is rejected which means the readiness to try iscorrelated with the indicators of Year or Age. Readiness to tryis dependent of Age which means readiness increases with theadvancement of Age.
26 | P a g e

Department Vs Readiness To TryLevel of significance α = 0.05
Variables
Degreesoffreedom
H0 (nullhypothesis)
Χ2
(cal)Χ2
(tab) Result Inference
Dept.VsReadiness to try
1Nocorrelation
0.115 3.84H0
accepted
There is nocorrelation betweenthe two variablesDept. and Readinessto try.
Here, Ho accepted which means the readiness to try is notcorrelated with the indicators of Course one pursue. Readinessto try is independent of Courses.
Response to Ads Vs Readiness To TryLevel of significance α = 0.05
Variables
Degreesoffreedom
H0 (nullhypothesis)
Χ2
(cal)Χ2
(tab) Result Inference
Responseto adsVsReadiness to try
2Nocorrelation
29.50 5.99H0
rejected
There is correlationbetween the twovariables Responseto ads and Readinessto try.
Here, Ho is rejected which means two variables are correlated.The readiness to try depends on whether the individual findsthe ads to be interesting.
27 | P a g e

§1 Conclusion for the response of ads
In response to ad, majority of students, from differentdepartment says that the given ads were interesting.In response to ad, majority of students from different year,says that ads were interesting.In response to ad, majority of students from different gender,found the ad as interesting.
In overall response to ad, majority of the students found it asinteresting.
§2 Conclusion for the dependence of attribute
In gender Vs response, there is no correlation, which shows adsare independent of gender.In year Vs response, there is no correlation between two, whichshows ads are independent of age.In department Vs response, there is no correlation, which showsads are independent of course one pursues.Readiness to try Vs gender and department, there is nocorrelation, which means readiness to try is independent ofgender and course one pursues.Readiness to try Vs year, there is correlation which showsreadiness to try is dependent of age.In response to ads Vs readiness to try, there is correlation,which means readiness to try is depends on whether theindividual finds the ads to be interesting.
28 | P a g e

Recommendation & Suggestions
As per conclusions, majority of the students found the givensubliminal ads as interesting and they are also ready to trythe products which shows, the subliminal ad is having positiveimpact among the students of APC, BCREC.From the Finding & Analysis of data, it is clear that uses ofsubliminal perceptual embedding in ad of food & beverages arehaving positive impact among the students of APC, BCREC.Hence, it is beneficial for the marketers to use SUBLIMINALPERCEPTUAL EMBEDDING in ad of food & beverages.
29 | P a g e

Bibliography
BOOKS:
1)MARKETING MANAGEMENT BY- SAXENA RAJAN PUBLISHER-M.C GRAWHILL (2010)2)MARKETING MANAGEMENT TEXTS AND CASES BY-GOPAL RAJAPUBLISHER-VIKAS PUBLISHINH HOUSE PVT.LTD (2011)3)MARKETING MANAGEMENT-A SOUTH ASIAN PROSPECTIVE, BY- KOTLERPHILIP,KELLER KEVIN,KOSHY ABHRAHAM AND JHA MITHILESHWARPUBLISHER- PEARSON (2009)
WEBSITES:
1)www.marketingpower.com
2)www.marketingandsales.com
3)www.encyclopaedia.co
4)www.wikipidia.com
30 | P a g e