Project Report On Study on Performance Appraisal At IFB ...
106
PROJECT REPORT On STUDY ON PERFORMANCE APPRAISAL At IFB AUTOMATIVE PRIVATE LIMITED BY NANDINI H S 1NH20BA092 Submitted to DEPARTMENT OF MANAGEMENT STUDIES NEW HORIZON COLLEGE OF ENGINEERING, OUTER RING ROAD, MARATHALLI, BENGALURU In partial fulfilment of the requirements for the award of the degree of MASTER OF BUSINESS ADMINISTRATION Under the guidance of Ms. SAUMI ROY Asst. Professor 2020-2022
-
Upload
khangminh22 -
Category
Documents
-
view
0 -
download
0
Transcript of Project Report On Study on Performance Appraisal At IFB ...

PROJECT REPORT
On
STUDY ON PERFORMANCE APPRAISAL
At
IFB AUTOMATIVE PRIVATE LIMITED
BY
NANDINI H S
1NH20BA092
Submitted to
DEPARTMENT OF MANAGEMENT STUDIES
NEW HORIZON COLLEGE OF ENGINEERING,
OUTER RING ROAD, MARATHALLI,
BENGALURU
In partial fulfilment of the requirements for the award of the degree of
MASTER OF BUSINESS ADMINISTRATION
Under the guidance of
Ms. SAUMI ROY
Asst. Professor
2020-2022

DEPARTMENT OF MANAGEMENT STUDIES
CERTIFICATE
This is to certify that Nandini H S bearing USN 1NH20BA092 (2020-22 batch), is a bonafide
student of Master of Business Administration, New Horizon College of Engineering, Bengaluru
affiliated to Visvesvaraya Technological University, Belagavi.
Project report on A study on Performance Appraisal at IFB Automative private limited is prepared
by him/her under the guidance of Ms.Saumi Roy, in partial fulfillment of the requirements for
the award of the degree of Master of Business Administration of Visveswaraya Technological
University, Belagavi, Karnataka.
Signature of Internal Guide Signature of HOD Principal
Name of the Examiners with affiliation: Signatures with date
1. External Examiner
2. Internal Examiner

CERTIFICATE OF COMPLETION
This is to certify that Ms.NANDHINl H S, a student of Master of Business
Administration program at “new horizon college of engineering" bearing Roll
No:1NH20BA092 has successfully completed a project in HR Department on the
topic °STUDY ON PERFORMANCE APPRAISAL AT IFB AUTOMOTIVE
PRNATE LIMITED” for the duration of two months.
This project has taught pl8ctical implications of the above topic and we found her
to be sincere, punctual, inquisitiv,e -during her entire project. We believe this
practical exposure of Ms‹I?ANDHINl, H S, at our oqanisation will give her a lead
in her upcoming career ahd future, ”of/her greater•opportunIties.
We wish her ail success ahd good l5ck in her upcoming pursuits.
Head HR
IFB Automotive Private Limited
#Doddanekkundi Industrial Area2, phase1,
BengaIuru,Karnataka- 560048
dy

DECLARATION
I, Nandini H S hereby declare that the project report at “IFB AUTOMATIVE PRIVATE
LIMITED” prepared by me under the guidance of Ms. Saumi Roy, faculty of M.B.A
Department, New Horizon College of Engineering.
I also declare that this project report is towards the partial fulfillment of the university
regulations for the award of the degree of Master of Business Administration by
Visvesvaraya Technological University, Belgaum.
I declare that this report is based on the original study undertaken by me and has not been
submitted for the award of a degree/diploma from any other University / Institution.
Signature of Student Nandini H S
Place: Bangalore

ACKNOWLEDGEMENT The successful completion of the project report would not have been possible without the
guidance and support of many people. I express my sincere gratitude Bhargavi redday,Head
HR, for giving me an opportunity to do this Project report.
I am thankful to my internal guide Ms. Saumi Roy, for her constant support and inspiration
and invaluable suggestions, guidance and also for providing valuable information.
Finally, I express my gratitude towards my parents and family for their continuous support
during the study.
Name Nandini H S
USN 1NH20BA092

TABLE OF CONTENTS
SL. NUMBER CONTENTS PAGE NUMBERS
1 Introduction
2 Research methodology
3 Industry profile
4 Theoretical background
5 Data Analysis and
interpretation
6 Findings and conclusion
7 Bibliography

CHAPTER 1
INTRODUCTION
Performance appraisal is a method of assessing the behaviour and performance of an employee
or group of employees at the workplace. The appraisal system includes both qualitative and
quantitative aspects of job performance. It is also referred as performance rating, performance
evaluation, employee assessment, performance review, merit rating, etc. In other words,
performance appraisal method is a systematic process that evaluates an individual employee’s
performance in terms of his productivity with respect to the pre-determined goals and objectives
set by the organization. The appraisal system mostly happens annually, which gives an
opportunity to the employees working in that particular organization to reflect on the duties that
were dispatched by him. It not only involves receiving feedback regarding their performance but
also evaluates an individual’s attitude, personality, behavior, and stability in his job profile.
There are various applications of appraisals like compensation, performance
improvement, promotion, termination, test validation, etc. There are various methods of
performance appraisal which differ from one organisation to another. Appraisals facilitate
communication between the management and their employee which also helps in conveying the
expectations of the management to the employee and vice versa. The frequency of appraisals
also varies in different organizations where most of the multinational companies (MNC’s) offer
them annually, some opt for shorter cycles like half yearly, quarterly, or even monthly if the
employees perform exceptionally at his/her job. In case of startups, it has been observed that
shorter cycles of performance appraisal are preferred so that they can motivate their
employees more frequently to perform better in the organization.
The criteria for performance appraisal methods are based on various aspects like
productivity, quality of work, duration of service and training. Productivity in the manufacturing
concerns is measured mostly in the case of manufacturing i.e. the number of units manufactured
or delivered by the employee. Performance Appraisal is carried out to identify the various
abilities and competencies of an employee for future growth and development. It is aimed at
ascertaining the worth of the employee to the organization, in which he/she works.
1

Performance Appraisal is defined as a systematic process, in which the personality and
performance of an employee is assessed by the supervisor or manager, against predefined
standards, such as knowledge of the job, quality and quantity of output, leadership abilities,
attitude towards work, attendance, cooperation, judgment, versatility, health, initiative and so
forth. The objectives of performance appraisal system are as follows:
To help the employees, on the basis of their performance and competence in the
organization.
To identify the need for training and developmental programs of employees.
To provide confirmation/acceptance to those employees who are hired as probationary
employees, upon completion of the term.
To take decisions regarding the hike in employees pay, incentives, bonus, recognition,
etc.
To facilitate proper communication between superior and their subordinates.
To help employees in understanding where they stand in terms of one’s own performance
in the organization.
Data obtained from the appraisal of performance, are documented for future reference by
the organization.
PERFORMANCE APPRAISAL PROCESS:
Performance appraisal process is planned, developed and implemented through a series of steps.
Each step in the process is crucial and is arranged logically. Many organizations make every
effort to approximate the ideal process, resulting in first-rate appraisal systems. Unfortunately,
many others fail to consider one or more of the steps and, therefore, have less-effective appraisal
system.
2
Measure Actual Performance
Communicate the Standards
Establish Performance Standards

Establish performance standards:
Appraisal systems require performance standards, which serves as benchmarks against which
performance is measured. To be useful, standards should relate to the desired results of each job.
The performance standards or goals must be developed after a thorough analysis of the job.
Goals must be written down. Just talking about them is not enough. They must be measurable
within certain time and cost considerations.
Communicate the Standards:
Performance appraisal involves at least two parties; the appraiser and who does the appraisal
and the appraisee whose performance is being evaluated. Both are expected to do certain things.
The appraiser should prepare job description clearly’ help the appraisee set his goals and targets,
analyzes results objectively, offer coaching and guidance to the appraisee whenever required and
reward good results. The appraisee should be very clear about what he is doing it. For the
purpose performance standards must be communicated to appraisee and their reactions should be
noted right away. These standards must be revised or modified.
Measure Actual Performance:
After the performance standards are set and accepted, the next step is to measure actual
performance. This requires the use of dependable performance measures, the ratings used to
evaluate performance. Performance measures to be helpful must be easy to use, reliable, and
report on the critical behaviors that determine performance. Four common sources of
3
Taking Corrective Actions, if necessary
Communicate Actual Performance with Standards and Discuss
the Appraisal

information which are generally used by managers regarding how to measure actual performance
are personal observations, statistical reports, oral reports, and written reports.
Compare actual performance with standards and discuss the appraisal:
Actual performance may be better than expected and sometimes it may go off the track.
Whatever be the consequences, there is a way to communicate and discuss the final outcome.
Taking corrective actions, if necessary; Corrective actions are of two types: one puts the fires
immediately, while the other destroys the root of the problem permanently. Immediate action
sets things right and get things back on track whereas the basic corrective action gets to the
source of deviations and seeks to adjust the difference permanently. Basic corrective steps seek
to find out how and why performance deviates.
Taking Corrective Actions, if necessary:
When a gap is found between the actual level and expected level of performance, corrective
actions should be undertaken. By analyzing the reason for a gap, proper action should be taken
so that the gap is bridged. When the actual and the standard performance match, there is no need
for any corrective action to be taken.
METHODS OF PERFORMANCE APPRAISAL:
Each method of performance appraisal has its strengths and weaknesses may be suitable
for one organisation and non-suitable for another one. As such, there is no single appraisal
method accepted and used by all organizations to measure their employees’ performance. All the
methods of appraisal devised so far have been classified differently by different authors. While
DeCenzo and Robbins have classified appraisal methods into three categories: absolute methods,
relative methods and objective methods; Aswathappa has classified these into two categories
past-oriented and future-oriented. Michael R Carrel et. al. have classified all appraisal methods
into as many as six categories: rating scales, comparative methods, critical incidents, essay,
MBO and combination methods. Rock and Levis” have classified the methods into two broad
4

categories: narrow interpretation and broad interpretation. Beatty and Schneier have categorized
various methods of appraisal into four groups: comparative methods, absolute methods, goal
setting, and direct indices.
A more widely used classification of appraisal methods into two categories, viz.,
traditional methods and modern methods, is given by Strauss and Sayles”. While traditional
methods lay emphasis on the rating of the individual’s personality traits, such as initiative,
dependability, drive creativity, integrity, intelligence, leadership potential, etc.; the modem
methods, on the other hand, place more emphasis on the evaluation of work results, i.e., job
achievements than the personal traits! Modern methods tend to be more objective and
worthwhile.
TRADITIONAL METHODS:
Ranking Method:
It is the oldest and simplest formal systematic method of performance appraisal in which
employee is compared with all others for the purpose of placing order of worth. The employees
are ranked from the highest to the lowest or from the best to the worst.
In doing this the employee who is the highest on the characteristic being measured and
also the one who is L lowest, are indicated. Then, the next highest and the next lowest between
next highest and lowest until all the employees to be rated have been ranked. Thus, if there are
ten employees to be appraised, there will be ten ranks from 1 to 10.
However, the greatest limitations of this appraisal method are:
It does not tell that how much better or worse one is than another
The task of ranking individuals is difficult when a large number of employees are related,
and
5

It is very difficult to compare one individual with others having varying behavioral traits.
To remedy these defects, the paired comparison method of performance appraisal has
been evolved.
Paired comparison method:
In this method, each employee is compared with other employee in the organization on
one-on-one basis, usually based on one trait only. The rater is provided with a bunch of slips
each coining pair of names, the rater puts a tick mark against the employee whom he thinks is the
best amongst the two. The number of times this employee is compared with others determines
his or her final ranking in the organization.
The number of pairs for a given number of employees is ascertained by the following formula:
N (N-1)/2
Where, n= total number of employees considered to be evaluated.
Thus, the pairs so ascertained give the maximum possible permutations and combinations. The
number of times a worker is considered better makes his/her score. Such scores are determined
for each worker and he/she is ranked according to his/her score. One obvious disadvantage of
this method is that the method can become unwieldy when large numbers of employees are being
compared.
Grading Method:
In this method, certain categories of grades are established in advance and carefully
defined. There can be three categories established for each employee: outstanding, satisfactory
and unsatisfactory. There can be more than three grades. Employee performance is compared
with grade definitions. The employee is, then, allotted with the grade that best describes his or
her performance.
6

Such type of grading is done is semester pattern of examinations and in the selection of a
candidate in the public service sector. One of the major drawbacks of this method is that the rater
may rate most of the employees on the higher side of their performance.
Forced Distribution Method:
This method was evolved by Tiffen to eliminate the central tendency of rating most of the
employees at a higher end of the scale. The method assumes that employees’ performance level
confirms to a normal statistical distribution i.e., 10,20,40,20 and 10 per cent. This is useful for
rating a large number of employees’ job performance and promo ability. It tends to eliminate or
reduce bias.
It is also highly simple to understand and easy to apply in appraising the performance of
employees in the organizations. It suffer from the drawback that improve similarly, no single
grade would rise in a ratings.
Forced-Choice Method:
The forced-choice method is developed by J. P. Guilford. It contains a series of groups of
statements, and rater rates how effectively a statement describes each individual being evaluated.
Common method of forced-choice method contains two statements, both positive and negative.
Examples of positive statements are:
Gives good and clear instructions to the subordinates.
Can be depended upon to complete any job assigned.
A pair of negative statements may be as follows:
Makes promises beyond his limit to keep these.
Inclines to favor some employees.
Each statement carries a score or weight, which is not made known to the rater. The human
resource section does rating for all sets of statements— both positive and negative. The final
7

rating is done on the basis of all sets of statements. Thus, employee rating in this manner makes
the method more objective. The only problem associated with this method is that the actual
constructing of several evaluative statements also called ‘forced-choice scales’, takes a lot of
time and effort.
Check-List Method:
The basic purpose of utilizing check-list method is to ease the evaluation burden upon the
rater. In this method, a series of statements, i.e., questions with their answers in ‘yes’ or ‘no’ are
prepared by the HR department. The check-list is, then, presented to the rater to tick appropriate
answers relevant to the appraisee. Each question carries a weight-age in relationship to their
importance. When the check-list is completed, it is sent to the HR department to prepare the final
scores for all appraises based on all questions. While preparing questions an attempt is made to
determine the degree of consistency of the rater by asking the same question twice but in a
different manner.
However, one of the disadvantages of the check-list method is that it is difficult to
assemble, analyze and weigh a number of statements about employee characteristics and
contributions From a cost stand point also, this method may be inefficient particularly if there are
a number of job categories in the organisation, because a check-list of questions must be
prepared for each category of job. It will involve a lot of money, time and efforts.
Critical Incidents Method:
In this method, the rater focuses his or her attention on those key or critical behaviors that
make the difference between performing a job in a noteworthy manner (effectively or
ineffectively). There are three steps involved in appraising employees using this method.
First, a list of noteworthy (good or bad) on-the-job behaviour of specific incidents is
prepared. Second, a group of experts then assigns weightage or score to these incidents,
depending upon their degree of desirability to perform a job. Third, finally a check-list indicating
incidents that describe workers as “good” or “bad” is constructed. Then, the check-list is given to
the rater for evaluating the workers. The basic idea behind this rating is to apprise the workers
8

who can perform their jobs effectively in critical situations. This is so because most people work
alike in normal situation. The strength of critical incident method is that it focuses on behaviors
and, thus, judge’s performance rather than personalities.
Its drawbacks are to regularly write down the critical incidents which become time-
consuming and burdensome for evaluators, i.e., managers. Generally, negative incidents are
positive ones. It is rater’s inference that determines which incidents are critical to job
performance. Hence, the method is subject to all the limitations relating to subjective judgments.
Graphic Rating Scale Method:
The graphic rating scale is one of the most popular and simplest techniques for appraising
performance. It is also known as linear rating scale. In this method, the printed appraisal form is
used to appraise each employee.
The form lists traits (such as quality and reliability) and a range of job performance
characteristics (from unsatisfactory to outstanding) for each trait. The rating is done on the basis
of points on the continuum. The common practice is to follow five points scale. The rater rates
each appraisee by checking the score that best describes his or her performance for each trait all
assigned values for the traits are then totaled.
This method is good for measuring various job behaviors of an employee. However, it is
also subjected to rater’s bias while rating employee’s behaviour at job. Occurrence of ambiguity
in design- mg the graphic scale results in bias in appraising employee’s performance.
Essay Method:
Essay method is the simplest one among various appraisal methods available. In this
method, the rater writes a narrative description on an employee’s strengths, weaknesses, past
performance, potential and suggestions for improvement. Its positive point is that it is simple in
use. It does not require complex formats and extensive/specific training to complete it.
However, essay method, like other methods, is not free from drawbacks. In the absence
of any prescribed structure, the essays are likely to vary widely in terms of length and content.
9

And, of course, the quality of appraisal depends more upon rater’s writing skill than the
appraiser’s actual level of performance.
Moreover, because the essays are descriptive, the method provides only qualitative
information about the employee. In the absence of quantitative data, the evaluation suffers from
subjectivity problem. Nonetheless, the essay method is a good start and is beneficial also if used
in conjunction with other appraisal methods.
Field Review Method:
When there is a reason to suspect rater’s biasness or his or her rating appears to be quite
higher than others, these are neutralized with the help of a review process. The review process is
usually conducted by the personnel officer in the HR department.
The review process involves the following activities:
Identify areas of inter-rater disagreement.
Help the group arrive at a consensus.
Ensure that each rater conceives of the standard similarity.
However, the process is a time-consuming one. The supervisors generally resent what they
consider the staff interference. Hence, the method is not widely used.
Confidential Report:
It is the traditional way of appraising employees mainly in the Government Departments.
Evaluation is made by the immediate boss or supervisor for giving effect to promotion and
transfer. Usually a structured format is devised to collect information on employee’s strength
weakness, intelligence, attitude, character, attendance, discipline, etc. report.
10

Modern Methods:
Management by Objectives (MBO):
Most of the traditional methods of performance appraisal are subject to the antagonistic
judgments of the raters. It was to overcome this problem; Peter F. Drucker propounded a new
concept, namely, management by objectives (MBO) way back in 1954 in his book “The Practice
of management”. The concept of MBO as was conceived by Drucker, can be described as a
“process whereby the superior and subordinate managers of an organization jointly identify its
common goals, define each individual’s major areas of responsibility in terms of results expected
of him and use these measures as guides for operating the unit and assessing the contribution of
each its members”.
In other words, stripped to its essentials, MBO requires the manager to goals with each
employee and then periodically discuss his or her progress toward these goals. In fact, MBO is
not only a method of performance evaluation. It is viewed by the Practicing managers and
pedagogues as a philosophy of managerial practice because .t .s a method by wh.ch managers
and subordinates plan, organize, communicate, control and debate.
An MBO programme consists of four main steps: goal setting, performance standard,
comparison, and periodic review. In goal-setting, goals are set which each individual, s to attain.
The superior and subordinate jointly establish these goals. The goals refer to the desired outcome
to be achieved by each individual employee. In performance standards, the standards are set for
the employees as per the previously arranged time period. When the employees start performing
their jobs, they come to know what is to be done, what has been done, and what remains to be
done.
In the third step the actual level of goals attained are compared with the goals agreed
upon. This enables the evaluator to find out the reasons variation between the actual and standard
performance of the employees. Such a comparison helps devise training needs for increasing
employee’s performance it can also explore the conditions having their bearings on employee’s
performance but over which the employees have no control. Finally, in the periodic review step,
corrective measure is initiated when actual performance deviates from the slandered established
11

in the first step-goal-setting stage. Consistent with the MBO philosophy periodic progress
reviews are conducted in a constructive rather than punitive manner. The purpose of conducting
reviews is not to degrade the performer but to aid in his/her future performance. From a
motivational point of view, this would be representative of McGregor’s theories.
Limitation of MBO:
As with other methods, it also suffers from some limitations as mentioned below:
Setting Un-measurable Objectives:
One of the problems MBO suffers from is unclear and un-measurable objectives set for
attainment. An objective such as “will do a better job of training” is useless as it is un-
measurable. Instead, “well have four subordinates promoted during the year” is a clear and
measurable objective.
Time-consuming:
The activities involved in an MBO programme such as setting goals, measuring progress, and
providing feedback can take a great deal of time.
Tug of War:
Setting objectives with the subordinates sometimes turns into a tug of war in the sense that
the manager pushes for higher quotas and the subordinates push for lower ones. As such, goals
so set are likely to be unrealistic.
Lack of Trust:
MBO is likely to be ineffective in an environment where management has little trust in its
employees. Or say, management makes decisions autocratically and relies heavily on external
controls.
12

Behaviorally Anchored Rating Scales (BARS):
The problem of judgmental performance evaluation inherent in the traditional methods of
performance evaluation led to some organizations to go for objective evaluation by developing a
technique known as “Behaviorally Anchored Rating Scales (BARS)” around 1960s. BARS are
descriptions of various degrees of behaviour with regard to a specific performance dimension.
It combines the benefits of narratives, critical incidents, and quantified ratings by
anchoring a quantified scale with specific behavioral examples of good or poor performance. The
proponents of BARS claim that it offers better and more equitable appraisals than do the other
techniques of performance appraisal we discussed so far.
Developing BARS typically involves five steps:
Generating Critical Incidents:
Critical incidents (or say, behaviors) are those which are essential for the performance of the
job effectively Persons who are knowledgeable of the job in question (jobholders and/or
supervisors) are asked to describe specific critical incidents of effective and ineffective
performance. These critical incidents may be described in a few short sentences or phrases using
the terminology.
Developing Performance Dimensions:
The critical incidents are then clustered into a smaller set of performance dimensions, usually
five to ten. Each cluster, or say, dimension is then defined.
Reallocating Incidents:
Various critical incidents are reallocated dimensions by another group of people who also
know the job in question. Various critical incidents so reallocated to original dimensions are
clustered into various categories, with each cluster showing similar critical incidents. Those
critical incidents are retained which meet 50 to 80% of agreement with the cluster as classified in
step 2.
13

Scaling Incidents:
The same second group as in step 3 rates the behaviour described in each incident in terms of
effectiveness or ineffectiveness on the appropriate dimension by using seven to nine points scale.
Then, average effectiveness ratings for each incident are determined to decide which incidents
will be included in the final anchored scales.
Developing Final BARS Instrument:
A subset of the incidents (usually six or seven per cluster) is used as a behavioral anchor for
the final performance dimensions. Finally, a BARS instrument with vertical scales is drawn to be
used for performance appraisal. BARS method of performance appraisal is considered better
than the traditional ones because it provides advantages like a more accurate gauge, clearer
standards, better feedback, and consistency in evaluation. However, BARS is not free from
limitations.
The research on BARS indicates that it too suffers from distortions inherent in most rating
scales. The research study concluded that “it is clear that research on BARS to date does not
support the high promise regarding scale independence In short, while BARS may outperform
conventional rating techniques, it is clear that they are not a panacea for obtaining high inter rater
reliability”
Assessment Centre’s:
The introduction of the concept of assessment centre’s as a method of performance
method is traced back in 1930s in the Germany used to appraise its army officers. The concept
gradually spread to the US and the UK in 1940s and to the Britain in 1960s. The concept, then,
traversed from the army to business arena during 1960s. The concept of assessment centre is, of
course, of a recent origin in India. In India, Crompton Greaves, Eicher, Hindustan Lever and
Modi Xerox have adopted this technique of performance evaluation.
In business field, assessment centre’s are mainly used for evaluating executive or
supervisory potential. By definition, an assessment centre is a central location where managers
14

come together to participate in well-designed simulated exercises. They are assessed by senior
managers supplemented by the psychologists and the HR specialists for 2-3 days.
Assessee is asked to participate in in-basket exercises, work groups, simulations, and role
playing which are essential for successful performance of actual job. Having recorded the
assessee’s behaviour the raters meet to discuss their pooled information and observations and,
based on it, they give their assessment about the assessee. At the end of the process, feedback in
terms of strengths and weaknesses is also provided to the assessee.
The distinct advantages the assessment centre’s provide include more accurate
evaluation, minimum biasness, right selection and promotion of executives, and so on.
Nonetheless, the technique of assessment centre’s is also plagued by certain limitations and
problems. The technique is relatively costly and time consuming, causes suffocation to the solid
performers, discourages to the poor performers (rejected), breeds unhealthy competition among
the assesses, and bears adverse effects on those not selected for assessment.
360 – Degree Appraisal:
Yet another method used to appraise the employee’s performance is 360 – degree
appraisal. This method was first developed and formally used by General Electric Company of
USA in 1992. Then, it travelled to other countries including India. In India, companies like
Reliance Industries, Wipro Corporation, Infosys Technologies, Thermax, Thomas Cook etc.,
have been using this method for appraising the performance of their employees. This feedback
based method is generally used for ascertaining training and development requirements, rather
than for pay increases. Under 360 – degree appraisal, performance information such as
employee’s skills, abilities and behaviors, is collected “all around” an employee, i.e., from
his/her supervisors, subordinates, peers and even customers and clients.
In other worlds, in 360-degree feedback appraisal system, an employee is appraised by
his supervisor, subordinates, peers, and customers with whom he interacts in the course of his job
performance. All these appraisers provide information or feedback on an employee by
completing survey questionnaires designed for this purpose. All information so gathered is then
compiled through the computerized system to prepare individualized reports. These reports are
15

presented to me employees being rated. They then meet me appraiser—be it one’s superior,
subordinates or peers—and share the information they feel as pertinent and useful for developing
a self-improvement plan.
In 360 – degree feedback, performance appraisal being based on feedback “all around”,
an employee is likely to be more correct and realistic. Nonetheless, like other traditional
methods, this method is also subject to suffer from the subjectivity on the part of the appraiser.
For example, while supervisor may penalize the employee by providing negative feedback, a
peer, being influenced by ‘give and take feeling’ maygive a rave review on his/her colleague.
Cost Accounting Method:
This method evaluates an employee’s performance from the monetary benefits the
employee yields to his/her organisation. This is ascertained by establishing a relationship
between the costs involved in retaining the employee, and the benefits an organisation derives
from him/her.
While evaluating an employee’s performance under this method, the following factors are
also taken into consideration:
Unit wise average value of production or service.
Quality of product produced or service rendered.
Overhead cost incurred.
Accidents, damages, errors, spoilage, wastage caused through unusual wear and tear.
Human relationship with others.
Cost of the time supervisor spent in appraising the employee.
16

IFB INDUSTRIES PVT LTD – INDIAN FINE BLANK
IFB INDUSTRIES PVT LTD was established by MR.BIJON NAG in 1974 in kolkata to pioneer in India the
manufacture of fine blanking automotive components.
OBJECTIVES
To excel in customer satisfaction
To be a leader in the chosen business segment – auto, home appliances and agro
To be a global player
Quality in everything we do
IFB INDUSTRIES PVT LTD - MILESTONES
1. IFB INDUSTRIES PVT LTD industries - 1st factory in KOLKATA in 1974
Main products - Fine blanking components
2. IFB INDUSTRIES PVT LTD industries - 2nd factory in Bangalore
Main products - Fine blanking components and automotive sub assys
3. IFB INDUSTRIES PVT LTD Home Appliances – 3rd and 4th factory in Goa and Govardan (1990)
Main products – Washing machine, Dish washer, Microwave oven
4. IFB AUTOMOTIVE Pvt. Ltd. – 5th factory in Bangalore (1989)
Main products – Seating mechanisms, automotive motors and latches
5. IFB AUTOMOTIVE R&D Center – Bangalore (2002)
(Drawing and development of models)
6. IFB INDUSTRIES PVT LTD AGRO – Noorpur (1987)
Main products – Alcohol
IFB INDUSTRIES PVT LTD OVERVIEW (NO. 1)
IFB INDUSTRIES PVT LTD industries (Home appliances) - in India for front load washing
machines
IFB AUTOMOTIVE s – in India for seating mechanisms and window regulators
IFB INDUSTRIES PVT LTD AGRO – Largest producer of alcohol (Vodka, Whisky) in eastern India
(Assam, Orissa)
IFB INDUSTRIES PVT LTD industries (Fine blanking) – Largest Fine blanking company in Asia
17

IFB INDUSTRIES PVT LTD GROUP OVERVIEW
GROUP SALES – Rs. 1200 Crores
No. of Employees – 3500
IFB INDUSTRIES PVT LTD - Home Appliances
Annual sales – Rs. 250 Crores
No. of employees – 400
IFB INDUSTRIES PVT LTD – Industries (Fine blanking)
Annual sales – Rs. 70 Crores
No. of employees – 400
IFB INDUSTRIES PVT LTD – Automotive Pvt. Ltd
Annual sales – Rs. 450 Crores
No. of employees –1250
(Contact Employees – 800, Office Workers – 450)
New Business Initiatives
Launderette
Operation – 6 in Bangalore and 5 in kerala
Modular kitchen (chimney)
First deal of 500 nos. was done with kolkata builder.
18

IFB AUTOMOTIVE PVT.LTD.
INTRODUCTION
IFB Automotive Pvt. Ltd. BANGALORE branch was established in 1989 at No.36, Vishweshwraiah
Industrial Estate, Whitefield Off, Mahadevapura, Bangalore - 560038. Is a pioneer in design and
manufacture of seating systems, door systems and automotive motors. The company has built a reputation as a leading technology provider for safety critical and comfort related products in the automotive sector. To
meet the growing needs of the auto industry, IFB AUTOMOTIVE has spread its manufacturing base in
different parts of India to ensure Just-In-Time supplies to all the customers.
The state of art Research and Development centre of IFB AUTOMOTIVE has the capability to develop new
products responding to the diverse needs of its domestic and international customers.
BRIEF HISTORY
IFB industries ltd, originally known as Indian Fine Blanking limited started operations in India during 1974 in collaboration with Heinrich Schmid AG Switzerland.
IFB APL is promoted by IFB industries ltd who is pioneers and leaders in the manufacture and
supply of fine blanking components to all the automobile manufacture, apart from imported fine
blanking presses for manufacture of auto components. The entry of Suzuki of Japan into the
automobile scene in India gave an opportunity for the enterprising ones. Therefore IFB APL was a
natural diversification into automobiles sub assemblers. This company has been a pioneer in design,
development and manufacture of automotive seating mechanisms since 1989. Started as a joint
venture with RHW of Germany; it became a subsidiary of IFB INDUSTRIES PVT LTD industries
19

in 1997 when the principles changed hands in 1995. Later it became a subsidiary of IFB INDUSTRIES PVT LTD Agro industries, a public limited company and hence IFB APL was a
deemed public company and now it is a private limited company.
Operating in the backdrop of tough global competition, IFB AUTOMOTIVE strives to meet the highest quality demands of national and international regulatory bodies as well as stringent customer specific
requirements.
Branches of IFB APL:
GURGAON
BINOLA
BANGALORE
RUDRAPUR
PUNE
Quality Credentials:
Customer trust in IFB AUTOMOTIVE’s brand, end user safety and total reliability for all stakeholders associated with the company are at the core of IFB AUTOMOTIVE’s quality policy. High quality, stable,
cost-effective products manufactured through meticulous production planning, production methodologies
and production engineering adhere to company’s self-imposed stringent product quality targets.
The company’s superb quality assurance record exceeds the international benchmark of 100 defective parts per million (PPM) shipped to OEMs and targets the ambitious 0 defect goal in near future.
IFB AUTOMOTIVE’s relentless pursuit of quality and strict adherence to procedures has earned for it:
1998: ISO 9000
2000: QS 9000
2003: ISO 14001
2003: TS 16949
2004: 100 PPM
Achievements/Awards:
QS-9000
MS-9000
ISO/TS 16949 QMS certificate
ISO/TS 14001 EMS certificate
Q1-FORD
Achieve 100ppm from HMIL
VISION
To be the vehicle manufacturer’s first choice for safety and comfort related products through innovation and
quality excellence.
20

MISSION
The mission is to create and deliver high quality and innovative products that will contribute to the customer’s
success and deliver value to shareholders. The organization shall provide complete solutions through the
system capabilities in design, analysis, development, testing and validation.
POLICIES
Material Policy
To visualize customer needs and provide satisfaction through prompt supply of products.
To continuously improve the delivery performance through use of appropriate technique/service, cost
effective operations and team work of all associates.
To maintain safe work environment.
Quality Policy
To have world class human resources through training and motivating them for higher aspirations.
Environment Policy
IFB APLsupplying automotive systems is committed to environmental preservation and social responsibility
by:
Optimum utilization of natural resources and energy.
Adhering to statutory and applicable legal and other requirements.
Awareness on EMS to employees and associates.
Monitoring and continuous improvement of environmental aspects.
Safety Policy
To ensure clean and safe environment for Men, Machine and Material through appropriate training and
awareness program on prevention of accidents and continuous improvement in the area.
Milestones
1989: IFB AUTOMOTIVE Seating & systems, Bangalore established
1989: launched SEAT RECLINER
1995: launched SEAT SLIDER
1995: launched WINDOW REGULATOR
1999: launched BLOWER MOTOR
2000: launched RADIATOR & CONDENSOR MOTOR
2003: R & D Centre, Bangalore established
21

2004: launched ANTI PINCH REGULATOR
2004: launched DOOR MODULE
2005: launched HIGH STRENGTH RECLINER & SLIDER
General Guidelines
Lateness: Habitual late coming is subject to disciplinary procedure. All employees are expected to be
in their place of work ready at least five minutes prior to the starting time.
Public Holidays: National and Festival paid holidays in a year in a calendar year will be 12 days as per the National & Festival Holidays Act. The lists of holidays are displayed in the notice board and printed in the calendar. The holidays are marked in RED in the calendar.
Payment: Salary will be paid on the before seventh day of the next month. For the payment
the employees are requested to open an account in BOI of white field branch so as to transfer
the salary to the employees bank account every month. Salary is not paid by cheque or by cash.
Method of Pay: payment will be made in cash/in bank account.
Induction: The Newly joined Employee will be received, welcomed and introduced to the job
and the organization through the process of Induction / Orientation.
Socialization: The New recruit will be made to understand and accept the values, norms and beliefs
held by others in the organization through Socialization.
Self-Discipline: It will be fair if we follow certain practice such as switching off the fans, lights, PC’s whenever not required / while leaving work place, which will in turn save power and cost, leave your
office furniture intact, as you would like to see, keep all papers inside drawers, leaving a clean office.
And also as far as possible use your computer and work towards a paperless office.
Attendance: The Company uses Time Tracker Software to update the working hours of the staff and
Finger Print Access Machine for the operators.
Health and Safety rules
• Keep your work area clean and tidy.
• Do not run on company property or take part any acts which may harm yourself or others.
• Report to your supervisor or safety committee representative any condition or practice you think may
cause injury to employees or damage to equipment.
• Only use, adjust, repair or move any equipment or machinery when authorized to do so by your
supervisor.
• The wearing of loose or unsuitable clothing and jeweler is not permitted while working near
machinery.
• Long hair is not permitted while working near machinery.
• Only fully enclosed footwear is to be worn.
• Obey all specific instructions, rules and signs.
• Employees are to acquaint themselves with fire alarm points, fire extinguishers and exits.
• Smoking is prohibited in Company premises.
• Personal hygiene is to be encouraged.
• Consumption of alcoholic beverages on the premises is not permitted at any time.
22

Benefits
Employees Provident Funds:
• Every employee, who is in receipt of salary & wages, shall be eligible for becoming member under The Employees Provident Funds & Miscellaneous Provisions Act, 1952.
• The employer and employee shall be contributing 12% each on the consolidated salary. Out of 24%
contribution, 8.33% of employer’s contribution is remitted to the Pension fund.
Canteen Facility:
All employees in the company are provided meals on subsided rate.
Medical Benefits:
• Free medical treatment will be given in ESI hospitals and other hospitals as per reference by the ESI
hospital.
• Annual health checkup for all the employees on general health, eye sight, ear and throat each year.
Leave:
Earned leave of 1 day for every 20 days worked and medical leave as per ESI Act is applicable for all the employees.
Bonus:
Once in a year bonus will be distributed as per the Bonus act. Last year bonus distributed was 20% of the
salary.
Uniform and shoes:
4 pair of uniforms and a pair of shoes per year is provided at free of cost for all the employees.
Insurance:
Personal accident insurance – this insurance will be covered for the sum of Rs. 1lac from the company
for any unexpected incidents and is applicable for all the employees.
EDLI – Employee Deposit Linked Insurance is a part of statutory provided for all the employees.
Superannuation – this is an insurance provided when the employee dies due to some disease or accident before the retirement age. The sum amount is paid for the balance period of service.
Term life coverage – an insurance wherein the sum amount is paid for the balance period of service
when the employee dies accidentally.
Mediclaim – an insurance provided to the employee and his family i.e., wife and 2 children during
their hospitalization.
Gratuity:
Gratuity will be given for those employees who serve more than 5yrs in a company as per the Gratuity Act.
Loan:
Departments at IFB INDUSTRIES PVT LTD APL
The various departments at IFB APL are as follows:
23

1. Supply Chain Management (purchase dept.)
2. Manufacturing department
3. Maintenance department
4. Quality control department
5. Finance department
6. Human Resource department
7. Marketing department
8. Administration department
24

FUNCTIONS:
Preparing and releasing of purchase order
Scheduling
Ensuring timely availability of materials at suppliers place
25

Daily collection plan to suppliers
Collection of materials as per daily collection plan
Preparation of GRN – Goods Receipt note
Storing and preserving of goods with identification
Issuing of materials as per MRS – Material Requisition Slip
Issue as per FIFO – First In First Out
Ensuring one day system fill for all the local parts at stores
Control of inventory
Disposal of rejected materials
Issuing of raw materials and parts to secondary suppliers
Issue of latest level (revised) drawings to suppliers
Recommendation for change of source
Monitoring suppliers performance
Ensuring one week system fill for all out station parts at stores
Cost reduction activities with supplier
MDA preparation
Management of clearing and forwarding agent for imported materials
Opening of LC
Issue of supplier rating to suppliers (once in a month for local and out station suppliers & once in 3
months for overseas suppliers)
Preparation of Delivery Documents
Delivery of finished goods.
Production planning
Production planning is the function concerned with planning, directing and controlling the methods to be used
to make products.
Steps followed for production planning:
The customer requirement plan is received in the last week of every month. The customer issues
confirming schedule for 1 month and tentative schedule for next 2 months.
Consolidation of all customer schedules is done.
Then it is circulated to the following departments i.e., production, materials, logistics, stores (SCM).
The monthly schedule is converted into daily plans for production and dispatch.
The monitored plan is compared with the achievement everyday and if there is any backlog found, it
will be made to overcome in the next day.
Any changes made in the customer schedule, the monthly plan is revised and above steps are repeated.
INVENTORY CONTROL
Inventory control is a planned approach of determining what to order and how much to order and how much to
stock so that costs associated with buying and storing are optimal without interrupting production and sales.
Inventory control basically deals with two problems:
26

When should an order be placed? (order level)
How much should be ordered? (order quantity)
INTRODUCTION
Manufacturing industries
These industries are engaged with the conversion of raw materials or semi-finished goods into finished goods.
Manufacturing industries are classified into following 4 categories:
Analytical industries
Synthetic industries
Processing industries
Assembly industries
IFB APLis an assembly line industry wherein various components or spare parts already produced are
assembled to get a new product.
Manufacturing process (of raw materials required by IFB APLbefore entering into the industry)
Manufacturing process covers the entire process starting from metal extraction from ores until it is converted
27

into a finished product as required. It involves a wide variety of operations. Manufacturing process can be
mainly classified as:
Primary Process
Secondary Process
PRIMARY PROCESS
It is the process of converting the metal extracted from ores into the final shape as required or a shape on which further operations can be carried out. The metal is heated and liquefied so that it can be poured into
moulds to obtain the required shape.
The various primary processes are:
1. forging
2. casting
3. moulding
SECONDARY PROCESS
It is the process of converting the metal blanks into the final shape required. It involves removal of material
from the blank by various operations. The final shape is obtained at the end of these processes.
The different secondary processes are:
1. forming
2. turning
3. drilling
4. boring
5. grinding
6. super finishing
The ORGANISATION STRUCTURE of manufacturing dept. in IFB APLis as follows:
SEATING SYSTEMS
DOOR SYSTEMS
AUTOMOTIVE MOTORS
LATCHES
Seating Systems
Seating systems division provides the complete solution in seating mechanisms. It has the capability to supply
both manual and power seating mechanisms which are compatible in nature. The mechanism is designed to
adjust basic functions such as, angle of seat backrest and liner movements of an entire seat and adjustment in
seat heights to supplement the comfort systems of a car. It enables the auto makers to offer their end users a
safe & comfort seating experience.
This division manufactures:
Seat recliners
Seat sliders
Seat latches etc.,
The child parts required to manufacture seat recliners for the Model – Chevrolet BEAT ; Co. code – M300
28

Rivet, inner sector LH-finished, plate arm-LH, recliner cover MTG bracket, spring return-finished, spring
lever, lever release-LH (EDP coated), upper support BRKT LH, plain washer plated, upper part LH-finished, wave washer, inner sector LH-finished, cam plate LH-finished, guide plate-finished, lower part LH-finished,
shaft arm.
Production process:
Stage 1 – Plate arm assembly
Stage 2 – Manual Assembly Stage -1
Stage 3 – Manual Assembly Stage -2
Stage 4 – Plate holder sub assembly staking
Stage 5 – Spring Assembly of recliner sub assembly
Stage 6 – Torque checking of recliner sub assembly
Stage 7 – Center staking of recliner sub assembly
Stage 8 – Final Inspection and packing
OUTPUT/PRODUCTION – 140 recliners/hr. (Manual)
Door Systems
Doors are the second most complex system in a vehicle because they must combine aesthetics with high safety,
reliability and functionality by accommodating many intricate mechanisms in a small space.
IFB AUTOMOTIVE is the only automotive full service system supplier in India, with design and
manufacturing capability for window regulators, latches and door modules. Over the decade, the company has
acquired knowledge & skills in developing, unique, reliable & cost effective products for door systems. The
company is proudly associated with all the major OEMs (Original Equipment Manufacturer) and has been supplying Window regulators, door latches, hood & trunk lid latches.
Manual window regulator
Power window regulator
Door modules etc.,
The child parts required to manufacture Power window regulators for the Model – Indigo
Guide rail, roller pulley, roller rivet, base plate, drum cover, drum pulley, wire rope, lifting plate, rubber
stopper, motor screw, back plate screw, back plate.
Production process:
Stage 1 – roller riveting
Stage 2 – caulking
Stage 3 – winding and lifting plate insertion
Stage 4 – lifting plate and guide rail assembly
Stage 5 – motor fixing
Stage 6 – back plate fixing
Stage 7 – final testing i.e., apply grease and check for the
Movements
Stage 8 – parameters are checked.
OUTPUT/PRODUCTION – 90 regulators/ hr
29

Automotive Motors
“Only Organization that manufactures four (4) motors”
The motor division was started in 1999 for manufacturing HVAC blower & condenser motors for air
conditioning, engine cooling fan motors for passenger car applications in India. At present IFB APLmanufactures 3 lakhs motors annually with a planned capacity of 1 million motors. The kinds of motors
being designed and developed by IFB INDUSTRIES PVT LTD include:
HVAC blower motors
Condenser motors
Wiper etc.,
Major parts of a radiator
Armature/Rotor
Stator (assembly line)
The child parts required to manufacture radiator motor for the Model – Indica vista
Armature child parts –
Rotor stack/lamination, end insulation, commutator, copper wire for winding purpose (diameter varies according to customer specification)
Production process:
Stage 1 – end insulation pressing
Stage 2 – commutator pressing
Stage 3 – rotor winding
Stage 4 – hot stacking/welding (enamel coating)
Stage 5 – 2nd pressing
Stage 6 – commutator turning (remove rough surface of commutator)
Stage 7 – run out checking
Stage 8 – balancing
Stage 9 – armature testing
Tests:
Joint – this test ensures proper hot stacking of the armatures
Coir and diagonal – these tests checks the proper no. of turns present and ensures that the laminations
are not discharged
Surge
High voltage – 500 volts PC
Rotor child parts –
Shell, ball bearing, bearing housing, magnet, magnet holding spring, end cover, dish spring, felt, bush bearing, brush plate, nylon washer, grommet and grommet cover, M5 screw (5mm diameter)
30

Production process:
Stage 1 – shell and ball bearing assembly (bearing crimping)
Stage 2 – magnet pressing
Stage 3 – magnetization (induce magnet property in the magnetic material
Stage 4 – assembly (rotor pressing)
Stage 5 – brush plate assembly
Stage 6 – end cover (final assembly)
Stage 7 – the manufactured product is sent to the noise checking chamber which make sure to have a minimum decibel level of 55-60 DB as specified by the customer.
Performance testing:
Revolution Per Minute (RPM)
Current
*As per customer requirement
OUTPUT/PRODUCTION – 60 motors/ hr
LATCHES
A latch (locking system) is one of the most important components of a car. The categories in which the latches
produced are Manual, automatic and key less entry. The types of latches produced in IFB APLare –
Door latches
Hood latches
Door striker
The child parts required to manufacture door latches (LH) for the Model – Ashoka Leyland
Frame box LH, ALH release lever LH, STD shoulder stud, BTH outside operating lever LH, HUL spring
cartridge, SCF torsion spring AB-LH, outside operating lever clip, AVH outside locking lever LH, STD
shoulder stud (lock lever rivet), KIF over center spring LH, BTH inside release IB LH, STD shoulder stud IB, PUR bumper SH, PUR bumper DRF, housing, HUL bushing, SCF torsion spring DRF LH, catch over mould, STD shoulder stud DRF, SPK pawl LH, frame plate LH, pawl operating lever LH, SCF spring SPK LH, PUR
bumper lock lever, DTG sealing, inside release rod LH, inside lock rod LH, outside release rod LH.
Production process:
Stage 1 – outside operating lever riveting
Stage 2 – frame box inside operating lever riveting
Stage 3 – frame box outside operating lever riveting and sub assy
Stage 4 – pawl riveting
Stage 5 – housing sub assy
Stage 6 – housing sub assy riveting
Stage 7 - housing and frame box sub assy
Stage 8 – actuator fixing
Stage 9 – caulking
Stage 10 – lock laver assy
Stage 11 – BTH sealing
Stage 12 – final testing i.e., lock and unlock functional testing
Stage 13 – center locking
31

Stage 14 – final inspection and packing
OUTPUT/PRODUCTION – 120/hr
The Organization has a systematic way of house keeping by following ‘5S’ and ‘3C’:
5S is a methodology that uses a list of five Japanese words. The list describes how items are stored and how
new order is maintained.
ELEMENTS of 5S –
SEIRI - SORT
SEITON - SET IN ORDER
SEISO - SPIC AND SPAN
SEIKESTSU - STANDARDISE
SHITSUKE - SUSTENANCE
SORT means Remove unnecessary items from the work place.
‘Done with the objective of saving and recovering space’
SET IN ORDER means systematic arrangement of required materials, which reduce the searching time of the
items.
SPIC AND SPAN means keeping everything swept and clean.
‘Done with the objective of inspecting for problems and taking faster corrective actions’
STANDARDISE means to create a consistent way of doing tasks and procedures.
SUSTENANCE means to make a habit of properly maintaining
correct procedures.
‘Done with the objective of achieving higher productivity and better quality through higher employee morale’
ELEMENTS of 3C –
CONSTANT LOCATION
CONSTANT CONTAINER
CONSTANT QUANTITY
32

CONSTANT LOCATION - the materials in the work place are to be kept in specified location.
CONSTANT CONTAINER – the materials are to be kept in the specified container.
CONSTANT QUANTITY – the materials are to be kept in specified quantity i.e., the container should not be
overloaded.
POKA YOKE
Poka yoke is a Japanese term that means Mistake Proof Mechanism. A Poka yoke is any mechanism in a
manufacturing process that helps to avoid manual errors/mistakes. Its purpose is to eliminate product defects
by preventing, correcting or drawing attention to human errors as they occur.
Note: The operator has to ensure the working condition of ‘POKA-YOKE’ before starting the production.
SOP – Standard Operating Procedure
SOP is a document that mentions a specified way to carry out an activity or a process. It is also known as
“Working Standards”.
PRODUCT TRACEABILITY
Product traceability is the ability of the organization to refer all the details about any product (in case if
rejected by the customers) by just looking at its product code. The product code is generally ensured in the
following way:
12456B
12 – Year
45 – Week
6 – Day
B - Shift
Just-in-time manufacturing
Just-in-time technique is an inventory control tool which supplies the material, what is needed, when it is
needed and the amount needed. By JIT inventory can be controlled to optimized level.
IFB APLhas certain JIT commandments which are as follows:
Throw out traditional manufacturing methods.
Think of how the new method will work, not how it won’t work.
Don’t accept excuses.
Don’t seek perfection. A 50% implementation rate is fine as long as it is done on the spot.
Correct mistakes the moment they are done.
Don’t spend money on Kaikaku (Innovation).
Problems give you a chance to use your brain.
33
Ten people’s ideas are better than one person’s knowledge.
Kaikaku knows no limits.
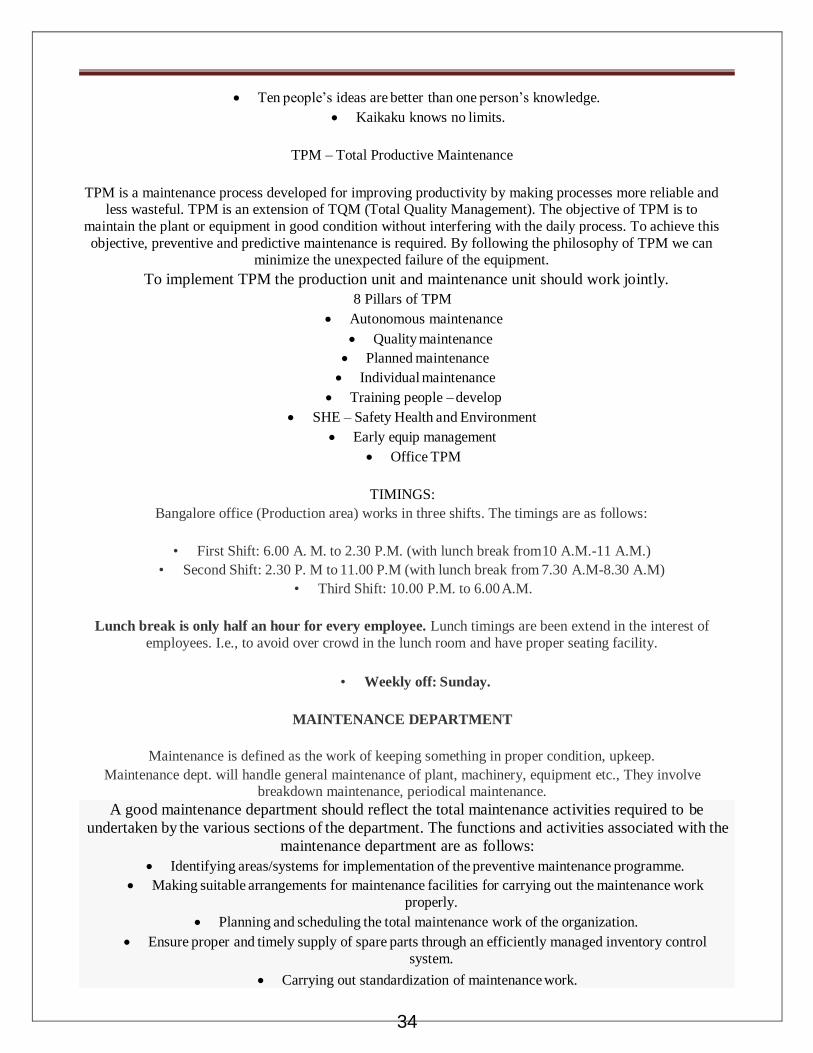
TPM – Total Productive Maintenance
TPM is a maintenance process developed for improving productivity by making processes more reliable and
less wasteful. TPM is an extension of TQM (Total Quality Management). The objective of TPM is to
maintain the plant or equipment in good condition without interfering with the daily process. To achieve this
objective, preventive and predictive maintenance is required. By following the philosophy of TPM we can minimize the unexpected failure of the equipment.
To implement TPM the production unit and maintenance unit should work jointly.
8 Pillars of TPM
Autonomous maintenance
Quality maintenance
Planned maintenance
Individual maintenance
Training people – develop
SHE – Safety Health and Environment
Early equip management
Office TPM
TIMINGS:
Bangalore office (Production area) works in three shifts. The timings are as follows:
• First Shift: 6.00 A. M. to 2.30 P.M. (with lunch break from 10 A.M.-11 A.M.)
• Second Shift: 2.30 P. M to 11.00 P.M (with lunch break from 7.30 A.M-8.30 A.M)
• Third Shift: 10.00 P.M. to 6.00 A.M.
Lunch break is only half an hour for every employee. Lunch timings are been extend in the interest of
employees. I.e., to avoid over crowd in the lunch room and have proper seating facility.
• Weekly off: Sunday.
MAINTENANCE DEPARTMENT
Maintenance is defined as the work of keeping something in proper condition, upkeep.
Maintenance dept. will handle general maintenance of plant, machinery, equipment etc., They involve breakdown maintenance, periodical maintenance.
34
A good maintenance department should reflect the total maintenance activities required to be
undertaken by the various sections of the department. The functions and activities associated with the
maintenance department are as follows:
Identifying areas/systems for implementation of the preventive maintenance programme.
Making suitable arrangements for maintenance facilities for carrying out the maintenance work
properly.
Planning and scheduling the total maintenance work of the organization.
Ensure proper and timely supply of spare parts through an efficiently managed inventory control
system.
Carrying out standardization of maintenance work.

QUALITY CONTROL DEPARTMENT
INTRODUCTION:
Quality control is the systematic control of materials encountered in manufacturing process which affect the excellence of end product. It emphasizes testing of products to uncover defects and reporting to management
who make the decision to allow or deny product release.
FUNCTIONS:
There are 3 stages involved-
Incoming quality
Processing quality
Final inspection
In the incoming quality stage, as soon as the raw materials reaches the industry GRN is prepared the incoming
inspection team checks the quality if RM received. If satisfied with the quality and as per the PO they will
accept the RM after which it is handed over to the stores.
Process quality – in this stage, the quality team will inspect the production process so as to verify whether the
processing is as per the SOP.
Final inspection – before dispatching, the final products manufactured are verified and then give the clearance
for dispatch.
GLOBAL TESTING FACILITIES:
IFB AUTOMOTIVE believe that testing of products to national and international standards is very vital,
for conformance to quality, product development and; research and development’. At IFB AUTOMOTIVE
there is no compromise on quality for all its products. The components and products are put through rigorous testing at all levels, which, includes structural, dynamic life cycles, environment and metallurgical testing.
Superior and sophisticated measuring and recording instruments and gauges are used to facilitate the testing
provision of the Company.
Company has set up the state of the art global standard testing and validation facilities, which includes,
Performance and endurance testing systems for door regulators, automotive latches, seat sliders, seat
recliners and motors
Door slam test rig for latches and window regulators
Combined vibration and environmental chamber to test products at temperatures ranging between –65 and +180 degrees Celsius, along with vibrations measuring 1000 kg in humidity range of 10 - 95%
Seat anchorage test
35
Arranging import substitutions of components, if necessary.
Implementing modifications and updating to the existing equipment, wherever possible.
Assisting the purchase department in procuring new machinery, construction work related to machines
and replacement of the parts of the equipment.
Disbursement of services such as, water, compressed air, steam, electricity and the like required for
maintenance functions.
Identification of obsolete and surplus equipment for replacement and disposal.
Training of maintenance personnel.
Ensuring safety of personnel and equipment.

Crash test
MAJOR CUSTOMERS of IFB INDUSTRIES PVT LTD APL
IFB AUTOMOTIVE believes that the most important issue for the customer is on-time delivery with
technical service. The application engineers constantly are in touch with the customers' development engineers from the project to ensure that proper design and process are deployed to make the part of high quality
standard. The focus of the application engineers are not restricted to the parts supply, they even study the field
problems along with the customer engineers to unlock the hidden technical problems for finding innovative solutions.
Maruti udyog Limited
Mahindra & Mahindra
Ford
Hyundai
Tata Motors
General Motors
Honda
Toyota
FIAT
BEHR India
36

Tata Johnson Controls
Tata Toyo
Hanil Lear India Private Limited
Subros
Krishna Maruti Ltd.
BSL
TS Tech
Sanden Vikas
FINANCE DEPARTMENT
INTRODUCTION
In this modern era of money making, finance is one of the basis foundations for all kinds of economic
activities. It is the master key, which provides access to all sources to be employed in manufacturing and
merchandising activities. It has been rightly said that business needs money to make more money.
For effective and continuous working of organization the main thing that is required is sufficient
finance. In other words, ‘Finance is the life blood of businesses.’
NEED AND IMPORTANCE
To purchase fixed assets i.e., machinery, fixtures etc.
To pay for purchase of raw materials, wages etc.
To expand the existing business
To hold stock of materials and finished goods.
Managing the available monetary resources is the primary function of any organization. To carry on
37

this function the finance department came into existence. This function should be well organized in a firm. So there will be a separate department to look after the financial aspects of the firm.
To work more effectively and efficiently the finance department has several sections such as,
Bills section
Materials accounts section
Sales section
Costing section
Cash and bank section
Accounts section
The department deals with payables and receivables. Here initially the PO (Purchase Order) is
prepared then the GRN (Goods Received Note) will be made for goods. Later quality assurance
department checks the quality. Once the QAD approves then the invoice copy is sent to the accounts
department where the bills are passed, until this stage all the transactions are carried out by ERP
(Enterprise Resource Planning) software. Then the further operations are carried out by Tally
package.
BUDGETING:
The company has yearly budgeting for each and every department. Each and every department will give the
schedule as per the requirements of budge jets about machining, tools etc. If any extra budget is required apart from the allotted amount the company has procedure of filling in CAPEX (Capital Expenditure) form, which
contains the details of amount required. To avoid destructions in their working, the company will go for long
term or short term borrowings from corporate.
The company’s banking transactions is with BOI (Bank of India).
ACCOUNTS SECTION:
Accounts section is a must for any business concern. The main function of accounts section is that of
accounting.
Accounting is process of identifying, measuring, recording and communicating economic information capable
of being expressed in terms of money, at least partially to facilitate appraisal of an institution or situation,
inform judgment and decisions by users of an institutions, it essentially considers the needs of a specific economic unit, which an information system design to serve organizational objective. The utility of accounting
information lies in the ability to reduce uncertainty.
MAIN FUNCTIONS OF THIS SECTION:
Preparing the profit and loss account and the balance sheet of concerned at the end of every accounting year.
The guidelines followed during the preparations of the annual report are as follows:
1. Significant accounting policies:
The financial statements has to be prepared as of a going concern on historical cost convention and on the
accrual method of accounting in accordance with generally accepted accounting principles and provisions of
the company’s act 1956 as adapted consistently by the company.
2. Fixed assets:
Fixed assets are carried at the cost of acquisition or construction less accumulated depreciation.
Physical counting is done once in a year. The cost includes the value of internal transfers for capital
works taken at actual factory cost or market price, if any extraordinary events such as
38

addition/deduction in respect to long term liabilities/loans utilized for acquisitions of fixed assets is added to / reduced from the cost.
3. Borrowing costs:
Borrowing costs that are attributable to the manufacture, acquisition or construction of assets, are included as part of the cost of such assets. The cash credit limit of the company is 350 lakh. The company’s bank
transactions are with Bank of India.
4. Investments:
Long-term investments are carried at costs. The current investments are on the new projects and also for the expansion of the company. The cost of investments includes acquisition charges such as brokerage, fees and
duties .any reduction in the carrying amount and any reversals of such reductions are charged or credited to the
profit & loss account.
5. Terminal benefits:
Provident fund and Employee’s family pension scheme contributions are accounted for an accrual basis.
Liability for gratuity, leave encashable at the time of retirement medical benefits are accounted for in
accordance with actuarial valuation. The actuarial liability is determined with reference to employees at the
beginning of each calendar year.
6. Depreciation:
Depreciation is calculated at the end of every year and depreciation on fixed assets is charged on written down value method as per the rate prescribed in the company’s act, 1956.
7. Research & Development:
Research & Development expenditure is charged to profit & loss account in the year of incurrence. It has an
expenses benefit of 150% in income tax. Fixed assets acquired for the purpose of research and developments
are capitalized.
8. Accounting for foreign currency transactions:
The company has exports but not directly, it’s through agents and hence the payments are made in the Indian
currency. But for imports it is in the form of Euro, GBP (Great Britain Pounds) for the accounting purpose the
figures are converted in to rupees. In case of payments, the Indian currency is converted to respective
currencies and paid. Any exchange differences arising out of foreign exchange currency transactions are recognized as income or as expense in the period in which they arise.
39

HUMAN RESOURCE DEPARTMENT
INTRODUCTION
IFB AUTOMOTIVE reckons its human resources as its most treasured asset and main resource of strength for the organization. The company believes that product success and customer trust can only be achieved through
enthusiastic and dedicated effort and innovative ideas given willingly by its people.
The company provides working environment where every employee can make most effective use of his
knowledge with enthusiasm. To develop and improve the knowledge base and skills of its employees, IFB AUTOMOTIVE team members are sent to different training programs and professional courses.
HR OBJECTIVE:
Promote culture for learning.
Foster teamwork.
Nurture creativity.
Preferred supplier for automotive system in passenger car, utility vehicles and commercial vehicles
segments.
Aspire to be preferred company by all other associates.
Participate in social development and be eco friendly in all our activities.
Office working hours-
Start time: 8.30 A.M.
Finish time: 5.45 P.M.
Saturdays: 8.30 A.M. to 1.30 P.M.
Weekly off: Sunday
HR POLICY:
The company firmly believes that well motivated employees are important for fulfilling our customer
commitment to supply the product that will consistently exceed customer expectations.
The company strongly believes that attracting and retaining right talents and inculcating a quality
culture will result in becoming a preferred supplier due to excellence in quality and services.
The company believes in creating and maintaining a desire amongst employees to continuously improve their competency. Nature teamwork and collaboration thereby creating an environment that will foster teamwork
and achieve total quality in all the activities of the company.
The company strongly believes in promoting professional integrity and proper functional discipline amongst
employees and creates role model. The company will initiate and support activities aimed at improving
standard in the quality of life around the community it operates.
OBJECTIVES:
40

1. To achieve excellence in business by exceeding customer exceptions through well motivated and competent
employees working in a culture of teamwork and continuous improvement with professional integration.
2. To attract and retain right talent.
3. To develop the potentials in the pursuits of organizational goals through self-development.
RECRUITMENT POLICY:
1. Policy statements:
To induct fresh graduates with consistently good academic record for placement in executive position by
planned and effective selection and train them to suit to the discipline relevant to the present and future
business requirements.
To prepare them to face the challenges of new millennium by nurturing technique, managerial,
behavioral competencies and to develop world-class professionals as we move towards world-class standards.
Breeding-internal managerial talents to occupy higher positions of tomorrow.
2. Methods:
Facilitate proper manpower planning.
Recruit through advertisement/agencies/contacts/data banks.
Fill up the vacancies within the organization.
Campus recruitment-presentation, written test and aptitude test.
RETAINING POLICY:
Good scheme to attract readymade talent in the market
HR interventions.
Induction programs for new entrants.
Conduct wage survey comparative study on employee’s welfare and benefits.
Professional pledges.
Industry-institute collaboration.
Individual growth plan.
Promoting professional activities.
Conduct exit interview.
Six ways to build a top staff:
To build a staff into a team that does the best possible job for the organization,
Be friendly to staff members but don’t treat them like close personal friends. They want you to be the boss and they want to be employees. It works better that way.
Tell them everything except them to tell you the same. Shared knowledge building loyalty and trust.
I invest heavy in loyalty. If staff members know that you are always loyal to them, they will give you
the same in return.
Realize that fairness-not cleanliness-is next to godliness.
Never be too busy to laugh. Nothing gets people through a crisis like a good laugh-and a manager who
is willing to enjoy it with them.
41

Proposals of higher education:
IFB APLbelieves in creating and maintaining desire amongst employees to continuously improve competency,
skill Etc. constant up gradation of skill, technique knowledge, concepts, managerial skills etc, will help
employees to perform in consistency with their demanding job responsibilities.
Scope:
Engineers who have minimum 5 yrs of experience.
Managers who have minimum 3Yrs of experience.
Qualifications:
The qualification of the employees should be any one of the following:
Diploma in engineering
Or Bachelor of engineering
Or any other degree
Courses proposed: (benefits)
The following courses are proposed for following department employees,
1. Managerial/general:
MBA
Engineering business management.
2. Master of technology (M.tech):
Design and development.
Quality systems
Manufacturing systems engineering.
3. Doctorate (PhD):
Design engineering
Research and development
Any other stream (M.Sc)
Cost:
The course cost varies from Rs.10000 to Rs.200000 for 2 years.
Budget:
The annual budget proposed for the courses is around Rs.600000 per year. However it may vary from year to year depending upon the fee structure of the college/university
SYSTEM OF RECRUITMENT
1. MAN POWER PLANNING:
Recruitment and selection is based on policy of the company on manpower planning. Manpower plan
is made available in the beginning of the financial year. The plan is prepared after critical evaluation
42

and systematic review of all jobs, working methods, productivity norms, long and short-term business plans and targets.
2. MAN POWER REQUISITION:
Request for approval of manpower either for a new position or a replacement will be through the manpower requisition format which has to be submitted by the departmental heads to HR department with the approval of
the divisional unit head for senior manger required. Recruitment process must be initiated only on receipt of
approval. Also manpower requisition form should be submitted to the HR department at least 3 months in
advance.
On receipt of manpower requisition form HR department will work into the following possibilities for following up the vacancy.
Assigning additional responsibilities to the existing staff.
Internal transfer.
Promotion to the existing person
SOURCES OF RECRUITMENT:
Professional contracts i.e., professional agency, through contracts.
Employee references.
Through campus interview.
Through employment exchange.
Through advertisement in newspaper.
Head hunting/placement agencies.
PROCEDURE:
All recruitments are based on the requirement of the department\organization. As fare as possible new recruits
should be inducted in the starting levels like diploma, trainees, GETS, postgraduate, trainees, management
trainees experience candidates are placed at the higher cadre or where there is no substitute available within the organization.
The designed manpower analysis should also cover aspects like educational qualification, background and
experience detaining out description of the job to be carried out, key personnel qualities of candidates,
essential attributes, job related competencies.
RECRUITMENT AND SELECTION:
The unit head of each unit company who will interview all candidates before releasing offer letters
will sign all appointment letters.
Selection will be purely based on recruit and through adoption of systematic selection process.
No back door entry will be allowed hiring of direct or indirect relations of employees will be avoided.
SELECTION PROCESS:
Screening:
43

Screening by HR department based on job description, age, education qualification and number of years of relevant experience are the factors to be considered. For executives and above, short listed
application will be next to the concerned department head\ divisional head for final screening.
Interview call letters:
HR department shall schedule the interview in consultation with department manager. The ratio
would be 1:7 for a position in the junior level and 1:5 in the middle management level. Hr department
will send interview call letters well in advance at least 7 days before the date of interview.
Written test:
For all entry-level positions there is a written test to assess the candidate’s knowledge of the
generation subjects like arithmetic, general English, and technical\ job knowledge. The test includes
an attitude\ personality questionnaire. These tests should have approval of Hr department concerned
department and will be reviewed from time to time.
Practical test:
In addition to the written test there is also a practical test for the entry-level positions in the respective job/skills/trade.
Interview:
Interviews will be used as the main mode of selection. There will be 2-interview panel for all position
preliminary interviews and final interview panel. The candidates who are through in the 2nd round
will be called again to meet the divisional heads and final selection shall be done by unit
head/CEO/director.
Pre employment verification:
For all positions below executive level a pre-employment verification of character antecedents is
done to check the family background of the candidate, his social circle, performance in the previous
job, college/institution where he studied, criminal records.
Pre employment medical check up:
All the candidates who are provisionally selected have to undergo medical check up by the company
approved doctors. E.g.: uric acid, urea, urea for R/E, chest X-rays, eye check up and ECG.
Salary And Grade Fixation:
The level of the entry in the terms of grade and salary will be fixed depending on age, qualification, salary drawn, experience, performance in the interview etc., care must be taken not to disturb the
existing structure.
Unit head\corporate approval:
Before issuing the appointment letters to the president\ director IFB AUTOMOTIVE is to be obtained.
44

Appointment letters:
Appointment letter will be issued by HR department per the prescribed format- it will be signed by
the unit head\manager HR. details of salary perks will be given along with appointment letter.
Joining time:
Normally joining time is one month from the date of reject of offer. For senior positions, if the
present employment terms demand more than one month, we may allow up to a maximum 3 months
Joining formalities:
It includes filling up of joining report, all statutory declaration forms like ES, PF gratuity, Medi-claim
forms etc and verification of original document.
Salary advice to accounts:
The HR department sends the payroll notice signed by the unit head to the accounts department for
the payment of salary.
Reference checks:
For all recruitment in the executive category and above, a reference checking is done with previous employer as per format-enclosed format.
Induction program:
The induction program\induction training through which the newly joined various department and
work culture of the organization. The induction programs are planned differently for deferent
levels.
1. Graduate engineer’s trainees/management trainee’s diploma trainees- the induction period is
one month.
2. Engineers at the entry level (1-3 yrs experiences the duration is 15 days).
3. Senior level the induction period is 7-10 days.
45

RESEARCH DESIGN
The main aim of performance appraisal is to reward the great performance and to address the weaknesses. STATEMENT OF THE PROBLEM:
Performance appraisal is one of the most important and unavoidable part of any organization
whether it is for – profit or non – profitable purpose, as this process helps the organization to
evaluate the performance of the employees and to formally recognize their achievements and
contribution towards the organization
This study mainly focuses on finding out the effectiveness of performance appraisal on
the employees working at IFB Automatic pvt ltd, Bangalore and to evaluate the current status of
the satisfaction of employees with the present performance appraisal system at IFB Automatic
pvt ltd, Bangalore. If there is found some dissatisfactory factors, the study will try to provide
some suggestions to improve the situation.
NEED OF THE STUDY:
There are numerous needs to study the effectiveness of performance appraisal, some of
them are listed below:
The ultimate need of performance appraisal system is towards achieving organizational
goals.
Performance appraisal helps the superior to know the level of competency and have a
proper understanding about their subordinates.
Performance appraisal is also significant in providing ranking based on performance of
the employees.
To provide fair and equitable compensation based on performance of the employees.
To ensure organizational effectiveness by correcting the employees based on the
standards set in order to improve their performance and suggesting the required changes.
46

OBJECTIVES OF THE STUDY:
To measure the effectiveness of performance appraisal system at IFB Automatic pvt ltd,
Bangalore.
To analyze the factors which contribute towards the effectiveness of performance
appraisal system.
To suggest some measures for improving the factors contributing towards the
effectiveness of performance appraisal system at IFB Automatic pvt ltd, Bangalore.
SCOPE OF THE STUDY:
The study was carried out to evaluate the effectiveness of performance appraisal and
development programme conducted at IFB Automatic pvt ltd, Bangalore.
It helps to know the importance of performance appraisal system by considering both on-
the-job performance as well as the personal qualities of the employees.
To improve the employee work performance by helping them to utilize their potential to
the maximum in carrying out the objectives of the organization.
To evaluate the performance and provide valuable feedback to the employees in the areas
to be improved to efficiently achieve firm’s mission.
To allow the management to make decisions based on the performance of the employees
relating to payroll and compensation, training and development, promotion, demotion,
transfer, etc……
47

RESEARCH METHODOLOGY
RESEARCH DESIGN Descriptive research design.
TYPE OF DATA Primary data- Questionnaire
Secondary data- Company website, literature review and internet portals
DATA COLLECTION TOOL Questionnaire.
SAMPLING UNIT 100 employees.
STATISTICAL TOOLS Tables, Charts, Graphs and Regression Analysis
SAMPLE UNIT IFB AUTOMATIC PVT LTD BANGLORE
LIMITATIONS OF THE STUDY:
Time constraint was a major drawback as the period of research was limited to only 8
weeks for data collection.
The sample size was restricted onlyto 100 employees.
The chances of human error cannot be ruled out due to the possibility of
misrepresentation of the data by the respondents.
HYPOTHESIS:
HYPOTHESIS 1
H0: There is no significant effect from Design of appraisal form on performance appraisal
system.
H1: There is a significant effect from Design of appraisal form on performance appraisal system.
48

HYPOTHESIS 2
H0: There is no significant effect of Employee training and development on performance
appraisal system.
H1: There is a significant effect of Employee training and development on performance
appraisal system.
49

DATA ANALYSIS AND INTERPRETATION
DEMOGRAPHIC PROFILE OF THE RESPONDENTS:
Table No. 4.1
Gender of the respondents
Sl No Particulars Frequency Percentage
1. Male 42 42
2. Female 58 58
Source: Primary Data
Analysis:
Table No. 4.1 shows that out of 50 respondents considered for data collection, 42% of the
respondents were male and 58% respondents were female.
Chart no. 4.1
Gender of the Respondents
Interpretation:
From the above table we can interpret out of the total respondents used for data collection,
majority of them were female and rest were male respondents.
50
70
60
50
40
30
20
10
0
Male
Female
1 2

Table No. 4.2
Age Group of the Respondents
Sl. No Particulars Frequency Percentage
1. Below 25 24 24
2. 25 to 34 42 42
3. 35 to 44 28 28
4. 45 and above 6 6
Source: Primary Data
Analysis:
From the above table no. 4.2, it can be analyzed that, out of 50 respondents, 24% of the
respondents belong to the age group of below 25, 42% of the respondents belong to the age
group of 25 to 34, 28% of the respondents belongs to the age group of 35 to 44 and 6% of the
respondents belong to the age group of 45 and above.
Chart no. 4.2
Age Group of the Respondents
Interpretation:
From the above chart we can interpret that majority of the respondents belong to the age group of
25 to 34 being 42% while other 58% belongs to the various sub groups mentioned in the table
no. 4.2.
51
50
40
30
2
0
Frequency
Percentage 10
0 Below 25 25 to 34 35 to 44 45and
above

Table no. 4.3
Educational Qualification of the Respondents
Sl. No Particulars Frequency Percentage
1. SSLC 6 6
2. PUC 24 24
3. Graduation/
Diploma
44 44
4. Post Graduation 26 26
Source: Primary Data
Analysis:
Table no. 4.3 shows the educational qualification of the respondents. From the above table it can
be analyzed that out of 100%, 6% of the respondents have completed SSLC, 24% of the
respondents have completed PUC, 44% of the respondents have completed their graduation/
diploma and 26% of the respondents are post graduates.
Chart no. 4.3
Educational Qualification of the Respondents
Interpretation:
From the above chart no. 4.3, it is clear around 44% respondents have completed their
graduation/diploma and 26% have completed their post graduation while other 30% are under
graduates.
52
50 45 40 35 30 25 20 15 10
5 0
Frequency
Percentage

Table no. 4.4
Current Employment Status of the Employees
Sl. No Particulars Frequency Percentage
1 Full-time 64 64
2 Part-time 12 12
3 Regular 20 20
4 Temporary 4 4
Source: Primary Data
Analysis:
The table no. 4.4 shows the current employment status of the employees where out of 50
employees/ respondents, 64% are full – time workers, 12% are part- time workers, 20% are
regular employees and 4% are temporary employees.
Chart no. 4.4
Current Employment Status of the Employees
Interpretation:
From the above chart no. 4.4 it is clear that about 64% of the employees are full – time workers
while others 46% of the employees fall under the category of part-time, regular and temporary
employees.
53
70
60
50
40
30
20
10
0
Current
employment status
Frequency
Current
employment status
Percentage

Table no. 4.5
Work Experience
Sl. No Particulars Frequency Percentage
1 Below 1 year 12 12
2 1 to 3 years 28 28
3 3 to 5 years 26 26
4 Above 5 years 34 34
Source: Primary Data
Analysis:
Table no. 4.5 shows the working experience of the employees in the organization where it can be
analyzed that amongst 50 total respondents, 12% employees fall into the category of working
experience of below one year, 28% employees fall under the category having working
experience of 1 to 3 years, 26% of the employees fall under the category having working
experience of 3 to 5 years, and 34% of the employees fall under the category having working
experience of more than 5 years.
Chart no. 4.5
Work Experience of the Employees
Interpretation:
From the above chart no. 4.5 it is clear that majority of the employees fall under the category of
having working experience of more than 5 years where mostly these type of workers are doctors
or senior nursing staff.
54
40
35
30
25
20
15
10
5
0
Work experience Frequency
Work experience
Percentage
Below 1 1 to 3 3 to 5 Above 5 year years years years

Table no. 4.6
How often is appraisal carried out in your Organization?
Sl. No Particulars Frequency Percentage
1 Once in 6 months 20 20
2 Once in a year 80 80
Source: Primary Data
Analysis:
The above table no. 4.6 shows how often the appraisal process is carried out in the organization
and with the help of the data collected from the respondents we can analyze that around 80% of
the employees says that it takes place once in a year and only 20% of the employees says once in
6 months.
Chart no. 4.6
How often is appraisal carried out in your organization?
Interpretation:
From the above chart no. 4.6 we can interpret that performance appraisal carried out in the
organization is once in a year as around 80% of the employees agree for the same.
55
90
80
70
60
50
40
30
20
10
Once in 6 months
Once in a year
Frequency Percentage

Table no. 4.7
How would you rank the performance appraisal method in your organization?
Sl. No Particulars Frequency Percentage
1 Easy 42 42
2 Complicated 10 10
3 Efficient 48 48
4 Inefficient 0 0
Analysis:
The above table no. 4.7 shows how the employees rank the performance appraisal carried out in
their organization where around 42% of the employees says that it is easy, 10% says it is
complicated, 48% says it is efficient and 0% says it is inefficient.
Chart no. 4.7
How would you rank the performance appraisal method in your organization?
Interpretation:
From the above chart no. 4.7, it is clear that majority of the employees says it is easy and
efficient and only like 10% of the employees feels it is complicated.
56
60
50
40
30
20
10
0
Frequency
Percentage

LIKERT QUESTIONS:
Table no.4.8
Attitude of the Employees
4.8.1: You are satisfied with the performance appraisal results of the organization.
Sl. No Particulars Frequency Percentage
1 Strongly Agree 44 44
2 Agree 40 40
3 Neutral 10 10
4 Disagree 4 4
5 Strongly disagree 2 2
Source: Primary Data
Analysis:
The above table no. 4.8.1 shows how well the employees are satisfied with the performance
appraisal results of the organization where the percentage goes as strongly agree is 44%, agree is
40%, neutral is 10%, disagree is 4% and strongly disagree is just 2%.
Chart no.4.8.1
You are satisfied with the performance appraisal results of the organization.
Interpretation:
Therefore, it is clear from the analysis results of the above table no.4.8.1 which shows the
attitude of the employees towards the performance appraisal results of the organization and
around 44% people out of the total 50 sampling size of 50 respondents have strongly agreed and
57
50
45
40
35
30
25
20
15
10
5
0
FREQUENCY
PERCENTAGE
Strongly Agree Neutral Disagree Strongly Agree disagree

hence we can say that they are satisfied with the performance appraisal results of the
organization.
Table no. 4.8.2
The criteria of performance appraisal is also considering the performance of the employees
Sl. No Particulars Frequency Percentage
1 Strongly Agree 12 12
2 Agree 78 78
3 Neutral 8 8
4 Disagree 2 2
5 Strongly disagree 0 0
Source: Primary Data
Analysis:
The above table no. 4.8.2 shows the criteria of performance appraisal is also considering the
performance of the employees or not. Therefore, around 12% of the respondents have opted for
strongly agree, 78% for agree, 8% are neutral, 2% respondents opt for disagree and nobody for
strongly disagree.
Chart no. 4.8.2
The criteria of performance appraisal is also considering the performance of the employees
Interpretation:
From the above chart no. 4.8.2 it is clear that around 78% of the respondents out of 100% have
agreed that the organization does consider the performance of the employees at the time of
performance appraisal in the organization. Hence we can conclude that the organization is not
58
90 80 70 60 50 40 30 20 10 0
FREQUENCY
PERCENTAGE
Strongly Agree Neutral Disagree Strongly Agree disagree

partial amongst the employees and they do take proper consideration regarding the employee’s
performance without any bias between them.
Table no. 4.8.3
Are you satisfied with the outcomes of the appraisal?
Sl. No Particulars Frequency Percentage
1 Strongly Agree 22 22
2 Agree 36 36
3 Neutral 34 34
4 Disagree 4 4
5 Strongly disagree 4 4
Source: Primary Data
Analysis:
Table no. 4.8.3 shows whether the employees are satisfied with the performance appraisal results
or not wherein, around 22% respondents have strongly agreed, 36% respondents have agreed,
34% respondents are neutral i.e., neither agree nor disagree, 4% have opted for disagree and 4%
of them have strongly disagreed.
Chart no. 4.8.3
Are you satisfied with the outcomes of the appraisal?
Interpretation:
From the above analysis result which is also shown with the help of the diagram in chart no.
4.8.3 shows that around 36% of the respondents are satisfied with the outcomes of performance
59
40 35
30
25
20
15
10
5
0
FREQUENCY
PERCENTA
GE
Strongly Agree Neutral Disagree Strongly Agree disagree

appraisal and around 34% are neutral i.e., neither satisfied nor dissatisfied. Therefore, the
organization can take the necessary steps and find out what corrective measures have to be taken
to make the results of the performance appraisal more accurate and make their employees happy.
Table no. 4.8.4
Do you think there is still scope to improve performance appraisal system
Sl. No Particulars Frequency Percentage
1 Strongly Agree 14 14
2 Agree 36 36
3 Neutral 24 24
4 Disagree 18 18
5 Strongly disagree 8 8
Source: Primary Data
Analysis:
The above table no. 4.8.4 shows whether there is still scope to improve the performance
appraisal system of the organization or not. Based on the response it is found that around 14% of
the respondents have strongly agreed, 36% of the respondents have agreed, 24% of the
respondents are neutral, 18% of the respondents have disagreed and around 8% of the
respondents have strongly disagreed.
Chart no. 4.8.4
Do you think there is still scope to improve performance appraisal system.
60
40
35
30
25
20
15
1
0
FREQUENCY
PERCENTA
GE
Strongly Agree Neutral Disagree Strongly Agree disagree

Interpretation:
From the above chart no. 4.8.4 it is clear that majority of the respondents have agreed that there
is still scope for improving the performance appraisal system in the organization. Therefore, the
organization can improve its performance appraisal system by taking necessary corrective
measures for further appraisal of the employees.
Table no. 4.9
Design of the appraisal form
4.9.1: All the goals and targets have been clearly expressed and assigned to me by the
management.
Sl. No Particulars Frequency Percentage
1 Strongly Agree 32 32
2 Agree 40 40
3 Neutral 12 12
4 Disagree 16 16
5 Strongly disagree 0 0
Source: Primary Data
Analysis:
The above table no. 4.9.1 shows whether all the goals and targets have been clearly expressed
and assigned to the employees by the management in the organization or not. Based on the
response it is found that out of 50 respondents around 32% of the respondents have strongly
agreed, 40% of the respondents have agreed, 12% of the respondents are neutral, 16% of the
respondents have disagreed and 0% of the respondents have strongly disagreed.
61

Chart no. 4.9.1
All the goals and targets have been clearly expressed and assigned to me by the
management.
Interpretation:
Based on the analysis it is clear that majority of the respondents have agreed and they feel that all
the goals and targets or standards are clearly expressed and assigned to them by the management
and hence they have no issues with the communication issues between the management and the
respondents.
Table no. 4.9.2
I feel the standards set for performance evaluation are pretty justifiable.
Sl. No Particulars Frequency Percentage
1 Strongly Agree 6 6
2 Agree 48 48
3 Neutral 26 26
4 Disagree 18 18
5 Strongly disagree 2 2
Source: Primary Data
Analysis:
From the above table no. 4.9.2, it can be analyzed that out of 50 respondents 6% have strongly
agreed with the standards set are justified, 48% have agreed, 26% are neutral, 18% respondents
62
70
60
50
40
30
2
0
PERCENTAGE
FREQUEN
CY 10
0 Strongly Agree Neutral Disagree Strongly Agree disagree

do not agree and only around 2% of the respondents strongly disagree with the above mentioned
statement.
Chart no. 4.9.2
I feel the standards set for performance evaluation are pretty justifiable.
Interpretation:
From the above results based on the analysis we can interpret that around 48% of the respondents
feel that the standards set for the performance evaluation are pretty justifiable.
Table no. 4.9.3
The reliability of the factors considered in appraisal system is satisfactory.
Sl. No Particulars Frequency Percentage
1 Strongly Agree 20 20
2 Agree 32 32
3 Neutral 18 18
4 Disagree 22 22
5 Strongly disagree 8 8
Source: Primary Data
Analysis:
The above table no. 4.9.3 shows that the reliability of the factors considered in appraisal system
by the management are satisfactory or not. Based on the response it is found that out of 50
respondents around 20% of the respondents have strongly agreed, 32% of the respondents have
63
80
70
60
50
40
30
20
10
0
PERCENTAGE
FREQUEN
CY
Strongly Agree Neutral Disagree Strongly Agree disagree

agreed, 18% of the respondents are neutral, 122% of the respondents have disagreed and 8% of
the respondents have strongly disagreed.
Chart no. 4.9.3
The reliability of the factors considered in appraisal system is satisfactory.
Interpretation:
The results are quiet clear from the analysis which is also shown in the chart no. 4.9.3 where
majority of the respondents in the organization feel that the reliability of the factors considered
by the management for evaluating the performance appraisal results of the employees are
satisfactory. The management can further revise the factors, if necessary, to get more accurate
results.
Table no. 4.9.4
I feel the performance appraisal system set by the management is satisfactory.
Sl. No Particulars Frequency Percentage
1 Strongly Agree 22 22
2 Agree 34 34
3 Neutral 16 16
4 Disagree 16 16
5 Strongly disagree 12 12
Source: Primary Data
64
60
50
40
30
2
0
PERCENTAGE
FREQUEN
CY 10
0 Strongly Agree Neutral Disagree Strongly Agree disagree

Analysis:
The above table no. 4.9.4 shows the analysis results collected from the respondents based on
whether they feel the performance appraisal system set b the management is worth it or not or
whether they are satisfied or not. From the above results we got to know that out of 50
respondents around 22% respondents have strongly agreed, 34% of the respondents have agreed,
16% are neutral, 16% respondents didn’t agree, and around 12% of the respondents strongly
disagree.
Chart no. 4.9.4
I feel the performance appraisal system set by the management is satisfactory.
Interpretation:
From the above chart no. 4.9.4 it is quite clear that out of total 50 respondents, 34% of the
employees have agreed that the performance appraisal system set by the management is
satisfactory and they have no objections regarding such system.
65
60
50
40
30
2
0
PERCENTAGE
FREQUEN
CY 10
Strongly Agree Neutral Disagree Strongly Agree disagree

Table no. 4.10
Employee Training and Development.
4.10.1: I feel training delivered after appraisal contributes in improving my performance.
Sl. No Particulars Frequency Percentage
1 Strongly Agree 36 36
2 Agree 24 24
3 Neutral 18 18
4 Disagree 12 12
5 Strongly disagree 10 10
Source: Primary Data
Analysis:
The above table no. 4.10.1, it can be said that, out of total 50 respondents 36% of the respondents
strongly agree with the above mentioned statement, 24% respondents agree, 18% respondents are
neutral, 12% of the respondents don’t agree, and only 10% of the respondents strongly disagree.
Chart no. 4.10.1
4.10.1: I feel training delivered after appraisal contributes in improving my performance.
Interpretation:
From the above results it is clear that majority of the respondents have strongly agreed that the
training delivered after appraisal contributes in improving the employees performance. Hence,
the organization can rely on the same training methods and can improvise it if necessary.
66
40
35
30
25
20
15
1
0
FREQUENCY
PERCENTA
GE
0
Strongly Agree Neutral Disagree Strongly Agree disagree

Table no. 4.10.2
All my appraisal skills are revived by the management on a daily basis.
Sl. No Particulars Frequency Percentage
1 Strongly Agree 12 12
2 Agree 34 34
3 Neutral 20 20
4 Disagree 16 16
5 Strongly disagree 18 18
Source: Primary Data
Analysis:
From the above table no. 4.10.2, it can be said that, out of total 50 respondents 12% of the
respondents strongly agree with the above mentioned statement, 34% respondents agree, 20%
respondents are neutral, 16% of the respondents don’t agree, and only 18% of the respondents
strongly disagree.
Chart no. 4.10.2
All my appraisal skills are revived by the management on a daily basis.
Interpretation:
From the above results it is clear that majority of the respondents has agreed that all of their
appraisal skills are revived by the management on the daily basis so that they can meet the
objectives of the organization and targets set by the management considered for performance
appraisal more effectively.
67
40
35
30
25
20
15
10
5
0
FREQUENCY
PERCENTA
GE
Strongly Agree Neutral Disagree Strongly Agree disagree

Table no. 4.10.3
Training provided by the organization improves my motivation and knowledge.
Sl. No Particulars Frequency Percentage
1 Strongly Agree 32 32
2 Agree 20 20
3 Neutral 26 26
4 Disagree 12 12
5 Strongly disagree 10 10
Source: Primary Data
Analysis:
The above table no. 4.10.3 shows that out of total 50 respondents, 32% of the employees strongly
agree that training provided by the organization improves their motivation and knowledge,
wherein, 20% of the respondents selects the second option i.e., agreed, 26% of the respondents
are neutral, 12% of the respondents don’t agree and only 10% of the respondents strongly
disagree.
Chart no. 4.10.3
Training provided by the organization improves my motivation and knowledge.
Interpretation:
From the above results shown in the chart no. 4.10.3 shows that majority of the people i.e., out of
50 respondents, 32% of the employees strongly agree with the statement that training provided
by the organization improves the motivation and knowledge of the employees. Hence, the
68
35
30
25
20
15
1
0
FREQUENCY
PERCENTA
GE 5
0
Strongly Agree Neutral Disagree Strongly Agree disagree

organization can provide more of such trainings to the employees to enhance their skills and
make them feel more confident about their job.
Table no. 4.10.4
Appraisal training helps me to overcome weak areas related to my job.
Sl. No Particulars Frequency Percentage
1 Strongly Agree 20 20
2 Agree 42 42
3 Neutral 20 20
4 Disagree 12 12
5 Strongly disagree 6 6
Source: Primary Data
Analysis:
The above table no. 4.10.4 shows the analysis results collected from the respondents based on
whether they feel that the appraisal training helps them to overcome the weak areas related to
their job or not or. From the above results we got to know that out of 50 respondents around 20%
respondents have strongly agreed, 42% of the respondents have agreed, 20% are neutral, 12%
respondents didn’t agree, and around 6% of the respondents strongly disagree.
Chart no. 4.10.4
Appraisal training helps me to overcome weak areas related to my job.
69
45
40
35
30
25
20
15
10
5
0
FREQUENCY
PERCENTA
GE
Strongly Agree Neutral Disagree Strongly Agree disagree

Interpretation:
From the above chart no. 4.10.4, we can interpret the results saying majority of the respondents
i.e., around 40% have agreed that appraisal training given by the management to them helps
them to overcome the weak areas related to their job, enhances their skills and make them more
competent in doing their job.
Table no. 4.11
Feedback on performance by the management
4.11.1: Appraisal feedback provided by the management is an important factor to improve
my on-the-job performance.
Sl. No Particulars Frequency Percentage
1 Strongly Agree 60 60
2 Agree 18 18
3 Neutral 6 6
4 Disagree 10 10
5 Strongly disagree 6 6
Source: Primary Data
Analysis:
The above table no. 4.11.1 shows that out of total 50 respondents, 60% of the employees strongly
agree with the above mentioned statement, around 18% of the respondents agree with the fact,
6% of the respondents are neutral, 10% respondents disagree and only 6% of the respondents
strongly disagree.
70

Chart no. 4.11.1
Appraisal feedback provided by the management is an important factor to improve my on-
the-job performance.
Interpretation:
The results are quite clear from the above chart no. 4.11.1 which shows that around 60% of the
respondents out of total 100% strongly agree that the appraisal feedback provided by the
management is an important factor to improve their on-the-job performance. Hence the
organization should focus on providing more of such feedbacks to their employees to keep them
motivated.
Table no. 4.11.2
I feel appraisal outcomes helps in diagnosing both organizational and individual problems.
Sl. No Particulars Frequency Percentage
1 Strongly Agree 16 16
2 Agree 50 50
3 Neutral 16 16
4 Disagree 10 10
5 Strongly disagree 8 8
Source: Primary Data
Analysis:
The above table no. 4.11.2 shows what the employees feel about the appraisal outcomes, whether
it helps them in diagnosing both organizational and individual problems or not. Therefore, out of
71
100
90 80
70
60
50
40
30
20
10
0
PERCENTAGE
FREQUEN
CY
Strongly Agree Neutral Disagree Strongly Agree disagree

50 respondents, 16% of the employees strongly agree, 50% of the respondents agree with the
statement, 16% respondents are neutral, 10% of the respondents disagree and only 8% of the
respondents strongly disagree.
Chart no. 4.11.2
I feel appraisal outcomes helps in diagnosing both organizational and individual problems.
Interpretation:
From the above results shown in the chart no. 4.11.2 shows that majority of the people i.e., out of
50 respondents, 50% of the employees strongly feels that appraisal outcomes helps in diagnosing
both organizational as well as individual problems. Hence, the organization can opt for such
appraisal outcomes which can help them to retain more employees with their job in the
organization.
Table no. 4.11.3
Interaction with the management enhances appraisal effectiveness.
Sl. No Particulars Frequency Percentage
1 Strongly Agree 20 20
2 Agree 38 38
3 Neutral 36 36
4 Disagree 4 4
5 Strongly disagree 2 2
Source: Primary Data
72
80
70
60
50
40
3
0
PERCENTAGE
FREQUEN
CY 20
1
0 Strongly Agree Neutral Disagree Strongly Agree disagree

Analysis:
The above table no. 4.11.3 shows that out of 50 respondents considered for data collection, 20%
of the respondents strongly agree, 38% of the respondents agree with the statement, 36% of the
respondents are neutral, 4% of the respondents don’t agree and 2% of the respondents strongly
disagree.
Chart no. 4.11.3
Interaction with the management enhances appraisal effectiveness.
Interpretation:
From the above results shown in the chart no. 4.11.3 shows that majority of the people i.e., out of
50 respondents, 38% of the employees agrees that the interaction with the management enhances
their appraisal effectiveness. The employees feel more recognized in the organization when the
management interacts with them and rewards the best performance of the employees.
73
60
50
40
30
20 PERCENTAGE
FREQUEN
CY 10
0 Strongly Agree Neutral Disagree Strongly Agree disagree

Table no. 4.11.4
Performance feedback motivates employees indirectly to perform better.
Sl. No Particulars Frequency Percentage
1 Strongly Agree 14 14
2 Agree 28 28
3 Neutral 22 22
4 Disagree 22 22
5 Strongly disagree 14 14
Source: Primary Data
Analysis:
The above table no. 4.11.4 shows that out of 50 respondents considered for data collection, 14%
of the respondents strongly agree, 28% of the respondents agree with the statement, 22% of the
respondents are neutral, 22% of the respondents don’t agree and 14% of the respondents strongly
disagree.
Chart no. 4.11.4
Performance feedback motivates employees indirectly to perform better.
Interpretation:
From the above results shown in the chart no. 4.11.4 shows that majority of the people i.e., out of
50 respondents, 28% of the employees agrees that the performance feedback provided by the
management post performance evaluation motivates the employees directly or indirectly to
perform better in their job.
74
45 4
0
35
30
25
20
15
10
5
0
PERCENTAGE
FREQUEN
CY
Strongly Agree Neutral Disagree Strongly Agree disagree

Table no. 4.12
Linking rewards to performance appraisal system
4.12.1: I feel there exist a direct link between performance and pay in the organization.
Sl. No Particulars Frequency Percentage
1 Strongly Agree 32 32
2 Agree 30 30
3 Neutral 16 16
4 Disagree 14 14
5 Strongly disagree 8 8
Source: Primary Data
Analysis:
The above table no. 4.12.1 shows that out of 50 respondents considered for data collection, 32%
of the respondents strongly agree, 30% of the respondents agree with the statement, 16% of the
respondents are neutral, 14% of the respondents don’t agree and 8% of the respondents strongly
disagree.
Chart no. 4.12.1
I feel there exist a direct link between performance and pay in the organization.
Interpretation:
From the above chart no. 4.12.1, we can interpret that majority of the respondents feel that there
exist a direct link between performance and pay in the organization. The rewards given to the
employees by the management is based on their performance post performance evaluation
results.
75
35
30
25
20
15
10
5
0
FREQUENCY
PERCENTAGE
Strongly Agree Neutral Disagree Strongly Agree disagree

Table no. 4.12.2
Performance based pay is given on a flat rate to every employee
Sl. No Particulars Frequency Percentage
1 Strongly Agree 4 4
2 Agree 40 40
3 Neutral 34 34
4 Disagree 16 16
5 Strongly disagree 6 6
Source: Primary Data
Analysis: The above table no. 4.12.2 shows that out of total of 50 respondents considered for data collection, 4% of the
respondents strongly agree, 40% of the respondents agree with the statement, 34% of the respondents are
neutral, 16% of the respondents don’t agree and 6% of therespondents strongly disagree.
HYPOTHESIS TESTING:
HYPOTHESIS 1
H0: There is no significant effect from Design of appraisal form on performance appraisal
system.
H1: There is a significant effect from Design of appraisal form on performance appraisal system.
CHI-SQUARE TEST
Case Processing Summary
Cases
Valid Missing Total
N Percent N Percent N Percent
How would you rank the
Performance Appraisal method in
your organisation? * I feel the
performance appraisal system set
by management is satisfactory
50 100.0% 0 0.0% 50 100.0%
76

How would you rank the
Performance Appraisal method in
your organisation? * I feel the
standards set for performance
evaluation are pretty justifiable
50 100.0% 0 0.0% 50 100.0%
How would you rank the Performance Appraisal method in your organisation? * I feel the
performance appraisal system set by management is satisfactory
Crosstab
Count I feel the performance appraisal system set by
management is satisfactory
Agree
Disagree
Neutral
Strongly
Agree
How would you rank
the Performance
Appraisal method in
your organisation?
Complicated 2 2 1 0
Easy 6 2 4 6
Efficient 9 4 3 5
77

Total 17 8 8 11
Crosstab
Count
I feel the performance
appraisal system set by
management is
satisfactory
Strongly Disagree
Total
How would you rank the Performance
Appraisal method in your organisation?
Complicated 0 5
Easy 3 21
Efficient 3 24
Total 6 50
Chi-Square Tests
Value
df
Asymptotic
Significance (2-
sided)
Pearson Chi-Square 5.258a 8 .730
Likelihood Ratio 6.485 8 .593
N of Valid Cases 50
a. 12 cells (80.0%) have expected count less than 5. The minimum expected count is .60.
Symmetric Measures
Value
Approximate
Significance
Nominal by Phi .324 .730
Nominal Cramer's V .229 .730
N of Valid Cases 50
78

How would you rank the Performance Appraisal method in your organisation? * I feel the
standards set for performance evaluation are pretty justifiable
Crosstab
Count I feel the standards set for performance
evaluation are pretty justifiable
Agree
Disagree
Neutral
Strongly
Agree
How would you rank the Complicated 4 0 1 0
Performance Appraisal Easy 13 3 4 1
method in your
organisation?
Efficient 7 6 8 2
Total 24 9 13 3
79

Crosstabs:
Count
I feel the standards
set for performance
evaluation are pretty
justifiable
Strongly Disagree
Total
How would you rank the
Performance Appraisal method in
your organisation?
Complicated 0 5
Easy 0 21
Efficient 1 24
Total 1 50
Chi-Square Tests
Value
df
Asymptotic
Significance
(2-sided)
Pearson Chi-Square 8.011a 8 .432
Likelihood Ratio 9.563 8 .297
N of Valid Cases 50
a. 11 cells (73.3%) have expected count less than 5. The minimum expected count is .10.
Symmetric Measures
Value
Approximate
Significance
Nominal by
Nominal
Phi .400 .432
Cramer's V .283 .432
N of Valid Cases 50
80

ORDINAL REGRESSION:
Case Processing Summary
N Marginal Percentage
How would you rank the
Performance Appraisal method in
your organisation?
Complicated 5 10.0%
Easy 21 42.0%
Efficient 24 48.0%
I feel the standards set for Agree 24 48.0%
performance evaluation are pretty
justifiable
Disagree 9 18.0%
Neutral 13 26.0%
Strongly Agree 3 6.0%
Strongly Disagree 1 2.0%
I feel the performance appraisal Agree 17 34.0%
system set by management is
satisfactory
Disagree 8 16.0%
Neutral 8 16.0%
Strongly Agree 11 22.0%
Strongly Disagree 6 12.0%
All the goals and targets have been
clearly expressed and assigned to me
Agree 20 40.0%
Disagree 8 16.0%
81

by management Neutral 6 12.0%
Strongly Agree 16 32.0%
The reliability of the factors Agree 16 32.0%
considered in appraisal system are
satisfactory
Disagree 11 22.0%
Neutral 9 18.0%
Strongly Agree 10 20.0%
Strongly Disagree 4 8.0%
Valid 50 100.0%
Missing 0
Total 50
Model Fitting Information
-2 Log
Model Likelihood
Chi-Square
df
Sig.
Intercept
Only
84.752
Final 66.685 18.067 15 .259
Link function: Logit.
Goodness-of-Fit
Chi-Square df Sig.
Pearson 108.296 53 .000
Deviance 57.896 53 .299
Link function: Logit.
Pseudo R-Square
.191
Link function: Logit.
82
Cox and Snell .303
Nagelkerke .357
McFadden

Parameter Estimates
Estimat
e
Std.
Error
Wald
df
Sig.
95% Confidence
Interval
Lower
Bound
Upper
Bound
Thres
hold
[HowwouldyourankthePer
formanceAppraisalmethod
inyourorganisation =
Complicated]
-23.408 2.757 72.082 1 .000 -28.812 -18.004
[HowwouldyourankthePer
formanceAppraisalmethod
inyourorganisation =
Easy]
-20.485 2.647 59.873 1 .000 -25.674 -15.297
Locat
ion
[Ifeelthestandardssetforper
formanceevaluationarepret
tyjustifiable=Agree]
-21.213 1.648 165.749 1 .000 -24.442 -17.983
[Ifeelthestandardssetforper
formanceevaluationarepret
tyjustifiable=Disagree]
-18.327 1.813 102.228 1 .000 -21.879 -14.774
[Ifeelthestandardssetforper
formanceevaluationarepret
tyjustifiable=Neutral]
-18.841 1.722 119.766 1 .000 -22.215 -15.467
[Ifeelthestandardssetforper
formanceevaluationarepret
tyjustifiable=Strongly
Agree]
-18.176 .000 . 1 . -18.176 -18.176
[Ifeelthestandardssetforper
formanceevaluationarepret
tyjustifiable=Strongly
Disagree]
0a . . 0 . . .
[Ifeeltheperformanceappra
isalsystemsetbymanageme
ntissatisfactory=Agree]
-.038 1.483 .001 1 .980 -2.944 2.868
[Ifeeltheperformanceappra
isalsystemsetbymanageme
ntissatisfactory=Disagree]
.325 1.551 .044 1 .834 -2.716 3.365
83

[Ifeeltheperformanceappra
isalsystemsetbymanageme
ntissatisfactory=Neutral]
-.779 1.717 .206 1 .650 -4.144 2.587
[Ifeeltheperformanceappra
isalsystemsetbymanageme
ntissatisfactory=Strongly
Agree]
.271 1.309 .043 1 .836 -2.295 2.837
[Ifeeltheperformanceappra
isalsystemsetbymanageme
ntissatisfactory=Strongly
Disagree]
0a . . 0 . . .
[Allthegoalsandtargetshav
ebeenclearlyexpressedand
assignedtomebyma=Agree
]
-2.280 .969 5.534 1 .019 -4.180 -.380
[Allthegoalsandtargetshav
ebeenclearlyexpressedand
assignedtomebyma=Disag
ree]
-1.583 1.169 1.834 1 .176 -3.874 .708
[Allthegoalsandtargetshav
ebeenclearlyexpressedand
assignedtomebyma=Neutr
al]
-1.502 1.327 1.281 1 .258 -4.102 1.099
[Allthegoalsandtargetshav
ebeenclearlyexpressedand
assignedtomebyma=Stron
gly Agree]
0a . . 0 . . .
[Thereliabilityofthefactors
consideredinappraisalsyste
maresatisfac=Agree]
1.938 1.631 1.412 1 .235 -1.259 5.134
[Thereliabilityofthefactors
consideredinappraisalsyste
maresatisfac=Disagree]
.352 1.693 .043 1 .835 -2.966 3.669
[Thereliabilityofthefactors
consideredinappraisalsyste
maresatisfac=Neutral]
.602 1.595 .142 1 .706 -2.524 3.727
84

[Thereliabilityofthefactors
consideredinappraisalsyste
maresatisfac=Strongly
Agree]
-.749 1.546 .234 1 .628 -3.780 2.282
[Thereliabilityofthefactors
consideredinappraisalsyste
maresatisfac=Strongly
Disagree]
0a . . 0 . . .
Link function: Logit.
a. This parameter is set to zero because it is redundant.
Test of Parallel Linesa
-2 Log
Model Likelihood
Chi-Square
df
Sig.
Null
Hypothesis
66.685
General 37.770b 28.915c 15 .016
The null hypothesis states that the location parameters (slope
coefficients) are the same across response categories.a
a. Link function: Logit.
b. The log-likelihood value cannot be further increased after
maximum number of step-halving.
c. The Chi-Square statistic is computed based on the log-
likelihood value of the last iteration of the general model. Validity
of the test is uncertain.
Analysis:
From the above mentioned tests for hypothesis 1, the value of factor analysis and chi- square test
is greater than 0.05 which means there is a strong and positive relationship between design of the
appraisal form and performance appraisal. So, therefore we can accept the alternative hypothesis
(H1) and reject the null hypothesis (H0).
85

HYPOTHESIS 2
H0: There is no significant effect of Employee training and development on performance
appraisal system.
H1: There is a significant effect of Employee training and development on performance
appraisal system.
CHI-SQUARE TEST:
Case Processing Summary
Cases
Valid Missing Total
N Percent N Percent N Percent
How often is appraisal carried out
in your organisation? * Appraisal
training helps me overcome weak
areas related to my job
50 100.0% 0 0.0% 50 100.0%
How often is appraisal carried out
in your organisation? * Training
provided by organization improves
my motivation and knowledge
50 100.0% 0 0.0% 50 100.0%
How often is appraisal carried out in your organisation? * Appraisal training helps me
overcome weak areas related to my job
Count
Crosstab
Appraisal training helps me overcome
weak areas related to my job
Agree
Disagree
Neutral
Strongly
Agree
How often is appraisal
carried out in your
organisation?
Once in 6 months 4 1 1 4
Once in a year 17 5 9 6
Total 21 6 10 10
86

Crosstab
Count
Appraisal training helps me
overcome weak areas
related to my job
Strongly Disagree
Total
How often is appraisal carried out
in your organisation?
Once in 6 months 0 10
Once in a year 3 40
Total 3 50
Chi-Square Tests
Value
df
Asymptotic
Significance
(2-sided)
Pearson Chi-Square 3.929a 4 .416
Likelihood Ratio 4.221 4 .377
N of Valid Cases 50
a. 7 cells (70.0%) have expected count less than 5. The minimum expected count is .60.
Symmetric Measures
Approximate
Value Significance
Nominal by
Nominal
Phi .280 .416
Cramer's V .280 .416
N of Valid Cases 50
87

How often is appraisal carried out in your organisation? * Training provided by
organization improves my motivation and knowledge
Crosstab
Count Training provided by organization
improves my motivation and
knowledge
Agree Disagree Neutral
How often is appraisal
carried out in your
organisation?
Once in 6 months 0 2 2
Once in a year 10 4 11
Total 10 6 13
Crosstab
Count
Training provided by organization improves
my motivation and knowledge
Strongly Agree
Strongly
Disagree
Total
How often is appraisal Once in 6 months 6 0 10
88

carried out in your Once in a year
organisation?
10 5 40
Total 16 5 50
Chi-Square Tests
Value
df
Asymptotic
Significance
(2-sided)
Pearson Chi-Square 7.652a 4 .105
Likelihood Ratio 10.070 4 .039
N of Valid Cases 50
a. 7 cells (70.0%) have expected count less than 5. The minimum expected count is 1.00.
Symmetric Measures
Approximate
Value Significance
Nominal by
Nominal
Phi .391 .105
Cramer's V .391 .105
N of Valid Cases 50
89

ORDINAL REGRESSION:
Case Processing Summary
N
Marginal
Percentage
How often is appraisal carried out in your
organisation?
Once in 6 months 10 20.0%
Once in a year 40 80.0%
I feel training delivered after appraisal
contributes in improving my performance
Agree 12 24.0%
Disagree 6 12.0%
Neutral 9 18.0%
Strongly Agree 18 36.0%
Strongly Disagree 5 10.0%
All my appraisal skills are revived by the
management on a daily basis
Agree 17 34.0%
Disagree 8 16.0%
Neutral 10 20.0%
Strongly Agree 6 12.0%
Strongly Disagree 9 18.0%
Training provided by organization improves my
motivation and knowledge
Agree 10 20.0%
Disagree 6 12.0%
Neutral 13 26.0%
Strongly Agree 16 32.0%
Strongly Disagree 5 10.0%
Appraisal training helps me overcome weak
areas related to my job
Agree 21 42.0%
Disagree 6 12.0%
Neutral 10 20.0%
Strongly Agree 10 20.0%
Strongly Disagree 3 6.0%
Valid 50 100.0%
Missing 0
Total 50
Model Fitting Information
-2 Log
Model Likelihood
Chi-Square
df
Sig.
Intercept
Only
47.843
Final 1.622 46.221 16 .000
Link function: Logit.
90

Goodness-of-Fit
Chi-Square df Sig.
Pearson .000 22 1.000
Deviance .000 22 1.000
Link function: Logit.
Pseudo R-Square
.924
Link function: Logit.
Parameter Estimates
Estimate
Std. Error
Wal
d
df
Sig.
95% Confidence
Interval
Lower
Bound
Upper
Bound
Thres [Howoftenisappraisa
hold lcarriedoutinyourorg
anisation = Once in
6 months]
-139.855 41183.820 .000 1 .997 -80858.659 80578.948
Locat [Ifeeltrainingdeliver -21.659 14657.397 .000 1 .999 -28749.628 28706.311
ion edafterappraisalcontr
ibutesinimprovingm
yperf=Agree]
[Ifeeltrainingdeliver -37.442 14367.643 .000 1 .998 -28197.504 28122.620
edafterappraisalcontr
ibutesinimprovingm
yperf=Disagree]
[Ifeeltrainingdeliver -41.234 .000 . 1 . -41.234 -41.234
edafterappraisalcontr
ibutesinimprovingm
yperf=Neutral]
91
Cox and Snell .603
Nagelkerke .954
McFadden

[Ifeeltrainingdeliver
edafterappraisalcontr
ibutesinimprovingm
yperf=Strongly
Agree]
-20.011 20359.720 .000 1 .999 -39924.330 39884.307
[Ifeeltrainingdeliver
edafterappraisalcontr
ibutesinimprovingm
yperf=Strongly
Disagree]
0a . . 0 . . .
[Allmyappraisalskill
sarerevivedbythema
nagementonadailyba
sis=Agree]
55.437 19543.709 .000 1 .998 -38249.529 38360.403
[Allmyappraisalskill
sarerevivedbythema
nagementonadailyba
sis=Disagree]
146.678 .000 . 1 . 146.678 146.678
[Allmyappraisalskill
sarerevivedbythema
nagementonadailyba
sis=Neutral]
18.850 18209.158 .000 1 .999 -35670.443 35708.144
[Allmyappraisalskill
sarerevivedbythema
nagementonadailyba
sis=Strongly Agree]
37.786 .000 . 1 . 37.786 37.786
[Allmyappraisalskill
sarerevivedbythema
nagementonadailyba
sis=Strongly
Disagree]
0a . . 0 . . .
[Trainingprovidedby
organizationimprove
smymotivationandkn
owledge=Agree]
-57.127 .000 . 1 . -57.127 -57.127
[Trainingprovidedby
organizationimprove
smymotivationandkn
owledge=Disagree]
-150.992 14456.476 .000 1 .992 -28485.165 28183.181
92

[Trainingprovidedby
organizationimprove
smymotivationandkn
owledge=Neutral]
-117.029 18912.768 .000 1 .995 -37185.372 36951.314
[Trainingprovidedby
organizationimprove
smymotivationandkn
owledge=Strongly
Agree]
-115.298 14967.809 .000 1 .994 -29451.664 29221.068
[Trainingprovidedby
organizationimprove
smymotivationandkn
owledge=Strongly
Disagree]
0a . . 0 . . .
[Appraisaltraininghe
lpsmeovercomeweak
areasrelatedtomyjob
=Agree]
-39.646 28731.325 .000 1 .999 -56352.008 56272.715
[Appraisaltraininghe
lpsmeovercomeweak
areasrelatedtomyjob
=Disagree]
30.233 40453.910 .000 1 .999 -79257.973 79318.440
[Appraisaltraininghe
lpsmeovercomeweak
areasrelatedtomyjob
=Neutral]
30.565 41122.151 .000 1 .999 -80567.370 80628.501
[Appraisaltraininghe
lpsmeovercomeweak
areasrelatedtomyjob
=Strongly Agree]
-79.485 39687.587 .000 1 .998 -77865.726 77706.757
[Appraisaltraininghe
lpsmeovercomeweak
areasrelatedtomyjob
=Strongly Disagree]
0a . . 0 . . .
Link function: Logit.
a. This parameter is set to zero because it is redundant.
93

Test of Parallel Linesa
-2 Log
Model Likelihood
Chi-Square
df
Sig.
Null
Hypothesis
1.622
General 1.622 .000 0 .
The null hypothesis states that the location parameters (slope
coefficients) are the same across response categories.a
a. Link function: Logit.
Analysis:
From the above mentioned tests for hypothesis 1, the value of factor analysis and chi- square test
is greater than 0.05 which means there is a strong and positive relationship between employee
training and development and performance appraisal. So, therefore we can accept the alternative
hypothesis (H1) and reject the null hypothesis (H0).
94

CHAPTER 6
FINDINGS AND CONCLUTION
SUMMARY OF FINDINGS:
From the analysis it was found that out of the total respondents used for data collection,
majority of them were male around 58% and rest were Female respondents.
It was found that majority of the respondents belong to the age group of 25 to 34 being 42%
while other 58% belongs to the various other sub groups.
From the analysis it is clear that around 44% respondents have completed their
graduation/diploma and 26% have completed their post graduation while other 30% are
under graduates.
It was found that about 64% of the employees are full – time workers while others 46% of
the employees fall under the category of part-time, regular and temporary employees.
Majority of the employees fall under the category of having working experience of more than
5 years where mostly these types of workers are doctors or senior nursing staff.
Performance appraisal carried out in the organization is once in a year as around 80% of the
employees agree for the same.
Majority of the employees says that the performance appraisal process is easy and efficient.
Out of total respondents around 44% have strongly agreed that the attitude of the employees
depend upon the performance evaluation results. Hence we can say that they are satisfied
with the performance appraisal results of the organization.
Based on the results of the above chart no. 4.8.2 we can conclude that the organization is not
partial amongst the employees and they do take proper consideration regarding the
employee’s performance without any bias between them.
95

From the above chart no. 4.8.4 it is clear that majority of the respondents have agreed that
there is still scope for improving the performance appraisal system in the organization.
Therefore, the organization can improve its performance appraisal system by taking
necessary corrective measures for further appraisal of the employees.
Majority of the respondents have agreed and they feel that all the goals and targets or
standards are clearly expressed and assigned to them by the management and hence they
have no issues regarding communication with the management.
From the above results based on the analysis we can interpret that around 48% of the
respondents feel that the standards set for the performance evaluation are pretty justifiable.
Majority of the respondents in the organization feel that the reliability of the factors
considered by the management for evaluating the performance appraisal results of the
employees is satisfactory. The management can further revise the factors, if necessary, to get
more accurate results.
Out of total 50 respondents, 34% of the employees have agreed that the performance
appraisal system set by the management is satisfactory and they have no objections regarding
such system.
As majority of the respondents have strongly agreed that the training delivered after appraisal
contributes in improving the employee’s performance. Hence, the organization can rely on
the same training methods and can improvise it if necessary.
Majority of the respondents has agreed that all of their appraisal skills are revived by the
management on the daily basis so that they can meet the objectives of the organization and
targets which are considered for performance appraisal more effectively.
Out of 50 respondents, 32% of the employees strongly agree that training provided by the
organization improves the motivation and knowledge of the employees. Hence, the
organization can provide more of such trainings to the employees to enhance their skills and
make them feel more confident about their job.
Around 40% have agreed that appraisal training given by the management to them helps
them to overcome the weak areas related to their job, enhances their skills and make them
more competent in doing their job.
Around 60% of the respondents strongly agree that the appraisal feedback provided by the
management is an important factor to improve their on-the-job performance. Hence the
96

organization should focus on providing more of such feedbacks to their employees to keep
them motivated.
Around 50% of the employees strongly feels that appraisal outcomes helps in diagnosing
both organizational as well as individual problems. Hence, the organization can opt for such
appraisal outcomes which can help them to retain more employees with their job in the
organization.
Out of 50 respondents, 38% of the employees agrees feel more recognized in the
organization when the management interacts with them and rewards the best performance of
the employees.
Around 28% of the employees agrees that the performance feedback provided by the
management post performance evaluation motivates the employees directly or indirectly to
perform better in their job.
Majority of the respondents feel that there exist a direct link between performance and pay in
the organization. The rewards given to the employees by the management is based on their
performance post performance evaluation results.
From the above chart no. 4.12.2, we can interpret that majority of the respondents feel that
the performance based pay is given on a flat rate to every employee without any bias.
Majority of the respondents strongly feel they are satisfied the way their performance is
appraised and rewarded. Therefore, in order to get more effective results the organization can
concentrate on the people who are dissatisfied and improvise the areas they feel has to be
revised.
From the above chart no. 4.12.4, we can interpret that majority of the respondents feel the
performance based pay they earn will have an impact on their future performance. Hence, the
organization should be more careful with the performance evaluation of the employees
because any error occurred by the management will de-motivate the employees to perform
better which will have a direct impact on their future performance.
As both the hypothesis testing results are greater than 0.05%, it shows that the design of the
appraisal form and training and development considered as the factors of the study amongst
all has a positive relationship and a strong impact on performance appraisal system set by the
organization.
97

IFB AUTOMATIC PVT
LTD
SUGGESTIONS:
Performance appraisal should be transparent, timely and effective for the employees.
Employees should be made more aware about the appraisal process and benefits.
To make the appraisal results more accurate the organization can also adopt a 360 degreeappraisal
method.
The organization should continue to provide same training or counseling to theemployees after
appraisal.
Employees should be given feedback regarding their appraisal. This will help them toimprove
their weak areas in performing their job.
The frequency of training program for the appraiser should be increased and thesesessions should
be made interactive.
Constant monitoring of the appraisal system should be done through discussions.
Employees should be informed that appraisal is not only related to monetary benefits butit can also
be non-monetary ones.
CONCLUSION:
Performance Appraisal is the process of assessing employee performance by way of comparing present
performance with already established standards which have been already communicated to employees,
subsequently providing feedback to employees about their performance level for the purpose of improving
their skills and knowledge through training andmotivation.
As the objectives of the study is to analyze the factors which contributes towards the effectiveness of
performance appraisal system, the results of the same has been analyzed with thehelp of questionnaire and
few statistical tests including factor analysis, based on the data collected it was found that all these factors
considered havea verystrong impact on the performance appraisal system of the organization.
Hence, the organization is doing a great job in implementing all these factors and keeping their
employees and working conditions of the organization extremely eminent.

BIBLIOGRAPHY
BOOKS:
Bascal, Robert. Performance Management. (New York: McGraw-Hill, 1999).
DelPo, Amy. The Performance Appraisal Handbook, Legal & Practical Rules for
Managers. (Berkeley, CA:Nolo, 2005).
Grote, Dick. The Complete Guide to Performance Appraisal. (New York: AMACOM, 1996)
ARTICLE:
Mert, Ibrahim Sani, 2011. "The Perception of the Employees toward the Outcomes and
Detriments of Performance Appraisal System," Business and Economics Research
Journal, Uludag University, Faculty ofEconomics and Administrative Sciences, vol.
2(3), pages 1-87, July.
ANNEXURE:
Company website:
www.ifbappliances.com
Company magazine
Internal resource
99

A study on effectiveness of performance appraisal of
employment ORIGINALITY REPORT
6 6
SIMILARITY INDEX INTERNET SOURCES PUBLICATIONS STUDENT PAPERS
Ravindra Hewa Kuruppuge, Ales Gregar. "Family Involvement, Employee Engagement and Employee Performance in Enterprising
Family Firms", Acta Universitatis Agriculturae et Silviculturae Mendelianae Brunensis, 2017 Publication
"FORUM: A SMALL WORLD AFTER ALL" Journal of Management in Engineering, 1998
196 Publication
Rajesh K. Yadav, Nishant Dabhade. "Work Life
Balance Amongst the Working Women in Public Sector Banks A Case Study of State Bank of India", International Letters of Social
1 %
and Humanistic Sciences, 2013 Publication
4 DONALD P. SCHWAB. "BEHAVIORALLY ANCHORED RATING SCALES: A REVIEW OF THE LITERATURE", Personnel Psychology, 12/1975 Publication