an evaluation of the performance appraisal system and its ...
Upload
khangminh22Category
view
0download
0
PROJECT REPORT
On
Study On Effectiveness Of Performance Appraisal Of
The Employees At Sakaria Hospital
By
Faraz Ahmed
1NH19MBA46
Submitted to
DEPARTMENT OF MANAGEMENT STUDIES
NEW HORIZON COLLEGE OF ENGINEERING,
OUTER RING ROAD, MARATHALLI,
BENGALURU
In partial fulfilment of the requirements for the award of the degree of
MASTER OF BUSINESS ADMINISTRATION
Under the guidance of
Ms. Saumi Roy
Asst. Professor
2019 - 2021

CERTIFICATE
This is to certify that Faraz Ahmed bearing USN 1NH19MBA46, is a bonafide student of
Master of Business Administration course of the Institute 2019-21, autonomous program,
affiliated to Visvesvaraya Technological University, Belgaum. The project report on “Study
On Effectiveness Of Performance Appraisal Of The Employees At Sakaria Hospital ” is
prepared by him under the guidance of Prof. Saumi Roy, in partial fulfilment of requirements
for the award of the degree of Master of Business Administration of Visvesvaraya
Technological University, Belgaum Karnataka.
Signature of Internal Guide Signature of HOD Signature of principal
Name of the Examiners with affiliation Signature with date
1. External Examiner
2. Internal Examiner

DECLARATION
I, Faraz Ahmed hereby declare that the project report on “Study On Effectiveness Of
Performance Appraisal Of The Employees At Sakaria Hospital ” with reference prepared by
me under the guidance of Prof. Saumi Roy, faculty of M.B.A Department, New Horizon College
of Engineering.
I also declare that this project report is towards the partial fulfilment of the university
regulations for the award of the degree of Master of Business Administration by Visvesvaraya
Technological University, Belgaum.
I have undergone an industry project for a period of Twelve weeks. I further declare that this
report is based on the original study undertaken by me and has not been submitted for the award
of a degree/diploma from any other University / Institution.
Signature of Student
Place:
Date:

ACKNOWLEDGEMENT
The successful completion of the project would not have been possible without
the guidance and support of many people. I express my sincere gratitude to all
for allowing to do my project.
I thank the staff of multiple companies for their support and guidance and
helping me in completion of the report.
I am thankful to my internal guide Prof. Saumi Roy, for her constant support
and inspiration throughout the project and invaluable suggestions, guidance and
also for providing valuable information.
Finally, I express my gratitude towards my parents and family for their
continuous support during the study.
Faraz Ahmed
1NH19MBA46

TABLE OF CONTENTS
CHAPTER
NUMBER
TITLE PAGE
NUMBER
Chapter-1 Introduction Page 1-
1.1 Introduction about the organization and industry 1
1.2 Industryprofile 2-6
1.3 Company profile, mission, vision, quality policy, and SWOT analysis
6-14
Chapter-2 Conceptual background and literature review 15-43
2.1 Conceptual background 15
2.2 Literature review 31-43
Chapter-3 Research Design 44-47
3.1 Statement of the problem 44
3.2 Need of the study 44
3.3 Objectives of the study 45
3.4 Scope of the study 45
3.5 Research methodology 45-46
3.6 Hypothesis 46
3.7 Limitations of the study 46
3.8 Chapter scheme 47
Chapter-4 Data analysis and interpretation 48-100
4.1 Demographic profile of the respondents 48-54
4.2 Likert five point scale 55-76
4.3 Factor Analysis 77-82
4.4 Hypothesis Testing 83-100
Chapter-5 Findings, suggestions and conclusion 101-104
5.1 Summary of findings 101-103
5.2 Suggestions 104
5.3 Conclusion 104

LIST OF TABLES
TABLE
NUMBER
TABLES PAGE
NUMBER
4.1 Table showing the Gender of Respondents 48
4.2 Table showing the Age Group of the Respondents 49
4.3 Table showing the Educational qualification of the Respondents 50
4.4 Table showing the Current Employment Status of the
Respondents
51
4.5 Table showing the working experience of the employees 52
4.6 Table showing how often is appraisal carried out in your organization
53
4.7 Table showing how would you rank the performance appraisal method in your organization
54
4.8 Attitude of the employees 55-59
4.8.1 Table showing you are satisfied with the performance appraisal
results of the organization
55-56
4.8.2 Table showing the criteria of performance appraisal is also considering the performance of the employees
56-57
4.8.3 Table showing are you satisfied with the outcomes of the appraisal
57-58
4.8.4 Table showing do you think there is still scope to improve performance appraisal system
58-59
4.9 Design of the appraisal form 59-63
4.9.1 Table showing all the goals and targets have been clearly
expressed and assigned to me by the management.
59-60
4.9.2 Table showing I feel the standards set for performance evaluation are pretty justifiable.
60-61
4.9.3 Table showing the reliability of the factors considered in appraisal system is satisfactory.
61-62
4.9.4 Table showing I feel the performance appraisal system set by the management is satisfactory.
62-63
4.10 Table showing Employee training and development 64-68
4.10.1 Table showing I feel training delivered after appraisal contributes in improving my performance.
64
4.10.2 Table showing all my appraisal skills are revived by the management on a daily basis.
65
4.10.3 Table showing the training provided by the organization 66-67

improves my motivation and knowledge.
4.10.4 Table showing the appraisal training helps me to overcome weak areas related to my job.
67-68
4.11 Feedback on performance by the management 68-72
4.11.1 Table showing the appraisal feedback provided by the
management is an important factor to improve my on-the-job
performance.
68-69
4.11.2 Table showing I feel appraisal outcome helps in diagnosing both organizational and individual problems.
69-70
4.11.3 Table showing the interaction with the management enhances appraisal effectiveness
70-71
4.11.4 Table showing the performance feedback motivates employees indirectly to perform better.
72
4.12 Linking rewards to performance appraisal system 73-76
4.12.1 Table showing I feel there exist a direct link between performance and pay in the organization.
73
4.12.2 Table showing performance based pay is given on a flat rate to every employee.
74
4.12.3 Table showing I’m satisfied the way my performance is appraised and rewarded.
75
4.12.4 Table showing the performance based pay I earn will have an impact on my future performance.
76

Page 1
CHAPTER 1
INTRODUCTION ABOUT THE ORGANISATION AND
INDUSTRY
“The Health Care Industry refers to that segment of an economy which provides drugs,
medicines and all other related services for patients with preventive, healing, rehabilitative, and
soothing care. Therefore health care services mainly involves forming together tangible and
intangible factors where intangible factors dominates the tangible ones. Rooms, beds and other
decors are included in the tangible factors.”
“The various types of services related to health and welfare are provided by health care
industry. This health care sector is also referred to as social sector which is governed by the
central government at various state levels.”
“At present these health care industries is divided into many sub divisions and are taken
care by various interdisciplinary team which includes skilled and semi skilled professionals to
satisfy various needs of individuals related to their health.”
“The Health Care Industry is extremely of great significance to the people across the
globe. This type of industry includes all the other participants like doctors, hospitals, nursing
homes, diagnostic laboratories, pharmacies, medical device manufacturers, and all other various
elements of health caresystem.”

Page 2
1.2 INDUSTRYPROFILE:
1.2.1 WHAT IS HEALTH CAREINDUSTRY?
“Health Care Industry refers to that type of industry which provides goods and services to
cure patients with curative, alleviate, preventive, or soothing care.”
“It includes setting up of this type of industry where which employsprofessionals varying from
confined (small town) private practices of doctors who hire only one medical assistant when
compared to busy inner-city hospitals that supply thousands of different jobs in this sector.
Health Care Industry is bestowed with numerous threats and challenges because it is the only
industry which requires timely innovation in its goods and services based on various regulations
and advancement of technology in this sector.”
1.2.2 IMPACT OF HEALTH CARE INDUSTRY ONECONOMY:
“As the Health Care Industry is extremely of a great significance to the people around the
world, it is also one of the flourishing and fastest growing industries across the globe. As it
consumes around 10 percent of Gross Domestic Product (GDP) of developed nations, there exist
an extremely strong correlation between these two factors which includes:”
Various income levels,and
Various expenditures of individuals on HealthCare.
“For an instance, few of the substantial developing countries like Brazil, India, China, Russia,
etc…. concentrate investing less on Health Care when compared to the industrialized or the
developed countries such as United States, France, Switzerland, Germany, etc”
“The Health Care Industry also plays a very significant role in providing employment
opportunities to the people across the globe, if we sum up the people working in different sectors
of Health Care Industry around the world. In most of the countries, the employment growth rate
of Health Care Industry is higher than that of other type of industries. Nevertheless, the Health
Care Industry which exists today is highly exploded and divided into many different firms and
competitors and there is no such firm or company that has enough number of shares or monopoly
of the market which has the ability to influence the industry’s direction or price levels in the
market.”

Page 3
1.2.3 CLASSIFICATION OF HEALTH CAREINDUSTRY:
“For the purpose of Finance and Management, the Health Care Industry is particularly
divided into different areas. As a basic framework for defining the sector, the United Nations
Indian Standards Industrial Classification (ISIC) divides the Health Care Industry into three
types which consistof:”
HospitalActivities.
Medical and Dental practicesActivities.
Other Human HealthActivities.”
“”The third type of Human Heath Activity refers to all those type of activities which should
be carried on under the supervision and examination of nurses, midwives, physiotherapists,
diagnostic laboratories, residential health facilities of various other health professions e.g., in the
field of medical massage, yoga therapy, music therapy, occupational therapy, speech therapy,
homeopathy, optometry, etc….””
“”Further, the United Nations Indian Standards Industrial Classification (ISIC) has been
divided or classified the Health Care Industry into two different groups whichincludes:””
Health care equipments andservices
Pharmaceuticals, biotechnology and related lifesciences.
“”The companies dealing with health care equipments and services refers to those companies
which provide medical equipments, medical supplies, and health care services such as hospitals,
nursing homes, etc. the next group refers to those companies that produce biotech, pharmacy and
miscellaneous scientific services.””
1.2.4 HEALTH CARE PROVIDERS ANDPROFESSIONALS:
“”This type of industry also includes people who are not directly related to health care
itself, but are indirectly a part of management and support of health care system. The incomes
earned by various professionals and nonprofessionals related to Health Care Industry which
includes doctors, nurses, managers, administrators, underwriters, marketers, investors, share
holders of for-profit organizations are all credited to health carecosts.””

Page 4
1.2.5 DELIVERY OF HEALTH CARESERVICES:
“”It comprises of three levels of delivery of health care services which includes
Primarylevel
Secondary level,and
Tertiary level of healthcare.”
“These levels form the most insight fragment of any health care services, both for end users and
general public. There are numerous ways of providing health care services in this technologically
advanced world, as the services can be rendered from anywhere across the world be it in the
home or at the work place, or in health facilities. But the most common and the best way of
rendering this type of services is through face to face delivery, where the patient and the doctor
will happen to see each other in front of their eyes and cure it in a better way. This is what
happens when a person has to consult a doctor for general medicine in most countries. However,
with the help of modern telecommunication technology, in absentia health care is becoming very
common. This happens when the practitioner or the doctor and patient communicate each other
via phone, video conferencing, the internet, e-mail, text messages, or any other form of non-face-
to-face communication””
1.2.6 MEDICALTOURISM:
“Medical tourism also termed as medical travel, health tourism, or global health care was
initially coined by travel agencies and the mass media which describes the increasingly number
of people travelling across the globe or international borders to gain health care. These type of
services generally include all he selective processes as well as complex specialized surgeries
such as joint replacement (knee or hip), cardiac surgery, dental surgery and cosmetic surgeries.
However, almost every type of health care including psychiatry, alternative treatments,
convalescent care and even burial services are available. Practically, the practitioners and
consumers generally follows informal channels of communication-connection-contract, and in
such cases this leads to inferior regulatory or legal oversight to assume quality and less formal
recourse to reimbursement, if needed.”
“Over 50 countries have identified Health Care Industry as national industry but however
accredition and quality differs from one industry to another across the globe and their exists high
risk and other ethical issues which makes this medical technology, a method of obtaining

Page 5
medical care wrangling and also, some places across the globe may prove to be dangerous for
medical tourists to look at in this regard.”
1.2.7 HOME REMEDIES A TRADITIONAL HEALTHCARE:
“Home remedies have been one of the ancient methods which are still followed by the
people to cure all the minor and very general diseases. Home remedy is a treatment which was
provided to cure diseases that comprises the use of certain spices, vegetables or other common
items. Home remedies may or may not have medicinal properties that treat or cure disease but
can provide temporary cure to suchdiseases.”
“When we look back to the history of human civilization, everything from birth to curing
of disease was taken care by the practitioners or experts within one’s own house. Heath care
began as purely medicinal practices, in which the people the medicinal properties of plants
through trial and error, by trying it out and also passed the knowledge to others. Although there
is no record as to how the people got to know about the use of such plants but it is proved that it
provides instant relief for the disease for long. Later it also became a subject for purposeful study
by many countries including Persian, Egyptian, Greco-Roman, Indian and Chinesecultures.”
1.2.8 ANCIENT PHARMACOLOGY AND MEDICALPRACTITIONERS:
“Traditional practitioners or Health Care Industry were benefited with immense
knowledge of local flora and devised the principals and practices of ancient pharmacology. The
oldest and solely most extensive instance comes from Mesopotamia known as “Treatise of
Medical Diagnosis and Prognoses” were nearly 40 tablets were given which comprised of
prescriptions and treatises that outline treatments based on logical observation of the human
body.As the tribal culture involves specific castes, the people or practitioners who followed
Mesopotamia of 40 tablets were called as Shamans who performed the “Niche occupation” of
healing, and in the societies were exits the existed specialist in herbal remedies, referred as
physicians due to their immense knowledge in medical field.”

Page 6
1.2.9 TECHNOLOGICAL, CHEMICAL AND BIOLOGICALADVANCES:
“In the early 19th century, there exist numerous technological, chemical, and biological
advances that paved a way for the practitioners to better understand and cure the diseases. These
discoveries included anesthetics, syringes, X-rays, antiseptics etc….but they were not used at a
wider range.”“During the beginning of 20th century, these modern health care services began to
evolve. The doctors started using these equipments as a part of their profession and providing
medical insurance to the people who are in need to meet their medical emergencies which are
carried out even today.”
1.2.10 GLOBALIZATION OF HEALTH CAREINDUSTRY:
“The concept of global Health Care Industry is a recent phenomenon and inspite of the
fact that the health Care Industry is becoming more global each day but health care has always
been considered as a local industry, particularly to individual countries, the practice and
development of Health Care Industry varies across the globe because in each country the Health
Care Industry has its own history and cycle of evolvement. Now, globalization of ancillary
Health Care Industry, new technological advancement and standardization of various aspects of
industry is driving the trend towards globalization of Health Care Industry in theworld.”

Page 7
1.3 “COMPANY PROFILE OF SAKARIA HOSPITALPVT.LTD.”
1.3.1 BACKGROUND:
“To provide world-class healthcare services to the citizens of Bangalore North, Eleven
years back our SAKARIA HOSPITAL was established No.797, 10th main, 3rd block, HBR
Layout, Banglore-560043. It gives us immense pleasure to introduce you SAKARIA
HOSPITAL. The project was started in the Bangalore North to meet the needs of the patients and
community and provide quality care at an affordable cost. We are housed in a modern 12,000 sq.
ft. independentpremises”
“Most people tend to take good health for granted. But you may never even know when
your current lifestyle may adversely affect your health in the future. Constant stress, irregular
food habits and lack of exercise can be the main culprits.”“It is a fact that almost major ailment
first manifests itself as minor symptoms, which are often not noticed and hence, neglected. A
proper preventive health check-up helps in the assessment of your health conditions and may
provide the proverbial “stitch intime”.”
“At Sakaria, they continue to emphasize the age-old adage that “Prevention is better than
cure”. Sakaria Hospitals Group pioneered the Preventive Healthcare Packages in the country and
has so far to their credit more than 4 lakh health checks.”
“Sakaria Health Checks are a set of comprehensive and reliable Preventive Healthcare
Packages, designed keeping in mind the varied requirements of all the members of our family.
While undergoing the health checks our executives ensure that you are comfortable and well
taken care of.”“This coupled with our smooth, swift and systematic procedures will indeed make
our experience a pleasant one.”“Regular health checks are also done to ensure that we enjoy the
benefits of uninterrupted good health over a long period of time.”
“Sakaria Hospital is for diagnostic imaging and preventive health checkups in Bangalore,
India. Sakaria Hospital gives you a warm and friendly environment to make your time &
hospitality comfortable.”“Our medical and nursing staffs are committed to focus on the comfort
and safety of our patients. Sakaria Hospital is always best option in Bangalore, with a staff of
well-skilled and highly experienced doctors who take care of all the medical needs.”“Sakaria
Hospital has an exclusive division committed to the needs of international patients who visit

Page 8
“The company acts as a facilitator between patients or visitors and various hospitals suggesting
various options available based on the required treatment of other services.”
In the facility, we have 35 bedded hospital with different categories of rooms- Deluxe
room, Private rooms, Twin/Sharing beds, and multi sharing beds. Two numbers of operation
theatres with all the sophisticated equipments and infrastructure to handle all kinds of cases and
emergencies. Labor room with life saving equipment for the newborns. ICU for all emergency
situations. Round the clock- medical emergency services, Casualty, Laboratory, OPD services,
Radiology services, Pharmacy.”
“Sakaria Hospital has a tie up with major insurance companies such as:”
“”Star HealthInsurance”
“United Healthcare Pvt. Ltd (ParekhTPA)”
“TTK Healthcare TPA Pvt. Ltd. (Vidal)”
“Medi Assist India TPA Pvt.Ltd.,
“E- Meditek TPA Pvt. Ltd.,”
“Vipul- Medicorp TPA Pvt.Ltd.,”
“Future Generali India Insurance Co.Ltd.,”
“Reliance Insurance”
“DHS”
“Paramount”
“GHPLTPA”
“Med saveTPA”
“Medicare”
“HDFC Ergo General Insurance- ApolloMunich”
“Aditya BirlaCapital”
“Safeway”

Page 9
1.3.2 “COMPANY DETAILS:”
KPME NO. BLU01432AANH
Company Name Sakaria Hospital
Company Status Active
RoC RoC-Bangalore
Company Category Partnership Firm
Company Sub Category Non-govt company
Date of Incorporation 2009
Age of Company 11 years
Activity Health Care Services
1.3.3 WHY US?
Expert DoctorTeam
GoodInfrastructure
EasyAccessible
Skilled and dedicatedstaff
Cost-effective
Accurate DiagnosticResults.

Page 10
1.3.4. VISION, MISSION, AND QUALITY POLICY OF SAKARIAHOSITAL
1.3.4.1 VISION:
“Sakaria Hospital gives you a warm and friendly environment to make your time & hospitality
comfortable. Our medical and nursing staff’s are committed to focus on the comfort and safety of
our patients.”
1.3.4.2 MISSION:
“Our mission is to blend state-of-the-art medical technology & research with a dedication to
patient welfare & healing to provide you with the best possible health care.”
1.3.4.3 QUALITY POLICY:
“Patient’s safety and well- being will always be our top priority. We will strive for continuous
quality improvement and also comply with the international standards to implement quality
systems and also to maintain the quality of ophthalmic services on par as per the international
standards.”
1.3.4. SERVICESOFFERED:
Health Check up:
“If you are having check up procedure done at Sakaria Hospital, you can rest easy
knowing that you are getting the best possible care. Our healthcare is equipped with the latest
technology and an excellent staff of medical professionals to ensure you have a great experience
during your day. We follow the following health plans too which includes primary, senior
citizens, gold, platinum, diamond, and deluxe whichever the customers want to opt according to
theirconvenience.”
Whole body MRI (Outsourcing):
“Whole body MRI evaluates all the organs in the body including the head, neck, chest,
abdomen, pelvis, musculoskeletal whole spine. Our healthcare is equipped with the latest
technology and an excellent staff of medical professionals to ensure you have a great experience
during your day. It includes:”
“Whole body MRI has no sideeffects”
Requires no priorpreparations

Page 11
“It’s completely harmless with no exposure toradiation”
“Fully non- invasive with no injection ofcontrast.”
Diagnostic tests:
It includes the following types:
Stress Test(TMT)
Fully AutomatedPathology
Digital X –ray
2D Echo
ColourDoppler
Mammography
CT scans with Cardiac
Sonography
Pulmonary Function Test(PFT)
EEG
Sleepstudies
Allergytests
ARFI (Acoustic Radiation ForceImpulse)
DEXA BoneDensitometry
All types of LaboratoryTest.
Hair Transplant:
“Hair transplantation is a surgical technique that removes hair follicles from one part of
the body, called the 'donor site', to a bald or balding part of the body known as the 'recipient
site'.”“If you think up top or going bald really bothers you then this process can be one way to
feel more confident about your looks. You can always consult with the doctors in Sakaria
Hospital about what you can expect during and after thesurgery.””
Specialist consultations of all Specialities:
“A Consulting Specialist provides expertise services in a wide range of business and
service sectors, such as recruitment, finance, advertising, sales, human resources, and much
more. They work with clients or customers who need their advice orassistance.”

Page 12
Health Checkups:
“It is a thorough physical examination; includes a variety of tests depending on the age
and sex and health of the person. Regular health checks can identify any early signs of health
issues. When you have a health check, your doctor will talk with you about your medical history,
your family's history of disease and your lifestyle, including your diet, weight, physical activity,
alcohol use and whether you smoke,etc…..”
Trauma Management:
“Traumatic injuries can range from minor isolated wounds to complex injuries involving
multiple organ systems. All trauma patients require a systematic approach to management to
maximize outcomes and reduce the risk of undiscovered injuries. Physical injuries are first
stabilized and then treated in a chain of medical actions that begin in the field with effective
emergency care and end with discharge to physical therapy.”
Pharmacy:
“It refers to a shop or hospital dispensary where medicinal drugs are prepared or sold.
Most pharmacists work in a community setting, such as a retail drugstore, or in a healthcare
facility, such as a hospital. Pharmacists in community pharmacies dispense medications, counsel
patients on the use of prescription and over-the-counter medications, and advise physicians about
medication therapy. The pharmacy is located just below the hospital which has all the medicines
available withthem.”
Eye hospital:
“Ophthalmology is a branch of medicine and surgery which deals with the diagnosis and
treatment of eye disorders. An ophthalmologist is a specialist in ophthalmology.
Ophthalmologists are allowed to use medications to treat eye diseases, implement laser therapy,
and perform surgery when needed. You can find the best of the best ophthalmologist at this
hospital.”
Dental services:
“Dental care is the maintenance of healthy teeth and may refer to: Oral hygiene, the
practice of keeping the mouth and teeth clean in order to prevent dental disorders. Dentistry is
the professional care of teeth, including professional oral hygiene and dental surgery. Sakaria
Hospital provides all the types of dental services with best doctor’steam.”

Page 13
Physiotherapy:
“The treatment of disease, injury, or deformity by physical methods such as massage,
heat treatment, and exercise rather than by drugs or surgery is called as physiotherapy.
Physiotherapists help people affected by injury, illness or disability through movement and
exercise, manual therapy, education and advice. They maintain health for people of all ages,
helping patients to manage pain and prevent disease.”
1.3.5. INFRASTRUCTUREFACILITY:
“We are housed in a modern 12,000 sq. ft. independent premises. In the facility, we have 25
bedded hospital with different categories of rooms- Deluxe rooms, Twin/Sharing beds, and multi
sharing beds with ICU facility and also other facilities like:”
24*7 IP- Patient AdmissionFacility
MaternityFacilities
2 Nos. of O.T.Facilities
Emergency Room- MinorOT
24 hrs Ambulanceservice
2 Nos. of ConsultationRooms
24*7 Duty DoctorsFacility
24*7Pharmacy
24*7 In - HouseLaboratory
Physiotherapy
Dental
Eye – All types of CataractSurgery’s
Digital X - ray, C -Arm
Ultrasound
Waste DisposalSystem
Laundryservice
Ups andGenerator
Page 14
1.3.6. COMPETITORS:
The major competitors of Sakaria Hospital are:
Chris Super SpecialityHospital
CDEC Hospital, HBRLayout
JMJHospital
Narayana Multi-specialityHospital
Fortis Hospital
Shifa multi-specialityHospital
SpecialistHospital
Good ShepherdHospital.
1.3.7. SWOTANALYSIS:
STRENGTHS:
Strong tie-up with various channelintermediaries.
Excellent customer service with friendlyambiance.
Easy availability of medicines at the pharmacy right below thehospital.
They offer service to the customers at affordablecost.
Great Geographiclocation.
WEAKNESS:
Absence of proper marketingplan.
Lack of proper infrastructural facilities.
Long waiting time forconsultation.
Shortage of staff at times in different departments due to variousshifts.
OPPORTUNITIES:
To increase the emergencyreferrals.
To adopt new technicalequipments.
Addition of doctors in thedepartments.
To collaborate with various insurance providing companies inIndia.

Page 15
THREATS:
Establishment of new hospitals in and around SakariaHospital.
New tariff cost from insurance companies is the greatestthreat.
Changes in the regulations of World Health Organisation(WHO).

Page 16
CHAPTER 2
2.1 MEANING:
CONCEPTUAL BACKGROUND
“Performance appraisal is a method of assessing the behaviour and performance of an employee
or group of employees at the workplace. The appraisal system includes both qualitative and
quantitative aspects of job performance. It is also referred as performance rating, performance
evaluation, employee assessment, performance review, merit rating, etc. In other words,
performance appraisal method is a systematic process that evaluates an individual
employee’sperformance in terms of his productivity with respect to the pre-determined goals and
objectives set by the organization. The appraisal system mostly happens annually, which gives an
opportunity to the employees working in that particular organization to reflect on the duties that
were dispatched by him. It not only involves receiving feedback regarding their performance but
also evaluates an individual’s attitude, personality, behavior, and stability in his jobprofile.”
“There are various applications of appraisals like compensation, performance
improvement, promotion, termination, test validation, etc. There are various methods of
performance appraisal which differ from one organisation to another. The frequency of
appraisals also varies in different organizations where most of the multinational companies
(MNC’s) offer them annually, some opt for shorter cycles like half yearly, quarterly, or even
monthly if the employees perform exceptionally at his/her job. In case of startups, it has been
observed that shorter cycles of performance appraisal are preferred so that they can motivate
their employees more frequently to perform better in theorganization.”
“The criteria for performance appraisal methods are based on various aspects like
productivity, quality of work, duration of service and training. Productivity in the manufacturing
concerns is measured mostly in the case of manufacturing i.e. the number of units manufactured
or delivered by the employee. Performance Appraisal is carried out to identify the various
abilities and competencies of an employee for future growth and development. It is aimed at
ascertaining the worth of the employee to the organization, in which he/she works.””

“Performance Appraisal is defined as a systematic process, in which the personality and
performance of an employee is assessed by the supervisor or manager, against predefined
standards, such as knowledge of the job, quality and quantity of output, leadership abilities,
attitude towards work, attendance, cooperation, judgment, versatility, health, initiative and so
forth. The objectives of performance appraisal system are as follows:”
“To help the employees, on the basis of their performance and competence in
the organization.”
“To identify the need for training and developmental programs ofemployees.”
“To provide confirmation/acceptance to those employees who are hired
asprobationary employees, upon completion of theterm.”
“To take decisions regarding the hike in employees pay, incentives, bonus,
recognition, etc.”
“To facilitate proper communication between superior and theirsubordinates.”
“To help employees in understanding where they stand in terms of one’s own
performance in the organization.”
“Data obtained from the appraisal of performance, are documented for future
referenceby the organization.”
2.1.2 PERFORMANCE APPRAISALPROCESS:
“””Performance appraisal process is planned, developed and implemented through a series of
steps. Each step in the process is crucial and is arranged logically. Many organizations make
every effort to approximate the ideal process, resulting in first-rate appraisal systems.
Unfortunately, many others fail to consider one or more of the steps and, therefore, have less-
Page 17
Measure Actual Performance
Communicate the Standards
Establish Performance Standards

effective appraisal system.”

Page 18
2.1.2.1 Establish performancestandards:
“Appraisal systems require performance standards, which serves as benchmarks against
which performance is measured. To be useful, standards should relate to the desired results of
each job. The performance standards or goals must be developed after a thorough analysis of the
job. Goals must be written down. Just talking about them is not enough. They must be
measurable within certain time and costconsiderations.”
2.1.2.2 Communicate theStandards:
“Performance appraisal involves at least two parties; the appraiser and who does the appraisal
and the appraisel whose performance is being evaluated. Both are expected to do certain things.
The appraiser should prepare job description clearly’ help the appraisee set his goals and targets,
analyzes results objectively, offer coaching and guidance to the appraisee whenever required and
reward good results. The appraisee should be very clear about what he is doing it. For the
purpose performance standards must be communicated to appraisee and their reactions should be
noted right away. These standards must be revised ormodified.”
2.1.2.3 Measure ActualPerformance:
“After the performance standards are set and accepted, the next step is to measure actual
performance. This requires the use of dependable performance measures, the ratings used to
evaluate performance. Performance measures to be helpful must be easy to use, reliable, and
report on the critical behaviors that determine performance. Four common sources of
Taking Corrective Actions, if necessary
Communicate Actual Performance with Standards and Discuss
the Appraisal

Page 19
information which are generally used by managers regarding how to measure actual performance
are personal observations, statistical reports, oral reports, and written reports.””
2.1.2.4 Compare actual performance with standards and discuss theappraisal:
“Actual performance may be better than expected and sometimes it may go off the track.
Whatever be the consequences, there is a way to communicate and discuss the final outcome.
Taking corrective actions, if necessary; Corrective actions are of two types: one puts the fires
immediately, while the other destroys the root of the problem permanently. Immediate action
sets things right and get things back on track whereas the basic corrective action gets to the
source of deviations and seeks to adjust the difference permanently. Basic corrective steps seek
to find out how and why performancedeviates.”
2.1.2.5 Taking Corrective Actions, ifnecessary:
“When a gap is found between the actual level and expected level of performance, corrective
actions should be undertaken. By analyzing the reason for a gap, proper action should be taken
so that the gap is bridged. When the actual and the standard performance match, there is no need
for any corrective action to be taken.”
2.1.3 METHODS OF PERFORMANCEAPPRAISAL:
“Each method of performance appraisal has its strengths and weaknesses may be suitable
for one organisation and non-suitable for another one. As such, there is no single appraisal
method accepted and used by all organizations to measure their employees’ performance. All the
methods of appraisal devised so far have been classified differently by different authors. While
DeCenzo and Robbins have classified appraisal methods into three categories: absolute methods,
relative methods and objective methods; Aswathappa has classified these into two categories
past-oriented and future-oriented. Michael R Carrel et. al. have classified all appraisal methods
into as many as six categories: rating scales, comparative methods, critical incidents, essay,
MBOandcombinationmethods.RockandLevis”haveclassifiedthemethodsintotwobroad

Page 20
categories: narrow interpretation and broad interpretation. Beatty and Schneier have categorized
various methods of appraisal into four groups: comparative methods, absolute methods, goal
setting, and direct indices.”
“A more widely used classification of appraisal methods into two categories, viz.,
traditional methods and modern methods, is given by Strauss and Sayles”. While traditional
methods lay emphasis on the rating of the individual’s personality traits, such as initiative,
dependability, drive creativity, integrity, intelligence, leadership potential, etc.; the modem
methods, on the other hand, place more emphasis on the evaluation of work results, i.e., job
achievements than the personal traits! Modern methods tend to be more objective and
worthwhile.”
2.1.3.1 TRADITIONALMETHODS:
Ranking Method:
“It is the oldest and simplest formal systematic method of performance appraisal in which
employee is compared with all others for the purpose of placing order of worth. The employees are
ranked from the highest to the lowest or from the best to the worst.”
“”In doing this the employee who is the highest on the characteristic being measured and also the
one who is L lowest, are indicated. Then, the next highest and the next lowest between next highest
and lowest until all the employees to be rated have been ranked. Thus, if there are ten employees to
be appraised, there will be ten ranks from 1 to10.”
However, the greatest limitations of this appraisal method are:
“It does not tell that how much better or worse one is than another”
“The task of ranking individuals is difficult when a large number of employees are
related, and”

Page 21
“It is very difficult to compare one individual with others having varying behavioral
traits. To remedy these defects, the paired comparison method of performance appraisal
has beenevolved.”
Paired comparison method:
“In this method, each employee is compared with other employee in the organization on
one-on-one basis, usually based on one trait only. The rater is provided with a bunch of slips
each coining pair of names, the rater puts a tick mark against the employee whom he thinks is the
best amongst the two. The number of times this employee is compared with others determines
his or her final ranking in theorganization.”
“The number of pairs for a given number of employees is ascertained by the
following“formula: N(N-1)/2”
“Where, n= total number of employees considered to be evaluated.”
“Thus, the pairs so ascertained give the maximum possible permutations and combinations. The
number of times a worker is considered better makes his/her score. Such scores are determined
for each worker and he/she is ranked according to his/her score. One obvious disadvantage of
this method is that the method can become unwieldy when large numbers of employees are being
compared.”
Grading Method:
“In this method, certain categories of grades are established in advance and carefully
defined. There can be three categories established for each employee: outstanding, satisfactory
and unsatisfactory. There can be more than three grades. Employee performance is compared
with grade definitions. The employee is, then, allotted with the grade that best describes his or
herperformance.”

Page 22
“Such type of grading is done is semester pattern of examinations and in the selection of a
candidate in the public service sector. One of the major drawbacks of this method is that the rater
may rate most of the employees on the higher side of their performance.”
Forced Distribution Method:
“This method was evolved by Tiffen to eliminate the central tendency of rating most of
the employees at a higher end of the scale. The method assumes that employees’ performance
level confirms to a normal statistical distribution i.e., 10,20,40,20 and 10 per cent. This is useful
for rating a large number of employees’ job performance and promo ability. It tends to eliminate
or reduce bias.”
“It is also highly simple to understand and easy to apply in appraising the performance of
employees in the organizations. It suffer from the drawback that improve similarly, no single
grade would rise in a ratings.”
Forced-Choice Method:
“The forced-choice method is developed by J. P. Guilford. It contains a series of groups
of statements, and rater rates how effectively a statement describes each individual being
evaluated. Common method of forced-choice method contains two statements, both positive and
negative.”
Examples of positive statements are:
“Gives good and clear instructions to thesubordinates.”
“Can be depended upon to complete any job assigned.”
A pair of negative statements may be as follows:
“Makes promises beyond his limit to keepthese.”
“Inclines to favor someemployees.”
“Each statement carries a score or weight, which is not made known to the rater. The human
resource section does rating for all sets of statements— both positive and negative.”“The final

Page 23
rating is done on the basis of all sets of statements. Thus, employee rating in this manner makes
the method more objective. The only problem associated with this method is that the actual
constructing of several evaluative statements also called ‘forced-choice scales’, takes a lot of
time andeffort.”
Check-List Method:
“The basic purpose of utilizing check-list method is to ease the evaluation burden upon
the rater. In this method, a series of statements, i.e., questions with their answers in ‘yes’ or ‘no’
are prepared by the HR department. The check-list is, then, presented to the rater to tick
appropriate answers relevant to the appraisee. Each question carries a weight-age in relationship
to their importance. When the check-list is completed, it is sent to the HR department to prepare
the final scores for all appraises based on all questions. While preparing questions an attempt is
made to determine the degree of consistency of the rater by asking the same question twice but in
a different manner.”
“However, one of the disadvantages of the check-list method is that it is difficult to
assemble, analyze and weigh a number of statements about employee characteristics and
contributions From a cost stand point also, this method may be inefficient particularly if there are
a number of job categories in the organisation, because a check-list of questions must be
prepared for each category of job. It will involve a lot of money, time andefforts.”
Critical Incidents Method:
“In this method, the rater focuses his or her attention on those key or critical behaviors
that make the difference between performing a job in a noteworthy manner (effectively or
ineffectively). There are three steps involved in appraising employees using this method.”
“First, a list of noteworthy (good or bad) on-the-job behaviour of specific incidents is
prepared. Second, a group of experts then assigns weightage or score to these incidents,
depending upon their degree of desirability to perform a job. Third, finally a check-list indicating
incidents that describe workers as “good” or “bad” is constructed. Then, the check-list is given to
the rater for evaluating the workers.”“The basic idea behind this rating is to apprise the workers

Page 24
who can perform their jobs effectively in critical situations. This is so because most people work
alike in normal situation. The strength of critical incident method is that it focuses on behaviors
and, thus, judge’s performance rather than personalities”
“Its drawbacks are to regularly write down the critical incidents which become time-
consuming and burdensome for evaluators, i.e., managers. Generally, negative incidents are
positive ones. It is rater’s inference that determines which incidents are critical to job
performance. Hence, the method is subject to all the limitations relating to subjective
judgments.”
Graphic Rating Scale Method:
“The graphic rating scale is one of the most popular and simplest techniques for
appraising performance. It is also known as linear rating scale. In this method, the printed
appraisal form is used to appraise each employee.
The form lists traits (such as quality and reliability) and a range of job performance
characteristics (from unsatisfactory to outstanding) for each trait. The rating is done on the basis
of points on the continuum. The common practice is to follow five points scale. The rater rates
each appraisee by checking the score that best describes his or her performance for each trait all
assigned values for the traits are then totaled.”
“This method is good for measuring various job behaviors of an employee. However, it is
also subjected to rater’s bias while rating employee’s behaviour at job. Occurrence of ambiguity
in design- mg the graphic scale results in bias in appraising employee’s performance.”
Essay Method:
“Essay method is the simplest one among various appraisal methods available. In this
method, the rater writes a narrative description on an employee’s strengths, weaknesses, past
performance, potential and suggestions for improvement. Its positive point is that it is simple in
use. It does not require complex formats and extensive/specific training to complete it.”
“However, essay method, like other methods, is not free from drawbacks. In the absence of any
prescribed structure, the essays are likely to vary widely in terms of length andcontent.”

Page 25
“And, of course, the quality of appraisal depends more upon rater’s writing skill than the
appraiser’s actual level of performance.”
“Moreover, because the essays are descriptive, the method provides only qualitative
information about the employee. In the absence of quantitative data, the evaluation suffers from
subjectivity problem. Nonetheless, the essay method is a good start and is beneficial also if used
in conjunction with other appraisal methods.”
Field Review Method:
“When there is a reason to suspect rater’s biasness or his or her rating appears to be quite
higher than others, these are neutralized with the help of a review process. The review process is
usually conducted by the personnel officer in the HR department.”
The review process involves the following activities:
“Identify areas of inter-raterdisagreement.”
“Help the group arrive at aconsensus.”
“Ensure that each rater conceives of the standardsimilarity.”
“However, the process is a time-consuming one. The supervisors generally resent what they
consider the staff interference. Hence, the method is not widely used.”
Confidential Report:
“It is the traditional way of appraising employees mainly in the Government
Departments. Evaluation is made by the immediate boss or supervisor for giving effect to
promotion and transfer. Usually a structured format is devised to collect information on
employee’s strength weakness, intelligence, attitude, character, attendance, discipline, etc.
report.”

Page 26
2.1.3.2 ModernMethods:
“Management by Objectives (MBO):”
“Most of the traditional methods of performance appraisal are subject to the antagonistic
judgments of the raters. It was to overcome this problem; Peter F. Drucker propounded a new
concept, namely, management by objectives (MBO) way back in 1954 in his book “The Practice
of management”. The concept of MBO as was conceived by Drucker, can be described as a
“process whereby the superior and subordinate managers of an organization jointly identify its
common goals, define each individual’s major areas of responsibility in terms of results expected
of him and use these measures as guides for operating the unit and assessing the contribution of
each its members”.
“In other words, stripped to its essentials, MBO requires the manager to goals with each
employee and then periodically discuss his or her progress toward these goals. In fact, MBO is
not only a method of performance evaluation. It is viewed by the Practicing managers and
pedagogues as a philosophy of managerial practice because .t .s a method by wh.ch managers
and subordinates plan, organize, communicate, control anddebate.”
“An MBO programme consists of four main steps: goal setting, performance standard,
comparison, and periodic review. In goal-setting, goals are set which each individual, s to attain.
The superior and subordinate jointly establish these goals. The goals refer to the desired outcome
to be achieved by each individual employee. In performance standards, the standards are set for
the employees as per the previously arranged time period. When the employees start performing
their jobs, they come to know what is to be done, what has been done, and what remains to be
done”
“In the third step the actual level of goals attained are compared with the goals agreed upon. This
enables the evaluator to find out the reasons variation between the actual and standard
performance of the employees. Such a comparison helps devise training needs for increasing
employee’s performance it can also explore the conditions having their bearings on employee’s
performance but over which the employees have no control. Finally, in the periodic review step,
corrective measure is initiated when actual performance deviates from the slandered established

Page 27
in the first step-goal-setting stage. Consistent with the MBO philosophy periodic progress
reviews are conducted in a constructive rather than punitive manner. The purpose of conducting
reviews is not to degrade the performer but to aid in his/her future performance. From a
motivational point of view, this would be representative of McGregor’stheories.”
Limitation of MBO:
“As with other methods, it also suffers from some limitations as mentioned below:”
“Setting Un-measurableObjectives:”
“One of the problems MBO suffers from is unclear and un-measurable objectives set for
attainment. An objective such as “will do a better job of training” is useless as it is un-
measurable. Instead, “well have four subordinates promoted during the year” is a clear and
measurable objective.”
Time-consuming:
“The activities involved in an MBO programme such as setting goals, measuring progress, and providing
feedback can take a great deal of time.”
Tug of War:
“Setting objectives with the subordinates sometimes turns into a tug of war in the sense that
the manager pushes for higher quotas and the subordinates push for lower ones. As such, goals
so set are likely to beunrealistic.”
Lack ofTrust:
“MBO is likely to be ineffective in an environment where management has little trust in its
employees. Or say, management makes decisions autocratically and relies heavily on external
controls.”

Page 28
Behaviorally Anchored Rating Scales (BARS):
“The problem of judgmental performance evaluation inherent in the traditional methods
of performance evaluation led to some organizations to go for objective evaluation by
developing a technique known as “Behaviorally Anchored Rating Scales (BARS)” around 1960s.
BARS are descriptions of various degrees of behaviour with regard to a specific performance
dimension.”
“It combines the benefits of narratives, critical incidents, and quantified ratings by
anchoring a quantified scale with specific behavioral examples of good or poor performance. The
proponents of BARS claim that it offers better and more equitable appraisals than do the other
techniques of performance appraisal we discussed so far.”
Developing BARS typically involves five steps:
Generating CriticalIncidents:
“Critical incidents (or say, behaviors) are those which are essential for the performance of the
job effectively Persons who are knowledgeable of the job in question (jobholders and/or
supervisors) are asked to describe specific critical incidents of effective and ineffective
performance. These critical incidents may be described in a few short sentences or phrases using
the terminology.”
Developing PerformanceDimensions:
“The critical incidents are then clustered into a smaller set of performance dimensions,
usually five to ten. Each cluster, or say, dimension is then defined.”
ReallocatingIncidents:
“Various critical incidents are reallocated dimensions by another group of people who also
know the job in question. Various critical incidents so reallocated to original dimensions are
clustered into various categories, with each cluster showing similar critical incidents. Those
critical incidents are retained which meet 50 to 80% of agreement with the cluster as classified”

Page 29
ScalingIncidents:
“The same second group as in step 3 rates the behaviour described in each incident in terms
of effectiveness or ineffectiveness on the appropriate dimension by using seven to nine points
scale. Then, average effectiveness ratings for each incident are determined to decide which
incidents will be included in the final anchored scales.”
Developing Final BARS Instrument:
“A subset of the incidents (usually six or seven per cluster) is used as a behavioral anchor for
the final performance dimensions. Finally, a BARS instrument with vertical scales is drawn to be
used for performance appraisal. BARS method of performance appraisal is considered better
than the traditional ones because it provides advantages like a more accurate gauge, clearer
standards, better feedback, and consistency in evaluation. However, BARS is not free from
limitations.”
“The research on BARS indicates that it too suffers from distortions inherent in most rating
scales. The research study concluded that “it is clear that research on BARS to date does not
support the high promise regarding scale independence In short, while BARS may outperform
conventional rating techniques, it is clear that they are not a panacea for obtaining high inter rater
reliability”
Assessment Centre’s:
“The introduction of the concept of assessment centre’s as a method of performance
method is traced back in 1930s in the Germany used to appraise its army officers. The concept
gradually spread to the US and the UK in 1940s and to the Britain in 1960s. The concept, then,
traversed from the army to business arena during 1960s. The concept of assessment centre is, of
course, of a recent origin in India. In India, Crompton Greaves, Eicher, Hindustan Lever and
Modi Xerox have adopted this technique of performance evaluation.”

Page 30
360 – Degree Appraisal:
“Yet another method used to appraise the employee’s performance is 360 – degree
appraisal. This method was first developed and formally used by General Electric Company of
USA in 1992. Then, it travelled to other countries including India. In India, companies like
Reliance Industries, Wipro Corporation, Infosys Technologies, Thermax, Thomas Cook etc.,
have been using this method for appraising the performance of their employees. This feedback
based method is generally used for ascertaining training and development requirements, rather
than for pay increases. Under 360 – degree appraisal, performance information such as
employee’s skills, abilities and behaviors, is collected “all around” an employee, i.e., from
his/her supervisors, subordinates, peers and even customers andclients.”
“In other worlds, in 360-degree feedback appraisal system, an employee is appraised by
his supervisor, subordinates, peers, and customers with whom he interacts in the course of his job
performance. All these appraisers provide information or feedback on an employee by
completing survey questionnaires designed for this purpose. All information so gathered is then
compiled through the computerized system to prepare individualized reports.”
“In 360 – degree feedback, performance appraisal being based on feedback “all around”, an
employee is likely to be more correct and realistic. Nonetheless, like other traditional methods, this
method is also subject to suffer from the subjectivity on the part of the appraiser. For example,
while supervisor may penalize the employee by providing negative feedback, a peer, being
influenced by ‘give and take feeling’ may give a rave review on his/hercolleague.”

Page 31
Cost Accounting Method:
“This method evaluates an employee’s performance from the monetary benefits the
employee yields to his/her organisation. This is ascertained by establishing a relationship
between the costs involved in retaining the employee, and the benefits an organisation derives
fromhim/her.”
“While evaluating an employee’s performance under this method, the following factors are
also taken into consideration:”
“Unit wise average value of production orservice.”
“Quality of product produced or servicerendered.”
“Overhead costincurred.”
“Accidents, damages, errors, spoilage, wastage caused through unusual wear andtear.”
“Human relationship withothers.”
“Cost of the time supervisor spent in appraising theemployee.”

Page 32
2.2 LITERATUREREVIEW:
(Angelo S. DeNisi, 2017)
“Assessing the performance of the employees at work is an important task in any organization. It
refers to a formal process which happens once in a year or half yearly depending on the
organization, through which the employees of the organization are evaluated by the management
professionals who assess the employees performance based on the certain pre-determined
dimensions, assigns score to the assessment, and then usually informs the particular group of
employees about their formal rating. The author and researches or the study has reviewed around
hundred years of research on performance appraisal and performance management, mostly
focusing on the articles published in Journal of Applied Psychology. This study mainly focuses on
the latest trends on performance appraisal which includes scale formats, criteria for evaluating
ratings, training, reaction to appraisal, purpose of rating, rating sources, demographic differences in
ratings and cognitive process. the study has also focused on the trends during the heyday of the
performance appraisal research in Journal of Applied Psychology, which were more productive and
which enhanced the progress of the employees. This study resulted that Journal of Applied
Psychology’s role was not merely to propose models and ideas but also to test the ideas and models
proposed earlier. It has also made an important contribution in the field of performance
management by addressing the questions raised by various individuals and employees regarding
the critical incidents in performance appraisal.”
(Balasubramanian, 2016)
“Total Quality Management (TQM) has become one of the major issues in the Healthcare
Industry from the past few decades. This area was more focused due to various changes made in
government regulations, influence of customers, and hospital management initiatives. Moreover,
there are many more hurdles in managing the healthcare organizations in such a competitive
marketplace where there is no support given from the local bodies especially in the developing
countries. The main objective of the study was to provide a framework for implementation of
total quality management concept which is made compatible even with the local culture of India.
The test used SERQUAL model which served the healthcare facility by not onlyachieving”

Page 33
“employee’s satisfaction but also the satisfaction of its customers. There are also certain
limitations to healthcare industries when it has to gel with total quality management which
includes the traditional culture in various countries, leadership style, and the mentality of the
medical professionals. The study also resulted in providing the suggestion that this Total Quality
Management can be of a great support to the healthcare sector in the world which will help the
organization to overcome its barriers and improve its performance.”
(Pushpalatha K, 2016)
“It is necessary to understand and evaluate the socio-economic and personal elements which
influence the individual behaviour and opinions in the organization. This study focuses on the
professionals and semi-professionals and follows interviewed questionnaire method to collect the
data and to analyze the attitude, perception, opinions and information of the library professionals.
These data professionals were mainly the librarians where the librarians need to plan, direct and
supervise various library operations for which professional knowledge is utmost important. This
paper reports on the views of the respondents and their perceptions on common pitfalls of
performance appraisal system. The objectives of the study were firstly, to examine and evaluate
the key features of performance appraisal, secondly, to highlight the strengths and weaknesses of
the appraisal system and thirdly, to raise major implications to strengthen the performance
management system. The study used multiple regression and correlation techniques for data
analysis. The study resulted that the appraisal establishes link between organizational as well as
individual performance. In many colleges there is lack of seriousness about appraisal interviews.
Therefore, the findings recommend that the librarian should adopt strategic planning and pay
attention to human resources. The salary and compensation should be in the direction rather than
being flat. The study also recommends that the performance appraisal technique need thorough
training of both the appraisers and the appraises by the human resource department so that they
provide relaxed and motivated encouragement to the employees of the particular organization.”

Page 34
(Leece, 2016)
“This article aims at determining whether performance appraisal in the Australian industry has to
be updated or not. The paper mainly focuses on the findings of a recent study of performance
appraisal system in Australian industry, updating the research conducted earlier with the view of
contemporary organisation changes and industry relation changes. As we are aware that
performance appraisal is still a Human Resource Management tool, with an increase in employee
coverage and an emphasis on management by objectives. This survey of performance appraisal
practice in Australian industry was conducted in the year 1995 to do the necessary changes based
on the existing result of the survey. The survey was conducted using standard questionnaire and
covered around eighteen questions which were sub divided into four sections i.e., organization type
performance appraisal programmes, purpose and uses of performance e appraisal, and methods and
features of performance appraisal. This survey was distributed to 1500HRMspecialist who were
randomly selected from the 1995 Australian human resource management directory. The survey
found that performance appraisal schemes are usually designed by the HR specialist themselves
around 44%, consultation with other group of individuals 13% the result from the study shows the
traditional view of performance appraisal with some areas needed changes. Some authors consider
to distinct performance appraisal purposes-performance evaluation and training and development
this study clearly indicates that the current focus of many organisation is on the former, possibly at
the expense of latter.”
(Dr. Muhammad Zahid Iqbal, 2015)
“Based on the robust analysis of the existing literature on performance appraisal, this paper aims at
making a case for an integrated framework of effectiveness of performance appraisal (EPA). To
achieve this, it draws on the expanded view of measurement criteria of effectiveness of
performance appraisal i.e., purposefulness, fairness, and accuracy, and identifies their relationships
with rate reactions. These were discussed in two parts ‘general’(dealing with research trends in the
sub-field of EPA), and ‘specific’(focusing on the rate reactions-based integrated framework of
EPA). This paper used variety of research designs such as cross- sectional and longitudinal, surveys
and experiments or quasi-experiments. With regard to the 104 empirical studies, 64% were carried
out with real actors (e.g., employees) and 27% werein

Page 35
artificial settings (e.g., with students). The first objective of this paper was to identify the
relationship between measurement criteria and their respective outcomes and the final objective
was to seek an integrated framework of EPA. This paper has also provided with empirical
confirmations based on a priori theory which suggested nomological networks for the above-
mentioned relationships, which are all set for empirical testing. This expansion on performance
appraisal fairness suggests newly established nomological networks, which were ignored in the
past, e.g., the relationship between distributive fairness and organization-referenced outcomes.
Further, refinements in performance appraisal accuracy reveal a more comprehensive
categorization of rating biases. Coherence amongst measurement criteria has resulted in a rate
reactions-based integrated framework, which will be useful for both researchers as well as
practitioners.”
(Ushus Mathew, 2015)
“The main aim of the study was to determine the relationship between the work performance
with the performance appraisal and motivation among the nurses of a multi-speciality hospital in
Kerala. The basic purpose of any appraisal system should be towards improving the performance
of the employees that caters towards organization success. In order to examine the relationship
data was collected through pre tested structured questionnaire from the sample size of 100 nurses
of that particular hospital. Convenience sampling method was used to collect the data due to time
and resource constraints. Regression and correlation techniques were used for data analysis and
interpretation. Reliability analysis was another technique used to check the reliability of the
questionnaire. It was concluded from the study that there is an insignificant relationship between
work performance and motivation. Thus, the appraisal system should first contribute towards
motivation of the employees. Health care sectors should seek to enhance the employee’s
motivation so that they improve their performance. It was also concluded from the study that the
nursing staff of multi-speciality hospital have high work performance due to satisfaction towards
the current performance appraisal system of the organization.”

Page 36
(Y,2014)
“In every hospital industry which is also referred as service sector where the patients also called
as customers are the most important persons. It is a duty of every employees of the hospital to
perform their duties in an outstanding way so that they satisfy their customers. Therefore, this
study aims at determining how performance appraisal will motivate the employees to perform
better and also it helps to determine the training needs of the employees which will in turn help
them to enhance their skills and make them more competent to perform their task. The study
included around 400 employees across 5 hospitals in Kerala. The data was collected from the
respondents in the form of questionnaires. Discussions and informal interviews were also taken
in order to collect the first hand information. The study used convenience and judgmental
sampling techniques for data collection. The study resulted that performance appraisal should not
be adopted just as a routine activity but its importance should be communicated to each and
every employee in the organization. New methods of appraisal should also be adopted so that
both the appraiser and the appraisee interestingly take part in the performance appraisal
process.teh study also reveals that the employees who are performing better each time should be
rewarded and made the mentors so that they can motivate other employees to perform better in
theirjobs.”
(Krishnendu Hazra, 2014)
“This study aims at finding out the role of motivation on employee’s performance in different
segments of catering sectors under hospitality industry in Kolkata. As we are aware that
employees are the most vital factor in the success and failure of any organization therefore
motivating them is also important as it is the most crucial part to motivate the employees to
improve their performance. The catering industry is a type of service based industry that sells
foods and other things to its guests therefore performance of the employees is very important.
The hospitality industry in India is running short of good employees and also facing a cut-throat
competition from other sectors also. This reason behind this could be due to some motivational
factors like good remuneration, a proper work life balance, better working conditions and faster
professional growth provided by the other service sectors. The total numbers of observations
consideredwere304andquestionnairewasusedtocollectthedata.Correlationandregression

Page 37
analysis were used for data analysis. As motivation is truly a multi-dimensional factor and it also
defers from one person to another based on their likes, dislikes, passion, interest, desires, etc.
The employees working in hospitality industry will have a unique character as they do not have
any stipulated time frame for any assigned job. It is the sector which keeps on operating 24/7 of
365 days. The outcome of the study has provided an organization with a wider and better picture
to evaluate the employee’s motivation level based on their performance. Out of the 23 variables,
only 8 variables act more prominent to enhance the motivational level of the employee’s
performance than the other variables. Hence in order to retain the employees at the right time on
the right job the organizations has to redesign their performance appraisal and reward system
according to the local culture keeping in mind the motivational factors. Each and every
organization has to build its own motivational system based on compatibility between the
organizational and individualgoals.”
(Verma, 2014)
“Business perceptions of the construction industry have changed drastically during the last few
decades. Due to the immense competition and globalization issues, the performance assessment
which was done using objective measures. Both internal and external factors have a significant
influence on the performance appraisal system. Therefore, in order to analyze how the organization
improves their performance appraisal tool for better management of human resource at the
organization, this study aims at finding out whether the workers and managers knows that
improved technologies have been used under performance appraisal system and if these techniques
influence the performance appraisal system and if yes, then which worker has the more clear
picture of the improved techniques of performance appraisal system in the organization. The
objectives of the study are classified into two-fold, firstly to identify the variables of the
performance appraisal system and secondly to measure the perception gap between various
categories of managers on selected variables with effect of current performance appraisal system at
the organization. The primary data was collected through questionnaires filled by the workers and
managers of Rajasthan State Miles and Minerals ltd (RSMML), while the secondary data was
collected from the company’s official website. Hypothesis testing,
regressionanalysis,ANOVAandPostHoctestwereusedfordataanalysis.”

Page 38
.
(Satoris S. Culberstone, 2013)
“Employee satisfaction with performance appraisal plays a wide role to find out the effectiveness
of performance appraisal. This study focuses to find out reactions to a real performance appraisal
that had meaningful consequence for employees. This study, however, is limited by the cross-
sectional design, which does not permit casual inferences. A total of 234 staff employees were
included in the survey in which 68% were female at a large south western US university. This
survey was completed approximately three months right after the annual merit-based
performance appraisal were completed. The sample size of the study included approximately
around 167 to169 employees. The study examined the joint effects of feedback sign whether
positive or negative and three goal orientations dimensions i.e., learning, performance-prove,
performance-avoid on performance appraisal satisfaction. The study used Vande Walle’s goal
orientation inventory to measure the goal oriented results. Another potential limitation is the
single-source nature of our data. However ,because our primary focus was mainly focused with
interaction effects, common method variance is less concerning this study relied upon self-
reports of overall ratings on performance for data collection rather than actual employment
records. Therefore the results of the study revealed the negative relationship between negative
feedback and performance appraisal satisfaction. Additionally, the relationship between positive
feedback and performance appraisal was stronger for individuals low on PPGO and weaker for
individuals high onPPGO.”
(Rabia Karimi, 2011)
“This study aims at to examine the relationship between employee performance appraisal system
and employee satisfaction. This study was conducted to the employees working at one of the
International non-profit organization. It considered 101 employees for the sample collection. The
data was collected with the help of adopted questionnaires. Convenient sampling and snow-ball

Page 39
sampling techniques were used for data analysis. The outcome of the study shows that there is a
positive relationship between the Independent and Dependent variables and this is due to the
reason that the organization which was selected for data collection was an International
organization which believes in enjoying the policies and procedures in a fair manner. The study
also resulted that there is no significant difference between the male and female employees with
respect to their performance appraisal system and employee satisfaction. It also confirms that the
performance appraisal system in practice is fair enough to keep all the employees in the
organization satisfied.”
(Soni, 2011)
“To know whether an employee has shown his or her best performance on a given job, performance
appraisal and employee assessment can be used. Organizations goals can be achieved only when
the people put in their best efforts. This paper examines the nature and limitations of performance
appraisal for host country managers in a sector of health care industry in Australia. The main
objectives used in the study are firstly, to study about the recent trends in performance appraisal,
secondly, to study about the global trends of performance appraisal in multi-national organizations
with supporting data and thirdly, to know about the pre-requisites for effective and successful
performance appraisal like documentation, standards/goals, practical and simple format, evaluation
techniques, communication, feedback, personal bias. The study found that performance appraisals
are widely used in the organizations, but in most of the cases around 80% were perceived as
ineffective. The findings suggest that the host country manager’s experience of the appraisal
system often result in the manager perceiving limited opportunities for the career development and
advancement in the organization. This may also impact on the overall long term performance of the
subsidiary company. The study recommends that some straight-forward modifications to the
appraisal could make a significant contribution to both retention as well as the development of
these managers, and, also towards their performance in the organization.”

Page 40
(Kamencu, 2011) (Ushus Mathew, 2015)
“The purpose of this study was to find out the effectiveness of performance appraisal system in
Kenya Tea Development Agency. The objectives of the study were classified into general and
specific category. This research adopted a descriptive research design where the population of
interest in the selected tea estate were visited where only 70 respondents were selected out of 348
possible respondents using stratifies random sampling by taking 20% of the targeted population
from each stratum or group. Thus, the study revealed that the factors like competence, assessment
and development, employee training, performance based pay and management by objectives were
the key factors that influenced the employee performance as indicated by the respondents and these
factors cannot be ignored. From correlation and regression analysis we found that performance
appraisal systems namely; management by objectives, performance based pay and employee
training has the largest effect on employee performance. Competence, assessment and development
also had a positive effect on employee performance by the positive correlation of 0.389. This was
an indication that all the independent factors (competence, assessment and development,
management by objectives, performance based pay and employee training) with coefficient
determination of 67.2% had a large effect on the dependent variables, which was the
employeeperformance.”
(Al-Sabri, 2009)
“This study aims at bridging the gap that exist between understanding of demographic factors,
work motivation, job satisfaction, and work performance in a government health care sector in the
Middle East, especially in the UAE. It analyses the nature and significance and also how the
demographic variables remained unexplored in the public sector heath care in the UAE. It also
investigates the role of these demographic factors like marital status, age, and education and how
these factors affect the level of employees work motivation and job satisfaction. It also aims at
identifying if there exist some relationship between work motivation, job satisfaction and work
performance of the employees with performance appraisal system. The sample size used was 450
employees and questionnaire method was used to collect the data. Regression and correlation
analysis,likertfivepointscale,anddescriptiveanalysiswerethetoolsusedforthisreview.”

Page 41
(Steven E. Abraham, 2001)
“Expanding on the work of a pilot study done in the year 1998, this study used survey research
questions to investigate two general issues focusing on the managerial competencies and
performance appraisal i.e., whether a set of managerial competencies currently being used by the
organizations to describe successful managers and whether organizations are using these same
competencies in appraising the managerial employees as a part of their performance appraisal
process. A sample of 2,500 firms were surveyed for data collection and asked which competencies
they consider descriptive of successful managerial employees, whether they use the competencies
to appraise their managerial employees and which are the six major competencies constituting to be
more vital than others. According to 277 survey respondents the similar six competencies said by
them are leadership skills, customer focus, result oriented, problem solver, communication skills
and team worker. The results also show that many firms are not appraising these competencies in
their managerial performance appraisal process. the result of the study also suggest that
organizations are willing to identify a set of managerial competencies that describes the successful
manager, organizations which are successful running in the market should be encouraged not only
to identify the managerial competencies that are most critical to successful performance but also to
ensure that same are incorporated in the performance appraisalprocess.”
(Kluger, Feedback effectiveness: Can 360-degree appraisals be improved?, 2000)
“Performance feedback is an important part of many organizational interventions. Managers
typically assume that providing employees with feedback about their performance makes it more
likely that the on the job performance of the employees will be improved. Despite the prevalence of
feedback mechanisms in management interventions, feedback is not always as effective as it is
typically assumed. In this study the author present specific conditions in which feedback might be
less effective, or even harmful. The author has also discussed with the implications of our results
and model for designing of interventions which aimed at improving performance, and focused
more narrowly on 360-degree appraisal systems. After arguing that these systems typically have
designed the characteristics that reduce effectiveness, the author concludes with the
recommendations for improving their effectiveness. The author has alsoemphasized on the

Page 42
need for systematic evaluations of feedback interventions about the performance appraisal
system at theorganization.”
(Blau, 1999)
“Job satisfaction has probably been the most often researched work attitude in the organizational
behavior literature. By using a longitudinal sample of medical technologies (MT’s), this study
found after controlling for prior overall job satisfaction, individual differences, and organization-
level variables, that task responsibilities and employee performance appraisal satisfaction
significantly affected subsequent overall MT job satisfaction. Data also suggested that the impact of
task responsibilities on overall job satisfaction can dissipate overtime, and that the supervisor’s role
in affecting employee job satisfaction is important. Mean, standard deviations, reliabilities and
correlations of continuous variables were used for data analysis. The correlation results included
stronger positive relationships between the job satisfaction and performance appraisal system of
theorganization.”

Page 43
CHAPTER 3
RESEARCH DESIGN
3.1 STATEMENT OF THEPROBLEM:
“Performance appraisal is one of the most important and unavoidable part of any
organization whether it is for – profit or non – profitable purpose, as this process helps the
organization to evaluate the performance of the employees and to formally recognize their
achievements and contribution towards the organization. The main aim of performance appraisal
is to reward the great performance and to address the weaknesses.”
“This study mainly focuses on finding out the effectiveness of performance appraisal on
the employees working at Sakaria Hospital, Bangalore and to evaluate the current status of the
satisfaction of employees with the present performance appraisal system at Sakaria Hospital,
Bangalore. If there is found some dissatisfactory factors, the study will try to provide some
suggestions to improve the situation.”
3.2 NEED OF THESTUDY:
“There are numerous needs to study the effectiveness of performance appraisal, some of
them are listed below:”
“The ultimate need of performance appraisal system is towards achieving organizational
goals.”
“Performance appraisal helps the superior to know the level of competency and have a
proper understanding about theirsubordinates.”
“Performance appraisal is also significant in providing ranking based on performance of
the employees.”
“To provide fair and equitable compensation based on performance of theemployees.”
“To ensure organizational effectiveness by correcting the employees based on the
standards set in order to improve their performance and suggesting the requiredchanges.”

Page 44
3.3 OBJECTIVES OF THESTUDY:
“To measure the effectiveness of performance appraisal system at Sakaria Hospital,
Bangalore.”
“To analyze the factors which contribute towards the effectiveness of performance
appraisalsystem.”
“To suggest somemeasures for improving the factors contributing towards the
effectiveness of performance appraisal system at Sakaria Hospital,Bangalore.”
3.4 SCOPE OF THESTUDY:
“The study was carried out to evaluate the effectiveness of performance appraisal and
development programme conducted at Sakaria Hospital,Bangalore.”
“It helps to know the importance of performance appraisal system by considering both
on- the-job performance as well as the personal qualities of theemployees.”
“To improve the employee work performance by helping them to utilize their potential to
the maximum in carrying out the objectives of theorganization.”
“To evaluate the performance and provide valuable feedback to the employees in the
areas to be improved to efficiently achieve firm’smission.”
“To allow the management to make decisions based on the performance of the employees
relating to payroll and compensation, training and development, promotion, demotion,
transfer,etc……”
3.5 RESEARCH METHODOLOGY:
RESEARCH DESIGN “Descriptive research design.”
TYPE OF DATA Primary data- Questionnaire
and
Secondary data- Company website,
literature review and internet portals.3.
DATA COLLECTION TOOL Questionnaire.
SAMPLING TECHNIQUE “Census sampling.”

Page 45
SAMPLING SIZE 50 employees.
SAMPLING UNIT Sakaria Hospital, Bangalore.
STATISTICAL TOOLS Tables, Charts, Graphs and Regression
Analysis
STATISTICAL PACKAGE SPSS, MS Excel
3.6 HYPOTHESIS:
HYPOTHESIS 1
H0: “There is no significant effect from Design of appraisal form on performance appraisal
system.”
H1: “There is a significant effect from Design of appraisal form on performance appraisal
system.”
HYPOTHESIS 2
H0: “There is no significant effect of Employee training and development on performance
appraisalsystem”.
H1: “There is a significant effect of Employee training and development on performance
appraisalsystem.”
3.7 LIMITATIONS OF THESTUDY:
“Time constraint was a major drawback as the period of research was limited to only six
weeks for datacollection, Also the outbreak of Novel Corona Virus made a Major
Drawback”
“The sample size was restricted only to 50employees.”
“”The chances of human error cannot be ruled out due to the possibility of
misrepresentation of the data by therespondents."”

Page 46
3.8 CHAPTERSCHEME:
“Chapter 1: Introduction about the project, Industry and Company profile, Vision, Mission and
Quality policy, SWOT Analysis.
“Chapter 2: Conceptual background and Literature review.”
“Chapter 3: Research Design.”
“Chapter 4: Data Analysis and Interpretation.”
“Chapter 5: Summary of Findings, Conclusions and Suggestions.”

Page 47
CHAPTER 4
“DATA ANALYSIS AND INTERPRETATION”
“DEMOGRAPHIC PROFILE OF THE RESPONDENTS:”
“Table No. 4.1
Gender of the respondents
Sl No Particulars Frequency Percentage
1. Male 21 42
2. Female 29 58
Source: Primary Data
Analysis:
“Table No. 4.1 shows that out of 50 respondents considered for data collection, 42% of the
respondents were male and 58% respondents were female.”
Chart no. 4.1
Gender of the Respondent
“Interpretation:
From the above table we can interpret out of the total respondents used for data collection,
majority of them were female and rest were male respondents.”
70
60
50
40
30
20
10
0
Male
Female
1 2

Page 48
Table No. 4.2
Age Group of the Respondents
Sl. No Particulars Frequency Percentage
1. Below 25 12 24
2. 25 to 34 21 42
3. 35 to 44 14 28
4. 45 and above 3 6
Source: Primary Data
Analysis:
“From the above table no. 4.2, it can be analyzed that, out of 50 respondents, 24% of the
respondents belong to the age group of below 25, 42% of the respondents belong to the age
group of 25 to 34, 28% of the respondents belongs to the age group of 35 to 44 and 6% of the
respondents belong to the age group of 45 andabove.”
Chart no. 4.2
Age Group of the Respondents
“Interpretation:”
“From the above chart we can interpret that majority of the respondents belong to the age
groupof 25 to 34 being 42% while other 58% belongs to the various sub groups mentioned in the
table no.4.2.”
Below25 25to34 35to44 45and above
0
Frequency
Percentage
50
40
30
20
10

Page 49
Table no. 4.3
Educational Qualification of the Respondents
Sl. No Particulars Frequency Percentage
1. SSLC 3 6
2. PUC 12 24
3. Graduation/
Diploma
22 44
4. Post Graduation 13 26
Source: Primary Data
Analysis:
“Table no. 4.3 shows the educational qualification of the respondents. From the above table it
can be analyzed that out of 100%, 6% of the respondents have completed SSLC, 24% of the
respondents have completed PUC, 44% of the respondents have completed their graduation/
diploma and 26% of the respondents are postgraduates.”
Chart no.4.3
Educational Qualification of the Respondents
“Interpretation:”
“From the above chart no. 4.3, it is clear around 44% respondents have completed their
graduation/diploma and 26% have completed their post graduation while other 30% are under
graduates.”
50 45 40 35 30 25 20 15 10 5 0
Frequency
Percentage

Page 50
Table no. 4.4
“Current Employment Status of the Employees”
Sl. No Particulars Frequency Percentage
1 Full-time 32 64
2 Part-time 6 12
3 Regular 10 20
4 Temporary 2 4
Source: Primary Data
Analysis:
“The table no. 4.4 shows the current employment status of the employees where out of 50
employees/ respondents, 64% are full – time workers, 12% are part- time workers, 20% are
regular employees and 4% are temporary employees.”
Chart no. 4.4
“Current Employment Status of the Employees”
Interpretation:
“From the above chart no. 4.4 it is clear that about 64% of the employees are full – time workers
while others 46% of the employees fall under the category of part-time, regular and temporary
employees.”
70
60
50
40
30
20
10
0
Current
employment status
Frequency
Current
employment status
Percentage

Page 51
Table no. 4.5
Work Experience
Sl. No Particulars Frequency Percentage
1 Below 1 year 6 12
2 1 to 3 years 14 28
3 3 to 5 years 13 26
4 Above 5 years 17 34
Source: Primary Data
Analysis:
“Table no. 4.5 shows the working experience of the employees in the organization where it can
be analyzed that amongst 50 total respondents, 12% employees fall into the category of working
experience of below one year, 28% employees fall under the category having working
experience of 1 to 3 years, 26% of the employees fall under the category having working
experience of 3 to 5 years, and 34% of the employees fall under the category having working
experience of more than 5years.”
Chart no. 4.5
Work Experience of the Employees
Interpretation:
“From the above chart no. 4.5 it is clear that majority of the employees fall under the category of
having working experience of more than 5 years where mostly these type of workers are doctors
or senior nursing staff.”
40
35
30
25
20
15
10
5
0
Work experience
Frequency
Work experience
Percentage
Below1 1to3 3to5 Above5
year years years years

Page 52
Table no. 4.6
How often is appraisal carried out in your Organization?
Sl. No Particulars Frequency Percentage
1 Once in 6 months 10 20
2 Once in a year 40 80
Source: Primary Data
Analysis:
“The above table no. 4.6 shows how often the appraisal process is carried out in the organization
and with the help of the data collected from the respondents we can analyze that around 80% of
the employees says that it takes place once in a year and only 20% of the employees says once in
6months.”
Chart no. 4.6
How often is appraisal carried out in your organization?
Interpretation:
“From the above chart no. 4.6 we can interpret that performance appraisal carried out in the
organization is once in a year as around 80% of the employees agree for the same.”
Frequency Percentage
Once in 6 months
Once in a year
90
80
70
60
50
40
30
20
10
0

Page 53
Table no. 4.7
How would you rank the performance appraisal method in your organization?
Sl. No Particulars Frequency Percentage
1 Easy 21 42
2 Complicated 5 10
3 Efficient 24 48
4 Inefficient 0 0
Analysis:
“The above table no. 4.7 shows how the employees rank the performance appraisal carried out in
their organization where around 42% of the employees says that it is easy, 10% says it is
complicated, 48% says it is efficient and 0% says it is inefficient.”
Chart no. 4.7
How would you rank the performance appraisal method in your organization?
Interpretation:
“From the above chart no. 4.7, it is clear that majority of the employees says it is easy and
efficient and only like 10% of the employees feels it iscomplicated.”
Frequency
Percentage
60
50
40
30
20
10
0

Page 54
LIKERT QUESTIONS:
Table no.4.8
Attitude of the Employees
4.8.1: You are satisfied with the performance appraisal results of the organization.
Sl. No Particulars Frequency Percentage
1 Strongly Agree 22 44
2 Agree 20 40
3 Neutral 5 10
4 Disagree 2 4
5 Strongly disagree 1 2
Source: Primary Data
Analysis:
“The above table no. 4.8.1 shows how well the employees are satisfied with the performance
appraisal results of the organization where the percentage goes as strongly agree is 44%, agree is
40%, neutral is 10%, disagree is 4% and strongly disagree is just 2%.”
Chart no.4.8.1
You are satisfied with the performance appraisal results of the organization.
Interpretation:
“Therefore, it is clear from the analysis results of the above table no.4.8.1 which shows the
attitude of the employees towards the performance appraisal results of the organization and
around 44% people out of the total 50 sampling size of 50 respondents have stronglyagreed and
50
45
40
35
30
25
20
15
10
5
0
FREQUENCY
PERCENTAGE
Strongly Agree Neutral Disagree Strongly Agree disagree

Page 55
hence we can say that they are satisfied with the performance appraisal results of the
organization.”
Table no. 4.8.2
“The criteria of performance appraisal is also considering the performance of the
employees”
Sl. No Particulars Frequency Percentage
1 Strongly Agree 6 12
2 Agree 39 78
3 Neutral 4 8
4 Disagree 1 2
5 Strongly disagree 0 0
Source: Primary Data
Analysis:
“The above table no. 4.8.2 shows the criteria of performance appraisal is also considering the
performance of the employees or not. Therefore, around 12% of the respondents have opted for
strongly agree, 78% for agree, 8% are neutral, 2% respondents opt for disagree and nobody for
strongly disagree.” Chart no. 4.8.2
The“criteria of performance appraisal is also considering the performance of the employees
Interpretation:
“From the above chart no. 4.8.2 it is clear that around 78% of the respondents out of 100% have
agreed that the organization does consider the performance of the employees at the time of
performance appraisal in the organization. Hence we can conclude that the organization is not
Strongly Agree Neutral Disagree Strongly Agree disagree
FREQUENCY
PERCENTAGE
90 80 70 60 50 40 30 20 10
0

Page 56
partial amongst the employees and they do take proper consideration regarding the employee’s
performance without any bias between them.”
Table no. 4.8.3
Are you satisfied with the outcomes of the appraisal?
Sl. No Particulars Frequency Percentage
1 Strongly Agree 11 22
2 Agree 18 36
3 Neutral 17 34
4 Disagree 2 4
5 Strongly disagree 2 4
Source: Primary Data
Analysis:
“Table no. 4.8.3 shows whether the employees are satisfied with the performance appraisal
results or not wherein, around 22% respondents have strongly agreed, 36% respondents have
agreed, 34% respondents are neutral i.e., neither agree nor disagree, 4% have opted for disagree
and 4% of them have strongly disagreed.”
Chart no. 4.8.3
Are you satisfied with the outcomes of the appraisal?
Interpretation:
“Fromtheaboveanalysisresultwhichisalsoshownwiththehelpofthediagraminchartno.4.8.3showstha
taround36%oftherespondentsaresatisfiedwiththeoutcomesofperformance
Strongly Agree Neutral Disagree Strongly Agree disagree
FREQUENCY
PERCENTAGE
40
35
30
25
20
15
10
5
0

Page 57
appraisal and around 34% are neutral i.e., neither satisfied nor dissatisfied. Therefore, the
organization can take the necessary steps and find out what corrective measures have to be taken to
make the results of the performance appraisal more accurate and make their employees happy.”
Table no. 4.8.4
Do you think there is still scope to improve performance appraisal system
Sl. No Particulars Frequency Percentage
1 Strongly Agree 7 14
2 Agree 18 36
3 Neutral 12 24
4 Disagree 9 18
5 Strongly disagree 4 8
Source: Primary Data
Analysis:
“The above table no. 4.8.4 shows whether there is still scope to improve the performance
appraisal system of the organization or not. Based on the response it is found that around 14% of
the respondents have strongly agreed, 36% of the respondents have agreed, 24% of the
respondents are neutral, 18% of the respondents have disagreed and around 8% of the
respondents have stronglydisagreed.”
Chart no. 4.8.4
Do you think there is still scope to improve performance appraisal system.
40
35
30
25
20
15
10
5
0
FREQUENCY
PERCENTAGE
Strongly Agree Neutral DisagreeStrongly Agree disagree

Page 58
Interpretation:
“From the above chart no. 4.8.4 it is clear that majority of the respondents have agreed that there
is still scope for improving the performance appraisal system in the organization. Therefore, the
organization can improve its performance appraisal system by taking necessary corrective
measures for further appraisal of theemployees.”
Table no. 4.9
Design of the appraisal form
4.9.1: All the goals and targets have been clearly expressed and assigned to me by the
management.
Sl. No Particulars Frequency Percentage
1 Strongly Agree 16 32
2 Agree 20 40
3 Neutral 6 12
4 Disagree 8 16
5 Strongly disagree 0 0
Source: Primary Data
Analysis:
“The above table no. 4.9.1 shows whether all the goals and targets have been clearly expressed
and assigned to the employees by the management in the organization or not. Based on the
response it is found that out of 50 respondents around 32% of the respondents have strongly
agreed, 40% of the respondents have agreed, 12% of the respondents are neutral, 16% of the
respondents have disagreed and 0% of the respondents have stronglydisagreed.”

Page 59
Chart no. 4.9.1
All the goals and targets have been clearly expressed and assigned to me by the
management.
Interpretation:
“Based on the analysis it is clear that majority of the respondents have agreed and they feel that
all the goals and targets or standards are clearly expressed and assigned to them by the
management and hence they have no issues with the communication issues between the
management and the respondents.”
Table no. 4.9.2
I feel the standards set for performance evaluation are pretty justifiable.
Sl. No Particulars Frequency Percentage
1 Strongly Agree 3 6
2 Agree 24 48
3 Neutral 13 26
4 Disagree 9 18
5 Strongly disagree 1 2
Source: Primary Data
Analysis:
“From the above table no. 4.9.2, it can be analyzed that out of 50 respondents 6% have strongly
agreed with the standards set are justified, 48% have agreed, 26% are neutral, 18% respondents
70
60
50
40
30
20
PERCENTAGE
FREQUENCY
10
0
Strongly Agree Neutral Disagree Strongly Agree disagree

Page 60
do not agree and only around 2% of the respondents strongly disagree with the above mentioned
statement.”
Chart no. 4.9.2
I feel the standards set for performance evaluation are pretty justifiable.
Interpretation:
“From the above results based on the analysis we can interpret that around 48% of the
respondents feel that the standards set for the performance evaluation are pretty justifiable.”
Table no. 4.9.3
The reliability of the factors considered in appraisal system is satisfactory.
Sl. No Particulars Frequency Percentage
1 Strongly Agree 10 20
2 Agree 16 32
3 Neutral 9 18
4 Disagree 11 22
5 Strongly disagree 4 8
Source: Primary Data
Analysis:
“The above table no. 4.9.3 shows that the reliability of the factors considered in appraisal system
by the management are satisfactory or not. Based on the response it is found that out of 50
respondents around 20% of the respondents have strongly agreed, 32% of the respondents have
80
70
60
50
40
30
20
10
0
PERCENTAGE
FREQUENCY
Strongly Agree Neutral Disagree Strongly Agree disagree

Page 61
agreed, 18% of the respondents are neutral, 122% of the respondents have disagreed and 8% of
the respondents have strongly disagreed.”
Chart no. 4.9.3
“The reliability of the factors considered in appraisal system is satisfactory.”
“Interpretation:
The results are quiet clear from the analysis which is also shown in the chart no. 4.9.3 where
majority of the respondents in the organization feel that the reliability of the factors considered
by the management for evaluating the performance appraisal results of the employees are
satisfactory. The management can further revise the factors, if necessary, to get more accurate
results.”
“Table no. 4.9.4
I feel the performance appraisal system set by the management is satisfactory.
Sl. No Particulars Frequency Percentage
1 Strongly Agree 11 22
2 Agree 17 34
3 Neutral 8 16
4 Disagree 8 16
5 Strongly disagree 6 12
Source: Primary Data
60 50
40
30
20
PERCENTAGE
FREQUENCY
10
0
Strongly Agree Neutral Disagree Strongly Agree disagree

Page 62
Analysis:
“The above table no. 4.9.4 shows the analysis results collected from the respondents based on
whether they feel the performance appraisal system set b the management is worth it or not or
whether they are satisfied or not. From the above results we got to know that out of 50
respondents around 22% respondents have strongly agreed, 34% of the respondents have agreed,
16% are neutral, 16% respondents didn’t agree, and around 12% of the respondents strongly
disagree.”
Chart no. 4.9.4
“I feel the performance appraisal system set by the management is satisfactory.”
Interpretation:
“From the above chart no. 4.9.4 it is quite clear that out of total 50 respondents, 34% of the
employees have agreed that the performance appraisal system set by the management is
satisfactory and they have no objections regarding such system.”
Strongly Agree Neutral Disagree Strongly Agree disagree
10
0
PERCENTAGE
FREQUENCY
60
50
40
30
20

Page 63
Table no. 4.10
Employee Training and Development.
4.10.1: I feel training delivered after appraisal contributes in improving my performance.
Sl. No Particulars Frequency Percentage
1 Strongly Agree 18 36
2 Agree 22 24
3 Neutral 9 18
4 Disagree 6 12
5 Strongly disagree 5 10
Source: Primary Data
Analysis:
“The above table no. 4.10.1, it can be said that, out of total 50 respondents 36% of the
respondents strongly agree with the above mentioned statement, 24% respondents agree, 18%
respondentsare neutral, 12% of the respondents don’t agree, and only 10% of the respondents
stronglydisagree.”
Chart no. 4.10.1
4.10.1: I feel training delivered after appraisal contributes in improving my performance.
Interpretation:
“From the above results it is clear that majority of the respondents have strongly agreed that the
training delivered after appraisal contributes in improving the employees performance. Hence,
the organization can rely on the same training methods and can improvise it if necessary.”
40
35
30
25
20
15
10
5
0
FREQUENCY
PERCENTAGE
Strongly Agree Neutral DisagreeStrongly Agree disagree

Page 64
Table no. 4.10.2
All my appraisal skills are revived by the management on a daily basis.
Sl. No Particulars Frequency Percentage
1 Strongly Agree 6 12
2 Agree 17 34
3 Neutral 10 20
4 Disagree 8 16
5 Strongly disagree 9 18
Source: Primary Data
Analysis:
“From the above table no. 4.10.2, it can be said that, out of total 50 respondents 12% of the
respondents strongly agree with the above mentioned statement, 34% respondents agree, 20%
respondents are neutral, 16% of the respondents don’t agree, and only 18% of the respondents
strongly disagree.”
Chart no. 4.10.2
All my appraisal skills are revived by the management on a daily basis.
Interpretation:
“From the above results it is clear that majority of the respondents has agreed that all of their
appraisal skills are revived by the management on the daily basis so that they can meet the
objectives of the organization and targets set by the management considered for performance
appraisal more effectively.”
40
35
30
25
20
15
10
5
0
FREQUENCY
PERCENTAGE
Strongly Agree Neutral Disagree Strongly Agree disagree
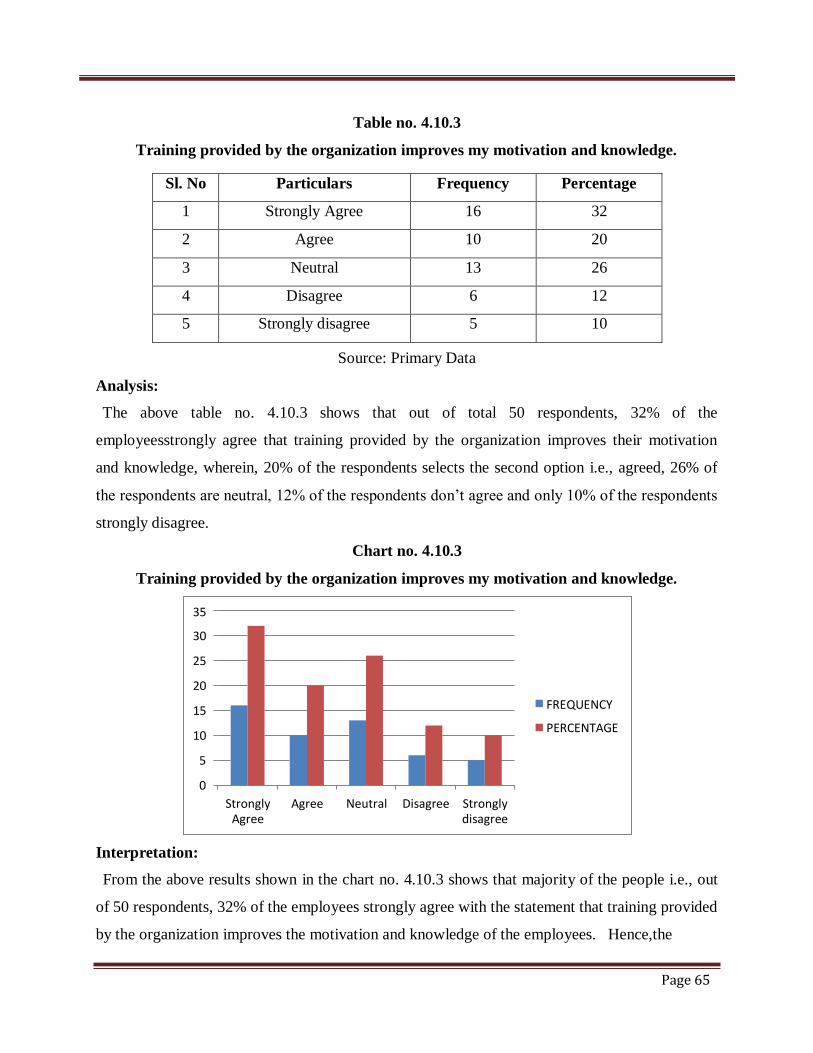
Page 65
Table no. 4.10.3
Training provided by the organization improves my motivation and knowledge.
Sl. No Particulars Frequency Percentage
1 Strongly Agree 16 32
2 Agree 10 20
3 Neutral 13 26
4 Disagree 6 12
5 Strongly disagree 5 10
Source: Primary Data
Analysis:
“The above table no. 4.10.3 shows that out of total 50 respondents, 32% of the
employeesstrongly agree that training provided by the organization improves their motivation
and knowledge, wherein, 20% of the respondents selects the second option i.e., agreed, 26% of
the respondents are neutral, 12% of the respondents don’t agree and only 10% of the respondents
strongly disagree.”
Chart no. 4.10.3
Training provided by the organization improves my motivation and knowledge.
Interpretation:
“From the above results shown in the chart no. 4.10.3 shows that majority of the people i.e., out
of 50 respondents, 32% of the employees strongly agree with the statement that training provided
by the organization improves the motivation and knowledge of the employees.” Hence,the
35
30
25
20
15
10
5
0
FREQUENCY
PERCENTAGE
Strongly Agree Neutral Disagree Strongly Agree disagree

Page 66
organization can provide more of such trainings to the employees to enhance their skills and
make them feel more confident about their job.
Table no. 4.10.4
Appraisal training helps me to overcome weak areas related to my job.
Sl. No Particulars Frequency Percentage
1 Strongly Agree 10 20
2 Agree 21 42
3 Neutral 10 20
4 Disagree 6 12
5 Strongly disagree 3 6
Source: Primary Data
Analysis:
“The above table no. 4.10.4 shows the analysis results collected from the respondents based on
whether they feel that the appraisal training helps them to overcome the weak areas related to
their job or not or. From the above results we got to know that out of 50 respondents around 20%
respondents have strongly agreed, 42% of the respondents have agreed, 20% are neutral, 12%
respondents didn’t agree, and around 6% of the respondents strongly disagree.”
Chart no. 4.10.4
Appraisal training helps me to overcome weak areas related to my job.
45
40
35
30
25
20
15
10
5
0
FREQUENCY
PERCENTAGE
Strongly Agree Neutral Disagree Strongly Agree disagree

Page 67
Interpretation:
“From the above chart no. 4.10.4, we can interpret the results saying majority of the respondents
i.e., around 40% have agreed that appraisal training given by the management to them helps
them to overcome the weak areas related to their job, enhances their skills and make them more
competent in doing theirjob.”
Table no. 4.11
Feedback on performance by the management
4.11.1: Appraisal feedback provided by the management is an important factor to improve
my on-the-job performance.
Sl. No Particulars Frequency Percentage
1 Strongly Agree 30 60
2 Agree 9 18
3 Neutral 3 6
4 Disagree 5 10
5 Strongly disagree 3 6
Source: Primary Data
Analysis:
“The above table no. 4.11.1 shows that out of total 50 respondents, 60% of the
employeesstrongly agree with the above mentioned statement, around 18% of the respondents
agree with the fact, 6% of the respondents are neutral, 10% respondents disagree and only 6% of
the respondents stronglydisagree.”

Page 68
Chart no. 4.11.1
Appraisal feedback provided by the management is an important factor to improve my on-
the-job performance.
Interpretation:
“The results are quite clear from the above chart no. 4.11.1 which shows that around 60% of the
respondents out of total 100% strongly agree that the appraisal feedback provided by the
management is an important factor to improve their on-the-job performance. Hence the
organization should focus on providing more of such feedbacks to their employees to keep them
motivated.”
Table no. 4.11.2
I feel appraisal outcomes helps in diagnosing both organizational and individual problems.
Sl. No Particulars Frequency Percentage
1 Strongly Agree 8 16
2 Agree 25 50
3 Neutral 8 16
4 Disagree 5 10
5 Strongly disagree 4 8
Source: Primary Data
Analysis:
“The above table no. 4.11.2 shows what the employees feel about the appraisal outcomes,
whether it helps them in diagnosing both organizational and individual problems or not. therefore
100 90
80
70
60
50
40
30
20
10
0
PERCENTAGE
FREQUENCY
Strongly Agree Neutral Disagree Strongly Agree disagree

Page 69
50 respondents, 16% of the employees strongly agree, 50% of the respondents agree with the
statement, 16% respondents are neutral, 10% of the respondents disagree and only 8% of the
respondents strongly disagree.”
Chart no. 4.11.2
I feel appraisal outcomes helps in diagnosing both organizational and individual problems.
Interpretation:
“From the above results shown in the chart no. 4.11.2 shows that majority of the people i.e., out
of 50 respondents, 50% of the employees strongly feels that appraisal outcomes helps in
diagnosing both organizational as well as individual problems. Hence, the organization can opt
for such appraisal outcomes which can help them to retain more employees with their job in the
organization.”
Table no. 4.11.3
Interaction with the management enhances appraisal effectiveness.
Sl. No Particulars Frequency Percentage
1 Strongly Agree 10 20
2 Agree 19 38
3 Neutral 18 36
4 Disagree 2 4
5 Strongly disagree 1 2
Source: Primary Data
Strongly Agree Neutral Disagree Strongly Agree disagree
20
10
0
PERCENTAGE
FREQUENCY
80
70
60
50
40
30

Page 70
Analysis:
“The above table no. 4.11.3 shows that out of 50 respondents considered for data collection, 20%
of the respondents strongly agree, 38% of the respondents agree with the statement, 36% of the
respondents are neutral, 4% of the respondents don’t agree and 2% of the respondents strongly
disagree.”
Chart no. 4.11.3
Interaction with the management enhances appraisal effectiveness.
Interpretation:
“From the above results shown in the chart no. 4.11.3 shows that majority of the people i.e., out
of 50 respondents, 38% of the employees agrees that the interaction with the management
enhances their appraisal effectiveness. The employees feel more recognized in the organization
when the management interacts with them and rewards the best performance of the employees.”
60
50
40
30
20
10
0
PERCENTAGE
FREQUENCY
Strongly Agree Neutral Disagree Strongly Agree disagree

Page 71
Table no. 4.11.4
Performance feedback motivates employees indirectly to perform better.
Sl. No Particulars Frequency Percentage
1 Strongly Agree 7 14
2 Agree 14 28
3 Neutral 11 22
4 Disagree 11 22
5 Strongly disagree 7 14
Source: Primary Data
Analysis:
“The above table no. 4.11.4 shows that out of 50 respondents considered for data collection, 14%
of the respondents strongly agree, 28% of the respondents agree with the statement, 22% of the
respondents are neutral, 22% of the respondents don’t agree and 14% of the respondents strongly
disagree.”
Chart no. 4.11.4
Performance feedback motivates employees indirectly to perform better.
Interpretation:
“From the above results shown in the chart no. 4.11.4 shows that majority of the people i.e., out
of 50 respondents, 28% of the employees agrees that the performance feedback provided by the
management post performance evaluation motivates the employees directly or indirectly to
perform better in their job.”
Strongly Agree Neutral Disagree Strongly Agree disagree
PERCENTAGE
FREQUENCY
45
40
35
30
25
20
15
10
5
0

Page 72
Table no. 4.12
Linking rewards to performance appraisal system
4.12.1: I feel there exist a direct link between performance and pay in the organization.
Sl. No Particulars Frequency Percentage
1 Strongly Agree 16 32
2 Agree 15 30
3 Neutral 8 16
4 Disagree 7 14
5 Strongly disagree 4 8
Source: Primary Data
Analysis:
“The above table no. 4.12.1 shows that out of 50 respondents considered for data collection, 32%
of the respondents strongly agree, 30% of the respondents agree with the statement, 16% of the
respondents are neutral, 14% of the respondents don’t agree and 8% of the respondents strongly
disagree.”
Chart no. 4.12.1
I feel there exist a direct link between performance and pay in the organization.
Interpretation:
“From the above chart no. 4.12.1, we can interpret that majority of the respondents feel that there
exist a direct link between performance and pay in the organization. The rewards given to the
employees by the management is based on their performance post performance evaluation
results.”
35
30
25
20
15
10
5
0
FREQUENCY
PERCENTAGE
Strongly Agree Neutral Disagree Strongly Agree disagree

Page 73
Table no. 4.12.2
Performance based pay is given on a flat rate to every employee
Sl. No Particulars Frequency Percentage
1 Strongly Agree 2 4
2 Agree 20 40
3 Neutral 17 34
4 Disagree 8 16
5 Strongly disagree 3 6
Source: Primary Data
Analysis:
“The above table no. 4.12.2 shows that out of total of 50 respondents considered for data
collection, 4% of the respondents strongly agree, 40% of the respondents agree with the
statement, 34% of the respondents are neutral, 16% of the respondents don’t agree and 6% of the
respondents strongly disagree.”
Chart no. 4.12.2
Performance based pay is given on a flat rate to every employee
Interpretation:
“From the above chart no. 4.12.2, we can interpret that majority of the respondents feel that the
performance based pay is given on a flat rate to every employee without any bias.”
Strongly Agree Neutral Disagree Strongly Agree disagree
FREQUENCY
PERCENTAGE
45
40
35
30
25
20
15
10
5
0

Page 74
Table no. 4.12.3
I’m satisfied the way my performance is appraised and rewarded.
Sl. No Particulars Frequency Percentage
1 Strongly Agree 18 36
2 Agree 13 26
3 Neutral 10 20
4 Disagree 7 14
5 Strongly disagree 2 4
Source: Primary Data
Analysis:
“The above table no. 4.12.3 shows that out of total of 50 respondents considered for data
collection, 36% of the respondents strongly agree, 26% of the respondents agree with the
statement, 20% of the respondents are neutral, 14% of the respondents don’t agree and 4% of the
respondents strongly disagree.”
Chart no. 4.12.3
“I’m satisfied the way my performance is appraised and rewarded.”
Interpretation:
“From the above chart no. 4.12.3, we can interpret that majority of the respondents strongly feel
they are satisfied the way their performance is appraised and rewarded. Therefore, in order to get
more effective results the organization can concentrate on the people who are dissatisfied and
improvise the areas they feel has to be revised.”
Strongly Agree Neutral Disagree Strongly Agree disagree
FREQUENCY
PERCENTAGE
40
35
30
25
20
15
10
5
0

Page 75
Table no. 4.12.4
The performance based pay I earn will have an impact on my future performance
Sl. No Particulars Frequency Percentage
1 Strongly Agree 14 28
2 Agree 18 36
3 Neutral 9 18
4 Disagree 5 10
5 Strongly disagree 4 8
Source: Primary Data
Analysis:
“The above table no. 4.12.4 shows that out of total of 50 respondents considered for data
collection, 28% of the respondents strongly agree, 36% of the respondents agree with the
statement, 18% of the respondents are neutral, 10% of the respondents don’t agree and 8% of the
respondents strongly disagree.”
Chart no. 4.12.4
“The performance based pay I earn will have an impact on my future performance”
Interpretation:
“From the above chart no. 4.12.4, we can interpret that majority of the respondents feel the
performance based pay they earn will have an impact on their future performance. Hence, the
organization should be more careful with the performance evaluation of the employees because
any error occurred by the management will de-motivate the employees to perform better which
will have a direct impact on their future performance.”
Strongly Agree Neutral Disagree Strongly Agree disagree
FREQUENCY
PERCENTAGE
40
35
30
25
20
15
10
5
0

Page 76
FACTOR ANALYSIS:
Descriptive Statistics
Mean Std. Deviation Analysis N
“I feel the standards set for performance evaluation are
pretty justifiable”
3.38 .923 50
“I feel the performance appraisal system set by
management issatisfactory”
3.38 1.323 50
“I feel training delivered after appraisal contributesin
improving my performance”
3.64 1.352 50
“Training provided by organization improves my
motivation andknowledge”
3.52 1.328 50
“Appraisal training helps me overcome weak areas
related to my job”
3.58 1.126 50
“The reliability of the factors considered in appraisal
system are satisfactory”
3.34 1.255 50
Correlation Matrix
a. Determinant = .646
KMO and Bartlett's Test
“Kaiser-Meyer-Olkin Measure of Sampling Adequacy.” .522
“Bartlett's Test of Sphericity Approx. Chi-Square” 20.161
df 15
Sig. .166

Page 77
Communalities
Initial Extraction
“I feel the standards set for performance evaluation are pretty
justifiable”
1.000 .752
“I feel the performance appraisal system set by management is
satisfactory”
1.000 .891
“I feel training delivered after appraisal contributes in improving
my performance”
1.000 .701
“Training provided by organization improves my motivation and
knowledge”
1.000 .646
“Appraisal training helps me overcome weak areas related to my
job”
1.000 .562
“The reliability of the factors considered in appraisal system are
satisfactory”
1.000 .427
Extraction Method: Principal Component Analysis.
Total VarianceExplained
Initial Eigen values Extraction Sums of Squared Loadings
Compo
nent Total
% of Variance
Cumulative %
Total
% of
Variance
Cumulative
%
1 1.652 27.532 27.532 1.652 27.532 27.532
2 1.275 21.250 48.782 1.275 21.250 48.782
3 1.052 17.534 66.316 1.052 17.534 66.316
4 .826 13.760 80.076
5 .661 11.024 91.099
6 .534 8.901 100.000
Total VarianceExplained
Rotation Sums of Squared Loadings
Component Total % of Variance Cumulative %
26.904
48.187
66.316 18.129 1.088 3
21.283 1.277 2
26.904 1.614 1

Page 78
Component Metric: 1 2 3
-.485
.862
-.251
-.047
.075
.048 -.132 .638 “The reliability of the factors considered in appraisal system
are satisfactory”
-.186 .722 “Appraisal training helps me overcome weak areas related
to my job”
.720 .354 “Training provided by organization improves my motivation
and knowledge”
.799 -.015 “I feel training delivered after appraisal contributes in
improving my performance”
.221 .314 “I feel the performance appraisal system set by management
is satisfactory”
-.132 .706 “I feel the standards set for performance evaluation are
pretty justifiable”
Extraction Method: Principal Component Analysis.
Component
Extraction Method: Principal Component Analysis.
a. 3 components extracted.
6
5
4

Page 79
Reproduced Correlations
I feel Trainin
training g
I feel the delivere provide The
standards d after d by reliability
set for I feel the appraisa organiz of the
performa performanc l ation Appraisal factors
nce e appraisal contribu improv training considered
evaluatio system set tes in es my helps me in
n are by improvi motivat overcome appraisal
pretty manageme ng my ion and weak areas system are
justifiabl nt is perform knowle related to satisfactor
e satisfactory ance dge my job y
“Reprod “I feel the .752a -.226 .006 .177 .445 .445
uced standards set for
Correla performance
Tion” evaluation are
pretty justifiable”
“I feel the -.226 .891a -.045 .230 .213 .213
performance
appraisal system
set by
management is
Satisfactory”
“I feel training .006 -.045 .701a .582 -.127 -.127
delivered after
appraisal
contributes in
improving my
Performance”
“Training .177 .230 .582 .646a .129 .129
provided by
organization
improves my
motivation and
Knowledge”

Page 80
“Appraisal
training helps me
overcome weak
areas relatedto
my job”
.499 .250 -.178 .118 .489 .489
The reliability of
the factors
considered in
appraisalsystem
are satisfactory
.445 .213 -.127 .129 .427a .427a
Residua
lb
I feel the
standards setfor
.155 -.008 -.059 -.154 -.154
performance
evaluation are
pretty justifiable
I feel the .155 .055 -.101 -.071 -.071
performance
appraisal system
set by
management is
satisfactory
I feel training -.008 .055 -.316 .092 .092
delivered after
appraisal
contributes in
improving my
performance
Training -.059 -.101 -.316 -.078 -.078
provided by
organization
improves my
motivation and
knowledge
Appraisal -.146 -.086 .064 -.010 -.285 -.285
training helps me
overcome weak
areas related to
my job

Page 81
The reliability of
the factors
considered in
appraisalsystem
are satisfactory
-.154 -.071 .092 -.078
Extraction Method: Principal Component Analysis.
a. Reproducedcommunalities
b. Residuals are computed between observed and reproduced correlations. There are
13 (86.0%) non redundant residuals with absolute values greater than0.05.
Rotated Component Matrix
Extraction Method: Principal Component Analysis.
Rotation Method: Varimax with Kaiser Normalization.a
a. Rotation converged in 4 iterations.
Component Transformation Matrix
Component 1 2 3
1 .957 .193 .215
2 -.235 .953 .191
3 -.168 -.233 .958
Extraction Method: Principal Component Analysis.
Rotation Method: Varimax with Kaiser Normalization.
Component
1 2 3
-.339
.935
-.092
.169
.191
.158 -.013 .634 “The reliability of the factors considered in appraisal system are
satisfactory”
-.055 .723 “Appraisal training helps me overcome weak areas related to my
job”
.766 .177 “Training provided by organization improves my motivation and
knowledge”
.817 -.160 “I feel training delivered after appraisal contributes in improving my
performance”
.070 .104 “I feel the performance appraisal system set by management is
satisfactory”
.123 .789 “I feel the standards set for performance evaluation are pretty
justifiable”

Page 82
HYPOTHESIS TESTING:
HYPOTHESIS 1
H0: “There is no significant effect from Design of appraisal form on performance appraisal
system.”
H1: “There is a significant effect from Design of appraisal form on performance appraisal system.”
CHI-SQUARE TEST
Case Processing Summary
Cases
Valid Missing Total
N Percent N Percent N Percent
“How would you rank the
Performance Appraisal method in
your organisation? * I feel the
performance appraisal systemset
by management is satisfactory”
50 100.0% 0 0.0% 50 100.0%
“How would you rank the
Performance Appraisal method in
your organisation? * I feel the
standards set for performance
evaluation are pretty justifiable”
50 100.0% 0 0.0% 50 100.0%
“How would you rank the Performance Appraisal method in your organisation? * I feel the
performance appraisal system set by management is satisfactory”
Crosstab
Count I feel the performance appraisal system set by
management is satisfactory
Agree
Disagree
Neutral
Strongly
Agree
“How would you rank
the Performance
Appraisal methodin
your organisation?”
Complicated 2 2 1 0
Easy 6 2 4 6
Efficient 9 4 3 5

Page 83
Total 17 8 8 11
Crosstab
Count
I feel the performance
appraisal system set by
management is
satisfactory
Strongly Disagree
Total
How would you rank the Performance
Appraisal method in your organisation?
Complicated 0 5
Easy 3 21
Efficient 3 24
Total 6 50
Chi-Square Tests
Value
df
Asymptotic
Significance (2-
sided)
Pearson Chi-Square 5.258a 8 .730
Likelihood Ratio 6.485 8 .593
N of Valid Cases 50
a. 12 cells (80.0%) have expected count less than 5. The minimum expected count is .60.
Symmetric Measures
Value
Approximate
Significance
Nominal by
Nominal
Phi .324 .730
Cramer's V .229 .730
N of Valid Cases 50

Page 84
“How would you rank the Performance Appraisal method in your organisation? * I feel the
standards set for performance evaluation are pretty justifiable”
Crosstab
Count I feel the standards set for performance
evaluation are pretty justifiable
Agree
Disagree
Neutral
Strongly
Agree
“How would you rank the
Performance Appraisal
method in your
organisation?”
Complicated 4 0 1 0
Easy 13 3 4 1
Efficient 7 6 8 2
Total 24 9 13 3

Page 85
Crosstabs:
Count
I feel the standards
set for performance
evaluation are pretty
justifiable
Strongly Disagree
Total
“How would you rank the
Performance Appraisal methodin
your organisation?”
Complicated 0 5
Easy 0 21
Efficient 1 24
Total 1 50
Chi-Square Tests
Value
df
Asymptotic
Significance
(2-sided)
Pearson Chi-Square 8.011a 8 .432
Likelihood Ratio 9.563 8 .297
N of Valid Cases 50
a. 11 cells (73.3%) have expected count less than 5. The minimum expected count is .10.
Symmetric Measures
Value
Approximate
Significance
Nominal by
Nominal
Phi .400 .432
Cramer's V .283 .432
N of Valid Cases 50

Page 86
ORDINAL REGRESSION:
Case Processing Summary
N Marginal Percentage
“How would you rank the
Performance Appraisal method in
your organisation?”
Complicated 5 10.0%
Easy 21 42.0%
Efficient 24 48.0%
““I feel the standards set for
performance evaluation are pretty
justifiable”
Agree 24 48.0%
Disagree 9 18.0%
Neutral 13 26.0%
Strongly Agree 3 6.0%
Strongly Disagree 1 2.0%
“I feel the performance appraisal
system set by management is
satisfactory”
Agree 17 34.0%
Disagree 8 16.0%
Neutral 8 16.0%
Strongly Agree 11 22.0%
Strongly Disagree 6 12.0%
“All the goals and targets have been
clearly expressed and assigned to me
Agree 20 40.0%
Disagree 8 16.0%

Page 87
by management” Neutral 6 12.0%
Strongly Agree 16 32.0%
“The reliability of the factors
considered in appraisal system are
satisfactory”
Agree 16 32.0%
Disagree 11 22.0%
Neutral 9 18.0%
Strongly Agree 10 20.0%
Strongly Disagree 4 8.0%
Valid 50 100.0%
Missing 0
Total 50
Model Fitting Information
-2 Log
Model Likelihood
Chi-Square
df
Sig.
Intercept
Only
84.752
Final 66.685 18.067 15 .259
Link function: Logit.
Goodness-of-Fit
Chi-Square df Sig.
Pearson 108.296 53 .000
Deviance 57.896 53 .299
Link function: Logit.
Pseudo R-Square
.191
Link function: Logit.
Cox and Snell .303
Nagelkerke .357
McFadden

Page 88
Parameter Estimates
Estimat
e
Std.
Error
Wald
df
Sig.
95% Confidence
Interval
Lower
Bound
Upper
Bound
Thres
hold
[“HowwouldyourankthePe
r
formanceAppraisalmethod
inyourorganisation =
Complicated”]
-23.408 2.757 72.082 1 .000 -28.812 -18.004
[“HowwouldyourankthePe
r
formanceAppraisalmethod
inyourorganisation =
Easy”]
-20.485 2.647 59.873 1 .000 -25.674 -15.297
Locat
ion
[“Ifeelthestandardssetforpe
r
formanceevaluationarepret
tyjustifiable=Agree”]
-21.213 1.648 165.749 1 .000 -24.442 -17.983
[“Ifeelthestandardssetforpe
r
formanceevaluationarepret
tyjustifiable=Disagree”]
-18.327 1.813 102.228 1 .000 -21.879 -14.774
[“Ifeelthestandardssetforpe
r
formanceevaluationarepret
tyjustifiable=Neutral”]
-18.841 1.722 119.766 1 .000 -22.215 -15.467
[“Ifeelthestandardssetforpe
r
formanceevaluationarepret
tyjustifiable=Strongly
Agree”]
-18.176 .000 . 1 . -18.176 -18.176
[“Ifeelthestandardssetforpe
r
formanceevaluationarepret
tyjustifiable=Strongly
Disagree”]
0a . . 0 . . .

Page 89
[“Ifeeltheperformanceappr
a
isalsystemsetbymanageme
ntissatisfactory=Agree”]
-.038 1.483 .001 1 .980 -2.944 2.868
[“Ifeeltheperformanceappr
a
isalsystemsetbymanageme
ntissatisfactory=Disagree”]
.325 1.551 .044 1 .834 -2.716 3.365

Page 90
[Ifeeltheperformanceappra
isalsystemsetbymanageme
ntissatisfactory=Neutral]
-.779 1.717 .206 1 .650 -4.144 2.587
[Ifeeltheperformanceappra
isalsystemsetbymanageme
ntissatisfactory=Strongly
Agree]
.271 1.309 .043 1 .836 -2.295 2.837
[Ifeeltheperformanceappra
isalsystemsetbymanageme
ntissatisfactory=Strongly
Disagree]
0a . . 0 . . .
[Allthegoalsandtargetshav
ebeenclearlyexpressedand
assignedtomebyma=Agree
]
-2.280 .969 5.534 1 .019 -4.180 -.380
[Allthegoalsandtargetshav
ebeenclearlyexpressedand
assignedtomebyma=Disag
ree]
-1.583 1.169 1.834 1 .176 -3.874 .708
[Allthegoalsandtargetshav
ebeenclearlyexpressedand
assignedtomebyma=Neutr
al]
-1.502 1.327 1.281 1 .258 -4.102 1.099
[Allthegoalsandtargetshav
ebeenclearlyexpressedand
assignedtomebyma=Stron
gly Agree]
0a . . 0 . . .
[Thereliabilityofthefactors
consideredinappraisalsyste
maresatisfac=Agree]
1.938 1.631 1.412 1 .235 -1.259 5.134
[Thereliabilityofthefactors
consideredinappraisalsyste
maresatisfac=Disagree]
.352 1.693 .043 1 .835 -2.966 3.669
[Thereliabilityofthefactors
consideredinappraisalsyste
maresatisfac=Neutral]
.602 1.595 .142 1 .706 -2.524 3.727

Page 91
[“Thereliabilityofthefactor
s
consideredinappraisalsyste
maresatisfac=Strongly
Agree”]
-.749 1.546 .234 1 .628 -3.780 2.282
[“Thereliabilityofthefactor
s
consideredinappraisalsyste
maresatisfac=Strongly
Disagree”]
0a . . 0 . . .
Link function: Logit.
a. This parameter is set to zero because it is redundant.
Test of Parallel Linesa
-2 Log
Model Likelihood
Chi-Square
df
Sig.
Null
Hypothesis
66.685
General 37.770b 28.915c
15 .016
“The null hypothesis states that the location parameters (slope
coefficients) are the same across response categories.a
a. Link function:Logit.”
b. “The log-likelihood value cannot be further increased after
maximum number ofstep-halving.”
c. “The Chi-Square statistic is computed based on the log-
likelihood value of the last iteration of the general model. Validity
of the test isuncertain.”
Analysis:
“From the above mentioned tests for hypothesis 1, the value of factor analysis and chi- square
test is greater than 0.05 which means there is a strong and positive relationship between design of
the appraisal form and performance appraisal. So, therefore we can accept the alternative
hypothesis (H1) and reject the null hypothesis (H0).”

Page 92
HYPOTHESIS 2
H0: “There is no significant effect of Employee training and development on performance
appraisalsystem.”
H1: “There is a significant effect of Employee training and development on performance
appraisalsystem.”
CHI-SQUARE TEST:
Case Processing Summary
Cases
Valid Missing Total
N Percent N Percent N Percent
How often is appraisal carried out
in your organisation? * Appraisal
training helps me overcomeweak
areas related to my job
50 100.0% 0 0.0% 50 100.0%
How often is appraisal carried out
in your organisation? * Training
provided by organizationimproves
my motivation and knowledge
50 100.0% 0 0.0% 50 100.0%
“How often is appraisal carried out in your organisation? * Appraisal training helps me
overcome weak areas related to my job”
Count
Crosstab
Appraisal training helps me overcome
weak areas related to my job
Agree
Disagree
Neutral
Strongly
Agree
How often is appraisal
carried out in your
organisation?
Once in 6 months 4 1 1 4
Once in a year 17 5 9 6
Total 21 6 10 10

Page 93
Crosstab
Count
Appraisal training helps me
overcome weak areas
related to my job
Strongly Disagree
Total
How often is appraisal carried out
in your organisation?
Once in 6 months 0 10
Once in a year 3 40
Total 3 50
Chi-Square Tests
Value
df
Asymptotic
Significance
(2-sided)
Pearson Chi-Square 3.929a 4 .416
Likelihood Ratio 4.221 4 .377
N of Valid Cases 50
a. 7 cells (70.0%) have expected count less than 5. The minimum expected count is .60.
Symmetric Measures
Value
Approximate
Significance
Nominal by
Nominal
Phi .280 .416
Cramer's V .280 .416
N of Valid Cases 50

Page 94
“How often is appraisal carried out in your organisation? * Training provided by
organization improves my motivation and knowledge”
Crosstab
Count Training provided by organization
improves my motivation and
knowledge
Crosstab
Count
Training provided by organization improves
my motivation and knowledge
Agree Disagree Neutral
How often is appraisal
carried out in your
organisation?
Once in 6 months 0 2 2
Once in a year 10 4 11
Total 10 6 13
Strongly Agree
Strongly
Disagree
Total
How often is appraisal Once in 6 months 6 0 10

Page 95
carried out in your Once in a year
organisation?
10 5 40
Total 16 5 50
Chi-Square Tests
Value
df
Asymptotic
Significance
(2-sided)
Pearson Chi-Square 7.652a 4 .105
Likelihood Ratio 10.070 4 .039
N of Valid Cases 50
a. 7 cells (70.0%) have expected count less than 5. The minimum expected count is 1.00.
Symmetric Measures
Value
Approximate
Significance
Nominal by
Nominal
Phi .391 .105
Cramer's V .391 .105
N of Valid Cases 50

Page 96
ORDINAL REGRESSION:
Case Processing Summary
N
Marginal
Percentage
How often is appraisal carried out in your
organisation?
Once in 6 months 10 20.0%
Once in a year 40 80.0%
I feel training delivered after appraisal
contributes in improving myperformance
Agree 12 24.0%
Disagree 6 12.0%
Neutral 9 18.0%
Strongly Agree 18 36.0%
Strongly Disagree 5 10.0%
All my appraisal skills are revived by the
management on a daily basis
Agree 17 34.0%
Disagree 8 16.0%
Neutral 10 20.0%
Strongly Agree 6 12.0%
Strongly Disagree 9 18.0%
Training provided by organization improves my
motivation and knowledge
Agree 10 20.0%
Disagree 6 12.0%
Neutral 13 26.0%
Strongly Agree 16 32.0%
Strongly Disagree 5 10.0%
Appraisal training helps me overcome weak
areas related to my job
Agree 21 42.0%
Disagree 6 12.0%
Neutral 10 20.0%
Strongly Agree 10 20.0%
Strongly Disagree 3 6.0%
Valid 50 100.0%
Missing 0
Total 50
Model Fitting Information
-2 Log
Model Likelihood
Chi-Square
df
Sig.
Intercept
Only
47.843
Final 1.622 46.221 16 .000
Link function: Logit.

Page 97
Goodness-of-Fit
Chi-Square df Sig.
Pearson .000 22 1.000
Deviance .000 22 1.000
Link function: Logit.
Pseudo R-Square
Cox and Snell .603
Nagelkerke .954
McFadden .924
Link function: Logit.
Parameter Estimates
Estimate
Std. Error
Wal
d
df
Sig.
95% Confidence
Interval
Lower
Bound
Upper
Bound
Thres[Howoftenisappraisa
hold lcarriedoutinyourorg
anisation = Oncein
6 months]
-139.855 41183.820 .000 1 .997 -80858.659 80578.948
Locat
ion
[Ifeeltrainingdeliver
edafterappraisalcontr
ibutesinimprovingm
yperf=Agree]
-21.659 14657.397 .000 1 .999 -28749.628 28706.311
[Ifeeltrainingdeliver
edafterappraisalcontr
ibutesinimprovingm
yperf=Disagree]
-37.442 14367.643 .000 1 .998 -28197.504 28122.620
[Ifeeltrainingdeliver
edafterappraisalcontr
ibutesinimprovingm
yperf=Neutral]
-41.234 .000 . 1 . -41.234 -41.234

Page 98
[Ifeeltrainingdeliver -20.011 20359.720 .000 1 .999 -39924.330 39884.307
edafterappraisalcontr
ibutesinimprovingm
yperf=Strongly
Agree]
[Ifeeltrainingdeliver 0a . . 0 . . .
edafterappraisalcontr
ibutesinimprovingm
yperf=Strongly
Disagree]
[Allmyappraisalskill 55.437 19543.709 .000 1 .998 -38249.529 38360.403
sarerevivedbythema
nagementonadailyba
sis=Agree]
[Allmyappraisalskill 146.678 .000 . 1 . 146.678 146.678
sarerevivedbythema
nagementonadailyba
sis=Disagree]
[Allmyappraisalskill 18.850 18209.158 .000 1 .999 -35670.443 35708.144
sarerevivedbythema
nagementonadailyba
sis=Neutral]
[Allmyappraisalskill 37.786 .000 . 1 . 37.786 37.786
sarerevivedbythema
nagementonadailyba
sis=Strongly Agree]
[Allmyappraisalskill 0a . . 0 . . .
sarerevivedbythema
nagementonadailyba
sis=Strongly
Disagree]
[Trainingprovidedby -57.127 .000 . 1 . -57.127 -57.127
organizationimprove
smymotivationandkn
owledge=Agree]
[Trainingprovidedby -150.992 14456.476 .000 1 .992 -28485.165 28183.181
organizationimprove
smymotivationandkn
owledge=Disagree]

Page 99
[“Trainingprovidedb
y
-117.029 18912.768 .000 1 .995 -37185.372 36951.314
organizationimprove
smymotivationandkn
owledge=Neutral”]
[“Trainingprovidedby
-115.298 14967.809 .000 1 .994 -29451.664 29221.068
organizationimprove
smymotivationandkn
owledge=Strongly
Agree”]
[“Trainingprovidedb
y
0a . . 0 . . .
organizationimprove
smymotivationandkn
owledge=Strongly
Disagree”]
[Appraisaltraininghe -39.646 28731.325 .000 1 .999 -56352.008 56272.715
lpsmeovercomeweak
areasrelatedtomyjob
=Agree]
[Appraisaltraininghe 30.233 40453.910 .000 1 .999 -79257.973 79318.440
lpsmeovercomeweak
areasrelatedtomyjob
=Disagree]
[Appraisaltraininghe 30.565 41122.151 .000 1 .999 -80567.370 80628.501
lpsmeovercomeweak
areasrelatedtomyjob
=Neutral]
[Appraisaltraininghe -79.485 39687.587 .000 1 .998 -77865.726 77706.757
lpsmeovercomeweak
areasrelatedtomyjob
=Strongly Agree]
[Appraisaltraininghe 0a . . 0 . . .
lpsmeovercomeweak
areasrelatedtomyjob
=Strongly Disagree]
Link function: Logit.
a. This parameter is set to zero because it is redundant.

Page 100
Test of Parallel Linesa
-2 Log
Model Likelihood
Chi-Square
df
Sig.
Null
Hypothesis
1.622
General 1.622 .000 0 .
“The null hypothesis states that the location parameters (slope
coefficients) are the same across response categories.a”
a. Link function: Logit.
Analysis:
“From the above mentioned tests for hypothesis 1, the value of factor analysis and chi- square
test is greater than 0.05 which means there is a strong and positive relationship between
employee training and development and performance appraisal. So, therefore we can accept the
alternative hypothesis (H1) and reject the null hypothesis (H0).
“

Page 101
CHAPTER 5
FINDINGS, SUGGESTIONS, AND CONCLUSION
5.1 SUMMARY OF FINDINGS:
“From the analysis it was found that out of the total respondents used for data collection,
majority of them were female around 58% and rest were malerespondents.”
“It was found that majority of the respondents belong to the age group of 25 to 34 being 42%
while other 58% belongs to the various other subgroups.”
“From the analysis it is clear that around 44% respondents have completed their
graduation/diploma and 26% have completed their post graduation while other 30% are
undergraduates.”
“It was found that about 64% of the employees are full – time workers while others 46% of
the employees fall under the category of part-time, regular and temporaryemployees.”
“Majority of the employees fall under the category of having working experience of more
than 5 years where mostly these types of workers are doctors or senior nursingstaff.”
“Performance appraisal carried out in the organization is once in a year as around 80% of the
employees agree for thesame.”
“Majority of the employees says that the performance appraisal process is easy andefficient.”
“Out of total respondents around 44% have strongly agreed that the attitude of the employees
depend upon the performance evaluation results. Hence we can say that they are satisfied
with the performance appraisal results of theorganization.”
“Based on the results of the above chart no. 4.8.2 we can conclude that the organization is not
partial amongst the employees and they do take proper consideration regarding the
employee’s performance without any bias betweenthem.”

Page 102
“From the above chart no. 4.8.4 it is clear that majority of the respondents have agreed that
there is still scope for improving the performance appraisal system in the organization.
Therefore, the organization can improve its performance appraisal system by taking
necessary corrective measures for further appraisal of theemployees.”
“Majority of the respondents have agreed and they feel that all the goals and targets or
standards are clearly expressed and assigned to them by the management and hence they
have no issues regarding communication with themanagement.”
“From the above results based on the analysis we can interpret that around 48% of the
respondents feel that the standards set for the performance evaluation are prettyjustifiable.”
“Majority of the respondents in the organization feel that the reliability of the factors
considered by the management for evaluating the performance appraisal results of the
employees is satisfactory. The management can further revise the factors, if necessary, to get
more accurateresults.”
“Out of total 50 respondents, 34% of the employees have agreed that the performance
appraisal system set by the management is satisfactory and they have no objections regarding
suchsystem.”
“As majority of the respondents have strongly agreed that the training delivered after
appraisal contributes in improving the employee’s performance. Hence, the organization can
rely on the same training methods and can improvise it ifnecessary.”
“Majority of the respondents has agreed that all of their appraisal skills are revived by the
management on the daily basis so that they can meet the objectives of the organization and
targets which are considered for performance appraisal moreeffectively.”
“Out of 50 respondents, 32% of the employees strongly agree that training provided by the
organization improves the motivation and knowledge of the employees. Hence, the
organization can provide more of such trainings to the employees to enhance their skills and
make them feel more confident about theirjob.”
“Around 40% have agreed that appraisal training given by the management to them helps
them to overcome the weak areas related to their job, enhances their skills and make them
more competent in doing theirjob.”
“Around 60% of the respondents strongly agree that the appraisal feedback provided by the
management is an important factor to improve their on-the-job performance. Hencethe

Page 103
organization should focus on providing more of such feedbacks to their employees to keep
them motivated.”
“Around 50% of the employees strongly feels that appraisal outcomes helps in diagnosing
both organizational as well as individual problems. Hence, the organization can opt for such
appraisal outcomes which can help them to retain more employees with their job in the
organization.”
“Out of 50 respondents, 38% of the employees agrees feel more recognized in the
organization when the management interacts with them and rewards the best performance of
the employees.”
“Around 28% of the employees agrees that the performance feedback provided by the
management post performance evaluation motivates the employees directly or indirectly to
perform better in theirjob.”
“Majority of the respondents feel that there exist a direct link between performance and pay
in the organization. The rewards given to the employees by the management is based on their
performance post performance evaluationresults.”
“From the above chart no. 4.12.2, we can interpret that majority of the respondents feel that
the performance based pay is given on a flat rate to every employee without anybias.”
“Majority of the respondents strongly feel they are satisfied the way their performance is
appraised and rewarded. Therefore, in order to get more effective results the organization can
concentrate on the people who are dissatisfied and improvise the areas they feel has to be
revised.”
“From the above chart no. 4.12.4, we can interpret that majority of the respondents feel the
performance based pay they earn will have an impact on their future performance. Hence, the
organization should be more careful with the performance evaluation of the employees
because any error occurred by the management will de-motivate the employees to perform
better which will have a direct impact on their futureperformance.”
“As both the hypothesis testing results are greater than 0.05%, it shows that the design of the
appraisal form and training and development considered as the factors of the study amongst
all has a positive relationship and a strong impact on performance appraisal system set by the
organization.”

Page 104
5.2 SUGGESTIONS:
“Performance appraisal should be transparent, timely and effective for theemployees.”
“Employees should be made more aware about the appraisal process andbenefits.”
“To make the appraisal results more accurate the organization can also adopt a 360
degree appraisalmethod.”
“The organization should continue to provide same training or counseling to the
employees afterappraisal.”
“Employees should be given feedback regarding their appraisal. This will help them to
improve their weak areas in performing theirjob.”
“The frequency of training program for the appraiser should be increased and these
sessions should be madeinteractive.”
“Constant monitoring of the appraisal system should be done throughdiscussions.”
“Employees should be informed that appraisal is not only related to monetary
benefitsbut it can also be non-monetaryones.”
5.3 CONCLUSION:
“Performance Appraisal is the process of assessing employee performance by way of
comparing present performance with already established standards which have been already
communicated to employees, subsequently providing feedback to employees about their
performance level for the purpose of improving their skills and knowledge through training and
motivation.”
“As the objectives of the study is to analyze the factors which contributes towards the
effectiveness of performance appraisal system, the results of the same has been analyzed with the
help of questionnaire and few statistical tests including factor analysis, chi-square test and
ordinal regression based on the data collected it was found that all these factors considered have
a very strong impact on the performance appraisal system of theorganization.”
“Hence, the organization is doing a great job in implementing all these factors and
keeping their employees and working conditions of the organization extremely eminent.”

Page 105

Page 106

Page 107

Page 108

Page 109

Page 110

Page 111
Copyright © 2022 FDOKUMEN