PROJECT REPORT on A STUDY ON BSE AND NSE AT ...
79
PROJECT REPORT on A STUDY ON BSE AND NSE AT JOULES TO WATTS BUSINESS SOLUTIONS PVT LTD BY Catherine Faustina R 1NZ18MBA16 Submitted to DEPARTMENT OF MANAGEMENT STUDIES NEW HORIZON COLLEGE OF ENGINEERING, OUTER RING ROAD, MARATHALLI, BENGALURU In partial fulfilment of the requirements for the award of the degree of MASTER OF BUSINESS ADMINISTRATION Under the guidance of Mrs Jayashree N Assistant Professor 2018 - 20
-
Upload
khangminh22 -
Category
Documents
-
view
0 -
download
0
Transcript of PROJECT REPORT on A STUDY ON BSE AND NSE AT ...

PROJECT REPORT
on
A STUDY ON BSE AND NSE AT JOULES TO WATTS
BUSINESS SOLUTIONS PVT LTD
BY
Catherine Faustina R
1NZ18MBA16
Submitted to
DEPARTMENT OF MANAGEMENT STUDIES
NEW HORIZON COLLEGE OF ENGINEERING,
OUTER RING ROAD, MARATHALLI,
BENGALURU
In partial fulfilment of the requirements for the award of the degree of
MASTER OF BUSINESS ADMINISTRATION
Under the guidance of
Mrs Jayashree N
Assistant Professor
2018 - 20

CERTIFICATE
This is to certify that CATHERINE FAUSTINA R bearing USN 1NZ18MBA16, is a bonafide
student of Master of Business Administration course of the Institute 2018-20, autonomous
program, affiliated to Visvesvaraya Technological University, Belgaum. Project report on “A
Study on BSE And NSE At Joules to Watts Business Solutions Pvt Ltd” is prepared by her
under the guidance of Mrs Jayashree N, in partial fulfilment of requirements for the award of the
degree of Master of Business Administration of Visvesvaraya Technological University, Belgaum
Karnataka.
Signature of Internal Guide Signature of HOD Principal
Name of the Examiners with affiliation: Signatures with date
1. External Examiner
2. Internal Examiner

DECLARATION
I, Catherine Faustina R, hereby declare that the project report on “A Study on BSE and NSE”
with reference to “Joules to Watts Business Solutions Pvt Ltd” prepared by me under the
guidance of Mrs Jayashree N, faculty of M.B.A Department, New Horizon College of
Engineering.
I also declare that this project report is towards the partial fulfilment of the university regulations
for the award of the degree of Master of Business Administration by Visvesvaraya Technological
University, Belgaum.
I have undergone an industry project for a period of Eight weeks. I further declare that this report
is based on the original study undertaken by me and has not been submitted for the award of a
degree/diploma from any other University / Institution.
Signature of Student
Place:
Date:


ACKNOWLEDGEMENT
The successful completion of the project would not have been possible without the
guidance and support of many people. I express my sincere gratitude to Mr Nikhil
Sharma, Joules to Watts Business Solutions Pvt Ltd, Bengaluru, for allowing to
do my project at Joules to Watts Business Solutions Pvt Ltd .
I thank the staff of Joules to Watts Business Solutions Pvt Ltd, Bengaluru for their
support and guidance and helping me in completion of the report.
I am thankful to my internal guide Mrs Jayashree N, for her constant support and
inspiration throughout the project and invaluable suggestions, guidance and also for
providing valuable information.
Finally, I express my gratitude towards my parents and family for their continuous
support during the study.
CATHERINE FAUSTINA R
1NZ18MBA16
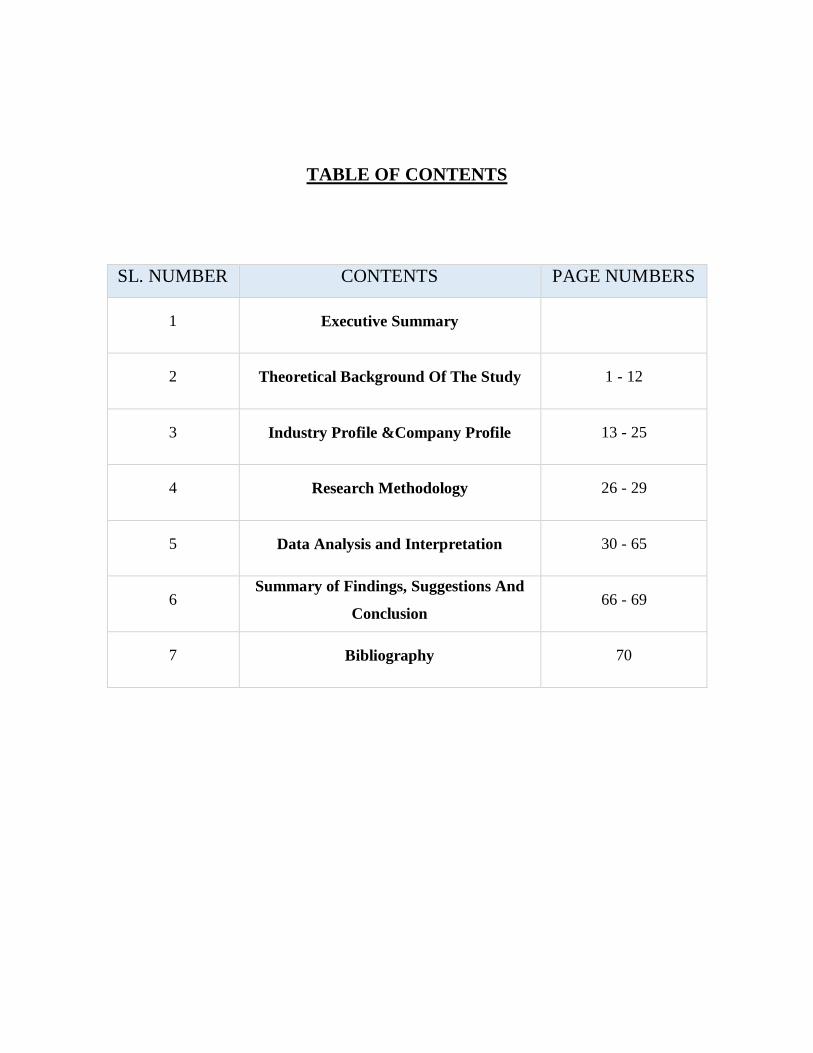
TABLE OF CONTENTS
SL. NUMBER CONTENTS PAGE NUMBERS
1 Executive Summary
2 Theoretical Background Of The Study 1 - 12
3 Industry Profile &Company Profile 13 - 25
4 Research Methodology 26 - 29
5 Data Analysis and Interpretation 30 - 65
6 Summary of Findings, Suggestions And
Conclusion 66 - 69
7 Bibliography 70

EXECUTIVE SUMMARY
I did a project on “A STUDY ON BSE and NSE” in which I have done analysis on risk and
return of selected shares that were transacted in Joules to Watts Business Solutions. The project
duration was nearly eight weeks.
The data has collected first hand by the researcher concerned with the research problem. Personal
discussion was made with Unit manager and interaction with other personnel in the organization
for this purpose. There is no formal design of questionnaire are used in this study. Sample size
was 5 companies from 5 sectors.
The objective behind that is to evaluate investment in equity shares of selected companies which
were listed in BSE. BSE is Bombay Stock exchange located in Mumbai. SENSEX is the index
of BSE.
Stock investment requires meticulous planning and careful evaluation of the underlying stock
before making investment on any stock. It is necessary for the investors to study the stock market
and to understand market philosophy so that they can invest and make optimal decisions
The main aim of the project is to evaluate the return and risk and to find the market volatility of
shares through beta. This project helps investors to take sound investment decision in future
regarding shares, funds for individual and corporate.

1
CHAPTER – 1
THEORETICAL BACKGROUND OF THE STUDY
What is Investment?
“The money you earn is partly spent and the rest saved for meeting future expenses. Instead of
keeping the savings idle you may like to use savings in order to get the return on it in the future.”
This is called as Investment.
Why should one invest? One needs to invest to:
Earn return on your idle resources
Generate a specified sum of money for a specific goal in
life Make a provision for an uncertain future
One of the important reasons why one needs to invest wisely is to meet the cost of Inflation.
Inflation is the rate at which the cost of living increases. The cost of living is simply what it costs
to buy the goods and services you need to live.
Investor:
An investor is any party that makes an investment. An individual who commits money to
investment products with the expectation of financial return.
The term has taken on a specific meaning in finance to describe the particular types of people
and companies that regularly purchase equity or debt securities for financial gain in exchange
for funding an expanding company.
Investor's behavior:
Generally, Investors Behavior regarding the any investment is primary concern with to minimize
risk while maximizing return, as opposed to a speculator, who is willing to accept a higher level
of risk in the hopes of collecting higher-than-average profits.
While, some people are also believes in “High Risk, High Return” Many investors purchase a
particular stock with the intention of making a big profit over a short period of time. However,
this action is not investing, but a pure gambling. The stock market is characterized by the trade-
off between risk and return. The higher the risk the investor is willing and able to take, the higher

2
the potential rewards from the investment. Therefore, if a particular investment offers you high
returns, it is an indication that it will come with a high risk burden.
Some people are also believes in that there is no safe investment that will provide you with high
returns over a short period of time. Therefore, you should direct your resources toward long-
term investments that are more likely to reward you for the patience with high returns.
Investors Behavior regarding the financial investment is closely related with the “Behavioral
Finance” and “Behavioral Economics” are closely related fields making up a separate branch of
economic and financial analysis using social, cognitive and emotional factors in understanding the
economic decisions of investors for investment, and their effects on market prices, returns and the
allocation of resources.
Information of Equity Market & various sectors
What is Equity Market?
“A market where investors buy and sell securities providing ownership of a company's
shares.”
The market in which shares are issued and traded, either through exchanges or over-the-counter
markets. Also known as the stock market, it is one of the most vital areas of a market economy because
it gives companies access to capital and investors a slice of ownership in a company with the potential
to realize gains based on its future performance.
Equity market, or stock market, is a system through which company shares are traded. The
equity market offers investors an opportunity to participate in a company's success through an
increase in its stock price. With enhanced opportunity, however, the equity market usually
carries greater risk than debt markets.
There are mainly 3 types of equity they are,
1. Bonus equity
2. Right equity
3. Sweat equity
3
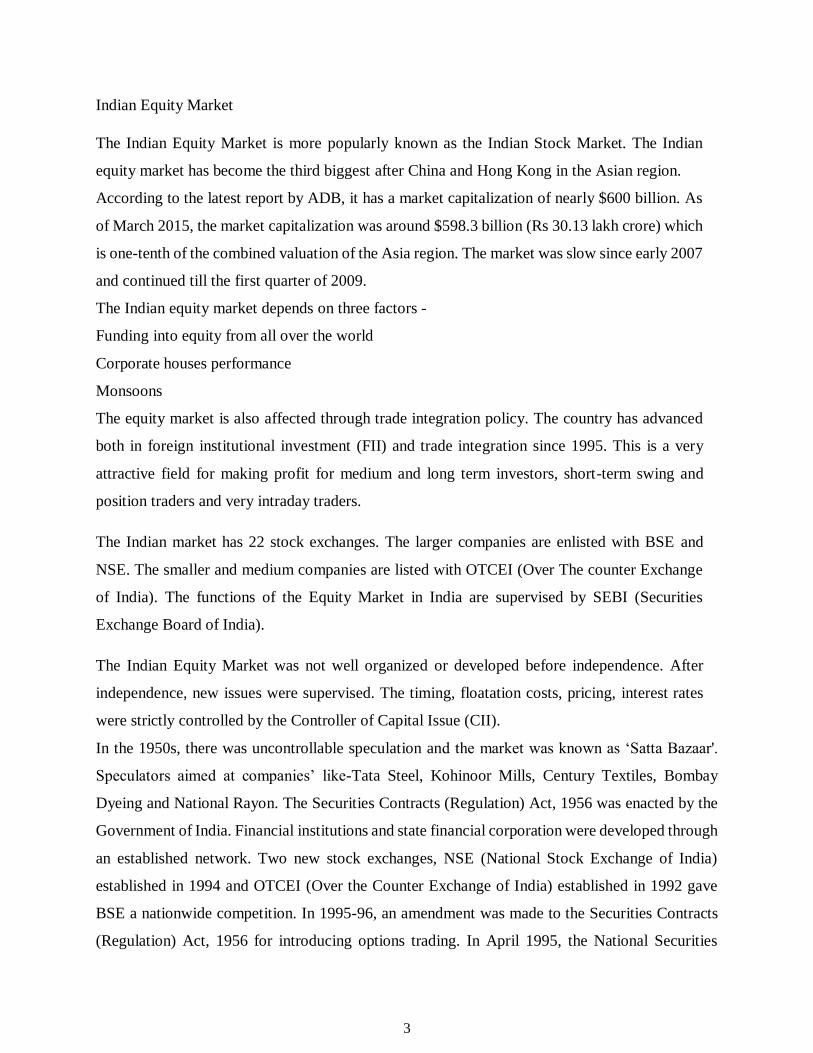
Indian Equity Market
The Indian Equity Market is more popularly known as the Indian Stock Market. The Indian
equity market has become the third biggest after China and Hong Kong in the Asian region.
According to the latest report by ADB, it has a market capitalization of nearly $600 billion. As
of March 2015, the market capitalization was around $598.3 billion (Rs 30.13 lakh crore) which
is one-tenth of the combined valuation of the Asia region. The market was slow since early 2007
and continued till the first quarter of 2009.
The Indian equity market depends on three factors -
Funding into equity from all over the world
Corporate houses performance
Monsoons
The equity market is also affected through trade integration policy. The country has advanced
both in foreign institutional investment (FII) and trade integration since 1995. This is a very
attractive field for making profit for medium and long term investors, short-term swing and
position traders and very intraday traders.
The Indian market has 22 stock exchanges. The larger companies are enlisted with BSE and
NSE. The smaller and medium companies are listed with OTCEI (Over The counter Exchange
of India). The functions of the Equity Market in India are supervised by SEBI (Securities
Exchange Board of India).
The Indian Equity Market was not well organized or developed before independence. After
independence, new issues were supervised. The timing, floatation costs, pricing, interest rates
were strictly controlled by the Controller of Capital Issue (CII).
In the 1950s, there was uncontrollable speculation and the market was known as ‘Satta Bazaar'.
Speculators aimed at companies’ like-Tata Steel, Kohinoor Mills, Century Textiles, Bombay
Dyeing and National Rayon. The Securities Contracts (Regulation) Act, 1956 was enacted by the
Government of India. Financial institutions and state financial corporation were developed through
an established network. Two new stock exchanges, NSE (National Stock Exchange of India)
established in 1994 and OTCEI (Over the Counter Exchange of India) established in 1992 gave
BSE a nationwide competition. In 1995-96, an amendment was made to the Securities Contracts
(Regulation) Act, 1956 for introducing options trading. In April 1995, the National Securities
4
Clearing Corporation (NSCC) and in November 1996, the National Securities Depository Limited
(NSDL) were set up for demutualized trading, clearing and settlement.
Risk and return
Risk in holding securities is generally associated with the possibility that realized returns will be
less than the returns that were expected.
Types of risks
Systematic risk
1. Market risk
2. Interest rate risk
3. Purchasing power risk
Unsystematic risk
1. Business risk
2. Financial risk
Stock Market
Stock markets refer to a market place where investors can buy and sell stocks. The price at which
each buying and selling transaction takes is determined by the market forces.
A stock market is a public market for the trading of company stock and derivatives at an agreed
price; these are securities listed on a stock exchange as well as those only traded privately.
The size of the world stock market was estimated at about $55 trillion USD at the close of 2012
The stock market is one of the most important sources for companies to raise money, along with
debt markets which are generally more imposing but do not trade publically. This allows
businesses to be publicly traded, or raise additional capital for expansion by selling shares of
ownership of the company in a public market. In fact, the stock market is often considered the
primary indicator of a country's economic strength and development. Rising share prices, for
instance, tend to be associated with increased business investment and vice versa.
In this way, investing in stock market, the stock exchanges also play importance role. Exchanges
also act as the clearinghouse for each transaction, meaning that they collect and deliver the
shares, and guarantee payment to the seller of a security. This eliminates the risk to an individual

5
buyer or seller that the counterparty could default on the transaction. So, here we also understand
about Stock Exchanges as follows.
Stock exchange:
A stock exchange is an entity or place which provides "trading" facilities for stock brokers and
traders, to trade stocks and other securities.
Stock Exchanges are an organized marketplace, either corporation or mutual organization, where
members of the organization gather together to trade company stocks or other securities. A large
company will usually have its stock listed on many exchanges across the world.
Stock exchanges also provide facilities for the issue and redemption of securities as well as other
financial instruments and capital events including the payment of income and dividends.
The securities traded on a stock exchange include: shares issued by companies, unit trusts,
derivatives, pooled investment products and bonds. To be able to trade a security on a certain
stock exchange, it has to be listed in the stock exchange. Usually there is a central location at
least for recordkeeping, but trade is less and less linked to such a physical place, as modern
markets are electronic networks, which gives them advantages of speed and cost of transactions.
Trade on an exchange is by members only. The initial offering of stocks and bonds to investors
is by definition done in the primary market and subsequent trading is done in the secondary
market.
A stock exchange is often the most important component of a stock market. Supply and demand
in stock markets is driven by various factors which, as in all free markets, affect the price of
stocks.
There is usually no compulsion to issue stock via the stock exchange itself, nor must stock be
subsequently traded on the exchange. Such trading is said to be off exchange or over-the-
counter. This is the usual way that derivatives and bonds are traded. Increasingly, stock
exchanges are part of a global market for securities.
Major stock exchanges in the world;
There are mainly twenty major stock exchanges in the world
Where, Two major Stock Exchanges from India, which is
6
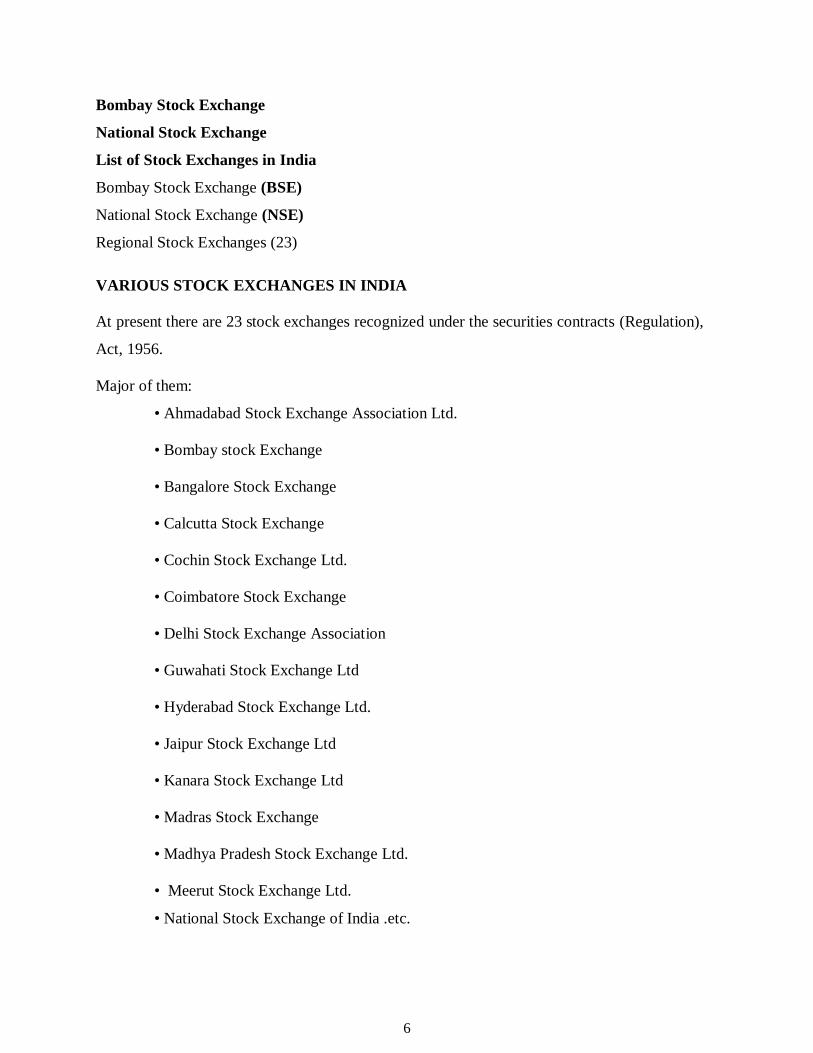
Bombay Stock Exchange
National Stock Exchange
List of Stock Exchanges in India
Bombay Stock Exchange (BSE)
National Stock Exchange (NSE)
Regional Stock Exchanges (23)
VARIOUS STOCK EXCHANGES IN INDIA
At present there are 23 stock exchanges recognized under the securities contracts (Regulation),
Act, 1956.
Major of them:
• Ahmadabad Stock Exchange Association Ltd.
• Bombay stock Exchange
• Bangalore Stock Exchange
• Calcutta Stock Exchange
• Cochin Stock Exchange Ltd.
• Coimbatore Stock Exchange
• Delhi Stock Exchange Association
• Guwahati Stock Exchange Ltd
• Hyderabad Stock Exchange Ltd.
• Jaipur Stock Exchange Ltd
• Kanara Stock Exchange Ltd
• Madras Stock Exchange
• Madhya Pradesh Stock Exchange Ltd.
• Meerut Stock Exchange Ltd.
• National Stock Exchange of India .etc.

7
Bombay Stock Exchange (BSE)
The Bombay Stock Exchange Limited is the oldest stock exchange not only in the country, but
also in Asia with a rich heritage of over 133 years of existence. In the early days, BSE was
established as "The Native Share & Stock Brokers Association."
It was established in the year 1875 and became the first stock exchange in the country to be
recognized by the government of India. In 1956, BSE obtained a permanent recognition from
the Government of India under the Securities Contracts (Regulation) Act, 1956.
Today, BSE is the world's number one exchange in terms of the number of listed companies and
the world's 5th in handling of transactions through its electronic trading system. Itis considered
to be one of Asia’s fastest growing stock exchanges, with a trade speed of 6 microseconds and
one of India’s leading exchange groups and the oldest stock exchange in the South Asia region.
Bombay Stock Exchange is the world's11th largest stock market by market capitalization
at$1.64 trillion as of Sep 2015. More than 5,500 companies are listed on BSE.
The BSE Index, SENSEX, is India's first and most popular stock market benchmark index. The
BSE SENSEX (Sensitive index), also called the "BSE 30", is a widely used market index in
India and Asia. Sensex is tracked worldwide. It constitutes of 30 stocks representing 12 major
sectors. The SENSEX is constructed on a 'free-float' methodology, and is sensitive in nature to
market movements and market realities. Apart from the SENSEX, BSE offers 23 indices,
including 13 sectoral indices.
BSE provides an efficient and transparent market for trading in equity, debt instruments and
derivatives.
BSE is the first exchange in India and the second in the world to obtain an ISO 9001:2000
certifications. It is also the first exchange in the country and second in the world to receive.
Information Security Management System Standard BS 7799-2-2002 certification for its BSE
On-line Trading System (BOLT).
BSE continues to innovate. In 2006, it became the first national level stock exchange to launch
its website in Gujarati and Hindi and now Marathi to reach out to a larger number of investors.

8
The BSE On-line Trading (BOLT):
BSE On-line Trading (BOLT) facilitates on-line screen based trading in securities. BOLT is
currently operating in 25,000 Trader Workstations located across over 359 cities in India.
BSE Vision
The vision of the Bombay Stock Exchange is -
"To Emerge as the premier Indian stock exchange by establishing global benchmarks."
BSE Profile
Address : Phiroze Jeejeebhoy Towers, Dalal Street, Mumbai-
400001, India Telephone :91-22-227212334
Website : www.bseindia.com
Trading hours : Monday-Friday, 9:00am to 3:30 pm
Securities : Stocks, derivatives,debt
Trading System : Electronic
MD&CEO : Mr. Madhu Kannan
History of BSE
The Bombay Stock Exchange is known as the oldest exchange in Asia. It traces its history to the
1850s, when stockbrokers would gather under banyan trees in front of Mumbai's Town Hall.
The location of these meetings changed many times, as the number of brokers constantly
increased. The group eventually moved to Dalal Street in 1874 and in 1875 became an official
organization known as 'The Native Share & Stock Brokers Association'. In 1956, the BSE
became the first stock exchange to be recognized by the Indian Government under the Securities
Contracts Regulation Act.
The Bombay Stock Exchange developed the BSE Sensex in 1986, giving the BSE a means to
measure overall performance of the exchange. In 2000 the BSE used this index to open its
derivatives market, trading Sensex futures contracts. The development of Sensex options along
with equity derivatives followed in 2001 and 2002, expanding the BSE's trading platform.
Indices of BSE:
Sensex
BSE 100(This covers Banking Sector)

9
BSE 200(This covers Capital goods)
BSE 500(This covers Consumer goods)
BSE mid-cap index
BSE small-cap index
BSE mid-cap index covers the FMCG sector and BSE small-cap index covers the IT sector,
Metal, Oil & gas, Power industry, PSUs, etc.
BSE disseminates information on the Price-Earnings Ratio, the Price to Book Value Ratio and
the Dividend Yield Percentage on day-to-day basis of all its major indices.
The values of all BSE indices are updated every 15 seconds during market hours and displayed
through the BOLT system, BSE website and news wire agencies in the market.
All BSE Indices are reviewed periodically by the BSE Index Committee. This Committee which
comprises eminent independent finance professionals frames the broad policy guidelines for the
development and maintenance of all BSE indices. The BSE Index Cell carries out the day-to-
day maintenance of all indices and conducts research on development of new indices.
Awards achieved by BSE
The World Council of Corporate Governance awarded the Golden Peacock Global CSR Award
for BSE's initiatives in Corporate Social Responsibility (CSR).
ICAI award for excellence in financial reporting for the year 2006-07
BSE has won the Asia - Pacific HRM awards for its efforts in employer branding through talent
management at work, health management at work and excellence in HR through technology.
National Stock Exchange (NSE)
The National Stock Exchange of India Limited (NSE), is a Mumbai-based stock exchange. It is
the largest stock exchange in India in terms of daily turnover and number of trades, for both
equities and derivative trading.
NSE has a market capitalization of more than US$1.65trillion, making it the world’s 12th largest
stock exchange as of January 2015 and is expected to become the biggest stock exchange in
India in terms of market capitalization by 2015 end. Though a number of other exchanges exist,
NSE and the Bombay Stock Exchange are the two most significant stock exchanges in India,
and between them are responsible for the vast majority of share transactions NSE's flagship

10
index, the Nifty, the 50 stock index, is used extensively by investors in India and around the
world as a barometer of the Indian capital markets.
NSE is mutually-owned by a set of leading financial institutions, banks, insurance companies
and other financial intermediaries in India but its ownership and management operate as separate
entities.
There are at least 2 foreign investors NYSE Euro next and Goldman Sachs who have taken a
stake in the NSE. As of 2006, the NSE VSAT terminals, 2799 in total, cover more than 1500
cities across India.
In October 2007, the equity market capitalization of the companies listed on the NSE was US$
1.46 trillion, making it the second largest stock exchange in South Asia. NSE is the third largest
Stock Exchange in the world in terms of the number of trades in equities. It is the second fastest
growing stock exchange in the world with a recorded growth of 16.6%.
Origins:
The National Stock Exchange of India was promoted by leading financial institutions at the behest
of the Government of India, and was incorporated in November 1992 as a tax-paying company.
In April 1993, it was recognized as a stock exchange under the Securities Contracts (Regulation)
Act, 1956. NSE commenced operations in the Wholesale Debt Market (WDM) segment in June
1994.
The Capital Market (Equities) segment of the NSE commenced operations in November 1994,
while operations in the Derivatives segment commenced in June 2000.
Markets:
Currently, NSE has the following major segments of the capital market:
Equity
Futures and Options
Retail Debt Market
Wholesale Debt
Market Currency
futures
11
NSE became the first stock exchange to get approval for Interest rate futures as recommended
by SEBI-RBI committee, on 31 August,2009, a futures contract based on 7% 10 Year GOI bond
(NOTIONAL) was launched with quarterly maturities.
Hours:
NSE's normal trading sessions are conducted from 9:00 am India Time to 3:30 pm India Time
on all days of the week except Saturdays, Sundays and Official Holidays declared by the
Exchange (or by the Government of India) in advance.
The exchange in association with BSE (Bombay Stock Exchange Ltd.,) thinking to revise its
timings from 9.00 am India Time till 5.00 pm India Time.
However, on Dec 17, 2009, after strong protests from brokers, the Exchange decided to postpone
the change in trading hours till Jan 04, 2010.
NSE new market timing from Jan 04, 2010 is 9:00 am till 3:30 pm India Time.
NSE Group:
National Securities Clearing Corporation Ltd. (NSCCL)
National Securities Depository Ltd. (NSDL)
India Index Services & Products Ltd. (IISL)
NSE. IT ltd.
DotEx International Limited
History of N.S.E
Capital market reforms in India and the launch of the Securities and Exchange Board of India
(SEBI) accelerated the incorporation of the second Indian stock exchange called the National Stock
Exchange (NSE) in 1992. After a few years of operations, the NSE has become the largest stock
exchange in India.
Three segments of the NSE trading platform were established one after another. The Wholesale
Debt Market (WDM) commenced operations in June 1994 and the Capital Market (CM) segment
was opened at the end of 1994. Finally, the Futures and Options segment began operating in
2000. Today the NSE takes the 14th position in the top 40 futures exchanges in the world.

12
In 1996, the National Stock Exchange of India launched the S&P CNX Nifty and CNX Junior
Indices that make up 100 most liquid stocks in India. CNX Nifty is a diversified index of 50
stocks from 25 different economy sectors. The Indices are owned and managed by India Index
Services and Products Ltd (IISL) that has a consulting and licensing agreement with Standard
& Poor's.
In 1998, the National Stock Exchange of India launched its web-site and was the first exchange
in India that started trading stock on the Internet in 2000. The NSE has also proved its leadership
in the Indian financial market by gaining many awards such as 'Best IT Usage Award' by
Computer Society in India (in 1996 and 1997) and CHIP Web Award by CHIP magazine(1999).
Indices of N.S.E
NSE also set up as index services firm known as India Index Services & Products Limited (IISL)
and has launched several stock indices, including:
S&P CNX Nifty(Standard & Poor's CRISIL NSE Index)
CNX Nifty Junior
CNX 100 (= S&P CNX Nifty + CNX Nifty Junior)
S&P CNX 500 (= CNX 100 + 400 major players across 72 industries)
CNX Midcap (introduced on 18 July 2005 replacing CNX Midcap 200)
Mission of N.S.E.
NSE's mission is setting the agenda for change in the securities markets in India. The NSE was
set-up with the main objectives of:
Establishing a nation-wide trading facility for equities, debt instruments and hybrids,
Ensuring equal access to investors all over the country through an appropriate communication
network.
Providing a fair, efficient and transparent securities market to investors using electronic trading
systems, Enabling shorter settlement cycles and book entry settlements systems, and Meeting the
current international standards of securities markets. The standards set by NSE in terms of
market practices and technology have become industry benchmarks and are being emulated by
other market participants. NSE is more than a mere market facilitator. It's that force which is
guiding the industry towards new horizons and greater opportunities.
13
CHAPTER – 2
INDUSTRY PROFILE AND COMPANY PROFILE
The Indian retail brokerage industry consists of companies that primarily act as agent between
the buyer and seller of securities (e.g. stocks, shares, and similar financial instruments) on a
commission or transaction fee or Brokerage basis.
An agent will charges a fee or commission for executing buys and sell orders submitted by an
investor. The firm that acts as an agent for a customer, charge the customer the commission for
its service. Roles similar to that of a stockbroker include investment advisor, financial advisor
and probably many others. A stockbroker may or may not be also an investment advisor.
A brokerage firm, or simply brokerage, is a financial institution that facilitates the buying and
selling of financial securities between a buyer and a seller on a commission basis. Brokerage
firms serve a clientele of investors who trade public stocks and other securities, usually through
the firm’s agent.
A stockbroker is a regulated professional broker who buys and sells shares and other securities
through market makers or Agency Only Firms on behalf of investors. Stockbroker is are known
by numerous professional designations, depending on the license they hold for the organization,
the type of securities they sell ,or the services they provide for the investors who invest in
particular stocks and securities.
Typically, a broker who receives an order from a customer will communicate with a company
employee located at a particular exchange, who will execute the order at the exchange and report
details of the transaction to the broker. Customers typically keep their securities in an account
with the broker. Brokers charge customers commissions for conducting transactions and services
and fees for maintaining their accounts.
Some of the main characteristics of the brokerage industry include growth in e-broking, decline
in brokerage fees and growing derivative market and many more.
There are several national as well as local players in stock trading services which are providing
various services to their customers like online trading, portfolio management system, stock
broking etc.
14
They are helping the investors to take decision about where to invest because there is lots of
Investment Avenue available with investors. Some of them are as follows working at the national
level.
5Paisa.com - Online trading, live stock quotes and market research
Anagram Capital - Stock broking, portfolio management and investment Banking services
Angel Broking - Stock-Broking and Wealth Management services
Advani Share Brokers - Share broking and market research services
Anand Rathi Securities- Portfolio management, corporate finance, equity & fixed income
brokerage services
Brescon Group - Advisory and broking services
CIL Securities- Stock broking & merchant banking services
CRN India- Trends of stock market, trading tips, chat etc
Churiwala Securities - Stock trading, quotes and market analysis
DSP Merrill Lynch- Investment banking and brokerage services
Dalmia Securities - Stock broking & depository services
Equity Trade - Stock trading, company news & market research
Gandhi Securities - Stock broking and investment services
Gogia Capital Services - Stock broking and market analysis
Hasmukh Lal bhai - Stock trading services
Idafa Investments - Stock broking services
India Info line Securities - Stock broking, portfolio management and investment banking services
India Market Access- Offers stock broking, portfolio management and investment banking
services
Investmart India - Personal finance advisory & online brokerage services
Kisan Ratilal Choksey Shares - Stock broking and e-trading services
Kotak Securities - Brokerage services & retail distributor of financial securities
Manubhai Mangaldas Securities - Stock broking and market analysis
Moneypore - Investment and broking services
Motilal Oswal Securities - Online trading, live BSE and NSE quotes
Navia Markets - Stock broking, IPO and mutual funds services
Parag Parikh - Stock broking and portfolio management
15
Parsoli Corporation - Investment management & stock trading services
Pratibhuti Viniyog - Stock broking services
Prudential - Investment management services
PROFILE OF THE ORGANISATION
Introduction to Joules to Watts Business Solutions
Since inception in1948, the company has admirably proven themselves as a singular touch point
for investors with varied investment needs by providing expert services across various assets
classes they have marked their strong presence in the field of equity and related products (Retail
and institution) currencies, commodities, debt instruments, corporate Finance, Investment
Banking, Wealth Management, SLB and Third party Product Distribution.
They provide seamless services to more than 80,000 satisfied customers with their extensive
network having indelible presence across more than 150 cities pan India, through 30 branches
and over 350 Business associates with Head Office at Nariman point Mumbai.
They provide customized research and advisory services to their customers and Business
Associates through their strong research and advisory team- providing both fundamental and
technical research. Their research team has proven an excellent performance track record of over
decade.
They have best in the industry IT systems and network, including MPLS for trade requiring very
high speed. Joules to Watts Business Solutions trading platform (offline and online) are extremely
user friendly and time tested with advance charting system to meet every individual customers
needs integrating 24*7 systems support.
Their cutting edge robust Risk management System across all segments of the market enables
us to provide our customers and Business Associates with required leverages to facilitate trades
in a systematic and organized manner on a real time basis.
Their 24*7 customer service platform with well-defined Turnaround Time (TAT) is dedicated
and monitored to provide customer delight.
Their professional, experienced, talented and energetic team of over 400 members pan India
continuously endeavors to provide better services to customers and Business Associates through

16
innovative processes across all functions of their business. All these and more makes Joules to
Watts Business Solutions the most preferred business and brokerage house.
REGISTRATIONS &MEMBERSHIP
Trading and Clearing Member of NSE BSE & MCX- SX(Capital, F&O/ Debt
Market).
Depository participant of CDSL.
Member of commodity Exchanges- MCX, NCDEX, NSEL and ICEX( through
Alpha commodities Private Limited).
Member of MCX SX and NSE Currency Segment
Category 1 Merchant Bankers
Participant of Securities Borrowing and Lending Scheme.
AMFI registered all India Mutual Fund Distributor
VALUE ADDED SERVICES & SUPPORT
Competitive product offering across Equity, commodity, currencies and Debt
Quality Research and Advisory services, including fundamental,
technical and derivatives
Efficient and User friendly trading platform with high speed connectivity
J2W BOSS online gateway to their holding and ledger
Online Portal providing all necessary sales and back office in formation
Instant funds transfer through integrated payment gateway covering all
major banks
24*7 online customer Help Desk
Flexible leverage with robust and real-time Risk Management System
Support for lead Generation and Client Acquisition
17
SMS alerts
Portfolio Tracker
Latest Market News and Information with Company analysis
Account related information through SMS with no extra cost
Exclusive online account services for Demat accountholders
Dedicated Relationship managers
Exclusive PCG desk
LEADING-EDGE RESEARCH AND ADVISORY TEAM
Converting research to profitable advice is where they believe the client benefits the most. They
ensure that every rupee deployed works the hardest it can. Their research and Advisory team
consists of highly qualified, trained and experienced professionals.
They proactively helps you take informed investment and trading decisions and endeavors its best
to help you build healthy portfolio giving superior returns. Their experts also help review
investments and portfolios periodically and provide advice suiting the client s profile and
requirements. Their advisory team caters to your every investment and trading needs, in a
seamless, speedy and reliable manner.
J2Ws Media Presence:
2W’s research team enjoys strong, is the key to making consistent money in equities and they help
you choose from the thousands of stocks available in the market .Their fundamental research team
covers various s stock market game shows on Business News channel that include CNBC s Bulls
Eye, Super -6, ET Now s-Buy Now sell Now and many others. Stocks recommended by our
research team are featured in prominent business broad sheets like Economic Times Business
standard, Mint and others. Columns written by their team is regularly featured in business
magazines such as India Today, Outlook, Forbes and others, J2W’s research team is also invited
as panel members on channels and prominent business events.
18
FUNDAMENTAL RESEARCH
Informed investment decision, is the key to making consistent money in equities and we help you
choose from the thousands of stocks available in the market. Our Fundamental research team
covers various sectors, industries and companies to provide detailed analysis, ideas, updates and
reports –thereby enabling our customers earn superior returns their special focus on selection of
stocks at nascent stage from mid-cap as well as small- cap companies is well in the market. This
enables their customers to acquire multi – bagger stocks time and again.
TECHNICALS
With a wide array of products suited for a short term trader to a long term investor, J2W Advisory
offers you an opportunity to create disciplined wealth from stock market .Their experienced team
of technical analysts spot market trends and help you participate in it. They will also offer you
various kinds of advisory reports that are designed to suit your needs.
J2W Advisory provides technical research on a daily basis .So get subscribed to the daily tips on
stocks and stat making wealth. All recommendations are sent via SMS, Messenger services,
emails, through news flash on your online trading platform etc.
DERIVATIVES (FUTURES AND OPTIONS)
Successful Investment strategy is simple let your profits run, and cut your losses quickly with their
derivatives advisory, you have the advantage of high leverage and thereby can participate in
making higher return from the respective stocks. Also using their various strategies, clients can
mitigate their risks to a large extent.
Their focus in derivatives ranges from plain vanilla option strategies to complex Option strategies
.Their core team of J2W advisory can customize option strategies based on your portfolio queries
Derivatives reports also keep you updated with detailed information and in-depth analysis of the
F&O segment .Their product ranges from daily derivatives view, special reports such as Rollover
reports, position building and much more.
19
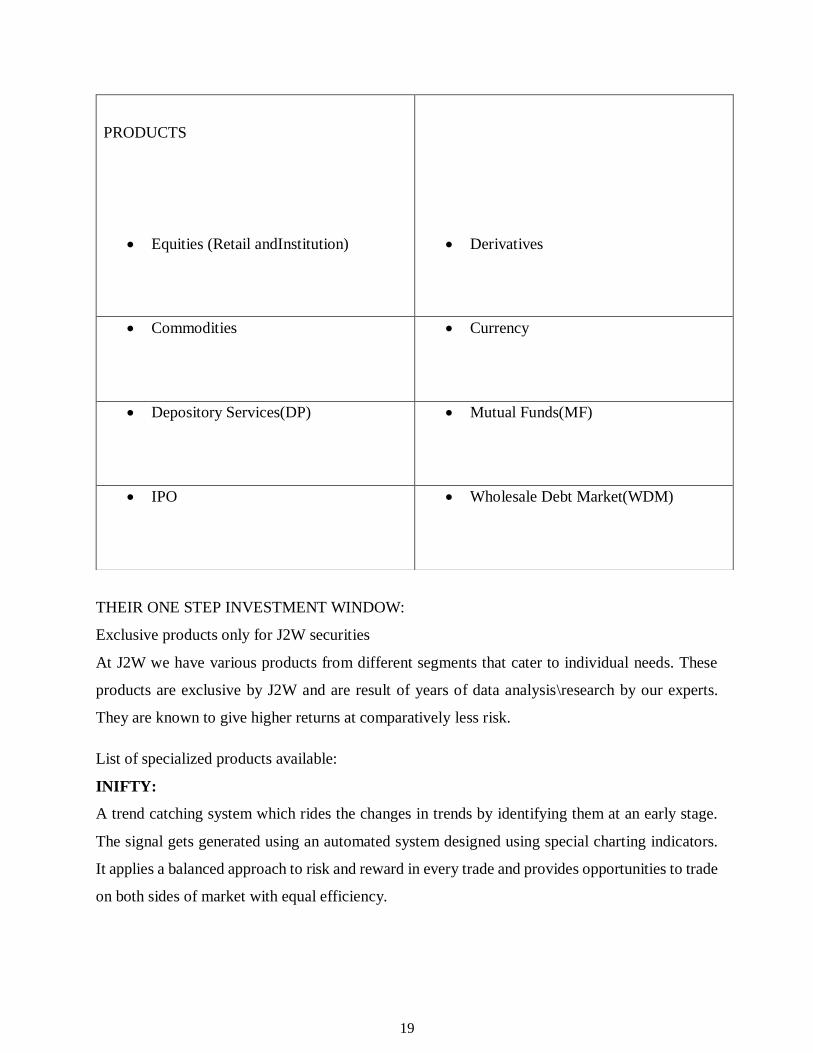
THEIR ONE STEP INVESTMENT WINDOW:
Exclusive products only for J2W securities
At J2W we have various products from different segments that cater to individual needs. These
products are exclusive by J2W and are result of years of data analysis\research by our experts.
They are known to give higher returns at comparatively less risk.
List of specialized products available:
INIFTY:
A trend catching system which rides the changes in trends by identifying them at an early stage.
The signal gets generated using an automated system designed using special charting indicators.
It applies a balanced approach to risk and reward in every trade and provides opportunities to trade
on both sides of market with equal efficiency.
PRODUCTS
Equities (Retail andInstitution)
Derivatives
Commodities Currency
Depository Services(DP) Mutual Funds(MF)
IPO Wholesale Debt Market(WDM)

20
VWAP:
This is an expiry day strategy which involves buying or selling current month futures without a
need for equity transaction. Since the positions in individual futures expire at the end of the day,
this strategies carries very small risk. One of the factors that make this strategy quite lucrative is
its ability to profit from trending expiry irrespective of direction.
J2W Pairs:
The strategy provides opportunities to make profits irrespective of market direction. This is a
market neutral strategy which works on the principle of mean reversion. The strategy emphasizes
on the outperformance of one stock relative to other.
7 Picks for the Quarter:
A thematic report is released in every quarter containing seven picks which meet rigorous selection
criteria. The stocks which are back by strong fundamentals and are on verge of giving a strong
technical move are selected. These selected stocks are suggested for a period of three months but
can also be held for longer time frames. Since a balanced mix of midcap as well as large cap stocks
are selected, market participants get a lucrative risk reward from their investments.
Cash Future Arbitrage:
This strategy aims to benefit from difference between prices of stocks and their futures. This is a
hedged strategy which involves buying a stock and simultaneously selling its future. Since this is
an arbitrage strategy it carries negligible risk.
J2W MIST:
The strategy aims to benefit from the variance between Bank Nifty and Nifty. It involves buying
and selling index options. One of the factors that make this strategy quite lucrative is its ability to
profit from trending market irrespective of direction.
Result/Event Based Strategies:
These strategies are applied before the advent of quarterly results or major events like RBI Policy,
Union Budget, etc. The stocks/indices showing increased activity in derivatives segments or
showing increased signs of a strong technical move are selected. These include a basket of futures
and options strategies which cater to different risk appetite of market participants. However, all of
21
these strategies carry limited risk which saves the market participants from significant losses in
case the outcome of event goes against the one desired.
THIRD PARTY PRODUCTS
In order to provide a gamut of products and make J2W truly a one stop window for all your
investment needs. J2W has tied up with various well-known brands in the industry to provide best
quality of products and services. Thus enabling and guiding our clients to invest in various avenues
such as Real Estate, Insurance, IPO’s, Bonds, etc.
Partnered with TATA AIG and Bajaj Allianz for general Insurance
Partnered with Bajaj Allianz for Life Insurance.
MFSS platform for MF
Offline MF support
Active co-ordination for all the IPO’s, Bonds,
Channel Partners with Real estate developers like Lodha, Nirmal Lifestyle, Oberoi,
Rustomjee, Kalpataru, India Bulls, Kanakia,etc.
SECURE IT INFRASTRUCTURE
We at J2W give top priority to your security and hence our IT department has deployed the latest
technology available making our system secure and robust against any kind of attack. With almost
zero downtime and easy access our clients are able to transfer funds, view their statements, and
make transactions with utmost confidence.
Online Back Office Access to view all transaction reports/DP holdings etc.
21 Banks for online funds transfer
SSL secure servers
32/64 bit encryption

22
MANAGEMENT TEAM
Their company is managed by a team of highly qualified and experience professionals from the
finance industry across the country. Know more about them:
Mr.M.V Doshi Executive Chairman
Mr.Vineeth N.Suchanti DirectorMr.
Sayanta Basu Director Mr.Hari
Padmanabhan Director Mr. Milan S.
Bhise –Director
COMPETITIVESTRENGTH
Regional management (regional hub and spoke topology) for retail operation
Larger and diverse distribution network
Strong track record of high growth and profitability
Strong risk management system
Well established brand
EXISTING BUSINESS NETWORKS
J2W Securities Ltd has 7 Zonal offices and 1,000 plus Franchise Location
Head office: Mumbai, Maharastra
Branch Office:
Ludhiana,Punjab
Jaipur,Rajasthan
Noida, UttarPradesh
Indore,Madya Pradesh
Patna,Bihar
23
Bhubaneswar,Orissa
Hyderabad, AndraPradesh
Quantum Securities - Offers broking and portfolio management services.
Religare Enterprises Limited - Stock broking services and diversified financial services group
with in multiple international locations
Sivan Securities - offers services related investment banking & stock broking with a focus on
South India.
Lots of brokerage companies are moving towards consolidation with the smaller ones becoming
either franchisee for the larger brokers or closing operations. There is an increasing demand for
online trading due to consumer’s growing preference for Internet as compared to approaching the
brokers.
New forms of trading including T+2 settlement system, dematerialization etc. are strengthening
the retail brokerage market and attracting foreign companies to enter the Indian industry Various
alternative forms of investment including fixed deposits with banks and post offices etc act as
substitutes to retail broking products and services.
SWOT ANALYSIS
STRENGTHS
Original research: According to the analysis based on facts, theories, ideas which
have not yet been subject to peer review by experts which are reliable publication.
The company has an integrated technology: Itis a converged solution with the problems
relating to system and technology. The technology as learning area in a multi-
disciplinary and effective integration to achieve the information in timely manner
analyzes and present professionally.
One stop shop for all the clients: Itis the company which have umbrella of services
to its customers where they can get all they need in just one shop.
Pan Indian distribution network: Itis an Act where the government provides the
benefits to the employees who lost their lives for working with the company.
24
Company has dedicated research team who looks at the throughout the day where to
invest and where to sell.
Company has positive cash flow for last three years i.e. the total assets in 2011 is 3220
million, in 2012 itis 3580million, and in 2013 is 2598million.
A good reputation and a strong brand name in financial sector.
It has a strong balance sheet with total assets rounding to 1300 million for last
three years.
Company has a growing turnover and profitability as per balance sheet analysis.
Sound financial condition gives the advantage over the competitors as they have high
profits and turnovers compared to other firms.
WEAKNESSES
Insignificant presence in institutional segment
Turnover of employees: At J2W it is the process of replacing one worker to
other when it comes to performance or any other reason within a given time
period. This leads to the higher rates of employees.
High cost structure in IT department: Investment on costly software’s and
programming devices increases the cost for the company.
Lack with the customer and clients.
Poor presence in the world’s largest markets.
Lack of investment in R and D department below the industry average.
OPPORTUNITIES
Upcoming alterations in the individual a system rules can control on sales.
Market growth for the firm’s main product and services
Falling interest rates with the companies favorable percentage.
Changing of customer habits.
25
Economy is expected to increase by 4% next year.
The new introduction of financial bankers who are keen to fund expansion.
THREATS
Neworincreasedcompetitionisoneofthemajorthreatstothecompanybe
causeoffree government policies and regulations make other firms to
enter into the market.
Insurance plans changes according to times per the IRD interests of the policy
holders to regulate and promote the growth of the insurance.
Adverse government policies: The change in economic and political policies
or laws affects the business adversely which results the negative outcome of
financial condition.
Economic slow down: The state where the GDP growth slow downs but does
notdecline where analysts do not considers lowdown but recession of
unemployment.
Litigation: It is also famous as authorized fundinganda3rd
party finance, which
supports the taker to arbitrate without paying.
Lenders reducing credit lines or increasing charges
Many online competitors who are teaming up and expanding the distribution channels and
customer base.
26
CHAPTER – 3
RESEARCH METHODOLOGY
STAMENT OF THE PROBLEM
Stock investment requires meticulous planning and careful evaluation of the underlying stock
before making investment on any stock. A statistical data in the recent past year indicated that
95% of the investors in the stock market are losers, since they undertake investment without any
awareness about which stock to invest, whether to hold, sell or buy stocks. In the current
economic scenario interest rates are falling and fluctuation in the share market has put investors
in confusion. One finds it difficult to take decision on investment. This is primarily, because
investments are risky in nature and investors have to consider various factors before investing
in investment avenues. Therefore the study aims equity in form their risk, return & creating
awareness about Equity among the investors to invest in the respective company to earn the
more returns on their investment. It is necessary for the investors to study the stock market and
to understand market philosophy so that they can invest and make optimal decisions. The
researcher intended to evaluate the comparative study on return and risk of Indian Stock Market
with reference to J2W Securities during the year 2013 and 2015.
OBJECTIVES OF THE STUDY
To understand the comprehensive details of Indian stock market during
2013and2015
• To understand the stock price movements during the year 2013 and
2015 at J2W Securities
• To analyze the return and risk of selected companies which were
transacted at J2W Securities
• To find the volatility of shares by using Beta
SCOPE OF THE STUDY
This study helps to get the awareness to investors regarding risk, return, beta and alpha rates on
invested stock and market volatility of shares during the year 2013 and April 2016

27
IMPORTANCE OF THE STUDY
This study helps to know the percentage of risk and return on the shares
This study helps to know the market volatility on respective shares
This study helps to the investors to make investment decision on
respective shares
This study helps to know the information about Indian stock market to
the investors.
NEED OF THE STUDY
The need of this study is to find out the risk and return of the stocks during 2013 and 2015at
J2W securities ltd and to find out the market volatility of shares through beta. This study helps
to know the risk and return involved on the shares during 2013 and2015.
TOOLS FOR DATACOLLECTION
Sources of the data collection:
Primary Data
Secondary Data
Primary Data
The data has collected first hand by the researcher concerned with the research problem refers
to the Primary data.
Personal discussion was made with Unit manager and interaction with other personnel in the
organization for this purpose. There is no formal design of questionnaire are used in this study.
Secondary Data
The information available at various sources made for some other purpose but facilitating the
study undertaken is called as Secondary Data.
The various sources that were used for the collection of secondary data are
28
o Various Text books were used to understand the concepts of risk and return.
o Websites of the company.
o Newspapers such as Economic Times, Business Line.
o Magazines such as Business World, Capital Market.
PLAN OFANALYSIS
The analysis will be done on the basis of the data collected from J2W
Securities and other secondary sources.
Analysis of Risk and Return have done for the year 2013 to2015
Comparative analysis of the stocks will be done for the year 2013to2015.
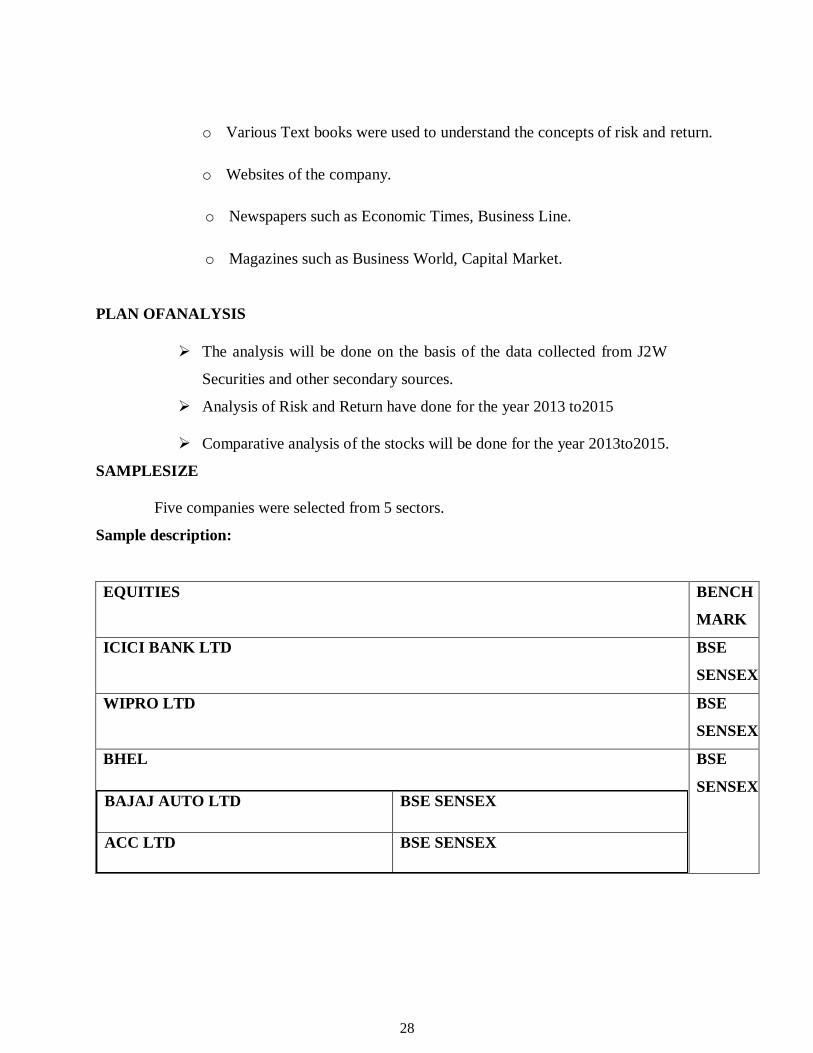
SAMPLESIZE
Five companies were selected from 5 sectors.
Sample description:
EQUITIES BENCH
MARK
ICICI BANK LTD BSE
SENSEX
WIPRO LTD BSE
SENSEX
BHEL BSE
SENSEX
BAJAJ AUTO LTD BSE SENSEX
ACC LTD BSE SENSEX

29
LIMITATIONS OF THE STUDY
Analysis has done only for the selected sector companies
The study is based on only secondary data not primary data
The study limited only to the companies registered and operates in India
It focuses on every month ending closing prices of during the period from 31st
Jan 2013 to 30th April2016
30
CHAPTER – 4
DATA ANALYSIS AND INTERPRETATION
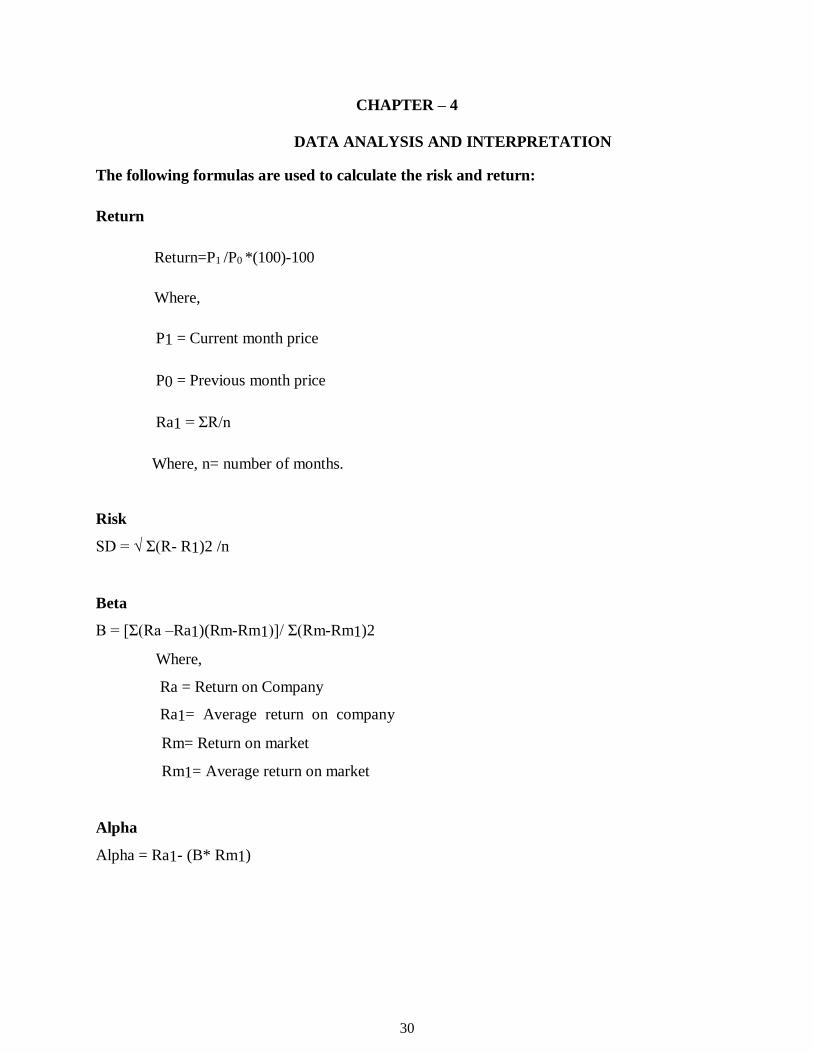
The following formulas are used to calculate the risk and return:
Return
Return=P1 /P0 *(100)-100
Where,
P1 = Current month price
P0 = Previous month price
Ra1 = ΣR/n
Where, n= number of months.
Risk
SD = √ Σ(R- R1)2 /n
Beta
B = [Σ(Ra –Ra1)(Rm-Rm1)]/ Σ(Rm-Rm1)2
Where,
Ra = Return on Company
Ra1= Average return on company
Rm= Return on market
Rm1= Average return on market
Alpha
Alpha = Ra1- (B* Rm1)
31
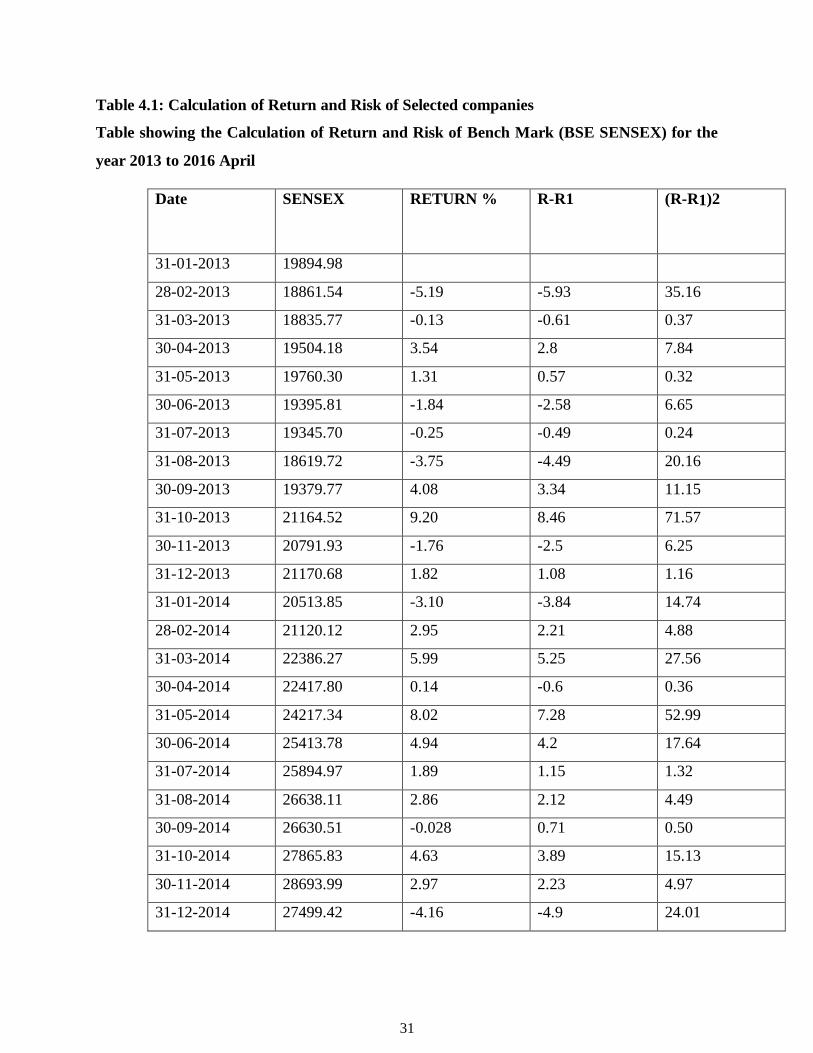
Table 4.1: Calculation of Return and Risk of Selected companies
Table showing the Calculation of Return and Risk of Bench Mark (BSE SENSEX) for the
year 2013 to 2016 April
Date SENSEX RETURN % R-R1 (R-R1)2
31-01-2013 19894.98
28-02-2013 18861.54 -5.19 -5.93 35.16
31-03-2013 18835.77 -0.13 -0.61 0.37
30-04-2013 19504.18 3.54 2.8 7.84
31-05-2013 19760.30 1.31 0.57 0.32
30-06-2013 19395.81 -1.84 -2.58 6.65
31-07-2013 19345.70 -0.25 -0.49 0.24
31-08-2013 18619.72 -3.75 -4.49 20.16
30-09-2013 19379.77 4.08 3.34 11.15
31-10-2013 21164.52 9.20 8.46 71.57
30-11-2013 20791.93 -1.76 -2.5 6.25
31-12-2013 21170.68 1.82 1.08 1.16
31-01-2014 20513.85 -3.10 -3.84 14.74
28-02-2014 21120.12 2.95 2.21 4.88
31-03-2014 22386.27 5.99 5.25 27.56
30-04-2014 22417.80 0.14 -0.6 0.36
31-05-2014 24217.34 8.02 7.28 52.99
30-06-2014 25413.78 4.94 4.2 17.64
31-07-2014 25894.97 1.89 1.15 1.32
31-08-2014 26638.11 2.86 2.12 4.49
30-09-2014 26630.51 -0.028 0.71 0.50
31-10-2014 27865.83 4.63 3.89 15.13
30-11-2014 28693.99 2.97 2.23 4.97
31-12-2014 27499.42 -4.16 -4.9 24.01
32
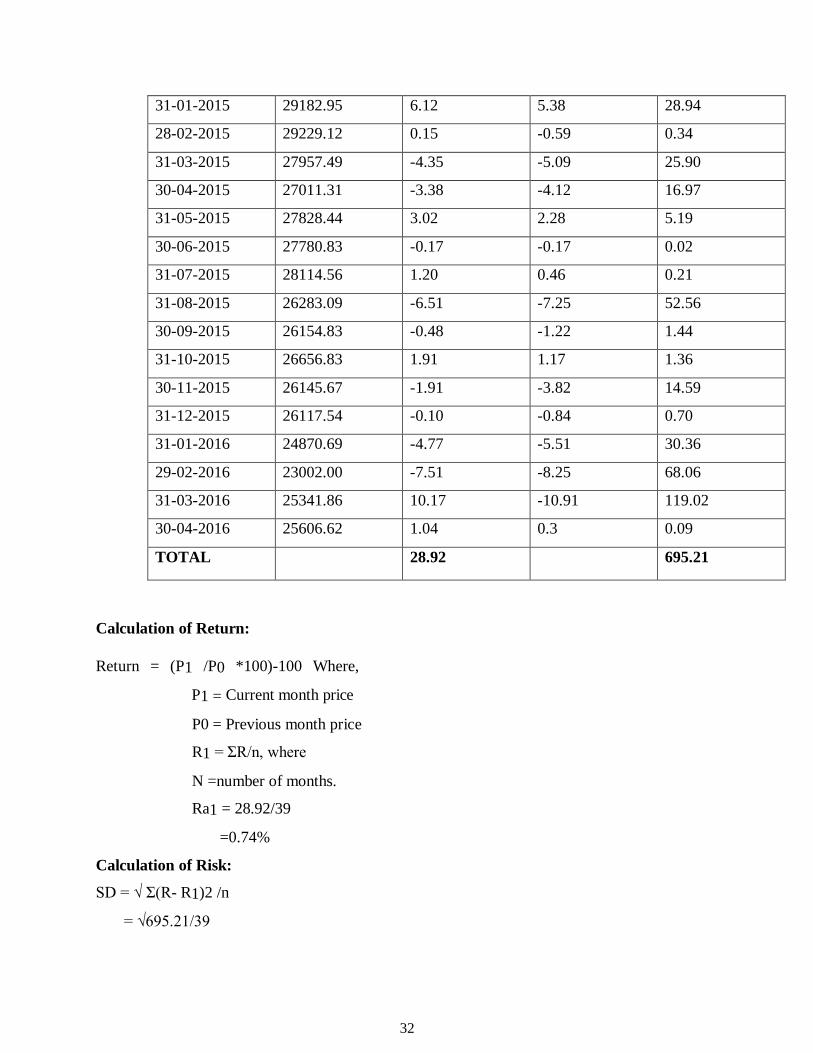
31-01-2015 29182.95 6.12 5.38 28.94
28-02-2015 29229.12 0.15 -0.59 0.34
31-03-2015 27957.49 -4.35 -5.09 25.90
30-04-2015 27011.31 -3.38 -4.12 16.97
31-05-2015 27828.44 3.02 2.28 5.19
30-06-2015 27780.83 -0.17 -0.17 0.02
31-07-2015 28114.56 1.20 0.46 0.21
31-08-2015 26283.09 -6.51 -7.25 52.56
30-09-2015 26154.83 -0.48 -1.22 1.44
31-10-2015 26656.83 1.91 1.17 1.36
30-11-2015 26145.67 -1.91 -3.82 14.59
31-12-2015 26117.54 -0.10 -0.84 0.70
31-01-2016 24870.69 -4.77 -5.51 30.36
29-02-2016 23002.00 -7.51 -8.25 68.06
31-03-2016 25341.86 10.17 -10.91 119.02
30-04-2016 25606.62 1.04 0.3 0.09
TOTAL 28.92 695.21
Calculation of Return:
Return = (P1 /P0 *100)-100 Where,
P1 = Current month price
P0 = Previous month price
R1 = ΣR/n, where
N =number of months.
Ra1 = 28.92/39
=0.74%
Calculation of Risk:
SD = √ Σ(R- R1)2 /n
= √695.21/39
33
= 4.22%
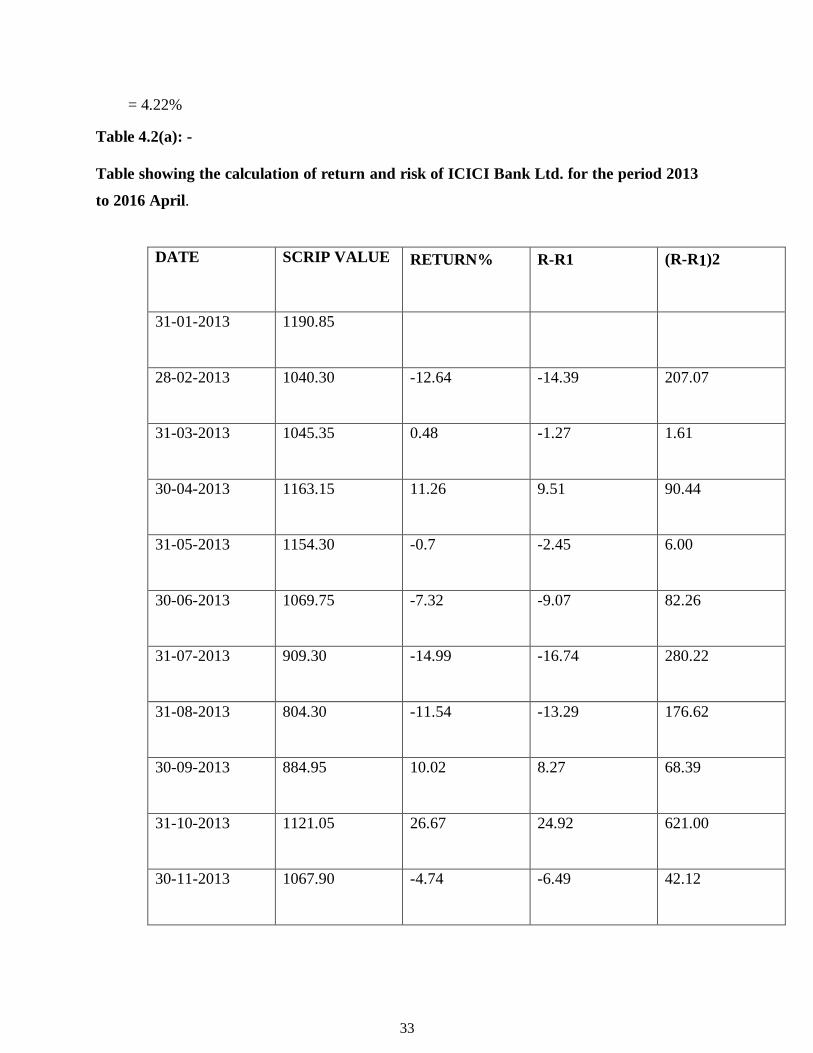
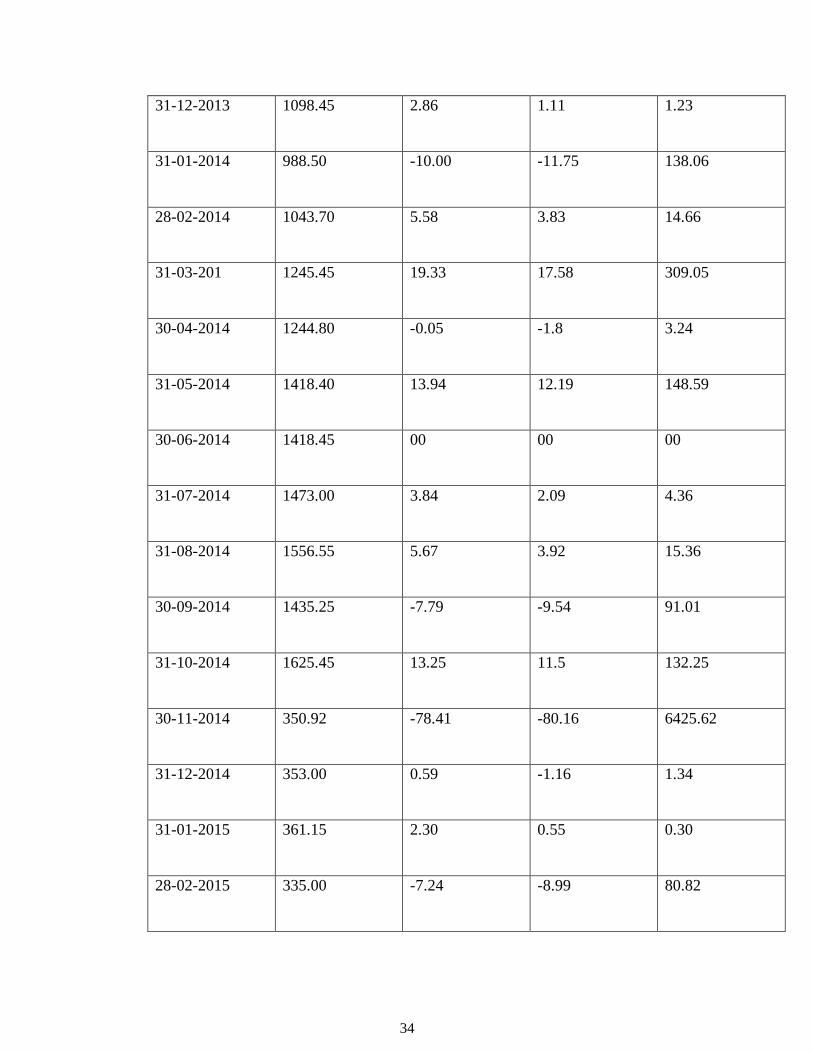
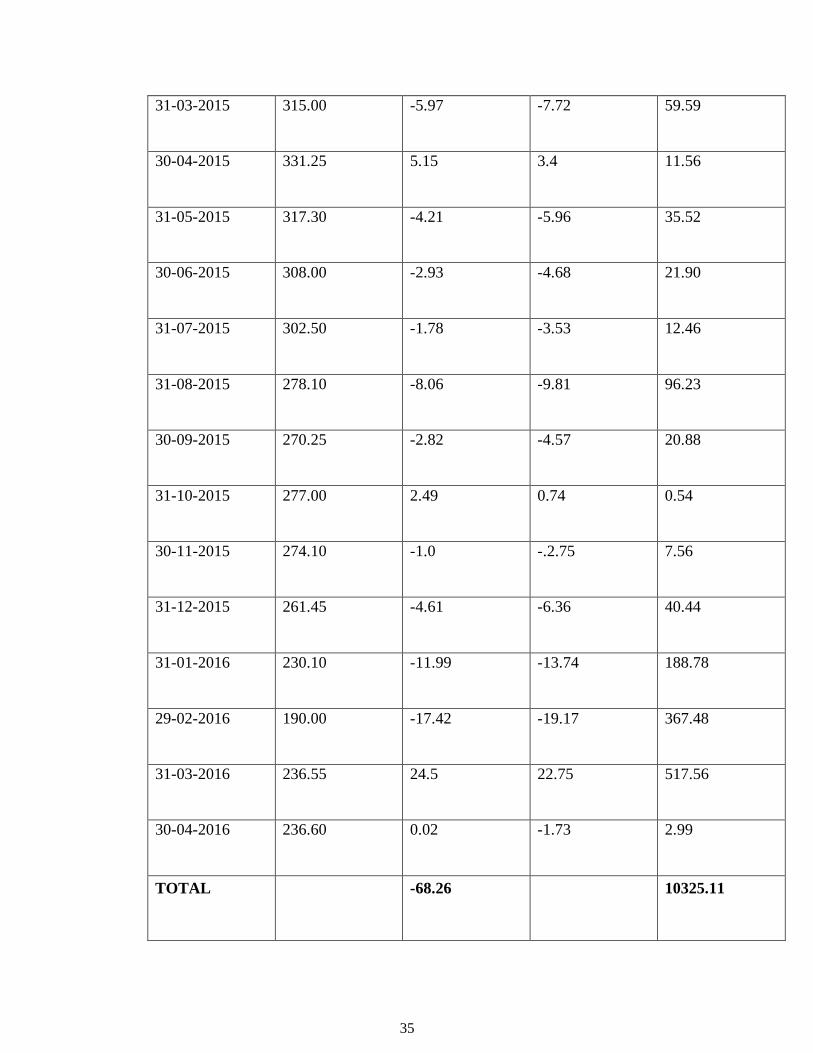
Table 4.2(a): -
Table showing the calculation of return and risk of ICICI Bank Ltd. for the period 2013
to 2016 April.
DATE SCRIP VALUE RETURN% R-R1 (R-R1)2
31-01-2013 1190.85
28-02-2013 1040.30 -12.64 -14.39 207.07
31-03-2013 1045.35 0.48 -1.27 1.61
30-04-2013 1163.15 11.26 9.51 90.44
31-05-2013 1154.30 -0.7 -2.45 6.00
30-06-2013 1069.75 -7.32 -9.07 82.26
31-07-2013 909.30 -14.99 -16.74 280.22
31-08-2013 804.30 -11.54 -13.29 176.62
30-09-2013 884.95 10.02 8.27 68.39
31-10-2013 1121.05 26.67 24.92 621.00
30-11-2013 1067.90 -4.74 -6.49 42.12
34
31-12-2013 1098.45 2.86 1.11 1.23
31-01-2014 988.50 -10.00 -11.75 138.06
28-02-2014 1043.70 5.58 3.83 14.66
31-03-201 1245.45 19.33 17.58 309.05
30-04-2014 1244.80 -0.05 -1.8 3.24
31-05-2014 1418.40 13.94 12.19 148.59
30-06-2014 1418.45 00 00 00
31-07-2014 1473.00 3.84 2.09 4.36
31-08-2014 1556.55 5.67 3.92 15.36
30-09-2014 1435.25 -7.79 -9.54 91.01
31-10-2014 1625.45 13.25 11.5 132.25
30-11-2014 350.92 -78.41 -80.16 6425.62
31-12-2014 353.00 0.59 -1.16 1.34
31-01-2015 361.15 2.30 0.55 0.30
28-02-2015 335.00 -7.24 -8.99 80.82
35
31-03-2015 315.00 -5.97 -7.72 59.59
30-04-2015 331.25 5.15 3.4 11.56
31-05-2015 317.30 -4.21 -5.96 35.52
30-06-2015 308.00 -2.93 -4.68 21.90
31-07-2015 302.50 -1.78 -3.53 12.46
31-08-2015 278.10 -8.06 -9.81 96.23
30-09-2015 270.25 -2.82 -4.57 20.88
31-10-2015 277.00 2.49 0.74 0.54
30-11-2015 274.10 -1.0 -.2.75 7.56
31-12-2015 261.45 -4.61 -6.36 40.44
31-01-2016 230.10 -11.99 -13.74 188.78
29-02-2016 190.00 -17.42 -19.17 367.48
31-03-2016 236.55 24.5 22.75 517.56
30-04-2016 236.60 0.02 -1.73 2.99
TOTAL -68.26 10325.11
36
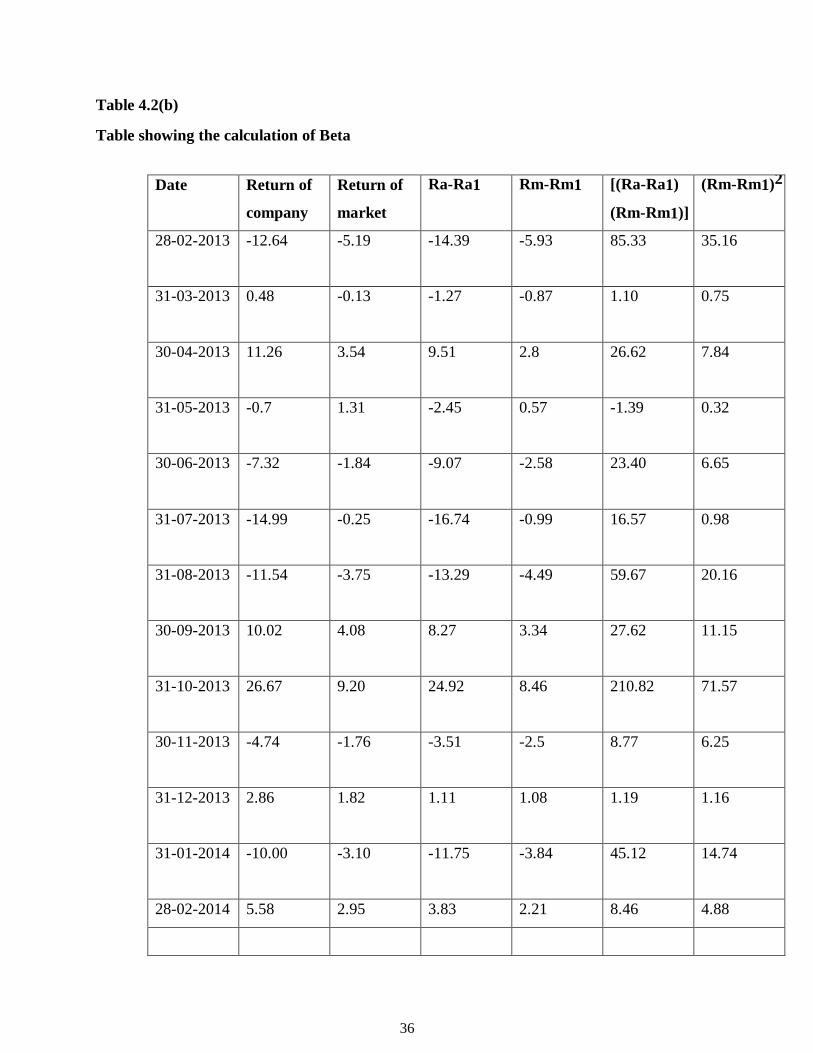
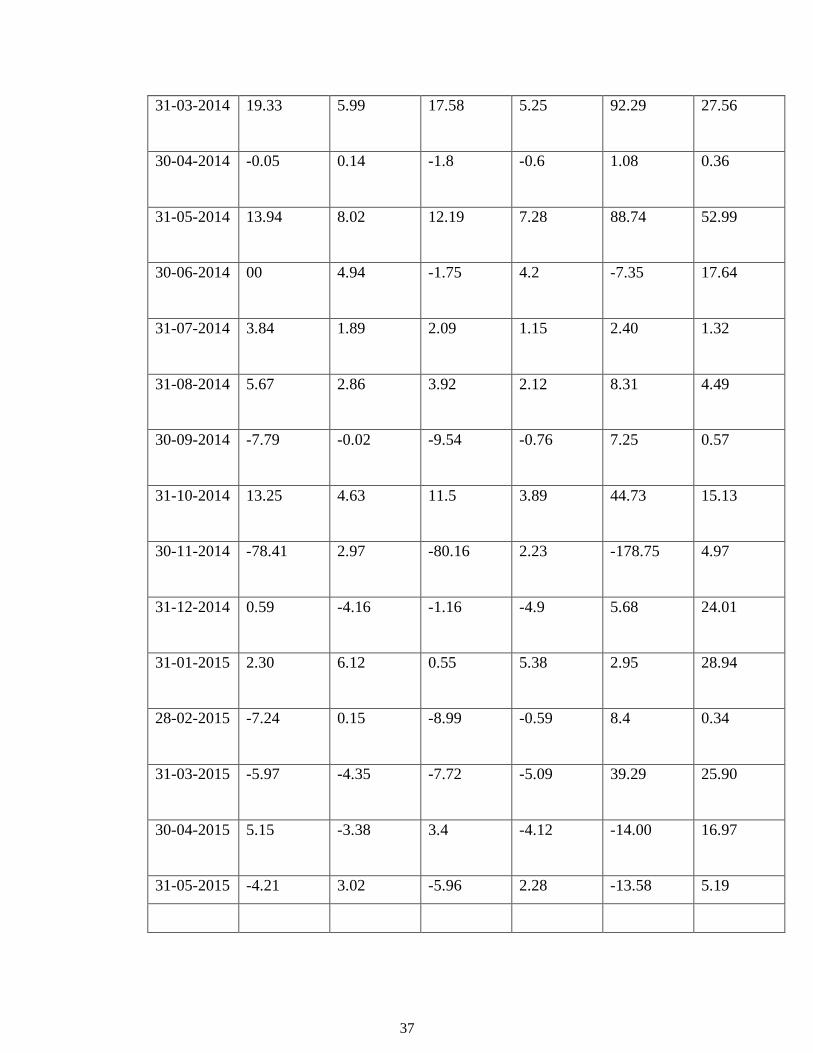
Table 4.2(b)
Table showing the calculation of Beta
Date Return of
company
Return of
market
Ra-Ra1 Rm-Rm1 [(Ra-Ra1)
(Rm-Rm1)]
(Rm-Rm1)2
28-02-2013 -12.64 -5.19 -14.39 -5.93 85.33 35.16
31-03-2013 0.48 -0.13 -1.27 -0.87 1.10 0.75
30-04-2013 11.26 3.54 9.51 2.8 26.62 7.84
31-05-2013 -0.7 1.31 -2.45 0.57 -1.39 0.32
30-06-2013 -7.32 -1.84 -9.07 -2.58 23.40 6.65
31-07-2013 -14.99 -0.25 -16.74 -0.99 16.57 0.98
31-08-2013 -11.54 -3.75 -13.29 -4.49 59.67 20.16
30-09-2013 10.02 4.08 8.27 3.34 27.62 11.15
31-10-2013 26.67 9.20 24.92 8.46 210.82 71.57
30-11-2013 -4.74 -1.76 -3.51 -2.5 8.77 6.25
31-12-2013 2.86 1.82 1.11 1.08 1.19 1.16
31-01-2014 -10.00 -3.10 -11.75 -3.84 45.12 14.74
28-02-2014 5.58 2.95 3.83 2.21 8.46 4.88
37
31-03-2014 19.33 5.99 17.58 5.25 92.29 27.56
30-04-2014 -0.05 0.14 -1.8 -0.6 1.08 0.36
31-05-2014 13.94 8.02 12.19 7.28 88.74 52.99
30-06-2014 00 4.94 -1.75 4.2 -7.35 17.64
31-07-2014 3.84 1.89 2.09 1.15 2.40 1.32
31-08-2014 5.67 2.86 3.92 2.12 8.31 4.49
30-09-2014 -7.79 -0.02 -9.54 -0.76 7.25 0.57
31-10-2014 13.25 4.63 11.5 3.89 44.73 15.13
30-11-2014 -78.41 2.97 -80.16 2.23 -178.75 4.97
31-12-2014 0.59 -4.16 -1.16 -4.9 5.68 24.01
31-01-2015 2.30 6.12 0.55 5.38 2.95 28.94
28-02-2015 -7.24 0.15 -8.99 -0.59 8.4 0.34
31-03-2015 -5.97 -4.35 -7.72 -5.09 39.29 25.90
30-04-2015 5.15 -3.38 3.4 -4.12 -14.00 16.97
31-05-2015 -4.21 3.02 -5.96 2.28 -13.58 5.19

38
30-06-2015 -2.93 -0.17 -4.68 -0.91 4.25 0.82
31-07-2015 -1.78 1.20 -3.53 0.46 -1.62 0.21
31-08-2015 -8.06 -6.51 -9.81 -7.25 71.12 52.56
30-09-2015 -2.82 -0.48 -4.57 -1.22 5.57 1.48
31-10-2015 2.49 1.91 0.74 1.17 0.86 1.36
30-11-2015 -1.0 -1.91 -2.75 -2.65 7.28 7.02
31-12-2015 -4.61 -0.10 -6.36 -0.84 5.34 0.70
31-01-2016 -11.99 -4.77 -13.74 -5.51 75.70 30.36
29-02-2016 -17.42 -7.51 -19.17 -8.25 158.15 68.06
31-03-2016 24.5 10.17 22.75 9.43 214.53 88.92
30-04-2016 0.02 1.04 -1.73 0.3 -0.51 0.09
TOTAL -68.26 28.92 1141.39 659.57
Calculation of return:
Return=(P1/P0*100)-100
Where, P1 = Current month price,
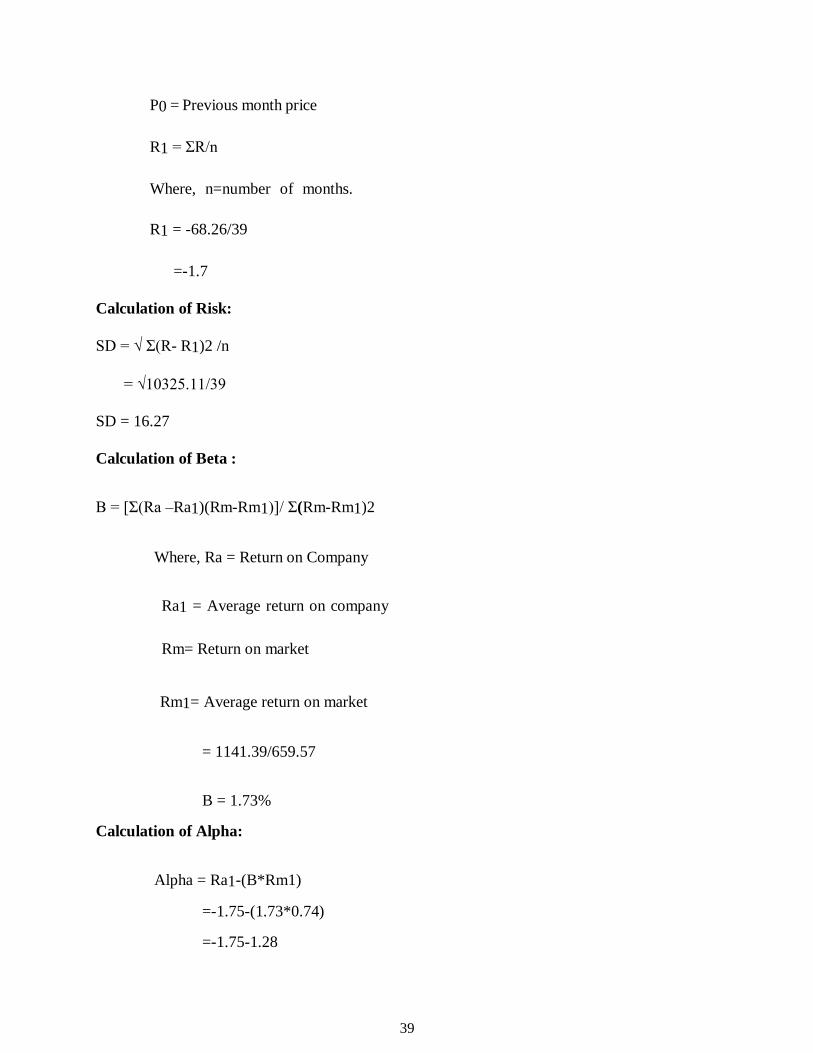
39
P0 = Previous month price
R1 = ΣR/n
Where, n=number of months.
R1 = -68.26/39
=-1.7
Calculation of Risk:
SD = √ Σ(R- R1)2 /n
= √10325.11/39
SD = 16.27
Calculation of Beta :
B = [Σ(Ra –Ra1)(Rm-Rm1)]/ Σ(Rm-Rm1)2
Where, Ra = Return on Company
Ra1 = Average return on company
Rm= Return on market
Rm1= Average return on market
= 1141.39/659.57
B = 1.73%
Calculation of Alpha:
Alpha = Ra1-(B*Rm1)
=-1.75-(1.73*0.74)
=-1.75-1.28
40
Alpha=-3.03
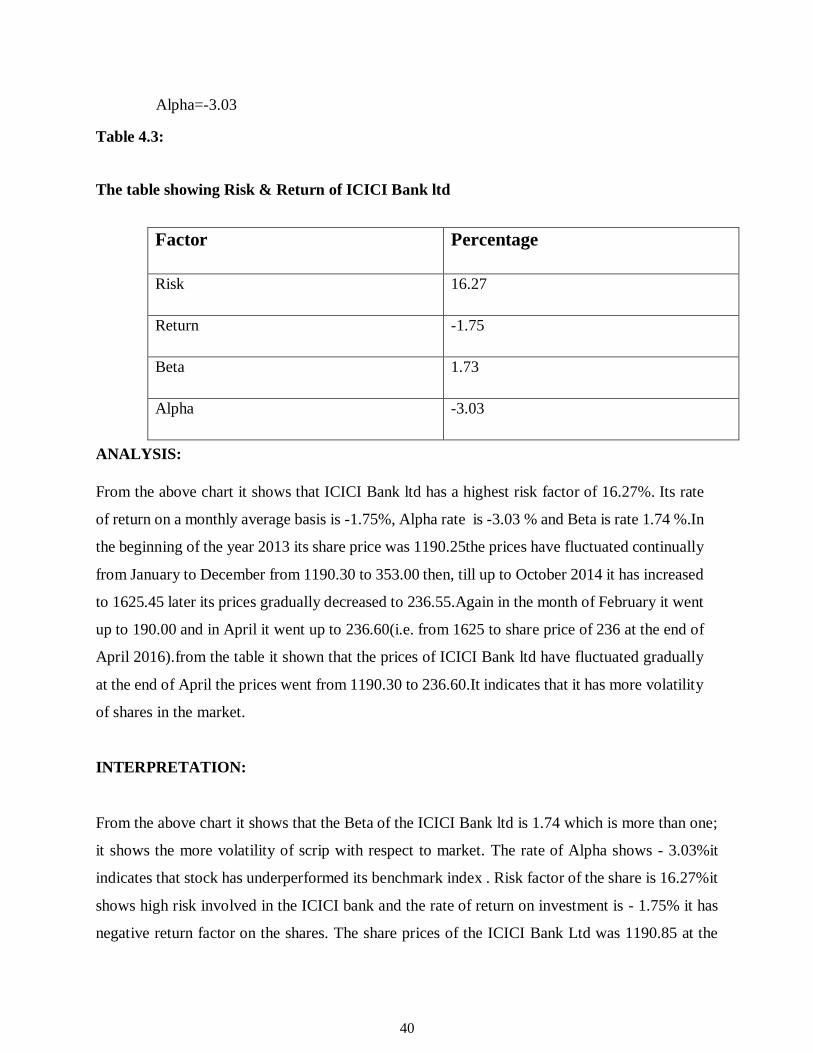
Table 4.3:
The table showing Risk & Return of ICICI Bank ltd
Factor Percentage
Risk 16.27
Return -1.75
Beta 1.73
Alpha -3.03
ANALYSIS:
From the above chart it shows that ICICI Bank ltd has a highest risk factor of 16.27%. Its rate
of return on a monthly average basis is -1.75%, Alpha rate is -3.03 % and Beta is rate 1.74 %.In
the beginning of the year 2013 its share price was 1190.25the prices have fluctuated continually
from January to December from 1190.30 to 353.00 then, till up to October 2014 it has increased
to 1625.45 later its prices gradually decreased to 236.55.Again in the month of February it went
up to 190.00 and in April it went up to 236.60(i.e. from 1625 to share price of 236 at the end of
April 2016).from the table it shown that the prices of ICICI Bank ltd have fluctuated gradually
at the end of April the prices went from 1190.30 to 236.60.It indicates that it has more volatility
of shares in the market.
INTERPRETATION:
From the above chart it shows that the Beta of the ICICI Bank ltd is 1.74 which is more than one;
it shows the more volatility of scrip with respect to market. The rate of Alpha shows - 3.03%it
indicates that stock has underperformed its benchmark index . Risk factor of the share is 16.27%it
shows high risk involved in the ICICI bank and the rate of return on investment is - 1.75% it has
negative return factor on the shares. The share prices of the ICICI Bank Ltd was 1190.85 at the
41
beginning of the year 2013 but has decreased to 236.60 at the end of the month April 2016. Hence
from this it can be concluded that due to decrease in share price risk has increased as shown in the
graph this is because split of stock.
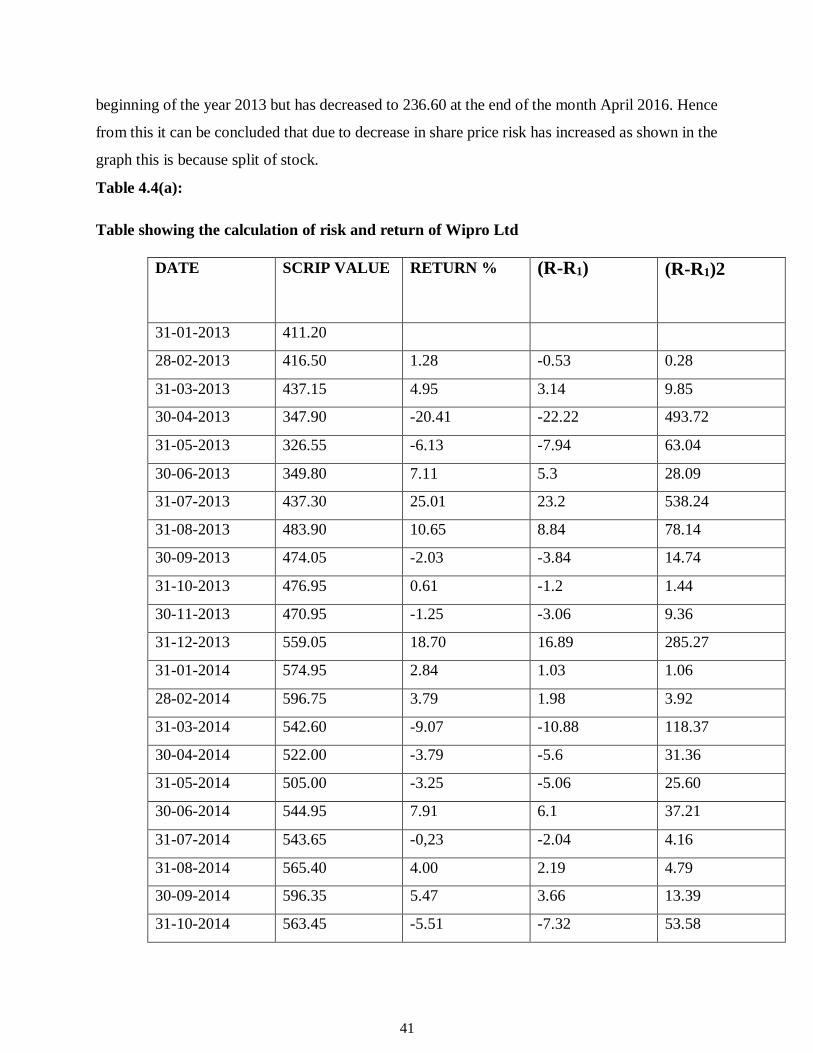
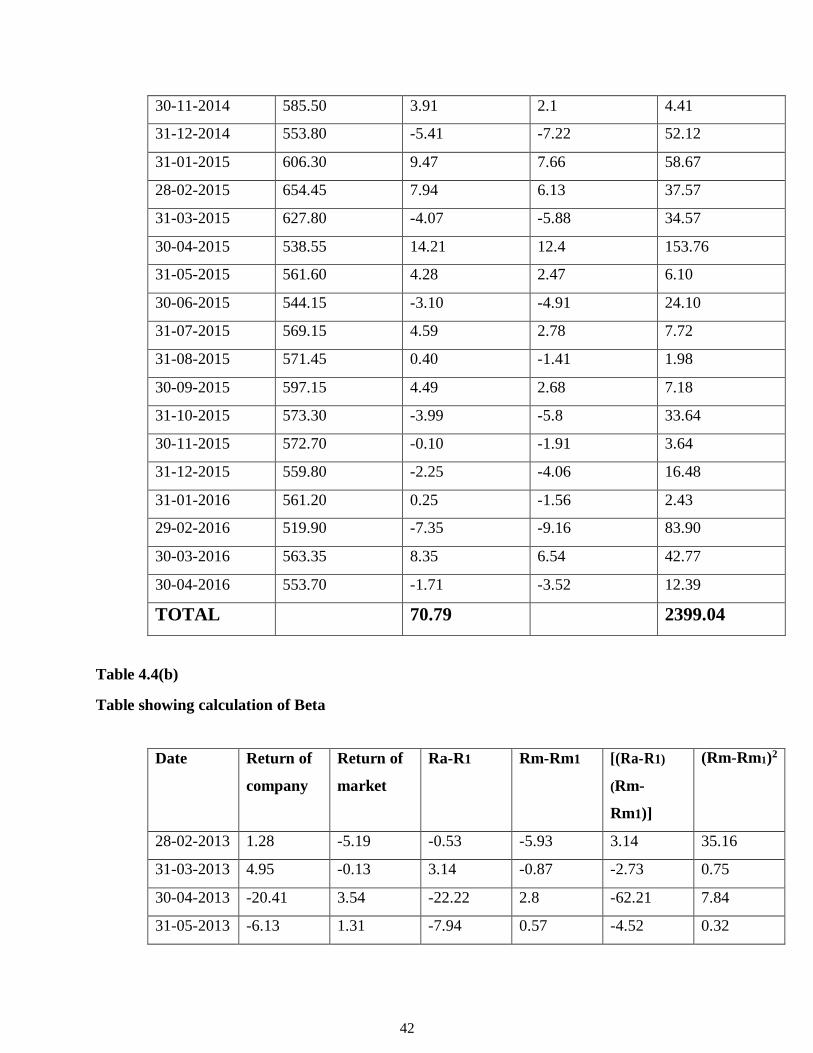
Table 4.4(a):
Table showing the calculation of risk and return of Wipro Ltd
DATE SCRIP VALUE RETURN % (R-R1) (R-R1)2
31-01-2013 411.20
28-02-2013 416.50 1.28 -0.53 0.28
31-03-2013 437.15 4.95 3.14 9.85
30-04-2013 347.90 -20.41 -22.22 493.72
31-05-2013 326.55 -6.13 -7.94 63.04
30-06-2013 349.80 7.11 5.3 28.09
31-07-2013 437.30 25.01 23.2 538.24
31-08-2013 483.90 10.65 8.84 78.14
30-09-2013 474.05 -2.03 -3.84 14.74
31-10-2013 476.95 0.61 -1.2 1.44
30-11-2013 470.95 -1.25 -3.06 9.36
31-12-2013 559.05 18.70 16.89 285.27
31-01-2014 574.95 2.84 1.03 1.06
28-02-2014 596.75 3.79 1.98 3.92
31-03-2014 542.60 -9.07 -10.88 118.37
30-04-2014 522.00 -3.79 -5.6 31.36
31-05-2014 505.00 -3.25 -5.06 25.60
30-06-2014 544.95 7.91 6.1 37.21
31-07-2014 543.65 -0,23 -2.04 4.16
31-08-2014 565.40 4.00 2.19 4.79
30-09-2014 596.35 5.47 3.66 13.39
31-10-2014 563.45 -5.51 -7.32 53.58
42
30-11-2014 585.50 3.91 2.1 4.41
31-12-2014 553.80 -5.41 -7.22 52.12
31-01-2015 606.30 9.47 7.66 58.67
28-02-2015 654.45 7.94 6.13 37.57
31-03-2015 627.80 -4.07 -5.88 34.57
30-04-2015 538.55 14.21 12.4 153.76
31-05-2015 561.60 4.28 2.47 6.10
30-06-2015 544.15 -3.10 -4.91 24.10
31-07-2015 569.15 4.59 2.78 7.72
31-08-2015 571.45 0.40 -1.41 1.98
30-09-2015 597.15 4.49 2.68 7.18
31-10-2015 573.30 -3.99 -5.8 33.64
30-11-2015 572.70 -0.10 -1.91 3.64
31-12-2015 559.80 -2.25 -4.06 16.48
31-01-2016 561.20 0.25 -1.56 2.43
29-02-2016 519.90 -7.35 -9.16 83.90
30-03-2016 563.35 8.35 6.54 42.77
30-04-2016 553.70 -1.71 -3.52 12.39
TOTAL 70.79 2399.04
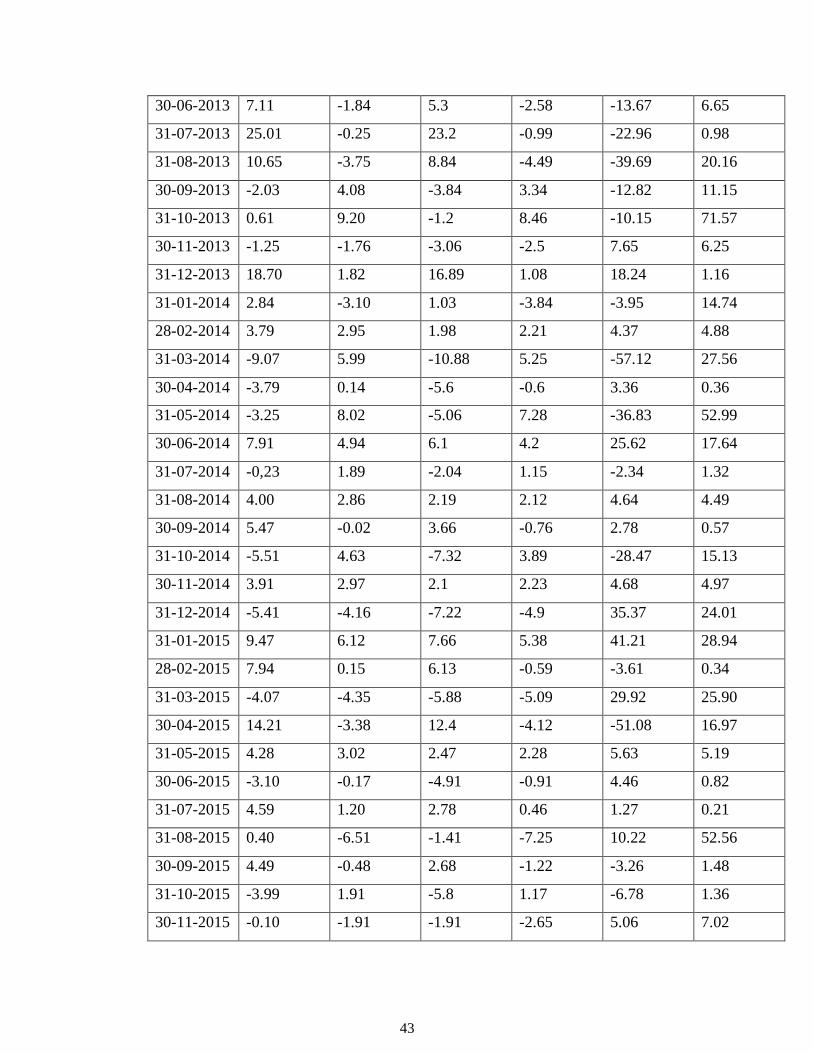
Table 4.4(b)
Table showing calculation of Beta
Date Return of
company
Return of
market
Ra-R1 Rm-Rm1 [(Ra-R1)
(Rm-
Rm1)]
(Rm-Rm1)2
28-02-2013 1.28 -5.19 -0.53 -5.93 3.14 35.16
31-03-2013 4.95 -0.13 3.14 -0.87 -2.73 0.75
30-04-2013 -20.41 3.54 -22.22 2.8 -62.21 7.84
31-05-2013 -6.13 1.31 -7.94 0.57 -4.52 0.32
43
30-06-2013 7.11 -1.84 5.3 -2.58 -13.67 6.65
31-07-2013 25.01 -0.25 23.2 -0.99 -22.96 0.98
31-08-2013 10.65 -3.75 8.84 -4.49 -39.69 20.16
30-09-2013 -2.03 4.08 -3.84 3.34 -12.82 11.15
31-10-2013 0.61 9.20 -1.2 8.46 -10.15 71.57
30-11-2013 -1.25 -1.76 -3.06 -2.5 7.65 6.25
31-12-2013 18.70 1.82 16.89 1.08 18.24 1.16
31-01-2014 2.84 -3.10 1.03 -3.84 -3.95 14.74
28-02-2014 3.79 2.95 1.98 2.21 4.37 4.88
31-03-2014 -9.07 5.99 -10.88 5.25 -57.12 27.56
30-04-2014 -3.79 0.14 -5.6 -0.6 3.36 0.36
31-05-2014 -3.25 8.02 -5.06 7.28 -36.83 52.99
30-06-2014 7.91 4.94 6.1 4.2 25.62 17.64
31-07-2014 -0,23 1.89 -2.04 1.15 -2.34 1.32
31-08-2014 4.00 2.86 2.19 2.12 4.64 4.49
30-09-2014 5.47 -0.02 3.66 -0.76 2.78 0.57
31-10-2014 -5.51 4.63 -7.32 3.89 -28.47 15.13
30-11-2014 3.91 2.97 2.1 2.23 4.68 4.97
31-12-2014 -5.41 -4.16 -7.22 -4.9 35.37 24.01
31-01-2015 9.47 6.12 7.66 5.38 41.21 28.94
28-02-2015 7.94 0.15 6.13 -0.59 -3.61 0.34
31-03-2015 -4.07 -4.35 -5.88 -5.09 29.92 25.90
30-04-2015 14.21 -3.38 12.4 -4.12 -51.08 16.97
31-05-2015 4.28 3.02 2.47 2.28 5.63 5.19
30-06-2015 -3.10 -0.17 -4.91 -0.91 4.46 0.82
31-07-2015 4.59 1.20 2.78 0.46 1.27 0.21
31-08-2015 0.40 -6.51 -1.41 -7.25 10.22 52.56
30-09-2015 4.49 -0.48 2.68 -1.22 -3.26 1.48
31-10-2015 -3.99 1.91 -5.8 1.17 -6.78 1.36
30-11-2015 -0.10 -1.91 -1.91 -2.65 5.06 7.02
44
31-12-2015 -2.25 -0.10 -4.06 -0.84 3.41 0.70
31-01-2016 0.25 -4.77 -1.56 -5.51 8.59 30.36
29-02-2016 -7.35 -7.51 -9.16 -8.25 75.57 68.06
30-03-2016 8.35 10.17 6.54 9.43 61.67 88.92
30-04-2016 -1.71 1.04 -3.52 0.30 -1.05 0.09
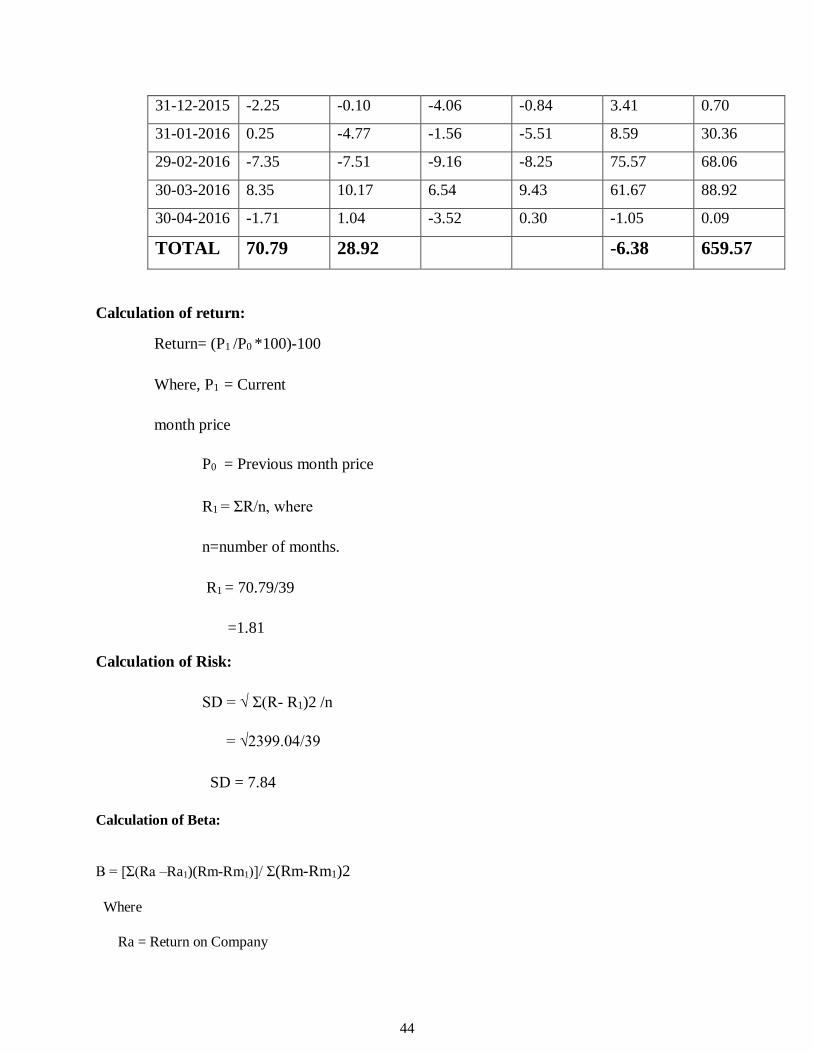
TOTAL 70.79 28.92 -6.38 659.57
Calculation of return:
Return= (P1 /P0 *100)-100
Where, P1 = Current
month price
P0 = Previous month price
R1 = ΣR/n, where
n=number of months.
R1 = 70.79/39
=1.81
Calculation of Risk:
SD = √ Σ(R- R1)2 /n
= √2399.04/39
SD = 7.84
Calculation of Beta:
B = [Σ(Ra –Ra1)(Rm-Rm1)]/ Σ(Rm-Rm1)2
Where
Ra = Return on Company
45
Ra1= Average return on company
Rm= Return on market
Rm1= Average return on market
= -6.38/659.57
= - 0.009
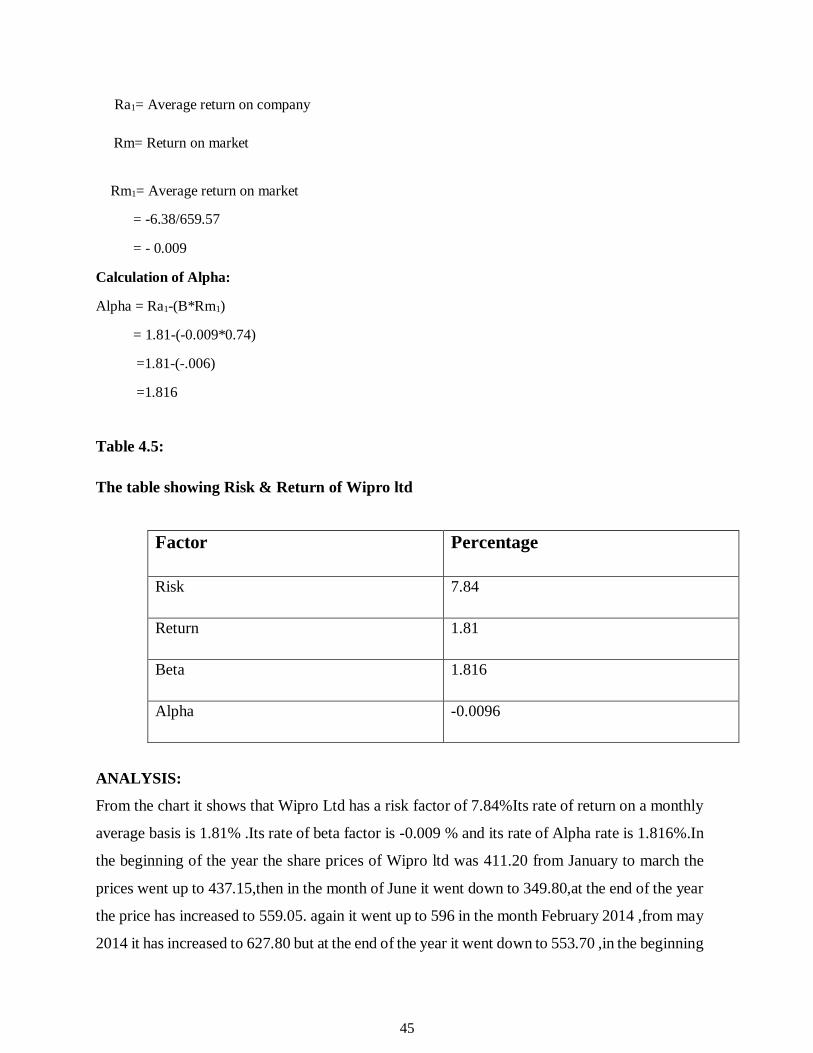
Calculation of Alpha:
Alpha = Ra1-(B*Rm1)
= 1.81-(-0.009*0.74)
=1.81-(-.006)
=1.816
Table 4.5:
The table showing Risk & Return of Wipro ltd
Factor Percentage
Risk 7.84
Return 1.81
Beta 1.816
Alpha -0.0096
ANALYSIS:
From the chart it shows that Wipro Ltd has a risk factor of 7.84%Its rate of return on a monthly
average basis is 1.81% .Its rate of beta factor is -0.009 % and its rate of Alpha rate is 1.816%.In
the beginning of the year the share prices of Wipro ltd was 411.20 from January to march the
prices went up to 437.15,then in the month of June it went down to 349.80,at the end of the year
the price has increased to 559.05. again it went up to 596 in the month February 2014 ,from may
2014 it has increased to 627.80 but at the end of the year it went down to 553.70 ,in the beginning
46
of the year 2015 the price went up to 606.30 and it has decreased to 559.15 at the end of the
year. In the beginning of the year 2016 its price was 561.20 but in the month April it went down
to 553.70. From the table it shown that Wipro Ltd share prices has increased from 411.20 to the
price of 553.73 from 2013 to end of April2016.
INTERPRETATION:
From the chart it shows that the Beta of the Wipro ltd is -0.009% which has a negative beta
correlation would mean an investment that moves in the opposite direction from the stock market.
When the market rises, then a negative-beta investment generally falls. When the market falls, then
the negative-beta investment will tend to rise.it shows the less volatility of scrip with respect to
market .the rate of Alpha shows 1.816% it indicates that stock has outperformed its benchmark
index. Risk factor of the share is 7.84% it shows low risk involved in the Wipro ltd investment and
the rate of return on investment is only 1.81%.The share prices of the Wipro Ltd was 411.20 at the
beginning of the year 2013 but has increased to 553.73 at the end of the month April 2016. Hence
from this it can be concluded that due to increase in share price risk has decreased as shown in the
above chart.
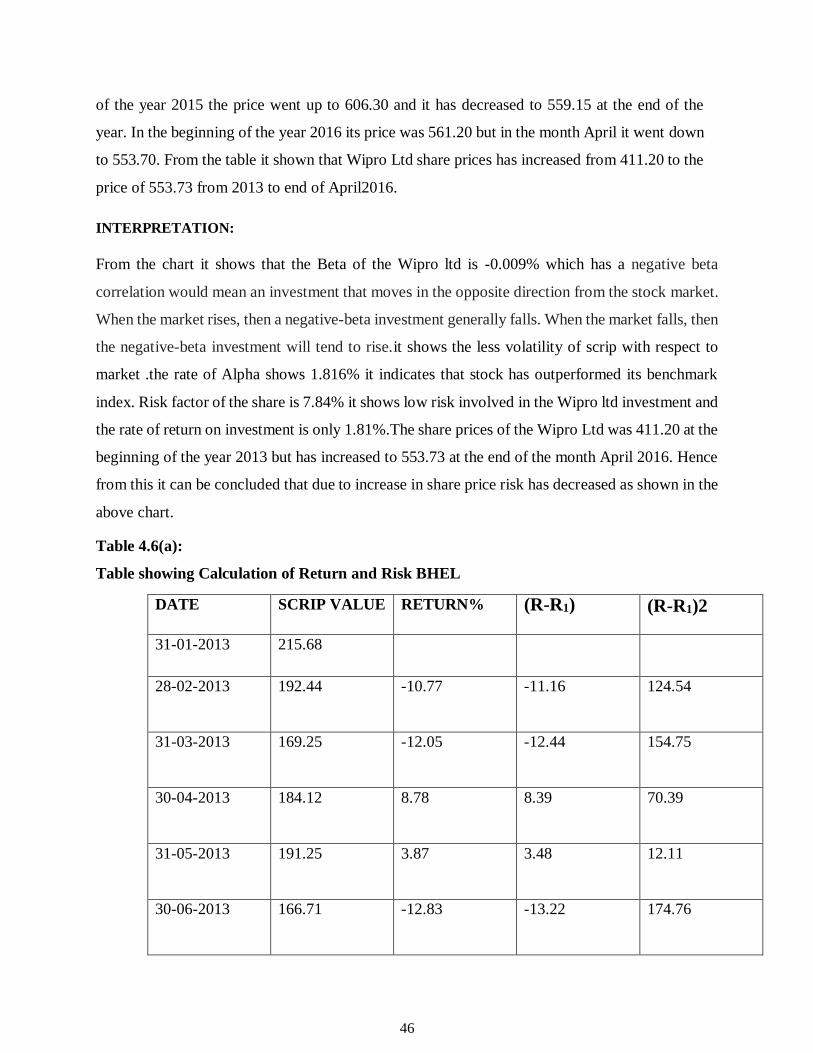
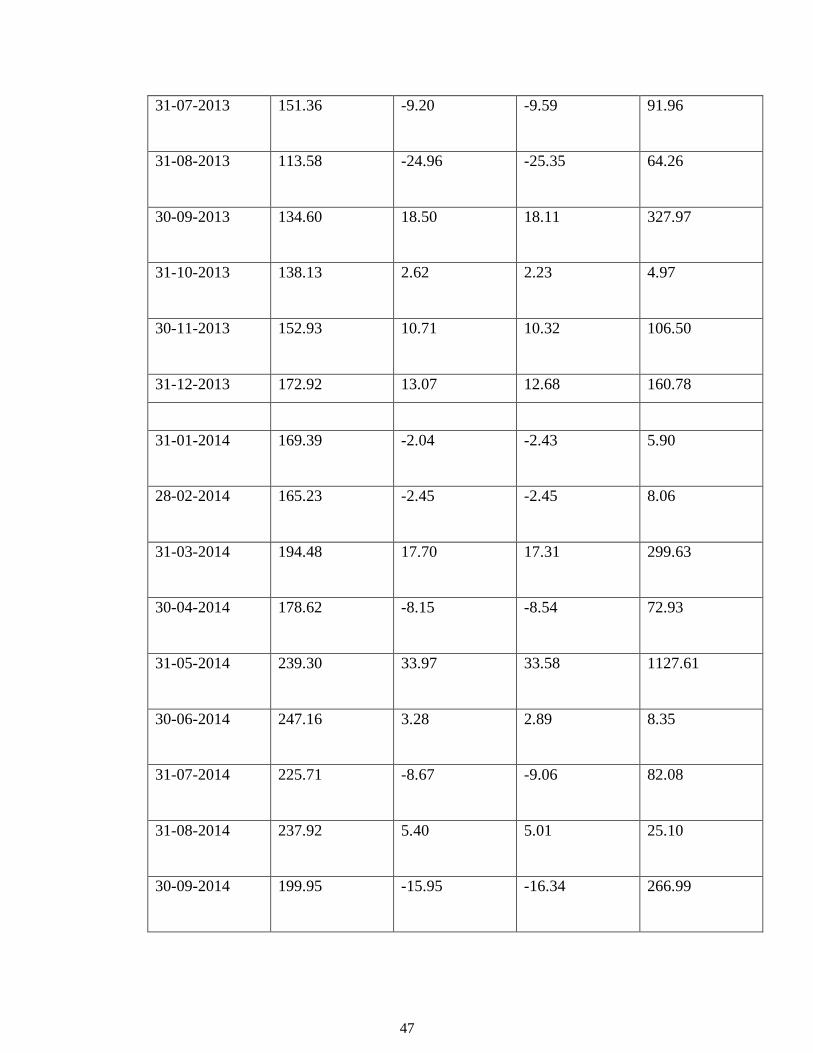
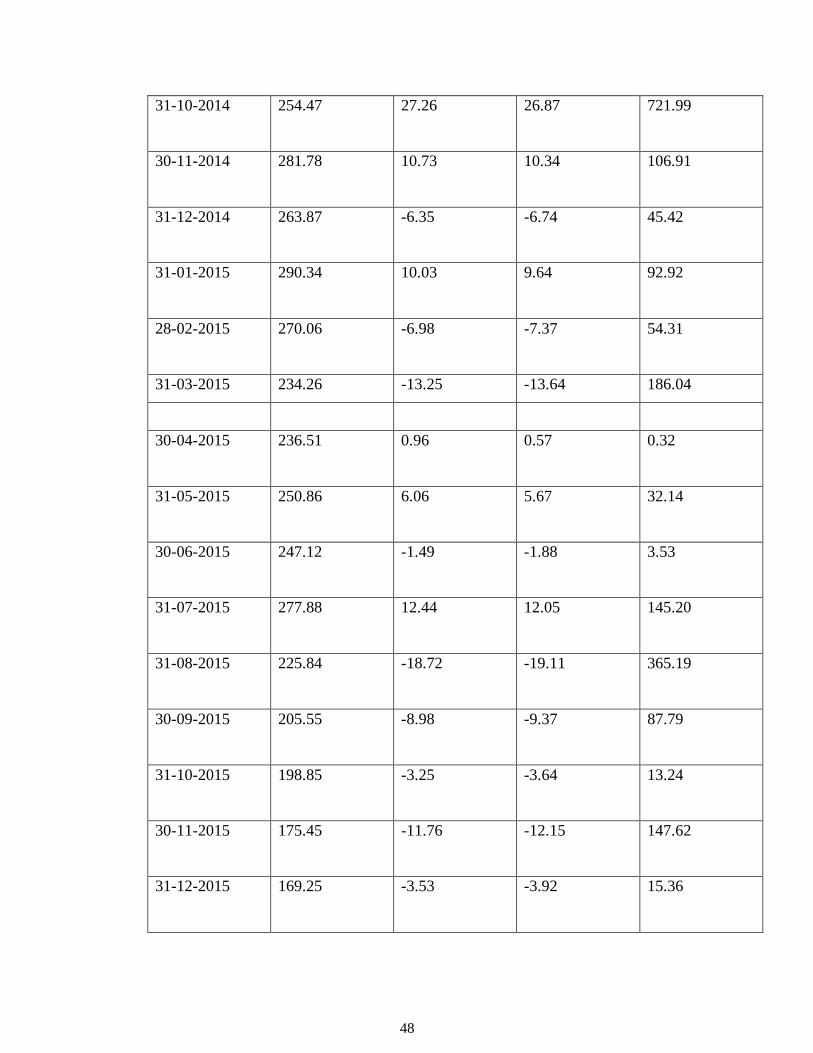
Table 4.6(a):
Table showing Calculation of Return and Risk BHEL
DATE SCRIP VALUE RETURN% (R-R1) (R-R1)2
31-01-2013 215.68
28-02-2013 192.44 -10.77 -11.16 124.54
31-03-2013 169.25 -12.05 -12.44 154.75
30-04-2013 184.12 8.78 8.39 70.39
31-05-2013 191.25 3.87 3.48 12.11
30-06-2013 166.71 -12.83 -13.22 174.76
47
31-07-2013 151.36 -9.20 -9.59 91.96
31-08-2013 113.58 -24.96 -25.35 64.26
30-09-2013 134.60 18.50 18.11 327.97
31-10-2013 138.13 2.62 2.23 4.97
30-11-2013 152.93 10.71 10.32 106.50
31-12-2013 172.92 13.07 12.68 160.78
31-01-2014 169.39 -2.04 -2.43 5.90
28-02-2014 165.23 -2.45 -2.45 8.06
31-03-2014 194.48 17.70 17.31 299.63
30-04-2014 178.62 -8.15 -8.54 72.93
31-05-2014 239.30 33.97 33.58 1127.61
30-06-2014 247.16 3.28 2.89 8.35
31-07-2014 225.71 -8.67 -9.06 82.08
31-08-2014 237.92 5.40 5.01 25.10
30-09-2014 199.95 -15.95 -16.34 266.99
48
31-10-2014 254.47 27.26 26.87 721.99
30-11-2014 281.78 10.73 10.34 106.91
31-12-2014 263.87 -6.35 -6.74 45.42
31-01-2015 290.34 10.03 9.64 92.92
28-02-2015 270.06 -6.98 -7.37 54.31
31-03-2015 234.26 -13.25 -13.64 186.04
30-04-2015 236.51 0.96 0.57 0.32
31-05-2015 250.86 6.06 5.67 32.14
30-06-2015 247.12 -1.49 -1.88 3.53
31-07-2015 277.88 12.44 12.05 145.20
31-08-2015 225.84 -18.72 -19.11 365.19
30-09-2015 205.55 -8.98 -9.37 87.79
31-10-2015 198.85 -3.25 -3.64 13.24
30-11-2015 175.45 -11.76 -12.15 147.62
31-12-2015 169.25 -3.53 -3.92 15.36
49
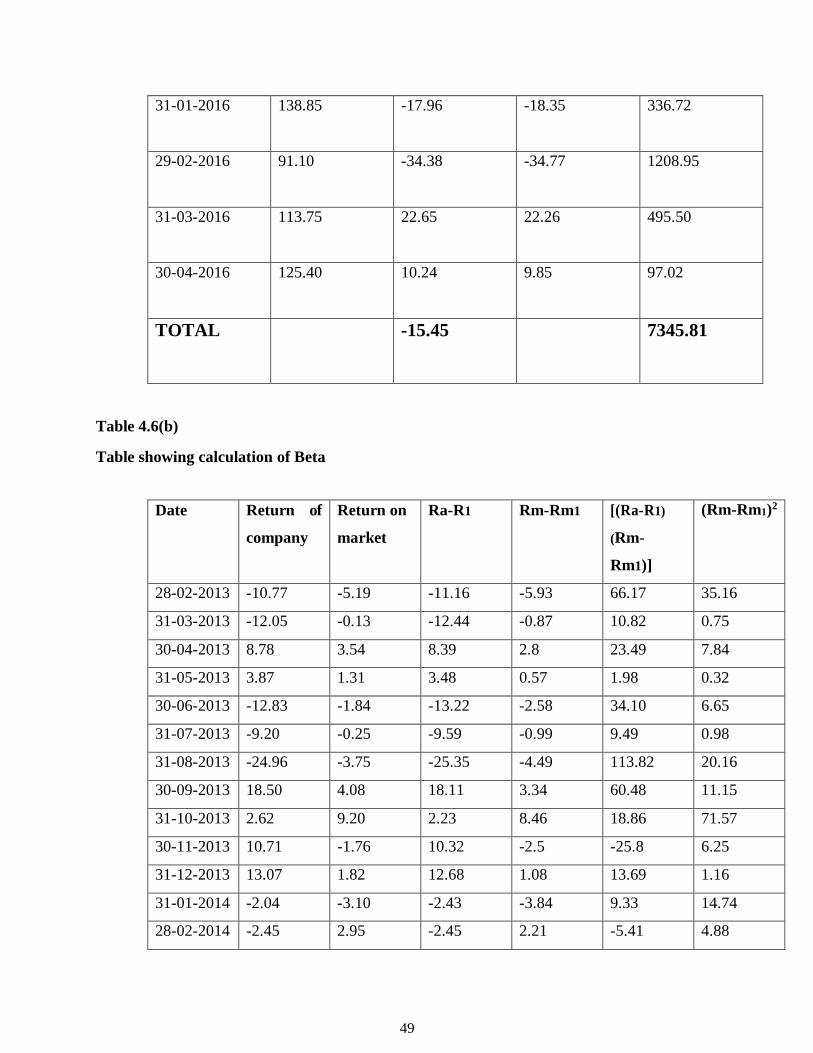
31-01-2016 138.85 -17.96 -18.35 336.72
29-02-2016 91.10 -34.38 -34.77 1208.95
31-03-2016 113.75 22.65 22.26 495.50
30-04-2016 125.40 10.24 9.85 97.02
TOTAL -15.45 7345.81
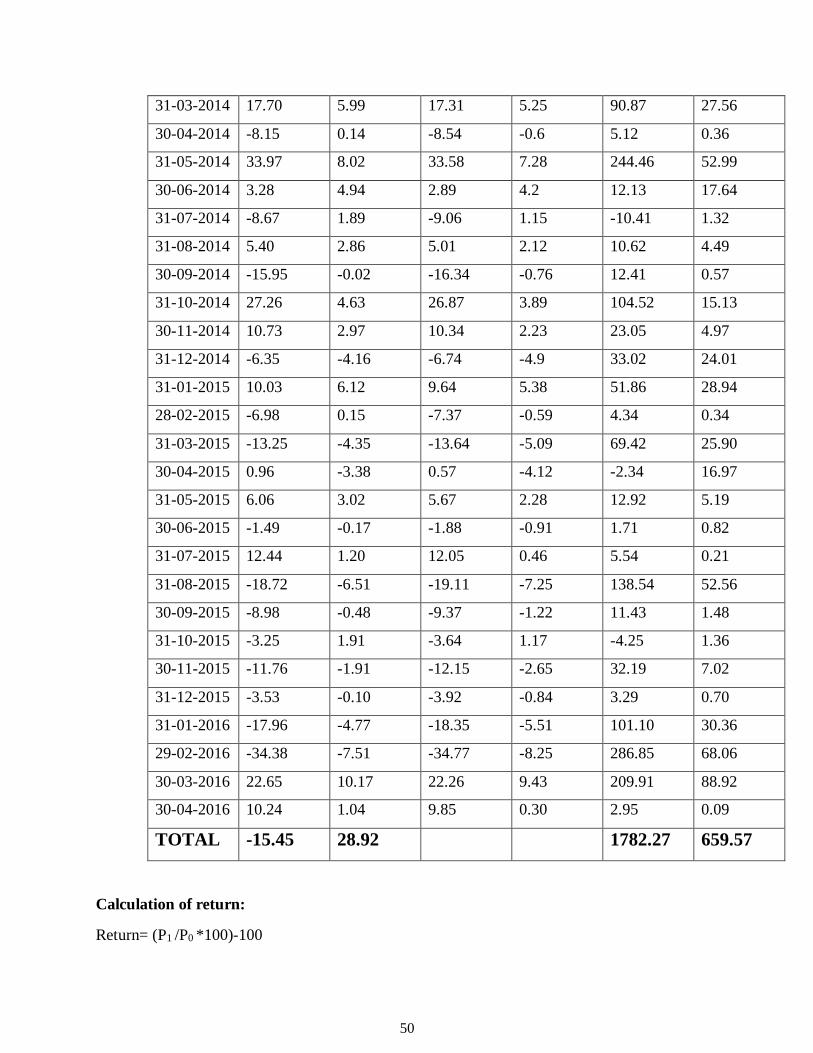
Table 4.6(b)
Table showing calculation of Beta
Date Return of
company
Return on
market
Ra-R1 Rm-Rm1 [(Ra-R1)
(Rm-
Rm1)]
(Rm-Rm1)2
28-02-2013 -10.77 -5.19 -11.16 -5.93 66.17 35.16
31-03-2013 -12.05 -0.13 -12.44 -0.87 10.82 0.75
30-04-2013 8.78 3.54 8.39 2.8 23.49 7.84
31-05-2013 3.87 1.31 3.48 0.57 1.98 0.32
30-06-2013 -12.83 -1.84 -13.22 -2.58 34.10 6.65
31-07-2013 -9.20 -0.25 -9.59 -0.99 9.49 0.98
31-08-2013 -24.96 -3.75 -25.35 -4.49 113.82 20.16
30-09-2013 18.50 4.08 18.11 3.34 60.48 11.15
31-10-2013 2.62 9.20 2.23 8.46 18.86 71.57
30-11-2013 10.71 -1.76 10.32 -2.5 -25.8 6.25
31-12-2013 13.07 1.82 12.68 1.08 13.69 1.16
31-01-2014 -2.04 -3.10 -2.43 -3.84 9.33 14.74
28-02-2014 -2.45 2.95 -2.45 2.21 -5.41 4.88
50
31-03-2014 17.70 5.99 17.31 5.25 90.87 27.56
30-04-2014 -8.15 0.14 -8.54 -0.6 5.12 0.36
31-05-2014 33.97 8.02 33.58 7.28 244.46 52.99
30-06-2014 3.28 4.94 2.89 4.2 12.13 17.64
31-07-2014 -8.67 1.89 -9.06 1.15 -10.41 1.32
31-08-2014 5.40 2.86 5.01 2.12 10.62 4.49
30-09-2014 -15.95 -0.02 -16.34 -0.76 12.41 0.57
31-10-2014 27.26 4.63 26.87 3.89 104.52 15.13
30-11-2014 10.73 2.97 10.34 2.23 23.05 4.97
31-12-2014 -6.35 -4.16 -6.74 -4.9 33.02 24.01
31-01-2015 10.03 6.12 9.64 5.38 51.86 28.94
28-02-2015 -6.98 0.15 -7.37 -0.59 4.34 0.34
31-03-2015 -13.25 -4.35 -13.64 -5.09 69.42 25.90
30-04-2015 0.96 -3.38 0.57 -4.12 -2.34 16.97
31-05-2015 6.06 3.02 5.67 2.28 12.92 5.19
30-06-2015 -1.49 -0.17 -1.88 -0.91 1.71 0.82
31-07-2015 12.44 1.20 12.05 0.46 5.54 0.21
31-08-2015 -18.72 -6.51 -19.11 -7.25 138.54 52.56
30-09-2015 -8.98 -0.48 -9.37 -1.22 11.43 1.48
31-10-2015 -3.25 1.91 -3.64 1.17 -4.25 1.36
30-11-2015 -11.76 -1.91 -12.15 -2.65 32.19 7.02
31-12-2015 -3.53 -0.10 -3.92 -0.84 3.29 0.70
31-01-2016 -17.96 -4.77 -18.35 -5.51 101.10 30.36
29-02-2016 -34.38 -7.51 -34.77 -8.25 286.85 68.06
30-03-2016 22.65 10.17 22.26 9.43 209.91 88.92
30-04-2016 10.24 1.04 9.85 0.30 2.95 0.09
TOTAL -15.45 28.92 1782.27 659.57
Calculation of return:
Return= (P1 /P0 *100)-100

51
Where, P1 = Current month price,
P0 = Previous monthprice
R1 = ΣR/n
n=number of months.
R1 = -15.45/3
=-0.39%
Calculation of Risk:
SD = √ Σ(R- R1)2 /n
=√7345.81/39
SD = 13.72
Calculation of Beta:
B = [Σ(Ra –Ra1)(Rm-Rm1)]/ Σ(Rm-Rm1)2
Where, Ra = Return on Company
Ra1= Average return on company
Rm= Return on market
Rm1= Average return on market
= 1782.27/659.57
B = 2.70
Calculation of Alpha:
Alpha = Ra1-(B*Rm1)
= 0.39-(2.70*0.74) = - 1.6
52
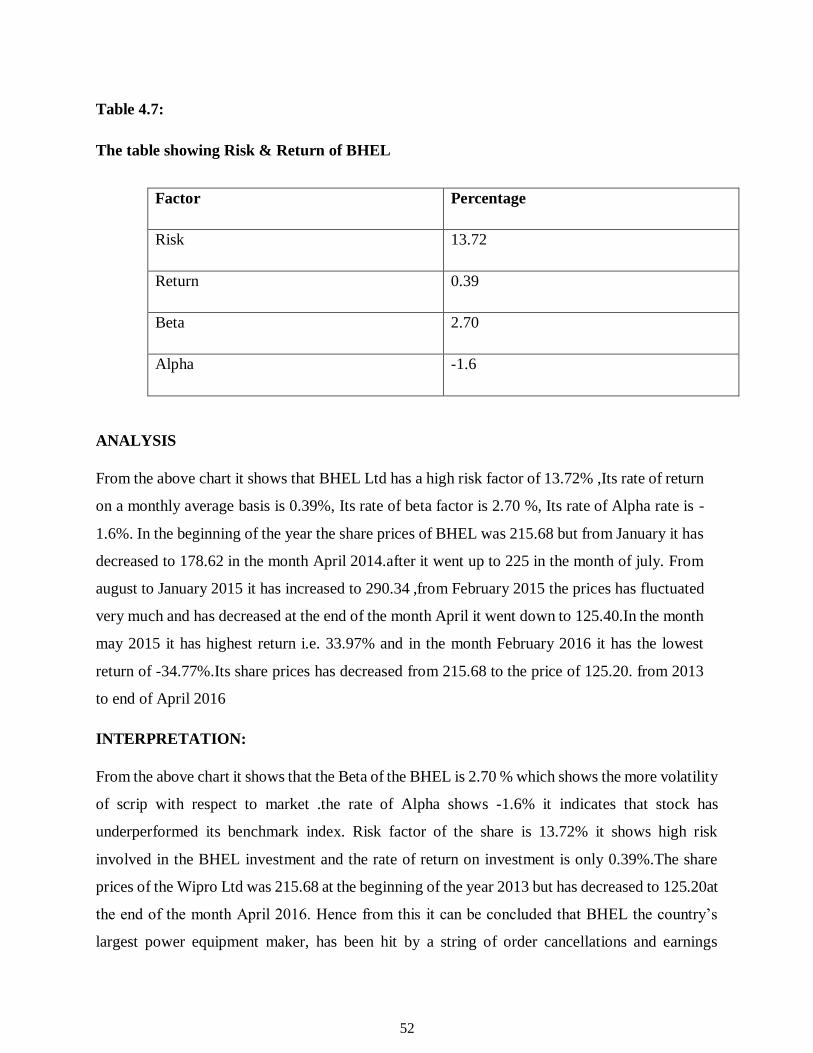
Table 4.7:
The table showing Risk & Return of BHEL
Factor Percentage
Risk 13.72
Return 0.39
Beta 2.70
Alpha -1.6
ANALYSIS
From the above chart it shows that BHEL Ltd has a high risk factor of 13.72% ,Its rate of return
on a monthly average basis is 0.39%, Its rate of beta factor is 2.70 %, Its rate of Alpha rate is -
1.6%. In the beginning of the year the share prices of BHEL was 215.68 but from January it has
decreased to 178.62 in the month April 2014.after it went up to 225 in the month of july. From
august to January 2015 it has increased to 290.34 ,from February 2015 the prices has fluctuated
very much and has decreased at the end of the month April it went down to 125.40.In the month
may 2015 it has highest return i.e. 33.97% and in the month February 2016 it has the lowest
return of -34.77%.Its share prices has decreased from 215.68 to the price of 125.20. from 2013
to end of April 2016
INTERPRETATION:
From the above chart it shows that the Beta of the BHEL is 2.70 % which shows the more volatility
of scrip with respect to market .the rate of Alpha shows -1.6% it indicates that stock has
underperformed its benchmark index. Risk factor of the share is 13.72% it shows high risk
involved in the BHEL investment and the rate of return on investment is only 0.39%.The share
prices of the Wipro Ltd was 215.68 at the beginning of the year 2013 but has decreased to 125.20at
the end of the month April 2016. Hence from this it can be concluded that BHEL the country’s
largest power equipment maker, has been hit by a string of order cancellations and earnings
53
downgrade over the past month over the last month, the stock has fallen 20 percent, while the
Sensex has declined 2.5 percent .New orders are difficult to come because high interest rates have
affected the investment cycle. So, cancellation of orders leads to negative sentiments and decreased
in the value of shares
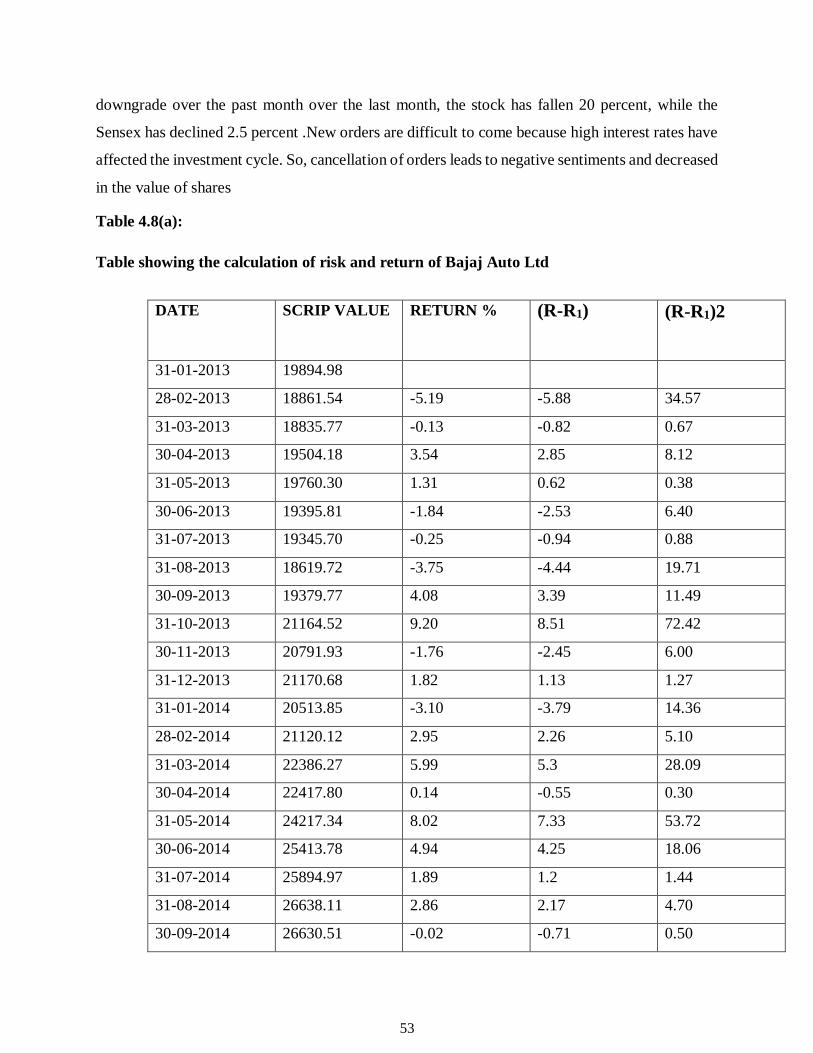
Table 4.8(a):
Table showing the calculation of risk and return of Bajaj Auto Ltd
DATE SCRIP VALUE RETURN % (R-R1) (R-R1)2
31-01-2013 19894.98
28-02-2013 18861.54 -5.19 -5.88 34.57
31-03-2013 18835.77 -0.13 -0.82 0.67
30-04-2013 19504.18 3.54 2.85 8.12
31-05-2013 19760.30 1.31 0.62 0.38
30-06-2013 19395.81 -1.84 -2.53 6.40
31-07-2013 19345.70 -0.25 -0.94 0.88
31-08-2013 18619.72 -3.75 -4.44 19.71
30-09-2013 19379.77 4.08 3.39 11.49
31-10-2013 21164.52 9.20 8.51 72.42
30-11-2013 20791.93 -1.76 -2.45 6.00
31-12-2013 21170.68 1.82 1.13 1.27
31-01-2014 20513.85 -3.10 -3.79 14.36
28-02-2014 21120.12 2.95 2.26 5.10
31-03-2014 22386.27 5.99 5.3 28.09
30-04-2014 22417.80 0.14 -0.55 0.30
31-05-2014 24217.34 8.02 7.33 53.72
30-06-2014 25413.78 4.94 4.25 18.06
31-07-2014 25894.97 1.89 1.2 1.44
31-08-2014 26638.11 2.86 2.17 4.70
30-09-2014 26630.51 -0.02 -0.71 0.50
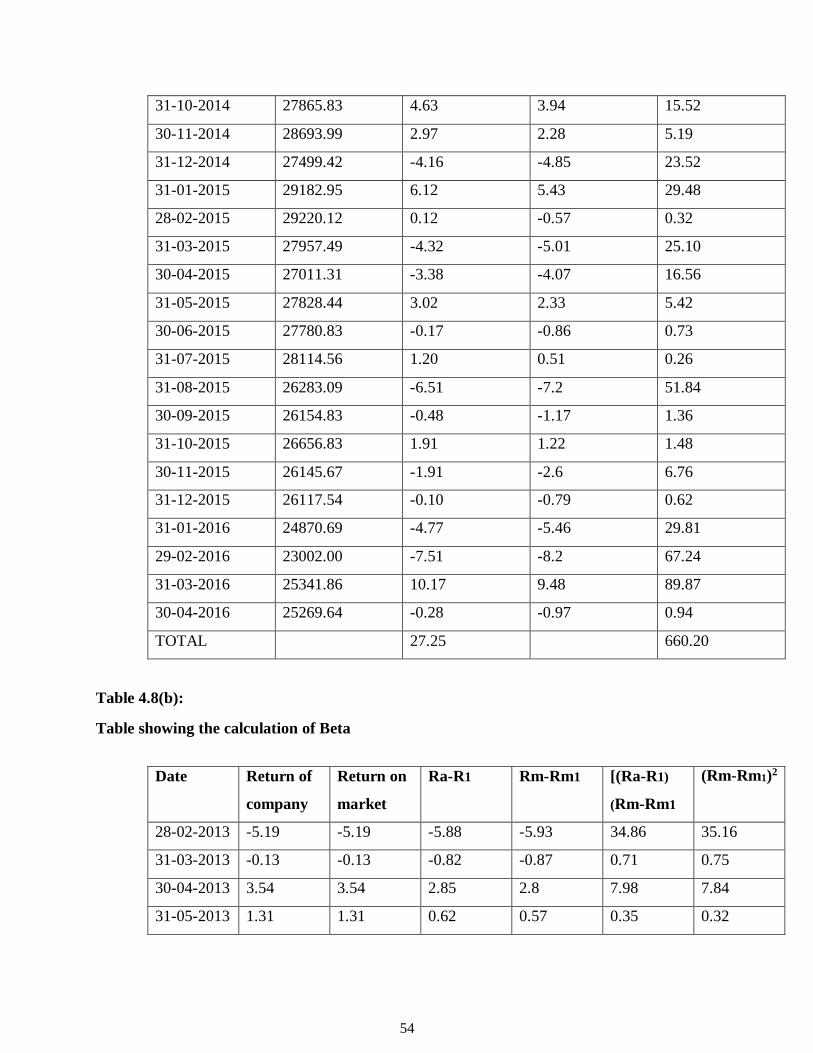
54
31-10-2014 27865.83 4.63 3.94 15.52
30-11-2014 28693.99 2.97 2.28 5.19
31-12-2014 27499.42 -4.16 -4.85 23.52
31-01-2015 29182.95 6.12 5.43 29.48
28-02-2015 29220.12 0.12 -0.57 0.32
31-03-2015 27957.49 -4.32 -5.01 25.10
30-04-2015 27011.31 -3.38 -4.07 16.56
31-05-2015 27828.44 3.02 2.33 5.42
30-06-2015 27780.83 -0.17 -0.86 0.73
31-07-2015 28114.56 1.20 0.51 0.26
31-08-2015 26283.09 -6.51 -7.2 51.84
30-09-2015 26154.83 -0.48 -1.17 1.36
31-10-2015 26656.83 1.91 1.22 1.48
30-11-2015 26145.67 -1.91 -2.6 6.76
31-12-2015 26117.54 -0.10 -0.79 0.62
31-01-2016 24870.69 -4.77 -5.46 29.81
29-02-2016 23002.00 -7.51 -8.2 67.24
31-03-2016 25341.86 10.17 9.48 89.87
30-04-2016 25269.64 -0.28 -0.97 0.94
TOTAL 27.25 660.20
Table 4.8(b):
Table showing the calculation of Beta
Date Return of
company
Return on
market
Ra-R1 Rm-Rm1 [(Ra-R1)
(Rm-Rm1
(Rm-Rm1)2
28-02-2013 -5.19 -5.19 -5.88 -5.93 34.86 35.16
31-03-2013 -0.13 -0.13 -0.82 -0.87 0.71 0.75
30-04-2013 3.54 3.54 2.85 2.8 7.98 7.84
31-05-2013 1.31 1.31 0.62 0.57 0.35 0.32
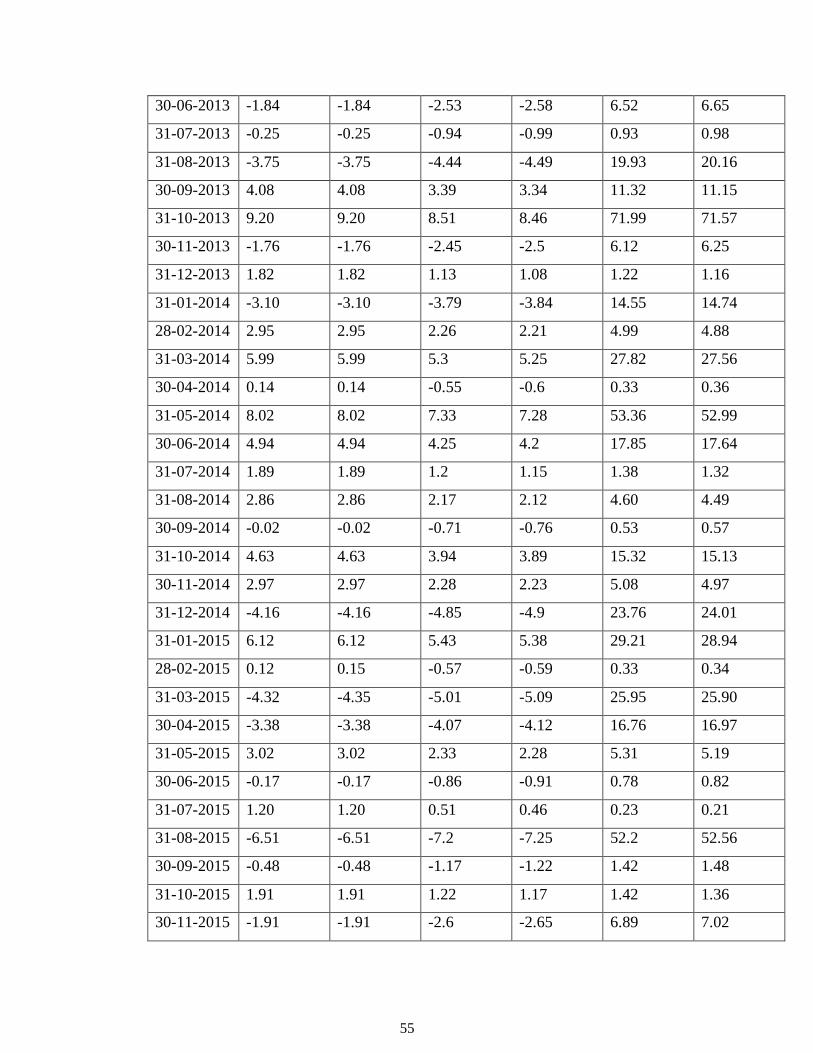
55
30-06-2013 -1.84 -1.84 -2.53 -2.58 6.52 6.65
31-07-2013 -0.25 -0.25 -0.94 -0.99 0.93 0.98
31-08-2013 -3.75 -3.75 -4.44 -4.49 19.93 20.16
30-09-2013 4.08 4.08 3.39 3.34 11.32 11.15
31-10-2013 9.20 9.20 8.51 8.46 71.99 71.57
30-11-2013 -1.76 -1.76 -2.45 -2.5 6.12 6.25
31-12-2013 1.82 1.82 1.13 1.08 1.22 1.16
31-01-2014 -3.10 -3.10 -3.79 -3.84 14.55 14.74
28-02-2014 2.95 2.95 2.26 2.21 4.99 4.88
31-03-2014 5.99 5.99 5.3 5.25 27.82 27.56
30-04-2014 0.14 0.14 -0.55 -0.6 0.33 0.36
31-05-2014 8.02 8.02 7.33 7.28 53.36 52.99
30-06-2014 4.94 4.94 4.25 4.2 17.85 17.64
31-07-2014 1.89 1.89 1.2 1.15 1.38 1.32
31-08-2014 2.86 2.86 2.17 2.12 4.60 4.49
30-09-2014 -0.02 -0.02 -0.71 -0.76 0.53 0.57
31-10-2014 4.63 4.63 3.94 3.89 15.32 15.13
30-11-2014 2.97 2.97 2.28 2.23 5.08 4.97
31-12-2014 -4.16 -4.16 -4.85 -4.9 23.76 24.01
31-01-2015 6.12 6.12 5.43 5.38 29.21 28.94
28-02-2015 0.12 0.15 -0.57 -0.59 0.33 0.34
31-03-2015 -4.32 -4.35 -5.01 -5.09 25.95 25.90
30-04-2015 -3.38 -3.38 -4.07 -4.12 16.76 16.97
31-05-2015 3.02 3.02 2.33 2.28 5.31 5.19
30-06-2015 -0.17 -0.17 -0.86 -0.91 0.78 0.82
31-07-2015 1.20 1.20 0.51 0.46 0.23 0.21
31-08-2015 -6.51 -6.51 -7.2 -7.25 52.2 52.56
30-09-2015 -0.48 -0.48 -1.17 -1.22 1.42 1.48
31-10-2015 1.91 1.91 1.22 1.17 1.42 1.36
30-11-2015 -1.91 -1.91 -2.6 -2.65 6.89 7.02
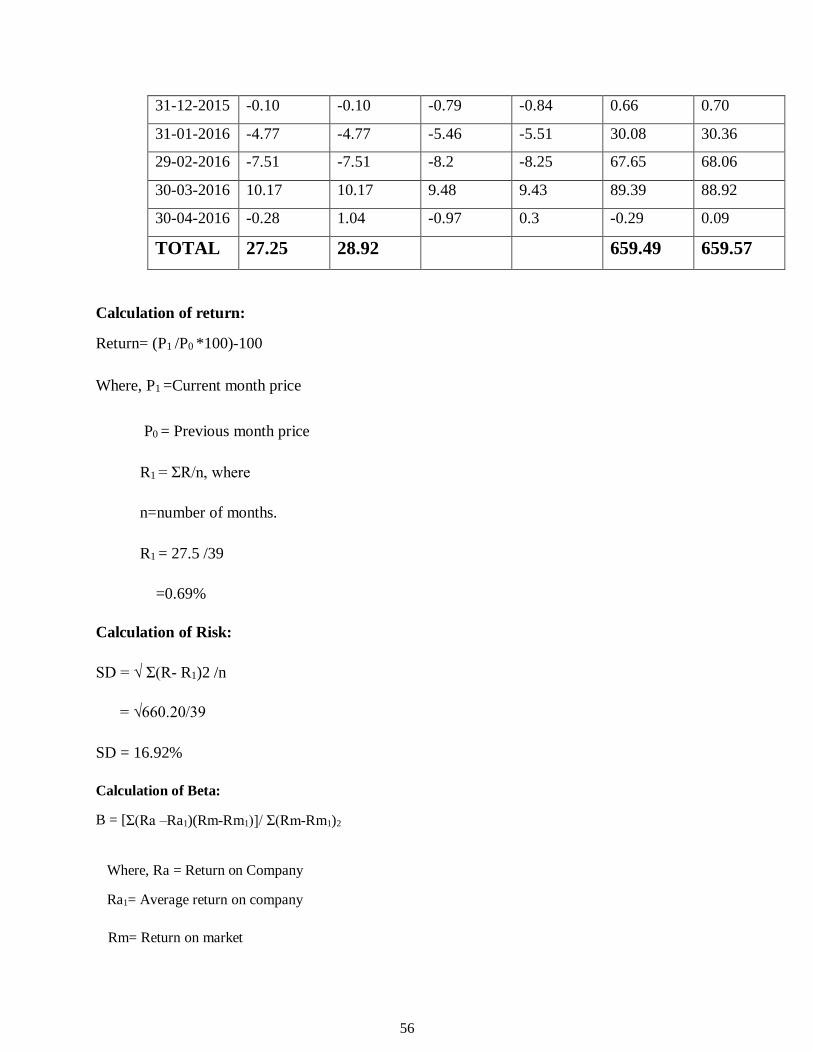
56
31-12-2015 -0.10 -0.10 -0.79 -0.84 0.66 0.70
31-01-2016 -4.77 -4.77 -5.46 -5.51 30.08 30.36
29-02-2016 -7.51 -7.51 -8.2 -8.25 67.65 68.06
30-03-2016 10.17 10.17 9.48 9.43 89.39 88.92
30-04-2016 -0.28 1.04 -0.97 0.3 -0.29 0.09
TOTAL 27.25 28.92 659.49 659.57
Calculation of return:
Return= (P1 /P0 *100)-100
Where, P1 =Current month price
P0 = Previous month price
R1 = ΣR/n, where
n=number of months.
R1 = 27.5 /39
=0.69%
Calculation of Risk:
SD = √ Σ(R- R1)2 /n
= √660.20/39
SD = 16.92%
Calculation of Beta:
B = [Σ(Ra –Ra1)(Rm-Rm1)]/ Σ(Rm-Rm1)2
Where, Ra = Return on Company
Ra1= Average return on company
Rm= Return on market

57
Rm1= Average return on market
= 659.49/659.57
B = 0.99
Calculation of Alpha:
Alpha = Ra1-(B*Rm1)
= 0.69- (0.99*0.74)
= 0.69-0.73
=1.42
Table 4.9:
The table showing Risk & Return of Bajaj Ltd
Factor Percentage
Risk 16.92
Return 0.69
Beta 0.99
Alpha 1.42
ANALYSIS:
From the above chart it shows that Bajaj Auto Ltd has a high risk factor of 16.92% ,Its rate of
return on a monthly average basis is 0.69% ,Its rate of beta factor is 0.99 % ,Its rate of Alpha
rate is 1.42%.In the beginning of the year the share prices of Baja Auto Ltd was 19894.98 but it
went down to 18835.77 in the month march later it increased to 19345.70 in the month of july,
in the end of the year 2013 the price was 21170.68.on January 2014 the price was 20153.85 and
has increased to 27499.42 in the end of the year 2014.In the beginning of the year 2015 the share
prices went up to 29182.95 but it has continuously decreased to 26117.54 at the end of the year
2015 .In th month march 2016 it has the highest monthly average return of 10.17% and in the
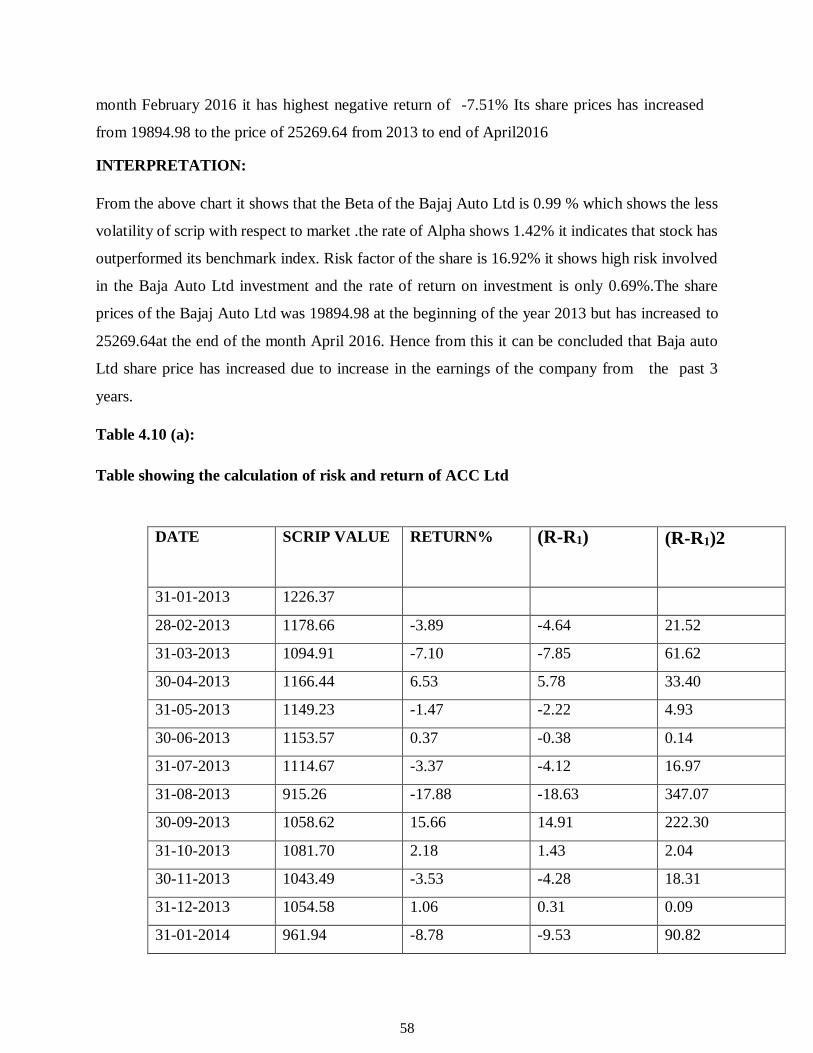
58
month February 2016 it has highest negative return of -7.51% Its share prices has increased
from 19894.98 to the price of 25269.64 from 2013 to end of April2016
INTERPRETATION:
From the above chart it shows that the Beta of the Bajaj Auto Ltd is 0.99 % which shows the less
volatility of scrip with respect to market .the rate of Alpha shows 1.42% it indicates that stock has
outperformed its benchmark index. Risk factor of the share is 16.92% it shows high risk involved
in the Baja Auto Ltd investment and the rate of return on investment is only 0.69%.The share
prices of the Bajaj Auto Ltd was 19894.98 at the beginning of the year 2013 but has increased to
25269.64at the end of the month April 2016. Hence from this it can be concluded that Baja auto
Ltd share price has increased due to increase in the earnings of the company from the past 3
years.
Table 4.10 (a):
Table showing the calculation of risk and return of ACC Ltd
DATE SCRIP VALUE RETURN% (R-R1) (R-R1)2
31-01-2013 1226.37
28-02-2013 1178.66 -3.89 -4.64 21.52
31-03-2013 1094.91 -7.10 -7.85 61.62
30-04-2013 1166.44 6.53 5.78 33.40
31-05-2013 1149.23 -1.47 -2.22 4.93
30-06-2013 1153.57 0.37 -0.38 0.14
31-07-2013 1114.67 -3.37 -4.12 16.97
31-08-2013 915.26 -17.88 -18.63 347.07
30-09-2013 1058.62 15.66 14.91 222.30
31-10-2013 1081.70 2.18 1.43 2.04
30-11-2013 1043.49 -3.53 -4.28 18.31
31-12-2013 1054.58 1.06 0.31 0.09
31-01-2014 961.94 -8.78 -9.53 90.82
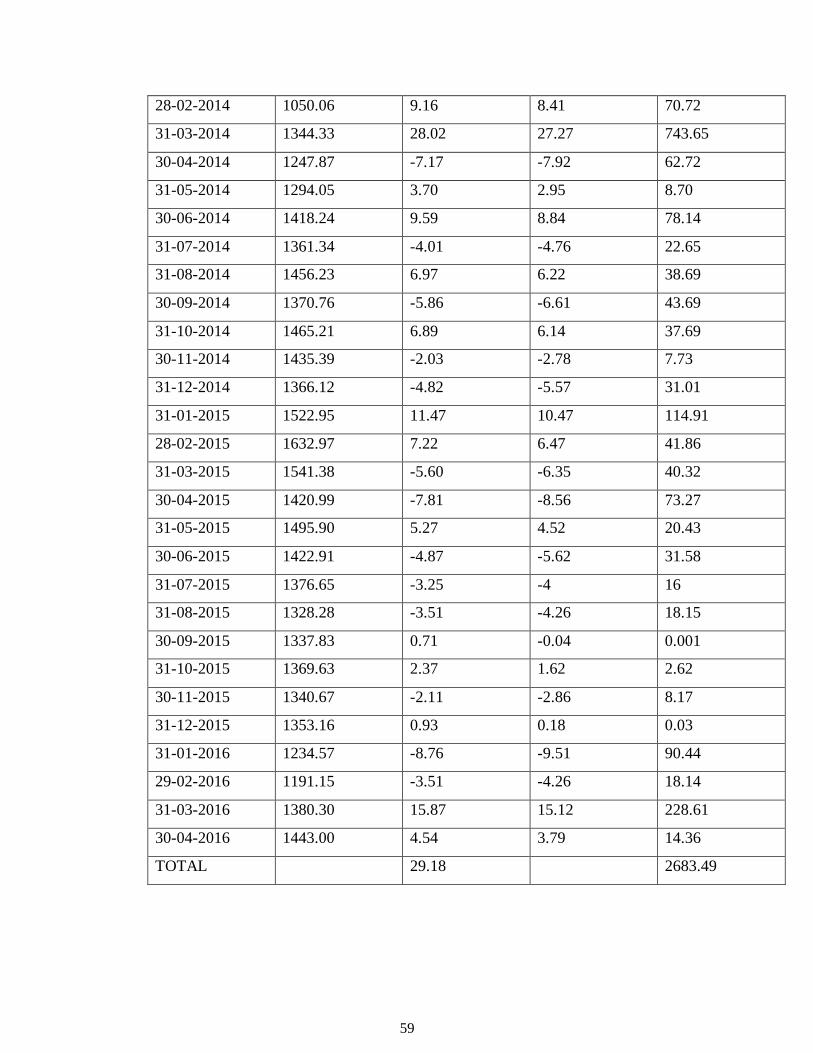
59
28-02-2014 1050.06 9.16 8.41 70.72
31-03-2014 1344.33 28.02 27.27 743.65
30-04-2014 1247.87 -7.17 -7.92 62.72
31-05-2014 1294.05 3.70 2.95 8.70
30-06-2014 1418.24 9.59 8.84 78.14
31-07-2014 1361.34 -4.01 -4.76 22.65
31-08-2014 1456.23 6.97 6.22 38.69
30-09-2014 1370.76 -5.86 -6.61 43.69
31-10-2014 1465.21 6.89 6.14 37.69
30-11-2014 1435.39 -2.03 -2.78 7.73
31-12-2014 1366.12 -4.82 -5.57 31.01
31-01-2015 1522.95 11.47 10.47 114.91
28-02-2015 1632.97 7.22 6.47 41.86
31-03-2015 1541.38 -5.60 -6.35 40.32
30-04-2015 1420.99 -7.81 -8.56 73.27
31-05-2015 1495.90 5.27 4.52 20.43
30-06-2015 1422.91 -4.87 -5.62 31.58
31-07-2015 1376.65 -3.25 -4 16
31-08-2015 1328.28 -3.51 -4.26 18.15
30-09-2015 1337.83 0.71 -0.04 0.001
31-10-2015 1369.63 2.37 1.62 2.62
30-11-2015 1340.67 -2.11 -2.86 8.17
31-12-2015 1353.16 0.93 0.18 0.03
31-01-2016 1234.57 -8.76 -9.51 90.44
29-02-2016 1191.15 -3.51 -4.26 18.14
31-03-2016 1380.30 15.87 15.12 228.61
30-04-2016 1443.00 4.54 3.79 14.36
TOTAL 29.18 2683.49

60
Table 4.10(b):
Table showing the calculation of Beta of ACC ltd
Date Return on
Company
Return on
market
Ra-R1 Rm-Rm1 [(Ra-R1)
(Rm-Rm1
(Rm-Rm1)2
28-02-2013 -3.89 -5.19 -4.64 -5.93 27.51 35.16
31-03-2013 -7.10 -0.13 -7.85 -0.87 6.82 0.75
30-04-2013 6.53 3.54 5.78 2.8 16.18 7.84
31-05-2013 -1.47 1.31 -2.22 0.57 -1.26 0.32
30-06-2013 0.37 -1.84 -0.38 -2.58 0.98 6.65
31-07-2013 -3.37 -0.25 -4.12 -0.99 4.07 0.98
31-08-2013 -17.88 -3.75 -18.63 -4.49 83.64 20.16
30-09-2013 15.66 4.08 14.91 3.34 49.79 11.15
31-10-2013 2.18 9.20 1.43 8.46 12.09 71.57
30-11-2013 -3.53 -1.76 -4.28 -2.5 10.7 6.25
31-12-2013 1.06 1.82 0.31 1.08 0.33 1.16
31-01-2014 -8.78 -3.10 -9.53 -3.84 36.59 14.74
28-02-2014 9.16 2.95 8.41 2.21 18.58 4.88
31-03-2014 28.02 5.99 27.27 5.25 143.16 27.56
30-04-2014 -7.17 0.14 -7.92 -0.6 4.75 0.36
31-05-2014 3.70 8.02 2.95 7.28 21.47 52.99
30-06-2014 9.59 4.94 8.84 4.2 37.12 17.64
31-07-2014 -4.01 1.89 -4.76 1.15 -5.47 1.32
31-08-2014 6.97 2.86 6.22 2.12 13.18 4.49
30-09-2014 -5.86 -0.02 -6.61 -0.76 5.02 0.57
31-10-2014 6.89 4.63 6.14 3.89 23.88 15.13
30-11-2014 -2.03 2.97 -2.78 2.23 -6.19 4.97
31-12-2014 -4.82 -4.16 -5.57 -4.9 27.29 24.01
31-01-2015 11.47 6.12 10.47 5.38 56.32 28.94
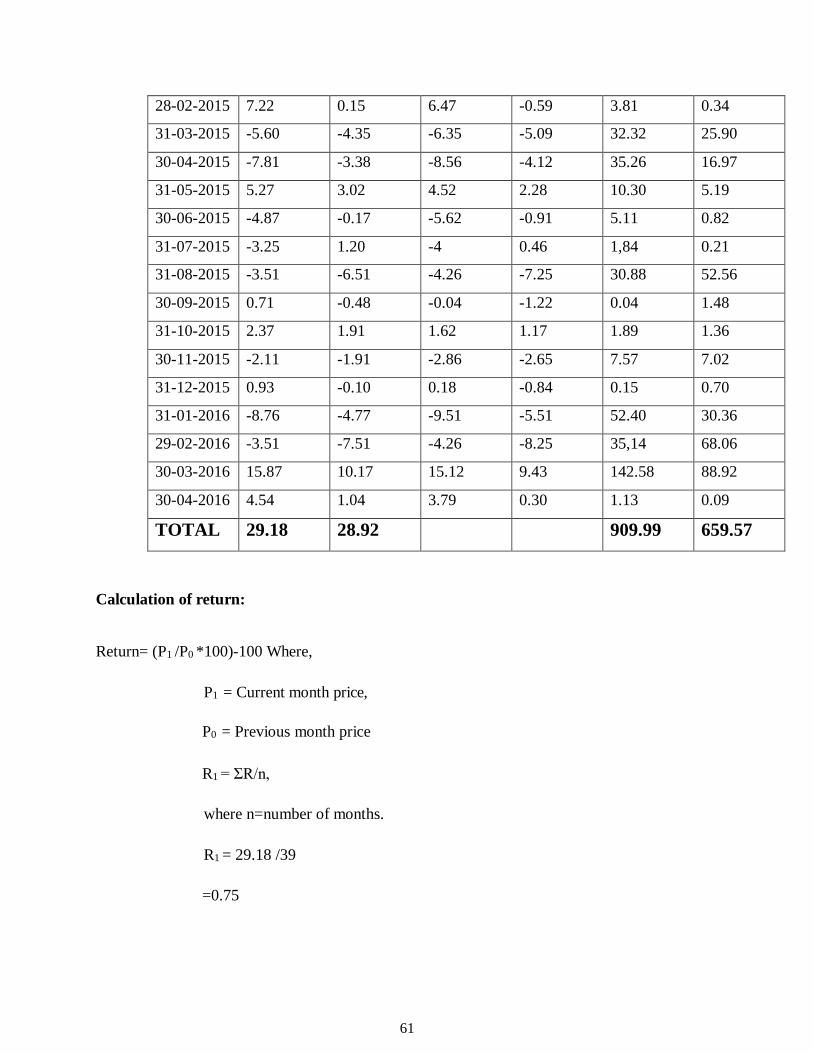
61
28-02-2015 7.22 0.15 6.47 -0.59 3.81 0.34
31-03-2015 -5.60 -4.35 -6.35 -5.09 32.32 25.90
30-04-2015 -7.81 -3.38 -8.56 -4.12 35.26 16.97
31-05-2015 5.27 3.02 4.52 2.28 10.30 5.19
30-06-2015 -4.87 -0.17 -5.62 -0.91 5.11 0.82
31-07-2015 -3.25 1.20 -4 0.46 1,84 0.21
31-08-2015 -3.51 -6.51 -4.26 -7.25 30.88 52.56
30-09-2015 0.71 -0.48 -0.04 -1.22 0.04 1.48
31-10-2015 2.37 1.91 1.62 1.17 1.89 1.36
30-11-2015 -2.11 -1.91 -2.86 -2.65 7.57 7.02
31-12-2015 0.93 -0.10 0.18 -0.84 0.15 0.70
31-01-2016 -8.76 -4.77 -9.51 -5.51 52.40 30.36
29-02-2016 -3.51 -7.51 -4.26 -8.25 35,14 68.06
30-03-2016 15.87 10.17 15.12 9.43 142.58 88.92
30-04-2016 4.54 1.04 3.79 0.30 1.13 0.09
TOTAL 29.18 28.92 909.99 659.57
Calculation of return:
Return= (P1 /P0 *100)-100 Where,
P1 = Current month price,
P0 = Previous month price
R1 = ΣR/n,
where n=number of months.
R1 = 29.18 /39
=0.75

62
Calculation of Risk:
SD = √ Σ(R- R1)2 /n
= √2683.49/39
SD= 8.29
Calculation of Beta:
B = [Σ(Ra –Ra1)(Rm-Rm1)]/ Σ(Rm-Rm1)2
Where, Ra = Return on Company
Ra1= Average return on company
Rm= Return on market
Rm1= Average return on market
= 909.99/659.57
B = 1.37
Calculation of Alpha:
Alpha = Ra1-(B*Rm1)
= 0.75-(1.37*0.74)
= 0.75-1.01
=-0.26%
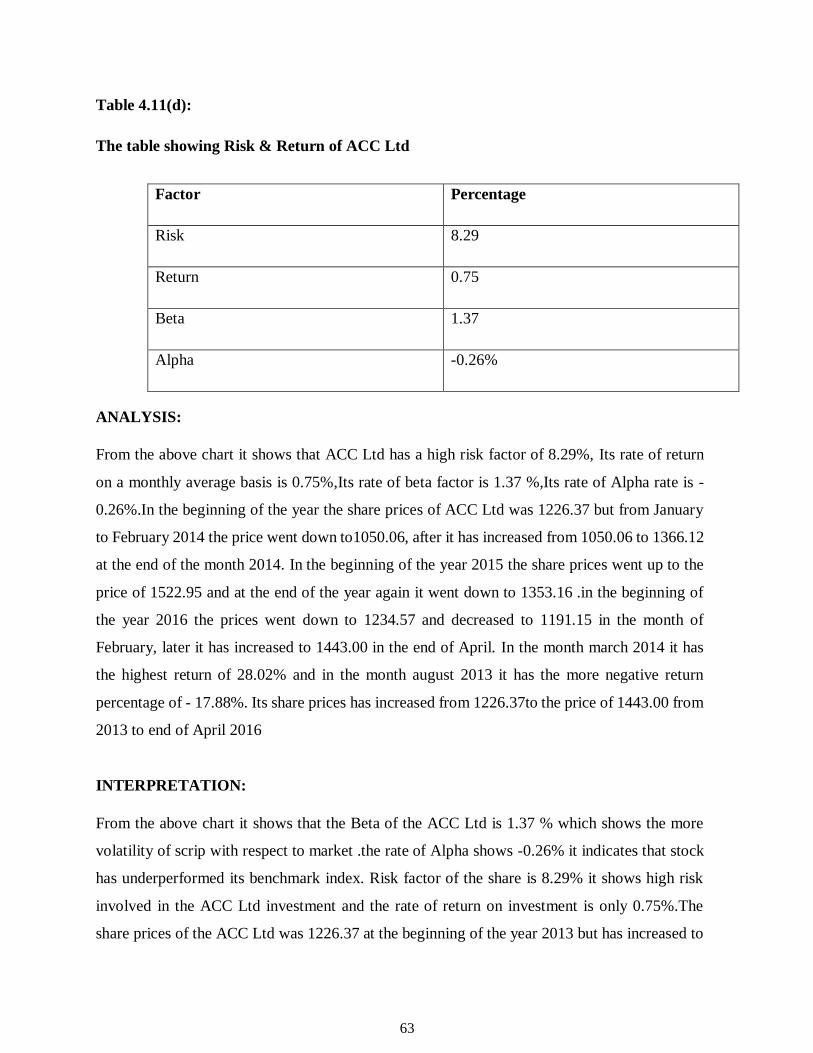
63
Table 4.11(d):
The table showing Risk & Return of ACC Ltd
Factor Percentage
Risk 8.29
Return 0.75
Beta 1.37
Alpha -0.26%
ANALYSIS:
From the above chart it shows that ACC Ltd has a high risk factor of 8.29%, Its rate of return
on a monthly average basis is 0.75%,Its rate of beta factor is 1.37 %,Its rate of Alpha rate is -
0.26%.In the beginning of the year the share prices of ACC Ltd was 1226.37 but from January
to February 2014 the price went down to1050.06, after it has increased from 1050.06 to 1366.12
at the end of the month 2014. In the beginning of the year 2015 the share prices went up to the
price of 1522.95 and at the end of the year again it went down to 1353.16 .in the beginning of
the year 2016 the prices went down to 1234.57 and decreased to 1191.15 in the month of
February, later it has increased to 1443.00 in the end of April. In the month march 2014 it has
the highest return of 28.02% and in the month august 2013 it has the more negative return
percentage of - 17.88%. Its share prices has increased from 1226.37to the price of 1443.00 from
2013 to end of April 2016
INTERPRETATION:
From the above chart it shows that the Beta of the ACC Ltd is 1.37 % which shows the more
volatility of scrip with respect to market .the rate of Alpha shows -0.26% it indicates that stock
has underperformed its benchmark index. Risk factor of the share is 8.29% it shows high risk
involved in the ACC Ltd investment and the rate of return on investment is only 0.75%.The
share prices of the ACC Ltd was 1226.37 at the beginning of the year 2013 but has increased to
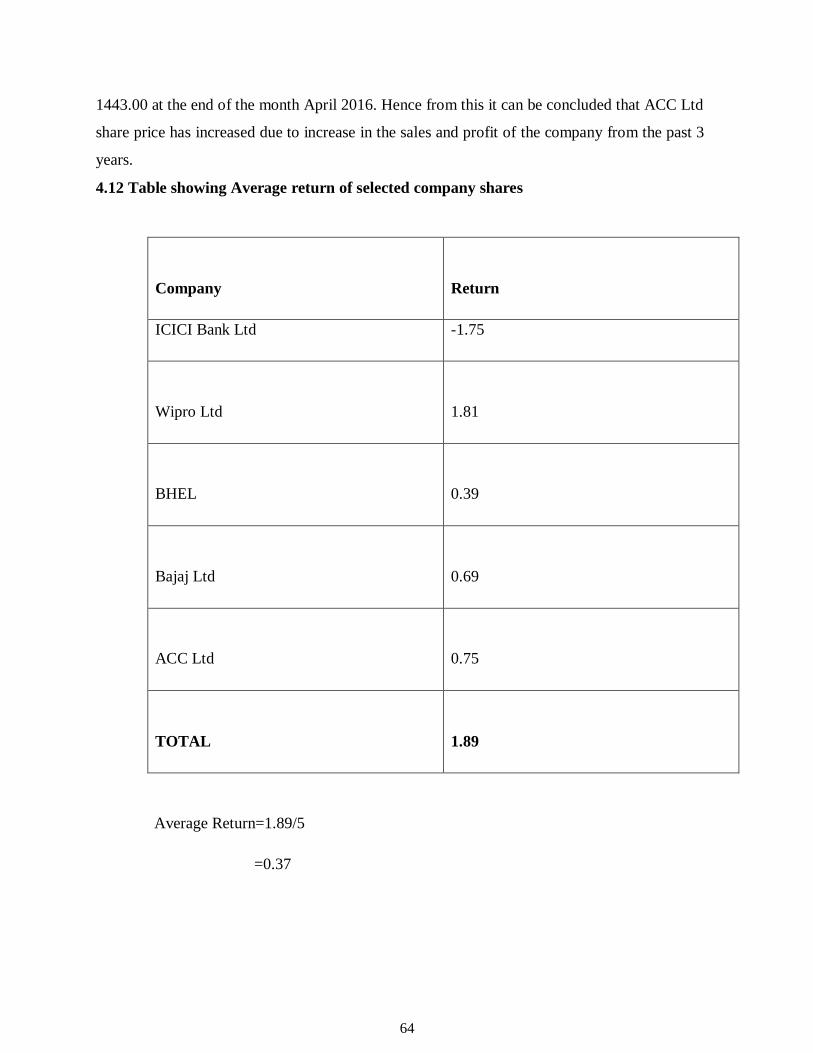
64
1443.00 at the end of the month April 2016. Hence from this it can be concluded that ACC Ltd
share price has increased due to increase in the sales and profit of the company from the past 3
years.
4.12 Table showing Average return of selected company shares
Company
Return
ICICI Bank Ltd -1.75
Wipro Ltd
1.81
BHEL
0.39
Bajaj Ltd
0.69
ACC Ltd
0.75
TOTAL
1.89
Average Return=1.89/5
=0.37
65
ANALYSIS:
From the above analysis it shows that Wipro Ltd shares have got the highest return of 1.81%
compared to other selected companies ICICI Bank LTD shares have got the lower return of -
1.75% (i,e negative return rate)On an average equity shares have got 0.37% per month of all the
5 selected companies.
INTERPRETATION
Return is a major factor influencing factor to all type of investors. In the above selected equity
shares average return is0.37%, from the chart it shows that Wipro company shares has got the
higher monthly average return of 1.81 % due to increase in the earnings and performance of the
company the prices of shares has increased and the average return also increased.
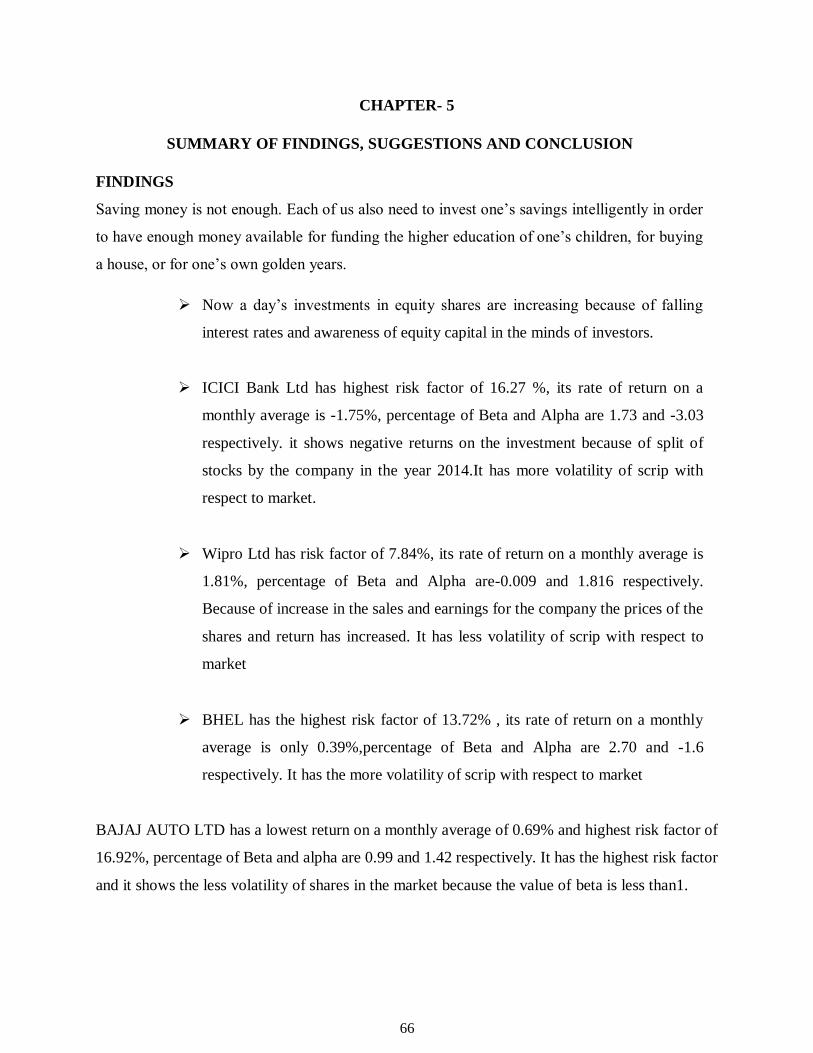
66
CHAPTER- 5
SUMMARY OF FINDINGS, SUGGESTIONS AND CONCLUSION
FINDINGS
Saving money is not enough. Each of us also need to invest one’s savings intelligently in order
to have enough money available for funding the higher education of one’s children, for buying
a house, or for one’s own golden years.
Now a day’s investments in equity shares are increasing because of falling
interest rates and awareness of equity capital in the minds of investors.
ICICI Bank Ltd has highest risk factor of 16.27 %, its rate of return on a
monthly average is -1.75%, percentage of Beta and Alpha are 1.73 and -3.03
respectively. it shows negative returns on the investment because of split of
stocks by the company in the year 2014.It has more volatility of scrip with
respect to market.
Wipro Ltd has risk factor of 7.84%, its rate of return on a monthly average is
1.81%, percentage of Beta and Alpha are-0.009 and 1.816 respectively.
Because of increase in the sales and earnings for the company the prices of the
shares and return has increased. It has less volatility of scrip with respect to
market
BHEL has the highest risk factor of 13.72% , its rate of return on a monthly
average is only 0.39%,percentage of Beta and Alpha are 2.70 and -1.6
respectively. It has the more volatility of scrip with respect to market
BAJAJ AUTO LTD has a lowest return on a monthly average of 0.69% and highest risk factor of
16.92%, percentage of Beta and alpha are 0.99 and 1.42 respectively. It has the highest risk factor
and it shows the less volatility of shares in the market because the value of beta is less than1.
67
SUGGESTIONS
Now a day’s Indian capital market is attracting more and more foreign
institutional investors (FII’s) because of economic stability and increasing
growth rate, it leads to gradual increase in the stock market indices.
Company should provide research tips and market information to the customer
to know the market volatility risk and return of the particular stocks.
Company should avoid delays in settlement of customers so that customer may
feel happy with the company this will lead to the attraction of investors towards
company.
Interest rates are falling gradually and equity markets are booming because of
this reason investors can move from bank deposits to equities investment.
The company should practice to provide quick service as it is competing with
other broking companies so that company can be attract more investors for
investment on stock market.
The employees in research group should be trained well to guide the customers
who are interested in investing but who does not have much knowledge on stock
market investment.
Company should also start trading in the mutual funds and derivatives.
Broking firms or companies should promote Equity investment
aggressively for long term investment purpose.
68
Company has to invest on Research and Development department so that it
will attract more investors towards the investment by providing market
information
Company should have to concentrate on those people who are not investing
in Equity Market because of High risk than convert them in investing other
security like-Mutual Fund, Bonds, derivatives, commodity ,wholesale debt
market and Insurance etc. which also provides moderate return for the
investors.
The Stock Broking firm should also provide better services to the investor to
increase the satisfaction level of the investors by providing required
information and quick services to the investors without delaying in settlements.
ACC LTD has a lowest risk factor of 8.29% and its rate of return on a monthly
average is 0.75%, its percentage on Beta and Alpha are 1.37 and -0.26
respectively. It has more volatility of scrip with respect to market.
On the basis of above analysis of selected Equity shares have a risk factor on
an average 12.60%, and their average monthly returns are0.37%
On the basis of above statements it is proved that “higher the risk higher the
return and lower the risk lower the return”.
The study shows that more investment in equity market, rather than commodity
mark.

69
CONCLUSION
Saving money is not enough. Each of us also need to invest one’s savings intelligently in order
to have enough money available for funding the higher education of one’s children, for buying
a house, or for one’s own golden years.
The study will guide the new investor who wants to invest in equity by providing knowledge
about how to measure the risk and return of particular scrip. The study recommends new
investors to go for equities, because of high risk and market instability. From the calculation it
is found that the average risk of equities based on sample size is 12.60% & they are earning
0.37% returns per month.
The linkage between risk and reward is not always perfect or predictable, but there is a time –
tested correlation between risk and reward. If investors want higher returns, they have to be
willing to take on higher risk.
A low-risk or high return portfolio is more often about fraud than reality. Moreover, not all risk
is bad for an individual investor. The key, then, is taking on the right risks. After all-risk only
becomes problematic if, or when, an investor is wrong.
It is important to understand another key detail of “High-risk” portfolios – Volatility is not risk.
True, many academics and market participants do use volatility as a proxy for risk(beta for
instance),but in many respects volatility is a poor analog to risk, As most investors would define
it, is either the probability of loss or the probability of an asset (or collection of assets) providing
less than the expected.

70
BIBLIOGRAPHY
Harry M. Markowitz, “RISK-RETURN ANALYSIS”, Volume 2: The theory and Practice of
Rational Investing
Dr. P. Karthika, P.Karthikeyan, “A Study on Comparative Analysis of risk and return with
reference to selected stocks of BSE Sensex Index”, The international journal’s Research Journal
of social science and Research, Volume:01
P Subramanyam, Bala Nalla, Nalla Bala Kalyan, “A Study on Risk and Return Analysis of
Selected Securities in India”
Ravi Shukla and Charles Trzcinka, “Research on Risk and Return”, the journal of portfolio
management
https://www.bseindia.com
https://m.economictimes.com
https://www.moneycontrol.com
https://joulestowatts.com
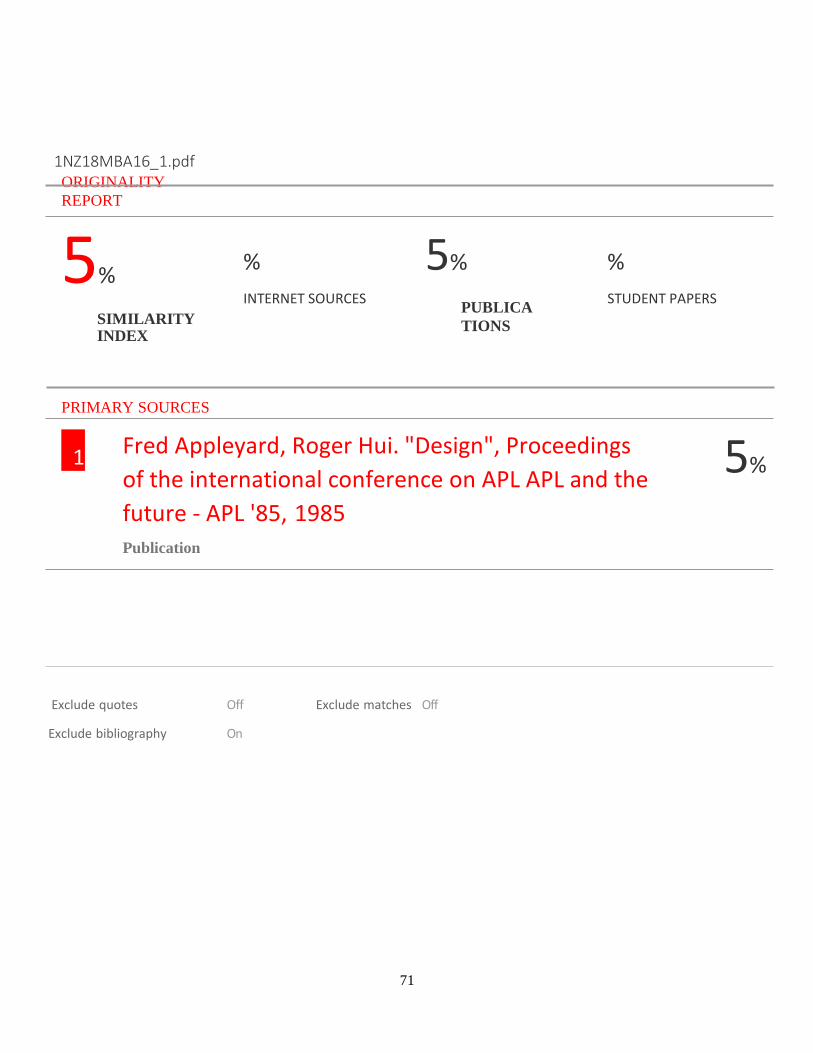
71
1NZ18MBA16_1.pdf ORIGINALITY
REPORT
5%
SIMILARITY INDEX
%
INTERNET SOURCES
5%
PUBLICA
TIONS
%
STUDENT PAPERS
PRIMARY SOURCES
1 Fred Appleyard, Roger Hui. "Design", Proceedings
of the international conference on APL APL and the
future - APL '85, 1985
Publication
Exclude quotes Off Exclude matches Off
Exclude bibliography On
5%