PROJECT PLANNING IN CONSTRUCTION PROCUREMENT: The Case of Nigerian Indigenous Contractors (PhD...
270
PROJECT PLANNING IN CONSTRUCTION PROCUREMENT: THE CASE OF NIGERIAN INDIGENOUS CONTRACTORS INUWA IBRAHIM IBRAHIM DOCTOR OF PHILOSOPHY (Construction Project Management) JOMO KENYATTA UNIVERSITY OF AGRICULTURE AND TECHNOLOGY 2014
-
Upload
abubakartafawabalewabauchinigeria -
Category
Documents
-
view
0 -
download
0
Transcript of PROJECT PLANNING IN CONSTRUCTION PROCUREMENT: The Case of Nigerian Indigenous Contractors (PhD...

PROJECT PLANNING IN CONSTRUCTION
PROCUREMENT: THE CASE OF NIGERIAN
INDIGENOUS CONTRACTORS
INUWA IBRAHIM IBRAHIM
DOCTOR OF PHILOSOPHY
(Construction Project Management)
JOMO KENYATTA UNIVERSITY OF
AGRICULTURE AND TECHNOLOGY
2014

Project Planning In Construction Procurement: The Case of
Nigerian Indigenous Contractors
Inuwa Ibrahim Ibrahim
A thesis submitted in fulfillment for the degree of Doctor of
Philosophy in Construction Project Management in the Jomo
Kenyatta University of Agriculture and Technology
2014

iii
DECLARATION
This thesis is my original work and has not been presented for a degree in any other
university.
Signature … Date
Inuwa Ibrahim Ibrahim
This thesis has been submitted for examination with our approval as university
supervisors:
Signature… Date…
Dr. Wanyona Githae, Ph.D.
JKUAT, Kenya
Signature Date
Dr. Stephen Diang’a, Ph.D.
JKUAT, Kenya

iv
DEDICATION
I dedicate this work to:
My parents: Alhaji Inuwa Ibrahim and Mairo (Lucy)
To late Alhaji Baba Isa Tahir
My wife Amina (Mimi)
My children: Aisha (Mama), Aliyu, Fatima (Zahra), and Muhammad
(Abbati),
To the entire Inuwa family.

v
ACKNOWLEDGEMENT
My sincere gratitude goes to my supervisors Dr. Wanyona Githae and Dr. Stephen
Diang’a for their profound guidance and patience in seeing me through this study.
Their contributions have been tremendous to the completion of this work. I also
acknowledge the contributions received from Dr. Gerryshom Munala and Dr.
Bernard Mugwima of School of Architecture and Building Science (SABS), Jomo
Kenyatta University of Agriculture and Technology (JKUAT), Kenya staff, and from
Professor Yakubu Ibrahim, Professor Mansur Usman Malunfashi, Dr. Sani Kunya
and Dr. Alhassan Dahiru, all from Abubakar Tafawa Balewa University (ATBU),
Bauchi-Nigeria. I also acknowledge the assistance accorded to me by Dr. Susan
Kibue (Dean SABS, JKUAT), Dr. Ahmad Alkizim, Dr. Titus Kivaa, Mr Daniel
Saiva, Monica Kahura and the entire staff of the construction management
department of JKUAT.
My gratitude also goes to my employer ATBU, Bauchi-Nigeria for funding this
study. My appreciation is also extended to my family which has endured my absence
throughout my stay in Kenya. I love you all and your patience is highly appreciated.
This acknowledgement will not be complete without mentioning my dear friend
Seneiya Kamotho who edited this work. You have been pleasing and helpful, I
appreciate you. I am also grateful to Alhaj Ramadan Nanji for being kind and
supportive; may the Almighty GOD continue to shower HIs blessing on you and
your entire family.
Above all, I thank the Almighty GOD for seeing me through this study. You are
magnificent and merciful. You are worthy to be worshipped.
vi
TABLE OF CONTENTS
DECLARATION…………………………………………………………………...iii
DEDICATION……………………………………………………………………...iv
ACKNOWLEDGEMENT………………………………………………………….v
TABLE OF CONTENTS…………………………………………………………..vi
LIST OF TABLES…………………………………………………………………xii
LIST OF FIGURES……………………………………………………………….xiv
LIST OF APPENDICES………………………………………………………….xvi
LIST OF ACRONYMS…………………………………………………………..xvii
ABSTRACT……………………………………………………………………......xix
CHAPTER ON………………………………………………………………………1
1.0 INTRODUCTION……………………………………………………………….1
1.1 Research Background......................................................................................... 1
1.2 Statement of the Problem ................................................................................... 3
1.3 Objectives of the Research ................................................................................. 6
1.4 Research Hypotheses ......................................................................................... 7
1.5 Significance of the Study ................................................................................... 8
1.6 Justification of the Study .................................................................................... 9
1.7 Scope and Delimitation .................................................................................... 12
1.8 Operational Definitions of Terms .................................................................... 12
vii
CHAPTER TWO………………………………………………………………......15
2.0 LITERATURE REVIEW……………………………………………………..15
2.1 Introduction ...................................................................................................... 15
2.2 The Construction Industry................................................................................ 15
2.2.1 Nigeria Construction Industry ................................................................... 16
2.3 Construction Contracting Business .................................................................. 22
2.4 Nigerian Indigenous Contractors ..................................................................... 24
2.4.1 The NICs Project Management Performance ............................................ 24
2.5 Construction Procurement ................................................................................ 26
2.5.1 Construction Procurement Process ............................................................ 27
2.5.2 Construction Procurement Systems ........................................................... 30
2.6 Contractors’ Role in Procurement Systems ..................................................... 32
2.6.1 The DBB Systems ...................................................................................... 33
2.6.2 Management Oriented Contracts ............................................................... 35
2.6.3 Integrated Contracts ................................................................................... 41
2.7 Application and Performances of Building Project Procurement .................... 45
Systems in Nigeria ................................................................................................. 45
2.8 Construction Project Planning Techniques ...................................................... 48
2.8.1 Bar Charts and Linked Bar Charts ............................................................. 50
2.8.2 Line of Balance .......................................................................................... 53
2.8.3 Network Method ........................................................................................ 55
2.8.4 ICT Application in Project Planning ......................................................... 57

viii
2.9 The NICs Project Planning Challenges ............................................................ 59
2.10 Influencing Factors for NICs Project Planning .............................................. 61
2.11 Contractors’ Project Planning Success Indicators.......................................... 64
2.12 Research on Construction Procurement and Contractors............................... 68
2.13 Theoretical Framework .................................................................................. 73
2.13.1 The Theory of Project .............................................................................. 74
2.13.2 Management Theory of Project Management ......................................... 81
2.13.3 Implication of Project Management Theory to the Study Objectives ..... 83
Source: Author (2013) ........................................................................................ 89
2.13.4 Advantages of Project Management over Traditonal Management ........ 89
2.14 Conceptual Framework ............................................................................... 90
2.15 Discussion ...................................................................................................... 93
CHAPTER THREE………………………………………………………………..95
3.0 RESEARCH METHODOLOGY……………………………………………..95
3.1 Introduction ...................................................................................................... 95
3.2 Research Design ............................................................................................... 96
3.2.1 Research Strategy ...................................................................................... 97
3.2.2 Area of the Study ....................................................................................... 99
3.2.3 Study Population ...................................................................................... 100
3.3 Sample ............................................................................................................ 102
3.3.1 Sample Size.............................................................................................. 103
3.3.2 Sampling Technique ................................................................................ 104

ix
3.3.3 Method of Questionnaire Administration ................................................ 106
3.4 Method of Data Collection ............................................................................. 106
3.4.1 Questionnaire Design ............................................................................... 107
3.4.2 Pre-testing of questionnaire ..................................................................... 109
3.4.3 Questionnaire Survey Validity and Reliability Test ................................ 111
3.4.4 Method Adopted for Case Study ............................................................. 114
3.5 Method of Data Analysis ............................................................................... 115
3.5.1 Method of Data Analysis for Questionnaires Survey .............................. 116
3.5.2 Method of Data Analysis for Case Study ................................................ 118
3.5.3 Case Study Validity and Reliability Test ................................................. 119
3.6 Ethical Consideration ..................................................................................... 120
CHAPTER FOUR………………………………………………………………...121
4.0 DATA ANALYSIS……………………………………………………………121
4.1 Introduction .................................................................................................... 121
4.2 Response to Questionnaires ........................................................................... 121
4.2.1 Respondents' Response Rates .................................................................. 121
4.2.2 Missing Values ........................................................................................ 124
4.3 Demographic Profiles of Respondents ........................................................... 125
4.3.1 Respondents’ Organization in the Construction Industry ........................ 125
4.3.2 Contractors' Demographic Profiles .......................................................... 126
4.3.3 Consultants' Demographic Profiles .......................................................... 134
4.3.4 PBPs Demographic Profiles..................................................................... 135
x
4.3.5 Combined Respondents' Years of Experience ......................................... 137
4.4 Respondents’ Test of Association .................................................................. 138
4.5 Hypotheses Testing ........................................................................................ 139
4.5.1 Hypothesis 1, 2, and 3 .............................................................................. 139
4.5.2 Hypothesis 4, 5, and 6 .............................................................................. 143
4.6 Data Analyses for the Study Objectives......................................................... 146
4.6.1 Objective 1: Involvement in Construction Procurement Systems ........... 146
4.6.2 Objective 2: NICs Projects Time and Cost Performance ........................ 149
4.6.3 Objective 3: NICs application of Project Planning Techniques .............. 153
4.6.4 Objective 4: NICs Project Planning Challenges ...................................... 154
4.6.5 Objective 5: Factors for Influencing NICs Project Planning ................... 158
4.6.6 Objective 6: Success Indicators for Contractors’ Project Planning ......... 162
4.6.7 Measures for Enhancing NICs Project Planning ..................................... 165
4.7 Case Study Data Analysis .............................................................................. 167
4.7.1 Analysis of Case Study ............................................................................ 167
4.7.3 Case Study Interpretation......................................................................... 176
CHAPTER FIVE…………………………………………………………………180
5.0 DISCUSSION OF RESULTS………………………………………………..180
5.1 Introduction .................................................................................................... 180
5.2 NICs Involvement in Project Procurement Systems ...................................... 180
5.3 NICs Project Time and Cost Performances ................................................... 182
5.4 NICs Application of Project Planning Techniques ........................................ 184
xi
5.5 NICs Project Planning Challenges ................................................................. 186
5.6 Influencing Factors for NICs Project Planning .............................................. 187
5.7 Contractors’ Project Planning Success Indicators.......................................... 189
5.8 NICs Project Performance Case Study .......................................................... 190
5.9 Measures for Enhancing NICs Project Planning ............................................ 193
5.10 Strategy for NICs Projects Operational Planning ........................................ 194
5.10.1 Initiation Stage ....................................................................................... 194
5.10.2 Implementation Stage ............................................................................ 197
5.10.3 Completion Stage ................................................................................... 199
CHAPTER SIX…………………………………………………………………...202
6.0 CONCLUSIONS AND RECOMMENDATIONS…………………………..202
6.1 Introduction .................................................................................................... 202
6.2 Summary of Findings ..................................................................................... 204
6.2 Conclusions .................................................................................................... 206
6.2.1 Addition to Knowledge ............................................................................ 208
6.3 Recommendations .......................................................................................... 210
6.3.1 Recommendations for Further Studies .................................................... 213
REFERENCES……………………………………………………………………215
APPENDICES…………………………………………………………………….227

xii
LIST OF TABLES
Table 2.1: Theoretical Foundation of Project Management……………………….74
Table 2.2: Theoretical and Conceptual Framework Relationship…………………89
Table 3.1: Cronbach’s α Values Interpretation…………………………………...113
Table 3.2: Questionnaire Factor Categories Cronbach’s α Scores……………….,113
Table 4.1: Respondents’ Response Rate…………………………………………,122
Table 4.2: Response Rate According to Category of Respondents……………….123
Table 4.3: Contractors’ Project Managers' Experience…………………………...132
Table 4.4: Combined Respondents’ Years of Experience………………………...138
Table 4.5: Respondents Agreement Analysis……………………………………..139
Table 4.6: Details of χ2 Tests……………………………………………………...143
Table 4.7: Details of Kruskal-Wallis H Tests……………………………………..146
Table 4.8: NICs Building Procurement Systems Involvement……………………148
Table 4.9: Summary of Contractors’Procurement Systems Involvement…………149
Table 4.10: NICs Projects Percentage Time Overruns (%TO)……………………..151
Table 4.11: NICs Projects Percentage Cost Overruns (%CO)……………………...152
Table 4.12: NICs Application of Projects Planning Tools.........................................153
Table 4.13: Individual Groups Assessment of NICs Projects Planning Challenges..156
Table 4.14: Combined Assessment of NICs Project Planning Challenges…………157
Table 4.15: Individuals Groups Assessment of Factors for Influencing NICs Projects
Planning……………………………………………………………….160
Table 4.16: Combined Ranking of Factors Influencing Project Planning…………..161
xiii
Table 4.17: Individual Group’s Assessment of Contractors’ Project Planning Success
Indicators……………………………………………………………...164
Table 4.18: Combined Assessments of Contractors Project Planning……………..165
Success Indicators…………………………………………………….165
Table 4.19: Measures for Enhancing Contractors’ Project Planning………………166
Table 4.20: Case Study Data Presentation………………………………………….179
xiv
LIST OF FIGURES
Figure 2.1: Trend of the NCI GDP Contribution to the Economy ........................ 19
Figure 2.2: Construction Procurement Process ..................................................... 30
Figure 2.3: Contractor’s operation in DBB system ............................................... 35
Figure 2.4: Management/construction management contractors’ ......................... 39
operations.. .......................................................................................... 39
Figure 2.5: Design and management contractor operations .................................. 41
Figure: 2.6: Design and construct contractor operations ........................................ 43
Figure 2.7: Design and Build contractor operations .............................................. 44
Figure 2.8: Contractor’s operations in All-in-contract .......................................... 45
Figure 2.9: Bar chart for a building work .............................................................. 51
Figure 2.10: A linked bar-chart ............................................................................... 52
Figure 2.11: Line of balance .................................................................................... 54
Figure: 2.12: A Typical CPM Network .................................................................... 56
Figure 2.13: Conceptual Framework ....................................................................... 92
Figure 4.1: Distribution of Respondents Organization in the NCI ...................... 126
Figure 4.2: Contractors' Business Registration Category .................................... 127
Figure 4.3: Distribution of Contractors Contract Registration Category ............ 128
Figure 4.4: Distribution of Contractors Full Time Staff ...................................... 129
Figure 4.5: Distribution of Contractors Contract Staff ........................................ 130
Figure 4.6: Distribution of Contractors Project Managers Educational Specialization
………………………………………………………………………132
Figure 4.7: Distribution of consultancy firms type………………………………134

xv
Figure 4.8: Distribution of PBPs Educational Specializations .............................. 135
Figure 4.9: Distribution of PBPs Highest Educational Qualification .................... 136
Figure 4.10: Distribution of BPBs Professional Registration .................................. 137
Figure 5.1: Strategy for Contractors Project Operational Planning ....................... 200
xvi
LIST OF APPENDICES
Appendix 1: Questionnaire Cover Letter ............................................................. 227
Appendix 2: Questionnaire for Contractors ......................................................... 228
Appendix 3: Questionnaire for Consultants ........................................................ 236
Appendix 4: Questionnaire for PBPs ................................................................... 242
Appendix 5: Nigeria Geo-political Zones ............................................................ 248
Appendix 6: List of Publications ......................................................................... 249

xvii
LIST OF ACRONYMS
AMS Average Mean Score
CM: Construction Management
CPM: Critical Path Method
DB: Design-Build
DBB: Design-Bid-Build
DC: Design and Construct
DMC: Design and Management Contract
EDI: Electronic Data Interchange
ETF Education Trust Fund
FGN: Federal Government of Nigeria
FOCI: The Federation of Construction Industry
FMHUD: Federal Ministry of Housing & Urban Development
GDP: Gross Domestic Product
ICT: Information and Communication Technology
JCT: Joint Contract Tribunal
MC: Management Contract
NCI: Nigerian Construction Industry
NIA: Nigerian Institute of Architects
NICs: Nigerian Indigenous Contractors’
NIOB Nigerian Institute of Buildings
NSE: Nigerian Society of Engineers
NIQS: Nigerian Institute of Quantity Surveyors’
NPC: National Population Commission

xviii
PBPs: Public Building Professionals’
PERT: Project Evaluation and Review Technique
PFI Private Finance Initiative
PMBOK: Project Management Body of Knowledge
PMI: Project Management Institute
PPP Public-Private Partnerships
PTF Petroleum Trust Fund
QSRBN: Quantity Surveyors’ Registration Board of Nigeria
SAP: Structural Adjustment Programme
TFV: Transformation Flow Value
UNCITRAL: The United Nation Commission on International Trade Law
WBS: Work Breakdown Structure
xix
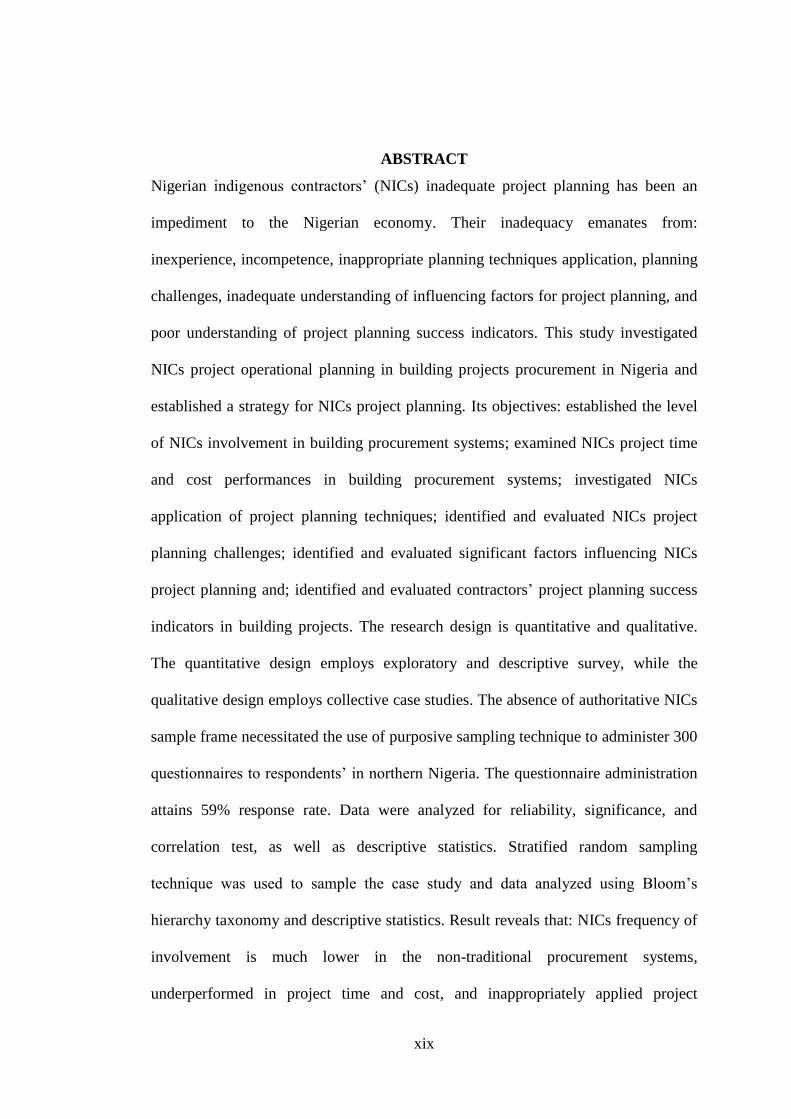
ABSTRACT
Nigerian indigenous contractors’ (NICs) inadequate project planning has been an
impediment to the Nigerian economy. Their inadequacy emanates from:
inexperience, incompetence, inappropriate planning techniques application, planning
challenges, inadequate understanding of influencing factors for project planning, and
poor understanding of project planning success indicators. This study investigated
NICs project operational planning in building projects procurement in Nigeria and
established a strategy for NICs project planning. Its objectives: established the level
of NICs involvement in building procurement systems; examined NICs project time
and cost performances in building procurement systems; investigated NICs
application of project planning techniques; identified and evaluated NICs project
planning challenges; identified and evaluated significant factors influencing NICs
project planning and; identified and evaluated contractors’ project planning success
indicators in building projects. The research design is quantitative and qualitative.
The quantitative design employs exploratory and descriptive survey, while the
qualitative design employs collective case studies. The absence of authoritative NICs
sample frame necessitated the use of purposive sampling technique to administer 300
questionnaires to respondents’ in northern Nigeria. The questionnaire administration
attains 59% response rate. Data were analyzed for reliability, significance, and
correlation test, as well as descriptive statistics. Stratified random sampling
technique was used to sample the case study and data analyzed using Bloom’s
hierarchy taxonomy and descriptive statistics. Result reveals that: NICs frequency of
involvement is much lower in the non-traditional procurement systems,
underperformed in project time and cost, and inappropriately applied project
xx
planning techniques; identified project planning challenges are severe; identified
influencing factors are important; and identified contractors’ project planning success
indicators are important. This study recommends: NICs acquire skills for the
management of non-traditional procurement systems and, public and private clients
should patronize the NICs in the execution of non-traditional procurement systems;
NICs should adopt project management techniques; consultants/NICs should conduct
exhaustive brief evaluation, adequate feasibility study and appropriate scope
definition; clients and consultants should adhere to project management procedures;
NICs should apply appropriate planning techniques, employ competent personnel,
embark on continuous training, use the project planning success indicators as a guide
for the management and planning of project operational tasks; form of building
contract used in Nigeria should be reviewed to enforce proficiency in contractors
project planning; and project management courses should be introduce in the training
of construction related discipline in Nigerian institutions. Adherence to these
recommendations will enhance NICs project planning and, facilitate their project
management performance in meeting construction best practice.
Keywords: Construction industry, Indigenous contractors, Nigeria,
Procurement systems, Project planning.
1
CHAPTER ONE
1.0 INTRODUCTION
1.1 Research Background
Since time immemorial, man has relied on procurement to acquire what he needs
from others. His needs can be for a service, a product or both. Aqua Group (1999)
defines procurement as the process of obtaining goods and services from another for
some consideration. It seems simple, but not in construction; the execution of
modern construction projects according to Chitkara (2012), requires speed and
involves interrelationship of the voluminous interdependent activities. In addition,
construction projects procurement has been acknowledged as the procurement of a
complex system, which offers insights from the procurement of other types of
complex systems (Hughes, 2012). Its complexity stems from an extensive process
and diverse systems (Idoro, 2012a; Hughes, 2012; Gollenbeck, 2008; Harris &
McCaffer, 2005; Anyadike, 2000).
This makes construction specific procurement more complex unlike other forms of
general procurement (Ibrahim, 2008). Consequently, the contractor who is regarded
as a major player in the construction project delivery team (Chitkara, 2012; Usman,
et al. 2012a), is saddled with more roles in contemporary construction procurement
beyond their traditional role as integrators in a design-bid-build procurement system
(Mbamali & Okotie, 2012; Gollenbeck, 2008), to a more complex role in
management oriented systems, integrated systems or, discretionary contracts
(Mathonsi & Thwala, 2012; Babatunde, et al., 2010; Harris & McCaffer, 2005).
2
These complexities vis-a-vis the expectation from contractors necessitates adequate
project planning if success is to be attained (Passenheim, 2009; Bailey, et al., 2008).
Planning is a fundamental tool in project management used in meeting project scope,
time and cost (Passenheim, 2009). Planning defines the activities and actions, time
and cost targets, and performance milestones which will result in successful project
objectives (Teslang, 2004 in Ubani, et al., 2010). In the developed countries,
according to Harris and McCaffer (2005), contractors have embraced planning
because the results of a well-planned, carefully monitored and controlled contract
directly impact on performance and profitability of the contract and the company.
However, in a depressed economy like Nigeria, projects are vulnerable to failure
because of myriad problems. Even if the resources are available, projects fail due to
variations in plans, defective plans and inefficient management (Ubani, et al., 2010).
This is further compounded by the inability of Nigerian indigenous contractors
(NICs) to deliver projects successfully due to inadequate project planning for their
contractual requirements.
These resulted in the few foreign firms, which constitute just 5% of the total number
of contractors in the formal sector, control 95% of the major public projects in the
construction market, giving the indigenous firms just 5% share of the market
(Aniekwu & Audu, 2010; Oladapo, 2006). This impedes the Nigerian construction
industry (NCI) from meeting the construction needs of the nation and limits the
country’s economic growth (Odediran, et al., 2012; Aniekwu & Audu, 2010; Saleh,
2004).
3
Idoro (2014) affirmed that construction is the bedrock of development and no
country can think, Dream and experience development without an efficient and
effective construction industry. According to Alzahrani and Emsley (2013), and
Yimam (2011), construction projects and their success are highly dependent on
contractors. Hence, contractors’ role in the construction industry cannot be
overemphasized; their competence and capability is a function of performance and
output in the construction industry (Odediran, et al. 2012; Yimam, 2011).
1.2 Statement of the Problem
Numerous problems confronting the NCl, coupled with the inability of the NICs to
provide the enabling environment for sustainable development, as well as the
requisite potentials to address the challenges of globalization, have remained a
serious concern to all in the Nigerian economy (Idoro, 2014; Mbamali & Okotie,
2012; Odediran, et al. 2012; Aniekwu & Audu, 2010). Hence, the NICs are
frequently criticized by clients’ and other stakeholders for poor project performance
(Aniekwu & Audu, 2010; Idoro & Akande-Subar, 2008; Saleh, 2004).
Their performances are replete with: abandonment of projects; cost and time
overruns; poor workmanship; poor management capability; financial difficulties;
poor planning; poor mechanization and high frequency of litigation (Odediran, et al.
2012; Oladimeji & Ojo, 2012; Aniekwu & Audu, 2010; Muazu & Bustani, 2004;
Achuenu, et al. 2000; Adams, 1997).
Consequences of these underperformances has contributed to the inability of the NCI
to deliver services effectively and efficiently, hence the industry is routinely accused
4
of being wasteful, inefficient, and unsafe, falling short of quality and quantity targets,
and being late in delivery (Ibrahim& Musa-Haddary, 2010; Omole, 2001). Moreover,
construction projects in Nigeria cost more than similar ones in other parts of the
world (Nasiru, et al. 2012; Quantity Surveyors Registration Board of Nigeria-
QSRBN, 2012).
According to QSRBN (2012) and Ubani, et al. (2010), high cost, time overruns, and
slipped milestone of projects experienced in Nigeria, all have a negative impact on
the development of the nation’s economy. These amongst other factors have made
the NCI unable to address the huge deficit of basic amenities, essential public
infrastructure, and population pressure on the urban centres, resulting in 60% of
urban inhabitants in desperate need of housing (Dahiru & Mohammed, 2012; Oni &
Wyk, 2012; National Planning Commission-NPC, 2004). This makes the attainment
of the country's ambition envisioned in the Millennium Development Goals (MDG)
target of 2015 and, the Vision 20:2020 doubtful (Dahiru & Mohammed, 2012; Oni &
Wyk, 2012).
Consequent to the inefficiency of the NICs, foreign contractors dominate 95% of the
major public projects in the country (Odediran et al., 2012; Aniekwu & Audu, 2010;
Oladapo, 2006; Muazu & Bustani, 2004). The outcome to the NCI and the economy
are: low income generation and redistribution due to expatriates repatriating their
profits abroad; inexperience of indigenous contractors; an insignificant value
addition to construction and local industries supplying construction materials; and
consistent contribution of 1% employment over the last decade as against the World
Bank’s average observation of about 3.2% in other developing countries (Odediran,
5
et al. 2012; Aniekwu & Audu, 2010; IDr.us & Sodangi, 2010; Bala, et al., 2009;
Jinadu, 2007; Muazu & Bustani, 2004; Adams, 1997).
Many researchers have attributed the underperformance of NICs to poor project
planning due to: non-adoption of project management techniques; incompetence and
inexperience; inefficient policies and practices; weak institutions and an adverse
business environment; and complex social and cultural practices (Odediran, et al.,
2012; Aniekwu & Audu, 2010; Bala, et al., 2009; Muazu & Bustani, 2004; Achuenu,
et al., 2000; Adams, 1997). Contractor’s planning capability and procurement
methods according to Azhar, et al. (2008), are part of the qualitative significant
factors affecting project procurement performance; hence, it needs adequate
attention. This becomes necessary because there is an element of entrepreneurial risk
associated with the assignment of procurement tasks due to lack of understanding
and implementation of factors to achieve results from work performed by others
(Anyadike, 2000).
A review of several studies conducted on NICs and procurement in the NCI shows
no evidence of studies on NICs: involvement (experience) and performance
(competence), planning techniques application, project planning challenges, planning
influencing factors, and contractor’s project planning success indicators in
construction procurement systems (Inuwa et al., 2013; Iro, et al., 2013; Ujene, et al.,
2013; Dada, 2012; Idoro, 2012a; Idoro, 2012b; Ikediashi, et al., 2012; Odediran, et
al., 2012; Tunji-Olayeni & Omuh, 2012; Usman, et al., 2012; Fagbenle, et al. 2011;
Aniekwu & Audu, 2010; Babatunde et al., 2010; Idrus & Sodangi, 2010; Bala et al.,
2009; Idoro & Akande-Subar, 2008; Ibrahim, 2008; Hamilton, 2006; Ojo, et al.,
6
2006; Uduak, 2006; Muazu & Bustani, 2004; Saleh, 2004; Ameh & Odusami, 2002;
Achuenu, et al., 2000; Adams, 1997).
Underperformance of the NICs is perhaps due to inexperience, incompetence,
inadequate understanding of factors that can significantly influence contractors
project planning, none or inappropriate application of project planning techniques,
none appreciation of indigenous contractors planning challenges and poor
understanding of project planning success indicators that will ensure successful
project delivery in the NICs organization, unlike other developed countries. The
study therefore aims at investigating indigenous contractors’ project operational
planning in building projects procurement in Nigeria, and establish an appropriate
strategy that will facilitate NICs project planning for enhanced building project
procurement in Nigeria.
1.3 Objectives of the Research
To achieve its aim the research set up the following objectives:
i. To establish the level of NICs involvement in building procurement
systems.
ii. To examine NICs time and cost performances in building procurement
systems.
iii. To investigate NICs application of project planning techniques for
contractual operations in project procurement.
iv. To identify and evaluate NICs project planning challenges in building
procurement systems.
7
v. To identify and evaluate significant influencing factors for NICs project
planning in projects procurement systems.
vi. To identify and evaluate contractors project planning success indicators in
building projects procurement systems.
1.4 Research Hypotheses
This study used nonparametric statistics to test the following null (H0) and alternative
(H1) hypotheses:
i. H0: There is no disproportionate distribution in the frequencies of
responses among NICs to a question on their level of involvement in
building procurement systems.
H1: There is disproportionate distribution in the frequencies of responses
among NICs to a question on their level of involvement in building
procurement systems.
ii. H0: NICs underperformed in terms of cost and time in building
procurement systems.
H1: NICs performed in terms of cost and time in building procurement
systems.
iii. H0: The NICs inappropriately apply project planning tools for their
contractual operations in project procurement systems.
H1: The NICs appropriately apply project planning tools for their
contractual operations in project procurement systems.

8
iv. H0: The distribution of rankings is not the same among the respondents’
on NICs project planning challenges in building procurement
systems.
H1: The distribution of rankings is the same among the respondents’ on
NICs project planning challenges in building procurement systems.
v. H0: The distribution of rankings is not the same among the respondents’
on the significant influencing factors for NICs project planning in
projects procurement systems.
H1: The distribution of rankings is the same among the respondents’ on
the significant influencing factors for NICs project planning in
projects procurement systems.
vi. H0: The distribution of rankings is not the same among respondents’ on
contractors’ project planning success indicators in building projects
procurement systems.
H1: The distribution of rankings is the same among respondents’ on
contractors’ project planning success indicators in building projects
procurement systems.
1.5 Significance of the Study
This study will contribute valuable knowledge to contractors’ project planning in
developing countries, especially in Africa. The outcome of this research will be used
to: enhance and facilitate indigenous contractors’ efficiency in project delivery in
Nigeria; expose how contractors and other parties to a contract contribute to the
9
failure or success of contractors’ project planning and; enrich literature within
academia for the training of construction professionals, as well as eventually
contribute to high performance in the NCI. The significance of the study stems from
the contribution that accrues from the construction industry to the economy.
An efficient construction sector, according to Oyewobi and Ogunsemi (2010), is a
pre-requisite to effective national development. This is because, the products of the
construction industry are desired mainly for the services which they help to create, as
most business, social, religious, economic and, industrial activities operate on her
structural base (Nwachukwu, 2008). However, all these benefits can only accrue
from the industry to the economy when construction projects are efficiently
delivered.
This study’s result and recommendations will contribute to the NCI’s attainment of
best practice globally. The study result will be disseminated through: conferences,
workshops, journal publications, and academia-teaching. The research result will
benefit: indigenous and foreign contractors in Nigeria, construction professionals,
construction clients, and academic institutions.
1.6 Justification of the Study
In almost all countries, the construction sector is always used to invigorate national
economies (Mogbo, 2001, p.1), because it contributes to the economy through the
various resources, infrastructure and facilities it produce (Shaikh, et al., 2010). The
industry produces and maintains infrastructures and facilities required for various
social, economic and industrial functions such as buildings, highways, dams, ports,

10
industries and power stations (Alzahrani & Emsley, 2013; Achuenu, et al., 2000).
The infrastructural facilities produced by the industry are used for transportation,
housing, communication, water and power supply, manufacturing and waste
disposals, and the acquirement of these facilities enhances, supports, and defines the
economic growth of a nation (Alzahrani & Emsley, 2013; Achuenu, et al., 2000).
However, Nigeria like other developing countries have a wide range of infrastructure
deficits in four infrastructure sectors of the economy (power sector, railway, road, oil
& gas), and it is estimated that the country need to invest US$100 billion in the next
6 years, if it is to meet its annual growth targets and become one of the largest 20
economies in the world by the year 2020 (Draft National Policy on Public-Private
Partnership, 2009 cited in Dahiru, et al., 2010). The country attaining a spot in the 20
largest economies in the world by 2020 is also a priority to the Federal Government
of Nigeria (FGN) Vision 20:2020, and one of the aims of the Vision is to bridge
Nigeria’s huge housing deficit of 12-14 million housing units, which is estimated to
cost 35 trillion naira (US$24 billion) (Oni & Wyk, 2012). This has been a point of
concern that requires a large stock of competent indigenous firms with qualified
personnel (competent and capable) for the Vision to be realized (Oni & Wyk, 2012).
Several studies have acknowledged that for a construction industry of any country to
contribute to economic growth, it requires: technological advancement, the use of
local material and human resources that has the ability to compete globally (Mbamali
& Okotie, 2012; Odediran et al., 2012; Aniekwu & Audu, 2010; Ogunsemi & Saka,
2006). According to Yimam (2011) enhancing the performance of the construction
11
industry in the developing countries requires an improvement of contractors’ project
management capability.
However, the current shortage of competent indigenous firms in the NCI has
constrained the productive capacity of the sector and aggravated the nation’s
infrastructure deficits problem (Oni & Wyk, 2012; Aniekwu & Audu, 2010; Jinadu,
2007; Adams, 1997). Consequently, the NICs lack the technical and managerial
competence in contributing to NCIs Drive towards the economic growth of Nigeria
(Mbamali & Okotie, 2012; Aniekwu & Audu, 2010; Muazu & Bustani, 2004).
The underperformance of the NICs towards the development of the Nigerian
economy has informed the call by researchers in Nigeria for a developmental effort
towards improving its performance to meet global construction best practice
(Mbamali & Okotie, 2012; Aniekwu & Audu, 2010; Achuenu, et al., 2000). Hence,
the NCI requires indigenous contractors that are competent in the discharge of their
contractual obligation; those who are efficient and able to deliver constructed facility
within cost and schedule and according to the desired quality without recourse to
litigation or arbitration (Saleh, 2004), and those who will ultimately develop the
NICs to a technically and managerially sound position according to international
construction best practice (Mbamali & Okotie, 2012; Achuenu, et al., 2000). The
improvement of the productive capacity of the NICs will contribute to the economic
growth of Nigeria through: the reduction of infrastructural deficits; attract local and
foreign investments; create employment; generate income, and augment NICs ability
to compete globally and generate foreign exchange.

12
1.7 Scope and Delimitation
This study investigate NICs project planning in construction procurement systems.
This study was conducted in northern Nigeria and delimited its investigation to
ascertaining: NICs involvement in all but discretionary building procurement
systems, NICs time and cost performance in the targeted procurement systems, NICs
application of project planning techniques in building projects delivery, NICs
challenges in projects planning, significant factors influencing NICs project
planning, and contractor’s project planning success indicators.
This study was delimited to main/general building contractors’ operational planning
at the post contract stage in building procurement systems. The term main/general
contractors used in this study is in relation to building procurement systems and it
include: construction manager (CM), management contractor (MC), design and
management contractor (DMC), design and build contractor (DB), and design and
construct contractor (DCC). The scope of this study does not include investigating
subcontractors’ project planning.
1.8 Operational Definitions of Terms
I. Contractor: A corporate body that runs a contracting business that entails the
provision of materials or a service to clients for a fee.
II. Construction project procurement: An organized method or process and
procedure of obtaining or acquiring a construction product such as a house,
shopping complex or road and jetty. It also involves arranging and
coordinating people to achieve prescribed construction goals and objectives.
13
III. Consultants: Core building professionals (architects, building engineers,
construction and project managers, service and structural engineers, quantity
surveyors) involved in building project procurement, and who are responsible
for developing the requirements of project clients, setting targets and,
deadlines, as well as establishing standards for meeting these requirements,
preparing project documents that describe the targets, setting deadlines and
standards, and monitoring the activities of contractors.
IV. Nigerian indigenous contractors (NICs): Contracting firms that are fully-
owned and managed by Nigerians; the nationality of the firms’ ownership and
management is exclusively Nigeria.
V. Operations: Activities or tasks a contractor is expected to accomplish in his
contractual obligation in any type of construction procurement system.
VI. Operational planning: A method statement and programme of work. The
method statement involves establishing a method statement for each activity
that allows a detailed look at the project’s resource requirements, which are
not obvious at the strategic level. A programme of works primarily presents
the sequence in which the various activities should occur with their associated
durations and resource requirements
VII. Public Building Professionals (PBPs): Building professionals (architects,
building engineers, construction and project managers, service and structural
engineers, quantity surveyors), working under government establishment as
14
in-house consultants. They serve as the government (client) public works
supervisory staff in Nigeria.
VIII. Procurement: The process of obtaining goods and services from another for
some consideration.
IX. Procurement process: A series of operations or actions taken in order to
achieve the intended aim of construction project procurement. The scope of
construction procurement process covers every aspect of a project delivery
system.
X. Procurement systems: An organizational system that assigns specific
responsibilities and authorities to people and organizations, and defines the
relationships of the various elements in the construction of a project.
XI. Respondents: This comprised of NICs, consultants and PBPs; they are the
elements that make up the study population, and provide answers to the study
enquiry.
15
CHAPTER TWO
2.0 LITERATURE REVIEW
2.1 Introduction
This chapter covers literature review and includes: Nigeria construction industry
(NCI), Nigerian indigenous contractors’ (NICs), construction contracting business,
construction procurement, contractors’ role in procurement systems, application and
performances of building projects procurement systems in Nigeria, construction
project planning techniques, the NICs project planning challenges, influencing
factors for NICs project planning, contractors’ project planning success indicators,
and the study research gap (review of literature on: construction procurement and
contractors).
2.2 The Construction Industry
The construction industry is considered one of the oldest industries organized on a
project basis (Gollenbeck, 2009, p.1). Well known examples are the Egyptian
pyramids (3rd millennium B.C.) and the aqueducts carrying water to cities and
industrial sites that were constructed in Rome in 312 B.C. (Gollenbeck, 2009, p.1).
One thing that is common to all these historic structures is the use of both human and
material resources which are planned, organized, coordinated and controlled for the
sole aim of realizing the projects. It also involves a complex structure of different
trades and professionals working in harmony towards the realization of the projects.
The construction industry is of strategic importance to any nation due to the role it
plays in the economy (Gollenbeck, 2009; Jinadu, 2007). It is responsible for the
provision of infrastructure and contributes to a country's gross domestic product

16
(Dada, 2012). The industry worldwide accounts for a sizeable proportion of a
nation’s economic activities and globally accounts for about 10% of the world
economy (Adindu, 2012; Freeman, 2011). Approximately 70% of construction
investment is accounted for in the USA, Western Europe, and Japan. The continent
of Africa accounts for about 1%. Per capita investment in construction in the
developed world is approximately $2 500 per annum as against $46 per annum in
Africa (Freeman, 2011, p.14).
The low level of construction investment in Africa and lack of human capital
potential has created a huge infrastructural deficit and this account for the low socio
economic growth of the continent. The industry can be used for the socio economic
development of developing economies (Hamilton, 2006). This is because of its
unique ability to facilitate development of a nation by providing directly for human
needs, stimulating investment, and generating employment (Hamilton, 2006). Hence,
the construction industry is a sector that can assist the African continent to develop
its economy as well as provide employment opportunity to its teeming population.
2.2.1 Nigeria Construction Industry
The NCI, according to the Nigerian Institute of Quantity Surveyors (NIQS) 2008),
has grown from the world wars up to 1960s, and it has been British oriented both in
design and operational modus. Thereafter, various incursions were made from other
areas of Europe and America. All these innovations and Nigerians own concepts,
according to NIQS (2008), metamorphosed into a new complexity, which can rightly
be regarded as NCI culture.

17
In Nigeria, the construction industry plays a fundamental role in national
development since the post war era; 1967-1970 (Adindu, 2012). Construction
activity in Nigeria is extremely diverse, ranging from simple housing developments
to complex infrastructure projects. It activities include:
Creation of infrastructure facilities: This involves projects like power
stations, airports, roads, bridges, water schemes, hospitals and administrative
facilities;
Provision of industrial facilities: This involves the provision of buildings and
other utilities in order to enhance production and earning capacity of
industries; including factories, and workshops and offices
Provision of accommodation and recreational facilities: Such projects include
housing schemes, churches, mosques, sports facilities, recreational centres,
and so on (Adindu, 2012).
Mogbo (2001) asserted that the NCI represents an important and crucial sector in the
economy. In 1960, it recorded a gross fixed capital formation of 50% and accounted
for 4.8% of the GDP of Nigeria (Oladirin, et al., 2014). The industry’s contribution
remained relatively stable, rising gently in five years to 5.22% in 1965 to 5.4% in
1966, and then declining as a result of the civil war that took place between 1967-
1970, to 4.38% (Oladirin, et al., 2014; Mogbo, 2001). In 1975-1980 and 1981-1985,
the NCI recorded its share of the gross fixed capital formation as 61.06% and
52.16% respectively (Anago, 2001). Correspondingly, its share of the GDP increased
to 5.70% in 1975 and 15.9% in 1980 (Oladirin, et al., 2014; Anago, 2001). This
unprecedented increase in GDP between 1975-1980 was attributed to the ‘oil boom’
18
and the reconstruction and rehabilitation works to mend the havoc resulting from the
civil war that ended in 1970 (Ojo, et al., 2006; Achuenu, et aI., 2000).
However, foreign firm benefitted more because they were the major contracting and
competent companies available (Achuenu, et aI., 2000). The GDP then Dropped
sharply from 15.9% of total output in 1980 to 4.7% in 1981 and a paltry 1.9% GDP
in 1985 (Anago, 2001). This declining trend of the industry’s contribution to the
Nation’s GDP was attributed to political instability, a decline in oil revenue in the
1980s, and the Nigerian government restructuring of the economy under the
Structural Adjustment Programme (SAP) (Oladirin, et al., 2014; Fagbenle, et al.,
2011). Within this period, the rulership of the country had changed hands thirteen
times, and each regime had different strategies of solving the economic problems
(Fagbenle, et al., 2011). In the late 1980’s the contribution of NCI to the economy
improved substantially, accounting for about 70% of the country’s GDP (Planning
Committee on National Construction Policy, 1989 cited in Ibrahim, 2008).
The performance indicators for the period 1991-1995 showed an averaged share of
gross fixed capital formation of 54% and a GDP of 4.02%, and this performance
according to Anago (2001) has generally remained the same. However, the advent of
civilian administration in May 1999, raised the hope that investment in constructions
would provide the much needed push to kick-start economic growth (Anago, 2001).
However, the NCI GDP share under the democratic dispensation has not been
encouraging; it accounted for 1.92% and 2% in 2009 and 2010 respectively (NPC,
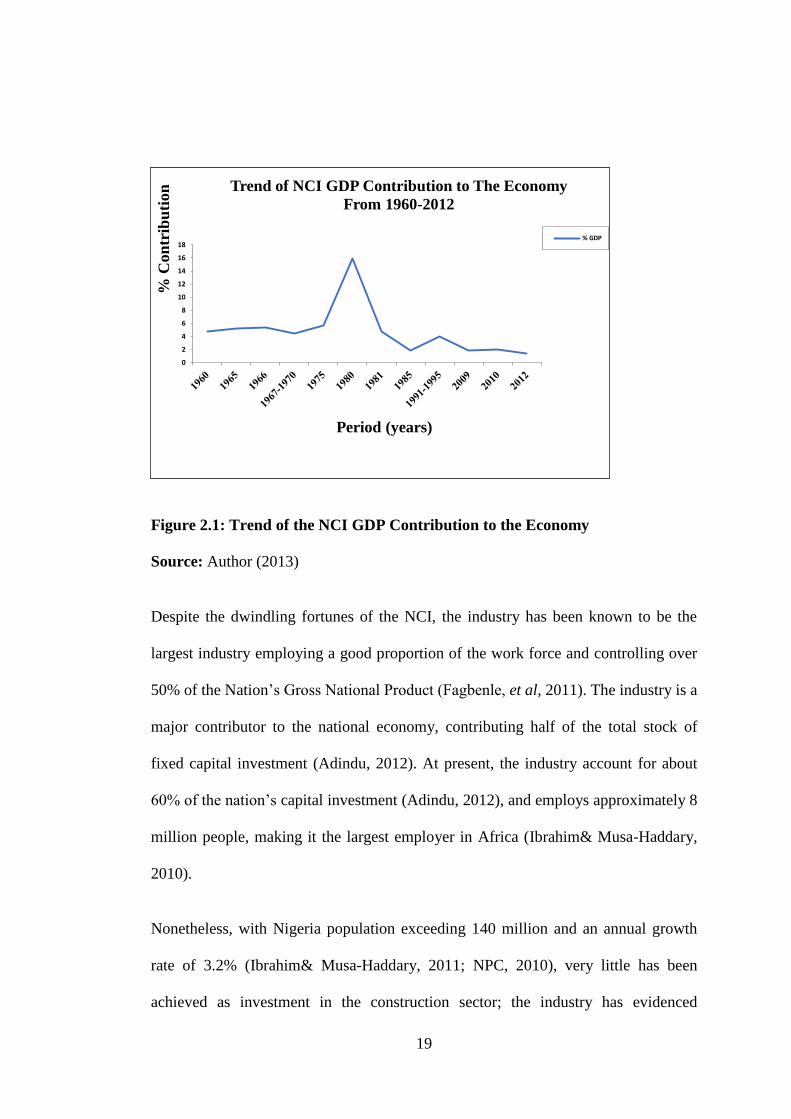
2010). The industry’s GDP Dropped to 1.4% in 2012 (Odediran et al., 2012). Figure
2.1 shows the trend of the NCI GDP contribution to the economy.
19
Figure 2.1: Trend of the NCI GDP Contribution to the Economy
Source: Author (2013)
Despite the dwindling fortunes of the NCI, the industry has been known to be the
largest industry employing a good proportion of the work force and controlling over
50% of the Nation’s Gross National Product (Fagbenle, et al, 2011). The industry is a
major contributor to the national economy, contributing half of the total stock of
fixed capital investment (Adindu, 2012). At present, the industry account for about
60% of the nation’s capital investment (Adindu, 2012), and employs approximately 8
million people, making it the largest employer in Africa (Ibrahim& Musa-Haddary,
2010).
Nonetheless, with Nigeria population exceeding 140 million and an annual growth
rate of 3.2% (Ibrahim& Musa-Haddary, 2011; NPC, 2010), very little has been
achieved as investment in the construction sector; the industry has evidenced
0
2
4
6
8
10
12
14
16
18
% C
on
trib
uti
on
Period (years)
Trend of NCI GDP Contribution to The Economy
From 1960-2012
% GDP
20
minimal multiplier effects in the economy (Anago, 2001). This has resulted in NCI
being described as a ‘sleeping giant’ within its continental neighborhood in terms of:
service delivery, contribution to the economy and, the capacity to satisfy the needs of
its clients (IDr.us & Sodangi, 2010; Idoro, 2014; Ibrahim. & Musa-Haddary, 2010).
NCI is said to be ‘sleeping’ because it has severally been credited with inability to
deliver services effectively and efficiently (Ibrahim& Musa-Haddary, 2010). For
instance there have been several reports of poor management of projects: rushed
project implementation, inadequate planning and budgetary provisions, projects
executed at high cost, inefficient and poor service delivery, abandoned or non-
functional facilities, and collapsed buildings (Ibrahim & Musa-Haddary, 2010). More
so, the industry is dominated by foreign contractors due to the incompetence and
non-involvement of the indigenous contractors in major construction projects
(Odediran, et al., 2012; Aniekwu & Audu, 2010; Muazu & Bustani, 2004)
Additionally, many completed or on-going projects in Nigeria are deficient in
performance objectives because clients and customers are not satisfied, project time
and cost overruns, low quality and shoddy outputs, project conflict between the
contractors and claims arising from variation in contract sum (Ubani, et al., 2010).
Oyegoke (2005) cited in Ibrahim (2012) identifies and categorizes the constraint in
infrastructure development in Nigeria into two forms:
Internal constraints: This involve the shortcomings in the entire society
starting from governance, investment and financial institutions, professional
bodies, contracting firms and developers, project owners and educational
institutions and;
21
The external constraints: These are centred on the reputation of Nigeria,
especially with regard to scams, a high level of corruption, limited security of
life and property, and economic risks and uncertainty.
Moreover, construction, like other industries, has been experiencing profound
changes involving both the business environment and internal organization
(Marchesan & Formoso, 2000 cited in Inuwa, 2006). Inuwa (2006) reported that
most industries are dynamic in nature and the construction industry is no exception.
Its environment has become more dynamic due to the increasing uncertainties in
technology, budgets and development processes. The industry’s construction project
of the 21st century is becoming a more complex process that spans many phases, is
technologically Driven, has many stake-holders, involves new types of clients, and
finances and project organizations (Oyegoke, 2006). This has resulted in changes in
construction methods that affect the structure of the industry, the roles of parties, and
the procurement methods employed (Oyegoke, 2006).
The procurement of building projects, according to Rashid et al. (2006), is vast in
scope because it involves the gathering and organizing of myriads of separate
individuals, firms and companies to design, manage, and build construction products
such as houses, office buildings, shopping complexes, and roads, bridges, and so on
for specific clients. The different building procurement systems brought changes not
only to the process and procedure of project delivery but also to the aspects of
management and organization (Rashid et al., 2006; Bennett, 2003). The dynamism in
the construction industry and the demand for modern procurement systems obviously
22
requires the contractors to gear up to the demands brought about by the dynamism of
the industry, if they are to remain relevant in discharging their duties.
2.3 Construction Contracting Business
Construction contracting is a business that rapidly emerged in developing countries
during colonial rule and shortly after World War II (Laryea & Mensah, 2010; Uduak,
2006; Harris & McCaffer, 2005). The owners of contracting business are referred to
as contractors. Their statutory business registration, according to Harris and
McCaffer (2005), can either be sole-proprietorship, partnership, or corporation. As a
firm, their primary responsibility is to ensure that all resources; manpower,
machinery, materials and money are employed optimally for the efficient delivery of
a project, and to produce maximum profit for the investors in the enterprise (Olateju,
1992 cited in Fagbenle, et al., 2011; Saleh, 2004). Contractors form the backbone of
the construction business as they execute most of the construction work. They
occupy a significant position in the construction industry, hence are regarded as
major players in it (Chitkara, 2012; Usman, et al., 2012b).
Contractors role in the management of modern construction projects is circumscribed
within design and management decisions, direct physical production of the facility
on site, project close-out/final accounting, and rehabilitation and maintenance of
existing facilities (Windapo, 2013; Babatunde, et al., 2010; Oyegoke, 2006; Rashid,
et al., 2006; Harris & McCaffer, 2005). Construction contractors’ participation in a
building projects can either be in the form of Main/General Contractors’,
Subcontractors’ or Prime contractors’(Laryea & Mensah, 2010; Ricketts, 2000).
23
The concept of general contracting according to Laryea and Mensah (2010) refers to
the professional practice or system where an organization or individual undertakes to
supply the resources and services required to execute a project in accordance with a
contract document. General contractors usually assume responsibility for an entire
construction project, but may subcontract to Subcontractors’ all of the actual
construction works or those portions requiring special skills or equipment (Popescu,
et al., 2003; Ricketts, 2000). Legally, Subcontractors’ are in contract with the
General Contractors’ rather than the client even when the client has stipulated which
subcontractor is to be used (Baily, et al. 2008; Popescu, et al., 2003; Ricketts, 2000).
The essence of subcontracting according to Baily, et al. (2008), is to augment the
general contractor’s limited resources and skills while enabling the general
contractor to concentrate on their main area of expertise.
Sometimes (Ricketts, 2000), in addition to a general contractor, the owner’s (client’s)
contracts separately with specialty contractors, such as electrical and mechanical
contractors, who perform a substantial amount of the work required for a building.
Such contractors are called Prime contractors’. Their work is scheduled and
coordinated by the general contractor, but they are paid directly by the owner
(Ricketts, 2000). Basically contractors’ are required by virtue of their business to
provide materials or a service to another (clients’) for a set of fee (Inuwa, et al.,
2013). In modern day construction business, contractors are faced with challenges
which amongst others include: higher clients’ requirements through increasing
complexity of modern construction procurements, globalization, impact of
computerization and, competition within the industry (Mbamali & Okotie, 2012;
24
Babatunde et al. 2010; David, et al., 2007; Oyediran, 2006; Rashid et al. 2006;
Harris & McCaffer, 2005). Moreover, clients’ quest for efficiency and Drive for
competitiveness are the fundamental goals of the globalized economy (Oyediran,
2006). Hence, in strategic terms, contractors must understand clients’ needs and
values if they want to differentiate themselves from their competitors (Holder &
Coffey, 1997). Contractors according to Oyediran (2006), who are able to deliver
the clients’ needs and values (goals) will certainly be the best choice of the industry
and this enables a contractor to enjoy full endorsement and patronage from the
industry’s clients.
2.4 Nigerian Indigenous Contractors
In Nigeria, construction contractors are categorised by several criteria (Idoro, 2011;
Idoro & Akande-Subar, 2008; Muazu & Bustani, 2004): scope of operation (local,
regional, national and multinational); specialization (building and engineering); size
and category of contracts (small, medium and large); and the company's owners’
nationality (foreign and indigenous). Most frequently the comparison of the
performances of foreign and indigenous firms is of concern to many researchers in
the NCI. Indigenous contractors are contracting firms that are fully-owned and
managed by Nigerians (Idoro & Akande-Subar, 2008); the nationality of the firms’
ownership and management is exclusively Nigeria.
2.4.1 The NICs Project Management Performance
The debate on project management performance in the NCI centres mainly on the
performances of foreign and indigenous contractors (Aniekwu & Audu, 2010; Idoro
& Akande-Subar, 2008; Muazu & Bustani, 2004). The expectation of construction
25
clients’ and other stakeholders’ on contractors’ project performance is to meet
delivery dates, budgets, quality, as well as stakeholder satisfaction (Gollenbeck,
2008). However, there are conflicting views amongst researchers on the NICs
meeting the expected projects management performance. To Uduak (2006) and Y.
Ibrahim (2012) the NICs performance in managing projects is better and they
claimed that they can be entrusted with large and highly technical projects. On the
other hand, most researchers acknowledge that the NICs performance is marred with:
abandonment, cost and time overruns, poor quality, poor workmanship; poor
management capability, financial difficulties, poor planning, poor mechanization and
high frequency of litigation (Oladimeji & Ojo, 2012;Idoro & Akande-Subar, 2008;
Muazu & Bustani, 2004; Achuenu, et al. 2000).
Many researchers have attributed NICs poor performance to incompetence,
inexperience, poor planning and the adoption of a traditional management approach,
which has been proven to be ineffective in the management of construction projects
(Ekundayo, et al., 2013; Aniekwu & Audu, 2010; Muazu & Bustani, 2004; Adams,
1997). These have resulted in poor management and low productivity of the NICs
compared to their foreign counter-parts, and causing a major percentage of the total
projects in Nigeria to be given to foreign contractors (Aniekwu & Audu, 2010;
Muazu & Bustani, 2004).
Contracting is a high risk business (Seeley, 1986, p.254). Consequently, it is a terrain
that calls for high specialization (Muazu & Bustani, 2004). Thus, it is practically
impossible to diligently run a construction firm without the requisite project
management knowledge (Alzahrani & Emsley, 2013; Yimam, 2011; Freeman, 2011).

26
However, by comparison, one is at pains to claim finding an indigenous firm in
Nigeria able to match, or surpass the skill and competence of foreign firms (Muazu
& Bustani, 2004). The greatest single edge a foreign firm has over an indigenous
firm according to Muazu and Bustani (2004) is efficient management.
The outcome of the NICs underperformance to the Nigerian economy has resulted in:
low income generation and redistribution due to foreign firms repatriating their
profits abroad; an insignificant value addition to construction and local industries
supplying construction materials; and consistent contribution of 1% employment
over the last decade as against the World Bank’s average observation of about 3.2%
in other developing countries (Aniekwu & Audu, 2010; Idrus & Sodangi, 2010).
Consequently, this is preventing the country from fully benefitting from the
industry's contribution to economic growth (Aniekwu & Audu, 2010; Bala, et al.
2009; Adams, 1997).
2.5 Construction Procurement
Synonymous with the word ‘procurement’ in the Oxford Dictionary of English
(2010) are: ‘the act of getting possession of something’; ‘to acquire something’; and
‘the action of obtaining or procuring something’. The United Nation Commission on
International Trade Law (UNCITRAL) (1994) cited in Ibrahim(2008, P.4), defines
procurement as the process used for the acquisition of goods, works, and related
services (i.e. transportation, insurance, installation, training, maintenance and other
similar services) required in the execution of a project, excluding consultancy
services.
27
From the construction point of view (Ibrahim, 2008), procurement is broadly divided
into two: general procurement and construction specific procurement. General
procurement is concern with the acquisition of goods and services (Ibrahim, 2008). It
is simple to execute in comparison to the construction-specific procurement
(Ibrahim, 2008). Construction-specific procurement is a series of interdependent
operations (process) undertaken within a well-defined framework (system) used in
acquiring a construction project. According to Rashid et al. (2006) construction
procurement is an organized method or process and procedure of obtaining or
acquiring a construction product such as a house, shopping complex or road and
jetty. It also involves arranging and coordinating people to achieve prescribed goals
or objectives (Rashid et al., 2006). According to Ibrahim (2008) construction-
specific procurement is more complex than general procurement, hence the need for
the management of the process to be undertaken by people with appropriate
knowledge, skills, expertise and tools. Its complexity stems from its extensive
process and variance of systems (Hughes, 2012; Idoro, 2012a).
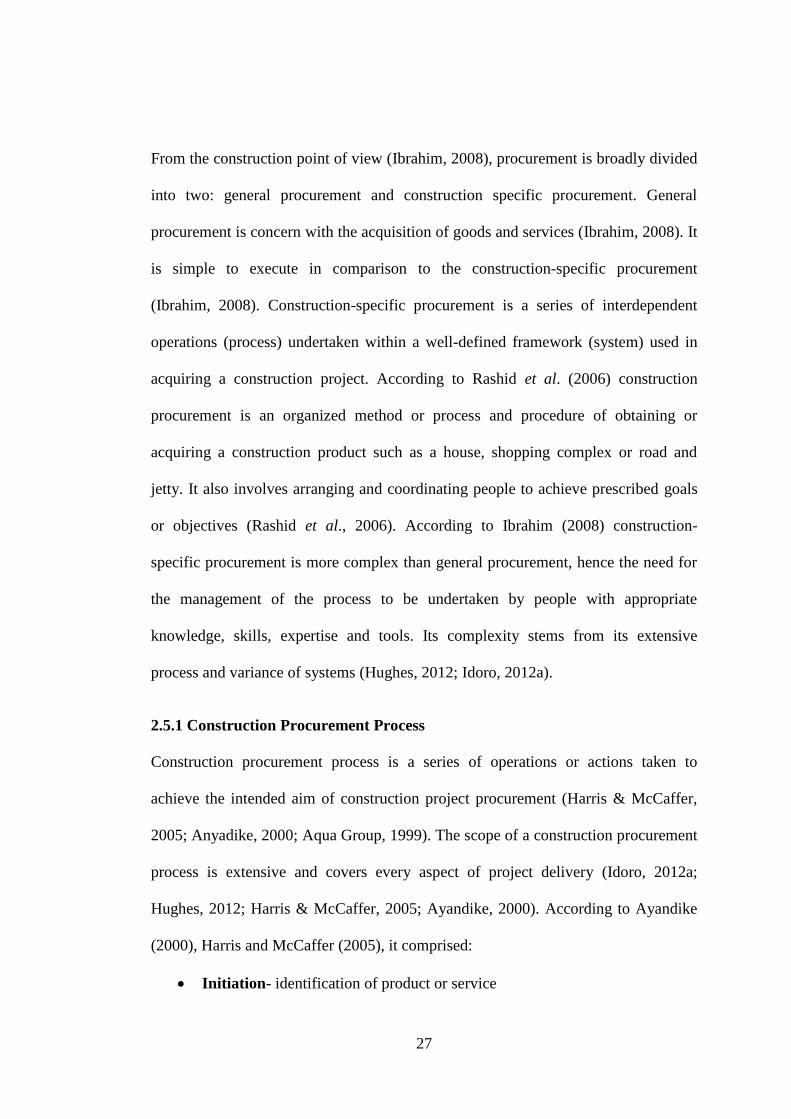
2.5.1 Construction Procurement Process
Construction procurement process is a series of operations or actions taken to
achieve the intended aim of construction project procurement (Harris & McCaffer,
2005; Anyadike, 2000; Aqua Group, 1999). The scope of a construction procurement
process is extensive and covers every aspect of project delivery (Idoro, 2012a;
Hughes, 2012; Harris & McCaffer, 2005; Ayandike, 2000). According to Ayandike
(2000), Harris and McCaffer (2005), it comprised:
Initiation- identification of product or service

28
Preliminary- feasibility studies, strategic and finance planning, preliminary
estimation
Evaluation of project brief- engineering/construction technology and
costing, approximate quantities method-estimation
Design management- detailed drawings and cost planning (cost allocation
and target)
Contracts and procurement-contractor selection (bid invitation and
evaluation)
Manufacture and construction- installation and construction (Actualization
of plan)
Commissioning- handing over and commissioning
Facility management- operation and maintenance
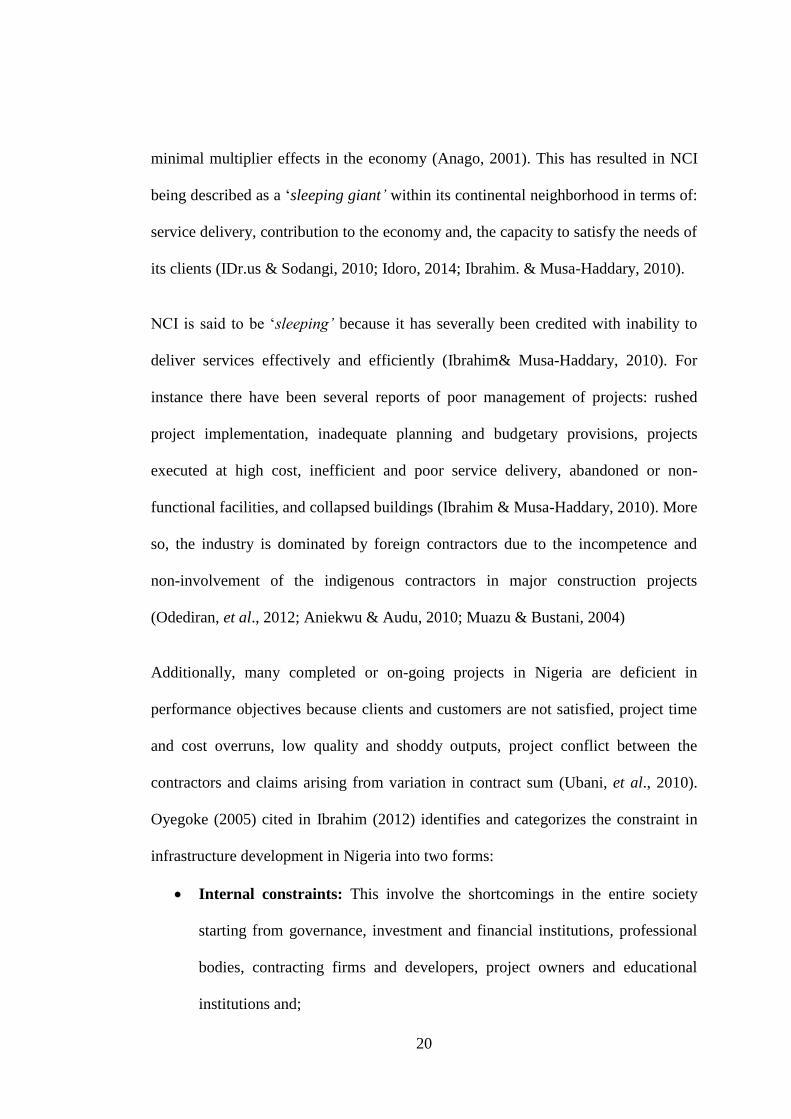
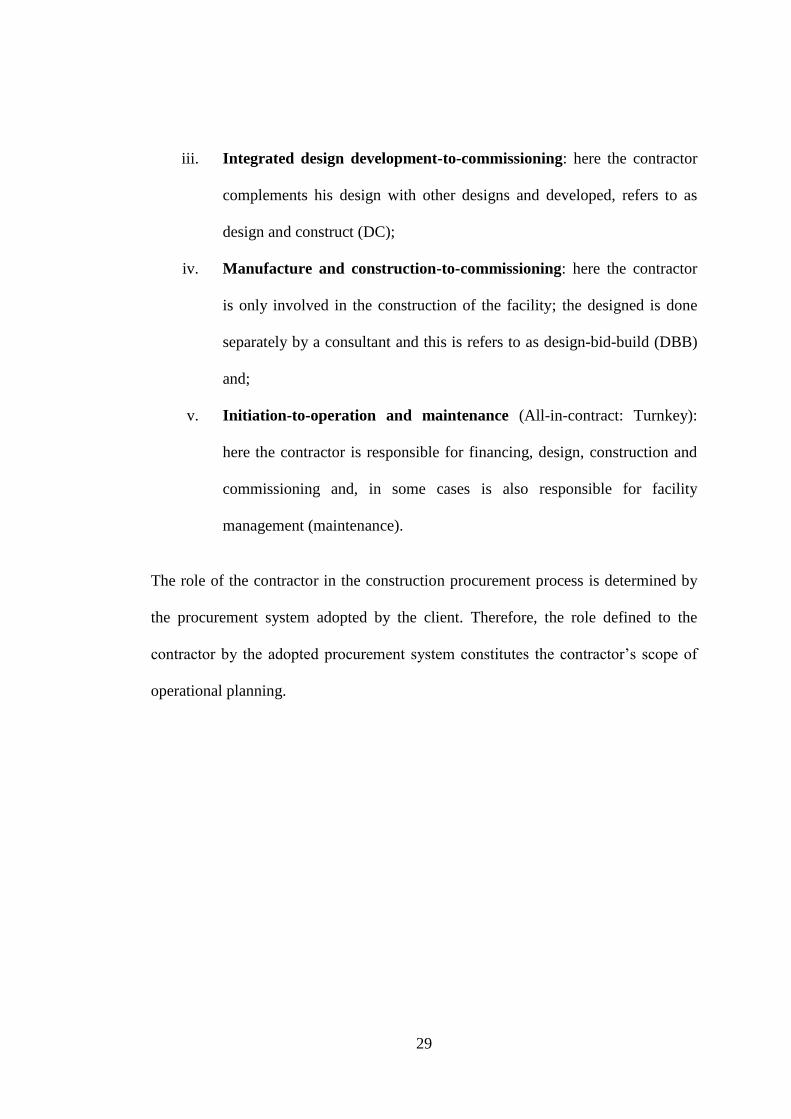
The procurement phases shown in figure 2.2 depicts the process in construction
procurement and it shows the stages, operations or task and sequence of task to be
undertaking by the key players (clients, consultants and contractors) in building
project procurement systems.
The contractor’s role in a procurement system defines his contractual obligation and
this role may include the following stages in the procurement process:
i. Initiation-to-commissioning: here the contractor is involved in
management contracting (MC);
ii. Design and development-to-commissioning: here the contractor is
contracted to design and build (DB);
29
iii. Integrated design development-to-commissioning: here the contractor
complements his design with other designs and developed, refers to as
design and construct (DC);
iv. Manufacture and construction-to-commissioning: here the contractor
is only involved in the construction of the facility; the designed is done
separately by a consultant and this is refers to as design-bid-build (DBB)
and;
v. Initiation-to-operation and maintenance (All-in-contract: Turnkey):
here the contractor is responsible for financing, design, construction and
commissioning and, in some cases is also responsible for facility
management (maintenance).
The role of the contractor in the construction procurement process is determined by
the procurement system adopted by the client. Therefore, the role defined to the
contractor by the adopted procurement system constitutes the contractor’s scope of
operational planning.
30
Stage Task Sequence of tasks
Initiation Product identification
Preliminary Feasibility studies, strategic & financial planning
Design and development Engineering and costing
Detailed design Detailed engineering
Contracts and procurement Procurement
Construction Construction
Commissioning Commissioning
Operation and maintenance Operation and maintenance
Figure 2.2: Construction Procurement Process
Source: Harris and McCaffer (2005)
2.5.2 Construction Procurement Systems
The term construction procurement systems according to Ibrahim (2008), is
synonymous with the terms: procurement methods, procurement routes, contractual
arrangement, procurement strategy, and project delivery systems. Construction
procurement system is an organizational system that assigns specific responsibilities
and authorities to people and organizations, and defines the relationships of the
various elements in the construction of a project (Love et al., 1998 cited in Ibrahim,
2008). Construction project procurement systems according to Oyegoke (2006),
Fu
lly o
per
atio
nal
Co
mm
issi
on
ing
Pla
ce c
on
trac
ts
Fin
al S
chem
e an
d
Pro
cure
men
t
Dec
isio
n
to
pro
ceed
w
ith
pro
ject
Dec
isio
n t
o p
roce
ed w
ith
stu
dy
Est
abli
sh t
erm
s o
f re
fere
nce
31
establishes the contractual framework that determines the nature of the relationship
between the project team within the duration of their interaction.
For the organization of building projects, different project procurement systems exist
(Gollenbeck, 2008) and are available for meeting different clients’ needs and projects
specifics (Babatunde, et al., 2010). Construction project procurement systems are
broadly categorized into two: traditional and non-traditional system (Harris &
McCaffer, 2005; Babatunde, et al., 2010; Mathonsi & Thwala, 2012).
Traditional Procurement Systems
Traditional Procurement System is also referred to as separated contract, fragmented
contracts, or design-bid-build (DBB) (Oyegoke, 2006; Harris and McCaffer, 2005).
The name ‘traditional' according to Mathonsi and Thwala (2012), is due to the
system existence for a long time and has been the only choice available for most
clients of the construction industry for many years. The system imposes a contractual
and organizational separation between design and construction (Dada, 2012). At the
design stage consultants’ (Architects; Engineers; Quantity Surveyors; etc.) are
responsible for all the tasks required (Babatunde, et al., 2010; Ojo, et al., 2006),
while at the construction stage the contractor is responsible for the construction of
the facility as designed and specified by the consultants (Ojo et al. , 2006;
Babatunde, et al., 2010). In essence (Mathonsi & Thwala, 2012), the client is under
two contractual obligations: consultants and the contractor. There are different types
of separated contracts: lump sum; bill of quantities; schedule of rates; fixed or
percentage fee; cost reimbursement; target cost; and direct labour (Harris and
McCaffer, 2005; Bennett, 2003).
32
Non-Traditional Procurement Systems
According to Mathonsi and Thwala (2012), non-traditional is a generic term used to
refer to all emerging or contemporary procurement systems of the construction
industry other than the traditional procurement system. Under this system falls the
management oriented approach, integrated approach, and special task organization
(discretionary contract). What informs the emergence of this system is considered in
twofold:
firstly, the shortcomings of the separated contract due to the fragmentation of
building projects into two mutually exclusive entities (design and construction) and,
subsequently, creating room for ineffective communication and coordination, which
often results in conflict between the designers and the contractors, and often affects
the quality of a project by not taking into consideration buildability/constructability
and life-cycle costing (Ojo et al. 2007; Oyegoke, 2006).
Secondly, the increased size and complexity of construction projects, financial
challenges, political and social consideration, and information technology (Mathonsi
& Thwala, 2012). The ultimate reason for the introduction of non-traditional project
procurement system is to achieve more efficient and speedier project delivery
systems and better project performance (Babatunde, et al., 2010; Rashid et al., 2006).
2.6 Contractors’ Role in Procurement Systems
Both traditional and the non-traditional project procurement systems have the client,
contractor and the consultant (designer) as the major players, and other individuals as
part of the project team (Rashid, et al., 2006; Bennett, 2003). The relationships of the
33
project team members vary according to different systems and ownership (Bennett,
2003). These differences in systems and ownership brought changes to the process
and procedure of project delivery and to the management and organization of a
project (Rashid et al. 2006; Bennett, 2003).
The different systems also prescribe the variation of the organizational structure of
the project teams in terms of role, responsibility and authority (Rashid et al, 2006;
Bennett, 2003). This implies that the role of a contractor keeps changing with
different procurement systems allocating different roles to contractors and other
stakeholders (Rashid, et al. 2006). Hence, in each of the building procurement
systems, contractors play different roles according to different procurement systems.
It is therefore imperative for the contractors to note that successful execution of their
building project, undertaken within the scope of any type of procurement system,
depends on the understanding of their role, and limitation, the role of other parties, as
well as how they interrelate to define their contractual relationship (Gollenbeck,
2008).
2.6.1 The DBB Systems
According to Babatunde et al., (2010) the design-bid-build (DBB) system is a project
procurement system where the three sequential phases of design, bid and build are
identified as separate tasks. Under this system, the responsibilities of designing and
construction of the project are separated and are carried out by different independent
organizations namely: the consultants are responsible for the projects designs as well
the organization and overseeing of the bidding process, while the contractors’ role is
primarily to construct the facility based on the drawings and specification prepared
34
by the client’s consultants (Harris & McCaffer, 2005). In executing the construction
works, the contractor is responsible for: the detailed activity definition, the activity
sequencing, the activity duration estimation, and the resources requirements
(schedule development) (Oyegoke, 2006).
The contractor can as well sub-contract some or most of his work to specialist firms
but he remains liable. In addition, the contractor is also responsible for attending and
integrating the sub-contractors work with his own (Oyegoke, 2006; Rashid et al,
2006). The main contractor’s responsibilities ends at the construction stage and do
not cover facility/maintenance management (Oyegoke, 2006).
The contractor should always remember that meeting the needs and values of the
clients as dictated by the terms of the contract is of paramount importance for
meeting the contract objectives (Holder & Coffey, 1997). As a guide to the contract
and a representative of the clients, the lead consultants (architect/engineer/project
manager), though not in contract with the contractor, are mandated at the
construction stage for supervision of the construction works, issuance of variation
order, sanction payments, claims negotiation` and settling matters of disagreement
arising with the parties to the contract (Harris & McCaffer, 2005).
The main sub-classification (variants) of DBB procurement system as identified by
Babatunde et al., (2010) and, Harris and McCaffer, (2005) are: bills of firm
quantities; bills of approximate quantities; drawings and specification; schedule of
rates; cost reimbursement; fixed or percentage fee; and target cost and direct labour.
All the options maintain the separation of design and construction, the variants in the

35
DBB system determines the basis of contractors tender and how the contractors cost
of construction is arrived at (Harris & McCaffer, 2005). The
Figure 2.3: Contractor’s operation in DBB system
Source: Author (2013)
Figure 2.3 depicts the operations of a contractor in the DBB system. The overall
responsibility of the contractor in the DBB systems is to manufacture a building in
accordance with the building design and specification, as well as the integration of
the subcontractors work. Hence his operations include: site planning and
organization, execution of the main construction work, integrating and coordinating
subcontractors work, and commissioning (Figure 2.3).
2.6.2 Management Oriented Contracts
According to Rashid et al. (2006), management oriented contract is a system that
gives greater emphasis to the management and integration of the design and
Site planning &
Organization
Execution of
main
construction
work
Integrating &
Coordinating
Subcontractors
work
Commissioning
Contractor
Assembling and
Integration

36
construction of projects. According to Rashid et al. (2006), this procurement
approach was introduced based on the conception that a contractor has more
expertise to manage the design and construction of a project. As management
consultant, the appointed contractor does not carry out the design or construction of
the project. His main responsibility is to manage the design and construction of the
design, the consultants, and the many specialist contractors respectively (Oyegoke,
2006; Harris & McCaffer, 2005).
According to Harris and McCaffer (2005) the construction manager or managing
contractor joins the professional team at the earliest possible time prior to
construction, and on equal terms to other consultants. The responsibilities of the
contractor include preparing the overall construction programme and work packages,
steering these through the design stage, recommending/appointing the works (sub)
contractors and securing their smooth integration (Harris & McCaffer, 2005).
The well-established traditional forms of agreement generally apply to the
management contract with contracts between client and designer, client and
contractor, contractor and sub-contractors (Harris & McCaffer, 2005). Management
oriented contracts are sub-classified as (Rashid et al., 2006; Oyegoke, 2006; Harris
and McCaffer, 2005): management contract/ At-risk construction management;
construction management contract/Agency construction management and; design and
management contract.
The Construction Management Contract (CM)
The construction management contract also referred to as agency construction
management (CM), is a fee-based arrangement in which the construction manager is
37
responsible exclusively to the owner and acts in the owner’s interest at every stage of
the project (Oyegoke, 2006). In agency CM system, the client initiates the project
and involves a construction manager at the onset (Oyegoke, 2006). The contractor
(construction manager) is appointed early according to Harris and McCaffer (2005),
to plan, manage and co-ordinate the project.
According to Harris and McCaffer (2005) the construction management contractor is
not allowed to carry out any construction itself; the actual construction works are
contracted out to many package or specialist contractors (Rashid et al., 2006). The
client has a direct contract with each individual works contractor (sub-contractors)
and since all the actual orders with the various works contractors are with the client,
the construction manager carries virtually no risks (Harris & McCaffer, 2005).
The contractor (construction manager) offers advice on (Oyegoke, 2006): the
optimum use of the available funds, control of the scope of work, project scheduling,
avoidance of delays, changes and disputes, enhancing project design and
construction qualities, and optimum flexibilities in contracting and procurement. The
construction manager is involved in comprehensive management in every stage of
the project, beginning with scope planning, in the form of a written scope statement,
which outlines the project objectives, the agreement between the client and the
project team, and the major project deliverables.
The construction manager is also involved in the project scope definition by
subdividing the major projects into smaller deliverables by trade. The construction
manager co-ordinates and monitors the various trade contractors, who become direct
38
(prime) contractors to the owner (Oyegoke, 2006). The construction management
firm according to Harris and McCaffer (2005) takes responsibility for advising the
designer on buildability, including drawing up suitable work package contracts,
arranging procurement contracts and managing the bidding phases of the works
contracts. Though, the services of the construction manager (agency) do not extend
to facility/maintenance management (Oyegoke, 2006). The duties and services
provided by the construction management firm (contractor) are akin to those of a
project manager (Harris & McCaffer, 2005). In addition, contractors who specialize
in programming with solid management skills stand a better chance in delivering
construction management contracts successfully (Harris & McCaffer, 2005). Figure
2.4 shows the scope of construction management operations.

39
Figure 2.4: Management/construction management contractors’ operations
Source: Author (2013)
The Management Contract
The management contract is one where a main contractor is appointed (Seeley, 1986)
either by negotiation or in competition, and works closely with the employer’s
professional advisor (s).The contractor is engaged early to provide planning,
management and co-ordination of construction, and then sub-contracts the work
(Harris & McCaffer, 2005).
All physical construction is undertaken by sub-contractors (Seeley, 1986), the main
contractor is barred from carrying out any construction work itself as in construction
management (Harris & McCaffer, 2005). According to Seeley (1986) the works are
divided into packages agreed to by the employer’s professional advisor (s) and the
Project
scope
definition,
Ensuring
buildability
in design
Preliminary,
Feasibility
studies,
Strategic &
finance
planning
Attendance
provision,
Project
planning,
scheduling &
control
Engaging,
integrating &
coordinating
subcontractors
work
Management
contractor
Management
Design stage Construction stage Commissioning
40
management contractor as the most appropriate for the particular project. Although
on some projects the contractor provides common items for sub-contractors like
(Harris & McCaffer, 2005): scaffolds, tower crane and access road. According to
Seeley (1986), the management contractor provides common services to the sub-
contractors such as welfare facilities, and plant and equipment that are not confined
to one sub-contractor, and sufficient management both on and off the site to
undertake the planning and management, co-ordination and control of the project.
The management contractor performs similar duties to the construction manager, but
carries more risk (Rashid et al., 2006). Figure 2.4 also portrays the scope of
management contractors operations.
According to Rashid et al. (2006) the main difference between management contract
and construction management contracting is that in the former, the package
contractors (sub-contractors) have a contract with the management contractor. In the
latter, the package contractors (specialist sub-contractors) are in contract with the
client or building owner. The management contractor’s role is primarily that of a
planner, manager and organizer (Seeley, 1986). The services of the management
contractor do not extend to facility/maintenance management (Oyegoke, 2006).
Design and Management Contract
Under the design and management system, a single organization or firm is
commissioned to be responsible for designing the project and managing its
construction (Rashid et al., 2006; Harris & McCaffer, 2005). The initial scope design
is often executed by the clients own staff or an independent design firm, and forms
the basis for inviting tenders (Harris & McCaffer, 2005). Subsequently, a design and
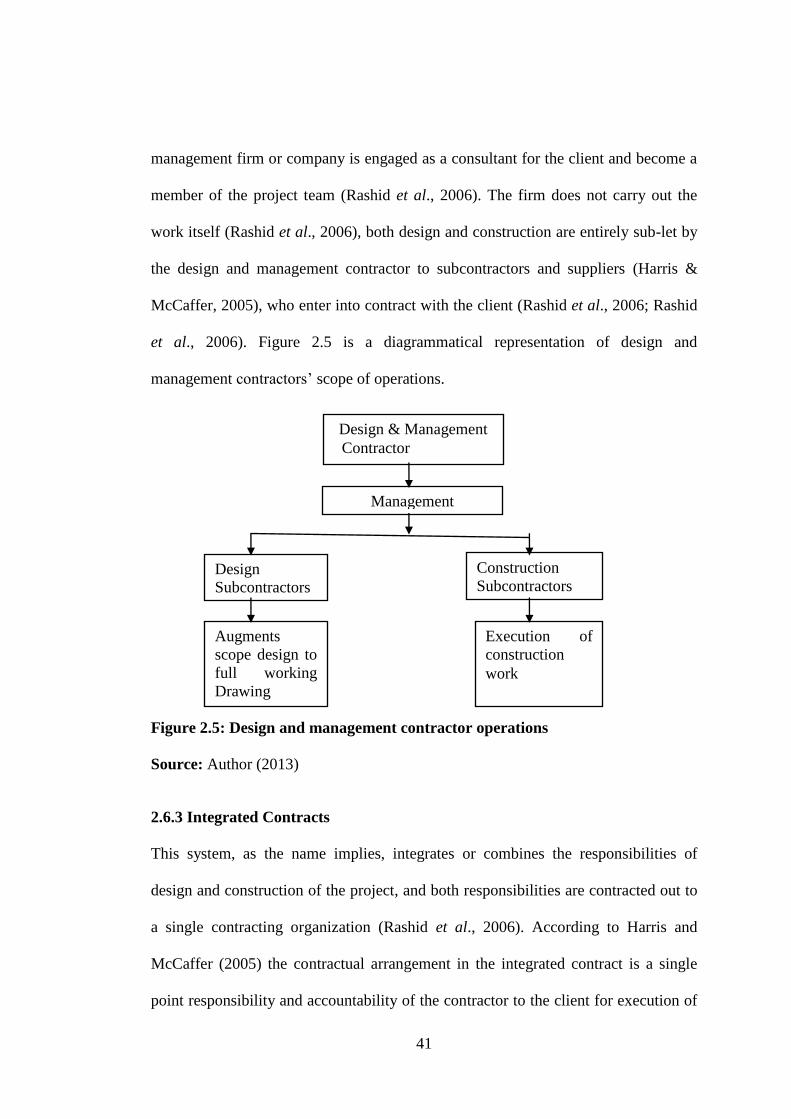
41
management firm or company is engaged as a consultant for the client and become a
member of the project team (Rashid et al., 2006). The firm does not carry out the
work itself (Rashid et al., 2006), both design and construction are entirely sub-let by
the design and management contractor to subcontractors and suppliers (Harris &
McCaffer, 2005), who enter into contract with the client (Rashid et al., 2006; Rashid
et al., 2006). Figure 2.5 is a diagrammatical representation of design and
management contractors’ scope of operations.
Figure 2.5: Design and management contractor operations
Source: Author (2013)
2.6.3 Integrated Contracts
This system, as the name implies, integrates or combines the responsibilities of
design and construction of the project, and both responsibilities are contracted out to
a single contracting organization (Rashid et al., 2006). According to Harris and
McCaffer (2005) the contractual arrangement in the integrated contract is a single
point responsibility and accountability of the contractor to the client for execution of
Design & Management
Contractor
Augments
scope design to
full working
Drawing
Execution of
construction
work
Management
Design
Subcontractors
Construction
Subcontractors

42
both the design and construction facets. The contractor for the job will be selected on
the basis of a project brief and client’s requirements, prepared by the client together
with his consultants (Rashid et al., 2006). Very often the successful contractor will
enter into a contract based on a lump sum price and a fixed duration (Rashid et al.,
2006).
The client in the integrated contract relinquishes control to some degree over the
design; although, an advisor might be appointed but usually only to monitor the
various aspects of the work and provide commercial management, should the client
feel the need to engage this kind of service when lacking in-house expertise (Harris
& McCaffer, 2005). Types of integrated contract include (Rashid et al., 2006; Harris
& McCaffer, 2005): design and construct; design and build contract; all-in
(Turnkey/package deal) contract; and private finance initiative (PFI).
Design and Construct Contract (DC)
This system is also referred to as develop and construct (Rashid et al., 2006). In this
system the contractor is given the responsibility to design and construct (Rashid et
al., 2006), but his design responsibility is shared with the client consultant.
According to Harris and McCaffer (2005) the client separately engages an architect
in the case of a building work to produce a scope drawings generally relating to
specific functional or essential aesthetic details, and specification fully describing the
design.
The contractor thereafter augments (integrate) the Drawing with their own working
Drawings and secures all statutory approvals including those needed from the
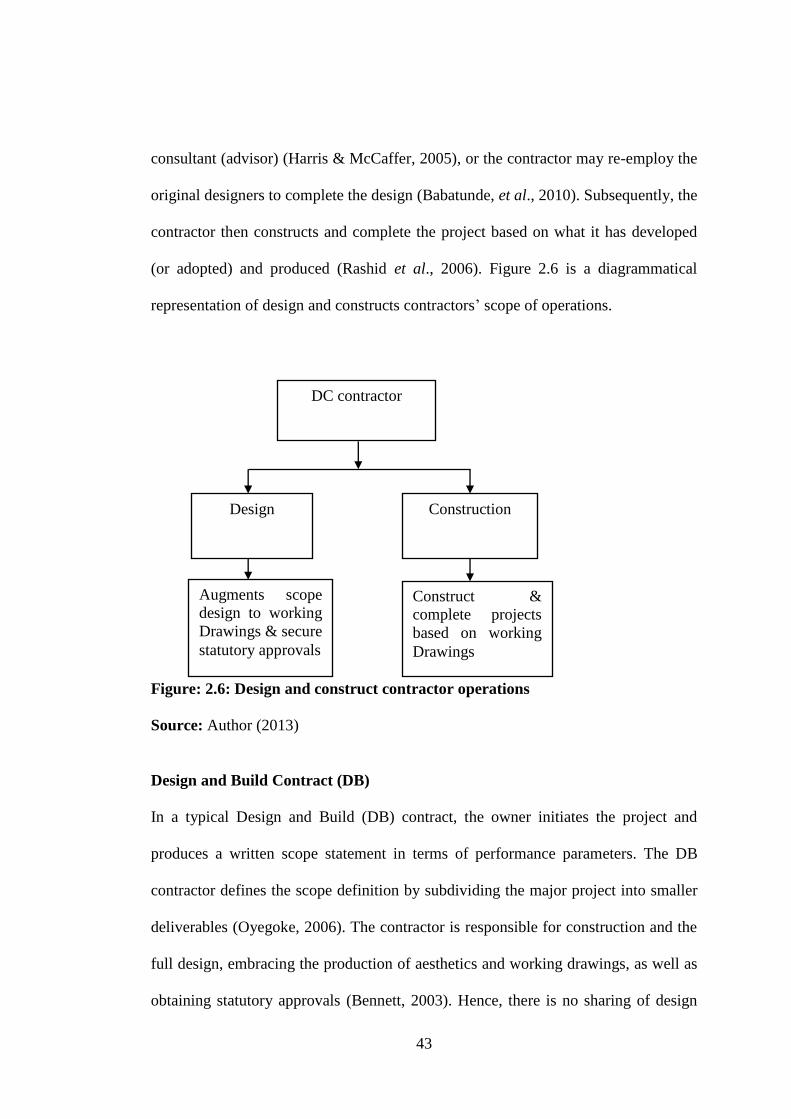
43
consultant (advisor) (Harris & McCaffer, 2005), or the contractor may re-employ the
original designers to complete the design (Babatunde, et al., 2010). Subsequently, the
contractor then constructs and complete the project based on what it has developed
(or adopted) and produced (Rashid et al., 2006). Figure 2.6 is a diagrammatical
representation of design and constructs contractors’ scope of operations.
Figure: 2.6: Design and construct contractor operations
Source: Author (2013)
Design and Build Contract (DB)
In a typical Design and Build (DB) contract, the owner initiates the project and
produces a written scope statement in terms of performance parameters. The DB
contractor defines the scope definition by subdividing the major project into smaller
deliverables (Oyegoke, 2006). The contractor is responsible for construction and the
full design, embracing the production of aesthetics and working drawings, as well as
obtaining statutory approvals (Bennett, 2003). Hence, there is no sharing of design
DC contractor
Design Construction
Augments scope
design to working
Drawings & secure
statutory approvals
Construct &
complete projects
based on working
Drawings
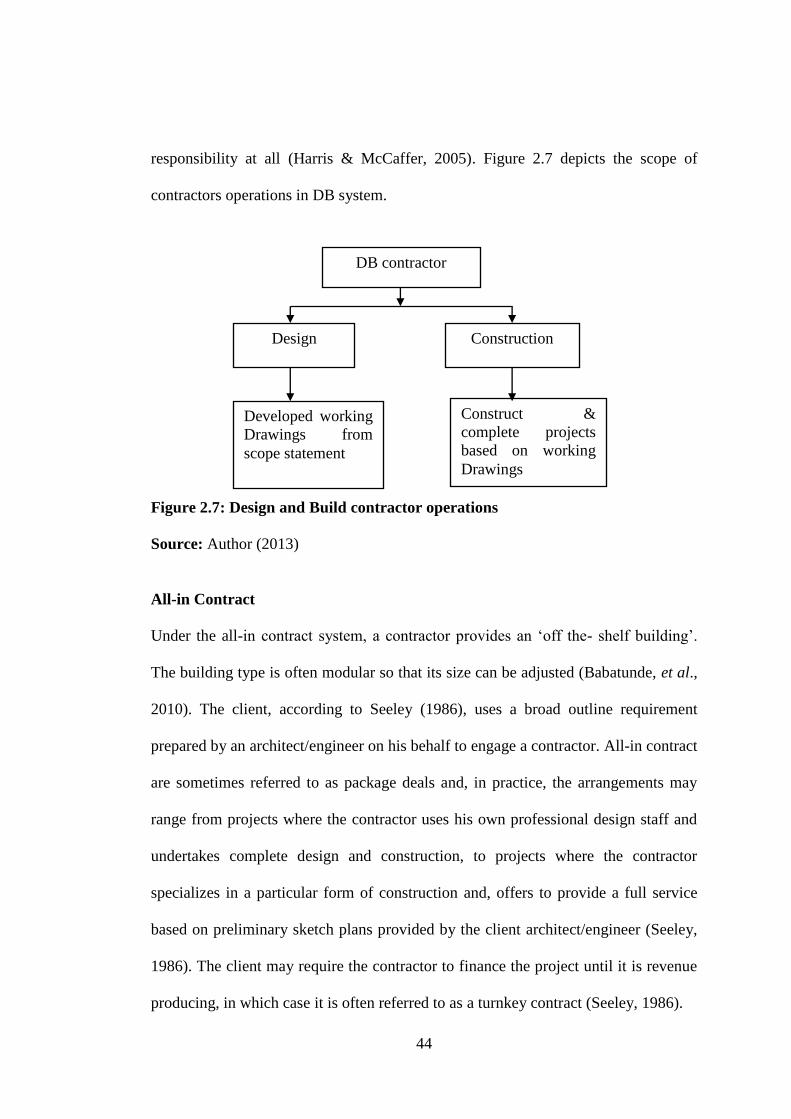
44
responsibility at all (Harris & McCaffer, 2005). Figure 2.7 depicts the scope of
contractors operations in DB system.
Figure 2.7: Design and Build contractor operations
Source: Author (2013)
All-in Contract
Under the all-in contract system, a contractor provides an ‘off the- shelf building’.
The building type is often modular so that its size can be adjusted (Babatunde, et al.,
2010). The client, according to Seeley (1986), uses a broad outline requirement
prepared by an architect/engineer on his behalf to engage a contractor. All-in contract
are sometimes referred to as package deals and, in practice, the arrangements may
range from projects where the contractor uses his own professional design staff and
undertakes complete design and construction, to projects where the contractor
specializes in a particular form of construction and, offers to provide a full service
based on preliminary sketch plans provided by the client architect/engineer (Seeley,
1986). The client may require the contractor to finance the project until it is revenue
producing, in which case it is often referred to as a turnkey contract (Seeley, 1986).
DB contractor
Design Construction
Developed working
Drawings from
scope statement
Construct &
complete projects
based on working
Drawings
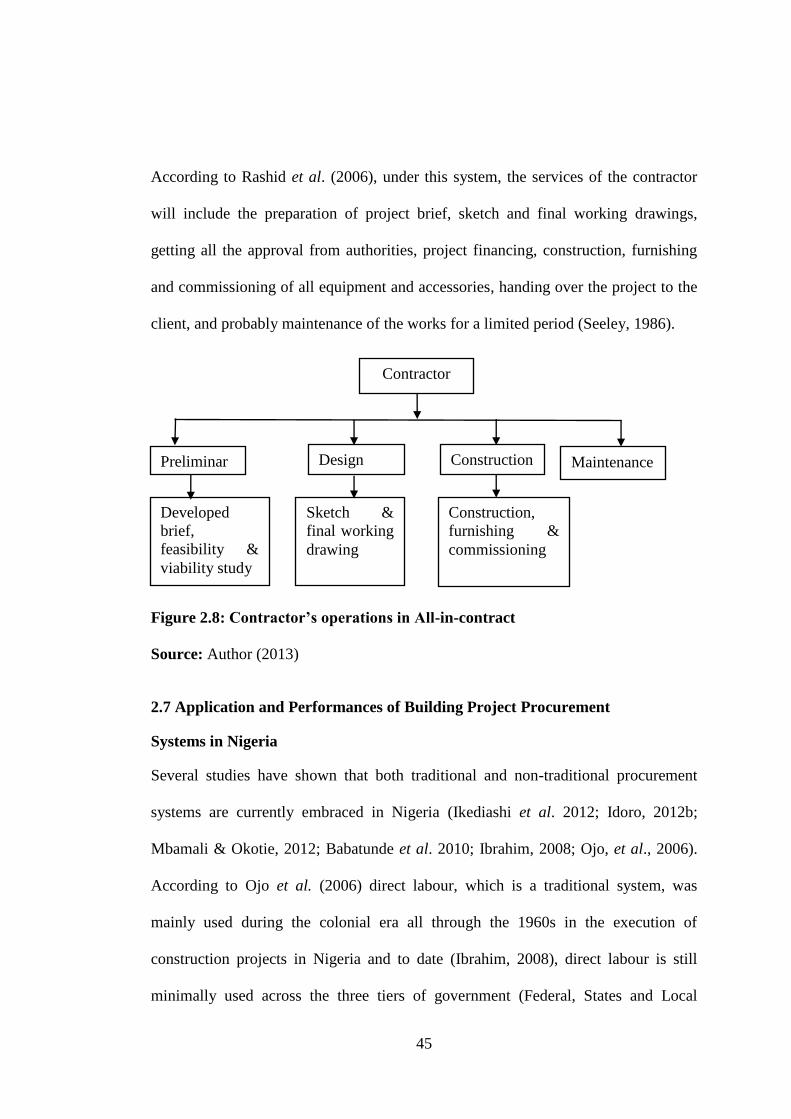
45
According to Rashid et al. (2006), under this system, the services of the contractor
will include the preparation of project brief, sketch and final working drawings,
getting all the approval from authorities, project financing, construction, furnishing
and commissioning of all equipment and accessories, handing over the project to the
client, and probably maintenance of the works for a limited period (Seeley, 1986).
Figure 2.8: Contractor’s operations in All-in-contract
Source: Author (2013)
2.7 Application and Performances of Building Project Procurement
Systems in Nigeria
Several studies have shown that both traditional and non-traditional procurement
systems are currently embraced in Nigeria (Ikediashi et al. 2012; Idoro, 2012b;
Mbamali & Okotie, 2012; Babatunde et al. 2010; Ibrahim, 2008; Ojo, et al., 2006).
According to Ojo et al. (2006) direct labour, which is a traditional system, was
mainly used during the colonial era all through the 1960s in the execution of
construction projects in Nigeria and to date (Ibrahim, 2008), direct labour is still
minimally used across the three tiers of government (Federal, States and Local
Contractor
Preliminar
y
Design Construction Maintenance
Developed
brief,
feasibility &
viability study
Sketch &
final working
drawing
Construction,
furnishing &
commissioning
46
government), primarily for maintenance and new works of minor nature. However,
direct labour projects are said to be ineffectively managed resulting in cost and time
overruns (Mbamali & Okotie, 2012).
The oil boom in Nigeria and the need for reconstruction and rehabilitation works to
mend the havoc resulting from the Nigerian civil war that ended in 1970, ushered in
the use of the design-bid-build (DBB) procurement system (traditional) into the NCI
(Mbamali & Okotie, 2012; Ojo et al. 2006). This system was also used by the
National Housing Policy (NHP); a policy enacted into law in 1991 by the Nigerian
Government to provide decent housing accommodation at affordable cost for the
country, in adherence to the campaign launched by the United Nation (UN) tagged
‘Housing for All by the year 2000’. Though, the DBB method was later discovered
to bring long delays in project conception and delivery, leading to high project cost
(Mbamali & Okotie, 2012; Ojo et al. 2006 citing Osemenam, 1992).
Despite the criticism of the performance of DBB system in Nigeria, the system is still
used by government establishments and some uninformed private clients (Ojo et al.,
2006). The short comings of the traditional systems (Direct labour and DBB) in
Nigeria brought about the emergence of the non-traditional procurement systems
amongst which is the design and build (DB) method (Mbamali & Okotie, 2012;
Ikediashi, et al., 2012 cited in Ikediashi, et al. 2010). The DB option, according to
Babatunde et al. (2010), is one of the procurement systems that have gained
prominence in the NCI. However, its application in Nigeria records high time and
cost overruns (Idoro, 2012b).

47
The use of management contracting (MC) in Nigeria, span back to the era of the
defunct Petroleum (Special) Trust Fund (PTF) mass rehabilitation of key public
infrastructure across the country in 1994-1999 (Hassan, 2004 in Ibrahim, 2008).
Babatunde, et al. (2010) also reported that management oriented contracts and
PPP/PFI are among the methods used in the execution of construction projects in
metropolitan Lagos, although not as much as the DBB method. According to Ibrahim
and Musa-Haddary (2010) the immediate past (1999-2008) and present governments
(2008 to date) at various levels/tiers in Nigeria, encouraged the introduction of
public-private partnerships (PPP) as a way of promoting active private sector
involvement in the provision of public infrastructure and services, in an attempt to
contain the infrastructure deficits in the country.
According to Mbamali and Okotie (2012), partnering, which is a discretionary
procurement system has also evolved in Nigeria, though it application seems to be
negligible due to management incapacity and poor client understanding of it. Despite
the NCI experiences in the application of both the traditional and non-traditional
procurement systems, the industry has not really achieved the comparative
advantages of using those procurement methods in Nigeria. This according to Idoro
(2012b), and Aniekwu and Audu (2010), could be attributed to weak institutions,
poor practices and policies, and ineffective and inefficient planning, among other
things. Idoro (2012b) stressed that several studies reveal that planning has a
considerable effect on the outcome of projects. All the studies reviewed elicited vital
information on the application of procurement systems and their performances in the
48
NCI, yet, none of the studies focused entirely on NICs involvement and
performances in construction procurement systems in the NCI.
2.8 Construction Project Planning Techniques
Eigege (2005, p.11) defines planning as a systematic devise to develop, on a
continuing basis, specific courses of action towards a desired objective or goal in the
most effective, efficient and economic manner. Planning as a process involves
essentially answering the following questions in accomplishing any task: What are
we going to do? Why are we doing it? When do we do it? How do we do it? How
much will it cost to do it? Where do we do it and who does it? (Eigege, 2005, p.12)
In this light, planning has four goals in any proposed task: to offset uncertainty and
change, to focus attention on objectives, to make economic operations possible, and
to assist managers in control (Krishnamurthy & Ravindra, 2010, p.2).
There are two main levels of planning associated with construction projects: strategic
and operational (Seeley, 1986; Gahlot & Dhir, 1992; Harris & McCaffer, 2005;
Bamisile, 2008). This study is delimited to contractors’ operational planning at the
post-contract stage of a building project. Operations here, refers to any activities or
tasks a contractor is expected to accomplish in his contractual obligation using any
type of construction procurement system. Projects operations, according to Gupta
(2010), involve a large number of activities, and their constraints and resources
cannot be visualized easily. Hence, it calls for project planning if success is to be
attained (Gupta, 2010). Contractors’ operational planning involves establishing a
method statement for each activity which allows a detailed look at the project’s
49
resource requirements, which are not obvious at the strategic level (Harris &
McCaffer, 2005).
In addition, a contractor’s operational plan incorporates a construction programme of
works (Harris & McCaffer, 2005; Gahlot & Dhir, 1992). A programme of works
primarily presents the sequence in which the various activities should occur with
their associated durations and resource requirements (Harris & McCaffer, 2005,
p.73). The contractor’s development of his programme of work is a requirement
stipulated in most conditions of contract used for building projects (Federal Ministry
of Housing and Urban Development (FMHUD), 2006; JCT, 2005a; JCT, 2005b).
Though, according to Scott (1995), the contractor’s programme of work is not a
contract document and as such, neither the contractor nor the client is bound by it.
The contractor’s programme of work is a document that conveys the contractor’s
intention on how he will execute his work. To arrive at an effective and efficient
method statement and programme of work in construction, project planning
techniques are used (Roberts & Wallace, 2004; Scott, 1995).
However, inadequate technical and managerial know-how of the NICs and their
inability to utilize the appropriate project planning techniques has resulted in projects
failure in Nigeria (Mbamali & Okotie, 2012; Aniekwu & Audu, 2010; Muazu &
Bustani, 2004). Moreover (Scott, 1995), the conditions of contracts for building
projects do not specify to contractors’ what type of planning technique to use for
their master programme (FMHUD. 2006; JCT, 2005a; JCT, 2005b).
50
There are many types of project planning techniques; understanding how they work
and their inherent advantage is of paramount importance to contractors. The common
project planning techniques are: bar charts and linked bar charts, line of balance, and
the network method (Bhavikatti, 2012; Chitkara, 2012; Baily et al. 2008; Harris &
McCaffer, 2005; Seeley, 1986).
2.8.1 Bar Charts and Linked Bar Charts
The Bar chart also referred to as Gantt chart, was developed by Henry Gantt in 1900
originally for industrial production management and has since been widely used in
construction management (Bhavikatti, 2012; Abubakar, et al., 2008). The bar chart is
a pictorial device that consist of two co-ordinate axes, one showing the time and the
other showing project operations or activities, and each operation (activity) is shown
by a bar (Bhavikatti, 2012; Krishnamurthy & Ravindra, 2010; Gahlot & Dhir, 1992) .
The duration of the activity is indicated by the length of the bar; the left end of the
bar shows the starting time, the right end shows the ending time (Figure 2.3)
(Bhavikatti, 2012; Krishnamurthy & Ravindra, 2010).
The simplicity and visual clarity of the Bar chart makes it a very valuable medium
for displaying job schedule information (Krishnamurthy & Ravindra, 2010;
Bhavikatti, 2012;Passenheim, 2009). It is immediately intelligible to people who
have no knowledge of network diagrams (Bhavikatti, 2012; Krishnamurthy &
Ravindra, 2010). It provides an easy and convenient way to monitor job progress,
schedule equipment and crews, and record project advancement (Bhavikatti, 2012;
Krishnamurthy & Ravindra, 2010; Passenheim, 2009).
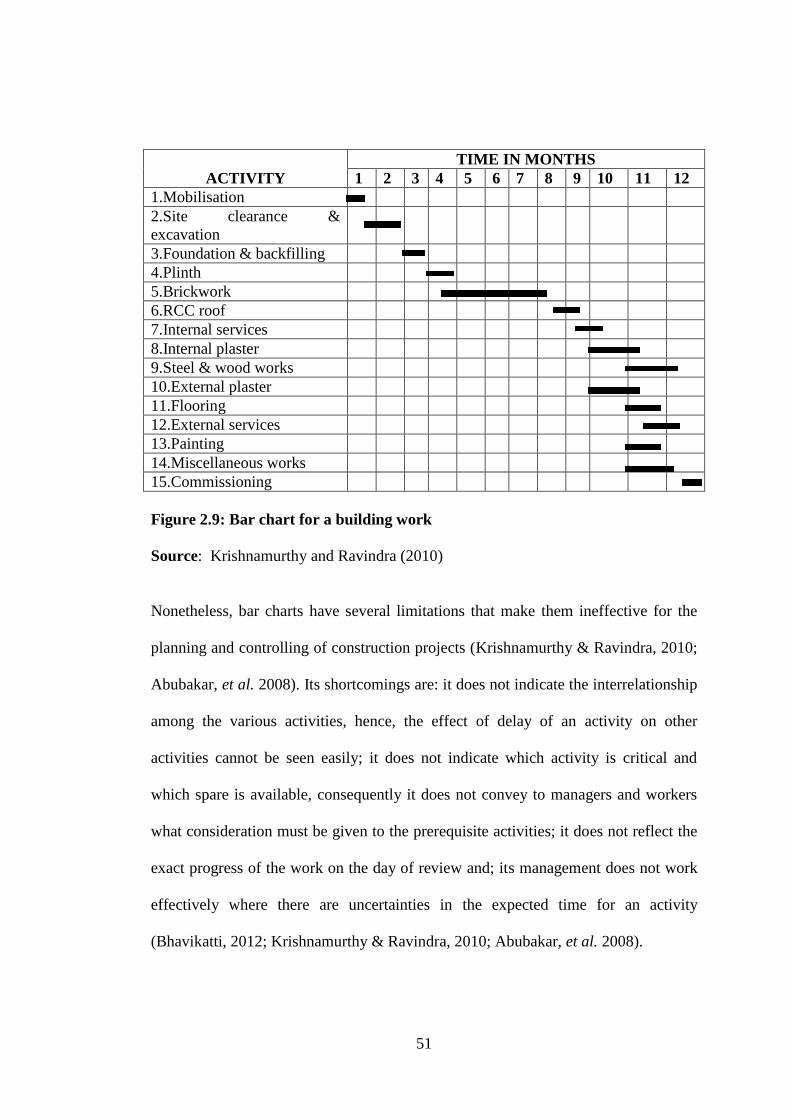
51
ACTIVITY
TIME IN MONTHS
1 2 3 4 5 6 7 8 9 10 11 12
1.Mobilisation
2.Site clearance &
excavation
3.Foundation & backfilling
4.Plinth
5.Brickwork
6.RCC roof
7.Internal services
8.Internal plaster
9.Steel & wood works
10.External plaster
11.Flooring
12.External services
13.Painting
14.Miscellaneous works
15.Commissioning
Figure 2.9: Bar chart for a building work
Source: Krishnamurthy and Ravindra (2010)
Nonetheless, bar charts have several limitations that make them ineffective for the
planning and controlling of construction projects (Krishnamurthy & Ravindra, 2010;
Abubakar, et al. 2008). Its shortcomings are: it does not indicate the interrelationship
among the various activities, hence, the effect of delay of an activity on other
activities cannot be seen easily; it does not indicate which activity is critical and
which spare is available, consequently it does not convey to managers and workers
what consideration must be given to the prerequisite activities; it does not reflect the
exact progress of the work on the day of review and; its management does not work
effectively where there are uncertainties in the expected time for an activity
(Bhavikatti, 2012; Krishnamurthy & Ravindra, 2010; Abubakar, et al. 2008).
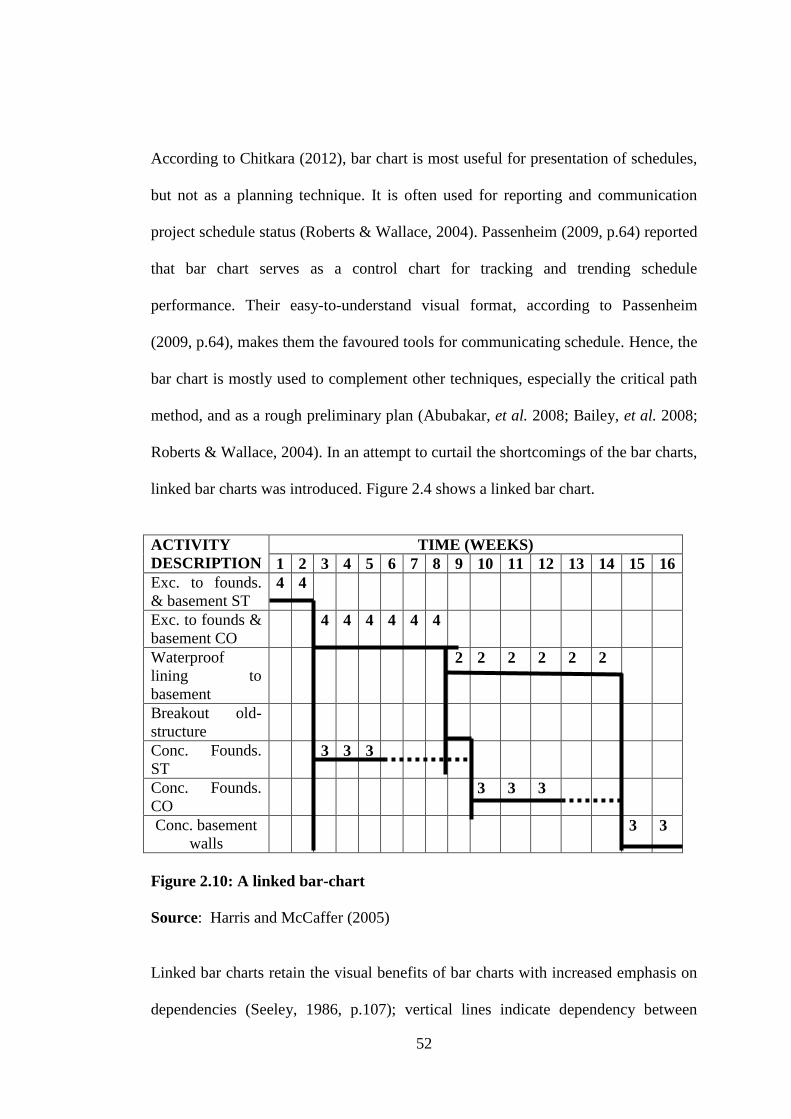
52
According to Chitkara (2012), bar chart is most useful for presentation of schedules,
but not as a planning technique. It is often used for reporting and communication
project schedule status (Roberts & Wallace, 2004). Passenheim (2009, p.64) reported
that bar chart serves as a control chart for tracking and trending schedule
performance. Their easy-to-understand visual format, according to Passenheim
(2009, p.64), makes them the favoured tools for communicating schedule. Hence, the
bar chart is mostly used to complement other techniques, especially the critical path
method, and as a rough preliminary plan (Abubakar, et al. 2008; Bailey, et al. 2008;
Roberts & Wallace, 2004). In an attempt to curtail the shortcomings of the bar charts,
linked bar charts was introduced. Figure 2.4 shows a linked bar chart.
ACTIVITY
DESCRIPTION
TIME (WEEKS)
1 2 3 4 5 6 7 8 9 10 11 12 13 14 15 16
Exc. to founds.
& basement ST 4
4
Exc. to founds &
basement CO 4 4 4 4 4 4
Waterproof
lining to
basement
2 2 2 2 2 2
Breakout old-
structure
Conc. Founds.
ST 3 3 3
Conc. Founds.
CO 3 3 3
Conc. basement
walls 3 3
Figure 2.10: A linked bar-chart
Source: Harris and McCaffer (2005)
Linked bar charts retain the visual benefits of bar charts with increased emphasis on
dependencies (Seeley, 1986, p.107); vertical lines indicate dependency between
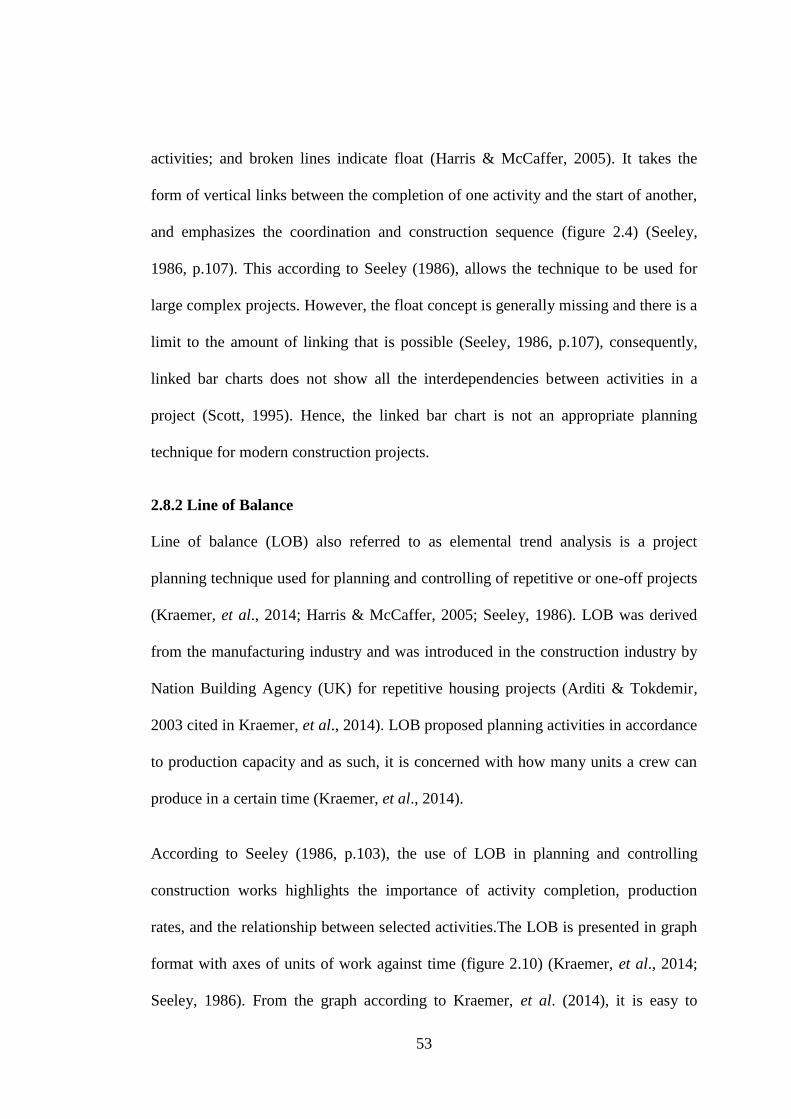
53
activities; and broken lines indicate float (Harris & McCaffer, 2005). It takes the
form of vertical links between the completion of one activity and the start of another,
and emphasizes the coordination and construction sequence (figure 2.4) (Seeley,
1986, p.107). This according to Seeley (1986), allows the technique to be used for
large complex projects. However, the float concept is generally missing and there is a
limit to the amount of linking that is possible (Seeley, 1986, p.107), consequently,
linked bar charts does not show all the interdependencies between activities in a
project (Scott, 1995). Hence, the linked bar chart is not an appropriate planning
technique for modern construction projects.
2.8.2 Line of Balance
Line of balance (LOB) also referred to as elemental trend analysis is a project
planning technique used for planning and controlling of repetitive or one-off projects
(Kraemer, et al., 2014; Harris & McCaffer, 2005; Seeley, 1986). LOB was derived
from the manufacturing industry and was introduced in the construction industry by
Nation Building Agency (UK) for repetitive housing projects (Arditi & Tokdemir,
2003 cited in Kraemer, et al., 2014). LOB proposed planning activities in accordance
to production capacity and as such, it is concerned with how many units a crew can
produce in a certain time (Kraemer, et al., 2014).
According to Seeley (1986, p.103), the use of LOB in planning and controlling
construction works highlights the importance of activity completion, production
rates, and the relationship between selected activities.The LOB is presented in graph
format with axes of units of work against time (figure 2.10) (Kraemer, et al., 2014;
Seeley, 1986). From the graph according to Kraemer, et al. (2014), it is easy to
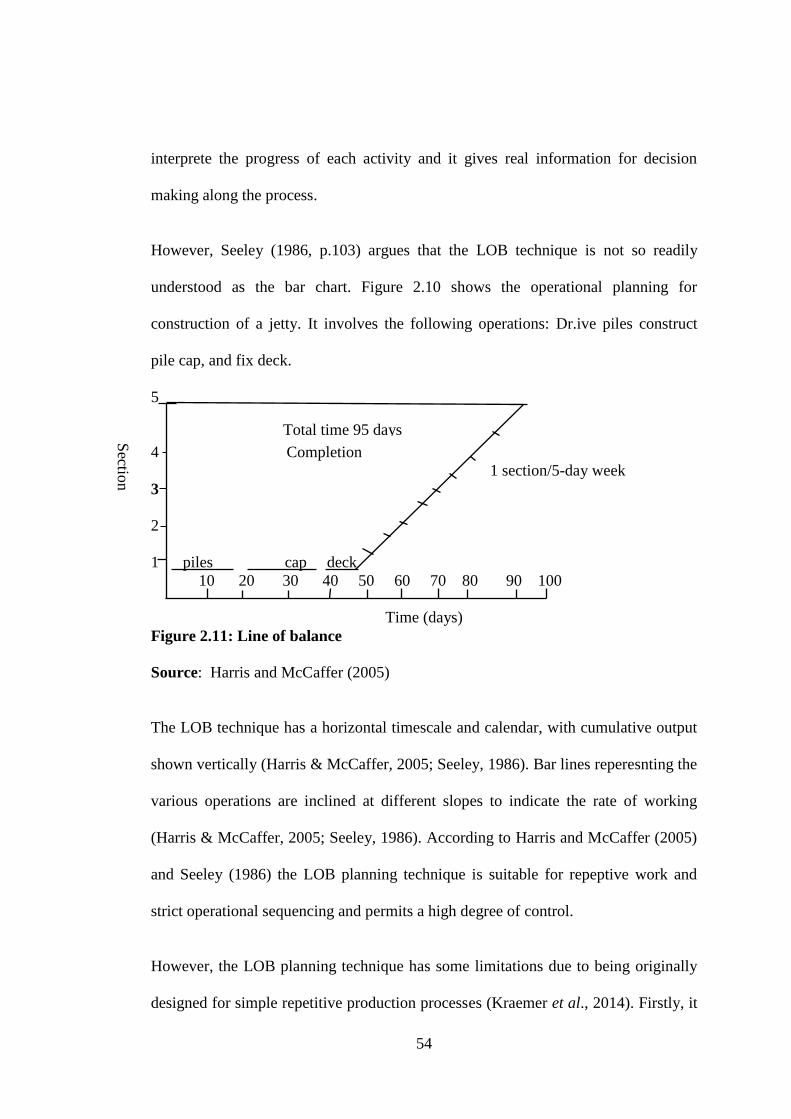
54
interprete the progress of each activity and it gives real information for decision
making along the process.
However, Seeley (1986, p.103) argues that the LOB technique is not so readily
understood as the bar chart. Figure 2.10 shows the operational planning for
construction of a jetty. It involves the following operations: Dr.ive piles construct
pile cap, and fix deck.
5
4 Completion
1 section/5-day week
3
2
1 piles cap deck
10 20 30 40 50 60 70 80 90 100
Time (days)
Figure 2.11: Line of balance
Source: Harris and McCaffer (2005)
The LOB technique has a horizontal timescale and calendar, with cumulative output
shown vertically (Harris & McCaffer, 2005; Seeley, 1986). Bar lines reperesnting the
various operations are inclined at different slopes to indicate the rate of working
(Harris & McCaffer, 2005; Seeley, 1986). According to Harris and McCaffer (2005)
and Seeley (1986) the LOB planning technique is suitable for repeptive work and
strict operational sequencing and permits a high degree of control.
However, the LOB planning technique has some limitations due to being originally
designed for simple repetitive production processes (Kraemer et al., 2014). Firstly, it
Sectio
n
Total time 95 days

55
shows only a limited amount of information and a limited degree of complexity
(Kraemer et al., 2014). Secondly, LOB can only identify a delay in one unit, or other
changes in activities, but it cannot preview any accompanying delay in the total
project completion (Suhail & Neale, 1994 in Kraemer et al., 2014). Contemporary
construction projects according to Chitkara (2012) and Hughes (2012), are complex,
less repetitive and with a lot of systems. Hence, the LOB technique cannot
adequately address the contemporary construction projects planning and controlling
requirements, consequently LOB is not an appropriate project planning technique for
modern construction projects.
2.8.3 Network Method
According to Bhavikatti (2012, p.344) the network method is a project planning
technique that involves representing graphically and in the form of a network all
steps of a project. It is simply a precedence diagram with activity durations added to
it (Roberts & Wallace, 2004). There are two major network systems (Bhavikatti,
2012): program evaluation and review technique (PERT), and critical path method
(CPM).
Program Evaluation and Review Technique (PERT)
PERT was developed by the US Navy in 1958 for planning and scheduling of the
Polaris Weapon System(Krishnamurthy & Ravindra, 2010). According to Bhavikatti
(2012), PERT is suitable for projects that are non-repetitive in nature, in which there
is no precise idea about the time required for various activities. In construction
(Bhavikatti, 2012), however, determining the time for various activities is not a
problem, as a lot of previous data and experience are available. Hence, PERT
56
according to Bhavikatti (2012), is not a preferred technique in planning and
scheduling construction works.
Critical Path Method (CPM)
The CPM was developed in 1956 in the USA, by engineeers’ working for the DuPont
Corporation in order to allow the programming of maintenance work during a
chemeical plant shut down (Krishnamurthy & Ravindra, 2010; Abubakar, et al.,
2008). CPM is a deterministic approach to project planning that uses estimates
activity durations that are known (reasonably accurately) (Roberts & Wallace, 2004).
CPM calculates the minimum completion time for a project, along with the possible
start and finish times for the project activities (Bhavikatti, 2012; Roberts & Wallace,
2004).
preparation of preparation of tendering construct
building Dr.awing estimates foundation
Figure: 2.12: A Typical CPM Network
Source: Bhavikatti (2012)
CPM offers the following advantages when used in construction project management
(Bhavikatti, 2012; Chitkara, 2012; Krishnamurthy & Ravindra, 2010; Kerzner,
2000): it identifies critical activities, so that management can concentrate on these
activities to maintain the construction schedule; helps in crashing the project
completion period by identifying activities to be crashed; identifies the most
1
2 3 5 6
4
preparation of
structural design
& Dr.awing
57
economical construction period and resource scheduling may be prepared to suit that;
resource mobilization can be planned well in advance; if some thing goes wrong, the
activities to speed up can be identified and necessary action initiated; it helps in
identifying the best combination of equipment and labour; it helps in identifying
slack times for various activities, which helps in distributing labour; it rationalizes
construction, costing and financing, and it provides the basic structure for reporting
information.
Nonetheless, the CPM technique is criticised because (Kerzner, 2000): time, labour,
and intensive effort is required to use them, and the ability of upper-level
management to contribute to decision making have been reduced. Inspite of its short
comings, the CPM according to Olatunji (2010), has the capacity to identify key
construction activities of a project, and this quality enables it to positively impact on
project delivery. In addition, the CPM is argued by many to be the most preferable
planning technique for construction project, due to its suitability for construction
projects planning and scheduling (Bhavikatti, 2012; Krishnamurthy & Ravindra,
2010; Passenheim, 2009; Bailey, et al., 2008; Abubakar, et al., 2008; Roberts &
Wallace, 2004; Scott, 1995).
2.8.4 ICT Application in Project Planning
The application of the appropriate project planning technique in modern day
construction project management without the adoption of Information and
Communication Technology (ICT), will not ensure successful project planning
(Inuwa, et al., 2013; Roberts & Wallace, 2004; Kerzner, 2000), because the planning
and management of construction project involves and generates a lot of information
58
that needs speedy processing and accuracy in its output, that will be used in guiding
the project manager’s decisions (Khatri, 2000 cited in Inuwa et al., 2012; Oladapo,
2006; Rashid, et al., 2006; Harris & McCaffer, 2005).
ICT is a general expression covering the use and integration of computers,
telecommunications and electronics (Browning, 1990 cited in Inuwa, 2006). The
Computer has promised to be a reliable tool in all spheres of human endeavour
(Oyediran & Odusami, 2005 cited in Inuwa, 2006). Its emergence, according to
Kerzner (2000), has aided companies to implement project management very fast
through computer based software for project planning, estimating, scheduling, and
control. Project planning software packages have made it much easier to update and
reschedule project plans, and they provide the information in the form of both bar
charts and network diagrams (Roberts and Wallace, 2004, p.5/35). Roberts and
Wallace (2004, p.5/35) emphasized that the combination of bar charts and network
diagram will effectively communicate the project plan.
The industrialized countries like the US, UK, Canada, Sweden, Denmark, Finland
and New Zealand, among others, have for long embraced the use of ICT for their
construction projects operations and they have benefited from this, unlike developing
countries, like Nigeria, where very few achievements in terms of computer usage in
indigenous firms operations are recorded (Mbamali & Okotie, 2012; Inuwa, 2006;
Muazu & Bustani, 2004). Hence, the adoption of ICT by the NICs in project
planning and management is recognized as a very important factor that enhances
project management performance and facilitates attainment of construction best
practice (Mbamali & Okotie, 2012; Oladapo, 2006).
59
2.9 The NICs Project Planning Challenges
The major blame for poor project performance of a structure, according to Idoro and
Akande-Subar (2008), should be borne by contractors because they are directly
responsible for its production. However, this is not always so; other factors hinder
the performance of indigenous contractors in Nigeria (Aniekwu & Audu, 2010; Bala
et al. 2009; Achuenu, et al. 2000; Adams, 1997). According to Adams (1997)
challenges on contractors’ performance emanates from the business environment, the
client, or his representatives, and from contractors deficiencies. Within these three
sub-classifications, Adams (1997) identified 26 factors, amongst which are:
uncertainties in supplies and prices of materials, obtaining interim payments, access
to capital, access to plant and equipment, company organization, shortage of skilled
labour, incomplete contract documentation, inadequate communication with client
and representatives, design changes, inadequate project planning and site
management, contract disputes, inadequate technical know-how, poor meeting of
contract deadlines, and corruption.
Bala et al. (2009) categorized challenges faced by NICs into government and firm-
related ones. Government-related challenges, are problems created either directly or
indirectly by the government and this has a significant impact on the development of
the industry. The most severe of these problems are: an unfavorable business
environment, a weak economy, corruption, lack of government patronage and
patronage of foreign firms (Bala et al. 2009).
Firm-related challenges are problems internal to the firm and within the firm’s
control. These problems Bala et al., stressed, can inhibit the firms from developing
60
core-capabilities from firm-specific resources. The most severe are: lack of vision,
lack of entrepreneurial skills, limited technical expertise, limited plant and
equipment, limited managerial expertise, limited trained manpower and inadequacy
of local materials, among other problems (Bala et al. 2009).
Other challenges that contractors face in project planning are: non-availability of
materials due to shortage or late delivery; plant, equipment and machine breakdown;
change in demand, designs and rush orders; absenteeism of workers; and lack of
communication between various functional areas of business (Teslang, 2004 cited in
Ubani, et al. 2010). The fast changing environment, according to Chitkara (2012),
also impose numerous time, cost and financial, legal, ethical, environmental, and
logical constraints to projects.
Moreover, inferences from other studies acknowledged by Aniekwu and Audu
(2010, p.1) reveal that the NCI is plagued by inefficient policies and practices, weak
institutions and an adverse business environment, complicated by complex social and
cultural practices, which make it difficult for indigenous contractors to perform
efficiently. Such problems obviously affect the performance of the contractors’
project planning in project execution. Consequent to these problems, the NICs are
unable to contribute considerably, relative to their foreign counterparts in the
country's construction industry (Bala, et al. 2009; Adams, 1997); which accounts for
a substantial percentage of Nigeria’s Gross National Product (GNP) as well as half of
the government spending (Aniekwu & Audu, 2010).
61
2.10 Influencing Factors for NICs Project Planning
The underperformance of the NICs due to management and project planning
incapacity requires urgent attention to: avoid westage, to ensure economic growth of
the country, and expedite the NCI to meet construction best practice. To this end,
Aniekwu and Audu (2010) discovered that a substantial part of the NICs
performance problems can be addressed through training, pre-construction planning
and the application of modern construction techniques and most importantly, through
the understanding and application of project management techniques (Ekundayo, et
al., 2013; Gollenbeck, 2008).
Moreover, project management benefits contractors in accomplishing their work in
construction that involves multiple priorities, complex and numerous tasks, datelines,
constant communication across organization boundaries, limited resources with little
precedence and guidelines (Weiss & Wysocki, 1992). The advantage of project
management to the contractor according to Kerzner (2000, p.), is that its
organizational structure allows the arrangement of work flow and project
coordination vertically and horizontally across the various functional groups. This
arrangement generates productivity, efficiency, and effectiveness. This also results in
improved coordination and communication among employees and managers
(Kerzner (2000, p.). Gollenbeck (2008) and Kerzner (2000) admitted that the
contractors’ project managers and their firms must have project management
capability for them to succeed in contemporary construction business.Yimam (2011)
also argued that contractors’ successful delivery of a project depends on their project
management capability.
62
Client demands for contemporary procurement systems pose a challenge to
contractors (Harris & McCaffer, 2005; Bennett, 2003). Hence, for the contractors to
be relevant, they need technical skills, management and entrepreneurial skills, good
knowledge of the markets, adequacy of plants and equipment, and continuous
improvement of business knowledge (Mbamali & Okotie, 2012; Aniekwu & Audu,
2010; Phaladi & Thwala, 2008; Harris & McCaffer, 2005; Muazu & Bustani, 2004;
Saleh, 2004). The variances in modern construction procurement systems impose
different roles on contractors (Oyegoke, 2006; Rashid et al. 2006; Harris &
McCaffer, 2005). This calls for the contractors to understand their expected roles in
any type of procurement systems because their roles in relation to other parties can
invariably affect the performance of any type of procurement systems (Rashid et al.
2006; Anyadike, 2000).
Construction according to Khatri (2000) cited in Inuwa et al. (2012) is a multi-
organizational process that is heavily dependent on the exchange of large and
complex data. Successful completion of a project depends on the accuracy,
effectiveness and timely communication and exchange of critical information and
data between the project teams (Khatri, 2000 in Inuwa et al. 2012). Managing of
modern construction information which basically deals with design and project
management requires the application of ICT (Inuwa, et al., 2013; Roberts & Wallace,
2004). The advent of ICT has revolutionized the construction industry through more
accurate data processing systems in design development and project management
(Roberts & Wallace, 2004). Construction contracting also deals with a lot of design
and management information (Oladapo, 2006; Rashid, et al., 2006; Harris &
63
McCaffer, 2005). Hence, a contractor requires the application of ICT to be able to
accomplish their tasks; especially in project planning (Roberts & Wallace, 2004).
The issue of sustainability in the construction industry has been of concern to
stakeholders in recent times (Jatau & Wescott, 2011; Nwokoro & Onukwube, 2011).
The industry’s approach towards addressing this issue is through sustainable
construction (Jatau & Wescott, 2011). Sustainable construction has emerged as a
guiding paradigm to create a new kind of construction environment; one that meets
the needs of humans in the present without limiting the ability of future generations
to meet their own needs (Ofori, 2001 cited in Nwokoro & Onukwube, 2011).
Construction is a major and primary sector of Nigerian economy and its
consideration of the issues of sustainability covers a huge spectrum of the sector
(Nwafor, 2006 cited in Nwokoro & Onukwube, 2011). The contractors
understanding, application and adherence to a country’s environmental laws in
relation to sustainable construction will assist his/her project planning consideration
and inputs. This also encompasses social progress, which includes health and safety,
employee interest, learning and development, and community involvement in project
execution (Jatau & Wescott, 2011).
The late honoring of interim payments to the contractors by clients in Nigeria as
acknowledged by Bala et al. (2009), Ogunsemi and Saka (2006), and Adams (1997),
is an impediment to contractors’ project planning capability and performance. Most
indigenous contractors’ have no access to capitals (Bala et al. 2009; Phaladi &
Thwala, 2008; Adams, 1997). Where they are able to access capital-loans from the
banks, they access it at higher interest rates and if interim payments are delayed it
64
attracts more interest. Thus, prompt honoring of contractors interim payments can
have a significant influence on their project planning. Furthermore, the prevalence of
corruption in the NCI is an issue that needs to be addressed as it negatively affects
projects performance (Adebanjo, 2012; Owoyebi, et al., 2011). The industry’s
business culture needs to be free of corruption for all parties to effectively and
efficiently attain their aims.
Another factor that can play a significant influence on contractors’ project planning
is the adherence to the concept of buildability/constructability (Aina & Wahab,
2011). According to Aina and Wahab (2011) buildability is increasingly becoming a
major requirement in building practice. Buildability is the extent to which the design
of a building facilitates ease of construction, subject to the overall requirements for
the completed building (CIRIA, 1983 in Aina & Wahab, 2011). Buildability is often
described as integrating construction knowledge, resources, technology and
experience into the engineering and design of a project (Aina & Wahab, 2011). The
aforementioned factors has significant influence on contractors’ project planning
capability, hence play a vital role in determining contractors project planning
effectiveness for attaining project success.
2.11 Contractors’ Project Planning Success Indicators
According to Bennett (2003), to achieve success in project planning there must be: a
clear understanding of the project’s objectives, purposes, scope and nature by both
the client/owner and the organization responsible for carrying out the work and a
relationship between the client/owner; establishment of the project delivery
organization, with clearly defined roles and responsibilities. Without this, the client

65
or the consultant will negatively affect the contractor's project planning. This
therefore requires a good working relationship and sound communication network
between the client/owner and the project delivery organization. The issue of attaining
project planning success in developed countries is no longer a problem as they have
embraced project management methodology, and consequently reaps its benefits
(Ekundayo, et al., 2013; Harris & McCaffer, 2005; Kerzner, 2000).
In developing countries like Nigeria however, indigenous contractors’ construction
project planning is very poor due to non-adoption of project management techniques,
management incapacity and the inability to plan projects adequately according to
contractual requirements (Oladimeji & Ojo, 2012; Aniekwu & Audu, 2010; Idrus &
Sodangi, 2010; Muazu & Bustani, 2004; Achuenu, et al. 2000; Saleh, 2004). This
problem can be addressed if indigenous contractors understand the indicators of
project planning success and apply the knowledge of this understanding to planning
their projects (Muazu & Bustani, 2004; Saleh, 2004; Achuenu, et al. 2000; Scott,
1995).
According to Oxford Dictionary of English (2000), success is the accomplishment of
an aim or purpose, while an indicator is a thing that indicates the state or level of
something. Therefore, success indicators can be construed as signals or signs that
inform that an event, operation or activity has accomplished its intended purpose. A
success indicator confirms a state of prosperity in an operation, or the attainment of
success in an endeavour. In this context, any factor that signifies the attainment of
the benefits of contractors’ construction works operational planning, the curbing of
66
wastage, and curtailing risks and accidents, constitutes an operational planning
success indicator.
An operational plan should include sufficient details to enable proper consideration
to be given to the timing and duration of operations, type and quantity of materials
and equipment’s, delivery dates and manpower requirements (Chitkara, 2012; Gupta,
2010; Krishnamurthy & Ravindra, 2010; Harris & McCaffer, 2005; Gahlot & Dhir,
1992). For contractors’ operational plan to attain this feat, according to Gahlot and
Dhir (1992), it must satisfy the essential characteristics of a good operational plan
(programme), and this include:
It must be suitable for use as a control tool against which progress can be
measured
It must be sufficiently accurate to enable its use for forecasting requirements
of materials, manpower, machinery and money
It must provide for difficulties likely to be encountered in future in respect of
quality, scope, processes and for taking remedial measures.
These characteristics by implication can be used by contractors to gauge their
operational plan performance and can subsequently be used as indicators for
attaining project operational planning success. Looking at the abovementioned
characteristics in succession, the following can be deduced as project planning
success indicators: plan's provision for facilitating project monitoring and control,
ability of plan in facilitating project resource organization and, plan's flexibility. In
addition (Scott, 1995; Seeley, 1986), the contractors’ operational plan should be use
as the agreed plan against which the effects of delays to the project will be
67
determined and as such, can be used as an indicator for contractors’ project planning
success through its (plan’s) ability to facilitates claim assessment for delay.
Scott (1995) identified factors that ensures contractors’ project operational plan
effectiveness and efficiency as defined by construction projects supervisors
(architects/engineers/projects manager). These factors are (Scott, 1995):
The durations of activities defined by the contractor should be sensible
Any specific restrictions stated in the contract should be complied with:
targets dates, staged completion, completion of the whole work.
A proper logical sequence had been adopted
Identified major tasks in the project, ensure activities size were reasonable
and ensures adequate accommodation of contractor’s, subcontractors’ and
public utilities works had been considered.
Thus, success indicators in consideration of the aforementioned requirements
includes: plan's adherence to time, cost estimate, and to quality, adequacy of plan in
determining suppliers' delivery dates, plan's capability to accommodate contractors’
work, plan’s provision of basis for preparing schedules and, plan's efficiency in
integrating the sub-contractors’ work.
Furthermore, the breakdown of activities in a contractors’ operational plan according
to Scott (1995), must be such that all operations that might be affected by work
changes and delays should be identified individually and as such, contractors’ agent
should have a good working knowledge of the project operational plan (programme).
Trade heads need to be able to read the project schedules, tasks involved and
specification, according to Passenheim (2009), to assist them in knowing what to do
68
next. To achieve this, the contractors’ project operational plan should be
comprehensible. Hence, as a success indicator, the plan should be clear in
communication and also comprehensible among trade heads.
A good contractor’s operational plan according to Scott (1995), should be able to
meet his job technical requirements including: appropriate time for striking
formwork, ensuring correct sequences, having proper allowance for weather
susceptible operations, etc. Hence, a contractor’s project operational plan should be
realistic and should properly predict what may happen to the project (Chitkara, 2012;
Gupta, 2010; Scott, 1995; Seeley, 1986). Project planning success indicators
construed from the abovementioned factors include: plan's adherence to project
technical requirements, plan’s efficiency in identifying accident-prone areas and,
plan’s ability to curb re-work.
2.12 Research on Construction Procurement and Contractors
There is a lot of research across the globe on construction procurements amongst
which are: Dada (2012); Idoro (2012a); Idoro (2012b); Ikediashi, et al. (2012);
Mathonsi and Thwala (2012); Babatunde et al (2010); Ibrahim (2008); Ojo et al.
(2006); Oyegoke (2006); Rashid et al. (2006); Love (2002); Alarcon et al.(1999);
Love et al. (1998). The significance of construction procurement according to Idoro
(2012a), stems from two reasons: firstly, it involves a series of interrelated and
sequential processes and the effectiveness and efficiency of these processes have a
considerable impact on the success or failure of a project; secondly, there are several
procurement methods available for a developer to adopt when procuring a project.
69
Alarcon et al. (1999) developed a methodology to diagnose and evaluate the
procurement process for investment projects for continuous improvement in Chile.
Applying the methodology on selected projects, they discovered the main problem of
procurement to be schedule delays and lack of specified quality for a project and
these they said can be averted through dedicating important resources (money,
personnel, time, etc.) to monitor and control the process. On another set of projects
they discovered that the main sources of waste were from engineering the system
itself, the suppliers, and the policies. They recommended that improvement can be
attained through electronic mails, electronic data interchange (EDI), bar codes, and
other policies as applied to the procurement process. In Finland, Oyegoke (2006)
used four project management areas of scope, time, and cost as a framework of
reference in studying how to manage clients’ expectations in project delivery. His
findings exposed the weakness of the prevalent routes in managing these key
management variables and revealed that the discretionary contract approach supports
a better management system.
In Australia, Love et al. (1998) indicated that a single set of criteria is generally
adequate and sufficient for procurement path selection. However, similar clients do
not have similar procurement needs but only one procurement method. Love (2002)
discovered that direct and indirect consequences of rework do not differ relative to
project type or procurement methods in Australia. He found rework to be 52% of the
cause of project cost growth which brought about 26% of the variance in cost
growth. To improve project performance, he recommends knowing rework:
magnitude, causes, and effective prevention strategies. In Malaysia, Rashid et al.
70
(2006) reveals that different procurement systems differ from each other in terms of
allocation of responsibilities, activities sequencing, process and procedures and
organizational approach in project delivery, which invariably affect the project
performance of time, cost and quality.
In South Africa, Mathonsi and Thwala (2012) quantitatively classified factors
influencing the selection of procurement systems into internal and external ones. The
internal factors were broadly divided into client's and project characteristics. The
client's characteristics are: client's level of knowledge and control; funding
arrangements; political and social consideration; familiarity of procurement systems;
competition; government/risks allocation, whereas, project characteristics are: size
and technical complexity of project; influence of project life cycle; expedited project
delivery time; quality and price certainty. While, market competition, information
technology, regulatory environment, natural causes and globalization constitute the
external factors. Using qualitative approach (literature search) they discovered five
new factors: socio-economic consideration; client requirements; capital cost/cash
flow; procurement policy and project characteristics.
Dada (2012); Idoro (2012a); Idoro (2012b); Ikediashi, et al. (2012); Babatunde et al.
(2010); Ibrahim, (2008); and Ojo, et al. (2006), all studied different areas in
construction procurement in Nigeria. Ojo et al. (2006) discovered that projects
category of 1-5, 5-10, over 10 million Naira (N) (US$1 = N160) showed a time
overrun of 18.98%, 99.64 % and 34.55 % respectively for housing projects procured
through traditional contract. They concluded that the 1-5 million Naira cost category
is suitable for traditional contract procurement on housing projects in Nigeria.
71
Babatunde, et al. (2010) discovers that variants of traditional method of procurement
is the most adopted in project execution in Nigeria. They also reveal that project
completion at estimated time is the highest factor considered for traditional method,
while quality assurance is the highest with the non-conventional method, though
their study was delimited to Lagos.
Dada (2012) using a logistic regression analysis developed a model with the
procurement method as the dependent variable and several other variables as the
independent variables for predicting procurement selection. Idoro (2012b) reveals
that the use of project documents during each project stage and the overall
procurement phase in projects procured by the traditional contract method must be
improved, as it will enhance the outcome of the projects. In another study, Idoro
(2012b) discovered that at inception, design, tendering and construction stages, plans
are not prepared in many of the projects procured through Design-Build (DB) in
Nigeria, and concludes that the level of use of project plans can be used to reduce
the high time and cost overruns recorded in DB projects. He suggested that
stakeholders should ensure that the required project plans are prepared when projects
are procured by DB.
Ikediashi, et al. (2012) identified: job cost reporting, time performance, quality of
work, Health and Safety, and Cost per Unit, as the most important amongst eight Key
Performance Indicators for DB projects in Nigeria. They advocated fundamental
changes to reduce the high cost overruns associated with DB projects. Ibrahim(2008)
runs a critique on the professional philosophy and mechanism of the public
procurement Act’s 2007, focusing on the construction industry and highlighted
72
shortcomings related to the Act operational philosophy and mechanism, both at the
central coordinating level and at the completion level of the Act vis-a-vis their
regulatory, certification, monitoring, training and advisory functions. Although all
the research efforts reviewed highlighted essential information concerning
construction procurements, none of the research investigated contractors’ projects
planning in construction procurement systems.
A further review of literature on contractors in Malaysia (Judi & Rashid, 2010),
Indonesia (Mangitung, 2010), UAE (Nasser, 2009), Pakistan (Masood & Chouldhry,
2010), Palestine (Enshassi & Shaat, 2007; Enshassi, et al., 2006), Botswana
(Freeman, 2011), South Africa (Ian, 2008; Phaladi & Thwala, 2008;), Ghana (Peter,
et al., 2012; Laryea, 2010; Laryea & Mensah, 2010) and Nigeria (Inuwa et al., 2013;
Iro, et al., 2013; Ujene, et al., 2013; Odediran, et al., 2012; Tunji-Olayeni & Omuh,
2012; Usman, et al., 2012; IDr.us & Sodangi, 2010; Fagbenle, et al., 2011; Idoro,
2011a; Aniekwu & Audu, 2010; Bala et al., 2009; Idoro & Akande-Subar, 2008;
Hamilton, 2006; Uduak, 2006; Muazu & Bustani, 2004; Saleh, 2004; Ameh &
Odusami, 2002; Achuenu, et al., 2000; Adams, 1997) revealed that none of the
research centered on NICs: involvements and performance, planning tools
application, planning challenges, planning influencing factors; and contractor’s
project planning success indicators in building procurement systems in Nigeria.
Therefore, there is a need to investigate NICs project planning in building project
procurement systems due to their inability to effectively and efficiently manage and
plan their contractual obligation, which is negatively impacting the growth of the
NCI and the Nigerian economy at large.

73
2.13 Theoretical Framework
This study is modelled on the theory of project management. Construction, according
to Ireland (2006), may have been the seed for developing project management.
Artifacts dating back nearly 5000 years reveals the application of project
management in the delivering of great construction works of history (Chitkara, 2012;
Ireland, 2006; Roberts & Wallace, 2004): pyramids, Great Wall of China, and
Roman roads and aqueducts. Project management as a discipline according to
Chitkara (2012, p.39), originated with the development of CPM/PERT planning
techniques in the early sixties, when the volume and complexity of tasks increased,
especially in construction, aerospace and defense projects.
Kerzner (2000) affirmed that the understanding of project management begins with
the recognition of what a project is. A project according to Kerzner (2000), is an
endeavor that has a definable objective, consumes resources, and operates under
time, cost, and quality constraints. A project he affirms, comes with a challenge in
managing activities that have never been attempted in the past and may never be
repeated in the future. With the understanding of project in mind, Kerzner (2000)
defined project management as the planning, scheduling, and controlling of a series
of integrated tasks such that the objectives of a project are achieved successfully and
in the best interest of the project stakeholders. John and Herman (2008) cited in
Abdulrazaq and Ahmad (2011, p.2) described project management as a composition
of organization, structure, information processing, practice and procedure that permit
integration of all project element-tasks, resources, information, stakeholders, etc.
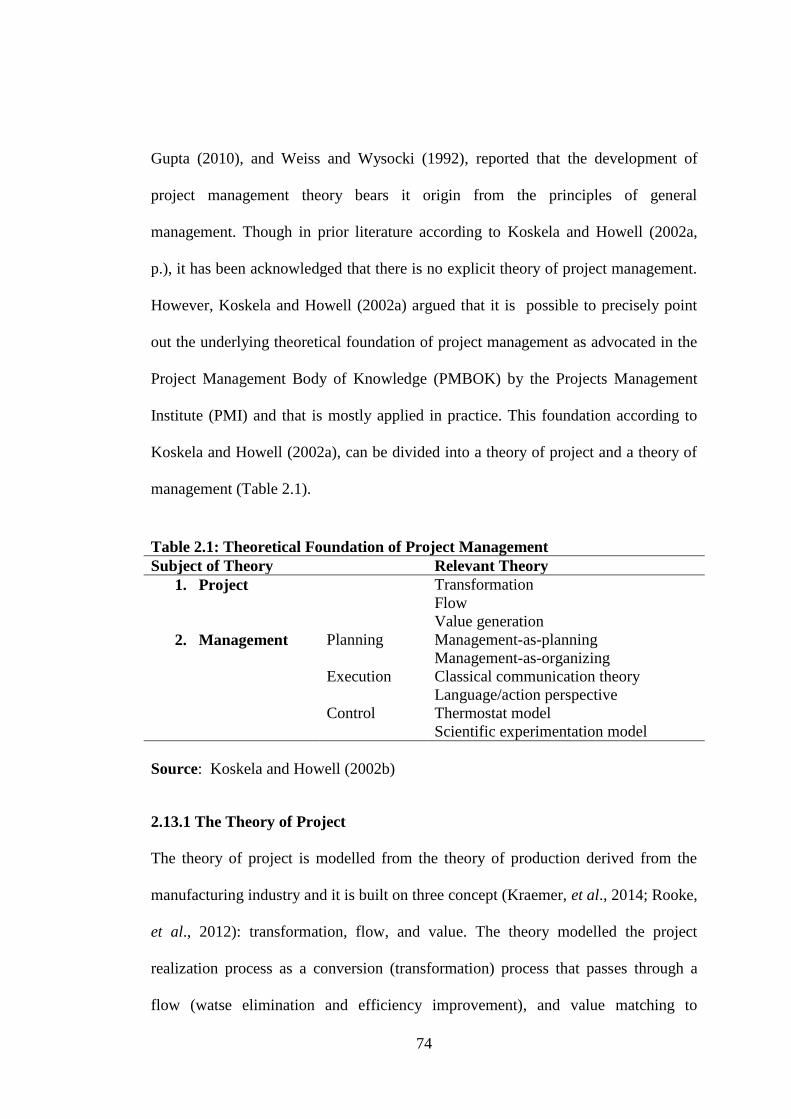
74
Gupta (2010), and Weiss and Wysocki (1992), reported that the development of
project management theory bears it origin from the principles of general
management. Though in prior literature according to Koskela and Howell (2002a,
p.), it has been acknowledged that there is no explicit theory of project management.
However, Koskela and Howell (2002a) argued that it is possible to precisely point
out the underlying theoretical foundation of project management as advocated in the
Project Management Body of Knowledge (PMBOK) by the Projects Management
Institute (PMI) and that is mostly applied in practice. This foundation according to
Koskela and Howell (2002a), can be divided into a theory of project and a theory of
management (Table 2.1).
Table 2.1: Theoretical Foundation of Project Management
Subject of Theory Relevant Theory
1. Project Transformation
Flow
Value generation
2. Management Planning Management-as-planning
Management-as-organizing
Execution Classical communication theory
Language/action perspective
Control Thermostat model
Scientific experimentation model
Source: Koskela and Howell (2002b)
2.13.1 The Theory of Project
The theory of project is modelled from the theory of production derived from the
manufacturing industry and it is built on three concept (Kraemer, et al., 2014; Rooke,
et al., 2012): transformation, flow, and value. The theory modelled the project
realization process as a conversion (transformation) process that passes through a
flow (watse elimination and efficiency improvement), and value matching to
75
customer requirements (customer requirements integration) (Rooke, et al., 2012).
Consequently (Kraemer, et al., 2014; Rooke, et al., 2012), it is referred to as the
transformation-flow-value (TFV) theory.
Transformation- According to Koskela and Howell (2002a) the end product of a
project passes through a transformation of inputs to ouputs in its production
operations. This transformation (Knoepfel, 1992), produces an end product that is a
new system or a new state of an existing system, which is more satisfying than the
initial preproject situation. The total transformation path of a project can be
decomposed into manageable and well-understood sub-tansformations and tasks
(Koskela & Howell, 2002b). Hence, a project can be realized in an optimal manner
and the tasks in optimal sequence (Koskela & Howell, 2002b). The correlation here,
according to Koskela and Howell (2002b), is that project performance can be
enhanced by improving the tasks and its sequence. The assumptions behind the
concept of transformation path of a project is that (Koskela & Howell, 2002b):
i. Tasks are independent, except sequential relationships
ii. Tasks are discrete and bounded
iii. Uncertainty as to requirements and tasks are low
iv. All work is captured by top-down decomposition of the total transformation;
work breakdown structure (WBS)
v. Requirements exist at the outset and they can be decomposed along with
work.
Knoepfel (1992) described project tramsformation as a structure of systems,
composed of subsystems and components that have attributes and that may be
76
related to each other and to systems, subsystems and components in the environment
of the systems, through certain attributes. According to Knoepfel (1992), a project
structure operates in a defined way to achieve it objectives. These objectives can be
interrelated, and their value depends on the attributes of the systems. In construction
projects management (Knoepfel, 1992), projects systems, subsystems and
componenets are identified in several levels. This allows the project management to
concentrate its attention on certain system, subsystems or components for a limited
time to bring it to a certain state of study, investigation, design, realization or
operation. These help to surpervise operation concepts and the layout of existing and
new parts of facilities, to manage the overall configuration of the systems and to
control the interfaces. By comprehending the operational structure of a project,
project management provides the technical basis for answers to economic, time-
scheduling, quality, quantity and organization questions (Knoepfel, 1992).
Flow- The concept of flow according to Kraemer, et al. (2014), viewed production
path of a project as a flow composed of value adding activities (transformation) and
non-value adding activities (waiting, inspection and moving). The main objective of
the flow concept is to eliminate or minimize the share of non value adding activities
through the improvement of project lead time, variability reduction, flexibility, and
transparency (Koskela cited in Kraemer, et al., 2014). The flow concept in
construction is conceptualized within four contexts (Kraemer, et al., 2014): Adding
and non-value adding activities, even flow, variability and, preconditions to work
tasks in construction.
77
i. Adding and non value adding activities: Adding and non-value adding
activities view flow as a value adding activities (transformation) and non
value adding activities (Kraemer, et al., 2014). Its concept is about
improving efficiency through doing things better and reducing waste. It is a
concept adopted from Henry Ford’s proposal of continous motion, that
suggests that everything should be kept in motion (Kraemer, et al., 2014). It
requires tasks (operations) to be taken to the operatives and not the other way
round (Ford & Crowther, 1998 cited in Kraemer, et al., 2014). Though, this
proposal contradicts the production process in construction, where the
building is stationary and is built through different phases of assembly
(Kraemer, et al., 2014).
Nonetheless, Ford’s proposal advocated for efficiency improvement and
waste elimination in production, and these reasons makes it important to
project management in construction. Adding and non-value adding concepts
see idleness as a waste (Kraemer, et al., 2014). Waste might emanate from an
operative waiting for a material or assistance, or a machine breakdown with
no replacement waiting for repairs (Kraemer, et al., 2014). Adding and non-
value adding activities of flow, are continous process aimed at identifying
and eliminating all waste that adds cost and do not add value (Liker, 2004
cited in Kraemer, et al., 2014).Therefore, the ultimate aim of adding and non-
value adding concepts of flow according to Kraemer, et al. (2014), is to
reduce or eliminate waste.
78
ii. Even flow: This means leveling production rates of each task against their
required resources and crews along the transformation path while aiming at a
continous production process (Kraemer, et al., 2014). Even flow aims at
leveling production rates to generate a smooth and continous construction
process (Kraemer, et al., 2014).
iii. Variability: This in a project production transformation flow is concerned
with how variability influences the input and output activities from one
workstation to another, considering delays that will increase the project lead
time (Kraemer, et al., 2014). Variability is the quality of non-uniformity of a
class of entities (Hopp & Spearman, 2001 cited in Kraemer, et al., 2014).
Variability is experienced in all construction production processes and have a
great impact on performance (Kraemer, et al., 2014).
Hence, it is important for contractors to understand and manage variability to
achieve an effective production (Hopp & Spearman, 2001 cited in Kraemer,
et al., 2014). Variability is divided into two: process time variability and flow
variablity (Hopp & Spearman, 2001 cited in Kraemer, et al., 2014). Process
time variability according to Hopp and Spearman (2001) cited in Kraemer, et
al. (2014), refers to the job at an individual workstation, and it causes are
natural (ie minor fluctuation in process time due to differences in operators,
equipment and materials), random outages, and setup and workers
availability. The delay resulting from a workstation due to process time
variability can influence the next workstation in line, thus resulting in flow
variability (Kraemer, et al., 2014).
79
Flow variability in construction production according to Kraemer, et al.
(2014), refers to variability caused by continous process fed diverse activities
with different inputs (specialty unit workers) in different locations (floors).
Consequences of variability in construction can be (Kraemer, et al., 2014):
time overrun and high levels of work-in-progress, wasted capacity, or lost
ouput, and cost overrun. Variabilty can occur in any activity along the
transformation path (Kraemer, et al., 2014). However, variability occuring in
the initial activities in the construction process is more disruptive than in the
final activities (Koskela, 2000 cited in Kraemer, et al., 2014). The goal of
flow variability is to eliminate or reduce variability from the construction
process (Kraemer, et al., 2014).
iv. Preconditions to work tasks in construction: According to Lindhard and
Wandahl (2012), before an activity can be conducted, a number of
preconditions first have to be fulfilled; the idea of preconditions to work tasks
is to itemized the pre-requirements to start any activity in construction
(Koskela, 2004). A fault in any of these preconditions according to Koskela
(2004), result in a ‘making-do-waste’. Koskela (2004) described ‘making-do-
waste’ as a situation where a task is started without all its standard inputs, or
the execution of a task is continued although at least one standard input is
lacking.
The consequences of ‘making-do-waste’ are (Kokela, 2004): rework, increase
of variability, poor quality, and cost and time overruns. The essence of the
80
precondition is to avoid waste emanating from ‘making-do-waste’ (Kraemer,
et al., 2014; Koskela, 2004). Kraemer, et al. (2014) and, Lindhard and
Wandahl (2012) itemized the following as the preconditions to work tasks in
construction: construction design and management (information),
components and materials are present, workers are present, equipment and
machinery are present, sufficient space so that the tasks can be executed,
connecting works (previous activities must be completed), climate conditions
have to be acceptable, safe working conditions in relation to national laws
have to be present and, known working conditions.
However, Kraemer, et al. (2014), and Lindhard and Wandahl (2012)
preconditions to work tasks seem to be centred on the DBB system alone and
as such, do not consider other preconditions where the contractor task
involves: design (integrated contracts and DM), planning, management and
coordination (management contracts). Thus, clients brief (business case),
programme and project management organizational chart are also considered
as additonal preconditions that will accommodate the pre-requirements for
the commencement of activities in integrated and management oriented
contracts (Passenheim, 2009, p.16; Harris & McCaffer, 2005).
Value- The value concepts focuses on how best to match customer requirement
(design and production) (Kraemer, et al., 2014). It is expected that the design and
specifications of a project capture and integrate the customer requirements. Hence,
value is centred from the point of view of the customer (Kraemer, et al., 2014). The
concept of value in the transformation of a project, therefore, requires a contractor in
81
planning his project tasks to always take into consideration the customer’s optimum
requirements in the project inputs, tasks, and sequence of operations throughout the
transformation path.
Kraemer, et al. (2014) asserted that the TFV theory is needed in understanding the
nature and requirements along the project conversion (transformation) path and, for
the TFV theory to be effective and efficient, it must be used at the same time in a
complementary way. The most impotant contribution of the TFV theory according to
Kraemer, et al. (2014), is in bringing interest to modelling, structuring, controlling
and improving production from all these three points of view and adding a new
insight showing that these are three fundamental phenomena in production, which
should be simultaneously managed.
2.13.2 Management Theory of Project Management
Management theory of project management is founded on three theories (Koskela &
Howell, 2002b): planning, execution and control (Table 2.1).
Theory of Planning- The theory of planning interpreted management as planning
and organizing (Koskela & Howell, 2002a). Thus, it is subdivided into: management-
as-planning and management-as-organizing (Table 2.1) (Koskela & Howell, 2002b).
In management-as-planning; management at the operations level consists of creation,
revision and implementation of plans (Koskela & Howell, 2002a). Management-as-
planning, conceptualized that in planning a project, there is a managerial part and an
effector part (Koskela & Howell, 2002a); The primary function of the managerial
82
part is planning, and the primary function of the effector part is to translate the
resultant plan into action.
On the other hand, management-as-organizing requires the assembly of the necessary
resources (inputs: manpower, materials, time and money) for carrying out the work
defined in the plan (Kraemer, et al., 2014; Weiss & Wysocki, 1992). Management-
as-organizing in construction project management entails tailoring the requirements
of the specific project (knoepfel, 1992). To organize in construction project
management according to Knoepfel (1992), means to define the work tasks with the
responsibilities, to allocate them to positions, to design the procedures in the
organization, and to select adequate performers for the positions. Management-as-
organizing is optimally aimed at assembling necessary resources into a cohesive
structure in accordance with the project plan requirements (Weiss & Wysocki, 1992).
Theory of Execution-The theory of execution is viewed within the context of
dispatching model and the language/action perspective. The dispatching model
conceptualized that, managerially, execution is about dispatching tasks to work
stations and, this is regarded as the classical communication theory (Koskela &
Howell, 2002b). However, for execution to be effective, the classical communication
theory must be complemented with the language/action perspective (Winograd and
Flores, 1986 cited in Koskela & Howell, 2002b); this emphasizes two-way
communication and commitment, instead of the mere one-way communication
according to the classical communication theory. Thus, the vice used in
communicating the tasks dispatched to work stations must be completely
comprehensive to the operatives. They should be feedback mechanisms that will

83
convey the operatives understanding of the instruction passed to him and as such,
enable tasks to be executed as it is envisaged in the plan.
Theory of Control- The theory of control consist of two models: themostat model
and the scientific experimentation model (Koskela & Howell, 2002a). The themostat
model conceptualized that in the production process, there is a process to control, a
unit for performance measurement, a standard of performance, and a controlling unit,
while the scientific experimental model of control as advocated by Shewhart and
Deming (1983) cited in Koskela and Howell (2002b) focuses on finding causes of
deviations and acting on those causes, instead of only changing the performance
level for achieving predetermined goals in the case of deviation. The scientific
experimentation model adds the aspect of learning to control (Koskela & Howell,
2002a). Thus, project control involves gauging performance, identifying deviation
and learning what are the causes of deviations, their effects and the best means of
countering them. The learning process is an avenue that can be used by contractors to
improve on their project management potentials.
2.13.3 Implication of Project Management Theory to the Study Objectives
The variables for this study are argued as independent variables to contractors’
operational planning within the context of project management theory. The variables
are: frequency of NICs involvement in building projects procurement systems
(experience), NICs time and cost performance in building projects procurement
systems, influencing factors for NICs project planning, NICs application of project
planning techniques, NICs project planning challenges, and contractors’ project
planning success indicators.

84
i. NICs Involvement in Procurement Systems: The frequency of the NICs
involvement in building procurement systems is an independent variable that
can affect the outcome of the contractor’s project operational planning within
the context of the theory of project. The contractors’ involvement in the
various types of building projects procurement systems will enable them
appreciate the project conversion (transformation) path (TFV) and how it
relates to project planning and organization.
The contractors’ understanding of the TFV theory and its application
significantly contributes to construction projects planning, organizing,
controlling and improving (Kraemer, et al., 2014). NICs frequent
involvement will enable them acknowledged how a project, depending on the
type of procurement system, can be decomposed into manageable and well-
understood sub-transformation and tasks within the context TFV and as such,
enables a contractor to realize project operational plan in an optimal manner
(Koskela & Howell, 2002a). Comprehending the operations of a project TFV
levels will provide contractors the technical basis for answers to economic,
time-scheduling, quality, quantity and organization questions in relation to
their project operational plan (Knoepfel, 1992).
Moreover, understanding how a project transformation is developed from
inputs to outputs (conversion); the tasks required and their sequential
relationship, taking into consideration flow and value, provides a better guide
to the contractors on how to develop a project operational plan that will be
85
effective and efficient towards achieving project management success
(Koskela & Howell, 2002b).
ii. NICs Time and Cost Performance: Contractors time and cost performance
in building project procurement systems is an independent variable that can
influence contractors’ project operational planning and this can be argued
using the project management theory of control. A review of several studies
revealed that contractors underperformed in terms of cost and time in the NCI
(Idoro, 2012b; Mbamali & Okotie, 2012; Babatunde, et al., 2010 Ikediashi,
et al., 2012).
The adherence to the project management concept of control through the
thermostat model and the scientific experimentation model can facilitates the
performance of contractor’s project operational planning. Since the
thermostat model is conceptualized for controlling a process which is guided
by an operational plan (Koskela & Howell, 2002a). The scientific
experimentation model can be used as a learning process to study the causes
of deviations resulting in time and cost overruns in the project management
process (Shewhart and Deming, 1983 cited in Koskela & Howell, 2002b),
thus adding to the contractor’s knowledge of the causes of time and cost
overruns. This, is eventually used as additional knowledge in putting
measures to counter causes of time and cost overruns in project operational
planning (Knoepfel, 1992).
86
iii. Application of Project Planning Technique: The other complement of the
concept of management-as-planning conceptualized that there is an affector
part to planning, whose primary function is to translate the resultant plan into
action (Koskela & Howell, 2002a). Therefore, inaddition to the management
function of project planning, the contractors management within the context
of project management, is required to translate its resultant operational plan
into action (Koskela & Howell, 2002b). The tools required to accomplish
this task are the use of project planning technique, however, this is subject to
the use of an appropriate planning technique (Bhavikatti, 2012; Roberts &
Wallace, 2004; Scott, 1995). Hence, NICs application of an appropriate
project planning techniques is an independent variable that can affect the
performance of operational planning.
iv. NICs Project Planning Challenges: Project planning forms the basis for
project control (Krishnamurthy & RavinDr.a, 2010; Bamisile, 2008; Eigege,
2005). The scientific experimentation model of control is concerned with
studying the causes of deviations in the whole process of project planning
with the sole aim of identifying causes of deviations (challenges) and how the
challenges can be adDr.essed in light of attaining a successful project
operational plan (Shewhart & Deming, 1983 cited in Koskela & Howell,
2002b). Hence, identifying contractors project planning challenges and
learning how to counter their effects will result in efficient and effective
projects operational planning.
87
v. Project Planning Influencing Factors: Factors that can significantly
influence NICs project planning in building projects procurement systems is a
variable for contractors’ project operational planning that might emanate
from other parties besides the contractors’. However, it is the responsibility of
the contractor’s management as conceptualized by the theory of planning at
the operations level, to create, revise, and implement operational plans
(Koskela & Howell, 2002a).
Hence, it is their responsibility to identify and adhere to measures that will
influence their ability to create an operational plan that can be easily revised
and operationally implemented. This is according to the concept of
management-as-planning. It is, conceptualized that in planning a project,
theres is a managerial role, which functions primarily as planning (Koskela &
Howell, 2002a).
Therefore, the contractors’ organization through its project manager, has a
managerial responsibility for planning their projects. This places a
responsibility to the contractors to acquire and adhere to factors that can
influence their project planning so as to be able to create, revise and
implement their project operational plan (Koskela & Howell, 2002a). Hence,
acquiring and adhering to these factors can significantly influence the NICs
project planning and it is a variable that can affect the effectiveness and
effeiciency of project operational plans.
88
vi. Contractors’ Project Planning Success Indicators: Thermostat model of
the theory of control conceptualized projects planning implementation as a
process that is subject to control, which has a unit for performance
measurement, a standard of performance and a controlling unit. Thus, a
contractor’s project planning success indicators can be used as a standard
performance measure in contractors’ project operational planning, and also
serve as contractors’ project operational planning controlling unit.
Hence, contractors’ project operatioal planning success indicators are
variables that can affect contractors’ project operational planning. The
implication of the project management theory to the study objectives are
represented in the relationship between the study’s theoretical and conceptual
framework in Table 2.2.
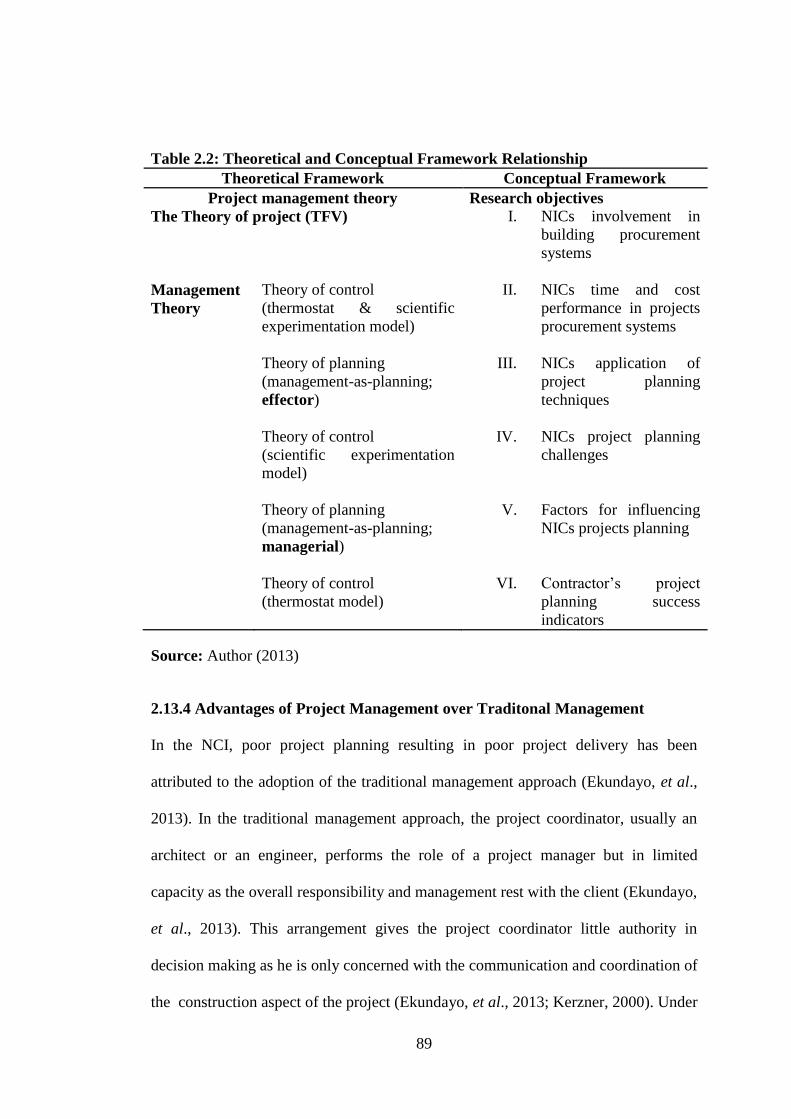
89
Table 2.2: Theoretical and Conceptual Framework Relationship
Theoretical Framework Conceptual Framework
Project management theory Research objectives
The Theory of project (TFV) I. NICs involvement in
building procurement
systems
Management
Theory
Theory of control
(thermostat & scientific
experimentation model)
Theory of planning
(management-as-planning;
effector)
Theory of control
(scientific experimentation
model)
Theory of planning
(management-as-planning;
managerial)
Theory of control
(thermostat model)
II. NICs time and cost
performance in projects
procurement systems
III. NICs application of
project planning
techniques
IV. NICs project planning
challenges
V. Factors for influencing
NICs projects planning
VI. Contractor’s project
planning success
indicators
Source: Author (2013)
2.13.4 Advantages of Project Management over Traditonal Management
In the NCI, poor project planning resulting in poor project delivery has been
attributed to the adoption of the traditional management approach (Ekundayo, et al.,
2013). In the traditional management approach, the project coordinator, usually an
architect or an engineer, performs the role of a project manager but in limited
capacity as the overall responsibility and management rest with the client (Ekundayo,
et al., 2013). This arrangement gives the project coordinator little authority in
decision making as he is only concerned with the communication and coordination of
the construction aspect of the project (Ekundayo, et al., 2013; Kerzner, 2000). Under
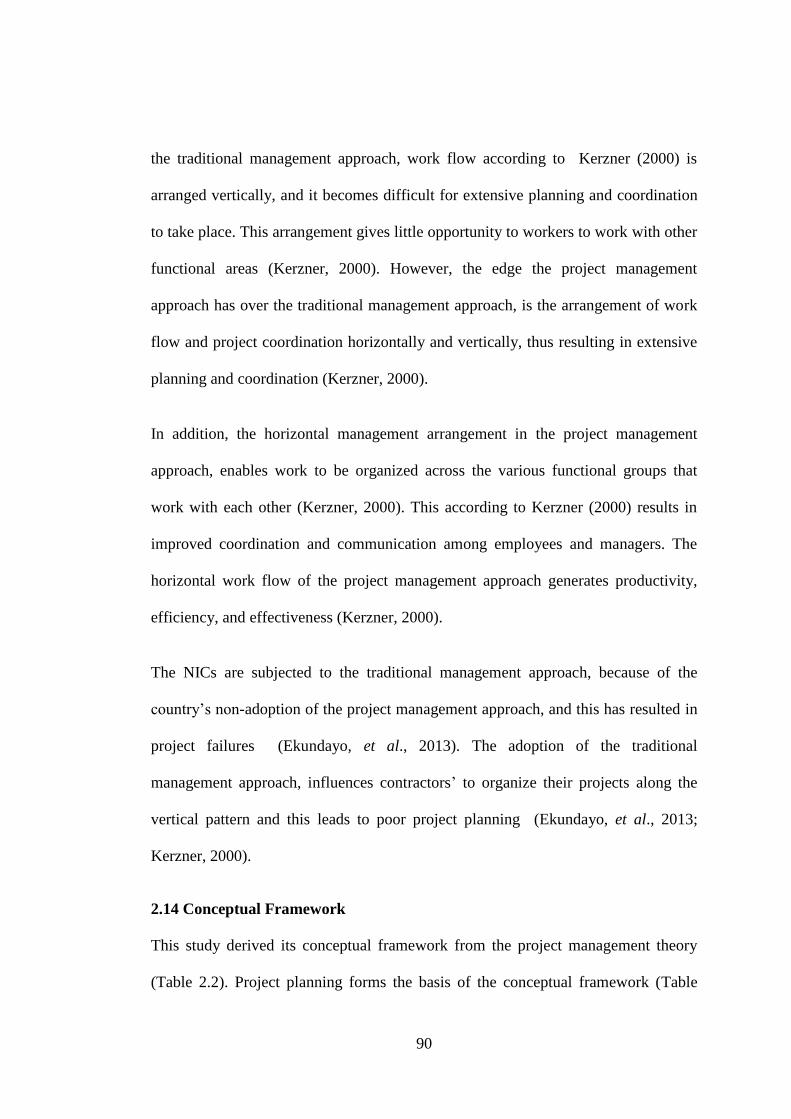
90
the traditional management approach, work flow according to Kerzner (2000) is
arranged vertically, and it becomes difficult for extensive planning and coordination
to take place. This arrangement gives little opportunity to workers to work with other
functional areas (Kerzner, 2000). However, the edge the project management
approach has over the traditional management approach, is the arrangement of work
flow and project coordination horizontally and vertically, thus resulting in extensive
planning and coordination (Kerzner, 2000).
In addition, the horizontal management arrangement in the project management
approach, enables work to be organized across the various functional groups that
work with each other (Kerzner, 2000). This according to Kerzner (2000) results in
improved coordination and communication among employees and managers. The
horizontal work flow of the project management approach generates productivity,
efficiency, and effectiveness (Kerzner, 2000).
The NICs are subjected to the traditional management approach, because of the
country’s non-adoption of the project management approach, and this has resulted in
project failures (Ekundayo, et al., 2013). The adoption of the traditional
management approach, influences contractors’ to organize their projects along the
vertical pattern and this leads to poor project planning (Ekundayo, et al., 2013;
Kerzner, 2000).
2.14 Conceptual Framework
This study derived its conceptual framework from the project management theory
(Table 2.2). Project planning forms the basis of the conceptual framework (Table

91
2.12). The study variables explained within the context of project management
theory constitute the independent variables, while an effective and efficient
contractor project operational planning in building procurement systems is the
dependent variable according to this study’s conceptual framework (Figure 2.13).
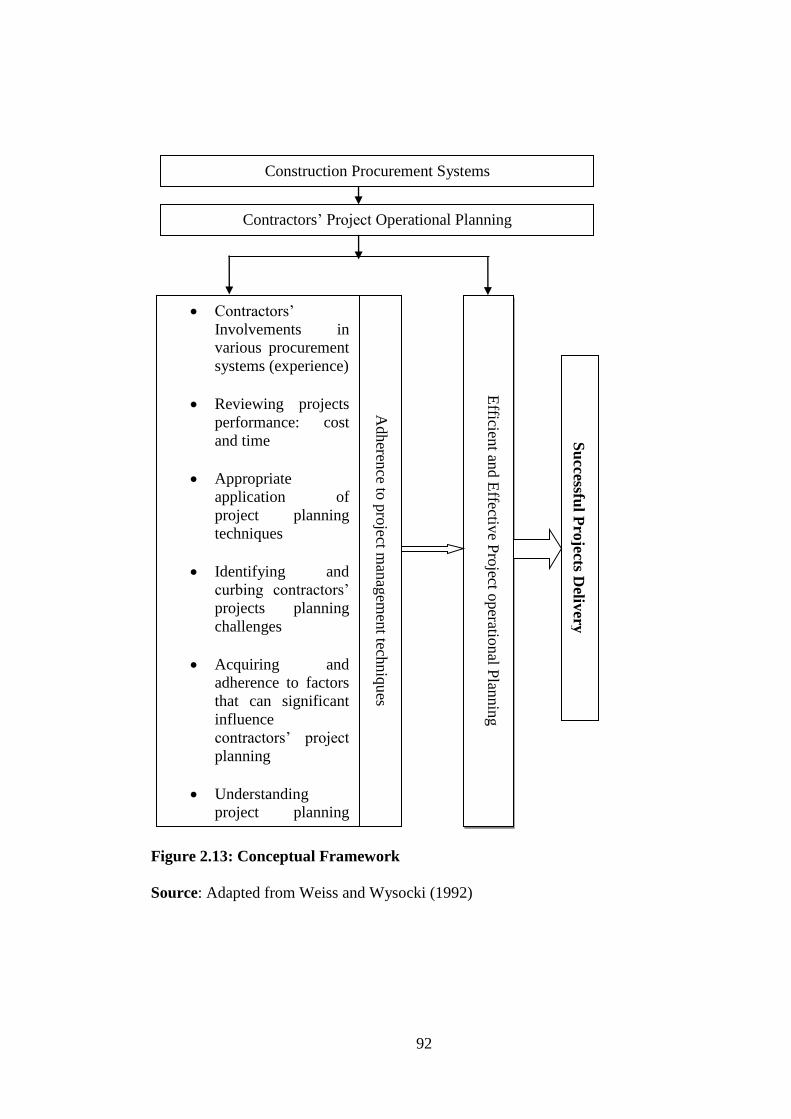
92
Figure 2.13: Conceptual Framework
Source: Adapted from Weiss and Wysocki (1992)
Contractors’ Project Operational Planning
Construction Procurement Systems
Contractors’
Involvements in
various procurement
systems (experience)
Reviewing projects
performance: cost
and time
Appropriate
application of
project planning
techniques
Identifying and
curbing contractors’
projects planning
challenges
Acquiring and
adherence to factors
that can significant
influence
contractors’ project
planning
Understanding
project planning
success indicators
Efficien
t and E
ffective P
roject o
peratio
nal P
lannin
g
Adheren
ce to p
roject m
anag
emen
t techniq
ues
Su
ccessful P
rojects D
elivery
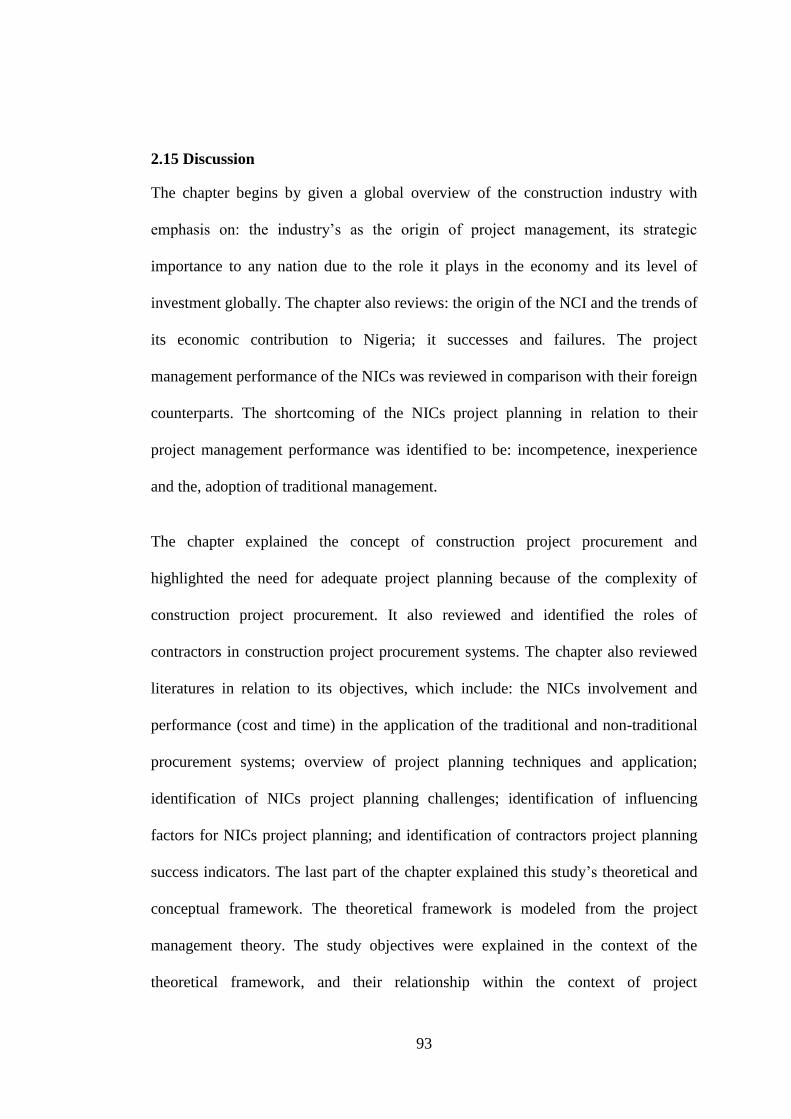
93
2.15 Discussion
The chapter begins by given a global overview of the construction industry with
emphasis on: the industry’s as the origin of project management, its strategic
importance to any nation due to the role it plays in the economy and its level of
investment globally. The chapter also reviews: the origin of the NCI and the trends of
its economic contribution to Nigeria; it successes and failures. The project
management performance of the NICs was reviewed in comparison with their foreign
counterparts. The shortcoming of the NICs project planning in relation to their
project management performance was identified to be: incompetence, inexperience
and the, adoption of traditional management.
The chapter explained the concept of construction project procurement and
highlighted the need for adequate project planning because of the complexity of
construction project procurement. It also reviewed and identified the roles of
contractors in construction project procurement systems. The chapter also reviewed
literatures in relation to its objectives, which include: the NICs involvement and
performance (cost and time) in the application of the traditional and non-traditional
procurement systems; overview of project planning techniques and application;
identification of NICs project planning challenges; identification of influencing
factors for NICs project planning; and identification of contractors project planning
success indicators. The last part of the chapter explained this study’s theoretical and
conceptual framework. The theoretical framework is modeled from the project
management theory. The study objectives were explained in the context of the
theoretical framework, and their relationship within the context of project

94
management theory was established, and this was used as a basis for this study
conceptual framework.
95
CHAPTER THREE
3.0 RESEARCH METHODOLOGY
3.1 Introduction
In this chapter the methodology and general procedures used in this study are
explained. This includes research design, and which basically covers schemes,
outlines or plans that are used to generate answers to research problems. It includes a
description of the research methodology adopted, description of survey area,
population, sample and sampling procedures, questionnaire design and pre-testing of
research instruments, and data collection and analysis techniques.
This study follows a philosophical orientation founded on ontology and
epistemology, both of which are concerned with knowledge and the way scientist
develop knowledge (Steup, 2014). According to McNabb (2009, p. 13) ontology
deals with what we can learn; what is out there that can be known. Ontology has to
do with what is the nature of the world we experience. In this context this study’s
statement of the problem is being guided by the philosophy of ontology. This enables
this study to use literature in justifying the existence of a problem, worthy to be
studied within the context of the experiences in the NCI.
On the other hand, this study used the epistemological philosophy in adopting a
research design. Epistemology is concerned with questions about the way we can
learn; the approaches used by scientist to gain knowledge. It is concerned with the
validity of knowledge; it deals with the questions about how we can know anything,
and how we can be certain what we know is true (Steup, 2014; McNabb, 2009). In
96
adherence to the epistemological philosophical requirements on how to obtain
knowledge, this study used a research design that enables it spells out a logical
structure suitable for gathering data that are sufficient and appropriate for answering
the research questions completely and unambiguously, and enables it ascertain the
authenticity of the data obtain in answering the questions (de Vaus, 2001 cited in
McNabb, 2009, p.96).
3.2 Research Design
The objectives of this research is to ascertain the level of contractors’ participation
and performance in the different types of construction procurement systems and to
understand, the factors surrounding indigenous contractors’ project operational
planning in procurement systems: planning performance, projects planning
influencing factors (requirements); use and method of planning tools application;
challenges encountered by indigenous contractors in project planning; and indicators
of success in project planning. The objectives also aimed at systematically describing
the: situation; problem; phenomenon; service and describe an attitude towards NICs
planning (McNabb, 2009; Maina, 2012). According to McNabb (2009) and Wanyona
(2005), the objectives of a research determine the research design to be adopted.
Considering the aforementioned demands of the research objectives, the research
approached its design in three stages: conducted an initial inquiry to gain insights and
ideas about the research problems and the variables and issues associated with the
problems through an extensive literature search and a pilot interview (explorative
design) (McNabb, 2009); afterwards carefully mapped out a circumstance, situation,
or set of events to describe what is happening or what has happened, mainly through
97
the benefits of questionnaire techniques (descriptive method) (McNabb, 2009;
Rosenthal and Rosnow, 1991 cited in McNabb, 2009; Buys, 2004) and; finally,
followed up questionnaire (contractors) responses by searching written records and
accounts of past happenings and events in contractors business dealings (contract
execution), using historical data (documentation) (Buys, 2004).
The research design adopted (explorative, descriptive and explanatory) fall under the
two broad classification of research design (McNabb, 2009): quantitative design
(exploratory and descriptive); and qualitative design (explanatory). In this light
therefore, the research uses both qualitative and quantitative research design
respectively.
3.2.1 Research Strategy
A preliminary research approach comprising of a qualitative method of data
production used a thorough literature review and semi-structure pilot interviews of a
convenience sample comprising: 4 indigenous contractors (medium and large), 4
construction consultants (Architects, Builders, Engineers, and Quantity Surveyors)
and 2 public building professionals in the Northern geo-political zones of Nigeria.
The interviews aimed at acquiring more information concerning contractors’
operational planning when involved in project procurement with emphasis on
indigenous contractor': involvement and performance in building projects
procurement systems, use and method of applying projects planning tools, projects
planning challenges, projects planning influencing factors, and projects planning
success indicators. Information from the literature review and the outcomes of the
98
interviews were used as a basis for developing the research questionnaires.
Afterward, questionnaires were pre-tested before being used to obtain quantitative
data from respondents (contractors, consultants and public building professionals).
Questionnaire results according to Guthrie (2010) might be misleading in some cases
and this might be true were a study is investigating the performance of contractor
because, according to Adams (1997), to get an objective opinion on contractors’
performance rest on three parties: contractors, consultants and other clients
representatives (PBPs). However, some of the critical questions in the questionnaire
targeting contractors’ performance in which consultants and PBPs might not be
competent enough to respond to, were subjected to further probe.
Consequently, a collective case study approach through a documentary analysis
(historic data) was used to follow up the questionnaire responses to ascertain whether
the involvement and performance of indigenous contractors in construction
procurement systems, and their application of project planning techniques followed
the same pattern in Northern Nigeria (McNabb, 2009). This method allows for more
extensive probe on specific issues identified in the main questionnaire responses
(Guthrie, 2010; McNabb, 2009). Moreover, according to Buys (2004) historic data
are primary data that contain facts about individuals, organizational behaviours
written in records, or acounts of past happenings and events.
A stratified random sampling technique was used on the returned questionnaires to
select fifteen (15) contractors from the study area. The sub-study areas of Abuja,
Bauchi/Gombe, and Kano formed the strata used for the stratified sampling. The

99
sampled contractors completed project files in the custody of clients were obtained,
and was used as a case study to conduct a document analysis. This is in line with
previous researches in the construction industry (Laryea, 2010; Olatunji, 2010; Musa,
et al., 2011), who had used historic approach methodology through document
analysis on completed projects files as a case study to achieve their research aims'.
3.2.2 Area of the Study
The study was conducted in the northern geo-political zones of Nigeria. The northern
geo-political zones constitute slightly more than half of Nigeria's 36 States and it
Capital (19 states and Abuja). It has a land size of 744,249.08 sq. km representing
almost 80% of Nigeria's total land size of 937,052.16 sq. km and a population size of
over 75 million people, representing 54% of Nigeria's total population (NPC, 2010).
The northern geo-political zones constitute 3 of the 6 geo-political zones of Nigeria:
north-central, north-eastern and, north-western geo-political zones respectively (see
appendix 5).
The study area was further divided into three sub-study areas; with Bauchi and
Gombe merged as a sub-study area from the north-eastern geo-political zone; while
Kano state and Abuja (Federal Capital Territory- The Capital City of Nigeria) were
selected as sub-study areas from the north-western and north-central geo-political
zones respectively. These sub-study areas are referred to in this study as:
Bauchi/Gombe; Kano and; Abuja.
Besides Bauchi State having the highest population size in the north-eastern zone
(NPC, 2010), Bauchi and Gombe States where selected for two reasons: firstly, their
100
high concentration of construction activities in the north-eastern zone (Usman et al.,
2012) and; secondly, they are relatively peaceful from Boko Haram (a terrorist
organization operating in Northern Nigeria) insurgence compared to other States in
the zone. These States are 2 of the 3 states out of the 6 states in the north-eastern
zone not affected by Nigerian Government recent declaration of a state of emergency
(Punch Newspaper, 2013; Daily Trust Newspaper, 2013).
Kano State was selected from the north-western zone because of its population size
(the largest in Nigeria), with over 9 million people. Kano State also has the highest
and largest commercial activities in the whole of the northern zones, second only to
Lagos State in the country (Kano State Government, 2013; NPC, 2010). Kano State
has the highest concentration of construction activities in the north western zone
(Ameh & Odusami, 2010). Abuja was selected from the north-central zone due to its
status of being the Seat of Government; the Capital of Nigeria and having the highest
concentration of construction activities in the country (Typad, 2013; Ameh &
Odusami, 2010; Oladapo, 2006).
3.2.3 Study Population
The target population for the research comprises mainly of medium and large
indigenous contractors registered within categories B, C and D in Nigeria. However,
according to Adams (1997), the best way to obtain information free of bias and with
increased accuracy concerning domestic contractors is from contractors themselves,
independent consultants who work in the industry and, clients' supervisory staff (who
in this study are referred to as public building professionals), who work closely with
the contractors.
101
Therefore construction consultants (Architects, Builders, Engineers and, quantity
surveyors) and public building professionals (building professionals working for
government establishments) were also involved in the research as part of the
population. Adams (1997) emphasized that the last group (consultants and clients'
supervisory staff) will probably be more objective in judging contractors
performance. Furthermore, public building professionals serve as government
(client) supervisory staff in Nigeria. Since Nigeria is a developing economy, the
government is the major client of the industry with a construction share of about 75%
(Iro, et al., 2013).
Obtaining a reliable population size for the study is not achievable. The only
literature available that gave a population size for Nigerian contractors was from
Adeyemi (2006) cited in Fagbenle et al., (2011), who reported that there are 105
contractors registered with the Federation of Construction Industry (FOCI).
However, this figure (105) is contradicted by Adams (1997) in a previous study on
contractors’ development in Nigeria; Adams study concentrated on domestic
(Indigenous) contractors in the south-western geo-political zone of Nigeria and
distributed 200 questionnaires to contractors. Adams (1997) contractors' sample size
exceeded the population reported by Adeyemi (2006). Moreover, the FOCI figure
quoted by Adeyemi (2006) is in conflict with Achuenu, et al. (2000)
acknowledgement that the number of contractors has been increasing since
independence (1960), hence, the FOCI figure is unreliable.
Moreover, Idoro (2011a); Idoro and Akande-Subar (2008); Jinadu (2007); Muazu
and Bustani (2004); Achuenu, et al. (2000) and; Adams (1997) all acknowledge that,
102
target population size for active contractors in Nigeria cannot be authoritatively
ascertained as the industry is full of marginal indigenous contractors using addresses
that could not be traced in the field. Many of these contractors are non-professionals
who venture into construction to make easy money using their political influence to
source for contracts which they eventually sell to active contractors to execute
(Idoro, 2014; Jinadu, 2007; Muazu and Bustani, 2004; Achuenu, et al., 2000). This
has resulted in an unreliable number (size) of active registered indigenous contractors
in Nigeria. Nonetheless, a population size of 500 is used for the study and this
comprises of 250 contractors, 125 consultants and 125 Public building professionals
respectively.
3.3 Sample
The target population of 500 was divided into 250, 125, and 125 among the three
categories of contractors, consultants and public building professionals respectively.
The study then uses the formula for determining the sample size of unlimited
population by Ayoub and McCuen (2000) cited in Enshassi, et al., 2006) in order to
ensure that the chosen sample fully represents the target population.
SS = Z2* P (1-P) =
C2
Where;
SS = Sample Size
Z = Z value (e.g. 1.96 for 95% confidence level)
P = Percentage picking a choice, expressed as decimal (0.5 used for sample size
needed)

103
C = Confidence interval (0.5)
SS = 1.962 x 0.5 (1- 0.5) = 384
0.52
Therefore, going by Ayoub and McCuen (2000) formula cited in Enshassi, et al.
(2006), correction for finite population will be:
New SS= SS = 282.50
1+ SS-1
Pop
Where;
New SS= New sample size
SS= sample size= 384
Pop = population size = 500
However, in order to maximize the amount of the study responses because of the
poor response rate usually recorded in the construction industry studies (Ibrahim,
2011; Crafford, 2007), and in accordance with Sambo’s (2008) and Guthrie’s (2010)
recommendation that the bigger the sample size the better its ability to represent the
population, the sample size was increased to 300.
3.3.1 Sample Size
A total of 300 questionnaires were distributed among the respondents in the ratio of
2:1:1 resulting in the questionnaire being distributed in the order of: 150; 75; and 75;
to contractors, consultants and public building professionals respectively, in the
entire study area. Therefore, in each sub-study area a total of 100 questionnaires were
distributed in the following order: 50 (contractors); 25 (consultants) and; 25 (PBPs).
104
The sample size (300) used for this study is higher than the samples of 20, 140, 43,
108 and 50 used by Odediran, et al. (2012); Fagbenle et al. (2011); Idoro and
Akande-Subar, (2008); Muazu and Bustani (2004); and Achuenu, et al. (2000)
respectively in previous studies targeting contractors in Nigeria.
3.3.2 Sampling Technique
The study adopted two different types of sampling techniques, one for the structured
questionnaires, and the other for case study.
Sampling Technique for Questionnaire Survey
Due to the presence of marginal and inactive indigenous contractors in the NCI, this
resulted in non-availability of an authoritative active indigenous contractors’
population frame (Idoro and Akande-Subar, 2008; Muazu and Bustani, 2004;
Achuenu, et al. 2000; Adams, 1997). This study therefore, could not adopt a random
sampling technique (a probabilistic technique), despite its statistical preference to
any type of sampling; owing to its significance in producing samples that are free
from bias (Sambo, 2008). Though, Sambo (2008) also acknowledged that other
sampling procedures apart from random sampling can be employed when a
population has some definite characteristics that need to be reflected in the sample.
According to Mugenda and Mugenda (2003) when a study is targeting some
characteristics from a sample like specific: age group; profession or trade; religious
sect; or educational level, purposive sampling is preferred.
This study targeted medium and large, active indigenous contractors in northern
Nigeria, of which their actual population size cannot be ascertained from an
105
authoritative population frame. In this light, the study therefore employed a non-
probabilistic sampling technique of purposive sampling. The choice of purposive
sampling technique was hinged on the fact that the study is directed towards a
defined group of respondents who are best able to respond to the research issues
(Ibrahim, 2011). This technique enables the study to target and administer
questionnaires to medium and large active indigenous contractors, so as to obtain
reliable information that enhances and facilitates the reliability of the study. The
adoption of purposive sampling technique benefitted the study with the following
advantages (Maina, 2012, p. 44-45):
The people who do not fit the requirements are eliminated;
The sample is an accurate or near to accurate representation of the
population;
The results are expected to be more accurate;
It is less time consuming and;
It is less expensive as it involves lesser search costs.
Case Study Sample Size and Sampling Technique
According to Guthrie (2010) a case study can be used to generalize on a study
population if the sample of the cases is systematically chosen. This Guthrie (2010)
emphasized, will provide a high probability for the outcome of a case study to
exemplify its population pattern. The sample size for the case study therefore, was
systematically obtained through a stratified random sampling technique on the
contractors questionnaires that were responded to, in order to enable its
generalization on the study population. A total of fifteen (15) contractors were
106
selected; five (5) from each sub-study area (Abuja, Bauchi/Gombe, and Kano). The
selected contractors’ completed projects files were subsequently obtained from
clients organizations and these files (document; archival) were used for the case
study.
3.3.3 Method of Questionnaire Administration
The postal method of questionnaire administration is said to be cheaper than other
methods (Christianson & Tortora, 1996 cited in Oladapo, 2006). However, the
inefficiency and unreliability of the Nigerian postal system, coupled with the poor
response rate in the administration of questionnaires through internet (emails) and
post office in Nigeria (Oladapo, 2006), necessitated a hand-to-hand administration of
the questionnaires. Prior to the distribution of the questionnaires the three research
assistants were briefed on the research and were meant to comprehend the content of
the questionnaires and what they were expected to achieve.
3.4 Method of Data Collection
The method of data collection was determined by the methods adopted for the
research; explorative (literature search), descriptive and explanatory (collective case
study). For explorative method, data were collected through an intensive and
extensive literature search, for descriptive methods; data were collected through
interviews and questionnaires which according to McNabb (2009), are the most
appropriate means to obtain data (information) for descriptive methods; and data for
explanatory method (collective case study) were obtained through documentary
analysis of completed building projects files, which according to Guthrie (2010) and
107
Buys (2004), contain most facts about the object of the study (project planning) and
is considered a primary data.
The research data were collected through primary and secondary sources. Primary
data were collected through interviews, the use of questionnaires and case studies
(documentation), while secondary data were collected through a critical review of
literature from the following sources: Conference, Workshop and Journal papers,
Newspapers, Forms of contract, Text books, Theses, and the internet.
3.4.1 Questionnaire Design
Consequent to a thorough literature search, the research conducted interviews of
contractors, consultants and public building professionals (PBPs) on contractors’
project planning in construction project procurement systems. The interviews aimed
at:
Acquiring more information concerning Nigerian indigenous contractors’
application of project planning techniques (tools) in project execution in
Nigeria to enrich the questionnaire;
Discovering additional challenges that indigenous contractors' encounter in
executing their project planning in construction procurement system in
Nigeria for inclusion in the questionnaire;
Uncovering additional significant influencing factors for contractors projects
planning in procurement systems for inclusion in the questionnaire and;
Identifying additional success indicators for contractor’s operational planning
for inclusion in the questionnaire.
108
A total of 10 interviewees’ comprising contractors (4), consultants (4) and PBPs (2)
practicing in Northern Nigeria were interviewed.
Research Questionnaires
The questionnaires were designed to elicit information from the study respondents
that leads to the attainment of the study objectives. The questionnaires capture all the
relevant data that were acknowledged during the literature review and the interview
stages. Three sets of questionnaires were designed: one set each for indigenous
contractors, consultants and PBPs.
The indigenous contractors’ questionnaire consists of four sections. Section one
consists of closed categorical questions about respondents’ demographic
information and information on respondents’ involvement, time and cost
performance in projects procurement systems in the last five years (2008-2013).
Section 2 has 2 sub-sections: the first consists of open and close-ended questions to
obtain information on the use of operational planning techniques; while the second
sub-section listed challenges of NICs in project planning in project procurement
systems, with a 5 point severity index Likert rank scale, from 1-least severe to 5-
extremely severe.
Section 3 listed significant influencing factors for contractors’ project planning with
a five point importance index rank Likert scale; from 1-not important to 5-very
important. Section 4 has 2 sub-section: the first listed contractors’ project planning
success indicators with a 5 point importance index rank Likert scale, from 1-not
important to 5-extremely important; while the second is an open-ended question

109
requesting respondents’ to proffer measures that will enhance contractor’s project
planning for any type of construction project procurement systems in Nigeria
Appendix 2).
The construction consultants’ questionnaire (Appendix 3) and that of PBPs
(Appendix 4) are virtually the same; with differences only in their section 1
(demographic data). The questionnaire consists of 4 sections. Section 1 consists of
closed categorical questions about respondents’ demographic information. Section 2
is a duplication of contractors’ questionnaire second subsection two. Section 3 is a
duplication of the contractors’ questionnaire section 3, while section 4 is a
duplication of contractors’ questionnaires’ section .4
3.4.2 Pre-testing of questionnaire
Once a questionnaire is finalized, it should be tried out in the field for pre-testing
(Buys, 2004; Mugenda & Mugenda, 2003). Pre-testing is the surest means for a
questionnaire to be comprehensible and error free (Buys, 2004). In this light, this
research used a convenience sample of 10 people in Bauchi State-Nigeria to conduct
a pilot survey on the respondents to pre-test the questionnaires. Among the
respondents' were three academic staff who major in risk, procurement and
management in the construction industry respectively; they comprised of a professor,
an Associate Professor and a Senior Lecturer. All the experts have more than 15
years of experience in the industry. The other respondents comprised of 5 indigenous
contractors and 2 PBPs, all having more than 15 years’ experience in the NCI.

110
Questions were asked about the questionnaires in order to get responses. These
responses were acted upon to ensure comprehensibility and an error-free
questionnaire. The responses obtained led to the following changes on the draft
questionnaires:
Inclusion of the university's logo on the questionnaire cover letter
Re-aligning of the school address on the questionnaire cover letter from left
to center and rephrasing of the research title
Inclusion of the word area as the last word in the first sentence of the first
paragraph of the questionnaires' cover letter
Interchange of the second and third sentence in the first paragraph of the
questionnaires' cover letter
Deletion of the second sentence in the second paragraph from the
questionnaire cover letter
Inclusions of the alphabet d to the word 'use' and, a definite article the before
the word utmost in the fourth paragraph of the questionnaire cover letter
Inclusion of candidate's school registration number and contact details (email
address and phone number) on the questionnaire cover letter
Replacing the word right with the word selected in the instruction of section
one (demographic data) in all the respondents' questionnaire
Inclusion of the phrase operational headquarter at the end of question 1 in
Section 1(demographic data) in all the respondents' questionnaire
Replacing the phrase to what form of business registration your firm
belongs with your type of firm in third question of section one for
contractors' and consultants'
111
Inclusion of PhD as part of the category options in question 2 of Section B in
the contractors' questionnaire
Inclusion of the word within before the phrase, the last five (5) years, in the
instruction of Section C of the contractors' questionnaire
Editing of words, inclusion of the Nigerian currency sign (Naira-N) and
replacing of the words Initial duration and final duration with Initial
contract periods (months) and Final completion period (months) in the
table provided in Section C of the contractors' questionnaire
Inclusion of the phrase at completion to the title of the last column in the
table provided in Section C of the contractors' questionnaire
Replacing the word Less on all the Likert scale with the word Least
Rephrasing tenses, correcting spellings and punctuations on the headings and
itemizing factors to be ranked in all the respondents questionnaires'
All the respondents used in the pre-testing exercise agreed that the questionnaires
were easy to comprehend and that each could be completed within 25-30 minutes.
3.4.3 Questionnaire Survey Validity and Reliability Test
This study conducted validity and reliability test on the data obtained in the
questionnaire and on the questionnaire construct respectively.
Validity Test
This research satisfies both the content and construct validity test. The content
validity test refers to the adequacy with which a measure or scale has sampled from
the intended universe or domain of content. This research used purposive sampling
technique to sample from the intended universe. The adequacy of the sampling
112
emanates from the facts that the research is directed towards a defined group of
respondents who are best able to respond to the research issues (Maina, 2012;
Ibrahim, 2011; Mugenda & Mugenda, 2003). The construct validity test is concerned
with a variable measurement instrument measuring particularly that which it is
intended to measure. This condition was also attained by this study questionnaire; the
questionnaires were able to measure all it intended to measure. Consequently, this
enabled the study to test all it hypotheses and answer it objectives.
Reliability Test
This study used the internal consistency test to test its questionnaire reliability.
According to Field (2006) Cronbach’s alpha (α) is used to measure questionnaire
reliability index. Technically, Cronbach's α is not a statistical test (Ibrahim, 2011); it
is a coefficient of reliability (or consistency). It measures the consistency of a
questionnaire’s construct (items) and indicates how a scale is free from random error
(Ibrahim, 2011; Pallant, 2001). This study therefore used Cronbach's alpha (α) to
tests its questionnaire construct consistency and level of random error.
The use of Cronbach's α, allows negative construct to be detected and positive to be
accepted ranging from a scale of 0 to 1.0 (Ogwueleka, 2011). The minimum
acceptable value for Cronbach’s alpha is from 0.5 to 0.6 (Ogwueleka, 2011; Olatunji,
2010). The cut-off value for this study therefore is 0.70; in essence, for items to be
used together as a scale in this study, the items must be above the cut-off value.
Table 3.1 shows the Cronbach’s α values interpretation within a scale of 0-1.
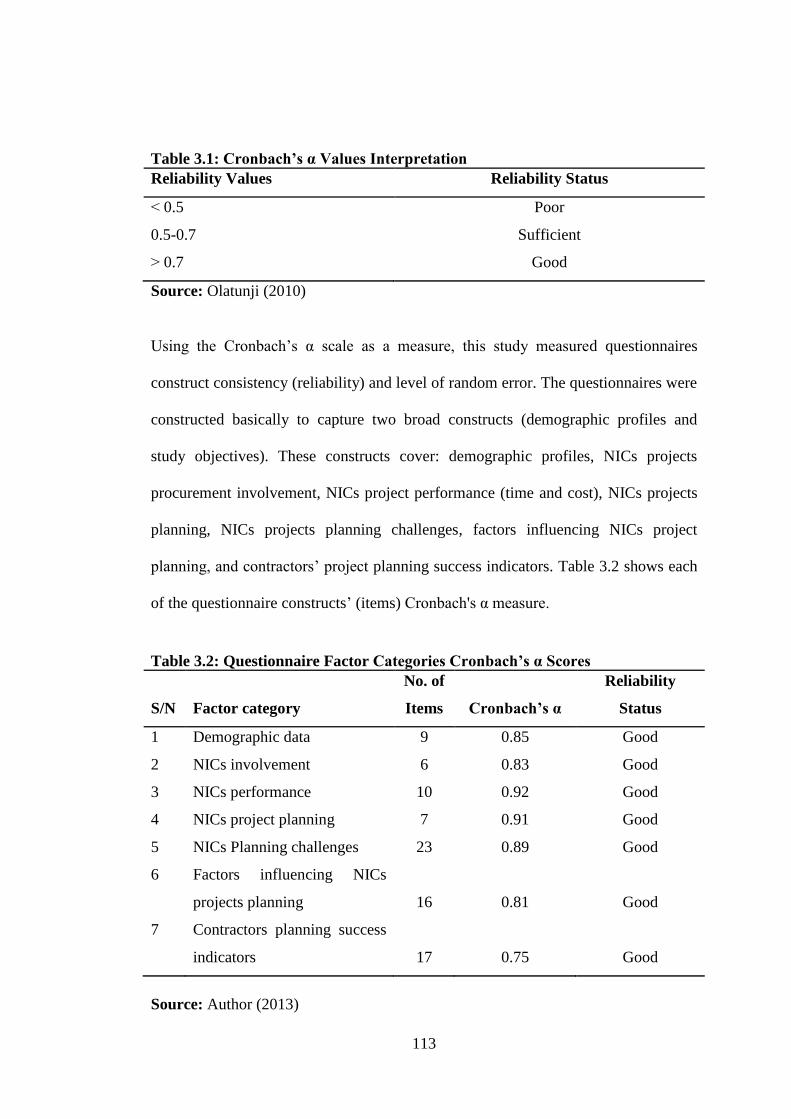
113
Table 3.1: Cronbach’s α Values Interpretation
Reliability Values Reliability Status
˂ 0.5 Poor
0.5-0.7 Sufficient
˃ 0.7 Good
Source: Olatunji (2010)
Using the Cronbach’s α scale as a measure, this study measured questionnaires
construct consistency (reliability) and level of random error. The questionnaires were
constructed basically to capture two broad constructs (demographic profiles and
study objectives). These constructs cover: demographic profiles, NICs projects
procurement involvement, NICs project performance (time and cost), NICs projects
planning, NICs projects planning challenges, factors influencing NICs project
planning, and contractors’ project planning success indicators. Table 3.2 shows each
of the questionnaire constructs’ (items) Cronbach's α measure.
Table 3.2: Questionnaire Factor Categories Cronbach’s α Scores
S/N Factor category
No. of
Items Cronbach’s α
Reliability
Status
1 Demographic data 9 0.85 Good
2 NICs involvement 6 0.83 Good
3 NICs performance 10 0.92 Good
4 NICs project planning 7 0.91 Good
5 NICs Planning challenges 23 0.89 Good
6 Factors influencing NICs
projects planning 16 0.81 Good
7 Contractors planning success
indicators 17 0.75 Good
Source: Author (2013)
114
The Cronbach’s α measure recorded for this study revealed that the reliability of the
questionnaires’ constructs are very high, all exceeding the cut off score of 0.7. This
indicates that the questionnaires are highly reliable (consistent) and free from random
error.
3.4.4 Method Adopted for Case Study
A case study is a process or record of research into the development of a particular
person, group, or situation over a period of time (Oxford Dictionary of English,
2000). According to McNabb (2009) many definitions for case studies in research
have been proposed and one of such definitions is from Yeager (1989) cited in
McNabb (2009, p.358) as a description of a management situation based on
interview, archival, naturalistic observation, and other data, constructed to be
sensitive to the context in which management behavior takes place and to its
temporal restraints. These characteristics Yeager stressed are shared by all cases.
In the views of Lang and Heiss (1990); Arenson (1993) cited in McNabb (2009,
p.358), case studies are often intensive studies of one or a few exemplary individuals,
families, events, time periods, decisions or set of decisions, processes, programs,
institutions, organizations, groups, or even entire community. Case studies are
associated with qualitative research but, they can also illuminate quantitative findings
and can incorporate quantitative data (Guthrie, 2010).
According to McNabb (2009) a subject is selected for case study either because it
points out some underlying problems, or because it represents a successful solution
115
to a problem. Stakes (2000) in McNabb (2009) classified case studies into three
types: instrumental, intrinsic, and collective.
This study adopted the collective case study approach. This approach is also refers to
as multiple-case, cross-case, or multisite qualitative research. The design is one of
the major research approaches taken in comparative studies. The approach looks at a
group of similar cases to study a particular phenomenon, and it is also used to
suggest whether characteristics might be common to larger population of similar
cases. According to McNabb (2009) the cases selected may be chosen because they
are similar or they are different, and because the researcher believes that
understanding what is going on in those cases will result in better understanding
about a larger population.
This study thus used the multisite qualitative research (collective) case study
approach in studying NICs projects operational planning in Nigeria, in order to
ascertain whether the activities and actions of indigenous contractors in projects
planning followed the same pattern in Nigeria. In addition, this method allows this
study to follow up contractors' responses in the questionnaire, and as such allows for
a more extensive probe on specific issues identified in the main investigation
(questionnaire survey) (Guthrie, 2010).
3.5 Method of Data Analysis
This study used both structured questionnaires and a multisite (collective) case study
approach to generate quantitative and qualitative data from respondents. The method
of data analysis was conducted using statistical package for social sciences (SPSS)

116
and Bloom's taxonomy hierarchy (Guthrie, 2010) for the data's obtained from
structured questionnaires and case studies respectively.
3.5.1 Method of Data Analysis for Questionnaires Survey
Statistical package for social sciences (SPSS) for Windows, Version 17.0 (SPSS,
2008) was used for the statistical analyses of the data generated from the
questionnaire survey. The analyses undertaken include: agreement test (association),
and test of significance and descriptive statistics. SPSS (version 17) offers the study
a package of programmes for manipulating, analyzing, and presenting data (Field,
2006; Landau & Everitt, 2003). This makes it easier for the study to file, edit, view,
input, transform and, analyze data for the agreement test, test of significance and
descriptive statistics. In addition to SPSS being interactive (user friendly), it also
allows the presentation of research results with tables, charts and graphs in a simple
and comprehensive manner (Field, 2006; Landau & Everitt, 2004).
Descriptive Statistics
Descriptive statistics, according to Sambo (2008), is a numerical index that describes
or summarizes certain characteristics of a distribution. This study therefore used
descriptive statistics for the tasks of describing the sample size, providing a
quantitative summary of the research variables, summarizing the data sets, and for
inferential purposes (McNabb, 2009).
This study used the four categories of descriptive statistics of measures of central
tendency; measures of variability (dispersion); measures of relative position; and
measures of correlation to analyze its data. These four types of measurements enable
117
the study to reduce its large data set to a smaller amount of meaningful numbers that
everyone can understand (McNabb, 2009). Unless otherwise necessary, the study
selected and used in each category of the descriptive statistics the best that satisfies
the characteristics of good descriptive statistics; it should be: singled-value,
algebraically tractable, consider every observed value, and consider the frequency of
every observed value (Frank & Althoen, 1994 cited in Sambo, 2008, p.58).
This study accordingly used the following descriptive statistics:
percentages/frequencies, arithmetic means, standard deviations, Spearman's rank
correlation coefficient (ρ), chi-square (χ2) and, Kruskal-Wallis H-Test. These
descriptive statistics were used because this study’s data were basically in nominal
and ordinal measurement scales (Guthrie, 2010; McNabb, 2009; Sambo, 2008).
Ranking of the level of importance and severity index used in the questionnaires
were based on arithmetic mean value scores, using Likert scales of 1-5. For
interpretation purposes, the mean score of 1 indicates ‘not important/severe’, 2 ‘least
important/severe’, 3 ‘moderately important/severe’, 4 ‘important/severe’ and 5 ‘very
important/extremely severe’. Lower mean value indicates a lower level of
importance or severity (Ibrahim, 2011). Although the use of arithmetic means
suggests treating Likert scale-based data at an interval level of measurement
(Ibrahim, 2011, p. 9), the mean scores should not be deemed as ‘quantities’ to show
how much more important one factor is than the other, but as ‘indicators’ to establish
a rank order of importance or severity for the factor (Idrus and Newman, 2002 cited
in Ibrahim, 2011, p. 9). For instance, if the mean score of a particular
importance/severity index is 3.2, then it could be interpreted that the
118
importance/severity index is perceived to be between ‘moderately
important/moderately severe’ and ‘important/severe’ but leans more towards being
“moderately important/moderately severe” (Ibrahim, 2011).
Hypotheses Testing
According to McNabb (2009) there are three main types of hypothesis: predictive,
comparative, and associative. All of these experimental hypotheses can be connected
to a single problem (McNabb, 2009). In sequence with this study’s objectives, this
study used comparative hypotheses for hypothesis 1, predictive hypothesis for
hypothesis 2 and 3, and associative hypotheses for hypothesis 4, 5 and 6 respectively.
The following non-parametric statistics hypothesis testing techniques were used to
test the research hypotheses:
In hypothesis 1 Chi-square test
In hypothesis 2 Chi-square test
In hypothesis 3 Chi-square test
In hypothesis 4 Kruskal-Wallis Analyses-of-Variance Test
In hypothesis 5 Kruskal-Wallis Analyses-of-Variance Test
In hypothesis 6 Kruskal-Wallis Analyses-of-Variance Test
3.5.2 Method of Data Analysis for Case Study
The case study (historic method) applied for this study extracted its data exclusively
from completed building projects files obtained from the project clients' offices. The
study covers projects executed between 2003-2013.The study sort and recorded
information that include the following:
Project type: residential, commercial, institutional, or recreational.

119
Type of procurement systems adopted
Type of client: private or public
Date of contract award
Type of condition of contract adopted
Contract sum and duration of contract
Time and cost overrun
Causes of time and cost overrun
Variation and reason for variation
Type of planning tool/tools used
ICT compliance in project planning
The data extracted from the project files were presented using Bloom's taxonomy
hierarchy (Guthrie, 2010): first, describe; then analyze (classify); and Dr.aw
conclusions or interpret. In describing the data, the study writes out the facts as they
are, in clear descriptive reporting, free of adjectival colour and filters out those which
are not relevant to the research problem (Guthrie, 2010). The study then classifies the
data to identify similarities and differences, before interpreting them in readiness for
the research findings, conclusion and recommendation.
3.5.3 Case Study Validity and Reliability Test
This study used the external and internal criticism technique to test the case study
data validity and reliability respectively.
120
External Criticism
The external criticism technique is a validity test applied on historic data
(documents) (Guthrie, 2010). It is concerned with ascertaining the genuineness of a
data from a source. This was applied on the historic data used for this research case
study. To ensure the genuineness of the data obtained from the clients’ custody, all
the materials used as a source of data for the research case study bears (Guthrie,
2010): letter heads, titles, file numbers, official stamps, dates, and official signatures.
Internal Criticism
The internal criticism technique is a reliability test conducted on historic data
(document). It is concerned with the meaning of a data; whether it presents the full
picture and whether there is a balanced view (Guthrie, 2010). This test was satisfied
by this study. All the files used for the study were project files in the custody of the
clients representing all correspondence of the parties involved during the execution
of the building contracts.
3.6 Ethical Consideration
In recognition of ethical requirements in research, which emphasized on exhibiting
high standard of professionalism (Guthrie, 2010). This study was guided by research
ethics in the planning, conducting, and reporting the results of the research (McNabb,
2009). To ensure that the research ethics are properly adheres to, this study follows
the four ethical principles in research: truthfulness, thoroughness, objectivity, and
relevance. All the respondents engaged in the study are assured of confidentiality,
and none were coerced, or unduly engaged in the study.
121
CHAPTER FOUR
4.0 DATA ANALYSIS
4.1 Introduction
This chapter presents analyses and interpretation of data collected. The analysis used
literature review, questionnaire survey and case study. Literature review was used to
identify: NICs project planning challenges, significant influencing factors for NICs
project planning and, contractors’ project planning success indicators. The
questionnaire survey section covers information concerning: responses to
questionnaires, demographic profiles of respondents’, agreement analysis (test of
association), hypotheses testing, data presentation, analyses and interpretation. The
case study section carries information concerning: data presentation, data analysis,
and interpretation.
4.2 Response to Questionnaires
This study administered three (3) sets of questionnaires to contractors, consultants,
and PBPs in the Northern geo-political zones of Nigeria. The distribution and
responses are shown in the sub-section below.
4.2.1 Respondents' Response Rates
Table 4.1 is the representation of the response rates among the three categories of
respondents': contractors, consultants and PBPs respectively in the study area, while
Table 4.2 is the representation of the response rate according to all respondents.

122
Table 4.1: Respondents’ Response Rate
Contractors'
Location Distribution (No) Returned (No) % Response Rate
Abuja 50 20 40.00
Bauchi/Gombe 50 30 60.00
Kano 50 19 38.00
Consultants
Location Distribution (No) Returned (No) % Response Rate
Abuja 25 18 72.00
Bauchi/Gombe 25 16 64.00
Kano 25 10 40.00
Public Building Professionals (PBPs)
Location Distribution (No) Returned (No) % Response Rate
Abuja 25 20 80.00
Bauchi/Gombe 25 25 100.00
Kano 25 19 76.00
Source: Author (2013)
Table 4.1 shows that 50 questionnaires were distributed to contractors in the study
area and this yielded a response rates of 40%, 60% and 38% from Abuja,
Bauchi/Gombe and, Kano respectively. Table 4.1 also depicts the distribution and
response rates of the consultants' questionnaire in the study area. A distribution of 25
questionnaires in each of the sub-study areas recorded response rates of 72%, 64%
and 40% from Abuja, Bauchi/Gombe and, Kano respectively, while a distribution of
25 questionnaires in each of the sub-study areas to PBPs recorded the following
response rates: 80%; 100% and; 76% from Abuja, Bauchi/Gombe and, Kano
respectively.
Table 4.2 illustrates the distribution and the response rates according to all
respondents' in the study area. A total of 300 questionnaires were distributed

123
according to the ratio of 2:1:1 to contractors (150), consultants (75) and, public
building professionals (PBP) (75). The distribution received the following response
rates: 38.98%, 24.86% and, 36.16% from contractors, consultants and PBPs
respectively. Using the formula for computing questionnaires success rate (Olatunji,
2010):
Questionnaire success rate = (Questionnaires received X 100)
(Questionnaires administered)
The study therefore recorded an overall questionnaire response rate of 59%.
Table 4.2: Response Rate According to Category of Respondents
Respondents' Distribution (No) Response (No) % Response Rate
Contractors 150 69 38.98
Consultants 75 44 24.86
PBPs 75 64 36.16
TOTAL 300 177 100
Source: Author (2013)
A total of 177 questionnaires were returned; representing a 59% response rate and
this was used for the study analysis. This response rate for this type of survey is
higher than other studies carried out in the construction industry. For instance,
Usman, et al. (2012) recorded a response rate of 55.25%, Iro, et al. (2013) received a
55.25% response rate, Ibrahim (2011) recorded a 47% response rate, Emuze (2011)
recorded a 25.4% response rate, Olatunji (2010) obtained a 33.5% response rate,
Crafford (2007) received a response rate of 22.8%, Buys (2004) received a 32.2%
response rate and Adams (1997) obtained 35% response rate.
124
This study owes much of its high questionnaire response rates to the following
measures:
The cover letter humbly solicited for respondents' contribution to the
development of Nigeria's economy by responding to the questionnaires
The respondents were assured of utmost confidentiality.
The wording questions were (Guthrie, 2010, p.134): short, simple, specific,
unambiguous, and neutral.
The responses expected from respondents were constructively guided to be
short and precise.
The questionnaires were kept to a minimum length for a study of this size.
Phone calls and physical follow-up were made a week after sending the
questionnaires, and subsequently every two weeks, for a period of three
months to remind respondents who had not responded to do.
4.2.2 Missing Values
The responses in the questionnaires show that questions were answered adequately
and as such recorded nearly zero missing values. Though, Crafford (2007),
acknowledged that missing values in a questionnaire are sometimes inevitable, as
some respondents might not be experienced or knowledgeable in some areas. In
recognition of the possibility of missing values, this study therefore targeted and
engaged respondents that have a wealth of experience and are knowledgeable in the
field of construction contracting and management. For contractors, their project
managers were engaged, while for consultants and PBPs mostly experienced
125
management personnel were targeted. This resulted in curtailing the number of
missing values to a minimum level in the responded questionnaires.
4.3 Demographic Profiles of Respondents
According to Buys (2004, p.87) an analysis of the demographic data assists the
researcher to ensure that all the variables that may have an influence on the
correctness of the data have been analysed. By implication, this ensures that the
respondents used for a study are appropriate sample for the intended universe or
domain of content (Pallant, 2001). In view of the above, this section conveyed
information concerning the demographic profiles of research respondents and this
covers: types of respondents’ organization in the construction industry, contracting
firms (company and construction/project managers), consultants, and PBPs.
4.3.1 Respondents’ Organization in the Construction Industry
Figure 4.1 shows the percentage distribution of the respondents’ organization in the
NCI. Contracting firms have a representation of 39%; the largest, followed by public
institutions (PBPs) with a representation of 36%, then consultancy firms with a share
of 25%. PBPs represents Public institutions, and according to Iro, et al. (2013),
public institutions have 75% of the total construction share in Nigeria, which make
them a major client of the construction industry.
This representation therefore depicts the primary triads of parties involved in the
management of construction projects: client, contractor and, consultant (Usman, et
al. 2012; Bennett, 2003). These categories of organization can further be divided
into public sector (public institutions-36%) and private sector comprising the
contracting (39%) and the consultancy firms (25%) respectively (private sector-
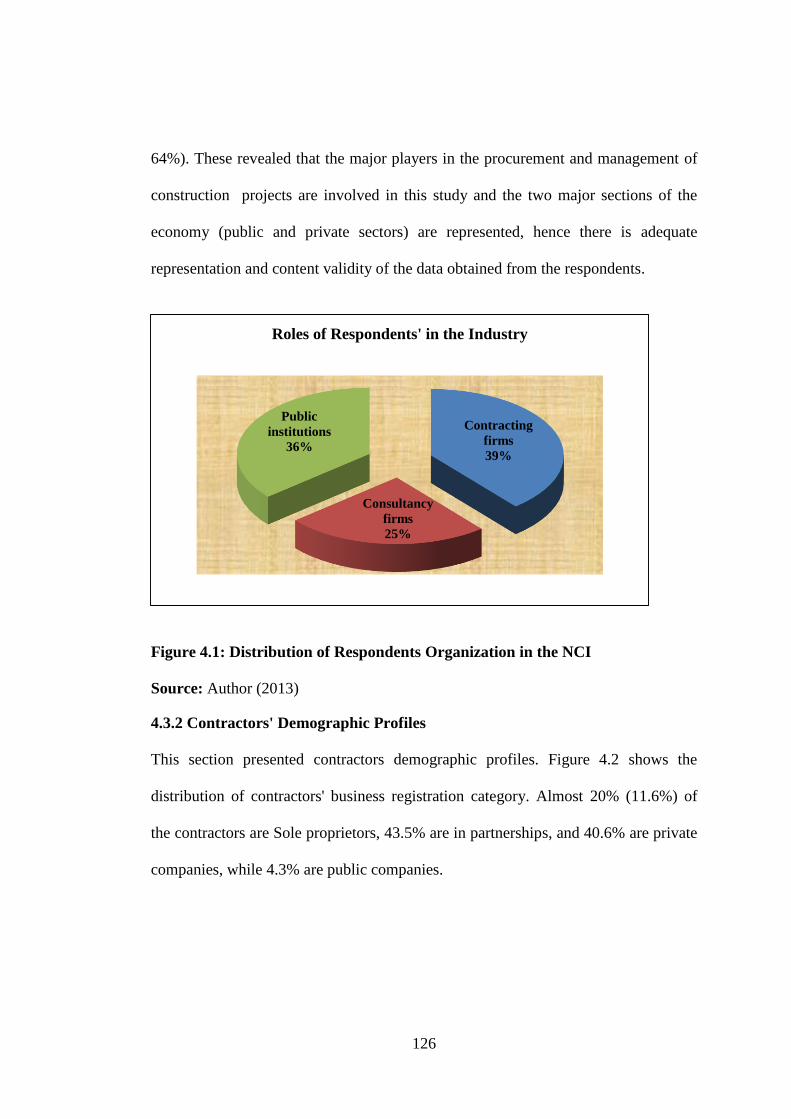
126
64%). These revealed that the major players in the procurement and management of
construction projects are involved in this study and the two major sections of the
economy (public and private sectors) are represented, hence there is adequate
representation and content validity of the data obtained from the respondents.
Figure 4.1: Distribution of Respondents Organization in the NCI
Source: Author (2013)
4.3.2 Contractors' Demographic Profiles
This section presented contractors demographic profiles. Figure 4.2 shows the
distribution of contractors' business registration category. Almost 20% (11.6%) of
the contractors are Sole proprietors, 43.5% are in partnerships, and 40.6% are private
companies, while 4.3% are public companies.
Contracting
firms
39%
Consultancy
firms
25%
Public
institutions
36%
Roles of Respondents' in the Industry
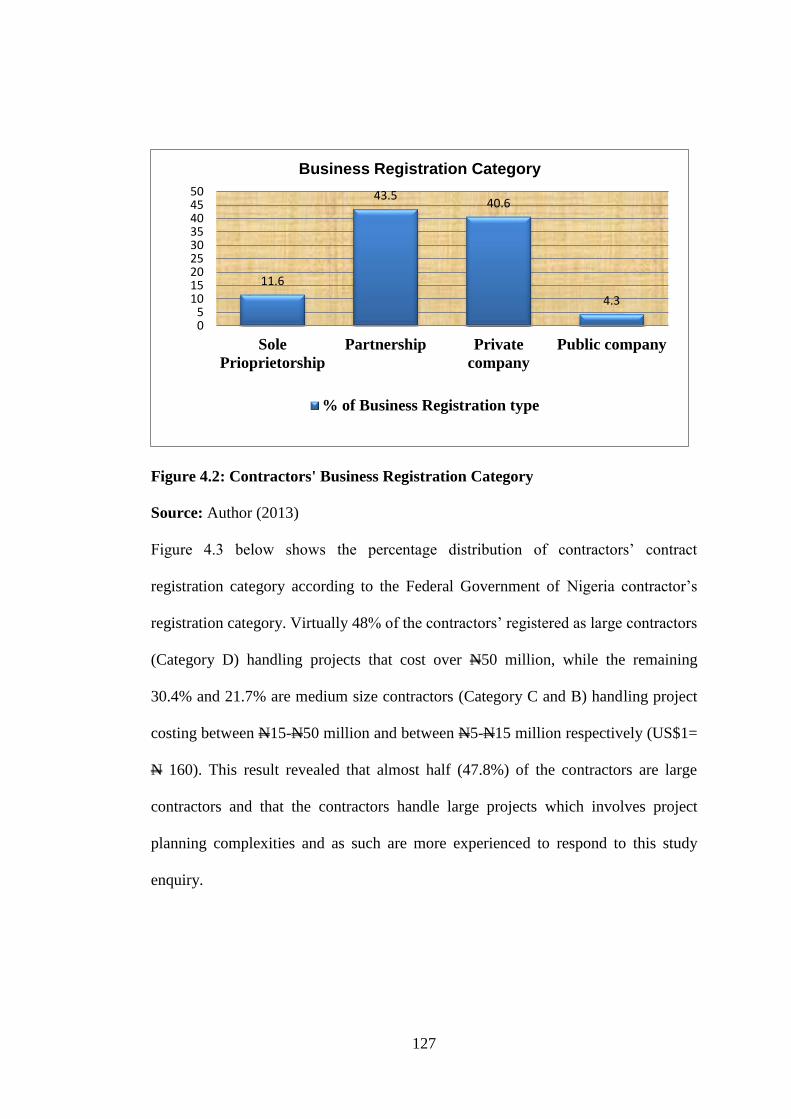
127
Figure 4.2: Contractors' Business Registration Category
Source: Author (2013)
Figure 4.3 below shows the percentage distribution of contractors’ contract
registration category according to the Federal Government of Nigeria contractor’s
registration category. Virtually 48% of the contractors’ registered as large contractors
(Category D) handling projects that cost over N50 million, while the remaining
30.4% and 21.7% are medium size contractors (Category C and B) handling project
costing between N15-N50 million and between N5-N15 million respectively (US$1=
N 160). This result revealed that almost half (47.8%) of the contractors are large
contractors and that the contractors handle large projects which involves project
planning complexities and as such are more experienced to respond to this study
enquiry.
11.6
43.540.6
4.3
05
101520253035404550
Sole
Prioprietorship
Partnership Private
company
Public company
Business Registration Category
% of Business Registration type
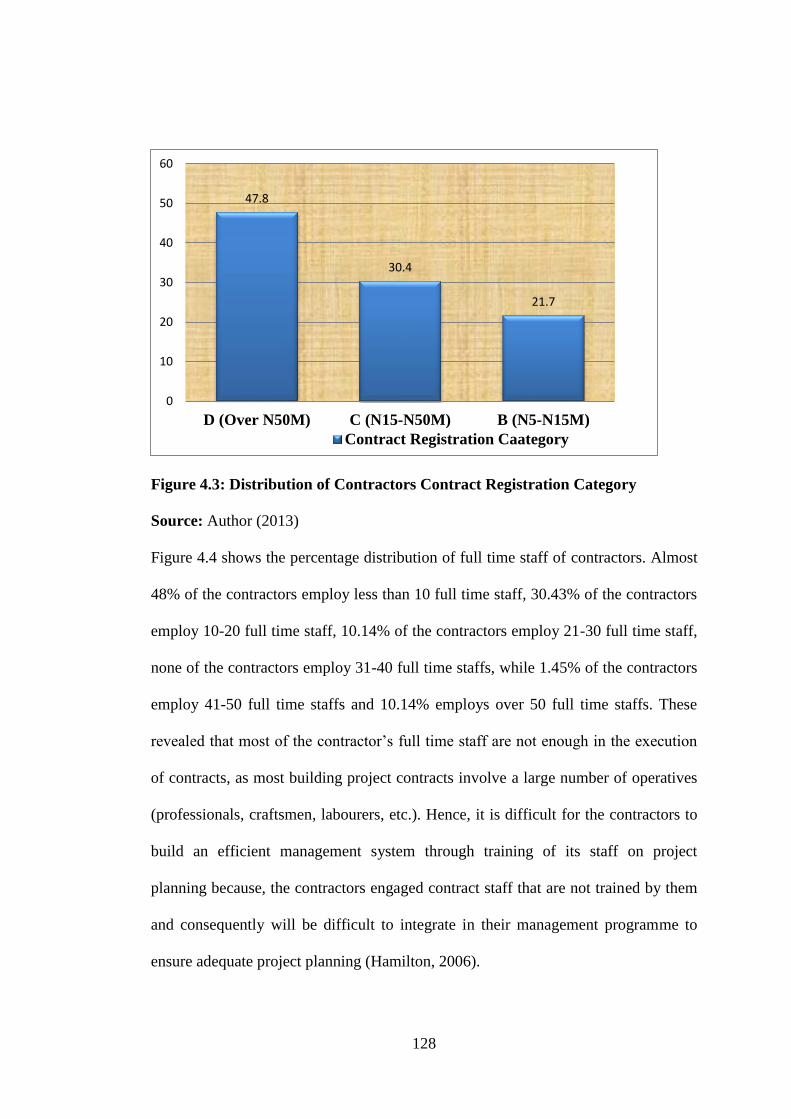
128
Figure 4.3: Distribution of Contractors Contract Registration Category
Source: Author (2013)
Figure 4.4 shows the percentage distribution of full time staff of contractors. Almost
48% of the contractors employ less than 10 full time staff, 30.43% of the contractors
employ 10-20 full time staff, 10.14% of the contractors employ 21-30 full time staff,
none of the contractors employ 31-40 full time staffs, while 1.45% of the contractors
employ 41-50 full time staffs and 10.14% employs over 50 full time staffs. These
revealed that most of the contractor’s full time staff are not enough in the execution
of contracts, as most building project contracts involve a large number of operatives
(professionals, craftsmen, labourers, etc.). Hence, it is difficult for the contractors to
build an efficient management system through training of its staff on project
planning because, the contractors engaged contract staff that are not trained by them
and consequently will be difficult to integrate in their management programme to
ensure adequate project planning (Hamilton, 2006).
47.8
30.4
21.7
0
10
20
30
40
50
60
D (Over N50M) C (N15-N50M) B (N5-N15M)
Contract Registration Caategory
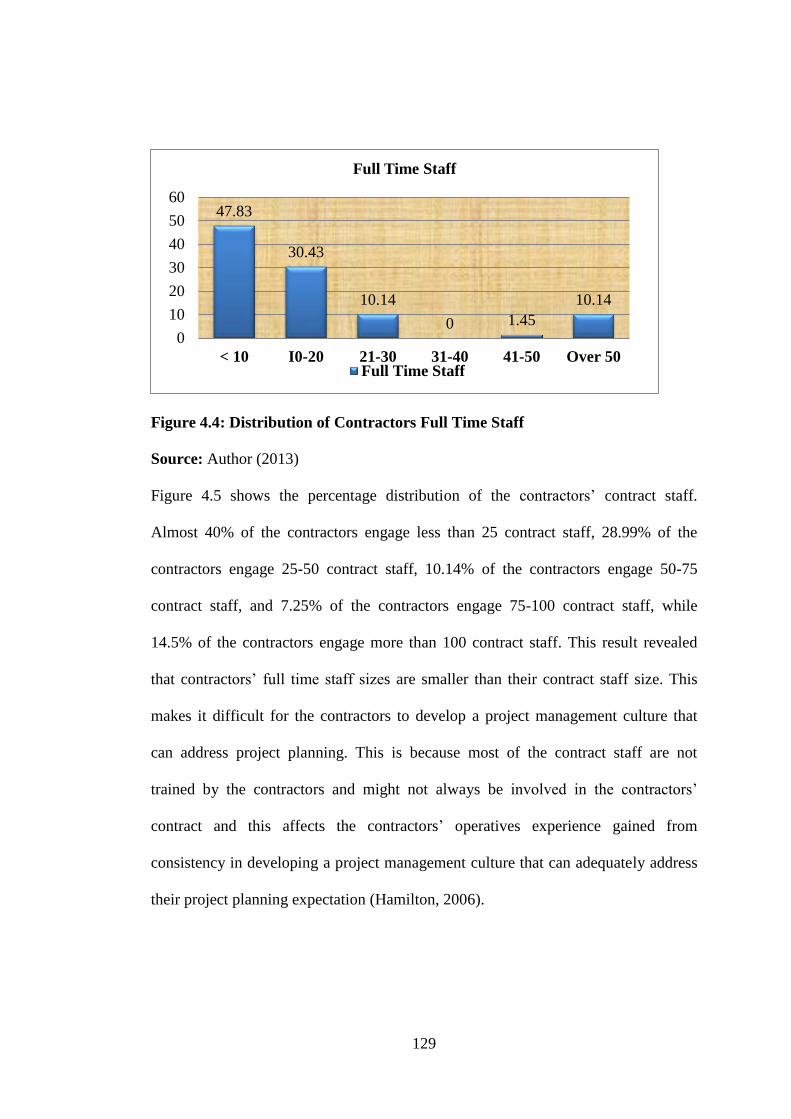
129
Figure 4.4: Distribution of Contractors Full Time Staff
Source: Author (2013)
Figure 4.5 shows the percentage distribution of the contractors’ contract staff.
Almost 40% of the contractors engage less than 25 contract staff, 28.99% of the
contractors engage 25-50 contract staff, 10.14% of the contractors engage 50-75
contract staff, and 7.25% of the contractors engage 75-100 contract staff, while
14.5% of the contractors engage more than 100 contract staff. This result revealed
that contractors’ full time staff sizes are smaller than their contract staff size. This
makes it difficult for the contractors to develop a project management culture that
can address project planning. This is because most of the contract staff are not
trained by the contractors and might not always be involved in the contractors’
contract and this affects the contractors’ operatives experience gained from
consistency in developing a project management culture that can adequately address
their project planning expectation (Hamilton, 2006).
47.83
30.43
10.14
0 1.45
10.14
0
10
20
30
40
50
60
< 10 I0-20 21-30 31-40 41-50 Over 50
Full Time Staff
Full Time Staff
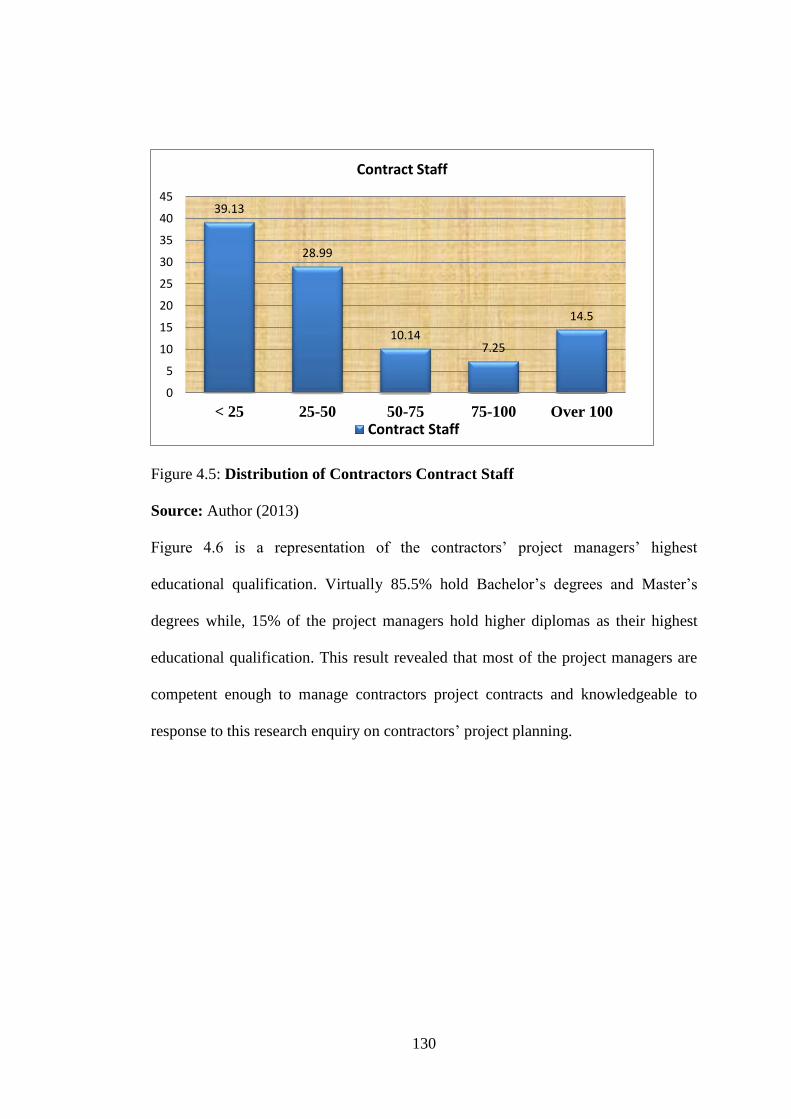
130
Figure 4.5: Distribution of Contractors Contract Staff
Source: Author (2013)
Figure 4.6 is a representation of the contractors’ project managers’ highest
educational qualification. Virtually 85.5% hold Bachelor’s degrees and Master’s
degrees while, 15% of the project managers hold higher diplomas as their highest
educational qualification. This result revealed that most of the project managers are
competent enough to manage contractors project contracts and knowledgeable to
response to this research enquiry on contractors’ project planning.
39.13
28.99
10.147.25
14.5
0
5
10
15
20
25
30
35
40
45
< 25 25-50 50-75 75-100 Over 100
Contract Staff
Contract Staff
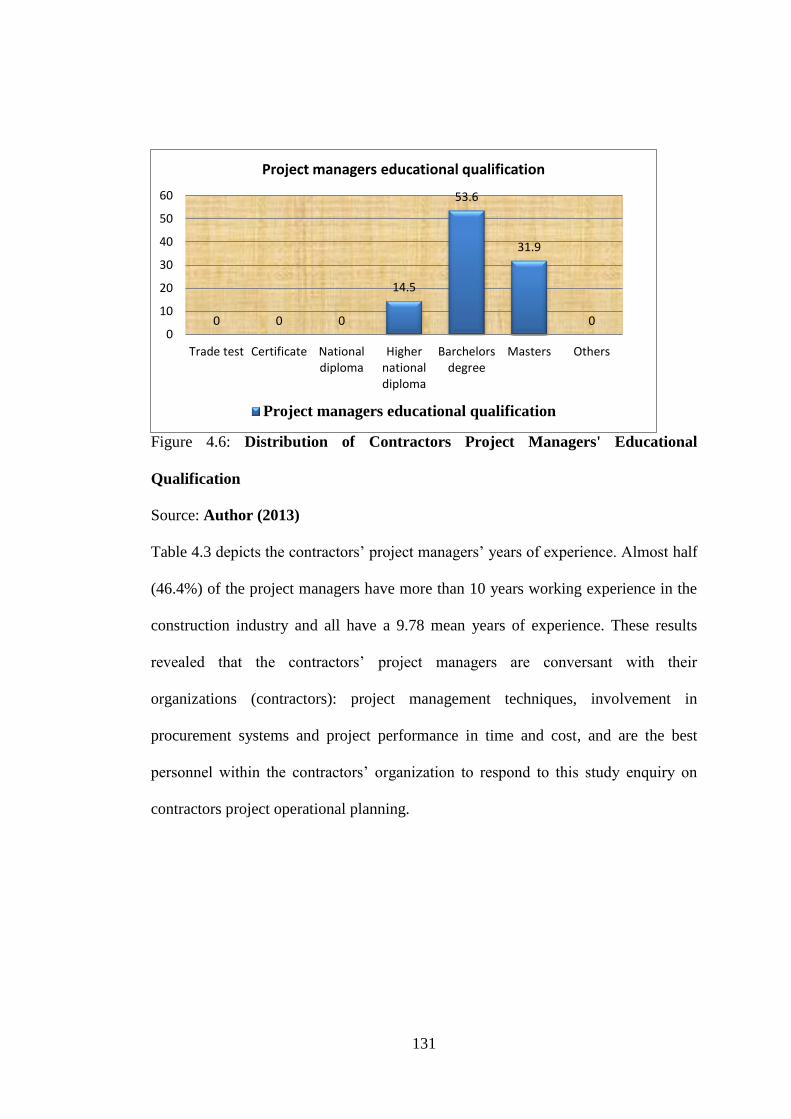
131
Figure 4.6: Distribution of Contractors Project Managers' Educational
Qualification
Source: Author (2013)
Table 4.3 depicts the contractors’ project managers’ years of experience. Almost half
(46.4%) of the project managers have more than 10 years working experience in the
construction industry and all have a 9.78 mean years of experience. These results
revealed that the contractors’ project managers are conversant with their
organizations (contractors): project management techniques, involvement in
procurement systems and project performance in time and cost, and are the best
personnel within the contractors’ organization to respond to this study enquiry on
contractors project operational planning.
0 0 0
14.5
53.6
31.9
00
10
20
30
40
50
60
Trade test Certificate Nationaldiploma
Highernationaldiploma
Barchelorsdegree
Masters Others
Project managers educational qualification
Project managers educational qualification
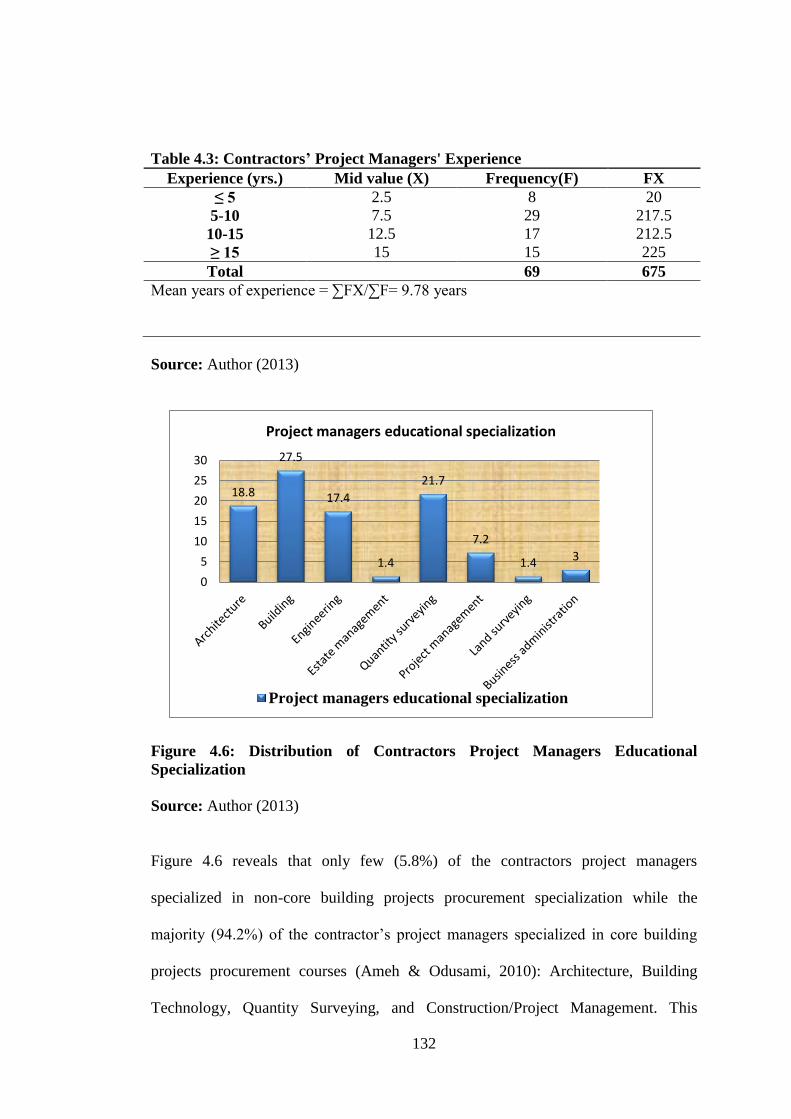
132
18.8
27.5
17.4
1.4
21.7
7.2
1.4 3
0
5
10
15
20
25
30
Project managers educational specialization
Project managers educational specialization
Table 4.3: Contractors’ Project Managers' Experience
Experience (yrs.) Mid value (X) Frequency(F) FX
≤ 5 2.5 8 20
5-10 7.5 29 217.5
10-15 12.5 17 212.5
≥ 15 15 15 225
Total 69 675
Mean years of experience = ∑FX/∑F= 9.78 years
Source: Author (2013)
Figure 4.6: Distribution of Contractors Project Managers Educational
Specialization
Source: Author (2013)
Figure 4.6 reveals that only few (5.8%) of the contractors project managers
specialized in non-core building projects procurement specialization while the
majority (94.2%) of the contractor’s project managers specialized in core building
projects procurement courses (Ameh & Odusami, 2010): Architecture, Building
Technology, Quantity Surveying, and Construction/Project Management. This

133
revealed that virtually all the project managers are educated on operational planning
and are involved/aware of contractors’ project operational planning performance
(Krishnamurthy & RavinDr.a, 2010). Thus, they are competent to respond to this
study enquiry on contractors’ project planning.

134
4.3.3 Consultants' Demographic Profiles
Figure 4.7 depicts the demographic profiles on the percentage distribution of firms’
consultancy types.
Figure 4.7: Distribution of consultancy firms type
Figure 4.7 reveals that a majority (88.6%) of the consultants used for this research
run consultancy firms that renders services that are primarily concerned with
building projects procurement (Ameh & Odusami, 2010). This result also revealed
that a majority of the consultants are the class of consultants engaged by clients in
building projects management and for the monitoring of the activities of contractors
(1doro, 2011b). Consultants according to Adams (1997), are considered to be the
most objective in assessing contractors’ project performance. Thus, this confirms that
the consultancy firms used for this study are competent to respond to this research
enquiry on contractors’ project planning.
40.9
6.8
15.99.1
15.911.4
05
1015202530354045
Architecture Building Constructionmanagement
Engineering(Civil)
Quantitysurveying
Others
Consultancy types
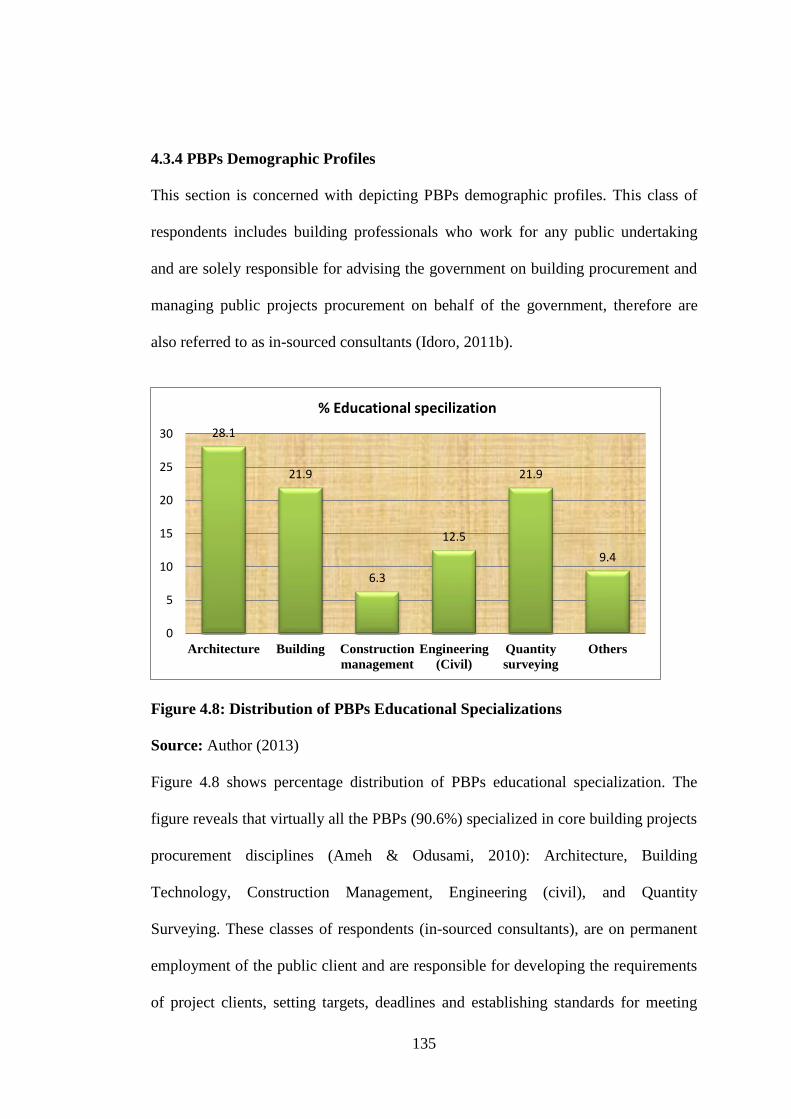
135
4.3.4 PBPs Demographic Profiles
This section is concerned with depicting PBPs demographic profiles. This class of
respondents includes building professionals who work for any public undertaking
and are solely responsible for advising the government on building procurement and
managing public projects procurement on behalf of the government, therefore are
also referred to as in-sourced consultants (Idoro, 2011b).
Figure 4.8: Distribution of PBPs Educational Specializations
Source: Author (2013)
Figure 4.8 shows percentage distribution of PBPs educational specialization. The
figure reveals that virtually all the PBPs (90.6%) specialized in core building projects
procurement disciplines (Ameh & Odusami, 2010): Architecture, Building
Technology, Construction Management, Engineering (civil), and Quantity
Surveying. These classes of respondents (in-sourced consultants), are on permanent
employment of the public client and are responsible for developing the requirements
of project clients, setting targets, deadlines and establishing standards for meeting
28.1
21.9
6.3
12.5
21.9
9.4
0
5
10
15
20
25
30
Architecture Building Construction
management
Engineering
(Civil)
Quantity
surveying
Others
% Educational specilization
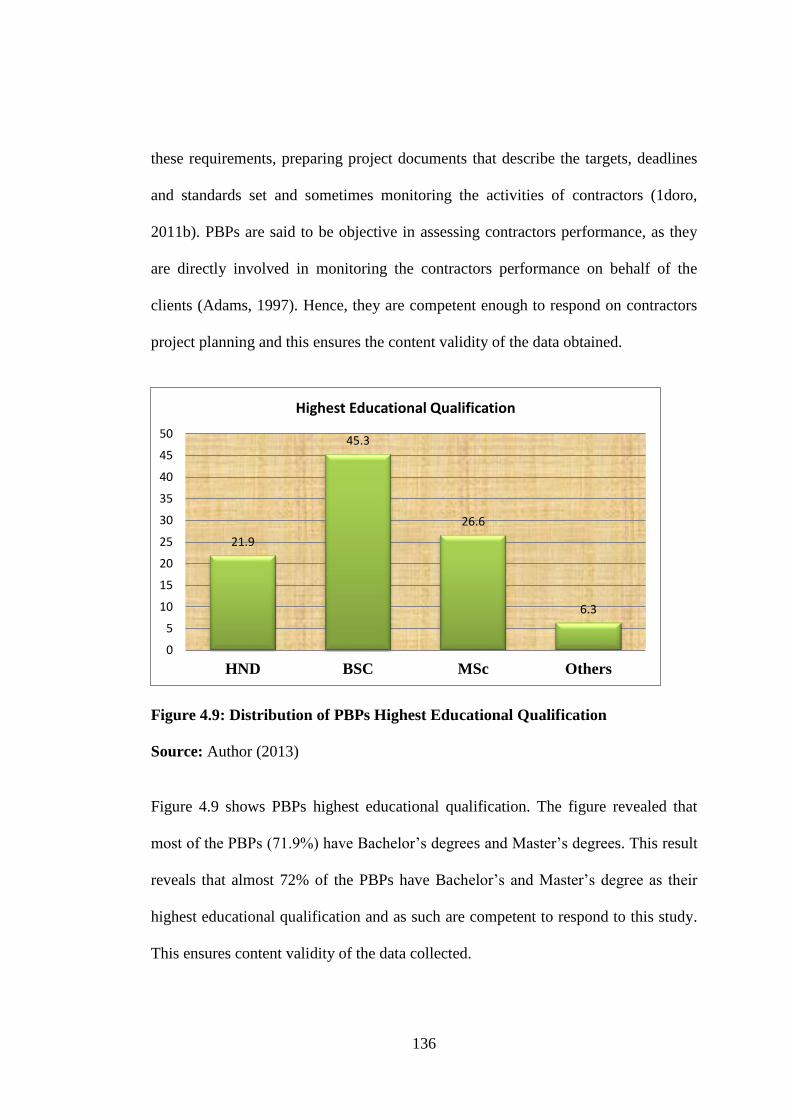
136
these requirements, preparing project documents that describe the targets, deadlines
and standards set and sometimes monitoring the activities of contractors (1doro,
2011b). PBPs are said to be objective in assessing contractors performance, as they
are directly involved in monitoring the contractors performance on behalf of the
clients (Adams, 1997). Hence, they are competent enough to respond on contractors
project planning and this ensures the content validity of the data obtained.
Figure 4.9: Distribution of PBPs Highest Educational Qualification
Source: Author (2013)
Figure 4.9 shows PBPs highest educational qualification. The figure revealed that
most of the PBPs (71.9%) have Bachelor’s degrees and Master’s degrees. This result
reveals that almost 72% of the PBPs have Bachelor’s and Master’s degree as their
highest educational qualification and as such are competent to respond to this study.
This ensures content validity of the data collected.
21.9
45.3
26.6
6.3
0
5
10
15
20
25
30
35
40
45
50
HND BSC MSc Others
Highest Educational Qualification
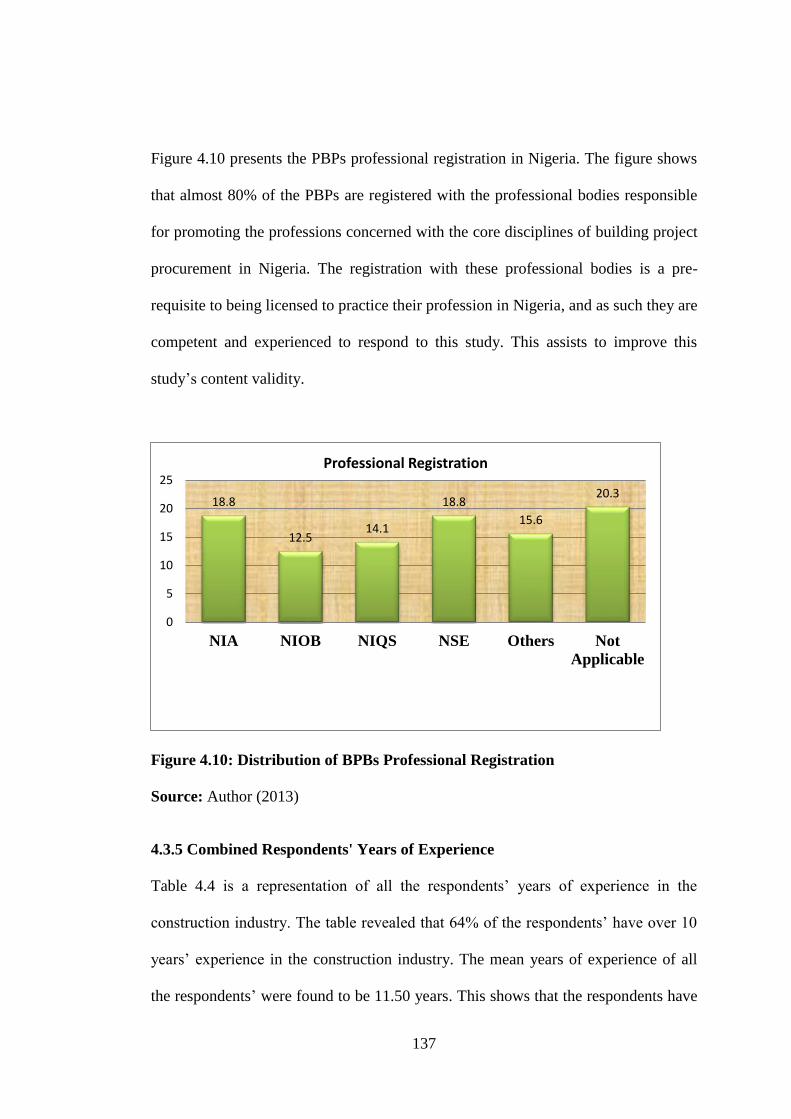
137
Figure 4.10 presents the PBPs professional registration in Nigeria. The figure shows
that almost 80% of the PBPs are registered with the professional bodies responsible
for promoting the professions concerned with the core disciplines of building project
procurement in Nigeria. The registration with these professional bodies is a pre-
requisite to being licensed to practice their profession in Nigeria, and as such they are
competent and experienced to respond to this study. This assists to improve this
study’s content validity.
Figure 4.10: Distribution of BPBs Professional Registration
Source: Author (2013)
4.3.5 Combined Respondents' Years of Experience
Table 4.4 is a representation of all the respondents’ years of experience in the
construction industry. The table revealed that 64% of the respondents’ have over 10
years’ experience in the construction industry. The mean years of experience of all
the respondents’ were found to be 11.50 years. This shows that the respondents have
18.8
12.514.1
18.8
15.6
20.3
0
5
10
15
20
25
NIA NIOB NIQS NSE Others Not
Applicable
Professional Registration
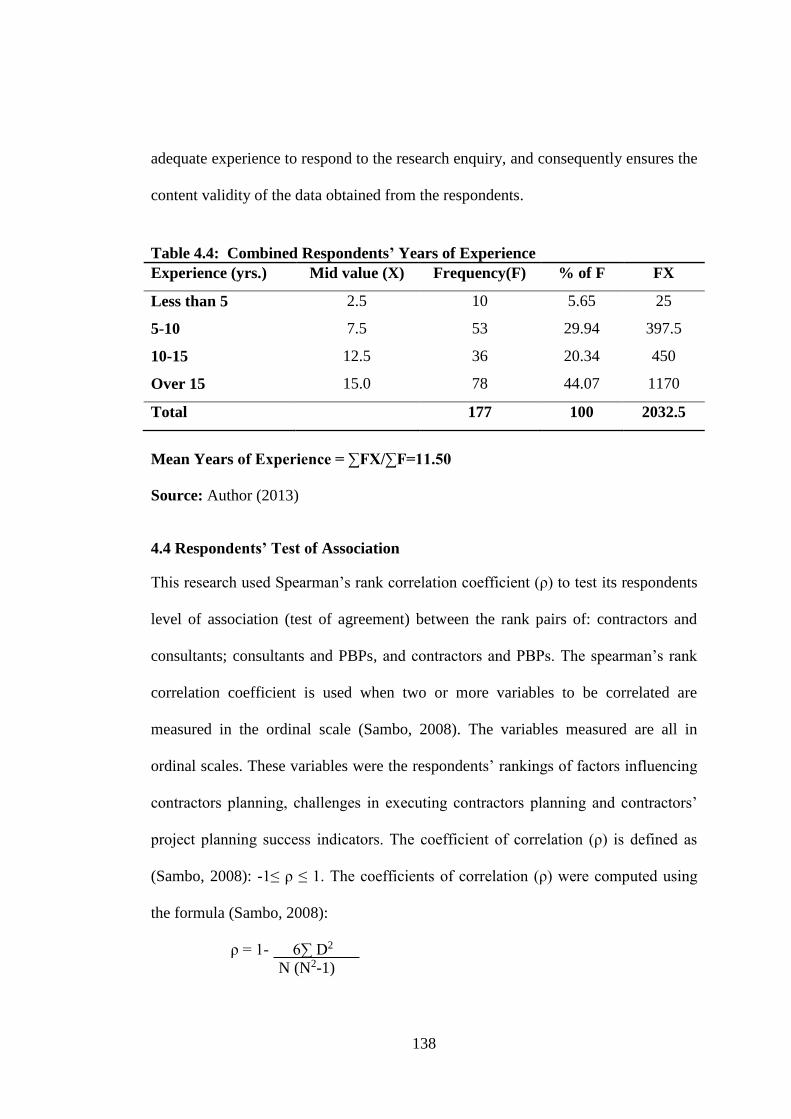
138
adequate experience to respond to the research enquiry, and consequently ensures the
content validity of the data obtained from the respondents.
Table 4.4: Combined Respondents’ Years of Experience
Experience (yrs.) Mid value (X) Frequency(F) % of F FX
Less than 5 2.5 10 5.65 25
5-10 7.5 53 29.94 397.5
10-15 12.5 36 20.34 450
Over 15 15.0 78 44.07 1170
Total 177 100 2032.5
Mean Years of Experience = ∑FX/∑F=11.50
Source: Author (2013)
4.4 Respondents’ Test of Association
This research used Spearman’s rank correlation coefficient (ρ) to test its respondents
level of association (test of agreement) between the rank pairs of: contractors and
consultants; consultants and PBPs, and contractors and PBPs. The spearman’s rank
correlation coefficient is used when two or more variables to be correlated are
measured in the ordinal scale (Sambo, 2008). The variables measured are all in
ordinal scales. These variables were the respondents’ rankings of factors influencing
contractors planning, challenges in executing contractors planning and contractors’
project planning success indicators. The coefficient of correlation (ρ) is defined as
(Sambo, 2008): -1≤ ρ ≤ 1. The coefficients of correlation (ρ) were computed using
the formula (Sambo, 2008):
ρ = 1- 6∑ D2
N (N2-1)

139
Where:
ρ (rho); is the rank correlation coefficient,
D; is the rank difference in a particular pair and
N; the number of pairs
Table 4.5: Respondents Agreement Analysis
S/N Attribute
Contractors &
consultants
Consultants
& PBPs
Contractors
& PBPs
Agreements
Status
1
Influencing
factors 0.998 0.999 0.999 Very strong
2 Challenges 0.999 0.999 0.999 Very strong
3
Success
indicators 0.990 0.997 0.993 Very strong
Source: Author (2013)
Table 4.5 shows the spearman’s rank correlation coefficient computed for the pairs
of contractors and consultants, consultants and PBPs and, contractors and PBPs for
factors influencing contractors project planning (0.998, 0.999 and, 0.999), for
challenges in executing contractors project planning (0.999, 0.999, and 0.999) and
for the contractors’ project planning success indicators (0.990, 0.997 and, 0.993)
respectively. These results revealed that the degrees of association among the
respondents are positive and very high. This implied that the respondents are in
agreement (consistency) in their opinions about this study.
4.5 Hypotheses Testing
4.5.1 Hypothesis 1, 2, and 3
This research used the non-parametric one-sample chi-square test (goodness-of-fit
test), to test hypothesis 1, 2 and 3, as they are all nominal data (McNabb, 2009). The
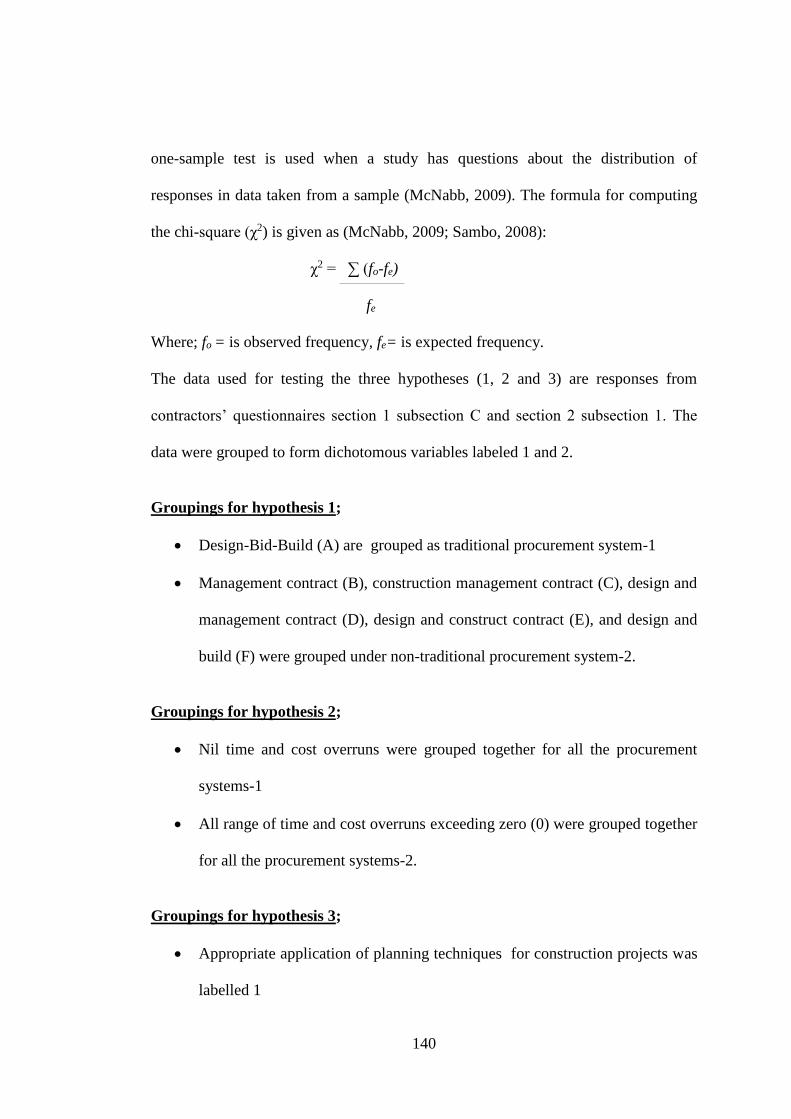
140
one-sample test is used when a study has questions about the distribution of
responses in data taken from a sample (McNabb, 2009). The formula for computing
the chi-square (χ2) is given as (McNabb, 2009; Sambo, 2008):
χ2 = ∑ (fo-fe)
fe
Where; fo = is observed frequency, fe= is expected frequency.
The data used for testing the three hypotheses (1, 2 and 3) are responses from
contractors’ questionnaires section 1 subsection C and section 2 subsection 1. The
data were grouped to form dichotomous variables labeled 1 and 2.
Groupings for hypothesis 1;
Design-Bid-Build (A) are grouped as traditional procurement system-1
Management contract (B), construction management contract (C), design and
management contract (D), design and construct contract (E), and design and
build (F) were grouped under non-traditional procurement system-2.
Groupings for hypothesis 2;
Nil time and cost overruns were grouped together for all the procurement
systems-1
All range of time and cost overruns exceeding zero (0) were grouped together
for all the procurement systems-2.
Groupings for hypothesis 3;
Appropriate application of planning techniques for construction projects was
labelled 1
141
Inappropriate application of planning techniques for construction projects
was labelled 2.
Hypothesis 1
H0: There is no disproportionate distribution in the frequencies of responses among
NICs to a question on their level of involvement in building procurement
systems.
H1: There is disproportionate distribution in the frequencies of responses among
NICs to a question on their level of involvement in building procurement
systems.
Decision rule: According to McNabb (2009), decisions regarding the nonparametric
hypothesis testing for one sample chi-square test, are made based on the size of the
p-value. Accept null hypothesis if the computed p-value is greater than 0.05
confidence level for the test (McNabb, 2009; Pallant, 2001). Hence, the null
hypothesis was accepted, since the computed p-value of 0.720 at 2 degree of freedom
(DF) is greater than 0.05 confidence level. This result revealed that there is no
disproportionate distribution in the frequencies of responses among NICs to a
question on their level of involvement in building procurement systems, and implied
that NICs are involved in both traditional and non-traditional building procurement
systems.
Hypothesis 2
H0: NICs underperformed in terms of cost and time in building project
procurement systems.
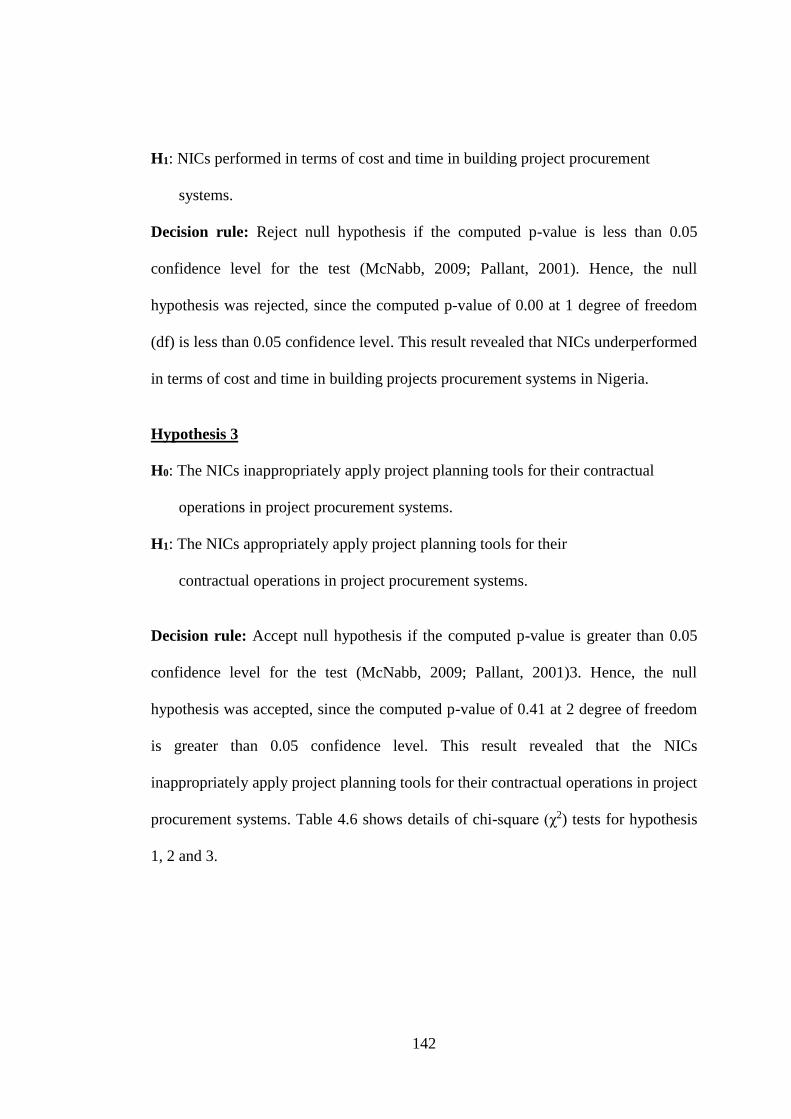
142
H1: NICs performed in terms of cost and time in building project procurement
systems.
Decision rule: Reject null hypothesis if the computed p-value is less than 0.05
confidence level for the test (McNabb, 2009; Pallant, 2001). Hence, the null
hypothesis was rejected, since the computed p-value of 0.00 at 1 degree of freedom
(df) is less than 0.05 confidence level. This result revealed that NICs underperformed
in terms of cost and time in building projects procurement systems in Nigeria.
Hypothesis 3
H0: The NICs inappropriately apply project planning tools for their contractual
operations in project procurement systems.
H1: The NICs appropriately apply project planning tools for their
contractual operations in project procurement systems.
Decision rule: Accept null hypothesis if the computed p-value is greater than 0.05
confidence level for the test (McNabb, 2009; Pallant, 2001)3. Hence, the null
hypothesis was accepted, since the computed p-value of 0.41 at 2 degree of freedom
is greater than 0.05 confidence level. This result revealed that the NICs
inappropriately apply project planning tools for their contractual operations in project
procurement systems. Table 4.6 shows details of chi-square (χ2) tests for hypothesis
1, 2 and 3.
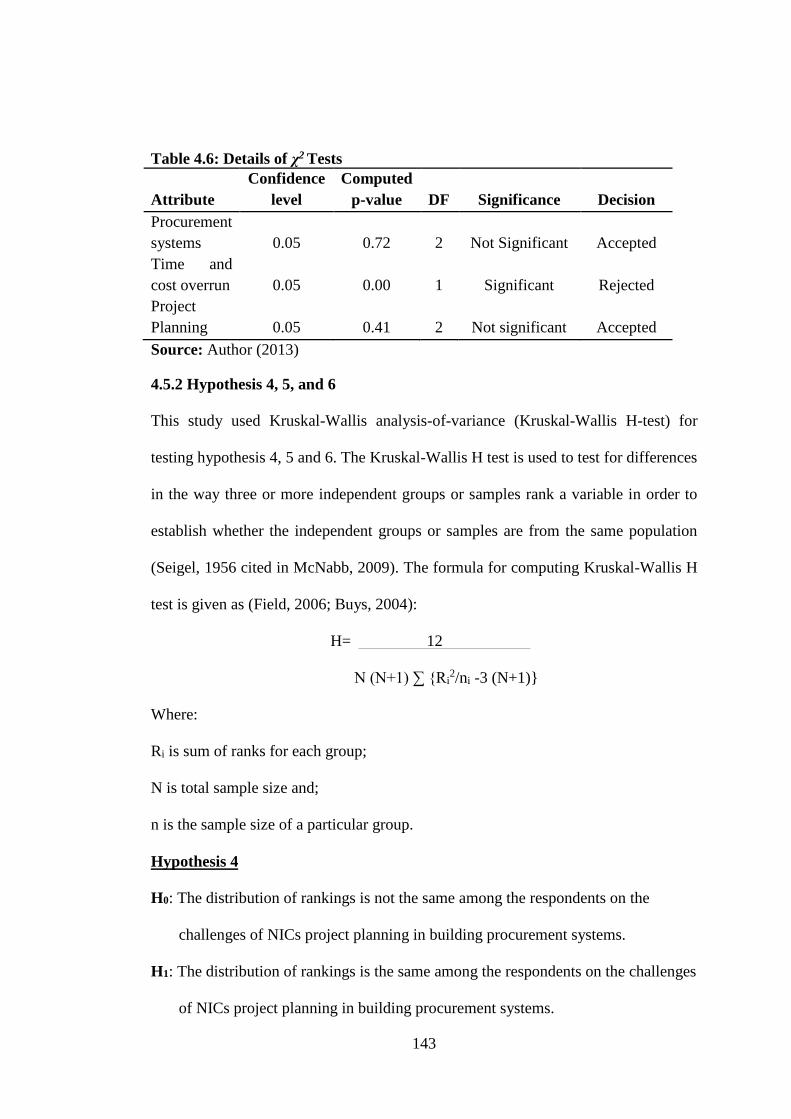
143
Table 4.6: Details of χ2 Tests
Attribute
Confidence
level
Computed
p-value DF Significance Decision
Procurement
systems 0.05 0.72 2 Not Significant Accepted
Time and
cost overrun 0.05 0.00 1 Significant Rejected
Project
Planning 0.05 0.41 2 Not significant Accepted
Source: Author (2013)
4.5.2 Hypothesis 4, 5, and 6
This study used Kruskal-Wallis analysis-of-variance (Kruskal-Wallis H-test) for
testing hypothesis 4, 5 and 6. The Kruskal-Wallis H test is used to test for differences
in the way three or more independent groups or samples rank a variable in order to
establish whether the independent groups or samples are from the same population
(Seigel, 1956 cited in McNabb, 2009). The formula for computing Kruskal-Wallis H
test is given as (Field, 2006; Buys, 2004):
H= 12
N (N+1) ∑ {Ri2/ni -3 (N+1)}
Where:
Ri is sum of ranks for each group;
N is total sample size and;
n is the sample size of a particular group.
Hypothesis 4
H0: The distribution of rankings is not the same among the respondents on the
challenges of NICs project planning in building procurement systems.
H1: The distribution of rankings is the same among the respondents on the challenges
of NICs project planning in building procurement systems.

144
Decision rule: The decision rule according to McNabb (2009) and Pallant (2001),
for Kruskal-Wallis H test hypotheses test, is that the null hypothesis should be
rejected if the computed chi-square value is greater than the chi-square table value at
5% significance level, or reject if the computed p-value is less than the study p-value
of 0.05. Hence, the null hypothesis was rejected, since both the computed chi-square
value of 7.785 at 2 degree of freedom is greater than the chi-square table value of
5.991 at 5% significance level, and the computed p-value of 0.020 is less than the
study p-value of 0.05. This result confirms that the distribution of rankings is the
same among the respondents’ on the challenges of NICs project planning in building
procurement systems, despite their different background. This result revealed that all
the respondents agree on the challenges of NICs project planning in building
procurement systems.
Hypothesis 5
H0: The distribution of rankings is not the same among respondents on the significant
influencing factors for NICs project planning in building procurement systems.
H1: The distribution of rankings is the same among respondents on the significant
influencing factors for NICs project planning in building procurement systems.
Decision rule: Reject null hypothesis if the computed chi-square value is greater
than the chi-square table value at 5% significance level or reject if the computed p-
value is less than the study p-value of 0.05 (McNabb, 2009; Pallant, 2001). Hence,
the null hypothesis was rejected, since both the computed chi-square value of 9.304
at 2 degree of freedom is greater than the chi-square table value of 5.991 at 5%
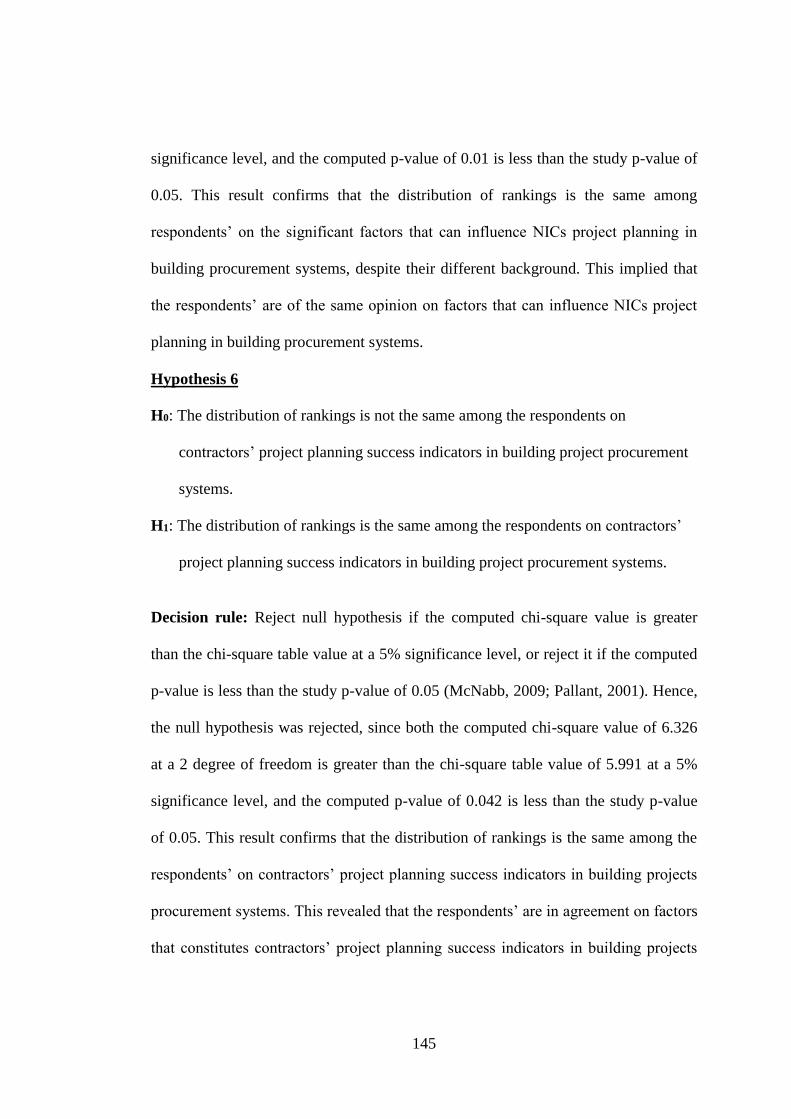
145
significance level, and the computed p-value of 0.01 is less than the study p-value of
0.05. This result confirms that the distribution of rankings is the same among
respondents’ on the significant factors that can influence NICs project planning in
building procurement systems, despite their different background. This implied that
the respondents’ are of the same opinion on factors that can influence NICs project
planning in building procurement systems.
Hypothesis 6
H0: The distribution of rankings is not the same among the respondents on
contractors’ project planning success indicators in building project procurement
systems.
H1: The distribution of rankings is the same among the respondents on contractors’
project planning success indicators in building project procurement systems.
Decision rule: Reject null hypothesis if the computed chi-square value is greater
than the chi-square table value at a 5% significance level, or reject it if the computed
p-value is less than the study p-value of 0.05 (McNabb, 2009; Pallant, 2001). Hence,
the null hypothesis was rejected, since both the computed chi-square value of 6.326
at a 2 degree of freedom is greater than the chi-square table value of 5.991 at a 5%
significance level, and the computed p-value of 0.042 is less than the study p-value
of 0.05. This result confirms that the distribution of rankings is the same among the
respondents’ on contractors’ project planning success indicators in building projects
procurement systems. This revealed that the respondents’ are in agreement on factors
that constitutes contractors’ project planning success indicators in building projects
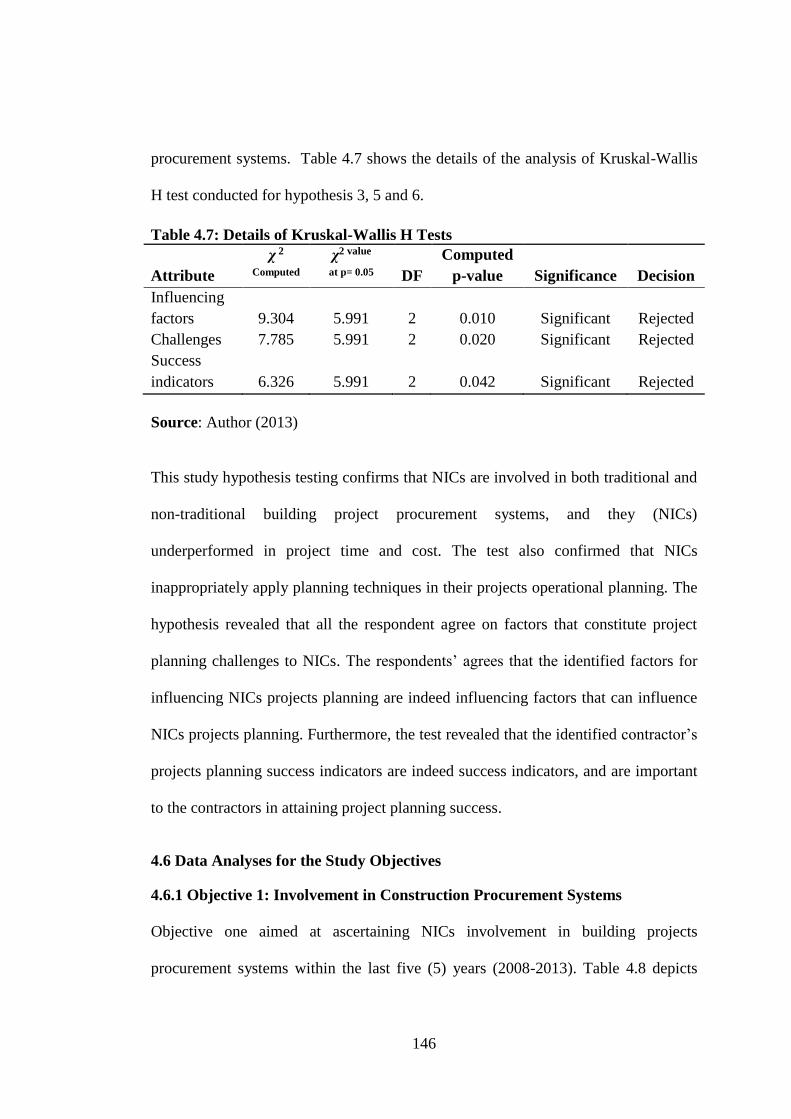
146
procurement systems. Table 4.7 shows the details of the analysis of Kruskal-Wallis
H test conducted for hypothesis 3, 5 and 6.
Table 4.7: Details of Kruskal-Wallis H Tests
Attribute
χ 2
Computed
χ2 value
at p= 0.05 DF
Computed
p-value Significance Decision
Influencing
factors 9.304 5.991 2 0.010 Significant Rejected
Challenges 7.785 5.991 2 0.020 Significant Rejected
Success
indicators 6.326 5.991 2 0.042 Significant Rejected
Source: Author (2013)
This study hypothesis testing confirms that NICs are involved in both traditional and
non-traditional building project procurement systems, and they (NICs)
underperformed in project time and cost. The test also confirmed that NICs
inappropriately apply planning techniques in their projects operational planning. The
hypothesis revealed that all the respondent agree on factors that constitute project
planning challenges to NICs. The respondents’ agrees that the identified factors for
influencing NICs projects planning are indeed influencing factors that can influence
NICs projects planning. Furthermore, the test revealed that the identified contractor’s
projects planning success indicators are indeed success indicators, and are important
to the contractors in attaining project planning success.
4.6 Data Analyses for the Study Objectives
4.6.1 Objective 1: Involvement in Construction Procurement Systems
Objective one aimed at ascertaining NICs involvement in building projects
procurement systems within the last five (5) years (2008-2013). Table 4.8 depicts
147
NICs building procurement systems involvement. Data were collected from a total of
184 building projects executed between 2008 and 2013.
Seventy five percent of the projects were procured by public clients, while 15% were
procured by private clients. The frequency of the involvement of contractors in the
various procurement systems by public clients were: 77.54% (DBB); 2.17% (MC);
10.14% (CMC); 6.52% (DMC); 2.17% (DCC); and 1.45% (DB). For private clients,
their frequencies of involvement were: 21.74% (DBB); 19.57% (MC); 17.39%
(CMC); 10.87% (DMC); 8.69% (DCC); and 21.74% (DB).
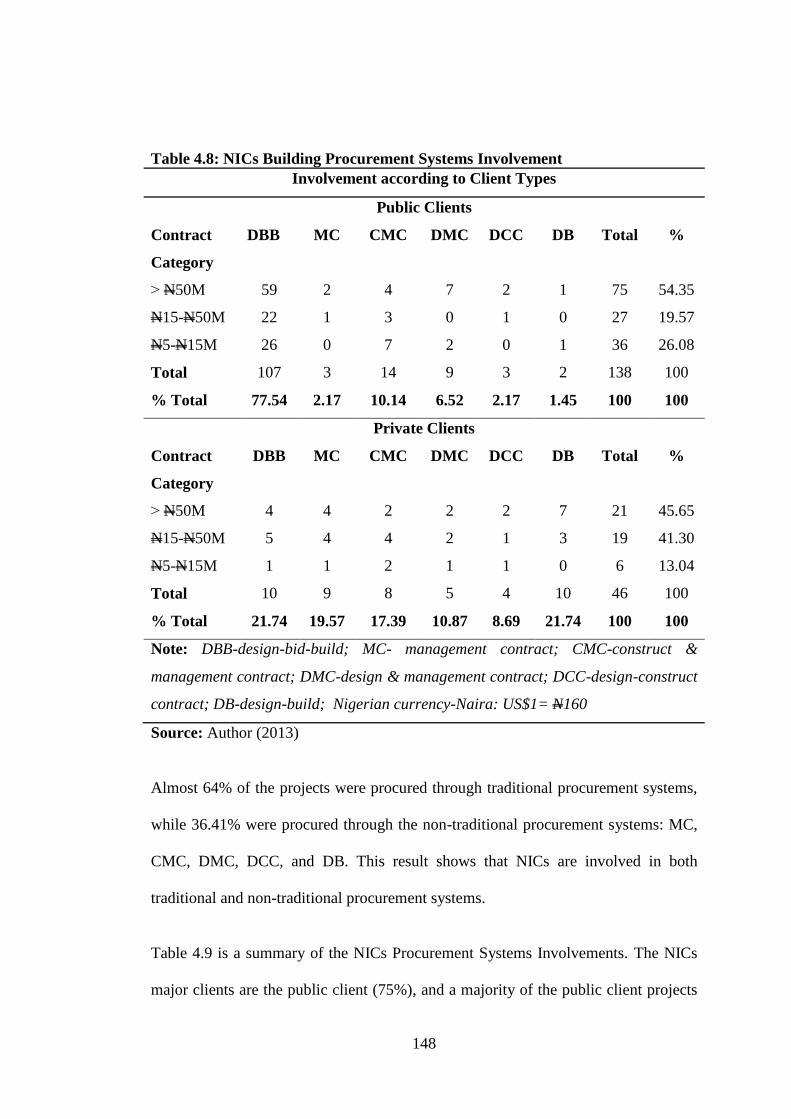
148
Table 4.8: NICs Building Procurement Systems Involvement
Involvement according to Client Types
Public Clients
Contract
Category
DBB MC CMC DMC DCC DB Total %
˃ N50M 59 2 4 7 2 1 75 54.35
N15-N50M 22 1 3 0 1 0 27 19.57
N5-N15M 26 0 7 2 0 1 36 26.08
Total 107 3 14 9 3 2 138 100
% Total 77.54 2.17 10.14 6.52 2.17 1.45 100 100
Private Clients
Contract
Category
DBB MC CMC DMC DCC DB Total %
˃ N50M 4 4 2 2 2 7 21 45.65
N15-N50M 5 4 4 2 1 3 19 41.30
N5-N15M 1 1 2 1 1 0 6 13.04
Total 10 9 8 5 4 10 46 100
% Total 21.74 19.57 17.39 10.87 8.69 21.74 100 100
Note: DBB-design-bid-build; MC- management contract; CMC-construct &
management contract; DMC-design & management contract; DCC-design-construct
contract; DB-design-build; Nigerian currency-Naira: US$1= N160
Source: Author (2013)
Almost 64% of the projects were procured through traditional procurement systems,
while 36.41% were procured through the non-traditional procurement systems: MC,
CMC, DMC, DCC, and DB. This result shows that NICs are involved in both
traditional and non-traditional procurement systems.
Table 4.9 is a summary of the NICs Procurement Systems Involvements. The NICs
major clients are the public client (75%), and a majority of the public client projects
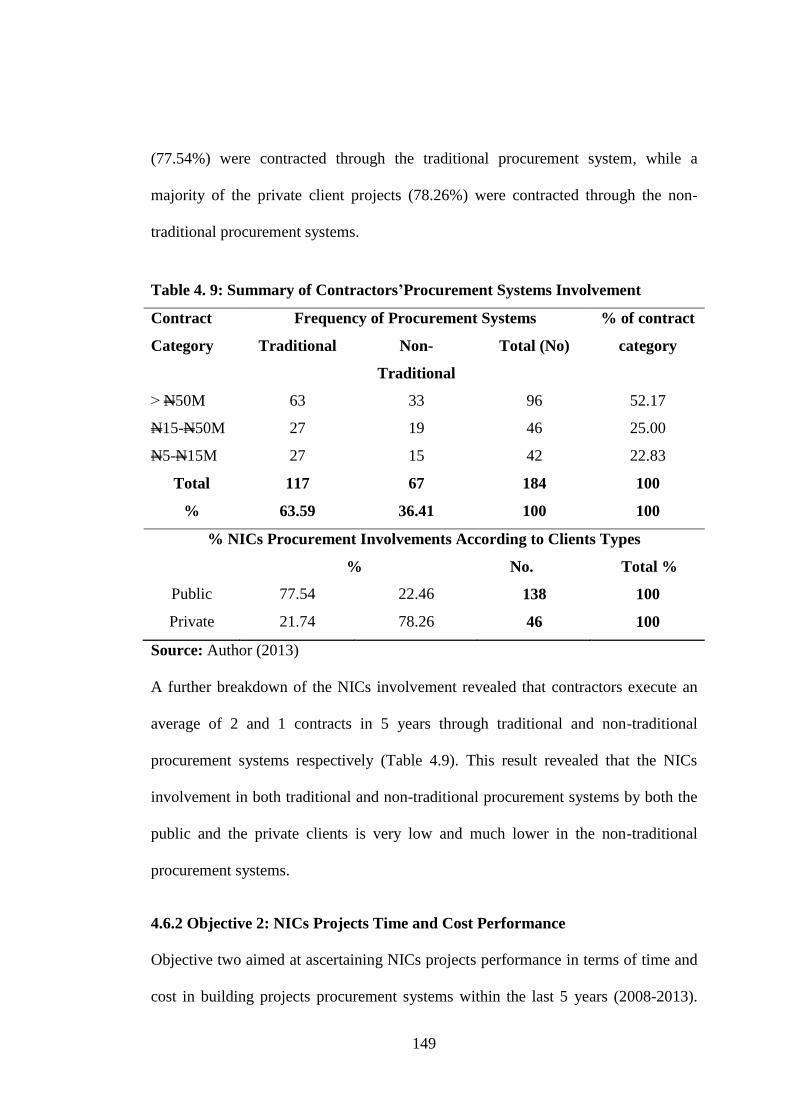
149
(77.54%) were contracted through the traditional procurement system, while a
majority of the private client projects (78.26%) were contracted through the non-
traditional procurement systems.
Table 4. 9: Summary of Contractors’Procurement Systems Involvement
Contract
Category
Frequency of Procurement Systems % of contract
category Traditional Non-
Traditional
Total (No)
˃ N50M 63 33 96 52.17
N15-N50M 27 19 46 25.00
N5-N15M 27 15 42 22.83
Total 117 67 184 100
% 63.59 36.41 100 100
% NICs Procurement Involvements According to Clients Types
% No. Total %
Public 77.54 22.46 138 100
Private 21.74 78.26 46 100
Source: Author (2013)
A further breakdown of the NICs involvement revealed that contractors execute an
average of 2 and 1 contracts in 5 years through traditional and non-traditional
procurement systems respectively (Table 4.9). This result revealed that the NICs
involvement in both traditional and non-traditional procurement systems by both the
public and the private clients is very low and much lower in the non-traditional
procurement systems.
4.6.2 Objective 2: NICs Projects Time and Cost Performance
Objective two aimed at ascertaining NICs projects performance in terms of time and
cost in building projects procurement systems within the last 5 years (2008-2013).
150
Table 4.10 shows the NICs project performances percentage time overruns in the
various building procurement systems. Data were collected from a total of 158
building projects executed between 2008 and 2013. The contractors recorded nil time
overruns (TOs) in twenty of the projects (not shown in Table 4.11), while 138 of the
projects record TOs in all the procurement systems ranging from ≤ 25% to ≥ 100%.
The DMC system records the highest % means TOs’ of 61.54%, and the least DBB
records 34.09%.
Table 4.11 shows the NICs project performances percentage cost overruns (Cos) in
the various procurement systems. Data were collected from a total of 164 building
projects executed between 2008 and 2013. The contractors recorded no COs in 23 of
the projects (not shown in Table 4.11), while 141 of the projects record COs in all
the procurement systems ranging from ≤ 25% to ≥ 100%. The DBB system record
the highest % mean COs’ of 47.17%, followed by the DCC with a records of
42.50%, then the DMC records 40.83%, DMC followed with a record of 37.50%,
next was CMC with a records of 32.35%, and the least was DB which records
31.25%.
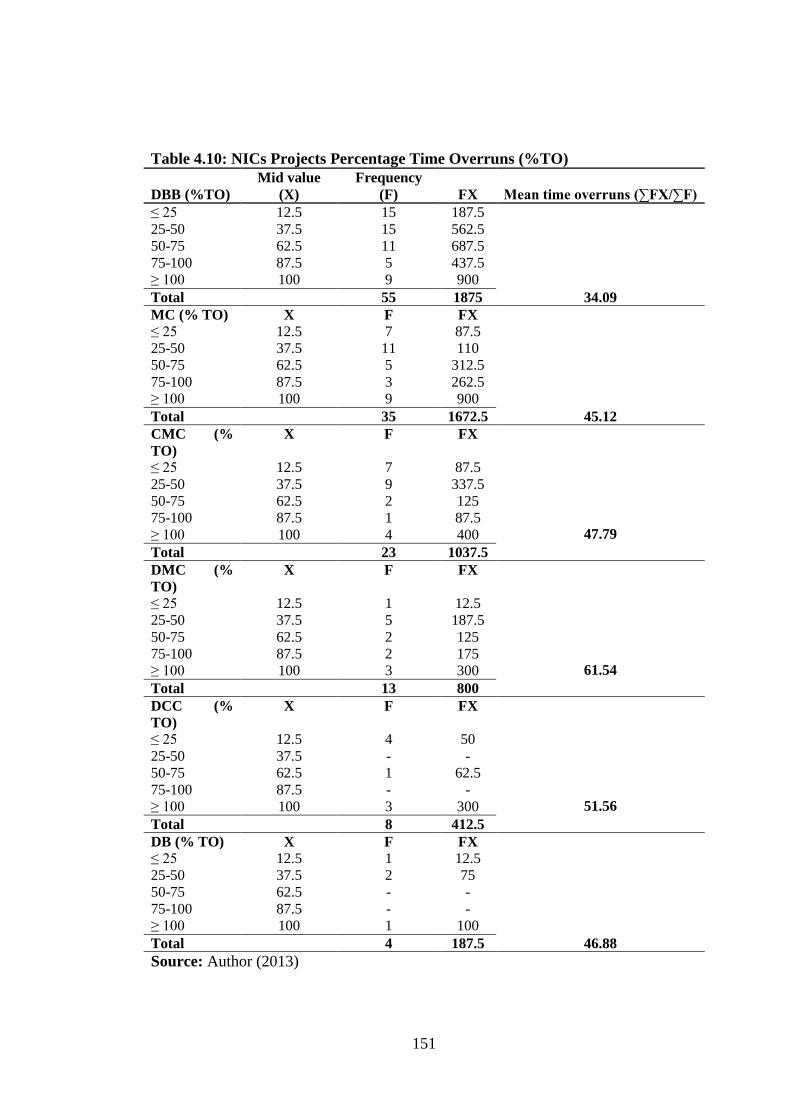
151
Table 4.10: NICs Projects Percentage Time Overruns (%TO)
DBB (%TO) Mid value
(X) Frequency
(F) FX Mean time overruns (∑FX/∑F) ≤ 25 12.5 15 187.5
34.09
25-50 37.5 15 562.5 50-75 62.5 11 687.5 75-100 87.5 5 437.5 ≥ 100 100 9 900 Total 55 1875 MC (% TO) X F FX
45.12
≤ 25 12.5 7 87.5 25-50 37.5 11 110 50-75 62.5 5 312.5 75-100 87.5 3 262.5 ≥ 100 100 9 900 Total 35 1672.5 CMC (%
TO) X F FX
47.79
≤ 25 12.5 7 87.5 25-50 37.5 9 337.5 50-75 62.5 2 125 75-100 87.5 1 87.5 ≥ 100 100 4 400 Total 23 1037.5 DMC (%
TO) X F FX
61.54
≤ 25 12.5 1 12.5 25-50 37.5 5 187.5 50-75 62.5 2 125 75-100 87.5 2 175 ≥ 100 100 3 300 Total 13 800 DCC (%
TO) X F FX
51.56
≤ 25 12.5 4 50 25-50 37.5 - - 50-75 62.5 1 62.5 75-100 87.5 - - ≥ 100 100 3 300 Total 8 412.5 DB (% TO) X F FX
46.88
≤ 25 12.5 1 12.5 25-50 37.5 2 75 50-75 62.5 - - 75-100 87.5 - - ≥ 100 100 1 100 Total 4 187.5
Source: Author (2013)
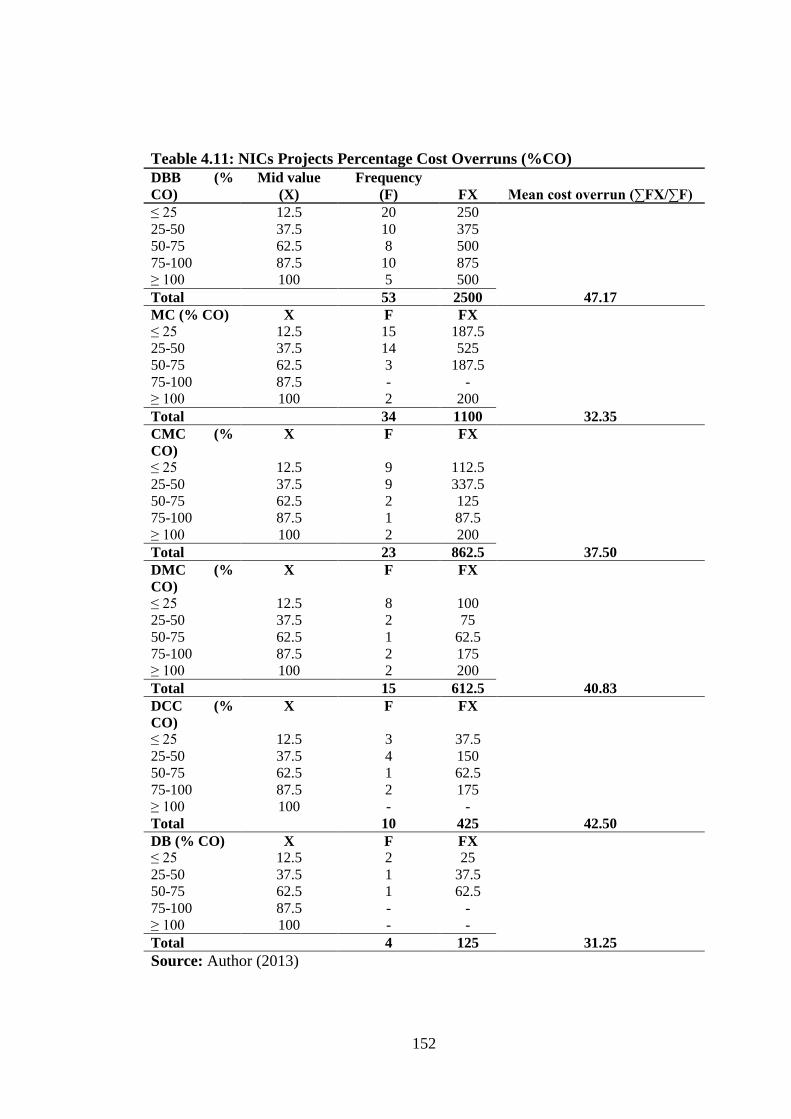
152
Teable 4.11: NICs Projects Percentage Cost Overruns (%CO)
DBB (%
CO) Mid value
(X) Frequency
(F) FX Mean cost overrun (∑FX/∑F) ≤ 25 12.5 20 250
47.17
25-50 37.5 10 375 50-75 62.5 8 500 75-100 87.5 10 875 ≥ 100 100 5 500 Total 53 2500 MC (% CO) X F FX
32.35
≤ 25 12.5 15 187.5 25-50 37.5 14 525 50-75 62.5 3 187.5 75-100 87.5 - - ≥ 100 100 2 200 Total 34 1100 CMC (%
CO) X F FX
37.50
≤ 25 12.5 9 112.5 25-50 37.5 9 337.5 50-75 62.5 2 125 75-100 87.5 1 87.5 ≥ 100 100 2 200 Total 23 862.5 DMC (%
CO) X F FX
40.83
≤ 25 12.5 8 100 25-50 37.5 2 75 50-75 62.5 1 62.5 75-100 87.5 2 175 ≥ 100 100 2 200 Total 15 612.5 DCC (%
CO) X F FX
42.50
≤ 25 12.5 3 37.5 25-50 37.5 4 150 50-75 62.5 1 62.5 75-100 87.5 2 175 ≥ 100 100 - - Total 10 425 DB (% CO) X F FX
31.25
≤ 25 12.5 2 25 25-50 37.5 1 37.5 50-75 62.5 1 62.5 75-100 87.5 - - ≥ 100 100 - - Total 4 125
Source: Author (2013)
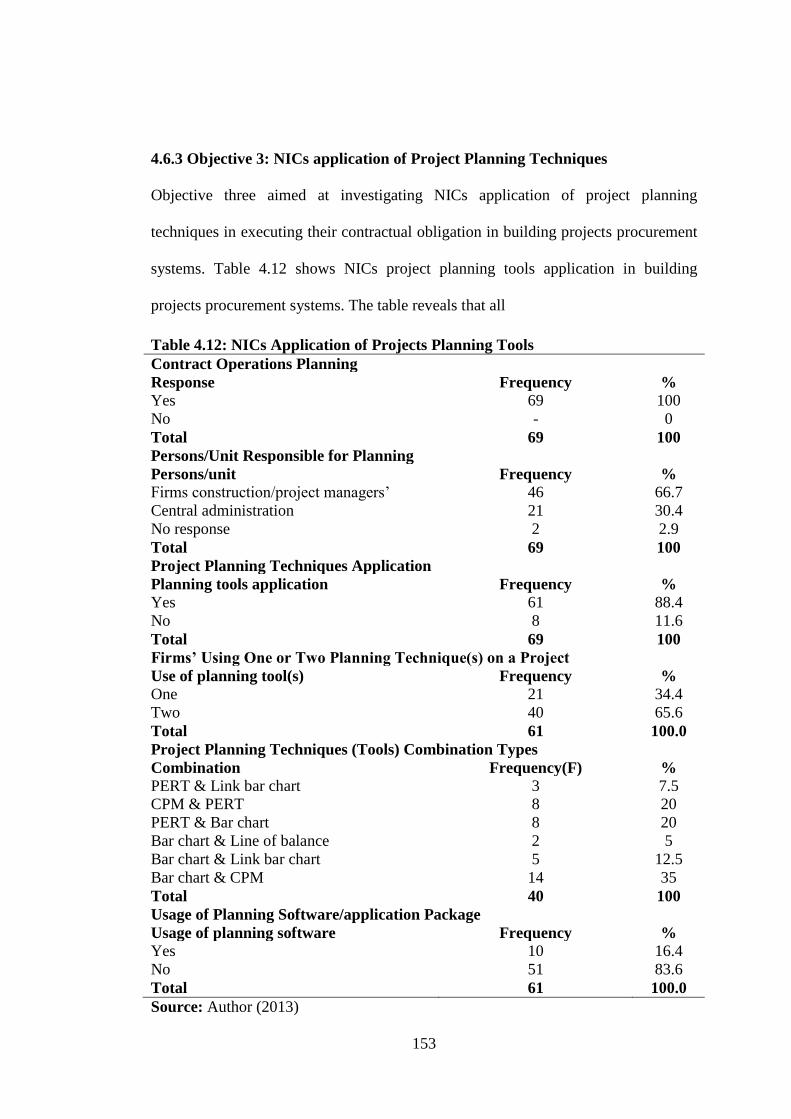
153
4.6.3 Objective 3: NICs application of Project Planning Techniques
Objective three aimed at investigating NICs application of project planning
techniques in executing their contractual obligation in building projects procurement
systems. Table 4.12 shows NICs project planning tools application in building
projects procurement systems. The table reveals that all
Table 4.12: NICs Application of Projects Planning Tools
Contract Operations Planning
Response Frequency %
Yes 69 100
No - 0
Total 69 100
Persons/Unit Responsible for Planning
Persons/unit Frequency %
Firms construction/project managers’ 46 66.7
Central administration 21 30.4
No response 2 2.9
Total 69 100
Project Planning Techniques Application
Planning tools application Frequency %
Yes 61 88.4
No 8 11.6
Total 69 100
Firms’ Using One or Two Planning Technique(s) on a Project
Use of planning tool(s) Frequency %
One 21 34.4
Two 40 65.6
Total 61 100.0
Project Planning Techniques (Tools) Combination Types
Combination Frequency(F) %
PERT & Link bar chart 3 7.5
CPM & PERT 8 20
PERT & Bar chart 8 20
Bar chart & Line of balance 2 5
Bar chart & Link bar chart 5 12.5
Bar chart & CPM 14 35
Total 40 100
Usage of Planning Software/application Package
Usage of planning software Frequency %
Yes 10 16.4
No 51 83.6
Total 61 100.0
Source: Author (2013)
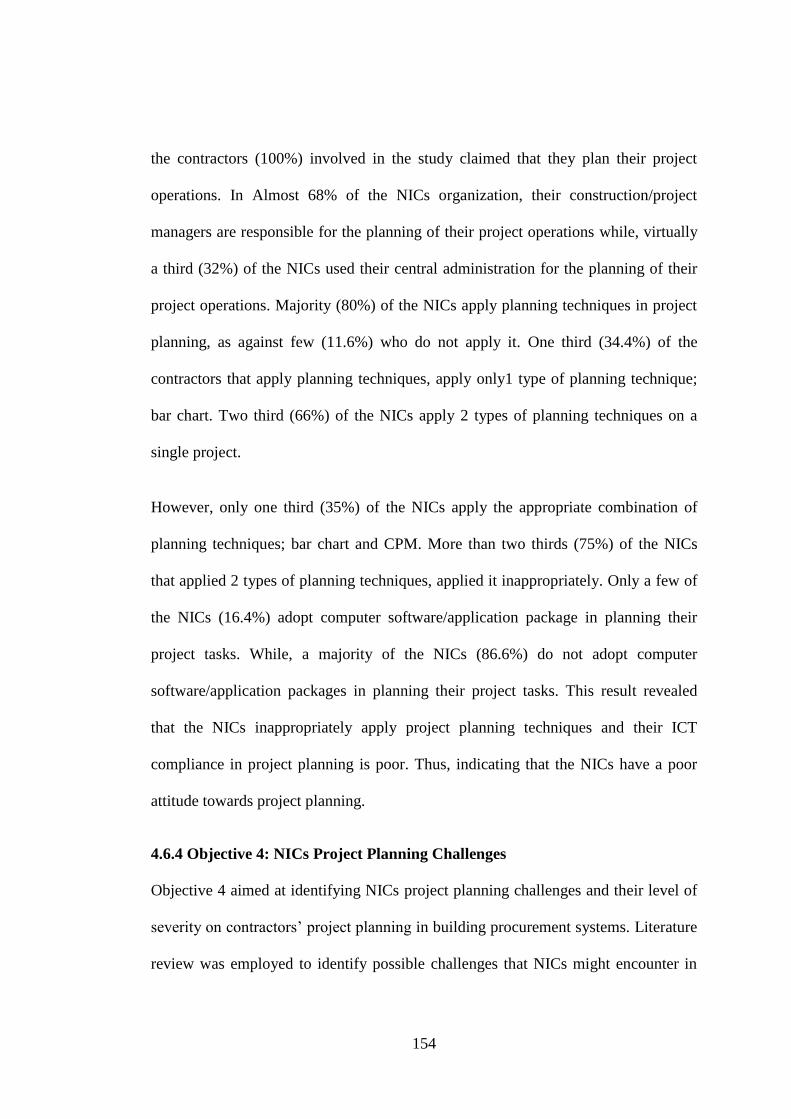
154
the contractors (100%) involved in the study claimed that they plan their project
operations. In Almost 68% of the NICs organization, their construction/project
managers are responsible for the planning of their project operations while, virtually
a third (32%) of the NICs used their central administration for the planning of their
project operations. Majority (80%) of the NICs apply planning techniques in project
planning, as against few (11.6%) who do not apply it. One third (34.4%) of the
contractors that apply planning techniques, apply only1 type of planning technique;
bar chart. Two third (66%) of the NICs apply 2 types of planning techniques on a
single project.
However, only one third (35%) of the NICs apply the appropriate combination of
planning techniques; bar chart and CPM. More than two thirds (75%) of the NICs
that applied 2 types of planning techniques, applied it inappropriately. Only a few of
the NICs (16.4%) adopt computer software/application package in planning their
project tasks. While, a majority of the NICs (86.6%) do not adopt computer
software/application packages in planning their project tasks. This result revealed
that the NICs inappropriately apply project planning techniques and their ICT
compliance in project planning is poor. Thus, indicating that the NICs have a poor
attitude towards project planning.
4.6.4 Objective 4: NICs Project Planning Challenges
Objective 4 aimed at identifying NICs project planning challenges and their level of
severity on contractors’ project planning in building procurement systems. Literature
review was employed to identify possible challenges that NICs might encounter in

155
planning their projects tasks in building procurement systems. These identified
challenges level of severity were then assessed by respondents.
Table 4.13 shows the assessment of NICs projects planning challenges. The table
shows the weighted mean ranges of: 2.9697-4.2059; 3.0000-4.3182; and 3.0794-
4.1450 for contractors, consultants and public building professionals respectively.
These results revealed that all the respondents’ assessments were almost and above a
score of 3 in the Likert scale. This revealed that each of the individual group’s
assessments acknowledged that NICs experienced these challenges to a severe level
in projects planning. The 3 most severe factors for the individual groups are: late
honoring of payments certificates (4.2059), too many variations (4.1912), and delays
(4.0169) for contractors; late honoring of payments certificates (4.3182), design
deficiencies (4.1136), and too many variations (4.0000) and increase in prices of
materials and labour (4.0000) for consultants; and technical incompetence (4.1450),
late honoring of payments certificates (4.0469) and too many variations (4.0469) for
public building professionals.
The results of each of the individual respondents’ groups SD’s show low values:
(0.8904-2.7289), (0.7559-1.3148), and (0.88985-1.1882) for contractors, consultants
and PBPs respectively. These results indicate that there is uniformity (consistency) in
each of the respondents’ group’s opinions.

156
Table 4.13: Individual Groups Assessment of NICs Projects Planning Challenges
Factors
Contractors Consultants PBPs S/N
Mean SD Rank Mean SD Rank
Mean
SD Rank 1 Too many variations 4.1912 0.9345 2 4.0000 0.7559 3 4.0469 0.9332 3 2 Project complexity 3.7059 0.9152 8 3.6190 0.8540 10 3.6190 0.9576 12 3 Materials shortages or late delivery 3.9853 0.9541 4 3.8810 1.0407 5 3.9194 1.0291 6 4 Client's dissatisfaction 3.2826 1.2769 17 3.4419 1.3148 14 3.7188 1.1882 8 5 Claims 3.6176 1.1974 10 3.6744 0.8652 9 3.5556 0.9466 16 6 Poor weather conditions 3.1176 1.0724 19 3.2727 1.0199 18 3.3750 1.0616 19 7 Accidents on site 2.9697 1.0809 21 3.1818 1.0625 19 3.1094 0.9278 21 8 Plants, equipment’s & machine breakdown/inadequacy 3.6324 1.0914 9 3.5814 1.0518 12 3.6557 1.1088 10 9 Late honoring of payments' certificates 4.2059 0.8904 1 4.3182 0.9590 1 4.0469 0.8985 2 10 Disputes 3.7941 1.0867 7 3.4318 1.1493 15 3.5873 1.1164 13 11 Technical incompetence 3.868 1.1833 6 3.9070 1.2500 4 4.1450 1.1852 1 12 Organizational problems 3.5522 1.0340 13 3.6136 1.1855 11 3.5714 1.1175 14 13 Communications problem between functional areas of
business 3.2647 1.0597 18 3.4091 1.0852 16 3.5079 1.0453 18
14 Cultural influence 3.0147 1.2518 20 3.0000 1.1206 21 3.0794 1.1116 22 15 Poor work definition 3.5588 1.3646 12 3.5682 1.1289 13 3.6250 1.0764 11 16 Environmental regulations 3.5294 2.7289 14 3.3721 1.1132 17 3.2813 0.9835 20 17 Inadequate project documentation 3.6119 1.0438 11 3.8636 1.2122 6 3.5625 1.0370 15 18 Design deficiencies 3.8806 1.1081 5 4.1136 1.1251 2 3.9375 1.0965 5 19 Delays 4.0169 0.9190 3 3.8409 1.0103 7 3.7656 1.0800 7 20 Project risks & uncertainty 3.4746 0.9533 15 3.7045 0.9543 8 3.5238 0.9308 17 21 Absenteeism of workers/shortage of craftsmen 3.3559 1.2967 16 3.1591 1.1195 20 3.6984 1.1864 9 22 Increase in prices of materials/labour 3.3559 1.2967 16 4.0000 0.7559 3 3.9531 0.9500 4
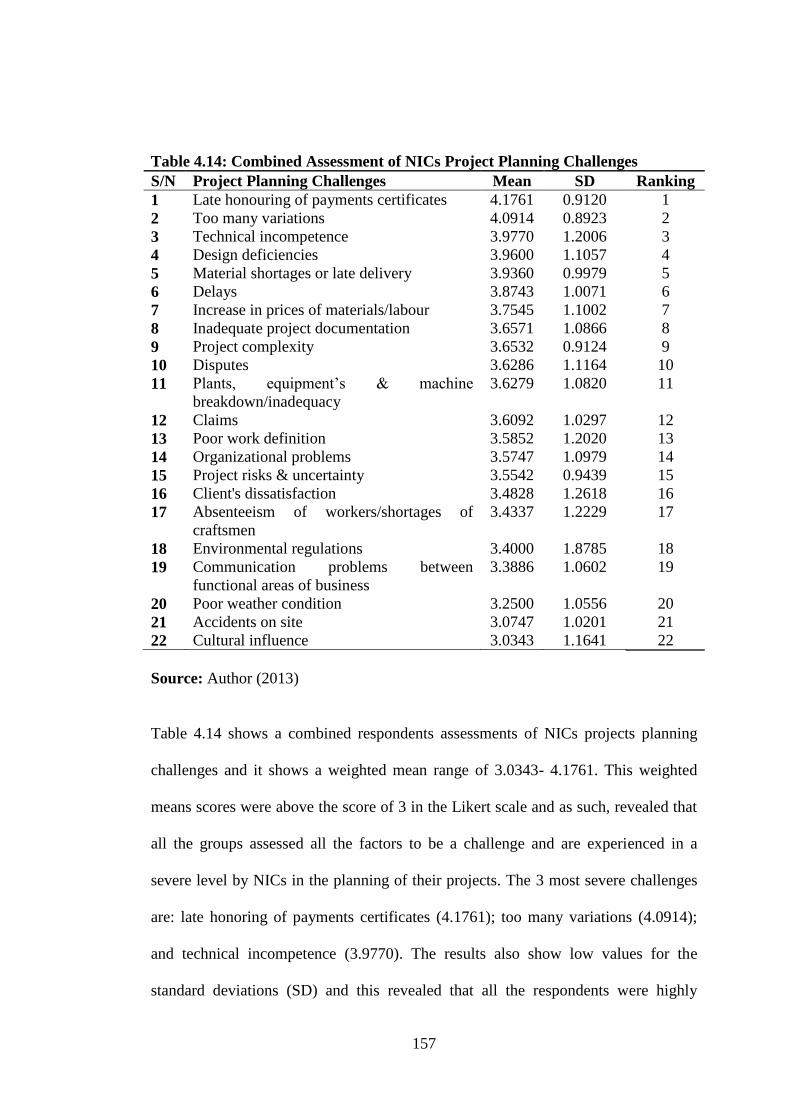
157
Table 4.14: Combined Assessment of NICs Project Planning Challenges
S/N Project Planning Challenges Mean SD Ranking
1 Late honouring of payments certificates 4.1761 0.9120 1
2 Too many variations 4.0914 0.8923 2
3 Technical incompetence 3.9770 1.2006 3
4 Design deficiencies 3.9600 1.1057 4
5 Material shortages or late delivery 3.9360 0.9979 5
6 Delays 3.8743 1.0071 6
7 Increase in prices of materials/labour 3.7545 1.1002 7
8 Inadequate project documentation 3.6571 1.0866 8
9 Project complexity 3.6532 0.9124 9
10 Disputes 3.6286 1.1164 10
11 Plants, equipment’s & machine
breakdown/inadequacy
3.6279 1.0820 11
12 Claims 3.6092 1.0297 12
13 Poor work definition 3.5852 1.2020 13
14 Organizational problems 3.5747 1.0979 14
15 Project risks & uncertainty 3.5542 0.9439 15
16 Client's dissatisfaction 3.4828 1.2618 16
17 Absenteeism of workers/shortages of
craftsmen
3.4337 1.2229 17
18 Environmental regulations 3.4000 1.8785 18
19 Communication problems between
functional areas of business
3.3886 1.0602 19
20 Poor weather condition 3.2500 1.0556 20
21 Accidents on site 3.0747 1.0201 21
22 Cultural influence 3.0343 1.1641 22
Source: Author (2013)
Table 4.14 shows a combined respondents assessments of NICs projects planning
challenges and it shows a weighted mean range of 3.0343- 4.1761. This weighted
means scores were above the score of 3 in the Likert scale and as such, revealed that
all the groups assessed all the factors to be a challenge and are experienced in a
severe level by NICs in the planning of their projects. The 3 most severe challenges
are: late honoring of payments certificates (4.1761); too many variations (4.0914);
and technical incompetence (3.9770). The results also show low values for the
standard deviations (SD) and this revealed that all the respondents were highly
158
consistent in their opinions. This, confirms that all the major players (contractors,
consultants and clients) in the management of building projects unanimously
acknowledged that all the assessed factors are definitely experienced to a severe level
by NICs in projects planning.
4.6.5 Objective 5: Factors for Influencing NICs Project Planning
Objective 5 aimed at identifying factors that can significantly influence NICs project
planning and to ascertain their order (level) of importance. The factors were
identified through literature search and respondents were asked to rank their level of
importance in the questionnaires.
Table 4.15 is an assessment by the individual respondents of the significant factors
that can influence NICs project planning in construction procurement systems. It
shows the weighted means and ranks of the individual respondents’ assessments of
the level of importance of the significant factors for NICs project planning. The table
shows the weighted means range of the individual group’s respondent’s level of
importance of factors that can significantly influence NICs project planning in
construction procurement systems as: 4.54-3.45, 4.68-3.73, and 4.81-3.44 for
contractors, consultants and PBPs respectively. These ranges show that all the
rankings of the respondents’ are above the score of 3 in the Likert scale, hence,
revealing that all the identified factors are important to NICs in project planning of
their procurement tasks. The top three most significantly important factors as
assessed by individual respondent groups, are: contractors’ project manager's
capability, technical competence, and contractors’ project management capability
(contractors’); technical competence, understanding contractors’ project procurement
159
task, and contractors’ project manager's capability (consultants’); and technical
competence, contractors’ project management capability, and understanding
contractors project procurement task.
The computed standard deviation (SD) results for contractors (0.6788-1.2548),
consultants (0.4891-1.0330), and PBPs (0.4375-1.1109) show a low value, hence,
indicating that each of the groups are in agreement of their assessments. These
results therefore revealed that each of the group respondents is in harmony in their
assessment on the identified factors. Looking at the individual group’s assessment,
there is barely any divergence in the groups assessments on the factors assessed. This
revealed that the assessed factors are unanimously acknowledged by the major
players in the management of projects to be very significant in improving the project
planning potentials of NICs in any type of building project procurement systems.
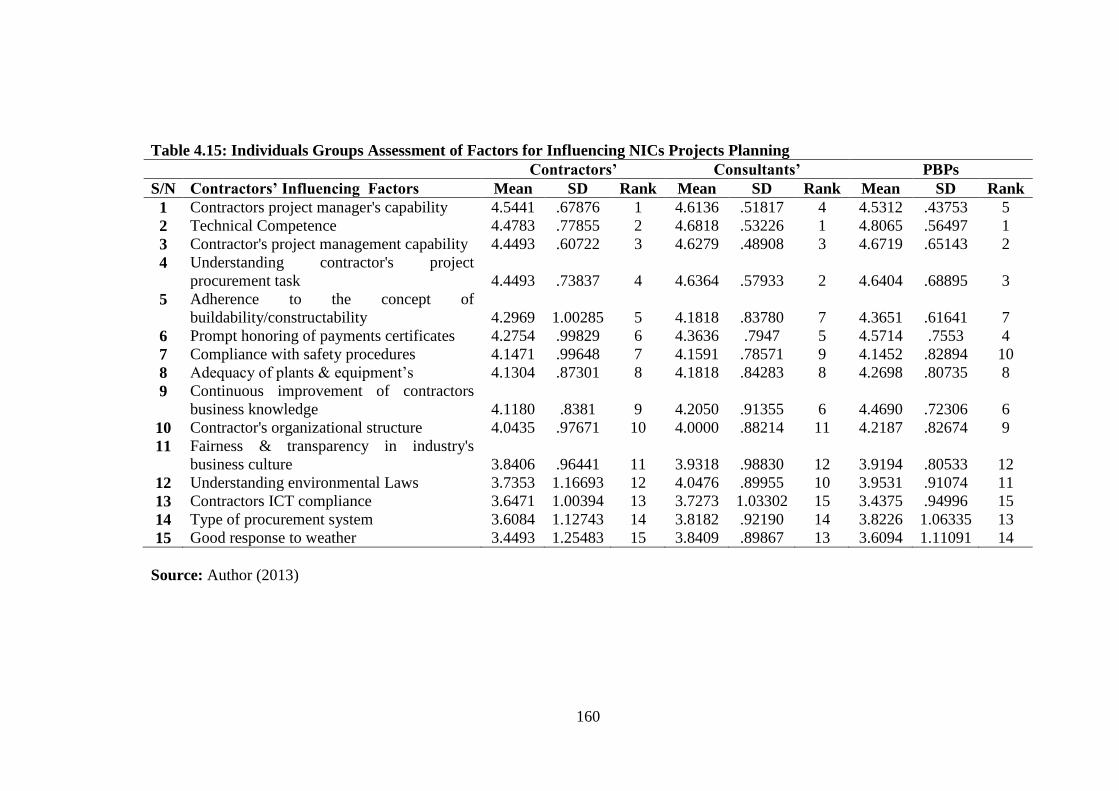
160
Table 4.15: Individuals Groups Assessment of Factors for Influencing NICs Projects Planning
Source: Author (2013)
Contractors’ Consultants’ PBPs
S/N Contractors’ Influencing Factors Mean SD Rank Mean SD Rank Mean SD Rank
1 Contractors project manager's capability 4.5441 .67876 1 4.6136 .51817 4 4.5312 .43753 5
2 Technical Competence 4.4783 .77855 2 4.6818 .53226 1 4.8065 .56497 1
3 Contractor's project management capability 4.4493 .60722 3 4.6279 .48908 3 4.6719 .65143 2
4 Understanding contractor's project
procurement task 4.4493 .73837 4 4.6364 .57933 2 4.6404 .68895 3
5 Adherence to the concept of
buildability/constructability 4.2969 1.00285 5 4.1818 .83780 7 4.3651 .61641 7
6 Prompt honoring of payments certificates 4.2754 .99829 6 4.3636 .7947 5 4.5714 .7553 4
7 Compliance with safety procedures 4.1471 .99648 7 4.1591 .78571 9 4.1452 .82894 10
8 Adequacy of plants & equipment’s 4.1304 .87301 8 4.1818 .84283 8 4.2698 .80735 8
9 Continuous improvement of contractors
business knowledge 4.1180 .8381 9 4.2050 .91355 6 4.4690 .72306 6
10 Contractor's organizational structure 4.0435 .97671 10 4.0000 .88214 11 4.2187 .82674 9
11 Fairness & transparency in industry's
business culture 3.8406 .96441 11 3.9318 .98830 12 3.9194 .80533 12
12 Understanding environmental Laws 3.7353 1.16693 12 4.0476 .89955 10 3.9531 .91074 11
13 Contractors ICT compliance 3.6471 1.00394 13 3.7273 1.03302 15 3.4375 .94996 15
14 Type of procurement system 3.6084 1.12743 14 3.8182 .92190 14 3.8226 1.06335 13
15 Good response to weather 3.4493 1.25483 15 3.8409 .89867 13 3.6094 1.11091 14

161
Table 4.16: Combined Ranking of Factors Influencing Project Planning
S/N Contractors Influencing Factors Mean SD Rank
1 Technical competence 4.6457 0.6253 1
2 Contractor's project management capability 4.5739 0.5709 2
3 Understanding contractor's project
procurement task 4.5650 0.6636 3
4 Contractors project manager's capability 4.5568 0.6299 4
5 Prompt honouring of payments certificates 4.4034 0.8631 5
6 Adherence to the concept of
buildability/constructability 4.2924 0.8858 6
7 Improvement of contractor's business
knowledge 4.2670 0.8087 7
8 Adequacy of plants & equipment’s 4.1932 0.8398 8
9 Compliance with safety procedures 4.1494 0.9127 9
10 Contractor's organizational structure 4.0960 0.8962 10
11 Fairness & transparency in industry's business
culture 3.8914 0.9252 11
12 Understanding environmental Laws 3.8908 0.9823 12
13 Type of procurement system 3.7371 1.0168 13
14 Good response to weather 3.6045 1.1390 14
15 Contractors ICT compliance 3.5909 1.0213 15
Source: Author (2013)
Table 4.16 shows that the weighted means of the combined respondents’ ranking of
the level of importance of factors that can significantly influence NICs project
planning in construction procurement systems ranges between 3.5909 and 4.6457.
This reveals that all the identified factors are significantly important to the NICs in
project planning of their procurement tasks. The top 3 most significantly important
factors are: technical competence (4.66); contractors’ project management capability
(4.60); and understanding contractors’ procurement tasks (4.57). The results show
low values for the standard deviations, which indicates a high degree of consistency
in the respondents’ opinions. This shows that all the respondents’ are in agreement
that the assessed factors are significant in improving the NICs project planning.
162
4.6.6 Objective 6: Success Indicators for Contractors’ Project Planning
Objective six aimed at identifying contractors projects planning success indicators
and their level of importance in building projects procurement systems. This study
used a thorough literature search to identify contractors’ project planning success
indicators and requested respondents’ to assess their level of importance in attaining
contractors’ project planning success.
Table 4.17 shows individual groups’ respondents’ assessment of contractors’ project
planning success indicators. The weighted mean range for the 3 respondents groups
are: 3.7206-4.6119, 3.7727-4.5682, and 3.5238-4.5512 for contractors, consultants
and PBPs respectively. These show that their score was above the score of three in
the Likert scale, thus, revealing that each groups assessed all the success indicators to
be very important to contractors in attaining projects planning success. The most
important success indicators as assessed by the individual groups are: adequacy of
plan in determining suppliers' delivery dates (4.6119), plan's adherence to quality
(4.4925), plan’s adherence to time (4.4412) and plan's capability to accommodate
contractors work (4.4412) for contractors; plan's adherence to quality (4.5682), plan's
adherence to time (4.5455), and plan's adherence to cost estimate (4.4318) for
consultants; and plan's adherence to time (4.5512), plan's adherence to quality
(4.5469) and adequacy of plan in determining suppliers' delivery dates (4.5079) for
PBPs. The computed weighted means reveal low values for the SDs’ indicating a
high degree of consistencies in the respondents' opinions, thus signifying that each
member of the group’s opinion on the assessment are not conflicting and this
confirmed that there is uniformity in their opinions.
163
Table 4.18 shows combined respondents’ assessments of contractor’s projects
planning success indicators. Their weighted mean ranges from 3.7299- 4.7159. This
shows that the combined respondents’ assessment score exceeded the Likert scale
score of three, hence, revealed that all the groups are in consensus that all the
identified contractor’s project planning success indicators are important to the
contractors’ in attaining their projects planning success. The most important success
indicators according to the consensus of all the respondents’ groups are: plan's
adherence to time (4.7159), plan’s adherence to quality (4.5314), and adequacy of
plan in determining suppliers' delivery dates (4.5230). The computed weighted
means used for the assessments shows low values of SD’s, thus, revealing that there
is uniformity in the respondents’ opinions in the assessments of the factors.
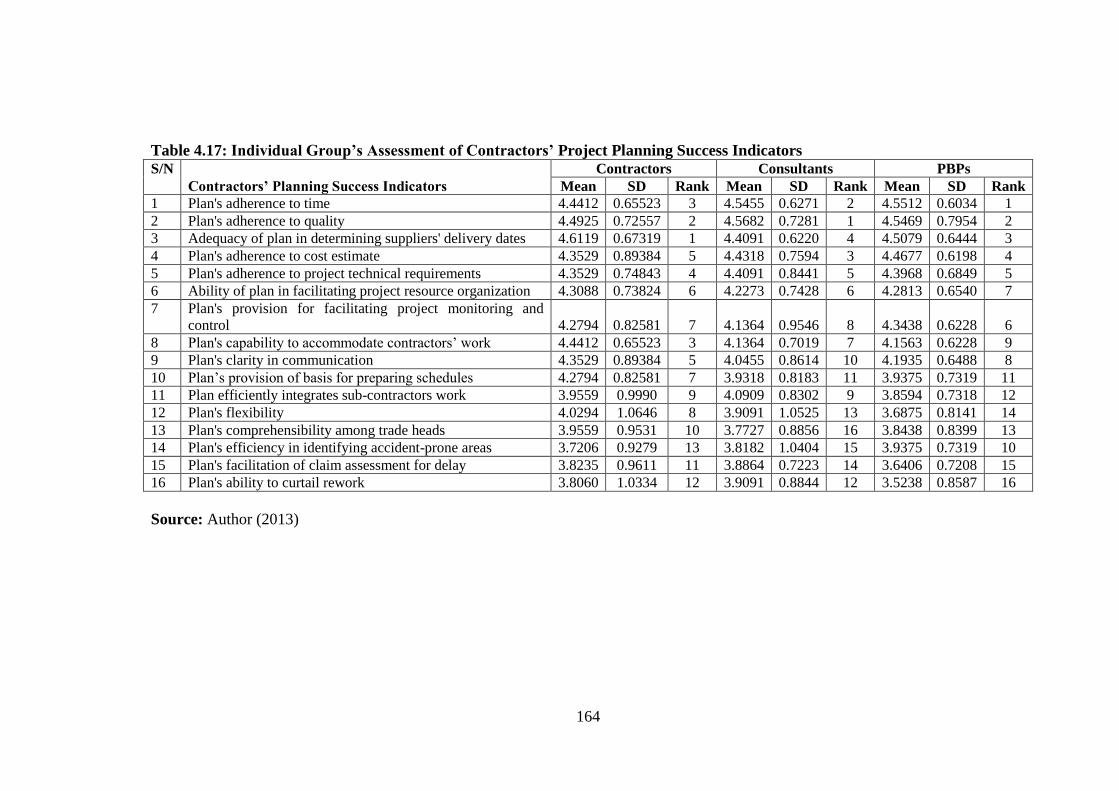
164
Table 4.17: Individual Group’s Assessment of Contractors’ Project Planning Success Indicators
S/N Contractors’ Planning Success Indicators
Contractors Consultants PBPs Mean SD Rank Mean SD Rank Mean SD Rank
1 Plan's adherence to time 4.4412 0.65523 3 4.5455 0.6271 2 4.5512 0.6034 1 2 Plan's adherence to quality 4.4925 0.72557 2 4.5682 0.7281 1 4.5469 0.7954 2 3 Adequacy of plan in determining suppliers' delivery dates 4.6119 0.67319 1 4.4091 0.6220 4 4.5079 0.6444 3 4 Plan's adherence to cost estimate 4.3529 0.89384 5 4.4318 0.7594 3 4.4677 0.6198 4 5 Plan's adherence to project technical requirements 4.3529 0.74843 4 4.4091 0.8441 5 4.3968 0.6849 5 6 Ability of plan in facilitating project resource organization 4.3088 0.73824 6 4.2273 0.7428 6 4.2813 0.6540 7 7 Plan's provision for facilitating project monitoring and
control 4.2794 0.82581 7 4.1364 0.9546 8 4.3438 0.6228 6 8 Plan's capability to accommodate contractors’ work 4.4412 0.65523 3 4.1364 0.7019 7 4.1563 0.6228 9 9 Plan's clarity in communication 4.3529 0.89384 5 4.0455 0.8614 10 4.1935 0.6488 8 10 Plan’s provision of basis for preparing schedules 4.2794 0.82581 7 3.9318 0.8183 11 3.9375 0.7319 11 11 Plan efficiently integrates sub-contractors work 3.9559 0.9990 9 4.0909 0.8302 9 3.8594 0.7318 12 12 Plan's flexibility 4.0294 1.0646 8 3.9091 1.0525 13 3.6875 0.8141 14 13 Plan's comprehensibility among trade heads 3.9559 0.9531 10 3.7727 0.8856 16 3.8438 0.8399 13 14 Plan's efficiency in identifying accident-prone areas 3.7206 0.9279 13 3.8182 1.0404 15 3.9375 0.7319 10 15 Plan's facilitation of claim assessment for delay 3.8235 0.9611 11 3.8864 0.7223 14 3.6406 0.7208 15 16 Plan's ability to curtail rework 3.8060 1.0334 12 3.9091 0.8844 12 3.5238 0.8587 16
Source: Author (2013)

165
Table 4.18: Combined Assessments of Contractors Project Planning
Success Indicators
S/
N Contractors Planning Success Indicators Mean SD Rank
1 Plan's adherence to time 4.7159 3.04424 1
2 Plan's adherence to quality 4.5314 0.74886 2
3 Adequacy of plan in determining suppliers'
delivery dates
4.5230 0.65140 3
4 Plan's adherence to cost estimate 4.4138 0.76863 4
5 Plan's adherence to project technical
requirements
4.3829 0.74798 5
6 Ability of plan in facilitating project resource
organization
4.2784 0.70653 6
7 Plan's provision for facilitating project
monitoring and control
4.2670 0.79444 7
8 Plan's capability to accommodate contractors
work
4.2614 0.66752 8
9 Plan's clarity in communication 4.2184 0.81070 9
10 Plan’s provision of basis for preparing
schedules
4.0682 0.80421 10
11 Plan's efficiently integrates sub-contractors
work
3.9545 0.86730 11
12 Plan's flexibility 3.8750 0.98343 12
13 Plan's comprehensibility among trade heads 3.8693 0.89441 13
14 Plan's efficiency in identifying accident prone
areas
3.8239 0.89296 14
15 Plan's facilitating claim assessment for delay 3.7727 0.82431 15
16 Plan's curtailing rework 3.7299 0.94442 16
Source: Author (2013)
4.6.7 Measures for Enhancing NICs Project Planning
The last part of all the three questionnaires used for this study seeks to elicit
information on measures for enhancing NICs projects planning through open-ended
questions. These opinions were collected, organized and presented in their order of
importance based on frequencies and percentages (Table 4.19).

166
Table 4.19: Measures for Enhancing Contractors’ Project Planning
S/N
Measures for Enhancing Contractors Project
Planning F % Rank
1 Adequate and competent workforce 48 14.50 1
2 Efficiency in firm’s management systems 38 11.48 2
3 Fairness and transparency 27 8.16 3
4 Uninterrupted project cash flow 24 7.25 4
5 Use and adherence to appropriate planning techniques 24 7.25 4
6 Training and retraining of contractors workforce 22 6.65 5
7 Compliance with contract documents 21 6.34 6
8 Adequate project monitoring and evaluation 21 6.34 6
9 Understanding work schedule 19 5.74 7
10 Adequacy of plant and equipment’s 17 5.14 8
11 Good knowledge of construction markets 14 4.23 9
12 Adequate cost planning 12 3.63 10
13 Adequate contract documentation 7 2.11 11
14 Minimal variations 6 2.72 12
15 Government patronage 6 2.72 12
16 Enforcing planning through contract condition 6 2.72 12
17 Granting soft loans to indigenous contractors 5 1.51 13
18 Staff welfare 4 1.21 15
19 Avoidance of sub-standard materials 4 1.21 15
20 Inclusion of project management in curriculum of
technical and vocational schools
2
0.60
16
21 Proper project record keeping for future reference 2 0.60 16
22 Availability and use of local standardised materials 2 0.60 16
23 Indigenous contractors partnering with expatriate
contractors on technical issues
1
0.30
11
Source: Author (2013)
Table 4.19 shows 23 measures for enhancing NICs project planning identified by the
respondents’. The measures with high frequencies and percentages as ranked by all
the respondents’ in descending order are: adequate and competent workforce (1);
efficiency of firms’ management systems (2); fairness and transparency in the
construction industry (3); uninterrupted project cash flow (4); use and adherence to
appropriate planning techniques (4); training and retraining of contractors workforce
(5); adequate project monitoring and evaluation (6); compliance with contract
documents (6); understanding work schedule (7); adequacy of plants and
167
equipment’s (8); good knowledge of construction markets (9); and adequate cost
planning (10).
4.7 Case Study Data Analysis
This section conveys information concerning a collective case study on NICs: data
analysis, presentation and interpretation. A collective case study is a research design
concerned with studying a group of similar cases, in this case the NICs, so as to
ascertain whether their involvement, time and cost performance, project planning
challenges, and planning techniques application follow the same pattern in Nigeria
(Guthrie, 2010; McNabb, 2009). Hence, the design is used to suggest whether some
characteristics might be common to larger populations of similar cases (Guthrie,
2010). The case study was also used to probe the responses received from the
contractors questionnaire survey (Guthrie, 2010).
4.7.1 Analysis of Case Study
Table 4.20 shows the data presentation for the research collective case study (CS).
The CS collected data on projects executed in Abuja, Bauchi/Gombe, and Kano
between 2003 and 2013 (10 years); a total of 15 number case studies (CS01-CS15)
were presented.
CSO1: Hospital Building
The CSO1 is a hospital building located in Abuja procured by a public client through
the design-bid-build method (DBB), using JCT form of contract. It was contracted in
2009 at an initial cost (contract sum) of N248, 618,816.25, and expected to be
completed in 6½ months. The building was finally completed at a cost of N421,
041,104, in 30 months. The contract recorded a cost and time overrun of 69.35%
168
(N172, 422,288) and 361.54% (23½ months) respectively. Documentary evidence
attributed the cost and time overrun to late honoring of payment certificates and,
variations emanating from the project consultants’ and the client’s due to: change in
specification, additional hospital wards and consulting rooms, and omitted items in
the BOQ. The main contractor for the project used Bar Chart but later discarded it,
because it became invalid. The work was done based on money provided by the
client. The contractor did not use any computer software/application package for
planning the project.
CS02: Administrative Block Building:
CSO2 is an administrative office building (3-storey) located in Abuja procured by a
government ministry (public client) through the DBB method, using ministry of
housing condition of contract (lump sum with quantities). It was awarded in 2003 at
an initial cost of N282, 560,190 and expected to be executed within 54 months. The
building was completed at a final cost of N712, 874,024 and within 117 months.
Delay of interim payments and the conversion of car parks to offices, shoot up the
contract sum and duration. The contract recorded a cost and time overruns of
152.29% (N430, 313,834) and 117% (63 months) respectively. The only planning
tool used by the contractor was bar chart, and there were no evidence of applying
computer software/application packages for planning the project.
CS03: Mega Shopping Plaza:
CS03 is a mega shopping plaza (3-storey) procured through design-build (DB)
method, by a private client, using JCT condition of contract. It is located in Abuja
and contracted in 2003. The structure was completed at a cost of N680, 015,245, in
169
21 months as against an initial cost estimate and duration of N572, 350,095 and 14
months respectively. The initial estimated cost and time, overran by 18.81% (N107,
665,150) and 50% (7 months) respectively. Documents studied reveals the cost and
time overrun was as a result of delayed payments and variation emanating from
expansion and alteration of initial design, which eventually necessitated structural
details adjustments. A completed staircase and a hall were altered resulting in a
rework. The only planning tool used by the contractor was bar chart, and there were
no evidence of applying computer software/application package for planning the
project.
CS04: Administrative Block
CS04 is an administrative block building (2-storey) located in Abuja, contracted in
2005 by a public client, through a DBB method, using JCT contract condition
(awarded as fluctuation price contract). The structure was built within 28 months at a
final cost of N297, 787,635. It was initially estimated to cost N249, 109,900, and to
be built within 15 months. The differences in cost and time were 19.30% (N48,
677,735) and 86.67% (13 months) respectively. The causes of the cost and time
overrun as gathered from the project file emanates from: poor feasibility study, delay
in payments, fluctuation in prices of materials and labour, and design inadequacies.
The proposed location of the structure was changed to another location 25 km away
from the initial location after it has been contracted. The change of location increased
the cost of labour and materials due to an increase in transportation. Progress of
work was smooth in the first 5 months of the contract. Afterwards, work stopped on
site due to non-honoring of payment certificates; only 1 payment out of 5, was
170
honored in the entire 5 months period. This resulted in the contractor abandoning the
work for 10 months. Amendment of a structural design error took the structural
engineer a lot of time to address. This also contributed to delay in the project
progress of work. These delays resulted in a fluctuation in materials and labour
prices to the sum of N12, 696,164 and loss and expenses on running preliminaries
amounting to N1, 840,800. Other variations in the contract cost a total of N34,
140,771. The only planning tool used by the contractor was bar chart, and there was
no evidence of applying computer software/application package for planning the
project.
CS05: Shops & Offices
CSO5 is a private owned 3-storey shops and offices building procured through DB
method. It was contracted in 2009 using the JCT form of contract (fixed sum; no
fluctuation claims is to be entertained from the contractor). The contractor was paid
15% mobilization fee before the commencement of work. Yet, the contract overran
its initial estimated cost and time by 44.15% (N10, 341,485) and 50% (2 ½ months)
respectively. The initial estimated contract sum and duration was N23, 423,325 and 5
months respectively.
Variations from the client call for the adjustment of the structural details, costing N1,
749,440, and resulted in delay also. The contractor’s fluctuation claim to the sum N8,
592,045 for increase in prices of materials and labour was accepted. Consequently,
shoot up the initial cost and duration to N33, 764,810 and 7 ½ months respectively.
A bar chart was the only evidence of the planning tool used for the project. No
171
computer software/application package was used in planning the project by the
contractor.
CS06: Lecture Hall
CS06 is a 2-storey lecture hall located in Bauchi/Gombe contracted in 2011 by public
client using Education Trust Fund (ETF) condition of contract. It was awarded at a
cost of N47, 193,052, and expected to be executed within 7 ½ months. Documentary
evidence reveals that the contract experienced delays both from the contractor and
the client. There was a delay in payments and in the contractor’s work and supply of
materials. Variation from the client resulted in cost overrun of 21.19% (N10,
000,000). Hence, the duration of the contract was extended to 16 months (113.33%).
Bar chart was the only evidence of planning tool used for the project. No computer
software/application package was used in planning the project by the contractor.
CS07: Office Block
CSO7 is a public institution office block building located in Bauchi/Gombe and
contracted in 2007. The building was procured through DBB method, using the ETF
condition of contract. Documentary study shows that the contract was awarded at a
sum of N13, 050,430 and for a duration of 3 months. The contractor for the job was
paid 25% advance payment prior to commencement of work. Thereafter, there was a
delay due to the Government bureaucratic process in confirming the contractor’s
competence and integrity. The delay caused by the Government was used to claim
for material fluctuation amounting to N1, 773,405. The client in-house consultant
issued 16 number variation orders in the course of the project. The reasons for the
variation as gathered from the project file were a result of poor feasibility study and

172
design inadequacies. These contributed to an increase in the contract sum by N481,
190. The contract was finally completed at a cost of N15, 305,025, in 21 months,
reflecting 17.32% (N2, 254,595) and 600% (17 months) increase in the contract sum
and duration respectively. Bar chart was used by the contractor for planning the
project. No computer software/application package was used in planning the project
by the contractor.
CS08: Classroom Block
CS08 is a classroom block procured by a public client located in Bauchi/Gombe and
contracted in 2005.The project for the building was contracted out at a cost of N23,
680,260, for duration of 4 months, using ETF condition of contract. It was completed
at a cost of N 31,968,351, for duration of 8 months. The contract recorded 35% (N8,
288,091) and 50% (4 months) cost and time overrun respectively. Variations and
delay in payments resulted in the differences in cost and time. No planning tool was
used by the contractor to plan the project.
CS09: Classroom and Residential Building
CS09 is the renovation of existing classrooms, building of new classrooms and
residential buildings in Bauchi/Gombe. It is a State government contract, awarded in
2010, using the State government contract agreement (inclusive of conditions) to a
single contractor. The contract was a fixed sum contract subject to variation from the
client, under the DBB method. The initial contract sum was N190, 052,787, for
duration of 15 months. The contractor was advanced 50% payment prior to
commencement of work. The initial contract sum and duration overran by 18.94%
(N36, 000,000) and 50% (7 months) respectively.
173
Documentary evidence indicated that the cause of the overruns were: additional
payments of N28, 000,000 recommended by the client in-house consultants (PBPs)
for additional works not explicitly stated and backed by documents and; an
observation raised by the contractor for work items omitted in the BOQ and a
fluctuation claim for increase in prices of materials and labour, to a turn of N8,
000,000. These resulted in a final contract sum and duration of N226, 052,787.68
and 21 ½ months respectively. No planning tool was used by the contractor to plan
the project.
CS10: Residential Building
CS10 is a 3-beDr.oom residential apartment procured through the traditional method
(DBB) by a public client in Bauchi/Gombe. It was contracted in 2010 on a fixed sum
basis, subject to variation from the client, using the State government condition of
contract. The project files studied reveals that the contractor was paid 50% in
advance prior to commencement of the work. However, the contract was eventually
completed at a cost of N21, 850,000, in a duration of 5 months, as against its initial
estimated cost and duration of N18, 215,052 and 2 months respectively. This
translates to a difference in cost and duration of 19.92% (N3, 634,948) and 150% (3
months). Causes of the difference in cost and time respectively, as deduced from
contract correspondence, pointed to: bureaucratic hiccups, delay in honoring
payments and delay in the contractor’s operations. There was no evidence of
planning tool (s) used by the contractor for planning the project.

174
CS11: Library Extension
CS11 is a contract for extending a library building (1-storey), procured by a public
institution through the DBB method in Kano. The contract was a fixed fee contract,
using the JCT condition of contract. The contractor for the job was paid an advance
of 30%, prior to commencement of work. The job was finally completed at the initial
estimated cost of N87, 124,454, recording a 0% cost overrun. However, the duration
of the contract over shot its initial estimated duration of 9 months by 55.56% (5
months). Causes of duration extension as evident from the contract correspondence
are: delay in payments; and an instruction from the project architect to the contractor
for the removal and reconstruction of 8 number work items (rework), due to the
usage of sub-standard materials and poor workmanship. Bar chart was the only
planning tool used for planning the project programme of work.
CS12: Lecture Theatre
CS12 is a 1000 capacity lecture theatre, with integrated offices, procured by a public
client through the DBB method, using the JCT contract condition. It was contracted
at a sum of N87, 772,643, and to be executed in 14 months. However, it was
completed in 20 months and at a cost of N114, 804,671. It record a cost and time
overrun of 30.8% (N27, 032,028) and 42.86% (6 months) respectively.
The differences in cost and time emanates from a poor feasibility study, and
variations and fluctuations. Inadequacy of aggregates at and within the domain of the
contract compelled the contractor to source for it from a neighboring State 200 km
away from the site. Thirteen (13) number variations were introduced by the
consultants, mostly due to design inadequacies. There was a revision in electrical
175
services drawing. There was also inadequate information on the theatre’s furniture
which form part of the main contractor’s work. Poor soil test resulted in an excess of
80% excavation in rock, which was not anticipated. There was delay in payments (2-
4 months delay). All these brought about delays and fluctuation in prices of materials
and labour. These compel the contractor to ask for an extension of 6 months. The
only planning tool used for developing the contractor’s programme of work was bar
chart.
CS13: Offices and Classrooms Block
CS13 is a 3-storey office and classroom block building, procured by a public client,
through the DBB method, using the JCT condition of contract. The contract record a
cost and time overrun of 4.6% (N7, 430,035) and 23.53% (2 months). Against an
initial estimated cost and time of N163, 011,157.70 and 8 ½ months respectively.
The differences in cost and time are as a result of variations due to inadequacies in
architectural and structural design. This resulted to delay in the progress of work on
site. The contractor therefore requested for an extension of time and additional
payment. The contractor used only bar chart to plan his programme of work.
CS14: Residential Building
CS14 is a 3-beDr.oom residential building procured by a private client, using the DB
method. The contract as awarded at a sum of N10, 000,000 and to be completed in 8
months. However, the final cost and time shoot to N14, 630,000 and 14½ months
respectively. Recording a cost and time overrun of 46.3% (N4, 630,000) and 81.25%
(6½ months) respectively. This was a result of variations, delays in payments and
176
fluctuation of prices. The contractor did not use any planning tool for planning its
programme of work.
CS15: Shops and Offices
CS15 was a one-storey block building for shops and offices, owned by a private
client. The contract used the DB method for the project. The contract was awarded at
a sum of N20, 000,000 and expected to be completed in 9 months. The project was
completed at a sum of N27, 360, 000 and in a period of 16 months. The project
recorded a cost and time overrun of 36.8% (N7, 360,000) and 73.68% (7 months)
respectively. Causes of differences in cost and time were variations, delays in
payments and fluctuation of prices. No any planning tool used and no programme of
work for the work.
4.7.3 Case Study Interpretation
Table 4.19 shows the detail of the data used for the case study. The following are
detail interpretation of the documentary case studies conducted on 15 number
projects executed within a period 10 years (2003-2013).
NICs Procurement Involvements
1. NICs were involved in both traditional and non-traditional procurement
methods. The major clients were public (73.33%). Majority of the
procurement type used was DBB (89%). Most of the projects procured (80%)
by public clients were through the DBB method. While, 67% of the projects
procured by private clients were through the DB methods. NICs are not
involved in other types of non-traditional procurement systems.
177
2. NICs are more involved in the traditional method than the non-traditional
methods; DB only.
NICs Project performance Cost and Time Overruns
1. All the projects (100%) record time overrun rates ranging from 23.53-361.54
and 50-81% in the DBB and DB methods respectively.
2. Almost all (93.33%) the projects experienced cost overrun. Their rate ranges
from 4.6-152% and 5-21% for DBB and DB respectively.
3. The cumulative initial contract sum and duration for all the 15 number
projects were N2.04 billion and 175½ months respectively. However, the
differences in cost and time resulted to the cumulative final cost and time to
shoot to N2.91billion and 352 months respectively.
4. The cumulative cost and time overrun for the 15 projects were 43.02%
(N876, 040,000) and 100.57% (176½ months) respectively.
NICs Project Planning Challenges
1. Late honouring of payment certificates
2. Too many variations.
3. Design inadequacies
4. Delays
5. Incompetence,
6. Changes in prices of materials and labour.
178
NICs Application of Project Planning Techniques
1. Virtually sixty seven percent (66.67%) of the contractors used only bar charts
in planning their projects operations, while 33.33% of the contractors did not
used any planning tool.
2. None of the contractors apply computer software/application package in
planning their project operations.
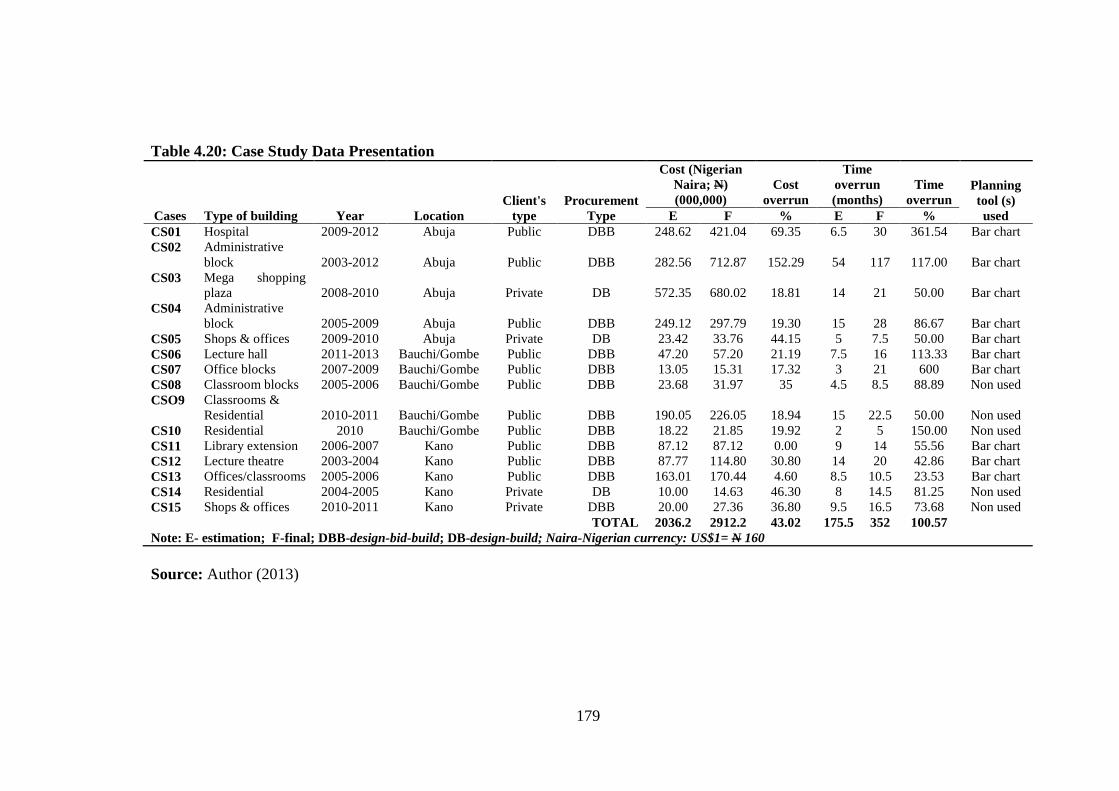
179
Table 4.20: Case Study Data Presentation
Source: Author (2013)
Cases
Type of building Year
Location
Client's
type
Procurement
Type
Cost (Nigerian
Naira; N)
(000,000)
Cost
overrun
Time
overrun
(months)
Time
overrun Planning
tool (s)
used E F % E F %
CS01 Hospital 2009-2012 Abuja Public DBB 248.62 421.04 69.35 6.5 30 361.54 Bar chart
CS02 Administrative
block 2003-2012 Abuja Public DBB 282.56 712.87 152.29 54 117 117.00 Bar chart
CS03 Mega shopping
plaza 2008-2010 Abuja Private DB 572.35 680.02 18.81 14 21 50.00 Bar chart
CS04 Administrative
block 2005-2009 Abuja Public DBB 249.12 297.79 19.30 15 28 86.67 Bar chart
CS05 Shops & offices 2009-2010 Abuja Private DB 23.42 33.76 44.15 5 7.5 50.00 Bar chart
CS06 Lecture hall 2011-2013 Bauchi/Gombe Public DBB 47.20 57.20 21.19 7.5 16 113.33 Bar chart
CS07 Office blocks 2007-2009 Bauchi/Gombe Public DBB 13.05 15.31 17.32 3 21 600 Bar chart
CS08 Classroom blocks 2005-2006 Bauchi/Gombe Public DBB 23.68 31.97 35 4.5 8.5 88.89 Non used
CSO9 Classrooms &
Residential 2010-2011 Bauchi/Gombe Public DBB 190.05 226.05 18.94 15 22.5 50.00 Non used
CS10 Residential 2010 Bauchi/Gombe Public DBB 18.22 21.85 19.92 2 5 150.00 Non used
CS11 Library extension 2006-2007 Kano Public DBB 87.12 87.12 0.00 9 14 55.56 Bar chart
CS12 Lecture theatre 2003-2004 Kano Public DBB 87.77 114.80 30.80 14 20 42.86 Bar chart
CS13 Offices/classrooms 2005-2006 Kano Public DBB 163.01 170.44 4.60 8.5 10.5 23.53 Bar chart
CS14 Residential 2004-2005 Kano Private DB 10.00 14.63 46.30 8 14.5 81.25 Non used
CS15 Shops & offices 2010-2011 Kano Private DBB 20.00 27.36 36.80 9.5 16.5 73.68 Non used
TOTAL 2036.2 2912.2 43.02 175.5 352 100.57
Note: E- estimation; F-final; DBB-design-bid-build; DB-design-build; Naira-Nigerian currency: US$1= N 160
180
CHAPTER FIVE
5.0 DISCUSSION OF RESULTS
5.1 Introduction
This chapter is concerned with the discussion of results. It entails interpreting
findings in light of previous studies, as well as describing the implications of the
findings. This study was informed by NICs underperformance in the management of
construction projects, which is due to inexperience, none or inappropriate application
of project planning techniques, none appreciation for indigenous contractors projects
planning challenges, inadequate understanding of factors that can significantly
influence contractors project planning, and poor understanding of project planning
success indicators that will ensure successful project delivery in the NICs.
This study broadly used both quantitative and qualitative research approaches. For
the quantitative approach, the study employed the exploratory and descriptive survey
methods through an extensive literature search and questionnaire survey methods
respectively. While for the qualitative design approach, it employed an explanatory
method through a collective case study based on documentary analysis. This study
results were presented using average mean scores (AMS), frequencies and
percentages.
5.2 NICs Involvement in Project Procurement Systems
The first objective was to establish the level of NICs involvement in building
projects procurement systems. Data analysis and questionnaire responses from NICs
revealed that both public and private clients involved NICs in traditional and non-
traditional procurement system. Seventy five percent of building projects contracted

181
to NICs was procured by public clients, while 15% of the projects contracted to NICs
were procured by private clients. It also revealed that the Government (public) clients
procure 75% of their projects through the DBB traditional procurement systems, as
against 15% procured through the non-traditional systems. The private clients
contracted 78% of their projects to NICs through non-traditional procurement
system, as against 12% through traditional procurement system. This result revealed
that there is no disproportionate distribution in the frequencies of responses to a
question on their level of involvement in building procurement systems among NICs,
hence, confirming that the NICs are involved in both traditional and non-traditional
procurement systems. However, their level of involvement in both procurement
systems is very low and much lower in the non-traditional procurement systems.
This result conforms to Ojo et al. (2006) findings that DBB systems are mostly used
by public and uninformed private clients in Nigeria. This result seems to corroborate
Aniekwu and Audu (2010) assertions that the NICs has lesser share in the volume of
contracts executed in the NCI compares to their foreign counterparts. The result also
reveals that public clients have the largest share of the projects contracted to NICs in
the industry. This corroborates Mbamali and Okotie (2012), and Iro et al. (2012)
assertion that the Government in Nigeria (public client) has almost 75% of the total
construction share. Furthermore, it revealed that private clients employ more non-
traditional procurement systems in procuring projects than the public clients.
These results revealed that NICs are less involved in the countries construction
activity and this has a tremendous consequences in their experience and technical
development. The result also implies that if the NICs are to remain relevant and
182
attract more patronage from the construction industry and competes globally, they
need to understand and perfect how to plan their projects vis-à-vis their role in the
non-traditional building procurement systems. This is because globally (Nigeria
inclusive) public sector are encouraging and promoting active private sector
involvement in the provision of public infrastructure and services due to: dwindling
public resources competing for alternative uses; the global shift toward scaling back
the size of governments through policies of deregulation and privatization; and a
natural quest for more efficient and sustainable systems and structures for provision
of public services and a need to supplant the largely bureaucratic public sector led
regime (Ibrahim& Musa-Haddary, 2010; Omagbitse, 2010).
The implication is that public clients will in future surrender to the public clients the
position of being the major client of the industry, and the private clients’ method of
procuring projects is mostly through non-traditionally procurement systems (Ojo et
al., 2006). Hence, contractor need to develop project management skill because,
project management is a management discipline that is applied to all types of
building project procurement systems to attain project success (Georg & Tryggestad,
2009 cited in Ekundayo, et al., 2013; Harris & McCaffer, 2005).
5.3 NICs Project Time and Cost Performances
The second objective was to examine NICs time and cost performances in building
projects procurement systems. Data analysis of questionnaire responses from NICs
revealed that the NICs recorded time overruns of 34-146% and 45-60% in the
traditional and non-traditional procurement systems respectively. The NICs cost
performances recorded cost overruns of 35-47% and 31-36% in the traditional and
183
non-traditional procurement systems respectively. This result reveals that the NICs
recorded high rates of time and cost overruns in the execution of both traditional and
non-traditional procurement systems. This indicates that NICs underperformed in
terms of cost and time in building procurement systems. These findings are in
agreement with the findings of Idoro (2012); Mbamali and Okotie (2012); Babatunde
et al. (2010); Ikediashi et al. (2012); Ibrahim(2008); Ojo et al. (2006), that both
traditional and non-traditional procurement systems application in Nigeria record
high cost and time overruns. According to Jagboro and Aibinu (2002), most building
projects in Nigeria experience severe time and cost overruns due to delay.
Odeyinka and Yusif (1997) cited in Jagboro and Aibinu (2002, p.594) acknowledged
that contractor-related delays include financial difficulties, material management
problems, planning and scheduling problems, inadequate site inspection, equipment
management problems and shortage of manpower. Most of these problems according
to Ekundayo, et al. (2013) are attributed to the NICs adoption of traditional
management approch. Moreover, the adoption of this approach results in poor project
planning and coordination (Ekundayo, et al., 2013; Kerzner, 2000). According to
Passenheim (2009) poor project planning results in poor project coordination, and
cost and time overruns.
The QSRBN (2012), as well as several studies, have confirmed that contractors’ poor
project planning is the major cause of cost and time overruns in building projects in
Nigeria (Idoro, 2012b; Aniekwu & Audu, 2010; Bala, et al.,2009; Muazu & Bustani,
2004; Saleh, 2004; Achuenu, et aI. 2000; Adams, 1997). This among other things, is
the reason why the NICs underperformed in terms of cost.
184
According to Passenheim (2009) adequate project planning is a fundamental tool
used in building project management in meeting the projects time, cost, and scope.
The implication of this result to the NICs is that unless they are well equiped with a
requisite management approach capable of addressing these problems, their quest for
attaining successful project delivery in the management of modern building projects
will be unattainable.
The adoption of the project management approach has been proven to address such
problems in the construction industries of developed and some advanced developing
countries, to achieve all of the project objectives of cost, time, quality, scope, risks
and uncertainty, change and stakeholder management (Ekundayo, et al., 2013; Aina
& Wahab, 2011; Kerzner, 2000). Hence, NICs need to adopt project management
techniques (Ekundayo et al., 2013; Kerzner, 2000).
5.4 NICs Application of Project Planning Techniques
The third objective was to investigate NICs application of project planning
techniques for contractual operations in building projects procurement systems. Data
analysis and questionnaire responses revealed that NICs inappropriately apply
planning techniques. In some cases, the NICs central administration are responsible
for planning the company’s project tasks for their construction/project managers.
This action conflicts with the project management requirement which bestowed the
responsibility of project planning to project managers (Gupta, 2010; Passenheim,
2009). There are contractors who do not apply planning techniques and those who
do, applied it inappropriately. Few of the contractors (33%) who apply planning
technique, apply only bar chart. Unfortunately, bar chart is not an appropriate

185
planning technique; it is only appropriate for construction projects planning when
used as a complement of the CPM (Chitkara, 2012; Bhavikatti, 2012; Abubakar et
al., 2008; Krishnamurthy & Ravindra, 2010; Roberta & Wallace, 2004; Seeley,
1986).
Most of the contractors (75%) that apply two type of planning techniques on a sinlge
projects, apply it wrongly. Only a few of the contractors (35%) used the appropriate
combination of planning techniques; bar chart and CPM (Chitkara, 2012; Bhavikatti,
2012; Abubakar et al. 2008; Krishnamurthy & Ravindra, 2010; Roberts & Wallace,
2004; Seeley, 1986).
The research also reveals that most of the contractors (84%) do not apply computer
software/application package in project planning. This verifies the findings of
Mbamali and Okotie (2012), and Inuwa (2006) that there is poor adoption of
computer application in the NCI. This study reveals that the NICs have a poor
attitude towards project planning; only a few use the appropriate planning
techniques. Furthermore, most indigenous contractors do not use computer
software/application package in planning their project.
Despite the contractors’ project managers’ experience, high educational qualification
and specialization in building procurement, their responses on project planning
techniques application exposes their incompetence and poor attitude towards project
planning. This confirms the assertions of several authors that indigenous contractors
are unable to plan their contractual obligation (Aniekwu & Audu, 2010; Muazu &
Bustani, 2004; Saleh, 2004; Achuenu, et aI., 2000; Adams, 1997). The results also
186
confirm NICs non-adoption of the project management approach (Ekundayo, et
al.,2013). In addition, the result reveals that the NICs do not apply ICT in planning
their projects. This corroborates Mbamali and Okotie (2012), and Inuwa (2006)
claims that the NICs poorly adopt ICT in the planning and management of their
projects. The shortcomings of the NICs in the application of project planning
techniques, and poor adoption of ICT, confirms Aniekwu and Audu (2010) assertion
that most of the NICs performance problems can be addressed through training, pre-
construction planning and the application of modern construction techniques, which
Gollenbeck (2008) admitted can be curbed through the application of project
management techniques.
5.5 NICs Project Planning Challenges
The fourth objective was to identify NICs project planning challenges in building
procurement systems. The data analysis and questionnaire responses from the NICs,
consultants and PBPs revealed that the identified project planning challenges (Table
4.14) were agreed by the respondents to be experienced to a severe degree by NICs
in planning their project tasks in building project procurement systems in Nigeria,
and as such should be taken seriously and addressed accordingly.
However, late honoring of payments certificates, too many variations, and technical
incompetence, were found to be the most severe challenges faced by NICs in project
planning. The research further discovered that these identified challenges faced by
NICs in executing project planning emanates from the clients, consultants and the
contractors as well. The result indicates that the distribution of rankings is the same
among the respondents on the challenges of NICs project planning in building
187
procurement systems, hence, confirming that all the respondents agrees on the
challenges face by NICs in the planning of building projects.
Late honoring of payments certificates, too many variations, and design deficiencies
in the NCI, are challenges emanating from consultants and clients, which according
to Aina and Jagboro (2002), are due to the deficiencies in clients and consultants
project management procedure. The issue of incompetence is a challenge emanating
from the contractors’ organization. This result concurs with the findings of Aniekwu
and Audu (2010), Bala et al. (2009), Bustani and Muazu (2004), Achuenu, et al.
(2000), and Adams (1997), that NICs are incompetence.
The implication of this result is that unless these challenges are taken seriously and
addressed accordingly, the project planning performance of NICs will never
improve. The challenges emanating from the clients and consultants can be
controlled through prompt honoring of payment certificates, curtailing variations
through exhaustive brief evaluation, adequate feasibility study and appropriate scope
definition, and adherence to project management procedures (Aniekwu & Audu,
2010; Bala, et al. 2009; Aina & Jagboro, 2002). The NICs can curtail their issue of
incompetence through the development of entrepreneurial skills and the adoption of
project management (Ekundayo, et al.,2013; Bala, et al. 2009).
5.6 Influencing Factors for NICs Project Planning
The fifth objective was to identify significant factors that can influence NICs project
planning in building projects procurement systems. The data analysis and
questionnaires responses from NICs, consultants and PBPs revealed that the
188
identified influencing factors (Table 4.16) were agreed to be significantly important
in influencing NICs building projects planning in building procurement systems by
all the respondents. Besides, technical competence, contractor's project management
capability and understanding contractors’ procurement tasks were assessed to be the
most important factors. This result indicate that the distribution of ranking among
the respondents is the same, hence confirming that all the respondents are in
agreement that the factors are significantly important to NICs project planning.
It is therefore necessary for NICs to take these factors seriously in developing their
project planning potentials. Research on NICs by Aniekwu and Audu (2010); Bala et
al. (2009); Muazu and Bustani (2004); Saleh (2004); Achuenu, et al. (2000); Adams
(1997) confirmed that technical competence, among other things, is a panacea for
NICs to improve on its project planning performance. Research has also shown that
the adoption of traditional management in the NCI, despite its shortcomings, has
contributed to NICs underperformance in project management (Ekundayo et al.
2013).
By implication, this result reveals that NICs attainment of the significant factors that
can influence project planning will improve the NICs potentials in the planning of
projects in any type of building project procurement system. Project management
gives the NICs avenue to develop these potentials (Ekundayo, et al., 2013); as it
employs the application of efficient ways required for the attainment of project
success, exposes hindrances and proffers ways of curbing them to achieve project
success (Kerzner, 2000). Moreover, if NICs are not able to acquire these significant
factors, and other project stakeholders such as clients and consultants, are not able to
189
meet the factors emanating from them like prompt honoring of payment certificate,
then the vision of the NCI of developing the NICs to compete national and
internationally will never be achieved. The attainment of these influencing factors for
NICs project planning will facilitate its meeting international construction best
practice.
5.7 Contractors’ Project Planning Success Indicators
The sixth objective was to identify contractors’ project planning success indicators in
building project procurement systems. Data analysis and questionnaire responses
from the NICs, consultants and PBPs revealed that contractors’ project planning
success indicators identified (Table 4.18) were important to contractors in achieving
project planning success. In addition, plan's adherence to time, plan's adherence to
quality and, adequacy of plan in determining suppliers' delivery dates are the most
important contractors’ project planning success indicators in project planning. This
result indicates that the distribution of rankings is the same among the respondents
on contractors’ project planning success indicators in building project procurement
systems.
The contractors’ aim of planning construction project is to pre-determine how their
project objectives will be achieved (Chitkara, 2012), and the attainment of this aim
requires that project plans meet the: essential characteristics of good project plan,
basic use/benefits of contractors’ project planning and, things being considered by
supervision engineers’/architects’ when checking to ensure the effectiveness and
efficiency of contractor’s project planning. This result agrees with the publications
of: Gahlot and Dhir (1992) on the essential characteristics of good project plans;
190
Chitkara (2012) and Seeley (1986) on the use/benefits of project plans. The result is
also in line with Scott’s (1995) finding on the things being considered by supervision
engineer’s/architect’s when checking to ensure the effectiveness and efficiency of
contractor’s project plans.
Furthermore, the research agrees with the opinion of Krishnamurthy and Ravindra
(2010) that a contractor’s project plan should be flexible to accommodate changes
brought about by unexpected events. It also agrees with the finding of Scott (1995)
that the contractor’s project plan should be comprehensible and realistic in predicting
what will happen in future. The implication of this result is that contractors who
understand and adhere to these indicators will be able to address their management
and project planning incapacity, and enhance their probabilities in delivering
building projects successfully (Scott, 1995).
5.8 NICs Project Performance Case Study
This study conducted a collective case study on some selected NICs projects
performance historic (documentary) data. The case study solely aimed at probing the
responses received from the questionnaires so as to ascertain whether the
performance and involvement, planning challenges and application of planning
techniques in procurement systems in the NICs follow the same pattern. The
collective case study revealed the following:
Both public and private clients involved NICs in traditional and non-
traditional procurement systems.
Seventy three percent (73.33%) of the clients are public clients, while 26.67%
are private clients.
191
Public clients procured 91.67% of their projects through traditional
procurement systems, while private clients procured 8.33% of their projects
through traditional procurement systems.
Private clients procured 78.26% of their projects through the non-traditional
procurement systems, as against 33.33% procured through non-traditional
procurement systems by public clients.
Ninety three percent (93%) of the projects recorded cost overruns ranging
between 46% and 152.29%.
All the projects (100%) recorded time overruns ranging between 23.53% and
361.54%.
Seventy three percent (73.33%) of the projects experienced late honouring of
payment certificates resulting in delays.
Virtually eighty seven percent (86.67%) of the projects experienced high
frequency of variations.
Almost fifty four percent (53.85%) of the causes of variations are design
inadequacies, omitted items in the BOQ, poor work definitions, and the
clients’ changes in decision, which constitute 46.15% of the causes of
variation.
Contractors, consultants and clients all contributed to delays. But clients and
consultants are the main causes of delay, due to indecision, poor feasibility
studies and design inadequacies.
Twenty percent (20%) of the projects were poorly finished and delayed as a
result of contractors’ incompetence.
192
Virtually forty seven percent (46.67%) of the projects encountered changes in
prices of materials and labour, due to delays emanating from the clients and
the consultants.
Nearly sixty seven percent (66.67%) of the contractors used bar chart only for
planning their project programmes, 33.33% of the contractors did not used
any planning tool and none of the contractors combined two planning
techniques for planning a project.
None of the contractors applied computer software/application package in
planning their projects.
The collective case study result revealed that the NICs: are involved in both
traditional and non-traditional procurement systems (DB method only);
underperformed in terms of cost and time; and experienced project planning
challenges. All these are in conformity with the questionnaire responses. However,
the case study revealed most of the contractors (67%) applied only bar chart as their
planning technique. None of the contractors used computer software/application
packages in planning their projects. This confirms that NICs apply only bar chart and
do not used computer software/application packages in planning. This result conflicts
with the contractors’ questionnaire responses that revealed that few contractors’
(33%) apply the appropriate planning techniques combination; bar chart and CPM. It
also conflicts with the contractors’ questionnaire responses on computer application
in planning.
193
5.9 Measures for Enhancing NICs Project Planning
Respondents identified 23 measures (Table 4.18) that can enhance NICs projects
planning through open-ended questions. The measures identified with high level of
importance in descending order are: adequate and competent workforce, efficiency of
firms’ management systems, fairness and transparency in the construction industry,
uninterrupted project cash flow, use and adherence to appropriate planning
techniques, and training and retraining of contractors’ workforce.
These results are in agreement with the assertions and findings of Muazu and Bustani
(2004), Aniekwu and Audu (2010) and, Ekundayo, et al. (2013) on the reasons
behind the poor projects management performance of the NICs in the NCI. Muazu
and Bustani (2004) reported that NICs are characterised with an incompetent
workforce, poor projects planning and scheduling, and poor management systems.
These, according to Muazu and Bustani (2004), among other factors defines the
underperformance of the NICs in the NCI. Aniekwu and Audu (2010) agree with this
assertion and advocate for the adoption of project management techniques and the
embarking on continous training and retraining of the NICs personnel. To Ekundayo,
et al. (2013) the adoption of the traditonal management approach is majorly the
cause of the NICs projects management underperformance, and they advocated for
the adoption of project mangement techniques by the NICs in the management of
their projects. Hence, there is a need for the NICs to adopt project management
techniques for them to improve on their project planning, which will eventually
improve their project amangement potentials.
194
5.10 Strategy for NICs Projects Operational Planning
This study used literature review and the findings from its objectives to establish a
strategy for NICs project operational planning.The responsibility of project planning
in the contractors’ organization should be headed by the contractors’ project
managers, and the contractors organizations should provide all the necessary
resources that will enable the project manager achieve project management success.
The strategy is subdivided into: initiation, implementation, monitoring and
controlling, and completion.
5.10.1 Initiation Stage
The initiation stage is divided into three stages: acquisition of project operational
planning influencing factors, development of contractor’s projects operational plan
using the TFV concepts, and project resource organization.
Acquisition of Projects Operational Planning Influencing Factors
The first step at the initiation stage for the strategy for NICs project operational
planning is for contractors to acquire the skills and adhere to the conditions that will
significantly influence their project operational planning towards project success.
This is in compliance with the concept of management-as-planning in the theory of
planning (Kraemer, et al., 2014; Koskela & Howell, 2002b). The concept advocated
that management involves planning and organizing (Kraemer, et al., 2014; Koskela
& Howell, 2002b). At the planning stage, according to Kraemer, et al. (2014), there
are two functions involved; managerial and effector. The managerial function
bestowed the responsibility of projects planning to the management and as such, it
becomes necessary for the contractors’ management to acquire skills that will enable
195
it perform its duty of planning its projects operations (Kraemer, et al., 2014, Koskela
& Howell, 2002b). The skills were identified in this study’s objective five (Table
4.16) and were assessed to be very important for influencing NICs project
operational planning.
However, prompt honoring of payment certificates is excluded; this is because it is
emanating from the clients side and is beyond the control of the contractors. Hence,
the factors that constitute NICs project planning influencing factors includes:
technical competence, contractors’ project management capability, understanding
contractors’ project procurement tasks, contractors’ project managers’ capability ,
adherence to the concept of buildability/constructability, improvement of
contractor’s business knowledge, adequacy of plant and equipment, compliance with
safety procedures, contractor’s project organizational structure, fairness and
transparency in industry’s business culture, understanding environmental laws,
understanding all types of procurement systems, good response to weather and
contractor’s ICT compliance. The next step at the initiation stage is for the contractor
to use the skills he has acquired to develop projects operational plan using the TFV
concepts.
Development of Project Operational Plan Using the TFV Concepts
This stage involves a series of successive steps and procedures using the TFV
concept and is in compliance with the ‘effector’ part of the management-as-planning
in the theory of planning. The effector part of planning is concerned with making
sure that what is planned is accomplished effectively and efficiently (Kraemer, et al.,
2014, Koskela & Howell, 2002b). These steps and procedures serve as measures that
196
will ensure effective accomplishment of contractors’ project operational plan. The
steps and procedures are:
i. Identify scope of contractors’ contractual obligation
ii. Identify and acquire the preconditions necessary for the commencement of all
the contractors’ tasks within its contractual obligations.
iii. Identify each and every discrete tasks (operations) within the scope of the
contractor’s contractual obligation.
iv. Capture all the contractors’ tasks (operations) by top-down decomposition
(work breakdown structure; WBS) within the project transformation path.
v. Establish the best method for executing each task through: elimination of
non-value adding activities (e.g. idleness, waiting time, etc.), improved
efficiency (value-adding activities), elimination of process time and flow
variability, and match value with client requirements.
vi. Plan the project operations using the CPM, which will be used to establish
(Bailey, et al., 2008): total tasks constituted in the project, how each and
every tasks are related, tasks duration and cost, tasks demand on resources,
degree of flexibility or floats of the individual tasks within the project,
milestones and, the project minimum lead time (critical path).
vii. Use bar chart as a supplementary planning technique to establish a project
operation schedule and to serve as a control chart for trending and tracking
project schedule performance.
viii. The project manager should also use the contractors’ project planning success
indicators (Table 4.18) as a standard performance of project planning and use
it as a controlling unit to gauge project planning performance.

197
Contractor’s Project Resource Organization
The next stage is to organize the project resource and this is in compliance with the
concept of planning-as-organizing. This requires the assembly of the necessary
resources for carrying out the work defined in the plan (Kraemer, et al., 2014; Weiss
& Wysocki, 1992). The project manager should used CPM to assemble the project
resources; which can be referred to as assets, actions and strategy that can be drawn
or used by a person or an organization in order to function effectively (Oxford
Dictionary of English, 2000). Therefore, the contractor’s project resources include:
materials, finance, manpower, plant and equipment, time, space, and project
organizational structure (management).
The activities involves in the contractor’s project resource organization are:
I. The contractor adopts a project management organizational structure
(Kerzner, 2000); organizes and manages work flow and project coordination
horizontally and vertically.
II. Defines the work tasks with the responsibilities
III. Allocates tasks to positions and designs the procedures in the organization.
IV. Selects adequate operatives for the positions.
The next stage is the implementation stage.
5.10.2 Implementation Stage
The implementation stage is further subdivided into two stages: the execution stage
and the monitoring and controlling stage.
198
The Execution Stage
At this stage the contractor’s project manager put the project operational plan
developed using the CPM into action. The contractor uses the CPM as a basis for
dispatching tasks to work stations. In dispatching tasks, the contractor should make
sure that workflow of all critical tasks along the critical path is not delayed. The
dispatching of all other tasks not on the critical path can be delayed but not to an
extent of affecting the overall duration of the project.
The methods/tools used in instructing the tasks execution to the contractor’s
operatives should be communicated in the right way. The contractor should create a
feedback mechanism from the operatives to ensure that the instructions passed to
them on the tasks dispatched are clearly understood and comprehensive.
Monitoring and Controlling Stage
This stage goes concurrently with the execution stage. At this stage, the contractor’s
project manager monitors and controls the project planning performance. The bar
chart should be used to monitor the project schedule performance, while the
contractor’s project planning success indicators should be used to monitor project
planning success. Both the bar chart and the success indicators are then used to
control the contractor’s project operational plan. The controlling aspect is concerned
with noting deviations in the schedule performance and success indicators. These
deviations are then subjected to the scientific experimental method of control; which
involves uncovering the causes of deviation and proffering solutions to counter its
effects on the project plan. This process should be a continuous process throughout
the execution stage and should be considered a learning process. These solutions are
199
then effected in the project plans, and the lessons learn can also be applicable to
subsequent projects.
5.10.3 Completion Stage
This stage comes after the accomplishment of the project operational plan. At this
stage the contractor should document all the lessons learned from the challenges, and
the deviations encountered during the execution of the project operational plan. The
lessons learned from the execution of a project plan should be used in solving similar
challenges and deviations encountered in prospective project planning. Figure 5.1
depicts a flow chart of the strategy for contractors project operational planning
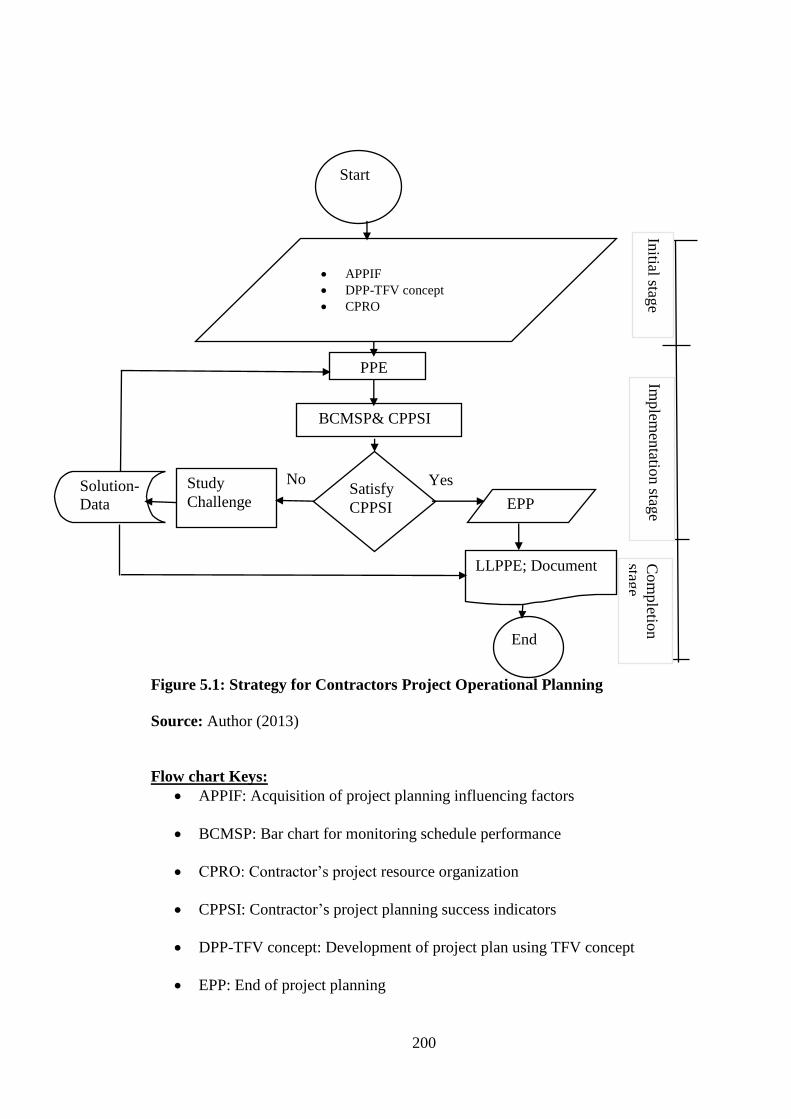
200
No Yes
Figure 5.1: Strategy for Contractors Project Operational Planning
Source: Author (2013)
Flow chart Keys:
APPIF: Acquisition of project planning influencing factors
BCMSP: Bar chart for monitoring schedule performance
CPRO: Contractor’s project resource organization
CPPSI: Contractor’s project planning success indicators
DPP-TFV concept: Development of project plan using TFV concept
EPP: End of project planning
No Yes
Initial stag
e Im
plem
entatio
n stag
e C
om
pletio
n
stage
BCMSP& CPPSI
PPE
Satisfy
CPPSI
Study
Challenge Solution-
Data
EPP
LLPPE; Document
End
Start
APPIF
DPP-TFV concept
CPRO
0
20
40
60
80
100
1st Qtr 2nd Qtr 3rd Qtr 4th Qtr
East
West
North

201
PPE: Project plan execution
LLPPE: Lesson learned during project planning execution.
202
CHAPTER SIX
6.0 CONCLUSIONSAND RECOMMENDATIONS
6.1 Introduction
This chapter is concerned with the result that is derived from the reasoned judgement
of the issues raised by this study (Oso & Onen, 2011).
This study aimed at investigating NICs project operational planning in construction
procurement and to establish a strategy for NICs project operational planning that
will ensure successful project delivery in the NCI. This was in relation to the
underperformances of the NICs project delivery due to: inexperience, inappropriate
application of project planning techniques, none appreciation of project planning
challenges, inadequate understanding of factors that can significantly influence
project planning; and poor understanding of contractor’s project planning success
indicators, compared to other developed countries.
This study used six objectives to achieve its aim. The study objectives determine the
data collection methods and analysis used. The data obtained were subsequently
interpreted in line with the study objectives. This study used both quantitative
(exploratory and descriptive) and qualitative design methods (explanatory-case
study). The quantitative design methods employs an explorative technique through
literature review to identify most importantly, the variables and constructs that
produce questions used to answer the study objectives. Afterwards, interviews were
used to identify additional variables and constructs to enrich the study
questionnaires. The questionnaires were then pretested before being administered to
203
contractors, consultants and PBPs in northern Nigeria using a purposive sampling
technique. The qualitative method employs an explanatory technique through a
collective case study to probe the contractors’ questionnaire responses. The
contractors for the case study were selected through a stratified random sampling
technique. The quantitative method used Spearman’s correlation, Chi-square,
Kruskal-Wallis H test, AMS, frequencies and percentages for its analysis, while the
qualitative method used Bloom’s taxonomy hierarchy, frequencies and percentages
for its analysis.
These study objectives were to: establish the level of NICs involvement in building
procurement systems; examine NICs time and cost performances in building
procurement systems; investigate NICs application of project planning techniques for
contractual operations in project procurement; identify and evaluate NICs project
planning challenges in building procurement systems; identify and evaluate
significant factors that can influence NICs project planning in projects procurement
systems; and identify and evaluate contractor’s project planning success indicators in
building project procurement systems. This study was able to achieve its stated
objectives.
The results for this study hypotheses show that:
NICs are involved in both traditional and non-traditional procurement
systems in the NCI.
NICs underperformed in terms of time and cost in building projects
procurement systems in Nigeria.
204
NICs inappropriately apply planning techniques in planning their projects
procurement tasks.
All the respondents are in agreement on the factors that constitute NICs
project planning challenges in building projects procurement systems.
All the respondents are in agreement on the factors that can significantly
influence NICs project planning in building projects procurement systems.
All the respondents are in agreement on the factors that determines
contractors’ project planning success indicators in building procurement
systems.
6.2 Summary of Findings
In the light of the study objectives and hypotheses, this study presents the following
as its summary of findings:
i. The NICs are involved in both traditional and non-traditional procurement
systems. Their major clients are the public client (75%) and the majority of
the public client projects (77.54%) were contracted through the traditional
procurement system. While, majority of the private clients projects (53%)
were contracted through the non-traditional procurement systems. However,
the NICs frequency of involvement in both traditional and non-traditional
procurement systems is very low and, it is much lower in the non-traditional
procurement systems.
ii. The NICs underperformed in projects time and cost in both traditional and
non-traditional procurement systems. NICs project performance record high
rates of time and cost overruns. The NICs projects delivery time overrun rates
205
range from 34-146% in traditional procurement systems and 45-60% in non-
traditional systems. Their project cost overrun rates ranges from 35-47% in
traditional system and 31-36% in the non-traditional systems.
iii. Some of the NICs do not apply project planning techniques, and majority of
the NICs that applies project planning techniques applied it inappropriately.
The NICs do not use computer application for project planning.
iv. Twenty two (22) projects planning challenges experienced by NICs were
identified, and assessed to be experienced to a severe level by NICs during
their projects planning (Table 2.15). The most severe challenges are: late
honouring of payment certificates, technical incompetence, design
deficiencies, materials shortages/supply and, delays, increase in prices of
materials/labour, inadequate documentations, and projects complexity and,
disputes.
v. Fifteen (15) factors were identified and assessed to be significantly important
for influencing NICs project planning in any type of procurement systems
(Table 4.12). The factors in order of importance are: technical competence,
contractor’s project management capability, understanding contractor’s
procurement tasks and, contractor’s project manager’s capability.
vi. Sixteen (16) contractors’ project planning success indicators’ were identified,
and acknowledged to be very important in determining contractor’s project
planning success (Table 2.17). The contractor’s project planning success
indicators in order of importance are: plan’s adherence to time, plan’s
206
adherence to quality, adequacy of plan in determining suppliers’ delivery
dates, plan’s adherence to cost, plan’s adherence to project technical
requirements, ability of plan in facilitating project resource organization,
plan’s capability to accommodate contractor’s work, plan’s provision of basis
for preparing schedules, plan’s efficiently integrates subcontractors work and,
plan’s flexibility.
6.2 Conclusions
This study used literature review, interviews, questionnaire survey methods, and a
collective case study to attain its aim of investigating NICs projects planning, and to
establish a strategy for NICs project planning in building projects procurement
systems. The study concludes that:
NICs are involved in both traditional and non-traditional procurement
systems. However, their frequency of involvement in both traditional and
non-traditional procurement systems is very low and it is much lower in the
non-traditional procurement systems. NICs lack adequate experience in the
management of non-traditional building projects and this contributes to their
poor projects planning.
NICs underperformed in terms of time and cost in both traditional and non-
traditional project procurement systems. NICs project performance record
high rates of time and cost overruns. This is as a result of their inability to
plan their projects.
207
Some NICs used their central administration instead of their project managers
to plan their projects operations; some NICs do not apply a project planning
technique. Majority of the NICs apply project planning techniques,
inappropriately. NICs do not adopt ICT in projects planning. NICs poor
attitude towards project planning contributed to their underperformance in
project time and cost. This is an indication of the NICs poor project
management capability.
NICs experienced severe challenges in project planning. The most severe
challenges experienced are: late honouring of payment certificates, technical
incompetence, design deficiencies, materials shortages/supply, delays,
increases in prices of materials/labour, inadequate documentation, and
projects complexity and disputes. These challenges emanate from the
contractors, consultants, and PBPs.
The factors that can positively influence the NICs project planning
performance were identified to be important. The most important factors are:
technical competence, contractor’s project management capability,
understanding contractor’s procurement tasks and, contractor’s project
manager’s capability.
The identified contractors’ project planning success indicators are important
to the NICs for attaining project planning success. The most important
success indicators in descending order are: plan’s adherence to time, plan’s
adherence to quality, adequacy of plan in determining suppliers’ delivery
208
dates, plan’s adherence to cost, plan’s adherence to project technical
requirements, ability of plan in facilitating project resource organization,
plan’s capability to accommodate contractor’s work, plan’s provision of basis
for preparing schedules, plan’s efficiently integrates subcontractors work and,
plan’s flexibility. The NICs adherence to these factors will guide their project
planning capability, as well as ensure their project planning success.
This study concluded that the inability of the NICs in project planning is as a
result of non-adoption of project management techniques.
6.2.1 Addition to Knowledge
Notable contributions to knowledge of this study are explained in the following
paragraphs:
Most literatures available on building projects procurement (Bailey, et al., 2008;
Harris & McCaffer, 2005; Bennett, 2003) explained the role of the three principal
parties in project management (client, contractor, and consultant) in relation to
various procurement systems in a way that is complex to comprehend. The
information they provide did not explicitly enumerate at each stage of the project
delivery system the role of the contractor in the various procurement systems
available. This study however, used literature review to explicitly enumerate in detail
the roles of contractors at each stage of the project delivery systems in the building
project procurement systems.
Previous studies revealed that NICs have less patronage compared to their foreign
counterparts (Aniekwu & Audu, 2010; Bala, et al., 2009; Oladapo, 2006; Muazu &

209
Bustani, 2004; Adams, 1997). In addition, other studies revealed the application of
building project procurement systems in the NCI (Ikediashi et al. 2012; Idoro,
2012b; Mbamali & Okotie, 2012; Babatunde, et al. 2010; Ibrahim 2008; Ojo, et al.,
2006). However, none of the studies provided a detail account of the NICs level of
involvement and performance in building projects procurement systems. This study
revealed the extent of NICs involvement and performance in project delivery
systems. The NICs are involved in both traditional and non-traditional procurement
systems. However, their extent of involvement (experience) in non-traditional
procurement systems is very low.
Despite several studies acknowledgement of the NICs inability to plan their projects
(Ekundayo, et al., 2013; Aniekwu & Audu, 2010; Bala, et al., 2009; Muazu &
Bustani, 2004; Saleh, 2004; Achuenu, et aI., 2000; Adams, 1997), none investigated
the NICs project planning. This study investigated NICs project planning, and
provided information on NICs: planning techniques application, planning challenges,
and project planning influencing factors. It also established contractors’ project
planning success indicators, which can be used as a standard for contractors’ project
planning performance (benchmark), as well as a controlling unit for contractors’
project planning monitoring and control. This study established a strategy for
contractors’ operational planning using the theory of project management.
The research on the application of ICT in the NCI has been centred on general
application across the industry (Inuwa, 2006; Oladapo, 2006). However, studies on
NICs adoption and application of ICT in the management of projects is not available.
This study to some extent depicts the level of NICs ICT adoption in project planning.
210
The findings of this study are a valuable resource and reference in academia in the
teaching and understanding of the actual position of the NICs as it relates to:
involvement and performance in building project procurement in the NCI,
application of project planning techniques, project planning challenges, project
planning influencing factors, ICT application in project planning, and what
constitutes contractors’ project planning success indicators. It will as well provide
information on indigenous contractors’ project planning attitude in developing
countries.
6.3 Recommendations
This study has argued that NICs low level of involvement in the execution of
building projects in NCI negatively affects their competency and capability to
adequately plan projects. Their underperformance in cost and time is argued
to result from poor project planning. It has also argued that NICs have a poor
attitude towards project planning and do not adopt ICT in their project
planning. Besides, the NICs experience severe challenges in the execution of
their project operational plans. These challenges can be curbed by acquiring
and adhering to factors that can influence their project planning. This study
also argued that the NICs understanding and adherence to contractors’ project
planning success indicators will guide the NICs in the planning and
management of projects to ensure project success. Based on this study
findings, the following recommendations are proffered:

211
The NICs should acquire skills for the management of non-traditional
procurement systems.
There should be developmental effort by the Nigerian construction
academicians and the Nigerian Government to train NICs in the management
and planning of building projects in the non-traditional procurement systems.
The Nigerian Government should patronize NICs in the execution of building
projects in non-traditional procurement systems. The Government should also
encourage private clients to engage more NICs in the execution of their
projects.
The Nigerian Government should create and enforce a policy that will ensure
the involvement of competent NICs in the NCI.
The NICs and the NCI should discard the traditional management approach
and adopt the project management approach. The NICs should organize their
project tasks horizontally and vertically, so as to ensure extensive planning
and coordination. In addition, the NICs should adopt the concept of
buildability.
The NICs should apply the appropriate project planning techniques. They
should employ competent personnel and embark on continuous training, and
also adopt ICT in their operations.
The NICs should invest in knowledge management so as to keep abreast with
global trends in the construction industry.

212
The standard form of contracts used in Nigeria should be reviewed to include
a clause enforcing contractors to apply the appropriate project planning
techniques.
Clients should promptly honor payments certificates and adhere to project
management procedure.
Consultants/contractors should employ exhaustive evaluation of briefs,
adequate feasibility study, and appropriate scope definition to curtail
variations.
The NICs should acquire entrepreneurial and project management skills.
The NICs should improve on their technical competence and acquire project
management capability.
The NICs should have a good understanding of their role in project
procurement systems.
The NICs should use the contractors’ project planning success indicators as a
guide in the management and planning of their project operational tasks.
The NICs should use the contractors’ project planning success indicators as a
standard for project planning performance, and as a controlling unit for
monitoring and controlling project planning performance.
213
Project management course should be introduced in the curricula of
vocational training centres, technical colleges, polytechnics, colleges of
education and universities across Nigeria.
The findings of this study should serve as a basis for further research to
improve on contractors’ project management performance.
6.3.1 Recommendations for Further Studies
This study recognized from its findings, areas of concern and importance to NICs
project planning that could not be studied appropriately in the course of this work,
hence are worthy of further study.
1. Factors Inhibiting NICs Application of Project Management
This study discovered that one of the major problem militating against the
NICs adequate project planning, and project management performance is
their non-adoption of the project management techniques in the planning and
management of projects. Further study can be conducted to investigate factors
inhibiting the NICs in applying project management so as to proffer solutions
to that effect.
2. NICs ICT Literacy and Application in Project Management
The volume and complexity of information generated during project planning
and management calls for the adoption of ICT if success is to be attained in
project management. However, this study discovered that virtually all the
NICs involved in this study do not adopt ICT in planning building projects.
Therefore, further study can be conducted to investigate the level of NICs
214
ICT literacy and application, and what factors hinder NICs adoption of ICT in
project planning.
3. Review of Standard Form of Construction Contracts in Nigeria.
The FMHUD standard form of contract used in Nigeria was adopted from the
British standard form of contract (Joint Contract Tribunal; JCT). This study
discovered that most of the clauses on project planning do not emphasized the
planning techniques to be used for building projects; presumably because it is
British oriented where most contractors are competent and educated to know
the best technique that will enhance their contract performance (Harris &
McCaffer, 2005). However, that is not the case in Nigeria and other
developing countries, where construction contracting is open to everybody
that can afford to register a company. Most of the contractors lack the basic
skills to use appropriate planning technique in construction. A study can be
conducted therefore to review the standard form of contract in order to
introduce measures that will enforce proficiency on contractors.
4. Contractors Competency Requirements for Modern Procurement
Systems
A study should be conducted to ascertain contractors’ competency
requirement for the management of modern building procurement systems.
215
REFERENCES
Abdulrazaq, M., & Ahmad, F. (2011). Investigating Clients' Awareness of the
Appointment of a Certified Project Manager. 24th NIQS Biennial Conference
and General Meeting. Abuja: NIQS.
Abubakar, A. E., Grennwood, D., & Osborne, A. (2008). A Study of Project
Planning on Libyan Construction Projects. ARCOM Conference (pp. 789-
798). Cardiff UK: Dainty, A. (Ed) Proceedings of the 24th Annual ARCOM
Conference, 1-3 september, 2008.
Achuenu, E., Izam, Y. D., & Bustani, S. A. (2000). Investigating the Activities of
Indigenous Contractors in the Nigerian Construction Industry. Journal of
Construction Technology and Management, 3(1):91-103.
Adams, S. O. (1997). Contractor Development in Nigeria: Perception of Contractors
and Professionals. Journal of Construction Management and Economics,
15:95-108.
Adebanjo, A. (2012). Institutional Framework for Achieving Value for Money in
Construction Projects in Nigeria. 1st National Project Cost Reduction
Summit. Abuja: Quantity Surveyors Registration Board of Nigeria (QSRBN).
Adindu, C. C. (2012). Developing Templates for Project Costing in Nigeria: Basic
Considerations. 1st National Project Cost Reduction Summit. Abuja:
QSRBN.
Aina, A. A., & Jagboro, G. O. (2002). The Effects of Construction Delays on Project
Delivery in Nigerian Construction Industry. International Journal of Project
Management, 20: 593-599.
Aina, O. O., & Wahab, A. B. (2011). An Assessment of Buildability Problems in the
Nigerian Construction Industry. Global Journal of Researches in
Engineering, vol 11 (2), version 1.0: 43-52.
Alzahrani, J. I., & Emsley, M. W. (2013). The Impact of Contractors' Attributes on
Construction Project Success: A Post Construction Evaluation. International
Journal of Project Management, 31: 313-322.
Ameh, J. O., & Odusami, K. T. (2010). Nigerian Building Professionals' Ethical
Ideology and Perceived Ethical Judgement. Australian Journal of
Construction Economics and Building, 10(3):1-13.
Ameh, O. J., & Odusami, T. (2002). Factors Affecting Labour Productivity in the
Nigerian Construction Industry: A Case Study of Indigenous Contracting
Organisation in Lagos. The Quantity Surveyor: Journal of the Nigerian
Institute of Quantity Surveyors, 40(3):14-18.
216
Ameh, O. J., Odusami, K. T., & Achi, F. O. (2007). An Assessment of Professional
Ethics Content in the Academic Curriculum of Construction Disciplines in
Nigerian Universities. Built Environment Education Conference. CEBE.
Anago, I. T. (2001). The Role of Quantity Surveyor in National Development. In
NIQS, Quantity Surveying and Total Cost Management: Context, Issues, and
National Development (pp. 1-18). Lagos: NIQS.
Aniekwu, A. N., & Audu, H. O. (2010). The Effects of Management on Productivity:
A Comparative Study of Indigenous and Foreign Firms in the Nigerian
Construction Industry. Proceedings of West Africa Built Environment
(WABER) Conference, 27-18 July 2010, (pp. 567-578). Accra-Ghana:
WABER.
Anyadike, E. I. (2000). The Role of Procurement Management in the Implementation
of the Open & Competitive Tendering System. In NIQS, Open & Competitive
Tendering in the Procurement of Public & Private Sector (pp. 121-129).
Lagos: NIQS.
Aqua Group. (1999). Tenders and Contracts for Building. 3rd edn. Oxford:
Blackwell Science Ltd.
Ayodele, E. O., Ogunbode, A. B., Ariyo, I. E., & Alabi, O. M. (2011). Corruption in
the Construction Industry of Nigeria: Causes & Solutions. Journal of
Engineering Trends in Economics & Management Sciences, 156-159.
Azhar, N., Farooqui, R. U., & Ahmed, S. M. (2008). Cost Overrun Factors in
Construction Industry of Pakistan. 1st International Conference on
Construction in Developing Countries (ICCIDC-1), 4-5 August, 2008 (pp.
499-500). Karachi: ICCIDC.
Babatunde, S. O., Opawole, A., & Ujaddaghe, I. C. (2010). An Appraisal of Project
Procurement Method in the Nigerian Construction Industry. Civil
Engineering Dimension, 12(1):1-7.
Bailey, P., Farmer, D., Crocker, B., Jessop, D., & Jones, D. (2008). Procurement
Principles and Management. England: Pearson Education Limited.
Bala, K., Bello, A., Kolo, B. A., & Bustani, S. A. (2009). Factors Inhibiting the
Growth of Local Construction Firms in Nigeria. Procs 25th ARCOM
Conference, 7-9 Sept. 2009 (pp. 351-359). Nottingham U.K.: ARCOM.
Bamisile, A. (2008). Project Planning and Scheduling for Effective Project Delivery.
The Quantity Surveyor: Journal of the Nigerian Institute of Quantity
Surveyors, 55(1):11-17.
217
Bennett, F. (2003). The Management of Construction Projects: A Life Cycle
Approach. Oxford: Butterworth-Heinnemann.
Bhavikatti, S. S. (2012). Building Construction. New Delhi: Vikas Publishing House
PVT Ltd.
Buys, N. S. (2004). Building Maintenance Management Systems in South African
Tertiary Institutions. Port Elizabeth: PhD Thesis, University of Port
Elizabeth.
Chitkara, K. K. (2012). Construction Project Management: Planning, Scheduling &
Controlling. New Delhi: Tata McGraw-Hill.
Crafford, G. J. (2007). Clients' Views on Construction and Design Team
Competencies. South Africa: PhD. Thesis: NMMU.
Dada, M. O. (2012). Predictors of Procurement Selection: An Investigation of
Traditional & Integrated Methods in Nigeria. Journal of Construction in
Developing Countries, 7(1): 69-83.
Dahiru, A. D., & Mohammed, I. Y. (2012). The Roles of Researchers in the
Construction Sector towards Achieving Millenium Development Goals.
Journal of Science & Multidisciplinary Research, 4: 8093.
Dahiru, A., Bala, A., & Bustani, S. A. (2010). Assessing the Critical Success Factors
of BOT Projects in Nigeria. Second Internation Conference on Construction
in Developing Countries, (pp. 201-209). Cairo-Egypt.
Eigege, A. (2005). Fundamentals of Management. Jos-Nigeria: His Grace Press.
Ekundayo, D., Jewell, C., & Awodele, O. A. (2013). Executive Project Management
Structure and the Challenges Facing its Adoption in the Nigerian
Construction. International Journal of Architecture, Engineering and
Construction, vol2(3):158-169.
Emuze, F. A. (2011). Performance Improvement in South African Construction.
South Africa: PhD Thesis NMMU.
Enshassi, A., & Shaat, K. (2007). Training Assessment of Palestinian Contractors.
Journal of Construction in Developing Countries, 12(1):39-37.
Enshassi, A., Al-Hallaq, K., & Mohamed, S. (2006). Causes of Contractors Business
Failure in Developing Countries: The Case of Palestine. International
Journal of Construction in Developing Countries, 11(2):1-14.
Federal Ministry of Housing and Urban Development. (2006). Standard Form of
Building Contract. Abuja: Federal Government of Nigeria.
218
Federal Office of Statistics. (1998). Annual Abstract of Statistics. Abuja: FOS
Nigeria.
Field, A. (2006). Discovering Statistics Using SPSS, 2 Ed. London: SAGE
Publications.
Freeman, H. M. (2011). A Review of the Performance of Botswana Citizen Building
Contractors . Nelson Mandela Metropolitan University: South Africa: MSc
Thesis.
Gahlot, P. S., & Dhir, B. M. (1992). Construction Planning and Management. New
Delhi: Wiley Eastern Limited.
Gollenbeck, L. (2008). Planning of Construction Projects: A Managerial Approach.
Siegen: Ph,D Thesis Universitat Siegen.
Gupta, A. K. (2010). Engineering Management, Revised Edn. New Delhi: S Chand
& Company Ltd.
Guthrie, G. (2010). Basic Research Methods: An Entry to Social Science Research.
New Delhi: SAGE Publications India Pvt Ltd.
Hamilton, D. (2006). Contract Staff Management Systems in the Construction
Industry in Nigeria. Pakistan Economic and Social Review, XLIV (1): 1-18.
Harris, F., & McCaffer, R. (2005). Modern Construction Management. Accra: EPP
Books Services.
Holder, L., & Coffey, M. (1997). Customer Feedback and Contractor Appraisal in
Contruction. 13th Annual ARCOM Conference 15-17 September, 1997 (pp.
Vol. 1: 334-341). King's College, Cambridge: Stephenson P. (Ed).
Hughes, W. (2012). The Business of Construction Procurement: Selecting, Defining
and Managing Procurement. Proceedings of the 4th WABER Conference (pp.
24-26). Abuja-Nigeria: Laryea, S., Agyepon, S., Leiringer, R. & Hughes, W.
(Eds).
Ian, M. (2008). An Investigation of Training and Mentoring of Emerging Contractors
in the Eastern Cape. South africa: PhD. Thesis: NMMU.
Ibrahim, A. D. (2011). Investigating Into the Knowledge Requirements of Nigerian
Quantity Surveyors to Meet Future Challenges. 25th Biennial Conference of
The NIQS (pp. 7-18). Abuja: NIQS.
Ibrahim, A. D. (3-8 November, 2008). A Critique of the Operational Philosophy and
Mechanism of Public Procurement Act 2007: Construction Industry
Perspective. 23rd Biennial Conference of NIQS. kaduna: NIQS.

219
Ibrahim, A. D., & Musa-Haddary, Y. G. (2010). Concept of Value for Money in
Public Infrastructure Development. International Workshop on PPP
Approach for Infrastructure Development in Nigeria. Abuja: NIQS.
Ibrahim, Y. (29-30, March, 2012). The Strategies for Reducing the High Cost of
Road and Engineering Projects in Nigeria. First National Project Cost
Summit. Abuja-Nigeria: Quantity Surveying Registration Board of Nigeria
(QSRBN).
Idoro, G. I. (2011a). Comparing Occupational Health and Safetty Management
Efforts and Performance of Nigerian Construction Contractors. Journal of
Construction in Developing Countries.
Idoro, G. I. (2011b). Influence of In-sourcing and Outsourcing of Consultants on
Construction Project Performance in Nigeria. Australian Journal of
Construction Economics and Building, vol 11 (4): 45-58.
Idoro, G. I. (2012). Influence of Projects Plans on the Outcome of Construction
Projecs Procured by D-B in Nigeria. Journal of Construction in Developing
Countries, 17(2):77-99.
Idoro, G. I. (2012a). The Influence of Project Documents on the Outcome of
Construction Projects Procured by Traditional Methods in Nigeria. Journal of
Construction in Developing Countries, 17 (1):1-19.
Idoro, G. I. (2014). Address Presented by Professor Godwin Idoro, Conference Co-
chair CIB Conference 2014. CIB Conference. Lagos-Nigeria.
Idoro, G. I. (2014). Foreword to Conference Book of Proceedings. International
Conference of the International Council for Research and Innovation in
Building and Construction in Developing Countries (CIB) W107 (p. i).
Lagos-Nigeria: University of Lagos and Heriot Watt University, Edinburgh,
UK.
Idoro, G. I., & Akande-Subar, L. O. (2008). Clients' Assessment of the Quality
Performance of Indigenous and Expatriate Construction Contractors in
Nigeria. A paper presented at COBRA: The Construction & Building
Research Conference of the RICS. Held on 4-5 Sept. 2008, at the Dublin
Institute of Technology: RICS.
Idrus, A., & Sodangi, M. (2010). Framework for Evaluating Quality Performance of
Contractors in Nigeria. International Journal of Civil and Environmental
Engineering, 10(01):34-39.
Ikediashi, D. I., Mendie, A., Achuenu, E., & Oladokun, M. (2012). Key Performance
Indicators of Design & Build Projects in Nigeria. Journal of Human Ecology,
37(1):37-46.
220
Inuwa, I. I. (2006). Unit Rate Software Development for Effective Time Management
for Construction Projects in Nigeria. University of Jos-Nigeria: Unpublish
MSc Thesis.
Inuwa, I. I., Iro, A. I., & Dantong, J. S. (2013). Construction Work Items Unit Rate
Model for Building Contractors Project Pricing in Nigeria. Journal of
Engineering and Applied Sciences, 5(1):95-103.
Ireland, L. (2006, December 2). Project Management: Past, Present, Future.
Retrieved from www.osun.org: www.osun.org
Iro, A. I., Inuwa, I. I., & Dantong, J. S. (2013). Investigation Into Contractors
Craftsmen Training in the Nigerian Construction Industry. Internation
Journal of Engineering Research and Technology, 2(1):1-6.
Jatau, A., & Wescott, A. (2011). Sustainable construction in Nigeria: methods of
delivering sustainable. Procs West Africa Built Environment Research
(WABER) Conference, 19-21 July 2011 (pp. 871-882). Accra: Laryea, S.,
Leiringer, R. and Hughes, W. (Eds).
JCT. (2005a). Standard Building Contract Without Quantities. UK: The Joint
Contract Tribunal Limited.
JCT. (2005b). Standard Building Contract With Quantities. UK: Standard Building
Contract Limited.
Jinadu, A. M. (2007). Understanding The Basics of Housing: A Book of Study Notes
for Students in Tertiary Institutions Rvsd Edn. Jos: Jos University Press
Limited.
Judi, S. S., & Rashid, R. A. (2010). Contractor's Right of Action for Late or Non-
Payments by the Employer. Journal of Surveying, Construction & Property ,
vol. 1 (1): 65-95.
Kerzner, H. (2000). Applied Project Management: Best Practices on Implementation.
New York: John Wiley & Sons, Inc.
Knoepfel, H. (1992). Theory and Practice of Project Management in Construction.
International Journal of Project Management, 10 (4): 243-251.
Koskela, L. (2004). Making-Do: The Eighth Category of Waste. 12th International
Group for Lean Construction Conference. Elsinore-Denmark: IGLC.
Koskela, L., & Howell, G. (2002a). The Theory of Project Management: Explanation
to Novel Methods. Proceedings IGLC-10. Gramado-Brazil.
221
Koskela, L., & Howell, G. (2002b). The Theory of Project Management-Problem and
Opportunity. Working Paper. VTT Technical Research Centre of Finland &
Lean Construction Institute.
Kraemer, K., Henrich, G., Koskela, L., & Kagioglou, M. (2014, May 30). How
Construtcion Flows Have Been Understood in Lean Construction. Retrieved
from Professor Lauri Koskela Papers: http://www.laurikoskela.com
Krishnamurthy, K. G., & Ravindra, S. V. (2010). Construction and Project
Management: For Engineers, Planners and Builders. New Delhi: Satish
Kumar J.
Landau, S., & Everitt, B. S. (2003). A Handbook of Statistical Analyses Using SPSS.
London: Chapman & Hall/CRC Press LLC.
Laryea, S. (2010). Contractor project estimates vs. consultant project estimates in
Ghana. The Construction, Building and Real Estate Research Conference of
the Royal Institution of Chartered Surveyors (RICS). Paris: RICS.
Laryea, S., & Mensah, S. (2010). The Evolution of Contractors in Ghana.
Proceedings of the West African Built Environment Research Conference, 27-
28 July, 2010 (pp. 579-588). Accra: Laryea, S., Leiringer, R. &Highes, W
(Eds).
Lindhard, S., & Wandahl, S. (2012). Improving The Making Ready Process-
Exploring The Preconditions To Work Tasks in Construction. 20th Annual
Conference of the International Group for Lean Construction. San Diego-
USA: IGLC.
Maina, S. M. (2012). Qualitative and Quantitative Research Methods Simplified.
Nairobi-Kenya: Printers Mall.
Mangitung, D. M. (2010). Typical Contractor Prequalification Characteristics of
Public Procurement Practices in Indonesia. COBRA Conference. Universite
Paris Dauphine, France: COBRA.
Masood, R., & Chouldhry, R. M. (2010). Identification of Risk Factors for
Construction Contracting Firms- Encompassing Mitigation Stance. 2nd
International Conference on Construction in Developing Countries
'Advancing & Integrating Construction Education, Research & Practices,
August 3-5, 2010. Cairo.
Mathonsi, M. D., & Thwala, W. D. (2012). Factors Influencing the Selection of
Procurement Systems in South Africa. African Journal of Business
Management, 6(10): 3583-3594.
222
Mbamali, I., & Okotie, A. J. (2012). An Assessment of the Threats and Opportunities
of Globalization on Building Practice in Nigeria. American International
Journal of Contemporary Research, vol. (4):143-150.
McNabb, D. E. (2009). Research Methods for Political Science: Qualitative and
Quantitative Methods. New Delhi: PHI Learning Private Limited.
Mogbo, T. C. (2001). The Construction Sector and the Economic Growth of Nigeria,
1981-95. The Quantity Surveyor: Journal of the Nigerian Institute of Quantity
Surveyors, vol. 35 (2): 8-13.
Muazu, D. A., & Bustani, S. A. (2004). A Comparative Analysis of Litigation
Among Foreign and Indigenous Construction Firms in Nigeria. ATBU
Journal of Environmental Technology, 3(1):13-16.
Mugenda, O. M., & Mugenda, A. G. (2003). Research Methods: Qualitative and
Quantitative Approach. Nairobi-Kenya: ARTS Press.
Musa, H., Ibrahim, Y. M., & Ibrahim, A. D. (2011). On the accuracy of cost
estimates: Identifying flaws in Bills of Quantities for Building Projects in
Nigeria. Procs West Africa Built Environment Research (WABER)
Conference, 19-21 July 2011, (pp. 761-769). Accra-Ghana: Laryea, S.,
Leiringer, R. and Hughes, W. (Eds).
Nasiru, Z. M., Kunya, S. U., & Abdurrahman, M. (2012). Assessment of Factors that
Affect Cost Control by Nigerian Construction Contractors. Journal of
Engineering and Applied Science, 71-79.
Nasser, K. (2009, December 28 ). Evaluating Contractor Performance: Application
to The Dubai Construction Industry. Retrieved from www.osun.org
National Planning Commission. (2004). National Economic Empowerment Strategy
(NEEDS). Abuja: National Planning Commission.
National Population Commission. (2010, December 29). Population Distribution by
Sex, State, LGA & Senatorial Districts. Retrieved from NPC-Federal
Republic of Nigeria: http://www.population.gov.ng
Nicholas, C., & Paul, D. (2010). Project Cost-Overruns Factors in Ghanaian Road
Construction Sector. 2nd International Conference on Construction in
Developing Countries, (pp. 1-8). Cairo-Egypt.
Nigerian Institute of Quantity Surveyors (NIQS). (2008). Building and Engineering
Standard Methods of Measurement-3 (BESMM-3). Lagos: NIQS.
223
Nwachukwu, C. C. (2008). The Analysis of Factors that Constraint Project
Management Success of Public and Private Sector Construction in Nigeria.
Owerri-Nigeria: PhD. Thesis: FUTO.
Nwokoro, I., & Onukwube, H. (2011). Sustainable or green construction in Lagos,
Nigeria: principles, attributes and framework. Procs West Africa Built
Environment Research (WABER) Conference, 19-21 July 2011 (pp. 883-895).
Accra: Laryea, S., Leiringer, R. and Hughes, W. (Eds).
Odediran, S. J., Adeyinka, B. F., Opatunji, O. A., & Morakinyo, K. O. (2012).
Business Structure of Indigenous Firm in the Nigerian Construction Industry.
International Journal of Business Research and Management, vol3 (5):255-
264.
Ogunsemi, D. R., & Saka, N. (2006). The NEPAD Iniative and the Challenge of
Efficient Cost Management of Infrastructure Development in Nigeria. NIQS
22nd Bienniel Conference (pp. 14-20). Calabar-Nigeria: NIQS.
Ogwueleka, A. (2011). The Critical Success Fcators Influencing Project Performance
in Nigeria. International Journal of Management Science and Engineering
Management, 6 (5): 343-349.
Ojo, S. O., Adeyemi, A. Y., & Fagbenle, O. I. (2006). The Performance of
Traditional Contract Procurement on Housing Projects in Nigeria. Civil
Engineering Dimensions, 8(2):81-86.
Oladapo, A. (2006). The Impact of ICT on Professional Practice in Nigerian
Construction Industry. The Electronic Journal on Information System in
Developing Countries, 1-19.
Oladimeji, O., & Ojo, G. K. (2012). An Appraisal of Indigenous Limited Liability
Construction Company in South-Western Nigeria. Proceedings of the 4th
WABER Conference, 24-26 July, 2012, (pp. 1095-1109). Abuja-Nigeria.
Oladirin, O. T., Ogunsemi, D. R., & Aje, I. O. (2014). The Causal Relationship
Between Construction Growth and Economic Growth: A Comparative Study
of Nigeria and South Africa. International Conference of the International
Council for Research and Innovation in Building and Construction (pp. 83-
96). Lagos: CIB W107.
Olatunji, A. A. (2010). Influences on Construction Project Delivery Time. South
Africa: PhD Thesis NMMU.
Omagbitse, B. C. (2010). Project Finance Issues for Infrastructure Provision. 3 – Day
International Workshop on Public Private Partnership Approach to
Infrastructure Development in Nigeria. Abuja: NIQS.

224
Omole, A. O. (2001). Quantity Surveyor and Resource Management. In Quantity
Surveying and Total Cost Management: Context, Issues, and National
Development (pp. 42-53). Lagos: NIQS.
Oni, J. O., & Wyk, J. J. (2012). Strategies to Address Skills Shortages in the Nigerian
House Sector. RICKS Conference. Las Vegas, Nevada, USA: RICKS.
Oso, W. Y., & Onen, D. (2011). Writing Research Proposal and Report: A
Handbook for Beginning Researchers, Rsvd edn. Nairobi-Kenya: The Jomo
Kenyatta Foundation.
Oxford Dictionary of English. (2000). Oxford Dictionary of English. Oxford: Oxford
University Press.
Oyediran, O. S. (2006). The 21st Century Quantity Surveying and University
Education. 22nd NIQS Biennial Conference. Calabar-Nigeria: NIQS.
Oyegoke, A. (2006). Managing Client's Expectations in Project Delivery: A
Comparative Study of Delivery Systems. 22nd NIQS Biennial Conference.
Held on 22-25 November, 2006 in Calabar-Nigeria: NIQS.
Oyewobi, L. O., & Ogunsemi, D. R. (2010). factors affecting reworks occurrence in
construction: A Study of Selected Building Projects in Nigeria. Journal of
Building Performance, vol. 1(1): 7-19.
Pallant, J. (2001). SPSS Survival Manual: A Step by Step to Data Analysis Using
SPSS. New South Wales: Allen & Unwin.
Passenheim, O. (2009). Project Management. bookboon.
Peter, A., Divine, K. A., & Dansoh, A. (2010). The Factors Affecting Construction
Performance in Ghana: The Perspective os Small-Scale Building Contractors.
The Ghana Surveyor.
Phaladi, M. J., & Thwala, W. D. (2008). Critical Success Factors for Small &
Medium Sized Contractors in North West Province, South Africa. CIDB
Conference. CIDB.
Popescu, C. M., Phaobunjong, K., & Ovarain, N. (2003). Estimating Building Costs.
New York: MARCEL DEKKER, INC.
QSRBN. (2012). Welcome Address by Husain A. Dikko, President of the Quantity
Surveyors' Registration Board of Nigeria (QSRBN). 1st National Project
Cost Reduction Summit. Abuja-Nigeria: QSRBN.
QSRBN. (2012). Welcome Address by Husaini A. Dikko, President of the Quantity
Surveyors Registration Board of Nigeria (QSRBN) . at the 1ST National

225
Project Cost Reduction Summit Held on 29th & 30th March, 2012. at the
Shehu Musa Yar'’adua Centre, Abuja: QSRBN.
Rashid, R. A., Nasib, M. A., Ahmad, W. W., Taib, I. M., Ali, W. W., & Zainordin, Z.
M. (2006, April 20). Effects of Procurement Systems on the Performance of
Construction Project. Retrieved from www.osun.org
Ricketts, J. T. (2000). System Fundamentals. In F. S. Merrit, & J. T. Ricketts,
Building Design and Construction Hanbook, 6th Edn. (p. Section 1). New
York: McGRAW-HILL.
Roberts, A., & Wallace, W. (2004). Project Management. Edinburgh: Pearson
Education.
Rooke, J., Koskela, L., Howell, G., & Kagioglou, M. (2012, 6 5). Developing
Production Theory: What Issues Need to be Taken into Consideration? 12th
Annual Conference of the International Group for Lean Construction. San
Diego-USA: IGLC. Retrieved from Professor Lauri Koskela:
http://laurikoskela.com
Saleh, M. S. (2004). A Review of the Factors Affecting Contractor Efficiency on
Building Projects. ATBU Journal of Environmental Technology, vol 3(1):62-
68.
Sambo, A. A. (2008). Statistical Principles for Research in Education and Social
Sciences. Zaria-Nigeria: S. Asekome & co.
Scott, S. (1995). Checking The Project Plan. Construction Management and
Economics, 13, 127-136.
Seeley, I. H. (1986). Civil Engineering Contract and Administration. London:
MacMillan Education Ltd.
Shaikh, A. W., Muree, M. R., & Soomro, A. S. (2010). Identification of Critical
Delay Factors in Construction. Sindh University Journal (Science Series),
42(2): 11-14.
Steup, M. (2014, November 6). Epistemology. Retrieved from Stanford Encyclopedia
of Philosophy web site:
http://plato.standard.edu/archives/spr2014/entries/epistemology
Tunji-Olayeni, & Omuh. (2012, December 4th). Srategies for Improving Indigenous
Contractors Participation in R & D in Nigeria. Retrieved from
www.osun.org.
226
Ubani, E. C., Nwachukwu, C. C., & Nwokonkwo, O. C. (2010). Variation Factors of
Project Plan and Their Contributions to Project Failure in Nigeria. American
Journal of Social and Management Sciences, 1(2):141-149.
Uduak, I. I. (2006). Assessment of Indigenous Contractors Participation in
Construction Project Delivery in Nigeria. The Quantity Surveyor: Journal of
the Nigerian Institute of Quantity Surveyors, 54(2):2-9.
Ujene, A. O., Idoro, G. I., & Odesola, I. A. (2013). Contractors Perceptions of
Effects of Project Overhead Costs on Building Project Performance in South-
South of Nigeria. Civil Engineering Dimensions, vol.15(2):102-113.
Usman, N. A., Inuwa, I. I., Iro, A. I., & Dantong, J. S. (2012). Training of
Contractors Craftsmen for Productivity Improvement in the Nigerian
Construction Industry. Journal of Engineering and Applied Sciences, 4:1-12.
Usman, N. D., Inuwa, I. I., & Iro, A. I. (2012b). The Influence of Unethical
Professional Practices on the Management of Construction Projects in North
Eastern Sates of Nigeria. International Journal of Economics Development
Research and Investment, vol3(2): 124-129.
Weiss, J. W., & Wysocki, R. K. (1992). 5-Phase of Project Management: A
Practical Planning & Implementation Guide. Cambridge, Massachusetts:
Perseus Books.
Windapo, A. (2013). Fundamentals of Construction Management. Ventures
Publishing ApS.
Yimam, A. H. (2011). Project Management Maturity in the Construction Industry of
Developing Countries: The Case of Ethiopian Contractors. MSc Thesis:
University of Maryland.

227
APPENDICES
Appendix 1: Questionnaire Cover Letter
JOMO KENYATTA UNIVERSITY OF AGRICULTURE AND
TECHNOLOGY
SCHOOL OF ARCHITECTURE AND BUILDING SCIENCES (SABS)
DEPARTMENT OF CONSTRUCTION MANAGEMENT
NAIROBI-KENYA
18TH March, 2013.
TO WHOM IT MAY CONCERN
Dear Sir/Madam,
PROJECT PLANNING IN CONSTRUCTION PROCUREMENT: The Case of
Nigerian Indigenous Contractors’
I am a Postgraduate student in the above addressed institution conducting a research
on the above subject area. The research is for meeting the requirement for the degree
of Doctor of Philosophy in Construction Project Management at the Jomo Kenyatta
University of Agriculture and Technology, Nairobi. The research aims at
contributing to the development of Nigerian Indigenous Building Contractors in the
discharge of their contractual obligation.
Kindly respond to the attached questionnaire by completing it. By cooperating to
respond to the questionnaire, you are making a significant contribution to the
construction industry as well as to the economic growth of Nigeria.
I assure you that the information you provide will be treated with the utmost
confidentiality and will only be used as an empirical data to enhance the reliability of
the research. Your prompt response will be highly appreciated.
Thanking you in anticipation of your cooperation.
Sincerely yours,
Inuwa Ibrahim Ibrahim Dr. Wanyona Githae
(Reg. Nr: AB443-3627/2012) (Lead supervisor)
PhD (Construction Project Management) Candidate
(Email: [email protected]) (Tel Nr: +2348087775505;
+254738279277)
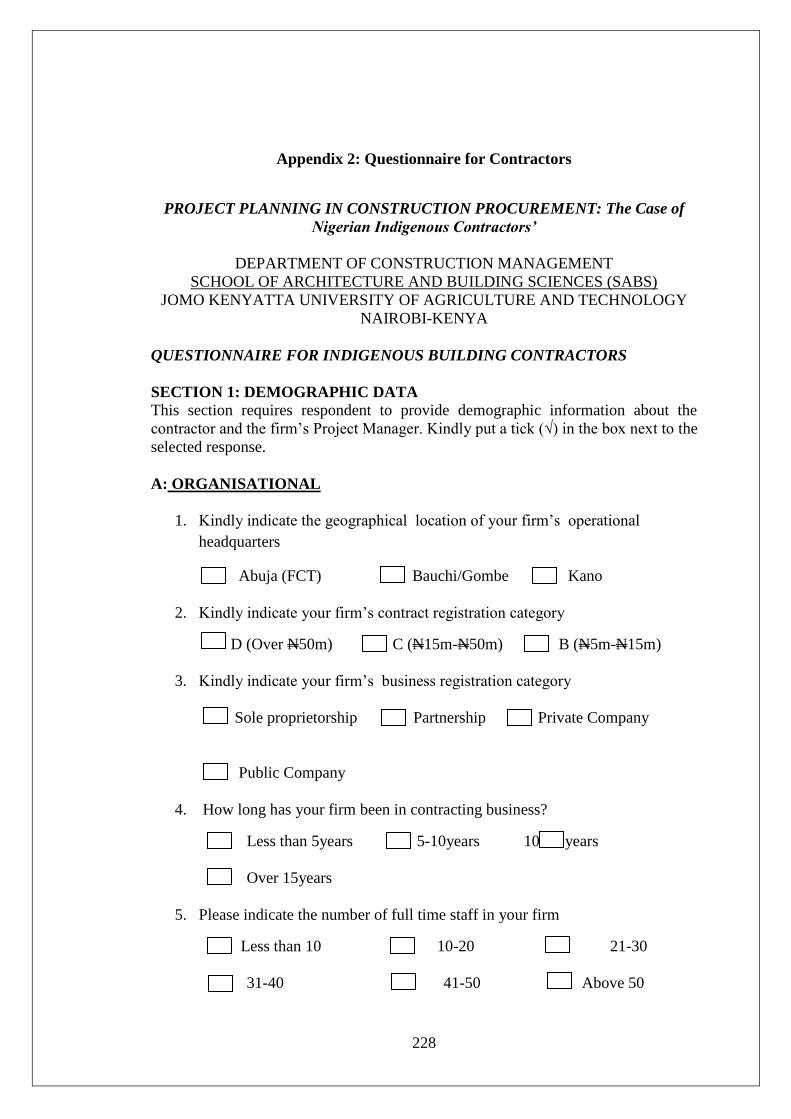
228
Appendix 2: Questionnaire for Contractors
PROJECT PLANNING IN CONSTRUCTION PROCUREMENT: The Case of
Nigerian Indigenous Contractors’
DEPARTMENT OF CONSTRUCTION MANAGEMENT
SCHOOL OF ARCHITECTURE AND BUILDING SCIENCES (SABS)
JOMO KENYATTA UNIVERSITY OF AGRICULTURE AND TECHNOLOGY
NAIROBI-KENYA
QUESTIONNAIRE FOR INDIGENOUS BUILDING CONTRACTORS
SECTION 1: DEMOGRAPHIC DATA
This section requires respondent to provide demographic information about the
contractor and the firm’s Project Manager. Kindly put a tick (√) in the box next to the
selected response.
A: ORGANISATIONAL
1. Kindly indicate the geographical location of your firm’s operational
headquarters
Abuja (FCT) Bauchi/Gombe Kano
2. Kindly indicate your firm’s contract registration category
D (Over N50m) C (N15m-N50m) B (N5m-N15m)
3. Kindly indicate your firm’s business registration category
Sole proprietorship Partnership Private Company
Public Company
4. How long has your firm been in contracting business?
Less than 5years 5-10years 10-15 years
Over 15years
5. Please indicate the number of full time staff in your firm
Less than 10 10-20 21-30
31-40 41-50 Above 50
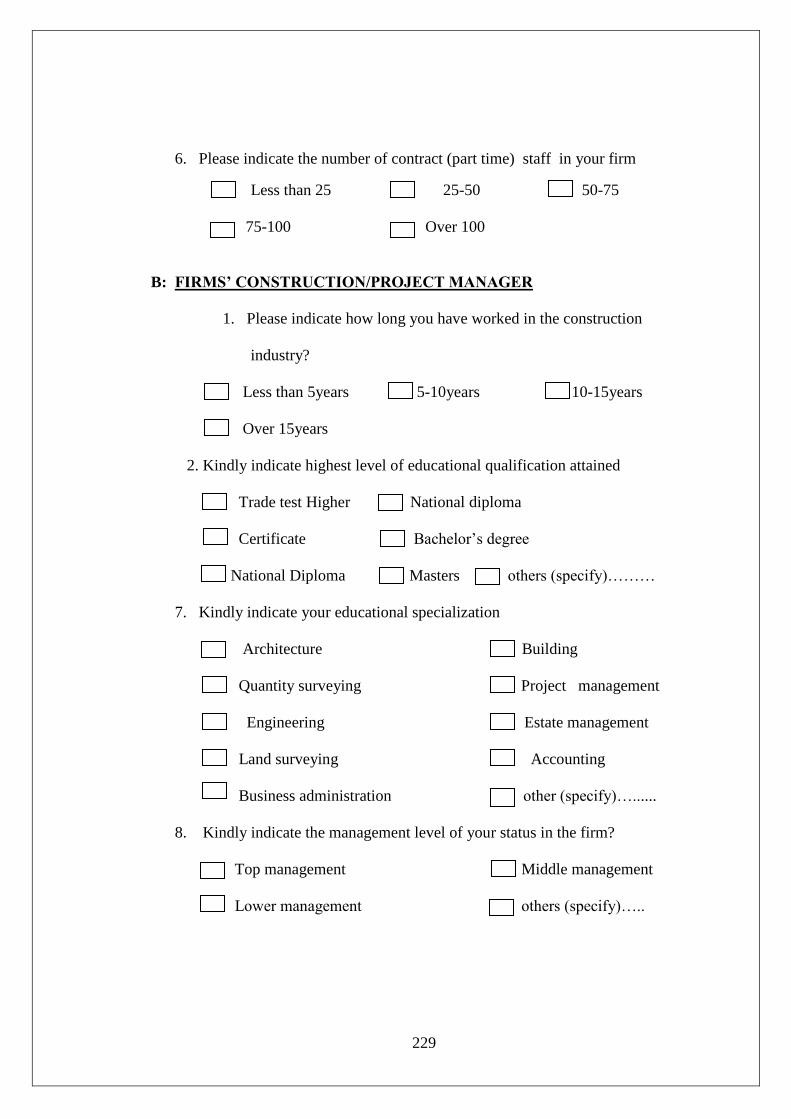
229
6. Please indicate the number of contract (part time) staff in your firm
Less than 25 25-50 50-75
75-100 Over 100
B: FIRMS’ CONSTRUCTION/PROJECT MANAGER
1. Please indicate how long you have worked in the construction
industry?
Less than 5years 5-10years 10-15years
Over 15years
2. Kindly indicate highest level of educational qualification attained
Trade test Higher National diploma
Certificate Bachelor’s degree
National Diploma Masters others (specify)………
7. Kindly indicate your educational specialization
Architecture Building
Quantity surveying Project management
Engineering Estate management
Land surveying Accounting
Business administration other (specify)…......
8. Kindly indicate the management level of your status in the firm?
Top management Middle management
Lower management others (specify)…..
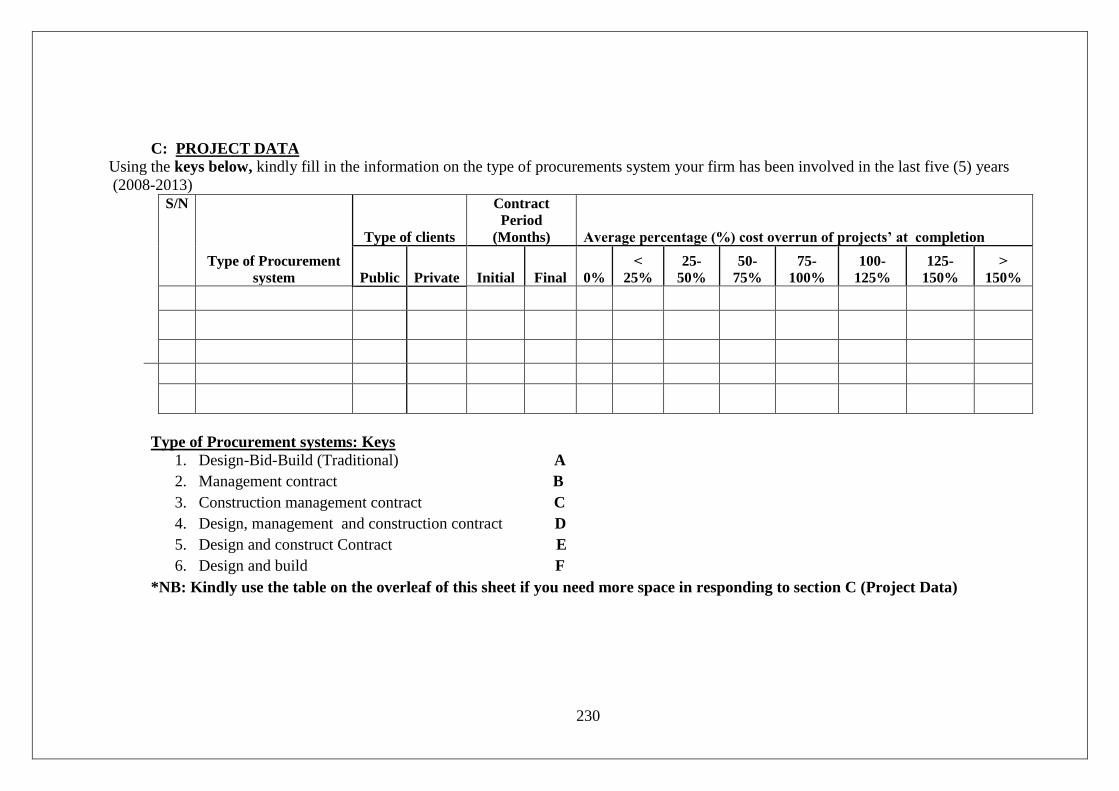
230
C: PROJECT DATA
Using the keys below, kindly fill in the information on the type of procurements system your firm has been involved in the last five (5) years
(2008-2013)
S/N
Type of Procurement
system
Type of clients
Contract
Period (Months) Average percentage (%) cost overrun of projects’ at completion
Public Private Initial Final 0% ˂
25% 25-
50% 50-
75% 75-
100% 100-
125% 125-
150% ˃
150%
Type of Procurement systems: Keys
1. Design-Bid-Build (Traditional) A
2. Management contract B
3. Construction management contract C
4. Design, management and construction contract D
5. Design and construct Contract E
6. Design and build F
*NB: Kindly use the table on the overleaf of this sheet if you need more space in responding to section C (Project Data)
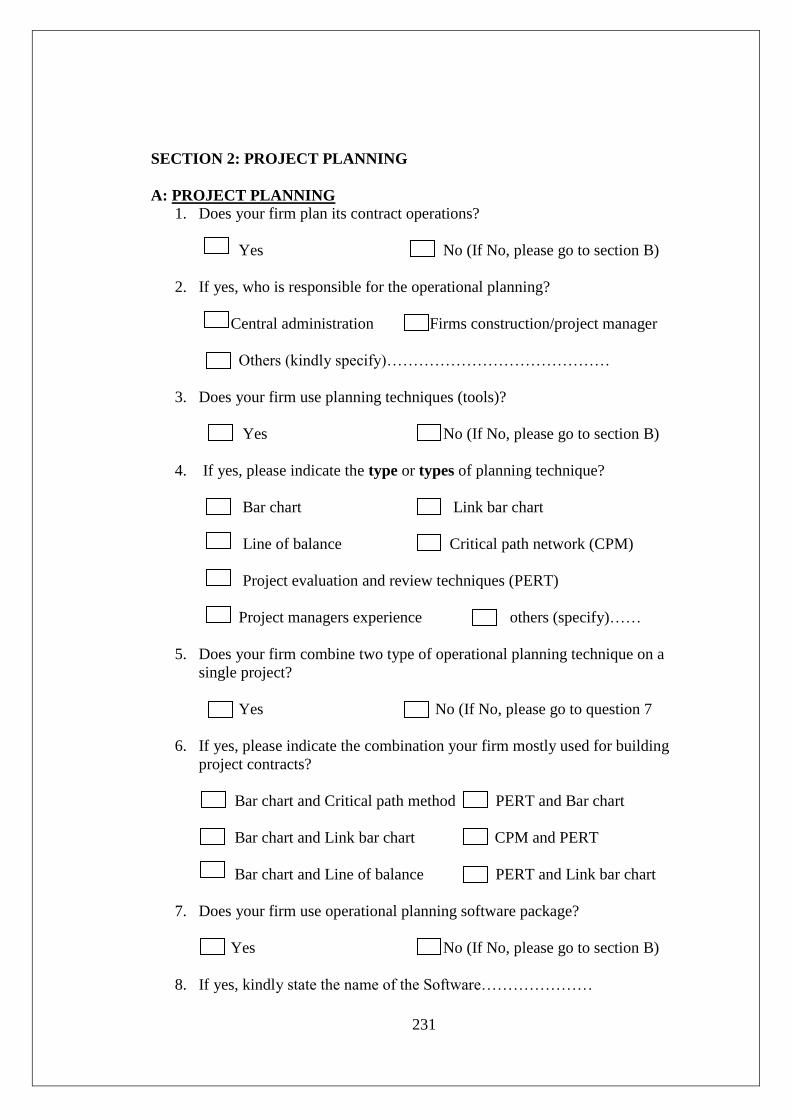
231
SECTION 2: PROJECT PLANNING
A: PROJECT PLANNING 1. Does your firm plan its contract operations?
Yes No (If No, please go to section B)
2. If yes, who is responsible for the operational planning?
Central administration Firms construction/project manager
Others (kindly specify)……………………………………
3. Does your firm use planning techniques (tools)?
Yes No (If No, please go to section B)
4. If yes, please indicate the type or types of planning technique?
Bar chart Link bar chart
Line of balance Critical path network (CPM)
Project evaluation and review techniques (PERT)
Project managers experience others (specify)……
5. Does your firm combine two type of operational planning technique on a
single project?
Yes No (If No, please go to question 7
6. If yes, please indicate the combination your firm mostly used for building
project contracts?
Bar chart and Critical path method PERT and Bar chart
Bar chart and Link bar chart CPM and PERT
Bar chart and Line of balance PERT and Link bar chart
7. Does your firm use operational planning software package?
Yes No (If No, please go to section B)
8. If yes, kindly state the name of the Software…………………
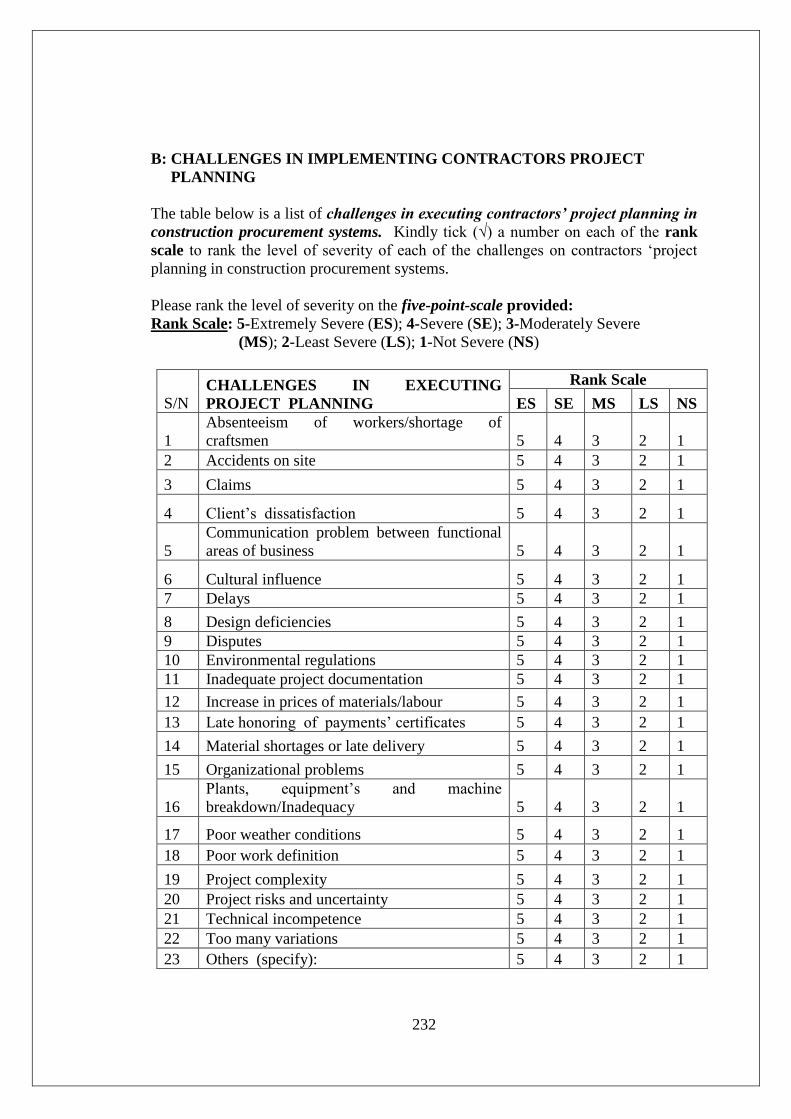
232
B: CHALLENGES IN IMPLEMENTING CONTRACTORS PROJECT
PLANNING
The table below is a list of challenges in executing contractors’ project planning in
construction procurement systems. Kindly tick (√) a number on each of the rank
scale to rank the level of severity of each of the challenges on contractors ‘project
planning in construction procurement systems.
Please rank the level of severity on the five-point-scale provided:
Rank Scale: 5-Extremely Severe (ES); 4-Severe (SE); 3-Moderately Severe
(MS); 2-Least Severe (LS); 1-Not Severe (NS)
S/N CHALLENGES IN EXECUTING
PROJECT PLANNING
Rank Scale
ES SE MS LS NS
1
Absenteeism of workers/shortage of
craftsmen 5 4 3 2 1
2 Accidents on site 5 4 3 2 1
3 Claims 5 4 3 2 1
4 Client’s dissatisfaction 5 4 3 2 1
5
Communication problem between functional
areas of business 5 4 3 2 1
6 Cultural influence 5 4 3 2 1
7 Delays 5 4 3 2 1
8 Design deficiencies 5 4 3 2 1
9 Disputes 5 4 3 2 1
10 Environmental regulations 5 4 3 2 1
11 Inadequate project documentation 5 4 3 2 1
12 Increase in prices of materials/labour 5 4 3 2 1
13 Late honoring of payments’ certificates 5 4 3 2 1
14 Material shortages or late delivery 5 4 3 2 1
15 Organizational problems 5 4 3 2 1
16
Plants, equipment’s and machine
breakdown/Inadequacy 5 4 3 2 1
17 Poor weather conditions 5 4 3 2 1
18 Poor work definition 5 4 3 2 1
19 Project complexity 5 4 3 2 1
20 Project risks and uncertainty 5 4 3 2 1
21 Technical incompetence 5 4 3 2 1
22 Too many variations 5 4 3 2 1
23 Others (specify): 5 4 3 2 1

233
SECTION 3: INFLUENCINGFACTORS FOR CONTRACTORS
PROJECT PLANNING
Please rank each of the following factors influencing contractors’ project
planning in construction procurement systems’ in order of their importance.
Kindly tick (√) to rank the level of importance on the five-point-scale provided:
Rank Scale: 5-Very Important (VI); 4-Important (IM); 3-Fairly Important
(FI); 2-Least Important (LI); 1-Not Important (NI)
S/
N FACTORS INFLUENCING
CONTRACTORS’ PROJECT PLANNING
Rank Scale
VI IM FI LI NI
1 Adequacy of plants and equipment’s 5 4 3 2 1
2 Adherence to the concept of buildability/constructability
5 4 3 2 1
3 Compliance with safety procedures
5 4 3 2 1
4 Contractors ICT Compliance 5 4 3 2 1
5 Contractors organizational structure 5 4 3 2 1
6 Continuous improvement of contractor’s
business Knowledge 5 4 3 2 1
7 Contractor’s project management capability 5 4 3 2 1
8 Contractors project manager’s capability 5 4 3 2 1
9 Fairness and transparency in Industry’s
business culture 5 4 3 2 1
10 Good response to weather 5 4 3 2 1
11 Prompt honoring of payments certificates 5 4 3 2 1
12 Technical competence 5 4 3 2 1
13 Type of procurement system 5 4 3 2 1
14 Understanding environmental laws 5 4 3 2 1
15 Understanding Contractor’s project
procurement task 5 4 3 2 1
16 Others (specify) : 5 4 3 2 1
5 4 3 2 1
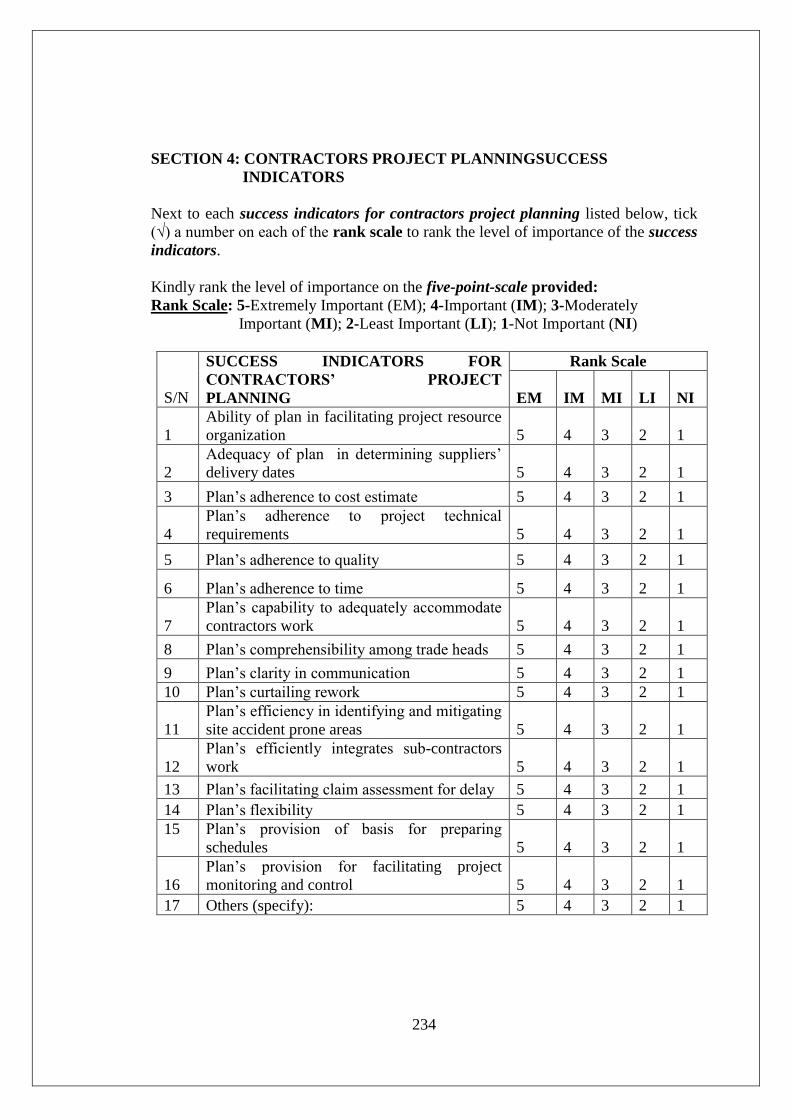
234
SECTION 4: CONTRACTORS PROJECT PLANNINGSUCCESS
INDICATORS
Next to each success indicators for contractors project planning listed below, tick
(√) a number on each of the rank scale to rank the level of importance of the success
indicators.
Kindly rank the level of importance on the five-point-scale provided:
Rank Scale: 5-Extremely Important (EM); 4-Important (IM); 3-Moderately
Important (MI); 2-Least Important (LI); 1-Not Important (NI)
S/N
SUCCESS INDICATORS FOR
CONTRACTORS’ PROJECT
PLANNING
Rank Scale
EM IM MI LI NI
1
Ability of plan in facilitating project resource
organization 5 4 3 2 1
2
Adequacy of plan in determining suppliers’
delivery dates 5 4 3 2 1
3 Plan’s adherence to cost estimate 5 4 3 2 1
4
Plan’s adherence to project technical
requirements 5 4 3 2 1
5 Plan’s adherence to quality 5 4 3 2 1
6 Plan’s adherence to time 5 4 3 2 1
7
Plan’s capability to adequately accommodate
contractors work 5 4 3 2 1
8 Plan’s comprehensibility among trade heads 5 4 3 2 1
9 Plan’s clarity in communication 5 4 3 2 1
10 Plan’s curtailing rework 5 4 3 2 1
11
Plan’s efficiency in identifying and mitigating
site accident prone areas 5 4 3 2 1
12
Plan’s efficiently integrates sub-contractors
work 5 4 3 2 1
13 Plan’s facilitating claim assessment for delay 5 4 3 2 1
14 Plan’s flexibility 5 4 3 2 1
15 Plan’s provision of basis for preparing
schedules 5 4 3 2 1
16
Plan’s provision for facilitating project
monitoring and control 5 4 3 2 1
17 Others (specify): 5 4 3 2 1

235
Please state in your opinion measures you think will enhance your firm’s project
planning in any type of construction procurement systems?
…………………………………………………………………………
…………………………………………………………………………
…………………………………………………………………………
…………………………………………………………………………
…………………………………………………………………………
…………………………………………………………………………
…………………………………………………………………………
Thank you for your time!

236
Appendix 3: Questionnaire for Consultants
PROJECT PLANNING IN CONSTRUCTION PROCUREMENT: The Case of
Nigerian Indigenous Contractors’
DEPARTMENT OF CONSTRUCTION MANAGEMENT
SCHOOL OF ARCHITECTURE AND BUILDING SCIENCES (SABS)
JOMO KENYATTA UNIVERSITY OF AGRICULTURE AND TECHNOLOGY
NAIROBI-KENYA
QUESTIONNAIRE FOR BUILDING COSNTRUCTION CONSULTANTS
SECTION 1: DEMOGRAPHIC DATA
This section requires respondent to provide information about their experience and
that of their consulting firms. Kindly put a tick (√) in the box next to the selected
response.
A: ORGANISATIONAL
1. Kindly indicate the geographical location of your firm’s operational
headquarter
Abuja (FCT) Bauchi/Gombe Kano
2. Kindly indicate your firm’s consultancy type.
Architecture Building Technology
Construction management
Engineering (Civil) Quantity surveying
Others (specify).............................................
3. Kindly indicate to what form of business registration your firm belongs
Sole proprietorship Partnership
4. Kindly indicate how long your firm has been in practice as consultant.
Less than 5years 5-10years 10-15years
Over 15years

237
5. Please indicate your age.
Under 25years 25-30years 31-40years
41-50years Over 50 years
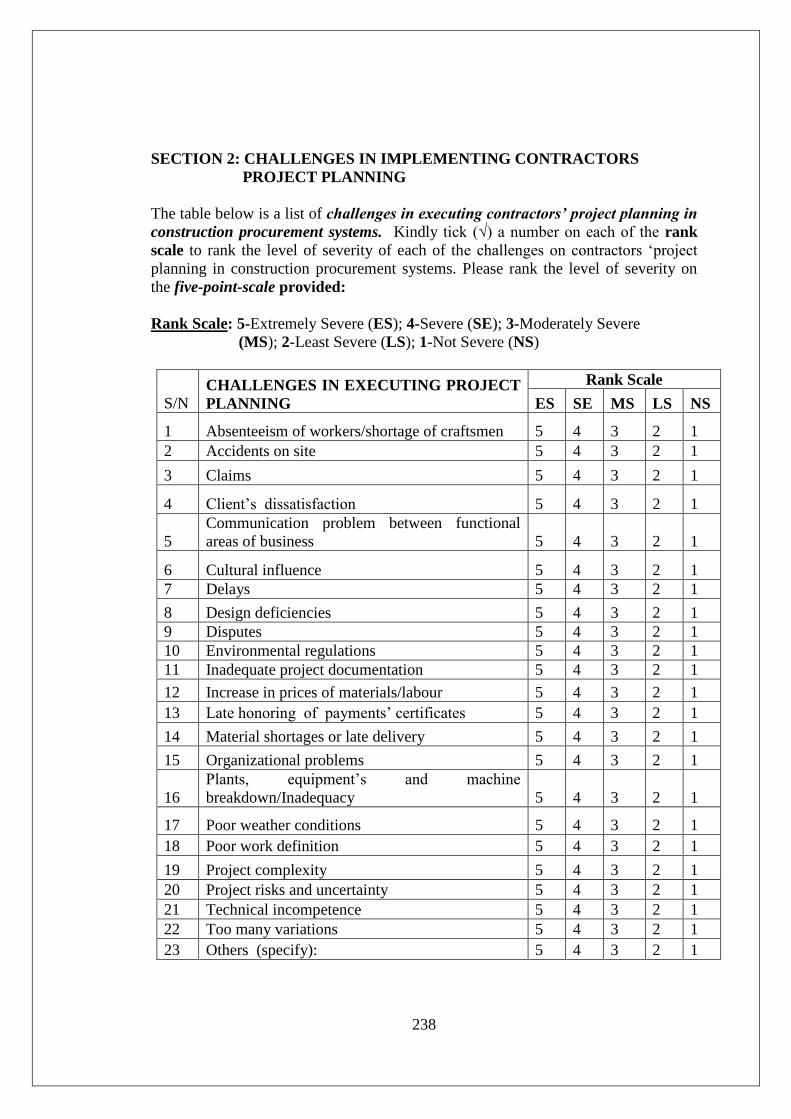
238
SECTION 2: CHALLENGES IN IMPLEMENTING CONTRACTORS
PROJECT PLANNING
The table below is a list of challenges in executing contractors’ project planning in
construction procurement systems. Kindly tick (√) a number on each of the rank
scale to rank the level of severity of each of the challenges on contractors ‘project
planning in construction procurement systems. Please rank the level of severity on
the five-point-scale provided:
Rank Scale: 5-Extremely Severe (ES); 4-Severe (SE); 3-Moderately Severe
(MS); 2-Least Severe (LS); 1-Not Severe (NS)
S/N CHALLENGES IN EXECUTING PROJECT
PLANNING
Rank Scale
ES SE MS LS NS
1 Absenteeism of workers/shortage of craftsmen 5 4 3 2 1
2 Accidents on site 5 4 3 2 1
3 Claims 5 4 3 2 1
4 Client’s dissatisfaction 5 4 3 2 1
5
Communication problem between functional
areas of business 5 4 3 2 1
6 Cultural influence 5 4 3 2 1
7 Delays 5 4 3 2 1
8 Design deficiencies 5 4 3 2 1
9 Disputes 5 4 3 2 1
10 Environmental regulations 5 4 3 2 1
11 Inadequate project documentation 5 4 3 2 1
12 Increase in prices of materials/labour 5 4 3 2 1
13 Late honoring of payments’ certificates 5 4 3 2 1
14 Material shortages or late delivery 5 4 3 2 1
15 Organizational problems 5 4 3 2 1
16
Plants, equipment’s and machine
breakdown/Inadequacy 5 4 3 2 1
17 Poor weather conditions 5 4 3 2 1
18 Poor work definition 5 4 3 2 1
19 Project complexity 5 4 3 2 1
20 Project risks and uncertainty 5 4 3 2 1
21 Technical incompetence 5 4 3 2 1
22 Too many variations 5 4 3 2 1
23 Others (specify): 5 4 3 2 1

239
SECTION 3: INFLUENCINGFACTORS FOR CONTRACTORS
PROJECT PLANNING
Please rank each of the following factors influencing contractors’ project
planning in construction procurement systems’ in order of their importance. Kindly
tick (√) to rank the level of importance on the five-point-scale provided:
Rank Scale: 5-Very Important (VI); 4-Important (IM); 3-Fairly Important
(FI); 2-Least Important (LI); 1-Not Important (NI)
S/
N FACTORS INFLUENCING
CONTRACTORS’ PROJECT PLANNING
Rank Scale
VI IM FI LI NI
1 Adequacy of plants and equipment’s 5 4 3 2 1
2
Adherence to the concept of buildability/constructability
5 4 3 2 1
3 Compliance with safety procedures 5 4 3 2 1
4 Contractors ICT Compliance 5 4 3 2 1
5 Contractors organizational structure 5 4 3 2 1
6 Continuous improvement of contractor’s business
Knowledge 5 4 3 2 1
7 Contractor’s project management capability 5 4 3 2 1
8 Contractors project manager’s capability 5 4 3 2 1
9 Fairness and transparency in Industry’s business
culture 5 4 3 2 1
10 Good response to weather 5 4 3 2 1
11 Prompt honoring of payments certificates 5 4 3 2 1
12 Technical competence 5 4 3 2 1
13 Type of procurement system 5 4 3 2 1
14 Understanding environmental laws 5 4 3 2 1
15 Understanding Contractor’s project procurement
task 5 4 3 2 1
16 Others (specify) : 5 4 3 2 1
5 4 3 2 1

240
SECTION 4: CONTRACTORS PROJECT PLANNING SUCCESS
INDICATORS
Next to each success indicators for contractors project planning listed below, tick
(√) a number on each of the rank scale to rank the level of importance of the success
indicators. Kindly rank the level of importance on the five-point-scale provided:
Rank Scale: 5-Extremely Important (EM); 4-Important (IM); 3-Moderately
Important (MI); 2-Least Important (LI); 1-Not Important (NI)
S/N SUCCESS INDICATORS FOR
CONTRACTORS’ PROJECT PLANNING
Rank Scale
EM IM MI LI NI
1
Ability of plan in facilitating project resource
organization 5 4 3 2 1
2
Adequacy of plan in determining suppliers’
delivery dates 5 4 3 2 1
3 Plan’s adherence to cost estimate 5 4 3 2 1
4
Plan’s adherence to project technical
requirements 5 4 3 2 1
5 Plan’s adherence to quality 5 4 3 2 1
6 Plan’s adherence to time 5 4 3 2 1
7
Plan’s capability to adequately accommodate
contractors work 5 4 3 2 1
8 Plan’s comprehensibility among trade heads 5 4 3 2 1
9 Plan’s clarity in communication 5 4 3 2 1
10 Plan’s curtailing rework 5 4 3 2 1
11
Plan’s efficiency in identifying and mitigating
site accident prone areas 5 4 3 2 1
12
Plan’s efficiently integrates sub-contractors
work 5 4 3 2 1
13 Plan’s facilitating claim assessment for delay 5 4 3 2 1
14 Plan’s flexibility 5 4 3 2 1
15 Plan’s provision of basis for preparing
schedules 5 4 3 2 1
16
Plan’s provision for facilitating project
monitoring and control 5 4 3 2 1
17 Others (specify): 5 4 3 2 1

241
Please state in your opinion measures you think will enhance indigenous contractors’
project planning in any type of construction procurement systems?
…………………………………………………………………………
…………………………………………………………………………
…………………………………………………………………………
…………………………………………………………………………
…………………………………………………………………………
…………………………………………………………………………
…………………………………………………………………………
…………………………………………………………………………
…………………………………………………………………………
…………………………………………………………………………
Thank you for your time!

242
Appendix 4: Questionnaire for PBPs
PROJECT PLANNING IN CONSTRUCTION PROCUREMENT: The Case of
Nigerian Indigenous Contractors’
DEPARTMENT OF CONSTRUCTION MANAGEMENT
SCHOOL OF ARCHITECTURE AND BUILDING SCIENCES (SABS)
JOMO KENYATTA UNIVERSITY OF AGRICULTURE AND TECHNOLOGY
NAIROBI-KENYA
QUESTIONNAIRE FOR PUBLIC BUILDING PROFESSIONALS (PBPs)
SECTION 1: DEMOGRAPHIC DATA
This section requires respondent to provide demographic information and their
construction experience in public service. Kindly put a tick (√) in the box next to the
selected response.
A: ORGANISATIONAL
1. Kindly indicate the geographical location of your public operational
headquarters
Abuja (FCT) Bauchi/Gombe Kano
2. Kindly indicate your educational specialization type.
Architecture Building Technology
Construction management Engineering (Civil)
Quantity surveying others (specify)…………..
3. Kindly indicate highest level of educational qualification attained
HND BSc MSc
PhD others (specify)……………………
4. Kindly indicate to which professional body you are registered to, if not
leave out the question
NIA NIOB NIQS
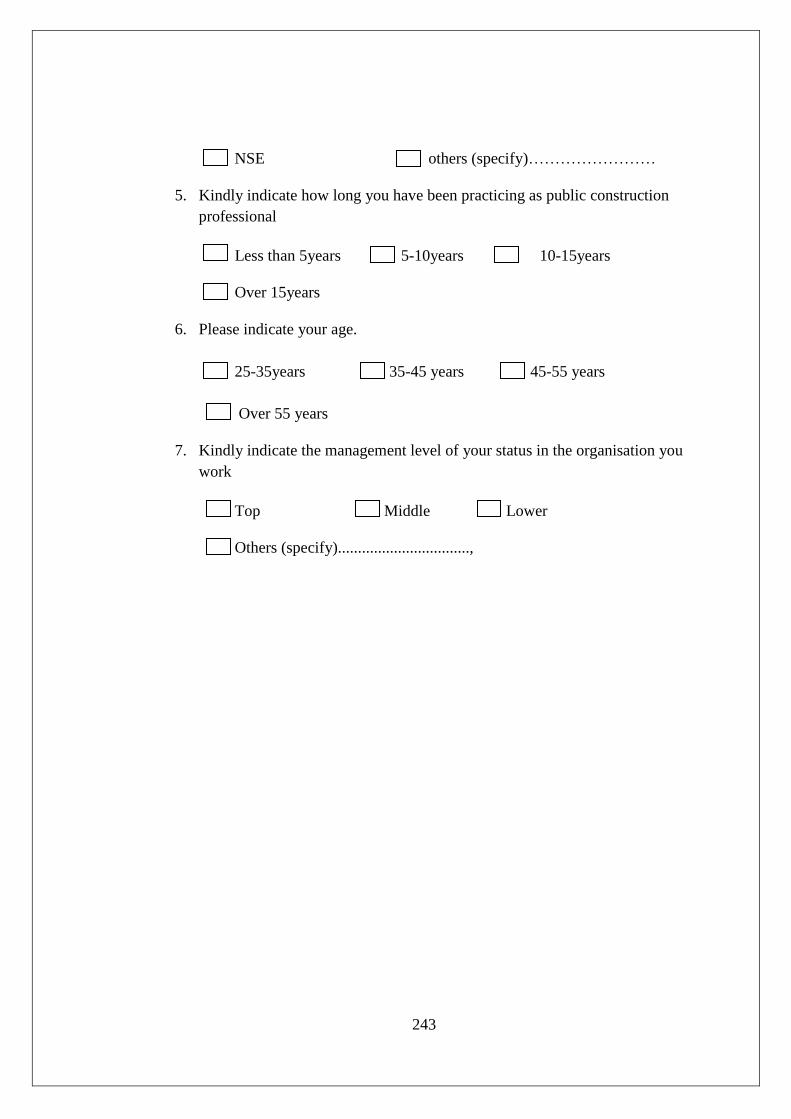
243
NSE others (specify)……………………
5. Kindly indicate how long you have been practicing as public construction
professional
Less than 5years 5-10years 10-15years
Over 15years
6. Please indicate your age.
25-35years 35-45 years 45-55 years
Over 55 years
7. Kindly indicate the management level of your status in the organisation you
work
Top Middle Lower
Others (specify).................................,
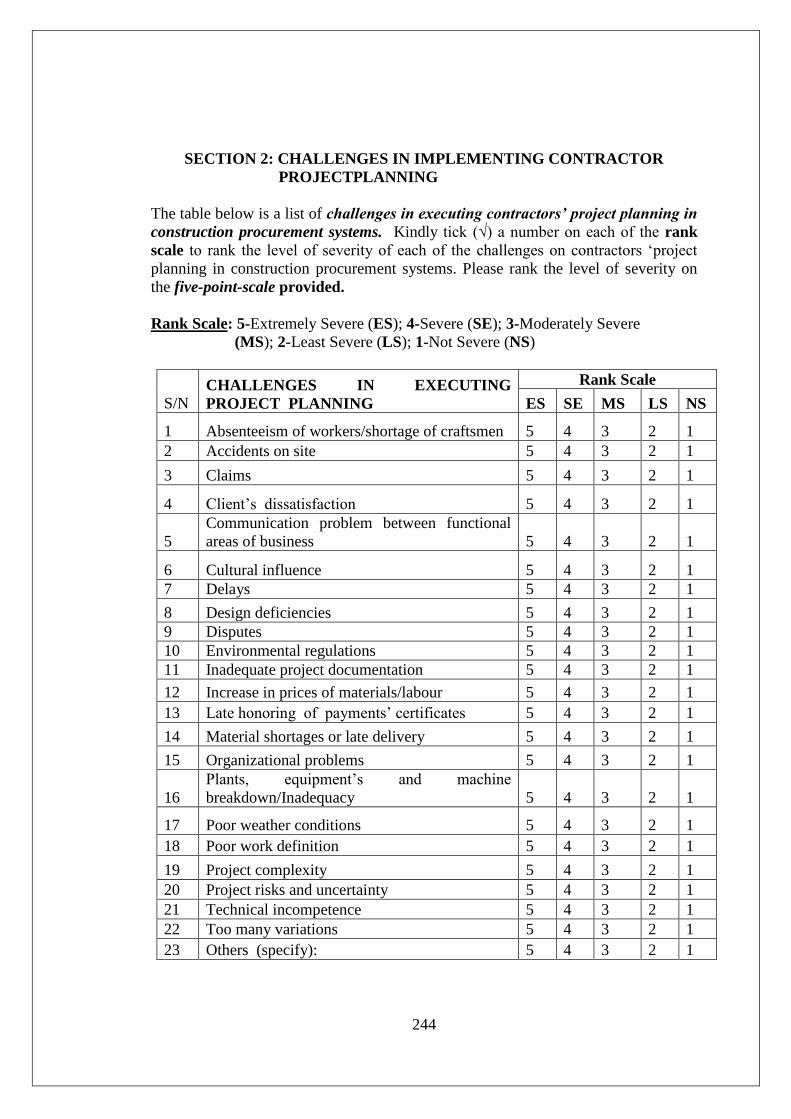
244
SECTION 2: CHALLENGES IN IMPLEMENTING CONTRACTOR
PROJECTPLANNING
The table below is a list of challenges in executing contractors’ project planning in
construction procurement systems. Kindly tick (√) a number on each of the rank
scale to rank the level of severity of each of the challenges on contractors ‘project
planning in construction procurement systems. Please rank the level of severity on
the five-point-scale provided.
Rank Scale: 5-Extremely Severe (ES); 4-Severe (SE); 3-Moderately Severe
(MS); 2-Least Severe (LS); 1-Not Severe (NS)
S/N CHALLENGES IN EXECUTING
PROJECT PLANNING
Rank Scale
ES SE MS LS NS
1 Absenteeism of workers/shortage of craftsmen 5 4 3 2 1
2 Accidents on site 5 4 3 2 1
3 Claims 5 4 3 2 1
4 Client’s dissatisfaction 5 4 3 2 1
5
Communication problem between functional
areas of business 5 4 3 2 1
6 Cultural influence 5 4 3 2 1
7 Delays 5 4 3 2 1
8 Design deficiencies 5 4 3 2 1
9 Disputes 5 4 3 2 1
10 Environmental regulations 5 4 3 2 1
11 Inadequate project documentation 5 4 3 2 1
12 Increase in prices of materials/labour 5 4 3 2 1
13 Late honoring of payments’ certificates 5 4 3 2 1
14 Material shortages or late delivery 5 4 3 2 1
15 Organizational problems 5 4 3 2 1
16
Plants, equipment’s and machine
breakdown/Inadequacy 5 4 3 2 1
17 Poor weather conditions 5 4 3 2 1
18 Poor work definition 5 4 3 2 1
19 Project complexity 5 4 3 2 1
20 Project risks and uncertainty 5 4 3 2 1
21 Technical incompetence 5 4 3 2 1
22 Too many variations 5 4 3 2 1
23 Others (specify): 5 4 3 2 1

245
SECTION 3: INFLUENCING FACTORSFOR CONTRACTORS
PROJECT PLANNING
Please rank each of the following factors influencing contractors’ project
planning in construction procurement systems’ in order of their importance. Kindly
tick (√) to rank the level of importance on the five-point-scale provided.
Rank Scale: 5-Very Important (VI); 4-Important (IM); 3-Fairly Important
(FI); 2-Least Important (LI); 1-Not Important (NI)
S/
N INFLUENCING FACTORS FOR
CONTRACTORS’ PROJECT PLANNING
Rank Scale
VI IM FI LI NI
1 Adequacy of plants and equipment’s 5 4 3 2 1
2 Adherence to the concept of buildability/constructability
5 4 3 2 1
3 Compliance with safety procedures
5 4 3 2 1
4 Contractors ICT Compliance 5 4 3 2 1
5 Contractors organizational structure 5 4 3 2 1
6 Continuous improvement of contractor’s
business Knowledge 5 4 3 2 1
7 Contractor’s project management capability 5 4 3 2 1
8 Contractors project manager’s capability 5 4 3 2 1
9 Fairness and transparency in Industry’s business
culture 5 4 3 2 1
10 Good response to weather 5 4 3 2 1
11 Prompt honoring of payments certificates 5 4 3 2 1
12 Technical competence 5 4 3 2 1
13 Type of procurement system 5 4 3 2 1
14 Understanding environmental laws 5 4 3 2 1
15 Understanding Contractor’s project procurement
task 5 4 3 2 1
16 Others (specify) : 5 4 3 2 1
5 4 3 2 1
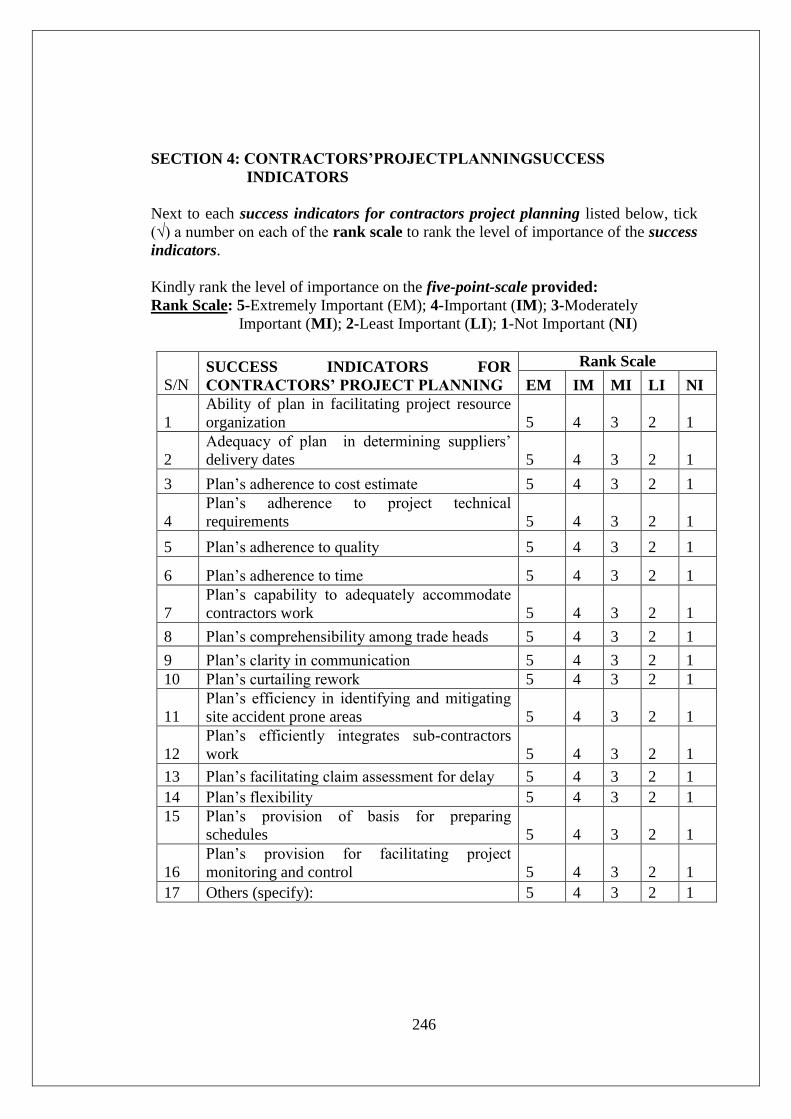
246
SECTION 4: CONTRACTORS’PROJECTPLANNINGSUCCESS
INDICATORS
Next to each success indicators for contractors project planning listed below, tick
(√) a number on each of the rank scale to rank the level of importance of the success
indicators.
Kindly rank the level of importance on the five-point-scale provided:
Rank Scale: 5-Extremely Important (EM); 4-Important (IM); 3-Moderately
Important (MI); 2-Least Important (LI); 1-Not Important (NI)
S/N SUCCESS INDICATORS FOR
CONTRACTORS’ PROJECT PLANNING
Rank Scale
EM IM MI LI NI
1
Ability of plan in facilitating project resource
organization 5 4 3 2 1
2
Adequacy of plan in determining suppliers’
delivery dates 5 4 3 2 1
3 Plan’s adherence to cost estimate 5 4 3 2 1
4
Plan’s adherence to project technical
requirements 5 4 3 2 1
5 Plan’s adherence to quality 5 4 3 2 1
6 Plan’s adherence to time 5 4 3 2 1
7
Plan’s capability to adequately accommodate
contractors work 5 4 3 2 1
8 Plan’s comprehensibility among trade heads 5 4 3 2 1
9 Plan’s clarity in communication 5 4 3 2 1
10 Plan’s curtailing rework 5 4 3 2 1
11
Plan’s efficiency in identifying and mitigating
site accident prone areas 5 4 3 2 1
12
Plan’s efficiently integrates sub-contractors
work 5 4 3 2 1
13 Plan’s facilitating claim assessment for delay 5 4 3 2 1
14 Plan’s flexibility 5 4 3 2 1
15 Plan’s provision of basis for preparing
schedules 5 4 3 2 1
16
Plan’s provision for facilitating project
monitoring and control 5 4 3 2 1
17 Others (specify): 5 4 3 2 1

247
Please state in your opinion measures you think will enhance indigenous contractors’
project planning in any type of construction procurement systems?
…………………………………………………………………………
…………………………………………………………………………
…………………………………………………………………………
…………………………………………………………………………
…………………………………………………………………………
…………………………………………………………………………
…………………………………………………………………………
…………………………………………………………………………
Thank you for your time!

248
Appendix 5: Nigeria Geo-political Zones
Source: NPC (2010)
249
Appendix 6: List of Publications
A. Journal Publications:
1. Inuwa, I.I., Wanyona, G., and Diang’a, S (2014) Indigenous Contractors
Involvement and Performance in Construction Procurement Systems in
Nigeria. Global Journal of Researches in Engineering. Vol. (14)1: 5-15
2. Inuwa, I.I., Wanyona, G., and Diang’a, S (2014) Construction Procurement
Systems: Influencing Factors for Nigerian Indigenous Contractors’ Project
Planning. International Journal of Engineering Research and Technology.
Vol. (3) 4: 43-50
3. Inuwa, I.I., Wanyona, G., and Diang’a, S (2014) Application of Project
Planning Techniques in Construction Procurement: The Case of Nigerian
Indigenous Contractors. International Journal of Economic Development
Research and Investment. 5(1): 31-47
4. Inuwa, I.I., Saiva, D., and Alkizim, A. (2014) Investigating Nigerian
Indigenous Contractors Project Planning In Construction Procurement: An
Explanatory Approach. International Journal of Civil & Environmental
Engineering. 14(04): 16-25
5. Inuwa, I.I., Wanyona, G., and Diang’a, S (2015) Identifying Building
Contractors’ Project Planning Success Indicators: The Case of Nigerian
Indigenous Contractors. Accepted for publication: African Journal of Applied
Research (AJAR). Vol. 1(1).

250
B. Conference Proceedings:
1. Inuwa, I.I., Wanyona, G., and Diang’a, S (2014) Construction Project
Procurement: Project Planning Challenges of Nigerian Indigenous
Contractors. Proceedings of the International Council for Research and
Innovation in Building and Construction Conference (CIB W107, 28-30
January, 2014, Lagos-Nigeria): 107-117.
2. Inuwa, I.I., Wanyona, G., and Diang’a, S (2014) Identifying Building
Contractors’ Project Planning Success Indicators: The Case of Nigerian
Indigenous Contractors. Proceedings of the 3rd Applied Research Conference
in African. ARCA Conference, Accra, Ghana: 468-482