Project Management Road Trip: PMBOK 4th Edition: Chapter 6
63
-
Upload
khangminh22 -
Category
Documents
-
view
1 -
download
0
Transcript of Project Management Road Trip: PMBOK 4th Edition: Chapter 6
Project Management Road Trip for the Project Management Professional:Your Key to PMP Certification and Understanding the PMBOK Fourth Edition
© Copyright 2009 by J. Alex Sherrer
ALL RIGHTS RESERVEDVersion 2010.08.30
Visit Project Management Road Trip on the Internet at http://www.PMRoadTrip.com
“PMI,” “PMP,” “Project Management Professional” and “PMBOK” are registered certification marks ofthe Project Management Institute, Inc. in the United States and other nations.
“Project Management Road Trip” is a registered trademark of Joel Alex Sherrer.
Although the author has made every effort to ensure accuracy and completeness of information containedin this book, he can assume no responsibility for errors, inaccuracies, omissions, or inconsistenciescontained herein.
TABLE OF CONTENTS
6.0 Project Scope Management .................................................................................................. 127-186Overview ................................................................................................................................ 1296.1 Define activities ................................................................................................................ 1316.2 Sequence activities ............................................................................................................ 1356.3 Estimate activity resources ................................................................................................ 1416.4 Estimate activity durations ................................................................................................ 1476.5 Develop schedule .............................................................................................................. 1546.6 Control schedule ............................................................................................................... 179Chapter summary.................................................................................................................... 183Exam summary ....................................................................................................................... 184

CHAPTER 6: TIME MANAGEMENT 6
Project Management Road Trip® 127 6: Time Management
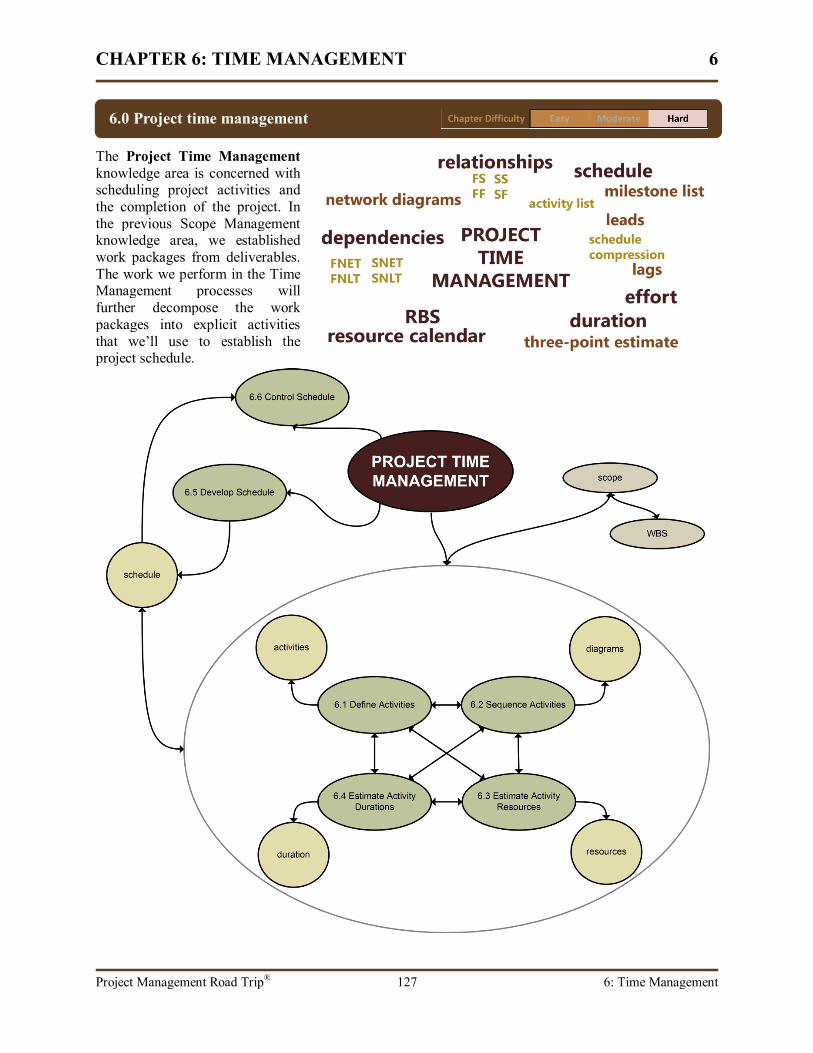
The Project Time Managementknowledge area is concerned withscheduling project activities andthe completion of the project. Inthe previous Scope Managementknowledge area, we establishedwork packages from deliverables.The work we perform in the TimeManagement processes willfurther decompose the workpackages into explicit activitiesthat we’ll use to establish theproject schedule.
6.0 Project time management
CHAPTER 6: TIME MANAGEMENT 6
Project Management Road Trip® 128 6: Time Management
Keywords
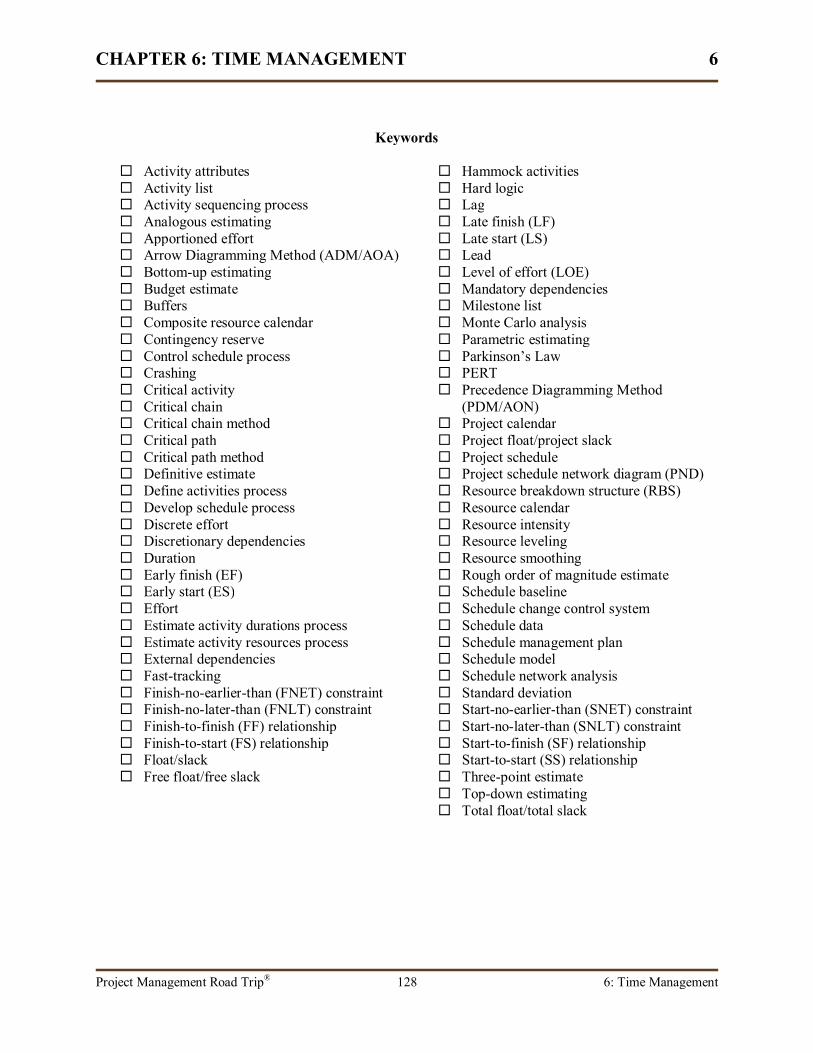
Activity attributes Activity list Activity sequencing process Analogous estimating Apportioned effort Arrow Diagramming Method (ADM/AOA) Bottom-up estimating Budget estimate Buffers Composite resource calendar Contingency reserve Control schedule process Crashing Critical activity Critical chain Critical chain method Critical path Critical path method Definitive estimate Define activities process Develop schedule process Discrete effort Discretionary dependencies Duration Early finish (EF) Early start (ES) Effort Estimate activity durations process Estimate activity resources process External dependencies Fast-tracking Finish-no-earlier-than (FNET) constraint Finish-no-later-than (FNLT) constraint Finish-to-finish (FF) relationship Finish-to-start (FS) relationship Float/slack Free float/free slack
Hammock activities Hard logic Lag Late finish (LF) Late start (LS) Lead Level of effort (LOE) Mandatory dependencies Milestone list Monte Carlo analysis Parametric estimating Parkinson’s Law PERT Precedence Diagramming Method
(PDM/AON) Project calendar Project float/project slack Project schedule Project schedule network diagram (PND) Resource breakdown structure (RBS) Resource calendar Resource intensity Resource leveling Resource smoothing Rough order of magnitude estimate Schedule baseline Schedule change control system Schedule data Schedule management plan Schedule model Schedule network analysis Standard deviation Start-no-earlier-than (SNET) constraint Start-no-later-than (SNLT) constraint Start-to-finish (SF) relationship Start-to-start (SS) relationship Three-point estimate Top-down estimating Total float/total slack
CHAPTER 6: TIME MANAGEMENT 6
Project Management Road Trip® 129 6: Time Management
Software engineers are eternal optimists. Whenplanning software projects, we usually assumethat everything will go exactly as planned. Or,we take the other extreme position: the creativenature of software development means we cannever predict what's going to happen, so what'sthe point in making detailed plans? Both of theseperspectives can lead to software surprises, whenunexpected things happen that throw the projectoff track. In my experience, software surprisesare never good news.1
Know Your Enemy: Introduction to Risk Management,Software Development magazine.
The project schedule provides the starting and ending dates for all project activities. The schedule iswhat the project team refers to for what needs done and when it needs done.
In order to develop a project schedule, the workpackages have to be further decomposed intoactivities. These activities must then be sequenced,and the resources needed for each activitydetermined, and this is followed by figuring outhow long each activity will take. Once all thecomponent pieces are known, a project schedulecan be created. Time management processes occurat least once on every project, but since the projecttasks are closely tied to scope, cost, and quality, it'svery likely that these processes will reoccur oftenduring the project and that the project schedule willunder revisions.
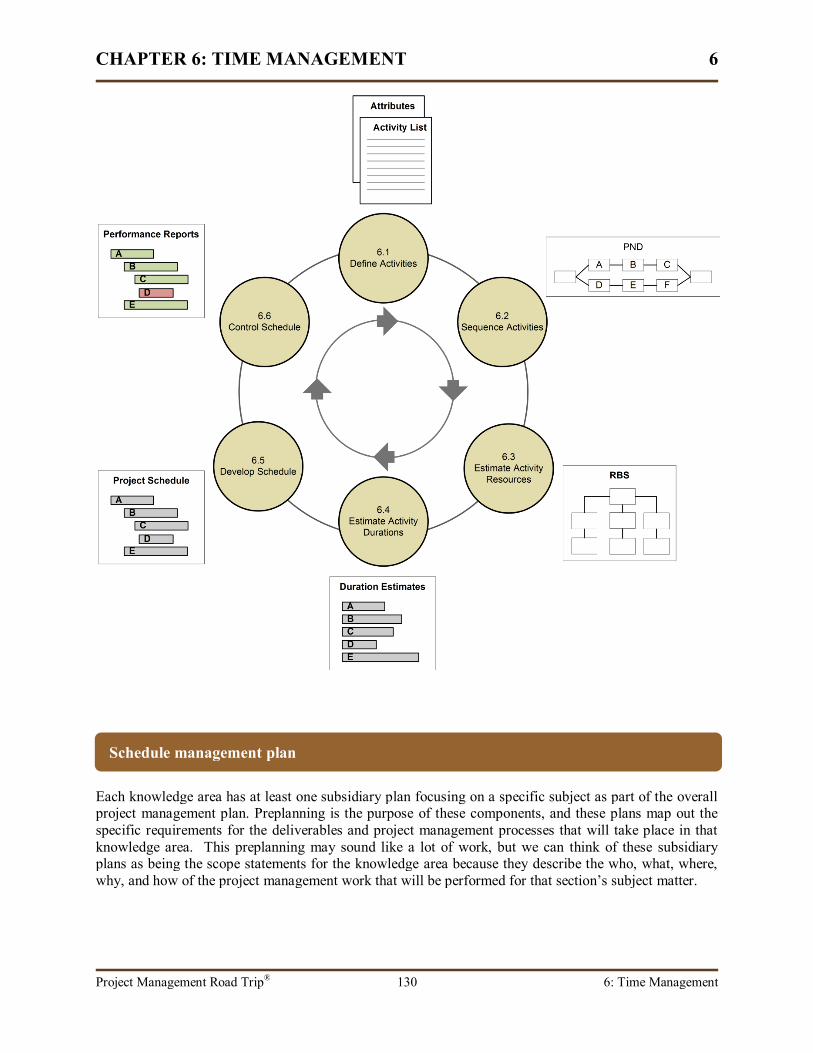
Though in practice the Time Management processes may be performed concurrently, there is an inherentorder as illustrated on the following page to the scheduling processes. The processes in TimeManagement are:
Define Activities: Decomposing the work packages into activities.
Sequence Activities: Determining the order the activities need performed in.
Estimate Activity Resources: Finding out the quantities and types of resources needed for theactivities.
Estimate Activity Durations: Determining how long the activities will take.
Develop Schedule: Creating the project schedule.
Control Schedule: Monitoring the schedule and influencing the factors that can lead to schedulechanges.
Overview
CHAPTER 6: TIME MANAGEMENT 6
Project Management Road Trip® 130 6: Time Management
Each knowledge area has at least one subsidiary plan focusing on a specific subject as part of the overallproject management plan. Preplanning is the purpose of these components, and these plans map out thespecific requirements for the deliverables and project management processes that will take place in thatknowledge area. This preplanning may sound like a lot of work, but we can think of these subsidiaryplans as being the scope statements for the knowledge area because they describe the who, what, where,why, and how of the project management work that will be performed for that section’s subject matter.
Schedule management plan
CHAPTER 6: TIME MANAGEMENT 6
Project Management Road Trip® 131 6: Time Management
The schedule management plan is a subsidiary component of the project management plan, created inthe Develop Project Management Plan process (4.2), and it should be established before work begins inthe time management processes because it describes:
What activities, methodologies, tools, and processes will be used for creating the projectschedule.
How the schedule will be approved by the stakeholders and project team.
How likely schedule changes are to occur on the project and what kind of special approvals arenecessary for schedule changes.
As with other subsidiary plans, templates can help provide the basis for the schedule management plan.The complexity of the project and how likely schedule changes are to occur will be factors in decidinghow detailed the schedule management plan needs to be.
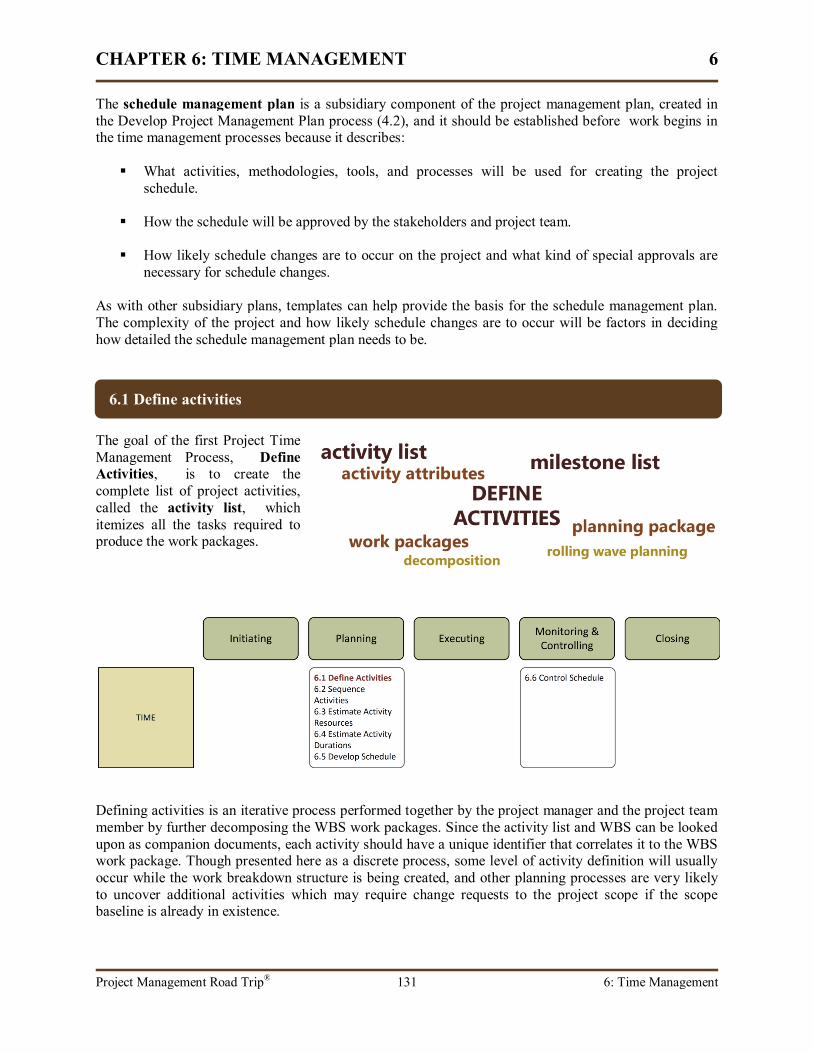
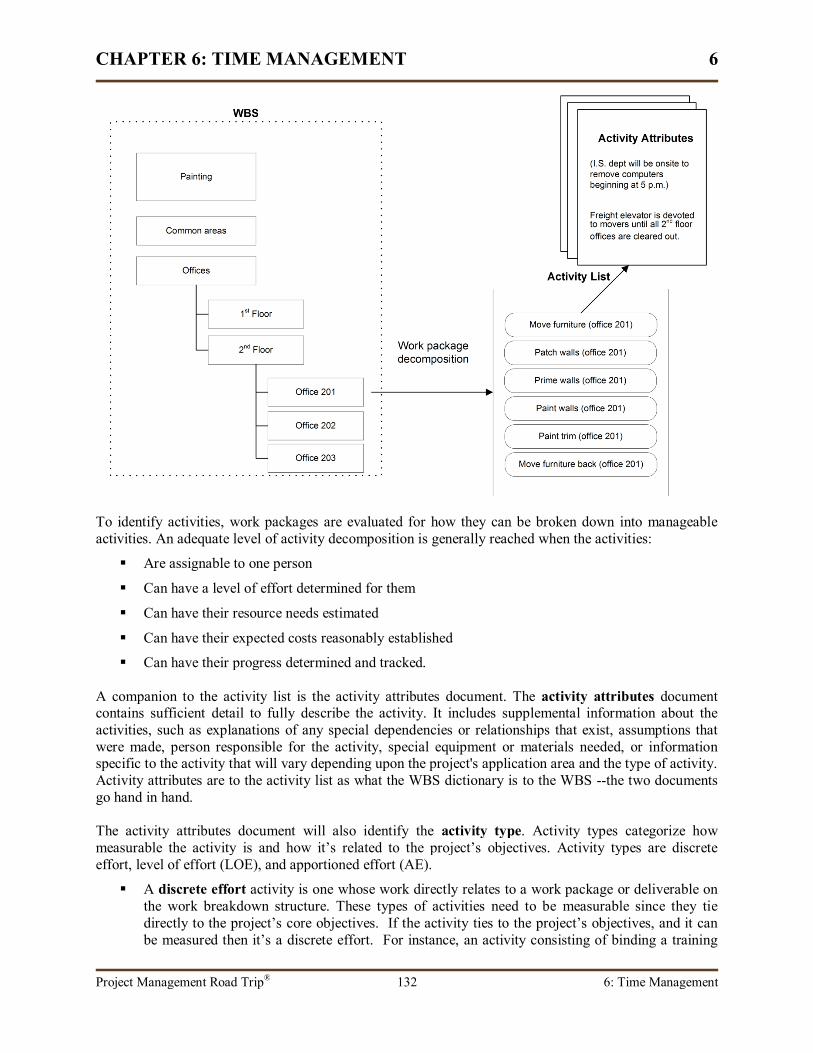
The goal of the first Project TimeManagement Process, DefineActivities, is to create thecomplete list of project activities,called the activity list, whichitemizes all the tasks required toproduce the work packages.
Defining activities is an iterative process performed together by the project manager and the project teammember by further decomposing the WBS work packages. Since the activity list and WBS can be lookedupon as companion documents, each activity should have a unique identifier that correlates it to the WBSwork package. Though presented here as a discrete process, some level of activity definition will usuallyoccur while the work breakdown structure is being created, and other planning processes are very likelyto uncover additional activities which may require change requests to the project scope if the scopebaseline is already in existence.
6.1 Define activities
CHAPTER 6: TIME MANAGEMENT 6
Project Management Road Trip® 132 6: Time Management
To identify activities, work packages are evaluated for how they can be broken down into manageableactivities. An adequate level of activity decomposition is generally reached when the activities:
Are assignable to one person
Can have a level of effort determined for them
Can have their resource needs estimated
Can have their expected costs reasonably established
Can have their progress determined and tracked.
A companion to the activity list is the activity attributes document. The activity attributes documentcontains sufficient detail to fully describe the activity. It includes supplemental information about theactivities, such as explanations of any special dependencies or relationships that exist, assumptions thatwere made, person responsible for the activity, special equipment or materials needed, or informationspecific to the activity that will vary depending upon the project's application area and the type of activity.Activity attributes are to the activity list as what the WBS dictionary is to the WBS --the two documentsgo hand in hand.
The activity attributes document will also identify the activity type. Activity types categorize howmeasurable the activity is and how it’s related to the project’s objectives. Activity types are discreteeffort, level of effort (LOE), and apportioned effort (AE).
A discrete effort activity is one whose work directly relates to a work package or deliverable onthe work breakdown structure. These types of activities need to be measurable since they tiedirectly to the project’s core objectives. If the activity ties to the project’s objectives, and it canbe measured then it’s a discrete effort. For instance, an activity consisting of binding a training
CHAPTER 6: TIME MANAGEMENT 6
Project Management Road Trip® 133 6: Time Management
A frequent misuse of milestones is simply notusing them enough. Milestones can be anefficient scheduling tool, taking the place oftasks which take less than a day to complete.2
Paul Brough, Vice President of Warner ConstructionConsultants, Inc. Scheduling Group
manual for a software project would be considered a discrete effort since the effort to produce themanual could be measured and the training manual would be an identified deliverable in theWBS.
A level of effort (or LOE) is usually an activity performed by a supporting role that is difficult tomeasure, but is still related to the project’s core objectives. For example, a salesperson acting asa liaison between the customer and the project team would usually be performing LOE activities.
An apportioned effort (or AE) activity is one which is usually related to project management –it’s necessary for the efficient functioning of the project, but it isn’t directly related to theproject’s final product, service, or result.
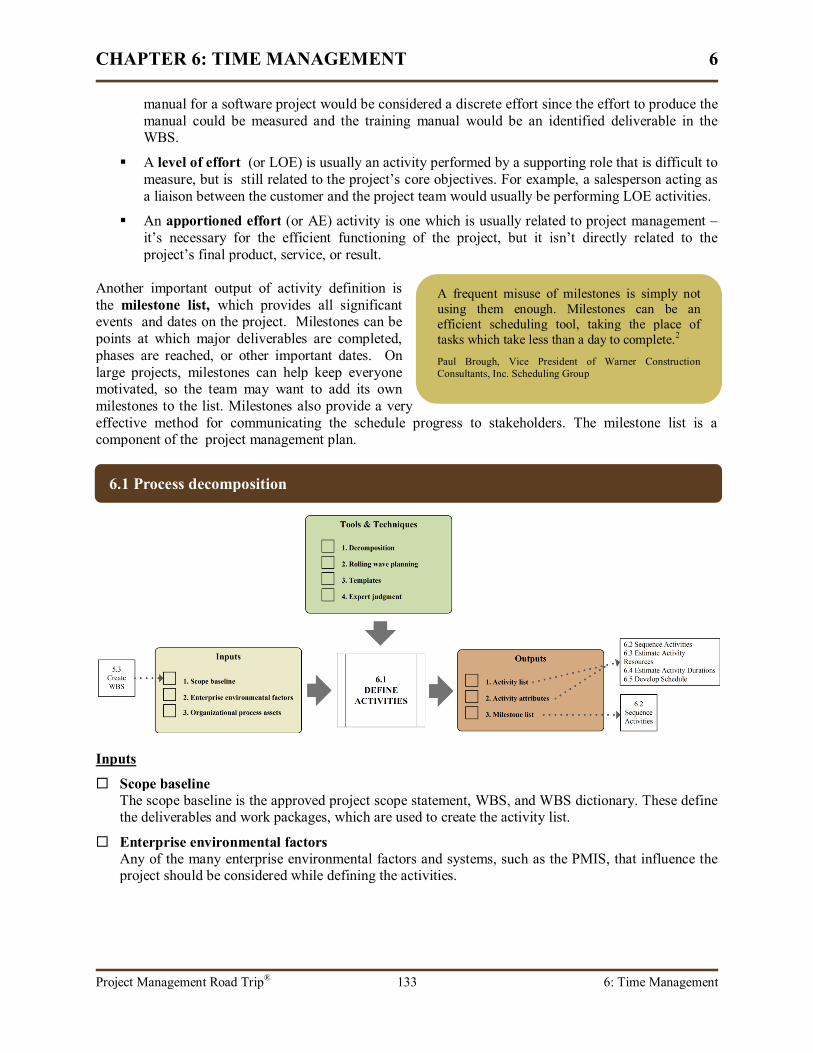
Another important output of activity definition isthe milestone list, which provides all significantevents and dates on the project. Milestones can bepoints at which major deliverables are completed,phases are reached, or other important dates. Onlarge projects, milestones can help keep everyonemotivated, so the team may want to add its ownmilestones to the list. Milestones also provide a veryeffective method for communicating the schedule progress to stakeholders. The milestone list is acomponent of the project management plan.
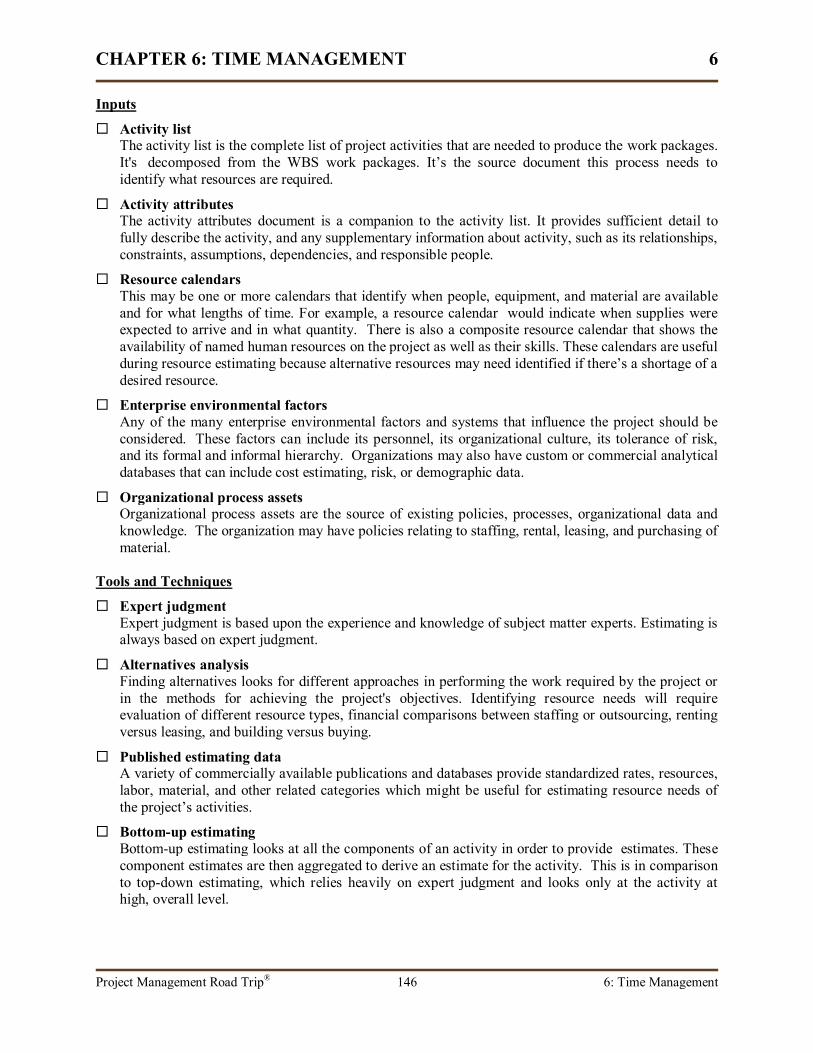
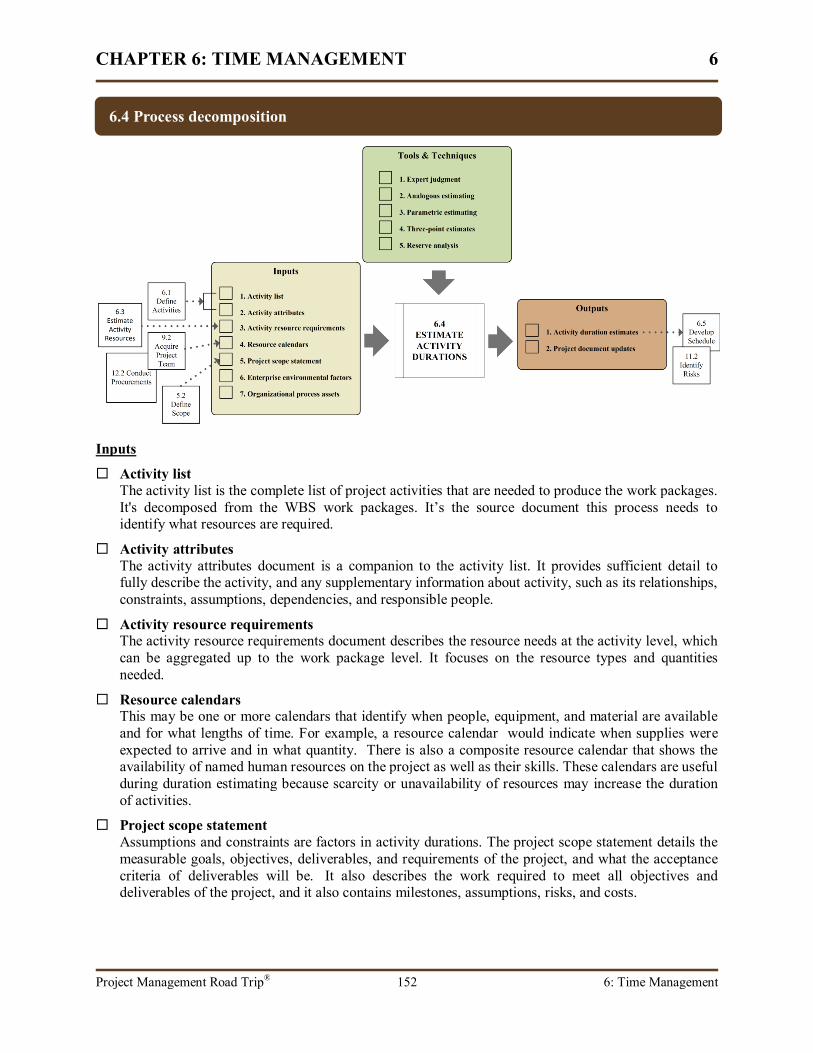
Inputs
Scope baselineThe scope baseline is the approved project scope statement, WBS, and WBS dictionary. These definethe deliverables and work packages, which are used to create the activity list.
Enterprise environmental factorsAny of the many enterprise environmental factors and systems, such as the PMIS, that influence theproject should be considered while defining the activities.
6.1 Process decomposition
CHAPTER 6: TIME MANAGEMENT 6
Project Management Road Trip® 134 6: Time Management
Organizational process assetsOrganizational process assets are the source of existing policies, processes, organizational data andknowledge. These assets include the entire collection of formal and informal methodologies, policies,procedures, plans, and guidelines, as well as the organization's "knowledge base," which includeslessons learned from prior projects.
Tools and Techniques
DecompositionDecomposition breaks down larger items into manageable components. Work packages from theWBS are decomposed into the activities needed.
Rolling wave planningAn iterative approach in which items not required immediately by the project are planned for later asthe need for them draws closer. This means that future activities may only be decomposed at arelatively high level, but as the need for them draws near, further planning will take place.
TemplatesActivities and milestones from similar projects may be useful as a starting point for defining activitiesand milestones on a new project.
Expert judgmentExpert judgment is based upon the experience and knowledge of subject matter experts. Subjectmatter expertise in scheduling, scope statements, and WBS decomposition is needed for timemanagement.
Outputs
Activity listThe activity list is the complete list of project activities that are needed to produce the work packages.Activities are decomposed from the WBS work packages. The activity list is a component of theproject management plan.
Activity attributesThe activity attributes document is a companion to the activity list. It provides sufficient detail tofully describe the activity, and any supplementary information about activity, such as its relationships,constraints, assumptions, dependencies, and responsible people.
Milestone listThe milestone lists contains all project milestones regardless of whether they originated from thecustomer, enterprise, stakeholders, or the project team. The list also identifies whether each milestoneis optional or mandatory. The milestone list is a component of the project management plan.
CHAPTER 6: TIME MANAGEMENT 6
Project Management Road Trip® 135 6: Time Management
The Sequence Activities process putsthe activities in the order they need tobe performed. This process is notconcerned with when the activitieswill occur on the project timeline, justin what order.
Properly sequencing activities involves determining the dependencies and relationships between activitiesand applying leads and lags. Activity sequences are shown through project schedule network diagrams,which are schematics showing the order and relationships of project activities.
Dependencies restrict the order in whichactivities can be performed. Dependenciesshould be described when they exist, usuallyon the activity attributes document as well asthrough narratives on the project schedulenetwork diagram or through a supplementarydocument to the diagram. There are threetypes of dependencies:
Mandatory: A required, hard logic, or inherent order to the activities. For example, a book can't bebound until it has been printed. Mandatory dependencies can also be caused by regulatoryrequirements or organizational procedures. Mandatory dependencies cannot be altered --they are whatthey are and the project has to adhere to those dependencies.
Discretionary: A logical or preferred order to the activities. For example, in a remodeling project theteam would prefer that carpeting not be installed until all painting has been completed. Discretionarydependencies can be reordered if necessary but doing so may result in additional risk factors.
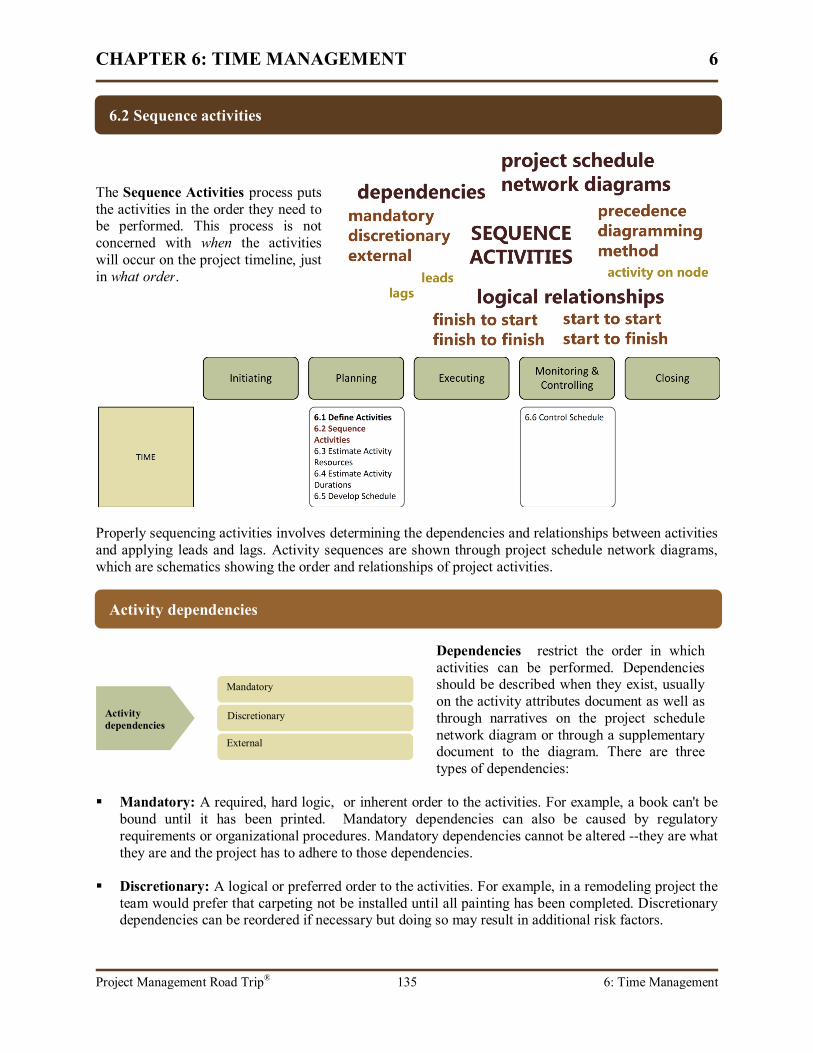
Activity dependencies
Activitydependencies
Mandatory
Discretionary
External
6.2 Sequence activities

CHAPTER 6: TIME MANAGEMENT 6
Project Management Road Trip® 136 6: Time Management
External: The dependency is outside of the project and usually beyond its direct control. Forexample, a technician can't begin installing the equipment until the vendor delivers it. Thoughsometimes external dependencies can be influenced or made contractual (such as with a vendor orconsultant), they can't usually be altered. External dependencies can also lead to scheduling problemswhen no hard date is available. For example, some modes of transportation can provide only a daterange of when materials can be expected to arrive.
Activity relationships are another restrictionthat affect the order of activities byestablishing the start and finish relationshipsbetween successor and predecessor activities.If there is any unusual logic to therelationships, it should be documented on theactivity attributes document as well asthrough narratives on the project schedulenetwork diagram or on a supplementarydocument to the diagram. There are fourtypes of activity precedence relationships.
Finish-to-Start (FS): The successor activity can begin onlyafter the predecessor activity is completed (Activity B can'tstart until Activity A is completed). This is the mostcommon type of relationship. For example, a house'sconcrete foundation can't be poured until the excavationactivity is fully completed.
Finish-to-Finish (FF): The completion of the successoractivity depends upon the completion of the predecessoractivity (Activity B can't finish until Activity A is finished).This relationship is necessary when both activities need tofinish at the same time (or very close) to each other, butthere's not any relationship between the activity start dates.For example, in order to be ready for binding, the cover of abook needs completed around the same time as the printingof the book’s pages are done.
Activity relationships
Activityrelationships
Finish-to-start
Finish-to-finish
Start-to-start
Start-to-finish

CHAPTER 6: TIME MANAGEMENT 6
Project Management Road Trip® 137 6: Time Management
Start-to-Start (SS): The successor activity can't start untilthe predecessor activity starts (Activity B can't start untilActivity A has started). This relationship is needed whenthe starting dates of the activities are dependent upon eachother, but the ending dates are not. For example, surveyresponses can start being tabulated as soon as the surveyresults begin coming in since there’s no real need to waituntil all survey results have been returned before enteringthem into a database.
Start-to-Finish (SF): The completion of the successoractivity depends upon the predecessor activity starting(Activity B can't complete until Activity A has started). Forexample, in a project in which equipment is being replaced,before the old equipment can be fully decommissioned(Activity B), the initial testing of the new equipment shouldhave been successfully started (Activity A). The testingdoesn't need to be fully completed but just far enough alongthat the team can be assured the new equipment isfunctioning before the old equipment is dismantled.
Leads and lags are artificial effects on the timing of activities and are used in conjunction with activityrelationships and dependencies. Leads and lags and the reasoning behind their use should be welldocumented because it may not be obvious to the casual observer why they were established.
Lags are delays or waiting time between activities. For example, if a parking lot is being resurfaced andthere’s a 24-hour curing period for asphalt before striping can begin, there would be a one day lagbetween these activities used in conjunction with a finish-to-start relationship: Activity B (striping) can'tbegin until one day after Activity A (asphalting) is completed. We can think of lag as positive time addedto an activity's duration. If the asphalting task takes two days and there's a one day lag while waiting for itto cure, the duration of theasphalt activity is three days.
Leads speed up activities withoutchanging the relationshipsbetween the activities. We canthink of leads as “negative” timebecause they allow activities tooccur in parallel that wouldnormally be done sequentially. For example, after the parking lot has been resurfaced with asphalt and thepainting of parking spaces begun, inserting the signs for handicapped spaces could start even thoughstriping of the spaces isn’t done. Activity C (posting handicapped parking spaces) will begin one daybefore Activity B (striping) is scheduled to be completed. Leads can lead to rework and usually pose otherrisk factors as well, so they should be used carefully.
Leads and lags

CHAPTER 6: TIME MANAGEMENT 6
Project Management Road Trip® 138 6: Time Management
...computers have made it easy to slap togethersomething that looks right, but there is a thoughtprocess that must be involved, and it is hard totell in many contemporary schedules if thethinking happened or not. 3
Critics Can't FInd the Logic in Many of Today's CPMSchedules
Project schedule network diagrams, sometimes referred to by the acronym PND, graphically show therelationships, sequences, and durations of all activities from the start to the end of the project. Thesediagrams are an integral part of the scheduling process and are necessary for determining the critical pathof the project. Most project managementsoftware applications will produce projectschedule network diagrams, but we should knowhow to read them and create them by hand forthe PMP examination. Though time consuming,producing them by hand, even if only at asummary level, has the added benefit of oftenuncovering missed activities, incorrectlysequenced, or erroneous relationships betweenactivities.
Project schedule network diagrams for complex projects can become very large documents and becomedifficult to view. If only a portion of the diagram is shown, these snippets are called a subnetwork orfragment. It's also common for PNDs to sometimes show only summary activities, called hammock
activities. These summary activities representseveral component activities and are aggregatedfrom the detailed activities. For example, asoftware development project might involve manyactivities related to a particular user-interface form;however, for simplicity, one hammock activity,such as Develop Form XYZ, is used to represent allassociated activities.
All project schedule network diagrams must have one startingand ending point, and they can't have any circular references. Acircular reference is an erroneous relationship between activitiesthat results in an endless loop in the network path. For example,setting a relationship so that activity D can't start until activity Cis completed, and also having activity C dependent upon activityD being completed results in a circular reference.
Project schedule network diagrams
CHAPTER 6: TIME MANAGEMENT 6
Project Management Road Trip® 139 6: Time Management
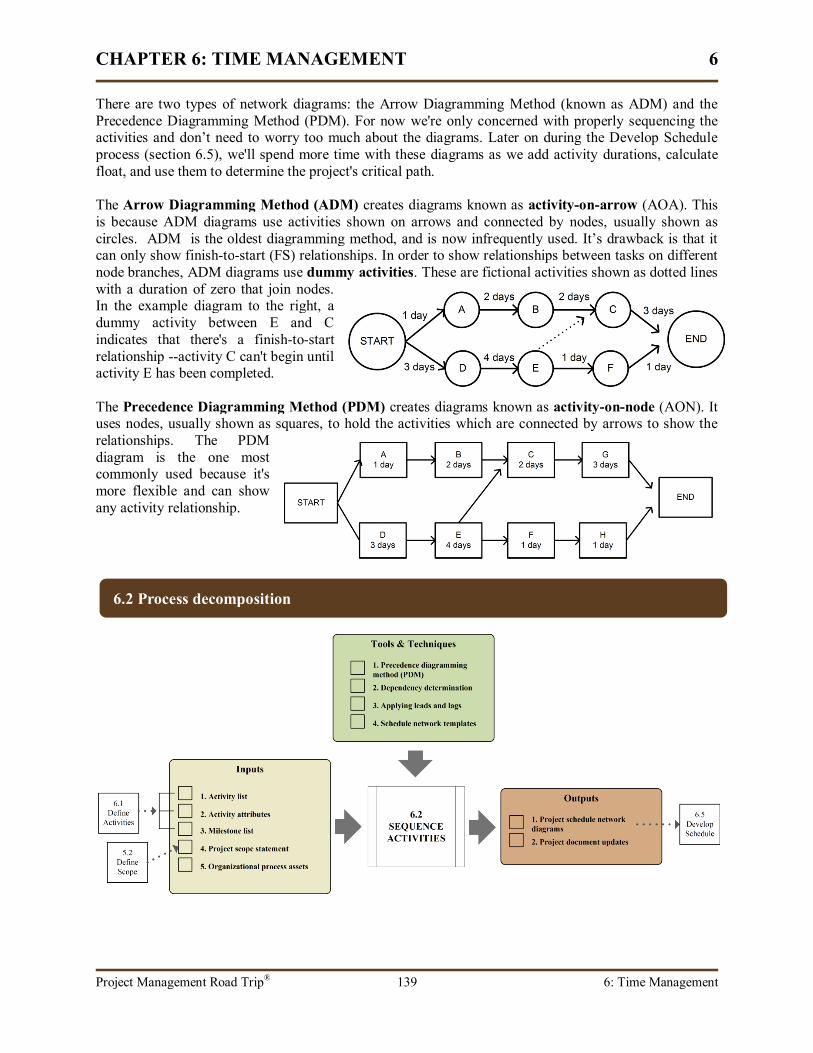
There are two types of network diagrams: the Arrow Diagramming Method (known as ADM) and thePrecedence Diagramming Method (PDM). For now we're only concerned with properly sequencing theactivities and don’t need to worry too much about the diagrams. Later on during the Develop Scheduleprocess (section 6.5), we'll spend more time with these diagrams as we add activity durations, calculatefloat, and use them to determine the project's critical path.
The Arrow Diagramming Method (ADM) creates diagrams known as activity-on-arrow (AOA). Thisis because ADM diagrams use activities shown on arrows and connected by nodes, usually shown ascircles. ADM is the oldest diagramming method, and is now infrequently used. It’s drawback is that itcan only show finish-to-start (FS) relationships. In order to show relationships between tasks on differentnode branches, ADM diagrams use dummy activities. These are fictional activities shown as dotted lineswith a duration of zero that join nodes.In the example diagram to the right, adummy activity between E and Cindicates that there's a finish-to-startrelationship --activity C can't begin untilactivity E has been completed.
The Precedence Diagramming Method (PDM) creates diagrams known as activity-on-node (AON). Ituses nodes, usually shown as squares, to hold the activities which are connected by arrows to show therelationships. The PDMdiagram is the one mostcommonly used because it'smore flexible and can showany activity relationship.
6.2 Process decomposition
CHAPTER 6: TIME MANAGEMENT 6
Project Management Road Trip® 140 6: Time Management
Inputs
Activity listThe activity list is the complete list of project activities that are needed to produce the work packages.It's decomposed from the WBS work packages. It’s the source document this process needs toidentify what the activities are that need sequenced.
Activity attributesThe activity attributes document is a companion to the activity list. It provides sufficient detail tofully describe the activity, and any supplementary information about activity, such as its relationships,constraints, assumptions, dependencies, and responsible people.
Milestone listThe milestone lists contains all project milestones regardless of where they originated and whetherthe milestone is optional or mandatory. Milestones can originate from the customer, performingorganization, project manager, or project team. Milestones can generate dependencies andrelationships between activities and might necessitate the need for leads and lags.
Project scope statementThe product scope describes the characteristics and functionality of the product, service, or result.Compared to the project scope, it is more focused on explaining what the product will be and how itwill be used. The scope statement may identify constraints that will generate dependencies andrelationships between activities and might necessitate the need for leads and lags.
Organizational process assetsOrganizational process assets are the source of existing policies, processes, organizational data andknowledge. These assets include the entire collection of formal and informal methodologies, policies,procedures, plans, and guidelines, as well as the organization's "knowledge base," which includeshistorical performance data. Of use to sequencing activities could be data from prior projects.
Tools and Techniques
Precedence diagramming method (PDM)A method for producing project schedule network diagrams, PDM produces activity-on-node (AON)diagrams. These are schematics that show activity sequencing and relationships and are used in theCritical Path Methodology (CPM).
Dependency determinationWhen they exist, dependencies between activities can be mandatory, discretionary, or external.Mandatory dependencies are dictated by contract or the nature of the work; discretionarydependencies are a preferred sequence; and external dependencies are those controlled by factorsoutside the project.
Applying leads and lagsLeads and lags are needed in the schedule for a variety of reason, such as dependencies betweenactivities. Leads cause two activities to occur (for some period of time) in parallel when they'dnormally have been sequential. Lags cause a delay between the finish of one activity and the start ofthe successor activity.
Schedule network templateTemplates can be helpful to decrease the time needed to create a project network diagram.
CHAPTER 6: TIME MANAGEMENT 6
Project Management Road Trip® 141 6: Time Management
Outputs
Project schedule network diagramProject schedule network diagrams (PND) are schematics that show the sequencing of activities andactivity interrelationships. The two types of diagrams are activity-on-arrow (AOA) and activity-on-
node (AON).
Project document updatesSequencing of activities will usually result in updates to one or more other project documents.
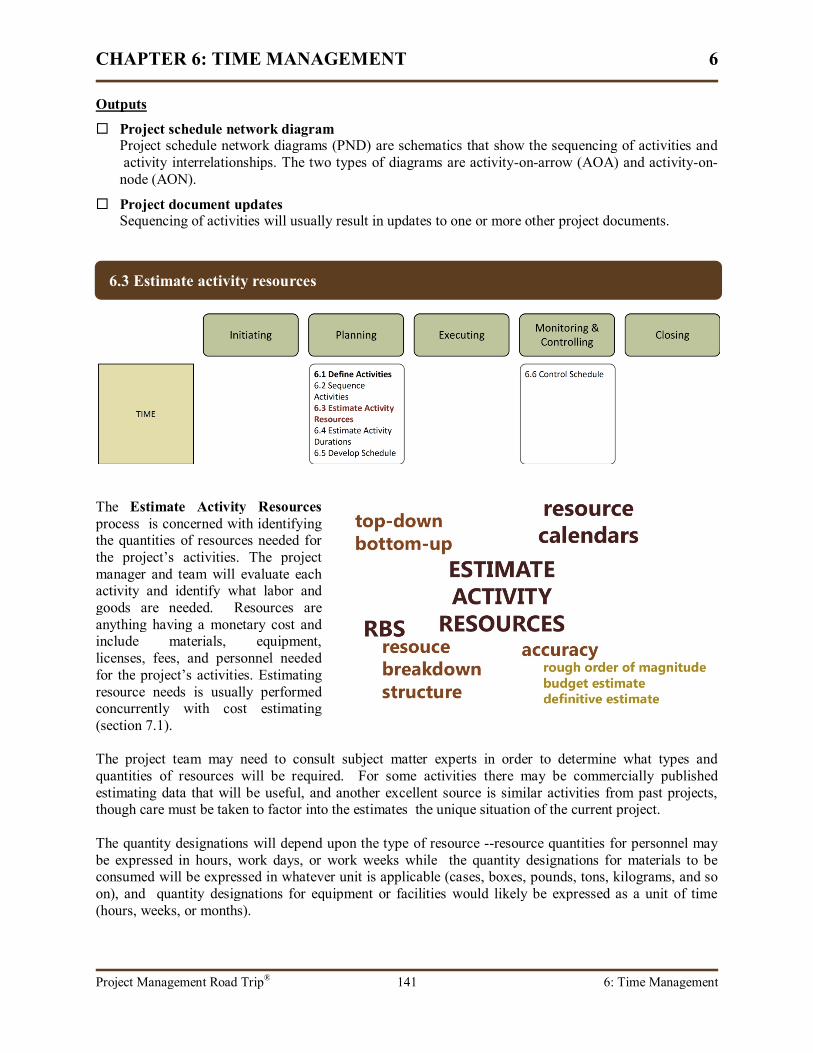
The Estimate Activity Resourcesprocess is concerned with identifyingthe quantities of resources needed forthe project’s activities. The projectmanager and team will evaluate eachactivity and identify what labor andgoods are needed. Resources areanything having a monetary cost andinclude materials, equipment,licenses, fees, and personnel neededfor the project’s activities. Estimatingresource needs is usually performedconcurrently with cost estimating(section 7.1).
The project team may need to consult subject matter experts in order to determine what types andquantities of resources will be required. For some activities there may be commercially publishedestimating data that will be useful, and another excellent source is similar activities from past projects,though care must be taken to factor into the estimates the unique situation of the current project.
The quantity designations will depend upon the type of resource --resource quantities for personnel maybe expressed in hours, work days, or work weeks while the quantity designations for materials to beconsumed will be expressed in whatever unit is applicable (cases, boxes, pounds, tons, kilograms, and soon), and quantity designations for equipment or facilities would likely be expressed as a unit of time(hours, weeks, or months).
6.3 Estimate activity resources
CHAPTER 6: TIME MANAGEMENT 6
Project Management Road Trip® 142 6: Time Management
Many (perhaps most) of the problems that you havewith estimating result from not being really sure whatthe work entails. You should avoid estimating workthat you don't understand. If you're getting ready tostart a project, you should know enough so that youcan estimate the work to within plus or minus 10%. Ifyou can't estimate the work to this level of confidence,you should spend more time investigating andunderstanding the work. If the work is just too large tobe able to estimate at that level of confidence, considerbreaking the project into smaller pieces so that youcan estimate each smaller project to within 10%.4
Tom Mochal, PMP and President, TenStep, Inc.
For human resources we’re not trying toidentify specific named individuals but ratheronly the types of personnel needed and theeffort required, such as programmers,engineers, architects, electricians, foremen,specialists, and so on. Regulations, industryrequirements, laws, and regional codes mayrestrict the types of personnel that can performsome activities.
Other enterprise and organizational factors maylimit what personnel types are available, andwe'll need to keep in mind the generalavailability of resources and whether availabilityis restricted by geography, experience, cost, or any other factor. Known limitations will force us to lookfor alternatives. For instance, we might need to use a junior-level staff member to perform some activitiesrather than a senior-level staff member, but in finding alternative approaches, we should keep in mind anyperformance or quality trade-offs the alternative approach will have.
There are two general approaches to estimating. Which approach we take is largely dependent upon howmuch information we have, so estimating during early phases is likely to be prone to inaccuracies, and thetwo different approaches can end up with different results.
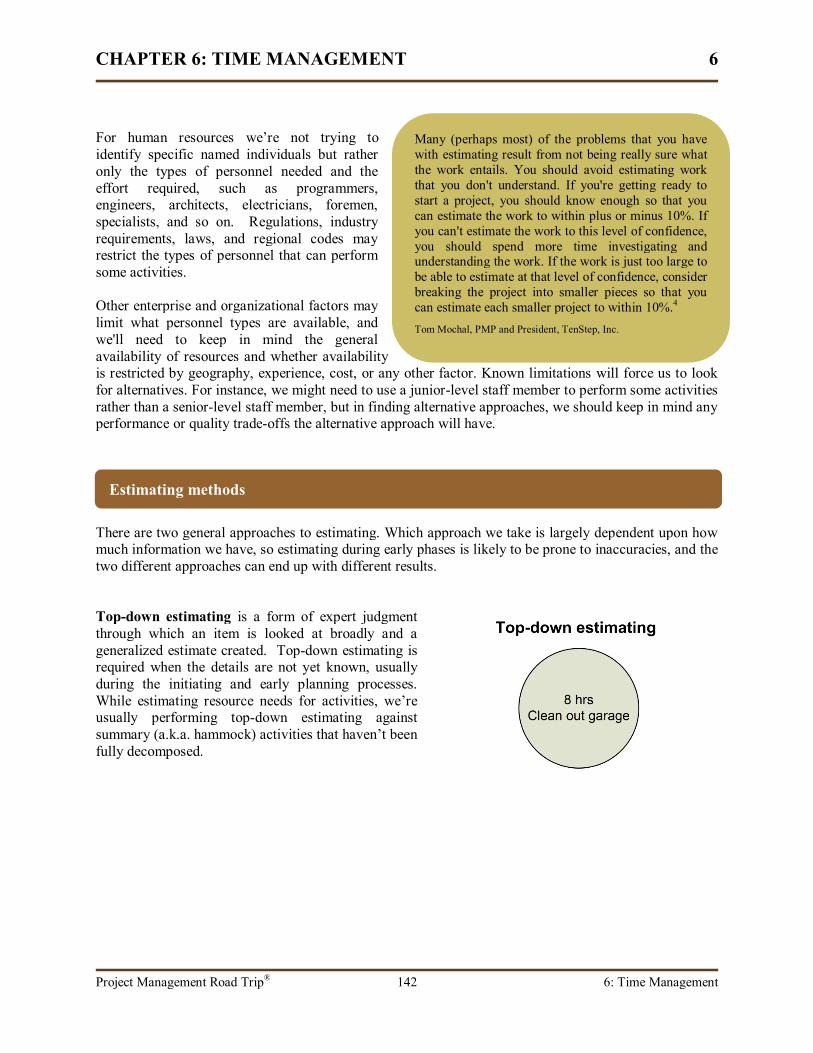
Top-down estimating is a form of expert judgmentthrough which an item is looked at broadly and ageneralized estimate created. Top-down estimating isrequired when the details are not yet known, usuallyduring the initiating and early planning processes.While estimating resource needs for activities, we’reusually performing top-down estimating againstsummary (a.k.a. hammock) activities that haven’t beenfully decomposed.
Estimating methods
CHAPTER 6: TIME MANAGEMENT 6
Project Management Road Trip® 143 6: Time Management
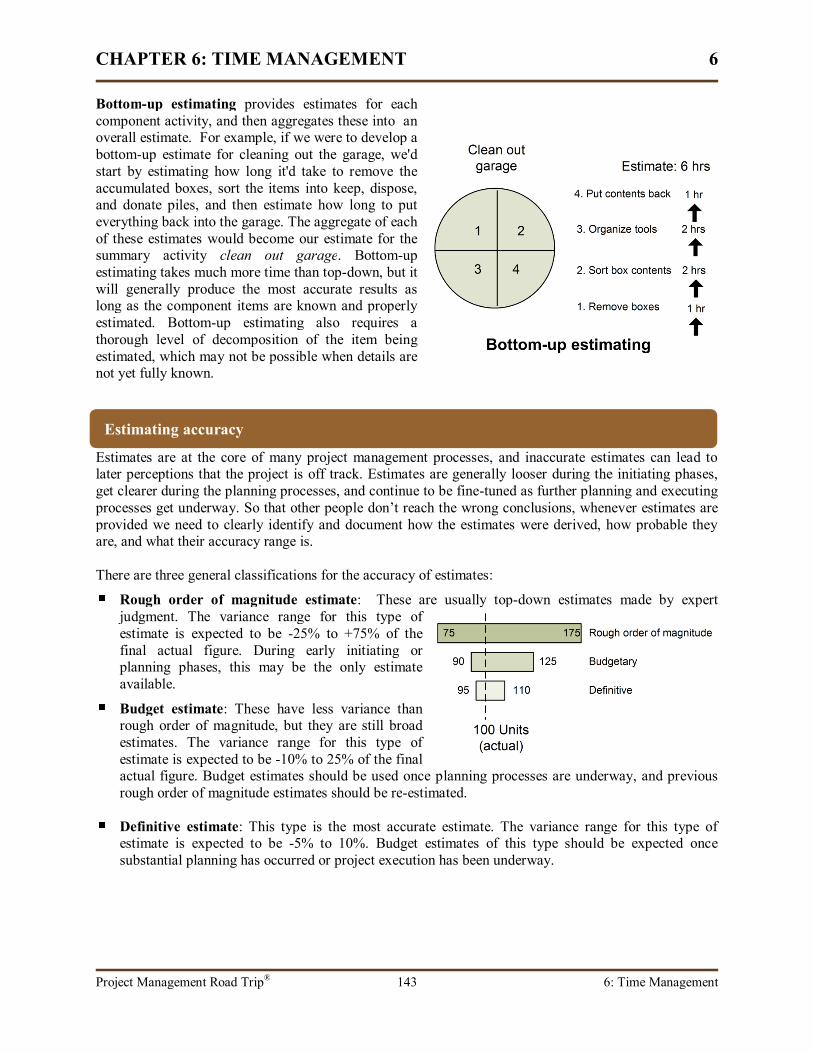
Bottom-up estimating provides estimates for eachcomponent activity, and then aggregates these into anoverall estimate. For example, if we were to develop abottom-up estimate for cleaning out the garage, we'dstart by estimating how long it'd take to remove theaccumulated boxes, sort the items into keep, dispose,and donate piles, and then estimate how long to puteverything back into the garage. The aggregate of eachof these estimates would become our estimate for thesummary activity clean out garage. Bottom-upestimating takes much more time than top-down, but itwill generally produce the most accurate results aslong as the component items are known and properlyestimated. Bottom-up estimating also requires athorough level of decomposition of the item beingestimated, which may not be possible when details arenot yet fully known.
Estimates are at the core of many project management processes, and inaccurate estimates can lead tolater perceptions that the project is off track. Estimates are generally looser during the initiating phases,get clearer during the planning processes, and continue to be fine-tuned as further planning and executingprocesses get underway. So that other people don’t reach the wrong conclusions, whenever estimates areprovided we need to clearly identify and document how the estimates were derived, how probable theyare, and what their accuracy range is.
There are three general classifications for the accuracy of estimates:
Rough order of magnitude estimate: These are usually top-down estimates made by expertjudgment. The variance range for this type ofestimate is expected to be -25% to +75% of thefinal actual figure. During early initiating orplanning phases, this may be the only estimateavailable.
Budget estimate: These have less variance thanrough order of magnitude, but they are still broadestimates. The variance range for this type ofestimate is expected to be -10% to 25% of the finalactual figure. Budget estimates should be used once planning processes are underway, and previousrough order of magnitude estimates should be re-estimated.
Definitive estimate: This type is the most accurate estimate. The variance range for this type ofestimate is expected to be -5% to 10%. Budget estimates of this type should be expected oncesubstantial planning has occurred or project execution has been underway.
Estimating accuracy
CHAPTER 6: TIME MANAGEMENT 6
Project Management Road Trip® 144 6: Time Management
To develop the RBS, it is necessary to begin bydividing the pool of resources into entitiesspecific enough so that this structure can serveas a shopping catalog for resources that arenecessary to accomplish project activities...5
Parviz Rad & Dennis Cioffi, Work and ResourceBreakdown Structures for Formalized Bottom-UpEstimating
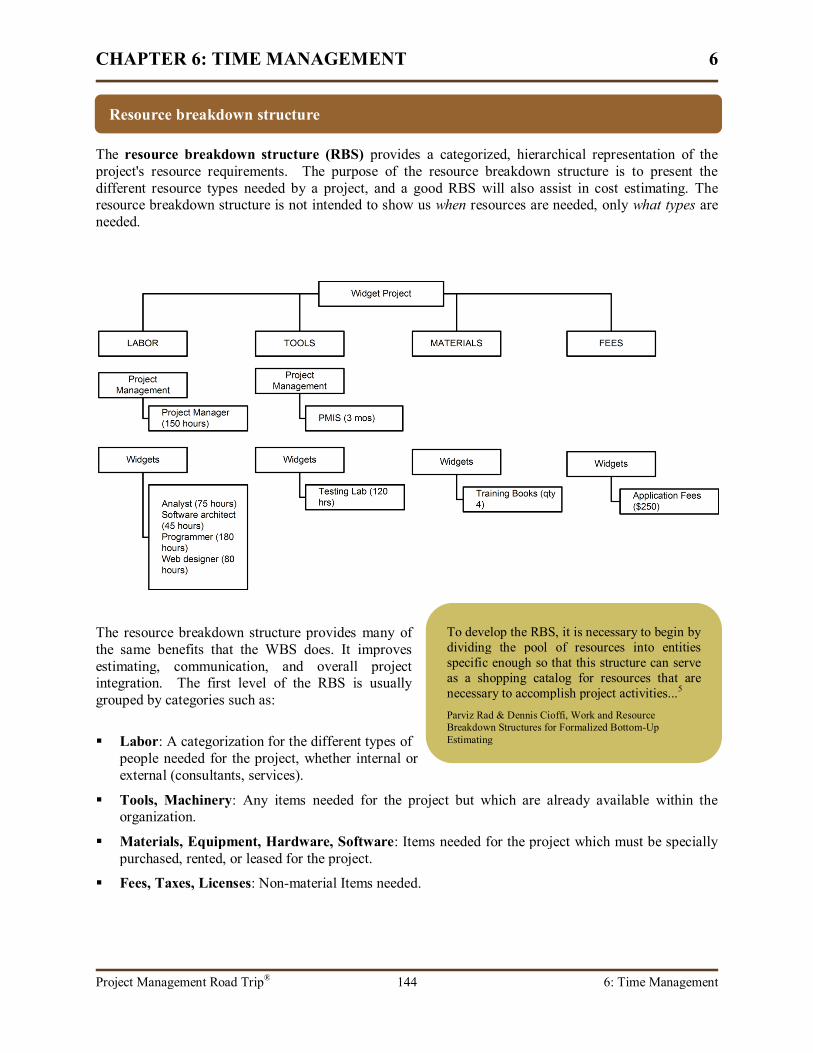
The resource breakdown structure (RBS) provides a categorized, hierarchical representation of theproject's resource requirements. The purpose of the resource breakdown structure is to present thedifferent resource types needed by a project, and a good RBS will also assist in cost estimating. Theresource breakdown structure is not intended to show us when resources are needed, only what types areneeded.
The resource breakdown structure provides many ofthe same benefits that the WBS does. It improvesestimating, communication, and overall projectintegration. The first level of the RBS is usuallygrouped by categories such as:
Labor: A categorization for the different types ofpeople needed for the project, whether internal orexternal (consultants, services).
Tools, Machinery: Any items needed for the project but which are already available within theorganization.
Materials, Equipment, Hardware, Software: Items needed for the project which must be speciallypurchased, rented, or leased for the project.
Fees, Taxes, Licenses: Non-material Items needed.
Resource breakdown structure
CHAPTER 6: TIME MANAGEMENT 6
Project Management Road Trip® 145 6: Time Management
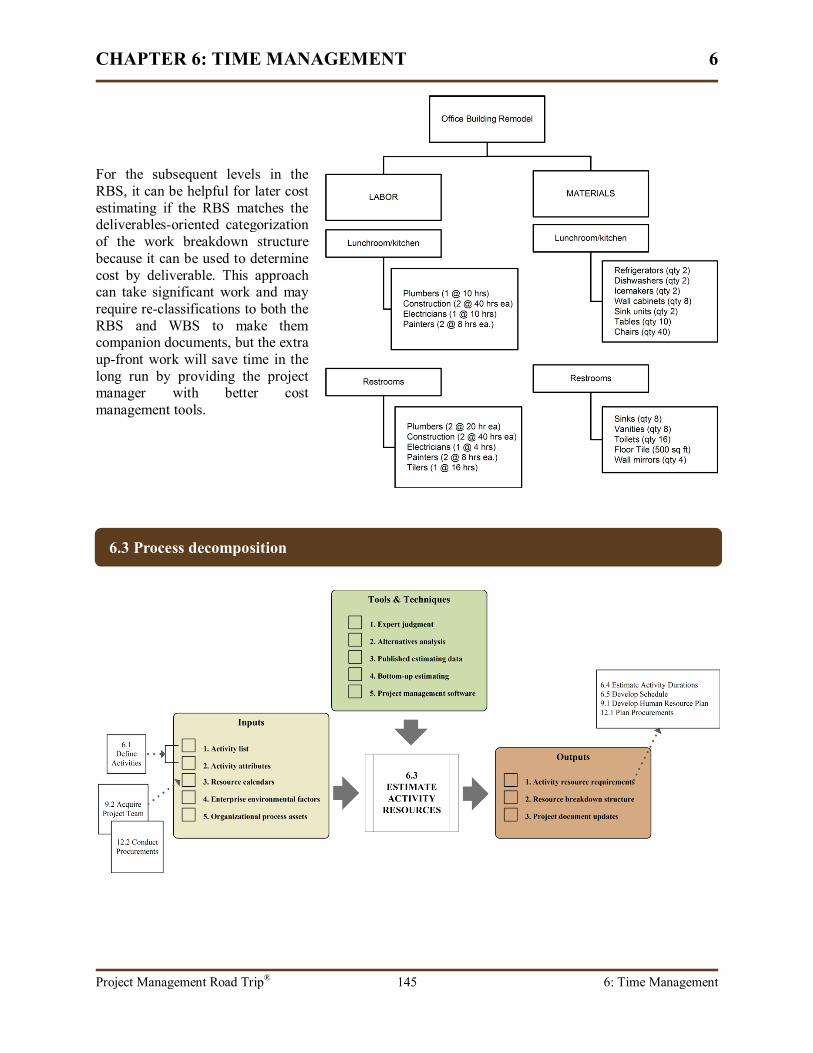
For the subsequent levels in theRBS, it can be helpful for later costestimating if the RBS matches thedeliverables-oriented categorizationof the work breakdown structurebecause it can be used to determinecost by deliverable. This approachcan take significant work and mayrequire re-classifications to both theRBS and WBS to make themcompanion documents, but the extraup-front work will save time in thelong run by providing the projectmanager with better costmanagement tools.
6.3 Process decomposition
CHAPTER 6: TIME MANAGEMENT 6
Project Management Road Trip® 146 6: Time Management
Inputs
Activity listThe activity list is the complete list of project activities that are needed to produce the work packages.It's decomposed from the WBS work packages. It’s the source document this process needs toidentify what resources are required.
Activity attributesThe activity attributes document is a companion to the activity list. It provides sufficient detail tofully describe the activity, and any supplementary information about activity, such as its relationships,constraints, assumptions, dependencies, and responsible people.
Resource calendarsThis may be one or more calendars that identify when people, equipment, and material are availableand for what lengths of time. For example, a resource calendar would indicate when supplies wereexpected to arrive and in what quantity. There is also a composite resource calendar that shows theavailability of named human resources on the project as well as their skills. These calendars are usefulduring resource estimating because alternative resources may need identified if there’s a shortage of adesired resource.
Enterprise environmental factorsAny of the many enterprise environmental factors and systems that influence the project should beconsidered. These factors can include its personnel, its organizational culture, its tolerance of risk,and its formal and informal hierarchy. Organizations may also have custom or commercial analyticaldatabases that can include cost estimating, risk, or demographic data.
Organizational process assetsOrganizational process assets are the source of existing policies, processes, organizational data andknowledge. The organization may have policies relating to staffing, rental, leasing, and purchasing ofmaterial.
Tools and Techniques
Expert judgmentExpert judgment is based upon the experience and knowledge of subject matter experts. Estimating isalways based on expert judgment.
Alternatives analysisFinding alternatives looks for different approaches in performing the work required by the project orin the methods for achieving the project's objectives. Identifying resource needs will requireevaluation of different resource types, financial comparisons between staffing or outsourcing, rentingversus leasing, and building versus buying.
Published estimating dataA variety of commercially available publications and databases provide standardized rates, resources,labor, material, and other related categories which might be useful for estimating resource needs ofthe project’s activities.
Bottom-up estimatingBottom-up estimating looks at all the components of an activity in order to provide estimates. Thesecomponent estimates are then aggregated to derive an estimate for the activity. This is in comparisonto top-down estimating, which relies heavily on expert judgment and looks only at the activity athigh, overall level.
CHAPTER 6: TIME MANAGEMENT 6
Project Management Road Trip® 147 6: Time Management
Project management softwareProject management software will offer tools to plan, calendar, estimate, evaluate, organize, andmanage resource needs.
Outputs
Activity resource requirementsThe activity resource requirements document describes the resource needs at the activity level, whichcan be aggregated up to the work package level. It focuses on the resource types and quantitiesneeded.
Resource breakdown structureThe Resource Breakdown Structure is a graphical, hierarchical presentation of resources by type.There is no hard and fast rule for its categorization, but it's generally better to have the RBS'scategorization be in a manner similar to the work breakdown structure.
Project document updatesResource estimating and alternatives analysis may result in updates to the activity list, activityattributes, and resource calendars.
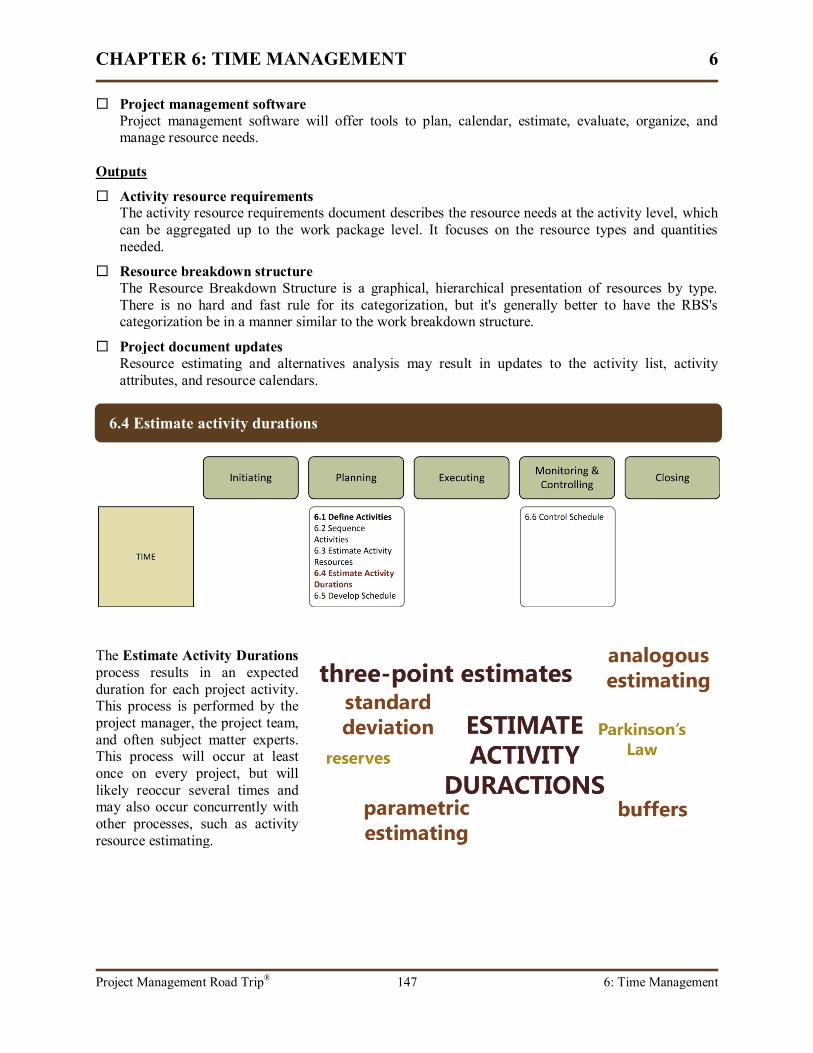
The Estimate Activity Durationsprocess results in an expectedduration for each project activity.This process is performed by theproject manager, the project team,and often subject matter experts.This process will occur at leastonce on every project, but willlikely reoccur several times andmay also occur concurrently withother processes, such as activityresource estimating.
6.4 Estimate activity durations
CHAPTER 6: TIME MANAGEMENT 6
Project Management Road Trip® 148 6: Time Management
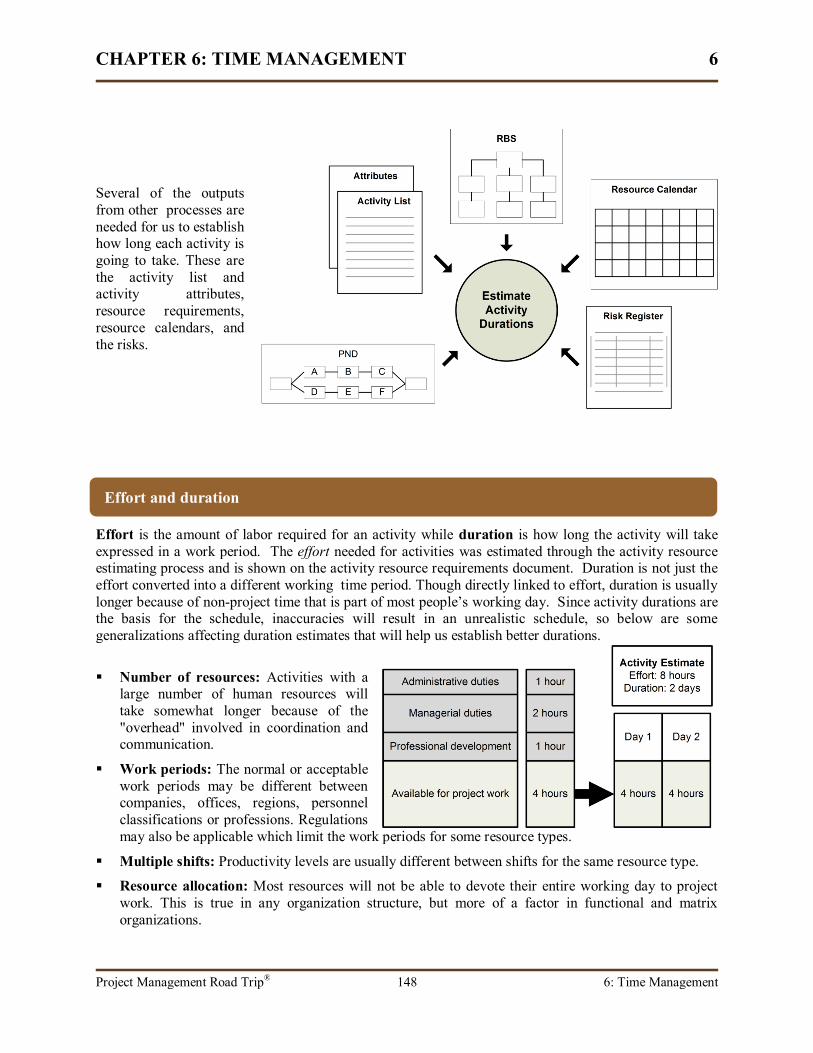
Several of the outputsfrom other processes areneeded for us to establishhow long each activity isgoing to take. These arethe activity list andactivity attributes,resource requirements,resource calendars, andthe risks.
Effort is the amount of labor required for an activity while duration is how long the activity will takeexpressed in a work period. The effort needed for activities was estimated through the activity resourceestimating process and is shown on the activity resource requirements document. Duration is not just theeffort converted into a different working time period. Though directly linked to effort, duration is usuallylonger because of non-project time that is part of most people’s working day. Since activity durations arethe basis for the schedule, inaccuracies will result in an unrealistic schedule, so below are somegeneralizations affecting duration estimates that will help us establish better durations.
Number of resources: Activities with alarge number of human resources willtake somewhat longer because of the"overhead" involved in coordination andcommunication.
Work periods: The normal or acceptablework periods may be different betweencompanies, offices, regions, personnelclassifications or professions. Regulationsmay also be applicable which limit the work periods for some resource types.
Multiple shifts: Productivity levels are usually different between shifts for the same resource type.
Resource allocation: Most resources will not be able to devote their entire working day to projectwork. This is true in any organization structure, but more of a factor in functional and matrixorganizations.
Effort and duration
CHAPTER 6: TIME MANAGEMENT 6
Project Management Road Trip® 149 6: Time Management
Overcoming Parkinson's Law7
Determine priorities. Give more time to top priorities. Use reliable estimating techniques. Take frequent measurements on
performance. Maintain visibility of those measurements.
Ralph Kliem and Irwin Ludain, Tools and Tips for Today'sProject Manager
Resource types: Though experienced resources may be more efficient than those with lessexperience, resource availability or cost factors will influence what resource types can be used onwhich activities. Sometime it’s necessary to opt for less-experienced personnel because of availabilityor scarcity, meaning it’ll usually take them longer to perform the same tasks.
Risk factors: Risky activities need undertaken with more attention to detail, which likely meanslonger efforts and durations.
Multi-tasking: Multi-tasking is a productivity loser, but it can’t always be avoided. Any resourcewho is juggling other job duties or performing multiple project activities simultaneously is multi-tasking. When we cannot rearrange the person’s tasks to eliminate multitasking, we need to allowlonger durations for those resource's activities.
Funding limits: Calendar-based funding limits, either established by the customer or performingorganization, may restrict when work can be performed and can affect durations. For example, if thebudget limit for November is $25,000, but there is $30,000 of scheduled activities planned, $5,000 ofthose scheduled activities is going to have to be adjusted, either by rescheduling the start date orlimiting the number of resources performing those activities, which will increase duration.
Another contributor to inaccurate duration estimates is a situation known as Parkinson's Law. Though theintent of his paper was not directly related to its subsequent interpretation, Cyril Parkinson firstintroduced this topic in a 1955 paper6. Parkinson's Law states that work expands to fill the timeavailable. This means that if it we estimated an activity will take two weeks, it'll end up taking two weekseven if it could have been finished it in one.
This isn't due to deliberate misinformation on anyone’s part. For example, our two week estimate mighthave included padding because we know some other things are also due during that two weeks, or we
might have allowed extra time for risks that we knewmight be involved in the activity. We might alsohave just wanted to be absolutely sure we wouldmeet that deadline, so we gave ourselves severalextra days. But the problem that arises fromParkinson's Law is that even when this "padding" isdone with the best of intentions, it results inadditional time that is invisible and unaccountable.
As project managers, we have no real idea whetherthe activity indeed took two weeks or only seven
days, and this not only makes the activity durations onour project inaccurate, but could lead to inaccuracies in other projects which rely on our project forhistorical data.
Parkinson’s Law
CHAPTER 6: TIME MANAGEMENT 6
Project Management Road Trip® 150 6: Time Management
Importance of correct estimating is obvious.Under-estimating may result in the clientgetting an unpleasant shock when tenders areopened and drastically modifying orabandoning the work at that stage. Over-estimating may lose the engineer or estimatorhis client or his job, or in any case hisconfidence.8
Construction Estimating Techniques, ConstructionInformation Services
There are three estimating approaches that can help make duration estimates more accurate. These areanalogous estimating, parametric estimating, and three-point estimates.
Analogous estimating is a form of expertjudgment that relies on the duration from a similarpast activity to predict how long another activitywill take. Care must be taken when using historicalinformation from other projects because an activitycan sometimes appear similar in projectdocumentation but have actually been muchdifferent or have been performed under muchdifferent circumstances. For example, theexperience level of the other project team may havebeen lower or there could have been hiddenpadding in the activity's duration. Still, analogousestimating is more accurate than estimates from theproject team or expert judgment alone.
Parametric estimating uses mathematicalformulas as the source for duration estimates. Itisn’t applicable to all activities, but it can be usedwhen the quantity of work and productivity rate areknown. For example, if brochures can be producedat the rate of 1000 per hour, it will take 10 hours toprint 10,000 brochures. As long as other activityfactors and attributes are also taken intoconsideration, parametric estimates can be veryaccurate.
We have to account for uncertainty in our estimates, and so it’s common to use pessimistic, optimistic,and most likely values. Pessimistic is the worst-casescenario, optimistic is the best-case scenario, andthe most likely estimate is the one based on areasonable situation. Standard deviation and three-point estimates can be used when the estimates thatare coming from team members for the sameactivity are varying widely. Standard deviationidentifies how diverse the data population is. A highstandard deviation indicates a lot of uncertainty inthe estimates.
The formula for standard deviation used by the PMBOK is:
(Pessimistic Estimate - Optimistic Estimate)6
For example, the most pessimistic estimate received from the project teamis 12 weeks, and the most optimistic estimate is 4 weeks. The standarddeviation for this activity is 1.33.
(12 - 4) / 6 = 1.33
Estimating techniques
CHAPTER 6: TIME MANAGEMENT 6
Project Management Road Trip® 151 6: Time Management
Some of the uncertainty in estimates can be factored out by using three-point estimates. A three-pointestimate, sometimes referred to as PERT, uses the three estimates and applies a mathematical formula.The result is a duration estimate that is a weighted average.
The formula for a three-point estimate is:
(Pessimistic Estimate + (4 x Most Likely Estimate) + Optimistic Estimate)6
If the pessimistic estimate for an activity is 12 weeks, the optimisticestimate is 4 weeks, and the most likely is 7 weeks, then the three-pointestimate is 7.33.
(12 + (4 x 7) + 4) / 6(12 + 28 + 4)/644 / 6 = 7.33
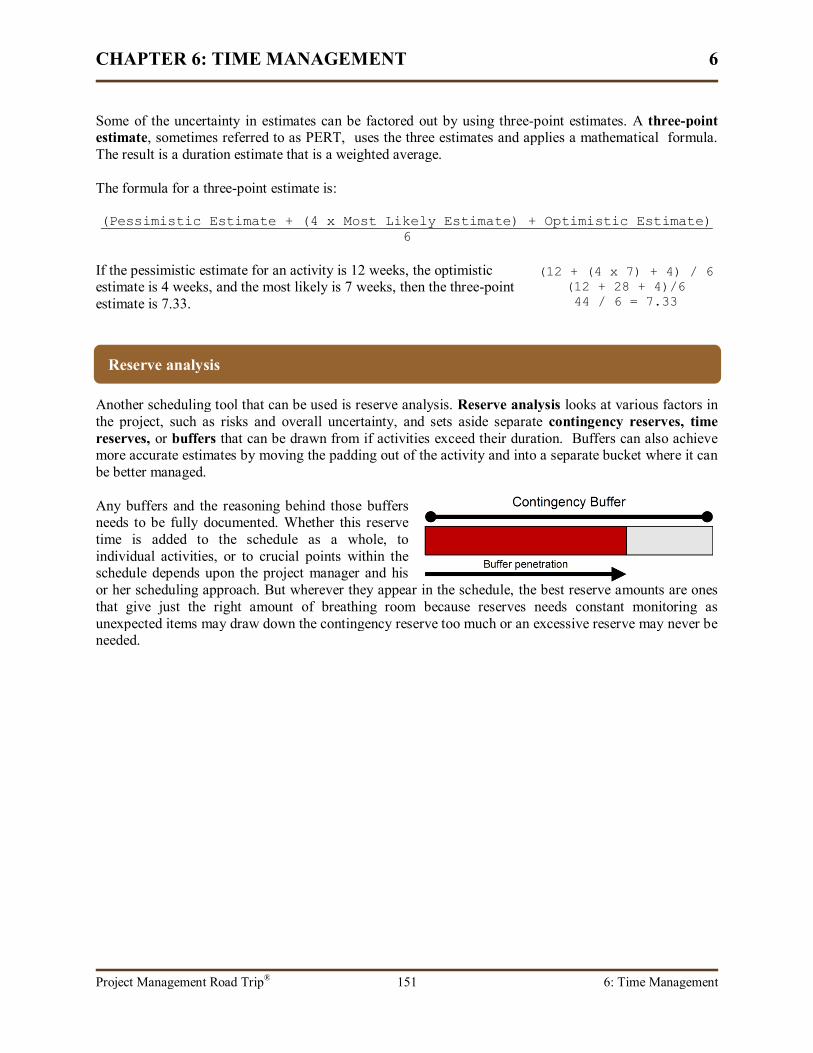
Another scheduling tool that can be used is reserve analysis. Reserve analysis looks at various factors inthe project, such as risks and overall uncertainty, and sets aside separate contingency reserves, timereserves, or buffers that can be drawn from if activities exceed their duration. Buffers can also achievemore accurate estimates by moving the padding out of the activity and into a separate bucket where it canbe better managed.
Any buffers and the reasoning behind those buffersneeds to be fully documented. Whether this reservetime is added to the schedule as a whole, toindividual activities, or to crucial points within theschedule depends upon the project manager and hisor her scheduling approach. But wherever they appear in the schedule, the best reserve amounts are onesthat give just the right amount of breathing room because reserves needs constant monitoring asunexpected items may draw down the contingency reserve too much or an excessive reserve may never beneeded.
6.4.0.4 Three-point estimatesReserve analysis
CHAPTER 6: TIME MANAGEMENT 6
Project Management Road Trip® 152 6: Time Management
Inputs
Activity listThe activity list is the complete list of project activities that are needed to produce the work packages.It's decomposed from the WBS work packages. It’s the source document this process needs toidentify what resources are required.
Activity attributesThe activity attributes document is a companion to the activity list. It provides sufficient detail tofully describe the activity, and any supplementary information about activity, such as its relationships,constraints, assumptions, dependencies, and responsible people.
Activity resource requirementsThe activity resource requirements document describes the resource needs at the activity level, whichcan be aggregated up to the work package level. It focuses on the resource types and quantitiesneeded.
Resource calendarsThis may be one or more calendars that identify when people, equipment, and material are availableand for what lengths of time. For example, a resource calendar would indicate when supplies wereexpected to arrive and in what quantity. There is also a composite resource calendar that shows theavailability of named human resources on the project as well as their skills. These calendars are usefulduring duration estimating because scarcity or unavailability of resources may increase the durationof activities.
Project scope statementAssumptions and constraints are factors in activity durations. The project scope statement details themeasurable goals, objectives, deliverables, and requirements of the project, and what the acceptancecriteria of deliverables will be. It also describes the work required to meet all objectives anddeliverables of the project, and it also contains milestones, assumptions, risks, and costs.
6.4 Process decomposition

CHAPTER 6: TIME MANAGEMENT 6
Project Management Road Trip® 153 6: Time Management
Enterprise environmental factorsAny of the many enterprise environmental factors and systems that influence the project should beconsidered when estimating activity durations. These factors can include its personnel, itsorganizational culture, its tolerance of risk, and its formal and informal hierarchy. Organizations mayalso have custom or commercial analytical databases that can include cost estimating, risk, ordemographic data.
Organizational process assetsOrganizational process assets are the source of existing policies, processes, organizational data andknowledge. These assets include the entire collection of formal and informal methodologies, policies,procedures, plans, and guidelines, as well as the organization's "knowledge base," which includeshistorical performance data, labor information, service and maintenance history, issue and defecthistory, project files, and financial data.
Tools and Techniques
Expert judgmentExpert judgment is based upon the experience and knowledge of subject matter experts. It's used toassess and evaluate the inputs and the information they contain.
Analogous estimatingAnalogous estimating is a form of expert judgment that uses similar activities from past projects toprovide duration or cost estimates.
Parametric estimatingParametric estimating uses mathematical formulas, usually involving quantity and productivity rates,to determine estimates.
Three-point estimatesThree-point estimates provide a weighted average that helps level out some of the uncertainty inestimates. Three point estimates use the optimistic, pessimistic, and most likely estimates.
Reserve analysisReserves are time or cost buffers in the project schedule or budget that help the project respond touncertainties. Reserve analysis monitors these buffers and will use, reduce, or eliminate them basedon the current situation.
Outputs
Activity duration estimatesActivity duration estimates are the work periods required to complete a scheduled activity. There aremany factors that influence duration, including resource availability, multi-tasking, and risks.
Project document updatesEstimating activity durations may result in updates to project documents, including constraints,assumptions, and activity attributes.
CHAPTER 6: TIME MANAGEMENT 6
Project Management Road Trip® 154 6: Time Management
The schedule provides a form of contractbetween every person on a team...There ispsychological power in a schedule thatexternalizes and amplifies the commitment thatis being made...It is not as easy to forget orignore something when it's posted on awhiteboard. 9
Scott Berkum The Art of Project Managment
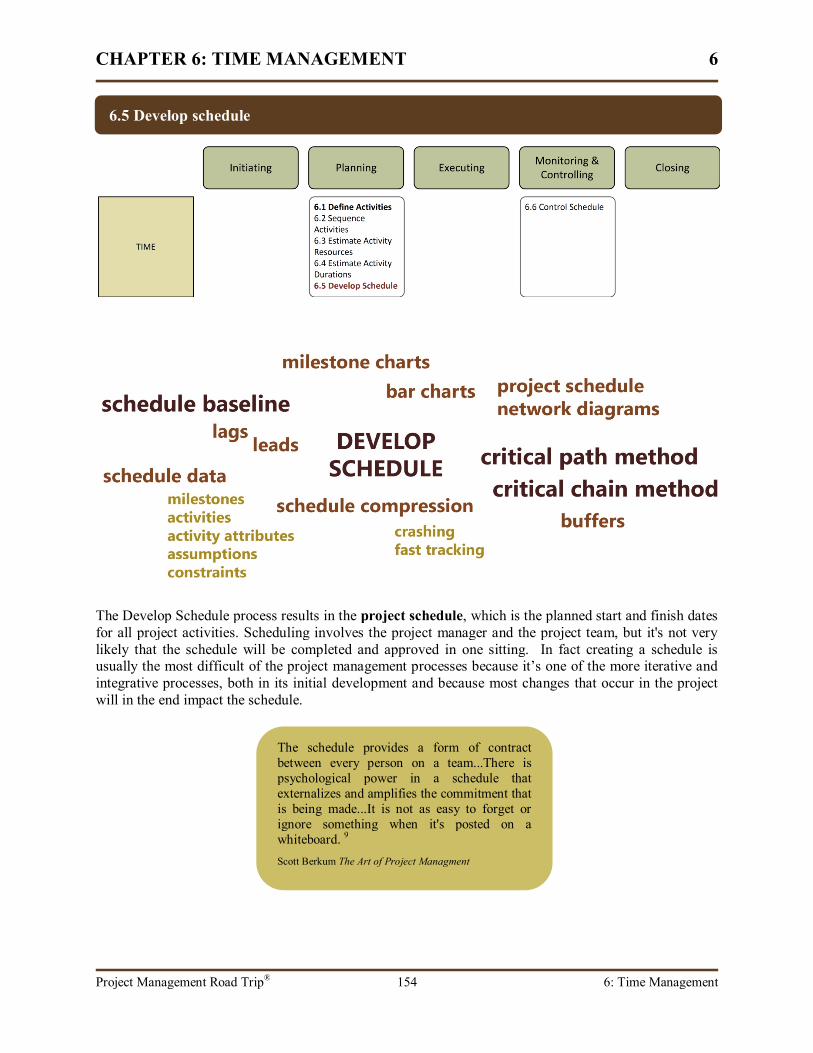
The Develop Schedule process results in the project schedule, which is the planned start and finish datesfor all project activities. Scheduling involves the project manager and the project team, but it's not verylikely that the schedule will be completed and approved in one sitting. In fact creating a schedule isusually the most difficult of the project management processes because it’s one of the more iterative andintegrative processes, both in its initial development and because most changes that occur in the projectwill in the end impact the schedule.
6.5 Develop schedule
CHAPTER 6: TIME MANAGEMENT 6
Project Management Road Trip® 155 6: Time Management
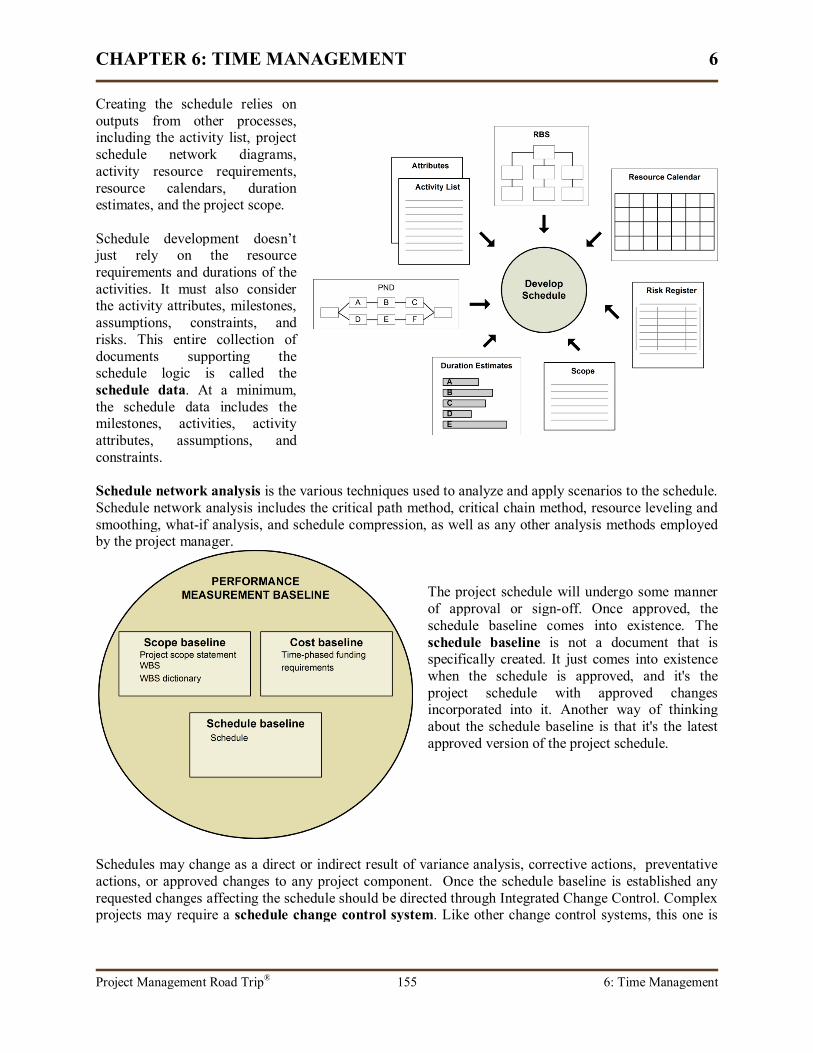
Creating the schedule relies onoutputs from other processes,including the activity list, projectschedule network diagrams,activity resource requirements,resource calendars, durationestimates, and the project scope.
Schedule development doesn’tjust rely on the resourcerequirements and durations of theactivities. It must also considerthe activity attributes, milestones,assumptions, constraints, andrisks. This entire collection ofdocuments supporting theschedule logic is called theschedule data. At a minimum,the schedule data includes themilestones, activities, activityattributes, assumptions, andconstraints.
Schedule network analysis is the various techniques used to analyze and apply scenarios to the schedule.Schedule network analysis includes the critical path method, critical chain method, resource leveling andsmoothing, what-if analysis, and schedule compression, as well as any other analysis methods employedby the project manager.
The project schedule will undergo some mannerof approval or sign-off. Once approved, theschedule baseline comes into existence. Theschedule baseline is not a document that isspecifically created. It just comes into existencewhen the schedule is approved, and it's theproject schedule with approved changesincorporated into it. Another way of thinkingabout the schedule baseline is that it's the latestapproved version of the project schedule.
Schedules may change as a direct or indirect result of variance analysis, corrective actions, preventativeactions, or approved changes to any project component. Once the schedule baseline is established anyrequested changes affecting the schedule should be directed through Integrated Change Control. Complexprojects may require a schedule change control system. Like other change control systems, this one is
CHAPTER 6: TIME MANAGEMENT 6
Project Management Road Trip® 156 6: Time Management
part of the project change control system, and it ensures that the review, approval, and documentationprocesses for schedule changes are followed.
Some people also mistakenly refer to the project plan and project schedule interchangeably, but the twoare not the same. We know from the chapter four that the project plan is a comprehensive document thatdrives the entire execution, management, and control of the project, of which the project schedule is justone component.
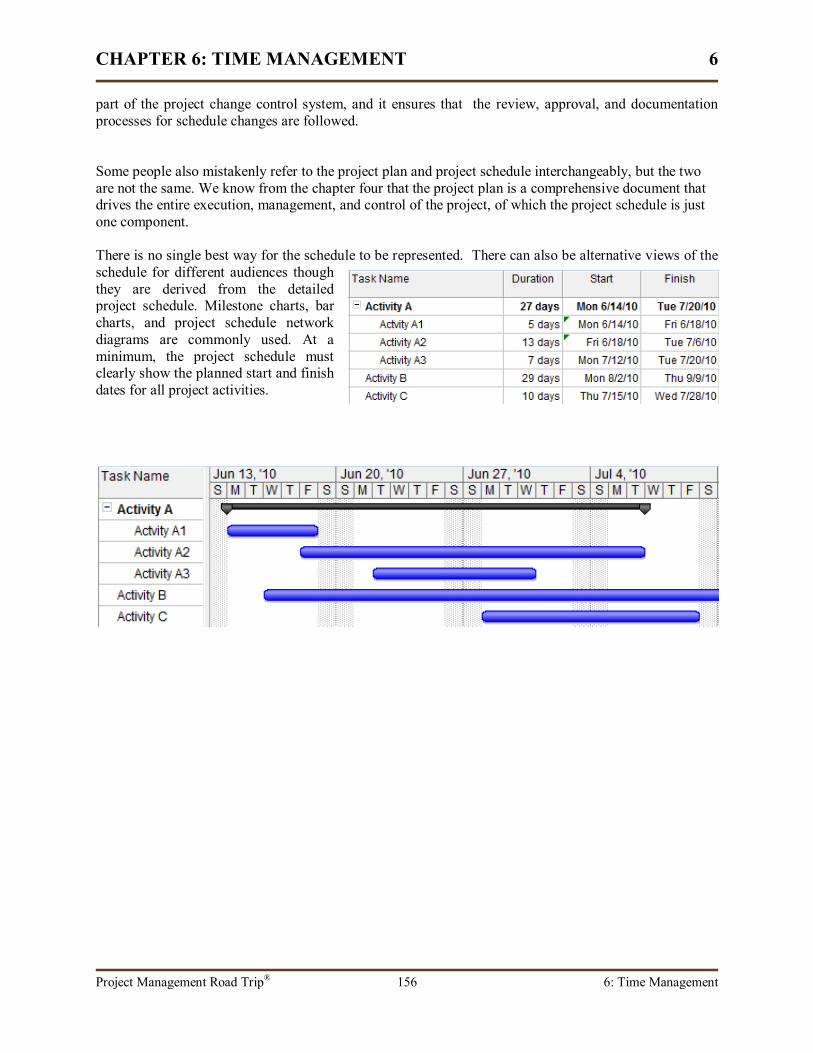
There is no single best way for the schedule to be represented. There can also be alternative views of theschedule for different audiences thoughthey are derived from the detailedproject schedule. Milestone charts, barcharts, and project schedule networkdiagrams are commonly used. At aminimum, the project schedule mustclearly show the planned start and finishdates for all project activities.

CHAPTER 6: TIME MANAGEMENT 6
Project Management Road Trip® 157 6: Time Management
We usually face limitations on whenactivities can start and end. Those constraintscan be imposed by the customer, sponsor,regulations, vendors, industry guidelines,market conditions, environmental or weatherconditions, and even the project team.Milestones, whether established by thesponsor, customer, or the project team, mayalso result in activity constraints.
Constraints can also be applied to the projectas a whole, such as the project must be startedor completed by a predetermined date. Whenconstraints are applied to activities, they serveto restrict when the activities can begin orend. Use of constraints may also forcemandatory leads and lags in the schedule.
There are four types of constraints:
Start No Earlier Than (SNET or SNE): The activity can't start until a predetermined date.
Start No Later Than (SNLT or SNL): The activity must be started before but not later than apredetermined date.
Finish No Earlier Than (FNET or FNE): The activity must be finished after a predetermined date.
Finish No Later Than (FNLT or FNL): The activity must be finished before a predetermined date.
Float, also referred to as slack, is how much leeway an activity's duration has before it causes delays insuccessor activities or the project itself. There are three types of float we need to know as well as how tocalculate them. Calculating float is discussed fully in the section on the Critical Path Method, but a briefoverview is necessary here. To determine float, we have to return to project schedule network diagrams.
Activity constraints
Float and slack
Activityconstraints
Start no earlier than
Start no later than
Finish no earlier than
Finish no later than
CHAPTER 6: TIME MANAGEMENT 6
Project Management Road Trip® 158 6: Time Management
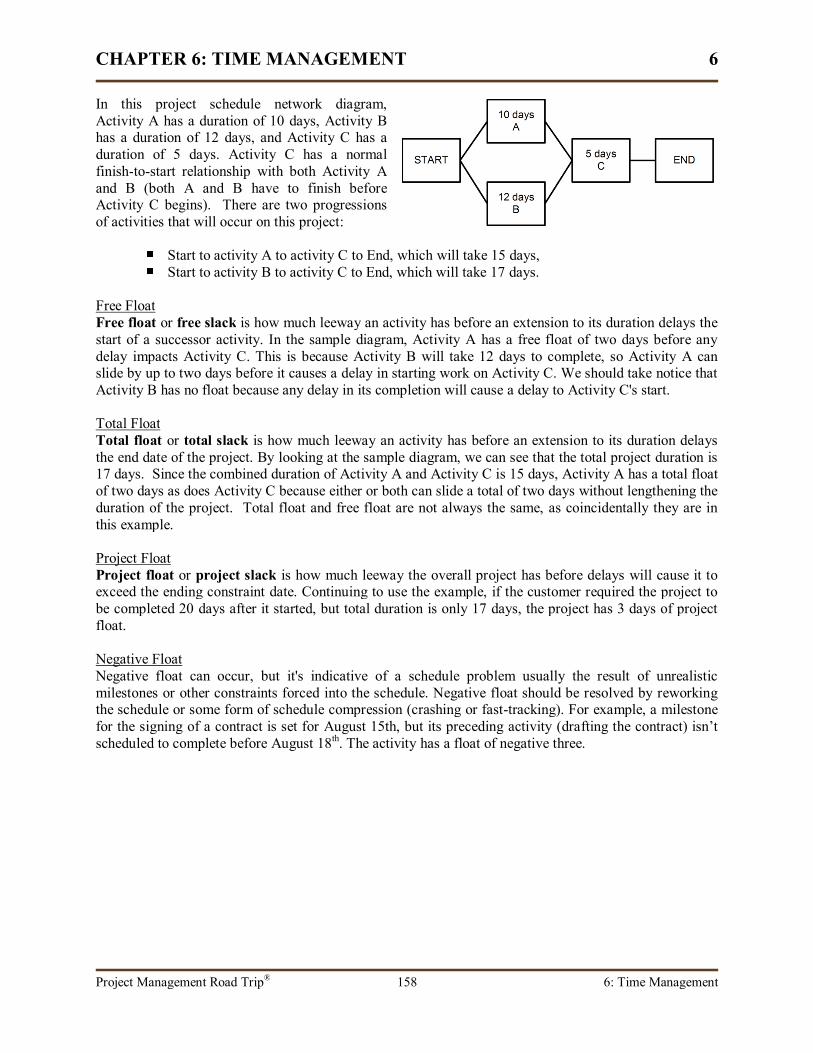
In this project schedule network diagram,Activity A has a duration of 10 days, Activity Bhas a duration of 12 days, and Activity C has aduration of 5 days. Activity C has a normalfinish-to-start relationship with both Activity Aand B (both A and B have to finish beforeActivity C begins). There are two progressionsof activities that will occur on this project:
Start to activity A to activity C to End, which will take 15 days,Start to activity B to activity C to End, which will take 17 days.
Free FloatFree float or free slack is how much leeway an activity has before an extension to its duration delays thestart of a successor activity. In the sample diagram, Activity A has a free float of two days before anydelay impacts Activity C. This is because Activity B will take 12 days to complete, so Activity A canslide by up to two days before it causes a delay in starting work on Activity C. We should take notice thatActivity B has no float because any delay in its completion will cause a delay to Activity C's start.
Total FloatTotal float or total slack is how much leeway an activity has before an extension to its duration delaysthe end date of the project. By looking at the sample diagram, we can see that the total project duration is17 days. Since the combined duration of Activity A and Activity C is 15 days, Activity A has a total floatof two days as does Activity C because either or both can slide a total of two days without lengthening theduration of the project. Total float and free float are not always the same, as coincidentally they are inthis example.
Project FloatProject float or project slack is how much leeway the overall project has before delays will cause it toexceed the ending constraint date. Continuing to use the example, if the customer required the project tobe completed 20 days after it started, but total duration is only 17 days, the project has 3 days of projectfloat.
Negative FloatNegative float can occur, but it's indicative of a schedule problem usually the result of unrealisticmilestones or other constraints forced into the schedule. Negative float should be resolved by reworkingthe schedule or some form of schedule compression (crashing or fast-tracking). For example, a milestonefor the signing of a contract is set for August 15th, but its preceding activity (drafting the contract) isn’tscheduled to complete before August 18th. The activity has a float of negative three.
CHAPTER 6: TIME MANAGEMENT 6
Project Management Road Trip® 159 6: Time Management
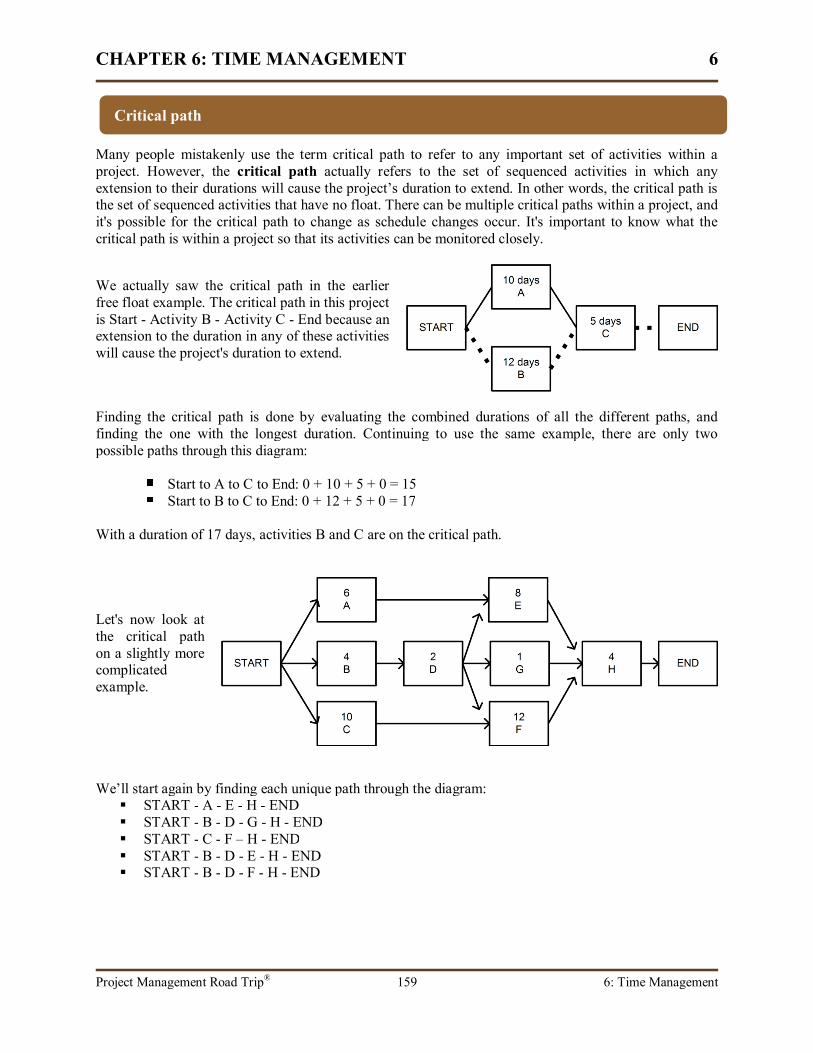
Many people mistakenly use the term critical path to refer to any important set of activities within aproject. However, the critical path actually refers to the set of sequenced activities in which anyextension to their durations will cause the project’s duration to extend. In other words, the critical path isthe set of sequenced activities that have no float. There can be multiple critical paths within a project, andit's possible for the critical path to change as schedule changes occur. It's important to know what thecritical path is within a project so that its activities can be monitored closely.
We actually saw the critical path in the earlierfree float example. The critical path in this projectis Start - Activity B - Activity C - End because anextension to the duration in any of these activitieswill cause the project's duration to extend.
Finding the critical path is done by evaluating the combined durations of all the different paths, andfinding the one with the longest duration. Continuing to use the same example, there are only twopossible paths through this diagram:
Start to A to C to End: 0 + 10 + 5 + 0 = 15Start to B to C to End: 0 + 12 + 5 + 0 = 17
With a duration of 17 days, activities B and C are on the critical path.
Let's now look atthe critical pathon a slightly morecomplicatedexample.
We’ll start again by finding each unique path through the diagram: START - A - E - H - END START - B - D - G - H - END START - C - F – H - END START - B - D - E - H - END START - B - D - F - H - END
Critical path

CHAPTER 6: TIME MANAGEMENT 6
Project Management Road Trip® 160 6: Time Management
Next, let’s determine the duration of each path:
START - A - E - H - END 0 + 6 + 8 + 4 + 0 = 18 START - B - D - G - H - END 0 + 4 + 2 + 1 + 4 + 0 = 10 START - C - F – H - END 0 + 10 + 12 +4 + 0 = 26 START - B - D - E - H - END 0 + 4 + 2 + 8 + 4 + 0 = 18 START - B - D - F - H - END 0 + 4 + 2 + 12 + 4 + 0 = 22
The path that is 26 periods is the longest in duration, so it is the critical path.
Both examples aboveused PDM diagrams,so let's look at thecritical path using anAOA diagram eventhough these arerarely used.
Here are all the paths through this network diagram:
START - A - B - C - END START - D - E - F - END START - G - H - F - END START - G - H - I - END
Notice that the dummy activity indicates that activity H needs to be completed before F can begin. Thereis no duration on this relationship, but it creates another path through the diagram.
Next, determine the duration of each path:
START - A - B - C - END 2 + 5 + 6 + 8 = 21 START - D - E - F - END 1 + 3 + 5 + 7 = 16 START - G - H - F - END 2 + 4 + 0 + 7 = 13 START - G - H - I - END 2 + 4 + 3 + 1 = 10
So the critical path is START to A to B to C to END with a duration of 21 periods.
CHAPTER 6: TIME MANAGEMENT 6
Project Management Road Trip® 161 6: Time Management
A good rule of thumb is that sequentialactivities can sometimes be fast-tracked by upto 33%. In other words, if you're fast-tracking,you can start the second of two sequentialactivities when the first activity is 66%complete. There is risk involved. However, thisseems to be a level of fast-tracking risk that isnormally acceptable. 10
Tom Mochal, PMP and President, TenStep, Inc.
Schedule compression is used to decrease the duration of the project or specific activities. It can also beused as a corrective action to bring what is actually occurring back in line with what was planned for inthe schedule. There are two ways to compress the schedule:
Crashing: Adding more resources to the activity or project.
Fast-Tracking: Allowing activities to occur in parallel that would normally have been donesequentially.
Crashing adds more resources, usually personnel, in order to decrease an activity's duration. Forexample, an activity assigned to one person with a duration of 10 days might be reduced to six days if twopeople were assigned to it. When crashing is an option, the decrease in the activity's duration is notalways linear to the increase in resources. If it would take two people two weeks to complete an activity,adding four people to the activity does not automatically decrease its duration to one week. This isbecause there's almost always a productivity loss as more resources are added, and there is a point whenadditional resources will actually begin increasing the activity's duration. Crashing results in more cost,whether in labor or equipment, so there are also budgetary considerations.
Fast-tracking allows multiple activities to occur simultaneously when they were previously sequential.Fast-tracking essentially cheats the finish-to-start (FS)relationship by creating leads. For example, if theprinting of a catalog cover is not normally starteduntil after the catalog's contents have been printed,fast-tracking would allow the catalog cover to beprinted before the catalog itself had been printed.Since fast-tracking is essentially adding leads toactivities, it has the same drawbacks --namelyincreasing risks and the likelihood of quality andrework issues if the risks aren't properly managed.
Schedule compression techniques
Crashing
Fast tracking
CHAPTER 6: TIME MANAGEMENT 6
Project Management Road Trip® 162 6: Time Management
Applying what-if and other scenarios against the schedule can be used to point out potential trouble spotsshould certain conditions occur. For example, inclement weather scenarios could be applied against aproject schedule that relies on fair weather conditions to see what impact a 1-, 2-, or 3-day rain delaywould have during portions of the project. Scenarios can also help identify alternate approaches.
Though more commonly discussed in terms of risk, Monte Carlo analysis is one schedule scenariotechnique. Monte Carlo analysis is a computer-driven simulation technique that applies differentvariables to the schedule, and the results can identify high-risk and vulnerable areas within the schedule.Monte Carlo analysis requires specialized skills to perform; however, effective scenarios for most projectscan also be accomplished by making temporary changes to the schedule and viewing the results.
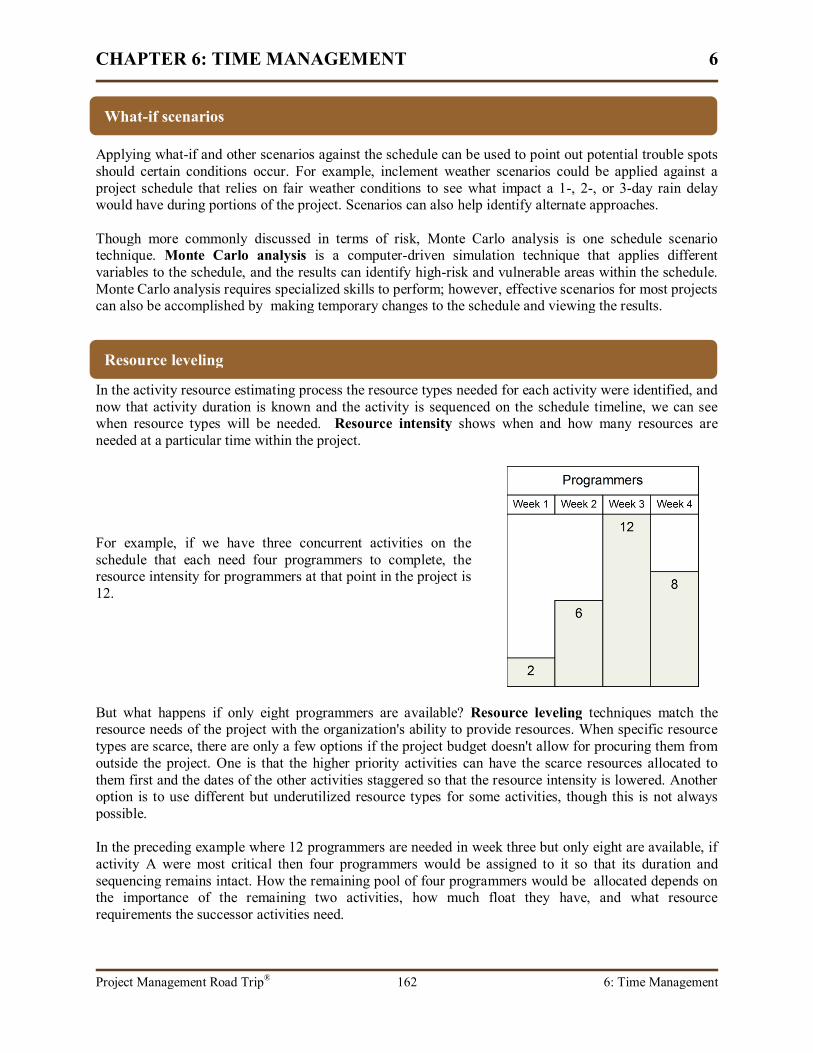
In the activity resource estimating process the resource types needed for each activity were identified, andnow that activity duration is known and the activity is sequenced on the schedule timeline, we can seewhen resource types will be needed. Resource intensity shows when and how many resources areneeded at a particular time within the project.
For example, if we have three concurrent activities on theschedule that each need four programmers to complete, theresource intensity for programmers at that point in the project is12.
But what happens if only eight programmers are available? Resource leveling techniques match theresource needs of the project with the organization's ability to provide resources. When specific resourcetypes are scarce, there are only a few options if the project budget doesn't allow for procuring them fromoutside the project. One is that the higher priority activities can have the scarce resources allocated tothem first and the dates of the other activities staggered so that the resource intensity is lowered. Anotheroption is to use different but underutilized resource types for some activities, though this is not alwayspossible.
In the preceding example where 12 programmers are needed in week three but only eight are available, ifactivity A were most critical then four programmers would be assigned to it so that its duration andsequencing remains intact. How the remaining pool of four programmers would be allocated depends onthe importance of the remaining two activities, how much float they have, and what resourcerequirements the successor activities need.
What-if scenarios
Resource leveling

CHAPTER 6: TIME MANAGEMENT 6
Project Management Road Trip® 163 6: Time Management
Especially in a projectized or strong matrix organization, it's generally abetter use of resources to maintain some consistency between the supply ofresources to the demand of resources during the periods when they areneeded, and this is what resource smoothing tries to accomplish. Resourcesmoothing is a form of resource leveling, and it tries to maintain the mostefficient use of the pool of resources types across the project by smoothingout the peaks and valleys of the resource intensity. By working within thefloat of individual activities, resource smoothing makes the demand forresource types more level across time periods.
The critical path method (CPM) involves identifying and analyzing the activities that have the leastflexibility in the project schedule. We've already seen some simple examples of how to identify theactivities on the critical path. But the critical path method combines many of the techniques we've seenalong with some new analysis techniques. CPM requires us to be proficient in project schedule networkdiagramming, calculating float, and determining the early start, early finish, late start, and late finish foractivities and the project.
Let's first review some terms and look at a few new ones.
Project schedule network diagram: The schematic showing the sequenced project activities. Thereare two diagramming methods: Precedence Diagramming Method (PDM), which produces activity-on-node (AON) diagrams, and the Arrow Diagramming Method (ADM), which produces activity-on-arrow (AOA) diagrams.
Network path: The sequence of activities from the start of the project to the end of the project. Onlyin the cases of very simple projects will there be only one network path.
Critical path: The network path in which any lengthening of its duration will extend the project's enddate. The common definition of the critical path is those set of sequenced activities that have zerofloat.
Critical activity: Any activity that is on the project's critical path(s).
Float/Slack: A general term that indicates how much flexibility there is in the activity's duration. Freefloat identifies how long the activity's duration can extend before successor activities are delayed.Total float refers to how much float the activity has without affecting the project's duration.
Forward/Backward pass: Refers to whether we traverse forward through the network diagram, fromstart to end, or whether we traverse backward through the network diagram, from end to start. Somecalculation methods for late start and late finish require backward passes.
Early start (ES): The earliest an activity can begin without affecting any dependencies.
Early finish (EF): The earliest an activity can complete without affecting any dependencies.
Late start (LS): The latest activity can begin without affecting any dependencies.
Late finish (LF): The latest an activity can complete without affecting any dependencies.
Critical path method
CHAPTER 6: TIME MANAGEMENT 6
Project Management Road Trip® 164 6: Time Management
When evaluating critical chain dependencies.be on the lookup for dependencies that rely onresources who may have a small but crucialrole in downstream activities. For example, anexecutive, committee, or external resource whomay have an approval role in an activity or adecision that needs made that subsequentactivities rely upon. Because of so manydemands on their time, directors, officers,executives, and managers can often be thesource of bottlenecks. 12
Tony Rizzo, The Critical Chain Model
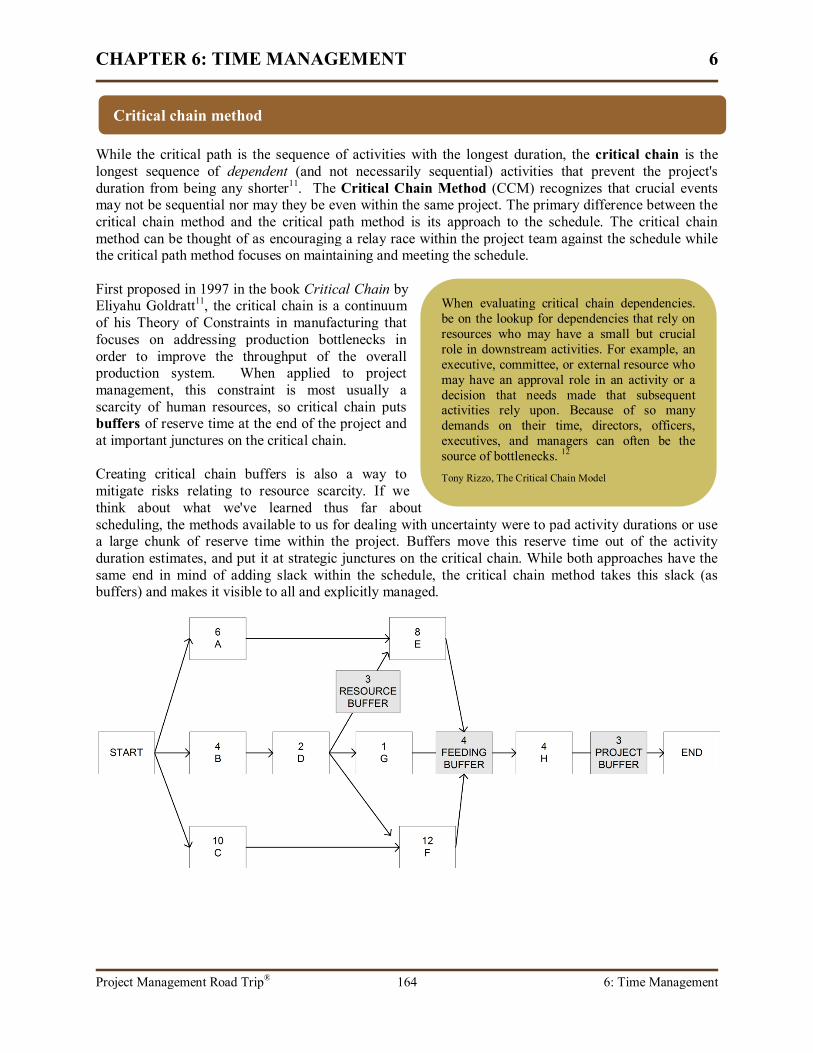
While the critical path is the sequence of activities with the longest duration, the critical chain is thelongest sequence of dependent (and not necessarily sequential) activities that prevent the project'sduration from being any shorter11. The Critical Chain Method (CCM) recognizes that crucial eventsmay not be sequential nor may they be even within the same project. The primary difference between thecritical chain method and the critical path method is its approach to the schedule. The critical chainmethod can be thought of as encouraging a relay race within the project team against the schedule whilethe critical path method focuses on maintaining and meeting the schedule.
First proposed in 1997 in the book Critical Chain byEliyahu Goldratt11, the critical chain is a continuumof his Theory of Constraints in manufacturing thatfocuses on addressing production bottlenecks inorder to improve the throughput of the overallproduction system. When applied to projectmanagement, this constraint is most usually ascarcity of human resources, so critical chain putsbuffers of reserve time at the end of the project andat important junctures on the critical chain.
Creating critical chain buffers is also a way tomitigate risks relating to resource scarcity. If wethink about what we've learned thus far aboutscheduling, the methods available to us for dealing with uncertainty were to pad activity durations or usea large chunk of reserve time within the project. Buffers move this reserve time out of the activityduration estimates, and put it at strategic junctures on the critical chain. While both approaches have thesame end in mind of adding slack within the schedule, the critical chain method takes this slack (asbuffers) and makes it visible to all and explicitly managed.
Critical chain method
CHAPTER 6: TIME MANAGEMENT 6
Project Management Road Trip® 165 6: Time Management
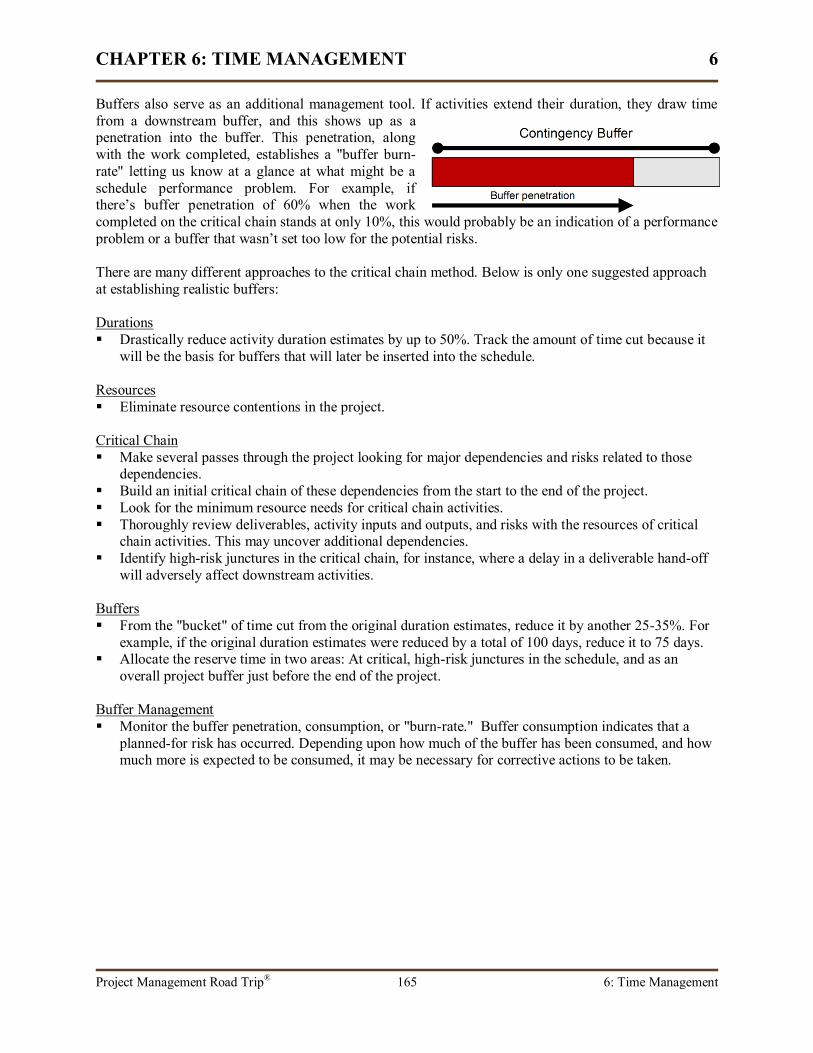
Buffers also serve as an additional management tool. If activities extend their duration, they draw timefrom a downstream buffer, and this shows up as apenetration into the buffer. This penetration, alongwith the work completed, establishes a "buffer burn-rate" letting us know at a glance at what might be aschedule performance problem. For example, ifthere’s buffer penetration of 60% when the workcompleted on the critical chain stands at only 10%, this would probably be an indication of a performanceproblem or a buffer that wasn’t set too low for the potential risks.
There are many different approaches to the critical chain method. Below is only one suggested approachat establishing realistic buffers:
Durations Drastically reduce activity duration estimates by up to 50%. Track the amount of time cut because it
will be the basis for buffers that will later be inserted into the schedule.
Resources Eliminate resource contentions in the project.
Critical Chain Make several passes through the project looking for major dependencies and risks related to those
dependencies. Build an initial critical chain of these dependencies from the start to the end of the project. Look for the minimum resource needs for critical chain activities. Thoroughly review deliverables, activity inputs and outputs, and risks with the resources of critical
chain activities. This may uncover additional dependencies. Identify high-risk junctures in the critical chain, for instance, where a delay in a deliverable hand-off
will adversely affect downstream activities.
Buffers From the "bucket" of time cut from the original duration estimates, reduce it by another 25-35%. For
example, if the original duration estimates were reduced by a total of 100 days, reduce it to 75 days. Allocate the reserve time in two areas: At critical, high-risk junctures in the schedule, and as an
overall project buffer just before the end of the project.
Buffer Management Monitor the buffer penetration, consumption, or "burn-rate." Buffer consumption indicates that a
planned-for risk has occurred. Depending upon how much of the buffer has been consumed, and howmuch more is expected to be consumed, it may be necessary for corrective actions to be taken.
CHAPTER 6: TIME MANAGEMENT 6
Project Management Road Trip® 166 6: Time Management
Following is a step-by-step example that will lead us through creating a schedule network diagram usingthe precedence diagramming method. It's important for us to understand and be able to perform all thesemethods for the PMP examination.
Though there are different approaches to calculating early start, late start, early finish, and late finish, themethod shown here is the "brute-force" method. It requires us to fully diagram the path and run throughall the calculations. Overall, this takes longer, but it is less to memorize. As we get better and morefamiliar with the technique, there are lots of shorter methods we can learn.
When presented with a critical path, float, or ES, LS, EF, LF question, we're going to solve it by:
1. Creating the project PDM diagram.2. Determining the critical path(s).3. Calculating each activity's float.4. Determining the early start and early finish of each activity.5. Determining the late start and late finish of each activity.
Precedence diagramming method

CHAPTER 6: TIME MANAGEMENT 6
Project Management Road Trip® 167 6: Time Management
To make our diagramming easier, we need to createa table of all the activities, their predecessors, andtheir durations. On the PMP examination, somequestions may provide this information textually,so we’ll need to convert it to tabular form.
Activity Predecessor Duration
START - -
A START 2
B A 5
C B,F 3
D C,I 4
E START 4
F E 6
G START 1
H G 1
I H 2
END D -
1. Begin by drawing the starting node.
2. Next, draw the activity nodes that have the starting node astheir predecessor and connect the nodes. As activities areadded, put the duration above the activity node.
3. Continue adding the successor activitynodes and drawing the relationships. Anytime there are multiple predecessors,there'll be a dependency between thesuccessor activity and one or more otherpaths in the diagram. The relationshipshould be assumed to be a finish-to-startunless otherwise indicated.
A few more activities from the table areshown in the diagram to the right.
Creating a PDM diagram
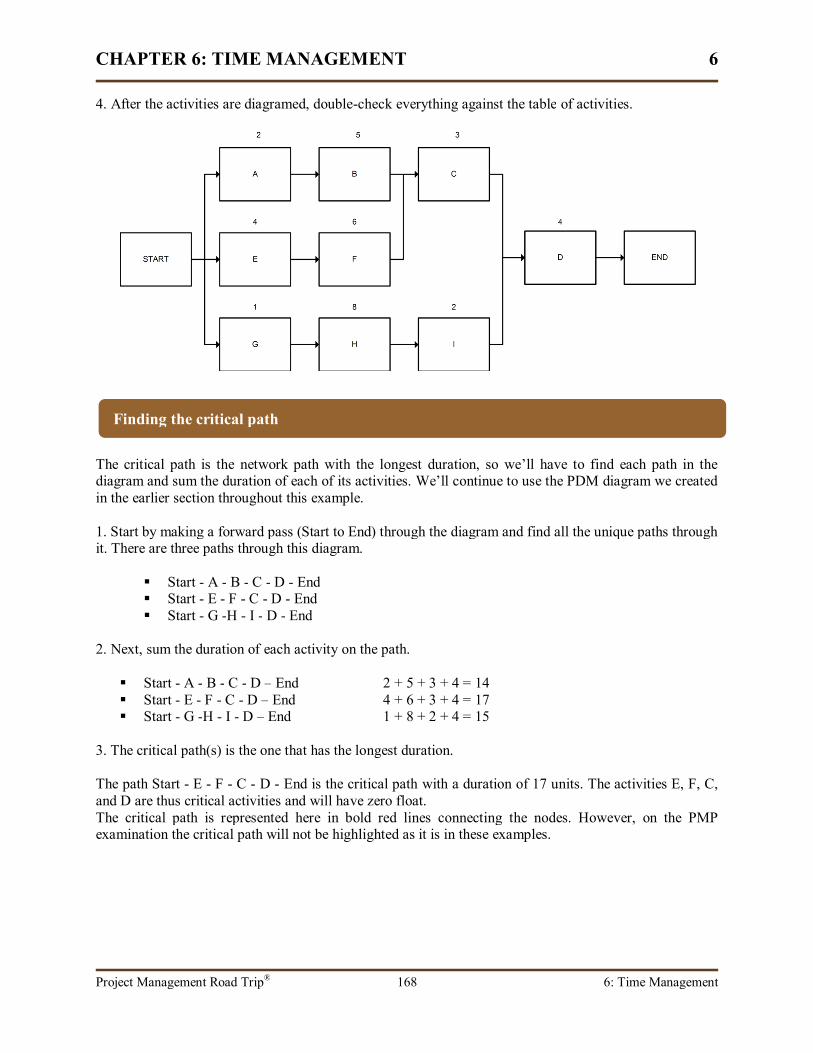
CHAPTER 6: TIME MANAGEMENT 6
Project Management Road Trip® 168 6: Time Management
4. After the activities are diagramed, double-check everything against the table of activities.
The critical path is the network path with the longest duration, so we’ll have to find each path in thediagram and sum the duration of each of its activities. We’ll continue to use the PDM diagram we createdin the earlier section throughout this example.
1. Start by making a forward pass (Start to End) through the diagram and find all the unique paths throughit. There are three paths through this diagram.
Start - A - B - C - D - End Start - E - F - C - D - End Start - G -H - I - D - End
2. Next, sum the duration of each activity on the path.
Start - A - B - C - D – End 2 + 5 + 3 + 4 = 14 Start - E - F - C - D – End 4 + 6 + 3 + 4 = 17 Start - G -H - I - D – End 1 + 8 + 2 + 4 = 15
3. The critical path(s) is the one that has the longest duration.
The path Start - E - F - C - D - End is the critical path with a duration of 17 units. The activities E, F, C,and D are thus critical activities and will have zero float.The critical path is represented here in bold red lines connecting the nodes. However, on the PMPexamination the critical path will not be highlighted as it is in these examples.
Finding the critical path
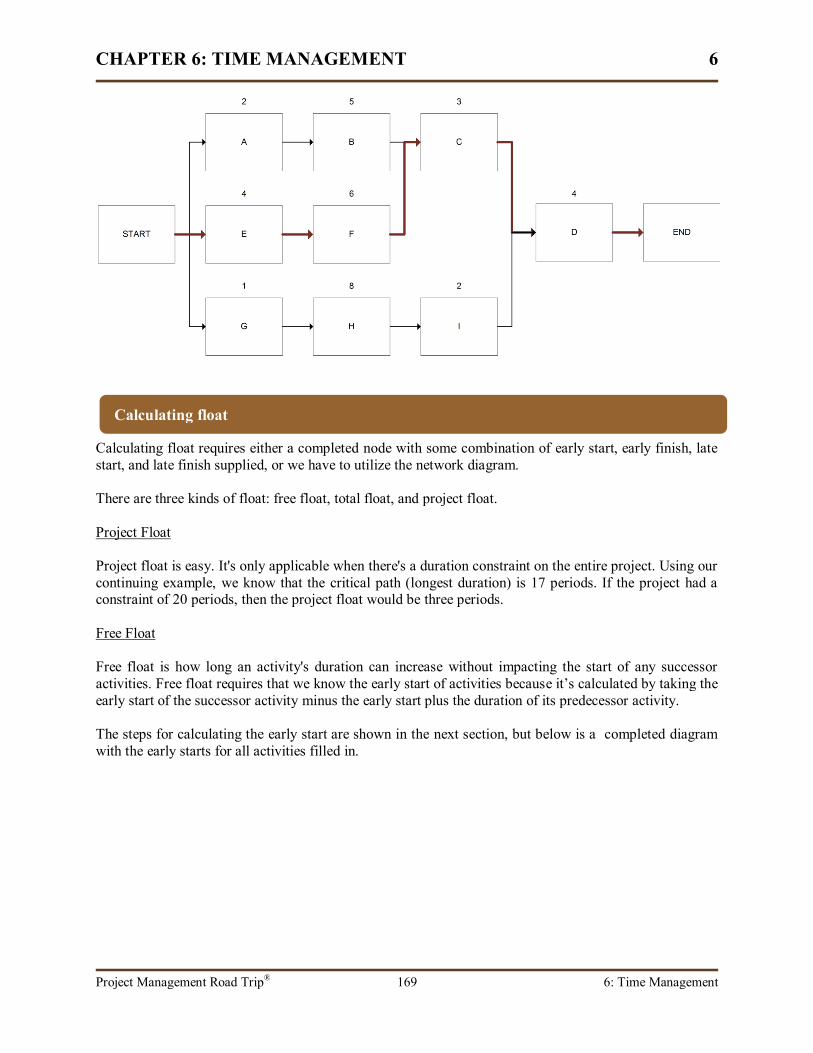
CHAPTER 6: TIME MANAGEMENT 6
Project Management Road Trip® 169 6: Time Management
Calculating float requires either a completed node with some combination of early start, early finish, latestart, and late finish supplied, or we have to utilize the network diagram.
There are three kinds of float: free float, total float, and project float.
Project Float
Project float is easy. It's only applicable when there's a duration constraint on the entire project. Using ourcontinuing example, we know that the critical path (longest duration) is 17 periods. If the project had aconstraint of 20 periods, then the project float would be three periods.
Free Float
Free float is how long an activity's duration can increase without impacting the start of any successoractivities. Free float requires that we know the early start of activities because it’s calculated by taking theearly start of the successor activity minus the early start plus the duration of its predecessor activity.
The steps for calculating the early start are shown in the next section, but below is a completed diagramwith the early starts for all activities filled in.
Calculating float
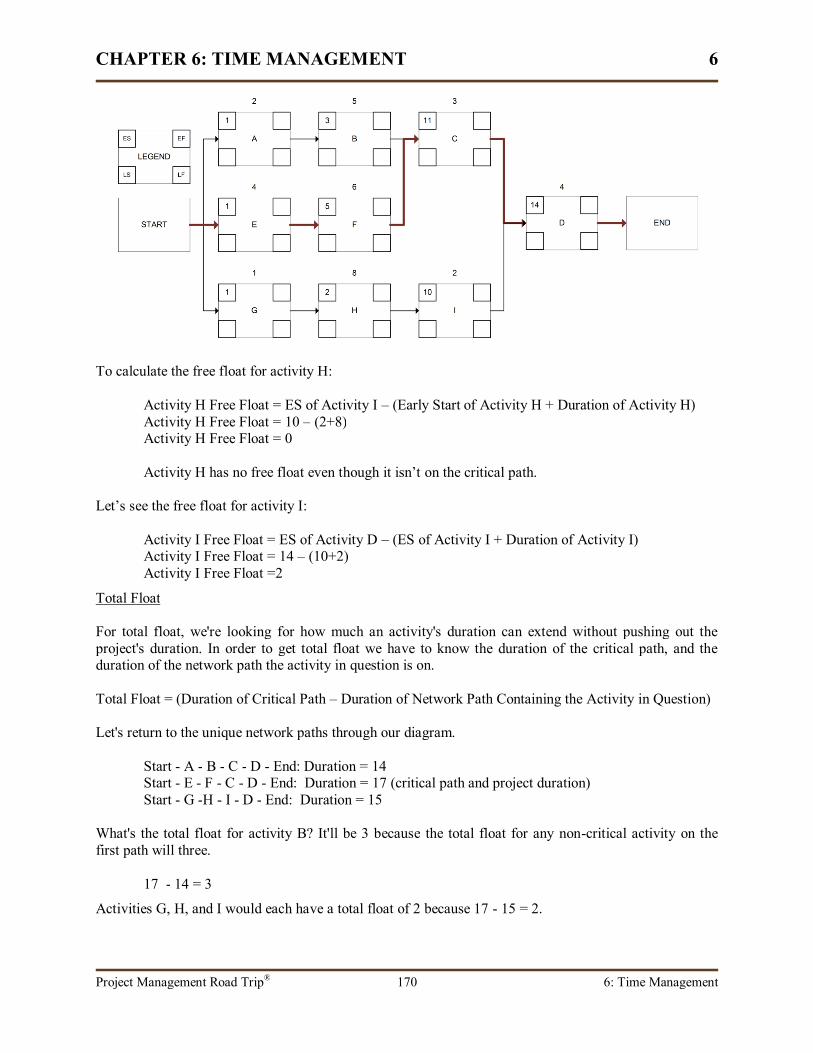
CHAPTER 6: TIME MANAGEMENT 6
Project Management Road Trip® 170 6: Time Management
To calculate the free float for activity H:
Activity H Free Float = ES of Activity I – (Early Start of Activity H + Duration of Activity H)Activity H Free Float = 10 – (2+8)Activity H Free Float = 0
Activity H has no free float even though it isn’t on the critical path.
Let’s see the free float for activity I:
Activity I Free Float = ES of Activity D – (ES of Activity I + Duration of Activity I)Activity I Free Float = 14 – (10+2)Activity I Free Float =2
Total Float
For total float, we're looking for how much an activity's duration can extend without pushing out theproject's duration. In order to get total float we have to know the duration of the critical path, and theduration of the network path the activity in question is on.
Total Float = (Duration of Critical Path – Duration of Network Path Containing the Activity in Question)
Let's return to the unique network paths through our diagram.
Start - A - B - C - D - End: Duration = 14Start - E - F - C - D - End: Duration = 17 (critical path and project duration)Start - G -H - I - D - End: Duration = 15
What's the total float for activity B? It'll be 3 because the total float for any non-critical activity on thefirst path will three.
17 - 14 = 3
Activities G, H, and I would each have a total float of 2 because 17 - 15 = 2.

CHAPTER 6: TIME MANAGEMENT 6
Project Management Road Trip® 171 6: Time Management
What about the total float for activity C? Don't get fooled by questions such as this. Any activity on thecritical path has zero float even if that activity is on other paths.
The early start is calculated by making a forward pass through the diagram and adding the activity'sduration to the early start of the predecessor activity and adding one. Let's look again our project schedulenetwork diagram immediately after we added durations to the activities.
1. Starting with the left-most activities with the Start node astheir predecessor, set their early start to 1.
Calculating early start and early finish
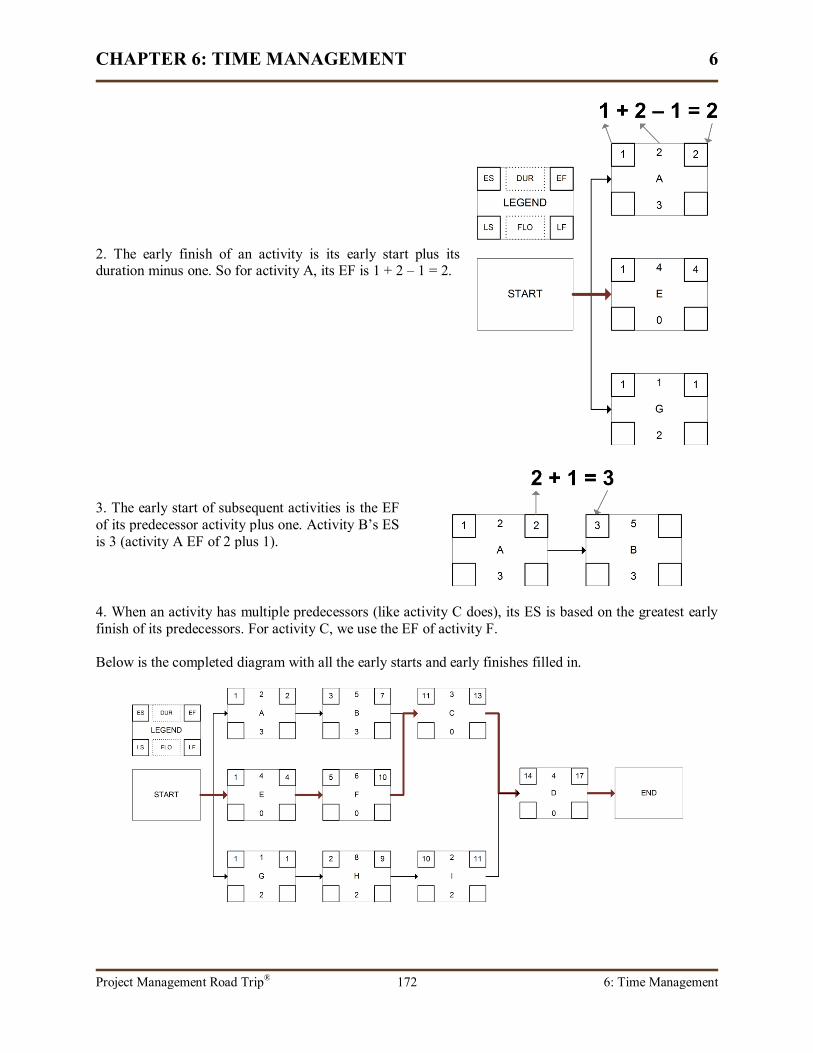
CHAPTER 6: TIME MANAGEMENT 6
Project Management Road Trip® 172 6: Time Management
2. The early finish of an activity is its early start plus itsduration minus one. So for activity A, its EF is 1 + 2 – 1 = 2.
3. The early start of subsequent activities is the EFof its predecessor activity plus one. Activity B’s ESis 3 (activity A EF of 2 plus 1).
4. When an activity has multiple predecessors (like activity C does), its ES is based on the greatest earlyfinish of its predecessors. For activity C, we use the EF of activity F.
Below is the completed diagram with all the early starts and early finishes filled in.
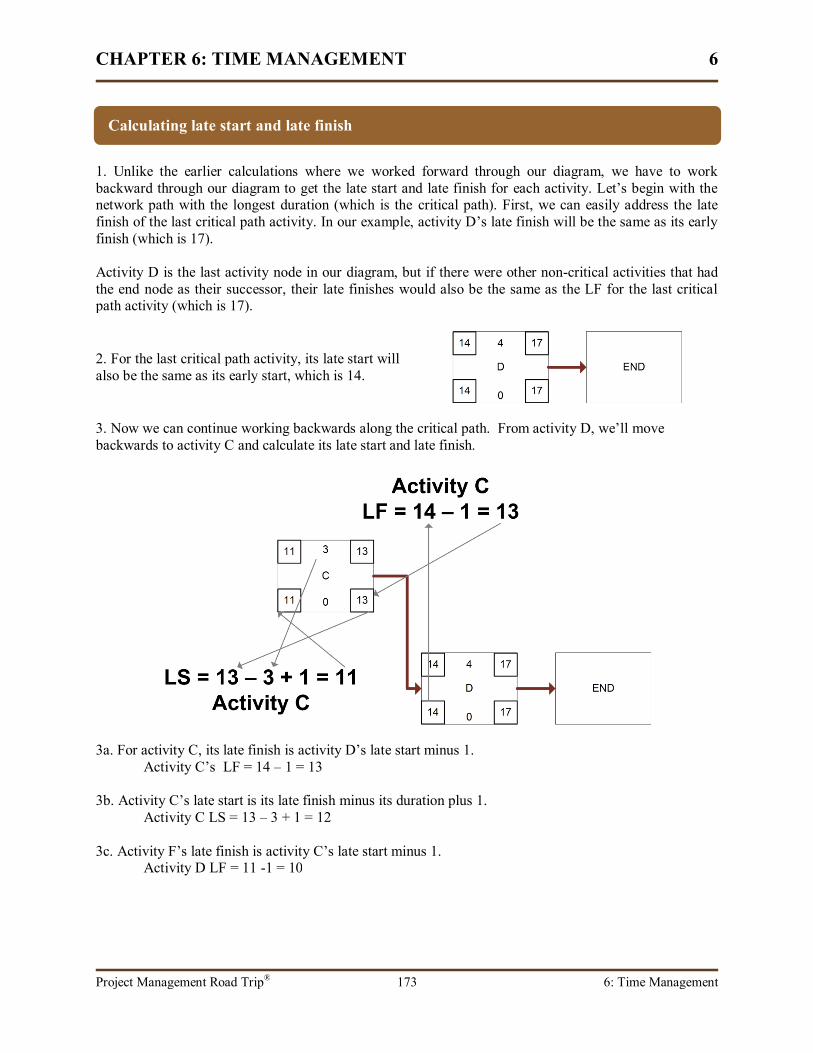
CHAPTER 6: TIME MANAGEMENT 6
Project Management Road Trip® 173 6: Time Management
1. Unlike the earlier calculations where we worked forward through our diagram, we have to workbackward through our diagram to get the late start and late finish for each activity. Let’s begin with thenetwork path with the longest duration (which is the critical path). First, we can easily address the latefinish of the last critical path activity. In our example, activity D’s late finish will be the same as its earlyfinish (which is 17).
Activity D is the last activity node in our diagram, but if there were other non-critical activities that hadthe end node as their successor, their late finishes would also be the same as the LF for the last criticalpath activity (which is 17).
2. For the last critical path activity, its late start willalso be the same as its early start, which is 14.
3. Now we can continue working backwards along the critical path. From activity D, we’ll movebackwards to activity C and calculate its late start and late finish.
3a. For activity C, its late finish is activity D’s late start minus 1.Activity C’s LF = 14 – 1 = 13
3b. Activity C’s late start is its late finish minus its duration plus 1.Activity C LS = 13 – 3 + 1 = 12
3c. Activity F’s late finish is activity C’s late start minus 1.Activity D LF = 11 -1 = 10
Calculating late start and late finish
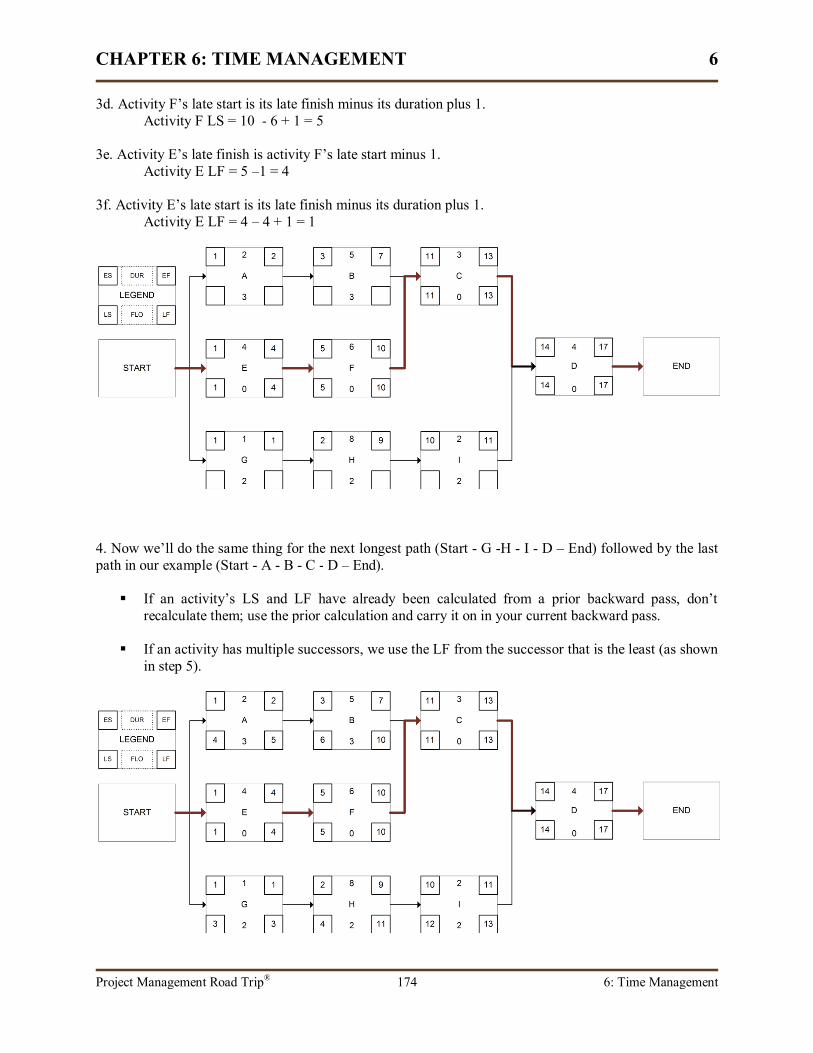
CHAPTER 6: TIME MANAGEMENT 6
Project Management Road Trip® 174 6: Time Management
3d. Activity F’s late start is its late finish minus its duration plus 1.Activity F LS = 10 - 6 + 1 = 5
3e. Activity E’s late finish is activity F’s late start minus 1.Activity E LF = 5 –1 = 4
3f. Activity E’s late start is its late finish minus its duration plus 1.Activity E LF = 4 – 4 + 1 = 1
4. Now we’ll do the same thing for the next longest path (Start - G -H - I - D – End) followed by the lastpath in our example (Start - A - B - C - D – End).
If an activity’s LS and LF have already been calculated from a prior backward pass, don’trecalculate them; use the prior calculation and carry it on in your current backward pass.
If an activity has multiple successors, we use the LF from the successor that is the least (as shownin step 5).
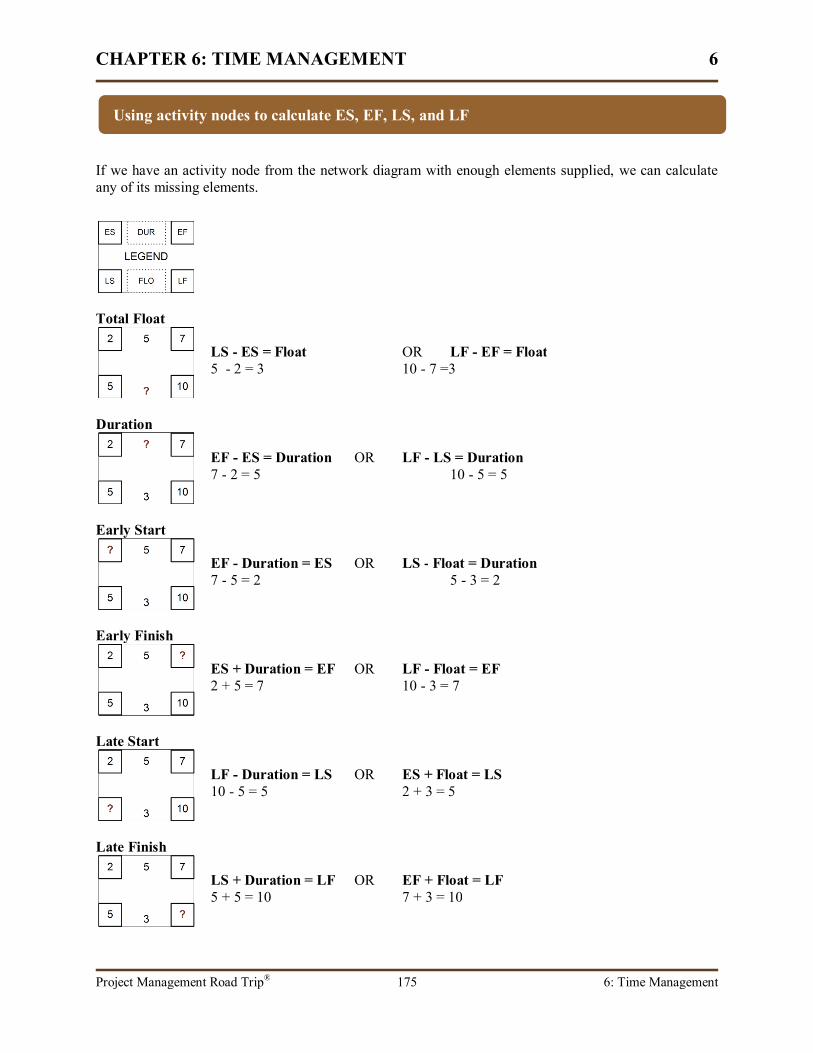
CHAPTER 6: TIME MANAGEMENT 6
Project Management Road Trip® 175 6: Time Management
If we have an activity node from the network diagram with enough elements supplied, we can calculateany of its missing elements.
Total Float
LS - ES = Float OR LF - EF = Float5 - 2 = 3 10 - 7 =3
Duration
EF - ES = Duration OR LF - LS = Duration7 - 2 = 5 10 - 5 = 5
Early Start
EF - Duration = ES OR LS - Float = Duration7 - 5 = 2 5 - 3 = 2
Early Finish
ES + Duration = EF OR LF - Float = EF2 + 5 = 7 10 - 3 = 7
Late Start
LF - Duration = LS OR ES + Float = LS10 - 5 = 5 2 + 3 = 5
Late Finish
LS + Duration = LF OR EF + Float = LF5 + 5 = 10 7 + 3 = 10
Using activity nodes to calculate ES, EF, LS, and LF
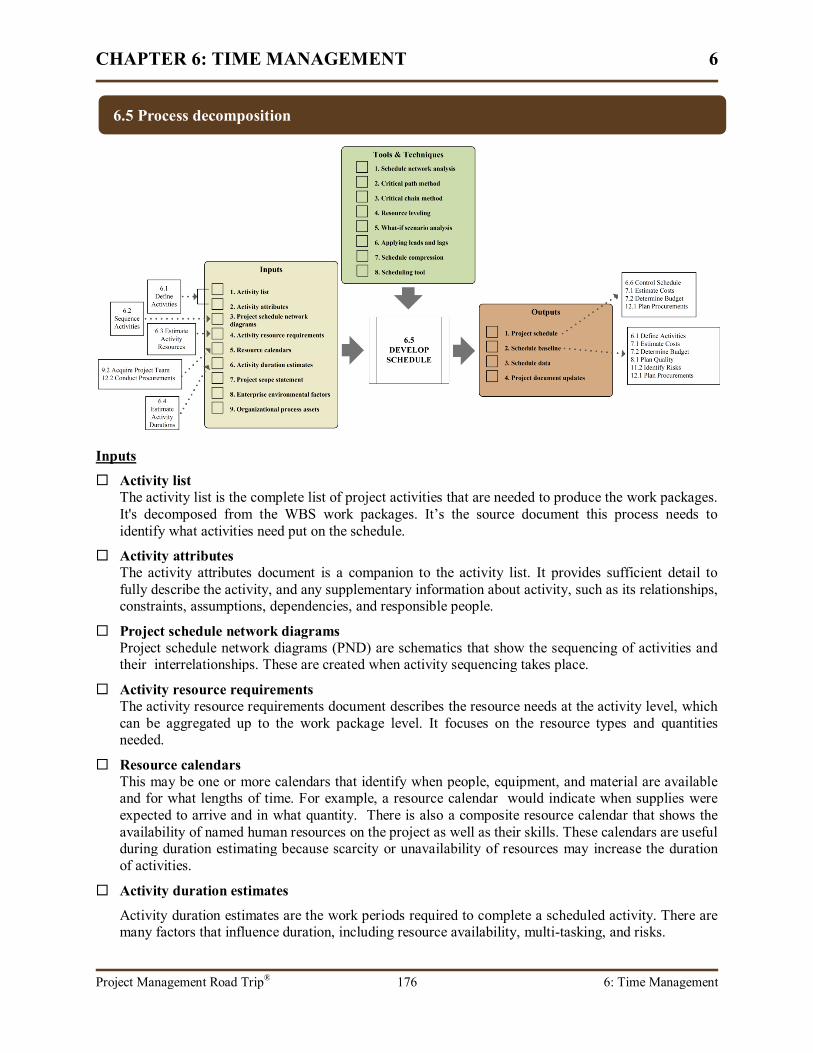
CHAPTER 6: TIME MANAGEMENT 6
Project Management Road Trip® 176 6: Time Management
Inputs
Activity listThe activity list is the complete list of project activities that are needed to produce the work packages.It's decomposed from the WBS work packages. It’s the source document this process needs toidentify what activities need put on the schedule.
Activity attributesThe activity attributes document is a companion to the activity list. It provides sufficient detail tofully describe the activity, and any supplementary information about activity, such as its relationships,constraints, assumptions, dependencies, and responsible people.
Project schedule network diagramsProject schedule network diagrams (PND) are schematics that show the sequencing of activities andtheir interrelationships. These are created when activity sequencing takes place.
Activity resource requirementsThe activity resource requirements document describes the resource needs at the activity level, whichcan be aggregated up to the work package level. It focuses on the resource types and quantitiesneeded.
Resource calendarsThis may be one or more calendars that identify when people, equipment, and material are availableand for what lengths of time. For example, a resource calendar would indicate when supplies wereexpected to arrive and in what quantity. There is also a composite resource calendar that shows theavailability of named human resources on the project as well as their skills. These calendars are usefulduring duration estimating because scarcity or unavailability of resources may increase the durationof activities.
Activity duration estimates
Activity duration estimates are the work periods required to complete a scheduled activity. There aremany factors that influence duration, including resource availability, multi-tasking, and risks.
6.5 Process decomposition
CHAPTER 6: TIME MANAGEMENT 6
Project Management Road Trip® 177 6: Time Management
Project scope statementAssumptions and constraints are factors in activity durations. The project scope statement details themeasurable goals, objectives, deliverables, and requirements of the project, and what the acceptancecriteria of deliverables will be. It also describes the work required to meet all objectives anddeliverables of the project, and it also contains milestones, assumptions, risks, and costs.
Enterprise environmental factorsAny of the many enterprise environmental factors and systems that influence the project should beconsidered when developing the schedule, the most common of which is a scheduling application.
Organizational process assetsOrganizational process assets are the source of existing policies, processes, organizational data andknowledge. These assets include the entire collection of formal and informal methodologies, policies,procedures, plans, and guidelines, as well as the organization's "knowledge base," which includeshistorical performance data, labor information, service and maintenance history, issue and defecthistory, project files, and financial data.
Tools and Techniques
Schedule network analysisThese are any analysis techniques applied to preliminary schedule models that result in a final projectschedule. Techniques include the critical path method, critical chain method, resource leveling,resource smoothing, and schedule compression.
Critical path methodCPM is a schedule network analysis technique uses the critical path, early and late starts, and earlyand late finishes to manage critical activities within the schedule.
Critical chain methodCCM is a schedule network analysis technique that addresses resource scarcity. It uses buffersstrategically placed on the critical chain to allow for potential bottlenecks.
Resource levelingResource leveling is a schedule network analysis technique that aims for a consistent and steadydemand for resource types instead of having high demand periods followed by low demand periods.
What-if scenario analysisWhat-if scenario analysis: A technique for schedule network analysis which applies simulations to theproject schedule to assess the feasibility and agility of the project schedule under adverse situations.Monte Carlo analysis is a form of what-if scenario analysis.
Applying leads and lagsLeads and lags speed up and slow down when activities can start.
Schedule compressionSchedule compression uses crashing (adding more resources) or fast-tracking (allowing activities tobe done in parallel) in order to reduce the duration of the project.
Scheduling toolProject scheduling most often requires the use of automated scheduling tools to assist in developing,analyzing, and tracking scheduled activities.

CHAPTER 6: TIME MANAGEMENT 6
Project Management Road Trip® 178 6: Time Management
Outputs
Project scheduleThe project schedule specifies the planned start and finish date for each scheduled activity. Asspecific resources are assigned, the project schedule includes those assignments. Project schedules arepresented in different manners, some in summary form and some in detailed form. These includeproject schedule network diagrams or bar charts, such as Gantt charts.
Schedule baselineThe schedule baseline is the approved project schedule that will continue to be updated as anyscheduling change requests are approved.
Schedule dataThe schedule data contains supporting information for the project schedule. It at least contains themilestones, activities, activity attributes, assumptions, and constraints.
Project document updatesDeveloping and managing the project schedule is likely to result in changes to project documents.
The Control Schedule process begins as soon as the schedule baseline comes into existence, which is thepoint when the project schedule is approved. Just like other controlling processes, this one is concernedwith monitoring the schedule for progress and variances, managing approved changes to the schedule, andproactively influencing the factors that might lead to schedule changes. Activities performed in thisprocess are framed by the schedule management plan, part of the project management plan.
Changes are very likely to be needed to the schedule, and this process makes sure that change proceduresare followed and that all project documents are updated. Complex projects may have a schedule changecontrol system that’s devoted just to changes impacting the schedule. Approved changes coming outintegrated change control will result in updates to the schedule baseline. Any updates to the schedulebaseline, for whatever reason, require changes to all components involved, including the schedule modeldata, project schedule network diagrams, and the schedule management plan. The rationale behindschedule changes, whatever their cause, such as variances, external events, or corrective actions, shouldbe reflected in the lessons learned so that later project managers and project teams can reference.
Performance reviews provide information on how the project is progressing, and will also alert the projectmanager and team to scheduling issues. Progress reporting, performance measurements, and varianceanalysis are also used during schedule control, but we’ll explore those variance formulas in the CostManagement knowledge area.
6.6 Control schedule
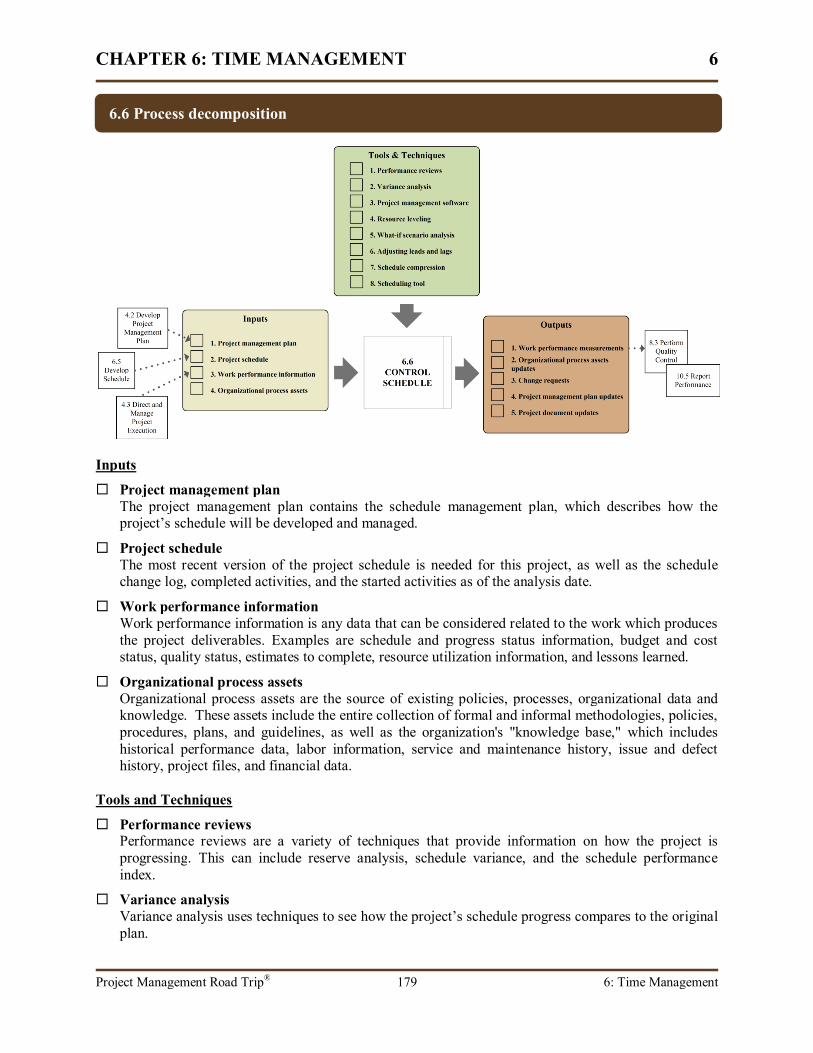
CHAPTER 6: TIME MANAGEMENT 6
Project Management Road Trip® 179 6: Time Management
Inputs
Project management planThe project management plan contains the schedule management plan, which describes how theproject’s schedule will be developed and managed.
Project scheduleThe most recent version of the project schedule is needed for this project, as well as the schedulechange log, completed activities, and the started activities as of the analysis date.
Work performance informationWork performance information is any data that can be considered related to the work which producesthe project deliverables. Examples are schedule and progress status information, budget and coststatus, quality status, estimates to complete, resource utilization information, and lessons learned.
Organizational process assetsOrganizational process assets are the source of existing policies, processes, organizational data andknowledge. These assets include the entire collection of formal and informal methodologies, policies,procedures, plans, and guidelines, as well as the organization's "knowledge base," which includeshistorical performance data, labor information, service and maintenance history, issue and defecthistory, project files, and financial data.
Tools and Techniques
Performance reviewsPerformance reviews are a variety of techniques that provide information on how the project isprogressing. This can include reserve analysis, schedule variance, and the schedule performanceindex.
Variance analysisVariance analysis uses techniques to see how the project’s schedule progress compares to the originalplan.
6.6 Process decomposition

CHAPTER 6: TIME MANAGEMENT 6
Project Management Road Trip® 180 6: Time Management
Project management softwareProject management software aids in tracking activities and forecasting performance.
Resource levelingResource leveling is a schedule network analysis technique that aims for a consistent and steadydemand for resource types instead of having high demand periods followed by low demand periods.
What-if scenario analysisWhat-if scenario analysis: A technique for schedule network analysis which applies simulations to theproject schedule to assess the feasibility and agility of the project schedule under adverse situations.Monte Carlo analysis is a form of what-if scenario analysis.
Adjusting leads and lagsLeads and lags speed up and slow down when activities can start.
Scheduling toolThe scheduling tool and schedule data are used along with manual methods to perform schedulenetwork analysis
Outputs
Work performance measurementsThis includes work performance information that specifically provides mathematical measurementsof performance that is communicated to stakeholders.
Organizational process assets updatesOrganizational process assets are the source of existing policies, processes, organizational data andknowledge. These assets include the organization's "knowledge base," which includes historicalperformance data and variance analysis.
Change requestsReviews of schedule performance may necessitate the need for changes to the schedule, which arechange requests that go through integrated change control.
Project management plan updatesChanges to the project schedule will impact the schedule baseline, and schedule compressiontechniques may result in additional costs.. Schedule analysis may also illuminate changes that areneeded to the schedule management plan.
Project document updatesDocuments that may undergo updates include schedule data and executive summary schedules, suchas milestone charts.
CHAPTER 6: TIME MANAGEMENT 6
Project Management Road Trip® 181 6: Time Management
1. CMP Media, Inc. (1998). Know Your Enemy: Introduction to Risk Management. Software Development, 1998,6(10), 38-42. Retrieved from http://msdn.microsoft.com/en-us/library/cc500363.aspx.
2. Brough, Paul. (n.d.). Proper Use of Milestones and Constraints, retrieved from Warner Construction Consultants,Inc. from http://www.warnercon.com/articles/Article%207%20-%20Use%20of%20Milestones%20and%20Constraints.pdf.
3. Lewton, Russell. (2003). Quoted in Critics Can't Find the Logic in Many of Today's CPM Schedules. EngineeringNews-Record, 5/26/2003, retrieved from http://www.pmicos.org/fse.asp.
4. Mochal, Tom. (2006). Do Simple Preparation Before Estimating Work. Retrieved fromhttp://articles.techrepublic.com.com/5100-10878_11-6054158.html.
5. Rad, Parviz F. and Dennis F. Cioffi. (2000). Work and Resource Breakdown Structures for Formalized Bottom-Up Estimating, Retrieved from http://www.betsaonline.com/articles/WRBS.pdf.
6. Parkinson, C. Northcote. (1955). The Economist, November 1955. Retrieved fromhttp://alpha1.montclair.edu/~lebelp/ParkinsonsLaw.pdf.
7. Kliem, Ralph L. and Ludin, Irwin S. (1999). Tools and Tips for Today's Project Manager. Project ManagementInstitute: Newton Square, PA.
8. Construction Information Services (misronet), (n.d.). Construction Estimating Techniques retrieved fromhttp://www.misronet.com/estimating.htm.
9. Berkum, Scott. (2005). The Art of Project Managment. Sebastopol, CA: O'Reilley Media, Inc.
10. Mochal, Tom.(2006). Fast-Tracking and Crashing Can Get Your Project Back on Schedule. TechRepublic,December 18, 2006. Retrieved from http://articles.techrepublic.com.com/5100-10878_11-6144481.html.
11. Goldratt, Eliyahu. (1997). Critical Chain. The North River Press Publishing Company: Great Barrington, MA.
12. Rizzo, Tony. (2004). The Critical Chain Model. The Project Management Soap Box, November 4, 2004.Retrieved from http://www.pdinstitute.com/soapbox/2004/11/17-critical-chain-model.html.
References
CHAPTER 6: TIME MANAGEMENT 6
Project Management Road Trip® 182 6: Time Management
The Project Time Management knowledge area is concerned with creating and managing the project’sschedule. Its six processes are:
Define Activities: Decompose the work packages into activities, producing the activity list andactivity attributes.
Sequence Activities: Putting the activities in the desired order of execution.
Estimate Activity Resources: Estimating the resources needed for each of the project’s activities.
Estimate Activity Durations: Determining how long each project activity will take.
Develop Schedule: Establishing the start and stop dates for all activities.
Control Schedule: Managing and controlling the schedule and ensuring change control proceduresare followed.
Define ActivitiesThe activity list contains all activities necessaryto produce the project's deliverables. Theactivity list is created by decomposing the workpackages from the work breakdown structure.The activity attributes is a companion documentthat provides supplemental information aboutactivities. Another important output of theDefine Activities process is the milestone list.The milestone list is part of the projectmanagement plan, and it contains every projectmilestone.
Sequence ActivitiesSequence Activities is concerned with orderingthe activities. Activity sequencing results inproject schedule network diagrams (PNDs) thatare usually activity-on-node (AON or PDM)diagrams. Properly sequencing activitiesinvolves considering the mandatory, optional,and external dependencies, and also the activityrelationships between each other. The mostcommon activity relationship is the Finish-to-Start (FS). Leads and lags affect the sequencingof activities by either speeding up the start ofactivities (leads) or slowing down the start ofactivities(lags).
Estimate Activity ResourcesThe types of resources needed for the projectand in what quantities are determined throughthis process. Resources include personnel,equipment, licenses, facilities, or anything thatcosts money. The resource breakdown structureis also created in this process, and it’s ahierarchical representation of the resource needs,and it is useful for cost estimating.
Estimate Activity DurationsThrough this process we'll determine how longeach activity will take. There are many factorsthat affect duration, and these include resourceavailability, risks, resource types, and resourceworkload. Duration estimates can be improvedby using analogous or parametric estimatingwhen possible. Analogous estimating uses theduration from similar past activities as the basisfor estimating. Parametric estimating usesmathematical formulas involving productionrates and quantities. Another way of addressinguncertainty is to use three-point estimates. Athree-point estimate uses the optimistic,pessimistic, and most likely estimates in order toproduce a weighted average.
Chapter summary

CHAPTER 6: TIME MANAGEMENT 6
Project Management Road Trip® 183 6: Time Management
Develop ScheduleOur objective in this process is to establish anapproved schedule showing the start and enddates for all activities. Once approved, theschedule baseline is established. The baseline isalways the latest schedule version that includesapproved changes. There are many schedulenetwork analysis techniques, which includeresource leveling, applying what-if scenarios toidentify vulnerabilities in the schedule, applyingleads and lags, and the schedule compressiontechniques of fast-tracking and crashing. Theproject manager needs to know what activitiesand sets of activities are critical to manageclosely for the project schedule to remain ontrack. The critical path method involves findingthe critical path through the project schedule
network diagram. The critical chain method usesbuffers placed at strategic locations within theschedule to address potential bottlenecks thatmight occur due to result of resource scarcity.
Control ScheduleThis process is concerned with managing,monitoring, and controlling the schedulebaseline. It involves performance monitoring,variance analysis, and may result in requestedchanges to the schedule or corrective actions inorder to bring what is actually occurring back inline with the project schedule. The schedulemanagement plan, a component of the projectmanagement plan, is the guiding document forschedule control.
The Define Activities process results in the activity list, activity attributes, and milestone list.
The activity list is decomposed from the work packages in the WBS.
The activity attributes contains supplemental information about activities. It is a companion documentto the activity list.
The Sequence Activities process establishes the order for activities.
Activity dependencies may be mandatory, discretionary, or external.
There are four activity relationships: Finish-to-Start (FS), Finish-to-Finish (FF), Start-to-Start (SS),and Start-to-Finish (SF). Finish-to-Start is the most common activity relationship.
Leads speed up the start of activities.
Lags slow down the start of activities.
The project schedule network diagram (PND) graphically shows the flow of sequenced activities fromthe project start to project end.
Hammock activities are summary, high-level activities.
A portion of the PND is called a subnetwork or fragment network.
There are two diagramming method: Arrow Diagramming Method (ADM) and PrecedenceDiagramming Method (PDM). PDM is the most common.
ADM produces activity-on-arrow (AOA) diagrams, which can only show finish-to-start relationshipsthrough zero-duration "dummy" activities.
PDM produces activity-on-node (AON) diagrams.
The primary output of the Sequence Activities process is the project schedule network diagram.
Exam summary
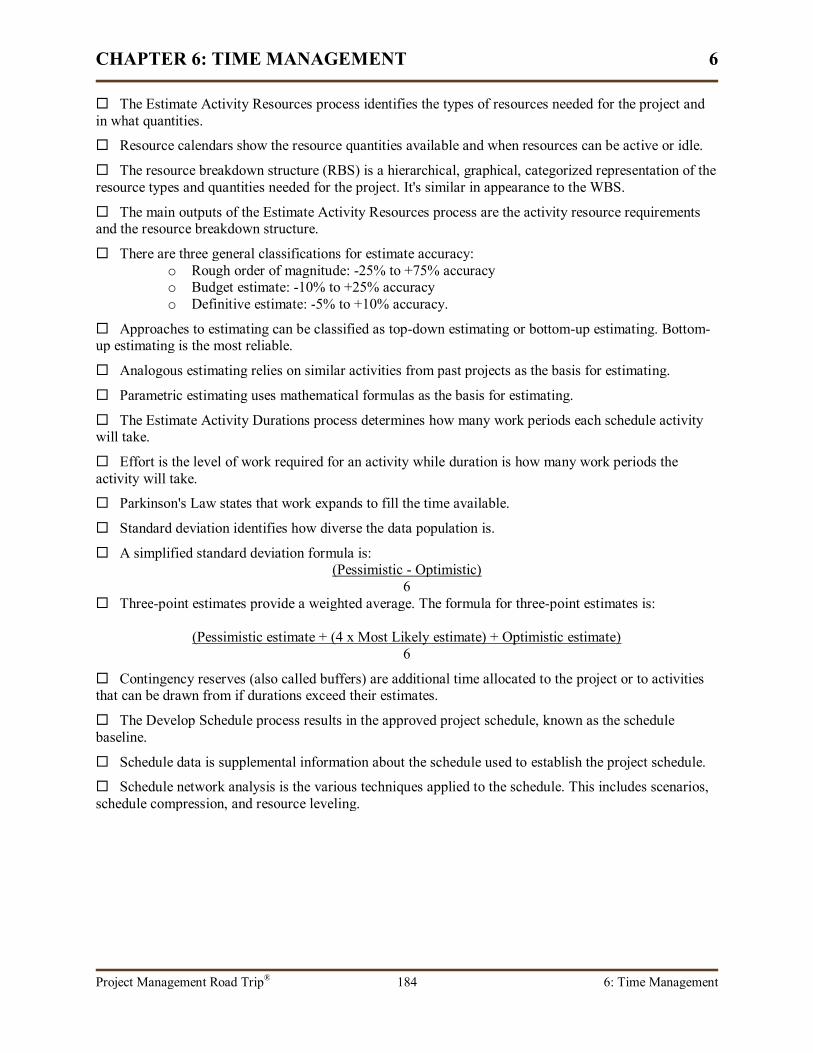
CHAPTER 6: TIME MANAGEMENT 6
Project Management Road Trip® 184 6: Time Management
The Estimate Activity Resources process identifies the types of resources needed for the project andin what quantities.
Resource calendars show the resource quantities available and when resources can be active or idle.
The resource breakdown structure (RBS) is a hierarchical, graphical, categorized representation of theresource types and quantities needed for the project. It's similar in appearance to the WBS.
The main outputs of the Estimate Activity Resources process are the activity resource requirementsand the resource breakdown structure.
There are three general classifications for estimate accuracy:o Rough order of magnitude: -25% to +75% accuracyo Budget estimate: -10% to +25% accuracyo Definitive estimate: -5% to +10% accuracy.
Approaches to estimating can be classified as top-down estimating or bottom-up estimating. Bottom-up estimating is the most reliable.
Analogous estimating relies on similar activities from past projects as the basis for estimating.
Parametric estimating uses mathematical formulas as the basis for estimating.
The Estimate Activity Durations process determines how many work periods each schedule activitywill take.
Effort is the level of work required for an activity while duration is how many work periods theactivity will take.
Parkinson's Law states that work expands to fill the time available.
Standard deviation identifies how diverse the data population is.
A simplified standard deviation formula is:(Pessimistic - Optimistic)
6 Three-point estimates provide a weighted average. The formula for three-point estimates is:
(Pessimistic estimate + (4 x Most Likely estimate) + Optimistic estimate)6
Contingency reserves (also called buffers) are additional time allocated to the project or to activitiesthat can be drawn from if durations exceed their estimates.
The Develop Schedule process results in the approved project schedule, known as the schedulebaseline.
Schedule data is supplemental information about the schedule used to establish the project schedule.
Schedule network analysis is the various techniques applied to the schedule. This includes scenarios,schedule compression, and resource leveling.

CHAPTER 6: TIME MANAGEMENT 6
Project Management Road Trip® 185 6: Time Management
Constraints restrict when activities can begin or end. The four types of constraints are:o Start no earlier than (SNET)o Start no later than (SNLT)o Finish no earlier than (FNET)o Finish no later than (FNLT)
Float (or slack) is how much an activity's duration can extend without delaying successor activities orextending the project's duration.
Schedule compression uses crashing or fast-tracking to reduce the duration of the project or activities.Crashing adds more resources to the project while fast-tracking allows activities to run in parallel thatwould not normally do so.
Crashing increases costs while fast-tracking increases risks.
Monte Carlo Analysis is a computerized scenario technique that identify vulnerabilities in theschedule.
Resource leveling matches resource use to the organization's ability to provide those resources.
The Critical Path Method identifies and analyzes the activities that have the least flexibility in theproject schedule.
The critical path is the sequence of activities that have no float. It’s the longest path(s) within theproject schedule network diagram.
A critical activity is an activity on a critical path in the project.
The Critical Chain Method focuses on potential bottlenecks in the scheduled activities due to scarceresources. Buffers of reserve time are placed at crucial junctures on the critical chain that can be drawnfrom if durations are exceeded.
The Control Schedule process focuses on monitoring the schedule for variances and progress,managing approved changes, and controlling the schedule from unnecessary changes.


![PMBOK - 4ta Edición [ES]](https://static.fdokumen.com/doc/165x107/6325b326584e51a9ab0bb56e/pmbok-4ta-edicion-es.jpg)