Progression of change following median nerve section in the cortical representation of the hand in...
26
Neuroscience Vol. 10,No. 3, pp. 639-665, 1983 0306-4522/83 $3.00 + 0.00 Printedm Great Britain Pergamon Press Ltd IBRO PROGRESSION OF CHANGE FOLLOWING MEDIAN NERVE SECTION IN THE CORTICAL REPRESENTATION OF THE HAND IN AREAS 3b AND 1 IN ADULT OWL AND SQUIRREL MONKEYS M. M. MERZENICH,* J. H. KAAs,t J. T. WALL,t M. SUR, R. J. NELSON and D. J. FELLEMANt *Coleman Laboratory, Departments of Otolaryngology and Physiology, University of California at San Francisco, San Francisco, CA 94143 tDepartments of Psychology and Anatomy, Vanderbilt University, Nashville, TN 37240, U.S.A. Abstract-In an earlier study (Neuroscience 8,33-55, 1983),we found that the cortex representing the skin of the median nerve within parietal somatosensory fields 3b and 1 was completely occupied by ‘new’ inputs from the ulnar and radial nerves, 2-9 months after the median nerve was cut and tied in adult squirrel and owl monkeys. In this report, we describe the results of studies directed toward determining the time course and likely mechanisms underlying this remarkable plasticity. Highly detailed maps of the hand surface representation were derived in monkeys before, immediately after, and at subsequent short and intermediate time stagesafter median nerve section. In one monkey, maps were derived before nerve section, immediately after nerve section, and 11, 22 and 144 days later. Thus, direct comparisons in cortical map structure could be made over time in this individual monkey. In other experiments, single maps were derived at given post-section intervals. These studies revealed that: (1) large cortical sectors were ‘silenced’ by median nerve transection. (2) Significant inputs restricted to the dorsum of the radial hand and the dorsum of digits 1, 2 and 3 were immediately ‘unmasked’ by median nerve transection. (3) These immediately ‘unmasked’ regions were topographically crude, and represented only fragments of this dorsal skin. They were transformed, over time, into very large, highly topographic and complete representations of dorsal skin surfaces. (4) Representations of bordering glabrous skin surfaces progressively expanded to occupy larger and larger portions of the former median nerve cortical representational zone. (5) These ‘expanded’ representations of ulnar nerve-innervated skin surfaces sometimes moved, in entirety, into the former median nerve representational zone. (6) Almost all of the former median nerve zone was driven by new inputs in a map derived 22 days after nerve section. At shorter times (3.6 and 1I days), ‘reoccupation’ was still incomplete. (7) Very significant changesin map dimensions within and outside of the former median skin cortical field were seen after the ‘reoccupation’ of the deprived cortex by ‘new’ inputs was initially completed. (8) Progressive changes were recorded within the original ulnar and radial nerve cortical representational zones, as skin surfacesoriginally overtly represented wholly within these regions expanded into the former median nerve zone. (9) Throughout the studied period, the cortical representational loci of many skin sites appeared to change continually and often markedly. (10) The locations of map discontinuities also shifted significantly over time. (1 I) Concommitant with changes in representational magnification over time, inverse changes in receptive field sizes were recorded. (12) Immediately ‘unmasked’ inputs had greater than normal receptive field overlap as a function of distance across the cortical surface. The normal ‘hypercolumn’ rule6’ was progressively re-established. (13) The topographical progression of reorganiz- ation and ultimate reorganizational patterns differed greatly in Areas 3b and I. The evident capacity for change in and around the deprived cortical zone of: (a) cortical map dimensions; (b) cortical sites of representation of different skin surfaces (obversely, the skin surfaces represented at given cortical sites over time); (c) receptive field sizesand overlaps; and (d) of the locations of map discontinuities clearly demonstrates that details of cortical map structure in Areas 3b and 1 are dynamically maintained. The present studies indicate that nerve transection results in both immediate and progressively developing changes in the cortical maps of this skin surface. While some portions of the deprived cortex were not cutaneously responsiveimmediately after transection, other parts of this cortex were immediately activated by ‘new’ cutaneous inputs. The reoccupation of the deprived cortex gradually increased, and dramatic changes in somatotopic organization occurred even after initial complete reactivation. Changes in receptive field sizeswere seenconcurrent with changesin somatotopic organization. These results have important implications for consideration of the nature of reorganization processes. They provide further, strong evidence that the detailed structure of the manifest somatotopic cortical organization is dynamically maintained. They bear implications for consideration of the significance and of the nature of physiologically recorded topographic representations of sensory epithelia in normal monkeys. The present investigations are part of a series of that there are separate, systematic representations of studies on the effects of peripheral nerve damage on the body surface in each of the two architectonic the organization of somatosensory cortex in mon- fields, Areas 3b and 1, of postcentral parietal cortex keys. Initial studies in normal monkeys demonstrated of monkeys.2**39*ss~67 Subsequent studies were desig- 639
Transcript of Progression of change following median nerve section in the cortical representation of the hand in...
Neuroscience Vol. 10, No. 3, pp. 639-665, 1983 0306-4522/83 $3.00 + 0.00 Printed m Great Britain Pergamon Press Ltd
IBRO
PROGRESSION OF CHANGE FOLLOWING MEDIAN NERVE SECTION IN THE CORTICAL REPRESENTATION OF THE
HAND IN AREAS 3b AND 1 IN ADULT OWL AND SQUIRREL MONKEYS
M. M. MERZENICH,* J. H. KAAs,t J. T. WALL,t M. SUR, R. J. NELSON and D. J. FELLEMANt
*Coleman Laboratory, Departments of Otolaryngology and Physiology, University of California at San Francisco, San Francisco, CA 94143
tDepartments of Psychology and Anatomy, Vanderbilt University, Nashville, TN 37240, U.S.A.
Abstract-In an earlier study (Neuroscience 8,33-55, 1983), we found that the cortex representing the skin of the median nerve within parietal somatosensory fields 3b and 1 was completely occupied by ‘new’ inputs from the ulnar and radial nerves, 2-9 months after the median nerve was cut and tied in adult squirrel and owl monkeys. In this report, we describe the results of studies directed toward determining the time course and likely mechanisms underlying this remarkable plasticity. Highly detailed maps of the hand surface representation were derived in monkeys before, immediately after, and at subsequent short and intermediate time stages after median nerve section. In one monkey, maps were derived before nerve section, immediately after nerve section, and 11, 22 and 144 days later. Thus, direct comparisons in cortical map structure could be made over time in this individual monkey. In other experiments, single maps were derived at given post-section intervals.
These studies revealed that: (1) large cortical sectors were ‘silenced’ by median nerve transection. (2) Significant inputs restricted to the dorsum of the radial hand and the dorsum of digits 1, 2 and 3 were immediately ‘unmasked’ by median nerve transection. (3) These immediately ‘unmasked’ regions were topographically crude, and represented only fragments of this dorsal skin. They were transformed, over time, into very large, highly topographic and complete representations of dorsal skin surfaces. (4) Representations of bordering glabrous skin surfaces progressively expanded to occupy larger and larger portions of the former median nerve cortical representational zone. (5) These ‘expanded’ representations of ulnar nerve-innervated skin surfaces sometimes moved, in entirety, into the former median nerve representational zone. (6) Almost all of the former median nerve zone was driven by new inputs in a map derived 22 days after nerve section. At shorter times (3.6 and 1 I days), ‘reoccupation’ was still incomplete. (7) Very significant changes in map dimensions within and outside of the former median skin cortical field were seen after the ‘reoccupation’ of the deprived cortex by ‘new’ inputs was initially completed. (8) Progressive changes were recorded within the original ulnar and radial nerve cortical representational zones, as skin surfaces originally overtly represented wholly within these regions expanded into the former median nerve zone. (9) Throughout the studied period, the cortical representational loci of many skin sites appeared to change continually and often markedly. (10) The locations of map discontinuities also shifted significantly over time. (1 I) Concommitant with changes in representational magnification over time, inverse changes in receptive field sizes were recorded. (12) Immediately ‘unmasked’ inputs had greater than normal receptive field overlap as a function of distance across the cortical surface. The normal ‘hypercolumn’ rule6’ was progressively re-established. (13) The topographical progression of reorganiz- ation and ultimate reorganizational patterns differed greatly in Areas 3b and I.
The evident capacity for change in and around the deprived cortical zone of: (a) cortical map dimensions; (b) cortical sites of representation of different skin surfaces (obversely, the skin surfaces represented at given cortical sites over time); (c) receptive field sizes and overlaps; and (d) of the locations of map discontinuities clearly demonstrates that details of cortical map structure in Areas 3b and 1 are dynamically maintained.
The present studies indicate that nerve transection results in both immediate and progressively developing changes in the cortical maps of this skin surface. While some portions of the deprived cortex were not cutaneously responsive immediately after transection, other parts of this cortex were immediately activated by ‘new’ cutaneous inputs. The reoccupation of the deprived cortex gradually increased, and dramatic changes in somatotopic organization occurred even after initial complete reactivation. Changes in receptive field sizes were seen concurrent with changes in somatotopic organization.
These results have important implications for consideration of the nature of reorganization processes. They provide further, strong evidence that the detailed structure of the manifest somatotopic cortical organization is dynamically maintained. They bear implications for consideration of the significance and of the nature of physiologically recorded topographic representations of sensory epithelia in normal monkeys.
The present investigations are part of a series of that there are separate, systematic representations of studies on the effects of peripheral nerve damage on the body surface in each of the two architectonic the organization of somatosensory cortex in mon- fields, Areas 3b and 1, of postcentral parietal cortex keys. Initial studies in normal monkeys demonstrated of monkeys.2**39*ss~67 Subsequent studies were desig-
639

640 M M. Merzenich et ul.
ned to determine the effects of chronically depriving sectors of these two representations of their normal evident source of activation.43 In those experiments, large portions of the hand representations were deprived of normal inputs by sectioning and ligating the median nerve, thereby permanently dennervating about 60% of the glabrous surface of the hand. When regions of Areas 3b and 1 which normally represent the hand were mapped with micro- electrodes two or more months later, the entire cortex formerly representing the skin of the median nerve was responsive to tactile stimulation of adjacent hand regions which are innervated by the ulnar and radial nerves. Some of the deprived cortex contained large ‘new’ representations of parts of the hand that were still represented elsewhere in normal locations in the two maps. Other portions of the deprived cortex were occupied by representations that appeared to be greatly expanded from the normal bordering cortex into the deprived zone. Both ‘new’ and expanded repre~ntations were topographically organized, and in at least several sectors of the reorganized cortex, the receptive field sizes were inversely related to cortical magnification. These experiments thus de- monstrate a remarkable capacity for reorganization of the somatosensory system in adult primates.
The major goal of the present experiments was to study the sequence of progressively occurring changes which resulted in the organization patterns observed in these chronically deafferented animafs. Some experiments were directed toward determining changes that occur in cortex as an immediate consequence of nerve section, This was accomplished by mapping the representations of the hand in great detail in Areas 3b and 1 in individual monkeys, both immediately before and immediately after transection of the median nerve. in addition, several monkeys were studied at short, predesignated times (3-30 days) after median nerve section. Finally, one monkey was mapped immediately before, immedi- ately after and at three subsequent times after nerve section. Double and multiple mapping procedures allowed progressively occurring changes in the struc- ture of cortical maps to be systematically analyzed, since the organization of the same identifiable region of cortex could be studied over time in the same monkey. Thus, changes were seen directly, without being inferred from comparisons of experimental and normal monkeys.
Preliminary reports of these results have appeared elsewhere.38s41
EXPERIMENTAL PROCEDURES
Experiments were conducted on five squmel monkeys and three owl monkeys. As judged by weight, all were adults. In each mapping study, receptive fields were defined for neurons within 204-540 parallel microelectrode pene- trations completely covering the hand representations in Areas 3b and 1, using methods described earlier.3P*43 In this and in all other experimental series, in each penetration: (I) the cortical surface contact was precisely determmed vtsually, and the electrode relatively rapidly advanced 600-IOOO~m deep into the cortex. (2) The hand was mechanically stabilized, and its surfaces carefully explored with a fine opaque glass probe. (3) The ‘minimal receptive field’ was defined by careful exnforation of the boundartes of the responsive skin surface. The minimal receptive field is that skin surface over which the recorded neuron or neurons could be driven with just-visible indentation of the skin. (4) While receptive fields were often defined for single units, they were defined for small clusters of units in the majority of microelectrode penetrations. This is a necessity in these highly detailed mapping studies m which a receptive field must be relatively rapidly defined in every micro- electrode penetration. We have earlier pointed out (and have repeatedly confirmed in this and all earlier and subsequent studies) that receptive fields recorded anywhere along a vertical penetration within the cortical middle layers are virtually identical, and that receptive fields defined for units and for small clusters of units are commonly indistjnguishabfe.39
In four monkeys, a map was defined m this detail, and the median nerve then cut and the cortex immediately re- mapped in equal detail. It should be noted that experience in this and in other studies indicates that mapping under these conditions generally did not affst the responsiveness of cortex. Thus, in remapping the cortical regions deriving input from the intact ulnar nerve, responses in the second map were qualitatively indistinguishable from those re- corded in the first, and very few or no ‘silent’ penetrations were seen in these regions in remap cases.
In a second set of experiments, detailed cortzcal maps of the entire hand were derived in a normal squirrel monkey, and the nerve then cut and the hand immediately remapped. Sterile surgical conditions (including the use of sterilized microelectrodes) were maintained throughout these procedures. At the end of this second mapping procedure, the dura was closed and the skull covered with a smail methylmethacrylate prosthesis. The skull covering was opened and the dura reflected 11, 22, and 144 days later, and mapped each time in detail. Maps derived I1 and 22 days after nerve transection were again obtained using strict sterile procedures. One hundred and forty-four days after nerve section, a highly detailed (over 500 penetration) map was derived acutely.
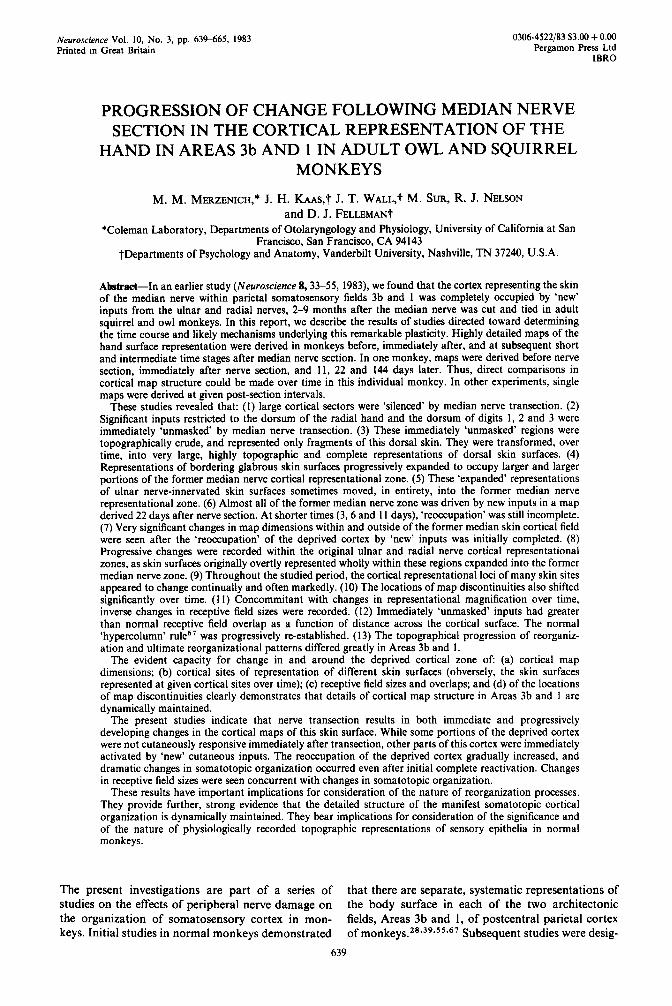
The appearance of the cortical surface vasculature was relatlveiy constant over the duration of this experiment (Fig. I). Thus, changes in the map recorded over time could be accurately related to this invariant vascular pattern. The cortex containing the hand representation was highly responsive during each recording period, and there was no indication that earlier recording experiments had thems&es altered cortical responsiveness or map structure. All of the
Fig. 1. Surface vasculature in the cortical area representing of the hand within Areas 3b and 1 just prior to a mapping experiment preceding transection of the median nerve (0 days, upper left), and imm~iately prior to mapping experiments conducted II and 144 days later. The 540 penetration sites at which receptive fields were defined in the final (144 day) map are illustrated at the lower right. This map extended completely across the hand representations. In all experiments, including one not shown conducted 22 days after the nerve lesion, the cortical region of representation of the hand was free of any evident surfate damage (although adhesions of dwal sutures to the cortex resulted in some focal damage around this zone). There are some differences in par&ax in ~t~~aphs; for that reason, comparisons between maps were made by referencing all maps to the photograph derived in the final (144 day post-lesion) experiment
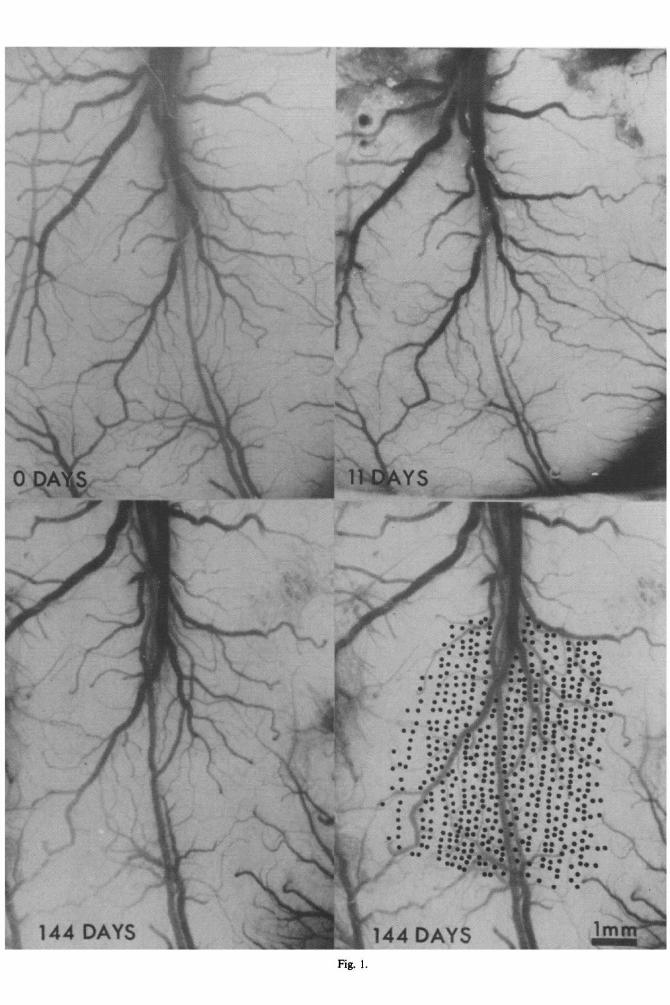
Fig. 1.

Cortical plasticity following median nerve section 643
maps derived in this monkey were drawn with reference to the appearance of the cortical vasculature at 144 days following nerve transection to eliminate problems of parallax in successive brain photographs.
In the third set of experiments, single maps were derived acutely in previously unmapped owl monkeys, 3 and 6 and 30 days after median nerve section. These studies were conducted principally to confirm observations made in remapped monkeys.
At the end of all experiments, specific recording sites were marked with microlesions. Brains were subsequently blocked, sectioned frozen and stained with Cresyl Violet. The cytoarchitectonic borders of Areas 3b and 1 were determined and later related to the cortical maps. Maps were constructed as described in a preceding paper.43 All measurements of cortical and receptive field areas were done with an electronic planimeter.
There are several methodological reservations that con- dition the interpretation of the results of these mapping studies. They are described in detail after the presentation of experimental results.
RESULTS
Changes in the hand representation immediately following section of the median nerve
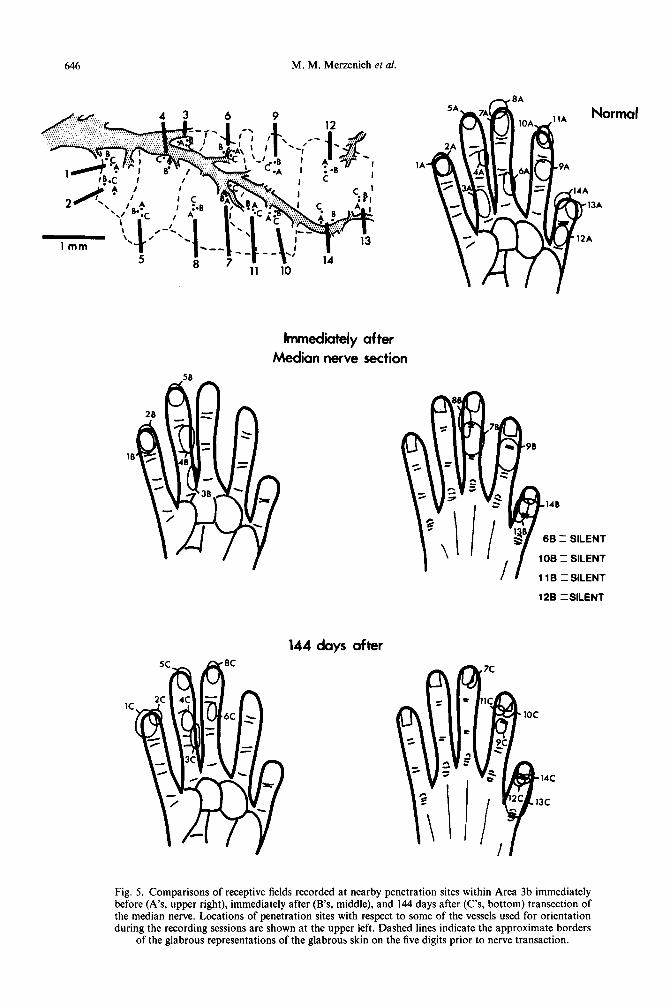
The cortical hand representations in Areas 3b and 1 were mapped in detail in three squirrel monkeys and in one owl monkey immediately before, and again immediately after median nerve transection. Immediately after cutting the nerve in squirrel monkeys, neurons within much of the former representational zone of the median nerve were unresponsive to cutaneous stimulation of the hand (Figs 2, 6, 7). However, within a significant fraction of penetrations into the cortical territory of the median nerve (as defined in the map derived prior to nerve section) neurons were activated by the stimul- ation of hand surfaces innervated by the radial and ulnar nerves (Figs 2, 6, 7). Large fragmented sectors of the dorsal surfaces of digits 1, 2 and 3 were found to be coarsely represented within the deprived sectors of both Areas 3b and 1 immediately after nerve transection (see Figs 4, 12). In Area 3b, the immediately appearing receptive fields never com- pletely covered the dorsal surfaces of any digit. Receptive fields were several times larger, and had greater overlap with receptive fields of nearby neurons as a function of distance across the cortical surface than were later recorded. The immediately ‘unmasked’ inputs extended significant distances within the original boundaries of representation of the median nerve, and principally represented dorsal digital skin innervated by the radial nerve. Further, these unmasked inputs appeared primarily within the sector of the median nerve territory originally representing the glabrous digital surfaces. When unmasked inputs were recorded in this region, the dorsal locations of new receptive fields matched the ventral locations of the glabrous fields found at these sites prior to nerve transection (Fig. 5). Thus, for example, if a receptive field for neurons at a given cortical site was on the radial side of the middle segment (phalanx) of the hairless (glabrous) surface
of digit 2 before transection and if these neurons were responsive after nerve section, they would be driven from stimulation near the radial side of the middle phalanx on the hairy dorsum of the second digit.
In addition to the unmasked inputs from the dorsal surface of the digits described above, there was often a significant expansion of the territories of representation of bordering ulnar and radial skin surfaces (e.g. pad 3 in Areas 3b and 1, Fig. 2; pad 3 in Area 3b, Fig. 3) recorded immediately after median nerve transection. On the ulnar-median border, this may partly reflect the fact that receptive fields at many of these sites originally extended from a central location on median nerve skin onto ulnar nerve skin. However, this cannot apply to the median-radial border, as receptive fields do not normally extend from the glabrous (median nerve-innervated) skin onto the hairy (radial nerve-innervated) skin. Moreover, receptive fields even along the ulnar-median border were not notably smaller than normal, as might be expected if part of their inputs were removed. Finally, in two monkeys significant inputs from the 3rd palmar pad were recorded in Area 1 in a map sector that was well removed from the original overt sites of representations of this palmar pad (see Figs 2, 7).
Several other features of the maps recorded immediately after nerve section were also of special interest because of their great differences with maps derived at later post-section times.43 Thus, (a) there was only a small residual represented fragment of glabrous digit 3 (innervated by the ulnar nerve) in all studied monkeys. Digit 3 was represented over a several times larger cortical area in Area 3b in all longer-term monkeys. (b) The residual representation of the ulnar insular pad was very small (the owl monkey case illustrated in Fig. 2 constitutes a modest exception). Again, it was far larger in all longer-term monkeys. (c) There was no representation of the hypothenar eminence in the median nerve cortex, or anywhere within hundreds of microns from the border of the representation of the median and ulnar nerves immediately after nerve section. The hypo- thenar eminence has been found to be at least partially represented in nearly all longer-term monkeys.
Immediately after nerve section, over 50 pene- trations were introduced into the large, continuous cortical zone formerly activated by the median nerve in one studied owl monkey (Fig. 2). The hand and arm surfaces were carefully explored in all of these penetrations. In contrast to the three squirrel mon- keys for which complete post-section maps were derived, there was no indication of cutaneous driving of neurons anywhere within this large region. All along the border separating representations of the hand and face, neurons within penetrations separated by 150-300 microns changed from being completely unresponsive to any cutaneous stimulation to being strongly driven from receptive fields on the face.
Normal
,- _-
Fig. 2. Reprmentation of the s am! imtllcaiately after cutting responsive cm&al zone (‘sildnt’ or me cm hawted. This manJmy h
Cortical plasticity following median nerve section 645
Normal Owl Monkey
After Nerve Section
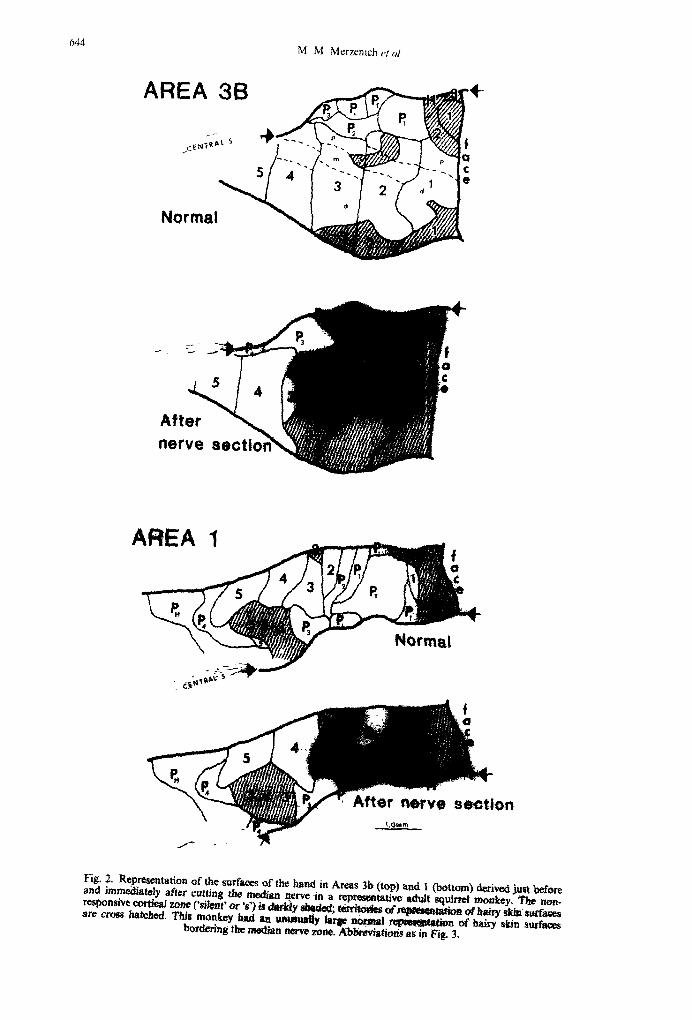
Fig. 3. Representation of the surfaces of the hand in Area 3b derived just before and immediately after transection of the median nerve in an adult owl monkey. Abbreviations for the cortical zones representing different hand surfaces in this and in all other illustrations are summarized in the hand drawing at the left. There, I-S number the digits; d, m and p = the distal middle and proximal digital phalanges; PI-P4 are the palmar pads at the bases of the fingers. P, = hypothe nar pad (eminence); P, = the insular pads in the center of the palm; and Pr = the thenar pad (eminence). Other labels employed in later drawings include H (hand dorsum) and W (wrist). Areas of representation of dorsal (hairy) skin surfaces are cross hatched. ‘Silent’ areas are darkly shaded. The dashed line represents the approximate line of demarcation of the skin fields on the glabrous hand innervated by the ulnar and median nerves. Arrows on the cortical map
indicate the approximate line of the Area 3b-Area I border.
Receptive Fields in Former Median Nerve Cortex ; Immediately after Section
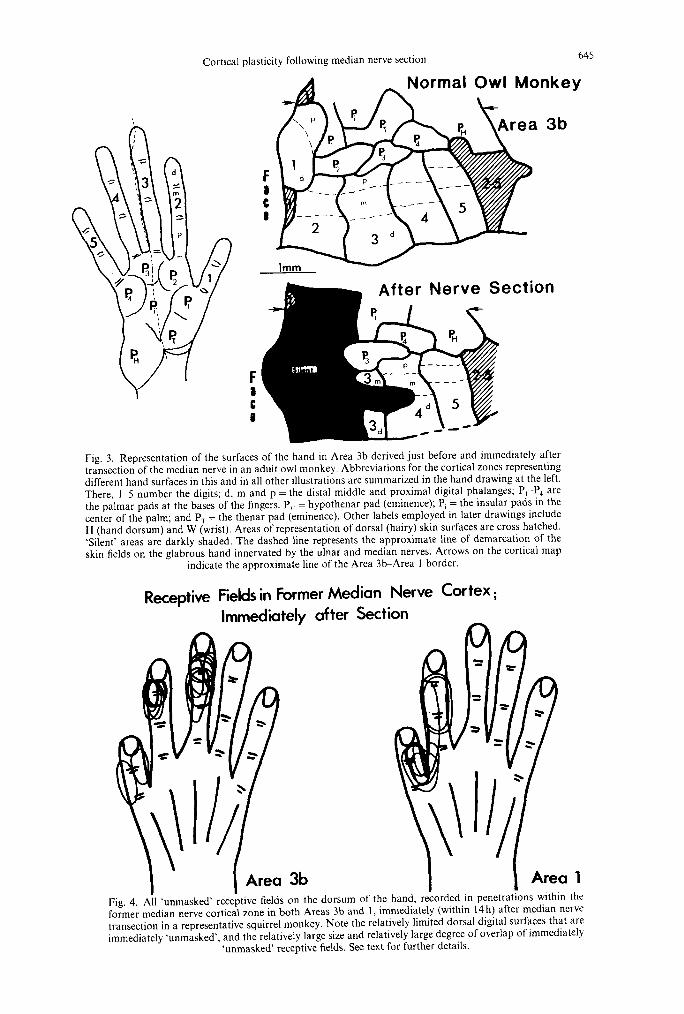
Fig. 4. All ‘unmasked’ receptive fields on the dorsum of the hand, recorded in penetrations within the former median nerve cortical zone in both Areas 3b and 1, immediately (within 14 h) after median nerve transection in a representative squirrel monkey. Note the relatively limited dorsal digital surfaces that are immediately ‘unmasked’, and the relatively large size and relatively large degree of overlap of immediately
‘unmasked’ receptive fields. See text for further details.
646 M. M. Merzenich et al.
Immediately of ter Median nerve section
148
6B = SILENT
1 OB q SILENT
11 B Z SILENT
128 ZSILENT
144 days after
Fig. 5. Comparisons of receptive fields recorded at nearby penetration sites within Area 3b immediately before (A’s, upper right), immediately after (B’s, middle), and 144 days after (C’s, bottom) transection of the median nerve. Locations of penetration sites with respect to some of the vessels used for orientation during the recording sessions are shown at the upper left. Dashed lines indicate the approximate borders
of the glabrous representations of the glabrous skin on the five digits prior to nerve transaction.
Cortical plasticity following median nerve section 647
Subsequent progressive change3 in map dimensions
In the single owl monkey studied, the cortical territory of the median nerve (except for a narrow marginal zone along the median-ulnar border) was silent immediately after transection of the median nerve. In several studied squirrel monkeys, there were crude, immediately ‘unmasked’ partial represent- ations of the dorsal finger surfaces that appeared in the cortical territory previously driven by inputs from the median nerve. There were also large territories in squirrel monkeys in which neurons were not ac- tivated by cutaneous stimuli immediately following nerve section. How does the map change, in time, to occupy these large ‘silent’ regions? Are immediately unmasked responsive regions topographically stable over time? How are the later-recorded highly ordered ‘new’ and ‘expanded’ representations of ulnar and radial nerve-innervated skin surfaces generated within these chronically deprived cortical sectors?
Changes in map structure over time following nerve sec:ion were studied in two ways. First, the cortical hand representations in an individual mon-
key were mapped repeatedly, before and at staged times after the median nerve was cut and tied. Second, as a control for this direct time sequence study, several monkeys were studied at given, relatively short postsection times, without derivation of prior maps.
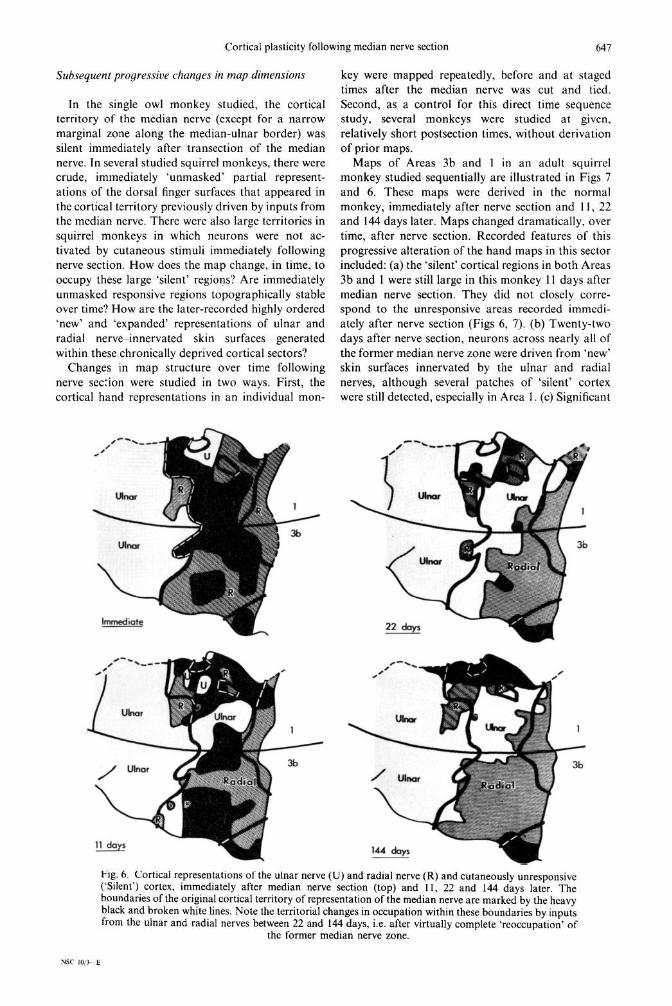
Maps of Areas 3b and I in an adult squirrel monkey studied sequentially are illustrated in Figs 7 and 6. These maps were derived in the normal monkey, immediately after nerve section and I I, 22 and 144 days later. Maps changed dramatically, over time, after nerve section. Recorded features of this progressive alteration of the hand maps in this sector included: (a) the ‘silent’ cortical regions in both Areas 3b and I were still large in this monkey 11 days after median nerve section. They did not closely corre- spond to the unresponsive areas recorded immedi- ately after nerve section (Figs 6, 7). (b) Twenty-two days after nerve section, neurons across nearly all of the former median nerve zone were driven from ‘new’ skin surfaces innervated by the ulnar and radial nerves, although several patches of ‘silent’ cortex were still detected, especially in Area 1. (c) Significant
big. 6. Cortical representations of the ulnar nerve (U) and radial nerve (R) and cutaneously unresponsive (‘Silent’) cortex, immediately after median nerve section (top) and 11, 22 and 144 days later. The boundaries of the original cortical territory of representation of the median nerve are marked by the heavy black and broken white lines. Note the territorial changes in occupation within these boundaries by inputs from the ulnar and radial nerves between 22 and 144 days, i.e. after virtually complete ‘reoccupation’ of
the former median nerve zone.

648 M. M. Merzenich et nl.
TIME SEQENCE POST-SECTION MAPS
AREA 38 AREA 1
Fig. 7. Representations of the hand in Areas 3b (left column) and 1 (right column) derived from a single squirrel monkey that was mapped before (top), immediately after, and 11, 22 and I44 days after median
nerve transection, Regions that were not driven by cutaneous stimulation (‘silent’ or ‘s’) are darkly shaded; areas of representation of dorsal hand surfaces are cross hatched. Abbreviations as in Frg. 3. Bar
at bottom of right column = 1 .O mm.
Cortical plasticity following median nerve section 649
changes in internal map dimensions were recorded after nearly complete territorial ‘reoccupation’ of the median nerve representational cortex by inputs from the radial and ulnar nerves. For example, compare the insular and hypothenar pad regions in Areas 1, or the ‘new’ dorsal second digit representation in Areas 3b at 22 and 144 days after nerve section (Fig. 7); and compare the territories of occupation of the ulnar and radial nerves at these two times (Fig. 6). (d) Normal cortical representations of bordering skin surfaces innervated by ulnar and radial nerves (e.g. residual ulnar glabrous digit 3, insular pad) progress- ively expanded, to occupy larger and larger areas within the former median nerve cortical zone. (e) The large, duplicative, fragmentary representations of the dorsal surfaces of digits 1, 2 and 3 that appeared immediately after nerve section, and the hypothenar eminence representation that was first recorded 11 days after nerve transection later progressively increased in cortical extent, completeness and order- liness of representation. (f) Some expansions of repre- sentation appeared to be temporary; thus, for exam- ple, immediately unmasked representations of the dorsal surface of digits 2 and 3 in Area 3b contracted at 11 days and the digit 3 representation never fully regained its immediately ‘unmasked’ territory (Fig. 7, left column). (g) There were striking changes in inter- nal topography, and correlative changes in receptive field sizes, over time.
The results from this repeatedly-mapped monkey were extended by conducting studies on other monkeys at additional post-section times. In these monkeys, a single map was derived at a given post- lesion time. In an owl monkey studied 6 days after nerve section, the overall picture was similar to that illustrated in Fig. 7 after 11 days. Thus, (a) ‘silent’ areas were observed (although they were actually smaller) in both fields; (b) ‘unmasked’ represent- ations were still incomplete; (c) moderately ex- panded representations of the insular pad and of the hypothenar eminence (smaller than in later post- section maps) were recorded; (d) receptive fields were larger than those recorded in later post-transection monkeys; and (e) receptive field overlap was signifi- cantly greater than normal. Similarly, in a monkey studied 30 days after nerve interruption, the map resembled that obtained at 22 days post-section, that is, all of the deprived cortex was cutaneously responsive, dorsal digital surfaces were completely represented, and overall orderliness was qualitatively poorer than in longer-term monkeys.
Thus, to summarize: over time, the immediately unmasked fragmentary representations of the dorsal surfaces of the digits grew in extent. The skin surfaces they represented also expanded so that ultimately all of the dorsal surfaces of digits 1 and 2 were represented in detail. Through this reorganizational process, this representation continuously reordered its internal topography. In the process, as represent- ations grew, the sizes of receptive fields recorded for
neurons in individual penetrations diminished. These ‘new’ representations of finger dorsi in Area 3b were located within the same regions as the original cortical territories of representation of the glabrous surfaces of the corresponding digits. In time, they also encroached on cortex formerly representing palmar surfaces. The cortical representations of palmar surfaces and the small fraction of the surface of digit 3 that is innervated by the ulnar nerve expanded into the former median nerve cortex, producing enlarged representations of this skin. A representation of the hypothenar pad arose and expanded within the median nerve cortex, well removed from the site of its original overt represent- ation in the medial aspect of the hand representation. ‘New’ and ‘expanded’ representations of ulnar skin surfaces of the palm ultimately occupied a propor- tionally larger cortical area in Area 1 than in Area 3b, while dorsal skin surfaces innervated by the radial nerve seemed to be more predominant in Area 3b (Fig. 5; also see Merzenich et ~1.~~).
Progressive expansion, internal topographic alteration and apparent movement of skin surface representations in reorganizing cortex
Basic features of the sequence of cortical reorganiz- ation in Areas 3b and 1 following median nerve section are documented by considering four specific illustrative examples from the intensively studied adult squirrel monkey described above.
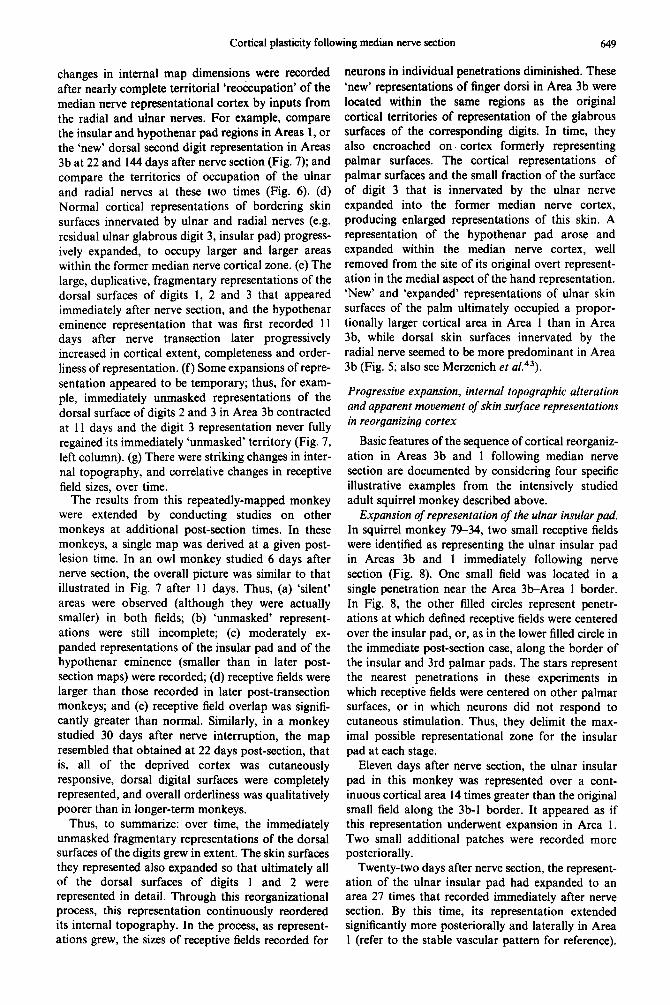
Expansion of representation of the ulnar insular pad. In squirrel monkey 79-34, two small receptive fields were identified as representing the ulnar insular pad in Areas 3b and 1 immediately following nerve section (Fig. 8). One small field was located in a single penetration near the Area 3b-Area 1 border. In Fig. 8, the other filled circles represent penetr- ations at which defined receptive fields were centered over the insular pad, or, as in the lower filled circle in the immediate post-section case, along the border of the insular and 3rd palmar pads. The stars represent the nearest penetrations in these experiments in which receptive fields were centered on other paimar surfaces, or in which neurons did not respond to cutaneous stimulation. Thus, they delimit the max- imal possible representational zone for the insular pad at each stage.
Eleven days after nerve section, the ulnar insular pad in this monkey was represented over a cont- inuous cortical area 14 times greater than the original small field along the 3b-1 border. It appeared as if this representation underwent expansion in Area 1. Two small additional patches were recorded more posteriorally.
Twenty-two days after nerve section, the represent- ation of the ulnar insular pad had expanded to an area 27 times that recorded immediately after nerve section. By this time, its representation extended significantly more posteriorally and laterally in Area 1 (refer to the stable vascular pattern for reference).
650 M. M. Merzenich et al.
SQMonkey 79-34 . l
hmediately after nerve section 22 days after nerve section
11 days after nerve section 144daysaftermrvesectiu1
Fig. 8. Cortical representation of the ulnar insular pad (Pi., stippled) and hypothenar eminence (Ps, crosshatched) in one monkey at four different times after transection of the median nerve. Penetrations are drawn over a simplified drawing of the cortical surface vasculature. The heavy line (indicated by arrow) represents the approximate line of the Area 3b-Area 1 border (3b is toward the bottom). Dots are penetration sites at which receptive fields were on the insular pad or hypothenar eminence. Stars are nearest penetration sites at which receptive fields were on other skin surfaces, or at which neurons were not driven by cutaneous stimulation. (Note that at 22 and 144 days, neurons in nearly all surrounding penetrations in this and in the following two Figures were driven by cutaneous stimulation.) Bar at lower
right = l.Omm.
There was now an apparent significant area of representation within Area 3b.
One hundred and forty-four days after nerve section, the medial boundary of the representation of the ulnar insular pad had shifted medially, and the caudolateral border had retracted. The Area 3b representation appeared to be smaller than earlier. No patches of insular pad representation were recorded posterior to the ‘main’ representation, despite the high density of penetrations made into this area. The size of the large continuous represent- ation was now about 21 times that seen immediately after nerve transection, and about 0.82 times the size of the representation defined 22 days after nerve section. These changes, in time, are summarized in an overlay illustration in Fig. 11.
The appearance and subsequent expansion of a representation of the hypothenar eminence in Area 1. No receptive fields could be identified as centered on or extending onto the hypothenar eminence for recordings immediately after nerve section in Area 1
median nerve cortex. A partial representation of this skin surface (normally represented in the far medial aspect of the representation of the hand in Area 1) was first seen 11 days after nerve section (Fig. 8). It progressively expanded in area, 22 and 144 days after nerve section, over the final period principally at the expense of the territory of the representation of the ulnar insular pad. The skin surfaces on the hypo- thenar eminence represented in this cortical sector also progressively expanded (Fig. 12).
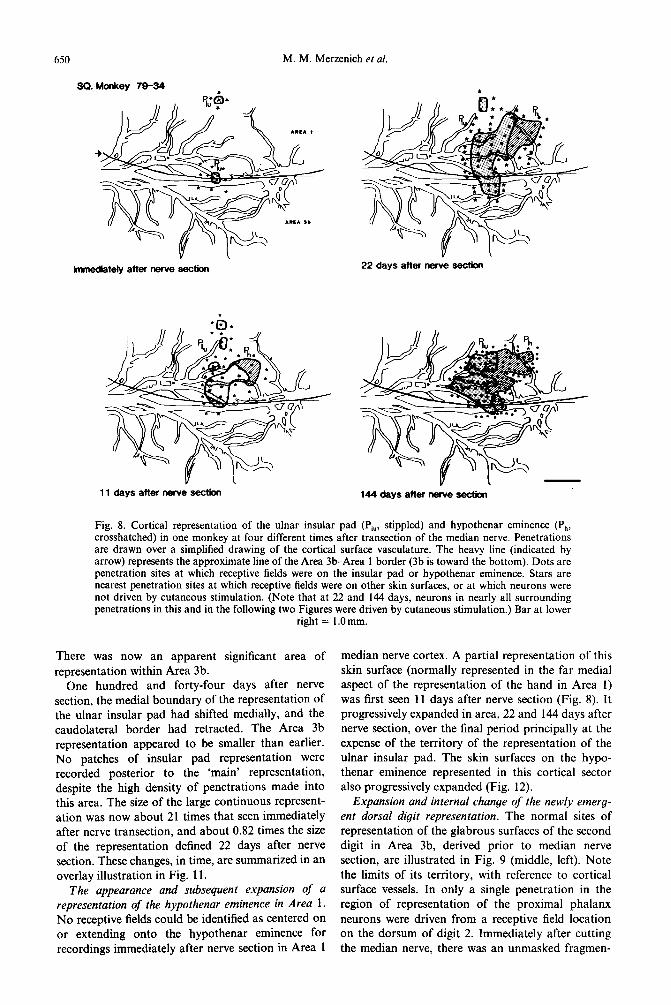
Expansion and internal change of the newly emerg- ent dorsal digit representation. The normal sites of representation of the glabrous surfaces of the second digit in Area 3b, derived prior to median nerve section, are illustrated in Fig. 9 (middle, left). Note the limits of its territory, with reference to cortical surface vessels. In only a single penetration in the region of representation of the proximal phalanx neurons were driven from a receptive field location on the dorsum of digit 2. Immediately after cutting the median nerve, there was an unmasked fragmen-

Cortical plasticity following median nerve section 651
tary representation of the dorsal surfaces of this digit the area of the immediately unmasked representation in the area of cortex formerly representing its volar of the dorsal digital surfaces), and the skin area surfaces (Fig. 9). Only limited skin areas on the represented on the proximal dorsal surfaces of digit 2 dorsal surfaces of the digit were represented in this in this small cortical sector was actually larger (Fig. ‘unmasked’ cortical sector (Fig. 12). Eleven days 12). Twenty-two days after nerve section, the cortical later, the cortical area of representation of the representation had enlarged to nearly four times the dorsum of digit 2 was actually smaller (about 40% of area recorded at 11 days. Note, again, that by 22
sqlllrrel Monkey
Somatosensory
SQ. Monkey 79-34
Normal
immediately after section 144 days
Fig. 9. Cortical representation of digit 2, defined in a normal monkey, immediately after median nerve section and 1 I, 22 and 144 days later. Cross-hatched areas (seen only in the normal case) represent cortex in which receptive fields were on the glabrous surface of Digit 2. Stippled areas represent cortex with receptive fields on the hairy surfaces of Digit 2. Dots are penetration sites in which neurons had Digit 2 receptive fields. Stars are nearest penetration sites at which neurons had receptive fields on other skin surfaces, or within which neurons were not driven by cutaneous stimulation. The approximate location of the hand representation is shown at the upper left. Note that in the illustrations showing progressive changes in representation (Figs 8-1 I), the medial aspect of the hand representation is to the left. Bar at
lower right = l.Omm.
652 M. M Merzentch et al
days, ‘reoccupation’ of the deprived cortical zone was almost complete, i.e. almost all cortical territory formerly representing the median nerve was driven by inputs from other skin fields. Nonetheless, the dorsal digit 2 representation continued to expand, so that at 144 days it was 1.61 times the area of representation at 22 days. The area that it ultimately occupied corresponded approximately in location with the original glabrous skin representation of digit 2 in the original map. The ‘new’ representation was somewhat (1.28 x ) larger. Again, this sequence of changes is summarized in an overlay in Fig. 11.
Thus, with reorganization, the sizes and distri- butions of the representations of the ulnar insular pad, hypothenar eminence and dorsal digit 2 in these two cortical representations underwent different sequences of change. The insular pad representation
it n C’
C’
0
n it
i it t< u Sl
Cl
Sl
n
1 Area 1 first seemed to expand from :I small esidual ulnar representation to occupy a very large ortical territory. Its representational territory then ontracted after the cortical map was completely ccupied at 22 days. In contrast, there was no evident esidual representation of the hypothenar eminence 1 the cortical territory of the median nerve immedl- tely following nerve section. First recorded at 11 ays post-section, it enlarged progressively, expand- rg significantly (and continuously) in area. Its :rritory of representation increased after the cortex /as initially fully occupied by ‘new’ inputs. The ulnar kin surface on the eminence represented within this ortical zone also continuously expanded. By contrast, a significant fragment of the dorsal
urface of digit 2 was ‘unmasked’ immediately. The spresentational areas of this surface subsequently
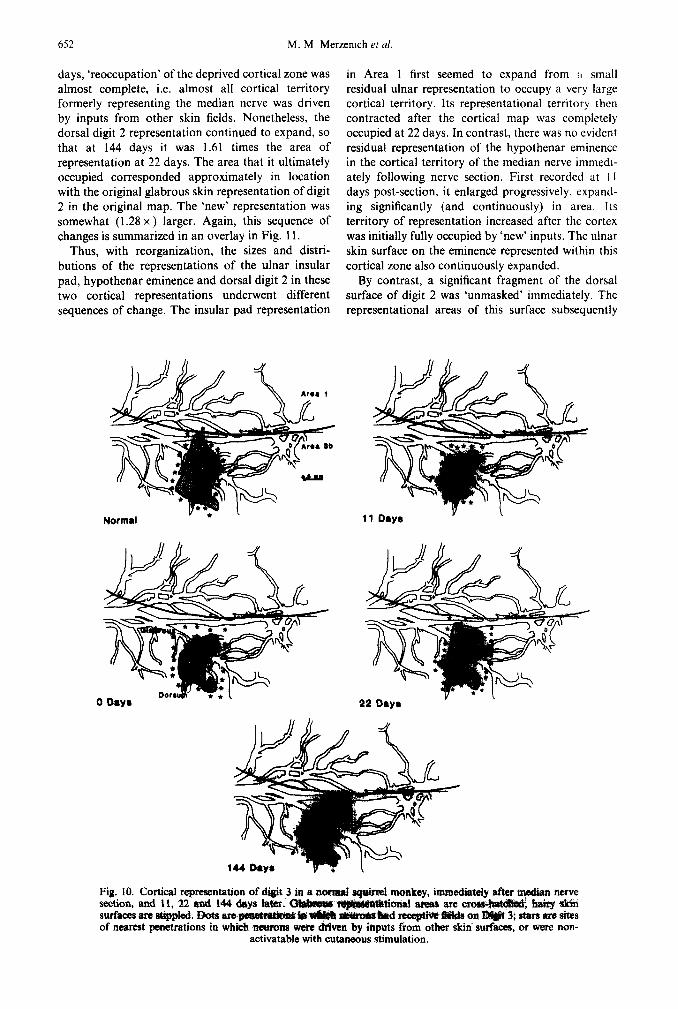
Fig. 10. Cortical representatioa of digit 3 in a a@mal s@xei monkuy, section, and 11, 22 and 144 days War.
immediately aftar ++dian nerve
surfaces mu s&&ad. Dota a~~~~~~ of nearest penetrations in which neurons wet-a drlvm by inputs from other skiri sm-f&ces, or ware nun-
activatable with cutaneous stimulation.
Cortical plasticity following median nerve section 653
Digit 2 Dorsum Digit 3 Glabrous Digit 3 Dorsum
. . . . ..&- , d?
I ?.pJ t..: \.s7
i . ..~-I+~' ,;"--/
. . . \ . ..J !i
\ +-a ' \ . ..',. i : 1'7'"
Hypothenar Pad
/- \ I . ..r..-\ j-i :’
,P :. l
.: ;,
;: 3
.; . . . y
.* l .-.t: .
..--’
::’ : . :.....: :
:-3 i,--
-*-* . . . ...* ., -,
;Q
:. I. . . . ..I -. *-(
.e...*
l ----* Immodlmto
. . . . . . . . . . 11 Day.
-w-N 22 Dayr
m 144 Days
Pomt-•octlon
\ wr Imm
.-- !
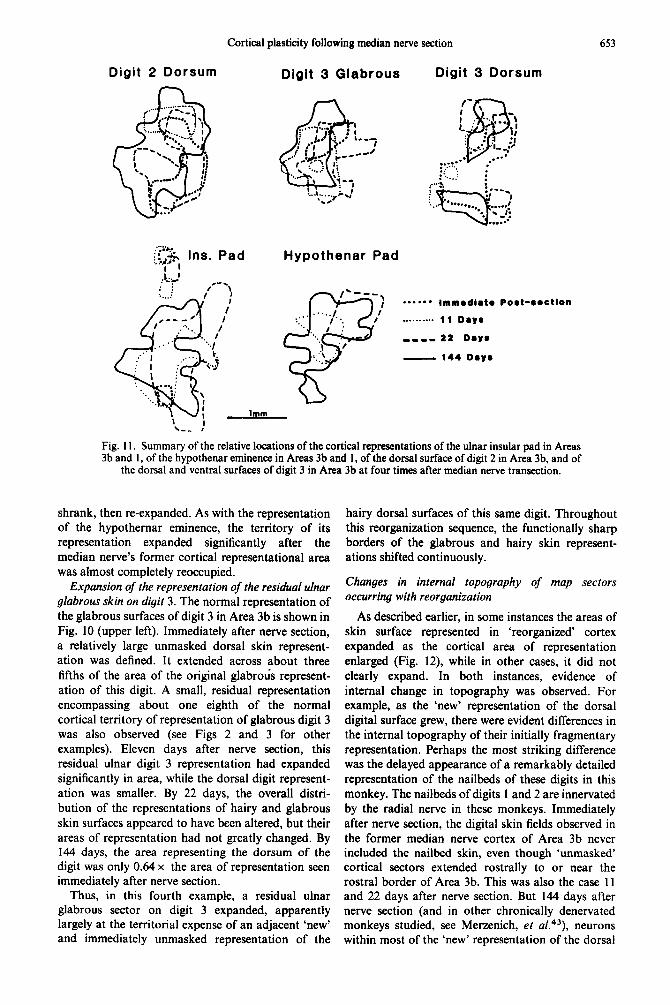
Fig. I 1. Summary of the relative locations of the cortical representations of the ulnar insular pad in Areas 3b and 1, of the hypothenar eminence in Areas 3b and 1, of the dorsal surface of digit 2 in Area 3b, and of
the dorsal and ventral surfaces of digit 3 in Area 3b at four times after median nerve transection.
shrank, then re-expanded. As with the representation of the hypothernar eminence, the territory of its representation expanded significantly after the median nerve’s former cortical representational area was almost completely reoccupied.
Expansion of the representation of the residual ulnar glabrous skin on digit 3. The normal representation of the glabrous surfaces of digit 3 in Area 3b is shown in Fig. 10 (upper left). Immediately after nerve section, a relatively large unmasked dorsal skin represent- ation was defined. It extended across about three fifths of the area of the original glabrous represent- ation of this digit. A small, residual representation encompassing about one eighth of the normal cortical territory of representation of glabrous digit 3 was also observed (see Figs 2 and 3 for other examples). Eleven days after nerve section, this residual ulnar digit 3 representation had expanded significantly in area, while the dorsal digit represent- ation was smaller. By 22 days, the overall distri- bution of the representations of hairy and glabrous skin surfaces appeared to have been altered, but their areas of representation had not greatly changed. By 144 days, the area representing the dorsum of the digit was only 0.64 x the area of representation seen immediately after nerve section.
Thus, in this fourth example, a residual ulnar glabrous sector on digit 3 expanded, apparently largely at the territorial expense of an adjacent ‘new’ and immediately unmasked representation of the
hairy dorsal surfaces of this same digit. Throughout this reorganization sequence, the functionally sharp borders of the glabrous and hairy skin represent- ations shifted continuously.
Changes in internal topography of map sectors occurring with reorganization
As described earlier, in some instances the areas of skin surface represented in ‘reorganized’ cortex expanded as the cortical area of representation enlarged (Fig. 12), while in other cases, it did not clearly expand. In both instances, evidence of internal change in topography was observed. For example, as the ‘new’ representation of the dorsal digital surface grew, there were evident differences in the internal topography of their initially fragmentary representation. Perhaps the most striking difference was the delayed appearance of a remarkably detailed representation of the nailbeds of these digits in this monkey. The nailbeds of digits 1 and 2 are innervated by the radial nerve in these monkeys. Immediately after nerve section, the digital skin fields observed in the former median nerve cortex of Area 3b never included the nailbed skin, even though ‘unmasked’ cortical sectors extended rostrally to or near the rostra1 border of Area 3b. This was also the case I I and 22 days after nerve section. But 144 days after nerve section (and in other chronically denervated monkeys studied, see Merzenich, et a1.43), neurons within most of the ‘new’ representation of the dorsal

654 M. M. Merzenich rt iri.
EXPANSION OF SKIN SURFACES REPRESENTED IN THE FORMER MEDIAN NERVE CORTICAL FIELD
sular and Hypothenar Pads
Dorsal Digit 2
Fig. 12. Skin surfaces represented in the former median nerve cortical zone as a function of post-iesion time, for the insular and hypothenat pads, and for the dorsum of digit 2. The shaded areas represent the total area circumscribed by all receptive fieIds recorded in Areas 1 and 3b for the insuiar and hypothenar
pads, and in Area 3b for the dorsum of digit 2, at each post-lesion time.
surfaces of digits I and 2 were driven by topographi~lly-ordered inputs from the nailbeds. With respect to to~~aphy, it should be noted that the immediately unmasked inputs from other parts of the dorsal surfaces of the digits largely overlie what almost certainly becomes an exclusive area of representation of the nailbeds. In thii most intens- ively studied monkey, the entire internal represent- ation of the dorsal digits changed, re cortical tocation of representation, between 22 days and 144 days after nerve section.
The residual representation of glabrous digit 3 illustrates an instance in which the &-of the skin area represented in cortex changed little over time,
while the cortical area over which it was represented in this monkey changed more than four-fold (Fig. 12). The initial recantation was topographic, as was the representation at 144 days. To represent the same skin surface over a four times greater area, the- internal topography must change rhi ut the fidii of represent&ion.
Within the ‘new’ repr~n~~n of the hairy &g&s and the expanded representations of-t& &rsaLh&td, the r&@&e fkk$ ‘did-not chane in s&e fram;S to 1 I days, aItd then they &e&red ptqrG&vely. The mean receptive fieM size over the middie and ptotimaE

Cortical plasticity following median nerve section 655
0 Days to) -
no- 00 0
+ 0
0 2 0 11 Days (*I 0 601 0* go0 00 0’ 0 * l . 0 r, 40- 0
0 20- 0
l 0 0
0 0
,I I I I I I I I I I I I I II I I I1 I 0 400 wo 1200 1600 2oaJ
0 200 400 6cxl mo Cortical Distance (in microns)
Fig. 13. Percent overlap of receptive fields on the dorsal surfaces of digits l-3 as a function of distance between cortical recording sites immediately and at 11 days after median nerve section (top) and at 22 days (lower left) and 144 days (lower right) after nerve section. All recording sites were within the former median nerve representational zone. Only receptive fields from the middle and proximal phalanges were included in the sample, as it is very difficult to determine extent of overlap for receptive fields extending
into the nail beds.
dorsal phalangeal surfaces on the 144th day after nerve section was about one third that recorded on the 11 th day. Over this time, the cortical areas representing dorsal digits 1 and 2 greatly increased. It should be remembered that the extent of dorsal digital skin that was represented in the deprived cortex also increased, in time, after nerve section.
Some understanding of the interplay of the factors of receptive field sixes, cortical areas of represent- ation and areas of skin represented, is provided by an analysis of receptive field overlap as a function of distance across the cortex. Immediately after and at 11 days after nerve section, there was far greater overlap of receptive fields for dorsal digital fields in Area 3b than for normal fields (Fig. 13). Throughout Areas 3b and 1 in the normal case, receptive fields defined in this manner did not overlap when recorded at interpenetration distances greater than about 600pm. Immediately, and at 11 days after nerve section, significant receptive field overlaps were recorded for neurons separated by distances as great as nearly 2mm over the cortical surface (Fig. 13). At 22 days, fields were more separated as a function of cortical interpenetration distance than at 11 days, and the overlap condition approached the normal. At 144 days, overlap was virtually normal, i.e. again receptive fields defined in penetrations separated by more than about 600 pm did not overlap (Fig. 13).
In all other monkeys studied shortly after transec- tion of the median nerve, receptive fields appeared to be several times larger than those recorded in chronically denervated monkeys, and receptive field
overlap as a function of distance across the cortical surface appeared to be consistently significantly greater than normal.
Change in topography outside the former median skin field
As described elsewhere, 43 there were changes in the original (pre-nerve section) representational ter- ritory of the ulnar nerve 2-9 months after nerve section. Such changes were also seen in the present experiments. The apparent expansion of the cortical representation of digit 4 between the immediate and the 11 day map is an example (Fig. 7). By comparison with the normal case, it would appear to occupy most of the territory originally representing the median nerve skin on the proximal and middle phalanges of glabrous digit 3. Note that at 11 days, the representation of digit 4 had expanded and was topographic. That is, all parts of the digit 4 surface had expanded, in the occupation of this significantly larger territory. At this time, the digit 4 represent- ation was significantly larger than any digit 4 representation of this digit measured in any of 8 normal squirrel monkeys. The expansion of the representation of digit 4 is a common result of median nerve section in Area 3b.43
There were apparent changes throughout the ulnar field, recorded at each successive time (Fig. 6). Some of these changes are probably due to errors in defining map boundaries (discussed below). Others are difficult to explain on such bases. Even the border of the face representation, close to the deafferented

656 M. M. Merzenich et al.
HAND - FACE BORDER
NORMAL IMMEDIATE 11 DAYS 22 DAYS 144 DAYS
Fig. 14. Border between the representations of the hand and face for one monkey that was mapped before and at four times after transection of the median nerve. Portions of the surface vssculsture are shown for
orientation. See text for further details.
cortical zone, appeared to change to some extent over time (Fig. 14). Interestingly, the face map itself was not absolutely static. In fact, a striking difference was recorded in the bordering face area between 22 and 144 days after nerve section. In the first four maps, all receptive 5elds along the Area 1 hand-face border were on the chin and the side of the face. This was the case in the map derived 22 days after nerve section. However, 122 days later, a large region of representation of the neck and anterior chest was defined in this border area. It was continuous with the representation of the chin and the side of the face, which was now removed hundreds of microns from the hand-face border. The face area would thus appear to be subject to internal changes, in time, of its own.
Dtflerences in progression of change in Areas 36 and I
There were obvious and marked differences in the progressions of change in Areas 3b and 1. Thus, to cite several examples (see Fig. 7): (a) the represent- ation of the dorsal surface of digit 1 expanded and then de&red in Area 1; while it expanded pqress- ively within Area 3b. (b) The nrpresentation of uinar glabrous digit 3 expanded greatly in Area 3b and little if at all in Area 1. (c) The pad 3 tqnmentation contracted, expanded, and contracted 1; it was relatively stable and was invariably smaller in Atea 3b. As de&&d in an earlier paper, large differences in the ultimate pattern of Area 3b .and Area 1 reotganizsbfon are characteri& of ehroni- calIy denervated monkeys.43
Occasional responses to inputs from noncutanetws receptors; other reqwnse clmractertstics of neuroiis in reorganizing cortex
In a small prwntqe of penetrations-of Area 3b in both squirrel and owl monkeys, vigwxws from ‘deep’ receptors were ‘unmasked’. I penetrations, neurons were not driven from any cutaneous receptive field, but could be excited by more intensive mechanic& stimulation, and by joint rotation. All receptive fields and all dest$ptions heretofore apply exclusively to cutaneous inputs.
Over much of the immediately ‘umnaaW corti@l zone in these monkeys, neurons were driven from their ‘new’ receptive Atlds 88 vigorously as from their normal receptive fields. Over other unmasked set- tors, responses were much weaker than normal. Inputs from receptive looations that were unmasked by nerve section were not apparent in normal mon- keys. That is, as a rule, neurons at any one time were driven exclusively from a single (glabrons) source At the same time, scattered small sectors within the predominantly glabrous skin digitsinE#ainalq&reland
to sS of the dorsal
waanoovertinput
response regions after nerve section.

Cortical plasticity following median nerve section 651
DISCUSSION
In this discussion, we briefly review specific aspects of cortical reorganization following nerve section that models of the reorganization process must explain. General features of dynamic system main- tenance that might underlie and account for this reorganization are considered. The sites within the somatosensory system at which these ‘plastic’ changes might be effected are discussed. Some implications of these results for perception are outlined. Finally, some methodological reservations and precautions are reviewed.
Some implications of these results for how reorganiz- ation occurs, andfor how normal somatosensory maps are dynamically maintained
These results provide insight, into how cortical somatosensory representations are established and are dynamically maintained. We discuss these implic- ations, by considering specific aspects of these results that the reorganization process(es) must explain, and then relate them to normal dynamic system organization. Related issues have been discussed in an earlier review of Merrill & Wall,j’ and in discussions of the bases of development and re- organization of the optic tecta after restricted peripheral deafferentation in amphibians and fish.s*‘4
Immediate consequences of nerve transection. Im- mediately after nerve transection, ‘unmasked’ inputs were recorded in the cortex formerly devoted to the denervated skin, Explanations are required for the following features of these unmasked inputs. (1) These inputs were not found throughout the deprived cortex. They appeared principally within the former territory of representation of the glabrous digits, and they predominantly represented skin surfaces on the dorsal digits. No immediate unmasking was recorded in cortex formerly representing most of the de- nervated palm. (2) In normal animals, small discrete patches of representations of dorsal digital skin were often found within the territories of representation of the glabrous digits. 45B54 These patches were readily distinguished from normal continuous represent- ations of the ulnar and radial dorsal digital surfaces represented medial and lateral to the glabrous digital surface representation, respectively. Immediately after the median nerve was cut, these small dorsal digit representational patches were embedded within much larger ‘unmasked’ input zones. (3) The ‘new’ unmasked dorsal inputs and the original driving glabrous inputs were roughly topographically matched on the opposite sides of the digits. At the same time, initially unmasked representations were topographically relatively crude, compared to normal or to later reorganized representations, and they only incompletely represented the dorsal sur- faces of the digits.
There are several conclusions about the re- organizational process(es) that can be drawn from these experimental observations. (1) The immediately unmasked inputs must be present, but almost completely suppressed in the normal case.30937.46 Thus, there appears to be a ‘switching’ mechanism by which one of two sets of topographically discont- inuous inputs can dominate these cortical sectors, while suppressing the second input. The small discrete dorsal representational patches seen amid the glabrous digit representation may also manifest the operation of this ‘switching’ mechanism in the normal monkey. (2) Such suppressed potential sources of input are not subject to the normally enforced relation between receptive field size and cortical magnification6’ as unmasked represent- ations are initially crude and have abnormally large receptive field areas and overlaps. (3) Only certain sectors of representations have somatotopically sep- arated ‘second’ sets of inputs which can be un- masked. Why is this type of unmasking limited to the sector representing the digits? It may be due to the fact that the digits are mechanically more ‘transpa- rent’ than the palm. Thus, peripheral axons with receptive fields on the dorsal surfaces of the digits may often be activated in close temporal sequence or in synchrony with axons with receptive fields in roughly matched positions on the glabrous surfaces of the digits. It has long been contended that synchronous or closely sequenced firing might un- derly the development and maintenance of map organization. 21 The digits may constitute a case, then, where topographically separated sectors might atypically converge to common locations, because of temporal firing pattern correlations. A similar explanation might account for evidence that cortex activated from the foot and lower leg overlies a suppressed second-source input from the thigh,47 as these surfaces are synchronously or nearly synchron- ously activated in locomotion.
It is also possible that normal glabrous receptive fields are the product of a projection system ‘filter’ (see below) which is normally fed but suppresses inputs extending onto the dorsal skin of the digits. Thus, unmasking might occur deep within the median nerve zone of representation of the digits simply because there exists there, uniquely, fringe and normally masked inputs from another nerve projection source. (the radial nerve) near the respons- ive passband of the ‘filter’ and deep within the median nerve’s overt representational territory.
Progressive cortical reorganization; representational expansion of immediately unmasked inputs. After the initial appearance of ‘new’ inputs over a fraction of the deprived territory, these partial and crude inputs expand to occupy much of the original deprived zone with highly ordered ‘new’ and greatly enlarged representations. Features of this process which reorganizational models must explain include: (1) the originally unmasked zone of representation can both

658 M. M. Merzenich et (I/
expand and contract, over time. (2) Receptive fields m expanded representations become more restricted in size and receptive field overlap as a function of distance across the cortical representation decreases to the normal. (3) The sites of representation of specific skin locations change, over time. (Obversely, the skin surfaces represented at any given cortical site change, over time.) (4) Relatively sharp functional borders form wherever zones of cortex activated by glabrous and hairy skin abut. These borders appear to shift in location during the reorganizational process. (5) Throughout reorganization, internal local topographic continuities are maintained. (6) Ultimately, ‘new’ representations of the dorsal sur- faces of the digits come to be topographically continuous with the original representations of these skin surfaces in the lateral aspect of the hand representation. (7) The ‘new’ representations of the dorsal digital surfaces are consistently larger than the original representations of the glabrous surfaces of the digits.
It follows from these observations that: (1) import- ant features of cortical organization are dynamically maintained. Thus, receptive field sizes for unmasked inputs (as well as for expanding bordering represent- ations) are dynamically adjusted. In addition, recep- tive field overlap as a function of cortical distance is also dynamically re-established (for unmasked in- puts) or maintained as receptive field sizes change (for expanding bordering representations). Thus, the ‘hypercolumn’ dimension6s~67 in somatosensory cor- tex appears to be the product of an active process that operates on the unmasked input after nerve section, to re-establish gradually the normal relation- ships between receptive field size and overlap and cortical magnification. Finally, a dynamic ‘switching’ mechanism must account for the development and maintenance of relatively sharp discontinuities in the map between the representations of glabrous and hairy skin. This mechanism must have the inherent flexibility to account for the apparent movements of these borders. (2) The anatomical distribution of potential driving inputs is apparently more extensive than that revealed by recordings immediately after nerve transection. It should be noted that the further, gradual post-section expansion and completion of dorsal digital representations is not simply the result of a point-by-point revelation of a fixed, underlying second map. An active process imposes apparent movement of representational sites within the un- masked input zone, allows for territorial contractions as well as gains, and adjusts receptive field overlaps and sizes. (3) Reorganizational addressing in cortex representing the digits appears to be determined by or related to the general topography of immediately unmasked inputs, which initially ‘seed’ a large cortical sector. Thus, the crude initial front-back topographic correspondence of normal and un- masked inputs probably accounts for the ultimate emergence of a topographically continuous line of
reversal between the ‘new’ and the original reprcsent- ation of the dorsum of digit I. Similarly, it could account for the ultimate topographical front-back congruency along the discontinuity across the zone of representation of the third digit.43 Given the capacity for apparent shifting of representational loci during the reorganization process, the ultimately relatively precise topographic alignment of newly formed borders supports the contention that synch- ronous or nearly synchronous activation of inputs operates in the establishment and maintenance of neighborhood relationships in these maps.*’
Features of the progressive expansion of represent- ations of bordering ulnar and radial nerve skin into the former representational zone of the median nerve. After median nerve section, the normal represent- ations of the portions of the palm and glabrous digit 3 innervated by the ulnar nerve and the represent- ation of the radial hand dorsum innervated by the radial nerve progressively expand into the former zone of the median nerve. In monkeys studied after long-term nerve section 43 there was an up to 7-fold expansion of the cortical representation of the radial hand dorsum; an approximately 3- to 4-fold expan- sion of the representation of the ulnar nerve- innervated skin on digit 3: and a many-fold expan- sion of representation of the ulnar insular pad. Models of the reorganizational process(es) must account for the following features of these represent- ational expansions. (1) Topographic continuity ap- pears to be maintained throughout the expansion process. (2) Cortical sites of representation of given skin surfaces were sometimes seen to shift in location hundreds of microns across the cortex, through the course of this progressive reoccupation. Given repre- sentational sites commonly ‘moved’ from locations outside to locations inside the original median nerve representational territory. (3) Topographic readjust- ments were recorded well away from the edges of territorial reoccupation, and extended into the original (pre-section) ulnar nerve representational territory. (4) A ‘new’ and second representation of the hypothenar pad appeared in cortex l-2 mm away from its normal location. This duplicative represent- ation was in topographic continuity with the expand- ing representation of the adjoining palm.
The recorded features of these expansions of representation of bordering skin fields indicate that (1) the progression of reorganization in the palmar region was similar to that recorded in unmasked sectors in the digital regions after initial ‘seeding’ of those zones (i.e. after immediate unmasking). (2) In reorganization, continuous topography was at least usually strictly maintained. That is. the reorganiz- ation process did not occur simultaneously and mosaically over the deprived zone. It always ex- tended continuously from an edge of that zone. (3) The appearance of a ‘new’ representation of the hypothenar eminence, not formerly represented nearby, suggests that suppressed or subliminal inputs

Cortical plasticity following median nerve section 659
from this skin surface might normally be present in the region of representation of the thenar eminence. The emergence of a hypothenar representation is consistent with the conclusion that anatomical con- vergence of connections is much wider than that suggested by normal map topography and receptive field dimensions (see below). (4) The process of reorganization is not restricted to the leading edge of reoccupation, but is simultaneously occurring over a significant cortical distance away from this leading edge, including areas within the ulnar nerve repres- entation many hundreds of microns away from the original boundary of the representation of the median nerve skin. (5) The extent of expansion and of apparent movement of representation reflects the degree of cutaneous spread of inputs to given cortical sites and reflects the distances over which terminals or synaptic effectivenesses must move or change (see below).
Models for dynamic system maintenance
There are several basic views of sensory projection system organization that would require fundament- ally different mechanisms to account for changes recorded after nerve section. In one common view, the projection system has strict connections that directly determine receptive field structure. In a second view, there is convergence of inputs from skin surfaces to cortical loci extending far beyond the inputs manifest in recorded receptive fields. Recep- tive field properties are the product of a projection system ‘filter’, usually imagined to be generated by facilitatory and antagonistic dynamic neuronal inter- actions.Z*3*18~24*32.48.52.56 In a third view, there are convergent projections from other sources which do not topographically correspond precisely with the strictly-ordered primary lemniscal projection. With elimination of the primary input source, input effec- tiveness from these alternative input sources36.5’.7’ might be strengthened, gradually revealing a com- plete second map.
Before discussing how these data might and might not be consistent with these or other models of reorganization, it is important to remember that several different processes need explanation. Thus, we have recorded (a) immediate second-source un- masking; (b) progressive topographic expansions with concommitant changes in receptive field struc- ture; and (c) establishment and maintenance of relatively sharp internal map discontinuities.
In a strict direct projection model, receptive fields are a simple anatomical consequence of system wiring. In such a system, terminal movement over distances of many hundreds of microns would be required to account for the observed reorganization. One might hypothesize that territorial competition for synaptic sites coupled with a mechanism for maintaining neighborhood relations (somatotopic continuity and overlap) could result in a gradually shifting map order. Such a model might account for
many of the present observations. It is one of the models that has been invoked to explain the gradual reordering of afferents into the optic tecta of non- mammalian vertebrates following induction of re- stricted peripheral lesions.21 Of course the initially ‘unmasked’ inputs must be due to the previous existence of a second input source.37*46 However, subsequent remarkable dynamic reorganization changes recorded in these studies could well involve another mechanism. The time course of progressive reoccupation after initial ‘seeding’, and by expansion of surrounding skin surface representational areas, is sufficiently slow to allow for terminal sprouting to occur, given estimations of the rates of such processes.’
There are several difficulties with any model of map reorganization based on significant movement of terminals. First, there is at present no compelling evidence for axonal growth or movement of the required scale after deprivation. In the somato- sensory system, the strongest evidence for axonal growth into denervated tissue has been at the level of the spinal cord, where ‘sprouting’ in adult animals was first reported by Liu & Chambers.3s However, more recent studies suggest that even there, sprouting does not occur or is minimal (e.g. see Rodin et aL61; Hulsebosch & Coggeshal122). In other systems, even in response to directly removing rather than deact- ivating ‘competing’ synapses, terminal movement effects may be minimal.’ Perhaps more seriously, it is difficult to account for observed reorganization topography by a simple mechanism of afferent terminal movement. Thus, for example, initially unmasked inputs only incompletely represent the dorsal surfaces of the digits; later, very complete representations of these surfaces are recorded. From where do these later appearing inputs emerge? Similarly, there is a delayed appearance of inputs from the hypothenar eminence, normally represented in a cortical sector far removed (l-2 mm) from where it appears in the median nerve zone during reorganiz- ation. From what location, then, can these later appearing inputs sprout or move?
In a second model of the reorganizational process, there are highly convergent and divergent (‘degene- rate’) projections, and the receptive fields recorded represent the outputs of system ‘filters’. In such a model, progressive map changes would require a remarkably spatially coordinated redistribution of the effective zones of cortical activation in order to account for progressive movements across the cortex of up to many hundreds of microns, Moreover, for these ‘filters’; (a) receptive field sizes must be variable over at least a several-fold range, and (b) receptive field overlap across the continuous map dimension must be dynamically maintained. It is important to note that it is the overlap of dynamically alterable active terminal zones that is actively maintained.
This view of normal dynamic system maintenance is consistent with several features of reorganization

660 M. M. Merzentch et al.
recorded in these studies. Thus, while initially ‘unmasked’ inputs only incompletely represent the surfaces of the dorsal digits, widespread but still- suppressed inputs might well account for the later generation of more complete representations, and for the delayed appearance of a hypothenar eminence representation. The emergence of a representation of the hypothenar eminence in a cortical region for- merly representing the thenar eminence is consistent with the existence of anatomically convergent (norm- ally suppressed) inputs from across the thenar representational discontinuity39*42 onto the hypo- thenar pad. This is an especially interesting case, because it presumably reflects the extent of the normal anatomical convergence (the degree of degen- eracy) to this cortical location.
It is important to remember that some of the observed topographic adjustments follow a relatively slow time course (days). They thereby infer the existence of a slowly developing change in synaptic efficacyzl probably dependent upon levels of activ- ation. This ‘strengthening’ or change of effectiveness of otherwise static connections might involve changes in the sensitivity of receiving neurons, in synaptic release, or in the number of synaptic contacts. Synaptic turnover seems to be a continuous process in cortex (see Cotman et al9 for review) and there is evidence that partial deactivation of the cortex by dorsal column damage may result in a temporary increase in the rate of synaptic turnover.4
Certainly, the results cannot be simply the conse- quence of the gradual point-by-point revelation of a map of a second input source, since the sites of representations of given skin surfaces shift over the cortical surface, and receptive field dimensions and overlaps and territories of representation of different skin surfaces and lines of discontinuity change significantly. Nor does it appear likely that reorganiz- ation can be accounted for by the overlap of radial and ulnar nerve-innervated skin into the median nerve from a more diffuse secondary projection input source (e.g. the anterolateral system). It has been suggested that a temporary hypersensitivity of the skin along the margins of the field of a cut nerve might be the product of a central non- correspondence of boundaries of lemniscal and anterolateral inputs. lo Given their possible overlapp- ing projection zones in the thalamus,36 it might therefore be reasonable to expect emergence of some anterolateral input within the median nerve cortical zone following median nerve section. However, it seems very unlikely that this more diffuse input source can be responsible for reorganization of the median nerve zone: first, that would necessitate that once unmasked, this second input would be subject to all of the changes catalogued above; second, ultimate reorganized maps are as strictly topographic and have receptive field sizes and internal order equivalent or superior to those recorded in normal maps of these hand surfaces. It is difficult to see how
diffuse anterolateral system projecttons or an! other alternative input source in primates could establish this degree of order; third. bordering skin \urface representations sometimes appear to move m entirety into the deprived zone. Does this mean that their input sources are changed from one projection system to another? That seems highly unlikely Finally, hypersensitivity to noxious stimuli within the median nerve skin field after nerve transection IS only evoked by high threshold stimuli. The skin fields of cut nerves are completely anesthetic for the light tactile stimulation employed in this study.60.69 For these and other reasons, it would seem improbable that reorganizational changes can be accounted for by the occupation of the deprived cortical field by an input source from a second projection system.
Evidence from other studies
The anatomical organization of the somatosensory system is consistent with a wide-convergence and system ‘filter’ model. For example, the cortical terminal arbors in Areas 3b in these monkeys spread 150-450~m.26~57 Moreover, significant terminal spread in the dorsal column nuclei and the ven- trobasal thalamus clearly add to this range (see Ramon y Cajak5* Scheibel & Scheibel;62 also see Zarzecki7*). Obviously, the dimensions of receptive fields in normal monkeys are much smaller than would follow from the divergence of projections at each level of the somatosensory system. This discrep- ancy between potential and observed receptive field sizes strongly implies the existence of projection system ‘filters’.
Of course, many investigators have envisioned restricted somatosensory cortical receptive fields as being derived from a more widely spread projection input. 18.19.20.24.32.48.59 ln at least one of these
cortical fields in the monkey, Area 1, an excitatory- inhibitory center-surround field organization has been described. However, no such receptive field structure has been recorded convincingly in Area 3b in monkeys. 65*66 Most of these investigators have concluded that inhibitory surround effects, when recorded, are a product of afferent inhibition, but studies of the influences of descending projections have long indicated that cortical receptive field structure may at least in part be imposed by the input shaping influences of descending map-to-map projections.2*3s23*33
Several investigators and especially Mountcast- le48*49.50.5i have argued that map features (recepttve field structure, sharp column boundaries, effective column input sources) are the product of dynamic cortical processes. Our results fully support that conclusion for the somatosensory cortex, but we add the provisos that such dynamic processes are not fixed in situ, and that these resultant movements manifest a principal cortical process. Of course, there are clear examples in which functional boundaries are dictated, at least roughly, by the limits of spreads
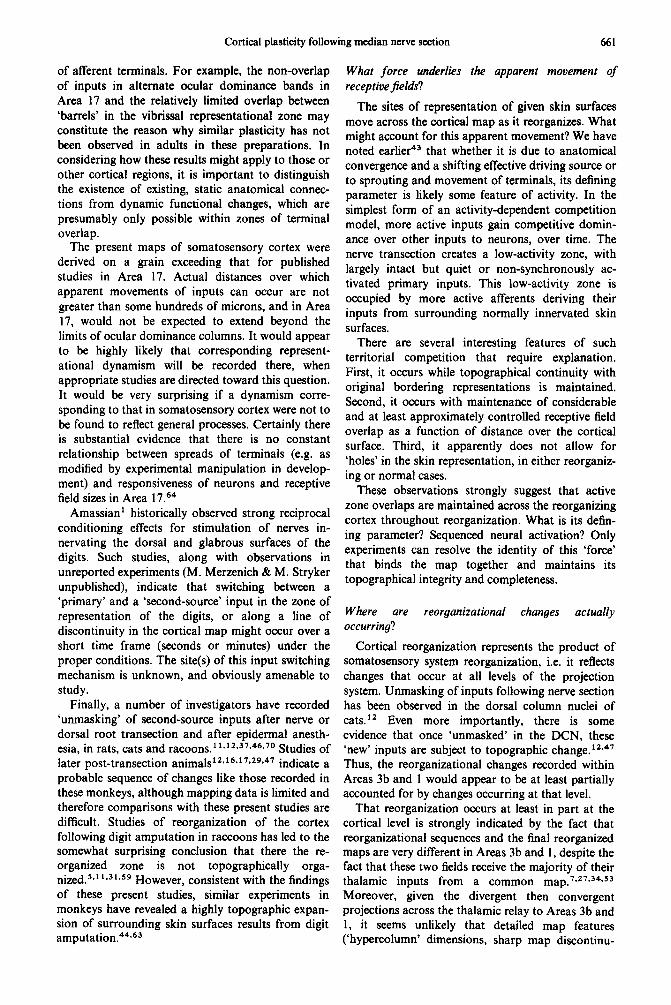
Cortical plasticity following median nerve section 661
of afferent terminals. For example, the non-overlap of inputs in alternate ocular dominance bands in Area 17 and the relatively limited overlap between ‘barrels’ in the vibrissal representational zone may constitute the reason why similar plasticity has not been observed in adults in these preparations. In considering how these results might apply to those or other cortical regions, it is important to distinguish the existence of existing, static anatomical connec- tions from dynamic functional changes, which are presumably only possible within zones of terminal overlap.
The present maps of somatosensory cortex were derived on a grain exceeding that for published studies in Area 17. Actual distances over which apparent movements of inputs can occur are not greater than some hundreds of microns, and in Area 17, would not be expected to extend beyond the limits of ocular dominance columns. It would appear to be highly likely that corresponding represent- ational dynamism will be recorded there, when appropriate studies are directed toward this question. It would be very surprising if a dynamism corre- sponding to that in somatosensory cortex were not to be found to reflect general processes. Certainly there is substantial evidence that there is no constant relationship between spreads of terminals (e.g. as modified by experimental manipulation in develop- ment) and responsiveness of neurons and receptive field sizes in Area 1 7.64
Amassian’ historically observed strong reciprocal conditioning effects for stimulation of nerves in- nervating the dorsal and glabrous surfaces of the digits. Such studies, along with observations in unreported experiments (M. Merzenich 8z M. Stryker unpublished), indicate that switching between a ‘primary’ and a ‘second-source’ input in the zone of representation of the digits, or along a line of discontinuity in the cortical map might occur over a short time frame (seconds or minutes) under the proper conditions. The site(s) of this input switching mechanism is unknown, and obviously amenable to study.
Finally, a number of investigators have recorded ‘unmasking’ of second-source inputs after nerve or dorsal root transection and after epidermal anesth- esia, in rats, cats and racoons.’ 1*12,37*46,70 Studies of later post-transection animals’z~‘6~17~2q*47 indicate a probable sequence of changes like those recorded in these monkeys, although mapping data is limited and therefore comparisons with these present studies are difficult. Studies of reorganization of the cortex following digit amputation in raccoons has led to the somewhat surprising conclusion that there the re- organized zone is not topographically orga- nized.‘*’ ‘*31*5q However, consistent with the findings of these present studies, similar experiments in monkeys have revealed a highly topographic expan- sion of surrounding skin surfaces results from digit amputation.44s63
What force underlies the apparent movement of receptive jields?
The sites of representation of given skin surfaces move across the cortical map as it reorganizes. What might account for this apparent movement? We have noted earlier4j that whether it is due to anatomical convergence and a shifting effective driving source or to sprouting and movement of terminals, its defining parameter is likely some feature of activity. In the simplest form of an activity-dependent competition model, more active inputs gain competitive domin- ance over other inputs to neurons, over time. The nerve transection creates a low-activity zone, with largely intact but quiet or non-synchronously ac- tivated primary inputs. This low-activity zone is occupied by more active afferents deriving their inputs from surrounding normally innervated skin surfaces.
There are several interesting features of such territorial competition that require explanation. First, it occurs while topographical continuity with original bordering representations is maintained. Second, it occurs with maintenance of considerable and at least approximately controlled receptive field overlap as a function of distance over the cortical surface. Third, it apparently does not allow for ‘holes’ in the skin representation, in either reorganiz- ing or normal cases.
These observations strongly suggest that active zone overlaps are maintained across the reorganizing cortex throughout reorganization. What is its defin- ing parameter? Sequenced neural activation? Only experiments can resolve the identity of this ‘force’ that binds the map together and maintains its topographical integrity and completeness.
Where are reorganizational changes actually occurring?
Cortical reorganization represents the product of somatosensory system reorganization, i.e. it reflects changes that occur at all levels of the projection system. Unmasking of inputs following nerve section has been observed in the dorsal column nuclei of catsi Even more importantly, there is some evidence that once ‘unmasked’ in the DCN, these ‘new’ inputs are subject to topographic change.‘2*47 Thus, the reorganizational changes recorded within Areas 3b and 1 would appear to be at least partially accounted for by changes occurring at that level.
That reorganization occurs at least in part at the cortical level is strongly indicated by the fact that reorganizational sequences and the final reorganized maps are very different in Areas 3b and 1, despite the fact that these two fields receive the majority of their thalamic inputs from a common map.7~27*34~53 Moreover, given the divergent then convergent projections across the thalamic relay to Areas 3b and 1, it seems unlikely that detailed map features (‘hypercolumn’ dimensions, sharp map discontinu-

662 M M. Merzenlch el (11.
ities, and so forth) are simply passed forward from a fully detailed DCN map. Finally, we have recently shown that the Area 3b map reorganizes over a similar time course following restricted cortical lesions.25 It is almost certain that this reorganization is occurring at the level of the cortex or thalamus, or both.
It may be too simplistic to look for receptive field ‘filters’ (or the disabling or enabling processes that underlie them) or for any other dynamic mechanism at any specific location. They could well be a product of a dynamic process(es) operating at all levels, and may well involve descending as well as ascending map-to-map projections. Wherever they reside, de- lineation of the basic mechanisms underlying this cortical map dynamism are of fundamental im- portance. They are, fortunately, amenable to direct experimental attack.
A further note on cortical reorganization and perception
Some of the functional implications of the dynamic maintenance of cortical map structure have been considered in an earlier report.43 The basic conclu- sions of that study are further reinforced by the results of the present mapping experiments. In the time-sequenced mapping study, the derivation of a normal map provided a frame of reference for later maps. Thus, sites of representation of skin surfaces could be unequivocally determined to have shifted from initial representational sites surrounding the median field to enter it, sometimes in entirety. While earlier studies only demonstrated that a second ‘map’ could replace the first, the present experiments add the observation that sites of representation appa- rently move throughout the reorganization process.
As noted earlier,43 spatial perceptual distortions (e.g. false localization) do not follow a lesion of this kind. That constitutes strong evidence that the cortex is perceptually ‘transparent’, re peripheral reference. That would, again, be requisite for a highly dynamic representational system like this one. Again, this data further supports the basic conclusion that peripheral reference is maintained at the first order. Only at the first order is addressing preserved following such a lesion. Finally, again, these experiments indicate that to the extent that the topography of projections of any ‘secondary’ inputs or of any outputs to or from Areas 3b or Area 1 loci are critical to its function, these input sources and output destinations must also be dynamically adjusted over this time course.
Finally, these studies suggest that there is local connectional degeneracy of a form consistent with the organizational requirements of a ‘selective’ theory of recognition. r5 Considered with the ana- tomy, they support a ‘selective stabilization’ hypo- thesis of the specification of neuronal networks,6 with the important added provision that networks retain a capacity to change effective pathways locally, in adult animals. These results are completely
contrary to a view of sensory systems as consisting of a series of hardwired machines, essentially es- tablished through a critical period of development, and static thereafter. That is. while anatomical wiring may or may not be static, and almost certainly limits distances across maps over which reorganization can occur44 after that early critical stage of brarn development, dynamic modification of local map detail occurs throughout life. It is reasonable to suppose that such alterability is relevant to learning. recognition, and the acquisition of tactile skill.
Some methodological reservations and precautions
Several experimental factors should be considered in the interpretation of the present results. First, the introduction of hundreds of penetrations into the hand representation in multiply-mapped monkeys might be expected in itself to induce cortical map changes. In these experiments. every attempt was made to limit cortical damage by the use of thin microelectrodes, and by using special caution in siting microelectrodes to avoid damage to surface vessels. While the possibility of some electrode- caused cortical damage cannot be ruled out, the following points suggest that the damage was minimal and had no major bearing on the subsequent results. (a) Representations with normal innervation from the ulnar nerve were relatively constant, compared with representations in the reorganizing former median nerve zone, and silent penetrations were not recorded within it at any stage. (b) There was no visible evidence of corticat damage over the region of representation of the hand (see Fig. I) during the experiment, and at the end of the study there was no histological evidence of damage within this cortical zone. (c) At 22 days post-section, only a few unresponsive penetrations were recorded within the median nerve zone; at 144 days, none were recorded (except possibly along the margins of the hand representations). In any event, the findings from the immediate post-section cases, the intermedi- ate time cases derived without prior maps, and the maps defined in chronically denervated monkeys43 are all consistent with and support the major conclusions drawn from this time-sequence study. Thus, we feel that the results from remapped monkeys were not very significantly affected by these remapping procedures.
A second concern is the accuracy of the summary maps. What are the possible errors in drawing map boundaries? At least three major sources of error are possible, ie. errors in the definition of map bound- aries, in the definition of receptive field locations, and in correctly siting electrode penetration locations. In the present experiments, the degree of error involved in drawing map boundaries was limited by the high density of cortical sites sampIed. as can be appre- ciated by comparing the reference penetration grid in Fig. 1 (lower right) with map boundaries iflustrated in Figs. 8-10. The outlined areas in Figs 8-10 fall

Cortical plasticity following median nerve section 663
halfway between penetrations with receptive fields on a given body part, and penetrations with receptive fields on other body parts. Placing the borders closer or farther from any of the designated penetrations would produce only minor changes in the maps. Furthermore, receptive field locations and bound- aries were determined with great care using identical procedures for each monkey. Receptive field extents and locations, when determined by different mem- bers of the group of investigators for the same recording sites, closely corresponded. Finally, a small error can exist between the sited and actual location of electrode penetrations. This error was minimal since siting was done with a greatly magnified view of the brain via an operating microscope onto a greatly enlarged photograph of the brain surface. In sum- mary, the possible errors inherent in these mapping procedures are judged to be small relative to the magnitudes of the induced changes, and they do not appear to be capable of accounting for any of the basic changes in maps described above.
Anothe; concern is that the anesthetic state of the monkey somehow altered cortical organization. Dun- can and colleagues ’ 3 have recently demonstrated that ketamine anesthesia can result in a shrinking and displacement of the central focus of receptive fields in macaque monkeys. The dose levels of ketamine employed in the present study were near and undoubtedly sometimes extended into the range at which these investigators recorded anesthetic effects on receptive field structure. However, it might be noted that: (a) illustrated examples from the report of Duncan and colleagues are nearly all from Area 2 rather than the fields studied in the present experi- ments. It is likely that the cutaneous input into Area 2 is the result of a cortical relay and therefore is more susceptible to anesthetic suppression.53 (b) Our own experience in alert and NO1-anesthetized animals reveals receptive field structure and overlap for Areas 3b and 1 similar to that recorded at these levels of ketamine anesthesia. (c) Receptive field sizes and internal map topography were remarkably constant in these studies, even though exact ketamine levels must have been shifting into and out of the range at which Duncan and colleagues recorded anesthetic effects. (d) All data recorded in the present study was derived from the middle cortical layers, while anesthetic effects are likely more powerful in the superficial layers. (e) Perhaps most importantly, both normal monkeys and monkeys at all stages of
recovery were studied under similar anesthetic con- ditions. Thus, the changes observed were not pro- duced by any anesthetic condition. However, it is possible that recording in awake monkeys would produce somewhat different results. The most likely difference is that the ‘unmasked’ zones recorded immediately after nerve section are underestimated in extent. Doetsch and colleagues’3 have found that in adult raccoons, the cortical sector deafferented by the amputation of a digit was completely unresponsive in animals that were deeply anesthetized with barbitu- rates, while some (not all) of this cortex was driven by ‘unmasked’ inputs when nitrous oxide anesthesia was used. The present results were derived under relatively light ketamine anesthesia, presumably less suppressive of cortical responses than deep barbitu- rate anesthesia. Nevertheless, it is possible that use of anesthesia might lead to an underestimation of the immediately ‘unmasked’ responsive region. Two experimental observations suggest that this may be the case. First, the boundaries of non-responsive zones did not clearly correspond in maps derived at different post-transection times in the same monkey. Some regions defined as responsive immediately after nerve section were unresponsive 11 days later, and vice versa. Second, the median nerve zone was almost completely unresponsive to cutaneous stimulation immediately after nerve transection in one owl monkey. However, in a second owl monkey mapped three days after nerve transection, the size of the unresponsive region was similar to that seen in squirrel monkeys mapped immediately after transec- tion. These observations could indicate that the anesthetic state of some animals resulted in an underestimation of the cortical area activatable by cutaneous stimulation immediately after nerve trans- ection. They could, however, also merely reflect variability and volatility in the time course and effectiveness of driving of second source inputs, inherent in the reorganization process. Further experiments are required to resolve these questions.
AcknowledgementsThe authors thank J. Molinari, Dr W. Jenkins, T. Pons and R. Weller for technical assistance; and Drs G. Edelman, G. Loeb and V. Mountcastle, for useful discussions of implications and interpretations of these findings. Research was supported by NIH Grants NS-10414 and NS-16446. This manuscript was completed during a visit of Drs Merzenich and Kaas to the Neuroscience Institute of the NRP, 1230 York Avenue, New York. NY.
REFERENCES
1. Amassian V. E. (1952) Interaction in the somatovisceral projection system. Res. Publ. Ass. New. Menf. Dis. 30, 371-402.
2. Andersen P., Eccles J. C. and Sears T. A. (1964) The ventro-basal complex of the thalamus: Types of cells, their responses and their functional organization. J. Physiol., Land. 174,340-399.
3. Andersen P., Eccles J. C., Oshima T. and Schmidt R. F. (1964) Mechanisms of synaptic transmission in the cuneate nucleus. J. Neurophysiof. 27, 1096-l 116.

664 M. M Merzemch ef ai
4. Bernstein J. J.. Gelderd J. B. and Bernstein M. E. (1974) Alteration of neuronal synaptic complement durmp regeneration and axonal sprouting of rat spinal cord. Exp. Neural. 44,47&482
5. Carson L. V., Kelahan A. M., Race R. H., Massey C. E. and Doetsch G. S. (1982) Effects of early peripheral lesions on the somatosensory organization of the cerebral cortex. In: Clinicul Neurosurgqv (ed Carmel P. W ) Vol 28. pp 532-546. Williams and Wilkins, Baltimore.
6. Changeux J. P. and Danchin A. (1976) Selective stabili~tion of developmg synapses as a mechanism for the specification of neuronal networks. Nature New Viol. Z&4,705-712.
7. Clark W. E. L. and Powell T. P. S. (1957) On the thalamo-cortical connexions of the general sensory cortex ot‘ Macaca Proc. RI Sot. B 141,467-487.
8. Constantine-Paton M. (1982) The retinotectal hookup: The process of neural mapping. In: Developmental Order Its
9.
10. 11.
12,
13.
14.
15.
16.
17.
18.
19,
20.
21. 22. 23.
24.
2s.
26.
21.
28.
29.
30.
31.
32.
33.
34.
3.5. 36.
37.
38.
39.
41.
Origin and Regulation. Annual Symposium of the Society for Deuelopmental Biology (in press). Cotman C. W., Nieto-Sampedro M. and Harns E. W. (1982) Synapse turnover in adult vertebrates. P@siol. Ret?. 61, 684-784. Denny-Brown D. (1965) The release of deep pain by nerve injury. Brain &3, 721-738. Doetsch G. S., Massey C. E., Wilson B. T. and Ketahan A. M. (1983) Time-dependent functional changes in somatosensory cerebral cortex following digit amputation in adult raccoons. J. camp. Neural. To be published. Dostrovsky J. O., Millar J. and Wall P. D. (1976) The immediate shift of afferent drive of dorsal column nucleus cells following deafferentation: A comparison of acute and chronic deafferentation in gracile nucleus and spinal cord. Exp. Neurol. 52,480-495. Duncan G. H., Dreyer D. A., McKenna J. M. and Whitsel B. L. (1982) Dose- and time-dependent effects of ketamine on SI neurons with cutaneous receptive fields. J. Neurophysjo~. 47,677-699. Edds M. V., Gaze R. M., Schneider G, E. and Irwin I.,. N. (1979) Specificity and Plasticity O~Ret~~otecta~ Connections. NRP Bulletin, Vol. 17, MIT Press, Cambridge. Edelman G. M. (1982) Group selection as a basis for higher brain function. In: The Organization of the Cerebral Cortex. (eds Schmitt F. P., Worden F. G., Adelman G. and Dennis S. G.) pp. 535-563. MIT Press, Cambridge. Franck J. L. (1980) Functional reorganization of cat somatic sensory-motor cortex (SmI) after selective dorsal root rhizotomies. Brain Res. U&,458-462. Franck J. L. (1979) On the functional reorganization of cat somatic sensory motor cortex (SMI) via selective dorsal root rhizotomges. PhD Thesis, Yale, New Haven. Gardner E. P. and Spencer W. A. (1972) Sensory funneling II. Cortical neuronal representation of patterned cutaneous stimuli. J. Neurophysiol. 35, 954-977. Gardner E. P. and Costanzo R. M. (1980) Spatial integration of multiple-point stimuli in primary somatosensory cortical receptive fields in alert monkeys. J. Neurophysiol. 43,420-443. Gardner E. P. and Costanzo R. M. (1980) Temporal integration of multiple-point stimuli in primary somatosensory cortical receptive fields in alert monkeys. 1. Neurophysiol. 43,444-468. Hebb D. 0. (1949) Organjzation of Behuoior. J. Wiley, New York. Hulsebosch C. E. and Coggeshatl R. E. (1981) Sprouting of dorsal root axons. Brain Res. 224, l7@-274. Jabbur S. J. and Towe A. L (1961) Cortical excitation of neurons in dorsal column nucleus of eat, including an analysis of pathways. J. Neurophysiol. 24,499-X@. Janig W., Spencer W. A. and Younkin S. G. (1979) Spatial and temporal features of afferent inhibition of thalamocortical relay cells. J. Neurophysiol. 42, 1450-1460. Jenkins W. A., Merzenich M. M., Zook J. M., Fowler B. C. and Stryker M. P. (1982) The Area 3b representation of the hand in owi monkeys reorganizes after induction of restricted cortical lesions. Neurosci. Abstr. 8, 141. Jones E. G. and Burton H. (1976) Areal differences in the Iaminar dis~~t~on of thaiamic afferents in cortical fieU-s of the insular parietal and temporal regions of primates. J. camp. Neuroi. 168, 197-248. Jones E. G., Wise S. P. and Coulter J. D. (1979) Differential thalamic relationships of sensory-motor and parietal cortical fields in monkeys. J. camp. Neural. 183,833-882. Kaas J. H., Nelson R. J., Sur M. and Menenich M. M. (1979) Multiple representations of the body within the primary somatosensory cortex of primates. Science, N. Y. 2M, 521-523. Kalaska J. and Pomeranz B. (1979) Chronic paw degeneration causes an age-dependent appearance of novel responses from forearm in “paw cortex” of kittens and adult cats. J. ~~rophys~o~. 42,618-633. Kelahan A. M. and Doetsch G. S. (1981) Short term changes in the functional organization of somato~nsory (SmI) cortex of adult raccoons after digit amputation. Sot. Neurosci. Abstr. 7, 540. Kelahan A. M., Ray R. H., Carson L. V., Massey C. E. and Doetsch, G. S. (1982) Functional reorganization of adult raccoon somatosensory cerebral cortex following neonatal digit amputation. Brain Res. 223, 152-159. Lashin S. W. and Spencer W. A. (1979) Cutaneous masking II. Geometry of excitatory and inhibitory receptive fields of single units in the somatosensory cortex of the cat. J. Neurophysiol. 42,1061-1082. Levitt M., Carreras M., Liu C. N. and Chambers W. W, (1964) Pyramidal and extrapyramidal m~ulation of somato~nsory activity in gracile and cuneate nuclei. Arch. ital. BioL 102, 194-229. Lin C.-S.. Merzenich M. M., Sur M. and Kaas .I. H. (1979) Connections of Areas 3b and I of the part&al somatose&ory strip with the ventroposterior nucleus in tie o&l monkey (Aofus friuirgatus) J. camp. Neurk 1% 355-371. Liu C. N. and Chambers W. W. (1958) Intraspinal sprouting of dorsal root axons. Arch Neural. Psychiut. 79,46-61. Mehler W. R. (1966) Some observations on secondary ascending afferent systems in the central nervous system. In: Pain (eds Knighton R. S. and Dumke P. R.), Little, Brown & Co., Boston. Merrill E. G. and Wall P. D. (1978) Plasticity of connection in the adult nervous system. In: Neuronai PIastieity (ed. Cotman C. W.) pp. 94-111. Raven Press, New York. Merzenich M. M. and Kaas J. H. (1982) Reorganization of somatosensory cortex in mammals following peripheral nerve injury. Trends Neurosil. Merzenich M. M., Kaas J. H., Sur M. and Lin C.-S. (1978) Double representation of the body surface within cytoarchitectonic Areas 3b and I in “SI’” in the owi monkey (Aofw 6riu@WbJ, J. camp. Newd. 1% 41-74. Merzenich M. M.. Kaas J. H., Nelson R, J., Wall J. T., Sur M. and Fellernan D. J. (1980) Progressive topographic
Cortical plasticity following median nerve section 665
reorganization of representations of the hand within Areas 3b and 1 of monkeys following median nerve section. Sot. Neurosci. Abstr. 6,65 1.
42. Merzenich M. M., Sur M., Nelson R. J. and Kaas J. H. (1981) The organization of the SI cortex: multiple renresentations of the body in primates. In: Cortical Sensory Organization. Vol. I. Multiple Somatic Areas (ed Woolsey C: N.) pp. 3648. Humana Press, Clifton, N.J.
43. Merzenich M. M., Kaas J. H., Wall J., Nelson R. J., Sur M. and Felleman D. (1983) Topographic reorganization of somatosensory cortical Areas 3b and 1 in adult monkeys following restricted deafferentation. Neuroscience 8,33-55.
44. Merzenich M. M., Nelson R. J., Stryker M. P., Cynader M., Schoppmann A. and Zook J. M. (1982) Somatosensory cortical map changes following digit amputation in adult monkeys. J. camp. Neurol. In press. Merzenich M. M.. Nelson R. J.. Kaas J. H.. Strvker M. P., Sur M., Wall J. T., Zook J. M., Cynader M. S., Felleman D. 45. J. and Schoppmann A. (1982) Variability in hand surface representations in Areas 3b and 1 in adult owl and squirrel monkeys. J. camp. Neural. To be published.
46.
41.
48.
49.
50.
51. 52.
53.
Metzler J. and Marks P. S. (1979) Functional changes in cat somatic sensory-motor cortex during short-term reversible epidermal blocks. Brain Res. 177,379-383. Millar J., Basbaum A. I. and Wall P. D. (1976) Restructuring of the somatotopic map and appearance of abnormal neuronal activity in the gracile nucleus after partial deafferentation. Exp. Neural. 80,658-672. Mountcastle V. B. (1957) Modality and topographic properties of single neurons of cat’s somatic sensory cortex. J. Neurophysiol. M,408-434.
54.
55.
56.
51.
58. 59.
60. 61.
62.
Mountcastle V. B. (1975) The view from within: pathways to the study of perception. Bull. Johns Hopkins Hosp. 136, 109-131. Mountcastle V. B. (1979) An organizaing principle for cerebral function: The unit module and the distributed system. In: The Neurosciences. Fourth Study Program (eds Schmitt F. 0. and Worden F. G.) pp. 2142. MIT Press, Cambridge. Mountcastle V. B. (1980) Medical Physiology. C. V. Mosby, St. Louis. Mountcastle V. B. and Powell T. P. S. (1959) Neural mechanisms subserving cutaneous sensibility with special reference to the role of afferent inhibition in sensory perception and discrimination. Bull. Johns Hopkins Hosp. 105, 201-232. Nelson R. J. and Kaas J. H. (1981) Connections of the ventroposterior nucleus of the thalamus with the body surface representations in cortical Areas 3b and 1 of the cynomologous macaque (Macacafascicularis). J. camp. Neural. 199, 29-64. Nelson R. J., Merzenich M. M., Wall J., Sur M., Felleman D. J. and Kaas J. H. (1980) Variability in the proportional representations of the hand in somatoscnsory cortex of’primates. Neurosci. Abstr. 6.65 I. Nelson R. J., Sur M., Felleman D. J. and Kaas J. H. (1981) Representations of the body surface in postcentral parietal cortex of Macaca fascicularis. J. camp. Neurol. 192.61 l-643. Poggio G. F. and Mountcastle V. B. (1963) The functional properties of ventrobasal thalamic neurons studied in unanesthetized monkeys. J. Neurophysiol. 26,755-806. Pons T., Sur M. and Kaas J. H. (1981) Axonal arborizations in Area 3b of somatosensory cortex in the owl monkey, Aotus trivirgatus. Anat. Rec. 202, 151A. Ramon y Cajal S. (1911) Histologie du Systeme Nerveux de I’homme et des Vertebres, Vol. 2, Maloine, Paris. Rasmusson D. D. (1982) Reorganization of raccoon somatosensory cortex following removal of the fifth digit. J. camp. Neurol. 205,3 13-326. Rivers W. H. R. and Head H. (1905) A human experiment in nerve division. Brain 31,323450. Rodin B. E., Sampogna S. and Kruger L. (1981) A reevaluation of intraspinal sprouting of primary afferents. Neurosci. Abstr. I, 66. Scheibel M. E. and Scheibel A. B. (1970) Elementary processes in selected thalamic and cortical subsystems-the structural substrates. In: The Neurosciences. Second Study Program (ed Schmitt F. 0.). Rockefeller Univ. Press, New York.
63.
64.
65. 66.
61.
68.
69. 70.
71. 72.
Schoppmann A., Nelson R. J., Stryker M. P., Cynader M., Zook J. and Merzcnich M. M. (1981) Reorganization of hand representation within Area 3b following digit amputation in owl monkey. Sec. Neurosci Abstr. 7,842. Sherman S. M. and Spear P. D. (1982) Organization of visual pathways in normal and visually deprived cats. Physiol. Rev. 62,738-855. Sur M. (1979) Some principles of organization of somatosensory cortex. PhD Thesis, Vanderbilt University, Nashville. Sur M. (1980) Receptive fields of neurons in areas 3b and 1 of somatosensory cortex in monkeys. Brain Res. 198, 465481. Sur M., Merzenich M. M. and Kaas J. H. (1980) Magnification, receptive field area, and “hypcrcolumn” size in Areas 3b and 1 of somatosensory cortex in owl monkeys. J. camp. Neural. 44,295-3 I 1. Towe A. L. (1973) Somatosensory cortex: Descending influence on ascending systems. In: Handbook of Sensory Physiology, Vol. 2, Somatosensory System (ed Iggo A.) Springer, Heidelberg.
- _
Trotter W. and Davies H. M. (1909) Experimental studies in the innervation of the skin. J. Physiol., Lond. 38, 134-246. Wall P. D. and Egger M. D. (1971) Formation of new connections in adult rat brains after partial deafferentation. Nature, New Biol. 232,542-545. Welker W. I. (1973) Principles of organization of the ventrobasal complex in mammals. Brain Behav. Evof. 7,253-336. Zarzccki P. and Wiggin D. M. (1982) Convergence of sensory inputs upon projection neurons of somatosensory cortex. Exp. Brain Res. 48, 28-42.
(Accepted 8 April 1983)