Progress toward Global Reduction in Under-Five Mortality: A Bootstrap Analysis of Uncertainty in...
12
Progress toward Global Reduction in Under-Five Mortality: A Bootstrap Analysis of Uncertainty in Millennium Development Goal 4 Estimates Leontine Alkema 1,2 *, Jin Rou New 1 1 Department of Statistics and Applied Probability, National University of Singapore, Singapore, 2 Saw Swee Hock School of Public Health, National University of Singapore, Singapore Abstract Background: Millennium Development Goal 4 calls for an annual rate of reduction (ARR) of the under-five mortality rate (U5MR) of 4.4% between 1990 and 2015. Progress is measured through the point estimates of the United Nations Inter- agency Group for Child Mortality Estimation (UN IGME). To facilitate evidence-based conclusions about progress toward the goal, we assessed the uncertainty in the estimates arising from sampling errors and biases in data series and the inferior quality of specific data series. Methods and Findings: We implemented a bootstrap procedure to construct 90% uncertainty intervals (UIs) for the U5MR and ARR to complement the UN IGME estimates. We constructed the bounds for all countries without a generalized HIV epidemic, where a standard estimation approach is carried out (174 countries). In the bootstrap procedure, potential biases in levels and trends of data series of different source types were accounted for. There is considerable uncertainty about the U5MR, particularly for high mortality countries and in recent years. Among 86 countries with a U5MR of at least 40 deaths per 1,000 live births in 1990, the median width of the UI, relative to the U5MR level, was 19% for 1990 and 48% for 2011, with the increase in uncertainty due to more limited data availability. The median absolute width of the 90% UI for the ARR from 1990 to 2011 was 2.2%. Although the ARR point estimate for all high mortality countries was greater than zero, for eight of them uncertainty included the possibility of no improvement between 1990 and 2011. For 13 countries, it is deemed likely that the ARR from 1990 to 2011 exceeded 4.4%. Conclusions: In light of the upcoming evaluation of Millennium Development Goal 4 in 2015, uncertainty assessments need to be taken into account to avoid unwarranted conclusions about countries’ progress based on limited data. Please see later in the article for the Editors’ Summary. Citation: Alkema L, New JR (2012) Progress toward Global Reduction in Under-Five Mortality: A Bootstrap Analysis of Uncertainty in Millennium Development Goal 4 Estimates. PLoS Med 9(12): e1001355. doi:10.1371/journal.pmed.1001355 Academic Editor: Peter Byass, Umea ˚ Centre for Global Health Research, Umea ˚ University, Sweden Received July 27, 2012; Accepted October 30, 2012; Published December 11, 2012 Copyright: ß 2012 Alkema, New. This is an open-access article distributed under the terms of the Creative Commons Attribution License, which permits unrestricted use, distribution, and reproduction in any medium, provided the original author and source are credited. Funding: LA was funded by a grant from the National University of Singapore. The funder had no role in study design, data collection and analysis, decision to publish, or preparation of the manuscript. Competing Interests: LA is a member of the technical advisory group of the UN IGME. JRN is a consultant for UNICEF. The views expressed in this paper are those of the authors and do not necessarily reflect the views of the United Nations Children’s Fund. The authors declare that no other competing interests exist. Abbreviations: ARR, annual rate of reduction; DHS, Demographic and Health Surveys; IHME, Institute for Health Metrics and Evaluation; MDG, Millennium Development Goal; MICS, Multiple Indicator Cluster Surveys; U5MR, under-five mortality rate; UI, uncertainty interval; UN IGME, United Nations Inter-agency Group for Child Mortality Estimation; VR, vital registration * E-mail: [email protected] PLOS Medicine | www.plosmedicine.org 1 December 2012 | Volume 9 | Issue 12 | e1001355
-
Upload
independent -
Category
Documents
-
view
1 -
download
0
Transcript of Progress toward Global Reduction in Under-Five Mortality: A Bootstrap Analysis of Uncertainty in...
Progress toward Global Reduction in Under-FiveMortality: A Bootstrap Analysis of Uncertainty inMillennium Development Goal 4 EstimatesLeontine Alkema1,2*, Jin Rou New1
1 Department of Statistics and Applied Probability, National University of Singapore, Singapore, 2 Saw Swee Hock School of Public Health, National University of
Singapore, Singapore
Abstract
Background: Millennium Development Goal 4 calls for an annual rate of reduction (ARR) of the under-five mortality rate(U5MR) of 4.4% between 1990 and 2015. Progress is measured through the point estimates of the United Nations Inter-agency Group for Child Mortality Estimation (UN IGME). To facilitate evidence-based conclusions about progress toward thegoal, we assessed the uncertainty in the estimates arising from sampling errors and biases in data series and the inferiorquality of specific data series.
Methods and Findings: We implemented a bootstrap procedure to construct 90% uncertainty intervals (UIs) for the U5MRand ARR to complement the UN IGME estimates. We constructed the bounds for all countries without a generalized HIVepidemic, where a standard estimation approach is carried out (174 countries). In the bootstrap procedure, potential biasesin levels and trends of data series of different source types were accounted for. There is considerable uncertainty about theU5MR, particularly for high mortality countries and in recent years. Among 86 countries with a U5MR of at least 40 deathsper 1,000 live births in 1990, the median width of the UI, relative to the U5MR level, was 19% for 1990 and 48% for 2011,with the increase in uncertainty due to more limited data availability. The median absolute width of the 90% UI for the ARRfrom 1990 to 2011 was 2.2%. Although the ARR point estimate for all high mortality countries was greater than zero, foreight of them uncertainty included the possibility of no improvement between 1990 and 2011. For 13 countries, it isdeemed likely that the ARR from 1990 to 2011 exceeded 4.4%.
Conclusions: In light of the upcoming evaluation of Millennium Development Goal 4 in 2015, uncertainty assessments needto be taken into account to avoid unwarranted conclusions about countries’ progress based on limited data.
Please see later in the article for the Editors’ Summary.
Citation: Alkema L, New JR (2012) Progress toward Global Reduction in Under-Five Mortality: A Bootstrap Analysis of Uncertainty in Millennium DevelopmentGoal 4 Estimates. PLoS Med 9(12): e1001355. doi:10.1371/journal.pmed.1001355
Academic Editor: Peter Byass, Umea Centre for Global Health Research, Umea University, Sweden
Received July 27, 2012; Accepted October 30, 2012; Published December 11, 2012
Copyright: � 2012 Alkema, New. This is an open-access article distributed under the terms of the Creative Commons Attribution License, which permitsunrestricted use, distribution, and reproduction in any medium, provided the original author and source are credited.
Funding: LA was funded by a grant from the National University of Singapore. The funder had no role in study design, data collection and analysis, decision topublish, or preparation of the manuscript.
Competing Interests: LA is a member of the technical advisory group of the UN IGME. JRN is a consultant for UNICEF. The views expressed in this paper arethose of the authors and do not necessarily reflect the views of the United Nations Children’s Fund. The authors declare that no other competing interests exist.
Abbreviations: ARR, annual rate of reduction; DHS, Demographic and Health Surveys; IHME, Institute for Health Metrics and Evaluation; MDG, MillenniumDevelopment Goal; MICS, Multiple Indicator Cluster Surveys; U5MR, under-five mortality rate; UI, uncertainty interval; UN IGME, United Nations Inter-agency Groupfor Child Mortality Estimation; VR, vital registration
* E-mail: [email protected]
PLOS Medicine | www.plosmedicine.org 1 December 2012 | Volume 9 | Issue 12 | e1001355
Introduction
The assessment of levels and trends in child mortality is of key
importance for measuring progress toward Millennium Develop-
ment Goal (MDG) 4, which calls for a reduction of two-thirds in
mortality in children under five (the under-five mortality rate
[U5MR]), and for measuring the impact of interventions. For
countries without well-functioning vital registration (VR) systems
(the great majority of developing countries), assessing levels and
trends in U5MR is challenging because of limited data availability
and/or issues with data quality. The United Nations Inter-agency
Group for Child Mortality Estimation (UN IGME, including the
United Nations Children’s Fund, the World Health Organization,
the World Bank, and the United Nations Population Division)
produces and publishes estimates of child mortality annually for all
UN member states. The most recent set of estimates was published
in 2012 [1].
When analyzing trends in U5MR, the focus is generally on the
‘‘best’’ estimates, i.e., the point estimates. This can lead to
inaccurate conclusions about countries’ progress in reducing the
U5MR. For example, the annual rate of reduction (ARR) in Benin
between 1990 and 2005 was estimated to be 2.4% in the most
recent UN IGME estimates, based on all data available in 2012.
Based on the data assumed to have been available in 2006 (i.e.,
data series from fieldwork conducted prior to 2006), the estimate
of the ARR for the same period is only 1.8% (authors’ calculation,
using the current UN IGME U5MR estimation method);
additional data increased the point estimate of the ARR by
33%. Such changes in point estimates of past ARRs are to be
expected in many developing countries without well-functioning
VR systems because data in such countries are mostly collected
retrospectively and are subject to sampling and non-sampling
errors. That is, a recent survey can provide data points for the
1990s and 2000s and can potentially further change the point
estimate of the ARR for past periods. For an evidence-based
analysis of progress in reducing U5MR, an uncertainty assessment
of the estimates for U5MR levels and trends, in the form of
uncertainty intervals (UIs), is thus required.
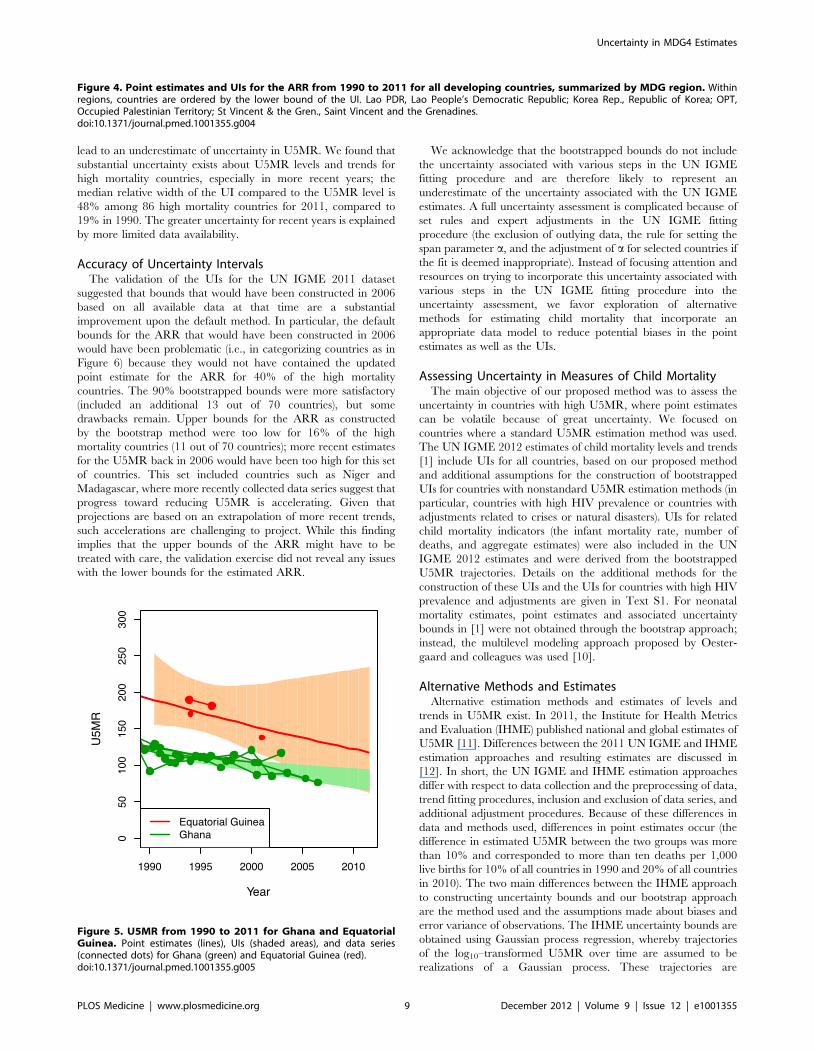
UIs are also required for more informed comparisons across
countries. For example, even though the UN IGME point
estimates for the ARR from 1990 to 2011 are very similar for
Ghana and Equatorial Guinea (2.1% and 2.3%, respectively), the
estimate for Equatorial Guinea is based on five data points in total
and thus highly uncertain. Lower bounds of the UIs for the ARRs
that quantify the minimum progress that most likely has been
made would allow for a more informative ranking of countries in
terms of proven progress in reducing U5MR.
In short, to avoid inaccurate conclusions and comparisons about
countries’ progress in reducing the U5MR, uncertainty in the
estimation of U5MR and its rate of reduction needs to be assessed
and taken into account when analyzing trends. The objective of
this article is to propose a method to construct plausible UIs for the
U5MR as well as for the ARR. In the previous UN IGME
publication in 2011 [2], no uncertainty bounds were published
because the bounds that were constructed by the default method
were deemed implausible, i.e., too narrow. We discuss the default
method and its drawbacks and introduce an alternative method to
construct bootstrapped uncertainty bounds. We constructed the
bounds for all countries without a generalized HIV epidemic and
where a standard estimation approach was carried out (174
countries), compared the performance of the proposed method
with the existing method, and highlight findings for high mortality
countries. The proposed method was incorporated in the most
recent UN IGME estimates in 2012 [1].
Methods
UN IGME Database and Estimation ApproachThe UN IGME 2012 database is publicly available on CME
Info (http://www.childmortality.org/). The database includes
data on the U5MR for all countries from VR systems, as well as
data series constructed from other sources, most commonly
surveys or censuses that collected summary or complete birth
histories. Birth histories are collected in many developing countries
that do not have well-functioning VR systems. They contain
records of all births to a woman over her lifetime, as well as
information on the survival status of her children. Complete birth
histories list detailed information on dates of birth and death, while
summary birth histories provide more limited information in the
form of the total number of children ever born to a woman and
the number of children that are still alive. Birth histories provide
U5MR observations for years before the survey/census date based
on various U5MR calculation methods. Specifically, so-called
direct methods provide U5MR observations from complete birth
histories, while indirect methods provide U5MR observations
from complete or summary birth histories [3,4]. Common large-
scale household surveys that collect birth histories include
Demographic and Health Surveys (DHS) and Multiple Indicator
Cluster Surveys (MICS).
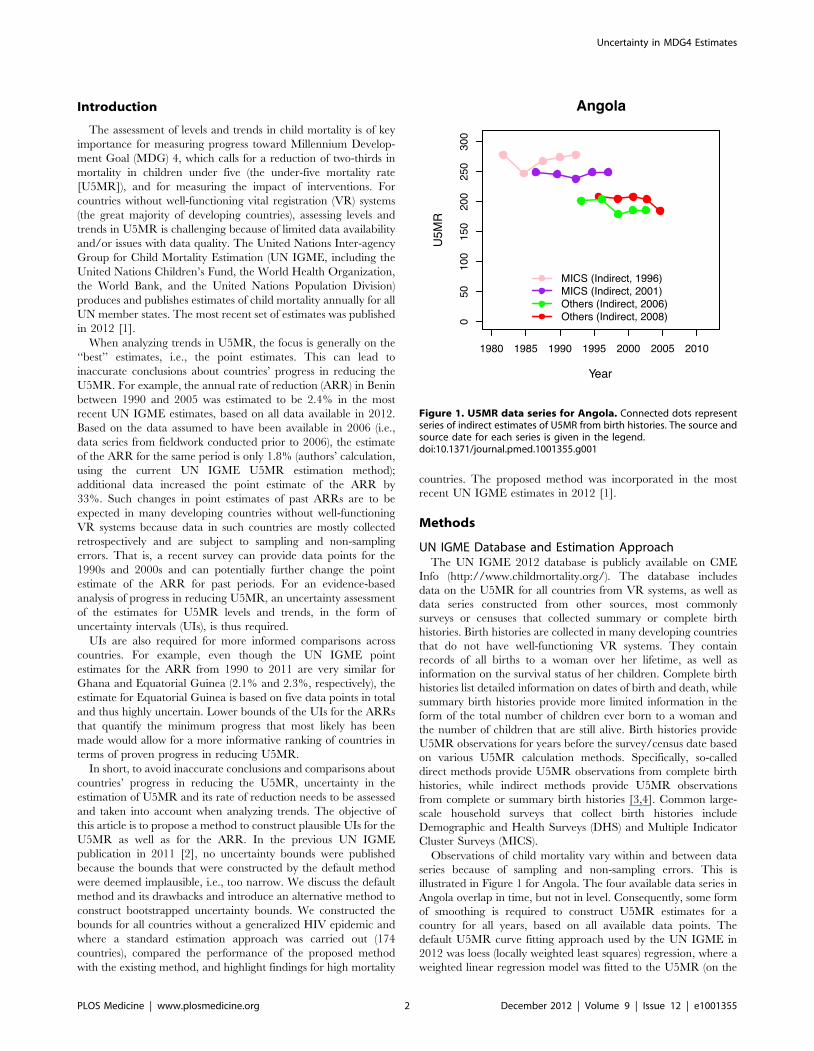
Observations of child mortality vary within and between data
series because of sampling and non-sampling errors. This is
illustrated in Figure 1 for Angola. The four available data series in
Angola overlap in time, but not in level. Consequently, some form
of smoothing is required to construct U5MR estimates for a
country for all years, based on all available data points. The
default U5MR curve fitting approach used by the UN IGME in
2012 was loess (locally weighted least squares) regression, where a
weighted linear regression model was fitted to the U5MR (on the
Figure 1. U5MR data series for Angola. Connected dots representseries of indirect estimates of U5MR from birth histories. The source andsource date for each series is given in the legend.doi:10.1371/journal.pmed.1001355.g001
Uncertainty in MDG4 Estimates
PLOS Medicine | www.plosmedicine.org 2 December 2012 | Volume 9 | Issue 12 | e1001355
natural logarithmic scale) for all years of interest. A smoothing
parameter a determined the range of points included in each fit
and their weights (the flexibility of the fitted trend line decreases
with a). The default setting for a was based on the number of
surveys/censuses and data points from VR in each country [5].
For a limited number of countries, the smoothing parameter aused in the loess trend fitting procedure was adjusted to better
capture more recent trends in the data. An alternative estimation
approach was used for countries with a generalized HIV/AIDS
epidemic (defined as countries where HIV prevalence in the
general population was more than 5% at any point in time since
1980, 17 countries in total) and for countries with conflicts or
limited observations of dubious quality (four countries in total) [5].
In 2011, UIs were constructed for the UN IGME estimates for
countries where the default method was used, based on the
uncertainty in (the parameters of) the local log-linear fits. The
resulting UIs were deemed implausible (too narrow) by experts for
many countries, and therefore not published. One reason why
uncertainty was likely to be underestimated in that approach is the
ignorance of the structure of the U5MR data, specifically,
potential biases in levels and trends of U5MR data series
(explained in more detail in the next section). A second reason is
the omission of the possibility that a specific data series is of
inferior quality, and a third reason is the lack of inclusion of model
uncertainty (i.e., the choice of span parameter a in the loess fit and
expert adjustments, and, more generally, the choice of a loess
smoother instead of a different curve fitting procedure).
We used a bootstrap method [6] for constructing uncertainty
bounds for all countries where a standard loess fitting procedure
was used (174 countries out of 195 countries for which the UN
IGME published estimates in 2012). The new method improves
upon the default method by taking into consideration the U5MR
data structure as well as the possibility of data series that are of
inferior quality. Model uncertainty is not evaluated (see Discussion).
Bootstrap Procedure for Constructing UncertaintyIntervals
Simplified summary of bootstrap procedure. Because of
errors in observed data series, true national child mortality rates
are unknown. If there are many data series with small errors
available in a given country, the UN IGME point estimates are
likely to be very close to the true rates; the fewer the number of
data series or the larger the errors in the data series, the further
away the UN IGME estimates could be from the truth.
Bootstrapped uncertainty bounds are based on the following
assessment. Supposing that the UN IGME point estimates for a
given country were equal to the truth, which data series could have
been obtained in that country (instead of the data series included
in the UN IGME database), and, from those, what UN IGME
point estimates could have been constructed? For countries with a
small number of data series that are deemed to have large errors,
the range of data series that could have been obtained will range
widely, and, consequently, a wide range of UN IGME point
estimates could have been obtained. On the other hand, in
countries with many data series of high quality, estimates for a
given year will tend to be more similar. Bootstrapped uncertainty
bounds are based on the set of estimates that could have been
obtained for each country, based on the scenario that the UN
IGME estimates are equal to the truth, and reflect the data
availability in the country, as well as the likely errors in the avai-
lable data series, based on an assessment of biases in data series.
In-depth explanation of bootstrap procedure. Bootstra-
pping refers to creating a large number of ‘‘new’’ datasets (that
could have been observed instead of the dataset at hand), and
then repeating the curve fitting procedure to obtain a large
number of point estimates in the form of U5MR trajectories. The
set of ‘‘bootstrapped’’ trajectories illustrates the uncertainty
associated with the original estimates. Associated 90% uncertainty
bounds for the U5MR are obtained by selecting the 5th and 95th
percentiles of the bootstrapped trajectories. Similarly, the UI for
the ARR for a country in a given period is obtained by selecting
the 5th and 95th percentiles of the bootstrapped ARR estimates,
where each bootstrapped ARR estimate is calculated from one
bootstrapped U5MR trajectory.
The difficulty in the bootstrap procedure is the first step: how to
generate ‘‘new’’ datasets that lead to a similar variability in point
estimates as the dataset at hand. Non-parametric and parametric
bootstrapping procedures incorporate different approaches to the
sampling step. In the non-parametric bootstrap procedure, data
are resampled from the original dataset with replacement. This
procedure is not easily applicable in the U5MR estimation context
because U5MR observations are organized in series, or distinct
sampling units. That is, surveys and censuses that collect birth
histories provide a number of U5MR data points, as illustrated in
Figure 1 for Angola. If we were to resample from the original
dataset with replacement, we would need to resample the data
series (instead of the observations). This approach is not feasible
for U5MR estimation for most countries because of the limited
number of data series in each country (e.g., there are only four
series in Angola).
In this study, we used a parametric bootstrap procedure to
generate new datasets [6]. In this approach, data are sampled
based on a probability model for the data (hereafter referred to as
the ‘‘data model’’), replacing the unknown parameters in the data
model by point estimates based on the sample at hand. The
approach is most easily understood in a simplified example: in a
patient study of disease status, new data (measurements of the
disease outcome) are generated in a parametric bootstrap by
simulating data from a Bernoulli distribution where the probability
of having the disease is given by the point estimate from the
current sample at hand.
Potential biases in trends and levels of U5MR data series need
to be accounted for in the data model for the U5MR, as illustrated
in Figure 1 for Angola. The four data series in Angola overlap in
time, but not in level. The illustration suggests that some data
series might systematically over- or underestimate the true U5MR
with respect to the mortality level and/or trend. We used a
multilevel modeling approach to estimate the mean and variability
in biases in levels and trends, as well as additional error variance.
Based on potential differences in biases, non-VR data were
categorized into eight different ‘‘source types’’ by data source and
U5MR calculation method (namely, DHS Direct with reported
sampling errors, DHS Direct without reported sampling errors,
DHS Indirect, MICS Indirect, Census Indirect, Others Direct
[including MICS and Census Direct], Others Indirect, and Other
Source Types). For each source type, for each data series, biases
in the trend were modeled as a linear function of the retrospective
period of the observation in the survey (the difference between
the observation reference date and the date of the survey/census).
This approach was motivated by known problems with
retrospective data, such as the occurrence of recall biases and
violations of modeling assumptions when calculating indirect
U5MR observations. Details of the U5MR data model are given
in Text S1. In short, the data model for observation i is given as
follows:
log yið Þ~log uc i½ �,t i½ �� �
zdi, ð1Þ
Uncertainty in MDG4 Estimates
PLOS Medicine | www.plosmedicine.org 3 December 2012 | Volume 9 | Issue 12 | e1001355
where yi is the observed U5MR, uc i½ �,t i½ � is the true U5MR in
country c[i] and year t[i], and exp(di) represents the relative
difference between the true and observed U5MR. The log-
difference di for non-VR data is modeled as follows:
di*N b0,s i½ �zb1,s i½ �pi,s2i
� �, ð2Þ
where the mean function b0,s i½ �zb1,s i½ �pi represents the bias in
level and trend as a function of the retrospective period pi for
observation i in data series s[i], and s2i represents the error
variance (a combination of sampling and non-sampling variance,
where sampling variance is given for a large subset of the DHS
Direct series). Using the UN IGME 2012 estimates for the true
U5MR, we obtained parameter estimates for the distribution of
the random intercept b0,s and slope b1,s for each data series by
source type, and for s2i .
For countries with data from VR systems, the log-differences di
for VR observations are modeled as either random draws from a
normal distribution or realizations from a time series process (for
countries where the loess smoother did not adequately capture
temporal fluctuations).
Based on the estimates of mean bias in levels and trends and
error variance by source type, as well as the variability of biases
across data series, ‘‘new’’ data series were sampled around the
current UN IGME estimates in the first step of the bootstrap
procedure, after which the loess smoother was fitted to the
bootstrapped dataset. Instead of resampling all observed non-VR
data series in the country in each bootstrap, one randomly selected
data series was left out for countries with at least three data series.
The leave-one-out step was motivated by the issue that an
included data series could have been of low quality. By leaving out
one series at a time at random, the influence of any one series on
the resulting curve fit is reduced.
The dataset consisted of 867 data series and 8,336 observations
for 174 countries where the UN IGME loess estimation proce-
dure was used. An overview of the number of data series and
observations is given in Table 1. Additional details on the boot-
strap procedure are given in Text S1.
Validation of Uncertainty BoundsModel performance for the default method and the proposed
bootstrap method of constructing UIs was assessed based on the
UN IGME 2011 dataset [2] by applying the modeling approach to
a subset of the observations (called the training set) and then
verifying how accurate the U5MR/ARR bounds were by
comparing them to those obtained with the complete dataset.
Given the retrospective nature of U5MR data and the occurrence
of data in data series, the training set was not constructed by
leaving out observations at random, but based on all data available
in some year in the past, here 2006 [7]. To construct the training
set, all data that were collected in or after 2006 were removed. For
example, if a DHS survey was carried out in 2006, all
(retrospective) observations from that DHS survey were left out
of the training set. The observations that were left out of the
training set formed the test set. To construct UIs using data in
the training set only, we fitted the loess smoother to the data from
the training set and carried out the bootstrap procedure. This
approach resulted in UIs that would have been constructed in
2006 based on the proposed method. To validate the bounds, we
Table 2. Categorization of countries based on evidence for progress in reducing U5MR and accomplishing the MDG 4 target of anARR of 4.4% from 1990 to 2011.
Category ARR 1990–2011 Evidence of Progress?
Lower Bound (L) Upper Bound (U) Progress in Reducing U5MR? Progress at ARR of 4.4% or Above?
1 L#0% U$4.4% Not clear (estimate of ARR is highly uncertain)
2 L#0% 0%#U,4.4% Not clear Unlikely
3 0%,L,4.4% U,4.4% Likely Unlikely
4 0%,L,4.4% U$4.4% Likely Not clear
5 L$4.4% U$4.4% Likely Likely
doi:10.1371/journal.pmed.1001355.t002
Table 1. Overview of the number of data series and observations by source type.
Source Type Number of Data Series (Number of Observations)
VR 96 (3,209)
DHS Direct (with reported sampling errors) 185 (2,580)
DHS Direct (without reported sampling errors) 29 (94)
Others Direct (including MICS and Census Direct) 118 (355)
DHS Indirect 10 (50)
MICS Indirect 66 (318)
Census Indirect 178 (887)
Others Indirect 127 (623)
Other Source Types 58 (220)
doi:10.1371/journal.pmed.1001355.t001
Uncertainty in MDG4 Estimates
PLOS Medicine | www.plosmedicine.org 4 December 2012 | Volume 9 | Issue 12 | e1001355
calculated how often the UN IGME 2011 estimates [2] were inside
previously constructed UIs for the U5MR in 1990, 2000, and
2005, and for the ARR from 1990 to 2005.
Interpreting UIs for the ARRThe goal of constructing UIs is to enable and promote evidence-
based assessments of progress toward reducing U5MR. We
propose to categorize countries based on the UI for their ARR
for 1990 to 2011 into five categories, as summarized in Table 2.
In this categorization, category 1 includes all countries for which
no conclusion at all can be drawn about progress made in reducing
U5MR (the UI for the ARR from 1990 to 2011 is very wide,
ranging from less than 0% to more than 4.4%). For countries in
category 2, it is not clear whether any progress has been made in
reducing U5MR, and it is deemed unlikely that the country is on
track for MDG 4. For countries in categories 3 and 4, there is
evidence that progress has been made, but the categories differ
based on the upper bound for the ARR: in category 3 it is deemed
unlikely that the countries are on track for MDG 4 based on
available data, while this is yet to be determined for the countries
in category 4. Category 5 includes all countries for which it is
deemed likely that the country is on track to reach the MDG 4
target (the lower bound for the ARR from 1990 to 2011 is above
4.4%).
The analysis was carried out in open source software R [8] and
WinBUGS [9].
Results
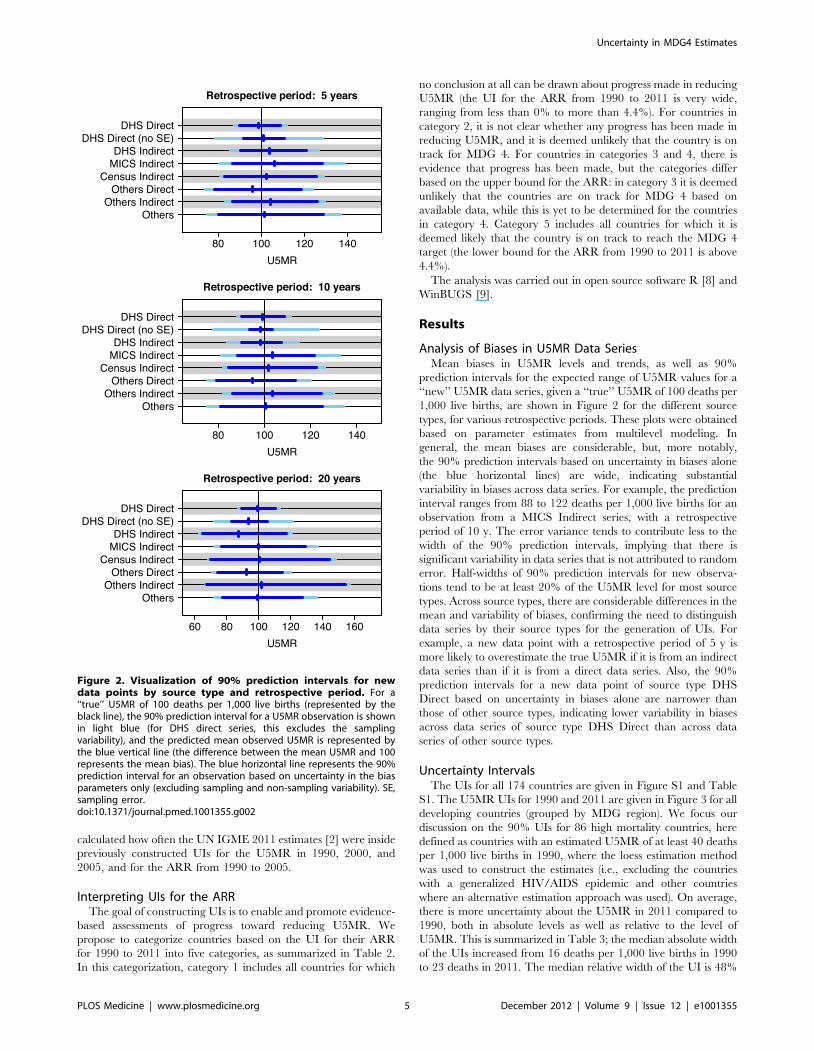
Analysis of Biases in U5MR Data SeriesMean biases in U5MR levels and trends, as well as 90%
prediction intervals for the expected range of U5MR values for a
‘‘new’’ U5MR data series, given a ‘‘true’’ U5MR of 100 deaths per
1,000 live births, are shown in Figure 2 for the different source
types, for various retrospective periods. These plots were obtained
based on parameter estimates from multilevel modeling. In
general, the mean biases are considerable, but, more notably,
the 90% prediction intervals based on uncertainty in biases alone
(the blue horizontal lines) are wide, indicating substantial
variability in biases across data series. For example, the prediction
interval ranges from 88 to 122 deaths per 1,000 live births for an
observation from a MICS Indirect series, with a retrospective
period of 10 y. The error variance tends to contribute less to the
width of the 90% prediction intervals, implying that there is
significant variability in data series that is not attributed to random
error. Half-widths of 90% prediction intervals for new observa-
tions tend to be at least 20% of the U5MR level for most source
types. Across source types, there are considerable differences in the
mean and variability of biases, confirming the need to distinguish
data series by their source types for the generation of UIs. For
example, a new data point with a retrospective period of 5 y is
more likely to overestimate the true U5MR if it is from an indirect
data series than if it is from a direct data series. Also, the 90%
prediction intervals for a new data point of source type DHS
Direct based on uncertainty in biases alone are narrower than
those of other source types, indicating lower variability in biases
across data series of source type DHS Direct than across data
series of other source types.
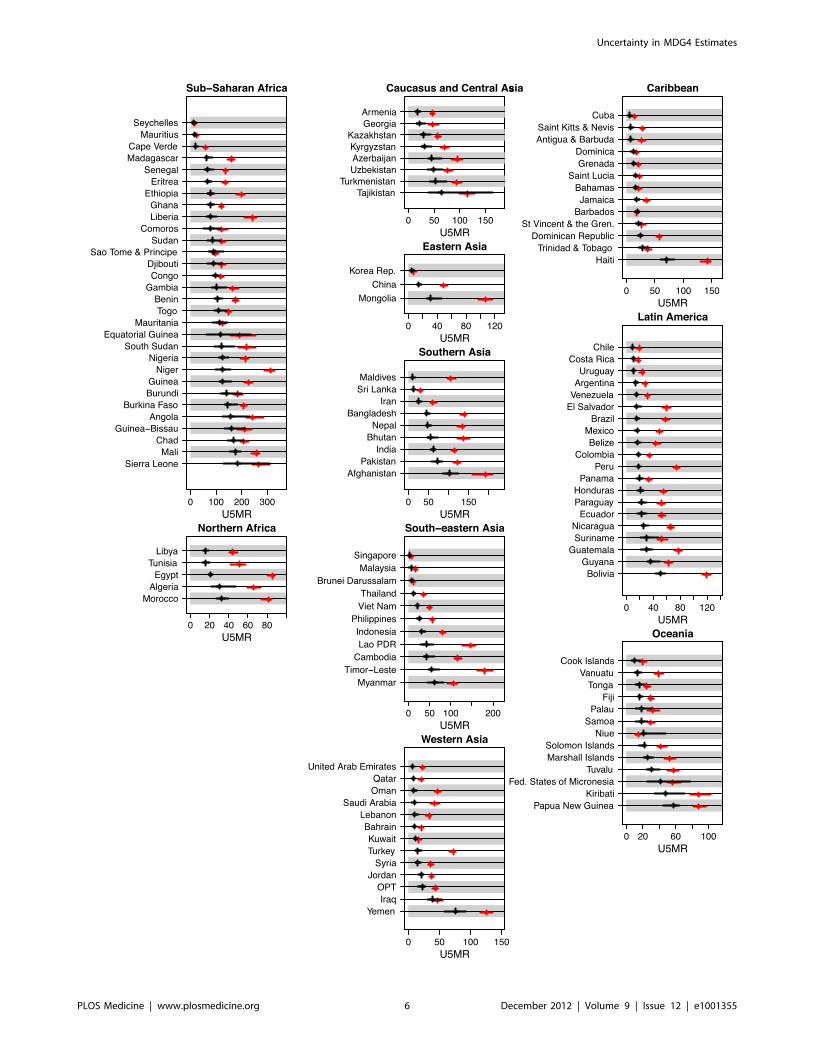
Uncertainty IntervalsThe UIs for all 174 countries are given in Figure S1 and Table
S1. The U5MR UIs for 1990 and 2011 are given in Figure 3 for all
developing countries (grouped by MDG region). We focus our
discussion on the 90% UIs for 86 high mortality countries, here
defined as countries with an estimated U5MR of at least 40 deaths
per 1,000 live births in 1990, where the loess estimation method
was used to construct the estimates (i.e., excluding the countries
with a generalized HIV/AIDS epidemic and other countries
where an alternative estimation approach was used). On average,
there is more uncertainty about the U5MR in 2011 compared to
1990, both in absolute levels as well as relative to the level of
U5MR. This is summarized in Table 3; the median absolute width
of the UIs increased from 16 deaths per 1,000 live births in 1990
to 23 deaths in 2011. The median relative width of the UI is 48%
Figure 2. Visualization of 90% prediction intervals for newdata points by source type and retrospective period. For a‘‘true’’ U5MR of 100 deaths per 1,000 live births (represented by theblack line), the 90% prediction interval for a U5MR observation is shownin light blue (for DHS direct series, this excludes the samplingvariability), and the predicted mean observed U5MR is represented bythe blue vertical line (the difference between the mean U5MR and 100represents the mean bias). The blue horizontal line represents the 90%prediction interval for an observation based on uncertainty in the biasparameters only (excluding sampling and non-sampling variability). SE,sampling error.doi:10.1371/journal.pmed.1001355.g002
Uncertainty in MDG4 Estimates
PLOS Medicine | www.plosmedicine.org 5 December 2012 | Volume 9 | Issue 12 | e1001355
Uncertainty in MDG4 Estimates
PLOS Medicine | www.plosmedicine.org 6 December 2012 | Volume 9 | Issue 12 | e1001355
for the U5MR in 2011, compared to 19% for 1990 (and 24% in
2000). The median width for the ARR from 1990 to 2011 is 2.2%.
The increase in uncertainty from 1990 to 2011 in the U5MR
can be explained by more limited data availability for recent years.
For the 86 high mortality countries, out of a total of 4,528
observations used for the UN IGME loess estimation procedure,
1,283 observations have reference dates in the 1980s, and 1,148
observations have reference dates in the 1990s. In contrast, only
483 observations were available since the year 2000. The median
extrapolation period (number of years between the last available
observation and the year 2011.5) for these countries is 5.2 y.
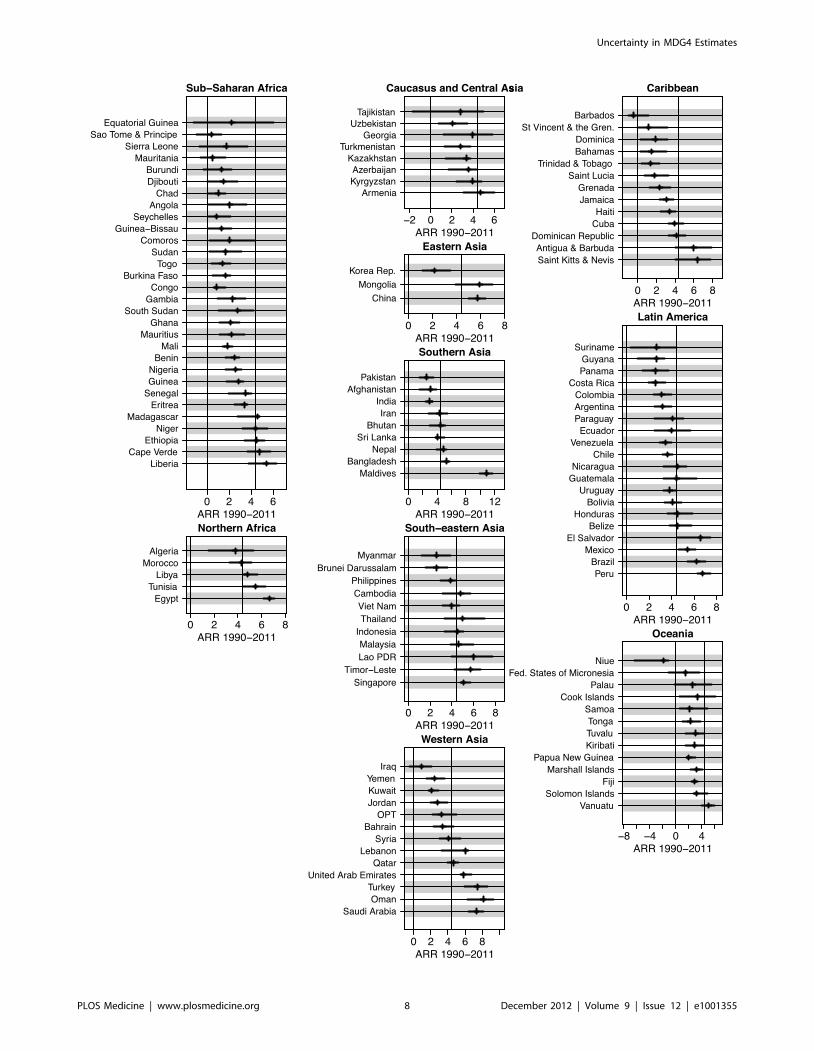
Figure 4 shows UIs for the ARR from 1990 to 2011 for all
developing countries (grouped by MDG region), sorted by the
lower bound of the ARR. The widths of the UIs vary greatly
across countries. As alluded to in the Introduction, the figure
illustrates that while the point estimates of the ARR may be similar
for countries like Ghana and Equatorial Guinea (2.1% for Ghana
and 2.3% for Equatorial Guinea), there is much greater
uncertainty about the ARR in Equatorial Guinea. The lower
bounds of these countries’ respective UIs (1.1% for Ghana and
21.3% for Equatorial Guinea) show evidence of progress in
Ghana compared to lack of information about the rate of
reduction in Equatorial Guinea. The difference in data availabil-
ity, as illustrated in Figure 5, is the main driver of the difference in
uncertainty in ARR between the two countries.
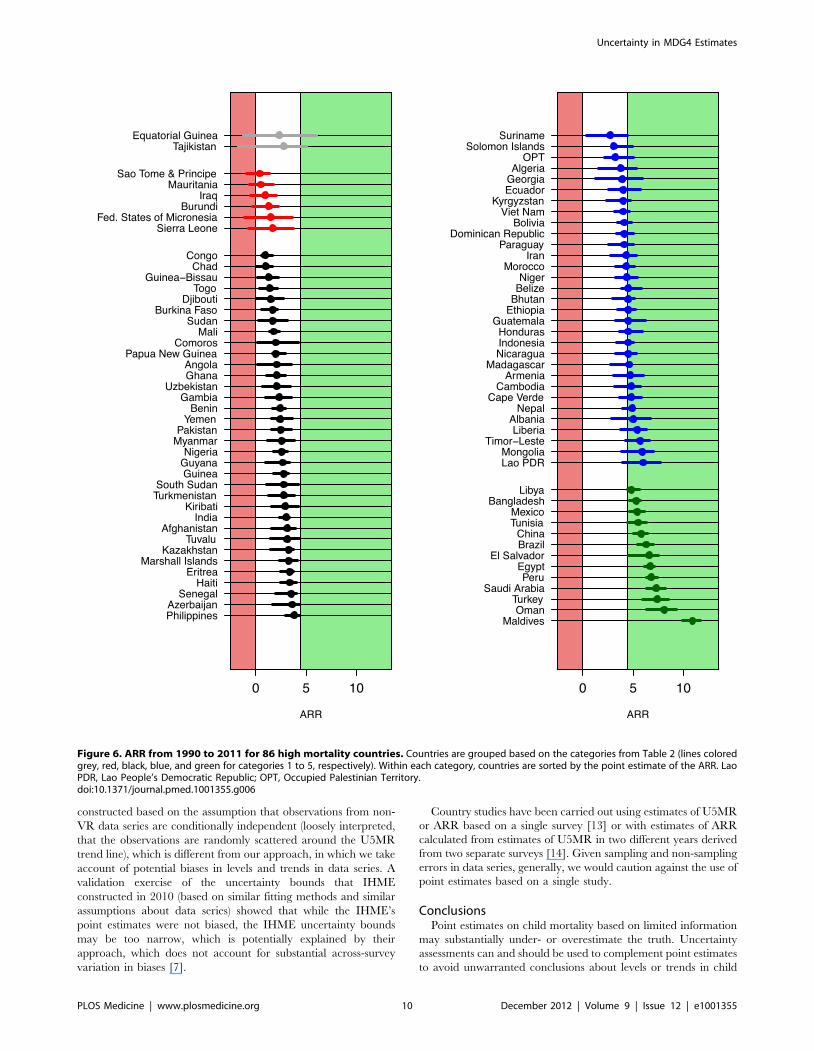
The categorization of Table 2 is illustrated in Figure 6 for the
high mortality countries. For Equatorial Guinea and Tajikistan, in
category 1, the estimate for the ARR is highly uncertain: there is
insufficient evidence both to conclude that any progress has been
made and to exclude the possibility that the country is on track to
achieve MDG 4. For the six countries in category 2 (7% of the
high mortality countries), there is also insufficient evidence to
conclude that any progress has been made. In all countries in the
remaining categories, there is evidence to conclude that progress
has been made in reducing U5MR. In particular, while several
countries in category 3 (34 countries, 40%) have ARR point
estimates that are comparable to the point estimates to countries in
categories 1 and 2, the lower bounds of the UIs for the category 3
countries do highlight that there is evidence of progress in
reducing child mortality.
Based on the upper bounds of the UIs, the countries in categories
2 and 3 are not considered to be on track for meeting MDG 4. For
the 31 countries in category 4 (36%), it is not clear whether they are
on track for meeting the MDG 4 target or not. This category
includes countries such as Suriname, with a point estimate for the
ARR of 2.7%, as well as Lao People’s Democratic Republic, with a
much higher point estimate of 6.0%. The great uncertainty in the
ARR in these two countries around the point estimate is explained
by the scarcity of the data; in both countries, there are only two
observations since 2000. Finally, for the 13 countries in category 5
(15%), there is evidence that the ARR has already exceeded the
MDG 4 target of 4.4%. Maldives, the country with the highest
point estimate for the ARR, 10.9%, is also the country with the
highest lower bound for the ARR, 9.9%. The UI for the Maldives is
relatively narrow (compared to other high mortality countries)
because of greater data availability; the Maldives dataset includes a
number of data series in the past decades, going back as far as the
1960s, and VR data from 2006 to 2011.
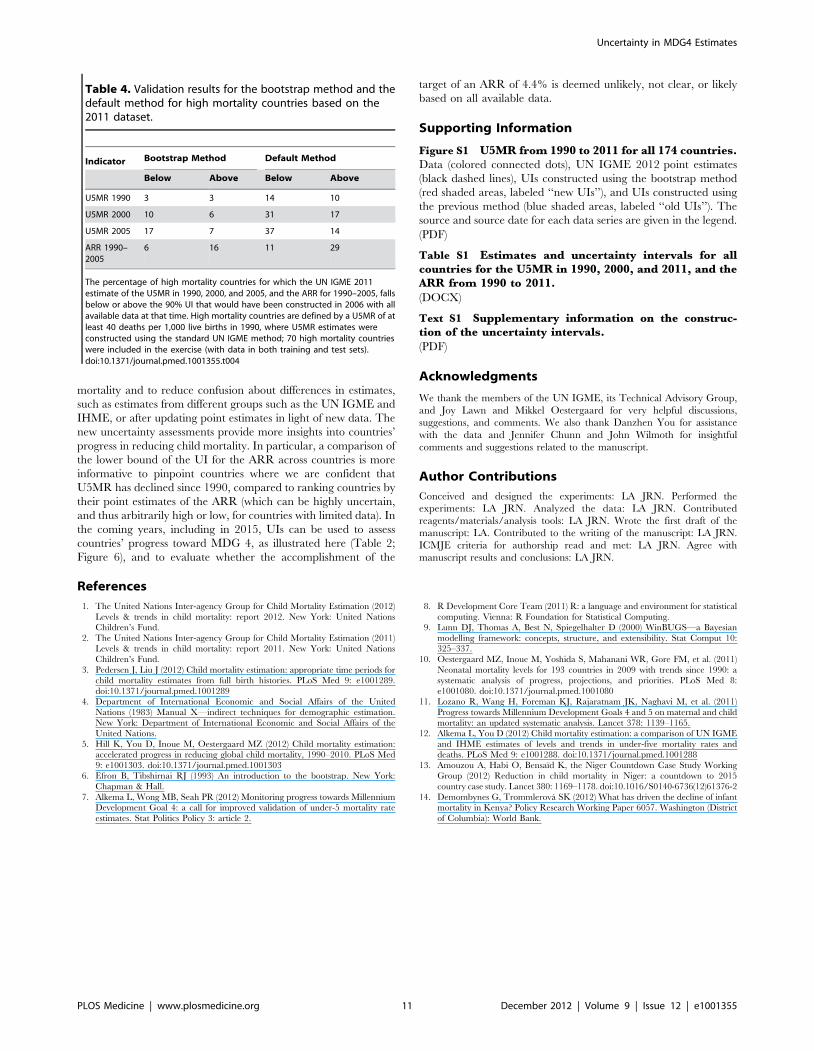
Validation and Comparison of Uncertainty MethodsValidation measures for the U5MR and ARR (from 1990 to
2005) based on the UN IGME 2011 dataset are summarized in
Table 4 for the bootstrap method and the default method to
construct UIs. The results are presented for the 70 high mortality
countries that were included in the validation exercise (for which
observations were included in both the training as well as the test
sets). In total, 18% of the data were left out for these countries for
the training set (21% on average per country). For the bootstrap
method, the updated ARR based on the UN IGME 2011 dataset
ended up above the 90% UI that would have been constructed in
2006 for 16% of the countries (11 countries), while only 6% of the
updated ARRs ended up below the previously constructed UIs.
This suggests that the upper bound for the ARR was too low (too
conservative with respect to estimating accelerated progress) in
2006, while the lower bound was reasonable. This is in line with
the findings for the UIs for the U5MR in 1990, 2000, and 2005.
The proportion of updated estimates for 2005 that fell below the
UIs (17%) was higher than expected; the recent U5MR would
have been overestimated in 2006 based on all data available at that
time for a subset of countries. The results for the default method
were qualitatively the same (the ARR would have been
underestimated and recent U5MR would have been overestimated
in 2006), but the results were substantially worse for the default
method compared to the bootstrap method: the default UI for the
ARR would not have contained the updated estimate for 40% of
all high mortality countries.
Discussion
We used a bootstrap procedure to construct uncertainty bounds
for the U5MR and the ARR for all countries, to provide more
information about the evidence (or lack thereof) of countries’
progress in reducing the U5MR. Our analysis was based on
estimates of biases in levels and trends for different source types,
and the variability therein. We found that there is substantial
across-survey variation in biases and that half-widths of 90%
prediction intervals for ‘‘new observations’’ tend to be at least 20%
of the U5MR level for most source types. Ignoring these biases can
Figure 3. Point estimates and UIs for the U5MR in 1990 and 2011 for all developing countries, summarized by MDG region. Pointestimates and UIs for the U5MR in 1990 (red) and 2011 (black). Within regions, countries are ordered by the point estimate of the U5MR for 2011. LaoPDR, Lao People’s Democratic Republic; Korea Rep., Republic of Korea; OPT, Occupied Palestinian Territory; St Vincent & the Gren., Saint Vincent andthe Grenadines.doi:10.1371/journal.pmed.1001355.g003
Table 3. Overview of width of uncertainty bounds for U5MRin 1990, 2000, and 2011 for 86 high mortality countries.
Year UI Width (U5MR)UI Width Relative to U5MR(Percent)
Mean Median Mean Median
1990 21 16 20 19
2000 21 16 25 24
2010 31 23 52 48
High mortality countries are defined by a U5MR of more than 40 deaths per1,000 live births in 1990, where U5MR estimates were constructed using thestandard UN IGME method. The width is reported in number of deaths per1,000 live births. Relative width is reported as a percentage of the U5MR pointestimates.doi:10.1371/journal.pmed.1001355.t003
Uncertainty in MDG4 Estimates
PLOS Medicine | www.plosmedicine.org 7 December 2012 | Volume 9 | Issue 12 | e1001355
Uncertainty in MDG4 Estimates
PLOS Medicine | www.plosmedicine.org 8 December 2012 | Volume 9 | Issue 12 | e1001355
lead to an underestimate of uncertainty in U5MR. We found that
substantial uncertainty exists about U5MR levels and trends for
high mortality countries, especially in more recent years; the
median relative width of the UI compared to the U5MR level is
48% among 86 high mortality countries for 2011, compared to
19% in 1990. The greater uncertainty for recent years is explained
by more limited data availability.
Accuracy of Uncertainty IntervalsThe validation of the UIs for the UN IGME 2011 dataset
suggested that bounds that would have been constructed in 2006
based on all available data at that time are a substantial
improvement upon the default method. In particular, the default
bounds for the ARR that would have been constructed in 2006
would have been problematic (i.e., in categorizing countries as in
Figure 6) because they would not have contained the updated
point estimate for the ARR for 40% of the high mortality
countries. The 90% bootstrapped bounds were more satisfactory
(included an additional 13 out of 70 countries), but some
drawbacks remain. Upper bounds for the ARR as constructed
by the bootstrap method were too low for 16% of the high
mortality countries (11 out of 70 countries); more recent estimates
for the U5MR back in 2006 would have been too high for this set
of countries. This set included countries such as Niger and
Madagascar, where more recently collected data series suggest that
progress toward reducing U5MR is accelerating. Given that
projections are based on an extrapolation of more recent trends,
such accelerations are challenging to project. While this finding
implies that the upper bounds of the ARR might have to be
treated with care, the validation exercise did not reveal any issues
with the lower bounds for the estimated ARR.
We acknowledge that the bootstrapped bounds do not include
the uncertainty associated with various steps in the UN IGME
fitting procedure and are therefore likely to represent an
underestimate of the uncertainty associated with the UN IGME
estimates. A full uncertainty assessment is complicated because of
set rules and expert adjustments in the UN IGME fitting
procedure (the exclusion of outlying data, the rule for setting the
span parameter a, and the adjustment of a for selected countries if
the fit is deemed inappropriate). Instead of focusing attention and
resources on trying to incorporate this uncertainty associated with
various steps in the UN IGME fitting procedure into the
uncertainty assessment, we favor exploration of alternative
methods for estimating child mortality that incorporate an
appropriate data model to reduce potential biases in the point
estimates as well as the UIs.
Assessing Uncertainty in Measures of Child MortalityThe main objective of our proposed method was to assess the
uncertainty in countries with high U5MR, where point estimates
can be volatile because of great uncertainty. We focused on
countries where a standard U5MR estimation method was used.
The UN IGME 2012 estimates of child mortality levels and trends
[1] include UIs for all countries, based on our proposed method
and additional assumptions for the construction of bootstrapped
UIs for countries with nonstandard U5MR estimation methods (in
particular, countries with high HIV prevalence or countries with
adjustments related to crises or natural disasters). UIs for related
child mortality indicators (the infant mortality rate, number of
deaths, and aggregate estimates) were also included in the UN
IGME 2012 estimates and were derived from the bootstrapped
U5MR trajectories. Details on the additional methods for the
construction of these UIs and the UIs for countries with high HIV
prevalence and adjustments are given in Text S1. For neonatal
mortality estimates, point estimates and associated uncertainty
bounds in [1] were not obtained through the bootstrap approach;
instead, the multilevel modeling approach proposed by Oester-
gaard and colleagues was used [10].
Alternative Methods and EstimatesAlternative estimation methods and estimates of levels and
trends in U5MR exist. In 2011, the Institute for Health Metrics
and Evaluation (IHME) published national and global estimates of
U5MR [11]. Differences between the 2011 UN IGME and IHME
estimation approaches and resulting estimates are discussed in
[12]. In short, the UN IGME and IHME estimation approaches
differ with respect to data collection and the preprocessing of data,
trend fitting procedures, inclusion and exclusion of data series, and
additional adjustment procedures. Because of these differences in
data and methods used, differences in point estimates occur (the
difference in estimated U5MR between the two groups was more
than 10% and corresponded to more than ten deaths per 1,000
live births for 10% of all countries in 1990 and 20% of all countries
in 2010). The two main differences between the IHME approach
to constructing uncertainty bounds and our bootstrap approach
are the method used and the assumptions made about biases and
error variance of observations. The IHME uncertainty bounds are
obtained using Gaussian process regression, whereby trajectories
of the log10–transformed U5MR over time are assumed to be
realizations of a Gaussian process. These trajectories are
Figure 4. Point estimates and UIs for the ARR from 1990 to 2011 for all developing countries, summarized by MDG region. Withinregions, countries are ordered by the lower bound of the UI. Lao PDR, Lao People’s Democratic Republic; Korea Rep., Republic of Korea; OPT,Occupied Palestinian Territory; St Vincent & the Gren., Saint Vincent and the Grenadines.doi:10.1371/journal.pmed.1001355.g004
Figure 5. U5MR from 1990 to 2011 for Ghana and EquatorialGuinea. Point estimates (lines), UIs (shaded areas), and data series(connected dots) for Ghana (green) and Equatorial Guinea (red).doi:10.1371/journal.pmed.1001355.g005
Uncertainty in MDG4 Estimates
PLOS Medicine | www.plosmedicine.org 9 December 2012 | Volume 9 | Issue 12 | e1001355
constructed based on the assumption that observations from non-
VR data series are conditionally independent (loosely interpreted,
that the observations are randomly scattered around the U5MR
trend line), which is different from our approach, in which we take
account of potential biases in levels and trends in data series. A
validation exercise of the uncertainty bounds that IHME
constructed in 2010 (based on similar fitting methods and similar
assumptions about data series) showed that while the IHME’s
point estimates were not biased, the IHME uncertainty bounds
may be too narrow, which is potentially explained by their
approach, which does not account for substantial across-survey
variation in biases [7].
Country studies have been carried out using estimates of U5MR
or ARR based on a single survey [13] or with estimates of ARR
calculated from estimates of U5MR in two different years derived
from two separate surveys [14]. Given sampling and non-sampling
errors in data series, generally, we would caution against the use of
point estimates based on a single study.
ConclusionsPoint estimates on child mortality based on limited information
may substantially under- or overestimate the truth. Uncertainty
assessments can and should be used to complement point estimates
to avoid unwarranted conclusions about levels or trends in child
Figure 6. ARR from 1990 to 2011 for 86 high mortality countries. Countries are grouped based on the categories from Table 2 (lines coloredgrey, red, black, blue, and green for categories 1 to 5, respectively). Within each category, countries are sorted by the point estimate of the ARR. LaoPDR, Lao People’s Democratic Republic; OPT, Occupied Palestinian Territory.doi:10.1371/journal.pmed.1001355.g006
Uncertainty in MDG4 Estimates
PLOS Medicine | www.plosmedicine.org 10 December 2012 | Volume 9 | Issue 12 | e1001355
mortality and to reduce confusion about differences in estimates,
such as estimates from different groups such as the UN IGME and
IHME, or after updating point estimates in light of new data. The
new uncertainty assessments provide more insights into countries’
progress in reducing child mortality. In particular, a comparison of
the lower bound of the UI for the ARR across countries is more
informative to pinpoint countries where we are confident that
U5MR has declined since 1990, compared to ranking countries by
their point estimates of the ARR (which can be highly uncertain,
and thus arbitrarily high or low, for countries with limited data). In
the coming years, including in 2015, UIs can be used to assess
countries’ progress toward MDG 4, as illustrated here (Table 2;
Figure 6), and to evaluate whether the accomplishment of the
target of an ARR of 4.4% is deemed unlikely, not clear, or likely
based on all available data.
Supporting Information
Figure S1 U5MR from 1990 to 2011 for all 174 countries.Data (colored connected dots), UN IGME 2012 point estimates
(black dashed lines), UIs constructed using the bootstrap method
(red shaded areas, labeled ‘‘new UIs’’), and UIs constructed using
the previous method (blue shaded areas, labeled ‘‘old UIs’’). The
source and source date for each data series are given in the legend.
(PDF)
Table S1 Estimates and uncertainty intervals for allcountries for the U5MR in 1990, 2000, and 2011, and theARR from 1990 to 2011.
(DOCX)
Text S1 Supplementary information on the construc-tion of the uncertainty intervals.
(PDF)
Acknowledgments
We thank the members of the UN IGME, its Technical Advisory Group,
and Joy Lawn and Mikkel Oestergaard for very helpful discussions,
suggestions, and comments. We also thank Danzhen You for assistance
with the data and Jennifer Chunn and John Wilmoth for insightful
comments and suggestions related to the manuscript.
Author Contributions
Conceived and designed the experiments: LA JRN. Performed the
experiments: LA JRN. Analyzed the data: LA JRN. Contributed
reagents/materials/analysis tools: LA JRN. Wrote the first draft of the
manuscript: LA. Contributed to the writing of the manuscript: LA JRN.
ICMJE criteria for authorship read and met: LA JRN. Agree with
manuscript results and conclusions: LA JRN.
References
1. The United Nations Inter-agency Group for Child Mortality Estimation (2012)
Levels & trends in child mortality: report 2012. New York: United NationsChildren’s Fund.
2. The United Nations Inter-agency Group for Child Mortality Estimation (2011)Levels & trends in child mortality: report 2011. New York: United Nations
Children’s Fund.
3. Pedersen J, Liu J (2012) Child mortality estimation: appropriate time periods forchild mortality estimates from full birth histories. PLoS Med 9: e1001289.
doi:10.1371/journal.pmed.10012894. Department of International Economic and Social Affairs of the United
Nations (1983) Manual X—indirect techniques for demographic estimation.
New York: Department of International Economic and Social Affairs of theUnited Nations.
5. Hill K, You D, Inoue M, Oestergaard MZ (2012) Child mortality estimation:accelerated progress in reducing global child mortality, 1990–2010. PLoS Med
9: e1001303. doi:10.1371/journal.pmed.10013036. Efron B, Tibshirnai RJ (1993) An introduction to the bootstrap. New York:
Chapman & Hall.
7. Alkema L, Wong MB, Seah PR (2012) Monitoring progress towards MillenniumDevelopment Goal 4: a call for improved validation of under-5 mortality rate
estimates. Stat Politics Policy 3: article 2.
8. R Development Core Team (2011) R: a language and environment for statistical
computing. Vienna: R Foundation for Statistical Computing.9. Lunn DJ, Thomas A, Best N, Spiegelhalter D (2000) WinBUGS—a Bayesian
modelling framework: concepts, structure, and extensibility. Stat Comput 10:325–337.
10. Oestergaard MZ, Inoue M, Yoshida S, Mahanani WR, Gore FM, et al. (2011)
Neonatal mortality levels for 193 countries in 2009 with trends since 1990: asystematic analysis of progress, projections, and priorities. PLoS Med 8:
e1001080. doi:10.1371/journal.pmed.100108011. Lozano R, Wang H, Foreman KJ, Rajaratnam JK, Naghavi M, et al. (2011)
Progress towards Millennium Development Goals 4 and 5 on maternal and child
mortality: an updated systematic analysis. Lancet 378: 1139–1165.12. Alkema L, You D (2012) Child mortality estimation: a comparison of UN IGME
and IHME estimates of levels and trends in under-five mortality rates anddeaths. PLoS Med 9: e1001288. doi:10.1371/journal.pmed.1001288
13. Amouzou A, Habi O, Bensaıd K, the Niger Countdown Case Study WorkingGroup (2012) Reduction in child mortality in Niger: a countdown to 2015
country case study. Lancet 380: 1169–1178. doi:10.1016/S0140-6736(12)61376-2
14. Demombynes G, Trommlerova SK (2012) What has driven the decline of infantmortality in Kenya? Policy Research Working Paper 6057. Washington (District
of Columbia): World Bank.
Table 4. Validation results for the bootstrap method and thedefault method for high mortality countries based on the2011 dataset.
Indicator Bootstrap Method Default Method
Below Above Below Above
U5MR 1990 3 3 14 10
U5MR 2000 10 6 31 17
U5MR 2005 17 7 37 14
ARR 1990–2005
6 16 11 29
The percentage of high mortality countries for which the UN IGME 2011estimate of the U5MR in 1990, 2000, and 2005, and the ARR for 1990–2005, fallsbelow or above the 90% UI that would have been constructed in 2006 with allavailable data at that time. High mortality countries are defined by a U5MR of atleast 40 deaths per 1,000 live births in 1990, where U5MR estimates wereconstructed using the standard UN IGME method; 70 high mortality countrieswere included in the exercise (with data in both training and test sets).doi:10.1371/journal.pmed.1001355.t004
Uncertainty in MDG4 Estimates
PLOS Medicine | www.plosmedicine.org 11 December 2012 | Volume 9 | Issue 12 | e1001355
Editors’ Summary
Background. In September 2000, world leaders adoptedthe United Nations Millennium Declaration, committingmember states (countries) to a new global partnership toreduce extreme poverty and improve global health bysetting out a series of time-bound targets with a deadline of2015—the Millennium Development Goals (MDGs). There areeight MDGs and the fourth, MDG 4, focuses on reducing thenumber of deaths in children aged under five years by two-thirds from the 1990 level. Monitoring progress towardsmeeting all of the MDG targets is of vital importance tomeasure the effectiveness of interventions and to prioritizeslow progress areas. MDG 4 has three specific indicators, andevery year, the United Nations Inter-agency Group for ChildMortality Estimation (the UN IGME, which includes the keyagencies the United Nations Children’s Fund, the WorldHealth Organization, the World Bank, and the United NationsPopulation Division) produces and publishes estimates ofchild death rates for all countries.
Why Was This Study Done? Many poorer countries donot have the infrastructure and the functioning vitalregistration systems in place to record the number of childdeaths. Therefore, it is difficult to accurately assess levels andtrends in the rate of child deaths because there is limitedinformation (data) or because the data that exists may beinaccurate or of poor quality. In order to deal with thissituation, analyzing trends in under-five child death rates (toshow progress towards MDG 4) currently focuses on the‘‘best’’ estimates from countries, a process that relies on‘‘point’’ estimates. But this practice can lead to inaccurateresults and comparisons. It is therefore important to identifya framework for calculating the uncertainty surroundingthese estimates. In this study, the researchers use a statisticalmethod to calculate plausible uncertainty intervals for theestimates of death rates in children aged under five yearsand the yearly reduction in those rates.
What Did the Researchers Do and Find? The researchersused the publicly available information from the UN IGME2012 database, which collates data from a variety of sources,and a statistical method called bootstrapping to constructuncertainty levels for 174 countries out of 195 countries forwhich the UN IGME published estimates in 2012. This newmethod improves current practice for estimating the extent
of data errors, as it takes into account the structure and(potentially poor) quality of the data. The researchers used90% as the uncertainty level and categorized countriesaccording to the likelihood of meeting the MDG 4 target.Using these methods, the researchers found that in countrieswith high child mortality rates (40 or more deaths per 1,000children in 1990), there was a lot of uncertainty (wideuncertainty intervals) about the levels and trends of deathrates in children aged under five years, especially morerecently, because of the limited availability of data. Overall, in2011 the median width of the uncertainty interval for thechild death rate was 48% among the 86 countries with highdeath rates, compared to 19% in 1990. Using their newmethod, the researchers found that for eight countries, it isnot clear whether any progress had been made in reducingchild mortality, but for 13 countries, it is deemed likely thatprogress exceeded the MDG 4 target.
What Do These Findings Mean? These findings suggestthat new uncertainty assessments constructed by a statisticalmethod called bootstrapping can provide more insights intocountries’ progress in reducing child mortality and meetingthe MDG 4 target. As demonstrated in this study, when dataare limited, uncertainty intervals should to be taken intoaccount when estimating progress towards MDG 4 in orderto give more accurate assessments on a country’ progress,thus allowing for more realistic comparisons and conclu-sions.
Additional Information. Please access these websites viathe online version of this summary at http://dx.doi.org/10.1371/journal.pmed.1001355.
N The UN website has more information about theMillennium Development Goals, including country-specific data
N More information is available from UNICEF’s ChildInfowebsite about the UN IGME and child mortality
N All UN IGME child mortality estimates and data areavailable via CME Info
N Countdown to 2015 tracks coverage levels for healthinterventions proven to reduce child mortality andproposes new actions to reach MDG 4
Uncertainty in MDG4 Estimates
PLOS Medicine | www.plosmedicine.org 12 December 2012 | Volume 9 | Issue 12 | e1001355