PROGRESS REPORT - WHO | World Health Organization
37
PROGRESS REPORT 2021 APR 2020 - DEC 2021
-
Upload
khangminh22 -
Category
Documents
-
view
0 -
download
0
Transcript of PROGRESS REPORT - WHO | World Health Organization
PROGRESS REPORT2021APR 2020 - DEC 2021
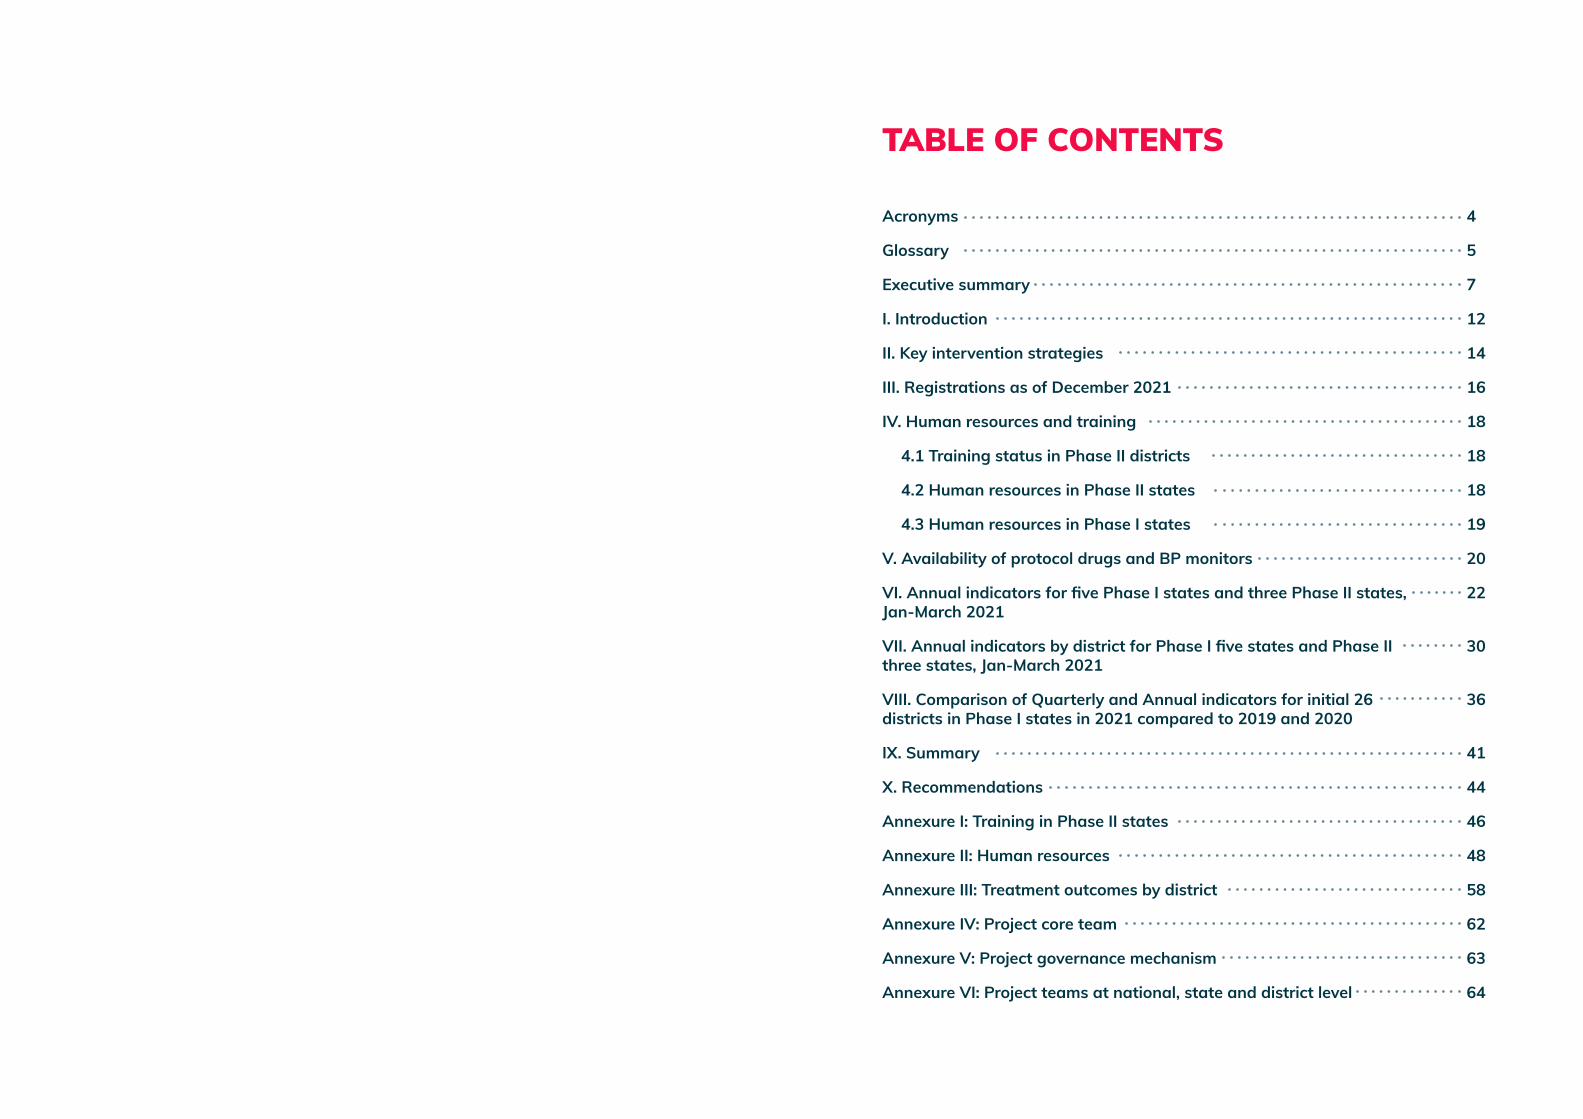
TABLE OF CONTENTS
Acronyms
Glossary
Executive summary
I. Introduction
II. Key intervention strategies
III. Registrations as of December 2021
IV. Human resources and training
4.1 Training status in Phase II districts
4.2 Human resources in Phase II states
4.3 Human resources in Phase I states
V. Availability of protocol drugs and BP monitors
VI. Annual indicators for five Phase I states and three Phase II states, Jan-March 2021
VII. Annual indicators by district for Phase I five states and Phase II three states, Jan-March 2021
VIII. Comparison of Quarterly and Annual indicators for initial 26 districts in Phase I states in 2021 compared to 2019 and 2020
IX. Summary
X. Recommendations
Annexure I: Training in Phase II states
Annexure II: Human resources
Annexure III: Treatment outcomes by district
Annexure IV: Project core team
Annexure V: Project governance mechanism
Annexure VI: Project teams at national, state and district level
4
5
7
12
14
16
18
18
18
19
20
22
30
36
41
44
46
48
58
62
63
64
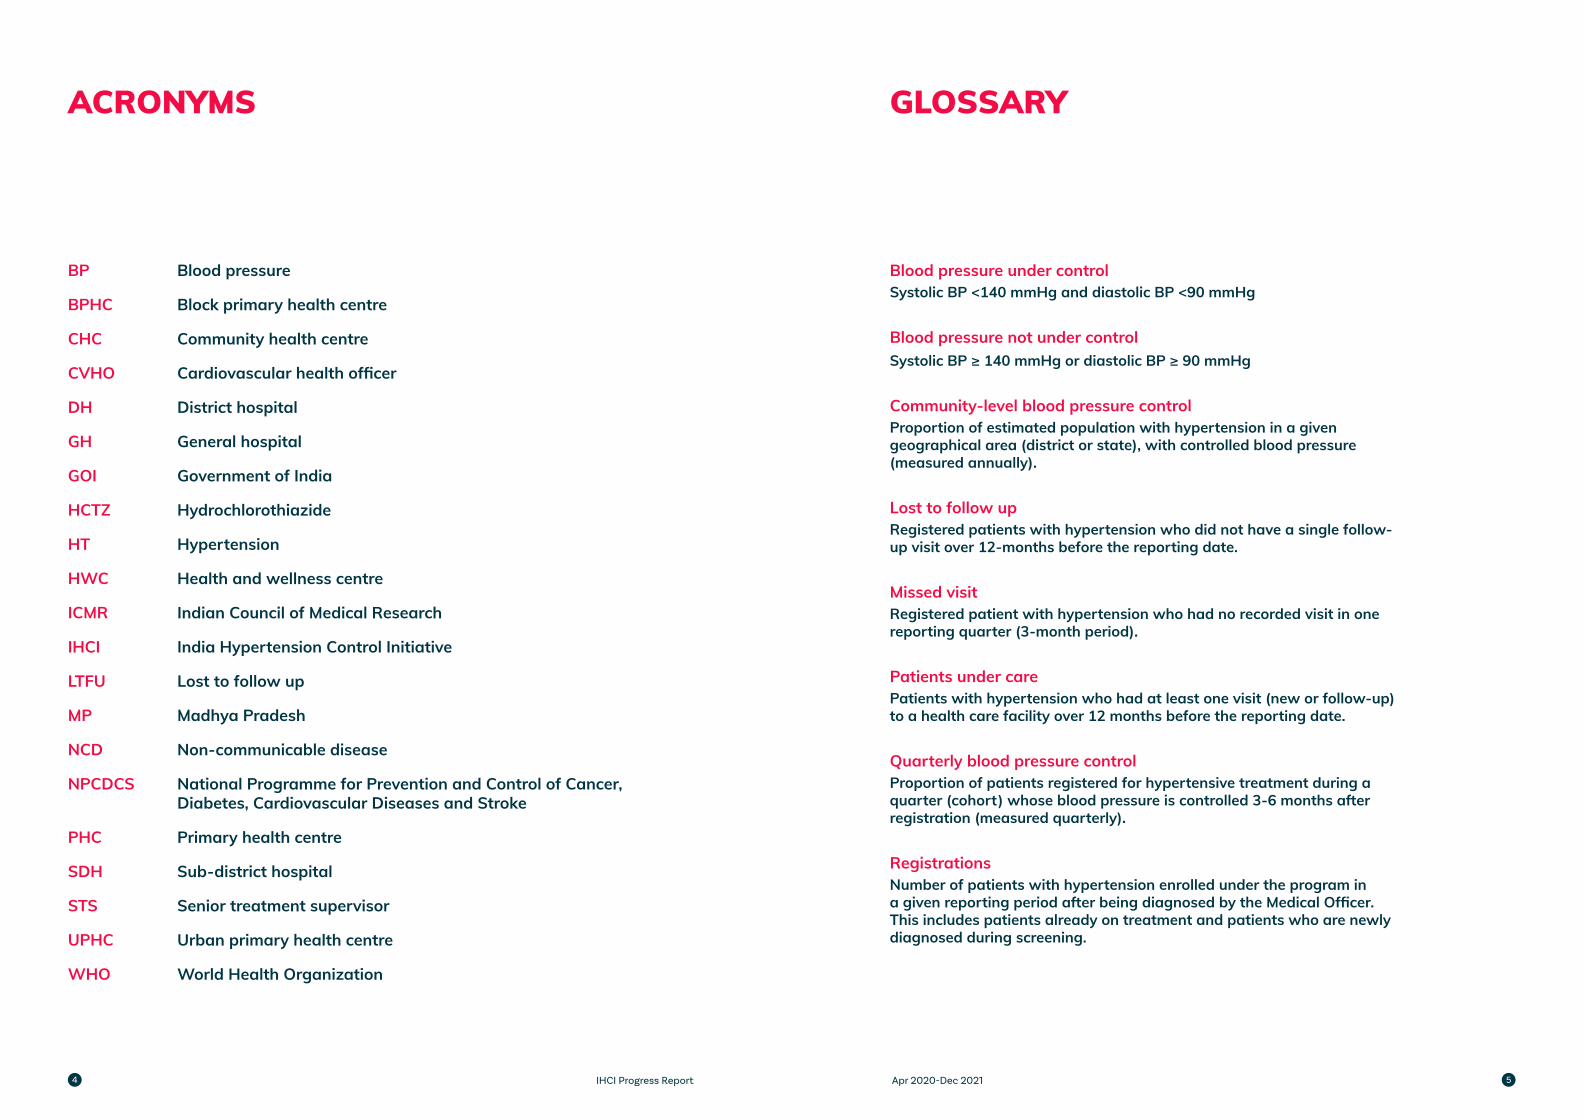
ACRONYMS GLOSSARY
BP
BPHC
CHC
CVHO
DH
GH
GOI
HCTZ
HT
HWC
ICMR
IHCI
LTFU
MP
NCD
NPCDCS
PHC
SDH
STS
UPHC
WHO
Blood pressure
Block primary health centre
Community health centre
Cardiovascular health officer
District hospital
General hospital
Government of India
Hydrochlorothiazide
Hypertension
Health and wellness centre
Indian Council of Medical Research
India Hypertension Control Initiative
Lost to follow up
Madhya Pradesh
Non-communicable disease
National Programme for Prevention and Control of Cancer, Diabetes, Cardiovascular Diseases and Stroke
Primary health centre
Sub-district hospital
Senior treatment supervisor
Urban primary health centre
World Health Organization
Blood pressure under controlSystolic BP <140 mmHg and diastolic BP <90 mmHg
Blood pressure not under controlSystolic BP ≥ 140 mmHg or diastolic BP ≥ 90 mmHg
Community-level blood pressure controlProportion of estimated population with hypertension in a given geographical area (district or state), with controlled blood pressure (measured annually).
Lost to follow upRegistered patients with hypertension who did not have a single follow-up visit over 12-months before the reporting date.
Missed visitRegistered patient with hypertension who had no recorded visit in one reporting quarter (3-month period).
Patients under carePatients with hypertension who had at least one visit (new or follow-up) to a health care facility over 12 months before the reporting date.
Quarterly blood pressure controlProportion of patients registered for hypertensive treatment during a quarter (cohort) whose blood pressure is controlled 3-6 months after registration (measured quarterly).
RegistrationsNumber of patients with hypertension enrolled under the program in a given reporting period after being diagnosed by the Medical Officer. This includes patients already on treatment and patients who are newly diagnosed during screening.
IHCI Progress Report Apr 2020-Dec 20214 5
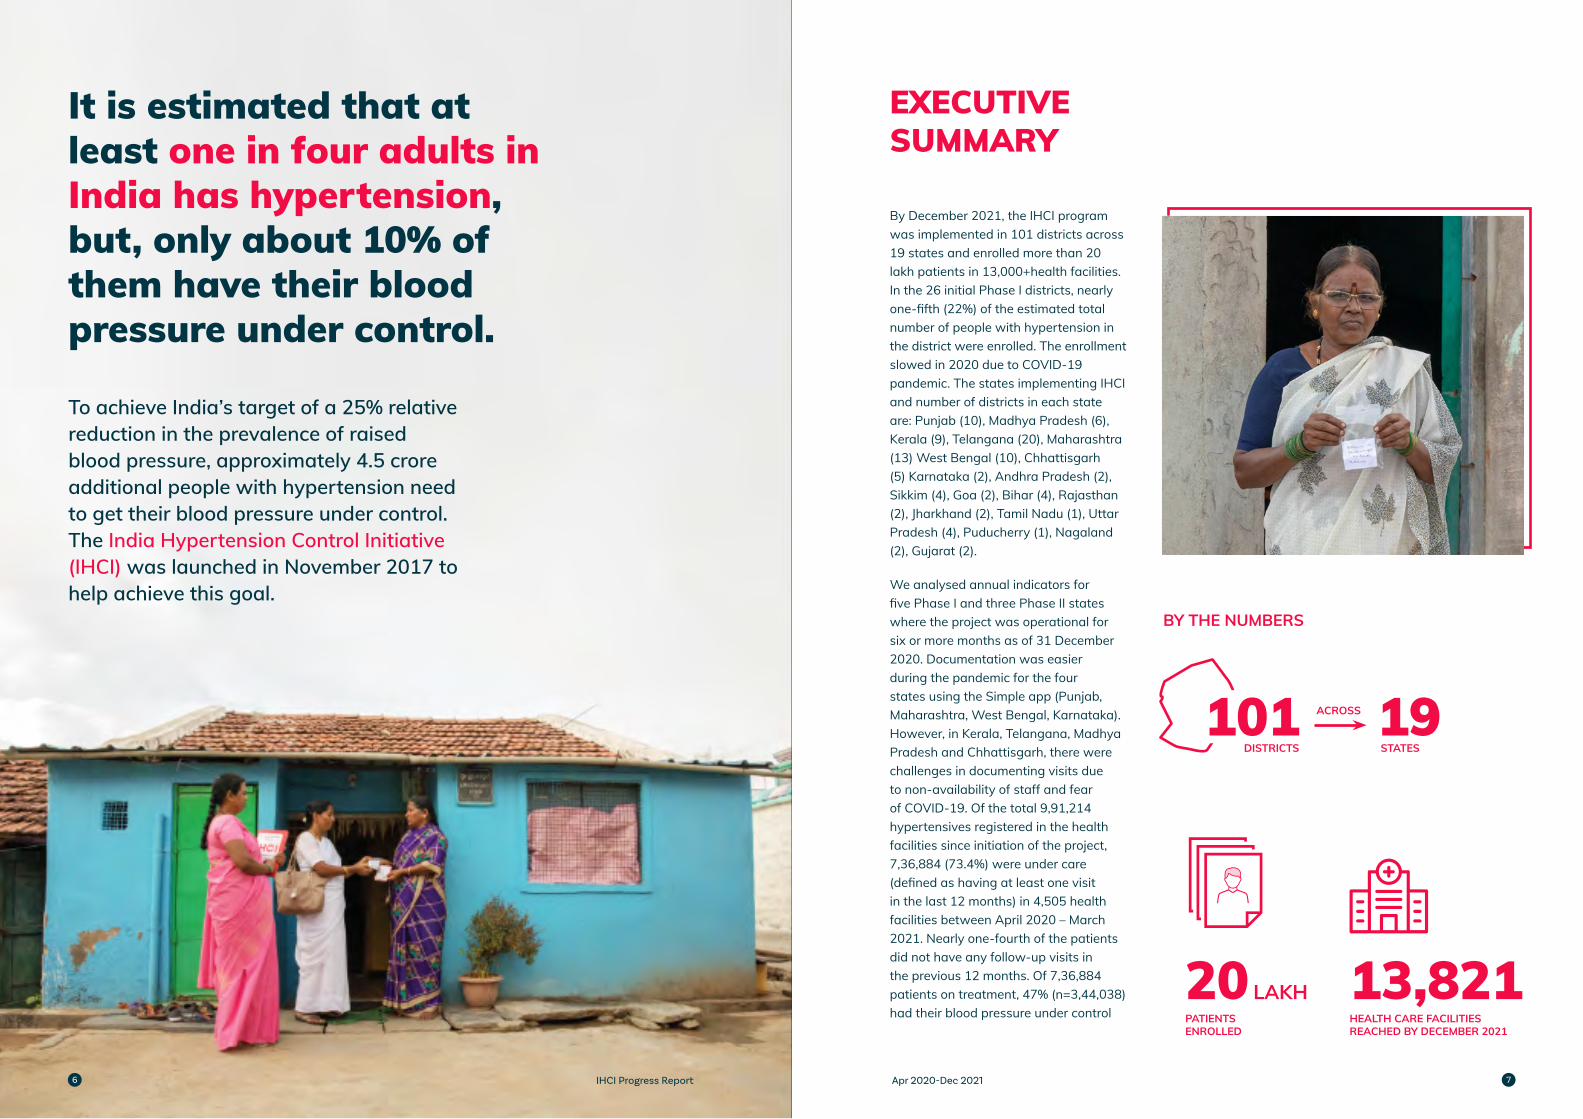
It is estimated that at least one in four adults in India has hypertension, but, only about 10% of them have their blood pressure under control.
To achieve India’s target of a 25% relative reduction in the prevalence of raised blood pressure, approximately 4.5 crore additional people with hypertension need to get their blood pressure under control. The India Hypertension Control Initiative (IHCI) was launched in November 2017 to help achieve this goal.
EXECUTIVE SUMMARY
By December 2021, the IHCI program was implemented in 101 districts across 19 states and enrolled more than 20 lakh patients in 13,000+health facilities. In the 26 initial Phase I districts, nearly one-fifth (22%) of the estimated total number of people with hypertension in the district were enrolled. The enrollment slowed in 2020 due to COVID-19 pandemic. The states implementing IHCI and number of districts in each state are: Punjab (10), Madhya Pradesh (6), Kerala (9), Telangana (20), Maharashtra (13) West Bengal (10), Chhattisgarh (5) Karnataka (2), Andhra Pradesh (2), Sikkim (4), Goa (2), Bihar (4), Rajasthan (2), Jharkhand (2), Tamil Nadu (1), Uttar Pradesh (4), Puducherry (1), Nagaland (2), Gujarat (2).
We analysed annual indicators for five Phase I and three Phase II states where the project was operational for six or more months as of 31 December 2020. Documentation was easier during the pandemic for the four states using the Simple app (Punjab, Maharashtra, West Bengal, Karnataka). However, in Kerala, Telangana, Madhya Pradesh and Chhattisgarh, there were challenges in documenting visits due to non-availability of staff and fear of COVID-19. Of the total 9,91,214 hypertensives registered in the health facilities since initiation of the project, 7,36,884 (73.4%) were under care (defined as having at least one visit in the last 12 months) in 4,505 health facilities between April 2020 – March 2021. Nearly one-fourth of the patients did not have any follow-up visits in the previous 12 months. Of 7,36,884 patients on treatment, 47% (n=3,44,038) had their blood pressure under control
BY THE NUMBERS
ACROSS
DISTRICTS STATES
HEALTH CARE FACILITIES REACHED BY DECEMBER 2021
PATIENTS ENROLLED
19
20 13,821LAKH
IHCI Progress Report Apr 2020-Dec 20216 7

during the most recent visit in the first quarter of 2021. Nearly one-fourth (23%) had uncontrolled BP despite continuing to attend health facilities, and 27% did not have a documented visit in this period. Overall, blood pressure control was highest (55%) at Health and Wellness Centres and second highest (48%) at PHCs.
We compared the key indicators in 2020 and 2021 for the initial 26 Phase I districts. The quarterly cohort blood pressure control rates declined in the second and third quarters of 2020 due to COVID-19-related disruptions; control rates started improving in the first quarter of 2021. Community-level hypertension control improved in 21 project districts in 2021 compared to 2020. Among the estimated 46 lakh hypertensives across initial Phase I 26 districts, BP control increased more than four-fold, although from a very low baseline: 6.1% achieved BP control in Q1-2021 compared to 4.9% in Q1, 2020 and 1.4% in Q1-2019. Overall, the number of patients with controlled BP continued to increase over three years (2,83,457 in Q1-2021; 2,18,340 in Q1-2020 and 64,704 in Q1-2019). The numbers declined in Kerala due to poor documentation during the pandemic and inability to provide medication refills at the subcentre level. Six districts achieved more than 10% community level BP control.
Medication availability at the district level has improved in the initial 26 districts due to better planning, streamlining of procurement process and field-level monitoring. Punjab, Madhya Pradesh and Telangana had hypertension protocol drug stocks for nearly six months. Kerala had only a one-month stock and Maharashtra had a two-month stock available in May 2021. In several Phase II states, slow medication procurement up to one year in some states delayed implementation.
One of the highlights of 2020-21 was the operationalisation of Health and Wellness Centres at the sub-centre level for blood pressure monitoring and provision of medication refills for hypertension patients. Overall, nearly half of all the implementing facilities were Sub-centre Health and Wellness Centres (SC-HWC).
The project demonstrated the feasibility of hypertension care at the most peripheral health facilities in context of the COVID-19 pandemic. The districts and states with functional HWCs improved blood pressure control and patient retention. Districts using the Simple App were able to document patient visits even during the pandemic while states
using a paper-based system faced challenges in retrieving and updating patient records. Progress in both the Phase I and Phase II districts was possible despite the pandemic, due to strong collaboration and coordination among the Indian Council of Medical Research, World Health Organization, NPCDCS and State governments; state and district health officials’ commitment and international technical partnership. IHCI field teams consisting of Cardiovascular Health Officers, who are public health specialists (one for several districts and the state nodal office) and Senior Treatment Supervisors (1-2 per district) played a key role in implementation and coordination with state and district teams.
DECLINE IN QUARTERLY COHORT BLOOD PRESSURE CONTROL RATES in the second and third quarters of 2020 due to COVID-19 related disruptions
IMPROVEMENT IN COMMUNITY-LEVEL HYPERTENSION CONTROLin 21 project districts in the first quarter of 2021
INCREASE IN COMMUNITY LEVEL BP CONTROL among ~46lakh hypertensives across Phase I 26 districts
INCREASE IN NUMBER OF PATIENTS with controlled BP over three years
4x
Districts using the Simple App were able to document patient visits even during the pandemic, while states using paper-based systems faced challenges in retrieving and updating patient records.
KEY IHCI OUTCOME INDICATORS
Q1 (2019) Q1 (2020) Q1 (2021)
2,83,457
2,18,340
64,704
IHCI Progress Report Apr 2020-Dec 20218 9
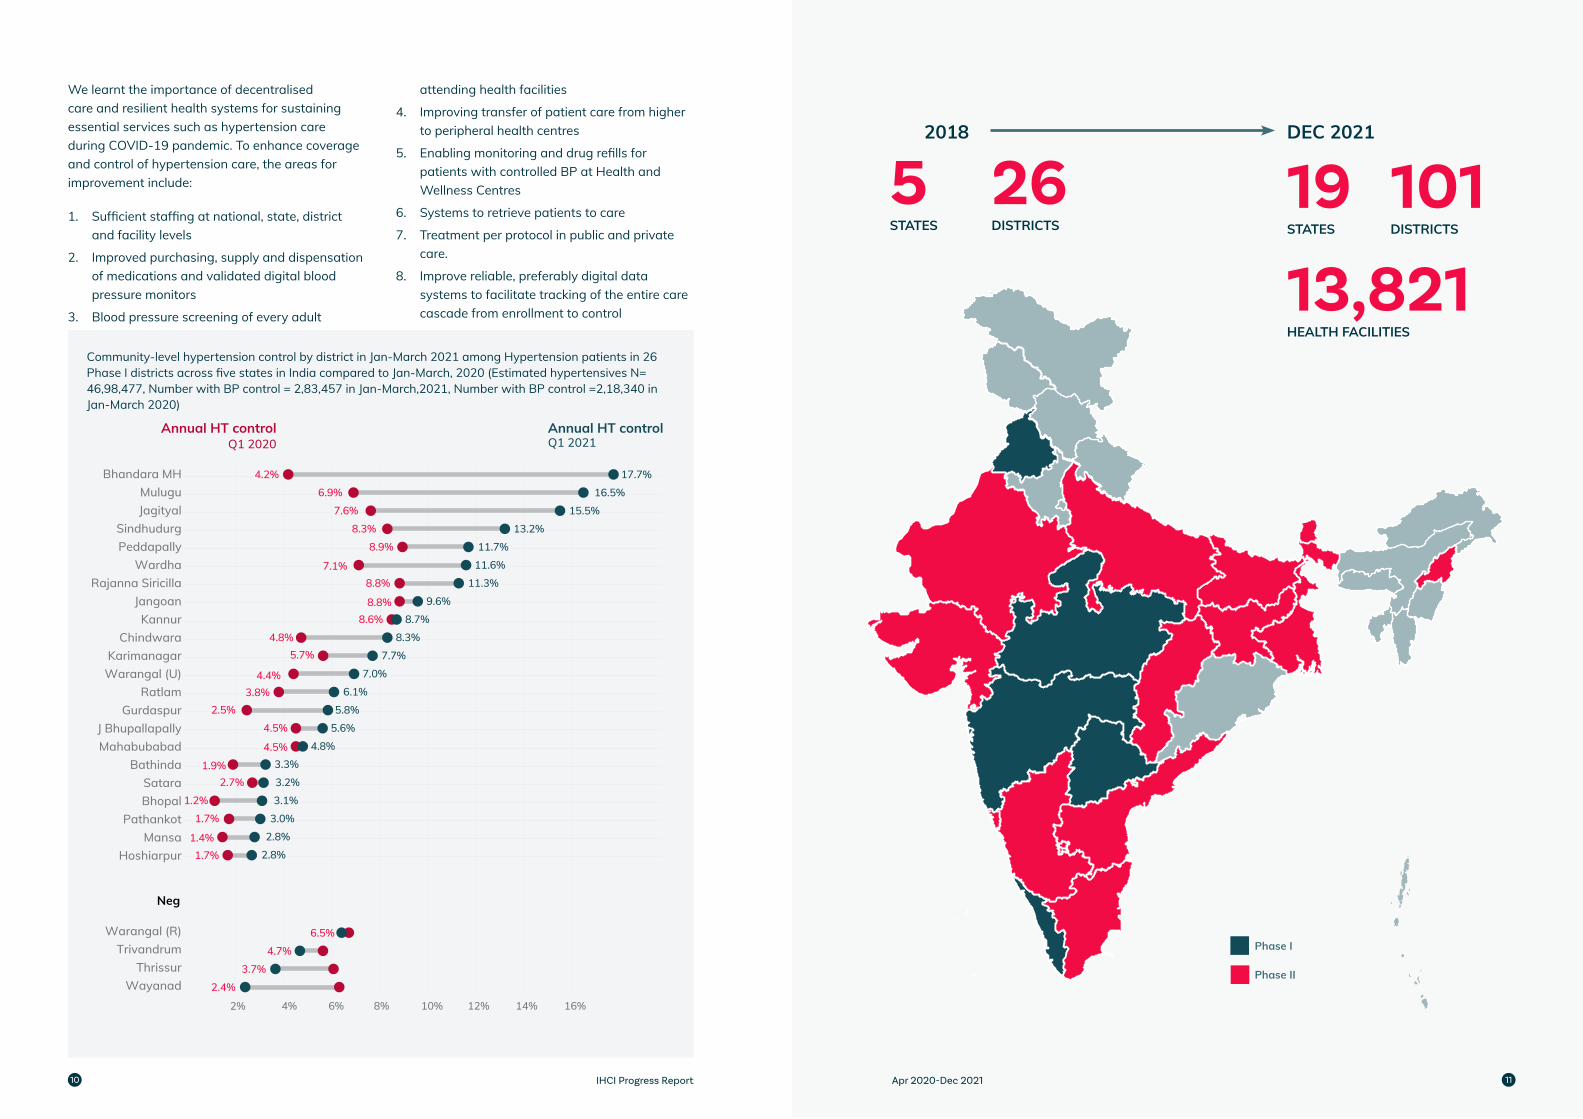
Community-level hypertension control by district in Jan-March 2021 among Hypertension patients in 26 Phase I districts across five states in India compared to Jan-March, 2020 (Estimated hypertensives N= 46,98,477, Number with BP control = 2,83,457 in Jan-March,2021, Number with BP control =2,18,340 in Jan-March 2020)
We learnt the importance of decentralised care and resilient health systems for sustaining essential services such as hypertension care during COVID-19 pandemic. To enhance coverage and control of hypertension care, the areas for improvement include:
1. Sufficient staffing at national, state, district and facility levels
2. Improved purchasing, supply and dispensation of medications and validated digital blood pressure monitors
3. Blood pressure screening of every adult
attending health facilities
4. Improving transfer of patient care from higher to peripheral health centres
5. Enabling monitoring and drug refills for patients with controlled BP at Health and Wellness Centres
6. Systems to retrieve patients to care
7. Treatment per protocol in public and private care.
8. Improve reliable, preferably digital data systems to facilitate tracking of the entire care cascade from enrollment to control
Phase I
Phase II
2018
101DISTRICTS
26DISTRICTS
19STATES
5STATES
DEC 2021
13,821HEALTH FACILITIES
2% 4% 6% 8% 10% 12% 14% 16%
17.7%
16.5%
15.5%
13.2%
11.7%
7.0%
6.1%
5.8%
5.6%
4.8%
3.3%
3.2%
3.1%
3.0%
2.8%
2.8%
11.6%
11.3%
9.6%
8.7%
8.3%
7.7%
4.2%
6.9%
7.6%
8.3%
8.9%
7.1%8.8%
8.8%8.6%
4.8%5.7%
4.4%3.8%
2.5%
4.5%
4.5%
1.9%2.7%
1.2%
1.7%
1.4%1.7%
6.5%
4.7%
3.7%
2.4%
Q1 2021Annual HT controlAnnual HT control
Q1 2020
Bhandara MHMuluguJagityal
SindhudurgPeddapally
WardhaRajanna Siricilla
JangoanKannur
ChindwaraKarimanagar
Warangal (U)Ratlam
GurdaspurJ BhupallapallyMahabubabad
BathindaSataraBhopal
PathankotMansa
Hoshiarpur
Warangal (R)Trivandrum
ThrissurWayanad
Neg
IHCI Progress Report Apr 2020-Dec 202110 11
INTRODUCTION
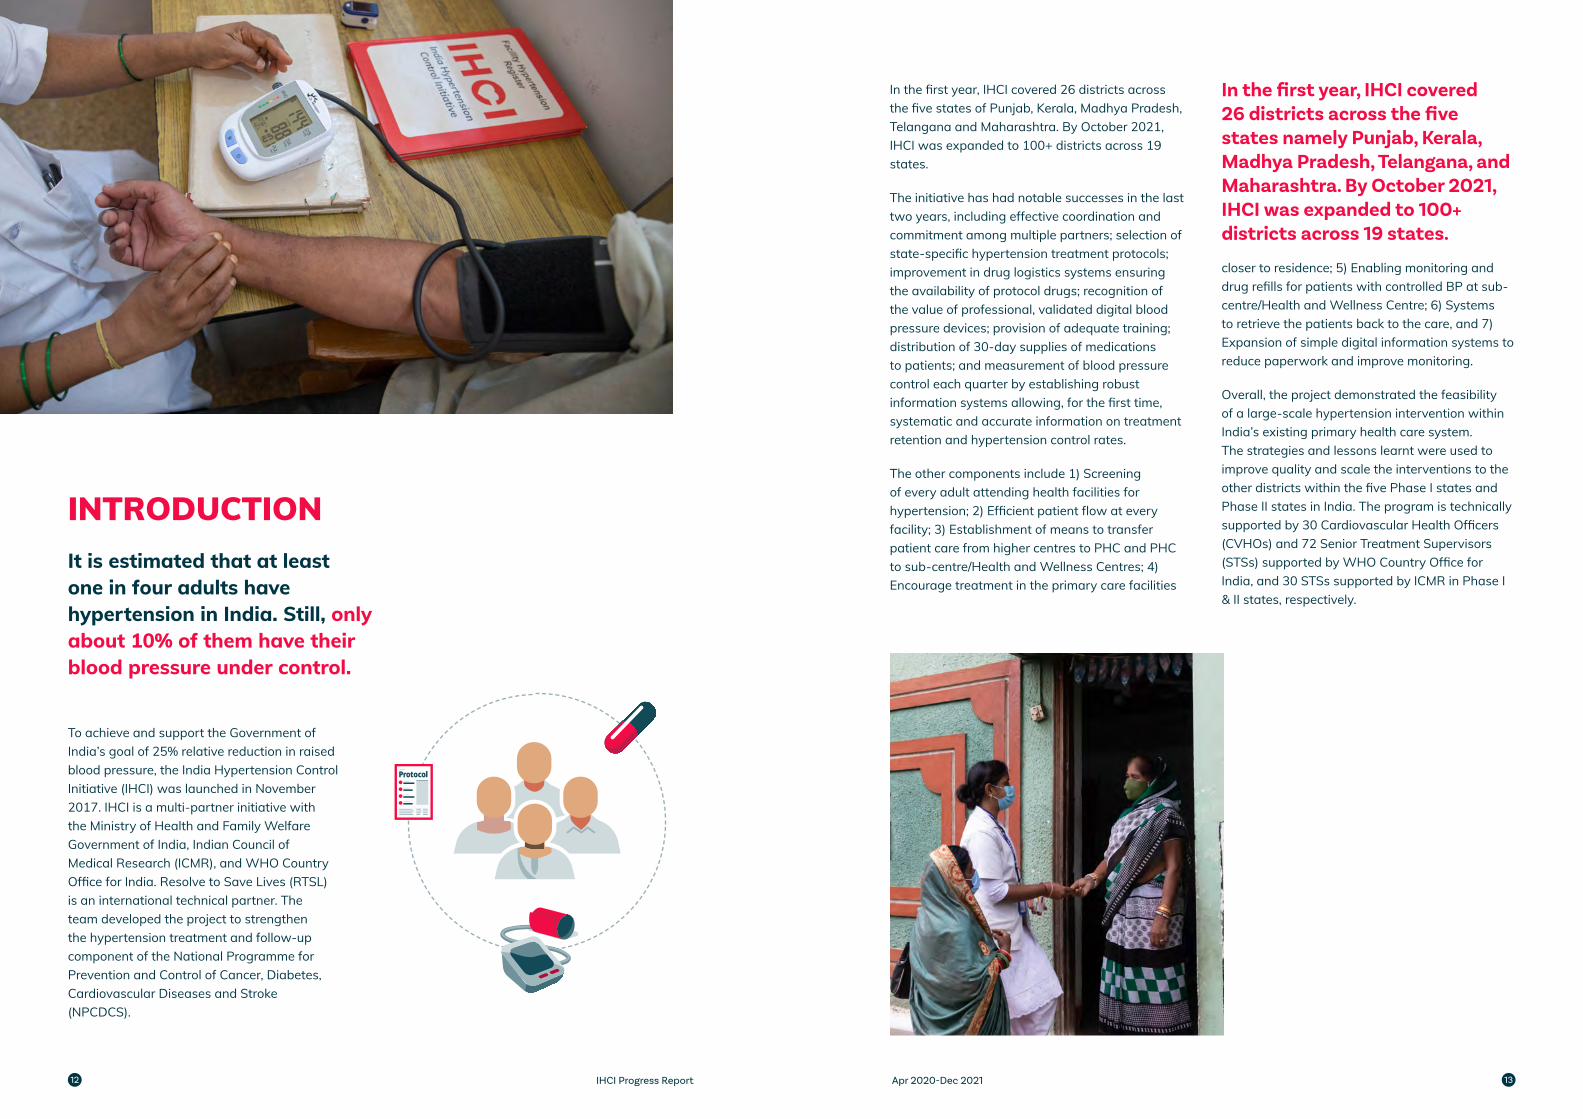
To achieve and support the Government of India’s goal of 25% relative reduction in raised blood pressure, the India Hypertension Control Initiative (IHCI) was launched in November 2017. IHCI is a multi-partner initiative with the Ministry of Health and Family Welfare Government of India, Indian Council of Medical Research (ICMR), and WHO Country Office for India. Resolve to Save Lives (RTSL) is an international technical partner. The team developed the project to strengthen the hypertension treatment and follow-up component of the National Programme for Prevention and Control of Cancer, Diabetes, Cardiovascular Diseases and Stroke (NPCDCS).
It is estimated that at least one in four adults have hypertension in India. Still, only about 10% of them have their blood pressure under control.
In the first year, IHCI covered 26 districts across the five states of Punjab, Kerala, Madhya Pradesh, Telangana and Maharashtra. By October 2021, IHCI was expanded to 100+ districts across 19 states.
The initiative has had notable successes in the last two years, including effective coordination and commitment among multiple partners; selection of state-specific hypertension treatment protocols; improvement in drug logistics systems ensuring the availability of protocol drugs; recognition of the value of professional, validated digital blood pressure devices; provision of adequate training; distribution of 30-day supplies of medications to patients; and measurement of blood pressure control each quarter by establishing robust information systems allowing, for the first time, systematic and accurate information on treatment retention and hypertension control rates.
The other components include 1) Screening of every adult attending health facilities for hypertension; 2) Efficient patient flow at every facility; 3) Establishment of means to transfer patient care from higher centres to PHC and PHC to sub-centre/Health and Wellness Centres; 4) Encourage treatment in the primary care facilities
closer to residence; 5) Enabling monitoring and drug refills for patients with controlled BP at sub-centre/Health and Wellness Centre; 6) Systems to retrieve the patients back to the care, and 7) Expansion of simple digital information systems to reduce paperwork and improve monitoring.
Overall, the project demonstrated the feasibility of a large-scale hypertension intervention within India’s existing primary health care system. The strategies and lessons learnt were used to improve quality and scale the interventions to the other districts within the five Phase I states and Phase II states in India. The program is technically supported by 30 Cardiovascular Health Officers (CVHOs) and 72 Senior Treatment Supervisors (STSs) supported by WHO Country Office for India, and 30 STSs supported by ICMR in Phase I & II states, respectively.
In the first year, IHCI covered 26 districts across the five states namely Punjab, Kerala, Madhya Pradesh, Telangana, and Maharashtra. By October 2021, IHCI was expanded to 100+ districts across 19 states.
IHCI Progress Report Apr 2020-Dec 202112 13
KEY INTERVENTION STRATEGIES
1
4
7
2
5
8
3
6
9
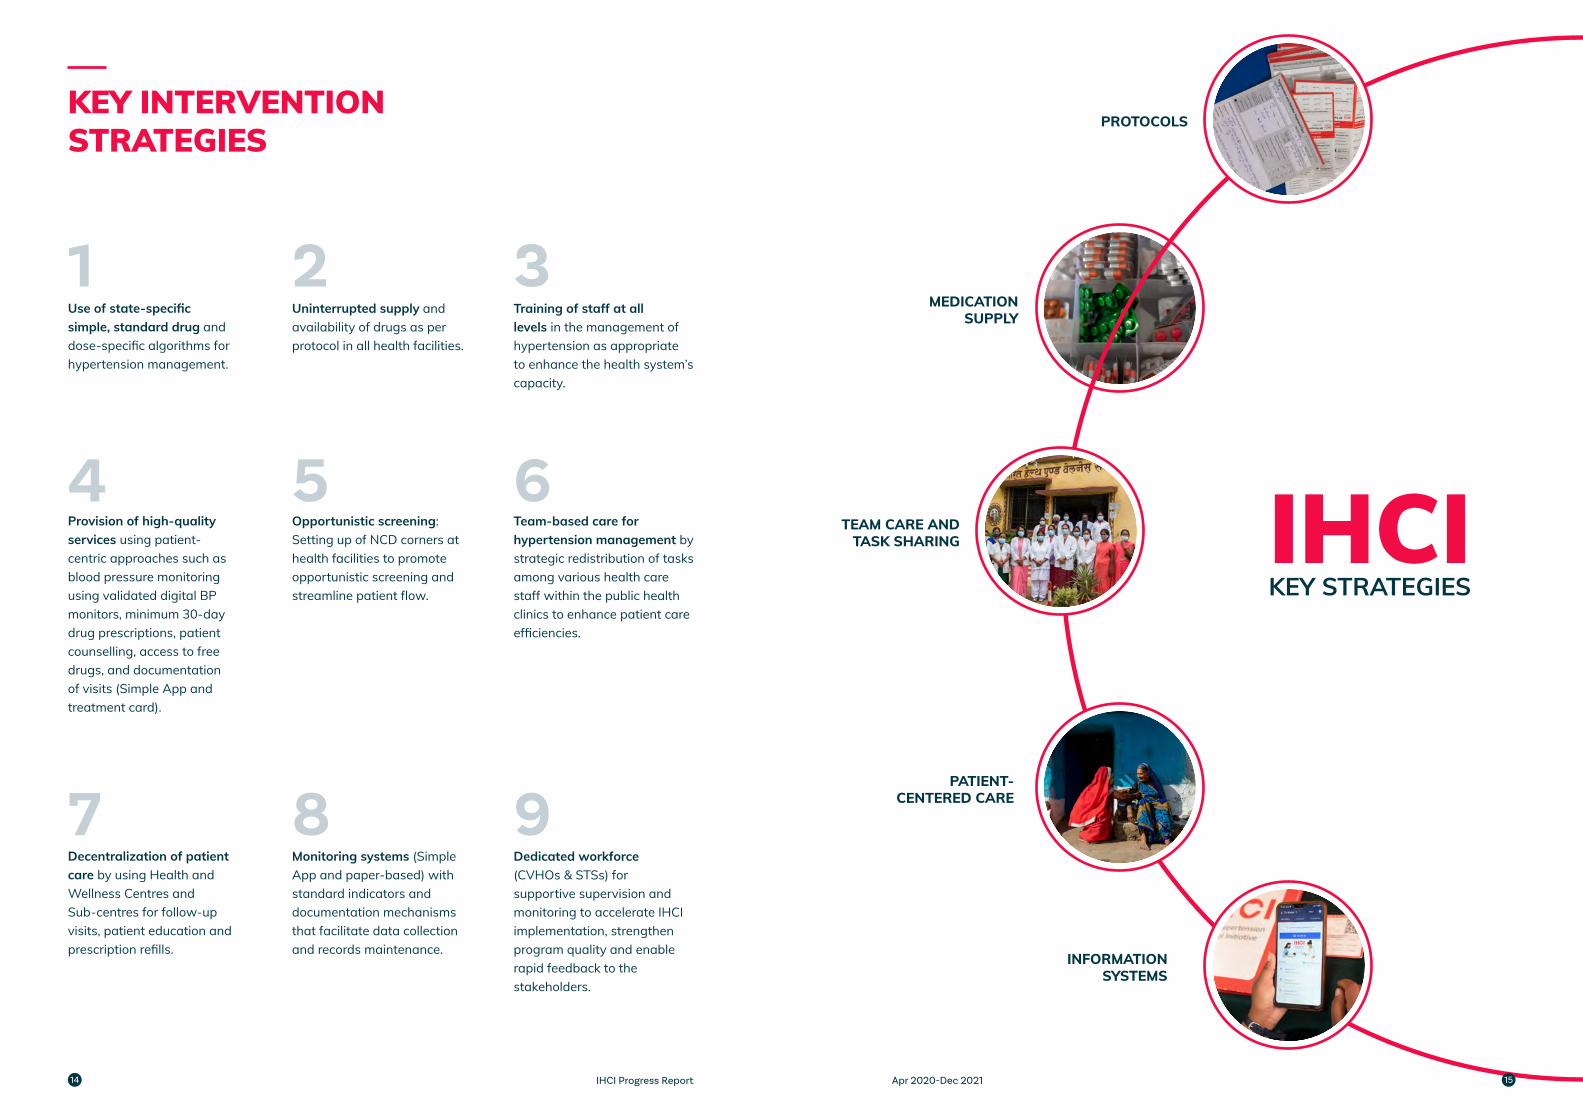
Use of state-specific simple, standard drug and dose-specific algorithms for hypertension management.
Provision of high-quality services using patient-centric approaches such as blood pressure monitoring using validated digital BP monitors, minimum 30-day drug prescriptions, patient counselling, access to free drugs, and documentation of visits (Simple App and treatment card).
Decentralization of patient care by using Health and Wellness Centres and Sub-centres for follow-up visits, patient education and prescription refills.
Uninterrupted supply and availability of drugs as per protocol in all health facilities.
Opportunistic screening: Setting up of NCD corners at health facilities to promote opportunistic screening and streamline patient flow.
Monitoring systems (Simple App and paper-based) with standard indicators and documentation mechanisms that facilitate data collection and records maintenance.
Training of staff at all levels in the management of hypertension as appropriate to enhance the health system’s capacity.
Team-based care for hypertension management by strategic redistribution of tasks among various health care staff within the public health clinics to enhance patient care efficiencies.
Dedicated workforce (CVHOs & STSs) for supportive supervision and monitoring to accelerate IHCI implementation, strengthen program quality and enable rapid feedback to the stakeholders.
INFORMATION SYSTEMS
PATIENT-CENTERED CARE
KEY STRATEGIESIHCI
PROTOCOLS
TEAM CARE AND TASK SHARING
MEDICATION SUPPLY
IHCI Progress Report Apr 2020-Dec 202114 15
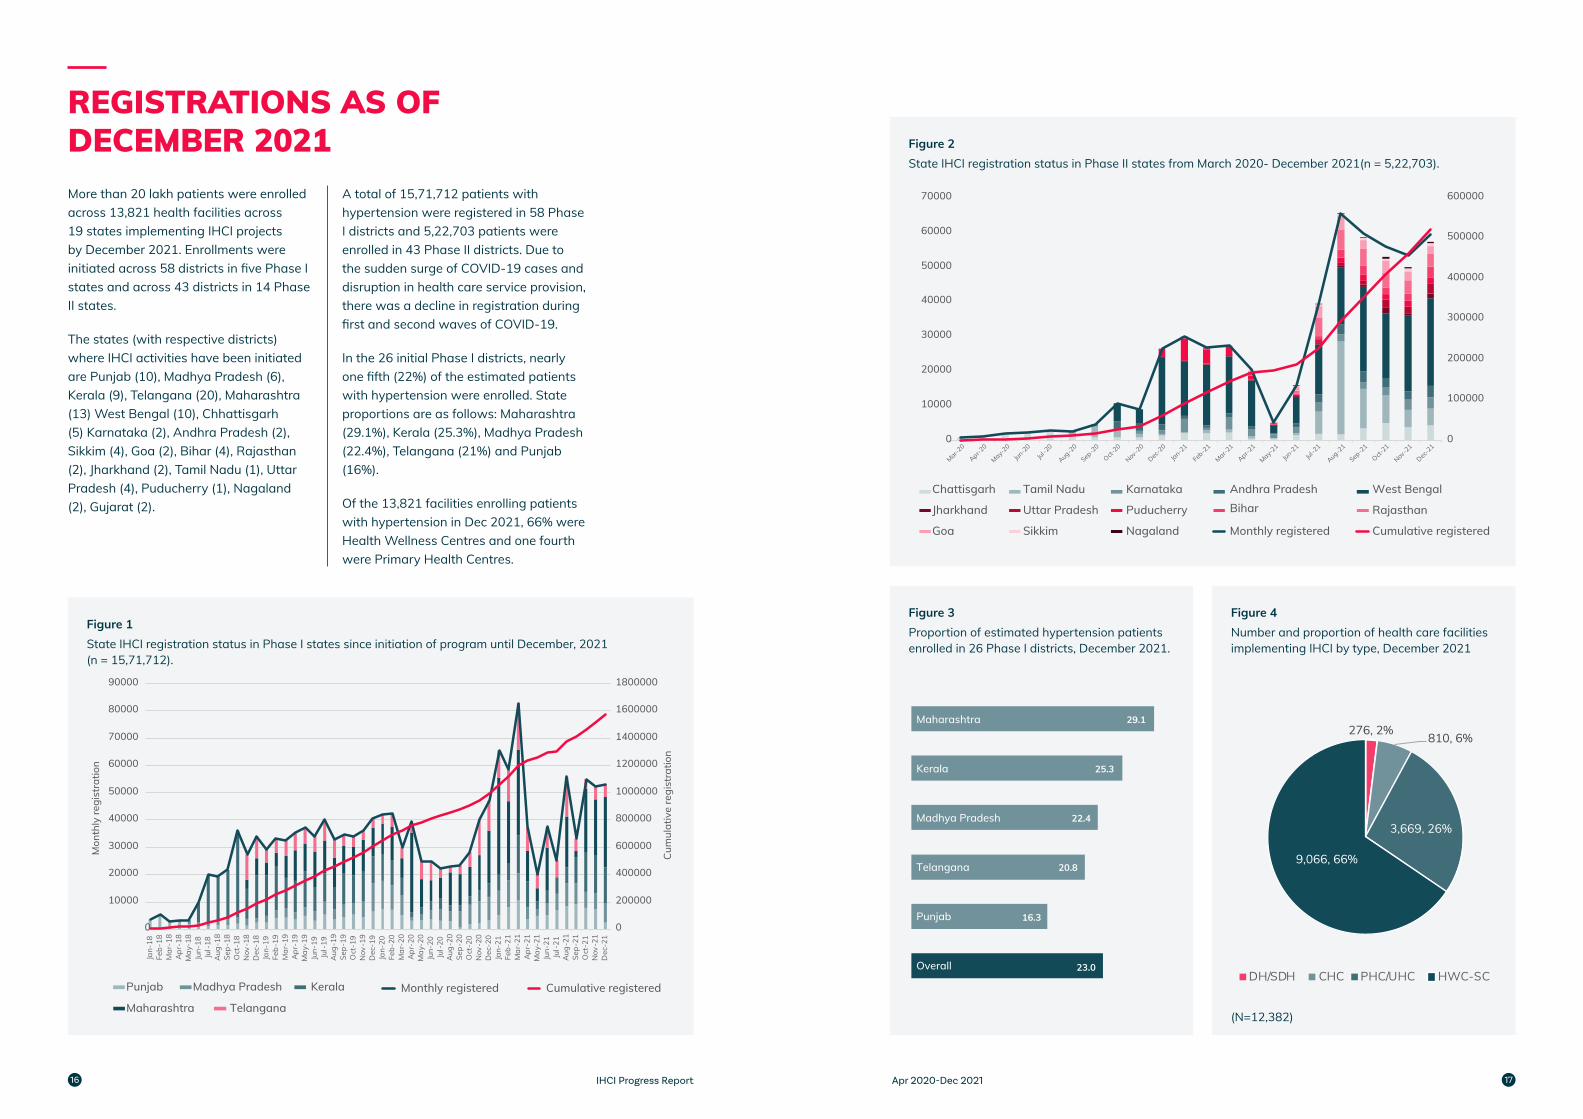
Figure 2State IHCI registration status in Phase II states from March 2020- December 2021(n = 5,22,703).
REGISTRATIONS AS OF DECEMBER 2021
Figure 1State IHCI registration status in Phase I states since initiation of program until December, 2021 (n = 15,71,712).
More than 20 lakh patients were enrolled across 13,821 health facilities across 19 states implementing IHCI projects by December 2021. Enrollments were initiated across 58 districts in five Phase I states and across 43 districts in 14 Phase II states.
The states (with respective districts) where IHCI activities have been initiated are Punjab (10), Madhya Pradesh (6), Kerala (9), Telangana (20), Maharashtra (13) West Bengal (10), Chhattisgarh (5) Karnataka (2), Andhra Pradesh (2), Sikkim (4), Goa (2), Bihar (4), Rajasthan (2), Jharkhand (2), Tamil Nadu (1), Uttar Pradesh (4), Puducherry (1), Nagaland (2), Gujarat (2).
A total of 15,71,712 patients with hypertension were registered in 58 Phase I districts and 5,22,703 patients were enrolled in 43 Phase II districts. Due to the sudden surge of COVID-19 cases and disruption in health care service provision, there was a decline in registration during first and second waves of COVID-19.
In the 26 initial Phase I districts, nearly one fifth (22%) of the estimated patients with hypertension were enrolled. State proportions are as follows: Maharashtra (29.1%), Kerala (25.3%), Madhya Pradesh (22.4%), Telangana (21%) and Punjab (16%).
Of the 13,821 facilities enrolling patients with hypertension in Dec 2021, 66% were Health Wellness Centres and one fourth were Primary Health Centres.
0
200000
400000
600000
800000
1000000
1200000
1400000
1600000
1800000
0
10000
20000
30000
40000
50000
60000
70000
80000
90000
Jan-
18Fe
b-18
Mar
-18
Apr
-18
May
-18
Jun-
18Ju
l-18
Aug
-18
Sep-
18O
ct-1
8N
ov-1
8D
ec-1
8Ja
n-19
Feb-
19M
ar-1
9A
pr-1
9M
ay-1
9Ju
n-19
Jul-
19A
ug-1
9Se
p-19
Oct
-19
Nov
-19
Dec
-19
Jan-
20Fe
b-20
Mar
-20
Apr
-20
May
-20
Jun-
20Ju
l-20
Aug
-20
Sep-
20O
ct-2
0N
ov-2
0D
ec-2
0Ja
n-21
Feb-
21M
ar-2
1A
pr-2
1M
ay-2
1Ju
n-21
Jul-
21A
ug-2
1Se
p-21
Oct
-21
Nov
-21
Dec
-21
Cum
ulat
ive
regi
stra
tion
Mon
thly
regi
stra
tion
Punjab Madhya Pradesh Kerala
Maharashtra Telangana
Monthly registered Cumulative registered
0
100000
200000
300000
400000
500000
600000
0
10000
20000
30000
40000
50000
60000
70000
Mar-20
Apr-20
May-20
Jun-20
Jul-20
Aug-20
Sep-2
0
Oct-20
Nov-2
0
Dec-2
0
Jan-21
Feb-2
1
Mar-21
Apr-21
May-21
Jun-21
Jul-21
Aug-21
Sep-2
1
Oct-21
Nov-2
1
Dec-2
1
Chattisgarh Tamil Nadu Karnataka Andhra Pradesh West Bengal
Jharkhand Uttar Pradesh Puducherry Bihar Rajasthan
Goa Sikkim Nagaland Monthly registered Cumulative registered
Figure 3Proportion of estimated hypertension patients enrolled in 26 Phase I districts, December 2021.
Figure 4Number and proportion of health care facilities implementing IHCI by type, December 2021
23.0
16.3
20.8
22.4
25.3
29.1
Overall
Punjab
Telangana
Madhya Pradesh
Kerala
Maharashtra276, 2% 810, 6%
3,669, 26%
9,066, 66%
DH/SDH CHC PHC/UHC HWC-SC
(N=12,382)
IHCI Progress Report Apr 2020-Dec 202116 17
HUMAN RESOURCES AND TRAINING
9,600
386
3,108
4,856
1,636
4.1 Training status in Phase II districtsWe analysed the training status of doctors, staff nurses and pharmacists by district for Phase II states (Annex I, Table 1). The training load, or number of health care workers requiring training, was 9,600 in 30 districts across 14 Phase I states. (Training load refers to the number of health workers, planned to be trained.) In Phase II districts, 3,108 doctors, 4,856 staff nurses and 1,636 pharmacists had to be trained. Among them, 53% doctors, 39% nurses and 52% of pharmacists were trained.
4.2 Human resources in Phase II statesOut of 30 districts included in the analysis, 101 health facilities (PHC & UPHC) in 12 districts are functioning without any doctor (Annex II, Table 2). These constitute 8% of the total 1,339 functional PHCs and UPHCs. Lalitpur (Uttar Pradesh) and Ranchi (Jharkhand) were two districts where more than 50% of PHCs & UPHCs did not have any doctor. Data from all 30 districts shows that at least one doctor was available in all the 256 CHCs and Block PHCs (BPHC).
In seven districts (Annex II, Table 3), there were 167 PHCs & UPHCs functioning without any nurse. These constituted 12% of 1,339 functional PHCs & UPHCs. Nurses were available in all CHCs & BPHCs.
In these 30 districts, there are 71 district hospitals (DH) and sub-district hospitals (SDH) (Annex II, Table 4). A total of 226 doctors were available at OPD for hypertension treatment and 111 dedicated staff nurses are posted under NPCDCS. However, DH and SDH of Krishna, Visakhapatnam (Andhra Pradesh), Muzaffarpur (Bihar), Bikaner (Rajasthan), North & East Sikkim did not have dedicated staff nurses in place. A total of 257 pharmacists were posted in various DH and SDH.
In 256 CHCs & BPHCs, a total 486 doctors were available at OPD for hypertension treatment. But the number of dedicated nurses posted at CHC & BPHC under NPCDCS, were not adequate. Only 100 nurses were posted against the total 256 CHC & BPHC. No dedicated staff nurse was posted under NPCDCS in the project districts of Rajasthan, Andhra Pradesh, Bihar, North & East Sikkim, Mokokchung (Nagaland) (Annex II, Table 5).
There are 1,339 PHC & UPHC in 30 districts. At OPD, a total of 1,365 doctors were posted. The majority of districts did not have dedicated staff nurse under NPCDCS. Only Durg, Raipur (Chhattisgarh), South Goa, Puducherry, Chennai and Howrah (West Bengal) had dedicated staff nurses in place in at least one or more facilities. (Annex II, Table 6).
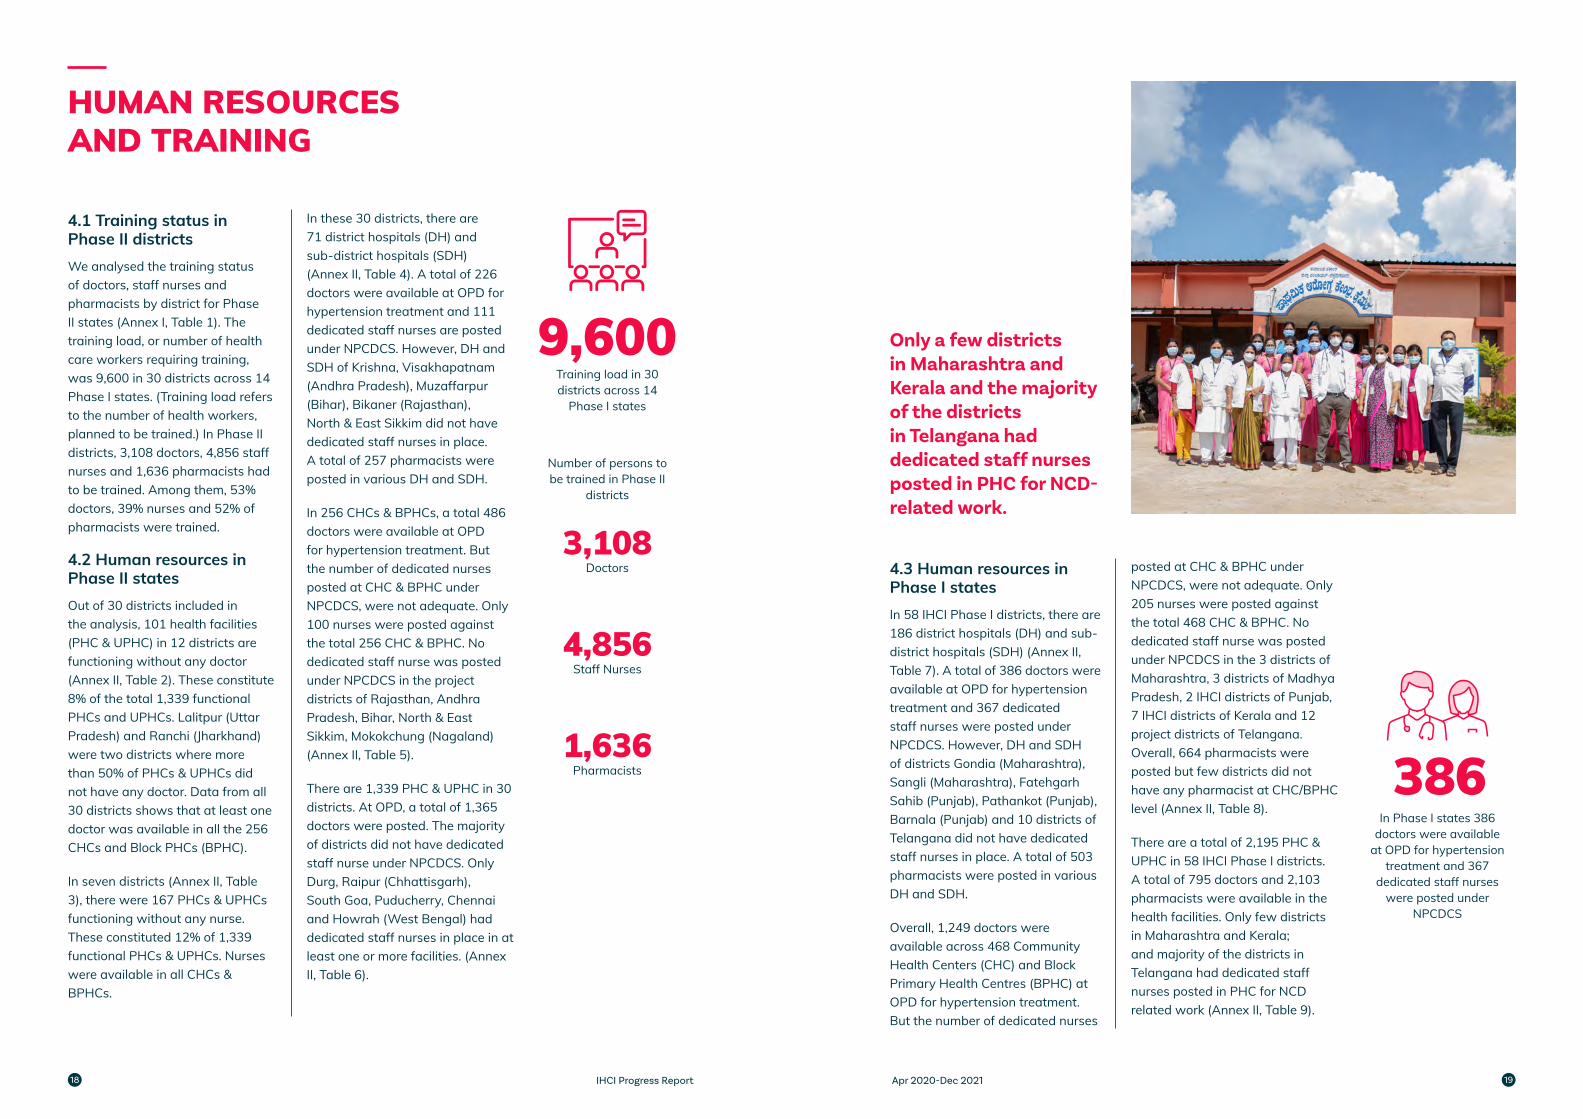
4.3 Human resources in Phase I statesIn 58 IHCI Phase I districts, there are 186 district hospitals (DH) and sub-district hospitals (SDH) (Annex II, Table 7). A total of 386 doctors were available at OPD for hypertension treatment and 367 dedicated staff nurses were posted under NPCDCS. However, DH and SDH of districts Gondia (Maharashtra), Sangli (Maharashtra), Fatehgarh Sahib (Punjab), Pathankot (Punjab), Barnala (Punjab) and 10 districts of Telangana did not have dedicated staff nurses in place. A total of 503 pharmacists were posted in various DH and SDH.
Overall, 1,249 doctors were available across 468 Community Health Centers (CHC) and Block Primary Health Centres (BPHC) at OPD for hypertension treatment. But the number of dedicated nurses
posted at CHC & BPHC under NPCDCS, were not adequate. Only 205 nurses were posted against the total 468 CHC & BPHC. No dedicated staff nurse was posted under NPCDCS in the 3 districts of Maharashtra, 3 districts of Madhya Pradesh, 2 IHCI districts of Punjab, 7 IHCI districts of Kerala and 12 project districts of Telangana. Overall, 664 pharmacists were posted but few districts did not have any pharmacist at CHC/BPHC level (Annex II, Table 8).
There are a total of 2,195 PHC & UPHC in 58 IHCI Phase I districts. A total of 795 doctors and 2,103 pharmacists were available in the health facilities. Only few districts in Maharashtra and Kerala; and majority of the districts in Telangana had dedicated staff nurses posted in PHC for NCD related work (Annex II, Table 9).
Number of persons to be trained in Phase II
districts
Training load in 30 districts across 14
Phase I states
Doctors
Staff Nurses
Pharmacists
In Phase I states 386 doctors were available
at OPD for hypertension treatment and 367
dedicated staff nurses were posted under
NPCDCS
Only a few districts in Maharashtra and Kerala and the majority of the districts in Telangana had dedicated staff nurses posted in PHC for NCD- related work.
IHCI Progress Report Apr 2020-Dec 202118 19
AVAILABILITY OF PROTOCOL DRUGS AND BP MONITORS
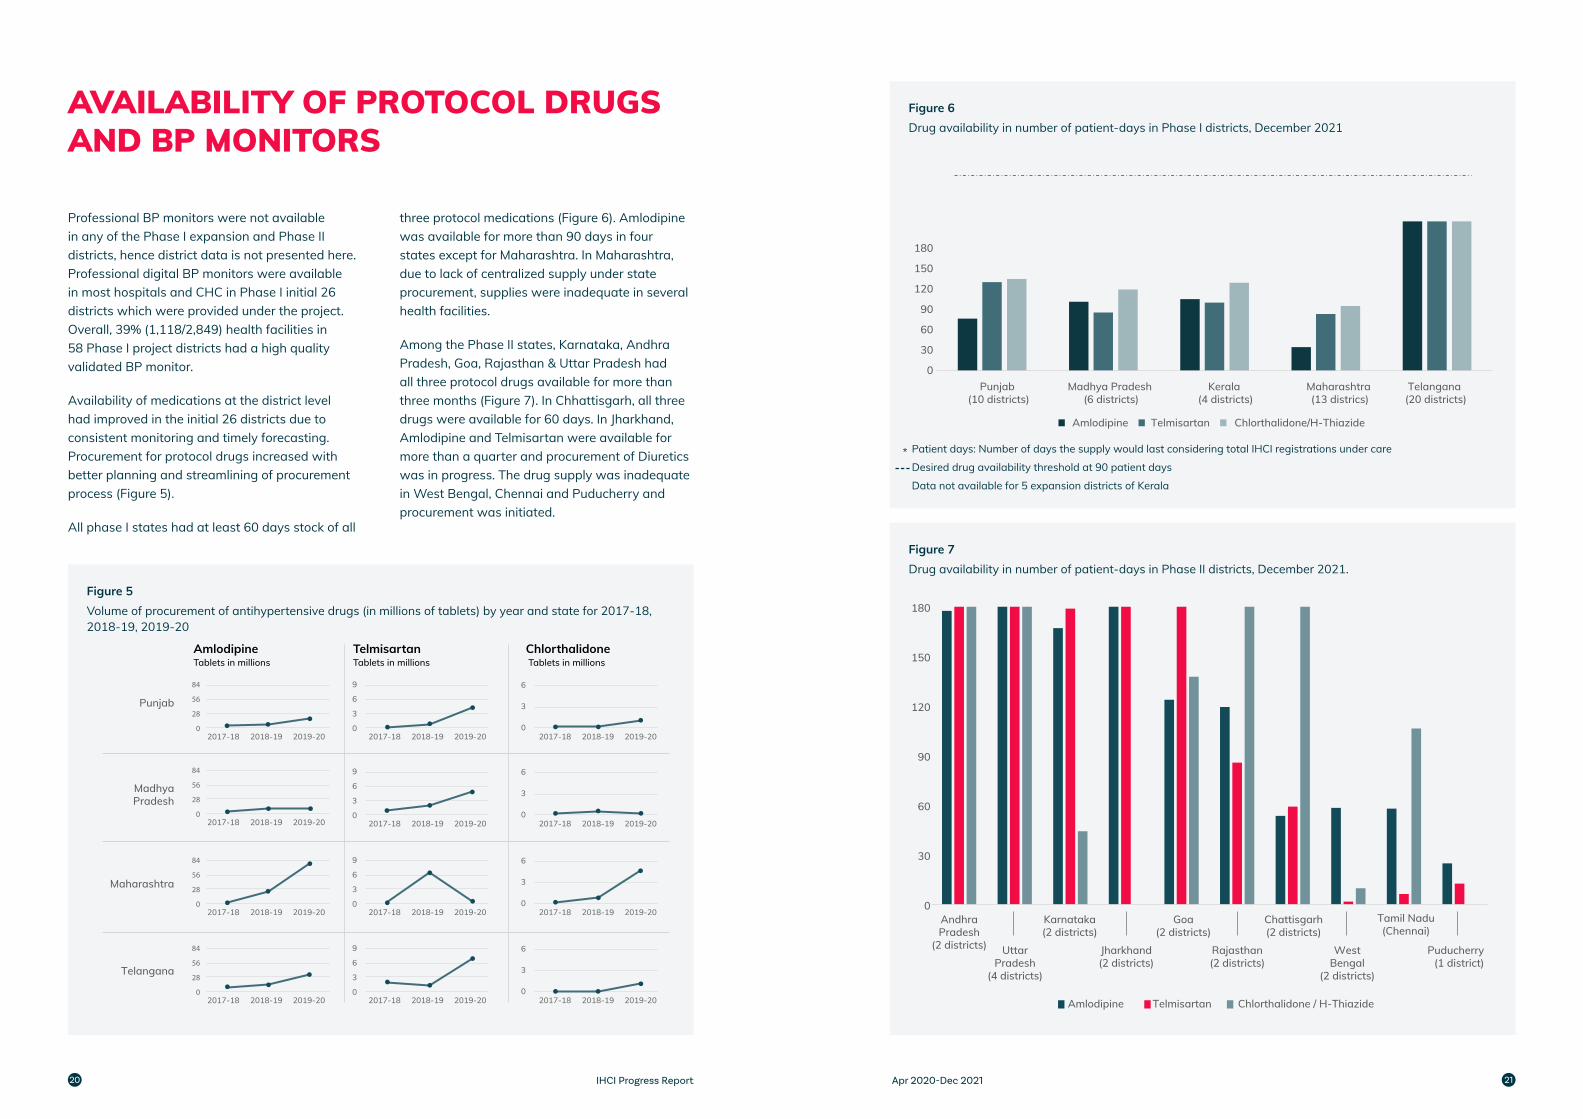
Professional BP monitors were not available in any of the Phase I expansion and Phase II districts, hence district data is not presented here. Professional digital BP monitors were available in most hospitals and CHC in Phase I initial 26 districts which were provided under the project. Overall, 39% (1,118/2,849) health facilities in 58 Phase I project districts had a high quality validated BP monitor.
Availability of medications at the district level had improved in the initial 26 districts due to consistent monitoring and timely forecasting. Procurement for protocol drugs increased with better planning and streamlining of procurement process (Figure 5).
All phase I states had at least 60 days stock of all
three protocol medications (Figure 6). Amlodipine was available for more than 90 days in four states except for Maharashtra. In Maharashtra, due to lack of centralized supply under state procurement, supplies were inadequate in several health facilities.
Among the Phase II states, Karnataka, Andhra Pradesh, Goa, Rajasthan & Uttar Pradesh had all three protocol drugs available for more than three months (Figure 7). In Chhattisgarh, all three drugs were available for 60 days. In Jharkhand, Amlodipine and Telmisartan were available for more than a quarter and procurement of Diuretics was in progress. The drug supply was inadequate in West Bengal, Chennai and Puducherry and procurement was initiated.
Figure 6Drug availability in number of patient-days in Phase I districts, December 2021
Patient days: Number of days the supply would last considering total IHCI registrations under care
Desired drug availability threshold at 90 patient days
Data not available for 5 expansion districts of Kerala
0
30
60
90
120
150
180
Punjab (10 districts)
Madhya Pradesh (6 districts)
Kerala (4 districts)
Maharashtra (13 districs)
Telangana (20 districts)
Amlodipine Telmisartan Chlorthalidone/H-Thiazide
Figure 5Volume of procurement of antihypertensive drugs (in millions of tablets) by year and state for 2017-18, 2018-19, 2019-20
Figure 7Drug availability in number of patient-days in Phase II districts, December 2021.
2017-18 2018-19 2019-20
84
56
28
0
2017-18 2018-19 2019-20
84
56
28
0
2017-18 2018-19 2019-20
84
56
28
0
2017-18 2018-19 2019-20
84
56
28
0
9
6
3
02017-18 2018-19 2019-20
9
6
3
02017-18 2018-19 2019-20
9
6
3
02017-18 2018-19 2019-20
9
6
3
02017-18 2018-19 2019-20
6
3
02017-18 2018-19 2019-20
6
3
02017-18 2018-19 2019-20
6
3
02017-18 2018-19 2019-20
6
3
02017-18 2018-19 2019-20
AmlodipineTablets in millions Tablets in millions Tablets in millions
Punjab
MadhyaPradesh
Maharashtra
Telangana
Telmisartan Chlorthalidone
0
30
60
90
120
150
180
AndhraPradesh
(2 districts) UttarPradesh
(4 districts)
Karnataka(2 districts)
Jharkhand(2 districts)
Goa(2 districts)
Rajasthan(2 districts)
Chattisgarh(2 districts)
WestBengal
(2 districts)
Tamil Nadu(Chennai)
Puducherry(1 district)
Amlodipine Telmisartan Chlorthalidone / H-Thiazide
*
IHCI Progress Report Apr 2020-Dec 202120 21
ANNUAL INDICATORS FOR FIVE PHASE I STATES AND THREE PHASE II STATES, JAN-MARCH 2021
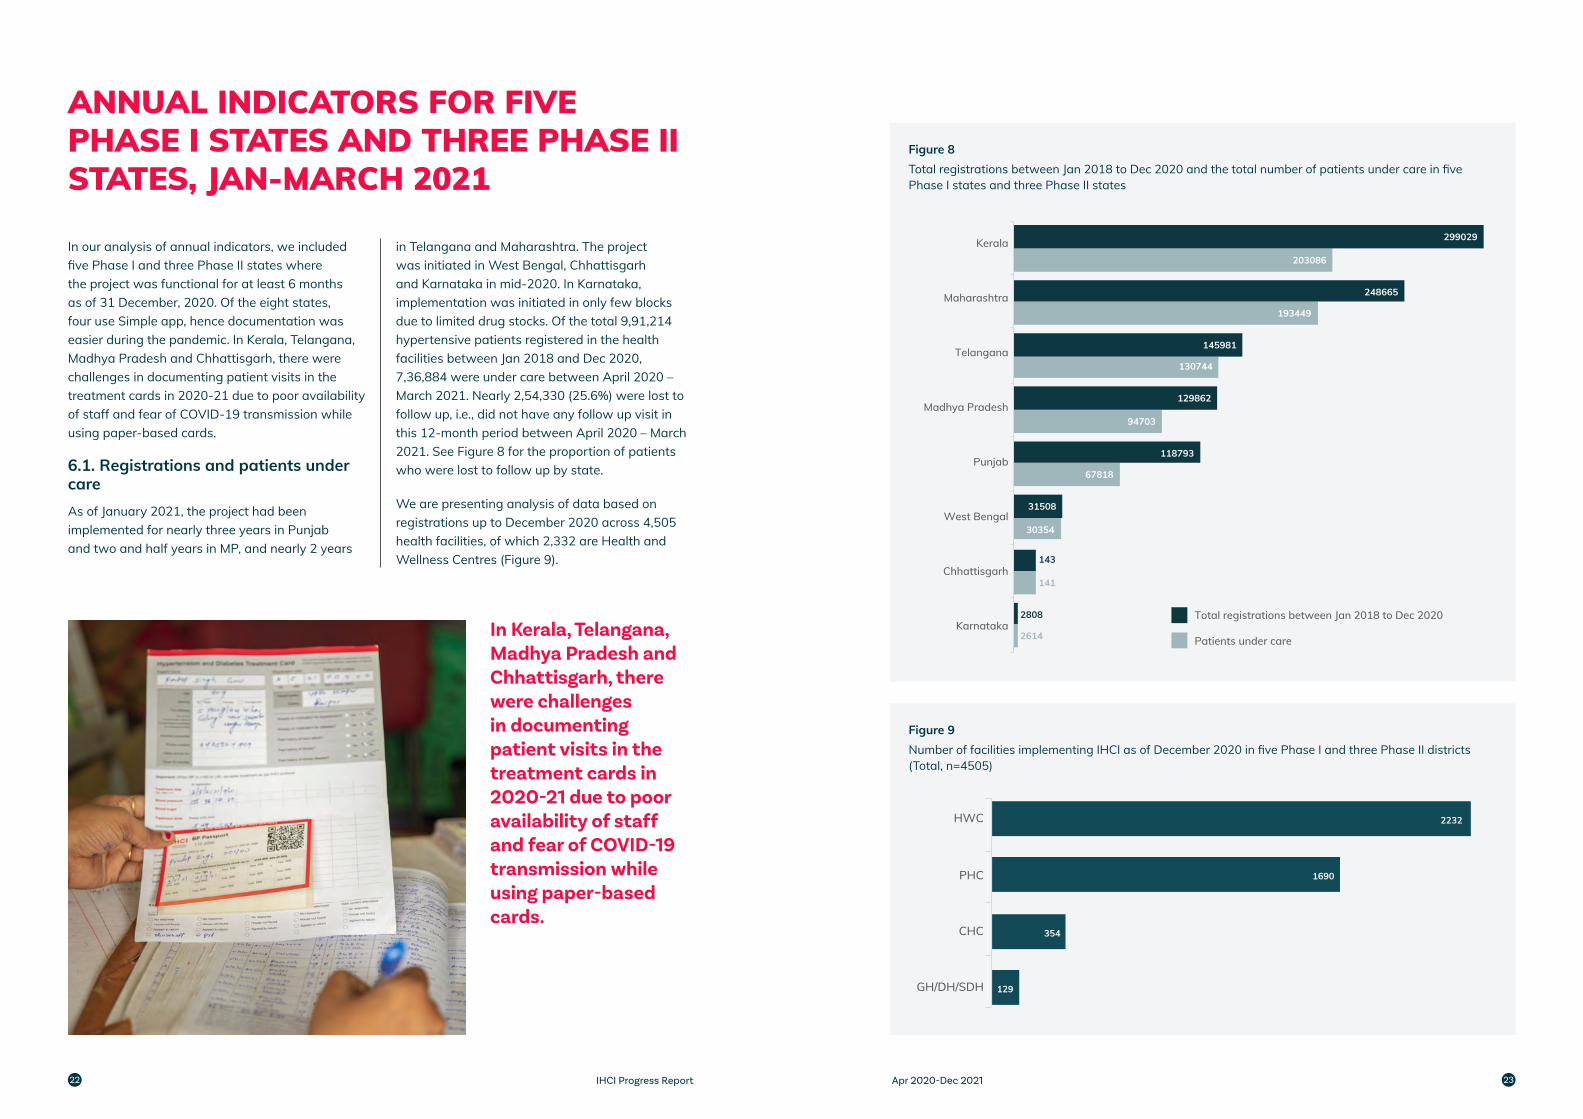
In our analysis of annual indicators, we included five Phase I and three Phase II states where the project was functional for at least 6 months as of 31 December, 2020. Of the eight states, four use Simple app, hence documentation was easier during the pandemic. In Kerala, Telangana, Madhya Pradesh and Chhattisgarh, there were challenges in documenting patient visits in the treatment cards in 2020-21 due to poor availability of staff and fear of COVID-19 transmission while using paper-based cards.
6.1. Registrations and patients under careAs of January 2021, the project had been implemented for nearly three years in Punjab and two and half years in MP, and nearly 2 years
in Telangana and Maharashtra. The project was initiated in West Bengal, Chhattisgarh and Karnataka in mid-2020. In Karnataka, implementation was initiated in only few blocks due to limited drug stocks. Of the total 9,91,214 hypertensive patients registered in the health facilities between Jan 2018 and Dec 2020, 7,36,884 were under care between April 2020 – March 2021. Nearly 2,54,330 (25.6%) were lost to follow up, i.e., did not have any follow up visit in this 12-month period between April 2020 – March 2021. See Figure 8 for the proportion of patients who were lost to follow up by state.
We are presenting analysis of data based on registrations up to December 2020 across 4,505 health facilities, of which 2,332 are Health and Wellness Centres (Figure 9).
Figure 8Total registrations between Jan 2018 to Dec 2020 and the total number of patients under care in five Phase I states and three Phase II states
Total registrations between Jan 2018 to Dec 2020
Patients under care2614
141
30354
67818
94703
130744
193449
203086
2808
143
31508
118793
129862
145981
248665
299029Kerala
Maharashtra
Telangana
Madhya Pradesh
Punjab
West Bengal
Chhattisgarh
KarnatakaIn Kerala, Telangana, Madhya Pradesh and Chhattisgarh, there were challenges in documenting patient visits in the treatment cards in 2020-21 due to poor availability of staff and fear of COVID-19 transmission while using paper-based cards.
Figure 9Number of facilities implementing IHCI as of December 2020 in five Phase I and three Phase II districts (Total, n=4505)
129
354
1690
2232
GH/DH/SDH
CHC
PHC
HWC
IHCI Progress Report Apr 2020-Dec 202122 23
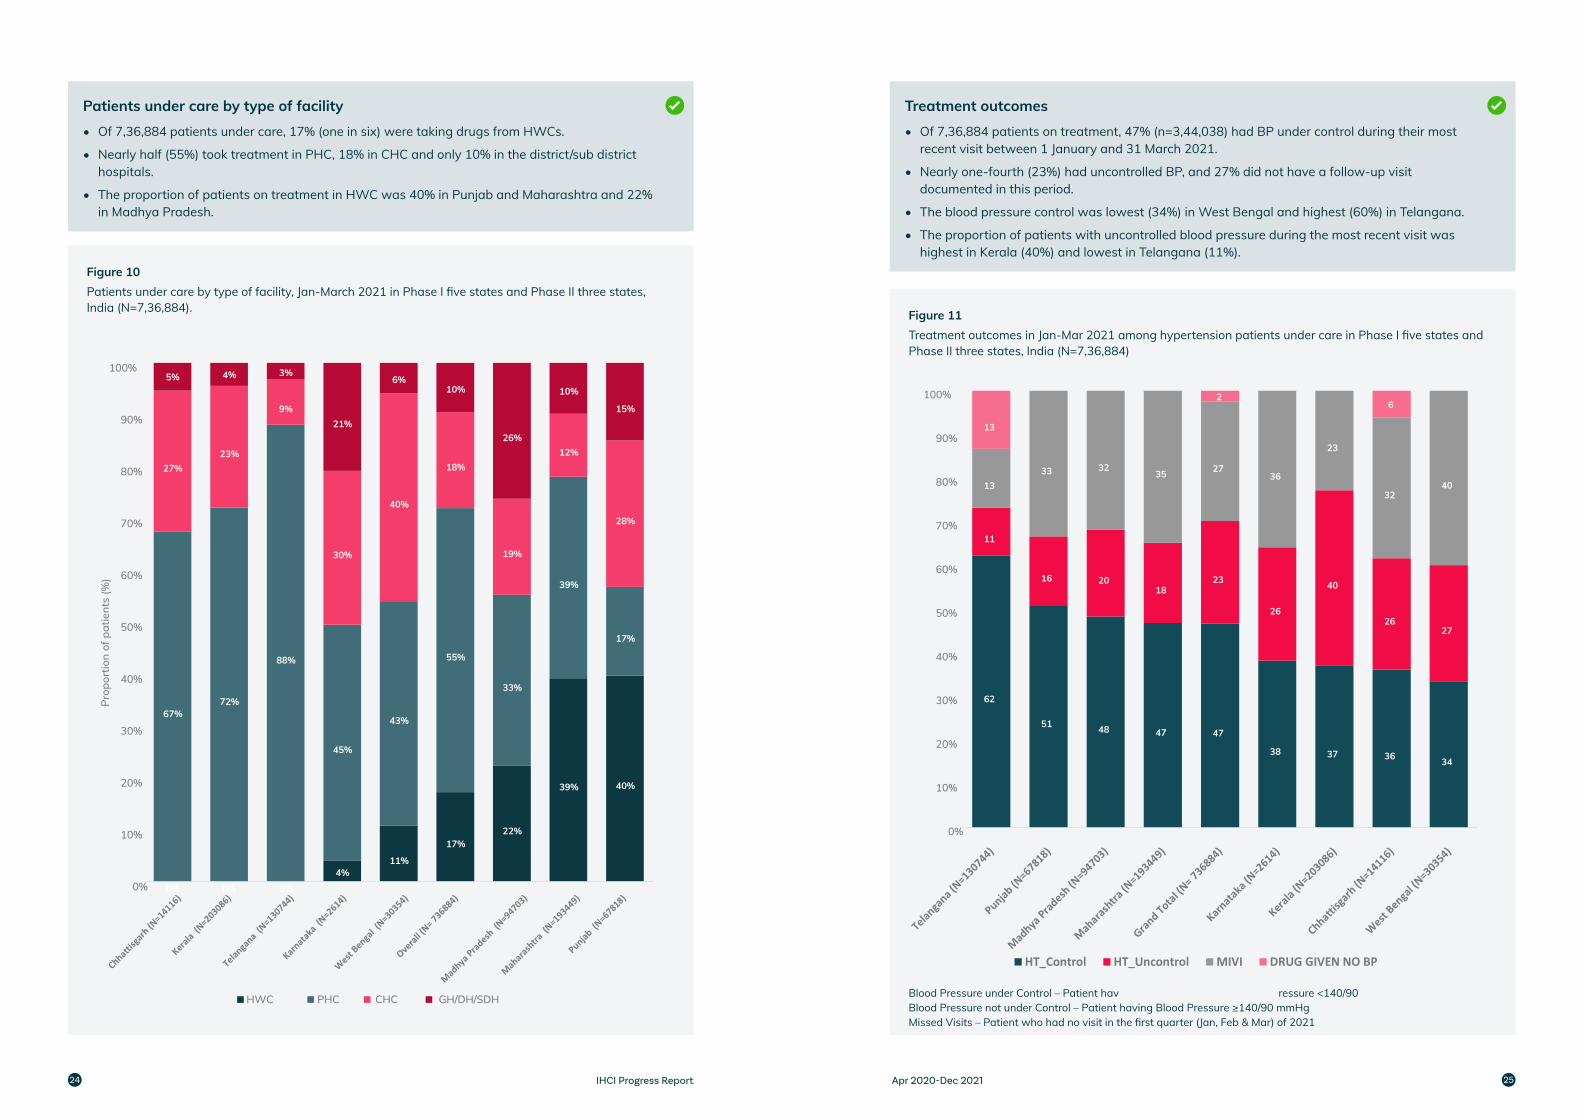
Figure 11Treatment outcomes in Jan-Mar 2021 among hypertension patients under care in Phase I five states and Phase II three states, India (N=7,36,884)
62
51 48 47 47
38 37 36 34
11
16 2018
23
26
40
2627
1333 32
35 2736
23
3240
13
26
0%
10%
20%
30%
40%
50%
60%
70%
80%
90%
100%
HT_Control HT_Uncontrol MIVI DRUG GIVEN NO BP
Blood Pressure under Control – Patient having Blood Pressure <140/90 mmHg Blood Pressure not under Control – Patient having Blood Pressure ≥140/90 mmHg Missed Visits – Patient who had no visit in the first quarter (Jan, Feb & Mar) of 2021
Figure 10Patients under care by type of facility, Jan-March 2021 in Phase I five states and Phase II three states, India (N=7,36,884).
0% 0% 0%
4%11%
17%22%
39% 40%
67%72%
88%
45%
43%
55%
33%
39%
17%
27%23%
9%
30%
40%
18%
19%
12%
28%
5% 4% 3%
21%
6%10%
26%
10%
15%
0%
10%
20%
30%
40%
50%
60%
70%
80%
90%
100%
Prop
ortio
n of
pat
ient
s (%
)
HWC PHC CHC GH/DH/SDH
Treatment outcomes• Of 7,36,884 patients on treatment, 47% (n=3,44,038) had BP under control during their most
recent visit between 1 January and 31 March 2021.
• Nearly one-fourth (23%) had uncontrolled BP, and 27% did not have a follow-up visit documented in this period.
• The blood pressure control was lowest (34%) in West Bengal and highest (60%) in Telangana.
• The proportion of patients with uncontrolled blood pressure during the most recent visit was highest in Kerala (40%) and lowest in Telangana (11%).
Patients under care by type of facility• Of 7,36,884 patients under care, 17% (one in six) were taking drugs from HWCs.
• Nearly half (55%) took treatment in PHC, 18% in CHC and only 10% in the district/sub district hospitals.
• The proportion of patients on treatment in HWC was 40% in Punjab and Maharashtra and 22% in Madhya Pradesh.
IHCI Progress Report Apr 2020-Dec 202124 25
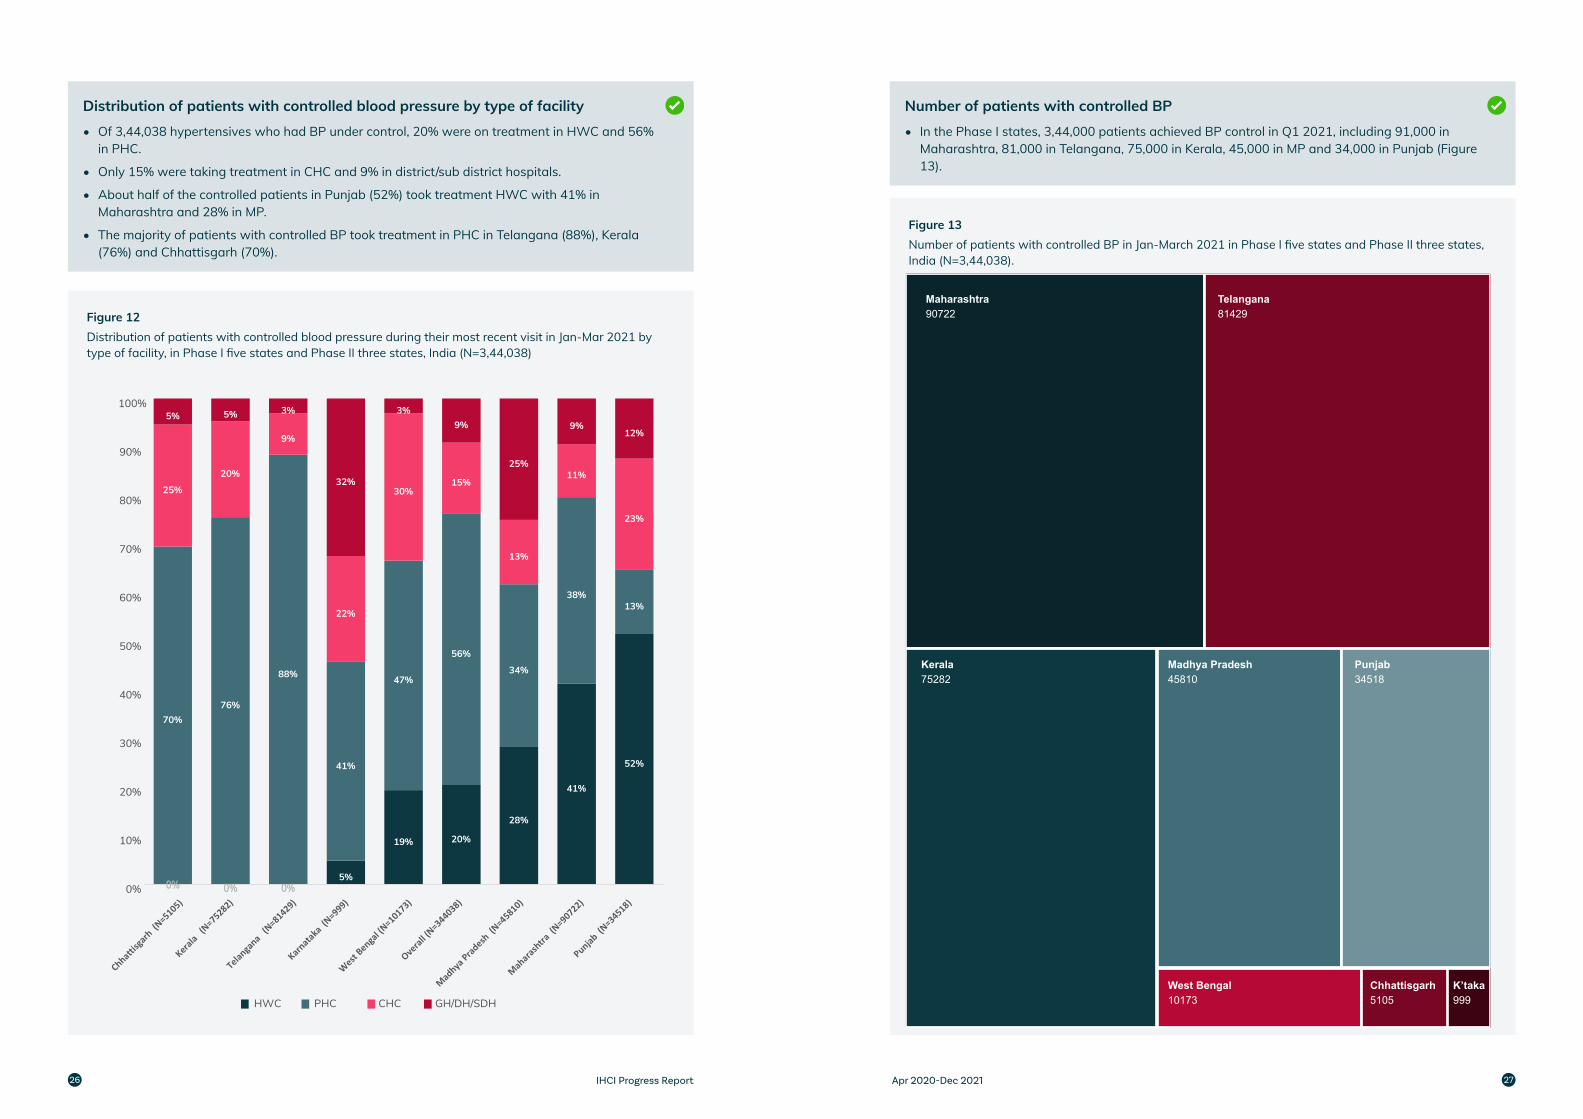
Figure 13Number of patients with controlled BP in Jan-March 2021 in Phase I five states and Phase II three states, India (N=3,44,038).
Maharashtra90722
Telangana81429
Kerala75282
Madhya Pradesh45810
West Bengal10173
Chhattisgarh K’taka5105 999
Punjab34518
Figure 12Distribution of patients with controlled blood pressure during their most recent visit in Jan-Mar 2021 by type of facility, in Phase I five states and Phase II three states, India (N=3,44,038)
0% 0% 0%5%
19% 20%
28%
41%
52%
70%76%
88%
41%
47%
56%
34%
38%13%
25%
20%
9%
22%
30%15%
13%
11%
23%
5% 5% 3%
32%
3%9%
25%
9%12%
0%
10%
20%
30%
40%
50%
60%
70%
80%
90%
100%
HWC PHC CHC GH/DH/SDH
Distribution of patients with controlled blood pressure by type of facility• Of 3,44,038 hypertensives who had BP under control, 20% were on treatment in HWC and 56%
in PHC.
• Only 15% were taking treatment in CHC and 9% in district/sub district hospitals.
• About half of the controlled patients in Punjab (52%) took treatment HWC with 41% in Maharashtra and 28% in MP.
• The majority of patients with controlled BP took treatment in PHC in Telangana (88%), Kerala (76%) and Chhattisgarh (70%).
Number of patients with controlled BP• In the Phase I states, 3,44,000 patients achieved BP control in Q1 2021, including 91,000 in
Maharashtra, 81,000 in Telangana, 75,000 in Kerala, 45,000 in MP and 34,000 in Punjab (Figure 13).
IHCI Progress Report Apr 2020-Dec 202126 27
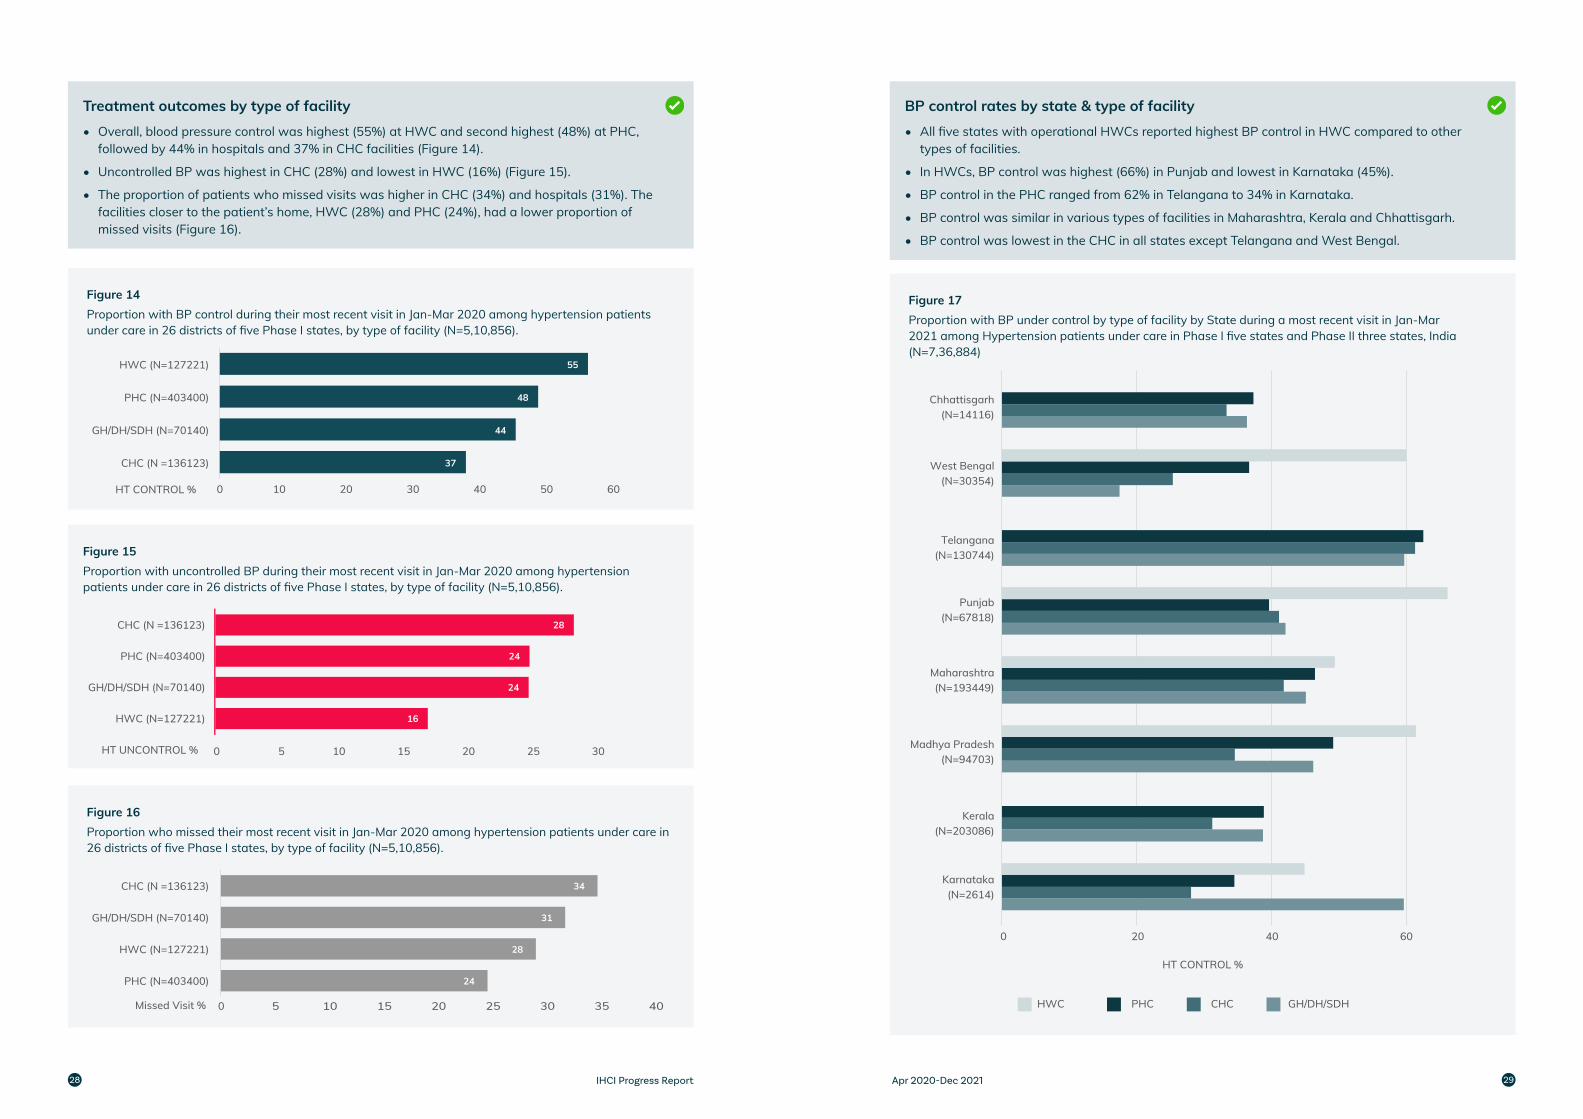
Figure 14Proportion with BP control during their most recent visit in Jan-Mar 2020 among hypertension patients under care in 26 districts of five Phase I states, by type of facility (N=5,10,856).
37
44
48
55
0 10 20 30 40 50 60
CHC (N =136123)
GH/DH/SDH (N=70140)
PHC (N=403400)
HWC (N=127221)
HT CONTROL %
Figure 15Proportion with uncontrolled BP during their most recent visit in Jan-Mar 2020 among hypertension patients under care in 26 districts of five Phase I states, by type of facility (N=5,10,856).
16
24
24
28
0 5 10 15 20 25 30
HWC (N=127221)
GH/DH/SDH (N=70140)
PHC (N=403400)
CHC (N =136123)
HT UNCONTROL %
Figure 16Proportion who missed their most recent visit in Jan-Mar 2020 among hypertension patients under care in 26 districts of five Phase I states, by type of facility (N=5,10,856).
24
28
31
34
0 5 10 15 20 25 30 35 40
PHC (N=403400)
HWC (N=127221)
GH/DH/SDH (N=70140)
CHC (N =136123)
Missed Visit %
Figure 17Proportion with BP under control by type of facility by State during a most recent visit in Jan-Mar 2021 among Hypertension patients under care in Phase I five states and Phase II three states, India (N=7,36,884)
0 20 40 60
Karnataka(N=2614)
Kerala(N=203086)
Madhya Pradesh(N=94703)
Maharashtra(N=193449)
Punjab(N=67818)
Telangana(N=130744)
West Bengal(N=30354)
Chhattisgarh(N=14116)
HT CONTROL %
HWC PHC CHC GH/DH/SDH
Treatment outcomes by type of facility• Overall, blood pressure control was highest (55%) at HWC and second highest (48%) at PHC,
followed by 44% in hospitals and 37% in CHC facilities (Figure 14).
• Uncontrolled BP was highest in CHC (28%) and lowest in HWC (16%) (Figure 15).
• The proportion of patients who missed visits was higher in CHC (34%) and hospitals (31%). The facilities closer to the patient’s home, HWC (28%) and PHC (24%), had a lower proportion of missed visits (Figure 16).
BP control rates by state & type of facility• All five states with operational HWCs reported highest BP control in HWC compared to other
types of facilities.
• In HWCs, BP control was highest (66%) in Punjab and lowest in Karnataka (45%).
• BP control in the PHC ranged from 62% in Telangana to 34% in Karnataka.
• BP control was similar in various types of facilities in Maharashtra, Kerala and Chhattisgarh.
• BP control was lowest in the CHC in all states except Telangana and West Bengal.
IHCI Progress Report Apr 2020-Dec 202128 29
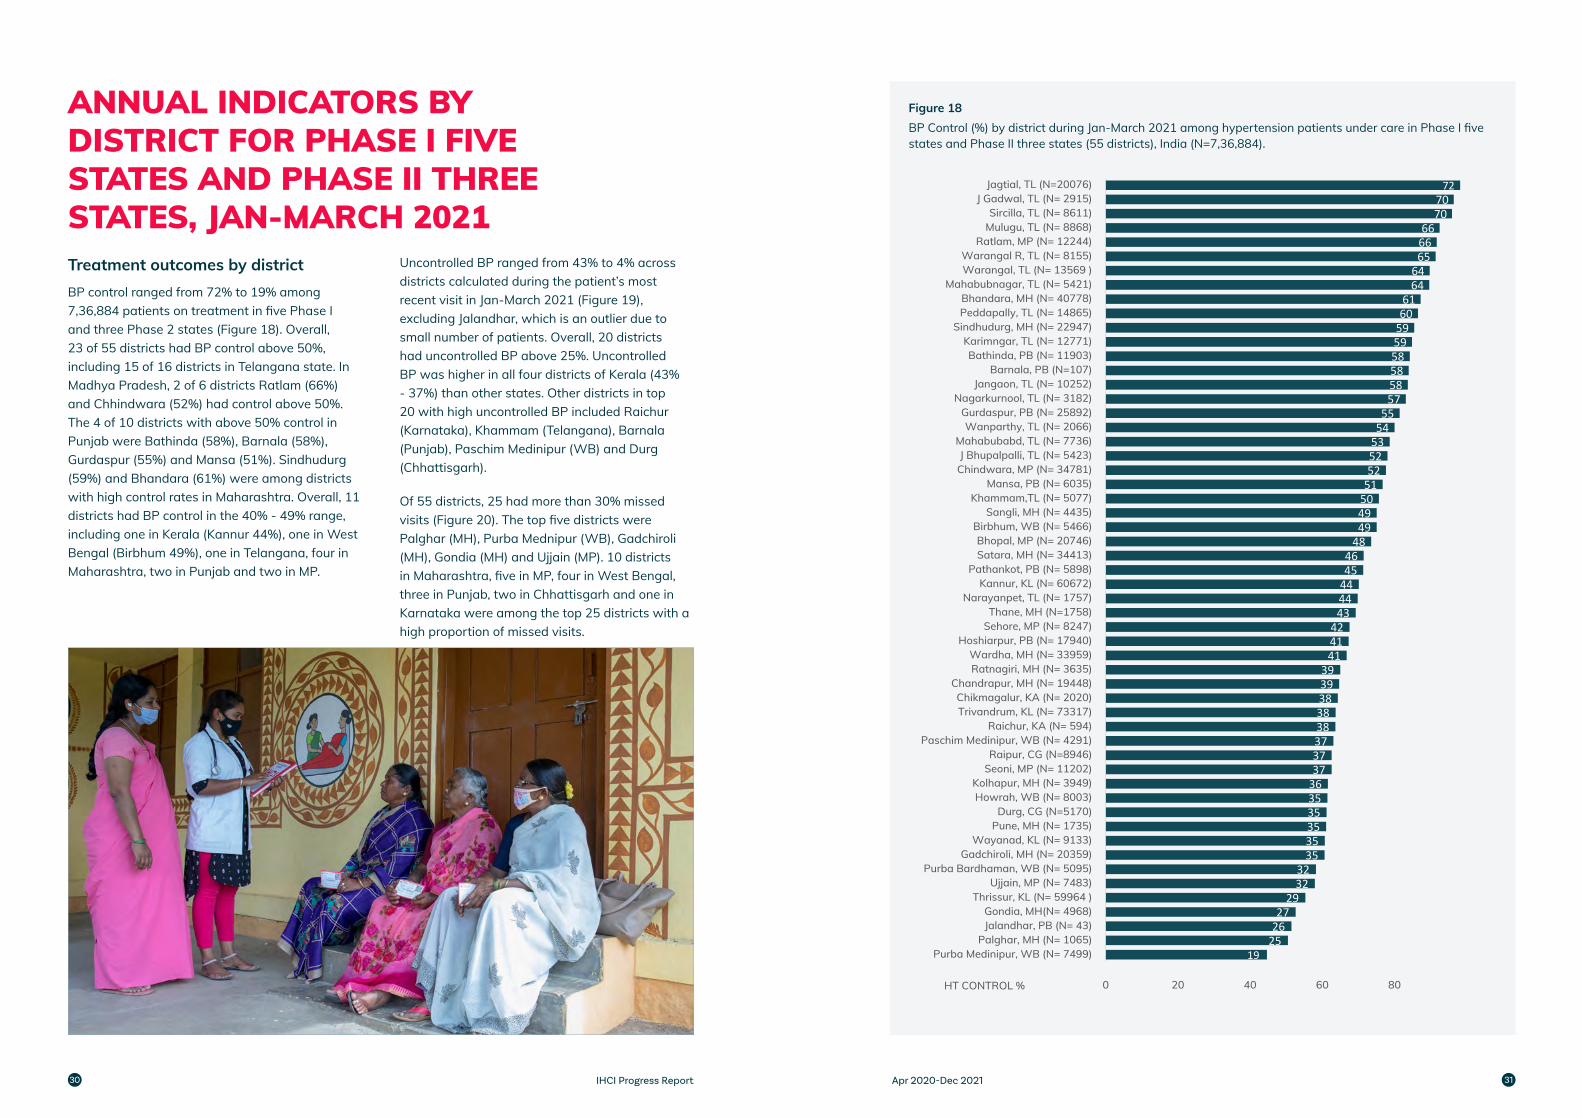
Treatment outcomes by districtBP control ranged from 72% to 19% among 7,36,884 patients on treatment in five Phase I and three Phase 2 states (Figure 18). Overall, 23 of 55 districts had BP control above 50%, including 15 of 16 districts in Telangana state. In Madhya Pradesh, 2 of 6 districts Ratlam (66%) and Chhindwara (52%) had control above 50%. The 4 of 10 districts with above 50% control in Punjab were Bathinda (58%), Barnala (58%), Gurdaspur (55%) and Mansa (51%). Sindhudurg (59%) and Bhandara (61%) were among districts with high control rates in Maharashtra. Overall, 11 districts had BP control in the 40% - 49% range, including one in Kerala (Kannur 44%), one in West Bengal (Birbhum 49%), one in Telangana, four in Maharashtra, two in Punjab and two in MP.
Uncontrolled BP ranged from 43% to 4% across districts calculated during the patient’s most recent visit in Jan-March 2021 (Figure 19), excluding Jalandhar, which is an outlier due to small number of patients. Overall, 20 districts had uncontrolled BP above 25%. Uncontrolled BP was higher in all four districts of Kerala (43% - 37%) than other states. Other districts in top 20 with high uncontrolled BP included Raichur (Karnataka), Khammam (Telangana), Barnala (Punjab), Paschim Medinipur (WB) and Durg (Chhattisgarh).
Of 55 districts, 25 had more than 30% missed visits (Figure 20). The top five districts were Palghar (MH), Purba Mednipur (WB), Gadchiroli (MH), Gondia (MH) and Ujjain (MP). 10 districts in Maharashtra, five in MP, four in West Bengal, three in Punjab, two in Chhattisgarh and one in Karnataka were among the top 25 districts with a high proportion of missed visits.
ANNUAL INDICATORS BY DISTRICT FOR PHASE I FIVE STATES AND PHASE II THREE STATES, JAN-MARCH 2021
Figure 18BP Control (%) by district during Jan-March 2021 among hypertension patients under care in Phase I five states and Phase II three states (55 districts), India (N=7,36,884).
19252627
293232
3535353535363737373838383939
414142
4344444546
48494950515252535455
5758585859596061
6464
656666
7070
72
0 20 40 60 80
Purba Medinipur, WB (N= 7499)Palghar, MH (N= 1065)
Jalandhar, PB (N= 43)Gondia, MH(N= 4968)
Thrissur, KL (N= 59964 )Ujjain, MP (N= 7483)
Purba Bardhaman, WB (N= 5095)Gadchiroli, MH (N= 20359)
Wayanad, KL (N= 9133)Pune, MH (N= 1735)Durg, CG (N=5170)
Howrah, WB (N= 8003)Kolhapur, MH (N= 3949)
Seoni, MP (N= 11202)Raipur, CG (N=8946)
Paschim Medinipur, WB (N= 4291)Raichur, KA (N= 594)
Trivandrum, KL (N= 73317)Chikmagalur, KA (N= 2020)
Chandrapur, MH (N= 19448)Ratnagiri, MH (N= 3635)Wardha, MH (N= 33959)
Hoshiarpur, PB (N= 17940)Sehore, MP (N= 8247)Thane, MH (N=1758)
Narayanpet, TL (N= 1757)Kannur, KL (N= 60672)
Pathankot, PB (N= 5898)Satara, MH (N= 34413)Bhopal, MP (N= 20746)
Birbhum, WB (N= 5466)Sangli, MH (N= 4435)
Khammam,TL (N= 5077)Mansa, PB (N= 6035)
Chindwara, MP (N= 34781)J Bhupalpalli, TL (N= 5423)
Mahabubabd, TL (N= 7736)Wanparthy, TL (N= 2066)
Gurdaspur, PB (N= 25892)Nagarkurnool, TL (N= 3182)
Jangaon, TL (N= 10252)Barnala, PB (N=107)
Bathinda, PB (N= 11903)Karimngar, TL (N= 12771)
Sindhudurg, MH (N= 22947)Peddapally, TL (N= 14865)Bhandara, MH (N= 40778)
Mahabubnagar, TL (N= 5421)Warangal, TL (N= 13569 )Warangal R, TL (N= 8155)
Ratlam, MP (N= 12244)Mulugu, TL (N= 8868)Sircilla, TL (N= 8611)
J Gadwal, TL (N= 2915)Jagtial, TL (N=20076)
HT CONTROL %
IHCI Progress Report Apr 2020-Dec 202130 31
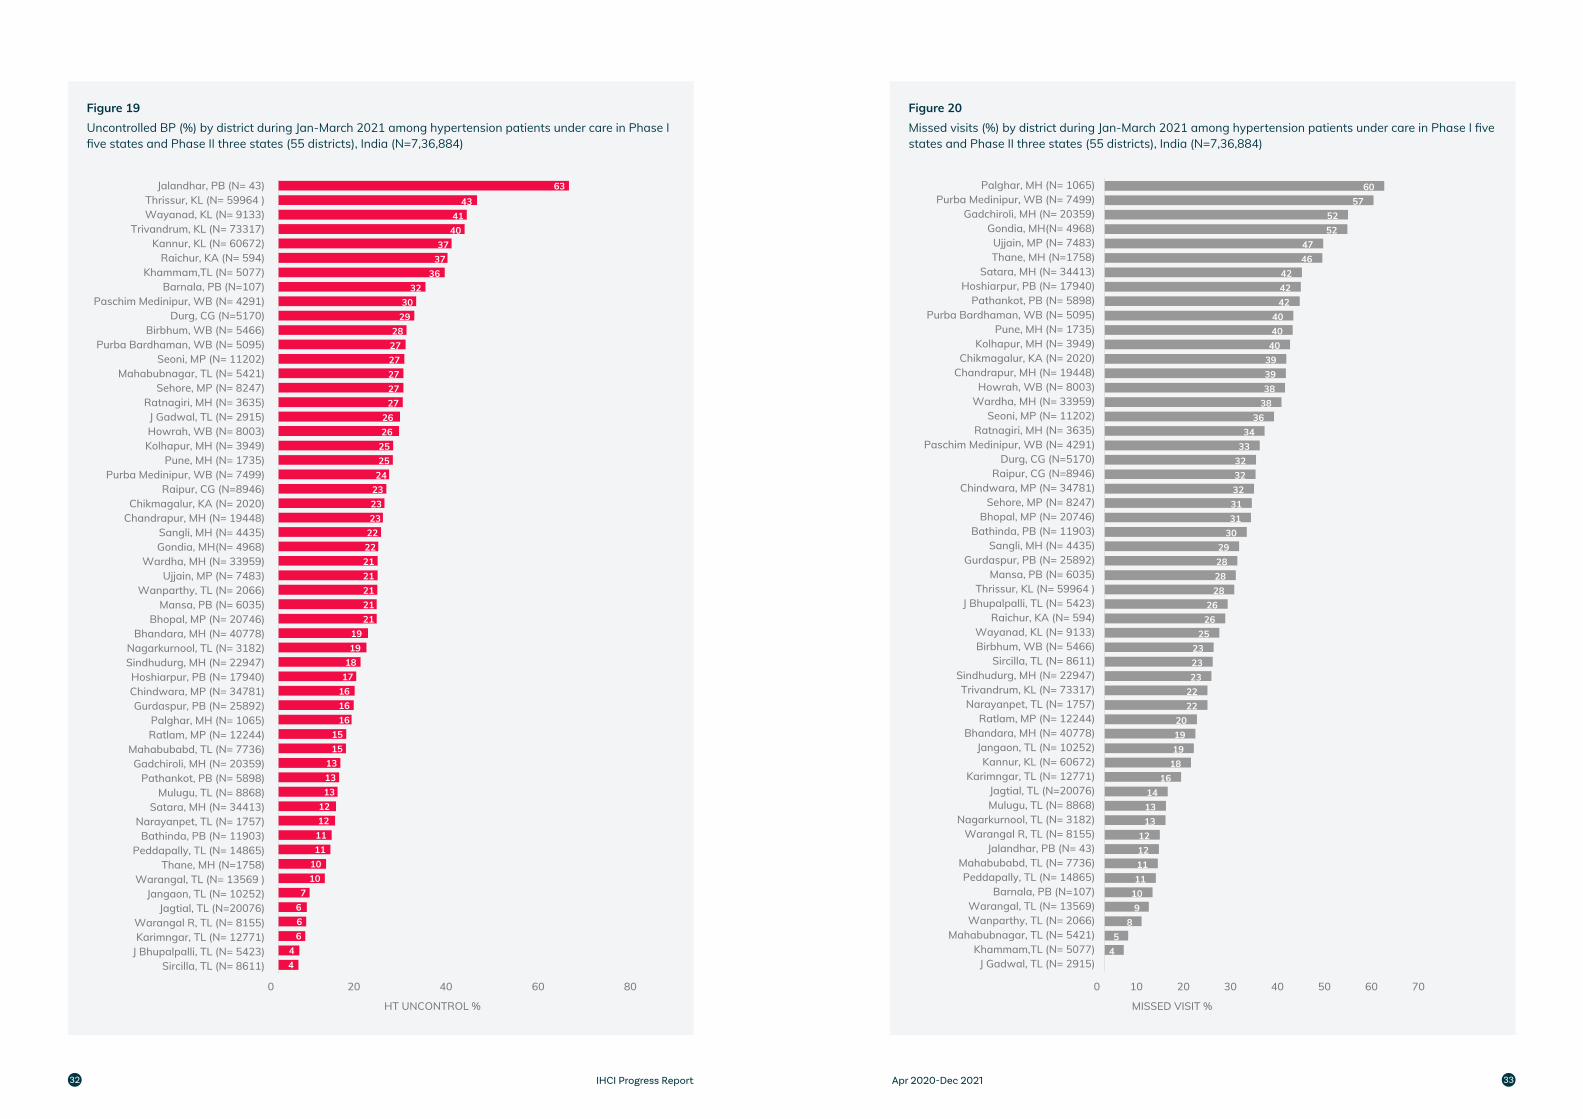
Figure 20Missed visits (%) by district during Jan-March 2021 among hypertension patients under care in Phase I five states and Phase II three states (55 districts), India (N=7,36,884)
Figure 19Uncontrolled BP (%) by district during Jan-March 2021 among hypertension patients under care in Phase I five states and Phase II three states (55 districts), India (N=7,36,884)
Sircilla, TL (N= 8611)J Bhupalpalli, TL (N= 5423)Karimngar, TL (N= 12771)Warangal R, TL (N= 8155)
Jagtial, TL (N=20076)Jangaon, TL (N= 10252)
Warangal, TL (N= 13569 )Thane, MH (N=1758)
Peddapally, TL (N= 14865)Bathinda, PB (N= 11903)
Narayanpet, TL (N= 1757)Satara, MH (N= 34413)
Mulugu, TL (N= 8868)Pathankot, PB (N= 5898)
Gadchiroli, MH (N= 20359)Mahabubabd, TL (N= 7736)
Ratlam, MP (N= 12244)Palghar, MH (N= 1065)
Gurdaspur, PB (N= 25892)Chindwara, MP (N= 34781)Hoshiarpur, PB (N= 17940)
Sindhudurg, MH (N= 22947)Nagarkurnool, TL (N= 3182)
Bhandara, MH (N= 40778)Bhopal, MP (N= 20746)
Mansa, PB (N= 6035)Wanparthy, TL (N= 2066)
Ujjain, MP (N= 7483)Wardha, MH (N= 33959)
Gondia, MH(N= 4968)Sangli, MH (N= 4435)
Chandrapur, MH (N= 19448)Chikmagalur, KA (N= 2020)
Raipur, CG (N=8946)Purba Medinipur, WB (N= 7499)
Pune, MH (N= 1735)Kolhapur, MH (N= 3949)Howrah, WB (N= 8003)J Gadwal, TL (N= 2915)
Ratnagiri, MH (N= 3635)Sehore, MP (N= 8247)
Mahabubnagar, TL (N= 5421)Seoni, MP (N= 11202)
Purba Bardhaman, WB (N= 5095)Birbhum, WB (N= 5466)
Durg, CG (N=5170)Paschim Medinipur, WB (N= 4291)
Barnala, PB (N=107)Khammam,TL (N= 5077)
Raichur, KA (N= 594)Kannur, KL (N= 60672)
Trivandrum, KL (N= 73317)Wayanad, KL (N= 9133)Thrissur, KL (N= 59964 )
Jalandhar, PB (N= 43)
HT UNCONTROL %
44
6667
101011111212131313
1515
16161617181919
212121212122222323232425252626
272727272728
2930
3236
3737
4041
4363
0 20 40 60 80
045
89
1011111212
131314
1618191920
2222232323
252626
28282829
3031313232323334
3638383939404040
424242
4647
5252
5760
0 10 20 30 40 50 60 70
J Gadwal, TL (N= 2915)Khammam,TL (N= 5077)
Mahabubnagar, TL (N= 5421)Wanparthy, TL (N= 2066)Warangal, TL (N= 13569)
Barnala, PB (N=107)Peddapally, TL (N= 14865)
Mahabubabd, TL (N= 7736)Jalandhar, PB (N= 43)
Warangal R, TL (N= 8155)Nagarkurnool, TL (N= 3182)
Mulugu, TL (N= 8868)Jagtial, TL (N=20076)
Karimngar, TL (N= 12771)Kannur, KL (N= 60672)
Jangaon, TL (N= 10252)Bhandara, MH (N= 40778)
Ratlam, MP (N= 12244)Narayanpet, TL (N= 1757)
Trivandrum, KL (N= 73317)Sindhudurg, MH (N= 22947)
Sircilla, TL (N= 8611)Birbhum, WB (N= 5466)Wayanad, KL (N= 9133)
Raichur, KA (N= 594)J Bhupalpalli, TL (N= 5423)
Thrissur, KL (N= 59964 )Mansa, PB (N= 6035)
Gurdaspur, PB (N= 25892)Sangli, MH (N= 4435)
Bathinda, PB (N= 11903)Bhopal, MP (N= 20746)
Sehore, MP (N= 8247)Chindwara, MP (N= 34781)
Raipur, CG (N=8946)Durg, CG (N=5170)
Paschim Medinipur, WB (N= 4291)Ratnagiri, MH (N= 3635)
Seoni, MP (N= 11202)Wardha, MH (N= 33959)Howrah, WB (N= 8003)
Chandrapur, MH (N= 19448)Chikmagalur, KA (N= 2020)
Kolhapur, MH (N= 3949)Pune, MH (N= 1735)
Purba Bardhaman, WB (N= 5095)Pathankot, PB (N= 5898)
Hoshiarpur, PB (N= 17940)Satara, MH (N= 34413)
Thane, MH (N=1758)Ujjain, MP (N= 7483)
Gondia, MH(N= 4968)Gadchiroli, MH (N= 20359)
Purba Medinipur, WB (N= 7499)Palghar, MH (N= 1065)
MISSED VISIT %
IHCI Progress Report Apr 2020-Dec 202132 33
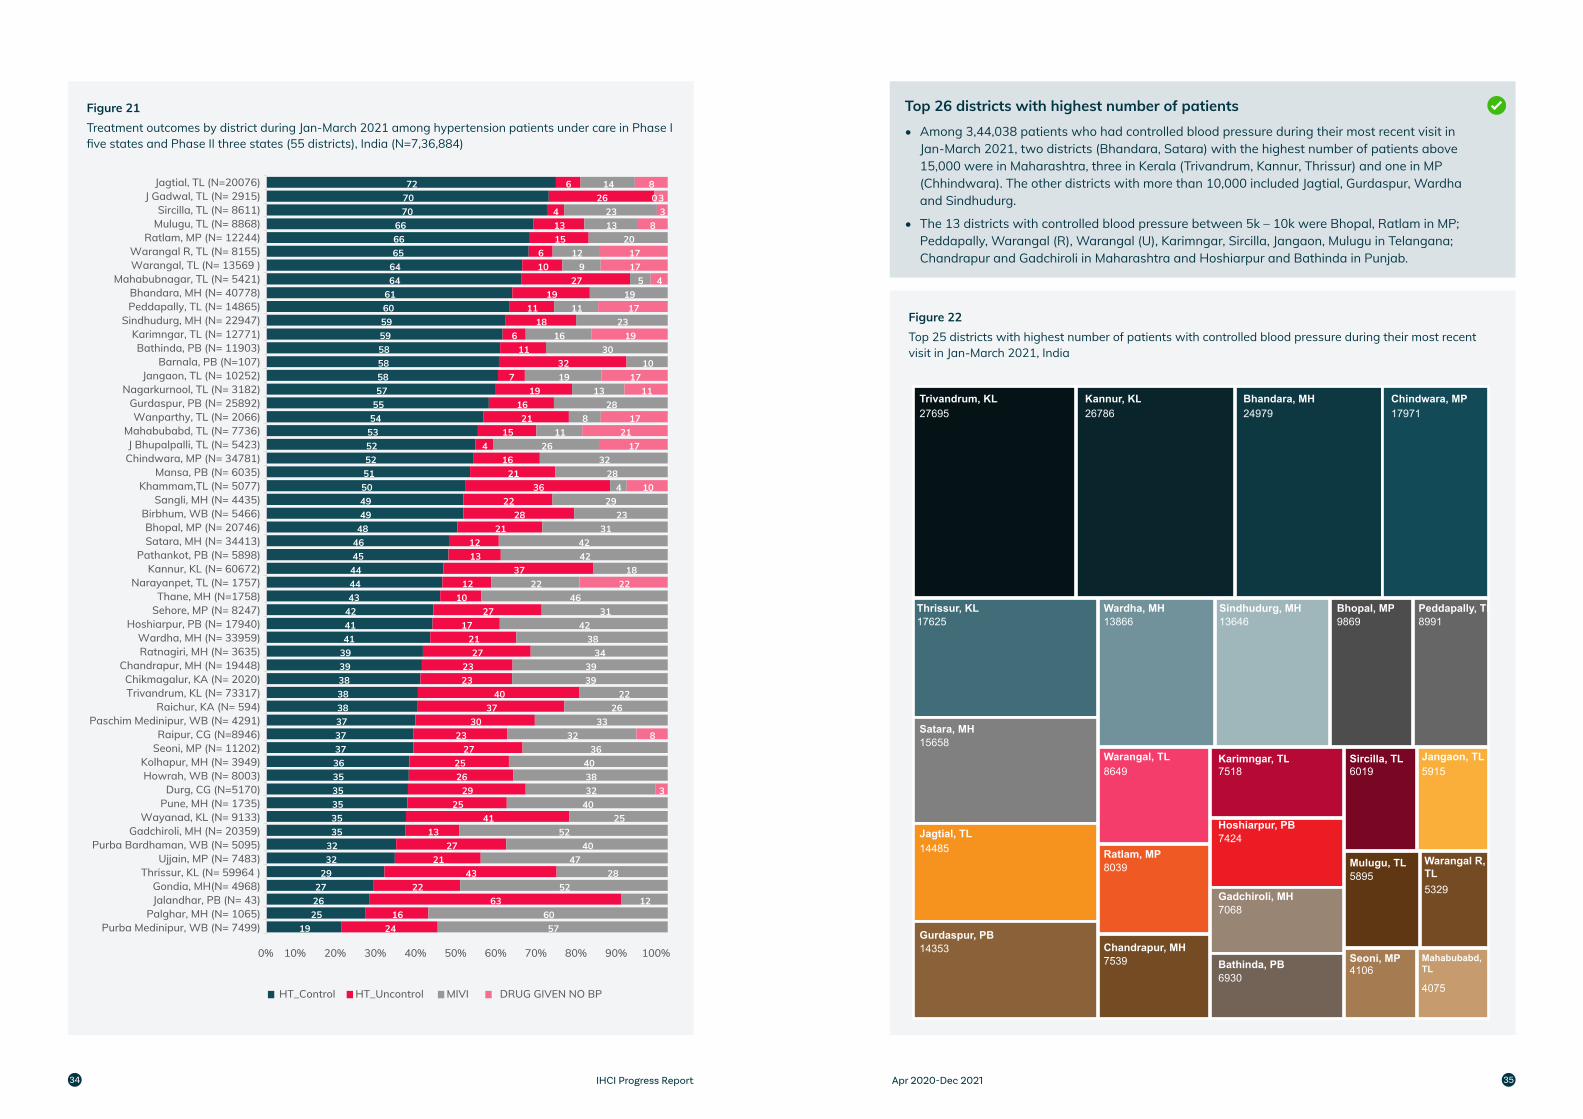
Figure 21Treatment outcomes by district during Jan-March 2021 among hypertension patients under care in Phase I five states and Phase II three states (55 districts), India (N=7,36,884)
Figure 22Top 25 districts with highest number of patients with controlled blood pressure during their most recent visit in Jan-March 2021, India
Trivandrum, KL 27695
Kannur, KL26786
Bhandara, MH24979
Chindwara, MP17971
Thrissur, KL 17625
Satara, MH15658
Jagtial, TL14485
Gurdaspur, PB14353
Wardha, MH 13866
Sindhudurg, MH13646
Bhopal, MP9869
Peddapally, TL8991
Warangal, TL 8649
Ratlam, MP8039
Chandrapur, MH7539
Karimngar, TL7518
Hoshiarpur, PB7424
Gadchiroli, MH7068
Bathinda, PB6930
Sircilla, TL6019
Jangaon, TL5915
Mulugu, TL5895
Warangal R, TL5329
Seoni, MP4106
Mahabubabd,TL
4075
Top 26 districts with highest number of patients• Among 3,44,038 patients who had controlled blood pressure during their most recent visit in
Jan-March 2021, two districts (Bhandara, Satara) with the highest number of patients above 15,000 were in Maharashtra, three in Kerala (Trivandrum, Kannur, Thrissur) and one in MP (Chhindwara). The other districts with more than 10,000 included Jagtial, Gurdaspur, Wardha and Sindhudurg.
• The 13 districts with controlled blood pressure between 5k – 10k were Bhopal, Ratlam in MP; Peddapally, Warangal (R), Warangal (U), Karimngar, Sircilla, Jangaon, Mulugu in Telangana; Chandrapur and Gadchiroli in Maharashtra and Hoshiarpur and Bathinda in Punjab.
19252627
293232353535353536373737383838393941414243444445464849495051525253545557585858595960616464656666
707072
2416
6322
4321
2713
4125
292625
2723
3037
402323
2721
1727
1012
371312
2128
2236
2116
415
2116
197
3211
618
1119
27106
15134
266
5760
1252
2847
4052
2540323840
3632
3326
223939
3438
4231
4622
184242
3123
294
2832
2611
828
1319
1030
1623
1119
59
1220
1323
014
3
8
22
10
1721
17
1117
19
17
41717
833
8
0% 10% 20% 30% 40% 50% 60% 70% 80% 90% 100%
Jagtial, TL (N=20076)J Gadwal, TL (N= 2915)
Sircilla, TL (N= 8611)Mulugu, TL (N= 8868)
Ratlam, MP (N= 12244)Warangal R, TL (N= 8155)Warangal, TL (N= 13569 )
Mahabubnagar, TL (N= 5421)Bhandara, MH (N= 40778)Peddapally, TL (N= 14865)
Sindhudurg, MH (N= 22947)Karimngar, TL (N= 12771)Bathinda, PB (N= 11903)
Barnala, PB (N=107)Jangaon, TL (N= 10252)
Nagarkurnool, TL (N= 3182)Gurdaspur, PB (N= 25892)Wanparthy, TL (N= 2066)
Mahabubabd, TL (N= 7736)J Bhupalpalli, TL (N= 5423)
Chindwara, MP (N= 34781)Mansa, PB (N= 6035)
Khammam,TL (N= 5077)Sangli, MH (N= 4435)
Birbhum, WB (N= 5466)Bhopal, MP (N= 20746)Satara, MH (N= 34413)
Pathankot, PB (N= 5898)Kannur, KL (N= 60672)
Narayanpet, TL (N= 1757)Thane, MH (N=1758)
Sehore, MP (N= 8247)Hoshiarpur, PB (N= 17940)
Wardha, MH (N= 33959)Ratnagiri, MH (N= 3635)
Chandrapur, MH (N= 19448)Chikmagalur, KA (N= 2020)Trivandrum, KL (N= 73317)
Raichur, KA (N= 594)Paschim Medinipur, WB (N= 4291)
Raipur, CG (N=8946)Seoni, MP (N= 11202)
Kolhapur, MH (N= 3949)Howrah, WB (N= 8003)
Durg, CG (N=5170)Pune, MH (N= 1735)
Wayanad, KL (N= 9133)Gadchiroli, MH (N= 20359)
Purba Bardhaman, WB (N= 5095)Ujjain, MP (N= 7483)
Thrissur, KL (N= 59964 )Gondia, MH(N= 4968)Jalandhar, PB (N= 43)
Palghar, MH (N= 1065)Purba Medinipur, WB (N= 7499)
HT_Control HT_Uncontrol MIVI DRUG GIVEN NO BP
IHCI Progress Report Apr 2020-Dec 202134 35
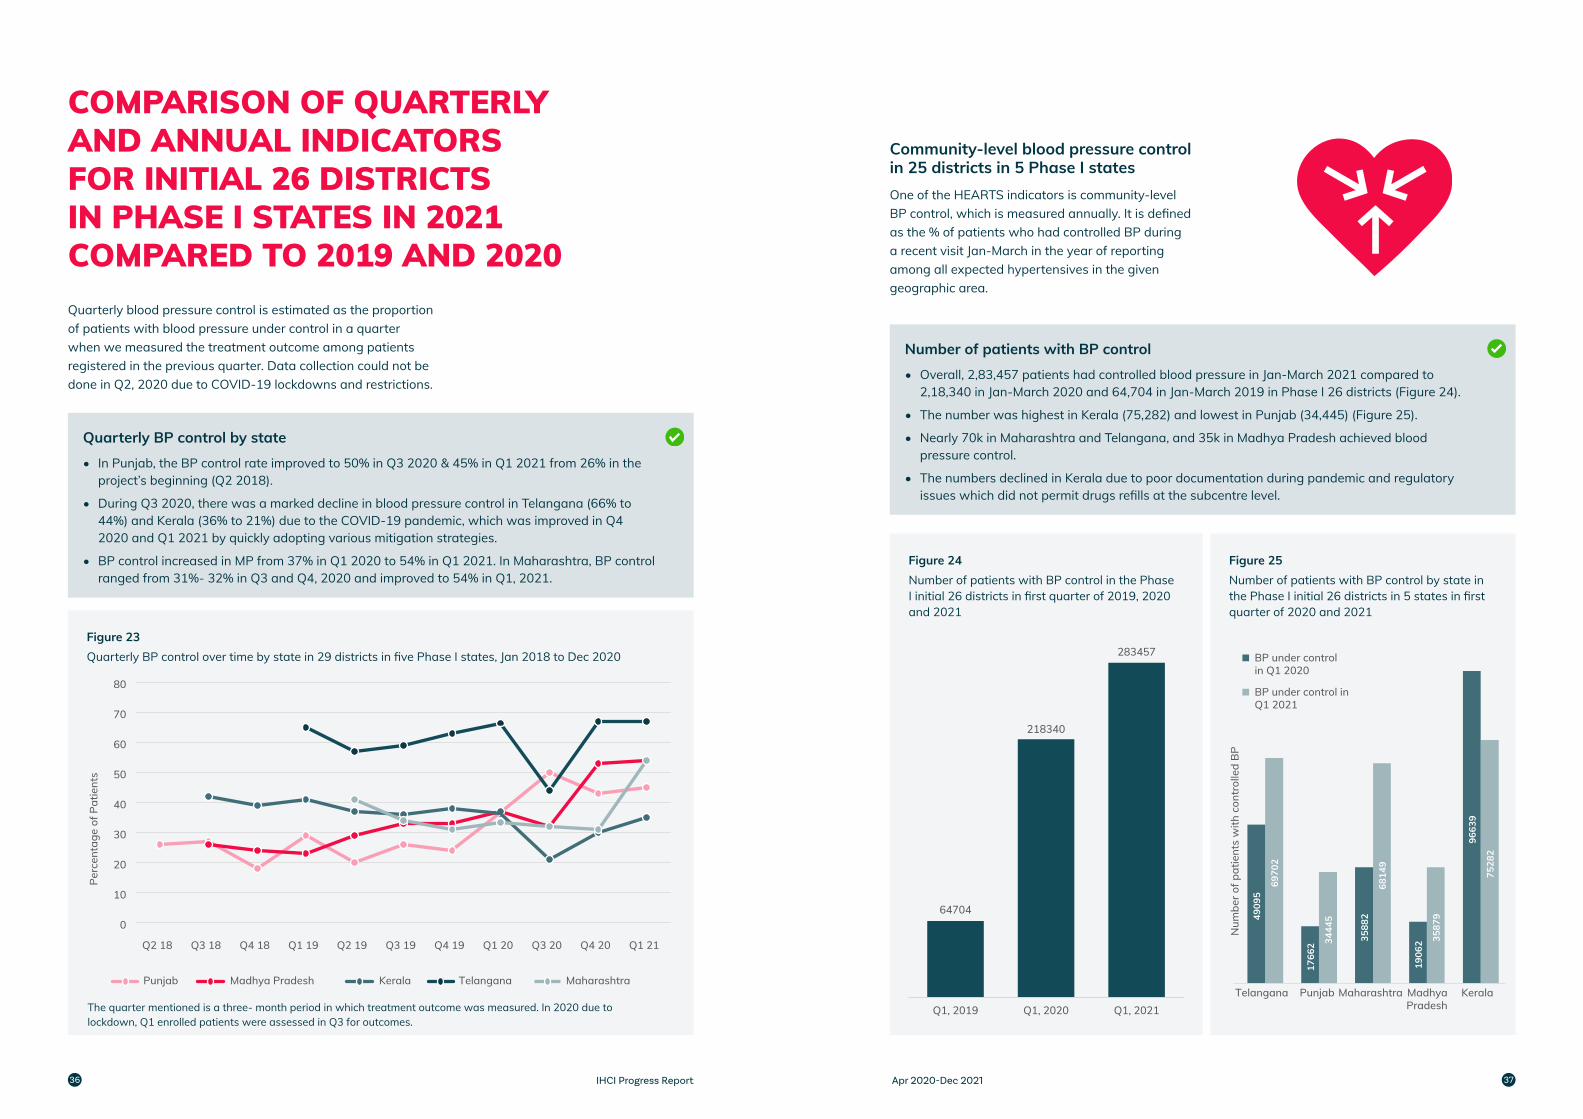
Quarterly blood pressure control is estimated as the proportion of patients with blood pressure under control in a quarter when we measured the treatment outcome among patients registered in the previous quarter. Data collection could not be done in Q2, 2020 due to COVID-19 lockdowns and restrictions.
Figure 23Quarterly BP control over time by state in 29 districts in five Phase I states, Jan 2018 to Dec 2020
0
10
20
30
40
50
60
70
80
Q2 18 Q3 18 Q4 18 Q1 19 Q2 19 Q3 19 Q4 19 Q1 20 Q3 20 Q4 20 Q1 21
Perc
enta
ge o
f Pat
ient
s
Punjab Madhya Pradesh Kerala Telangana Maharashtra
The quarter mentioned is a three- month period in which treatment outcome was measured. In 2020 due to lockdown, Q1 enrolled patients were assessed in Q3 for outcomes.
Community-level blood pressure control in 25 districts in 5 Phase I statesOne of the HEARTS indicators is community-level BP control, which is measured annually. It is defined as the % of patients who had controlled BP during a recent visit Jan-March in the year of reporting among all expected hypertensives in the given geographic area.
Figure 24Number of patients with BP control in the Phase I initial 26 districts in first quarter of 2019, 2020 and 2021
64704
218340
283457
Q1, 2019 Q1, 2020 Q1, 2021
COMPARISON OF QUARTERLY AND ANNUAL INDICATORS FOR INITIAL 26 DISTRICTS IN PHASE I STATES IN 2021 COMPARED TO 2019 AND 2020
Quarterly BP control by state• In Punjab, the BP control rate improved to 50% in Q3 2020 & 45% in Q1 2021 from 26% in the
project’s beginning (Q2 2018).
• During Q3 2020, there was a marked decline in blood pressure control in Telangana (66% to 44%) and Kerala (36% to 21%) due to the COVID-19 pandemic, which was improved in Q4 2020 and Q1 2021 by quickly adopting various mitigation strategies.
• BP control increased in MP from 37% in Q1 2020 to 54% in Q1 2021. In Maharashtra, BP control ranged from 31%- 32% in Q3 and Q4, 2020 and improved to 54% in Q1, 2021.
Number of patients with BP control• Overall, 2,83,457 patients had controlled blood pressure in Jan-March 2021 compared to
2,18,340 in Jan-March 2020 and 64,704 in Jan-March 2019 in Phase I 26 districts (Figure 24).
• The number was highest in Kerala (75,282) and lowest in Punjab (34,445) (Figure 25).
• Nearly 70k in Maharashtra and Telangana, and 35k in Madhya Pradesh achieved blood pressure control.
• The numbers declined in Kerala due to poor documentation during pandemic and regulatory issues which did not permit drugs refills at the subcentre level.
Figure 25Number of patients with BP control by state in the Phase I initial 26 districts in 5 states in first quarter of 2020 and 2021
7528
2
3587
9
6814
9
3444
5
6970
2
9663
9
1906
23588
2
1766
2
4909
5
KeralaMadhyaPradesh
MaharashtraPunjabTelangana
Num
ber o
f pat
ient
s w
ith c
ontr
olle
d B
P
BP under control in Q1 2020
BP under control in Q1 2021
IHCI Progress Report Apr 2020-Dec 202136 37
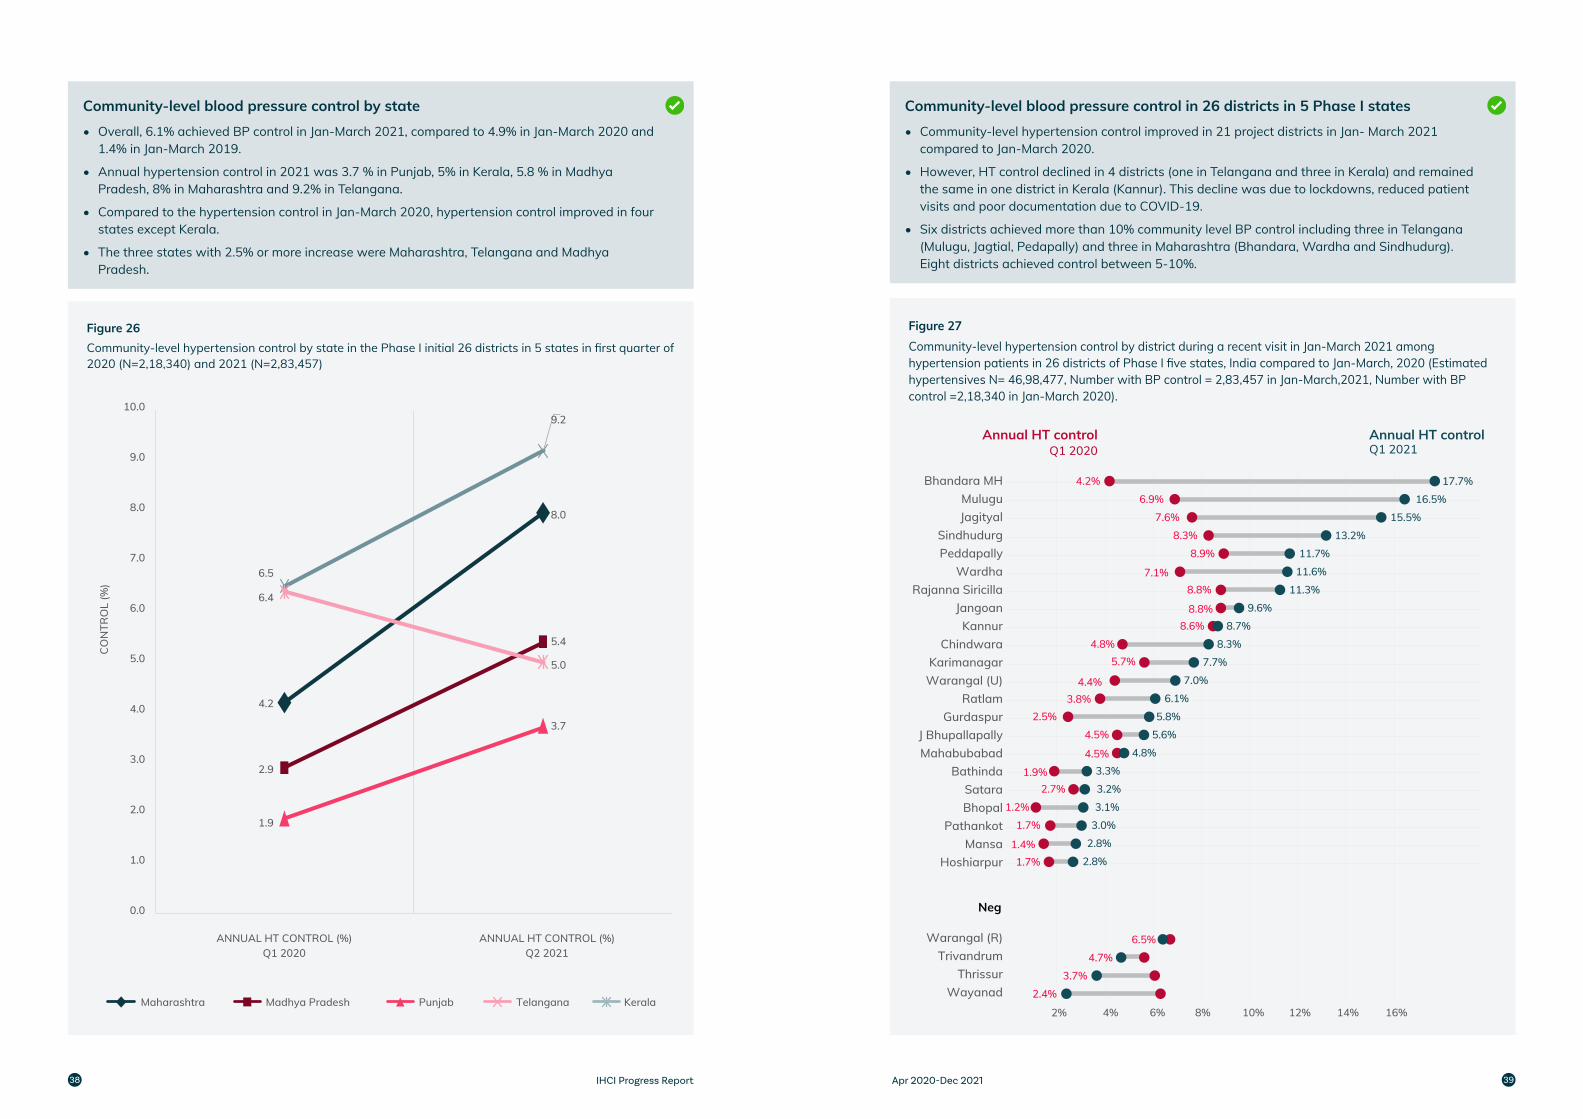
Figure 26Community-level hypertension control by state in the Phase I initial 26 districts in 5 states in first quarter of 2020 (N=2,18,340) and 2021 (N=2,83,457)
4.2
8.0
2.9
5.4
1.9
3.7
6.5
9.2
6.4
5.0
0.0
1.0
2.0
3.0
4.0
5.0
6.0
7.0
8.0
9.0
10.0
ANNUAL HT CONTROL (%)Q1 2020
ANNUAL HT CONTROL (%)Q2 2021
CO
NTR
OL
(%)
Maharashtra Madhya Pradesh Punjab Telangana Kerala
Figure 27Community-level hypertension control by district during a recent visit in Jan-March 2021 among hypertension patients in 26 districts of Phase I five states, India compared to Jan-March, 2020 (Estimated hypertensives N= 46,98,477, Number with BP control = 2,83,457 in Jan-March,2021, Number with BP control =2,18,340 in Jan-March 2020).
2% 4% 6% 8% 10% 12% 14% 16%
17.7%
16.5%
15.5%
13.2%
11.7%
7.0%
6.1%
5.8%
5.6%
4.8%
3.3%
3.2%
3.1%
3.0%
2.8%
2.8%
11.6%
11.3%
9.6%
8.7%
8.3%
7.7%
4.2%
6.9%
7.6%
8.3%
8.9%
7.1%8.8%
8.8%8.6%
4.8%5.7%
4.4%3.8%
2.5%
4.5%
4.5%
1.9%2.7%
1.2%
1.7%
1.4%1.7%
6.5%
4.7%
3.7%
2.4%
Q1 2021Annual HT controlAnnual HT control
Q1 2020
Bhandara MHMuluguJagityal
SindhudurgPeddapally
WardhaRajanna Siricilla
JangoanKannur
ChindwaraKarimanagar
Warangal (U)Ratlam
GurdaspurJ BhupallapallyMahabubabad
BathindaSataraBhopal
PathankotMansa
Hoshiarpur
Warangal (R)Trivandrum
ThrissurWayanad
Neg
Community-level blood pressure control by state• Overall, 6.1% achieved BP control in Jan-March 2021, compared to 4.9% in Jan-March 2020 and
1.4% in Jan-March 2019.
• Annual hypertension control in 2021 was 3.7 % in Punjab, 5% in Kerala, 5.8 % in Madhya Pradesh, 8% in Maharashtra and 9.2% in Telangana.
• Compared to the hypertension control in Jan-March 2020, hypertension control improved in four states except Kerala.
• The three states with 2.5% or more increase were Maharashtra, Telangana and Madhya Pradesh.
Community-level blood pressure control in 26 districts in 5 Phase I states• Community-level hypertension control improved in 21 project districts in Jan- March 2021
compared to Jan-March 2020.
• However, HT control declined in 4 districts (one in Telangana and three in Kerala) and remained the same in one district in Kerala (Kannur). This decline was due to lockdowns, reduced patient visits and poor documentation due to COVID-19.
• Six districts achieved more than 10% community level BP control including three in Telangana (Mulugu, Jagtial, Pedapally) and three in Maharashtra (Bhandara, Wardha and Sindhudurg). Eight districts achieved control between 5-10%.
IHCI Progress Report Apr 2020-Dec 202138 39
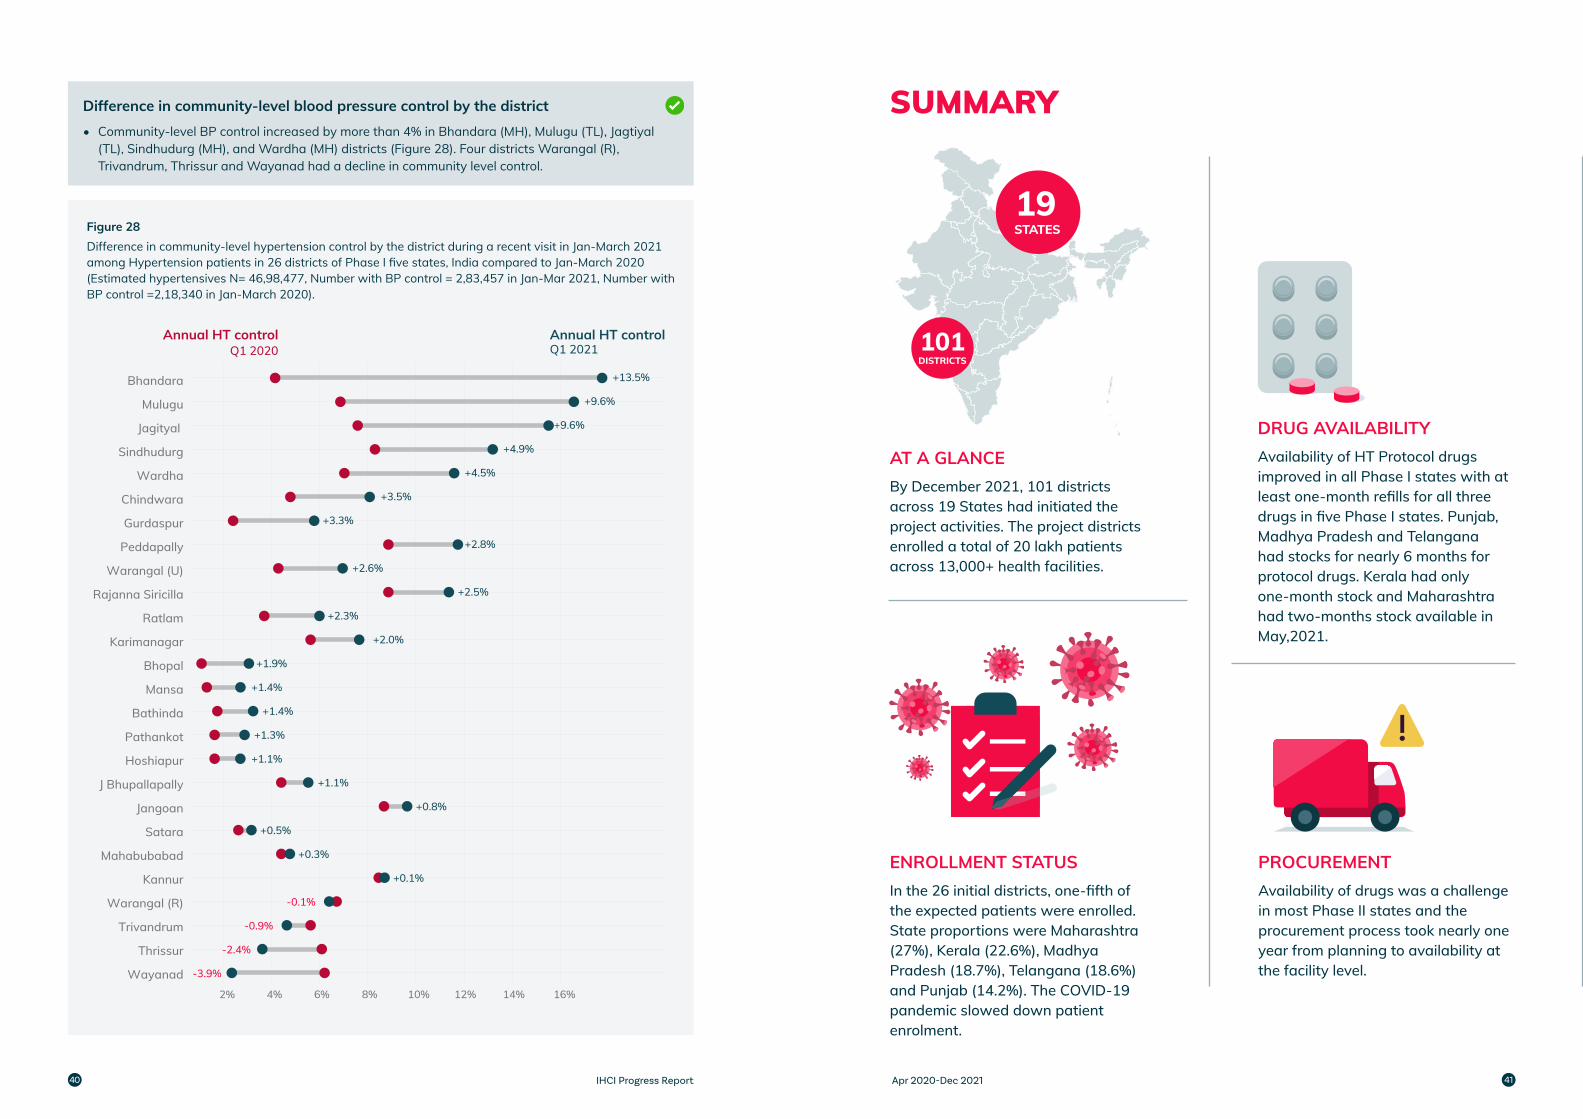
Figure 28Difference in community-level hypertension control by the district during a recent visit in Jan-March 2021 among Hypertension patients in 26 districts of Phase I five states, India compared to Jan-March 2020 (Estimated hypertensives N= 46,98,477, Number with BP control = 2,83,457 in Jan-Mar 2021, Number with BP control =2,18,340 in Jan-March 2020).
2% 4% 6% 8% 10% 12% 14% 16%
Q1 2021Annual HT controlAnnual HT control
Q1 2020
+13.5%
+9.6%
+9.6%
+4.9%
+3.5%
+3.3%
+2.8%
+2.6%
+2.5%
+2.3%
+2.0%
+1.9%
+1.4%
+1.4%
+1.3%
+1.1%
+1.1%
+0.8%
+0.5%
+0.3%
+0.1%
-0.1%
-0.9%
-2.4%
-3.9%
+4.5%
Bhandara
Mulugu
Jagityal
Sindhudurg
Wardha
Chindwara
Gurdaspur
Peddapally
Warangal (U)
Rajanna Siricilla
Ratlam
Karimanagar
Bhopal
Mansa
Bathinda
Pathankot
Hoshiapur
J Bhupallapally
Jangoan
Satara
Mahabubabad
Kannur
Warangal (R)
Trivandrum
Thrissur
Wayanad
Difference in community-level blood pressure control by the district• Community-level BP control increased by more than 4% in Bhandara (MH), Mulugu (TL), Jagtiyal
(TL), Sindhudurg (MH), and Wardha (MH) districts (Figure 28). Four districts Warangal (R), Trivandrum, Thrissur and Wayanad had a decline in community level control.
SUMMARY
AT A GLANCEBy December 2021, 101 districts across 19 States had initiated the project activities. The project districts enrolled a total of 20 lakh patients across 13,000+ health facilities.
ENROLLMENT STATUSIn the 26 initial districts, one-fifth of the expected patients were enrolled. State proportions were Maharashtra (27%), Kerala (22.6%), Madhya Pradesh (18.7%), Telangana (18.6%) and Punjab (14.2%). The COVID-19 pandemic slowed down patient enrolment.
DRUG AVAILABILITYAvailability of HT Protocol drugs improved in all Phase I states with at least one-month refills for all three drugs in five Phase I states. Punjab, Madhya Pradesh and Telangana had stocks for nearly 6 months for protocol drugs. Kerala had only one-month stock and Maharashtra had two-months stock available in May,2021.
PROCUREMENTAvailability of drugs was a challenge in most Phase II states and the procurement process took nearly one year from planning to availability at the facility level.
101DISTRICTS
19STATES
IHCI Progress Report Apr 2020-Dec 202140 41
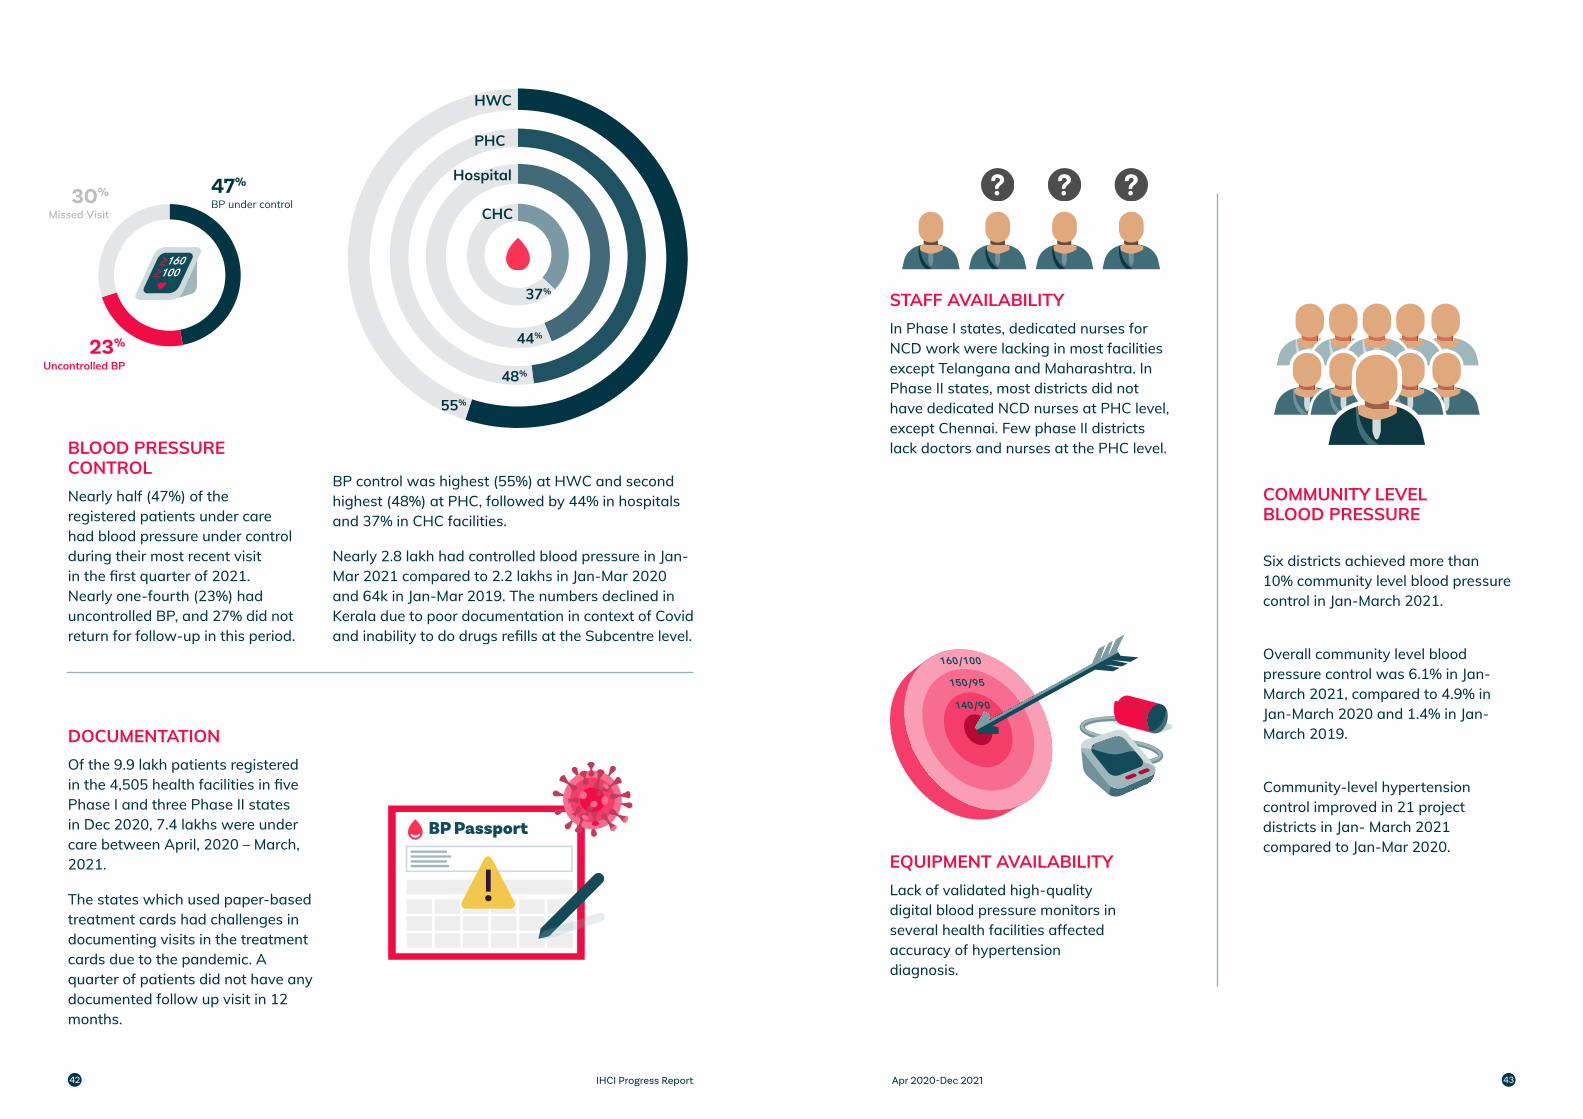
BLOOD PRESSURE CONTROLNearly half (47%) of the registered patients under care had blood pressure under control during their most recent visit in the first quarter of 2021. Nearly one-fourth (23%) had uncontrolled BP, and 27% did not return for follow-up in this period.
DOCUMENTATIONOf the 9.9 lakh patients registered in the 4,505 health facilities in five Phase I and three Phase II states in Dec 2020, 7.4 lakhs were under care between April, 2020 – March, 2021.
The states which used paper-based treatment cards had challenges in documenting visits in the treatment cards due to the pandemic. A quarter of patients did not have any documented follow up visit in 12 months.
BP control was highest (55%) at HWC and second highest (48%) at PHC, followed by 44% in hospitals and 37% in CHC facilities.
Nearly 2.8 lakh had controlled blood pressure in Jan-Mar 2021 compared to 2.2 lakhs in Jan-Mar 2020 and 64k in Jan-Mar 2019. The numbers declined in Kerala due to poor documentation in context of Covid and inability to do drugs refills at the Subcentre level.
47+23+30+OBP under control
Missed Visit
Uncontrolled BP
47%30%
23% 55+45+T48+52+S44+56+O37+63+HHWC
PHC
Hospital
CHC
37%
44%
48%
55%
Overall community level blood pressure control was 6.1% in Jan-March 2021, compared to 4.9% in Jan-March 2020 and 1.4% in Jan-March 2019.
Community-level hypertension control improved in 21 project districts in Jan- March 2021 compared to Jan-Mar 2020.
Six districts achieved more than 10% community level blood pressure control in Jan-March 2021.
STAFF AVAILABILITYIn Phase I states, dedicated nurses for NCD work were lacking in most facilities except Telangana and Maharashtra. In Phase II states, most districts did not have dedicated NCD nurses at PHC level, except Chennai. Few phase II districts lack doctors and nurses at the PHC level.
EQUIPMENT AVAILABILITYLack of validated high-quality digital blood pressure monitors in several health facilities affected accuracy of hypertension diagnosis.
COMMUNITY LEVEL BLOOD PRESSURE
? ? ?
IHCI Progress Report Apr 2020-Dec 202142 43
1
3 4
2
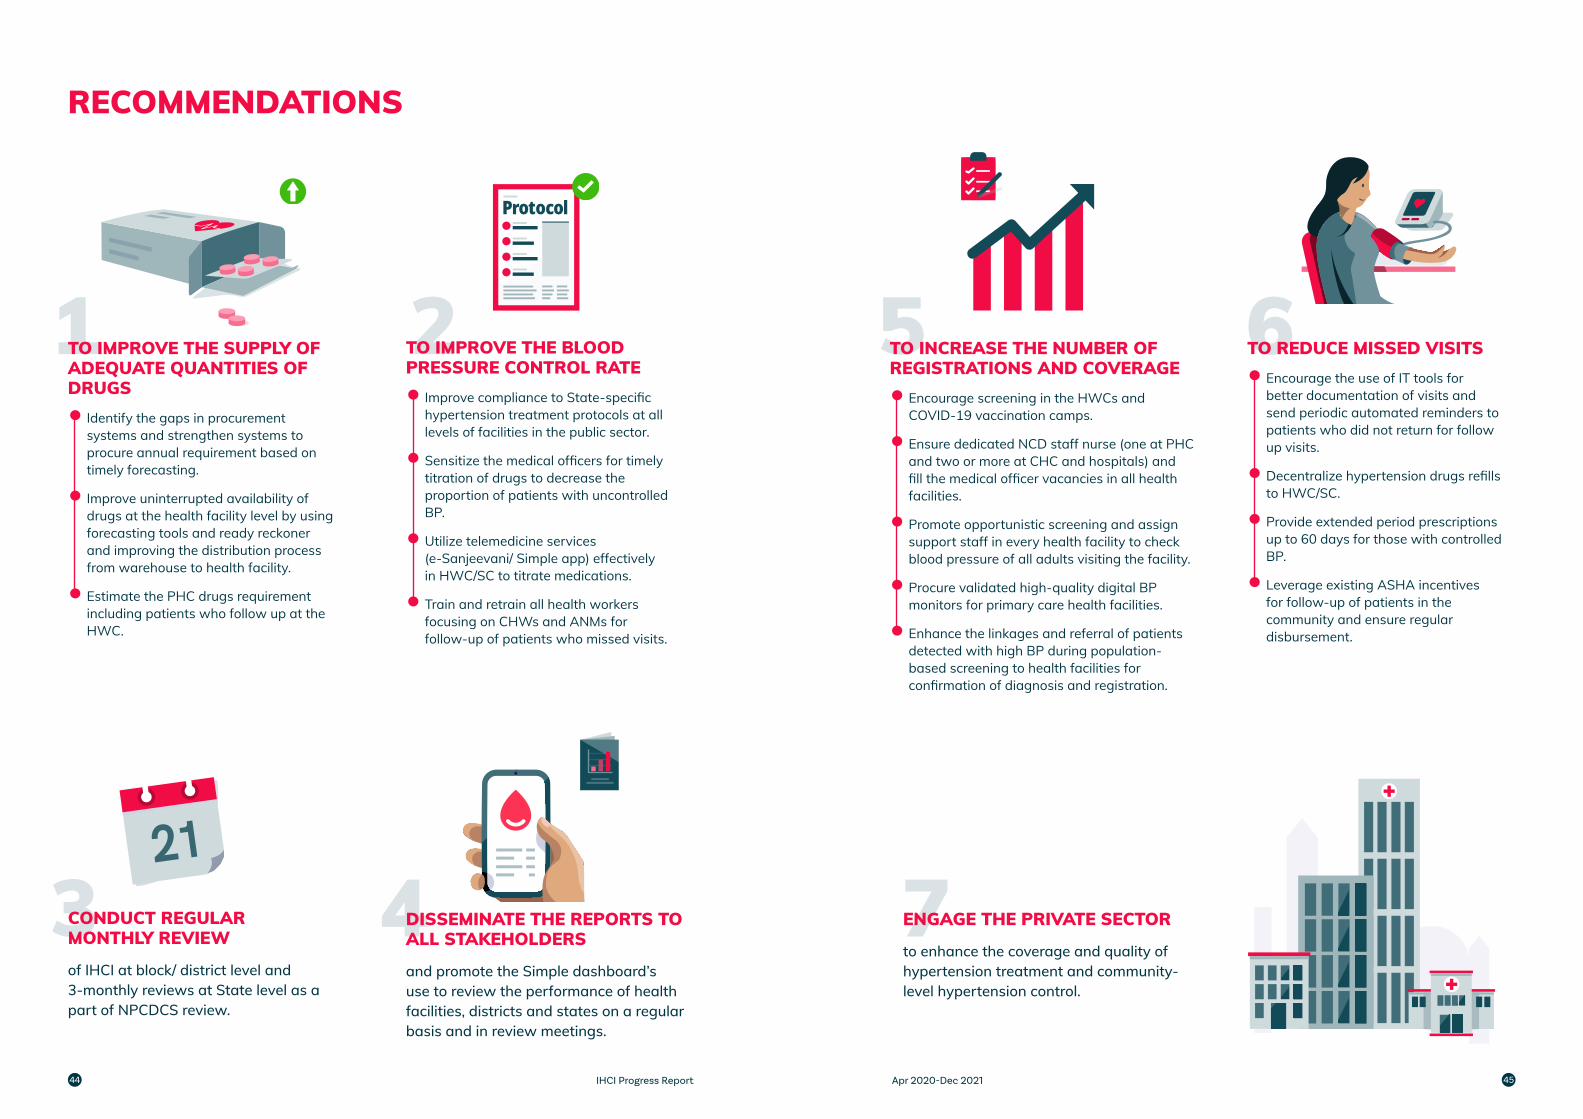
RECOMMENDATIONS
TO IMPROVE THE SUPPLY OF ADEQUATE QUANTITIES OF DRUGS• Identify the gaps in procurement
systems and strengthen systems to procure annual requirement based on timely forecasting.
• Improve uninterrupted availability of drugs at the health facility level by using forecasting tools and ready reckoner and improving the distribution process from warehouse to health facility.
• Estimate the PHC drugs requirement including patients who follow up at the HWC.
TO IMPROVE THE BLOOD PRESSURE CONTROL RATE• Improve compliance to State-specific
hypertension treatment protocols at all levels of facilities in the public sector.
• Sensitize the medical officers for timely titration of drugs to decrease the proportion of patients with uncontrolled BP.
• Utilize telemedicine services (e-Sanjeevani/ Simple app) effectively in HWC/SC to titrate medications.
• Train and retrain all health workers focusing on CHWs and ANMs for follow-up of patients who missed visits.
DISSEMINATE THE REPORTS TO ALL STAKEHOLDERS
and promote the Simple dashboard’s use to review the performance of health facilities, districts and states on a regular basis and in review meetings.
CONDUCT REGULAR MONTHLY REVIEW
of IHCI at block/ district level and 3-monthly reviews at State level as a part of NPCDCS review.
7
5 6TO INCREASE THE NUMBER OF REGISTRATIONS AND COVERAGE • Encourage screening in the HWCs and
COVID-19 vaccination camps.
• Ensure dedicated NCD staff nurse (one at PHC and two or more at CHC and hospitals) and fill the medical officer vacancies in all health facilities.
• Promote opportunistic screening and assign support staff in every health facility to check blood pressure of all adults visiting the facility.
• Procure validated high-quality digital BP monitors for primary care health facilities.
• Enhance the linkages and referral of patients detected with high BP during population-based screening to health facilities for confirmation of diagnosis and registration.
TO REDUCE MISSED VISITS• Encourage the use of IT tools for
better documentation of visits and send periodic automated reminders to patients who did not return for follow up visits.
• Decentralize hypertension drugs refills to HWC/SC.
• Provide extended period prescriptions up to 60 days for those with controlled BP.
• Leverage existing ASHA incentives for follow-up of patients in the community and ensure regular disbursement.
ENGAGE THE PRIVATE SECTOR
to enhance the coverage and quality of hypertension treatment and community-level hypertension control.
IHCI Progress Report Apr 2020-Dec 202144 45
State DistrictPhysician Staff Nurse Pharmacist
Trained Load# % Trained Load# % Trained Load# %
Andhra PradeshKrishna 157 172 91 234 242 97 107 112 96
Visakhapatnam 148 190 78 127 240 53 72 115 63
BiharMuzaffarpur 45 113 40 14 52 27 3 24 13
Vaishali 65 149 44 11 198 6 25 25 100
ChhattisgarhRaipur 97 188 52 149 218 68 75 80 94
Durg 83 146 57 232 315 74 61 78 78
GoaNorth 73 85 86 29 255 11 38 57 67
South 59 83 71 29 390 7 50 55 91
GujaratSurat 0 142 0 0 99 0 0 76 0
Rajkot 0 65 0 0 29 0 0 80 0
JharkhandBokaro 72 85 85 116 130 89 10 15 67
Ranchi 15 138 11 16 150 11 4 11 36
KarnatakaChikmagalur 55 78 71 45 55 82 11 38 29
Raichur * 33 50 66 47 50 94 27 37 73
NagalandMokokchung 27 30 90 0 33 0 27 37 73
Kohima 21 29 72 16 44 36 27 30 90
Puducherry Puducherry 62 109 57 102 170 60 39 42 93
RajasthanBikaner 29 154 19 0 254 0 0 88 0
Churu 124 281 44 120 459 26 13 46 28
Sikkim
East 13 13 100 8 11 73 5 6 83
South 8 9 89 8 18 44 5 5 100
North 0 6 0 0 7 0 0 1 0
West 8 9 89 8 18 44 5 5 100
Tamil Nadu Chennai ** 32 35 91 55 59 93 25 27 93
Uttar Pradesh
Jhansi 0 108 0 104 104 100 0 76 0
Lalitpur 0 42 0 0 65 0 0 30 0
Allahabad 94 156 60 178 285 62 44 194 23
Varanasi 128 196 65 34 99 34 49 108 45
West BengalBirbhum 65 73 89 71 71 100 53 54 98
Howrah 123 174 71 120 736 16 68 84 81
30 districts' total: 1636 3108 53 1873 4856 39 843 1636 52
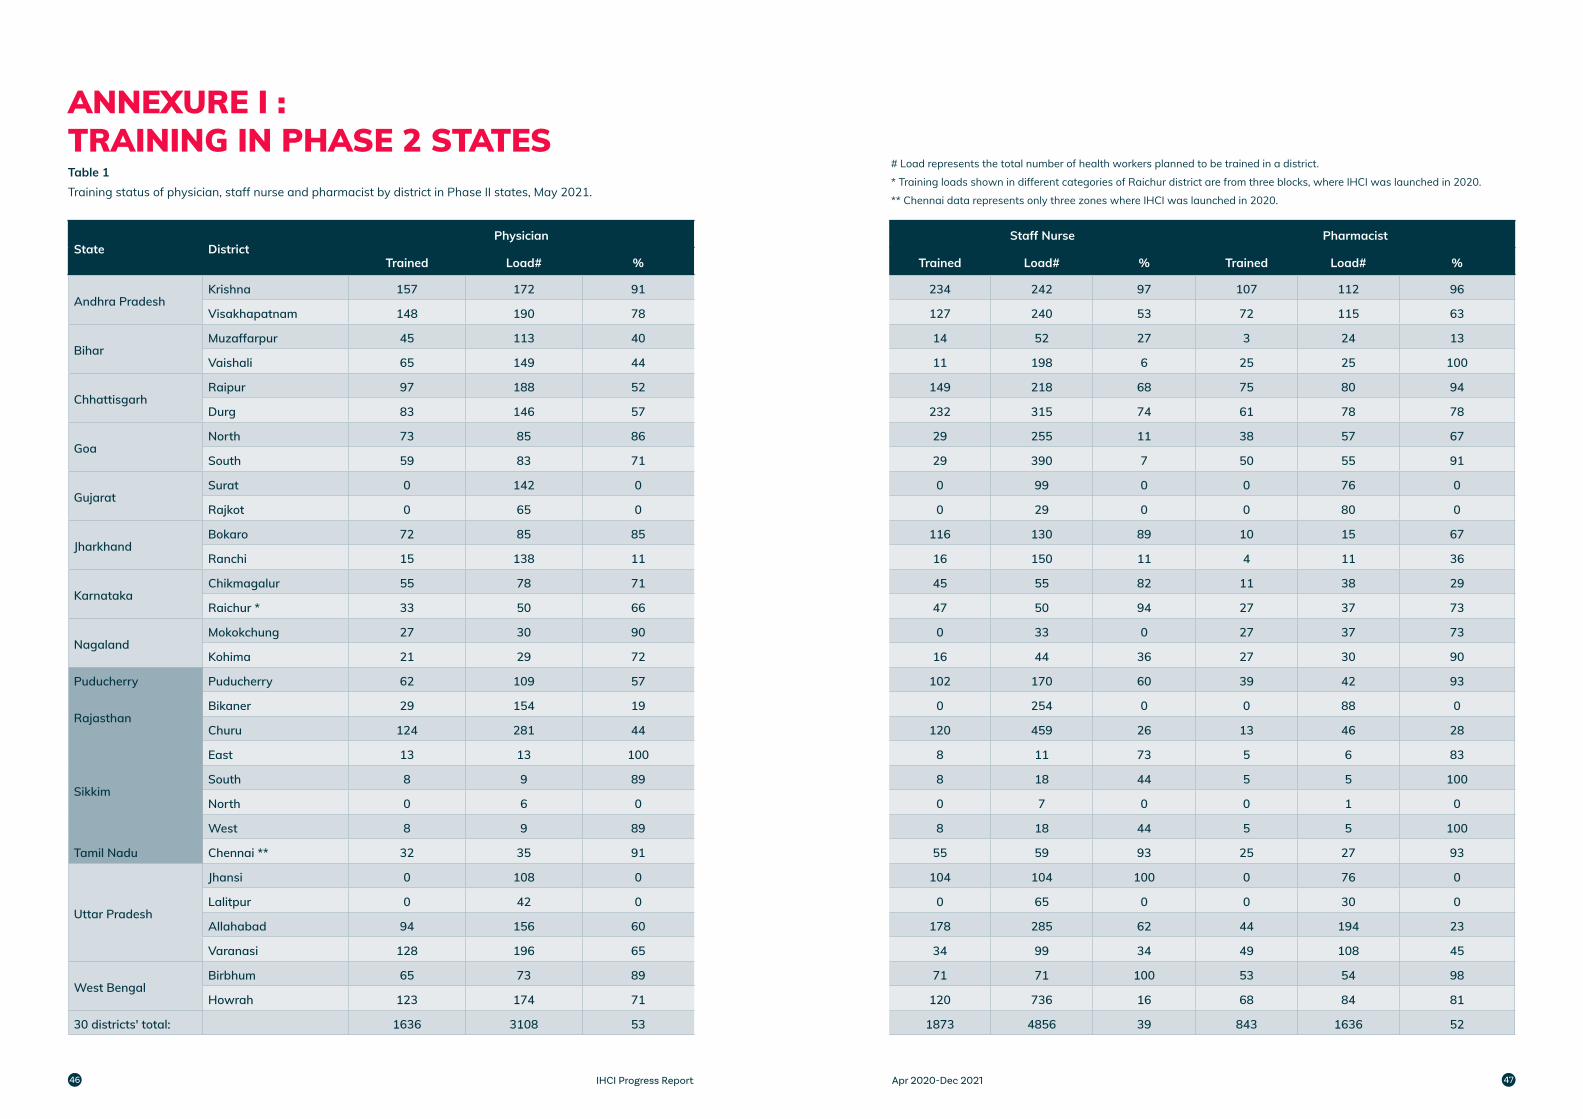
ANNEXURE I : TRAINING IN PHASE 2 STATESTable 1Training status of physician, staff nurse and pharmacist by district in Phase II states, May 2021.
# Load represents the total number of health workers planned to be trained in a district.
* Training loads shown in different categories of Raichur district are from three blocks, where IHCI was launched in 2020.
** Chennai data represents only three zones where IHCI was launched in 2020.
IHCI Progress Report Apr 2020-Dec 202146 47
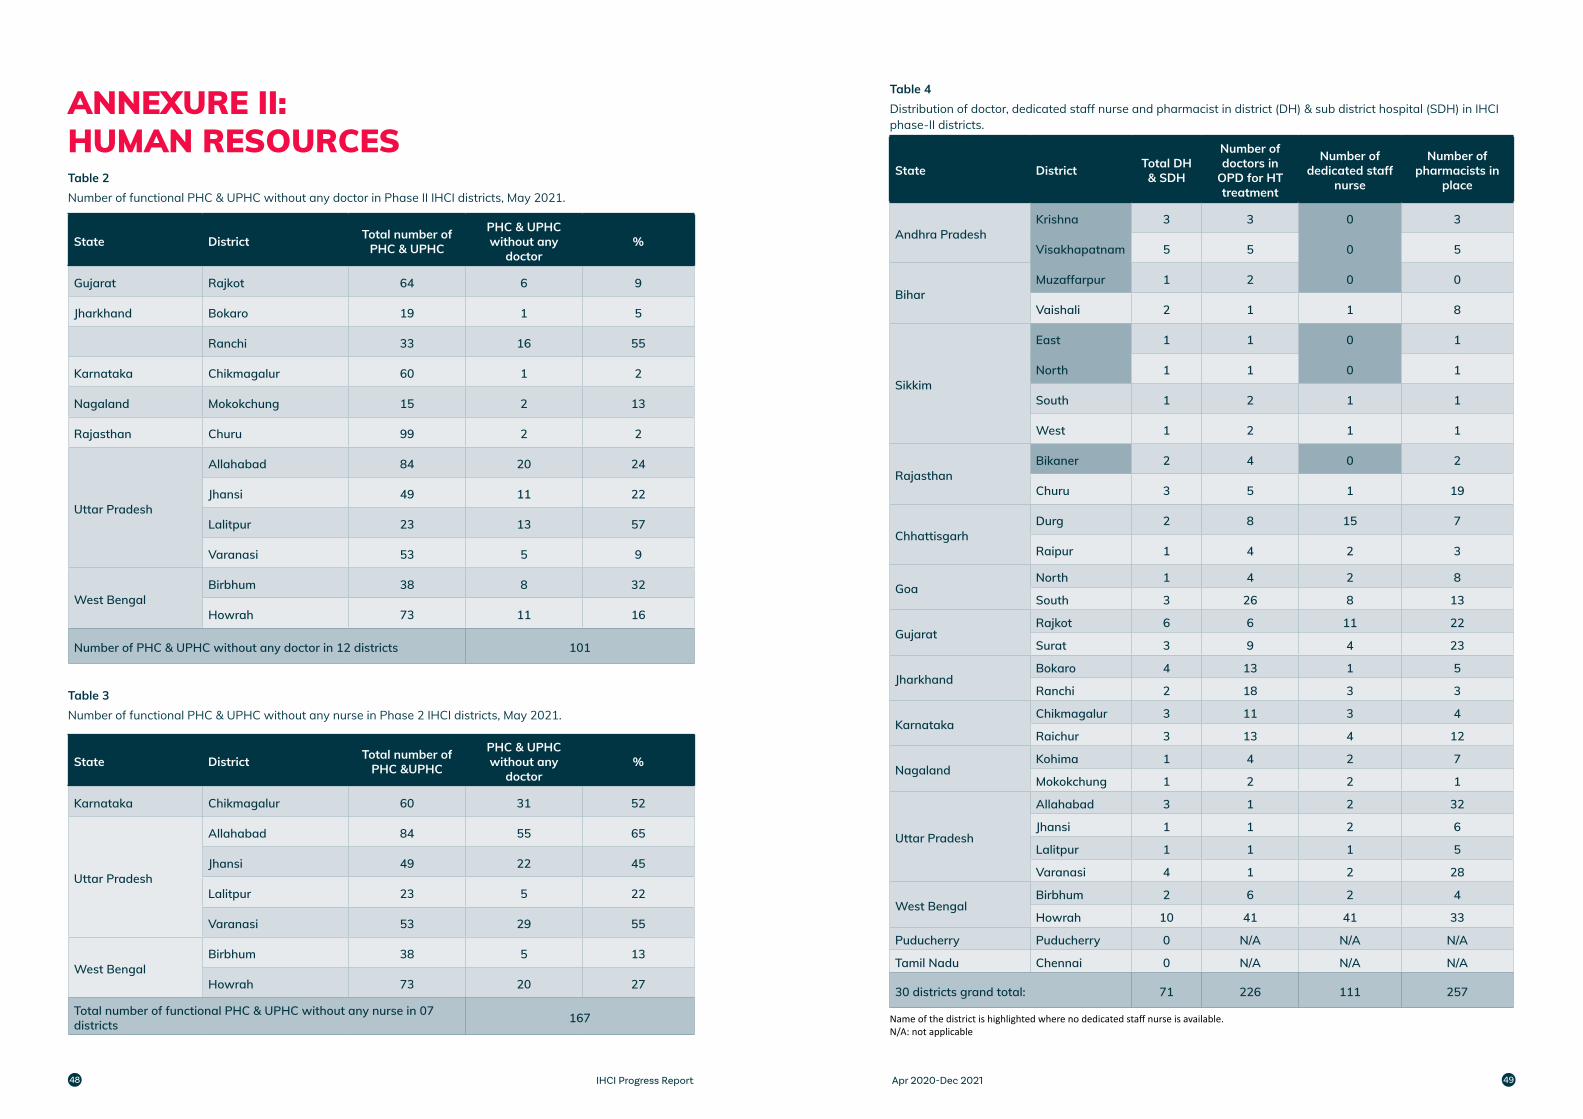
ANNEXURE II: HUMAN RESOURCESTable 2Number of functional PHC & UPHC without any doctor in Phase II IHCI districts, May 2021.
Table 3Number of functional PHC & UPHC without any nurse in Phase 2 IHCI districts, May 2021.
State District Total number of PHC & UPHC
PHC & UPHC without any
doctor%
Gujarat Rajkot 64 6 9
Jharkhand Bokaro 19 1 5
Ranchi 33 16 55
Karnataka Chikmagalur 60 1 2
Nagaland Mokokchung 15 2 13
Rajasthan Churu 99 2 2
Uttar Pradesh
Allahabad 84 20 24
Jhansi 49 11 22
Lalitpur 23 13 57
Varanasi 53 5 9
West BengalBirbhum 38 8 32
Howrah 73 11 16
Number of PHC & UPHC without any doctor in 12 districts 101
State District Total number of PHC &UPHC
PHC & UPHC without any
doctor%
Karnataka Chikmagalur 60 31 52
Uttar Pradesh
Allahabad 84 55 65
Jhansi 49 22 45
Lalitpur 23 5 22
Varanasi 53 29 55
West BengalBirbhum 38 5 13
Howrah 73 20 27
Total number of functional PHC & UPHC without any nurse in 07 districts 167
Table 4Distribution of doctor, dedicated staff nurse and pharmacist in district (DH) & sub district hospital (SDH) in IHCI phase-II districts.
State District Total DH & SDH
Number of doctors in
OPD for HT treatment
Number of dedicated staff
nurse
Number of pharmacists in
place
Andhra PradeshKrishna 3 3 0 3
Visakhapatnam 5 5 0 5
BiharMuzaffarpur 1 2 0 0
Vaishali 2 1 1 8
Sikkim
East 1 1 0 1
North 1 1 0 1
South 1 2 1 1
West 1 2 1 1
RajasthanBikaner 2 4 0 2
Churu 3 5 1 19
ChhattisgarhDurg 2 8 15 7
Raipur 1 4 2 3
GoaNorth 1 4 2 8
South 3 26 8 13
GujaratRajkot 6 6 11 22
Surat 3 9 4 23
JharkhandBokaro 4 13 1 5
Ranchi 2 18 3 3
KarnatakaChikmagalur 3 11 3 4
Raichur 3 13 4 12
NagalandKohima 1 4 2 7
Mokokchung 1 2 2 1
Uttar Pradesh
Allahabad 3 1 2 32
Jhansi 1 1 2 6
Lalitpur 1 1 1 5
Varanasi 4 1 2 28
West BengalBirbhum 2 6 2 4
Howrah 10 41 41 33
Puducherry Puducherry 0 N/A N/A N/A
Tamil Nadu Chennai 0 N/A N/A N/A
30 districts grand total: 71 226 111 257
Name of the district is highlighted where no dedicated staff nurse is available.N/A: not applicable
IHCI Progress Report Apr 2020-Dec 202148 49
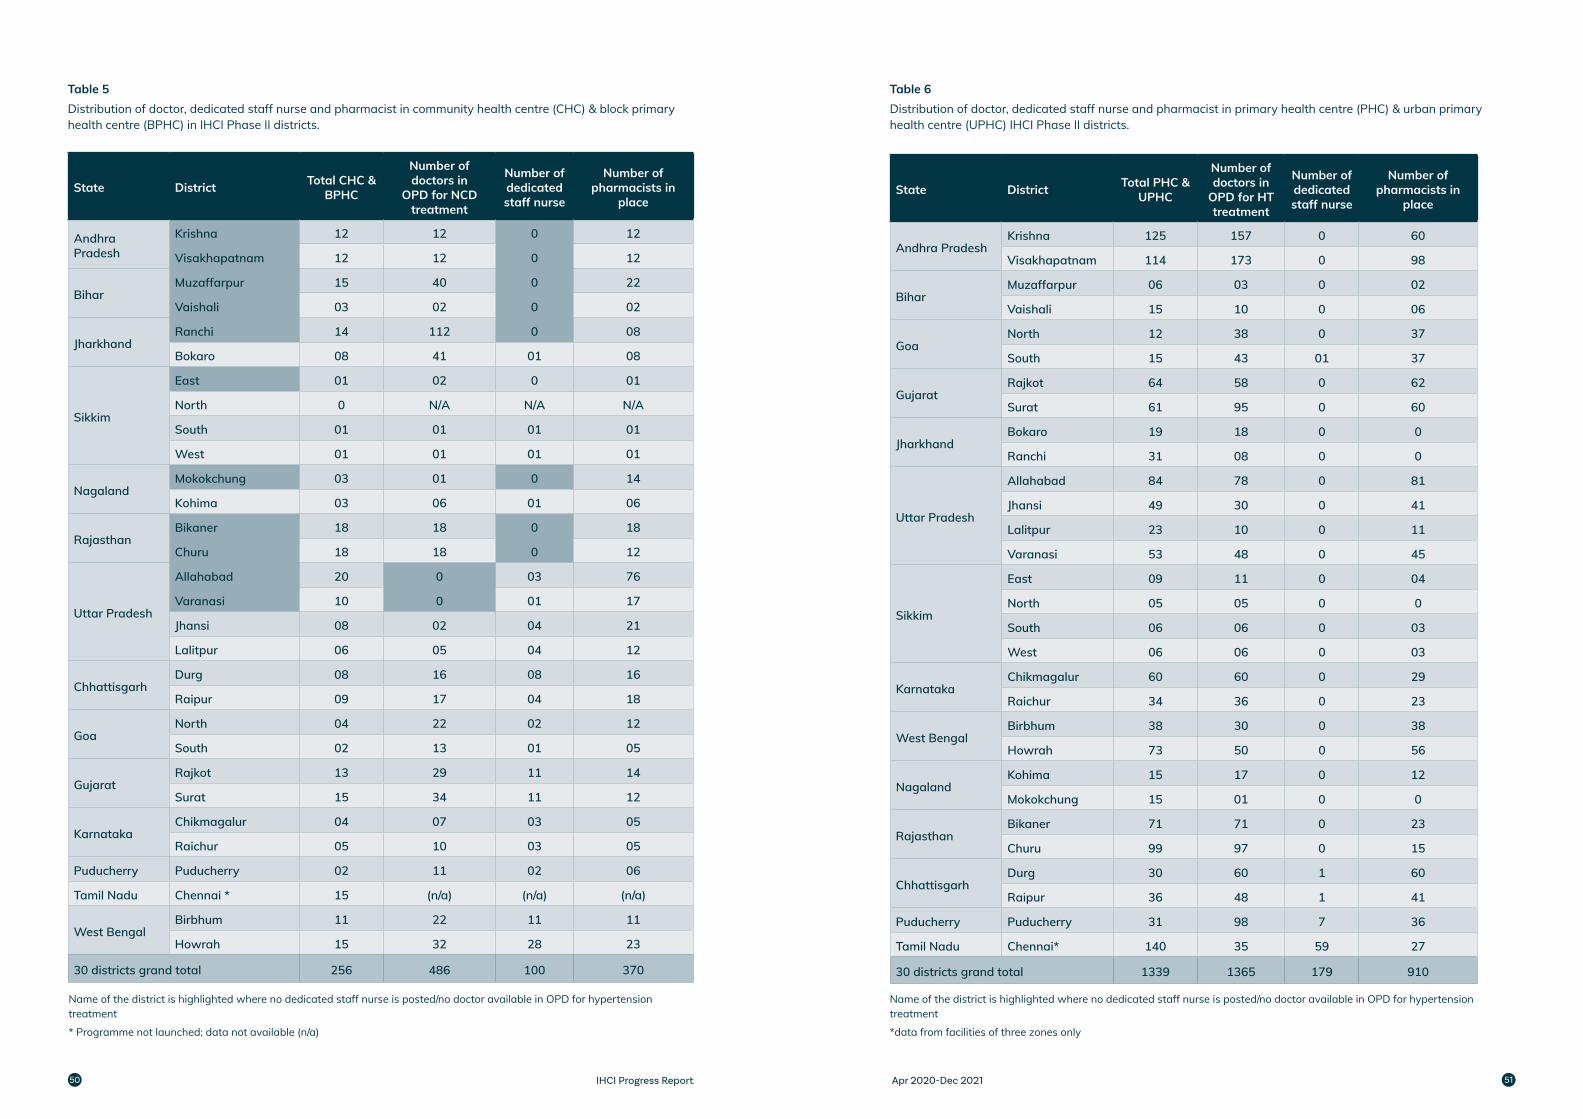
Table 5Distribution of doctor, dedicated staff nurse and pharmacist in community health centre (CHC) & block primary health centre (BPHC) in IHCI Phase II districts.
State District Total CHC & BPHC
Number of doctors in
OPD for NCD treatment
Number of dedicated staff nurse
Number of pharmacists in
place
Andhra Pradesh
Krishna 12 12 0 12
Visakhapatnam 12 12 0 12
BiharMuzaffarpur 15 40 0 22
Vaishali 03 02 0 02
JharkhandRanchi 14 112 0 08
Bokaro 08 41 01 08
Sikkim
East 01 02 0 01
North 0 N/A N/A N/A
South 01 01 01 01
West 01 01 01 01
NagalandMokokchung 03 01 0 14
Kohima 03 06 01 06
RajasthanBikaner 18 18 0 18
Churu 18 18 0 12
Uttar Pradesh
Allahabad 20 0 03 76
Varanasi 10 0 01 17
Jhansi 08 02 04 21
Lalitpur 06 05 04 12
ChhattisgarhDurg 08 16 08 16
Raipur 09 17 04 18
GoaNorth 04 22 02 12
South 02 13 01 05
GujaratRajkot 13 29 11 14
Surat 15 34 11 12
KarnatakaChikmagalur 04 07 03 05
Raichur 05 10 03 05
Puducherry Puducherry 02 11 02 06
Tamil Nadu Chennai * 15 (n/a) (n/a) (n/a)
West BengalBirbhum 11 22 11 11
Howrah 15 32 28 23
30 districts grand total 256 486 100 370
Name of the district is highlighted where no dedicated staff nurse is posted/no doctor available in OPD for hypertension treatment
* Programme not launched; data not available (n/a)
Table 6Distribution of doctor, dedicated staff nurse and pharmacist in primary health centre (PHC) & urban primary health centre (UPHC) IHCI Phase II districts.
State District Total PHC & UPHC
Number of doctors in
OPD for HT treatment
Number of dedicated staff nurse
Number of pharmacists in
place
Andhra PradeshKrishna 125 157 0 60
Visakhapatnam 114 173 0 98
BiharMuzaffarpur 06 03 0 02
Vaishali 15 10 0 06
GoaNorth 12 38 0 37
South 15 43 01 37
GujaratRajkot 64 58 0 62
Surat 61 95 0 60
JharkhandBokaro 19 18 0 0
Ranchi 31 08 0 0
Uttar Pradesh
Allahabad 84 78 0 81
Jhansi 49 30 0 41
Lalitpur 23 10 0 11
Varanasi 53 48 0 45
Sikkim
East 09 11 0 04
North 05 05 0 0
South 06 06 0 03
West 06 06 0 03
KarnatakaChikmagalur 60 60 0 29
Raichur 34 36 0 23
West BengalBirbhum 38 30 0 38
Howrah 73 50 0 56
NagalandKohima 15 17 0 12
Mokokchung 15 01 0 0
RajasthanBikaner 71 71 0 23
Churu 99 97 0 15
ChhattisgarhDurg 30 60 1 60
Raipur 36 48 1 41
Puducherry Puducherry 31 98 7 36
Tamil Nadu Chennai* 140 35 59 27
30 districts grand total 1339 1365 179 910
Name of the district is highlighted where no dedicated staff nurse is posted/no doctor available in OPD for hypertension treatment
*data from facilities of three zones only
IHCI Progress Report Apr 2020-Dec 202150 51
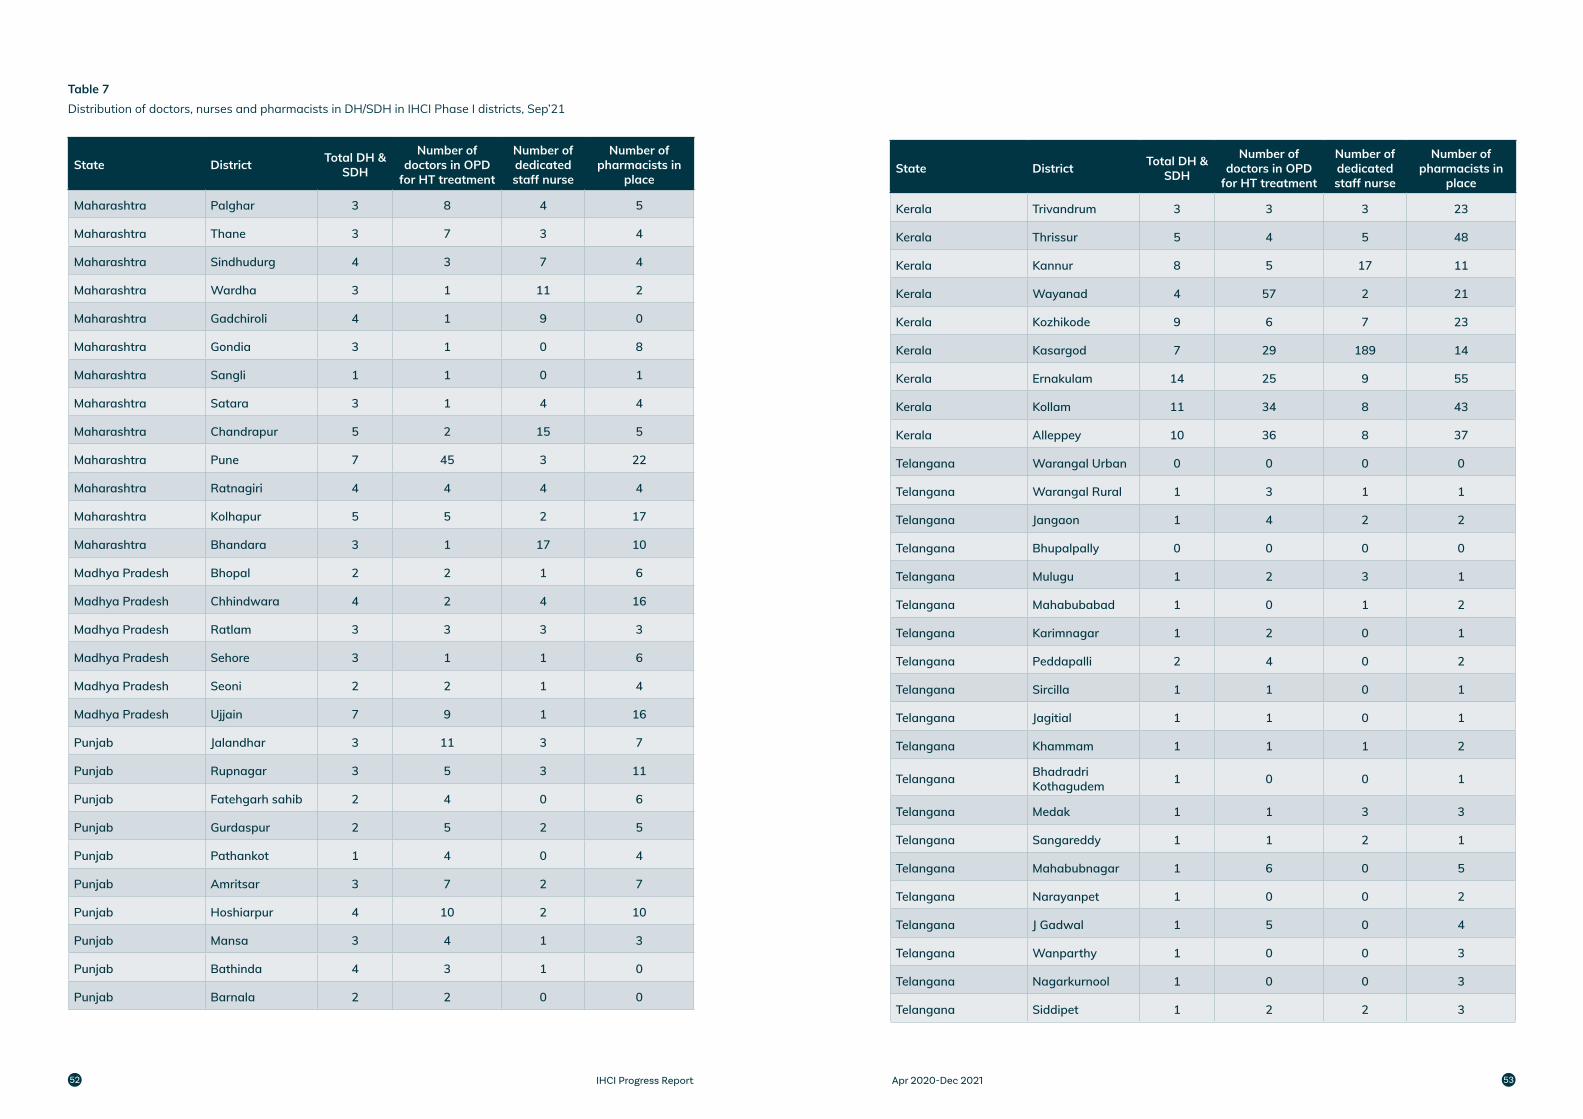
Table 7Distribution of doctors, nurses and pharmacists in DH/SDH in IHCI Phase I districts, Sep’21
State District Total DH & SDH
Number of doctors in OPD
for HT treatment
Number of dedicated staff nurse
Number of pharmacists in
place
Maharashtra Palghar 3 8 4 5
Maharashtra Thane 3 7 3 4
Maharashtra Sindhudurg 4 3 7 4
Maharashtra Wardha 3 1 11 2
Maharashtra Gadchiroli 4 1 9 0
Maharashtra Gondia 3 1 0 8
Maharashtra Sangli 1 1 0 1
Maharashtra Satara 3 1 4 4
Maharashtra Chandrapur 5 2 15 5
Maharashtra Pune 7 45 3 22
Maharashtra Ratnagiri 4 4 4 4
Maharashtra Kolhapur 5 5 2 17
Maharashtra Bhandara 3 1 17 10
Madhya Pradesh Bhopal 2 2 1 6
Madhya Pradesh Chhindwara 4 2 4 16
Madhya Pradesh Ratlam 3 3 3 3
Madhya Pradesh Sehore 3 1 1 6
Madhya Pradesh Seoni 2 2 1 4
Madhya Pradesh Ujjain 7 9 1 16
Punjab Jalandhar 3 11 3 7
Punjab Rupnagar 3 5 3 11
Punjab Fatehgarh sahib 2 4 0 6
Punjab Gurdaspur 2 5 2 5
Punjab Pathankot 1 4 0 4
Punjab Amritsar 3 7 2 7
Punjab Hoshiarpur 4 10 2 10
Punjab Mansa 3 4 1 3
Punjab Bathinda 4 3 1 0
Punjab Barnala 2 2 0 0
State District Total DH & SDH
Number of doctors in OPD
for HT treatment
Number of dedicated staff nurse
Number of pharmacists in
place
Kerala Trivandrum 3 3 3 23
Kerala Thrissur 5 4 5 48
Kerala Kannur 8 5 17 11
Kerala Wayanad 4 57 2 21
Kerala Kozhikode 9 6 7 23
Kerala Kasargod 7 29 189 14
Kerala Ernakulam 14 25 9 55
Kerala Kollam 11 34 8 43
Kerala Alleppey 10 36 8 37
Telangana Warangal Urban 0 0 0 0
Telangana Warangal Rural 1 3 1 1
Telangana Jangaon 1 4 2 2
Telangana Bhupalpally 0 0 0 0
Telangana Mulugu 1 2 3 1
Telangana Mahabubabad 1 0 1 2
Telangana Karimnagar 1 2 0 1
Telangana Peddapalli 2 4 0 2
Telangana Sircilla 1 1 0 1
Telangana Jagitial 1 1 0 1
Telangana Khammam 1 1 1 2
Telangana Bhadradri Kothagudem 1 0 0 1
Telangana Medak 1 1 3 3
Telangana Sangareddy 1 1 2 1
Telangana Mahabubnagar 1 6 0 5
Telangana Narayanpet 1 0 0 2
Telangana J Gadwal 1 5 0 4
Telangana Wanparthy 1 0 0 3
Telangana Nagarkurnool 1 0 0 3
Telangana Siddipet 1 2 2 3
IHCI Progress Report Apr 2020-Dec 202152 53
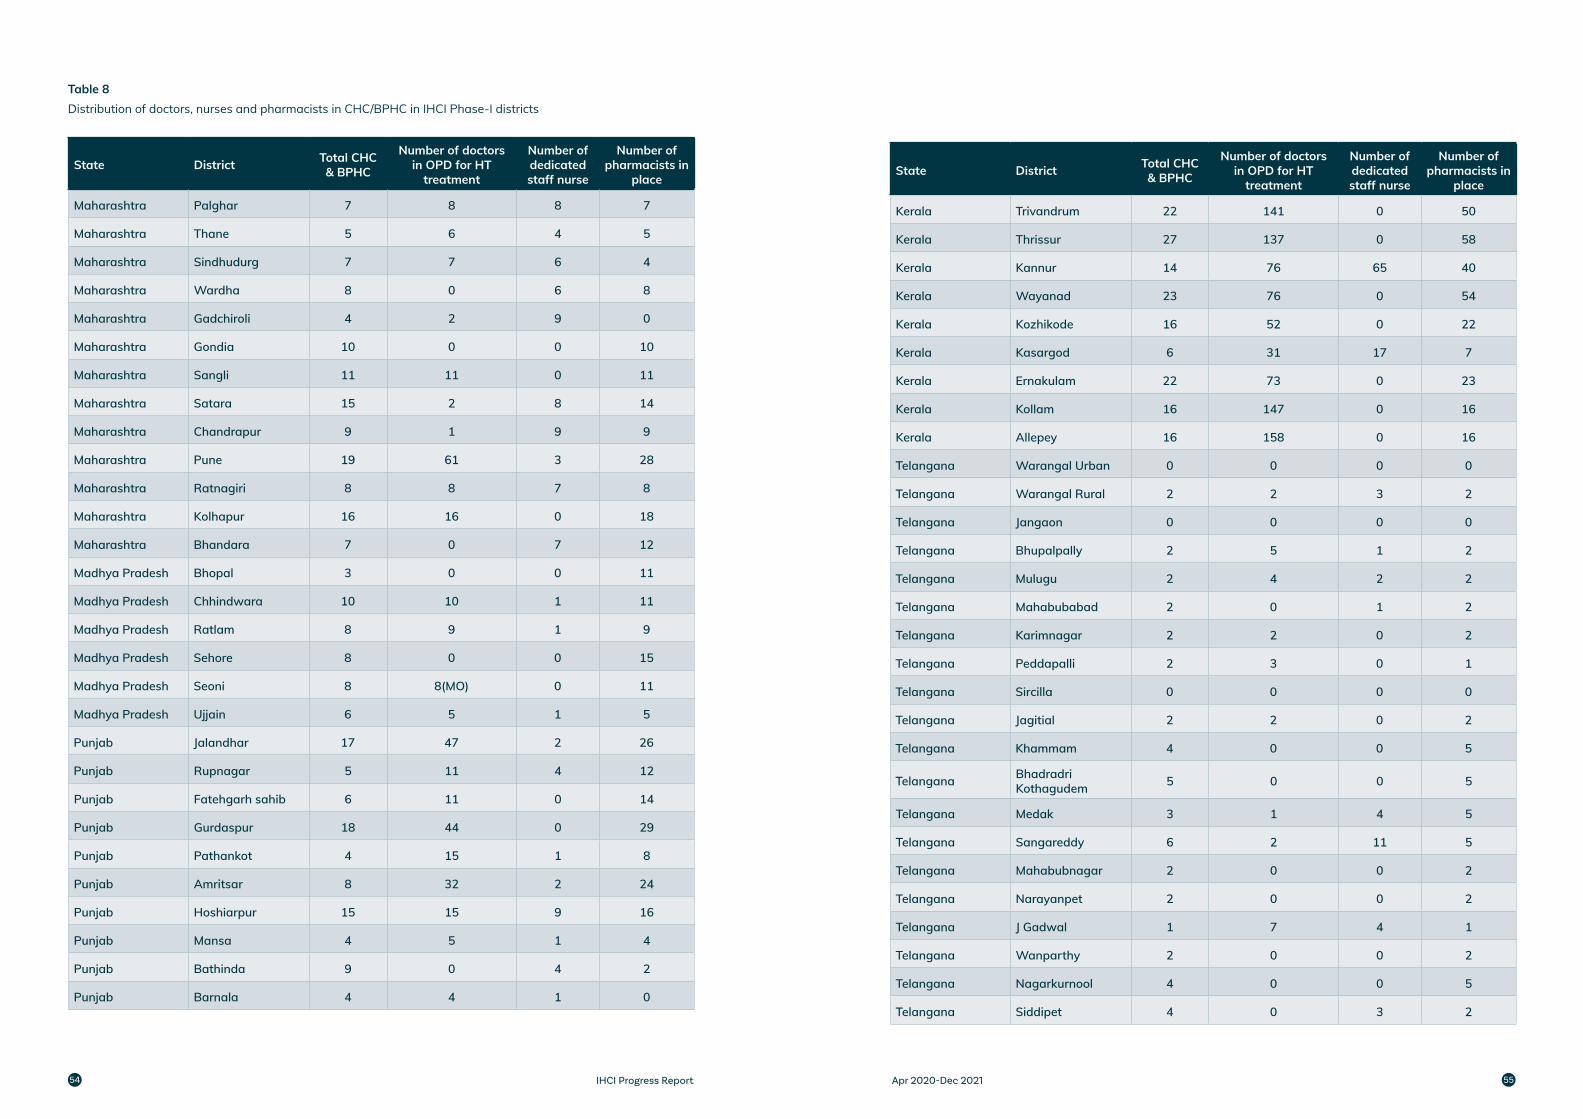
Table 8Distribution of doctors, nurses and pharmacists in CHC/BPHC in IHCI Phase-I districts
State District Total CHC & BPHC
Number of doctors in OPD for HT
treatment
Number of dedicated staff nurse
Number of pharmacists in
place
Maharashtra Palghar 7 8 8 7
Maharashtra Thane 5 6 4 5
Maharashtra Sindhudurg 7 7 6 4
Maharashtra Wardha 8 0 6 8
Maharashtra Gadchiroli 4 2 9 0
Maharashtra Gondia 10 0 0 10
Maharashtra Sangli 11 11 0 11
Maharashtra Satara 15 2 8 14
Maharashtra Chandrapur 9 1 9 9
Maharashtra Pune 19 61 3 28
Maharashtra Ratnagiri 8 8 7 8
Maharashtra Kolhapur 16 16 0 18
Maharashtra Bhandara 7 0 7 12
Madhya Pradesh Bhopal 3 0 0 11
Madhya Pradesh Chhindwara 10 10 1 11
Madhya Pradesh Ratlam 8 9 1 9
Madhya Pradesh Sehore 8 0 0 15
Madhya Pradesh Seoni 8 8(MO) 0 11
Madhya Pradesh Ujjain 6 5 1 5
Punjab Jalandhar 17 47 2 26
Punjab Rupnagar 5 11 4 12
Punjab Fatehgarh sahib 6 11 0 14
Punjab Gurdaspur 18 44 0 29
Punjab Pathankot 4 15 1 8
Punjab Amritsar 8 32 2 24
Punjab Hoshiarpur 15 15 9 16
Punjab Mansa 4 5 1 4
Punjab Bathinda 9 0 4 2
Punjab Barnala 4 4 1 0
State District Total CHC & BPHC
Number of doctors in OPD for HT
treatment
Number of dedicated staff nurse
Number of pharmacists in
place
Kerala Trivandrum 22 141 0 50
Kerala Thrissur 27 137 0 58
Kerala Kannur 14 76 65 40
Kerala Wayanad 23 76 0 54
Kerala Kozhikode 16 52 0 22
Kerala Kasargod 6 31 17 7
Kerala Ernakulam 22 73 0 23
Kerala Kollam 16 147 0 16
Kerala Allepey 16 158 0 16
Telangana Warangal Urban 0 0 0 0
Telangana Warangal Rural 2 2 3 2
Telangana Jangaon 0 0 0 0
Telangana Bhupalpally 2 5 1 2
Telangana Mulugu 2 4 2 2
Telangana Mahabubabad 2 0 1 2
Telangana Karimnagar 2 2 0 2
Telangana Peddapalli 2 3 0 1
Telangana Sircilla 0 0 0 0
Telangana Jagitial 2 2 0 2
Telangana Khammam 4 0 0 5
Telangana Bhadradri Kothagudem 5 0 0 5
Telangana Medak 3 1 4 5
Telangana Sangareddy 6 2 11 5
Telangana Mahabubnagar 2 0 0 2
Telangana Narayanpet 2 0 0 2
Telangana J Gadwal 1 7 4 1
Telangana Wanparthy 2 0 0 2
Telangana Nagarkurnool 4 0 0 5
Telangana Siddipet 4 0 3 2
IHCI Progress Report Apr 2020-Dec 202154 55
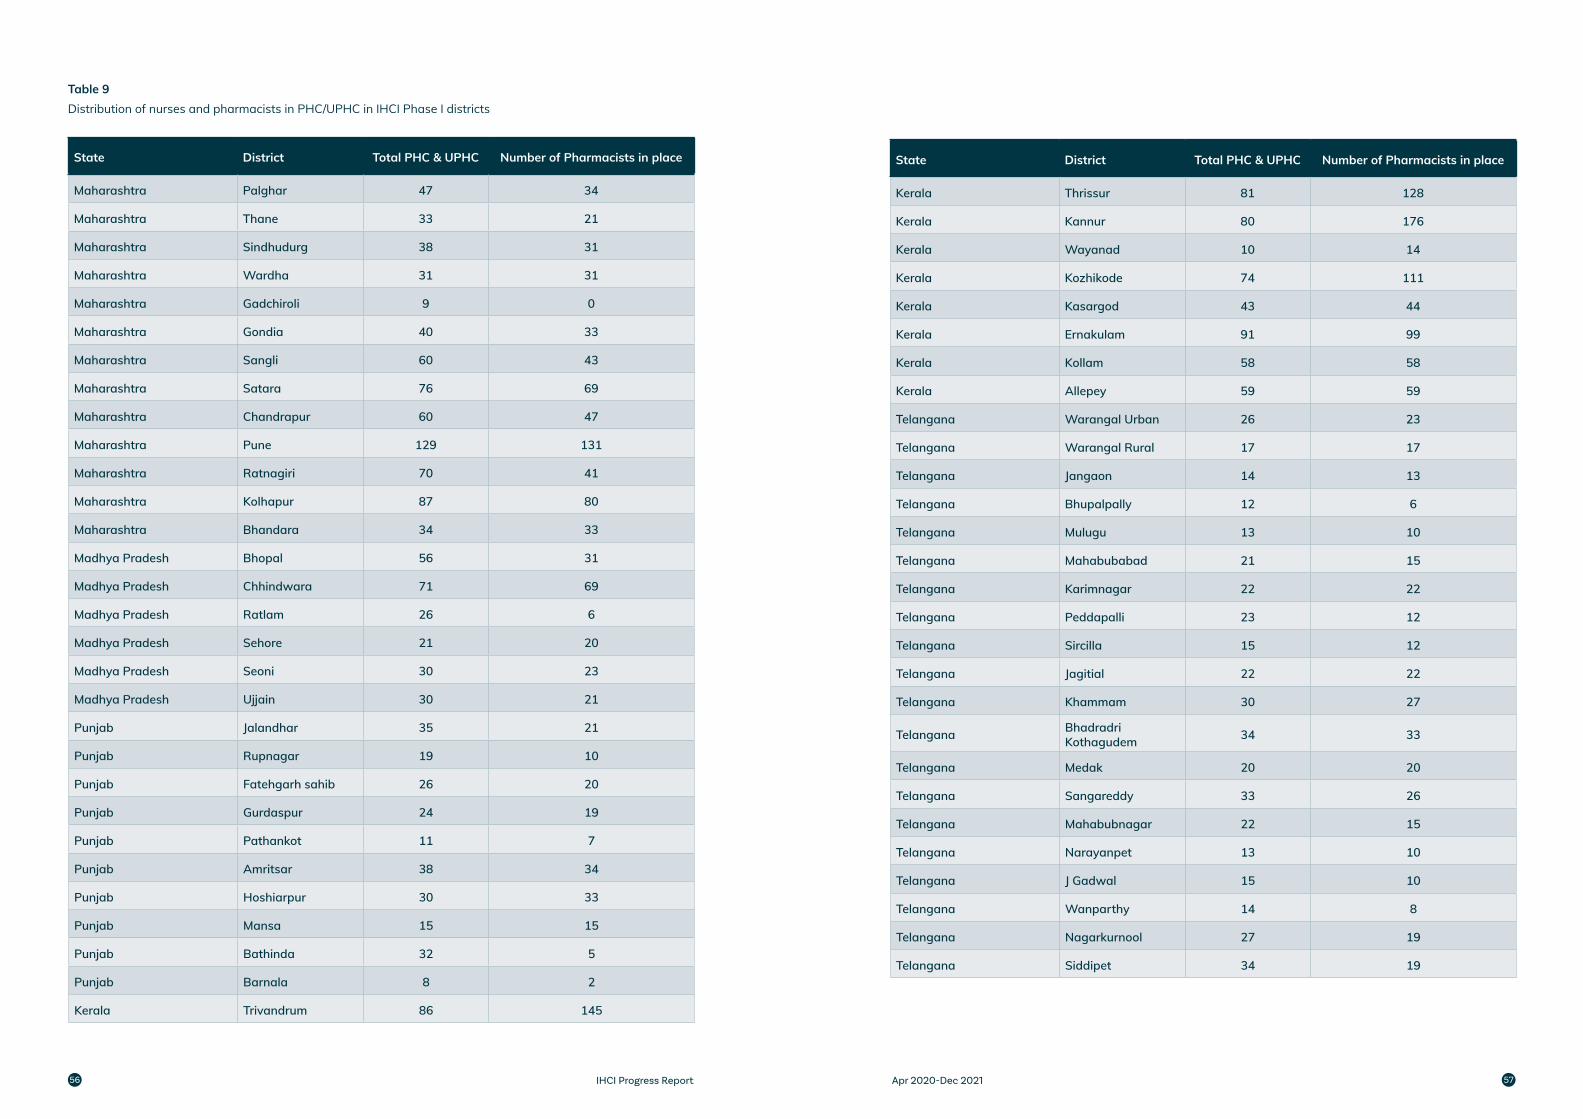
Table 9Distribution of nurses and pharmacists in PHC/UPHC in IHCI Phase I districts
State District Total PHC & UPHC Number of Pharmacists in place
Maharashtra Palghar 47 34
Maharashtra Thane 33 21
Maharashtra Sindhudurg 38 31
Maharashtra Wardha 31 31
Maharashtra Gadchiroli 9 0
Maharashtra Gondia 40 33
Maharashtra Sangli 60 43
Maharashtra Satara 76 69
Maharashtra Chandrapur 60 47
Maharashtra Pune 129 131
Maharashtra Ratnagiri 70 41
Maharashtra Kolhapur 87 80
Maharashtra Bhandara 34 33
Madhya Pradesh Bhopal 56 31
Madhya Pradesh Chhindwara 71 69
Madhya Pradesh Ratlam 26 6
Madhya Pradesh Sehore 21 20
Madhya Pradesh Seoni 30 23
Madhya Pradesh Ujjain 30 21
Punjab Jalandhar 35 21
Punjab Rupnagar 19 10
Punjab Fatehgarh sahib 26 20
Punjab Gurdaspur 24 19
Punjab Pathankot 11 7
Punjab Amritsar 38 34
Punjab Hoshiarpur 30 33
Punjab Mansa 15 15
Punjab Bathinda 32 5
Punjab Barnala 8 2
Kerala Trivandrum 86 145
State District Total PHC & UPHC Number of Pharmacists in place
Kerala Thrissur 81 128
Kerala Kannur 80 176
Kerala Wayanad 10 14
Kerala Kozhikode 74 111
Kerala Kasargod 43 44
Kerala Ernakulam 91 99
Kerala Kollam 58 58
Kerala Allepey 59 59
Telangana Warangal Urban 26 23
Telangana Warangal Rural 17 17
Telangana Jangaon 14 13
Telangana Bhupalpally 12 6
Telangana Mulugu 13 10
Telangana Mahabubabad 21 15
Telangana Karimnagar 22 22
Telangana Peddapalli 23 12
Telangana Sircilla 15 12
Telangana Jagitial 22 22
Telangana Khammam 30 27
Telangana Bhadradri Kothagudem 34 33
Telangana Medak 20 20
Telangana Sangareddy 33 26
Telangana Mahabubnagar 22 15
Telangana Narayanpet 13 10
Telangana J Gadwal 15 10
Telangana Wanparthy 14 8
Telangana Nagarkurnool 27 19
Telangana Siddipet 34 19
IHCI Progress Report Apr 2020-Dec 202156 57
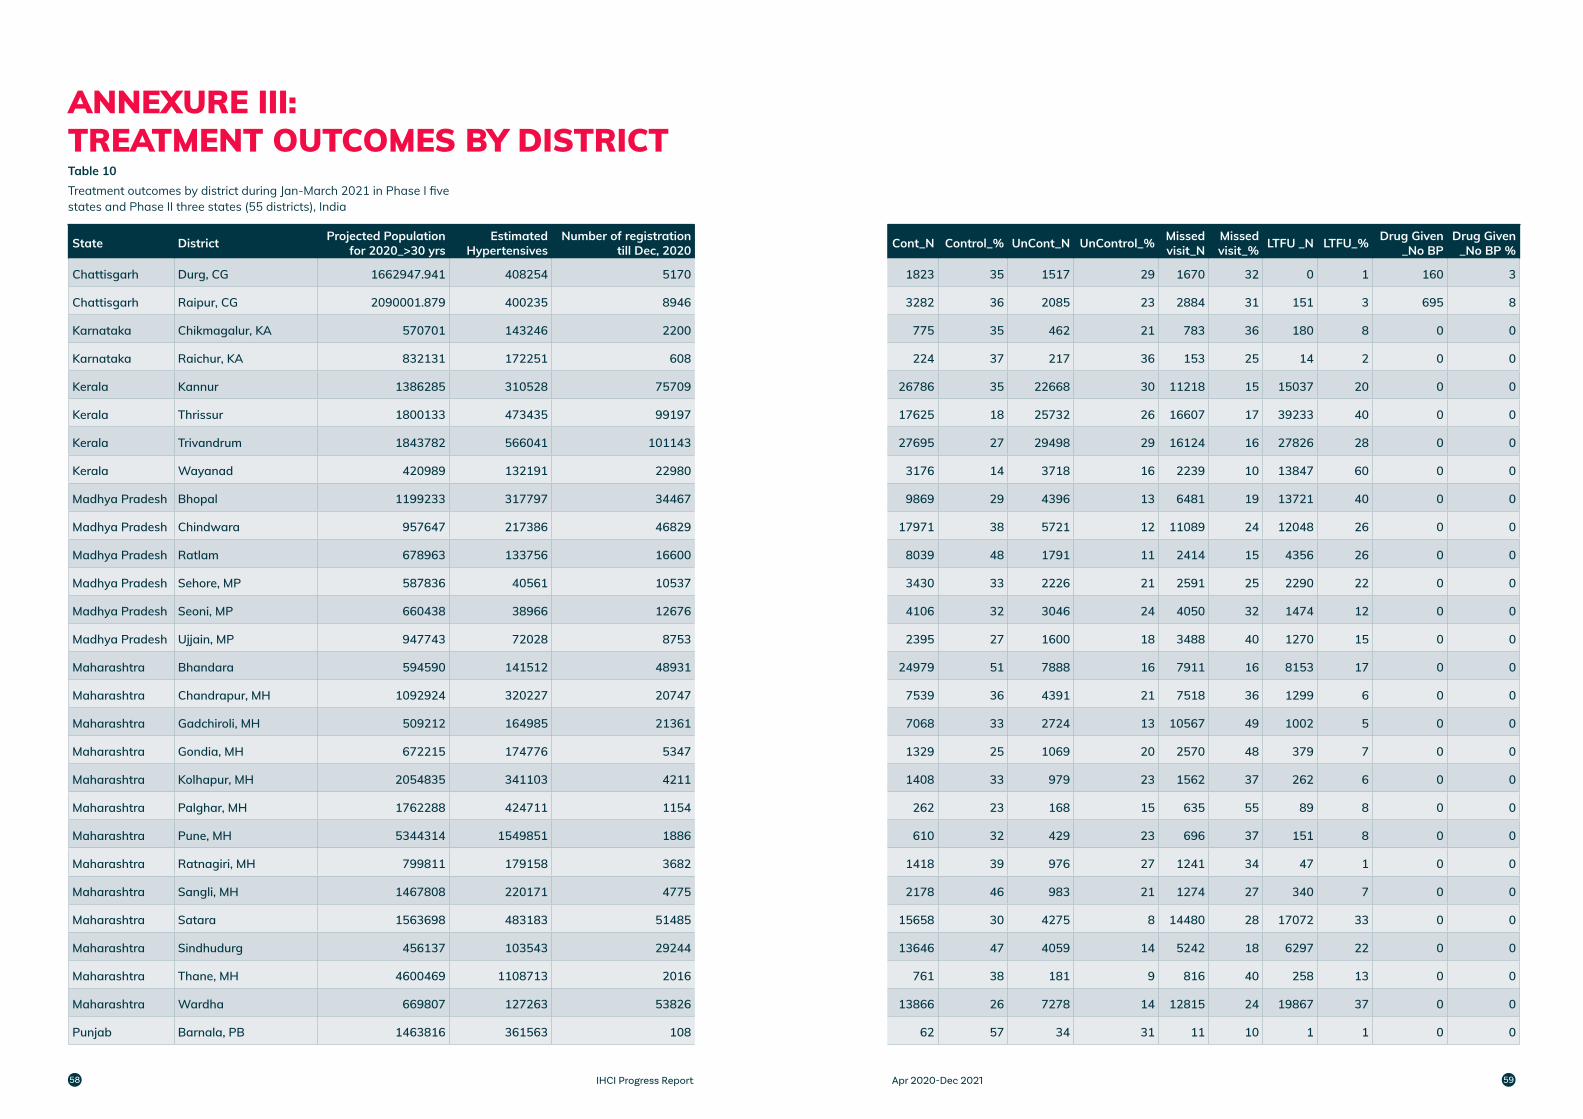
ANNEXURE III: TREATMENT OUTCOMES BY DISTRICTTable 10Treatment outcomes by district during Jan-March 2021 in Phase I five states and Phase II three states (55 districts), India
State District Projected Population for 2020_>30 yrs
Estimated Hypertensives
Number of registration till Dec, 2020 Cont_N Control_% UnCont_N UnControl_% Missed
visit_NMissed visit_% LTFU _N LTFU_% Drug Given
_No BPDrug Given
_No BP %
Chattisgarh Durg, CG 1662947.941 408254 5170 1823 35 1517 29 1670 32 0 1 160 3
Chattisgarh Raipur, CG 2090001.879 400235 8946 3282 36 2085 23 2884 31 151 3 695 8
Karnataka Chikmagalur, KA 570701 143246 2200 775 35 462 21 783 36 180 8 0 0
Karnataka Raichur, KA 832131 172251 608 224 37 217 36 153 25 14 2 0 0
Kerala Kannur 1386285 310528 75709 26786 35 22668 30 11218 15 15037 20 0 0
Kerala Thrissur 1800133 473435 99197 17625 18 25732 26 16607 17 39233 40 0 0
Kerala Trivandrum 1843782 566041 101143 27695 27 29498 29 16124 16 27826 28 0 0
Kerala Wayanad 420989 132191 22980 3176 14 3718 16 2239 10 13847 60 0 0
Madhya Pradesh Bhopal 1199233 317797 34467 9869 29 4396 13 6481 19 13721 40 0 0
Madhya Pradesh Chindwara 957647 217386 46829 17971 38 5721 12 11089 24 12048 26 0 0
Madhya Pradesh Ratlam 678963 133756 16600 8039 48 1791 11 2414 15 4356 26 0 0
Madhya Pradesh Sehore, MP 587836 40561 10537 3430 33 2226 21 2591 25 2290 22 0 0
Madhya Pradesh Seoni, MP 660438 38966 12676 4106 32 3046 24 4050 32 1474 12 0 0
Madhya Pradesh Ujjain, MP 947743 72028 8753 2395 27 1600 18 3488 40 1270 15 0 0
Maharashtra Bhandara 594590 141512 48931 24979 51 7888 16 7911 16 8153 17 0 0
Maharashtra Chandrapur, MH 1092924 320227 20747 7539 36 4391 21 7518 36 1299 6 0 0
Maharashtra Gadchiroli, MH 509212 164985 21361 7068 33 2724 13 10567 49 1002 5 0 0
Maharashtra Gondia, MH 672215 174776 5347 1329 25 1069 20 2570 48 379 7 0 0
Maharashtra Kolhapur, MH 2054835 341103 4211 1408 33 979 23 1562 37 262 6 0 0
Maharashtra Palghar, MH 1762288 424711 1154 262 23 168 15 635 55 89 8 0 0
Maharashtra Pune, MH 5344314 1549851 1886 610 32 429 23 696 37 151 8 0 0
Maharashtra Ratnagiri, MH 799811 179158 3682 1418 39 976 27 1241 34 47 1 0 0
Maharashtra Sangli, MH 1467808 220171 4775 2178 46 983 21 1274 27 340 7 0 0
Maharashtra Satara 1563698 483183 51485 15658 30 4275 8 14480 28 17072 33 0 0
Maharashtra Sindhudurg 456137 103543 29244 13646 47 4059 14 5242 18 6297 22 0 0
Maharashtra Thane, MH 4600469 1108713 2016 761 38 181 9 816 40 258 13 0 0
Maharashtra Wardha 669807 127263 53826 13866 26 7278 14 12815 24 19867 37 0 0
Punjab Barnala, PB 1463816 361563 108 62 57 34 31 11 10 1 1 0 0
IHCI Progress Report Apr 2020-Dec 202158 59
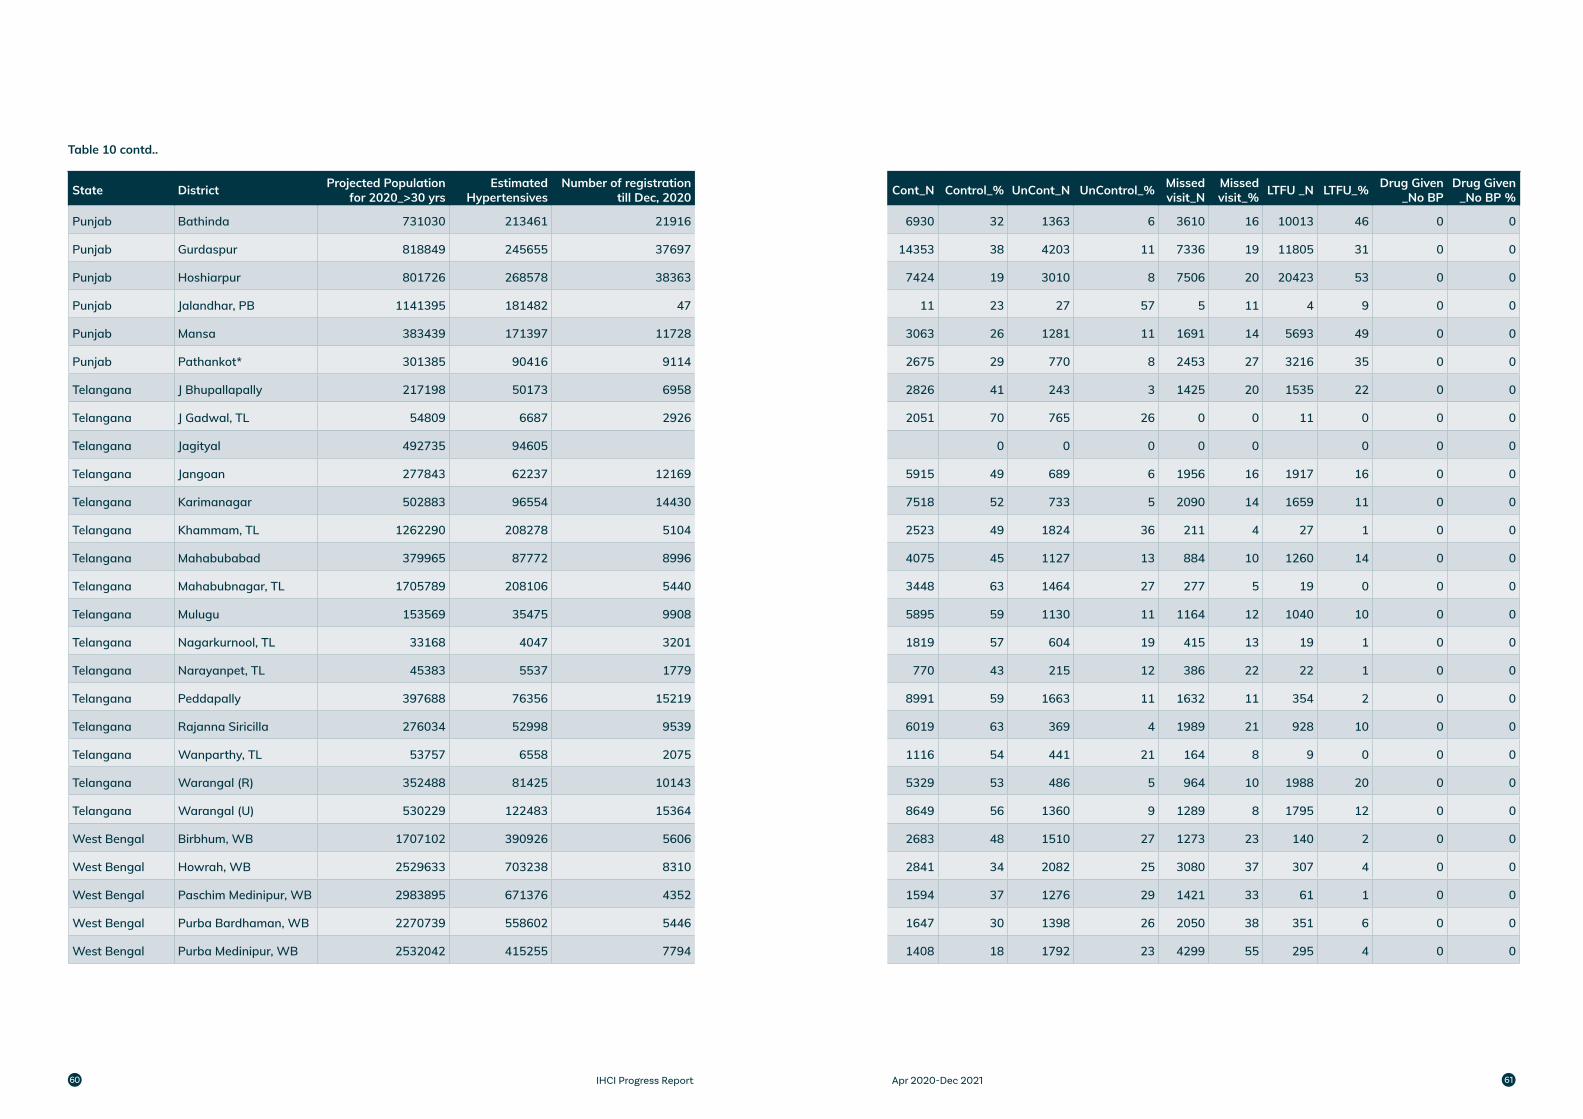
State District Projected Population for 2020_>30 yrs
Estimated Hypertensives
Number of registration till Dec, 2020 Cont_N Control_% UnCont_N UnControl_% Missed
visit_NMissed visit_% LTFU _N LTFU_% Drug Given
_No BPDrug Given
_No BP %
Punjab Bathinda 731030 213461 21916 6930 32 1363 6 3610 16 10013 46 0 0
Punjab Gurdaspur 818849 245655 37697 14353 38 4203 11 7336 19 11805 31 0 0
Punjab Hoshiarpur 801726 268578 38363 7424 19 3010 8 7506 20 20423 53 0 0
Punjab Jalandhar, PB 1141395 181482 47 11 23 27 57 5 11 4 9 0 0
Punjab Mansa 383439 171397 11728 3063 26 1281 11 1691 14 5693 49 0 0
Punjab Pathankot* 301385 90416 9114 2675 29 770 8 2453 27 3216 35 0 0
Telangana J Bhupallapally 217198 50173 6958 2826 41 243 3 1425 20 1535 22 0 0
Telangana J Gadwal, TL 54809 6687 2926 2051 70 765 26 0 0 11 0 0 0
Telangana Jagityal 492735 94605 0 0 0 0 0 0 0 0
Telangana Jangoan 277843 62237 12169 5915 49 689 6 1956 16 1917 16 0 0
Telangana Karimanagar 502883 96554 14430 7518 52 733 5 2090 14 1659 11 0 0
Telangana Khammam, TL 1262290 208278 5104 2523 49 1824 36 211 4 27 1 0 0
Telangana Mahabubabad 379965 87772 8996 4075 45 1127 13 884 10 1260 14 0 0
Telangana Mahabubnagar, TL 1705789 208106 5440 3448 63 1464 27 277 5 19 0 0 0
Telangana Mulugu 153569 35475 9908 5895 59 1130 11 1164 12 1040 10 0 0
Telangana Nagarkurnool, TL 33168 4047 3201 1819 57 604 19 415 13 19 1 0 0
Telangana Narayanpet, TL 45383 5537 1779 770 43 215 12 386 22 22 1 0 0
Telangana Peddapally 397688 76356 15219 8991 59 1663 11 1632 11 354 2 0 0
Telangana Rajanna Siricilla 276034 52998 9539 6019 63 369 4 1989 21 928 10 0 0
Telangana Wanparthy, TL 53757 6558 2075 1116 54 441 21 164 8 9 0 0 0
Telangana Warangal (R) 352488 81425 10143 5329 53 486 5 964 10 1988 20 0 0
Telangana Warangal (U) 530229 122483 15364 8649 56 1360 9 1289 8 1795 12 0 0
West Bengal Birbhum, WB 1707102 390926 5606 2683 48 1510 27 1273 23 140 2 0 0
West Bengal Howrah, WB 2529633 703238 8310 2841 34 2082 25 3080 37 307 4 0 0
West Bengal Paschim Medinipur, WB 2983895 671376 4352 1594 37 1276 29 1421 33 61 1 0 0
West Bengal Purba Bardhaman, WB 2270739 558602 5446 1647 30 1398 26 2050 38 351 6 0 0
West Bengal Purba Medinipur, WB 2532042 415255 7794 1408 18 1792 23 4299 55 295 4 0 0
Table 10 contd..
IHCI Progress Report Apr 2020-Dec 202160 61
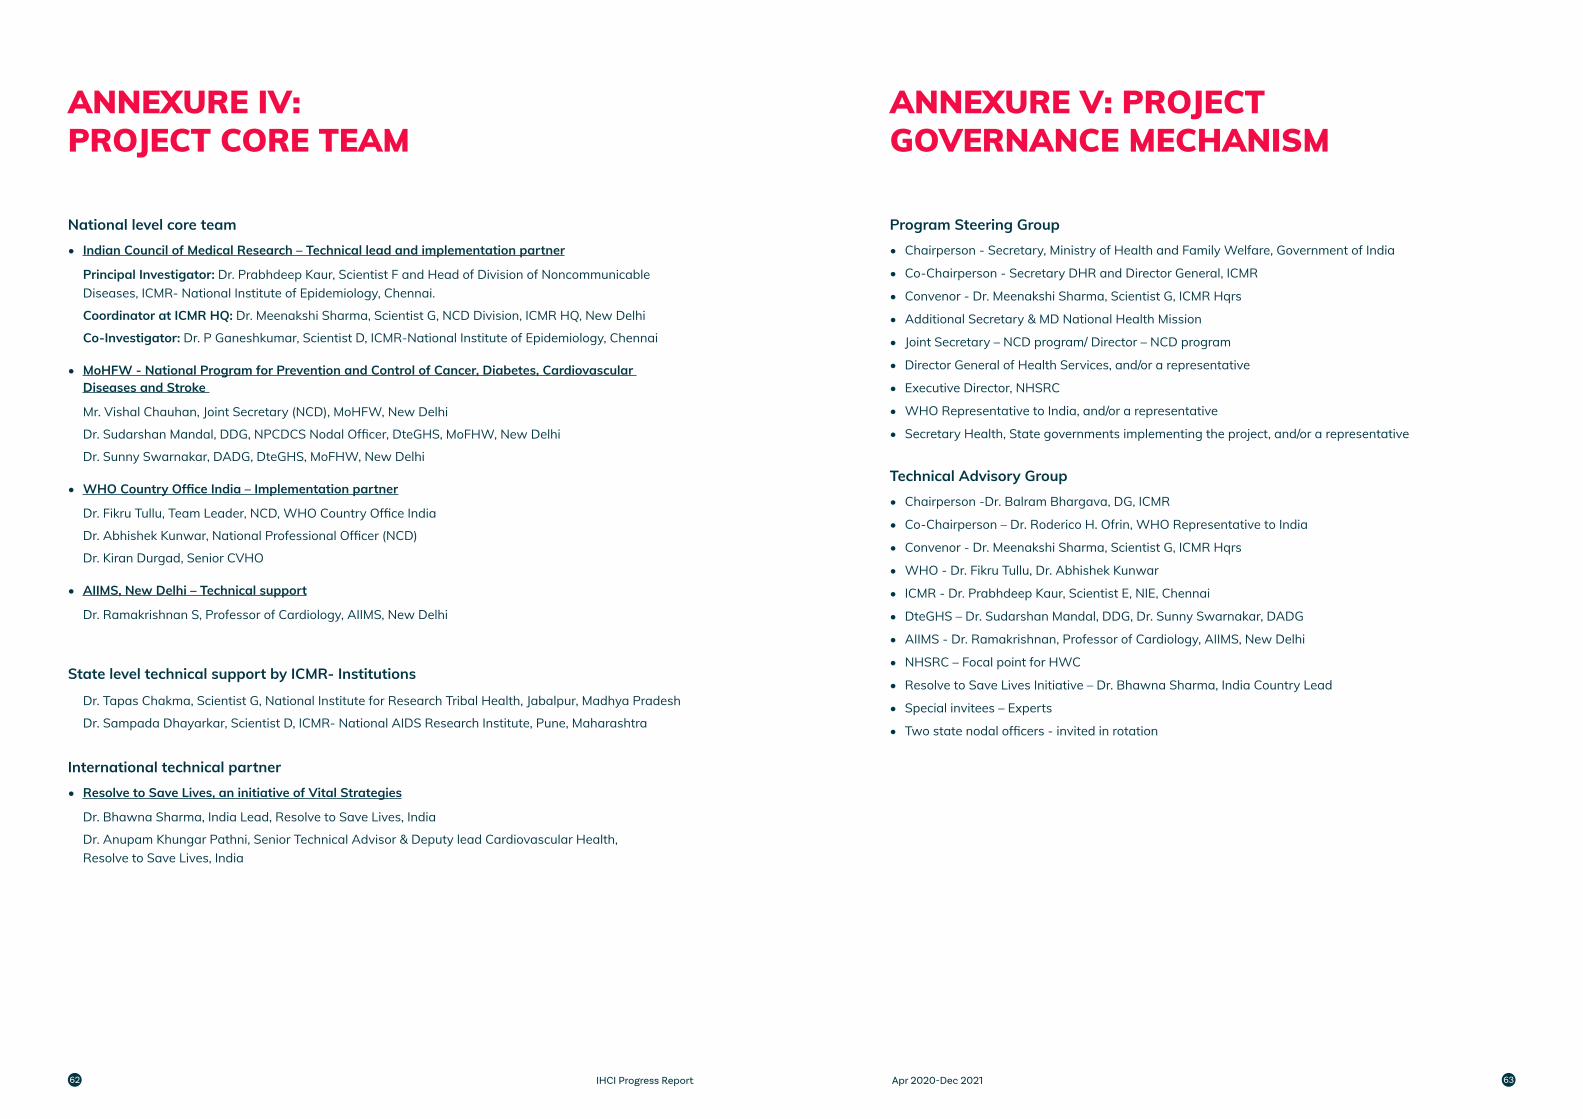
ANNEXURE IV: PROJECT CORE TEAM
ANNEXURE V: PROJECT GOVERNANCE MECHANISM
National level core team• Indian Council of Medical Research – Technical lead and implementation partner
Principal Investigator: Dr. Prabhdeep Kaur, Scientist F and Head of Division of Noncommunicable Diseases, ICMR- National Institute of Epidemiology, Chennai.
Coordinator at ICMR HQ: Dr. Meenakshi Sharma, Scientist G, NCD Division, ICMR HQ, New Delhi
Co-Investigator: Dr. P Ganeshkumar, Scientist D, ICMR-National Institute of Epidemiology, Chennai
• MoHFW - National Program for Prevention and Control of Cancer, Diabetes, Cardiovascular Diseases and Stroke
Mr. Vishal Chauhan, Joint Secretary (NCD), MoHFW, New Delhi
Dr. Sudarshan Mandal, DDG, NPCDCS Nodal Officer, DteGHS, MoFHW, New Delhi
Dr. Sunny Swarnakar, DADG, DteGHS, MoFHW, New Delhi
• WHO Country Office India – Implementation partner
Dr. Fikru Tullu, Team Leader, NCD, WHO Country Office India
Dr. Abhishek Kunwar, National Professional Officer (NCD)
Dr. Kiran Durgad, Senior CVHO
• AIIMS, New Delhi – Technical support
Dr. Ramakrishnan S, Professor of Cardiology, AIIMS, New Delhi
State level technical support by ICMR- Institutions
Dr. Tapas Chakma, Scientist G, National Institute for Research Tribal Health, Jabalpur, Madhya Pradesh
Dr. Sampada Dhayarkar, Scientist D, ICMR- National AIDS Research Institute, Pune, Maharashtra
International technical partner• Resolve to Save Lives, an initiative of Vital Strategies
Dr. Bhawna Sharma, India Lead, Resolve to Save Lives, India
Dr. Anupam Khungar Pathni, Senior Technical Advisor & Deputy lead Cardiovascular Health, Resolve to Save Lives, India
Program Steering Group• Chairperson - Secretary, Ministry of Health and Family Welfare, Government of India
• Co-Chairperson - Secretary DHR and Director General, ICMR
• Convenor - Dr. Meenakshi Sharma, Scientist G, ICMR Hqrs
• Additional Secretary & MD National Health Mission
• Joint Secretary – NCD program/ Director – NCD program
• Director General of Health Services, and/or a representative
• Executive Director, NHSRC
• WHO Representative to India, and/or a representative
• Secretary Health, State governments implementing the project, and/or a representative
Technical Advisory Group • Chairperson -Dr. Balram Bhargava, DG, ICMR
• Co-Chairperson – Dr. Roderico H. Ofrin, WHO Representative to India
• Convenor - Dr. Meenakshi Sharma, Scientist G, ICMR Hqrs
• WHO - Dr. Fikru Tullu, Dr. Abhishek Kunwar
• ICMR - Dr. Prabhdeep Kaur, Scientist E, NIE, Chennai
• DteGHS – Dr. Sudarshan Mandal, DDG, Dr. Sunny Swarnakar, DADG
• AIIMS - Dr. Ramakrishnan, Professor of Cardiology, AIIMS, New Delhi
• NHSRC – Focal point for HWC
• Resolve to Save Lives Initiative – Dr. Bhawna Sharma, India Country Lead
• Special invitees – Experts
• Two state nodal officers - invited in rotation
IHCI Progress Report Apr 2020-Dec 202162 63
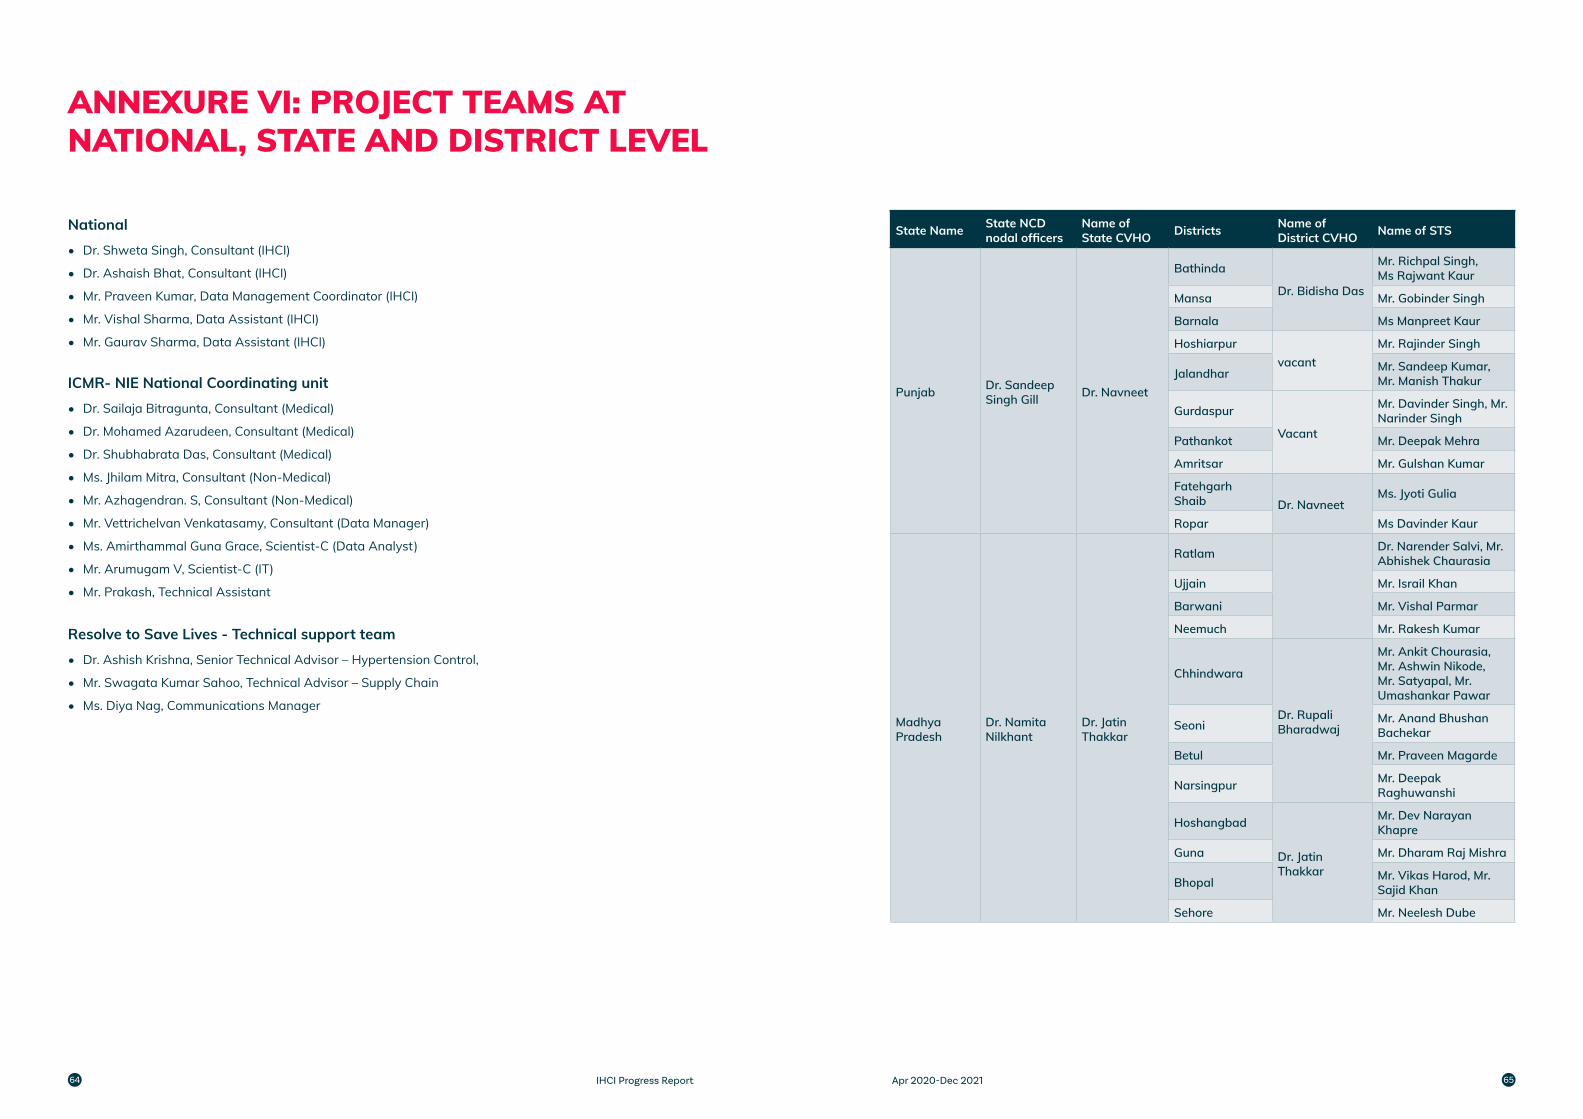
ANNEXURE VI: PROJECT TEAMS AT NATIONAL, STATE AND DISTRICT LEVEL
National• Dr. Shweta Singh, Consultant (IHCI)
• Dr. Ashaish Bhat, Consultant (IHCI)
• Mr. Praveen Kumar, Data Management Coordinator (IHCI)
• Mr. Vishal Sharma, Data Assistant (IHCI)
• Mr. Gaurav Sharma, Data Assistant (IHCI)
ICMR- NIE National Coordinating unit• Dr. Sailaja Bitragunta, Consultant (Medical)
• Dr. Mohamed Azarudeen, Consultant (Medical)
• Dr. Shubhabrata Das, Consultant (Medical)
• Ms. Jhilam Mitra, Consultant (Non-Medical)
• Mr. Azhagendran. S, Consultant (Non-Medical)
• Mr. Vettrichelvan Venkatasamy, Consultant (Data Manager)
• Ms. Amirthammal Guna Grace, Scientist-C (Data Analyst)
• Mr. Arumugam V, Scientist-C (IT)
• Mr. Prakash, Technical Assistant
Resolve to Save Lives - Technical support team• Dr. Ashish Krishna, Senior Technical Advisor – Hypertension Control,
• Mr. Swagata Kumar Sahoo, Technical Advisor – Supply Chain
• Ms. Diya Nag, Communications Manager
State Name State NCD nodal officers
Name of State CVHO Districts Name of
District CVHO Name of STS
Punjab Dr. Sandeep Singh Gill Dr. Navneet
Bathinda
Dr. Bidisha Das
Mr. Richpal Singh, Ms Rajwant Kaur
Mansa Mr. Gobinder Singh
Barnala Ms Manpreet Kaur
Hoshiarpurvacant
Mr. Rajinder Singh
Jalandhar Mr. Sandeep Kumar, Mr. Manish Thakur
Gurdaspur
Vacant
Mr. Davinder Singh, Mr. Narinder Singh
Pathankot Mr. Deepak Mehra
Amritsar Mr. Gulshan Kumar
Fatehgarh Shaib Dr. Navneet
Ms. Jyoti Gulia
Ropar Ms Davinder Kaur
Madhya Pradesh
Dr. Namita Nilkhant
Dr. Jatin Thakkar
Ratlam Dr. Narender Salvi, Mr. Abhishek Chaurasia
Ujjain Mr. Israil Khan
Barwani Mr. Vishal Parmar
Neemuch Mr. Rakesh Kumar
Chhindwara
Dr. Rupali Bharadwaj
Mr. Ankit Chourasia, Mr. Ashwin Nikode, Mr. Satyapal, Mr. Umashankar Pawar
Seoni Mr. Anand Bhushan Bachekar
Betul Mr. Praveen Magarde
Narsingpur Mr. Deepak Raghuwanshi
Hoshangbad
Dr. Jatin Thakkar
Mr. Dev Narayan Khapre
Guna Mr. Dharam Raj Mishra
Bhopal Mr. Vikas Harod, Mr. Sajid Khan
Sehore Mr. Neelesh Dube
IHCI Progress Report Apr 2020-Dec 202164 65
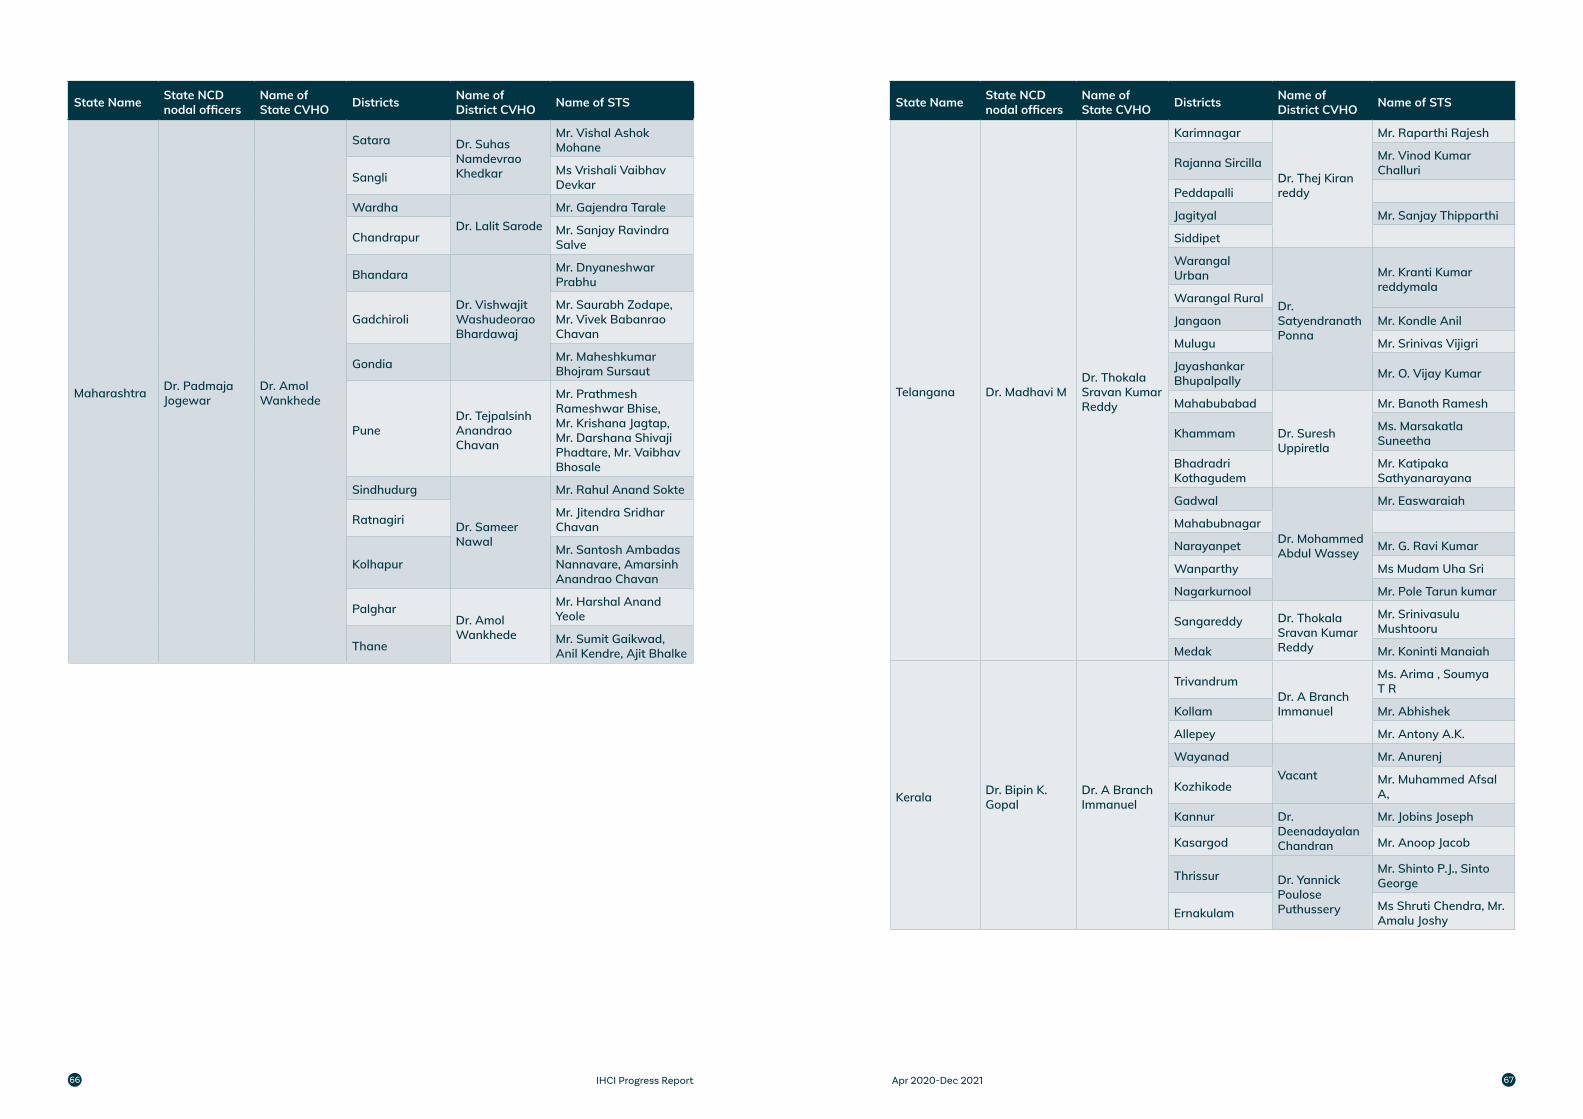
State Name State NCD nodal officers
Name of State CVHO Districts Name of
District CVHO Name of STS
Maharashtra Dr. Padmaja Jogewar
Dr. Amol Wankhede
Satara Dr. Suhas Namdevrao Khedkar
Mr. Vishal Ashok Mohane
Sangli Ms Vrishali Vaibhav Devkar
WardhaDr. Lalit Sarode
Mr. Gajendra Tarale
Chandrapur Mr. Sanjay Ravindra Salve
Bhandara
Dr. Vishwajit Washudeorao Bhardawaj
Mr. Dnyaneshwar Prabhu
GadchiroliMr. Saurabh Zodape, Mr. Vivek Babanrao Chavan
Gondia Mr. Maheshkumar Bhojram Sursaut
PuneDr. Tejpalsinh Anandrao Chavan
Mr. Prathmesh Rameshwar Bhise, Mr. Krishana Jagtap, Mr. Darshana Shivaji Phadtare, Mr. Vaibhav Bhosale
Sindhudurg
Dr. Sameer Nawal
Mr. Rahul Anand Sokte
Ratnagiri Mr. Jitendra Sridhar Chavan
KolhapurMr. Santosh Ambadas Nannavare, Amarsinh Anandrao Chavan
PalgharDr. Amol Wankhede
Mr. Harshal Anand Yeole
Thane Mr. Sumit Gaikwad, Anil Kendre, Ajit Bhalke
State Name State NCD nodal officers
Name of State CVHO Districts Name of
District CVHO Name of STS
Telangana Dr. Madhavi MDr. Thokala Sravan Kumar Reddy
Karimnagar
Dr. Thej Kiran reddy
Mr. Raparthi Rajesh
Rajanna Sircilla Mr. Vinod Kumar Challuri
Peddapalli
Jagityal Mr. Sanjay Thipparthi
Siddipet
Warangal Urban
Dr. Satyendranath Ponna
Mr. Kranti Kumar reddymala
Warangal Rural
Jangaon Mr. Kondle Anil
Mulugu Mr. Srinivas Vijigri
Jayashankar Bhupalpally Mr. O. Vijay Kumar
Mahabubabad
Dr. Suresh Uppiretla
Mr. Banoth Ramesh
Khammam Ms. Marsakatla Suneetha
Bhadradri Kothagudem
Mr. Katipaka Sathyanarayana
Gadwal
Dr. Mohammed Abdul Wassey
Mr. Easwaraiah
Mahabubnagar
Narayanpet Mr. G. Ravi Kumar
Wanparthy Ms Mudam Uha Sri
Nagarkurnool Mr. Pole Tarun kumar
Sangareddy Dr. Thokala Sravan Kumar Reddy
Mr. Srinivasulu Mushtooru
Medak Mr. Koninti Manaiah
Kerala Dr. Bipin K. Gopal
Dr. A Branch Immanuel
TrivandrumDr. A Branch Immanuel
Ms. Arima , Soumya T R
Kollam Mr. Abhishek
Allepey Mr. Antony A.K.
WayanadVacant
Mr. Anurenj
Kozhikode Mr. Muhammed Afsal A,
Kannur Dr. Deenadayalan Chandran
Mr. Jobins Joseph
Kasargod Mr. Anoop Jacob
Thrissur Dr. Yannick Poulose Puthussery
Mr. Shinto P.J., Sinto George
Ernakulam Ms Shruti Chendra, Mr. Amalu Joshy
IHCI Progress Report Apr 2020-Dec 202166 67
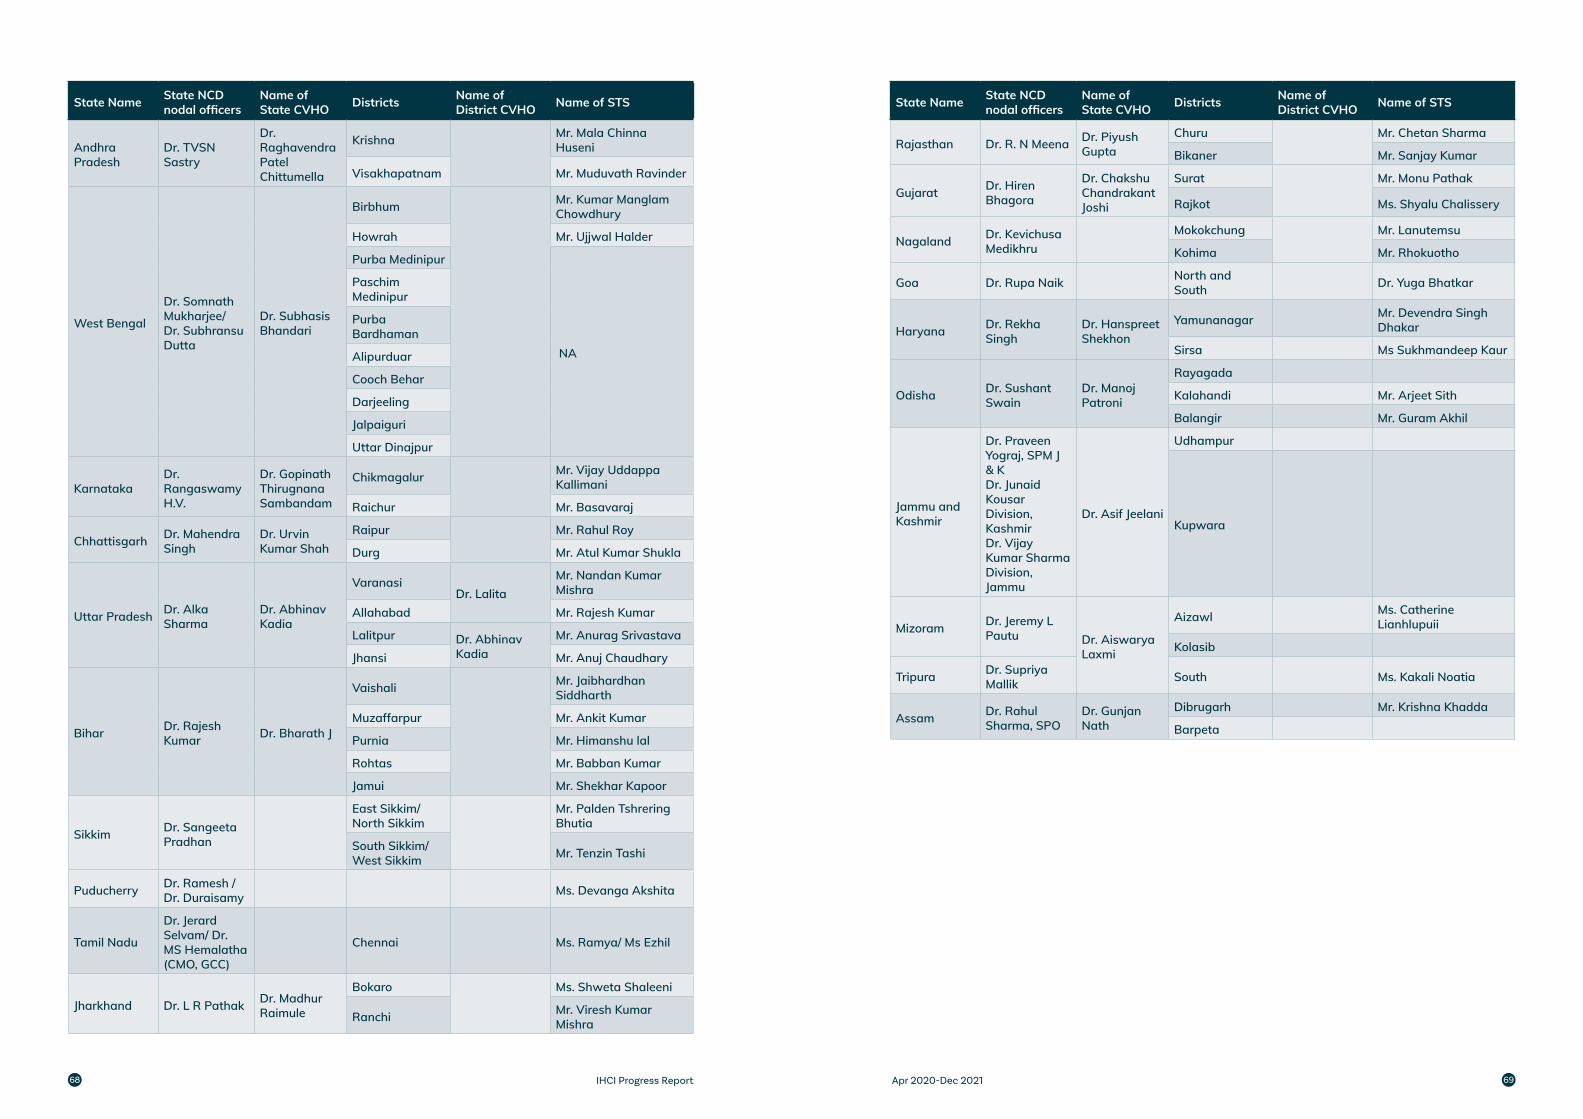
State Name State NCD nodal officers
Name of State CVHO Districts Name of
District CVHO Name of STS
Andhra Pradesh
Dr. TVSN Sastry
Dr. Raghavendra Patel Chittumella
Krishna
Mr. Mala Chinna Huseni
Visakhapatnam Mr. Muduvath Ravinder
West Bengal
Dr. Somnath Mukharjee/ Dr. Subhransu Dutta
Dr. Subhasis Bhandari
Birbhum Mr. Kumar Manglam Chowdhury
Howrah Mr. Ujjwal Halder
Purba Medinipur
NA
Paschim Medinipur
Purba Bardhaman
Alipurduar
Cooch Behar
Darjeeling
Jalpaiguri
Uttar Dinajpur
KarnatakaDr. Rangaswamy H.V.
Dr. Gopinath Thirugnana Sambandam
Chikmagalur Mr. Vijay Uddappa Kallimani
Raichur Mr. Basavaraj
Chhattisgarh Dr. Mahendra Singh
Dr. Urvin Kumar Shah
Raipur Mr. Rahul Roy
Durg Mr. Atul Kumar Shukla
Uttar Pradesh Dr. Alka Sharma
Dr. Abhinav Kadia
VaranasiDr. Lalita
Mr. Nandan Kumar Mishra
Allahabad Mr. Rajesh Kumar
Lalitpur Dr. Abhinav Kadia
Mr. Anurag Srivastava
Jhansi Mr. Anuj Chaudhary
Bihar Dr. Rajesh Kumar Dr. Bharath J
Vaishali Mr. Jaibhardhan Siddharth
Muzaffarpur Mr. Ankit Kumar
Purnia Mr. Himanshu lal
Rohtas Mr. Babban Kumar
Jamui Mr. Shekhar Kapoor
Sikkim Dr. Sangeeta Pradhan
East Sikkim/North Sikkim
Mr. Palden Tshrering Bhutia
South Sikkim/West Sikkim Mr. Tenzin Tashi
Puducherry Dr. Ramesh / Dr. Duraisamy Ms. Devanga Akshita
Tamil Nadu
Dr. Jerard Selvam/ Dr. MS Hemalatha (CMO, GCC)
Chennai Ms. Ramya/ Ms Ezhil
Jharkhand Dr. L R Pathak Dr. Madhur Raimule
Bokaro Ms. Shweta Shaleeni
Ranchi Mr. Viresh Kumar Mishra
State Name State NCD nodal officers
Name of State CVHO Districts Name of
District CVHO Name of STS
Rajasthan Dr. R. N Meena Dr. Piyush Gupta
Churu Mr. Chetan Sharma
Bikaner Mr. Sanjay Kumar
Gujarat Dr. Hiren Bhagora
Dr. Chakshu Chandrakant Joshi
Surat Mr. Monu Pathak
Rajkot Ms. Shyalu Chalissery
Nagaland Dr. Kevichusa Medikhru
Mokokchung Mr. Lanutemsu
Kohima Mr. Rhokuotho
Goa Dr. Rupa Naik North and South Dr. Yuga Bhatkar
Haryana Dr. Rekha Singh
Dr. Hanspreet Shekhon
Yamunanagar Mr. Devendra Singh Dhakar
Sirsa Ms Sukhmandeep Kaur
Odisha Dr. Sushant Swain
Dr. Manoj Patroni
Rayagada
Kalahandi Mr. Arjeet Sith
Balangir Mr. Guram Akhil
Jammu and Kashmir
Dr. Praveen Yograj, SPM J & K Dr. Junaid Kousar Division, Kashmir Dr. Vijay Kumar Sharma Division, Jammu
Dr. Asif Jeelani
Udhampur
Kupwara
Mizoram Dr. Jeremy L Pautu Dr. Aiswarya
Laxmi
Aizawl Ms. Catherine Lianhlupuii
Kolasib
Tripura Dr. Supriya Mallik South Ms. Kakali Noatia
Assam Dr. Rahul Sharma, SPO
Dr. Gunjan Nath
Dibrugarh Mr. Krishna Khadda
Barpeta
IHCI Progress Report Apr 2020-Dec 202168 69

This page is intentionally left blank
IHCI Progress Report 70