Evaluation of the Home-School Partnership-Literacy Programme
Upload
khangminh22Category
view
3download
0
15Programme Evaluation
and Review Technique
LEARNING OBJECTIVES :
After studying this chapter, you will be able to :
� Explain generic term network analysis and such related terms as Critical Path
Analysis. Critical Path Method (CPM) and Programme Evaluation and Review
Technique (PERT).
� Work out how network analysis helps managers to plan when to start various tasks
to monitor actual progress and to know when control action is needed to prevent
delay in completion of the project
� Draw diagram and chart representing inter-relationships between various elements
of the project and finally establishing critical path
� Identify dummy activities
� Identify earliest event times and latest even times for each event
� Identify total float, free float and independent float
� Crash times, costs and consumption of resources
� Help in decision making about project times and resource allocation
� Calculate the probability of completing the network in a given time when multiple
time estimates of activity duration are available
15.1 INTRODUCTION
Hitherto our emphasis has been on CPM which is applicable where activity durations can
be estimated from experience, past historical records and work study techniques fairly
precisely. CPM is incapable of handling uncertainty in timing which is a rule rather than a
expection for innovational projects such as introducing a new product or oil exploration
project. PERT (Program Evaluation and Review Technique) is more relevant for handing
such projects which have a great deal of uncertainity associated with the activity durations.

15.2 Advanced Management Accounting
To take these uncertainity into account, three kinds of times estimates are generally obtained.
These are:
(a) The Optimistic Times Estimate : This is the estimate of the shortest possible time in
which an activity can be completed under ideal conditions. For this estimate, no provision
for delays or setbacks are made. We shall denote this estimate by to.
(b) The Pessimistic Time Estimate : This is the maximum possible time which an activity
could take to accomplish the job. If everything went wrong and abnormal situations prevailed,
this would be the time estimate. It is denoted by tp.
(c) The Most Likely Time Estimate : This is a time estimate of an activity which lies between
the optimistic and the pessimistic time estimates. It assumes that things go in a normal way
with few setbacks. It is represents by tm.
Beta distribution is a assumed for these “guess estimates” and PERT analysts have found
that beta-distribution curve happens to give fairly satisfactory results for most of the activities.
For a distribution of this type, the standard deviation is approximately one sixth of the range,
i.e.
-
6
p o
t
t tS =
The variance, therefore; is
2 2 -
6
p o
t
t tS
⎛ ⎞= ⎜ ⎟⎝ ⎠
Exppected time : The expected time (te) is the average time taken for the completion of
the job. By using beta-distribution, the expcetion time can be obtianed by following formula.
4
6
o m p
e
t t tt
+ +=
Probability estimate in PERT : Those experience and possessing expertise in the various
technical aspects of the projects are required to make three times estimates from which is
computed te the expected times and S
t the standard deviation of the activity duration. The
expected time may then be used as the activity duration and the critical path may be found
by the analytical method explained earlier. But to what use is St put? Well this provides quite
a useful information at the expense of completing a project by a given date. Here is the
procedure.
15.2 PROBABILITY OF ACHIEVING COMPLETION DATE
Suppose we wish to find out the probability that a project will be completed with the
scheduled completion time. The time te as determined by b distribution after taking into
account three times estimates viz. to, tp and tm only represents a fifty pre cent chance that
the activity will be completed with the time te. If the distribution curve for activity-i-j is as
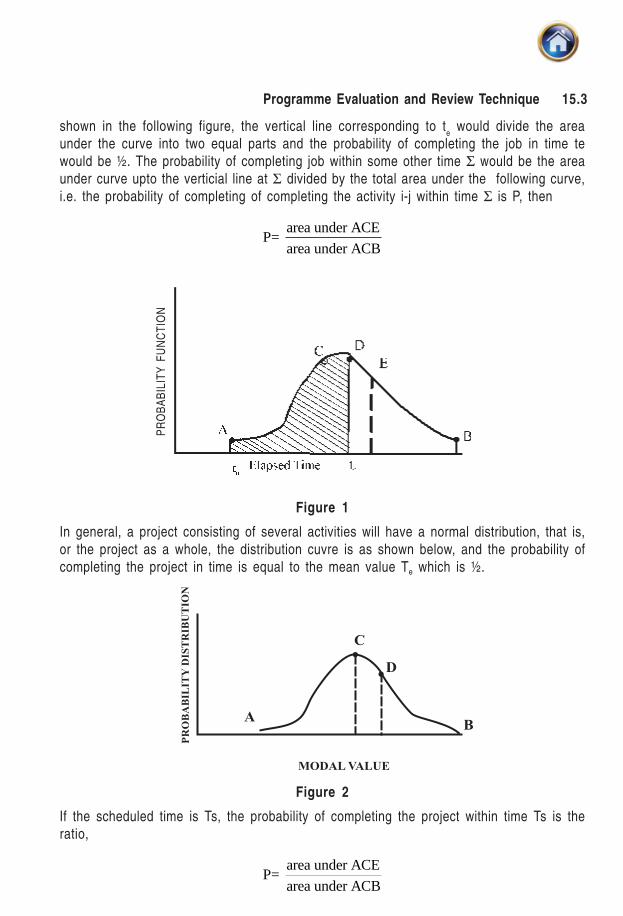
15.3Programme Evaluation and Review Technique
shown in the following figure, the vertical line corresponding to te would divide the area
under the curve into two equal parts and the probability of completing the job in time te
would be ½. The probability of completing job within some other time Σ would be the area
under curve upto the verticial line at Σ divided by the total area under the following curve,
i.e. the probability of completing of completing the activity i-j within time Σ is P, then
area under ACEP=
area under ACB
Figure 1
In general, a project consisting of several activities will have a normal distribution, that is,
or the project as a whole, the distribution cuvre is as shown below, and the probability of
completing the project in time is equal to the mean value Te which is ½.
Figure 2
If the scheduled time is Ts, the probability of completing the project within time Ts is the
ratio,
area under ACEP=
area under ACB
PR
OB
AB
ILIT
Y F
UN
CT
ION

15.4 Advanced Management Accounting
In order to apply the above analysis to a network it is necessary to reduce the random curve
obtained from the particular network into normal form. The advantage of this is that we can
use information and data available about the normal curve in the books of Statistics.
A standardized normal curve has an area equal to unity and a standard deviation ‘I’. further,
it is symmetrical about the mean value te. Hence the area under the curve AC is 50% of the
total area under the curve ACB. The area under the curve ACD depends on the location of
Ts along the time axis. The point t
e can be taken as the reference point and the distance t
e.
Ts can expressed in terms of standard deviation. For example, if T
s is on the right t
e at a
distance of 1 standard deviation then the area enclosed by ACD is 84.1%. If Ts is on the left
of te at a distance of 1 standard deviation then area enclosed is 15.9%. These facts can be
stated in a distance of -1 corresponds to 15.9% probability. By using proper statistical tables
and using the probabilities as obtained above, the value of standard normal variate (Z) can
be determined. But we know from statistics that
1 cpT –TZ =
. .S D
where T1 denotes the duration in which we wish to complete the project and T
cp represent
the duration on the critical path, S.D. stnds for standard deviation of the earliest finish of
a nwetwok.
Complute variance, Vt (=S2t) of all the activity duraitons of the critical path. Sum these up
and take square root. This yields the S.D. of the earliest finish time of a network. Let the
critical path duration be designeted by Tcp
. Assuming normal distribution for the total duration,
you should be in a position to find the confidence interval for Tcp
. Note that 3SD give the
limits of the total possible duration with 99% confidence. Put it in another way.
Suppose you wish that the project be completed within a duration to T1. Find
T1–TcpZ,
SD=
the standard normal variate.
Look to the standard normal probability distribution tables (Appendix 1) for the probability ofcompleting the projcet within the given duration of T
1.
Illustration
If the critical path of a project is 20 months alongwith a standard duration of 4 months, whatis the probability that the project will be completed within :
(a) 20 months (b) 18 months (c) 24 months?
Solution
(a)20–20
Z = 4
= 0; Probability = 0.50
(b)18–20
Z = 4
= –0.50; Probability = 0.31
15.5Programme Evaluation and Review Technique
(c)24–20
Z = 4
= 1; Probability = 0.84
Illustration
PERT calculations yield a project length of 60 weeks with variance of 9. Within how manyweeks would you expect the project to be completed with probability of 0.99? (That is theproject length that you would expect to be exceeded only by 1% of the times if the projectwere repeated many times is an identical manner).
Solution
Tcp = 60 S.D. = 9 = 3.
60 + 3 × 2.3 = 67 weeks (Answer)
Illustration
A small project is composed of 7 activities whose time estimates are listed in the tablebelow. Activities are identified by their beginning (i) and ending (j) node numbers.
(a) Draw the project network and identify all the paths through it.
(b) Find the expected duration and variance for each activity. What is the expected projectlength ?
(c) Calculate the variance and standard deviation of project length. What is the probabilitythat the project will be completed :
(i) at least 3 weeks earlier than expected ?
(ii) no more than 3 weeks later than expected ?
(d) If the project due date is 18 weeks, what is the probability of not meeting the due date ?
(e) What due date has about 90% chance of being met?
Activity Estimated duration in Weeks
i–j Optimistic Most Likely Pessimistic
1–2 1 1 7
1–3 1 4 7
1–4 2 2 8
2–5 1 1 1
3–5 2 5 14
4–6 2 5 8
5–6 3 6 15
15.6 Advanced Management Accounting
Solution
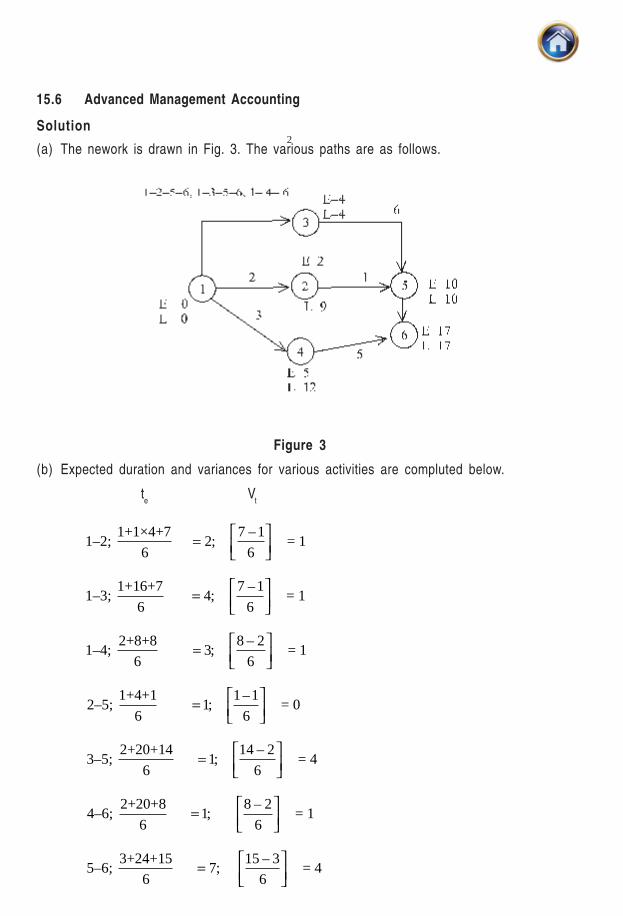
(a) The nework is drawn in Fig. 3. The various paths are as follows.
Figure 3
(b) Expected duration and variances for various activities are compluted below.
te
Vt
1+1×4+7 7 –1
1–2; 2; = 16 6
⎡ ⎤= ⎢ ⎥⎣ ⎦
1+16+7 7 –1
1–3; 4; = 16 6
⎡ ⎤= ⎢ ⎥⎣ ⎦
2+8+8 8 – 2
1–4; 3; = 16 6
⎡ ⎤= ⎢ ⎥⎣ ⎦
1+4+1 1–1
2–5; 1; = 06 6
⎡ ⎤= ⎢ ⎥⎣ ⎦
2+20+14 14 – 2
3–5; 1; = 46 6
⎡ ⎤= ⎢ ⎥⎣ ⎦
2+20+8 8 – 2
4–6; 1; = 16 6
⎡ ⎤= ⎢ ⎥⎣ ⎦
3+24+15 15 – 3
5–6; 7; = 46 6
⎡ ⎤= ⎢ ⎥⎣ ⎦
2
15.7Programme Evaluation and Review Technique
(c) Expected project Length = 17 weeks (Answer)
Variance of the critical path 1–3–5–6 = 1+4+4 = 9 (Answer)
∴Standard Deviation = 9 = 3 (Answer)
(i) Probability = 0.159 (Answer)
(ii) Probability = 0.841 (Answer)
(d) Tcp
= 17; T1 = 18;
Therefore, probability of meeting the due date = 0.63.
And probability of not meeting the date = 0.37 (=1–0.63)
(e) At 90% Probability, Z = 1.3 approximately.
∴1.3 = or T2 = 20.9 weeks approximately.
Illustration
Find event variances in the network of previous illustration.
Solution
Event variance for both the TE and T
L of each event are derived below. The computational
procedure should be self evident. We shall put to use hte variances of the various activitiesderive in part (b) of solution to example 3 above.
Earliest Time, TE (D=Duration)
Event Longest path leading to it *Variance
1 Nill (D=0) 0
2 1–2 (D=2) 1
3 1–3 (D=3) 1
4 1–4 (D=4) 1
5 1–3, 3–5 (D = 4 + 6 = 10) 1 + 4 = 5
6 1–3, 3–5, 5–6 (D=17) 1 + 4 + 4 = 9
Suppose we wish to find the projbability of reaching event 5 in 9 days. This can be computedas below:
* (N.B. If there are two equal longest path, higher of the two variances would be picked up).
15.8 Advanced Management Accounting
Probability (from Appendix 1) of reaching event 5 in 9 days is equal to 0.5 – .1723 = .3275.
Likewise we can determine probabilities of reaching other events.
Longest Time TL
Event Longest path from it to last event 6 Variance
1 1–3, 3–5, 5–6 9
2 2–5, 5–6 4
3 3–5, 5–6 8
4 4–6 1
5 5–6 4
6 Nill 0
Illustration
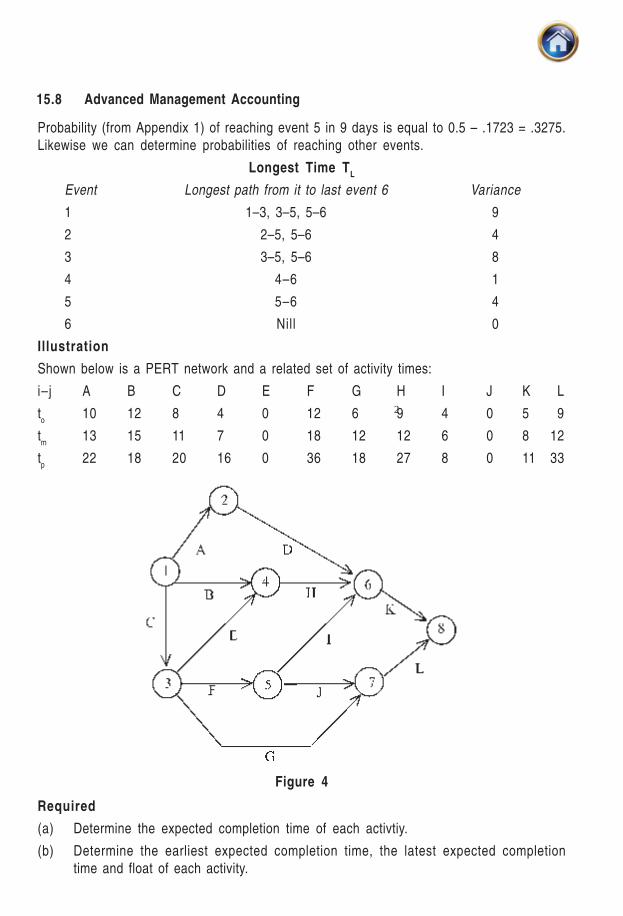
Shown below is a PERT network and a related set of activity times:
i–j A B C D E F G H I J K L
to
10 12 8 4 0 12 6 9 4 0 5 9
tm
13 15 11 7 0 18 12 12 6 0 8 12
tp
22 18 20 16 0 36 18 27 8 0 11 33
Figure 4
Required
(a) Determine the expected completion time of each activtiy.
(b) Determine the earliest expected completion time, the latest expected completion
time and float of each activity.
2

15.9Programme Evaluation and Review Technique
(c) What is the total project completion time, and what are activities on the critical
path?
(d) Determine S.D. of expected completion time for only those activities on the critical
path.
(e) Determine the probability that the project will be completed within 41 weeks.
Solution
Figure 5
p m o p ot + 4t + t t – tte = ;
6 6⎛ ⎞= ⎜ ⎟⎝ ⎠
Time estimates Start Finish
i–j to
4tm
tp
te
E L E L Float Vt
S.D
1–2 10 52 22 14 0 17 14 31 17
1–3 8 44 20 12 0 0 12 12 0 4 2
1–4 12 60 18 15 0 10 15 25 10
2–6 4 28 16 8 14 31 22 39 17
3–4 0 0 0 0 12 25 12 25 13
3–5 12 72 36 20 12 12 32 32 0 16 4
3–7 6 48 18 12 12 20 24 32 8
4–6 9 48 27 14 15 25 29 39 10
5–6 4 24 8 6 32 33 38 39 1
5–7 0 0 0 0 32 32 32 32 0 0 0
6–8 5 32 11 8 38 39 46 47 1
7–8 9 48 33 15 32 32 47 47 0 16 4
tV = 36∑
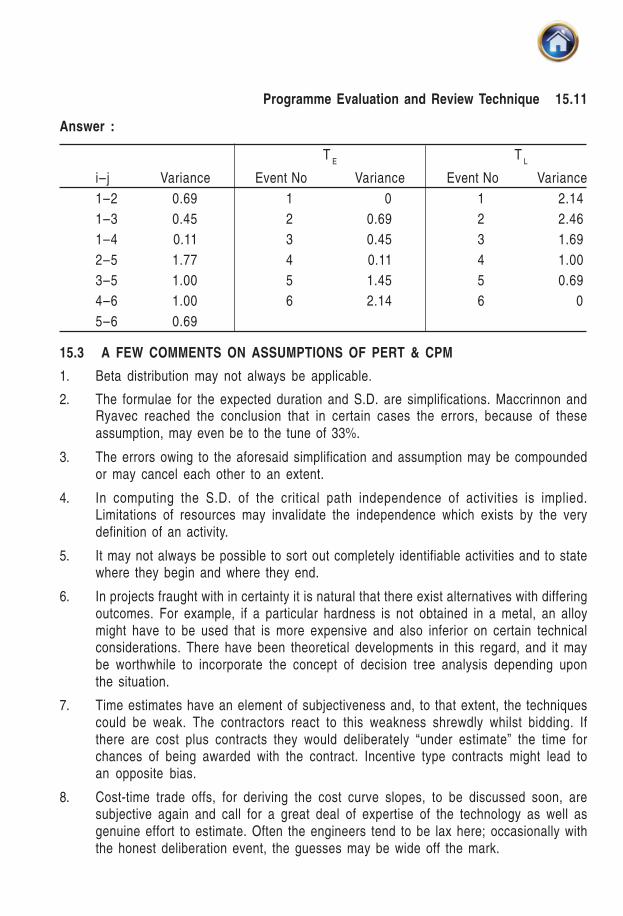
15.10 Advanced Management Accounting
Hence S.D. of the critical path = 36 = 6.
Probability of completion critical path in 41 weeks is computed below:
41 – 47z = –1.
6=
∴ Probability = 0.159 (Answer).
Exercise
1. The following table lists the jobs of a network alongwith their time estimates.
i–j Optimistic Most Likely Pesstimistic
Duration Duration Duration
1–2 3 6 15
1–6 2 5 14
2–3 6 12 30
2–4 2 5 8
3–5 5 11 17
4–5 3 6 15
5–8 1 4 7
6–7 3 9 26
7–8 4 19 28
(a) Draw the project network.
(b) Calculate the length and variance of critical path.
(c) What is the approximate probability that jobs on the critical path will be completed bythe due date of 41 days?
(d) What is the approximate probability that jobs on the next most critical path will becompleted by the due date?
Answer : (b) Length = 36 days; Variance = 25; (c) 0.84; (d) 0.84
2. Below are given the three times estimates of each activity of a project network.Construct the network. Find the variance of each activity and variances of T
E and T
L of each
event.
i–j 1–2 1–3 1–4 2–5 3–5 4–6 5–6
to
7 15 7 9 20 14 2
tm
10 18 8 12 24 18 3
tp
12 20 9 17 26 20 7
15.11Programme Evaluation and Review Technique
Answer :
TE
TL
i–j Variance Event No Variance Event No Variance
1–2 0.69 1 0 1 2.14
1–3 0.45 2 0.69 2 2.46
1–4 0.11 3 0.45 3 1.69
2–5 1.77 4 0.11 4 1.00
3–5 1.00 5 1.45 5 0.69
4–6 1.00 6 2.14 6 0
5–6 0.69
15.3 A FEW COMMENTS ON ASSUMPTIONS OF PERT & CPM
1. Beta distribution may not always be applicable.
2. The formulae for the expected duration and S.D. are simplifications. Maccrinnon andRyavec reached the conclusion that in certain cases the errors, because of theseassumption, may even be to the tune of 33%.
3. The errors owing to the aforesaid simplification and assumption may be compoundedor may cancel each other to an extent.
4. In computing the S.D. of the critical path independence of activities is implied.Limitations of resources may invalidate the independence which exists by the verydefinition of an activity.
5. It may not always be possible to sort out completely identifiable activities and to statewhere they begin and where they end.
6. In projects fraught with in certainty it is natural that there exist alternatives with differingoutcomes. For example, if a particular hardness is not obtained in a metal, an alloymight have to be used that is more expensive and also inferior on certain technicalconsiderations. There have been theoretical developments in this regard, and it maybe worthwhile to incorporate the concept of decision tree analysis depending uponthe situation.
7. Time estimates have an element of subjectiveness and, to that extent, the techniquescould be weak. The contractors react to this weakness shrewdly whilst bidding. Ifthere are cost plus contracts they would deliberately “under estimate” the time forchances of being awarded with the contract. Incentive type contracts might lead toan opposite bias.
8. Cost-time trade offs, for deriving the cost curve slopes, to be discussed soon, aresubjective again and call for a great deal of expertise of the technology as well asgenuine effort to estimate. Often the engineers tend to be lax here; occasionally withthe honest deliberation event, the guesses may be wide off the mark.
15.12 Advanced Management Accounting
15.4 DISTINCTION BETWEEN PERT AND CPM
The PERT and CPM models are similar in terms of their basic structure, rationale andmode of analysis. However, there are certain distinctions between PERT and CPM networkswhich are enumerated below: .
(i) CPM is activity oriented i.e. CPM network is built on the basis of activities. Also resultsof various calculations are considered in terms of activities of the project. On theother hand, PERT is event oriented.
(ii) CPM is a determistic model i.e. It does not take into account the uncertainties involvedin the estimation of time for execution of a job or an activity. It completely ignores theprobabilistic element of the problem. PERT, however, is a probabilistic model. It usesthree estimates of the activity time; optimistic, pessimistic and most likely; with a viewto take into account time uncertainty. Thus, the expected duration of each activity isprobabilistic and expected duration indicates that there is fifty per cent probability ofgetting the job done within that time.
(iii) CPM places dual emphasis on time and cost and evaluates the trade-off betweenproject cost and project time. By deploying, additional resources, it allows the criticalpath project manager to manipulate project duration within certain limits so thatproject duration can be shortened at an optimal cost. On the other hand, PERT isprimarily concerned with time. It helps the manager to schedule and coordinatevarious activities so that the project can be completed on scheduled time.
(iv) CPM is commonly used for those projects which are repetitive in nature and whereone has prior experience of handling similar projects. PERT is generally used forthose projects where time required to complete various activities are not known aspriori. Thus, PERT is widely used for planning and scheduling research anddevelopment projects.
15.5 UPDATING THE NETWORK
The progress of various activities in a project network is measured periodically. Normally,either most of the activities are ahead or behind the schedule. It is therefore, necessary toupdate or redraw the network periodically to know the exact position of completion of eachactivity of the project. The task of updating the network may be carried out once in a month.Sometimes the updating of the network may provide useful information to such an extentthat it may demand the revision of even those very activities which have not started. Eventhe logic may also change i.e. some of the existing activities may have to be dropped andnew activities may be added up. In brief the network should be amended accordingly in thelight of new developments.
It is also not unlikely that the total physical quantum of work accomplished at a point of timemay exceed what was planned but the progress against the critical path alone may beslower than the scheduled pace. To understand how the task of updating is carried out,consider the following example:
15.13Programme Evaluation and Review Technique
Illustration
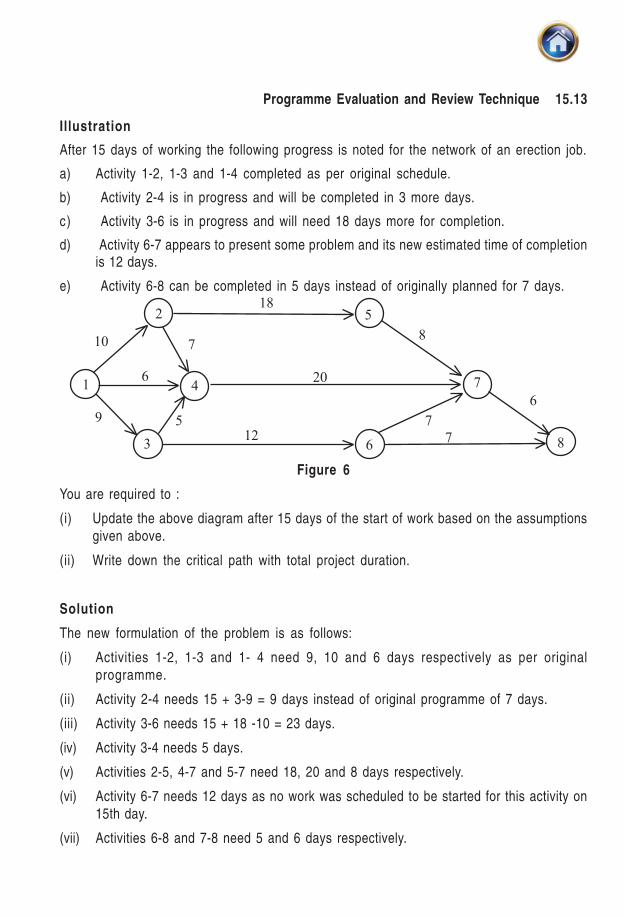
After 15 days of working the following progress is noted for the network of an erection job.
a) Activity 1-2, 1-3 and 1-4 completed as per original schedule.
b) Activity 2-4 is in progress and will be completed in 3 more days.
c) Activity 3-6 is in progress and will need 18 days more for completion.
d) Activity 6-7 appears to present some problem and its new estimated time of completionis 12 days.
e) Activity 6-8 can be completed in 5 days instead of originally planned for 7 days.
Figure 6
You are required to :
(i) Update the above diagram after 15 days of the start of work based on the assumptions
given above.
(ii) Write down the critical path with total project duration.
Solution
The new formulation of the problem is as follows:
(i) Activities 1-2, 1-3 and 1- 4 need 9, 10 and 6 days respectively as per original
programme.
(ii) Activity 2-4 needs 15 + 3-9 = 9 days instead of original programme of 7 days.
(iii) Activity 3-6 needs 15 + 18 -10 = 23 days.
(iv) Activity 3-4 needs 5 days.
(v) Activities 2-5, 4-7 and 5-7 need 18, 20 and 8 days respectively.
(vi) Activity 6-7 needs 12 days as no work was scheduled to be started for this activity on
15th day.
(vii) Activities 6-8 and 7-8 need 5 and 6 days respectively.
15.14 Advanced Management Accounting
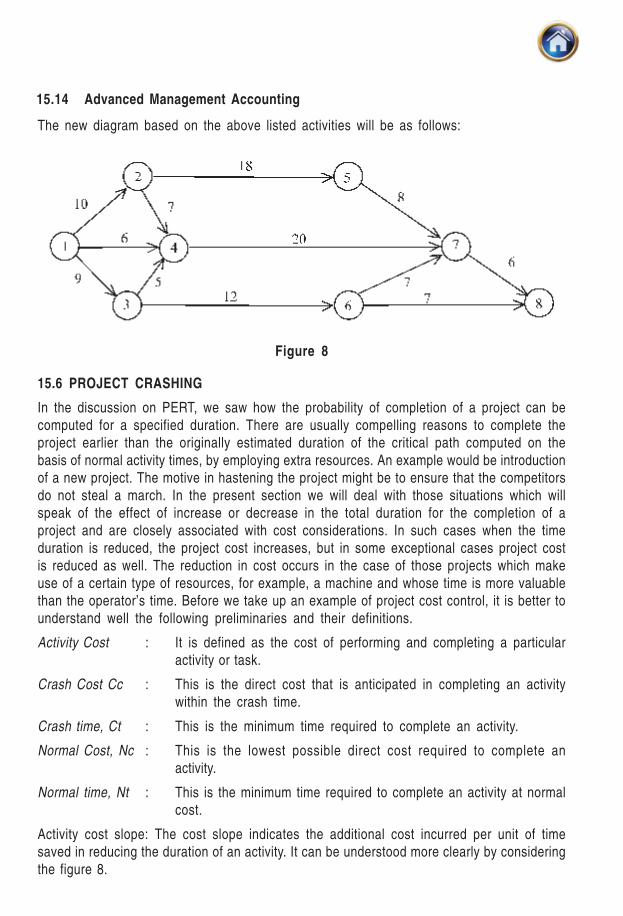
The new diagram based on the above listed activities will be as follows:
Figure 8
15.6 PROJECT CRASHING
In the discussion on PERT, we saw how the probability of completion of a project can be
computed for a specified duration. There are usually compelling reasons to complete the
project earlier than the originally estimated duration of the critical path computed on the
basis of normal activity times, by employing extra resources. An example would be introduction
of a new project. The motive in hastening the project might be to ensure that the competitors
do not steal a march. In the present section we will deal with those situations which will
speak of the effect of increase or decrease in the total duration for the completion of a
project and are closely associated with cost considerations. In such cases when the time
duration is reduced, the project cost increases, but in some exceptional cases project cost
is reduced as well. The reduction in cost occurs in the case of those projects which make
use of a certain type of resources, for example, a machine and whose time is more valuable
than the operator’s time. Before we take up an example of project cost control, it is better to
understand well the following preliminaries and their definitions.
Activity Cost : It is defined as the cost of performing and completing a particular
activity or task.
Crash Cost Cc : This is the direct cost that is anticipated in completing an activity
within the crash time.
Crash time, Ct : This is the minimum time required to complete an activity.
Normal Cost, Nc : This is the lowest possible direct cost required to complete an
activity.
Normal time, Nt : This is the minimum time required to complete an activity at normal
cost.
Activity cost slope: The cost slope indicates the additional cost incurred per unit of time
saved in reducing the duration of an activity. It can be understood more clearly by considering
the figure 8.
15.15Programme Evaluation and Review Technique
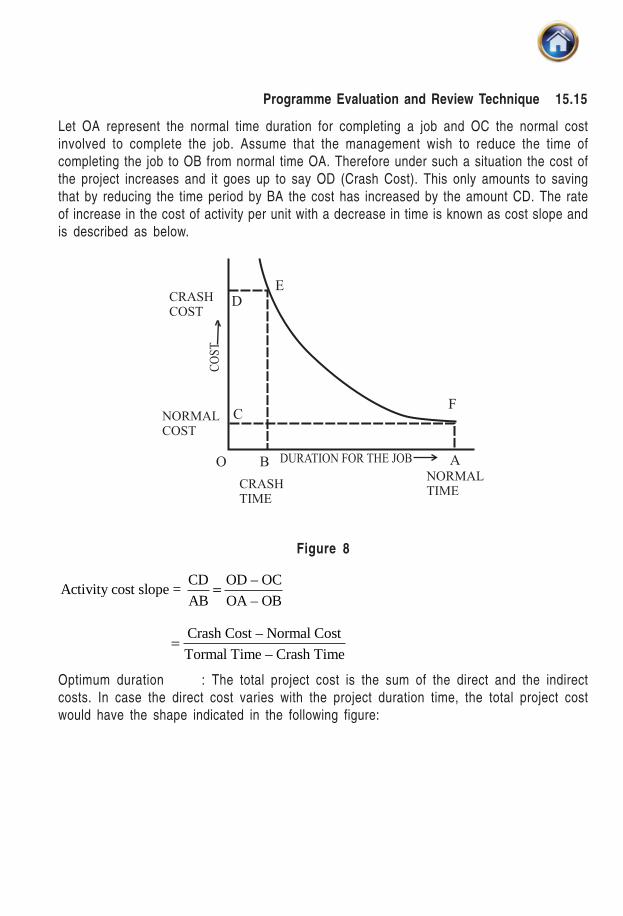
Let OA represent the normal time duration for completing a job and OC the normal cost
involved to complete the job. Assume that the management wish to reduce the time of
completing the job to OB from normal time OA. Therefore under such a situation the cost of
the project increases and it goes up to say OD (Crash Cost). This only amounts to saving
that by reducing the time period by BA the cost has increased by the amount CD. The rate
of increase in the cost of activity per unit with a decrease in time is known as cost slope and
is described as below.
Figure 8
CD OD – OCActivity cost slope =
AB OA – OB=
Crash Cost – Normal Cost
Tormal Time – Crash Time=
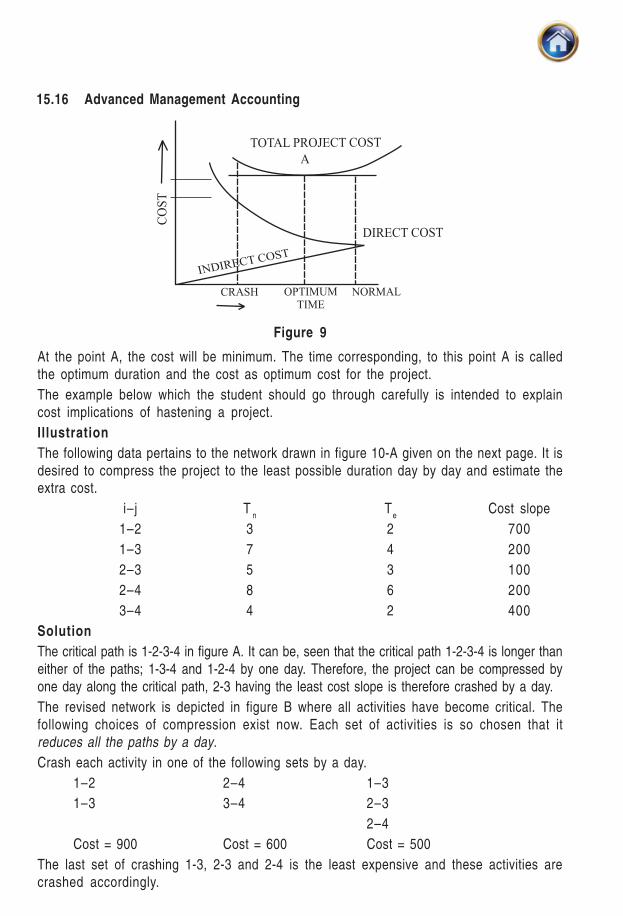
Optimum duration : The total project cost is the sum of the direct and the indirect
costs. In case the direct cost varies with the project duration time, the total project cost
would have the shape indicated in the following figure:
15.16 Advanced Management Accounting
Figure 9
At the point A, the cost will be minimum. The time corresponding, to this point A is called
the optimum duration and the cost as optimum cost for the project.
The example below which the student should go through carefully is intended to explain
cost implications of hastening a project.
Illustration
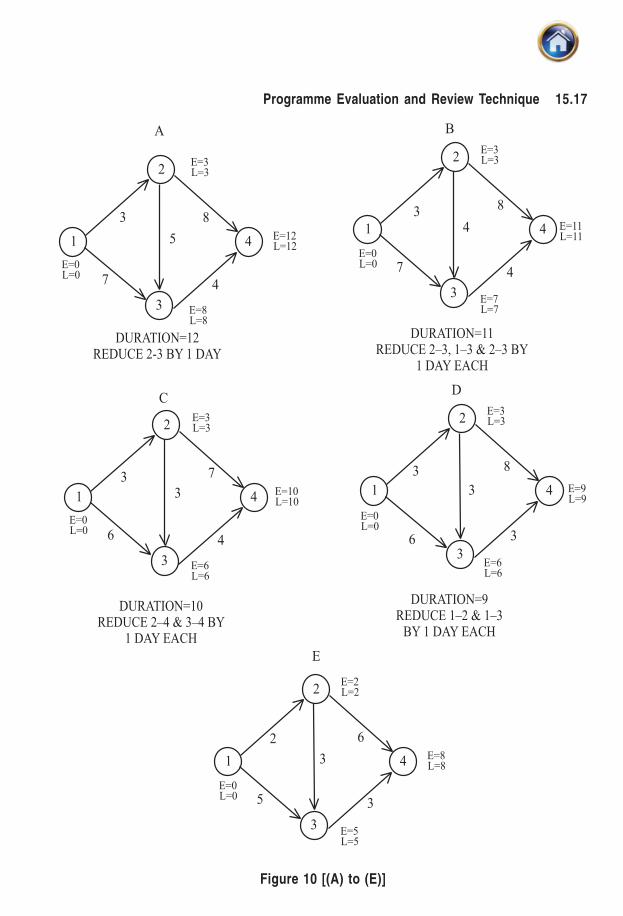
The following data pertains to the network drawn in figure 10-A given on the next page. It is
desired to compress the project to the least possible duration day by day and estimate theextra cost.
i–j Tn
Te
Cost slope
1–2 3 2 700
1–3 7 4 200
2–3 5 3 100
2–4 8 6 200
3–4 4 2 400
Solution
The critical path is 1-2-3-4 in figure A. It can be, seen that the critical path 1-2-3-4 is longer than
either of the paths; 1-3-4 and 1-2-4 by one day. Therefore, the project can be compressed by
one day along the critical path, 2-3 having the least cost slope is therefore crashed by a day.
The revised network is depicted in figure B where all activities have become critical. The
following choices of compression exist now. Each set of activities is so chosen that it
reduces all the paths by a day.
Crash each activity in one of the following sets by a day.
1–2 2–4 1–3
1–3 3–4 2–3
2–4
Cost = 900 Cost = 600 Cost = 500
The last set of crashing 1-3, 2-3 and 2-4 is the least expensive and these activities are
crashed accordingly.
15.17Programme Evaluation and Review Technique
Figure 10 [(A) to (E)]
15.18 Advanced Management Accounting
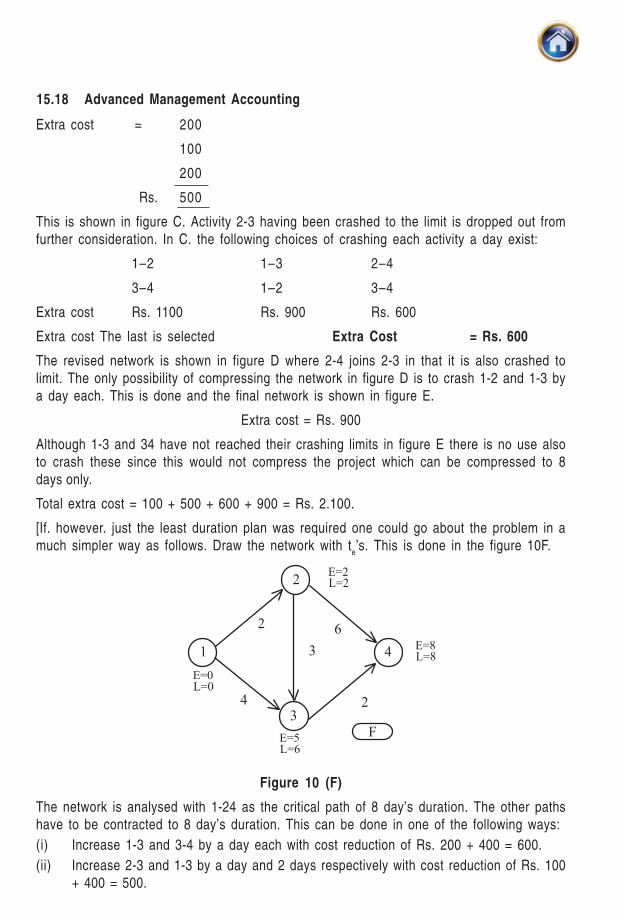
Extra cost = 200
100
200
Rs. 500
This is shown in figure C. Activity 2-3 having been crashed to the limit is dropped out from
further consideration. In C. the following choices of crashing each activity a day exist:
1–2 1–3 2–4
3–4 1–2 3–4
Extra cost Rs. 1100 Rs. 900 Rs. 600
Extra cost The last is selected Extra Cost = Rs. 600
The revised network is shown in figure D where 2-4 joins 2-3 in that it is also crashed to
limit. The only possibility of compressing the network in figure D is to crash 1-2 and 1-3 by
a day each. This is done and the final network is shown in figure E.
Extra cost = Rs. 900
Although 1-3 and 34 have not reached their crashing limits in figure E there is no use also
to crash these since this would not compress the project which can be compressed to 8
days only.
Total extra cost = 100 + 500 + 600 + 900 = Rs. 2.100.
[If. however. just the least duration plan was required one could go about the problem in a
much simpler way as follows. Draw the network with te’s. This is done in the figure 10F.
Figure 10 (F)
The network is analysed with 1-24 as the critical path of 8 day’s duration. The other paths
have to be contracted to 8 day’s duration. This can be done in one of the following ways:
(i) Increase 1-3 and 3-4 by a day each with cost reduction of Rs. 200 + 400 = 600.
(ii) Increase 2-3 and 1-3 by a day and 2 days respectively with cost reduction of Rs. 100
+ 400 = 500.

15.19Programme Evaluation and Review Technique
Obviously the 1st course is to be preferred and the network. if now revised. would be
identical with the one of figure E.
Often. however. management would be interested in the least total cost duration rather than
the least possible duration.
Now, suppose there is an indirect cost of Rs. 800 per day. What would then be the least costproject duration for the example on hand ? The various cost data are tabulated below:
Duration Direct (Crashing) cost Indirect cost Total cost
12 0 9600 9600
11 100 8800 8900
10 600 8000 8600
9 1200 7200 8400
8 2100 6400 8500
Thus 9 days is the least toal cost duration and rationally the management should go in forthis unless high opportunity losses compel them to select a lower duration project plan.
Illustration
Consider the following network and the table for a particular project which consists of 7activities.
Figure 11
(The number indicated along the activity arrows are the normal duration.)
Activity Noraml Crash Cost slopesTimes Cost Time Cost ΔT ΔC ΔC/ΔT(days) Rs. (days) Rs.
1–2 3 360 2 400 1 40 40 2–3 6 1440 4 1620 2 180 90 2–4 9 2160 5 2380 4 220 55 2–5 7 1120 5 1600 2 480 240 3–4 8 400 4 80 4 400 100 4–5 5 1600 3 1770 2 170 85 5–6 3 480 2 760 1 280 280
7560 9330
The indirect cost is Rs. 160/-per day. Determine optimum duration in the above case.
15.20 Advanced Management Accounting
Solution
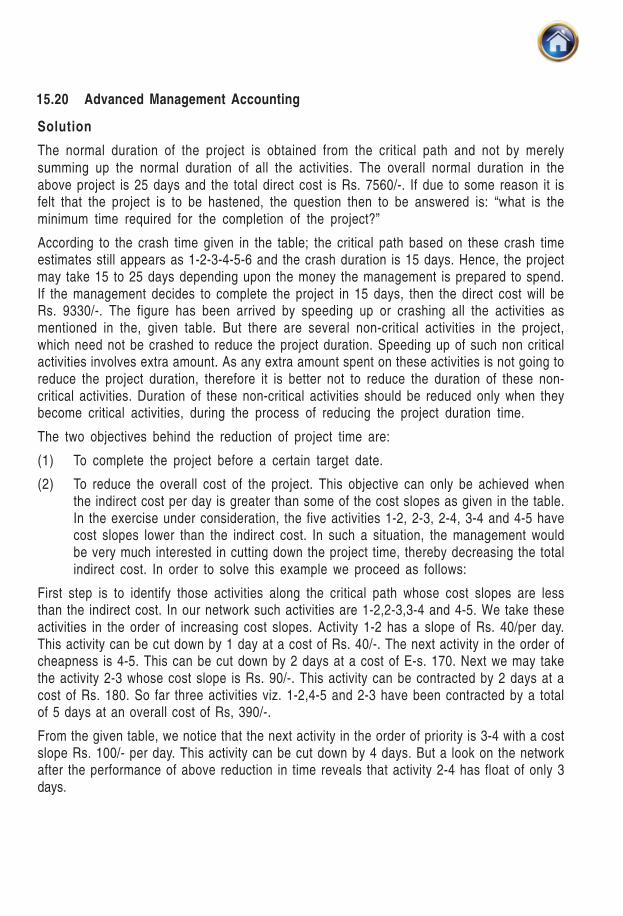
The normal duration of the project is obtained from the critical path and not by merelysumming up the normal duration of all the activities. The overall normal duration in theabove project is 25 days and the total direct cost is Rs. 7560/-. If due to some reason it isfelt that the project is to be hastened, the question then to be answered is: “what is theminimum time required for the completion of the project?”
According to the crash time given in the table; the critical path based on these crash timeestimates still appears as 1-2-3-4-5-6 and the crash duration is 15 days. Hence, the projectmay take 15 to 25 days depending upon the money the management is prepared to spend.If the management decides to complete the project in 15 days, then the direct cost will beRs. 9330/-. The figure has been arrived by speeding up or crashing all the activities asmentioned in the, given table. But there are several non-critical activities in the project,which need not be crashed to reduce the project duration. Speeding up of such non criticalactivities involves extra amount. As any extra amount spent on these activities is not going toreduce the project duration, therefore it is better not to reduce the duration of these non-critical activities. Duration of these non-critical activities should be reduced only when theybecome critical activities, during the process of reducing the project duration time.
The two objectives behind the reduction of project time are:
(1) To complete the project before a certain target date.
(2) To reduce the overall cost of the project. This objective can only be achieved whenthe indirect cost per day is greater than some of the cost slopes as given in the table.In the exercise under consideration, the five activities 1-2, 2-3, 2-4, 3-4 and 4-5 havecost slopes lower than the indirect cost. In such a situation, the management wouldbe very much interested in cutting down the project time, thereby decreasing the totalindirect cost. In order to solve this example we proceed as follows:
First step is to identify those activities along the critical path whose cost slopes are lessthan the indirect cost. In our network such activities are 1-2,2-3,3-4 and 4-5. We take theseactivities in the order of increasing cost slopes. Activity 1-2 has a slope of Rs. 40/per day.This activity can be cut down by 1 day at a cost of Rs. 40/-. The next activity in the order ofcheapness is 4-5. This can be cut down by 2 days at a cost of E-s. 170. Next we may takethe activity 2-3 whose cost slope is Rs. 90/-. This activity can be contracted by 2 days at acost of Rs. 180. So far three activities viz. 1-2,4-5 and 2-3 have been contracted by a totalof 5 days at an overall cost of Rs, 390/-.
From the given table, we notice that the next activity in the order of priority is 3-4 with a costslope Rs. 100/- per day. This activity can be cut down by 4 days. But a look on the networkafter the performance of above reduction in time reveals that activity 2-4 has float of only 3days.
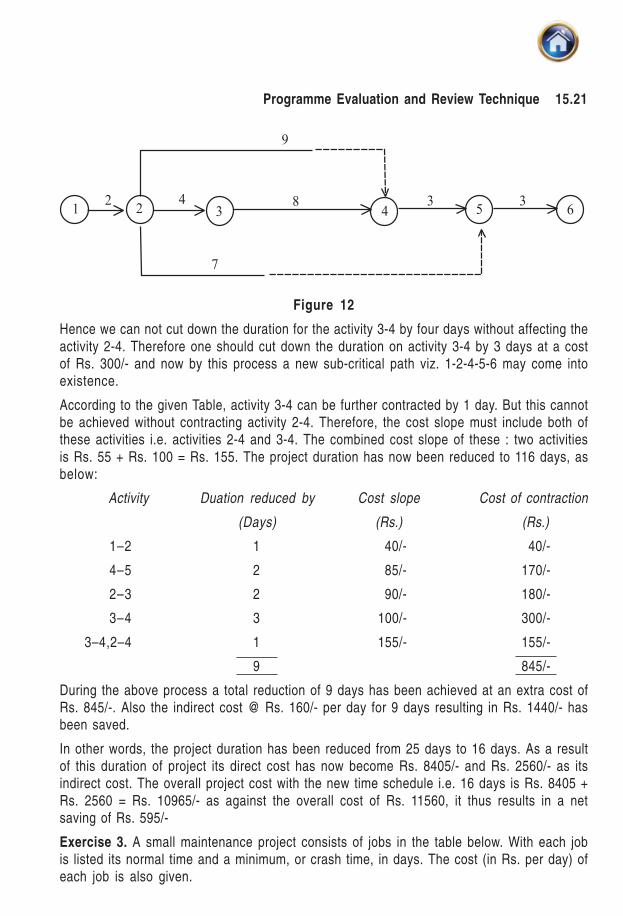
15.21Programme Evaluation and Review Technique
Figure 12
Hence we can not cut down the duration for the activity 3-4 by four days without affecting theactivity 2-4. Therefore one should cut down the duration on activity 3-4 by 3 days at a costof Rs. 300/- and now by this process a new sub-critical path viz. 1-2-4-5-6 may come intoexistence.
According to the given Table, activity 3-4 can be further contracted by 1 day. But this cannotbe achieved without contracting activity 2-4. Therefore, the cost slope must include both ofthese activities i.e. activities 2-4 and 3-4. The combined cost slope of these : two activitiesis Rs. 55 + Rs. 100 = Rs. 155. The project duration has now been reduced to 116 days, asbelow:
Activity Duation reduced by Cost slope Cost of contraction
(Days) (Rs.) (Rs.)
1–2 1 40/- 40/-
4–5 2 85/- 170/-
2–3 2 90/- 180/-
3–4 3 100/- 300/-
3–4,2–4 1 155/- 155/-
9 845/-
During the above process a total reduction of 9 days has been achieved at an extra cost ofRs. 845/-. Also the indirect cost @ Rs. 160/- per day for 9 days resulting in Rs. 1440/- hasbeen saved.
In other words, the project duration has been reduced from 25 days to 16 days. As a resultof this duration of project its direct cost has now become Rs. 8405/- and Rs. 2560/- as itsindirect cost. The overall project cost with the new time schedule i.e. 16 days is Rs. 8405 +Rs. 2560 = Rs. 10965/- as against the overall cost of Rs. 11560, it thus results in a netsaving of Rs. 595/-
Exercise 3. A small maintenance project consists of jobs in the table below. With each jobis listed its normal time and a minimum, or crash time, in days. The cost (in Rs. per day) ofeach job is also given.

15.22 Advanced Management Accounting
Job Normal day Minimum (crash) Cost/day
i-j duration day duration
1-2 9 6 20
1-3 8 5 25
1-4 15 10 30
2-4 5 3 10
3-4 10 6 15
4-5 2 1 40
(a) What is the normal project length and the minimum project length?
(b) Determine the minimum crashing cost of schedules ranging from normal length downto, and including, the minimum length schedule. That is, if L = length of the schedule,find the costs of schedules which are L, L - 1, L-2 and so on days long.
(c) Overhead costs total Rs. 60 per day. What is the optimum length schedule in terms ofboth crashing and overhead cost? List the scheduled duration of each job for your solution:
Answer : (a) 20 days: 12 days
(b) Length (days Crashing Cost Total Cost
Rs. Rs.
20 0 1200
19 15 1155
18 30 1110
17 45 1065
16 85 1045
15 130 1030
14 195 1035
13 260 1040
12 335 1055
(c) Optimum length = 15 days.
Illustration
The Arcot Machinery Company has been offered a contract to build and deliver nine
extruding pressess to the Home Bottling Company. The contract price negotiated is
contingent upon meeting a specified delivery time, with a bonus offerd for early delivery.
The marketing department has established the following cost and time information:
15.23Programme Evaluation and Review Technique
Normal time (weeks) Normal Cost Crash Time Crash Cost
Activity a b m (Rs.) (weeks) (Rs.)
1–2 1 5 3 5000 1 9000
2–3 1 7 4 8000 3 14000
2–4 1 5 3 4000 2 6000
2–5 5 11 8 5000 7 6000
3–6 2 6 4 3000 2 5000
4–6 5 7 6 2000 4 3600
5–7 4 6 5 10000 4 14000
6–7 1 5 3 7000 1 10600
Normal delivery time is 16 weeks for a contract price of Rs. 62,000.
On the basis of the calculated profitability for each delivery time specified in the following
table, what delivery schedule do you recommend that the company may implement?
Contract Delivery Time Contract Amount
(weeks) (Rs.)
15 62,500
14 65,000
13 70,000
12 72,500
(Here a = to : optimistic time, b=t
p; pessimistic time, m=t
m; most likely time.)
Solution
Let us first calculate the expect duration of each activity.
Normal Time (weeks) Expected Normal Crash Crash Cost
Activity a b m duration Cost T ime Cost Slope
(weeks) Rs. (weeks) (Rs.)
1-2 1 5 3 3 5000 1 9000 2000
2-3 1 7 4 4 8000 3 14000 6000
2-4 1 5 3 3 4000 2 6000 2000
2-5 5 11 8 8 5000 7 6000 1000
3-6 2 6 4 4 3000 2 5000 1000
4-6 5 7 6 6 2000 4 3600 800
5-7 4 6 5 5 10000 4 14000 4000
6-7 1 5 3 3 7000 1 10600 1800
15.24 Advanced Management Accounting
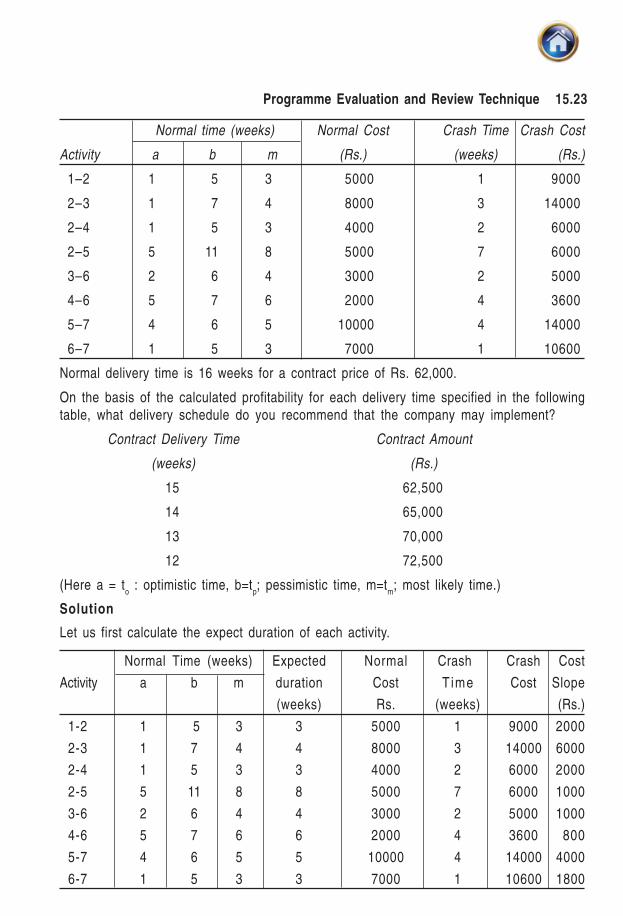
The network for the given problem is drawn below:
Figure 13
The critical path is 1-2-5-7 with total duration 0116 weeks. Cost of all activities is Rs.44,000.Contract price is Rs. 62,000 for normal delivery time of 16 weeks. Hence the profit is of Rs.18000.
For calculating the most profitable delivery schedule, let us start crashing the activities onthe critical path. Cost slopes for various activities are given in the above table.
Step 1: The critical activity 2-5 has the least cost slope of Rs. 1,000, so we crash thisactivity by 1 day. Crashing cost is Rs. 1000. The contract amount for delivery time of 15weeks is Rs. 62,500
Profit = Rs. 62,500 - (Rs. 44,000 + Rs. 1,000)
= Rs. 62,500 -Rs. 45,000 = Rs. 17,500
Step 2: Now there are two critical paths viz. 1-2-4-6-7 and 1-2-5-7 with duration of 15 weeks. Sowe crash activity 1-2 by 1 day at crash cost of Rs. 2000. Project duration is 14 weeks.
Profit = Rs. 65,000 - Rs. (45,000 + 2,000) = Rs. 18,000.
Step 3: We again crash activity 1-2 by 1 day. So the project duration is 13 weeks
Profit = Rs. 70,000 - (Rs. 47,000 + Rs. 2,000)
= Rs. 70,000 - Rs. 49,000 = Rs. 21,000
Step 4: Now we crash activity 4-6 for path 1-2-4-6-7 at crash cost of Rs. 800 andactivity 5-7 for path 1-2-5-7 at crash cost of Rs. 4000. Project duration is now 12weeks.
Profit = Rs. 72,500 - (Rs. 49,000 + Rs. 4000 + Rs. 800)
= Rs. 72,500 - Rs. 53,800 = Rs. 18,700
No further crashing is possible.
From step 3, it can be seen that the profit is maximum when the project duration is 13
weeks. Hence, the company should implement the delivery schedule of 13 weeks at a
contract amount of Rs. 70,000 to gain maximum profit of Rs. 21,000
15.25Programme Evaluation and Review Technique
15.7 RESOURCE SMOOTHING
It is a network technique used for smoothening peak resource requirement during different
periods of the project network. Under this technique the total project duration is maintained
at the minimum level. For example, if the duration of a project is 15 days, then the project
duration is maintained, but the resources required for completing different activities of a
project are smoothened by utilising floats available on non critical activities. These non
critical activities having floats are rescheduled or shifted so that a uniform demand on
resources is achieved. In other words, the constraint in the case of resource smoothing
operation would be on the project duration time. Resource smoothing is a useful technique
or business managers to estimate the total resource requirements for various project
activities.
In resources smoothing, the time-scaled diagram of various activities and their floats (if
any), along with resource requirements are used. The periods of maximum demand for
resources are identified and non critical activities during these periods are staggered by
rescheduling them according to their floats for balancing the resource requirements.
Before explaining the process, let us first illustrate the concept of ‘ Time Scaled Diagram’
which we will be using in the subsequent problems:
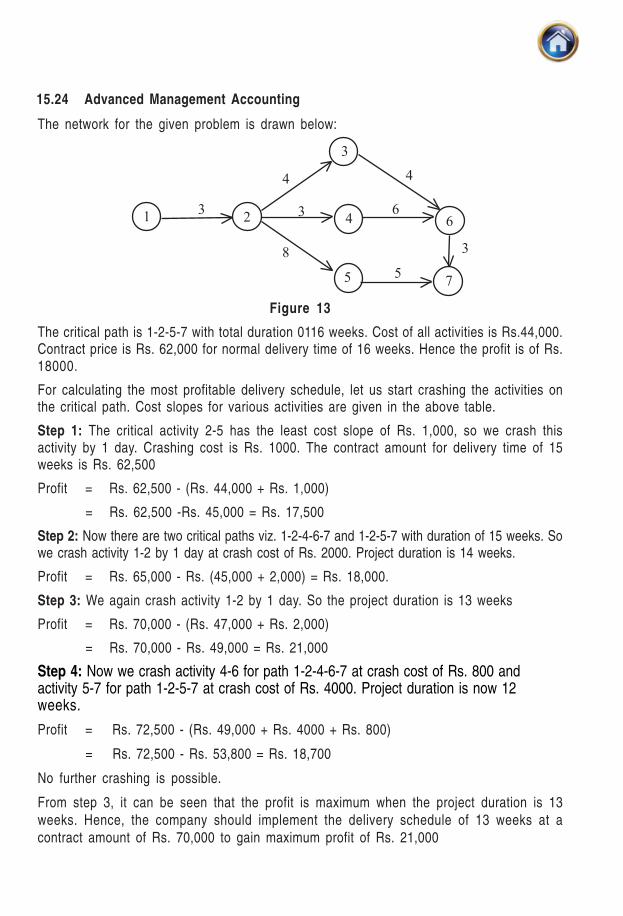
15.7.1 Time Scaled Diagrams: In the network diagrams which we have considered, it has
been stressed that the length of the individual arrows has no relation to the duration of the
activity which each arrow represented. It is of course possible to draw the arrows to a time
scale, and this can be a very useful method of presentation for small networks.
Figure 14
The figure above shows the network diagram for a problem drawn to a horizonal time scale.
the critical path has been arranged as a straight line with non-critical events above or
below it. Solid lines represent activities, dotted horizontal lines represent float, and dotted
vertical lines represent dummies. The presentation has obvious advantages. The events
are entered in the time scale version at the earliest start time. (The latest start times can
also be used as an alternative).
15.26 Advanced Management Accounting
Illustration
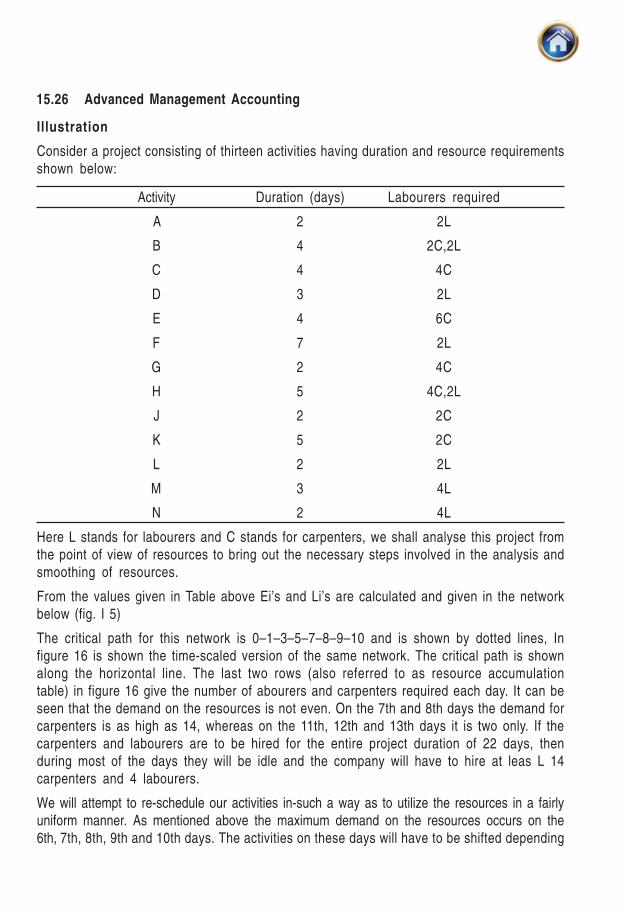
Consider a project consisting of thirteen activities having duration and resource requirements
shown below:
Activity Duration (days) Labourers required
A 2 2L
B 4 2C,2L
C 4 4C
D 3 2L
E 4 6C
F 7 2L
G 2 4C
H 5 4C,2L
J 2 2C
K 5 2C
L 2 2L
M 3 4L
N 2 4L
Here L stands for labourers and C stands for carpenters, we shall analyse this project from
the point of view of resources to bring out the necessary steps involved in the analysis and
smoothing of resources.
From the values given in Table above Ei’s and Li’s are calculated and given in the network
below (fig. I 5)
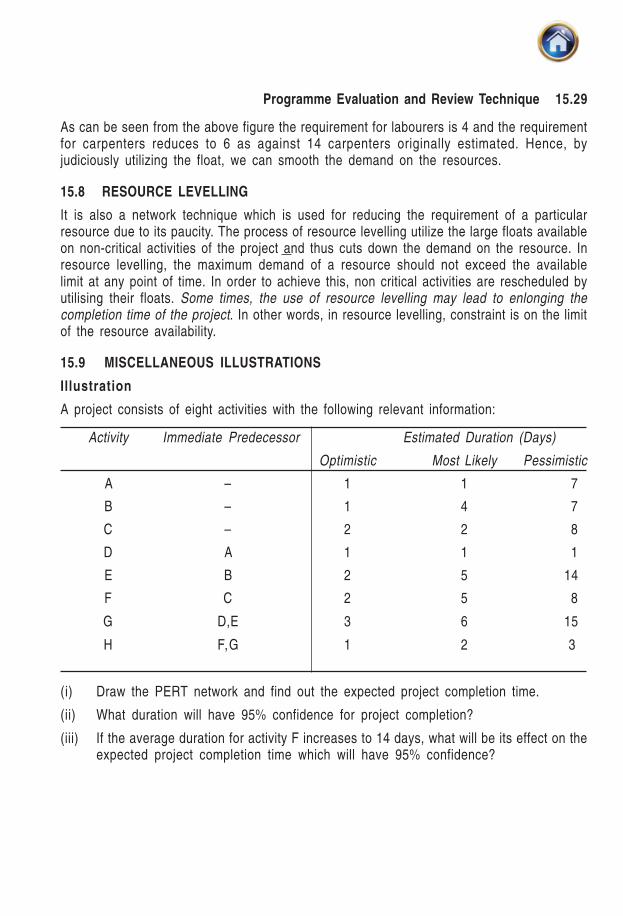
The critical path for this network is 0–1–3–5–7–8–9–10 and is shown by dotted lines, In
figure 16 is shown the time-scaled version of the same network. The critical path is shown
along the horizontal line. The last two rows (also referred to as resource accumulation
table) in figure 16 give the number of abourers and carpenters required each day. It can be
seen that the demand on the resources is not even. On the 7th and 8th days the demand for
carpenters is as high as 14, whereas on the 11th, 12th and 13th days it is two only. If the
carpenters and labourers are to be hired for the entire project duration of 22 days, then
during most of the days they will be idle and the company will have to hire at leas L 14
carpenters and 4 labourers.
We will attempt to re-schedule our activities in-such a way as to utilize the resources in a fairly
uniform manner. As mentioned above the maximum demand on the resources occurs on the
6th, 7th, 8th, 9th and 10th days. The activities on these days will have to be shifted depending
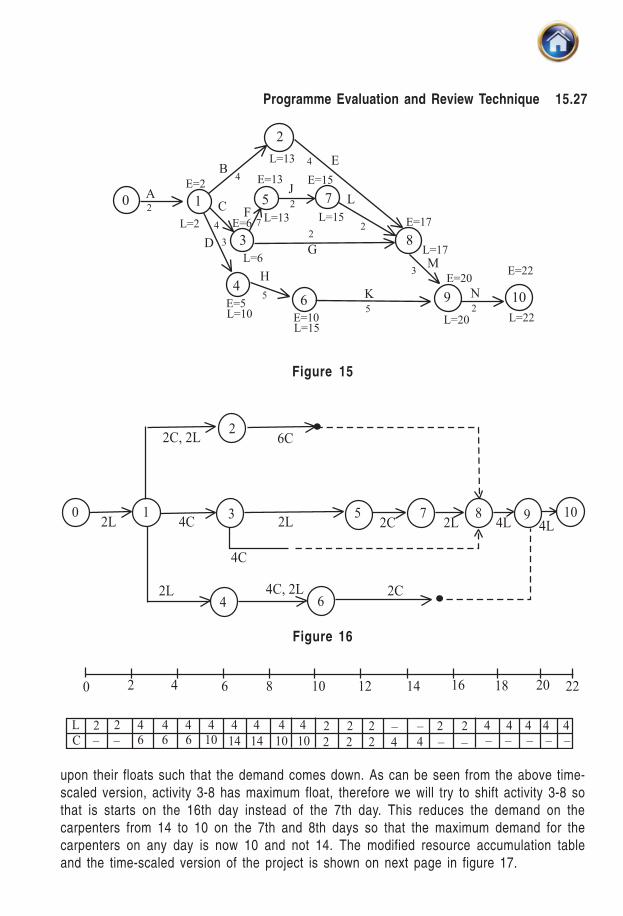
15.27Programme Evaluation and Review Technique
Figure 15
upon their floats such that the demand comes down. As can be seen from the above time-
scaled version, activity 3-8 has maximum float, therefore we will try to shift activity 3-8 so
that is starts on the 16th day instead of the 7th day. This reduces the demand on the
carpenters from 14 to 10 on the 7th and 8th days so that the maximum demand for the
carpenters on any day is now 10 and not 14. The modified resource accumulation table
and the time-scaled version of the project is shown on next page in figure 17.
Figure 16

15.28 Advanced Management Accounting
Figure 17
It is evident from the above figure that the maximum demand now is for 10 carpenters on
the 6th, 7th, 8th, 9th and 10th days. We will now try to explore that possibility of futher
smoothing the resources which is possible because activities 1–4, 4–6 and 6–9 have a
total float of 5 days. The resultant time-scaled network and the resource accumulation
table are given below in fig. 18.
Figure 18
15.29Programme Evaluation and Review Technique
As can be seen from the above figure the requirement for labourers is 4 and the requirementfor carpenters reduces to 6 as against 14 carpenters originally estimated. Hence, byjudiciously utilizing the float, we can smooth the demand on the resources.
15.8 RESOURCE LEVELLING
It is also a network technique which is used for reducing the requirement of a particularresource due to its paucity. The process of resource levelling utilize the large floats availableon non-critical activities of the project and thus cuts down the demand on the resource. Inresource levelling, the maximum demand of a resource should not exceed the availablelimit at any point of time. In order to achieve this, non critical activities are rescheduled byutilising their floats. Some times, the use of resource levelling may lead to enlonging thecompletion time of the project. In other words, in resource levelling, constraint is on the limitof the resource availability.
15.9 MISCELLANEOUS ILLUSTRATIONS
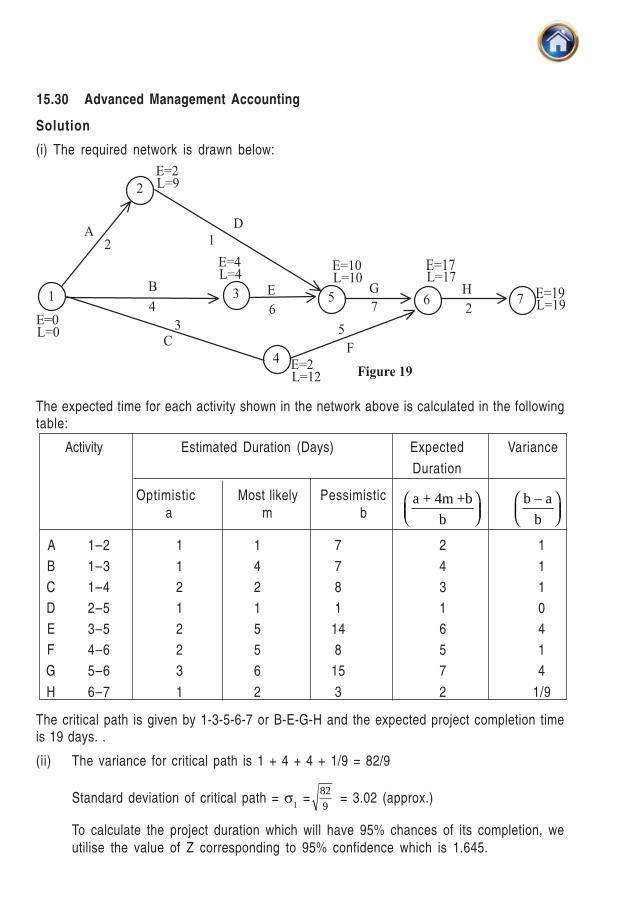
Illustration
A project consists of eight activities with the following relevant information:
Activity Immediate Predecessor Estimated Duration (Days)
Optimistic Most Likely Pessimistic
A – 1 1 7
B – 1 4 7
C – 2 2 8
D A 1 1 1
E B 2 5 14
F C 2 5 8
G D,E 3 6 15
H F,G 1 2 3
(i) Draw the PERT network and find out the expected project completion time.
(ii) What duration will have 95% confidence for project completion?
(iii) If the average duration for activity F increases to 14 days, what will be its effect on theexpected project completion time which will have 95% confidence?
15.30 Advanced Management Accounting
Solution
(i) The required network is drawn below:
The expected time for each activity shown in the network above is calculated in the followingtable:
Activity Estimated Duration (Days) Expected Variance
Duration
a + 4m +b
b⎛ ⎞⎜ ⎟⎝ ⎠
b – a
b⎛ ⎞⎜ ⎟⎝ ⎠
A 1–2 1 1 7 2 1
B 1–3 1 4 7 4 1
C 1–4 2 2 8 3 1
D 2–5 1 1 1 1 0
E 3–5 2 5 14 6 4
F 4–6 2 5 8 5 1
G 5–6 3 6 15 7 4
H 6–7 1 2 3 2 1/9
The critical path is given by 1-3-5-6-7 or B-E-G-H and the expected project completion timeis 19 days. .
(ii) The variance for critical path is 1 + 4 + 4 + 1/9 = 82/9
Standard deviation of critical path = σ1 =82
9 = 3.02 (approx.)
To calculate the project duration which will have 95% chances of its completion, we
utilise the value of Z corresponding to 95% confidence which is 1.645.
Optimistic Most likely Pessimistic
a m b
15.31Programme Evaluation and Review Technique
Thus, X – 19
3.02 = 1.645,
or X = 1.645 × 3.02 + 19 = 23.97 days = 24 days
Hence, 24 days of project completion time will have 95% probability of its completion.
(iii) If the average duration for activity F increases to 14 days, then the path 1-4-6-7 i.e.,C-F-H will also become critical path with expected project completion time of 19days. Now, activities C and F are also critical activities. Since we and, given only theaverage duration for activity F, it is assumed that the variance for this activity is zero.Further, since PERT analysis is based on the assumption that the activities areindependent in terms of their variance, therefore, standard deviation of critical pathscan be computed as:
1 = 1+4+4+ 0 1
9σ + + =
110 +
9 =318. approx
We now wish to calculate the expected project completion time that will have 95%confidence level,
P (Z < 1.645) = 0.95
X – X – 191.645
3.18
µσ
= =
or X = 19 + 1.645 x 3.18 = 24.23 days.
Hence the project duration of 24.23 days will have 95% confidence of completion.
Illustration
The following information is given below:
Activity (1–2) (2–3) (2–4) (3–5) (4–6) (5–6) (5–7) (6–7)
Pessimistic time 3 9 6 8 8 0 5 8
(in weeks)
Most likely time 3 6 4 6 6 0 4 5
(in weeks)
Optmistic time 3 3 2 4 4 0 3 2
(in weeks)
Draw the network diagram for the above. Calculate :
(i) Variance to each activity.
(ii) Critical path and expected project length.
(iii) The probability that the project will be completed in 23 weeks is drawn below:
15.32 Advanced Management Accounting
Solution
The required network is drawn below:
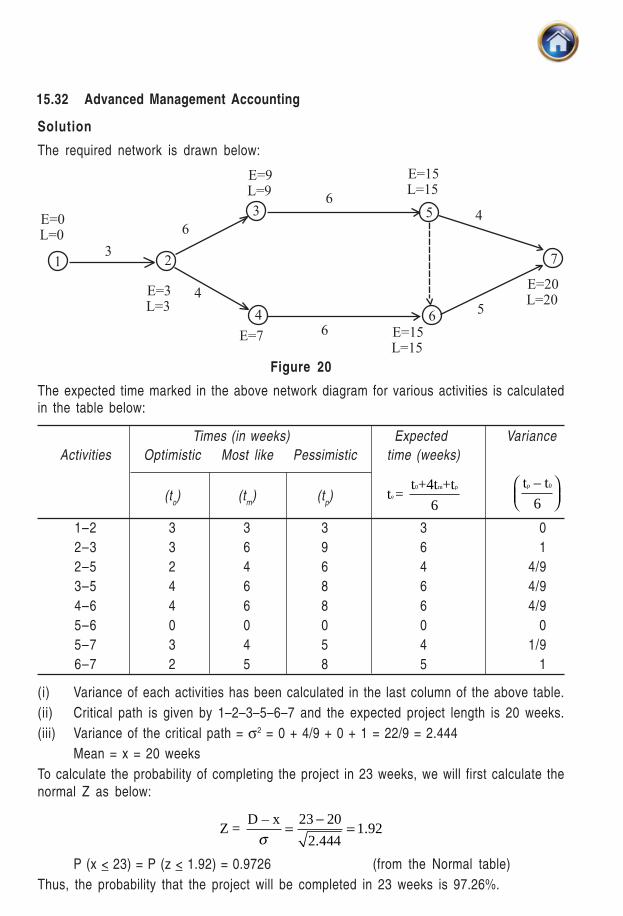
Figure 20
The expected time marked in the above network diagram for various activities is calculatedin the table below:
Times (in weeks) Expected Variance
Activities Optimistic Most like Pessimistic time (weeks)
(to) (t
m) (t
p)
0 m p
e
t +4t +tt =
6
p 0t – t
6⎛ ⎞⎜ ⎟⎝ ⎠
1–2 3 3 3 3 0
2–3 3 6 9 6 1
2–5 2 4 6 4 4/9
3–5 4 6 8 6 4/9
4–6 4 6 8 6 4/9
5–6 0 0 0 0 0
5–7 3 4 5 4 1/9
6–7 2 5 8 5 1
(i) Variance of each activities has been calculated in the last column of the above table.
(ii) Critical path is given by 1–2–3–5–6–7 and the expected project length is 20 weeks.
(iii) Variance of the critical path = σ2 = 0 + 4/9 + 0 + 1 = 22/9 = 2.444
Mean = x = 20 weeks
To calculate the probability of completing the project in 23 weeks, we will first calculate the
normal Z as below:
D – x 23 20Z = 1.92
2.444σ−
= =
P (x < 23) = P (z < 1.92) = 0.9726 (from the Normal table)
Thus, the probability that the project will be completed in 23 weeks is 97.26%.

15.33Programme Evaluation and Review Technique
Illustration
A small maintenance project consists of the following twelve jobs whose precedence
relations are identified with their node number:
Job (i–j) (1,2) (1,3) (1,4) (2,3) (2,5) (2,6)
Duration (in days) 10 4 6 5 12 9
Job (i–j) (3,7) (4,5) (5,6) (6,7) (6,8) (7,8)
Duration (in days) 12 15 6 5 4 7
(i) Draw an arrow diagram representing the project.
Figure 21
(ii) Calculate earliest start, earliest finish, start and latest finish time for all jobs.
(iii) Find the critical path and project duration.
(iv) Tabulate total float, free float and independent float.
Solution : (i) The required arrow diagram is drawn in figure 21.
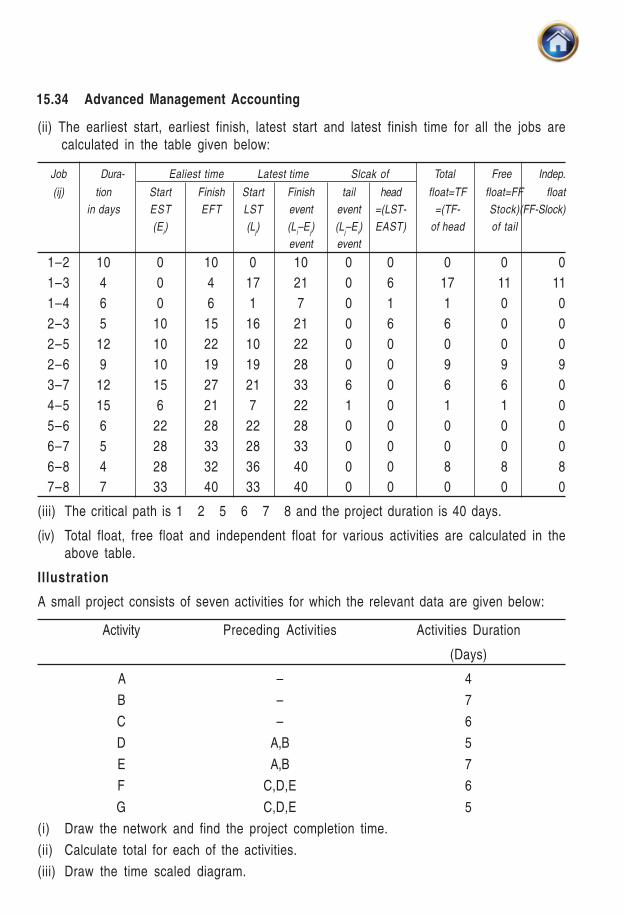
15.34 Advanced Management Accounting
(ii) The earliest start, earliest finish, latest start and latest finish time for all the jobs are
calculated in the table given below:
Job Dura- Ealiest time Latest time Slcak of Total Free Indep.
(ij) tion Start Finish Start Finish tail head float=TF float=FF float
in days EST EFT LST event event =(LST- =(TF- Stock)(FF-Slock)
(Ei) (L
j) (L
i–E
j) (L
j–E
i) EAST) of head of tail
event event
1–2 10 0 10 0 10 0 0 0 0 0
1–3 4 0 4 17 21 0 6 17 11 11
1–4 6 0 6 1 7 0 1 1 0 0
2–3 5 10 15 16 21 0 6 6 0 0
2–5 12 10 22 10 22 0 0 0 0 0
2–6 9 10 19 19 28 0 0 9 9 9
3–7 12 15 27 21 33 6 0 6 6 0
4–5 15 6 21 7 22 1 0 1 1 0
5–6 6 22 28 22 28 0 0 0 0 0
6–7 5 28 33 28 33 0 0 0 0 0
6–8 4 28 32 36 40 0 0 8 8 8
7–8 7 33 40 33 40 0 0 0 0 0
(iii) The critical path is 1 2 5 6 7 8 and the project duration is 40 days.
(iv) Total float, free float and independent float for various activities are calculated in the
above table.
Illustration
A small project consists of seven activities for which the relevant data are given below:
Activity Preceding Activities Activities Duration
(Days)
A – 4
B – 7
C – 6
D A,B 5
E A,B 7
F C,D,E 6
G C,D,E 5
(i) Draw the network and find the project completion time.
(ii) Calculate total for each of the activities.
(iii) Draw the time scaled diagram.
15.35Programme Evaluation and Review Technique
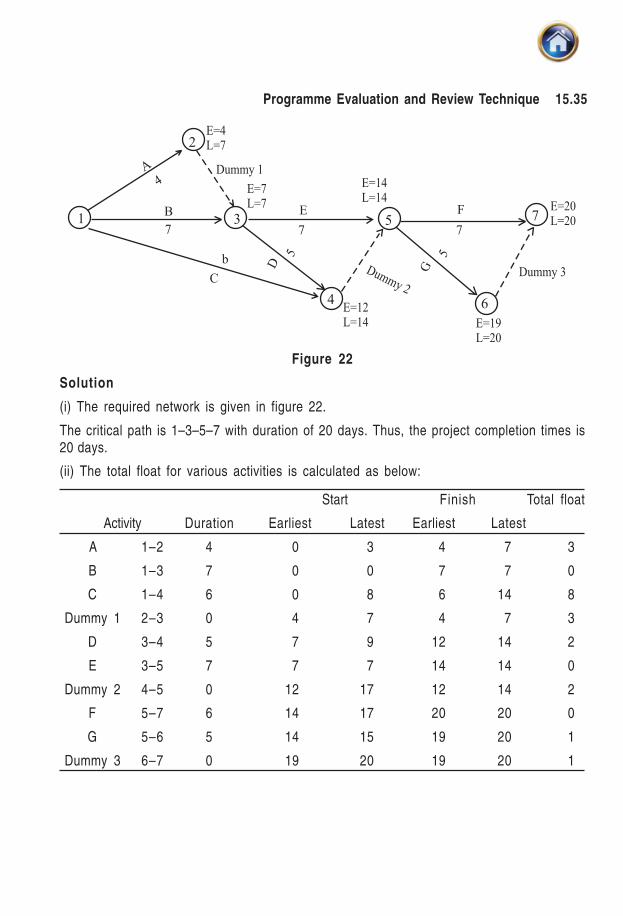
Figure 22
Solution
(i) The required network is given in figure 22.
The critical path is 1–3–5–7 with duration of 20 days. Thus, the project completion times is20 days.
(ii) The total float for various activities is calculated as below:
Start Finish Total float
Activity Duration Earliest Latest Earliest Latest
A 1–2 4 0 3 4 7 3
B 1–3 7 0 0 7 7 0
C 1–4 6 0 8 6 14 8
Dummy 1 2–3 0 4 7 4 7 3
D 3–4 5 7 9 12 14 2
E 3–5 7 7 7 14 14 0
Dummy 2 4–5 0 12 17 12 14 2
F 5–7 6 14 17 20 20 0
G 5–6 5 14 15 19 20 1
Dummy 3 6–7 0 19 20 19 20 1

15.36 Advanced Management Accounting
(iii) The required time diagram is drawn below:
Figure 23
Illustration
A small project is having seven activities. The relevant data about these activties is given
below:
Activity Dependence Normal Crash Normal Crash
duration duration cost cost
(Days) (Days) (Rs.) (Rs.)
A – 7 5 500 900
B A 4 2 400 600
C A 5 5 500 500
D A 6 4 800 1,000
E B,C 7 4 700 1,000
F C,D 5 2 800 1,400
G E,F 6 4 800 1,600
(i) Find out the normal duration and the minimum duration.
(ii) What is the percentage increse in cost to complete the project in 21 days ?

15.37Programme Evaluation and Review Technique
Solution
The network is given below:
Figure 24
(i) The critical path of the project is A C E G or 1–2–3–4–6–7 with normal duration of
25 days.
The minimum duration of the project is 18 days.
(ii) The cost slope for various activities is given below:
Activity Normal Crash Normal Crash Cost
duration duration cost(Rs.) cost(Rs.) slope (Rs.)
A(1-2) 7 5 500 900900 – 500
2007 – 5
=
B(2-4) 4 2 400 600600 – 400
1004 – 2
=
C(2-3) 5 5 500 500 N.A
D(2-5) 6 4 800 10001000 – 800
1006 – 4
=
E(4-6) 7 4 700 10001000 – 700
1007 – 4
=
F(5-6) 5 2 800 14001400 – 800
2005– 2
=
G(6-7) 6 4 800 16001600 – 800
4006– 4
=
Total 4,500
15.38 Advanced Management Accounting
Step-I: Various paths of the network are given below:
1-2-3-4-6-7 with duration = 25 days
1-2-4-6-7 with duration = 24 days
1-2-3-5-6-7 with duration = 23 days
1-2-5-6-7 with duration = 24 days
In order to determine the cost of completing the project in 21 days, let us crash that activity
on the critical path which has minimum cost slope. It can be seen that the minimum cost
slope of Rs. 100 corresponds to activity E( 4-6) and it lies on the critical path. Hence, we
crash activity E (4-6) by 1 day at an additional cost of Rs. 100.
Step-2: Various paths now are
1-2-3-4-6-7 with duration = 24 days
1-2-4-6-7 with duration = 23 days
1-2-3-5-6- 7 with duration = 23 days
1-2-5-’6-7 with duration = 24 days
An examination of the above four paths clearly points out that there are two critical paths
namely 1-2-3-4-6-7 and 1-2-5-6-7, each with duration = 24 days. To reduce the project
duration by three days more, there are following possible combination of activities.
1. Crash activities 4 - 6 on the path 1-2-3-4-6-7 and 5 - 6 on the path 1-2-5-6-7 by one day
each at an addition cost of Rs. 100 + Rs. 200 = Rs. 300
2. Crash activities 4-6 on path 1-2-3-4-6-7 and 2-5 on path 1-2-5-6-7 by one day each at
an additional cost of Rs. 100 + Rs. 100 =Rs. 200
3. Crash activity 1-2 by one day at an additional cost of Rs. 200.
It can be observed that the additional cost of reducing the project duration by one day in
combination 2 as well as combination 3 is Rs. 200. Hence any of these two can be selected
for crashing. However, since crashing activity 1-2 by 1 day reduces the duration of all the
paths by 1 day, we will crash it by 1 day. The project duration becomes = 23 days at an
additional cost = Rs. 200.
Step-3: Crash activity 1-2 by 1 day further, it would reduce the project duration to 22 days
at an additional cost = Rs. 200.
Step-4: Activity 1-2 can not be crashed further. So, we now select the combination 2
stated above for crashing. Crash activities 4-6 and 2-5 by one day each at an
additional cost of Rs. 100 + Rs. 100 = Rs. 200.
The project duration now becomes equal to 21 days.
Hence, in order to complete the project in 21 days, an additional cost of Rs. 100 + Rs. 200+
Rs. 200 + Rs. 200 = Rs. 700 will be incurred.
The normal cost of completing the project in 25 days = Rs. 4500.

15.39Programme Evaluation and Review Technique
Hence, the percentage increase in cost to complete the project in
21 days = Rs. 700
100 15.5%Rs. 4500
× =
SUMMARY :
Three kinds of times estimates
� The Optimistic Time Estimate
� The Pessimistic Time Estimate
� The Most Likely Time Estimate
Variance : 2 2 -
6
p o
tt t
S⎛ ⎞= ⎜ ⎟⎝ ⎠
Expected time : The expected time (te) is the average time taken for the completion of
the job. By using beta-distribution, the expcetion time can be obtianed by following formula.
4
6
o m p
e
t t tt
+ +=
Activity Cost : It is defined as the cost of performing and completing a particular
activity or task.
Crash Cost Cc :This is the direct cost that is anticipated in completing an activity
within the crash time.
Crash time, Ct : This is the minimum time required to complete an activity.
Normal Cost, Nc : This is the lowest possible direct cost required to complete an
activity.
Normal time, Nt : This is the minimum time required to complete an activity at normal
cost.
Activity cost slope : The cost slope indicates the additional cost incurred per unit of
time saved in reducing the duration of an activity
Resource smoothing
It is a network technique used for smoothening peak resource requirement during different
periods of the project network. Under this technique the total project duration is maintained
at the minimum level.
Resource levelling
It is also a network technique which is used for reducing the requirement of a particularresource due to its paucity. The process of resource levelling utilize the large floats
available on non-critical activities of the project and thus cuts down the demand on the
resource. In resource levelling, the maximum demand of a resource should not
exceed the available limit at any point of time. In order to achieve this, non critical
activities are rescheduled by utilising their floats.
15.40 Advanced Management Accounting
SELF-EXAMINATION QUESTIONS
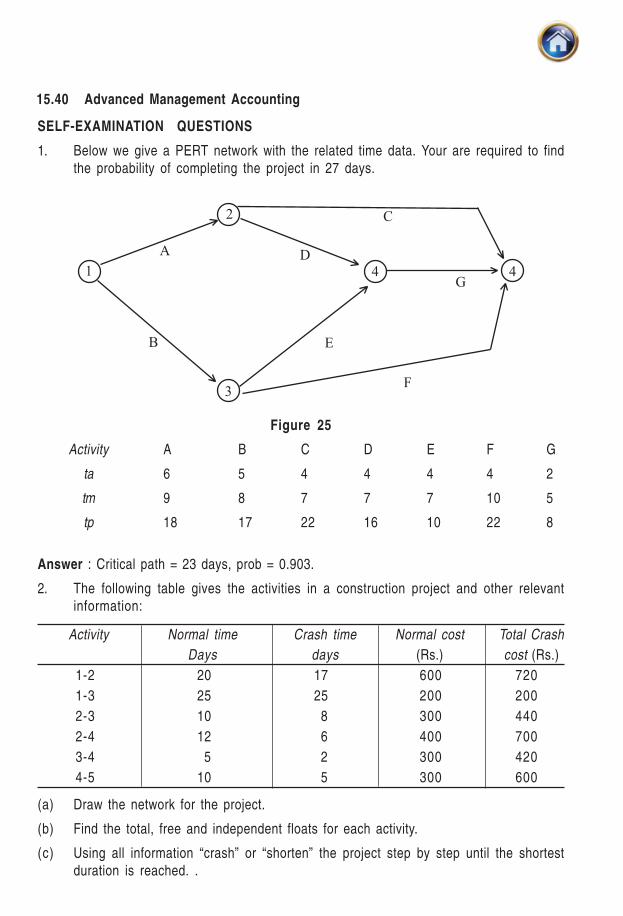
1. Below we give a PERT network with the related time data. Your are required to find
the probability of completing the project in 27 days.
Figure 25
Activity A B C D E F G
ta 6 5 4 4 4 4 2
tm 9 8 7 7 7 10 5
tp 18 17 22 16 10 22 8
Answer : Critical path = 23 days, prob = 0.903.
2. The following table gives the activities in a construction project and other relevant
information:
Activity Normal time Crash time Normal cost Total Crash
Days days (Rs.) cost (Rs.)
1-2 20 17 600 720
1-3 25 25 200 200
2-3 10 8 300 440
2-4 12 6 400 700
3-4 5 2 300 420
4-5 10 5 300 600
(a) Draw the network for the project.
(b) Find the total, free and independent floats for each activity.
(c) Using all information “crash” or “shorten” the project step by step until the shortest
duration is reached. .
15.41Programme Evaluation and Review Technique
3. Projects India Limited undertakes special contracts. The following table gives
estimates of time and cost for activities involved in completing one contract which
has been just offered to them.
Activity Previous Normal time Normal cost Minimum Cost of
activities days (Rs.) time minimum time
A – 12 10,000 8 14,000
B – 10 5,000 10 5,000
C A 0 0 0 0
D A 6 4,000 4 5,000
E B,C 16 9,000 14 12,000
F D 16 3,200 8 8,000
60 31,200 44 44,000
“Previous activities” must be completed before the activity in question can be started. The
minimum time represents the shortest time in which the activity can be completed given
the use of special costly methods of operation. Assume that it is possible to reduce the
normal time to the minimum time is small steps and the extra cost incurred will be
proportional to the time saved.
(a) Draw a network diagram and identify the critical path for normal procedures
(b) Recommend what programme be followed if the job must be completed in 30 days
and calculate the total cost for the programme.
4. Alpha construction company has an opportunity to submit a bid for the construction
of a new apartment building. From specifications provided by the developer, a PERT
network for the project has been developed, and is shown below. Also shown for each
activity are estimates of most optimistic, most likely, and most pessimistic completion
times in weeks (a, m and b, respectively).
Activity a m b Activity Description
A 5 8 17 Excavate basement
B 5 8 11 Building concrete elevator tower
C 3 5 7 Pour concrete foundation
D 0 0 0
E 6 9 18 Excavate parking ramp area
F 5 8 17 Install temporary manual elevator
G 5 7 12 Erect main building
H 0 0 0
I 0 0 0
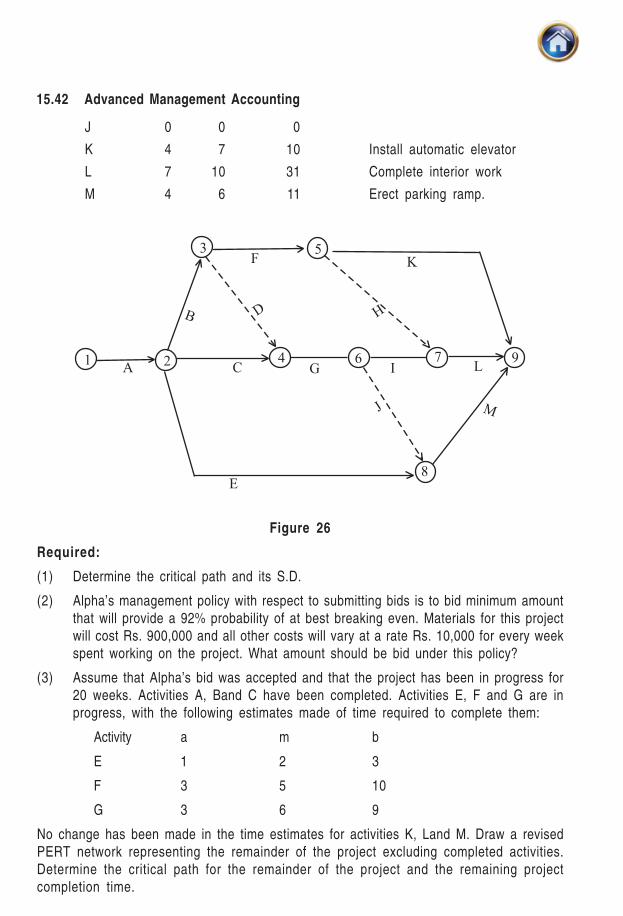
15.42 Advanced Management Accounting
J 0 0 0
K 4 7 10 Install automatic elevator
L 7 10 31 Complete interior work
M 4 6 11 Erect parking ramp.
Figure 26
Required:
(1) Determine the critical path and its S.D.
(2) Alpha’s management policy with respect to submitting bids is to bid minimum amount
that will provide a 92% probability of at best breaking even. Materials for this project
will cost Rs. 900,000 and all other costs will vary at a rate Rs. 10,000 for every week
spent working on the project. What amount should be bid under this policy?
(3) Assume that Alpha’s bid was accepted and that the project has been in progress for
20 weeks. Activities A, Band C have been completed. Activities E, F and G are in
progress, with the following estimates made of time required to complete them:
Activity a m b
E 1 2 3
F 3 5 10
G 3 6 9
No change has been made in the time estimates for activities K, Land M. Draw a revised
PERT network representing the remainder of the project excluding completed activities.
Determine the critical path for the remainder of the project and the remaining project
completion time.

15.43Programme Evaluation and Review Technique
5. Table on next page shows jobs, normal and crash time and cost for a project:
Indirect cost for the project is Rs. 300 per day.
(i) Draw the network of the project.
(ii) What is the normal duration and cost of project?
(iii) Find the optimum duration and minimum project cost.
(iv) If all activities are crashed, what will be the project duration and corresponding cost?
Job Normal Crash
i-j Time Days Cost (Rs.) Time (Days) Cost (Rs.)
1-2 6 1,400 4 1,900
1-3 8 2,000 5 2,800
2-3 4 1,100 2 1,500
2-4 3 800 2 14,000
3-4 Dummy - - -
2-5 6 900 3 1,600
4-6 10 2,500 6 3,500
5-6 3 500 2 800
Answer. (ii) 20 days, Rs. 15,200 (iii) 12 days, Rs.13,132 (iv) 12 days. Rs. 13,500
Figure 27
In the network above are indicated the duration in days, and number of men required for
each activity. You are required to find the number of days in which the project can be
completed with (i) unlimited resources and (ii) with a total of only 5 men available.
Answer : (i) 8 days, (ii) 9 days

15.44 Advanced Management Accounting
7. Construct a PERT network for the following project, and determine the critical path.
Activity Times Immediate Predecessor
A 4 None
B 1 None
C 1 A
D 1 B
E 6 C
F 8 E
G 2 F
H 4 F
I 1 H
J 5 G,I
K 5 D,G
L 7 K
Copyright © 2022 FDOKUMEN