
Programa de Doctorado en Materiales
408
1 Programa de Doctorado en Materiales MATERIALES BIDIMENSIONALES EN DISPERSIÓN COLOIDAL. PREPARACIÓN ESCALABLE, CARACTERIZACIÓN Y APLICACIONES TESIS DOCTORAL Jose María Munuera Fernández Junio 2019
-
Upload
khangminh22 -
Category
Documents
-
view
0 -
download
0
Transcript of Programa de Doctorado en Materiales

1
Programa de Doctorado en Materiales
MATERIALES BIDIMENSIONALES EN DISPERSIÓN
COLOIDAL. PREPARACIÓN ESCALABLE,
CARACTERIZACIÓN Y APLICACIONES
TESIS DOCTORAL
Jose María Munuera Fernández
Junio 2019

2

3
Programa de Doctorado en Materiales
MATERIALES BIDIMENSIONALES EN DISPERSIÓN
COLOIDAL. PREPARACIÓN ESCALABLE,
CARACTERIZACIÓN Y APLICACIONES
TESIS DOCTORAL
Juan Ignacio Paredes Nachón
Juan Manuel Diez Tascón

4

5

6

7
Tabla de contenido
ÍNDICE ............................................................................................................................. 7
AGRADECIMIENTOS ................................................................................................ 11
RESUMEN ..................................................................................................................... 15
1. INTRODUCCIÓN ..................................................................................................... 17 1.1 MATERIALES 2D ................................................................................................................ 17
1.1.1 Grafeno ...................................................................................................................... 18
1.1.2 Disulfuro de molibdeno (MoS2) .................................................................................. 22
1.1.1 Óxido de cobalto (Co3O4) .......................................................................................... 25
1.2 MÉTODOS DE OBTENCIÓN DE MATERIALES 2D ................................................................. 27
1.2.1 Métodos bottom-up..................................................................................................... 27
1.2.2 Métodos top-down ...................................................................................................... 29
BIBLIOGRAFÍA ......................................................................................................................... 37
2. OBJETIVOS Y PLANTEAMIENTO DE LA MEMORIA ................................... 47 2.1 OBJETIVOS ......................................................................................................................... 47
2.2 ORGANIZACIÓN DE LA MEMORIA....................................................................................... 48
3. MATERIALES Y MÉTODOS ................................................................................. 51 3.1 GRAFENO ........................................................................................................................... 51
3.1.1 Exfoliación electroquímica con electrolito de sulfato de potasio .............................. 51
3.1.2 Exfoliación electroquímica con electrolitos de sulfonatos aromáticos ...................... 52
3.1.3 Pretratamiento con ácido sulfúrico............................................................................ 52
3.1.4 Exfoliación electroquímica con electrolitos de halogenuros ..................................... 52
3.1.5 Exfoliación electroquímica con aditivos de electrolito de carácter antioxidante ...... 53
3.2 DISULFURO DE MOLIBDENO ............................................................................................... 53
3.2.1 Exfoliación química ................................................................................................... 53
3.2.2 Funcionalización con grupos de ácido acético .......................................................... 53
3.3 ÓXIDO DE COBALTO ........................................................................................................... 54
3.3.1 Síntesis de Co3O4 ........................................................................................................ 54
3.4 PREPARACIÓN DE HÍBRIDOS DE MATERIAL BIDIMENSIONAL-NANOPARTÍCULAS METÁLICAS
................................................................................................................................................. 54
3.4.1 Híbridos de grafeno/surfactante con nanopartículas de platino ............................... 54
3.4.2 Híbridos de f-MoS2 con nanopartículas de plata ....................................................... 54
3.5 PREPARACIÓN DE ELECTRODOS PARA CARACTERIZACIÓN ELECTROQUÍMICA ................. 55
3.5.1 Electrodos de grafeno ................................................................................................ 55
3.5.2 Electrodos de óxido de cobalto .................................................................................. 55
4. TÉCNICAS DE CARACTERIZACIÓN ................................................................. 57 4.1 ESPECTROSCOPÍAS ............................................................................................................. 57
4.1.1 Espectroscopía de absorción ultravioleta-visible (UV-vis) ....................................... 57
4.1.2 Espectroscopía infrarroja (IR) ................................................................................... 60
4.1.3 Espectroscopía Raman ............................................................................................... 62
4.1.4 Espectroscopía fotoelectrónica de rayos X (XPS) ..................................................... 64
4.2 MICROSCOPÍAS .................................................................................................................. 66
4.2.1 Microscopía electrónica de transmisión (TEM) ........................................................ 66
4.2.2 Microscopía electrónica de barrido (SEM) ............................................................... 68
4.2.3 Microscopía de fuerza atómica (AFM) ...................................................................... 71
4.3 TÉCNICAS ELECTROQUÍMICAS ........................................................................................... 73
4.3.1 Voltamperometría ...................................................................................................... 73
4.3.2 Carga-descarga galvanostática ................................................................................ 75
4.3.3 Espectroscopía de impedancia electroquímica (EIS) ................................................ 76
4.3 MEDIDA DE CONDUCTIVIDAD ELÉCTRICA DE FILMES ........................................................ 77

8
4.5 ESTUDIOS DE BIOCOMPATIBILIDAD Y PROLIFERACIÓN ..................................................... 78
4.6 ACTIVIDAD CATALÍTICA .................................................................................................... 79
4.7 DIFRACCIÓN DE RAYOS X .................................................................................................. 81
BIBLIOGRAFÍA ......................................................................................................................... 83
5. RESÚMENES Y ARTÍCULOS ................................................................................ 87 5.1 EXFOLIACIÓN ELECTROQUÍMICA DE GRAFENO ................................................................. 87
5.1.1 Resúmenes de los artículos I a V ................................................................................ 87
5.1.2 Artículo I .................................................................................................................... 99
5.1.3 Artículo II ................................................................................................................. 135
5.1.4 Artículo III ................................................................................................................ 197
5.1.5 Artículo IV ................................................................................................................ 211
5.1.6 Artículo V ................................................................................................................. 265
5.2 FUNCIONALIZACIÓN COVALENTE DE DISULFURO DE MOLIBDENO .................................. 303
5.2.1 Resumen del artículo VI ........................................................................................... 303
5.2.2 Artículo VI ................................................................................................................ 307
5.3 SÍNTESIS Y APLICACIONES DE ÓXIDO DE COBALTO ......................................................... 345
5.3.1 Resumen del artículo VII .......................................................................................... 345
5.3.2 Artículo VII .............................................................................................................. 349
6. CONCLUSIONES ................................................................................................... 403
ANEXO ......................................................................................................................... 405

9

10

11
Agradecimientos
Creo que no es de recibo empezar el desarrollo de la perorata científica que
resume y condensa los años de tesis doctoral sin antes agradecer a quien lo ha hecho
posible, llevadero e incluso divertido.
Como no podría ser de otra manera, antes de nada debo agradecerle a mis
directores Nacho y Tascón el haber depositado su confianza en un individuo como yo
para trabajar con ellos, cuando estaba huyendo de la facultad de Química aterrado por
mi futuro inmediato. Y no solo por eso, sino por su tremendo esfuerzo en sacar adelante
el trabajo que se realiza en nuestro grupo. También al resto de personas pertenecientes
al grupo de Materiales Carbonosos, que han tenido a bien no sólo enseñarme todo lo
que necesitaba saber y no sabía sobre la investigación en ciencia de materiales, sino que
año tras año han aguantado mis divagaciones, peroratas, anécdotas, estupideces y
despropósitos en general. Silvia, Fabián, Amelia, Rubén, Laura, Miguel, Tomás, Óscar,
Bárbara y Sergio, gracias. El primer nombre de esta tesis es el mío, pero (casi) todos los
vuestros están recogidos en los trabajos, y con buena razón.
A mi familia cercana en general y muy en especial a Luján, mi señora madre. A
ella, que se ha preocupado por mí (y sigue haciéndolo) más allá de toda cordura y
necesidad, y me ha hecho convertirme en el hombre que soy. Pero también a mi padre
José, de quien he heredado muchas cosas, entre ellas mi carácter, mis gestos y andares.
Y a mis hermanas Amaya e Itziar, y a mi hermano Aitor, que siempre han estado
pendientes de mi bienestar y mi aprendizaje.
A mis amigos, tanto los más veteranos (Chus, Pablo, Víctor, Sarah, Julio y
Andrés) como los más recientes (Franchi, Helio, Rut, Pei, Pepe y Pablón), porque sois
la gente que me conecta al mundo real, y quienes más han aguantado mis despropósitos
y defectos de carácter, y aun así seguís dirigiéndome la palabra.
A quien ha pasado fugazmente por mi vida estos últimos años, en ocasiones
dejando recuerdos gratos y en muchas otras un sabor agridulce. Gracias por enseñarme
involuntariamente a apreciar lo que tengo, lo que me pierdo y lo que he perdido.
Y por último a quien está leyendo esta tesis, porque no es una molestia menor
navegar entre estas páginas y espero que, aunque larga y tediosa, la lectura sea
interesante.

12

13
“Y el árbol se planta,
la flor vuelve y crece,
somos la estrella que alumbra,
aunque estemos sin luz seis meses.”
-Benito Antonio Martínez Ocasio

14
15
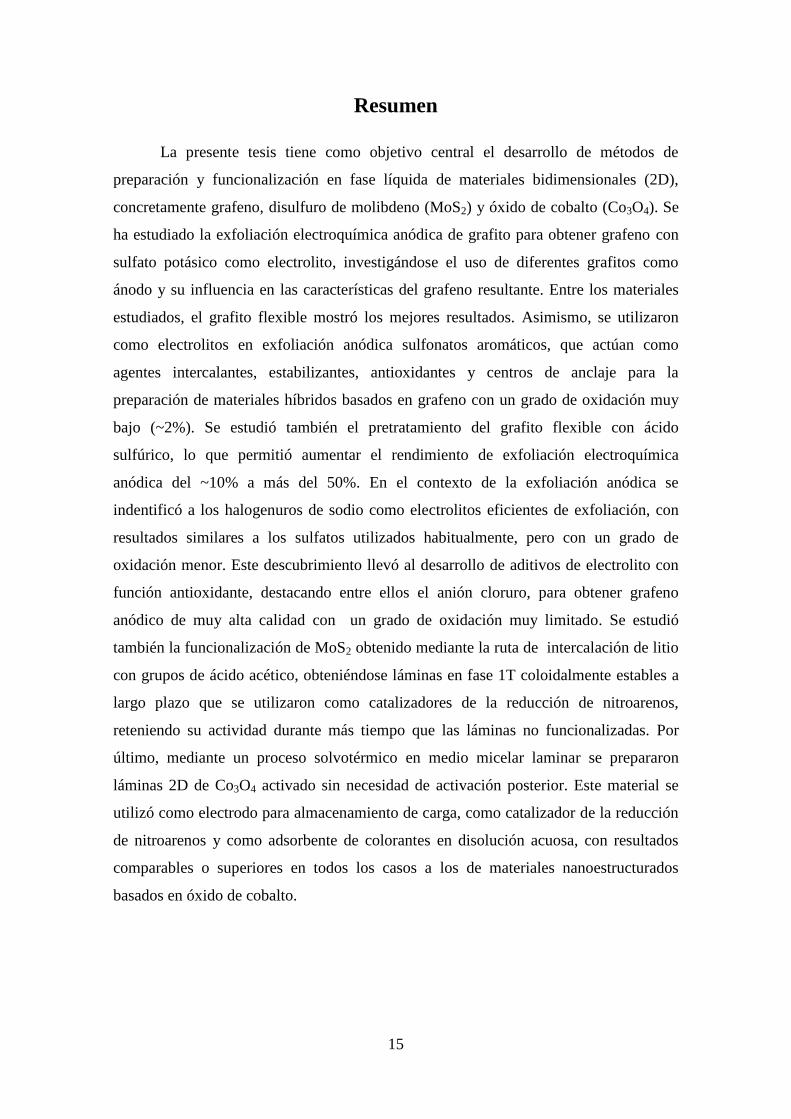
Resumen
La presente tesis tiene como objetivo central el desarrollo de métodos de
preparación y funcionalización en fase líquida de materiales bidimensionales (2D),
concretamente grafeno, disulfuro de molibdeno (MoS2) y óxido de cobalto (Co3O4). Se
ha estudiado la exfoliación electroquímica anódica de grafito para obtener grafeno con
sulfato potásico como electrolito, investigándose el uso de diferentes grafitos como
ánodo y su influencia en las características del grafeno resultante. Entre los materiales
estudiados, el grafito flexible mostró los mejores resultados. Asimismo, se utilizaron
como electrolitos en exfoliación anódica sulfonatos aromáticos, que actúan como
agentes intercalantes, estabilizantes, antioxidantes y centros de anclaje para la
preparación de materiales híbridos basados en grafeno con un grado de oxidación muy
bajo (~2%). Se estudió también el pretratamiento del grafito flexible con ácido
sulfúrico, lo que permitió aumentar el rendimiento de exfoliación electroquímica
anódica del ~10% a más del 50%. En el contexto de la exfoliación anódica se
indentificó a los halogenuros de sodio como electrolitos eficientes de exfoliación, con
resultados similares a los sulfatos utilizados habitualmente, pero con un grado de
oxidación menor. Este descubrimiento llevó al desarrollo de aditivos de electrolito con
función antioxidante, destacando entre ellos el anión cloruro, para obtener grafeno
anódico de muy alta calidad con un grado de oxidación muy limitado. Se estudió
también la funcionalización de MoS2 obtenido mediante la ruta de intercalación de litio
con grupos de ácido acético, obteniéndose láminas en fase 1T coloidalmente estables a
largo plazo que se utilizaron como catalizadores de la reducción de nitroarenos,
reteniendo su actividad durante más tiempo que las láminas no funcionalizadas. Por
último, mediante un proceso solvotérmico en medio micelar laminar se prepararon
láminas 2D de Co3O4 activado sin necesidad de activación posterior. Este material se
utilizó como electrodo para almacenamiento de carga, como catalizador de la reducción
de nitroarenos y como adsorbente de colorantes en disolución acuosa, con resultados
comparables o superiores en todos los casos a los de materiales nanoestructurados
basados en óxido de cobalto.
16
Abstract
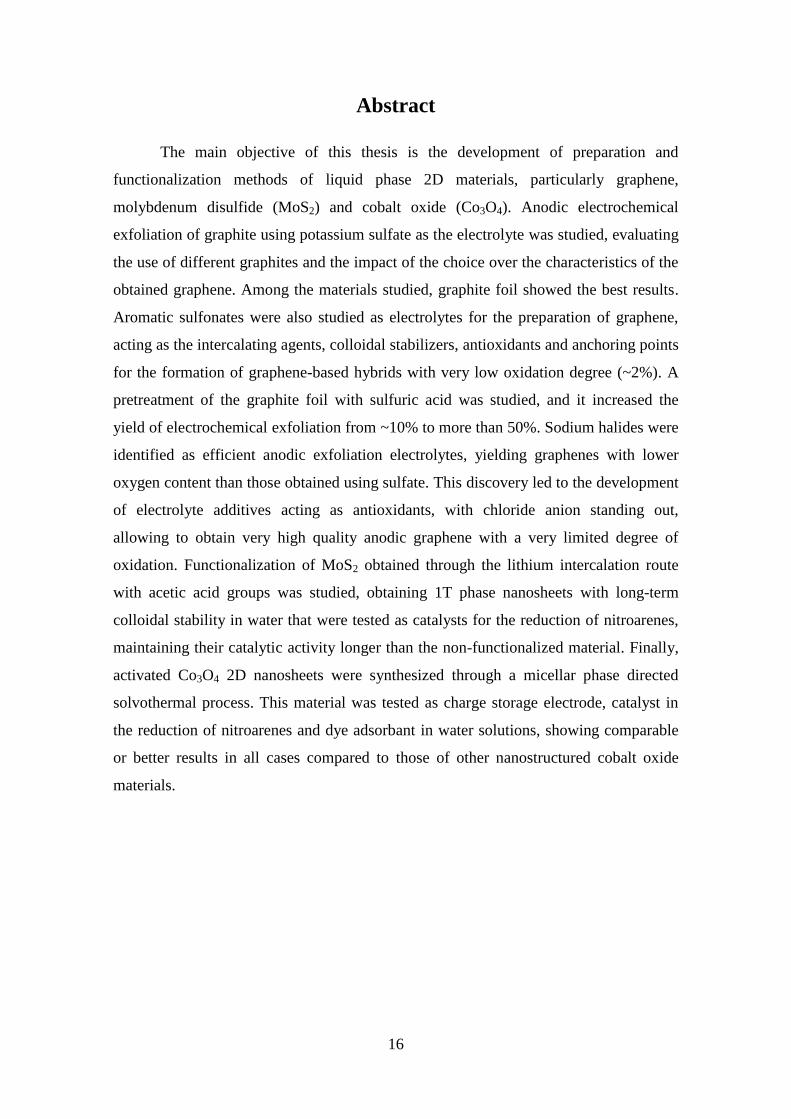
The main objective of this thesis is the development of preparation and
functionalization methods of liquid phase 2D materials, particularly graphene,
molybdenum disulfide (MoS2) and cobalt oxide (Co3O4). Anodic electrochemical
exfoliation of graphite using potassium sulfate as the electrolyte was studied, evaluating
the use of different graphites and the impact of the choice over the characteristics of the
obtained graphene. Among the materials studied, graphite foil showed the best results.
Aromatic sulfonates were also studied as electrolytes for the preparation of graphene,
acting as the intercalating agents, colloidal stabilizers, antioxidants and anchoring points
for the formation of graphene-based hybrids with very low oxidation degree (~2%). A
pretreatment of the graphite foil with sulfuric acid was studied, and it increased the
yield of electrochemical exfoliation from ~10% to more than 50%. Sodium halides were
identified as efficient anodic exfoliation electrolytes, yielding graphenes with lower
oxygen content than those obtained using sulfate. This discovery led to the development
of electrolyte additives acting as antioxidants, with chloride anion standing out,
allowing to obtain very high quality anodic graphene with a very limited degree of
oxidation. Functionalization of MoS2 obtained through the lithium intercalation route
with acetic acid groups was studied, obtaining 1T phase nanosheets with long-term
colloidal stability in water that were tested as catalysts for the reduction of nitroarenes,
maintaining their catalytic activity longer than the non-functionalized material. Finally,
activated Co3O4 2D nanosheets were synthesized through a micellar phase directed
solvothermal process. This material was tested as charge storage electrode, catalyst in
the reduction of nitroarenes and dye adsorbant in water solutions, showing comparable
or better results in all cases compared to those of other nanostructured cobalt oxide
materials.

1. INTRODUCCIÓN
17
1. Introducción
1.1 Materiales bidimensionales (2D)
Los materiales nanoestructurados o nanomateriales, son una familia de sólidos
que se caracterizan por tener una morfología en la que al menos una de sus dimensiones
se encuentra en la escala de los nanómetros, o bien por poseer poseen una estructura
interna en dicha escala. Así, los materiales con 3 dimensiones nanométricas se
denominan cero-dimensionales (0D, como los puntos cuánticos), y materiales
unidimensionales (1D) y bidimensionales (2D) para aquellos sólidos con dos y una
dimensiones nanométricas, respectivamente (como nanotubos y nanoláminas) [1]. La
escala nanométrica en la estructura no es trivial, sino que afecta a las propiedades de
estos materiales y los distingue de los correspondientes sólidos no nanoestructurados.
Como ejemplo, el grafito, un material blando en su estado bulk, presenta una dureza
extremadamente alta al ser exfoliado hasta monocapas de grafeno [2]. El
descubrimiento de este material en 2004 por los físicos Geim y Novoselov dio pie al
estudio del caso que centra esta tesis, a saber, los materiales 2D [3]. Estos materiales
presentan una morfología laminar con espesores del orden de pocos nanómetros o
angstroms y tamaños laterales de entre decenas de nanómetros y centímetros, en función
del material y el método de preparación. En muchos casos, los materiales 2D están
directamente relacionados con los materiales laminares, una familia de sólidos
(naturales y artificiales) compuestos por capas apiladas que presentan enlaces fuertes (p.
e. covalentes) en el plano y que están unidas entre sí por fuerzas débiles tipo van der
Waals [4]. A raíz del descubrimiento del grafeno se ha desatado una enorme actividad
investigadora, que continúa a día de hoy, en torno a los materiales 2D, de los que han
sido documentados diferentes familias, como se indica en la Figura 1. Partiendo de los
materiales laminares conocidos, como el grafito, nitruro de boro hexagonal y los
dicalcogenuros de metales de transición (TMDs, transition metal dichalcogenides) se
han desarollado métodos de preparación, tanto de síntesis a partir de precursores
moleculares (bottom-up) como de exfoliación a partir de dichos materiales laminares
(top-down) para obtener los correspondientes materiales 2D [5-8].

1. INTRODUCCIÓN
18
Familia de
grafeno
Grafeno
hBN
BCN Fluorografeno Óxido de grafeno
Calcogenuros
2D
MoS2, WS2, MoSe2,
WSe2
Dicalcogenuros
semiconductores:
MoTe2,WTe2,
ZrS2, ZrSe2, etc.
Dicalcogenuros metálicos:
NbSe2, NbS2, TaS2, TiS2, NiSe2, etc.
Semiconductores laminares:
GaSe, GaTe, InSe, Bi2Se3, etc.
Óxidos 2D
Micas,
BSCCO
MoO3, WO3
Tipo Perovskita:
LaNb2O7, (Ca,Sr) 2Nb3O10,
Bi4Ti3O12, Ca2Ta2TiO10,
etc.
Hidróxidos:
Ni(OH) 2,
Eu(OH)2, etc.
Óxidos
de Cu
laminares
TiO2, MnO2,
V2O5, TaO3,
RuO2, etc.
Otros
Figura 1. Clases de materiales 2D. Adaptado de [8].
En el desarrollo de esta tesis se ha trabajado fundamentalmente con materiales
2D, en concreto grafeno, disulfuro de molibdeno y óxido de cobalto.
1.1.1 Grafeno
El grafeno, por definición, consiste en una lámina plana formada por átomos de
carbono unidos covalentemente en estructura hexagonal, con anillos de 6 átomos en
hibridación sp2, cuyo espesor es 0.34 nm. A pesar de esta definición estricta, es habitual
considerar grafeno a láminas de entre 2 y 10 capas, debido a que sus propiedades son
marcadamente diferentes a las del grafito bulk (<10 capas), y a que estos materiales
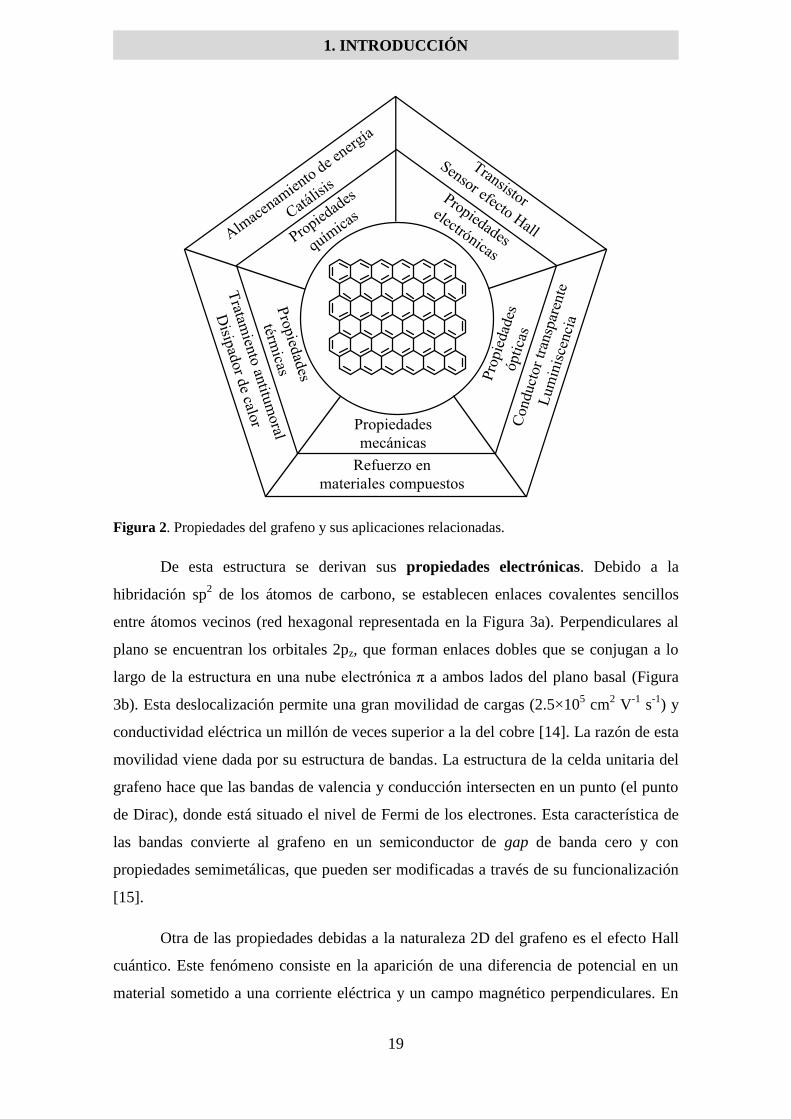
tienen un gran interés práctico en aplicaciones (Figura 2) [9-13].
1. INTRODUCCIÓN
19
Figura 2. Propiedades del grafeno y sus aplicaciones relacionadas.
De esta estructura se derivan sus propiedades electrónicas. Debido a la
hibridación sp2 de los átomos de carbono, se establecen enlaces covalentes sencillos
entre átomos vecinos (red hexagonal representada en la Figura 3a). Perpendiculares al
plano se encuentran los orbitales 2pz, que forman enlaces dobles que se conjugan a lo
largo de la estructura en una nube electrónica π a ambos lados del plano basal (Figura
3b). Esta deslocalización permite una gran movilidad de cargas (2.5×105 cm
2 V
-1 s
-1) y
conductividad eléctrica un millón de veces superior a la del cobre [14]. La razón de esta
movilidad viene dada por su estructura de bandas. La estructura de la celda unitaria del
grafeno hace que las bandas de valencia y conducción intersecten en un punto (el punto
de Dirac), donde está situado el nivel de Fermi de los electrones. Esta característica de
las bandas convierte al grafeno en un semiconductor de gap de banda cero y con
propiedades semimetálicas, que pueden ser modificadas a través de su funcionalización
[15].
Otra de las propiedades debidas a la naturaleza 2D del grafeno es el efecto Hall
cuántico. Este fenómeno consiste en la aparición de una diferencia de potencial en un
material sometido a una corriente eléctrica y un campo magnético perpendiculares. En

1. INTRODUCCIÓN
20
el fenómeno clásico existe una relación lineal entre el voltaje de Hall y el campo
magnético aplicado, mientras que en el fenómeno cuántico la relación es escalonada y,
en el caso particular del grafeno, está cuantizada en números semienteros [16,17].
Debido a estas propiedades, así como a su estabilidad química y las posibilidades de
modificación y funcionalización, se han documentado aplicaciones del grafeno en
baterías, condensadores de doble capa eléctrica (EDLC, electrostatic double layer
capacitors, denominados habitualmente supercondensadores), pilas de combustible,
celdas solares, transistores y sensores electroquímicos y de efecto Hall [18,19, 20, 21]
También son relevantes las propiedades ópticas del grafeno. Una monocapa
(0.34 nm de espesor) posee una transmitancia del 97.7% de luz visible y una
reflectancia del 0.1%. Para filmes más gruesos la transmitancia disminuye linealmente
con el espesor, hasta un 70% para 10 nm [22]. El grafeno absorbe radiación en el
espectro visible e infrarrojo (IR) cercano sin rasgos distintivos, y de forma casi
constante entre 300 y 2500 nm. También presenta absorción en el ultravioleta (UV) con
un pico característico a ~270 nm, que corresponde a transiciones π→π* de los orbitales
moleculares de la estructura [22]. Estas características, junto a la conductividad eléctrica
mencionada antes, hacen al grafeno un buen candidato como conductor transparente, un
posible sustituto del óxido de indio y estaño (ITO, indium tin oxide) de uso común a día
de hoy en dispositivos electrónicos [23]. Por otra parte, mediante la modificación de las
dimensiones de las láminas de grafeno (para tener nanocintas o puntos cuánticos) o
modificando la estructura del plano basal, es posible modificar sus características como
el gap de banda, lo que permite obtener materiales luminiscentes que permiten fabricar
sensores y visualizar tejidos vivos [24].
En cuanto a las propiedades mecánicas del grafeno, destaca particularmente su
excepcional rigidez. El módulo de Young para este material es de ~1 TPa, 5 veces
superior al del acero estructural estándar. Además, su resistencia a la tracción es de 130
GPa, muy superior a la de ese mismo acero (0.4 GPa) o la del kevlar (0.38 GPa) [25].
Estas propiedades hacen del grafeno un gran candidato como refuerzo de materiales
compuestos con diferentes matrices (poliméricas, cerámicas, metálicas), dando como
resultado una gran mejora en las propiedades mecánicas con cargas de grafeno
relativamente bajas [26].

1. INTRODUCCIÓN
21
Otro apartado en el que el grafeno destaca y es candidato a diversas aplicaciones
es el referente a sus propiedades térmicas. En su forma prístina, este material posee
una conductividad térmica de ~5000 W m-1
K-1
, más de 10 veces superior a la del cobre
[27], lo que lo hace idóneo como componente disipador de calor en componentes
electrónicos [28]. Es posible también su incorporación en materiales compuestos para
mejorar su conductividad y estabilidad térmicas, además de modificar las temperaturas
de transición de fase [29]. Por otra parte, estas propiedades térmicas y de absorción IR
permiten la aplicación de láminas de grafeno en nanomedicina, por ejemplo para la
destrucción de células cancerígenas mediante calentamiento por láser (terapia
fototérmica), reduciendo el daño a los tejidos colindantes en comparación con el uso de
otros materiales[30].
Figura 3. (a) Estructura de una monocapa de grafeno. (b) Hibridación sp2 y enlace doble entre
átomos de carbono.
Es importante destacar también las propiedades químicas de este material, que
proporcionan oportunidades para otras aplicaciones. El procesado del grafeno en fase
líquida para diversos usos requiere la preparación de dispersiones coloidales estables del
material, y para ello existen metodologías de funcionalización de las láminas, orientadas
tanto a facilitar su estabilidad coloidal como a modificar sus propiedades
(hidrofobia/hidrofilia, gap de banda, superficie específica, actividad catalítica,
almacenamiento de carga, etc.). Existen dos enfoques cualitativamente diferentes para
abordar esta funcionalización: la vía covalente y la no covalente.
La primera de estas dos vías implica la formación de enlaces covalentes entre las
láminas del grafeno y una especie externa, como pueden ser átomos, moléculas
pequeñas o macromoléculas [31,32]. Los bordes del grafeno son la zona más reactiva de

1. INTRODUCCIÓN
22
las láminas, y por tanto los centro más propensos a la funcionalización covalente. No
obstante, es posible modificar el plano basal mediante sustitución atómica, de manera
que átomos de carbono se intercambian por heteroátomos, siendo los más habituales
nitrógeno y azufre. De esta manera, es posible modificar la estructura electrónica de las
láminas, mejorando sus características en aplicaciones como catalizador de la reacción
de reducción de oxígeno (ORR, oxygen reduction reaction), electrodos de baterías y de
pilas de combustible [33,34].
Por otra parte es posible la funcionalización no covalente del grafeno, que
habitualmente implica la adsorción de moléculas por interacciones dispersivas o π-π con
el plano basal del grafeno. De esta manera la estructura del material permanece
inalterada, aunque permite modificar su estructura electrónica mediante la transferencia
de carga con la especie adsorbida [35], lo que facilita la fabricación de sensores [36],
catalizadores [37] y electrodos de supercondensadores [38].
La funcionalización puede tener como objetivo mejorar la estabilidad coloidal en
disolventes orgánicos o en agua, tanto mediante la modificación covalente como
mediante la adsorción no covalente de moléculas anfifílicas (surfactantes) [39-41]. Esta
mejora facilita el procesado del material en fase líquida, lo que a su vez permite una
diversidad de aplicaciones mediante la preparación de materiales híbridos, composites,
recubrimientos, filmes y estructuras 3D a partir de las dispersiones coloidales de
grafeno. Así, es posible obtener materiales con actividad catalítica [42], electrodos para
supercondensadores [43] y baterías [44], dispositivos electrónicos flexibles [45], filmes
para el estudio de proliferación celular [46] y espumas para tratamiento de aguas
contaminadas [47].
1.1.2 Disulfuro de molibdeno (MoS2)
Los dicalcogenuros de metales de transición (TMDs, transition metal
dichalcogenides), son compuestos de fórmula general MX2, donde M es un metal de
transición (Mo, W, Ti, Nb, etc.) y X es un calcógeno (S, Se, Te). Esta familia de
materiales laminares ha sido partícipe del auge del grafeno y los materiales 2D en los
últimos años, debido a la variedad de combinaciones que permite y sus diferentes
características. Por ejemplo, existen TMDs semiconductores (MoS2, WS2, etc.),

1. INTRODUCCIÓN
23
metálicos (p. e. NbS2, VSe2), semimetálicos (p. e. WTe2, TiSe2), magnéticos (CrSe2) y
superconductores (PdTe2). Entre ellos, el MoS2 es el material que más intensamente está
siendo investigado, debido a sus propiedades químicas, ópticas, mecánicas y sus
posibles aplicaciones [48,49], y sobre todo debido a su relativa abundancia [50].
El MoS2 bulk posee una estructura tridimensional compuesta por láminas unidas
débilmente por fuerzas de van der Waals. Las láminas están formadas por una
monocapa de átomos de molibdeno situada entre dos monocapas de átomos de azufre.
Existen dos coordinaciones de los átomos de azufre alrededor del molibdeno (Figura 4),
en forma de prisma trigonal (fase 2H, termodinámicamente estable) y octaédrica (fase
1T, metaestable) [51,52].
Figura 4. Fases (a) 2H y (b) 1T del MoS2. Adaptado de [51].
Las propiedades electrónicas y ópticas del MoS2, al igual que las de otros
materiales 2D, dependen sensiblemente del número de capas. En su forma bulk este
material es un semiconductor de gap de banda indirecto de 1.29 eV, mientras que al ser
exfoliado en monocapas el gap se hace directo y tiene un valor de ~1.9 eV [53]. Este
gap de banda dependiente del número de capas permite el uso del material en
a b
Prisma trigonal (D3h) Octaedro (Oh)
S
S Mo
Fase 2H Fase 1T

1. INTRODUCCIÓN
24
dispositivos electrónicos, como transistores de efecto de campo [54], dispositivos
bioelectrónicos [55] y sensores [56].
Las propiedades mecánicas del MoS2 lo hacen apropiado para su uso en
dispositivos electrónicos flexibles [57] y como refuerzo en materiales compuestos [58].
Su módulo de Young es comparable al del acero (270 frente a 400 GPa) [59], y los
filmes de MoS2 2D son marcadamente elásticos, con deformaciones de 10 nm para
espesores de 5 a 25 láminas [60].
En cuanto a las propiedades térmicas, su conductividad térmica a lo largo del
plano es de ~ 18 W m-1
K-1
, con variaciones en función del grado de exfoliación [61].
Así, es posible utilizar el MoS2 en materiales compuestos para mejorar tanto sus
propiedades térmicas como su estabilidad a temperaturas altas [62].
Por último, las propiedades químicas del MoS2 son también relevantes. Las
vacantes de azufre en la red atómica, relativamente abundantes debido a su baja energía
de formación, provocan la existencia de centros catalíticamente activos de molibdeno,
de manera que el material puede utilizarse como catalizador en reacciones como
evolución de hidrógeno (HER, hydrogen evolution reaction) [63], hidrodesulfuración
[64], reducción de óxido de azufre [65] y reducción de nitroarenos [66]. La exfoliación
química del material bulk mediante la intercalación de litio permite la transformación de
la fase 2H (semiconductora) en fase 1T (metálica) con un exceso de electrones, lo que
mejora la estabilidad coloidal de las láminas en dispersión acuosa, y contribuye también
a una mejora de la actividad catalítica [66] y de sus prestaciones cuando se usa como
electrodo para almacenamiento electroquímico de energía [67].
La modificación de láminas de MoS2 por vía no covalente permite obtener, entre
otros, híbridos con nanopartículas metálicas catalíticamente activos [68,69] o aptos
como sensores de espectroscopía Raman amplificada por superficie [70]. Es posible
también mejorar la estabilidad coloidal de láminas en fase 2H mediante el uso de
surfactantes [71,72] o biomoléculas [73] lo que permite su uso como catalizadores para
HER en el primer caso, y mejora su biocompatibilidad y permite el uso en terapia
quimiofototérmica en el segundo.
Por otra parte, la modificación covalente permite el dopaje mediante
heteroátomos para la fabricación de transistores y dispositivos optoelectrónicos [74],

1. INTRODUCCIÓN
25
debido, por ejemplo, a la sustitución de átomos de molibdeno por niobio. Además, es
posible la funcionalización del MoS2 2D a través de los átomos de azufre con
complejos metálicos coordinados [75] y con grupos moleculares provenientes de
compuestos organoyodados, que reaccionan por sustitución nucleófila, mejorando en
ambos casos la estabilidad coloidal de las láminas y facilitando su uso en aplicaciones
[76].
1.1.3 Óxido de cobalto (Co3O4)
En la familia de los materiales 2D, buena parte de ellos se pueden obtener
mediante exfoliación de los correspondientes materiales laminares, esto es, aquellos
cuya estructura está compuesta de capas unidas débilmente entre sí. No obstante, para la
mayoría de los materiales, como muchos óxidos de metales de transición MxOy (M= Ti,
Fe, Co, Ni, etc.) no existe esa posibilidad, ya que en su forma bulk presentan una
estructura de enlaces iónicos y/o covalentes 3D, no compuesta por capas susceptibles de
ser separadas. Estos materiales, y en particular los óxidos metálicos son de gran interés
tanto en su estado bulk como en forma de láminas 2D, debido a sus posibles
aplicaciones en campos como la conversión y el almacenamiento de energía y a su
relativa abundancia y bajo coste [77,78].
Figura 5. Celda unitaria del Co3O4. Adaptado de [79].
Tetraedro
[Co2+
O4]
Octaedro
[Co3+
O6]

1. INTRODUCCIÓN
26
El óxido de cobalto (Co3O4) tiene una estructura cristalina 3D de espinela
(Figura 5) compuesta por cationes Co2+
y Co3+
rodeados en disposición tetraédrica y
octaédrica respectivamente por aniones O2-
. Esta estructura cristalina no está organizada
en capas, y por tanto no es posible su exfoliación. Por tanto su obtención en forma de
láminas 2D hace que sea necesario recurrir a otras estrategias de preparación [77].
Debido a la presencia de iones Co2+
con electrones desapareados, este óxido
posee propiedades magnéticas que han sido ampliamente estudiadas tanto en el
material bulk como en formas nanoestructuradas, con vistas a su aplicación como
materiales magnéticos [79].
En cuanto a las propiedades ópticas y eléctricas, el Co3O4 presenta absorción
tanto en el espectro visible como en el ultravioleta, con bandas características. Esta
absorción, debida al gap de banda ensanchado por la preparación en forma de láminas
2D, permiten el uso del óxido en fotodetectores, dando una respuesta lineal de corriente
al ser irradiados con luz UV [77].
Por último, son las propiedades químicas de este material las que lo hacen apto
para sus aplicaciones más habituales. Por su morfología, las láminas 2D de Co3O4
poseen una gran proporción de superficie frente a volumen, y en consecuencia gran
cantidad de centros activos superficiales. Estos sitios activos son centros de Co2+
que,
por su densidad electrónica, son catalíticamente activos y permiten el uso de este
material en procesos de electrorreducción [80], fotocatálisis [81] y ORR [82]. El control
de la morfología y la porosidad durante la síntesis del óxido en forma de láminas
permite la preparación de sensores de gases [83] y, junto a la presencia de centros
electroactivos, hace que sea posible su uso como electrodo en almacenamiento de
energía en condensadores [78] y baterías de litio [84].
Sin embargo, y como es habitual en el caso de óxidos metálicos en aplicaciones
electroquímicas, una de las mayores limitaciones de la eficiencia del material es su
conductividad eléctrica relativamente baja [85]. Las soluciones habituales a este
problema pasan por la preparación de híbridos con la adición de materiales conductores
como níquel [86] o grafeno [87], o bien por la modificación química del Co3O4. Esta
modificación puede llevarse a cabo a través del dopaje para obtener óxidos mixtos,
MCo2O4 [88], o mediante la activación del material por reducción parcial, obteniéndose
1. INTRODUCCIÓN
27
así materiales con vacantes de oxígeno y con mayor proporción de Co2+
[89], que
presentan mejores características en las aplicaciones relacionadas.
1.2 Métodos de obtención de materiales 2D
Como sucede con todos los nanomateriales, las propiedades de los materiales 2D
suelen ser sustancialmente diferentes de las de sus equivalentes bulk 3D. Estas
propiedades son generalmente dependientes del grosor de las láminas, y por tanto es
crucial controlar el grado de exfoliación en los materiales 2D obtenidos a partir de
materiales laminares, así como el espesor en materiales 2D no laminares, de cara a
obtener materiales útiles en aplicaciones tecnológicas. Teniendo esto en cuenta, es
importante señalar que no existe un único método de preparación de materiales 2D, sino
que durante los últimos años se han ido desarrollando técnicas fundamentadas en
diferentes metodologías, con diferentes características en cuestión de precio, cantidad
obtenida, rendimiento, escalabilidad, control de las características del material (espesor,
tamaño lateral, oxidación, defectos, grupos funcionales, morfología, etc.), rapidez y
subproductos contaminantes generados. Es necesario, por tanto, seleccionar el método
apropiado de preparación de láminas 2D en función de los requerimientos de la
aplicación concreta que se busque. De forma general, los métodos de obtención de
materiales 2D se pueden clasificar en dos grandes familias: los métodos bottom-up o
ascendentes y top-down o descendentes.
1.2.1 Métodos bottom-up
Esta familia de métodos de preparación se basa en la síntesis de láminas 2D a
partir de precursores atómicos o moleculares mediante reacciones químicas que
permiten la formación del material con morfología 2D. Entre ellos, los que destacan en
fase líquida son la síntesis de TMDs y de óxidos metálicos a partir de precursores
moleculares por vía solvotérmica.
Síntesis de TMDs a partir de precursores moleculares: es posible sintetizar
láminas 2D de TMDs como el MoS2 a partir de precursores moleculares, aprovechando

1. INTRODUCCIÓN
28
la ventaja de que su estructura en capas favorece el crecimiento en forma laminar [90].
Mediante este método se obtienen láminas de MoS2 ejerciendo control sobre la
proporción de las fases 1T y 2H en función de las condiciones de preparación [91], y los
materiales obtenidos muestran una actividad mejorada en su uso como catalizadores de
HER [91], electrodos de baterías de ión litio [92] y en terapias antitumorales [93].
Síntesis de láminas 2D controlada por fases micelares: los materiales que por
no estar constituidos por capas en su estructura 3D no pueden ser exfoliados (como los
óxidos metálicos) se pueden sintetizar en forma de láminas delgadas (2D) a partir de
precursores moleculares en fase líquida. Los precursores utilizados habitualmente son
sales metálicas que, por tratamiento solvotérmico y mediante el uso de agentes
directores de la estructura tipo surfactante, dan lugar a láminas nanométricos (Figura 6)
[77]. La función de estos agentes directores es la formación de fases micelares en las
que tiene lugar la nucleación y crecimiento a partir de los precursores, de manera que
los productos obtenidos son láminas 2D. Existen procedimientos generales para la
preparación de óxidos metálicos basados en el uso de fases micelares de morfología
laminar en las que se utilizan como agentes directores polímeros anfifílicos [77] y
surfactantes [94], o bien el uso de otros materiales 2D como óxido de grafeno [95]. Las
láminas obtenidas por estos métodos se han empleado como fotodetectores [77],
catalizadores de ORR [94] y en almacenamiento de carga eléctrica [95].

1. INTRODUCCIÓN
29
Figura 6. Síntesis de láminas 2D de óxidos metálicos dirigida por fases micelares de morfología
laminar. Adaptado de [77].
1.2.2 Métodos top-down
Esta familia de métodos se basa en la obtención de láminas 2D (tanto materiales
monocapa como multicapa) mediante la exfoliación de un material laminar bulk. Estos
materiales están formados por láminas individuales que se mantienen unidas por fuerzas
débiles tipo van der Waals, formando estructuras 3D por apilamiento. Dichas fuerzas
débiles entre capas deben ser superadas para aislar las láminas individuales, de manera
que es necesario aplicar algún tipo de estímulo o fuerza externa que aumente el
espaciado interlaminar. Las interacciones involucradas son proporcionales a 1/d6
(siendo d la distancia interlaminar) y se vuelven despreciables por encima de distancias
de ~5 Å [96]. Las estrategias que se utilizan para separar las láminas se basan en aplicar
fuerzas a través de procesos como cambios de temperatura, intercalación de especies
químicas, ultrasonidos o fuerzas de cizalla, con diferentes condiciones y mecanismos
asociados en cada caso.
Históricamente, el primer método utilizado para aislar monocapas de un material 2D
a partir de un material fue el método de la cinta adhesiva (Scotch tape, o de forma
general, exfoliación micromecánica), mediante el cual se obtuvieron láminas de
Oligómeros
precursores
Estructuras laminares autoensambladas
Cristalización y
eliminación del molde
Autoensamblaje
Moléculas de surfactante Lámina 2D de óxido metálico

1. INTRODUCCIÓN
30
grafeno a partir de grafito pirolítico altamente orientado (HOPG, highly oriented
pyrolitic graphite) en 2004 [3]. En ese trabajo, los autores llevaron a cabo la exfoliación
pegando y despegando la cinta adhesiva a una pieza de grafito. Al repetir este proceso
un gran número de veces se va reduciendo progresivamente el número de capas del
material, de manera que es posible obtener monocapas. Como el proceso no involucra
reactivos ni condiciones agresivas, los materiales obtenidos tienen una altísima calidad
estructural, por lo que es posible utilizarlo para estudios fundamentales y desarrollo de
prototipos. Además, por su propia naturaleza, es un proceso aplicable a cualquier
material laminar bulk en forma de cristales a partir de pocos mm2 de tamaño, por lo que
su uso se ha extendido a otros materiales como MoS2, WS2, NbSe2, fósforo negro, hBN
y otros [97].
No obstante, y como cabe esperar, la productividad de este método es muy baja, por
lo que ha sido necesario desarrollar otras estrategias que sean capaces de producir
mayores cantidades de materiales 2D. Los métodos más habituales son los que se llevan
a cabo en fase líquida, ya que permiten grandes números de láminas del material 2D en
dispersión coloidal, lo que facilita su procesado. En función de la fuerza impulsora de la
exfoliación (ultrasonidos, modificación química, intercalación), tenemos diferentes
clases de métodos de preparación. Las más relevantes son las siguientes:
a) Exfoliación por ultrasonidos/cizalla
Una de las vías más extendidas para la preparación de dispersiones coloidales de
láminas 2D es la exfoliación de materiales bulk mediante sonicación o fuerzas de cizalla
[98]. El fundamento de este método es la aplicación de fuerzas laterales y verticales a
los planos basales que separen las capas en el material bulk, provocando su exfoliación
hasta obtener láminas 2D de pocas capas de espesor. Estas fuerzas pueden ser generadas
por las burbujas de cavitación que se generan al aplicar ultrasonidos en fase líquida, así
como por fuerzas de cizalla generadas por un rotor que gira sumergido en un disolvente
[99,100] (Figura 7). Para obtener resultados satisfactorios en cualquiera de los dos casos
es necesario llevar a cabo el proceso en un medio líquido cuya energía superficial sea
muy similar a la del plano basal del material a exfoliar, de manera que se minimice la
energía requerida para la exfoliación y solvatación de las láminas 2D. Es habitual el uso
de disolventes orgánicos como la N-metilpirrolidona (NMP), el isopropanol (IPA) y la
N,N-dimetilformamida (DMF), tanto para la exfoliación de grafeno [99] como de otros
materiales 2D como MoS2, WS2, MoSe2, MoTe2, TaSe2, NbSe2, NiTe2, BN, y Bi2Te3

1. INTRODUCCIÓN
31
[101]. Es posible además utilizar mezclas de agua y otras sustancias, como otros
disolventes o moléculas anfifílicas, para minimizar la energía requerida en la
exfoliación. Así, se han usado mezclas agua/alcohol [102], así como surfactantes [103],
polímeros [104] y biomoléculas [105].
Figura 7. Exfoliación mediante ultrasonidos/cizalla de un material laminar para obtener
dispersiones de láminas 2D.
El resultado de este método son dispersiones coloidales de láminas 2D formadas por
pocas capas (habitualmente entre 3 y 10 capas, en diferentes proporciones) y con un
rendimiento de exfoliación habitualmente por debajo del 1% en peso [99]. Por norma
general, la calidad estructural de los materiales 2D obtenidos es muy alta, ya que el
proceso no implica una modificación química significativa de la estructura, sino que la
fuerza directora de la exfoliación proviene de fenómenos físicos esencialmente
mecánicos. Las dispersiones obtenidas son fácilmente procesables, y han sido utilizadas
para preparar, entre otros, materiales compuestos [106], electrodos de
supercondensadores [107] y transistores [108].
b) Ruta del óxido de grafeno
Otra de las vías más populares para la preparación de láminas 2D en dispersión
coloidal es la modificación química de materiales laminares. El mejor ejemplo es la ruta
del óxido de grafeno (GO, graphene oxide, Figura 8). El GO se puede preparar mediante
la oxidación de grafito por el método de Hummers o modificaciones del mismo
[109,110]. En una primera etapa, se oxida el grafito mediante el uso de oxidantes fuertes
como el KMnO4 en medio ácido, obteniéndose así óxido de grafito. Este óxido presenta
gran proporción de grupos oxigenados tanto en el plano basal como en los bordes de
lámina, lo que aumenta su espaciado interlaminar y disminuye la energía requerida para

1. INTRODUCCIÓN
32
separar unas capas de otras. Ello permite dispersar el material tanto en agua como en
disolventes orgánicos [110,111], ya que la presencia de grupos oxigenados capaces de
desprotonarse hace que el material tenga buena dispersabilidad coloidal, obteniéndose
fácilmente suspensiones de láminas monocapa de GO mediante sonicación. Por último
es necesario llevar a cabo una reducción del GO para obtener el denominado óxido de
grafeno reducido (rGO, reduced graphene oxide), con la intención de recuperar en l
medida de lo posible la estructura y las propiedades del grafeno prístino. De hecho, una
conversión completa a grafeno prístino solo se puede alcanzar en filmes a muy altas
temperaturas [112], mientras que en dispersión coloidal es posible solamente reducir
parcialmente el material y por tanto sólo recuperar parcialmente sus propiedades.
Existen muchas metodologías para la obtención de rGO, entre ellos el uso de reductores
químicos como hidracina [113], vitamina C [114], hidrógeno [115] o biomoléculas
[116], así como procesos de reducción térmica [117], electroquímica [118] y
fotorquímica [119].
Figura 8. Proceso de preparación de rGO.
Se ha utilizado rGO preparado por estos métodos en materiales híbridos para
aplicaciones como el almacenamiento y conversión de energía [120,121],
electrocatálisis [118] y tratamiento de aguas [119].

1. INTRODUCCIÓN
33
c) Exfoliación química
Una de las posibles fuerzas directoras de la exfoliación de materiales laminares
como los TMDs es la intercalación de especies químicas que aumenten el espaciado
interlaminar y por tanto faciliten la deslaminación al debilitar las interacciones
cohesivas del material [122]. En la exfoliación de MoS2 y otros TMDs esta estrategia se
lleva a cabo habitualmente mediante la intercalación de metales alcalinos en forma de
compuestos como el n-butil-litio, de manera que se obtienen compuestos de
intercalación (p. e. LixMoS2), en los que tiene lugar una transferencia de electrones del
litio al metal, que en muchos casos induce un cambio de la fase original 2H
(semiconductora) a la 1T (metálica) [123,124,125]. Estos compuestos de intercalación
suelen ser es altamente reactivos, y al hacerse reaccionar con agua dan lugar a la
formación de LiOH e hidrógeno gaseoso, de manera que se produce la exfoliación del
material (Figura 9). Esta exfoliación química da lugar a una dispersión coloidal acuosa
de láminas 2D formadas por monocapas del TMD cargadas negativamente debido al
exceso de electrones, lo que les proporciona estabilidad coloidal en el medio acuoso. No
obstante, el exceso de electrones de las láminas las hace bastante reactivas, y su
tendencia a oxidarse por reacción con el agua provoca que pierdan la carga eléctrica y
por tanto precipiten irreversiblemente en cuestión de pocas semanas [126].
Figura 9. Exfoliación de un material laminar mediante intercalación de una especie química.
Adaptado de [122].
La transformación del MoS2 y otros TMDs a la fase metálica 1T y el
correspondiente aumento de la densidad electrónica hacen apropiado el uso de láminas
2D de estos materiales en aplicaciones como el almacenamiento de energía en
supercondensadores [124], catalizador de HER [125] y de reducción de nitroarenos
[127], mostrando en muchos casos mejores resultados que la fase 2H.
Intercalación
Agit
ació
n

1. INTRODUCCIÓN
34
d) Exfoliación electroquímica
Uno de los métodos más recientes y prometedores para llevar a cabo la preparación
de grafeno en fase líquida de forma escalable y en cantidades más allá de la escala de
laboratorio es la exfoliación de grafito por vía electroquímica [128,129]. La fuerza
directora del proceso es la aplicación de un voltaje a un electrodo de grafito sumergido
en un electrolito líquido. Este voltaje aplicado induce la intercalación de especies
iónicas solvatadas en la estructura del grafito, aumentando el espaciado interlaminar y
facilitando por tanto su deslaminación para obtener grafeno (Figura 10). Existen dos
variantes de esta técnica, en función del signo positivo o negativo del potencial aplicado
al electrodo de grafito, y esta elección tiene consecuencias en términos de los
electrolitos apropiados, así como en las características del grafeno obtenido [128].
Figura 10. Exfoliación electroquímica de un ánodo de grafito.
En la exfoliación catódica el electrodo de grafito se somete a un potencial
negativo (típicamente de -2 a -10 V), y por tanto tiene lugar la intercalación de cationes
en la estructura [130]. Este proceso suele llevarse a cabo utilizando como electrolitos
sales de Li+ [131], de alquilamonio [132,133] o líquidos iónicos [134], habitualmente en
disolventes orgánicos como dimetilsulfóxido (DMSO) o carbonato de propileno (PC). A

1. INTRODUCCIÓN
35
continuación, es habitual someter al electrodo expandido a un proceso de sonicación
que complete la deslaminación del material, de manera que se obtienen dispersiones
coloidales de láminas de grafeno. Por norma general, los materiales obtenidos están
constituidos por láminas relativamente delgadas (entre 5 y 10 capas), con poco
contenido en oxígeno y defectos [130], y han sido utilizados en aplicaciones como el
almacenamiento y la conversión de energía [129], sensores y LEDs [130].
Por otra parte, la exfoliación anódica se fundamenta en la aplicación de un
potencial positivo en un ánodo de grafito y la consiguiente intercalación de aniones. En
esta variante de exfoliación es habitual utilizar agua como disolvente y electrolitos
como ácido sulfúrico [135], ácido fosfórico [136], sales de sulfato [137], sulfonatos
orgánicos [138] y líquidos iónicos [139]. Como se detalla en la Figura 10, al someter al
electrodo de grafito a un potencial positivo (entre 4 y 30 V, siendo lo más común aplicar
10 V) tiene lugar la oxidación de los bordes de grano y lámina del grafito, lo cual
facilita la intercalación de los aniones presentes en el electrolito. Debido a que este
potencial es superior al de oxidación del agua, el proceso genera especies altamente
reactivas como el radical OH·, que atacan (oxidan) el ánodo de grafito tanto en los
bordes como en el plano basal y generan especies gaseosas. Este proceso induce la
expansión del ánodo, dando lugar a un grafito expandido que puede terminar de ser
exfoliado en láminas de grafeno mediante sonicación. Los materiales grafénicos
obtenidos mediante exfoliación aniónica están compuestos generalmente por láminas
muy delgadas (entre 1 y 3 monocapas en su mayoría). Sin embargo, la naturaleza
oxidativa del proceso hace que el contenido en oxígeno sea relativamente alto, con
porcentajes típicos entre el 10 y el 30% [129].
Durante el proceso de exfoliación electroquímica anódica es posible la
utilización de electrolitos y aditivos de electrolito especiales, con objeto de cumplir dos
funciones: disminuir la oxidación del grafeno anódico y/o promover su funcionalización
[140]. El control de la oxidación se lleva a cabo mediante el uso de sustancias
susceptibles de ser oxidadas en el proceso electrolítico en lugar del grafeno (es decir,
sustancias antioxidantes, ya sean el electrolito intercalante o aditivos añadidos al
electrolito intercalante). Algunas de las sustancias utilizadas como aditivos de
electrolito son la melamina [141], el 2,2,6,6-tetrametilpiperidin-1-il)oxil (TEMPO)
[142] y el benzoato de sodio [143], con contenidos de oxígeno en el grafeno anódico
resultante de aproximadamente 4% en los tres casos, y utilizados en aplicaciones como
relleno de materiales compuestos [141], electrodos de supercondensadores [142] y

1. INTRODUCCIÓN
36
electrocatalizadores [143]. Por otra parte, es posible la funcionalización del grafeno en
el proceso, tanto de forma no covalente con el propio electrolito [138] como
covalentemente, mediante dopaje atómico. Este dopaje suele llevarse a cabo con átomos
de nitrógeno [144], azufre [145] o ambos [146], y mejora sus propiedades en el uso del
grafeno en supercondensadores [144,145] y catalizador de ORR [146].

1. INTRODUCCIÓN
37
Bibliografía
[1] International Organization for Standardization, ISO/TS 80004:2015 Nanotechnologies-
Vocabulary.
[2] Lee, J.-U.; Yoon, D.; Cheong, H. Estimation of young's modulus of graphene by Raman
spectroscopy. Nano Lett., 2012, 12, 4444-4448.
[3] Novoselov, K. S.; Geim, A. K.; Morozov, S. V.; Jiang, D.; Zhang, Y.; Dubonos, S. V.;
Grigorieva, I.V.; Firsov, A.A.; Electric field in atomically thin carbon films. Science, 2004, 306,
666-669.
[4] Butler, S. Z.; Hollen, S. M.; Cao, L.; Cui, Y.; Gupta, J.A.; Gutiérrez, H.R.; Heinz, T.F.;
Hong, S. S.; Huang, J.; Ismach, A. F.; Johnston-Halperin, E.; Kuno, M.; Plashnitsa, V. V.;
Robinson, R. D.; Ruoff, R. S.; Salahuddin, S.; Shan, J.; Shi, L.; Spencer, M. G.; Terrones, M.;
Windl, W.; Goldberger, J. E. Progress, Challenges, and Opportunities in Two-Dimensional
Materials Beyond Graphene. ACS Nano, 2013, 7, 2898-2926.
[5] Bhimanapati, G. R.; Lin, Z.; Meunier, V.; Jung, Y.; Cha, J.; Das, S.; Xiao, D.; Son, Y.;
Strano, M. S.; Cooper, V. R.; Liang, L.; Louie, S. G.; Ringe, E.; Zhou, W.; Kim, S. S.; Naik, R.
R.; Sumpter, B. G.; Terrones, H.; Xia, F.; Wang, Y.; Zhu, J.; Akinwande, D.; Alem, N.;
Schuller, J. A.; Schaak, R. E.; Terrones, M.; Robinson, J.A. Recent Advances in Two-
Dimensional Materials beyond Graphene. ACS Nano, 2015, 9, 11509-11539.
[6] Mas-Ballesté, R.; Gómez-Navarro, C.; Gómez-Herrero, J.; Zamora, F. 2D materials: To
graphene and beyond. Nanoscale, 2011, 3, 20-30.
[7] Lv, R.; Robinson, J. A.; Schaak, R. E.; Sun, D.; Sun, Y.; Mallouk, T. E.; Terrones, M.
Transition metal dichalcogenides and beyond: Synthesis, properties, and applications of single-
and few-layer nanosheets. Acc. Chem. Res., 2015, 48, 56-64.
[8] Geim, A. K.; Grigorieva, I. V. Van der Waals heterostructures. Nature, 2013, 499, 419-425.
[9] Rao, C. N. R.; Sood, A. K.; Subrahmanyam, K. S .; Govindaraj, A. Graphene: The new two-
dimensional nanomaterial. Angew. Chem. Int. Ed., 2009, 48, 7752-7777.
[10] Ohta, T.; Bostwick, A.; Seyller, T.; Horn, K.; Rotenberg, E. Controlling the Electronic
Structure of Bilayer Graphene. Science, 2006, 313, 951-954.
[11] Zhang, Y.; Tang, T.-T.; Girit, C.; Hao, Z.; Martin, M. C.; Zettl, A.; Crommie, M. F.; Shen,
Y. R.; Wang, F. Direct observation of a widely tunable bandgap in bilayer graphene. Nature,
2009, 459, 820-823.
[12] Shahil, K. M. F.; Balandin, A. A. Graphene-Multilayer Graphene Nanocomposites as
Highly Efficient Thermal Interface Materials. Nano Lett., 2012, 12, 861-867.
[13] Tan, P. H.; Han, W. P.; Zhao, W. J.: Wu, Z. H.; Chang, K.; Wang, H.; Wang, Y. F.; Bonini,
N.; Marzari, N.; Pugno, N.; Savini, G.; Lombardo, A.; Ferrari, A.C. The shear mode of
multilayer graphene. Nat. Mat., 2012, 11, 294-300.
[14] Novoselov, K. S.; Fal'Ko, V. I.; Colombo, L.; Gellert, P. R.; Schwab, M. G.; Kim, K. A
roadmap for graphene. Nature, 2012, 490, 192-200.
[15] Weiss, N. O.; Zhou, H.; Liao, L.; Liu, Y.; Jiang, S.; Huang, Y.; Duan, X. Graphene: An
emerging electronic material. Adv, Mater., 2012, 24, 5782-5825.
[16] Zhang, Y.; Tan, Y.-W.; Stormer, H. L.; Kim, P. Experimental observation of the quantum
Hall effect and Berry's phase in graphene. Nature, 2005, 438, 201-204.
[17] Novoselov, K. S.; Jiang, Z.; Zhang, Y.; Morozov, S. V.; Stormer, H. L.; Zeitler, U.; Maan,
J. C.; Boebinger, G. S.; Kim, P.; Geim, A. K. Room-temperature quantum hall effect in
graphene. Science, 2007, 315, 1379.
1. INTRODUCCIÓN
38
[18] Sun, Y.; Wu, Q.; Shi, G. Graphene based new energy materials, Energy Environ. Sci.,
2011, 4, 1113-1132.
[19] Bonaccorso, F.; Colombo, L.; Yu, G.; Stoller, M.; Tozzini, V.; Ferrari, A. C.; Ruoff, R. S.;
Pellegrini, V. Graphene, related two-dimensional crystals, and hybrid systems for energy
conversion and storage. Science, 2017, 347, 1246501.
[20] Schwierz, F. Graphene transistors, Nat. Nanotechnol., 2010, 5, 487-496
[21] Novoselov, K. S.; Fal'Ko, V. I.; Colombo, L.; Gellert, P. R.; Schwab, M. G.; Kim, K. A
roadmap for graphene. Nature, 2012, 490, 192-200.
[22] Bonaccorso, F.; Sun, Z.; Hasan, T.; Ferrari, A. C. Graphene photonics and optoelectronics.
Nat. Photonics, 2010, 4, 611-622.
[23] Shuping Pang, S.; Hernandez, Y.; Feng, X.; Müllen, K. Graphene as Transparent Electrode
Material for Organic Electronics. Adv. Mater., 2011, 23, 2779-2795.
[24] Prezzi, D.; Varsano, D.; Ruini, A.; Marini, A.; Molinari, E. Optical properties of graphene
nanoribbons: The role of many-body effects. Phys. Rev. B. 2008, 77, 041404(R).
[25] Lee, C.; Wei1, X.; Kysar, J. W.; Hone1, J. Measurement of the Elastic Properties and
Intrinsic Strength of Monolayer Graphene. Science, 2008, 321, 385-388.
[26] Graphene Reinforced Metal Matrix Composite (GRMMC): A Review. Procedia Eng.,
2014, 97, 1033-1040.
[27] Balandin, A. A.; Thermal properties of graphene and nanostructured carbon materials. Nat.
Mater., 2011, 10, 569-581.
[28] Weiss, N.O.; Zhou, H.; Liao, L.; Liu Y.; Jiang, S.; Huang, Y.; Duan, X. Graphene: an
emerging electronic material. Adv Mater., 2012, 24, 5782-825.
[29] Pottsa, J. R.; Dreyerb, D. R.; Bielawski, C. W.; Ruoff, R. S. Graphene-based polymer
nanocomposites. Polymer, 2011, 52, 5-25.
[30] Yang, K.; Feng, L.; Shi, X.; Liu, Z. Nano-graphene in biomedicine: theranostic
applications. Chem. Soc. Rev., 2013,42, 530-547
[31] Georgakilas, V.; Otyepka, M.; Bourlinos, A. B.; Chandra, V.; Kim, N.; Kemp, K. C.;
Hobza, P.; Zboril, R.; Kim, K. S. Functionalization of Graphene: Covalent and Non-Covalent
Approaches, Derivatives and Applications. Chem. Rev., 2012, 112, 6156-6214.
[32] Kuilaa, T.; Bose, S.; Mishra, A. K.; Khanraa, P.; Kim, N. H.; Lee, J. H. Chemical
functionalization of graphene and its applications. Prog. Mater Sci., 2012, 57, 1061-1105.
[33] Chua, C. K.; Pumera, M. Covalent chemistry on Graphene. Chem. Soc. Rev., 2013,42,
3222-3233.
[34] Paredes, J. I.; Munuera, J. M. Recent advances and energy-related applications of high
quality/chemically doped graphenes obtained by electrochemical exfoliation methods.
J. Mater. Chem. A, 2017, 5, 7228-7242
[35] Uddin, M. U.; Kuila, T.; Nayak, G. C.; Kim, N. H.; Ku, B-C.; Lee, J. H. Effects of various
surfactants on the dispersion stability and electrical conductivity of surface modified Graphene.
J. Alloys Compd., 2013, 562, 134-142.
[36] Liu, Y.; Wang, R.; Zhu, Y.; Li, R.; Zhang, J. Photoelectrochemical sensing of catechol
based on CdS-DNA-pristinegraphene nanocomposite film. Sens. Actuators, B, 2015, 210, 355-
361.
[37] Bin, D.; Ren, F.; Wang, Y.; Zhai, C.; Wang, C.; Guo, J.; Yang, P.; Du, Y. Pd-
nanoparticle-supported, PDDA-functionalized graphene as a promising catalyst for alcohol
oxidation. Chemistry - An Asian Journal, 2015, 10, 667-673.

1. INTRODUCCIÓN
39
[38] Lü, Q.-F.; Chen, G.; Lin, T.-T.; Yu, Y. Dye-functionalized graphene/polyaniline
nanocomposite as an electrode for efficient electrochemical supercapacitor. Composites Science
and Technology, 2015, 115, 80-86.
[39] Choudhary, S.; Mungse, H. P.; Khatri, O. P. Dispersion of alkylated graphene in organic
solvents and its potential for lubrication applications. J. Mater. Chem., 2012, 22, 21032-21039.
[40] Hou, S.; Cuellari, R.D.; Hakimi, N.H.H.; Patel, K.; Shah, P.; Gorring, M.; Brachfeld, S.
Amino Terminated Polyethylene Glycol Functionalized Graphene and Its Water Solubility.
Mater. Res. Soc. Symp. Proc., 2010, 1205, 13-19.
[41] Ayan-Varela, M.; Paredes, J. I.; Guardia, L.; Villar-Rodil, S.; Munuera, J. M.; Díaz-
Gonzalez, M.; Fernandez-Sanchez, C.; Martínez-Alonso, A.; Tascón, J. M. D. Achieving
extremely concentrated aqueous dispersions of graphene flakes and catalytically efficient
graphene-metal nanoparticle hybrids with flavin mononucleotide as a high-performance
stabilizer. ACS Appl. Mater. Interfaces, 2015, 7, 10293−10307
[42] Ayán-Varela, M.; Ruiz-Rosas, R.; Villar-Rodil, S.; Paredes, J. I.; Cazorla-Amorós, D.;
Morallón, E.; Martínez-Alonso, A.; Tascón, J. M. D. Efficient Pt electrocatalysts supported
onto flavin mononucleotide–exfoliated pristine graphene for the methanol oxidation reaction,
Electrochimica Acta, 2017, 231, 386-395.
[43] Martinez, J.G.; Ayán-Varela, M.; Paredes, J. I.; Villar-Rodil, S.; Aznar-Cervantes, S. D.;
Otero, T. F. Electrochemical synthesis and characterization of flavin mononucleotide-exfoliated
pristine graphene/polypyrrole composites. ChemElectroChem, 2017, 4, 1487-1497.
[44] Xing, X.; Liu, R.; Liu, S.; Xiao, S.; Xu, Y.; Wang, C.; Wu, D. Surfactant-assisted
hydrothermal synthesis of cobalt oxide/nitrogen-doped graphene framework for enhanced
anodic performance in lithium ion batteries. Electrochimica Acta, 2016, 194, 310-316.
[45] Torres Alonso, E.; Karkera, G.; Jones, G. F.; Craciun, M. F.; Russo, S. Homogeneously
Bright, Flexible, and Foldable Lighting Devices with Functionalized Graphene Electrodes. ACS
Applied Materials and Interfaces, 2016, 8, 16541-16545.
[46] Parandhaman, T.; Das, S. K. Facile synthesis, biofilm disruption properties and
biocompatibility study of a poly-cationic peptide functionalized graphene-silver nanocomposite.
Biomaterials Science, 2018, 6, 3356-3372.
[47] Cao, J.; Wang, Z.; Yang, X.; Tu, J.; Wu, R.; Wang, W. Green synthesis of amphipathic
graphene aerogel constructed by using the framework of polymer-surfactant complex for water
remediation. Applied Surface Science, 2018, 444, 399-406.
[48] Ganatra, R.; Zhang, Q. Few-layer MoS2: A promising layered semiconductor. ACS Nano,
2014, 4074-4099.
[49] Huang, X.; Zeng, Z.; Zhang, H. Metal dichalcogenide nanosheets: preparation, properties
and applications. Chem. Soc. Rev., 2013, 42, 1934-1946.
[50] Winer, W.O. Molybdenum disulfide as a lubricant: A review of the fundamental
knowledge. Wear, 1967, 10, 422-452.
[51] Chhowalla, M.; Shin, H. S.; Eda, G.; Li, L.-J.; Loh, K. P.; Zhang, H. The chemistry of two-
dimensional layered transition metal dichalcogenide nanosheets. Nat. Chem., 2013, 5, 263-275.
[52] Benavente, E.; Santa Ana, M.A.; Mendizábal, F.; González, G. Intercalation chemistry of
molybdenum disulfide. Coord. Chem. Rev., 2002, 224, 87-109.
[53] Mak, K.F.; Lee, C.; Hone, J.; Shan, J.; Heinz, T.F. Atomically thin MoS2: a new direct-gap
semiconductor. Phys Rev Lett., 2010, 105, 136805.
[54] Ghatak, S.; Pal, A.N.; Ghosh, A. Nature of electronic states in atomically thin MoS2 field-
effect transistors. ACS Nano, 2011, 5, 7707-7712.
1. INTRODUCCIÓN
40
[55] Kang, P.; Wang, M. C.; Nam, S. Bioelectronics with two-dimensional materials,
Microelectron. Eng., 2016, 161, 18–35.
[56] Zhang, W.; Zhang, P.; Su, Z.; Wei, G. Synthesis and sensor applications of MoS2-based
nanocomposites. Nanoscale, 2015, 7, 18364-18378.
[57] Lembke, D.; Bertolazzi, S.; Kis, A. Single-Layer MoS2 Electronics. Acc. Chem. Res., 2015,
48, 100-110.
[58] Wang, X.; Kalali, E. N.; Wang, D-Y. An in situ polymerization approach for functionalized
MoS2/nylon-6 nanocomposites with enhanced mechanical properties and thermal stability. J.
Mater. Chem. A, 2015, 3, 24112-24120.
[59] Bertolazzi, S.; Brivio, J.; Kis, A. Stretching and breaking of ultrathin MoS2. ACS Nano,
2011, 5, 9703-9709.
[60] Castellanos-Gomez, A.; Poot, M.; Steele, G.A.; van der Zant, H.S.J.; Agraït, N.; Rubio-
Bollinger, G. Elastic properties of freely suspended MoS2 nanosheets, Adv. Mater, 2012, 24,
772-775.
[61] Kim, J.-Y.; Choi, S.M.; Seo, W.-S.; Cho, W.-S. Thermal and Electronic Properties of
Exfoliated Metal Chalcogenides. Bull. Korean Chem. Soc., 2010, 31, 3225-3227.
[62] Zhou, K.; Liu, J.; Zeng, W.; Hu, Y.; Gui, Z. In situ synthesis, morphology, and
fundamental properties of polymer/MoS2 nanocomposites. Compos. Sci. Technol., 2015, 107,
120-128.
[63] Jaramillo, T.F.; Jørgensen, K.P.; Bonde, J.; Nielsen, J.H.; Horch, S.; Chorkendorff, I.
Identification of active edge sites for electrochemical H2 evolution from MoS2 nanocatalysts.
Science, 2007, 317, 100-102.
[64] Grange, P.; Delmon, B. The role of cobalt and molybdenum sulphides in
hydrodesulphurisation catalysts: A review. J. Less Common. Met., 1974, 36, 353-360.
[65] Zhang, X.; Hayward, D.O.; Lee, C.; Mingos, D.; Michael, P. Microwave assisted catalytic
reduction of sulfur dioxide with methane over MoS2 catalysts. Appl. Catal., B, 2001, 33, 137-
148.
[66] Guardia, L.; Paredes, J. I.; Munuera, J. M.; Villar-Rodil, S.; Ayan-Varela, M.; Martínez-
Alonso, A.; Tascón, J. M. D. Chemically exfoliated MoS2 nanosheets as an efficient catalyst for
reduction reactions in the aqueous phase. ACS Appl. Mater. Interfaces 2014, 6, 21702−21710.
[67] Acerce, M.; Voiry, D.; Chhowalla, M. Metallic 1T phase MoS2 nanosheets as
supercapacitor electrode materials. Nat. Nanotech., 2015, 10, 313-318.
[68] Kim, J.; Byun, S.; Smith, A.J.; Yu, J.; Huang, J. Enhanced Electrocatalytic Properties of
Transition-Metal Dichalcogenides Sheets by Spontaneous Gold Nanoparticle Decoration. J.
Phys. Chem. Lett., 2013, 4, 1227-1232.
[69] Yuwen, L.; Xu, F.; Xue, B.; Luo, Z.; Zhang, Q.; Bao, B.; Su, S.; Weng, L.; Huang, W.;
Wang, L. General synthesis of noble metal (Au, Ag, Pd, Pt) nanocrystal modified MoS2
nanosheets and the enhanced catalytic activity of Pd–MoS2 for methanol oxidation. Nanoscale,
2014, 6, 5762-5769.
[70] Lu, J.; Lu, J.H.; Liu, H.; Liu, B.; Gong, L.; Tok, E.S.; Loh, K.P.; Sow, C.H.
Microlandscaping of Au Nanoparticles on Few-Layer MoS2 Films for Chemical Sensing. Small,
2015, 11, 1792-1800.
[71] Varrla, E.; Backes, C.; Paton, K.R.; Harvey, A.; Gholamvand, Z.; McCauley, J.; Coleman,
J.N. Large-Scale Production of Size-Controlled MoS2 Nanosheets by Shear Exfoliation. Cem.
Mat., 2015, 27, 1129-1139.

1. INTRODUCCIÓN
41
[72] Guardia, L.; Paredes, J.I.; Rozada, R.; Villar-Rodil, S.; Martínez-Alonso, A.; Tascón,
J.M.D. Production of aqueous dispersions of inorganic graphene analogues by exfoliation and
stabilization with non-ionic surfactants. RSC Adv., 2014, 4, 14115-14127.
[73] Chen, L.; Feng, W.; Zhou, X.; Qiu, K.; Miao, Y.; Zhang, Q.; Qin, M.; Li, L.; Zhang, Y.;
He, C. Facile synthesis of novel albumin-functionalized flower-like MoS2 nanoparticles for in
vitro chemophotothermal synergistic therapy. RSC Adv., 2016, 6, 13040-13049.
[74] Suh, J.; Park, T.-E.; Lin, D.-Y.; Fu, D.; Park, J.; Jung, H.J.; Chen, Y.; Ko, C.; Jang, C.;
Sun, Y.; Sinclair, R.; Chang, J.; Tongay, S.; Wu, J. Doping against the Native Propensity of
MoS2: Degenerate Hole Doping by Cation Substitution. Nano Lett., 2014, 14, 6976-6982.
[75] Backes, C.; Berner, N.C.; Chen, X.; Lafargue, P.; LaPlace, P.; Freeley, M.; Duesberg, G.S.;
Coleman, J.N.; McDonald, A.R. Functionalization of Liquid-Exfoliated Two-Dimensional 2H-
MoS2. Angew. Chem. Int. Ed., 2015, 54, 2638-2642.
[76] Voiry, D.; Goswami, A.; Kappera, R.; Castro e Silva, C. C.; Kaplan, D.; Fujita, T.; Chen,
M.; Asefa, T.; Chhowalla, M. Covalent functionalization of monolayered transition metal
dichalcogenides by phase engineering. Nat. Chem., 2015, 7, 45-49.
[77] Sun, Z.; Liao, T.; Dou, Y.; Hwang, S. M.; Park, M.-S.; Jiang, L.; Kim, J. H.; Dou, S. X.
Generalized self-assembly of scalable two-dimensional transition metal oxide nanosheets. Nat.
Commun., 2014, 5, 3813-3822.
[78] Tan, H. T.; Sun, W.; Wang, L.; Yan, Q. 2D transition metal oxides/hydroxides for energy-
storage applications. ChemNanoMat, 2015, 2, 562–577.
[79] Seidov, Z.; Açıkgöz, M.; Kazan, S.; Mikailzade, F. Magnetic properties of Co3O4
polycrystal powder. Ceramics International, 2016, 42, 12928-12931.
[80] Gao, S.; Jiao, X.; Sun, Z.; Zhang, W.; Sun, Y.; Wang, C.; Hu, Q.; Zu, X.; Yang, F.; Yang,
S.; Liang, L.; Wu, J.; Xie, Y. Ultrathin Co3O4 Layers Realizing Optimized CO2 Electroreduction
to Formate. Angew. Chem. Int. Ed., 2016, 55, 698–702.
[81] Zheng, Y.; Wang, W.; Jiang, D.; Zhang, L.; Li, X.; Wang, Z. Ultrathin mesoporous Co3O4
nanosheets with excellent photo-/thermo-catalytic activity. J. Mater. Chem. A, 2016,4, 105-112.
[82] Du, S.; Ren, Z.; Qu, Y.; Wu, J.; Xi, W.; Zhu, J.; Fu, H. Co3O4 nanosheets as a high
performance catalyst for oxygen evolution proceeding via a double two electron process, Chem.
Commun., 2016, 52, 6705–6708.
[83] Wang, X.; Yao, S.; Wu, X.; Shi, Z.; Sun, H.; Que, R. High gas-sensor and supercapacitor
performance of porous Co3O4 ultrathin nanosheets. RSC Adv., 2015, 5, 17938-17944.
[84] Mei, J.; Liao, T.; Kou, L.; Sun, Z. Two-dimensional metal oxide nanomaterials for next-
generation rechargeable batteries. Adv. Mater., 2017, 29, 1700176.
[85] Kou, T.; Yao, B.; Liu, T.; Li, Y. Recent advances in chemical methods for activating
carbon and metal oxide based electrodes for supercapacitors. J. Mater. Chem. A, 2017, 5,
17151–17173.
[86] Yuan, C.; Yang, L.; Hou, L.; Shen, L.; Zhang, X.; Lou, X. W. Growth of ultrathin
mesoporous Co3O4 nanosheet arrays on Ni foam for high-performance electrochemical
capacitors. Energy Environ. Sci., 2012, 5, 7883–7887.
[87] Yao, Y.; Zhu, Y.; Zhao, S.; Shen, J.; Yang, X.; Li, C. Halide ion intercalated
electrodeposition synthesis of Co3O4 nanosheets with tunable pores on graphene foams as free-
standing and flexible Li-ion battery anodes. ACS Appl. Energy Mater., 2018, 1, 1239–1251.
[88] Kaneti, Y. V.; Salunkhe, R. R.; Septiani, N. L. W.; Young, C.; Jiang, X. C.; He, Y. B.;
Kang, Y. M.; Sugahara, Y.; Yamauchi, Y. General template-free strategy for fabricating
mesoporous two-dimensional mixed oxide nanosheets via self-deconstruction/reconstruction of
monodispersed metal glycerate
1. INTRODUCCIÓN
42
Nanospheres. J. Mater. Chem. A, 2018, 6, 5971–5983.
[89] Yang, M.-Q.; Wang, J.; Wu, H.; Ho, G. W. Noble metal-free nanocatalysts with vacancies
for electrochemical water splitting. Small, 2018, 14, 1703323.
[90] Chua, C. K.; Loo, A. H.; Pumera, M. Top-Down and Bottom-Up Approaches in
Engineering 1 T Phase Molybdenum Disulfide (MoS2): Towards Highly Catalytically Active
Materials. Chemistry - A European Journal, 2016, 22, 14336-14341.
[91] Sun, K.; Liu, Y.; Pan, Y.; Zhu, H.; Zhao, J.; Zeng, L.; Liu, Z.; Liu, C. Targeted bottom-up
synthesis of 1T-phase MoS2 arrays with high electrocatalytic hydrogen evolution activity by
simultaneous structure and morphology engineering. Nano Research, 2018, 11, 4368–4379.
[92] Gong, Y.; Yang, S.; Zhan, L.; Ma, L.; Vajtai, R.; Ajayan, P. M. A bottom-up approach to
build 3D architectures from nanosheets for superior lithium storage. Advanced Functional
Materials, 2014, 24, 125-130.
[93] Wang, S.; Li, K.; Chen, Y.; Chen, H.; Ma, M.; Feng, J.; Zhao, Q.; Shi, J. Biocompatible
PEGylated MoS2 nanosheets: Controllable bottom-up synthesis and highly efficient
photothermal regression of tumor. Biomaterials, 2015, 39, 206-217.
[94] Zhuang, L.; Ge, L.; Yang, Y.; Li, M.; Jia, Y.; Yao, X.; Zhu, Z. Ultrathin iron-cobalt oxide
nanosheets with abundant oxygen vacancies for the oxygen evolution reaction. Adv. Mater.,
2017, 1606793.
[95] Chen, P.-Y.; Liu, M.; Valentin, T. M.; Wang, Z.; Steinberg, R. S.; Sodhi, J.; Wong, I. Y.;
Hurt, R. H. Hierarchical metal oxide topographies replicated from highly textured graphene
oxide by intercalation templating. ACS Nano, 2016, 10, 10869-10879.
[96] From graphite to graphene: direct liquid-phase exfoliation of graphite to produce single-
and few layered pristine graphene. J. Mater. Chem. A, 2013, 1, 10592-10606.
[97] Novoselov, K.S.; Jiang, D.; Schedin, F.; Booth, T.J.; Khotkevich, V.V.; Morozov, S.V.;
Geim, A.K. Two-dimensional atomic crystals. Proc. Natl. Acad. Sci. U.S.A., 2005, 102, 10451-
10453.
[98] Coleman, J.N.; Lotya, M.; O'Neill, A.; Bergin, S.D.; King, P.J.; Khan, U.; Young, K.;
Gaucher, A.; De, S.; Smith, R.J.; Shvets, I.V.; Arora, S.K.; Stanton, G.; Kim, H.-Y.; Lee, K.;
Kim, G.T.; Duesberg, G.S.; Hallam, T.; Boland, J.J.; Wang, J.J.; Donegan, J.F.; Grunlan, J.C.;
Moriarty, G.; Shmeliov, A.; Nicholls, R.J.; Perkins, J.M.; Grieveson, E.M.; Theuwissen, K.;
McComb, D.W.; Nellist, P.D.; Nicolosi, V. Two-dimensional nanosheets produced by liquid
exfoliation of layered materials. Science, 2011, 331, 568-571.
[99] Hernandez, Y.; Nicolosi, V.; Lotya, M.; Blighe, F. M.; Sun, Z.; De, S.; McGovern, I. T.;
Holland, B.; Byrne, M.; Gun'Ko, Y. K.; Boland, J. J.; Niraj, P.; Duesberg, G.; Krishnamurthy,
S.; Goodhue, R., Hutchison, J.; Scardaci, V.; Ferrari, A. C.; Coleman, J. N. High-yield
production of graphene by liquid-phase exfoliation of graphite. Nature Nanotechnology, 2008,
3, 563–568.
[100] Paton, K. R.; Varrla, E.; Backes, C.; Smith, R. J.; Khan, U.; O’Neill, A.; Boland, C.;
Lotya, M.; Istrate, O. M.; King, P.; Higgins, T.; Barwich, S.; May, P.; Puczkarski, P.; Ahmed,
I.; Moebius, M.; Pettersson, H.; Long, E.; Coelho, J.; O’Brien, S. E.; McGuire, E. K.; Sanchez,
B. M.; Duesberg, G. S.; McEvoy, N.; Pennycook, T. J.; Downing, C.; Crossley, A.; Nicolosi,
V.; Coleman, J. N. Scalable production of large quantities of defect-free few-layer graphene by
shear exfoliation in liquids. Nature Materials, 2014, 13, 624–630.
[101] Coleman, J. N.; Lotya, M.; O'Neill, A.; Bergin, S. D.; King, P. J.; Khan, U.; Young, K.;
Gaucher, A.; De, S.; Smith, R. J.; Shvets, I. V.; Arora, S. K.; Stanton, G.; Kim, H.-Y.; Lee, K.;
Kim, G. T.; Duesberg, G. S.; Hallam, T.; Boland, J. J.; Wang, J. J.; Donegan, J. F.; Grunlan, J.
C.; Moriarty, G.; Shmeliov, A.; Nicholls, R. J.; Perkins, J. M.; Grieveson, E. M.; Theuwissen,

1. INTRODUCCIÓN
43
K.; McComb, D. W.; Nellist, P. D.; Nicolosi, V. Two-dimensional nanosheets produced by
liquid exfoliation of layered materials. Science, 2011, 331, 568-571.
[102] Halim, U.; Zheng, C. R.; Chen, Y.; Lin, Z.; Jiang, S.; Cheng, R.; Huang, Y.; Duan, X. A
rational design of cosolvent exfoliation of layered materials by directly probing liquid–solid
interaction. Nature Commun., 2013, 4, 2213-2020.
[103] Lotya, M.; Hernandez, Y.; King, P. J.; Smith, R. J.; Nicolosi, V.; Karlsson, L. S.; Blighe,
F. M.; De, S.; Zhiming, W.; McGovern, I. T.; Duesberg, G. S.; Coleman, J. N. Liquid phase
production of graphene by exfoliation of graphite in surfactant/water solutions. J. Am. Chem.
Soc., 2009, 131, 3611-3620.
[104] Bourlinos, A. B.; Georgakilas, V.; Zboril, R.; Steriotis, T. A.; Stubos, A. K.; Trapalis, C.
Aqueous-phase exfoliation of graphite in the presence of polyvinylpyrrolidone for the
production of water-soluble graphenes. Solid State Communications, 2009, 149, 2172-2176.
[105] Caridad, B.; Paredes, J. I.; Pérez-Vidal, O.; Villar-Rodil, S.; Pagán, A.; Cenis, J. L.;
Martínez-Alonso, A.; Tascón, J. M. D. A biosupramolecular approach to graphene:
Complementary nucleotide-nucleobase combinations as enhanced stabilizers towards aqueous-
phase exfoliation and functional graphene-nucleotide hydrogels. Carbon, 2018, 129, 321-334.
[106] Shahil, K. M. F.; Balandin, A. A. Graphene-multilayer graphene nanocomposites as
highly efficient thermal interface materials. Nano Letters, 2012, 12, 861-867.
[107] Bissett, M. A.; Kinloch, I. A.; Dryfe, R. A. W. Characterization of MoS2-Graphene
Composites for High-Performance Coin Cell Supercapacitors. ACS Appl. Mater. Interfaces,
2015, 7, 17388-17398.
[108] Kelly, A. G.; Hallam, T.; Backes, C.; Harvey, A.; Esmaeily, A. S.; Godwin, I.; Coelho, J.;
Nicolosi, V.; Lauth, J.; Kulkarni, A.; Kinge, S.; Siebbeles, L. D. A.; Duesberg, G. S.; Coleman,
J. N. All-printed thin-film transistors from networks of liquid-exfoliated nanosheets. Science,
2017, 356, 69–73.
[109] Dreyer, D.R.; Park, S.; Bielawski, C.W.; Ruoff, R.S. The chemistry of graphene oxide.
Chem. Soc. Rev., 2010, 39, 228-240.
[110] Zhu, Y.; Murali, S.; Cai, W.; Li, X.; Suk, J.W.; Potts, J.R.; Ruoff, R.S. Graphene and
Graphene Oxide: Synthesis, Properties, and Applications. Adv. Mater., 2010, 22, 3906-3924.
[111] Paredes, J. I.; Villar-Rodil, S.; Martínez-Alonso, A.; Tascón, J. M. D. Graphene oxide
dispersions in organic solvents. Langmuir, 2008, 24, 10560-10564.
[112] Rozada, R.; Paredes, J. I.; López, M. J.; Villar-Rodil, S.; Cabria, I.; Alonso, J. A.;
Martínez-Alonso, A.; Tascón, J. M. D. From graphene oxide to pristine graphene: Revealing the
inner workings of the full structural restoration. Nanoscale, 2015, 7, 2374-2390.
[113] Stankovich, S.; Dikin, D.A.; Piner, R.D.; Kohlhaas, K.A.; Kleinhammes, A.; Jia, Y.; Wu,
Y.; Nguyen, S.T.; Ruoff, R.S. Synthesis of graphene-based nanosheets via chemical reduction
of exfoliated graphite oxide. Carbon, 2007, 45, 1558-1565.
[114] Fernández-Merino, M.J.; Guardia, L.; Paredes, J.I.; Villar-Rodil, S.; Solís-Fernández, P.;
Martínez-Alonso, A.; Tascón, J.M.D. Vitamin C Is an Ideal Substitute for Hydrazine in the
Reduction of Graphene Oxide Suspensions. J. Phys. Chem. C, 2010, 114, 6426-6432.
[115] Pham, V.H.; Pham, H.D.; Dang, T.T.; Hur, S.H.; Kim, E.J.; Kong, B.S.; Kim, S.; Chung,
J.S. Chemical reduction of an aqueous suspension of graphene oxide by nascent hydrogen. J.
Mater. Chem., 2012, 22, 10530-10536.
[116] Aunkor, M.T.H.; Mahbubul, I.M.; Saidur, R.; Metselaar, H.S.C. The green reduction of
graphene oxide. RSC Adv., 2016, 6, 27807–27828.

1. INTRODUCCIÓN
44
[117] Acik, M.; Lee, G.; Mattevi, C.; Pirkle, A.; Wallace, R.M.; Chhowalla, M.; Cho, K.;
Chabal, Y. The Role of Oxygen during Thermal Reduction of Graphene Oxide Studied by
Infrared Absorption Spectroscopy. J. Phys. Chem. C, 2011, 115, 19761-19781.
[118] Guo, H.-L.; Wang, X.-F.; Qian, Q.-Y.; Wang, F.-B.; Xia, X.-H. A Green Approach to the
Synthesis of Graphene Nanosheets. ACS Nano, 2009, 3, 2653-2659.
[119] Guardia, L.; Villar-Rodil, S.; Paredes, J.I.; Rozada, R.; Martínez-Alonso, A.; Tascón,
J.M.D. UV light exposure of aqueous graphene oxide suspensions to promote their direct
reduction, formation of graphene–metal nanoparticle hybrids and dye degradation. Carbon,
2012, 50, 1014-1024.
[120] Huang, X.; Qi, X.; Boey, F.; Zhang, H. Graphene-based composites. Chemical Society
Reviews, 2012, 41, 666-686.
[121] Huang, X.; Yin, Z.; Wu, S.; Qi, X.; He, Q.; Zhang, Q.; Yan, Q.; Boey, F.; Zhang, H.
Graphene-based materials: Synthesis, characterization, properties, and applications. Small,
2011, 7, 1876-1902.
[122] Nicolosi, V.; Chhowalla, M.; Kanatzidis, M. G.; Strano, M. S.; Coleman, J. N. Liquid
Exfoliation of Layered Materials. Science, 2013, 340, 1226419.
[123] Joensen, P.; Frindt, R. F.; Morrison, S. R. Single-layer MoS2. Materials Research
Bulletin, 1986, 21, 457-461.
[124] Acerce, M., Voiry, D., Chhowalla, M. Metallic 1T phase MoS2 nanosheets as
supercapacitor electrode materials. Nature Nanotechnology, 2015, 10, 313-318.
[125] Lukowski, M.A., Daniel, A.S., Meng, F., Forticaux, A., Li, L., Jin, S. Enhanced
hydrogen evolution catalysis from chemically exfoliated metallic MoS2 nanosheets. J. Am.
Chem. Soc., 2013, 135, 10274-10277.
[126] Chou, S. S.; De, M.; Kim, J.; Byun, S.; Dykstra, C.; Yu, J.; Huang, J.; Dravid, V. P.
Ligand conjugation of chemically exfoliated MoS2. J. Am. Chem. Soc., 2013, 135, 4584−4587.
[127] Guardia, L.; Paredes, J. I.; Munuera, J. M.; Villar-Rodil, S.; Ayán-Varela, M.; Martínez-
Alonso, A.; Tascón, J. M. D. Chemically exfoliated MoS2 nanosheets as an efficient catalyst for
reduction reactions in the aqueous phase. ACS Appl. Mater. Interfaces, 2014, 6, 21702-21710.
[128] Abdelkader, A. M.; Cooper, A. J.; Dryfe, R. A. W.; Kinloch, I A. How to get between the
sheets: a review of recent works on the electrochemical exfoliation of graphene materials from
bulk graphite. Nanoscale, 2015, 7, 6944-6956.
[129] Yang, S.; Lohe, M. R.; Müllen, K.; Feng, X. New‐generation graphene from
electrochemical approaches: production and applications. Adv. Mater., 2016, 28, 6213–6221.
[130] Low, C. T. J.; Walsh, F. C.; Chakrabarti, M. H.; Hashim, M. A.; Hussain, M. A.
Electrochemical approaches to the production of graphene flakes and their potential
applications. Carbon, 2013, 54, 1-21.
[131] Wang, J.; Manga, K. K.; Bao, Q.; Loh, K. P. High-yield synthesis of few-layer graphene
flakes through electrochemical expansion of graphite in propylene carbonate electrolyte. J. Am.
Chem. Soc., 2011, 133, 23, 8888-8891.
[132] Cooper, A. J.; Velický, M.; Kinloch, I. A.; Dryfe, R. A. W. On the controlled
electrochemical preparation of R4N+ graphite intercalation compounds and their host structural
deformation effects. Journal of Electroanalytical Chemistry, 2014, 730, 34-40.
[133] Cooper, A. J.; Wilson, N. R.; Kinloch, I. A.; Dryfe, R. A. W. Single stage electrochemical
exfoliation method for the production of few-layer graphene via intercalation of
tetraalkylammonium cations. Carbon, 2014, 66, 340-350.
[134] Yang, Y.; Lu, F.; Zhou, Z.; Song, W.; Chen, Q.; Ji, X. Electrochemically cathodic
exfoliation of graphene sheets in room temperature ionic liquids N-butyl, methylpyrrolidinium

1. INTRODUCCIÓN
45
bis(trifluoromethylsulfonyl)imide and their electrochemical properties. Electrochimica Acta,
2013, 113, 9–16.
[135] Parvez, K.; Li, R.; Puniredd, S. R.; Hernandez, Y.; Hinkel, F.; Wang, S.; Feng, X.;
Müllen, K. Electrochemically exfoliated graphene as solution-processable, highly conductive
electrodes for organic electronics. ACS Nano, 2013, 7, 3598–3606.
[136] Liu, J. L.; Yang, H. P.; Zhen, S. G.; Poh, C. K.; Chaurasia, A.; Luo, J. S.; Wu, X. Y.;
Yeow, E. K. L.; Sahoo, N. G.; Lin, J. Y.; Shen, Z. X. A green approach to the synthesis of high-
quality graphene oxide flakes via electrochemical exfoliation of pencil core. RSC Adv., 2013, 3,
11745-11750.
[137] Parvez, K.; Wu, Z.-S.; Li, R.; Liu, X.; Graf, R.; Feng, X.; Mullen, K. Exfoliation of
graphite into graphene in aqueous solutions of inorganic salts. J. Am. Chem. Soc., 2014, 136,
6083−6091.
[138] Alanyalıoğlu, M.; Segura, J. J.; Oró-Solè, J.; Casañ-Pastor, N. The synthesis of graphene
sheets with controlled thickness and order using surfactant-assisted electrochemical processes.
Carbon, 2012, 50, 142-152.
[139] Liu, N.; Luo, F.; Wu, H.; Liu, Y.; Zhang, C.; Chen, J. One-step ionic-liquid-assisted
electrochemical synthesis of ionic-liquid-functionalized graphene sheets directly from graphite.
Adv. Funct. Mater., 2008, 18, 1518–1525.
[140] Paredes, J. I.; Munuera, J. M. Recent advances and energy-related applications of high
quality/chemically doped graphenes obtained by electrochemical exfoliation methods. J. Mater.
Chem. A, 2017, 5, 7228-7242.
[141] Chen, C.-H.; Yang, S.-W.; Chuang, M.-C.; Woon, W.-Y.; Su, C.-Y. Towards the
continuous production of high crystallinity graphene via electrochemical exfoliation with
molecular in situ encapsulation. Nanoscale, 2015, 7, 15362-15373.
[142] Yang, S.; Brüller, S.; Wu, Z.-S.; Liu, Z.; Parvez, K.; Dong, R.; Richard, F.; Samorì, P.;
Feng, X.; Müllen, K. Organic Radical-Assisted Electrochemical Exfoliation for the Scalable
Production of High-Quality Graphene. J. Am. Chem. Soc., 2015, 137, 13927-13932.
[143] Kurys, Y. I.; Ustavytska, O. O.; Koshechkoa, V. G.; Pokhodenko, V. D. Structure and
electrochemical properties of multilayer graphene prepared by electrochemical exfoliation of
graphite in the presence of benzoate ions. RSC Adv., 2016, 6, 36050-36057.
[144] Yang, Y.; Shi, W.; Zhang, R.; Luan, C.; Zeng, Q.; Wang, C.; Li, S.; Huang, Z.; Liao H.;
Ji, X. Electrochemical exfoliation of graphite into nitrogen-doped graphene in glycine solution
and its energy storage properties. Electrochim. Acta, 2016, 204, 100–107.
[145] Parveen, N.; Ansari, M. O.; Ansari, S. A.; Cho, M.H. Simultaneous sulfur doping and
exfoliation of graphene from graphite using an electrochemical method for supercapacitor
electrode materials. J. Mater. Chem. A, 2016, 4, 233–240.
[146] Parvez, K.; Rincón, R. A.; Weber, N.-E.; Cha, K. C.; Venkataraman, S. S. One-step
electrochemical synthesis of nitrogen and sulfur co-doped, high-quality graphene oxide. Chem.
Commun., 2016, 52, 5714–5717.

1. INTRODUCCIÓN
46

2. OBJETIVOS Y PLANTEAMIENTO DE LA MEMORIA
47
2. Objetivos y planteamiento de la memoria
2.1 Objetivos
Como se ha descrito en el capítulo previo, los materiales 2D poseen un gran
interés científico en términos de sus propiedades y aplicaciones, pero actualmente su
uso está severamente limitado fuera del ámbito de la investigación. Esta limitación se
debe en gran parte a la falta de métodos de preparación escalables y que permitan
obtener materiales 2D de alta calidad y en grandes cantidades de manera asequible. En
este sentido, la preparación de dispersiones de materiales 2D en fase líquida por vías
como la exfoliación electroquímica permiten cumplir en gran medida estas premisas,
por lo que su estudio permitirá avanzar no solo en el conocimiento per se, sino en la
implementación del material en aplicaciones prácticas. Por otra parte, el estudio de la
activación y funcionalización de materiales por vía química y térmica constituye una
manera viable de mejorar sus propiedades con vistas a su implementación en
aplicaciones.
Como objetivo general de esta tesis se ha planteado el desarrollo de
metodologías de preparación y funcionalización de materiales 2D,concretamente
grafeno, MoS2 y Co3O4, así como su caracterización y el estudio de algunas
aplicaciones potenciales. Los objetivos específicos son los siguientes:
Estudio de la exfoliación de grafeno por vía electroquímica, con las siguientes
variables:
o Tipo de grafito de partida.
o Uso de electrolitos que posean funcionalidades adicionales al efecto
exfoliante.
o Pretratamiento del grafito de partida.
o Uso de aditivos de electrolito que permitan limitar el grado de oxidación del
grafito resultante.
Estudio de la funcionalización covalente de MoS2 2D preparado mediante
exfoliación química por intercalación de litio.
Desarrollo de metodologías directas de preparación de Co3O4 2D activado.
Caracterización de los materiales obtenidos.
Ensayo en aplicaciones de almacenamiento de energía (grafeno y Co3O4), catálisis
(grafeno, MoS2 y Co3O4), eliminación de contaminantes del agua (grafeno y Co3O4)
y estudios de biocompatibilidad (grafeno y MoS2).

2. OBJETIVOS Y PLANTEAMIENTO DE LA MEMORIA
48
2.2 Organización de la memoria
En el primer capítulo de esta tesis (introducción) se describen de forma general
los materiales 2D y de forma más detallada aquellos en los que se ha trabajado, es decir,
grafeno, MoS2 y Co3O4, así como los métodos de preparación de estos materiales. En el
presente capítulo se describen los objetivos y la organización de la memoria. En el
tercer capítulo se recogen los métodos de preparación y caracterización de los
materiales empleados en la tesis. El cuarto capítulo contiene una recopilación de los
fundamentos y aplicaciones de las técnicas de caracterización empleadas. En el quinto
capítulo se recopilan los resultados de la tesis en forma de los artículos publicados y
enviados, precedidos en cada bloque de resúmenes detallados para cada artículo. La
tabla mostrada a continuación recoge los artículos publicados y enviados a revistas,
junto al nombre de las mismas, su índice de impacto (ISI JCR 2017) y valor de
CiteScore de Scopus 2017, así como su posición frente al número total de revistas y el
área de publicación relevante en ambas bases de datos. Las publicaciones se han
agrupado en tres bloques, coincidiendo con los tres materiales estudiados. Un bloque de
grafeno con seis artículos, y otros dos bloques para MoS2 y Co3O4, con un artículo cada
uno. Las conclusiones de esta tesis están descritas en el capítulo sexto, y se ha incluido
un anexo que recoge las publicaciones relacionadas que no pertenecen a la tesis, así
como una compilación de las comunicaciones a congresos.
Título
Revista
Índice
de
impacto
Posición/
nº de
revistas
total
CiteScore
Posición/
nº de
revistas
total
Áreas
High quality, low
oxygen content and
biocompatible graphene
nanosheets obtained by
anodic exfoliation of
different graphite types
Carbon 7.466 33/293 7.42 25/371 Materials
Science,
General
Chemistry
Electrolytic exfoliation
of graphite in water
with multifunctional
electrolytes: en route
towards high quality,
oxide-free graphene
flakes
Nanoscale 6.970 41/293 7.17 37/439 Materials
Science,
General
Materials
Science
A simple strategy to
improve the yield of
graphene nanosheets in
the anodic exfoliation of
graphite foil
Carbon 7.466 33/293 7.42 25/371 Materials
Science,
General
Chemistry
Electrochemical
Exfoliation of Graphite
in Aqueous Sodium
Halide Electrolytes
toward Low Oxygen
Content Graphene for
ACS
Applied
Materials
&
Interfaces
8.456 27/293 8.69 24/439 Materials
Science,
General
Materials
Science

2. OBJETIVOS Y PLANTEAMIENTO DE LA MEMORIA
49
Energy and
Environmental
Applications
High quality, low-
oxidized graphene via
anodic exfoliation with
table salt as an efficient
oxidation-preventing
co-electrolyte for
water/oil remediation
and capacitive energy
storage applications
Applied
Materials
Today
8.013 30/293 8.10 28/439 General
Materials
Science
Impact of covalent
functionalization on the
aqueous processability,
catalytic activity, and
biocompatibility of
chemically exfoliated
MoS2 nanosheets
ACS
Applied
Materials
&
Interfaces
8.456 27/293 8.69 24/439 Materials
Science,
General
Materials
Science
A direct route to
activated two-
dimensional cobalt
oxide nanosheets for
electrochemical energy
storage, catalytic and
environmental
applications
Journal of
Colloid and
Interface
Science
6.361 29/148 5.93 9/116 Chemistry,
Surfaces

2. OBJETIVOS Y PLANTEAMIENTO DE LA MEMORIA
50

3. MATERIALES Y MÉTODOS
51
3. Materiales y métodos
3.1 Grafeno
3.1.1 Exfoliación electroquímica con electrolito de sulfato de potasio
Se ha preparado grafeno mediante exfoliación electroquímica. El método
consiste en utilizar grafito como ánodo en una celda electroquímica, usando platino
como cátodo y disoluciones acuosas de sales como electrolito. En el caso de grafito en
polvo (grado 2910, Mersen) y en copos (Ref. 332461, Sigma–Aldrich) se compactan
500 mg en forma de pastilla de 12 mm de diámetro a una presión de 1 tonelada, y se
perfora un agujero en la misma por el que se introduce un hilo de platino que se conecta
a la fuente de corriente como ánodo. En el caso de HOPG (grado ZYH, Advanced
Ceramics) o grafito flexible (Papyex I980, Mersen), la pieza se conecta directamente a
la fuente de corriente mediante una pinza. El cátodo es un hilo de platino que se conecta
mediante una pinza a la fuente (Agilent 6614C). Se pesan 1.394 g de sulfato de potasio
(Ref. P0072, Sigma Aldrich) y se disuelven en 80 mL de agua milli-Q. Se sumergen los
electrodos en la disolución acuosa separados a una distancia de ~2 cm uno de otro y se
aplica un potencial de 10 V con una corriente máxima de 0.5 A durante un tiempo fijado
de 3, 15 o 60 minutos. Durante este tiempo se desprenden del ánodo partículas de
grafito expandido. El grafito expandido se filtra y lava con abundante agua, y a
continuación se seca a vacío y temperatura ambiente durante 18 horas, si se va a utilizar
sin procesar.
Para preparar dispersiones de grafeno a partir del material tratado
electroquímicamente, se toma el producto lavado y se sonica durante 3 h en baño de
ultrasonidos (JP Selecta Ultrasons system, 40 KHz, 20 W L-1
) en una disolución de sal
sódica de riboflavina 5′-monofosfato (pureza de 73-79%, Sigma Aldrich, F6750) a 1 mg
mL-1
o en N, N-dimetilformamida (Ref. 103053, Merck). A continuación, para descartar
el material sin exfoliar se centrifuga a 200 g durante 20 min (Eppendorf 5424). Si se ha
dispersado el material en sal de riboflavina se hacen dos ciclos de centrifugado a 20000
g durante 20 min y redispersión en agua milli-Q para eliminar el exceso de dicha sal.
La concentración de grafeno en dispersión se determina mediante espectroscopía
UV-Vis usando la ley de Lambert-Beer, A/l = αC, donde A es la absorbancia medida a

3. MATERIALES Y MÉTODOS
52
660 nm para la dispersión de grafeno, l es el paso óptico, α es el coeficiente de extinción
a esa longitud de onda (2440 mL mg-1
m-1
) y C es la concentración de grafeno.
3.1.2 Exfoliación electroquímica con electrolitos de sulfonatos aromáticos
El procedimiento para la exfoliación electroquímica con sulfonatos aromáticos
sigue el proceso general descrito en el apartado anterior con las siguientes
particularidades. Se utiliza una pieza de grafito flexible de 35×25×0.5 mm3 como ánodo
y un hilo de platino como cátodo. Los electrodos se sumergen en 20 mL de disolución
del sulfonato (Sigma Aldrich) en agua milli-Q a una concentración entre 0.001 y 0.2 M
y se aplica un voltaje de 10 V durante 1 h. El material expandido se sonica en la propia
disolución durante 3 h, se centrifuga dos veces a 20000 g durante 20 min redispersando
en agua milli-Q, y por último se centrifuga a 200 g durante 20 min, recuperando el
sobrenadante.
3.1.3 Pretratamiento con ácido sulfúrico
Con el objetivo de aumentar el rendimiento de la exfoliación anódica, se realiza
un pretratamiento consistente en sumergir una pieza de grafito flexible (55×30×0.5
mm3) en ácido sulfúrico (95-98%, Sigma Aldrich) durante tiempos de 1 a 72 h. A
continuación se lleva a cabo la exfoliación de la misma manera a la descrita en el
apartado 3.1.1. El material expandido resultante se sonica en una mezcla de agua y 2-
propanol 65/35 % en volumen durante 3 h y se dializa durante 72 h. A continuación, se
centrifuga como ha sido descrito previamente.
3.1.4 Exfoliación electroquímica con electrolitos de halogenuros
La exfoliación electroquímica con halogenuros de sodio sigue el mismo
procedimiento general que el seguido para el sulfato de potasio. Se utilizan piezas de
grafito flexible de 35×25×0.5 mm3 como ánodo y una lámina de platino (cuadrada, 25
mm de lado) como cátodo, y ambos electrodos se sumergen en disoluciones 0.01 a 1.0
M de NaCl, NaBr y NaI (Sigma Aldrich). Los materiales expandidos se lavan con
abundante agua y etanol y se sonican y centrifugan como está descrito en el apartado
3.1.1.

3. MATERIALES Y MÉTODOS
53
3.1.5 Exfoliación electroquímica con aditivos de electrolito de carácter antioxidante
Con objeto de impedir la oxidación del grafeno durante la exfoliación
electroquímica, se lleva a cabo el proceso descrito en 3.1.1, utilizando sulfato de sodio
0.1 M y añadiendo especies antioxidantes (etanol, cloruro de potasio, cloruro, bromuro,
yoduro, citrato, ascorbato, sulfito y borohidruro de sodio) en concentraciones de 0.01 a
0.70 M.
3.2 Disulfuro de molibdeno
3.2.1 Exfoliación química
En caja seca bajo atmósfera de argón, se añaden 3 mL de n-butil-litio (1.6 M en
hexano, Sigma Aldrich, 186171) a 300 mg de MoS2 en polvo (Sigma Aldrich, 69860).
Se deja reaccionar durante 48 h, se filtra y lava con 60 mL de hexano (pureza 95%,
Sigma Aldrich, 296090). Se extrae el producto de la caja seca y se sumerge
inmediatamente en agua Milli-Q. Se sonica en baño de ultrasonidos durante 1 h para
obtener una dispersión de MoS2 exfoliado químicamente (ce-MoS2). La dispersión se
dializa durante 48 h para eliminar restos de litio e impurezas presentes. Para determinar
la concentración del ce-MoS2 se utiliza espectroscpía UV-Vis, midiendo la absorbancia
a 450nm y utilizando un coeficiente de extinción de 5045 m−1
g−1
L para aplicar la ley
de Lambert-Beer.
3.2.2 Funcionalización con grupos de ácido acético
Para funcionalizar el ce-MoS2, se añade ácido yodoacético (1.1 mmol) a 40 mL
de una dispersión ácida (pH ~4) de ce-MoS2 a 0.44 mg mL-1
, que se mantiene con
agitación a temperatura ambiente durante 5 días. A continuación la dispersión se lava
con isopropanol, etanol y agua mediante ciclos de centrifugación a 1743g durante 30
min y redispersión (3 ciclos para cada disolvente). La dispersión resultante se dializa
durante 72 h para eliminar las impurezas restantes, obteniéndose ce-MoS2
funcionalizado (f-MoS2)

3. MATERIALES Y MÉTODOS
54
3.3 Óxido de cobalto
3.3.1 Síntesis de Co3O4
Para sintetizar el óxido amorfo precursor CoO, se disuelven 200 mg del
copolímero tribloque Pluronic 123 (Sigma Aldrich) en 14 mL de agua/etanol (33/2 v/v)
con agitación. A esta mezcla se le añaden a continuación 125 mg de acetato de cobalto
(II) tetrahidrato (Sigma Aldrich) y 70 mg de hexametilentetraamina (Sigma Aldrich). Se
agita la mezcla durante 15 minutos, para después añadir 13 mL de etilenglicol y agitar
durante otros 30 minutos. Se deja reposar durante 24 h la mezcla y a continuación se
calienta en autoclave de teflón a 170 ºC durante 2 h. El sólido verde resultante se lava
mediante ciclos de 2000 g durante 20 min y redispersión en agua y etanol (3 ciclos cada
disolvente), para después secar a vacío y temperatura ambiente durante 24 h. Para
obtener Co3O4, el sólido obtenido previamente se calcina a temperaturas de 250, 350 y
450 ºC durante 2 h.
3.4 Preparación de híbridos de material bidimensional-nanopartículas
metálicas
3.4.1 Híbridos de grafeno/surfactante con nanopartículas de platino
Se calientan 9 mL de una dispersión 0.2 mg mL-1
de grafeno/surfactante
(naftaleno 1,5-disulfonato de sodio o pireno 1,3,6,8-tetrasulfonato de sodio) a 85 ºC y se
añade 1 mL de K2PtCl4 (99.99%, Sigma Aldrich) 1.1 mM en disolución acuosa. La
mezcla se mantiene en agitación a esta temperatura 2 h, y posteriormente se centrifuga a
200 g durante 20 min y se redispersa en agua milli-Q. Se añaden 20 µL de una
disolución acuosa de NaBH4 de concentración 1.5 M y se deja a temperatura ambiente
sin agitación durante 45 min. A continuación, para purificar los híbridos se realizan dos
ciclos de centrifugación a 20000 g durante 20 min y redispersión en agua milli-Q.
3.4.2 Híbridos de f-MoS2 con nanopartículas de plata
Se mezclan disoluciones acuosas de nitrato de plata 0.5 mM, borohidruro de
sodio 22.5 mM y dispersión acuosa de f-MoS2 0.1 mg mL-1
, y se dejan reaccionar sin

3. MATERIALES Y MÉTODOS
55
agitación durante 2 h. El producto de la reacción se purifica mediante dos ciclos de
centrifugado a 20000 g durante 20 min y redispersión en agua milli-Q.
3.5 Preparación de electrodos para caracterización electroquímica
3.5.1 Electrodos de grafeno
Para preparar los electrodos de trabajo de las celdas electroquímicas se utilizó el
grafito expandido producido en la exfoliación electroquímica tras un lavado y secado,
sin posteriores tratamientos.
En el caso de las medidas con dos electrodos, se toman dos porciones de 7 mg de
una pasta de grafito expandido y politetrafluoroetileno (PTFE) en proporción 8 a 1 en
masa, y se presionan a 1 tonelada durante 15 segundos, formando discos de ~0.78 cm2.
Los electrodos se desgasifican a 100 ºC durante 4 h y se sumergen en el electrolito
(H2SO4 1M) durante 24 horas. Los electrodos, separados por una membrana de fibra de
vidrio (grado 934-AH, Whatman), se colocan en una celda tipo Swagelok y se conectan
al potenciostato (PGZ 402 Voltalab, from Radiometer Analytical) para llevar a cabo la
caracterización electroquímica.
Para medidas con tres electrodos, el grafeno se utiliza como electrodo de trabajo
tomando 10 mg y prensando (1 tonelada, 15 s) sobre una pieza de grafito flexible de
0.78 cm2. El contraelectrodo consiste en una mezcla de carbón activado comercial (ACF
A20), PTFE y negro de carbono en proporción en peso de 95:5:5. Los electrodos se
sumergen en el electrolito (H2SO4 1M) durante 24 h, se desgasifican a vacío durante 1
min y se colocan en una celda Swagelok separados por una membrana de fibra de vidrio
(grado 934-AH, Whatman). El electrodo de referencia es Ag/AgCl (KCl 3M) y la celda
se conecta a un potenciostato Biologic VSP para realizar las medidas.
3.5.2 Electrodos de óxido de cobalto
Las medidas electroquímicas realizadas sobre los óxidos de cobalto se llevan a
cabo según el mismo procedimiento descrito para el grafeno en configuración de tres
electrodos, con la diferencia de que se deposita un volumen de dispersión (400 μL, 0.5
mg mL-1
) sobre el grafito flexible, dejando evaporar 24 h a temperatura ambiente. El

3. MATERIALES Y MÉTODOS
56
electrolito en este caso es KOH 6M y el electrodo de referencia de Hg/HgO (NaOH
1M).
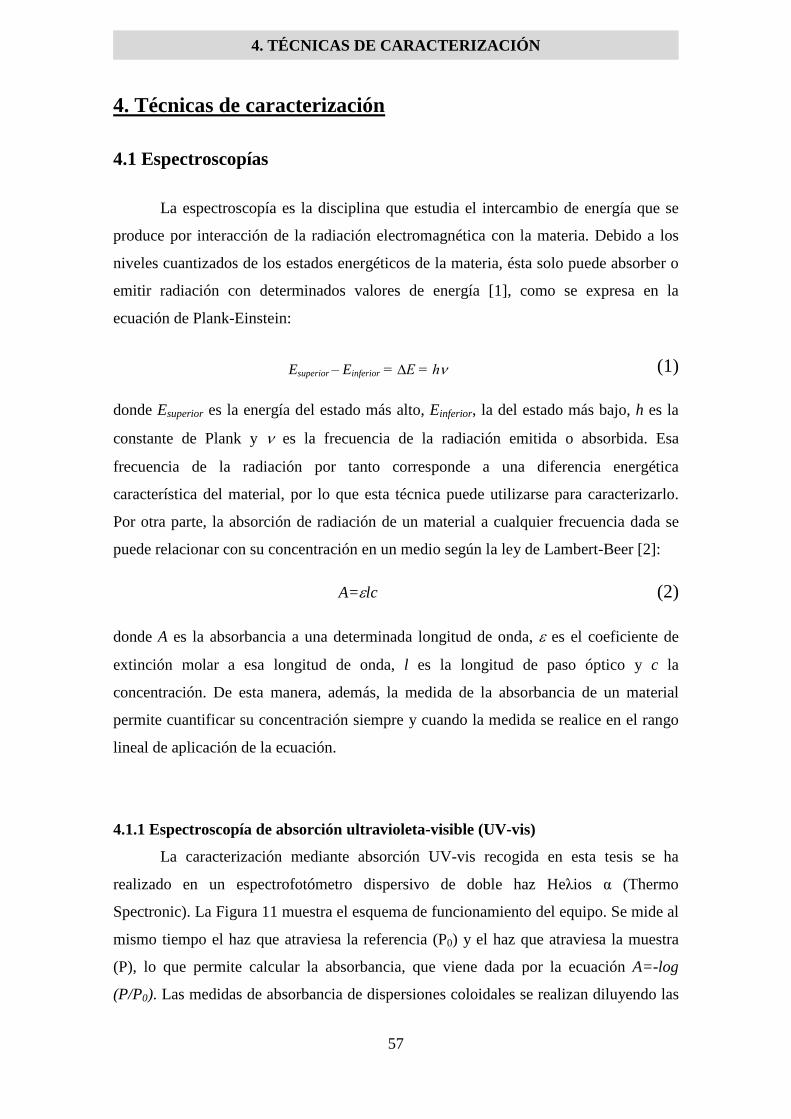
4. TÉCNICAS DE CARACTERIZACIÓN
57
4. Técnicas de caracterización
4.1 Espectroscopías
La espectroscopía es la disciplina que estudia el intercambio de energía que se
produce por interacción de la radiación electromagnética con la materia. Debido a los
niveles cuantizados de los estados energéticos de la materia, ésta solo puede absorber o
emitir radiación con determinados valores de energía [1], como se expresa en la
ecuación de Plank-Einstein:
(1)
donde Esuperior es la energía del estado más alto, Einferior, la del estado más bajo, h es la
constante de Plank y es la frecuencia de la radiación emitida o absorbida. Esa
frecuencia de la radiación por tanto corresponde a una diferencia energética
característica del material, por lo que esta técnica puede utilizarse para caracterizarlo.
Por otra parte, la absorción de radiación de un material a cualquier frecuencia dada se
puede relacionar con su concentración en un medio según la ley de Lambert-Beer [2]:
A=lc (2)
donde A es la absorbancia a una determinada longitud de onda, es el coeficiente de
extinción molar a esa longitud de onda, l es la longitud de paso óptico y c la
concentración. De esta manera, además, la medida de la absorbancia de un material
permite cuantificar su concentración siempre y cuando la medida se realice en el rango
lineal de aplicación de la ecuación.
4.1.1 Espectroscopía de absorción ultravioleta-visible (UV-vis)
La caracterización mediante absorción UV-vis recogida en esta tesis se ha
realizado en un espectrofotómetro dispersivo de doble haz Heλios α (Thermo
Spectronic). La Figura 11 muestra el esquema de funcionamiento del equipo. Se mide al
mismo tiempo el haz que atraviesa la referencia (P0) y el haz que atraviesa la muestra
(P), lo que permite calcular la absorbancia, que viene dada por la ecuación A=-log
(P/P0). Las medidas de absorbancia de dispersiones coloidales se realizan diluyendo las
Esuperior – Einferior = ∆E = h
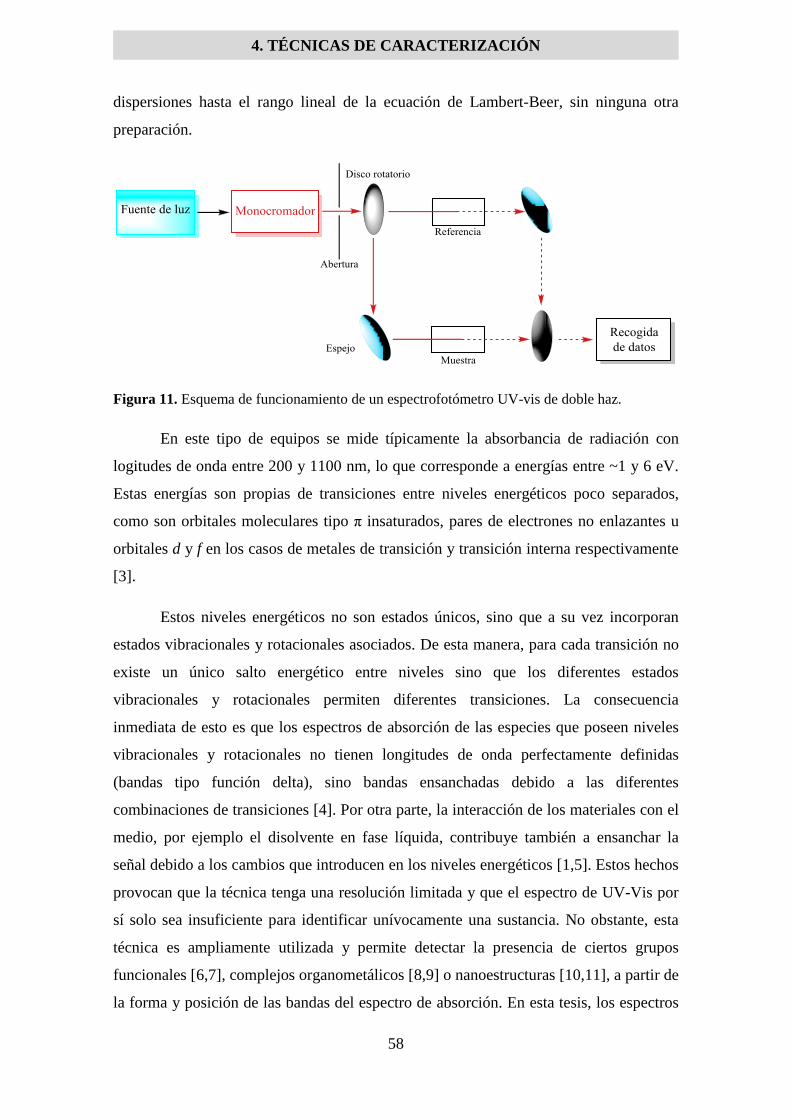
4. TÉCNICAS DE CARACTERIZACIÓN
58
dispersiones hasta el rango lineal de la ecuación de Lambert-Beer, sin ninguna otra
preparación.
Figura 11. Esquema de funcionamiento de un espectrofotómetro UV-vis de doble haz.
En este tipo de equipos se mide típicamente la absorbancia de radiación con
logitudes de onda entre 200 y 1100 nm, lo que corresponde a energías entre ~1 y 6 eV.
Estas energías son propias de transiciones entre niveles energéticos poco separados,
como son orbitales moleculares tipo π insaturados, pares de electrones no enlazantes u
orbitales d y f en los casos de metales de transición y transición interna respectivamente
[3].
Estos niveles energéticos no son estados únicos, sino que a su vez incorporan
estados vibracionales y rotacionales asociados. De esta manera, para cada transición no
existe un único salto energético entre niveles sino que los diferentes estados
vibracionales y rotacionales permiten diferentes transiciones. La consecuencia
inmediata de esto es que los espectros de absorción de las especies que poseen niveles
vibracionales y rotacionales no tienen longitudes de onda perfectamente definidas
(bandas tipo función delta), sino bandas ensanchadas debido a las diferentes
combinaciones de transiciones [4]. Por otra parte, la interacción de los materiales con el
medio, por ejemplo el disolvente en fase líquida, contribuye también a ensanchar la
señal debido a los cambios que introducen en los niveles energéticos [1,5]. Estos hechos
provocan que la técnica tenga una resolución limitada y que el espectro de UV-Vis por
sí solo sea insuficiente para identificar unívocamente una sustancia. No obstante, esta
técnica es ampliamente utilizada y permite detectar la presencia de ciertos grupos
funcionales [6,7], complejos organometálicos [8,9] o nanoestructuras [10,11], a partir de
la forma y posición de las bandas del espectro de absorción. En esta tesis, los espectros

4. TÉCNICAS DE CARACTERIZACIÓN
59
de absorción UV-Vis de materiales bidimensionales en dispersión coloidal se han
utilizado para determinar de forma cualitativa:
La efectividad del proceso de purificación de grafenos dispersos con surfactantes. Al
utilizar especies anfifílicas como agentes dispersantes del grafeno, es necesario
efectuar un paso de purificación después de la preparación para eliminar el exceso
de dichas sustancias. Este paso se lleva a cabo mediante diálisis o ciclos de
centrifugado y redispersión, y puede monitorizarse mediante UV-Vis, ya que los
surfactantes muestran en muchos casos bandas de absorción en la zona UV del
espectro (~200-400 nm). Esto se observa en la Figura 12a, donde están
representados espectros antes y después del proceso de purificación.
La formación de nanopartículas de plata sobre la superficie de láminas de MoS2. En
nanopartículas metálicas puede darse el fenómeno de resonancia plasmónica
superficial, cuando la frecuencia de una radiación incidente coincide con la
frecuencia de oscilación colectiva de los electrones en el material. Esta frecuencia
viene determinada por el tamaño y forma de las nanopartículas y en el caso de
nanopartículas de plata sobre MoS2 se pudo comprobar su formación al aparecer una
banda a ~400 nm asociada al plasmón superficial.
El cambio de fase 2H a 1T y viceversa en dispersiones de MoS2 exfoliado por
intercalación de litio. Estas dos fases implican diferentes coordinaciones de los
átomos de azufre alrededor del molibdeno en la estructura (trigonal prismática en
2H y octaédrica en 1T). Estas diferentes coordinaciones tienen diferente simetría, lo
que origina diferentes niveles energéticos para cada estructura, y particularmente un
mayor número de transiciones posibles en la estructura menos simétrica (2H) [12]
La Figura 12b muestra espectros UV-Vis de dispersiones en fase 1T y 2H.
La formación de óxido de cobalto (II) mediante un proceso solvotérmico. Las
especies Co(OH)2, CoO y Co3O4 presentan bandas de absorción a diferentes
longitudes de onda en el espectro visible, que corresponden con sus diferentes
colores rosa, verde y negro respectivamente [13].
Esta técnica es también aplicable a la cuantificación de especies absorbentes
siempre y cuando el disolvente sea transparente (no absorba radiación) en el rango de
medida y la concentración de la especie se encuentre dentro del rango lineal de la
ecuación de Lambert-Beer. En esta tesis se ha utilizado la espectroscopía UV-Vis para
cuantificar:
La concentración de grafeno y MoS2 en dispersión coloidal. Utilizando los
coeficientes de extinción molar documentados en la literatura a diferentes longitudes
de onda [14,15] y la ecuación de Lambert-Beer, se pudieron calcular las
concentraciones de las dispersiones utilizadas.

4. TÉCNICAS DE CARACTERIZACIÓN
60
Seguimiento de reacciones en las cuales alguno de los reactivos o productos tienen
un espectro característico. La reacción de reducción de nitroarenos puede estudiarse
mediante esta técnica, ya que los reactivos 4-nitrofenol y 4-nitroanilina tienen
bandas de absorción a ~400 y ~380 nm respectivamente, y por tanto la disminución
de la absorbancia a esas longitudes de onda permite medir los tiempos de reacción
[6].
La adsorción de colorantes sobre materiales bidimensionales. Dado que los
colorantes son moléculas que presentan espectros de absorción con bandas muy
intensas en el rango visible, es posible cuantificar con precisión la cantidad
adsorbida sobre láminas de grafeno u óxidos de cobalto midiendo la absorbancia de
una disolución de colorante antes y después de estar en contacto con el material.
[16].
Figura 12. Espectros de (a) grafeno exfoliado con surfactantes anfifílicos antes (rojo) y después
(negro) del proceso de lavado y (b) MoS2 en fase 1T sin funcionalizar (negro) y funcionalizado
(verde) y en fase 2H (rojo)
4.1.2 Espectroscopía infrarroja (IR)
La radiación electromagnética de longitudes de onda entre 2.5 y 25 μm (números
de onda entre ~400 y 4000 cm-1
) constituye el espectro infrarrojo medio, y su
interacción con la materia se corresponde con las transiciones entre estados energéticos
vibracionales [1,5]. No todos los modos de vibración son activos en IR sino que, para
que la absorción sea permitida por las leyes de la mecánica cuántica, el momento
dipolar de la especie debe cambiar con el modo de vibración [1]. La frecuencia
0.1
0.3
0.5
0.7
0.9
1.1
1.3
200 400 600 800 1000
Abso
rban
cia
(u. a.
)
Longitud de onda (nm)
0
0.2
0.4
0.6
0.8
1
1.2
200 400 600 800 1000
Abso
rban
cia
(u. a.
)
Longitud de onda (nm)
a b

4. TÉCNICAS DE CARACTERIZACIÓN
61
correspondiente a un modo de vibración es tanto mayor cuanto más fuertes son los
enlaces implicados y cuanto menor es la masa reducida de los átomos implicados. Por
esta razón, los grupos funcionales con enlaces muy polares y aquellos unidos a
hidrógeno suelen tener frecuencias de vibración altas y desacopladas de las del resto de
la sustancia, apareciendo sus bandas características en el espectro IR en rangos de
número de ondas generalmente independientes de la sustancia. De esta manera es
posible la identificación de grupos funcionales de un material mediante el espectro de
IR medio, aunque debido a la menor resolución y sensibilidad en comparación con la
espectroscopía UV-Vis, su cuantificación no suele ser posible.
Para la obtención de medidas de IR, en esta tesis se ha utilizado un
espectrómetro infrarrojo de transformada de Fourier (Fourier transform infrared
spectroscopy, FTIR) modelo Nicolet 8700 (Thermo Scientific). Las medidas se
realizaron en modo de reflexión total atenuada (attennuated total reflectance, ATR). Se
utilizaron las medidas de IR para comprobar la presencia de grupos funcionales
oxigenados en grafenos exfoliados anódicamente a partir de diferentes materiales
grafíticos. Aquellos grafenos más oxidados presentan bandas en la región de ~3000-
3500 cm-1
, características de los grupos funcionales –OH (Fig. XX).
Figura 13. Espectro ATR-FTIR de muestras de grafeno obtenidas a partir de (a) grafito en
polvo (3 min de exfoliación), (b) grafito flexible (15 min), (c) grafito flexible (60 min) y (d)
HOPG (60 min).
4000 3500 3000 2500 2000 1500 1000
Absorb
ance (
a. u.)
Wavenumber(cm-1)
d
c
b
a
Número de onda (cm-1
)
Abso
rban
cia
(u.
a.)
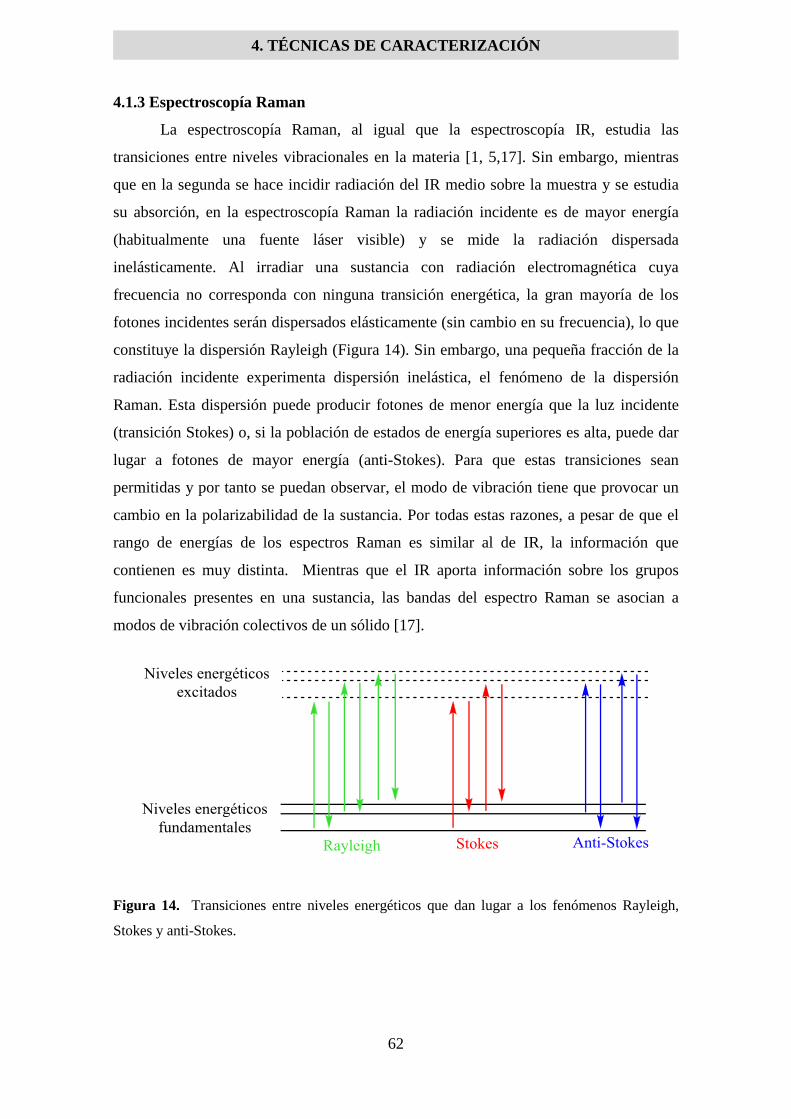
4. TÉCNICAS DE CARACTERIZACIÓN
62
4.1.3 Espectroscopía Raman
La espectroscopía Raman, al igual que la espectroscopía IR, estudia las
transiciones entre niveles vibracionales en la materia [1, 5,17]. Sin embargo, mientras
que en la segunda se hace incidir radiación del IR medio sobre la muestra y se estudia
su absorción, en la espectroscopía Raman la radiación incidente es de mayor energía
(habitualmente una fuente láser visible) y se mide la radiación dispersada
inelásticamente. Al irradiar una sustancia con radiación electromagnética cuya
frecuencia no corresponda con ninguna transición energética, la gran mayoría de los
fotones incidentes serán dispersados elásticamente (sin cambio en su frecuencia), lo que
constituye la dispersión Rayleigh (Figura 14). Sin embargo, una pequeña fracción de la
radiación incidente experimenta dispersión inelástica, el fenómeno de la dispersión
Raman. Esta dispersión puede producir fotones de menor energía que la luz incidente
(transición Stokes) o, si la población de estados de energía superiores es alta, puede dar
lugar a fotones de mayor energía (anti-Stokes). Para que estas transiciones sean
permitidas y por tanto se puedan observar, el modo de vibración tiene que provocar un
cambio en la polarizabilidad de la sustancia. Por todas estas razones, a pesar de que el
rango de energías de los espectros Raman es similar al de IR, la información que
contienen es muy distinta. Mientras que el IR aporta información sobre los grupos
funcionales presentes en una sustancia, las bandas del espectro Raman se asocian a
modos de vibración colectivos de un sólido [17].
Figura 14. Transiciones entre niveles energéticos que dan lugar a los fenómenos Rayleigh,
Stokes y anti-Stokes.

4. TÉCNICAS DE CARACTERIZACIÓN
63
Las medidas de espectroscopía Raman en esta tesis fueron realizadas en un
espectrómetro Horiba Jobin-Yvon LabRam con una fuente láser de 532 nm y 2 mW de
potencia. Los espectros registrados corresponden a transiciones Stokes, y fueron
registrados:
Como pastilla, en el caso de tratarse de muestras sólidas (grafito, disulfuro de
molibdeno, óxidos de cobalto).
En muestras depositadas a partir de dispersiones, mediante la evaporación del
disolvente a 50–60 ºC sobre discos de acero inoxidable, o bien en forma de filmes
preparados mediante filtración de las dispersiones.
La espectroscopía Raman se usa rutinariamente para caracterizar las propiedades de
materiales carbonosos [18-22] y materiales bidimensionales como el grafeno [21,23] y
óxidos metálicos [13]. En el trabajo contenido en esta tesis se ha empleado para:
Evaluar la calidad estructural de las láminas de grafeno midiendo la relación de
intensidades integradas de las bandas denominadas G y D, características de
materiales grafíticos, situadas en números de onda 1582 cm-1
y 1348 cm-1
,
respectivamente. Por ejemplo, en el espectro Raman de grafeno preparado por
exfoliación anódica con NaCl, NaBr y NaI como electrolitos (Figura 15a), la
relación entre las intensidades de ambas bandas (ID/IG) se toma como medida del
desorden estructural presente en el material [24-30], tomando en este caso valores
entre 0.8 y 1.4, que varían en función del electrolito y su concentración.
Estudiar la naturaleza amorfa o cristalina de láminas de CoO y Co3O4
respectivamente, así como la presencia de defectos. Estos compuestos se
sintetizaron por un proceso solvotérmico y posterior calcinación en aire, y el análisis
de sus espectros de Raman permitió confirmar que se trataba de esas especies así
como descartar la presencia de otras, como el Co(OH)2, debido a las bandas
características presentes (Figura 15b).

4. TÉCNICAS DE CARACTERIZACIÓN
64
Figura 15. Espectros Raman de (a) grafeno exfoliado con NaCl (superior), NaBr (medio) y NaI
(inferior) y (b) Co3O4 preparado a 250 (azul), 350 (rojo) y 450ºC (negro).
4.1.4 Espectroscopía fotoelectrónica de rayos X (XPS)
La espectroscopía fotoelectrónica de rayos X (XPS), a diferencia de los tipos de
espectroscopías antes mencionados, estudia las transiciones de electrones desde niveles
internos del átomo al continuo de energía, esto es, electrones arrancados del material
debido al efecto fotoeléctrico [1,5,31]. Para que tenga lugar este efecto, es necesario
irradiar la muestra con fotones de energía superior a la suma de la energía de ligadura
del electrón al atómo (binding energy, BE) y la función de trabajo del equipo (Φ, la
energía necesaria para llevar el electrón al nivel de Fermi del vacío cercano a la
muestra). El resto de la energía correspondiente a la radiación incidente se transfiere al
electrón en forma de energía cinética (kinetic energy, KE), de manera que la ecuación
de Plank-Einstein se puede escribir en la forma:
(3)
En esta espectroscopía se utilizan rayos X que expulsan electrones de capas
internas de los átomos de la muestra a analizar y se obtiene su energía de ligadura a
través de la medida de su energía cinética. En el espectro XPS se representa la
intensidad de la señal (número de electrones emitidos) en función de la energía de
ligadura. Solo aquellos electrones procedentes de átomos situados en las capas más
∆E = h= BE + Φ + KE
a
c
bIn
tensi
ty (
a. u
.)
1500 2000 2500 3000
Raman shift (cm-1)
D
G
534 532 530 528792 788 784 780 776
30 40 50 60 70 250 500 750 1000 500 7500.0
0.5
1.0
Binding energy (eV)
In
ten
sity (
a.u
.)
e
d
In
ten
sity (
a. u
.)
Binding energy (eV)
a
Inte
nsity (
a. u.)
2(°)
b
Inte
nsity (
a. u.)
Wavelength(nm)
Raman shift(cm-1)
c
Inte
nsi
dad
(u
. a.
)
Número de onda (cm-1
) Número de onda (cm-1
)
Inte
nsi
dad
(u
. a.
)
a b
4. TÉCNICAS DE CARACTERIZACIÓN
65
superficiales de la muestra pueden escapar de ésta y ser detectados por el equipo, ya que
los generados a mayores profundidades son reabsorbidos por la muestra tras sufrir
colisiones inelásticas. Por tanto, los espectros de XPS solamente proporcionan
información de la superficie de la muestra, con un espesor de análisis de unos pocos
nanómetros. Mediante XPS es posible detectar todos los elementos salvo H y He, por lo
que es posible obtener la composición superficial de una muestra. Además, la energía de
ligadura de los electrones internos se ve afectada por el entorno químico de los átomos,
de modo que también es posible obtener información acerca de los estados de oxidación
y los enlaces entre átomos a partir de la forma detallada del espectro correspondiente a
cada elemento (espectros de alta resolución).
El equipo en el que se han realizado las medidas de esta tesis es un espectrómetro
XPS de marca SPECS que utiliza fuentes de rayos X tanto Al Kα monocromática como
Mg Kα no monocromática. El equipo se opera a presiones inferiores a 10-7
Pa durante
las medidas, y las muestras analizadas fueron preparadas de la misma manera que las
utilizadas en análisis Raman. En esta tesis se ha empleado XPS para:
Estudiar el contenido en oxígeno de los grafenos preparados mediante exfoliación
anódica. El proceso provoca la oxidación del material [32], y la proporción entre las
señales de oxígeno y carbono se toma como indicador del contenido global en
oxígeno. (Figura 16a).
Confirmar la formación de híbridos de materiales bidimensionales con
nanopartículas metálicas (grafeno-Pt, MoS2-Ag) y comprobar que los metales se
encuentran en estado de oxidación 0 [33].
Calcular la proporción de las fases 2H y 1T en MoS2 exfoliado químicamente,
funcionalizado y tratado térmicamente. Estos tres procesos alteran la fase del
material, y mediante el análisis del espectro de alta resolución del Mo 3d es posible
estimar la proporción de cada una [12] (Figura 16b).
Estudiar la composición de óxidos de cobalto antes y después del tratamiento de
calcinación, en concreto la proporción entre Co(II) y Co(III) [13].

4. TÉCNICAS DE CARACTERIZACIÓN
66
Figura 16. Espectros XPS de (a) grafeno exfoliado con NaCl (arriba), NaBr (medio) y NaI
(abajo) y (b) MoS2 1T (rojo, verde) y 2H (rojo).
4.2 Microscopías
4.2.1 Microscopía electrónica de transmisión (TEM)
Debido a las limitaciones de resolución de la microscopía óptica (resolución del
orden de la longitud de onda de la luz visible, ~400 nm), es necesaria una técnica con
mayor poder de resolución. Dado que los electrones pueden comportarse de manera
similar a fotones cuando son emitidos por un filamento y acelerados por un campo
electromagnético (a voltajes de 100-1000 kV), su uso constituye la base de la
microscopía electrónica [1]. Si se trabaja con muestras delgadas (espesor menor de 200
nm), los electrones pueden ser transmitidos a su través de forma análoga a lo que ocurre
con los fotones en microscopía óptica, lo cual permite obtener imágenes con mucha
mayor resolución que dicha técnica. La Figura 17 representa esquemáticamente los
componentes de un equipo de microscopía electrónica de transmisión (transmission
electron microscopy, TEM). En la parte superior se sitúa la fuente de electrones, y estos
a
c
b
Inte
nsity (
a.
u.)
600 500 400 300 200
f
Binding energy (eV)Binding energy (eV)
e
d
290 288 286 284 282
O 1s
C 1s
b
Inte
nsity (a
. u
.)
234 232 230 228 226
Binding energy (eV)Energía de ligadura (eV)
Inte
nsi
dad
(u
. a.
)
Inte
nsi
dad
(u
. a.
)
Energía de ligadura (eV)
a b
234 232 230 228 226

4. TÉCNICAS DE CARACTERIZACIÓN
67
se concentran hacia la muestra por acción de las lentes electromagnéticas. Tras atravesar
la muestra, los electrones transmitidos pasan por otro juego de lentes que los dirigen al
detector, donde se registran. El equipo utilizado en las medidas para esta tesis es un
microscopio JEOL 200 EX-II operado a 160 kV. Para su medida, las muestras se han
preparado depositando 40 μL de una mezcla 1:1 de dispersión acuosa y etanol sobre
rejillas de cobre recubiertas de un filme delgado de carbono (Electron Microscopy
Sciences), dejando evaporar los disolventes a temperatura ambiente.
Figura 17. Esquema de los componentes de un microscopio TEM.
En la presente tesis se han analizado mediante TEM láminas de MoS2, así como
los híbridos de grafeno-Pt y MoS2-Ag. En ambos casos, las imágenes obtenidas
permiten observar la morfología de las láminas (delgadas, constituidas por muy pocas
capas), así como el tamaño y la distribución de las nanopartículas metálicas depositadas
sobre los materiales [33,34]. En la Figura 18 se pueden observar imágenes típicas de
estos materiales.

4. TÉCNICAS DE CARACTERIZACIÓN
68
Figura 18. Imágenes TEM de (a) MoS2 y (b) híbrido grafeno-PtNPs.
4.2.2 Microscopía electrónica de barrido (SEM)
De forma similar a un microscopio TEM, un equipo de microscopía electrónica
de barrido (scanning electron microscopy, SEM), utiliza una fuente de electrones
(acelerados en este caso por voltajes menores, de ~40 kV) y los concentra mediante
lentes electromagnéticas sobre la muestra [1,35] Un esquema de la operación de este
equipo se puede ver en la Figura 19a:
Figura 19. (a) Esquema de un microscopio electrónico de barrido (SEM). (b) Diferentes tipos
de emisión al hacer incidir un haz de electrones sobre la superficie de la muestra.
100 nm 200 nm
b a
a b

4. TÉCNICAS DE CARACTERIZACIÓN
69
Los electrones incidentes sobre la muestra pueden:
Experimentar choques elásticos, “rebotando” en la superficie de la muestra sin
perder energía. Estos son los llamados electrones retrodispersados.
Interaccionar con los electrones de la banda de conducción, dando lugar a la
expulsión de estos últimos. Debido a esta interacción de tipo inelástico la energía de
estos electrones, llamados secundarios, es menor que la de los retrodispersados.
Como los electrones procedentes de capas internas del sólido pierden energía por
choques inelásticos, los que se detectan en este rango de energía son superficiales,
razón por la que los electrones secundarios son los que se utilizan habitualmente
para obtener imágenes de la superficie de sólidos.
Expulsar los electrones de capas internas de los átomos de la muestra. Esta
interacción provoca estados electrónicos excitados, que se relajan mediante la caída
de electrones a niveles internos y la consiguiente emisión de fotones de rayos X.
Éstos, al sufrir menos interacciones que los electrones, salen de la muestra sin ser
alterados desde profundidades mayores.
En la Figura 19b se representan los electrones incidentes, los distintos tipos de
señales procedentes de la muestra y la profundidad de la zona de procedencia. Los
detectores recogen las diferentes señales, sean electrones o fotones, y a partir de ella se
construye punto a punto la imagen de la superficie de la muestra. Esta técnica, debido a
que es capaz de enfocar superficies de tamaños muy diferentes (desde pocas decenas de
nm a varios mm), es tremendamente útil para estudiar la morfología de materiales.
Para tomar las imágenes de esta tesis se ha utilizado un microscopio Quanta FEG
650 (FEI Company), operado a 25 kV y utilizando la señal de electrones secundarios.
Se ha estudiado por SEM la morfología de:
Diferentes tipos de grafito (polvo, copos, HOPG, grafito flexible) utlizados como
material de partida en la exfoliación anódica para obtener grafeno. (Figura 20a)
Los mismos materiales después del tratamiento electroquímico. (Figura 20b)
Grafeno obtenido en dispersión coloidal a partir de los materiales anteriores.
CoO y Co3O4 obtenido a diferentes temperaturas, en estado sólido (Figura 20c) y en
dispersión coloidal (Figura 20d).
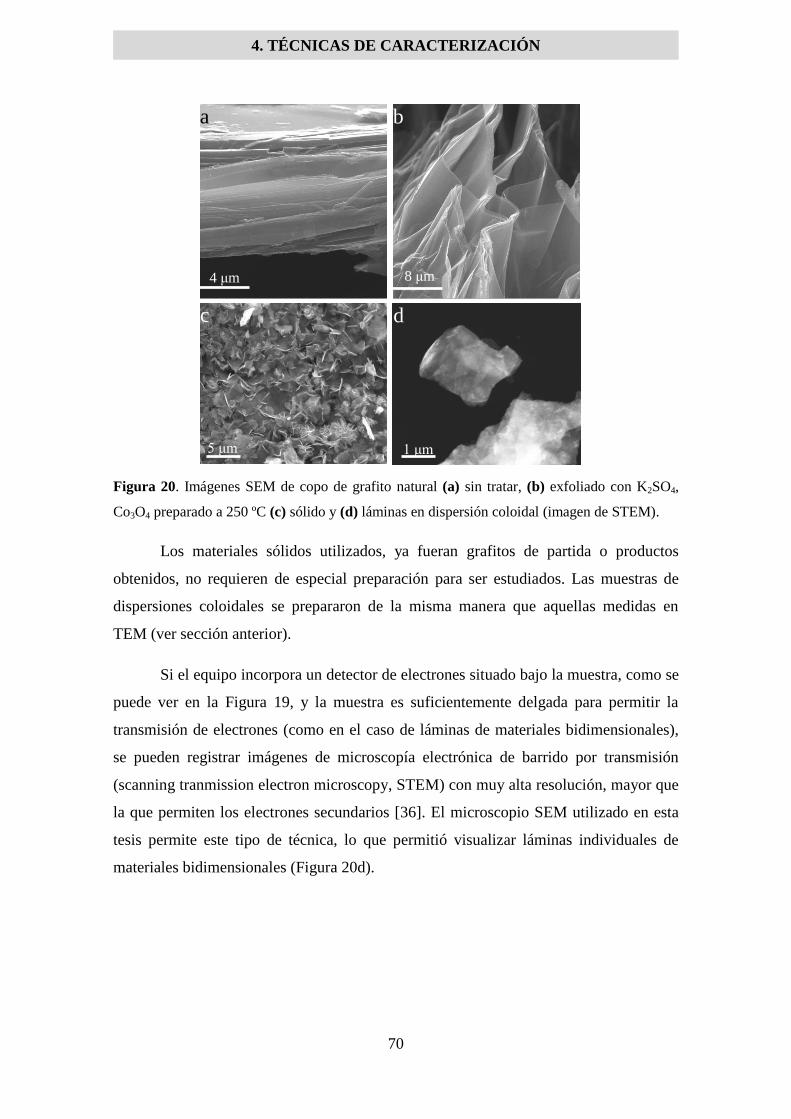
4. TÉCNICAS DE CARACTERIZACIÓN
70
Figura 20. Imágenes SEM de copo de grafito natural (a) sin tratar, (b) exfoliado con K2SO4,
Co3O4 preparado a 250 ºC (c) sólido y (d) láminas en dispersión coloidal (imagen de STEM).
Los materiales sólidos utilizados, ya fueran grafitos de partida o productos
obtenidos, no requieren de especial preparación para ser estudiados. Las muestras de
dispersiones coloidales se prepararon de la misma manera que aquellas medidas en
TEM (ver sección anterior).
Si el equipo incorpora un detector de electrones situado bajo la muestra, como se
puede ver en la Figura 19, y la muestra es suficientemente delgada para permitir la
transmisión de electrones (como en el caso de láminas de materiales bidimensionales),
se pueden registrar imágenes de microscopía electrónica de barrido por transmisión
(scanning tranmission electron microscopy, STEM) con muy alta resolución, mayor que
la que permiten los electrones secundarios [36]. El microscopio SEM utilizado en esta
tesis permite este tipo de técnica, lo que permitió visualizar láminas individuales de
materiales bidimensionales (Figura 20d).
4 μm
a
8 μm
b
5 μm 1 μm
d c

4. TÉCNICAS DE CARACTERIZACIÓN
71
4.2.3 Microscopía de fuerza atómica (AFM)
Se denominan microscopías de proximidad a aquellas técnicas microscópicas
que, acercando una punta a la muestra a escala de nanómetros o angstroms y midiendo
las interacciones resultantes, permiten obtener imágenes de su superficie. En el caso de
la microscopía de fuerza atómica (atomic force microscopy, AFM) se detecta la fuerza
que experimenta una punta al interactuar con la superficie de la muestra en función de la
distancia que las separa, como se representa en la Figura 21a [1]. La punta está situada
de manera perpendicular al final de una palanca flexible (cantilever), que puede oscilar
verticalmente. Sobre el cantilever se hace incidir un láser, cuya señal reflejada se recoge
en un fotodetector dividido en secciones, de manera que el movimiento de flexión queda
registrado y puede ser representado en un mapa topográfico para la superficie de la
muestra al hacer barridos sobre la misma (Figura 21b).
Figura 21. (a) Interacción punta-muestra en función de la distancia. (b) Esquema de operación
de un microscopio AFM.
La técnica AFM tiene como ámbito de aplicación el estudio de superficies de
materiales, y debido a que la interacción se da con cualquier sólido, es aplicable a
cualquier muestra con una superficie relativamente plana [37-40]. La interacción punta-
muestra medida en AFM puede ser repulsiva a distancias muy cortas y atractiva a
distancias ligeramente superiores. Así, esta técnica se puede utilizar en modo de
contacto, donde la interacción punta-muestra es repulsiva, o en modo de contacto
intermitente (tapping) [41]. Este segundo modo es mucho menos agresivo con la
superficie de la muestra, y por ello es posible utilizarlo para estudiar materiales
bidimensionales depositados sobre sustratos planos, tales como grafeno sobre HOPG
[42]. El fundamento de este modo de AFM consiste en la oscilación del cantilever con

4. TÉCNICAS DE CARACTERIZACIÓN
72
una amplitud de ~100-200 nm por la aplicación de un voltaje a un elemento
piezoeléctrico situado en su extremo. Cuando la punta se acerca a la superficie de la
muestra a distancias inferiores a esta oscilación, la interacción con la superficie hace
que se reduzca la amplitud de oscilación. Manteniendo la amplitud de oscilación
constante y registrando los cambios en la posición vertical del cantilever, esta técnica
permite generar mapas topográficos de la superficie de la muestra mediante barridos
lineales.
Para la obtención de imágenes de AFM en modo tapping, en esta tesis se ha
utilizado un microscopio Nanoscope IIIa Multimode de Veeco Instruments, utilizando
cantilevers de silicio de constante de fuerza ~40 N m-1
y frecuencia de resonancia ~250–
300 kHz (Bruker Corporation). Para preparar las muestras a medir, se depositaron
pequeños volúmenes (10 L) de una dispersión acuosa diluida (~0.05 mg mL−1
) del
material sobre un sustrato de HOPG, mica o silicio recubierto de SiO2 (300 nm de
espesor) precalentado a 50-60 ºC.
A diferencia de las microscopías antes mencionadas (TEM y SEM), la
microscopía AFM posee un gran poder de resolución en la dirección perpendicular a la
superficie de la muestra, lo que permite determinar el espesor de láminas de grosor
atómico, además de su morfología y tamaño lateral [42]. En esta tesis se ha utilizado
extensamente AFM para obtener imágenes de láminas de materiales bidimensionales
(grafeno, MoS2 y óxidos de cobalto) depositadas desde dispersión coloidal, y de esta
manera determinar su grosor, número de capas (en el caso de grafeno y MoS2) y
dimensiones laterales, como se ejemplifica en la Figura 22.
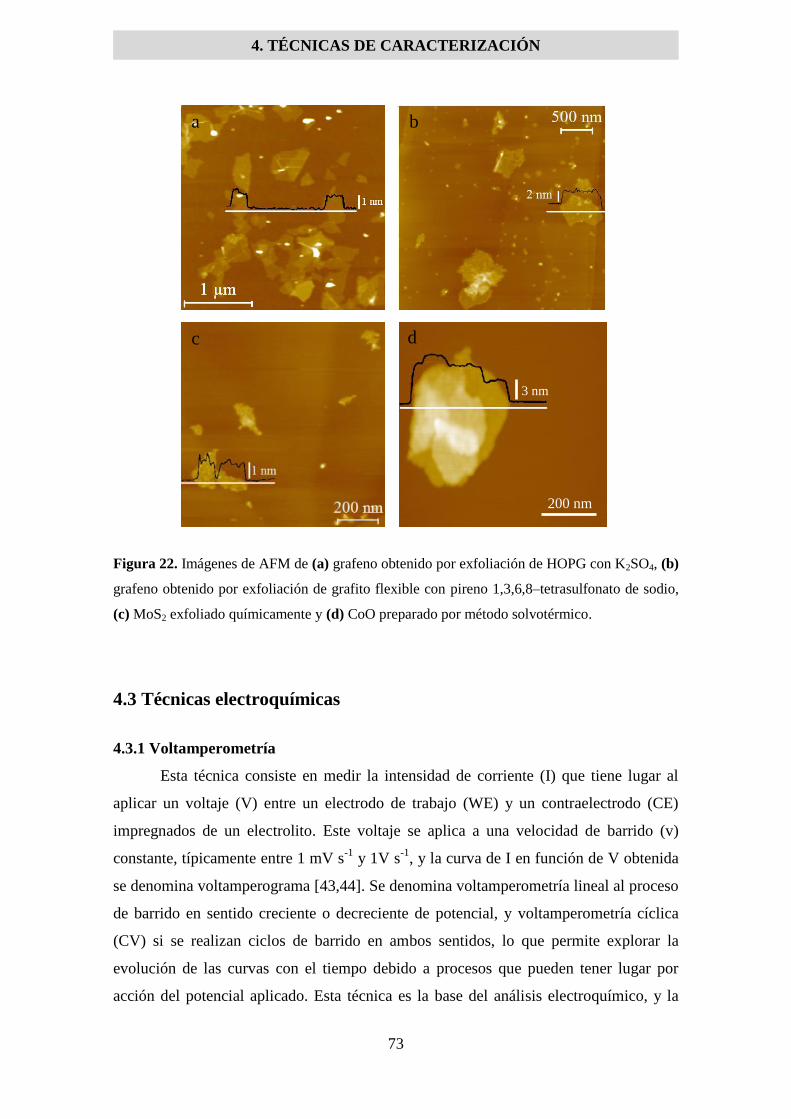
4. TÉCNICAS DE CARACTERIZACIÓN
73
Figura 22. Imágenes de AFM de (a) grafeno obtenido por exfoliación de HOPG con K2SO4, (b)
grafeno obtenido por exfoliación de grafito flexible con pireno 1,3,6,8–tetrasulfonato de sodio,
(c) MoS2 exfoliado químicamente y (d) CoO preparado por método solvotérmico.
4.3 Técnicas electroquímicas
4.3.1 Voltamperometría
Esta técnica consiste en medir la intensidad de corriente (I) que tiene lugar al
aplicar un voltaje (V) entre un electrodo de trabajo (WE) y un contraelectrodo (CE)
impregnados de un electrolito. Este voltaje se aplica a una velocidad de barrido (v)
constante, típicamente entre 1 mV s-1
y 1V s-1
, y la curva de I en función de V obtenida
se denomina voltamperograma [43,44]. Se denomina voltamperometría lineal al proceso
de barrido en sentido creciente o decreciente de potencial, y voltamperometría cíclica
(CV) si se realizan ciclos de barrido en ambos sentidos, lo que permite explorar la
evolución de las curvas con el tiempo debido a procesos que pueden tener lugar por
acción del potencial aplicado. Esta técnica es la base del análisis electroquímico, y la
3 nm
200 nm
a b
c d

4. TÉCNICAS DE CARACTERIZACIÓN
74
facilidad con la que se pueden modificar sus parámetros le confiere mucha versatilidad.
Experimentos de CV permiten, entre otras cosas, estudiar procesos redox, adsorción
sobre superficies, intercalación de iones, procesos catalíticos, cinéticas de reacción y
almacenamiento de energía [43,44].
Las medidas de voltamperometría cíclica se realizaron en dos potenciostatos, un
equipo PGZ 402 Voltalab, de Radiometer Analytical y otro VSP, de Bio-Logic Science
Instruments. Se realizaron estudios en configuración de dos electrodos simétricos y de
tres electrodos. En la segunda configuración se usaron electrodos de trabajo con el
material activo, contraelectrodos de pasta de carbón activado y electrodos de referencia
de Ag/AgCl o Hg/HgO dependiendo del tipo de electrolito. Los materiales utilizados
como electrodos de trabajo se utilizaron en estado sólido presionados contra grafito
flexible o depositando dispersiones sobre el mismo grafito flexible y dejando evaporar
el disolvente a temperatura ambiente.
En esta tesis se realizaron experimentos de voltamperometría para caracterizar la
respuesta electroquímica y la capacidad de almacenamiento de energía de materiales de
grafeno y óxidos de cobalto. La Figura 23 muestra voltamperometrías cíclicas de
grafeno preparado por exfoliación electroquímica con NaI.
Figura 23. Voltamperogramas de grafeno exfoliado electroquímicamente con (a) NaI con
diferentes ventanas de voltaje y (b) Na2SO4 y NaCl a diferentes velocidades de barrido.
0.0 0.4 0.8 1.2
-150
-100
-50
0
50
100
150
Cap
acita
nce
(F/g
)
Voltage (V)
1.1 V 1.3 V
1.2 V 1.4 V
Voltaje (V)
Cap
acit
anci
a (F
/g)
-0.2 0.0 0.2 0.4 0.6 0.8-0.4
-0.2
0.0
0.2
0.4
0.6
-0.2 0.0 0.2 0.4 0.6 0.8
-20
-10
0
10
20
30
0 1000 2000 3000 4000 5000
-0.2
0.0
0.2
0.4
0.6
0.8
1.0
0 2 4 6 8 100
25
50
75
100
125
5000 100000
25
50
75
100
cb
I(A
g-1)
E(V) vs Ag/AgCl
500 mV s-1
3 mV s-1
d
I(A
g-1)
E(V) vs Ag/AgCl
e10 A g
-1
E(V
) vs A
g/A
gC
l
Time (s)
0.05 A g-1
a
Specific
capacitance (
F g
-1)
Current density (A g-1
)
0
100
200
300
400
meth
yl ora
nge
meth
yle
ne b
lue
basic
fuchsin
meth
yle
ne g
reen
Adsorp
tion (
mg/g
)
rose b
engal 0
10
20
30
pum
p o
il (u
sed)
pum
p o
il (n
ew
)
oliv
e o
il
eth
anol
eth
yle
ne g
lycol
chlo
rofo
rm
dodecane
hexane
aceto
ne
tetr
ahydro
fura
n
Weig
ht
gain
(g/g
)
tolu
ene
f
Ca
pa
cita
nce
re
ten
tio
n (
%)
cycle number
Voltaje (V) vs Ag/AgCl
I (A
/g)
a b

4. TÉCNICAS DE CARACTERIZACIÓN
75
4.3.2. Carga-descarga galvanostática
Si a un electrodo de trabajo se le aplica una intensidad de corriente constante
(habitualmente entre 0.1 y 20 A g-1
), y se mide el voltaje creciente de la celda en
función del tiempo, se obtiene una curva de carga galvanostática (o de descarga si la
corriente es negativa y el voltaje es decreciente). Al aplicar la corriente, y dependiendo
de las características químicas, morfológicas y superficiales del electrodo, en él tienen
lugar procesos de adsorción del electrolito y/o redox que implican el almacenamiento de
energía (carga eléctrica) en el material (procesos denominados capacitivos y
pseudocapacitivos/tipo batería respectivamente ) [43,44]. El análisis de estas curvas de
carga y descarga permite caracterizar el tipo de procesos que tienen lugar en el material,
así como evaluar su capacitancia en diferentes condiciones.
Los experimentos de carga y descarga galvanostáticos fueron llevados a cabo en
los mismos potenciostatos y las mismas condiciones que las voltamperometrías cíclicas.
Esta técnica se utilizó para calcular la capacitancia de materiales grafénicos y óxidos de
cobalto. La Figura 24 muestra curvas de carga-descarga de grafeno exfoliado con
Na2SO4 y NaCl.
Figura 24. Curvas de carga-descarga galvanostática de grafeno exfoliado con (a) NaI a
diferentes ventanas de voltaje y (b) Na2SO4 y NaCl a diferentes densidades de corriente.
-0.2 0.0 0.2 0.4 0.6 0.8-0.4
-0.2
0.0
0.2
0.4
0.6
-0.2 0.0 0.2 0.4 0.6 0.8
-20
-10
0
10
20
30
0 1000 2000 3000 4000 5000
-0.2
0.0
0.2
0.4
0.6
0.8
1.0
0 2 4 6 8 100
25
50
75
100
125
5000 100000
25
50
75
100
cb
I(A
g-1)
E(V) vs Ag/AgCl
500 mV s-1
3 mV s-1
d
I(A
g-1)
E(V) vs Ag/AgCl
e10 A g
-1
E(V
) vs A
g/A
gC
l
Time (s)
0.05 A g-1
a
Specific
capacitance (
F g
-1)
Current density (A g-1
)
0
100
200
300
400
meth
yl ora
nge
meth
yle
ne b
lue
basic
fuchsin
meth
yle
ne g
reen
Adsorp
tion (
mg/g
)
rose b
engal 0
10
20
30
pum
p o
il (u
sed)
pum
p o
il (n
ew
)
oliv
e o
il
eth
anol
eth
yle
ne g
lycol
chlo
rofo
rm
dodecane
hexane
aceto
ne
tetr
ahydro
fura
n
Weig
ht
gain
(g/g
)
tolu
ene
f
Ca
pa
cita
nce
re
ten
tio
n (
%)
cycle number
Tiempo (s)
-600 -400 -200 0 200 400 600
0.2
0.4
0.6
0.8
1.0
1.2
1.4
Vol
tage
(V)
time (sec)
1.1 V
1.2 V
1.3 V
1.4 V
Tiempo (s)
Volt
aje
(V)
vs
Ag/A
gC
l
Volt
aje
(V)
a b

4. TÉCNICAS DE CARACTERIZACIÓN
76
4.3.3 Espectroscopía de impedancia electroquímica (EIS)
Se define la impedancia electroquímica Z para una celda electroquímica como el
cociente entre el potencial aplicado V y la corriente I que circula (Z= V/I) [43,44]. La
espectroscopía de impedancia electroquímica consiste en someter a la celda con la
muestra a un potencial que varía sinusoidalmente en un rango de frecuencias y registrar
la corriente que circula por dicha celda. La impedancia obtenida es dependiente de la
frecuencia del voltaje, y esta relación proporciona información acerca de los procesos
de transferencia de carga y masa que puedan tener lugar en el electrodo. En esta tesis se
usó la EIS para caracterizar los procesos que tienen lugar en los dispositivos de
almacenamiento de energía (ya fueran tipo condensador o tipo batería) de forma
complementaria a las otras técnicas electroquímicas. Los equipos utilizados para este
análisis fueron los mismos que en los apartados anteriores y con la misma preparación
de las muestras. Como ejemplo, en la Figura 25 están representados espectros de EIS de
muestras de óxidos de cobalto.
Figura 25. Espectros de EIS de óxidos de cobalto.
0.0 0.2 0.4 0.6
-60
-40
-20
0
20
40
60
0.0 0.2 0.4 0.6
-600
-400
-200
0
200
400
600
0 5 10 15 20 250
25
50
75
100
0 50 100 150 200 250 3000.0
0.1
0.2
0.3
0.4
0.5
0 50 100 150 200 250 3000.0
0.1
0.2
0.3
0.4
0.5
0 10 20 30 40 50 600
50
100
150
200
250
300
0 25 50 75 100 125 150 175 2000
25
50
75
100
125
150
175
200
0 5 10 150
5
10
15
non–calcined
250 °C
350 °C
450 °C
b
Cu
rre
nt d
en
sity(A
/g)
E(V) vs Hg/HgO
a
3 mV/s
5 mV/s
10 mV/s 100 mV/s
30 mV/s 300 mV/s
50 mV/s 500 mV/s
Cu
rre
nt d
en
sity(A
/g)
E(V) vs Hg/HgO
Cu
rre
nt(
mA
)
(scan rate)1/2
(mV)1/2
non–calcined
250 °C
350 °C
450 °C
E(V
) vs H
g/H
gO
Gravimetric capacity (mAh/g)
c
1 A/g 5 A/g
2 A/g 10 A/g
3 A/g
15 A/g
20 A/g
30 A/g
40 A/g
50 A/g
60 A/g
E(V
) vs H
g/H
gO
Gravimetric capacity (mAh/g)
d non–calcined
250 °C
350 °C
450 °C
Gra
vim
etr
ic c
ap
acity (
mA
h/g
)
Current density (A/g)
e non-calcined
250 °C
350 °C
450 °C
-Z''(
)
Z' ()
f
-Z''(
)
Z' ()1
no calcinado
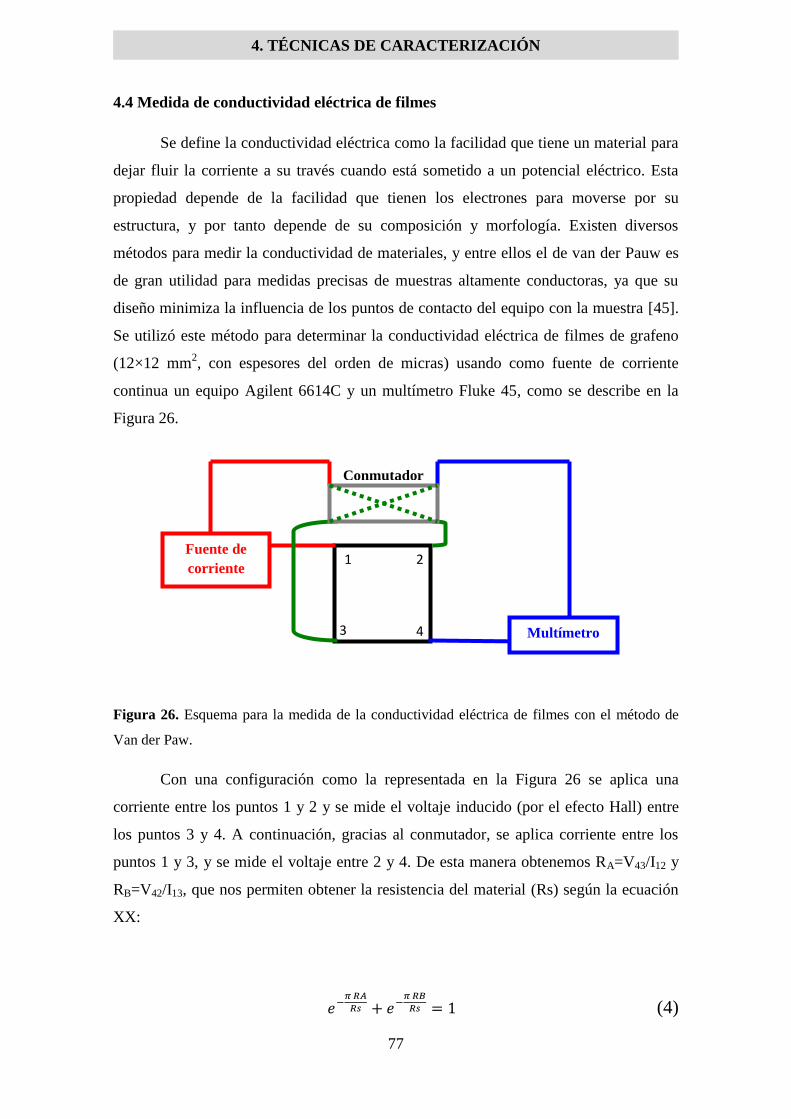
4. TÉCNICAS DE CARACTERIZACIÓN
77
4.4 Medida de conductividad eléctrica de filmes
Se define la conductividad eléctrica como la facilidad que tiene un material para
dejar fluir la corriente a su través cuando está sometido a un potencial eléctrico. Esta
propiedad depende de la facilidad que tienen los electrones para moverse por su
estructura, y por tanto depende de su composición y morfología. Existen diversos
métodos para medir la conductividad de materiales, y entre ellos el de van der Pauw es
de gran utilidad para medidas precisas de muestras altamente conductoras, ya que su
diseño minimiza la influencia de los puntos de contacto del equipo con la muestra [45].
Se utilizó este método para determinar la conductividad eléctrica de filmes de grafeno
(12×12 mm2, con espesores del orden de micras) usando como fuente de corriente
continua un equipo Agilent 6614C y un multímetro Fluke 45, como se describe en la
Figura 26.
Figura 26. Esquema para la medida de la conductividad eléctrica de filmes con el método de
Van der Paw.
Con una configuración como la representada en la Figura 26 se aplica una
corriente entre los puntos 1 y 2 y se mide el voltaje inducido (por el efecto Hall) entre
los puntos 3 y 4. A continuación, gracias al conmutador, se aplica corriente entre los
puntos 1 y 3, y se mide el voltaje entre 2 y 4. De esta manera obtenemos RA=V43/I12 y
RB=V42/I13, que nos permiten obtener la resistencia del material (Rs) según la ecuación
XX:
𝑒−𝜋 𝑅𝐴
𝑅𝑠 + 𝑒−𝜋 𝑅𝐵
𝑅𝑠 = 1 (4)
3 4
1 2
Multímetro
Fuente de
corriente
Conmutador
4. TÉCNICAS DE CARACTERIZACIÓN
78
Con este valor de resistencia y conocidas la longitud (L) y el área de la sección
(A) del filme se puede calcular la conductividad σ según la ecuación XX:
𝜎 =𝐿
𝑅𝑠 𝐴 (5)
4.5 Estudios de biocompatibilidad y proliferación
En esta tesis se han realizado estudios de biocompatibilidad de grafeno y
disulfuro de molibdeno mediante el método MTT (bromuro de 3-(4,5-dimetiltiazol-2-
ilo)-2-5-difeniltetrazol). Estos ensayos consisten en pruebas de proliferación celular de
fibroblastos de ratón L-929 en presencia de los materiales a ensayar y habitualmente se
utilizan como medida del posible efecto citotóxico de dichos materiales.
El fundamento del ensayo es la reducción de MTT que tiene lugar por acción de
una enzima mitocondrial (la succinato-deshidrogenasa) para generar formazán, una
especie coloreada cuya concentración se puede medir mediante su absorbancia a 570 nm
[46-48]. La concentración de formazán es proporcional al número de células vivas, de
manera que se puede cuantificar así la proliferación celular en presencia de los
materiales a ensayar (Figura 27). Las medidas de absorbancia del formazán se llevaron a
cabo en un equipo BMG FLUOstar Galaxy (MTX Lab Systems, Inc).

4. TÉCNICAS DE CARACTERIZACIÓN
79
Figura 27. Estudios de proliferación celular L-929 por el método MTT para filmes delgados de
grafenos preparados a partir de diferentes grafitos.
4.6 Actividad catalítica
Se ha estudiado la actividad catalítica de híbridos grafeno-nanopartículas de Pt y
disulfuro de molibdeno. Para ello se han utilizado dos reacciones modelo para el ensayo
de catalizadores, las de reducción de 4-nitrofenol (4-NP) y 4-nitroanilina (4-NA) con
borohidruro de sodio [6]. Como los reactivos son especies que poseen bandas de
GO
GO
+ 5
% F
MN
S
Polv
o 3
min
Copos
3 m
in
Gra
fito
fle
xib
le 1
5 m
in
HO
PG
3 m
in
HO
PG
15 m
in
HO
PG
60 m
in
Pla
ca d
e cu
ltiv
o
Ab
sorb
anci
a
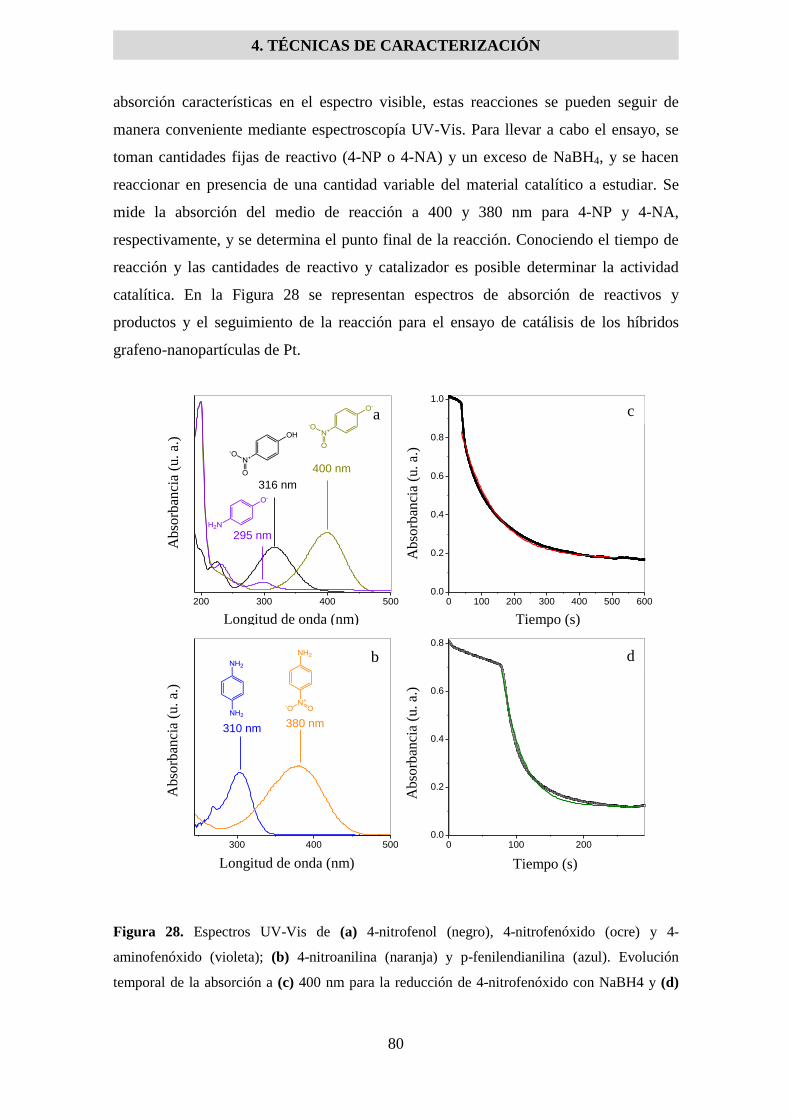
4. TÉCNICAS DE CARACTERIZACIÓN
80
absorción características en el espectro visible, estas reacciones se pueden seguir de
manera conveniente mediante espectroscopía UV-Vis. Para llevar a cabo el ensayo, se
toman cantidades fijas de reactivo (4-NP o 4-NA) y un exceso de NaBH4, y se hacen
reaccionar en presencia de una cantidad variable del material catalítico a estudiar. Se
mide la absorción del medio de reacción a 400 y 380 nm para 4-NP y 4-NA,
respectivamente, y se determina el punto final de la reacción. Conociendo el tiempo de
reacción y las cantidades de reactivo y catalizador es posible determinar la actividad
catalítica. En la Figura 28 se representan espectros de absorción de reactivos y
productos y el seguimiento de la reacción para el ensayo de catálisis de los híbridos
grafeno-nanopartículas de Pt.
Figura 28. Espectros UV-Vis de (a) 4-nitrofenol (negro), 4-nitrofenóxido (ocre) y 4-
aminofenóxido (violeta); (b) 4-nitroanilina (naranja) y p-fenilendianilina (azul). Evolución
temporal de la absorción a (c) 400 nm para la reducción de 4-nitrofenóxido con NaBH4 y (d)
200 300 400 500
295 nm
316 nm
Absorb
ance
Wavelength (nm)
400 nm
a
0 100 200 300 400 500 6000.0
0.2
0.4
0.6
0.8
1.0
b
cA
bsorb
ance a
t=
400 n
m
Time (s)
300 400 500
310 nm 380 nm
Absorb
ance
Wavelength (nm)
0 100 2000.0
0.2
0.4
0.6
0.8
d
Absorb
ance a
t=
380 n
m
Time (s)
Longitud de onda (nm)
Abso
rban
cia
(u.
a.)
Ab
sorb
anci
a (u
. a.
)
Longitud de onda (nm)
Abso
rban
cia
(u.
a.)
Ab
sorb
anci
a (u
. a.
)
Tiempo (s)
Tiempo (s)
a c
b d

4. TÉCNICAS DE CARACTERIZACIÓN
81
380 nm para la reducción de 4-nitroanilina, ambos en presencia de híbrido grafeno-
nanopartículas de Pt.
4.7 Difracción de rayos X
Una de las técnicas más comunes para el estudio de sólidos cristalinos, y
particularmente en el caso de materiales laminares, es la difracción de rayos X (DRX)
[1]. El fundamento de esta técnica es la irradiación de una muestra cristalina con rayos
X y el posterior estudio de la radiación difractada. Al hacer incidir la radiación sobre el
material cristalino, ésta es reflejada por la red. Esta reflexión tiene lugar en los
diferentes planos de la red cristalina, lo que provoca que la radiación reflejada tenga un
desfase correspondiente a la separación entre planos, y a su vez que se produzca un
fenómeno de interferencia en función del ángulo de incidencia de la radiación, lo que
origina un patrón de difracción (Figura 29).
Figura 29. Esquema de la radiación incidente y reflejada sobre un cristal. La diferencia de
caminos origina el patrón de difracción por la interferencia.
La relación entre el ángulo de la radiación incidente y la separación entre los
planos cristalinos viene dada por la ley de Bragg:
2𝑑 𝑠𝑒𝑛 (𝜃) = 𝑛𝜆 (6)
, donde d es la distancia entre planos cristalinos, θ el ángulo entre la dirección de la
radiación y el plano, n un número entero positivo y λ la longitud de onda de la radiación

4. TÉCNICAS DE CARACTERIZACIÓN
82
incidente. Si se hace incidir radiación sobre la muestra en un rango de ángulos θ
(habitualmente se utiliza 2θ en el equipo y en el tratamiento de datos), se obtiene un
patrón de difracción, que puede ser transformado en un difractograma cuando se
representa la intensidad de la radiación reflejada frente a 2θ. La presencia de picos
(interferencia constructiva de la difracción) permite deducir las distancias interplanares
de la red cristalina, y por tanto obtener información sobre su estructura.
En esta tesis se utilizó un equipo de difracción Bruker D8 Advance, usando Cu
Kα (λ= 0.154 nm) como fuente de rayos X. Se utilizó esta técnica para determinar si el
tratamiento del grafito flexible por inmersión en ácido sulfúrico provoca la separación
de los planos del grafito y para el estudio de la cristalinidad de óxidos de cobalto. En la
Figura 30 se observan los difractogramas de Co3O4 obtenidos por calentamiento de CoO
amorfo a diferentes temperaturas y de distintos tipos de grafito flexible.
Figura 30. Difractogramas de (a) Co3O4 obtenidos a 250 (azul), 350 (rojo) y 450ºC (negro) y
(b) grafito flexible antes (arriba) y después (abajo) de 24h de inmersión en H2SO4.
534 532 530 528792 788 784 780 776
30 40 50 60 70 250 500 750 1000 500 7500.0
0.5
1.0
Binding energy (eV)
In
ten
sity (
a.u
.)
e
d
In
ten
sity (
a. u
.)
Binding energy (eV)
a
Inte
nsity (
a. u.)
2(°)
b
Inte
nsity (
a. u.)
Wavelength(nm)
Raman shift(cm-1)
c
10 20 30 40
b
Inte
nsity (
a. u
.)
2 (°)
a
2θ (º)
Inte
nsi
dad
(u.
a.)
2θ (º)
Inte
nsi
dad
(u.
a.)
b
a

4. TÉCNICAS DE CARACTERIZACIÓN
83
BIBLIOGRAFÍA
[1] Faraldos, M.; Goberna C. Técnicas de análisis y caracterización de materiales. Madrid:
Consejo Superior de Investigaciones Científicas, 2011.
[2] Beer, A. Determination of the absorption of red light in colored liquids, Annalen der Physik
und Chemie, 1852, 86, 78–88.
[3] Jentoft, F. C. Characterization of solid materials and heterogeneous catalysts: from structure
to surface reactivity. Wiley-VCH, 2012, Volume 1.
[4] Pino, F.; Pérez, M. D., Análisis de elementos-traza por espectrofotometría de absorción
molecular ultravioleta-visible. Universidad de Sevilla. 1983.
[5] Skoog, D. A.; Holler, F. J.; Nieman, T. A. Principles of instrumental analysis. Belmont
(USA): Thomson Brooks/cole. 2007.
[6] Hervés, P.; Pérez-Lorenzo, M.; Liz-Marzán, L.M.; Dzubiella, J.; Lu, Y.; Ballauff, M.
Catalysis by metallic nanoparticles in aqueous solution: Model reactions. Chem. Soc. Rev.,
2012, 41, 5577-5587.
[7] Preat, J.; Michaux, C.; Jacquemin, D.; Perpèt, E. A. Enhanced efficiency of organic dye-
sensitized solar cells: triphenylamine derivatives. J. Phys. Chem. C, 2009, 113, 16821-16833.
[8] Liu, M.; Wang, L.; Meng, Y.; Chen, Q.; Li, H.; Zhang, Y.; Yao, S. (4-Ferrocenylethyne)
phenylamine functionalized graphene oxide modified electrode for sensitive nitrite sensing.
Electrochim. Acta, 2014, 116, 504-51.
[9] Deka, M. J.; Chowdhury, D. Tuning electrical properties of graphene with different π-
stacking organic molecules. J. Phys. Chem. C, 2016, 120, 4121-4129.
[10] Panáček, A.; Kvítek, L.; Prucek, R.; Kolář, M.; Večeřová, R.; Pizúrová, N.; Sharma, V. K.;
Nevěčná, T.; Zbořil, R. Silver colloid nanoparticles: synthesis, characterization, and their
antibacterial activity. J. Phys. Chem. B, 2006, 110, 16248-16253.
[11] Haiss, W.; Thanh, N. T. K.; Aveyard, J.; Fernig, D. G. Determination of size and
concentration of gold nanoparticles from UV−Vis spectra. Anal. Chem., 2007, 79, 4215-4221.
[12] Eda, G.; Yamaguchi, H.; Voiry, D.; Fujita, T.; Chen, M.; Chhowalla, M.
Photoluminescence from chemically exfoliated MoS2. Nano Lett., 2011, 11, 5111-5116.
[13] Sun, Z.; Liao, T.; Dou, Y.; Hwang, S. M.; Park, M-S.; Jiang, L.; 4, Kim, J. H.; Dou, S. X.
Generalized self-assembly of scalable two-dimensional transition metal oxide nanosheets. Nat.
Commun., 2014, 5, 3813-3822.
[14] Hernandez, Y.; Nicolosi, V.; Lotya, M.; Blighe, F. M.; Sun, Z.; De, S.; McGovern, I. T.;
Holland, B.; Byrne, M.; Gun'ko, Y. K.; Boland, J. J.; Niraj, P.; Duesberg, G.; Krishnamurthy,
S.; Goodhue, R.; Hutchison, J.; Scardaci, V.; Ferrari, A. C.; Coleman, J. N.; High-yield
production of graphene by liquid-phase exfoliation of graphite. Nat. Nanotechnol., 2008, 3, 563-
568.
[15] Ayán–Varela, M.; Paredes, J. I.; Guardia, L.; Villar–Rodil, S.; Munuera, J. M.; Díaz–
González, M.; Fernández–Sánchez, C.; Martínez–Alonso, A.; Tascón, J. M. D. Achieving
extremely concentrated aqueous dispersions of graphene flakes and catalytically efficient
graphene-metal nanoparticle hybrids with flavin mononucleotide as a high-performance
stabilizer. ACS Appl. Mater. Interfaces, 2015, 7, 10293–10307.
[16] Ramesha, G. K.; Kumara, A. V.; Muralidhara, H. B.; Sampath, S. Graphene and
graphene oxide as effective adsorbents toward anionic and cationic dyes. J. Colloid Interface
Sci., 2011, 361, 270-277.
[17] Smith, BC. Modern Raman spectroscopy: a practical approach. John Wiley & Sons, 2005.

4. TÉCNICAS DE CARACTERIZACIÓN
84
[18] Ferrari, A. C.; Robertson J. Interpretation of Raman spectra of disordered and amorphous
carbon. Phys. Rev. B, 2000, 61, 14095.
[19] Kataura, H.; Maniwa, Y.; Kodama, T.; Kikuchi, K.; Hirahara, K.; Suenaga, K.; Iijima, S.;
Suzuki, S.; Achiba, Y.; Krätschmer, W. High-yield fullerene encapsulation in single-wall
carbon nanotubes. Synth. Met., 2001, 121, 1195-1196.
[20] Dresselhaus, M. S.; Dresselhaus, G.; Saito, R.; Jorio, A. Raman spectroscopy of carbon
nanotubes. Phys. Rep., 2005, 409, 47-99.
[21] Ferrari, A.C. Raman spectroscopy of graphene and graphite: Disorder, electron-phonon
coupling, doping and nonadiabatic effects. Solid State Commun., 2007, 143, 47-57.
[22] Knight, D.S.; White, W.B. Characterization of diamond films by Raman spectroscopy. J.
Mater. Res., 1989, 4, 385-393.
[23] Ferrari A. C.; Meyer, J. C.; Scardaci, V.; Casiraghi, C.; Lazzeri, M.; Mauri, F.; Piscanec,
S.; Jiang, D.; Novoselov, K. S.; Roth, S.; Geim A. K. Raman spectrum of graphene and
graphene layers. Phys Rev Lett., 2006, 97, 187401.
[24] Paton, K. R.; Varrla, E.; Backes, C.; Smith, R. J.; Khan, U.; O’Neil, A.; Boland, C.; Lotya,
M.; Istrate, O. M.; King, P.; Higgins, T.; Barwich, S.; May, P.; Puczkarski, P.; Ahmed, I.;
Moebius, M.; Pettersson, H.; Long, E.; Coelho, J.; O’Brien, S. E.; McGuire, E. K.; Mendoza
Sanchez, B.; Duesberg, G. S.; McEvoy, N.; Pennycook, T. J.; Downing, C.; Crossley, A.;
Nicolosi, V.; Coleman, J. N. Scalable production of large quantities of defect-free few-layer
graphene by shear exfoliation in liquids. Nature Mater., 2014, 13, 624-630.
[25] Guardia, L.; Fernández-Merino, M. J.; Paredes, J. I.; Solís-Fernández, P.; Villar-Rodil, S.;
Martínez-Alonso, A.; Tascón, J. M. D. High-throughput production of pristine graphene in an
aqueous dispersion assisted by non-ionic surfactants. Carbon, 2011, 49, 1653-1662.
[26] Sun, Z.; Masa, J.; Liu, Z.; Schuhmann, W.; Muhler, M. Highly concentrated aqueous
dispersions of graphene exfoliated by sodium taurodeoxycholate: dispersion behavior and
potential application as a catalyst support for the oxygen-reduction reaction. Chem. Eur. J.
2012, 18, 6972-6978.
[27] Zhang, L.; Zhang, Z.; He, C.; Dai, L.; Liu, J., Wang L. Rationally designed surfactants for
few-layered graphene exfoliation: ionic groups attached to electron deficient π-conjugated unit
through alkyl spacers. ACS Nano, 2014, 8, 6663-6670.
[28] Buzaglo, M.; Shtein, M.; Kober, S.: Lovrinčić, R.: Vilan, A.; Regev, O. Critical parameters
in exfoliating graphite into graphene. Phys. Chem. Chem. Phys., 2013, 15, 4428-4435.
[29] Bourlinos, A. B.; Georgakilas, V.; Zboril, R.; Steriotis, T. A.; Stubos, A. K.; Trapalis, C.
Aqueous-phase exfoliation of graphite in the presence of polyvinylpyrrolidone for the
production of water-soluble graphenes. Solid State Commun., 2009, 149, 2172- 2176.
[30] Notley, S. M. Highly Concentrated suspensions of graphene through ultrasonic exfoliation
with continuous surfactant addition. Langmuir, 2012, 28, 14110-14113.
[31] Van der Heide, P. X-ray photoelectron spectroscopy: an introduction to the principles and
practices; John Wiley & Sons: Hoboken, NJ, 2012.
[32] Paredes, J. I.; Munuera, J. M. Recent advances and energy-related applications of high
quality/chemically doped graphenes obtained by electrochemical exfoliation methods, J. Mat.
Chem. A, 2017, 16, 7228-7242.
[33] Ayán-Varela, M.; Fernández-Merino, M. J.; Paredes, J. I.; Villar-Rodil, S.; Fernández-
Sánchez, C.; Guardia, L.; Martínez-Alonso, A.; Tascón, J. M. D. Highly efficient silver-assisted
reduction of graphene oxide dispersions at room temperature: Mechanism, and catalytic and
electrochemical performance of the resulting hybrids, J. Mat. Chem. A, 2014, 20, 7295-7305.
4. TÉCNICAS DE CARACTERIZACIÓN
85
[34] Guo, S.; Wang, E. Noble metal nanomaterials: controlable synthesis and application in fuel
cells and analytical sensors. Nano Today, 2011, 6, 240-264.
[35] Spence, J. C. H. High-Resolution Electron Microscopy, Oup Oxford, 2014.
[36] Egerton, R. F. Physical principles of electron microscopy. Springer. 2008.
[37] Biris, A. R.; Dervishi, E.; Ardelean, S.; Lazar, M. D.; Watanabe, F.; Biris, G. L.; Misan, I.;
Biris, A. S.; Giessibl, F. J. Advances in atomic force microscopy. Rev. Mod. Phys., 2003, 75,
949-983.
[38] Abu-Lail, N. I., Camesano, T. A. Polysaccharide properties probed with atomic force
microscopy. J. Microsc., 2003, 212, 217-238.
[39] Kuznetsov, Y. G.; Malin, A. J.; Lucas, R. W.; Plomp, M.; McPherson, A. Imaging of
viruses by atomic force microscopy. J. Gen. Virol., 2001, 82, 2025-2034.
[40] Jalili, N. ; Laxminarayana, K. A review of atomic force microscopy imaging systems:
Application to molecular metrology and biological sciences. Mechatronics, 2004, 14, 907-945.
[41] Haugstad, G. Atomic Force Microscopy: Understanding Basic Modes and Advanced
Applications. Wiley. 2012.
[42] Paredes, J. I.; Villar-Rodil, S.; Solís-Fernández, P.; Martínez-Alonso, A.; Tascón, J. M. D.
Atomic force and scanning tunneling microscopy imaging of graphene nanosheets derived from
graphite oxide. Langmuir, 2009, 25, 5957-5968.
[43] Scholz, F. Electroanalytical methods: guide to experiments and applications. Springer.
2010.
[44] Zoski, C. G. Handbook of electrochemistry. Elsevier. 2007.
[45] Van der Paw, L. A method of measuring the resistivity and Hall coefficient on lamellae of
arbitrary shape. Philips Tech. Rev., 1958, 20, 220-224.
[46] Carmichael, J.; Gazdar, A. F. Evaluation of a tetrazolium-based semiautomated
colorimetric assay: assessment of chemosensitivity testing. Cancer Research, 1987, 47, 936-
942.
[47] Denizot, F.; Lang, R. Rapid colorimetric assay for cell growth and survival. Modifications
to the tetrazolium dye procedure giving improved sensitivity and reliability. J. Immunol.
Methods, 1986, 89, 271-277.
[48] Hansen, M. B.; Nielsen, S. E.; Berg, K. Re-examination and further development of a
precise and rapid dye method for measuring cell growth/cell kill. J. Immunol. Methods, 1989,
119, 203-210.

4. TÉCNICAS DE CARACTERIZACIÓN
86

5. RESÚMENES Y ARTÍCULOS
87
5. Resúmenes y artículos
5.1 Exfoliación electroquímica de grafeno
Artículo I
High quality, low oxygen content and biocompatible graphene nanosheets obtained by
anodic exfoliation of different graphite types, Munuera, J.M. , Paredes, J.I., Villar-
Rodil, S., Ayán-Varela, M., Pagán, A., Aznar-Cervantes, S.D., Cenis, J.L., Martínez-
Alonso, A., Tascón, J.M.D., Carbon, 2015, 94, 729-739.
Artículo II
Electrolytic exfoliation of graphite in water with multifunctional electrolytes: En route
towards high quality, oxide-free graphene flakes, Munuera, J.M., Paredes, J.I., Villar-
Rodil, S. , Ayán-Varela, M., Martínez-Alonso, A., Tascón, J.M.D. Nanoscale, 2016,
8, 5, 2982-2998.
Artículo III
A simple strategy to improve the yield of graphene nanosheets in the anodic exfoliation
of graphite foil, Munuera, J.M. , Paredes, J.I., Villar-Rodil, S., Martínez-Alonso, A.,
Tascón, J.M.D., Carbon, 2017, 115, 625-628.
Artículo IV
Electrochemical exfoliation of graphite in aqueous sodium halide electrolytes toward
low oxygen content graphene for energy and environmental applications, Munuera, J.
M.; Paredes, J. I.; Enterría, M.; Pagán, A.; Villar-Rodil, S.; Martins, M. F. R.;
Figueiredo, J. I.; Cenis, J. L.; Martínez-Alonso, A.; Tascón, J. M. D.; ACS Applied
Materials and Interfaces, 2017, 9, 24085-24099.
Artículo V
High quality, low-oxidized graphene via anodic exfoliation with table salt as an efficient
oxidation-preventing co-electrolyte for water/oil remediation and capacitive energy
storage applications, Munuera, J. M.; Paredes, J. I.; Villar-Rodil, S.; Castro-Muñiz, A.;
Martínez-Alonso, A.; Tascón J. M. D.,Applied Materials Today, 2018, 11, 246–254.

5. RESÚMENES Y ARTÍCULOS
88
La exfoliación electroquímica de grafito es una técnica emergente de
preparación de grafeno que posee rasgos atractivos como versatilidad, potencial
escalabilidad y la calidad del grafeno obtenido. Esto queda evidenciado en el número de
publicaciones en las que se describe la preparación de grafeno por diferentes variaciones
de este método. No obstante, es necesario un estudio exhaustivo de cada una de las
variables del proceso, esto es, el voltaje y la corriente aplicados, el tiempo de
exfoliación, el tipo y morfología del grafito de partida, los posibles pretratamientos del
mismo, el electrolito y su concentración, la presencia de aditivos de electrolito y sus
concentraciones, y también en menor medida el tamaño del electrodo de grafito, así
como el volumen de electrolito. El estudio de estas variables es de gran importancia
debido a su influencia en las características del producto final, en términos de
rendimiento, grado de exfoliación, tamaño de las láminas, oxidación, así como cantidad
y tipos de defectos. Debido a la falta de estudios exhaustivos a fecha de inicio de la
presente tesis, se tomó como objetivo estudiar diferentes variaciones de algunos de los
parámetros mencionados, concretamente el material de partida en el artículo I, el uso
de diferentes electrolitos en los artículos II, IV y VI, un pretratamiento en el artículo
III y el uso de aditivos de electrolito como agentes antioxidantes en el artículo V.
La variable a considerar en el artículo I fue el grafito utilizado como ánodo en
la exfoliación anódica. Estudios previos a la publicación de este trabajo utilizaban
indistintamente grafitos de diferente morfología a conveniencia (grafito en polvo, en
copos, HOPG, grafito flexible) sin que hubiera un estudio de la posible influencia de
esta elección en las características del grafeno obtenido. Para evaluar esta influencia, se
procedió a estudiar la exfoliación anódica de grafitos con diferentes morfologías en un
mismo proceso, esto es, sometidos al mismo voltaje durante tiempos iguales,
sumergidos en disoluciones de sulfato de potasio de concentración 0.1 M, un electrolito
estándar y de eficacia ampliamente comprobada. Se exfolió grafito en polvo y copos
compactado en forma de pastilla en una prensa a baja presión, conectado a la fuente de
corriente mediante un hilo de platino. Se exfoliaron también grafito flexible y HOPG,
sujetados por medio de una pinza a la fuente de corriente. En todos los casos el grafito
se utilizó como ánodo en una celda electroquímica, utilizando como cátodo un hilo de
platino. Se aplicó un potencial de 10 V a la celda durante tiempos de 3, 15 y 60 minutos
y en todos los casos la aplicación del potencial condujo a la intercalación del electrolito
en el ánodo de grafito, produciendo una expansión muy marcada y el desprendimiento

5. RESÚMENES Y ARTÍCULOS
89
de partículas expandidas que, tras un proceso de sonicación (bien en N,N-dimetil
formamida (DMF), bien en agua con un dispersante) produjo dispersiones de
nanoláminas de grafeno.
No obstante, ya en el proceso de exfoliación se aprecian claras diferencias entre
los cuatro tipos de grafito. En el caso de grafitos de pequeño tamaño de partícula como
son el polvo y los copos (con partículas de tamaños del orden de decenas y cientos de
micras respectivamente), los ánodos en forma de pastilla se deshacen en tiempos del
orden de 3 a 6 minutos durante la exfoliación, ya que la intercalación del electrolito y la
posterior expansión hacen que las partículas se disgreguen del ánodo y pierdan contacto
eléctrico con la fuente. La consecuencia inmediata de esto es que el grado de
intercalación y exfoliación son limitados, apareciendo nanoláminas de grosores entre 3
y 5 nanómetros medidas por AFM, lo que corresponde a entre 6 y 12 capas de grafeno.
Por otra parte, el grafito flexible y HOPG, con tamaños de partícula del orden de
milímetros, que no requieren ser compactados, permiten tiempos de exfoliación
superiores. En ambos casos la aplicación del voltaje conduce a la intercalación del
electrolito y la expansión del electrodo, así como al desprendimiento de partículas de
grafito expandido. Sin embargo, a diferencia de los otros materiales, en estos casos el
ánodo de grafito sigue siendo estructuralmente sólido, manteniendo el contacto eléctrico
durante tiempos largos y permitiendo así una exfoliación más eficiente. Las
nanoláminas producidas usando estos materiales son más delgadas, con grosores típicos
por AFM de 1 a 2 nanómetros, lo que corresponde a 1 a 3 capas de grafeno.
Los grafenos obtenidos a partir de los cuatro tipos de grafito se analizaron
mediante espectroscopías Raman y fotoelectrónica de rayos X (XPS). En concreto, para
evaluar la presencia de defectos se estudió la relación de intensidades integradas de las
bandas D y G del espectro de Raman, y para determinar el grado de oxidación se midió
la proporción atómica de oxígeno respecto al carbono por medio de XPS. Los grafenos
obtenidos a partir de grafito en polvo y en copos presentan valores bajos de oxidación y
defectos, consistentes con los tiempos cortos de exfoliación (como se ha comentado
previamente, la exfoliación anódica es un proceso oxidativo, y mayores tiempos de
exfoliación implican generalmente mayor oxidación y más aparición de defectos en la
red del grafeno). Los grafenos obtenidos a partir de grafito flexible y HOPG, en cambio,
presentan cantidades de defectos y de oxidación relativamente altos en comparación con
los anteriores, particularmente a tiempos de exfoliación más largos. No obstante, estos

5. RESÚMENES Y ARTÍCULOS
90
dos materiales no se comportan igual, teniendo el grafeno derivado de HOPG un grado
de oxidación superior al del grafeno proveniente del grafito flexible (casi el doble para
tiempos iguales de exfoliación). Esta diferencia de comportamiento puede explicarse
una vez más por sus diferentes morfologías. Como se observó en las imágenes de FE-
SEM de los materiales de partida, el HOPG así como los grafitos en polvo y copos
presentan una estructura marcadamente laminar, con una morfología compacta. Sin
embargo el grafito flexible tiene una estructura menos densa, con multitud de arrugas,
huecos y recovecos debido al proceso de preparación del mismo (grafito en copos
expandido y posteriormente laminado entre rodillos). Esta morfología poco densa y
desordenada facilita enormemente la acción del electrolito puesto que, como se ha
comentado, la intercalación es un proceso que se origina en los bordes del grafito, y los
huecos y arrugas proporcionan muchos más puntos de entrada al electrolito que una
estructura densa de láminas perfectamente apiladas
En conjunto, todas las características de los grafenos obtenidos están dentro de
los valores habituales para grafenos exfoliados anódicamente, y queda patente la
relevancia de elegir uno u otro material de partida. Vistas en conjunto las características,
los materiales particulados (polvo y copos) se descartan como materiales idóneos por la
incomodidad que supone su uso, así como por el hecho de que las láminas producidas
son relativamente gruesas. Respecto al HOPG y grafito flexible, la elección es fácil por
dos motivos. El primero es el grado de oxidación. A pesar de que sus valores para
tiempos de tratamiento electrolítico de 60 minutos son aceptables y están dentro de lo
habitual para este tipo de grafenos (18% de oxígeno para HOPG, 11% para grafito
flexible), la menor oxidación de este último hace que el grafito flexible resulte más
atractivo. El segundo motivo y muy relevante, es el precio. El HOPG es un material de
muy alta calidad e incluso los grados más baratos tienen precios del orden de 100 € por
gramo, frente a los ~0.1 € por gramo para el grafito flexible. Por tanto, y considerando
todas estas variables, el material que exhibe las mejores características para ser usado
como ánodo en la exfoliación electroquímica es el grafito flexible, y así se ha seguido
utilizando en posteriores trabajos.
Debido a los potenciales usos en aplicaciones biomédicas de los materiales
grafénicos, se realizaron ensayos de biocompatibilidad de los grafenos producidos en
este trabajo. Estos ensayos consisten en pruebas de proliferación celular de fibroblastos
de ratón L-929, y aunque se aprecian leves diferencias según el contenido en oxígeno de

5. RESÚMENES Y ARTÍCULOS
91
los materiales grafénicos, todos ellos permiten la proliferación celular y por tanto se
consideran biocompatibles.
El uso del anión sulfato en forma de ácido o sales como electrolito está
ampliamente extendido en la exfoliación anódica de grafito, y ha demostrado
sobradamente su eficiencia en este proceso. No obstante su uso tiene limitaciones, como
son la oxidación significativa del grafeno producido y la necesidad de lavar
extensamente el material expandido para eliminar el sulfato y después dispersarlo en un
disolvente orgánico o agua (que requiere la adición de un surfactante). Por estas
razones, en el artículo II se explora el uso de compuestos aromáticos sulfonados como
electrolitos multifuncionales en la exfoliación anódica acuosa de grafito, utilizando el
mismo procedimiento que en el trabajo anterior. Estos compuestos, consistentes en uno
o varios grupos sulfonato anclados a anillos mono o poliaromáticos se emplearon para
corregir los problemas y deficiencias de los electrolitos habituales. Se estudiaron gran
cantidad de compuestos del mencionado tipo.
Debido a sus características, estos compuestos actúan como agentes intercalantes
de la misma manera que el anión sulfato, produciendo la expansión del grafito que
permite la obtención de grafeno mediante una posterior sonicación. En el caso del anión
sulfato, es necesario efectuar la sonicación en un medio dispersante apropiado, bien sea
un disolvente como el DMF o en agua mediante la adición de un surfactante. Sin
embargo, debido a la naturaleza anfifílica de los sulfonatos aromáticos, es posible
usarlos también como surfactantes, dando lugar a dispersiones de grafeno estabilizadas
por la propia acción de estos compuestos. Una vez preparadas estas dispersiones
estables de grafeno, la presencia de los sulfonatos aromáticos adsorbidos en la
superficie de las láminas sirve como punto de anclaje para la síntesis de nanopartículas,
lo que permitió la formación de híbridos grafeno-nanopartículas de platino, que
demostraron una excelente capacidad catalítica en la reducción de nitroarenos (4-
nitrofenol y 4-nitroanilina) con borohidruro de sodio.
Uno de los grandes inconvenientes de la exfoliación anódica de grafeno en
medio acuoso es la oxidación del producto final. Debido a la naturaleza oxidativa del
proceso electroquímico anódico, así como a la necesidad de oxidar los bordes de grano
del grafito para facilitar la intercalación de los aniones, existe la creencia extendida de
que es inevitable que se produzca una oxidación significativa del grafeno durante el

5. RESÚMENES Y ARTÍCULOS
92
proceso de exfoliación anódica. No obstante, la utilización de electrolitos
multifuncionales en la exfoliación puede afectar en gran medida a la calidad del grafeno
obtenido. La exfoliación anódica tiene lugar a potenciales muy superiores al de la
oxidación del agua, lo cual provoca la aparición de especies como el radical hidroxilo
(·OH). Estas especies son altamente inestables y tienden a oxidar cualquier compuesto o
material presente en el lugar de su formación, bien sea el electrolito o el ánodo de
grafito. En el caso de la exfoliación con sulfato, al no poder éste ser oxidado, las
especies oxidantes atacan los bordes y planos basales del grafito (y menor medida el
plano basal), dando lugar a grafenos oxidados. Sin embargo, si durante el proceso el
electrolito intercalante es un compuesto oxidable, estas especies lo atacarán y por tanto
la oxidación del grafeno será previsiblemente menor.
Se estudió el uso de varios sulfonatos aromáticos, determinándose que, en
general, todos ellos fueron eficientes en la exfoliación de grafeno, salvo aquellos que
por tener una parte hidrófoba demasiado grande son poco solubles en agua. Además,
todos los electrolitos con una componente apolar lo suficientemente grande como para
adsorberse sobre las láminas produjeron dispersiones estables en agua formadas por
grafeno de pocas capas. En lo que respecta a la presencia de oxidación y defectos, la
mayoría de electrolitos conducen a grafeno muy similar al obtenido usando el anión
sulfato, con un contenido en oxígeno de ~11% y una relación de intensidades de las
bandas D y G de Raman (ID/IG) de ~1.0. Sin embargo, como cabría esperar por la
capacidad de los anillos aromáticos para ser oxidados, algunos de estos electrolitos
permiten obtener grafenos con mucha menor oxidación y defectos. En concreto para el
1,3,6,8-pirenotetrasulfonato y el 1,5-naftalenodisulfonato se obtuvieron valores tan
bajos como 6 y 2% de oxígeno y relaciones ID/IG de 0.3 y 0.2 respectivamente, siendo
los segundos los menores documentados hasta la fecha para grafenos exfoliados
anódicamente.
Utilizando los grafenos preparados con estos dos electrolitos como soporte, se
prepararon nanopartículas de platino por reducción de tetracloroplatinato de potasio
(K2PtCl4) con borohidruro de sodio (NaBH4). La presencia de los aniones aromáticos
sulfonados adsorbidos en la superficie de las láminas no solo contribuye a estabilizar las
dispersiones acuosas, sino que facilita el anclaje de las nanopartículas, produciendo
híbridos con mayor cantidad y mejor distribución que en experimentos de control sin la
presencia de los electrolitos adsorbidos. Estos híbridos fueron estudiados como

5. RESÚMENES Y ARTÍCULOS
93
catalizadores de las reacciones de reducción de 4-nitrofenol y 4-nitroanilina, de las
cuales se sabe que el platino es un excelente catalizador. La distribución de las
nanopartículas sobre las láminas contribuye a una mayor eficiencia en la catálisis, y esto
se constata al determinar la actividad catalítica para ambos grafenos. Se obtuvieron
valores de 11-14 min-1
para la reducción de 4-nitrofenol y de 23-57 min-1
para la de 4-
nitroanilina, valores del mismo orden o superiores a los documentados para
nanopartículas de platino en dispersión coloidal.
Queda constatado, por tanto, que estos electrolitos son capaces de cumplir las
cuatro funcionalidades propuestas para ellos (intercalación, estabilidad coloidal,
remediar la oxidación y anclaje de nanopartículas) de forma excepcional, obteniendo
por este método grafeno comparable con el obtenido por sonicación directa mediante
ultrasonidos.
Uno de los mayores retos en cuanto a los métodos de producción de grafeno es
el rendimiento del proceso. Si el objetivo es disponer de grandes cantidades (o al menos
pasar de la escala de miligramos a la de gramos), es necesario que los procesos de
preparación tengan una capacidades de producción y rendimientos altos. La capacidad
de producción requiere procesos escalables, y aunque apenas se han publicado estudios
en los que se describen procesos a escala industrial, la exfoliación electroquímica se
plantea como uno de los métodos con mayor potencial de escalabilidad. Si pensamos en
términos de rendimiento, la mayor parte de métodos en fase líquida (sonicación directa,
cizalla) tienen rendimientos inferiores al 1%, considerando las masas de grafeno
obtenido y de grafito de partida. Por otra parte, los rendimientos de grafenos exfoliados
electroquímicamente, aunque son mayores que los anteriores, suelen ser relativamente
limitados. En el artículo III se describe el uso de un pretratamiento del grafito flexible
que permite incrementar el rendimiento del proceso hasta un 50%.
El pretratamiento se basa en la inmersión de las piezas de grafito flexible en
ácido sulfúrico concentrado durante tiempos de 1 a 72 horas. A continuación se lleva a
cabo el proceso de exfoliación electroquímica descrito previamente, esto es, se emplea
el grafito como ánodo, un hilo de platino como cátodo y se aplica un potencial de 10 V
durante una hora mientras ambos electrodos permanecen sumergidos en una disolución
de sulfato potásico 0.1 M.

5. RESÚMENES Y ARTÍCULOS
94
Durante el tiempo que el grafito flexible está sumergido en ácido sulfúrico se
aprecia una leve expansión que aumenta con el tiempo, debido a que este ácido tiene
gran afinidad por el grafito y se inserta en los huecos y arrugas propios de su
morfología. Mediante difracción de rayos X se puede comprobar que el espaciado de las
capas del grafito se mantiene constante durante el proceso, lo cual confirma que no se
produce un compuesto de intercalación como tal, sino la acumulación de ácido sulfúrico
en los huecos del grafito. Al utilizar el grafito como ánodo en la exfoliación
electroquímica descrita arriba, el efecto que tiene el ácido sulfúrico acumulado es de
acelerar enormemente el proceso, llegando a un rendimiento del 50% para 48 h de
inmersión, en comparación con un rendimiento del 10% para el grafito sin tratar con
ácido sulfúrico.
Dado que la exfoliación anódica es un proceso oxidativo y que genera defectos
en el grafeno producido, cabe preguntarse si aumentar el rendimiento mediante este
tratamiento tiene algún efecto sobre el producto. Para evaluar este efecto, se estudiaron
el porcentaje de oxígeno, el espectro Raman y la conductividad del grafeno pretratado, y
se compararon los valores con aquellos de grafeno exfoliado anódicamente
documentados en la literatura. En efecto, el porcentaje de oxígeno es relativamente alto
(~20%, frente a ~10% en el grafeno sin tratar). Sin embargo, esta cifra entra dentro del
rango de valores habituales para grafenos preparados anódicamente, que oscilan entre el
10 y el 30%. Por otra parte, los espectros Raman del grafeno preparado con y sin
pretratamiento apenas se diferencian, lo que indica que no hay un incremento muy alto
en la cantidad de defectos introducidos. Esto se corrobora con la medida de
conductividad, de ~35000 S m-1
, un valor muy alto y que implica la existencia de
dominios de grafeno prístino abundantes y extensos en las láminas. Por otra parte, se
estudiaron mediante AFM el grosor de las láminas y se descubrió que no hay
variaciones significativas respecto al grafeno obtenido sin pretratamiento, encontrando
láminas de menos de 4 capas de grafeno, como es habitual.
En conclusión, al aplicar este pretratamiento sencillo se ha incrementado 5 veces el
rendimiento (del 10 al 50%) sin alterar muy sustancialmente las características del
grafeno producido.
Si bien los electrolitos más utilizados en la exfoliación anódica de grafeno son
sales de sulfato en disolución acuosa, existe la posibilidad de utilizar otras sales, como

5. RESÚMENES Y ARTÍCULOS
95
se explora en el artículo IV. Existen en la literatura trabajos que describen el uso, con
diversos grados de éxito, de sales comunes como electrolitos, entre ellos fosfatos,
nitratos y halogenuros. Estos últimos han sido sistemáticamente desechados por los
grupos de investigación por no ser capaces de dar lugar a la exfoliación. No obstante,
habida cuenta de la experiencia de nuestro grupo al evaluar la influencia de las variables
del proceso de exfoliación anódica (en concreto el tipo de grafito y la concentración del
electrolito), decidimos explorar la posibilidad de exfoliar grafeno utilizando como
electrolitos las sales más sencillas que encontramos: halogenuros de sodio.
El primer paso para evaluar el uso de estos electrolitos fue explorar el tipo de
grafito usado. Se utilizaron grafito en copos, HOPG y grafito flexible como ánodos en
experimentos de exfoliación, y como electrolito una disolución de cloruro de sodio 0.1
M, aplicando un voltaje de 10 V durante una hora. Los tres materiales experimentan una
expansión visible, pero el análisis de la morfología de los materiales expandidos
muestra que solo en el caso del grafito flexible la expansión da lugar a láminas delgadas
(de nanómetros de grosor), que tras sonicación en un medio apropiado producen
dispersiones de grafeno. Por el contrario, los otros dos materiales producen láminas
muy gruesas que no son estables coloidalmente (por estar compuestas de grafito de
muchas capas).
Tras comprobar la importancia del material a exfoliar, se utilizaron como
electrolitos disoluciones de cloruro, bromuro y yoduro de sodio en concentraciones
desde 0.01 a 1.0 M utilizando como ánodo el grafito flexible. Así, se observó que los
tres halogenuros tienen diferentes rangos de concentración en los que producen una
exfoliación efectiva del grafito. A concentraciones bajas del electrolito la intercalación
es muy débil y apenas se observa expansión del ánodo ni desprendimiento de
fragmentos de grafito expandido. A concentraciones superiores se empieza a apreciar la
exfoliación, desprendiéndose materiales expandidos que, tras sonicación, producen
dispersiones estables de grafeno de pocas capas. No obstante, aunque mayores
concentraciones de electrolito generalmente conducen a un aumento de la cantidad de
material expandido (ya que aumenta la conductividad de la disolución), esto no redunda
directamente en un mayor rendimiento de la producción de grafeno, puesto que se
observa que a partir de un cierto umbral de concentración los materiales expandidos ya
no producen dispersiones estables tras sonicación, sino que están formados por placas
gruesas de grafito en lugar de grafeno de pocas capas. Este rango de concentraciones es
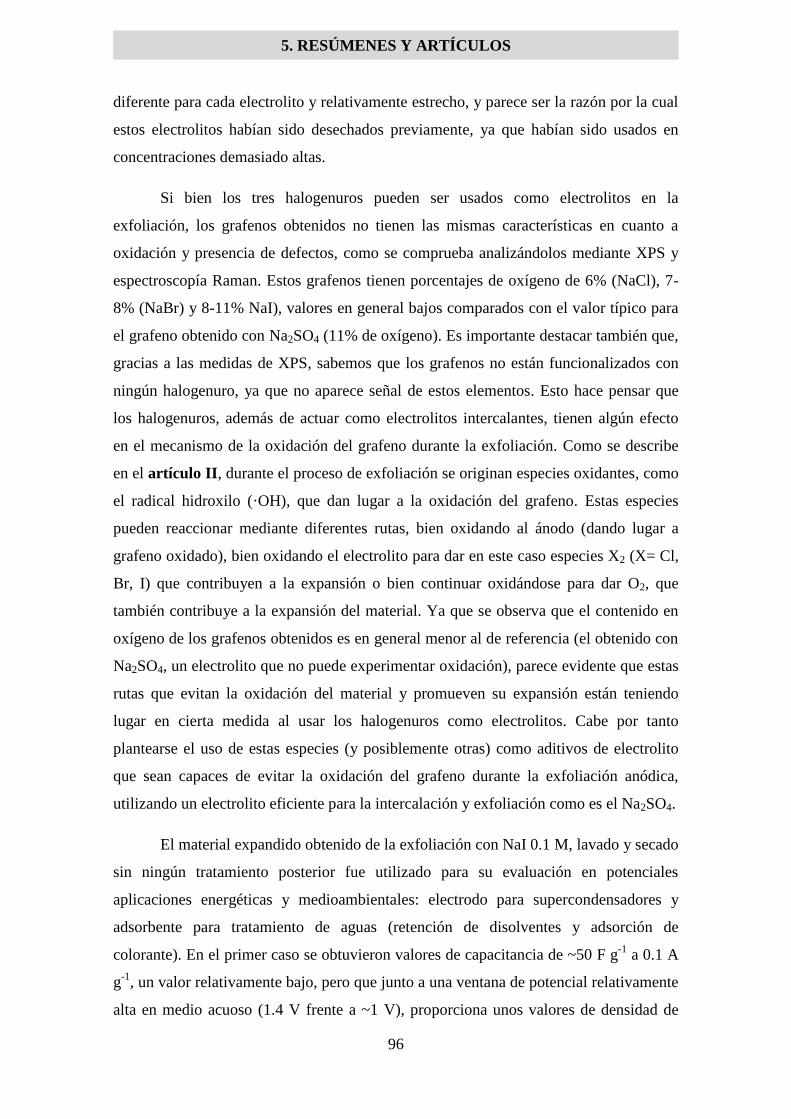
5. RESÚMENES Y ARTÍCULOS
96
diferente para cada electrolito y relativamente estrecho, y parece ser la razón por la cual
estos electrolitos habían sido desechados previamente, ya que habían sido usados en
concentraciones demasiado altas.
Si bien los tres halogenuros pueden ser usados como electrolitos en la
exfoliación, los grafenos obtenidos no tienen las mismas características en cuanto a
oxidación y presencia de defectos, como se comprueba analizándolos mediante XPS y
espectroscopía Raman. Estos grafenos tienen porcentajes de oxígeno de 6% (NaCl), 7-
8% (NaBr) y 8-11% NaI), valores en general bajos comparados con el valor típico para
el grafeno obtenido con Na2SO4 (11% de oxígeno). Es importante destacar también que,
gracias a las medidas de XPS, sabemos que los grafenos no están funcionalizados con
ningún halogenuro, ya que no aparece señal de estos elementos. Esto hace pensar que
los halogenuros, además de actuar como electrolitos intercalantes, tienen algún efecto
en el mecanismo de la oxidación del grafeno durante la exfoliación. Como se describe
en el artículo II, durante el proceso de exfoliación se originan especies oxidantes, como
el radical hidroxilo (·OH), que dan lugar a la oxidación del grafeno. Estas especies
pueden reaccionar mediante diferentes rutas, bien oxidando al ánodo (dando lugar a
grafeno oxidado), bien oxidando el electrolito para dar en este caso especies X2 (X= Cl,
Br, I) que contribuyen a la expansión o bien continuar oxidándose para dar O2, que
también contribuye a la expansión del material. Ya que se observa que el contenido en
oxígeno de los grafenos obtenidos es en general menor al de referencia (el obtenido con
Na2SO4, un electrolito que no puede experimentar oxidación), parece evidente que estas
rutas que evitan la oxidación del material y promueven su expansión están teniendo
lugar en cierta medida al usar los halogenuros como electrolitos. Cabe por tanto
plantearse el uso de estas especies (y posiblemente otras) como aditivos de electrolito
que sean capaces de evitar la oxidación del grafeno durante la exfoliación anódica,
utilizando un electrolito eficiente para la intercalación y exfoliación como es el Na2SO4.
El material expandido obtenido de la exfoliación con NaI 0.1 M, lavado y secado
sin ningún tratamiento posterior fue utilizado para su evaluación en potenciales
aplicaciones energéticas y medioambientales: electrodo para supercondensadores y
adsorbente para tratamiento de aguas (retención de disolventes y adsorción de
colorante). En el primer caso se obtuvieron valores de capacitancia de ~50 F g-1
a 0.1 A
g-1
, un valor relativamente bajo, pero que junto a una ventana de potencial relativamente
alta en medio acuoso (1.4 V frente a ~1 V), proporciona unos valores de densidad de
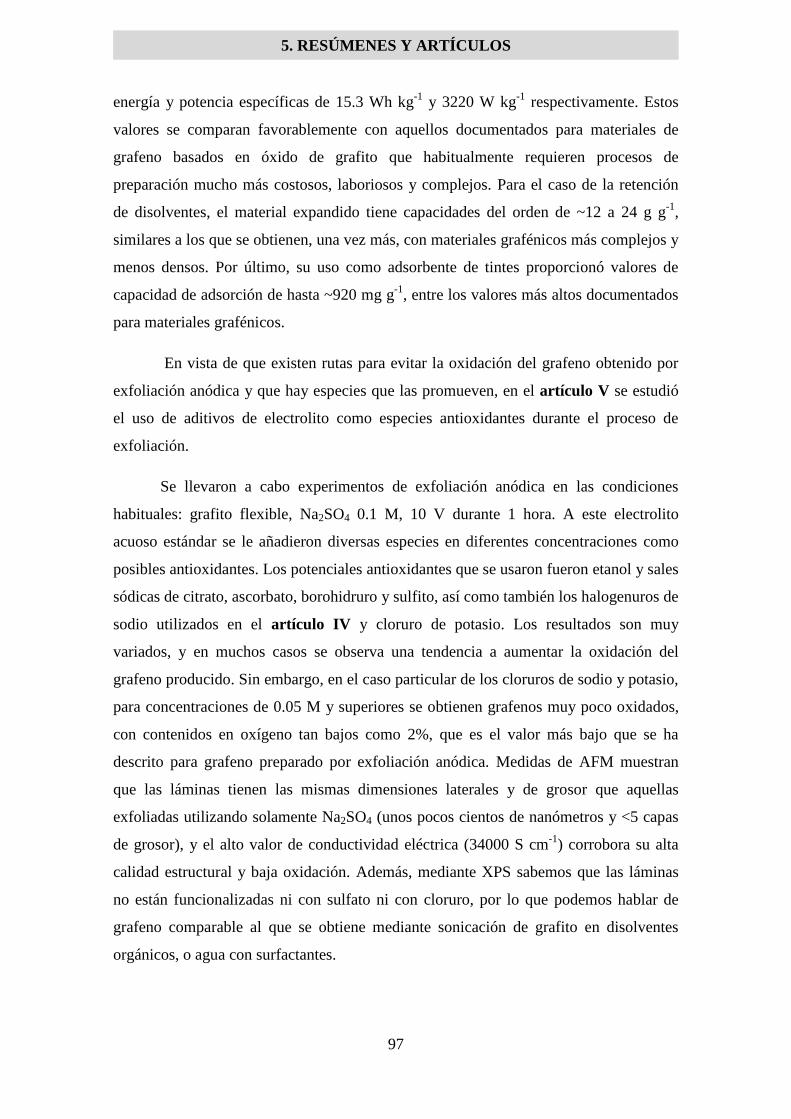
5. RESÚMENES Y ARTÍCULOS
97
energía y potencia específicas de 15.3 Wh kg-1
y 3220 W kg-1
respectivamente. Estos
valores se comparan favorablemente con aquellos documentados para materiales de
grafeno basados en óxido de grafito que habitualmente requieren procesos de
preparación mucho más costosos, laboriosos y complejos. Para el caso de la retención
de disolventes, el material expandido tiene capacidades del orden de ~12 a 24 g g-1
,
similares a los que se obtienen, una vez más, con materiales grafénicos más complejos y
menos densos. Por último, su uso como adsorbente de tintes proporcionó valores de
capacidad de adsorción de hasta ~920 mg g-1
, entre los valores más altos documentados
para materiales grafénicos.
En vista de que existen rutas para evitar la oxidación del grafeno obtenido por
exfoliación anódica y que hay especies que las promueven, en el artículo V se estudió
el uso de aditivos de electrolito como especies antioxidantes durante el proceso de
exfoliación.
Se llevaron a cabo experimentos de exfoliación anódica en las condiciones
habituales: grafito flexible, Na2SO4 0.1 M, 10 V durante 1 hora. A este electrolito
acuoso estándar se le añadieron diversas especies en diferentes concentraciones como
posibles antioxidantes. Los potenciales antioxidantes que se usaron fueron etanol y sales
sódicas de citrato, ascorbato, borohidruro y sulfito, así como también los halogenuros de
sodio utilizados en el artículo IV y cloruro de potasio. Los resultados son muy
variados, y en muchos casos se observa una tendencia a aumentar la oxidación del
grafeno producido. Sin embargo, en el caso particular de los cloruros de sodio y potasio,
para concentraciones de 0.05 M y superiores se obtienen grafenos muy poco oxidados,
con contenidos en oxígeno tan bajos como 2%, que es el valor más bajo que se ha
descrito para grafeno preparado por exfoliación anódica. Medidas de AFM muestran
que las láminas tienen las mismas dimensiones laterales y de grosor que aquellas
exfoliadas utilizando solamente Na2SO4 (unos pocos cientos de nanómetros y <5 capas
de grosor), y el alto valor de conductividad eléctrica (34000 S cm-1
) corrobora su alta
calidad estructural y baja oxidación. Además, mediante XPS sabemos que las láminas
no están funcionalizadas ni con sulfato ni con cloruro, por lo que podemos hablar de
grafeno comparable al que se obtiene mediante sonicación de grafito en disolventes
orgánicos, o agua con surfactantes.

5. RESÚMENES Y ARTÍCULOS
98
Al igual que en el trabajo anterior y debido a la similitud de los materiales
obtenidos, se estudió el uso del grafito expandido preparado usando Na2SO4 y NaCl 0.1
M sin ningún procesado posterior como electrodo para supercondensador y como
adsorbente en tratamiento de aguas. La capacitancia de los supercondensadores en
electrolito ácido es de 120 F g-1
a 0.05 A g-1
, mientras que la capacidad de retención de
disolventes es de ~15-30 g g-1
y la capacidad de adsorción de tintes presenta valores de
130 a 450 mg g-1
. Todos estos valores se comparan favorablemente y en algunos casos
superan a los documentados en la literatura para materiales grafénicos de características
similares, todos ellos con procesos de preparación más complejos y costosos que los
materiales aquí descritos.

ARTÍCULO I
99
High quality, low oxygen content and biocompatible graphene nanosheets obtained
by anodic exfoliation of different graphite types
J.M. Munueraa*
, J.I. Paredesa, S. Villar-Rodil
a, M. Ayán-Varela
a, A. Pagán
b, S.D.
Aznar-Cervantesb, J.L. Cenis
b, A. Martínez-Alonso
a, J.M.D. Tascón
a
aInstituto Nacional del Carbón, INCAR-CSIC, Apartado 73, 33080 Oviedo, Spain
bInstituto Murciano de Investigación y Desarrollo Agrario y Alimentario (IMIDA),
C/Mayor 1, 30150 La Alberca (Murcia), Spain
*Corresponding author. Tel: (+34) 985 11 90 90. E-mail: [email protected] (J.M:
Munuera)

ARTÍCULO I
100
Abstract
Anodic exfoliation of graphite has emerged as an attractive method to access
graphene nanosheets in large quantities, but oxidation reactions associated to this
process compromise the structural quality of the resulting materials. Here, we
demonstrate that the type of starting graphite material impacts the oxygen and defect
content of anodically exfoliated graphenes obtained thereof. We investigated highly
oriented pyrolytic graphite (HOPG) as well as graphite foil, flakes and powder as
electrode in the anodic process. Importantly, materials with low levels of oxidation and
disorder (similar to those typically achieved with cathodic exfoliation approaches) could
be attained through proper choice of the graphite electrode. Specifically, using graphite
foil afforded nanosheets of higher quality than that of HOPG-derived nanosheets. This
discrepancy was interpreted to arise from the structural peculiarities of the former,
where the presence of folds, voids and wrinkles would make its exfoliation process to
be less reliant on oxidation reactions. Furthermore, cell viability tests carried out with
murine fibroblasts on thin graphene films suggested that the anodically exfoliated
graphenes investigated here (possessing low or high oxidation levels) are highly
biocompatible. Overall, control upon the extent of oxidation and disorder should expand
the scope of anodically exfoliated graphenes in prospective applications.
1. Introduction
More than ten years after it could be first isolated by a relatively straightforward
exfoliation approach [1], graphene has become one of the most intensively studied
objects from the condensed matter physics and materials science fields [2–4]. Although
research efforts were originally focused for the most part on purely fundamental aspects
related to the exceptional electronic, mechanical, thermal and optical properties of this
two-dimensional carbon structure, more recent years have witnessed a shift in emphasis
towards its implementation in a wide variety of relevant target applications [4].
However, fulfilling the promise of graphene as a disruptive material in real-life

ARTÍCULO I
101
applications will first and foremost require its large-scale production by methods that
should ideally be simple, inexpensive and versatile enough to afford products with
characteristics tailored to each intended use. Because no single method known to date
can deliver cost-effective graphene materials with high yields and on-demand
characteristics at the same time, researchers have directed their efforts towards the
development of a pool of bottom-up and top-down fabrication approaches, each of
which exhibits its own advantages and drawbacks and is therefore best suited to certain
applications [4,5].
Bottom-up production methods are dominated by chemical vapor deposition (CVD)
of hydrocarbons onto suitable metal substrates (e.g., copper), which gives access to high
quality graphene wafers appropriate for applications in electronics and photonics [5,6].
Unfortunately, issues related to the use of high temperatures and a sacrificial metal or
the need of subsequent transfer processes hamper its widespread adoption. Among top-
down methods, which are based on the exfoliation of graphite and graphite derivatives
[7,8], the so-called graphite oxide route has received a great deal of attention, as it can
provide single-layer sheets of graphene oxide (GO) and reduced graphene oxide (RGO)
with high throughput and yield [9,10]. Nevertheless, the obtained materials are typically
very defective; as a result, many of the attractive physical properties observed in pristine
graphene have been found to degrade in GO/RGO [11]. While full structural restoration
of the latter has been shown to be feasible, the process relies on the use of very high
temperatures (>1500 ºC), making it impractical for most applications [ 12 , 13 ].
Alternatively, defect-free graphene flakes can be procured by direct exfoliation of
graphite in the liquid phase, usually with the assistance of ultrasound or shear forces
[14–16]. This method readily lends itself to the preparation of colloidal graphene
dispersions that can be further processed into useful materials, such as thin films,
composites or hybrids, but usually suffers from low yields and relatively limited
exfoliation degrees (multilayer graphene), as well as small flake sizes.
Another top-down approach to graphene production that has emerged in recent years
is the one based on electrochemical exfoliation of graphite, which boasts such appealing
features as simplicity and speed of operation or a strong potential to be scaled-up [17–
19]. Although a variety of electrochemical processes have been successfully tested
towards this end [19], they can be broadly classified into either (1) cathodic exfoliation
in organic solvents (propylene carbonate, dimethyl sulfoxide, etc) containing lithium or
alkylammonium salts as the electrolyte [20–24], or in water in some specific cases [25]

ARTÍCULO I
102
or (2) anodic exfoliation in ionic liquid-water mixtures or aqueous solutions of acids
(mainly H2SO4) or inorganic salts [ 26 – 33 ]. The anodic exfoliation protocols are
particularly attractive due to their greener character (use of water/ionic liquids vs.
organic solvents) and generally higher and faster production rates. However, contrary to
the case of cathodic exfoliation, the obtained graphene materials tend to be decorated
with significant amounts of oxygen functional groups that compromise their structural
quality [25,28–33]. Such functionalization is thought to be the result of oxidation
processes inherent to the application of anodic potentials to the graphite electrode. To
alleviate this problem, some researchers have proposed using aqueous solutions of
inorganic salts instead of acids as the electrolyte (e.g., K2SO4 rather than H2SO4)
[28,31], but the data available in the literature still reveal a wide variability in oxygen
content for anodically exfoliated graphenes prepared through such a strategy [31,33,34].
In addition to the electrolyte nature, we hypothesize that other factors such as the
type of graphite used for exfoliation could be critical in determining the oxygen content,
and thus the structural quality, of anodically derived graphenes. It is well-known in
carbon science that oxidation and intercalation of graphitic materials, the two main
processes that are thought to drive anodic exfoliation [27,31], are greatly dependent on
their specific microstructure (particle/grain size, presence of imperfections, etc) [35,36].
Consequently, graphene materials with different characteristics and thus a variety of
potential uses should be expected when different graphite types are employed, but to the
best of our knowledge this question has not yet been studied and elucidated, let alone
taken advantage of. In the present work, we address this issue by investigating the
anodic exfoliation of several different types of graphite to give graphene nanosheets.
The results indicate that the oxygen and defect contents of such graphenes are highly
dependent on graphite type, which could be mainly attributed to their morphological
peculiarities. More importantly, graphenes with minimized content of oxygen and
structural defects can be obtained through judicious choice of the starting graphite.
Finally, materials based on anodically exfoliated graphenes could be promising for
biomedical applications, but their biocompatibility has not yet been investigated. Hence,
we also report here cell proliferation tests on thin films of anodically exfoliated
graphenes of different characteristics towards the murine fibroblast cell line L-929,
which suggest these types of graphene to be highly biocompatible.
2. Experimental

ARTÍCULO I
103
2.1. Preparation of graphene by anodic exfoliation of different graphite types
Four different types of graphite were used in the present study: highly oriented
pyrolytic graphite (HOPG; grade ZYH, obtained from Advanced Ceramics), graphite
foil (Papyex I980, obtained from Mersen), natural graphite flakes (ref. 332461, from
Sigma-Aldrich) and natural graphite powder (grade 2910, from Mersen). For the
electrochemical exfoliation experiments, ~10×10×2 mm3 pieces of HOPG and graphite
foil were employed, whereas the graphite powder and flake materials were pressed into
circular pellets (12 mm in diameter, 2 mm in thickness) by means of a hydraulic press.
Exfoliation was conducted in a two-electrode system by immersing a graphite
piece/pellet and a Pt wire into an aqueous 0.1 M K2SO4 solution, which were used as
working and counter electrodes, respectively. The Pt wire was placed parallel to the
graphite sample at a distance of about 2 cm. Then, a positive voltage (10 V, 0.5 A) was
applied to the graphite electrode using a DC power supply (Agilent 6614C apparatus)
for periods of time that typically ranged between a few and several minutes. Such a
process led to the continuous expansion and detachment of graphite fragments from
their parent piece/pellet, which tended to float on the electrolyte solution. This expanded
product was then collected, thoroughly rinsed off with copious amounts of Milli-Q
water to remove residual salts and dried overnight at room temperature under reduced
pressure. Colloidal dispersions of the resulting expanded materials, either in water
assisted by flavin mononucleotide (FMN) as an efficient stabilizer or in N,N-
dimethylformamide (DMF), were obtained either through bath sonication (Selecta
Ultrasons system, 40 kHz) or, alternatively, by shear mixing (IKA T-25 Ultra-Turrax
high-speed homogenizer; rotor diameter: 12.7 mm; rotor-stator gap: 300 m; rotor
speed: 9000 rpm ) for 1 h, followed by centrifugation at 200 g for 20 min (Eppendorf
5424 microcentrifuge) to sediment the non fully exfoliated or poorly exfoliated graphite
fraction. Finally, the top ~75% of the obtained supernatant was collected and stored for
further use. In the case of the FMN-stabilized aqueous dispersions, this supernatant was
further subjected to two cycles of sedimentation (20000 g, 20 min) and resuspension in
Milli-Q water to remove the free (non-adsorbed) FMN fraction.
2.2. Characterization techniques
Characterization of the anodically exfoliated graphenes was carried out by UV-vis
absorption spectroscopy, field-emission scanning electron microscopy (FE-SEM),
atomic force microscopy (AFM), X-ray photoelectron spectroscopy (XPS), attenuated
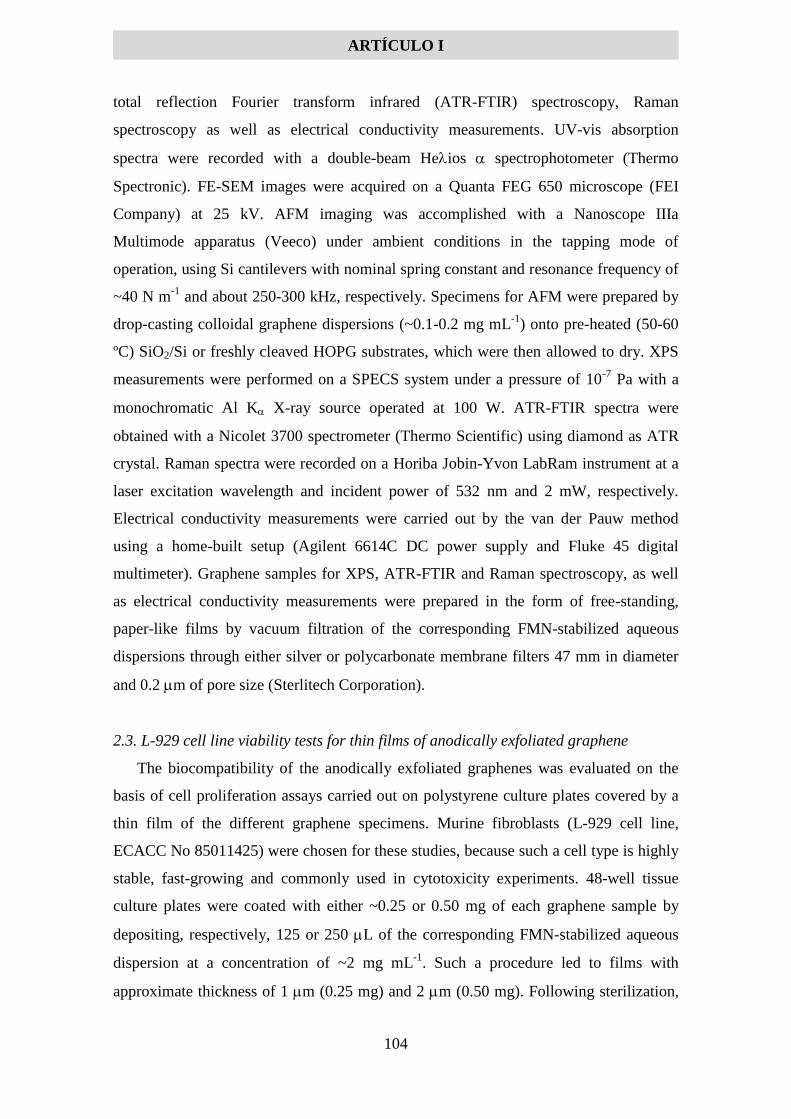
ARTÍCULO I
104
total reflection Fourier transform infrared (ATR-FTIR) spectroscopy, Raman
spectroscopy as well as electrical conductivity measurements. UV-vis absorption
spectra were recorded with a double-beam Heios spectrophotometer (Thermo
Spectronic). FE-SEM images were acquired on a Quanta FEG 650 microscope (FEI
Company) at 25 kV. AFM imaging was accomplished with a Nanoscope IIIa
Multimode apparatus (Veeco) under ambient conditions in the tapping mode of
operation, using Si cantilevers with nominal spring constant and resonance frequency of
~40 N m-1
and about 250-300 kHz, respectively. Specimens for AFM were prepared by
drop-casting colloidal graphene dispersions (~0.1-0.2 mg mL-1
) onto pre-heated (50-60
ºC) SiO2/Si or freshly cleaved HOPG substrates, which were then allowed to dry. XPS
measurements were performed on a SPECS system under a pressure of 10-7
Pa with a
monochromatic Al K X-ray source operated at 100 W. ATR-FTIR spectra were
obtained with a Nicolet 3700 spectrometer (Thermo Scientific) using diamond as ATR
crystal. Raman spectra were recorded on a Horiba Jobin-Yvon LabRam instrument at a
laser excitation wavelength and incident power of 532 nm and 2 mW, respectively.
Electrical conductivity measurements were carried out by the van der Pauw method
using a home-built setup (Agilent 6614C DC power supply and Fluke 45 digital
multimeter). Graphene samples for XPS, ATR-FTIR and Raman spectroscopy, as well
as electrical conductivity measurements were prepared in the form of free-standing,
paper-like films by vacuum filtration of the corresponding FMN-stabilized aqueous
dispersions through either silver or polycarbonate membrane filters 47 mm in diameter
and 0.2 m of pore size (Sterlitech Corporation).
2.3. L-929 cell line viability tests for thin films of anodically exfoliated graphene
The biocompatibility of the anodically exfoliated graphenes was evaluated on the
basis of cell proliferation assays carried out on polystyrene culture plates covered by a
thin film of the different graphene specimens. Murine fibroblasts (L-929 cell line,
ECACC No 85011425) were chosen for these studies, because such a cell type is highly
stable, fast-growing and commonly used in cytotoxicity experiments. 48-well tissue
culture plates were coated with either ~0.25 or 0.50 mg of each graphene sample by
depositing, respectively, 125 or 250 L of the corresponding FMN-stabilized aqueous
dispersion at a concentration of ~2 mg mL-1
. Such a procedure led to films with
approximate thickness of 1 m (0.25 mg) and 2 m (0.50 mg). Following sterilization,

ARTÍCULO I
105
the culture plates were incubated only with pure fetal bovine serum (FBS) at 37 ºC for 2
h to facilitate the initial fibroblast adhesion. Then, the FBS was removed and the culture
plates were seeded with the L-929 cells at a density of 5000 cells per well. Dulbecco´s
modified Eagle´s medium (DMEM) supplemented with 10% FBS, penicillin (100 U
mL-1
) and streptomycin (100 mg mL-1
) was used as culture medium at 37 ºC in a 7.5%
CO2 atmosphere. This medium was carefully replaced twice a week during the cell
growth experiments. Cell proliferation was determined by means of the MTT assay,
which is based on the enzymatic reduction of the tetrazolium dye 3-(4,5-
dimethylthiazol-2-yl)-2,5-diphenyltetrazolium bromide (MTT) to its corresponding
purple formazan. The assays were accomplished 1, 4 and 7 days after cell seeding, each
experiment being performed in triplicate. To this end, each well from the seeded culture
plates was incubated for 4 h in 500 L of MTT solution (1 mg mL-1
) at 37 ºC under 7.5%
CO2 atmosphere [37]. Then, the MTT solution was removed, 200 L of dimethyl
sulfoxide were added to solubilize the water-insoluble purple formazan crystals formed
by reduction of MTT, and the absorbance of the resulting solution was measured with a
BMG FLUOstar Galaxy microplate reader (MTX Lab Systems, Inc) at 570 nm as well
as 690 nm as the reference wavelength.
3. Results and discussion
3.1. Morphological evolution of different graphite types upon anodic treatment
For our study on the influence of the type of graphite starting material on the
characteristics of the graphene obtained from it by electrochemical exfoliation, we
applied a positive potential (10 V) to a graphite working electrode in a 0.1 M K2SO4
aqueous electrolyte. These specific values were chosen on the basis of very recent
studies on the anodic exfoliation of graphite in aqueous solutions of sulfate-based salts
[31,38] where such parameters were reported to be optimal for graphite exfoliation. In
line with these previous reports [31,33,38], application of such potential to a graphite
anode in aqueous electrolyte led to the expansion and detachment of small (up to a few
millimetres) fragments of the material. Evidence for such an expansion could be
gathered by examining the morphology of these fragments by FE-SEM, with noticeable
differences being observed depending on the type of graphite used. Fig. 1a-d shows
representative FE-SEM images of the starting HOPG (a,b) and graphite foil (c,d)
samples, both for basal plane (a,c) and edge (i.e., prismatic) plane (b,d) views. As could
be expected, the basal surface of HOPG appeared essentially flat and featureless (Fig.
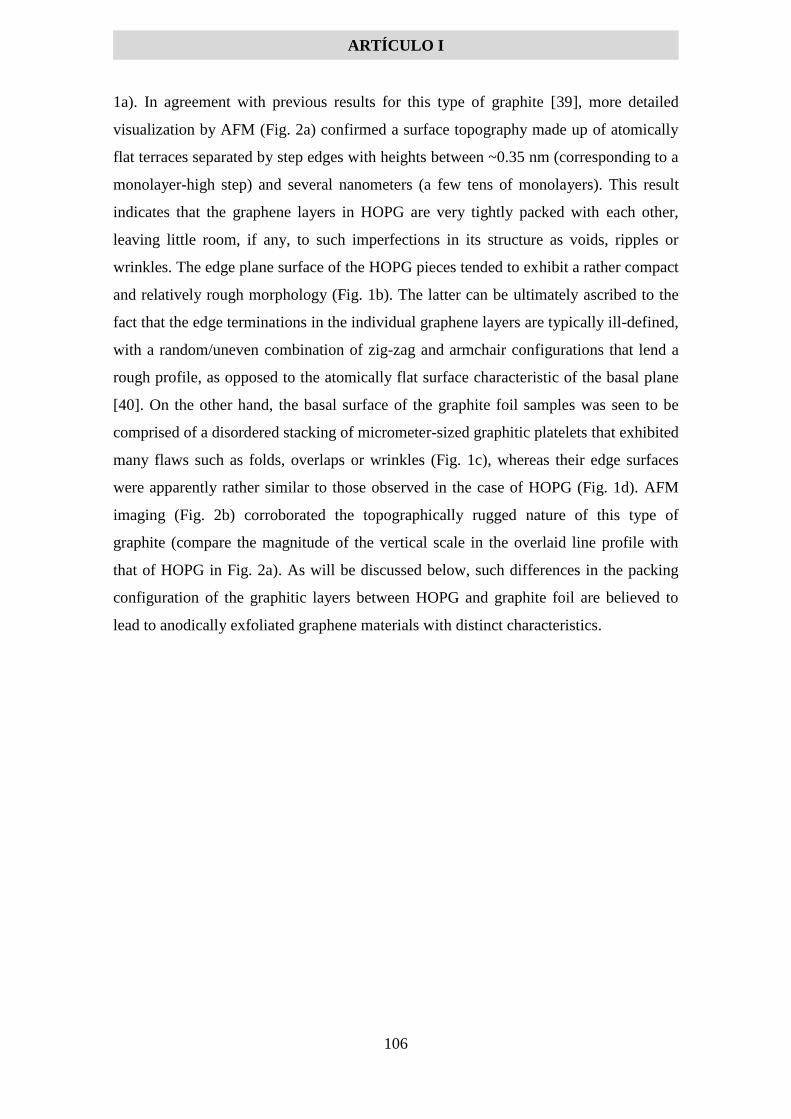
ARTÍCULO I
106
1a). In agreement with previous results for this type of graphite [39], more detailed
visualization by AFM (Fig. 2a) confirmed a surface topography made up of atomically
flat terraces separated by step edges with heights between ~0.35 nm (corresponding to a
monolayer-high step) and several nanometers (a few tens of monolayers). This result
indicates that the graphene layers in HOPG are very tightly packed with each other,
leaving little room, if any, to such imperfections in its structure as voids, ripples or
wrinkles. The edge plane surface of the HOPG pieces tended to exhibit a rather compact
and relatively rough morphology (Fig. 1b). The latter can be ultimately ascribed to the
fact that the edge terminations in the individual graphene layers are typically ill-defined,
with a random/uneven combination of zig-zag and armchair configurations that lend a
rough profile, as opposed to the atomically flat surface characteristic of the basal plane
[40]. On the other hand, the basal surface of the graphite foil samples was seen to be
comprised of a disordered stacking of micrometer-sized graphitic platelets that exhibited
many flaws such as folds, overlaps or wrinkles (Fig. 1c), whereas their edge surfaces
were apparently rather similar to those observed in the case of HOPG (Fig. 1d). AFM
imaging (Fig. 2b) corroborated the topographically rugged nature of this type of
graphite (compare the magnitude of the vertical scale in the overlaid line profile with
that of HOPG in Fig. 2a). As will be discussed below, such differences in the packing
configuration of the graphitic layers between HOPG and graphite foil are believed to
lead to anodically exfoliated graphene materials with distinct characteristics.
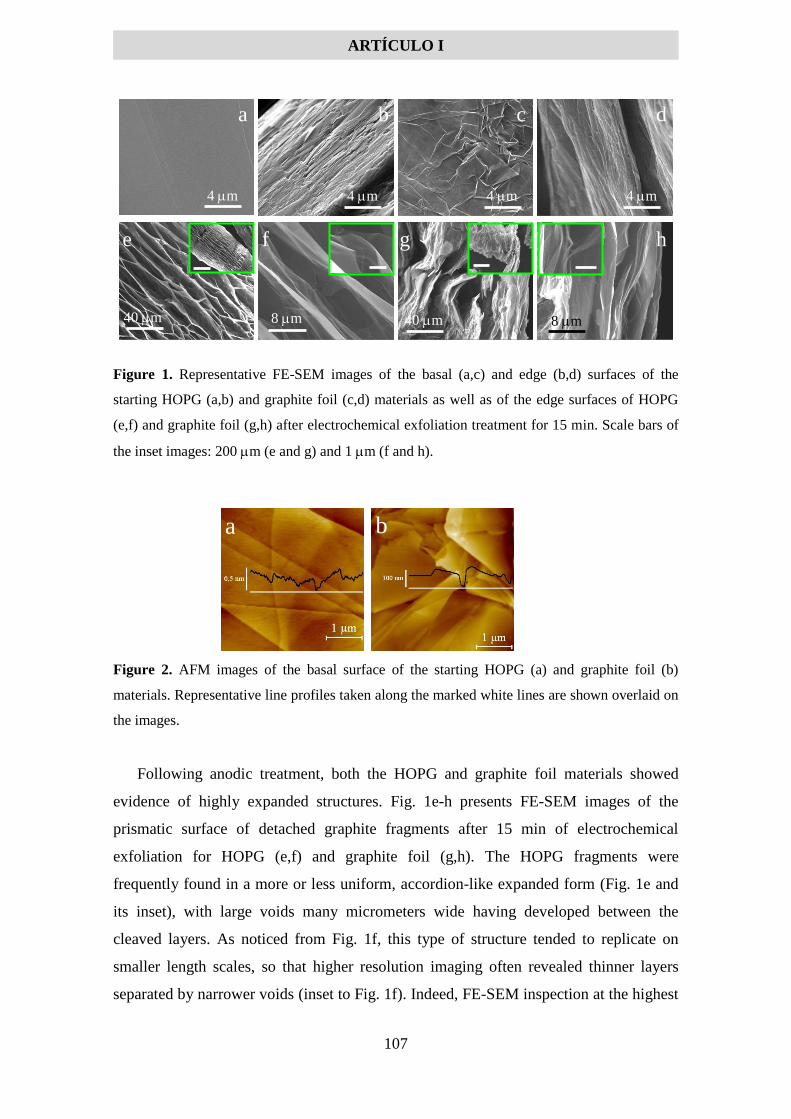
ARTÍCULO I
107
Figure 1. Representative FE-SEM images of the basal (a,c) and edge (b,d) surfaces of the
starting HOPG (a,b) and graphite foil (c,d) materials as well as of the edge surfaces of HOPG
(e,f) and graphite foil (g,h) after electrochemical exfoliation treatment for 15 min. Scale bars of
the inset images: 200 m (e and g) and 1 m (f and h).
Figure 2. AFM images of the basal surface of the starting HOPG (a) and graphite foil (b)
materials. Representative line profiles taken along the marked white lines are shown overlaid on
the images.
Following anodic treatment, both the HOPG and graphite foil materials showed
evidence of highly expanded structures. Fig. 1e-h presents FE-SEM images of the
prismatic surface of detached graphite fragments after 15 min of electrochemical
exfoliation for HOPG (e,f) and graphite foil (g,h). The HOPG fragments were
frequently found in a more or less uniform, accordion-like expanded form (Fig. 1e and
its inset), with large voids many micrometers wide having developed between the
cleaved layers. As noticed from Fig. 1f, this type of structure tended to replicate on
smaller length scales, so that higher resolution imaging often revealed thinner layers
separated by narrower voids (inset to Fig. 1f). Indeed, FE-SEM inspection at the highest
4 m
b
4 m
c
4 m
d
40 m
e
8 m
f
40 m
g
8 m
h
4 m
a
a b
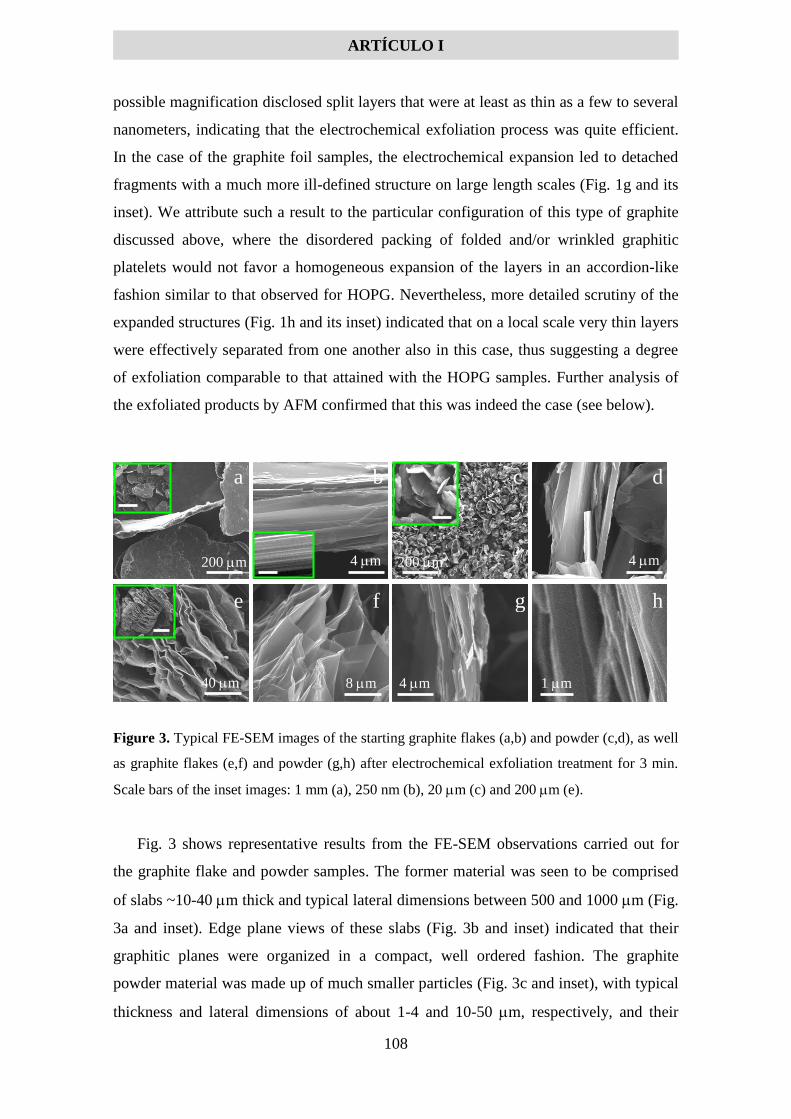
ARTÍCULO I
108
possible magnification disclosed split layers that were at least as thin as a few to several
nanometers, indicating that the electrochemical exfoliation process was quite efficient.
In the case of the graphite foil samples, the electrochemical expansion led to detached
fragments with a much more ill-defined structure on large length scales (Fig. 1g and its
inset). We attribute such a result to the particular configuration of this type of graphite
discussed above, where the disordered packing of folded and/or wrinkled graphitic
platelets would not favor a homogeneous expansion of the layers in an accordion-like
fashion similar to that observed for HOPG. Nevertheless, more detailed scrutiny of the
expanded structures (Fig. 1h and its inset) indicated that on a local scale very thin layers
were effectively separated from one another also in this case, thus suggesting a degree
of exfoliation comparable to that attained with the HOPG samples. Further analysis of
the exfoliated products by AFM confirmed that this was indeed the case (see below).
Figure 3. Typical FE-SEM images of the starting graphite flakes (a,b) and powder (c,d), as well
as graphite flakes (e,f) and powder (g,h) after electrochemical exfoliation treatment for 3 min.
Scale bars of the inset images: 1 mm (a), 250 nm (b), 20 m (c) and 200 m (e).
Fig. 3 shows representative results from the FE-SEM observations carried out for
the graphite flake and powder samples. The former material was seen to be comprised
of slabs ~10-40 m thick and typical lateral dimensions between 500 and 1000 m (Fig.
3a and inset). Edge plane views of these slabs (Fig. 3b and inset) indicated that their
graphitic planes were organized in a compact, well ordered fashion. The graphite
powder material was made up of much smaller particles (Fig. 3c and inset), with typical
thickness and lateral dimensions of about 1-4 and 10-50 m, respectively, and their
200 m
a
4 m
b
200 m
c
4 m
d
40 m
e
8 m
f
4 m
g
1 m
h

ARTÍCULO I
109
graphitic planes displayed a compact arrangement as well (Fig. 3d). For both types of
graphite, anodic exfoliation times of 3 min were employed. Due to their small size
(especially in the case of the powder samples), the individual graphite particles in the
pelletized working electrode tended to expand very quickly during the electrolytic
process. This led in turn to the prompt detachment of the particles from the pellet, so
that a graphite electrode with a mass comparable to that of the HOPG and graphite foil
electrodes used here (~0.5 g) was completely taken apart in 3 min. Such a length of time
was sufficient to induce a large, accordion-like expansion of the graphite flakes (Fig. 3e
and inset), yielding very thin separated layers (Fig. 3f) similar to those observed for
HOPG pieces after 15 min of electrochemical treatment (Fig. 1e and f). Furthermore, we
note that the same type of expanded structures was brought about with only 3 min of
treatment in HOPG (images not shown). However, the electrochemical expansion was
much more limited when using graphite powder (Fig. 3g). In this case, no accordion-
like structures were developed and only relatively narrow voids were generated between
the thin cleaved layers (Fig. 3h). This result suggests that exfoliation was significantly
less efficient with graphite powder compared to the other three types of graphite. We
interpret that, due to their small size, the individual graphite particles that comprise a
pellet of the powder material are in contact with neighboring particles only at a
relatively limited number of points. Thus, a graphite particle on the surface of the pellet
that is expanding as a result of the electrochemical treatment in contact with the
electrolyte will rapidly loose (electrical) contact with the pellet, so that its expansion
will become arrested at a relatively early stage of the process. Hence, the resulting
product can be expected to exhibit a limited extent of expansion, as it was indeed the
case (Fig. 3g and h). For pellets with much larger particle sizes (i.e., flakes) or
monolithic graphite samples (i.e., the HOPG and graphite foil pieces), the expanding
particles/fragments will be in contact with the rest of the electrode for longer times, thus
enabling higher degrees of expansion. Support for this interpretation was gathered from
the observation that detachment of graphitic fragments/particles from the electrodes
proceeded at the slowest pace for the HOPG and graphite foil samples, was somewhat
faster when using the flake material, and was the fastest with the graphite powder.
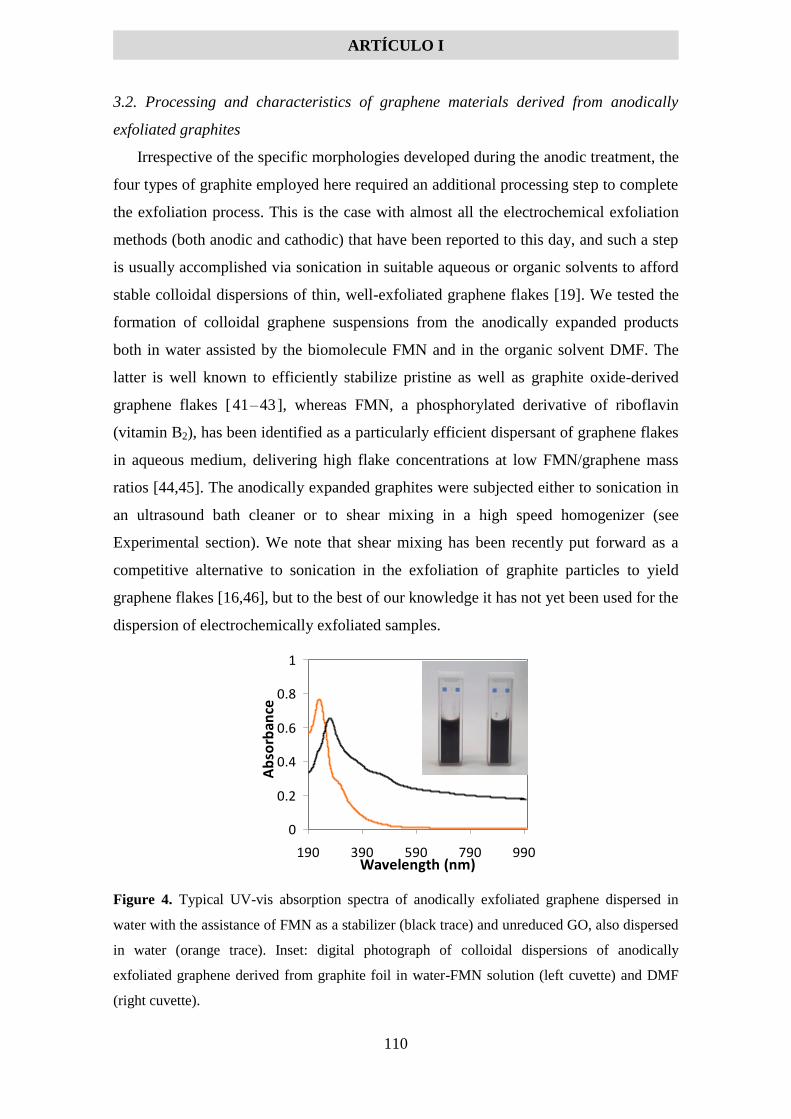
ARTÍCULO I
110
3.2. Processing and characteristics of graphene materials derived from anodically
exfoliated graphites
Irrespective of the specific morphologies developed during the anodic treatment, the
four types of graphite employed here required an additional processing step to complete
the exfoliation process. This is the case with almost all the electrochemical exfoliation
methods (both anodic and cathodic) that have been reported to this day, and such a step
is usually accomplished via sonication in suitable aqueous or organic solvents to afford
stable colloidal dispersions of thin, well-exfoliated graphene flakes [19]. We tested the
formation of colloidal graphene suspensions from the anodically expanded products
both in water assisted by the biomolecule FMN and in the organic solvent DMF. The
latter is well known to efficiently stabilize pristine as well as graphite oxide-derived
graphene flakes [41–43], whereas FMN, a phosphorylated derivative of riboflavin
(vitamin B2), has been identified as a particularly efficient dispersant of graphene flakes
in aqueous medium, delivering high flake concentrations at low FMN/graphene mass
ratios [44,45]. The anodically expanded graphites were subjected either to sonication in
an ultrasound bath cleaner or to shear mixing in a high speed homogenizer (see
Experimental section). We note that shear mixing has been recently put forward as a
competitive alternative to sonication in the exfoliation of graphite particles to yield
graphene flakes [16,46], but to the best of our knowledge it has not yet been used for the
dispersion of electrochemically exfoliated samples.
Figure 4. Typical UV-vis absorption spectra of anodically exfoliated graphene dispersed in
water with the assistance of FMN as a stabilizer (black trace) and unreduced GO, also dispersed
in water (orange trace). Inset: digital photograph of colloidal dispersions of anodically
exfoliated graphene derived from graphite foil in water-FMN solution (left cuvette) and DMF
(right cuvette).
0
0.2
0.4
0.6
0.8
1
190 390 590 790 990Wavelength (nm)
Ab
sorb
ance
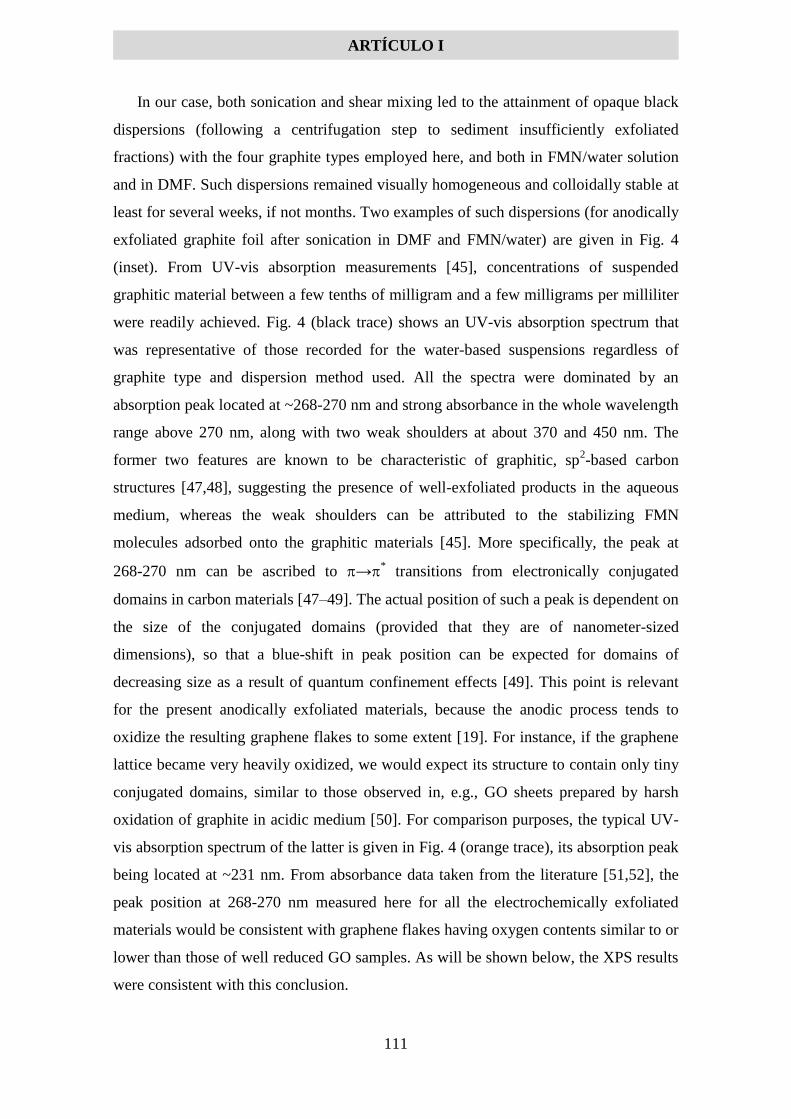
ARTÍCULO I
111
In our case, both sonication and shear mixing led to the attainment of opaque black
dispersions (following a centrifugation step to sediment insufficiently exfoliated
fractions) with the four graphite types employed here, and both in FMN/water solution
and in DMF. Such dispersions remained visually homogeneous and colloidally stable at
least for several weeks, if not months. Two examples of such dispersions (for anodically
exfoliated graphite foil after sonication in DMF and FMN/water) are given in Fig. 4
(inset). From UV-vis absorption measurements [45], concentrations of suspended
graphitic material between a few tenths of milligram and a few milligrams per milliliter
were readily achieved. Fig. 4 (black trace) shows an UV-vis absorption spectrum that
was representative of those recorded for the water-based suspensions regardless of
graphite type and dispersion method used. All the spectra were dominated by an
absorption peak located at ~268-270 nm and strong absorbance in the whole wavelength
range above 270 nm, along with two weak shoulders at about 370 and 450 nm. The
former two features are known to be characteristic of graphitic, sp2-based carbon
structures [47,48], suggesting the presence of well-exfoliated products in the aqueous
medium, whereas the weak shoulders can be attributed to the stabilizing FMN
molecules adsorbed onto the graphitic materials [45]. More specifically, the peak at
268-270 nm can be ascribed to →* transitions from electronically conjugated
domains in carbon materials [47–49]. The actual position of such a peak is dependent on
the size of the conjugated domains (provided that they are of nanometer-sized
dimensions), so that a blue-shift in peak position can be expected for domains of
decreasing size as a result of quantum confinement effects [49]. This point is relevant
for the present anodically exfoliated materials, because the anodic process tends to
oxidize the resulting graphene flakes to some extent [19]. For instance, if the graphene
lattice became very heavily oxidized, we would expect its structure to contain only tiny
conjugated domains, similar to those observed in, e.g., GO sheets prepared by harsh
oxidation of graphite in acidic medium [50]. For comparison purposes, the typical UV-
vis absorption spectrum of the latter is given in Fig. 4 (orange trace), its absorption peak
being located at ~231 nm. From absorbance data taken from the literature [51,52], the
peak position at 268-270 nm measured here for all the electrochemically exfoliated
materials would be consistent with graphene flakes having oxygen contents similar to or
lower than those of well reduced GO samples. As will be shown below, the XPS results
were consistent with this conclusion.

ARTÍCULO I
112
Figure 5. AFM images of anodically exfoliated graphenes obtained from HOPG (a) as well as
graphite foil (b), flakes (c) and powder (d). A typical line profile taken along the marked white
line is shown superimposed on each image.
The exfoliation degree and lateral size of the graphitic products present in the final
colloidal suspensions (i.e., after electrochemical expansion and sonication-/shear
mixing-assisted dispersion) was investigated by AFM. Fig. 5 shows typical height
images recorded for dispersions derived from HOPG (a) as well as from graphite foil
(b), flakes (c) and powder (d), which were drop-cast onto SiO2/Si substrates. It was
observed that both HOPG and graphite foil afforded very thin nanosheets or platelets
with lateral dimensions in the 200-600 nm range and apparent thickness mostly between
1 and 2 nm (see representative line profiles overlaid on the AFM images). Considering
that AFM measurements of thickness for both pristine and oxidized forms of graphene
supported onto SiO2/Si generally include an artifactual contribution amounting to ~1 nm
[53,54], we conclude that the actual thickness of the sheets obtained from HOPG and
graphite foil is not greater than about 1 nm, i.e., the sheets comprise no more than three
or four monolayers. We note that such a high extent of exfoliation was attained
irrespective of treatment time in the electrochemical expansion step. For example, the
AFM image of Fig. 5a corresponds to a treatment time of the HOPG piece of 15 min,
but the same results were obtained for 3 and 60 min of electrolytic treatment (images
not shown). On the other hand, the graphene platelets derived from graphite flakes and
a b
c d

ARTÍCULO I
113
powder (Fig. 5c and d, respectively) tended to be somewhat smaller and thicker. In both
cases, their lateral dimensions were between 100 and 400 nm, although larger platelets
(up to about 1m) were occasionally observed, with apparent thickness values mostly in
the ~3-4 nm range (for powder) and ~4-5 nm range (for flakes), implying that the
exfoliated products were made up of several (typically 6-12) monolayers, even though
thicker objects (up to 10-15 nm) were also sometimes present. The typical lateral size
and apparent thickness values for the graphene nanosheets obtained from the different
graphite types are collected in Table 1.
Because the exfoliated products obtained in the final colloidal dispersions had
undergone a sonication/shear-mixing step in addition to the electrolytic process, and the
former is known to directly induce the cleavage of graphite to give graphene platelets by
itself [14–16], the actual role of the electrochemical treatment in attaining an effective
exfoliation was a priori unclear. To address this issue, as a control experiment the
different as-received graphites (i.e., those without prior electrochemical expansion)
were subjected to the same sonication procedure as that applied to the anodically
expanded materials. For HOPG and graphite foil, hardly any material could be
exfoliated and dispersed in the liquid phase, and the exfoliated objects were much
thicker than 1-3 monolayers, implying that the electrolysis step was critical in the
exfoliation process. For graphite flakes and powder the amount of exfoliated material
was significant, but estimated to be only about 1/8 of that achieved when the
electrochemical expansion step was included, which indicates that such a step was still
the main driving force towards exfoliation. However, the apparent thickness of the
sonicated-only platelets was mostly ~5-6 nm, compared with ~3-5 nm measured for
products with prior electrochemical expansion, suggesting that electrolysis did not have
a very strong effect on the exfoliation degree of platelets derived from these two
graphite types.
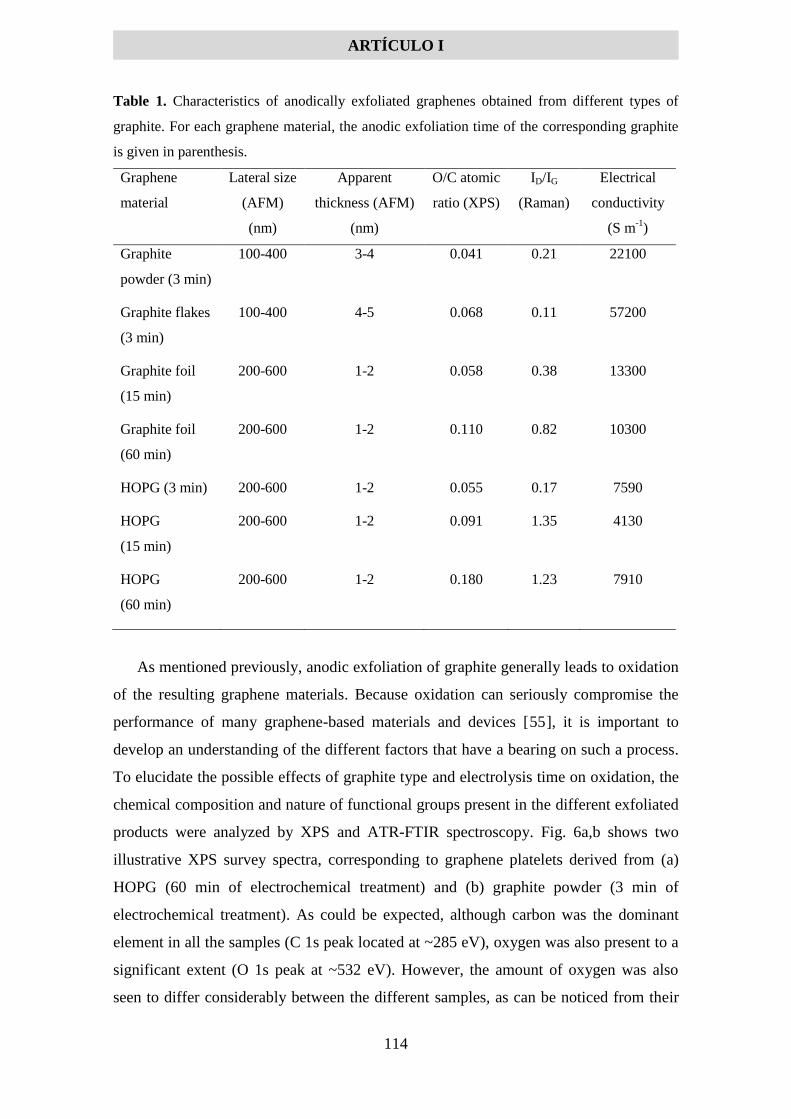
ARTÍCULO I
114
Table 1. Characteristics of anodically exfoliated graphenes obtained from different types of
graphite. For each graphene material, the anodic exfoliation time of the corresponding graphite
is given in parenthesis.
Graphene
material
Lateral size
(AFM)
Apparent
thickness (AFM)
O/C atomic
ratio (XPS)
ID/IG
(Raman)
Electrical
conductivity
(nm) (nm) (S m-1
)
Graphite
powder (3 min)
100-400 3-4 0.041 0.21 22100
Graphite flakes
(3 min)
100-400 4-5 0.068 0.11 57200
Graphite foil
(15 min)
200-600 1-2 0.058 0.38 13300
Graphite foil
(60 min)
200-600 1-2 0.110 0.82 10300
HOPG (3 min) 200-600 1-2 0.055 0.17 7590
HOPG
(15 min)
200-600 1-2 0.091 1.35 4130
HOPG
(60 min)
200-600 1-2 0.180 1.23 7910
As mentioned previously, anodic exfoliation of graphite generally leads to oxidation
of the resulting graphene materials. Because oxidation can seriously compromise the
performance of many graphene-based materials and devices [55], it is important to
develop an understanding of the different factors that have a bearing on such a process.
To elucidate the possible effects of graphite type and electrolysis time on oxidation, the
chemical composition and nature of functional groups present in the different exfoliated
products were analyzed by XPS and ATR-FTIR spectroscopy. Fig. 6a,b shows two
illustrative XPS survey spectra, corresponding to graphene platelets derived from (a)
HOPG (60 min of electrochemical treatment) and (b) graphite powder (3 min of
electrochemical treatment). As could be expected, although carbon was the dominant
element in all the samples (C 1s peak located at ~285 eV), oxygen was also present to a
significant extent (O 1s peak at ~532 eV). However, the amount of oxygen was also
seen to differ considerably between the different samples, as can be noticed from their

ARTÍCULO I
115
corresponding O/C atomic ratios given in Table 1. For graphene platelets derived from
graphite flakes and powder, the measured O/C ratios (~0.068 and 0.041, respectively)
were among the lowest that have ever been reported for anodically exfoliated graphenes.
This result could be reasonably anticipated, taking into account the short electrolysis
time applied in both cases and the fact that the individual graphite particles were quickly
detached from their pellet once they became exposed to the electrolyte solution, thus
arresting their oxidation process. Nonetheless, such a limited extent of oxidation was
attained at the expense of a comparatively low degree of platelet exfoliation, as noted
above. The most enlightening results, though, were those obtained for graphene samples
derived from the HOPG and graphite foil materials. First, the oxidation degree of the
platelets was seen to increase with increasing electrolysis time. For example, the
measured O/C atomic ratios were 0.055, 0.091 and 0.180 for samples derived from
HOPG after 3, 15 and 60 min of electrolysis, respectively, even when highly exfoliated
platelets were brought about in all cases. Second, and more significantly, for a given
electrolysis time the graphene platelets obtained from graphite foil were considerably
less oxidized than their HOPG-derived counterparts (e.g., O/C ratios of 0.058 vs. 0.091
and 0.110 vs. 0.180 for 15 and 60 min, respectively, of electrolysis). We note that in all
cases the reported amounts of oxygen must have been necessarily introduced during the
electrochemical treatment, because the O/C ratios measured for all the as-received
graphite types were very small (<0.01).

ARTÍCULO I
116
Figure 6. (a,b) Survey XPS spectra of anodically exfoliated graphenes obtained from (a) HOPG
(60 min of exfoliation time) and (b) graphite powder (3 min). (c-e) High resolution core level C
1s spectra for graphenes obtained from graphite foil after 15 (c) and 60 (d) min of exfoliation
time and (e) HOPG (60 min). In (c-e), components obtained by peak-fitting the experimentally
obtained envelopes are indicated by blue, red and green traces.
Information on the specific types of oxygen functional groups generated upon
exfoliation was gathered from the high resolution core level C 1s spectra of the samples,
as illustrated in Fig. 6c-e for graphenes derived from graphite foil [15 (c) and 60 min (d)
of electrolysis] and HOPG [60 min of electrolysis (e)]. The C 1s profiles were
dominated by a peak located at ~284.6 eV, which can be ascribed to carbon atoms in
unoxidized graphitic environments (C=C species), together with some additional
components at higher binding energies that can be attributed to oxidized carbon atoms.
More specifically, peak-fitting of these profiles yielded two components in addition to
1000 800 600 400 200 0
e
d
c
b
Inte
nsity (
a.
u.)
Binding energy (eV)
a
Inte
nsity (
a.
u.)
292 290 288 286 284 282
Binding energy (eV)

ARTÍCULO I
117
the main peak at 284.6 eV: one component was centered at about 286.5 eV, associated
to C-O species (e.g., hydroxyl or epoxide groups) and the other one was located at
~288.0 eV, which can be assigned to C=O species (e.g., carbonyl groups) [51,56]. The
high resolution C 1s spectra of the other graphene samples yielded the same
components (results not shown), but as could be expected, it was generally observed
that the weight of the C-O and C=O components relative to the main C=C graphitic
peak tended to diminish as the O/C atomic ratio of the samples decreased. ATR-FTIR
spectroscopy corroborated the presence of these oxygen functional groups, as
exemplified in Fig. 7 for some of the graphene samples, derived from graphite powder
[3 min of electrochemical exfoliation (a)], graphite foil [15 min (b) and 60 min (c)] and
HOPG [60 min (d)]. The following bands were observed for those samples with the
highest O/C ratios: 3000-3500 cm-1
(O-H stretching vibrations from hydroxyl or
carboxyl groups), ~1620 cm-1
(C=C stretching, skeletal vibrations from unoxidized
graphitic domains) with a shoulder at about 1720 cm-1
(C=O stretching vibrations from
carbonyl and carboxyl groups), 1300-1450 cm-1
(O-H bending vibrations and C-OH
stretching vibrations from hydroxyl groups) with a shoulder/edge at ~1260 cm-1
(breathing vibrations from epoxy groups) and ~1070 cm-1
(C-O stretching in ethers or
epoxides) [28,51, 57 ]. Such bands were seen to strongly decline in intensity with
decreasing O/C atomic ratio, and were barely discernible for graphene samples with the
lowest O/C ratios [e.g., spectrum (a) in Fig. 7].
Figure 7. ATR-FTIR spectra of graphene samples obtained from (a) graphite powder (3 min of
exfoliation time), (b) graphite foil (15 min), (c) graphite foil (60 min) and (d) HOPG (60 min).
4000 3500 3000 2500 2000 1500 1000
Absorb
ance (
a. u.)
Wavenumber(cm-1)
d
c
b
a

ARTÍCULO I
118
As is well known from some chemically derived forms of graphene (i.e., GO and
RGO) [9,11–13,50], oxidation is usually associated to the introduction of a significant
amount of defects and structural imperfections in the carbon lattice of graphene sheets,
which in turn has an impact on such relevant properties as their electrical conductivity.
The structural quality of the anodically exfoliated graphenes was evaluated by means of
Raman spectroscopy, as illustrated in Fig. 8 for some of the samples, specifically those
derived from graphite powder [3 min (e)], graphite foil [15 min (f) and 60 min (g)] and
HOPG [60 min (h)]. The Raman spectra of the starting graphite materials are shown in
Fig. 8a-d as a reference. The first-order region of the spectra (1100-1700 cm-1
)
comprised three peaks with different relative intensities depending on the specific
sample: a strong peak located at about 1582 cm-1
, the so-called graphitic G band, which
is the only band present in completely defect-free graphite/graphene, and two defect-
related bands, D and D´, which appear at ~1350 and 1620 cm-1
, respectively [58–60].
The starting graphites were seen to have increasing structural quality in the following
order: graphite powder, flakes, foil and HOPG. This was numerically reflected in the
integrated intensity ratio of the D and G bands (ID/IG ratio), which is widely adopted as
a quantitative measure of the amount of defects present in graphitic structures [59,60].
Indeed, the ID/IG ratios for the starting graphites were 0.10, 0.02, 0.01 and 0,
respectively, in the order given above. Generally speaking, the Raman spectra of the
graphene samples revealed that the D and D´ bands were typically more intense for
those possessing higher O/C ratios, which can be generally taken as a clear indication of
their larger extent of structural disorder. The calculated ID/IG values of the different
graphene samples are given in Table 1, and contrast with the comparatively smaller
values obtained for the starting graphites. There were, however, some exceptions to the
direct correlation between O/C atomic ratio and ID/IG value. For instance, the ID/IG ratio
measured for graphene obtained by 60 min of electrolysis from HOPG was similar
(slightly smaller) that that of the sample prepared by 15 min of electrolysis (1.23 vs.
1.35), even though the O/C ratio was much higher for the former (0.180 vs. 0.091). This
result could be due to the fact that, above a certain defect density in the
graphene/graphite lattice (in our case, defects are assumed to be mostly generated by
oxygen groups covalently attached to carbon atoms), the intensity of the D band
decreases, rather than increases, with increasing disorder [59,60]. Likewise, the spatial
distribution of the defects, and not just their overall density, is known to have a bearing
on the D band intensity, so that, e.g., a graphene sheet with scattered defects can yield a
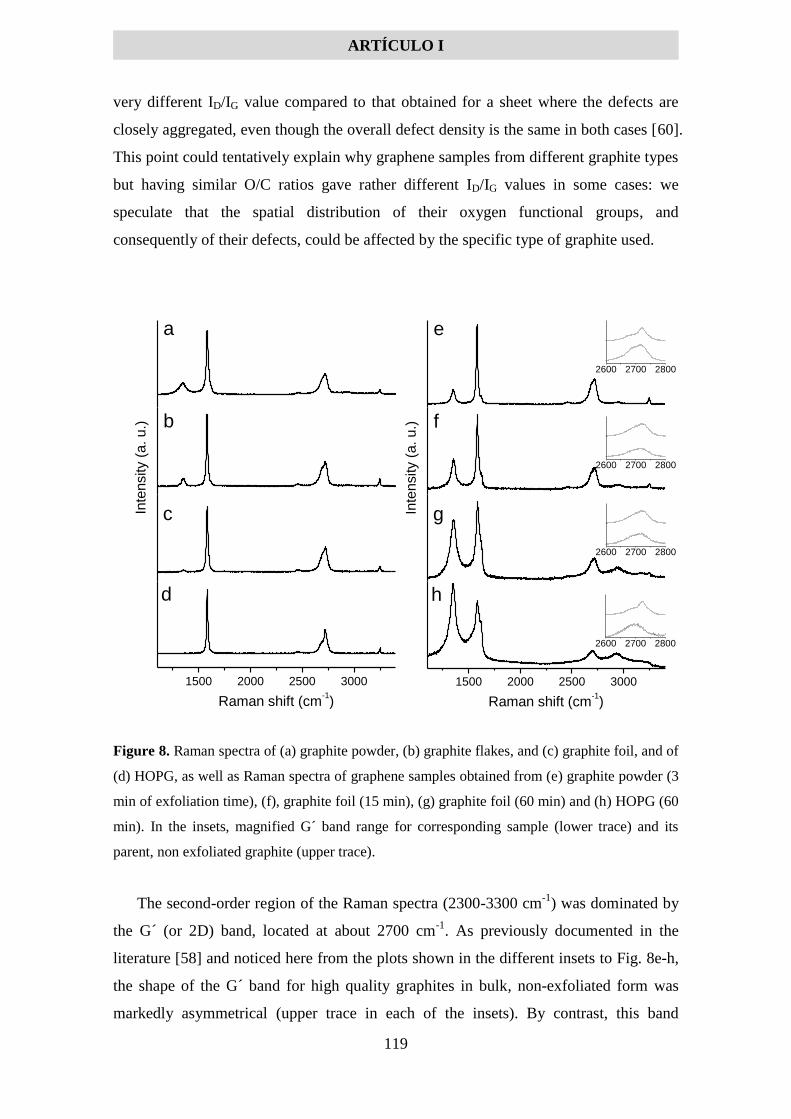
ARTÍCULO I
119
very different ID/IG value compared to that obtained for a sheet where the defects are
closely aggregated, even though the overall defect density is the same in both cases [60].
This point could tentatively explain why graphene samples from different graphite types
but having similar O/C ratios gave rather different ID/IG values in some cases: we
speculate that the spatial distribution of their oxygen functional groups, and
consequently of their defects, could be affected by the specific type of graphite used.
Figure 8. Raman spectra of (a) graphite powder, (b) graphite flakes, and (c) graphite foil, and of
(d) HOPG, as well as Raman spectra of graphene samples obtained from (e) graphite powder (3
min of exfoliation time), (f), graphite foil (15 min), (g) graphite foil (60 min) and (h) HOPG (60
min). In the insets, magnified G´ band range for corresponding sample (lower trace) and its
parent, non exfoliated graphite (upper trace).
The second-order region of the Raman spectra (2300-3300 cm-1
) was dominated by
the G´ (or 2D) band, located at about 2700 cm-1
. As previously documented in the
literature [58] and noticed here from the plots shown in the different insets to Fig. 8e-h,
the shape of the G´ band for high quality graphites in bulk, non-exfoliated form was
markedly asymmetrical (upper trace in each of the insets). By contrast, this band
Inte
nsity (
a. u.)
a
b
c
1500 2000 2500 3000
d
Raman shift (cm-1)
Inte
nsity (
a. u.)
e
f
g
1500 2000 2500 3000
h
Raman shift (cm-1)
2600 2700 2800
2600 2700 2800
2600 2700 2800
2600 2700 2800

ARTÍCULO I
120
became more symmetrical and was slightly down-shifted upon anodic exfoliation to
yield the different graphene samples (lower trace in the inset plots). Such features were
consistent with these samples being comprised of few- to several-layered sheets [16,59–
61], which in turn was in general agreement with the results obtained by AFM and
discussed above (Fig. 5).
The starting graphites possess high electrical conductivity values, namely, 1.69 ×
106 S m
-1 in the case of HOPG and 9.84 × 10
4 S m
-1 in that of graphite foil. The
significant difference in conductivity between these two types of graphite derives from
their distinct morphology (see Fig. 1a and 1c, and Fig. 2) and structural quality (Fig. 8c
and 8d). Indeed, the already mentioned abundant folds, overlaps and wrinkles present in
the platelets of graphite foil must act as dispersion sites for charge carriers, which would
limit its conductivity. The electrical conductivity of the graphene samples after their
processing into free-standing, paper-like films by vacuum filtration of the corresponding
FMN-stabilized aqueous dispersions was also determined, and the results are listed in
Table 1. The conductivities of the graphene samples are notably lower than those of
their corresponding parent graphites, being dominated by the relatively smaller size of
their nanosheets and their relatively high content in oxygen. As could be expected,
graphenes with lower O/C and ID/IG ratios, and therefore with smaller amounts of
structural disorder, tended to be more electrically conductive. Values between ~4000
and 57000 S m-1
were measured, which compare favorably with those reported
beforehand for other (non-annealed) anodically exfoliated graphenes (4000-25000 S m-1
)
[29,31,56] and also for high quality graphenes prepared by direct exfolitation of
graphite in the aqueous phase using sonication or shear-mixing and colloidally
stabilized by surfactants (2000-5000 S m-1
) [48,62,63]. We attribute such a positive
outcome not only to the relatively low defect content of some of our graphene samples,
but also to the fact that FMN was used as a dispersant. It has just been demonstrated
that small amounts of this vitamin B2 derivative are able to colloidally stabilize large
quantities of graphene flakes, so that the electrical conductivity of films obtained
therefrom is not very significantly degraded by the use of this dispersant, contrary to the
case of many surfactants investigated before [45].
The previous results comparing the characteristics of graphene nanosheets derived
from different types of graphite are significant in that they suggest that the oxidation
degree of the nanosheets can be minimized to a relevant extent simply by a proper
choice of the graphite type. This finding would constitute an important asset in the
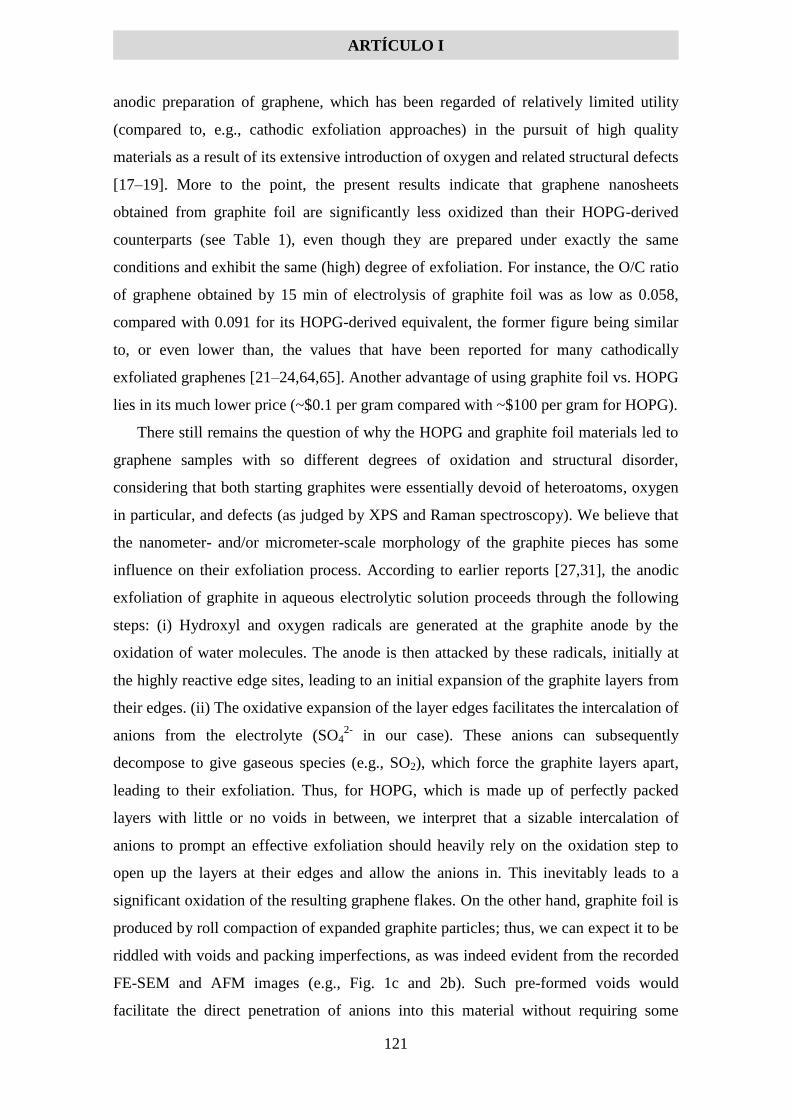
ARTÍCULO I
121
anodic preparation of graphene, which has been regarded of relatively limited utility
(compared to, e.g., cathodic exfoliation approaches) in the pursuit of high quality
materials as a result of its extensive introduction of oxygen and related structural defects
[17–19]. More to the point, the present results indicate that graphene nanosheets
obtained from graphite foil are significantly less oxidized than their HOPG-derived
counterparts (see Table 1), even though they are prepared under exactly the same
conditions and exhibit the same (high) degree of exfoliation. For instance, the O/C ratio
of graphene obtained by 15 min of electrolysis of graphite foil was as low as 0.058,
compared with 0.091 for its HOPG-derived equivalent, the former figure being similar
to, or even lower than, the values that have been reported for many cathodically
exfoliated graphenes [21–24,64,65]. Another advantage of using graphite foil vs. HOPG
lies in its much lower price (~$0.1 per gram compared with ~$100 per gram for HOPG).
There still remains the question of why the HOPG and graphite foil materials led to
graphene samples with so different degrees of oxidation and structural disorder,
considering that both starting graphites were essentially devoid of heteroatoms, oxygen
in particular, and defects (as judged by XPS and Raman spectroscopy). We believe that
the nanometer- and/or micrometer-scale morphology of the graphite pieces has some
influence on their exfoliation process. According to earlier reports [27,31], the anodic
exfoliation of graphite in aqueous electrolytic solution proceeds through the following
steps: (i) Hydroxyl and oxygen radicals are generated at the graphite anode by the
oxidation of water molecules. The anode is then attacked by these radicals, initially at
the highly reactive edge sites, leading to an initial expansion of the graphite layers from
their edges. (ii) The oxidative expansion of the layer edges facilitates the intercalation of
anions from the electrolyte (SO42-
in our case). These anions can subsequently
decompose to give gaseous species (e.g., SO2), which force the graphite layers apart,
leading to their exfoliation. Thus, for HOPG, which is made up of perfectly packed
layers with little or no voids in between, we interpret that a sizable intercalation of
anions to prompt an effective exfoliation should heavily rely on the oxidation step to
open up the layers at their edges and allow the anions in. This inevitably leads to a
significant oxidation of the resulting graphene flakes. On the other hand, graphite foil is
produced by roll compaction of expanded graphite particles; thus, we can expect it to be
riddled with voids and packing imperfections, as was indeed evident from the recorded
FE-SEM and AFM images (e.g., Fig. 1c and 2b). Such pre-formed voids would
facilitate the direct penetration of anions into this material without requiring some

ARTÍCULO I
122
preliminary oxidation of the graphite layers. As a result, exfoliation of the graphite foil
could be readily completed with a limited extent of oxidation compared to the case of
HOPG, which would be much more dependent on oxidation for its exfoliation to
proceed.
3.3. Biocompatibility of anodically exfoliated graphene films towards the L-929 cell line
Finally, graphene and graphene-based materials are currently the focus of increasing
research attention regarding their potential application in biomedicine [4,66,67]. For
example, graphene and graphene-containing (bio)polymer films could be used as
substrates for cell growth and differentiation or tissue regeneration, with a high
biocompatibility of such films being an obvious and necessary pre-requisite. Although
previous studies have revealed GO, RGO and CVD-derived graphene substrates to be
generally biocompatible towards a number of human and animal cell lines [66–70], to
the best of our knowledge no biocompatibility studies are available for
electrochemically exfoliated graphenes in general and anodically exfoliated graphenes
in particular. Because the latter can be prepared with different physicochemical
characteristics (e.g., a range of oxygen and defect contents, as shown above), which in
turn can differ significantly from those of GO, RGO and CVD-derived graphene, it is
unclear that the results of biocompatibility tests for these types of graphene can be
generalized to anodically exfoliated graphenes. Hence, we carried out a preliminary
biocompatibility assessment for thin films of several of the graphene samples prepared
in this work towards the murine fibroblast cell line L-929. This cell line is commonly
employed in the cytotoxicity screening of prospective biomaterials [71], and has already
been tested on a number of graphene-based and other carbon substrates [72–78]. The
biocompatibility tests were accomplished on thin graphene films deposited from their
corresponding FMN-stabilized aqueous dispersions onto polystyrene culture plates.
FMN is an innocuous and safe biomolecule used as a food additive, and therefore
constitutes an a priori very attractive dispersant of graphene sheets with a view to bio-
related applications of this material [45].
The results of the L-929 cell viability tests for several graphene samples, based on
the MTT assay and performed 1, 4 and 7 days after cell seeding on ~1 and 2 m thick
graphene films, are summarized in Fig. 9a, b and c, respectively. For comparison
purposes, tests were also carried out on thin GO films obtained from aqueous
dispersions that were either free of FMN and any other stabilizer (positive control) or

ARTÍCULO I
123
incorporated about the same amount of FMN as that present in the dispersions of
anodically exfoliated graphenes (~5 wt. % relative to the graphene content), as well as
on the bare culture plates (negative control). The GO dispersions were prepared by
oxidation of graphite powder via the Hummers method as described previously [51,52].
In general terms, all the anodically exfoliated graphenes afforded good cell proliferation
rates, implying that they are highly biocompatible materials. After 7 days (Fig. 9c), cell
proliferation was conspicuously higher for all the graphene samples (including the two
GO specimens) compared with the bare culture plate. There were not large differences
between the 1 and 2m thick films or between the different graphene samples, although
some subtle trends could be noticed. For example, comparison of the three graphene
samples obtained from HOPG with different exfoliation times (see Table 1) suggested
cell proliferation after both 4 and 7 days to increase somewhat with increasing oxygen
content of the flakes. This observation would be consistent with the idea that
hydrophilic surfaces tend to be better substrates for cell growth because they favour the
cell-material interaction [73,79]. Such an effect appeared to be most obvious for the
intermediate testing time of 4 days (Fig. 9b), with the highest cell proliferation being
detected on the extensively oxidized, and thus more hydrophilic, GO samples (O/C
atomic ratios ~0.40-0.45) and the lowest proliferation occurring on the less oxidized and
hence more hydrophobic graphenes (e.g., the sample derived from graphite powder).
However, factors other than oxygen content/hydrophilicity are also thought to play a
role in the promotion of L-929 cell growth on carbon substrates, in particular their
electrical conductivity (more conductive substrates allowing for higher proliferation of
L-929 cells) [78]. Thus, the fact that the anodically exfoliated graphenes afforded highly
conductive films while GO is an electrical insulator could help to explain why cell
proliferation on the former eventually caught up with that on GO films after a 7 day
period.

ARTÍCULO I
124
Figure 9. Results of L-929 cell proliferation tests, based on the MTT assay, for thin films of
different anodically exfoliated graphenes, as well as GO, deposited from their corresponding
aqueous dispersions onto polystyrene culture plates. The anodically exfoliated graphene
dispersions used for the tests were colloidally stabilized in water by FMN molecules
(FMN/graphene mass ratio of ~0.05), whereas GO dispersions both in the absence and presence
of FMN were assessed. Red and green bars indicate ~1 and 2 m thick films, respectively. The
light blue bars correspond to tests performed on the bare culture plate. Results of the MTT assay
1 (a), 4 (b) and 7 (c) days after L-929 cell seeding are shown.
4. Conclusions
We have demonstrated that anodically exfoliated graphenes exhibiting a range of
oxygen and defect contents can be attained through the use of starting graphite materials
of different characteristics. Significantly, graphene nanosheets with high structural
quality and minimized amount of oxygen functional groups (e.g., O/C atomic ratios of
0.0
0.5
1.0
c
b
Ab
so
rba
nce
a
0
1
2
3
4
GO
GO +
5%
FM
NS
Powde
r 3 m
in
Flake
s 3
min
graf
oil 1
5 m
in
HOPG
3 m
in
HOPG
15
min
HOPG
60
min
bare
cultu
re p
late
0
1
2
3
4
0.0
0.5
1.0
0
1
2
3
4
0
1
2
3
4

ARTÍCULO I
125
~0.04-0.06) could be obtained by selecting appropriate types of graphite, such as
graphite foil. This result was rationalized in terms of the specific microstructure of the
starting graphite material and the exfoliation mechanism that is thought to be in place
during the anodic process, and provides an avenue to access graphenes of similar quality
to that achieved with cathodic exfoliation approaches, while avoiding the use of organic
solvents at the same time. The implementation of anodically exfoliated graphenes in a
range of potential uses could benefit from the ability to control their extent of oxidation
and disorder. For example, graphenes with high oxygen/defect content would be
suitable for the nucleation and growth of nanoparticles to produce hybrids for catalytic
and biomedical applications, whereas the use of high quality materials would be
preferable when good electrical conductivity is required. Irrespective of their oxygen
and defect content, the anodically exfoliated graphenes were seen to be highly
biocompatible when processed into thin films from their corresponding aqueous
dispersions stabilized by the innocuous and safe biomolecule flavin mononucleotide, as
determined by cell proliferation tests performed with murine fibroblasts (L-929 line).
Finally, the fact that the oxidation degree of anodically exfoliated graphene can be
controlled (minimized) by means of some process variables (e.g., graphite type in the
present case) suggests that other strategies could also be effective in the pursuit of very
high quality nanosheets based on the aqueous anodic approach, and therefore they will
be worth exploring in the future.
Acknowledgements
Financial support from the Spanish MINECO and the European Regional
Development Fund (projects MAT2011-26399) is gratefully acknowledged. The authors
also acknowledge partial funding of this work by Plan de Ciencia, Tecnología e
Innovación 2013-2017 del Principado de Asturias and European Regional Development
Fund through project GRUPIN14-056. M.A.-V. thanks the receipt of a pre-doctoral
contract (FPI) from MINECO.
References
[1] Novoselov KS, Geim AK, Morozov SV, Jiang D, Zhang Y, Dubonos SV, et al.
Electric field effect in atomically thin carbon films. Science 2004; 306: 666-9.

ARTÍCULO I
126
[2] Novoselov KS, Fal´ko VI, Colombo L, Gellert PR, Schwab MG, Kim K. A roadmap
for graphene. Nature 2012; 490: 192-200.
[3] Randviir EP, Brownson DAC, Banks CE. A decade of graphene research:
production, applications and outlook. Mater Today 2014; 17(9): 426-32.
[4] Ferrari AC, Bonaccorso F, Fal’ko VI, Novoselov KS, Roche S, Bøggild P et al.
Science and technology roadmap for graphene, related two-dimensional crystals, and
hybrid systems. Nanoscale 2015; 7: 4598-810.
[5] Bonaccorso F, Lombardo A, Hasan T, Sun Z, Colombo L, Ferrari AC. Production
and processing of graphene and 2d crystals. Mater Today 2012; 15: 564-89.
[6] Zhang Y, Zhang L, Zhou C. Review of Chemical Vapor Deposition of Graphene and
Related Applications. Acc Chem Res 2013; 46(10): 2329-39.
[7] Cai M, Thorpe D, Adamson DH, Schniepp HC. Methods of graphite exfoliation. J
Mater Chem 2012; 22: 24992-5002.
[8] Zhong YL, Tian Z, Simon GP, Li D. Scalable production of graphene via wet
chemistry: progress and challenges. Mater Today 2015; 18(2): 73-8.
[9] Park S, Ruoff RS. Chemical methods for the production of graphenes. Nat Nanotech
2009; 4: 217-24.
[10] Dreyer DR, Park S, Bielawski CW, Ruoff RS. The chemistry of graphene oxide.
Chem Soc Rev 2010; 39: 228-40.
[11] Mattevi C, Eda G, Agnoli S, Miller S, Mkhoyan KA, Celik O, et al. Evolution of
Electrical, Chemical, and Structural Properties of Transparent and Conducting
Chemically Derived Graphene Thin Films. Adv Funct Mater 2009; 19(16): 2577-83.

ARTÍCULO I
127
[12] Rozada R, Paredes JI, Villar-Rodil S, Martínez-Alonso A, Tascón JMD. Towards
full repair of defects in reduced graphene oxide films by two-step graphitization. Nano
Res 2013; 6(3): 216-33.
[13] Rozada R , Paredes JI, López MJ, Villar-Rodil S, Cabria I, Alonso JA et al. From
graphene oxide to pristine graphene: revealing the inner workings of the full structural
restoration. Nanoscale 2015; 7: 2374-90.
[14] Coleman JN. Liquid exfoliation of defect-free graphene. Acc Chem Res 2013;
46(15): 14-22.
[15] Ciesielski A, Samorì P. Graphene via sonication assisted liquid-phase exfoliation.
Chem Soc Rev 2014; 43: 381-98.
[16] Paton KR, Varrla E, Backes C, Smith RJ, Khan U, O’Neill A, et al. Scalable
production of large quantities of defect-free few-layer graphene by shear exfoliation in
liquids. Nature Mater 2014; 13: 624-30.
[17] Low CTJ, Walsh FC, Chakrabarti MH, Hashim MA, Hussain MA. Electrochemical
approaches to the production of graphene flakes and their potential applications. Carbon
2013; 54: 1-21.
[ 18 ] Salavagione HJ. Promising alternative routes for graphene production and
functionalization. J Mater Chem A 2014; 2: 7138-46.
[19] Abdelkader AM, Cooper AJ, Dryfe R, Kinloch IA. How to get between the sheets:
a review of recent works on the electrochemical exfoliation of graphene materials from
bulk graphite. Nanoscale 2015; 7, 6944-56.
[20] Wang J, Manga KK, Bao Q, Loh KP. High-yield synthesis of few-layer graphene
flakes through electrochemical expansion of graphite in propylene carbonate
electrolyte. J Am Chem Soc 2011; 133(23): 8888-91.
ARTÍCULO I
128
[21] Zhou M, Tang J, Chg Q, Xu G, Cui P, Qin LC. Few-layer graphene obtained by
electrochemical exfoliation of graphite cathode. Chem Phys Lett 2013; 572: 61-5.
[22] Abdelkader AM, Kinloch IA, Dryfe RAW. Continuous electrochemical exfoliation
of micrometer-sized graphene using synergistic ion intercalations and organic solvents.
ACS Appl Mater Interfaces 2014; 6(3): 1632-9.
[23] Cooper AJ, Wilson NR, Kinloch IA, Dryfe RAW. Single stage electrochemical
exfoliation method for the production of few-layer graphene via intercalation of
tetraalkylammonium cations. Carbon 2014; 66: 340-50.
[ 24 ] Zhao M, Guo XY, Ambacher O, Nebel CE, Hoffmann R. Electrochemical
generation of hydrogenated graphene flakes. Carbon 2015; 83: 128-35.
[25] Morales GM, Schifani P, Ellis G, Ballesteros C, Martínez G, Barbero C, et al.
High-quality few layer graphene produced by electrochemical intercalation and
microwave-assisted expansion of graphite. Carbon 2014; 49: 2809-16
[26] Liu N, Luo F, Wu H, Liu Y, Zhang C, J. Chen. One-step ionic-liquid-assisted
electrochemical synthesis of ionic-liquid-functionalized graphene sheets directly from
graphite. Adv Func Mater 2008; 18(10): 1518-25.
[27] Lu J, Yang J, Wang J, Lim A, Wang S, Loh KP. One-pot synthesis of fluorescent
carbon nanoribbons, nanoparticles, and graphene by the exfoliation of graphite in ionic
liquids. ACS Nano 2009; 3(8): 2367-75.
[28] Su CY, Lu AY, Xu Y, Chen FR, Khlobystov AN, Li LJ. High-quality thin
graphene films from fast electrochemical exfoliation. ACS Nano 2011; 5(3): 2332-9.
[ 29 ] Parvez K, Li R, Puniredd SR, Hernandez Y, Hinkel F, Wang S, et al.
Electrochemically exfoliated graphene as solution-processable, highly conductive
electrodes for organic electronics. ACS Nano 2013; 7(4): 3598-606.
ARTÍCULO I
129
[30] Liu J, Yang H, Zhen SG, Poh CK, Chaurasia A, Luo J, et al. A green approach to
the synthesis of high-quality graphene oxide flakes via electrochemical exfoliation of
pencil core. RSC Adv 2013; 3(29): 11745-50.
[31] Parvez K, Wu ZS, Li R, Liu X, Graf R, Feng X, et al. Exfoliation of graphite into
graphene in aqueous solutions of inorganic salts. J Am Chem Soc 2014; 136(16): 6083-
91.
[32] Najafabadi AT, Gyenge E. High-yield graphene production by electrochemical
exfoliation of graphite: Novel ionic liquid (IL)–acetonitrile electrolyte with low IL
content. Carbon 2014; 71: 58-69.
[33] Rao KS, Sentilnathan J, Cho HW, Wu JJ, Yoshimura M. Soft processing of
graphene nanosheets by glycine-bisulfate ionic-complex-assisted electrochemical
exfoliation of graphite for reduction catalysis. Adv Funct Mater 2015; 25(2): 298-305.
[34] Liu J, Notarianni M, Will G, Tiong VT, Wang H, Motta N. Electrochemically
exfoliated graphene for electrode films: effect of graphene flake thickness on the sheet
resistance and capacitive properties. Langmuir 2013; 29(43): 13307-14.
[35] Lang FM, Magnier P, Action of oxygen and carbon dioxide above 100 millibars on
“pure” carbon. In: Walker PA, editor. Chemistry and physics of carbon, vol 3, New
York; Dekker; 1968 p. 121-209.
[36] Inagaki M, Kang F, Toyoda M. Exfoliation of graphite via intercalation compounds.
Chem Phys Carbon 2004; 29: 1-69. In: Radovic LR, editor. Chemistry and physics of
carbon, vol 29, New York; Dekker; 2004 p. 1-69.
[37] Vistica DT, Skehan P, Scudiero D, Monks A, Pittman A, Boyd MR. Tetrazolium-
based assays for cellular viability: a critical examination of selected parameters
affecting formazan production. Cancer Res 1991; 51: 2515-20.

ARTÍCULO I
130
[38] Chen K, Xue D. Preparation of colloidal graphene in quantity by electrochemical
exfoliation. J Colloid Interface Sci 2014; 436: 41-6.
[39] Paredes JI, Martínez-Alonso A, Tascón JMD. Multiscale imaging and tip-scratch
studies reveal insight into the plasma oxidation of graphite. Langmuir 2007; 23(17):
8932-43.
[40] Warner JH, Schäffel F, Rümmeli MH, Büchner B. Examining the edges of multi-
layer graphene sheets. Chem Mater 2009; 21(12): 2418-21.
[41] Park S, An J, Jung I, Piner RD, An SJ, Li X, et al. Colloidal suspensions of highly
reduced graphene oxide in a wide variety of organic solvents. Nano Lett 2009; 9(4);
1593-7.
[ 42 ] Villar-Rodil S, Paredes JI, Martínez-Alonso A, Tascón JMD. Preparation of
graphene dispersions and graphene-polymer composites in organic media. J Mater
Chem 2009; 19: 3591-3.
[43] Hernandez Y, Lotya M, Rickard D, Bergin SD, Coleman JN. Measurement of
multicomponent solubility parameters for graphene facilitates solvent discovery.
Langmuir 2010; 26(5): 3208-13.
[44] Yoon W, Lee Y, Jang H, Jang M, Kim JS, Lee HS, et al. Graphene nanoribbons
formed by a sonochemical graphene unzipping using flavin mononucleotide as a
template. Carbon 2015; 81: 629-38.
[ 45 ] Ayán-Varela M, Paredes JI, Guardia L, Villar-Rodil S, Munuera JM, Díaz-
González M, et al. Achieving extremely concentrated aqueous dispersions of graphene
flakes and catalytically efficient graphene-metal nanoparticle hybrids with flavin
mononucleotide as a high-performance stabilizer. ACS Appl. Mater. Interfaces 2015; 7:
10293−307.
ARTÍCULO I
131
[ 46 ] Varrla E, Paton KR, Backes C, Harvey A, Smith RJ, McCauley J, et al.
Turbulence-assisted shear exfoliation of graphene using household detergent and a
kitchen blender. Nanoscale 2014; 6: 11810-9.
[ 47 ] Li D, Müller MB, Gilje S, Kaner RB, Wallace GG. Processable aqueous
dispersions of graphene nanosheets. Nature Nanotech 2008; 3: 101-5.
[48] Guardia L, Fernández-Merino MJ, Paredes JI, Solís-Fernández P, Villar-Rodil S,
Martínez-Alonso A, et al. High-throughput production of pristine graphene in an
aqueous dispersion assisted by non-ionic surfactants. Carbon 2011; 49: 1653-62.
[49] Skoog DA, Holler FJ, Nieman TA, Principles of Instrumental Analysis, Hartcourt
Brace & Company, Philadelphia, 1998, ch. 13.
[50] Erickson K, Erni R, Lee Z, Alem N, Gannett W, Zettl A. Determination of the local
chemical structure of graphene oxide and reduced graphene oxide. Adv Mater 2010;
22(40): 4467-72.
[51] Fernández-Merino MJ, Guardia L, Paredes JI, Villar-Rodil S, Solís-Fernández P,
Martínez-Alonso A, et al. Vitamin C is an ideal substitute for hydrazine in the reduction
of graphene oxide suspensions. J Phys Chem C 2010; 114: 6426-32.
[52] Fernández-Merino MJ, Villar-Rodil S, Paredes JI, Solís-Fernández P, Guardia L,
García R, et al. Identifying efficient natural bioreductants for the preparation of
graphene and graphene-metal nanoparticle hybrids with enhanced catalytic activity from
graphite oxide. Carbon 2013; 63: 30-44.
[ 53 ] Nemes-Incze P, Osváth Z, Kamarás K, Biró LP. Anomalies in thickness
measurements of graphene and few layer graphite crystals by tapping mode atomic
force microscopy. Carbon 2008; 46(11): 1435-42.

ARTÍCULO I
132
[54] Solís-Fernández P, Paredes JI, Villar-Rodil S, Martínez-Alonso A, Tascón JMD.
Determining the thickness of chemically modified graphenes by scanning probe
microscopy. Carbon 2010; 48: 2657-60.
[55] Gómez-Navarro C, Weitz RT, Bittner AM, Scolari M, Mews A, Burghard M, et al.
Electronic transport properties of individual chemically reduced graphene oxide sheets.
Nano Lett 2007; 7(11): 3499-503.
[56] Wu L, Li W, Li P, Liao S, Qiu S, Chen M, et al. Powder, paper and foam of few-
layer graphene prepared in high yield by electrochemical intercalation exfoliation of
expanded graphite. Small 2014; 10(7): 1421-9.
[57] Liu J, Poh CK, Zhan D, Lai L, Lim SH, Wang L, et al. Improved synthesis of
graphene flakes from the multiple electrochemical exfoliation of graphite rod. Nano
Energy 2013; 2(3): 377-86.
[58] Pimenta MA, Dresselhaus G, Dresselhaus MS, Cançado LG, Jorio A, Saito R.
Studying disorder in graphite-based systems by Raman spectroscopy. Phys Chem Chem
Phys 2007; 9: 1276-91.
[ 59 ] Saito R, Hofmann M, Dresselhaus G, Jorio A, Dresselhaus MS. Raman
spectroscopy of graphene and carbon nanotubes. Adv Phys 2011; 60(3): 413-550.
[60] Ferrari AC, Basko DM. Raman spectroscopy as a versatile tool for studying the
properties of graphene. Nature Nanotech 2013; 8: 235-46.
[61] Hao Y, Wang Y, Wang L, Ni Z, Wang Z, Wang R, et al. Probing layer number and
stacking order of few-layer graphene by raman spectroscopy. Small 2010; 6(2): 195-200.
[62] De S, King PJ, Lotya M, O´Neill A, Doherty EM, Hernandez Y, et al. Flexible,
transparent, conducting films of randomly stacked graphene from surfactant-stabilized,
oxide-free graphene dispersions. Small 2010; 6(3): 458-64.

ARTÍCULO I
133
[63] Zhang L, Zhang Z, He C, Dai L, Liu J, Wang L. Rationally designed surfactants for
few-layered graphene exfoliation: ionic groups attached to electron-deficient π-
conjugated unit through alkyl spacers. ACS Nano 2014; 8(7): 6663-70.
[64] Huang H, Xia Y, Tao X, Du J, Fang J, Gan Y, et al. Highly efficient electrolytic
exfoliation of graphite into graphene sheets based on Li ions intercalation–expansion–
microexplosion mechanism. J Mater Chem 2012; 22: 10452-6.
[65] Najafabadi AT, Gyenge E. Synergistic production of graphene microsheets by
simultaneous anodic and cathodic electro-exfoliation of graphitic electrodes in aprotic
ionic liquids. Carbon 2015; 84: 449-59.
[66] Mao HY, Laurent S, Chen W, Akhavan O, Imani M, Ashkarran AA, et al.
Graphene: promises, facts, opportunities, and challenges in nanomedicine. Chem Rev
2013; 113(5): 3407-24.
[67] Zhang H, Grüner G, Zhao Y. Recent advancements of graphene in biomedicine. J
Mater Chem. B 2013; 1: 2542-67.
[68] Sanchez VC, Jachak A, Hurt RH, Kane AB. Biological interactions of graphene-
family nanomaterials: an interdisciplinary review. Chem Res Toxicol 2012; 25(1): 15-
34.
[69] Yang K, Li Y, Tan X, Peng R, Liu Z. Behavior and toxicity of graphene and its
functionalized derivatives in biological systems. Small 2013; 9(9-10): 1492-503.
[ 70 ] Akhavan O, Ghaderi E, Abouei E, Hatamie S, Ghasemi E. Accelerated
differentiation of neural stem cells into neurons on ginseng-reduced graphene oxide
sheets. Carbon 2014; 66: 395-406.
[71] Biological evaluation of medical devices. Part 5: Tests for in vitro cytotoxicity.
ISO 10993-5: 2009.
ARTÍCULO I
134
[72 ] Chen H, Müller MB, Gilmore KJ, Wallace GG, Li D. Mechanically strong,
electrically conductive, and biocompatible graphene paper. Adv Mater 2008; 20(18):
3557-61.
[ 73 ] Yan X, Chen J, Yang J, Xue Q, Miele P. Fabrication of free-standing,
electrochemically active, and biocompatible graphene oxide−polyaniline and
graphene−polyaniline hybrid papers. ACS Appl Mater Interfaces 2010; 2(9): 2521-9.
[74] Fan H, Wang L, Zhao K, Li N, Shi Z, Ge Z, et al. Fabrication, mechanical
properties, and biocompatibility of graphene-reinforced chitosan composites.
Biomacromolecules 2010; 11(9): 2345-51.
[ 75 ] Sayyar S, Murray E, Thompson BC, Gambhir S, Officer DL, Wallace GG.
Covalently linked biocompatible graphene/polycaprolactone composites for tissue
engineering. Carbon 2013; 52: 296-304.
[76] Correa-Duarte MA, Wagner N, Rojas-Chapana J, Morsczeck C, Thie M, Giersig M.
Fabrication and biocompatibility of carbon nanotube-based 3d networks as scaffolds for
cell seeding and growth. Nano Lett 2004; 4(11): 2233-6.
[77] Lobo AO, Corat MAF, Antunes EF, Palma MBS, Pacheco-Soares C, Garcia EE, et
al. An evaluation of cell proliferation and adhesion on vertically-aligned multi-walled
carbon nanotube films. Carbon 2010; 48 (1): 245-54.
[78] Kim SI, Sahu BB, Kim SE, Ali A, Choi EH, Han JG. Controlling conductivity of
carbon film for L-929 cell biocompatibility using magnetron sputtering plasmas. J
Mater Chem B 2015; 3(16): 3267-78.
[79] Akhavan O, Ghaderi E. The use of graphene in the self-organized differentiation of
human neural stem cells into neurons under pulsed laser stimulation. J Mater Chem B
2014; 2(34): 5602-11.

ARTÍCULO II
135
Electrolytic exfoliation of graphite in water with multifunctional electrolytes: en
route towards high quality, oxide–free graphene flakes†
J.M. Munuera, J.I. Paredes, S. Villar–Rodil,* M. Ayán–Varela, A. Martínez–Alonso,
J.M.D. Tascón
Instituto Nacional del Carbón, INCAR-CSIC, Apartado 73, 33080 Oviedo, Spain
* E–mail: [email protected]
† Electronic Supplementary Information (ESI) available: Experimental set–up for the
electrolytic anodic treatments; visual and microscopic evidence for the expansion of
graphite foil upon anodic treatment; evidence for the electrolytic treatment being the
critical step in the exfoliation; additional AFM characterization of the samples;
additional XPS characterization of the samples; measurement of film thickness by FE–
SEM; derivatization and XPS analysis of the graphene flakes obtained by anodic
treatments using SS as electrolyte; UHPLC/MS of the product of SNDS oxidation;
demonstration for starting graphites other than graphite foil; growth of Pt NPs on
electrolytically exfoliated graphene in the absence of amphiphile electrolyte/dispersants.

ARTÍCULO II
136
Abstract
Electrolytic – usually referred to as electrochemical – exfoliation of graphite in water
under anodic potential holds enormous promise as a simple, green and high–yield
method for the mass production of graphene, but currently suffers from several
drawbacks that hinder its widespread adoption, one of the most critical being the
oxidation and subsequent structural degradation of the carbon lattice that is usually
associated to such a production process. To overcome this and other limitations, we
introduce and implement the concept of multifunctional electrolytes. The latter are
amphiphilic anions (mostly polyaromatic hydrocarbons appended with sulfonate groups)
that play different relevant roles: (1) intercalating electrolyte to trigger exfoliation of
graphite into graphene flakes, (2) dispersant to afford stable aqueous colloidal
suspensions of the flakes suitable for further use, (3) sacrificial agent to prevent
graphene oxidation during exfoliation and (4) linker to promote nanoparticle anchoring
on the graphene flakes, yielding functional hybrids. The implementation of this strategy
with some selected amphiphiles even furnishes anodically exfoliated graphenes of a
quality similar to that of flakes produced by direct, ultrasound– or shear–induced
exfoliation of graphite in the liquid phase (i.e., almost oxide- and defect–free). These
high quality materials were used for the preparation of catalytically efficient graphene–
Pt nanoparticle hybrids, as demonstrated by model reactions (reduction of nitroarenes).
The multifunctional performance of these electrolytes is also discussed and rationalized,
and a mechanistic picture of their oxidation–preventing ability is proposed. Overall, the
present results open the prospect of anodic exfoliation as a competitive method for the
production of very high quality graphene flakes.
1. Introduction
Boasting exceptional physical properties and a strong potential for application in
many critical technological areas, including electronics, photonics, energy
conversion/storage, catalysis and biomedicine, graphene is set to become one of the key
materials of the next few decades.1–4
However, despite the enormous progress attained
over the last years, issues related to the mass production of this two–dimensional form
of carbon with on–demand specifications by cost–effective means have not yet been
settled and constitute a significant obstacle in the path of graphene-based disruptive
technologies.4 In this endeavor, top–down fabrication approaches, which rely on the
exfoliation of graphite and graphite derivatives, are the focus of considerable research

ARTÍCULO II
137
efforts, as they offer the opportunity to access very large quantities of graphene flakes
suitable for a wide range of prospective applications starting from an abundant and
affordable source material.4–6
Currently, three main top–down methods of graphene production that are
particularly promising in terms of scalability can be identified:7 (i) exfoliation and
subsequent reduction of graphite oxide, (ii) direct exfoliation of graphite in the liquid
phase, and (iii) electrolytic exfoliation of graphite. The graphite oxide route is
particularly attractive in that it can provide very large quantities of single–layer sheets,
in the form of both graphene oxide (GO) and reduced graphene oxide (RGO), which
have been found useful in a range of potential applications.8 –12
Nevertheless, the carbon
lattice in GO and RGO is generally riddled with oxygen groups and structural defects
derived from the harsh oxidation process, which have traditionally limited their wider
utility in the graphene realm.7,13,14
On the other hand, very high quality graphene can be
obtained by direct liquid–phase exfoliation of graphite, usually triggered by ultrasound
waves or shear forces.15 – 17
This method naturally affords colloidal dispersions of
defect–free graphene flakes that can be further processed into valuable materials, such
as thin conductive films, polymer composites or hybrid structures, but on the downside
it suffers from low exfoliation yields (typically <1 wt. %) and the as–prepared materials
are frequently dominated by multilayer (mostly 3–8) rather than single– or few–layer
(<4) flakes.16,17
By contrast, electrolytic exfoliation of graphite has been shown to
overcome, at least in part, some of the main limitations of the two previous
approaches.18–20
Specifically, this method can provide graphene samples at relatively
high yields consisting of single– and few–layer flakes of a structural quality better than
that of reduced graphene oxide. As a result, electrolytically exfoliated graphenes have
recently started to be explored towards their use as, e.g., electrodes for
supercapacitors21 , 22
and lithium–sulfur batteries,23
metal–free catalysts,24
catalyst
supports25
or electromagnetic interference shielding devices.26
Overall, electrolytic processes for the exfoliation of graphite into graphene can be of
either cathodic or anodic nature.20
Cathodic exfoliation is mostly based on the use of
lithium or alkylammonium salts dissolved in organic solvents (e.g., propylene carbonate
or dimethyl sulfoxide) as the electrolytic medium, 27–31
whereas anodic exfoliation is
usually carried out in water in the presence of ionic liquids, acids or inorganic
salts,24,25,32–36
being therefore more attractive from an environmental standpoint and also
generally in terms of production rates. Nevertheless, the anodic approach currently

ARTÍCULO II
138
suffers from some significant drawbacks. First, to be useful for further processing
purposes the exfoliated materials frequently need to be dispersed in the liquid phase to
afford colloidal suspensions. Due to their predominant hydrophobic nature, anodically
exfoliated graphenes are typically dispersed in organic solvents such as N,N–
dimethylformamide,24,25,33–35
whose efficiency to colloidally stabilize graphene flakes
has been established in earlier studies.37–39
For many prospective uses of this type of
graphene, however, water would be the preferred dispersing medium, and in such a case
the use of surfactants or other stabilizers becomes essential.15,16
Thus, the anodic
preparation of graphene could be deployed to a greater advantage if chemical species
with the ability to act efficiently both as an electrolyte during the anodic exfoliation and
as a dispersant to stabilize the resulting graphene flakes in water were identified. Some
previous work using, e.g., sodium dodecyl sulfate or copper phthalocyanine
tetrasulfonic acid has suggested such a strategy to be feasible.40–42
However, systematic
studies to identify effective species for this dual role, as well as to rationalize their
performance and compare it by some quantifiable metric would be needed to make the
most of this approach, but have not yet been undertaken.
Second, anodically exfoliated graphenes tend to be significantly oxidized due to the
generation of reactive oxygen species from water at the graphite anode, their oxidation
degree being generally comparable to that found for RGO.19,20
Similar to the case of the
latter, this generally unwanted effect induces structural degradation in the resulting
graphenes and compromises their application scope. To address this issue, researchers
have explored some approaches to curtail the extent of graphene oxidation, for example
the use of inorganic salts instead of acids as the electrolyte,34
certain additives in
combination with the electrolyte43
or specific types of graphite as the anode.44
Nevertheless, when these improved graphenes are compared with their corresponding
reference samples, such efforts are seen to be successful only to a limited degree. Indeed,
no anodic exfoliation strategy reported to date has afforded graphene flakes that exhibit
a quality similar to that of flakes obtained by direct liquid–phase exfoliation of graphite,
i.e. graphenes that are essentially oxide– and defect–free. Attaining such a goal would
thus constitute a significant step forward.
With the aim of providing a unified solution to the abovementioned issues, we have
conducted an investigation into a pool of electrolytes towards the anodic exfoliation of
graphite into graphene, the results of which are reported here. First, a number of readily
available amphiphilic anions are demonstrated to be effective as both exfoliating

ARTÍCULO II
139
electrolyte and dispersant, easily affording aqueous colloidal suspensions of well–
exfoliated graphene flakes. The performance of these chemical species in such a dual
role is quantitatively compared and rationalized. Second, several of the newly identified
electrolytes are also shown to prevent oxidation of the graphene flakes to a large extent,
an ability that can be related to their propensity to get themselves oxidized by reactive
oxygen species. Moreover, graphene flakes with chemical make–up and structural
quality comparable to those typical of samples produced by direct ultrasonic or shear
exfoliation of graphite are obtained using the best electrolytes. Finally, adding to the
multifunctional nature of these electrolytes, we demonstrate the growth of Pt
nanoparticles (NPs) onto the electrolyte–stabilized graphene flakes. The resulting
graphene-Pt NP hybrids were seen to possess a remarkably high catalytic activity, as
evaluated on the basis of model reduction reactions with nitroarenes.
2. Experimental
2.1. Materials and reagents
High purity graphite foil (Papyex I980, acquired from Mersen) was used as starting
material throughout the study. The following chemical species were tested as electrolyte
in the anodic exfoliation of graphite in aqueous medium: sodium sulfate (SS), sodium
dodecyl sulfate (SDS), sodium methanesulfonate (SMS), sodium benzenesulfonate
(SBS), disodium benzene–1,3–disulfonate (SBDS), sodium p–toluenesulfonate (STS),
sodium p–toluate (SPT), sodium dodecylbenzene sulfonate (SDBS), disodium
naphthalene–1,5–disulfonate (SNDS), disodium naphthalene–2,6–dicarboxylate
(SNDC), trisodium naphthalene–1,3,(6,7) –trisulfonate (SNTS), sodium pyrene–1–
sulfonate (SPS) and tetrasodium pyrene–1,3,6,8–tetrasulfonate (SPTS). These chemicals
were obtained from Sigma–Aldrich, either as such or in their corresponding acid form,
which was then converted to the sodium salt by mixing with the appropriate molar
amount of NaOH.
2.2. Anodic exfoliation and dispersion of graphite in water with different electrolytes
The anodic exfoliation process was carried out in a two–electrode configuration,
using a graphite foil piece (40×25×0.5 mm3) as working electrode and a platinum wire
as counter electrode. The two electrodes were submerged in an aqueous solution (20 mL)
ARTÍCULO II
140
of a given electrolyte at a certain concentration (specified below), and then a positive
voltage (10 V) was applied to the graphite electrode for 60 min using an Agilent 6614C
DC power supply. The platinum wire was placed parallel to the graphite foil surface at a
distance of about 2 cm. A digital photograph of the experimental set–up is depicted in
Fig. S1 of the ESI†. During the electrolytic treatment, the graphite sample was typically
seen to swell and expand. Visual and microscopic evidence for such expansion are
given in Fig. S2 of the ESI†. After the 60 min electrolysis period, the resulting
expanded product was gently scraped with a spatula from its parent graphite piece and
transferred directly to the working aqueous solution. The latter was subsequently
sonicated for 3 h in an ultrasound bath cleaner (J.P. Selecta Ultrasons system, 40 kHz).
The obtained dispersion was purified by two cycles of sedimentation via centrifugation
(20000g, 20 min; Eppendorf 5424 microcentrifuge) and re-suspension in Milli–Q water
with a brief (2–3 min) sonication, and finally subjected to a mild centrifugation step
(200g, 20 min) to remove the non–exfoliated or poorly exfoliated graphite fraction from
the resulting supernatant, which was collected for further use. The concentration of
graphene in the final supernatant was taken as a metric for the overall efficiency of the
investigated chemical species in the dual role of exfoliating (intercalating) electrolyte
and dispersant. Following previously reported protocols, the concentration was
determined by UV-vis absorption spectroscopy (double-beam Heios instrument,
from Thermo Spectronic) based on the Lambert-Beer law and using a value of 2440 mL
mg-1
m-1
for the extinction coefficient at the measured wavelength of 660 nm.45,46
2.3. Synthesis and catalytic activity of anodically exfoliated graphene–Pt NP hybrids
Graphene–Pt NP hybrids were prepared from several of the previously obtained
aqueous graphene dispersions by the following procedure: 9 mL of a given anodically
exfoliated graphene suspension (0.2 mg mL-1
) were heated at 85 ºC under magnetic
stirring in a 20 mL test tube sealed with a septum. Then, 1 mL of 1.1 mM aqueous
K2PtCl4 solution was added and the mixture was magnetically stirred at the mentioned
temperature for 2 h. To remove unreacted Pt salt, the resulting product was centrifuged
at 20000 g for 20 min and resuspended in Milli–Q water via sonication for 1–2 min.
Subsequently, 20 L of 1.5 M NaBH4 were added to the suspension and allowed to
react for 45 min at room temperature. Following this step, the final product was purified
by two cycles of sedimentation via centrifugation (20000 g, 20 min) and resuspension in
Milli–Q water. The catalytic activity of the obtained graphene–Pt NP hybrids was

ARTÍCULO II
141
evaluated on the basis of two model reactions with nitroarenes: the reduction of 4–
nitrophenol (4–NP) and 4–nitroaniline (4–NA) to 4–aminophenol (4–AP) and p–
phenylenediamine (p–PDA), respectively, in aqueous medium at room temperature
using NaBH4 as a reductant. To this end, mixed aqueous solutions containing 0.06 mM
of the nitroarene, 36 mM of NaBH4 and 1.8–4.8 g mL-1
of graphene flakes decorated
with Pt NPs (amounting to concentrations of the latter of 0.8–2.1 M) were freshly
prepared and the reaction progress was monitored by measuring their optical density at
a given wavelength at 0.25 s intervals with UV–vis absorption spectroscopy. For
reasons that will be discussed below, the monitored wavelengths were 400 and 380 nm
in the case of 4–NP and 4–NA, respectively.
2.4. Characterization techniques
Characterization of the samples was accomplished by UV–vis absorption
spectroscopy, Raman spectroscopy, X–ray photoelectron spectroscopy (XPS), scanning
transmission electron microscopy (STEM), transmission electron microscopy (TEM),
atomic force microscopy (AFM), inductively coupled plasma-mass spectrometry (ICP–
MS) and measurement of electrical conductivity. Raman spectra were recorded with a
Horiba Jobin–Yvon LabRam instrument using a laser excitation wavelength of 532 nm
at an incident power of 2.5 mW. XPS measurements were performed on a SPECS
apparatus under a pressure of 10-7
Pa with a non-monochromatic Mg K X–ray source
(11.81 kV, 150 W). Samples for both Raman spectroscopy and XPS were prepared by
drop-casting the corresponding suspension onto a pre-heated (~50–60 ºC) circular
stainless steel sample-holder 12 mm in diameter and allowing it to dry. STEM imaging
was accomplished with a Quanta FEG 650 system (FEI Company) operated at 30 kV,
while TEM images were acquired on a JEOL 2000 EX–II instrument operated at 160
kV. For STEM and TEM, specimens were prepared by mixing the corresponding
suspension with an equal volume of ethanol, and then 40 L of the resulting dispersion
were drop-cast onto a copper grid (200 square mesh) covered with a carbon film
(Electron Microscopy Sciences) and allowed to dry under ambient conditions. AFM
imaging was conducted with a Nanoscope IIIa Multimode apparatus (Veeco
Instruments) under ambient conditions in the tapping mode of operation. To this end,
rectangular silicon cantilevers with nominal spring constant and resonance frequency
values of 40 N m-1
and 250–300 kHz, respectively, were employed. Either highly

ARTÍCULO II
142
oriented pyrolytic graphite (HOPG) pieces or SiO2 (300 nm)/Si wafers were used as
substrates for AFM. The substrates were pre–heated at ~50–60 ºC and then a small
volume (20–40 L) of graphene dispersion (~0.05 mg mL-1
) was drop–cast and allowed
to dry. ICP-MS analysis of graphene–Pt NP hybrids was carried out with a 7500ce
apparatus (Agilent) furnished with an octopole collision/reaction cell to destroy
interfering ions. Before analysis, the samples were subjected to microwave-assisted acid
digestion. To measure electrical conductivity, the graphene samples were processed into
free–standing paper–like films by vacuum filtration of the corresponding colloidal
dispersions through silver membrane filters 25 mm in diameter and 0.2 m of pore size
(Sterlitech Corporation). Then, 12×12 mm2 square pieces were cut from the films and
their conductivity was determined through the van der Pauw method by means of a
homemade setup (Agilent 6614C potentiostat and Fluke 45 digital multimeter). The
thickness of the films was estimated by field–emission scanning electron microscopy
(FE–SEM, Quanta FEG 650 system, from FEI Company).
3. Results and discussion
3.1. Electrolytes with dual functionality towards the anodic exfoliation and dispersion
of graphite in water
As a first step in the investigation, we sought to identify chemical species that
function both as efficient electrolytes to promote the anodic exfoliation of graphite in
water and as dispersants to colloidally stabilize the resulting graphene flakes. Therefore,
some rationale had to be first established in the selection of the potential candidates that
were subsequently evaluated. To this end we note that, according to previous
reports,32,34
the anodic exfoliation of graphite in aqueous electrolytic solution relies on
the following two basic processes: (1) pre–expansion of the graphite layers, starting at
edge sites, through attack by hydroxyl and oxygen radicals generated from the oxidation
of water molecules at the anode; (2) subsequent separation of the pre–expanded layers
(i.e., exfoliation) as a result of the intercalation of anions from the electrolyte. This
mechanism implies that successful chemical species that can both exfoliate and
colloidally stabilize graphite by the approach investigated here have to be of anionic
nature. In addition, it is well known that the essentially hydrophobic character of
graphene requires the use of amphiphilic molecules for it to be colloidally stabilized in
water, and anodically exfoliated graphene is no exception in this regard.15,16
Such
amphiphilic dispersants typically consist of a non–polar, hydrophobic component that
ARTÍCULO II
143
adsorbs onto the graphene surface and a polar, hydrophilic moiety that extends into the
aqueous medium.16,47,48
With these considerations in mind, we selected a number of
molecules incorporating a hydrophobic (aromatic– and/or alkyl–containing) section
appended with one or several anionic groups that were intended to serve both as the
polar moiety required to make up the amphiphilic structure and as the anions that drive
the intercalation of the molecule during the electrolytic process. Although several
anions have been previously tested for electrolytic intercalation of graphite (e.g., sulfate,
phosphate, nitrate or tetrafluoroborate),24,32–34,49
sulfates and sulfonates were mostly
chosen for the present work, as they are known to be particularly efficient towards this
purpose and can also be readily combined with organic moieties to form amphiphilic
molecules.
Table 1 lists the name, chemical structure and acronym used for the species tested
here as potential electrolyte/dispersant, which generally comprise an alkyl (e.g., dodecyl)
or aromatic (benzene, naphthalene or pyrene) moiety appended with one, two, three or
four sulfonate groups. We note that some of these molecules have already been used as
dispersants in the direct exfoliation (via sonication) of graphite to give graphene.47,50,51
However, the high efficacy of a given amphiphile as a graphene dispersant is not
expected to guarantee its success as intercalating electrolyte and, therefore, that it can be
considered an efficient electrolyte/dispersant overall. To provide some quantitative
measure of overall performance, we carried out benchmark tests based on a protocol
that comprised the following steps (described in detail in the Experimental section): (1)
anodic treatment of a graphite piece of set dimensions in aqueous solution of a given
chemical species; (2) bath sonication of the anodically expanded product in the same
solution; (3) purification of the resulting dispersion by sedimentation via centrifugation
and subsequent re–suspension in Milli-Q water; (4) determination of the concentration
of graphene material in the final dispersion by UV-vis absorption spectroscopy. The
results of such tests performed for the different chemical species at various molar
concentrations are summarized in Table 1. Before discussing them in detail, we note
that in many cases the described preparation protocol led to homogeneous, opaque black
suspensions, as exemplified in Fig. 1a with SNTS, SPTS and SNDS, which were seen to
be colloidally stable for weeks to months. Fig. 1b shows some representative UV–vis
absorption spectra of the dispersions. The spectra were dominated by an intense band
located at ~270 nm, together with strong absorbance in the 300–1000 nm wavelength
range. These features were nearly identical to those observed previously for both

ARTÍCULO II
144
reduced graphene oxide and pristine graphene flakes,47,52,53
and are known to reveal the
presence of graphitic material possessing extended electronically conjugated domains.
Additional bands of varied intensity located in the 200–400 nm wavelength range were
also quite frequently noticed in the spectra of the obtained suspensions. Control
experiments indicated that they were associated to the chemical species used as
electrolyte/dispersant, and more specifically to their aromatic moieties (→*
transitions).54
Figure 1. (a) Digital photograph of graphene suspensions obtained in the presence of different
electrolytes (from left to right): SNTS, SPTS, and SNDS. (b) UV-vis absorption spectra of the
graphene suspensions in (a): SNTS (green trace), SPTS (blue trace), and SNDS (red trace).
Focusing now on the results of the tests (Table 1), we first note that a number of the
assayed chemical species were not successful in yielding aqueous dispersions with non–
negligible content of graphitic material (i.e., entries in Table 1 that indicate zero
graphene concentration), even though some of these species were known to be very
efficient either as electrolyte in the anodic exfoliation of graphite or as graphene
dispersant. For example, SS afforded a large amount of expanded product upon anodic
treatment, in agreement with previous results from the literature,21,34
but the sulfate
anion alone failed to colloidally stabilize the resulting graphene sheets due to the lack of
a hydrophobic moiety that could adsorb onto the sheets. Incorporation of a methyl unit
a
200 400 600 800 1000
Absorb
ance (
a. u.)
Wavelength (nm)
b

ARTÍCULO II
145
to the anion did not suffice to provide the electrolyte with the sought–after quality of
colloidal stabilizer, as demonstrated by the fact that SMS, while inducing also a
vigorous anodic expansion of the graphite piece (see Fig. S2 in ESI†), was not able to
afford final aqueous dispersions possessing any significant amount of graphitic product.
We interpret that, having such a short alkyl chain, SMS is only very weakly adsorbed on
the graphene sheets and thus cannot confer them enough colloidal stability. Likewise,
SPS, which is made up of a sulfonate group appended to a pyrene unit, has been shown
to be a powerful dispersant of graphene flakes in aqueous medium,50,51
but in the
present work could not be put to good use as electrolyte for the anodic expansion of
graphite. The graphite foil sample did not expand to any significant extent in aqueous
solutions of this species, and its surface was just seen to roughen after the 60 min
electrolytic treatment. We note that, due to solubility limitations, SPS could be tested
only at concentrations of up to 0.01 M, whereas sulfate salts (e.g., SS and others) in
successful anodic exfoliations have been typically used at concentrations in the range of
0.1 M.33–35
We conclude that just a very limited degree of intercalation is possible with
SPS at the attainable concentrations, being clearly insufficient to induce a significant
expansion, and then exfoliation, of the graphite anode.
Table 1. Characteristics of anodically exfoliated graphenes obtained with several intercalating
electrolytes. The apparent thickness of the graphene flakes was gathered by AFM. The O/C
atomic ratio was obtained from XPS survey spectra. ID/IG values were obtained from the Raman
spectra. The name, chemical structure and acronym and the different concentrations assayed for
each species tested here as potential electrolyte/dispersant electrolyte are indicated. The
concentration of graphene material in the final dispersion measured by UV–vis absorption
spectroscopy is also given.
Electrolyte Structure [electrolyte] [graphene] Apparent
thickness
O/C ID/IG
(acronym) (M) (mg mL-1
) (nm)
Sodium sultate
(SS)
0.10 0.00 2.1 0.11 1.0
Sodium methane
sulfonate
(SMS)
0.10 0.00 - - -
Sodium bencene 0.01 0.02 2.0 0.07 0.8

ARTÍCULO II
146
sulfonate
0.05 0.19 0.08 1.1
(SBS) 0.10 0.40 0.07 1.1
0.20 0.58 0.09 0.8
Sodium bencene 0.01 0.16 1.6 0.10 0.9
1,3–disulfonate
0.05 0.20 0.11 1.2
(SBDS) 0.10 0.42 0.12 1.0
0.20 0.15 0.10 0.9
Sodium p–toluene 0.01 0.04 2.4 0.07 0.4
sulfonate
0.05 0.13 0.08 0.7
(STS) 0.10 0.14 0.08 0.6
0.20 0.51 0.07 0.8
0.50 0.55 0.07 0.8
Sodium p–toluate
0.10 0.00 - - -
(SPT)
Sodium naphtalene 0.01 0.04 2.5 0.06 0.4
1,5–disulfonate
0.05 0.19 0.06 0.4
(SNDS) 0.10 0.17 0.04 0.3
0.20 0.84 0.02 0.2
Sodium naphtalene 0.10 0.00 - - -
2,6–dicarboxylate
(SNDC)
Sodium naphtalene
0.01 0.06 1.9 0.05 0.3
1,3,(6,7)– 0.05 0.37 0.06 0.4
trisulfonate 0.10 0.32 0.05 0.3
(SNTS) 0.20 0.40 0.05 0.3
Sodium pyrene
0.01 0.00 - - -
1–sulfonate
(SPS)
Sodium pyrene
0.005 0.12 1.8 0.08 0.6
1,3,6,8– 0.01 0.33 0.06 0.6
tetrasulfonate 0.05 0.14 0.06 0.3
(SPTS)
Sodium dodecyl 0.05 0.04 2.1 0.10 1.1
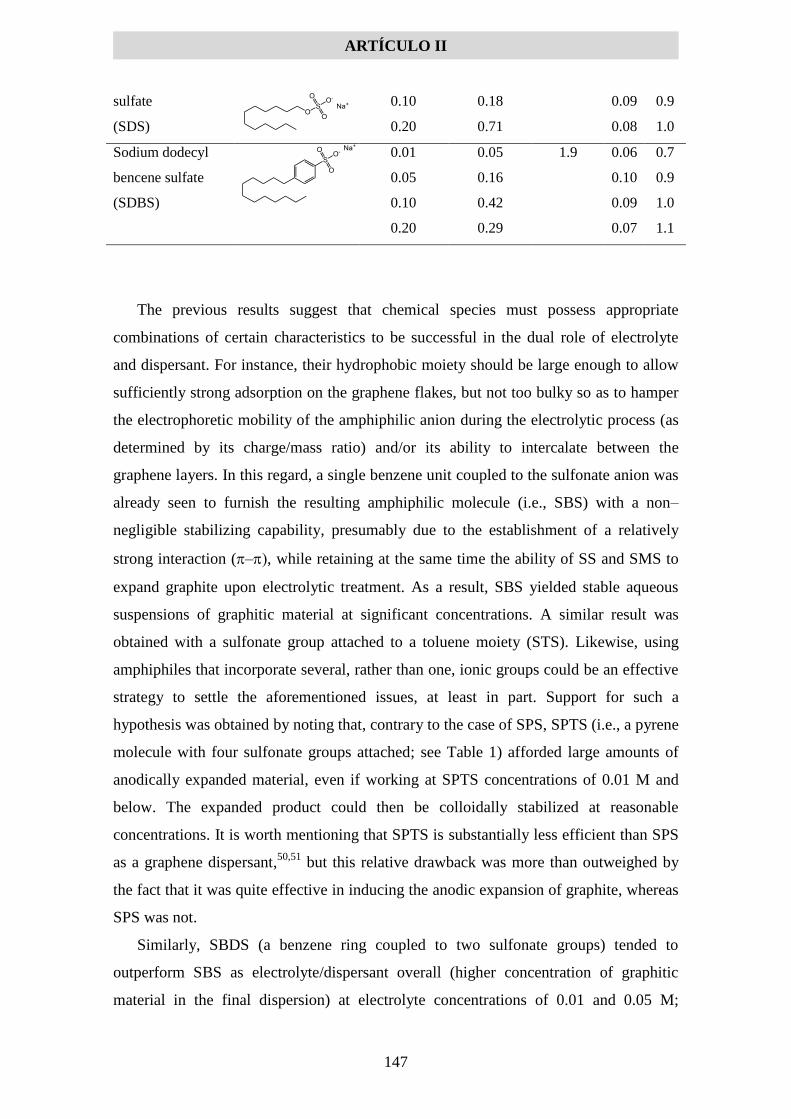
ARTÍCULO II
147
sulfate
0.10 0.18 0.09 0.9
(SDS) 0.20 0.71 0.08 1.0
Sodium dodecyl
0.01 0.05 1.9 0.06 0.7
bencene sulfate 0.05 0.16 0.10 0.9
(SDBS) 0.10 0.42 0.09 1.0
0.20 0.29 0.07 1.1
The previous results suggest that chemical species must possess appropriate
combinations of certain characteristics to be successful in the dual role of electrolyte
and dispersant. For instance, their hydrophobic moiety should be large enough to allow
sufficiently strong adsorption on the graphene flakes, but not too bulky so as to hamper
the electrophoretic mobility of the amphiphilic anion during the electrolytic process (as
determined by its charge/mass ratio) and/or its ability to intercalate between the
graphene layers. In this regard, a single benzene unit coupled to the sulfonate anion was
already seen to furnish the resulting amphiphilic molecule (i.e., SBS) with a non–
negligible stabilizing capability, presumably due to the establishment of a relatively
strong interaction (–, while retaining at the same time the ability of SS and SMS to
expand graphite upon electrolytic treatment. As a result, SBS yielded stable aqueous
suspensions of graphitic material at significant concentrations. A similar result was
obtained with a sulfonate group attached to a toluene moiety (STS). Likewise, using
amphiphiles that incorporate several, rather than one, ionic groups could be an effective
strategy to settle the aforementioned issues, at least in part. Support for such a
hypothesis was obtained by noting that, contrary to the case of SPS, SPTS (i.e., a pyrene
molecule with four sulfonate groups attached; see Table 1) afforded large amounts of
anodically expanded material, even if working at SPTS concentrations of 0.01 M and
below. The expanded product could then be colloidally stabilized at reasonable
concentrations. It is worth mentioning that SPTS is substantially less efficient than SPS
as a graphene dispersant,50,51
but this relative drawback was more than outweighed by
the fact that it was quite effective in inducing the anodic expansion of graphite, whereas
SPS was not.
Similarly, SBDS (a benzene ring coupled to two sulfonate groups) tended to
outperform SBS as electrolyte/dispersant overall (higher concentration of graphitic
material in the final dispersion) at electrolyte concentrations of 0.01 and 0.05 M;
ARTÍCULO II
148
however, the use of higher electrolyte concentrations (i.e., 0.1 and 0.2 M) led to similar
or even better performance for SBS. To shed an understanding on this question, we
carried out a control experiment to determine which of the two amphiphiles performs
better as a graphene dispersant. To this end, we first prepared a certain amount of
anodically expanded graphite using SS (0.1 M) as the electrolyte. After extensive
washing and drying, equal amounts of the obtained product were dispersed in aqueous
solutions of SBS and SBDS at different concentrations between 0.01 and 0.2 M, bath–
sonicated for 3 h and finally centrifuged. It was apparent to the naked eye, but also
confirmed by UV–vis absorption spectroscopy, that the amount of graphitic material
retained in the resulting supernatants was substantially larger when using SBS for all the
tested concentrations, i.e. this amphiphile was far superior to SBDS as a dispersant.
Such a result parallels the observations on the performance of SPS and SPTS as
graphene dispersants reported and rationalized by other authors, as mentioned above,
and can be explained by invoking a similar line of reasoning:51
the ability of these
amphiphilic anions to colloidally stabilize graphene sheets in aqueous medium is
expected to be governed by the strength of their adsorption onto the sheets, i.e., by their
adsorption free energy. The latter is in turn determined by the interplay between the
solvation free energy of the amphiphile in water and the interaction free energy of the
amphiphile with the graphene surface. The interaction free energy of SBS and SBDS
with graphene can be assumed to be similar or even somewhat larger for SBDS on
account of its additional sulfonate group. However, this additional group would make
the solvation free energy of SBDS to be substantially larger and hence its adsorption
free energy to be smaller than their counterparts for SBS. As a result, SBDS would
exhibit a weaker ability to colloidally stabilize graphene in water, as was indeed
observed in the control experiment.
In the light of the previous discussion, the following rationale can be put forward to
account for the observed behavior of SBS and SBDS towards their combined role of
electrolyte/dispersant. At low electrolyte concentration, the expected higher
electrophoretic mobility of SBDS will lead to a larger extent of intercalation of the
graphite anode, and consequently to a much larger amount of expanded product (as was
visually evident), compared with the case of SBS. As a result, SBDS will afford more
graphitic material in the final dispersion simply because there was very little expanded
product available for dispersion with SBS (see Table 1). On the other hand, it can be
argued that the low intercalation rate of the SBS molecule arising from its

ARTÍCULO II
149
comparatively low mobility can be compensated for when working at high electrolyte
concentrations. In such a case, the sheer amount of SBS used would be enough to
induce a sizable intercalation and expansion of the graphite anode, as was also observed
in the experiments. With a significant amount of expanded graphite in the aqueous
medium, the concentration of graphitic material in the final suspension after the
sonication step will most probably be dictated by the ability of the amphiphile to act as
a dispersant, so in this case higher concentrations would be expected when using SBS
compared to SBDS, as it was indeed observed.
A limited electrophoretic mobility of amphiphiles that incorporate a single anion
and a relatively bulky hydrophobic moiety, therefore possessing relatively low
charge/mass ratios, can also be invoked to explain why SDS (sulfate group with a
dodecyl chain) and SDBS (sulfonate group with a dodecylbenzene moiety), which are
known to be reasonably efficient surfactants for graphene,47, 55
did not succeed in
expanding the graphite anode to any significant extent at low electrolyte concentration
(0.01 M), similar to what was observed for SPS. However, contrary to the case of the
latter species and due to their ability to assemble into micelles, both SDS and SDBS
could be tested as electrolytes at concentrations well above 0.01 M. In line with the
ideas discussed in the preceding paragraph for SBS, the use of sufficiently high
concentrations of these species (e.g., 0.05 M for both SDS and SDBS) led to a
substantial expansion of the graphite anode and finally to aqueous dispersions
containing considerable amounts of graphitic material (see Table 1). We note that all the
concentrations tested for SDS and SDBS (see Table 1) were above their corresponding
critical micelle concentration values,56
which warranted the effectiveness of both
surfactants in the colloidal stabilization of the expanded graphitic products.
The information obtained from the experimental results presented above can be used
as a guide to select further amphiphiles that are effective in the sought–after dual role of
electrolyte and dispersant. Such results suggest that successful candidates must strike an
appropriate balance between their net charge and the mass of their hydrophobic moiety.
On one hand, the net charge should be high enough to promote efficient intercalation/
expansion of the graphite anode but not too high so as to critically weaken the free
energy of adsorption of the amphiphile on the graphene surface. On the other hand, the
hydrophobic component should be large enough to favour its adsorption onto the
graphene surface, but not too large so as to hamper the electrophoretic mobility of the
molecule. More specifically, if SPS suffers from solubility and electrophoretic mobility
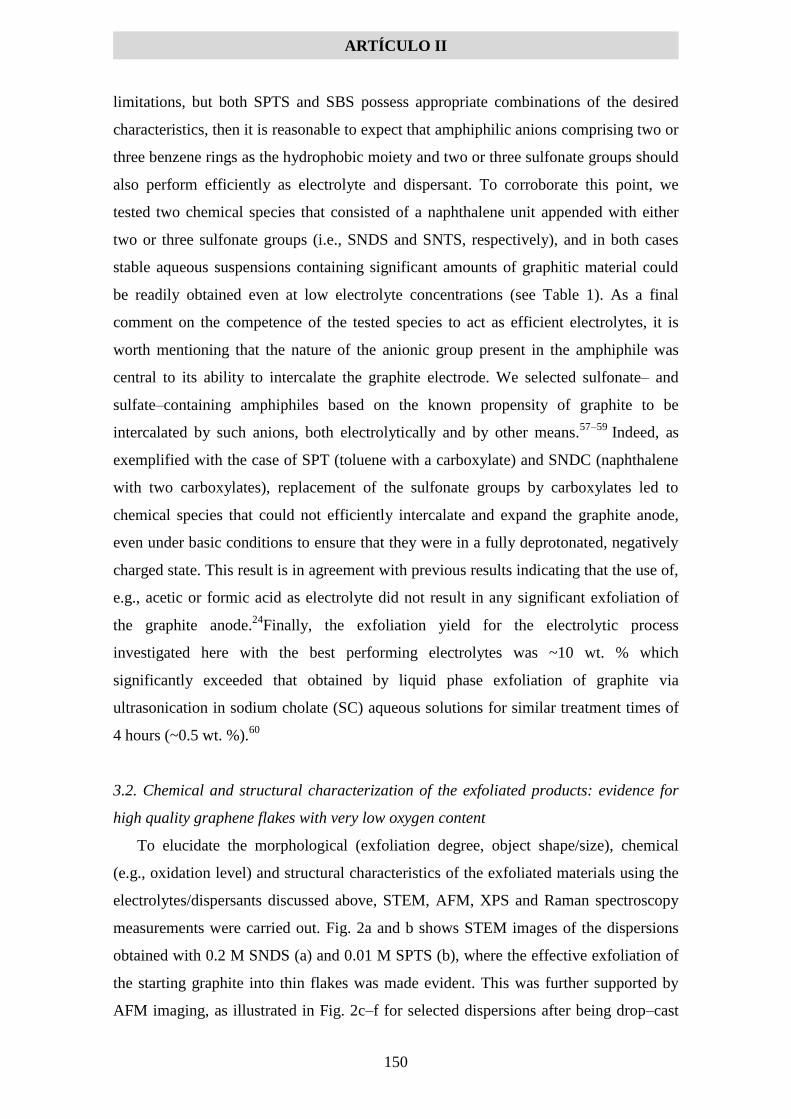
ARTÍCULO II
150
limitations, but both SPTS and SBS possess appropriate combinations of the desired
characteristics, then it is reasonable to expect that amphiphilic anions comprising two or
three benzene rings as the hydrophobic moiety and two or three sulfonate groups should
also perform efficiently as electrolyte and dispersant. To corroborate this point, we
tested two chemical species that consisted of a naphthalene unit appended with either
two or three sulfonate groups (i.e., SNDS and SNTS, respectively), and in both cases
stable aqueous suspensions containing significant amounts of graphitic material could
be readily obtained even at low electrolyte concentrations (see Table 1). As a final
comment on the competence of the tested species to act as efficient electrolytes, it is
worth mentioning that the nature of the anionic group present in the amphiphile was
central to its ability to intercalate the graphite electrode. We selected sulfonate– and
sulfate–containing amphiphiles based on the known propensity of graphite to be
intercalated by such anions, both electrolytically and by other means.57–59
Indeed, as
exemplified with the case of SPT (toluene with a carboxylate) and SNDC (naphthalene
with two carboxylates), replacement of the sulfonate groups by carboxylates led to
chemical species that could not efficiently intercalate and expand the graphite anode,
even under basic conditions to ensure that they were in a fully deprotonated, negatively
charged state. This result is in agreement with previous results indicating that the use of,
e.g., acetic or formic acid as electrolyte did not result in any significant exfoliation of
the graphite anode.24
Finally, the exfoliation yield for the electrolytic process
investigated here with the best performing electrolytes was ~10 wt. % which
significantly exceeded that obtained by liquid phase exfoliation of graphite via
ultrasonication in sodium cholate (SC) aqueous solutions for similar treatment times of
4 hours (~0.5 wt. %).60
3.2. Chemical and structural characterization of the exfoliated products: evidence for
high quality graphene flakes with very low oxygen content
To elucidate the morphological (exfoliation degree, object shape/size), chemical
(e.g., oxidation level) and structural characteristics of the exfoliated materials using the
electrolytes/dispersants discussed above, STEM, AFM, XPS and Raman spectroscopy
measurements were carried out. Fig. 2a and b shows STEM images of the dispersions
obtained with 0.2 M SNDS (a) and 0.01 M SPTS (b), where the effective exfoliation of
the starting graphite into thin flakes was made evident. This was further supported by
AFM imaging, as illustrated in Fig. 2c–f for selected dispersions after being drop–cast
ARTÍCULO II
151
onto HOPG substrates, more to the point those prepared with 0.1 M SS (c, dispersion
prepared in water–isopropanol mixture and shown for comparison purposes), 0.01 M
SPTS (d), 0.05 M SBDS (e) and 0.2 M SNDS (f). For all the successful
electrolytes/dispersants, the resulting suspensions were comprised of very thin and flat
objects displaying irregular polygonal shapes, consistent with them being well
exfoliated graphene flakes. We note that in Fig. 2d–f a high density of small rounded (as
opposed to polygonal) features decorate the HOPG surface. These can be attributed to
the amphiphilic dispersants, which are expected to strongly adsorb onto the HOPG
surface as well as onto the graphene flakes. The flakes exhibited typical lateral
dimensions between a few and several hundred nanometers, and their apparent thickness,
determined as flake height relative to the substrate (see exemplary line profiles in Fig.
2d–f), ranged between ~0.5 and 2.5 nm, although the specific values differed slightly
depending on the particular electrolyte/dispersant used (see Table 1 and Fig. S4 of the
ESI†). These values were very similar to the ones reported here and in the literature for
graphene flakes anodically exfoliated in sulphuric acid or sulfate salts (e.g., SS),33,44,61,62
suggesting that intercalation of the graphite electrode was not critically hampered by the
larger size of the (amphiphilic) anions used here. We also note that the apparent
thickness values were well below those usually reported for surfactant–stabilized
graphene dispersions obtained by direct exfoliation of graphite via sonication or shear
mixing (~3–8 nm),17,46
thus suggesting a much better degree of exfoliation. In fact,
taking into account that the typical thickness of the patches of amphiphilic molecules
adsorbed onto the HOPG surface (Fig. 2d–f) was slightly above 1 nm and that these
molecules are expected to contribute to the measured thickness of the flakes, we
conclude that all the samples obtained here are mostly made up of single– to few–layer
(<5) flakes.
ARTÍCULO II
152
Figure 2. Representative STEM images of the graphene dispersions obtained with 0.2 M SNDS
(a) and 0.01 M SPTS (b). Representative AFM images of graphene dispersions prepared with
0.1 M SS (c, dispersion prepared in water-isopropanol mixture and shown for comparison
purposes), 0.01 M SPTS (d), 0.05 M SBDS (e) and 0.2 M SNDS (f). A typical line profile taken
along the marked white line is shown superimposed on each image.
The chemical make–up of the exfoliated graphene flakes was investigated by XPS.
The recorded survey spectra (not shown) indicated that carbon was the dominant
element for all the samples, as expected, but oxygen and sulphur were also present to a
variable extent depending on the specific amphiphile used (see ESI† for further details
on XPS analysis). We note that the graphene dispersions employed for the XPS
measurements were subjected to a special purification protocol consisting of several
cycles of sedimentation via centrifugation and re–suspension in Milli–Q water. This
procedure aimed at removing the largest possible amount of amphiphile from the
samples, so that the actual oxygen content of the graphene flakes could be properly
determined without substantial interference from the sulfonate/sulfate groups of the
electrolyte/dispersant. Table 1 lists the oxygen content, expressed as O/C atomic ratio,
for the different graphene samples prepared with the successful amphiphiles as well as
with SS (0.1 M), the latter serving as a benchmark to afford direct comparisons with an
electrolyte commonly used in the anodic exfoliation of graphite. As could be anticipated,
1 m a c e
2 m b d f

ARTÍCULO II
153
the SS–derived graphene flakes were seen to be significantly oxidized (O/C ratio ~0.11).
Similar or even higher levels of oxidation are usually reported for anodically exfoliated
graphene,21,24,25,49,62,63
which are thought to be the result of oxidation reactions inherent
to such an exfoliation process carried out in aqueous medium. More specifically, it has
been postulated that water molecules are readily oxidized at the graphite anode, giving
rise to highly reactive hydroxyl and oxygen radicals that then attack the graphene layers.
32,34 Thus, a more or less extensive oxidation of the resulting graphenes has been
generally regarded as an inescapable consequence of the anodic exfoliation
approach.19,20
Because oxidation is almost invariably associated to degradation of the
structural quality and properties of graphene, anodically exfoliated graphenes are
deemed to have a relatively narrow scope of application compared to that of high
quality graphene flakes obtained, e.g., by cathodic exfoliation of graphite in organic
solvents or direct exfoliation in the liquid phase via ultrasound or shear forces.
Nevertheless, the present results indicated that graphenes with limited oxidation
could be attained with a proper choice of the electrolyte/dispersant. Although some
amphiphiles (e.g., SBDS, SBS or SDBS) yielded products with a similar or somewhat
lower O/C ratio than that of the SS–derived material (see Table 1), others (e.g., SPTS,
SNTS and SNDS) led to graphene samples with significantly reduced levels of
oxidation. SNDS was particularly effective in this regard, affording O/C ratios as low as
0.02. To the best of our knowledge, this is by far the lowest degree of oxidation reported
to date for any anodically exfoliated graphene, and is even lower than that typical of
graphenes obtained by cathodic exfoliation approaches in organic solvents (O/C ratios
~0.04-0.09).28–31,64
As illustrated in Fig. 3, the extent of oxidation of the graphene lattice
was reflected in the shape of the high resolution C 1s core level XPS spectrum. For
samples with high O/C ratios, e.g. those obtained with SS (a) and SBDS (b), the C 1s
spectrum was dominated by a component centered at ~284.6 eV, which can be
attributed to carbon atoms in non-oxidized graphitic environments (C=C species), with
an additional significant component located at about 286.5 eV (C-O species in, e.g.,
hydroxyl or epoxide groups) and a minor one at ~288.5 eV (C=O species; e.g.,
carbonyls).44,62
We note that the combined weight of the two latter components was
commensurate with the O/C atomic ratio of the corresponding samples as deduced from
their survey spectra. On the other hand, the weight of the C–O and C=O components
(relative to the C=C component) was seen to decrease substantially for graphene
samples with reduced extent of oxidation (e.g., Fig. 3c for SPTS with O/C ratio of 0.06),
ARTÍCULO II
154
and was virtually negligible for the SNDS–derived graphene with O/C ratio ~0.02 (Fig.
3d, black trace). For comparison purposes, the C 1s envelope of a graphene sample
prepared by direct exfoliation of graphite powder through sonication in a sodium
cholate aqueous solution, which is known to yield essentially pristine, oxide–free
flakes,65
is also shown in Fig. 3d (red trace), being almost identical to that of the SNDS–
derived graphene. O/C ratios of ~0.01 were measured for this pristine graphene sample,
as well as for both its parent graphite powder and the graphite foil used for anodic
exfoliation. These results indicate that oxidation of anodically exfoliated graphene can
be largely prevented as long as a suitable electrolyte is used (e.g., SNDS). This is in
sharp contrast with what has been usually found for this production method using
common electrolytes (e.g., H2SO4, K2SO4 or SS).
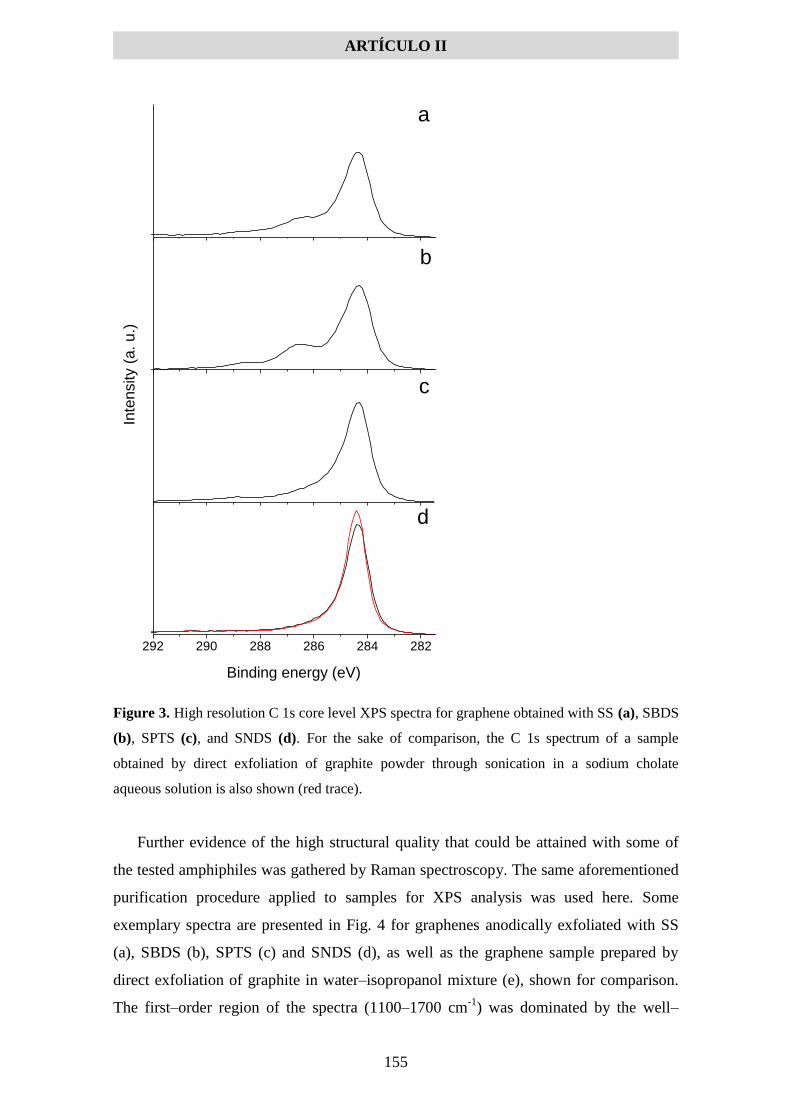
ARTÍCULO II
155
d
c
a
b
Inte
nsity (
a.
u.)
292 290 288 286 284 282
Binding energy (eV)
Figure 3. High resolution C 1s core level XPS spectra for graphene obtained with SS (a), SBDS
(b), SPTS (c), and SNDS (d). For the sake of comparison, the C 1s spectrum of a sample
obtained by direct exfoliation of graphite powder through sonication in a sodium cholate
aqueous solution is also shown (red trace).
Further evidence of the high structural quality that could be attained with some of
the tested amphiphiles was gathered by Raman spectroscopy. The same aforementioned
purification procedure applied to samples for XPS analysis was used here. Some
exemplary spectra are presented in Fig. 4 for graphenes anodically exfoliated with SS
(a), SBDS (b), SPTS (c) and SNDS (d), as well as the graphene sample prepared by
direct exfoliation of graphite in water–isopropanol mixture (e), shown for comparison.
The first–order region of the spectra (1100–1700 cm-1
) was dominated by the well–

ARTÍCULO II
156
known G and D bands of graphitic materials, located at about 1582 and 1350 cm-1
,
respectively, while the so–called 2D band (~2700 cm-1
) was the main feature observed
in the second–order region (2300–3300 cm-1
). As noticed from Fig. 4, the intensity of
the D band relative to the G band was seen to differ significantly between the different
samples. Because the D peak is a defect–related band, whereas the G peak is just
associated to the presence of sp2 carbon atoms, the integrated intensity ratio of the D
and G bands (ID/IG ratio) is frequently taken as a quantitative measure of the structural
disorder in graphite/graphene.66 , 67
The ID/IG ratio was calculated for the different
graphene samples and the results are given in Table 1. As could be expected, graphenes
with high O/C ratios tended to exhibit rather high values of ID/IG, indicative of carbon
lattices with substantial structural disorder, whereas those samples with lower degrees
of oxidation possessed correspondingly low ID/IG ratios. In particular, the graphene
material with the lowest O/C ratio (0.02), prepared using SNDS (0.2 M), exhibited an
ID/IG value of 0.2, i.e., it was much smaller than that obtained with a standard electrolyte
(SS, 1.0) but very similar to that of the graphene sample prepared by direct exfoliation
of graphite (~0.2). This is clear indication that extensive introduction of disorder in the
graphene lattice is not invariably associated to the anodic exfoliation process in aqueous
medium, but graphenes with a very low defect content are also possible under certain
preparation conditions (e.g., using appropriate electrolytes in the present case). As a
result, materials with attractive characteristics (e.g., a high electrical conductivity)
should be attainable using the high quality anodically exfoliated graphenes. For instance,
the electrical conductivity of free–standing, paper–like graphene films prepared by
vacuum filtration of dispersions derived from SNDS (0.2 M) and SPTS (0.01 M) was
46000 and 45000 S m-1
(see ESI† for details on film thickness by FE–SEM), which
compares favorably with values previously reported for graphene films obtained by
direct exfoliation of graphite via ultrasonication or shear mixing in organic solvents or
water–surfactant systems (2000-20000 S m-1
).17,46,47,68–71
We note that, although the
results presented here correspond to graphene dispersions prepared from graphite foil,
graphene dispersions could also be obtained by anodic exfoliation of other types of
graphite in the presence of SNDS, specifically, from HOPG and natural graphite
powder (see Fig S13, Table S1 and accompanying text in ESI†).
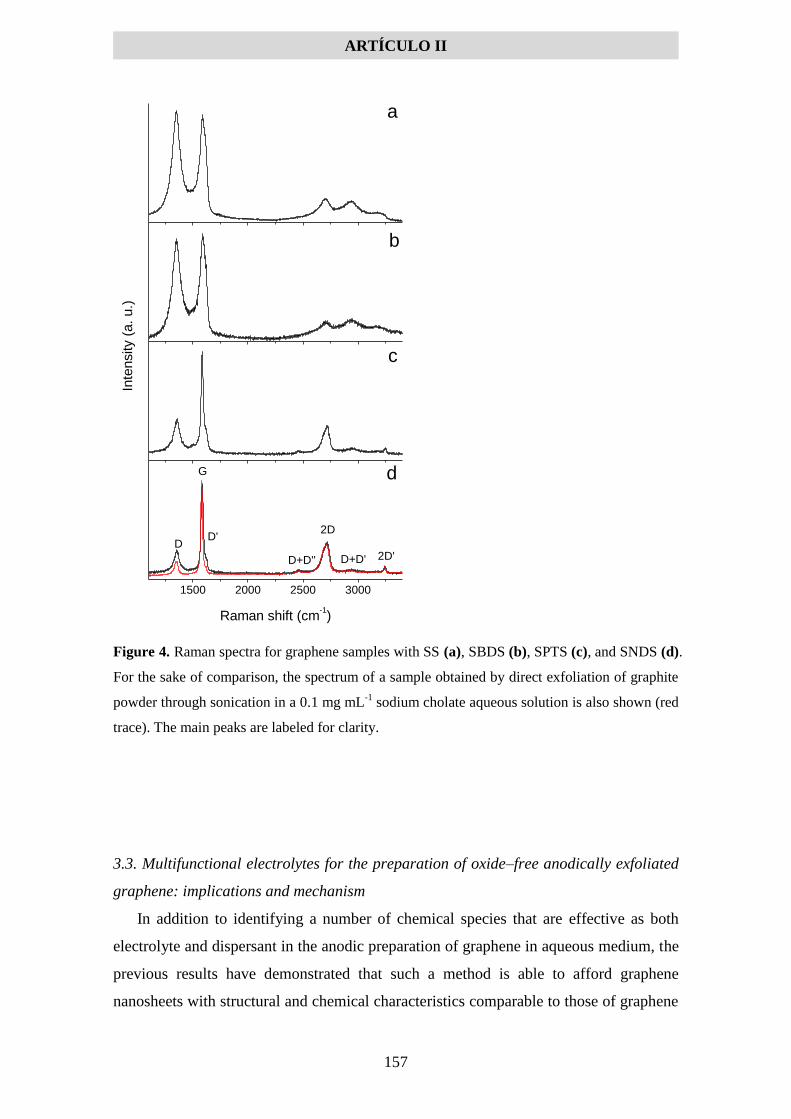
ARTÍCULO II
157
Figure 4. Raman spectra for graphene samples with SS (a), SBDS (b), SPTS (c), and SNDS (d).
For the sake of comparison, the spectrum of a sample obtained by direct exfoliation of graphite
powder through sonication in a 0.1 mg mL-1
sodium cholate aqueous solution is also shown (red
trace). The main peaks are labeled for clarity.
3.3. Multifunctional electrolytes for the preparation of oxide–free anodically exfoliated
graphene: implications and mechanism
In addition to identifying a number of chemical species that are effective as both
electrolyte and dispersant in the anodic preparation of graphene in aqueous medium, the
previous results have demonstrated that such a method is able to afford graphene
nanosheets with structural and chemical characteristics comparable to those of graphene
d
c
a
b
Inte
nsity (
a.
u.)
D
G
D'
2D'
1500 2000 2500 3000
2D
Raman shift (cm-1)
D+D'' D+D'

ARTÍCULO II
158
flakes produced by direct liquid–phase exfoliation of graphite (i.e., very low oxygen and
defect contents). In our opinion, this finding is important for two reasons. First, it has
the potential to broaden significantly the scope of application of anodically exfoliated
graphenes, which has been deemed to be somewhat limited as a result of the substantial
oxidation and relatively low structural quality usually associated to this graphene
type.19,20
Thus, through modulation of its oxygen and defect content, anodic graphene
could be targeted either for practical uses that are generally explored with high quality
flakes, such as those obtained by direct liquid–phase or cathodic exfoliation approaches
(e.g., in applications requiring high electrical or thermal conductivity), or alternatively,
for uses where an extensive oxidation of the material, similar to that of graphene oxides,
is desirable (e.g., to allow covalent functionalization with biomolecules towards
theranostic applications). In addition, aqueous anodic exfoliation boasts significant
advantages over other top–down, potentially scalable production methods. For example,
it does not require the use of harsh chemicals (compared to the graphite oxide route) or
organic solvents (as opposed to cathodic exfoliation), and affords higher yields and
degrees of exfoliation (thinner flakes) relative to direct liquid–phase exfoliation.
Second, contrary to previous assumptions,19,20
the mentioned finding proves that
significant oxidation of the graphene layers is neither a strictly required step nor an
inevitable consequence of the aqueous anodic exfoliation method. As discussed above,
anodic exfoliation is thought to be made possible by pre–expansion of the graphite
edges to allow an efficient intercalation of anions from the electrolyte. In turn, such a
pre–expansion is believed to be the result of attack of the graphite edges by hydroxyl
and oxygen radicals generated through anodic oxidation of water molecules.32,34
It
would then be conceivable that the only stringent requirement for anodic intercalation
and exfoliation to take place efficiently is that the edges of the graphene layers, but not
their interiors (i.e., their basal planes), become oxidized, even though in practice basal
plane oxidation occurs for the highly oxidized anodic graphenes that are usually
reported in the literature. Because just a very small fraction of carbon atoms are
expected to be located at the edge of graphene nanosheets with lateral sizes of a few
hundred nanometers or larger, this implies that anodic exfoliation should be possible
with minimal oxidation of the resulting graphenes, as actually demonstrated in the
present work with, e.g., SNDS.
The main question to elucidate in connection with these results is why oxidation of
the graphene flakes could be largely prevented with some electrolytes, especially SNDS.

ARTÍCULO II
159
To this end, we note that intercalation of anions from the electrolyte within the graphene
layers during the anodic process is probably accompanied by the co–intercalation of a
number of water molecules surrounding each anion (hydrated anion). Oxidation of these
water molecules at the high anodic potential applied (10 V) would generate the
hydroxyl and oxygen radicals that in turn oxidize the graphene layers. However, in
some cases oxidation of the anion itself would also be expected to take place. For
instance, organic compounds and especially polycyclic aromatic hydrocarbons (PAHs),
including sulfonated PAHs, are particularly prone to anodic oxidation in aqueous
medium as a result of their relatively low oxidation potential.72–74
In fact, electrolytic
oxidation methods have been successfully deployed for the degradation of organic
compounds in wastewaters.75
On this ground, it is reasonable to assume that either (1)
preferential anodic oxidation of the PAHs hinders the oxidation of water molecules and
hence the generation of hydroxyl/oxygen radicals or, as a more likely possibility, (2) the
PAHs do not avert water oxidation but act as scavengers of the resulting
hydroxyl/oxygen radicals, leading to their own oxidation (to give, e.g., hydroxylated
PAHs). As a result of either of these two processes, oxidation of the graphene layers
would be prevented. Therefore, the use of readily oxidizable electrolytes (e.g., SNDS)
can be an effective strategy to avoid the oxidation of anodically exfoliated graphenes
and thus yield very high quality materials. The actual performance of any given
oxidizable electrolyte towards this end is believed to depend on both thermodynamic
and kinetic factors, but an analysis in this regard is beyond the scope of the present
work. By contrast, non– or hardly oxidizable electrolytes (e.g., SS) will not be able to
impede oxidation of the graphene layers, leading to the well–known products of
relatively high oxygen content and low structural quality. The main processes thought to
be involved in these two situations, as well the as the consequences for the resulting
graphene nanosheets, are schematically depicted in Fig. 5. From these results it can be
concluded that several of the investigated electrolytes, most significantly SNDS, boast
not just a dual but a triple functionality in the anodic preparation of graphene: (1)
exfoliating electrolyte, (2) colloidal dispersant and (3) sacrificial agent to prevent
oxidation of the flakes.

ARTÍCULO II
160
Figure 5. A) When graphite is anodically exfoliated in water in the presence of a non–
oxidizable electrolyte such as sodium sulphate (SS), water molecules oxidize at the graphite
anode, giving rise to highly reactive hydroxyl and oxygen radicals that then attack the graphene
layers. As a result, the SS–derived graphene flakes are significantly oxidized. B) In the presence
of a readily oxidizable electrolyte (an electrolyte with low oxidation potential), such as sodium
benzenesulfonate (SBS), preferential anodic oxidation of electrolyte (to give, e.g., hydroxylated
electrolyte) hinders the oxidation of graphene. Thus, the electrolyte acts as sacrificial agent
preventing graphene oxidation.
3.4. Synthesis and catalytic activity of anodically exfoliated graphene–Pt NP hybrids
Hybrid nanostructures consisting of metallic and other types of NPs supported onto
graphene are currently the focus of intense research efforts due to their strong potential
for application in, e.g., catalysis or energy storage.76
However, the majority of such
efforts involve the use of GO nanosheets, whereas other graphene types have received
much less attention. This can be attributed to the fact that the oxygen functional groups
present in GO at very high densities serve as efficient anchoring sites for the NPs. In the
case of electrolytically exfoliated graphene, its combination with NPs to afford
functional hybrids has just started to be explored,63
where polyaniline was employed as
a linker to physically couple both components. We attempted the growth of Pt NPs on
graphene flakes prepared by electrolytic exfoliation with the non–amphiphilic,
A) Non–oxidizable electrolyte
B) Oxidizable electrolyte
Oxidized graphene
Non–oxidized graphene
ARTÍCULO II
161
commonly used electrolyte SS, which gives a significantly oxidized product (O/C
ratio~0.11, see Table 1). The procedure was based on reduction of a metal salt (K2PtCl4)
with NaBH4 in a water–isopropanol dispersion of exfoliated flakes. However, TEM
imaging (see Fig. S14 of the ESI†) indicated that very few particles were able to
associate to the flakes suggesting a lack of efficient anchoring sites for anodically
exfoliated graphenes even if there are relatively well oxidized in this case. Thus, for the
anodically exfoliated graphenes with very low extent of oxidation prepared here using
certain electrolytes/dispersants, the need for a linker to promote NP anchoring to the
graphene support appears to be necessary. Rather than resorting to an additional
component, we hypothesized that the very same chemical species used as electrolyte,
dispersant and sacrificial agent (e.g., SPTS and SNDS) could also play the role of
effective linker. These species must be strongly adsorbed on the graphene surface
through – interactions and their ionic (sulfonate) groups are expected to promote the
nucleation and attachment of the NPs by acting as anchors for the precursor metal
cationic species. To verify such a hypothesis, we synthesized Pt NPs by reduction of
K2PtCl4 in an aqueous dispersion of either SPTS– or SNDS–stabilized graphene flakes
(see Experimental section for details). As exemplified in Fig. 6a and c for SPTS– and
SNDS–based samples, respectively, TEM imaging confirmed the decoration of the
anodically exfoliated graphene flakes with large numbers of NPs. An analysis of their
size (see histograms in Fig. 6b and d) revealed that they were typically between 1 and 5
nm in diameter, with an average size of 1.9±0.8 (SPTS) and 3±1 (SNDS) nm. No stand–
alone NPs were observed in the TEM images, indicating that they were firmly anchored
to the graphene support. XPS measurements demonstrated that the NPs were made up
of Pt in metallic form. Fig. 6e shows the high resolution Pt 4f core level spectrum for
the SNDS–based sample (results for the SPTS-based hybrid were similar and are not
shown). The spectrum consisted of two slightly asymmetrical peaks (doublet band)
located at binding energies of 71.3 and 74.6 eV, which could be ascribed to the 4f7/2 and
4f5/2 levels of Pt0, respectively.
77 No significant peaks associated to oxidized Pt (e.g.,
Pt4+
) were noticed. The Pt/graphene mass ratio in the hybrids was determined by ICP–
MS, yielding values of 4.0% (SPTS) and 7.9% (SNDS).

ARTÍCULO II
162
Figure 6. Representative TEM images of anodically exfoliated graphene–Pt NP hybrids
obtained with SPTS (a) and SNDS (c). Histograms of nanoparticle size distribution derived
from the TEM images for the graphene–Pt NP hybrids obtained with SPTS (b) and SNDS (d).
(e) Representative high resolution XPS Pt 4f core level spectrum of the anodically exfoliated
graphene–Pt NP hybrids.
Among other potential applications, the anodically exfoliated graphene–Pt NP
hybrids reported here could find use as catalytic systems. Their catalytic activity was
evaluated on the basis of two model reactions carried out in aqueous medium at room
temperature, namely the reduction of 4–NP and 4–NA with NaBH4 to yield 4–AP and
p–PDA, respectively. Both reactions are thermodynamically favorable but their kinetics
is restricted by significant activation barriers, so that they need to be catalytically
promoted. In addition to their practical relevance in different areas, including the
synthesis of pharmaceutical compounds or the management of recalcitrant pollutants,
they are commonly studied benchmark reactions in the assessment of metal–based
catalysts.78 , 79
The reaction progress can be readily monitored through UV–vis
absorption spectroscopy in both cases. Fig. 7a shows the characteristic absorption
spectrum of 4–NP at the slightly acidic pH of deionized water (black trace), which
displays a strong band at ~316 nm. In the basic medium generated by the presence of
the reductant NaBH4, 4–NP deprotonates to give the 4–nitrophenoxide anion, whose
main absorption band is located at ~400 nm (green trace). Reduction of 4–
nitrophenoxide with NaBH4 yields the 4–aminophenoxide anion, which exhibits
absorption peaks at ~295 nm and below but lacks absorbance at 400 nm (red trace).
Therefore, reduction of 4–NP to 4–AP can be kinetically monitored by the decrease in
100 nm 40 nm
1 2 3 40
20
40
N
Diameter (nm)
2 3 4 50
20
40
NDiameter (nm)
80 78 76 74 72 70
Inte
nsity (
a. u
.)
Binding energy (eV)
Pt 4f7/2
Pt 4f5/2
a
b
c
d
e

ARTÍCULO II
163
absorbance at 400 nm. A similar reasoning leads to the selection of absorbance at 380
nm to follow the reduction of 4–NA (Fig. 7b, orange trace) to p–PDA (blue trace).
Figure 7. (a) UV–vis absorption spectra of 4-NP (black curve), 4-nitrophenoxide ion (dark
yellow), and 4-aminophenoxide ion (violet). The absorption peak at 400 nm of 4-nitrophenoxide
is used to monitor its conversion to 4-aminophenoxide by reduction with NaBH4. (b) UV–vis
absorption spectra of 4-NA (orange trace) and p-PDA (blue). The absorption peak at 380 nm of
4-NA is used to monitor the reaction progress. (c) Plot of absorbance at 400 nm vs. time for the
reduction of 4-nitrophenoxide with NaBH4 in the presence of the anodically exfoliated
graphene-Pt NP hybrid obtained with 0.01 M SPTS. The experimental kinetic profile could be
fitted to an exponential decay function, which is shown as an overlaid red line. (d) Plot of
absorbance at 380 nm for the reduction of 4-NA with NaBH4 as catalyzed by the anodically
exfoliated graphene-Pt NP hybrid obtained with 0.2 M SNDS. The experimental kinetic profiles
could be fitted to a straight line which is shown as an overlaid green line.
200 300 400 500
295 nm
316 nm
Absorb
ance
Wavelength (nm)
400 nm
a
0 100 200 300 400 500 6000.0
0.2
0.4
0.6
0.8
1.0
b
c
Absorb
ance a
t=
400 n
m
Time (s)
300 400 500
310 nm 380 nm
Absorb
ance
Wavelength (nm)
0 100 2000.0
0.2
0.4
0.6
0.8
dA
bsorb
ance a
t=
380 n
m
Time (s)

ARTÍCULO II
164
Figs. 7c and d show typical kinetic curves for the reduction of 4–NP and 4–NA,
respectively, in the presence of the anodically exfoliated graphene–Pt NP hybrids.
Reaction completion was generally seen to occur in less than 8 min. No significant
reduction took place in the absence of the hybrids or in the presence of only the
graphene flakes, demonstrating the catalytic role of the metal component. Considering
that the experimental kinetic profiles could be fitted to an exponential decay function
(see Figs. 7c and d) and that NaBH4 was used to a large excess, so that its concentration
could be regarded to remain constant throughout the reaction, the catalyzed reduction
was best described by pseudo–first–order kinetics with respect to the substrate (4–NP or
4–NA), i.e.,
]subs[kdt
]subs[dapp (1)
, where [subs] is the substrate concentration and kapp is the apparent reaction rate
constant. Typical values of kapp measured for the present hybrids were in the range of 1–
2×10⁻²
s-1
(4-NP) and 2–6×10⁻²
s-1
(4-NA). To allow direct comparisons with other
catalysts reported in the literature, the catalytic activity of the hybrids was quantified in
terms of turnover frequency (TOF), defined as the number of substrate moles converted
per mole of Pt used in the reaction per unit time. The calculated TOF values are given in
Table 2, together with those of some of the best performing Pt NP–based catalysts
documented beforehand towards 4–NP46,80–83
and 4–NA46,84–86
reduction. The catalytic
activity of our graphene–Pt NP hybrids was similar (in the case of 4–NP reduction) or
even higher (4–NA reduction) than that of the most efficient catalysts developed to date.
These results highlight the strong potential of the electrolytically exfoliated graphenes
developed here for use as catalyst supports.
Table 2. Comparison of turnover frequency (TOF) values for state-of-the-art Pt-based catalysts
used for the reduction of 4-NP and 4-NA with NaBH4 in aqueous medium
Catalyst TOF (min-1
) Reference
Reduction of 4-NP
Anodically exfoliated graphene (SPTS)-Pt NP hybrid 11 Present work
Anodically exfoliated graphene (SNDS)-Pt NP hybrid 14 Present work
Pt NPs supported on ultrasound-exfoliated graphene 11 46
Surfactant-capped Pt nanocubes 2.5 80
Pt NPs supported on Fe2O3/N-doped RGO hybrid 10.8 81

ARTÍCULO II
165
Pt NPs supported on Al2O3 microspheres 0.6 82
RGO-supported Pt NPs 10.4 83
Reduction of 4-NA
Anodically exfoliated graphene (SPTS)-Pt NP hybrid 57 Present work
Anodically exfoliated graphene (SNDS)-Pt NP hybrid 23 Present work
Pt NPs supported on ultrasound-exfoliated graphene 23 46
Bimetallic Pt-Ni NPs 8.7a 84
Pt NPs supported on RGO 14.5 85
Pt NPs embedded in RGO aerogel 0.8 86
aTOF value calculated considering only the molar amount of Pt present in the bimetallic NPs
4. Conclusions
We have identified a number of chemical species of amphiphilic nature that can be
used as multifunctional electrolytes towards the electrolytic (anodic) exfoliation of
graphite in water to give graphene flakes with much improved characteristics. First, a
pool of amphiphiles (specifically, sulfonate– and sulfate–containing hydrocarbons) with
the potential to exhibit a dual role as exfoliating (intercalating) electrolyte and colloidal
dispersant in aqueous medium was evaluated. Benchmark tests designed to quantify the
overall performance of the amphiphiles in fulfilling such a dual role indicated that
successful species possess an appropriate balance between the number of their ionic
groups and the size of their hydrophobic component. Second, in addition to acting as
electrolyte and dispersant, several of the amphiphiles were also effective in preventing
to a large extent the oxidation and structural degradation of the graphene flakes that is
usually associated to anodic exfoliation. As a result, hardly oxidized graphenes of a
similar quality to that of flakes produced via direct, ultrasound– or shear–induced
exfoliation of graphite could be obtained by the anodic route for the first time. This
highly relevant characteristic was rationalized on the basis of the ability of some
amphiphiles to function as scavengers of the reactive oxygen species that are thought to
attack and oxidize the graphene lattice during exfoliation, thus laying down a general
strategy to overcome one of the main drawbacks of the anodic approach. Finally, the
amphiphiles were also efficient linkers for the anchoring of metal nanoparticles onto the
graphene flakes, yielding hybrids that exhibited a very high catalytic activity in the
reduction of nitroarenes. We envisage this type of multifunctional electrolytes to be key
ARTÍCULO II
166
enabling elements in the future practical implementation of high quality electrolytically
exfoliated graphene.
Acknowledgements
Financial support from the Spanish Ministerio de Economía y Competitividad
(MINECO) and the European Regional Development Fund (ERDF) through project
MAT2011–26399 is gratefully acknowledged. Partial funding by Plan de Ciencia,
Tecnología e Innovación (PCTI) 2013–2017 del Principado de Asturias and the ERDF
(project GRUPIN14–056) is also acknowledged. J.M.M. and M.A.-V. are grateful to the
Spanish Ministerio de Educación, Cultura y Deporte (MECD) and MINECO,
respectively, for their pre-doctoral contracts.
References
1 A. K. Geim, K. S. Novoselov, Nat. Mater., 2007, 6, 183–191.
2 A. K. Geim, Science, 2009, 324, 1530–1534.
3 K. S. Novoselov, V. I. Fal´ko, L. Colombo, P. R. Gellert, M. G. Schwab, K. Kim,
Nature, 2012, 490, 192–200.
4 A. C. Ferrari, F. Bonaccorso, V. I. Fal’ko, K. S. Novoselov, S. Roche, P. Bøggild, S.
Borini, F. Koppens, V. Palermo, N. Pugno J. A. Garrido, R. Sordan, A. Bianco, L.
Ballerini, M. Prato, E. Lidorikis, J. Kivioja, C. Marinelli, T. Ryhänen, A. Morpurgo, J.
N. Coleman, V. Nicolosi, L. Colombo, A. Fert, M. Garcia-Hernandez, A. Bachtold, G.
F. Schneider, F. Guinea, C. Dekker, M. Barbone, C. Galiotis, A. Grigorenko, G.
Konstantatos, A. Kis, M. Katsnelson, C. W. J. Beenakker, L. Vandersypen, A. Loiseau,
V. Morandi, D. Neumaier, E. Treossi, V Pellegrini,M. Polini, A. Tredicucci, G. M.
Williams, B. H. Hong, J. H. Ahn, J. M. Kim, H. Zirath, B. J. van Wees, H. van der Zant,
L. Occhipinti, A. Di Matteo, I. A. Kinloch, T. Seyller, E. Quesnel, X. Feng, K. Teo, N.
Rupesinghe, P. Hakonen, S. R. T. Neil, Q.Tannock, T. Löfwander, J. Kinaret,
Nanoscale, 2015, 7, 4598–4810.
5 M. Cai, D. Thorpe, D. H. Adamson, H. C. Schniepp, J. Mater. Chem., 2012, 22,
24992–25002.
6 F. Bonaccorso, A. Lombardo, T. Hasan, Z. Sun, L. Colombo, A.C. Ferrari, Mater.
Today, 2012, 15, 564–589.

ARTÍCULO II
167
7 Y. L. Zhong, Z. Tian, G. P. Simon, D. Li, Mater. Today, 2015, 18, 73–78.
8 S. Park, R. S. Ruoff, Nat. Nanotechnol., 2009, 4, 217–224.
9 K. P. Loh, Q. Bao, G. Eda, M. Chhowalla, Nat. Chem., 2010, 2, 1015–1024.
10 L. Feng, L. Wu, X. Qu, Adv. Mater., 2013, 25, 168–186.
11 V. Chabot, D. Higgins, A. Yu, X. Xiao, Z. Chen, J. Zhang, Energy Environ. Sci.,
2014, 7, 1564–1596.
12 A. Esfandiar, A. Irajizad, O. Akhavan, S. Ghasemi, M. R. Gholami, Int. J. Hydrogen
Energy, 2014, 39, 8169–8179.
13 C. Mattevi, G. Eda, S. Agnoli, S. Miller, K.A. Mkhoyan, O. Celik, D.
Mastrogiovanni, G. Granozzi, E. Garfunkel, M. Chhowalla, Adv. Funct. Mater.,
2009,19, 2577–2583.
14 R. Rozada, J. I. Paredes, M. J. López, S. Villar-Rodil, I. Cabria, J. A. Alonso, A.
Martínez-Alonso, J. M. D. Tascón, Nanoscale, 2015, 7, 2374–2390.
15 J. N. Coleman, Acc. Chem. Res., 2013, 46, 14–22.
16 A. Ciesielski, P. Samorì, Chem. Soc. Rev., 2014, 43, 381–398.
17 K. R. Paton, E. Varrla, C. Backes, R. J. Smith, U: Khan, A. O’Neill, C. Boland, M.
Lotya, O. M. Istrate, P. King, T. Higgins, S. Barwich, P. May, P. Puczkarski, I. Ahmed,
M. Moebius, H. Pettersson, E. Long, J. Coelho, S. E. O’Brien, E. K. McGuire, B.
Mendoza Sanchez, G. S. Duesberg, N. McEvoy, T. J. Pennycook, C. Downing, A.
Crossley, V. Nicolosi1, J. N. Coleman, Nat. Mater., 2014, 13, 624–630.
18 C. T. J. Low, F. C. Walsh, M. H. Chakrabarti, M. A. Hashim, M. A. Hussain,
Carbon, 2013, 54, 1–21.
19 H. J. Salavagione, J. Mater. Chem. A, 2014, 2, 7138–7146.
20 A. M. Abdelkader, A. J. Cooper, R. A. W. Dryfe, I. A. Kinloch, Nanoscale, 2015, 7,
6944–6956.
21 J. Liu, M. Notarianni, G. Will, V.T. Tiong, H. Wang, N. Motta, Langmuir, 2013, 29,
13307–13314.
22 Z.-S. Wu, Z. Liu, K. Parvez, X. Feng, K. Müllen, Adv. Mater., 2015, 27, 3669–3675.
23 L. Zhang, H. Huang, H. Yin, Y. Xia, J. Luo, C. Liang, Y. Gan, X. Tao, W. Zhang, J.
Mater. Chem. A, 2015, 3, 16513–16519.
24 J. Liu, C. K. Poh, D. Zhan, L. Lai, S. H. Lim, L. Wang, X. Liu, N. G. Sahoo, C. Li, Z.
Shen, J. Lin, Nano Energy, 2013, 2, 377–386.
ARTÍCULO II
168
25 K. S. Rao, J. Sentilnathan, H.–W. Cho, J.–J. Wu, M. Yoshimura, Adv. Funct. Mater.,
2015, 25, 298–305.
26 P. Tripathi, Ch. R. P. Patel, A. Dixit, A. P. Singh, P. Kumar, M. A. Shaz, R.
Srivastava, G. Gupta, S. K. Dhawan, B. K. Gupta, O. N. Srivastava, RSC Adv., 2015, 5,
19074–19081.
27 J. Wang, K. K. Manga, Q. Bao, K. P. Loh, J. Am. Chem. Soc., 2011, 133, 8888–8891.
28 M. Zhou, J. Tang, Q. Cheng, G. Xu, P. Cui, L.-C. Qin, Chem. Phys. Lett., 2013, 572,
61–65.
29 A. M. Abdelkader, I. A. Kinloch, R. A. W. Dryfe, ACS Appl. Mater. Interfaces, 2014,
6, 1632–1639.
30 A.T. Najafabadi, E. Gyenge, Carbon, 2015, 84, 449–459.
31 M. Zhao, X.-Y. Guo, O. Ambacher, C. E. Nebel, R. Hoffmann, Carbon, 2015, 83,
128–135.
32 J. Lu, J. Yang, J. Wang, A. Lim, S. Wang, K. P. Loh, ACS Nano, 2009, 3, 2367–
2375.
33 C.-Y. Su, A.-Y. Lu, Y. Xu, F.-R. Chen, A. N. Khlobystov, L.-J. Li, ACS Nano, 2011,
5, 2332–2339.
34 K. Parvez, Z.-S. Wu, R. Li, X. Liu, R. Graf, X. Feng, K. Müllen, J. Am. Chem. Soc.,
2014, 136, 6083–6091.
35 A. T. Najafabadi, E. Gyenge, Carbon, 2014, 71, 58–69.
36 K. Chen, D. Xue, J. Colloid Interface Sci.,2014, 436, 41–46.
37 Y. Hernandez, M. Lotya, D. Rickard, S. D. Bergin, J. N. Coleman, Langmuir, 2010
26, 3208–3213.
38 S. Park, J. An, I. Jung, R. D. Piner, S. J. An, X. Li, A. Velamakanni, R. S. Ruoff,
Nano Lett., 2009, 9, 1593–1597.
39 S. Villar–Rodil, J. I. Paredes, A. Martínez–Alonso, J. M. D. Tascón, J. Mater.
Chem.,2009, 19, 3591–3593.
40 M. Alanyalıoğlu, J. J. Segura, J. Oró-Solè, N. Casañ–Pastor, Carbon, 2012, 50, 142–
152.
41 J. P. Mensing, T. Kerdcharoen, C. Sriprachuabwong, A. Wisitsoraat, D.
Phokharatkul, T. Lomas, A. Tuantranont, J. Mater. Chem , 2012, 22, 17094–17099.

ARTÍCULO II
169
42 T. Kuila, P. Khanra, N. H. Kim, S. K. Choi, H. J. Yun, J. H. Lee, Nanotechnology,
2013, 24, 365706.
43 C.-H. Chen, S.-W. Yang, M.-C. Chuang, W.-Y. Woon, C.-Y. Su, Nanoscale, 2015, 7,
15362–15373.
44 J. M. Munuera, J. I. Paredes, S. Villar–Rodil, M. Ayán–Varela, A. Pagán, S. D.
Aznar–Cervantes, J. L. Cenis, A. Martínez–Alonso, J. M. D. Tascón, Carbon, 2015, 94,
729–739.
45 Z. Sun, J. Masa, Z. Liu, W. Shuhmann, M. Muhler, Chem. Eur. J., 2012, 18, 6972–
6978.
46 M. Ayán–Varela, J. I. Paredes, L. Guardia, S. Villar–Rodil, J. M. Munuera, M. Díaz–
González, C. Fernández–Sánchez, A. Martínez–Alonso, J. M. D. Tascón, ACS Appl.
Mater. Interfaces, 2015, 7, 10293–10307.
47 L. Guardia, M. J. Fernández–Merino, J. I. Paredes, P. Solís–Fernández, S. Villar–
Rodil, A. Martínez–Alonso, J. M. D. Tascón, Carbon, 2011, 49, 1653–1662.
48 M. J. Fernández–Merino, J. I. Paredes, S. Villar–Rodil, L. Guardia, P. Solís–
Fernández, D. Salinas–Torres, D. Cazorla–Amorós, E. Morallón, A. Martínez–Alonso, J.
M. D. Tascón, Carbon, 2012, 50, 3184–3194.
49 X. Lu, C. Zhao, Phys. Chem. Chem. Phys., 2013, 15, 20005–20009.
50 D. Parviz, S. Das, H. S. T. Ahmed, F. Irin, S. Bhattacharia, M. J. Green, ACS Nano,
2012, 6, 8857–8867.
51 A. Schlierf, H. Yang, E. Gebremedhn, E. Treossi, L. Ortolani, L. Chen, A. Minoia, V.
Morandi, P. Samorì, C. Casiraghi, D. Beljonne, V. Palermo, Nanoscale, 2013, 5, 4205–
4216.
52 D. Li, M. B. Müller, S. Gilje, R .B. Kaner, G. G. Wallace, Nat. Nanotech., 2008, 3,
101–105.
53 J.-W. T. Seo, A. A. Green, A. L. Antaris, M. C. Hersam, J. Phys. Chem. Lett., 2011,
2, 1004–1008.
54 D. A. Skoog, F. J. Holler, T. A. Nieman, Principles of Instrumental Analysis,
Hartcourt Brace & Company, Philadelphia, 1998, ch. 13.
55 M. Lotya, Y. Hernandez, P. J. King, R. J. Smith, V. Nicolosi, L. S. Karlsson, F. M.
Blighe, S. De, Z. Wang, I. T. McGovern, G. S. Duesberg, J. N. Coleman, J. Am. Chem.
Soc., 2009, 131, 3611–3620.

ARTÍCULO II
170
56 H.-J. Butt, K. Graf, M. Kappl, Physics and Chemistry of Interfaces, Wiley-VCH,
Weinheim, 2003.
57 M. S. Dresselhaus, G. Dresselhaus, Adv. Phys., 1981, 30, 139–326.
58 M. Noel, R. Santhanam, J. Power Sources, 1998, 72, 53–65.
59 W. Yan, M. M. Lerner, Carbon, 2004, 42, 2981–2987.
60 M. Lotya, P. J. King, U. Khan, S. De, J. N Coleman. ACS Nano, 2010, 4, 3155–3162.
61 Z. Y. Xia, S. Pezzini, E. Treossi, G. Giambastiani, F. Corticelli, V. Morandi, A.
Zanelli, V. Bellani, V. Palermo, Adv. Funct. Mater., 2013, 23, 4684–4693.
62 L. Wu, W. Li, P. Li, S. Liao, S. Qiu, M. Chen, Y. Guo, Q. Li, C. Zhu, L. Liu, Small,
2014, 10, 1421–1429.
63 W. Wei, G. Wang, S. Yang, X. Feng, K. Müllen, J. Am. Chem. Soc., 2015, 137,
5576–5581.
64 A. J. Cooper, N. R. Wilson, I. A. Kinloch, R. A. W. Dryfe, Carbon, 2014, 66, 340–
350.
65 U. Halim, C. R. Zheng, Y. Chen, Z. Lin, S. Jiang, R. Cheng, Y. Huang, X. Duan, Nat.
Commun., 2013, 4, 2213.
66 M. A. Pimenta, G. Dresselhaus, M. S. Dresselhaus, L. G. Cançado, A. Jorio, R. Saito,
Phys. Chem. Chem. Phys., 2007, 9, 1276–1291.
67 A. C. Ferrari, D. M. Basko, Nat. Nanotechnol., 2013, 8, 235–246.
68 S. De, P. J. King, M. Lotya, A. O´Neill, E. M. Doherty, Y. Hernandez, G. S.
Duesberg, J. N. Coleman, Small, 2010, 6, 458–464.
69 U. Khan, A. O´Neill, M. Lotya, S. De, J. N. Coleman, Small, 2010, 6, 864–871.
70 V. Chabot, B. Kim, B. Sloper, C. Tzoganakis, A. Yu, Sci. Rep., 2013, 3, 1378.
71 L. Zhang, Z. Zhang, C. He, L. Dai, J. Liu, L. Wang, ACS Nano, 2014, 8, 6663–6670.
72 C.A. Martínez–Huitle, S. Ferro, Chem. Soc. Rev., 2006, 35, 1324–1340.
73 M. Panizza, M. Zolezzi, C. Nicolella, J. Chem. Technol. Biotechnol., 2006, 81, 225–
232.
74 J. Muff, E.G. Søgaard, Water Sci. Technol., 2010, 61, 2043–2051.
75 C.A. Martínez–Huitle, E. Brillas, Appl. Catal. B: Environ., 2009, 87, 105–145.
76 M. Khan, M. N. Tahir, S. F. Adil, H. U. Khan, M. R. H. Siddiqui, A. A. Al-warthan,
W. Tremel, J. Mater. Chem. A, 2015, 3, 18753–18808.

ARTÍCULO II
171
77 B. V. Crist, Handbook of Monochromatic XPS Spectra, XPS International LLC,
Mountain View, 2004, Vol. 1. The Elements and Native Oxides.
78 T. Aditya, A. Pal, T. Pal, Chem. Commun., 2015, 51, 9410–9431.
79 H. Hu, J.H. Xin, H. Hu, X. Wang, D. Miao, Y. Liu, J. Mater. Chem. A, 2015, 3,
11157–11182.
80 C. Kim, H. Lee, Catal. Commun., 2009, 10, 1305–1309.
81 Y. Dai, Y. Chai, Y. Sun, W. Fu, X. Wang, Q. Gu, T. H. Zeng, Y. Sun, J. Mater.
Chem. A, 2015, 3, 125–130.
82 E. Kan, L. Kuai, W. Wang, B. Geng, Chem. Eur. J., 2015, 21, 13291–13296.
83 B. K. Barman, K. K. Nanda, Appl. Catal. A: Gen., 2015, 491, 45–51.
84 S. K. Ghosh, M. Mandal, S. Kundu, S. Nath, T. Pal, Appl. Catal. A: Gen., 2004, 268,
61–66.
85 M. M. Raju, D. K. Pattanayak, RSC Adv., 2015, 5, 59541–59549.
86 X. Zhang, D. Liu, L. Yang, L. Zhou, T. You, J. Mater. Chem. A, 2015, 3, 10031–
10037.

ARTÍCULO II
172

ARTÍCULO II
173
Electronic Supplementary Information
for
Electrolytic exfoliation of graphite in water with multifunctional electrolytes: en route
towards high quality, oxide–free graphene flakes
J.M. Munuera, J.I. Paredes, S. Villar–Rodil,* M. Ayán–Varela, A. Martínez–Alonso,
J.M.D. Tascón
Instituto Nacional del Carbón, INCAR-CSIC, Apartado 73, 33080 Oviedo, Spain
*Corresponding author: E-mail address: [email protected] (S. Villar-Rodil)
ARTÍCULO II
174
Contents
S1. Experimental set–up for the electrolytic anodic treatments
S2. Visual and microscopic evidence for the expansion of graphite foil upon anodic treatment
S3. Evidence for the electrolytic treatment being the critical step in the exfoliation
S4. AFM characterization of the samples
S5. XPS characterization of the samples
S6. Measurement of film thickness by FE–SEM
S7. Derivatization and XPS analysis of the graphene flakes obtained by anodic treatments
using SS as electrolyte
S8. UHPLC/MS of the product of SNDS oxidation
S9. Demonstration for starting graphites other than graphite foil
S10. Growth of Pt NPs on electrolytically exfoliated graphene in the absence of amphiphile
electrolyte/dispersants.

ARTÍCULO II
175
S1. Experimental set–up
Figure S1. Digital photograph of the experimental set–up for the anodic exfoliation process consisting
of an Agilent 6614C DC power supply (1) and two electrodes, namely, a graphite foil piece
(40×25×0.5 mm3) as working electrode (2), and a platinum wire as counter electrode (3). The platinum
wire was placed parallel to the graphite foil surface at a distance of about 2 cm. The two electrodes
were immersed in an aqueous solution (20 mL) of a given electrolyte at a certain concentration (4).
1
2 3
4

ARTÍCULO II
176
S2. Visual and microscopic evidence for the expansion of graphite foil upon anodic
treatment
Figure S2. Digital photographs of graphite foil subjected to electrolytic treatment for the indicated
periods of time in the presence of different electrolytes, namely, sodium sulfate (SS), sodium
SN
DS
, 5
min
S
ND
S,
60 m
in
SM
S,
60 m
in
SM
S,
5 m
in
SS
, 6
0 m
in
no e
lectr
oly
te
5.4 mm 1.5 mm 380 m

ARTÍCULO II
177
methanesulfonate (SMS), or disodium naphthalene–1,5–disulfonate (SNDS). SEM images of the edge
surface of graphite foil at increasing magnification for the different electrolytic treatements are also
given.
Application of a positive potential of 10 V to a graphite working electrode in aqueous
solutions of the specified electrolytes (see Fig. S1) led to the expansion and detachment of
small fragments of material (up to a few millimeters), in line with recent studies on the anodic
exfoliation of graphite in aqueous solutions of sulfate–based salts [1,2,3]. The vigorous
expansion of the graphite slabs was noticeable even to the naked eye. The first column in Fig.
S2 shows digital pictures of the beaker where the electrolytic process takes place in the
presence of different electrolytes and for the treatment times indicated. On comparing any of
the photographs corresponding to graphite subjected to electrolysis with that corresponding to
the starting graphite foil in the absence of any electrolyte, the expansion of the foil becomes
apparent. Further evidence for such an expansion could be gathered by examining the
morphology of the edge planes of the graphite electrode by FE–SEM. The second, third and
forth columns in Fig. S2 gather representative FE–SEM edge plane views of graphite foil at
increasing magnification following th indicated electrolytic treatment conditions. The edge
plane surface of the starting graphite foil slab (first row in fig. S2) exhibits a rather compact
morphology. Anodic treatment in presence of any of the specified electrolytes brings about
expanded structures, consisting of thin layers separated by large voids several micrometers
wide. In some cases, the expansion takes place in a more or less homogeneous accordion–like
fashion. In other cases, detached, worm–like structures of expanded graphite are observed.

ARTÍCULO II
178
S3. Evidence for the electrolytic treatment being the critical step in the exfoliation
Fig. S3. Digital photograph of the dispersion of graphite foil obtained by ultrasonication for 3 h in the
a b
c d

ARTÍCULO II
179
presence of 1 mg mL-1
SNDS before (a), after centrifugation at 50g (b); in the presence of 0.1 mg mL-1
SC before (c), after centrifugation at 50g for 20 min (d).
We have demonstrated in the main text that, through electrolytic treatment with a suitable
electrolyte followed by ultrasonication, it is possible to obtain aqueous graphene dispersions
from graphite foil, which are colloidally stable for weeks or months. In contrast, when the
electrolytic treatment is omitted, and the graphite foil is only sonicated in the presence of the
same electrolyte, colloidal dispersions cannot be prepared. For instance, the dispersions
prepared in the presence of 1 mg mL-1
SNDS consist of quite large particles visible to the
naked eye before centrifugation (Fig. S3a). A very mild centrifugation at 50g induces
complete sedimentation of the particles (Fig. S3b), while the colloidally stable dispersions
prepared with a previous electrolytic step withstand centrifugation at 200g. The same happens
when a reportedly good dispersant for graphite, such as SC, is used (see Figs. S3c, and S3d,
right). We interpret that ultrasonication detaches some graphitic fragments from the surface of
the foil, but it does not exfoliate it significantly. Thus, the electrolytic step is essential for the
effective exfoliation of the material into graphene. In conclusion, in the approach investigated
here, the exfoliation process takes place mostly, if not exclusively, during the electrochemical
treatment. As previously stated in the literature [4], ultrasonication is only needed to detach
the pre–exfoliated material.
If HOPG is used as starting graphite material, ultrasonication alone does not lead to detached
graphitic fragments in any significant amount (photographs not shown), as HOPG is a
compact, very low surface area material. However, as we have demonstrated in a previous
work [4], effective exfoliation of HOPG is possible though electrolytic treatment.
Furthermore, in Fig. SX, we demonstrate that colloidally stable graphene dispersions are
obtained from HOPG though the same process as that described in the main text for graphite
foil.
Of course, as is well known, graphite powder can be effectively exfoliated by ultrasonication
only. However, as we previously reported [4], the dispersed amount is higher if a previous
electrolytic step is introduced (8–fold when SS is used as electrolyte). Therefore, even in the
case of graphite powder, the electrolytic treatment is a major driver for the exfoliation
process.

ARTÍCULO II
180
S4. AFM characterization of the samples
1-2 2-3 3-4 4-55-6 6-7 7-8 >80
5
10
15
20
25
30
N
Lateral size (×102 nm)
a
0-0.5 0.5-1 1-1.5 1.5-2 2-2.5 2.5-30
5
10
15
20
25
30
35
40
b
NThickness (nm)
1-2 2-3 3-4 4-55-6 6-7 7-8 >80
2
4
6
8
10
12
14
16
18
N
Lateral size (×102 nm)
c
0-0.5 0.5-1 1-1.5 1.5-2 2-2.5 2.5-30
5
10
15
20
25
30
35 d
N
Thickness (nm)
1-2 2-3 3-4 4-55-6 6-7 7-8 >80
2
4
6
8
10
12
14
16
18
N
Lateral size (×102 nm)
e
0-0.5 0.5-1 1-1.5 1.5-2 2-2.5 2.5-30
5
10
15
20
25
30
35
40
f
N
Thickness (nm)
1-2 2-3 3-4 4-55-6 6-7 7-8 >80
5
10
15
N
Lateral size (×102 nm)
g
0-0.5 0.5-1 1-1.5 1.5-2 2-2.5 2.5-30
5
10
15
20
25 h
N
Thickness (nm)

ARTÍCULO II
181
Figure S4. Histograms of flake lateral size (left) and apparent thickness (right) derived from a pool of
75 flakes measured from the AFM images of graphene dispersions obtained with 0.1M ss (blue
columns), 0.05 M SBDS (red columns), 0.01 M SPTS (green columns), and 0.2M SNDS (orange
columns).
The average apparent thickness for the graphene dispersions obtained with 0.1M SS, 0.05 M
SBDS, 0.01 M SPTS, and 0.2M SNDS is 1.3±0.5 nm, 1.5±0.5 nm, 1.5±0.4 nm, 1.6±0.5 nm,
respectively. Taking into account that the typical thickness of the patches of amphiphilic
molecules adsorbed onto the HOPG surface (see Fig. 2d–f in the main text) was slightly
above 1 nm and that these molecules are expected to contribute to the measured thickness of
the flakes, we conclude the actual thickness of the flakes to be noticeably lower than that
given in the histograms of apparent thickness of Fig. S4, and therefore consistent with the
flakes being mostly single– to few(<5) –layered.
S5. XPS characterization of the samples
Figure S5. XPS survey spectra for graphene obtained with SS (a), SBDS (b), SPTS (c), and SNDS
(d). The main XPS and Auger peaks have been labeled for clarity.
d
c
a
O1s
C1s
OKLLCKLL
S2p
b
Inte
nsity (
a.
u.)
1000 800 600 400 200 0
Binding energy (eV)
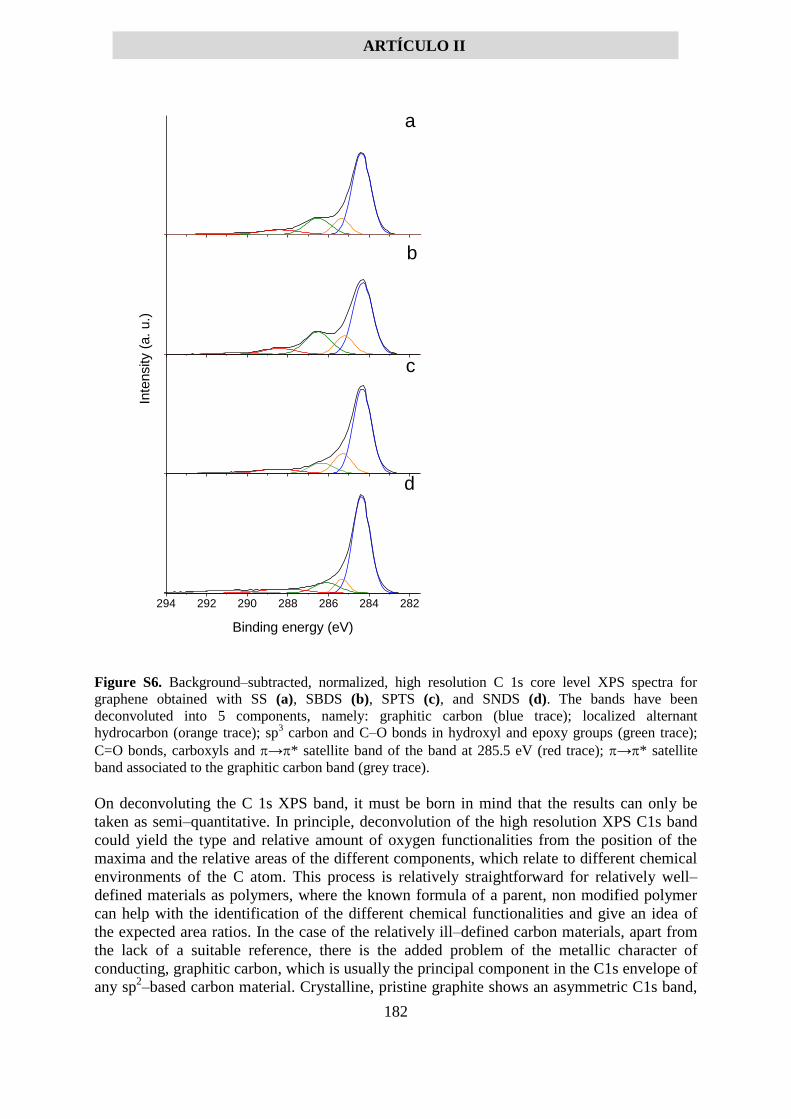
ARTÍCULO II
182
Figure S6. Background–subtracted, normalized, high resolution C 1s core level XPS spectra for
graphene obtained with SS (a), SBDS (b), SPTS (c), and SNDS (d). The bands have been
deconvoluted into 5 components, namely: graphitic carbon (blue trace); localized alternant
hydrocarbon (orange trace); sp3 carbon and C–O bonds in hydroxyl and epoxy groups (green trace);
C=O bonds, carboxyls and →* satellite band of the band at 285.5 eV (red trace); →* satellite
band associated to the graphitic carbon band (grey trace).
On deconvoluting the C 1s XPS band, it must be born in mind that the results can only be
taken as semi–quantitative. In principle, deconvolution of the high resolution XPS C1s band
could yield the type and relative amount of oxygen functionalities from the position of the
maxima and the relative areas of the different components, which relate to different chemical
environments of the C atom. This process is relatively straightforward for relatively well–
defined materials as polymers, where the known formula of a parent, non modified polymer
can help with the identification of the different chemical functionalities and give an idea of
the expected area ratios. In the case of the relatively ill–defined carbon materials, apart from
the lack of a suitable reference, there is the added problem of the metallic character of
conducting, graphitic carbon, which is usually the principal component in the C1s envelope of
any sp2–based carbon material. Crystalline, pristine graphite shows an asymmetric C1s band,
d
c
a
b
Inte
nsity (
a.
u.)
294 292 290 288 286 284 282
Binding energy (eV)

ARTÍCULO II
183
with a tail to the high binding energy (BE) side, with an associated →* shake–up satellite.
Both the band and the satellite correspond to a unique chemical environment – graphitic
carbon – and cover a wide BE range from 282 to 296 eV, approximately. Even for perfect
graphite, fitting the experimental C1s band to an analytical function is not a trivial task, let
alone for carbon materials where there are different chemical environments for its C atoms,
which give rise to bands superimposed on the graphitic C band. Furthermore, for a given
carbon material, the exact shape of the main component is unknown, having only the C1s
envelope of pristine graphite as a reference of an extreme case of maximum asymmetry and
minimum FWHM for the band, arising from its highest electrical conductivity and largest
homogeneity in the chemical environment, respectively, and maximum intensity of the
satellite. A survey of the literature on XPS analysis of carbon materials shows that the issue of
the asymmetry in the main component of the C1s band of (conducting) carbon materials is
seldom addressed, except for graphite. As a rather unsatisfactory solution, this component is
usually fitted with a symmetrical function (Gaussian–Lorentzian), just as any other
component of the C1s envelope. However, if the asymmetry of this main component is not
taken into account, the rest of the C 1s components will be overestimated [5]. In fact, this is
one of the reasons why the oxygen concentrations calculated from the deconvolution of the
high resolution C1s spectrum are significantly larger than the O1s/C1s value obtained from
the survey spectrum [6,7]. Another reason for this inconsistency in quantitative XPS results
for carbon materials is the sometimes ignored existence of a 2nd graphitic band, first
suggested by Proctor et al. as a–shift [8] but taken into account by very few authors [9],
which is sometimes attributed to sp3 C, in analogy with amorphous carbons. This 2nd
graphitic component has more recently being ascribed to defet alternat hydrocarbon structure,
although this assignment is not still widely adopted by the scientific community.
Herein, the C 1s band was allowed to fit to 6 symmetrical components with the following
locations and assignments, [9,10]: at ~284.6 eV, graphitic structure whose electrons are
extensively delocalized; at around 285.6 eV, defect sp2 structure having electron
delocalization less extensive than the former; at 286.6 eV, sp3 hybridized free radicals but also
C–O in hydroxyl and epoxy groups; at 287.8 eV, C=O bonds but also →* satellite band of
the band at 285.5 eV; at 288.9, carboxylic groups; at ~291.5 eV, also →* satellite band of
the band at ~284.6 eV. Note the presence of multiple overlapping bands and the fact that the
contribution of oxygen–containing functional groups to the total intensity will increase with
the extent of oxidation while the intensity of the →* satellite bands associated to
conduction will simultaneously decrease in an unknown amount. When the bands were
allowed to fit, just five bands were obtained: the bands for C=O and COOH are not resolved,
yielding just one band at an intermediate location ~ 288.4 eV. It is noteworthy that the relative
intensity of the component ascribed to hydroxyl and/or epoxy groups significantly diminishes
when SPTS and SNDS are used as electrolytes, confirming their effectiveness in avoiding the
oxidation of the graphene flakes.

ARTÍCULO II
184
Figure S7. Background–subtracted, normalized high resolution O 1s core level XPS spectra for
graphene obtained with SS (a), SBDS (b), SPTS (c), and SNDS (d).
d
c
a
b
Inte
nsity (
a.
u.)
538 536 534 532 530 528
Binding energy (eV)

ARTÍCULO II
185
Figure S8. Background–sustracted, normalized high resolution S 2p core level XPS spectra for
graphene obtained with SS (a), SBDS (b), SPTS (c), and SNDS (d).
Prior to XPS analysis, the samples were subjected to a special purification protocol to remove
the largest possible fraction of amphiphile from the samples. However, a small amount
remained. Indeed, some residual sulphur was detected in the samples (see survey spectra in
Fig. S5). The high resolution S 2p spectra obtained after extensive accumulation indicate that,
as expected, the sulphur present in the sample is of sulfate type in the case of graphene
obtained with SS (Fig. S8a) and of sulfonate type for the rest of the samples (e. g., Fig. S8b–
d).
d
c
a
b
Inte
nsity (
a.
u.)
172 170 168 166 164
Binding energy (eV)

ARTÍCULO II
186
S6. Measurement of film thickness by FE–SEM

ARTÍCULO II
187
Fig. S9. FE–SEM images of the section of the graphene paper prepared with SNDS on which
conductivity measurements were performed. The measurements of film thickness are indicated in
green traces on each image. The average value obtained is 21±2 m.
Fig. S10. FE–SEM images of the section of the graphene paper prepared with SPTS on which
conductivity measurements were performed. The measurements of film thickness are indicated in
green traces on each image. The average value obtained is 9±1 m.
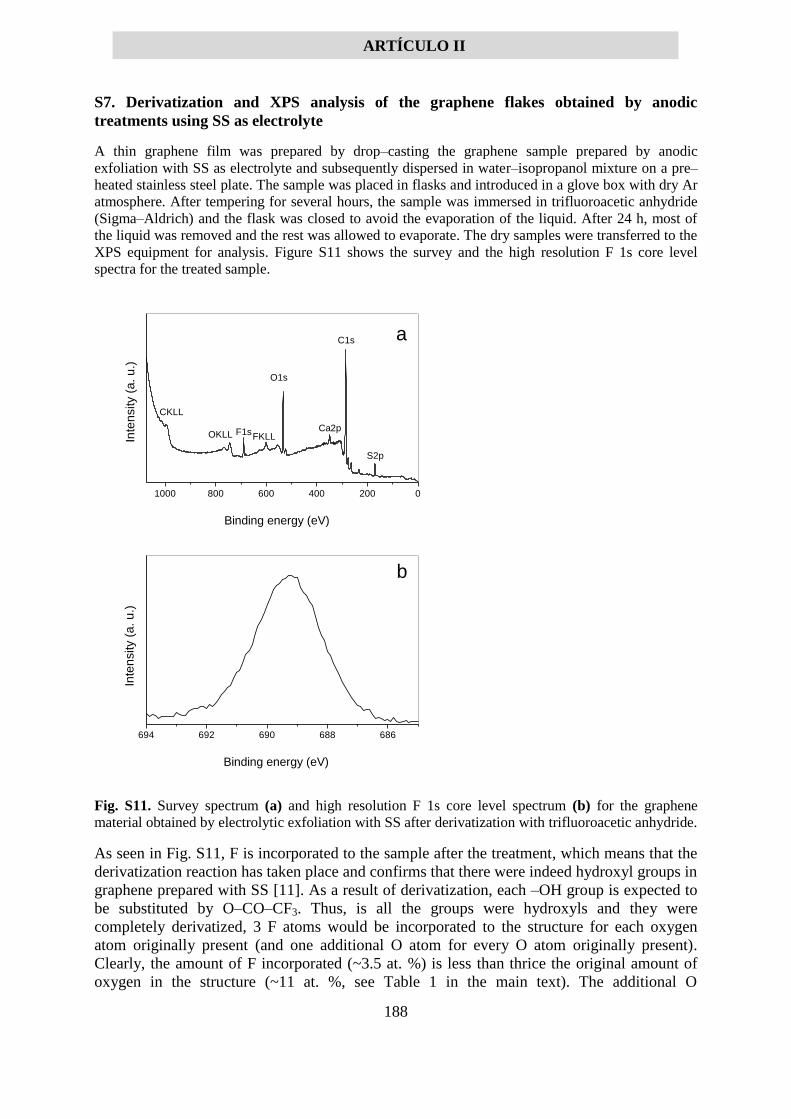
ARTÍCULO II
188
S7. Derivatization and XPS analysis of the graphene flakes obtained by anodic
treatments using SS as electrolyte
A thin graphene film was prepared by drop–casting the graphene sample prepared by anodic
exfoliation with SS as electrolyte and subsequently dispersed in water–isopropanol mixture on a pre–
heated stainless steel plate. The sample was placed in flasks and introduced in a glove box with dry Ar
atmosphere. After tempering for several hours, the sample was immersed in trifluoroacetic anhydride
(Sigma–Aldrich) and the flask was closed to avoid the evaporation of the liquid. After 24 h, most of
the liquid was removed and the rest was allowed to evaporate. The dry samples were transferred to the
XPS equipment for analysis. Figure S11 shows the survey and the high resolution F 1s core level
spectra for the treated sample.
Fig. S11. Survey spectrum (a) and high resolution F 1s core level spectrum (b) for the graphene
material obtained by electrolytic exfoliation with SS after derivatization with trifluoroacetic anhydride.
As seen in Fig. S11, F is incorporated to the sample after the treatment, which means that the
derivatization reaction has taken place and confirms that there were indeed hydroxyl groups in
graphene prepared with SS [11]. As a result of derivatization, each –OH group is expected to
be substituted by O–CO–CF3. Thus, is all the groups were hydroxyls and they were
completely derivatized, 3 F atoms would be incorporated to the structure for each oxygen
atom originally present (and one additional O atom for every O atom originally present).
Clearly, the amount of F incorporated (~3.5 at. %) is less than thrice the original amount of
oxygen in the structure (~11 at. %, see Table 1 in the main text). The additional O
1000 800 600 400 200 0
Ca2pF1sFKLL
Inte
nsity (
a. u
.)
Binding energy (eV)
Inte
nsity (
a. u
.)
Binding energy (eV)
a
CKLL
OKLL
O1s
C1s
S2p
694 692 690 688 686
b

ARTÍCULO II
189
incorporated (~4 at. %) is also less than the original 11 at. %. However, this apparently low
extent of derivatization comes partly from the fact that the reaction takes place strictly at the
surface of the film, while XPS probes a few nanometers (~3 nm). Hence, the atomic
composition yielded by XPS includes both the derivatized outer layers and the non–
derivatized inner layers of the film. As the atomic composition is an average over the
composition of both types of layers, this ~3.5 at. % of F incorporated to the material reflects a
relatively high extent of derivatization and thus a relatively large amount of hydroxyl groups
present in the original graphene.

ARTÍCULO II
190
S8. UHPLC/MS of the product of SNDS oxidation
The electrolytic treatment of graphite foil using SNDS as electrolyte was carried out as
described in the main text. Then, graphene was precipitated by ultracentrifugation at 20000g
and the supernatant was subjected to 1:50 dilution in water and analyzed by ultra high
performance liquid chromatography/ mass spectrometry (UHPLC/MS). The equipment was a
UHPLC Dionex Ultimate 3000 RS liquid chromatograph (Thermo Scientific) equipped with a
Bruker Impact II Q-ToF quadrupole–time of flight mass spectrometer (Bruker Daltonics
GmbH). The obtained chromatogram is shown in Fig. S12.
Fig. S12. Chromatograph for the supernatant obtained by precipitation of the graphene dispersion
prepared by electrolytic treatment of graphite foil with SNDS.
The chemical formulas determined by MS and the corresponding average, nominal oxidation
state for the C atoms of the separated products are the following:
1. C10H8O6S: -0.2
2. C8H6O5S: -0.25
3. C10H6O5S: -0.2
4. C8H6O6S: 0
5. SNDS: -0.6
6. C10H10O9S2: -0.4
7. C10H7O8S2: -0.3
8. undetermined mixture
9. mixture of C10H7O10S2 (+0.1), C10H8O10S2 )0), and C9H7O8S2 (-0.33).
Oxidation of the sacrificial agent is confirmed by the fact that the average, nominal oxidation
state of the C atoms in every detected product is higher than that of the starting substance
(SNDS in this case).
ARTÍCULO II
191
S9. Demonstration for starting graphites other than graphite foil
The same protocol established in the main text for graphite foil was assayed for HOPG (grade
ZYH, obtained from Advanced Ceramics) and natural graphite powder (grade 2910, from
Mersen). For the electrochemical exfoliation experiments, ~10×10×2 mm3 pieces of HOPG
were employed, whereas the graphite powder was pressed into a circular pellet (12 mm in
diameter, 2 mm in thickness) by means of a hydraulic press. These two additional graphite
types have been treated in exactly the same conditions described in the main text for the
electrolytic exfoliation of graphite foil in presence of 0.2 M SNDS, with the exception that in
the case of natural graphite powder electrolysis voltage was 3 min instead of 60 min. This
short time is due to the quick detachment of the individual graphite particles from their pellet
once they start to expand due to intercalation. Indeed, the individual graphite particles in the
pelletized working electrode expand very quickly during the electrolytic process due to their
small particle size, so that a powder graphite working electrode made up of pressed graphite
powder with a mass comparable to that of the HOPG electrode used here (or that of the
graphite foil electrode described in the main text) was completely detached in 3 min.

ARTÍCULO II
192
Figure S13. Digital photographs of the dispersions of HOPG (a) and natural graphite powder prepared
by electrolytic treatment at 10 V in 0.2 M SNDS aqueous solution followed by ultrasonication for 3 h
(c). AFM images of the dispersions prepared from HOPG (b) and natural graphite powder (d) drop–
cast onto HOPG substrates. A typical line profile (black trace) taken along the marked white line is
shown superimposed on each image. Background–subtracted, normalized, high resolution C 1s core
level XPS spectra of the drop–cast dispersions prepared from HOPG (e), and natural graphite powder
(f) with SNDS. For the sake of comparison, the C 1s spectrum of the drop–cast dispersions obtained
with SS are also shown (red trace). Raman spectra of the flakes obtained from HOPG (g), and natural
graphite powder (h). The main peaks are labeled.
Table S1. Characteristics of anodically exfoliated graphenes obtained from different types of graphite
using sodium sulfate (SS) and sodium naphthalene 1,5–disulfonate (SNDS). The anodic exfoliation
time is given in parenthesis.
graphite type electrolyte [electrolyte] [graphene] Apparent
thickness
O/C ID/IG
292 290 288 286 284 282
0.0
0.2
0.4
0.6
Inte
nsity (
a. u.)
Binding energy (eV)
e f
292 290 288 286 284 282
0.0
0.2
0.4
0.6
Inte
nsity (
a. u.)
Binding energy (eV)
g h
1500 2000 2500 3000
Inte
nsity (
a. u.)
Raman shift (cm-1)
D
G
D'
2D
D+D''D+D'
2D'
1500 2000 2500 3000
2D'D+D'
2D
D+D''D'
G
Inte
nsity (
a. u.)
Raman shift (cm-1)
D
a c d
b

ARTÍCULO II
193
(M) (mg mL-1
) (nm)
Natural graphite powder SS 0.10 3–4 0.04 [4] 0.2
(3 min) SNDS 0.20 0.22 3–4 0.04 0.2
Graphite foil (60 min) SS 0.10 0.66 1–2 0.11 [4] 1.0
SNDS 0.20 0.84 1–2 0.02 0.2
HOPG (60 min) SS 0.10 1–2 0.18 [4] 1.2
SNDS 0.20 0.07 1–2 0.06 0.9
Electrolytic treatment led to homogeneous, opaque black suspensions (see digital photographs
of the dispersions in Figs. S13a and S13c), which were colloidally stable for weeks. The
effective exfoliation of the starting graphites into thin flakes was evident from the AFM
images of the dispersions drop–cast onto HOPG substrates (Figs. S13b and S13d). The flakes
showed typical lateral dimensions between a few and several hundred nm, and their apparent
thickness, determined as flake height relative to the substrate (see exemplary line profiles in
Figs. S13b and S13d), ranged between ~1 and 2 nm for graphene derived from HOPG
(although a low proportion of flakes ~3 nm thick were found, see line profile in Fig. S13b),
and between ~3 and 4 nm for graphene derived from natural graphite powder. As already
found in a previous work [4], where the graphene dispersions obtained by anodic exfoliation
of different types of graphite (using a common electrolyte, K2SO4) were compared, the
exfoliation degree (flake thickness) tended to be better for graphene obtained from compact
graphite types, such as HOPG or graphite foil, compared with graphene from particulate
graphite types, such as natural graphite flakes and powder. This is due to the fact that the
duration of the electrolytic exfoliation process is limited in the case of the particulate forms
due to the quick detachment of the individual graphite particles of their pellets.
XPS analysis revealed that, in analogy with the results obtained for graphene from graphite
foil, SNDS prevents to a significant extent the oxidation of graphene derived from HOPG
compared with the use of a common electrolyte, such as SS. Indeed, the O/C ratios derived
from XPS survey spectra (not shown) are 0.06 graphene obtained in the presence of SNDS vs.
0.18 for graphene obtained with SS (see Table 1).
The role of SNDS as a sacrificial agent to prevent graphene oxidation is also evident from the
high resolution C 1s core level spectra (black and red trace in Fig. S13e for graphene obtained
from HOPG using SNDS and SS, respectively). The significant drop in intensity of the
component at ~286.5 eV assigned to carbon in hydroxyl and epoxy groups (C–O bonds) [10]
is apparent when using SNDS. In the case of natural graphite powder, the degree of oxidation
attained in the presence of common electrolytes, such as SS, is already low (O/C ratio of 0.04,
see Table 1). Such low oxidation degree is due to the aforementioned limited duration of the
electrolytic treatment (3 min). In this case, the oxidation degree remains unchanged if the
electrolyte is changed to SNDS (see Table 1). This is also apparent from the high resolution C
1s core level spectra (Fig. S13f). However, in this case SNDS keeps the dual role of
exfoliating electrolyte and colloidal dispersant.
Evidence of the structural quality of the anodically exfoliated graphene flakes was gathered
by Raman spectroscopy. Representative Raman spectra of the drop–cast dispersions prepared

ARTÍCULO II
194
from HOPG and natural graphite powder are presented in Figs. S13g and S13h, respectively.
The corresponding integrated intensity ratio of the D and G bands (ID/IG ratio), which is
indicative of the degree of structural quality in graphitic materials, is given in Table 1.
Anodically exfoliated natural graphite powder using either SS or SNDS as electrolyte yield
ID/IG ratio of 0.2 (vs. 0.1 for the starting graphite). As mentioned above, the short electrolytic
treatment time limits the extent of oxidation of the flakes. Accordingly, the amount of defects
and structural imperfections introduced in the carbon lattice are relatively small. In the case of
HOPG, anodic exfoliation significantly increases the structural disorder, the ID/IG value
increasing from 0 for the starting HOPG to 0.9 for the exfoliated flakes (See Table 1).
However, the disorder introduced using SNDS as electrolyte is lower than when SS is used.
Again, the presence of a sacrificial agent which diminishes oxidation brings about a lower
number of defects.
Therefore, the results discussed in the main text for graphene obtained from graphite foil can
be extended to other types of starting graphite. Indeed, with a suitable electrolyte it is possible
to directly obtain colloidally stable aqueous graphene dispersions by anodic exfoliation of
different types of graphite, with good exfoliation degree and reduced degree of oxidation.
These results also confirm the conclusions of our previous work [4] where a comparison
between graphene obtained from different starting graphites by electrolytical treatment with
potassium sulfate was carried out. In that work it was concluded that graphene flakes with
high structural quality and minimized amount of oxygen functional groups can be obtained by
selecting appropriate types of graphite, such as graphite foil. A similar conclusion can be
reached when using SNDS as electrolyte instead of SS. This behavior was rationalized in our
previous work in terms of the specific microstructure of the starting graphite material as well
as the general exfoliation mechanism during the anodic process [4].

ARTÍCULO II
195
S10. Growth of Pt NPs on electrolytically exfoliated graphene in the absence of
amphiphile electrolyte/dispersants
Figure S14. Representative TEM image of graphene–Pt NP hybrid obtained by the same protocol as
that described in the main text for graphene–Pt NP hybrids but in the absence of any amphiphilic
electrolyte. In this case, graphene was prepared by electrolytic exfoliation of graphite foil with the
non–amphiphilic electrolyte SS and dispersion of the exfoliated product in a water–isopropanol
mixture. Some NPs are marked by green arrows.
References
[1] K. Parvez, Z.-S. Wu, R. Li, X. Liu, R. Graf, X. Feng, K. Müllen, J. Am. Chem. Soc.,
2014, 136, 6083–6091.
[2] K. S. Rao, J. Sentilnathan, H.–W. Cho, J.–J. Wu, M. Yoshimura, Adv. Funct. Mater.,
2015, 25, 298–305.
[3] Chen, D. Xue, J. Colloid Interface Sci., 2014, 436, 41–46.
[4] J.M. Munuera, J.I. Paredes, S. Villar–Rodil, M. Ayán–Varela, A. Pagán , S.D. Aznar–
Cervantes, J.L. Cenis, A. Martínez–Alonso, J.M.D. Tascón. High quality, low oxygen content
and biocompatible graphene nanosheets obtained by anodic exfoliation of different graphite
types. Carbon 94 (2015) 729–739.
[5] Dirk Rosenthal, Marina Ruta, Robert Schlögl, Lioubov Kiwi-Minsker. Combined XPS
and TPD study of oxygen-functionalized carbon nanofibers grown on sintered metal fibers.
Carbon 2010, 48, 1835-1843.
[6] S. Yumitori. Correlation of C1s chemical state intensities with the O1s intensity in the
XPS analysis of anodically oxydised glass-like carbon samples. J. Mater. Sci., 2000, 35, 139-
146.
100 nm

ARTÍCULO II
196
[7] E. Papirer, R. Lacroix, J.-B. Donnet, G. Nanse, P. Froux.XPS study of the halogenation of
carbon black - part 1. Bromination. E. Papirer, R. Lacroix, J.-B. Donnet, G. Nanse, P. Froux.
Carbon 1994, 32, 1341-1358.
[8] A. Proctor, P. M. A. Sherwood. X-Ray photoelectron spectroscopic studies of carbon fibre
surfaces-II. The effect of electrochemical treatment. Carbon, 1983, 21, 51-59.
[9] G. Zhang, S. Sun, D. Yang, J.-P. Dodelet, E. Sacher. The surface analytical
characterization of carbon fibers functionalized by H2SO4/HNO3 treatment. Carbon 2008, 46,
196-205
[10] D.-Q. Yang, J.-F. Rochette, E. Sacher, Langmuir 21 (2005), 8539-8545.
[11] C. Buono, P. R. Davies, R. J. Davies, T. Jones, J. Kulhav´y, R. Lewis, D. J. Morgan, N.
Robinson, D. J. Willock. Spectroscopic and atomic force studies of the functionalisation of
carbon surfaces: new insights into the role of the surface topography and specific chemical
states. Faraday Discuss., 2014, 173, 257–272.

ARTÍCULO III
197
A simple strategy to improve the yield of graphene nanosheets in the anodic
exfoliation of graphite foil
J.M. Munuera*, J.I. Paredes, S. Villar-Rodil, A. Martínez-Alonso, J.M.D. Tascón
Instituto Nacional del Carbón, INCAR-CSIC, Apartado 73, 33080 Oviedo, Spain
Abstract
Strategies that improve the yield of graphene nanosheets in anodic exfoliation
processes are desirable for the mass production of this material. Here, a simple pre-
treatment of graphite foil with concentrated H2SO4 is demonstrated to be such an
effective strategy, affording overall exfoliation yields up to ~50 wt% under certain
experimental conditions, compared with a baseline value of ~10 wt% for untreated
graphite. Filling of inner voids and interstices of the graphite foil with H2SO4 molecules
was concluded to be responsible for the enhanced exfoliation performance. Additional
approaches to further increase the anodic exfoliation yield are also proposed and
discussed.
At present, the prospects for the large-scale production of graphene face several
hurdles that stand in the path of the widespread practical implementation of this two-
dimensional carbon material. Bottom-up production methods (most notably, chemical
vapor deposition) can afford monolayer graphene wafers of a high structural quality and
large lateral dimensions, but the conditions required for their synthesis are generally not
amenable for massive up-scaling [1]. On the other hand, mainstream approaches based
on exfoliation of graphite and graphite derivatives (top-down methods) suffer either
from a very low crystalline quality of the exfoliated material (e.g., the graphite oxide
route) or from low yield (<5 wt%) and incomplete exfoliation (typical flake thickness
>3-4 monolayers) of the starting graphites (e.g., direct liquid-phase exfoliation routes
reliant on sonication or shear forces) [1,2].
* Corresponding author. Phone number: (+34)985119090. E-mail address:
[email protected] (Jose Munuera)

ARTÍCULO III
198
In this context, electrochemical exfoliation methods, which rest on ion intercalation
of a graphite electrode triggered by an applied DC bias voltage, have recently emerged
as a promising alternative [3,4,5,6,7,8]. With the use of proper electrolytes and solvent
media, both cathodic and anodic exfoliation is possible, the latter being particularly
attractive and more usually deployed because it can be carried out in aqueous solutions
of common electrolytes, such as H2SO4 or its inorganic salts [4]. Concerning the
electrode material for exfoliation, graphite foil is a frequent choice owing to its modest
cost (~$10-20 per kilogram) as well as morphological features that are especially
conducive to facilitating delamination [9]. However, although graphenes produced by
anodic exfoliation tend to possess a higher structural quality than that of their graphite
oxide-derived counterparts and are better exfoliated than the typical nanosheets obtained
via direct sonication/shear routes, in many cases the overall yield of exfoliation is rather
low (e.g., ~10 wt% for graphite foil) [10], with the effect of different process parameters
on the yield being seldom investigated [4]. Thus, the development of rational strategies
aimed at increasing this yield is needed if anodic exfoliation is to become a truly
competitive option for the mass production of graphene. We report here that a simple
pre-treatment of graphite foil with concentrated H2SO4 is one such effective strategy, as
it affords much improved exfoliation yields during the subsequent anodic treatment in
aqueous electrolyte. H2SO4 is a common and widely used reactive, particularly in the
preparation of graphene oxide via the Hummers method and in the anodic exfoliation of
graphite into graphene. We also discuss the possible mechanisms responsible for the
observed behavior as well as some approaches to further increase the yield.
Treatment of graphite foil pieces ~0.5 mm in thickness with concentrated H2SO4 at
room temperature for a given period of time [see Electronic Supplementary Material
(ESM) for a description of the experimental procedure] afforded highly hygroscopic
materials, as visually evidenced by the condensation of water droplets on their surface
upon exposure to ambient air. Field emission scanning electron microscopy (FE-SEM)
imaging indicated that the graphite foil morphology, which was originally comprised of
random stacks of micrometer-sized graphite platelets and exhibited a high density of
folds, wrinkles and overlaps with voids and interstitial spaces in-between (Fig. 1a),
became slightly rougher and developed a number of dome-like features (blisters) after
exposure to H2SO4 (Fig. 1b). The latter were ascribed to H2SO4 molecules trapped in
the voids/interstices of the material. Moreover, prolonged exposure of the graphite foil
surface to the electron beam from the FE-SEM apparatus led to the progressive

ARTÍCULO III
199
disappearance of the blisters (images not shown), probably as a result of outward
diffusion of the H2SO4 molecules induced by a local temperature rise.
Figure 1. (a,b) Typical FE-SEM images of the surface of (a) untreated and (b) H2SO4-treated (6
h) graphite foil. (c,d) FE-SEM images of anodically expanded graphite foil (c) without and (d)
with H2SO4 pre-treatment (6 h).
The graphite foil samples (both untreated and treated with H2SO4 for different
periods of time) were then subjected to anodic exfoliation in aqueous 0.1 M K2SO4
solution (see ESM for details). In all cases, a significant fraction of the graphite material
was seen to expand and detach from the anode, as expected. FE-SEM inspection of the
expanded products after extensive washing with deionized water (Fig. 1c and d)
provided microscopic evidence of their delamination, revealing very thin, corrugated
layers that were separated by submicrometer-/ micrometer-sized voids. Such a type of
morphology is characteristic of successful anodic exfoliation processes [10,11]. No
significant morphological differences between the untreated (Fig. 1c) and any of the
H2SO4-treated graphite foil specimens (e.g., Fig. 1d) were apparent after the anodic
expansion. However, the net amount of expanded product that was generated from the
pre-treated samples was usually much larger than that obtained from their untreated
b
c d
a b
c d

ARTÍCULO III
200
counterpart, thus providing a first hint of the beneficial effect of such a pre-treatment on
exfoliation.
To provide a quantitative measure of the overall yield of exfoliation, the anodically
expanded products were bath-sonicated in N,N-dimethylformamide (DMF),
water/isopropanol mixture (65/35 v/v%) or in aqueous solution of flavin
mononucleotide (FMN) [9], and then centrifuged to separate the individual, well-
exfoliated graphene nanosheets (supernatant) from the incompletely delaminated
material (sediment). The exfoliation yield was calculated as the ratio of the amount of
graphene nanosheets dispersed in the solvent (estimated by means of UV-vis absorption
spectroscopy [10]) to the original mass of the graphite foil electrode. The results
obtained for different treatment times of the graphite foil with H2SO4 are presented in
Fig. 2, where it is apparent that such an approach had a sizable positive impact on the
exfoliation yield. Specifically, the yield increased from a baseline value of ~10 wt%
attained with untreated graphite foil under the experimental conditions described in the
ESM up to ~50 wt% for treatment times longer than ~40 h, i.e., a 5-fold increase in
yield was accomplished. However, short treatment times already afforded much
enhanced yields (e.g., a ~3-fold increase was observed after 5 h). We note that these
yield values exhibited a variance of ~10-20% for different samples prepared under
exactly the same conditions, as it is sometimes observed for electrochemically
exfoliated graphene. It is important to note that the criterion followed here to determine
the exfoliation yield was more stringent than others adopted in the literature. For
instance, in some cases the yield has been calculated as the amount of anodically
expanded product (before dispersion in any solvent) relative to the starting mass of the
graphite anode [11], or as the amount of solvent-dispersed graphene relative to the mass
of anodically expanded product (rather than the total mass of the graphite anode) [12].
Likewise, certain process parameters must have a critical effect on the exfoliation yield
(e.g., thinner graphite foils are expected to afford higher yields), but in many studies
such parameters are not provided. For these reasons, meaningful comparisons with
previous yield data from the literature are difficult to make, as such data cannot be taken
in absolute terms. Nevertheless, the present results clearly demonstrate that large
increases in the anodic exfoliation yield (and thus in the amount of generated graphene
per unit time) can be attained just by dipping the graphite foil in concentrated H2SO4.

ARTÍCULO III
201
Figure 2. Anodic exfoliation yield of graphite foil as a function of H2SO4 pre-treatment time.
The yield was determined as the amount of solvent-dispersed graphene nanosheets obtained
relative to the initial mass of the graphite foil anode.
Physicochemical characterization of the anodically delaminated products confirmed
the generation of graphene nanosheets from H2SO4-treated graphite foil. Fig. 3a shows a
representative UV-vis absorption spectrum of a colloidal dispersion obtained in
water/isopropanol mixture from graphite pre-treated in H2SO4 for 24 h (see inset for a
digital picture of the dispersion), where a peak at ~268 nm and strong absorbance in the
270-1000 nm range revealed the presence of suspended graphitic material [9]. This
spectrum was characteristic of those obtained for graphene dispersions obtained from
graphite foil electrodes dipped in H2SO4 for different times. Atomic force microscopy
(AFM) imaging showed that this material was made up of nanosheets typically between
a few and several hundred nanometers in lateral size with an apparent thickness of ~1-
1.5 nm (Fig. 3b), consistent with few-layer (< 4) graphene. As revealed by X-ray
photoelectron spectroscopy (XPS), pre-treatment with H2SO4 led to anodically
exfoliated nanosheets having an increased extent of oxidation (Fig. 3c). Indeed, the O/C
atomic ratio for graphenes obtained from foils pre-treated for long times was ~0.20,
compared with a value of ~0.10 for graphenes derived from untreated graphite foil.
However, such a level of oxidation was well within the range of values typically
reported for graphenes prepared by anodic exfoliation in H2SO4 or sulfate salt
electrolytes (O/C ratios ~0.10-0.30) [10,13,14]. Moreover, Raman spectroscopy
indicated that the structural quality of the graphene nanosheets was not seriously
degraded as a result of pre-treatment of the graphite foil with H2SO4, since no
significant changes to the D/G band ratios were observed (Fig. 3d). For comparison, the
spectrum of hydrazine-reduced graphene oxide exhibited broader D and G Raman bands
0 10 20 30 40 50 60 70
10
20
30
40
50
Yie
ld (
%)
Immersion time (h)
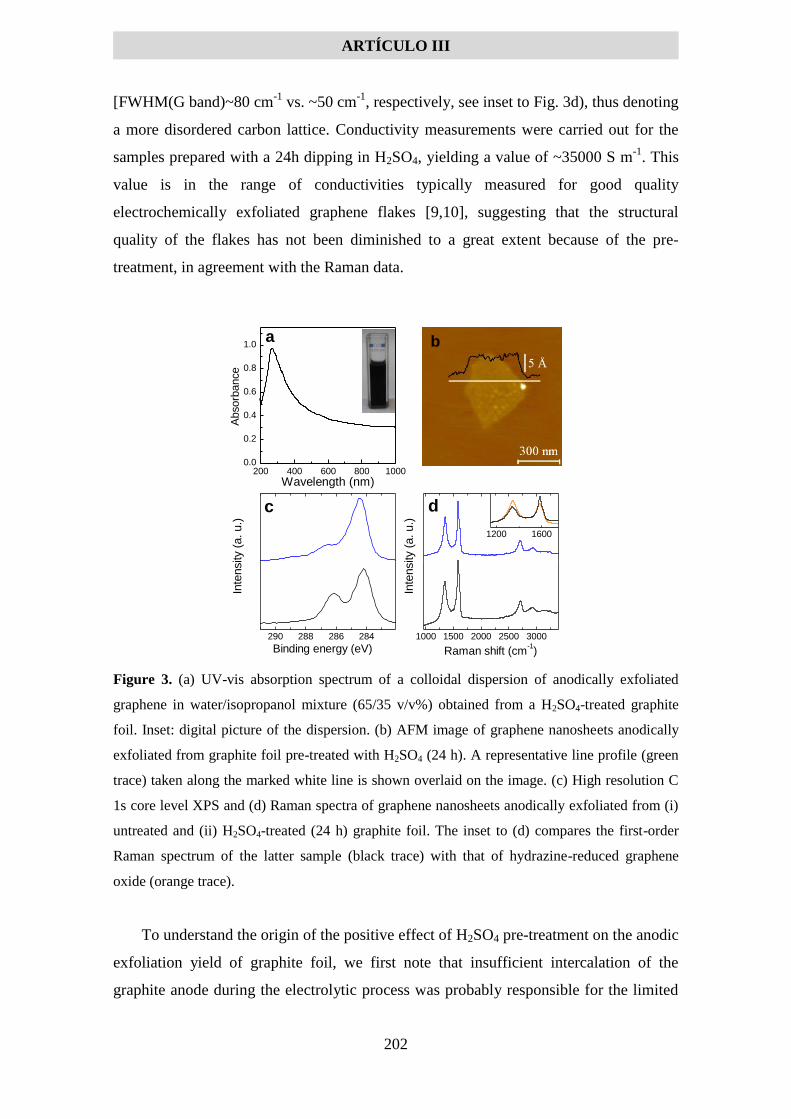
ARTÍCULO III
202
[FWHM(G band)~80 cm-1
vs. ~50 cm-1
, respectively, see inset to Fig. 3d), thus denoting
a more disordered carbon lattice. Conductivity measurements were carried out for the
samples prepared with a 24h dipping in H2SO4, yielding a value of ~35000 S m-1
. This
value is in the range of conductivities typically measured for good quality
electrochemically exfoliated graphene flakes [9,10], suggesting that the structural
quality of the flakes has not been diminished to a great extent because of the pre-
treatment, in agreement with the Raman data.
Figure 3. (a) UV-vis absorption spectrum of a colloidal dispersion of anodically exfoliated
graphene in water/isopropanol mixture (65/35 v/v%) obtained from a H2SO4-treated graphite
foil. Inset: digital picture of the dispersion. (b) AFM image of graphene nanosheets anodically
exfoliated from graphite foil pre-treated with H2SO4 (24 h). A representative line profile (green
trace) taken along the marked white line is shown overlaid on the image. (c) High resolution C
1s core level XPS and (d) Raman spectra of graphene nanosheets anodically exfoliated from (i)
untreated and (ii) H2SO4-treated (24 h) graphite foil. The inset to (d) compares the first-order
Raman spectrum of the latter sample (black trace) with that of hydrazine-reduced graphene
oxide (orange trace).
To understand the origin of the positive effect of H2SO4 pre-treatment on the anodic
exfoliation yield of graphite foil, we first note that insufficient intercalation of the
graphite anode during the electrolytic process was probably responsible for the limited
1000 1500 2000 2500 3000
Inte
nsity (
a. u.)
Raman shift (cm-1)
d
290 288 286 284
Inte
nsity (
a. u.)
Binding energy (eV)
c
200 400 600 800 1000
0.0
0.2
0.4
0.6
0.8
1.0a
Wavelength (nm)
Absorb
ance
1200 1600
b

ARTÍCULO III
203
exfoliation yield observed with the untreated material. Hence, approaches that boost the
extent of ion intercalation should be expected to give rise to increased yields. Second, as
noted above, graphite foil incorporates a large number of voids and interstitial spaces in
its structure (the density of the material used here was 0.7-1.3 g cm-3
vs ~2.26 g cm-3
for
defect-free, single-crystal graphite [15]). These voids and interstices can be assumed to
become progressively filled with H2SO4 molecules during exposure to the concentrated
acid, thus making the material hygroscopic. When such a pre-filled graphite is subjected
to anodic treatment in aqueous electrolyte, the very high local density of SO42-
anions
inside the graphite foil should promote an extensive initial intercalation of the material
that would facilitate the further entrance of anions from the aqueous medium, which in
turn would result in a more extensive delamination of the anode. We believe void filling
to be the only effect of H2SO4 pre-treatment, incorporation of the acid in the graphite
interlayer spaces to give H2SO4-graphite intercalation compounds (GICs) being
reasonably ruled out: X-ray diffraction did not support the formation of such GICs (Fig.
S1 in the ESM), which generally requires the presence of an oxidizing species in
addition to H2SO4 [16]. The key role played by the high density of voids/interstices was
made apparent in a control experiment in which graphite foil was replaced by a void-
free graphite, namely, highly oriented pyrolytic graphite (HOPG; density ~2.25 g cm-3
).
In this case, pre-treatment of HOPG with H2SO4 did not lead to a large increase in the
exfoliation yield. A schematic illustration of the proposed effect of H2SO4 pre-treatment
on the anodic exfoliation of graphite foil is provided in Fig. 4.

ARTÍCULO III
204
Figure 4. Schematic of the proposed anodic exfoliation process of graphite foil without and
with H2SO4 pre-treatment. When no pre-treatment is undertaken (path A), limited access of the
aqueous anions from the electrolyte (orange circles) to the interior of the foil leads to a low
exfoliation yield. When a H2SO4 pre-treatment is carried out (path B), the acid molecules filling
the inner voids and interstices of the graphite foil (red circles, step B1) promote a more
extensive intercalation of the material during the subsequent anodic process, resulting in a
higher exfoliation yield (step B2).
We note that simply increasing the aqueous electrolyte concentration as an
alternative to the H2SO4 pre-treatment is not an effective strategy, as it does not usually
lead to higher exfoliation yields [11]. In aqueous medium, access of the electrolyte
anions to the inner voids and interstices of the foil is probably restricted by the
hydrophobic nature of the material. Such a restriction should be lifted when these
voids/interstices become hygroscopic as a result of their filling with H2SO4, an effect
that would also contribute to increasing the exfoliation yield. On the other hand, dipping
the graphite foil in liquid N2 followed by soaking in ethanol, which created macroscopic
cracks and voids in the material, led to a ~2-fold increase in anodic exfoliation yield (up
to ~20 wt%). However, combined liquid N2/H2SO4 treatment did not increase the
overall exfoliation yield significantly above 50 wt%. Working with lower density
versions of graphite foil (densities as low as ~0.05 g cm-3
have been produced [17])
should be a better option than the aggressive liquid N2 treatment, as the higher numbers
of small-sized voids and interstices should favor an increased and more uniform filling
of the material with H2SO4 molecules that would result in higher exfoliation yields.
Other process parameters should also bear an influence on the exfoliation yield (e.g., we

ARTÍCULO III
205
have observed that higher electrolyte volume/graphite anode mass ratios as well as
thinner foils lead to higher yields), but their effect has not yet been systematically
investigated, which should warrant further studies along these lines in the future.
In summary, we have shown that pre-treatment with concentrated H2SO4 is an
effective strategy to increase the anodic exfoliation yield of graphite foil in aqueous
electrolyte. Such an increase was thought to arise from a more extensive intercalation of
this material during the electrolytic process due to the filling of its voids/interstices with
H2SO4 molecules. This simple approach should contribute to making anodic exfoliation
a more competitive method for the large-scale production of graphene.
Acknowledgements
Financial support from the Spanish Ministerio de Economía y Competitividad
(MINECO) and the European Regional Development Fund (ERDF) through project
MAT2015-69844-R is gratefully acknowledged. Partial funding by Plan de Ciencia,
Tecnología e Innovación 2013-2017 del Principado de Asturias and the ERDF (project
GRUPIN14-056) is also acknowledged. J.M.M. is grateful to the Spanish Ministerio de
Educación, Cultura y Deporte (MECD) for his pre-doctoral contract.
References
[1] A.C. Ferrari, F. Bonaccorso, V.I. Fal’ko, K.S. Novoselov, S. Roche, P.Bøggild, et
al., Science and technology roadmap for graphene, related two-dimensional crystals,
and hybrid systems, Nanoscale 7 (2015), 4598-810.
[2] A. M. Dimiev, G. Ceriotti, A. Metzger, N. D. Kim, J.M. Tour, Chemical mass
production of graphene nanoplatelets in ∼100% yield, ACS Nano 10, (2016), 274-9
[3] A.M. Abdelkader, A.J. Cooper, R.A.W. Dryfe, I.A. Kinloch, How to get between
the sheets: a review of recent works on the electrochemical exfoliation of graphene
materials from bulk graphite Nanoscale 7 (2015), 6944-56.
[4] A. J. Cooper, N. R. Wilson, I. A. Kinloch, R. A. W. Dryfe, Single stage
electrochemical exfoliation method for the production of few-layer graphene via
intercalation of tetraalkylammonium cations, Carbon 66, (2014), 340-50
[5] S. Yang, M.R. Lohe, K. Müllen, X. Feng, New-Generation Graphene from
Electrochemical Approaches: Production and Applications, Adv. Mater. 28 (2016),
6213-21.
[6] H. J. Salavagione, Promising alternative routes for graphene production and
functionalization, J. Mater. Chem. A, 2, (2014), 7138-46

ARTÍCULO III
206
[7] G.M. Morales, P. Schifani, G. Ellis, C. Ballesteros, G. Martínez, C. Barbero et al,
High-quality few layer graphene produced by electrochemical intercalation and
microwave-assisted expansion of graphite, Carbon 49, (2011), 2809
[8] A. Ambrosi, M. Pumera, Electrochemically exfoliated graphene and graphene oxide
for energy storage and electrochemistry applications, Chem. Eur. J, 22, (2016), 153-9
[9] J.M. Munuera, J.I. Paredes, S. Villar-Rodil, M. Ayán-Varela, A. Pagán, S.D. Aznar-
Cervantes, et al., High quality, low oxygen content and biocompatible graphene
nanosheets obtained by anodic exfoliation of different graphite types, Carbon 94
(2015), 729-39.
[10] J.M. Munuera, J.I. Paredes, S. Villar-Rodil, M. Ayán-Varela, A. Martínez-Alonso,
J.M.D. Tascón, Electrolytic exfoliation of graphite in water with multifunctional
electrolytes: en route towards high quality, oxide-free graphene flakes, Nanoscale 8
(2016), 2982-98.
[11] K. Parvez, Z.-S. Wu, R. Li, X. Liu, R. Graf, X. Feng, et al., Exfoliation of Graphite
into Graphene in Aqueous Solutions of Inorganic Salts, J. Am. Chem. Soc. 136 (2014),
6083-91.
[12] B.D. Ossonon, D. Bélanger, Functionalization of graphene sheets by the diazonium
chemistry during electrochemical exfoliation of graphite, Carbon 111 (2017), 83-93.
[13] J. Liu, M. Notarianni, G. Will, V.T. Tiong, H. Wang, N. Motta, Electrochemically
Exfoliated Graphene for Electrode Films: Effect of Graphene Flake Thickness on the
Sheet Resistance and Capacitive Properties, Langmuir 29 (2013), 13307-13314.
[14] J. Liu, C.K. Poh, D. Zhan, L. Lai, S.H. Lim, L. Wang, et al, Improved synthesis of
graphene flakes from the multiple electrochemical exfoliation of graphite rod, Nano
Energy 2 (2013), 377-86.
[15] Papyex Flexible Graphite Technical Guide,
https://www.mersen.com/uploads/tx_mersen/12-PAPYEX-flexible-graphite-
Mersen_07.pdf, Accessed October 2016.
[16] M.S. Dresselhaus, G. Dresselhaus, Intercalation compounds of graphite, Adv.
Phys. 51 (2002), 1-186.
[17] D.D.L. Chung, Exfoliation of graphite, J. Mater. Sci. 22 (1987), 4190-8.

ARTÍCULO III
207
Electronic Supplementary Material for
A simple strategy to improve the yield of graphene nanosheets in the anodic
exfoliation of graphite foil
J.M. Munuera, J.I. Paredes, S. Villar-Rodil, A. Martínez-Alonso, J.M.D. Tascón
Instituto Nacional del Carbón, INCAR-CSIC, Apartado 73, 33080 Oviedo, Spain
S1. Materials and reagents High purity graphite foil (Papyex I980) with a density of 0.7-1.3 g cm
-3 and a
thickness of ~0.5 mm was acquired from Mersen, whereas highly oriented pyrolytic
graphite (HOPG; grade ZYH) was obtained from Advanced Ceramics. Concentrated
H2SO4 (95-98%), K2SO4, N,N-dimethylformamide (DMF), sodium salt of flavin
mononucleotide (FMN), isopropanol and ethanol were purchased from Sigma-Aldrich
and used as received. Pt wire (diameter: 0.20 mm, purity: 99.99%) was acquired from
Goodfellow. Cellulose membranes for dialysis with a molecular weight cutoff of 12000
Da were obtained from Sigma Aldrich. Milli-Q deionized water (resistivity: 18.2
M·cm), from Millipore Corporation, was used throughout the study. Hydrazine-
reduced graphene oxide was obtained from graphite oxide by a procedure described
elsewhere [1].
S2. H2SO4 treatment and anodic exfoliation of graphite foil Graphite foil was cut into pieces of fixed dimensions (55×30×0.5 mm
3) for use in
all the subsequent experiments. The H2SO4 treatment was accomplished by immersing a
graphite foil piece into 50 mL of the concentrated acid at room temperature for a given
period of time, typically ranging from 1 to 72 h. Afterwards, the sample was briefly
rinsed with water and allowed to dry under ambient conditions. The anodic exfoliation
process was carried out in 80 mL of aqueous 0.1 M K2SO4 solution, using a two-
electrode configuration that comprised a piece of untreated or H2SO4-treated graphite
foil as the anode and Pt wire as the cathode. The latter was placed parallel to the
graphite foil surface at a distance of about 2 cm. A bias voltage of 10 V was then
applied for 1 h by means of an Agilent 6614C DC power supply. The resulting
anodically expanded product was collected and washed extensively with water through
filter paper. For a more efficient removal of remnants of acids and salts, the washed
material was subjected to bath-sonication (JP Selecta Ultrasons system, 40 kHz, ~20 W
L-1
) for 3 h in a water/isopropanol (65/35 v/v%) mixture and then dialyzed against water
(4×2 L) for a total of 72 h. Finally, the resulting wet product was transferred to DMF,
water/isopropanol mixture or aqueous FMN solution (1 mg mL-1
), bath-sonicated for 1
h and centrifuged at 200 g for 20 min (Eppendorf 5424 microcentrifuge) to obtain a
colloidal suspension of graphene nanosheets. The concentration of graphene in the
suspension was estimated by means of UV-vis absorption spectroscopy, using the
Lambert-Beer law: A/l = C, where A is the measured absorbance of the graphene
dispersion, l is the length of the optical path, is the extinction coefficient and C is the
graphene concentration. To determine C, the absorbance was measured at a wavelength
of 660 nm, for which an extinction coefficient = 2440 mL mg-1
m-1
[2,3] was used.

ARTÍCULO III
208
The overall exfoliation yield was calculated as the ratio of the amount of solvent-
dispersed graphene nanosheets to the initial mass of the graphite foil piece.
S3. Characterization techniques
UV-vis absorption spectra were recorded on a double-beam Heios
spectrophotometer, from Thermo Spectronic. Field emission scanning electron
microscopy (FE-SEM) images were obtained with a Quanta FEG 650 instrument (FEI
Company) operated at 30 kV. Atomic force microscopy (AFM) imaging was carried out
in the tapping mode of operation with a Nanoscope IIIa Multimode apparatus (Veeco),
using rectangular Si cantilevers with nominal spring constant and resonance frequency
of ~40 N m-1
and 250-300 kHz, respectively. Samples for AFM were prepared by drop-
casting dilute graphene dispersions (~0.05 mg mL-1
) onto pre-heated (~50-60 ºC),
freshly cleaved HOPG substrates, which were then allowed to dry. X-ray photoelectron
spectroscopy (XPS) was accomplished on a SPECS system with a non-monochromatic
Mg K X-ray source operated at 11.81 kV and 100 W under a pressure of 10-7
Pa.
Raman spectra were acquired with a Horiba Jobin-Yvon LabRam instrument using a
laser excitation wavelength of 532 nm at an incident power of ~2.5 mW. Specimens for
both XPS and Raman spectroscopy were prepared by drop-casting solvent-dispersed
graphene nanosheets onto a pre-heated (~50-60 ºC), circular stainless steel sample-
holder (diameter: 12 mm). X-ray diffraction (XRD) patterns were recorded with a
Bruker D8 Advance diffractometer, using Cu K ( = 0.154 nm) at a step size of 0.02º
and a step time of 1 s. Electrical conductivity measurements were carried out by the van
der Pauw method using a home-built setup (Agilent 6614C DC power supply and Fluke
45 digital multimeter).
S4. XRD of untreated and H2SO4-treated graphite foil
Figure S1. XRD patterns of (a) untreated and (b) H2SO4-treated (24 h) graphite foil. No
significant differences between the two samples were observed. In particular, no shift of the
(002) peak towards lower angles was noticed for the H2SO4-treated sample, which would have
been indicative of the formation of H2SO4-graphite intercalation compounds.
10 20 30 40
b
Inte
nsity (
a. u
.)
2 (°)
a

ARTÍCULO III
209
Figure S2. (a) High resolution C 1s core level XPS and (b) Raman spectra of graphite foil.
Figure S3. Histograms of (a) lateral dimension and (b) apparent height of 100 graphene flakes
measured by AFM.
S5. References
[1] M.J. Fernández-Merino, L. Guardia, J.I. Paredes, S. Villar-Rodil, P. Solís-
Fernández, et al., Vitamin C Is an Ideal Substitute for Hydrazine in the Reduction of
Graphene Oxide Suspensions J. Phys. Chem. C 114 (2010), 6426-32.
[2] Z. Sun, J. Masa, Z. Liu, W. Shuhmann, M. Muhler, Highly Concentrated Aqueous
Dispersions of Graphene Exfoliated by Sodium Taurodeoxycholate: Dispersion
Behavior and Potential Application as a Catalyst Support for the Oxygen-Reduction
Reaction, Chem. Eur. J. 18 (2012), 6972-8.
294 292 290 288 286 284 282
bIn
tensity (
cps)
Binding energy (eV)
a
1500 2000 2500 3000
Inte
nsity (
cps)
Raman shift (cm-1)
a
0
5
10
15
20
% o
f fl
ak
es
Lateral dimension (nm)
0
10
20
30
40
50
60
0-0.5 0.5-1.0 1.0-1.5 1.5-2.0 2.0-2.5
% o
f fl
ak
es
Apparent height (nm)
b
a
ARTÍCULO III
210
[3] M. Ayán-Varela, J.I. Paredes, L. Guardia, S. Villar-Rodil, J.M. Munuera, M. Díaz-
González, et al., Achieving Extremely Concentrated Aqueous Dispersions of Graphene
Flakes and Catalytically Efficient Graphene-Metal Nanoparticle Hybrids with Flavin
Mononucleotide as a High-Performance Stabilizer, ACS Appl. Mater. Interfaces 7
(2015), 10293-307.

ARTÍCULO IV
211
Electrochemical exfoliation of graphite in aqueous sodium halide electrolytes towards
low oxygen content graphene for energy and environmental applications
J.M. Munueraa*
, J.I. Paredesa, M. Enterría
b, A. Pagán
c, S. Villar-Rodil
a, M.F.R. Pereira
b, J.I.
Martinsd,e
, J.L. Figueiredob, J.L. Cenis
c, A. Martínez-Alonso
a, J.M.D. Tascón
a
aInstituto Nacional del Carbón, INCAR-CSIC, Apartado 73, 33080 Oviedo, Spain
bLaboratório de Processos de Separação e Reacção – Laboratório de Catálise e Materiais
(LSRE-LCM), Departamento de Engenharia Química, Faculdade de Engenharia,
Universidade do Porto, R. Dr. Roberto Frias s/n, 4200-465 Porto, Portugal cInstituto Murciano de Investigación y Desarrollo Agrario y Alimentario (IMIDA), Calle
Mayor 1, 30150 La Alberca, Spain dDepartamento de Engenharia Química, Faculdade de Engenharia, Universidade do
Porto, R. Dr. Roberto Frias s/n, 4200-465 Porto, Portugal eUniversidade do Minho, LAB2PT- Laboratório de Paisagens, Património e Território,
Portugal
Abstract
Graphene and graphene-based materials have shown great promise in many
technological applications, but their large-scale production and processing by simple and
cost-effective means still constitute significant issues in the path of their widespread
implementation. Here, we investigate a straightforward method for the preparation of a
ready-to-use and low oxygen content graphene material that is based on electrochemical
(anodic) delamination of graphite in aqueous medium with sodium halides as the
electrolyte. Contrary to previous conflicting reports on the ability of halide anions to act as
efficient exfoliating electrolytes in electrochemical graphene exfoliation, we show that
proper choice of both graphite electrode (e.g., graphite foil) and sodium halide
concentration readily leads to the generation of large quantities of single-/few-layer
graphene nanosheets possessing a degree of oxidation (O/C ratio down to ~0.06) lower than
that typical of anodically exfoliated graphenes obtained with commonly used electrolytes.
The halide anions are thought to play a role in mitigating the oxidation of the graphene
lattice during exfoliation, which is also discussed and rationalized. The as-exfoliated
graphene materials exhibited a three-dimensional morphology that was suitable for their
Keywords: graphene, electrochemical exfoliation, supercapacitors, environmental applications, sodium
halides
ARTÍCULO IV
212
practical use without the need to resort to any kind of post-production processing. When
tested as dye adsorbents, they outperformed many previously reported graphene-based
materials (e.g., they adsorbed ~920 mg g-1
for methyl orange) and were useful sorbents for
oils and non-polar organic solvents. Supercapacitor cells assembled directly from the as-
exfoliated products delivered energy and power density values (up to 15.3 Wh kg-1
and
3220 W kg-1
, respectively) competitive with those of many other graphene-based devices,
but with the additional advantage of extreme simplicity of preparation.
1. Introduction
Since its first isolation in 2004, graphene has spurred enormous interest in the scientific
community due to its excellent electronic, mechanical, thermal and optical properties, as
well as to its wide range of potential applications in many fields, including electronics,
photonics, energy conversion/storage, catalysis and biomedicine.1 However, one of the
most pressing issues that hinder the actual implementation and widespread use of graphene
is that related to its large-scale production. At present, there is no single method that can
simultaneously provide high amounts of material of good quality in a reasonable amount of
time at a low cost. The existing production methods can be classified into two types:
bottom-up and top-down. The former relies on synthesizing graphene sheets from small-
molecule precursors, usually following chemical vapor deposition (CVD) methodologies
and giving rise to large-area sheets.2 Top-down methods, on the other hand, rely on the
exfoliation of graphitic materials into single- and/or few-layer graphene flakes. Even
though there exists a number of exfoliation strategies, the most relevant ones are arguably
(i) the graphite oxide route, (ii) the direct liquid-phase exfoliation method and (iii) the
electrochemical exfoliation approach.3,4
The graphite oxide strategy involves harsh
oxidation of graphite, causing the oxidized basal planes to be easily exfoliated in polar
solvents (including water) into single-layer graphene oxide by sonication or other means.5
This oxidation can be partially reversed through a reduction process, but the resulting
product (reduced graphene oxide) always retains significant amounts of oxygen and
structural defects.6 Direct liquid-phase exfoliation generally circumvents oxidation issues
because delamination is directly promoted via, e.g., ultrasound waves or high-shear forces

ARTÍCULO IV
213
in a medium that can colloidally stabilize the graphene flakes (organic solvents, aqueous
surfactant solutions, etc).7 The main drawbacks of this method are the predominance of
several-layer or even multilayer graphene flakes rather than single- or few-layer (<4)
objects, as well as its low production yield (typically below 5 wt%).
On the other hand, electrochemical (or electrolytic) exfoliation methods are based on
the intercalation of ions between the layers of a graphite electrode due to the flow of
electrical current in an electrolytic cell. 8,9
These ions induce expansion of the interlayer
space in graphite and thus facilitate the exfoliation process. There are essentially two
approaches to electrochemical exfoliation, namely, the cathodic and the anodic approach. In
the former case, graphite acts as the cathode in the electrochemical cell and intercalates
cations from the electrolyte. Studies in this area have been typically carried out in organic
solvents with lithium or alkylammonium salts,10,11
as well as molten salts12,13
and ionic
liquids as the electrolyte,14
and the obtained products are usually few-layer to several-layer
graphene flakes of a high structural quality. Anodic exfoliation, on the other hand, takes
place with the graphite material as the anode and is typically accomplished in aqueous
electrolytes, which is advantageous from an environmental and practical standpoint.15,16,17,18
Some studies have also reported the possibility of simultaneous anodic and cathodic
exfoliation.19,20,21
One of the main issues regarding aqueous anodic exfoliation, though, is
related to the fact that graphite is subjected to a large positive voltage (typically between a
few and a few tens of volts).8 This voltage induces the formation of highly reactive oxygen
species (e.g., hydroxyl radicals) from the oxidation of water molecules, which in turn
trigger a significant oxidation and structural degradation the carbon lattice.8,15
Due to the well-known ability of the sulfate anion to intercalate graphite, sulfuric acid
is widely employed as an electrolyte in the preparation of graphene flakes by anodic
exfoliation.16,17,22,23,24
However, the highly acidic nature of this electrolyte is especially
conducive to obtaining graphene flakes with a considerable extent of oxidation (typical O/C
atomic ratios in the ~0.10-0.25 range). Other protic acids, such as phosphoric, oxalic or
perchloric acids have also been explored, with similar results. 23,25
Use of the corresponding
inorganic and organic salts of these acids (e.g., sodium sulfate, citrate or perchlorate) as
electrolytes has been proposed as a way to mitigate oxidation of the exfoliated graphenes,
but these efforts have met with varied success.17,22,26
More recently, novel strategies to

ARTÍCULO IV
214
prevent graphene oxidation during anodic exfoliation have been explored.27
For example,
exfoliation has been accomplished with standard electrolytes (e.g., sulfuric acid) in the
presence of certain additives that inhibit graphene oxidation, such as melamine,28
or the
antioxidants sodium borohydride, ascorbic acid and (2,2,6,6-tetramethylpiperidin-1-yl)oxyl
(TEMPO).29
Likewise, some sulfonated aromatic compounds have been simultaneously
used as electrolytes and oxidation-preventing agents for the production of low oxygen
content graphene flakes.30
In these cases, graphenes with O/C atomic ratios down to ~0.02-
0.04 were attained. However, such methods suffer from some drawbacks, including the use
of relatively expensive additives/electrolytes and the difficulty in removing adsorbed
additives/electrolytes from the exfoliated products to obtain neat graphenes (the additives
can also induce functionalization of the flakes). Thus, the availability of anodic exfoliation
methods that make use of very simple and inexpensive electrolytes and at the same time
afford low oxygen content and additive-free graphenes would be highly desirable, but for
the most part such methods are currently lacking.
We hypothesized that some very simple salts such as sodium halides (NaCl, NaBr,
NaI) could be effective, additive-free electrolytes for the anodic exfoliation of graphite into
graphene flakes with a limited extent of oxidation. This idea was supported by the fact that
graphitic materials can be intercalated with halogens/halides through electrochemical and
other means,31
so that anodic exfoliation of a graphite electrode could in principle be
possible in the presence of halide-based electrolytes. Although alkali halides have been
previously used as additives in the preparation of graphene via direct ultrasound-induced
exfoliation,32
there are conflicting reports as to the ability of halide anions to act as efficient
electrolytes in the aqueous anodic exfoliation of graphite.16,17,33
We also note that because
halide anions are relatively prone to oxidation, these intercalated species could act as
sacrificial agents and neutralize the oxygen radicals generated under anodic potential, thus
mitigating the oxidation of the graphene flakes in comparison with other commonly used
electrolytes, but this point has not yet been demonstrated.
We have thus investigated the use of sodium halides as electrolytes for the aqueous
anodic exfoliation of graphite, the results of which are reported here. Significantly, the
production of single- and few-layer graphene flakes with a limited degree of oxidation, and
thus of a high structural quality, was made possible by chosing an appropiate graphite

ARTÍCULO IV
215
material as the anode and carefully testing different electrolyte concentrations in order to
find the intermediate range where exfoliation is succesful. Considering the potential
scalability of this method together with the use of sustainable and widely available
electrolytes, and that no additives are required to limit oxidation, the present work should
broaden the prospects of anodic exfoliation as a competitive method for the large-scale
production of single-/few-layer graphene flakes towards different applications, particularly
in energy- and environment-related fields. Indeed, we demonstrate the use of the halide-
derived, as-exfoliated foam-like graphene products as efficient adsorbents for dyes and oils
as well as electrodes for supercapacitors. Also, the biocompatibility of these graphene
nanosheets is attested.
2. Results and discussion
2.1. Key aspects of the electrochemical exfoliation of graphite in aqueous halide-based
electrolytes
We aimed at determining whether some very simple and widely available salts, such as
the sodium halides NaCl, NaBr and NaI, could be effectively used as electrolytes towards
the anodic exfoliation of graphite in aqueous medium to give graphene flakes with a limited
extent of oxidation. Some previous experiments had concluded that the anodic exfoliation
of graphite using halide-based electrolytes was not even possible.16,17
On the other hand, a
recent work by Munaiah et al has suggested that exfoliated products can be obtained,
although they possess a considerable degree of oxidation (O/C atomic ratios of ~0.10-20).33
On the basis of a suite of tests with the aforementioned sodium halides, we found that
single-/few-layer graphene flakes could indeed be produced in considerable quantities. It is
important to note, though, that effective exfoliation was found to be critically dependent on
two main factors, namely, the type of graphite used as the anode and the concentration of
sodium halide used as electrolytic medium. To understand the influence of these two
factors, as well as some characteristics of the resulting graphene materials that will be
discussed below, the basic mechanism underlying the anodic exfoliation process has to be
borne in mind. Such a mechanism has been discussed elsewhere17
and will just be briefly
outlined here: first of all, exfoliation occurring at a graphite anode in the presence of
common aqueous electrolytes (e.g., H2SO4) under typical bias voltage conditions (5-15 V)

ARTÍCULO IV
216
is believed to start with the oxidation of grain boundaries and edges of the graphite crystals
due to the presence of oxygen radicals (e.g., hydroxyl species) generated through oxidation
of water molecules at the anode. This initial oxidation induces an expansion of the
interlayer space at the edges, which in turn facilitates the intercalation of the graphite layers
with anions from the electrolyte together with water molecules. Subsequent redox processes
involving the intercalated species are thought to give rise to gaseous products that exert
strong forces on the layers, leading to the expansion and swelling of the graphite anode. As
a result, an expanded graphitic material composed of very weakly attached layers is finally
formed, which can then be readily separated into individual single- or few-layer graphene
flakes in a proper solvent medium by means of low-power ultrasound or shear forces.17,18
In anodic exfoliation tests carried out with sodium halides using three different types of
graphite, namely, graphite foil, highly oriented pyrolytic graphite (HOPG) and graphite
flakes (+10 V applied to graphite anode for 60 min with platinum foil as a counter
electrode; see Experimental section), we observed that well-exfoliated graphitic materials
colloidally dispersed either in the organic solvent N,N-dimethylformamide (DMF) or in
water using, e.g., the biomolecule flavin mononucleotide (FMN) as a stabilizer18,34
could
only be obtained with the former graphite type. By contrast, just slightly expanded
materials that could not be stably suspended in DMF or water/FMN were attained with both
HOPG and graphite flakes. This result suggested that the halide anions failed to extensively
intercalate and/or expand the HOPG and graphite flake materials. We believe that the
distinct expansion behaviour of graphite foil is a consequence of its particular
morphological features and packing configuration. Specifically, the morphology of graphite
foil is typically made up of disordered stacks of micrometer-sized graphitic platelets that
exhibit many folds, wrinkles and voids in their structure, as noticed from field-emission
scanning electron microscopy (FE-SEM) images (Fig. 1a). On the other hand, the HOPG
crystals and graphite flakes are comprised of very tightly packed layers with no or very
little voids in-between such layers (Fig. 1b and c). The peculiar morphology of graphite foil
is a direct result of its production process, which is based on roll compaction of thermally
expanded graphite particles and leads to a relatively low density product (~0.7-1.3 g cm-3
according to the specifications of the manufacturer, to be compared with a value of ~2.25 g
cm-3
for HOPG). It is then reasonable to assume that the presence of a large number of

ARTÍCULO IV
217
openings and gaps within the layers facilitates the intercalation of chemical species (e.g.,
halide anions and water molecules) in graphite foil and its subsequent expansion during the
anodic treatment, whereas such a relative advantage would be essentially absent from
graphites with a more compact morphology (HOPG and graphite flakes). We also note that
explorative exfoliation experiments at different bias voltages, both higher and lower than
10 V, were carried out. We observed that the exfoliation process was only successful when
using bias voltages above a threshold value of ~4 V, but at such low voltages the flowing
current and thus the yield of exfoliated product were lower, whereas the quality of the
resulting graphene flakes did not change compared to exfoliation at 10 V. For bias voltages
above 10 V, neither the amount of exfoliated product nor its quality changed significantly.
Concerning the current profile during exfoliation, generally speaking it was observed to
increase at first, probably as a result of the expansion of the graphite anode and the ensuing
increase in surface area exposed to the aqueous electrolyte. However, after some time the
current tended to reach a plateau. The latter was probably due to the fact that further
increases in surface area resulting from exfoliation were counteracted by the loss of
expanded graphite fragments that were seen to detach from the anode.
Figure 1. Representative FE-SEM images of graphite foil (a,d), HOPG (b,e) and graphite flakes
(c,f) before (a,b,c) and after (d,e, f) electrochemical treatment in 0.05 M NaCl (+10 V, 60 min).
a b c
d e f

ARTÍCULO IV
218
The distinct fate of graphite foil was apparent from the FE-SEM images of the
anodically treated materials, as exemplified in Fig. 1d, e, and f using 0.05 M NaCl as the
electrolyte. While graphite foil (Fig. 1d) was seen to expand considerably as a result of the
anodic process, yielding very thin and well separated layers, a rather limited extent of
cleavage was noticed for both HOPG (Fig. 1e) and graphite flakes (Fig. 1f), which
exhibited just partially detached graphite platelets of a relatively large thickness. It is thus
not surprising that the subsequent mild sonication step was able to complete delamination
of the anodically treated graphites into graphene flakes only for the case of graphite foil,
but not for the poorly expanded HOPG and graphite flake materials. In line with this result,
the effect of compact vs. loose configuration of the graphite anode has been recently
highlighted by Yang et al, who reported that a modest pre-expansion of graphite foil prior
to the anodic exfoliation step with a sulfate-based electrolyte brings about a considerable
increase in the amount of generated single-/few-layer graphene flakes.29
In the present case,
we surmise that the intercalation and/or expansion of graphites using halide-based
electrolytes are relatively inefficient processes compared to those associated to the use of
commonly employed electrolytes (e.g., sulfate-based ones). Thus, the deployment of
graphite types for which the intercalation/expansion process is facilitated due to a suitable
morphology (e.g., having a large amount of interlayer openings, voids and gaps) could
make a critical difference in attaining a well-expanded product that can then be separated
into single-/few-layer graphene flakes, as was actually observed here with graphite foil
compared to HOPG and graphite flakes. Consequently, the former graphite type was used
exclusively for the remainder of this work. This forced choice of graphite turns out to be
quite advantageous with a view to up-scaling the graphene production process, taking into
account that graphite foil is a widely available and modestly priced commodity (less than
US$0.1 per gram, compared to ~US$100 per gram for HOPG). The fact that virtually no
graphene can be obtained with HOPG and graphite flakes does not necessarily mean that
the halide anions do not intercalate such graphites at all, but rather that if intercalation takes
place, it is too slow and/or limited in extent so as not to allow an efficient exfoliation of
these graphite types into graphene. Indeed, the latter are known to be readily intercalated
and delaminated by other commonly used anions, such as sulfates.

ARTÍCULO IV
219
The second decisive factor for successful anodic exfoliation using sodium halides was
the electrolyte concentration. In general terms, for a given applied bias voltage, the anodic
process is only able to afford graphene products within a certain range of electrolyte
concentrations.17
We tested the range of concentrations for each electrolyte, and found a
range where the exfoliation process is effective for each sodium halide. If the electrolyte
concentration is too low, the graphite anode will be poorly intercalated and no or very little
expanded product will be obtained. If the concentration is too high, a very vigorous and fast
intercalation process will usually take place, so that graphite fragments detach too quickly
from the anode without having completed their layer-by-layer expansion. As a result, a
large amount of incompletely expanded material will be attained, which cannot be
subsequently separated into single-/few-layer graphene flakes via sonication, but gives rise
to multilayer graphitic platelets instead, which are unstable in colloidal dispersion and
appear as thick (>10 nm) objects in AFM images. However, if an intermediate electrolyte
concentration is used, the process is slow enough for the detaching graphite fragments to
expand and delaminate to an extent large enough so as to yield graphene nanosheets after
sonication. As a result of this behavior, the final concentration of graphene dispersed in
solvents as a function of electrolyte concentration is seen to go through a maximum at
intermediate electrolyte concentrations (see Table 1 and discussion below). Such a
constraint in the useful concentration range was seen to be particularly stringent in the case
of sodium halides. To determine the useful concentration ranges for NaCl, NaBr and NaI,
pieces of graphite foil of fixed dimensions were subjected to a positive voltage (+10 V, 60
min) in aqueous solutions of the aforementioned salts at different concentrations (see
Experimental section for details). The resulting expanded products (if any) were thoroughly
rinsed with water and ethanol to remove remnants of salts and other reaction products, and
were subsequently dispersed via sonication either in DMF or in water/FMN. This cleaning
process was seen to be a vital step for the colloidal stability of the final graphene product,
as very small amounts of residual salts will drastically reduce the colloidal stability of the
dispersions. After a centrifugation step intended to sediment the non-fully exfoliated
fraction of the material, the concentration of the supernatant, which was the final graphene
dispersion, was measured using UV-vis absorption spectroscopy. We carried out a control
experiment under the same conditions in the absence of any electrolyte (i.e., only in pure
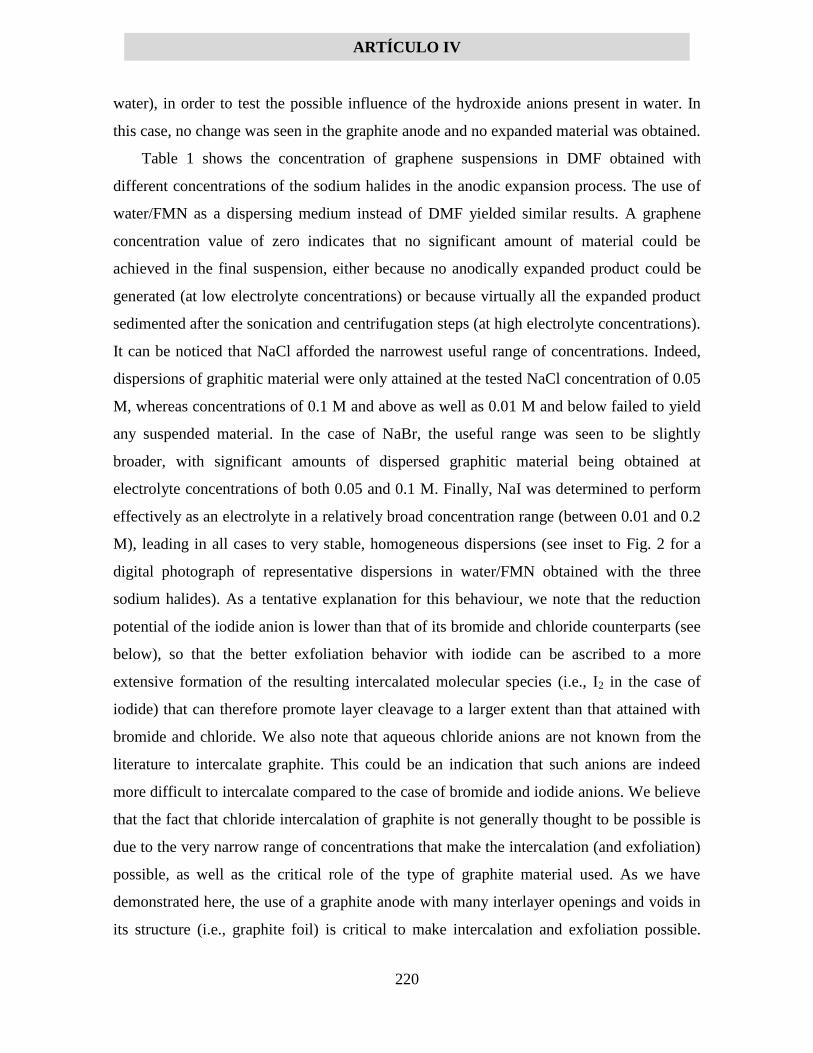
ARTÍCULO IV
220
water), in order to test the possible influence of the hydroxide anions present in water. In
this case, no change was seen in the graphite anode and no expanded material was obtained.
Table 1 shows the concentration of graphene suspensions in DMF obtained with
different concentrations of the sodium halides in the anodic expansion process. The use of
water/FMN as a dispersing medium instead of DMF yielded similar results. A graphene
concentration value of zero indicates that no significant amount of material could be
achieved in the final suspension, either because no anodically expanded product could be
generated (at low electrolyte concentrations) or because virtually all the expanded product
sedimented after the sonication and centrifugation steps (at high electrolyte concentrations).
It can be noticed that NaCl afforded the narrowest useful range of concentrations. Indeed,
dispersions of graphitic material were only attained at the tested NaCl concentration of 0.05
M, whereas concentrations of 0.1 M and above as well as 0.01 M and below failed to yield
any suspended material. In the case of NaBr, the useful range was seen to be slightly
broader, with significant amounts of dispersed graphitic material being obtained at
electrolyte concentrations of both 0.05 and 0.1 M. Finally, NaI was determined to perform
effectively as an electrolyte in a relatively broad concentration range (between 0.01 and 0.2
M), leading in all cases to very stable, homogeneous dispersions (see inset to Fig. 2 for a
digital photograph of representative dispersions in water/FMN obtained with the three
sodium halides). As a tentative explanation for this behaviour, we note that the reduction
potential of the iodide anion is lower than that of its bromide and chloride counterparts (see
below), so that the better exfoliation behavior with iodide can be ascribed to a more
extensive formation of the resulting intercalated molecular species (i.e., I2 in the case of
iodide) that can therefore promote layer cleavage to a larger extent than that attained with
bromide and chloride. We also note that aqueous chloride anions are not known from the
literature to intercalate graphite. This could be an indication that such anions are indeed
more difficult to intercalate compared to the case of bromide and iodide anions. We believe
that the fact that chloride intercalation of graphite is not generally thought to be possible is
due to the very narrow range of concentrations that make the intercalation (and exfoliation)
possible, as well as the critical role of the type of graphite material used. As we have
demonstrated here, the use of a graphite anode with many interlayer openings and voids in
its structure (i.e., graphite foil) is critical to make intercalation and exfoliation possible.
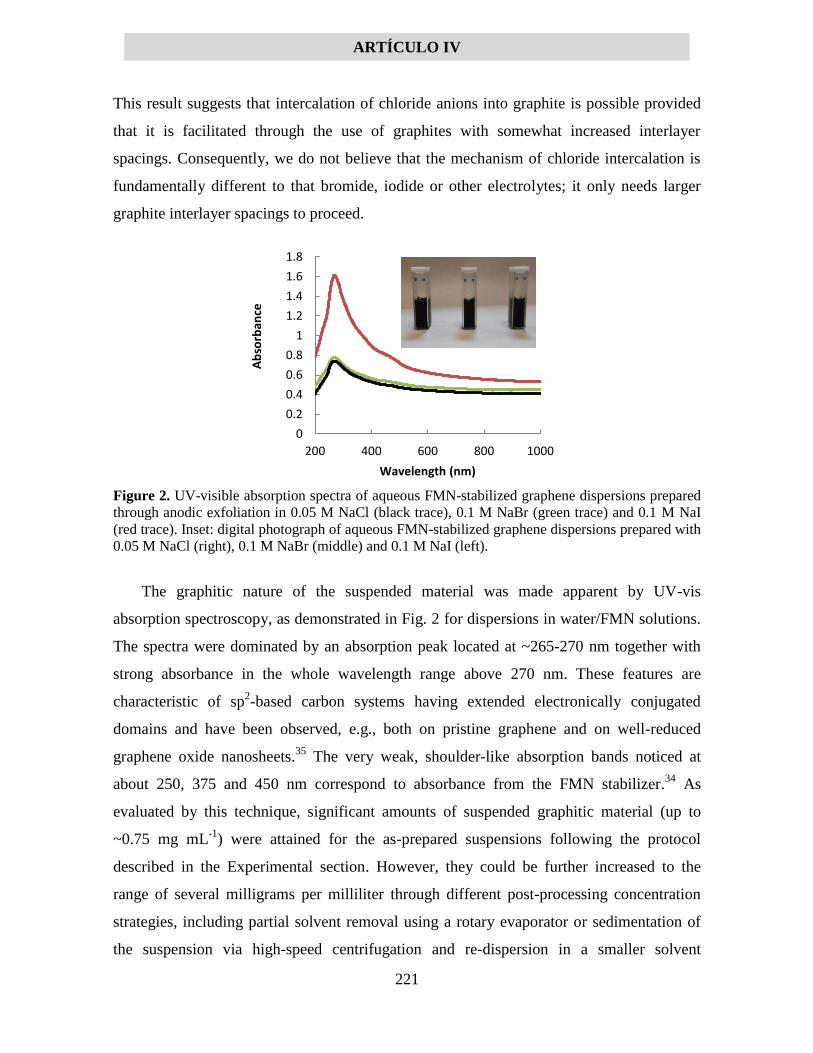
ARTÍCULO IV
221
This result suggests that intercalation of chloride anions into graphite is possible provided
that it is facilitated through the use of graphites with somewhat increased interlayer
spacings. Consequently, we do not believe that the mechanism of chloride intercalation is
fundamentally different to that bromide, iodide or other electrolytes; it only needs larger
graphite interlayer spacings to proceed.
Figure 2. UV-visible absorption spectra of aqueous FMN-stabilized graphene dispersions prepared
through anodic exfoliation in 0.05 M NaCl (black trace), 0.1 M NaBr (green trace) and 0.1 M NaI
(red trace). Inset: digital photograph of aqueous FMN-stabilized graphene dispersions prepared with
0.05 M NaCl (right), 0.1 M NaBr (middle) and 0.1 M NaI (left).
The graphitic nature of the suspended material was made apparent by UV-vis
absorption spectroscopy, as demonstrated in Fig. 2 for dispersions in water/FMN solutions.
The spectra were dominated by an absorption peak located at ~265-270 nm together with
strong absorbance in the whole wavelength range above 270 nm. These features are
characteristic of sp2-based carbon systems having extended electronically conjugated
domains and have been observed, e.g., both on pristine graphene and on well-reduced
graphene oxide nanosheets.35
The very weak, shoulder-like absorption bands noticed at
about 250, 375 and 450 nm correspond to absorbance from the FMN stabilizer.34
As
evaluated by this technique, significant amounts of suspended graphitic material (up to
~0.75 mg mL-1
) were attained for the as-prepared suspensions following the protocol
described in the Experimental section. However, they could be further increased to the
range of several milligrams per milliliter through different post-processing concentration
strategies, including partial solvent removal using a rotary evaporator or sedimentation of
the suspension via high-speed centrifugation and re-dispersion in a smaller solvent
0
0.2
0.4
0.6
0.8
1
1.2
1.4
1.6
1.8
200 400 600 800 1000
Ab
sorb
ance
Wavelength (nm)

ARTÍCULO IV
222
volume.34
The energy consumption in the anodic exfoliation process is largely due to the
current flowing through the cell, and is estimated to be ~0.05 kW h for a usual experiment
carried out in our laboratory considering the power consumption of the power supply.
2.2. Characteristics of the exfoliated products and role of the halide anions in the
exfoliation process
Having demonstrated that sodium halides can indeed be used in aqueous anodic
exfoliation processes to give stable dispersions of graphitic materials, the next step of the
investigation focused on determining their physicochemical characteristics. First, the lateral
size and exfoliation degree of the dispersed graphitic materials were investigated by means
of scanning transmission electron microscopy (STEM) and atomic force microscopy
(AFM). Fig. 3 shows typical STEM (a,b,c) and AFM (d,e,f) images recorded from
water/FMN dispersions obtained with the three different electrolytes at a given
concentration within their respective useful ranges: 0.05 M NaCl (a,d), 0.1 M NaBr (b,e)
and 0.1 M NaI (c,f). All the dispersions were comprised of thin nanosheets with mean
lateral dimensions of 560±210, 655±390 and 610±260 nm for 0.05 M NaCl, 0.1 M NaBr
and 0.1 M NaI respectively, and apparent thickness (derived from AFM height profiles)
between ~2 and 3 nm. The apparent thickness values for nanosheets from dispersions
obtained at other sodium halide concentrations were very similar and are given in Table 1.
The lateral size of the graphene flakes is mainly limited by the sonication step applied to
the electrolytically expanded graphite material and it is in the same range as that measured
for other electrolytes we have reported before. We also note that in the present work we
searched for conditions that allow an efficient delamination of the graphite anode so as to
attain very thin graphene nanosheets. In addition to the electrolytic treatment, sonication
and centrifugation steps were applied to the electrochemically delaminated material. The
main role of these steps, particularly centrifugation, is to select very thin nanosheets
generated in the process (if any are generated at all). Therefore, it is not surprising that we
obtained similar thickness values for all the samples, because the applied processes were
indeed meant to select the thinnest nanosheets. The fact that different halides lead to
different amounts of nanosheets was is most probably a result of the different efficiency of
the electrolytes in the delamination of the graphite anode. Considering that AFM thickness
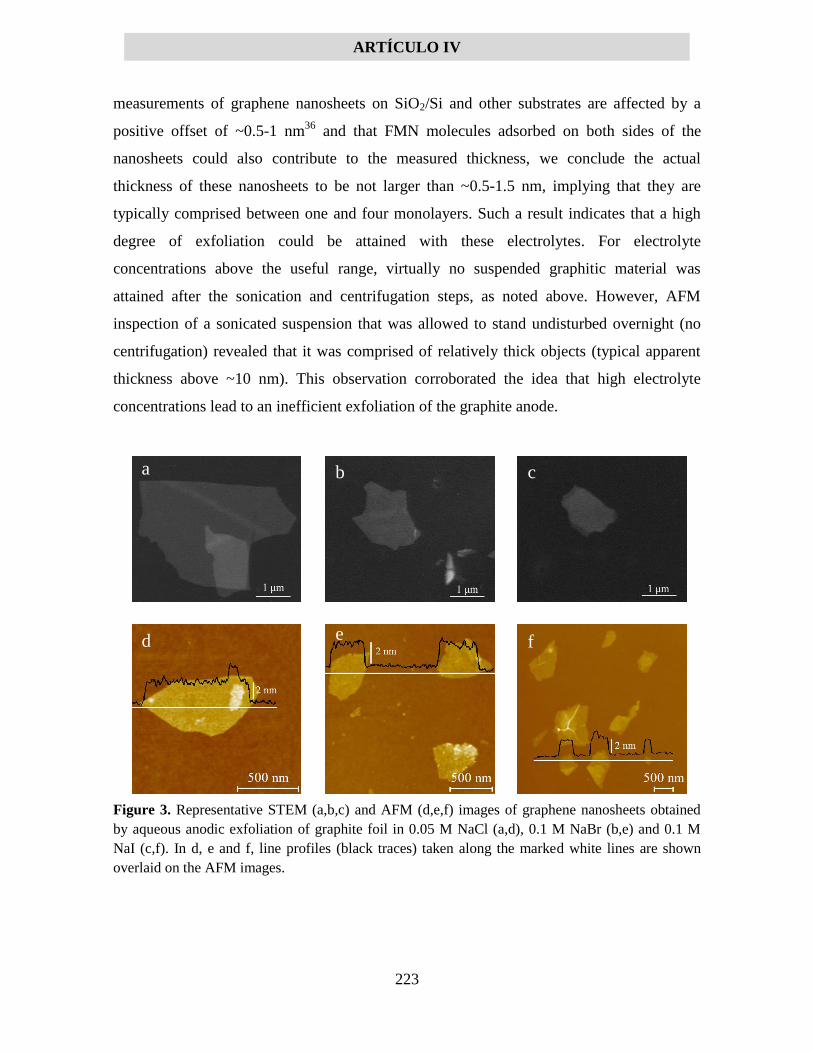
ARTÍCULO IV
223
measurements of graphene nanosheets on SiO2/Si and other substrates are affected by a
positive offset of ~0.5-1 nm36
and that FMN molecules adsorbed on both sides of the
nanosheets could also contribute to the measured thickness, we conclude the actual
thickness of these nanosheets to be not larger than ~0.5-1.5 nm, implying that they are
typically comprised between one and four monolayers. Such a result indicates that a high
degree of exfoliation could be attained with these electrolytes. For electrolyte
concentrations above the useful range, virtually no suspended graphitic material was
attained after the sonication and centrifugation steps, as noted above. However, AFM
inspection of a sonicated suspension that was allowed to stand undisturbed overnight (no
centrifugation) revealed that it was comprised of relatively thick objects (typical apparent
thickness above ~10 nm). This observation corroborated the idea that high electrolyte
concentrations lead to an inefficient exfoliation of the graphite anode.
Figure 3. Representative STEM (a,b,c) and AFM (d,e,f) images of graphene nanosheets obtained
by aqueous anodic exfoliation of graphite foil in 0.05 M NaCl (a,d), 0.1 M NaBr (b,e) and 0.1 M
NaI (c,f). In d, e and f, line profiles (black traces) taken along the marked white lines are shown
overlaid on the AFM images.
a b c
d e f

ARTÍCULO IV
224
Chemical analysis of the dispersed materials was carried out by X-ray photoelectron
spectroscopy (XPS). Fig. 4 shows survey spectra (a,c,e) as well as high resolution C 1s core
level spectra (b,d,f) for graphene dispersions obtained with 0.05 M NaCl (a,b), 0.1 M NaBr
(c,d) and 0.1 M NaI (e,f). In all cases carbon was the dominant element, although oxygen
was also present to a significant but variable extent depending on the specific electrolyte
concentration used for exfoliation. Signals corresponding to the halogen used in the anodic
process were not observed, i.e., the amount of halogen present in the graphene samples was
below the detection limit of this technique (~0.1 at%), implying that the washing procedure
applied to the anodically expanded products was rather effective. This is an advantage over
some previously reported electrolytes that cannot be readily removed due to their strong
adsorption onto the graphene nanosheets.30
Another advantage of the present electrolytes is
related to their cost: sodium halides are simple, inexpensive and widely available
chemicals. The O/C atomic ratios for the different tested electrolyte concentrations are
given in Table 1, which were seen to range between 0.06 and 0.11. The high resolution C
1s spectra provided information on the nature of the oxidized carbon species. These spectra
comprised a majority component located at ~284.6 eV that could be ascribed to carbon
atoms in unoxidized graphitic environments (C=C species) and a minor component at about
286.7 eV, which was attributed to carbon atoms single-bonded to oxygen (C-O species), for
example in hydroxyl, ether or epoxy groups.24
The XPS results thus indicated that the
exfoliated graphene nanosheets were oxidized only to a limited extent. Specifically, the
O/C atomic ratio of samples prepared with 0.05 M NaCl (0.06) and 0.1 M NaBr (0.07) lay
at the lower end of the range of values that have been reported for most graphenes
anodically exfoliated using a number of inorganic or organic electrolytes, such as sulfuric
acid (O/C ratios ~0.08-0.3),17,18,22,30,37
sulfate salts (~0.06-0.19),17,18,22,30,38
phosphoric acid
(~0.3),23
lithium perchlorate (~0.25),22
sodium methanesulfonate (~0.15)39
or sodium citrate
(~0.13).25
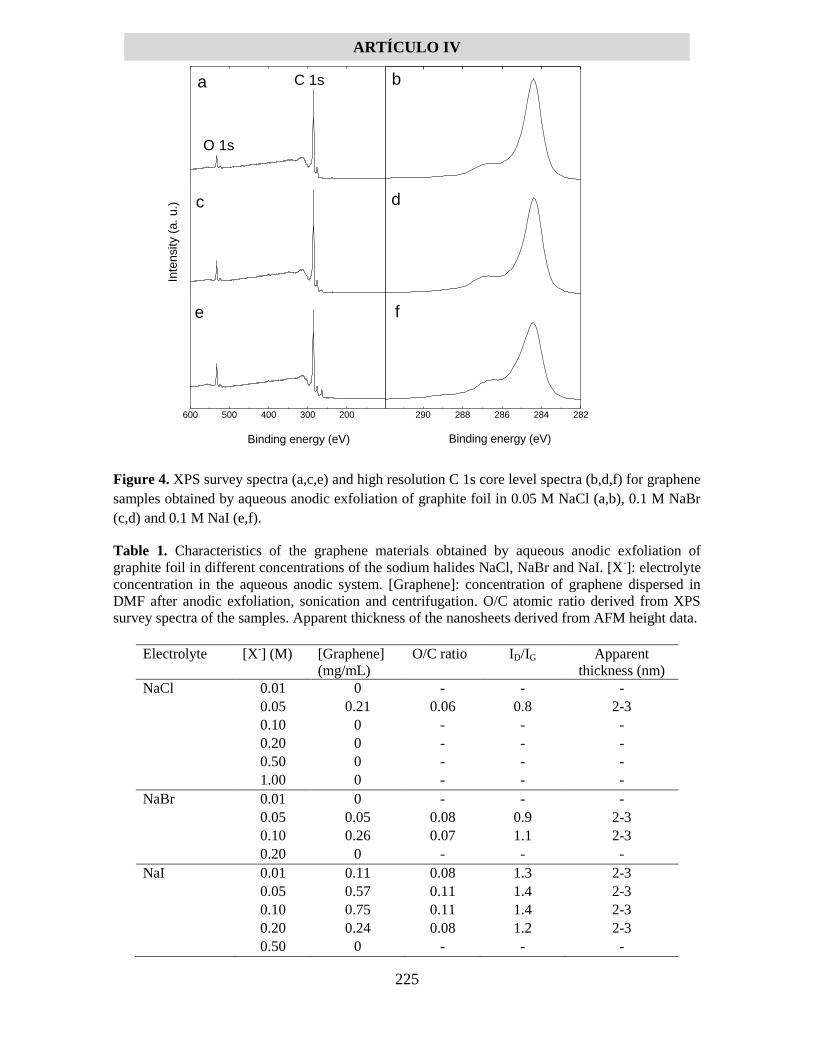
ARTÍCULO IV
225
Figure 4. XPS survey spectra (a,c,e) and high resolution C 1s core level spectra (b,d,f) for graphene
samples obtained by aqueous anodic exfoliation of graphite foil in 0.05 M NaCl (a,b), 0.1 M NaBr
(c,d) and 0.1 M NaI (e,f).
Table 1. Characteristics of the graphene materials obtained by aqueous anodic exfoliation of
graphite foil in different concentrations of the sodium halides NaCl, NaBr and NaI. [X-]: electrolyte
concentration in the aqueous anodic system. [Graphene]: concentration of graphene dispersed in
DMF after anodic exfoliation, sonication and centrifugation. O/C atomic ratio derived from XPS
survey spectra of the samples. Apparent thickness of the nanosheets derived from AFM height data.
Electrolyte [X
-] (M) [Graphene]
(mg/mL)
O/C ratio ID/IG Apparent
thickness (nm)
NaCl 0.01 0 - - -
0.05 0.21 0.06 0.8 2-3
0.10 0 - - -
0.20 0 - - -
0.50 0 - - -
1.00 0 - - -
NaBr 0.01 0 - - -
0.05 0.05 0.08 0.9 2-3
0.10 0.26 0.07 1.1 2-3
0.20 0 - - -
NaI 0.01 0.11 0.08 1.3 2-3
0.05 0.57 0.11 1.4 2-3
0.10 0.75 0.11 1.4 2-3
0.20 0.24 0.08 1.2 2-3
0.50 0 - - -
a
c
b
Inte
nsity (
a.
u.)
600 500 400 300 200
f
Binding energy (eV)Binding energy (eV)
e
d
290 288 286 284 282
O 1s
C 1s
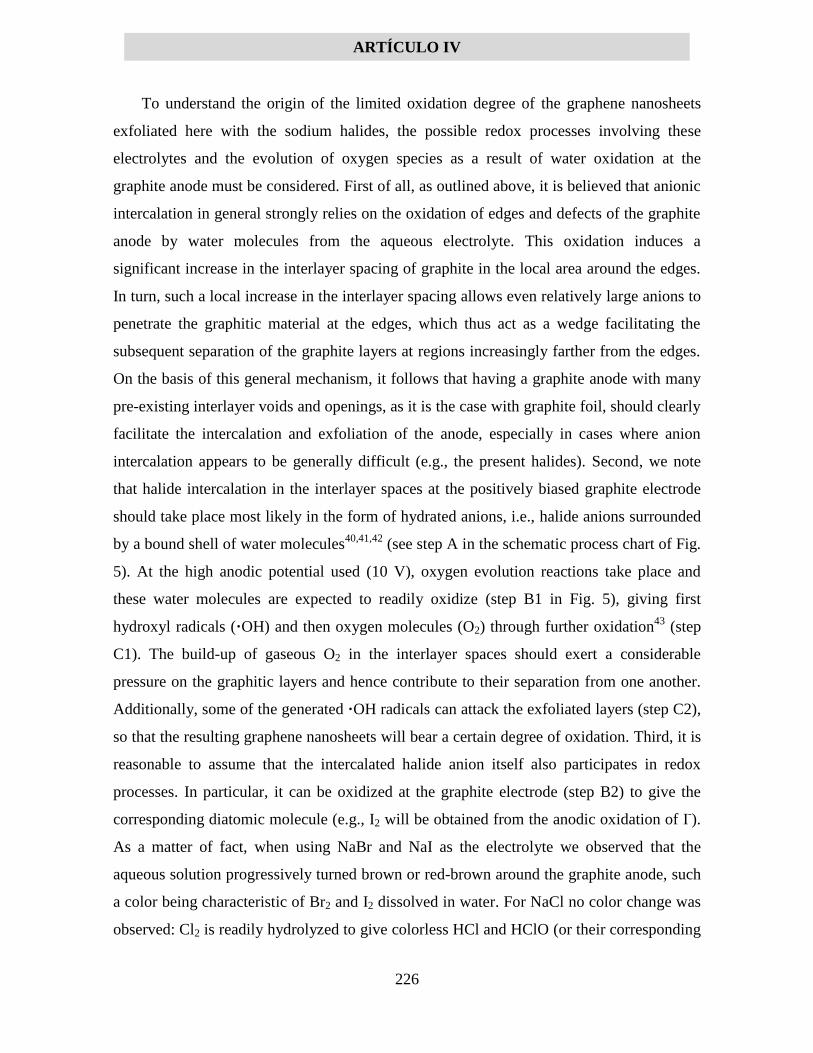
ARTÍCULO IV
226
To understand the origin of the limited oxidation degree of the graphene nanosheets
exfoliated here with the sodium halides, the possible redox processes involving these
electrolytes and the evolution of oxygen species as a result of water oxidation at the
graphite anode must be considered. First of all, as outlined above, it is believed that anionic
intercalation in general strongly relies on the oxidation of edges and defects of the graphite
anode by water molecules from the aqueous electrolyte. This oxidation induces a
significant increase in the interlayer spacing of graphite in the local area around the edges.
In turn, such a local increase in the interlayer spacing allows even relatively large anions to
penetrate the graphitic material at the edges, which thus act as a wedge facilitating the
subsequent separation of the graphite layers at regions increasingly farther from the edges.
On the basis of this general mechanism, it follows that having a graphite anode with many
pre-existing interlayer voids and openings, as it is the case with graphite foil, should clearly
facilitate the intercalation and exfoliation of the anode, especially in cases where anion
intercalation appears to be generally difficult (e.g., the present halides). Second, we note
that halide intercalation in the interlayer spaces at the positively biased graphite electrode
should take place most likely in the form of hydrated anions, i.e., halide anions surrounded
by a bound shell of water molecules40,41,42
(see step A in the schematic process chart of Fig.
5). At the high anodic potential used (10 V), oxygen evolution reactions take place and
these water molecules are expected to readily oxidize (step B1 in Fig. 5), giving first
hydroxyl radicals (·OH) and then oxygen molecules (O2) through further oxidation43
(step
C1). The build-up of gaseous O2 in the interlayer spaces should exert a considerable
pressure on the graphitic layers and hence contribute to their separation from one another.
Additionally, some of the generated ·OH radicals can attack the exfoliated layers (step C2),
so that the resulting graphene nanosheets will bear a certain degree of oxidation. Third, it is
reasonable to assume that the intercalated halide anion itself also participates in redox
processes. In particular, it can be oxidized at the graphite electrode (step B2) to give the
corresponding diatomic molecule (e.g., I2 will be obtained from the anodic oxidation of I-).
As a matter of fact, when using NaBr and NaI as the electrolyte we observed that the
aqueous solution progressively turned brown or red-brown around the graphite anode, such
a color being characteristic of Br2 and I2 dissolved in water. For NaCl no color change was
observed: Cl2 is readily hydrolyzed to give colorless HCl and HClO (or their corresponding
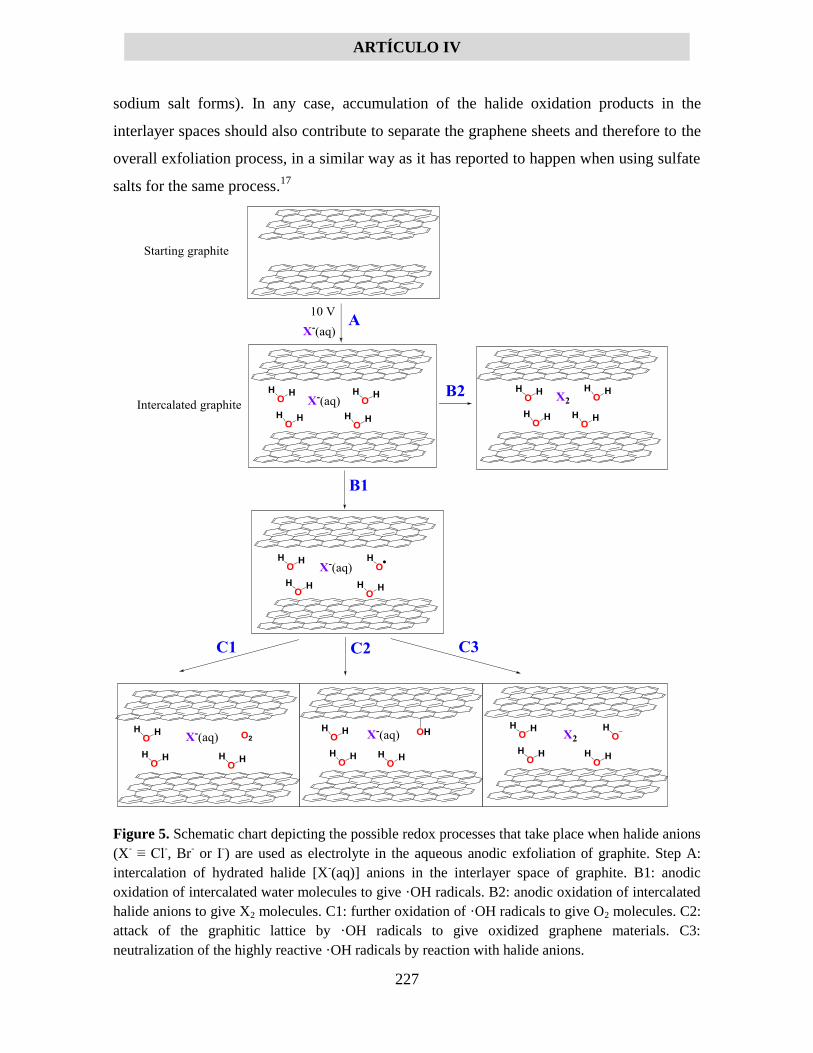
ARTÍCULO IV
227
sodium salt forms). In any case, accumulation of the halide oxidation products in the
interlayer spaces should also contribute to separate the graphene sheets and therefore to the
overall exfoliation process, in a similar way as it has reported to happen when using sulfate
salts for the same process.17
Figure 5. Schematic chart depicting the possible redox processes that take place when halide anions
(X- ≡ Cl
-, Br
- or I
-) are used as electrolyte in the aqueous anodic exfoliation of graphite. Step A:
intercalation of hydrated halide [X-(aq)] anions in the interlayer space of graphite. B1: anodic
oxidation of intercalated water molecules to give ·OH radicals. B2: anodic oxidation of intercalated
halide anions to give X2 molecules. C1: further oxidation of ·OH radicals to give O2 molecules. C2:
attack of the graphitic lattice by ·OH radicals to give oxidized graphene materials. C3:
neutralization of the highly reactive ·OH radicals by reaction with halide anions.

ARTÍCULO IV
228
However, besides reacting directly with the graphite anode, the halide anions can also
be oxidized by the generated ·OH radicals (step C3 in Fig. 5). This reaction is
thermodynamically feasible for the three halides contemplated here. Indeed, the standard
reduction potential of the different halogen/halide pairs in aqueous solution are +1.37 V for
Cl2/Cl-, +1.09 V for Br2/Br
- and +0.54 V for I2/I
-,,44
compared with a value of +1.9 V for the
·OH/OH- pair.43 Furthermore, the oxidation of aqueous Cl
-, Br
- and I
- ions by ·OH radicals
has been well investigated in the past,45,46,47
and such a process is known to involve
conversion of the highly oxidizing ·OH radicals to hydroxide anions (OH-) or water
molecules. The reaction of ·OH radicals with halide anions would thus be expected to
prevent, at least to some extent, the attack of the graphite electrode by the former species,
thus providing a mechanism to mitigate the oxidation of the graphene nanosheets that result
from the anodic treatment. On the other hand, this type of reaction is not expected to occur
when the electrolyte is comprised of a non-oxidizable anion, such as the sulfate, perchlorate
or phosphate anion (for these anions, S, Cl and P are in their corresponding highest possible
oxidation state). Hence, under such circumstances the intercalating anions would not be
able to curtail the oxidation of the graphene lattice. Based on these considerations, we
conclude that the halide anions play a dual role in the anodic exfoliation of graphite to give
graphene nanosheets: (1) they act as intercalating electrolyte to promote the exfoliation of
graphite, and (2) they mitigate the oxidation of the exfoliated graphene nanosheets by
acting as scavengers of the highly reactive oxygen radicals generated during the anodic
process. We also note that the presence of voids and openings in the starting graphite foil
electrode could contribute to mitigate the oxidation of the resulting graphene nanosheets, as
it is expected to make the exfoliation process faster and less reliant on the oxidative
opening of the interlayer spaces compared with the use of more compact types of graphite
(e.g., graphite rods).18,33
In addition to the morphological and chemical analysis, the structural quality of the
anodically exfoliated graphenes was probed by Raman spectroscopy, as illustrated in Fig. 6
for samples prepared with 0.05 M NaCl (a), 0.1 M NaBr (b) and 0.1 M NaI (c). In all
cases, the well-known G and D bands associated to graphite/graphene-based materials and
located at about 1582 and 1350 cm−1
, respectively, were seen to dominate the first-order
region of the spectra (i.e., the 1100–1700 cm−1
region), whereas the main feature observed

ARTÍCULO IV
229
in the second-order region (2300–3300 cm−1
) was the so-called G´ or 2D band (∼2700
cm−1
). As noticed from Table 1, the integrated intensity ratio of the D and G bands (ID/IG
ratio), which is usually taken as a quantitative measure of the structural disorder present in
graphite/graphene materials,48
was seen to differ somewhat between the different graphene
samples. Indeed, the ID/IG ratio tended to positively correlate with the O/C atomic ratio.
Such a result was reasonable considering that anodic oxidation of the graphene nanosheets
should be associated to the covalent grafting of oxygen functional groups on the carbon
lattice (e.g., hydroxyl groups; see XPS results from Fig. 4), which in turn should convert a
fraction of the originally sp2-hybridized carbon atoms to defect-like sp
3-hybridized species.
We note that, in the calculation of the IG value (integrated intensity of the G band), we
explicitly exclude the contribution of the D´ band, which appears as a shoulder on the high
wavenumber side of the G band (~1620 cm-1). Because we are calculating the ID/IG ratio
and not the ID/(IG+ID´) ratio, we first have to determine the areas associated to the G and D´
bands through a peak-fitting procedure. This implies that the actual area of the G band is
obviously smaller than the area of the composite (G+D´) envelope. As a result, the ID/IG
ratios given in Table 1 might appear to be somewhat larger than the values an observer
would guess through direct visual inspection of the spectra shown in Fig. 6. We also
measured the electrical conductivity of free-standing, paper-like graphene films obtained
through vacuum filtration of the corresponding dispersions in water/FMN. For example, the
conductivities of films made up of nanosheets obtained via exfoliation in 0.1 M NaBr (~10
µm thick, as determined by FE-SEM) and 0.1 M NaI (~12 µm thick) were 15220 and 6750
S m-1
, respectively. These values were lower by a factor of ~3-6 than those previously
reported for films derived from completely defect-free, pristine graphene flakes produced
by direct ultrasound-induced exfoliation of graphite in water/FMN solutions,34
which can
be attributed to the somewhat defected nature of the present anodically exfoliated materials.
On the other hand, they were similar to the conductivity values measured beforehand for
films made up of pristine graphene flakes prepared by ultrasound-exfoliation in water with
such stabilizers as sodium dodecylbenzenesulfonate (~1500 S m-1
),49
sodium cholate
(~15000 S m-1
),50
sodium taurodeoxycholate (~13000 S m-1
)51
or gum Arabic (~10000 S m-
1)52
. We note that these prior values could only be obtained after removing at least part of
the stabilizer from the as-filtered films through an appropriate treatment (e.g., high

ARTÍCULO IV
230
temperature annealing under inert or reducing atmosphere), whereas no post-treatment of
the films was required in the present case to achieve similar conductivity results.
Figure 6. Raman spectra of graphene samples prepared by aqueous anodic exfoliation of graphite
foil in 0.05 M NaCl (a), 0.1 M NaBr (b) and 0.1 M NaI (c).
2.3. Use of halide-based anodically exfoliated graphene in energy- and environment-
related applications
Owing to their high surface area, good electrical conductivity as well as prominent
chemical, mechanical and thermal stability, graphene materials are widely investigated
towards their implementation in a number of environment- and energy-related applications,
including their use as sorbents for oils and water-soluble organic compounds (e.g., dyes),53
or as electrodes for supercapacitors and Li-ion batteries.54
Central to a successful
performance in many of these applications is the ability to assemble the graphene sheets
into three-dimensional, macroscopic and porous structures in which the accessible area of
each individual sheet is retained to the largest possible extent. This has been typically
accomplished via appropriate processing of graphene oxide nanosheets or through CVD
protocols that make use of metal foams as templates,55
but such strategies are generally
a
c
b
Inte
nsity (
a. u
.)
1500 2000 2500 3000
Raman shift (cm-1)
D
G
2D

ARTÍCULO IV
231
time-consuming, elaborate and/or costly. As an alternative that could be competitive in
terms of both performance and cost, we propose to use the as-exfoliated graphene materials
developed here for some of the mentioned applications. Before their dispersion in any
solvent via sonication, these materials exhibit a foam-like appearance (Fig. 7a), with an
estimated density of ~40-45 mg cm-3
, and are comprised of expanded and loosely
connected graphene layers having micrometer- to nanometer-sized gaps in-between (Fig.
1d and inset to Fig. 7a). The extremely simple and expeditious nature of their preparation
process (just anodic treatment of graphite foil in sodium halide electrolyte) could facilitate
the large-scale deployment of such graphene products in many practical uses. Thus, to
probe their potential, we examined their performance as adsorbents for dyes and non-polar
organic solvents/oils, as well as electrodes for supercapacitors. The material exfoliated in
0.1 M NaI was selected for these studies mainly because it affords the largest amount of
graphene products among all the tested electrolytes (see Table 1), which is advantageous
from the viewpoint of applications.
Figure 7. Digital photograph of as-prepared anodically exfoliated graphene using 0.1M NaI as
electrolyte (a), SEM image of the same material (inset), adsorption capacities of this material for
different dyes (b) and weight gains of the material for different solvents and oils (c).
0
200
400
600
800
1000
Met
hy
lene
Blu
e
Bas
ic F
uch
sin
Met
hy
l O
rang
e
Rho
dam
in BA
dso
rpti
on
ca
pa
city
(m
g g
-1)
0
5
10
15
20
25
30
To
luen
eH
exan
eD
od
ecan
eT
etra
hyd
rofu
ran
Ace
ton
eC
hlo
rofo
rmE
thyle
ng
lyco
lE
than
ol
Oli
ve
Oil
Pu
mp
Oil
(n
ew)
Pu
mp
Oil
(u
sed)
Wei
gh
t g
ain
(g
g-1
)
300 μm
a b c

ARTÍCULO IV
232
Fig. 7b shows the adsorption capacity of the as-exfoliated graphene product towards
several dyes in aqueous solution, namely, rhodamine B, basic fuchsin, methylene blue and
methyl orange, measured at room temperature (295 K) and pH ~6. For the three cationic
dyes (i.e., rhodamine B, basic fuchsin and methylene blue), values between 300 and 400
mg g-1
were obtained, being comparable to or even higher than those of many graphene-
based adsorbent materials that have been previously reported.7,53,56,57,58
In most prior work,
however, the adsorbents typically comprised graphene oxide or reduced graphene oxide
nanosheets, which favored adsorption through electrostatic attraction between the positively
charged dyes and the negatively charged (ionizable) oxygen functional groups present in
the nanosheets (e.g., carboxylates), with - stacking probably also playing some role.53,57
On the other hand, although an electrostatic component could certainly be in place for the
present anodically exfoliated materials by virtue of their non-negligible oxidation, we
believe dye adsorption to be more reliant on - interactions in this case. This is because
anodically exfoliated graphenes tend to possess a more graphitic (electronically conjugated)
character than that of graphene oxides/reduced graphene oxides with a similar or even
smaller extent of oxidation.59
Furthermore, the adsorption capacity measured for the
anionic dye methyl orange was substantially higher than that of its cationic counterparts
(~920 mg g-1
), a result that is not consistent with a predominance of negatively charged
adsorption sites on the graphene sheets. To the best of our knowledge, the adsorbed amount
of methyl orange was the highest ever reported for a graphene-based adsorbent. The
different adsorption performance of the anodically exfoliated material towards methyl
orange and the three other dyes is currently not understood, but we hypothesize that it is
related to differences in packing densities of the molecules on the graphene surface. A
comparison of dye adsorption capacities of different graphene-based materials from the
literature is provided in Table S1 of the Electronic Supplementary Information. Likewise,
due to its primarily hydrophobic nature, the anodically exfoliated material was a good
sorbent for non-polar organic solvents and oils, such as toluene, hexane, dodecane,
tetrahydrofuran, acetone, chloroform, ethylenglycol, ethanol, olive oil or pump oil, with the
measured sorption capacities ranging between ~12 and 24 g g-1
(Fig. 7c). Although such
values are lower than those of lighter graphene and other carbon-based sorbents reported in
the literature (e.g., lightweight graphene aerogels), they are comparable to those of sorbents

ARTÍCULO IV
233
with a similar density.7,56,60
Nonetheless, we expect that the oil sorption performance of the
anodically exfoliated materials can be significantly improved on the basis of simple
strategies, such as working with starting graphite foils of a lower density (densities down to
~0.05 g cm-3
have been reported, compared to a value of 0.7-1.3 g cm-3
for the foils used
here). Because the use of a graphene or any other material in environmental applications
could require such material to be non-cytotoxic, we also explored the biocompatibility of
the present graphenes. In particular, we investigated the proliferation of murine fibroblasts
onto halide-based graphene film substrates. The results (see SI) suggested these materials to
be biocompatible.
Finally, the as-exfoliated graphene material was explored as a supercapacitor electrode
in aqueous 1 M H2SO4 electrolyte (two-electrode configuration). The recorded cyclic
voltammetry (CV) curves (Fig. 8a) exhibited an almost rectangular shape with negligible
deviation at the limit potentials, even for a voltage window as wide as 1.4 V (CV curves
were also obtained in a three-electrode configuration, and are presented and discussed in
the Electronic Supplementary Information). This rather unusual, wide operation voltage
was further confirmed by charging-discharging the supercapacitor cell at 0.1 A g-1
. As
noticed from Fig. 8b, the galvanostatic charge-discharge profiles kept a triangular form
when the voltage was gradually increased from 1.1 to 1.4 V. We note that the working
voltage window of two-electrode symmetric cells using aqueous electrolytes is generally
limited by the electrolytic decomposition of water to values ~1 V.61
In particular, a voltage
window of 1.4 V is considerably larger than that usually observed for porous carbon-based
aqueous supercapacitors. For conventional porous carbons (e.g., activated carbons),
although physisorption can furnish the water molecules with some degree of stability
against electrolytic decomposition, the extensive presence of amorphous and/or highly
defective structures in their lattice, which act as reactive chemisorption sites, tends to
promote water electrolysis. On the other hand, such reactive sites are expected to be much
less abundant in the as-exfoliated graphene materials investigated here due to their well-
preserved graphitic character (Fig. 6). This feature, together with the particular morphology
of voids and pores observed for this material (inset to Fig. 7a), is believed to contribute to a
broader voltage window.

ARTÍCULO IV
234
Figure 8. Supercapacitor performance tests for the halide-exfoliated graphite foil (0.1M NaI); a)
cyclic voltammetry curves and b)galvanostatic charge-discharge profiles at different potential
windows, c) Ragone plot for the exfoliated graphite and for some representative graphene-derived
porous structures and d) cycling stability of the symmetric supercapacitor at 1 A/g over 2500 cycles.
The evolution of electrode performance with current density was also investigated on
the basis of charge-discharge tests at 1.4 V, and the results were used for the construction of
the Ragone plot shown in Fig. 8c. Even though the cells yielded modest values of specific
capacitance (e.g., 50 F g-1
at 0.1 A g-1
), the fact that the device could be operated at a
relatively high voltage led to remarkable energy and power density characteristics, with
a
0.0 0.4 0.8 1.2
-150
-100
-50
0
50
100
150
Cap
acita
nce
(F/g
)
Voltage (V)
1.1 V 1.3 V
1.2 V 1.4 V
b
-600 -400 -200 0 200 400 600
0.2
0.4
0.6
0.8
1.0
1.2
1.4
Vol
tage
(V)
time (sec)
1.1 V
1.2 V
1.3 V
1.4 V
d
-20 -10 0 10 20
0.2
0.4
0.6
0.8
1.0
1.2
1.4
time (sec)
Vol
tage
(V
)
100 cycles
5000 cycles
101
102
103
104
105
100
101
102
En
ergy
Den
sity
(W
h k
g-1)
K1T8ref [10]
3D graphene ref [6]
RGO/CMK5 ref [9]
Power Density (W Kg-1)
GH-Hz8 ref [2]
Expanded graphite
U-GAsref [5]
HPGF 600 ref [3]
BN-GAsref [5]
RGOref [7]
RGORuO2/PANI ref [7]
SSGref [8]
e-CMGref [4]
C Halide-based anodic graphene (this work)
Ref. 65
Ref. 65
Ref. 64
Ref. 68
Ref. 66
Ref. 62
Ref. 63
Ref. 68
Ref. 67
Ref. 70
Ref. 69

ARTÍCULO IV
235
values up to 15.3 Wh kg-1
and 3220 W kg-1
, respectively. Such a good capacitive behavior
was made apparent by comparison to other similar graphene-based materials that have been
previously reported (also given in Fig. 8c). For example, the power and energy densities
delivered by the present graphene material were comparable or even higher than those of
many three-dimensional graphene structures (such as graphene aerogels),62,63,64,65,66
graphene films,67
graphene compounded with electroactive materials (e.g., polyaniline),68
or graphene/porous carbon hybrids.69,70
It is important to note that in addition to
competitive performance, a critical advantage of the present graphene materials lies in the
extreme simplicity and environmental friendliness of their preparation compared with that
of other graphene materials that rely on harsh chemical treatments (e.g, those based on
graphene oxide), high temperatures and/or complex processing strategies (e.g., supercritical
or freeze drying). Additional evidence of the cell stability was demonstrated on the basis of
cycling tests (Fig. 8d), which revealed that ~98% of the initial capacitance was retained
after 5000 cycles at 1 A g-1
. The plots in Fig. 8d suggest a significant internal resistance
(IR) drop in the cell, which is discussed in the Supporting Information. In any case, we
believe that the approach described here could greatly facilitate the practical
implementation of graphene materials towards supercapacitor applications.
3. Conclusions
We have demonstrated that sodium halides (NaCl, NaBr and NaI) are efficient
electrolytes in the aqueous anodic exfoliation of graphite, affording single-/few-layer
graphene nanosheets of a high structural quality and limited oxygen content. The successful
role of these salts as exfoliating electrolytes was seen to rely on two key aspects. First, a
proper selection of the graphite source material was required, in particular graphites having
many openings, gaps and inner voids in their structure. In this regard, graphite foil (a
modestly priced commodity) turned out to be an appropriate choice. Second, identification
of an operative range of salt concentrations was also critical towards successful exfoliation.
Such a range was seen to be particularly tight in the case of NaCl and NaBr. In addition to
their role as exfoliating electrolyte, the halide anions were concluded to act as sacrificial
agents that prevented the extensive oxidation of the graphene lattice during anodic
exfoliation. Such an oxidation-preventing ability was ascribed to the relatively low redox

ARTÍCULO IV
236
potentials of these anions. Significantly, the as-exfoliated graphene materials exhibited a
three-dimensional morphology that allowed their direct use in a number of energy- and
environment-related applications, thus avoiding the complex processing steps that are
usually required for many graphene-based materials. Testing of the halide-derived graphene
products as dye adsorbents, as sorbents for oils and non-polar organic solvents, and as
electrodes for supercapacitors revealed a performance comparable to or even higher than
that frequently reported for different types of graphene (e.g., those obtained from graphite
oxide). Cell proliferation tests also indicated a good biocompatibility of the halide-derived
graphenes. Overall, we believe that the extremely simple and environmentally friendly
nature of the production/processing method of graphene described here, combined with a
competitive performance of the material in some relevant applications, constitutes a
significant step forward towards the practical implementation of graphene in many real-life
applications. Further efforts to improve the performance of the graphene materials in these
and other applications along the lines proposed in this work are currently under way.
4. Experimental
4.1. Materials and reagents
Graphite anodes used throughout the study consisted of high purity graphite foil
(Papyex I980, acquired from Mersen). For comparison purposes, highly oriented pyrolytic
graphite (HOPG; grade ZYH, obtained from Advanced Ceramics) and natural graphite
flakes (Sigma-Aldrich, ref. 332461) were also employed. NaCl, NaBr and NaI solutions in
Milli-Q water were used as electrolytes. N,N-dimethylformamide (DMF) was used as a
dispersing solvent for graphene, and flavin mononucleotide (FMN, riboflavin 5′-
monophosphate sodium salt) was used as a stabilizer to colloidally disperse the graphene
flakes in aqueous medium. All these chemicals were purchased from Sigma-Aldrich and
used as received.
4.2. Aqueous anodic exfoliation of graphite using sodium halides as the electrolyte
The anodic exfoliation process was carried out in a two-electrode configuration, using
a piece of graphite foil (dimensions: 40×25×0.5 mm3) as the anode and a platinum foil
(dimensions: 25×25×0.025 mm3) as the cathode. HOPG pieces and graphite flake pellets

ARTÍCULO IV
237
were also used as anodes. In all cases both anode and cathode were held by spring clips
connected to the current source. Both electrodes were immersed in an aqueous solution (20
mL) of a sodium halide (NaCl, NaBr or NaI) at a certain concentration (specified below). A
positive voltage (10 V) was then applied to the graphite anode for 60 min using an Agilent
6614C DC power supply. The platinum foil cathode was placed parallel to the graphite foil
surface at a distance of about 2 cm. During this process, gas bubbles formed in both
electrodes, with the graphite anode being typically seen to expand and release graphitic
fragments from its surface. After the 60 min electrolysis period, the resulting expanded
graphitic product was gently rubbed off from the graphite anode using a spatula, thoroughly
rinsed with copious amounts of Milli-Q water and ethanol to remove residual salts as well
as other products of the electrochemical reaction and then dried overnight at room
temperature under reduced pressure. Subsequently, this expanded material was sonicated in
a given volume (20 mL) of either DMF or aqueous FMN solution (1 mg mL-1
) for 3 hours
(Selecta Ultrasons system, 40 kHz), and then the resulting dispersion was centrifuged at
200 g for 20 min (Eppendorf 5424 microcentrifuge) to sediment insufficiently exfoliated
material. The obtained supernatant was collected and stored for further use. In the case of
the FMN-stabilized aqueous dispersions, they were further purified (to remove the fraction
of free, non-adsorbed FMN from the medium) by two cycles of sedimentation via
centrifugation (20000 g, 20 min) and re-suspension in Milli-Q water with a brief sonication
step.
4.3. Characterization techniques
Characterization of the graphene samples was carried out by means of UV-vis
absorption spectroscopy, Raman spectroscopy, X-ray photoelectron spectroscopy (XPS),
field emission scanning electron microscopy (FE-SEM), scanning transmission electron
microscopy (STEM), atomic force microscopy (AFM) and measurement of electrical
conductivity. UV-vis absorption spectroscopy was carried out with a double-bean Heλios α
spectrophotometer, from Thermo Spectronic. Following previous reports,18,34
the
suspension concentration was estimated by means of UV-vis absorption spectroscopy on
the basis of the Lambert-Beer law and using a value of 2440 mL mg-1
m-1
for the extinction
coefficient at the measured wavelength of 660 nm. Raman spectra were acquired with a
ARTÍCULO IV
238
Horiba Jobin-Yvon LabRam instrument at an incident power of 2.5 mW and using a laser
excitation wavelength of 532 nm. XPS measurements were performed on a SPECS
apparatus at a pressure of 10-7
Pa and using a non-monochromatic Mg K X-ray source
(11.81 kV, 100 W). Samples for both Raman spectroscopy and XPS were prepared by
drop-casting the corresponding aqueous, FMN-stabilized graphene dispersion onto a pre-
heated (~50-60 ºC) circular stainless steel sample-holder 12 mm in diameter to give thin,
macroscopic graphene films. XPS survey spectra were used to determine the overall
elemental composition of the graphene samples in such films. Although XPS is a surface-
sensitive technique that only probes the outermost surface layer of materials (a few to
several nanometers deep), in the case of graphene samples prepared from colloidal
dispersions it can be inferred that the elemental compositions derived from XPS are
representative of the whole sample. Because the colloidal graphene suspensions used to
prepare the thin films are expected to be spatially homogeneous, there is no reason to
believe that the graphene nanosheets constituting the other surface of the formed films are
not representative of the whole graphene sample, i.e., the graphene sheets probed in the
XPS measurement must be representative of the sample as a whole. Also, because the
thickness of the graphene nanosheets is generally comparable to the probing depth of XPS,
this technique must probe individual graphene nanosheets in its entirety, and not just the
outer surface of nanosheets. Having these two factors in mind, we have to conclude that
survey XPS spectra must provide a reasonably accurate picture of the elemental
composition of this type of graphene samples. FE-SEM and STEM imaging was
accomplished with a Quanta FEG 650 system (FEI Company) operated at 20-30 kV.
Specimens for STEM were prepared by mixing a given volume of aqueous graphene
suspension with an equal volume of ethanol, and then 40 L of the resulting water-ethanol
dispersion were drop-cast onto copper grids (200 mesh) covered with a thin continuous film
of amorphous carbon. AFM images were recorded on a Nanoscope IIIa Multimode
apparatus (Veeco Instruments) in the tapping mode of operation under ambient conditions.
Rectangular silicon cantilevers with nominal spring constant and resonance frequency
values of ~40 N m-1
and 250-300 kHz, respectively, were employed. HOPG pieces or
SiO2(300 nm)/Si wafers were used as substrates in the preparation of specimens for AFM.
To this end, a small volume (20-40 L) of the graphene dispersion at a concentration of

ARTÍCULO IV
239
~0.05 mg mL-1
was drop-cast onto the HOPG or SiO2/Si substrate pre-heated at ~50-60 ºC
and then allowed to dry. For the measurement of electrical conductivity, free-standing
paper-like films were prepared from the aqueous graphene dispersions by vacuum filtration
through silver membrane filters 25 mm in diameter and 0.2 m in pore size (Sterlitech
Corporation). Conductivity was determined through the van der Pauw method by means of
a homemade setup (Agilent 6614C potentiostat and Fluke 45 digital multimeter) with
12×12 mm2 square pieces that were cut from the free-standing films. The thickness of the
films was estimated by FE-SEM.
4.4. Testing of as-prepared anodically exfoliated graphene in energy and environmental
applications
The graphene material obtained by anodic exfoliation in 0.1 M NaI was tested as an
adsorbent for water-soluble dyes as well as for non-polar organic solvents and oils, and as
an electrode for supercapacitors. To this end, the as-exfoliated product, i.e. the material
directly generated by the anodic treatment without subsequent sonication (only washed to
remove remnants of the electrolyte), was used. For the dye adsorption experiments, ~10 mg
of the graphene material was added to 10 mL of an aqueous solution of the dye (rhodamine
B, basic fuchsin, methylene blue and methyl orange) at room temperature and pH ~6,
which was then gently stirred with a magnetic bar for 48 h to ensure that the adsorption
equilibrium was attained. After removal of the graphene component via centrifugation
(10000 g, 10 min), the concentration of dye remaining in the aqueous solution was
determined through UV-vis absorption spectroscopy on the basis of absorption peaks
characteristic of each dye (located at ~555 nm for rhodamine B, 540 nm for basic fuchsin,
660 nm for methylene blue and 460 nm for methyl orange), which in turn was used to infer
the amount of dye adsorbed on the graphene sample. To estimate maximum adsorption
capacities, different starting concentrations of the dye were probed (typically up to 1-2 mg
mL-1
). For the oil/non-polar organic solvent sorption experiments, a certain amount of the
graphene material (~5 mg) was placed in a 1.5 mL centrifuge tube, and then small known
volumes of the oil/organic solvent (typically ~80-140 L) were added in succession. These
volumes were quickly absorbed by the graphene sample until a saturation point was
reached, which was used to estimate the amount retained by the graphene sorbent. Sorption

ARTÍCULO IV
240
assays were carried out with the following compounds: toluene, hexane, dodecane,
tetrahydrofuran, acetone, chloroform, ethylenglycol, ethanol, olive oil, new and used pump
oil.
For the supercapacitor electrode tests, the as-exfoliated graphene material was hand-
ground to obtain a homogeneous powder that was subsequently mixed with
polytetrafluoroethylene (PTFE) in absolute ethanol to obtain a carbon paste
(graphene:PTFE weight ratio of 8:1). This paste (~7 mg) was pressed in a mould under 1
ton for 15 s to obtain two circular pellets (~0.78 cm2) with similar mass and thickness. The
pellets were degassed at 100 ºC under vacuum for 4h, soaked into the electrolyte (1 M
H2SO4) for 24 h, and then used as symmetric working electrodes in a two-electrode
Swagelok-type with glass microfiber filter (grade 934-AH, from Whatman) acting as the
separator. The supercapacitor performance was tested by means of a computer-controlled
potentiostat (PGZ 402 Voltalab, from Radiometer Analytical). Cyclic voltammetry (CV)
tests were performed at 10 mV s-1
and different voltage windows. Galvanostatic charge-
discharge profiles were recorded up to different voltages (1.1-1.4 V) and at different current
loads (0.1-6 A g-1
). Long-term stability tests were carried out by cycling the cell at a
constant current density of 1 A g-1
for 5000 cycles. The gravimetric capacitance, CS (F g-1
)
of a single electrode was calculated on the basis of the following formula:
𝐶𝑆 =2 𝐼 ∆𝑡𝑑
𝑚 ∆𝑉𝑑 (1)
, where I is the current (A), ∆td is the time of discharge at the fixed potential window (s), m
is the mass of the active material within the working electrode (g) and ∆Vd is the potential
difference (V) between start and finish of the discharge process after omitting the internal
resistance (IR) drop. The gravimetric energy density of the electrode, E (Wh kg-1
), was
calculated through the formula:
𝐸 = 1
2 𝐶𝐶𝐸𝐿𝐿∆𝑉𝑑
2 (2)
ARTÍCULO IV
241
, where CCELL is the gravimetric capacitance of the total cell (F g-1
). Finally, the gravimetric
power density, P (W kg-1
), was calculated by applying the following equation:
𝑃 =𝐸
∆𝑡𝑑 (3)
Supporting Information
Cell proliferation tests of murine fibroblasts grown onto halide-based graphene substrates.
Characterization of as-exfoliated graphene material by N2 physisorption. Additional XPS
data of the exfoliated graphenes. Three electrode characterization of as-prepared anodically
exfoliated graphene. Discussion of IR drop contribution to the supercapacitor cell
performance. Table comparing adsorption capacities of dyes with different graphene-based
materials.
Corresponding Author
*Telephone: (+34) 985 11 90 90. Fax: (+34) 985 29 76 62. Email:
Acknowledgements
Financial support from both the Spanish Ministerio de Economía y Competitividad
(MINECO) and the European Regional Development Fund (ERDF) through grant
MAT2015-69844-R is gratefully acknowledged. We also acknowledge partial funding by
both Plan de Ciencia, Tecnología e Innovación 2013-2017 del Principado de Asturias and
the ERDF through Project GRUPIN14-056. This work was also partially funded by project
“AIProcMat@N2020 - Advanced Industrial Processes and Materials for a Sustainable
Northern Region of Portugal 2020” (NORTE-01-0145-FEDER-000006), supported by
Norte Portugal Regional Operational Programme (NORTE 2020), under the Portugal 2020
Partnership Agreement, through the European Regional Development Fund (ERDF) and of
Project POCI-01-0145-FEDER-006984 – Associate Laboratory LSRE-LCM funded by
ERDF through COMPETE2020 - Programa Operacional Competitividade e
Internacionalização (POCI) – and by national funds through FCT - Fundação para a Ciencia

ARTÍCULO IV
242
e a Tecnologia. A.P. thanks her research contract partially supported (80%) by the
ERDF/FEDER Operative Programme of the Region of Murcia (Project No. 14-20-01).
J.M.M. is grateful to the Spanish Ministerio de Educación, Cultura y Deporte (MECD) for
his pre-doctoral contract (FPU14/00792).
References
1 Ferrari, A. C.; Bonaccorso, F.; Fal'ko, V.; Novoselov, K. S.; Roche, S.; Boggild, P.;
Borini, S.; Koppens, F. H. L.; Palermo, V.; Pugno, N.; Garrido, J. A.; Sordan, R.; Bianco,
A.; Ballerini, L.; Prato, M.; Lidorikis, E.; Kivioja, J.; Marinelli, C.; Ryhanen, T.; Morpurgo,
A.; Coleman, J. N.; Nicolosi, V.; Colombo, L.; Fert, A.; Garcia-Hernandez, M.; Bachtold,
A.; Schneider, G. F.; Guinea, F.; Dekker, C.; Barbone, M.; Sun, Z.; Galiotis, C.;
Grigorenko, A. N.; Konstantatos, G.; Kis, A.; Katsnelson, M.; Vandersypen, L.; Loiseau,
A.; Morandi, V.; Neumaier, D.; Treossi, E.; Pellegrini, V.; Polini, M.; Tredicucci, A.;
Williams, G. M.; Hee Hong, B.; Ahn, J.-H.; Min Kim, J.; Zirath, H.; van Wees, B. J.; van
der Zant, H.; Occhipinti, L.; Di Matteo, A.; Kinloch, I. A.; Seyller, T.; Quesnel, E.; Feng,
X.; Teo, K.; Rupesinghe, N.; Hakonen, P.; Neil, S. R. T.; Tannock, Q.; Lofwander, T.;
Kinaret, J. Science and Technology Roadmap for Graphene, Related Two-Dimensional
Crystals, and Hybrid Systems. Nanoscale 2015, 7, 4598-4810.
2 Zhang, Y.; Zhang, L.; Zhou, C. Review of Chemical Vapor Deposition of Graphene and
Related Applications. Acc. Chem. Res. 2013, 46, 2329-2339.
3 Zhong, Y. L.; Tian, Z.; Simon, G. P.; Li, D. Scalable Production of Graphene Via Wet
Chemistry: Progress and Challenges. Mater. Today 2015, 18, 73-78.
4 Du, W.; Jiang, X.; Zhu, L. From Graphite to Graphene: Direct Liquid-Phase Exfoliation
of Graphite to Produce Single- and Few-Layered Pristine Graphene. J. Mater. Chem. A
2013, 1, 10592-10606.
5 Chen, L.; Xu, Z.; Li, j.; Li, Y.; Shan, M.; Wang, C.; Wang, Z.; Guo, Q.; Liu, L.; Chen,
G.; Qian, X. A Facile Strategy to Prepare Functionalized Graphene Via Intercalation,
Grafting and Self-Exfoliation of Graphite Oxide. J. Mater. Chem. 2012, 22, 13460-13463
6 Pei, S.; Cheng, H.-M. The Reduction of Graphene Oxide. Carbon 2012, 50, 3210-3228.
7 Niu, L.; Coleman, J. N.; Zhang, H.; Shin, H.; Chhowalla, M.; Zheng, Z. Production of
Two-Dimensional Nanomaterials Via Liquid-Based Direct Exfoliation. Small 2016, 12,
272-293
8 Abdelkader, A. M.; Cooper, A. J.; Dryfe, R. A. W.; Kinloch, I. A. How to Get Between
the Sheets: a Review of Recent Works on the Electrochemical Exfoliation of Graphene
Materials from Bulk Graphite. Nanoscale 2015, 7, 6944-6956.

ARTÍCULO IV
243
9 Yang, S.; Lohe, M. R.; Müllen, K.; Feng, X. New-Generation Graphene from
Electrochemical Approaches: Production and Applications. Adv. Mater. 2016, 28, 6213-
6221.
10 Abdelkader, A. M.; Kinloch, I. A.; Dryfe, R. A. W. Continuous Electrochemical
Exfoliation of Micrometer-Sized Graphene Using Synergistic Ion Intercalations and
Organic Solvents. ACS Appl. Mater. Interfaces 2014, 6, 1632-1639.
11 Cooper, A. J.; Wilson, N. R.; Kinloch, I. A.; Dryfe, R. A. W. Single Stage
Electrochemical Exfoliation Method for the Production of Few-Layer Graphene Via
Intercalation of Tetraalkylammonium Cations. Carbon 2014, 66, 340-350.
12 Ali Reza Kamali, A. R., Fraya, D. J. Large-Scale Preparation of Graphene by High
Temperature Insertion of Hydrogen into Graphite. Nanoscale, 2015, 7, 11310-11320
13 Kim, H. K.; Kamali, A. R.; Roh, K. C.; Kim, K. B.; Fray, D. J. Dual Coexisting
Interconnected Graphene Nanostructures for High Performance Supercapacitor
Applications. Energy Environ. Sci. 2016, 9, 2249-2256
14 Abdelkader, A. M.; Patten, H. V.; Li, Z.; Chen, Y.; Kinloch, I. A. Electrochemical
Exfoliation of Graphite in Quaternary Ammonium-Based Deep Eutectic Solvents: a Route
for the Mass Production of Graphane. Nanoscale, 2015, 7, 11386-11392
15 Lu, J.; Yang, J.-x.; Wang, J.; Lim, A.; Wang, S.; Loh, K. P. One-Pot Synthesis of
Fluorescent Carbon Nanoribbons, Nanoparticles, and Graphene by the Exfoliation of
Graphite in Ionic Liquids. ACS Nano 2009, 3, 2367-2375.
16 Su, C.-Y.; Lu, A.-Y.; Xu, Y.; Chen, F.-R.; Khlobystov, A. N.; Li, L.-J. High-Quality
Thin Graphene Films from Fast Electrochemical Exfoliation. ACS Nano 2011, 5, 2332-
2339.
17 Parvez, K.; Wu, Z.-S.; Li, R.; Liu, X.; Graf, R.; Feng, X.; Müllen, K. Exfoliation of
Graphite into Graphene in Aqueous Solutions of Inorganic Salts. J. Am. Chem. Soc. 2014,
136, 6083-6091.
18 Munuera, J. M.; Paredes, J. I.; Villar-Rodil, S.; Ayán-Varela, M.; Pagán, A.; Aznar-
Cervantes, S. D.; Cenis, J. L.; Martínez-Alonso, A.; Tascón, J. M. D. High Quality, Low
Oxygen Content and Biocompatible Graphene Nanosheets Obtained by Anodic Exfoliation
of Different Graphite Types. Carbon 2015, 94, 729-739.
19 Najafabadi, A. T.; Gyenge, E. Synergistic Production of Graphene Microsheets by
Simultaneous Anodic and Cathodic Electro-Exfoliation of Graphitic Electrodes in Aprotic
Ionic Liquids. Carbon, 2015, 84, 449-459

ARTÍCULO IV
244
20 Najafabadi, A. T.; Ng, N.; Gyenge, E. High-Yield Graphene Production by
Electrochemical Exfoliation of Graphite: Novel Ionic liquid (IL)–Acetonitrile Electrolyte
With Low IL Content. Carbon, 2014, 71, 58-69
21 Najafabadi, A. T.; Gyenge, E. Electrochemically Exfoliated Graphene Anodes with
Enhanced Biocurrent Production in Single-Chamber Air-Breathing Microbial Fuel Cells.
Biosens. Bioelectron. 2016, 81, 103-110
22 Ambrosi, A.; Pumera, M. Electrochemically Exfoliated Graphene and Graphene Oxide
for Energy Storage and Electrochemistry Applications. Chem. - Eur. J. 2016, 22, 153-159.
23 Liu, J.; Poh, C. K.; Zhan, D.; Lai, L.; Lim, S. H.; Wang, L.; Liu, X.; Gopal Sahoo, N.;
Li, C.; Shen, Z.; Lin, J. Improved Synthesis of Graphene Flakes From the Multiple
Electrochemical Exfoliation of Graphite Rod. Nano Energy 2013, 2, 377-386.
24 Wu, L.; Li, W.; Li, P.; Liao, S.; Qiu, S.; Chen, M.; Guo, Y.; Li, Q.; Zhu, C.; Liu, L.
Powder, Paper and Foam of Few-Layer Graphene Prepared in High Yield by
Electrochemical Intercalation Exfoliation of Expanded Graphite. Small 2014, 10, 1421-
1429.
25 Abdelkader, A. M.; Kinloch, I. A.; Dryfe, R. A. W. High-Yield Electro-Oxidative
Preparation of Graphene Oxide. Chem. Commun. 2014, 50, 8402-8404.
26 Chuang, C.-H.; Su, C.-Y.; Hsu, K.-T.; Chen, C.-H.; Huang, C.-H.; Chu, C.-W.; Liu, W.-
R. A Green, Simple and Cost-Effective Approach to Synthesize High Quality Graphene by
Electrochemical Exfoliation Via Process Optimization. RSC Adv. 2015, 5, 54762-54768.
27 Paredes, J. I.; Munuera, J. M. Recent Advances and Energy-Related Applications of
High Quality/Chemically Doped Graphenes Obtained by Electrochemical Exfoliation
Methods. J. Mater. Chem. A 2017, 5, 7228-7242.
28 Chen, C.-H.; Yang, S.-W.; Chuang, M.-C.; Woon, W.-Y.; Su, C.-Y. Towards the
Continuous Production of High Crystallinity Graphene Via Electrochemical Exfoliation
with Molecular In Situ Encapsulation. Nanoscale 2015, 7, 15362-15373.
29 Yang, S.; Brüller, S.; Wu, Z.-S.; Liu, Z.; Parvez, K.; Dong, R.; Richard, F.; Samorì, P.;
Feng, X.; Müllen, K. Organic Radical-Assisted Electrochemical Exfoliation for the
Scalable Production of High-Quality Graphene. J. Am. Chem. Soc. 2015, 137, 13927-
13932.
30 Munuera, J. M.; Paredes, J. I.; Villar-Rodil, S.; Ayán-Varela, M.; Martínez-Alonso, A.;
Tascón, J. M. D. Electrolytic Exfoliation of Graphite in Water with Multifunctional
Electrolytes: En Route Towards High Quality, Oxide-Free Graphene Flakes. Nanoscale
2016, 8, 2982-2998.

ARTÍCULO IV
245
31 Gaier, J. R.; Ditmars, N. F.; Dillon, A. R. Aqueous Electrochemical Intercalation of
Bromine into Graphite Fibers. Carbon 2005, 43, 189-193.
32 Niu, L.; Li, M.; Tao, X.; Xie, Z.; Zhou, X.; Raju, A. P. A.; Young, R. J.; Zheng, Z. Salt-
Assisted Direct Exfoliation of Graphite Into High-Quality, Large-Size, Few-Layer
Graphene Sheets. Nanoscale 2013, 5, 7202-7208.
33 Munaiah, Y.; Ragupathy, P.; Pillai, V. K. Single-Step Synthesis of Halogenated
Graphene through Electrochemical Exfoliation and Its Utilization as Electrodes for Zinc
Bromine Redox Flow Battery. J. Electrochem. Soc. 2016, 163, A2899-A2910.
34 Ayán-Varela, M.; Paredes, J. I.; Guardia, L.; Villar-Rodil, S.; Munuera, J. M.; Díaz-
González, M.; Fernández-Sánchez, C.; Martínez-Alonso, A.; Tascón, J. M. D. Achieving
Extremely Concentrated Aqueous Dispersions of Graphene Flakes and Catalytically
Efficient Graphene-Metal Nanoparticle Hybrids with Flavin Mononucleotide as a High-
Performance Stabilizer. ACS Appl. Mater. Interfaces 2015, 7, 10293-10307.
35 Guardia, L.; Fernández-Merino, M. J.; Paredes, J. I.; Solís-Fernández, P.; Villar-Rodil,
S.; Martínez-Alonso, A.; Tascón, J. M. D. High-Throughput Production of Pristine
Graphene in an Aqueous Dispersion Assisted by Non-Ionic Surfactants. Carbon 2011, 49,
1653-1662.
36 Nemes-Incze, P.; Osváth, Z.; Kamarás, K.; Biró, L. P. Anomalies in Thickness
Measurements of Graphene and Few Layer Graphite Crystals by Tapping Mode Atomic
Force Microscopy. Carbon 2008, 46, 1435-1442.
37 Xuhua, H.; Senlin, L.; Zhiqiang, Q.; Wei, Z.; Wei, Y.; Yanyan, F. Low Defect
Concentration Few-Layer Graphene Using a Two-Step Electrochemical Exfoliation.
Nanotechnology 2015, 26, 105602-105608
38 Lou, F.; Buan, M. E. M.; Muthuswamy, N.; Walmsley, J. C.; Ronning, M.; Chen, D.
One-Step Electrochemical Synthesis of Tunable Nitrogen-Doped Graphene. J. Mater.
Chem. A 2016, 4, 1233-1243.
39 Wei, W.; Wang, G.; Yang, S.; Feng, X.; Müllen, K. Efficient Coupling of Nanoparticles
to Electrochemically Exfoliated Graphene. J. Am. Chem. Soc. 2015, 137, 5576-5581.
40 Mancinelli, R.; Botti, A.; Bruni, F.; Ricci, M. A.; Soper, A. K. Hydration of Sodium,
Potassium, and Chloride Ions in Solution and the Concept of Structure Maker/Breaker. J.
Phys. Chem. B 2007, 111, 13570-13577.
41 D’Angelo, P.; Migliorati, V.; Guidoni, L. Hydration Properties of the Bromide Aqua
Ion: the Interplay of First Principle and Classical Molecular Dynamics, and X-ray
Absorption Spectroscopy. Inorg. Chem. 2010, 49, 4224-4231.

ARTÍCULO IV
246
42 Fulton, J. L.; Schenter, G. K.; Baer, M. D.; Mundy, C. J.; Dang, L. X.;
Balasubramanian, M. Probing the Hydration Structure of Polarizable Halides: A Multiedge
XAFS and Molecular Dynamics Study of the Iodide Anion. J. Phys. Chem. B 2010, 114,
12926-12937.
43 Foote, S. C.; Valentine, J. S.; Greenberg, A.; Liebman, J. F. Active Oxygen in
Chemistry, 1st ed.; Chapman & Hall: Glasgow, 1995.
44 Vanýsek, P., CRC Handbook of Chemistry and Physics, 93rd
ed.; CRC Press: Boca
Raton, 2012.
45 Jayson, G. G.; Parsons, B. J.; Swallow, A. J. Some Simple, Highly Reactive, Inorganic
Chlorine Derivatives in Aqueous Solution. Their Formation Using Pulses of Radiation and
Their Role in the Mechanism of the Fricke Dosimeter. J. Chem. Soc., Faraday Trans.1
1973, 69, 1597-1607.
46 Zehavi, D.; Rabani, J. Oxidation of Aqueous Bromide Ions by Hydroxyl Radicals. Pulse
Radiolytic Investigation. J. Phys. Chem. 1972, 76, 312-319.
47 Thomas, J. K. Rates of Reaction of the Hydroxyl Radical. Trans. Faraday Soc. 1965,
61, 702-707.
48 Ferrari, A. C.; Basko, D. M. Raman Spectroscopy as a Versatile Tool for Studying the
Properties of Graphene. Nat. Nanotechnol. 2013, 8, 235-246.
49 Lotya, M.; Hernandez, Y.; King, P. J.; Smith, R. J.; Nicolosi, V.; Karlsson, L. S.;
Blighe, F. M.; De, S.; Wang, Z.; McGovern, I. T.; Duesberg, G. S.; Coleman, J. N. Liquid
Phase Production of Graphene by Exfoliation of Graphite in Surfactant/Water Solutions. J.
Am. Chem. Soc. 2009, 131, 3611-3620.
50 De, S.; King, P. J.; Lotya, M.; O'Neill, A.; Doherty, E. M.; Hernandez, Y.; Duesberg, G.
S.; Coleman, J. N. Flexible, Transparent, Conducting Films of Randomly Stacked
Graphene from Surfactant-Stabilized, Oxide-Free Graphene Dispersions. Small 2010, 6,
458-464.
51 Sun, Z.; Masa, J.; Liu, Z.; Schuhmann, W.; Muhler, M. Highly Concentrated Aqueous
Dispersions of Graphene Exfoliated by Sodium Taurodeoxycholate: Dispersion Behavior
and Potential Application as a Catalyst Support for the Oxygen-Reduction Reaction. Chem.
- Eur. J. 2012, 18, 6972-6978.
52 Chabot, V.; Kim, B.; Sloper, B.; Tzoganakis, C.; Yu, A. High Yield Production and
Purification of Few Layer Graphene by Gum Arabic Assisted Physical Sonication. Sci. Rep.
2013, 3, 1378-1385
53 Perreault, F.; Fonseca de Faria, A.; Elimelech, M. Environmental Applications of
Graphene-Based Nanomaterials. Chem. Soc. Rev. 2015, 44, 5861-5896.

ARTÍCULO IV
247
54 Raccichini, R.; Varzi, A.; Passerini, S.; Scrosati, B. The Role of Graphene for
Electrochemical Energy Storage. Nat. Mater. 2015, 14, 271-279.
55 Sherrell, P. C.; Mattevi, C. Mesoscale Design of Multifunctional 3D Graphene
Networks. Mater. Today 2016, 19, 428-436.
56 Chen, B.; Ma, Q.; Tan, C.; Lim, T.-T.; Huang, L.; Zhang, H. Carbon-Based Sorbents
with Three-Dimensional Architectures for Water Remediation. Small 2015, 11, 3319-3336.
57 Li, F.; Jiang, X.; Zhao, J.; Zhang, S. Graphene Oxide: A Promising Nanomaterial for
Energy and Environmental Applications. Nano Energy 2015, 16, 488-515.
58 Wang, H.; Yuan, X.; Zeng, G.; Wu, Y.; Liu, Y.; Jiang, Q.; Gu, S. Three Dimensional
Graphene Based Materials: Synthesis and Applications from Energy Storage and
Conversion to Electrochemical Sensor and Environmental Remediation. Adv. Colloid
Interface Sci. 2015, 221, 41-59.
59 Munuera, J. M.; Paredes, J. I.; Villar-Rodil, S.; Martínez-Alonso, A.; Tascón, J. M. D. A
Simple Strategy to Improve the Yield of Graphene Nanosheets in the Anodic Exfoliation of
Graphite Foil. Carbon 2017, 115, 625-628.
60 Wan, W.; Lin, Y.; Prakash, A.; Zhou, Y. Three-Dimensional Carbon-Based
Architectures for Oil Remediation: From Synthesis and Modification to Functionalization.
J. Mater. Chem. A 2016, 4, 18687-18705.
61 Dai, Z.; Peng, C.; Chae, J. H.; Ng, K. C.; Chen, G. Z. Cell Voltage Versus Electrode
Potential Range in Aqueous Supercapacitors. Sci. Rep. 2015, 5, 9854-9862.
62 Zhang, L.; Shi, G. Preparation of Highly Conductive Graphene Hydrogels for
Fabricating Supercapacitors with High Rate Capability. J. Phys. Chem. C 2011, 115,
17206-17212.
63 Zuo, Z.; Kim, T. Y.; Kholmanov, I.; Li, H.; Chou, H.; Li, Y. Ultra-light Hierarchical
Graphene Electrode for Binder-Free Supercapacitors and Lithium-Ion Battery Anodes.
Small 2015, 11, 4922-4930.
64 Choi, B. G.; Yang, M.; Hong, W. H.; Choi, J. W.; Huh, Y. S. 3D Macroporous
Graphene Frameworks for Supercapacitors with High Energy and Power Densities. ACS
Nano 2012, 6, 4020-4028.
65 Wu, Z.-S.; Winter, A.; Chen, L.; Sun, Y.; Turchanin, A.; Feng, X.; Müllen, K. Three-
Dimensional Nitrogen and Boron Co-doped Graphene for High-Performance All-Solid-
State Supercapacitors. Adv. Mater. 2012, 24, 5130-5135.

ARTÍCULO IV
248
66 Ramadoss, A.; Yoon, K.-Y.; Kwak, M.-J.; Kim, S.-I.; Ryu, S.-T.; Jang, J.-H. Fully
Flexible, Lightweight, High Performance All-Solid-State Supercapacitor Based on 3-
Dimensional-Graphene/Graphite-Paper. J. Power Sources 2017, 337, 159-165.
67 Yang, X.; Zhu, J.; Qiu, L.; Li, D. Bioinspired Effective Prevention of Restacking in
Multilayered Graphene Films: Towards the Next Generation of High-Performance
Supercapacitors. Adv. Mater. 2011, 23, 2833-2838.
68 Zhang, J.; Jiang, J.; Li, H.; Zhao, X. S. A High-Performance Asymmetric
Supercapacitor Fabricated with Graphene-Based Electrodes. Energy Environ. Sci. 2011, 4,
4009-4015.
69 Lei, Z.; Liu, Z.; Wang, H.; Sun, X.; Lu, L.; Zhao, X. S. A High-Energy-Density
Supercapacitor with Graphene-CMK-5 as the Electrode and Ionic Liquid as the Electrolyte.
J. Mater. Chem. A 2013, 1, 2313-2321.
70 Enterría, M.; Martín-Jimeno, F. J.; Suárez-García, F.; Paredes, J. I.; Pereira, M. F. R.;
Martins, J. I.; Martínez-Alonso, A.; Tascón, J. M. D.; Figueiredo, J. L. Effect of
Nanostructure on the Supercapacitor Performance of Activated Carbon Xerogels Obtained
from Hydrothermally Carbonized Glucose-Graphene Oxide Hybrids. Carbon 2016, 105,
474-483.

ARTÍCULO IV
249
Supporting Information
Electrochemical exfoliation of graphite in aqueous sodium halide electrolytes towards
low oxygen content graphene for energy and environmental applications
J.M. Munueraa*
, J.I. Paredesa, M. Enterría
b, A. Pagán
c, S. Villar-Rodil
a, M.F.R. Pereira
b, J.I.
Martinsd,e
, J.L. Figueiredob, J.L. Cenis
c, A. Martínez-Alonso
a, J.M.D. Tascón
a
aInstituto Nacional del Carbón, INCAR-CSIC, Apartado 73, 33080 Oviedo, Spain
bLaboratório de Processos de Separação e Reacção – Laboratório de Catálise e Materiais
(LSRE-LCM), Departamento de Engenharia Química, Faculdade de Engenharia,
Universidade do Porto, R. Dr. Roberto Frias s/n, 4200-465 Porto, Portugal cInstituto Murciano de Investigación y Desarrollo Agrario y Alimentario (IMIDA), Calle
Mayor 1, 30150 La Alberca, Spain d Departamento de Engenharia Química, Faculdade de Engenharia, Universidade do
Porto, R. Dr. Roberto Frias s/n, 4200-465 Porto, Portugal e Universidade do Minho, LAB2PT- Laboratório de Paisagens, Património e Território,
Portugal

ARTÍCULO IV
250
S1. Biocompatibility of graphene derived from halide-based anodic exfoliation
S1.1 Experimental
To evaluate the biocompatibility of the graphene materials produced by the halide-
based anodic exfoliation approach, we investigated the proliferation of murine fibroblasts
(L929 cell line, ECACC No. 85011425) seeded onto thin graphene films deposited on
polystyrene tissue culture plates. The L929 cell line was chosen for the experiments
because it is highly stable, fast-growing and commonly used in cytotoxicity assays. The
fibroblasts were initially seeded at a density of 5000 cells per well onto 48-well culture
plates, where each well was pre-coated with either 0.25 or 0.5 mg of a given graphene
sample drop-cast from its corresponding aqueous dispersion in FMN. For comparison
purposes, wells pre-coated with vitamin C-reduced graphene oxide (graphene oxide
acquired from Graphenea) were also included in the tests. After fibroblast seeding, the
plates were incubated at 37 ºC in a 5% CO2 atmosphere using Dulbecco´s modified Eagle´s
medium (DMEM) supplemented with 10% fetal bovine serum (FBS), penicillin (100 U mL-
1) and streptomycin (100 mg mL
-1) as the culture medium. This medium was replaced twice
a week during the tested cell proliferation period. Cell proliferation was determined at
certain time intervals, namely 4, 7 and 10 days after fibroblast seeding, by means of the
MTT assay.1 This assay is based on the enzymatic reduction of the tetrazolium dye 3-(4,5-
dimethylthiazol-2-yl)-2,5-diphenyltetrazolium bromide (MTT, acquired from Sigma) to its
corresponding purple formazan. To this end, the culture medium was carefully removed
from each well and replaced by aqueous MTT solution (1 mg mL-1
, 500 L per well).
Following incubation at 37 ºC in 5% CO2 atmosphere for 4 h, the MTT solution was
removed and then dimethyl sulfoxide (200 L per well) was added to solubilize the water-
insoluble purple formazan crystals that could have been formed. Finally, the optical
absorbance of the obtained formazan solution was evaluated with a BMG FLUOstar Galaxy
microplate reader (MTX Lab Systems, Inc) at 570 nm as well as the 690 nm reference
wavelength. For statistically meaningful results, the experiments were performed in
hexaplicate, and the statistical analysis was carried out using the SPSS software. When data
obeyed the normality and homogeneity of variance requirements, their average was

ARTÍCULO IV
251
compared by means of the parametric test ANOVA followed by Bonferroni´s post hoc
multiple t-test. The significance level was set to p < 0.05.
S1.2. Results
Owing to a number of attractive features, including high mechanical strength,
flexibility, chemical inertness and good electrical conductivity, graphene is considered a
serious candidate for use as a support or scaffold in tissue engineering applications (e.g.,
cell growth and differentiation, tissue regeneration, etc).2,3
To this end, the first and
foremost requirement that a graphene material (as well as any prospective biomaterial)
must satisfy is that of biocompatibility and non-cytotoxicity. Biocompatibility is also an
important issue with a view to using graphene materials in environmental remediation (e.g.,
water decontamination) applications.4 While many graphene materials have demonstrated a
good biocompatibility towards different mammal cell lines when used as
substrates/scaffolds in cell growth and proliferation studies,5 it has also been recognized
that their specific physicochemical characteristics (e.g., nanosheet lateral size and
thickness, surface chemistry, presence of impurities, etc) have a strong bearing on their
interactions with biological systems.3 For this reason, graphenes obtained by novel
production methods should be tested for biocompatibility on an individual basis. For the
anodically exfoliated graphenes developed here using sodium halides as the electrolyte, the
presence of even tiny amounts of certain by-products derived from the redox reactions (e.g.,
such species as I2, Br2, Cl2 or HClO, which possess a strong oxidizing character) could pose
an issue with a view to their use in bio-related applications. To shed some light on this
question, we carried out a preliminary investigation into the biocompatibility of graphenes
produced by the halide-based anodic approach towards the murine fibroblast cell line L929.
More specifically, we applied the MTT assay to study the proliferation of fibroblasts seeded
onto thin graphene films supported on polystyrene tissue culture plates. We note that the
MTT assay and the L929 cell line are commonly employed for the in vitro assessment of
cellular toxicity of medical devices6 and have been previously used in biocompatibility tests
of different graphene and graphene-containing materials.7,8,9,10
Fig. S1 shows the results of the cell proliferation tests for fibroblasts seeded onto ~1 (a)
and 2 (b) m thick graphene films derived from anodic exfoliation either in 0.05 M NaCl or

ARTÍCULO IV
252
in 0.1 M NaI as the electrolyte. The tests were performed 4, 7 and 10 days after seeding the
fibroblasts. The ~1 (2) m thick films were obtained by depositing about 0.25 (0.5) mg of
the corresponding graphene nanosheets dispersed in water/FMN per well of the culture
plate. The two graphene samples tested for biocompatibility were chosen so as to span the
whole range of specimens prepared in this work in terms of their oxidation degree (see
Table 1), i.e., we included the graphene product having the lowest O/C ratio (0.06, obtained
with 0.05 M NaCl) and a product with the highest ratio (0.11, prepared with 0.1 M NaI).
For comparison purposes, a graphene sample with an even larger extent of oxidation
(vitamin C-reduced graphene oxide (RGO), O/C ratio ~0.15-0.20) was also tested. For
either film thickness, it can be seen that the anodically exfoliated graphenes led to a
somewhat lower cell proliferation rate compared to the case of the RGO material, which in
turn was slightly lower than the proliferation rate of the control sample (bare plate well). In
general, this effect appeared to be more noticeable for the 2 m thick graphene films
(compare panels a and b in Fig. S1), suggesting that some level of cytotoxicity might be
present in the halide-based samples. However, the fact that the measured absorbance values
distinctly increased with time for the two halide-based samples of either thickness indicated
that fibroblast proliferation was not impeded, and therefore that these materials can be
considered biocompatible overall. We also note that the differences in proliferation between
the halide-based graphenes and RGO could be ascribed, at least in part, to their different
oxygen content/hydrophilicity. It is well known that moderately hydrophilic substrates are
more convenient for cell growth than their hydrophobic counterparts because they favor
cellular adhesion.8,11,12
The fact that fibroblast proliferation on the graphene samples tended
to positively correlate with their oxidation extent (O/C ratio), i.e., it followed the trend 0.05
M NaCl graphene < 0.1 M NaI graphene < RGO, particularly at days 4 and 7, would be
consistent with the idea that cell attachment is initially disadvantaged and therefore
proliferation delayed on the less oxidized, more hydrophobic graphene surfaces.
Nevertheless, for longer culture times (10 days) fibroblast proliferation on the less oxidized
graphene substrate (0.05 M NaCl) tended to catch up with that of the 0.1 M NaI graphene
and RGO substrates, which would imply that a fast cell growth rate can also be attained on
the former once the fibroblasts are able to settle in.

ARTÍCULO IV
253
Figure S1. Proliferation of murine fibroblasts (L929 cell line) seeded onto ~1 (a) and 2 (b) m thick
graphene films obtained either from the anodic exfoliation of graphite foil in 0.05 M NaCl and 0.1
M NaI or from the reduction of graphene oxide with vitamin C (RGO) and supported onto
polystyrene culture plates. Results for the bare (graphene-free) culture plate are also shown as a
control sample. Proliferation was quantified on the basis of the MTT test 4 (white bars), 7 (grey
bars) and 10 (black bars) days after fibroblast seeding. For a given testing day, statistically
significant differences (p < 0.05) between the studied materials are indicated by the use of different
symbols (*, † and •). Data are given as average absorbance value (570-690 nm) ± standard deviation
(n = 6).
0.0
0.5
1.0
1.5
2.0
2.5
3.0
3.5
4.0
0.5M NaCl 0.1M NaI RGO Control
Ab
so
rba
nc
e (
57
0-6
90
nm
)
*
* •
*
*
† †
† *
• • †
A
0.0
0.5
1.0
1.5
2.0
2.5
3.0
3.5
4.0
0.5M NaCl 0.1M NaI RGO Control
Ab
so
rba
nc
e (
57
0-6
90
nm
)
• †
•
* •
•
*
*
*
† ¤ †
B

ARTÍCULO IV
254
S2. N2 adsorption/desorption isotherm of as-exfoliated graphene
N2 physisorption for the as-obtained graphene samples exfoliated in 0.1 M NaI was
measured in an Autosorb-1 volumetric analyzer (Quantachrome) at -196 ºC in the relative
pressure range between 10-7 and 0.99 (Fig. S2). The sample was degassed under vacuum at
125 ºC for 16 h. The BET surface area was determined on the basis of the BET model from
the N2 adsorption branch of the isotherm in the relative pressure range between 0.01 and
0.3, yielding a value of 35 m2 g
-1. The isotherm exhibited significant hysteresis at
intermediate relative pressures as well as strong adsorption at relative pressures close to 1,
revealing the presence of a large amount of mesoporous and macroporous voids in the
sample, as could be anticipated. However, we believe that the BET surface area of the as-
exfoliated graphene materials measured through N2 physisorption does not necessarily
reflect the surface area that was actually available in many of the applications tested in the
manuscript. For the measurement of N2 adsorption/desorption isotherms the graphene
samples had to be thoroughly dried through the abovementioned procedure, implying that
substantial restacking of the expanded graphene layers and thus a reduction in the available
surface area was most likely taking place. By contrast, the graphene samples for the
application tests were either used in a wet state without drying (e.g., dye adsorption) or
were just mildly dried under ambient conditions (e.g., supercapacitor electrodes). In these
cases, restacking of the graphene layers was probably avoided to a large extent.
Figure S2. N2 adsorption/desorption isotherm of as-exfoliated graphene prepared by
electrochemical exfoliation of graphite foil in 0.1 M NaI. Solid (dashed) line represents adsorption
(desorption).
0
10
20
30
40
50
60
70
0 0.2 0.4 0.6 0.8 1P/P0
Ad
sorb
ed v
olu
me
(cm
3 g-1
STP
)

ARTÍCULO IV
255
S3. Further XPS characterization of halide-based anodically exfoliated graphenes
a
c
bIn
tensity (
a. u.)
600 500 400 300 200
nm
f
Binding energy (eV)Binding energy (eV)
e
d
290 288 286 284 282
g
ji
h
k l
Figure S3. XPS survey spectra (a,c,e,g,i,k,m) and high resolution C 1s core level spectra
(b,d,f,h,j,l,n) for graphene samples obtained by aqueous anodic exfoliation of graphite foil in 0.05
M NaCl (a,b), 0.05 M NaBr (c,d) 0.1 M NaBr (e,f), 0.01 M NaI (g,h), 0.05 M NaI (i,j), 0.1 M NaI
(k,l), and 0.2 M NaI (m,n).

ARTÍCULO IV
256
In Fig. S3, the experimentally obtained high resolution C 1s envelopes (black traces)
were peak-fitted into 5 components according to previous work.13,14
These components
were located at about 284.6 eV (carbon atoms in graphitc C=C environments), 285.4 eV
(carbon atoms in localized alternant hydrocarbon configurations), 286.7 eV (carbon atoms
in oxidation state +1, i.e., carbons single-bonded to oxygen as in hydroxyl and epoxide
groups),15
288.3 eV (carbon atoms in oxidation state +2, i.e. carbons double-bonded to
oxygen, as in carbonyl groups; carbons in oxidation state +3, as in carboxylic groups) and
291.3 (* shake-up satellite peak for the band centered at 284.6 eV. Although the
original peak-fitting scheme allowed for two different components for carbon oxidation
states of +2 and +3, only one component was finally retained as they converged during the
fitting calculation. The two components assigned to carbon in oxidation state 0 (i.e., those
located at 284.6 and 285.4 eV) are shown as a single combined component (gray trace),
while those assigned to oxidation states +1 and +2/+3 are shown as blue and red traces,
respectively.

ARTÍCULO IV
257
S4. Three electrode characterization of as-prepared anodically exfoliated graphene
The NaI-exfoliated graphite foil (0.1 M) was electrochemically characterized in a
three-electrode cell in 1 M H2SO4 with an Ag/AgCl (1 M KCl) reference electrode. The
working electrode was prepared by sandwiching a PTFE/carbon pellet (19 mg of carbon
paste composed of 80 wt% as-exfoliated graphene material and 10 wt% PTFE) in a
stainless steel mesh and pressing them with 1 ton during 15 s. The counter electrode was
prepared in the same manner but using 30 mg of paste prepared with Norit DLC Supra 50®
carbon as the active material. The working and counter electrodes were arranged in a stack,
separated by filter paper (Whatmann®, qualitative filter paper Grade 1) and connected to
two Pt wires as current collectors. Nitrogen gas was bubbled into the electrolyte for 30 min
prior to measurement to remove the O2 present into the electrolyte solution. The obtained
voltammetry curves (-0.5 to 0.9 V) displayed two reversible humps centered at 0.3 V (Fig.
S4). This pseudofaradaic activity is generally ascribed to the quinone/hydroxyquinone
redox pair. The intensity of the observed peaks decreased gradually with increasing scan
rate, confirming the pseudocapacive contribution of the surface oxygen functionalities.
Hence, the capacitance decreased from 103 to 10 F g-1
by increasing the scan rate from 2 to
500 mV s-1
.
Figure S4. Cyclic voltammetry curves for halide-exfoliated graphite foil (0.1 M NaI) at different
scan rates
-0.8 -0.6 -0.4 -0.2 0.0 0.2 0.4 0.6 0.8 1.0 1.2-300
-200
-100
0
100
200
300
Cap
acita
nce
(F/g
)
Voltage (V vs Ag/AgCl)
2 mV s -1
10 mV s -1
20 mV s -1
50 mV s-1
100 mV s-1
300 mV s-1

ARTÍCULO IV
258
S5. Discussion of IR drop contribution to the supercapacitor cell performance
Fig. 8d in the main text suggests that the IR drop in the supercapacitor cell is quite
high. The operation voltage of a supercapacitor cell is determined by the following
equation:16
E = ETHD + EIR + EH + EO (1)
, where ETHD is the thermodynamic term, EIR is the IR drop term, EH is the overpotential
for hydrogen gas evolution reaction, and EO is the overpotential for oxygen gas evolution.
Both EH and EO, depends largely on the electrode material.17
The ETHD value for 1 M
H2SO4 electrolyte is generally around 0.9 V, sometimes even lower. The EIR was
investigated by means of chronopotenciometry and electrochemical impedance
spectroscopy (EIS) (see Fig. S5). The IR drop in the cell turned out to be around 0.3 Ω in
both cases, which in fact is not too high a value. Indeed, the main component contributing
to the electronic resistance was not the IR drop, but the Faradaic activity of the oxygenated
species in the electrode surface (ESR, see Fig. S5b).
Figure S5. (a) Chronopotentiometry at 1 A mg
-1 and (b) Nyquist plot extracted from EIS at 0 V of
the two-electrode cell.
Based on these results, the potential required for water splitting in this cell, considering
the overpotential caused by the IR drop (0.3 Ω * 1A = 0.3 V), would be 1.2 V at most. To
get some insight into the EH and EO values, which depend on the electrode nature, we
performed some tests in a three-electrode cell using the same electrolyte (Fig. S6). Fig. S6a
shows the cyclic voltammetry of the as-prepared graphene material (0.1 M NaI) at 10 mV s-
70 80 90 100 110 120 1300.0
0.4
0.8
1.2
1.6
Vo
lta
ge
(V
)
time (sec)
a
0 10 20 30 40 50 600
20
40
60
0 2 4 6 8 100
2
4
6
8
10
-Zi (O
hm
.cm
2)
Zr (Ohm. cm2)
b
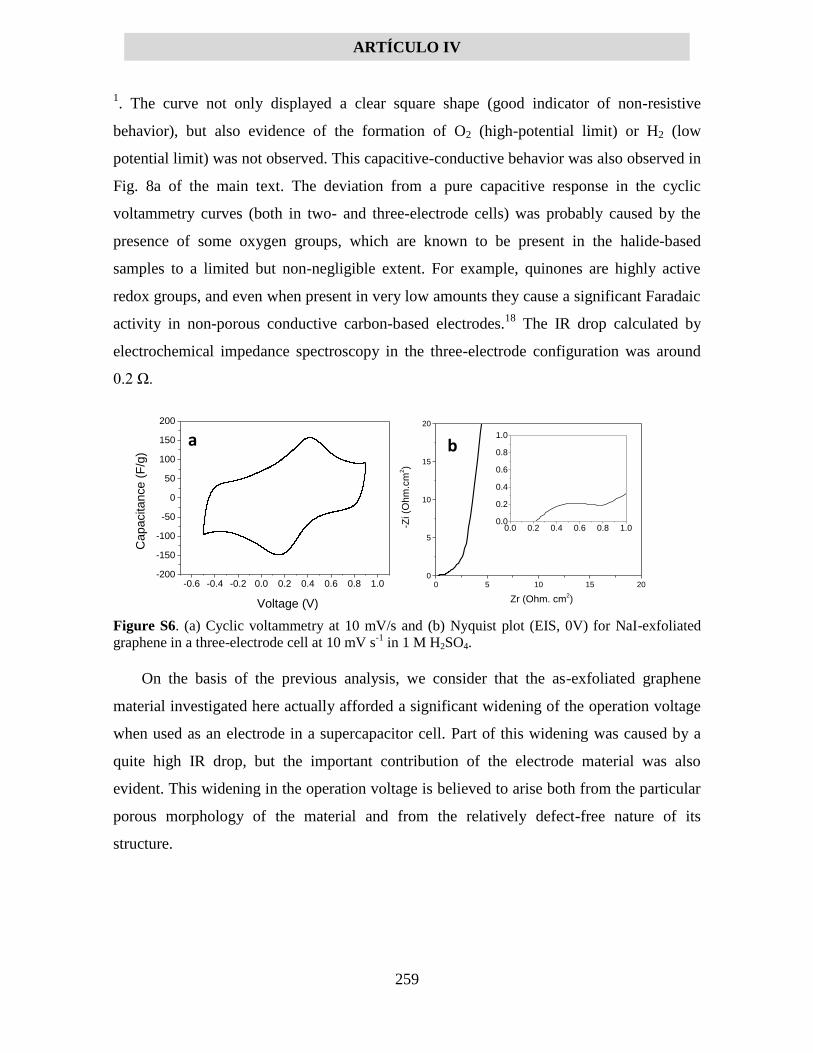
ARTÍCULO IV
259
1. The curve not only displayed a clear square shape (good indicator of non-resistive
behavior), but also evidence of the formation of O2 (high-potential limit) or H2 (low
potential limit) was not observed. This capacitive-conductive behavior was also observed in
Fig. 8a of the main text. The deviation from a pure capacitive response in the cyclic
voltammetry curves (both in two- and three-electrode cells) was probably caused by the
presence of some oxygen groups, which are known to be present in the halide-based
samples to a limited but non-negligible extent. For example, quinones are highly active
redox groups, and even when present in very low amounts they cause a significant Faradaic
activity in non-porous conductive carbon-based electrodes.18
The IR drop calculated by
electrochemical impedance spectroscopy in the three-electrode configuration was around
0.2 Ω.
Figure S6. (a) Cyclic voltammetry at 10 mV/s and (b) Nyquist plot (EIS, 0V) for NaI-exfoliated
graphene in a three-electrode cell at 10 mV s-1
in 1 M H2SO4.
On the basis of the previous analysis, we consider that the as-exfoliated graphene
material investigated here actually afforded a significant widening of the operation voltage
when used as an electrode in a supercapacitor cell. Part of this widening was caused by a
quite high IR drop, but the important contribution of the electrode material was also
evident. This widening in the operation voltage is believed to arise both from the particular
porous morphology of the material and from the relatively defect-free nature of its
structure.
0 5 10 15 200
5
10
15
20
0.0 0.2 0.4 0.6 0.8 1.00.0
0.2
0.4
0.6
0.8
1.0
Zr (Ohm. cm2)
-Zi (O
hm
.cm
2)
-0.6 -0.4 -0.2 0.0 0.2 0.4 0.6 0.8 1.0-200
-150
-100
-50
0
50
100
150
200
Capacitance (
F/g
)
Voltage (V)
b a

ARTÍCULO IV
260
Table S1. Adsorption capacities of dyes with different graphene-based materials
Material Adsorbate Adsorption capacity
(mg g-1
)
Ref
Hemyn/graphene hydrogel Methyl orange 40 19
Graphene hydrogel Methyl orange 50 20
Graphene oxide/isophorone
diisocyanate
Methyl orange 83 21
Graphene oxide/Ni-Al LDH Methyl orange 84 22
Graphene oxide/Ni-Cr LDH Methyl orange 160 23
Graphene oxide/chitosan Methyl orange 567 24
Halide-based anodic graphene Methyl orange 923 This work
Hemyn/graphene hydrogel Methylene blue 100 19
Reduced graphene oxide Methylene blue 158 25
Graphene oxide/chitosan Methylene blue 180 26
Graphene oxide/calcium alginate Methylene blue 182 27
Graphene oxide sponge Methylene blue 397 28
Graphene oxide Methylene blue 714 29
Halide-based anodic graphene Methylene blue 360 This work
Reduced graphene oxide/Fe2O4 Rhodamine B 23 30
Graphene oxide/Fe3O4 Rhodamine B 50 31
Graphene sponge Rhodamine B 73 32
Graphene/TiO2 hydrogel Rhodamine B 73 33
3D graphene Rhodamine B 207 34
Hemyn/graphene hydrogel Rhodamine B 350 19
Halide-based anodic graphene Rhodamine B 343 This work
Reduced graphene oxide Basic fuchsin 34 35
Reduced graphene oxide/ PSSMA Basic fuchsin 388 36
Graphene oxide/polyacrylamide Basic fuchsin 1034 37
Halide-based anodic graphene Basic fuchsin 355 This work

ARTÍCULO IV
261
References
1 Vistica, D.T.; Skehan, P.; Scudiero, D.; Monks, A.; Pittman, A.; Boyd, M. R.
Tetrazolium-based Asays for Celular Viabilty: A Critcal Examination of Selected
Parameters Afecting Formazan Production. Cancer Res. 1991, 51, 2515-2520.
2 Zhang, Y.; Nayak, T. R.; Hong. H; Cai, W. Graphene: a Versatile Nanoplatform for
Biomedical Applications. Nanoscale 2012, 4, 3833-3842.
3 Thompson, B. C.; Murray, E.; Wallace, G. G. Graphite Oxide to Graphene. Biomaterials
to Bionics. Adv. Mater. 2015, 27, 7563-7582.
4 Kemp, K. C.; Seema, H.; Saleh, M.; Le, N. H.; Mahesh, K.; Chandra, K. V.; Kim, K. S.
Environmental Applications Using Graphene Composites: Water Remediation and Gas
Adsorption. Nanoscale 2013, 5, 3149-3171.
5 Yang, K.; Li, Y.; Tan, X.; Peng, R.; Liu, Z. Behavior and Toxicity of Graphene and Its
Functionalized Derivatives in Biological Systems. Small 2013, 9, 1492-1503.
6 Biological evaluation of Medical Devices, Part 5: Tests for in vitro cytotoxicity. ISO
10993-5. 2009.
7 Munuera, J. M.; Paredes, J. I.; Villar-Rodil, S.; Ayán-Varela, M.; Pagán, A.; Aznar-
Cervantes, S. D.; Cenis, J. L.; Martínez-Alonso, A.; Tascón, J. M. D. High Quality, Low
Oxygen Content and Biocompatible Graphene Nanosheets Obtained by Anodic Exfoliation
of Different Graphite Types. Carbon 2015, 94, 729-739.
8 Yan, X.; Chen, J.; Yang, J.; Xue, Q.; Miele, P. Fabrication of Free-Standing,
Electrochemically Active, and Biocompatible Graphene Oxide−Polyaniline and
Graphene−Polyaniline Hybrid Papers. ACS Appl. Mater. Interfaces 2010, 2, 2521-2529.
9 Fan, H.; Wang, L.; Zhao, K.; Li, N.; Shi, Z.; Ge, Z.; Jin, Z. Fabrication, Mechanical
Properties, and Biocompatibility of Graphene-Reinforced Chitosan Composites.
Biomacromolecules 2010, 11, 2345-2351.
10 Wang, L.; Lu, C.; Zhang, B.; Zhao, Wu, F.; Guan, S. Fabrication and Characterization of
Flexible Silk Fibroin Films Reinforced With Graphene Oxide for Biomedical Applications
RSC Adv. 2014, 4, 40312-40320.
11 Masters, K. S.; Anseth, K. S. Cell-Material Interactions. In Advances in Chemical
Engineering; Sefton, M., Ed.; Academic Press, 2004, vol. Volume 29, pp. 7-46.
12 O. Akhavan, O.; Ghaderi, E. The Use of Graphene in the Self-Organized Differentiation
of Human Neural Stem Cells Into Neurons Under Pulsed Laser Stimulation. J.

ARTÍCULO IV
262
Mater. Chem. B 2014, 2, 5602-5611.
13 Yang, D.-Q.; Rochette, J.-F.; Sacher, E. Controlled Chemical Functionalization of
Multiwalled Carbon Nanotubes by Kiloelectronvolt Argon Ion Treatment and Air Exposure
Langmuir 2005, 21, 8539-8545.
14 Yang, D.-Q.; Sacher, E. Carbon 1s X-ray Photoemission Line Shape Analysis of Highly
Oriented Pyrolytic Graphite: The Influence of Structural Damage on Peak Asymmetry.
Langmuir 2006, 22, 860-862
15 Wang, Q.; Kaliaguine, S.; Ait-Kadi, A. Catalytic Grafting: A New Technique for
Polymer-Fiber Composites. III. Polyethylene-Plasma-Treated KevlarTM
Fibers Composites:
Analysis of the Fiber Surface. J. Appl. Polym. Sci. 1993, 48, 121-148.
16 Iida, T.; Matsushima, H.; Fukunaka, Y. Water Electrolysis under a Magnetic Field. J.
Electrochem. Soc. 2007, 154, E112-E115
17 Zhong, C.; Deng, Y.; Hu, W.; Jinli Qiao, J.; Zhang, L.; Zhang, J. A Review of
Electrolyte Materials and Compositions for Electrochemical Supercapacitors. Chem. Soc.
Rev. 2015, 44, 7484—7539.
18 Enterría, M.; Gonçalvesa, A. G.; Pereira, M. F. R.; Martins, J. I.; Figueiredo, J. L.
Electrochemical Storage Mechanisms in Non-Stoichiometric Cerium Oxide/Multiwalled
Carbon Nanotube Composites. Electrochim. Acta 2016, 209, 25-35.
19 Zhao, Y.; Zhang, Y.; Liu, A.; Wei, Z.; Liu, S. Construction of Three-Dimensional
Hemin-Functionalized Graphene Hydrogel with High Mechanical Stability and Adsorption
Capacity for Enhancing Photodegradation of Methylene Blue. ACS Appl. Mater. Interfaces
2017, DOI: 10.1021/acsami.6b10959.
20 Zhang, X.; Liu, D.; Yang, L.; Zhou, L.; You, T. Self-Assembled Three-Dimensional
Graphene-Based Materials for Dye Adsorption and Catalysis. J. Mater. Chem. A 2015, 3,
10031-10037.
21 Yan, J.; Zhu, Y.; Qiu, F.; Zhao, H.; Yang, D.; Wang, J.; Wen, W. Kinetic, Isotherm and
Thermodynamic Studies for Removal of Methyl Orange Using a Novel β-Cyclodextrin
Functionalized Graphene Oxide-Isophorone Diisocyanate Composites. Chemical
Engineering Research and Design 2016, 106, 168-177.
22 Yang, Z.; Ji, S.; Gao, W.; Zhang, C.; Ren, L.; Tjiu, W. W.; Zhang, Z.; Pan, J.; Liu, T.
Magnetic Nanomaterial Derived from Graphene Oxide/Layered Double Hydroxide Hybrid
for Efficient Removal of Methyl Orange from Aqueous Solution. J. Colloid Interface Sci.
2013, 408, 25-32.

ARTÍCULO IV
263
23 Ruan, X.; Chen, Y.; Chen, H.; Qian, G.; Frost, R. L. Sorption Behavior of Methyl
Orange from Aqueous Solution on Organic Matter and Reduced Graphene Oxides
Modified Ni–Cr Layered Double Hydroxides. Chem. Eng. J. 2016, 297, 295-303.
24 Wang, Y.; Liu, X.; Wang, H.; Xia, G.; Huang, W.; Song, R. Microporous Spongy
Chitosan Monoliths Doped with Graphene Oxide as Highly Effective Adsorbent for Methyl
Orange and Copper Nitrate (Cu(NO3)2) Ions. J. Colloid Interface Sci. 2014, 416, 243-251.
25 Chen, L.; Yang, J.; Zeng, X.; Zhang, L.; Yuan, W. Adsorption of Methylene Blue in
Water by Reduced Graphene Oxide: Effect of Functional Groups. Mater. Express 2013, 3,
281-290.
26 Fan, L.; Luo, C.; Sun, M.; Li, X.; Lu, F.; Qiu, H. Preparation of Novel Magnetic
Chitosan/Graphene Oxide Composite as Effective Adsorbents Toward Methylene Blue.
Bioresour. Technol. 2012, 114, 703-706.
27 Li, Y.; Du, Q.; Liu, T.; Sun, J.; Wang, Y.; Wu, S.; Wang, Z.; Xia, Y.; Xia, L. Methylene
Blue Adsorption on Graphene Oxide/Calcium Alginate Composites. Carbohydr. Polym.
2013, 95, 501-507.
28 Liu, F.; Chung, S.; Oh, G.; Seo, T. S. Three-Dimensional Graphene Oxide
Nanostructure for Fast and Efficient Water-Soluble Dye Removal.ACS Appl. Mater.
Interfaces 2012, 4, 922-927.
29 Yang, S.-T.; Chen, S.; Chang, Y.; Cao, A.; Liu, Y.; Wang, H. Removal of Methylene
Blue from Aqueous Solution by Graphene Oxide. J. Colloid Interface Sci. 2011, 359, 24-
29.
30 Bai, S.; Shen, X.; Zhong, X.; Liu, Y.; Zhu, G.; Xu, X.; Chen, K. One-Pot Solvothermal
Preparation of Magnetic Reduced Graphene Oxide-Ferrite Hybrids for Organic Dye
Removal. Carbon 2012, 50, 2337-2346.
31 Geng, Z.; Lin, Y.; Yu, X.; Shen, Q.; Ma, L.; Li, Z.; Pan, N.; Wang, X. Highly Efficient
Dye Adsorption and Removal: a Functional Hybrid of Reduced Graphene Oxide-Fe3O4
Nanoparticles as an Easily Regenerative Adsorbent. J. Mater. Chem. 2012, 22, 3527-3535.
32 Zhao, J.; Ren, W.; Cheng, H.-M. Graphene Sponge for Efficient and Repeatable
Adsorption and Desorption of Water Contaminations. J. Mater. Chem. 2012, 22, 20197-
20202.
33 Hou, C.; Zhang, Q.; Li, Y.; Wang, H. P25–Graphene Hydrogels: Room-Temperature
Synthesis and Application for Removal of Methylene Blue from Aqueous Solution. J.
Hazard. Mater. 2012, 205–206, 229-235.
34 Li, W,; Gao, S.; Wu, L.; Qiu, S.; Guo, Y.; Geng, X.; Chen, M.; Liao, S.; Zhu, C.; Gong,
Y.; Long, M.; Xu, J.; Wei, X.; Sun, M.; Liu, L. High-Density Three-Dimension Graphene

ARTÍCULO IV
264
Macroscopic Objects for High-Capacity Removal of Heavy Metal Ions. Sci. Rep. 2013, 3,
2125.
35 Tokalioʇlu, Ş.; Yavuz, E.; Aslantaş, A.; Şahan, H.; Taşkin, F.; Patat,
Ş.Spectrophotometric Determination of Basic Fuchsin from Various Water Samples after
Vortex Assisted Solid Phase Extraction Using Reduced Graphene Oxide as an Adsorbent.
Spectrochim. Acta Mol. Biomol. Spectrosc. 2015, 149, 378-384.
36 Song, Y.-B.; Song, X.-D.; Cheng, C.-J.; Zhao, Z.-G. Poly(4-Styrenesulfonic Acid-co-
Maleic Acid)-Sodium-Modified Magnetic Reduced Graphene Oxide for Enhanced
Adsorption Performance Toward Cationic Dyes. RSC Adv. 2015, 5, 87030-87042.
37 Yang, X.; Li, Y.; Du, Q.; Sun, J.; Chen, L.; Hu, S.; Wang, Z.; Xia, Y.; Xia, L. Highly
Effective Removal of Basic Fuchsin from Aqueous Solutions by Anionic
Polyacrylamide/Graphene Oxide Aerogels. J. Colloid Interface Sci. 2015, 453, 107-114.

ARTÍCULO V
265
High quality, low-oxidized graphene via anodic exfoliation with table salt as an
efficient oxidation-preventing co-electrolyte for water/oil remediation and
capacitive energy storage applications
J.M. Munuera1, J.I. Paredes
1, S. Villar-Rodil, A. Castro-Muñiz, A. Martínez-Alonso,
J.M.D. Tascón
Instituto Nacional del Carbón, INCAR-CSIC, C/Francisco Pintado Fe 26,CP33011
Oviedo, Spain
1 Corresponding authors.
E-mail addresses: [email protected]; [email protected]
ARTÍCULO V
266
Abstract
The production of graphene through anodic exfoliation of graphite in water is
regarded as a competitive approach in the efforts to scale-up the manufacturing of this
two-dimensional material for different practical uses. However, issues related to
oxidative attack of the nanosheets inherent to this delamination process have
traditionally precluded the attainment of high quality materials, with the use of proper
electrolyte additives as oxidation-preventing agents being proposed as a possible way
out. Here we demonstrate that sodium chloride (table salt) can be used as a highly
efficient additive (co-electrolyte) of common sulfate-based electrolytes, yielding
anodically exfoliated graphene with minimal oxidation (O/C ratio ~0.02-0.03) and thus
a high structural quality. As an oxidation-preventing co-electrolyte, sodium chloride
clearly outperformed other tested additives, including sodium borohydride, sulfite,
citrate, bromide and iodide, ascorbic acid or ethanol, as well as other recently reported
chemical species of a more complex nature and/or less readily available. The apparently
contradicting ability of the chloride anion to avert oxidation of anodic graphene without
negatively interfering with the exfoliation process itself was also discussed and
ultimately ascribed to the different chemical reactivity of graphite edges and basal
planes. The as-prepared, low-oxidized graphene exhibited a notable adsorption capacity
towards organic dyes in aqueous solution (e.g., ~450 mg g-1
for methyl orange), a
substantial ability to absorb oils and non-polar organic solvents (15-30 g g-1
), and
displayed a good capacitive energy storage behavior (e.g., ~120 F g-1
at 0.1 A g-1
), all
without the need of any post-processing steps that are so common for graphene-based
materials. Overall, the demonstration that low-oxidized anodic graphene can be
obtained by resorting only to inexpensive and widely available reagents should facilitate
the implementation of this methodology in the industrial manufacturing of high quality
graphene for several applications.
Keywords
Graphene
Electrochemical exfoliation
Energy storage
Water remediation
ARTÍCULO V
267
1. Introduction
The electrochemical exfoliation of graphite has emerged in recent years as a very
promising approach in the efforts to tackle one of the most pressing issues that hinder
the widespread implementation of graphene in real-life applications, namely, its large-
scale production [1-5]. Such an approach boasts a number of assets that are not always
present in other potentially scalable methods of graphene production, such as simplicity
of operation, versatility (e.g., in terms of electrolyte choice), alacrity (short processing
times) and cost-effectiveness. The electrochemical process of graphite delamination to
give graphene nanosheets can be carried out under either cathodic or anodic conditions
[3,4], or by a combination of both [6,7]. Cathodic exfoliation typically makes use of
lithium or alkylammonium salts in organic solvents as the electrolytic system, yielding
graphene materials of a high structural quality and limited oxidation (O/C atomic ratios
of ~0.03-0.08) [8-10]. However, it tends to suffer from low exfoliation degrees (flakes
frequently comprising more than 5 monolayers) and yields. Anodic exfoliation, on the
other hand, is generally accomplished in water with inorganic acids or their salts as the
electrolyte, which is attractive from an environmental and practical point of view [3,4].
Further, the anodic approach is normally more efficient than its cathodic counterpart in
terms of both delamination degree (single- to few-layered nanosheets) and yield.
Unfortunately, anodic graphene has a strong tendency to oxidize during exfoliation,
due to attack by oxygen radicals generated from the oxidation of water molecules at the
graphite anode. For common electrolytes (e.g., sulfuric acid, sulfate salts and others),
graphenes with O/C ratios in the 0.10-0.20 range are usually obtained [11-16]. This
extent of oxidation compromises the structural quality of the material, and thus
constitutes a serious drawback of the anodic approach that limits its wider practical
utility. Still, recent studies have provided evidence that such an oxidation is not an
unescapable outcome of anodic exfoliation, and that indeed it can be largely avoided by
resorting to appropriate electrolytes and/or electrolyte additives [17]. To this day, only a
few chemical species have been identified to be useful towards this purpose, specifically
(2,2,6,6-tetramethylpiperidin-1-yl)oxyl (TEMPO) [18] and melamine [19] as additives
of sulfate-based electrolytes, as well as sulfonated naphthalene as an electrolyte itself
[20]. A significant problem of these organic species is that they are relatively complex
and expensive compounds, thus hindering their prospects of use in the industrial
production of graphene. Moreover, they can strongly adsorb on the resulting graphene
product, making purification of the latter difficult [20]. Hence, the identification of

ARTÍCULO V
268
much simpler, readily available, low-cost and easy-to-remove species with a similar or
even better oxidation-preventing ability to give high quality, oxide-free anodic graphene
nanosheets would be highly desirable, but has so far not been attained.
We report here the finding that a readily available and extremely simple substance,
namely NaCl (table salt), is a highly efficient oxidation-preventing additive (co-
electrolyte) towards the anodic exfoliation of graphite. The use of NaCl as an additive
of sulfate-based electrolytes is shown to afford anodic graphene with the lowest degree
of oxidation documented to date (O/C ratio of ~0.02-0.03) and a high structural quality.
Indeed, these features are very similar to those typical of pristine graphene flakes
obtained by direct, liquid-phase exfoliation of graphite via ultrasound or shear forces,
but with the additional advantage of a process that exhibits higher exfoliation yields and
degrees. Concerning its potential utility application-wise, the as-obtained graphene
product is shown to be an efficient adsorbent of industrial dyes from the aqueous phase
as well as of non-polar organic solvents/oils, and also exhibits a good performance as an
electrode for capacitive energy storage. Owing to the obvious practical advantage of
NaCl over other electrolyte additives, we believe this work will strengthen the position
of electrochemical exfoliation as a method of choice in current efforts to industrialize
the production of high quality graphene.
2. Results and discussion
2.1. NaCl as an efficient electrolyte additive (co-electrolyte) towards low-oxidized
anodic graphene
The aqueous anodic exfoliation of graphite to give graphene nanosheets is generally
considered to rely, at least in its early stages, on oxidation processes that assist in the
interlayer expansion at edges, grain boundaries and other structural defects of the
graphitic lattice, thus facilitating the subsequent intercalation of anions from the
electrolyte together with water molecules (hydrated anions) to induce an efficient
delamination [4,21]. The oxidative attack of the graphite electrode is triggered by highly
reactive oxygen species, such as hydroxyl radicals (·OH), generated from the anodic
oxidation of water molecules. Hence, the inclusion of chemical species in the
electrolytic medium as additives or co-electrolytes with an ability to neutralize (i.e.,
reduce) these oxygen radicals could be an effective strategy to curtail the oxidation of
the anodically derived graphene nanosheets [17]. Obvious candidates for this role are
certain organic and inorganic compounds that are widely employed as reducing agents

ARTÍCULO V
269
or antioxidants in chemical reactions, such as NaBH4 or ascorbic acid. However, their
efficacy in preventing oxidative attack during anodic exfoliation could be compromised
by kinetic and other factors that are difficult to ascertain, and they could also negatively
interfere with the delamination process itself [18]. Alternatively, we hypothesize that
chemical species without a well-known ability to act as reductants or antioxidants, but
having a reduction potential lower than that of the oxygen radicals generated during the
anodic process, could be efficient in averting oxidation of the exfoliated nanosheets. In
particular, we focus our attention on NaCl as a potential oxidation-preventing
electrolyte additive. NaCl is a very common and low-priced commodity, making its use
especially attractive with a view to the scaled-up production of graphene, and the
standard reduction potential of the relevant redox pair (i.e., the Cl-/Cl2 pair, +1.37 V) is
lower than that of the ·OH/OH- pair (+1.9 V) [22,23]. Indeed, oxidation of the Cl
- anion
by ·OH radicals in aqueous medium to give OH- anions or water molecules has been
well documented in past studies [24].
As schematically depicted in Fig. 1a, we carried out a series of benchmark
exfoliation experiments by which a graphite foil piece (working electrode) was set to a
positive voltage (10 V) relative to a platinum foil (counter electrode). The process was
conducted in an aqueous solution containing 0.1 M Na2SO4 as the main (exfoliating)
electrolyte and a given molar concentration of another chemical species (e.g., NaCl) as
the prospective oxidation-preventing agent [see Electronic Supplementary Material
(ESM) for details on the experimental procedure]. Na2SO4 was chosen as the main
electrolyte owing to the well-known ability of the sulfate anion to intercalate and
expand the interlayer space of graphite under anodic conditions [25-28]. For comparison
purposes, additives or co-electrolytes other than NaCl were tested in the exfoliation
experiments, including KCl, KBr, KI, NaBH4, Na2SO3, sodium citrate, ascorbic acid
and ethanol. KBr and KI were selected because the redox potential of the Br-/Br2 and I
-
/I2 pairs (+1.09 and +0.54 V, respectively [23]) is also lower than that of the ·OH/OH-
pair, while NaBH4, Na2SO3, sodium citrate, ascorbic acid and ethanol are common
reductants/antioxidants. Upon application of the bias voltage the graphite foil anode was
seen to swell and enlarge in thickness, giving rise to exfoliated products in significant
quantities (Fig. 1b) made up of worm-like, highly expanded particles (Fig. 1c) with a
morphology of very thin, corrugated layers separated by micrometric or even
nanometric voids (Fig. 1d). This morphology is characteristic of anodically delaminated
graphites [21,29]. The as-exfoliated material was then transferred to the liquid phase

ARTÍCULO V
270
with the aid of a mild sonication step, finally yielding colloidal suspensions of graphene
nanosheets in, e.g., water/isopropanol mixture, N,N-dimethylformamide or water with
flavin mononucleotide dispersant that were stable for weeks (Fig. 1e; see ESM for
details). The UV-vis absorption spectra of the suspensions in water/isopropanol (Fig. 1f)
exhibited a peak centered at ~270 nm together with strong absorbance in the whole
measured wavelength range above 270 nm. This result was consistent with the presence
of extended, electronically conjugated sp2-based domains in the dispersed material, as
reported previously for graphenes with limited oxidation (e.g., highly reduced graphene
oxide and pristine graphene flakes) [30,31].
Figure 1. (a) Schematic of the anodic exfoliation of graphite using different compounds as
additives (co-electrolytes) of Na2SO4 (main electrolyte) in the potential role of oxidation-
preventing agents. (b-d) Digital photograph (b) as well as low (c) and high (d) magnification
FE-SEM images of the as-prepared graphene product obtained with NaCl as a co-electrolyte
with scale bars of 1mm (c) and 20 μm (d). (e) Digital photograph of graphene obtained with
NaCl as a co-electrolyte and colloidally dispersed in water/isopropanol mixture (left cuvette),
N,N-dimethylformamide (center) and water with flavin mononucleotide stabilizer (right) after
mild sonication of the as-prepared material. (f) UV-vis optical absorption spectrum of the
graphene dispersion in water/isopropanol mixture.
To quantify the impact of the abovementioned additives on the extent of oxidation
of the exfoliated nanosheets, their corresponding dispersions in water/isopropanol were
deposited onto metallic sample holders, forming thin graphene films that were
0.3
0.5
0.7
0.9
1.1
1.3
200 700
Ab
sorb
ance
Wavelength (nm)
a b
c d
f e
ARTÍCULO V
271
subsequently investigated by X-ray photoelectron spectroscopy (XPS). Table 1 shows
the O/C atomic ratio measured by this technique for anodic graphenes obtained at
different molar concentrations of the additives. In the absence of any additive (control
sample; only 0.1 M Na2SO4 was used as electrolytic medium), this ratio was determined
to be ~0.09. It was generally observed that at low molar concentrations (e.g., 0.01-0.02
M), the additives had a detrimental effect on the oxidation of the nanosheets, i.e., the
resulting graphenes tended to exhibit O/C ratios higher than that of the control sample
(~0.11-0.18 vs 0.09). On the other hand, concentrations around 0.1 M of the NaCl and
KCl additives afforded graphenes with a remarkably reduced degree of oxidation,
boasting O/C ratios as low as 0.02-0.03. Indeed, the latter figures were among the
lowest ever documented for anodically exfoliated graphenes [17-20]. For example,
using TEMPO and melamine as additives, O/C ratios around 0.04 were attained [18,19].
but different to the case of these previous reports, the present results were obtained
using readily available, very low-priced and environmentally friendly substances in the
electrolytic process. The amount of oxygen in these samples was very close to that
present in the starting graphite foil material (O/C ratio ~0.01), implying that anodic
oxidation of the graphite electrode could be kept to a minimum using the chloride-based
additives. Noticeably, for ionic additives incorporating anions other than Cl-,
specifically Br-, I
- and SO3
2-, as well as for ethanol, the use of concentrations in the
order of 0.1 M (or even higher) did not bring about large reductions, if any at all, in the
extent of oxidation of the corresponding graphene samples compared to the control one.
For some compounds (NaBH4 and ascorbic acid), swelling and expansion of the
graphite anode did not even take place to any substantial extent at concentrations of 0.1
M, and thus no exfoliated products were procured. In the case of 0.1 M sodium citrate,
only a small amount of exfoliated material could be obtained. We have also determined
the yield of graphene material produced both in the absence (control sample) and
presence of Cl- (i.e., 0.1 M Na2SO4 plus 0.1 M NaCl or KCl). For graphite foil pieces
with a thickness around 500 m, the measured yields were ~13 and 10 wt% for anodic
exfoliation in the absence and presence of Cl-, respectively. First of all, we note that in
general these yield values cannot be directly compared with those reported in the
literature by other groups, because exfoliation yields are dependent, among other
factors, on the thickness of the graphite piece used in the electrolytic process [28].
Indeed, we have used a graphite foil that is several times thicker than those used in other
reports [21], implying that the yield should be several times lower. Second, the yield

ARTÍCULO V
272
values measured here in the absence and presence of Cl- were of a similar magnitude
(somewhat lower for the latter), indicating that the presence of this additive in the
electrolyte (at the relevant moderate concentration of 0.1 M) does not hamper the
exfoliation process to a very significant extent.

ARTÍCULO V
273
Table 1. O/C atomic ratios determined from XPS data for anodic graphene obtained in the
presence of 0.1 M Na2SO4 as the main electrolyte and different molar concentrations of a
second compound used as an additive (co-electrolyte).
Electrolyte
additive
Concentration
(M)
O/C ratio
None 0.00 0.09
NaCl 0.01 0.24
0.05 0.05
0.10 0.03
0.20 0.03
0.50 0.03
KCl 0.01 0.13
0.05 0.02
0.10 0.04
0.25 0.02
NaBr 0.01 0.19
0.10 0.11
NaI 0.01 0.16
0.10 0.13
Na2SO3 0.01 0.19
0.10 0.12
Sodium citrate 0.01 0.14
0.10 0.05
Sodium ascorbate 0.01 0.12
NaBH4 0.01 0.16
Ethanol 0.02 0.20
0.04 0.21
0.20 0.24
0.30 0.23
0.40 0.24
0.50 0.09
0.70 0.06

ARTÍCULO V
274
It is currently unknown why the chloride-based additives perform so efficiently in
averting the oxidation of anodic graphene in a certain range of concentrations around
0.1 M, whereas at lower molar concentrations all the tested additives appear to promote
graphene oxidation. We can expect a number of different competing processes that arise
from complex interactions between the graphite electrode, main electrolyte, additive and
water molecules to be in place during the anodic treatment. In turn, such processes and
interactions are probably dependent, among other factors, on the electrolyte and additive
concentration. This hypothesis was supported by the observation that at sufficiently
high additive concentrations (e.g., NaBH4 and ascorbic acid at 0.1 M, but also NaCl and
KCl at 1 M, and ethanol at 3 M), exfoliation of the graphite anode did not even take
place, suggesting that these compounds could inhibit intercalation of the sulfate anion
or, alternatively, certain subsequent reactions that trigger expansion of the interlayer
space in the anode. The complexity of the involved mechanisms is also made apparent
by noting that the oxidation-preventing ability of the halide-based additives did not
correlate directly with the redox potential of the corresponding halide/halogen pair. If
such a correlation were indeed in place, we would expect the KBr and KI additives to
yield graphenes with a lower oxidation degree than that afforded by the NaCl/KCl
additives by virtue of the lower redox potential of the Br-/Br2 and I
-/I2 pairs relative to
the Cl-/Cl2 pair, but that was not the case. It is thus very likely that kinetic factors play a
relevant role in the reactions occurring between different chemical species during
intercalation and exfoliation of the graphite anode.
The present results also raise the apparently contradicting question of why the
exfoliation yield was not critically affected by the addition of 0.1 M NaCl (or KCl)
while at the same time this additive prevented to a large extent the oxidation of the
graphite anode, which on the other hand is assumed as a prerequisite for exfoliation to
occur. In this regard, a couple of points have to be considered. First, it is quite likely
that the only strict requirement for anodic exfoliation to proceed is the oxidation of the
graphite edges, but not of its basal planes. This oxidation would locally increase the
interlayer spacing at the graphite edge, thus facilitating the penetration of hydrated
anions from the electrolyte. Once a number of hydrated anions have been inserted into
the interlayer space at the edges, further oxidation of the graphite lattice (i.e., at
locations other than the edges) would not be strictly necessary, as the inserted ions and
water molecules themselves (or their electrolyzed products) would readily trigger the
interlayer expansion (exfoliation) of the material increasingly further away from the
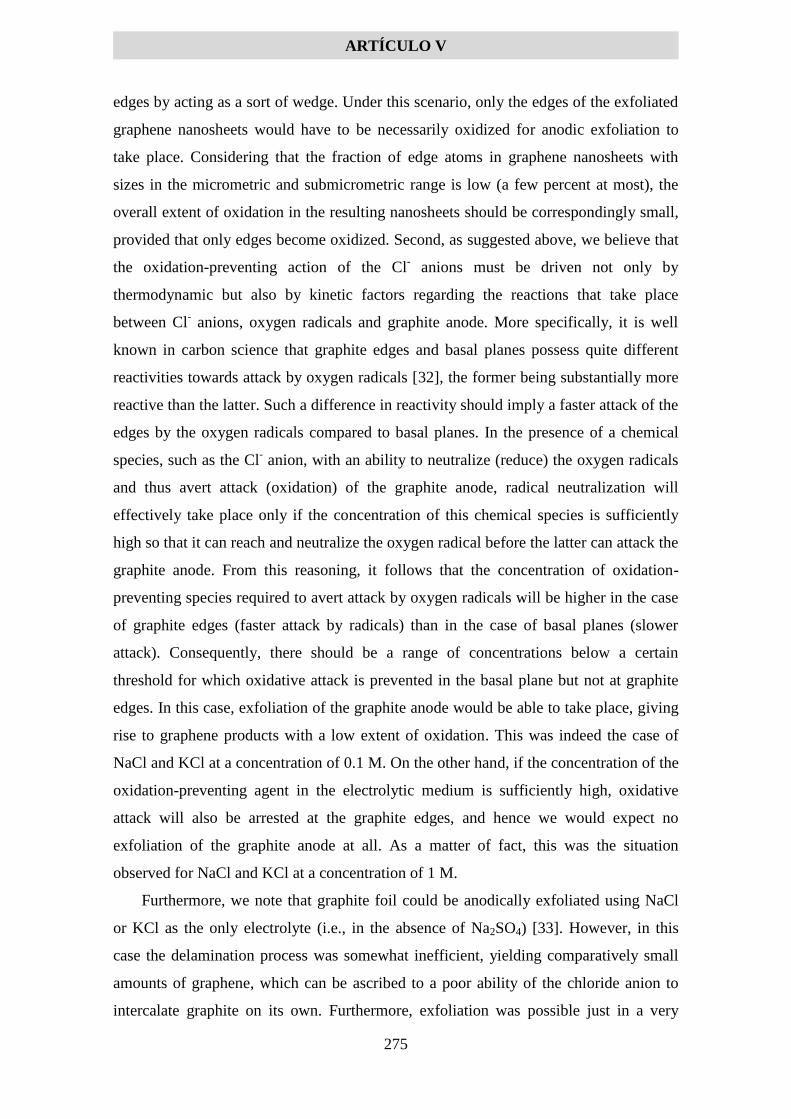
ARTÍCULO V
275
edges by acting as a sort of wedge. Under this scenario, only the edges of the exfoliated
graphene nanosheets would have to be necessarily oxidized for anodic exfoliation to
take place. Considering that the fraction of edge atoms in graphene nanosheets with
sizes in the micrometric and submicrometric range is low (a few percent at most), the
overall extent of oxidation in the resulting nanosheets should be correspondingly small,
provided that only edges become oxidized. Second, as suggested above, we believe that
the oxidation-preventing action of the Cl- anions must be driven not only by
thermodynamic but also by kinetic factors regarding the reactions that take place
between Cl- anions, oxygen radicals and graphite anode. More specifically, it is well
known in carbon science that graphite edges and basal planes possess quite different
reactivities towards attack by oxygen radicals [32], the former being substantially more
reactive than the latter. Such a difference in reactivity should imply a faster attack of the
edges by the oxygen radicals compared to basal planes. In the presence of a chemical
species, such as the Cl- anion, with an ability to neutralize (reduce) the oxygen radicals
and thus avert attack (oxidation) of the graphite anode, radical neutralization will
effectively take place only if the concentration of this chemical species is sufficiently
high so that it can reach and neutralize the oxygen radical before the latter can attack the
graphite anode. From this reasoning, it follows that the concentration of oxidation-
preventing species required to avert attack by oxygen radicals will be higher in the case
of graphite edges (faster attack by radicals) than in the case of basal planes (slower
attack). Consequently, there should be a range of concentrations below a certain
threshold for which oxidative attack is prevented in the basal plane but not at graphite
edges. In this case, exfoliation of the graphite anode would be able to take place, giving
rise to graphene products with a low extent of oxidation. This was indeed the case of
NaCl and KCl at a concentration of 0.1 M. On the other hand, if the concentration of the
oxidation-preventing agent in the electrolytic medium is sufficiently high, oxidative
attack will also be arrested at the graphite edges, and hence we would expect no
exfoliation of the graphite anode at all. As a matter of fact, this was the situation
observed for NaCl and KCl at a concentration of 1 M.
Furthermore, we note that graphite foil could be anodically exfoliated using NaCl
or KCl as the only electrolyte (i.e., in the absence of Na2SO4) [33]. However, in this
case the delamination process was somewhat inefficient, yielding comparatively small
amounts of graphene, which can be ascribed to a poor ability of the chloride anion to
intercalate graphite on its own. Furthermore, exfoliation was possible just in a very

ARTÍCULO V
276
narrow range of chloride concentrations (around 0.05 M, but not at 0.01 and 0.1 M) and
the process was substantially less efficient in averting graphene oxidation (O/C ratio of
the resulting graphene ~0.06). Hence, the use of NaCl or KCl as an additive (co-
electrolyte) of a main electrolyte (Na2SO4) is clearly advantageous over their use as the
only electrolyte for anodic exfoliation. We surmise that the sulfate anions act as a sort of
advance party in the intercalation and exfoliation of the graphite anode, triggering the
expansion of the interlayer space to a point where the subsequent entry of the oxidation-
preventing chloride anions is greatly facilitated. Likewise, the use of commercial table
salt (typically made up of 97-99 wt% NaCl plus some anticaking and other added agents
as minor components) as an additive led to anodically exfoliated graphenes with the
same characteristics as those of graphenes derived from the pure, analytical-grade NaCl.
Particularly, high quality graphene with a very low degree of oxidation could be
similarly attained with a proper concentration of table salt, i.e., 6 mg mL-1
(amounting
to ~0.1 M of its NaCl component). Considering that up-scaling the production of
electrochemically exfoliated graphene to the tonne scale is expected in the near future
[34], the present results bode well for the industrial implementation of the anodic
approach towards high quality, low-oxidized graphene, as only very cheap and abundant
source materials are required.
2.2. Further characterization of the low-oxidized anodic graphene
The improved structural quality of the anodic graphenes obtained using NaCl or
KCl as an electrolyte additive was confirmed by their high resolution C 1s X-ray
photoelectron spectra as well as by Raman spectroscopy. Fig. 2a shows the C 1s
photoelectron spectrum of graphene prepared with 0.1 M NaCl additive (red trace). For
comparison purposes, the spectra for the starting graphite foil (black trace) and the
control sample (graphene exfoliated only with 0.1 M Na2SO4, orange trace) are also
given. The survey spectra of these three samples are also presented in Fig. S2 of the
ESM. In all cases, the C 1s envelope was dominated by a component centered at a
binding energy of about 284.6 eV, corresponding to carbon atoms in unoxidized
graphitic environments (sp2-based C=C species). Nonetheless, while the relatively
oxidized control sample exhibited significant additional components in the 285-288 eV
range, ascribed to carbon atoms in different oxidation states (C-O and C=O species)
[7,11,20,29], such components were almost absent from the graphene sample obtained
using the NaCl additive, as noticed by comparing its C 1s envelope with that of the
starting graphite foil. This result further supports the conclusion that very few carbon
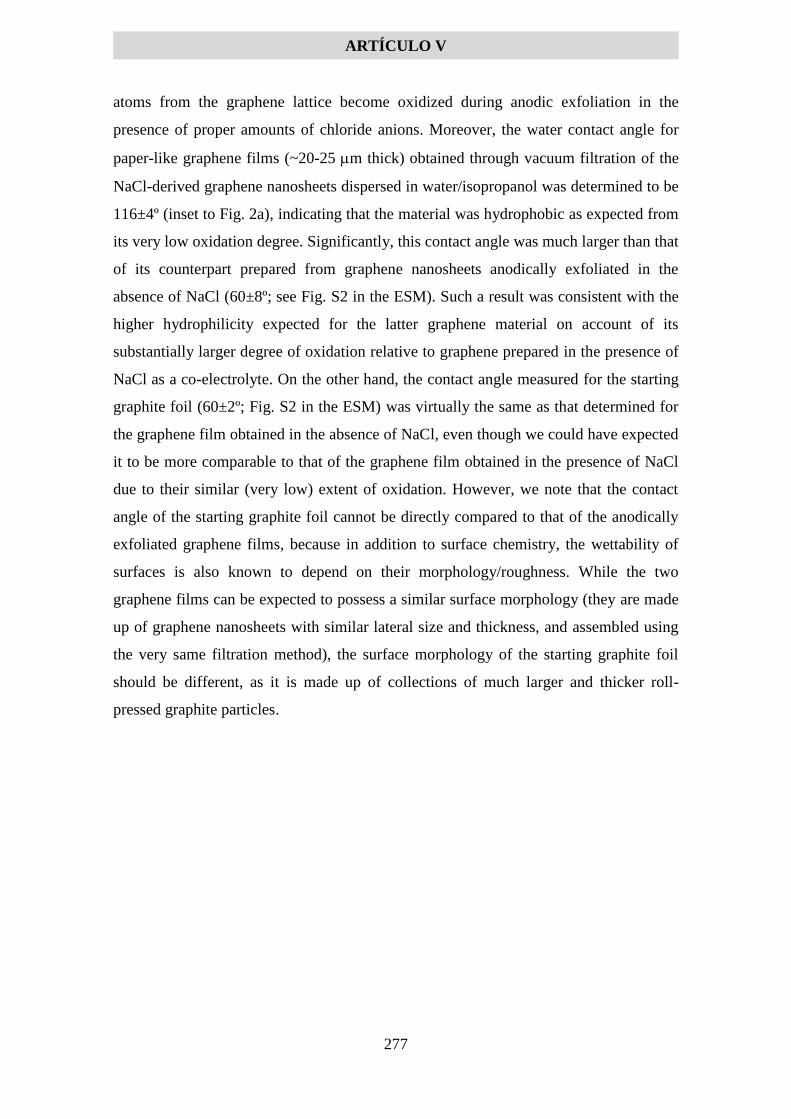
ARTÍCULO V
277
atoms from the graphene lattice become oxidized during anodic exfoliation in the
presence of proper amounts of chloride anions. Moreover, the water contact angle for
paper-like graphene films (~20-25 m thick) obtained through vacuum filtration of the
NaCl-derived graphene nanosheets dispersed in water/isopropanol was determined to be
116±4º (inset to Fig. 2a), indicating that the material was hydrophobic as expected from
its very low oxidation degree. Significantly, this contact angle was much larger than that
of its counterpart prepared from graphene nanosheets anodically exfoliated in the
absence of NaCl (60±8º; see Fig. S2 in the ESM). Such a result was consistent with the
higher hydrophilicity expected for the latter graphene material on account of its
substantially larger degree of oxidation relative to graphene prepared in the presence of
NaCl as a co-electrolyte. On the other hand, the contact angle measured for the starting
graphite foil (60±2º; Fig. S2 in the ESM) was virtually the same as that determined for
the graphene film obtained in the absence of NaCl, even though we could have expected
it to be more comparable to that of the graphene film obtained in the presence of NaCl
due to their similar (very low) extent of oxidation. However, we note that the contact
angle of the starting graphite foil cannot be directly compared to that of the anodically
exfoliated graphene films, because in addition to surface chemistry, the wettability of
surfaces is also known to depend on their morphology/roughness. While the two
graphene films can be expected to possess a similar surface morphology (they are made
up of graphene nanosheets with similar lateral size and thickness, and assembled using
the very same filtration method), the surface morphology of the starting graphite foil
should be different, as it is made up of collections of much larger and thicker roll-
pressed graphite particles.

ARTÍCULO V
278
Figure 2. (a,b) High resolution C 1s core-level spectra (a) and Raman spectra (b) of the starting
graphite foil (black trace), graphene anodically exfoliated in 0.1 M Na2SO4 electrolyte (orange
trace) and graphene anodically exfoliated in 0.1 M Na2SO4 with 0.1 M NaCl as a co-electrolyte
(red trace). Inset to a: digital photograph of a water droplet (~2 L) deposited onto a vacuum-
filtered film of graphene prepared by anodic exfoliation in the presence of NaCl co-electrolyte.
(c,d) STEM (c) and AFM (d) images of graphene nanosheets produced by anodic exfoliation
with NaCl co-electrolyte. A typical line profile of a nanosheet taken along the marked white line
is shown overlaid on the AFM image.
The Raman spectra of graphene obtained with 0.1 M NaCl additive (red trace),
starting graphite foil (black) and control sample (orange) are presented in Fig. 2b. Their
first-order region (1100-1700 cm-1
range) incorporated the well-known G and defect-
related D bands characteristic of graphite- and graphene-based materials [35,36], which
were located at ~1582 and ~1350 cm-1
, respectively. An additional, weaker defect-
related band (D´ band) appeared in some cases as a shoulder on the high wavenumber
side of the G band at ~1620 cm-1
. The second order region (2300-3300 cm-1
) was
dominated by the 2D band (~2700 cm-1
). As a quantitative proxy of structural quality
and defect density [36], the integrated intensity ratio of the D and G bands (ID/IG ratio)
was used to reveal the possible introduction of structural imperfections in the graphene
samples upon anodic exfoliation. The ID/IG ratio for graphene prepared with 0.1 M NaCl
additive was determined to be 0.21±0.06, which was significantly smaller than that of
the control sample (1.3±0.2) and consistent with the higher structural quality expected
for the former as a result of its lower extent of oxidation. By contrast, the ID/IG ratio for
the starting graphite foil was a meager 0.03±0.02. Rather than arising from basal plane
c
500 nm
d
2 nm
295 290 285 1500 2000 2500 3000
Inte
nsity (
a. u.)
Binding energy (eV)
a b
Inte
nsity (
a. u.)
Raman shift (cm-1
)
1 m

ARTÍCULO V
279
defects induced by oxidation, we infer that the significant increase in ID/IG ratio
observed for the NaCl-derived graphene relative to the starting graphite stems mostly
from the presence of a larger fraction of edges in the exfoliated nanosheets, which in
turn can be ascribed to their relatively small (micrometric/submicrometric) size. Such a
conclusion was supported by measurement of the ID/ID, ratio, the magnitude of which
has been proposed to reflect the type of prevailing defect in graphene materials [37,38].
Specifically, ID/ID´ values around 13, 7 and 3.5 have been associated to graphenes with
imperfections dominated by basal plane sp3-defects, vacancy defects and
boundaries/edges, respectively. ID/ID´ was calculated to be ~4.5 for the NaCl-derived
graphene, thus suggesting that the increase in ID/IG ratio for such a sample relative to the
starting graphite foil referred to above was largely due to the generation of exfoliated
nanosheets with relatively small sizes (increased fraction of edges). Furthermore, when
using the measured ID/IG ratio to estimate the average lateral size of the graphene
nanosheets (<L>) by way of the formula recently proposed by Backes et al [39], which
assumes the intensity of the D band to arise mostly from edges and not from basal plane
defects, we obtained <L> values in the range between a few and several hundreds of
nanometers. This result was in good agreement with the typical sizes of the nanosheets
as imaged by scanning transmission electron microscopy (STEM; Fig. 2c) and atomic
force microscopy (AFM; Fig. 2d). By contrast, the values of <L> derived from ID/IG for
the control sample were substantially smaller (~50-100 nm), even though the actual size
of the corresponding nanosheets was very similar to that of their NaCl-derived
counterparts (images not shown). Hence, unlike the case of the latter, the nanosheets
from the control sample were concluded to possess a significant amount of basal plane
defects generated from the anodic delamination process, as could be anticipated on the
basis of their substantial oxidation degree.
As illustrated by the line profiles from Fig. 2d, AFM was also used to assess the
thickness of the exfoliated nanosheets deposited onto SiO2/Si substrates. Apparent
thickness values were determined to be typically between ~1.5 and 2.5 nm. Taking into
account that this technique introduces a positive offset of ~1 nm in the measurement of
graphene thickness, as is well known [40-42], we estimated the actual thickness of the
nanosheets to be between ~0.5 and 1.5 nm. This result implies that such nanosheets
were mostly single- to few-layered (< 5) objects, which in turn indicates that the
efficiency of the anodic exfoliation process was not compromised by the use of NaCl as
an electrolyte additive. The electrical conductivity ( of the paper-like, NaCl-derived

ARTÍCULO V
280
graphene films was measured to further emphasize their high structural quality, yielding
~34000 S m-1
. This figure was similar to, or even higher than, those previously
reported for films of high quality, low-oxidized anodic graphene obtained with other
oxidation-preventing electrolytes, such as sulfonated naphthalenes ( ~46000 S m-1
)
[20], or electrolyte additives (e.g., TEMPO; ~10000 S m-1
[18]), and generally higher
than those determined for as-prepared (without post-treatment) films of pristine
graphene derived from direct, ultrasound- or shear-induced exfoliation in organic
solvents ( ~5400-20000 S m-1
) [38-44].
2.3. Applications of the low-oxidized anodic graphene in water/oil remediation and
capacitive energy storage
A high quality, low-oxidized graphene produced in large amounts in powder form,
like the one developed here by anodic exfoliation with NaCl as an electrolyte additive,
could find practical use in water and oil remediation applications, where hydrophobic
sorbents are typically required [45-47], and in electrochemical energy storage, where
electrodes with a high electrical conductivity are needed [48-50]. Indeed, as discussed
above, this graphene material was highly hydrophobic and electrically conductive. To
explore such possibilities, we have examined its performance as an adsorbent of dyes
from the aqueous phase and as a sorbent for oils and non-polar organic solvents, as well
as an electrode for capacitive energy storage (see ESM for details on the experimental
procedures). To this end, we used the as-exfoliated product (Fig. 1b), i.e., the material
directly obtained from the anodic treatment (only washed with water and dried) that was
not submitted to sonication in any solvent to separate individual graphene nanosheets
from one another. Such a material was a fluffy, low density powder (~30-40 mg cm-3
)
that could be manipulated for the intended purposes more conveniently than the
individual, solvent-dispersed nanosheets.
Fig. 3a shows the measured adsorption capacities of the graphene product towards
five different dyes, namely, rose bengal, methylene green, basic fuchsin, methylene blue
and methyl orange. The adsorption values ranged between ~130 mg g-1
(for rose bengal)
and ~450 mg g-1
(for methyl orange). These figures were similar to, or even better than,
those of many graphene-based adsorbents previously reported in the literature
[45,51,52] (see Table S1 in the ESM for a detailed comparison of adsorption
capacities). The good adsorption performance of the present graphene powder can be

ARTÍCULO V
281
ascribed to its characteristic morphology consisting of very thin rippled sheets separated
by micrometer- to nanometer-sized voids (Fig. 1d), which in turn should be associated
to a large exposed surface area. Indeed, the dye adsorption capacities of the as-
exfoliated graphene following a sonication step, whereby many individual graphene
nanosheets are physically detached from the bulk powder, were not very different to
those determined before sonication, thus suggesting that the surface area available for
dye adsorption was already well developed in the as-exfoliated (non-sonicated)
material. Concerning the sorption of oils and non-polar organic solvents, the measured
capacities were typically between 15 and 30 g g-1
(Fig. 3b). Even though these values
were relatively modest compared to those obtained with very lightweight graphene-
based sorbents [45,47] (a detailed comparison of different sorbents is given in Table S2
of the ESM), they were nonetheless consistent with what could be expected for a
material with a density of 30-40 mg cm-3
. Moreover, very lightweight graphene-based
sorbents are commonly obtained through the production and processing of graphite
oxide, which in turn involves time-consuming and relatively complicated procedures
[46,47]. By contrast, the anodic graphene material investigated here can be prepared in a
short time by a very simple process, thus making its use particularly attractive from an
applied perspective.

ARTÍCULO V
282
Figure 3. Applications of the as-prepared, low-oxidized anodic graphene obtained with NaCl as
a co-electrolyte. (a,b) Histograms showing the adsorption capacity of the material towards
different dyes in aqueous solution (a) as well as its sorption capacity towards different oils and
non-polar organic solvents (b). (c) Cyclic voltammogram recorded at a potential scan rate of 3
mV s-1
. (d) Cyclic voltammograms recorded at potential scan rates between 3 and 500 mV s-1
.
(e) Galvanostatic charge/discharge curves recorded at different current densities between 0.05
and 10 A g-1
. (f) Gravimetric capacitance values determined at different current densities from
the discharge curves in e. Inset to f: evolution of capacitance values (in percentage) of the
electrode measured at a current density of 2 A g-1
for consecutive charge/discharge cycles (up to
10000).
The results of testing the low-oxidized anodic graphene as an electrode for
capacitive energy storage are presented in Fig. 3c-f. The measurements were carried out
in a three-electrode configuration, using a commercial activated carbon as a counter
electrode and Ag/AgCl (3 M KCl) as a reference electrode (see ESM for details). Fig.
3c shows the cyclic voltammogram of the graphene electrode recorded at a potential
scan rate of 3 mV s-1
. Even at such a low scan rate, the voltammogram exhibited a
nearly rectangular shape with no significant redox peaks (except for some slight
oxidation/reduction humps at ~0.4-0.5 V vs Ag/AgCl), indicating that charge storage in
the electrode was mostly dominated by the formation of an electric double layer with
little contribution from Faradaic processes (i.e., pseudocapacitance). This observation
was in agreement with the very limited amount of oxygen functional groups (and indeed
of any other heteroatoms) detected by XPS for this graphene sample, the presence of
-0.2 0.0 0.2 0.4 0.6 0.8-0.4
-0.2
0.0
0.2
0.4
0.6
-0.2 0.0 0.2 0.4 0.6 0.8
-20
-10
0
10
20
30
0 1000 2000 3000 4000 5000
-0.2
0.0
0.2
0.4
0.6
0.8
1.0
0 2 4 6 8 100
25
50
75
100
125
5000 100000
25
50
75
100
cb
I(A
g-1)
E(V) vs Ag/AgCl
500 mV s-1
3 mV s-1
d
I(A
g-1)
E(V) vs Ag/AgCl
e10 A g
-1
E(V
) vs A
g/A
gC
l
Time (s)
0.05 A g-1
a
Specific
capacitance (
F g
-1)
Current density (A g-1
)
0
100
200
300
400
meth
yl ora
nge
meth
yle
ne b
lue
basic
fuchsin
meth
yle
ne g
reen
Adsorp
tion (
mg/g
)
rose b
engal 0
10
20
30
pum
p o
il (u
sed)
pum
p o
il (n
ew
)
oliv
e o
il
eth
anol
eth
yle
ne g
lycol
chlo
rofo
rm
dodecane
hexane
aceto
ne
tetr
ahydro
fura
n
Weig
ht
gain
(g/g
)
tolu
ene
f
Ca
pa
cita
nce
re
ten
tio
n (
%)
cycle number

ARTÍCULO V
283
which is generally ascribed to the emergence of pseudocapacitance in carbon materials
[48,49]. Furthermore, the rectangular shape of the voltammograms was largely retained
upon increasing the voltage scan rate (Fig. 3d), although some degree of distortion
became apparent at the highest rates (i.e., 300 and 500 mV s-1
). The latter would
indicate that access of the electrolyte ions to certain areas of the electrode is somewhat
sluggish, which in turn could be due to the particular morphology of the graphene
product that is obtained from the anodic process. More specifically, the FE-SEM images
of the anodically expanded material (e.g., Fig. 1d) suggest that there could be very
narrow voids between parallel sheets at some specific points, creating two-dimensional
slit pores where ion adsorption/desorption can take place. Because the anodic treatment
does not lead on its own to a complete separation of the graphene layers, we can expect
many of these two-dimensional voids to be closed at one of their ends, thus creating cul-
de-sac porosities that hamper ionic transport to/from these pores.
Typical galvanostatic charge/discharge curves recorded at different current
densities between 0.05 and 10 A g-1
are presented in Fig. 3e. The curves displayed
mostly triangular and symmetrical shapes, this being again consistent with capacitive
processes as the main driving force behind charge storage in the graphene electrode. As
shown in Fig. 3f, the gravimetric capacitance values derived from the discharge curves
were highest (around 120 F g-1
) at the lowest current densities and decreased down to
~50 F g-1
at a current density of 10 A g-1
. These figures lay within the range of values
measured for many graphene-based materials that have previously tested as electrodes
for capacitive energy storage [48,50] (see Table S3 in the ESM for a comparative list).
However, different to the case of these prior graphene materials, many of which were
obtained through complex preparation and processing steps (e.g., via the graphite oxide
route, or by chemical vapor deposition for very high quality graphenes), a practical
advantage of the present approach was its simplicity of operation and the use of
inexpensive, environmentally friendly and widely available reagents. Moreover, the
stability of the graphene electrode was demonstrated by noting that about 98% of its
initial capacitance could be retained after 10000 consecutive charge/discharge cycles at
2 A g-1
(inset to Fig. 3f).
3. Conclusions
We have demonstrated the production of high quality and low-oxidized graphene
nanosheets by anodic exfoliation of graphite in water using NaCl (table salt) as an

ARTÍCULO V
284
electrolyte additive (co-electrolyte) with a remarkable efficiency in preventing the
oxidation of the nanosheets that is commonly associated to such a process. Different to
previous instances, where relatively complex and expensive electrolyte additives were
employed to avert the oxidation of anodically exfoliated graphene, the present work has
introduced a particularly cheap, straightforward and readily available substance as an
alternative oxidation-preventing co-electrolyte. The high efficiency of this additive in
curtailing oxidative attack of the exfoliated nanosheets was particularly significant,
yielding anodic graphene with the lowest extent of oxidation reported to date (O/C ratio
~0.02-0.03). The as-prepared, low-oxidized graphene material also demonstrated its
potential practical utility as a sorbent of dyes and non-polar organic solvents for
water/oil remediation processes, as well as an electrode for capacitive energy storage, its
simplicity of preparation and processing being an additional asset compared to other
graphene-based materials. Finally, because only inexpensive raw materials that are
available in large quantities were required for its production, we believe the anodic
route is now better positioned as a competitive approach in the efforts to industrialize
the manufacturing of high quality graphene for different applications.
Acknowledgements
Funding by the Spanish Ministerio de Economía y Competitividad (MINECO) and
the European Regional Development Fund (ERDF) through project MAT2015-69844-R
is gratefully acknowledged. We also acknowledge partial funding by Plan de Ciencia,
Tecnología e Innovacción 2013-2017 del Principado de Asturias and the ERDF through
project GRUPIN14-056. J.M.M. is grateful to the Spanish Ministerio de Educación,
Cultura y Deporte (MECD) for his pre-doctoral contract (FPU14/00792).
ARTÍCULO V
285
References
[1] A.C. Ferrari, F. Bonaccorso, V. Fal'ko, K. S. Novoselov, S. Roche, P. Boggild, S.
Borini, F. H. L. Koppens, V. Palermo, N. Pugno, J. A. Garrido, R. Sordan, A. Bianco,
L. Ballerini, M. Prato, E. Lidorikis, J. Kivioja, C. Marinelli, T. Ryhanen, A. Morpurgo,
J. N. Coleman, V. Nicolosi, L. Colombo, A. Fert, M. Garcia-Hernandez, A. Bachtold,
G. F. Schneider, F. Guinea, C. Dekker, M. Barbone, Z. Sun, C. Galiotis, A. N.
Grigorenko, G. Konstantatos, A. Kis, M. Katsnelson, L. Vandersypen, A. Loiseau, V.
Morandi, D. Neumaier, E. Treossi, V. Pellegrini, M. Polini, A. Tredicucci, G. M.
Williams, B. Hee Hong, J.-H. Ahn, J. Min Kim, H. Zirath, B. J. van Wees, H. van der
Zant, L. Occhipinti, A. Di Matteo, I. A. Kinloch, T. Seyller, E. Quesnel, X. Feng, K.
Teo, N. Rupesinghe, P. Hakonen, S. R. T. Neil, Q. Tannock, T. Lofwander, J. Kinaret,
Science and technology roadmap for graphene, related two-dimensional crystals, and
hybrid systems, Nanoscale 7 (2015), 4598-4810.
[2] H.J. Salavagione, Promising alternative routes for graphene production and
functionalization, J. Mater. Chem. A 2 (2014), 7138-7146.
[3] A.M. Abdelkader, A.J. Cooper, R.A.W. Dryfe, I.A. Kinloch, How to get between
the sheets: a review of recent works on the electrochemical exfoliation of graphene
materials from bulk graphite, Nanoscale 7 (2015), 6944-6956.
[4] S. Yang, M.R. Lohe, K. Müllen, X. Feng, New-generation graphene from
electrochemical approaches: production and applications, Adv. Mater. 28 (2016), 6213-
6221.
[5] Y.L. Zhong, Z. Tian, G.P. Simon, D. Li, Scalable production of graphene via wet
chemistry: progress and challenges, Mater. Today 18 (2015), 73-78.
[6] A.T. Najafabadi, E. Gyenge, Synergistic production of graphene microsheets by
simultaneous anodic and cathodic electro-exfoliation of graphitic electrodes in aprotic
ionic liquids, Carbon 84 (2015), 449-459.
[7] S. Yang, A.G. Ricciardulli, S. Liu, R. Dong, M.R. Lohe, A. Becker, M.A. Squillaci,
P. Samorì, K. Müllen, X. Feng, Ultrafast delamination of graphite into high-quality
graphene using alternating currents, Angew. Chem. Int. Ed. 56 (2017), 6669-6675.
[8] A.J. Cooper, N.R. Wilson, I.A. Kinloch, R.A.W. Dryfe, Single stage electrochemical
exfoliation method for the production of few-layer graphene via intercalation of
tetraalkylammonium cations, Carbon 66 (2014), 340-350.
ARTÍCULO V
286
[9] M. Zhao, X.-Y. Guo, O. Ambacher, C.E. Nebel, R. Hoffmann, Electrochemical
generation of hydrogenated graphene flakes, Carbon 83 (2015), 128-135.
[10] Y.R. Leroux, J.-F. Bergamini, S. Ababou, J.-C. Le Breton, P. Hapiot, Synthesis of
functionalized few-layer graphene through fast electrochemical expansion of graphite, J.
Electroanal. Chem. 753 (2015), 42-46.
[11] J. Liu, M. Notarianni, G. Will, V.T. Tiong, H. Wang, N. Motta, Electrochemically
exfoliated graphene for electrode films: effect of graphene flake thickness on the sheet
resistance and capacitive properties, Langmuir 29 (2013), 13307-13314.
[12] L. Wu, W. Li, P. Li, S. Liao, S. Qiu, M. Chen, Y. Guo, Q. Li, C. Zhu, L. Liu,
Powder, paper and foam of few-layer graphene prepared in high yield by
electrochemical intercalation exfoliation of expanded graphite, Small 10 (2014), 1421-
1429.
[13] A. Ambrosi, M. Pumera, Electrochemically exfoliated graphene and graphene
oxide for energy storage and electrochemistry applications, Chem. Eur. J. 22 (2016),
153-159.
[14] Z. Liu, Z.-S. Wu, S. Yang, R. Dong, X. Feng, K. Müllen, Ultraflexible in-plane
micro-supercapacitors by direct printing of solution-processable electrochemically
exfoliated graphene, Adv. Mater. 28 (2016), 2217-2222.
[15] P. Khanra, T. Kuila, S. H. Bae, N. H. Kim, J. H. Lee, Electrochemically exfoliated
graphene using 9-anthracene carboxylic acid for supercapacitor application, J. Mater.
Chem. 22 (2012) 24403–24410.
[16] P. Khanra, C.-N. Lee, T. Kuila, N. H. Kim, M. J. Park, J. H. Lee, 7,7,8,8-
Tetracyanoquinodimethane-assisted one step electrochemical exfoliation of graphite and
its performance as an electrode material, Nanoscale 6 (2014) 4864–4873.
[17] J.I. Paredes, J.M. Munuera, Recent advances and energy-related applications of
high quality/chemically doped graphenes obtained by electrochemical exfoliation
methods, J. Mater. Chem. A 5 (2017), 7228-7242.
[18] S. Yang, S. Brüller, Z.-S. Wu, Z. Liu, K. Parvez, R. Dong, F. Richard, P. Samorì,
X. Feng, K. Müllen, Organic radical-assisted electrochemical exfoliation for the
scalable production of high-quality graphene, J. Am. Chem. Soc. 137 (2015), 13927-
13932.

ARTÍCULO V
287
[19] C.-H. Chen, S.-W. Yang, M.-C. Chuang, W.-Y. Woon, C.-Y. Su, Towards the
continuous production of high crystallinity graphene via electrochemical exfoliation
with molecular in situ encapsulation, Nanoscale 7 (2015), 15362-15373.
[20] J.M. Munuera, J.I. Paredes, S. Villar-Rodil, M. Ayán-Varela, A. Martínez-Alonso,
J.M.D. Tascón, Electrolytic exfoliation of graphite in water with multifunctional
electrolytes: en route towards high quality, oxide-free graphene flakes, Nanoscale 8
(2016), 2982-2998.
[21] K. Parvez, Z.-S. Wu, R. Li, X. Liu, R. Graf, X. Feng, K. Müllen, Exfoliation of
graphite into graphene in aqueous solutions of inorganic salts, J. Am. Chem. Soc. 136
(2014), 6083-6091.
[22] S.C. Foote, J.S. Valentine, A. Greenberg, J.F. Liebman, Active Oxygen in
Chemistry, Chapman & Hall, Glasgow, 1995.
[23] P. Vanÿsek, CRC handbook of Chemistry and Physics, 93rd
edition, CRC Press,
Boca Raton, 2012.
[24] G.G. Jayson, B.J. Parsons, A.J. Swallow, Some simple, highly reactive, inorganic
chlorine derivatives in aqueous solution. Their formation using pulses of radiation and
their role in the mechanism of the Fricke dosimeter, J. Chem. Soc., Faraday Trans. 1 69
(1973), 1597-1607.
[25] L.B. Ebert, Annu. Intercalation compounds of graphite, Rev. Mater. Sci. 6 (1976),
181-211.
[26] H. Shioyama, R. Fujii, Electrochemical reactions of stage 1 sulfuric acid—Graphite
intercalation compound, Carbon 25 (1987), 771-774.
[27] C.-Y. Su, A.-Y. Lu, Y. Xu, F.-R. Chen, A.N. Khlobystov, L.-J. Li, High-quality
thin graphene films from fast electrochemical exfoliation, ACS Nano 5 (2011), 2332-
2339.
[28] J.M. Munuera, J.I. Paredes, S. Villar-Rodil, A. Martínez-Alonso, J.M.D. Tascón, A
simple strategy to improve the yield of graphene nanosheets in the anodic exfoliation of
graphite foil, Carbon 115 (2017), 628-632.
[29] J.M. Munuera, J.I. Paredes, S. Villar-Rodil, M. Ayán-Varela, A. Pagán, S.D.
Aznar-Cervantes, J.L. Cenis, A. Martínez-Alonso, J.M.D. Tascón, High quality, low
oxygen content and biocompatible graphene nanosheets obtained by anodic exfoliation
of different graphite types, Carbon 94 (2015), 729-739.

ARTÍCULO V
288
[30] D. Li, M.B. Müller, S. Gilje, R.B. Kaner, G.G. Wallace, Processable aqueous
dispersions of graphene nanosheets, Nat. Nanotechnol. 3 (2008), 101-105.
[31] L. Guardia, M.J. Fernández-Merino, J.I. Paredes, P. Solís-Fernández, S. Villar-
Rodil, A. Martínez-Alonso, J.M.D. Tascón, High-throughput production of pristine
graphene in an aqueous dispersion assisted by non-ionic surfactants, Carbon 49 (2011),
1653-1662.
[32] J.I. Paredes, A. Martínez-Alonso, J.M.D. Tascón, Multiscale imaging and tip-
scratch studies reveal insight into the plasma oxidation of graphite, Langmuir 23 (2007),
8932-8943.
[33] J.M. Munuera, J.I. Paredes, M. Enterría, A. Pagán, S. Villar-Rodil, M.F.R. Pereira,
J.I. Martins, J.L. Figueiredo, J.L. Cenis, A. Martínez-Alonso, J.M.D. Tascón,
Electrochemical exfoliation of graphite in aqueous sodium halide electrolytes toward
low oxygen content graphene for energy and environmental applications, ACS Appl.
Mater. Interfaces 9 (2017), 24085-24099.
[34] X.-Y. Wang, A. Narita, K. Müllen, Precision synthesis versus bulk-scale
fabrication of graphenes, Nat. Rev. Chem. 2 (2017), 00100.
[35] M.A. Pimenta, G. Dresselhaus, M.S. Dresselhaus, L.G. Cançado, A. Jorio, R. Saito,
Studying disorder in graphite-based systems by Raman spectroscopy, Phys. Chem.
Chem. Phys. 9 (2007), 1276-1291.
[36] A.C. Ferrari, D.M. Basko, Raman spectroscopy as a versatile tool for studying the
properties of graphene, Nat. Nanotechnol. 8 (2013), 235-246.
[37] A. Eckmann, A. Felten, A. Mishchenko, L. Britnell, R. Krupke, K.S. Novoselov, C.
Casiraghi, Probing the nature of defects in graphene by Raman spectroscopy, Nano Lett.
12 (2012), 3925-3930.
[38] K. R. Paton, E. Varrla, C. Backes, R. J. Smith, U. Khan, A. O'Neill, C. Boland, M.
Lotya, O. M. Istrate, P. King, T. Higgins, S. Barwich, P. May, P. Puczkarski, I. Ahmed,
M. Moebius, H. Pettersson, E. Long, J. Coelho, S. E. O'Brien, E. K. McGuire, B.
Mendoza Sanchez, G. S. Duesberg, N. McEvoy, T. J. Pennycook, C. Downing, A.
Crossley, V. Nicolosi, J. N. Coleman, Scalable production of large quantities of defect-
free few-layer graphene by shear exfoliation in liquids, Nat. Mater. 13 (2014), 624–630.
[39] C. Backes, K.R. Paton, D. Hanlon, S. Yuan, M.I. Katsnelson, J. Houston, R.J.
Smith, D. McCloskey, J.F. Donegan, J.N. Coleman, Spectroscopic metrics allow in situ

ARTÍCULO V
289
measurement of mean size and thickness of liquid-exfoliated few-layer graphene
nanosheets, Nanoscale 8 (2016), 4311-4323.
[40] K.S. Novoselov, A.K. Geim, S.V. Morozov, D. Jiang, Y. Zhang, S.V. Dubonos,
I.V. Grigorieva, A.A. Firsov, Electric field effect in atomically thin carbon films,
Science 306 (2004), 666-669.
[41] P. Nemes-Incze, Z. Osváth, K. Kamarás, L.P. Biró, Anomalies in thickness
measurements of graphene and few layer graphite crystals by tapping mode atomic
force microscopy, Carbon 46 (2008), 1435-1442.
[42] P. Solís-Fernández, J.I. Paredes, S. Villar-Rodil, A. Martínez-Alonso, J.M.D.
Tascón, Determining the thickness of chemically modified graphenes by scanning probe
microscopy, Carbon 48 (2010), 2657-2660.
[43] U. Khan, A. O´Neill, M. Lotya, S. De, J.N. Coleman, High-concentration solvent
exfoliation of graphene, Small 6 (2010), 864-871.
[44] K.H. Park, B.H. Kim, S.H. Song, J. Kwon, B.S. Kong, K. Kang, S. Jeon,
Exfoliation of non-oxidized graphene flakes for scalable conductive film, Nano Lett. 12
(2012), 2871-2876.
[45] Z. Niu, L. Liu, L. Zhang, X. Chen, Porous graphene materials for water
remediation, Small 10 (2014), 3434-3441.
[46] B. Chen, Q. Ma, C. Tan, T.-T. Lim, L. Huang, H. Zhang, Carbon-based sorbents
with three-dimensional architectures for water remediation, Small 11 (2015), 3319-
3336.
[47] W. Wan, Y. Lin, A. Prakash, Y. Zhou, Three-dimensional carbon-based
architectures for oil remediation: from synthesis and modification to functionalization,
J. Mater. Chem. A 4 (2016), 18687-18705.
[48] J. Chen, C. Li, G. Shi, Graphene materials for electrochemical capacitors, J. Phys.
Chem. Lett. 4 (2013), 1244-1253.
[49] R. Raccichini, A. Varzi, S. Passerini, B. Scrosati, The role of graphene for
electrochemical energy storage, Nat. Mater. 14 (2015), 271-279.
[50] H. Wu, Y. Zhang, L. Cheng, L. Zheng, Y. Li, W. Yuan, X. Yuan, Graphene based
architectures for electrochemical capacitors, Energy Stor. Mater. 5 (2016), 8-32.
[51] F. Li, X. Jiang, J. Zhao, S. Zhang, Graphene oxide: A promising nanomaterial for
energy and environmental applications, Nano Energy 16 (2015), 488-515.

ARTÍCULO V
290
[52] H. Wang, X. Yuan, G. Zeng, Y. Wu, Y. Liu, Q. Jiang, S. Gu, Three dimensional
graphene based materials: Synthesis and applications from energy storage and
conversion to electrochemical sensor and environmental remediation, Adv. Colloid
Interface Sci. 221 (2015), 41-59.

ARTÍCULO V
291
Electronic Supplementary Material for
High quality, low-oxidized graphene via anodic exfoliation with table salt as an
efficient oxidation-preventing co-electrolyte for water/oil remediation and
capacitive energy storage applications
J.M. Munuera, J.I. Paredes, S. Villar-Rodil, A. Castro-Muñiz, A. Martínez-Alonso,
J.M.D. Tascón
Instituto Nacional del Carbón, INCAR-CSIC, Apartado 73, 33080 Oviedo, Spain
Contents
S1. Electrochemical exfoliation experiments
S2. Characterization techniques
S3. Applications of the high quality, anodically exfoliated graphene
S4. Additional figures
S5. Additional tables
S6. References

ARTÍCULO V
292
S1. Electrochemical exfoliation experiments
Unless otherwise stated, all the materials and chemicals used throughout this study
were obtained from Sigma-Aldrich. Milli-Q deionized water (Millipore Corporation;
resistivity: 18.2 M·cm) was employed in all the experiments. The electrochemical
(anodic) exfoliation experiments were carried out in a two-electrode setup consisting of
a high purity graphite foil piece (Papyex I980, acquired from Mersen; dimensions: ~40
× 25 × 0.5 mm3) as the working electrode and a platinum foil (thickness: 0.025 mm) as
the counter electrode. Both electrodes were immersed in an aqueous electrolyte solution
(80 mL) incorporating 0.1 M Na2SO4 as the main electrolyte and a given molar
concentration of another chemical species as the electrolyte additive. Although best
results in terms of preventing oxidation of the exfoliated graphene nanosheets were
obtained with NaCl, other electrolyte additives tested included KCl, KBr, KI, NaBH4,
Na2SO3, sodium citrate, vitamin C and ethanol. To trigger its delamination, a positive
voltage (10 V) was applied to the graphite foil electrode for 60 min by means of an
Agilent 6614C DC power supply, while keeping the platinum counter electrode parallel
to the graphite foil surface at a distance of about 2 cm. During the electrolytic process
the outer layers of the graphite electrode were seen to swell and expand, giving rise to
many millimeter-sized fragments that detached from the electrode and tended to float on
the aqueous solution. Subsequently, these fragments as well as the swollen graphitic
material that had not yet detached from the electrode (retrieved by gently scraping with
a spatula) were collected, rinsed off with copious amounts of water through filter paper
and dried overnight at room temperature under reduced pressure. The resulting product
was transferred either to a water/isopropanol mixture (65/35 v/v%), to an aqueous
solution of the dispersant flavin mononucleotide (FMN, 1 mg mL-1
) or to the organic
solvent N,N-dimethylformamide (DMF), sonicated in an ultrasound bath cleaner (J.P.
Selecta Ultrasons system, 40 kHz) for 3 h and finally centrifuged at 200 g for 20 min
(Eppendorf 5424 microcentrifuge) to obtain a colloidal suspension (supernatant) of
graphene nanosheets in these solvents.
S2. Characterization techniques
The obtained materials were characterized by field emission scanning electron
microscopy (FE-SEM), scanning transmission electron microscopy (STEM), atomic
force microscopy (AFM), UV-vis absorption spectroscopy, Raman spectroscopy, X-ray

ARTÍCULO V
293
photoelectron spectroscopy (XPS) and measurement of electrical conductivity and water
contact angle. FE-SEM and STEM images were recorded in a Quanta FEG 650
microscope (FEI Company) at 25 kV. Specimens for STEM were prepared by drop-
casting ~40 L of graphene dispersed in water/isopropanol onto copper grids (200
mesh) covered with a thin continuous film of amorphous carbon. AFM imaging of the
graphene nanosheets was performed in the tapping mode of operation with a Nanoscope
IIIa Multimode apparatus (Veeco Instruments), using rectangular silicon cantilevers
(spring constant: ~40 N m-1
; resonance frequency: 250-300 kHz). To this end, the
nanosheets were deposited onto pre-heated (~50-60 ºC) highly oriented pyrolytic
graphite (HOPG) substrates by drop-casting their colloidal dispersion in
water/isopropanol. UV-vis absorption spectroscopy was accomplished in a double-beam
Heios spectrophotometer (Thermo Spectronic). Raman spectra were acquired in a
Horiba Jobin-Yvon LabRam instrument at a laser excitation wavelength and incident
power of 532 nm and 2 mW, respectively. XPS was carried out on a SPECS apparatus
under a pressure of 10-7
Pa using a non-monochromatic Al K X-ray source (11.81 kV,
100 W). Specimens for both Raman spectroscopy and XPS were prepared by drop-
casting graphene dispersions in water/isopropanol onto pre-heated (~50-60 ºC) stainless
steel disks 12 mm in diameter until a thin, continuous graphene film with a lustrous
gray tone became visible to the naked eye. The electrical conductivity of paper-like
graphene films was measured on the basis of the van der Pauw method using a home-
made setup consisting of an Agilent 6614C DC power supply and a Fluke 45 digital
multimeter. The graphene films were prepared by vacuum filtration of graphene
dispersions in water/isopropanol through polycarbonate membrane filters (Whatman;
diameter: 25 mm; pore size: 0.2 m) and were cut into 12 × 12 mm2 square pieces for
the measurements, with their thickness being estimated by both FE-SEM and a high
precision electronic caliper (Digimatic Micrometer, model MDC-25PX, from
Mitutoyo). Measurement of water contact angles was carried out on the paper-like
graphene films by carefully dropping 2 L of water on the films with a pipette and
immediately taking images of the droplet using a standard digital camera attached with
a macro lens. Contact angles were determined from the recorded images through
analysis with ImageJ software.
ARTÍCULO V
294
S3. Applications of the high quality, anodically exfoliated graphene
To explore their possible applications, the high quality graphene materials
developed in this work were tested as adsorbents for water-soluble dyes and as sorbents
for non-polar organic solvents and dyes, as well as electrodes for capacitive energy
storage. In this case, the as-exfoliated graphene materials, i.e., the products directly
obtained from the anodic delamination process without a subsequent sonication step
(only washed with water to remove remnants of the electrolyte) were used, as they
exhibited a powdery, three-dimensional morphology that was convenient for their
manipulation. The dye adsorption tests were carried out by adding ~1.5 mg of graphene
material to 1.5 mL of an aqueous solution of a given dye at room temperature and pH
~6, followed by gently stirring with a magnetic bar for 24 h to ensure the attainment of
adsorption equilibrium and centrifuging the solution (20000 g, 20 min) to sediment the
graphene component. The concentration of the dye in the resulting supernatant was then
determined by means of UV-vis absorption spectroscopy and contrasted with that of the
starting dye solution, which in turn allowed the amount of dye adsorbed on the graphene
sample to be estimated. The adsorption experiments were performed with the following
dyes (wavelengths given in parenthesis correspond to the position of the absorption
peak used to measure the dye concentration): methyl orange (460 nm), methylene blue
(660 nm), basic fuchsin (540 nm), methylene green (660 nm) and rose bengal (560 nm).
To determine the maximum adsorption capacities of the graphene materials, different
starting concentrations of the dye (typically up to 2-3 mg mL-1
) were probed in the tests.
For the sorption of oils and non-polar solvents, a certain mass of graphene material
(typically ~5 mg) was first put into a 1.5 mL centrifuge tube. Then, small known
volumes of a given oil/solvent (usually around 100 L) were successively added to the
tube. Such volumes were readily taken up by the graphene sample until a point was
reached where the latter became saturated, which in turn allowed to estimate the total
volume of oil/solvent retained by the sorbent. Sorption tests were conducted with the
following substances: toluene, hexane, dodecane, tetrahydrofuran, acetone, chloroform,
ethylene glycol, ethanol, olive oil, as well as unused and used pump oil.
Testing of the high quality anodic graphene as an electrode for capacitive energy
storage was accomplished in a three-electrode configuration with a Swagelok-type cell,
using a paste based on a commercial activated carbon (ACF A20) as the counter
electrode and Ag/AgCl (3M KCl) as the reference electrode in an acidic aqueous
electrolyte (1 M H2SO4). The counter electrode paste consisted of a mixture of the
ARTÍCULO V
295
activated carbon, polytetrafluoroethylene (PTFE) as a binder and carbon black as a
conductive additive in a weight ratio of 90:5:5. The graphene working electrode was
prepared by pressing the as-prepared anodic graphene under a moderate force (1 ton for
15 s) onto a graphite foil support by means of a hydraulic press. Two pieces of glass
microfiber filter (grade 934-AH, from Whatman) were used as the separator. Prior to
assembling the cell, the working electrode, counter electrode and separator were soaked
in the electrolyte and vacuum-degassed. The assembled cell with the electrolyte was
also vacuum-degassed before the measurements, which were conducted in a Biologic
VSP potentiostat. Both cyclic voltammograms at different potential scan rates and
galvanostatic charge/discharge curves at different current densities were recorded.

ARTÍCULO V
296
S4. Additional figures
Figure S1. XPS survey spectra of the starting graphite foil (black trace), graphene anodically
exfoliated in 0.1 M Na2SO4 electrolyte (orange trace) and graphene anodically exfoliated in 0.1
M Na2SO4 with 0.1 M NaCl as a co-electrolyte (red trace).
Figure S2. Digital photographs of water droplets (1–2 L) deposited onto the starting graphite
foil (a), and vacuum-filtered films of graphene prepared by anodic exfoliation in the absence (b)
and presence (c) of 0.1 M NaCl as a co-electrolyte.
600 500 400 300 200
C 1s
O 1s
Inte
nsity (
a. u.)
Binding energy (eV)
b c a

ARTÍCULO V
297
S5. Additional tables
Table S1. Adsorption capacities of different dyes (methyl orange, methylene blue, methylene
green, basic fuchsin and rose bengal) with a range of graphene-based materials.
Material Adsorbate Adsorption
capacity (mg g-1
)
Ref.
Graphene oxide Methyl Orange 17 S1
CoFe2O4 functionalized graphene Methyl orange 72 S2
Graphene oxide/Ni-Al LDH Methyl orange 84 S3
Graphene oxide/Ni-Cr LDH Methyl orange 160 S4
Graphene oxide/chitosan Methyl orange 567 S5
As-prepared anodic graphene Methyl orange 457 This work
Reduced graphene oxide Methylene blue 154 S6
Graphene oxide Methylene blue 244 S7
Citric acid functionalized magnetic
graphene oxide
Methylene blue 316 S8
Agar/graphene oxide composite aerogel Methylene blue 578 S9
Porous graphene oxide/hydrogel
nanocomposite
Methylene blue 714 S10
As-prepared anodic graphene Methylene blue 415 This work
As-prepared anodic graphene Methylene green 343 This work
Reduced graphene oxide Basic fuchsin 34 S11
β-cyclodextrin–carboxymethyl cellulose–
graphene oxide composite
Basic fuchsin 59 S12
Reduced graphene oxide/ PSSMA Basic fuchsin 388 S13
Graphene/β-cyclodextrin composite Basic fuchsin 426 S14
Graphene oxide/polyacrylamide Basic fuchsin 1034 S15
As-prepared anodic graphene Basic fuchsin 361 This work
Graphene oxide/sodium
alginate/polyacrylamide hydrogel
Rose Bengal 6 S16
Graphene Oxide@PLA@HA Composite
Microcapsule
Rose Bengal 53 S17
Graphene sheets/graphene
quantum dots
Rose Bengal 587 S18
As-prepared anodic graphene Rose Bengal 130 This work

ARTÍCULO V
298
Table S2. Range of sorption capacities of different graphene-based materials towards oils and
non-polar organic solvents.
Material Retention capacity (g/g) Ref.
Magnetic graphene foam 7-27 S19
Hydrothermal graphene sponge 20-35 S20
Graphene–carbon nanotube aerogel 20-35 S21
GO foam 5-40 S22
N-doped graphene aerogel 40-110 S23
Graphene sponge 80-160 S24
As-prepared anodic graphene 15-30 This work
Table S3. Gravimetric capacitance values of a range of graphene-based materials determined at
different current densities.
Material Current density (A/g) Capacity (F/g) Ref
rGO 0.3 57 S25
rGO/carbon black 1 79 S26
rGO 0.5 82 S27
rGO 1 116 S28
rGO foam 5 125 S29
rGO 1 130 S30
graphene hydrogel 1 186 S31
graphene/PANI
nanofibers
0.3 210 S25
Highly crumpled N-doped
graphene nanosheets
1 246 S32
Anodic graphene 0.3 105 This work
Anodic graphene 0.5 100 This work
Anodic graphene 1 94 This work
Anodic graphene 5 63 This work

ARTÍCULO V
299
S6. References
[S1] D. Robatia, B. Mirzab, M. Rajabic, O. Moradid, I. Tyagie, S. Agarwaleg, V. K.
Gupta, Removal of hazardous dyes-BR 12 and methyl orange using graphene oxide as
an adsorbent from aqueous phase, Chem. Eng. J. 284 (2016) 687-697.
[S2] N. Li, M. Zheng, X. Chang, G. Ji, H. Lu, L. Xue, L. Pan, J. Cao, Preparation of
magnetic CoFe2O4-functionalized graphene sheets via a facile hydrothermal method
and their adsorption properties, J. Solid State Chem.184 (2011) 953-958.
[S3] Z. Yang, S. Ji, W. Gao, C. Zhang, L. Ren, W. W. Tjiu, Z. Zhang, J. Pan, T. Liu,
Magnetic Nanomaterial Derived from Graphene Oxide/Layered Double Hydroxide
Hybrid for Efficient Removal of Methyl Orange from Aqueous Solution, J. Colloid
Interface Sci. 408 (2013) 25-32.
[S4] X. Ruan, Y. Chen, H. Chen, G. Qian, R. L. Frost, Sorption Behavior of Methyl
Orange from Aqueous Solution on Organic Matter and Reduced Graphene Oxides
Modified Ni–Cr Layered Double Hydroxides, Chem. Eng. J. 297 (2016) 295-303.
[S5] Y. Wang, X. Liu, H. Wang, G. Xia, W. Huang, R. Song, Microporous Spongy
Chitosan Monoliths Doped with Graphene Oxide as Highly Effective Adsorbent for
Methyl Orange and Copper Nitrate (Cu(NO3)2) Ions, J. Colloid Interface Sci. 416
(2014) 243-251.
[S6] T. Liu,Y. Lia, Q. Du. J. Sun, Y. Jiao, G. Yang, Z. Wang, Y. Xia, W. Zhang. K.
Wang, H. Zhu, D. Wu, Adsorption of methylene blue from aqueous solution by
graphene, Colloids Surf. B 90 (2012) 197-203.
[S7] Y. Li, Q. Du, T. Liu, X. Peng, J. Wang, J. Sun, Y. Wang, S. Wu, Z. Wang, Y. Xia,
L. Xia Comparative study of methylene blue dye adsorption onto activated carbon,
graphene oxide, and carbon nanotubes, Chem. Eng. Res. Des. 91 (2013) 361-368.
[S8] H. Ge, C. Wang, S. Liu, Z. Huang, Synthesis of citric acid functionalized magnetic
graphene oxide coated corn straw for methylene blue adsorption, Bioresour. Technol.
221 (2016) 419-429.
[S9] L.Chen, Y. Li, Q. Du, Z. Wang, Y. Xia, E. Yedinak, J. Lou, L. Ci, High
performance agar/graphene oxide composite aerogel for methylene blue removal,
Carbohydr. Polym. 155 (2017) 345-353.

ARTÍCULO V
300
[S10] A. Pourjavadi, M. Nazari, B. Kabiri, S. H. Hosseini, C Bennett, Preparation of
porous graphene oxide/hydrogel nanocomposites and their ability for efficient
adsorption of methylene blue, RSC Adv. 6 (2016) 10430-10437.
[S11] Ş.Tokalioʇlu, E. Yavuz, A. Aslantaş, H. Şahan, F. Taşkin, Ş. Patat,
Spectrophotometric Determination of Basic Fuchsin from Various Water Samples after
Vortex Assisted Solid Phase Extraction Using Reduced Graphene Oxide as an
Adsorbent, Spectrochim. Acta A 149 (2015) 378-384.
[S12] J. Yuan, F. Qiu, P. Li, Synthesis and characterization of β-cyclodextrin–
carboxymethyl cellulose–graphene oxide composite materials and its application for
removal of basic fuchsin, J. Iran. Chem. Soc. 14 (2017) 1827-1837
[S13] Y.-B. Song, X.-D. Song, C.-J. Cheng, Z.-G. Zhao, Poly(4-Styrenesulfonic Acid-
co-Maleic Acid)-Sodium-Modified Magnetic Reduced Graphene Oxide for Enhanced
Adsorption Performance Toward Cationic Dyes, RSC Adv. 5 (2015) 87030-87042.
[S14] P. Tan, Y. Hu, Improved synthesis of graphene/β-cyclodextrin composite for
highly efficient dye adsorption and removal, J. Mol. Liq. 242 (2017) 181-189.
[S15] X. Yang, Y. Li, Q. Du, J. Sun, L. Chen, S. Hu, Z. Wang, Y. Xia, L. Xia, Highly
Effective Removal of Basic Fuchsin from Aqueous Solutions by Anionic
Polyacrylamide/Graphene Oxide Aerogels. J. Colloid Interface Sci. 453 ( 2015) 107-
114.
[S16] J. Fan, Z. Shi, M. Lian, H. Li, J. Yin Mechanically strong graphene oxide/sodium
alginate/polyacrylamide nanocomposite hydrogel with improved dye adsorption
capacity J. Mater. Chem. A, 1 (2013) 7433-7443
[S17] H. Guo, Y. Wang, Y. Huang, F. Huang, S. Li, Y. Shen, M. Zhu, A. Xie, A
GO@PLA@HA Composite Microcapsule: Its Preparation and Multistage and
Controlled Drug Release, Eur. J. Inorg. Chem. 27 (2017) 3312–3321.
[S18] Y. Ying, P. He, G. Ding, X. Peng, Ultrafast adsorption and selective desorption of
aqueous aromatic dyes by graphene sheets modified by graphene quantum dots,
Nanotechnology 27 (2016) 245703.
[S19] S.Yang, L. Chen, L. Mu, P.-C. Ma, Magnetic graphene foam for efficient
adsorption of oil and organic solvents J. Colloid Interface Sci. 430 (2014) 337-344.
ARTÍCULO V
301
[S20] R.Wu, B.Yu, X. Liu, H.Li, W. Wang, L. Chen, Y. Bai, Z. Ming, S.-T. Yang, One-
pot hydrothermal preparation of graphene sponge for the removal of oils and organic
solvents Appl. Surf. Sci. 362 (2016) 56-62.
[S21] S. Kabiri, D. N. H. Tran, T. Altalhi, D. Losic, Outstanding adsorption
performance of graphene–carbon nanotube aerogels for continuous oil removal, Carbon
80 (2014) 523-533
[S22] Z. Niu , J. Chen , H. H. Hng , J. Ma , X. Chen , A Leavening Strategy to Prepare
Reduced Graphene Oxide Foams, Adv. Mater. 24 (2012) 4144-4150.
[S23] H. Ren, X. Shi, J. Zhu, Y. Zhang, Y. Bi, L. Zhang, Facile synthesis of N-doped
graphene aerogel and its application for organic solvent adsorption, J. Mater. Sci. 51
(2016) 6419-6427.
[S24] J. Zhao, W. Ren, H.-M. Cheng, Graphene sponge for efficient and repeatable
adsorption and desorption of water contaminations J. Mater. Chem. 22 (2012) 20197-
20202.
[S25] Q. Wu, Y. X. Xu, Z. Y. Yao, A. R. Liu, G. Q. Shi, Supercapacitors Based on
Flexible Graphene/Polyaniline Nanofiber Composite Films, ACS Nano, 4 (2010) 1963–
1970.
[S26] Y. Wang, J. Chen, J. Cao, Y. Liu, Y. Zhou, J.-H. Ouyang, D. Jia,
Graphene/Carbon Black Hybrid Film for Flexible and High Rate Performance
Supercapacitor, J. Power Sources 271 (2014) 269−277.
[S27] J.-Y. Kim, K.-H. Kim, S.-B. Yoon, H.-K. Kim, S.-H. Park, K.-B. Kim, In situ
chemical synthesis of ruthenium oxide/reduced graphene oxide nanocomposites for
electrochemical capacitor applications, Nanoscale, 5 (2013) 6804–6811.
[S28] Z. F. Li, H. Zhang, Q. Liu, L. Sun, L. Stanciu, J. Xie, Fabrication of High-
Surface-Area Graphene/Polyaniline Nanocomposites and Their Application in
Supercapacitors, ACS Appl. Mater. Interfaces, 5 (2013) 2685–2691.
[S29] J. Yan, Y. Ding, C. Hu, H. Cheng, N. Chen, Z. Feng, Z. Zhang, L. Qu,
Preparation of multifunctional microchannel-network graphene foams, J. Mater. Chem.
A, 2 (2014) 16786-16792.
ARTÍCULO V
302
[S30] D. Mhamane, S. M. Unni, A. Suryawanshi, O. Game, C. Rode, B. Hannoyer, S.
Kurungot and S. Ogale, Trigol based reduction of graphite oxide to graphene with
enhanced charge storage activity, J. Mater. Chem. 22 (2012) 11140–11145.
[S31] Y. Xu, Z. Lin, X. Huang, Y. Liu, Y. Huang, X. Duan, Flexible Solid-State
Supercapacitors Based on Three-Dimensional Graphene Hydrogel Films. ACS Nano 7
(2013) 4042−4049.
[S32] Z. H. Wen, X. C. Wang, S. Mao, Z. Bo, H. Kim, S. M. Cui, G. H. Lu, X. L. Feng,
J. H. Chen, Crumpled Nitrogen-Doped Graphene Nanosheets with Ultrahigh Pore
Volume for High-Performance Supercapacitor, Adv. Mater. 24 (2012) 5610-5616.
5. RESÚMENES YARTÍCULOS
303
5.2 Funcionalización covalente de disulfuro de molibdeno
Artículo VI
Impact of Covalent Functionalization on the Aqueous Processability, Catalytic Activity,
and Biocompatibility of Chemically Exfoliated MoS2 Nanosheets, Paredes, J.I.,
Munuera, J.M., Villar-Rodil, S. , Guardia, L., Ayán-Varela, M., Pagán, A., Aznar-
Cervantes, S.D., Cenis, J.L., Martínez-Alonso, A., Tascón, J.M.D., ACS Applied
Materials and Interfaces, 2016, 8, 41, 27974-27986.
Aparte del grafeno, el material bidimensional más ampliamente estudiado en los
últimos años es el disulfuro de molibdeno (MoS2). Los métodos de preparación de este
material se basan en tres grandes enfoques: depósito en fase vapor, exfoliación directa
por ultrasonidos/cizalla y exfoliación química por intercalación de metales alcalinos.
Estos dos últimos métodos, ambos llevados a cabo generalmente en fase líquida,
presentan grandes diferencias en cuanto a las características del material obtenido. En el
caso de ultrasonidos/cizalla, las dispersiones obtenidas están formadas por láminas
multicapa de MoS2, y la fase mayoritaria presente en el material es la 2H
(termodinámicamente estable), la misma que en el material bulk sin exfoliar. Sin
embargo, durante la exfoliación química por reacción con un metal alcalino
(normalmente litio) se forman compuestos de intercalación tipo LixMoS2, en los que
tiene lugar un cambio de fase de la original 2H a la fase metálica 1T (metaestable). Al
reaccionar con agua, estos compuestos de intercalación, al reaccionar con agua dan
lugar a la exfoliación, y permiten obtener dispersiones de láminas de disulfuro de
molibdeno 1T (denotados como ce-MoS2) compuestas mayoritariamente por
monocapas, que son estables coloidalmente en agua debido al exceso de electrones que
produjo la intercalación de litio. No obstante, uno de los mayores problemas que
plantean estas dispersiones es su estabilidad coloidal y estructural, ya que, por reacción
con el agua, las láminas pierden rápidamente sus electrones en exceso (y por tanto su
carga eléctrica) y las dispersiones precipitan irreversiblemente en cuestión de pocas
semanas, a la par que la fase 1T va revirtiendo progresivamente a la 2H.
En el artículo VI se describe un método de funcionalización de ce-MoS2 con
grupos funcionales de ácido acético, y se estudia su influencia en la estabilidad coloidal
a lo largo del tiempo, así como las posibles aplicaciones del material funcionalizado (f-
MoS2) respecto al original. Para la funcionalización, se hizo reaccionar el ce-MoS2 con

5. RESÚMENES YARTÍCULOS
304
ácido yodoacético en medio ácido, donde tras cinco días tiene lugar una sustitución
nucleófila por parte del azufre del ce-MoS2, que sustituye al átomo de yodo dando como
resultado el enlace covalente de las moléculas de ácido acético a las nanoláminas en una
proporción de 0.4 moléculas por cada unidad de MoS2. El primer efecto evidente de la
funcionalización es la estabilidad coloidal de las dispersiones. Mientras que las
dispersiones de ce-MoS2 precipitaron irreversiblemente en cuatro semanas, las de f-
MoS2 mantuvieron su estabilidad durante periodos de varios meses sin precipitación
irreversible.
Debido a la intercalación de litio, las láminas de ce-MoS2 están constituidas
mayoritariamente por la fase metálica 1T (73% 1T, 27% 2H). Como se comprobó
mediante espectroscopías UV-visible y XPS, a pesar de que la reacción elimina el
exceso de electrones (y por tanto la conductividad propia de la fase metálica), la fase 1T
sigue siendo mayoritaria e incluso aumenta ligeramente su proporción (79%) debido a la
funcionalización, que parece tener un efecto estabilizador en la fase 1T.
En vista de la estabilidad coloidal del f-MoS2, y conociendo la actividad
catalítica que presentan las dispersiones de este material en fase 1T, se estudió su uso
como catalizador de la reacción de reducción de nitroarenos y la evolución de su
eficiencia con el tiempo. En el caso del ce-MoS2, la actividad catalítica disminuye
drásticamente en pocas semanas, mientras que para el material funcionalizado, a pesar
de ser menor en inicio, a lo largo del tiempo su disminución es menor, llegando a
valores iguales o superiores al material sin funcionalizar. Los valores obtenidos para
ambas reacciones catalíticas a los 3 meses de la preparación del f-MoS2 se encuentran
dentro del rango superior de los valores documentado para catalizadores basados en
materiales bidimensionales y nanopartículas, siendo solo superados por materiales
basados en metales preciosos como platino o paladio.
Si bien existen protocolos conocidos para la conversión de la fase 2H del MoS2
(la presente en el material sin exfoliar) a la 1T en dispersión acuosa, como el método de
exfoliación química, el proceso inverso solo ha sido descrito previamente en disolventes
de alto punto de ebullición, y es habitual que los productos obtenidos posean poca
estabilidad coloidal. En este trabajo se describe un método hidrotérmico consistente en
un calentamiento a 160 ºC de la dispersión de f-MoS2 que permite la reversión
mayoritaria a la fase 2H (81%). Este proceso implica una cierta pérdida de la
5. RESÚMENES YARTÍCULOS
305
funcionalización, bajando de 0.4 a 0.16 moléculas de ácido acético por unidad de MoS2.
Sin embargo, este grado de funcionalización no altera significativamente la estabilidad
coloidal de las láminas, manteniéndose las dispersiones acuosas estables durante meses.
Por último, se sometió a los tres materiales [ce-MoS2, f-MoS2(1T) y f-
MoS2(2H)] a estudios de biocompatibilidad para evaluar el efecto de la funcionalización
y el cambio de fase en las posibles aplicaciones biomédicas de los mismos. En los
ensayos de proliferación de células de ratón L929 se aprecia una mejora significativa de
la biocompatibilidad en el caso del f-MoS2(1T), lo que apoya el futuro uso de este
material en aplicaciones biológicas.

5. RESÚMENES YARTÍCULOS
306

ARTÍCULO VI
307
Impact of Covalent Functionalization on the Aqueous Processability, Catalytic
Activity and Biocompatibility of Chemically Exfoliated MoS2 Nanosheets
Juan I. Paredes,a Jose M. Munuera,
a Silvia Villar–Rodil,
a,* Laura Guardia,
a Miguel
Ayán–Varela,a Ana Pagán,
b Salvador Aznar-Cervantes,
b Jose L. Cenis,
b Amelia
Martínez–Alonso,a Juan M.D. Tascón
a
aInstituto Nacional del Carbón, INCAR-CSIC, Apartado 73, 33080 Oviedo, Spain
bInstituto Murciano de Investigación y Desarrollo Agrario y Alimentario (IMIDA),
Calle Mayor 1, 30150 La Alberca, Spain
*Corresponding author: E-mail address: [email protected] (S. Villar-Rodil)
Abstract
Chemically exfoliated MoS2 (ce-MoS2) has emerged in recent years as an attractive
two-dimensional material for use in relevant technological applications, but fully
exploiting its potential and versatility will most probably require the deployment of
appropriate chemical modification strategies. Here, we demonstrate that extensive
covalent functionalization of ce-MoS2 nanosheets with acetic acid groups (~0.4 groups
grafted per MoS2 unit) based on the organoiodide chemistry brings a number of benefits
in terms of their processability and functionality. Specifically, the acetic acid-
ARTÍCULO VI
308
functionalized nanosheets were furnished with long-term (>6 months) colloidal stability
in aqueous medium at relatively high concentrations, exhibited a markedly improved
temporal retention of catalytic activity towards the reduction of nitroarenes and could be
more effectively coupled with silver nanoparticles to form hybrid nanostructures.
Furthermore, in vitro cell proliferation tests carried out with murine fibroblasts
suggested that the chemical derivatization had a positive effect on the biocompatibility
of ce-MoS2. A hydrothermal annealing procedure was also implemented to promote the
structural conversion of the functionalized nanosheets from the 1T phase that was
induced during the chemical exfoliation step to the original 2H phase of the starting
bulk material, while retaining at the same time the aqueous colloidal stability afforded
by the presence of the acetic acid groups. Overall, by highlighting the benefits of this
type of chemical derivatization, the present work should contribute to strengthen the
position of ce-MoS2 as a two-dimensional material of significant practical utility.
Keywords: MoS2, two-dimensional material, transition metal dichalcogenides (TMDs),
colloidal dispersion, functionalization, metal nanoparticles, catalytic reduction.
1. Introduction
Over the last decade, graphene has been the focus of intense research efforts aimed
at exploiting the exceptional electronic, mechanical, thermal and optical properties of
this two-dimensional (2D) carbon material towards a wide variety of different
technological applications.1 Such an interest has progressively broadened in recent years
to include other 2D materials, as it has become increasingly apparent that many of them
boast their own share of attractive and frequently unusual physical properties that are
distinct from those of their bulk counterparts and complementary to those of
graphene.1,2
At present, one of the most actively investigated 2D materials beyond
graphene is arguably MoS2, which belongs to the larger family of layered transition
metal dichalcogenides (TMDs).3,4
As recent work has demonstrated, single- and few-
layer sheets of MoS2 and other TMDs are very promising platforms for use in, e.g.,
electronic and optoelectronic devices,5 catalysis,
6 energy conversion and storage,
7
molecular sensing8 or biomedicine.
9
Similar to the case of other 2D materials, it is generally accepted that the successful
implementation of atomically thin MoS2 in real-life applications will first and foremost
ARTÍCULO VI
309
depend on the availability of efficient techniques for its production in large quantities.
In this regard, three main approaches that show promise towards the mass production of
2D MoS2 can be currently identified: (1) chemical vapor deposition (CVD) from
molybdenum and sulfur precursor species onto appropriate substrates,10
(2) direct
liquid-phase exfoliation of bulk MoS2 assisted by ultrasound or shear forces,11,12
and (3)
chemical exfoliation based on the intercalation of alkali metals (typically Li) into the
bulk parent solid.13–15
Although bottom-up CVD methods appear ideally suited to attain
high quality, large-area wafers of single-/few-layer MoS2 for use in high-end electronic
or photonic applications, top-down exfoliation strategies are probably a better option
when large amounts of solution-processable 2D flakes are sought after. Indeed, direct
exfoliation of bulk MoS2 powder in proper organic solvents (e.g., N-methyl-2-
pyrrolidone) or water/surfactant solutions is known to afford stable colloidal dispersions
of 2D flakes.12
Such dispersions can then be made into useful macroscopic materials,
such as thin films, coatings or composites, by straightforward processing techniques
(vacuum filtration, spray-coating, solution blending, etc). However, this exfoliation
approach suffers from some significant drawbacks, most notably a low exfoliation yield
(< 5 wt%) and a population of exfoliated objects dominated by few- and several-layer
MoS2 flakes rather than single-layer ones.16
By contrast, chemical exfoliation based on Li intercalation has been reported to
afford almost fully delaminated products, both in terms of yield (> 90 wt%) and flake
thickness (mostly monolayers).17
Intercalation is typically carried out by reaction of
bulk MoS2 with an organolithium reagent (e.g., n-butyllithium) or by electrochemical
means, which involve electron transfer to the host MoS2 lattice.13,18
Such a reduction
process facilitates the subsequent exfoliation of the intercalated product (LixMoS2) in
aqueous medium as well as the colloidal stabilization of the resulting negatively
charged, chemically exfoliated MoS2 (ce-MoS2) nanosheets, but also triggers a
conversion of the MoS2 structure from the original semiconducting 2H phase to the
metallic 1T phase.17
Albeit this semiconducting-to-metallic phase transition can be
detrimental in some cases (e.g., in electronic devices), recent work has demonstrated
that 1T-phase ce-MoS2 outperforms its 2H-phase counterpart when used, for example,
as a catalyst and/or co-catalyst in the electrochemical and photocatalytic production of
hydrogen19,20
as well as in aqueous-phase organic reduction reactions,21
or as an
electrode material for supercapacitors.22
The utility of ce-MoS2 in biomedicine23
and
sensing24
has also been demonstrated.
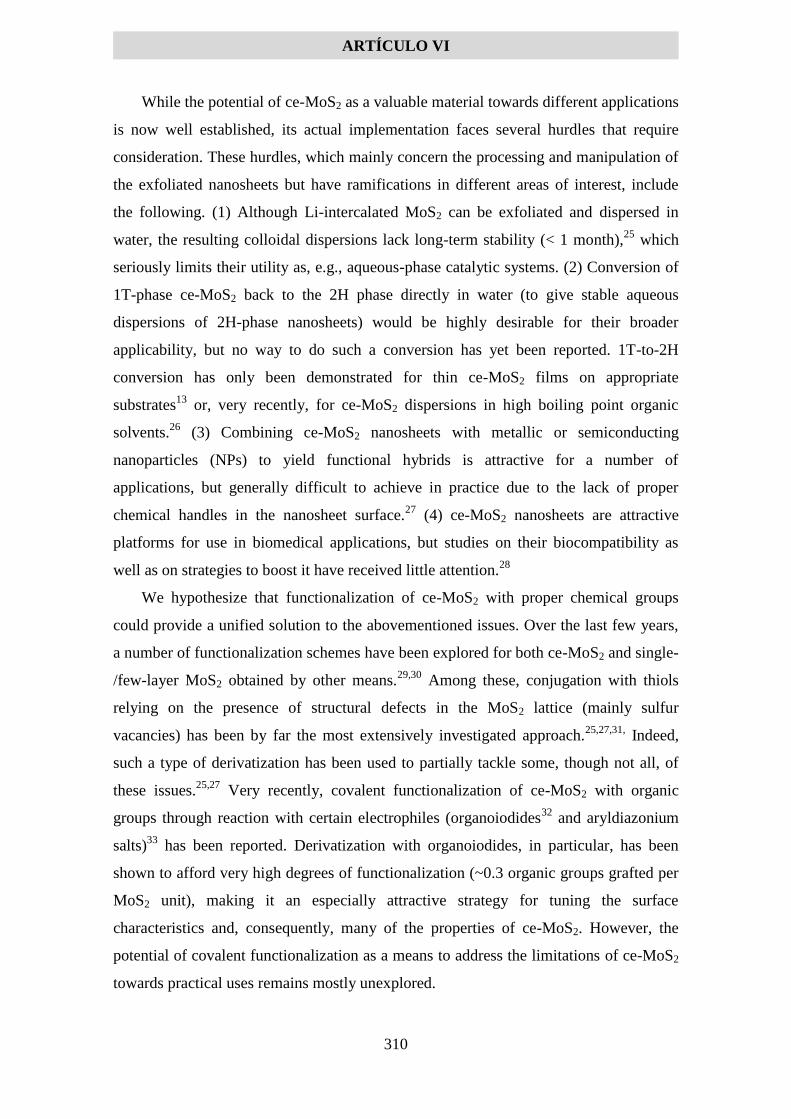
ARTÍCULO VI
310
While the potential of ce-MoS2 as a valuable material towards different applications
is now well established, its actual implementation faces several hurdles that require
consideration. These hurdles, which mainly concern the processing and manipulation of
the exfoliated nanosheets but have ramifications in different areas of interest, include
the following. (1) Although Li-intercalated MoS2 can be exfoliated and dispersed in
water, the resulting colloidal dispersions lack long-term stability (< 1 month),25
which
seriously limits their utility as, e.g., aqueous-phase catalytic systems. (2) Conversion of
1T-phase ce-MoS2 back to the 2H phase directly in water (to give stable aqueous
dispersions of 2H-phase nanosheets) would be highly desirable for their broader
applicability, but no way to do such a conversion has yet been reported. 1T-to-2H
conversion has only been demonstrated for thin ce-MoS2 films on appropriate
substrates13
or, very recently, for ce-MoS2 dispersions in high boiling point organic
solvents.26
(3) Combining ce-MoS2 nanosheets with metallic or semiconducting
nanoparticles (NPs) to yield functional hybrids is attractive for a number of
applications, but generally difficult to achieve in practice due to the lack of proper
chemical handles in the nanosheet surface.27
(4) ce-MoS2 nanosheets are attractive
platforms for use in biomedical applications, but studies on their biocompatibility as
well as on strategies to boost it have received little attention.28
We hypothesize that functionalization of ce-MoS2 with proper chemical groups
could provide a unified solution to the abovementioned issues. Over the last few years,
a number of functionalization schemes have been explored for both ce-MoS2 and single-
/few-layer MoS2 obtained by other means.29,30
Among these, conjugation with thiols
relying on the presence of structural defects in the MoS2 lattice (mainly sulfur
vacancies) has been by far the most extensively investigated approach.25,27,31,
Indeed,
such a type of derivatization has been used to partially tackle some, though not all, of
these issues.25,27
Very recently, covalent functionalization of ce-MoS2 with organic
groups through reaction with certain electrophiles (organoiodides32
and aryldiazonium
salts)33
has been reported. Derivatization with organoiodides, in particular, has been
shown to afford very high degrees of functionalization (~0.3 organic groups grafted per
MoS2 unit), making it an especially attractive strategy for tuning the surface
characteristics and, consequently, many of the properties of ce-MoS2. However, the
potential of covalent functionalization as a means to address the limitations of ce-MoS2
towards practical uses remains mostly unexplored.

ARTÍCULO VI
311
We report here an investigation on the derivatization of ce-MoS2 nanosheets with
iodoacetic acid. Significantly, an extensive degree of functionalization could be attained
(~0.4 acetic acid groups grafted per MoS2 unit), which afforded a radical change in the
long-term aqueous dispersibility of the nanosheets (stable dispersions for more than 6
months were attained) as well as a significantly extended shelf-life of the nanosheet
dispersions when used as a catalyst for reduction reactions in water. Furthermore, a
hydrothermal method for the conversion of the functionalized, 1T-phase ce-MoS2 to
2H-phase ce-MoS2 while retaining the long-term colloidal stability of the nanosheets
was implemented, which was previously not possible. Finally, the covalent
functionalization of ce-MoS2 with acetic acid was also seen to be beneficial for the
nucleation and growth of Ag NPs onto the nanosheets to form hybrid structures and in
enhancing the biocompatibility of the as-prepared nanosheets, as evaluated from cell
proliferation studies using murine fibroblasts. Taken together, the present results
highlight the benefits of this type of derivatization in improving the processability and
functionality of ce-MoS2 towards a number of uses.
2. Results and discussion
2.1. Covalent functionalization of ce-MoS2 nanosheets with acetic acid groups
Lithium intercalation of bulk MoS2 powder based on reaction with n-butyllithium
and subsequent ultrasound-induced exfoliation of the intercalated product (LixMoS2) in
water is well-known to afford colloidal dispersions of ce-MoS2 nanosheets, which are
mostly single-layered objects.13,17
Although the starting bulk MoS2 material exhibits the
thermodynamically stable, semiconducting 2H phase (trigonal prismatic coordination),
charge transfer from the lithium intercalates to the host MoS2 lattice triggers an
extensive (although incomplete) structural transformation in LixMoS2 to the metastable,
metallic 1T phase (octahedral coordination) that is carried forward to the ce-MoS2
nanosheets dispersed in aqueous medium.17
The excess electron charges present in the
nanosheets are also thought to be responsible for their dispersibility in aqueous medium.
However, this colloidal stability is generally rather limited, in particular when working
at moderately high ce-MoS2 nanosheet concentrations. For example, aqueous
dispersions at a concentration of ~0.8 mg mL-1
are seen to precipitate in a matter of just
3 weeks (Supporting Information, Fig. S1), whereas strong agglomeration is already
observed after 1 month for ~0.1 mg mL-1
suspensions. Precipitation of the ce-MoS2
nanosheets is an irreversible process, as the sedimented material cannot be successfully

ARTÍCULO VI
312
re-dispersed even after sonication for several hours. Such a behavior is likely due to the
slow reaction of water molecules with the excess electrons,34
but in any case it is clearly
detrimental to the manipulation and use of ce-MoS2 towards different applications. We
envisaged that covalent derivatization of the nanosheets with proper organoiodides
could be a particularly efficient way to overcome this issue, taking into account the
extensive degree of functionalization that has been previously achieved using this
particular approach for MoS2 and other TMDs.32
Organoiodides having ionic or
ionizable moieties should be well suited for the intended purpose, as the net charge
associated to the covalently grafted groups would be expected to provide the nanosheets
with enhanced and enduring colloidal stability. To test this hypothesis, we selected
iodoacetic acid and iodomethanesulfonic acid, which possess, respectively, a pH-
dependent carboxylate anion and a permanent sulfonate anion.
Addition of iodoacetic acid to a mildly acidic ce-MoS2 dispersion in water was seen
to induce a slight coagulation of the nanosheets within several hours. After being
allowed to react for a total of 5 days and thoroughly washed, the nanosheets could be
readily re-dispersed in neutral and basic aqueous medium (see Experimental section for
details). Evidence for their successful functionalization with acetic acid groups was
obtained using a suite of characterization techniques. Fig. 1a (black trace) shows the
UV-vis absorption spectrum of the starting, non-functionalized ce-MoS2 dispersion.
Unlike the case of MoS2 flakes produced by direct exfoliation of the bulk powder, the
structure of which is dominated by the semiconducting 2H polymorph,11,35
no excitonic
peaks in the 400-500 and 600-700 nm wavelength ranges were observed for ce-MoS2.
Instead, two absorption bands at ~255 and 300 nm, together with essentially featureless
absorbance above 300 nm, were noticed. Such attributes are characteristic of MoS2 with
a predominance of metallic 1T phase, as expected for the as-prepared ce-MoS2
nanosheets.13
The two mentioned bands, which are largely absent from 2H-phase MoS2
flakes, can be ascribed to plasmon resonances associated to the metallic state of ce-
MoS2.36
By contrast, these plasmon bands tended to disappear after treating the
nanosheets with iodoacetic acid, whereas the rest of the spectrum remained essentially
unaltered except for the emergence of a shoulder-like feature at about 400 nm (Fig. 1a,
green trace). Such a result was indicative of changes to the electronic structure of the
nanosheets, which in turn would be consistent with derivatization having taken pace.
Furthermore, recent experimental and theoretical work has suggested that the originally
metallic nature of the as-prepared ce-MoS2 nanosheets becomes semiconducting upon
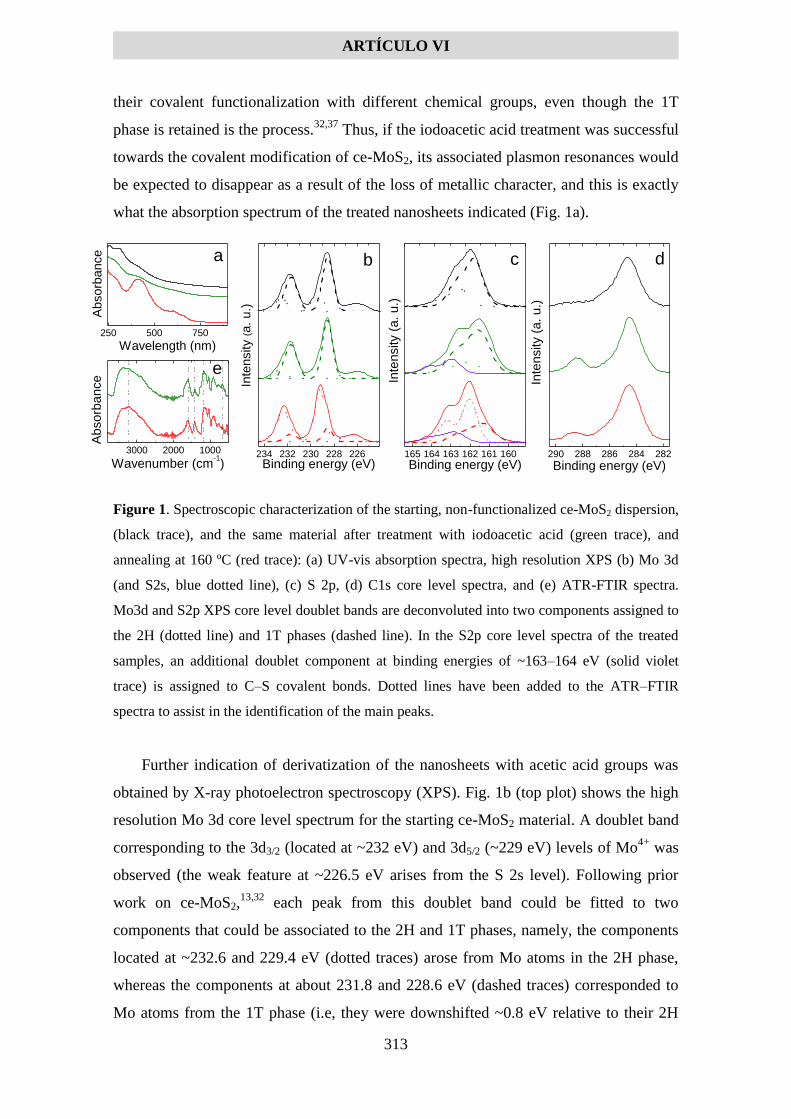
ARTÍCULO VI
313
their covalent functionalization with different chemical groups, even though the 1T
phase is retained is the process.32,37
Thus, if the iodoacetic acid treatment was successful
towards the covalent modification of ce-MoS2, its associated plasmon resonances would
be expected to disappear as a result of the loss of metallic character, and this is exactly
what the absorption spectrum of the treated nanosheets indicated (Fig. 1a).
Figure 1. Spectroscopic characterization of the starting, non-functionalized ce-MoS2 dispersion,
(black trace), and the same material after treatment with iodoacetic acid (green trace), and
annealing at 160 ºC (red trace): (a) UV-vis absorption spectra, high resolution XPS (b) Mo 3d
(and S2s, blue dotted line), (c) S 2p, (d) C1s core level spectra, and (e) ATR-FTIR spectra.
Mo3d and S2p XPS core level doublet bands are deconvoluted into two components assigned to
the 2H (dotted line) and 1T phases (dashed line). In the S2p core level spectra of the treated
samples, an additional doublet component at binding energies of ~163–164 eV (solid violet
trace) is assigned to C–S covalent bonds. Dotted lines have been added to the ATR–FTIR
spectra to assist in the identification of the main peaks.
Further indication of derivatization of the nanosheets with acetic acid groups was
obtained by X-ray photoelectron spectroscopy (XPS). Fig. 1b (top plot) shows the high
resolution Mo 3d core level spectrum for the starting ce-MoS2 material. A doublet band
corresponding to the 3d3/2 (located at ~232 eV) and 3d5/2 (~229 eV) levels of Mo4+
was
observed (the weak feature at ~226.5 eV arises from the S 2s level). Following prior
work on ce-MoS2,13,32
each peak from this doublet band could be fitted to two
components that could be associated to the 2H and 1T phases, namely, the components
located at ~232.6 and 229.4 eV (dotted traces) arose from Mo atoms in the 2H phase,
whereas the components at about 231.8 and 228.6 eV (dashed traces) corresponded to
Mo atoms from the 1T phase (i.e, they were downshifted ~0.8 eV relative to their 2H
bIn
tensity (a.
u.)
234 232 230 228 226
Binding energy (eV)
c
In
ten
sity (
a.
u.)
165 164 163 162 161 160
Binding energy (eV)
d
In
ten
sity (
a.
u.)
290 288 286 284 282
Binding energy (eV)
250 500 750
Ab
so
rba
nce
Wavelength (nm)
a
3000 2000 1000
e
Ab
so
rba
nce
Wavenumber (cm-1)

ARTÍCULO VI
314
counterparts). Such a peak-fitting allowed quantification of the percentage of each phase
present in the nanosheets, revealing that the 1T polymorph was predominant (~73% 1T
phase, ~27% 2H phase). This phase composition was comparable (slightly higher) to
that previously reported for ce-MoS2.32
Following treatment of the nanosheets with
iodocacetic acid, the Mo 3d core level spectrum did not experience very significant
changes (Fig. 1b, middle plot), which would be consistent with the idea that
organoiodide functionalization takes place through sulfur but not molybdenum atoms of
ce-MoS2.32
However, a slight but clear increase in the fraction of 1T phase (up to about
79%) was noticed. We interpret this increase to be a consequence of functionalization. It
has been recently reported on the basis of theoretical calculations that covalent grafting
of MoS2 with a number of chemical groups (such as –H and –CH3) through its sulfur
atoms induces stabilization of the originally metastable 1T phase, so that above a certain
threshold coverage of grafted groups (estimated to be ~20% of the sulfur atoms) this
phase becomes the thermodynamically stable one.37
It is therefore not unreasonable to
assume that grafting of acetic acid groups triggered a partial conversion of the 2H phase
remaining in the ce-MoS2 nanosheets to the stabilized 1T polymorph.
More direct evidence of the covalent bonding of acetic acid groups to the ce-MoS2
nanosheets was gathered from the high resolution S 2p core level spectra of the samples.
The S 2p band is also a doublet, with peaks located at ~162 (2p1/2) and ~163 (2p3/2) eV
for 2H-phase MoS2 that are again downshifted by ~0.8 eV in the case of 1T-phase
MoS2.13,32
As expected, the S 2p spectrum of as-prepared, non-functionalized ce-MoS2
(Fig. 1c, top plot) could be fitted to four components that can be associated to both the
2H and 1T polymorphs, but with a prevalence of the latter. (For simplicity, the two
components of each phase in Fig. 1c are shown as a single line: dotted line for 2H,
dashed line for 1T). After treatment with iodoacetic acid, the shape of the S 2p band
underwent some noticeable changes (Fig. 1c, middle plot), so that in addition to the 1T-
and 2H-related components, a new doublet component appeared at binding energies of
~163-164 eV (solid violet trace). Such additional doublet component can be ascribed to
sulfur atoms covalently bonded to carbon,32
thus constituting direct indication of the
grafting of acetic acid groups to the nanosheets. The presence of this chemical group
was also made apparent from the C 1s region of the XPS spectra (Fig. 1d). For non-
functionalized ce-MoS2 (top plot), a relatively broad band centered at ~285 eV was
observed. This a priori unexpected feature can be assigned to the adventitious carbon
(hydrocarbon contamination) that so pervasively comes to light when samples are

ARTÍCULO VI
315
investigated by XPS.38
By contrast, for iodoacetic acid-treated ce-MoS2 a further
component at about 288.4 eV was clearly noticed (Fig. 1d, middle plot), which could be
attributed to carbon atoms in carboxylic acids, therefore substantiating the idea that
acetic acid groups were incorporated to the ce-MoS2 nanosheets. Furthermore, Fig. 1e
(top plot) shows the ATR-FTIR spectrum of iodoacetic acid-treated ce-MoS2, which
exhibited additional indication of successful functionalization. Specifically, the
following features were observed: (1) a sharp peak located at ~655 cm-1
, ascribed to S–
C stretching vibrations arising from acetic acid groups grafted onto the nanosheets via
sulfur atoms), (2) a peak at ~1170 cm-1
, attributed to CH2-S wagging, (3) a peak at
~1420 cm-1
, attributed to symmetric C=O stretching of acetate groups, and to a
combination of C–O stretch. and O–H deformation vibrations from the carboxylic acid
group of acetic acid, (4) a peak at ~1600 cm-1
assigned to asymmetric stretching for
C=O bonds in acetate groups together with a shoulder on its high wavenumber side
(~1680 cm-1
) corresponding to C=O stretch. for H–bonded COOH groups, and (5) an
intense and broad band (2750–3400 cm-1
), which can be associated to O-H stretching
vibrations from H–bonded carboxylic acid groups. Thus, the ATR–FTIR spectrum of
the iodoacetic acid-treated ce-MoS2 in the solid phase indicates the presence of both
acetate salts and H–bonded COOH groups. Moreover, derivatization with acetic acid
groups was not seen to induce significant changes to the morphology of the ce-MoS2
nanosheets, as evidenced from both transmission electron microscopy (TEM; Fig. 2a
and c) and atomic force microscopy (AFM; Fig. 2b and d) imaging. The non-
functionalized sample (Fig. 2a and b) was comprised of lamellar objects with typical
lateral sizes in the 50–500 nm range and apparent thickness of ~1–2 nm, indicating that
they were mainly single-layer ce-MoS2 nanosheets.17,21
The acetic acid-functionalized
material was 1–2 nm thicker (Fig. 2c and d), which is consistent with the presence of
carboxylic acids on both sizes of the nanosheets adding to their thickness.

ARTÍCULO VI
316
Figure 2. TEM (a,b) and AFM (c,d) images of the starting non-functionalized material (a,c) and
the acetic acid-functionalized material (b,d). (e) Digital photographs of ~0.2 mg mL-1
dispersions of non-functionalized ce-MoS2 (top row) and acetic acid-functionalized ce-MoS2
(bottom row) (left column: just prepared; middle column: after 4 weeks; right column: after 4
months).
We note that iodoacetic acid could not have simply adsorbed on the ce-MoS2
nanosheets, but instead must have reacted to form covalent bonding with this material.
If the former situation had taken place, we would expect to observe the presence of
iodine in the XPS survey spectrum (i.e., the I 3d5/2 band at ~621 eV), feature which is
not found (see Supporting Information, Fig. S2b), as well as a component in the C 1s
region of the spectrum associated to C–I bonds (spectrum not shown). However, none
of these features were noticed, but only the emergence of a component consistent with
S–C bonds in the S 2p spectra (Fig. 1c). The XPS data were also used to estimate the
degree of functionalization of the nanosheets. This calculation was done by two
different, independent ways: (1) determining the amount of carbon atoms present in
carboxylic acid groups relative to the amount of either sulfur or molybdenum atoms in
the functionalized samples, taking into account that the number of carboxylic acid
carbons equals the number of acetic acid groups, and (2) determining the amount of
carbon-bonded sulfur atoms relative to the total amount of sulfur in the sample, using
the areas of the peak-fitted components from the S 2p spectra and considering that the
number of carbon-bonded sulfur atoms equals the number of grafted acetic acid groups.
The values derived from these two methods were seen to be consistent with each other,
yielding a functionalization degree for the nanosheets in the range of 0.17-0.20 acetic
acid groups per sulfur atom, or equivalently, 0.35-0.40 groups per MoS2 unit. This
a
b d
c
200 nm
200 nm
4 months 4 weeks just prepared
e
ce-M
oS
2
acetic a
cid
-tre
ate
d
ce-M
oS
2

ARTÍCULO VI
317
extent of derivatization is considerably larger than that reported for other
functionalization schemes of ce-MoS2. For example, covalent grafting of 4-
methoxyphenyl groups based on the use of the corresponding diazonium salt has led to
a functionalization degree of ~0.2 groups per MoS2 unit,33
whereas conjugation with 3-
mercaptopropionic acid afforded ~0.1 groups per MoS2 unit.27
By comparison, the
previous report on functionalization of ce-MoS2 with organoiodides (2-iodoacetamide)
attained 0.29 grafted groups per MoS2 unit.32
Treatment of the ce-MoS2 material
prepared in the present work with 2-iodoacetamide yielded a slightly higher
derivatization degree (~0.34). We interpret this difference to arise from the somewhat
larger extent of 1T fraction present in our nanosheets (73 vs 65%). Considering that the
covalent grafting of chemical groups appears to be energetically very favorable on the
1T phase but very weak on the 2H phase,37
a larger fraction of 1T phase in ce-MoS2
should be associated to larger numbers of readily available derivatization sites, and
consequently to the possibility of higher functionalization degrees.
2.2. Effect of functionalization on the aqueous processability, catalytic activity and use
as nanoparticle support of ce-MoS2
Functionalization with acetic acid groups was seen to drastically improve the
dispersibility of the nanosheets in water, particularly in the long term. This point is
illustrated in Fig. 2e, which shows digital photographs of dispersions (~0.2 mg mL-1
) of
both non-functionalized (left column) and acetic acid-functionalized (right column) ce-
MoS2 following different standing times after their preparation (first row: just prepared;
second row: 4 weeks; third row: 4 months). It can be noticed that the non-functionalized
nanosheets precipitated in a matter of 4 weeks, whereas their acetic acid-derivatized
counterparts remained colloidally stable, forming homogeneous suspensions to the
naked eye well beyond 4 months (this was observed also for acetic acid-functionalized
dispersions at concentrations up to 0.4 mg mL-1
). Such a result can be ascribed to the
presence of negatively charged, deprotonated carboxylate moieties associated to the
grafted acetic acid groups in the functionalized samples, which are expected to furnish
the nanosheets with enhanced colloidal stability through electrostatic repulsion. In
particular, we note that full deprotonation of the carboxylic acids can be expected to
bestow the functionalized nanosheets with a net negative charge of ~0.35-0.40e per
MoS2 unit. This figure is larger than the estimated value for the excess charge present in
as-prepared ce-MoS2 nanosheets (~0.15-0.25e),34
although the latter should probably

ARTÍCULO VI
318
depend on the particular extent of 2H-to-1T phase conversion attained for each sample
in question, which differs considerably in the literature.13,21,32
Nevertheless, extensive
deprotonation of carboxylic acids usually takes place only under basic, neutral and very
slightly acidic conditions, but not at lower pH values. In accordance with this, the acetic
acid-functionalized nanosheets were seen to be colloidally stable at basic and neutral pH
values, whereas they precipitated in acidified media.
In an attempt to make the nanosheets colloidally stable in a wider pH range, we
tried to derivatize ce-MoS2 with iodomethanesulfonic acid instead of iodoacetic acid, as
the former organoiodide possesses a more permanent anion (the pKa value of sulfonic
acids is typically around -3). However, analysis of the nanosheets treated with
iodomethanesulfonic acid suggested such an attempt to be unsuccessful. For instance,
XPS (S 2p region) did not show evidence of the formation of S-C bonds in the
nanosheets (spectrum not shown), but rather pointed to the presence of unreacted
organoiodide molecules (iodine detected in the survey spectrum; see Supporting
Information, Fig. S2a). Furthermore, the colloidal stability of as-prepared ce-MoS2 was
not changed after treatment with iodomethanesulfonic acid, so that dispersions exposed
to this reagent also precipitated in 4 weeks. We believe that this functionalization
reaction cannot effectively take place due to electrostatic repulsions between the
nanosheets and the organoiodide, i.e. the permanent negative charge associated to the
sulfonate group prevents the organoiodide from approaching the nanosheets, which are
also negatively charged.
The enhanced processability of ce-MoS2 nanosheets in water after their covalent
functionalization with acetic acid groups should have a number of practical benefits. For
example, it has been recently demonstrated that ce-MoS2 is rather efficient as a catalyst
in reduction reactions of several organic molecules (including nitroarenes and dyes)
carried out in aqueous medium.21
We can expect this catalytic activity to be strongly
dependent on the number of active sites that are readily available for interaction with the
reaction medium, and thus to be dependent on the degree of agglomeration of the
nanosheets. Therefore, non-functionalized ce-MoS2 should become a much less
effective catalyst after a few weeks as a result of its colloidal instability in water, i.e.,
the shelf life of this catalyst should be quite limited. On the other hand, although we
envisage the catalytic performance of acetic acid-functionalized ce-MoS2 to be initially
lower than that of its non-functionalized counterpart (due to, e.g., steric barriers to
reaction associated to the presence of functional groups on the catalytically active 1T

ARTÍCULO VI
319
domains),21
the increased colloidal stability of the former should lead to a less
pronounced decline in activity with time. It would thus be conceivable that the
functionalized nanosheets exhibit a better catalytic performance in the long run
compared to the non-functionalized nanosheets. To test this hypothesis, we compared
the reduction of two nitroarenes, namely the reduction of 4-nitrophenol (4-NP) to 4-
aminophenol (4-AP) and the reduction of 4-nitroaniline (4-NA) to p-phenylenediamine
(p-PDA), in aqueous medium at room temperature using sodium borohydride as a
reductant. In addition to their practical relevance, e.g., as key steps in the synthesis of
certain drugs and polymers, these reduction reactions are frequently used to benchmark
the activity of different catalytic systems.39
As detailed in the Experimental section and
thoroughly discussed elsewhere,21,40
both reactions can be readily followed using UV-
vis absorption spectroscopy. For the present studies, because some ce-MoS2 dispersions
(specifically, non-functionalized ones) could be found in a precipitated state, we
routinely sonicated all the aqueous samples for a few minutes to temporarily re-suspend
the catalytic material and be able to perform the catalytic measurements.
Fig. 3 compares the catalytic activity (determined as number of moles of substrate
converted per hour per mole of MoS2 used) of non-functionalized and acetic acid-
functionalized ce-MoS2 in the reduction of 4-NP (a) and 4-NA (b) measured
immediately, one month and three months after preparation of the nanosheets. From
these results, several points can be noticed. First, the catalytic activity of the nanosheets
(either functionalized or non-functionalized) tended to be lower towards reduction of 4-
NP compared to 4-NA. This outcome is probably related to the fact that under the basic
pH of the reaction medium, electrostatic repulsions between the deprotonated 4-NP
molecules (4-nitrophenoxide anions)40
and the negatively charged nanosheets hinders
the approach of the substrate to the active sites on the catalyst. By contrast, such
electrostatic barriers are expected to be absent in the case of 4-NA because this substrate
lacks a net charge. Second, as expected, the catalytic activity of acetic acid-
functionalized ce-MoS2 immediately after its preparation was lower than that of its non-
functionalized counterpart for both 4-NP and 4-NA reduction. However, in relative
terms the difference between non-functionalized and functionalized nanosheets was
much more significant for the former reaction (~70% reduction in catalytic activity for
4-NP compared to ~30% for 4-NA). Again, electrostatic effects can be invoked to
rationalize this result. The catalytically active sites of ce-MoS2 are thought to be mostly
located on its 1T domains,21
but such domains have been very extensively grafted with
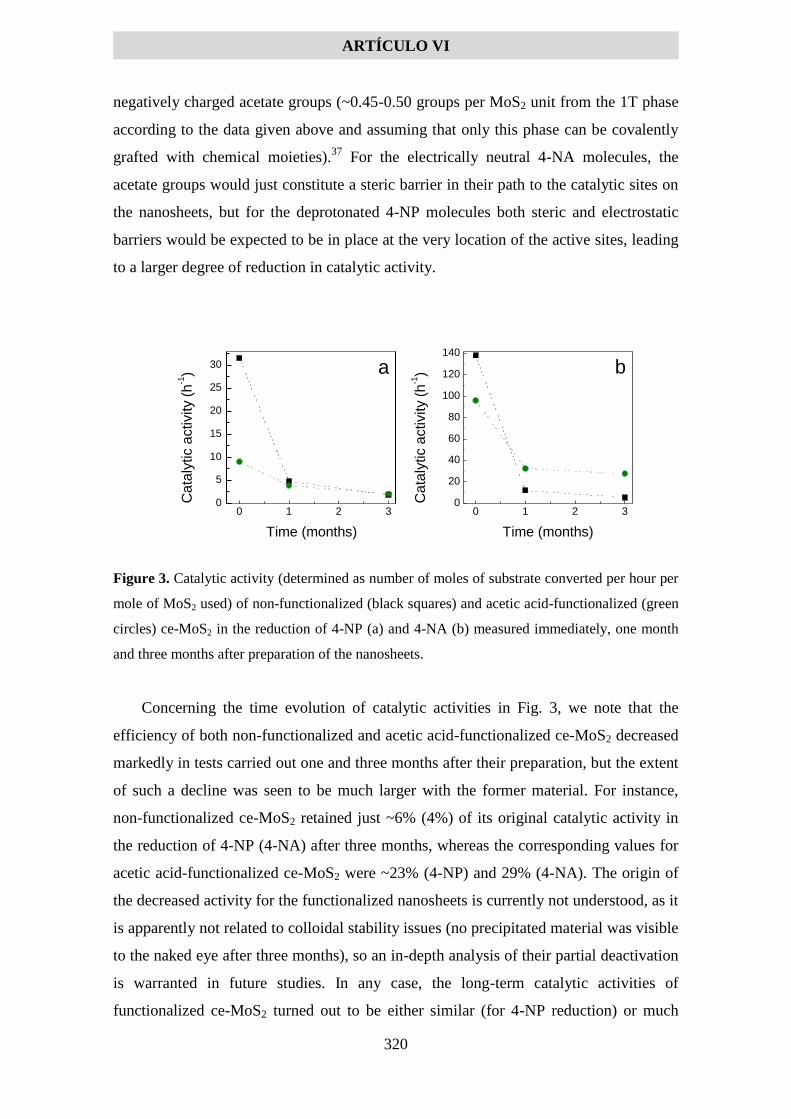
ARTÍCULO VI
320
negatively charged acetate groups (~0.45-0.50 groups per MoS2 unit from the 1T phase
according to the data given above and assuming that only this phase can be covalently
grafted with chemical moieties).37
For the electrically neutral 4-NA molecules, the
acetate groups would just constitute a steric barrier in their path to the catalytic sites on
the nanosheets, but for the deprotonated 4-NP molecules both steric and electrostatic
barriers would be expected to be in place at the very location of the active sites, leading
to a larger degree of reduction in catalytic activity.
Figure 3. Catalytic activity (determined as number of moles of substrate converted per hour per
mole of MoS2 used) of non-functionalized (black squares) and acetic acid-functionalized (green
circles) ce-MoS2 in the reduction of 4-NP (a) and 4-NA (b) measured immediately, one month
and three months after preparation of the nanosheets.
Concerning the time evolution of catalytic activities in Fig. 3, we note that the
efficiency of both non-functionalized and acetic acid-functionalized ce-MoS2 decreased
markedly in tests carried out one and three months after their preparation, but the extent
of such a decline was seen to be much larger with the former material. For instance,
non-functionalized ce-MoS2 retained just ~6% (4%) of its original catalytic activity in
the reduction of 4-NP (4-NA) after three months, whereas the corresponding values for
acetic acid-functionalized ce-MoS2 were ~23% (4-NP) and 29% (4-NA). The origin of
the decreased activity for the functionalized nanosheets is currently not understood, as it
is apparently not related to colloidal stability issues (no precipitated material was visible
to the naked eye after three months), so an in-depth analysis of their partial deactivation
is warranted in future studies. In any case, the long-term catalytic activities of
functionalized ce-MoS2 turned out to be either similar (for 4-NP reduction) or much
0 1 2 30
5
10
15
20
25
30
Ca
taly
tic a
ctivity (
h-1)
Time (months)
a
0 1 2 30
20
40
60
80
100
120
140
b
Ca
taly
tic a
ctivity (
h-1)
Time (months)
ARTÍCULO VI
321
higher (4-NA) than those of its non-functionalized correlative, suggesting the former to
be a more convenient catalyst for extended use. Furthermore, as can be noticed from
Table 1, even such decreased, long-term activities were competitive with those reported
in the literature in recent years for a considerable number of catalytic systems. For
example, the catalytic activity of acetic acid-functionalized ce-MoS2 towards 4-NP
reduction after three months (~2 h-1
) lay in the lower range of values typically
documented for catalysts based on expensive noble metal (e.g., Pt or Pd) NPs,41–46
whereas it was similar to or somewhat higher than that of non-noble metal (e.g., Cu)
NP-based catalysts47–50
but much higher than that of novel metal-free catalysts based on
heteroatom-containing carbon materials, such as nitrogen-doped reduced graphene
oxide.51–55
In the case of 4-NA reduction, the long-term catalytic activity of the
functionalized nanosheets (27.6 h-1
) was comparable to the values typically reported
with noble metal NP-based catalysts56–62
and much higher than that of nitrogen-doped
reduced graphene oxide21
(data for catalysts based exclusively on non-noble metal NPs
are not available for this reaction in the literature).
Table 1. Comparison of the catalytic activity (defined as number of moles of substrate
converted per hour per mole of catalyst used) of non-functionalized and acetic acid-
functionalized ce-MoS2 three months after their preparation with that of other catalysts
towards the reduction of 4-NP and 4-NA.

ARTÍCULO VI
322
Catalytic system Catalytic activity
(h-1
)
Ref.
Reduction of 4-NP
Non-functionalized ce-MoS2 (3 months)
Acetic acid-functionalized ce-MoS2 (3 months)
Pt NPs on graphene oxide/PVA/Fe3O4 composite gel
PtPd3 bimetallic NPs
Porous Pd nanoclusters
Dendritic Pd NPs
Ir NPs
Au NPs supported on poly(-caprolactone) nanofibers
Cu NPs supported onto carbon microspheres
Cu and Sn sponges/dendrites
Cu2O octahedrons supported on BN nanosheets
Ni NPs supported on MOF-derived mesoporous carbon
N-doped reduced graphene oxide
Hydrothermally reduced graphene oxide
Vitamin C-reduced graphene oxide
N-doped porous carbons derived from different MOFs
1.8
2
3
1.8
0.3
6
2.4
0.6
0.2
1.2-1.8
0.7
0.25
0.06
0.05
0.002
0.05-0.25
Present work
Present work
41
42
43
44
45
46
47
48
49
50
51
52
53
54,55
Reduction of 4-NA
Non-functionalized ce-MoS2 (3 months)
Acetic acid-functionalized ce-MoS2 (3 months)
N-doped reduced graphene oxide
5.4
27.6
0.08
Present work
Present work
21
Pt NPs supported on graphene aerogel
Bimetallic Pt-Ni NPs
NiFe2O4-Pd NP hybrid
Polyaniline/Fe3O4/Pd NP hybrid
Pd NPs supported on reduced graphene oxide
Polyhedral Au NPs
Hollow Ag nanospheres
48
18
180
15
25
1-6
6
56
57
58
59
60
61
62
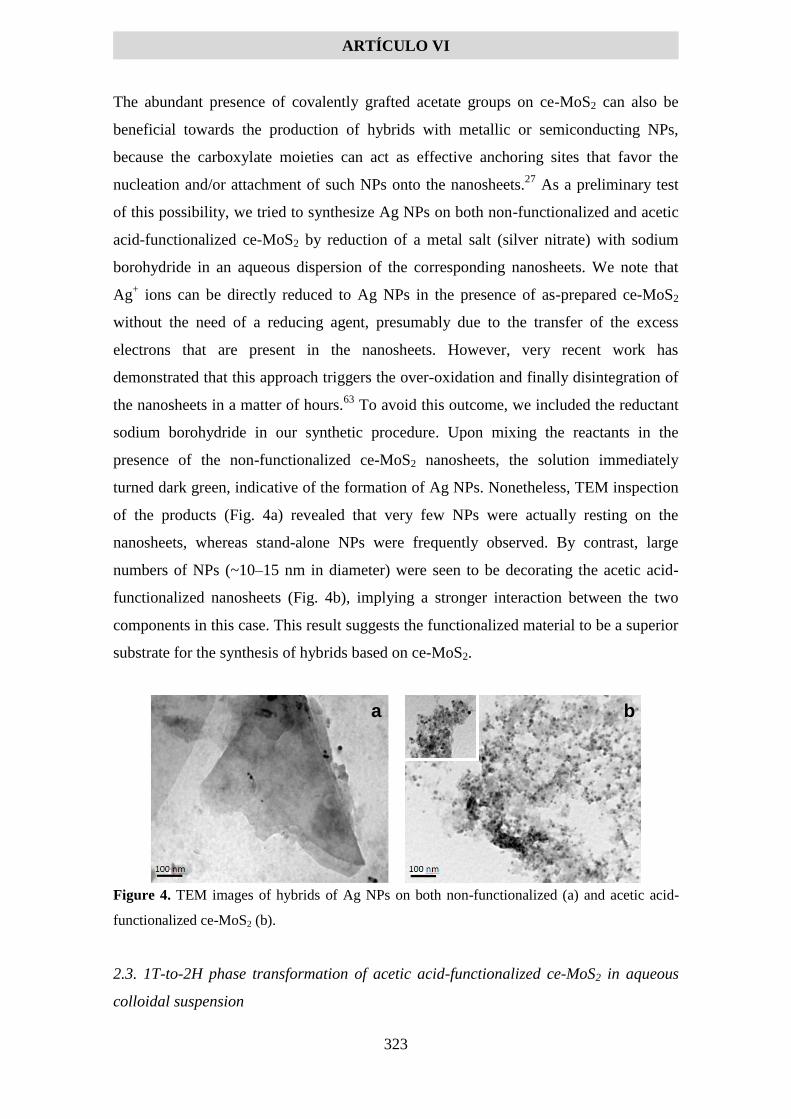
ARTÍCULO VI
323
The abundant presence of covalently grafted acetate groups on ce-MoS2 can also be
beneficial towards the production of hybrids with metallic or semiconducting NPs,
because the carboxylate moieties can act as effective anchoring sites that favor the
nucleation and/or attachment of such NPs onto the nanosheets.27
As a preliminary test
of this possibility, we tried to synthesize Ag NPs on both non-functionalized and acetic
acid-functionalized ce-MoS2 by reduction of a metal salt (silver nitrate) with sodium
borohydride in an aqueous dispersion of the corresponding nanosheets. We note that
Ag+ ions can be directly reduced to Ag NPs in the presence of as-prepared ce-MoS2
without the need of a reducing agent, presumably due to the transfer of the excess
electrons that are present in the nanosheets. However, very recent work has
demonstrated that this approach triggers the over-oxidation and finally disintegration of
the nanosheets in a matter of hours.63
To avoid this outcome, we included the reductant
sodium borohydride in our synthetic procedure. Upon mixing the reactants in the
presence of the non-functionalized ce-MoS2 nanosheets, the solution immediately
turned dark green, indicative of the formation of Ag NPs. Nonetheless, TEM inspection
of the products (Fig. 4a) revealed that very few NPs were actually resting on the
nanosheets, whereas stand-alone NPs were frequently observed. By contrast, large
numbers of NPs (~10–15 nm in diameter) were seen to be decorating the acetic acid-
functionalized nanosheets (Fig. 4b), implying a stronger interaction between the two
components in this case. This result suggests the functionalized material to be a superior
substrate for the synthesis of hybrids based on ce-MoS2.
Figure 4. TEM images of hybrids of Ag NPs on both non-functionalized (a) and acetic acid-
functionalized ce-MoS2 (b).
2.3. 1T-to-2H phase transformation of acetic acid-functionalized ce-MoS2 in aqueous
colloidal suspension
a b

ARTÍCULO VI
324
As demonstrated above, the covalent functionalization of ce-MoS2 with acetic acid
groups promotes the aqueous dispersibility of the nanosheets, which in turn can bring
several advantages when considering the practical use of this material. Nonetheless,
similar to the case of its as-prepared, non-functionalized counterpart, the functionalized
ce-MoS2 material incorporates a majority of 1T phase in its structure. It would be
desirable to be able to convert ce-MoS2 back to its original 2H phase while retaining at
the same time a good dispersibility of the nanosheets in aqueous medium. In principle,
this phase conversion can be achieved by thermal annealing at moderate temperatures
(150–300 ºC),13
so that for nanosheets in aqueous dispersion a hydrothermal treatment
could be a convenient way to induce the 1T-to-2H conversion. In this context,
successful phase conversion of ce-MoS2 stably dispersed in non-polar or low-polarity
organic solvents has been recently reported after electrostatic binding of oleylamine to
the nanosheets,26
but conversion in water has not yet been achieved. As a matter of fact,
we observed that hydrothermal treatment of non-functionalized ce-MoS2 at relevant
temperatures (>100 ºC) led to immediate and irreversible precipitation of the
suspensions unless the process was carried out at low nanosheet concentrations (~0.05
mg mL-1
and below), and even in the latter case the resulting annealed dispersions
tended to precipitate in a matter of several hours to a few days. We note, however, that
it was possible to induce conversion of the acetic acid-functionalized ce-MoS2
nanosheets back to the 2H phase while retaining their aqueous dispersibility to a large
degree. To this end, the hydrothermal annealing temperature had to be carefully chosen
so as to strike a balance between the extent of phase conversion attained and the degree
of defunctionalization that is also associated to the annealing process, the latter being
detrimental to the aqueous colloidal stability of the nanosheets.
A suite of hydrothermal annealing experiments revealed a temperature of 160 ºC to
be appropriate for the intended purpose. As noticed from Fig. 1a (red trace), absorption
features in the 400–500 and 600–700 nm wavelength regions, which can be ascribed to
excitonic transitions in 2H-phase MoS2, were seen to emerge after annealing the
functionalized dispersions at 160 ºC. Furthermore, the high resolution Mo 3d core level
spectrum of this sample (Fig. 1b, bottom plot) indicated that an extensive (although
incomplete) structural conversion to the 2H phase had occurred (81% 2H phase vs 21%
for functionalized but non-annealed ce-MoS2). Such an extent of phase conversion was
comparable to that recently reported in non-polar/low-polarity organic solvents.26
Consistent with the idea that the catalytically active sites in ce-MoS2 are mostly located

ARTÍCULO VI
325
on the 1T phase (some non-negligible contribution from the nanosheet edges is also
expected to be in place),21
the catalytic activity of the hydrothermally annealed
nanosheets immediately after their preparation was seen to decrease by a factor of 3 to 5
in the reduction of 4-NP and 4-NA compared to their non-annealed counterpart (results
not shown). In parallel to the phase conversion, we observed by XPS a decrease in the
amount of acetic acid groups grafted onto the nanosheets, i.e., a less intense S-C
component in the S 2p region (Fig. 1c, bottom plot) as well as a weaker feature at
~288.4 eV related to carboxylic acids in the C 1s region (Fig. 1d, bottom plot). This
conclusion was supported by ATR-FTIR spectroscopy (Fig. 1e, bottom plot), as the
peak associated to S–C stretching vibrations became clearly less intense compared to
that of the non-annealed sample (top plot).
XPS-based quantification of the functionalization degree for the dispersions
annealed at 160 ºC yielded a value of about 0.16 acetic acid groups grafted per MoS2
unit. This figure was significantly lower than that estimated for the non-annealed
nanosheets (0.35-0.40; see above) but nonetheless comparable to the values reported for
non-annealed nanosheets functionalized via thiol conjugation or reaction with
aryldiazonium salts (~0.1-0.2).27,33
We also note that such a degree of functionalization
is consistent with the fraction of 1T phase remaining in the annealed nanosheets (19%).
If the covalent attachment of chemical moieties is strongly favored at sulfur atoms from
the 1T phase relative to the 2H phase,37
then we would expect the degree of
functionalization of the annealed sample not to be higher than 0.19 grafted groups per
MoS2 unit, which was in agreement with the actual data derived from the XPS
measurements. In any case, the decreased extent of functionalization associated to the
annealed nanosheets was still sufficient to afford their aqueous dispersibility at
significant concentrations (e.g., 0.2–0.4 mg mL-1
) for reasonable periods of time. Even
though the annealed suspensions tended to precipitate before then non–annealed ones,
they could be re-dispersed by a simple hand-shaking procedure. We also note that
different annealing temperatures either failed to induce a considerable 1T-to-2H phase
conversion (<160 ºC) or led to colloidally unstable products that agglomerated
immediately due to extensive defunctionalization (>160 ºC), so that a temperature of
160 ºC constituted a reasonable compromise between these two opposing requirements.

ARTÍCULO VI
326
2.4. Biocompatibility of acetic acid-functionalized ce-MoS2
Finally, we carried out a preliminary investigation on the biocompatibility of acetic
acid-functionalized ce-MoS2. 2D materials, including MoS2, are currently the focus of
intense research activities towards their prospective application in biomedicine, e.g., as
drug carriers in different therapies or as contrast agents in diagnostic imaging.9 In the
particular case of ce-MoS2 nanosheets, previous work has explored their use as
photothermal agents23
or as drug carriers in combined photothermal, photodynamic and
chemotherapy of cancer.64
For these and other bio-related applications, it is obvious that
the nanosheets need to be highly biocompatible and non-cytotoxic, and so studies on
their biological interactions are highly relevant.65
Although 2D MoS2 (including ce-
MoS2) nanosheets are generally regarded to exhibit low toxicity towards mammalian
cell lines,65,66
it is also known that their specific toxicity profile is affected by a number
of physicochemical parameters associated to the material, such as its exfoliation degree,
aggregation state or electrical conductivity.28,66
Similar to the case of graphene,67
we
also expect the biocompatibility/cytotoxicity of the ce-MoS2 nanosheets to be
modulated by their surface chemistry, and therefore to be sensitive to functionalization
treatments, but such a point has not yet been investigated. To shed light on this
question, we explored and compared the biocompatibility of the different ce-MoS2
materials prepared here towards murine fibroblasts (L929 cell line) on the basis of the
MTT assay. The L929 cell line is generally used as a benchmark in the biocompatibility
assessment of medical devices.
Fig. 5 summarizes the results of L929 cell proliferation tests carried out on
polystyrene culture plates 24 h after having seeded the cells at an initial density of 5500
cells cm-2
, in the presence of different concentrations of ce-MoS2 materials in the
culture medium. For comparison purposes, tests with graphene oxide nanosheets were
also performed. At the lowest nanosheet concentration (10 g mL-1
), all the ce-MoS2
materials, i.e. the non-functionalized, acetic acid-functionalized as well as
functionalized and 160 ºC annealed samples, displayed somewhat reduced cell
proliferation values compared with the control test (no nanosheets in the culture
medium, 100% proliferation), although the reduction was more significant for the two
latter samples. As the nanosheet concentration was progressively increased up to 100 g
mL-1
, cell proliferation values tended to decrease a bit in the presence of non-
functionalized ce-MoS2, whereas they increased slightly for the functionalized and
annealed material. By contrast, the functionalized nanosheets (i.e., without annealing)

ARTÍCULO VI
327
afforded significantly enhanced proliferation. Such a result suggests that the extensive
grafting of acetic acid moieties (0.35-0.40 groups per MoS2 unit in the functionalized
material compared to ~0.16 after annealing at 160 ºC) has a clearly beneficial effect on
the biocompatibility of the nanosheets. We also note that the performance of the
functionalized material paralleled that of the graphene oxide nanosheets, as both
appeared to stimulate substantially the proliferation of L929 cells with increasing
concentration of the 2D material. On the other hand, at the highest nanosheet
concentration (150 g mL-1
), both non-functionalized and functionalized/annealed ce-
MoS2 became remarkably cytotoxic (~70-90% reduction in proliferation compared to
the control test), while proliferation in the presence of the functionalized material was
also seen to decrease relative to lower concentrations, but nonetheless kept pace with
that of the control. This behavior was not observed with graphene oxide, which
seemingly induced further cellular proliferation at the concentration of 150 g mL-1
.
Figure 5. Results of L929 cell proliferation tests, based on the MTT assay, for aqueous
dispersions of ce-MoS2 (black), acetic acid-functionalized ce-MoS2 (green), hydrothermically
treated acetic acid-functionalized ce-MoS2 (red), and graphene oxide (orange) at different
concentrations. The light blue bar corresponds to the blank experiment. Significant statistical
differences between the different materials according to the concentration data groups are
indicated by the use of the different symbols *, † and •.
Overall, the L929 cell proliferation studies suggested the presence of acetic acid
groups on the surface of the functionalized ce-MoS2 nanosheets, and more specifically
their associated carboxylic acid groups, to be a major driver in boosting the
0
50
100
150
200
250
150100502510
Ce
ll p
rolif
era
tio
n (
%)
Concentration (g mL-1)
0
•
•
*†
†
††
**
*
**
*
*
†
†
†
†
*
*
**

ARTÍCULO VI
328
biocompatibility of this material. This conclusion would be in line with previous results
obtained using other nanostructured materials. For example, comparison between
unreduced and reduced forms of graphene oxide, which only differ in the amount of
oxygen functional groups (hydroxyl, epoxy, carboxylic) grafted onto the carbon lattice,
revealed that the unreduced, heavily functionalized nanosheets were more
biocompatible towards L929 cells than their reduced counterparts.67
Similarly,
functionalization of carbon nanotubes with either carboxylic or sulfonic acid groups was
demonstrated to drastically reduce their in vitro cytotoxicity towards human dermal
fibroblasts.68
Despite the very different chemical composition and structure of the
starting material in question, the present results indicate that covalent functionalization
can be an effective strategy to improve the biocompatibility also in the case of ce-MoS2.
3. Conclusions
In conclusion, the extensive covalent derivatization of chemically exfoliated MoS2
(ce-MoS2) nanosheets with acetic acid groups has been made possible based on reaction
of the nanosheets with the corresponding organoiodide (i.e., iodoacetic acid). Analysis
of the resulting products indicated that a high degree of functionalization can be attained
with this approach (0.35-0.40 acetic acid groups grafted per MoS2 unit). The ensuing
presence of a very high density of carboxylic acid groups on the surface of the
functionalized ce-MoS2 nanosheets has demonstrated a number of practical benefits
regarding the processing and practical use of this two-dimensional material. More to the
point, the functionalized nanosheets exhibited greatly improved long-term (>6 months)
colloidal dispersibility in aqueous medium, a much higher temporal retention of
catalytic activity towards the reduction of nitroarenes as well as an enhanced ability to
anchor silver nanoparticles and form hybrid structures in comparison with their non-
functionalized counterpart. Likewise, hydrothermal treatment of the acetic acid-
functionalized, 1T-phase ce-MoS2 material at an appropriate temperature (160 ºC)
afforded its extensive conversion to the original 2H phase while retaining at the same
time a significant aqueous colloidal dispersibility in the phase-reversed nanosheets,
which was not previously possible. Functionalization with acetic acid groups was also
seen to significantly improve the in vitro biocompatibility of the ce-MoS2 nanosheets, as
evaluated by cell proliferation tests using murine fibroblasts. Finally, we anticipate that
the abundant presence of carboxylic acid moieties on this functionalized material can be
exploited, e.g., towards the covalent attachment of biomolecules (DNA, proteins, etc)

ARTÍCULO VI
329
on the ce-MoS2 nanosheets through well-developed chemistries, giving rise to hybrid
structures with potential utility in biomedicine or biosensing.
4. Experimental
4.1. Materials and reagents
The following chemicals were obtained from Sigma-Aldrich and used as received:
MoS2 powder, n-hexane, 1.6 M n-butyllithium solution in n-hexane, 2-iodoacetamide,
iodoacetic acid, iodomethanesulfonic acid, isopropanol, ethanol, silver nitrate, 4-
nitrophenol, 4-nitroaniline, sodium borohydride and sodium hydroxide. Cellulose ester
dialysis membranes (molecular weight cutoff: 14000 Da) were also acquired from
Sigma-Aldrich, whereas alumina membrane filters (pore size: 0.2 m; diameter: 25
mm) were purchased from Whatman. Milli-Q water (resistivity: 18.2 M cm) was used
throughout the studies.
4.2. Preparation of ce-MoS2 nanosheets
The method originally described by Morrison and co-workers,69
based on the
intercalation of MoS2 through reaction with n-butyllithium, was used for the preparation
of ce-MoS2 nanosheets. Caution must be exercised in dealing with such a highly
pyrophoric reagent such as n-butyllithium. Specifically, a solution of n-butyllithium in
n-hexane (1.6 M, 3 mL) was poured into MoS2 powder (300 mg) in an argon-filled
glovebox, and the mixture was left to stand for 48 h at room temperature under static
conditions to obtain a lithium-intercalated product (LixMoS2). The latter was then
washed with n-hexane (60 mL) through filter paper to remove unreacted n-butyllithium
as well as residues from its reaction with MoS2, and immediately dispersed in water
under bath sonication (JP Selecta Ultrasons system, frequency: 40 kHz, ultrasound
power: 22 W L-1
) for 1 h to exfoliate the LixMoS2 powder into individual nanosheets.
The resulting aqueous dispersion of ce-MoS2 nanosheets was purified by dialyzing it
against water for 2 days and subsequently stored for further use. The concentration of
the as-prepared ce-MoS2 suspensions was estimated by UV-vis absorption spectroscopy
on the basis of the Lambert-Beer law (A/l = C), where, A/l is the absorbance per unit
length of optical path, C is the concentration and is the extinction coefficient. The
measurements were carried out at a wavelength of 450 nm, for which the extinction
coefficient of ce-MoS2 had been previously determined (450 = 5045 m-1
g-1
L).21

ARTÍCULO VI
330
4.3. Covalent functionalization of ce-MoS2 nanosheets with acetic acid groups
Derivatization of ce-MoS2 nanosheets with acetic acid groups was accomplished
through a slight modification of the general scheme recently developed by Voiry et al
for functionalization with acetamide and methyl groups, which is based on reaction of
the nanosheets with the corresponding electrophilic organoiodides.32
More to the point,
iodoacetic acid (1.1×10⁻³
mol) was added to a mildly acidic (pH~ 4) aqueous dispersion
of ce-MoS2 nanosheets (40 mL, 0.44 mg mL-1
), and the mixture was left to stand for 5
days at room temperature. Afterwards, the dispersion was washed consecutively with
isopropanol, ethanol and water via repeated cycles of sedimentation via centrifugation
(1743g, 30 min) and re-suspension in the corresponding solvent (3 cycles for each
solvent). Following completion of this washing procedure, the functionalized
nanosheets were obtained in aqueous dispersion, which was dialyzed for 2 days against
water to further remove unreacted species. For comparison purposes, treatment of ce-
MoS2 with either 2-iodoacetamide or iodomethanesulfonic acid instead of iodoacetic
acid was also carried out, using the same molar amounts in all cases.
4.4. 1T-to-2H phase conversion of acetic acid-functionalized ce-MoS2 nanosheets in
aqueous dispersion
A hydrothermal treatment was implemented to induce conversion of the acetic acid-
functionalized ce-MoS2 from the 1T phase that was brought about by the lithium
intercalation step back to the original 2H phase, while attaining at the same time a long-
term colloidal stability in water of the converted nanosheets. Briefly, an aqueous
dispersion of acetic acid-functionalized, 1T-phase ce-MoS2 (20 mL, 0.2 mg mL-1
) was
first purged with an argon flow (45 mL min-1
) for 30 min and then transferred to a
Teflon-lined stainless steel autoclave (50 mL in capacity), where it was heated at 160 ºC
for 4 h. After cooling down to room temperature, the dispersion was collected and its
pH was adjusted to ~8 with addition of NH3 to promote the colloidal stability of the
nanosheets.
4.5. Testing of the catalytic activity of non-functionalized and acetic acid-functionalized
ce-MoS2 nanosheets
The catalytic activity of non-functionalized and acetic acid-functionalized ce-MoS2
was evaluated on the basis of two reduction reactions, namely, the reduction of 4-
ARTÍCULO VI
331
nitrophenol (4-NP) and 4-nitroaniline (4-NA) to 4-aminophenol (4-AP) and p-
phenylenediamine (p-PDA), respectively, carried out with sodium borohydride as a
reducing agent at room temperature. It has been previously shown that as-prepared ce-
MoS2 nanosheets are rather efficient catalysts for both reactions.21
To this end, an
aqueous mixed solution (2.5 mL) containing either non-functionalized or acetic acid-
functionalized ce-MoS2 nanosheets (concentration of ce-MoS2 component: ~0.015 mg
mL-1
), either 4-NP (0.12 mM) or 4-NA (0.11 mM), as well as sodium borohydride [72
mM (for 4-NP) or 110 mM (for 4-NA)] was prepared and then the reaction progress was
monitored through UV-vis absorption spectroscopy by measuring the intensity of the
peak located either at ~400 nm (characteristic of 4-NP) or at ~382 nm (characteristic of
4-NA).
4.6. Growth of Ag NPs onto non-functionalized and acetic acid-functionalized ce-MoS2
nanosheets
The growth of Ag NPs onto ce-MoS2 nanosheets was carried out in the aqueous
phase and was based on the reduction of a metal precursor (silver nitrate) with sodium
borohydride in the presence of the nanosheets. Specifically, mixed aqueous solutions
containing 0.5 mM silver nitrate, 22.5 mM sodium borohydride and 0.1 mg mL-1
ce-
MoS2 were prepared and left to react undisturbed for 2 h. Subsequently, the reacted
product was purified by two cycles of sedimentation through centrifugation (20000 g,
20 min) and re-dispersion in water.
4.7. Biocompatibility testing of ce-MoS2 materials
Murine fibroblasts (L929 cell line, ECACC 85011425) were chosen to evaluate the
biocompatibility of the different ce-MoS2 materials, as these fibroblasts are highly
stable, fast-growing and commonly used in cell culture studies for cytotoxicity
assessment. The fibroblasts were seeded at a density of 5500 cells cm-2
onto 96-well
tissue culture polystyrene plates. The culture medium used was Dulbecco’s modified
Eagle’s medium (DMEM) supplemented with 10% fetal bovine serum (FBS), penicillin
(100 U mL-1
), and streptomycin (100 mg mL-1
), and incubation was carried out at 37 °C
in a 5% CO2 atmosphere. 72 hours after seeding, the culture medium was replaced by
fresh medium that also contained a given type of ce-MoS2 (non-functionalized, acetic
acid-functionalized as well as functionalized and hydrothermally treated) at different
concentrations: 10, 25, 50, 100 and 150 μg mL-1
. For comparison purposes, graphene

ARTÍCULO VI
332
oxide (obtained from Graphenea) was also assayed at the same concentrations. The cell
proliferation tests were carried out 24 h after addition of the MoS2-containing media by
means of the MTT assay (Sigma-Aldrich). This assay is based on the enzymatic
reduction of the tetrazolium dye 3-(4,5-dimethylthiazol-2-yl)-2,5-diphenyltetrazolium
bromide (MTT) to its water-insoluble formazan derivative.70
To this end, the MoS2-
containing culture medium was taken out from each seeded well and then 200 L of
aqueous MTT solution (1 mg mL-1
) were added to each well. To exclude interference of
the MoS2 material on the MTT assay, special emphasis was placed on thoroughly
removing the MoS2-containing medium from the wells. After incubation at 37 °C under
5% CO2 atmosphere for 4 h, the MTT solution was carefully removed, 100 μL of
dimethyl sulfoxide were added to solubilize the generated formazan crystals and finally
the absorbance of this reaction product was measured with a BMG FLUOstar Galaxy
microplate reader (MTX Lab Systems, Inc.) at 570 nm and the reference wavelength of
690 nm. Statistical analysis of the results was performed with the SPSS Statistics
software. When data followed the normality and homogeneity of variance requirements,
their means were compared by the parametric test ANOVA followed by Bonferroni’s
post hoc multiple t-test. The significance level was set to a p-value < 0.05.
4.8. Characterization techniques
The different ce-MoS2 materials were characterized by UV-vis absorption
spectroscopy, X-ray photoelectron spectroscopy (XPS), attenuated total reflection
Fourier transform infrared (ATR-FTIR) spectroscopy, atomic force microscopy (AFM)
and transmission electron microscopy (TEM). UV-vis absorption spectra were recorded
on a double-beam Heios spectrophotometer (Thermo Spectronics). XPS was carried
out with a SPECS system at a pressure of 10-7
Pa with a non-monochromatic Mg K X-
ray source operated at a power of 100 W. The high resolution spectra were taken at pass
energy of 10 eV with an energy step of 0.1 eV. The binding energy scale of all spectra
was referenced to the maximum of the C1s band for adventitious carbon. ATR-FTIR
spectroscopy was accomplished on a Nicolet 8700 spectrometer (Thermo Scientific)
with a diamond ATR crystal. Specimens for XPS and ATR-FTIR spectroscopy were
prepared in the form of free-standing, paper-like films by vacuum-filtering aqueous
dispersions of the corresponding ce-MoS2 sample (60 mL, 0.1 mg mL-1
) through anodic
alumina membrane filters. AFM imaging of the ce-MoS2 nanosheets was performed

ARTÍCULO VI
333
with a Nanoscope IIIa Multimode apparatus (Veeco Instruments) in the tapping mode of
operation, using silicon cantilevers (spring constant ~40 N m-1
; resonance frequency
~250-300 kHz). To this end, a small volume of a diluted aqueous dispersion of the
nanosheets (~10 L, ~0.05 mg mL-1
) was drop-cast onto a freshly cleaved mica
substrate and allowed to dry under ambient conditions. TEM images were recorded on a
JEOL 2000 EX-II microscope operated at 160 kV. In this case, the aqueous ce-MoS2
dispersion was diluted with an equal volume of ethanol, and then 50 L of the resulting
suspension were drop-cast onto a copper grid (200 mesh) covered with a continuous
amorphous carbon film and allowed to dry under ambient conditions.
Supporting Information. Evidence for the limited colloidal stability of as–prepared
aqueous dispersions of ce-MoS2; survey XPS spectra of ce–MoS2 treated with
iodomethanesulfonic and iodoacetic acid.
Acknowledgements
Financial support from the Spanish Ministerio de Economía y Competitividad
(MINECO) and the European Regional Development Fund (FEDER) through project
MAT2015-69844-R is gratefully acknowledged, as well as partial support of the
ERDF/FEDER. Operative Program of the Región de Murcia 2007–2013. We also
acknowledge partial funding by Plan de Ciencia, Tecnología e Innovación 2013-2017
del Principado de Asturias and FEDER through grant GRUPIN14-056. M.A-V. and
J.M.M. are thankful to MINECO and the Spanish Ministerio de Educación, Cultura y
Deporte (MECD), respectively, for their pre-doctoral contracts.
References
(1) Ferrari, A.C.; Bonaccorso, F.; Falko, V.; Novoselov, K. S.; Roche, S.; Bøggild, P.;
Borini, S.; Koppens, F.; Palermo, V.; Pugno N.; Garrido, J. A.; Sordan, R.; Bianco, A.;
Ballerini, L.; Prato, M.; Lidorikis, E.; Kivioja, J.; Marinelli, C.; Ryhänen, T.; Morpurgo,
A.; Coleman, J. N.; Nicolosi, V.; Colombo, L.; Fert, A.; Garcia-Hernandez, M.;
Bachtold, A.; Schneider, G. F.; Guinea, F.; Dekker, C.; Barbone, M.; Galiotis, C.;
Grigorenko, A.; Konstantatos, G.; Kis, A.; Katsnelson, M.; Beenakker, C. W. J.;
Vandersypen, L.; Loiseau, A.; Morandi, V.; Neumaier, D.; Treossi, E.; Pellegrini, V.;

ARTÍCULO VI
334
Polini, M.; Tredicucci, A.; Williams, G. M.; Hong, B. H.; Ahn, J. H.; Kim, J. M.; Zirath,
H.; van Wees, B. J.; van der Zant, H.; Occhipinti, L.; Di Matteo, A.; Kinloch, I. A.;
Seyller, T.; Quesnel, E.; Feng, X.; Teo, K.; Rupesinghe, N.; Hakonen, P.; Neil, S. R. T.;
Tannock, Q.; Löfwander, T.; Kinaret, J. Science and Technology Roadmap for
Graphene, Related Two-Dimensional Crystals, and Hybrid Systems. Nanoscale 2015, 7,
4598–4810.
(2) Bhimanapati, G. R.; Lin, Z.; Meunier, V.; Jung, Y.; Cha, J.; Das, S; Xiao, D.; Son,
Y.; Strano, M. S.; Cooper, V. R.; Liang, L.; Louie, S. G.; Ringe, E.; Zhou, W.; Kim, S.
S.; Naik, R. R.; Sumpter, B. G.; Terrones, H.; Xia, F.; Wang, Y.; Zhu, J.; Akinwande,
D.; Alem, N.; Schuller, J. A.; Schaak, R. E. Terrones, M.; Robinson, J. A. Recent
Advances in Two-Dimensional Materials beyond Graphene. ACS Nano 2015, 9, 11509–
11539.
(3) Lv, R.; Robinson, J.A.; Schaak, R.E.; Sun, D.; Sun, Y.; Mallouk, T.E.; Terrones, M.
Transition Metal Dichalcogenides and Beyond: Synthesis, Properties, and Applications
of Single- and Few-Layer Nanosheets. Acc. Chem. Res. 2015, 48, 56–64.
(4) Subbaiah, Y.P.V.; Saji, K.J.; Tiwari, A. Atomically Thin MoS2: A Versatile
Nongraphene 2D Material. Adv. Funct. Mater. 2016, 26, 2046–2069.
(5) Wang, Q.H.; Kalantar-Zadeh, K.; Kis, A.; Coleman, J.N.; Strano, M.S. Electronics
and Optoelectronics of Two-Dimensional Transition Metal Dichalcogenides. Nat.
Nanotechnol. 2012, 7, 699–712.
(6) Lu, Q.; Yu, Y.; Ma, Q.; Chen, B.; Zhang, H. 2D Transition-Metal-Dichalcogenide-
Nanosheet-Based Composites for Photocatalytic and Electrocatalytic Hydrogen
Evolution Reactions. Adv. Mater. 2016, 28, 1917–1933.
(7) Latorre-Sánchez, M.; Esteve-Adell, I.; Primo, A.; García, H. Innovative Preparation
of MoS2–graphene Heterostructures Based on Alginate Containing (NH4)2MoS4 and
their Photocatalytic Activity for H2 Generation. Carbon 2015, 81, 587–596.
(8) Huang, Y.; Guo, J.; Kang, Y.; Ai, Y.; Li, C.M. Two Dimensional Atomically Thin
MoS2 Nanosheets and their Sensing Applications. Nanoscale 2015, 7, 19358–19376.
(9) Chimene, D.; Alge, D.L.; Gaharwar, A.K. Two-Dimensional Nanomaterials for
Biomedical Applications: Emerging Trends and Future Prospects. Adv. Mater. 2015, 27,
7261–7284.

ARTÍCULO VI
335
(10) Shi, Y.; Li, H.; Li, L.-J. Recent Advances in Controlled Synthesis of Two-
Dimensional Transition Metal Dichalcogenides via Vapour Deposition Techniques.
Chem. Soc. Rev. 2015, 44, 2744–2756.
(11) Varrla, E.; Backes, C.; Paton, K.R.; Harvey, A.; Gholamvand, Z.; McCauley, J.
Coleman, J.N. Large-Scale Production of Size-Controlled MoS2 Nanosheets by Shear
Exfoliation. Chem. Mater. 2015, 27, 1129–1139.
(12) Quinn, M. D. J.; Ho, N. H.; Notley, S. M. Aqueous Dispersions of Exfoliated
Molybdenum Disulfide for Use in Visible-Light Photocatalysis. ACS Appl. Mater.
Interfaces 2013, 5, 12751−12756.
(13) Eda, G.; Yamaguchi, H.; Voiry, D.; Fujita, T.; Chen, M.; Chhowalla, M.
Photoluminiscence from Chemically Exfoliated MoS2. Nano Lett. 2011, 11, 5111–5116.
(14) Zheng, J.; Zhang, H.; Dong, S.; Liu, Y.; Nai, C.T.; Shin, H.S.; Jeong, H.Y., Liu, B.
Loh, K.P. High Yield Exfoliation of Two-Dimensional Chalcogenides Using Sodium
Naphthalenide Nat. Commun. 2014, 5, 2995.
(15) Jeffery, A. A.; Nethravathi, C.; Rajamathi, M. Two-Dimensional Nanosheets and
Layered Hybrids of MoS2 and WS2 through Exfoliation of Ammoniated MS2 (M =
Mo,W). J. Phys. Chem. C 2014, 118, 1386–1396.
(16) Niu, L.; Coleman, J.N.; Zhang, H.; Shin, H.; Chhowalla, M.; Zheng, Z. Production
of Two-Dimensional Nanomaterials via Liquid-Based Direct Exfoliation. Small 2016,
12, 272–293.
(17) Chhowalla, M.; Shin, H.S.; Eda, G.; Li, L.-J.; Loh, K.P.; Zhang, H. The Chemistry
of Two-Dimensional Layered Transition Metal Dichalcogenide Nanosheets. Nat. Chem.
2013, 5, 263–275.
(18) Zeng, Z.; Yin, Z.; Huang, X.; Li, H.; He, Q.; Lu, G.; Boey, F.; Zhang, H. Single-
Layer Semiconducting Nanosheets: High-Yield Preparation and Device Fabrication
Angew. Chem. Int. Ed. 2011, 50, 11093–11097.
(19) Lukowski, M.A.; Daniel, A.S.; Meng, F.; Forticaux, A.; Li, L.; Jin, S. Enhanced
Hydrogen Evolution Catalysis from Chemically Exfoliated Metallic MoS2 Nanosheets.
J. Am. Chem. Soc. 2013, 135, 10274–10277.
(20) Bai, S.; Wang, L.; Chen, X.; Du, J.; Xiong, Y. Chemically Exfoliated Metallic
MoS2 Nanosheets: A Promising Supporting Co-Catalyst for Enhancing the
Photocatalytic Performance of TiO2 Nanocrystals. Nano Res. 2015, 8, 175–183.

ARTÍCULO VI
336
(21) Guardia, L.; Paredes, J.I.; Munuera, J.M.; Villar-Rodil, S.; Ayán-Varela, M.;
Martínez-Alonso, A.; Tascón, J.M.D. Chemically Exfoliated MoS2 Nanosheets as an
Efficient Catalyst for Reduction Reactions in the Aqueous Phase. ACS Appl. Mater.
Interfaces 2014, 6, 21702–21710.
(22) Acerce, M.; Voiry, D.; Chhowalla, M. Metallic 1T Phase MoS2 Nanosheets as
Supercapacitor Electrode Materials. Nat. Nanotechnol. 2015, 10, 313–318.
(23) Chou, S.C.; Kaehr, B.; Kim, J.; Foley, B.M.; De, M.; Hopkins, P.E.; Huang, J.;
Brinker, C.J.; Dravid, V.P. Chemically Exfoliated MoS2 as Near-Infrared Photothermal
Agents. Angew. Chem. Int. Ed. 2013, 52, 4160–4164.
(24) Ge, J.; Ou, E.-C.; Yu, R.-Q.; Chu, X. A Novel Aptameric Nanobiosensor Based on
the Self-assembled DNA–MoS2 Nanosheet Architecture for Biomolecule Detection. J.
Mater. Chem. B 2014, 2, 625–628.
(25) Chou, S.S.; De, M.; Kim, J.; Byun, S.; Dykstra, C.; Yu, J.; Huang, J.; Dravid, V.P.
Ligand Conjugation of Chemically Exfoliated MoS2. J. Am. Chem. Soc. 2013, 135,
4584–4587.
(26) Chou, S.S.; Huang, Y.-K.; Kim, J.; Kaehr, B.; Foley, B.M.; Lu, P.; Dykstra, C.;
Hopkins, P.E.; Brinker, C.J.; Huang, J.; Dravid, V.P. Controlling the Metal to
Semiconductor Transition of MoS2 and WS2 in Solution. J. Am. Chem. Soc. 2015, 137,
1742–1745.
(27) Cheng, Z.; He, B.; Zhou, L. A General One-Step Approach for in Situ Decoration
of MoS2 Nanosheets with Inorganic Nanoparticles. J. Mater. Chem. A 2015, 3, 1042–
1048.
(28) Chng, E.L.; Sofer, Z.; Pumera, M. MoS2 Exhibits Stronger Toxicity with Increased
Exfoliation. Nanoscale 2014, 6, 14412–14418.
(29) Presolski, S.; Pumera, M. Covalent Functionalization of MoS2. Mater. Today
2016, 19, 140–145.
(30) Chen, X.; McDonald, A.R. Functionalization of Two-Dimensional Transition-
Metal Dichalcogenides. Adv. Mater. 2016, 28, 5738–5746.
(31) Cho, K.; Min, M.; Kim, T.-Y.; Jeong, H.; Pak, J.; Kim, J.-K.; Jang, J.; Yun, S.J.
Lee, Y.H.; Hong, W.-K.; Lee, T. Electrical and Optical Characterization of MoS2 with
Sulfur Vacancy Passivation by Treatment with Alkanethiol Molecules. ACS Nano 2015,
9, 8044–8053.

ARTÍCULO VI
337
(32) Voiry, D.; Goswami, A.; Kappera, R.; Silva, C.D.C.E.; Kaplan, D.; Fujita, T.;
Chen, M.; Asefa, T.; Chhowalla, M. Covalent Functionalization of Monolayered
Transition Metal Dichalcogenides by Phase Engineering. Nat. Chem. 2015, 7, 45–49.
(33) Knirsch, K.C.; Berner, N.C.; Nerl, H.C.; Cucinotta, C.S.; Gholamvand, Z.;
McEvoy, N.; Wang, Z.; Abramovic, I.; Vecera, P.; Halik, M.; Sanvito, S.; Duesberg,
G.S.; Nicolosi, V.; Hauke, F.; Hirsch, A.; Coleman, J.N.; Backes, C. Basal-Plane
Functionalization of Chemically Exfoliated Molybdenum Disulfide by Diazonium Salts.
ACS Nano 2015, 9, 6018–6030.
(34) Heising, J.; Kanatzidis, M.G. Exfoliated and Restacked MoS2 and WS2: Ionic or
Neutral Species? Encapsulation and Ordering of Hard Electropositive Cations. J. Am.
Chem. Soc. 1999, 121, 11720–11732.
(35) Guardia, L.; Paredes, J.I.; Rozada, R.; Villar-Rodil, S.; Martínez-Alonso, A.;
Tascón, J.M.D. Production of Aqueous Dispersions of Inorganic Graphene Analogues
by Exfoliation and Stabilization with Non-Ionic Surfactants. RSC Adv. 2014, 4, 14115–
14127.
(36) Wang, Y.; Ou, J.Z.; Chrimes, A.F.; Carey, B.J.; Daeneke, T.; Alsaif, M.M.Y.A.;
Mortazavi, M.; Zhuiykov, S.; Medhekar, N.; Bhaskaran, M.; Friend, J.R.; Strano, M.S.
Kalantar-Zadeh, K. Plasmon Resonances of Highly Doped Two-Dimensional MoS2.
Nano Lett. 2015, 15, 883–890.
(37) Tang, Q.; Jiang, D. Stabilization and Band-Gap Tuning of the 1T-MoS2 Monolayer
by Covalent Functionalization. Chem. Mater. 2015, 27, 3743–3748.
(38) P. Swift. Adventitious Carbon-The Panacea for Energy Referencing? Surf.
Interface Anal. 1982, 4, 47–51.
(39) Hu, H.; Xin, J.H.; Hu, H.; Wang, X.; Miao, D.; Liu, Y. Synthesis and Stabilization
of Metal Nanocatalysts for Reduction Reactions – a Review. J. Mater. Chem. A 2015, 3,
11157–11182.
(40) Ayán-Varela, M.; Paredes, J.I.; Guardia, L.; Villar-Rodil, S.; Munuera, J.M.; Díaz-
González, M.; Fernández-Sánchez, C.; Martínez-Alonso, A.; Tascón, J.M.D. Achieving
Extremely Concentrated Aqueous Dispersions of Graphene Flakes and Catalytically
Efficient Graphene-Metal Nanoparticle Hybrids with Flavin Mononucleotide as a High-
Performance Stabilizer. ACS Appl. Mater. Interfaces 2015, 7, 10293–10307.

ARTÍCULO VI
338
(41) Cheng, Z.; Liao, J.; He, B.; Zhang, F.; Zhang, F.; Huang, X.; Zhou, L. One-Step
Fabrication of Graphene Oxide Enhanced Magnetic Composite Gel for Highly Efficient
Dye Adsorption and Catalysis. ACS Sustainable Chem. Eng. 2015, 3, 1677–1685.
(42) Zhang, B.; Zhan, X.; Zhao, P.; Li, Z. Ionic Liquid-Mediated Synthesis of Unique
PtPd Bimetallic Particles with Tiny Subunits for Efficient Electrocatalytic and Catalytic
Applications. RSC Adv. 2015, 5, 57640–57646.
(43) Halder, A.; Patra, S.; Viswanath, B.; Munichandraiah, N.; Ravishankar, N. Porous,
Catalytically Active Palladium Nanostructures by Tuning Nanoparticle Interactions in
an Organic Medium. Nanoscale 2011, 3, 725–730.
(44) Premkumar, T.; Geckeler, K.E. Palladium Nanostructures: Solvent-Less, One-Pot
Mechano-Chemical Synthesis Using Poly(vinylpyrolidone) and Catalytic Activity.
Colloids Surf. A 2014, 456, 49–54.
(45) Xu, D.; Diao, P.; Jin, T.; Wu, Q.; Liu, X.; Guo, X.; Gong, H.; Li, F.; Xiang, M.;
Ronghai, Y. Iridium Oxide Nanoparticles and Iridium/Iridium Oxide Nanocomposites:
Photochemical Fabrication and Application in Catalytic Reduction of 4-Nitrophenol.
ACS Appl. Mater. Interfaces 2015, 7, 16738–16749.
(46) Kim, I.; Son, H.Y.; Yang, M.Y.; Nam, Y.S. Bioinspired Design of an
Immobilization Interface for Highly Stable, Recyclable Nanosized Catalysts. ACS Appl.
Mater. Interfaces 2015, 7, 14415–14422.
(47) Cheng, X.; Fu, A.; Li, H.; Wang, Y.; Guo, P.; Liu, J.; Zhang, J.; Zhao, X.S.
Sustainable Preparation of Copper Particles Decorated Carbon Microspheres and
Studies on Their Bactericidal Activity and Catalytic Properties. ACS Sustainable Chem.
Eng. 2015, 3, 2414–2422.
(48) Barman, B.K.; Nanda, K.K. Uninterrupted Galvanic Reaction for Scalable and
Rapid Synthesis of Metallic and Bimetallic Sponges/Dendrites as Efficient Catalysts for
4-Nitrophenol Reduction. Dalton Trans. 2015, 44, 4215–4222.
(49) Huang, C.; Ye, W.; Liu, Q.; Qiu, X. Dispersed Cu2O Octahedrons on h-BN
Nanosheets for p-Nitrophenol Reduction. ACS Appl. Mater. Interfaces 2014, 6, 14469–
14476.
(50) Zuo, W.; Yu, G.; Dong, Z. A MOF-Derived Nickel Based N-Doped Mesoporous
Carbon Catalyst with High Catalytic Activity for the Reduction of Nitroarenes. RSC
Adv. 2016, 6, 11749–11753.

ARTÍCULO VI
339
(51) Kong, X.; Sun, Z.; Chen, M.; Chen, C.; Chen, Q. Metal-Free Catalytic Reduction
of 4-Nitrophenol to 4-Aminophenol by N-Doped Graphene. Energy Environ. Sci. 2013,
6, 3260–3266.
(52) Kong, X.; Chen, Q.; Lun, Z. Probing the Influence of Different Oxygenated Groups
on Graphene Oxide's Catalytic Performance. J. Mater. Chem. A 2014, 2, 610–613.
(53) Hu, H.; Xin, J.H.; Hu, H.; Wang, X. Structural and Mechanistic Understanding of
an Active and Durable Graphene Carbocatalyst for Reduction of 4-Nitrophenol at Room
Temperature. Nano Res. 2015, 8, 3992–4006.
(54) Yang, Y.; Zhang, W.; Ma, X.; Zhao, H.; Zhang, X. Facile Construction of
Mesoporous N-Doped Carbons as Highly Efficient 4-Nitrophenol Reduction Catalysts.
ChemCatChem 2015, 7, 3454–3459.
(55) Huang, G.; Yang, L.; Ma, X.; Jiang, J.; Yu, S.-H.; Jiang, H.-L. Metal–Organic
Framework-Templated Porous Carbon for Highly Efficient Catalysis: The Critical Role
of Pyrrolic Nitrogen Species. Chem. Eur. J. 2016, 22, 3470–3477.
(56) Zhang, X.; Liu, D.; Yang, L.; Zhou, L.; You, T. Self-Assembled Three-
Dimensional Graphene-Based Materials for Dye Adsorption and Catalysis. J. Mater.
Chem. A 2015, 3, 10031–10037.
(57) Ghosh, S.K.; Mandal, M.; Kundu, S.; Nath, S.; Pal, T. Bimetallic Pt–Ni
Nanoparticles Can Catalyze Reduction of Aromatic Nitro Compounds by Sodium
Borohydride in Aqueous Solution. Appl. Catal. A 2004, 268, 61–66.
(58) Karaoġlu, E.; Özel, U.; Caner, C.; Baykal, A.; Summak, M.M.; Sözeri, H.
Synthesis and Characterization of NiFe2O4–Pd Magnetically Recyclable Catalyst for
Hydrogenation Reaction. Mater. Res. Bull. 2012, 47, 4316–4321.
(59) Kong, L.; Lu, X.; Jin, E.; Jiang, S.; Bian, X.; Zhang, W.; Wang, C. Constructing
Magnetic Polyaniline/Metal Hybrid Nanostructures Using Polyaniline/Fe3O4 Composite
Hollow Spheres as Supports. J. Solid State Chem. 2009, 182, 2081–2087.
(60) Yang, M.-Q.; Pan, X.; Zhang, N.; Xu, Y.-J. A Facile One-Step Way to Anchor
Noble Metal (Au, Ag, Pd) Nanoparticles on a Reduced Graphene Oxide Mat with
Catalytic Activity for Selective Reduction of Nitroaromatic Compounds.
CrystEngComm 2013, 15, 6819–6828.
ARTÍCULO VI
340
(61) Chiu, C.-Y.; Chung, P.-J.; Lao, K.-U.; Liao, C.-W.; Huang, M.H. Facet-Dependent
Catalytic Activity of Gold Nanocubes, Octahedra, and Rhombic Dodecahedra toward 4-
Nitroaniline Reduction. J. Phys. Chem. C 2012, 116, 23757–23763.
(62) Vadakkekara, R.; Chakraborty, M.; Parikh, P.A. Reduction of Aromatic Nitro
Compounds on Colloidal Hollow Silver Nanospheres. Colloids Surf. A 2012, 399, 11–
17.
(63) Mondal, B.; Som, A.; Chakraborty, I.; Baksi, A.; Sarkar, D.; Pradeep, T. Unusual
Reactivity of MoS2 Nanosheets. Nanoscale 2016, 8, 10282–10290.
(64) Liu, T.; Wang, C.; Gu, X.; Gong, H.; Cheng, L.; Shi, X.; Feng, L.; Sun, B.; Liu, Z.
Drug Delivery with PEGylated MoS2 Nano-sheets for Combined Photothermal and
Chemotherapy of Cancer. Adv. Mater. 2014, 26, 3433–3440.
(65) Wang, Z.; Zhu, W.; Qiu, Y.; Yi, X.; von dem Bussche, A.; Kane, A.; Gao, H.;
Koski, K.; Hurt, R. Biological and Environmental Interactions of Emerging Two-
Dimensional Nanomaterials. Chem. Soc. Rev. 2016, 45, 1750–1780.
(66) Wang, X.; Mansukhani, N.D.; Guiney, L.M.; Ji, Z.; Chang, C.H.; Wang, M.; Liao,
Y.-P.; Song, T.-B.; Sun, B.; Li, R.; Xia, T.; Hersam, M.C.; Nel, A.E. Differences in the
Toxicological Potential of 2D versus Aggregated Molybdenum Disulfide in the Lung.
Small 2015, 11, 5079–5087.
(67) Wojtoniszak, M.; Chen, X.; Kalenczuk, R.J.; Wajda, A.; Łapczuk, J.; Kurzewski,
M.; Drozdzik, M.; Chu, P.K.; Borowiak-Palen, E. Synthesis, Dispersion, and
Cytocompatibility of Graphene Oxide and Reduced Graphene Oxide. Colloid Surf. B
2012, 89, 79–85.
(68) Sayes, C.M.; Liang, F.; Hudson, J.L.; Mendez, J.; Guo, W.; Beach, J.M.; Moore,
V.C.; Doyle, C.D.; West, J.L.; Billups, W.E.; Ausman, K.D.; Colvin, V.L.
Functionalization Density Dependence of Single-Walled Carbon Nanotubes
Cytotoxicity In Vitro. Toxicol. Lett. 2006, 161, 135–142.
(69) Joensen, P.; Frindt, R.F.; Morrison, S.R. Single-Layer MoS2. Mater. Res. Bull.
1986, 21, 457–461.
(70) Vistica, D.T.; Skehan, P.; Scudiero, D.; Monks, A.; Pittman, A.; Boyd, M.R.
Tetrazolium-based Assays for Cellular Viability: A Critical Examination of Selected
Parameters Affecting Formazan Production. Cancer Res. 1991, 51, 2515–2520.

ARTÍCULO VI
341
Supporting Information
for
Impact of Covalent Functionalization on the Aqueous Processability, Catalytic Activity
and Biocompatibility of Chemically Exfoliated MoS2 Nanosheets
Juan I. Paredes,a Jose M. Munuera,
a Silvia Villar–Rodil,
a,* Laura Guardia,
a Miguel Ayán–
Varela,a Ana Pagán,
b Salvador Aznar-Cervantes,
b Jose L. Cenis,
b Amelia Martínez–Alonso,
a
Juan M.D. Tascóna
aInstituto Nacional del Carbón, INCAR-CSIC, Apartado 73, 33080 Oviedo, Spain
bInstituto Murciano de Investigación y Desarrollo Agrario y Alimentario (IMIDA), Calle
Mayor 1, 30150 La Alberca, Spain
*Corresponding author: E-mail address: [email protected] (S. Villar-Rodil)

ARTÍCULO VI
342
Contents
S1. Evidence for the limited colloidal stability of as–prepared aqueous dispersions of ce-MoS2
S2. Survey XPS spectra of ce–MoS2 treated with iodomethanesulfonic and iodoacetic acid

ARTÍCULO VI
343
S1. Evidence for the limited colloidal stability of as–prepared aqueous dispersions of ce-
MoS2
Figure S1. Digital photographs of an aqueous dispersion of ce-MoS2 at a concentration of ~0.8 mg
mL-1
just prepared (left) and 3 weeks after its preparation (right).
S2. Survey XPS spectra of ce–MoS2 treated with iodomethanesulfonic and iodoacetic
acid
Figure S2. XPS survey spectra of ce–MoS2 treated with (a) iodomethanesulfonic acid and with (b)
iodoacetic acid.
I 3d3/2
Inte
nsity (
a. u.)
aI 3d
5/2
1000 800 600 400 200 0
b
Binding energy (eV)

ARTÍCULO VI
344
5. RESÚMENES Y ARTÍCULOS
345
5.3 Síntesis y aplicaciones de óxido de cobalto
Artículo VII
A direct route to activated two-dimensional cobalt oxide nanosheets for electrochemical
energy storage, catalytic and environmental applications, Munuera, J. M.; Paredes, J. I.;
Villar-Rodil, S.; García-Dalí, S.; Castro-Muñiz, A.; Martínez-Alonso, A.; Tascón J. M.
D., Journal of Colloid and Interface Science 2019, 539, 263–276.
Dentro del campo de los materiales bidimensionales, una de las familias que está
despertando interés de la comunidad científica es la de los materiales bidimensionales
no laminares, como pueden ser los óxidos TiO2, SnO2, -Fe2O3 y Co3O4, entre otros.
Éstos, a diferencia de los materiales bidimensionales laminares, no possen una
estructura laminar en su forma bulk tridimensional, sino que poseen una estructura
cristalina con enlaces fuertes en las tres direcciones espaciales. Para obtener láminas
delgadas de estos materiales, generalmente se utilizan metodologías ascendentes
(bottom-up), en las que se utilizan precursores moleculares que se ensamblan por la
acción de surfactantes en fase líquida. Estos materiales bidimensionales no laminares
han despertado interés porque, al igual que otros materiales bidimensionales, su
morfología laminar implica un aumento de su superficie específica y su reactividad, y
abre la posibilidad de utilizarlos en aplicaciones relacionadas con el almacenamiento y
conversión de energía y la catálisis. Entre ellos, el Co3O4, por su bajo coste, baja
toxicidad y alta estabilidad, ha despertado interés como catalizador de la reacción de
evolución de oxígeno, y como electrodo de supercondensadores y de baterías de litio.
Los métodos convencionales para la preparación de óxidos de cobalto bidimensionales
ricos en centros de Co(II) activos consisten habitualmente en la obtención de Co3O4
mediante calcinación a alta temperatura de precursores, para posteriormente activar el
material mediante un proceso de reducción. Estos procesos son típicamente ineficientes,
por lo que es conveniente desarrollar métodos de preparación más directos de los
materiales activados, en los que no sea necesario una etapa de reducción.
En el artículo VII se detalla un método de preparación de láminas de óxido de
cobalto activado y sus aplicaciones como electrodos para almacenamiento de carga
eléctrica, como catalizador de la reducción de nitroarenos y como adsorbente de
colorantes en agua.
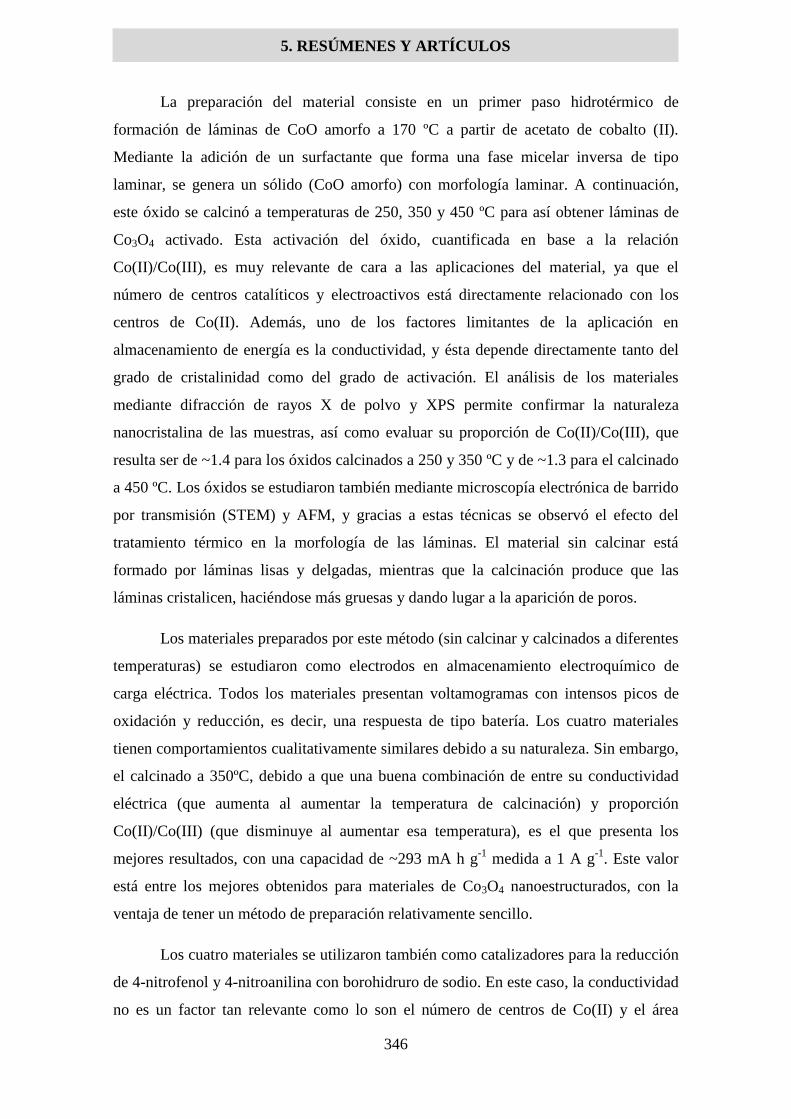
5. RESÚMENES Y ARTÍCULOS
346
La preparación del material consiste en un primer paso hidrotérmico de
formación de láminas de CoO amorfo a 170 ºC a partir de acetato de cobalto (II).
Mediante la adición de un surfactante que forma una fase micelar inversa de tipo
laminar, se genera un sólido (CoO amorfo) con morfología laminar. A continuación,
este óxido se calcinó a temperaturas de 250, 350 y 450 ºC para así obtener láminas de
Co3O4 activado. Esta activación del óxido, cuantificada en base a la relación
Co(II)/Co(III), es muy relevante de cara a las aplicaciones del material, ya que el
número de centros catalíticos y electroactivos está directamente relacionado con los
centros de Co(II). Además, uno de los factores limitantes de la aplicación en
almacenamiento de energía es la conductividad, y ésta depende directamente tanto del
grado de cristalinidad como del grado de activación. El análisis de los materiales
mediante difracción de rayos X de polvo y XPS permite confirmar la naturaleza
nanocristalina de las muestras, así como evaluar su proporción de Co(II)/Co(III), que
resulta ser de ~1.4 para los óxidos calcinados a 250 y 350 ºC y de ~1.3 para el calcinado
a 450 ºC. Los óxidos se estudiaron también mediante microscopía electrónica de barrido
por transmisión (STEM) y AFM, y gracias a estas técnicas se observó el efecto del
tratamiento térmico en la morfología de las láminas. El material sin calcinar está
formado por láminas lisas y delgadas, mientras que la calcinación produce que las
láminas cristalicen, haciéndose más gruesas y dando lugar a la aparición de poros.
Los materiales preparados por este método (sin calcinar y calcinados a diferentes
temperaturas) se estudiaron como electrodos en almacenamiento electroquímico de
carga eléctrica. Todos los materiales presentan voltamogramas con intensos picos de
oxidación y reducción, es decir, una respuesta de tipo batería. Los cuatro materiales
tienen comportamientos cualitativamente similares debido a su naturaleza. Sin embargo,
el calcinado a 350ºC, debido a que una buena combinación de entre su conductividad
eléctrica (que aumenta al aumentar la temperatura de calcinación) y proporción
Co(II)/Co(III) (que disminuye al aumentar esa temperatura), es el que presenta los
mejores resultados, con una capacidad de ~293 mA h g-1
medida a 1 A g-1
. Este valor
está entre los mejores obtenidos para materiales de Co3O4 nanoestructurados, con la
ventaja de tener un método de preparación relativamente sencillo.
Los cuatro materiales se utilizaron también como catalizadores para la reducción
de 4-nitrofenol y 4-nitroanilina con borohidruro de sodio. En este caso, la conductividad
no es un factor tan relevante como lo son el número de centros de Co(II) y el área
5. RESÚMENES Y ARTÍCULOS
347
superficial de las láminas. Los mejores resultados los presentan las láminas sin calcinar
y calcinadas a 250ºC, con valores de actividad catalítica comparables y en la mayoría de
casos superiores a los de materiales derivados de óxidos de cobalto, otros óxidos
metálicos y nanopartículas metálicas que no estén basados en metales nobles.
Debido a su morfología laminar y la facilidad de procesado, los materiales se
utilizaron también como adsorbentes de colorantes (naranja de metilo y azul de
metileno), para así estudiar su potencial aplicación en el tratamiento de aguas residuales.
Los materiales calcinados muestran capacidades de adsorción del orden de pocos
cientos de mg g-1
, superiores a las documentadas en la literatura. No obstante, el óxido
sin calcinar demostró ser un excelente adsorbente de ambos colorantes, con capacidades
de más de 900 mg g-1
, muy superior a cualquier otro óxido metálico documentado hasta
la fecha. Esta diferencia parece deberse a la morfología de los materiales antes y
después de la calcinación, ya que el óxido sin calcinar está formado por láminas
delgadas de material amorfo, mientras que la calcinación provoca una cristalización que
engrosa sensiblemente las láminas y reduce proporcionalmente su superficie.

5. RESÚMENES Y ARTÍCULOS
348

ARTÍCULO VII
349
A direct route to activated two-dimensional cobalt oxide nanosheets for
electrochemical energy storage, catalytic and environmental applications
J.M. Munuera,* J.I. Paredes,* S. Villar-Rodil, S. García-Dalí, A. Castro-Muñiz, A.
Martínez-Alonso, J.M.D. Tascón
Instituto Nacional del Carbón, INCAR-CSIC, C/Francisco Pintado Fe 26, 33011
Oviedo, Spain
* Corresponding author: [email protected]
* Corresponding author: [email protected]

ARTÍCULO VII
350
Abstract
Two-dimensional Co3O4 nanosheets have emerged as attractive materials for use in
a number of relevant technological applications. To exhibit a competitive performance
in such uses, however, their structure needs to be activated, which is frequently
accomplished via post-synthesis reduction strategies that introduce oxygen vacancies
and increase the number of active Co(II) sites. Here, we investigate a direct route for the
synthesis of activated Co3O4 nanosheets that avoids reduction post-treatments, yielding
materials with a high potential towards energy- and environment-related applications.
The synthesis relied on an interim amorphous cobalt oxide material with nanosheet
morphology, which upon calcination afforded Co3O4 nanosheets having Co(II) sites in
quantities similar to those usually found for Co3O4 nanostructures activated by
reduction post-treatments. When tested as electrodes for charge, the nanosheets
demonstrated a competitive behavior in terms of both capacity and rate capability, e.g.,
a gravimetric capacity of ~293 mAh g-1
at 1 A g-1
with 57% retention at 60 A g-1
was
measured for nanosheets calcined at 350 ºC. The materials were shown to be efficient
catalysts for the reduction of nitroarenes (4-nitrophenol and 4-nitroaniline),
outperforming other Co3O4 nanostructures, as well as effective adsorbents for the
removal of organic dyes (methyl orange, methylene blue) from water.
Keywords: two-dimensional (2D) material, non–layered material, cobalt oxide,
electrochemical charge storage, catalysis, dye adsorption.

ARTÍCULO VII
351
1. Introduction
Spurred by the impressive advances in both fundamental and applied research on
graphene and other two-dimensional (2D) materials of a layered nature (e.g., transition
metal dichalcogenides such as MoS2 and WS2, hexagonal boron nitride, phosphorene or
MXenes), the field of 2D materials has been continually evolving and maturing during
the past decade.1-5
In this regard, one of the most significant trends of the last few years
has been arguably the surge of activity in a vast, relatively unexplored subset of
materials from this family, namely the subset of non-layered 2D materials.6–8
The latter
can be defined as materials with a 2D morphology (nanosheets, atomically thin films,
etc) the bulk, 3D counterparts of which do not possess a lamellar structure of weakly
interacting (e.g., van der Waals type) atomic layers, but exhibit strong chemical bonds
in the three spatial directions instead. Thus, in addition to boasting the general
attractions of 2D materials, such as increased surface areas for interaction with the
environment or distinct electronic properties derived from electron confinement, non-
layered 2D materials (unlike layered ones) tend to possess sizable amounts of low-
coordinated surface atoms, which makes them intrinsically more reactive and hence
potentially useful in applications that rely on, e.g., redox reactions relevant in the areas
of catalysis and energy conversion/storage.8,9
The range of non-layered 2D materials
currently under scientific scrutiny mainly includes transition and post-transition metal
oxides (TiO2, SnO2, -Fe2O3, Co3O4, etc) and hydroxides, noble and non-noble metals
and their alloys (Au, Ag, Pd, Cu, etc), metal chalcogenides (e.g., Co3S4, CuS or CdSe),
as well as perovskites.6-8,10–12
Among non-layered metal oxides in 2D form, Co3O4 has received in recent years
significant attention with a view to practical applications, due to the low cost and
toxicity, earth abundance and high corrosion stability of this oxide.8,10,13
Furthermore,
thin (typically <10–20 nm) Co3O4 nanosheets exhibit large fractions of surface and
near-surface metal sites with different oxidation states and high activities towards a
number of redox and catalytic processes, making them an attractive material for use,
e.g., as electrocatalysts for the oxygen evolution reaction8,14–16
or as electrodes for
supercapacitors10,17–21
and Li-ion batteries.10,22–25
Nonetheless, as is usually the case
with many metal oxides, the performance of 2D Co3O4 nanosheets, and indeed of
virtually any nanostructured form of Co3O4, in these and other applications is
substantially limited by their poor electrical conductivity.26,27
To address this issue,
researchers have traditionally resorted to electrically conductive scaffolds of different
ARTÍCULO VII
352
types as supporting substrates of the metal oxides. Typical scaffolds include metal (Ni,
Cu, etc.) foams and wires/nanowires, as well as graphitic carbon materials (carbon
fibers, nanofibers and nanotubes, or graphene).10,16,17,19,25,28–31
However, more recent
efforts have targeted the intrinsic characteristics of the metal oxide, and thus have
sought to finely tune its atomic-scale structure as a means of activating it towards the
intended practical purpose, for instance through the introduction of defects or dopants,
which includes the synthesis of mixed metal oxides based on cobalt (i.e., MCo2O4).27,32–
34 Also of particular relevance within this kind of strategy is the activation of Co3O4
nanosheets and other nanostructures (as well as many other nanostructured metal
oxides) by post-synthesis reduction treatments that generate oxygen vacancies in the
lattice and convert a fraction of the original Co(III) sites to the more
(electro)catalytically active Co(II).16,20,26,35–39
As a testament of its practical benefits,
such an activation has led to Co3O4 nanosheets with much improved performance when
used as, e.g., supercapacitor electrodes20
or electrocatalysts for the oxygen evolution
reaction.16,39
Although highly effective in enhancing the performance of 2D Co3O4 nanosheets,
the aforementioned post-treatments are probably not the ideal option for activating this
material with a view to its large-scale manufacturing and practical implementation, as
they involve additional processing steps that require high temperatures and/or reducing
agents. Furthermore, from an atom-economy perspective, a synthesis strategy whereby a
large number of active Co(II) sites are originally present in the Co3O4 material is more
attractive than one by which a full-fledged Co3O4 lattice is first generated only to
remove a fraction of its oxygen atoms in a subsequent reduction step to increase the
amount of Co(II). In this regard, we hypothesized that activated, i.e. Co(II)-rich, Co3O4
nanosheets could be directly accessed via appropriate synthesis routes without the need
to resort to any kind of reduction post-treatment. Such a hypothesis was founded on the
idea that in the bottom-up production of metal oxides from atomic/molecular
precursors, the actual characteristics of the final (as well as intermediate) products
should be determined to a significant extent by a number of synthesis parameters, such
as the nature and amount of the precursors and solvents, the use of certain additives
(e.g., surfactants), or the temperature and pH of the reaction medium.40
Following this line of exploration, we report here that activated 2D Co3O4
nanosheets with a remarkable performance towards several applications can be readily
synthesized through a suitable procedure that obviates the need for any activation

ARTÍCULO VII
353
(reduction) post-treatment. The reported strategy is based on a general procedure
recently developed by Sun et al.41
and relies on the use of an interim material with
nanosheet morphology that can be viewed as an amorphous cobalt oxide having an
almost complete dominance of Co(II) sites. Subsequent calcination of this material at
properly chosen temperatures afforded nanocrystalline Co3O4 nanosheets that retained a
high fraction of Co(II) sites. When tested as electrodes for electrochemical charge
storage, the activated nanosheets outperformed many other activated and non-activated
Co3O4 nanomaterials that have been previously studied for such a purpose, and they
also exhibited a competitive performance as non-noble metal-based catalysts for the
reduction of nitroarenes and as adsorbents for organic pollutants (dyes) from the
aqueous phase. Such results demonstrate the potential advantages of these activated
Co3O4 nanosheets application-wise.
2. Results and discussion
2.1. Rationale of the proposed route and characteristics of the starting solvothermal
nanosheets
Fig. 1 shows a schematic representation of the rationale behind the proposed
strategy for directly accessing activated Co3O4 nanosheets, avoiding the need for
activation (reduction) post-treatments. The bottom-up synthesis of 2D Co3O4
nanosheets, as well as of Co3O4 in other nanostructured forms (e.g., 0D nanoparticles or
1D nanorods) generally relies on a solvothermal step carried out at a moderately low
temperature (usually < 150 ºC), whereby a molecular or ionic cobalt precursor species is
converted under basic conditions to - or -phase cobalt hydroxide (path A in Fig. 1).40
The latter is then transformed to cobalt oxide through calcination at typical temperatures
in the 250–500 ºC range. This process normally affords Co3O4 materials with a limited
concentration of active sites, i.e., Co(II) centers that are frequently associated to oxygen
vacancies in the lattice, so that a subsequent reduction post-treatment is required to
attain a substantial amount of such active sites.16,20,35,36,42,43
Typical reduction strategies
include high temperature annealing in a hydrogen-containing atmosphere or the use of
proper reducing agents, such as NaBH4, in the liquid phase. On the other hand, it has
been suggested that cobalt oxide already starts to form at temperatures around 150 ºC or
even lower, although this depends on the specific synthesis conditions.44–47
For
example, the presence of a small amount of water in the solvothermal medium has been
shown to trigger the structural evolution from the hydroxide to the oxide phase at

ARTÍCULO VII
354
moderate temperatures.48
Therefore, we surmised that conducting the solvothermal step
under appropriate conditions (e.g., temperature slightly above 150 ºC in the presence of
a small amount of water) could allow the cobalt precursors to react and develop past the
hydroxide stage into an incipient cobalt oxide material (path B in Fig. 1).48,49
Due to the
relatively low temperature of the solvothermal step, such an oxide (before calcination)
should possess a highly disordered or even amorphous structure, and thus should exhibit
a large concentration of active (defect) sites. Upon calcination, the solvothermal oxide
should evolve towards (nano)crystalline Co3O4. However, owing to its expected higher
stability relative to the hydroxide phase, the structural evolution of this oxide (and in
particular, the healing of its defect sites) could be somewhat limited, especially at
moderate calcination temperatures. As a result, the final Co3O4 material would retain a
large number of the defect sites originally present in the solvothermal oxide and hence
would be directly obtained in an activated state, hence circumventing the need for any
activation post-treatments.
Figure 1. Schematic chart depicting two different strategies to access activated Co3O4
nanosheets, namely, through a post-synthesis reduction treatment (path A) or via a direct route
that avoids reduction post-treatments (path B).
Building on this idea, we synthesized 2D Co3O4 nanosheets using a solvothermal
route at a relatively high temperature (170 ºC) that yielded an interim cobalt oxide,
which was then calcined at different temperatures (250, 350 and 450 ºC) to give a range

ARTÍCULO VII
355
of final Co3O4 materials having a substantial degree of activation. The solvothermal step
was based on a general procedure recently developed by Sun et al.41
and was carried out
in a mixed ethanol/water solvent with cobalt (II) acetate tetrahydrate as the precursor
and hexamethylenetetramine as a base, in the presence of the polymeric surfactant
Pluronic P123 as well as ethylene glycol as a co-surfactant (see Experimental section
for details). It was reported that with the assistance of ethylene glycol, the Pluronic
P123 surfactant forms an inverse micellar phase of a lamellar structure, which confines
the oligomerization and assembly of the cobalt precursor in a 2D space and thus
promotes the formation of a product with nanosheet morphology.41,50
In the work by
Sun et al.41
the synthesis of Co3O4 nanosheets is reported amidst several examples in the
more general framework of transition metal oxide. As long as cobalt oxide is concerned,
the focus is on the characteristics of the final, calcined product at a particular
temperature (400° C), no information being provided on the characteristics of the non-
calcined solvothermal product or the calcined products obtained in intermediate stages
of the process. Such an information is reported here in detail. As illustrated in Fig. 2a,
the solvothermal method developed by Sun et al.41
yielded a pale green powdery solid
(left) that could be readily dispersed in water by means of a mild sonication step (right).
Field emission scanning electron microscopy (FE-SEM) indicated that the as-prepared
solid was a collection of large (up to several hundreds of micrometers) and relatively
thin (~5–10 m) plates (Fig. 2b). Closer inspection of their edges revealed that the
plates were of a highly stratified nature (Fig. 2c), this being consistent with the
formation of the solid within the confinement of a lamellar micellar phase. Individual
nanosheets could be readily detached from the plates in large numbers through mild
sonication, the 2D character of which was made apparent by imaging them with
scanning transmission electron microscopy (STEM). Nanosheets that were highly
transparent to the electron beam and exhibited many wrinkles and folds could be
noticed (Fig. 2d). Apart from these morphological features, these nanosheets did not
display any internal structure and appeared essentially featureless in the images, with
their typical lateral sizes ranging between several hundreds of nanometers and a few
micrometers. Furthermore, atomic force microscopy (AFM) indicated that their
thickness was typically ~3–5 nm (Fig. 2e).

ARTÍCULO VII
356
Figure 2. (a) Digital photograph of the as-prepared solvothermal product (left) and the same
product after being dispersed in water by mild sonication (right). (b,c) FE-SEM images of the
as-prepared solvothermal solid highlighting its stratified nature. (d,e) STEM (d) and AFM (e)
images of individual nanosheets detached from the solvothermal solid. In (e), a line profile
taken along the marked white line is shown in black color superimposed on the AFM image.
The solvothermally obtained pale green nanosheets could not be assigned to a
cobalt hydroxide phase. - and -phase cobalt hydroxides, which are generally
associated to dark green (or deep blue) and pink solids (see Fig. S1 in the Supporting
Information), respectively. In fact, their color was that characteristic of cobalt oxide
with the metal in the divalent state (CoO).51
Of course, these colored substances can be
distiguished on the basis of their optical absorption spectra. Specifically, -Co(OH)2
displays a strong doublet band in the 600–700 nm wavelength range, arising from
Co(II) in tetrahedral coordination with hydroxide anions, together with an additional,
relatively weak band in the 450–550 nm region [Co(II) in octahedral coordination],
whereas only the latter is present in -Co(OH)2.52–55
Such bands were completely absent
from the UV-vis absorption spectrum of the solvothermal product (Fig. 3a), which was
characterized by a sharp peak at around 200 nm along with a relatively broad shoulder
in the 300–450 nm region. Indeed, these features were very similar to those previously
reported by other authors for several cobalt oxide nanostructures (including
nanosheets),56,57
suggesting that the present solvothermal solid was also a cobalt oxide
400 μm
1 μm 1 μm
b
c d e
a
3 nm
200 nm

ARTÍCULO VII
357
predominantly in an oxidation state of +2. It must be noted that although -Co(OH)2 has
been included in this discussion for completeness, it is not strictly Co(OH)2 as it
contains layers of anions other than hydroxide (such as nitrate, carbonate, chloride…)
[58]. Consequently, during the synthesis of our materials, in the absence of such anions,
such substance could not possibly have formed.
Figure 3. Spectroscopic characterization of the as-prepared solvothermal nanosheets: (a) UV-
vis absorption spectrum of the nanosheets dispersed in water, (b) Raman spectrum, and (c,d)
high resolution XPS Co 2p3/2 (c) and O 1s (d) core-level spectra.
The X-ray diffraction (XRD) pattern of the solvothermal material (not shown) was
completely featureless, pointing to a poorly crystalline or even amorphous structure. On
the other hand, its Raman spectrum (Fig. 3b) was dominated by an intense peak located
at ~515 cm-1
, a relatively weak peak at around 450 cm-1
and two broad bands at ~690
and 1060 cm-1
. Collectively, these Raman features could not be unequivocally assigned
to any crystalline, pristine cobalt oxide (CoO, Co3O4) or hydroxide phase,59-62
or even to
amorphous cobalt hydroxide.63
Still, they were consistent with the presence of a highly
defective oxide in which cobalt was mostly found in an oxidation state of +2. More
specifically, it is known that the Raman spectrum of single-crystal, defect-free CoO
only incorporates a broad and relatively weak band located at ~1060 cm-1
, which is
ascribed to a second-order, two-phonon scattering process, while first-order processes
are forbidden due to symmetry considerations.61
In the presence of structural disorder in
the CoO lattice, however, a number of first-order bands may appear in the 450–700 cm-1
region of the spectrum, in particular bands at ~510–540 and 450–480 cm-1
,61,64,65
this
534 532 530 528792 788 784 780 776
250 500 7500
1
2
250 500 750 1000 In
tensity (
a.
u.)
Binding energy (eV)
dc
Inte
nsity (
a.
u.)
Binding energy (eV)
a
Absorb
ance
Wavelength (nm)
b
Inte
nsity (
a.
u.)
Raman shift (cm-1)

ARTÍCULO VII
358
being similar to what was obtained with the solvothermal solid investigated here (Fig.
3b). We note that a sharp peak located around 670–690 cm-1
has also been frequently
reported in the literature for CoO materials, but such a peak has been recently ascribed
to Co3O4 generated by the partial oxidation of CoO due to laser-induced heating during
the Raman measurement.61
In our case, the solvothermal nanosheets exhibited a broad,
weak band at ~690 cm-1
, suggesting that Co(III) was only present to a minimal extent in
the solid. This result was consistent with the fact that the solvothermal synthesis was
carried out at a moderate temperature (< 200 ºC) in a closed autoclave (i.e., with a
limited supply of oxygen), so that conversion of the Co(II) precursor species to higher
oxidation states should be difficult to come about.
X-ray photoelectron spectroscopy (XPS) provided further support to the
aforementioned conclusion. The survey spectrum of the solvothermally derived
nanosheets (see Fig. S2a in the Electronic Supplementary Material) revealed the
presence of only cobalt, oxygen and carbon. The latter was mainly ascribed to the well-
known hydrocarbon contamination of surfaces (adventitious carbon) that so pervasively
comes to light in XPS in the form of a C 1s band located at a binding energy of ~285 eV
(Fig. S2b).66
The high resolution Co 2p and O 1s core-level spectra of the sample are
presented in Fig. 3c and d, respectively. We note that the Co 2p band is indeed a
doublet, corresponding to Co 2p1/2 and Co 2p3/2 levels. However, both components
contain the same information, so only the Co 2p3/2 region is shown in Fig. 3c for
simplicity. The Co 2p3/2 band comprised a main peak located at a binding energy of
~780 eV, which in principle contains contributions from cobalt species in different
oxidation states [including Co(III) at ~779.6 eV and Co(II) at ~780.9 eV], and a second,
less intense peak at around 786 eV, which has been identified as a satellite band arising
exclusively from Co(II) species67
(see Fig. S3 in the Supporting Information). Fitting of
the main peak with potential contributions from both Co(III) and Co(II) components led
to a negligible contribution from the former species, indicating that cobalt was mostly
(if not exclusively) present in an oxidation state of +2 in the solvothermal nanosheets.
The O 1s band exhibited a rather symmetrical shape, suggesting that all the oxygen
species in the material were essentially of the same type. Further, the position of this
band (~531 eV) was consistent with that expected for oxygen in defective locations of
cobalt oxides.68
Therefore, taken together, the characterization results described above
indicated that the solvothermal nanosheets synthesized by general procedure developed

ARTÍCULO VII
359
by Sun et al.41
were essentially a highly defective or even amorphous Co(II) oxide with
little, if any, contribution from Co(III) species.
2.2. Conversion of the solvothermal nanosheets to activated Co3O4 nanosheets
To convert the highly defective, solvothermal Co(II) oxide nanosheets to an
activated Co3O4 phase, i.e., to Co3O4 nanosheets that retain a substantial amount of
Co(II) sites, the former were subjected to calcination under static air conditions at
moderate temperatures (250, 350 and 450 ºC). In all cases, the pale green color of the
starting solid changed to a blackish tone upon calcination, consistent with the
emergence of the Co3O4 phase. Fig. 4 shows FE-SEM images of the products calcined
at 250 (a), 350 (b) and 450 ºC (c). Unlike their non-calcined counterpart (Fig. 2b), these
materials were made up of relatively loose clumps of randomly arranged, thin
nanosheets. Furthermore, a closer inspection of individual nanosheets by STEM [Fig.
4d and g (250 ºC), e and h (350 ºC), f and i (450 ºC)] revealed substantial differences
between the calcined and non-calcined samples. First, although the lateral size of the
individual nanosheets did not appear to change significantly upon calcination, the
calcined objects were much less transparent to the electron beam of the microscope and
appeared to exhibit less wrinkles and folds (Fig. 4d-f). These features were clearly
indicative of thicker and more rigid nanosheets. Indeed, AFM measurements (see inset
to Fig. 4e) revealed the thickness of the calcined nanosheets to range typically between
5 and 15 nm. Second, the calcined nanosheets possessed a distinct internal structure,
consisting of a more or less compact assembly of nanometric grains with scattered holes
in-between, the latter becoming somewhat larger but less abundant at higher calcination
temperatures (Fig. 4g-i). The grain size (generally ~8–15 nm, but tending to increase
slightly with calcination temperature) was similar to the thickness of the nanosheets
determined by AFM, suggesting that each individual nanosheet was made up of just one
monolayer of grains.

ARTÍCULO VII
360
Figure 4. FE-SEM (a-c) and STEM (d-i) images of the solvothermal nanosheets after
calcination at 250 (a,d,g) 350 (b,e,h) and 450 ºC (c,f,i).
We interpret the grainy structure of the calcined nanosheets to be a result of
localized crystallization events taking place in the starting, amorphous solvothermal
nanosheets during the heat treatment. In this process, Co3O4 nuclei would be initially
generated at many random locations throughout the nanosheet, with their surrounding
amorphous phase acting as the source material for the growth of these nuclei into
nanometer-sized grains. Owing to the isotropic, non-layered nature of the Co3O4 lattice,
the individual nanocrystals should be expected to grow at similar rates along the three
spatial directions, and in particular their growth along the direction perpendicular to the
nanosheet should not be confined to the very small thickness (~3–5 nm) of the starting
amorphous nanosheet. At the same time, however, this very small thickness should
200 nm
a b c
d e f
g h i
5 μm 5 μm 5 μm
1 μm 1 μm 1 μm
200 nm 200 nm
10 nm
250 nm

ARTÍCULO VII
361
prevent the formation of multiple grains along the direction perpendicular to the
nanosheet, because there would be a limited supply of source material along that
direction. In consequence, the amorphous solvothermal nanosheet would be converted
to a monolayer of interconnected Co3O4 nanocrystals, yielding nanosheets that could be
thicker than their corresponding solvothermal oxide precursors, as it was indeed the
case. The transformation of the amorphous solvothermal nanosheets into a thicker,
monolayered assembly of nanometer-sized grains should also lead to the appearance of
voids (holes) in the resulting nanosheets, which was observed in the STEM images as
well.
Direct evidence for the crystallization of the solvothermal nanosheets upon
calcination was obtained by XRD (Fig. 5a). Unlike the case of the starting nanosheets,
the XRD pattern of which was completely featureless, the diffractogram of the calcined
materials exhibited a peak located at ~36º (2), which could be assigned to the (311)
reflection of the Co3O4 lattice (standard XRD data for Co3O4 are shown in Fig.
S4).16,36,69,70
The intensity of the (311) reflection, which is generally the most intense
XRD peak observed in Co3O4 materials, rose with the calcination temperature, which
was ascribed to a corresponding increase of crystallinity. However, the fact that other,
rather intense peaks [e.g., (220) at ~31º, (511) at ~59º or (440) at ~66º] could not be
clearly made out from the background noise pointed to a relatively limited
crystallization of the solvothermal nanosheets upon calcination. Nonetheless, the
conversion of the latter to Co3O4 was corroborated by the emergence of the Raman
signature peaks of the spinel phase (Fig. 5b). More specifically, the Raman spectra of
the calcined nanosheets displayed five well–defined bands located at ~192, 470, 515,
610 and 672 cm-1
, which could be ascribed to three F2g, one Eg and one A1g vibrational
modes of Co3O4.59,65,69
It is worth noting that the position of these bands appeared
somewhat downshifted (a few to several cm-1
) relative to what is commonly found for
bulk and nanostructured Co3O4, a result that can be put down to the relatively poor
crystallinity of the present calcined nanosheets.20,70,71
The trend with calcination
temperature of such downshift was that expected from the above results on cristallinity,
i. e., the lower the calcination temperature, the larger the downshift. The UV-vis
absorption spectrum of all the calcined samples (Fig. 5c) was also in agreement with
that expected for Co3O4, which is mainly characterized by two broad bands centered at
about 470 and 770 nm.37,69
No clear trends with calcination temperature were found in
this case.

ARTÍCULO VII
362
To provide quantitative estimates of the degree of activation of these Co3O4
nanosheets, which is determined by the relative abundance of Co(II) sites, the XPS
technique was employed. Fig. 5d shows the high resolution Co 2p3/2 core-level spectra
for the samples calcined at the different temperatures. As could be anticipated, the
intensity of the Co(II)-associated satellite band relative to the main peak at ~786 eV
decreased significantly after calcination (compare with the spectrum of the non-calcined
material in Fig. 3c), strongly suggesting that Co(II) was no longer the only cobalt
species present in the nanosheets. In point of fact, as can be seen from Fig. 5d, the main
peak could be fitted with a combination of Co(II) and Co(III) components. In the fitted
spectra, the full width at half maximum of the former component was substantially
larger than that of its Co(III) counterpart (2.7 vs 1.7 eV), a result whose physical origin
is grounded on the fact that Co(II) is an unresolved spin-triplet system, whereas Co(III)
is a spin-singlet.68
The Co(II)/Co(III) molar ratio of the samples, which is taken as a
quantitative proxy of the degree of activation of Co3O4, was evaluated on the basis of
the area of the corresponding cobalt components in the spectra, yielding values of ~1.4
for the nanosheets calcined at 250 and 350 ºC and ~1.3 for those calcined at 450 ºC, the
degree of activation shows a slightly diminishing trend with calcination temperature.
For ideal, stoichiometric Co3O4, a Co(II)/Co(III) ratio of 0.5 is expected. Nevertheless,
the actual ratios determined in real Co3O4 materials synthesized using calcination
temperatures below 500 ºC tend to be higher, with typical values lying in the 0.6–1.0
range.16,20,42,71–73
On the other hand, activation of these materials through reduction
post-treatments has been shown to further increase the Co(II)/Co(III) ratio to the 1.2–
1.7 range.16,20,42
Such results indicate that the Co3O4 nanosheets investigated here
boasted a substantial degree of activation, even though no reduction post-treatment was
applied to them, and therefore demonstrate a direct, simplified route to access this type
of active material.
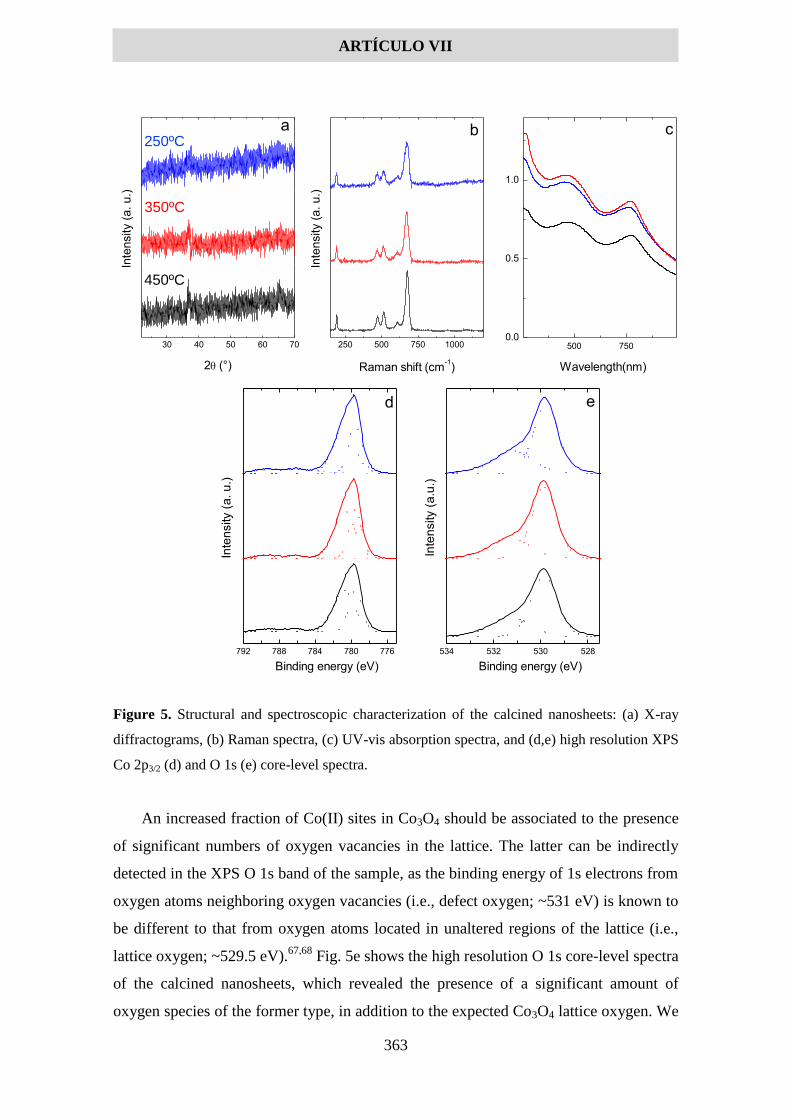
ARTÍCULO VII
363
Figure 5. Structural and spectroscopic characterization of the calcined nanosheets: (a) X-ray
diffractograms, (b) Raman spectra, (c) UV-vis absorption spectra, and (d,e) high resolution XPS
Co 2p3/2 (d) and O 1s (e) core-level spectra.
An increased fraction of Co(II) sites in Co3O4 should be associated to the presence
of significant numbers of oxygen vacancies in the lattice. The latter can be indirectly
detected in the XPS O 1s band of the sample, as the binding energy of 1s electrons from
oxygen atoms neighboring oxygen vacancies (i.e., defect oxygen; ~531 eV) is known to
be different to that from oxygen atoms located in unaltered regions of the lattice (i.e.,
lattice oxygen; ~529.5 eV).67,68
Fig. 5e shows the high resolution O 1s core-level spectra
of the calcined nanosheets, which revealed the presence of a significant amount of
oxygen species of the former type, in addition to the expected Co3O4 lattice oxygen. We
534 532 530 528792 788 784 780 776
30 40 50 60 70 250 500 750 1000 500 7500.0
0.5
1.0
Binding energy (eV)
In
ten
sity (
a.u
.)
e
d
In
ten
sity (
a. u
.)
Binding energy (eV)
a
Inte
nsity (
a. u.)
2(°)
b
Inte
nsity (
a. u.)
Wavelength(nm)
Raman shift(cm-1)
c
250ºC
350ºC
450ºC

ARTÍCULO VII
364
note, however, that a direct correlation between the area of the component associated to
defect oxygen in the O 1s band and the concentration of oxygen vacancies in the
material cannot be possibly made. This is because the number of defect oxygen atoms
that contribute to such a component should most likely be determined not only by the
overall density of oxygen vacancies, but also by their specific spatial distribution (e.g.,
isolated vs clustered vacancies), which should be highly dependent on the history of the
material.
2.3. Applications of the activated Co3O4 nanosheets
It is known that having an increased fraction of Co(II) sites in nanostructured
Co3O4 materials can bring a number of advantages with a view to their use in practical
applications. For instance, Co(II) centers associated to oxygen vacancies increase the
electrical conductivity of Co3O4 through n-type doping of the lattice, which can be
highly beneficial when used as an electrode in electrochemical energy storage and
conversion devices,35,39,42
and they have been identified as the main active site towards
different (electro)catalytic reactions, such as the oxygen evolution reaction,74
the
electroreduction of CO270
or the reduction of nitroarenes.36
Furthermore, because extra
Co(II) sites are associated to a local increase in electron density,35
those sites present on
the Co3O4 surface should exhibit enhanced interaction with certain foreign chemical
species (e.g., molecules with electron-deficient groups), so that activated Co3O4 with
high surface area (nanoparticles, nanosheets, etc) could also be an attractive material in
adsorption processes. To explore the potential of the activated Co3O4 nanosheets
investigated here in these application areas, we have examined their performance
towards three specific uses, namely (1) as electrodes for electrochemical charge storage,
(2) as catalysts for the reduction of nitroarenes (4-nitrophenol and 4-nitroaniline), and
(3) as adsorbents of dyes (methyl orange and methylene blue) from the aqueous phase.
2.3.1 Electrochemical energy storage
The electrochemical charge storage experiments were carried out in a three-electrode
configuration using the cobalt oxide samples supported onto graphite foil as the
working electrode, a commercial activated carbon as the counter electrode and Hg/HgO
as the reference electrode, with aqueous 6 M KOH as the electrolytic medium (see
Experimental section for details).

ARTÍCULO VII
365
Fig. 6a shows typical cyclic voltammograms (CVs) recorded at a potential scan rate of
10 mV s-1
for the non-calcined nanosheets as well as their counterparts calcined at
different temperatures. The evolution of the CVs of the sample calcined at 350 ºC with
increasing scan rate between 3 and 500 mV s-1
is presented in Fig. 6b, whereas the
corresponding results for the other three samples are given in Fig. S6 of the Electronic
Supplementary Material. Similar to what has been reported in the literature for Co3O4
materials,75
the obtained CVs were dominated by intense oxidation and reduction peaks,
indicative of a charge storage mechanism that is mostly reliant on Faradaic redox
reactions occurring at the metal centers of the oxide. This type of behavior allowed us to
categorize the present materials as having a battery-type response rather than a
capacitor-type one,75–77
where charge storage is mostly based on ionic intercalation into
the electrode and not on the formation of an electrical double layer on its surface. Such
a conclusion was further substantiated by the observation that the magnitude of the
measured current for the oxidation peak located at 0.42–0.46 V vs Hg/HgO was directly
proportional to the square root of the potential scan rate (i.e., I ~ 1/2
, where I is the
oxidation peak current and is the scan rate), as can be seen in the inset to Fig. 6b. This
square root dependence implied that the electrode capacity was controlled by diffusion
of the electrolyte ions into the material, which in turn was consistent with a battery-type
behavior.76

ARTÍCULO VII
366
Figure 6. Electrochemical testing of the nanosheets in 6 M KOH electrolyte: (a) cyclic
voltammograms recorded at a potential scan rate of 10 mV s-1
for the non-calcined and calcined
nanosheets, (b) cyclic voltammograms recorded at different scan rates between 3 and 500 mV s-
1 for the nanosheets calcined at 350 ºC (inset: magnitude of the oxidation peak current vs square
root of the potential scan rate), (c) galvanostatic charge-discharge curves recorded at a current
density of 10 A g-1
for the non-calcined and calcined nanosheets, (d) galvanostatic charge-
discharge curves recorded at different current densities between 1 and 60 A g-1
for the
nanosheets calcined at 350 ºC, (e) gravimetric capacity of the non-calcined and calcined
nanosheets measured as a function of current density, and (f) electrochemical impedance spectra
of the non-calcined and calcined nanosheets (inset: detailed view of the high frequency region
of the spectra).
Representative galvanostatic charge-discharge curves, in the form of voltage vs
gravimetric capacity plots, recorded for the different cobalt oxide nanosheet samples at
a current density of 10 A g-1
are shown in Fig. 6c, while charge-discharge curves for the
sample calcined at 350 ºC measured at current densities between 1 and 60 A g-1
are
presented in Fig. 6d. Charge-discharge curves for the other three materials can be found
in Fig. S7 of the Electronic Supplementary Material. As expected for battery-type
electrodes, the galvanostatic curves were highly non-linear, exhibiting large regions of
slowly varying potential, i.e., plateaus. For example, the plateaus in the discharge
curves of Fig. 6d were located in the 0.3–0.4 V range (vs Hg/HgO), which was
consistent with the potential at which reduction of the cobalt centers took place as
deduced from the reduction peaks in the CVs of this sample (Fig. 6b). From the
0.0 0.2 0.4 0.6
-60
-40
-20
0
20
40
60
0.0 0.2 0.4 0.6
-600
-400
-200
0
200
400
600
0 5 10 15 20 250
25
50
75
100
0 50 100 150 200 250 3000.0
0.1
0.2
0.3
0.4
0.5
0 50 100 150 200 250 3000.0
0.1
0.2
0.3
0.4
0.5
0 10 20 30 40 50 600
50
100
150
200
250
300
0 25 50 75 100 125 150 175 2000
25
50
75
100
125
150
175
200
0 5 10 150
5
10
15
non–calcined
250 °C
350 °C
450 °C
bC
urr
en
t d
en
sity(A
/g)
E(V) vs Hg/HgO
a
3 mV/s
5 mV/s
10 mV/s 100 mV/s
30 mV/s 300 mV/s
50 mV/s 500 mV/s
Cu
rre
nt d
en
sity(A
/g)
E(V) vs Hg/HgO
Cu
rre
nt(
mA
)
(scan rate)1/2
(mV)1/2
non–calcined
250 °C
350 °C
450 °C
E(V
) vs H
g/H
gO
Gravimetric capacity (mAh/g)
c
1 A/g 5 A/g
2 A/g 10 A/g
3 A/g
15 A/g
20 A/g
30 A/g
40 A/g
50 A/g
60 A/g
E(V
) vs H
g/H
gO
Gravimetric capacity (mAh/g)
d non–calcined
250 °C
350 °C
450 °C
Gra
vim
etr
ic c
ap
acity (
mA
h/g
)
Current density (A/g)
e non-calcined
250 °C
350 °C
450 °C
-Z''(
)
Z' ()
f
-Z''(
)
Z' ()1
ARTÍCULO VII
367
discharge curves we determined the gravimetric capacity delivered by the materials, the
values of which are plotted in Fig. 6e as a function of current density. At low current
densities, all the samples (both calcined and non-calcined) were seen to deliver similar
capacities (e.g., between 265 and 295 mAh g-1
at 1 A g-1
). However, significant
differences emerged in terms of their rate capability, with the non-calcined nanosheets
displaying the poorest performance. More to the point, the capacity values for the latter
dropped markedly with increasing current density (particularly in the range up to 30 A
g-1
), yielding a capacity retention of only ~18% at the highest current density of 60 A g-
1. By contrast, the reductions in capacity for the calcined nanosheets were much more
moderate, with retention values of about 43, 57 and 49% at 60 A g-1
for the materials
calcined at 250, 350 and 450 ºC, respectively. Moreover, the coulombic efficiency of
the nanosheets, defined as the ratio between the charge delivered in a discharge cycle
and the charge stored during a charging cycle, was ~85–90% at a current density of 1 A
g-1
and approached 100% at 60 A g-1
. Furthermore, their stability as electrodes was
tested by recording consecutive galvanostatic charge/discharge cycles. After 3000
cycles, ~95% of the initial capacity of the electrodes was retained with the nanosheets
calcined at 350 °C and 450 °C, whereas the capacity retention was around 105% for the
material calcined at 250 °C and 115% for the non-calcined material (Fig. S8 in the
Electronic Supplementary Material). Such increases in capacity with cycling are not
unusual in electrochemical energy storage devices of metal oxides, and can be ascribed
to the conditioning of the materials upon the charge-discharge cycles, especially those
with a poorer crystalline structure (i.e., non calcined sample and samples calcined at
lower temperatures in our case) [20,21,71]
It is concluded from Fig. 6e that the nanosheets calcined at 350 ºC boasted the best
performance, as they demonstrated the highest capacities across the whole current
density range together with the best rate capability. Table S1 in the Electronic
Supplementary Material compares the gravimetric capacity values obtained from this
sample at several selected current densities with literature data documented for other
Co3O4 nanomaterials. Concerning the collection of these data, we note that although in a
strict sense the concept of capacitance is not applicable to electrodes with a battery-type
behavior,75,76
in many instances capacitance (rather than capacity) values are given for
electrodes based on Co3O4 materials tested in basic electrolytes, which fall into such a
category. However, in these cases capacity values can be readily derived from the
reported capacitance data if the potential window is provided, which is most frequently

ARTÍCULO VII
368
the norm. Overall, it is apparent from Table S1 that the present activated nanosheets
exhibited a rather competitive performance, not only in terms of the capacity values
themselves but also as regards their retention at high current densities. In particular,
they compared favorably with oxygen vacancy-rich Co3O4 nanosheets and reduced
mesoporous Co3O4 nanowires reported previously, the electrochemical performance of
which had been substantially boosted through activation by reduction post-treatment
with NaBH4. For example, the capacity of the nanosheets calcined at 350 ºC was 291
mA h g-1
at 2 A g-1
, compared with values of ~227 and 136 mA h g-1
for the oxygen
vacancy-rich nanosheets and the reduced mesoporous nanowires, respectively, and their
capacity retention was ~92% at 10 A g-1
(compared to ~50% for the reduced
mesoporous nanowires) and ~88% at 15 A g-1
(compared to ~80% for the oxygen
vacancy-rich nanosheets).20,35
These results demonstrate that the direct route proposed
here for the preparation of Co3O4 nanosheets can afford activated materials with
comparable or even better performance than that of similar Co3O4 nanomaterials that
were activated post-synthesis, which can be beneficial when considering their practical
use.
It is reasonable to assume that the different rate capabilities of the investigated
materials, as noticed in Fig. 6e, arise from their distinct abilities to allow the conduction
of electrons and the (de)intercalation of ions, which are the two basic processes
accounting for their charge storage behavior. For example, the highly disordered or even
amorphous nature of the non-calcined nanosheets could lead to a poorer rate capability
relative to that of their calcined counterparts, as the amorphous structure would be
expected to hamper electron conduction in the lattice. To investigate this question, the
electrodes were analyzed by the electrochemical impedance spectroscopy (EIS)
technique. Fig. 6f shows Nyquist plots derived from the EIS data recorded in the
frequency range between 100 kHz and 10 mHz for the different cobalt oxide nanosheet
samples, with the inset providing a closer view of the high frequency region of the plots.
The latter was characterized by a semicircle profile, the diameter of which [i.e., the
equivalent series resistance (ESR) parameter] provided a measure of the electronic
conduction in the materials. As anticipated, the ESR value for the non-calcined
nanosheets (7.8 ) was larger than those determined for the calcined nanosheets (5.3,
4.5 and 1.8 for the samples calcined at 250, 350 and 450 ºC, respectively), indicative
of a relatively impaired electronic conduction in the former material. Having similar
numbers of Co(II) sites, the difference in conductivity between the calcined nanosheets

ARTÍCULO VII
369
can be ascribed to differences in crystallinity due to the calcination process (the higher
the calcination temperature, the more structured the samples become and therefore the
higher the electrical conductivity). On the other hand, from the lower frequency region
of the Nyquist plots we notice that the non-calcined material boasted the most vertical
line of all the samples, suggesting a better efficiency towards ion insertion.37
This result
can be understood on the basis of the smaller thickness of the non-calcined nanosheets
(~3–5 nm) relative to that of their calcined counterparts (around 10 nm), which implies
the former to be more accessible to ion intercalation. Among the activated Co3O4
nanosheets, the sample prepared by calcination at 350 ºC exhibited the most vertical line
in the higher frequency range, followed by the sample calcined at 450 ºC. Therefore,
even though the 350 ºC sample possessed neither the highest electronic conductivity nor
the best ion diffusion ability, it probably struck a proper balance between these two key
characteristics (it was the second best sample for both), finally resulting in the material
with the best overall performance in terms of capacity and rate capability.
2.3.2 Catalytic reduction of nitroarenes
The cobalt oxide nanosheets were also evaluated as catalysts for the reduction of
the nitroarenes 4-nitrophenol (4-NP) and 4-nitroaniline (4-NA) to 4-aminophenol (4-
AP) and p-phenylenediamine (p-PDA), respectively, with NaBH4 as the reducing agent,
which are reactions of practical relevance in, e.g., the synthesis of certain analgesic
drugs (paracetamol) or dyes.78,79
Both reactions are thermodynamically feasible but
kinetically hindered by substantial activation barriers, thus requiring the use of proper
catalysts to make them proceed at significant rates. Although catalysts based on noble
metals (Au, Ag, Pt, Pd, etc) have been intensively investigated for this purpose, a recent
move towards more abundant and cost-effective alternatives, such as those relying on
non-noble metals (e.g., Ni or Cu), has been gaining momentum.79
In this context,
nanostructured Co3O4 has been proposed as a suitable non-noble metal-based catalyst
for nitroarene reduction, with its activity being mostly attributed to additional Co(II)
centers (usually associated to oxygen vacancies in the lattice).72,80
Having an abundance
of the latter, the present nanosheets (both calcined and non-calcined) could be
particularly efficient catalysts for such reactions. Their performance was tested by
following the evolution of the intensity of optical absorption peaks characteristic of the
nitroarenes (see Fig. S9 of the Electronic Supplementary Material).72,81
Specifically, in
the case of 4-NP we monitored the evolution of the peak located at ~400 nm, which is
associated to the deprotonated form of this molecule (i.e., the nitrophenoxide anion,

ARTÍCULO VII
370
generated in the basic medium of NaBH4) and is not present in its reduced counterpart
(aminophenoxide anion; Fig. S9a). For 4-NA, we followed its signature peak at ~380
nm, which is absent from p-PDA (Fig. S9b). As the intensity of these absorption peaks
reflects the concentration of their respective substrate molecules in the reaction medium,
it can be used to plot kinetic profiles of the reaction progress.
Representative examples of the kinetic curves recorded for the cobalt oxide
nanosheets are given in Fig. 7a (4-NP) and b (4-NA). The profiles were generally seen
to decay in an exponential fashion (after an induction period), hence suggesting the
reduction reactions to obey a pseudo-first-order kinetic behavior with respect to the
substrate concentration.81
As expected, no reaction was observed to occur in the absence
of the nanosheets, i.e., when the nanosheet dispersion added to the reaction medium was
replaced either by pure water or by the supernatant liquid obtained after sedimentation
of the dispersed nanosheets through centrifugation, thus confirming their role as the
catalytically active component. As shown in Fig. S9, the reaction products (4-AP and p-
PDA) were detected by UV-vis absorption spectroscopy. Indeed, calibration of their
concentration by this technique indicated an aproximatley one-to-one conversion of
reagent to the corresponding expected product. To quantify the catalytic activity of the
nanosheets, we determined the number of moles of substrate (4-NP or 4-NA) converted
per unit time per mole of cobalt present in the nanosheets, the results of which are
shown in Fig. 7c. In the calculations, we assumed CoO and Co3O4 as the approximate
stoichiometric formulas for the non-calcined and calcined samples, respectively. There
were not very large differences in activity between the different materials, although the
values for the non-calcined nanosheets tended to be somewhat higher than those of their
calcined counterparts. This result can be probably ascribed to (1) the smaller thickness
of the former, which implies that more surface active sites are potentially available for
reaction per unit mass of catalyst, and/or (2) the fact that Co(II) centers, which are
assumed to be the catalytically active sites, are relatively more abundant in the non-
calcined nanosheets [~100%, almost no Co(III) centers] than in the calcined samples
[~55-60% Co(II) and ~40–45% Co(III)]. Nonetheless, concerning the latter possibility
we note that the actual catalytic activity of the Co(II) centers in the amorphous lattice of
the non-calcined nanosheets could be distinct to that of their counterparts in the (more
nanocrystalline) calcined nanosheets, but this point is currently unknown. It could also
be argued that the in-situ treatment of the nanosheets with NaBH4 during the catalytic

ARTÍCULO VII
371
reaction of the nitroarenes could be activating the nanosheets themselves (particularly
the calcined ones). However, XPS measurements (data not shown) of nanosheets treated
with NaBH4 showed no significant change in their Co(II)/Co(III) ratios, so we conclude
that the materials do not become further activated during the catalytic reaction. The
reason for this could be that because the as-prepared nanosheets are already
substantially activated, the remaining Co(III) sites could be hard to reduce to Co(II) by a
chemical species with a relatively limited reducing ability. At any rate, the nanosheets
boasted a competitive performance when compared with previously reported cobalt
oxide nanomaterials as well as other materials made up of non-noble metals and/or their
oxides, as noticed from catalytic activity data on 4-NP shown in Table S2 of the
Electronic Supplementary Material (data on 4-NA with similar catalysts are much less
abundant). In most cases, the activity of the nanosheets was significantly higher than
that of other nanostructured cobalt oxide catalysts. In particular, it was similar or even
higher than that of Co3O4 nanoplates of comparable thickness that were activated
through a common reduction post-treatment.72
Also, it is worth noting that the materials
could be reused through centrifugation of the suspension and then redispersion of the
nanosheets in water. Again, these results bear testament to the efficiency of the present
strategy in accessing activated Co3O4 without any post-treatment but at the same time
exhibiting improved performance towards practical uses. The fact that the non-calcined
sample performed better in these experiments than their calcined counterparts (unlike
the case of the electrochemical tests) can be ascribed to the relevance of different
factors, such as the electrical conductivity or the Co(II) content, that play a role in their
behavior towards different uses, While a good electrical conductuvity is key to the
nanosheet performance in electrochemical applications, the same is not expected to be
the case for the catalytic reactions, where a large number of active Co(II) centers
should be the most relevant single factor that determines nanosheet performance. Under
such circumstances, the non-calcined nanosheets should possess the better catalytic
activity because they possessed the larger amount of Co(II) sites, as was indeed
observed.

ARTÍCULO VII
372
Figure 7. (a,b) Kinetic profiles recorded for the reduction of 4-NP (a) and 4-NA (b) with
NaBH4 using the non-calcined and calcined nanosheets catalysts. (c) Catalytic activities of the
non-calcined and calcined nanosheets towards 4-NP (black columns) and 4-NA reduction with
NaBH4 (green columns), determined as the number of moles of substrate (4-NP or 4-NA)
converted per unit time per mole of cobalt present in the nanosheets. (d) Measured adsorption
capacities of the non-calcined and calcined nanosheets towards methylene blue (blue columns)
and methyl orange (orange columns) from the aqueous phase.
2.3.3 Dye adsorption
Finally, owing to their small thickness and hence large surface area, the nanosheets
could also act as efficient adsorbents for, e.g., the decontamination of polluted water. To
explore such a possibility, we have preliminarily tested the aqueous-phase adsorption of
two dyes (methylene blue and methyl orange) onto the cobalt oxide materials. These are
charged molecules, which can therefore be favorably adsorbed on the polar surface of
the nanosheets through charge-dipole interactions. Fig. 7d shows the corresponding
adsorption capacities measured for both the non-calcined and the calcined samples. In
most cases, the adsorbed amounts were found to be substantial (~300–900 mg g-1
),
suggesting that these nanosheets could make good adsorbents for environmental
applications. However, as could have probably been expected, the best results were
obtained for the non-calcined nanosheets (adsorption capacities around 900 mg g-1
),
which could be ascribed to their smaller thickness relative to that of their calcined
0 500 1000 15000.0
0.2
0.4
0.6
0.8
1.0
0 100 200 3000.0
0.2
0.4
0.6
0.8
1.0
0
2
4
6
0
200
400
600
800
non–calcined
250 °C
350 °C
450 °C
bA
bso
rba
nce
at =
40
0 n
m
Time (s)
a non–calcined
250 °C
350 °C
450 °C
Ab
so
rba
nce
at =
38
0 n
m
Time (s)
4–NP
4–NA
TO
F (
h-1)
non–calcined 250 °C 350 °C 450 °C
c
methylene blue
methyl orange
Ad
so
rptio
n (
mg
/g)
non–calcined 250 °C 350 °C 450 °C
d

ARTÍCULO VII
373
counterparts. Like we noted for the catalysis tests, the nanosheets could be reused,
through several centrifugation and redispersion steps in ethanol in order to desorb the
dyes. To put these figures into context, they are compared in Table S3 of the Electronic
Supplementary Material with adsorption data taken from the literature for a number of
metal oxides, including several in nanostructured form, with the same two dyes (we
note that data for Co3O4 materials could not be found). Overall, the present nanosheets
exhibited the best performance from this set of metal oxide materials in terms of the
amount of dye that can be taken up, which should warrant more detailed studies in the
future to disclose their full potential in this application area.
3. Conclusions
We have demonstrated that activated Co3O4 nanosheets having substantial amounts
of Co(II) sites can be obtained through a direct synthesis route that circumvents the
need of activation (reduction) post-treatments. The strategy based on a general
procedure recently developed by Sun et al.41
and relied on an intermediate cobalt oxide
material with nanosheet morphology and a highly disordered structure, the calcination
of which afforded Co3O4 nanosheets boasting Co(II)/Co(III) ratios of ~1.3–1.4, i.e.,
similar to those achieved for Co3O4 nanomaterials activated by reduction post-
treatments. These activated nanosheets demonstrated a good potential for use in a
number of energy- and environment-related applications. Specifically, they exhibited a
competitive performance in their role as an electrode for charge storage in alkaline
electrolyte, surpassing many other nanostructured Co3O4 materials in terms of both
gravimetric capacity and rate capability (including those materials activated post-
synthesis). Furthermore, the activated nanosheets were shown to be effective catalysts
in the reduction of nitroarenes, with their activity comparing favorably to that of other
catalysts based on non-noble metals and/or their oxides, and were also promising
adsorbents of dye pollutants from the aqueous phase. For these two latter applications
where electrical conductivity is not an issue, the solvothermal nanosheets prepared
without any calcination post-treatment, which were thinner and displayed almost
exclusively Co(II) sites, offered the best performance. Finally, the present results
suggest that the use of these nanosheets in other relevant applications where
nanostructured Co3O4 is known to have good prospects for development, such as
electrocatalysts for the oxygen evolution reaction or electrodes for Li-ion batteries, will
be worth exploring in the future.
ARTÍCULO VII
374
4. Experimental
4.1. Chemicals and reagents
The following chemicals and reagents were acquired from Sigma-Aldrich and used
as received: ethylene glycol, ethanol, hexamethylenetetramine, sodium borohydride,
potassium hydroxide, the surfactant Pluronic P123, the dyes methyl orange and
methylene blue, the nitroarenes 4-nitrophenol and 4-nitroaniline. Cobalt (II) acetate
tetrahydrate was obtained from Alfa Aesar. Ultrapure water (Milli-Q; resistivity: 18.2
M·cm) was used throughout the work.
4.2 Synthesis of activated 2D Co3O4 nanosheets
Activated Co3O4 nanosheets were prepared by first synthesizing amorphous cobalt
oxide nanosheets in the confined 2D space of inverse lamellar micelles of the non-ionic
surfactant Pluronic P123 in ethanol/water medium, followed by controlled calcination at
a given target temperature.41
To obtain the amorphous nanosheets, 200 mg of Pluronic
P123 were dissolved in 14 mL of a mixed ethanol/water (33/2, v/v) solvent under
stirring. Subsequently, 125 mg of cobalt (II) acetate tetrahydrate and 70 mg of
hexamethylenetetramine were added to the resulting mixture. After 15 min, a purple-
colored solution was obtained, into which 13 mL of ethylene glycol were poured. Under
continuous stirring, the purple solution became transparent in about 30 min, following
which it was allowed to statically age for 24 h. The aged solution was then transferred
to a Teflon-lined autoclave (capacity: 40 mL) and heat-treated at 170 ºC for 2 h. The
resulting greenish solid product was thoroughly washed by repeated cycles of
centrifugation (2000 g for 20 min, J.P. Selecta Meditronic centrifuge in 30 mL tubes)
and re-suspension in water and ethanol (3 cycles for each solvent), and finally dried at
room temperature under a vacuum. Calcination of this product was accomplished by
heating at different temperatures, namely 250, 350 and 450 ºC, for 2 h under static air
conditions (Thermolyne muffle furnace, from Thermo Scientific).
4.3 Characterization techniques
The samples were characterized by UV-vis absorption spectroscopy, field-emission
scanning electron microscopy (FE-SEM), scanning transmission electron microscopy
(STEM), atomic force microscopy (AFM), X-ray diffraction (XRD), Raman
spectroscopy and X-ray photoelectron spectroscopy (XPS). UV-vis absorption spectra
ARTÍCULO VII
375
were obtained with a double-beam Heios spectrophotometer (Thermo Spectronic).
FE-SEM and STEM images were recorded on a Quanta FEG 650 apparatus (FEI
Company) working at a voltage of 30 kV. Specimens for FE-SEM were directly
mounted onto metallic sample holders using double-sided carbon adhesive tape,
whereas for STEM the samples were first dispersed in water by bath-sonication for 20
min (J.P. Selecta Ultrasons system, 40 kHz, power ~20 W L-1
) and then drop-cast (~10
L) onto a copper grid (200 square mesh) covered with a thin, continuous carbon film
(Electron Microscopy Sciences). AFM imaging was carried out in the tapping mode of
operation with a Nanoscope IIIa Multimode microscope (Veeco), using silicon
cantilevers with nominal spring constant and resonance frequency of ~40 N m-1
and
250-300 kHz, respectively. SiO2 (300 nm)/Si was employed as a supporting substrate
for AFM, onto which an aqueous dispersion of the sample (prepared by bath-sonication)
was deposited by drop-casting. XRD patterns were recorded with a D5000
diffractometer (Siemens) at angles (2) between 20 and 70º, using Cu K radiation ( =
0.1504 nm) at a step size of 0.02º and time per step of 1 s. Raman spectroscopy was
conducted in a LabRam apparatus (Horiba Jobin Yvon) with a laser excitation
wavelength of 532 nm. To prevent damage to the samples, a low incident laser power
(0.5 mW) was applied. For XPS, a SPECS apparatus working at a pressure of 10-7
Pa
and using a non-monochromatic Mg K X-ray source (11.81 kV, 100 W) was
employed. Specimens for Raman spectroscopy and XPS were prepared in the form of
thin films supported onto silver membrane filters (0.2 m in pore size, 25 mm in
diameter, from Sterlitech Corporation), which were prepared by vacuum filtration of the
samples dispersed in aqueous medium.
4.4. Applications of the highly activated 2D Co3O4 nanosheets
The activated Co3O4 nanosheets were tested as electrodes for electrochemical
charge storage, as catalysts for the reduction of nitroarenes and as adsorbents for dyes
from the aqueous phase.
4.4.1 Electrochemical energy storage
The electrochemical energy storage experiments were carried out in a three-electrode
configuration with a Swagelok-type cell, using the Co3O4 materials as the working
electrode, a commercial activated carbon fiber as the counter electrode, Hg/HgO (1 M
NaOH) as the reference electrode and aqueous 6 M KOH as the electrolyte. The
ARTÍCULO VII
376
working electrode was prepared by drop-casting aqueous dispersions (0.5 mg mL-1
) of
the activated nanosheets onto circular (~0.8 cm in diameter) graphite foil pieces, which
were then allowed to dry under ambient conditions. Typical nanosheet loadings onto the
graphite foil support were in the 0.3–0.4 mg cm-2
range. The counter electrode was
obtained in the form of a paste that incorporated, in addition to the activated carbon
fiber, polytetrafluoroethylene as a binder and carbon black as a conductive additive, in a
weight ratio of 90:5:5. A circular piece (~1.3 cm in diameter) of nylon membrane filter
(0.45 m of pore size, from Whatman) was used as a separator for the working and
counter electrodes. Before the cell was assembled, the working and counter electrodes
as well as the separator were individually soaked in 6 M KOH and vacuum-degassed.
Prior to measurements, the assembled cell with the electrolyte was also vacuum-
degassed. The measurements were carried out in a VSP potentiostat (Bio-Logic Science
Instruments), recording both cyclic voltammograms at different voltage scan rates and
galvanostatic charge/discharge curves at different current densities.
4.4.2 Catalytic reduction of nitroarenes
The catalytic activity of the cobalt oxide nanosheets was evaluated in the reduction of
two nitroarenes, namely, 4-nitrophenol (4-NP) and 4-nitroaniline (4-NA), in aqueous
medium with NaBH4 as the reducing agent. To this end, aqueous solutions (2.105 mL)
containing either 4-NP (0.06 mM) or 4-NA (0.06 mM), a certain amount of the
nanosheets (typically ~14-24 mg mL-1
) and NaBH4 (36 mM) were prepared and
immediately transferred to an UV-vis absorption spectrophotometer. Kinetic profiles of
the reaction progress were then recorded by monitoring the intensity of an absorption
peak characteristic of the substrate molecule (i.e., the peak located at a wavelength of
~400 nm for 4-NP and ~380 nm for 4-NA) over a certain period of time.
4.4.3 Dye adsorption
For the dye adsorption tests, aqueous solutions of the dyes (methylene blue or methyl
orange) were mixed with a colloidal suspension of the nanosheets that was obtained by
sonicating the as-prepared powder in water, so that the final concentration of the latter
in the mixed solution was ~4 mg mL-1
. After being gently stirred with a magnetic bar
for 24 h, the nanosheets were separated from the solution by centrifugation (20000 g, 20
min). This long adsorption time was selected only to ensure the attainment of adsorption
equilibrium and allow the determination of maximum adsorbed concentrations,
although in actual applications much shorter times would probably suffice (kinetic tests
were beyond the scope of this work). Subsequently, the concentration of dye remaining

ARTÍCULO VII
377
in the supernatant was determined by UV-vis absorption spectroscopy and compared
with that of the starting solution before adsorption, so that the amount of dye taken up
by the nanosheets could be finally derived. Dye concentrations were estimated by
measuring the intensity of absorption peaks characteristic of the dyes, namely, the peak
located at a wavelength of ~660 nm for methylene blue and ~460 nm for methyl orange.
To assess the maximum adsorption capacities of the cobalt oxide nanosheets, the
starting concentrations of the dyes in the mixed solutions were purposefully chosen to
be high, typically between 1 and 4 mg mL-1
.
Acknowledgements
Funding by the Spanish Ministerio de Economía y Competitividad (MINECO) and
the European Regional Development Fund (ERDF) through project MAT2015-69844-R
is gratefully acknowledged. We are also grateful to Plan de Ciencia, Tecnología e
Innovación 2013-2017 del Principado de Asturias and the ERDF for partial funding
through project GRUPIN14-056. J.M.M. and S.G-D. are grateful to the Spanish
Ministerio de Educación, Cultura y Deporte (MECD) and MINECO, respectively, for
their pre-doctoral contracts (FPU14/00792 and BES/2016 077830, respectively).
Electronic Supplementary Material: Supplementary material on the mechanism of
formation of the cobalt oxides, digital photograph of pure cobalt hydroxide, additional
XPS characterization of the materials, standard powder diffraction pattern of crystalline
Co3O4, BET surface and total pore volume of the materials as calculated form N2
adsorption isotherms acquired at -196 °C, on electrochemical charge storage
experiments for the non-calcined nanosheets and the nanosheets calcined at 250 and 450
ºC, as well as the UV-vis absorption spectra of the reactants and the products of the
catalytic reduction of nitroarenes assayed in this work, and data from the literature on
the performance of similar materials in the different applications assayed in this work to
put our results into context is available.

ARTÍCULO VII
378
References
[1] Ferrari, A. C.; Bonaccorso, F.; Fal'ko, V.; Novoselov, K. S.; Roche, S.; Boggild, P.;
Borini, S.; Koppens, F. H. L.; Palermo, V.; Pugno, N. et al. Science and technology
roadmap for graphene, related two-dimensional crystals, and hybrid systems. Nanoscale
2015, 7, 4598-4810.
[2] Ng, V.M.H.; Huang, H.; Zhou, K.; Lee, P. S.; Que, W.; Xu, J.Z.; Kong, L.B. Recent
progress in layered transition metal carbides and/or nitrides (Mxenes) and their
composites: synthesis and applications. J. Mater. Chem. A 2017, 5, 3039-3068.
[3] Zhang, K.; Feng, Y.; Wang, F.; Yang, Z.; Wang, J. Two dimensional hexagonal
boron nitride (2D-hBN): synthesis, properties and applications. J. Mater. Chem. C 2017,
5, 11992-12022.
[4] Samadi, M.; Sarikhani, N.; Zirak, M.; Zhang, H.; Zhang, H.-L.; Moshfegh, A. Z.
Group 6 transition metal dichalcogenide nanomaterials: synthesis, applications and
future perspectives. Nanoscale Horiz. 2018, 3, 90-204.
[5] Zhang, S.; Guo, S.; Chen, Z.; Wang, Y.; Gao, H.; Gómez-Herrero, J.; Ares, P.;
Zamora, F.; Zhu, Z.; Zeng, H. Recent progress in 2D group-VA semiconductors: from
theory to experiment. Chem. Soc. Rev. 2018, 47, 982-1021.
[6] Tan, C.; Zhang, H. Wet-chemical synthesis and applications of non-layer structured
two-dimensional nanomaterials. Nat. Commun. 2015, 6, 7873.
[7] Wang, F.; Wang, Z.; Shifa, T. A.; Wen, Y.; Wang, F.; Zhan, X.; Wang, Q.; Xu, K.;
Huang, Y.; Yin, L. et al. Two‐dimensional non‐layered materials: synthesis, properties
and applications. Adv. Funct. Mater. 2017, 27, 1603254.
[8] Dou, Y.; Zhang, L.; Xu, X.; Sun, Z.; Liao, T.; Dou, S. X. Atomically thin non-
layered nanomaterials for energy storage and conversion. Chem. Soc. Rev. 2017, 46,
7338-7373.
ARTÍCULO VII
379
[9] Yang, W.; Zhang, X.; Xie, Y. Advances and challenges in chemistry of two-
dimensional nanosheets. Nano Today 2016, 11, 793-816.
[10] Tan, H. T.; Sun, W.; Wang, L.; Yan, Q. 2D transition metal oxides/hydroxides for
energy-storage applications. ChemNanoMat 2015, 2, 562-577.
[11] Chen, P.-Y.; Liu, M.; Valentin, T. M.; Wang, Z.; Steinberg, R. S.; Sodhi, J.; Wong,
I. Y.; Hurt, R. H. Hierarchical metal oxide topographies replicated from highly textured
graphene oxide by intercalation templating. ACS Nano 2016, 10, 10869-10879.
[12] Kong, X.; Liu, Q.; Zhang, C.; Peng, Z.; Chen, Q. Elemental two-dimensional
nanosheets beyond graphene. Chem. Soc. Rev. 2017, 46, 2127-2157.
[13] Liu, M.; Chen, P.-Y.; Hurt, R. H. Graphene inks as versatile templates for printing
tiled metal oxide crystalline films. Adv. Mater. 2018, 30, 1705080.
[14] Sun, Y.; Gao, S.; Lei, F.; Liu, J.; Liang, L.; Xie, Y. Atomically-thin non-layered
cobalt oxide porous sheets for highly efficient oxygen-evolving electrocatalysts. Chem.
Sci. 2014, 5, 3976-3982.
[15] Du, S.; Ren, Z.; Qu, Y.; Wu, J.; Xi, W.; Zhu, J.; Fu, H. Co3O4 Nanosheets as a
high-performance catalyst for oxygen evolution proceeding via a double two-electron
process. Chem. Commun. 2016, 52, 6705-6708.
[16] Cai, Z.; Bi, Y.; Hu, E.; Liu, W.; Dwarica, N.; Tian, Y.; Li, X.; Kuang, Y.; Li, Y.;
Yang, X.-Q et al. Single‐crystalline ultrathin Co3O4 nanosheets with massive vacancy
defects for enhanced electrocatalysis. Adv. Energy Mater. 2018, 8, 1701694.
[17] Yuan, C.; Yang, L.; Hou, L.; Shen, L.; Zhang, X.; Lou, X. W. Growth of ultrathin
mesoporous Co3O4 nanosheet arrays on Ni foam for high-performance electrochemical
capacitors. Energy Environ. Sci. 2012, 5, 7883-7887.

ARTÍCULO VII
380
[18] Feng, C.; Zhang, J.; He, Y.; Zhong, C.; Hu, W.; Liu, L.; Deng, Y. Sub-3 nm Co3O4
nanofilms with enhanced supercapacitor properties. ACS Nano 2015, 9, 1730-1739.
[19] Fan, H.; Quan, L.; Yuan, M.; Zhu, S.; Wang, K.; Zhong, Y.; Chang, L.; Shao, H.;
Wang, J.; Zhang, J. et al. Thin Co3O4 nanosheet array on 3D porous graphene/nickel
foam as a binder-free electrode for high-performance supercapacitors. Electrochim.
Acta 2016, 188, 222-229.
[20] Xiang, K.; Xu, Z.; Qu, T.; Tian, Z.; Zhang, Y.; Wang, Y.; Xie, M.; Guo, X.; Ding,
W.; Guo, X. Two dimensional oxygen-vacancy-rich Co3O4 nanosheets with excellent
supercapacitor performances. Chem. Commun. 2017, 53, 12410-12413.
[21] Xiao, Z.; Fan, L.; Xu, B.; Zhang, S.; Kang, W.; Kang, Z.; Lin, H.; Liu, X.; Zhang,
S.; Sun, D. Metal–organic framework-derived metal oxide embedded in nitrogen-doped
graphene network for high-performance lithium-ion batteries. ACS Appl. Mater.
Interfaces 2017, 9, 41827-41836.
[22] Son, M. Y.; Kim, J. H.; Kang, Y. C. Study of Co3O4 mesoporous nanosheets
prepared by a simple spray-drying process and their electrochemical properties as anode
material for lithium secondary batteries. Electrochim. Acta 2014, 116, 44-50.
[23] Wang, B.; Lu, X.-Y.; Tang, Y.; Ben, W. General polyethyleneimine‐mediated
synthesis of ultrathin hexagonal Co3O4 nanosheets with reactive facets for lithium‐ion
batteries. ChemElectroChem 2016, 3, 55-65.
[24] AbdelHamid, A. A.; Yu, Y.; Yang, J.; Ying, J. Y. Generalized synthesis of metal
oxide nanosheets and their application as Li‐ion battery anodes. Adv. Mater. 2017, 29,
1701427.

ARTÍCULO VII
381
[25] Yao, Y.; Zhu, Y.; Zhao, S.; Shen, J.; Yang, X.; Li, C. Magnetic electrodeposition
of hierarchical cobalt oxide nanostructure from spent lithium-ion batteries: its
application as supercapacitor electrode. ACS Appl. Energy Mater. 2018, 1, 1239-1251.
[26] Wang, G.; Yang, Y.; Han, D.; Li, Y. Oxygen defective metal oxides for energy
conversion and storage. Nano Today 2017, 13, 23-39.
[27] Kou, T.; Yao, B.; Liu, T.; Li, Y. Recent advances in chemical methods for
activating carbon and metal oxide based electrodes for supercapacitors. J. Mater. Chem.
A 2017, 5, 17151-17173.
[28] Kalantar-zadeh, K.; Ou, J. Z.; Daeneke, T.; Mitchell, A.; Sasaki, T.; Fuhrer, M. S.
Two dimensional and layered transition metal oxides. Appl. Mater. Today 2016, 5, 73-
89.
[29] Zhang, G.; Xiao, X.; Li, B.; Gu, P.; Xue, H.; Pang, H. transition metal oxides with
one-dimensional/one-dimensional-analogue nanostructures for advanced
supercapacitors. J. Mater. Chem. A 2017, 5, 8155-8186.
[30] Kong, D.; Ren, W.; Cheng, C.; Wang, Y.; Huang, Z.; Yang, H. Y. Three–
dimensional NiCo2O4@polypyrrole coaxial nanowire arrays on carbon textiles for high-
performance flexible asymmetric solid–state supercapacitor. ACS Appl. Mater.
Interfaces 2015, 7, 21334−21346.
[31] Sahoo, S.; Shim, J.-J. Facile synthesis of three-dimensional ternary
ZnCo2O4/reduced graphene oxide/NiO composite film on nickel foam for next
generation supercapacitor electrodes. ACS Sustainable Chem. Eng. 2017, 5, 241−251.
[32] Young, C.; Salunkhe, R. R.; Alshehri, S. M.; Ahamad, T.; Huang, Z.; Henzie, J.;
Yamauchi, Y. High energy density supercapacitors composed of nickel cobalt oxide
ARTÍCULO VII
382
nanosheets on nanoporous carbon nanoarchitectures. J. Mater. Chem. A 2017, 5, 11834-
11839.
[33] Kaneti, Y. V.; Salunkhe, R. R.; Septiani, N.L.W.; Young, C.; Jiang, X. C.; He, Y.
B.; Kang, Y. M.; Sugahara, Y.; Yamauchi, Y. General template-free strategy for
fabricating mesoporous two-dimensional mixed oxide nanosheets via self-
deconstruction/reconstruction of monodispersed metal glycerate nanospheres. J. Mater.
Chem. A 2018, 6, 5971-5983.
[34] Li, X.; Wang, L.; Shi, J.; Du, N.; He, G. Multishelled nickel−cobalt oxide hollow
microspheres with optimized compositions and shell porosity for high-performance
pseudocapacitors. ACS Appl. Mater. Interfaces 2016, 8, 17276−17283.
[35] Wang, Y.; Zhou, T.; Jiang, K.; Da, P.; Peng, Z.; Tang, J.; Kong, B.; Cai, W.-B.;
Yang, Z.; Zheng, G. Reduced mesoporous Co3O4 nanowires as efficient water oxidation
electrocatalysts and supercapacitor electrodes. Adv. Energy Mater. 2014, 4, 1400696.
[36] Chen, H.; Yang, M.; Tao, S.; Chen, G. Oxygen vacancy enhanced catalytic activity
of reduced Co3O4 towards p-nitrophenol reduction. Appl. Catal. B: Environ. 2017, 209,
648-656.
[37] Yang, S.; Liu, Y.; Hao, Y.; Yang, X.; Goddard, W. A.; Zhang, X. L.; Cao, B.
Oxygen-vacancy abundant ultrafine Co3O4/graphene composites for high-rate
supercapacitor electrodes. Adv. Sci. 2018, 5, 1700659.
[38] Yang, M.-Q.; Wang, J.; Wu, H.; Ho, G. W. Noble metal‐free nanocatalysts with
vacancies for electrochemical water splitting. Small 2018, 14, 1703323.
[39] Wei, R.; Fang, M.; Dong, G.; Lan, C.; Shu, L.; Zhang, H.; Bu, X.; Ho, J. C. High-
index faceted porous Co3O4 nanosheets with oxygen vacancies for highly efficient water
oxidation. ACS Appl. Mater. Interfaces 2018, 10, 7079-7086.

ARTÍCULO VII
383
[40] Qiao, L.; Swihart, M. T. Solution-phase synthesis of transition metal oxide
nanocrystals: morphologies, formulae, and mechanisms. Adv. Colloid Interface Sci.
2017, 244, 199-266.
[41] Sun, Z.; Liao, T.; Dou, Y.; Hwang, S. M.; Park, M.-S.; Jiang, L.; Kim, J. H.; Dou,
S. X. Generalized self-assembly of scalable two-dimensional transition metal oxide
nanosheets. Nat. Commun. 2014, 5, 3813.
[42] Xu, L.; Jiang, Q.; Xiao, Z.; Li, X.; Huo, J.; Wang, S.; Dai, L. Plasma‐engraved
Co3O4 nanosheets with oxygen vacancies and high surface area for the oxygen evolution
reaction. Angew. Chem. Int. Ed. 2016, 55, 5277-5281.
[43] Zhou, Y.; C.-K. Dong, C.-K.; L.-L. Han, L.-L.; J. Yang, J.; X.-W. Du, X.-D. Top-
down preparation of active cobalt oxide catalyst. ACS Catal. 2016, 6, 6699-6703.
[44] Shim, H.-S.; Shinde, V. R.; Kim, H. J.; Sung, Y.-E.; Kim, W. B. Porous cobalt
oxide thin films from low temperature solution phase synthesis for electrochromic
electrode. Thin Solid Films 2008, 516, 8573-8578.
[45] Farhadi, S.; Safabakhsh, J.; Zaringhadam, P. Synthesis, Characterization, and
investigation of optical and magnetic properties of cobalt oxide (Co3O4) nanoparticles.
J. Nanostruct. Chem. 2013, 3, 69.
[46] Kang, M.; Zhou, H. Facile synthesis and structural characterization of Co3O4
nanocubes. AIMS Mater. Sci. 2015, 2, 16-27.
[47] Samal, R.; Dash, B.; Sarangi, C. K.; Sanjay, K.; Subbaiah, T.; Senanayake, G.;
Minakshi, M. Influence of synthesis temperature on the growth and surface morphology
of Co3O4 nanocubes for supercapacitor applications. Nanomaterials 2017, 7, 356.
[48] Ma, K.; Liu, F.; Yuan, Y. F.; Liu, X. Q.; Wang, J.; Xie, J.; Cheng, J. P. CoO
microspheres and metallic Co evolved from Hexagonal α-Co(OH)2 plates in a

ARTÍCULO VII
384
hydrothermal process for lithium storage and magnetic applications. Phys. Chem. Chem.
Phys. 2018, 20, 595-604.
[49] Nethravathi, C.; Sen, S.; Ravishankar, N.; Rajamathi, M.; Pietzonka, C.;
Harbrecht, B. Ferrimagnetic nanogranular Co3O4 through solvothermal decomposition
of colloidally dispersed monolayers of α-cobalt hydroxide. J. Phys. Chem. B 2005, 109,
11468-11472.
[50] Dou, Y.; Zhang, L.; Xu, J.; He, C.-T.; Xu, X.; Sun, Z.; Liao, T.; Nagy, B.; Liu, P.;
Dou, S. X. Manipulating the architecture of atomically thin transition metal
(hydr)oxides for enhanced oxygen evolution catalysis. ACS Nano 2018, 12, 1878−1886.
[51] N. N. Greenwood, A. Earnshaw. Chemistry of the elements. Ch. 26: Cobalt,
rhodium and iridium., p. 1296. Pergamon Press. Oxford, 1984.
[52] Ma, R.; Liu, Z.; Takada, K.; Fukuda, K.; Ebina, Y.; Bando, Y.; Sasaki, T.
Tetrahedral Co(II) coordination in α-type cobalt hydroxide: Rietveld refinement and X-
ray absorption spectroscopy. Inorg. Chem. 2006, 45, 3964-3969.
[53] Al-Ghoul, M.; El-Rassy, H.; Coradin, T.; Mokalled, T. Reaction–diffusion based
co-synthesis of stable α- and β-cobalt hydroxide in bio-organic gels. J. Cryst. Growth
2010, 312, 856-862.
[54] Schneiderová, B.; Demel, J.; Pleštil, J.; Tarábková, H.; Bohuslav, J.; Lang, K.
Electrochemical performance of cobalt hydroxide nanosheets formed by the
delamination of layered cobalt hydroxide in water. Dalton Trans. 2014, 43, 10484-
10491.
[55] Lyu, F.; Bai, Y.; Wang, Q.; Wang, L.; Zhang, X.; Yin, Y. Phase-controllable
synthesis of cobalt hydroxide for electrocatalytic oxygen evolution. Dalton Trans. 2017,
46, 10545-10548.
ARTÍCULO VII
385
[56] Kim, T. W.; Oh, E.-J.; Jee, A.-Y.; Lim, S. T.; Park, D. H.; Lee, M.; Hyun, S.-H.;
Choy, J.-H.; Hwang, S.-J. Soft‐Chemical exfoliation route to layered cobalt oxide
monolayers and its application for film deposition and nanoparticle synthesis. Chem.
Eur. J. 2009, 15, 10752-10761.
[57] Kundu, S.; Jayachandran, M. Shape-selective synthesis of non-micellar cobalt
oxide (CoO) nanomaterials by microwave irradiations. J. Nanopart. Res. 2013, 15,
1543.
[58] Ma, R.; Liu, Z.; Takada, K.; Fukuda, K.; Ebina, Y.; Bando, Y.; Sasaki, T.
Tetrahedral Co(II) Coordination in α-type Cobalt Hydroxide: Rietveld Refinement and
X-Ray Absorption Spectroscopy. Inorg. Chem. 2006, 45, 3964-3969.
[59] Gallant, D.; Pézolet, M.; Simard, S. Optical and physical properties of cobalt oxide
films electrogenerated in bicarbonate aqueous media. J. Phys. Chem. B 2006, 110,
6871-6880.
[60] Alrehaily, L. M.; Joseph, J. M.; Wren, J. C. Radiation-induced formation of Co3O4
nanoparticles from Co2+
(aq): Probing the Kinetics Using Radical Scavengers. Phys.
Chem. Chem. Phys. 2015, 17, 24138-24150.
[61] Li, Y.; Qiu, W.; Qin, F.; Fang, H.; Hadjiev, V. G.; Litvinov, D.; Bao, J.
Identification of cobalt oxides with Raman scattering and Fourier transform infrared
spectroscopy. J. Phys. Chem. C 2016, 120, 4511-4516.
[62] Rivas-Murias, B.; Salgueiriño, V. Thermodynamic CoO– Co3O4 crossover using
Raman spectroscopy in magnetic octahedron‐shaped nanocrystals. J. Raman Spectrosc.
2017, 48, 837-841.

ARTÍCULO VII
386
[63] Li, H. B.; Yu, M. H.; Lu, X. H.; Liu, P.; Liang, Y.; Xiao, J.; Tong, Y. X.; Yang, G.
W. Amorphous cobalt hydroxide with superior pseudocapacitive performance. ACS
Appl. Mater. Interfaces 2014, 6, 745-749.
[64] Choi, H. C.; Jung, Y. M.; Noda, I.; Kim, S. B. A Study of the mechanism of the
electrochemical reaction of lithium with CoO by two-dimensional soft X-ray absorption
spectroscopy (2D XAS), 2D Raman, and 2D heterospectral XAS−Raman correlation
analysis. J. Phys. Chem. B 2003, 107, 5806-5811.
[65] Ravindra, A. V.; Behera, B. C.; Padhan, P. Laser induced structural phase
transformation of cobalt oxides nanostructures. J. Nanosci. Nanotechnol. 2014, 14,
5591-5595.
[66] Johansson, G.; Hedman, J.; Berndtsson, A.; Klasson, M.; Nilsson, R. Calibration
of electron spectra. J. Electron Spectrosc. 1973, 2, 295.
[67] Cochran, S. J.; Larkins, F. P. Surface reduction of some transition-metal oxides. an
X-Ray photoelectron spectroscopic study of iron, cobalt, nickel and zinc oxides. J.
Chem. Soc., Faraday Trans. 1, 1985, 81, 2179-2190
[68] Chuang, T. J.; Bridle, C. R.; Rice, D. W. Interpretation of the X-Ray photoemission
spectra of cobalt oxides and cobalt oxide surfaces. Surface Science 1976, 59, 413-429.
[69] Wang, G.; Shen, X.; Horvat, J.; Wang, B.; Liu, H.; Wexler, D.; Yao, J.
Hydrothermal synthesis and optical, magnetic, and supercapacitance properties of
nanoporous cobalt oxide nanorods. J. Phys. Chem. C 2009, 113, 4357-4361.
[70] Gao, S.; Sun, Z.; Liu, W.; Jiao, X.; Zu, X.; Hu, Q.; Sun, Y.; Yao, T.; Zhang, W.;
Wei, S. et al. atomic layer confined vacancies for atomic-level insights into carbon
dioxide electroreduction. Nat. Commun. 2017, 8, 14503.

ARTÍCULO VII
387
[71] Cheng, G.; Kou, T.; Zhang, J.; Si, C.; Gao, H.; Zhang, Z. O22-
/O- functionalized
oxygen-deficient Co3O4 Nanorods as high performance supercapacitor electrodes and
electrocatalysts towards water splitting. Nano Energy 2017, 38, 155-166.
[72] Tian, X.; Sun, X.; Jiang, Z.; Jiang, Z.-J.; Hao, X.; Shao, D.; Maiyalagan, T.
Exploration of the active center structure of nitrogen-doped graphene for control over
the growth of Co3O4 for a high-performance supercapacitor. ACS Appl. Energy Mater.
2018, 1, 143-153.
[73] Yan, K.-L.; Qin, J.-F.; Lin, J.-H.; Dong, B.; Chi, J.-Q.; Liu, Z.-Z.; Dai, F.-N.; Chai,
Y.-M.; Liu, C.-G. Probing the active sites of Co3O4 for the acidic oxygen evolution
reaction by modulating the Co2+
/Co3+
ratio. J. Mater. Chem. A 2018, 6, 5678-5686.
[74] Wang, H.-Y.; Hung, S.-F.; Chen, H.-Y.; Chan, T.-S.; Chen, H. M.; Liu, B. In
operando identification of geometrical-site-dependent water oxidation activity of spinel
Co3O4. J. Am. Chem. Soc. 2016, 138, 36-39.
[75] Brousse, T.; Bélanger, D.; Long, J. W. To be or not to be pseudocapacitive? J.
Electrochem. Soc. 2015, 162, A5185-A5189.
[76] Gogotsi, Y.; Penner, R. M. Energy storage in nanomaterials – capacitive,
pseudocapacitive, or battery-like? ACS Nano 2018, 12, 2081-2983.
[77] Tan, H.; Liu, Z.; Chao, D.; Hao, P.; Jia, D.; Sang, Y.; Liu, H.; Fan, H. J. Partial
nitridation‐induced electrochemistry enhancement of ternary oxide nanosheets for fiber
energy storage device. Adv. Energy Mater. 2018, 8, 1800685.
[78] Aditya, T.; Pal, A.; Pal, T. Nitroarene reduction: a trusted model reaction to test
nanoparticle catalysts. Chem. Commun. 2015, 51, 9410-9431.

ARTÍCULO VII
388
[79] Hu, H.; Xin, J. H.; Hu, H.; Wang, X.; Miao, D.; Liu, Y. Synthesis and stabilization
of metal nanocatalysts for reduction reactions – a review. J. Mater. Chem. A 2015, 3,
11157-11182.
[80] Mandlimath, T. R.; Gopal, B. Catalytic activity of first row transition metal oxides
in the conversion of p-nitrophenol to p-aminophenol. J. Mol. Catal. A: Chem. 2011,
350, 9-15.
[81] Ayán-Varela, M.; Paredes, J. I.; Guardia, L.; Villar-Rodil, S.; Munuera, J. M.;
Díaz- González, M.; Fernández-Sánchez, C.; Martínez-Alonso, A.; Tascón, J. M. D.
Achieving Extremely Concentrated Aqueous Dispersions of Graphene Flakes and
Catalytically Efficient Graphene-Metal Nanoparticle Hybrids with Flavin
Mononucleotide as a High Performance Stabilizer. ACS Appl. Mater. Interfaces 2015, 7,
10293-10307.
ARTÍCULO VII
389
Supporting Information for
A direct route to activated two-dimensional cobalt oxide nanosheets for
electrochemical energy storage, catalytic and environmental applications
J.M. Munuera, J.I. Paredes, S. Villar-Rodil, S. García-Dalí, A. Castro-Muñiz, A.
Martínez-Alonso, J.M.D. Tascón
Instituto Nacional del Carbón, INCAR-CSIC, C/Fracisco Pintado Fe 26, 33011 Oviedo,
Spain
Contents
S1. Reaction mechanism for the formation of cobalt oxides
S2. Additional information on the characterization of the materials
S3. Additional information on the applications of the materials
S4. References
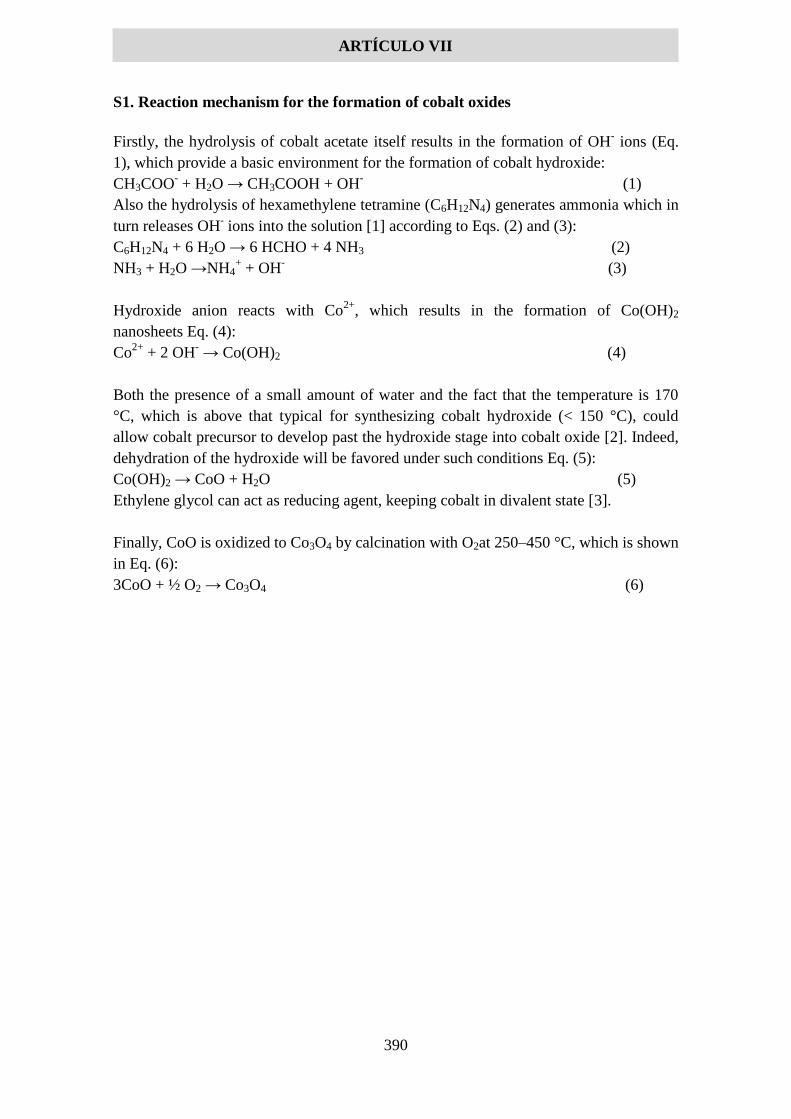
ARTÍCULO VII
390
S1. Reaction mechanism for the formation of cobalt oxides
Firstly, the hydrolysis of cobalt acetate itself results in the formation of OH- ions (Eq.
1), which provide a basic environment for the formation of cobalt hydroxide:
CH3COO- + H2O → CH3COOH + OH
- (1)
Also the hydrolysis of hexamethylene tetramine (C6H12N4) generates ammonia which in
turn releases OH- ions into the solution [1] according to Eqs. (2) and (3):
C6H12N4 + 6 H2O → 6 HCHO + 4 NH3 (2)
NH3 + H2O →NH4+ + OH
- (3)
Hydroxide anion reacts with Co2+
, which results in the formation of Co(OH)2
nanosheets Eq. (4):
Co2+
+ 2 OH- → Co(OH)2 (4)
Both the presence of a small amount of water and the fact that the temperature is 170
°C, which is above that typical for synthesizing cobalt hydroxide (< 150 °C), could
allow cobalt precursor to develop past the hydroxide stage into cobalt oxide [2]. Indeed,
dehydration of the hydroxide will be favored under such conditions Eq. (5):
Co(OH)2 → CoO + H2O (5)
Ethylene glycol can act as reducing agent, keeping cobalt in divalent state [3].
Finally, CoO is oxidized to Co3O4 by calcination with O2at 250–450 °C, which is shown
in Eq. (6):
3CoO + ½ O2 → Co3O4 (6)

ARTÍCULO VII
391
S2. Additional information on the characterization of the materials
Figure S1. Digital photograph of pure Co(OH)2 as received from Sigma-Aldrich.
Figure S2. XPS survey spectrum (a) and high resolution XPS C 1s core-level spectrum of the
as-prepared solvothermal nanosheets.
Figure S3. Background-subtracted, normalized Co 2p3/2 XPS spectra for all the materials
prepared here: as-prepared solvothermal nanosheets (green trace) and nanosheets calcined at
250 °C (blue trace), 350 °C (red trace) and 450 °C (black trace). The spectra of pure Co(OH)2
(magenta trace) has been added as a reference. The location of the main features of the spectra is
indicated by the dotted lines. Specifically, Co(III) peak is located at ~779.6 eV, while Co(II)
displays both a main band at ~780.9 eV and a satellite at ~786 eV.
792 788 784 780 776
Co(III)
Co(II)
Inte
nsity (
a. u.)
Binding energy (eV)
Co(II) satellite
1000 800 600 400 200 0 292 290 288 286 284 282 280
Co 2pCo 2s
C KLL
O KLL
O 1s
Co LMM
Co 3p
Co 3s
Inte
nsity (
a.u
)
b
Inte
nsity (
a.u
)
Binding energy (eV)
a
C 1s
Binding energy (eV)

ARTÍCULO VII
392
Figure S4. Powder Co3O4 diffraction pattern
Figure S5. N2 adsorption isotherms recorded at -196° on a volumetric apparatus (ASAP, from
Micromeritics) for the non-calcined material (green trace) and that calcined at 350° C (red
trace). Prior to the analysis, the samples were outgassed overnight at 150° C under vacuum. The
BET surface areas were calculated according to the BET model from the nitrogen isotherms in
the relative pressure range 0.05–0.35 and were 10 and 50 m2 g
-1 for the non-calcined and
calcined material, respectively. The total pore volumes were calculated as the amount of N2
adsorbed at the relative pressure of 0.95, yielding values of 0.02 and 0.11 cm3 g
-1 for the non-
calcined and the calcined material, respectively.
0.0 0.2 0.4 0.6 0.8 1.00
1
2
3
4
5
Am
ount adsorb
ed (
mm
ol/g)
P/P0
0
10
20
30
40
50
60
70
80
90
100
10 20 30 40 50 60 70 80 90
Inte
nsi
ty
2-theta
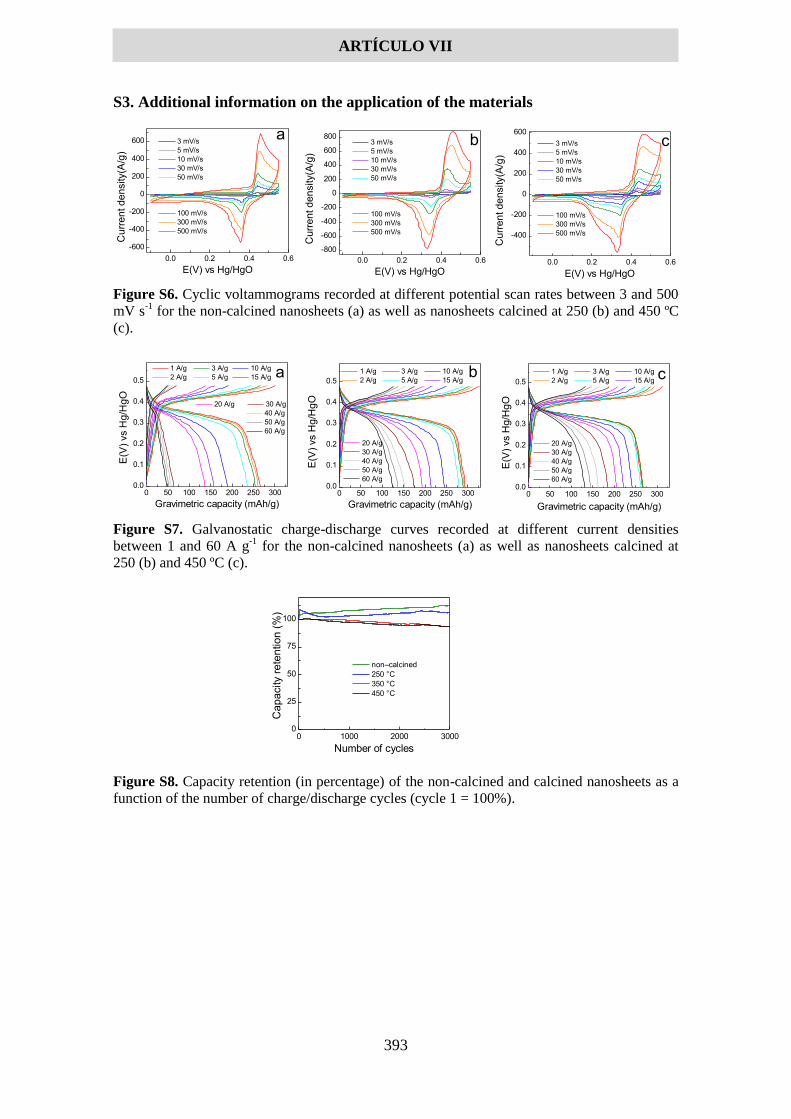
ARTÍCULO VII
393
S3. Additional information on the application of the materials
Figure S6. Cyclic voltammograms recorded at different potential scan rates between 3 and 500
mV s-1
for the non-calcined nanosheets (a) as well as nanosheets calcined at 250 (b) and 450 ºC
(c).
Figure S7. Galvanostatic charge-discharge curves recorded at different current densities
between 1 and 60 A g-1
for the non-calcined nanosheets (a) as well as nanosheets calcined at
250 (b) and 450 ºC (c).
Figure S8. Capacity retention (in percentage) of the non-calcined and calcined nanosheets as a
function of the number of charge/discharge cycles (cycle 1 = 100%).
0 50 100 150 200 250 3000.0
0.1
0.2
0.3
0.4
0.5
0 50 100 150 200 250 3000.0
0.1
0.2
0.3
0.4
0.5
0 50 100 150 200 250 3000.0
0.1
0.2
0.3
0.4
0.5
1 A/g 3 A/g 10 A/g
2 A/g 5 A/g 15 A/g
20 A/g 30 A/g
40 A/g
50 A/g
60 A/g
E(V
) vs H
g/H
gO
Gravimetric capacity (mAh/g)
a 1 A/g 3 A/g 10 A/g
2 A/g 5 A/g 15 A/g
20 A/g
30 A/g
40 A/g
50 A/g
60 A/g
E(V
) vs H
g/H
gO
Gravimetric capacity (mAh/g)
b 1 A/g 3 A/g 10 A/g
2 A/g 5 A/g 15 A/g
20 A/g
30 A/g
40 A/g
50 A/g
60 A/g
E(V
) vs H
g/H
gO
Gravimetric capacity (mAh/g)
c
0.0 0.2 0.4 0.6
-600
-400
-200
0
200
400
600
0.0 0.2 0.4 0.6
-800
-600
-400
-200
0
200
400
600
800
0.0 0.2 0.4 0.6
-400
-200
0
200
400
600
3 mV/s
5 mV/s
10 mV/s
30 mV/s
50 mV/s
100 mV/s
300 mV/s
500 mV/s
b
Curr
en
t d
en
sity(A
/g)
E(V) vs Hg/HgO
a 3 mV/s
5 mV/s
10 mV/s
30 mV/s
50 mV/s
100 mV/s
300 mV/s
500 mV/s
E(V) vs Hg/HgO
Cu
rren
t d
en
sity(A
/g)
E(V) vs Hg/HgO
3 mV/s
5 mV/s
10 mV/s
30 mV/s
50 mV/s
100 mV/s
300 mV/s
500 mV/s
Curr
en
t de
nsity(A
/g)
c
0 1000 2000 30000
25
50
75
100
non–calcined
250 °C
350 °C
450 °C
Ca
pa
city r
ete
ntio
n (
%)
Number of cycles

ARTÍCULO VII
394
Figure S9. (a) UV-vis absorption spectra of 4-NP (black curve), its corresponding 4-
nitrophenoxide anion (green) and the reduced anion 4-aminophenoxide (violet). (b) UV-vis
absorption spectra of 4-nitroaniline (orange curve) and its reduced form p-phenylenediamine
(blue).
200 250 300 350 400 450 200 250 300 350 400 450
b
Abso
rba
nce
Wavelength (nm)
a
295 nm
316 nm
400 nm
Abso
rba
nce
Wavelength (nm)
310 nm 380 nm
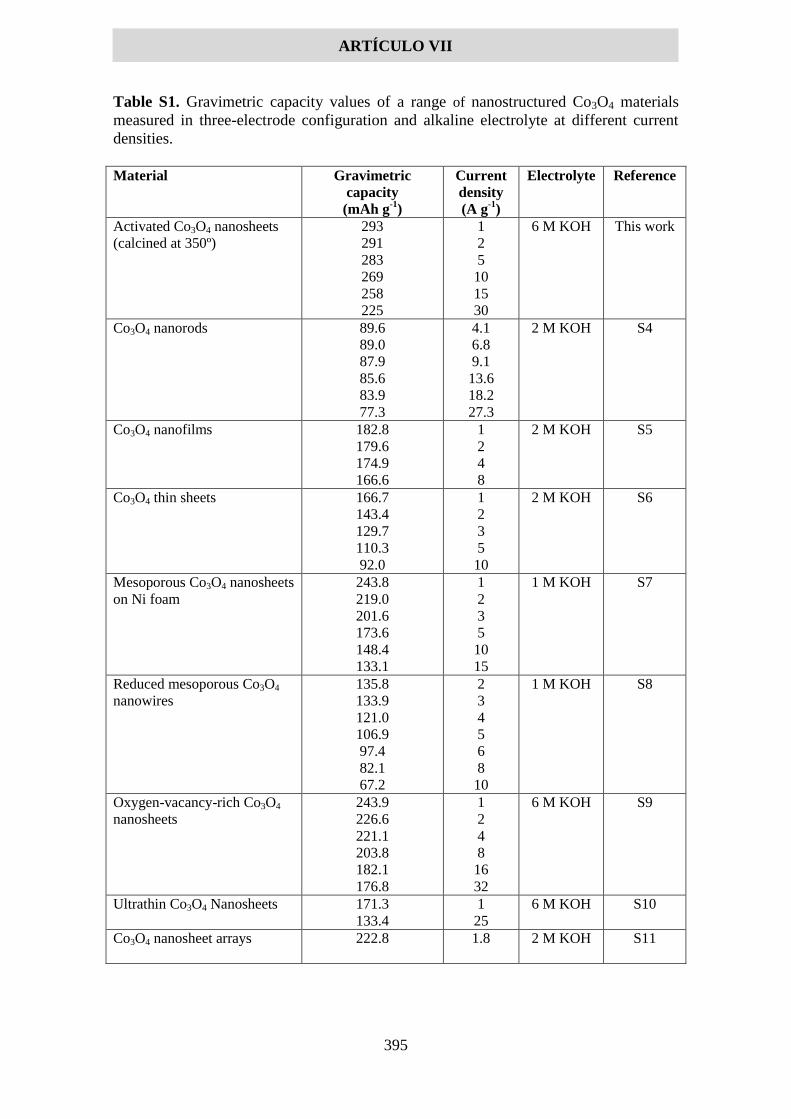
ARTÍCULO VII
395
Table S1. Gravimetric capacity values of a range of nanostructured Co3O4 materials
measured in three-electrode configuration and alkaline electrolyte at different current
densities.
Material Gravimetric
capacity
(mAh g-1
)
Current
density
(A g-1
)
Electrolyte Reference
Activated Co3O4 nanosheets
(calcined at 350º)
293
291
283
269
258
225
1
2
5
10
15
30
6 M KOH This work
Co3O4 nanorods 89.6
89.0
87.9
85.6
83.9
77.3
4.1
6.8
9.1
13.6
18.2
27.3
2 M KOH S4
Co3O4 nanofilms 182.8
179.6
174.9
166.6
1
2
4
8
2 M KOH S5
Co3O4 thin sheets 166.7
143.4
129.7
110.3
92.0
1
2
3
5
10
2 M KOH S6
Mesoporous Co3O4 nanosheets
on Ni foam
243.8
219.0
201.6
173.6
148.4
133.1
1
2
3
5
10
15
1 M KOH S7
Reduced mesoporous Co3O4
nanowires
135.8
133.9
121.0
106.9
97.4
82.1
67.2
2
3
4
5
6
8
10
1 M KOH S8
Oxygen-vacancy-rich Co3O4
nanosheets
243.9
226.6
221.1
203.8
182.1
176.8
1
2
4
8
16
32
6 M KOH S9
Ultrathin Co3O4 Nanosheets 171.3
133.4
1
25
6 M KOH S10
Co3O4 nanosheet arrays 222.8
1.8 2 M KOH S11

ARTÍCULO VII
396
Mesoporous Co3O4 nanosheet
arrays
341.9
315.4
274.9
238.9
221.0
198.3
183.9
2
3
4
5
6
8
10
2 M KOH S12
Phosphate ion functionalized
Co3O4 ultrathin nanosheets
286.0 4.5 6 M KOH S13
3D Co3O4 twinspheres 86.8
83.8
77.8
74.4
67.9
0.5
1
2
4
8
6 M KOH S14
Co3O4 nanosheets 39.3
34.7
1
10
2 M KOH S15
CoO/Co3O4 nanocomposite 50.1
43.2
39.2
36.2
34.2
1
5
10
15
20
3 M KOH S16
Mesoporous Co3O4
nanowire
161.1
138.3
122.8
119.6
113.9
2
5
10
15
20
6 M KOH S17
Macro-/
mesoporous Co3O4
103.1
56.1
0.5
20
2 M KOH S18

ARTÍCULO VII
397
Table S2. Catalytic activities of Co3O4 nanomaterials, as well as other materials based on non-
noble metals and/or their oxides, in the reduction of 4-NP with NaBH4. The catalytic activity is
calculated as the number of moles of 4-NP converted per unit time per mole of metal in the
catalyst. Acronyms: NP (nanoparticle), MOF (metal-organic framework), RGO (reduced
graphene oxide).
Catalyst
TOF 4-nitrophenol
(h-1
; relative to
molar amount of
Co)
TOF 4-nitroaniline
(h-1
; relative to
molar amount of
Co)
Reference
Non-calcined nanosheets 4.7 6.8 This work
Calcined at 250 ºC 3.8 7.0 This work
Calcined at 350 ºC 2.5 5.6 This work
Calcined at 450 ºC 2.1 3.8 This work
Co3O4 nanoplates activated
through reduction post-treatment
0.8-2.1 S19
Co3O4 nanowires 1.8 S20
Co3O4 powder 0.7 S21
CuO powder 0.7 S21
Fe2O3 powder 0.6 S21
NiO powder 0.05 S21
Mesoporous Co3O4 NPs 0.05 S22
Ca-doped mesoporous Co3O4
NPs
0.06 S23
CoOx clusters embedded in N-
doped carbon derived from MOF
9.9 S24
Cu NPs supported onto carbon
spheres
0.2 S25
Submicrometric Cu particles
supported onto carbon spheres
0.05-0.2 S25
Co@BN nanoparticles 0.4 S26
CuNi alloy NPs 12.0 S27
Cu nanocrystals supported onto
RGO
0.6 S28
Hexagonal Ni plates supported
onto RGO
0.4 S29
Hollow porous Cu particles 3.0 S30
Co NPs embedded in MOF-
derived nanoporous carbon
18.0 S31
Co NPs embedded in ordered
mesoporous carbon
7.8 S32
Ni NPs supported onto RGO 0.1 S33
Cu NPs supported onto
mesoporous carbon
9.6 S34
Ni NPs supported onto silica
nanotubes
1.8 S35
Ni NPs supported onto MOF-
derived mesoporous carbon
0.25 S36
Hollow CuO nanospheres 4.2 S37
Hollow NiO nanospheres 3.0 S37

ARTÍCULO VII
398
Table S3. Adsorption capacities of different metal oxides towards methylene blue and methyl
orange from the aqueous phase.
Material Adsorbate Adsorption capacity
(mg/g)
Reference
Co3O4 nanosheets Methyl orange 909.3 This work
Mg-Al mixed metal oxides Methyl orange 182.8 S38
Zn-Al mixed metal oxides Methyl orange 178.6 S39
CuO2 particles Methyl orange 96.42 S40
Fe3O4/ZnCr-layered double
hydroxide
Methyl orange 240.16 S41
Co3O4 nanosheets Methylene blue 916.2 This work
MgO-urea Methylene blue 19.2 S42
CoFe2O4 Methylene blue 26.4 S43
Co3O4/SiO2 Methylene blue 53.87 S44
Manganese Oxide
Nanostructures
Methylene blue 68.4 S45
γ-MnOOH nanorods Methylene blue 50.0 S46

ARTÍCULO VII
399
S4. References
[S1] X. Wang, H. Xia, Xiuqin Wang, J. Gao, B. Shi, Y. Fang. Facile synthesis ultrathin
mesoporous Co3O4 nanosheets for high-energy asymmetric supercapacitor. J. Alloys
Comp. 2016, 686, 969–975. [S2] Ma, K.; Liu, F.; Yuan, Y. F.; Liu, X. Q.; Wang, J.; Xie, J.; Cheng, J. P. CoO microspheres and
metallic Co evolved from Hexagonal α-Co(OH)2 plates in a hydrothermal process for lithium storage and
magnetic applications. Phys. Chem. Chem. Phys. 2018, 20, 595-604.
[S3] Li-Xia Yang, Ying-Jie Zhu, Liang Li, Ling Zhang, Hua Tong, Wei-Wei Wang,
Guo-Feng Cheng, and Jie-Fang Zhu.A Facile Hydrothermal Route to Flower-Like
Cobalt Hydroxide and Oxide. Eur. J. Inorg. Chem. 2006, 4787–4792.
[S4] Cheng, G.; Koub, T.; Zhang, J., Si, C.; Gao, H.; Zhang, Z. O22-/O- functionalized
oxygen-deficient Co3O4 nanorods as high performance supercapacitor electrodes and
electrocatalysts towards water splitting. Nano Energy 2017, 38, 155–166.
[S5] Feng, C.; Zhang, J.; He, Y.; Zhong, C.; Hu, W.; Liu, L.; Deng, Y. Sub‑3 nm Co3O4
nanofilms with enhanced supercapacitor properties. ACS Nano 2015, 9, 1730-1739.
[S6] Jiang, Y.; Chen, L.; Zhang, H.; Zhang, Q.; Chen, W.; Zhu, J.; Song, D. Two-
dimensional Co3O4 thin sheets assembled by 3D interconnected nanoflake array
framework structures with enhanced supercapacitor performance derived from
coordination complexes. Chem. Eng. J. 2016, 292, 1–12.
[S7] Qiu, K.; Lu, Y.; Cheng, J.; Yan, H.; Hou, X.; Zhang, D.; Lu, M.; Liu, X.; Luo, Y.
Ultrathin mesoporous Co3O4 nanosheets on Ni foam for high-performance
supercapacitors. Electrochim. Acta 2015, 157, 62–68.
[S8] Wang, Y.; Zhou, T.; Jiang, K.; Da, P.; Peng, Z.; Tang, J.; Kong, B.; Cai, W.; Yang,
Z.; Zheng, G. Reduced mesoporous Co3O4 nanowires as efficient water oxidation
electrocatalysts and supercapacitor electrodes. Adv. Energy Mater. 2014, 4, 1400696.
[S9] Xiang, K.; Xu, Z.; Qu, T.; Tian, Z.; Zhang, Y.; Wang, Y.; Xie, M.; Guo, X.; Ding,
W.; Guo, X. Two dimensional oxygen-vacancy-rich Co3O4 nanosheets with excellent
supercapacitor performances. Chem. Commun. 2017, 53, 12410-12413.
[S10] Xiao, Z.; Fan, L.; Xu, B.; Zhang, S.; Kang, W.; Kang, Z.; Lin, H.; Liu, X.; Zhang,
S.; Sun, D. Green fabrication of ultrathin Co3O4 nanosheets from metal−organic
framework for robust high-rate supercapacitors. ACS Appl. Mater. Interfaces 2017, 9,
41827−41836.
[S11] Yang, Q.; Lu, Z.; Sun, X.; Liu, J. Ultrathin Co3O4 nanosheet arrays with high
supercapacitive performance. Sci. Rep. 2013, 3, 3537.
[S12] Yuan, C.; Yang, L.; Hou, L.; Shen, L.; Zhang, X.; Lou, X. W. Growth of ultrathin
mesoporous Co3O4 nanosheet arrays on Ni foam for high-performance electrochemical
capacitors. Energy Environ. Sci. 2012, 5, 7883–7887.
[S13] Zhai, T.; Wan, L.; Sun, S.; Chen, Q.; Sun, J.; Xia, Q.; Xia, H. Phosphate ion
functionalized Co3O4 ultrathin nanosheets with greatly improved surface reactivity for
high performance pseudocapacitors. Adv. Mater. 2016, 1604167.
[S14] Xiao, Y.; Liu, S.; Li, F.; Zhang, A.; Zhao, J.; Fang, S.; Jia, D. 3D hierarchical
Co3O4 twin-spheres with an urchin-like structure: large-scale synthesis, multistep-
splitting growth, and electrochemical pseudocapacitors. Adv. Funct. Mater. 2012, 22,
4052.
[S15] Wang, Y.; Zhong, Z.; Chen, Y.; Ng, C. T.; Lin, J. Controllable Synthesis of
Co3O4 from Nanosize to Microsize with Large-Scale Exposure of Active Crystal Planes
and Their Excellent Rate Capability in Supercapacitors Based on the Crystal Plane
Effect. Nano Res. 2011, 7, 695–704.

ARTÍCULO VII
400
[S16] Pang, M.; Long, G.; Jiang, S.; Ji, Y.; Han, W.; Wang, B.; Liu, X.; Xi, Y.; Wang,
D.; Xu, F. Ethanol-assisted solvothermal synthesis of porous nanostructured cobalt
oxides (CoO/Co3O4) for high-performance supercapacitors. Chem. Eng. J. 2015, 280,
377–384.
[S17] Zhang, Z.; Yuan, C.; Lu, X.; Zhang, L.; Che, Q.; Zhang, X. Facile growth of
mesoporous Co3O4 nanowire arrays on Ni foam for high performance electrochemical
capacitors. J. Power Sources 2012, 203, 250–256.
[S18] Wang, X.; Sumboja, A.; Khoo, E.; Yan, C.; Lee, P. S. Cryogel Synthesis of
hierarchical interconnected macro-/mesoporous Co3O4 with superb electrochemical
energy storage. J. Phys. Chem. C 2012, 116, 4930−4935.
[S19] Chen, H.; Yang, M.; Tao, S.; Chen, G. Oxygen vacancy enhanced catalytic
activity of reduced Co3O4 towards p-nitrophenol reduction. Appl. Catal. B: Environ.
2017, 209, 648-656.
[S20]Huang, X.; Wu, D.; Cheng, D. Porous Co2P nanowires as high efficient
bifunctional catalysts for 4-nitrophenol reduction and sodium borohydride hydrolysis. J.
Colloid Interface Sci. 2017, 507, 429–436.
[S21] Triveni Rajashekhar Mandlimath, T. R.; Buvaneswari Gopal, B. Catalytic activity
of first row transition metal oxides in the conversion of p-nitrophenol to p-aminophenol.
J. Mol. Catal. A: Chem. 2011, 350, 9–15.
[S22]Mogudi, B. M.; Ncube, P.; Meijboom, R. Catalytic activity of mesoporous cobalt
oxides with controlled porosity and crystallite sizes: Evaluation using the reduction of
4-nitrophenol. Appl. Catal., B 2016, 198, 74–82.
[S23]Mogudi, B. M.; Ncube, P.; Bingwa, N.; Mawila, N.; Mathebula, S.; Meijboom, R.
Promotion effects of alkali- and alkaline earth metals on catalytic activity of
mesoporous Co3O4 for 4-nitrophenol reduction. Appl. Catal., B 2017, 218, 240–248.
[S24]Zhang, X.; Wang, N.; Geng, L.; Fu, J.; Hua, H.; Zhang, D.; Zhu, B.; Carozza, J.;
Han, H. Facile synthesis of ultrafine cobalt oxides embedded into N-doped
carbon with superior activity in hydrogenation of 4-nitrophenol. J. Colloid Interface Sci.
2018, 512, 844–852.
[S25]Cheng, X.; Fu, A.; Li, H.; Wang, Y.; Guo, P.; Liu, J.; Zhang, J.; Zhao, X. S.
Sustainable preparation of copper particles decorated carbon microspheres and studies
on their bactericidal activity and catalytic properties. ACS Sustainable Chem. Eng.
2015, 10, 2414-2422.
[S26] Du, M.; Liu, Q.; Huang, C.; Qiu, X. One-step synthesis of magnetically
recyclable
Co@BN core–shell nanocatalysts for catalytic reduction of nitroarenes. RSC Adv., 2017,
7, 35451–35459.
[S27]Fang, H.; Wen, M.; Chen, H.; Wu, Q.; Li, W. Graphene stabilized ultra-small
CuNi
nanocomposite with high activity and recyclability toward catalysing the reduction of
aromatic nitro-compounds. Nanoscale, 2016, 8, 536-542.
[S28]Guo, M.; Zhao, Y.; Zhang, F.; Xu, L.; Yang, H.; Song, X.; Bu, Y. Reduced
graphene oxide-stabilized copper nanocrystals with enhanced catalytic activity and
SERS properties. RSC Adv., 2016, 6, 50587–50594.
[S29]Ji, Z.; Wang, Y.; Shen, X.; Ma, H.; Yang, J.; Yuan, A.; Zhou, H. Facile synthesis
and enhanced catalytic performance of reduced graphene oxide decorated with
hexagonal structure Ni nanoparticles. J. Colloid Interface Sci.2017, 487, 223–230.

ARTÍCULO VII
401
[S30]Jiang, J.; Lim, Y. S.; Park, S.; Kim, S.-H.; Yoon, S.; Piao, L. Hollow porous Cu
particles from silica-encapsulated Cu2O nanoparticle aggregates effectively catalyze
4-nitrophenol reduction. Nanoscale, 2017, 9, 3873-3880.
[S31]Li, X.; Zeng, C.; Jiang, J.; Ai, L. Magnetic cobalt nanoparticles embedded in
hierarchically porous nitrogen-doped carbon frameworks for highly efficient and well-
recyclable catalysis. J. Mater. Chem. A, 2016, 4, 7476-7482
[S32]Liu, J.; Wang, Z.; Yan, X.; Jian, P. Metallic cobalt nanoparticles imbedded into
ordered mesoporous carbon: A non-precious metal catalyst with excellent
hydrogenation performance. J. Colloid Interface Sci.2017, 505, 789–795.
[S33]Qiu, H.; Qiu, F.; Han, X.; Li, J.; Yang, J. Microwave-irradiated preparation of
reduced graphene oxide-Ni nanostructures and their enhanced performance for catalytic
reduction of 4-nitrophenol. Appl. Surf. Sci. 2017, 407, 509–517.
[S34]Rath, P. C.; Saikia, D.; Mishra, M.; Kao, H.-M. Exceptional catalytic performance
of ultrafine Cu2O nanoparticles confined in cubic mesoporous carbon for 4-nitrophenol
reduction. Appl. Surf. Sci. 2018, 427, 1217–1226.
[S35]Zhang, S.; Gai, S.; He, F.; Ding, S.; Lia, L.; Yang, P. In situ assembly of well-
dispersed Ni nanoparticles on silica nanotubes and excellent catalytic activity in 4-
nitrophenol reduction. Nanoscale, 2014, 6, 11181-11188.
[S36] Zuo, W.; Yu, G.; Dong, Z. A MOF-derived nickel based N-doped mesoporous
carbon catalyst with high catalytic activity for the reduction of nitroarenes. RSC Adv.
2016, 6, 11749–11753.
[S37] Wu, G.; Liang, X.; Zhang, L.; Tang, Z.; Al-Mamun, M.; Zhao, H.; Su, X.
Fabrication of highly stable metal oxide hollow nanospheres and their catalytic activity
toward 4‑nitrophenol reduction. ACS Appl. Mater. Interfaces, 2017, 21, 18207–18214.
[S38] Gao, L.; Li, Q.; Hu, X.; Wang, X.; Song, H.; Yan, L.; Xiao, H. One-pot synthesis
of biomorphic Mg-Al mixed metal oxides with enhanced methyl orange adsorption
properties. Appl. Clay Sci. 2016, 126, 299–305.
[S39] Ni, Z.-M.; Xia, S.-J.; Wang, L.-G.; Xing, F.-F.; Pan, G.-X. Treatment of methyl
orange by calcined layered double hydroxides in aqueous solution: adsorption property
and kinetic studies. J. Colloid Interface Sci. 2007, 316, 284–291.
[S40] Ho, W. C. J.; Tay, Q.; Qi, H.; Huang, Z.; Li, J.; Chen, Z. Photocatalytic and
adsorption performances of faceted cuprous oxide (Cu2O) particles for the removal of
methyl orange (MO) from aqueous media. Molecules 2017, 22, 677.
[S41] Chena, D.; Li, Y.; Zhang, J.; Li, W.; Zhou, J.; Shao, L.; Qian, G. Efficient
removal of dyes by a novel magnetic Fe3O4/ZnCr-layered double hydroxide adsorbent
from heavy metal wastewater. J. Hazard. Mater. 2012, 243, 152–160.
[S42] Wanchanthuek, R.; Nunrung, W. The adsorption study of methylene blue onto
MgO from various preparation methods. J. Environ. Sci. Technol. 2011, 5, 534-542.
[S43] Jacob, N. M.; Kuruva, P.; Madras, G.; Thomas, T. Purifying water containing
both anionic and cationic species using a (Zn, Cu)O, ZnO, and cobalt ferrite based
multiphase adsorbent system. Ind. Eng. Chem. Res. 2013, 52, 16384−16395.
[S44] Ghafar, H. H. A.; Ali, G. A. M.; Fouad, O. A.; Makhlouf, S. A. Enhancement of
adsorption efficiency of methylene blue on Co3O4/SiO2 nanocomposite. Desalin. Water
Treat. 2015, 53, 2980-2989.
[S45] Chen, H.; He, J. Facile synthesis of monodisperse manganese oxide
nanostructures and their application in water treatment. J. Phys. Chem. C 2008, 112,
17540–17545.

ARTÍCULO VII
402
[S46] Varghese, S. P.; Babu, A. T.; Babu, B.; Antony, R. γ-MnOOH nanorods: Efficient
adsorbent for removal of methylene blue from aqueous solutions. Journal of Water
Process Engineering 2017, 19, 1–7.

6. CONCLUSIONES
403
6. Conclusiones
Los resultados obtenidos en esta tesis y recogidos en la presente memoria permiten
extraer las siguientes conclusiones:
El tipo de grafito usado en la exfoliación electroquímica anódica influye en las
características del grafeno obtenido; los grafitos no particulados permiten un mayor
grado y rendimiento de exfoliación, pero producen grafeno más oxidado. En
conjunto, el grafito flexible permite obtener el compromiso más satisfactorio entre
todas estas características.
Es posible utilizar sulfonatos aromáticos como electrolitos en la exfoliación anódica.
Estas moléculas cumplen simultáneamente la función de agente intercalante,
estabilizador coloidal, agente antioxidante y centro de anclaje para la formación de
híbridos. Es posible obtener así grafeno de muy alta calidad estructural
funcionalizado y dispersable en agua.
Un pretratamiento del grafito flexible con ácido sulfúrico permite aumentar el
rendimiento del proceso de exfoliación anódica, aunque con un aumento en el grado
de oxidación del grafeno resultante.
Es posible obtener grafeno exfoliado anódicamente utilizando como electrolitos
halogenuros de sodio en base a elegir cuidadosamente su concentración y el grafito
de partida. Los grafenos obtenidos muestran contenidos de oxígeno similares o
inferiores a los preparados con electrolitos estándar (sulfatos).
El anión cloruro es un aditivo de electrolito con función antioxidante eficiente en la
exfoliación anódica de grafeno, permitiendo obtener un grafeno de muy alta calidad
estructural y muy bajo grado de oxidación.
El MoS2 exfoliado por intercalación de litio puede ser funcionalizado
covalentemente con grupos de ácido acético, lo que permite extender su estabilidad
coloidal y su actividad catalítica.
Es posible obtener láminas de Co3O4 activado sin necesidad de post tratamiento
mediante un proceso solvotérmico dirigido por fases micelares laminares. Este
material posee un gran potencial como electrodo de almacenamiento de carga, así
como en aplicaciones en catálisis y eliminación de contaminantes del agua.

6. CONCLUSIONES
404
Conclusions
The results obtained during this thesis and presented along this document allow to
draw the following conclusions:
The type of graphite used in the electrochemical anodic exfoliation is key to the
properties of the obtained graphene. Non-particulate graphites allow a higher degree
and yield of exfoliation, however they yield a more oxidized graphene. Graphite foil
allows the best compromise within these characteristics.
Aromatic sulfonates can be used as electrolytes in the anodic exfoliation. These
molecules play simultaneously the role of intercalating agent, colloidal stabilizer,
antioxidant and anchoring center for the preparation of hybrids. This way it is
possible to obtain high quality, water dispersible functionalized graphene.
Pretreatment of the graphite foil with sulfuric acid can increase the yield of the
anodic exfoliation, but with an increase in the oxidation of the resulting graphene.
It is possible to obtain anodically exfoliated graphene using sodium halides as
electrolytes, choosing carefully their concentration and the starting graphite.
Graphenes obtained this way show similar or lower oxygen contents than those
prepared using standard electrolytes (sulfates).
Chloride anion is an efficient electrolyte additive with the role of antioxidant,
allowing to obtain graphene with very high structural quality and very low oxidation
degree.
MoS2 prepared through lithium intercalation can be covalently functionalized with
acetic acid groups, so its colloidal stability and catalytic activity can be extended.
It’s possible to obtain activated Co3O4 nanosheets through a micellar phase directed
solvothermal method without any post-processing treatment. This material has a
great potential as a charge storage electrode, as well as in applications in catalysis
and removal of pollutants from water.

ANEXO
405
Anexo
Durante la realización de la tesis doctoral se generaron una serie de publicaciones no
incluidas en esta memoria, aunque de temática íntimamente relacionada:
1. Guardia, L.; Paredes, J. I.; Munuera, J. M.; Villar-Rodil, S.; Ayan-Varela, M.;
Martínez-Alonso, A.; Tascon, J. M. D. Chemically exfoliated MoS2 nanosheets as
an efficient catalyst for reduction reactions in the aqueous phase. ACS Appl. Mater.
Interfaces, 2014, 6, 21702−21710.
2. Ayan-Varela, A.; Paredes, J. I.; Guardia, L.; Villar-Rodil, S.; Munuera, J. M.; Díaz-
Gonzalez, M.; Fernandez-Sanchez, C.; Martínez-Alonso, A.; Tascon, J. M. D.
Achieving extremely concentrated aqueous dispersions of graphene flakes and
catalytically efficient graphene-metal nanoparticle hybrids with flavin
mononucleotide as a high-performance stabilizer. ACS Appl. Mater. Interfaces,
2015, 7, 10293−10307.
3. Ayan-Varela, M.; Villar-Rodil, S.; Paredes, J. I.; Munuera, J. M.; Pagan, A.;
Lozano-Perez, A. A.; Cenis, J. L.; Martínez-Alonso, A.; Tascon J. M. D.
Investigating the dispersion behavior in solvents, biocompatibility, and use as
support for highly efficient metal catalysts of exfoliated graphitic carbon nitride.
ACS Appl. Mater. Interfaces, 2015, 7, 24032−24045.
4. Paredes, J. I.; Munuera, J. M. Recent advances and energy-related applications of
high quality/chemically doped graphenes obtained by electrochemical exfoliation
methods. J. Mater. Chem. A, 2017, 5, 7228-7242.
5. Ayan-Varela, M.; Perez-Vidal, O.; Paredes, J. I.; Munuera, J. M.; Villar-Rodil, S.;
Díaz-Gonzalez, M.; Fernandez-Sanchez, C.; Silva, V. S.; Cicuendez, M.; Vila, M.;
Martínez-Alonso, A.; Tascon, J. M. D. Aqueous exfoliation of transition metal
dichalcogenides assisted by DNA/RNA nucleotides: catalytically active and
biocompatible nanosheets stabilized by acid−base interactions. ACS Appl. Mater.
Interfaces, 2017, 9, 2835−2845.
6. García-Dalí, S.; Paredes, J. I.; Munuera, J. M.; Villar-Rodil, S.; Martínez-Alonso,
A.; Tascón, J. M. D. An aqueous cathodic delamination route towards high quality
graphene flakes for oil sorption and electrochemical charge storage applications.
Chem. Eng. J., 2019, 372, 1226-1239.

ANEXO
406
7. García-Dalí, S.; Paredes, J. I.; Munuera, J. M.; Villar-Rodil, S.; Adawy, A.;
Martinez-Alonso, A.; Tascon, J. M. D. An aqueous cathodic exfoliation strategy
towards solution-processable and phase-preserved MoS2 nanosheets for energy
storage and catalytic applications. Enviado para su publicación.
8. Munuera, J. M.; Paredes, J. I.; Enterría, M.; Villar-Rodil, S.; Kelly, A. G.;
Nalawade, Y.; Coleman, J. N.; Rojo, T.; Ortiz-Vitoriano, N.; Martínez-Alonso, A.;
Tascón, J. M. D. High performance Na-O2 batteries and printed micro-
supercapacitors based on water-processable, biomolecule-assisted anodic graphene.
Enviado para su publicación.
Participaciones en congresos:
1. Díaz-González, M.; Fernández-Sánchez, C.; Ayán-Varela, M.; Paredes, J.I.;
Guardia, L.; Villar-Rodil, S.; Munuera, J. M.; Martínez-Alonso, A.; Tascón, J. M.
D. Flavin mononucleotide-stabilized graphene-metal nanoparticle hybrids with high
catalytic activity toward O2 electroreduction. ICREA Workshop on Graphene
Nanobiosensors, Barcelona, España, 25/05/2015. Póster.
2. Munuera, J. M.; Paredes, J.I.; Villar-Rodil, S.; Ayán-Varela, M.; Martínez-Alonso,
A.; Tascón, J. M. D. Towards High Quality Graphene Flakes by Electrochemical
Exfoliation of Graphite With Multifunctional Electrolytes. European Graphene
Forum, París, Francia, 01/06/2016. Comunicación oral, presentada por J. M.
Munuera
3. Ayán-Varela, M.; Paredes, J.I.; Guardia, L.; Villar-Rodil, S.; Munuera, J. M.; Díaz-
González, M.; Fernández-Sánchez, C.; Martínez-Alonso, A.; Tascón, J. M. D.
Preparation of Few-Layer Graphene and Transition Metal Dichalcogenide Flakes in
Aqueous Dispersion through Flavin Mononucleotide-Assisted Liquid-Phase
Exfoliation. ANM2016, Universidad de Aveiro, 25/07/2016. Comunicación oral,
presentada por M. Ayán-Varela.
4. Paredes, J. I.; Munuera, J. M.; Villar-Rodil, S.; Guardia, L.; Ayan-Varela, M.;
Pagan, A.; Aznar-Cervantes, S. D.; Cenis, J. L.; Martínez-Alonso, A.; Tascon, J. M.
D. Covalent functionalization of chemically exfoliated MoS2 nanosheets to control
their aqueous processability, catalytic activity, and biocompatibility. European
Graphene Forum, París, Francia, 28/04/2017. Comunicación oral, presentada por J.
M. Munuera.

ANEXO
407
5. Munuera, J. M.; Paredes, J. I.; Enterría, M.; Pagan, A.; Villar-Rodil, S.; Pereira, M.
F. R.; Martins, J. I.; Figueiredo, J. L.; Cenis, J. L.; Martínez-Alonso, A.; Tascon, J.
M. D. Just add water and table salt: electrochemical exfoliation of graphite in
sodium halide electrolytes towards high quality graphene for energy and
environmental applications. Graphene 2018. Dresden, Alemania, 26/06/2018.
Comunicación oral, presentada por J. M. Munuera.
6. Munuera, J. M.; Paredes, J. I.; Enterría, M.; Pagan, A.; Villar-Rodil, S.; Pereira, M.
F. R.; Martins, J. I.; Figueiredo, J. L.; Cenis, J. L.; Martínez-Alonso, A.; Tascon, J.
M. D. Just add water and table salt: new perspectives on the electrochemical
exfoliation of high quality graphene. Carbon 2018, Madrid, España, 02/07/2018.
Keynote, presentada por J. M. Munuera.
7. Munuera, J. M.; Paredes, J. I.; Enterría, M.; Pagan, A.; Villar-Rodil, S.; Pereira, M.
F. R.; Martins, J. I.; Figueiredo, J. L.; Cenis, J. L.; Martínez-Alonso, A.; Tascon, J.
M. D. Just add water and table salt: new perspectives on the electrochemical
exfoliation of high quality graphene. Grapchina 2018, Xi’an, China, 19/09/2018.
Keynote invitada, presentada por J. M. Munuera.
8. Munuera, J. M.; Paredes, J. I.; Enterría, M.; Villar-Rodil, S.; Kelly, A. G.;
Nalawade, Y.; Coleman, J. N.; Rojo, T.; Ortiz-Vitoriano, N.; Martínez-Alonso, A.;
Tascon, J. M. D. Graphene 2019, Roma, Italia, 25/06/2019. Comunicación oral,
presentada por J. M. Munuera.

ANEXO
408