Profitability Analysis of a Beef Production on WW-B. Dahl (Bothriochloa bladhii) Pasture under...
10
The Texas Journal of Agriculture and Natural Resource 20:42-51 (2007) 42 ©Agriculture Consortium of Texas Profitability Analysis of a Beef Production on WW-B. Dahl (Bothriochloa bladhii) Pasture under Different Combinations of Irrigation and Supplement Feeding Carlos Ortega-Ochoa Carlos Villalobos Carlton M. Britton David B. Wester Department of Natural Resources Management, Texas Tech University, Lubbock, TX 79409-2125 Don E. Ethridge David B. Willis Department of Agricultural and Applied Economics, Texas Tech University, Lubbock, TX 79409-2132 ABSTRACT A benefit-cost analysis was performed on a stocker cattle operation on WW-B. Dahl [Bothriochloa bladhii (Retz) S.T. Blake] pastures under six combinations of irrigation and supplement. Beef production cost and net revenue in LI-S (low irrigation-supplement feeding), LI-NS (low irrigation-no supplement), HI- S (high irrigation-supplement feeding), HI-NS (high irrigation-no supplement), NI-S (no irrigation-supplement feeding), and NI-NS (no irrigation-no supplement) production scenarios were estimated. In the summers of 2003 and 2004 the cost of production considered in this research included expenditures on electricity, fertilizer, irrigation equipment maintenance, labor, feed, interest on steer investment, veterinary supplies, and minerals. Steer buying and selling prices used to estimate revenues were the average U.S. weekly steer prices reported for the Texas Panhandle region. Beef production cost was lower in the NI-NS scenario in both years and net revenue over operating cost was higher in the NI-NS scenario in 2003 ($124/acre) and the NI-S scenario in 2004 ($90/acre). These data suggest that incorporation of WW-B. Dahl into the forage/beef production systems of the Texas High Plains may provide a feasible economic option under non-irrigated conditions. KEYWORDS: Old World bluestem, Bothriochloa bladhii, irrigation, whole cottonseed, cattle, cost, revenue. INTRODUCTION Agriculture in the Texas High Plains depends on underground water from the Ogallala aquifer. Depletion of the aquifer is shifting land use from irrigated cropping systems to non-irrigated systems. This change affects agricultural producers and the regional economy (Johnson et al., 2004). Past research has focused on agricultural
Transcript of Profitability Analysis of a Beef Production on WW-B. Dahl (Bothriochloa bladhii) Pasture under...
The Texas Journal of Agriculture and Natural Resource 20:42-51 (2007) 42 ©Agriculture Consortium of Texas
Profitability Analysis of a Beef Production on WW-B. Dahl (Bothriochloa bladhii) Pasture under Different Combinations of Irrigation and Supplement Feeding Carlos Ortega-Ochoa Carlos Villalobos Carlton M. Britton David B. Wester
Department of Natural Resources Management, Texas Tech University, Lubbock, TX 79409-2125
Don E. Ethridge David B. Willis
Department of Agricultural and Applied Economics, Texas Tech University, Lubbock, TX 79409-2132
ABSTRACT
A benefit-cost analysis was performed on a stocker cattle operation on WW-B. Dahl [Bothriochloa bladhii (Retz) S.T. Blake] pastures under six combinations of irrigation and supplement. Beef production cost and net revenue in LI-S (low irrigation-supplement feeding), LI-NS (low irrigation-no supplement), HI-S (high irrigation-supplement feeding), HI-NS (high irrigation-no supplement), NI-S (no irrigation-supplement feeding), and NI-NS (no irrigation-no supplement) production scenarios were estimated. In the summers of 2003 and 2004 the cost of production considered in this research included expenditures on electricity, fertilizer, irrigation equipment maintenance, labor, feed, interest on steer investment, veterinary supplies, and minerals. Steer buying and selling prices used to estimate revenues were the average U.S. weekly steer prices reported for the Texas Panhandle region. Beef production cost was lower in the NI-NS scenario in both years and net revenue over operating cost was higher in the NI-NS scenario in 2003 ($124/acre) and the NI-S scenario in 2004 ($90/acre). These data suggest that incorporation of WW-B. Dahl into the forage/beef production systems of the Texas High Plains may provide a feasible economic option under non-irrigated conditions.
KEYWORDS: Old World bluestem, Bothriochloa bladhii, irrigation, whole cottonseed, cattle, cost, revenue.
INTRODUCTION
Agriculture in the Texas High Plains depends on underground water from the
Ogallala aquifer. Depletion of the aquifer is shifting land use from irrigated cropping systems to non-irrigated systems. This change affects agricultural producers and the regional economy (Johnson et al., 2004). Past research has focused on agricultural
The Texas Journal of Agriculture and Natural Resource 20:42-51 (2007) 43 ©Agriculture Consortium of Texas
practices that will extend the economic life of the aquifer and protect the regional economy. Proposed solutions have included planting crops that use less water (Terrell and Johnson, 1999; Johnson et al., 2004) to implementing new forage/beef production systems (Philipp, 2004; Allen et al., 2005).
Ethridge et al. (1987; 1990) and Almas (1999) used linear programming models to analyze stocker enterprises in Old World bluestem and other pastures in the Texas High Plains. Computer software has been developed to economically evaluate stocker livestock enterprises in improved pastures (Williams et al., 1988; Kreuter et al., 1996). Economic analysis of net return per head and per area in Old World bluestem pasture under different stocking rates was performed by Phillips and Coleman (1995). Brorsen et al. (1983) developed a simulation model to estimate growth pattern and economic outcomes in stocker operations. Bransby (1989) analyzed profitability of bermudagrass pasture subjected to variable stocking rates with stockers. However, no studies have evaluated the profitability of producing beef specifically in WW-B. Dahl pastures under diverse irrigation conditions in the Texas High Plains. The objective of this study was to perform an economic analysis of a stocker operation in a WW-B. Dahl pasture.
MATERIAL AND METHODS
This analysis was conducted during two consecutive summers, 2003 and 2004, in Old World bluestem WW-B. Dahl [Bothriochloa bladhii (Retz) S.T. Blake] pastures located at the Craig Farm in Lubbock County, Texas. The study area has an elevation of 3,260 feet above sea level. Soils are mainly Estacado clay loam, Lofton clay loam, Portales loam, Randall clay, and Zita loam, with slopes from 0 to 1% (USDA, 1979). Climate is semiarid with mild winters and average annual temperatures of 57 °F. The minimum and maximum temperatures are 25 °F in January and 92 °F in July. Most precipitation occurs from April to October with an annual mean of 17 inches. Growing season is 208 days (National Weather Service, 2005). A 134 acre WW-B. Dahl pasture which was seeded in June of 1999 was used in these experiments. Prior to the experiment, pasture was fertilized each spring with ammonia sulfate at a rate of 120 lb/acre.
Six beef production scenarios were developed for alternative combinations of irrigation and feed supplement levels. These six combinations were as follow: High irrigation-Supplement (HI-S), High irrigation-No supplement (HI-NS), Low irrigation-Supplement (LI-S), Low irrigation-No supplement (LI-NS), No irrigation-Supplement (NI-S), and No irrigation-No supplement (NI-NS). Size of the beef production scenarios ranged from 20 to 23 acres. The amount of irrigation water applied to each treatment was HI at 1.0 inch every 10 days, LI at 1.0 inch every 20 days, and NI with zero water application. The feed supplement treatments consisted of 1.0 lb/head/day of whole cottonseed fed three times each week. Experimental animals used for the grazing trial during this study were 142 steers, with an average initial weight of 398 lbs (SD ± 67.5 lbs) in 2003 and 108 steers, with an average initial weight 473 lbs (SD ± 57.6 lbs) in 2004. Grazing trial duration was 88 and 84 days in 2003 and 2004, respectively. The average stocking rate was 425 and 399 lb/acre of liveweight in 2003 and 2004, respectively. Forage production cost and cattle purchases and the revenues from cattle sales were calculated in $/acre. The following procedure was applied to estimate beef production cost and net revenue over operating cost in each production scenario. Net
The Texas Journal of Agriculture and Natural Resource 20:42-51 (2007) 44 ©Agriculture Consortium of Texas
revenue per acre (P) was determined by subtracting expenditure per acre (E) from revenue per acre (R) [P = R – E]. Revenue per acre was calculated as final steer liveweight in lb/acre (W) times selling price in $/lb (K) [R = K * W], and expenditure per acre consisted of adding all operating costs per acre.
All information regarding production costs was collected from farm accounting records for both years. Collected information consisted of monthly electricity consumption, maintenance cost for the central pivot irrigation system, fertilizer cost, and labor cost. Labor cost was estimated from the average farm wage rate paid in the Oklahoma-Texas Panhandle during each year of study (USDA, 2004) times the amount (hours) of labor actually applied in handling the steers in the experiment. Electricity cost and labor cost were prorated according to the frequency and amount of irrigation in each production scenario. Maintenance cost and fertilizer cost were prorated from a whole farm basis to the area under study.
Steers used in the study were provided by a local stocker grower, but were valued at price market at the beginning of each grazing trial during the summer. Steer cost was estimated as the average weekly steer price reported for the Texas Panhandle region at the beginning of each summer trial (Cattle Fax, 2005) that most closely matched the initiation of the grazing trial times average initial weight. The 2003 grazing trial began July 7. Therefore, the price reported in the first week of July 2003 ($1.08/lb) for steers with average weight of 450 lbs was used. In 2004, the grazing trial began June 5 and the price reported in the first week of June 2004 ($1.30/lb) for steers with average weight of 450 lbs was used. Other expenses considered in this research included interest on steer purchases; feed cost applied to those scenarios in which whole cottonseed was fed, vet and medicine cost, and mineral cost. The interest cost on cattle was estimated from the average fixed interest rates on farm loans from the Agricultural Finance Databook (Federal Reserve Bank of Dallas, 2004) for feeder cattle loans for the 2 years respectively. In 2003 a 7.4% annual interest rate for a length of 88 days was applied to the steer purchase cost, while a 7.2% annual interest rate was applied for a length of 84 days in 2004. Whole cottonseed and vet supplies costs were prorated from the whole farm to the area of study.
To estimate revenue from cattle sales, similar procedures as used in steer buying were followed. It was assumed that steers were sold at the end of each grazing trial after 88 days (2003) and 84 days (2004) of summer grazing. A steer price reported for sales was the market price for the week of assumed sale. In 2003, the trial ended on October 4 and the steer price reported by the US weekly report in the first week of October 2003 ($1.07/lb) was used for steers with an average weight of 550 lbs. The second year the grazing trial ended August 28. The price reported in the last week of August for that year and for steers weighting an average of 650 lbs ($1.23/lb) was used as the selling price. Estimated revenues for the selected years were also used to analyze the effect on net revenue over operating costs at several price differential levels.
RESULTS AND DISCUSSION
Summer 2003 had relatively low rainfall while 2004 was one of the wettest years. In summer 2003, total water availability (rainfall plus irrigation) was 7.5 inches, 4.5 inches, and 0.5 inches for HI, LI and NI scenarios respectively. In summer 2004,
The Texas Journal of Agriculture and Natural Resource 20:42-51 (2007) 45 ©Agriculture Consortium of Texas
total water availability was 15.5, 12.5, and 8.5 inches for HI, LI, and NI scenarios, respectively.
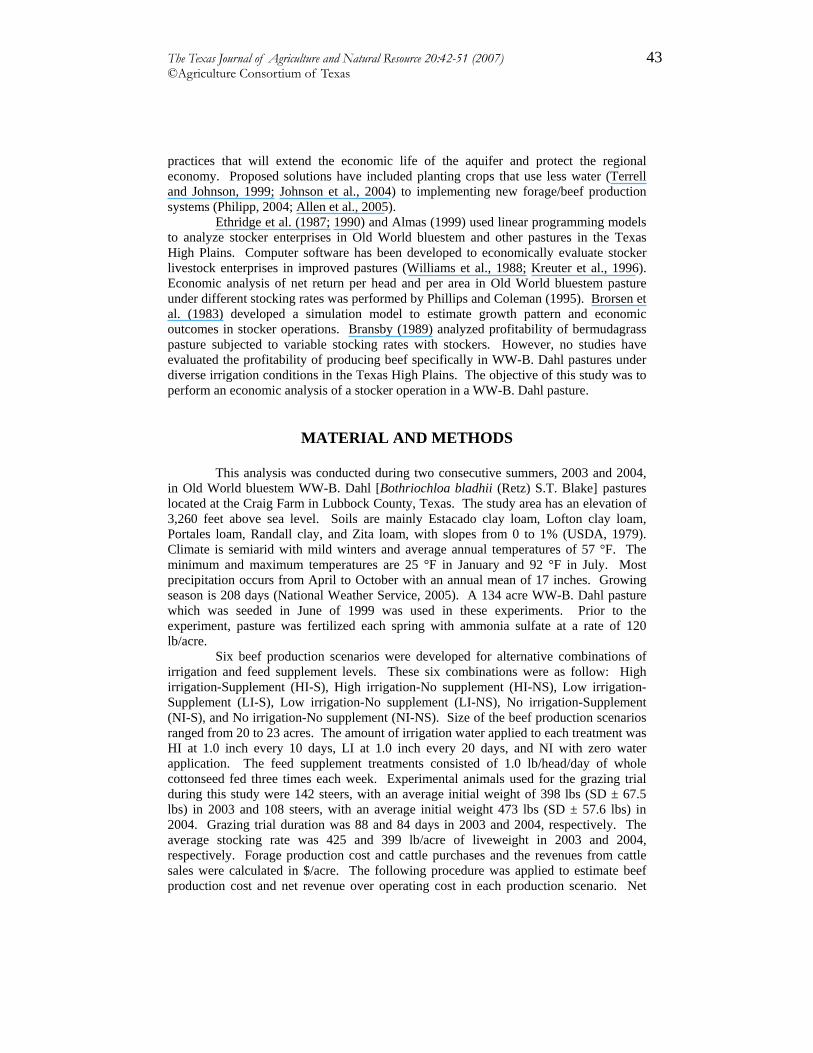
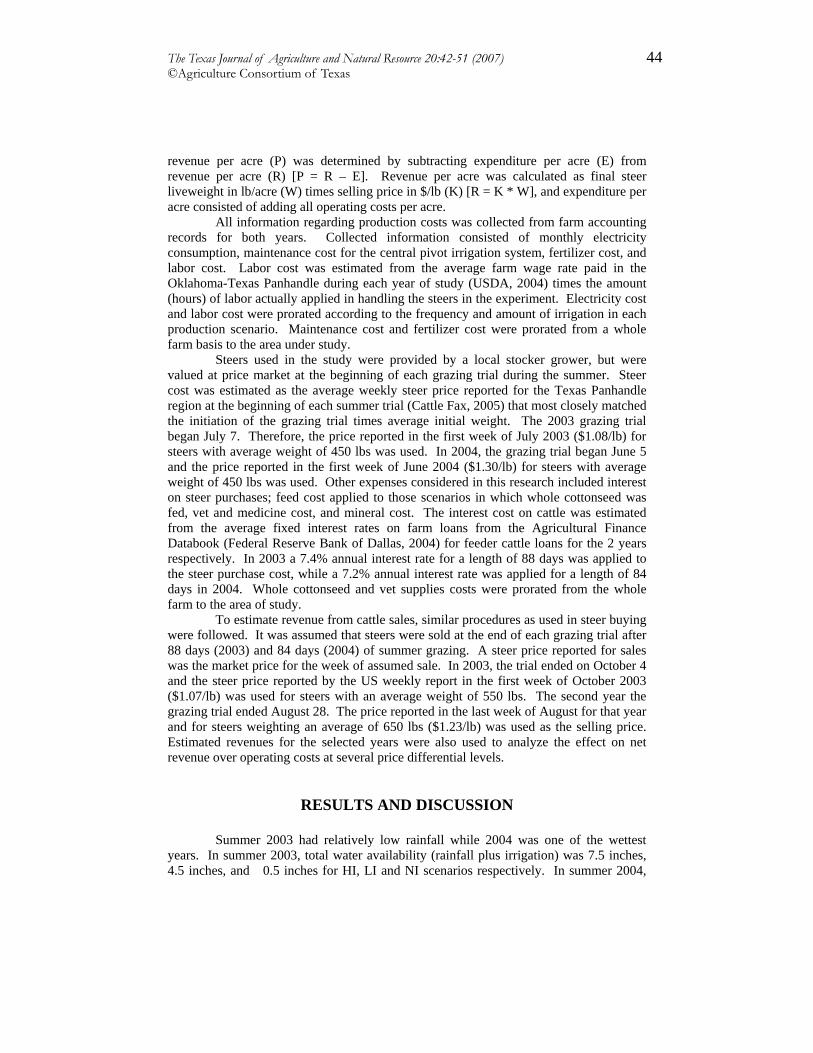
Beef production cost varied across production scenarios in 2003 (Figure 1). The lowest beef production cost was $0.28/lb in the NI-NS scenario. Non-irrigated production cost per lb of beef without supplement was $0.14 lower than NI-S scenario. Additionally, NI-NS beef production cost was $0.54 lower than the average production cost in the four irrigation scenarios. Higher revenue over operating cost per acre corresponded to the lower beef production costs (Figure 2 and Table 1). Higher revenue over operating cost per acre also occurred in the NI-NS scenario, which was 17% higher than in the NI-S scenario. Compared to the average net revenue in irrigation scenarios, it was $51.8/acre higher in 2003. Several factors may account for this outcome during 2003. First, operating costs in the irrigated and supplemented scenarios were high because of energy and supplement use (Table 1); in the LI-S and HI-S scenarios, energy plus supplement costs were $37.34 and $48.52 of the total operating costs, representing 46 and 53% of costs, respectively. In addition, in LI-NS and HI-NS, energy cost accounted for $22.11 and $36.58 representing 34 and 46%, of total costs respectively.
0.0
0.1
0.2
0.3
0.4
0.5
0.6
0.7
LI-S LI-NS HI-S HI-NS NI-S NI-NS
Beef production scenario
Bee
f pro
duct
ion
cost
($/lb
)
Figure 1. Beef production cost ($/lb) in six combinations of irrigation-supplement scenarios in a WW-B. Dahl (Bothriochloa bladhii) pasture under summer grazing in 2003. LI-S = (low irrigation–supplement), LI-NS = (low irrigation–no supplement), HI-S = (high irrigation-supplement), HI-NS = (high irrigation-no supplement), NI-S = (no irrigation-supplement), and NI-NS = (no irrigation-no supplement).
The Texas Journal of Agriculture and Natural Resource 20:42-51 (2007) 46 ©Agriculture Consortium of Texas
0
20
40
60
80
100
120
140
LI-S LI-NS HI-S HI-NS NI-S NI-NS
Beef production scenario
net r
even
ue o
ver o
pera
ting
cost
($/a
cre)
Figure 2. Net revenue per acre ($/acre) in six combinations of irrigation-supplement scenarios in a WW-B. Dahl (Bothriochloa bladhii) pasture grazed by steers in summer 2003. LI-S = (low irrigation–supplement), LI-NS = (low irrigation–no supplement), HI-S = (high irrigation-supplement), HI-NS = (high irrigation-no supplement), NI-S = (no irrigation-supplement), and NI-NS = (no irrigation-no supplement).
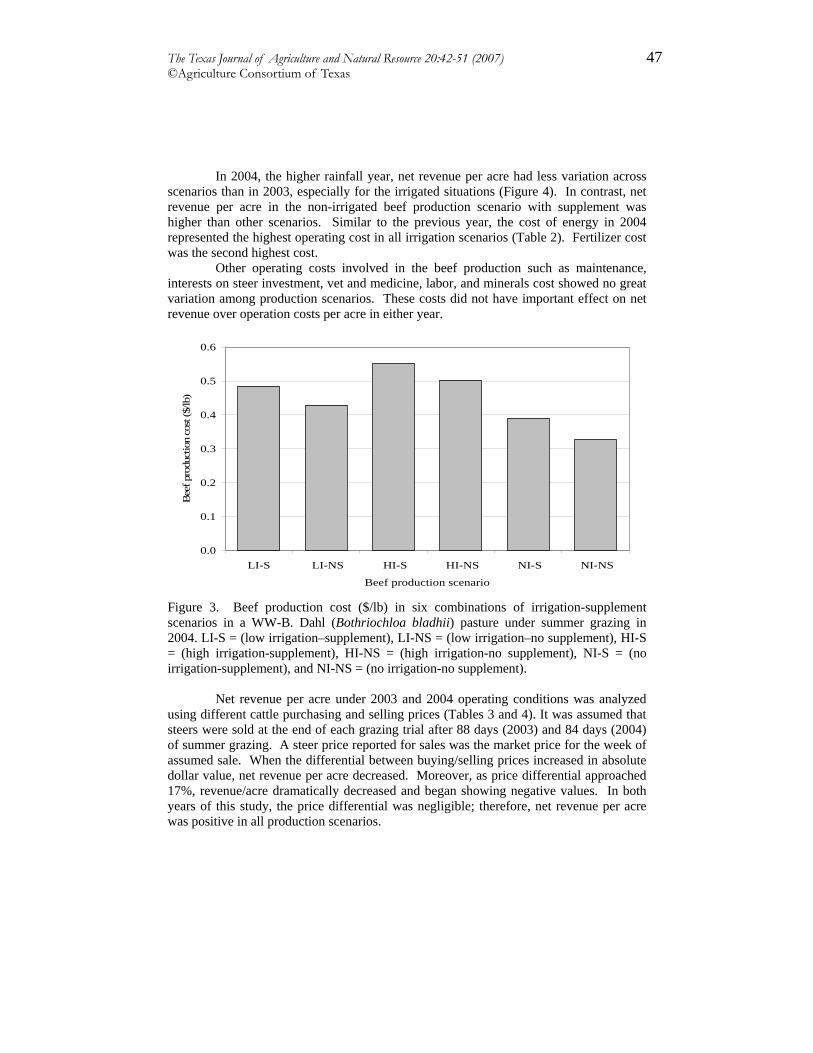
In the 2004 experiment, beef production costs are shown in Figure 3. Beef production cost in the NI-NS scenario was the lowest; it was $0.06/lb lower than the NI-S scenario and on average $0.16/lb lower than the HI-S, HI-NS, LI-S and LI-NS scenarios.
Table 1. Beef production costs and revenue in 2003 in six combinations of irrigation-supplement scenarios in a WW-B. Dahl (Bothriochloa bladhii) pasture grazed by steers in summer.
Beef production scenario Item LI-S LI-NS HI-S HI-NS NI-S NI-NS
--------------------------------$/acre----------------------------------- Energy 21.77 22.11 35.75 36.58 7.60 6.74 Fertilizer 15.37 15.37 15.37 15.37 15.37 6.22 Whole cottonseed 15.57 0.00 12.77 0.00 18.10 0.00 Interest in steer cost 8.43 8.29 7.26 7.84 9.90 8.33 Maintenance 6.28 6.28 6.28 6.28 6.28 6.28 Vet and medicine 6.47 6.05 5.53 5.94 7.83 6.44 Labor 6.28 5.10 7.69 6.84 4.57 1.87 Minerals 0.79 0.89 0.81 0.87 1.15 0.94 Total operating cost 80.96 64.09 91.46 79.72 63.20 36.82 Net revenue 78.81 67.06 80.21 61.93 105.82 123.87
LI-S = (low irrigation–supplement), LI-NS = (low irrigation–no supplement), HI-S = (high irrigation-supplement), HI-NS = (high irrigation-no supplement), NI-S = (no irrigation-supplement), and NI-NS = (no irrigation-no supplement).
The Texas Journal of Agriculture and Natural Resource 20:42-51 (2007) 47 ©Agriculture Consortium of Texas
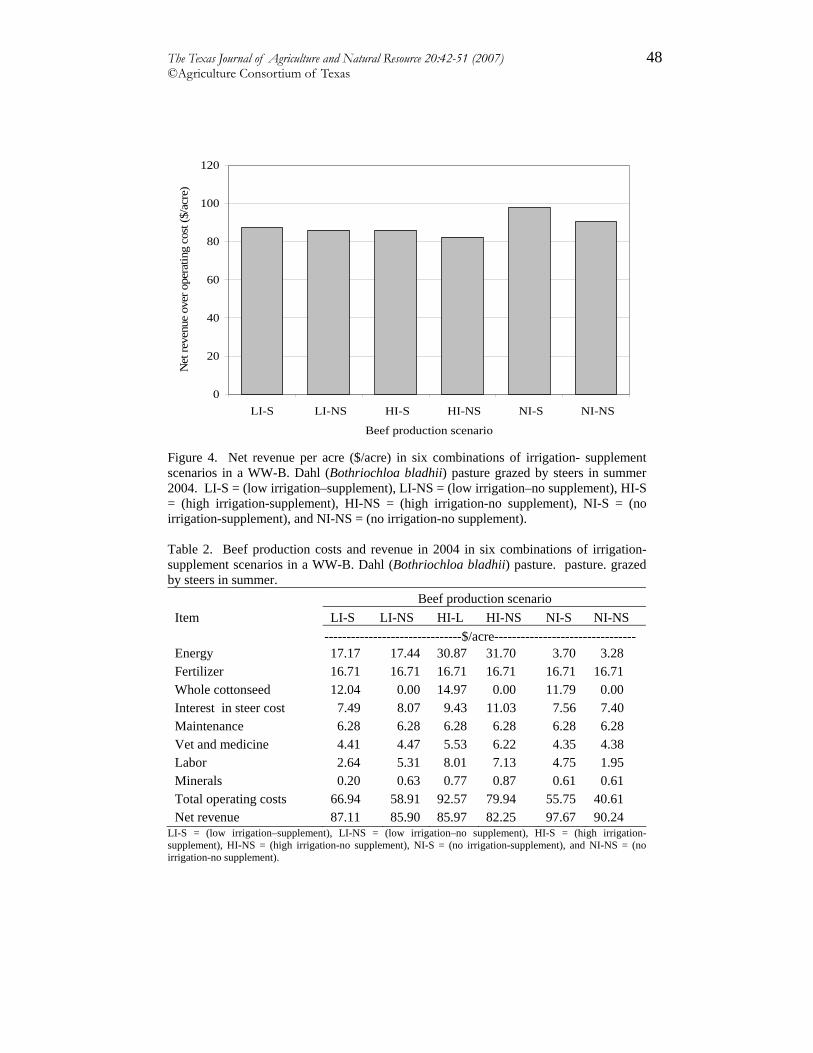
In 2004, the higher rainfall year, net revenue per acre had less variation across
scenarios than in 2003, especially for the irrigated situations (Figure 4). In contrast, net revenue per acre in the non-irrigated beef production scenario with supplement was higher than other scenarios. Similar to the previous year, the cost of energy in 2004 represented the highest operating cost in all irrigation scenarios (Table 2). Fertilizer cost was the second highest cost.
Other operating costs involved in the beef production such as maintenance, interests on steer investment, vet and medicine, labor, and minerals cost showed no great variation among production scenarios. These costs did not have important effect on net revenue over operation costs per acre in either year.
0.0
0.1
0.2
0.3
0.4
0.5
0.6
LI-S LI-NS HI-S HI-NS NI-S NI-NS
Beef production scenario
Bee
f pro
duct
ion
cost
($/lb
)
Figure 3. Beef production cost ($/lb) in six combinations of irrigation-supplement scenarios in a WW-B. Dahl (Bothriochloa bladhii) pasture under summer grazing in 2004. LI-S = (low irrigation–supplement), LI-NS = (low irrigation–no supplement), HI-S = (high irrigation-supplement), HI-NS = (high irrigation-no supplement), NI-S = (no irrigation-supplement), and NI-NS = (no irrigation-no supplement). Net revenue per acre under 2003 and 2004 operating conditions was analyzed using different cattle purchasing and selling prices (Tables 3 and 4). It was assumed that steers were sold at the end of each grazing trial after 88 days (2003) and 84 days (2004) of summer grazing. A steer price reported for sales was the market price for the week of assumed sale. When the differential between buying/selling prices increased in absolute dollar value, net revenue per acre decreased. Moreover, as price differential approached 17%, revenue/acre dramatically decreased and began showing negative values. In both years of this study, the price differential was negligible; therefore, net revenue per acre was positive in all production scenarios.
The Texas Journal of Agriculture and Natural Resource 20:42-51 (2007) 48 ©Agriculture Consortium of Texas
0
20
40
60
80
100
120
LI-S LI-NS HI-S HI-NS NI-S NI-NS
Beef production scenario
Net
reve
nue
over
ope
ratin
g co
st ($
/acr
e)
Figure 4. Net revenue per acre ($/acre) in six combinations of irrigation- supplement scenarios in a WW-B. Dahl (Bothriochloa bladhii) pasture grazed by steers in summer 2004. LI-S = (low irrigation–supplement), LI-NS = (low irrigation–no supplement), HI-S = (high irrigation-supplement), HI-NS = (high irrigation-no supplement), NI-S = (no irrigation-supplement), and NI-NS = (no irrigation-no supplement). Table 2. Beef production costs and revenue in 2004 in six combinations of irrigation-supplement scenarios in a WW-B. Dahl (Bothriochloa bladhii) pasture. pasture. grazed by steers in summer.
Beef production scenario Item LI-S LI-NS HI-L HI-NS NI-S NI-NS -------------------------------$/acre-------------------------------- Energy 17.17 17.44 30.87 31.70 3.70 3.28 Fertilizer 16.71 16.71 16.71 16.71 16.71 16.71 Whole cottonseed 12.04 0.00 14.97 0.00 11.79 0.00 Interest in steer cost 7.49 8.07 9.43 11.03 7.56 7.40 Maintenance 6.28 6.28 6.28 6.28 6.28 6.28 Vet and medicine 4.41 4.47 5.53 6.22 4.35 4.38 Labor 2.64 5.31 8.01 7.13 4.75 1.95 Minerals 0.20 0.63 0.77 0.87 0.61 0.61 Total operating costs 66.94 58.91 92.57 79.94 55.75 40.61 Net revenue 87.11 85.90 85.97 82.25 97.67 90.24
LI-S = (low irrigation–supplement), LI-NS = (low irrigation–no supplement), HI-S = (high irrigation-supplement), HI-NS = (high irrigation-no supplement), NI-S = (no irrigation-supplement), and NI-NS = (no irrigation-no supplement).
The Texas Journal of Agriculture and Natural Resource 20:42-51 (2007) 49 ©Agriculture Consortium of Texas
These results agree with Peel (2000) cited by Phillips et al. (2003) and Bransby (1989), which concluded that income comes from initial steer weight and weight gained during the grazing period. In addition, during summer 2003 and 2004, buying and selling prices registered in the Texas Panhandle region were considered high. Ethridge et al. (1987) recommended that, under high buying and high selling price, the most profitable alternative is to stock steers with average initial weight of 450 lbs from June to August in Old World bluestem pasture. In this study all of these conditions coincided and results strongly supported by the Ethridge et al. (1987) findings.
Table 3. Net revenue over operation costs per acre ($/acre) in selected buying and selling prices in six combinations of irrigation-supplement scenarios in operation conditions in 2003 in a WW-B. Dahl (Bothriochloa bladhii) pasture grazed by steers in summer. Beef production scenario
Steer price ($/lb) LI-S LI-NS HI-S HI-NS NI-S NI-NSBuy Sell Diff ------------------------------Net revenue ($/acre)---------------------0.99 0.84 0.19 -14.64 -19.12 -7.52 -23.41 -1.48 32.591.08 1.07 0.01 78.78 67.03 80.18 61.9 105.77 123.821.09 0.97 0.12 18.43 10.16 25.1 6.45 35.95 70.871.13 0.93 0.20 -23.38 -29.92 -12.16 -32.15 -12.71 23.95
LI-S = (low irrigation–supplement), LI-NS = (low irrigation–no supplement), HI-S = (high irrigation-supplement), HI-NS = (high irrigation-no supplement), NI-S = (no irrigation-supplement), and NI-NS = (no irrigation-no supplement). Buying price is based on 450 lbs steer liveweight. Selling price is based on 550 lbs steer liveweight. LI-S low irrigation–supplement Table 4. Net revenue over operation cost per acre ($/acre) in selected steer buying and selling prices in six combinations of irrigation-supplement scenarios in operation conditions in 2004 in a WW-B. Dahl (Bothriochloa bladhii) pasture grazed by steers in summer. Beef production scenario
Steer price ($/lb) LI-S LI-NS HI-S HI-NS NI-S NI-NS Buy Sell Diff ------------------------------Net revenue ($/acre)--------------------- 1.00 0.81 0.15 -16.98 -17.43 -40.12 -49.52 -3.83 -2.36 1.04 0.91 0.13 21.84 22.10 15.24 6.92 34.80 33.71 1.07 0.99 0.01 51.76 52.56 43.16 40.37 64.57 61.50 1.12 0.94 0.20 7.40 5.78 -11.86 -22.06 20.03 18.70 1.30 1.23 0.07 97.68 96.33 96.40 92.23 109.52 101.19
LI-S = (low irrigation–supplement), LI-NS = (low irrigation–no supplement), HI-S = (high irrigation-supplement), HI-NS = (high irrigation-no supplement), NI-S = (no irrigation-supplement), and NI-NS = (no irrigation-no supplement). Buying price is based on 450 lbs steer liveweight. Selling price is based on 650 lb steer liveweight.
Overall, these results show that stocker steers grazing on non-irrigated WW-B. Dahl provided higher net returns than irrigated in this experiment, during both 2003, a dry year, and 2004, a wet year. Further, comparing the net returns (NI-NS) from this experiment ($124/acre and $90/acre) to competing crop enterprises for land and water, Allen et al (2005) reported net revenues from irrigated cotton in the region of $125/acre for the 1997-2002 period and Sides et al (2005) reported net revenue above operating costs of $96.09/acre without government program payment and $127.27/acre with
The Texas Journal of Agriculture and Natural Resource 20:42-51 (2007) 50 ©Agriculture Consortium of Texas
government payments for non-irrigated cotton. Additionally, NI-NS system conserves groundwater and is less management and labor intensive than some competing alternatives.
CONCLUSIONS
Results from the economic analysis suggest that under current energy prices, the summer grazing of yearling steers on irrigated WW-B. Dahl pasture with the irrigation levels used is not profitable. In both wet and dry years irrigation provides insufficient additional beef gain revenue to cover the additional cost of irrigation. Moreover, under the current revenue and cost structure confronting cattle producers, irrigating WW-B. Dahl pasture will become increasingly unprofitable if the groundwater table continues to drop in the Texas High Plains. However, summer grazing on dryland WW-B. Dahl pasture is becoming very competitive with irrigated and dryland cotton production. The assessment of supplemental feeding whole cottonseed as an energy supplement to enhance beef production is not definitive from the results of this experiment since the supplement resulted in higher net revenue in one (the wet) year and less in the other (dry) year. The economic efficacy of the research recommendations are not impacted by variations in steer purchase and selling price under normal variation in their price spread.
WW-B. Dahl non-irrigated pasture combined with stocker enterprises appears to be generally competitive with non-irrigated cotton, the dominant field crop in the region. This would be particularly true if the government price support level for cotton is decreased in the future. The NI-NS beef enterprise offers a viable alternative; as lower-value cropping systems move more to a non-irrigated status, releasing limited groundwater for higher-value enterprises. Additional research on beef enterprise grazing within a production systems framework is required to further define these opportunities.
REFERENCES
Allen, V.G., C.P. Brown, R. Kellison, E. Segarra, T. Wheeler, P.A. Dotray, J.C.Conkwright, C.J. Green, and V. Acosta-Martinez. 2005. Integrating cotton and beef production to reduce water withdrawal from the ogallala aquifer in the Southern High Plains. Agron. J. 97:556-567.
Almas, L.K. 1999. Economic evaluation for old world bluestems in the Texas Panhandle. Dissertation. Texas Tech University. Lubbock, TX. 134 p.
Bransby, D.I. 1989. Justification for grazing intensity experiments: economic analysis. J. Range Manage. 42:425-430.
Brorsen, B.W., O.L. Walker, G.W. Horn, and T.R. Nelson. 1983. A stocker cattle growth simulation model. S. J. Agr. Econ. 15:115-122.
Cattle Fax. 2005. Weekly US average price report in steers in selected live weight. Available: www.cattle·fax.com. [2005, July 15].
Ethridge, D.E., J.D. Nance, and B.E. Dahl. 1987. Integration of cattle production and marketing strategies with improved pastures and native range. J. Range Manage. 40:199-202.

The Texas Journal of Agriculture and Natural Resource 20:42-51 (2007) 51 ©Agriculture Consortium of Texas
Ethridge, D.E., P. Zhang, B.E. Dahl, R.T. Ervin, and J. Rushemeza. 1990. Cattle ranching production and marketing strategies under combined price and weather risks. West. J. Agr. Econ. 15:175-185.
Federal Reserve Bank of Dallas. 2004. Agricultural finance databook. Federal reserve statistical release. Avaliable online at www.federalreserve.gov/releases/e15/20041231/afdr_c4.htm. [2005, Dec 10].
Johnson, J., P. Johnson, E. Segarra, and D. Willis. 2004. Water conservation policy alternatives for the Texas Southern High Plains. Beltwide Cotton Conferences Proceedings. National Cotton Council, Memphis, TN. CD-ROM.
Kreuter, U.P., R.C. Rowan, J.R. Conner, J.W. Stuth, and W.T. Hamilton. 1996. Decision support software for estimating the economic efficiency of grazing production. J Range Manage. 49:464-469.
National Weather Service. 2005. Available: www.srh.noaa.gov/lub/climat. [2005, March 18].
Philipp, D., 2004. Water use efficiency and nutritive value of three old world bluestems.(Bothriochloa spp) Dissertation. Texas Tech University. Lubbock, TX. 195 p.
Phillips, W.A., and S.W. Coleman. 1995. Productivity and economic return of three warm season grass stocker systems for the Southern Great Plains. J. Prod. Agric. 8:334-339.
Phillips, W.A., Pas, B.K. Northup, H.S. Mayeux, and J.A. Daniel. 2003. Performance and economic returns of stocker cattle on tallgrass prairie under different grazing management strategies. The Professional Animal Scientist. 19:416-423.
Sides, G., P. Johnson, and D. Schmidt. 2005. Profitability of cotton production in the Texas High Plains 1996-2004. Beltwide Cotton Conferences Proceedings. National Cotton Council. Memphis, TN.
Terrell, B.L., and P.N. Johnson. 1999. Economic impact of the depletion of the Ogallala aquifer: a case study of the Southern High Plains of Texas. Abstract. Amer. J. Agr. Econ. 81:1302.
United States Department of Agriculture.1979. Soil Survey of Lubbock County Texas.. Soil Conservation Service in cooperation with Texas Agricultural Experimental Station.
United States Department of Agriculture. 2004. Farm and ranch labor report. National Agricultural Statistics Service. USDA-NASS. Available online at www.nass.usda.gov/tx/labor7.htlm. [2005, September 3].
Williams, J.R., O.H., Buller, G.J., Dvorak, and H.L. Manges. 1988. A microcomputer model for irrigation system evaluation. S. J. Agr. Econ. 145-151.
Young K.B., and J.M. Coomer. 1979. Projected use of groundwater for irrigation in the Texas High Plains. West. J.Agr. Econ. 4:143-152.


![4YZ_R SfZ]Ud ScZUXV Re AR_X`_X WRTV `WW dZeV](https://static.fdokumen.com/doc/165x107/63379a15a5ba10dda701a5e7/4yzr-sfzud-sczuxv-re-arxx-wrtv-ww-dzev.jpg)


![7Rc^Vcd TR]] `WW ac`eVde dRj SRee]V h`_ hRc ` - Daily ...](https://static.fdokumen.com/doc/165x107/631e6ffe85e2495e150fea8f/7rcvcd-tr-ww-acevde-drj-sreev-h-hrc-daily-.jpg)