Profit Share and Returns on Capital Stock in Italy: the Role of Privatisations behind the Rise of...
38
CEP Discussion Paper No 671 January 2005 Profit Share and Returns on Capital Stock in Italy: the Role of Privatisations Behind the Rise of the 1990s Roberto Torrini
Transcript of Profit Share and Returns on Capital Stock in Italy: the Role of Privatisations behind the Rise of...

CEP Discussion Paper No 671
January 2005
Profit Share and Returns on Capital Stock in Italy:
the Role of Privatisations Behind the Rise of the 1990s
Roberto Torrini
Abstract Profit share in Italy has been growing between the mid-1970s and the mid-1990s, remaining stable at historically high levels since than. After dropping in the first half of the 1070s, owing to an unprecedented rapid rise in wages, profit share started to recover. The rise during the 1980s involved the entire business sector and was part of this recovery process. During the 1990s profit share continued to grow on average, but with large cross-sector differences. Profit share in manufacturing, which is more exposed to international competition, declined, together with the returns on capital stock, but increased in the rest of the business sector. We show that the better performance of the non-manufacturing business sector is mainly due to the industries most affected by the large-scale privatisations and restructuring of State-owned companies that began in the first half of the 1990s. They led to a rapid growth in total factor productivity and a deceleration in wages, without a major impact on the market power of privatised companies, even those previously in the position of incumbent monopolists. Our evidence for Italy thus strongly supports the hypothesis that profit share growth during the 1990s, which was also observed in other countries, was mainly due to a redistribution of rents rather than to biased technological change. Keywords: factor shares, returns on capital, privatisations JEL: E25, E22, E24, L32, L33, J30 This paper was produced as part of the Centre’s Labour Markets Programme. The Centre for Economic Performance is financed by the Economic and Social Research Council. Acknowledgements I benefited from many discussions with Andrea Brandolini. I also thank Riccardo Cristadoro, Marco Magnani, Alan Manning, and the participants at the Workshop on “Distribuzione del reddito e crescita in Italia” organised by Politica Economica, 4 June 2004, Bologna, Italy. The views expressed here do not necessarily reflect those of the Bank of Italy. Roberto Torrini is an economist at the Research Department of the Bank of Italy. He is also a member of the Centre for Economic Performance, London School of Economics. Published by Centre for Economic Performance London School of Economics and Political Science Houghton Street London WC2A 2AE All rights reserved. No part of this publication may be reproduced, stored in a retrieval system or transmitted in any form or by any means without the prior permission in writing of the publisher nor be issued to the public or circulated in any form other than that in which it is published. Requests for permission to reproduce any article or part of the Working Paper should be sent to the editor at the above address. © R. Torrini, submitted 2004 ISBN 0 7530 1811 X

1
1. Introduction
The relative stability of factor shares is one of the stylized facts of economic growth
described by Kaldor and customarily quoted in any macroeconomic textbook. However,
factor shares show rather sharp movements, at least in the short and medium run, especially
when analysed at the industry level. This is not a novelty. Solow (1958), looking at
movements of the wage share in several sectors of the American economy in the first half of
the 19th century, raised doubts about the soundness of Kaldor’s stylised fact. Recently,
several authors, starting with Blanchard’s works (Blanchard, 1997 and 1998), have found a
new interest in exploring the remarkable movements of factor shares observed since the early
1970s in several developed economies. In fact, after rising in the 1970s, the labour share
gradually declined throughout the 1980s, dropping to historically low levels during the 1990s
in several economies. Part of the interest of this analysis is due to the fact that these
movements seem to have involved principally the continental European countries, while the
USA, the UK and Canada have experienced greater stability of the factor shares (Blanchard,
1997)1.
A widely accepted explanation for the fall in the profit share during the 1970s is the
unprecedented wage-push episode which occurred in many European economies in the first
half of the decade, together with the first oil shock and the slowdown in total factor
productivity growth. There is much less consensus on the interpretation of the recovery of the
80s and of the sharp rise in profit share observed during the 1990s. In fact, the profit share
has reached historically high levels, while, despite widespread wage moderation, capital
intensity is still above the levels preceding the decline in the profit share.
Caballero and Hammour (1998) have advanced the hypothesis that the elasticity of
substitution between capital and labour would be lower than one in the short run because of a
putty clay structure of capital, and substantially higher than one in the long term. This could
explain both the increase in capital intensity and the reason why the wage-push of the
seventies brought about first an increase in the share of labour and then a drop. This
explanation, however, relies on a very long adjustment process to explain movements in
1 Sylvain (1998) finds similar results, even if in his analysis the movements of the UK labour share look much more like other European countries, once the oil sector is removed. Similar results are found in Cotis and Rignols (1998), for France, Germany and the US, Caballero and Hammour (1998) for France and the US, and Mihoubi (1999) for France and Germany.

2
factor shares that have taken place more than 20 years after the original wage-push.
Moreover, it is necessary to assume a long-run elasticity of substitution that is substantially
higher than one, which is at odds with most available evidence (Blanchard, 2000; Rowthorn,
1999).
Alternatively, others have pointed to non-neutral technical progress and/or institutional
changes, as having modified the relationship between relative factor prices, the capital-labour
ratio and factor shares. In particular, institutional changes could have spurred a redistribution
of rents between capital and labour, changing both capital intensity and factor shares, for any
given relative price of capital and labour.
The Italian case is of extreme interest for evaluating the merits of the institutional
explanation. Italy shares the same pattern observed in other continental European economies,
with the profit share gradually recovering in the 1980s after the sharp decline of the 1970s,
and then growing rapidly in the early 1990s. Moreover, major reforms of both the labour and
goods markets were undertaken in the 1990s. The risk of default of the public debt at the
beginning of the decade spurred a large-scale programme of privatisations, comparable in
scope to the privatisations of Thatcher’s governments in Britain. One of the most severe
recessions of the post-war period favoured a drastic reform of the centralised wage-setting
mechanism and, later on, the reform of labour market regulations.
To single out the role of institutional changes, we analyse the dynamics of factor shares
and returns on capital at the industry level. We exploit the different exposition of various
industries to structural reforms to identify their role in shaping the evolution of income
distribution across factors of production.
We first analyse factor shares in the whole economy, showing that aggregate analysis
can lead to unwarranted conclusions about the underlying explanations. First, both the levels
and the dynamics of factor shares are sensitive to the methods used to correct for self-
employed income. We obtain different results according to the wage we impute to self-
employed workers (the average level of the economy or the average wage paid in the sectors
they work in). Second, we show that between 1970 and 2003 a large part of the increase in
aggregate profit share is due to the increase in the incidence of dwelling services on value
added at current prices, caused by an increase in the relative price of housing. As this price
arguably reflects rents more than factor price movements, it seems better to abstract from this
component of value added. With these caveats in mind, focusing the analysis on the sole
business sector net of dwellings, and correcting for self-employment income at the
3
appropriate industry level, it still holds true that the profit share has increased since the
seventies, accelerating in the first half of the nineties.
Once we move to analyse income distribution at the industry level, we show that during
the nineties, unlike the previous two decades, the manufacturing sector followed a divergent
pattern. The capital share in this industry, which is more exposed to international competition
and less affected by the privatisation process, declined, especially compared with the late
1980s; returns on invested capital has fallen to very low levels; total factor productivity has
grown at extremely low rates since the mid-1990s. In the rest of the business sector, and
especially in industries where privatisations have played an important role, both profit share
and returns on capital have grown in the 1990s, and total factor productivity has accelerated,
outperforming the manufacturing sector for the first time in the last 30 years.
These conflicting developments seem to corroborate explanations of movements of
factor shares during the 1990s based on institutional changes, as the competing hypothesis of
non-neutral technical change does not seem to account for such marked industry variability.
Unless we assume that technical change affected the different industries in very different
ways, it seems easier to explain the observed dynamics of functional income distribution with
the idiosyncratic impact of institutional changes on sectors previously characterized by
different degrees of State intervention, both in terms of ownership and regulation. Other
factors, such as the remarkable wage moderation achieved in Italy with the 1992 agreement
between the social partners, have certainly favoured the increase in the aggregate profit share,
at least in the short and medium run, but cannot explain the different dynamics observed
across sectors.
The paper is organized as follows. In section 2 we briefly review some theoretical
results as a framework for interpreting the dynamics of factor shares; in section 3 we describe
the aggregate and sectoral evolution of factor shares, briefly discussing some methodological
issues, and present an accounting exercise, which breaks up factor share dynamics in the
business sector and manufacturing according to the evolution of its accounting determinants.
We then analyse in section 4 the evolution of returns on capital at the industry level. In
section 5 we link the evidence of the previous sections to the institutional transformation of
the nineties. Section 6 concludes.
4
2. Factor-share movements: some theoretical references
Movements in factor shares can be both due to changes in the relative price of capital
and labour, if the elasticity of substitution is different from one, and factors that modify the
relationship between factor shares, capital intensity and production factor prices. As shown
by Bentolila and Saint-Paul (2003), if firms operate along labour demand there is a one-to-
one relation between factor shares and the capital-output ratio (what Bentolila and Saint-Paul
call the share-capital schedule), which in turn depends on the relative prices of production
factors. If capital normally grows at the same rate as labour-augmenting technical progress,
any change in the capital-output ratio will reflect changes in the relative price of labour in
efficiency units, so that the capital-output ratio can be used to summarize the impact of factor
prices on factor shares (the impact is nil with an elasticity of substitution equal to one). Any
movements of factor shares that are not explained by a change in the capital-output ratio
cannot be due to production factor prices but have to be explained by factors which shift the
share-capital schedule or put the economy off this schedule.
To illustrate this point let us first assume that real wages are set along the marginal
revenue function. In this case, with imperfect competition, the wage share can be written as:
nynw pfpynR
Rn
Rw
Rwn
pywnq ,
''
111 µεη
=
−==== , (1)
where ( )ηµ 11−= is the Lerner index and ny ,ε is the elasticity of output with respect to
labour inputs. In the case of a CES production function:
( )111 −−−
+=
σσ
σσ
σσ
bkznay , (2)
equation (1) can be easily rewritten as a function of the capital-output ratio:

5
( )( ) ( )
−=
+−=
+=
+=
−
−−
−
−−
−−−1
11
1
11
111
111σσ
σσ
σσ
σσ
σσ
σσ
σσ
σσ
µµµµykb
bkzna
kbbkzna
znakzn
abqw
(3)
As equation (3) shows, the labour share can change in response to movements in the
capital-output ratio driven by factor prices or due to changes in the efficiency of capital, b, or
in the mark-up µ . The last two factors shift the relationship between the wage share and
capital-output ratio and thus between the wage share and relative price of labour and capital.
In the case of a Cobb-Douglas production function (elasticity of substitution equal to one),
the wage share can only move in response to technological changes (parameter α ) or mark-
up adjustments, as the elasticity of output with respect to labour is constant and does not
depend on the capital output ratio:
( ) αεαα =⇒= −nyznky ,
1 , and µα=wq (4)
If wages are set in a bargaining process, equations (3) and (4) still hold if the bargaining
takes place according to a right to manage or a monopolist union model, where employment
is set along the labour demand. In such a case any change in the bargaining power of workers
will drive movements in the wage share along the share-capital schedule; if, however, firms
and trade unions bargain over wages and employment, as in the efficient bargaining setting,
the wage share turns out to be (Balducci and Staffolani, 2001, Blanchard and Giavazzi,
2003):
β
µεβ+
+=
1,ny
wq , (5)
so that the share-capital schedule is displaced by changes in the bargaining power of workers,
β.
6
Factors like these, non-neutral technical change, mark-up movements or bargaining
power changes in an efficiency bargaining model2, are all possible explanations for changes
in the labour share not associated with a change in the capital-output ratio.
This framework can be enriched to take account of the determinants of wage
movements, explicitly modelling a wage-setting curve (as a reduce form of labour supply
behaviour) and the long-run adjustment of the stock of capital in response to a misalignment
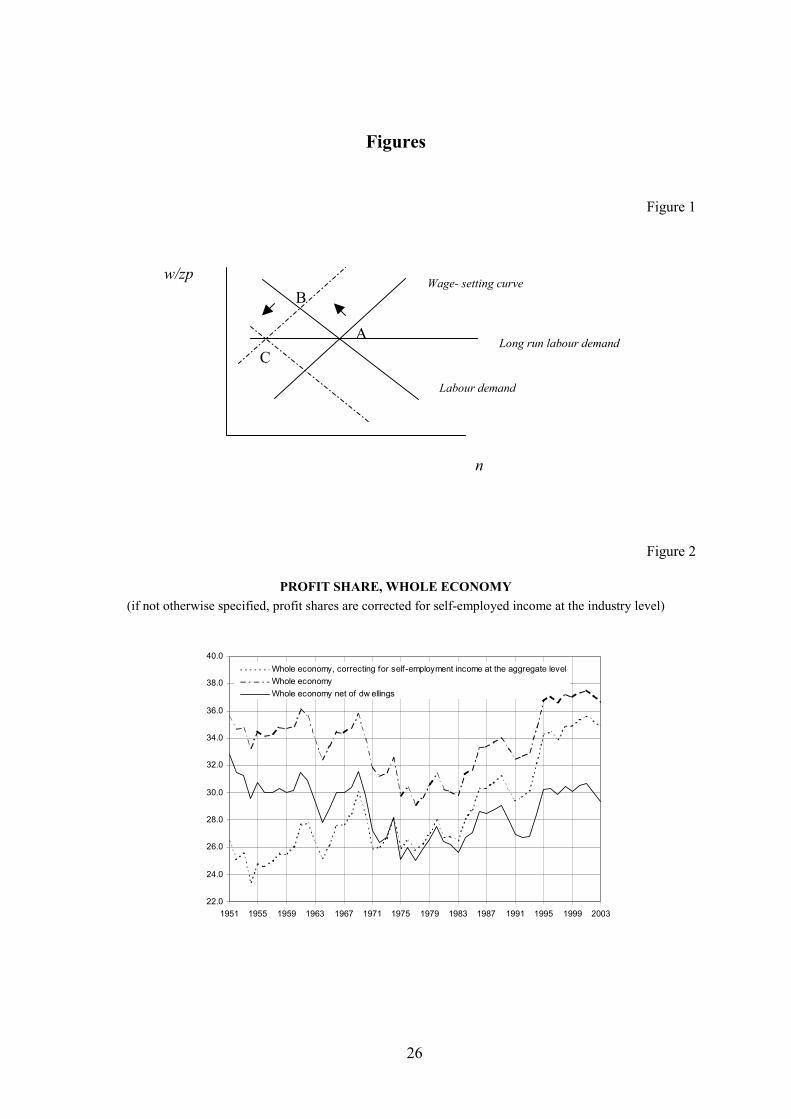
between the returns on capital and the opportunity cost of investments. Blanchard (1997)
assumes that employment is set along the short-run labour demand curve at the crossing point
with the wage-setting curve (upward bending in the wage-labour space). These two schedules
are drawn in terms of efficiency units of labour, as implied by a balanced growth pattern;
namely, both capital and wages are assumed to grow normally at the same rate as the
efficiency of labour (Figure 1).
This short-run wage-employment equilibrium, however, is compatible with the long-
run equilibrium only if the return on capital is equal to the exogenously given opportunity
cost of capital. For a given mark-up, there is only one wage level, along the factor price
frontier, that allows such equality, so that in the long run labour demand is horizontal and is
determined by the opportunity cost of capital.
rkp
wnznkRk
=−),,,( µ (6)
Blanchard envisages an adjustment process driven by movements in the capital stock. If
the returns on capital are too low (high), namely wages are too high (low) given the
opportunity cost of capital, firms will disinvest (invest), so that the short-run labour demand
will shift to the left (right) and the wage will fall (rise) along the wage-setting curve until the
returns on capital become equal to the opportunity cost. Any misalignment of the wage level
from its long-run equilibrium, due to a shift in the wage-setting curve, is thus doomed to be
undone and only affect the employment level: in the case of a shift to the left in the wage
setting curve, the economy will move from equilibrium A to the short-run equilibrium B, to
the new long-run equilibrium C, where the wage is back to its long-run equilibrium level and
the employment level is lower than in the previous equilibrium (Figure 1). Along the
2 Other factors capable of shifting the share-capital schedule are factors of production costs of adjustments and
7
adjustment process, the wage share will increase if the elasticity of substitution is less than
one, but will go slowly back to its original level once wages have once again reached the
long-run equilibrium. At the same time capital intensity will first increase and than return to
the equilibrium level.
The wage-setting curve links the real wage in efficiency units to the unemployment
rate, and its position is determined by a parameter γ, which grasps the impact of any wage-
push factors, such as the strength or preferences of the trade unions, outside opportunities as
determined, for instance, by the generosity of the unemployment benefits, and can include
any kind of wedge between the cost of labour and the real wage of workers, as determined by
fiscal factors or differences between production prices and consumption prices3.
( )γufzw = (7)
The short-run movements of wages and factor shares can be due to shifts both of labour
demand and of the wage-setting curve. However, only factors that modify the price frontier
will permanently change the wage level and the labour share. A reduction in price elasticity
will prompt an increase in the mark-up, a shift towards the left in short-run labour demand
and a downward shift in long-run labour demand, determining lower levels of wages,
employment and labour share. An increase in the opportunity cost of capital will have a
similar effect: in such a case equilibrium wages and employment will be lower and if the
long-run elasticity of substitution is less than one the wage share will be lower too.
In a multi-sector model, with a single wage set at the aggregate level, any idiosyncratic
shock at the industry level (say, a shock on labour efficiency or on relative prices, and any
kind of sector-specific institutional change affecting its returns on capital) will drive the
accumulation of or the reduction in its capital stock, according to the sign of the shock. This
framework can account for industry-specific movements in the distribution of income across
factors.
imported raw material prices (see Bentolila and Saint-Paul, 2003). 3 The inclusion of fiscal factors and the wedge between consumption and production prices as determined by indirect taxation or differences between the price of imports and produced goods, have been questioned on the grounds that they affect both the real wage and the outside opportunity of workers, leaving unchanged the equilibrium unemployment rate (see Layard, Nickel and Jackman, 1991). However, in the short run, these
8
3. The long-run evolution of factor shares in Italy
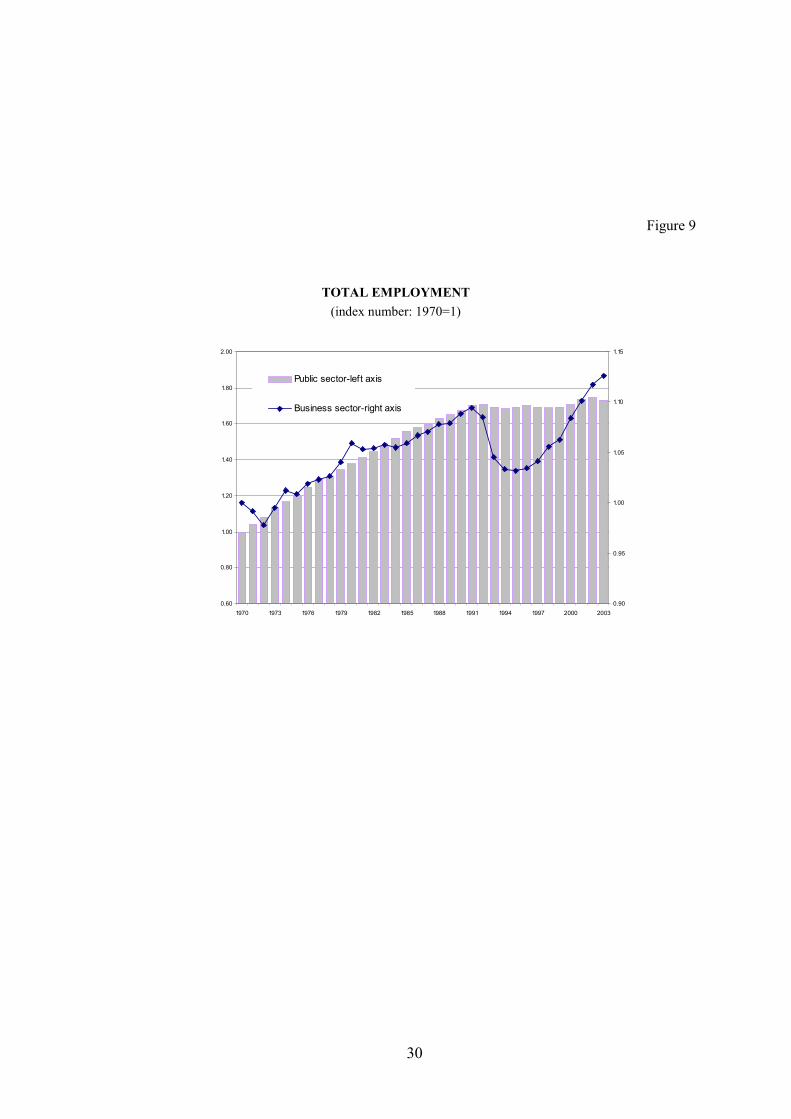
During the last thirty years, the profit share in Italy has shown wide and persistent
movements, broadly following the same pattern as other continental economies. After a
progressive reduction from the late 1960s to the middle 1970s, the profit share has steadily
increased (net of business cycle fluctuations), reaching again historically high levels in the
1990s (Figure 2)4.
However, a large part of the observed rise in Italy is due to the increasing weight of
dwellings in value added at current prices. As this component of the value added of the real-
estate sector only contributes to capital income, the rise in the relative price of dwelling
services since the beginning of the seventies has automatically inflated the profit share.
Between 1970 and 2003 the profit share increased by 2.8 percentage points at the aggregate
level, but this is entirely due to the price increase in the dwelling sector. Net of dwellings, the
profit share in 2003 is about the same as in 1970 (29 per cent), even if much higher than the
minimum reached in the mid-seventies (25 per cent).
Given that in the public administration net profits are by definition nil, as value added
is defined as the sum of the wage bill and capital consumption, it is more appropriate to
analyse the evolution of income distribution in the sole business sector. In this way we do not
allow factor shares to be affected by the size of the public sector. We take the business sector
net of agriculture, namely we consider sectors in the range C-K of Sec95 taxonomy.
Restricting the analysis to the business sector, the profit share on value added is quite
obviously higher (33.6 percent in 2003 excluding dwellings); the increase with respect to
factors are able to affect the wage requests of workers, at least until the expectations of workers adjust to new outside opportunities. 4 This statement has to be qualified taking into account that the computation of the factor shares is sensitive to the criteria used to correct for the labour income of the self-employed. In a country like Italy, where self-employment accounts for more than one fourth of total employment, it is not possible to ignore this component of the labour force. However, the choice of the wage to impute to them is critical in determining both the level and the dynamics of factor shares. The best that can be done (and this is the method we have chosen) is to attribute to self-employed workers the average wage level of employees working in the same industry, instead of the average wage level for the entire economy. This choice affects both the level and the dynamics of factor shares, as the two methods are influenced in a different way by the reallocation of labour across sectors. The profit share in 2003 is 34.8 when computed with the first method; it is 36.7 with the second. The increase in the profit share between 1970 and 2003 is 2.8 points; it would be 6.4 points imputing the average wage of the economy (Figure 2).

9
1970 is higher too (1.4 percentage points)5, but the general pattern seems to remain much the
same as that already outlined above6 (Figure 3). Hence, even if profit share growth is less
striking once we abstract from the dwelling sector, it is safe to say that it has increased
considerably since the mid seventies, reaching once again historically high levels7.
Before looking at any link between this evidence and the theoretical framework
developed in the previous section, it is worth going more in depth by analysing the evolution
of the profit share at industry level. A first meaningful distinction seems to be between the
manufacturing sector and other business activities8, as the first is more exposed to
international competition and is less affected by regulation and other form of State
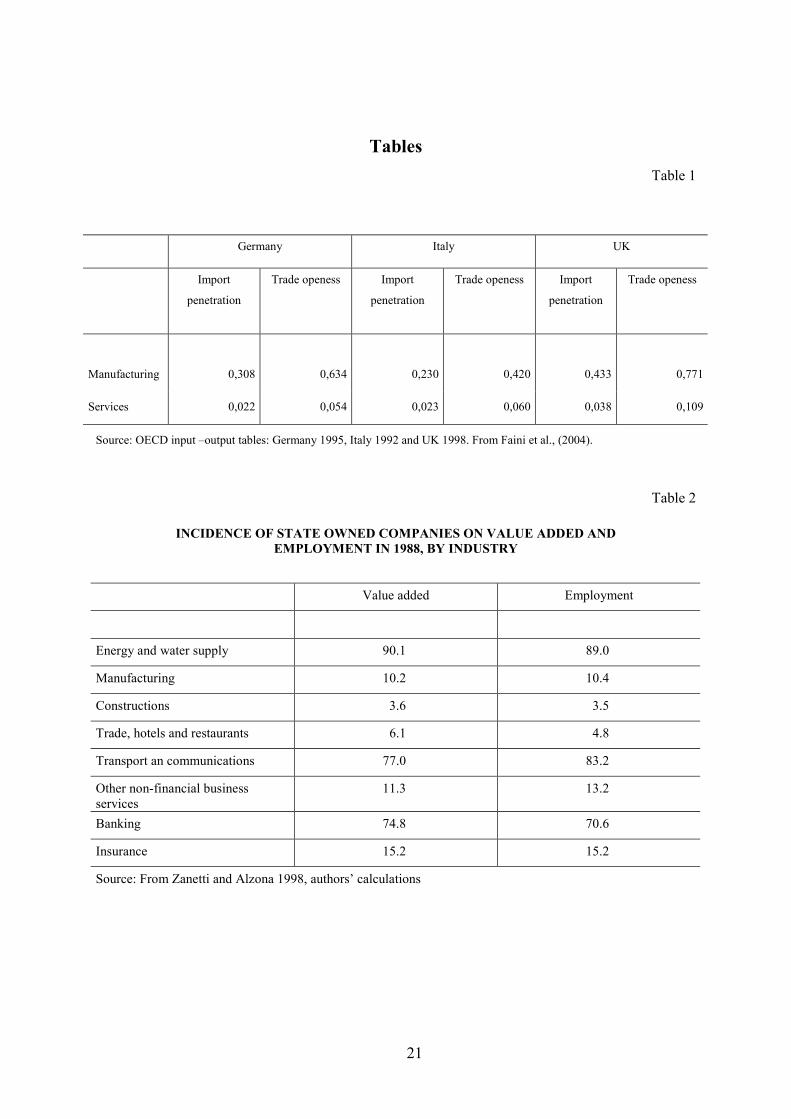
intervention. In Table 1 we report the openness to international trade of manufacturing and
services in Italy and in Germany and the UK from Faini et al. (2004), which shows how
manufacturing is much more exposed to international competition than other activities. As to
market regulation, until the early 1990s, in Italy State intervention was pervasive; however, in
some activities State companies accounted for most of the production, having a predominant
role (Giavazzi, Penati and Tabellini, 1998; Zanetti and Alzona, 1998). This was the case in
the energy sector, the banking sector, and transport and communication, where State
companies accounted for more than 70 per cent of value added (Table 2).
As shown in Figure 4, profit share in the two aggregates evolves in a similar way until
the early 90s, when the two series started to diverge. Apart from the well-known greater
sensitivity of manufacturing to business cycle fluctuations, which is mirrored by more
pronounced cyclical movements in the profit share, during the nineties profit share in the
manufacturing sector seems to have interrupted the increasing trend that began in the mid-
seventies, while it has continued or even accelerated in the rest of the business sector. This
evolution points to a structural break in the early 1990s, affecting the two sectors in opposite
ways.
5 Including dwellings, whose share of value added at current prices increased from 7.8 to 13.3 per cent; the increase with respect 1970 would be 5 percentage points. The rise in the share of value added due to the dwellings sector is to be attributed to the rise in the relative price of housing. The share of value added at constant prices has remained virtually unchanged. 6 It should be noted that the profit share is a pro-cyclical variable so that in the slow growth years 2002-2003 it decreased with respect to the beginning of this decade. 7 Once we abstract from dwellings, sector reallocation does not play a major role in explaining either profit share fluctuation or its trends. Therefore, the analysis by De Serres et al. (2002), which attributes to sector reallocation a large part of the increase in profit share in the OECD economies since the mid-seventies, does not seem to apply to the Italian economy. 8 We will refer to this aggregate indifferently as “non–manufacturing business sector” “other business sectors” “rest of the business sector”.
10
To gain insight on the possible explanations for such a peculiar pattern, we decompose
the evolution of profit share (see box) in an accounting exercise where the changes in factor
shares are explained by the contribution of:
- the real cost of labour (labour cost per worker on consumption price index);
- the ratio of consumption price index to value added deflator (relative prices);
- labour productivity (decomposed in the contribution of capital deepening and
total factor productivity9).
The justification for the inclusion of the relative price of value added hinges upon the
analysis of section 2, where we argue that wage pressure, and therefore the position of the
wage-setting curve, also depends on the prices of goods produced by firms relative to the
prices of consumption goods, which determine the purchasing power of salaries10.
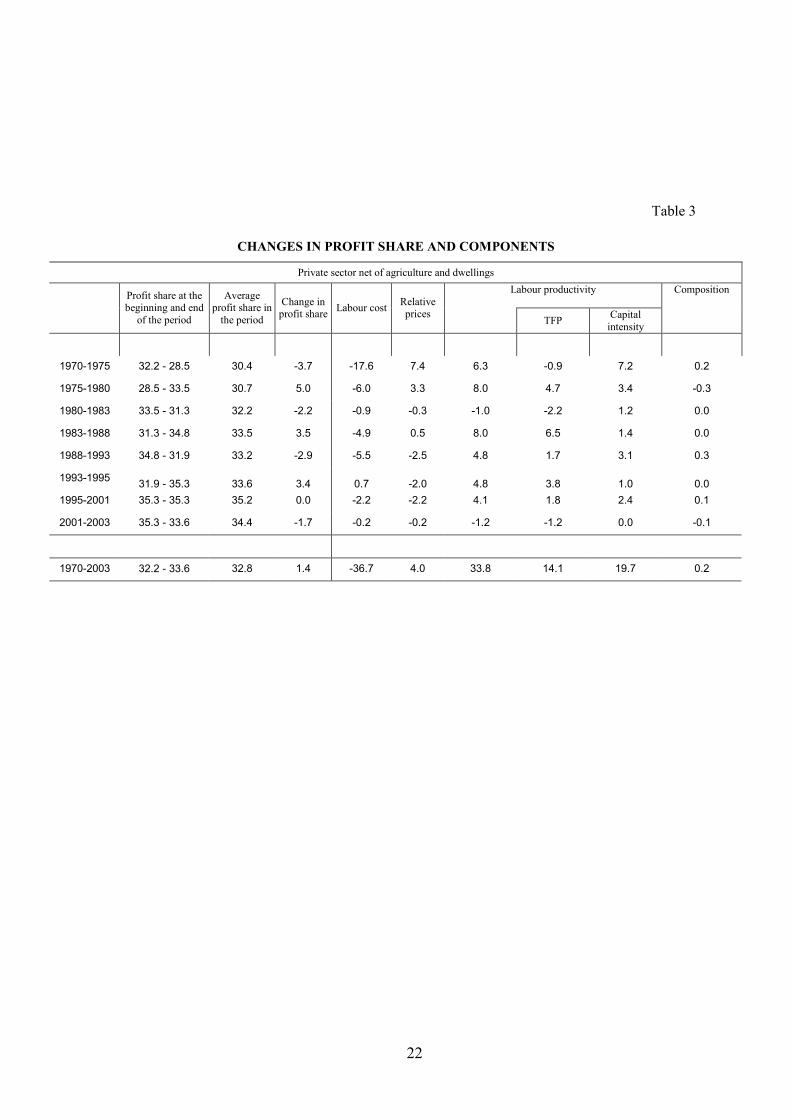
Table 3 reports the decomposition of profit share changes in the period 1970-2003 and
for a number of sub-periods defined by cyclical peaks.
The drop in the profit share in the early 1970s was due to the wage-push episode that
began in the late 1960s, and was only partially offset by productivity growth and a decline in
relative prices. In the short run, this episode, which can be described as an inward shift of the
wage-setting curve, led to an expansion of the labour share and a rise in the capital-labour
ratio, consistently with the theoretical framework of section 2. The concurrent reduction in
real interest rates (which turned negative in 1973) dampened the impact of the wage-push on
firms’ profitability and levels of activity, causing however, an acceleration of inflation11. In
the second half of the 1970s, the increase in capital intensity at the expense of employment
growth fostered a slowdown in real wages, productivity growth and a recovery of the profit
share. After the recession of the early 1980s, with the adoption of a more restrictive monetary
policy, relative prices contributed marginally to the profit share. The boost in productivity
pushed the profit share over the levels prior to the drop of the 1970s. Productivity growth was
boosted by total factor improvements, while capital deepening slowed down because of the
more moderate development of wages and the rise in the cost of capital.
9 To compute TFP growth in the 1970s we have extended official capital stock series, which start from 1980, by means of the permanent inventory method. 10 In a previous version of this exercise we also considered the role of the social contribution wedge and sector reallocation. Their inclusion, however, did not add much to the analysis and made the general picture less clear.

11
Profit share decomposition Moving from the definition of wage share:
1) Wage Share = WS = addedValue
CostLabour = ==YL
PvaPc
PcLWL
YWL
=π1wp
With: W = nominal unit labour cost L = workers (employees and self-employed) Y = value added Pc = consumption prices (consumption price index) Pva = production prices (value added deflator) π = labour productivity (value added per worker)
PcWw = = real compensation of employees per person employed
PvaPcp = = relative prices
The profit share can be written as π111 wpWSPS −=−= .
The aggregate profit share can be written as a weighted average of industries’ profit shares:
2) Profit Share ∑
−=
i iiiwqPSπ11
Where iq is the weight of sector i in total value added.
Changes in the profit share can be decomposed into the contribution of changes in industry composition, real unit labour cost, relative prices and labour productivity, which in turn can be decomposed into the contributions of capital deepening and total factor productivity growth:
3) ∑
∆
∂∂−∆
∂∂+∆
∂∂+∆
∂∂−≈∆−=∆
ii
i
iii
i
iii
i
iii
i
ii qWSww
qWSpp
qWSqq
qWSWSPS ππ
( )∑ ∆−∆+∆+∆−≈i
iiiiii qpwqWS πloglogloglog
Assuming a Cobb-Douglas production function and perfect competition, labour productivity can be further decomposed into the Solow residual and capital deepening contributions:
4) ( )LKWSA log1loglog ∆−+∆=∆ π
Where A is total factor productivity and K is the capital stock
During the 1990s, especially after the trough of 1993, relative prices made a negative
contribution to the profit share, and productivity grew at a slower pace. Nevertheless, the
11 Signorini and Visco (1997) and Rossi (2000) provide concise descriptions of the evolution of the Italian economy and of the monetary and budget policy during these period.

12
unprecedented period of wage moderation beginning from the 1993 agreement between the
social partners, allowed the profit share to reach historically high levels. Between 1992 and
2003, in a period of increasing tax pressure, gross real wages (nominal labour cost per worker
on the consumption price index) grew by only 0.8 per cent in the entire business sector. Wage
moderation, at first favoured by labour market slackness, continued in the second half of the
decade, in spite of the rapid and sustained growth of employment, pointing to an outward
shift in the wage-setting curve, which has dampened wage dynamics (Casadio, 2003).
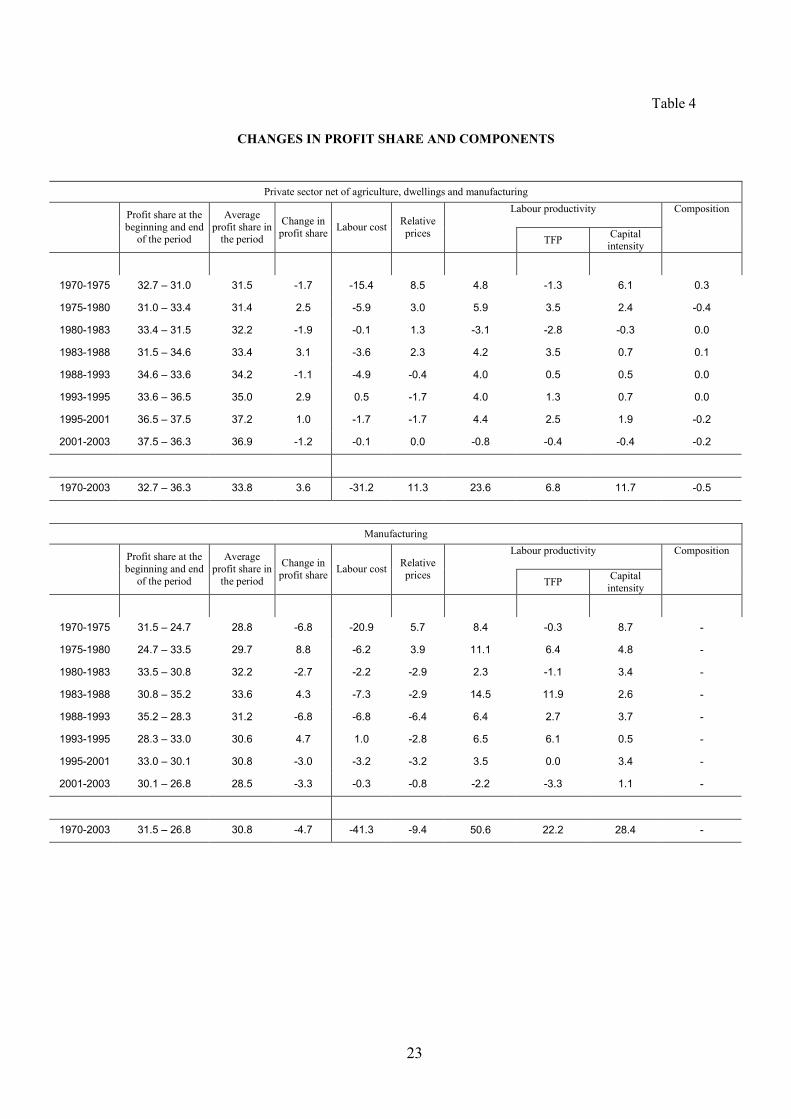
As to the divergent pattern of manufacturing with respect to the rest of the business
sector, it seems to depend on both faster wage dynamics12 and a higher negative contribution
of relative prices (Table 4). Since the beginning of the 1990s, the productivity growth gap
between the two sectors has also disappeared; for the first time in the period analysed, in the
second half of the 90s manufacturing was outperformed by the other business sectors, in
terms of both productivity and total factor productivity growth.
The recession of the early 1990s hit manufacturing more than the rest of the business
sector: between 1988 and 1993 the profit share declined by 6.8 percentage points in
manufacturing, compared with a 1.1 drop in the rest of the business sector. The different
performance reflects a higher sensitivity of manufacturing to the business cycle. However,
contrary to the slumps of the past, the recovery in the manufacturing sector that followed was
not strong enough to compensate the drop: between 1988 and 1995 the profit share declined
by about 2 percentage points in manufacturing, while it grew by 1.8 points in the rest of the
business sector.
Since 1995 the profit share has remained stable in the non-manufacturing business
sector, but it has fallen by almost 4 percentage points in manufacturing. Behind these
disparate evolutions lie very different movements in relative prices: the ratio of the
consumption price index to the value added deflator increased in manufacturing much more
than in the rest of the economy. This happened in spite of a smaller growth in productivity
and a larger increase in the cost of labour in the manufacturing sector.
It is interesting to compare the development of labour cost per efficiency unit which,
according to the model in section 2, in the short-run determines factor share movements and
the profitability of invested capital. This measure is defined as the ratio of real labour cost per
person employed (labour cost per person to the deflator of value added) to the efficiency of

13
labour, computed assuming labour-augmenting technological change and a Cobb-Douglas
aggregate production function (see Blanchard, 1998).
Figure 5 shows sharply divergent patterns, in particular since the end of the 80s. The
cost of labour per efficiency unit in 2003 was back at about the same level as in 1970 in the
other business sectors, while it was 40 per cent higher in manufacturing. This is due to the
fact that since the recession of 1993 labour efficiency has grown on average at about the same
pace in manufacturing as in the rest of the business sector, while prices have grown more and
wages less in the rest of the business sector. These patterns point to more favourable
conditions in the bargaining process with trade unions and milder competitive pressures on
the product market. We will return to this below.
4. Return on capital stock
Considering the period 1980-2003, for which official data on capital stock are
available, we analyse the evolution of the ratio of net profits at current prices to capital stock
at substitution prices13. Net returns on capital stock show the same dynamics as the profit
share. In fact, the contrast between the two sectors is even sharper.
Figure 6 shows that, in this period, the profit rate in manufacturing declined by 10
percentage points, while remained stable in the other sectors. The difference between the two
aggregates has increased since the end of the 1980s, partly because of the divergent pattern of
the profit share shown above, partly owing to the different performance of the capital-output
ratio. Between 1988 and 2003 capital intensity grew by around 23 per cent in manufacturing
and by 7 per cent in the rest of the business sector. In fact, looking more closely, only in the
mid 1990s did capital-output ratio in the two sectors start to diverge, increasing sharply in
manufacturing and declining marginally in the rest of the business sector (Figure 7); this was
due to similar performances of capital accumulation against a higher growth of output in the
rest of the business sector14.
Breaking down the manufacturing sector, there is no industry that has done better than
the non-manufacturing business sector, so that there is no harm in considering the
13 For a similar analysis see Wolff (2003). 14 Divergences in the capital output ratio in the last few years are affected by the downturn in the business cycle, which traditionally has a sharper impact on manufacturing.

14
manufacturing sector as a whole. As to the non-manufacturing business sector, in the period
1988-2003 the stability of the return of capital in this aggregate was due to an increase in
profitability in a bunch of industries and a decline in others which followed the downward
trend of the manufacturing sector, even if less markedly. We will return to this issue below.
According to Blanchard’s (1998) theoretical model, in the long run profit rate dynamics
should follow the evolution of the opportunity cost of capital through the adjustment of the
capital stock. We compare the profit rate in the two sectors with a measure of the user cost of
capital which takes into consideration the financial component, the relative price of capital,
the depreciation of capital stock, the capital gain, and fiscal factors15:
s
FWPP
rPP
U ttK
tKt
ti
tKti
+
∆−= δ
,
,
,
,,
Where iP is the value added deflator of sector i, KP is the capital stock deflator, r is the
nominal interest rate (computed as a weighted average between the financial market rate,
taken as the cost of self-financing, and the average rate paid on bank loans) and FW is a
measure of the fiscal wedge.
The user cost of capital grew until the beginning of the 1990s, declining sharply
thereafter. Its relationship with the return on capital in the two sectors seems to be weak. This
comes as no surprise, taking into account the long lags entailed by the adjustment process of
capital stock and the business cycle fluctuation of both the user cost and the profit rate. The
growing trend of the 1980s was matched by an increase in profitability in the non-
manufacturing business sector and its recovery in manufacturing. After the recession of the
early 1990s, the drop in user cost was paralleled by a decline in the returns on capital in
manufacturing, while in the rest of the business sector profitability remained stable at high
levels. The spread between gross returns on capital and user cost in the non-manufacturing
business sector remained relatively stable until the early 1990s, when it started to grow. In
manufacturing it fluctuated in the 1980s, fell at the end of the 1980s, and recovered after the
trough of 1992, remaining, however, below the average level of the 1980s (Figure 8).
15 This measure is taken from Bassanetti et. al. (2003).
15
These data add further evidence of a structural break in profitability at the beginning of
the 1990s. It could be tentatively argued that these two sectors have received shocks of
opposite sign. The non-manufacturing business sector performed very well when compared
both with manufacturing and the performance of the user cost of capital. Returns on
manufacturing declined with respect to the rest of the economy and declined even more than
the user cost of capital. As the market share of Italian exports in international trade has
dropped in the last 10 years, this could be related to a loss of competitiveness of Italian
products with respect its trade partners (between 1995 and 2003 the share at constant price of
Italian exports on the world market dropped from 4.5 to 3.0).
5. Privatisations, wage moderation and profitability: the structural break
of the 1990s
The diverging patterns of profitability across sectors point to sector-specific factors as a
major source of variability in the evolution of both profit share and returns on capital stock.
As the increase in the profit share is concentrated in the non-manufacturing business sector,
institutional reforms seem to be the most likely cause of the rise in the average profit share
observed in Italy in the 1990s. Other potential explanatory factors, such as biased
technological change, are more likely to affect all industries in a similar way.
Hence, in what follows we will try to make a direct link between these facts and the
deep structural reforms taking place in Italy since the beginning of the 1990s. In doing so we
provide a direct test of the theoretical hypotheses that consider institutional reforms the most
likely reason for the rise in the profit share observed in a number of countries since the
beginning of the 1990s (Blanchard, 2000; Blanchard Giavazzi, 2003).
In this respect two major events are behind the movements in factor shares observed
since the early 1990s:
1) The new collective bargaining framework resulted from the 1992 agreement
between the social partners, which has guaranteed substantial real wage
moderation since then.
2) The privatisation of many State-owned companies, which accounted for a
large share of the business sector, and the radical change in the management of

16
activities that, although remaining under State control, had to face more
stringent budget conditions due to fiscal consolidation and new European
Union rules against State aid.
The 1992 agreement between the social partners was reached during one of the most
severe recessions since the Second World War, when the consolidation of the public debt
made it virtually impossible for the State to sustain employment, and employment in the
business sector dropped sharply for the first time in 30 years.
During the 1990s the fiscal policy stance was very restrictive, (the budget restriction
brought an adjustment of the primary deficit of 11 percentage points of GDP between 1990
and 1992, 8 points between 1994-96).16 This was reflected in the dynamics of employment in
the public sector (public administration, health and schooling), which stopped growing after
20 years of steady increase, remaining almost constant between 1990 and 2003. At the same
time, contrary to the past, the fiscal turmoil did not allow State-owned companies operating
in the business sector (utilities, transport, communication) to share social concerns about
employment levels. Moreover, the new collective dismissals law introduced in 1991 allowed
larger firms to shed labour more easily than in the past. Hence, employment in the business
sector declined by 1 million full-time equivalent workers between 1991 and 1994, 4.6 per
cent of total employment (Figure 9).17
Under these circumstances, the trade unions agreed to stabilize wage dynamics with an
agreement that left to centralised bargaining at industry level the task of preserving the
purchasing power of wages, and assigned to firm level bargaining the task of redistributing
productivity gains (Casadio, 2003). The agreement linked wage increases to the targeted
inflation rate established yearly by the Government and envisaged the possibility of making
up for the differences between actual and targeted inflation realised ex post. As the coverage
of firm level bargaining was, at least at the beginning, quite limited and concentrated among
larger firms, this framework certainly hampered the redistribution of productivity gains.
Moreover, as union coverage differs across sectors, this is also likely to have affected wage
dynamics in a different way in different industries.
16 For a description of the measures taken to face the crisis of the State during the early 1990s see Banca d’Italia (2000), Signorini and Visco (1997) and Rossi, 2000. 17 The impact of reforms and State budget constraints on the evolution of employment in Italy in the early 90s is analysed by Bertola Ichino (1995, 1998).

17
This agreement can be considered an institutional response to a severe economic
downturn and to the necessity of stabilising the economy to rejoin the exchange rate
agreements quitted with the devaluation of 1992; nonetheless, it forged the wage setting
process for the entire decade that followed, guaranteeing unprecedented wage moderation in
spite of the strong recovery of employment since 1996. However, even if this agreement
helped to create the conditions for maintaining or increasing firm’s profitability, it cannot
explain by itself the cross-sector variability in the development of the wage share and of the
profit rate.
By contrast, the progressive disengagement of the State from a direct involvement in
business activities has certainly affected different industries in different ways according to the
incidence of State companies, which in certain sectors accounted for almost the entire
production.
In the 1990s the scope of privatisations was comparable to those of the Thatcher
Governments in the UK18. Privatisations included steel, engineering and food companies in
the manufacturing sector, the giants ENI and Telecom in the energy and telecommunication
sectors and Ina in the insurance business. Moreover a large part of the banking sector,
formerly almost entirely owned by the State, was privatised, while some public utilities were
prepared for privatisation (ENEL in the energy sector) or restructured to face budget
constraints (railways and post companies). The total revenue from privatisations during the
1990s was about 145000 millions of euros at 1995 prices (Banca d’Italia 2000). Three sectors
where most affected by this process: production and distribution of energy, transport and
telecommunication, and the finance sector where State-owned companies played a major role
(Table 2) and which accounted for 51, 26 and 19 per cent respectively of the revenue from
privatisations.
In these industries, State control heavily affected price setting, investment strategy,
employment and wage-setting policy. The institutional changes of the 1990s brought profit
maximising strategies into these industries, revolutionizing their management and
performance. Considering that these industries account for almost a quarter of the entire
business sector and for a third of the non-manufacturing business sector, it is an easy guess
that this revolution markedly affected the profitability of the entire business sector,
18 Between 1993 and 1999 revenues from privatisations amounted to 8 per cent of the average GDP of the period.

18
explaining a large part of the difference between manufacturing and the rest of the business
sector.
Moreover, as the privatisation process was conditioned by the need of the State to cash
in, competition and regulation concerns seem to have played a minor role, even in sectors
characterized by a monopolistic market structure, such as telecommunication and energy
(Banca d’Italia, 2000). This has probably allowed these companies to benefit from efficiency
gains by increasing profit margins rather than reducing prices.
To provide support for this hypothesis, we analyse at a more disaggregate level the
evolution of returns to capital, labour cost and total factor productivity, showing to what
extent the industries where the incidence of State-owned companies was higher have shown a
better performance.
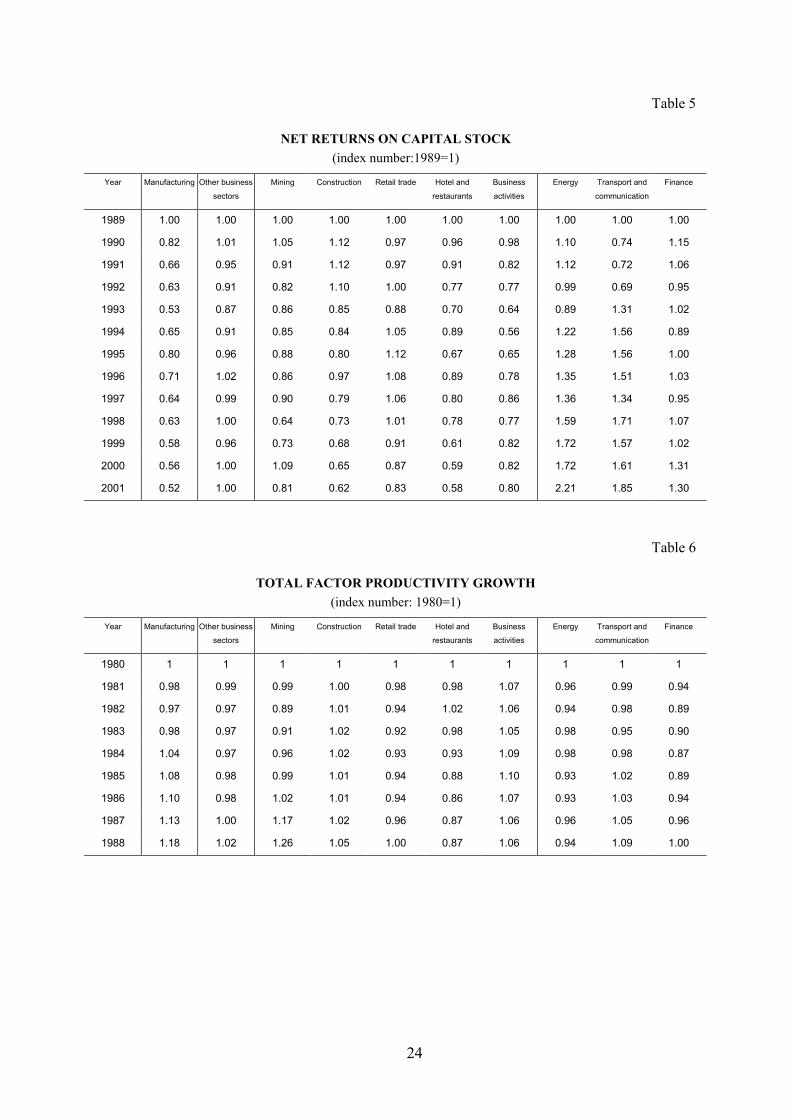
Table 5 reports the index number of the return on capital stock for the period 1989-
2001.19 Returns on capital only increased in energy, transport and communication and
finance; they declined in every other industry, even if no industry did worse than the
manufacturing sector. In this period three groups of industries seem to emerge:
manufacturing, open to international competition, which probably suffered a loss of
competitiveness in international markets; a group of industries where competitive pressures
are low and which are still awaiting for rationalisation and liberalisation (including retail
trade, liberal professions, OECD 2003), that did better than manufacturing; the privatised
sectors, including companies still under State control, which seem to have taken advantage of
the structural changes of the 1990s.
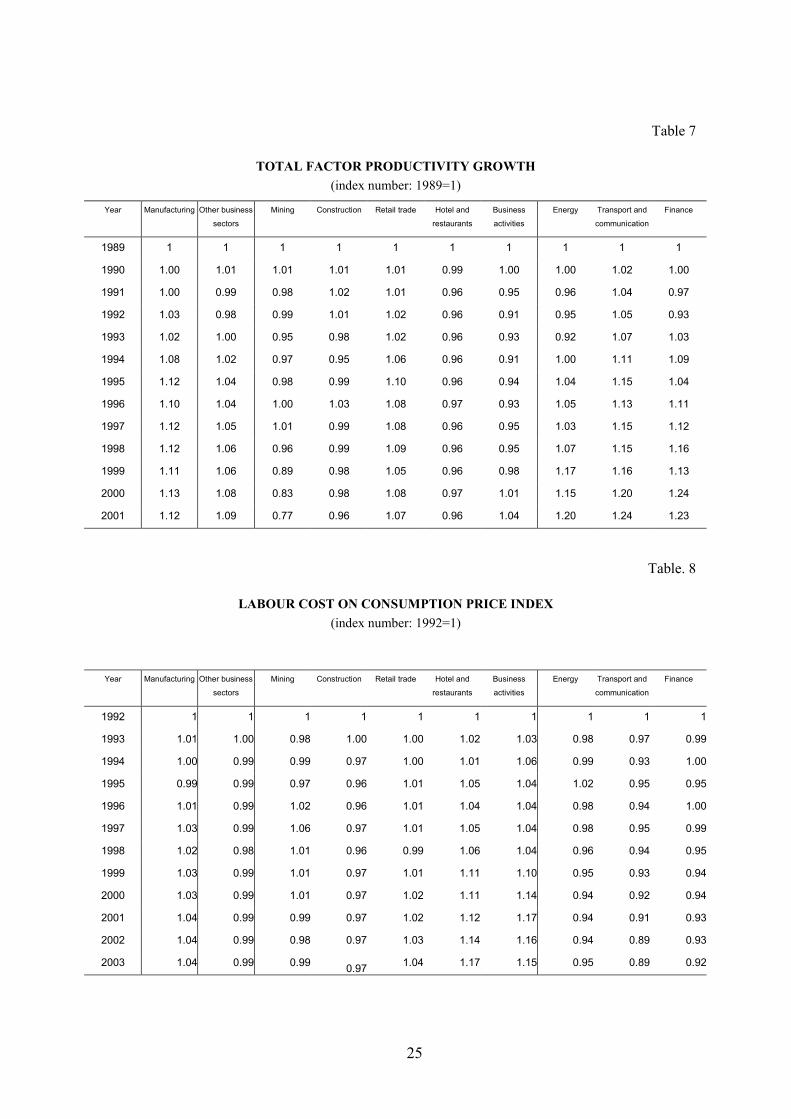
The same pattern emerges from the analysis of total factor productivity. Energy,
transport and communication and finance are the only ones in the period 1989-2001 that
outperformed the manufacturing sector (Table 7). This gain in efficiency seems to be strictly
related to the privatisation and institutional reforms of the 1990s, as in the previous decade
they did not do any better than the rest of the business sector and certainly had a lower TFP
growth than manufacturing (Table 6). Further evidence on the impact of restructuring comes
from labour cost dynamics after the 1992 agreements: in spite of a better productivity
performance, in these industries labour cost increased less than in the rest of the business
sector, and even less than the consumption price index (Table 8).
19 2001 is the last year for which we dispose of sufficiently detailed statistics on capital stock.
19
The simultaneous acceleration in TFP growth and the drop in real labour cost points to
a major change in the bargaining structure and bargaining power in these industries.
Privatisations seem to have brought about a reduction in the bargaining power of workers and
a major change in the structure of bargaining. This evidence is compatible with a shift from
an efficiency bargaining framework, where firms and unions bargain on both wages and
employment, to a right to manage one, where firms and unions bargain on wages only. The
loss of influence on employment choice and the organisational arrangements of workers’
representatives can explain the gain in efficiency, while a loss of power can account for the
reduction in real wages (Layard, Nickel and Jackman, 1991). The reduction in costs that this
entails has prompted a rise in the returns on capital, as privatisations do not seem to have
created a sufficiently competitive environment in these sectors. Companies seem to have
maintained substantial market power and so far the main result of privatisations seems to be a
reallocation of rents from wages to profits instead of a drastic reduction in prices. Difficulties
encountered in the construction of a sole European market for public utilities and finance can
contribute to explain this developments.
As a complement to this interpretation, it could be argued that what we have observed
is just a convergence process towards the average level of returns, assuming that in these
sectors returns on capital were particularly low before privatisations.20 This is equivalent to
the hypothesis of Blanchard and Philippon (2003), who argue that the elasticity of capital
supply with respect to its returns is increased substantially with privatisations and financial
market deregulation, forcing profitability to increase too. The effect of such an increase is
similar to that of a rise in the opportunity cost of capital, namely a reduction in capital
intensity and a rise in returns. The low growth in the capital-output ratio observed in these
industries is supportive of this hypothesis.
6. Conclusions
Abstracting from business cycle fluctuations, the profit share in Italy has steadily
increased from the mid-seventies to the second half of the ‘90s, when it reached the highest
level since the fifties. We have shown, however, that a large part of such an increase is due to
20 Comparisons of levels are particularly problematic, as they require confidence on the available measures of levels of capital stock, and for intangible assets to play a similar role in different sectors.
20
the rise in the price of dwelling services, which is a component of value added that only
contributes to capital earnings. Its weight in total value added at current prices increased from
7.8 per cent in 1970 to 13.8 in 2003, remaining stable when measured at constant prices. Net
of dwellings the profit share in 2003 was at the same levels as in 1970. Considering the sole
business sector, the rise of profit share was much more pronounced.
The drop in the profit share in the seventies, involving the whole economy, seems due
to the acceleration of wage growth with respect to the growth of productivity. Since the early
‘80s, the adoption of capital-intensive technologies and a more restrictive monetary policy
prompted a slowdown in employment growth and wage dynamics and a recovery of the profit
share.
During the 1990s, even if the aggregate profit share continued to grow, pronounced
differences across industries emerged. The profit share increased in the non-manufacturing
business sectors, while both the profit share and returns on capital dropped in manufacturing.
No industry inside the business sector did worse than manufacturing, pointing to a divergent
pattern between sectors exposed to international competition and sectors operating in more
protected markets. The reduction in Italy’s market share of international trade seems to
support a distinction between protected industries and industries exposed to international
sectors. Inside the non-manufacturing business sectors other interesting cross-sector
differences emerged. The large increase in the profit share in the early 1990s was actually due
to a few industries (energy, transport and communication and finance), where privatisations
had the largest impact. These are the only industries that showed an increase in the returns on
capital that between 1989 and 2001. These sectors, where several former public monopolist
are present, took advantage of the impact of privatisations on productivity growth and wage
dynamics that were not matched by a major reduction in market power. In these industries,
total factor productivity outperformed the manufacturing sector and wages grew less than the
consumption price index, with a major shift of rents from wages to profits.
All in all, this evidence provides support for the hypothesis that the reallocation of rents
due to institutional changes is the most important reason for the increase in the profit share
during the 1990s (Blanchard, 2000; Blanchard Giavazzi, 2003). The competing hypothesis of
non-neutral technical change does not seem to be able to explain such pronounced cross-
sector variability, which is instead easily linked to institutional characteristics of industries
and structural reforms.
21
Tables Table 1
Germany Italy UK
Import
penetration
Trade openess
Import
penetration
Trade openess
Import
penetration
Trade openess
Manufacturing 0,308 0,634 0,230 0,420 0,433 0,771
Services 0,022 0,054 0,023 0,060 0,038 0,109
Source: OECD input –output tables: Germany 1995, Italy 1992 and UK 1998. From Faini et al., (2004).
Table 2
INCIDENCE OF STATE OWNED COMPANIES ON VALUE ADDED AND EMPLOYMENT IN 1988, BY INDUSTRY
Value added Employment
Energy and water supply 90.1 89.0
Manufacturing 10.2 10.4
Constructions 3.6 3.5
Trade, hotels and restaurants 6.1 4.8
Transport an communications 77.0 83.2
Other non-financial business services
11.3 13.2
Banking 74.8 70.6
Insurance 15.2 15.2
Source: From Zanetti and Alzona 1998, authors’ calculations
22
Table 3
CHANGES IN PROFIT SHARE AND COMPONENTS
Private sector net of agriculture and dwellings Labour productivity
Composition
Profit share at the beginning and end
of the period
Average profit share in
the period
Change in profit share Labour cost Relative
prices TFP Capital intensity
1970-1975 32.2 - 28.5 30.4 -3.7 -17.6 7.4 6.3 -0.9 7.2 0.2
1975-1980 28.5 - 33.5 30.7 5.0 -6.0 3.3 8.0 4.7 3.4 -0.3
1980-1983 33.5 - 31.3 32.2 -2.2 -0.9 -0.3 -1.0 -2.2 1.2 0.0
1983-1988 31.3 - 34.8 33.5 3.5 -4.9 0.5 8.0 6.5 1.4 0.0
1988-1993 34.8 - 31.9 33.2 -2.9 -5.5 -2.5 4.8 1.7 3.1 0.3
1993-1995 31.9 - 35.3 33.6 3.4 0.7 -2.0 4.8 3.8 1.0 0.0 1995-2001 35.3 - 35.3 35.2 0.0 -2.2 -2.2 4.1 1.8 2.4 0.1
2001-2003 35.3 - 33.6 34.4 -1.7 -0.2 -0.2 -1.2 -1.2 0.0 -0.1
1970-2003 32.2 - 33.6 32.8 1.4 -36.7 4.0 33.8 14.1 19.7 0.2
23
Table 4
CHANGES IN PROFIT SHARE AND COMPONENTS
Private sector net of agriculture, dwellings and manufacturing Labour productivity
Composition
Profit share at the beginning and end
of the period
Average profit share in
the period
Change in profit share Labour cost Relative
prices TFP Capital intensity
1970-1975 32.7 – 31.0 31.5 -1.7 -15.4 8.5 4.8 -1.3 6.1 0.3
1975-1980 31.0 – 33.4 31.4 2.5 -5.9 3.0 5.9 3.5 2.4 -0.4
1980-1983 33.4 – 31.5 32.2 -1.9 -0.1 1.3 -3.1 -2.8 -0.3 0.0
1983-1988 31.5 – 34.6 33.4 3.1 -3.6 2.3 4.2 3.5 0.7 0.1
1988-1993 34.6 – 33.6 34.2 -1.1 -4.9 -0.4 4.0 0.5 0.5 0.0
1993-1995 33.6 – 36.5 35.0 2.9 0.5 -1.7 4.0 1.3 0.7 0.0
1995-2001 36.5 – 37.5 37.2 1.0 -1.7 -1.7 4.4 2.5 1.9 -0.2
2001-2003 37.5 – 36.3 36.9 -1.2 -0.1 0.0 -0.8 -0.4 -0.4 -0.2
1970-2003 32.7 – 36.3 33.8 3.6 -31.2 11.3 23.6 6.8 11.7 -0.5
Manufacturing Labour productivity
Composition
Profit share at the beginning and end
of the period
Average profit share in
the period
Change in profit share Labour cost Relative
prices TFP Capital intensity
1970-1975 31.5 – 24.7 28.8 -6.8 -20.9 5.7 8.4 -0.3 8.7 -
1975-1980 24.7 – 33.5 29.7 8.8 -6.2 3.9 11.1 6.4 4.8 -
1980-1983 33.5 – 30.8 32.2 -2.7 -2.2 -2.9 2.3 -1.1 3.4 -
1983-1988 30.8 – 35.2 33.6 4.3 -7.3 -2.9 14.5 11.9 2.6 -
1988-1993 35.2 – 28.3 31.2 -6.8 -6.8 -6.4 6.4 2.7 3.7 -
1993-1995 28.3 – 33.0 30.6 4.7 1.0 -2.8 6.5 6.1 0.5 -
1995-2001 33.0 – 30.1 30.8 -3.0 -3.2 -3.2 3.5 0.0 3.4 -
2001-2003 30.1 – 26.8 28.5 -3.3 -0.3 -0.8 -2.2 -3.3 1.1 -
1970-2003 31.5 – 26.8 30.8 -4.7 -41.3 -9.4 50.6 22.2 28.4 -
24
Table 5
NET RETURNS ON CAPITAL STOCK (index number:1989=1)
Year Manufacturing Other business
sectors
Mining Construction Retail trade Hotel and
restaurants
Business
activities
Energy Transport and
communication
Finance
1989 1.00 1.00 1.00 1.00 1.00 1.00 1.00 1.00 1.00 1.00
1990 0.82 1.01 1.05 1.12 0.97 0.96 0.98 1.10 0.74 1.15
1991 0.66 0.95 0.91 1.12 0.97 0.91 0.82 1.12 0.72 1.06
1992 0.63 0.91 0.82 1.10 1.00 0.77 0.77 0.99 0.69 0.95
1993 0.53 0.87 0.86 0.85 0.88 0.70 0.64 0.89 1.31 1.02
1994 0.65 0.91 0.85 0.84 1.05 0.89 0.56 1.22 1.56 0.89
1995 0.80 0.96 0.88 0.80 1.12 0.67 0.65 1.28 1.56 1.00
1996 0.71 1.02 0.86 0.97 1.08 0.89 0.78 1.35 1.51 1.03
1997 0.64 0.99 0.90 0.79 1.06 0.80 0.86 1.36 1.34 0.95
1998 0.63 1.00 0.64 0.73 1.01 0.78 0.77 1.59 1.71 1.07
1999 0.58 0.96 0.73 0.68 0.91 0.61 0.82 1.72 1.57 1.02
2000 0.56 1.00 1.09 0.65 0.87 0.59 0.82 1.72 1.61 1.31
2001 0.52 1.00 0.81 0.62 0.83 0.58 0.80 2.21 1.85 1.30
Table 6
TOTAL FACTOR PRODUCTIVITY GROWTH (index number: 1980=1)
Year Manufacturing Other business
sectors
Mining Construction Retail trade Hotel and
restaurants
Business
activities
Energy Transport and
communication
Finance
1980 1 1 1 1 1 1 1 1 1 1
1981 0.98 0.99 0.99 1.00 0.98 0.98 1.07 0.96 0.99 0.94
1982 0.97 0.97 0.89 1.01 0.94 1.02 1.06 0.94 0.98 0.89
1983 0.98 0.97 0.91 1.02 0.92 0.98 1.05 0.98 0.95 0.90
1984 1.04 0.97 0.96 1.02 0.93 0.93 1.09 0.98 0.98 0.87
1985 1.08 0.98 0.99 1.01 0.94 0.88 1.10 0.93 1.02 0.89
1986 1.10 0.98 1.02 1.01 0.94 0.86 1.07 0.93 1.03 0.94
1987 1.13 1.00 1.17 1.02 0.96 0.87 1.06 0.96 1.05 0.96
1988 1.18 1.02 1.26 1.05 1.00 0.87 1.06 0.94 1.09 1.00
25
Table 7
TOTAL FACTOR PRODUCTIVITY GROWTH (index number: 1989=1)
Year Manufacturing Other business
sectors
Mining Construction Retail trade Hotel and
restaurants
Business
activities
Energy Transport and
communication
Finance
1989 1 1 1 1 1 1 1 1 1 1
1990 1.00 1.01 1.01 1.01 1.01 0.99 1.00 1.00 1.02 1.00
1991 1.00 0.99 0.98 1.02 1.01 0.96 0.95 0.96 1.04 0.97
1992 1.03 0.98 0.99 1.01 1.02 0.96 0.91 0.95 1.05 0.93
1993 1.02 1.00 0.95 0.98 1.02 0.96 0.93 0.92 1.07 1.03
1994 1.08 1.02 0.97 0.95 1.06 0.96 0.91 1.00 1.11 1.09
1995 1.12 1.04 0.98 0.99 1.10 0.96 0.94 1.04 1.15 1.04
1996 1.10 1.04 1.00 1.03 1.08 0.97 0.93 1.05 1.13 1.11
1997 1.12 1.05 1.01 0.99 1.08 0.96 0.95 1.03 1.15 1.12
1998 1.12 1.06 0.96 0.99 1.09 0.96 0.95 1.07 1.15 1.16
1999 1.11 1.06 0.89 0.98 1.05 0.96 0.98 1.17 1.16 1.13
2000 1.13 1.08 0.83 0.98 1.08 0.97 1.01 1.15 1.20 1.24
2001 1.12 1.09 0.77 0.96 1.07 0.96 1.04 1.20 1.24 1.23
Table. 8
LABOUR COST ON CONSUMPTION PRICE INDEX (index number: 1992=1)
Year Manufacturing Other business
sectors
Mining Construction Retail trade Hotel and
restaurants
Business
activities
Energy Transport and
communication
Finance
1992 1 1 1 1 1 1 1 1 1 1
1993 1.01 1.00 0.98 1.00 1.00 1.02 1.03 0.98 0.97 0.99
1994 1.00 0.99 0.99 0.97 1.00 1.01 1.06 0.99 0.93 1.00
1995 0.99 0.99 0.97 0.96 1.01 1.05 1.04 1.02 0.95 0.95
1996 1.01 0.99 1.02 0.96 1.01 1.04 1.04 0.98 0.94 1.00
1997 1.03 0.99 1.06 0.97 1.01 1.05 1.04 0.98 0.95 0.99
1998 1.02 0.98 1.01 0.96 0.99 1.06 1.04 0.96 0.94 0.95
1999 1.03 0.99 1.01 0.97 1.01 1.11 1.10 0.95 0.93 0.94
2000 1.03 0.99 1.01 0.97 1.02 1.11 1.14 0.94 0.92 0.94
2001 1.04 0.99 0.99 0.97 1.02 1.12 1.17 0.94 0.91 0.93
2002 1.04 0.99 0.98 0.97 1.03 1.14 1.16 0.94 0.89 0.93
2003 1.04 0.99 0.99 0.97 1.04 1.17 1.15 0.95 0.89 0.92
26
Figures
Figure 1
Figure 2
PROFIT SHARE, WHOLE ECONOMY (if not otherwise specified, profit shares are corrected for self-employed income at the industry level)
22.0
24.0
26.0
28.0
30.0
32.0
34.0
36.0
38.0
40.0
1951 1955 1959 1963 1967 1971 1975 1979 1983 1987 1991 1995 1999 2003
Whole economy, correcting for self -employment income at the aggregate levelWhole economyWhole economy net of dw ellings
Labour demand
Wage- setting curve
n
w/zp
A
B
C Long run labour demand

27
Figure 3
PROFIT SHARE: WHOLE ECONOMY AND BUSINESS SECTOR
Figure 4
PROFIT SHARE
24.0
26.0
28.0
30.0
32.0
34.0
36.0
38.0
40.0
1970 1973 1976 1979 1982 1985 1988 1991 1994 1997 2000 2003
Business sector net of agriculture, dw ellings and manufacturingManufacturingBusiness sector net of agriculture and dw ellings
2 0.0
2 2.0
2 4.0
2 6.0
2 8.0
3 0.0
3 2.0
3 4.0
3 6.0
3 8.0
4 0.0
4 2.0
4 4.0
4 6.0
1970 1973 19 76 1979 198 2 19 85 19 8 8 19 91 199 4 19 9 7 2 0 00 20 03
Whole economy net of dw ellings
Business sector net of agriculture and dw ellings
Business sector net of agriculture

28
Figure 5
COST OF LABOUR PER EFFICIENCY UNIT
Figure 6
NET RETURNS ON CAPITAL STOCK (ratio of operating surplus net of capital consumption, corrected for self-employed income, to net capital stock)
0.02
0.04
0.06
0.08
0.10
0.12
0.14
0.16
0.18
0.20
0.22
1980 1982 1984 1986 1988 1990 1992 1994 1996 1998 2000 2002 2004
Business sector net of agriculture, dw ellings and manufacturing
Manufacturing
1.00
1.0 5
1.10
1.15
1.20
1.2 5
1.30
1.3 5
1.40
1.4 5
19 70 19 73 1976 19 79 19 82 198 5 19 88 199 1 199 4 199 7 20 00 20 03
Business sector net of agriculture and dw ellings
Business sector net of agriculture, dw ellings and manufacturing
Manufacturing

29
Figure 7
CAPITAL-OUTPUT RATIO
Figure 8
SPREAD BETWEEN GROSS RETURN ON CAPITAL AND USER COST OF CAPITAL
5.0
7.0
9.0
11.0
13.0
15.0
17.0
19.0
21.0
23.0
1980 1982 1984 1986 1988 1990 1992 1994 1996 1998 2000
Business sector net of agriculture, dw ellings and manufacturing
Manufacturing
1.40
1.50
1.60
1.70
1.80
1.90
2.00
2.10
1980 1982 1984 1986 1988 1990 1992 1994 1996 1998 2000 2002 2004
Business sector net of agriculture, dw ellings and manufacturingManufacturing
30
Figure 9
TOTAL EMPLOYMENT
(index number: 1970=1)
0.60
0.80
1.00
1.20
1.40
1.60
1.80
2.00
1970 1973 1976 1979 1982 1985 1988 1991 1994 1997 2000 20030.90
0.95
1.00
1.05
1.10
1.15
Public sector-left axis
Business sector-right axis

31
Appendix
We consider value added measured at factor prices. This measure includes payroll taxes
but does not include taxation on production. In 1998 a new tax on value added (IRAP) was
introduced, substituting for some payroll taxes. This entailed a drop in measured labour cost
and in value added measured at current prices. Given that the introduction of the new tax
reduced by the same amount both the wage bill (numerator of the labour share) and value
added (denominator of the labour share), the labour share was marginally reduced as well. By
taking factor shares of value added measured at factor cost, we are implicitly assuming that
the share of social contributions substituted by IRAP bears now on wages and profits
proportionally to their shares of value added.
Given that we are interested in assessing the role of both labour cost and value added
deflator in determining the evolution of the factor share, we try to neutralize the impact of
IRAP by estimating the reduction in labour cost it brought about and correcting value added
at current prices and the wage bill. We thus add the estimated reduction in labour cost to the
value added and reallocate it between labour and profits according to their share of value
added.
To estimate the impact of IRAP on labour cost we assume that if IRAP had not been
introduced, in 1998 labour cost (compensation of employees) would have grown at the same
rate as wages and salaries (compensation net of payroll taxes and workers social
contributions). We thus compute a virtual labour cost (VLC) in 1998 applying to the labour
cost in 1997 the same rate of growth of wages and salaries (W); from 1998 on, we assume
VLC to grow at the same rate as the official national accounts labour cost (LC):
98*
*
1
97
989798
>
=
=
−
iforLCLCVLCVLC
WWLCVLC
i
iii
By taking the difference between VLC and LC, we have a measure of the impact of the
introduction of the new tax, ( I ), that we use to compute the new series on value added (NVA)
and on labour cost (NLC):

32
98*
≥+=
+=−=
kforWSILCNLC
IVANVALCVLCI
kkkk
kk
kkk
k
where WS is the wage share.
33
References
Acemoglu D. (2003), ‘Labor-and Capital-augmenting Technical Change’, Journal of the European Economic Association, 1, pp. 1-37.
Balducci R., Staffolani S. (2001) ‘Efficient bargaining, labour share and employment’, in Balducci e Staffolani (edited by), Distribution, Growth and Employment, ESI, Napoli.
Banca d’Italia (2000), Annual report for 1999.
Bassanetti A., Iommi M., Jona-Lasino C., Zollino F. (2003), La bassa crescita dell’economia in Italiana negli anni novanta tra ritardo tecnologico e rallentamento della produttività. Banca d’Italia mimeo.
Bentolila S., Saint-Paul, G. (2003) ‘Explaining Movements in the Labor Share’, Contributions to Macroeconomics, 3.
Bertola G., Ichino A. (1995), Crossing the River: a Comparative Perspective on Italian Employment Dynamics, Economic Policy, 21, pp.359-420.
Bertola G., Ichino A. (1998), In mezzo al guado. Dalla rigidità alla flessibilità nel problema occupazionale italiano. In Giavazzi F., Penati A., Tabellini G. (a cura di) Liberalizzazioni dei mercati e privatizzazioni. Il Mulino, Bologna.
Blanchard O. J. (1997), ‘The Medium Run’, Brooking Papers on Economic Activity, 2, pp. 89-158.
Blanchard O. (1998), Revisiting European Unemployment: Unemployment, Capital and Factor Prices, NBER Working paper n. 6566.
Blanchard O. (2000), The Economics of Unemployment. Shocks, Institutions, and Interactions, Lionel Robbins Lecture, MIT mimeo.
Blanchard O., Giavazzi F. (2003), ‘Macroeconomic Effects of Regulation and Deregulation in Goods and Labor markets’, Quarterly Journal of Economics, 118, pp. 879-907.
Blanchard O., Philippon T. (2003), ‘The Decline of Rents, and the Rise and Fall of European Unemployment’, MIT mimeo.
Caballero R. J. , Hammour M. L. (1998), ‘Jobless Growth: Appropriability, Factor Substitution, and Unemployment’, Carnegie-Rochester Series on Public Policy, 48, pp. 51-99.
Casadio P. (2003), ‘Wage Formation in the Italian Private Sector After the 1992-93 Income Policy Agreements’, in Fagan G., Mongelli F., Morgan G., (edited by) Institutions and Wage Formation in Europe, Edgware Elgar, London.
Cotis J., E. Rignols (1998) ‘Le partage de la valeur ajoutée: quelques enseignement tirés du «paradox franco-américain»’, Revue de l’OFCE, 65, pp. 291-344.
De Serres, A., S. Scarpetta, de la Maisonneuve (2002), ‘Sectoral shifts in Europe and the United States : how they affect aggregate and the properties of the wage equations’, OECD Economic Department, Working paper n. 326.
34
Faini R., Hasckel J., Barba Navaretti G., Scarpa C., Wey C. (2003), ‘Contrasting Europe’s Decline: Do Products Markets Reforms help’, Fondazione De Benedetti.
Giammaroli N., Messina J., Steinberg T., Strozzi C. (2002), ‘European Labor Share Dynamics: An Institutional Perspective’, EUI Working paper n. 13.
Giavazzi F., Penati A., Tabellini G. (1998), (edited by) Liberalizzazioni dei mercati e privatizzazioni. Il Mulino, Bologna.
Layard R., Nickel S., Jackman R. (1991), Unemployment, Oxford University Press, Oxford.
Mihoubi F. (1999), ‘La partage de la valeur ajoutée en France et en Allemagne’, Banque de France Notes d’Etudes et de Recherche, n. 64.
OECD (2003), OECD economic survey-Italy. OECD Paris.
Rossi S. (2000), La politica economica italiana 1968-2000, Editori Laterza, Bari.
Rowthorn R. (1999), ‘Unemployment, wage bargaining and capital-labour substitution’, Cambridge Journal of Economics, 23, pp. 413-425.
Signorini L.F., Visco I. (1999), L’economia italiana, Il Mulino, Bologna.
Solow R. M. (1958), ‘A Skeptical Note on the Constancy of Relative Shares’, The American Economic Review, 48, pp. 618-631.
Sylvain A. (1998), ‘La partage de la valeur ajoutée, evolution pour cinque pays entre 1965 e 1996’, Economie Internationale 73, pp. 73-90.
Wolff E. N. (2003), What’s behind the rise in the profitability in the US in the 1980s and 1990s?, Cambridge Journal of Economics, 27, pp. 479-499.
Zanetti G., Alzona G. (1998), Capire le privatizzazioni, Il Mulino, Bologna.

CENTRE FOR ECONOMIC PERFORMANCE Recent Discussion Papers
670 Silvia Ardagna Francesco Caselli Timothy Lane
Fiscal Discipline and the Cost of Public Debt Service: Some Estimates for OECD Countries
669 Alejandro Cuñat Marco Maffezzoli
Can Comparative Advantage Explain the Growth of US Trade?
668 Francesco Caselli Silvana Tenreyro
Is Poland the Next Spain?
667 Francesco Caselli Accounting for Cross-Country Income Differences
666 Gianluca Benigno Pierpaolo Benigno
Designing Target Rules for International Monetary Policy Cooperation
665 Olmo Silva Entrepreneurship: Can the Jack-of-All-Trades Attitude be Acquired?
664 Maarten Goos Sinking the Blues: the Impact of Shop Closing Hours on Labor and Product Markets
663 Christopher A. Pissarides Giovanna Vallanti
Productivity Growth and Employment: Theory and Panel Estimates
662 Philip R. Lane Gian Maria Milesi-Ferretti
Financial Globalization and Exchange Rates
661 Alex Bryson Lorenzo Cappellari Claudio Lucifora
Do Job Security Guarantees Work?
660 David Marsden Richard Belfield
Unions, Performance-Related Pay and Procedural Justice: the Case of Classroom Teachers
659 Rachel Griffith Rupert Harrison John Van Reenen
How Special is the Special Relationship? Using the Impact of R&D Spillovers on UK Firms As a Test of Technology Sourcing

658 Douglas Kruse Richard B. Freeman Joseph Blasi Robert Buchele Adria Scharf Loren Rodgers Chris Mackin
Motivating Employee Owners in ESOP Firms: Human Resource Policies and Company Performance
657 Christopher Crowe Inflation, Inequality and Social Conflict
656 James Banks Richard Disney Alan Duncan John Van Reenen
The Internationalisation of Public Welfare Policy
655 Eran Yashiv The Self Selection of Migrant Workers Revisited
654 Hilary Steedman Sheila Stoney
Disengagement 14-16: Context and Evidence
653 Ralf Martin Globalisation, ICT and the Nitty Gritty of Plant Level Datasets
652 Jörn-Steffen Pischke Labor Market Institutions, Wages and Investment
651 Anthony J. Venables Evaluating Urban Transport Improvements: Cost Benefit Analysis in the Presence of Agglomeration and Income Taxation
650 John Van Reenen Is There a Market for Work Group Servers? Evaluating Market Level Demand Elasticities Using Micro and Macro Models
649 Rachel Griffith Stephen Redding Helen Simpson
Foreign Ownership and Productivity: New Evidence from the Service Sector and the R&D Lab
648 Fredrik Andersson Simon Burgess Julia I. Lane
Cities, Matching and the Productivity Gains of Agglomeration
The Centre for Economic Performance Publications Unit
Tel 020 7955 7673 Fax 020 7955 7595 Email [email protected] Web site http://cep.lse.ac.uk