
Profit Margin Analysis Of Private Sector Firms In ... - CiteSeerX
12
Researchjournali’s Journal of Commerce Vol. 2 | No. 8 October | 2014 ISSN 2348-0955 1 Priyanka Kulshreshtha Lecturer, Dayanand academy of management studies, house no. 459, sector 15, vasundhara, Ghaziabad Profit Margin Analysis Of Private Sector Firms In Telecommunication Industry Of India
-
Upload
khangminh22 -
Category
Documents
-
view
5 -
download
0
Transcript of Profit Margin Analysis Of Private Sector Firms In ... - CiteSeerX
Researchjournali’s Journal of Commerce Vol. 2 | No. 8 October | 2014 ISSN 2348-0955
1
Priyanka Kulshreshtha
Lecturer, Dayanand academy of management
studies, house no. 459, sector 15, vasundhara,
Ghaziabad
Profit Margin
Analysis Of Private
Sector Firms In
Telecommunication
Industry Of India
Researchjournali’s Journal of Commerce Vol. 2 | No. 8 October | 2014 ISSN 2348-0955
2
ABSTRACT
The fast track growth of the Indian telecom industry has made it a key contributor to India‟s progress. India
adopted a phased approach for reforming the telecom sector right from the beginning. Privatization was
gradually introduced, first in value-added services, followed by cellular and basic services. An independent
regulatory body, Telecom Regulatory Authority of India (TRAI), was established to deal with competition in
a balanced manner. This paper includes the study of the profit margin of the private sector firms in
Telecommunication industry of India. It includes three section first section deals with introduction and
research methodology. The second section deals with profit margin analysis: gross profit, net profit before tax
and net profit after tax. The third section deals with conclusion findings and suggestions.
1. INTRODUCTION
The telecom industry is one of the fastest growing industries in India. India has nearly 200 million telephone
lines making it the third largest network in the world after china and U.S.A. with a growth rate of 45%, Indian
telecom industry has the highest growth rate in the world. Indian Telecommunications started in 1851 when
the first operational land lines were laid by the government near Calcutta (seat of British power). Telephone
services were introduced in India in 1881. After independence in 1047, all the foreign telecommunication
companies were nationalized to form the posts, telephone and telegraph (PPT), a monopoly run by the
government‟s Ministry of Communications. The first wind of reforms in telecommunications sector began to
flow in 1980s when the private sector was allowed in telecommunications equipment manufacturing. In 1985,
Department of telecommunication (DOT) was established It was an exclusive provider of domestic and long
distance service that would be its own regulator (separate from the postal system).
Reforms in telecom sector begin in 1980 with telecom manufacturing being opened for private sector
followed by national telecom policy (NTP) in 1994 and 1999.
As every firms get reward based on its financial performance and profit is the very basis of any commercial
activity which indicates the cost and revenue differences .The very survival of commercial activity / business
in the long run is to earn profit. Profitability is the multiplication of profit margin and investment turnover. In
this paper profit margin of private sector firms in telecommunication industry of India has been discussed
during the period of 2002-2003 to2011-2012 to account for inter-period and inter unit variations.
(rustagi, 1999) Profit margin is the margin of profit on sales. It is the percent of sales revenue which remains
after deducting expenses and other provisions from it. The profit margin of an enterprise depends upon its
operating cost and selling price of the products. Generally an increase in the sales volume is favourable to
profit, but not necessarily. If increased sales figure results from a substantial rise in the cost of operations, and
Researchjournali’s Journal of Commerce Vol. 2 | No. 8 October | 2014 ISSN 2348-0955
3
thus a lower operating income, the effort to attain a large turnover may have to be curbed. A high profit
margin on sales is not always a blessing, unless it is related to a reasonably large volume of sales. The fact is
that a low profit margin on sales is better compared to a higher profit margin. But, If the former is
accompanied by a rapid turnover. Ultimately it is the return on investment which is the true indicator of
profitability.
(rustagi, 1999)Profit margin is the return generated by a company's assets and represents the difference
between revenues and total expenditure. „„In a manufacturing concern the profit margin results from sales of
its products. In fact, it is the key figure in the income statement or profit and loss account''.
Two main factors determine the size of profit margin of an enterprise. These are:
1. The management‟s ability to control operating costs, and
2. The management's ability to devise and implement a suitable and flexible pricing policy.
In fact both the factors must be kept in consonance or harmony with each other, if the operating ratio is 100
percent the profit margin will be zero. If the operating ratio is low it leaves a good profit margin in that case.
To obtain a good profit margin management should try to control operating cost because it is not possible to
continue to increase the selling price of a product in the present day competitive market.
The profit margin of an enterprise depends upon is operating costs and price policy. Management's capability
in regard to both these factor determines the size of profits. Profit Margin is a measure of overall profitability.
2. OBJECTIVES OF THE STUDY
To know about the development of telecommunication industry.
To know the profit margin of the private sector firms in telecom industry.
To estimate the financial and development operations of private sector in telecom industry.
3. RESEARCH METHODOLOGY
Coverage of the study: the study basically relates to the financial condition of the past ten years and the
prospect of future, past and present development of the Indian Telecom Industry in private sector.
Research Design: In the proposed study an attempt would be made to analytically study the condition of
private sector in telecom industry and to understand the problems faced by them. The study aims to view the
profit margin of private sector firms in telecom industry. For, the purpose of the proposed study the method
adopts is random sampling.
Researchjournali’s Journal of Commerce Vol. 2 | No. 8 October | 2014 ISSN 2348-0955
4
The sample of the study is as follows:
Reliance communication infrastructure ltd
Tata Teleservices ltd
Idea Cellular ltd
Vodafone cellular ltd
Bharti Airtel ltd
Method of data collection: For the purpose of the study primary and secondary data would be collected
and critically examined. The proposed study is primarily base on the secondary data which mainly consist of
the annual reports of the private firms. Apart from this primary data will also be collected through
observation, interview and questionnaire.
Analysis and interpretation of data: The method for analyzing the information was key content analysis.
Through content analysis, based on data codification, the key element contain in an information given are
transformed in to units that facilitated there description and analysis. The method was very useful to infer
objectives and reliable statements based on data provided by the interviews and based on the context in which
they were made.
On the basis of information that will be collected from various sources, appropriate analysis and interpretation
will be made. In the proposed study, the main source of information of the telecom industry will be personal
interview of the personnel, budgets, annual financial statements.
The information that will be obtained from various sources will be tabulated and result will be presented in
the form of tables and charts.
4. DISCUSSION
4.1 GROSS PROFIT MARGIN
Gross profit margin is the excess of selling price of sale proceeds over the cost of goods sold and it provides
the balance for operating expenses, income tax and return on capital employed. (kunchhal, 1977)
It is calculate by dividing gross profit by sales. It indicates the efficiency of operation and also price policy of
management. A high gross profit margin relative to the industry average implies that the firm is able to
produce its goods at a relatively lower cost. Kennedy and McMullan have given four factors for increasing
gross profit margin (monga, 1981).
[a] Higher sale prices and the cost of goods sold remaining constant,
[b] Lower cost of goods sold, sales price remaining the same,
Researchjournali’s Journal of Commerce Vol. 2 | No. 8 October | 2014 ISSN 2348-0955
5
[c] A combination of variation in sales prices and cost, the margin widening; and
[d] An increase in the proportionate volume of higher margin items.
These factors will reveal to the management, how a depressed gross profit margin can be improved.
A lower gross profit margin should be carefully investigated by a firm, whenever it occurs. it may reflect a
higher cost of goods sold due to the firm's ability to purchase raw materials at favourable terms, inefficient
utilization of plant and machinery resulting in a higher cost of production. The margin may also be low due
to fall in prices of marked reduction in selling price by the firm in an attempt to obtain larger sales volume the
cost of goods sold remaining unchanged.
Gross Profit to net sales ratio is calculated as under.
Gross Profit margin= Gross Profit X 100
Net sales
Here, net sales= Total income.
The gross profit of the private sector firms in telecommunication industry of India selected for the study have
been arrived at by deducting the cost of goods sold and services rendered from net income from sales and
services. Notably the non-operating income and non-operating expenses have not been taken into
consideration while calculating the gross profit. Depreciation has been treated as a part of operating expenses.
Table 1: Gross profit Margin of private sector firms in telecommunication industry of India
YEAR
TATA
AIRTEL
IDEA
RELIANCE
VODAFONE
Industry as
a
whole
2002-03 12.21 37.15 27.35 3.36 98.76 35.77
2003-04 19.86 25.00 28.06 7.81 98.81 35.91
2004-05 8.38 33.9 30.11 7.51 98.51 35.68
2005-06 -8.19 37.6 36.18 11.36 70.46 29.48
2006-07 11.39 36.00 36.37 29.39 71.44 36.92
2007-08 21.51 40.4 34.04 31.30 - 25.45
2008-09 27.13 42.2 33.68 8.49 70.07 36.44
2009-10 28.88 40.9 27.93 16.60 66.4 36.14
2010-11 23.73 40.28 27.9 8.97 9.91 22.16
2011-12 36.40 33.58 7.51 11.17 42.25 26.18
Average 18.13 36.70 28.91 13.60 62.66 32.01
Source: Annual Reports from F.Y.2002-03 to2011-12.
According to the above table the Gross profit margin of Tata Teleservices ltd shows a decreasing trend from
2003 till 2006 and after 2006, it represents an increasing trend till the year 2012 except in the year 2011.In the
year 2003, the ratio was 12.21 which decreases continuously till the year 2006 and becomes negative in this
Researchjournali’s Journal of Commerce Vol. 2 | No. 8 October | 2014 ISSN 2348-0955
6
year i.e. -8.19. Whereas after 2006, the company experience a continuous increase in its ratio till the year
2012 and becomes 36.40% except in the year 2011, which decrease to 23.73%.
The Gross profit Margin of Bharti Airtel ltd represents a fluctuating trend during the study period. In the
years 2003, the ratio stands to be 37.15% followed by a decrease in 2004 and becomes 25.00%.But the year
2005 recorded an increase in its ratio and becomes 33.9%. Not only this the year 2006 also shows an increase
in its ratio and recorded to be 37.6%.Again in the year 2007 the company‟s ratio decreases to 36%.The year
2008 and 2009 experience an increase in its ratio and stood to be 40.4% and 42.2% respectively. The year
2010 again represents a decrease in the ratio followed by a continuous increase in the ratio till 2011 and it
recorded to be 40.28%.But in 2012 the ratio once again decreases to 33.58%.
The Idea cellular ltd. recorded an increasing trend till the year 2007 and thereafter followed by a decreasing
trend till the year 2012.The year 2003 recorded a ratio of 27.35%. Followed by a continuous increase in the
ratio till the year 2007 and noted to be 36.37%.After 2008, the company experience a downfall in its ratio till
the year 2012 and represents to be 7.51%.
As far as the Gross profit Margin of Reliance communication infrastructure ltd. was concerned it shows an
increasing trend except in the years 2005,2009and 2011. In the year 2003, the ratio was 3.36% which
increases to 7.81% in the year 2004. Followed by a decrease in the year 2005 and becomes 7.51%. After
2005, the company experiences a continuous increase in its ratio till 2008 and represents to be 31.30%.the
year 2009, was the year of downfall. Which again increases to 16.60 in the year 2010.In the year 2011, the
ratio once again decrease to 8.97% and finally in the year 2012 it again increases to 11.17%.
The Vodafone cellular ltd depicts a decreasing trend except in the year 2004, 2007and2012. The year 2003
recorded as 98.76%. Which increases to 98.81% that was the highest ratio recorded among the companies
included under the study period, in the year 2004.In the year 2005 and 2006 the company experiences a
decrease in its ratio and becomes 70.46%.In the year 2007 it again increases to 71.44%.But after 2007, there
was a continuous decrease in its ratio till 2011 and recorded as 9.91%. The year 2012 was a year of increase
in the ratio and depicts to be 42.25%.
The Gross Profit ratio of private sector firms in telecommunication industry of India recorded a fluctuating
trend during the study period, the highest ratio was 62.66% and the lowest was 13.60%. The high profit
margin is a sign of good management and low ratio reflects the inefficiency of the management .The Gross
Profit margin of Bharti Airtel ltd. and Vodafone cellular ltd was also considered to be good as their average
was higher than the combined average of 32.01%.But the average of Tata Teleservices ltd. ,idea cellular ltd.
and Reliance communication infrastructure ltd was lower than the combined average of 32.01%.Thus the
Gross Profit margin of the above three companies cannot be considered to be good . It can be concluded that
Researchjournali’s Journal of Commerce Vol. 2 | No. 8 October | 2014 ISSN 2348-0955
7
the management of these companies should try to control the cost of goods sold and services rendered for
increasing the gross profit margin.
4.2 NET PROFIT BEFORE TAX TO NET SALES
The ratio of net profit before tax to net sales studies the relationship between net profit before tax and net
sales (kulshrestha, 1985-86). It is calculated in the basis of the following formula:
NET PROFIT BEFORE TAX X 100
NET SALES
Here, Net Sales=Total income.
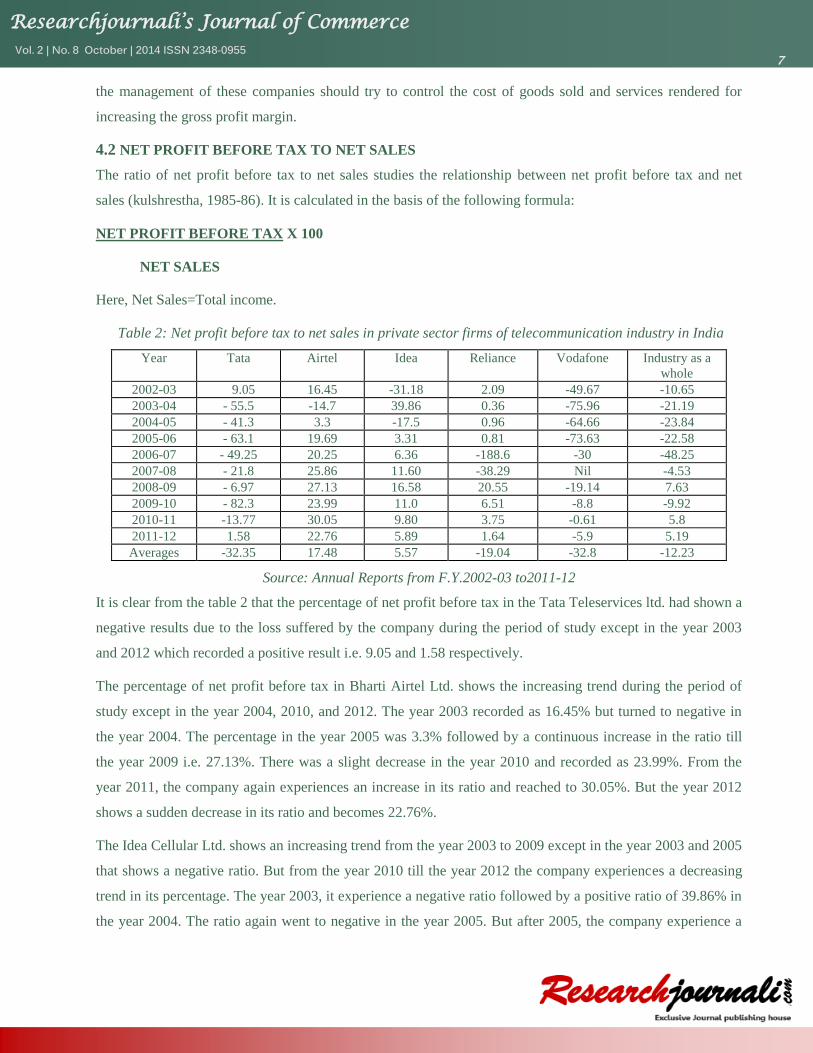
Table 2: Net profit before tax to net sales in private sector firms of telecommunication industry in India
Year Tata Airtel Idea Reliance Vodafone Industry as a
whole
2002-03 9.05 16.45 -31.18 2.09 -49.67 -10.65
2003-04 - 55.5 -14.7 39.86 0.36 -75.96 -21.19
2004-05 - 41.3 3.3 -17.5 0.96 -64.66 -23.84
2005-06 - 63.1 19.69 3.31 0.81 -73.63 -22.58
2006-07 - 49.25 20.25 6.36 -188.6 -30 -48.25
2007-08 - 21.8 25.86 11.60 -38.29 Nil -4.53
2008-09 - 6.97 27.13 16.58 20.55 -19.14 7.63
2009-10 - 82.3 23.99 11.0 6.51 -8.8 -9.92
2010-11 -13.77 30.05 9.80 3.75 -0.61 5.8
2011-12 1.58 22.76 5.89 1.64 -5.9 5.19
Averages -32.35 17.48 5.57 -19.04 -32.8 -12.23
Source: Annual Reports from F.Y.2002-03 to2011-12
It is clear from the table 2 that the percentage of net profit before tax in the Tata Teleservices ltd. had shown a
negative results due to the loss suffered by the company during the period of study except in the year 2003
and 2012 which recorded a positive result i.e. 9.05 and 1.58 respectively.
The percentage of net profit before tax in Bharti Airtel Ltd. shows the increasing trend during the period of
study except in the year 2004, 2010, and 2012. The year 2003 recorded as 16.45% but turned to negative in
the year 2004. The percentage in the year 2005 was 3.3% followed by a continuous increase in the ratio till
the year 2009 i.e. 27.13%. There was a slight decrease in the year 2010 and recorded as 23.99%. From the
year 2011, the company again experiences an increase in its ratio and reached to 30.05%. But the year 2012
shows a sudden decrease in its ratio and becomes 22.76%.
The Idea Cellular Ltd. shows an increasing trend from the year 2003 to 2009 except in the year 2003 and 2005
that shows a negative ratio. But from the year 2010 till the year 2012 the company experiences a decreasing
trend in its percentage. The year 2003, it experience a negative ratio followed by a positive ratio of 39.86% in
the year 2004. The ratio again went to negative in the year 2005. But after 2005, the company experience a
Researchjournali’s Journal of Commerce Vol. 2 | No. 8 October | 2014 ISSN 2348-0955
8
continuous increase its ratio till the year 2009 and reached to 16.58 whereas from the year 2010 the company
faces a decline in its ratio and reached to 5.89 in the year 2012.
According to the table the net profit before tax of Reliance Communication Infrastructure Ltd. shows a
decreasing trend in its percentage, except in the year 2009 during the period of study. The year 2003 recorded
a percentage of 2.09 followed by a continuous decrease till the year 2006 and becomes 0.81. The results in the
year 2007 and 2008 went to negative. In 2009, The Company shows a remarkable increase in its percentage
and becomes 20.55%. But, in 2010 the company again experiences a decline in its ratio and finally reached to
1.64 in the year 2012.
As far as the Vodafone Cellular Ltd., was concerned the percentage ratio shows negative results every year in
a fluctuative manner. The negative results mean that the company incurred losses during the period of study.
A part from this the industry as a whole represents a negative ratio from the year 2003 till 2006 and 2010. But
the year 2009, 2011 and 2012 depicts positive results.
It was depict from the above table that the average percentage of Bharti Airtel Ltd. and Idea Cellular Ltd.
shows a favorable results as their averages were higher than the combined average of -12.23, whereas the
average of Tata Teleservices Ltd., Reliance Communications Ltd. and Vodafone Cellular Ltd. were less than
the combined average. Thus conclude that the above companies are not able to earn sufficient profit thus it is
suggested that they should try to increase their profit.
4.3 NET PROFIT AFTER TAX TO NET SALES RATIO
In the net profit after tax measure tax is deducted from net profit to get the net profit after tax which one equal
to the sum of dividends and retained earnings (rustagi, 1999). It is indicative of “management‟s ability to
operate the business with sufficient success not only to recover from revenues of the period, the merchandise
or services, the expenses, of operating the business (including depreciation) and the cost of the borrowed
funds, but also to leave a margin of reasonable compensation to the owners for providing their capital at risk.
The ratio of net profit after tax to net sales essentially expressed the cost/price effectiveness of the operation.”
A higher ratio would reveal an advantages position in the face of falling sales price, rising costs of production
or lower declining demand for the product. A lower ratio has the opposite implications.
It is measured by dividing net profit after tax by net sales. It can be expressed as follows:
NET PROFIT AFTER TAX X 100
NET SALES
Here Net Sales= Total Income
Researchjournali’s Journal of Commerce Vol. 2 | No. 8 October | 2014 ISSN 2348-0955
9
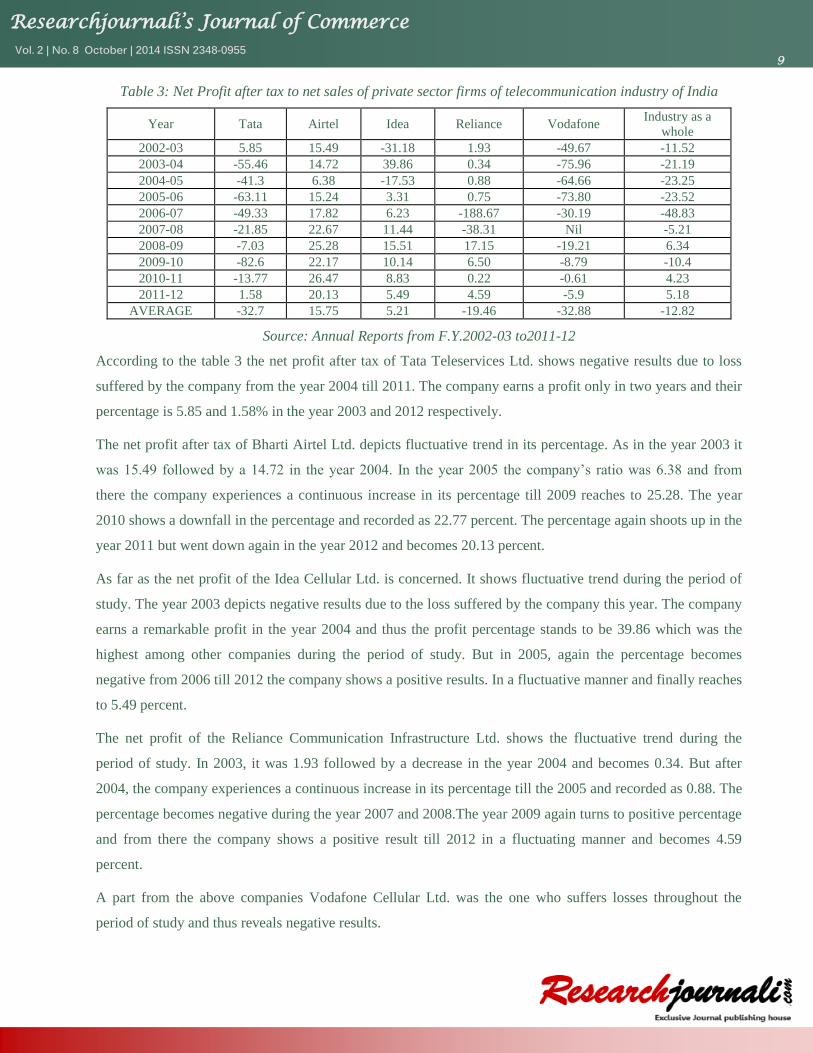
Table 3: Net Profit after tax to net sales of private sector firms of telecommunication industry of India
Year Tata Airtel Idea Reliance Vodafone Industry as a
whole
2002-03 5.85 15.49 -31.18 1.93 -49.67 -11.52
2003-04 -55.46 14.72 39.86 0.34 -75.96 -21.19
2004-05 -41.3 6.38 -17.53 0.88 -64.66 -23.25
2005-06 -63.11 15.24 3.31 0.75 -73.80 -23.52
2006-07 -49.33 17.82 6.23 -188.67 -30.19 -48.83
2007-08 -21.85 22.67 11.44 -38.31 Nil -5.21
2008-09 -7.03 25.28 15.51 17.15 -19.21 6.34
2009-10 -82.6 22.17 10.14 6.50 -8.79 -10.4
2010-11 -13.77 26.47 8.83 0.22 -0.61 4.23
2011-12 1.58 20.13 5.49 4.59 -5.9 5.18
AVERAGE -32.7 15.75 5.21 -19.46 -32.88 -12.82
Source: Annual Reports from F.Y.2002-03 to2011-12
According to the table 3 the net profit after tax of Tata Teleservices Ltd. shows negative results due to loss
suffered by the company from the year 2004 till 2011. The company earns a profit only in two years and their
percentage is 5.85 and 1.58% in the year 2003 and 2012 respectively.
The net profit after tax of Bharti Airtel Ltd. depicts fluctuative trend in its percentage. As in the year 2003 it
was 15.49 followed by a 14.72 in the year 2004. In the year 2005 the company‟s ratio was 6.38 and from
there the company experiences a continuous increase in its percentage till 2009 reaches to 25.28. The year
2010 shows a downfall in the percentage and recorded as 22.77 percent. The percentage again shoots up in the
year 2011 but went down again in the year 2012 and becomes 20.13 percent.
As far as the net profit of the Idea Cellular Ltd. is concerned. It shows fluctuative trend during the period of
study. The year 2003 depicts negative results due to the loss suffered by the company this year. The company
earns a remarkable profit in the year 2004 and thus the profit percentage stands to be 39.86 which was the
highest among other companies during the period of study. But in 2005, again the percentage becomes
negative from 2006 till 2012 the company shows a positive results. In a fluctuative manner and finally reaches
to 5.49 percent.
The net profit of the Reliance Communication Infrastructure Ltd. shows the fluctuative trend during the
period of study. In 2003, it was 1.93 followed by a decrease in the year 2004 and becomes 0.34. But after
2004, the company experiences a continuous increase in its percentage till the 2005 and recorded as 0.88. The
percentage becomes negative during the year 2007 and 2008.The year 2009 again turns to positive percentage
and from there the company shows a positive result till 2012 in a fluctuating manner and becomes 4.59
percent.
A part from the above companies Vodafone Cellular Ltd. was the one who suffers losses throughout the
period of study and thus reveals negative results.
Researchjournali’s Journal of Commerce Vol. 2 | No. 8 October | 2014 ISSN 2348-0955
10
As far as the industry as whole is concerned it shows an increasing trend except in the year 2008 and 2011.
The average percentage of Bharti Airtel Ltd. and Idea Cellular Ltd. was higher than its combined average of -
12.82 percent. This concludes that the company was earning sufficient profit whereas the average percentage
of Tata Teleservices Ltd., Reliance Infrastructure Ltd., and Vodafone Cellular Ltd., was below the combined
average of -12.82 percent which means that the above companies are not earning satisfactory profit thus
suggested to increase its profit.
5. CONCLUSION AND FINDING
The telecom industry has shown massive upsurge in the recent years in all respects of industrial growth
(bhattacharya). From the status of state monopoly with very little growth, the industry has grown in to the
level of an industry. The country is ranked third world wide with the growth rate of 40-50% P.a.
The liberalized economic policy in India led to the entry of more private and foreign players in to the Indian
telecom industry which in turn has to lead to a cut throat competition which influenced the financial
performance of the telecom companies. Hence, it becomes imperative to assess the financial health of the
Indian telecom companies in terms of its liquidity, profitability and return generating capability.
Profit is the acid test of the individual firm‟s performance (kulshrestha, 1985-86). Although profit as the basic
objective of economic activity has been universally recognized and accepted as a measure of business
efficiency. The excess of output over the input factors expressed in monetary terms is called profit. Thus, it is
the excess of income over cost. In fact profit is useful intermediate beacons towards which a firm‟s capital
should be directed to the financial management. Profit is the test of efficiency and a measure of control, to the
owner a measure of the worth of their investment, to the creditor, the margin of safety to the employees a
source of fringe benefits, to the government a measure of taxable capacity and the basis of legislative action,
to the country profits are an index of economic progress, national income, generated and rise in the standard
of living.
Profit is accepted as one of the objective of both private and public sector enterprise. It is the only measurable
variable that can be used for the analysis of profitability of business, firm or an industry. The analysis and
interpretation of profitability of an enterprise reflects its earning power and also its performance in using its
resources. The goal of an enterprise should not be maximizing of profit but the maximizing of profitability.
In this study, the profitability ratios have been used as a tool for measuring the performance of selected
companies. The objective of this study is to measure the profit margin of the telecom companies and their
relative significance of how well these ratios have been managed by selected companies.
Researchjournali’s Journal of Commerce Vol. 2 | No. 8 October | 2014 ISSN 2348-0955
11
Data of the present study have been obtained mainly from the annual reports of the selected private sector
firms in telecommunication industry of India. For the purpose of analysis the profit and loss account and
Balance Sheets have been recast and presented in condensed from various statements were prepared and
ratios calculated with the help of data. As par the calculation the tables are formed and from these tables the
findings are as follows:
The Gross Profit ratio of private sector firms in telecommunication industry of India recorded a
fluctuating trend during the study period, the highest ratio was 62.66% and the lowest was 13.60%.
The Gross Profit margin of Bharti Airtel ltd. and Vodafone cellular ltd was considered to be good as
their average was higher than the combined average of 32.01%.
The average of Tata Teleservices ltd. ,idea cellular ltd. and Reliance communication infrastructure ltd
was lower than the combined average of 32.01%.
The net profit before tax as per the industry as a whole represents a negative ratio from the year 2003 till
2006 and 2010. But the year 2009, 2011 and 2012 depicts positive results.
The average percentage of Bharti Airtel Ltd. and Idea Cellular Ltd. shows a favorable results as their
averages were higher than the combined average of -12.23.
The net profit after tax as per the industry as whole is concerned it shows an increasing trend except in
the year 2008 and 2011.
The average percentage of Bharti Airtel Ltd. and Idea Cellular Ltd. was higher than its combined
average of -12.82 percent.
Thus from the above findings it can easily depicts that Bharti Airtel ltd was the one who shows better profit
margin as compared to the other four companies.
6. SUGGESTIONS
Low level of net profit gives an indication that their non-operating expenses are mounting. So,
executives should try to minimize the non-operative expenses. The net profit of Tata Teleservices Ltd.,
Reliance Communications Ltd. and Vodafone Cellular Ltd. were less than the combined average. Thus
conclude that the above companies are not able to earn sufficient profit and it is suggested that they
should try to increase their profit.
The amount of depreciation should be minimized to increase the profit volume adequately.
Frequent training programmes for executives of the concern should be carried out periodically in order
to create sense of cost consciousness and responsibility of the incumbents towards organizational goal.
The problem of unhealthy competition can be solved if the companies make themselves specialized in
different fields/area of this industry.
Researchjournali’s Journal of Commerce Vol. 2 | No. 8 October | 2014 ISSN 2348-0955
12
7. REFERENCES
Annual reports of the companies.
C. Kunchhal, “ Financial Management:anAnalytical and conceptual approach”, Allahabad, Chaitanaya Publishing House,1977.
J.R.monga,“ Topics in financial Accounting”, New Delhi, National publishing house,1981.
Manas Bhattacharya, “Telecom Sector in India: Vision 2020”,telecommunication committee of India.
N.K. kulshrestha, “ Theory and Practice of Management Accounting”,Navman Prakashan,1985-86.
R.P. Rustagi, “financial management: Theory, concepts and problems”,Galgotia publishing company,1999.
www.google.com
www.Trai.Org