Profiling of Manufacturing Businesses in the Northern Cape
17
Profiling of Manufacturing Businesses in the Northern Cape 2015/16 Research and Development Unit Department of Economic Development and Tourism Northern Cape ©compiled by Research and Development, Department of Economic Development and Tourism, 2015.
-
Upload
khangminh22 -
Category
Documents
-
view
1 -
download
0
Transcript of Profiling of Manufacturing Businesses in the Northern Cape

Profiling of Manufacturing Businesses in
the Northern Cape Strategic Initiative Report 2015/16
Research and Development Unit
Department of Economic Development and Tourism
Northern Cape
©compiled by Research and Development, Department of Economic Development and Tourism, 2015.

Profiling of Manufacturing Businesses in the Northern Cape
Page 1
TABLE OF CONTENTS 1. INTRODUCTION .................................................................................................................................. 3
2. RESEARCH APPROACH ....................................................................................................................... 4
3. RESEARCH FINDINGS ......................................................................................................................... 6
3.1 MANUFACTURERS PROFILED ........................................................................................................ 6
3.2 MANUFACTURERS PER SECTOR .................................................................................................... 7
3.3 MANUFACTURING BUSINESSES PER DISTRICTS ...................................................................................... 8
3.3.1 ZF MGCAWU .......................................................................................................................... 8
3.3.2 FRANCES BAARD ..................................................................................................................... 9
3.3.3 PIXLEY KA-SEME ...................................................................................................................... 9
3.3.4 JOHN TAOLO GAETSEWE ....................................................................................................... 10
3.3.5 NAMAKWA ............................................................................................................................ 10
3.4 NUMBER OF EMPLOYEES ........................................................................................................... 11
4 CONCLUSION .................................................................................................................................. 12
5 RECOMMENDATIONS ......................................................................................................................... 1
“The Manufacturing Sector
has been prioritised as a job
driver because of its labour
intensive potential”- MEC
John Block

Profiling of Manufacturing Businesses in the Northern Cape
Page 2
Kalagadi Manganese Sinter, Hotazel

Profiling of Manufacturing Businesses in the Northern Cape
Page 3
1. INTRODUCTION
The Northern Cape is well endowed with
minerals and world class iron ore and
manganese deposits in the eastern part
of the province. Considerable diamond
production occurs across the entire
province and also production of base
metals in the form of copper, lead and
zinc. Not surprisingly, as the result of this
mineral endowment, mining has been
the mainstay of the Northern Cape
economy. Agricultural sector is the
second most significant sector after
mining. Despite this strong primary sector,
the contribution of the manufacturing
sector in the Provincial Gross Domestic
Product (GDP) is still minimal and
concerted effort is needed to help
support the growth of this sector.
Compared to the primary and tertiary
sectors, the contribution of the
manufacturing sector to the economy of
the Northern Cape has been less
significant over the years. In 2013, the
manufacturing sector contributed 3.2%
at current prices to the provincial
economy, a slight decrease from 3.5%
contribution in 2009. In addition, in 2013
the manufacturing industry in the
province contributed a meagre 0.2% to
the South African manufacturing sector.
However, It is believed that potential
exist for the Manufacturing sector to
expand and contribute significantly to
employment creation and Gross
Domestic Product (GDP) in the Province.
Amongst others, this is due to the
availability of raw materials produce and
a well-established Primary sector.
Government interventions set out in the
New Growth Path (NGP), the National
Development Plan (NDP) vision 2030,
National Industrialisation Policy
Framework, Industrial Policy Action Plan
and other policy documents, seek to
ensure that critical steps in support of the
restructuring of the economy are
secured to set the country on a more
value-adding and labor-intensive growth
(DTI), 2010). Long term development
needs are as such underpinned by these
interventions, which are all directed at
higher growth in the productive sectors,
led by manufacturing.
The latest developments around the
Renewable Energy and Strategic
Infrastructure Projects place the Northern
Cape as a strategic province for intense
manufacturing. As part of the initiatives
to support the manufacturing sector in
the province, the Department of
Economic Development and Tourism
(DEDaT) developed the Northern Cape
Manufacturing Strategy. One of the
recommendations of this strategy was
that a comprehensive database of
manufacturers in the province has to be
compiled.
The comprehensive database would
provide invaluable baseline information
as to who the manufacturers in the
province are, where are they located,
what are they manufacturing etc. It is
against this backdrop, that the Research
and Development (R&D) unit undertook
a research initiative of profiling and
compiling a database of manufacturers
in the province.

Profiling of Manufacturing Businesses in the Northern Cape
Page 4
The research initiative will not only prove
invaluable to the Department but will
place provincial government in a better
strategic position in understanding the
dynamics of the manufacturing sector in
the province. It is also envisaged that this
information will assist other programmes
in the Department like Trade and Sector
Development (TSD) and Small Business
Development (SBD) in their efforts to
create jobs through directing
interventions towards supporting and or
boosting manufacturing in the Northern
Cape.
2. RESEARCH APPROACH
The Research team used hybrid research
approaches in order to undertake this
study, comprising both the primary and
secondary data. As a basis, the team
sourced the manufacturers’ database
from Sector Development Unit within the
DEDaT (Trade and Sector Programme),
supplemented that with the database of
manufacturers sampled for the Uptake
of DTI Incentives 1 study that was
conducted by the R & D unit in 2014.
Together these informed the conclusive
list of manufacturers in the province,
which in entirety formed the initial
sample size of one hundred and fifty five
(155) manufacturers.
A data collection tool (Questionnaire)
was then developed. Guided by the
principles of designing a questionnaire
for accuracy and quality of data, the
questionnaire developed was kept
1 The DTI incentives report can be obtained
from the R & D Unit (DEDaT)
concise (See Appendix A). This was also
to ensure the interviews did not disturb
production of respondents.
The Research team then embarked on
field work based on planned site visits in
order to administer the survey to the
sample of 155 manufacturers. Towns with
a high concentration of business or
industrial or manufacturing activities
were prioritised for the field work. Due to
resource constraints, manufacturers in
the Pixley Ka-Seme and Namakwa
districts were all interviewed
telephonically and no site visits were
conducted.
The field work or site visits were very
helpful in the sense that the Research
team was able to identify and interview
an additional fifty one (51)
manufacturers that were not included in
the initial sample. However, some of the
businesses included in the initial sample,
fell off because during the interviews it
transpired that they are not necessarily
manufacturers whilst others are no longer
operational. Thus, affording the team the
opportunity to have an improved
database of one hundred and forty
three manufacturers.
The project team conducted field work
in the following towns:
Town Name Local
municipality
District
Municipalit
y
1. Kuruman Ga
Segonyana
John Taolo
Gaetsewe
2. Hotazel Gamagara
3. Kathu
Profiling of Manufacturing Businesses in the Northern Cape
Page 5
4. Danielskuil Kgatelopele
ZF
Mgcawu 5. Upington //Khara
Hais
6. Keimos Kai !Garib
7. Kakamas Kai !Garib
8. Postmasburg Tsantsaban
e
9. Kimberley Sol Plaatje Frances
Baard
Source: Research and Development, 2014
Some of the challenges that the
research team experienced when
conducting interviews include
reluctance of some of the respondents
to disclose certain information. Although
majority of respondents were willing to
share basic information regarding their
businesses, some were however
reluctant to share information on their
employee numbers.
The team experienced a challenge
whilst processing the data collected.
Guided by the Standard Industrial
Classifications (SIC) to categorize
manufacturers according to the relevant
sector, there were exceptional cases
that posed a challenge with
classifications. In some instances a
business would operate in more than
one sector (for example, Company
producing Signs, Number plates and
Clothing). According to SIC, Signs,
Number plates and advertising displays
that are not electrical falls under the
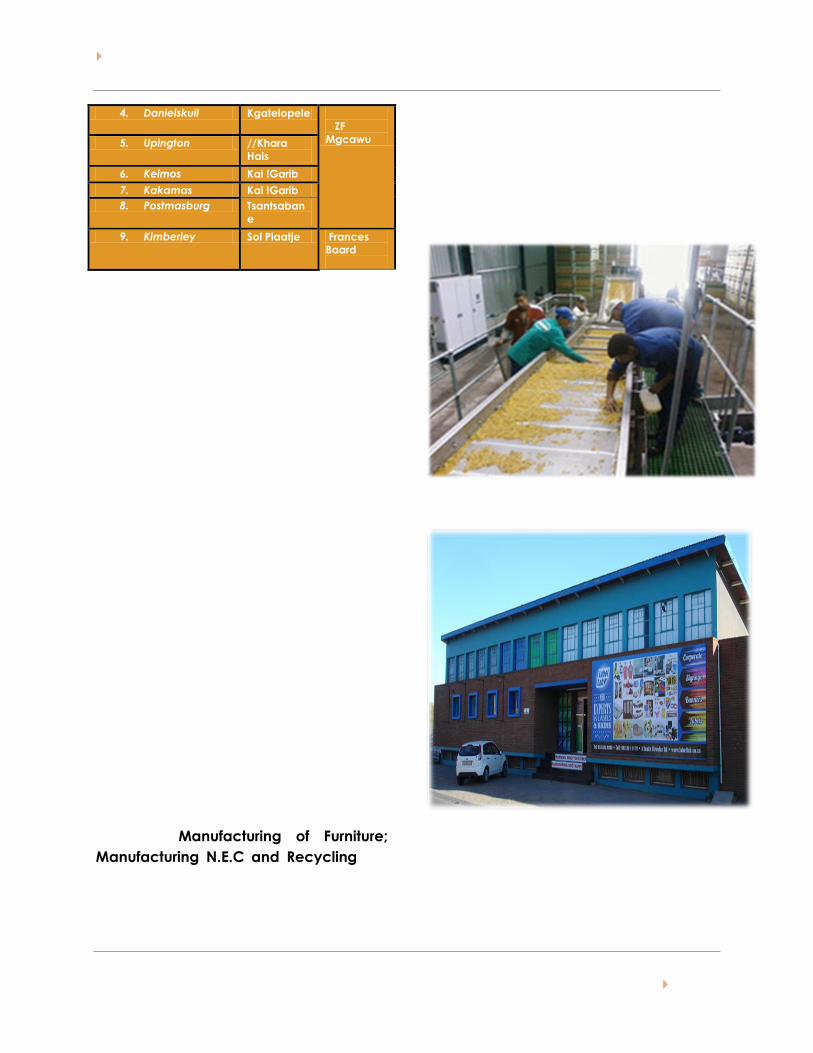
subsector Manufacturing of Furniture;
Manufacturing N.E.C and Recycling but
printing of clothing falls under another
subsector. In such scenarios, businesses
were categorized based on their primary
products.
Lastly, the R&D team would like to
acknowledge the fact that there might
be few manufacturers the team missed
in the profiling, however effort will be
made to ensure that the database will
be updated on regular basis.
Pic: Red Sun Factory, Keimos
Pic: Label Lab, 3 South Circular Road, Kimberley

Profiling of Manufacturing Businesses in the Northern Cape
Page 6
3. RESEARCH FINDINGS
The aim of this section is to present key
findings from interactions with
manufacturing businesses operating in
the Northern Cape.
3.1 MANUFACTURERS PROFILED
To be able to understand the dynamics
of manufacturing sector holistically, the
R&D unit interviewed all manufacturers
operating in the province. Based on the
compiled comprehensive list of
manufacturers and the additional
manufacturers identified during the site
visits, a total of two hundred and six (206)
manufacturers were interviewed by the
team. However, sixty three of these were
disqualified for reasons cited in the
previous section, leaving a total of one
hundred and forty three manufacturers
(143) whose questionnaires were
processed. In essence it can be said that
one hundred and forty three
manufacturers make up the final list of
manufacturers profiled in the province
and are thus included in the database.
Figure 3.1 shows the number of
manufacturers profiled in the Northern
Cape.
Figure 3.1: Manufacturers profiled
Source: (Research and Development, 2015)
Figure 3.1 above shows that, 143
manufacturers were profiled following
interviews in all five district municipalities
in Northern Cape. The majority of
manufacturers are located in Frances
Baard District Municipality (36%) and ZF
Mgcawu District (33%) as depicted in
Figure 3.2. This is not surprising as the two
districts are the most populated areas in
the province. In addition, most of the
manufacturers are based in main towns
like Kimberley and Upington. The two
towns supply various industrial areas,
wherein manufacturing activities are
concentrated.
Figure 3.2 depicts percentage
distribution of manufacturers profiled per
districts.
0 50 100 150
FB
ZFM
JTG
Pixley Ka-Seme
Namakwa
Total
51
47
16
17
12
143
Manufacturers Interviewed
Profiling of Manufacturing Businesses in the Northern Cape
Page 7
Figure 3.2: Manufacturers per district
Source: (Research and Development, 2015)
In Pixley Ka-Seme and John Taolo
Gaetsewe districts, a total of 33
manufactures (or 23%) of manufacturers
were profiled. In John Taolo Gaetsewe,
majority of manufacturers are
concentrated in the Kuruman Industrial
area under the Ga-Segonyana Local
Municipality jurisdiction. Whereas in Pixley
Ka-Seme, most businesses are located in
Emthanjeni Municipality specifically, De
Aar. In Thembelihle municipality, there is
little manufacturing activities taking
place in towns like Hopetown and
Douglas.
In Namakwa district, the majority of
businesses profiled are operating in
Springbok under the Nama-Khoi Local
Municipality. In addition, Namakwa has
the least number of manufacturing
businesses that were profiled. This is
reaffirmed by the low contribution of the
Manufacturing industry to the district’s
economy.
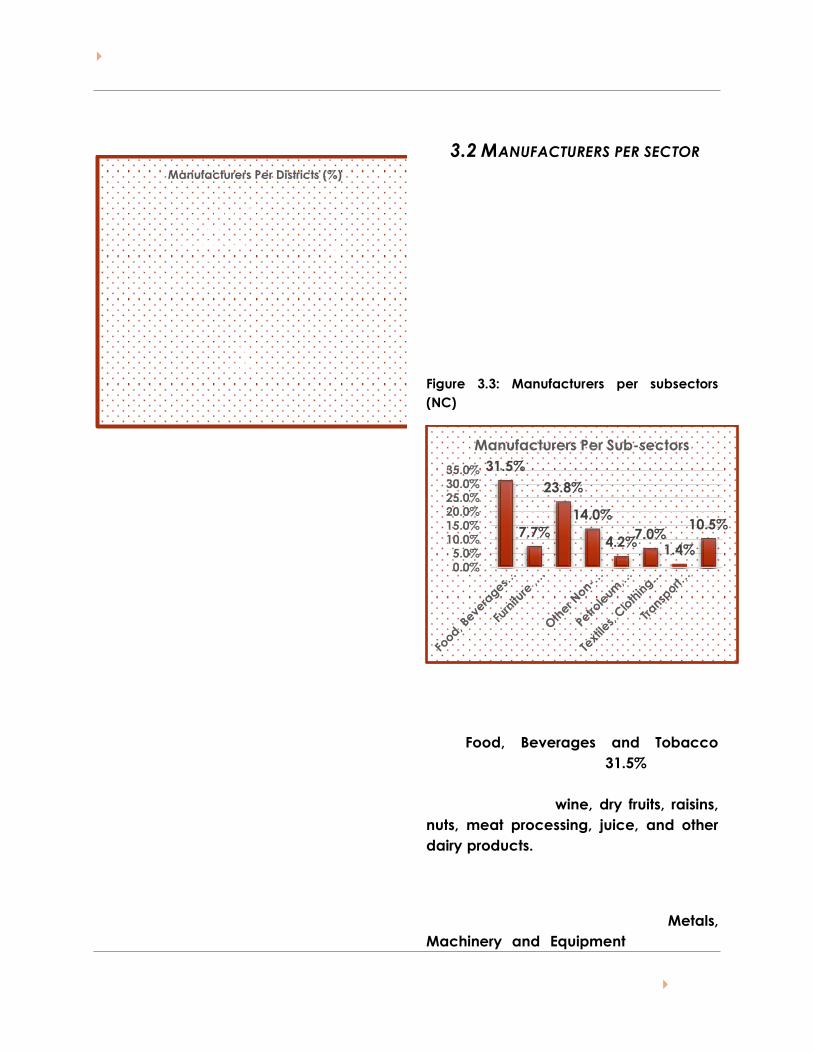
3.2 MANUFACTURERS PER SECTOR
Figure 3.3 depicts percentage
distribution of manufacturers that were
profiled per sub-sectors. . As alluded in
the previous section, the SIC was used to
categorize businesses into relevant
subsectors. Manufacturing in the
Northern Cape can be divided into 8
main sub-sectors.
Figure 3.3: Manufacturers per subsectors
(NC)
Source: (Research and Development, 2015)
Based on Figure 3.3, the majority of
manufacturers in the province operate in
the Food, Beverages and Tobacco
subsector, representing 31.5% or 45 of
total manufacturers profiled. Main
products include wine, dry fruits, raisins,
nuts, meat processing, juice, and other
dairy products. Majority of businesses are
located in ZF Mgcawu and Frances
Baard
The second largest subsector is Metals,
Machinery and Equipment accounting
FB
36%
ZFM
33%
JTG
11%
Pixley
Ka-Seme
12%
Namakw
a
8%
Manufacturers Per Districts (%)
31.5%
7.7%
23.8%
14.0%
4.2% 7.0%
1.4%
10.5%
0.0%5.0%
10.0%15.0%20.0%25.0%30.0%35.0%
Manufacturers Per Sub-sectors

Profiling of Manufacturing Businesses in the Northern Cape
Page 8
for over 23.8 % of businesses profiled. This
sector can play an important role in
supplying steel products to various
Strategic Infrastructure and or
Renewable Energy Projects in the
province. All major infrastructure projects
require steel as an input material. Most of
the companies in this sub-sector operate
in industrial areas in main towns like
Kimberley and Upington.
Over 14.0 % of manufacturers operate in
the Other Non-Metallic Minerals Products
and include manufacturing of bricks. The
sub-sector is the third largest after the
Metals, Machinery and Equipment.
The Wood, Paper, Publishing and Printing
subsector represents 10.5% of businesses
and the main services being provided
under this sector is printing, signage and
promotional items.
Other important manufacturing
subsectors in the province include
Manufacturing of Furniture and Textiles,
Clothing and Leather products,
accounting for 7.7% and 7.0% of all
businesses profiled respectively. A small
number of manufacturers operate in the
Petroleum, Chemicals, Rubber and
Plastics. The main products or services
rendered in this subsector is Salt
Processing around the //Khara Hais
District.
3.3 MANUFACTURING BUSINESSES PER
DISTRICTS This subsection discusses the
manufacturing activities in all the five
districts in detail and identify major
manufacturing companies operating in
those areas.
3.3.1 ZF MGCAWU
The manufacturing activities in this district
mirror those of the province, inferring
that the Food and Beverages sub-sector
(40.4%) is the largest followed by the
Metals, Machinery and Equipment
(27.7%).
Figure 3.3.1 ZF Mgcawu Manufacturing businesses
Source: (Research and Development, 2015)
Prominent9162.95 560.62 Tm [( )] T38015)

Profiling of Manufacturing Businesses in the Northern Cape
Page 9
Vrugte (Pioneer Foods) and dried fruits
and raisins producer; Red Sun.
In addition various salt processing
companies operate in the Upington
area. In the Furniture industry, Ohtrani
Meubels & Schmidt Skrynwerke
manufacture furniture and home décor
products in Upington Industrial area and
exports to neighbouring countries
(Namibia and Botswana).
3.3.2 FRANCES BAARD
Frances Baard has the largest number of
manufacturers profiled by the project
team, out of 143 businesses, 51 are
located in Frances Baard.
Figure 3.3.2 Frances Baard Manufacturers
Source: (Research and Development, 2015)
As in the case of ZF Mgcawu, the district
has a strong Food and beverages
industry, closely followed by Metals,
Machinery and Equipment. Fruit Juices,
dairy products, nuts and nuts oil related
products are some of the products
manufactured in the district. Hancor
Dairy in Kimberley, produces a wide
range of fruit juices and dairy products
and they supply to major retail
businesses e.g. Shoprite and Pick n Pay.
In the Metals, Machinery and Equipment
industry prominent companies include
Aveng Steel dale, Kimberley
Electroplating & Engineering and Mega
Frame Industries. Moreover, Future Home
based in De Beers, Kimberley,
manufacture furniture and home décor
products and distribute to their retail
stores around Kimberley. The company
has plans to expand their production
and venture into Office furniture in the
future.
3.3.3 PIXLEY KA-SEME Figure 3.3.3 Pixley Ka-Seme Manufacturers
Source (Research and Development, 2015)
Seven out of 17 manufacturers profiled in
Pixley Ka-Seme operate in the Food and
beverages industry (representing 41.2%
of all manufacturers). Main products in
the region include Dairy (i.e. cheese,
milk etc.), meat, nuts and to a lesser
extent wine. This is also in line with the
strong agricultural sector in the district.
Most Manufacturing businesses are
based in main towns like De Aar, Prieska,
Douglas and Hopetown.
27.5%
5.9%
25.5%
7.8%
2.0%
11.8%
19.6%
0.0% 10.0% 20.0% 30.0%
Food, Beverages…
Furniture ,…
Other Non-…
Petroleum,…
Textiles, Clothing…
Frances Baard 41.2%
5.9% 5.9% 11.8%
23.5%
5.9% 5.9%
0.0%
10.0%
20.0%
30.0%
40.0%
50.0%
Pixley Ka-Seme Manufacturers
Profiling of Manufacturing Businesses in the Northern Cape
Page 10
It is interesting to note that JOJO Tanks
have a manufacturing facility in the
district. In addition, Other Non-Metallic
Mineral products subsector is the second
largest sector in Pixley Ka-Seme and
prominent companies include; Aveng
Infraset (manufacturers of cement
sleepers) and Rocla (concrete products)
both companies can be suppliers to
major infrastructure projects in the
province.
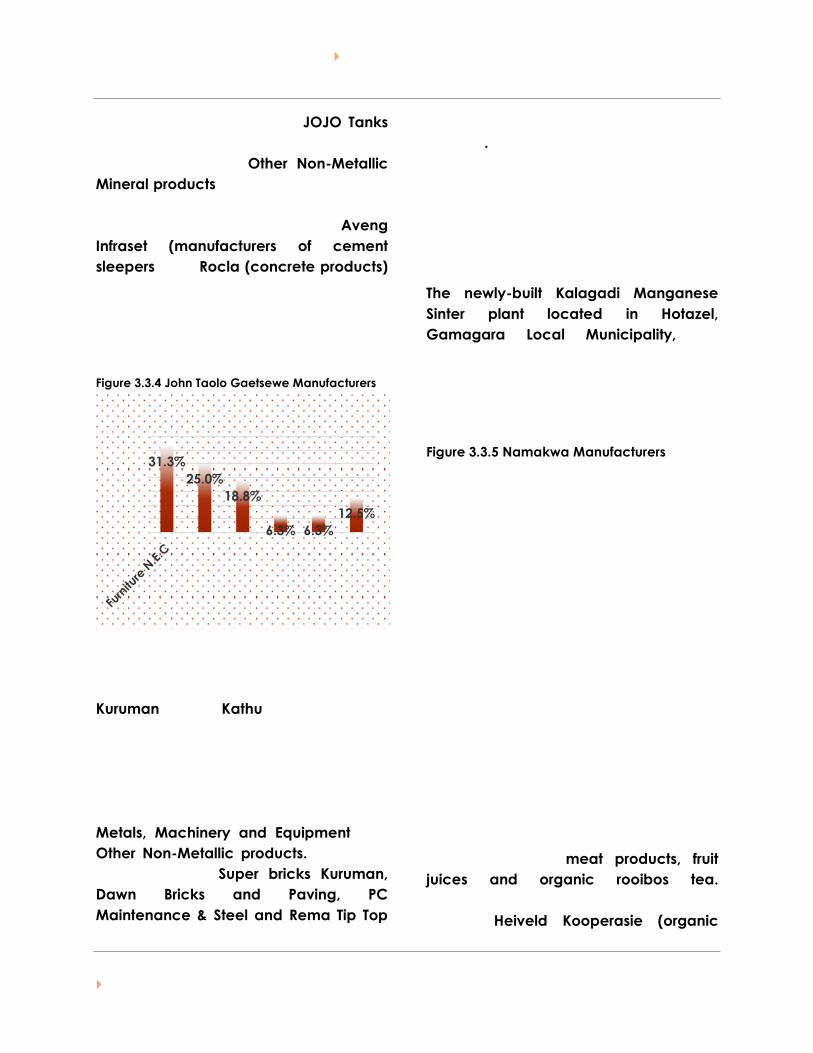
3.3.4 JOHN TAOLO GAETSEWE Figure 3.3.4 John Taolo Gaetsewe Manufacturers
Source (Research and Development, 2015)
Overall, 16 manufacturers were profiled
in the district and majority are located in
Kuruman and Kathu. Most of the
manufacturers (or 31.3%) profiled are in
the Furniture N.EC industry; producing
built-in cupboards, wardrobes, other
furniture and home décor products.
Moreover other main sectors include
Metals, Machinery and Equipment and
Other Non-Metallic products. Major role
players include Super bricks Kuruman,
Dawn Bricks and Paving, PC
Maintenance & Steel and Rema Tip Top
(manufacturers of conveyor belts and
splicing).
Manufacturing sector in John Taolo
Gaetsewe is relatively small and the most
important sector is mining. Hence, most
of other businesses in the district provide
goods and services to the mines.
The newly-built Kalagadi Manganese
Sinter plant located in Hotazel,
Gamagara Local Municipality, will
change the landscape of
manufacturing in the district and the
entire province once operational.
3.3.5 NAMAKWA
Figure 3.3.5 Namakwa Manufacturers
Source (Research and Development, 2015)
As with other districts, there is little
manufacturing activities in Namakwa.
Majority of businesses are in the Food
and Beverages industry and main
products include meat products, fruit
juices and organic rooibos tea.
Prominent businesses in the district
include Heiveld Kooperasie (organic
31.3%
25.0%
18.8%
6.3% 6.3%
12.5%
0.0%5.0%
10.0%15.0%20.0%25.0%30.0%35.0%
Profiling of Manufacturing Businesses in the Northern Cape
Page 11
Rooibos tea) based in Niewoudtville and
Carnarvon Abattoir.
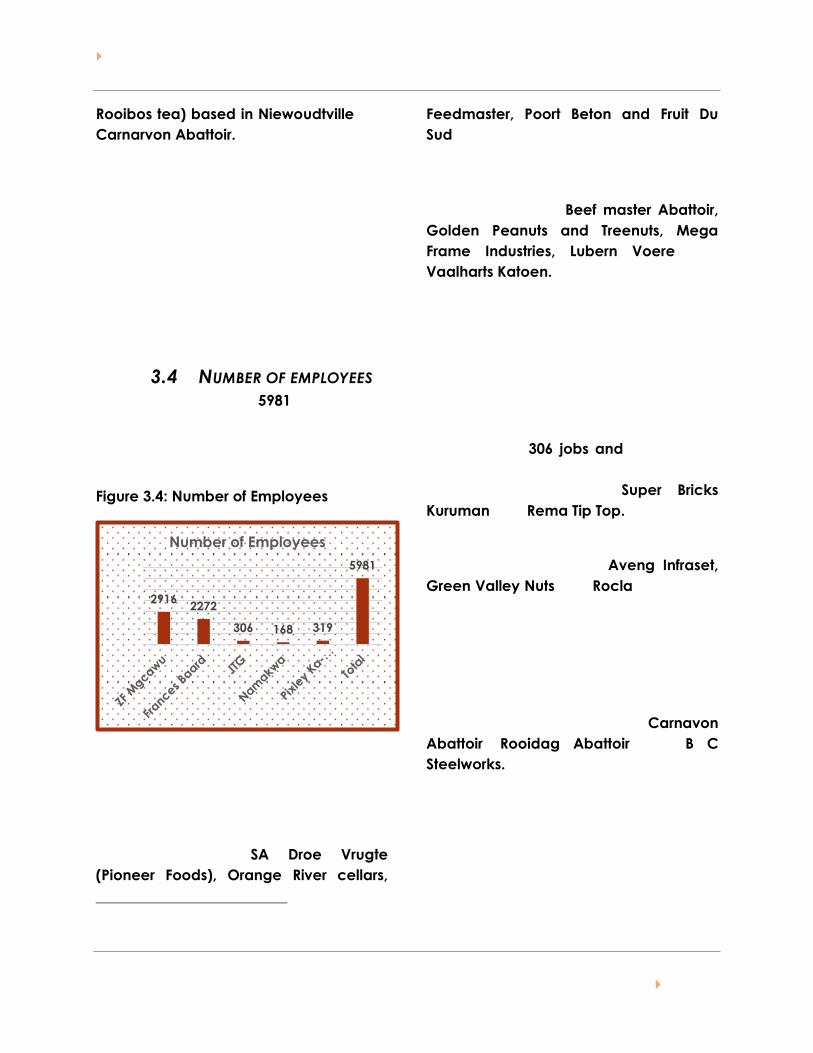
3.4 NUMBER OF EMPLOYEES
An estimated total of 59812 people are
employed by manufacturers that were
profiled. This number includes both part-
time and full-time workers.
Figure 3.4: Number of Employees
Source: (Research and Development, 2015)
Based on Figure 3.4 above, ZF Mgcawu
has the largest number of workers
employed in the manufacturing sector.
Some of the largest employers in ZF
Mgcawu include SA Droe Vrugte
(Pioneer Foods), Orange River cellars,
2 Please note it is not accurate but an estimation
because some of the respondents did not want to
disclose their employee numbers
Feedmaster, Poort Beton and Fruit Du
Sud.
Manufacturers in Frances Baard region
employ 2272 workers and main
employers include Beef master Abattoir,
Golden Peanuts and Treenuts, Mega
Frame Industries, Lubern Voere and
Vaalharts Katoen.
In John Taolo Gaetsewe, 16
manufactures were profiled and they
created over 306 jobs and some of the
prominent employers in the district
include among others Super Bricks
Kuruman and Rema Tip Top.
Manufacturers in Pixley Ka-Seme employ
about 319 workers and Aveng Infraset,
Green Valley Nuts and Rocla employ the
majority of the workers.
Lastly, Namakwa district employs the
least number in the manufacturing
sector as compared to other districts;
with only 168 workers. The largest
employers in the district are Carnavon
Abattoir, Rooidag Abattoir and B C
Steelworks.
2916 2272
306 168 319
5981
01000200030004000500060007000
Number of Employees

Profiling of Manufacturing Businesses in the Northern Cape
Page 12
Pic: Hieveld Kooperasie products, Niewoudtville
4 CONCLUSION
The findings of the profiling of
manufacturers firstly affirm that
manufacturing sector in the province is
relatively small as compared to other
provinces in the country. Secondly,
provincial manufacturing is dominated
by light manufacturing, specifically agro-
processing. This is evidenced by the
dominance of the Food, Beverages and
Tobacco sub-sector in all districts of the
province except John Taolo Gaetsewe.
Given that Northern Cape is home to the
majority of projects in the Renewable
Energy Independent Power Producer
Programme (REIPPPP), it is comforting to
observe that Metals, Machinery and
Equipment is the second most dominant
sub-sector in the province. Majority of
manufacturers are concentrated in ZF
Mgcawu and Frances Baard districts. It is
however disturbing to learn that out of all
businesses profiled, none are currently
manufacturing products or components3
3 Not to be confused with businesses that offer
installation services and sell solar energy products to
households and private sector.
for the renewable energy programme.
Therefore there is a need to develop and
support emerging entrepreneurs to
explore opportunities in the renewable
energy sector.
The manufacturing sector is relatively
small in the province as it currently
contributes roughly 2 per cent towards
the provincial employment. It is very
crucial that provincial government
prioritises the growth of its manufacturing
sector expressly given its high
unemployment levels. Profiling of
manufacturers is the first necessary step
in ascertaining existing manufacturing
capacity within the Northern Cape, so
that efforts at growth of the
manufacturing sector are well directed.
Lastly, the R&D unit would like to append
the profile of manufacturers in the
province (Appendix B). It should be
noted that the field trips were invaluable
in ensuring accuracy of the database.
The team was able to identify
manufacturers who were no longer
operational or those who were not

Profiling of Manufacturing Businesses in the Northern Cape
Page 1
necessarily manufacturers from the
preliminary database as well as update
the contact details of some
manufacturing businesses. It is
acknowledged that failure to conduct
site visits in the two district, Pixley Ka
Seme and Namakwa may result in some
manufacturers being missed, but this
does not compromise the accuracy and
quality of the survey undertaken.
5 RECOMMENDATIONS
Based on the findings of the study, the following are the recommendations:
i. Profiling manufacturers in the province is very crucial if interventions aimed at
assisting manufacturers establish markets are to bear fruits. The profiling of
manufacturers has revealed the eight manufacturing subsectors which make up
provincial manufacturing capacity. It is recommended therefore that value
chain analysis research work be undertaken, that will unpack key manufacturing
subsectors, which is at each level of the production processes, to not only
ascertain the gaps but provide valuable insight on the existing challenges facing
provincial manufacturers.
ii. Metals, Machinery and Equipment is the second most dominant sub-sector in the
province and other things being equal, this possibly displays the potential
capacity within the province to supply steel components for especially the solar
PV, CSP and Wind energy RE value chains. Also, provincial government can
negotiate on the SED capacity initiatives to ensure that local steel producers are
skilled to be able to produce even those specialized steel components.
iii. The DEDaT interventions need to be realistically synchronized with the fact that
light form of manufacturing in the form of agro-processing is the most dominant
in the province. Interventions aimed at job creation and economic growth and
development need to be cognizant of the Food, Beverages and Tobacco sub-
sector. Furthermore, DEDaT should support manufacturers in the Food, Beverages
and Tobacco sub-sector explore opportunities offered by inclusive business
models (e.g. partnership with retail companies like Shoprite, Pick n Pay and
Woolworths).
iv. DEDaT through the relevant programmes (Small Business Development and
Trade and Sector Development) must maintain regular contact with
manufacturers for information sharing dialogues on issues such as available

Profiling of Manufacturing Businesses in the Northern Cape
Page 1
incentive programmes grants, exporting opportunities as well as set up
exhibitions to support creation of markets.
v. DEDaT and provincial government need to play a role in ensuring multinational
companies establish production plants in the province and not only distribution
centres. Such a transition would have numerous backward and forward linkages
and contribute to reduction in the unemployment rate, especially among youth.
For instance big multinational companies like South African Breweries (SAB) and
Amalgamated Beverages Industries (ABI) - which produces Coca-Cola among
other products, currently have depots or distribution centres in the province Of
course taking into consideration that they are private organisations and have
their own cost curves and profit margins it would be worthwhile that such are
negotiated with to have manufacturing plants. In addition, large companies like
SASKO and Blue- Ribbon also operate using the same distribution model like the
aforementioned multinational companies. For instance, bread (SASKO and Blue
Ribbon) that is consumed in the Northern Cape is being baked in Bloemfontein,
Free State.
Bibliography
DTI), D. o. (2010). Industrial Policy Action Plan (IPAP) 2012/13-2014/15.
Research and Development. (2015). Profiling of Manufacturing Businesses in the Northern Cape
(Survey).
Profiling of Manufacturing Businesses in the Northern Cape
Page 1
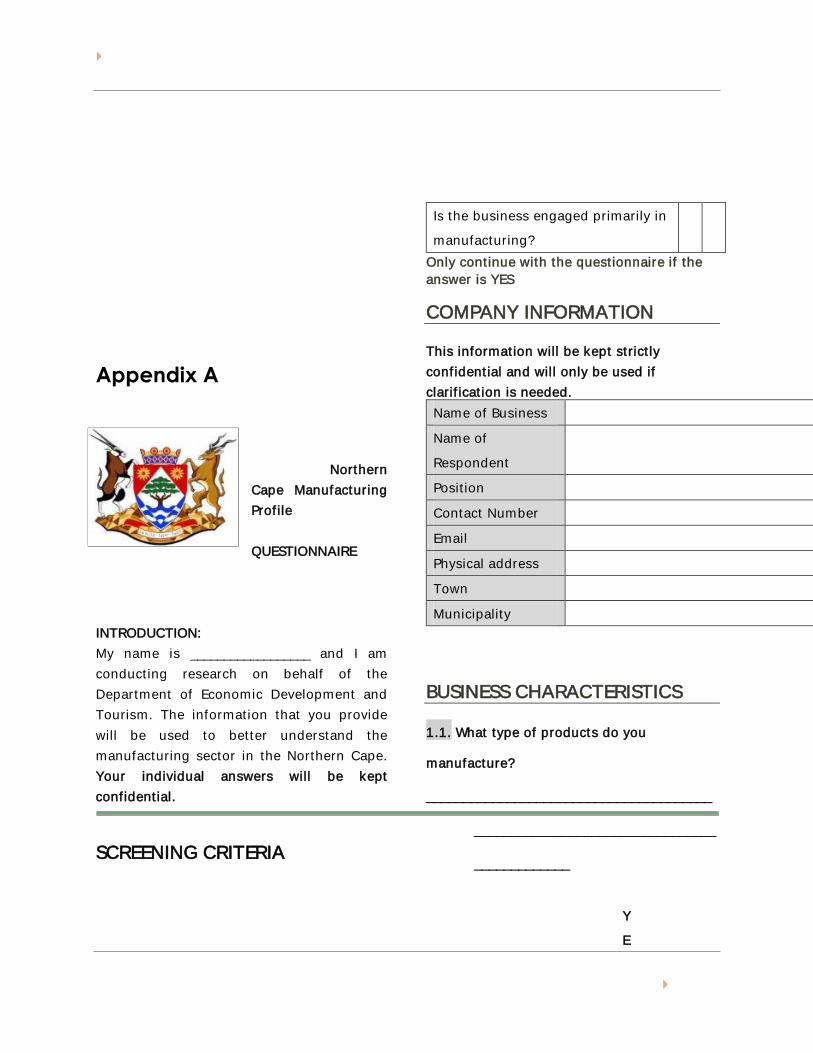
Appendix A
Northern
Cape Manufacturing
Profile
QUESTIONNAIRE
INTRODUCTION:
My name is __________________ and I am
conducting research on behalf of the
Department of Economic Development and
Tourism. The information that you provide
will be used to better understand the
manufacturing sector in the Northern Cape.
Your individual answers will be kept
confidential.
SCREENING CRITERIA
Y
E
S
N
O
Is the business engaged primarily in
manufacturing?
Only continue with the questionnaire if the
answer is YES
COMPANY INFORMATION
This information will be kept strictly
confidential and will only be used if
clarification is needed.
Name of Business
Name of
Respondent
Position
Contact Number
Physical address
Town
Municipality
BUSINESS CHARACTERISTICS
1.1. What type of products do you
manufacture?
_______________________________________
_________________________________
_____________

Profiling of Manufacturing Businesses in the Northern Cape
Page 2
_______________________________________
_________________________________
_____________
_______________________________________
_________________________________
_____________
_______________________________________
_________________________________
_____________
1.2 When did the business start operating?
_______________________________________
_________________________________
_____________
_______________________________________
_________________________________
_____________
1.3. What is the total number of employees
working for your business? Enter Number
Permanent or full time worker(s) 1
Part time worker(s) 2
Total (Must Add Up) 3
THANK YOU FOR YOUR PARTICIPATION