profile of poverty in the durban region - openSALDRU
165
J .. - ( /) PROFILE OF POVERTY IN THE DURBAN REGION PROJECT FOR STATISTICS ON LIVING STANDARDS AND DEVELOPMENT PREPARED BY J Cobbledick and M Sharratt Economic Research Unit University of Natal Durban OCTOBER 1993
-
Upload
khangminh22 -
Category
Documents
-
view
5 -
download
0
Transcript of profile of poverty in the durban region - openSALDRU

J ..
~,
~' -( /)
~ PROFILE OF POVERTY IN THE DURBAN REGION
PROJECT FOR STATISTICS ON LIVING STANDARDS AND DEVELOPMENT
PREPARED BY
J Cobbledick and
M Sharratt
Economic Research Unit University of Natal
Durban
OCTOBER 1993

. '
.. During 1992 the World Bank approached the Southern Africa Labour and Development Research Unit (SALDRU) at the University of Cape Town to coordinate, a study in South Africa called the Project on Statistics for Living $tandards and Development. This study was carried out during 1993, and consisteci of two phases. The first of these was a situation analysis, consisting of a number of regional poverty profiles and cross-cutting studies on a na~ional level. The second phase was a country wide household surVey conducted in the latter half of 1993. The Project has been built on the Second Carnegie Inquiry into Poverty, which assessed the situation up to the mid 1980's.
Whilst preparation of these papers for the situation analysis, using common guidelines, involved much discussion and criticism amongst all those involved in the Project, the final paper remains the responsibility of its authors .
-<, '"
-) 1 In the series of working papers on reilional poverty and cross-'"" . cutting themes there are 12 papers:
Regional Poverty Profiles:
Cross-Cutting Studies:
Ciskei Durban Eastern and Northern Transvaal NatallKwazulu OFS and Qwa-Qwa Port Elizabeth - Uitenhage PWV' Transkei Western Cape
Energy Nutrition Urbanisation & Housing Water Supply

TABLE OF CONTENTS
SECTION No. PAGE No.
1 INTRODUCTION
1.1 CONTEXTUALISING THE DURBAN REGION 1 \ '-. '1.2 DEMOGRAPHIC FEATURES 5
1.3 ECONOMIC ENVIROMENT 6
2 INCOME, EXPENDITURE AND EMPLOYMENT
2.1 INTRODUCTION 12
2.2 INCOME SOURCES 12
2.2.1 Dependency 12 2.2.1.1 Summary 15 2.2.2 Sources of household income 16 2.2.2.1 Occupation 16 2.2.2.1.1 Summary 17 2.2.2.2 Sector of employment 18 2.2.2.2.1 Summary 21 2.2.2.3 Sources of household income 21 2.2.2.3.1 Summary 26
2.3 INCOME LEVELS 27
2.3.1 Summary 34
2.4 HOUSEHOLD EXPENDITURE 35
2.4.1 Summary 38
ISBN: 0 - 7992 - 1547 - 3
i

·2.5 EXTENT OF POVERTY IN THE REGION 38
2.5.1 Summary 40
'.I ) . , 2.6 CONCLUDING SUMMARY 40
3 NON-INCOME INDICATORS OF POVERTY
3.1 INTRODUCTION 42
3.2 MORTALITY RATES 42
3.2.1 General mortality in Durban, Pinetown, Inanda, Ntuzuma and Umlazi 42
3.2.2 Childhood and infant mortality 42 3.2.2.1 Childhood mortality 49 3.2.2.2 Infant mortality rates 50 3.2.2.2.1 National trends 50 3.2.2.2.2 Regional trends 51 3.2.2.2.3 Magisterial trends 52 3.2.3 Summary 57
3.3 MORBIDITY 58
3.3.1 Measles 58 3.3.2 Meningococcal Meningitis 60 3.3.3 Typhoid 62 3.3.4 Viral Hepatitis A 64 3.3.5 . Pulmonary Tuberculosis 65 3.3.6 Sexually Transmitted Diseases 69 3.3.6.1 Human Immunodeficiency Virus (HIV) 69 3.3.7 Summary 70
3.4 NUTRITION STATUS 71
3.4.1 ' Introduction 71 3.4.2 National trends in nutrition status 72 3.4.3 The nutrition status of children outside the DMR 73 3.4.3.1 The Inanda Nutrition survey 73 3.4.3.2 The NatallKwaZulu Nutrition survey 74 3.4.3.3 The Besters Camp Nutrition survey 76 3.4.3.4 The Valley Trust Nutrition survey 77 3.4.3.5 Summary 78
3.4.4 The nutrition status of children within the DMR 79 3.4.4.1 . Summary 82 3.4.5 General summary 82
•
ii

3.5 IMMUNISATIONS 83
3.5.1 Immunisations within the DMR 83 -" 3.5.2 Summary 84
3.6· LITERACY AND SKILLS 85
4 AVAILABILITY AND ACCESS TO ESSENTIAL GOODS AND SERVICES
4.1 INTRODUCTION 89
4.2 HOUSING 89
4.3 ESSENTIAL SERVICES: ELECTRICITY, WATER AND SANITATION 94
4.3.1. Electricity 94 4.3.2 Water and sanitation 95
4.4 TRANSPORT 98
4.4.1 Taxi transport 1 01 ,. 4.4.2- Bus transport 102
4.4.3 Rail transport 107
4.5 EDUCATION 107
4.6 ACCESS TO HEALTH FACILITIES IN NATAL AND KWAZULU 112
4.6.1 Health care for Blacks in Natal and KwaZulu 112 4.6.2 Hospitals and clinics available 113 4.6.3 Person:bed ratios 113 4.6.4 Person:clinic ratios 115 4.6.5 . Spacial accessibility of health facilities in
Natal 116 4.6.6 Conclusion 116
• 5 POVERTY ALLEVIATION PROGRAMMES
5.1 INTRODUCTION 118
5.2 FEEDING SCHEMES WITHIN THE DURBAN REGION 118
5.2.1 Operation Hunger 118
iii '.

5.2.2 The Feed the Babies Fund 119 5.2.3 The Argus Milk Fund 119 5.2.4 The Durban City Health Department Feeding
Sdietnes 120 '<I
5.3 PUBLIC WORK SCHEMES 120
5.4 PENSIONS 121
5.5 LONG-TERM DEVELOPMENT INITIATIVES WITHIN THE DURBAN REGION 121
5.5.1 The RSA/KwaZulu Development Project 121 5.5.2 Operation Jumpstart 121 5.5.3 The DFR Metropolitan Development Forum 122 5.5.4 The Joint Executive Authority's DFR Framework 122
Plan 5.5.5 Important local non-government organisations 123 5.5.5.1 The Built Environment Support Group 123 5.5.5.2 The Centre for Community and Labour
Studies 123 5.5.5.3 Community, Organisation, Research and
Development 123 5.5.5.4 Urban Foundation Informal Settlements
Division 123
5.6 CONCLUSION 124
5.6.1 Feeding schemes within the Durban region 124 5.6.2 Public work schemes 124 5.6.3 Pensions 124 5.6.4 Long-term development initiatives within
the Durban region 124
iv

6 CONCLUSIONS
... 6.1 INCOME AND EXPENDITURE 125
6.1.1 Income sources 125 6.1.2 . Expenditure 126 6.1.3 Poverty datum line 126
6.2 NON-INCOME INDICATORS OF POVERTY 127
6.2.1 Mortality 127 6.2.2 Morbidity 127 6.2.3 Nutrition status 127 6.2.4 Immunisations 128 6.2.6 Literacy and skill levels 128
6.3 ACCESS TO ESSENTIAL GOODS AND SERVICES 128
6.3.1 Housing 128 6.3.2 Essential services: electricity, water and sanitation 129 6.3.3 Transport 129 6.3.4 Access to health facilities 129 6.3.5 Credit 129
"'
6.4 POVERTY ALLEVIATION PROGRAMMES 130
6.4.1 Feeding schemes within the Durban region 130 6.4.2 Public work schemes 130 6.4.3 Pensions 130 6.4.4 Development initiatives within the Durban
region 130
BIBLIOGRAPHY
v
LIST OF TABLES
TABLE No. PAGE No.
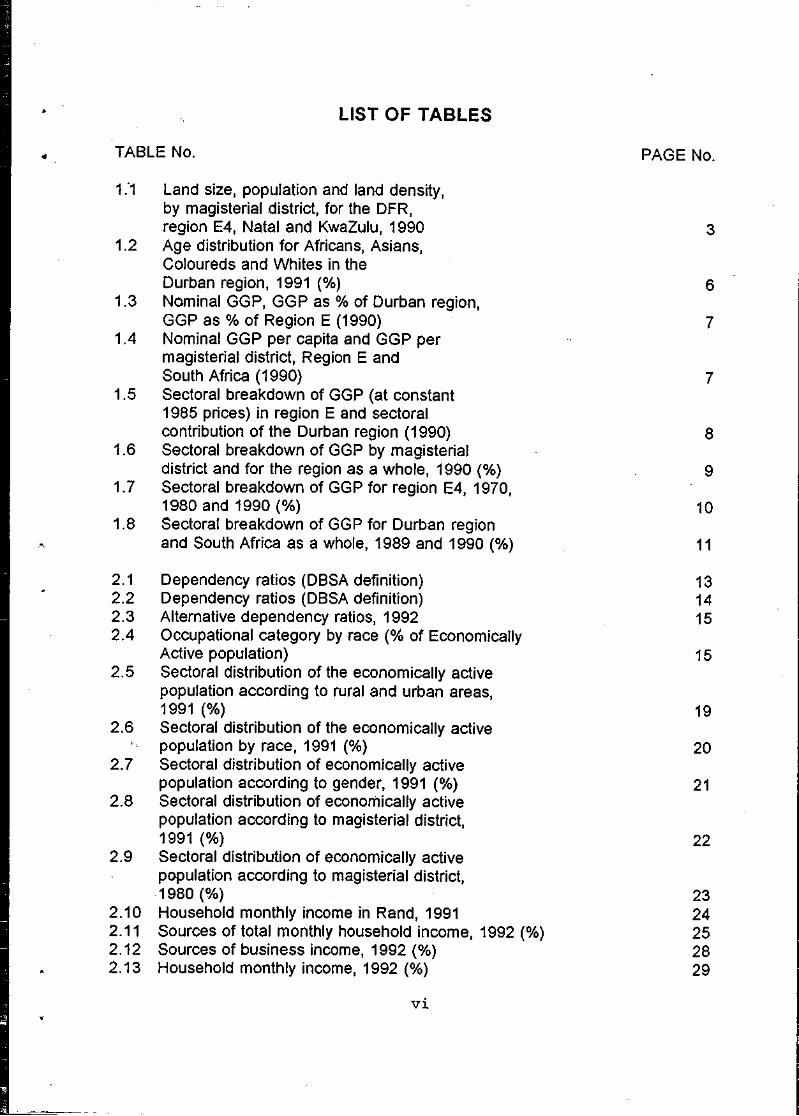
1."1 Land size, population and land density, by magisterial district, for the DFR, region E4, Natal and KwaZulu, 1990 3
1.2 Age distribution for Africans, ASians, Coloureds and Whites in the Durban region, 1991 (%) 6
1.3 Nominal GGP, GGP as % of Durban region, GGP as % of Region E (1990) 7
1.4 Nominal GGP per capita and GGP per magisterial district, Region E and South Africa (1990) 7
1.5 Sectoral breakdown of GGP (at constant 1985 prices) in region E and sectoral contribution of the Durban region (1990) 8
1.6 Sectoral breakdown of GGP by magisterial district and for the region as a whole, 1990 (%) 9
1.7 Sectoral breakdown of GGP for region E4, 1970, 1980 and 1990 (%) 10
1.8 Sectoral breakdown of GGP for Durban region -, and South Africa as a whole, 1989 and 1990 (%) 11
2.1 Dependency ratios (DBSA definition) 13 2.2 Dependency ratios (DBSA definition) 14 2.3 Alternative dependency ratios, 1992 15 2.4 Occupational category by race (% of Economica"y
Active population) 15 2.5 Sectoral distribution of the economically active
population according to rural and urban areas, 1991 (%) 19
2.6 Sectoral distribution of the economically active population by race, 1991 (%) 20
2.7 Sectoral distribution of economically active population according to gender, 1991 (%) 21
2.8 Sectoral distribution of economically active population according to magisterial district, 1991 (%) 22
2.9 Sectoral distribution of economically active population according to magisterial district, 1980 (%) 23
2.10 Household monthly income in Rand, 1991 24 2.11 Sources of total monthly household income, 1992 (%) 25 2.12 Sources of business income, 1992 (%) 28 2.13 Household monthly income, 1992 (%) 29
vi

2.14 Distribution of monthly African household incomes in informal settlements (%) 30
2.15 Distribution of annual individual income, 1991 (%) 30 .. 2.16 Mean monthly household incomes, 1990 (Rands) 31
2.17 Personal monthly income distribution, 1990 (%) 31 2.18 Household monthly income Distribution (DFR)
U.F.Model, 1992 32 2.19 Income distribution in the DFR by gender, 1991 33 2.20 Monthly individual income distribution in the DFR by
gender, and in terms of rural and urban areas,' 1991 34 2.21 Annual household expenditure, 1990 36 2.22 Household expenditure (Africans), 1992 (%) 37 2.23 Household Monthly Income (1992) 39
3.1 Mortality rates by race and magisterial district in 1990 43
3.2 Mortality rates by race and magisterial district in 1988 44
·3.3 Total deaths, overall mortality rate by race and urban/non-urban breakdown (Africans only) for 1990 46
3.4 Total deaths, overall mortality rate by race and urban/non-urban breakdown (Africans only) for 1988 46
" 3.5 Mortality rate by race within the DMR in 1991 46 3.6 Mortality rate by race within the DMR in 1988 47 3.7 Mortality rate by race within the DMR in 1985 48 3.8 Mortality rate by race within the DMR in 1980 48 3.9 National trends in childhood mortality: 1-4 years
. of age for South Africa per 1000 population at risk 49
3.10 National trends in the Under 5 Mortality Rate (U5MR) for South Africa (selected years) per 1000 live births 50
3.11 National trends in IMR for South Africa per 1000 live births 51
3.12 IMR by race (White, Coloured and Asian) for Natal in 1990 per 1000 live births 51
3.13 IMR by race (White, Coloured and Asian) For Natal in 1988 per 1000 live births 52
3.14 IMR by race within the DMR in 1991 per 1000 live births 52
3.15 IMR by race within the DMR in 1988 per 1000 live .births 53
3.16 IMR by race within the DMR in 1985 per 1000 live births 53
3.17 . IMR by race within the DMR in 1980 per 1000 live
" births 54
vii
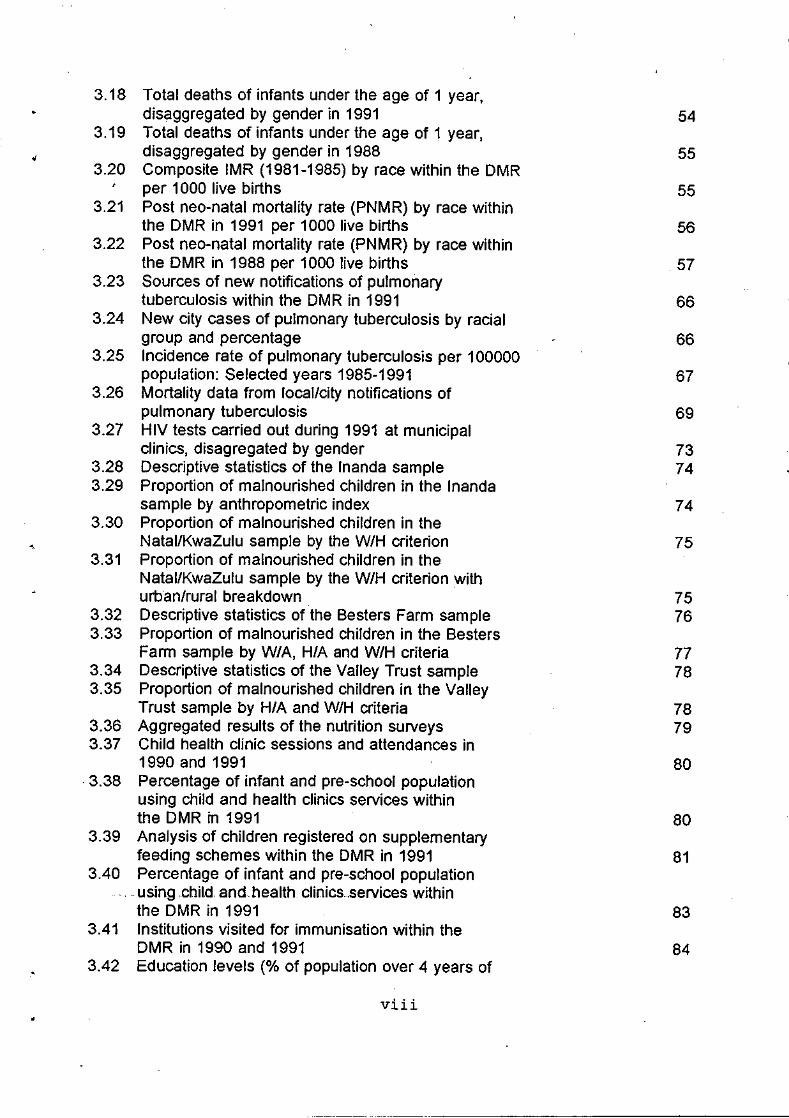
3.18 Total deaths of infants under the age of 1 year, disaggregated by gender in 1991 54
3.19 Total deaths of infants under the age of 1 year, disaggregated by gender in 1988 55
3.20 Composite IMR (1981-1·985) by race within the DMR per 1000 live births 55
3.21 Post neo-natal mortality rate (PNMR) by race within the DMR in 1991 per 1000 live births 56
3.22 Post neo-natal mortality rate (PNMR) by race within the DMR in 1988 per 1000 live births .57
3.23 Sources of new notifications of pulmonary tuberculosis within the DMR in 1991 66
3.24 New city cases of pulmonary tuberculosis by racial group and percentage 66
3.25 Incidence rate of pulmonary tuberculosis per 100000 population: Selected years 1985-1991 67
3.26 Mortality data from local/city notifications of pulmonary tuberculosis 69
3.27 H IV tests carried out during 1991 at municipal clinics, disagregated by gender 73
3.28 Descriptive statistics of the Inanda sample 74 3.29 Proportion of malnourished children in the Inanda
sample by anthropometric index 74 3.30 Proportion of malnourished children in the
~, NatallKwaZulu sample by the W/H criterion 75 3.31 Proportion of malnourished children in the
Natal/KwaZulu sample by the W/H criterion with urban/rural breakdown 75
3.32 Descriptive statistics of the Besters Farm sample 76 3.33 Proportion of malnourished children in the Besters
Farm sample by W/A, H/A and W/H criteria 77 3.34 Descriptive statistics of the Valley Trust sample 78 3.35 Proportion of malnourished children in the Valley
Trust sample by H/A and W/H criteria 78 3.36 Aggregated results of the nutrition surveys 79 3.37 Child health clinic sessions and attendances in
1990 and 1991 80 ·3.38 Percentage of infant and pre-school population
using child and health clinics services within the DMR rn 1991 80
3.39 Analysis of children registered on supplementary feeding schemes within the DMR in 1991 81
3.40 Percentage of infant and pre-school population .... using .. child and health clinics.,services within
the DMR in 1991 83 3.41 Institutions visited for immunisation within the
DMR in 1990 and 1991 84 3.42 Education levels (% of population over 4 years of
viii .'

age), 1980, 1991 86 3.43 Education levels, 1991 (% of population over 4
years of age) 87 .J 3.44 Education levels, 1980 and 1991 (% of population) 87
4.1. Proportion of the African population living in informal housing 90
4.2 Recent Informal Settlements 92 4.3 Household Electrification % 1991 94 4.4 Household Water-borne Sewerage (%) 1991 96 4.5 Sanitation levels in the DFR 97 4.6 Cars per 1000 population 99 4.7 Vehicle registration by area (1987) 99 4.8 Person trips by purpose and mode (1985) 100 4.9 Public transport fares form Durban eBD, September
1990 (Rand) 101 4.10 Taxi frequency in morning peak hour (1988) 102 4.11 Bus operations (1988) 103 4.12 Bus Service frequency in the afternoon
peakhour 105 4.13 Outbound train frequencies (1987) 107 4.14 Schools in the DFR (1992) 109 4.15 Educational institutions per district (1992) 110 4.16 African Teacher:Pupil ratios (1991) 111 4.17 Coloured teacher:pupil ratios (1991) 112 4.18 Person:bed ratios in NatallKwaZulu hospitals in
1985 114 4.19 Person:bed ratios in DMR, Pinetown, Inanda and
Umlazi in 1991 115 4.20 Person:clfnic ratios in DMR, Pinetown, Inanda and
Umlazi in 1991 116 4.21 Spacial accessibility (% over 5 km) to permanent
and mobile clinics by the Black population in Durban, Inanda and Pinetown 116
5.1 Number of children registered on supplementary feeding schemes, 1990 and 1991 120
ix

LIST OF DIAGRAMS
DIAGRAM No. PAGE No.
1.1 Local authorities and magisterial districts in the DFR 4
3.1 Local/city notifications of measles by racial group 1987-1991 59
3.2 Total notifications of measles 1980-1985 60 3.3 Local/city notifications of measles by racial
group 1979-1985 60 3.4 Local/city notifications of meningococcal
meningitis by racial group 1987-1991 61 3.5 Local/city notifications of meningococcal
meningitis 1982-1991 62 3.6 Local/city notifications of typhoid by racial
group 1987-1991 63 3.7 Local/city notifications of typhoid 1960-1990 64 3.8 Local/city notifications of viral hepatitis A by
racial group in 1991 65 3.9 New city cases of pulmonary tuberculosis in 1991:
Percentage distribution by age and sex 68 3.10 Nutrition status of children registered on
-", supplementary feeding schemes in the DMR, 1987-1991 82
4.1 African formal and informal settlements in the DFR 90 4.2 DTMB and Putco Bus routes and railway lines in the
DFR 104
x ..
LIST OF APPENDICES
APPENDIX No.
1.1 Local authorities with the Durban region
3.1 1985 and 1991 population census figures by race and magisterial district 1988 and 1990 interpolated population census figures using a linear natural logarithmic function
3.2 Disease nptifications within the DMR in 1991: Local, imported and ex-city
4.1 Hospitals and clinics available within the Durban region in 1992
xi
PAGE No.
131
133
133
135
138
1. INTRODUCTION
This report is concerned with the generation of a poverty profile in the Durban region. For the purposes of this report, the 'Durban region' is defmed as the magisterial districts of Durban, Chatsworth, Inanda, Pinetown, and Umlazi l
.
The report draws on a wide variety of data sources, and inevitably not all of these provide data disaggregatedby magisterial district. It has, therefore, been necessary on occasion to use data for greater or smaller areas, and infer conclusions for the study area. This was particularly the case for health indicators such as mortality, morbidity and nutrition status as well as for access to social services such as water, electricity, housing and transport. The lack of disaggregated data indicates the need for more integrated informational systems, both nationally and regionally.
The p'rofile has been divided into four sections. The introductory section is concerned with providing an overview of the geography, demography and economy of the region under analysis. Section 2 deals with income and expenditure; Section 3 with health indicators (mortality, morbidity, nutrition status and immunisation); and Section 4 access to social services (water, electricity, housing, transport, education and health). Section 5 is concerned with poverty alleviation strategies. The final section provides an overall summary of the findings of this report.
The following people and organisations were particularly helpful in the accessing of data for this report: Dr Jinabhai of CHESS, Julian May and Harrold Witt of DRA, Craig Munroe of KwaZulu Finance Corporation (who gave permission for the use of recent survey data), the Centre for Social and Development Studies at UND, and Dr Naidoo of the Durban City Health Department.
1.1 CONTEXTUALISING THE DURBAN REGION
The five magisteria), districts under analysis in this paper fall within development Region E (as defined by the Development Bank 'of South Africa (DBSA)). Taken together, these magisterial districts do not, however, form a complete functional development region. Rather, they are included in at least three identified development SUb-regions, namely sub-region E4 as defined by the DBSA. the boundaries of the Port-Natal - Ebhodwe Joint Services Board (JSB) area and the Durban Functional Region (DFR) as defined by Sutcliffe (1989, p3) for the purposes of the Tongaat - Hulett planning report (Tongaat - Hulett, 1989). For the purposes of this report the magisterial districts of Durban. Chatsworth, Inanda, Ntuzuma, Pinetown and Umlazi will collectively be refered to as the Durban region.
Prior to June 1988. the Inanda magisterial district was split into Inanda and Ntuzuma. For consistency in historical comparisons this distinction has been maintained. A further change which occured in 1988 was that Chatsworth was seperared from Durban.
1

The DBSA (1991a, p29) divides region E into a number of sub-regions, roughly along the lines of the boundaries of the JSBs. Chatsworth, Durban, Inanda (including Ntuzuma), Pinetown and Umlazi all fall within the ambit of the Port Natal - Ebhodwe JSB2 and as a result are classified (by the DBSA, 1991a) as falling within sub-region E4, which, in addition to. the Durban region, includes the magisterial districts of Lower Tugela, Mpumalanga, Ndwedwe and Umbumbulu (DBSA, 1991a, p28). The boundary of the DFR, as defined by Sutcliffe (1989, p3) is a rough semi-circle stretching from the Umkomaas river in the south, including Cato - Ridge in the west, to the Umhlali river mouth in.the north (Tongaat - Hulett, 1989. p7). The boundary of the DFR includes the five magisterial districts with which this paper is explicitly concerned and parts of Lower Tugela, Mpumalanga, Ndwedwe, Umbumbulu and Urnzinto. The fact that the magisterial districts under analysis do not fit the above definitions is at times problematic as not all of the data are available at all levels, introducing inaccuracies.
Table 1.1 shows the distribution of land and population. In terms of land area the Durban region makes up about 35 per cent of the area of the DFR and 32 per cent of the area of region E4. However, it contained 69 per cent of the population of region E4 in 1990, which is reflected in a person per square kilometre ratio of more than twice that .of region E4 as a whole. While the average population density ,in the Durban region is just under two thousand people per square kilometre, twenty-seven per cent of the population in the Durban region (Ntuzuma) live in areas where the population density is greater than seven thousand people per square kilometre.
The Port-Natal - Ebhodwe JSB comprises the magisterial districts of Durban. Inanda, Lower Tugela. Ndwedwe. Ntuzuma. Pinetown. Umlazi. Umbumbulu and parts of both Camperdown and Mpumalanga.
2

Table 1.1
Durban (N)
Inanda (N)
Pinetown (N)
Umlazi (K)
Ntuzuma (K)
Land size, population and land density, by magisterial district, for the DFR, region E4, Natal and KwaZulu (1990)
Area Land Size Pop. (km2) ('000) (pers/km2)
257 475.2 1849.0
338 346.5 1025.0
323 357.2 1106.0
38 242.5 6381.9
72 534.9 7429.4
Durban Region 1028 1956.3 1903.0
DFR (N/K) 2940 - - - -Region E4 3233 2841.5 878.9
Natal 55407 2614.3 47.2
KwaZulu 36074 4978.1 138.0
Source: DBSA. 1991a. pp 16
Note: 1. An N in paranthesis indicates that a magisterial district falls in Natal; a K that it lies in KwaZulu.
2. Chatsworth falls within the Durban magisterial district.
The Durban region is characterised by hilly terrain and is dissected by four major rivers. This combined with a high rainfa113, has had an impact on the development of the region in a number of important respects. The nature of the terrain means that the cost of providing services is higher in the DFR than in other major metropolitan areas (DBSA, 1993, p2). Moreover, while informal settlements in the region tend to be less dense than elsewhere in the country, flooding is frequent and tends to exacerbate water and sanitation problems (DBSA, 1993, p2)4.
The structure of local government in the region is complex, with forty local authorities (see Map 1 and Appendix 1.1). The Natal Provincial Administration (NP A) is administratively responsible for 11 boroughs, 7 townships and 7 health. The degree of control enjoyed by the NPA is greatest in the case of townships and health committees, with boroughs, although subjected to the Administrator's approval, largely able to make their own decisions. Apart from the boroughs of Isipingo Beach and Verulam, coloured and Indian areas are managed
Region E is both the highest rainfall zone, and has the highest rainfall:runoff ratio in South Africa (DBSA, 1991, pl8).
For details on the types of land tenure experienced by inhabitants of informal settlements see either DBSA (1993, p26) or Boaden and Gordon (1989. pp 1-4).
3
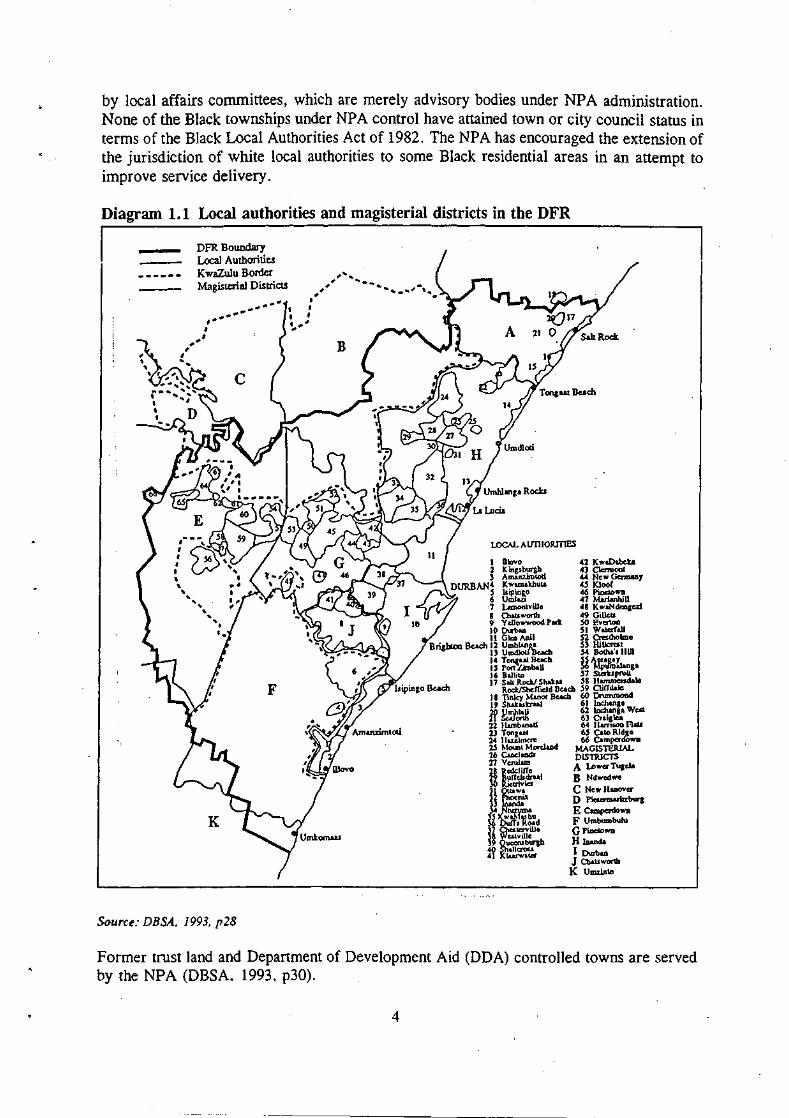
by local affairs committees, which are merely advisory bodies under NP A administration. None of the Black townships under NPA control have attained town or city council status in terms of the Black Local Authorities Act of 1982. The NPA has encouraged the extension of the jurisdiction of white local authorities to some Black residential areas in an attempt to improve service delivery.
Diagram 1.1 Local authorities and magisterial districts in the DFR
, I
DFR Boundary Local Authorities K waZulu Border Magisterial Districts
" ,
, .... , .. --- .... ....
....
K
Source: DBSA. 1993. p28
LOCAL AU1110RITlES
42 J( "aDabeb 43 Cletmool 44 Now GcrmaIIy 45 lClooC 46 PiDe\D ..... 47 MMimhlU 48 KwaN<lmgal 49 Gille .. 50 Ev<l1OD 51 Wal<fft.l\ 52 Crestbolme 53 Hi\JcrU! 54 JjoCha', IIID
14 Tona.11 \kKb 55 A".g.y IS Port i'JmbaU 56 Mpuro&langl 16 BLiIiID 57 SlCbpruli 17 SLIt RockI Shak.. 58 11amnienda\e
Roc.kJSbdfodd Bu<b S9 C1iCCdalc 1 B TInley MADOr Beach 60 0nmu000cI 19 Shak .. krul 61 \nchangl 20 UmhlaU 62 lnchangl WUl 21 Sulortb 63 cr.i81Ca 22 IWnb..,.d 64 IIllTl_ fllll 2J Tong .. ! 65 CaID RIdge 24 lluilmm: 66 Campado ..... 25 MOUDI M orclaDcI MAGlSruRlAL ~ ~ DlSllUCTS ~ l!~!i!f0 A Lo ...... Tugda ~ ~~I D Nd ... edwe
~ ~~~ C No ... III.,,, .....
1 ~ D }';o:unzwItzburJ Y...~u E Camperdo ..... o:Jf:'lt;;'d F Umbumbulll
~ O>at<;YiUo G PiDe\D ..... ~ w~~ H JDaoda
fl =~ I Durbao J a.au wortll K Umz!D1D
Former trust land and Department of Development Aid (DDA) controlled towns are served by the NPA (DBSA. 1993. p30).
4

Some of the Black residential areas under NP A administration are known as Development and Services Board (DSB) areas. Two types of area fall into this category, namely development and regulated areas. In development areas the DSB acts as a 'caretaker' providing services until the time when the area is administratively and financially able to take care of itself. Regulated areas tend to be those where informal urbanisation is occurring, where the DSB seeks to control further development (DBSA, 1993, p27).
The Durban City Council (DCC)is clearly the dominant local authority in the region, particularly with regard to the delivery of services. The DeC provides electricity to 47 towns in the DFR; sewage to 30; water to 16; fire service to many and public transport between most of the main centres adjoining Durban (DBSA, 1993, p32).
There is a different system of local government in KwaZulu areas. Both tribal and community authorities fall under the Department of the Chief Minister. Tribal authorities are generally related to traditional leadership structures, although in some urban areas leadership has been usurped by shacklords. Community authorities exist in areas where no distinct tribe can be identified. Urban local authorities in KwaZulu fall under the Department of the Interior, where services are provided through KwaZulu government departments. The autonomy of these urban local authorities is severely limited due to the fact that councillors are partly elected and partly nominated by the KwaZulu government (DBSA, 1993, p31).
1.2 DEMOGRAPIDC FEATURES
The population of the Durban region was estimated in the 1991 census to be 1 895 183. Africans are in the majority forming 49 per cent of the population. A feature which distinguishes the Durban region from other parts of the country is the large proportion of Asians (30 per cent). whites (17 per cent) and coloureds (3 per cent) form the minority population groups. The relative size of the African population has increased since 1980, while that of the Asian population has decreased. In 1980, the African group accounted for 40 per cent, while the Asian group accounted for 34 per cent.
Table 1.2 presents data on the age distributions of the four population groups in the Durban region in 1991. The white group is clearly the oldest of the four groups, while the " coloured pop~lation is the youngest.
5

--------~ ~ ----
Table 1.2 Age distribution for Africans, Asians, Coloureds and Whites in the Durban region, 1991 (%)
Africans Asians Coloureds Whites
<: 1 2.46 1.65 1.83 0.99
1 - 4 8.56 8.02 7.95 4.62
5 - 9 8.82 10.55 10.83 6.63
10 - 14 8.41 9.85 10.72 6.28
15 - 19 9.19 10.67 12.12 7.60
20 - 24 11.16 9.71 10.86 8.36
25 - 34 22.82 16.70 17.23 15.29
35 - 44 13.86 14.05 12.08 15.49
45 - 54 7.96 9.80 7.96 12.84
55 - 59 2.74 3.30 2.98 4.83
60 - 64 1.84 2.39 2.03 4.44
65 > 2.16 3.32 3.38 12.62
100.00 100.00 100.00 100.00
Source: css repon No 03-0J-03 (1991).
In terms of household structure, no data dealing with the population as a whole exists. A vailable data suggest that some 30 per cent of African households in the DFR are headed by women. These households would appear to be concentrated in informal settlements for a number of reasons. Lower incomes are translated into an inability to afford formal housing. Moreover, both legal constraints and tribal custom often prevent women from gaining access to land in fonnal areas. Household size is discussed in Section 2 of this paper.
1.3 ECONOMIC ENVIROlVJENT
The five magisterial districts under analysis in this paper playa central role in the economy of Region E. Collectively, Durban (including Chatsworth), Inanda (including Ntuzuma), Pinetown and Umlazi generated a nominal gross geographic product (GGP) of R19 935 408 000 in 1990, a contribution of 56 per cent to the total GGP of Region E5 and approximately 8 per cent of South Africa's GDP in 1990 (DBSA, 1991a, p s-7). Table 1.3 shows that the Durban magisterial district is by far the most important of the districts under analysis, with Pinetwon coming a poor second.
The importance of the Durban region in the economy of region E is underlined by the fact that in terms of area the five magisterial districts together contribute 0.94 % of the total area of region E.
6

Table 1.3 Nominal GGP, GGP. as % of 'Durban Region', GGP as % of Region E (1990)
Magisterial District % of 'Durban % of Region E '000 Region'
Durban 15 786 484 79.19 44.33
lnanda 566 156 2.84 1.59
Ntuzuma 758045 3.80 2.13
Pinetown 2 319 208 11.63 6.51
Umlazi 505 515 2.54 1.42
Total 19 935 408 100.00 55.98
Source: DBSA, 1991a, Table 2.7, p26 '.
Note: Chatsworth is included in the Durban Magisterial district
The relative economic importance and wealth of Durban and Pinetown is further underlined by inter-district comparisons of GGP per capita and GGP per square kilometre. Table 1.4 indicates that Durban is clearly flrst on both counts. Other than Durban, only Pinetown had a higher GGP per capita than either Region E or South Africa, taken as a whole. In terms of GGP per capita lnanda, Ntuzuma and Umlazi are considerably poorer than either Durban or Pinetown.
Table 1.4 Nominal GGP per capita and GGP per magisterial district, Region E and South Africa (1990)
Per capita GGP GGP per km2
R'OOO R'OOO
Durban 33.2 61 426.0
luanda 1.6 1 675.0
Ntuzuma 1.4 10 528.4
Pinetown 6.5 7 180.2
Umlazi 2.1 13 303.0
Region E 4.1 324.8
South Africa 6.3 - -
Source: DBSA, 1991a, Table 2.7, p26
Note: Chatsworth is included in the Durban Magisterial district
The relative importance of the Durban region in the economy of region E is obvious from a sectoral breakdown. Table 1.5 indicates that in flve sectors (manufacturing, construction,
7

commerce, transport and finance) the Durban region's economy contributes considerably more than half of region E' s output. Only mining and agriculture are relatively insignificant.
Table 1.5 Sectoral breakdown of GGP (at constant 1985 prices) in region E and sectoral contribution of the Durban region (1990)
Rm % contribution of Durban
region
Agriculture 1352.2 2.9
Mining 403.2 3.6
Manufacturing 5684.8 ." 63.9
Utilities 326.0 34.9
Construction 623.0 59.8
Commerce 2076.6 65.1
Transport 2283.8 69.0
Finance -1972.6 64.3
Community/social 3371.8 48.7
Total 18094.0 55.4
Source: DBSA, 1991a, p27 & p72 ,
NB: Inconsistencies between the Durban region's contribution to total GGP arising ,between this Table and Table 1.2 arise from' rounding errors'.
Although Region E' s transport sector output is most highly concentrated in the Durban region, transport is not the most important sector in the Durban region. Table 1.6 contains a sectoral breakdown of the economy in the Durban region by magisterial district. The manufacturing sector is clearly the largest, both in the Durban region as a whole and in all magisterial districts apart from Ntuzuma (where the community and social services sector is the largest). The community and social services sector plays a relatively more important role in the K waZulu magisterial districts than in the Natal magisterial districts. While construction in the Durban region contributed 59.8 per cent of the ouput of the construction sector in Region E's economy, it plays a relatively unimportant role in the economy of the Durban Region. The trends in Table 1.5 regarding agriculture and mining are reinforced in the magisterial and Durban region sectoral breakdowns. It is only in lnanda that agriculture makes any significant contribution.
8

Table 1.6 Sectoral breakdown of GGP by magisterial district and for the region as a whole, 1990 (%)
D I P U N Region
Agriculture 0.07 8.87 0.23 0.53 1.07 0.39
Mining 0.16 0.28 0.10 0.00 0.00 0.14
Manufacturing 34.21 49.10 48.60 40.39 28.43 36.24 -
Utilities 1.12 0.56 1.91 0.13 0.17 1.14
Construction 3.29 1.94 5.81 4.18 7.38 3.72
Commerce 14.48 11.48 13.45 1.64 2.19 13.49
Transport 18.72 3.94 2.37 9.92 .. 6.61 15.72
Finance 12.17 12.26 16.52 9.34 13.50 12.65
Cominunity / social 15.83 10.48 10.48 33.28 39.04 16.38 '.
Total 100.00 100.00 100.00 100.00 100.00 100.00
Source: DBSA. 1991a. p27 & p72
Note: D refers to the Durban magisterial district (including Chatsworth), I to Inanda, P to Pinetown, U to Umlazi, N to Ntuzuma and Region to the aggregation of these magisterial districts.
The relative importance of the different sectors has undergone considerable change in the period 1970 to 1990. Data were not, however, available for the magisterial districts with which this paper is specifically concerned. The only available data apply to development region E4, as defmed by the DBSA. A sectoral breakdown of GGP in region E4 (see Table 1.7) is similar to that of the Durban region and it is likely that general trends are too.
Table 1.7 indicates the relative contribution of different economic sectors to regional GGP in 1970, 1980 and 1990. Four sectors - agriculture, mining, electricty and construction - have steadily decreased in relative importance. The relative decline in construction is marked, decreasing from 6.8 per cent in 1970 to 3.7 per cent in 1990. Three sectors have shown fluctuating relative importance in the period from 1970 to 1990. While both commerce (which includes tourism) and community and social services showed a decrease in importance in the decade to 1980, their contribution in 1990 was higher than in 1970. Further, while the contribution of manufacturing decreased between 1980 and 1990, its contribution was nonetheless higher in 1990 than in 1970, and its position as the most important sector remained unchallenged. Two sectors showed clear upward trends in relative importance between 1970 and 1990. Finance increased from 10.2 percent ofGGP in 1970 to 12.2 percent in 1990. Transport's {which·includes·the port) share rose from 11.8 percent to 15.2 percent, the largest relative increase of all sectors.
9

Table 1.7 Sectoral breakdown of GGP for -region E4 1970, 1980 and 1990 (%)
1970 1980 1990
Agriculture 2.0 1.2 1.1
Mining 0.8 0.2 0.1
Manufacturing 35.6 37.6 36.4
Utilities 3.2 1.9 1.1
Construction 6.8 5.6 3.7
Commerce 12.7 11.7 13.1
Transport 11.8 14.9 15.2
Finance 10.2 11.1 12.2
Community I social 16.9 15.8 17.1
Total 100.0 100.0 100.0
Source: DBSA. 1991a. p82
Table 1.8 indicates the relative contribution of different sectors for the Durban region and South Africa, taken as a whole. While in the Durban region, transport contributes 16 per cent of regional GGP, in South Africa as a whole this sector contributes only 8 per cent. The relative importance of transport in the Durban region can be attributed to the presence of the port. While transport has an important position in the economy of the region, it is not as important as an employer. Further differences between the Durban region and South Africa occur in agriculture and mining which are relatively more important in South Africa than in the Durban region.
".:.':',
10

Table 1.8 Sectoral breakdown of GGP for Durban region and South Africa as a whole, 1989 and ,1990 (%)
Durban Region South Africa . (1990) (1989)
Agriculture 0.39 5.46
Mining 0.14 . 11.72
Manufacturing 36.24 23.91
Utilities 1.14 4.19
Construction 3.72 3.06
Commerce 13.49 12.89
Transport 15.72 8.06
Finance 12.65 13.44
Community/social 16.38 17.27
Total 100.00 100.00
Source: DBSA. J99Ja p27 & p72; DBSA. J99Jb p55
Note: For South Africa as a whole, the percentages given are percentages of GDP with imputed financial service charges included.
11

2. INCOME, EXPENDITURE AND EMPLOYMENT
2.1 INTRODUCTION
This section of this paper is concerned with measuring poverty in terms of the conventional indicators - income and expenditure. Our first consideration are the sources of income. In this regard two issues are addressed. The first is the extent of 'dependency' within the population. The second is the actual source from which income arises. This second aspect also provides some indication of the flow of income - '.vhether it is permanent or temporary. Moreover, issues such as the importance of assets and informal activities as an income source are also addressed. The second consideration of this section is the level of income. Here a crosssectional analysis compares not only mean household and per capita incomes but also considers different distributions. Our third consideration is expenditure patterns where a distinction is drawn between food and non-food expenditure. An attempt, albeit partial, is made to establish what part of consumption is achieved through earnings and what part through subsistence. The final consideration of this section is an attempt to guage the extent and composition of poverty in the DFR. This is achieved by drawing comparisons between what can be considered a 'regionally accepted poverty datum line' and the levels of income and its distribution within the region. Throughout this section, an attempt is made to provide both a cross-sectional and time-series picture. The cross-sectional component attempts to provide comparisons based on race, gender, between rural and urban areas and where relevant between formal and informal settlements. The time-series component looks at how this may have changed over periods of five to 10 years.
2.2 INCOME SOURCES
People can receive income from one of two sources. Individuals may either earn their own income6, or people may rely on other members of the household. The analysis of income sources is thus divided into two parts. The first is concerned with establishing just how pervasive dependancy is, that is, the extent to which people rely on other household members for their livelihood. The second part of this section is concerned with establishing the sources of income considering issues such as whether income arises from formal or informal sector activities; theJelative importance of remittances and transfers in household income; the relative importance of different economic sectors; and the occupational status of people.
2.2.1 Dependency
The extent of dependency can be measured in one of two ways. The Development Bank of Southern Africa (DBSA, 1991a) publishes what it terms a 'dependency ratio' - indicating the number of people each economically active person has to support. This statistic is merely the ratio of those in the economically inactive section of the population to those who are economically active; This ratio is' potentially misleading as those in the economically active sector may be unemployed and themselves dependent on others. The inadequacy of this first
6 Either directly through working or indirectly through transfers such as pensions.
12

indicator has led other researchers (Cross et aI, 1992; DRA, 1992; Kheis, 1993) to use an alternative ratio. They measure dependency as the ratio of the number of those who do not have full-time employment to those who do, whether in fonnal or infonnal activities. Hence what is derived is an indication of the number of people supported by those who are fonnally eqlployed or earning an income from infonnal sector activities. Obviously this second statistic is also potentially problematic in an important respect: those who are retired are regarded as dependent when in fact they may be 'independent, receiving an income from transfers. For the sake of completeness, both indicators are presented below.
Using the ratio of the economically active to the economically inactive, the DBSA (1991, p4) shows that while region E has the third highest dependency ratio of South Africa's development regions, sub-region E4, which includes the DFR, has a ratio of 1.6, having declined from 1.9 in 1980. However, this statistic includes magisterial districts other than those defined by this study. Table 2.1 contains the ratios relevant to this study. The data indicat~ that apart from Ntuzuma which showed an increase in dependency between 1980 and 1990, the sub-region as a whole experienced an improvement. Furthennore, with the exception of Ndwedwe7
, a largely rural area with parts which fall beyond the scope of this study, all areas had dependency ratios below 2. Unfortunately the data, which refer to the population as a whole, are too aggregated to allow any detailed cross-sectional analysis. The disparities between rural and urban areas are, however, indicated by the vast discrepency between Ndwedwe and the rest of the sub-region.
Table 2.1 Dependency ratios (DBSA)
1980 1990
Durban 1.3 0.9
Umlazi 1.6 1.1
Ntuzuma 1.4 1.5
lnanda 1.9 1.6
Ndwedwe 7.7 6.1
Pinetown 1.8 1.3
Source: DBSA, 1991a, p50
A similar indicator to the one calculated by the DBSA can be derived from the population census. The'data are sufficiently disaggregated to allow one to draw comparisons based on race and between rural and urban areas. The popUlation for the region as defined in the brief (i.e. Durban, Pinetown, lnanda, Umlazi, Chatsworth) together with Ntuzuma, a Kwa-Zulu magisterial district Jalling within Inanda,.is.J.895 .. 182 (CSS, 1991 , pp 102-161). Of this 882 036 are economically active and 1 013 146 inactive, generating a dependency ratio of 1.15. Table 2.2 disaggregates the census results for 1980 and 1990 according to race and between
7 Ndwedwe is a KwaZulu magisterial district, parts of which fall within the DFR.
13

-~---------------
urban and rural areas. A number of interesting trends appear in these data. In all instances there has ~en an improvement over the decade to 1990. Moreover the racial order of greatest to least dependency (Asian, coloured, rural African, white, urban African) has remained the same. The fact that urban Africans show the lowest dependency ratio could be an indication of migration of economically active adults from rural areas. This is possibly borne out by the higher dependency ratio of rural Africans.
Table 2.2 Dependency ratios (nnSA definition)
1980 1990
Asian 2.26 1.59
African (U) 1.07 '. 0.95
African (R) 1.79 1.18
Coloured 2.02 1.35
White 1.32 1.03
Rural Total - - 1.21
Urban Total - - 1.15
Source: CSSreports 02-80-05, 03-0J-08
The usefulness of the dependency ratio calculated by the DBSA arid using CSS data has already been questioned but warrants further comment. The decrease in dependency indicated by the statistic over the decade is particularly surprising given the poor perfonnance of the economy over this period. However, the improved ratio may reflect increasing unemployment: as household members lose their jobs, greater numbers from each household may be forced to seek work and thus enter the economically sector of the population decreasing the ratio of the economically inactive to the economically active. Thus, rather than indicating a decrease in dependency, the figures may in fact be consistent with an increase. An alternative figure is therefore used.
This alternative dependency indicator was calculated using data for KwaZulu areas from Data Research Africa8 (DRA, 1992). Specific areas within the DFR were selected for this study, namely rural Ndwedwe (specifically Ngcolosi, Embo and Molweni), urban Ntuzuma (Bambayi. Kwa-Mashu and Inanda New Town) and urban Umlazi (including Umlazi Shanty Infill). The dependency ratio was calculated by dividing the number of those who do not have full-time employment by the number of those who do. This alternative statistic is not comparable with the DBSA- and CSS-derived statistics. Not only do they measure different phenomena. but they also apply to different race groups. The DBSAICSS statistics refer to all groups but the DRA derived statistic refers only to Africans.
We acknowledge Mr C Munroe, of the KwaZulu Finance Corporation which commissioned the DRA study, for allowing us to use the DRA survey results.
14

Table 2.3,Alternative dependency ratios, 1992
Ndwedwe Ntuzuma Umlazi
% of sample not in 78.4 75.4 69.1 full-time employ.
% of sample in full- 21.6 24.6 30.9 time employment
Dependency ratio 3.63 3.06 2.23
Source: DRA 1992
While the aggregation of the above three ratios is problematic because they comprise both rural and urban areas and because parts of the urban areas are infonnal and others fonnal, a composite aggregate for urban Africans in the DFR can be obtained by combining the ratios for Ntuzuma and Umlazi: 2.6, which is considerably lower than the rural ratio of 3.6 (for Ndwedwe). Hence the urban/rural disparity suggested by the DBSA and CSS data is confirmed. The DRA data can be compared with May's 1985 (May, 1986, p27) result for Umlazi of 1.89 suggesting a worsening of dependency, unlike the DBSA and CSS data, and is consistent with the explanation for the DBSA and CSS results given above.
While a urban/rural disparity is clearly reflected by the different data sources, no clear trend exists regarding settlement type (ie fonnal vs informal). Cross, Bekker, Clark and Richards (1992, p19) have calculated 'the number of household members dependent upon one breadwinner' as five for four informal settlements in the Greater Inanda area in 1991. Their ratio is calculated in the same way as ours, suggesting that dependency is more pervasive in informal areas. This conclusion is, however, contradicted by Ardington (1992, pl1), whose survey of Canaan, an infonnal setlement in the DMR, indicates a dependency ratio of 1.77 (Ardington, 1992, pll) which is lower than both the rural and urban statistics calculated using the DRA data. The conflict may be partly resolved in that the average household size in Canaan was 3.6 (Ardington, 1992, plO) whereas in the Greater Inanda area it was 5 (Cross et aI, 1992, pI6). It is clearly problematic trying to extrapolate general trends from fragmentary data.
2.2.1.1 Summary
The data indicate that:
1. Using the ratio of the economically active to economically inactive both the sub-region as a whole and the individual race groups experienced an improvement in the extent of dependency over the decade to 1990.
2. Of the different groups, urban Africans show the lowest dependency ratio. This is perhaps an indication of the migration of economically active adults from rural areas.
15

3. The decrease in ~dependency over the decade is particularly surprising given the poor perfonnance of the economy over this period. The improved ratio may reflect increasing unemployment: as household members lose their jobs, greater numbers from each household may be forced to seek work. Thus rather than suggesting a decrease in dependency, the figures may in fact, be consistent with an increase.
4. The above conclusion is borne out in an analysis ·of an alternative ratio: those who do not have full-time employment to those who do. This statistic shows a worsening of dependency for Africans in Umlazi.
5. Both methods show a definite urban/rural disparity, with much higher dependency ratios in rural areas.
6. No clear trend exists regarding settlement type (ie formal vsinformal).
2.2.2 Sources of household income
Establishing the source of household income is difficult. While fragmentary data exist for the . African population in the region, the data for Asians and whites merely draw a distinction between direct and indirect income. No data exist for coloureds. The fragementary nature of these data reduce their usefulness considerably. Two supplementary aspects, occupation and sector of employmenta are also considered.
2.2.2.1 Occupation
The census provides data on the occupational status of the economically active population. Details of occupational category of Africans in selected areas can also be obtained from the DRA survey. However, the occupational breakdown provided is to some extent unsatisfactory because of the confusion between skill categories in manual jobs in the coding system used. It is possible, however, to distinguish between white collar and blue collar jobs.
Professional/technical, managerial/administrative and clerical/sale are taken as white collar occupations .and the rest as blue collar. Occupational categories can be analysed racially, geographically and in terms of gender. This analysis is concerned with racial and, to a lesser extent, geographic differences. Table 2.4, provides a breakdown of different occupations according to race for the DFR as a whole. The salient feature is that while the blue collar category is the most important category for Asians (44.80 per cent), Africans (68.50 per cent) and coloureds (50.42 per cent), for whites the most important occupational category (and possibly the most important source of income) is clerical and sales occupations - a white collar occupation. Indeed, in total, 67.93 per cent of economically active whites are involved in white collar occupations. A further interesting feature of these data is the relative importance of the unspecified category. It is the second largest occupational category for Africans and third largest for Asians and coloureds. While it includes occupations not elsewhere classified, it also includes the unemployed. The data probably therfore reflect the fact that the worst unemployment is experienced by the coloured and African groups.
16

Table 2.4 Occupational category by race (% of Economically Active population)
Whites Coloureds Asians Africans
PROFESSIONALrrECHNICAL 18.97 8.62 8.96 4.07
MANAGERIAL! ADMIN. 14.09 1.94 4.36 0.58
CLERICAL/SALES 34.87 20.33 28.00 8.21
BLUE COLLAR 25.37 50.42 44.80 68.50
UNSPECIFIED 6.70 19.16 13.92 18.62
TOTAL 100.00 100.00 100.00 100.00
Source: CSS Report 03-01-081991
The DRA data do not add much to this picture of occupation except to show that for the areas relevant to this study (Ndwedwe, Ntuzuma and Umlazi) the highest single occupational category is that of domestic worker: 20.62 per cent, 8.55 per cent and 8.04 per cent of the economically active population in Ndwedwe, Ntuzuma and Umlazi respectively are employed as domestic workers (DRA, 1992, Vol 6&7). Domestic work is clearly a more important occupation in rural than urban areas.
Our final concern is trends in informal settlements. Unfortunately, the surveys of these do not use the same categorisation as the CSS and DRA and consequently the results are not directly comparable. They do, however, seem to support the trends which emerge from the CSS data. Both Ardington (1992) and Cross et al (1992) suggest that blue collar activities are the most important in the formal sector. In the Greater Inanda area 88 per cent were employed in blue collar occupations (specifically: labourers - 33 per cent; factory workers - 13 per cent; domestics - 13 per cent; artisans - 11 per cent; drivers - 8 per cent; securtiy workers - 6 per cent; hotel workers - 4 per cent). The data suggest a higher proportion of blue collar workers in informal areas than in the region as a whole for the African group. The relative importance of domestic service is, however, supported by these data as 13 per cent of formal sector employees were domestic workers. The data for Canaan do not allow one to undertake a comparison on the basis of occupation although they do indicate that the single biggest employm~nt activity is that of domestic worker - 33 per cent (Ardington, 1992, p 16). The relative importance of domestic work is clear. The data also indicate that proportionally more blue-collar employees reside in informal settlements.
2.2.2.1.1 Summary
The data on occupation suggest the. following trends:
1. Blue collar occupations are the· most important category for Africans (69 per cent), coloureds (50 per cent) and Asians (45 per cent).
2. Two thirds of economically active whites are in white collar jobs.
17

3. Roughly 19 per cent of economically active coloureds and Africans fall into the unspecified category probably reflecting the fact that Africans and coloureds experience more unemployment than the other races.
4. The DRA data show that the most important single occupation for Africans in the region is domestic worker.
5. The data also suggest that among Africans there are fewer white collar workers in informal settlements.
2.2.2.2 Sector of employment
This section of the paper is concerned with the sectoral distribution of the economically active population. The analysis makes distinctions between rural and urban areas, between the races, between genders and between different magisterial districts.
Our first concern is the urban/rural distinctions. Table 2.5, which presents distributions of the economically active population employed in the different sectors, indicates that the most important sector in the region as a whole is community, social and personal services, employing 23 per cent of the economically active population. However, a greater proportion in rural areas fall into the unspecified category, which presumably includes most informal activities in addition to the unemployed. The unspecified category is the second largest category at the regional level. However, the unspecified category is larger in rural than urban areas, suggesting a higher level of unemployment. The third most important sector at the level of the region is that of manufacturing (20.18 per cent), followed by services (15.84 per cent), transport (6.43 per cent), finance (5.90 per cent), and construction (4.82 per cent). The order of importance is the same for urban areas, which is to be expected given that the region is largely urban. The most obvious difference between urban and rural areas, apart from the unspecified category, is the relative importance of the agricultural and construction sectors.
18

Table 2.5 Sectoral distribution of the economically active population according to rural and urban areas, 1991 (%) .
Urban Rural Total
Agriculture 0.52 8.91 0.98
Mining 0.18 0.04 0.18
Manufacturing 20.65 11.72 20.18
Utilities 0.59 0.54 0.59
Construction 4.62 8.36 4.82
Commerce 16.07 11.74 15.84
Transport 6.57 3.95 6.43,
Finance 6.20 0.64 5.90
Community services 23.02 23.17 23.03
Unspecified 21.57 30.92 22.08
Total 100.00 100.00 100.00
Source: CSS Report 03-01-09. 1991
Note: The 'unspecified I category includes the unemployed.
Our second concern regarding sector of employment is racial distinctions. Table 2.6 presents distributions of the economically active population employed in the different sectors, according to race. For Asians, urban and rural Africans and coloureds these sectors are dominant. Community, social and personal services sector; the finance and the manufacturing sectors account for over 75 per cent of the economically active populations. Moreover, for Asians. urban and rural Africans and coloureds, the unspecified category is relatively important, indicating the relative large indicating the relative importance of informal activities and high unemployment rates. The only group to rely on the agricultural sector to any degree is rural Africans.
19

, Table 2.6 Sectoral distribution of the economically active population by race, 1991
(%)
African '. Asian Coloured White Urban Rural
Agriculture 0.65 0.49 8.41 0.19 0.75
Mining 0.14 0.09 0.04 0.12 0.45
Manufacturing 32.08 16.27 10.75 16.49 17.26
Utilities 0.31 0.67 0.55 0.28 0.83
Construction 3.24 4.83 8.65 8.91 5.20
Commerce 19.56 13.44 11.71 18.95 17.68
Transport. 5.47 5.85 3.92 2.98 10.56
Finance 5.16 2.94 0.52 5.09 16.37
Community 14.78 28.13 23.94 18.51 21.49
Unspecified 18.60 27.29 31.52 28.47 9.41
Total 100.00 100.00 100.00 100.00 100.00
Source: CSS Report 03-01-09. 1991
Table 2.7 presents distributions of the economically active population according to economic sector for men and women. These data show that men are more evenly spread across sectors than women. Ninety per cent of women are involved in community, social and personal services, manufacturing, commerce and the unspecified category as against 75 per cent of men. For men the most important sector is manufacturing, while for women it is community, social and personal services.
20

Table 2.7 Sectoral distribution of economically active population according to gender, 1991 (%)
Men Women
Agriculture 1.31 0.48
Mining 0.25 0.05
Manufacturing 23.18 15.67
. Utilities 0.89 0.14
Construction 7.54 0.77
Services 17.37 13.56
Transport 9.47 1.89
Finance 5.29 6.36
Community 14.41 35.87
Unspecified 19.98 25.21
Total 100.00 100.00
Source: CSS RepoT1 03-01-09. 1991
The final concern of this section of the paper is how sectoral employment distributions vary between the different magisterial districts and whether these distributions have remained constant over the period from 1980 to 1991. Table 2.8 presents the distribution of the economically active population according to the economic sector for different magisterial districts in 1991. The data indicate that in -Durban, Pinetown, Umlazi and Ntuzuma the community, social and personal services sector is the most important. In Durban, Pinetown and Umlazi the manufacturing sector is the second most important, while in Ntuzuma the commerce is. The most important sector in Inanda is manufacturing, with commerce the second most important. It is interesting that while the transport sector contributed almost 16 per cent of the Durban region I s GGP, it contributes proportionately less in all magisterial districts.
21

Table 2.8 Sectoral distribution of economically active population according to magisterial district, 1991 (%)
Durban Inanda Pinetown Umlazi Ntuzuma
Agriculture 0.9 5.0 1.5 0.0 0.2
Mining 0.4 0.2 0.2 0.2 0.0
Manufacturing 25.4 35.6 20.3 29.1 21.3 .. Utilities 0.5 OA- 0.7 1.0 1.1
Construction 4.6 5.2 6.7 6.0 9.2
Services 19.9 21.2 17.4 19.5 22.2.
Transport 8.9 6.1 5.2 -10.3 8.6
Finance 10.4 6.3 11.7 2.4 5.2
Community 29.0 20.0 36.3 31.4 32.1
Total 100.0 100.0 100.0 100.0 100.0 Source: DBSA. 1993
Table 2.9 presents the distribution of the economically active population according to the economic sector for different magisterial districts in 1980. In general commerce has declined in importance. Moreover, in most districts the relative importance of community and social services has increased.
22
/

Table 2.9 Sectoral distribution of economically active population according to magisterial district, 1980 (%)
Durban. Inanda Pinetown Umlazi Ntuzuma
Agriculture 0.9 10.5 1.5 0.2 0.6
Mining 0.6 0.4 0.3 0.4 0.3
Manufacturing 25.7 34.6 40.2 41.5 28.8
Utilities 0.7 0.6 1.0 0.6 0.8
Construction 5.2 6.9 4.9 5.5 9.7
Services 16.2 16.6 14.8 15.6 22.0
Transport 13.3 6.1 6.3 .. 9.1 8.2
Finance 7.7 4.5 5.5 2.2 3.5
Community 29.7 19.9 25.5 24.9 26.2
Total 100.0 100.0 100.0 100.0 100.0
Source: DBSA, 1993
Note: Durban includes Chatsworth
2.2.2.2.1 Summary The data on occupation reveal the following trends:
1. The most important economic sector in the region is the community, social and personal services sector employing 23 per cent of the population.
2. The unspecified category is the second largest category in the region. It is, however, larger in rural than urban areas, suggesting a higher level of unemployment. This category is highest for rural Africans (32 per cent). Only whites have less than 10 per cent of their economically active population falling into this category.
3. The agricultural and construction sectors are more important in rural than urban areas. Only rural Africans work in rural agriculture to any significant degree.
4. Economically active men are spread across more economic sectors than women. The most important sector for men is manufacturing, while for women it is the community, social and personal services sector.
2.2.2.3 Sources of household income Sources of household income can be obtained from both the DRA survey and the CSS Survey of Household.Expenditure (CSS. 01~11-01, 1990). Both sources provide data on the relative importance of' direct' and' indirect' income in total household income, with the DRA survey providing an explicit breakdown of the' indirect' income sources. Both sources are limited in their usefulness. The CSS data are limited because they distinguish only between direct and indirect income and because they exclude coloureds. The DRA data are fragmentary and
23

limited only to Africans in selected areas of the region. Our first concern is with the ess data. Direct income is the' ... more or less regular income ... depended on for the redemption of current expenditure' (eSS 1992a, p17) and includes wages, remittances, transfers and business income. Indirect income, on the other hand, is derived from the sale of assets, lumpsum gains and gifts. Table 2.10 presents the data for whites, Asians and Africans. It is clear that direct income is the most important source of income for all races, and is relatively more important for Africans than whites.
Table. 2.10 Household monthly income in Rand, 1991
Whites Asians Africans
Direct 3652.79 (86.34%) 1917.08 (90.11 %) 980:00 (95.39%)
Indirect 577.99 210.50 47.39
Total 4230.78 2127.58 1027.39
Source: CSS report 01-11-01 (1992)
The above results can be compared with those from the DRA income and expenditure survey. According to the ess classification, wages, remittances, transfers, and businesss income as defined by the DRA would constitute direct income. 9 For the three relevant regions the relevant results are 10 presented in table 2.11. The relative importance of direct income for African households is clearly shown: it amounts to more than 95 per cent in all three areas. Moreover, wages form the largest component, irrespective of area type (rural or urban). There is however a urban/rural distinction: wages are more important in urban areas. Further, while pensions and transfers are the second most important source of income in rural areas (14.48 per cent), business income is the second most important source in urban areas. Indeed, irrespective of area, business income accounts for more than seven per cent of total monthly household incomes (it amounts to almost 11 per cent in rural areas).
9 Although part of theDRA's·'ffiiscellarieous'·· ind.mie'ca:t'egoty (viz maintanance grants and rent) would also constitute direct income, the category as a whole has been deemed indirect for the purposes of this analysis.
10 The data in the following table is constructed from the mean monthly household receipts from the different sources of income.
24

Table 2.11 Sources of total monthly household income, 1992 (%)
Ndwedwe Ntuzuma Umlazi
WAGES 62.06 82.85 84.07
REMITTANCES 8.34 3.52 3.25
TRANSFERS 14.48 4.47 4.20
GIFTS 4.08 1.84 1.19 --
MISCELLANEOUS 0.18 0.24 0.11
BUSINESS 10.84 7.08 7.18
AGRICULTURE 0.03 0.00 0.00
TOTAL 100.00 100.00 100.00
Source: DRA. 1992. volumes 6 & 7
The relative importance of business income merits some analysis. The data in Table 2.12 indicate that at an aggregated level, the most important source of business income is shebeens (27.17 per cent), followed by soft goods producers (21. 74 per cent) and spaza shops (13.04 per cent). No clear urban/rural trends exist. What is, how~ver, interesting is that the pattern is similar in Ndwedwe and Ntuzuma. Perhaps the reason why Umlazi is so different to Ntuzuma is that the sample was concentrated more in formal settlements. The implication is that business activities may be similar in urban informal and rural settlements/areas.
25

Table 2.12 Sources of business income, 1992 (%)
. Ndwedwe Ntuzuma Umlazi Total
Spaza Shop 20.00 18.80 2.90 13.04
Shebeen 28.00 12.50 40.00 27.17
Street Hawker 4.00 18.80 2.90 8.70
Other Retail 8.00 6.30 8.60 7.61
Hard Goods 0.00 6.30 0.00 2.17
Soft Goods 16.00 25.00 22.90 21.74
Ind. Sevices 4.00 0.00 2.90 2.17
Other Service 0.00 3.10 0.00 1.09
Taxi Operator 0.00 3.10 5.70 3.26
Illegal 0.00 0.00 2.90 1.09
Other 20.00 6.30 11.40 11.96
Total 100.00 100.00 100.00 100.00
Source: DRA, 1992, Volumes 6 & 7.
One final consideration regarding income sources is which assets provide income. In other words, consideration should be given to issues such as rent from property and the sale of livestock and crops. The issue of income from the sale of livestock/crops has already been addressed in Table 2.9. Only in Ndwedwe (rural) does the sale of agricultural produce contribute anything to household income (0.03 per cent). In the DRA report, rent and lobola are classified as miscellaneous income, which in all three areas contributed less than one per cent to monthly household income, suggesting that any income derived from rent or lobola is marginal. Indeed, at most, rent amounts to 0.02 per cent of monthly income (Ntuzuma). It is a more important source of income in urban as opposed to rural areas. Lobola payments are as insignificant as rent, contributing 0.06 per cent of total household income in rural Ndwedwe where lobola is a more important income source than in urban Ntuzuma and Umlazi.
2.2.2.3.1 Summary
The data on income sources indicate that
1. For all races, direct income is clearly the most important source and is relatively more important for Africans than whites.
2. Wages form the largest component of income for both rural and urban Africans, although they are more important in urban areas.
26

3. Business income is an important source of income for Africans. It accounts for more than seven per cent of total monthly household income, irrespective of area.
4. The most important source of business income is shebeens (27.17 per cent of business incomes).
5. No clear urban/rural trends exist regarding business activities. The data do, however, indicate that activities may be similar in urban informal and rural settlements/areas.
6. Assets contribute very little to houshold income: Agricultural sales contribute very little to houshold income. Only in Ndwedwe (rural) does the sale of agricultural produce contribute anything to household income (0.03 per cent). The contribution of rent and lobola to monthly household·income of Africans is marginal.
2.3 INCOME LEVELS
Two aspects of income are considered here: level and distribution. As required by the brief, comparisons are drawn between different races, rural and urban areas, and men and women. In addition to CSS and DRA data sources, the Urban Foundation demographic model as modified by May (1992) and informal settlement studies are also used. The data indicate that the distribution of monthly household income is skewed racially, between rural and urban areas, and between men and women. No formal/informal discrepancies could be established as the different data are not comparable. Racial, geographic and gender bias will each be considered in tum.
The first consideration is an analysis of urban/rural discrepancies. Both census and DRA data can be used for this purpose. Although in terms of mean household incomes a urban/rural distinction is obvious, the pattern regarding distributions is unclear. Table 2.13 shows that in Ndwedwe, a rural area, mean monthly household income is Rl 071.40 while in urban Umlazi and Ntuzuma mean monthly incomes are Rl 283.10 and Rl 516.30 respectively. This disparity is increased by the fact that, of the three, Ndwedwe has the highest mean number of household members, namely 6.8 as opposed to 5.9 (Ntuzuma) and 5.5 (Umlazi).
In terms of distribution, a clear urban/rural pattern emerges if one compares Ndwedwe (rural) with Umlazi (urban). The distribution of income in urban Ntuzuma is, however, very similar to the distribution in Ndwedwe. A possible explanation for this apparent anomaly is that the sample used to create the Ntuzuma distribution contained a larger percentage of informal dwellers (38 per cent) than the sample used to create the Umlazi distribution (27 per cent). The implication is that the distribution of income is similar in urban informal and rural areas and both these areas display a worse distribution than formal urban areas.
While in rural Ndwedwe 51.6 per cent of households earn less than R800 per month, in Ntuzuma the proportion is only slightly lower at 47.2 per cent. In Umlazi, on the other hand, the distribution shows that only 33.9 per cent of households received less than R800 per
27
I i
.. !
i '.

month. The picture at the top end of the distribution reinforces this pattern, with Umlazi showing the highest percentage of households earning more than R2 000 per month (20.6 per cent). The percentage of households earning more than R2 000 per month inNdwedwe and Ntuzuma is 12.6 per cent and 16.9 per cent respectively. The fact that the sample from which the Umlazi data were obtained contained a lower percentage of informal settlement respondents than the Ntuzuma sample (27.2 per cent as opposed to 38 per cent) supports the earlier. assertions regarding the similarities between rural and urban informal settlements.
Table 2.13 Household monthly income, 1992 (%)
Ndwedwe Ntuzuma Umlazi
< R400 23.10 26.00 .- 9.40
R401-R800 28.50 21.20 24.50
R801-R1000 8.10 11.50 10.70
R1001-R2000 28.10 24.60 34.40
R2001-R3000 7.80 8.l0 12.00
> R3000 4.80 8.70 8.60
TOTAL 100.00 100.00 100.00
MEAN 1071.40 1283.l0 1516.30
Source: DRA, 1992, Vol. 6 & 7.
Detailed data on monthly household incomes in informal settlements are available from Cross et aI's (1992) survey of informal settlements in the Inanda area. These data are presented in Table 2.14. Unfortunately, it is not possible to compare them with those from the other sources. Drawing comparisons with those derived from the DRA would be fruitless as the areas surveyed by the DRA include both formal and informal settlements with no breakdown by settlement type. Comparisons cannot be drawn with the CSS census data as these refer to the individual rather than the household. Neither can comparisons be drawn with the household expenditure survey, as this includes both formal and informal settlements in its sample.
Data for the different informal settlements surveyed are included to highlight the fact that these settlements are by no means homogeneous. In terms of general trends, 67 per cent of households surveyed earned less than Rl 000 per month, and 87 per cent less than Rl 500 in 1991 (with an average household size of 5.37 [Cross et aI, 1992, pI6]).
28

Table 2.14 Distribution of monthly African household incomes in informal settlements (%)
1 2 3 4 Total I
ROOOO 5 7 15 1 7
R 1-500 23 19 16 26 21
R 501-1000 31 42 41 36 38
R 1001-1500 20 15 18 26 20
R 1501-2000 8 5 3 8 6
R 2001-2500 4 10 3 3 5
R 2501-3000 3 1 3 - 2
> R 3000 7 1 1 - 2
Total 100.00 100.00 100.00 100.00 100.00
MEAN (Rand) 1041.00 864.20 768.10 805.20 869.63
Source: Cross et al (1992, p66).
Note: 1 refers to Amatikwe; 2 to Nhlungwane; 3 to Bhambayi; and 4 to Lindelani.
Income distribution in the region can also be analysed from the perspective of the individual. Whether or not such an approach is useful is, however, questionable. Moreover, in its raw form the CSS data are potentially misleading. The CSS data are presented for the entire population and include both the economically active and the economically inactive. The category which indicates no income would include those who neither work nor receive any income - in particular young people under 16 who conventionally are regarded as not economically active. The presence of children under 16 in the zero income category introduces a bias into derived distributions, making them appear more unequal. Hence the data were modified to remove such biases. All those under the age of 1511 were removed from the zero income category. Two considerations are worth noting: While people over 64 are also conventionally not regarded as economically active, they are possibly still income receivers (remittances and transfers). Secondly, some ofthose below 15 may in fact work and some of those above 16 may still be studying and hence not earning incomes.
Table 2.15 presents personal income distributions for the different races, distinguishing between rural and urban Africans. An urban/rural disparity for Africans appears in the CSS data - while 70.26 per cent of Africans earned less than R250 per month in rural areas, 59.62 per cent of urban Africans earned this amount. Moreover while only 0.54 per cent of rural Africans earn more than R2 500 per month, 0.95 per cent of urban Africans earn that amount.
II While 16 was a desirable limit it was not possible given the relevant age profile provided in the Census data.
29 -

~-~~~--------
Table 2.15 Distribution of annual individual income, 1991 (%)
African White Coloured Asian Urban Rural
No income 23.15 43.11 43.29 41.17 46.49
R1-999 1.82 2.60 2.23 2.82 2.84
R1000-2999 3.92 9.01 7.84 15.63 20.93 .. R3000-4999 3.99 3.71 3.54 7.91 8.32
RSOOO-6999 2.81 5.28 4.90 8.30 6.01
R7000-9999 4.09 8.73 10.37 10.52 7.47
R10000-29999 29.38 21.91 21.89 "12.70 7.47
R30000-49999 16.07 4.40 4.24 0.61 0.49
RSOOOO-69999 7.07 0.76 1.02 0.21 0.02
R70000-99999 4.24 0.26 0.40 0.10 0.01
R100000-299999 3.22 0.14 0.26 0.03 0.01
> R300000 0.23 0.02 0.04 0.01 0.01
Total 100.00 100.00 100.00 100.00 100.00
Source: C.S.S. Report 03-01-10 (1991)
Our next consideration is the data derived from the CSS household income expenditure survey. The data are limited in that they refer only to the Durban/Pinetown area. Table 2.16 presents mean incomes for whites, Asians and Africans, and indicate that white incomes were more than four times those of Africans, and twice those of Asians.
Table 2.16 Mean monthly household incomes, 1990 (Rands)
Whites Asians Africans
Annual Income 50769.37 25530.88 12328.67
Monthly Income 4230.78 2127.57 1027.39
Source: CSS report 01-11-01 (1991) =========================================d
A comparison of distributions as opposed to means indicates worse inequalities. Table 2.17 describes the extremes .in personaLincomes as indicated by. the .. census. Clearly, the group experiencing the worst incomes is rural Africans. The order from best to worst being whites, Asians, coloureds, urban Africans and rural Africans. The extent of the disparity between white personal incomes and other races is underlined by the fact that 31 per cent of whites earn more than R2 500 per month as against less than six per cent for the other groups.
30
___________________ . ____________________________ ---.-J

Table 2.17 Personal monthly income distribution, 1991 (%)
Africans Whites Coloureds Asians Urban Rural
<R250 28.89 54.78 53.36 59.62 70.26
>R2500 30.83 ·5.58 5.96 0.95 0.54
. Source: CSS Report 03-01-10 (}991l
A useful indicator of disparities in household incomes is the the Urban Foundation's Income Distribution Model; which has been manipulated by May (1993, pll). A number of caveats need to be noted regarding the data: the distribution is based upon the assumptions of the model, which is concerned with national as opposed to regional or sub-regional trends. Further, the data used are based on 1990 data adjusted to 1992 using an assumed growth rate of 2.5 per cent per annum (May, 1993, pI). A final problem with the data is that they cover only Asian, coloured and white households.
The data in table 2.18 can be compared with those derived from the DRA survey (see Table 2.13) as both are for 1992. The data suggest that white incomes are at least 3.5 times those of Africans and if rural African incomes are considered (Ndwedwe), then mean white incomes are five times those of Africans. These disparities are made further apparent by the fact that while 69 per cent of white households earned monthly incomes greater thanR3 000, less than nine per cent of African households in Ndwedwe, Ntuzuma and Umlazi received such incomes. The disparities of income are not restricted to Africans and whites. In terms of mean incomes, whites in the Durban region earn more than twice as much as either Asians or coloureds. Moreover, while 43 per cent of white households earned more than R5 000 per month, approximately 52 per cent of both Asian and coloured households earned less than R2 200 per month in the same region.
31

Table 2.18 Household monthly ~ncome distribution (DFR):U.F.Model, 1992
Whites Coloureds Asians
< R250 1.46 2.89 6.25
IU51-RSOO 1.47 2.88 6.24
RSOO-R825 1.95 7.16 9.53
R826-R1440 3.87 14.45 15.68
Rl441-R2193 8.73 24.77 14.02
R2194-R3000 13.98 24.20 18.06
R3001-R5000 25.04 13.45 17.35
>RSOOO 43.50 10.20 12.87
Total 100.00 100.00 100.00
Mean (Rand) 5369.08 2709.08 2567.80
Source: May 1993. p13
A third important dimension of income is the inequality between males and females. The only source of recent data for gender inequalities would appear to be the 1991 census. The distributions presented in Table 2.19 have been adjusted in two ways. The unspecified category has been removed and the category indicating no income has been adjusted to remove people under the age of 15. According to these data, 38 per cent of men received monthly incomes below R250 per month, as against 66 per cent of women. The extent of these income disparities is further underlined by the fact that while 13 per cent of men received monthly incomes greater than R2 500 per 'month, a mere three per cent of women fell into this category. One does need to be cautious when interpreting these results given the fact that women are likely to be less economically active than men.
32

Table 2.19 Income distribution in the DFR by gender, 1991
Men Women
ROOOO 27.98 49.36
RI-999 1.98 2.92
Rl000-2999 8.46 13.83
R3000-4999 5.45 6.07
R5000-6999 7.12 4.95
R7000-9999 11.75 6.29
Rl0000-29999 23.92 13.35
R30000-49999 7.05 2.46
R50000-69999 3.07 0.47
R70000-99999 1.78 0.18
Rl00000-299999 1.33 0.10
> R300000 0.10 0.02
Total 100.00 100.00
Source: CSS report 03-01-10 (1991)
A second useful dimension of gender-based inequalities which warrants some analysis are the differences between men and women's rural and urban incomes. Table 2.20 covers this dimension. The data in the table have been adjusted to remove the unspecified category and to remove those under the age of 15 from the zero-income category. The most striking feature of these distributions is the disparity between urban males and rural females. For example, 38 per cent of urban males earn less than R250 per month as against a massive 82 per cent of rural females. Moreover, although 14 per cent of urban males earn more than R2 500 per month, less than one per cent of rural women do. A substantial part of these discrepancies is likely to be explained by the different proportions employed.
33

Table 2.20 Monthly indhidual income distribution in the DFR by gender, and in terms of rural and urban areas, 1991
Men Women
Urban Rural Urban Rural
R 0000 27.73 33.29 48.91 56.80
Rl-999 1.95 2.64 2.91 2.95
R1000-2999 8.06 16.90 13.31 22.34
R3000-4999 5.19 11.09 6.09 5.71
RSOOO-6999 7.05 8.59 5.00 4.09
R7000-9999 11.70 12.80 6.46 3.64
R1 0000-29999 24.40 13.63 13.94 3.64
R3oooo-49999 7.36 0.62 2.57 0.77
RSoooo-69999 3.20 0.21 0.50 0.03
R7oooo-99999 1.86 0.10 0.19 0.02
R100000-299999 1.39 0.11 0.10 0.01
> R300000 0.11 0.02 0.02 0.00
Total 100.00 100.00 100.00 100.00
Source.: CSS report 03-01-10 (1991)
2.3.1 Summary
Household income levels in the DFR are characterised by the following trends.
1. For African households mean monthly incomes are higher in urban areas than in rural areas. However, no clear urban/rural pattern exists regarding the distribution of income.
2. The DRA data suggest that urban informal and rural areas have similar distributions which are worse than the distribution in formal urban areas. The data used do not, however, allow direct fonnal/informal settlement comparisons.
3. The CSS data indicate that white incomes were more than four times those of Africans and twice those of Asians.
-4. ·ComparingCSSdata for· whites and DRA. data for Africans shows white incomes to be at least 3.5 times those of Africans and if rural African incomes are considered then this increases to five times.
34

5. Comparing the Urban Foundation data for whites and the DRA data for Africans, 69 per cent of white households earned monthly incomes greater than R3 000, as against less than 9 per cent of African households in Ndwedwe, Ntuzuma and Umlazi.
6. .'
The disparities of income are not restricted to Africans and whites. In terms of mean incomes, whites in the Durban region earn more than twice as much as either Asians or coloureds. Moreover, while 43 per cent of white households earned more than R5 000 per month approximately 52 per cent of both Asian and coloured households earned less than R2 200 per month.
2.4 HOUSEHOLD EXPENDITURE
The sources used to construct consumption profiles are largely the same as those used for the income data, i.e. the CSS Household expenditure survey and the DRA income and expenditure survey. While it is reasonably simple to establish expenditure patterns and the relative importance of different commodity types, it is more difficult to establish the source of different consumption items. For Asians, coloureds and whites it is assumed that all consumption is effected through cash purchases. For Africans, some attempt has been made to establish what part of food consumption was achieved through subsistence production.
Table 2.21 is derived from the CSS household expenditure survey and shows important differences in expenditure on food and housing. While for both Asians and Africans food is the single bigest expense - 24 per cent and 22 per cent respectively - for whites it ranks second behind housing. Further, while housing is the second most important expense for Asians, clothing and footwear is for Africans, housing coming behind transport and furniture and equipment.
35

Table 2.21 Annual household expenditure, 1990
Asians Africans Whites
Rand % Rand % Rand %
Food 5550.08 23.54 2444.54 21.89 6195.45 12.32
k:loth. & Foot 1210.98 5.13 995.94 8.92 1603.09 3.19
fEnerl!v 891.84 3.78 332.20 2.97 896.22 1.78
~ousing 3502.46 14.86 460.24 4.12 11247.04 22.36
ifransport 1589.04 6.74 559.65 5.01 3836.38 7.63
!Medical 863.60 3.66 123.49 1.11 1894.46 3.77
iEducation 301.27 1.28 162.67 1.46 561.32 1.11
!R/hold Op. 434.51 1.84 299.74 2.68 467.07 0.93
Fum. & Equip. 896.16 3.80 525.75 4.71 1760.08 3.50
Total 23574.10 100 11167.00 100 50289.41 100
Source.: CSS Report 01-11-01 (1990)
It is interesting to compare the results derived from the CSS survey with those obtained by DRA. The data are not wholly comparable as CSS include water expenditure under housing, while it is included under energy in the DRA data. The most striking difference in the two sets of results presented in tables 2.21 and 2.22 is the relative importance of food. While according to the CSS (Table 2.21) food constitutes 22 per cent of total expenditure, according to the DRA data (Table 2.22) it is almost 40 per cent of household expenditure. For all areas surveyed by DRA, expenditure patterns follow a similar pattern. Food is the most important, followed by clothing and footwear, transport, furniture and equipment, energy and household operating expen~.es. According to the CSS results the order is largely similar but for the fact that housing is relatively more important, perhaps reflecting a sample bias towards more formal settlements which are easier to survey. Any urban/rural discrepancy in expenditure behaviour should emerge from a comparison of Ndwedwe with Ntuzuma and Umlazi. The expenditure patterns in the three areas are largely similar except for slight differences in expenditure on food and housing. Households in Ndwedwe spend proportionally more on food than those in Ntuzuma and Umlazi, perhaps reflecting the larger mean household sizes. Moreover, households in Ndwedwe spend proportionally less on housing, probably reflecting its largely informal nature.
36

Table. 2.22 Household expenditure (Africans), 1992 (%)
Ndwedwe Ntuzuma Umlazi CSS
iF00d 46.32 43.34 39.61 21.89
~loth. &_Foot 10.49 10.38 10.60 8.92
'Energy 6.44 5.86 7.31 2.97
Housing 0.96 2.82 2.14 4.12
Transport 8.54 9.14 9.39 5.01
Medical 1.17 1.12 0.91 1.11
Education --- 1.95 1.96 3~19 1.46
H/hold Operation 5.75 5.19 5.32 2.68
IF'um & Equip. 6.57 6.10 8.29 4.71
~ource: DRA. 1992. Vol. 6 & 7; CSS Report 01-11-01 (1990)
Our final consideration regarding consumption is the issue of the 'source' of consumption -whether consumption is of subsistence production or purchased. The only source of data in this regard is the DRA income and expenditure survey. The overriding impression is that households in the rural areas tend to provide a greater part of their own food consumption than those in urban areas.
Useful indirect indicators of the extent to which households provide for their own consumption are the amount of land to which they have access, the amount of livestock they own and number of animals they slaughter.
Access to land was limited in the three areas sampled. In urban Umlazi and urban Ntuzuma, 96.9 per cent and 95.2 per cent of households had no access to garden plots while even in rural Ndwedwe 82.5 per cent of households had none. In addition, average land holdings were extremely small and even in rural Ndwedwe only 2.3 per cent had access to one hectare or more. These data seem to be supported by data on consumption of home-produced maize. In Ntuzuma and Umlazi, none of the sampled households consumed any, while in Ndwedwe only 0.5 per cent of households did so.
In the urban areas a small percentage of households owned livestock: in Ntuzuma 12 per cent of households owned poultry and none owned any cattle, sheep or goats; in Umlazi 4.9 per cent of households owned poultry and none owned any other livestock. This lack of ownership of sheep, goats and cattle in urban areas is reflected by the fact that households in those areas did not slaughter any cattle, sheep or goats in the 12 months to June 1992.
In rural Ndwedwe the situation is somewhat different. Over half the households owned poultry, 5.4 per cent between one and 10 cattle (although 93.7 per cent owned no cattle), eight per cent at least one goat, and none any sheep. 11.4 per cent of all households owned some livestock other than poultry. Despite the relatively higher incidence of ownership, 99.5
37 -

per cent of households did not slaughter any cattle, sheep or goats in the 12 months to June 1992. The overriding impression is that even in the rural parts of the DFR; few households rely on subsistence production, perhaps indicating the extent to which these rural areas have been integrated into the urban economy.
2.4.1 Summary
The following patterns emerged regarding expenditure:
1. While for both Asians and Africans food is the single biggest expense, for whites it ranks second behind housing.
2. Although according to the CSS data food constitutes 22 per cent of total expenditure, according to the DRA data it is at least 40 per cent.
3. According to the DRA data for Africans food is the most important expenditure item, followed by clothing and footwear, transport, furniture and equipment, energy and household operating expenses.
4. For Africans expenditure patterns in rural and urban areas are largely similar except for slight differences in expenditure on food and housing. Rural households spend proportionally more on food and less on housing than do urban households. This possibly reflects the larger mean household sizes and the largely informal nature of rural areas.
5. Even in the rural parts of the DFR, few African households rely on subsistence production, perhaps indicating the extent to which these rural areas have been integrated into the urban economy.
2.5 EXTENT OF POVERTY IN THE REGION
Whether or not a 'regionally accepted poverty datum line' exists is difficult to determine. However most of the literature concerned with attempting to quantify the extent of poverty , either in the DFR as a whole or some part thereof, uses some version of the household subsistence level (HSL) published by the Institute for Planning research at the University of Port Elizabeth. The most common modification of the HSL is to adjust it for the mean household size of the group under analysis. The same approach has been adopted here.
Our first concern is establishing the extent of poverty for African households. The DRA data used above show mean household sizes to be 6.8, 5.9 and 5.5 for Ndwedwe, Ntuzuma and Umlazi respectively. The HSL for urban Africans in Durban is calculated for a six-member household. This was deemed suitable for Ntuzuma and Umlazi, but not for Ndwedwe. Not only was an extra child added to the household for Ndwedwe but the expenditure on rent halved in accordance with the trends apparent from the expenditure data (see Table 2.22).
38

The relevant HSL for a six-member urban African household in Durban in September 1991 was R743.50 and that for a seven-member rural African household, R807.21 (asSuming that the extra member was a child aged seven to 10). These HSLs were then inflated to June 1992 levels. The rise in the CPI in that period (118.6 to 131.6) implies an annual inflation rate of approximately 11 per cent - raising the urban HSL to R825.29 and the rural HSt to R896.oo. Table 2.23 shows the distribution of household income. While in all three areas sampled, mean incomes are higher than the HSL, it is clear that poverty is pervasivepanicularly in the rural areas. In Ndwedwe between 51.6 per cent and 59.7 per cent of all households fall below the poverty datum line as indicated by the HSL In Ntuzuma, the situation is marginally better, with between 47.2 per cent and 58.4 per cent of households below the HSL In Umlazi between 33.9 per cent and 44.6 per cent of the households sampled fall below the HSL. The siruation is possibly similar, if not worse, in informal settlements. Cross et aI's survey, (1992, p66) showed that i~ the informal settlements in the Greater Inanda area, 66 per cent of households had incomes below R1 000 per month. Ardington's (1992) analysis of Canaan is more detailed. She calculated subsistence levels for all households in the settlement and concluded that 56.5 per cent of those households had incomes below the relevant HSL (1992, p21).
Table 2.23 Household Monthly Income, 1992 (%)
Ndwedwe Ntuzuma Umlazi
< R400 23.10 26.00 9.40
!R401-R8oo 28.50 21.20 24.50
R801-Rl000 8.10 11.50 10.70
Rloo1-R2000 28.10 24.60 34.40
R2oo1-R3000 7.80 8.10 12.00
>R3000 4.80 8.70 8.60
Total 100.00 100.00 100.00
MEAN (Rands) 1071.40 1283.10 1516.30
H.S.L. (Rands) 993.87 915.43 915.43
~ource: DRA, 1992, Vol. 6 & 7.
Thus, according to our calculations, in rural areas between 52 and 60 per cent of rural African households (Ndwedwe), between 34 and 45 per cent of urban formal African households, and between 57 and 66 per cent of urban informal African households fell below the PDL in 19911~. McGrath (1989, p9) estimated that in 1985, 40 per cent of informal households, 85 per cent of rural households, and 13 per cent of urban formal households fell below the PDL for 1985. In arriving at these results McGrath (1989, p9) adjusted the Institute for Planning research HSL for 1985 downwards, reducing the number of people falling below the PDL. Hence our calculations and his are not directly comparable and it is difficult to
39
identify any trends. Furthermore, McGrath's analysis is concerned with the DFR as a whole whereas we are concerned only with parts of the DFR. .
Asian and coloured mean household sizes in the DFR were calculated using the 1991 census datfl and are 4.21 and 4.55 respectively. For the purposes of this analysis coloured households are regarded as consisting of four members and Asian households five members. The relevant HSLs for September 1991 are R889.88 for Asians and R744.41 for coloureds. Inflating to 1992 levels, we obtain R987.77 and R826.30 respectively. The Urban Foundation model presented in Table 2.18 shows that 22 per cent of Asian families and 13 per cent of coloured families in Durban earned less than R825 per month (38 per cent Asian families and 27 per cent coloured families less than RI440). While one cannot establish precisely the extent of poverty, it would appear that about 25 per cent of Asian families and 15 per cent of coloured families fell below the HSL.
2.5.1 Summary
While it is not possible to establish precisely the extent of poverty in the region, it is clear that poverty is pervasive. The following trends emerge.
1. Between 51.6 per cent and 59.7 per cent of rural African households fall below the poverty datum line.
2. In Ntuzuma, an urban area, a large part of which contains informal settlements, the situation is marginally better, with between 47.2 per cent and 58.4 per cent of African households below the HSL.
3. In Umlazi, a largely formally settled area, between 33.9 per cent and 44.6 per cent of African households fall below the HSL.
4. It is not possible to establish the extent of poverty in informal settlements but the fragmentary data which exist suggest that the situation is worse than in formal African residential areas.
5. While one cannot establish precisely the extent of poverty for Asian and coloured households it would appear that about 25 per cent of Asian families and 15 per cent of coloured families fell below the HSL.
2.6 CONCLUSION
Using the ratio of the economically active to economically inactive population both the subregion as a whole and the individual race groups experienced an improvement in the extent of dtependency over the decade to 199Q. )'his trend is surprising given the poor performance of the economy over this period. It is argued that the improved ratio may reflect increasing unemployment: as household members lose their jobs, greater numbers from each household may be forced to seek work increasing the economically active population. Thus rather than suggesting a decrease in dependency, the figures may in fact indicate an increase. This
. - 40
conclusion is borne out by examining the ratio of those who do not have full-time employment to those who do. This statistic shows a worsening of dependency for Africans in Umlazi.
The data on occupation show that blue collar occupations are the most important category for Africans (68.5 per cent), coloureds (50.4 per cent) and Asians (44.8 per cent), whereas white collar jobs occupy 68 per cent of economicaly active whites. Furthermore, a large percentage of coloureds (19.16 per cent) and Africans (18.62 per cent) fall into the unspecified category probably reflecting the fact that Africans and coloureds experience more unemployment than the other races. The DRA data show that the most important occupation for Africans in the region is domestic worker, a trend which is not specific to different settlement types.
The most important economic sector in the region is the community, social and personal services sector employing 23.03 per cent of the population. The unspecified category is the second largest category in the region, it is, however, larger in rural than urban areas, suggesting a higher level of unemployment in rural areas. This category is highest for rural Africans (31.52 per cent), and only whites have less than 10 per cent of their economically active population falling into this category.
For all races, direct income is clearly the most important source of income and is relatively more important for Africans than whites. For Africans, whether rural or urban, wages form the largest component of income, although they are relatively more important in urban areas. Business income is also an important source of income for Africans and accounts for mote than seven per cent of total monthly household incomes. No clear urban/rural trends exist regarding business activities although activities may be similar in urban informal and rural settlements/areas. Assets contribute very little to houshold income.
While food is the single bigest expense for both Asians and Africans, it ranks second behind housing for whites. What proportion of expenditure by Africans is on food is difficult to determine as the data are conflicting. For Africans expenditure patterns in rural and urban areas are largely similar except for slight differences in expenditure on food and housing. Rural households spend proportionally more on food and proportionally less on housing than do urban ones. This possibly reflects the larger mean household sizes and the largely informal nature of rural areas. Even in the rural parts of the DFR, few African households rely on subsistence production, indicating the extent to which these rural areas have been integrated into the urban economy.
While it is not possible to establish precisely the extent of poverty in the region, it is clear that poverty is pervasive. Between 51.6 per cent and 59.7 per cent of rural African households fall below the poverty datum line. In Umlazi, a largely formally settled area, between 33.9 per cent and 44.6 per cent of African households fall below the HSL. While it is not possible to establish the extent of poverty in informal settlements the fragmentary. data which exists suggests that the situation is worse than in formal African residential areas and similar to rural areas. While one cannot establish precisely the extent of poverty for Asian and coloured households it would appear that about 25 per cent of Asian families and 15 % of coloured families fall below the HSL.
41

3. NON-INCOME INDICATORS OF POVERTY
3.1 INTRODUCTION
This- section of the paper is concerned with non-income indicators of poverty.
Section 3.2 is concerned with mortality rates. Both general and infant rates are examined at a national, regional and magisterial level (where possible).
Section 3.3 addresses the issue of morbidity and the lack of data on this subject.
Section 3.4 is concerned with generating a nutrition status profile of children and infants within the area under investigation by examining four anthropometric surveys of nutrition outside the DMR in conjunction with data obtained from the Durban City Health Department.
Section 3.5 is concerned with the extent of immunisation of infants and children within the Durban region.
Section 3.6 is concerned with establishing skill and literacy levels and differences in the region.
3.2 MORTALITY RATES
3.2.1 General mortality in Durban, Pinetown, Inanda, Ntuzuma and Umlazi
Mortality rates are given by CSS but relate only to the specific racial group as an aggregated national unit. No regional disaggregation is provided. However, these rates can be calculated from the total deaths for each racial group for· a specific region or district and population estimates.
While data on deaths are provided annually by CSS, population census figures have only been published in 1985 and 1991. The most recent data on deaths are for 1990 whereas the most recent population census was in 1991. Consequently, population census figures from 1985 and 1991 were interpolated for 1990, assuming a constant growth rate equal to the average over this period, and mortality rates generated. A similar procedure was utilised to interpolate population figures for 1988 in order to calculate mortality rates for that year. The mortality rates calculated for 1988 were compared with those for 1990 in order to establish trends. Due to changes in magisterial districts prior to 1988 with respect to CSS data on deaths, intermagisterial comparisons of mortality could not be made between post-and pre-1988 years. However, data from the Durban MOH Reports prior to 1988 were utilised in order to assess trends in mortality for those years. The figures from the 1985 and 1991 popUlation census and the interpolated figures for both 1988 and 1990 are provided in Appendix 3.1.
42
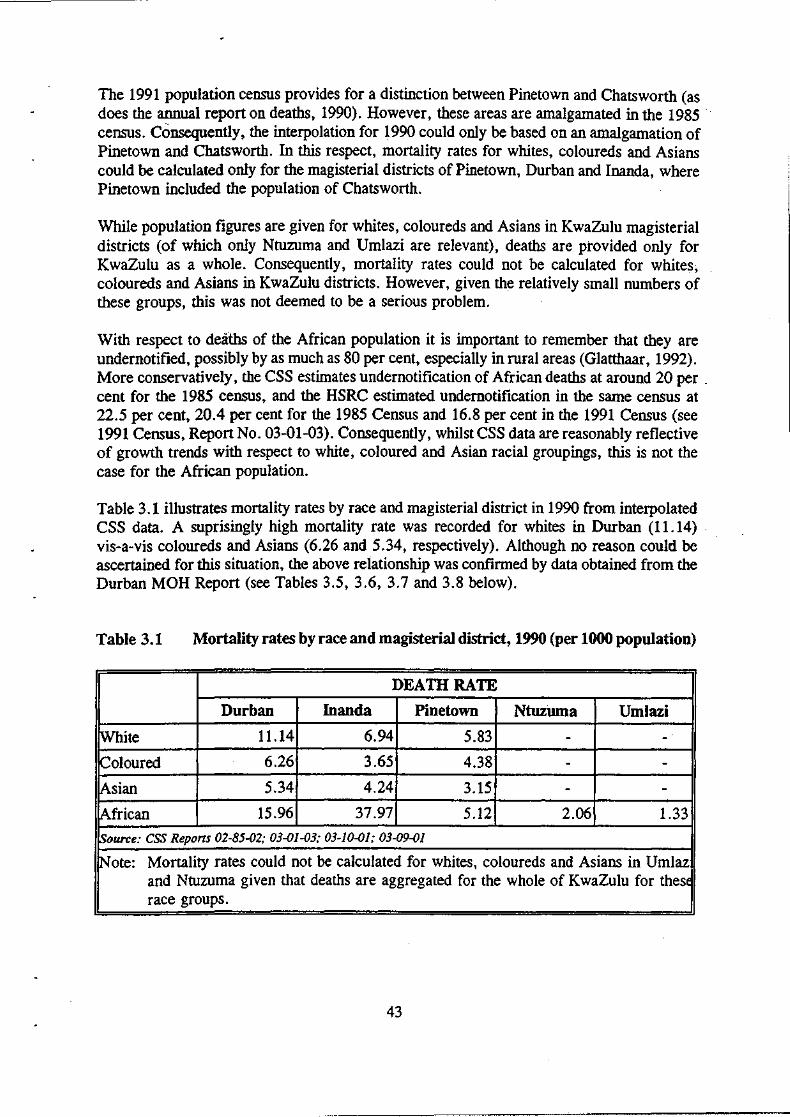
The 1991 population census provides for a distinction between Pinetown and Chatsworth (as does the annual report on deaths, 1990). However, these areas are amalgamated in the 1985 . census. Consequently, the interpolation for 1990 could only be based on an amalgamation of Pinetown and Chatsworth. In this respect, mortality rates for whites, coloureds and Asians could be calculated only for the magisterial districts of Pinetown, Durban and Inanda, where Pinetown included the population of Chatsworth.
While population figures are given for whites, coloureds and Asians in KwaZulu magisterial districts (of which only Ntuzuma and Umlazi are relevant), deaths are provided only for KwaZulu as a whole. Consequently, mortality rates could not be calculated for whites·, coloureds and Asians in KwaZulu districts. However, given the relatively small numbers of these groups, this was not deemed to be a serious problem.
With respect to deaths of the African popUlation it is important to remember that they are undernotified, possibly by as much as 80 per cent, especially in rural areas (Glatthaar, 1992). More conservatively, the CSS estimates undernotification of African deaths at around 20 per . cent for the 1985 census, and the HSRC estimated undemotification in the same census at 22.5 per cent, 20.4 per cent for the 1985 Census and 16.8 per cent in the 1991 Census (see 1991 Census, Report No. 03-01-03). Consequently, whilst CSS data are reasonably reflective of growth trends with respect to white, coloured and Asian racial groupings, this is not the case for the African population.
Table 3.1 illustrates mortality rates by race and magisterial district in 1990 from interpolated CSS data. A suprisingly high mortality rate was recorded for whites in Durban (11.14) . vis-a-vis coloureds and Asians (6.26 and 5.34, respectively). Although no reason could be ascertained for this situation, the above relationship was confirmed by data obtained from the Durban MOH Report (see Tables 3.5, 3.6, 3.7 and 3.8 below).
Table 3.1 Mortality rates by race and magisterial district, 1990 (per 1000 population)
DEATH RATE
Durban Inanda Pinetown Ntuzuma Umlazi
rwwte 11.14 6.94 5.83 - -
k:oloured 6.26 3.65 4.38 - -!Asian 5.34 4.24 3.15 - -
African 15.96 37.97 5.12 2.06 1.33
'source: CSS Reports 02-85-02; 03-01-03; 03-10-01; 03-09-01
Note: Mortality rates could not be calculated for whites, coloureds and Asians in Umlaz and Ntuzuma given that deaths are aggregated for the whole of KwaZulu for these race groups.
43
I
... ..J

In contrast to the high death rates for Africans in both Inanda (37.97) and Durban (15.96), the rates of2.06 and 1.33 for Africans in Ntuzuma and Umlazi, respectively, are suspiciously low, which could be attributed to a severe under-notification of deaths in these areas. Given that Ntuzuma and Umlazi account for 82 per cent of the African population within the area under investigation according to the interpolated CSS data, and Inanda and Durban only 12 per cent, one would, at the least, expect equally high death rates in Ntuzuma and Umlazi as in Durban and Inanda. In addition, Ntuzuma contains the greatest proportion of the total non-urban African population in the area under investigation vis-a-vis Inanda (approximately 75 per cent versus 15 per cent, respectively12) which would again necessitate an equally high, if not higher, mortality rate. Given that these areas do not exhibit any consistency in the mortality rates and given the above arguments, there is good reason to treat such data with suspicion, especially since under-notification of African deaths is a problem for all areas and not simply for Ntuzuma and Umlazi.
Table 3.2 represents the same information as Table 3.1 for the year 1988. Mortality rates in 1988 were generally higher than those in 1990. This being the case, similar patterns emerge with respect to inter-magisterial trends.
Table 3.2 Mortality rates by race and magisterial district, 1988 (per 1000 population)
DEATH RATE
Durban Inanda Pinetown Ntuzuma Umlazi
White 12.04 5.90 6.65 - -Coloured 10.22 4.10 6.12 - -. Asian 8.12 5.47 6.07 - -
[African 23.47 79.77 20.79 6.03 5.46
~ource: CSS Repons 02-85-02; 03-01-03; 03-10-01; 03-09-01
~ote: Mortality rates could not be calculated for whites, coloureds and Asians in Umlaz and Ntuzuma given that deaths are aggregated for the whole of KwaZulu for thes~ race groups.
In Durban, whites exhibited a relatively higher mortality rate vis-a-vis coloureds and Asians. However, as opposed to Table 3.1, this discrepancy was not as large. Contrasting Table 3.1 with Table 3.2 illustrates a downward trend in mortality rates for all race groups within the Durban magisterial district between 1988 and 1990. Although the mortality rate for Africans
12 However, the non-urban populations of Ntuzuma only accounts for 8 % of the total black population and Inanda, 1.4 % .
44

in Durban in 1988 is cause for concern at 23.4 7 (especially in contrast to the other racial groups), between 1988 and 1990 the mortality rate for Africans decreased by 47 per cent.
As with Table 3.1, Table 3.2 illustrates distUrbing inter-magisterial variations for African mortality rates in 1988. While the mortality rate for Africans was 79.77, that for Ntuzuma and Umlazi were 6.03 and 5.46, respectively. As with Table 3.1, these discrepancies were seen to be suspicious given that Ntuzuma and Umlazi account for a high proportion of both the total African population in the study area as well as the total rural African population. These inconsistencies serve to emphasise the unreliability of data on African deaths.
Table 3.3 illustrates average mortality fates for individual race groups in 1990 for the Durban region. Urban/rural breakdowns are only provided only for the African population. The relatively lower mortality rate of Africans vis-a-vis whites for the aggregated region under investigation confmns the problem with data on African deaths. This is clearly apparent with respect to the mortality rate for Africans in non-urban areas which, at 4.70, is much lower than one would expect. No reason could be established for the relatively higher mortality rate of whites within the area under investigation vis-a-vis coloureds and Asians.
Table 3.3
POP.
twhite
Coloured
Asian
lAfrican
Total deaths, overall mortality rate by race and urban/rural breakdown (Africans, .only), 1990 (per 1000 population)
MORTALITY RATE
TOTAL TOTAL OVERALL URBAN NON-URBAN DEATHS MORTALITY
RATE
324135 3108 9.59 - -64000 347 5.42 - -
559129 2277 4.07 - -
871713 3743 4.29 4.24 4.70
~ource: CSS Reports 02-85-02; 03-01-03; 03-10-01; 03-09-01
1N0te: (i) Total population for whites, coloureds and Asians excludes that found within Umlazi and Ntuzuma.
(ii) Magisterial districts have been aggregated in order to calculate average mortality rates for individual race groups.
Table 3.4 exhibits the same information as Table 3.3 for the year 1988. Declines in mortality rates were registered for coloureds, Asians and Africans between 1988 and 1990 as Tables 3.3 and 3.4 illustrate. The discrepancy between the white urban mortality rate and that for rural Africans in both Tables 3.3 and 3.4 probably stems from unreliable data on African deaths, particularly in rural areas.
45

Table 3.4 Total deaths, overall mortality rate by race and urban/rural breakdown (Africans, only), 1988 (per 1000 population)
MORTALITY RATE
trOTAL POP. TOTAL OVERALL URBAN RURAL DEATHS MORTALITY
RATE
!White 317645 3296 10.38 - -
!Co"loured 62561 515 8.23 - -
~sian 530026 3350 6.32 ."
- -
~frican 777830 8176 10.51 8.10 2.41
~ouTce: CSS Reports 02-85-02; 03-01-03; 03-10-01; 03-09-01
Note: Total population for whites, coloureds and Asians excludes that found within Umlazi and Ntuzuma.
Table 3.5 illustrates mortality rates by race within the DMR in 1991 calculated by the Durban City Health Department. It is notable that the mortality rate of whites in the DMR (11.14) calculated in Table 3.1 from CSS data concurs with that calculated by the Durban City Health Department in Table 3.5 (10.07), albeit that the City of Durban rate was calculated for 1991. Similarly, the rate calculated from CSS data for Asians and coloureds (5.34 and 6.26, respectively) concurs with those calculated by the Durban City Health Department (5.19 and 6.07, respectively). No reason could be established as to why the mortality rate of whites was relatively higher than that of coloureds and Asians but such a relationship was confirmed between the two data sources.
Table 3.5 Mortality rate by race within the DMR, 1991 (per 1000 population)
tpOP.GROUP TOTAL POP. TOTAL DEATHS MORTALITY RATE
rwhite 190000 1913 10.07
Coloured 61000 370 6.07
[Asian 460000 2388 5.19
[African 113000 491 4.35
IrOTAL 824000 5162 6.26
~ource: City of Durban Annual Report of the City Medical Officer of Health, 1991, p. 7.
tN"ote: Population is estimated population for formal residential areas in the DMR.
46

A large discrepancy exists, however, between the calculated death rate for Africans within the DMR (15.96) from CSS data as opposed to that from the Durban City Health Department (4.35). This discrepancy seems to lie in both the number of recorded deaths of Africans and the estimated population size within the DMR by the two statistical sources. The Durban City H~alth Department estimated the number of deaths "for Africans in 1990 to be 491. This can be juxtaposed with the CSS estimate of 1 247. Similarly, while the estimated African population size from the interpolated CSS data in 1990 was 78 118, the Durban City Health Department estimated the African population to be 113 000 in 1991. This would again indicate that data on Africans for both population sizes and deaths is simply unreliable.
Table 3.6 illustrates mortality rates by race within the DMR in 1988 as calculated by the Durban City Health Department. A comparison between Table 3.6 and Table 3.2 was made in order to assess the consistency of CSS and Durban City Health D~partment data for the year 1988. As with the comparison for the year 1990, similar patterns emerged. While the mortality rates for whites, coloureds and Asians were resonably consistent, a large discrepancy was found between the rates calculated for Africans: 7.38 from Durban City Health statistics as compared to 23.47 from CSS data. As above, this discrepancy was seen to stem from differences in both the estimated size of the African population and the number of recorded African deaths. Again, this emphasises the unreliability of data on African deaths.
Table 3.6 Mortality rate by race within the DMR, 1988 (per 1000 population)
tpOP.GROUP TOTAL POP. TOTAL DEATHS MORTALITY RATE
rwttite 182700 2195 12.01
~frican 69500 513 7.38
Coloured 57600 381 6.61
j\sian 403700 2518 6.24
TOTAL 713500 5607 7.86
Source: City of Durban Annual Report of the City Medical Officer of Health, 1988, p. 7.
Note: Population is estimated population for formal residential areas in the DMR.
Tables 3.7 and 3.8 show mortality rates by race within the DMR in 1985 and 1980, respectively, as calculated by the Durban City Health Department. Data from the 1985 and 1980 Durban MOH Reports were utilised in order to establish trends in mortality given that CSS data by magisterial district prior to 1988 were incompatible with those following 1988.
47

Table 3.7 Mortality rate by race within the DMR, 1985 (per 1000 population)
IPOP.GROUP TOTAL POP~ TOTAL DEATHS MORTALITY RATE
IWhlte 250665 2004 7.99
~frican 120958 486 4.98
~oloured 68324 340 4.02
~sian 453224 2546 5.62
IfOTAL 893171 5376 6.02
Isource: City of Durban Annual Report of the City Medical Officer of Health, 1985, p. 12.
Note: Population is estimated population for formal residential area~ in the DMR.
Table 3.8 Mortality rate by race within the DMR, 1980 (per 1000 population)
POP. GROUP TOTAL POP. TOTAL DEATHS MORTALITY RATE
White 230489 1480 6.42
African 105389 386 3.66
Coloured 58492 229 3.91
~sian 394874 1686 4.26
IrOTAL 789224 3781 4.79
~ource: City of Durban Annual Report of the City Medical Officer of Health, 1980, p. 8.
~ote: Population is estimated population for formal residential areas in the DMR.
It is immediately apparent that mortality rates increased for all race groups over most of the 1980s. Between 1980 and 1988 the overall mortality rate rose by 64 per cent. The most remarkable increase was that for Africans (101 per cent), followed by whites, coloureds and Asians at 87 per cent, 66 per cent and 46 per cent, respectively. Reasons for the increase in African mortality could include rapid urbanisation and political violence. However, the issue of deaths related to political violence has been a more prominent issue in the late 1980s and early 1990s where mortality rates have in fact fallen (see Tables 3.5 and 3.6). Similarly, it is difficult to explain why white mortality rates have risen by 87 per cent during the course of the 1980s. However, dissaggregating the data it is apparent that the greatest proportion of the increase in mortality fell between the years 1985 and 1988.
Certain statistical anomalies arise which could account for these rapid increases in general mortality. Firstly, it is noticeable that while the absolute number of deaths increased from 5 376 in 1985 to 5607 in 1988 (an increase of 4.29 per cent). the total population size declined from 893 171 in 1985 to 713 500 in 1988 (a decrease of 25 per cent). Consequently, while
48

the years 1980, 1985 and i991 follow the usual increasing population growth trends, the year 1988 illus.trates a decrease of 25 per cent.
In addition, the sample sizes in terms of numbers of deaths are reasonably small. Consequently, even minor changes from year to year exaggerate the proportional changes between the race groups.
Lastly, while mortality rates increased during the 1980s, they declined by 20 per cent. between 1988 and 1991.
3.2.2 Childhood and infant mortality
Childhood mortality rates are significant since they are highly reflective of the socio-economic environment in which the child or infant is brought up. An analysis of such data therefore sheds light on factors such as income distribution, nutritional status and access to health facilites.
3.2.2.1 Childhood mortality
Table 3.9 shows national trends in mortality of children of 1-4 years by race for South Africa as a whole. It is apparent that the childhood mortality rate has declined for all race groups since 1975. White and Asian children enjoy low mortality rates compared with their African and coloured counterparts. However, mortality rates overall are low due to the exclusion of deaths of infants under the age of one year. The rates can be compared with those in Table 3.10, where deaths of infants under the age of one year are included. This raises the mortality rate considerably. Further, the Infant Mortality Rate (IMR) (under one year of age) is more indicative of the socio-economic conditions into which the infant is born than the mortality rate of children aged between one and four years.
Table 3.9
IYEAR
1975
1978
1980
1985
1986
1987
National trends in childhood mortality: 1-4 years of age for South Africa (per 1000 population at risk)
White African Coloured Asian
1.3 - 1l.4 2.5
1.3 5.6 7.6 l.5
0.9 4.2 6.6 l.3
0.6 2.5 3.7 0.9
0.9 2.5 4.7 l.3
0.9 2.6 3.9 l.1
lS'ource: Department of National Health and Population Develoment, 1992.
49

It is clear from Table 3.l0 that the white group exhibits the lowest rates, followed closely by the Asian c:me. The rates for African and coloureds are at considerably higher levels. It is also clear that the under-five mortality rate (U5MR) generated from official registered deaths for African children and infants are under-notified by approximately 50 per cent, which emphasises the need to treat data on African deaths with caution. However, it is instructive to 'notice that the U5MR has declined over time for all race groups.
Table 3.10 National trends in the under 5 mortality rate (USMR) for South Africa, selected years (per 1000 live births)
YEAR White African Coloured Asian
REG. EST.
1978 23 45 82 108 29
1979 19 43 78 97 31
1980 17 36 64 85 30
1982 17 36 66 77 22
1985 12 30 54 53 20
1986 11 27 50 48 19
1987 17 30 55 60 23
1988 17 33 60 71 21
1989 12 30 54 44 15
fS'ource: Department of National Health and Population Development. 1992.
3.2.2.2 Infant Mortality Rates (IMR) - under the age of one year
The IMR is universally accepted as a sensitive index of the ,quality of the socio-economic enviroment and, more specifically, access to health facilities, nutrition status and income distribution.
3.2.2.2.1 National trends
Table 3.11 shows national trends in IMR for South Africa as whole by race group. The differences between the racial groups are clearly discernible. White infants and children enjoy a low rate of mortality which is comparable with their counterparts in the richest developed nations (Glatthaar, 1992). Asian infants and children have similar rates while those for coloureds and Africans are significantly higher. Such discrepancies are highlighted by the fact that the IMR of both Africans and coloureds in 1988 was higher than that of whites in 1945.
50

Table 3.11 National trends in IMR for South Africa (per 1000 live births)
tyEAR White African Coloured Asian
1945 40.3 190 151 82.5
1955 29.8 120 134.5 63.1
1965 25.9 90 132.3 55.6
1975 20.1 80 104 34.7
1985 9.3 60.6 40.7 16.1
1986 7.0 - 31.6 13.6
1987 11.9 - 46.3 19.0
1988 13.2 57.4 57.5 17.4
1989 8.6 51.8 35.1 12.2
Source: Department of National Health and Population Develoment, 1992.
3.2.2.2.2 Regional trends
Since infant deaths are given only at a provincial level by race, IMRs could be estimated only for the aggregated regions of Natal and KwaZulu. However, since data on total births and stillbirths are available only for whites, coloureds and Asians, the calculation of IMR at a provincial level is restricted to these groups. IMRs were generated for both 1990 and 1988 by subtracting stillbirths from total births and calculating deaths under one year per 1 000 of the population. The IMRs for 1988 and 1990 were contrasted in order to establish trends.
Table 3.12 illustrates IMRs in 1990 by race for Natal (excluding KwaZulu) calculated from CSS data. The IMRs for Natal in 1990 conform to the national trends discussed in Section 3.2.2.2.1. Both white and Asian infants have lower IMRs than their coloured counterparts (approximately half).
Table 3.12 IMR by race (White, Coloured and Asian) for Natal, 1990 (per 1000 live births)
TOTAL TOTAL IMR LIVE BIRTHS STILL BIRTHS STILL BIRTHS
!White 6856 39 7.92
Coloured 2492 19 20.62
Asian 15792 93 10.00
fS'ource: CSS Reports 03-10-01 .. 03-09-01 .. 03-05-01
51

Table 3.13 illustrates IMRs in 1988 by race for Natal calculated from CSS data. The IMRs for Natal in 1988 follow trends similar to the national ones. Contrasting Tables 3.12 and 3.13, it is apparent that IMRs for whites, coloureds ~d Asians rose between 1988 and 1990, the most dramatic rise being that for coloureds: 123' per cent.
Table 3.13 IMR by race (White, Coloured and Asian) for Natal, 1988 (per 1000 live births)
TOTAL TOTAL IMR LIVE BIRTHS STILL BIRTHS STILL BIRTHS
rwhite 6801 29 6.62
Coloured 2596 37 9.24
iAsian 15212 158 6.37
~ouTce: CSS Reports 03-10-01; 03-09-01; 03-05-01
3.2.2.2.3 Magisterial trends - DMR
Table 3.14 shows IMRs in 1991 by race within the DMR. In accordance with both national and regional data, Asians and whites enjoy lower rates than coloureds and Africans. Given that the above data pertain to inhabitants living only in formal, urban settlements within the DMR, the lower IMRs of Africans and coloureds in comparison to national trends is understandable.
Table 3.14 Infant mortality rate by race within the DMR, 1991 (per 1000 live births)
IPOP.GROUP TOTAL TOTAL TOTAL IMR-1991 IMR-1990 BIRTHS STILLBIRTHS DEATHS
rwhite 1809 8 13 7.22 6.32
!African . 2172 66 29 13.77 10.55
[coloured 1376 21 20 14.76 1l.50
!Asian 8672 108 93 10.86 10.70
ITOTAL 14029 203 155 11.21 10.17
fs'ouTce: City of Durban Annual Report of the City Medical Officer of Health, 1991, p. 8.
lNote: Deaths are deaths under the age of one year excluding stillbirths
Table 3.15 shows IMRs in 1988 by race for the DMR. Comparing these for the Durban magisterial district between 1987/88 and 1990/91, the following trends emerge. Between 1987
52
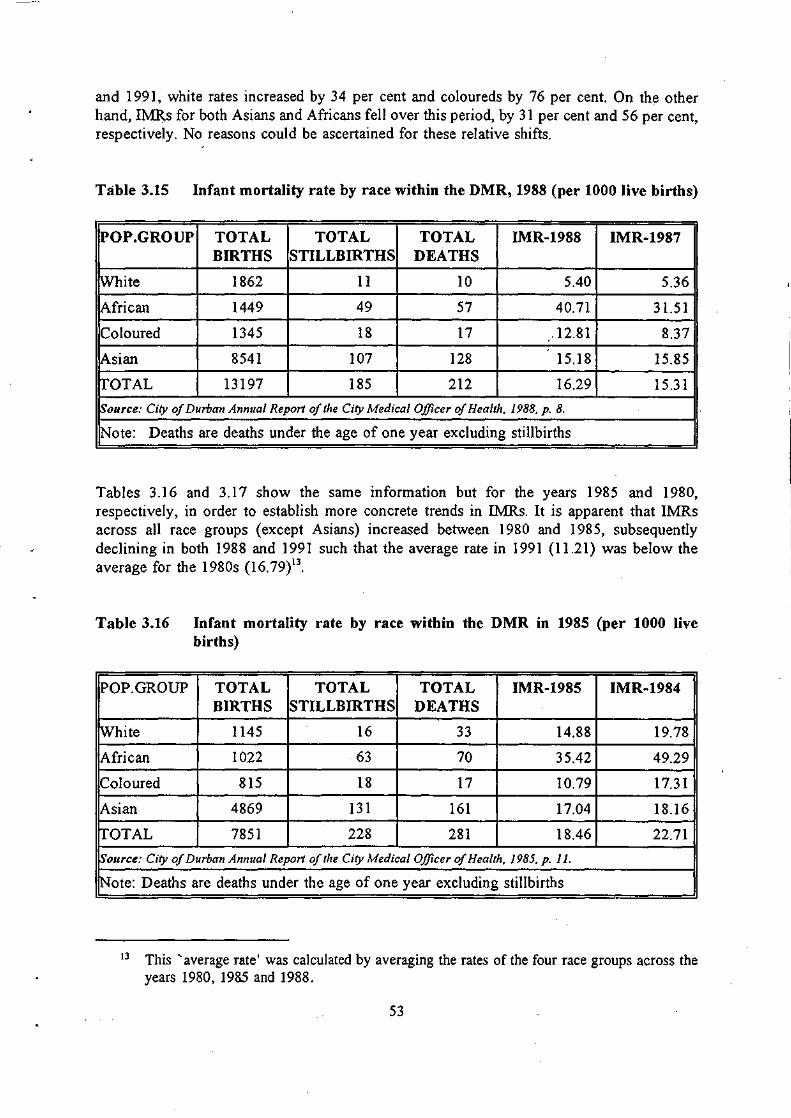
and 1991, white rates increased by 34 per cent and coloureds by 76 per cent. On the other hand, IMR,s for both Asians and Africans fell over this period, by 31 per cent and 56 per cent, respectively. No reasons could be ascertained for these relative shifts.
Table 3.15 Infant mortality rate by race within the DMR, 1988 (per 1000 live births)
POP.GROUP TOTAL TOTAL TOTAL IMR~1988 IMR~1987
BIRTHS STILLBIRTHS DEATHS
White 1862 11 10 5.40 5.36
African 1449 49 57 40.71 3l.51
Coloured 1345 18 17 .12.81 8.37
Asian 8541 107 128 15.l8 15.85
TOTAL 13197 185 212 16.29 15.31
Source: City of Durban Annual Report of the City Medical Officer of Health, 1988, p. 8.
Note: Deaths are deaths under the age of one year excluding stillbirths
Tables 3.16 and 3.17 show the same information but for the years 1985 and 1980, respectively, in order to establish more concrete trends in IMRs. It is apparent that IMRs across all race groups (except Asians) increased between 1980 and 1985, subsequently declining in both 1988 and 1991 such that the average rate in 1991 (1l.21) was below the average for the 1980s (16.79)13.
Table 3.16 Infant mortality rate by race within the DMR in 1985 (per 1000 live births)
POP. GROUP TOTAL TOTAL TOTAL IMR~1985 IMR~1984
BIRTHS STILLBIRTHS DEATHS
rwhite 1145 16 33 14.88 19.78
African 1022 63 70 35.42 49.29
Coloured 815 18 17 10.79 17.31
Asian 4869 131 161 17.04 18.16
ITOTAL 7851 228 281 18.46 22.71
~ource: City of Durban Annual Report of the City Medical Officer of Health, 1985, p. 11.
1N0te: Deaths are deaths under the age of one year excluding stillbirths
13 This' average rate' was calculated by averaging the rates of the four race groups across the years 1980, 1985 and 1988.
53

Table 3.17 Infant mortality rate by race within the DMR, 1980 (per 1000 live births)
POP. GROUP TOTAL TOTAL TOTAL I1\1R-1980 IMR-1979 BIRTHS STILLBIRTHS DEATHS
White 1198 11 22 9.52 12.00
fAfrican 1178 71 46 19.75 56.44
iColoured 708 27 8 5.43 11.76
iAsian 4304 98 150 17.96 20.94
[TOTAL 7388 207 226 15.63 24.04
~ource: City of Durban Annual Report of the City Medical Officer of Health. 1980. p. 9.
!Note: Deaths are deaths under the age of one year excluding stillbirths
Table 3.18 illustrates the total deaths of infants (under the age of one year) in the DMR in 1991 disaggregated by gender. It is notable that African male infants under the age of one year account for 18.2 per cent and coloureds 10.3 per cent of total male deaths (of all ages). This can be contrasted with white and Asian male infants which account for only 1.2 per cent and 7.4 per cent respectively of total male deaths. Similarly, African and coloured female infants account for 21 per cent and 12.1 per cent of total female deaths, respectively. Again, white and Asian female infants account for a much lower proportion of total female deaths, i.e. one per cent and 9.9 per cent, respectively. Of all the races, white male and female infants account for the lowest proportion of total deaths for their gender counterparts and Africans the highest.
Table 3.18 Total deaths of infants under the age of 1 year, disaggregated by gender, 1991
!POP. GROUP TOTAL % OF TOTAL DEATHS
MALE FEMALE 1\1 F
White 11 10 1.2 1.0
African 54 41 18.2 21.0
Coloured 21 20 10.3 12.1
iAsian 101 100 7.4 9.9
rrOTAL 187 171 6.7 7.3
~ource: City of Durban Annual Report of the Cit)' Medical Officer of Health. 1991. p. II.
!Note: (i) Deaths includes stillbirths (ii) % of total deaths refers to the number of gender deaths expressed as a percentage of he total gender deaths for that population group of all ages.
54

Table 3.19 shows the same information as Table 3.18 for the year 1988. The picture in both years is similar. In 1988, infants accounted for 18 per cent of total African male deaths and 25.1 per cent of total African female deaths. These proportions remained relatively constant for the African population between 1988 and 1990, which gives cause for concern. The
____ ~blLE.· g~ber proportions for African infant deaths than for the other race groups is indicative of the poorer socio-economic enviroment in which Africans live.
Table 3.19 Total deaths of infants under the age of 1 year, dis aggregated by gender, 1988
IPOP.GROUP TOTAL % OF TOTAL DEATHS
MALE FEMALE M .. F
White 14 7 1.3 0.6
~frican 58 48 18.0 25.1
!Coloured 20 15 9.7 8.6
!Asian 133 102 9.1 9.6
IrOTAL 225 172 7.4 6.7
~ource: City of Durban Annual Report of the City Medical Officer of Health. 1988. p. 12.
1N0te: (i) Deaths includes stillbirths (ii) % of total deaths refers to the number of gender deaths expressed as a
percentage of the total gender deaths for that population group of all ages.
In Table 3.20, Yach (1988) averaged the range of mortality rates between 1981 and 1985 in order to generate a composite mortality rate for the DMR for these years. The information was derived from the Medical Officer of the City of Durban.
Table 3.20 Composite IMR by race within the DMR, 1981 - 1985 (per 1000 live births)
POP. GROUP IMR (1981-1985)
White 14.3
African 33.6
Coloured 10.3 I
Asian 17.7
IAVERAGE 18.98
~ource: Yach. 1988.
55

The composite IMR (1981-1985) for Durban generated by Yach (1988) illustrates once again the discrepancy between African and white infant mortality. It is apparent that the coloured IMR was lower than that for the Asian group, but is not clear why.
Table 3.21 illustrates the Post Neo-Natal Mortality Rate (PNMR) in 1991 by race for the DMR. The PNMR (deaths of mfants aged between 29 days and eleven months) IS a useful indicator for assessing the influence of socio-economic and environmental influences as it excludes deaths during the neo-natal period, which are often unrelated to nutrition or the home environment (Glatthaar, 1992). Consequently, when available, the PNMR is considered a more sophisticated measurement than the IMR which includes such deaths.
Table 3.21 Post neo-natal mortality rate (PNMR) by race within the DMR, 1991 (per 1000 live births)
IPOP.GROUP TOTAL RATE
1991 1990 1991 1990
IWhite 3 6 1.67 3.16
!African 9 1 6.64 0.70
1C010ured 11 6 5.22 3.63
!Asian 23 30 2.69 3.49
IrOTAL 46 43 3.33 3.17
Source: City of Durban Annual Report of the City Medical Officer of Health. 1991. p. 10.
Both whites and Asians have a lower PNMR than coloureds and Africans, indicative of better socio-economic environments. Again, this is in accordance with national and regional trends. The large increase in the PNMR for Africans between 1990 and 1991 is indicative either of deteriorating socio-economic conditions under which Africans live in the DMR or simply of a statistical anomaly due to problems with under-notification of African infant deaths.
Table 3.22 exhibits the same information as Table 3.21 for the year 1988. While the PNMR for whites, coloureds and Asians has remained relatively constant at low levels between 1988 and 1991, the African PNMR has decreased by 740 per cent over this period. While this dramatic change could have been influenced by both under-notification and small sample sizes, the PNMR in 1991 for all race groups exhibit more consistent levels in relation to one another. However, in both years white and Asian PNMRs were lower than that for Africans and coloureds. a trend which has been ohserved f0f hath childhood and infant mortCllit~' rate<: at national, provincial and magisterial levels.
56
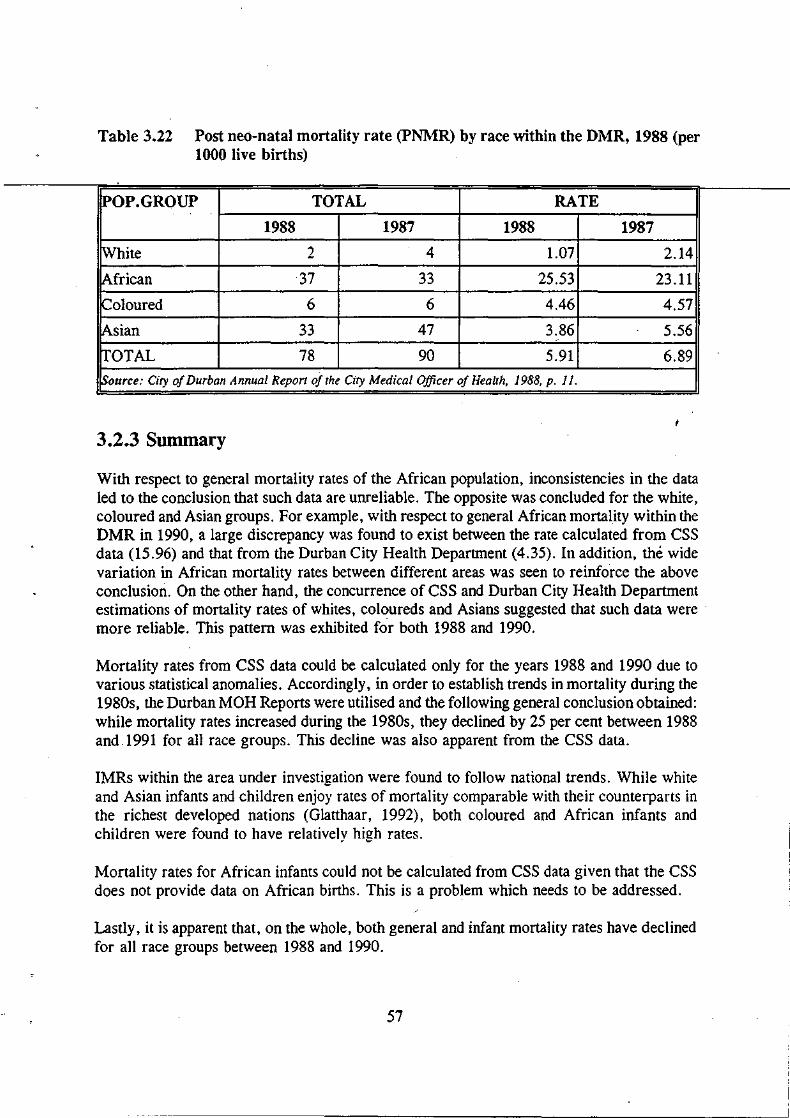
Table 3.22 Post ned-natal mortality rate (PNMR) by race within the DMR, 1988 (per 1000 live births)
POP. GROUP TOTAL RATE
1988 1987 1988 1987
White 2 4 1.07 2.14
African ·37 33 25.53 23.11
Coloured 6 6 4.46 4.57
Asian 33 47 3.86 5.56
TOTAL 78 90 5.91 6.89
Source: City of Durban Annual Report of the City Medical Officer of Health, 1988, p. 11.
3.2.3 Summary
With respect to general mortality rates of the African population, inconsistencies in the data led to the conclusion that such data are unreliable. The opposite was concluded for the white, coloured and Asian groups. For example, with respect to general African mortality within the DMR in 1990, a large discrepancy was found to exist between the rate calculated from CSS data (15.96) and that from the Durban City Health Department (4.35). In addition, the wide variation in African mortality rates between different areas was seen to reinforce the above conclusion. On the other hand, the concurrence of CSS and Durban City Health Department estimations of mortality rates of whites, coloureds and Asians suggested that such data were . more reliable. This pattern was exhibited for both 1988 and 1990.
Mortality rates from CSS data could be calculated only for the years 1988 and 1990 due to various statistical anomalies. Accordingly, in order to establish trends in mortality during the 1980s, the Durban MOH Reports were utilised and the following general conclusion obtained: while mortality rates increased during the 1980s, they declined by 25 per cent between 1988 and 1991 for all race groups. This decline was also apparent from the CSS data.
IMRs within the area under investigation were found to follow national trends. While white and Asian infants and children enjoy rates of mortality comparable with their counterparts in the richest developed nations (Glatthaar, 1992), both coloured and African infants and children were found to have relatively high rates.
Mortality rates for African infants could not be calculated from CSS data given that the CSS does not provide data on African births. This is a problem which needs to be addressed.
Lastly, it is apparent that, on the whole, both general and infant mortality rates have declined for all race groups between 1988 and 1990.
57

3.3 MORBIDITY
Given that CSS data on morbidity are available only in a highly aggregated form, it is impossible to calculate rates for racial groups for specific regions/districts. CSS data cover only total deaths from infectious diseases for each race group at the national level.
Data on infectious diseases are available for the DMR from the Durban MOR Reports (1980, 1985, 1991). However, such data pertain only to notification of infectious disease (as opposed to incidence). Consequently, this source of data is subject to undercount, the severity of which can only be guessed at, given, on the one hand, the large informal settlements surrounding the DMR and, on the other, the probable extent of non-notification.
The report distinguishes between 3 categories of notification.
(i) Local/city case: a person who contracts the disease while resident in the city. (ii) Imported case: a person who contracts the disease outside and enters the city during
the incubation period making the transmission of the disease possible. (iii) Ex-city case: a person who resides and contracts the disease outside but enters the city
for purposes of treatment.
Data on disease notification within the DMR in 1991 is given in Appendix 3.2.
The following subsections document trends in notification within the DMR during the 1980s for the following infectious diseases: measles, meningococcal meningitis, typhoid, viral hepatitis, pulmonary tuberculosis and human immunodeficiency virus. For a more comprehensive listing, the Durban MOR reports should be consulted.
3.3.1 Measles
Fourteen local cases were reported in 1991 with total notifications (local, imported and excity) standing at 146. Diagram 3.1 shows that there has been a continual downward trend in the local notifications of measles between 1987 and 1991. Further, it is notable that the highest proportion during the period 1987-1991 have come from the African population group. For white and Asian schools, 990 cases of measles were notified in 1991, down from a total of 1 152 in 199014
• Two people were recorded to have died from measles in 1990. There were no notifiable deaths from measles in 1991 15
•
14 No notifications were received by the City Health Department from black and coloured schools.
IS See Appendix A in City of Durban Annual Report of the City Medical Officer of Health. 1991, p. 219.
58

Diagram 3,1 Local/city notification of Measles by I'acial gl'oup 1987 - 1991:
70
60
50
40
30 ~
I
20 I I
I
I I
1987 1988 1989 1990 1991
!:!Hn'i:~ WHITE ~ COLOURED 0 BLACK @@lINDIAN
Source: City a/DI/rban Annl/al Report a/the Medical Officer a/Health. 1991. p.18.
In constrast to 1991, 358 local cases were reported in 1985, with total notifications standing at 2 432. Two hundred and ten local notifications were reported in 1980, with total notifications standing at 2 490. However, between these years total notifications declined to their lowest point in 1982 (approximately 1 250), subsequently rising as Diagram 3.2 illustrates. Since 1985, both local and total notifications have declined.
Diagram 3.2 Total notifications of Measles, 1980 - 1985
Source: City 0/ Dllrban AIIIII/al Report 0/ the Medical Officer of Health. 1985. p.18.
Lastly, while the highest proportion of notifications came from the African population group between 1987 and 1991, the increased incidence of measles during the period 1980 - 1985 was confined to the white population group (as Diagram 3.3 illustrates)
59

Diagram 3.2 Total notifications of Measles, 1980 - 1985
2 SOD
1 500
1 000
500
o 1979 1980 1981 1982 1983 1984 1985
Source: City of Durban Annual Report of the Medical Officer of Health, 1985, p.18
Diagram 3.3 Local/city notifications of Measles by ."acial group, 1979 - 1985
300 -' .. -. - .-.. ---.
Black 250
Irrlian 200
White 150
Coloured 100
50
1979 1980 1981 1982 1983 1984 1985
Source: City of Durban Annual Report of the Medical Officer of Health, 1985, p.18.
3.3.2 Meningococcal Meningitis
Nine local cases were notified in 199 I, none of which were related. Total notifications stood at 36. Of these local cases, two subsequently died. However, altogether six deaths were recorded in 1991.
60

It is apparent from Diagram 3.4 that there has been a downward trend in the local notification of meningococcal meningitis for all race groups since 1988.
Di~gram 3.4 Local/city notification of Meningococcal Meningitis by loacial group 1987 - 1991
30
25
20
15
10
5
o 1987 1988 1989 1990 1991
In::Hi:nHI WHITE ffij\~;3 COLOURED 0 BLACK ['jiM INDIAN
SOllTCe: City 0/ Durbal/ Anl/ual Repor/ 0/ the Medical Officer 0/ Health. 1991. p. 20.
Twelve local cases were notified in 1980 with total notifications standing at 33. In contrast, six local cases were notified during 1985 with total notifications at 20. Local notifications rose drastically between 1985 and 1988 (by approximately 733 per cent) and then subsequently declined until J 991 when nine local cases were reported as can be seen in Diagram 3.5.
61

Diagram 3.5 Local/city notifications of Meningococcal Meningitis 1982 - 1991
60r-------------------------~----------------------------------------------------------------~
jIf 50~-----------------------------/A\~------------~
40 / \
30 / \
20 j \ 10 ~ ~ O~ 1982 1983 1984 1985 1986 1987 1988 1989 1990 1991
SOllrce: Ci~v C?f Dllrball Allllllal Report C?f'II1e Medical Ojficer C?t Healt;'. 1991. p. 20.
3.3.3 Typhoid
In 1991, 33 local cases were notified with total notifications being 174. This represents an increase of 450 per cent on the previous year. However, no deaths were recorded. From Diagram 3.6, it is apparent that local/city notifications increased for all race groups between 1990 and 1991, except whites. In contrast, 20 local cases were reported in 1980 with total notifications being 551, while in 1985 local notifications accounted for 20 of the 797 total notifi cations.
62

Diagram 3.6 Local/city notifications of Typhoid by racial group, 1987 - 1991
14
1987 1988 1989 1990 1991
i!"lh";ilij WHITE a ,,1i:IW m COLOURED o BLACK gl{f$J INDIAN
SOIlTce: City 0.( Durban Annual Report of the Medical Officer 0.( Health. 1991, p.21
Diagram 3.7 illustrates local notifications of typhoid since 1960. Restricting the focus to the decade of the 1980s it is apparent that local notifications declined from 1980 until 1983, subsequently rising to their highest point in 1986 and then declining again in 1987. Between 1987 and 1989 they once again rose, declining in 1990 and rising by 450 per cent in 1991 (from 6 to 33 notifications).
63
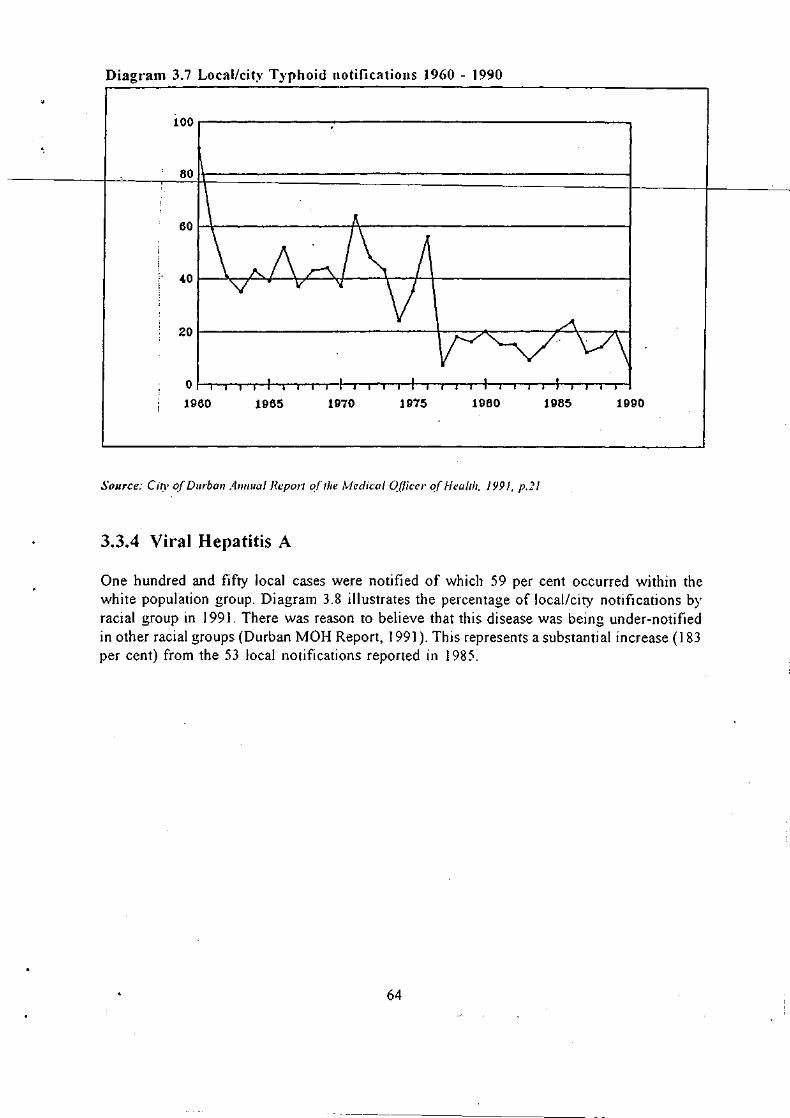
Diagr'am 3. 7 Local/cit~, Typhoid notifications 1960 - 1990
100.--------------------------------------------------,
801+-------------------------------------------------~
60~~--------------~------------------------------~
40~~~~~~~--~~--~--+_+_--------------------~
20~--------------------------~----~------~~l----~
0~~-r~4_~r_~_+_r,_~._r.~_._r;_~._~_+_r_r._~
1960 1965 1970 1975 1980 1985 1990
Source: CiTY o.f Durban A.//Ilual Report 0.( The Medical O.tlieer o.f HealTh. 1991. p.ll
3.3.4 Viral Hepatitis A
One hundred and fifty local cases were notified of which 59 per cent occurred within the white population group. Diagram 3.8 illustrates the percentage of local/city notifications by racial group in 1991. There was reason to believe that this disease was being under-notified in other racial groups (Durban MOH Report, 1991). This represents a substantial increase (183 per cent) from the 53 local notifications reported in 1985.
64

-~---- ----------- -
Diagram 3.8 Local/city notifications of Viral Hepatitis A 1991 (percentage by I"acial group)
'{VHf TE
COLOURED 22%
BlACI-., 2%
INDIAN 17%
Source: City of Durball Alllluall?eport 0/ the Medical Officer of Health. 1991. p.22.
3.3.5 Pulmonary Tuberculosis
A distinction is made between categories of notification
(i) City case: permanent residents of more than six months (ii) Ex-city: non-residents commuting to work in the city (iii) In transit: non-residents attending for diagnosis only and redirection for
treatment.
The data on the last two categories is limited to municipal clinics only .
• Table 3.23 shows sources of new notifications of pulmonary tuberculosis within the D.MR in 199]. In terms of total new notifications, there was an increase of 13.9 per cent between 1990 and ] 99]. Of the three categories of notification, 'In transit' notifications increased the most (by 27.5 per cent). The reasons for this large increase in 'In transit' notifications were:
(i) no chest X-Ray and/or facilities for direct sputum tests in 'home' area clinics (ii) better facilities for immediate results at the Durban Chest Clinic (DCC) which
remains the main control point for the diagnosis and treatment of Pulmonary Tuberculosis in the Durban area.
(iii) all services at DCC are free of charge.
65

Table 3.23 Sources of new notifications of Pulmonal1' Tuber-culosis within the DMR, 1991
SPURCE CITY EX-CITY IN TRANSIT
Municipal Clinic 669 (611) 935 (831) 913 (716)
IProvincial Hospital 149(190) NIK NIK
Other 18 (8) NIK NIK
trOTAL 836 (809) 935 (813)" 913 (716)
GRAND TOTAL 2684 (2356)
~ource: City of Durball Anllual Report of the Medical Officer 0.( Health. 1991. p.27
Note: Figures in parenthesis represent 1990 figures.
Table 3.24 illustrates the racial breakdown of the new city notifications of Pulmonary Tuberculosis over the period 1983-1991. While there is no clear linear trend for the individual racial groups, the aggregate data show an upward trend between 1983 to 1991. Importantly, notifications from African patients in 1991 represent the highest proportion of total new city notifications (49.3 per cent) with the lowest percentage being exhibited by whites at (4.5 per cent).
Table 3.24 New city cases of Pulmonal'y Tubel'culosis by I'acial gl'oup and pel'centage of total
lYeal' White African Coloured Asian Total
1983 6.03 44.26 II. 76 37.94 680
1984 3.86 41.71 15.14 39.29 700
1985 5.21 40.00 16.06 38.73 710
1986 5.49 41.35 13.05 40.] I 728
1987 3.63 46.36 11.04 38.96 770
1988 5.93 41.87 12.48 39.72 793
1989 2.99 43.16 13.55 40.30 804
1990 4.57 42.03 13.84 39.56 809
4.551 4Y.Ll) I lu.771 I
1991 .35.41 83b
'Source: City 0.( Durball Allllual Report 0.( the Medical Officer of Health. 1991. p.31
Table 3.25 shows the incidence of pulmonary tuberculosis by race within the DMR for selected years between 1985 and 1991. While whites and Asians exhibit the lowest incidence
66
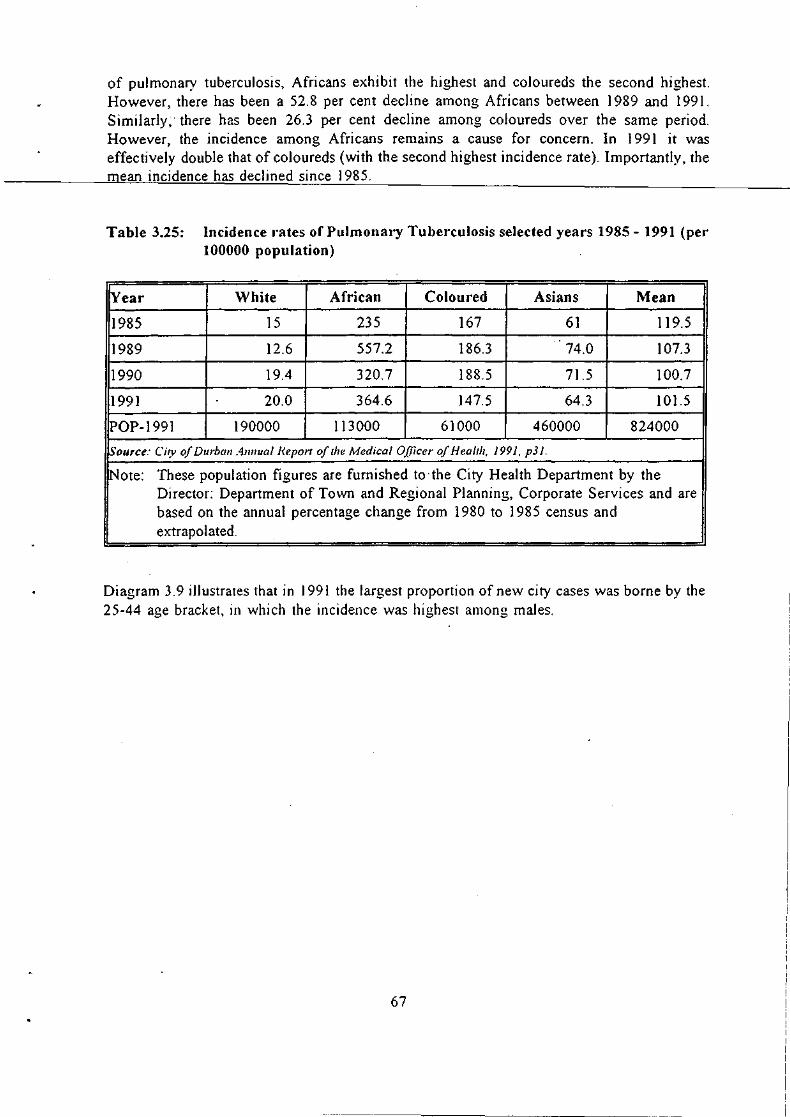
of pulmonary tuberculosis, Africans exhibit the highest and coloureds the second highest. However, there has been a 52.8 per cent decline among Africans between 1989 and 1991. Similarly; there has been 26.3 per cent decline among coloureds over the same period. However, the incidence among Africans remains a cause for concern. In 1991 it was effectively double that of coloureds (with the second highest incidence rate). Importantly, the mean incidence has declined since 1985.
Table 3.25: Incidence I"ates of Pulmonary Tuberculosis selected years 1985 - 1991 (per 100000 population)
!year White African Coloured Asians Mean
1985 15 235 167 61 119.5 ..
1989 12.6 557.2 186.3 74.0 107.3
1990 19.4 320.7 188.5 71.5 100.7
1991 20.0 364.6 147.5 64.3 101.5
POP-1991 190000 113000 61000 460000 824000
Source: City of Durbal/ AI/I/ual He.port oflhe Medical Officer of Health, 1991, p31.
!Note: These population figures are furnished to·the City Health Department by the Director: Department of Town and Regional Planning, Corporate Services and are based on the annual percentage change from 1980 to 1985 census and extrapolated.
Diagram 3.9 illustrates that in 1991 the largest proportion of new city cases was borne by the 25-44 age bracket, in which the incidence was highest among males.
67

Diagr'am 3,9 New city cases of Pulmonar'y Tuberculosis, 1991 (% distr'ibution by age and sex)
60
P E 40 R C E 30 N T A 20 G E
10
0 0-4 5-14 15-24 25-44 45-64 65+
AGE IN YEARS
I'E'J MALE ~ FEMALE
Source: City 0.( Durball Anllual Report 0/ the Medical Officer 0.( Health. 1991. p.30
Table 3.26 shows the absolute mortality data from city notifications of pulmonary tuberculosis. No clear trends can be discerned for the individual race groups, except that in terms of absolute mortality whites have clearly exhibited the lowest levels over the period 1984-1991, with both Africans and Asians exhibiting proportionately the highest. In terms of general mortality, between 1980 and 1987 there was an increase in total mortality which fell until 1990, subsequently rising. In addition, between 1990 and 1991 there has been an increase in mortality across all racial groups.
68

<,
Table 3.26 Mortality data from local/city notifications of Pulmonary Tuberculosis
lYear White African Coloured Asian Total
1980 0 1 0 3 4
1982 0 9 1 6 10-
1984 0 10 3 8 21
1985 1 8 3 8 20
1986 1 12 4 7 24
1987 1 9 5 14 29
1988 1 6 1 8 16
1989 0 3 3 12 18
1990 0 3 3 3 9
1991 2 13 4 7 26
Source: City of Durban Annual Report of the Medical Officer of Health, 1991, p.35.
3.3.6 Sexually Transmitted Diseases
Data on the numbers of the various STD diagnoses within the DMR are available in the Durban MOH Reports. There were no recorded mortalities from STDs during both 1990 and 1991.
3.3.6.1 Human Immunodeficiency Virus (HIV)
Table 3.27 shows the number of my tests given to males and females for each month of 1991, together with the incidence of positivity. While the number of tests administered declined through the year the incidence of positivity rose. In terms of aggregated results, the incidence of positivity stood at 14.3 per cent for 1991. It is important to remember that this figure relates purely to those patients who requested the test or who were advised to take it. Hence, such an 'incidence' figure does not reflect that in the population at large.
69
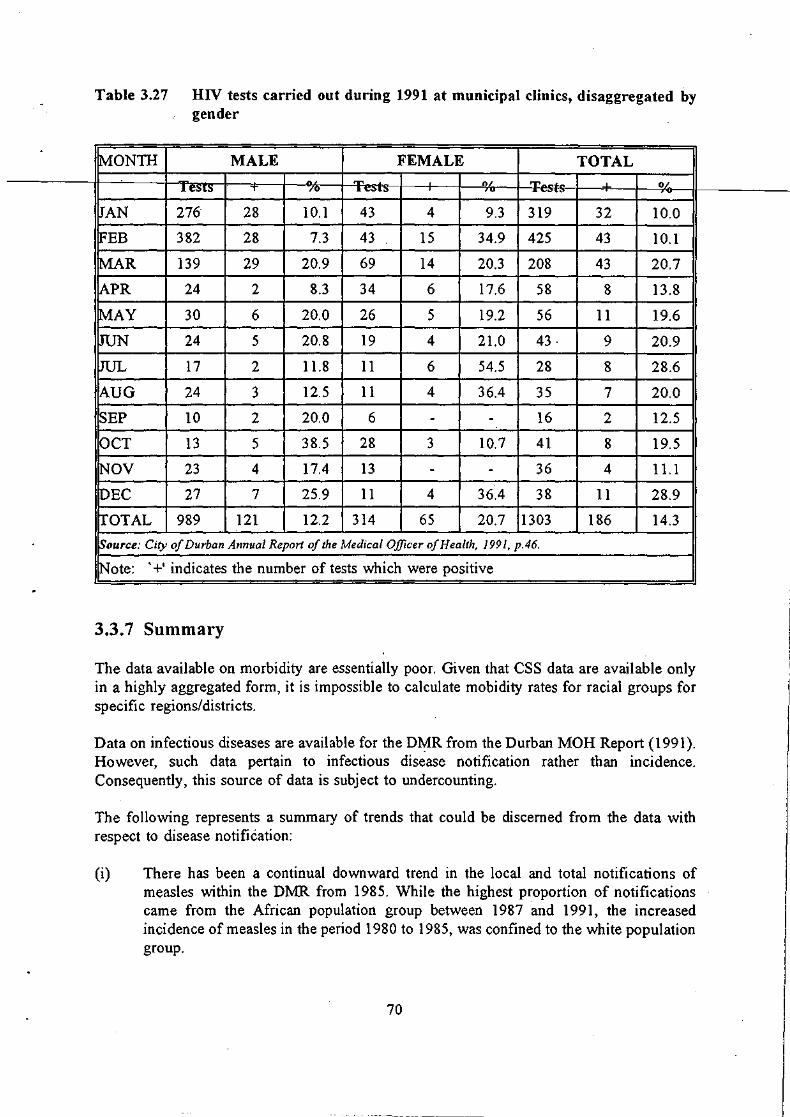
-
.
Table 3.27 HIV tests carried out during 1991 at municipal clinics, dis aggregated by gender
MONTH MALE FEMALE TOTAL
" ..... 0/ T . OL 1 e:Sl~ T -/0 .I. ",~ts-- 'u ~_v.u
JAN 276 28 10.1 43 4 9.3 319 32 10.0
FEB 382 28 7.3 43 15 34.9 425 43 10.1
MAR 139 29 20.9 69 14 20.3 208 43 20.7
APR 24 2 8.3 34 6 17.6 58 8 13.8
MAY 30 6 20.0 26 5 19.2 56 11 19.6
JUN 24 5 20.8 19 4 2l.0 43· 9 20.9
JUL 17 2 1l.8 11 6 54.5 28 8 28.6
AUG 24 3 12.5 11 4 36.4 35 7 20.0
SEP 10 2 20.0 6 - - 16 2 12.5
OCT 13 5 38.5 28 3 10.7 41 8 19.5
~OV 23 4 17.4 13 - - 36 4 1l.1
iDEC 27 7 25.9 11 4 36.4 38 11 28.9
!fOTAL 989 121 12.2 314 65 20.7 1303 186 14.3
~ource: City of Durban Annual Report of the Medical Officer of Health, 1991, p.46.
Note: '+' indicates the number of tests which were positive
3.3.7 Summary
.. The data avaIlable on morbIdIty are essentIally poor. Given that CSS data are avaIlable only in a highly aggregated form, it is impossible to calculate mobidity rates for racial groups for specific regions/districts.
Data on infectious diseases are available for the D¥R from the Durban MOH Report (1991). However, such data pertain to infectious disease notification rather than incidence. Consequently, this source of data is subject to undercounting.
The following represents a summary of trends that could be discerned from the data with respect to disease notification:
(i) There has been a continual downward trend in the local and total notifications of measles within the DMR from 1985. While the highest proportion of notifications came from the African population group between 1987 and 1991, the increased incidence of measles in the period 1980 to 1985, was confined to the white population group.
70
i

(ii) Local notifications of meningococcal meningitis rose drastically between 1985 and 1988 (by approximately 733 per cent). Subsequently, local notifications declined until 1991 where nine local cases were reported. This downward trend since 1988 has been common to all race groups.
(iii) Local notIfIcatIOns of typhOid declineOfrom 1980 untillg8r,Subsequently rising to their highest point in 1986 and then declining again in 1987. Between 1987 and 1989, local notifications once again rose, declining in 1990 and rising 450 per cent in 1991 (from 6 to 33).
(iv) One hundred and fifty local cases of viral hepatitis A were notified within the DMR in 1991, of which 59 per cent occurred within the white population group.
(v) While there is no clear linear trend for the individual racial groups, the aggregate data show an upward trend in the new city notifications of pulmonary tuberculosis between 1983 and 1991. Importantly, notifications from African patients in 1991 represented the highest proportion of total new city notifications (49.3 per cent), with the lowest percentage being exhibited by whites (4.5 per cent).
However, there has been a 52.8 per cent decline in the incidence of pulmonary tuberculosis among Africans between 1989 and 1991. Similarly, there has been a 26.3 per cent decline among coloureds over the same period. However, the incidence of Pulmonary Tuberculosis among Africans remains a cause for concern. In 1991, it was effectively double that of coloureds (which was the second highest). Importantly, since 1985 the mean incidence from pulmonary tuberculosis has declined.
In terms of absolute mortality from pulmonary tuberculosis, whites have clearly exhibited the lowest rate over the period 1984-1991, with both Africans and Asians exhibiting proportionately the highest. In terms of general mortality, between 1980 and 1987 there was an increase in total mortality which fell until 1990, subsequently rising. In addition, between 1990 and 1991 there has been an increase in mortality across all racial groups.
3.4 NUTRITIONAL STATUS
3.4.1 Introduction
Protein-Energy Malnutrition (PEM) is defined as a deficiency of protein and/or energy that leads to retardation of growth in its mild to moderate form and to marasmus or kwashiorkor in its severe form. In accordance with the World Health Organisation (WHO, 1983) recommendations, the following anthropometric indices are utilised for national/regional nutritional surveillance: weight-for-age (W/A), height-for-age (RIA) and weight-for-height (W /H). In order to assess whether nutritional stress is in fact present some reference standard has to be utilised. Given both the international and South African institutional acceptance, the statistical norms of the National Centre for Health Statistics (NCHS) are used (Waterlow et aI, 1977). Simply, the cut-off point for identifying nutritional stress or PEM is either (i) two or more standard deviations below the median value for the reference population or (ii) below
71

the third percentile for the reference population. Further, different types of PEM need to be classified in order to assess the severity of the incidence of PEM. 'Stunting' or' chronic' PEM is said to be present when HI A falls below the recommended cut-off point. This index is influenced by long-term negative socio-economic enviromental changes. 'Wasting' or' acute' PEM is said to be present when either W IH or WI A falls below the recommended cut-off level. These indices are sensItIve to short-term nutritional stress.
Mid-upper arm circumference (MUAC) is also a frequently utilised measure of nutritional status. Cut-off points for MUAC are 13.5cm for mild to moderate PEM and 12.5cm for severe PEM. Importantly, W/A and MUAC are the strongest discriminants of mortality and morbidity risk, whereas WIH is the weakest (Glatthaar, 1992).
Information on the prevalence of childhood PEM in South Africa is fragmented, incomplete • and mostly outdated (Glatthaar, 1992). As there is no systematic national nutrition surveillance programme (Natal Nutrition Working Group [NNWG], 1993; Glatthaar, 1992), estimates of the extent of the problem have had to be made from occasional or regional studies which are often carried out on selected groups. It is important to understand the methodological contrast between nutritional 'surveillance' and a nutritional 'survey' (NNWG, 1993). Surveillance implies a continuous, structured informational system where data are routinely collected; a survey is a once-off gathering of data. However, in the absence of a routinely structured informational system, the analysis of region-specific nutrition surveys, although inadequate, remains one of the only methods of attempting to assess current trends and at-risk groups. A further negative aspect to this type of study is that under current conditions of rapid urbanisation, rising unemployment and political/criminal violence, the analysis of trends in the prevalence of PEM by means of small, unrelated sample surveys is problematic as the information which they provide pertaining to specific communities can quickly become outdated.
3.4.2 National trends in nutrition status
In the absence of detailed regional studies on the issue of malnutrition (Glatthaar, 1992) it is important to assess trends that have emerged at the national level. Utilised in tandem with small sample surveys, such a national analysis serves to identify at-risk groups and extrapolate national trends to a regional level. Such methodological concerns are reflected below.
The Second Carnegie Inquiry into Poverty and Development in South Africa (1984) found that African, coloured and Asian population groups were at the greatest risk of malnutrition, with approximately one third of children being underweight and stunted. By constrast, PEM was a relatively unimportant health hazard among whites. However, given declining economic prosperity among the white population during the mid-1980s, the prevalence of PEM could have become more important subsequently.
The Second Carnegie Inquiry further found that mortality rates reflected the discrepancy in the prevalence in PEM between white children, on the on hand, and African, Asian and coloured children, on the other. The IMR was found to be three to 13 times higher in African I
and coloured infants than among whites. Further, in the 0 - 4 year age group, the mortality rate from nutritional diseases (expressed as the rate per 100 000) was estimated to be
72.

approximately 30 times higher in Africans and coloureds than among whites. The severe forms of malnutrition such as kwashiorkor and marasmus were found to occur in about 3 per cent of African rural school children. This prevalence rose to about 10 per cent in some very poor homeland areas, specifically some of the re-settlement camps.
More recent anthropometnc surveys on representative population samples have been undertaken. Most of these have focused on new peri-urban settlements, including squatter settlements such as Langa [Cape Town] (Ramphele et al, 1991), Nyanga [Cape Town] (Yach et aI, 1990), Khayelitsha [Cape Town] (Hugo-Hamman et aI, 1987; Le Roux et aI, 1991; Yach et aI, 1990); Inanda [Durban] (Kustner, 1984); Botshabelo [OFS] (Kotze et al 1988); and Umtata [Transkei] (Byaraguba, 1991). Assimilating the results of these studies provides certain general conclusions which can help identify groups at potential risk to malnutrition-related diseases in the absense of more specific data (Glatthaar, 1992):
(i) Nine to 15 per cent of African pre-school children in the above areas were underweight-for-age, with the highest prevalence in the age group of 13-36 months.
(ii) Twenty-five to 33 per cent of the children were stunted or chronically under-nourished, although in some areas the figure exceeded 50 per cent for 4 - 5 year olds.
(iii) acute PEM was present in 0 - 5 per cent of the children. (iv) recent arrivals in the peri-urban squatter communities are a particularly
high-risk group and have limited exposure to primary health care services.
3.4.3 The nutrition status of children outside the DMR
In terms of the areas covered in this brief, and noting the above methodological issues, the following small sample surveys are worth analysing and, notably, they affirm the above conclusions.
3.4.3.l: 3.4.3.2: 3.4.3.3: 3.4.3.4:
3.4.3.1
The Inanda nutrition survey (Kustner, 1984). The NatallKwaZulu nutrition survey (NNWG, 1993). The Besters Camp nutrition survey (CHESS, 1991). The Valley Trust nutrition survey (CHESS, 1993).
The Inanda nutrition survey
The Inanda nutrition survey was aimed at African children in the squatter settlements of Inanda 40km north of Durban between the ages of birth to sixty months over the week of 26 - 30 March 1984, where the sample population consisted of 600 children. The descriptive statistics are summarised in Table 3.28.
73

Table 3.28 Descriptive statistics of the Inanda sample
no. mean median std.dev.
IWA em 596 87.81 87.0 36.59
KAllA kg 596 12.37 12.5 3.53 7
KAlIH kg/em 600 11.37 11.5 3.12 3
~ource: Kustner. 1984
Table 3.29 shows the proportion of malnourished children in the Inanda sample according to the WIH, HlA and W/A anthropometric indices.
Table 3.29 Proportion of malnourished children in the Inanda sample by anthropometric index
PROPORTION OF 95% CONFIDENCE MALNOURISHED INTERVAL
CHILDREN
WIH 0.005 0.000 - 0.011
H/A 0.260 0.224 - 0.296
W/A 0.053 0.035 - 0.072
Source: Kustner. 1984
Importantly, of the 584 randomly chosen children in the age group of less than five years, only a single child turned out to be malnourished by all three criteria. Consequently, the Inanda Nutrition Survey concluded that no crisis was seen to exist in the Inanda squatter settlements in terms of acute PEM. However, there was evidence of past chronic malnutrition among the children tested given that the HI A criterion (reflecting long-term changes in social enviroment) showed 26 per cent of the sample below two standard deviations, while the W /A criterion (reflecting short-term changes in food consumption) showed 5.3 per cent of the sample below two standard deviations.
3.4.3.2 The NatallKwaZulu nutrition survey
The NatallKwaZulu nutrition survey was aimed at Grade II African school children in both N ataland K waZulu. Three thousand -children were randomly sampled from both Department of Education and Training (DET) schools (RSA) and Department of Education and Culture schools (KwaZulu). Forty children (20 male and 20 female) were assessed from each school where the sample consisted of 75 schools (11 DET and 64 KwaZulu). The survey was carried
74

out during the months of March, April and May 1992. Focus was placed on measurements ofW/H andMUAC given that precise ages of young children are often not commonly known, hence rendering W/A and H/A measurements meaningless.
Table 3.30 shows the proportion of malnourished children in the NatallKwaZulu sample by -----~the 'NIH criteri-e-AR-.:------------____________________ _
Table 3.30 Proportion of malnourished children in the Natal/KwaZulu sample by the W /H cr-iterion
TOTAL NO. NO. < NO. < NO. < OF CHILDREN 3RD C 5TH C 10TH C
INO.OF CHILDREN 2848 60 16S' 414
PROP. OF SAMPLE (%) 2.1% 5.8% 14.50,,'0
Source: NNWG. 1993
Note: C = percentile
Out of a sample of almost 3 000 Grade II African school children in Natal and KwaZulu, 2.1 per cent and 5.8 per cent of the children were at risk by the W IH criterion if the third and fifth percentile cut-off points were utilised respectively.
The Natal K waZulu survey also made provision for the analysis of the data according to urban and rural 'clusters': urban, rural, deep rural and white farms (sugar cane areas). This is shown in Table 3.3 I.
Table 3.31 Pl'oportion of malnourished children in the NatallKwaZulu sample by W IH cl'itel'ion with urban/rul'al breakdown
AREA TOTA NO. < NO. < NO. < L NO. 3RD C 5TH C 10TH C
'" °A, N %, N 0/0
URBAN 405 ... 0.74 12 2.96 30 7.4 .)
RURAL 1436 36 2.5 94 6.54 218 15.18
DEEP RURAL 542 15 '2.77 43 7.93 110 20.29
WHITE 465 6 1.29 16 3.44 56 12.04 FARMS
TOTAL 2848 60 2.1 165 5.8 414 14.53
Source: Nl':WG. 1993
75

It is clear that children in rural and deep rural areas are more susceptible to malnutrition than in urban areas and on white farms.
3.4.3.3 The Besters Camp nutrition sUI'vey
The Besters Camp nutrition survey ~aimed at 190 randomly selected pre-school children from the informal settlement of Besters Farm with ages varying between 3 and 6 years. WI A, HI A and W IH percentiles were calculated as welJ as the standard deviations of each child from the mean.
Table 3.32 shows the descriptive statistics of the Besters Camp sample.
Table 3.32 Descriptive statistics of the Besters Camp sample
AGE No. I~,
3 47 25
4 61 32
5 40 21
6 42 22
TOTAL 190 100
SEX
M 91 48
F 99 52
TOTAL 190 100
Source: CHESS. 1991
Table 3.33 shows the proportion of malnourished children by the WI A, HI A and W /H anthropometric indices.
76
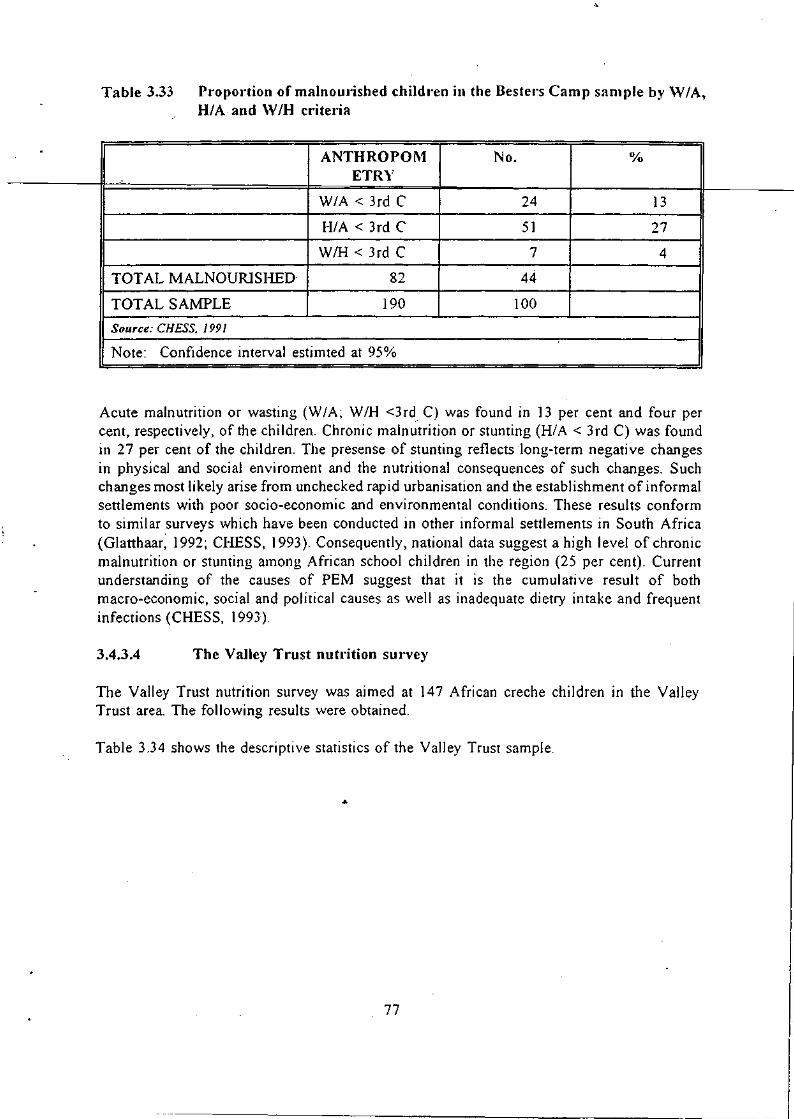
Table 3,33 Pr'opor'tion of malnoUl'ished childr'en in the Bester's Camp sample by \Y lA, H/A and \Y IH cr'iter'ia
TOT AL MALNOURISHED
TOT AL SAMPLE
Source: CHESS. 1991
ANTHROPOM ETRY
W/A < 3rd C
H/A < 3rd C
WIH < 3rd C
82
190
No,
24 13
51 27
7 4
44
100
--------------------------------------------~--------------~I Note: Confidence interval estimted at 95%
Acute malnutrition or wasting (W fA; W fH <3rd. C) was found in 13 per cent and four per cent, respectively, of the children. Chronic malnutrition or stunting (HI A < 3 rd C) was found in 27 per cent of the children. The presense of stunting reflects long-term negative changes in physical and social enviroment and the nutritional consequences of such changes. Such changes most likely arise from unchecked rapid urbanisation and the establishment of informal settlements with poor socio-economic and environmental conditions. These results conform to similar surveys which have been conducted in other informal settlements in South Africa (Glatthaar, 1992; CHESS, 1993). Consequently, national data suggest a high level of chronic malnutrition or stunting among African school children in the region (25 per cent). Current understanding of the causes of PEM suggest that it is the cumulative result of both macro-economic, social and political causes as well as inadequate dietry intake and frequent infections (CHESS, 1993).
3,4,3,4 The Valley Trust nutrition survey
The Valley Trust nutrition survey was aimed at 147 African creche children in the Valley Trust area. The following results were obtained.
Table 3.34 shows the descriptive statistics of the Valley Trust sample.
77

.
Table 3.34.. Descriptive statistics of the Valley Trust sample
SEX No. 0/0 ,. I. 75 51 H.L
F 72 49
TOTAL 147 100
Source: CHESS. J 993
Table 3.35 shows the proportion of malnourished children by the H/A and WIH criteria.
Table 3.35 Proportion of malnourished children in the Valley T.-ust sample by H/A and W/H critel·ia
ANTROPOMETRY No. 0/0
H/A < 2 s.d 34 23
W/H < 2 s.d. I 0.68
TOT AL MALNOURISHED 35 24
TOTAL SAMPLE 147 100
Source: CHESS. 1993
Note: Confidence interval estimated at 95%
Like the Inanda nutrition survey, the results suggest significant past chronic malnutrition or stunting (H/A shows 23 per cent of the sample below two standard deviations) while acute malnutrition was relatively limited (WIH shows only 0.68 per cent of the sample below two standard deviations). It can be concluded that there is currently no crisis.
3.4.3.5 Summary
Table 3.36 shows the aggregated results of the nutrition surveys undertaken outside of the DMR.
78

-
Table 3.36 Aggl'egated results of the nutrition surveys
SURVEY % PROPORTION> 2 S.D.l3RD C
WIH W/A H/A
lnanda V.J c ., ?f.. 0
NatallKwaZulu 2.1 - -Besters Camp 4.0 13.0 27.0
Valley Trust 0.68 2.04 23.0
Source: CHESS 0991,1993); KlIstllcl' (1984) & NNWG (l993j
Note: Degree of confidence for all samples except the NatallKwaZulu sample is 95%. For the latter sample, the confidence level is 99%.
The above four anthropometric surveys on representative samples cover a time span from 1984 to 1993. What is striking is that they conform to the national results of methodologically similar studies (see above and Glatthaar, 1992). While they generally indicate that no current crisis exists in these communities. they do indicate previous chronic malnutrition, evidenced by the reasonably high proportions of these communities suffering from stunting. This result serves to highlight the need to monitor peri-urban settlements which serve as catchment areas for urbani sing populations from rural areas.
The W/A criterion is the most sensitive criterion to short-term nutritional stress (NNWG, 1993). The relatively high levels of this criterion in Besters Camp (an example of an informal settlement) suggests a situation of inadequate dietary intake in informal areas, highlighting the need to carefully monitor such a criterion both throughout the region under investigation (given declining economic 'living standards) and more specifically in peri-urban and informal settlement areas.
3.4.4 The nutrition status of children within the DMR
An additional source of data for nutrition status for infants and children within the DMR is the City of Durban Annual Report of the City Medical Officer of Health (Durban MOH Report, 1991). The following data represent the utilisation of child health faci lities according to categories of below one year and one to four years. Table 3.37 indicates total attendances. for 1990 and 1991 while Table 3.38 illustrates a racially disaggregated situation with compansons of population size and attendances in order to generate a percentage of utilisation.
79
,
I I

Table 3.37 Child health clinic sessions and attendances within the DMR, 1990 and 1991
CLINIC ATTENDANCES ATTENDANCES TOTAL . ,.., ~ Tn~JT''[;'D 1 VR lYR + 1:)1!J~~JV1".J v. 1991
TOTAL 1991 3878 105188 88425 193613
TOTAL ]990 3745 102786 88796 191582
Source: City of Durban Annual Report of the City Medical Officer of Health. 1991. p.10.f.
Table 3.38 Percentage of infant and pre-school population using child and health clinic sel'vices within the DMR, 1991
POP UNDER 1 YR 1-4 YRS GROUP POP, ATTEND- 0/0 POP. ATTEND- 0/0
CENSUS ANCES CENSUS ANCES
White 4463 24100 90 6763 6494 19
Coloured 3032 11952 66 4601 6284 27
African 3957 21807 92 6767 12550 37
Asian 18515 47337 43 25765 50194 39
TOTAL 29967 105196 58 43896 75522 34
Source: City ofDurball Allllual Neport o/the City Medical Officer of Health. 1991. p. 67.
Note: (i) Population based on 1985 Census, CSS Report 02-85-02 (ii) The first percentage column represents the percentage of population based
on an average 6 attendences (iii) The second percentage column represents the percentage of population
based on an average 5 attendences
Patterns of attendance exhibit normal tendencies whereby the majority of attendances occur within the first year when feeding and general care routines are being established and primary immunisation occurs (Durban MOH Report, ) 991). Attendances within subsequent years are less frequent, being more related to developmental assessments, supplementary feeding and medical problems. However, an aggregated total of 58 per cent of infants within the DMR under the age of one year attended <.:hild heaitil dini<.:s [or six sessions on average. Similarly, 34 per cent of children within the DMR with ages between one and four years attended five sessIOns on average.
Children and infants attending child health clinics are graded into three main categories based on the WHO classification in order to identify malnutrition (Durban MOH Report, 1991).
80
,

(i) GRADE I - First degree or chronic malnutrition: 76 - 90 per cent of expected mass for age and sex
(ii) GRADE II - Second degree or moderate malnutrition: 75 - 61 per cent of expected mass for age and sex
(iii) GRADE III - Third degree or serious malnutrition: 60 per cent and less of expected mass for age and sex
Second degree malnutrition includes children with clinical signs of kwashiorkor- and third degree with clinical signs of marasmus. Children with normal mass for age and sex but whose family circumstances place them in a high risk group fall into a category above first degree malnutrition. Such children are issued with supplementary foods as a means of preventing malnutrition. Table 3.39 shows an analysis of children registered on supplementary feeding schemes in the DMR. .
Table 3.39 Analysis of children registered on supplementary feeding schemes within the DMR, 1991
ABOVE GRD I GRD II GRD III TOTAL GRD I 1991
White 119 5 0 0 124(7)
African 350 70 71 23 514(27)
Coloured 187 22 16 1 226(12)
Asian 612 212 201 4 1029(54)
Total 1991 1268(67) 309(17) 288(J5) 28( I) 1893
Total 1990 925(67) 230(17) 206(15 ) 20( 1 ) 1381
Source: Ci~}' of Durban Annual Report of the City Medical Officer of fiealth. 1991. p. !3.
Note: Figures in parenthesis represent percentages
Sixty-seven percent of the children on supplementary feeding schemes in 1991 were issued with milk and milk protein foods as a preventative measure (i.e. were classified' Above Grade I') while only 1.48 per cent were classified as Grade III. The combined percentage of children and infants classified as Grade II and III in 1991 (i.e. including those \vith clinical signs of kwashiorkor and maramus) was 16.7 per cent of the total number on the supplementary feeding schemes. Importantly, those classified as Grade] (or chronIcally malnourished) represented the highest proportion of the three grades at 17 per cent. These data support the conclusion in Section 3.4.3 that a crisis does not exist at present but that there is evidence of previous chronic malnutrition.
There has been a 37 per cent increase in children registered on feeding schemes since 1990 (from 1381 to 1893). Approximatel~' forty percent increases occurred through all grades
1>1

between 1990 and 1991. All of the above statistics are indicative of the deteriorating nutritional status of children in the Durban area, emphasising the need for careful and sustained monitoring.
Diagram 3.10 Nutritional status of childr'en register'ed on supplementar'Y feeding schemes in the DMR, 1987-1991
. NUMBER OF CHILDREN 1200.-----------------------------------------------------------~
1000 -t----
aoo-t---~
600+----
400 +----.<
200 -t--....,.,-
o
W C B
1 987
W C B I W C B I W CB
1 988 1 989 1 990 COMMUNITY GROUP AND YEAR
NUTRITIONAL STATUS
fl)'1J >G1 0 G1 R G2 H:mmH G3
Source: City of Durban Annual Report of the City Medical Officer of Health. 1991. p. 7-1.
3.4.4.1 Summary
weB
199 1
Of all the children on supplementary feeding schemes in 1991 within the DMR, 67 per cent were classified as 'Above Grade I' and received supplementary foods only as a preventative measure. The combined percentage of children and infants classified as Grade II and Grade III (i.e. including those with clinical signs of kwashiorkor and marasmus) was 16.7 per cent of the total number on the supplementary feeding schemes. Consequently, as in Section 3.4.3, the data indicate that there is no current crisis. However, there is evidence of previous chronic malnutrition. Importantly, however, there has been a 37 per cent increase in children registered on feeding schemes since 1990, indicating the deteriorating nutritional status of children in the Durban area.
3.4.5 General summary
Information on the nutrition status of children in South Africa is fragmented, incomplete and mostly outdated. The need for a systematic national and regional nutrition surveillance programme remains paramount. At present, estimates of the extent of the problem have had to be made from occasional or regional studies which are carried out on selected groups from which inference are made concerning at-risk groups.
82

3.5 IMMUNISATIONS
3.5.1 Immunisations within the DMR
One of the most useful indicators of health status (apart from IMRs) is the level of immunisation of babies under one year of age (Krige, 1990). However, the general unavailability of this statistic renders such an analysis impractical. Data can be compiled from the various health services, but given differences in the collation and format of such data, such compilation is time-consuming and difficult (Krige, 1990).
There are two ways in which a crude approximation can be made of the extent of immunisation within the area under investigation. Firstly, Table 3.41 illustrates the number of institutions within the DMR (pre-primary, primary and secondarY schools as well as day-care centres and childrens homes) visited by Department of City Health for immunisation. A second approximation is provided for through the utilisation of child health clinics facilities. Immunisation services are offered at all child health clinic sessions in the clinics listed below in Appendix 4.1. In this sense, the extent/coverage of immunisation of children within the region under investigation can be approximated by analysing the percentage of infants within the DMR and children utilising child health clinic services. This data is reflected in the Table 3.40 and is based on the 1985 population census.
Table 3.40 Percentage of infant and p."e-school population using child health clinic ser"vices within the DMR, 1991
POP UNDER 1 YR '1-4 YRS GROUP POP. ATTEND- (% POP. ATTEND- 0/0
ANCES ANCES
White 4463 24100 90 6763 6494 19
Coloured 3032 11952 66 4601 6284 27
African 3957 21807 92 6767 12550 37
Asian 18515 47J37 43 25765 50194 39
TOTAL 29967 105196 58 43896 75522 34
SOl/rce: CiTY (~rDllrb(/1I .-lllll/wl Uejlort (~/ti/(' C/~\, .I/ec/ie(/I oilie('/' (!I' Healtlt, /991. p.IO'[,
Note: (i) Population based on 1985 Census, CSS Report 02-85-02 (ii) The first percentage column represents the percentage of population based
on an average 6 attendences (iii) The second percentage column represents the percentage of population
based on an average 5 attendences
Patterns of attendance exhibit normal tendancies whereby the majority of attendances occur within the first year when feeding and general care routines are being established and primary
83
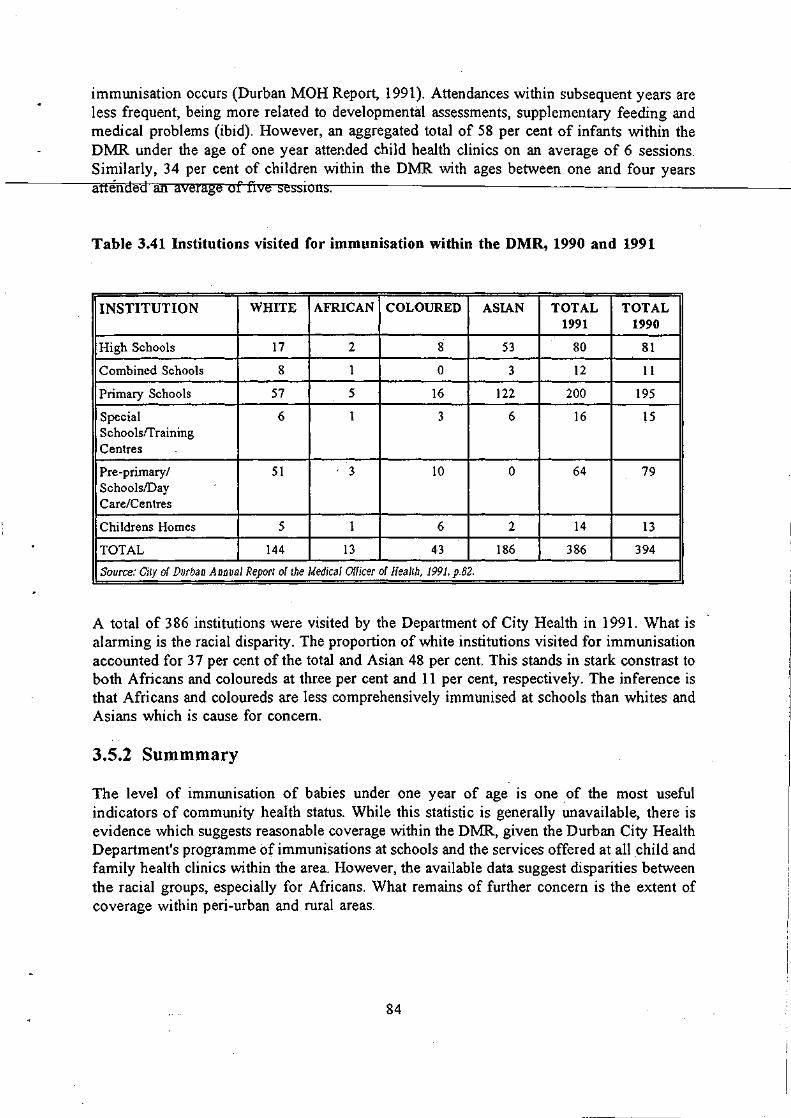
immunisation occurs (Durban MOH Report, 1991). Attendances within subsequent years are less frequent, being more related to developmental assessments, supplementary feeding and medical problems (ibid). However, an aggregated total of 58 per cent of infants within the DMR under the age of one year attended child health clinics on an average of 6 sessions. Similarly, 34 per cent of children within the DMR with ages between one and four years attended an average of five sessions.
Table 3.41 Institutions visited for immunisation within the DMR, 1990 and 1991
INSTITUTION WHITE AFRICAN COLOURED ASIAN TOTAL TOTAL 1991 1990
High Schools 17 2 8 53 80 81
Combined Schools 8 1 0 3 12 11
Primary Schools 57 5 16 122 200 195
Special 6 1 3 6 16 15 Schoolsrrraining Centres
Pre -primary / 51 . 3 10 0 64 79 SchoolslDay Care/Centres
Childrens Homes 5 1 6 2 14 13
TOTAL 144 13 43 186 386 394
Source: City of Durban Annual Report of the Medical Officer of Health, 1991, p.82.
A total of 386 institutions were visited by the Department of City Health in 1991. What is alarming is the racial disparity. The proportion of white institutions visited for immunisation accounted for 37 per cent of the total and Asian 48 per cent. This stands in stark constrast to both Africans and coloureds at three per cent and 11 per cent, respectively. The inference is that Africans and coloureds are less comprehensively immunised at schools than whites and Asians which is cause for concern.
3.5.2 Summmary
The level of immunisation of babies under one year of age is one of the most useful indicators of community health status. While this statistic is generally unavailable, there is evidence which suggests reasonable coverage within the DMR, given the Durban City Health Department's programme of immunisations at schools and the services offered at all child and family health clinics within the area. However, the available data suggest disparities between the racial groups, especially for Africans. What remains of further concern is the extent of coverage within peri-urban and rural areas.
84

3.6 LITERACY AND SKILL LEVELS
Literacy and skill levels were established by analysing levels of education in the Durban region. While not a direct indicator of literacy, completion of a certain amount of schooling is often used as an indicator of literacy. The Population Development Programme (PDP), for example, uses the completion of seven years of schooling (i.e. completion of plirnaIY schocrIH)------as a criterion for literacy (Tongaat-Hulett, 1989, p78). Given the data used, in order for comparisons over time and between races to be made this criterion could not be adopted here. The' cut-off for illiteracy had to be drawn at an education level of standard six. People with a lower education level are thus deemed illiterate. This indicator is therefore likely to overestimate the actual extent of illiteracy.
A further problem with the raw data is that they refer to the population as a whole, rather than merely to the adult population. 1980 and 1991 census data were used to generate distributions of education levels. The percentages at each level refer to the percentage of the population over the age of four (i.e. of at least school going age) in the case of aggregate rural urban areas (Table 3.42), and the percentage of the population as a whole in the case of the two genders (Table 3.43) and the different races (Table 3.44). Whether these data are of much use for the task at hand is debatable. It would be more useful to have distributions for the adult population. Nevertheless the data are analysed for any obvious trends.
The data show that at present, while improvements in both rural and urban areas have occurred over the past decade, clear rural! urban differences still exist. Moreover, while levels of literacy may have improved within race groups, disparities between groups have probably worsened between 1980 and 1991. No clear differences exist between men and women.
Table 3.42 suggests a definite urban/rural distinction, with urban dwellers in the region being more educated, and hence more literate, than rural dwellers. Using the criterion of literacy defined above, 40 per cent of the urban population and 64 per cent of the rural population older than four years of age were illiterate in 1991. Furthermore in urban areas, 22 per cent of the popUlation of school going age had matriculation or better, while in the rural population this figure stands at six per cent. A further outstanding feature of the data for rural areas is the fact that the ratio of diplomates to holders of degrees is much greater than in urban areas, suggesting a higher proportion of vocationally trained people. A possible reason for this difference is that those who have degrees may be more likely to migrate from rural areas.
85

-
Table 3.42 Education levels ('Yo of population over 4 yeal's of age), 1980, 1991
1980 1991
Urban Rural Urban Rural ..
lA7~ ?7 q1 11.11 19.82 !'IUllC
< Std 6 34.60 46.37 28.83 43.94
Std 6 12.81 10.23 10.57 9.31
Std 7 7.12 5.04 7.03 7.69
Std 8 11.64 5.38 12.78 8.38
Std 9 4.61 2.29 6.85 5.20
Std 10 9.15 1.89 16.54 4.56
Dip 1 1.05 0.34 0.44 0.03
Dip 2 2.81 0.38 3.71 0.93
Degree 1.43 0.18 2.14 0.14
Source: CSS Reports 02-80-07 (1980, &- 03-0/-07 (l99/)
Note: 1. Dip 1 is a pre - standard 10 diploma. 2. Dip 2 is a post - standard 10 diploma.
There has been a clear improvement in the level of literacy in the region between 1980 and 1991. While in 1980 49 per cent of the urban population and 74 percent of the rural population older than four were illiterate, this has declined to 40 and 64 per cent in urban and rural areas respectively. There have been similar improvements in the number of people holding matriculation or better with the percentage of urban dwellers rising from 14 per cent in 1980 to 22 per cent in 1991 and the percentage of rural dwellers rising from three per cent to six per cent.
Our second concern regarding literacy and skill is gender differences. Table 3.43 indicates that while there are marginal differences both at the extremes of education (i.e. less than standard six and above matric) and in certain categories, there do not appear to be any obvious gender based differences in education and hence literacy or skill. Indeed, using the criterion of literacy described above, 40 per cent of tl1e male population is illiterate as against 42 per cent of the female population. However. because the data applies to the population rather than merely to adults any discrepancies which exist may be hidden.
86
... _.-._----

.
Table 3.43 Education levels, 1991 (% of population ovel' 4 years of age)
Male Female
None 10.64 12.52
<;.~~d~ ~954 29.78
Std 6 10.32 10.68
Std 7 7.22 6.91
Std 8 12.48 12.59
Std 9 7.00 6.52
Std 10 16.42 15.37
Dip 1 0.45 0.40
Dip 2 3.42 3.70
Degree 2.52 1.55
SOUTce: CSS Report 03·01·07 (J99/)
Our final consideration regarding education levels is racial discrepancies. Table 3.44 shows educational attainment for the four race groups (with Africans disaggregated between urban and rural areas), expressed as percentages of the population as a whole. It is clear that there is a racial bias in the extent of illiteracy. While the level decreased for all race groups between 1980 and 1991, the order has remained unchanged, with whites being the most literate, coloureds second, Asians third and Africans last. Among Africans urban Africans are more literate than rural Africans.
Table 3.44 Education levels, 1980 & 1991 (% of population)
White Coloureds
1980 1991 1980 1991
None 13.68 11.56 20.73 17.27 ,
< Std 6 12.78 9.29 32.91 23.39
Std 6 7.95 4.56 18.06 14.19
Std 7 6.21 3.97 9.80 10.23
Std 8 17.81 16.39 9.82 14.09
Std 9 6.04 5.73 2.73 5.95
Std 10 21.36 30.77 3.33 11.35
Dip 1 2.33 1.41 . 1.08 0.44
Dip 2 7.88 9.72 1.21 2.34
87

1"'''.
. Degree I 3.95 I 6.60 J 0.34 I 0.79
Asian African . Urban Rural
lQOI'I 1001 .A ~I\OI\ 19:0 _1 .
~:70V .17.7.& A-/"'~ A-
None 25.58 19.70 29.63 22.55 43.02 31.94
< Std 6 33.89 24.25 39.53 34.29 39.59 38.69 i
Std 6 14.31 12.07 10.16 9.48 6.98 7.66
Std 7 5.80 6.02 6.52 7.25 3.88 6.59 !
Std 8 8.58 10.92 7.30 9.93 3.36 6.92
Std 9 3.73 6.31 3.35 6.34 l.66 4.36
Std 10 5.69 16.38 2.49 8.08 0.82 3.13
Dip 1 0.41 0.24 0.51 0.11 0.24 0.01
Dip 2 1.24 2.23 0.39 1.71 0;10 0.68
Degree 0.77 l.87 0.12 0.25 0.06 0.02
Source: CSS Reports 02-80-07 (l980j & 03-01-07 (l991i
88
4. A V AILABILITY OF AND ACCESS TO ESSENTIAL GOODS AND SERVICES
4.l INTRODUCTION
This section of the paper is concerned with establishing the access to and availability of essential goods and services.
Section 4.2 addresses the issue of how many informal settlements have emerged in the Durban area in the past five to 10 years, the location of these settlements, the number of dwellings and occupancy rates and the type of structures which are found.
Section 4.3 attempts to establish the extent and quality of coverage of electricity, water and sanitation.
Section 4.4 is concerned with access to transport and the quality of transport services.
Section 4.5 addresses the issue of access to education. Quality of education is assessed using teacher:pupil ratios.
Section 4.6 deals with access to health facilties in Natal and KwaZulu which is assessed on the basis on both person:bed and person:clinic ratios as well as spacial accessibility.
4.2 HOUSING
Using DBSA, Urban Foundation and Tongaat-Hulett data, Bekker (1992) shows that of the estimated 3.8 million people living in the DFR in 1990, 51 per cent (i.e. 1.8 million) lived in informal settlements, accounting for 70 per cent of the African population in the region (George, 1990). Bekker's estimate of the percentage of the African population living in informal settlements in the DFR is supported by the Urban Foundation's (DBSA, 1993, p23) comparative analysis of the percentages of African populations living in informal settlements in South Africa's major metropolitan areas. Table 4.1 indicates that of South Africa's six major mtftropolitan areas, relatively more members of the African population live in informal settlements in the DFR than elsewhere in the country. A possible explanation for this higher incidence is access to land in KwaZulu. Indeed the major concentrations.of African informal settlers are located just inside KwaZulu (See Diagram 4.1) (DBSA, 1993, p23). Access to KwaZulu land has also affected the Mture of informal dwelling. For example, in the PWY region there is a much higher incidence of backyard shacks and people living in out-buildings (DBSA, 1993, p22). The extent of inform~1 living is even more alarming when one considers that most informal settlements have little or no access to basic amenities such as electricity, water and sanitation, and tend to be distant from places of employment.
89
J

\
Table 4.1. P.'opo.,tion of the African population living in info."mal housing
I.n.a ..... PArrpnt nf total ACricaa..e..~lation
PWV 43
DFR 69
Port Elizabeth 55
Cape Town 57
Bloemfontein 34
East London 31·
SOUTce: DBSA, 1993. p23 Table 110 7.
Diagram 4.1 African formal and informal settlements in the DFR
ItWAZIILII
SOUTce: DBSA, 1993, p24
90
KEY:
-IIJ-
KwaZu/u Boundary National Road Rt.ilwayUne
Urbanisin, SCllIcmenll Formal SCllIemcnlS Daue Wormal SellIemcnll
-
In attempting to quantify the extent and type of new informal settlements, we found that both settlement-specific and broad regional data bases exist. Both the CSRI and the NPA have extensive data banks. Moreover, the World Bank has recently (May/June 1993) undertaken an Urban Sector Reconnaissance of the DFR in order to develop an investment profile for the provision of basic amenities. While their report details the extent of the provision of amenities in l.ow-income settlements in the DFR, it does not distinguish informal areas as such, limiting Its utility in this section of the-paperI6. The feport does, however, containsOJD __ e'------'-'re"'-'-l-"'-ev-'-'an~t _____ _ information. There are settlement-specific data on, inter alia, population size, number of dwellings and the coverage of the main essential services. Secondly, projected costs of improving the provision of services to different standards are provided. Thirdly, there are also data on the financial status of the local authorities found in the DFR.
The reliability of the CSIR data was regarded as questionable (Personal communication, C van Gass, Built Enviroment Support Group). The NPA data have been used to verify the results of an interview-based survey of informal settlements (Christensen & Gumede, 1993), which provides detailed data relating not only to the issue of housing but also regarding access to amenities and services in general. While it forms the basis of this section of the paper, attempts have been made to verify its concIusions with a number of settlement-specific studies.
The data presented in Table 4.2 show that approximately 191 200 people live in informal settlements which have emerged in the last five to 10 years. If, however, alternative estimates for Lindelani are employed, this figure then rises to between 369 200 (SATA, 1991, P n21-57) and 499 200 (community leaders estimate) However, the total reduces to 125 326 using Cross et al (1992) and Ardington's (1992) estimates for Nhlungwane, Lindelani and Canaan. Clearly, estimating the population is problematic, and further complicated by the fact that some of the estimates provided in the World Bank study conflict with those of Christensen and Gumede (1993)17.
Establishing precisely what sorts of structures exist and in what proportions is also problematic - the data only allow one to make general observations about which building materials are most prevalent. Further, some of the informal settlements, for example Canaan, are built on ecca-shale, and are not sufficiently stable for human habitation (Ardington, 1992, p4; Christensen & Gumede, 1993, p 19). Wattle and daub structures appear in all but one of these 'recent' settlements. Only in Block AK, a unique settlement close to Durban's CBD, is there no wattle and daub construction. Corrugated iron is used in structures in 10 of the 14 settlements, and plywood and blocks in nine. It is not possible, however, to determine the proportions of the different structure types.
16 What precisely is meant by low-income settlements is not entirely clear, nor is the proportion of the total population which is deemed to be low-income.
17 World Bank estimates of population, and number of structures are available for some of those settlements identified by Christensen & Gumede as being recent. Christensen & Gumede's study, however, appears to be more detailed than the World Bank study in some areas.
91

In the last ten years settlements have emerged only in certain parts of the DFR. Neither Pinetown nor Chatsworth appear to have any recent informal settlements. The most recent ones have emerged in Durban, InandalNtuzuma and Umlazi. While both InandafNtuzuma and Umlazi have each seen five new settlements emerge in the last five to 10 years,
-----llffll-Ha:Jfl-ni4dafN.H:t:rum-~e.jargest growth with between 16 271 and 49 271 dwellings housing between 129 000 and 437 000 people, depending on ·which estimates are used. Umlazi has experienced the second largest growth with 6 691 dwellings and 47 650 people. In Durban, which has experienced the lowest growth, four new settlements containing 1 970 dwellings and 14 550 people have appeared.
Table 4.2 Recent infol'mal settlements
Date Loc· Dwell. Type Occ Pop.
Block A.K. 89/90 D 50 1&2 5 250
Bottlebrush mid 80's D 550 3,4&5 5 2750
Canaan * 86 D 800 3,1&4 11 8800
Cato Manor 86 D 570 3,1,4&6 4.8 2750
Dalmeny Farm 87 lINt 4000 3,4,&6 7.5 30000
Geza 88 U 3800 3,1,4,7&6 7.1 27000
Limpopo 88 U l300 3,1,4,&6 6.9 9000
Lindelani * 80's Nt 9000 3,1,5&6 8 72000
Namibia 88 U 1000 3,6,7&4 7 7000
Nhlungwane * 80's I 1021 3,1,4&6 7.8 8000
Siyanda 87 I 500 3,1&6 8 4000
Sizamazulu * 83/87 1 1750 3,1&6 8.6 15000
Uganda 87/88 U 275 3,4&8 7.3 2000
Umlazi CC mid 80's U 316 3,1&4 8.4 2650
Total 24932 191200
SOIlrce: Christellsell & Gllmede, 1993
Note.: I. Loc refers to location, where D refers to Durban, to lnanda, Nt to Ntuzuma, and U to Umlazi magisterial districts
2. Type refers to the type of structure, I is plywood 2 plastic sheeting and drums. 3 wattle & dauh. 4 corrugated iron. 5 bricks, 6 blocks. 7 ljuba carton bricks and 8 tin shacks.
3. The asteriks indicate settlements which either experienced massive growth in the last 10 years but were established at an earlier time, or settlements whose population is disputed.
91
In addition to those settlements which have appeared only in the last five to 10 years, Christensen and Gumede identify five other settlements which have experienced considerable growth over this period: Inanda Mission Reserve, Glebe, Ekuthleni, Mtshebeni and Piesang River No.4, all of which are in close proximity in the Greater Inanda area. It is clear that this area not only contains the largest number of informal settlers and settlements but has also experienced the most growth in the recent past.
While it is possible to identify those settlements which have appeared in the last five to 10 years, it is also important to identify those older, established settlements which have experienced appreciable changes in population. The Inanda area, in particular, has experienced substantial change, not only in terms of new settlements appearing but also in the expansion of existing ones. Quantifying· changes to established settlements is, unfortunately, difficult owing to data deficiencies.
A number of those settlements presented as 'recent' have in fact existed for some time but experienced considerable growth recently. Both Nhlungwane and Sizamazulu fall into this category. Although Nhl ungwane was established in the 1960s and inhabited by both Asians and Africans, most Asian inhabitants fled in the face of the violence which flared in the area between 1985 and 1987, while the majority of Africans arrived in the 1980s, spilling over from KwaMashu and Ntuzuma (Christensen & Gumede, 1993, p89). Sizamazulu, on the other hand, was established in the late 1970s but experienced rapid growth in the 1983-1987 period (Christensen & Gumede, 1993, p 105).
Lindelani also experienced substantial growth in the 1980s having been established prior to 1979 (Christensen & Gumede, 1993, p59) but the data are also subject to dispute. The figures reported in the table are those of Christensen and Gumede (1993, p59). They state that the community leader in the area estimated that the settlement contained 42 000 dwellings, housing 380 000 people (with an occupancy rate of nine). However, the South African Township Annual (SAT A) reports that in 1991 the settlement contained 25 200 dwellings (200 of which were formal units) with an occupancy rate of eight, and a population in the region of 250 000. Cross et al (1992, p9), reports that Lindelani had a total population of 16926 in 1991 and occupancy rates per dwelling of 5.3 7 implying approximately 3 150 dwellings. While the precise size of Lindelani is clearly arguable, here once again there seems to be a systematic discrepancy between Christensen and Gumede and Cross et ai, with Cross et al consistently reporting lower populations and occupancy rates. Unfortunately the source of Cross et aI's results is not clear as they refer only to a 1991 survey estimate and the reason for the inconsistencies is uncertain. It is possible that they stem from over-estimates by the local authorities and community leaders interviewed. However, in the case of Bhambayi, a well-established settlement in lnanda, Christensen and Gumede report an NPA population estimate of 50 000 while Cross et al report a popUlation of 10 500. Nevertheless, whether Christensen & Gumede's data source is the NPA or local authorities, there does appear to be a some over-reporting of populations by them. Their survey results are larger than those of a settlement-specific survey of Canaan. Ardington (1992, p7) estimates that the number of dwellings in Canaan reached a- peak of between 500 and 600 dwellings in September 1990, and although no official population count was made' .. _ the average house occupancy of 3.6 persons .,. would suggest that there were approximately 1 500 people living there in the latter half of 1991' (Ardington, 1992, p3)_
93

4.3 ESSENTIAL SERVICES: ELECTRICITY, WATER AND SANITATION
This section of the paper is concerned with establishing the coverage of public services. _____ ....JP-Lre.cis..e details do not exist; indeed, in most instances it appears that the responsible
authorities are themselves not entirely certain of the coverage. The first part of this section deals with access to alternative sources of energy, and the second part with the water and sanitation.
4.3.1 Electricity
Establishing the extent of electrification· in the DFR is a difficult task. It would appear that even Durban Electricity, the responsible body, is not entirely certain .of the extent of nonelectrification (Personal Communication, Steven Harms, Durban Electricity). Nevertheless, it appears that established formal residential settlements, irrespective of race, already have access to electricity.
SA T A (1991) has data on the extent of infrastructural coverage in different residential townships. The data in Table 4.3 indicate some correlation between the number of formal houses and the extent of electricity coverage. Nonetheless there would appear to be some formal structures without electricity in Kwa-Mashu and Umlci. While these data do not provide detail of any racial disparities, the Asian residential township surveyed had full coverage while even in formal African settlements there appear to be some areas where electricity is not available. Durban Electricity felt that it was more likely to be the more recent formal settlements which did not have access (Personal communication, Steven Harms, Durban Electricity).
Table 4.3 Household electrification, 1991 (%)
Pel'centage of Percentage of Percentage of houses which are houses electrified streets lit
fOI'mal electrified
Chatsworth 99.37 100 100
Inanda 24.37 24 ')
Kwa-Mashu 63.37 55 100
Lindelani 0.80 0 70 .
Umlazi 74.30 66 100
Source: SATA. 1991, p 1121-1157
The observation that informal settlements have poor access to electricity is supported by surveys of informal settlements (Ardington, 1992, p27; Christensen & Gumede, 1993, P 132; Cross et ai, 1992, p 14). Christensen and Gumede (1993), for example, find that of the 56
94

settlements they surveyed in the DFR, only half had any electricity. Moreover, where there was a supply, it was mostly limited to commercial concerns and some community structures such as schools, creches and churches. The World Bank urban reconnaissance mission estimates 50.17 per cent of low-income dwellers in the DFR had no electricity supply (World Bank, 1993, Table 1.2). The DBSA estimates that approximately 60 percent of all residents in the DFR have no access to electricity (DBSA, 1993, P 19). The extent of under-coverage would obViously vary between settlements and within settlements. Cross et al-fl-9-9"r.26-;,-jp~Ii-'4'+1)r-----report that in 1986 in the Greater Inanda area, which has the largest number of settlements in the region, only about 200 dwellings were connected, while a further 800 had an electricty supply available. Where electricity is not available, wood, coal, gas and paraffin are relied on for cooking and heating while paraffin and candles are used for lighting. Some households run appliances on batteries (Christensen & Gumede, 1993, p132; Cross et ai, 1992, p14, Ardington, 1992, p27). The relative importance of the different types of fuel is difficult to determine, although it would appear that the least common source is wood - Cross et al (1992, P 14) don't mention it as an alternative fuel source, while Ardington's study of Canaan showed that ... residents in the main use paraffin for cooking and heating and candles for light' (Ardington, 1992, p27). However, Ardington (1992, p27) states that over half use wood for heating.
Durban electricity have embarked on an extensive electrification campaign - Electricity for All - which began in 1991 and is concerned with all people living within a 40 km radius of the 'Old Townhall' including areas within KwaZulu. The campaign initially identified 168000 dwellings without electricity and had a target of 160 000 connections over a five-year period, at a rate of approximately 2 000 connections a month. Forty-thousand connections are planned for Lindelani and 6 000 at Besters Camp (Daily News, April 30 1993). While Durban Electricity is not itself certain of the number of dwellings within the region that are without electricity, they aim to have electrified 95 per cent of all dwellings within the DFR within the next three to four years (Personal communication, Steven Harms). Rather than a conventional connection where dwellings need to be wired by an electrician, households are provided with a Rediboard which has a capacity of 60 amps; earth leakage; three plug sockets and a light (Daily News, 30.04.93). No constraint is imposed on the type of dwelling which can receive this type of connection (Personal communication, Steven Harms). The capital cost of the installation, which is recovered over a twenty-year period, is borne by the consumer in two separate payments. Electricity is charged at 21.86c per kilowatt hour as opposed to 15.68c for conventional consumers. Moreover, the consumer must pay R 142,50 for installation of the Rediboard (which requires pre-payment for consumption through a card and meter system), including a two-plate hotplate. The financial viability of the scheme is aided by Eskom's subsidy of 5.145c per kilowatt hour (DBSA, 1993, P 19).
4.3.2 'Vater and sanitation
The bodies responsible for supplying water for urban, industrial and agricultural purposes in the region is Umgeni Water (UW), a statutory body, and the Port-Natal - Ebodwe JSB which took over the provision of water from the Pinetown, Amanzimtoti and North Coast Regional Water Boards for outlying areas. Not only is UW responsible for most of the supply of water but also for the purification/disposal of waste water and effluent, water quality monitoring and pollution control. In 1987 UW, in the face of rapid urbanisation (and an expanding informally
95
J

settled population), commissioned the preparation of a 40-year Water Plan (HGP 1989) which was published in 1989. According to that plan the extent of the existing supply appears to be very similar to that of electricity. 'Reasonably high standards of services are generally provided for the white, coloured and Asian communities ... (with) '" no distinction apparent for the various settlement types for these groups'(HGP, 1989, Vol 2, p6.4). However. where
------1tt1lhf€6c..,/Aci.fI:i.Gan-population is concerned' water supply and sanitation range from full services to a total lack of services. The formal urban sector, accommodated in towns such as KwaMashu and Umlazi, are generally supplied with individual water connections and waterborne sanitation' (HGP, 1989, Vol 2, p6.4.). Informal settlements, on the other hand, initially tend not to have any piped water supply, relying on available raw water resources. As settlements expand and become denser, raw-water resources become contaminated and eventually piped water becomes necessary for all human needs. The earliest provision of services usually comprises standpipes and/or water kiosks and pit-latrine sanitation. The water plan assumes' water will only be provided to informal and rural consumers ... as and when funds become available, and not as a result of the densification of the settlements' (HGP, 1989, Vol 2 p6.7).
The perceptions contained in the water-plan are supported by the fragmentary data which are' available. While not explicitly dealing with water supply per se, statistics on water-borne sewerage give some indication of the extent of household water connections l8
. These data seem to suggest that in all townships surveyed, all formal houses and some informal housing in formal residential areas had a water supply. Informal settlements, however, generally appear to have poor access to water. The SAT A survey indicates that Lindelani had no water-borne sewerage; instead pit latrines were used. This statistic is supported by Christensen and Gumede (1993, p59). Extensive detail on the extent of both water supply and sanitation in informal settlements is contained in Christensen and Gumede (1993), World Bank (1993) and Cross et al (1992).
Table 4.4 Household watel'-borne sewerage, 1991 (%)
Pel'centage of formal Percentage of houses with housing Sewage
Chatsworth 99.37 100
lil an da 24.37 44
Kwa-Mashu 63.37 100
Lindelani 0.80 -Umlazi 74.30 100
So"rce: SATA. 1991. p 1/21-1/57
1M Water-borne sewerage requires piped water and is an indication, albeit partial, of the extent of water connections. The extent of water connections could of course be greater.
96

Of the 56 settlements surveyed by Christensen & Gumede (1993, p 127), only 2 (3.6 per cent) had a significant number of dwellings with septic tanks/water-borne sewerage, although the majority of the inhabitants relied on self-made pit latrines. Indeed, such latrines constructed from plywood/corrugated iron were found in 54 of the surveyed settlements. 5 settlements had
-----v.entilateiLpiLlatrines s onsored b inter alia the Urban Foundation, the N.P.A., the I.D.T. and the KwaZulu government. One settlement, Block A.K., had portable venti ate c emlca latrines (Christensen & Gumede, 1993, p 15). Cross et aI's (1992, p14) survey of informal settlements in the Greater lnanda area paints a similar picture. Of the four settlements19
surveyed, Amatikwe appears to have the greatest number of dwellings with water-borne sewerage - 1 per cent. The data from the SAT A survey's and from Christiansen & Gumede (1993) is supported by data from the Palmer Development group presented by the DBSA (1993, pI7).
Table 4.5 shows that 41 per cent of the popUlation in the DFR do not have access to adequate sanitation20
. The magnitude of this underprovision is underlined by the fact that in Cape Town 12 per cent of the population is without access to adequate sanitation, while in the PWV area, excluding Bophuthatswana ~d KwaNdebele) only eight per cent of the population is without adequate sanitation.
Table 4.5 Sanitaion levels in the DFR
Type White African African Effected Formal Informal Population
Full water-borne 230 000 120 500 333 1 645 000
Septic tank 19 750 0 0 79000
Bucket 0 500 0 3 000
VIP latrine 0 5 875 5 625 92000
Unimproved Pit 2 714 26 125 122 000 1 024 000
Other 143 0 250 3 000
None 286 2000 5 000 58 000
Source: Palmer Development group. /992.
The second concern of this section is the extent and quality of water supply in the Durban region. As argued above, water-borne sewerage provides a conservative estimate of the extent of water supply. Booyens (1990), estimates that 81 percent of households in the DFR have piped water into the house and a further 10 per cent have piped water into the yard, with the reamining 9 per cent of households using public taps and other sources (DBSA, 1993, P 18).
19 Amatikwe, Nhlungwanc, Bhambayi and Lindelani.
211 The source of the data for table 4.4 is DBSA (1993), where adequate refers to full water-borne sewerage. Whether this definition is appropriate is questionable.
97
::./ I
.' , . ,

These estimates appear to be improbable given the large proportion of informal dwellers in the DFR. Indeed, the World Bank (1993) estimate that 54 per cent of low-income people in the DFR rely on water from communal standpipes.
Inhabitants of informal settlements often obtain their water supplies from multiple sources. ------Not-one-of the settlemeAts-wFve-y.ed by Christensen 8. Gumed4li93~clie_d o~n.........".a-,s",-in~g=>,l,-",e _____ ,
source of water. Only six of the 56 (II per cent) settlements surveyed had any dwellings with direct connections although many of these relied on unofficial connections .. The two most important formal water sources in the surveyed settlements are water kiosks (corrugated iron structures from which water is sold) and standpipes.
4.4 TRANSPORT
Data regarding access to transport and the quality of available alternatives are sparse. The only comprehensive source is the Durban Metropolitan Transport area transport plan 1989 = 1994 (MTAB, 1990). While the report contains reasonably detailed historical statistics, data for the period after 1985 are merely speculative, being derived from forecasts. Hence the reliability and accuracy of the data for the present period rests on the assumptions of the forecasters. A DBSA report, Durban Functional Region: A strategic urban perspective, does provide supplementary data for the recent period for some aspects of the MT AB report, although it appears to have drawn extensively from the MTAB report. Before considering the data two caveats need to be noted: the area analysed by the report is larger than that analysed in this paper. The second problem concerns the quality of the services provided. The only indicators in this regard are the frequency of service and possibly the degree of overloading.
Management and planning of transport in the DFR is undertaken by '... a disorganised plethora of organisations at various levels of government' with disparate interests and jurisdictions preventing a co-ordinated approach to the provision of transport and the associated infrastructure (DBSA, 1993, P 19)~'.
In the broadest sense, two types of transport are available: public and private. Public transport could refer to those services provided by public enterprises or to those available to the public whether provided by public or private enterprise. The second definition is used in this paper. Our first concern is with aCCeSS to private transport. Table 4.6 indicates clear racial disparities in car ownership and provides a useful indication of the extent to which Africans and to a lesser extent coloureds and Asians are forced to rely on public transport services. A number of issues regarding the assumptions involved in generating the data forecasts, presented in Table 4.5, need to be raised. Central to forecasts of car ownership are population predictions: while two alternative scenarios are adopted for the period beyond 1995, a mere extrapolation of trends is used for 1985 - 1995. For this period it is assumed that population gro\\1h rates will be: one per cent for whites, 2.2 per cent for coloureds, 1.9 pe'r cent for Asians, and five per cent for Africans [based largely on the trends to 1985 (Vol 3, p4)]. A second determinant
21 The DB SA report (DBSA, 1993, p 19,p20,p54 & p55) contains details on those institutions undertaking transportation functions. Taht report also contains data on transportation expenditure and transport related incomc.
98

of total car ownership is the assumed ownership rate, which has .... been found to fit a logistic curve based on a saturation level of 600 cars per I 000 population' (MT AB. 1990, pl0).
Table 4.6 Cars per 1000 population
1985 1990 1995
Whites 459(77) 493(82) 517(86)
Asians/Coloureds 136(23) 177(30) 224(37)
Africans 24(4) 32(5) 42(7)
Source: MT AB, 1990,
Note: The numbers in parenthesis in 'the table refer to the absolute numbers per thousand as a percentage of the saturation level of 600 per 1000 as identified by the MTAB.
A further problem with these data is that they do not provide details of the number of vehicles in the different regions. The MTAB report does, however, have detail of the number of vehicles registered in the different areas, although the data are unfortunately somewhat outdated. These data are presented in Table 4.7. The areas described in the table do not refer to the magisterial districts used in this paper but rather to vehicle registration areas. Durban, for example includes most of Chatsworth and parts of Inanda, KwaMashu and Phoenix. Inanda incl udes parts of Durban, and Pinetown parts of Chatsworth (p41, Vol 1). Because of this overlapping and because of the fact that the different areas vary in size and population, not much can be derived from these data. Prima facie one could comment that urban Africans (as depicted by Umlazi) own more cars than rural Africans (as depicted by Ndwedwe). Such a statement is however flawed on a number of levels.
Table 4.7 Vehicle I'egistration by area, 1987
Area Code Registered Vehicles
Durban ND '343435
Inanda NJINT .' 32882
Ndwedwe NDW 194
Pinetown NPN/NU 83866
Umlazi NUl 5933
Source: MTAB 1990, p40, Vol 1.
99

Table 4.8 presents data on the mode of transport used by different race groups. The data clearly indicate that Africans rely most on 'public' transport (presumably including privately operated services), with 79 per cent of all trips being effected by this means. For Asians and coloureds this reliance was much lower - only 26 per cent of all trips. These results appear to correspond to the car ownership rates presented above. Indeed the MTAB argue that the , .... main and only significant determinant of mode choice is car availability.' (MTAB, 1990, Volume I, p93). Their surveys of commuters show that only 2 per cent of African and Asian public transport users could have made the trip by car. The 1980 survey showed that only 3 per cent of Asian and coloured bus passengers could have travelled by car (MT AB, 1990, Volume 3, pI5).
Table 4.8 Person trips by purpose and mode, 1985
Home- 0/0 Non-Work 0/0 Total 0/0
WOl'k
WHITES
Car 67700 89 58000 100 125700 94
Public 8500 II minimal - 8500 6
ASIANS/COLOUREDS
Car 71100 67 40600 87 111700 74
Public 34300 33 5200 13 39500 26
AFRICANS
Car 23600 13 24200 44 47800 21
Public 152700 87 30400 56 183100 79
ALL RACE
Car 162400 45 122800 78 285200 55
Public 195000 55 35600 22 231100 45
Source: MTAB. 1990, p93 Volume 1.
While fragmentary detail on the racial disaggregation of the ownership of different types of vehicle (i.e. motor cars, mini-buses, buses, commercial vehicles, motorcycles, tractors, and 'others') for Durban, Pinetown and lnanda, is available for 1987, it is not included because it does not provide any insight into the issue at hand: access to transport
Despite the paucity of data regarding private vehicle ownership, it is clear that of the different population groups in the DFR, Africans (and to a lesser degree coloureds and Asians) are most in need of public transport services. Three types are available in the DFR: combi-taxi, bus and train. Comparative fares are provided in Table 4.9 and show that rail transport is clearly the cheapest alternative.
100

.
Table 4.9 Public transport fares form Durban CBD, Septembel' 1990 (Rand)
To: KwaMashu Umlazi Pinetown
Combi taxi 1,50 1,50 1,20 0 .,,\. /..-<tQ 255 2,40 ~~..,
Bus - coupon (10 trip) 1,42 1,50 1,42
Train - cash (3rd class) 1,00 1,30 1,40
Train - cash (1st class) 2,30 2,90 2,90
Train - coupon (3rd class) 0,56 0,63 0,63
Source: DBSA, 1993, p21, table 6.
4.4.1 Taxi transport
The MT AB report comments that .... taxis are a valuable part of the transport system in African, Asian and coloured residential areas' (MTAB, 1990, P 59, Vo1.1). Two types of taxis operate in the DFR: metered and unmetered (MTAB, 1990, p59, Voll). The data fail to distinguish between them. However, it can be assumed that Africans, coloureds and Asians would use unmetered taxis and whites metered ones. Unmetered taxis may be used to feed other modes of transport (such as bus or rail transport) or to provide line-haul services for daily commuters or to provide long distance transport to areas outside the DFR.
In 1987,2 735 registerd taxis operated in the area under analysis with five per cent for whites (presumably metered) and 95 per cent for Africans, coloureds and Asians. Areas within the ambit of this study which had the biggest concentration of registered taxis were: Durban (620), Umlazi (477), Pinetown/Clermont (259), KwaMashu (198), and Inanda (l05) -contributing just over 60 per cent of the total. The number of unmetered taxis has grown considerably since 1987. The Local Road Transportation Board (LRTB) had issued 4408 taxi permits on 1 January 199022
• A large number of mini-buses operate as taxis without permits making it difficult to estimate the numbers operating in the DFR. Estimates range from 8 000 to 15 000 (DB SA, 1993, p20).
MT AB comment that in recent years there has been a .... phenomenal growth of taxis ... (which) often operate in direct competition with the buses that serve the African towns' (MT AB, 1990, p61, Vo!.l). Moreover, in 1990 they provided transport for 50 per cent of total CBD road-based commuters. In 1985 taxis and buses transporting African commuters were estimated to have similar peak-hour trip frequencies (52 000 for buses and 50 000 for taxis). MTAB predicted that taxi trips would increase at a faster rate than bus trips (MTAB, 1990, Vo1.5, p 9) .
.,.., While the board is responsible for an area greater than the DFR, it estimated that 90 per cent of the permits issued were issued in the DFR.
101
-.
:
'<-"
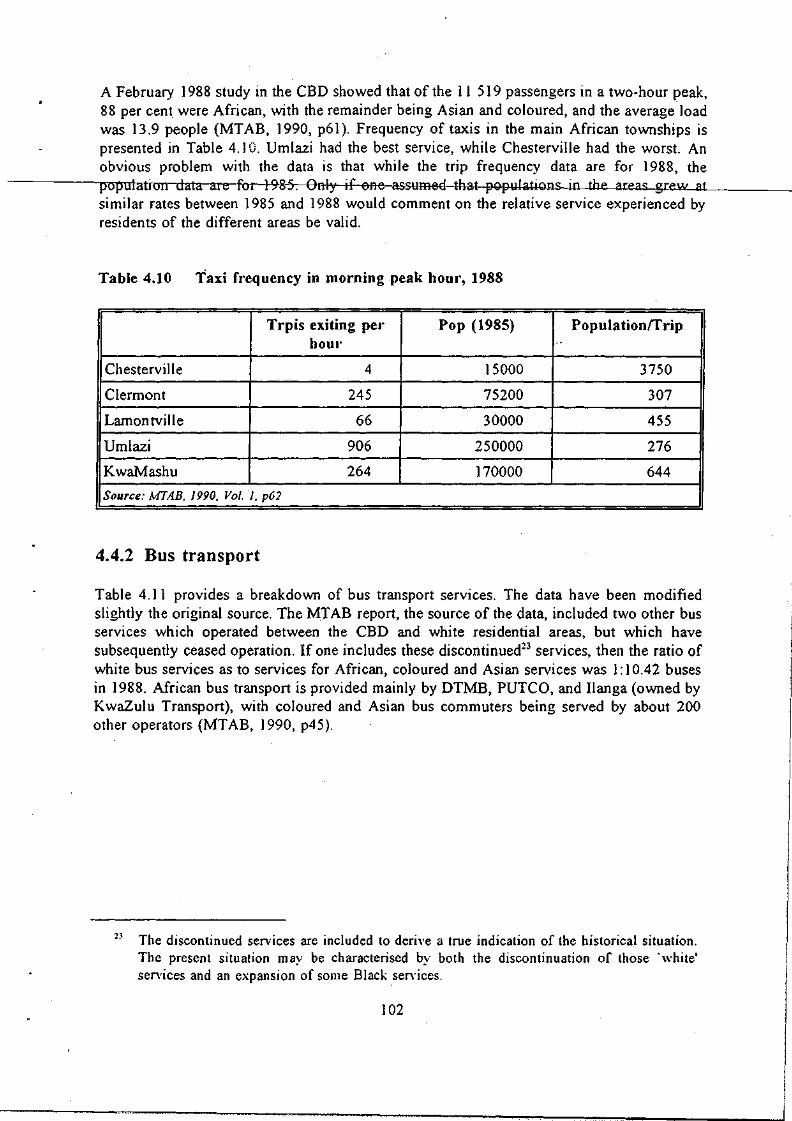
~'·t
A February 1988 study in the CBD showed that of the 11 519 passengers in a two-hour peak, 88 per cent were African, with the remainder being Asian and coloured, and the average load was 13.9 people (MTAB, 1990, p61). Frequency of taxis in the main African townships is presented in Table 4.] O. Umlazi had the best service, while Chesterville had the worst. An obvious problem with the data is that while the trip frequency data are for 1988, the population data al e for 198-5-:----enly if one assumed that populations in the areas grew---'a .... t ____ _
similar rates between 1985 and 1988 would comment on the relative service experienced by residents of the different areas be valid.
Table 4.10 Taxi frequency in morning peak hOUI', 1988
Trpis exiting pel' Pop (1985) Populationrrrip hoUl' .'
Chesterville 4 15000 3750
Clermont 245 75200 307
Lamontville 66 30000 455
Umlazi 906 250000 276
KwaMashu 264 170000 644
Source: MTA.B. 1990. Vol. 1. p62
4.4.2 Bus transport
Table 4.11 provides a breakdown of bus transport services. The data have been modified slightly the original source. The MTAB report, the source of the data, included two other bus services which operated between the CBD and white residential areas, but which have subsequently ceased operation. If one includes these discontinued23 services, then the ratio of white bus services as to services for African, coloured and Asian services was 1: 10.42 buses in 1988. African bus transport is provided mainly by DTMB, PUTCO, and IJanga (owned by KwaZulu Transport), with coloured and Asian bus commuters being served by about 200 other operators (MT AB, ] 990, p45).
2~ The discontinued services are included to derive a true indication of the historical situation. The present situation may be characterised by both the discontinuation of those 'white' services and an expansion of some Black sen·ices.
102

.
.
.
Table 4.11 Bus operations, 1988
Operator Owner Fleet Size Area
DTMB Durban Corp. (103) Within Durban
'. (36) City boundary
(472) Within city border & townships of KwaMashu, Ntuzuma Umlazi, Clermont.
Umhlanga Bus Borough of (4) Umhlanga Rocks & Service PUTCO Ltd Umhlanga CBD (whites)
Private (400) African townships in north, Newlands East & employment areas in metro. areas.
Ilanga Transport KwaZulu (62) Between KwaZulu area Durban employment areas & Pinetown.
South Coast Bus Private (85) Between African Servi ce (Pty) Ltd . townships to the
South and Durban CBD
Marinpine Transport Private (80) Between Pinetown, (Pty) Ltd Marianhill environs
and Durban.
Other indep. Asian Private (600) Asian areas within Operators & beyond Durban
boundary
Source: MTAB Vol 1. p45 (aj.
Data on frequencies of bus services are presented in Table 4.12 below. Diagram 4.2 is a map of both bus and rail routes in the DFR. While the data provide some indication of the relative frequency with which different areas are served they do not provide any insights into relative access to services on a per capita basis. African areas are clearly served with a greater frequency than other areas. This is to be anticipated given the relatively low car ownership rates among est Africans. For any valid comment to be made on the quality of services supplied some indication of the populations in each of the different areas served is needed. An interesting feature to emerge from the MTAB survey is that while detailed data on African bus patronage are not available it is clear that there has been a decrease in MTAB patronage
103
i
I
I

reo", .. '"''''
since June 1986 (MTAB, 1990, pSI, Yol.I). Moreover, in some fringe areas and townships bus services. have been withdrawn due to violence and/or competition from taxis (DBSA, 1993, p21). Nevertheless, the bus industry as a whole serves about 25 per cent of total peak travel in the DFR.
Source: DBSA, 1993, p20
104
railway lines ill the DFR
~ ~ .. '<
5' a
~ ~ >--< II>
, • • • ,
, , • • ,
• • • o. • •
;p;p nn 00
n~
!~.
"0
I I ~ 0 ::0 0 c a OCt!
ii~ :>-g:~' ..." ~1 ~'E ..
0
~ Ct! ::0 0 c n II>
\ I I \
@ ~
,

Table 4.12 . Bus service frequency in the afternoon peakhour
II
" Operator Route Trips per peak Hour.
-f)=FM:B-tWhi-te)- Gentt:al-IlbJ.l-tQ:
-Internal 4
-North Berea (D.N.) 26
-South Berea (D.N.) 18
-Sherwood (D.N.) 4
-Point (D.N.) 4
-Mount Vernon (D.S.) 6
-Woodlands (D.S.) 9 ,
-Bluff (D.S.) 13
-Glenashely (D.N.) 10
Umhlanga (White) -DBN - Umhlanga 2
DTMB (Black) Durban to:
-Pinetown (P) 7 I I I
-Clermont (P) 15
-KwaDabeka (P) 13 . -Shallcross (C) 5
-Westville Prison (P) 1 . -U.D.W. (P) 1
. -Ntuzuma via K waMashu (I) 27
-UmlazilLamontville (UID) 10
-Marine Garage (D.N.) 11
-Merewent (D.S.) 8 I
-Fynnlands (D.S.) 3
-Manor Gardens (D.N.) 2
-Ridge (D.N.) 2
-Glenashley (D.N.) 3
-Sydenham (D.N.) 9
-Point (D.N.) 21
-Newlands East (I) 3
PUTCO Durban to:
-K waMashu (1) 29
-Ntuzuma (1) 49
-eMachobeni (?) 10 .
105
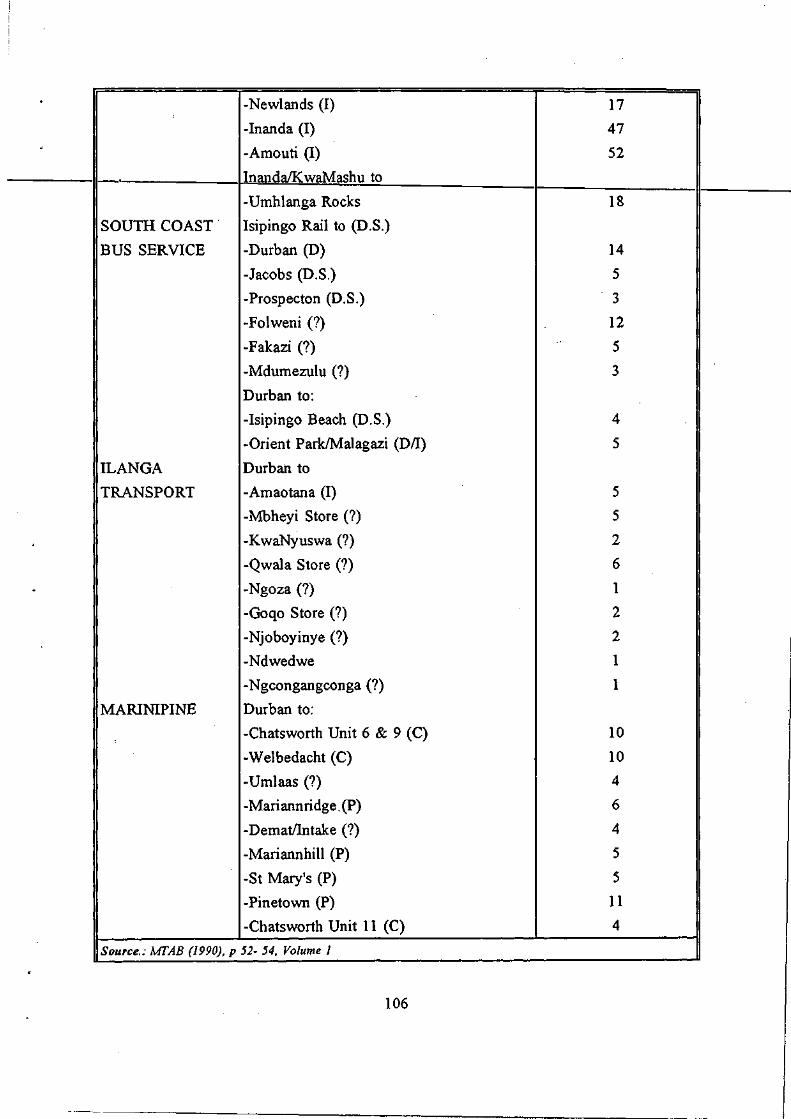
· -Newlands (I) 17
-Inanda (I) 47 " -Amouti (1) 52
InandaIKwaMashu to
-Umhlanga Rocks 18
SOUTH COAST Isipingo Rail to (D.S.)
BUS SERVICE -Durban (D) 14
-Jacobs (D.S.) 5
-Prospecton (D.S.) 3
-Folweni (?) 12
-Fakazi (?) 5
-Mdumezulu (?) 3
Durban to:
-Isipingo Beach (D.S.) 4 ,!
-Orient Park/Malagazi (D/I) 5
ILANGA Durban to
TRANSPORT -Amaotana (I) 5
-Mbheyi Store (?) 5
-K waNyuswa (?) 2
-Qwala Store (?) 6
- -Ngoza (?) 1
-Goqo Store (?) 2
-Njoboyinye (?) 2
-Ndwedwe 1
-Ngcongangconga (?) 1
MARINIPlNE Durban to:
-Chatsworth Unit 6 & 9 (C) 10
-Welbedacht (C) 10
-Umlaas (?) 4
-Mariannridge. (P) 6
-DematlIntake (?) 4
-Mariannhill (P) 5
-St Mary's (P) 5
-Pinetown (P) 11
-Chatsworth Unit 11 (C) 4
Source.: MTAB (1990). p 52- 54. Volume 1
106

Note.: D.N. refers to north of Durban; D.S. refers south of Durban; P to Pinetown; C to Chatsworth; I to Inanda; Nt to Ntuzuma and U to Umlazi. Where the destination falls ouside the defined ambit of this study or where it has not been possible to establish which magisterial district is relevant a ? is used.
4.4.3 Rail transport
Our final consideration is rail transport. Suburban rail passenger ticket sales indicate that there has been a steady decline in the use of such services by all race groups in the DFR since 1985 (DBSA, 1993, p22; MTAB, 1990, Vol. 1, p63). Passenger census counts do not reveal as much of a decline as ticket sales would suggest indicating widespread illegal use of trains (DB SA, 1993, p22). Although trains provide the cheapest form of transport in the DFR, many
as are not served by rail (see diagram 4.1). Indeed, 50 per cent of all trips during the day are are Det
between the African townships 'of Umlazi and KwaMashu and the central work areas. ails of peak-hour frequency are provided in Table 4.13, below.
Tab Ie 4.13
rban to: Du
Am
Cr
Urn
M
Pi
W
Ve
Kw
anzimtoti
ossmoor
lazi
ariannhill
netown
ests
rulam
aMashu
Outbound train frequencies, 1987
So urees: MTAB, 1990, Vol.1, P 67.
4.5 EDUCATION
No. of Trains/Hour
7
5
10
3
3
2
5
10
e different government departments are responsible for education in the region under Fiv ana Rep ofE edu use by Thi Bea
lysis. The Departments of Education and Culture under the Houses of Delegates and resentatives are responsible for Asian and coloured education respectively; the Department ducation and Training and the KwaZulu Department of Education and Culture for African
cation; and the Natal Education Department for white education. Two data sources were d. Edusource (a division of the Education Foundation) provides detailed data disaggregated magisterial district and responsible authority. These data were obtained from the HSRC. s data source may, however, be quite seriously flawed (Personal communication, Sue rd, Edusource). The data for the Department of Education and Training (DET), the
107

Department of Education and Culture in the House of Delegates [DEC (HOD)], and the Natal Education Department (NED) may have been duplicated in the magisterial districts of Durban, Pinetown and Inanda. The second data source is the Durban Functional Region Education Directory (1992) published by the HSRC in conjunction with the Education Contact Network. A p,otential problem with this second data source is that at times it refers to the DFR as a
-------,---!-=---homogeneous unit anortiS'aifflcultf()dtstinguislrb'etween-whar-is-relevant-e-r-tFFelev·ant-te------this study.
The first concern of this section is to establish how many institutions of formal education exist and where they can be found. Both sources of data are potentially misleading.
The education directory presents data for the DFR as a whole and is thus broader than required. This problem has been overcome by attempting to remove those schools which do not lie within the region under analysis. The procedure adopted was not.entirely satisfactory -only postal addresses are available and were used as an indication of where the schools are.
Because of the potential inaccuracies in this removal procedure, the data for the entire DFR are also provided in Table 4.13. The asterisks indicate data which have been altered. For the DET data, three more primary schools and one other high school can 'be found in the DFR.
The data in Table 4.14 are essentially self-explanatory and not much can be inferred. A racial breakdown of schools in the region can be derived by summing the DET and DEC data to obtain figures for Africans; the HOD data refers to Asians, the HOR to coloureds and the NED to whites. The data are not however amenable to a breakdown by magisterial district.
108
.!!>:

~
.
Table 4.14 Schools in the DFR, 1992
Low.Prim. Prim. Jun.Sec. High Spec.
DEC (KwaMashu) 33 17 6 11 1
DE'C (Mpumalangai!<) 3 1"2 :3 ~ Q
(Mpumalanga) 28 61 12 15 0
DEC (Ndwedwe*) 30 47 4 21 0
(Ndwedwe) 47 65 10 25 0
DEC (Umbumbulu*) 10 30 12 6 0
(Umbumbulu) 27 60 23 17 0
DEC (Umlazi) 28 42 13 ·17 2
DET* 7 27 5 10 0
DEC (HOD) 178 70 0
DEC (HOR) 15 9 2
NED 22 64 30 0
NED (Pvt) 13 13 0
Source: DFR Education Directory (1992) pp 56 - 87
Note: 1. DEC (HOD) only distinguishes between primary and secondary schools, of the primary schools, 25 are state-aided, and 1 of the secondary schools is.
2. DEC (HOR) only distinguishes between primary and high schools. 3. NED, distinguishes between junior primary and primary schools. 4. Where no juniour secondary schools are identified, all secondary schools
are classed as high schools. 5. The names in parenthesis after DET schools refer to circuit inspection
areas, and do not necessarily correspond to magisterial districts. 6. Asterisks refer to data which have been modified - see text.
The data provided by Edusource, and presented in Table 4.15, are flawed in that they only provide a partial breakdown by magisterial district. Specific data on only three of the five magisterial districts under analysis, namely Durban, Inanda and Umlazi, are available.
109

Table 4.15 Educational institutions per district, 1992
CoIl.Ed High Sch Prim. Combi Pre- Tech Other Sch Sch Prim. Coil Sch
DET 0 4 -r2 f) e Q-1-0 KwaZulu 0 0 0 0 0 0 0 HOD 1 56 136 ..,
0 1 7 j
HOR ) 8 16 0 0 I 3 NED I I 20 56 i 2 37 2 4
Durban 3 88 220 5 37 4 14
DET 0 7 17 0 2 0 0 KwaZulu 0 10 25 0 0 0 0 HOD 0 8 27 2 0 0 )
HOR 0 0 0 0 0 0 0
Inanda 0 25 69 2 3 0 2
Umlazi 0 30 65 0 3 I 0
SOllrce.: EdllSOllrce J 993b
Note: The only relevant authority for Umlazi is the KwaZulu department of Education and Culture.
One important indicator of the relative quality of education is teacher:pupil ratios. Again, only fragmentary data are available. Data are available only for African and coloured education and presented in Table 4. ) 6. Where direct comparisons are possible, clear patterns of discrepancies within African education appear in these data. Rural schools have better teacher:pupil ratios (i.e. more teachers) than urban schools. DET schoo is have better teacher:pupil ratios than KwaZulu schools. Finally in most areas secondary schools have better ratios than the corresponding primary schools.
In the case of the urban: rural distinction, in the five cases where direct c.omparisons are possible, three show better ratios in rural areas and one shows only a negligible difference. DET schools in rural Pinetown and KwaZulu schools in rural Umlazi and Pinetown show better teacher:pupil ratios than the urban schools in the same area under the same authority. Only in DET schools in lnanda do rural schools fare worse than their urban counterparts. The fifth area of comparison, KwaZulu schools in Pinetown, shows negligible differences between urban and rural schools.
The second area where some inferences can be drawn is between DET- and KwaZulucontrolled schools. In all instances where direct comparisons can be made (primary schools in urban and rural Pinetown and in rural Inanda; and secondary schools in urban Pinetown), the KwaZulu schools show worse teacher:pupil ratios.
The third area of comparison is between primary and secondary schools. Although in some areas the difference is marginal, in six of the seven areas where both primary and secondary
110

schools exist, primary schools have worse teacher:pupil ratios. Only secondary schools under KwaZulu .control in urban Pinetown have worse teacher:pupil ratios than the corresponding primary schools.
-.
laDre4:r6--itfFicarrt~adTer:·pu·pi·I-I·a-Hos;-l-9-9-11.--------____________ _
II~D-~-T----------~----p-r-im-a-ry----~----s-ec-o-n-da-ry----~---C-o-m_b_in_e_d __ ~~ ...
Durban (U) 1 :35.59 1 :34.06 -Pinetown (U) 1:43.35 1:33.97 -Pinetown (R) 1:35.82 - 1:43.5 ..
Inanda (U) 1 :36.73 1 :35.26 1:69.33
Inanda (R) 1:46.14 - -KwaZulu
Umlazi (U) 1:40.58 1:26.44 1 :27.70
Umlazi (R) - 1: 19.72 -Pinetown (U) 1 :50.61 1 :59.94 -Pinetown (R) 1:50.48 1:42.50 -Inanda (R) 1:59.33 1:31.33 -SOllree: Edusollrce 1993a.
Racial disparities in teacher:pupil ratios are likely to be greatest between African and white education. Asian and coloured education are likely to lie somewhere in between. Unfortunately data for white and Asian education are unavailable. Nevertheless comparing the data for coloured education with those for Africans may reveal something of the disparity in access between African and white. The data in Table 4.17 reveal a similar trend to that for African education. Primary schools seem to have worse teacher:pupil ratios than secondary schools. What is more interesting, however, is that while (on average) all coloured pupils experience classes with a teacher:pupil ratio better than I :30, only 20 per cent of African pupils have such' small' classes. Moreover, African pupils which experience these small class sizes are found only in Umlazi in KwaZulu schools.
III
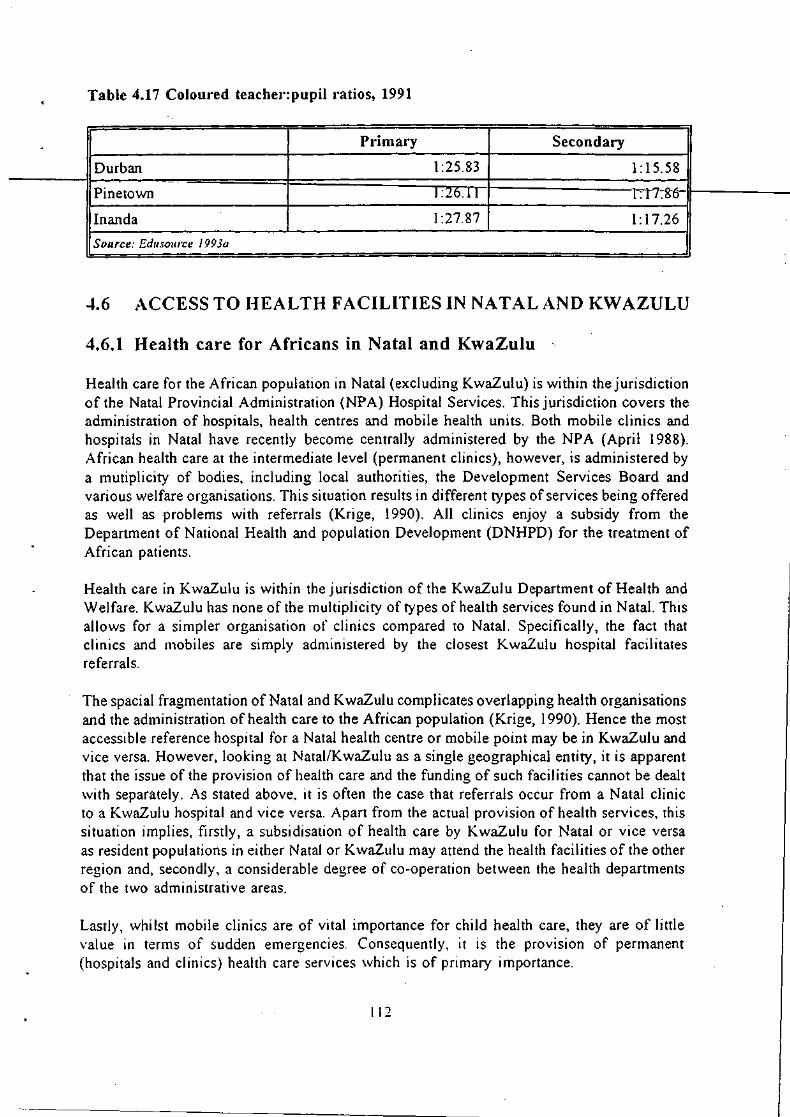
.
Table 4.17 Coloured teache .. :pupil ratios, 1991
Primary Secondary
Durban 1 :25.83 1:15.58
Pinetown 1 :20.rl l:17~8'6
Inanda 1 :27.87 1: 17.26
Source: Eduso/lrce 1993a
4.6 ACCESS TO HEALTH FACILITIES IN NATAL AND KWAZULU
4.6.1 Health care for Africans in Natal and KwaZulu
Health care for the African population in Natal (excluding KwaZulu) is within the jurisdiction of the Natal Provincial Administration (NPA) Hospital Services. This jurisdiction covers the administration of hospitals, health centres and mobile health units. Both mobile clinics and hospitals in Natal have recently become centrally administered by the NPA (April 1988). African health care at the intermediate level (permanent clinics), however, is administered by a mutiplicity of bodies, including local authorities, the Development Services Board and various welfare organisations. This situation results in different types of services being offered as well as problems with referrals (Krige, 1990). All clinics enjoy a subsidy from the Department of National Health and population Development (DNHPD) for the treatment of African patients.
Health care in KwaZulu is within the jurisdiction of the KwaZulu Department of Health and Welfare. KwaZulu has none of the multiplicity of types of health services found in Natal. This allows for a simpler organisation of clinics compared to Natal. Specifically, the fact that clinics and mobiles are simply administered by the closest KwaZulu hospital facilitates referrals.
The spacial fragmentation of Natal and KwaZulu complicates overlapping health organisations and the administration of health care to the African population (Krige, 1990). Hence the most accessible reference hospital for a Natal health centre or mobile point may be in KwaZulu and vice versa. However, looking at Natal/KwaZulu as a single geographical entity, it is apparent that the issue of the provision of health care and the funding of such facilities cannot be dealt with separately. As stated above, it is often the case that referrals occur from a Natal clinic to a KwaZulu hospital and vice versa. Apart from the actual provision of health services, this situation implies, firstly, a subsidisation of health care by KwaZulu for Natal or vice versa as resident populations in either Natal or KwaZulu may attend the health facilities of the other region and, secondly, a considerable degree of co-operation between the health departments of the two administrative areas.
Lastly, whilst mobile clinics are of vital importance for child health care, they are of little value in terms of sudden emergencies. Consequently, it is the provision of permanent (hospitals and clinics) health care services which is of primary importance.
111

4.6.2 Hospitals and clinics available
Data on hospitals and clinics were obtained primarily from the Hospital and Nursing Yearbook (Engelhardt, 1991; 1992). Data on clinics within the DMR were supplemented by
---__ tne_Clly_ofDu.Lban Annual Rep-ort of the City Medical Officer of Health (1991). The Hospital and Nursing Yearbook is updated annually and represents the most comprehensive r1st ot('""----hospitals and clinics14
..
The above data were used to calculate person:bed and person:clinic ratios. As noted above in section 4.6.1, KwaZulu health services operate on the basis that the physically closest hospital to the clinics in the area/region acts as a referral point for those clinics. Hence, in order to gain an impression of the population served by Prince Mshiyeni hospital in Umlazi, for example, one has to include those areas which contain clinics which refer patients to Prince Mshiyeni hospital. Therefore, in addition to the population of Umlazi, one has to also include those of Umbumbulu and Vulamehlo. While the population of Umlazi is estimated by CSS (1991) to stand at 299275, with the inclusion of Umbumbulu and Vulamehlo the estimated population served is approximately 800000 (Hospital and Nursing Yearbook, 1992), a figure which must be taken into consideration when calculating person:bed ratios in KwaZulu.
4.6.3 Person:bed ratios
Hospital access is usually measured in terms of a person to bed ratio. However, this is a crude measure in view of the differentiated services offered by hospitals (i.e. 'beds' are not uniform), the related issue of the nature of illness to be treated and the fact that clinics perform some of the functions of hospitals such as treatment of minor ailments, infectious diseases and the provision of maternal care etc. In addition, given that the regions under investigation here are reasonably geographically contained, the mobility of the population undermines the constraints implied by a strict interpretation of person:bed ratios within one given area.
However, on the assumption that physical proximity to a particular hospital is a good proxy indicator of potential utilisation of a particular hospital facility, then analyses of hospital site, bed numbers and population size data can be used to estimate the supply of beds in relation to the population in the region.
In terms of the entire NatalIKwaZulu region, Table 4.18 illustrates that there are sufficient beds within the area according to the Department of Health and Welfare's recommendations i.e. 199 people to a bed in all hospitals and 264 people to a bed with respect to referral and general hospitals. Disaggregating by race (i.e. prior to desegregation in 1990) it is clear that whites have been, historically, better served than blacks (195:1 vs 275:1, for general and
For a detailed breakdown of provincial and private hospitals and perm anent and mobile clinics available in the OM R. Pinetown, Inanda, Ntuzuma and Umlazi as well as the types of services provided. see Appendix 4.1.
113

referral hospitals). However, given the demise of apartheid and . own' affairs it is also apparent that there are adequate physical structures to cope with the general population in Natali KwaZulu region as the aggregated data suggest.
Table 4.18 People:bed ratios in NataI7KwaZiilUhospitalr,t985"5-------------
III-_____ t--_W_H_I_T_E_--t-__ B_L_A_C_K_--t-__ O_V_ER_A_L_L----liI
147 207 199 All hospitals I Referral and general 195 275 264 hospitals
Referral hospitals 260 643 565
Source: Zwarenstein. Krige and Wolfe. 1991.
Note: (i) National Plan for Health Service Facilities, Department of Health and Welfare, 1981, recommends 250 people per bed (based on the WHO 1981 recommendation of 4 beds per 1000 people)
(ii) The columns' White' and' Black' refer to hospitals reserved specifically for that racial group prior to desegregation in 1990 .. Overall' refers to all hospitals in the region operating on a non-racial basis .
(iii) . Hospitals' include state, private and industrial hospitals. (iv) . Black' refers to people classified as African, Asian or Coloured
However, looking at a more regionally disaggregated senario, the above conclusion cannot be sustained with respect to Umlazi (KwaZulu). This is shown in Table 4.19. While hospital facilities in terms of population served in Natal (DMR, Pinetown and Inanda) appear to be adequate, those in KwaZulu areas (i.e. Umlazi) are seen to be inadequate.
1 14

.
Table 4.19 People:bed I'atios in DMR, Pinetown, Inanda and Umlazi
AREA NO. OF BEDS POP. OR POP. PEOPLE:BED SERVED RATIO
DMR 7866 653783 8]
PINETOWN 754 184216 244
INANDA 1088 299379 275
UMLAZI 482 800000 1660
OVERALL TOTAL 9750 1937378 199
Source: .\'lIrsillg & Hospital real·book. 1991: CSS report 03-0/-03
Note: (i) Population figures were derived from the 1991 census· (ii) Population for Umlazi is an estimated figure of the population served by
Prince Mshiyeni Hospital (Nursing & Hospital Yearbook, 1991).
Purely in terms of hospital beds, the DMR has the lowest ratio of population to beds with respect to the regions under analysis here, well under the Department of National Health and Welfare's recommendations (J 981) of 250 people to a bed. Further, by this criterion (and again remembering the mobility of the population) both Inanda and Pinetown have adequate hospital facilities. What is of concern is the person:bed ratio in Umlazi which, conservatively, is six times greater than the Department of Health and Welfare's recommendations. As stated above, this situation arises from the fact that Prince Mshiyeni hospital acts as a referral hospital for clinics in Umbumbulu and Vulamehlo, in addition to Umlazi itself.
If we look at a more aggregated geographical picture of hospital:beds in Natal (as opposed to KwaZulu) which is more cognisant of regional mobility, the following situation emerges. Looking at the CSS-defined . Region 48' (Chatsworth, Durban, Inanda and Pinetown) with a total population of 1 137 378 versus a total number of beds equal to 9 708, the person:bed ratio stands at 117: I, which is well within DNHPD and WHO recommendations of 250: 1.
4.6.4 Person:clinic ratios
Table 4.20 shows people:clinic ratios for the DMR, Pinetown, Inanda, Ntuzuma and Umlazi. From Table 4.20, it is clear that the highest people:clinic ratios exist in Ntuzuma, Umlazi and Inanda in descending order, illustrating a discrepancy between urban areas, on the one hand, and peri-urban and rural areas, on the other, in terms of the availablity of health services. This discrepancy between rural and urban areas (especially with regards permanent health facilites) has been seen to exist at a provincial level (Krige, 1990). Importantly, it should be recognised that in terms of WHO recommendations (1981), 1 clinic should exist per 10 000 population, a target approached only by the DMR and Pinetown. In Ntuzuma, however, existing clinics are clearly overtaxed.
115

Table 4.20 People:clinic ratios in DMR, Pinetown, Inanda, Ntuzuma and Umlazi
AREA NO. OF CLINICS POP. PEOPLE:CLINIC RATIO
fJM'R 5.3_ 653783 12336
PINETOWN 13 184216 14170
INANDA 11 299379 27216
NT"CZu:"lA u -t58529 76422
UMLAZI 8 299275 37409
OVERALL TOTAL: 91 1895182 20826
Source: Nursing & Hospital Yearbook. 1991: CSS report 03-01-03
4.6.5 Spacial accessibility of health facilities in Natal
Table 4.21 shows the spcial accessibility of permanent and mobile clinics to the African population in Durban, Pinetown and Inanda. In terms of the these regions, the entire resident African populations (urban and rural) are within 10km of a permanent clinic (see Krige, 1990). However, although encouragIng, it is important to remember that 10km IS a considerable distance if regular transport is not available. In addition, the above tables illustrate that 10 per cent of the African population in Durban is further than five kilometres from a mobile clinic point with two per cent in a similar position in Inanda (although within 10km of a permanent clinic), which is cause for concern given that the frequency of mobile clinic visits can range between weekly and monthly.
Table 4.21 Spacial accessibility (I~) ove.' Skm) of pel'manent clinics and of mobile points to the African population in DUI'ban, Inanda and Pinetown
CENSUS POP TOTAL URBAN RURAL DISTRICT
Durban 83186 10 10 -Inanda 23612 2 0 3
Pinetown 48391 0 0 0
Source: Krige. 1990.
4.6.6 Conclusion
It was argued above that with respect to the provision of health care, Natal/KwaZulu should be treated as a single geographical entity in order to facilitate the provision and administration of health care to the resident populations.
116

Given the desegregation of health in 1990, it is apparent that there are adequate physical hospital structures to cope with the general population in NatallKwaZulu region as the aggregated data suggest. However, looking at a more regionaily disaggregated senario, whilst hospital facilities in terms of population served in Natal (DMR, Pinetown and Inanda) appear to be adequate, those in KwaZulu areas (i.e. Umlazi) are seen to be inadequate.
The analysis of person:bed ratios illustrated that within the CSS defined 'Region 48' (Chatsworth, Durban, Inanda and Pinetown), the personlbed ratio stands at 117: 1, well within DNHPD and WHO recommendations of 250: 1. What was seen to be of concern is the person:bed ratio in Gmiazi which, conservativeiy, is six times grcalt::r than recommended levels. This situation is a result of the fact that Prince Mshiyeni hospital acts as a referral hospital for clinics in Umbumbulu and Vulamehlo, in addition to Umlazi itself.
The highest people:c1inic ratios were found to exist in Ntuzuma, Umlazi and Inanda in descending order, illustrating a discrepancy between urban areas, on the one hand, and peri-urban and rural areas, on the other. In terms of WHO recommendations (1981), that one clinic should exist per 10 000 population, only the DMR and Pinetown were found to provide adequate clinic facilites.
In terms of the regions of Durban, Inanda and Pinetown, the entire resident African populations (urban and rural) are within 10km of a permanent clinic. While encouraging, 10 per cent of the African population in Durban remain further than five kilometres from a mobile clinic point with two per cent in a similar position in lnanda.
117

5. POVERTY ALLEVIATION PROGRAMMES
5.1 INTRODUCTION
This section of the paper is concerned with an analysis of poverty alleviation programmes within the DMR. Section 5.2 deals with the major feeding schemes operating in the Durban region. Section 5.3 is concerned with public work schemes. Section 5.4 deals with the issue of pensIons. Lastly, Section ).)IS concerned with both non-governmental organisations' (NGOs) and local/municipal governments' long-term developmental initiatives to alleviate poverty:). Section 5.5 can be conceptually differentiated from Sections 5.2 - 5.4 which are concerned explicitly with short-term poverty alleviation strategies.
5.2 FEEDING SCHEMES WITHIN THE DURBAN REG ION 26
5.2.1 Operation Hunger
Operation Hunger was established in 1980 and is a nationally-based poverty alleviation effort. With respect to Natal, Operation Hunger serves the entire area, from Mozambique in the north to the Transkei in the south.
The efforts of Operation Hunger are targetted mainly at Africans as the economically deprived group, but this does not exclude assistance to whites which has been increasing rapidly over the last year as the recession takes its toll. Generally, however, the outreach of Operation Hunger has been expanding since April 1991 when 32 000 individuals were fed per day in Natal alone. By April 1993, this assistance had increased to 85 000 individuals (in Natal): Most of the individuals fed are under five years of age. However, this is not exclusive of other needy age groups such as old-age pensioners.
The mechanisms of operation are as follows. People, organisations or communities ask for assistance to which Operation Hunger responds by sending out a field worker to assess the claim. Criteria that are utilised are the anthropometric indicators of Mid Upper Arm Circumference (MUAC) as well as W/A and HlA as per WHO recommendations. In addition, criteria such as drought and socio-economic conditions are taken into account. The feeding, itself, once a favourable assessment is made, occurs at a grassroots level by Operation Hunger itself. This feeding occurs through existing institutions such as schools, clinics and creches. Food that is supplied by Operation Hunger consists of mealie meal and soup. Importantly, attempts are made to prevent the development of dependency relations. In this regard,
:5 See Section 1 for an o\'crvic\\' of the 1l1ajor participants in the d'c\,cloplllental process~ both
govenlmcntal and non-govenlmcntal.
:6 The infonnation presented in this section was obtained [rom telephonic correspondence with members of the listcd organisations during August 1993.
118

Operation Hunger simultaneously supports community development projects, the most prevalent being the creation of subsistence farming through the establishment of . community gardens'. Other activities that are supported by Operation Hunger are bead and basket work.
\... These activities are meant to provide stability to community life, preventing influxes to urban areas.
5.2.2 The Feed the Babies Fund
Feed the Babies Fund (FBF) was established in 1958 in Cato Manor by Professor Zelda Jacobson and medical staff at the University of Natal (DBN) training hospital. At present, FBP operates in most of Natal: from the DFR to Port Shepstone and Margate in the south, to Rich~rds Bay in the north and Escourt and Underberg in the midlands.
The efforts of FBF 'are targetted primarily at young children (one to six years), guided by the philosophy that it is during this period that fundamentally important bodily and mental growth occurs. At present, FBF feeds 9 000 children per month in the Natal region (specified above). These are primarily . at-risk' African children. The . at-risk' classification is made by professional staff of clinics. There are two ways in which FBF subsequently operates. Either, FBF pays creche fees for a child classified' at-risk' or FBF will pay for the operation of the entire creche if such a creche fulfils certain criteria. These criteria stipulate that teachers attend recommended training courses offered by two organisations: Training and Resources of Early Education (TREE) and Educare. Under these circumstances, FBF uses its funds to purchase nutritious foods for the creche which are recommended by diaticians, doctors and the City Health Department. .
FBF operates through seven creches in Lamontville, three in Clermont and one in the foHowing areas: Cato Crest, Merewent, Sparks Estate, Umbilo, Point, Hillary, Pinetown, Umlazi, Ndwedwe, KwaMashu, Chatsworth, Chesterville. In terms of clinics, FBF operates through 42 clinics in the DMR and 20 Development Services Boards clinics (DSB). FBF activities have increased 100 per cent between April 1992 and April 1993.
5.2.3 The Argus Milk Fund
The Argus Milk Fund was established in 1937 and operates within a broad area of Natal: from Stanger in the north, to Port Shepstone in the south, to Pietermaritzburg in the midlands, inclusive of Durban.
The Argues Milk Fund is aimed primarily at children of ages six and below. These children are primarily African, but coloured and Asian children are also assisted. In addition, individual families are assisted for up to three months if certain criterias are met.
The fund operates primarily through pre-schools and creches in two ways. Fresh milk is given to those pre-schools and creches within the delivery areas of Creamline and Clover -essentiaHy formal, urban areas. On the other hand, in squatter and outlying rural areas milk powder is delivered.
119

In terms of assessing which pre-schools and creches qualify for assistance, the fund relies on various welfare agencies such as Durban Child and Welfare. Similarly, individual families have to be recommended by such agencies to qualify. Sources estimate that, at present, approximately 7 000 children are being supplied per day in Natal. Estimates could not be obtained for the Durban region specifically. ------
5.2.4 The Durban City Health Department Feeding Schemes
The Durban City Health Department operates supplementary feeding schemes from all the child health clinics listed in Appendix 4.1. Food supplements are in the form of full-cream and skimmed milk powders and Pronutro cereal. Children attending health clinic sessions which suffer from sub-nutrition or protein-calorie malnutrition are recommended for the scheme which is monitored subsequently by the clinic. The City Health Department obtains supplementary food from three principal sources: the State Subsidised Feeding Scheme, the Malnutrition Relief Fund and Feed the Babies Fund (see Section 5.2.2). Table 5.1 shows the number of children registered on supplementary feeding schemes in 1991 and 1990. In 1991, Asians constituted the highest proportion of children on the scheme (54 per cent) and whites the smallest (seven per cent). Importantly, the number of children registered on this feeding scheme rose by 37 per cent between 1990 and 1991.
Table 501
White
African
Coloured
Asian
Total 1991
Total 1990
Numbelo of children I'egisteloed on supplementary feeding schemes, 1990 and 1991
124(7)
514(27)
226(12)
1029(54)
1893
1381
Source: City of Durban AnTlual Report of tile City Medical Officer o/Health. 1991. p. 73
5.3 PUBLIC WORK SCHEMES
Sources in the Durban Branch of Department of Manpower said that local public works schemes that had historically been in operation had been closed down due to a cessation of funding. The reasons for this state of affairs is unclear but seems to stem from a national restructuring of the Department of Manpower.
120
,
I I
""''"r~ "'''''~''.' ".-,<,,~ ~·~~c·~.,,_c, ">
!
5.4 PENSIONS
South Africa's welfare system is divided according to racial categories. Whites are served by the ministry of Home Affairs in the House of Assembly, Asians by the House of Delegates
------and-co.lo.m:eds-b..y_the_HQus.e_o.t.Re.p.cesentatives. Africans in Natal KwaZulu receive welfare payments from either the Natal Provincial Administration or from the KwaZulu government.
While details of the number of pensioners was not obtained, a possible· rule of thumb' of the number of Africans receiving old-age pensions in the Durban region is 77.3 per cent of urban Africans and 70.8 per cent of rural Africans who are eligible for old-age pensions (Personal communication, F Lund, Centre for Social and Development Studies, University of Natal).
5.5 DEVELOPMENT INTIATIVES WITHIN THE DURBAN REGION
There are four major development initiatives within the DMR: the RSAlKwaZulu Development Project (RKDP), Operation Jumpstart, the DFR Metropolitan Development Forum and the Joint Executive Authority's (JEA) DFR Framework Plan (DBSA, 1993).
5.5.1 The RSA/KwaZulu Development Project (RKDP)
The RKDP arose in 1984 under the auspices of the KwaZulu Natal Planning Council. The Council proposed developmental projects costing Rl 124-million (in 1986 prices) to improve the living circumstances of Africans living in the Durban/ Pietermaritzburg area. These proposals were approved by both the South African and KwaZulu governments in 1988. Implementation of the proposals was assigned to a Co-ordinating and Implementing Committee. However, as it turned out, the RKDP was responsible for implementation in KwaZulu and on land controlled by the Department of Development Aid while the NPA implemented projects on its territory.
The RKDP was intended to last five years with a primary objective of providing 86 000 sites. However, the consultative processes underlying both the proposals and implementation of the projects was flawed. Affected communities were not consulted during planning and future urban development was perceived to occur in KwaZulu, away from the Durban City Centre.
The future of this developmental initiative is unclear. The Department of Development Aid has subsequently closed down. The OBSA was subsequently intended to serve as the primary source of funds. However, the lack of initial community participation has undermined this form of support (OBSA, 1993). In addition, the NPA seems also to have misgivings about joining the RKDP (OBSA, 1993).
5.5.2 Operation Jumpstart
Operation Jumpstart originated from the Planning Forum convenved by Tongaat-Hulett in 1988. The forum included academics, government officials and political party members. The forum published three reports in 1990 which elucidated a senario plan for the OFR. As a result. Operation Jumpstart was launched in October 1990 by the mayor of Durban.
121

This launch was intended to instigate a local participatory exercise to identify projects which would stimulate economic growth and create jobs. Operation Jumpstart is led by Terry Rosenberg (an important private sector figure) with membership including figures from the ANC, lnkatha, local civics and the municipalities within the region. Importantly, Operation
-----.J.ump.start.do.es_no.LI:ep.r.es.enLaILo.ngoing..initiative. Rather, the intention was to kickstart local developmental initiatives by providing an institutional co-ordinating structure. It was originally perceived that six months would be sufficient for this purpose. However, this was unrealistic and Operation ]umpstart has developed .into a quasi public-private partnership that has rleveloped an ad hoc list of priorities (DBSA. 1993), For example. cutting red tape concerning the principles guiding land use and development in the metropolitan area; the development of greater Cato Manor; the promotion of exports; the development of the Point and Victoria Embankment; the establishment of a major conference centre; the establishment of a lottery to raise funds for education, entrepreneurial training and special development projects and the provision of well-located and serviced land for low-income housing thoughout the DFR.
The DBSA argues that Operation ]umpstart does not have the resources and capacity to facilitate ongoing planning (DBSA, 1993). Further, the DBSA maintains that what is required is planning of a more strategic and co-ordinated nature, a task not currently fulfilled by Operation ]umpstart (DBSA, 1993).
5.5.3 The DFR Metropolitan Development Forum
This forum is being jointly facilitated by IDASA and Operation Jumpstart. Underlying this forum is the recognition that decisions regarding the development of the DFR need to be made at a metropolitan level in a co-ordinated and strategic fashion and that such decisions, regarding the allocation of financial resources, are premised on the existence of a politically acceptable decision-making process.
Current participants include the Advisory Committee on Planning of the loint Executive Authority (lEA), ANC, NP, Inkatha, Solidarity, House of Delegates, Natal Asian Congress, South African National Civic Association, Durban Housing Action Committee, Natal Municipal Association. In addition, SACOB and COS A TU have been invited to join the steering committee. Further, due to the number of local authorities in existance, it is anticipated that they will be represented by the NPA and the KwaZulu government. Terry Rosenberg (who leads Operation ]umpstart) chairs the forum.
The DBSA views this Forum as a potentially extremely important vehicle in assessing projects, prioritising the allocation of resources, promoting development and facilitating the restructuring of local government (DBSA, 1993).
5.5--' The Joint Executive Authority's (JEA) DFR Framework Plan
lEA is currently involved with developing a spacial development plan for the DFR. However, ANC sources have criticised this exercise for both making unilateral plans and for an unwillingness to work with the DFR Metropolitan Development Forum (DB SA, 1993). Direct contact with the NPA revealed that the plan is more ambitious than' spacial development' and includes an . overall policy framework' and a calculation of needs for municipal services and
122

shelter (DBSA, 1993). To the extent that these issues are being addressed by the DFR Metropolitan Forum there is the possibility of tension between the two initiatives.
5.5.5 Important local non-government organisations (NGOs)
NGOs are eitner commumty-rmlCea or pnvafe sector orgamsafions. Many oIthe communitylinked NGOs served as advocacy organisations that helped civics oppose apartheid measures and prepare development plans in opposition what was proposed by state authorities (DB SA, 1993).
5.5.5.1 The Built Enviroment Support Group (BESG)
BESG provides policy related research, project related training, alternative planning and policy advice, project implementation advice, advice of project funding and negotiations support. In terms of the Durban region, BESG became involved in project implementation in Soweto (Inanda) as well as in Cato Manor in 1991.
5.5.5.2 The Centre for Community and Labour Studies (CCLS)
The CCLS was formed in 1990 and serves to undertake secondary research and alternative policy proposals. The CCLS is involved in development projects in Inanda, KwaMashu, Lamontville, Cato Manor and informal settlements in Reservoir Hills.
5.5.5.3 Community, Organisation, Research and Development (CORD)
CORD operates in rural areas through out Natal. In the Durban region, CORD operates in areas such as Ndwedwe and parts of Tongaat. CORD serves to assist impoverished communities by increasing their ability to gain, access to resources required for sustainable development. This is achieved through fostering and recruiting skills to increase the organisational capacity of local communities; undertaking research specific to the material needs of the community and formulating alternatives to development projects in which the communities are already engaged.
5.5.5.4 Urban Foundation Informal Settlements Devision (UFISD)
UFISD has been involved with the upgrading of 8 100 sites at Besters Camp in Inanda. The success of this proj ect and the recognition of UFISD as a 'community-sensitive' organisation has established UFISD as an NGO in the DFR with the greatest capacity to implement upgrading projects (DBSA, 1993).
5.6 CONCLUSION
5.6.1 Feeding schemes within the Durban region
Well established feeding schemes have been in operation in the Durban Region for a number of years. The most prominent are the Durban City Health Department's scheme, Operation
123

Hunger, Feed the Babies Fund and the Argus Milk Fund. Importantly, these feeding schemes function through the established system of clinics operating in the Durban region as well as creches and schools. The spacial distribution of these feeding schemes is illustrated in Section 4.6.5, where it was established that the entire resident populations of Durban, Pinetown and Inanda were within 10km of a permanent clinic. In addition, feeding occurs through creches
-----nan=cl-scnools wrucnincreases the accessIon-It}' of-the population to sucnfeeoing schemes. Jt=p-=-art"...------from Operation Hunger, the Durban City Health Department, Feed the Babies Fund and the Argus Milk Fund rely on trained clinic personnel to assess children for signs of malnutrition. Operation Hunger, on the other hand, has its own field agents. The above facts illustrate that a networked feeding system is in operation in the Durban Region, a fact which should be recognised with respect to future policy formulation which should aim at strengthing the present network.
5.6.2 Public work schemes
Local public works schemes that had historically been in operation had been closed down due to a cessation of funding. The reasons for this state of affairs is unclear but seems to stem from a national restructuring of the Department of Manpower.
5.6.3 Pensions
South Africa's welfare system is divided according to racial categories. Whites are served by the ministry of Home Affairs in the House of Assembly, Asians by the House of Delegates and coloureds by the House of Representatives. Africans receive welfare payments from the Natal Provincial Administration and the KwaZulu government. A crude indicator of the number of African old-age pensioners is 77.3 per cent of urban and 70.8 per cent of rural inhabitants eligible for old-age pensions.
5.6.4 Long-term development initiatives within the Durban region
At present, there are four major developmental initiatives within the DMR: the RSAlKwaZulu Development Project (RKDP) , Operation Jumpstart, the DFR Metropolitan Development Forum and the Joint Executive Authority's (JEA) DFR Framework Plan (DBSA, 1993).
Of the four initiatives the DFR Metropolitan Development Forum was seen to hold the most promise for the future. Underlying this forum is the recognition that decisions regarding the development of the DFR need to be made at a metropolitan level in a co-ordinated and strategic fashion and that such decisions, regarding the allocation of financial resources, are premised on the existance of a politically acceptable decision-making process. The DBSA views this forum as a potentially extremely important vehicle in assessing projects, prioritising the allocation of resources, promoting development and facilitating the restructuring of local government (DBSA, 1993).
124

6. CONCLUSIONS
6.1 INCOME AND EXPENDITURE
The first section of this paper is concerned with measuring poverty in terms of the conventional indicators - income and expenditure. Four issues are addressed: sources of income; levels of income; the composition of expenditure and a comparison of household incomeS with a poverty datum line for the region. A number of different data sources are used, the most important being CSS census data, the CSS Survey of Household Expenditure (CSS, 01-11-01, 1990) data, and the DRA Income and Expenditure Survev (DRA, 1992) data. None of the data sources are entirely satisfactory, all being flawed in different ways. The census data are concerned with the individual rather than the household, the CSS household expenditure data are not sufficiently disaggregated, and the DRA data applies only to blacks in selected areas. By using the different sources a reasonable picture of income and expenditure was, however, derived.
6.1.1 Income sources
The section on sources of income addressed: the extent of dependency; the occupational breakdown of the economically active population; the most important economic sectors and the most important source of income. The general findings pertaining to each of these is discussed in turn.
Using the ratio of the economically active to economically inactive population both the subregion as a whole, the individual race groups experienced an improvement in the extent of dependency over the decade to 1990. That trend is surprising given the poor performance of the economy over this period. It is argued that the improved ratio may reflect increasing unemployment: as household f!1embers lose their jobs, greater numbers from each household may be forced to seek work increasing the economically active population. Thus rather than suggesting a decrease in dependency, the figures may in fact suggest an increase. This conclusion is borne out by an analysis of an alternative ratio: a ratio of those who do not have full-time employment to those who do. That statistic shows a worsening of dependency for blacks in Umlazi.
The data on occupation show that while blue-collar occupations are the most important category for blacks (68.5%), coloureds (50.42%) and Asians (44.8%), white-collar jobs account for 67.93% of economically active whites. Furthermore, a large percentage of coloureds (19.16%) and blacks (18.62%) fall into the unspecified category, probably reflecting the fact that blacks and coloureds experience more unemployment than the other races. The ORA data show that the most important occupation for blacks in the region is domestic worker. a trend which is not specific to different settlement types.
The most important economic sector in the region is the community, social and personal services sector employing 23.03% of the population. The unspecified category, which includes the unemployed, is the second largest category in the region. It is, however, larger in rural than urban areas, suggesting a higher level of unemployment in rural areas. This category is
125

highest for rural blacks (31.52%) and only whites have less than 10% of their economically active population faIling into this category.
For all races, direct income is clearly the most important source of income and is relatively _____ ..!-!m!,>,Qre important for blacks than whites. For blacks whether rural or urban, wages form the
largest component of income; and are relatively more important in urban than rural areas. Business income is also an important source of income for blacks and accounts for more than seven per cent of total monthly household incomes. No clear rural/urban trends exist regarding business activities. Assets contribute very little to houshold income.
6.1.2 Expenditure
While for both Asians and blacks, food is the single biggest expense, for whites it ranks second behind housing. What proportion of expenditure by blacks is' on food is difficult to determine as the data are conflicting. For blacks expenditure patterns in rural and urban areas are largely similar except for slight differences in expenditure on food and housing. Rural households spend proportionally more on food and proportionally less on housing than do urban households. This possibly reflects the larger mean household sizes and the largely informal nature of rural areas. Even in the rural parts of the DFR, few black households rely on subsistence production, perhaps indicating the extent to which these rural areas have been integrated into the urban economy.
6.1.3 Poverty datum line
The final concern is a comparison of household incomes with a poverty datum line. Whether or not a . regionally accepted poverty datum line' exists was difficult to determine. However most of the literature concerned with attempting to quantify the extent of poverty, either in the DFR as a whole or some part thereof, use some version of the household subsistence level (HSL) published by the Institute for Planning research at University of Port Elizabeth. The most common modification of the HSL is to adjust it for the mean household size of the area/race under analysis. The same approach has been adopted here.
Modification of the HSL for mean household sizes (using DRA data) showed that between 51.6% and 59.7% of rural black households fall below the poverty datum line. In Umlazi, a largely formally settled area, between 33.9% and 44.6% of black households fall below the HSL. While it is not possible to establish the extent of poverty in informal settlements the fragmentary data which exists suggests that the situation is possibly worse than in formal black residential areas and similar to rural areas.
While one cannot establish precisely the extent of poverty for Asian and coloured households, modification of the HSL using CSS household size data, showed that about 25% of Asian families and 15% of coloured families fell below the HSL.
126

6.2 NON-INCOME INDICATORS OF POVERTY
6.2.1 Mortality
Wtdlresp-e·ct-to-genefal-m0-f~al.i·ty-r-ates..o£.theJ)1a.Glcp_Q ulation, inconsistencies in the data led to the conclusion that such data are unreliable. In addition, the wide variation in blac mortality rates between different areas was seen to reinforce the above conclusion. This problem was seen to stem from the under-notification of black deaths. The opposite ccnc:!'..!sicn '.vas drav.fll for the white, coloured 2nd Asian populations.
Mortality rates for black infants by magisterial district could not be calculated given the CSS does not provide such data. This is a problem which needs to be addressed, but is one which serves to highlight the under-notification of black births.
IMRs within the area under investigation were found to follow national trends. While white and Asian infants and children enjoy low rates of mortality comparable with their counterparts in the richest developed countries, both coloured and black infants and children have significantly higher rates.
6.2.2 Morbidity
The data available on morbidity are essentially poor. Given that CSS data on morbidity are available only in highly aggregated form, it is impossible to calculate morbidity rates for racial groups for specific regions/districts.
Data on infectious diseases within the DMR were available from the Durban MOH reports (1980, 1985, 1991). However, such data pertains only to infectious disease notification and not incidence. Consequently, this source of data is subject to undercount.
6.2.3 Nutrition status
Information on the nutrition status of children in South Africa is fragmented and incomplete. The need for a systematic national and regional surveillance programme to combat malnutrition remains paramount. At present, estimates of the extent of the problem have had to be made from occasional or regional studies, which are carried out on selected groups from which inferences are made concerning at-risk groups.
The results of the four anthropometric surveys analysed in Section 3.4.3, concerning the nutrition status of children outside the DMR, conform to the national results of methodologically similar studies. While they generally indicate that no current crisis exists in these representative communities, they do indicate previous chronic malnutrition, evidenced by reasonably high proportions of these communities suffering from stunting. Since this reflects long-term negative socio-economic environmental changes, it serves to highlight the need to monitor peri-urban settlements which serve as catchment areas for urbanisation from rural areas.
127
6.2.4 Immunisations
The level of immunisation of babies under one year of age is a useful indicator of community health status. Although this statistic is generally unavailable, there is reasonable coverage
-----wi-thi·f1-the-9MR,gi-v.eR.-t.he-D.utban_Ci.ty_Health DeQartment's programme of immunisation at schools and the services offered at all child and family health clinics within the area. The data does suggest possible disparity amongst racial groups, particularly blacks. Also, what is of great concern is the extent of immunisation coverage in peri-urban and rural areas which are not covered by the City Health Department's programme nor enjoy the same access to clinic facilities as urban areas.
6.2.6 Literacy and skill levels
Although the census data reveal some disparities in education levels between urban and rural areas and between different races, the data are not entirely satisfactory. More useful inferences could be derived from data concerned specifically with the economically active population.
The available data suggest a definite urban/rural distinction. While in urban areas, 22.39% of the population of school going age had a matric or better, in the rural population this figure' stands at 5.63%. Moreover in rural areas the ratio of diplomates to holders of degrees is much greater than in urban areas - suggesting a higher proportion of vocationally trained people. A possible reason for this difference is that those who have degrees may be more likely to migrate from rural areas.
Although the data indicate marginal differences both at the extremes of education (ie less than standard three and above matric) and in certain categories, there do not appear to be any obvious gender-based differences in education and hence literacy or skill.
The data also indicate racial differences. Whites have the highest percentage of matriculants, diplomates and people holding degrees. Although blacks are the have the lowest skill levels, rural blacks, the poorest scetion of the population, have the worst literacy and skill levels.
6.3 ACCESS TO ESSENTIAL GOODS AND SERVICES
6.3.1 Housing
While there is agreement that the majority of the black population in the DFR are informally housed, quantifying the magnitude of changes in informal settlements in the last five to 10 years is difficult. While it is possible to identify those settlements which have appeared in the last five to 10 years, establishing the number of inhabitants and occupancy rates of houses is more difficult. The literature contains conflicting estimates of population. Furthermore, although one can identify the types of structure in different settlements. data on the numbers of the different types of structures do not exist.
128

6.3.2 Es~ential services: electricity, water and sanitation
Establishing details of the extent of electrification in the DFR is a difficult task. The prevailing perception is that established formal residential settlements, irrespective of race,
-----atready-have-access-to-eiectri-crty:-"Fhis-pefeeptien-is-stl'ppefl:ecl-:by-ffagm-entary-cl·ata-which·-----suggest some correlation between the number of formal houses and the extent of electricity coverage. An extensive electrification campaign began in the region in 1991, which aims to electrify 95% of all dwellings within the DFR within the next three to four years.
The extent of coverage of existing water supply appear to be similar to that of electricity. Reasonably high standards of services are generally provided for the white, coloured and Asian communities. However, where the black population is concerned, water supply and sanitation range from full services to a total lack of services. The 'formal' urban sector is generally supplied with individual water connections and waterborne sanitation. Informal settlements, on the other hand, initially tend not to have any piped water supply, relying on available raw water resources.
Precise detail on the extent of coverage of both electrifcation and water supply do not exist.
6.3.3 Transport
Establishing access to transport and assessing the quality of the different services provided is difficult. The data on car ownership rates which do exist indicate that Asians, blacks and coloureds are more in need of public transport than whites. Assessing the quality of those services provided for Asians, blacks, and coloureds is not possible.
6.3.4 Access to health facilities
Although at the aggregated level of NatallKwaZulu the person:bed ratios are satisfactory, disaggregated data reveals intra-regional discrepancies. While hospital facilities in Natal (Chatsworth, Durban, Inanda and Pinetown: Region 48) appear to be adequate on the basis of both person:bed ratios and spacial accessability, those in KwaZulu (Umlazi) appear to be inadequate in terms of the population served. Within Region 48, the person:bed ratio stands at 117: I, well within WHO recommendations of 250: I, whilst, in Umlazi, the person:bed ratio is six times greater.
The highest person:cIinic ratios were found to exist in Ntuzuma, Umlazi and Inanda (in descending order). In terms of WHO recommendations of one clinic per 10 000 people, only Durban and Pinetown exhibited adequate facilites, illustrating a discrepancy between rural and peri-urban areas, on the one hand, and urban, on the other.
6.3.5 Credit
Although the brief called for some analysis of access to credit no data relevant to the Durban region could be found. A masters student in the Economics Department at the University of Durban-Westville is, however, presently conducting research into credit in the region.
129

6.4 POVERTY ALLEVIATION PROGRAMMES
6.4.1 Feeding schemes within the Durban region
Well established feeding schemes have oeen in operation in tlrei7urb,an-R:eg-ien-fer-a-FH±ffi&e·F---___ 1
of years. The most prominant are the Durban City Health Department's scheme, Operation Hunger, Feed the Babies Fund and the Argus Milk Fund. Importantly, these feeding schemes function through the established system of clinics operating in the Durban region as well as creches and schools.
6.4.2 Public work schemes
Local public works schemes that had historically been in operation had been closed down due to a cessation of funding. The reasons for this state of affairs is unclear but seems to stem from a national restructuring of the Department of Manpower.
6.4.3 Pensions
South Africa's welfare system is divided according to racial categories. Whites are served by the ministry of Home Affairs in the House of Assembly, Indians by the House of Delegates and coloureds by the House of Representatives. Africans receive welfare payments from the Natal Provincial Administration and the KwaZulu government. A crude indicator of the number of African old-age pensioners is 77.3 per cent of urban and 70.8 per cent of rural inhabitants eligible for old-age pensions,
6.4.4 Development initiatives within the Durban region
At present, there are four major developmental initiatives within the DMR: the RSAlKwaZulu Development Project (RKDP), Operation Jumpstart, the DFR Metropolitan Development Forum and the loint Executive Authority'S (JEA) DFRFramework Plan (DBSA, 1993).
Of the four initiatives the DFR Metropolitan Development Forum was seen to hold the most promise for the future. Underlying this forum is the recognition that decisions regarding the development of the DFR need to be made at a metropolitan level in a co-ordinated and strategic fashion and that such decisions, regarding the allocation of financial resources, are premised on the existance of a politically acceptable decision-making process. The DBSA views this forum as a potentially extremely important vehicle in assessing projects, prioritising the allocation of resources, promoting development and facilitating the restructuring of local government (DBSA, 1993).
130

APPENDIX 1.1
LOCAL AUTHORITIES WITHIN THE DURBAN REGION
-M-a-gfsterhrl-Distrj'ct bj·ty..c+OW" Au.tho.r:i~
Durban Durban Durban city Westville Westville Queensbur~h Queensburgh Amanzimtoti Amanzimtoti Kingsburgh Kingsburgh Isipingo Beach Isipingo Beach Glen Anil Glen Anil Chesterville Chesterville Yellowwood Park Yellowood Park IIlovo Lower Illovo Umbogintwini Umbogintwini Ningizimu Ningizimu
Chatsworth Chatsworth NPA Lamontville NPA Shallcross DSB KlaarwaterlSt Wendolins NPA
Pinetown Clermont NPA . KwaDabeka NPA
Dassenhoek KwaZulu Hillcrest Hillcrest . Pinetown Pinetown municipality ;
KwaNdengezi KwaZulu New Germany New Germany Kloof Kloof Marianhill Marianhill Crestholme DSB Everton Everton
:
Waterfall DSB Gillits Emberton Gillits !
Umlazi Umlazi KwaZulu
131
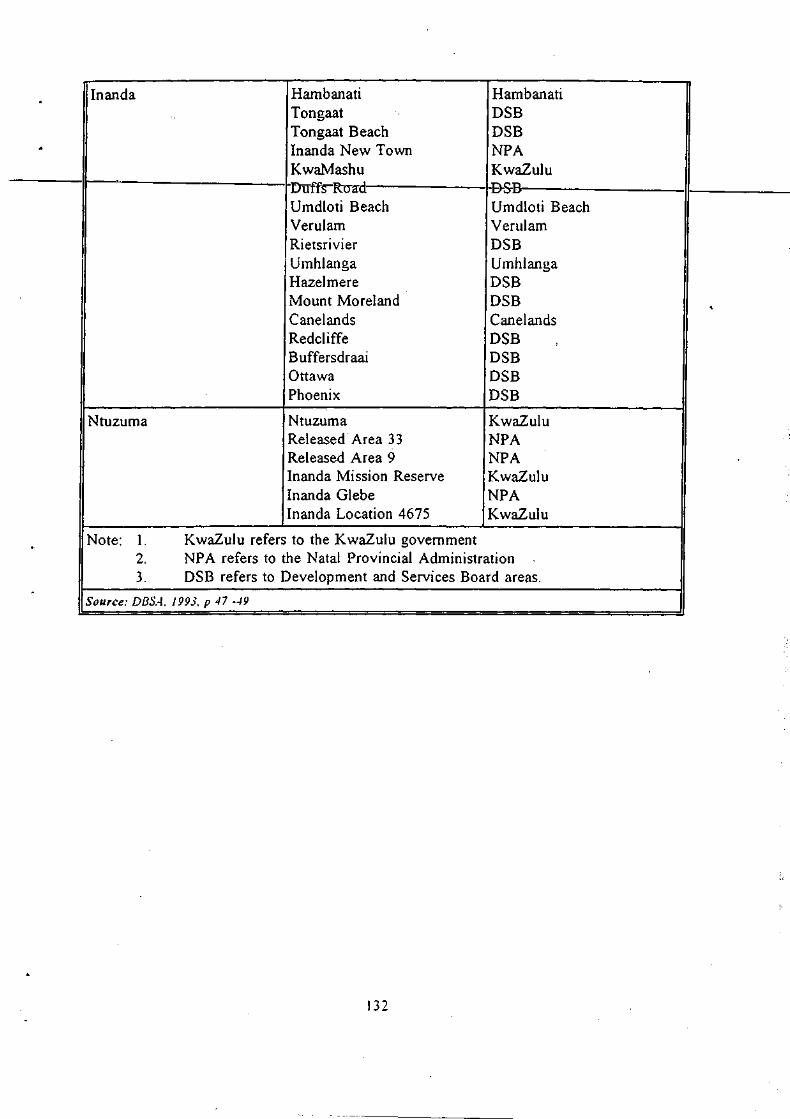
Inanda Hambanati Hambanati . Tongaat DSB Tongaat Beach DSB . Inanda New Town NPA KwaMashu KwaZulu Drrffs-R(Yad -B-5-B Umdloti Beach Umdloti Beach Verulam Verulam Rietsrivier DSB
. Umhlanga Umhlanga Hazelmere DSB Mount Moreland DSB , Canelands Canelands Redcliffe DSB B uffersdraai DSB Ottawa DSB Phoenix DSB
Ntuzuma Ntuzuma KwaZulu Released Area 33 NPA Released Area 9 NPA Inanda Mission Reserve KwaZulu Inanda Glebe NPA Inanda Location 4675 KwaZulu
Note: 1. KwaZulu refers to the KwaZulu government . 2. NPA refers to the Natal Provincial Administration 3. DSB refers to Development and Services Board areas.
-Source: DBSA, J 993, p 47 -49
132

APPENDIX 3.1
1985 Population Census Figures by Race and Magisterial District .. : D.B.!S __ t-lNANnA- e.I.NlLTO-WN- -NXUZUM.A-r-llMbAZ,.1
WHITES 215344 15440 77146 225 29
COLOUREDS 39749 15425 4751 670 166
ASIANS 125259 166101 199497 2831 9
BLACKS 65966 18693 38704 327863 204398 I
i
S(/urce: CSS Report 0]-85-02
1991 Population Census Figures by Race and Magisterial District
DBN INANDA PINETOWN NTUZUMA UMLAZI
WHITES 228586 15418 83480 39 1
COLOUREDS 42082 16301 6494 132 130
ASIANS 122352 141040 211876 32 0
BLACKS 80805 25922 62324 458326 299145
Source: CS5 Report 03-V / -OJ.
1988 Interpolated population census figures using a linear natural logarithmic function
DBN [NANDA PINETOWN NTUZUMA UMLAZI
WHITES 221866 15429 80251 94 5
COLOUREDS 40705 15857 5555 297 147
ASIANS 124040 200092 205593 301 -BLACKS 71785 22013 49114 387644 247274
Source: C55 Reports OJ-V / -03, OJ-85-VJ
133

1990 Interpolated population census figures using a linear natural logarithmic function
~ DBN INANDA PINETOWN NTUZUMA UMLAZI
WHITES 226324 15422 82389 52 2
COLOUREDS 41684 16152 6164 173 135
ASIANS 122832 226536 209761 68 -BLACKS 78118 24547 57567 433439 280746
r Source: css Repor~s OS-01-03, 02-85~02 I I ,
II
. 134

APPENDIX 3.2: DISEASE NOTIFICA nONS WITHIN THE DMR; LOCAL, IMPORTED AND EX-CITY
'. Local disease notification
White Black Coloured Asian Total
Acute Rheumatic Fever 0 1 1 2 4
Cholera 0 0 0 0 0
Congenital Syphilis 0 0 0 0 0
Leprosy 0 0 0 0 0
Malaria 0 0 0 0 0
Measles 1 9 2 2 14
Meningococcal Meningitis 2 I 1 5 9
Meningococcal Septicaemia 0 1 0 0 I
Poliomyelitis 0 0 0 0 0
Rabies 0 0 0 0 0
Rodenticide Poisoning 0 0 0 1 0
Rheumatic Heart Disease 0 1 0 0 I
Tetanus 0 0 0 0 0 .
Tetanus Neonatorum 0 0 0 0 0
Typhiod Fever I I 1 9 12 33 . Viral Hepatitis A 88 3 33 26 150
Viral Hepatitus B 10 5 5 7 27
Viral Hepatitus C I 1 1 0 3
Viral Hepatitus Unspecified 1 1 1 0 3
TOTAL 103 53 34 57 247
135

Imported disease notification
White Black Colour'ed Asian Total ',.
Acute Rheumatic Fever 0 0 0 0 0
-eh6+era Q- 1 Q Q 1
Congenital Syphilis 0 0 0 0 0
Leprosy 0 0 0 0 0
Malaria 3 0 0 0 0
Measles 0 0 0 0 0
Meningococcal Meningitis 0 0 0 0 0
Meningococcal Septicaemia 0 0 0 0 0
Poliomyelitis 0 0 0 0 0
Rabies 0 0 0 0 0
Rodenticide Poisoning 0 0 0 0 0
Rheumatic Heart Disease 0 0 0 0 0
Tetanus 0 0 0 0 0
Tetanus Neonatorum 0 0 0 0 0 I
Typhiod Fever 0 2 0 2 4 I
. Viral Hepatitis A 1 0 0 0 1
Viral Hepatitus B 0 0 0 1 1
- Viral Hepatitus C 0 0 0 0 0
Viral Hepatitus Unspec. 0 0 0 0 0
TOTAL 4 0 3 5 12
:
'" ,
136

Ex-city disease notification
White Black Coloured Asian Total .. Acute Rheumatic Fever 0 11 0 1 12
-Cholera 0 0 0 0 0
Congenital Syphilis 0 6 0 0 6
Leprosy 0 7 0 0 7
Malaria ..,
17 0 0 20 .>
Measles 0 128 1 3 132
Meningococcal Meningitis 4 18 2 2 26
~ Meningococcal Septicaemia 0 0 0 0 0
Poliomyelitis 0 1 0 0 1
Rabies 0 1 0 0 1
Rodenticide Poisoning 0 0 0 0 0
Rheumatic Heart Disease 0 14 0 0 14
Tetanus 1 9 0 0 10
Tetanus Neonatorum 0 5 0 0 5
Typhiod Fever 0 135 I I 137
. Viral Hepatitis A 19 36 I 2 58
I
Viral Hepatitus B 1 127 2 0 130 .
Viral Hepatitus C 0 0 0 0 0
i Viral Hepatitus Unspec. 0 7 0 0 7 I
TOTAL 28 522 7 9 566 . i Source: City 0/ Durball AIIII/Ial Report 0/ the .11edical Officer 0/ Health. 1991. p. 16. i
137

Appendix 4.1
KEY
HQSEIIALS:
A. General Medical HP. Heliport
B. General Surgical I. Occupational Therapy
BA. Number of Theatres J. Specialist Services Available
C. Maternity (No. of Beds) K. Spinal Cord Injuries Unit
CA. Casualty Dept. L. Psychiatric
D. Aged and Chronic Sick LA. Linear Accelerator for Canc'er
E. Tuberculosis M. Intensive Care
F. Infectious Cases N. High Care
G. X-Ray O. Orthopaedic
H. Physiotherapy P. Medical Labor~tory Services
:
CLINICS:
A. Ante-natal P. Polyclinic
C. Child Health Ps. Psychiatric
CPo Cancer Prevention Scr. Screening
D. Dental STD. Sexually Transmitted Diseases
F. Family Planning T. Tuberculosis I I
G. Geriatric VD. Veneral Disease
HE. Health Education YC. Youth Centre
1. Immunisations
ID. Infectious Diseases
M. Maternal Health
4.1.1 DURBAN METROPOLITAN REGION
138

4.1.1.1 Provincial Hospitals:
., NAME OF INSTITUTION NO. OF SERVICES PROVIDED BEDS
AdClington fO"I f\-;13:e{8'7jI):F , 6~f:l;t;:r,I:~Ntel;P;I=It>
Clairwood 1307 A,B,C(47),G,P,HP
Hillcrest (House of Asssembly) 231 D, Outpatients
R.K. Khan 694 A,B,C(l50),G,H,I,J,N,O,P
King Edward VIn 1983 A,B,C(350),G,H,I,J,L,M,O,P
King George V 1735 C(20),E,G,H,I,J,L,M,O,P
TOTAL BEDS 5950
139

4.1.1.2 Private Hospitals
'. NAME OF INSTITUTION NO. OF SERVICES PROVIDED BEDS
, Arena Park 30 i A,H,BA(lr,c,CA,CJ,r,O ,P
Chatsmed Garden Hospital 161 A,B,BA(7),C(l7),CA,G,H,HP,I,J,L,M,N,O, P
City Hospital 121 A,B,G,J,M,O, Dental
St. Aidens Mission 268 A,B,C(45),G,M
St. Augustines 394 A,B,BA( 15,C(28),CA,G,H,HP,I,J,L,M,N,O, P, Catherisation; Open Heart Surgery;C.A.T. Scanner; Bone Densitometer;Trauma Unit; Haemodialysis; Renal Transplants: Endoscopic Surgery; Laser Surgery and Therapy; G.!. Unit; Stomatheraphy Unit.
Dayanand Garden Home for 260 D,H,! the Aged
Durdoc Clinic 46 A,B,G,J,O,P,Dental Division of Dbn Anaesthetic Clinics
, Entabeni 292 A,B,G,H,J,L,M,N,O,P
Lancet Clinic (Div. of City 29 A,B,J,O,Dental, Overnight anaesthetic
. Hospital) recovery
Maxwell Clinic (Div. of 16 A,B,J,O,Dental City Hospital)
McCord 286 A,B,C(65),E,F,G,H,J
Parklands Nursing Home 177 A,B,C(35),G,H,1,M,L,P, Laser -
Shifa 96 A,B,C{ll),F,G,J,L,M
TOTAL BEDS 1916
GRAND TOTAL OF BEDS 7866 (PROY. + PRY)
4.1.1.3 Clinics
140

(i) Local Authority Clinics:
. NAME ON INSTITUTION SERVICES PROVIDED
AJbert Park C,I,F
Asherville C,I,F
Austerville C,F,I,T
Caneside C.F,I
Chatsworth - Unit 2 C,I,F,T
Chatsworth - Unit 6 (Township Centre) C,F,I,T,G
Chatsworth - Unit 10 C,F,I,T ,
Chesterville T,G,I,F
City (Lancers Road) C,I,F
Clairwood C,F,I,T I
Clare Estate C,F,I,T
Congella - Umbilo C,F,I
Durban North
Greyville
Glenwood C,F,I ,
Grosvenor C,F,I
. King Edward VIn Hospital SID
Lamontville C,F,I,T,G
Merebank C,F,I,T
Morningside
Montclair C,I,F
Mount Vernon C,F,I
Newlands East C,I,F,T
Newlands West C,F,I
Old Fort Place C,F,I
Overport
Phoenix Community Health Centre C,F,I,T
Point and City C,I,F
Red Hill
Reservoir Hills C,F,I
Reunion C,I,F
. Sea View C.F,I
141

.
. Sparks Estate
Stonebridge - Phoenix
Sydenham Heights
Wentw€>rth
Woodlands
Umbilo - Carrington Heights
Umhlatuzana
(ii) Other Clinics:
NAME ON INSTITUTION
Arundel Gardens
Bayview
Besters Camp
Glen Earle
Grove End
Hillary
KwaDabeka Community Health
Woodhurst
TOTAL = 8
(iii) Mobile Clinics:
Bon'ella
Bottlebrush
Cato Manor
Hillside
Welbedene
TOTAL = 5
GRAND TOTAL = 53
C,F,!
C,F,I,T
C,F,I,G
C,F,!
C,F,I
C,F,!
G
SERVICES PROVIDED
C,F,I,T,VD,CP,P,Ps,D,Scr,G
142

.~
4.2 PINETOWN
4.2.1 Private Hospitals
NAME OF INSTITUTION
Don Mackenzie
St. Marys
Westville
TOTAL BEDS
4.2.2. Clinics
(i) Local Authority Clinics:
NAME OF INSTITUTION
Chancery Lane
Dassenhoek
Klaarwater
Kloof
Marianridge
Mpola
New Germany (Municipal)
Northdene
St Wendolins
Tshelimnyama
Westville (Municipal)
TOTAL = 11
(ii) Mobile Clinics:
Mariannhill
Klaarwater
TOTAL = 2
GRAND TOTAL = 13
NO. OF BEDS SERVICES PROVIDED
258 A,B,F
301 A,B,C(80),D,E,F,G,H,I ."
195 A,B,C(23),G,H,HP,I,J,M,N,O,P,Las er,Dental, Maxillofacial '.'
754
SERVICES PROVIDED
T,VD,D
C,I,F,G
C,F,I,T,VD
A,C,CP,F,G,I,PC
C,I,F,T,VD,G,A
i·,:
143

" 4.3 NTUZUMA
4.3.1. Clinics
Goodwins
KwaMashu Polyclinic
Kwa Simama
Ntuzuma
Rydalevale
Sivananda
TOTAL = 6
4.4 INANDA
4.4.1 Provincial Hospitals
NAME OF INSTITUTION
Osindisweni (NP A Trust)
TOTAL BEDS
NO. OF SERVICES PROVIDED BEDS
450 A,B,C(42),E,F,G,P
450
144

~, 4.4.2 Private Hospitals
. NAME OF INSTITUTION NO. OF SERVICES PROVIDED BEDS
Fosa TB Settlement 250 E
Mt. Edgecombe 20 A,B,E,BA( 1 ),(Paed)
Phoenix Community Health 25 A,B,C(25),G,L,H Centre
Phoenix 81 A,B, C( 14), G,H,J, ° Tongaat-Hullet Group 70 A,B,C(7),F
Tongaat-Hullet's 68 A,B,C(2),BA(1)(Paed ..
Kearsney Estate
Yictoria 124 A,B,BA(3 ),C( 18),D,F,G,H,I,J,L,M,N,O,P
TOTAL BEDS 638
GRAND TOTAL (PROY. + 1088 PRY)
4.4.3. Clinics
(i) Natal National Health Clinics
NAME OF INSTITUTION SERVICES PROVIDE
Newtown Community Health Centre C,F,I,T, VD,CP,P,Ps,D,Scr,G
TOTAL = I
(ii) Welfare Organisation Clinics:
NAME OF INSTITUTION SERVICES PROVIDE
Ekukhanyeni
Ghandi A,C,I,M,T, VD .
Matikwe A,C,I,M,T,VD
Oakford
Umhlanga
TOTAL = .5
. ~, 145

(iii) . Other' Clinics:
Duffs Road Ottawa
-----I~I,.. p·filoenixPOlycfmirc-------------------------II----,...--
Redcliffe Tongaat TOTAL = 5 GRA:N1) TOTAL = 11
4.5 UMLAZI
4.5.1. KwaZulu Hospitals
I NAME OF INSTITUTION NO. OF BEDS SERVICES PROVIDED
Prince Mshiyeni 482 A,B,C(l13),G,J,L,O,P
TOTAL BEDS 482
4.5.2. Clinics: Umlazi
Ekupileni L
Urnlazi D
Urnlazi GG
Urnlazi Q Urnlazi U
Urnlazi V
Urnlazi Polyclinic
Urnzornuhle H
TOTAL = 8
146

4.5.3. Clinics: Umlazi/Umbumbulu
Baniyena Isolempilo
-----lr~w.aMakh.utha.a--------_:__-----------------II_---KwaNdengezi Mfume Mntungwane Nkwali Odidini Ozisweni Umbumbulu Central Zweu Bomvu
4.5.4. Clinics: Vulamehlo
Dududu lolivet Assisi (Mzumbe) TOTAL = 11 GRAND TOTAL = 19
Source: (i) (ii)
Hospital and Nursillg Yearbook, 1991; 1992. City of Durban Annllal Report of the Medical Officer of Health, 1991.
147

"
6. BIBLIOGRAPHY
Ardington, E.M., (1992). Buckpassing in Canaan, Rural Urban Studies Unit, Working Paper No. 24, Durban: University of Natal.
Bekker, S., (1992). The development of Informal Settlements in NatallKwaZulu: Some ideas on the sd)pe and nature of the challenge, unpublished paper, Center for Social and Development Studies, Durban: University of Natal.
Boaden B.G. and T. Gordon, (1989). Land tenure in the DFR, Appendix 9 in The Durban Functional Region - Planning for the 21 st Century. Report 1 The Current Situation. Durban: Appendices, Tongaat-Hulett Properties Ltd.
Bourne, D.E., Rip, M.R. and Woods, D.L., (1988). Characteristics of infant mortality in the RSA 1929 - 1983. South African Medical Journal, Vol. 73, 230 - 232.
Byaraguba, 1., (1991). The impact of urbanisation on the health of black pre-school children in the Umtata district, Transkei._South African Medical Journal, Vol. 79, 444-448.
CHESS, (Nov. 1991). Interrelationships between Vitamen A and other Factors in Children Living in an Informal Settlement, Ch 8, Durban: Centre for Health and Social Services.
CHESS, April. (1993). Nutritional Status of Creche Children in Valley Trust, Durban: Centre for Health and Social Services.
Christens~, F & Gumede A, (1993). Informal settlements within the Durban Functional Region, Durban: The Inkatha Institute for South Africa.
City of Durban Annual Report of the Medical Officer of Health, 1980, 1985, 1988, 1991.
Cross C., Bekker, S., Clark, C. and R. Richards, (1992). Moving On: Migration Streams Into and Out of Inanda, Natal Town and Regional Planning Supplementary Report, Vol 38, Pietermaritzburg: Natal Town and Regional Planning Commission.
CSS,( 1980), Population Census. Age by Development Region, Statistical Region and District, Report no. 02-80-04, Pretoria: Government Printer.
CSS, (1980). Level of Education by Development Region, Statistical Region and District, Report No 02-80-07, Pretoria: Government Printer.
CSS, (1985). Population Census. Age by Development Region, Statistical Region and District, Report no. 02-85-02, Pretoria: Government Printer.
CSS, (1990). Deaths of Blacks I,Report No. 03-10-0, Pretoria: Government Printer.
CSS, (1990). Deaths: Whites, Coloureds and Asians, Report no. 03-09-01, Pretoria: GovernmerH Printer.
148
~------------------------

CSS, (1990). Births: Whites, Coloureds and Asians, Report no. 03-05-01, Pretoria:. Government ?rinter.
CSS, (1990). Survey of Household Expenditure - 1990, Report No. 10-11-0 1, Pretoria: Government Printer.
CSS, (1991). ~opulation Census. Age by Development Region, Statistical Region and District, Report no. 03-01-03, Pretoria: Government Printer.
CSS, (1991). Level of Education by Development Region, Statistical Region and District, Report No 03-01-07, Pretoria: Government Printer.
CSS, (1991). Occupation by Development Region, Statistical Region and District, Report No 03-01-08, Pretoria: Government Printer.
CSS, (1991). Economic Sector by Development Region, Statistical Region and District, Report No 03-01-09, Pretoria: Government Printer.
CSS, (1991). Income by Development Region, Statistical Region and District, Report No 03-01-10, Pretoria: Government Printer.
CSS, (1991). Households, Report No 03-01-26, Pretoria: Government Printer.
Data Research Africa, (1992). A.study of income and expenditure and other socio-economic patterns in the urban and rural areas of KwaZulu Vol I, Report prepared for the KwaZulu Finance and Investment Corporation and the Department of Economic Affairs, KwaZulu Government, Durban: KFC.
Data Research Africa, (I992). A.study of income and expenditure and other socio-economic patterns in the urban and rural areas of KwaZulu Vol 6, Report prepared for the KwaZulu Finance and Investment Corporation and the Department of Economic Affairs, KwaZulu Government, Durban: KFC.
Data Research Africa, (1992). A.study of income and expenditure and other socio-economic patterns in the urban and rural areas of KwaZulu Vol 7, Report prepared for the KwaZulu Finance and Investment Corporation and the Department of Economic Affairs. KwaZulu Government, Durban: KFC.
Davies. R.J., (1991). Durban, in, Lemmon, A., [ed]. Homes Apart: South Africa's Segregated Cities, Cape Town: David Phillip.
DBSA, ( 1991 a). Economic and Social Memorandum: Region E, Midrand: Development Bank of Southern Africa.
DBSA, (1991 b). South Africa: An inter-regional experience, Midrand: Development Bank of South Africa.
149

" DBSA, (1993). Durban Functional Region: Strategic Urban Perspective, Midrand: Development Bank of South Africa.
Engelhardt, [ed.], (1991). Hospital and Nursing Yearbook, Pretoria: Department of National -----Heahh-ancl-Popttl-ati-ofl-DeveleJ7men·r.-t.------------------_______ _
•
Engelhardt, [ed.], (1992). Hospital and Nursing Yearbook, Pretoria: Department of National Health and Population Development.
Glatthaar, 1., (1992). Protein-energy malnutrition in South African pre-school children. South Africa's Continuing Medical Educational Monthly, Vol. 10, No.8, 1329 - 1340.
George, M.F., (1990). A Factual Update of the Durban Functional Region, 1990, Durban: The Inkatha Institue for South Africa. .
DNHPD, (1991). Health Trends in South Africa, Pretoria: Department of National Health and Population Development.
Hugo-Hamman, c.T., KibeI, M.A., Michie, C.A. and Yach, D., (1987). Nutrition status of pre-school children in a Cape Town township._South African Medical Journal, Vol. 72, 353 - 355.
HG&P, (1989). Water Plan 2025: Prepared for Umgeni Water, Durban: Horne, Glasson and Partners.
Institute for Planning Research, (1991). The Household Subsistence Level in Major Urban Centres of the Republic of South Africa, Fact Paper No.88, Port Elizabeth: University of Port Elizabeth.
KEHIS, (1993). KwaZulu Indicators, Unpublished mimeograph, 30/04/93, KwaZulu Epidemiology & Health Information System, Durban: Department of Health, KwaZulu.
Kotze, J.P., de Hoop, M.E., van Middelkoop, A. and van der Walt, E., (1988). Voedingstatusopname van voor-skoolse swart kinders in Botshabelo._Food Review, FeblMar (suppl), 87-89.
Krige, D., (1990). The basic needs approach to development: the question of health care for black people in Natal. Development Southern Africa, Vol. 7, No.1, 53 - 66.
Kustner, H.G.V., (1984). The Inanda Nutrition Survey. Epidemiological Comments, Vol. 11, No.7, 6 - 30.
Le Roux, I.M. and Le Roux, P.J., (1991). Survey of health and nutrition status of a squatter community in Khayelitsha._South African Medical Journal, Vol. 79, 500-503.
May, J.D., (1986). A Study of Income and Expenditure in Urban KwaZulu - Umlazi, Studies in Development, No 7/86, Durban: KwaZulu Finance Corporation Occasional Publication .
150
4, May, J.D., (1993). Demography and social concerns in region E, Durban: Data Research Africa. .
McGrath, M.D. (1989). Income distribution, expenditure patterns and poverty, Appendix 3 in -----+he-.-.I;;hn:baR E.un.~tionaLRegio~anning for the 21 st Century. Report 1 The Current
Situation: Appendices, Durban: Tongaat-Hulett Properties Ltd ..
•
. ~
MTAB, (1990). Interim Transport Plan for the years 1989-1994, Durban: Durban Metropolitan Transport Advisory Board.
NNWG, (1993).The Evaluation and Monitoring of the National Nutrition and Social Development Programme (NNSDP). Natal region. Final report submitted to the Department of National Health' and Population Development (Natal Region) by the Natal Nutrition Working Group.
Ramphele, M.A., Heap, M. and Trollip, D.K., (1991). Health Status of hostel dwellers. Part III. Nutritional status of children 0 - 5 years._South African Medical Journal., Vol. 79, 705 - 709.
Regional Health Organisation of Southern Africa (RHOSA), (1985). Anthropometric assessment of the nutritional status of rural black children under the ~of five years. South Africa, Pretoria: Department of National Health and Population Development.
Sutcliffe, M. (1989). Housing, Appendix lOin The Durban Functional Region - Planning for the 21st Century. Report 1 The Current Situation: Appendices, Durban: Tongaat-Hulett Properties Ltd.
Tongaat-Hulett, (1989). The Durban Functional Region - Planning for the 21 st Century. Report 1 The Current Situation: Durban: Tongaat-Hulett Properties Ltd.
Waterlow et aI, (1977). The presentation and use of height and weight data for comparing the nutritional status of groups of children under the age of ten years. Bulletin of the World Health Organisation, Vol. 55, No.4, 489.
Watters, D.A.K., Haffejee, A.A., Angorn, I.B. and Duffy, K.J., (1985). Nutritional parameters in urban and rural Zulus. South African Medical Journal, Vol. 68, 582 - 584.
World Bank, (1993). Durban Functional Region: Urban Sector Reconnaissance, Washington D.C: World Bank Mission.
WHO, (1981). Development of Indicators for Monitoring Progress towards Health for All Qy the Year 2000. Geneva: World Health Organisation.
WHO, (1983). Measuring Change in Nutritional Status. Geneva: World Health Organisation.
Yach, D., (1988). Infant mortality rates in urban areas of South Africa, 1981 - 1985. South African Medical Journal, Vol. 73, 232 - 234 .
I ~ I

. ,
&
\ ..
,
Yach, D., Coetzee, N. Hugo-Hamman, C.T., Fischer, S.A. and Kibei, M.A., (1990) . Identifying children at risk i!1 j)eri-urban Cape Town. South African Journal of Epidemiology Infections. Vol. 5, 6-8.
Zwarenstein, M., Krige, D., and Wolff, B., (1991). The use of a geographical catchment area res'earch in NatallK waZulu. South AfrIca Mea-Ical Journai,VOrgO-;-497--=-5UO"'".----------
152