PRODUCTIVE PERFORMANCE OF DANDARAWI CHICKENS DURING REARING AND LAYING PERIODS AS AFFECTED BY...
13
Egyptian J. Anim. Prod. (2012) 49(1):53-65 Issued by The Egyptian Society of Animal Production PRODUCTIVE PERFORMANCE OF DANDARAWI CHICKENS DURING REARING AND LAYING PERIODS AS AFFECTED BY DIFFERENT PHOTOPERIODS DURING THE REARING PERIOD M. El-Sagheer Department of Animal and Poultry Production, Faculty of Agriculture, Assiut University, 71526 Assiut, Egypt SUMMARY The lighting program can have a major influence on the productive performance of Dandarawi chickens during rearing and laying periods. Two hundred 8 weeks old Dandarawi pullets were equally distributed into 5 groups (G1 to G5). The pullets in G1 to G5 were exposed during the rearing period (8 to 18 weeks of age) to 8L:16D, 10L:14D, 12L:12D, 14L:10D, and 16L:8D hrs daily, respectively. The results showed that, at 26 and 62 weeks of age, no significant differences were observed in body weight among the 5 groups. Body weight gain during the rearing period for G5 significantly (P≤0.05) exceeded that of all the other groups. The total mortality rate (8-62 weeks of age) of the G3 group was lower than those of the other groups. The age at sexual maturity decreased gradually with increasing the photoperiod. No significant differences were observed in feed consumption (FC) and feed conversion, as g feed per g gain during rearing period among the 5 groups. However, during laying period, the hens of the 12L:12D group had significantly (P≤0.05) better feed conversion as g feed per g egg mass; decreased FC; greater egg production, eggs number, egg mass; and better shell percentage and economical efficiency than the other groups. No significant differences were observed in egg weight, egg shape index, egg yolk and albumen percentages among the 5 groups. The egg yolk index of 14L:10D group was significantly better (P≤0.05) those of the other groups. Haugh units of the G2, G3 and G4 were significantly (P≤0.05) higher than those of the G1 and G5. It was recommended to expose Dandarawi pullet’s, during the period from 8 to 18 wks of age, to 12L:12D hrs daily to obtain higher productive performance during the laying period . Keywords: Dandarawi, photoperiods, rearing, laying, egg quality, performance. INTRODUTION The light durations (photoperiods) during the rearing period of chickens are one of the most crucial environmental factors for controlling sexual maturity, body weight, activity, feed consumption, egg production and egg weight. The main objective of controlled lighting in the growing period is to retard or delay sexual maturity so as to increase early egg size and minimize mortality at the onset of lay. The adoption of a correct lighting program to achieve the desired egg output can have an enormous effect on income from eggs and profitability of the flock. (Morris, 1985; Hamilton and Kennie, 1997; and Mendes, et al., 2005). Research has shown that there is an optimum age for pullets to reach sexual maturity (50% lay) for each genetic stock and each set of economic conditions. The pattern of changing day length experienced by birds influences them in two ways: The first way, increasing natural day length, as occurs in spring, accelerates sexual maturity of growing pullets for the strain (produced by photo- stimulation at an early age) results in more total eggs but large numbers of small and peewee eggs. The second way, decreasing day length, as in autumn, slow growth, retards sexual maturity of growing pullets and restrains egg production. The heavier the pullet is at maturity, the larger her egg size will be, not only initially, but for her entire productive life (Leeson and Summers, 1985; Morris, 1994, and Lewis et al., 1996a). The standard lighting program we refer to in our management guides is to start chicks the first week with 20-22 hours of light per day. Then reduce day length each week to reach 8- 12 hours by eight weeks of age, or, in open housing, the longest natural day length the flock will experience between 8 and 18 weeks. That day length should be kept constant until maturity. Longer day lengths during the growing period usually result in more feed intake and heavier body weights. Assuming body weight is at or above target, light stimulation can begin at 17-18 weeks with weekly increases in day length of 30 minutes initially, and 15 minutes later, until about 16 hours of total day length is reached. That type of "normal" program should achieve the egg size and egg number standards we publish in
-
Upload
independent -
Category
Documents
-
view
4 -
download
0
Transcript of PRODUCTIVE PERFORMANCE OF DANDARAWI CHICKENS DURING REARING AND LAYING PERIODS AS AFFECTED BY...

Egyptian J. Anim. Prod. (2012) 49(1):53-65
Issued by The Egyptian Society of Animal Production
PRODUCTIVE PERFORMANCE OF DANDARAWI CHICKENS DURING
REARING AND LAYING PERIODS AS AFFECTED BY DIFFERENT
PHOTOPERIODS DURING THE REARING PERIOD
M. El-Sagheer
Department of Animal and Poultry Production, Faculty of Agriculture, Assiut University, 71526
Assiut, Egypt
SUMMARY
The lighting program can have a major influence on the productive performance of Dandarawi
chickens during rearing and laying periods. Two hundred 8 weeks old Dandarawi pullets were equally
distributed into 5 groups (G1 to G5). The pullets in G1 to G5 were exposed during the rearing period
(8 to 18 weeks of age) to 8L:16D, 10L:14D, 12L:12D, 14L:10D, and 16L:8D hrs daily, respectively.
The results showed that, at 26 and 62 weeks of age, no significant differences were observed in
body weight among the 5 groups. Body weight gain during the rearing period for G5 significantly
(P≤0.05) exceeded that of all the other groups. The total mortality rate (8-62 weeks of age) of the G3
group was lower than those of the other groups. The age at sexual maturity decreased gradually with
increasing the photoperiod. No significant differences were observed in feed consumption (FC) and
feed conversion, as g feed per g gain during rearing period among the 5 groups.
However, during laying period, the hens of the 12L:12D group had significantly (P≤0.05) better
feed conversion as g feed per g egg mass; decreased FC; greater egg production, eggs number, egg
mass; and better shell percentage and economical efficiency than the other groups. No significant
differences were observed in egg weight, egg shape index, egg yolk and albumen percentages among
the 5 groups. The egg yolk index of 14L:10D group was significantly better (P≤0.05) those of the other
groups. Haugh units of the G2, G3 and G4 were significantly (P≤0.05) higher than those of the G1 and
G5.
It was recommended to expose Dandarawi pullet’s, during the period from 8 to 18 wks of age, to
12L:12D hrs daily to obtain higher productive performance during the laying period .
Keywords: Dandarawi, photoperiods, rearing, laying, egg quality, performance.
INTRODUTION
The light durations (photoperiods) during
the rearing period of chickens are one of the
most crucial environmental factors for
controlling sexual maturity, body weight,
activity, feed consumption, egg production and
egg weight. The main objective of controlled
lighting in the growing period is to retard or
delay sexual maturity so as to increase early
egg size and minimize mortality at the onset of
lay. The adoption of a correct lighting program
to achieve the desired egg output can have an
enormous effect on income from eggs and
profitability of the flock. (Morris, 1985;
Hamilton and Kennie, 1997; and Mendes, et
al., 2005).
Research has shown that there is an
optimum age for pullets to reach sexual
maturity (50% lay) for each genetic stock and
each set of economic conditions. The pattern of
changing day length experienced by birds
influences them in two ways: The first way,
increasing natural day length, as occurs in
spring, accelerates sexual maturity of growing
pullets for the strain (produced by photo-
stimulation at an early age) results in more
total eggs but large numbers of small and
peewee eggs. The second way, decreasing day
length, as in autumn, slow growth, retards
sexual maturity of growing pullets and
restrains egg production. The heavier the pullet
is at maturity, the larger her egg size will be,
not only initially, but for her entire productive
life (Leeson and Summers, 1985; Morris,
1994, and Lewis et al., 1996a).
The standard lighting program we refer to
in our management guides is to start chicks the
first week with 20-22 hours of light per day.
Then reduce day length each week to reach 8-
12 hours by eight weeks of age, or, in open
housing, the longest natural day length the
flock will experience between 8 and 18 weeks.
That day length should be kept constant until
maturity. Longer day lengths during the
growing period usually result in more feed
intake and heavier body weights. Assuming
body weight is at or above target, light
stimulation can begin at 17-18 weeks with
weekly increases in day length of 30 minutes
initially, and 15 minutes later, until about 16
hours of total day length is reached. That type
of "normal" program should achieve the egg
size and egg number standards we publish in

El-Sagheer 54
the management guides, mostly based on those
reviewed by Morris (1968), and evaluated later
by Shanawany and Morris (1980).
Intensive poultry production in Egypt
depends not only on commercial hybrids but
also on local strains of chickens. Recently in
Egypt, a considerable attention has been paid
to improve the productive performance of
these local strains, especially Dandarawi.
Although many researches have been carried
out to determine the optimal requirements of
different local strains under different locations
in Egypt, the available data regarding their
requirement of photoperiods during rearing are
still insufficient. Therefore, this study aimed at
evaluating productive performance of
Dandarawi chicken during rearing and laying
as affected by different photoperiods in the
rearing period.
MATERIALS AND METHODS
This experiment was carried out at the
Poultry Researches Farm of the Animal and
Poultry Production Department, Faculty of
Agriculture, Assiut University, Assiut, Egypt.
The experiment started on March for sixty two
weeks, using six hundred, unsexed one-day-old
local chicks (Dandarawi). All chicks were
wing-banded, individually weighed and housed
on deep litter. During the first 8 weeks, all
chicks were fed a starter diet (Table 1). By 8
weeks of age, 200 pullets with similar live
body weights were selected and used in this
study. All pullets were shank banded, weighed
individually, randomly distributed into 5 equal
groups of 40 birds, and housed in 5 closed
floor pens in 5 rooms. Each group was kept in
an area of 6 square meters provided with wheat
straw litter (5 cm depth). The first, second,
third, fourth, and fifth groups (G1 to G5) were
exposed during rearing period (8 to 18 weeks
of age) to 8L:16D, 10L: 12D, 12L: 12D,
14L:10D, and 16L: 8D hrs daily, respectively
(Table 2). Light intensity was 10 and 20
Lux/m2 in rearing and laying periods,
respectively by using additional incandescent
light. The humidity and temperature ranged
from 60 to 70% and 22 to 26°C in rearing and
laying periods, respectively. Feed and water
were available ad libitum. All hens were kept
under similar adequate managerial and
hygienic conditions until the end of the
experiment. Diets were formulated according
to the NRC (1994) to cover the nutrients
requirements recommendation (Table 1). The
females received starter, grower and layer
experimental diets from one-day old to 8, 9 to
22 and 23 to 62 weeks of age, respectively.
Individual body weights (BW) were
recorded at 8 weeks of age, biweekly until 22
weeks of age, at 26 and 62 weeks of age. Egg
weight (EW), egg number (EN) and egg mass
(EM). Egg production was recorded daily and
calculated as hen-day and hen-housed egg
production (HDP&HHP). Feed consumption
(FC), feed conversion ratio expressed as g
feed/g gain (FCRg) and feed conversion ratio
expressed as g feed/g egg mass (FCRe) were
recorded weekly. Body weight gain (BWG),
FC and FCRg during growth period (from 8 to
22 weeks of age) were calculated biweekly.
Egg weight, EN, EM, HDP, HHP, FC, and
FCRe during laying period (from 22 to 62
weeks of age) were calculated every four
weeks. Dead females were recorded daily
throughout the experimental period and
expressed as percentages. The age at sexual
maturity was obtained per group when the egg
production reached to 50%.
Thirty fresh-laid eggs were taken every
eight weeks from each group during the laying
period to evaluate the egg quality traits. Egg
weight was recorded to the nearest 0.1 gram on
the same day of collection using special
automatic scale. The length and width of each
egg were determined by a sliding caliper and
the egg shape index was calculated according
to Reddy et al. (1979). The eggs were broken
gently on a glass surface. The heights of the
thick albumen and yolk were measured using a
micrometer as described by Brant and Shrader
(1952). The diameter of each yolk was
measured using a sliding caliber. The yolk was
separated from the albumen then it was
weighted. Shell with membranes were dried
then weighed to the nearest 0.01gm. Individual
Haugh unit (Haugh, 1937) score was
calculated using the egg weight and thick
albumen height (Doyon et al., 1986), using the
following formula:
Haugh unit = 100 Log (H – 1.7X W0.37
+7.6).
Where: H = the observed height of the
thick albumen in millimeters and W = Weight
of egg (grams).
Also, the egg yolk index (EYI) was
calculated by dividing the yolk’s height X
100/yolk’s diameter. The albumen was
calculated by subtracting the egg weight minus
the shell plus yolk weights. The three egg
components were expressed as percentages of
the total egg weight.
Total feed costs per bird were calculated by
multiplying mean FC per bird by the cost of 1
kg of diet of each female. The price of egg
mass per bird was calculated by multiplying
mean egg mass by price of one Kg egg mass.
Total revenue was calculated by summing
prices of egg mass and body weight change.
Net revenue was calculated by subtracting total
feed costs from total income of egg mass and
body weight change price. Economical
efficiency (EE) was estimated by dividing net
revenue by total feed costs. Relative

Egyptian J. Anim. Prod. (2012) 55
economical efficiency was calculated by
dividing the EE of groups G2, G3, G4 or G5
by the EE of the control group (G1). Data
collected were subjected to ANOVA by
applying the General Linear Model Procedure
of SAS software (SAS Institute, Version 6.12,
1996). Duncan (1955) was used to detect
differences among means of different groups if
significance existed. The percentages of HDP
and HHP were transformed to Arcsine values.
RESULTS AND DISCUSION
Body weight and body weight gain:
The body weight (BW) of G4 (14L:10D)
and G5 (16L:8D) were significantly (P≤0.05)
higher than those of the other groups at 10, 12,
14 and 16 weeks of age (Table 3). The BW of
16L:8D group was significantly higher than
that of other groups at 18 weeks of age. It was
also significantly (P≤0.05) higher than that of
the G1, G2 and G3 at 20 weeks of age and than
that of the G2 and G3 at 22 weeks of age. No
significant differences were found between G4
and G5 at 20 weeks of age. Also, there were no
significant differences in BW among G1, G4
and G5 at 22 weeks of age. At 26 and 62
weeks of age, no significant differences were
observed in BW among the 5 groups.
The overall mean of BWG of the G5 group
was significantly (P≤0.05) higher than those of
all the other groups studied (Table 4).
However, the overall means of BWG for G1,
G3 and G4 were significantly (P≤0.05) higher
than that of G2. Keshavarz (1998) showed that
body weight of the pullets on the step-down
light regimen (which were exposed to 23 h/d
light at day-old and was gradually reduced to 8
h/d at 15 wk of age) were heavier (P≤0.05)
than the pullets of the short-day light regimen
(which were exposed to 8 h/d light during the
growing period) during most parts of the
growing and laying periods. Lewis et al.
(1997) showed that body weight for Shaver
white-egg and ISA brown-egg pullets at first
egg increased by the delay in age at first egg.
However, body weight at 504 d of age was
unaffected by age at first egg.
Mortality rate and age at sexual maturity:
During the rearing period (8-22 weeks of
age), no mortalities occurred for pullets in G2,
G3 and G5, however the mortality rate (MR)
was 2.5 and 5.0% for G1 and G4, respectively
(Table 3). During laying period, the MR was
17.5, 20.0, 7.5, 15.7 and 10.0% for G1, G2,
G3, G4 and G5, respectively. The total MR (8-
62 weeks of age) of G3 was lower than those
of G1, G2, G4 and G5 by 16.7, 16.7, 17.6 and
3.3%, respectively. These mortality data are
consistent with the findings of Lewis et al.
(1992, 1996b, 1997). They studied that the
longer periods of daily illumination are
associated with a higher incidence of morality
during the laying year.
Results in Table 3 show that, the age at
sexual maturity decreased gradually with
increasing the photoperiod. The age at sexual
maturity was 158, 157, 155, 154 and 153 day
for G1, G2, G3, G4 and G5, respectively.
According to Shanawany (1983), the best age
for the hen to reach sexual maturity is between
150-160 days, and this is the condition for
producing the largest number of eggs with the
best alimentary conversion index. Also, Lewis
et al. (1997) showed that the mean age at first
egg of Shaver white-egg pullets transferred
from 8 h daily photoperiods to 8, 10, 13 or 16
h daily photoperiods at 9 weeks of age were
147.2, 137.3, 125.8 and 129.7d, respectively.
In contrast, Lewis et al. (1996a) reported that
birds reared on 10 h constant photoperiods
matured earlier than birds kept on 8, 13 or 18 h
constant photoperiods.
Feed consumption:
Results in Table 4 showed that, no
significant differences were observed in feed
consumption (FC) during rearing period
among the 5 groups at all experimental periods
studied as well as in the overall mean. The
overall mean of FC during rearing period of
pullets in the G3 was slightly lower than those
of G1, G2, G4 and G5 groups.
The obtained results, during egg
production, presented in Table 5 showed that,
the FC of G2 and G3 were significantly
(P≤0.05) lower than those of G1, G4 and G5
during the periods 22-26 and 26-30 weeks of
age. The hens of G3 consumed significantly
(P≤0.05) less feed than those of hens of the all
other groups at all age periods studied as well
as in the overall mean. It was observed that,
the overall mean of FC for G3 during laying
period was significantly (P≤0.05) less than
those of all other groups studied. Lewis et al.
(1997) showed that the mean daily feed intake
between 98 and 504 d of age of Shaver white-
egg and ISA brown-egg pullets transferred
from 8 h daily photoperiods to 8, 10, 13 or 16
h daily photoperiods at 9 weeks of age were
104.0, 107.0, 107.7 and 123.4g, respectively.
Shanawany (1983) reported that sexual
maturity has a minimal effect upon feed intake
during the laying year. Nevertheless, the data
do support a report by Lewis et al. (1994b) that
significant effect of photoperiod upon daily
feed intake, however, does have important
implications for the lighting of commercial egg
production stocks. However, Leeson et al.
(2005) reported that indirect influences
through the changes in age of first egg, evoked
by the lighting regiments, were evident with a
regression of mean daily feed intake on age of
first egg indicating that it was reduced by 1g

El-Sagheer 56
for each 4-d delay in sexual maturity. They
also added that the step-down lighting
regimens did not have direct influences on feed
consumption during the laying period. Also,
Keshavarz (1998) reported that feed
consumption during the laying cycle was not
influenced by light regimen during the growing
period.
Feed conversion ratio:
The pullets of G3, G4 and G5 had
significantly (P≤0.05) better feed conversion
ratio as g feed per g gain (FCRg) than those of
G1 and G2 during 8-10 weeks of age (Table 4).
It was also observed that, there were no
significant differences in FCRg among the 5
groups during the periods 10-12, 12-14 and 14-
16 weeks of age. The FCRg of G1 was
significantly (P≤0.05) better than those of all
other groups studied during the period 16-18
weeks of age. During the period from 18-20
weeks of age, the FCRg of G1 and G5 were
significantly (P≤0.05) better than those of G2
and G4, while the G3 had intermediate value.
During the period from 20-22 weeks of age,
the FCRg of G3 was significantly (P≤0.05)
better than those of all other groups studied.
No significant differences were observed in the
overall means of FCRg among all groups
studied.
Results presented in Table (5) showed that,
no significant differences were found in feed
conversion ratio as g feed per g egg mass
(FCRe) among the 5 groups during 22-26, 26-
30, 30-34 and 42-46 weeks of age. The hens of
G3 and G4 had significantly (P≤0.05) better
FCRe than those of G1, G2 and G5 during 34-
38 and 38-42 weeks of age. During the periods
46-50 and 50-54 weeks of age, the FCRe of
G1, G2, G3 and G5 wwere significantly
(P≤0.05) better than those of G4. It was
observed that, the FCRe of G3 was
significantly (P≤0.05) better than those of all
the other experimental groups studied during
54-58 and 58-62 weeks of age. The hens of G3
had significantly (P≤0.05) better overall mean
FCRe than those of G1, G2, G4 and G5. The
FCRe of G1, G2 and G5 were significantly
(P≤0.05) better than those of G4. Keshavarz
(1998) showed that the step-down light
regimen (exposed to 23 h/d light at day-old and
was gradually reduced to 8 h/d at 15 wks of
age) resulted in impaired feed conversion for
the entire experiment as compared to the short-
day light regimen (exposed to 8 h/d light
during the growing period).
Egg production, eggs number, egg mass and
egg weight:
No significant differences were observed in
egg weight (EW) among the five groups at all
age periods studied (Table 5).
The hens of G3 had higher hen housed egg
production (HHP), egg number (EN) and egg
mass (EM) than most of the other groups at all
age periods studied after the 30th
weeks of age
(Tables 6 and 7).
The G3 group had significantly (P≤0.05)
higher overall mean of HDP, HHP, cumulative
of EN and cumulative of EM than those of the
other groups (Tables 6&7). These results are in
agreement with those of Leeson and Summers
(1987). They showed that the lightest hens
(mean 15 wk body weight of 997 g) produced
significantly (P≤0.05) more eggs than the
heaviest hens (1226 g) but less than the middle
group (1110 g). Lewis et al. (1997) showed
that the mean egg production, to 504 d of age,
for ISA and Shaver pullets transferred from 8 h
daily photoperiods, to 8, 10, 13 or 16 h daily
photoperiods at 9 weeks of age, were 291.2
and 316.4; 286.7 and 319.4; 319.6 and 314.3;
and 318.9 and 319.2 for ISA and Shaver,
respectively. Keshavarz (1998) showed that the
step-down light regimen (exposed to 23 h/d
light at day-old and was gradually reduced to 8
h/d at 15 wks of age) resulted in increased egg
size and higher percentage of extra-large plus
large-sized eggs for the entire experiment as
compared to the short-day light regimen
(exposed to 8 h/d light during the growing
period). It also resulted in reduced hen-day egg
production and egg mass for the entire
experiment (18 to 66 wk of age).
Sexual maturity can be delayed by the use
of a step-down light regimen during the
growing period of pullets. Shutze et al. (1961)
reported that when pullets were exposed to
naturally declining daylight hours during the
growing period, sexual maturity was delayed,
but egg production rate remained significantly
(P≤0.05) greater and larger eggs were
produced than those raised under a constant 8 h
light regimen. McClary (1960) reported
delayed sexual maturity but increased egg
production and egg weight when pullets were
subjected to a step-down light regimen during
the growing period. After peak production was
reached, the rate of lay of the delayed groups
remained 8 to 10% higher than the natural-
lighted birds. Summers and Leeson (1983) and
Keshavarz (1995) reported a positive
correlation between the BW of pullets at the
age of housing and egg weight during the egg
production cycle. However, Leeson et al.
(2005) using Shaver white layers; they
reported no significant improvement in egg
weight, egg numbers and egg mass between
step down lighting and constant 8-h of light
during the growing period.
Egg quality:
Results in Table (8) showed that, no
significant differences were observed in egg

Egyptian J. Anim. Prod. (2012) 57
weight (EW) and egg shape index (ESI) among
the 5 groups at all ages studied as well as in the
overall means. However, Lewis et al. (1997)
showed that the mean egg weights (g) to 504 d
of age for ISA and Shaver pullets transferred
from 8 h daily photoperiods to 8, 10, 13 or 16
h daily photoperiods at 9 weeks of age were
62.7 and 54.7; 60.1 and 56.9; 57.5 and 55.8;
and 60.6 and 60.0 for ISA and Shaver,
respectively.
No significant differences were observed in
egg yolk index (EYI) among the five groups at
all ages studied except at 38 and 46 weeks of
age where the differences were significant. The
EYI of G4 was significantly (P≤0.05) higher
than that of all the other groups at 38 and 46
weeks of age, except at 38 weeks of age where
the differences were no significant between G4
and G2. Also, the overall mean of EYI of G 4
was significantly (P≤0.05) higher than of all
the other groups (Table 8). No significant
differences were observed in Haugh units (HU)
among the 5 groups at all ages studied, except
at 46 weeks of age where the differences were
significant. The HU of G2, G3 and G4 were
significantly (P≤0.05) higher than those of G1
and G5 at 46 weeks of age. Leeson et al.
(2005) in Shaver white layers; reported no
significant improvement in shell deformation
and albumen height between step down
lighting and constant 8-h of light during
rearing.
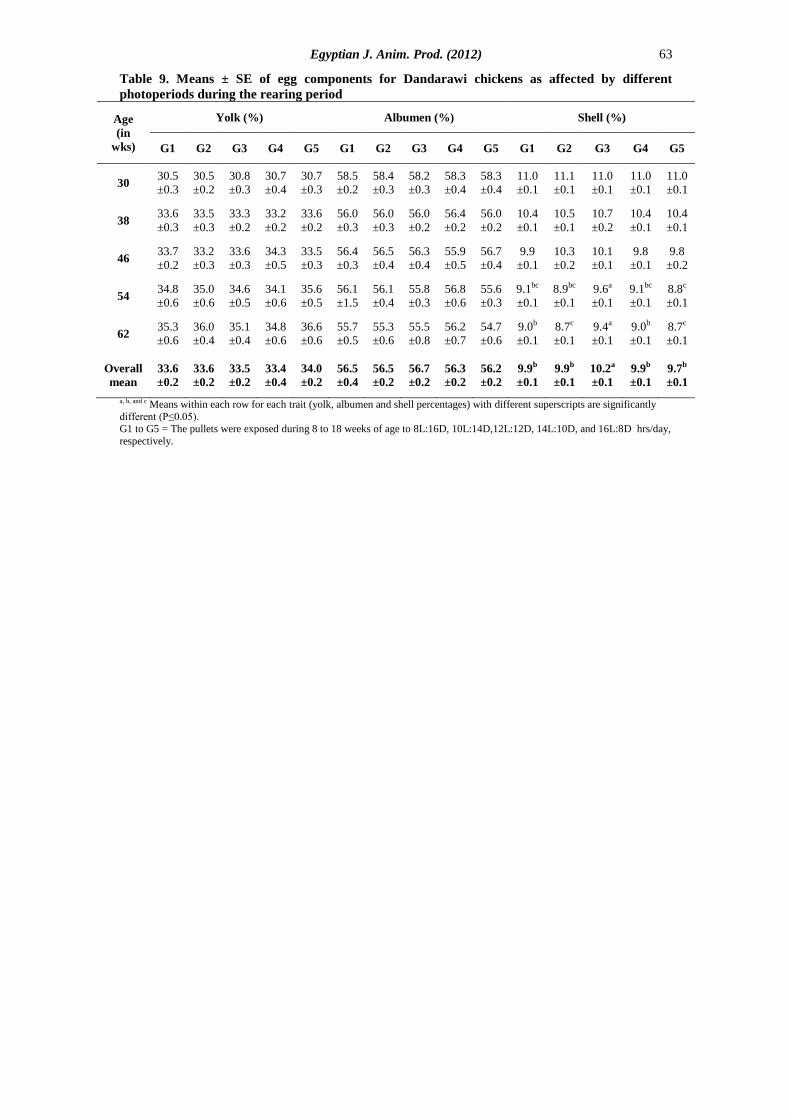
Egg components:
There were no significant differences in
egg yolk (YP) and albumen (AP) percentages
among the 5 groups at all ages studied as well
as their overall means (Table 9). The egg shell
percentage (SP) of G3 was significantly
(P≤0.05) higher than that in all other groups
studied, at 54 and 62 weeks of age, while there
were no significant differences in SP at 30, 38
and 46 weeks of age among the five groups.
The overall mean of SP of G3 was
significantly (P≤0.05) higher than that of G1,
G2, G4 and G5. Leeson and Summers (1985),
Leeson et al. (1991) and Lewis et al. (1997)
observed that shell quality was unaffected by
increasing photoperiod or age at first egg.
Economical evaluation:
The hens of G3 consumed less feed (Tables
4&5), thus it had the lowest feed cost (Table
10). Also, the hens of the same group had
highest egg number and mass (Table 7), total
revenue and net revenue per hen (Table 10)
than those of any of the other groups. Also,
economical efficiency (EE) and relative EE of
G 3 exceeded that of the other groups.
CONCLUSION
From the obtained results, it can be
concluded that hens of the G3 group (12L:12D
hrs during rearing period) had greater egg
production, EN, EM and better FC during the
layering period and improved FCRe and SP
and had the best EE as compared to those of all
other groups.
ACKNOWLEDGMENTS
Thanks are due to Prof. Dr. M.A.,
Abdelnabi for providing the birds and to all the
staff members and to my colleagues at the
Animal and Poultry Production Department,
Faculty of Agriculture, Assiut University for
their kind encouragement and their assistance.
REFERENCES
Brant, A.W. and H.L. Shrader, 1952. How to
measure internal egg quality? Bureau of
Animal Industry, Agric. Res.
Administration, U.S. Dept. of Agric.,
Circular P.A. 202.
Doyon, G., M. Bernier-Cardou, R.M.G.
Hamilton, F. Eastaigns, and C.T. Ramdald,
1986. Egg quality. 2. Albumen quality of
egg from five commercial strains of White
Leghorn hens during one year of lay. Poult.
Sci. 65: 63-66.
Duncan, D.B., 1955. Multiple range and
multiple F tests. Biometrics, 11:1-42.
Hamilton, R.M.G. and J. Kennie, 1997. The
effects of lighting program. Ingredient
particle size and feed form on the
performance of broiler turkey. Canadian J.
of Anim. Sci. 77: 3, 503-508.
Haugh, R.R., 1937. The Haugh unit for
measuring egg quality. U.S. Egg. Poult.
Mag., 43: 522-555 and 572-573.
Keshavarz, K., 1995. Further investigations on
the effect of dietary manipulations of
nutrients on early egg weight. Poult. Sci.
74:62–74.
Keshavarz, K., 1998. The effect of light
regimen, floor space, and energy and
protein levels during the growing period on
body weight and early egg size. Poult. Sci.
77:1266-1279.
Leeson, S., L. Caston, and P.D. Lewis, 2005.
Rearing and laying performance following
various step-down lighting regimens in the
rearing period. Poult. Sci. 84:626-632.
Leeson, S., L. Caston, and J.D. Summmers,
1991. Significance of physiological age of
Leghorn pullets in terms of subsequent
reproductive characteristics and economic
analysis. Poult. Sci. 70:37-43
Leeson, S. and J.D. Summmers, 1985.
Response of growing Leghorn pullets to

El-Sagheer 58
long or increasing photoperiods. Poult. Sci.
64:1617-1622.
Leeson, S. and J.D. Summmers, 1987. Effect
of immature body weight on laying
performance. Poult. Sci. 66:1924-1928.
Lewis, P.D., G.C. Perry, and T.R. Morris,
1994a. Effects of lighting regime and
grower diet energy concentration on energy
expenditure, fat deposition, and body
weight gain of laying hens. Br. Poult. Sci.
35: 407-415.
Lewis, P.D., G.C. Perry, and T.R. Morris,
1996a. Effect of contrast and of changing
photoperiods on age at first egg and related
traits in pullets. Br. Poult. Sci. 37:885-894.
Lewis, P.D., G.C. Perry, and T.R. Morris,
1996b. Lighting and mortality rates in
domestic fowl. Br. Poult. Sci. 37: 295-300.
Lewis, P.D., G.C. Perry, and T.R. Morris,
1997. Effect of size and timing of
photoperiod increase on age at first egg and
subsequent performance of two breeds of
laying hen. Br. Poult. Sci. 38:142-150.
Lewis, P.D., G.C. Perry, T.R. Morris, and B.K.
Follett, 1994b. Effects of timing and size of
daylenght change on brown egg laying
domestic hens. I. Plasma Luteinizing
Hormone concentration and sexual
maturity. Br. Poult. Sci. 35:25-31.
Lewis, P.D., G.C. Perry, T.R. Morris, and
M.M. Midgley, 1992. Intermittent lighting
regimes and mortality rates in laying hens.
World’s Poult Sci. j. 48:113-120.
McClary, C.F., 1960. Genetic behavior and
photoperiodism in laying chickens. Poult.
Sci. 39:1273.(Abstr).
Mendes, M., A. Karabayir, E. Ersoy, and C.
Atasoglu, 2005. Effects of three different
lighting programs on live weight change of
Bronze Turkey under semi-intensive
conditions. Arch Tierz 48, 86-93.
Morris, T.R., 1968. Light requirements of the
fowl, in: Carter, T.C. (Ed) Environmental
Control Production, pp. 15-39 (Edinbourgh,
Oliver and Boyd).
Morris, T.R., 1985. The manipulation of egg
size and egg quality. South African J. of
Anim. Sci. 15:1209-122.
Morris, T.R., 1994. Lighting for layers: what
we know and what we need to know.
World’s Poult Sci. j. 50:283-287.
National Research Council 1994. Nutrient
requirements of poultry. 9th
rev. ed
National Academy press, Washington, DC.
Reddy, P.M., V.R. Reddy, C.V. Reddy, and
P.S.P. Rap, 1979. Egg weight, shape index
and hatch ability in Khaki Campbell duck
egg. Ind. J. Poult. Sci. 14: 26-31.
SAS Institute, 1996. SAS® Users Guide,
Version 6.12. SAS Institute, Cary, NC.
Shanawany, M.M., 1983. Sexual maturity and
subsequent laying performance of fowls
under normal photoperiods. A review
1950-1975.-In :World's Poult Sci. J. 39, pp.
38-46.
Shanawany, M.M. and T.R. Morris, 1980.
Light, sexual maturity and subsequent
performance. WPSA (UK Branch) Summer
meeting. Reading University.
Shutze, J. V., W.E. Matson, and J. McCinnis,
1961. Influence of different photoperiods
during brooding and rearing on subsequent
productive characteristics in chickens.
Poult. Sci. 40:1604–1611.
Summers, J. D. and S. Leeson, 1983. Factors
influencing early egg size. Poult. Sci.
62:1155–1159.

Egyptian J. Anim. Prod. (2012) 59
Table 1. Composition and calculated analysis of the experimental diets
Ingredients (%) Starter
(0-8 weeks)
Grower
(9-22 weeks)
Layer
(23-62 weeks)
Yellow corn 62.1 71.40 67.97
Wheat bran
1.25 1.05 --
Soybean meal (44% CP) 28.90 19.70 17.85
Layer concentrate* (44%) -- -- 8.00
Salt 0.25 0.25 0.15
Limestone
1.50 1.70 6.0
Dicalcium Phosphate 1.70 1.60 --
Vit & Min. Premix** 0.30 0.30 --
Manganese -- -- 0.03
Sand 4.00 4.00 --
Total
100 100 100
Calculated analysis ***:
ME, Kcal/Kg 2812 2916 2971.6
Crude protein, %
18.4 15.1 17.51
Crude fiber, %
3.60 3.1 2.95
Ether extract, %
2.64 2.9 3.30
Lysine, % 1.00 0.75 0.93
Methionine, %
0.31 0.27 0.38
Total calcium,%
1.03 1.06 2.93
Available phosphorus,% 0.45 0.42 0.38
Cost/kg diet L.E. (Local price
during 2011)
2.814 2.721 2.973 * The layer concentrate contained: Crude protein, 44%; Crude fiber, 1.02%; Crude fat, 6.23%; Methionine, 1.58%;
Methionine + Cystine, 2.13%; Lysine, 3.05%; Calcium, 7.24%; Available phosphorus, 3.25%; Sodium, 1.30%;
and Metabolizable energy, 2457 Kcal / Kg diet. *Layer concentrate supplied the following per kilogram of the diet: Vit.
A, 10000 IU; vit. D3, 1000 IU; vit. E, 10 mg; Vit. K, 1 mg; Vit. B1,1 mg; Vit. B2, 4 mg; Pantothenic acid, 10 mg; Folic
acid,1 mg; Niacin,20 mg; Vit. B6, 1.5 mg; vit. B12, 0.01 mg; Biotin, 0.05 mg; Chlorine chloride, 500 mg; Iron, 30 mg;
Iodine, 0.3 mg; Zinc, 45 mg; Manganese, 40 mg; Copper, 3 mg; and Selenium, 0.1 mg.
**Vitamins and minerals premix provided per kilogram of the diet: Vit A (as all-transretinyl acetate), 12000 IU;
Vit D3, 2200 IU; Vit E (all rac-α-tocopheryl acetate), 10 mg; Vit K3, 3 mg; Vit B2, 10 mg; Pantothenic acid, 10
mg; Niacin, 20mg; Vit B12, 10µg; Vit B6, 1.5 mg; Thiamine (as thiamine mononitrate), 2.2 mg; Folic acid, 1 mg;
D-Biotin, 50 µg; Chorine chloride, 500 mg; Copper, 10mg; Iron, 30 mg; Manganese, 55 mg; Zinc, 50 mg,
Selenium, and 0.1 mg, Ethoxyquin, 3mg.
L.E. = Egyptian pound
*** Calculated according to NRC (1994).
Table 2. Lighting regimens
Age G1 G2 G3 G4 G5
Days 1-3 24 24 24 24 24
Days 3-4 22 22 22 22 22
Week 2 20 20 20 20 20
Week 3 18 18 18 18 18
Week 4 16 16 16 16 16
Week 5 14 14 14 14 16
Week 6 12 12 12 14 16
Week 7 10 10 12 14 16
Weeks 8-18 8 10 12 14 16
Week 19 12 12 12 14 16
Week 20 13 13 13 14 16
Week 21 14 14 14 14 16
Week 22 15 15 15 15 16
Week 23 16 16 16 16 16
Weeks 24-62 16 16 16 16 16 G1 to G5 = The pullets were exposed during 8 to 18 weeks of age to 8L:16D, 10L:14D,12L:12D, 14L:10D, and
16L:8D hrs/day, respectively

El-Sagheer 60
Table 3. Means ± SE of body weight (g), age at sexual maturity (day) and mortality rate (%) for Dandarawi
chickens as affected by different photoperiods during the rearing period
Items 8L:16D 10L:14D 12L:12D 14L:10D 16L:8D
Body
weight:
n n n n n
8th weeks 40 365 ± 7 40 367 ±10 40 365 ± 6 40 365 ± 6 40 365 ± 5
10th weeks 39 429bc ± 7 40 425c±10 40 428bc± 8 40 464a± 9 40 474a± 8
12th weeks 39 536b ± 8 40 532b±10 40 530b ± 8 39 570a ±11 40 589a± 9
14th weeks 39 655b ±10 40 643b±12 40 640b ±11 39 692a ±11 40 707a±10
16th weeks 39 761b ±10 40 766b±15 40 763b±13 39 813a±10 40 832a±12
18th weeks 39 897b ±14 40 877b±17 40 876b ±14 39 913b ±13 40 955a±15
20th weeks 39 1017bc±17 40 972b±20 40 988b ±16 38 1022ab±14 40 1070a±19
22nd weeks 39 1110ab±20 40 1053b±21 40 1094b±19 38 1107ab±16 40 1155a±22
26th weeks 39 1240 ±27 40 1247 ±23 40 1259 ±24 38 1220 ±17 39 1288 ±27
62nd weeks 33 1546 ±42 32 1590 ±35 37 1589 ±32 34 1596 ±29 36 1591 ±35
ASM 158 157 155 154 153
MR1 2.5 0.0 0.0 5.0 0.0
MR2 17.5 20.0 7.5 15.0 10.0
MR1+2 20.0 20.0 7.5 20.0 10.0 a––c means with different superscripts in the same row are significantly different (P≤0.05). n= number of hens
ASM = Age at sexual maturity (50% egg production).
MR1 = Mortality rate during rearing period (8-22 weeks of age. MR2 = Mortality rate during laying period (22-62 weeks of age).
MR1+2 = Total mortality rate (from 8 to 62 weeks of age). G1 to G5 = The pullets were exposed during 8 to 18 weeks of age to 8L:16D, 10L:14D,12L:12D, 14L:10D, and 16L:8D hrs/day,
respectively.
Table 4. Means ± SE of body weight gain (g/hen/day), feed consumption (g/hen/day) and feed
conversion (g feed/ g gain) during the rearing period for Dandarawi chickens as affected by
different photoperiods during the rearing period.
Age
(in wks)
Body weight gain Feed consumption Feed conversion
G1 G2 G3 G4 G5 G1 G2 G3 G4 G5 G1 G2 G3 G4 G5
8-10 4.62b
±0.27
4.20b
±0.34
4.51b
±0.34
7.09a
±0.46
7.74a
±0.35
36.1
±0.7
34.8
±0.8
32.4
±0.9
34.7
±0.8
35.6
±0.7
7.81a
±0.14
8.29a
±0.16
7.23b
±0.18
4.90c
±1.50
4.60d
±1.65
10-12 7.62ab
±0.23
7.62ab
±0.20
7.25b
±0.26
7.56b
±0.18
8.19a
±0.15
43.3
±1.0
43.6
±0.1
43.3
±0.0
44.1
±0.0
43.1
±0.1
5.68
±0.42
5.72
±0.33
5.97
±0.30
5.84
±0.32
5.26
±0.33
12-14 8.51ab
±0.26
7.91b
±0.25
7.88b
±0.28
8.74a
±0.17
8.45ab
±0.13
45.8
±0.9
45.0
±0.7
45.4
±0.9
47.1
±0.3
45.9
±0.1
5.38
±0.10
5.69
±0.10
5.76
±0.13
5.39
±0.13
5.43
±0.09
14-16 7.59
±0.54
8.80
±0.34
8.79
±0.36
8.65
±0.27
8.93
±0.29
54.9
±0.5
52.3
±0.7
53.0
±0.8
54.7
±0.7
53.2
±0.9
7.24
±0.22
5.94
±0.07
6.03
±0.70
6.32
±0.08
5.96
±0.19
16-18 9.67
±0.50
7.91
±0.28
8.11
±0.42
7.16
±0.40
8.79
±0.64
56.4
±0.8
55.9
±0.5
54.
±0.3
56.4
±0.3
54.8
±0.9
5.83b
±0.09
7.06a
±0.06
6.66a
±0.12
7.88a
±0.12
6.24a
±0.12
18-20 8.59a
±0.32
6.79b
±0.32
8.00a
±0.28
7.79a
±0.39
8.21a
±0.38
57.7
±0.5
55.9
±0.9
55.9
±0.9
57.5
±10
55.9
±0.9
6.72c
±0.02
8.24a
±0.06
6.99bc
±0.17
7.39b
±0.18
6.81c
±0.16
20-22 6.65a
±0.41
5.80b
±0.28
7.55a
±0.45
6.02b
±0.36
6.11b
±0.44
57.8
±0.7
56.0
±0.8
56.1
±0.9
57.7
±0.8
55.9
±0.7
8.69b
±0.02
9.66a
±0.38
7.43c
±0.05
9.58a
±0.08
9.15ab
±0.18
Overall
mean
7.61b
±0.16
7.01c
±0.14
7.44b
±0.14
7.57b
±0.13
8.06a
±0.13
50.3
±2.21
49.1
±2.0
48.6
±2.2
50.3
±2.2
49.2
±2.0
6.76
±0.30
7.23
±0.39
6.57
±0.19
6.76
±0.39
6.21
±0.38
a, b, c and d Means within each row for each trait (body weight gain, feed consumption and feed conversion) with
different superscripts are significantly different (P≤0.05).
G1 to G5 = The pullets were exposed during 8 to 18 weeks of age to 8L:16D, 10L:14D,12L:12D, 14L:10D, and
16L:8D hrs/day, respectively.

Egyptian J. Anim. Prod. (2012) 61
Table 5. Means ± SE of feed consumption (g/hen/day), feed conversion (g feed/g egg mass) and
egg weight (g) for Dandarawi chickens during egg production as affected by different
photoperiods during the rearing period
Age
(in
wks)
Feed consumption Feed conversion Egg weight
G1 G2 G3 G4 G5 G1 G2 G3 G4 G5 G1 G2 G3 G4 G5
22-26 74.8b
±0.3
71.3d
±0.1
70.6d
±0.5
79.2a
±0.1
73.0c
±0.2
7.05
±1.67
6.55
±1.86
6.35
±2.47
6.26
±3.56
5.71
±3.24
30.3
±0.5
31.1
±0.5
30.8
±0.6
30.8
±0.5
31.4
±0.5
26-30 83.7a
±0.5
75.8c
±0.5
75.7c
±0.4
84.1a
±0.2
78.2b
±0.6
3.37
±0.11
3.88
±0.31
3.71
±0.35
3.39
±0.19
3.46
±0.11
38.2
±0.5
38.5
±0.5
38.3
±0.5
39.0
±0.4
37.7
±0.5
30-34 101.0a
±0.1
97.1b
±1.7
93.1c
±1.1
102.8a
±0.7
97.3b
±0.7
4.07
±0.13
4.31
±0.18
4.06
±0.35
3.92
±0.16
4.08
±0.15
40.6
±0.6
40.2
±0.6
40.6
±0.4
41.2
±0.3
40.7
±0.6
34-38 110.5a
±1.1
107.7b
±0.4
103.0d
±0.2
106.6bc
±0.2
105.0c
±0.4
3.98a
±0.06
3.87a
±0.05
3.49b
±0.08
3.62b
±0.10
3.88a
±0.11
41.4
±0.7
41.0
±0.8
41.9
±0.7
42.1
±0.6
41.6
±0.5
38-42 110.2a
±0.7
106.9b
±0.5
102.8c
±0.9
107.3b
±0.1
106.0b
±0.1
4.00a
±0.08
4.19a
±0.11
3.56b
±0.06
3.72b
±0.07
3.99a
±0.17
42.4
±0.8
42.8
±0.7
42.6
±0.7
43.9
±0.6
43.3
±0.5
42-46 113.7a
±0.3
108.7b
±0.9
102.5d
±0.1
109.6b
±0.1
105.9c
±0.1
4.24
±0.17
3.86
±0.05
3.49
±0.09
4.34
±0.48
3.88
±0.48
43.2
±0.6
43.3
±0.5
44.4
±0.8
45.0
±0.7
45.0
±0.6
46-50 107.6bc
±1.0
108.9ab
±0.3
102.1d
±0.2
109.2a
±0.2
106.3c
±0.2
4.03b
±0.20
3.92b
±0.18
3.60b
±0.17
5.24a
±0.69
3.86b
±0.17
44.2
±0.8
44.2
±0.7
45.7
±0.6
44.9
±0.8
45.1
±0.7
50-54 106.5b
±0.2
108.4a
±0.1
101.7c
±0.2
108.4a
±0.1
106.9b
±0.3
3.91b
±0.12
3.62b
±0.07
3.56b
±0.03
5.85a
±0.40
3.75a
±0.42
50.2
±0.6
51.1
±0.6
51.0
±0.7
51.9
±0.6
51.5
±0.6
54-58 106.5b
±0.1
108.4a
±0.2
104.1b
±0.7
110.0a
±0.4
108.5a
±0.3
5.67b
±0.50
5.42b
±0.37
4.05c
±0.11
8.48a
±0.95
7.10a
±0.95
51.6
±0.6
52.8
±0.9
52.9
±0.7
54.2
±0.7
53.5
±0.8
58-62 109.3a
±0.4
109.6a
±0.1
101.0c
±0.2
109.1a
±0.6
108.1a
±0.7
7.13a
±0.88
6.70 a±0.22
4.48b
±0.44
10.54a
±1.21
7.54a
±1.22
53.0
±1.0
54.5
±0.8
53.1
±0.9
54.7
±0.9
54.7
±0.7
Overall
mean
102.4a
±0.9
100.3a
±1.0
95.6b
±0.4
102.6a
±1.0
99.5a
±1.1
4.74b
±0.21
4.63b
±0.30
4.04c
±0.31
5.54a
±0.23
4.72b
±0.21
43.5
±0.6
44.0
±0.6
44.1
±0.6
44.8
±0.6
44.5
±0.6 a, b, c and d Means within each row for each trait (feed consumption, feed conversion and egg weight) with different superscripts are significantly
different (P≤0.05).
G1 to G5 = The pullets were exposed during 8 to 18 weeks of age to 8L:16D, 10L:14D,12L:12D, 14L:10D, and 16L:8D hrs/day, respectively.
Table 6. Means±SE of hen day and hen housed egg production percentages of Dandarawi
chickens as affected by different photoperiods during the rearing period
Age
(in wks)
Hen day egg production (%) Hen housed egg production (%)
G1 G2 G3 G4 G5 G1 G2 G3 G4 G5
22-26 35.0±2.9 34.9±2.6 35.9±2.9 40.9±3.7 40.6±2.8 35.0±2.7 34.9±2.6 35.4±2.8 40.9±3.7 39.8±2.7
26-30 64.9a±1.4 50.6b±1.8 53.3b±2.0 63.4a±1.7 60.0a±1.8 60.8a±1.4 50.6b±1.8 52.0b±2.0 63.4a±1.7 58.4a±1.7
30-34 61.2ab±1.0 55.9c±1.3 56.6c±2.1 63.7a±1.2 58.5bc±1.4 56.5b±0.9 53.8b±1.2 55.2b±2.0 63.7a±1.2 55.5b±1.3
34-38 67.1ab±0.1 67.8ab±1.0 70.5a±1.1 70.1a±1.4 65.1b±1.1 60.4c±0.9 64.4b±1.0 68.8a±1.0 70.1a±1.4 61.9bc±1.1
38-42 64.9a±1.2 59.7b±1.0 68.0a±1.1 65.7a±2.3 61.4b±1.3 58.2b±1.1 55.6b±1.1 65.1a±1.1 64.7a±1.6 58.1b±1.2
42-46 62.3a±2.0 65.0a±1.6 66.2a±1.5 55.9b±2.3 60.8ab±1.4 55.9b±1.8 56.5b±1.5 63.0a±1.4 52.8b±2.2 56.3b±1.3
46-50 60.3a±1.6 63.0a±1.8 62.1a±1.1 46.3b±2.0 61.0a±1.4 54.1bc±1.5 50.7c±1.4 59.1a±1.0 43.8d±1.9 56.4ab±1.3
50-54 54.4a±1.5 58.5a±1.7 56.2a±1.2 35.8b±1.6 55.3a±1.2 48.6bc±1.3 46.8c±1.3 53.5a±1.1 33.8d±1.5 51.2ab±1.1
54-58 36.5a±3.2 37.9a±3.4 48.5a±1.4 24.1c±1.4 28.4b±1.8 31.7b±2.8 30.3b±2.7 44.4a±1.3 20.2c±1.1 25.8b±1.7
58-62 29.1bc±1.5 30.0b±0.1 42.5a±2.2 19.1d±1.1 26.2cd±1.1 22.8bc±1.1 24.0b±0.6 40.3a±2.1 17.2c±1.2 23.6b±1.0
Overall
mean 53.6b±1.0 52.3b±1.0 56.0a±0.8 48.5c±1.2 51.7b±1.0 48.4b±0.9 46.8b±0.9 53.7a±0.8 47.1b±1.2 48.7b±0.9
a, b, c and d Means within each row for each trait (hen day and hen housed egg production) with different superscripts are significantly different
(P≤0.05).
G1 to G5 = The pullets were exposed during 8 to 18 weeks of age to 8L:16D, 10L:14D, 12L:12D, 14L:10D, and 16L:8D hrs/day, respectively.

El-Sagheer 62
Table 7. Means±SE of egg number (egg/ hen/ 28 days) and egg mass (g/hen/28 days) for
Dandarawi chickens as affected by different photoperiods during the rearing period
Age
(in
wks)
Egg number Egg mass
G1 G2 G3 G4 G5 G1 G2 G3 G4 G5
22-26 9.8±0.8 9.8±0.7 10.1±0.8 11.5±1.0 11.4±0.8 296.9±28.3 304.8±26.8 311.1±29.4 354.2±36.3 358.0±28.8
26-30 18.2a±0.3 14.2b±0.5 14.9b±0.6 17.8a±0.5 16.8a±0.5 695.2a±14.8 546.7c±17.4 570.7c±19.0 694.2a±18.0 633.4b±19.1
30-34 17.1ab±0.3 15.7c±0.4 15.8c±0.6 17.8a±0.3 16.4bc±0.4 694.3ab±11.1 631.1c±14.2 641.5c±23.3 733.4a±14.1 667.5bc±15.7
34-38 18.8bc±0.3 19.0ab±0.3 19.7a±0.3 19.6ab±0.4 18.2c±0.3 778.3 b±11.6 779.0b±12.0 825.4a±12.1 825.2a±15.8 757.1b±14.1
38-42 18.2a±0.3 16.7±0.3 19.0a±0.3 18.4a±0.5 17.2b±0.4 771.7ab±15.4 714.8c±15.0 809.4 a±13.1 807.8a±20.9 744.8bc±16.3
42-46 17.4a±0.6 18.2a±0.5 18.5a±0.4 15.7b±0.7 17.0ab±0.4 751.7bc±22.8 788.1ab±19.3 821.4a±18.0 706.5c±30.0 765.0abc±19.5
46-50 16.9a±0.5 17.6a±0.5 17.4a±0.3 13.0b±0.6 17.1a±0.4 747.0a±20.8 777.9a±22.8 795.2a±13.4 583.7b±26.6 771.2a±17.2
50-54 15.2a±0.4 16.4a±0.5 15.7a±0.3 10.0b±0.5 15.5a±0.3 763.0b±20.0 838.0a±20.6 800.7ab±16.1 519.0c±23.9 798.3ab±18.9
54-58 10.2a±0.9 10.6a±1.0 13.6a±0.4 6.7c±0.4 8.0b±0.5 526.3a±45.0 559.7a±49.2 719.4a±20.1 363.1c±20.2 428.0b±25.6
58-62 8.1±0.4 8.4b±0.2 11.9a±0.6 5.3d±0.3 7.3cd±0.3 429.3bc±22.9 457.8a±11.4 631.9a±29.7 289.9d±16.6 401.3cd±15.2
Overall
mean 149.9b±2.7 146.6b±2.7 156.6a±2.4 135.8c±3.4 144.9b±2.7 6453.8b±113.0 6397.9b±120.5 6926.7a±111.3 5876.9c±132.2 6324.4b±114.8
a, b, c and d Means within each row for each trait (egg number and egg mass) with different superscripts are significantly different (P≤0.05).
G1 to G5 = The pullets were exposed during 8 to 18 weeks of age to 8L:16D, 10L:14D,12L:12D, 14L:10D, and 16L:8D hrs/day, respectively.
Table 8. Means ± SE of egg quality for Dandarawi chickens as affected different photoperiods
during the rearing period
Age
(in
wks)
Egg weight (g) Egg shape index (%) Egg yolk index (%) Haugh units
G1 G2 G3 G4 G5 G1 G2 G3 G4 G5 G1 G2 G3 G4 G5 G1 G2 G3 G4 G5
30 40.4
±0.6
39.8
±0.7
41.6
±0.8
41.4
±0.9
40.1
±0.8
78.9
±0.7
78.4
±0.5
78.8
±0.5
78.3
±0.5
79.
±0.4
54.3
±0.6
56.2
±0.8
56.0
±0.9
55.6
±0.6
53.9
±0.8
79.1
±1.6
82.8
±1.8
81.9
±1.8
79.9
±1.4
81.3
±1.7
38 41.7
±0.7
42.5
±0.7
42.1
±0.5
42.0
±0.7 42.6
±0.7 79.6
±0.7
80.5
±0.5
79.7
±0.4
80.7
±0.6
79.7
±0.9
54.7c
±0.7 57.5ab
±1.0 56.7bc
±0.7 59.5a
±0.7 56.1bc
±0.7 79.5
±1.4
80.2
±1.7
80.1
±1.5
81.5
±0.7
81.2
±1.1
46 44.2
±0.7
45.0
±0.6
45.6
±0.7
45.1
±1.0
46.8
±0.6
78.5
±0.5
78.2
±0.8
78.0
±0.5
78.8
±0.5
79.5
±0.6
54.6b
±0.6
55.3b
±0.5 54.8b
±0.6 57.2a
±0.8 55.4b
±0.5 80.5b
±1.5 85.0a
±1.6
85.7a
±1.1 85.7a
±1.4 80.0b
±1.5
54 50.1
±0.6
50.1
±0.8
49.7
±0.7
50.0
±0.6
50.5
±0.8
77.2
±0.6
77.5
±0.8
78.1
±0.7
76.5
±1.2
77.9
±0.9
54.2
±0.7
53.8
±0.7
53.6
±0.7
55.5
±0.8
53.4
±0.8
76.5
±1.7
78.0
±1.7
79.9
±1.3
79.8
±2.1
75.8
±1.7
62 52.3
±0.6
53.7
±0.7
53.1
±0.8
54.5
±0.6
54.1
±0.7
77.0
±0.5
77.2
±0.7
77.7
±0.8
76.4
±0.9
77.5
±0.8
53.7
±0.6
53.4
±0.5
53.1
±0.7
54.5
±0.9
53.0
±0.7
75.5
±2.3
77.0
±1.9
78.8
±1.8
78.5
±2.1
75.0
±2.1
Overall
mean
45.7
±0.6
46.2
±0.7
46.4
±0.6
46.6
±0.7
46.8
±0.6
78.2
±0.3
78.4
±0.4
78.5
±0.3
78.1
±0.3
78.7
±0.3
54.3c
±0.3
55.2b
±0.4
54.8bc
±0.3
56.5a
±0.4
54.4bc
±0.3
78.2b
±0.8
80.6a
±0.9
81.3a
±0.7
81.1a
±0.8
78.7b
±0.7
a, b and c Means within each row for each trait (Egg weight, egg shape index, egg yolk index and Haugh units)) with different superscripts are
significantly different (P≤0.05).
G1 to G5 = The pullets were exposed during 8 to 18 weeks of age to 8L:16D, 10L:14D,12L:12D, 14L:10D, and 16L:8D hrs/day, respectively.
Egyptian J. Anim. Prod. (2012) 63
Table 9. Means ± SE of egg components for Dandarawi chickens as affected by different
photoperiods during the rearing period
Age
(in
wks)
Yolk (%) Albumen (%) Shell (%)
G1 G2 G3 G4 G5 G1 G2 G3 G4 G5 G1 G2 G3 G4 G5
30 30.5
±0.3
30.5
±0.2
30.8
±0.3
30.7
±0.4
30.7
±0.3
58.5
±0.2
58.4
±0.3
58.2
±0.3
58.3
±0.4
58.3
±0.4
11.0
±0.1
11.1
±0.1
11.0
±0.1
11.0
±0.1
11.0
±0.1
38 33.6
±0.3
33.5
±0.3
33.3
±0.2
33.2
±0.2
33.6
±0.2
56.0
±0.3
56.0
±0.3
56.0
±0.2
56.4
±0.2
56.0
±0.2
10.4
±0.1 10.5
±0.1 10.7
±0.2 10.4
±0.1 10.4
±0.1
46 33.7
±0.2 33.2
±0.3
33.6
±0.3
34.3
±0.5
33.5
±0.3
56.4
±0.3
56.5
±0.4
56.3
±0.4
55.9
±0.5
56.7
±0.4
9.9
±0.1
10.3
±0.2
10.1
±0.1
9.8
±0.1
9.8
±0.2
54 34.8
±0.6
35.0
±0.6
34.6
±0.5
34.1
±0.6
35.6
±0.5
56.1
±1.5
56.1
±0.4
55.8
±0.3
56.8
±0.6
55.6
±0.3
9.1bc
±0.1 8.9bc
±0.1 9.6a
±0.1 9.1bc
±0.1 8.8c
±0.1
62 35.3
±0.6
36.0
±0.4
35.1
±0.4
34.8
±0.6
36.6
±0.6
55.7
±0.5
55.3
±0.6
55.5
±0.8
56.2
±0.7
54.7
±0.6
9.0b
±0.1
8.7c
±0.1
9.4a
±0.1
9.0b
±0.1
8.7c
±0.1
Overall
mean
33.6
±0.2
33.6
±0.2
33.5
±0.2
33.4
±0.4
34.0
±0.2
56.5
±0.4
56.5
±0.2
56.7
±0.2
56.3
±0.2
56.2
±0.2
9.9b
±0.1
9.9b
±0.1
10.2a
±0.1
9.9b
±0.1
9.7b
±0.1
a, b, and c Means within each row for each trait (yolk, albumen and shell percentages) with different superscripts are significantly
different (P≤0.05). G1 to G5 = The pullets were exposed during 8 to 18 weeks of age to 8L:16D, 10L:14D,12L:12D, 14L:10D, and 16L:8D hrs/day,
respectively.

El-Sagheer 64
Table 10. Economical evaluation for Dandarawi chickens as affected by different photoperiods
during the rearing period
Items G1 G2 G3 G4 G5
Feed costs during growth period (LE.) 13.87 13.54 13.40 13.87 13.57
Feed costs during laying period (LE.) 85.24 83.49 77.44 85.41 82.83
Total feed costs (LE.) 99.11 97.03 90.84 99.28 96.40
Live body weight change from 8 to 62 weeks of
age (kg) 1.181 1.224 1.224 1.232 1.226
Body weight change price (LE.) 23.62 24.48 24.48 24.64 24.52
Egg mass (kg/hen) 6.4538 6.3979 6.9267 5.8769 6.3224
Egg mass price (L.E.) 103.26 102.37 110.83 94.03 101.16
Total revenue (L.E.) 126.88 126.85 135.31 118.67 125.68
Net revenue per hen (not including constant
costs)
27.77 29.81 44.46 19.39 29.28
Economical efficiency per hen 0.28 0.31 0.49 0.20 0.30
Relative economic efficiency (%) 100 110 175 70 108
Price of 1kg eggs were 16.0 L.E. at the time of experimental period. Price of 1Kg grower diet was 2.721 L.E.
Price of 1Kg grower diet was 2.973 L.E. Price of 1 Kg live body weight was 20.0 L.E.
LE = Egyptian pound. Net revenue per hen = total revenue minus total
feed costs
Economical efficiency/hen =Net revenue per hen / total feed costs. Relative economical efficiency of the control
group
*Constant costs include: Price of body chick, housing, labour, heating, cooling, lighting and treatment regimens.
G1 to G5 = The pullets were exposed during 8 to 18 weeks of age to 8L:16D, 10L:14D ,12L:12D, 14L:10D, and
16L:8D hrs/day, respectively

Egyptian J. Anim. Prod. (2012) 65
ليج ا الجتيجوا أ أثنياء فترتي الرعايية لثير فترات االضاءة المختلفة أثناء فترة الرعاية علي االااء االتتيا أت
اتتا البيض
حسن محمج الصغير محمج
مصر –أسيوط 62517 – امعة أسيوط -كلية الزواعة -قسم اإلتتا الحيوات الج ا ن
وعات إلي خمسة مجماألناث بالتساوي وقسمت ، أسابيع 8اث طيور الدندراوي عند عمر أجريت هذه الدراسة على مائتان من ان
الي 8أثناء فترة الرعاية من عمر تعرضتالمجموعة األولي الي الخامسة منوالبداري ، (المجموعة االولي الي المجموعة الخامسة)
. ساعة اضاءة يوميا علي التوالي 81، 81، 81، 81، 8اسبوع لفترات 88
:أمكن تلخيص النتائج المتحصل عليها كالتالي
حققت طيور المجموعة . اسبوع 11، 11وزن الجسم عند عمر لم توجد اختالفات معنوية ما بين طيور المجاميع الخمسة في
نقص معدل النفوق في . عن طيور المجاميع االخري (P≤0.05) اعال معنويا خامسة معدل زيادة في وزن الجسم اثناء فترة الرعايةال
نقص العمر عند النضج الجنس تدريجيا مع الزيادة في فترة . اسبوع عن المجاميع االخري 11 – 8طيور المجموعة الثالثة من عمر
.معنوية ما بين طيور المجاميع الخمسة اثتاء فترة الرعاية في الغذاء المستهلك ، وكفاءة التحويل الغذائي لم تالحظ اختالفات. االضاءة
في كفاءة التحويل الغذائي، ونقص الغذاء (P≤0.05)حسنا معنويا الثالثة تطيور المجموعة أظهرت :ثناء فترة انتاج البيضأ
لم توجد .عن المجاميع االخري، وزادت نسبة القشرة والكفاءة االنتاجية وكتلة البيض المستهلك ، وارتفع إنتاج البيض وعدد البيض
سجل دليل شكل صفار البيضة . وزن البيضة ، ونسبتي البياض والصفار في البيضة ختالفات معنوية ما بين طيور المجاميع الخمسة فيإ
لطيور (P≤0.05)معنويا (HU)تحسنت وحدات جودة البياض .للطيور المجموعة الرابعة ارتفاعا معنويا عن المجاميع االخري
.األولي والخامسة المجموعة طيور الثانية ، والثالثة ، والرابعة عناميع المج
تربيتها تحت فترة أن يتميقترح للحصول علي أفضل معدل اداء إنتاجي لدجاج الدندراوي البياض أثناء فترة انتاج البيض بصفة عامه
.اسبوع 88 - 8ساعة اظالم يوميا اثناء فترة الرعاية من عمر 81اضاءة ، ساعة 81


![Rearing Healthy Calves Manual 2nd ed (1)[2] copy](https://static.fdokumen.com/doc/165x107/6326a762051fac18490ddddd/rearing-healthy-calves-manual-2nd-ed-12-copy.jpg)