Production & Use of Forest Products in Australia
40
This document has been scanned from hard-copy archives for research and study purposes. Please note not all information may be current. We have tried, in preparing this copy, to make the content accessible to the widest possible audience but in some cases we recognise that the automatic text recognition maybe inadequate and we apologise in advance for any inconvenience this may cause.
-
Upload
khangminh22 -
Category
Documents
-
view
3 -
download
0
Transcript of Production & Use of Forest Products in Australia

This document has been scanned from hard-copy archives for research and study purposes. Please note not all information may be current. We have tried, in preparing this copy, to make the content accessible to the widest possible audience but in some cases we recognise that the automatic text recognition maybe inadequate and we apologise in advance for any inconvenience this may cause.

PRODUCTION AND USE OF FOREST PRODUCTS IN AUSTRALIA
By F.A. Ximenes and W.D. Gardner
· . . - -. - I- •• - •• •

PRODUCTION AND USE OF
FOREST PRODUCTS IN AUSTRALIA
by
F. A. XIMENES and
W.D.GARDNER
FOREST RESOURCES RESEARCH NSW DEPARTMENT OF PRIMARY INDUSTRIES
SYDNEY 2005

Technical Paper No. 71 May 2005
The Authors:
Fabiano De Aquino Ximenes, Research Officer, CRC for Greenhouse Accounting/Forest Resources Research, NSW Department of Primary Industries, PO Box 100, Beecroft NSW 2119 Australia
W. David Gardner, Research Officer, Forest Resources Research, NSW Department of Primary Industries, PO Box 100, Beecroft. NSW 2119.
Published by:
Forest Resources Research,
Science and Research,
NSW Department of Primary Industries,
121-131 OratavaAvenue, West Pennant Hills 2125
PO Box 100, Beecroft 2119
Australia
Copyright © The State of NSW
NSW Department of Primary Industries
ISSN 1324-4345

TABLE OF CONTENTS
SUMMARY
INTRODUCTION
METHODS
1. GENERAL
2. LOG HARVEST BY STATE
(a) New South Wales (b) Australian Capital Territory (c) Queensland (d) Victoria (e) Tasmania (f) Western Australia (g) South Australia
3. END USES FOR FOREST PRODUCTS
RESULTS AND DISCUSSION
1. LOG HARVEST
(a) Volume of Logs Harvested in Australia (b) Volume of Logs Harvested in Australia by State
(i) Volume of logs harvested in New South Wales (ii) Volume of logs harvested in the Australian Capital Territory
(iii) Volume of logs harvested in Queensland (iv) Volume of logs harvested in Victoria (v) Volume of logs harvested in Tasmania
(vi) Volume of logs harvested in Western Australia (vii) Volume of logs harvested in South Australia
(c) Logs Usedfor Applications Other Than Sawn Timber in Australia in 199912000
(i) Electricity poles (ii) Roundwood used in the manufacture of other round products
(d) Production of Panel Products
2. END USES FOR FOREST PRODUCTS IN AUSTRALIA
(a) End Uses for Sawn Timber in Australia (i) Sawn timber in the residential sector
(ii) Sawn timber in the non-residential building sector (iii) Sawn timber in the furniture industry (iv) Volume of timber used in the manufacture of railway sleepers
and pallets in Australia (b) End Uses for Panel Products in Australia (c) Consumption of Forest Products in the Furniture Industry
GENERAL DISCUSSION
CONCLUSIONS
FOREST RESOURCES RESEARCH TECHNICAL PAPER NO. 71
PRODUCTION AND USE OF FOREST PRODUCTS IN AUSTRALIA
IV
1
2 2
2
2 2
2 3
3 3
4
4
5
5
5 7
9 11 11 12 14 14 16
16
16 17 17
18
18 18 21 21 21
22 23
24
26
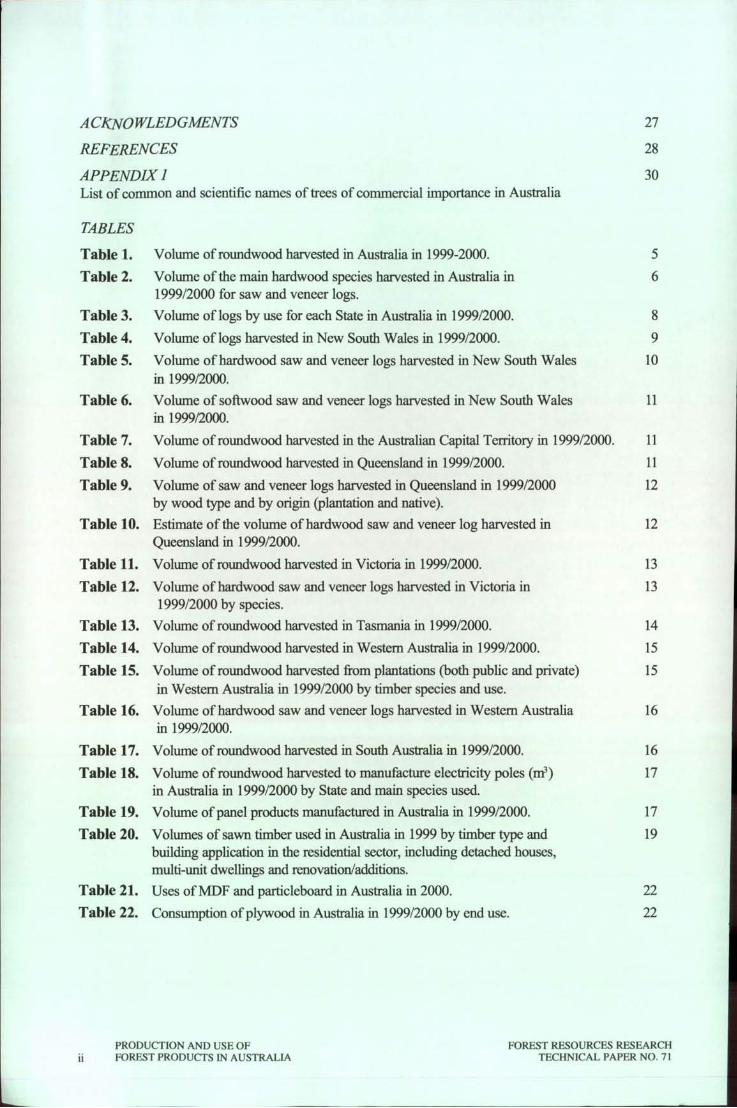
A ClCNOWLEDGMENTS
REFERENCES
APPENDIX 1 List of common and scientific names of trees of commercial importance in Australia
TABLES
Table 1.
Table 2.
Table 3.
Table 4.
Table 5.
Table 6.
Table 7.
Table 8.
Table 9.
Volume of round wood harvested in Australia in 1999-2000.
Volume of the main hardwood species harvested in Australia in 1999/2000 for saw and veneer logs.
Volume oflogs by use for each State in Australia in 1999/2000.
Volume oflogs harvested in New South Wales in 1999/2000.
Volume of hardwood saw and veneer logs harvested in New South Wales in 1999/2000.
Volume ofsoftwood saw and veneer logs harvested in New South Wales in 199912000.
Volume of round wood harvested in the Australian Capital Territory in 1999/2000.
Volume of round wood harvested in Queensland in 1999/2000.
Volume of saw and veneer logs harvested in Queensland in 1999/2000 by wood type and by origin (plantation and native).
27
28
30
5
6
8
9
10
11
11
11
12
Table 10. Estimate of the volume of hardwood saw and veneer log harvested in 12 Queensland in 1999/2000.
Table 11. Volume of round wood harvested in Victoria in 1999/2000. 13
Table 12. Volume of hardwood saw and veneer logs harvested in Victoria in 13 1999/2000 by species.
Table 13. Volume of round wood harvested in Tasmania in 1999/2000. 14
Table 14. Volume of round wood harvested in Western Australia in 1999/2000. 15
Table 15. Volume of round wood harvested from plantations (both public and private) 15 in Western Australia in 1999/2000 by timber species and use.
Table 16. Volume of hardwood saw and veneer logs harvested in Western Australia 16 in 1999/2000.
Table 17. Volume of round wood harvested in South Australia in 1999/2000. 16
Table 18. Volume of round wood harvested to manufacture electricity poles (m3) 17 in Australia in 1999/2000 by State and main species used.
Table 19. Volume of panel products manufactured in Australia in 1999/2000. 17
Table 20. Volumes of sawn timber used in Australia in 1999 by timber type and 19 building application in the residential sector, including detached houses, multi-unit dwellings and renovation/additions.
Table 21. Uses ofMDF and particleboard in Australia in 2000. 22
Table 22. Consumption of plywood in Australia in 1999/2000 by end use. 22
ii PRODUCTION AND USE OF FOREST PRODUCTS IN AUSTRALIA
FOREST RESOURCES RESEARCH TECHNICAL PAPER NO. 71

FIGURES
Figure 1. Percentage of the total volume of softwood saw and veneer logs harvested 6 by species in Australia in 1999/2000.
Figure 2. Estimate of the percentage of the volume of harvested saw and veneer logs 7 per species in Australia in 1999/2000.
Figure 3. Percentage of the total volume of radiata pine saw logs for each State in 8 Australia in 1999/2000.
Figure 4. Percentage of the total volume of hardwood saw and veneer logs by 9 State in Australia in 1999/2000.
Figure 5. Percentage of the total volume of softwood saw and veneer logs by State 9 in Australia in 1999/2000.
Figure 6. Production of forest products in Australia in 1999/2000. 18
Figure 7. Consumption of forest products in Australia in 1999/2000. 18
Figure 8. End uses for sawn timber in Australia. 19
Figure 9. End uses for sawn timber in the residential sector in Australia. 19
Figure 10. Main uses for Australian hardwood in the residential sector.
Figure 11. Main uses for imported hardwood in the residential sector.
Figure 12. Main uses for radiata pine in the residential sector.
20
20
20
Figure 13. Main uses for "other" pine in the residential sector. 20
Figure 14. Volume ('000 1Jil) of the main sawn timber species used in furniture making 21 in Australia in 1999.
Figure 15. Main end uses of the volume of sawn timber and panel products used in the furniture industry in Australia in 1999/2000.
23
FOREST RESOURCES RESEARCH TECHNICAL PAPER NO. 71
PRODUCTION AND USE OF FOREST PRODUCTS IN AUSTRALIA ill

SUMMARY
Carbon storage in forest products is being studied by the Co-operative Research Centre for Greenhouse Accounting (CRCGA). The fIrst step in the estimation of the size and likely turnover of the carbon pool in forest products is the development of detailed data on the annual manufacture and use of those products. Such information is not readily available in Australia. This report assembles detailed data from various sources on the production and use of forest products in Australia for the period 1999/2000.
A total of24,000,000 m3 oflogs were harvested from Australia's forests in 1999/2000. The majority of the roundwood harvested was in saw and veneer logs (10,982,000 m3) and pulpwood (10,781 ,000 m3). The volume of softwood logs harvested was 52% of the total. Softwoods represented the majority of saw and veneer logs (67%) and of panel products (approximately 97%). Hardwoods represented 70% of pulpwood harvested and above half of this came from Tasmania. About 93% of the hardwood logs were harvested from native forests . The only signifIcant volumes of plantation hardwood saw and veneer logs harvested were in New South Wales and Victoria. Radiata pine accounted for approximately 50% of the volume of saw and veneer logs and 76% of the total volume of softwood saw and veneer logs harvested.
New South Wales was the main producer of saw and veneer logs, with approximately 1.05 million m3 0f hardwood saw and veneer logs harvested. Blackbutt and spotted gum were the main hardwoods used for saw and veneer logs, accounting for 40% of the total volume. A total of 1.9 million m3 of softwood saw and veneer logs (mostly radiata pine) were harvested. A total of 1.3 million m3 of pulpwood was harvested in New South Wales. The total volume of logs harvested for other uses was 195,000 m3.
Approximately 1.6 million m3 of softwood saw and veneer logs and 670,000 m3 of softwood pulpwood were harvested in Victoria in 1999/2000. A total of 1.1 million m3 0fhardwood saw and veneer logs and 1.2 million m3 of hardwood pulpwood were harvested. The most important hardwood saw and veneer log species in Victoria are mountain ash, alpine ash and messmate.
Saw and veneer logs and pulpwood accounted for approximately 75% and 20% of the total volume harvested in Queensland. Approximately 1.4 million m3 of softwood saw and veneer logs and 470,000 m3
of softwood pulpwood were harvested. The main softwood species are slash pine and caribbean pine. The volume of hardwood saw and veneer logs harvested was 390,000 m3
• The total volume of logs harvested for other uses was 131,000 m3•
Pulpwood was the main log type harvested in Tasmania, accounting for 80% of the total volume. The pulpwood volume (5.4 million m3) was comprised almost entirely of hard woods (predominantly ''Tasmanian oak"). A total of 557,000 m3 of softwood and 542,000 m3 of hardwood saw and veneer logs were harvested. Radiata pine was the main softwood species harvested in Tasmania.
In Western Australia, saw and veneer logs accounted for approximately 50% of the volume of logs, followed by pulpwood (40% of the total) . A total of 537,000 m3 of hardwood (mainly jarrah and karri) and 379,000 m3 of softwood (mostly radiata pine) saw and veneer logs were harvested. The harvest of hardwoods for fIrewood and charcoal production was signifIcant (179,000 m3).
The total volume of roundwood (all radiata pine) harvested in the Australian Capital Territory was 125,000 m3.
In South Australia radiata pine accounted for 98% of the total volume of roundwood harvested. A total of 1.2 million m3 of saw and veneer logs and 508,000 m3 of pulpwood were harvested in South Australia.
PRODUCTION AND USE OF IV FOREST PRODUCTS IN AUSTRALIA
FOREST RESOURCES RESEARCH TECHNICAL PAPER NO. 71

The total production of timber electricity poles in Australia in 1999/2000 was estimated at 41,500 m3. It is predicted that the volumes of hardwood used for applications such as poles, piles and railway sleepers will continue to decrease as alternative materials are increasingly used.
The volume of panel products manufactured in Australia in 1999/2000 was 1.8 million m3• Particleboard
accounted for more than half of the total volume produced (and 15% of the total volume offorest products), followed by medium density fibreboard (MDF), which accounted for a third of the total volume of panel products.
Sawn timber accounted for more than 70% of the total volume offorest products consumed. The residential sector accounted for 74% of the sawn timber market, followed by non-residential construction, furniture and others, which shared approximately equal proportions (8-9%) of the sawn timber market. Most of the sawn timber consumed was used in the construction of new dwellings (53%).
Wall frames and roofing applications constituted the main end uses for sawn timber in Australia in 1999 (55%), followed by fencing, ceiling framing and sub-flooring, which all shared similar percentages of the market (10%). Radiata pine accounted for 57% of the volume of sawn timber used in the residential market, predominantly as wall and roof components, which represented 80% of that market. For hardwoods, the main uses of locally produced resource were fencing and sub-flooring, which combined account for more than 50% of that market. The smaller imported hardwood market was heterogeneous with the main end uses being doors, skirting, architraves, windows and fencing. An estimate of the volume of timber used in the non-residential sector by species was not available. However, the wall and roof framing markets represented a major component of the non-residential sector and, therefore, it is expected that radiata pine was the main species used in this sector as well.
The total estimated volume of sawn timber used in the manufacture of furniture in Australia was 376,000 m3•
Radiata pine was the dominant species in the furniture sector, accounting for 80% of the volume of sawn timber used in the manufacture of furniture in 1999. The use of hardwoods in the furniture industry has decreased dramatically. The manufacture of pallets also involves a significant amount of sawn timber; it is estimated that 200,000 m3 of sawn timber is used annually in the manufacture of pallets.
The furniture and kitchen sectors account for more than 50% of the use of particle board and MDF. Other major uses for those materials included flooring (particleboard) and shopfitting (MDF). The structural building market used 57% of the total volume of plywood used in 1999/2000. The total volume of forest products consumed in the furniture industry in Australia in 1999/2000 was approximately 1.1 million m3
,
which was equivalent to 15-20% of all forest products consumed in Australia.
FOREST RESOURCES RESEARCH TECHNICAL PAPER NO. 71
PRODUCTION AND USE OF FOREST PRODUCTS IN AUSTRALIA v
INTRODUCTION
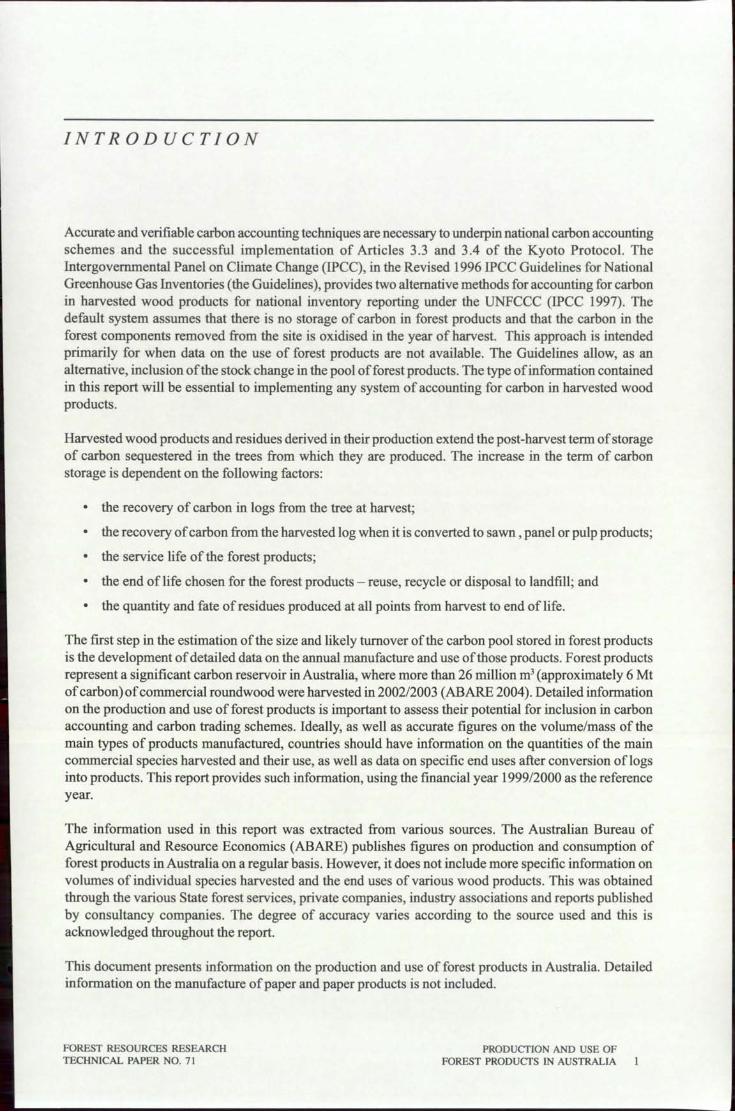
Accurate and verifiable carbon accounting techniques are necessary to underpin national carbon accounting schemes and the successful implementation of Articles 3.3 and 3.4 of the Kyoto Protocol. The Intergovernmental Panel on Climate Change (IPCC), in the Revised 1996 IPCC Guidelines for National Greenhouse Gas Inventories (the Guidelines), provides two alternative methods for accounting for carbon in harvested wood products for national inventory reporting under the UNFCCC (IPCC 1997). The default system assumes that there is no storage of carbon in forest products and that the carbon in the forest components removed from the site is oxidised in the year of harvest. This approach is intended primarily for when data on the use of forest products are not available. The Guidelines allow, as an alternative, inclusion of the stock change in the pool of forest products. The type of information contained in this report will be essential to implementing any system of accounting for carbon in harvested wood products.
Harvested wood products and residues derived in their production extend the post-harvest term of storage of carbon sequestered in the trees from which they are produced. The increase in the term of carbon storage is dependent on the following factors:
• the recovery of carbon in logs from the tree at harvest;
• the recovery of carbon from the harvested log when it is converted to sawn , panel or pulp products;
• the service life of the forest products;
• the end of life chosen for the forest products - reuse, recycle or disposal to landfill; and
• the quantity and fate of residues produced at all points from harvest to end of life.
The first step in the estimation ofthe size and likely turnover of the carbon pool stored in forest products is the development of detailed data on the annual manufacture and use of those products. Forest products represent a significant carbon reservoir in Australia, where more than 26 million m3 (approximately 6 Mt of carbon) of commercial roundwood were harvested in 2002/2003 (ABARE 2004). Detailed information on the production and use of forest products is important to assess their potential for inclusion in carbon accounting and carbon trading schemes. Ideally, as well as accurate figures on the volume/mass of the main types of products manufactured, countries should have information on the quantities of the main commercial species harvested and their use, as well as data on specific end uses after conversion of logs into products. This report provides such information, using the fmancial year 1999/2000 as the reference year.
The information used in this report was extracted from various sources. The Australian Bureau of Agricultural and Resource Economics (ABARE) publishes figures on production and consumption of forest products in Australia on a regular basis. However, it does not include more specific information on volumes of individual species harvested and the end uses of various wood products. This was obtained through the various State forest services, private companies, industry associations and reports published by consultancy companies. The degree of accuracy varies according to the source used and this is acknowledged throughout the report.
This document presents information on the production and use of forest products in Australia. Detailed information on the manufacture of paper and paper products is not included.
FOREST RESOURCES RESEARCH TECHNICAL PAPER NO. 71
PRODUCTION AND USE OF FOREST PRODUCTS IN AUSTRALIA

-----------------------------------------------------------METHODS
1. GENERAL
The values used in this report were derived from various sources, predominantly from industry and State forest services. When exact values were not available, estimates are provided as indicated throughout the report. The log harvest volumes for Australia were extracted from the regular ABARE publications on Australian forest and forest products statistics. These publications do not include a breakdown of volumes for States and species harvested in each State. As far as possible, this information was acquired directly from State forest services, private growers and industry associations. When it was not possible to obtain the exact volumes for a particular category, these were estimated as described. It was not possible to determine the volume of roundwood used for panel products in each state. This is included under the category "pulpwood" or "chips".
The log harvest figures for privately managed lands were often difficult to obtain and in some cases were estimated. The main log categories (saw and veneer logs and pulpwood) were reported for both Crown and private lands for each State and Territory in Australia. When the pulpwood harvest was available only in tonnes, a generic conversion factor of 1 tonnellm3 was applied (Jaakko Poyry 1999). The scientific names of the species mentioned in this report are included in Appendix 1.
2. LOG HARVEST BY STATE
An explanation of how the saw and veneer log volumes for each individual species were obtained for each State is included below.
(a) New South Wales
So/twoods and Hardwoods
The data were obtained from State Forests of NSW (now Forests NSW) Annual Reports and the NSW Office of Private Forestry. The volume of saw and veneer logs from private land did not include volumes for individual species. Therefore, for the purposes of this report, the percentage of each species reported for saw and veneer log harvested in public land was applied to the volume harvested from private land.
(b) Australian Capital Territory
Only softwoods were harvested in the Australian Capital Territory and all production was managed by the local public forest agency, from which the volumes harvested were obtained.
(e) Queensland
So/twoods
The data obtained from the State forest department included volume of saw and veneer logs harvested from private land. Although it was not possible to obtain exact values for each of the main exotic pines harvested in Queensland, slash pine and Caribbean pine represent the vast majority of that resource (DPI 2000). In this report, based on figures from the State agency annual reports, it is assumed that Caribbean and slash pine represent, respectively, 50 and 45% of the volume of exotic pines harvested in Queensland.
2 PRODUCTION AND USE OF FOREST PRODUCTS IN AUSTRALIA
FOREST RESOURCES RESEARCH TECHNICAL PAPER NO. 71
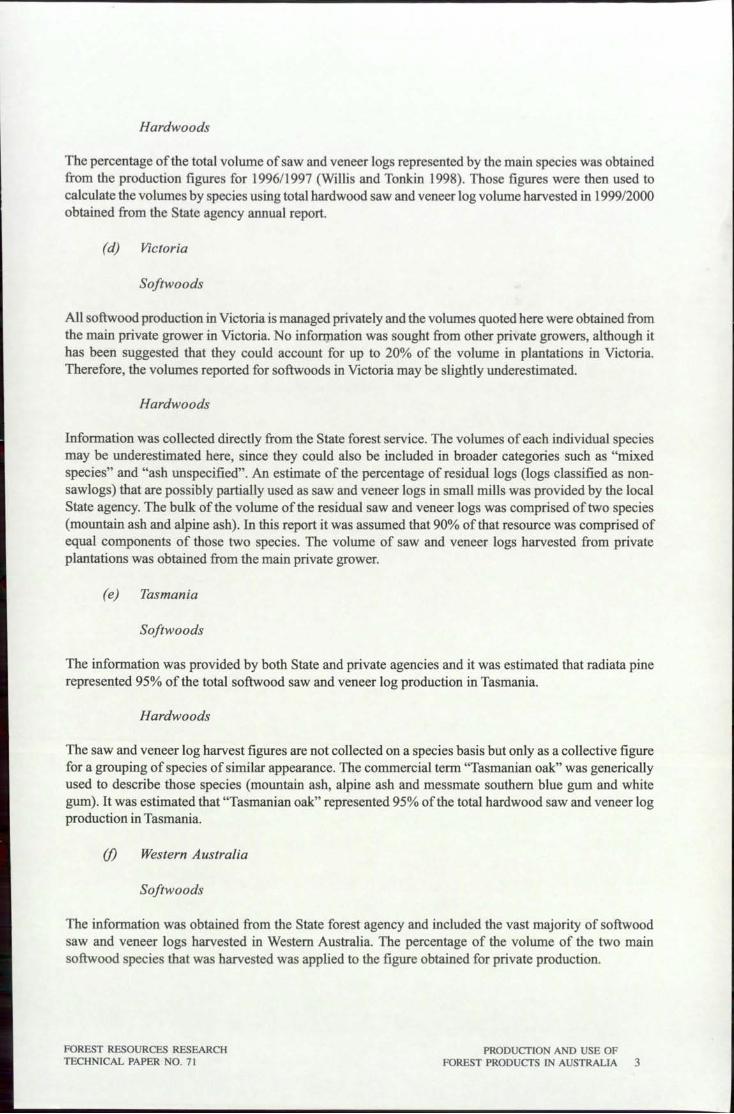
Hardwoods
The percentage of the total volume of saw and veneer logs represented by the main species was obtained from the production figures for 1996/1997 (Willis and Tonkin 1998). Those figures were then used to calculate the volumes by species using total hardwood saw and veneer log volume harvested in 1999/2000 obtained from the State agency annual report.
(d) Victoria
So/twoods
All softwood production in Victoria is managed privately and the volumes quoted here were obtained from the main private grower in Victoria. No inforrpation was sought from other private growers, although it has been suggested that they could account for up to 20% of the volume in plantations in Victoria. Therefore, the volumes reported for softwoods in Victoria may be slightly underestimated.
Hardwoods
Information was collected directly from the State forest service. The volumes of each individual species may be underestimated here, since they could also be included in broader categories such as "mixed species" and "ash unspecified". An estimate of the percentage of residual logs (logs classified as nonsawlogs) that are possibly partially used as saw and veneer logs in small mills was provided by the local State agency. The bulk of the volume of the residual saw and veneer logs was comprised of two species (mountain ash and alpine ash). In this report it was assumed that 90% of that resource was comprised of equal components of those two species. The volume of saw and veneer logs harvested from private plantations was obtained from the main private grower.
(e) Tasmania
So/twoods
The information was provided by both State and private agencies and it was estimated that radiata pine represented 95% of the total softwood saw and veneer log production in Tasmania.
Hardwoods
The saw and veneer log harvest figures are not collected on a species basis but only as a collective figure for a grouping of species of similar appearance. The commercial term "Tasmanian oak:" was generically used to describe those species (mountain ash, alpine ash and messmate southern blue gum and white gum). It was estimated that "Tasmanian oak:" represented 95% of the total hardwood saw and veneer log production in Tasmania.
(f) Western Australia
So/twoods
The information was obtained from the State forest agency and included the vast majority of softwood saw and veneer logs harvested in Western Australia. The percentage of the volume of the two main softwood species that was harvested was applied to the figure obtained for private production.
FOREST RESOURCES RESEARCH TECHNICAL PAPER NO. 71
PRODUCTION AND USE OF FOREST PRODUCTS IN AUSTRALIA 3
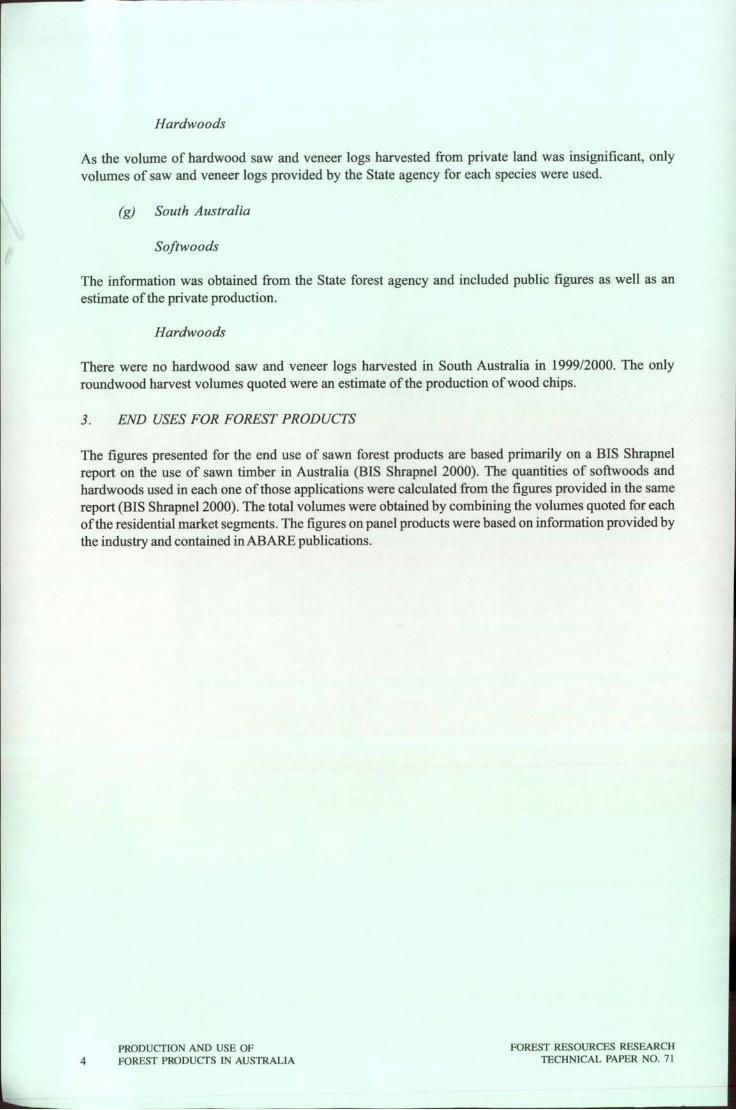
Hardwoods
As the volume of hardwood saw and veneer logs harvested from private land was insignificant, only volumes of saw and veneer logs provided by the State agency for each species were used.
(g) South Australia
Softwoods
The information was obtained from the State forest agency and included public figures as well as an estimate of the private production.
Hardwoods
There were no hardwood saw and veneer logs harvested in South Australia in 1999/2000. The only roundwood harvest volumes quoted were an estimate of the production of wood chips.
3. END USES FOR FOREST PRODUCTS
The figures presented for the end use of sawn forest products are based primarily on a BIS Shrapnel report on the use of sawn timber in Australia (BIS Shrapnel 2000). The quantities of softwoods and hardwoods used in each one of those applications were calculated from the figures provided in the same report (BIS Shrapnel 2000). The total volumes were obtained by combining the volumes quoted for each of the residential market segments. The figures on panel products were based on information provided by the industry and contained inABARE pUblications.
4 PRODUCfION AND USE OF FOREST PRODuers IN AUSTRALIA
FOREST RESOURCES RESEARCH TECHNICAL PAPER NO. 71

RESULTS AND DISCUSSION
1. LOG HARVEST
(aJ Volume of Logs Harvested in Australia
A total of 24,000,000 m3 of logs (roundwood) were harvested from Australia's forests in 1999/2000 (Table 1), (ABARE 2001). The majority of the roundwood harvested was found in saw and veneer logs and pulpwood (each log type accounting for approximately 45% of the total volume). Approximately 6% of the total volume of the logs were used in the manufacture of panel products.
Table 1. Volume of round wood harvested in Australia in 1999-2000 (ABARE 2001).
Types Hardwood Hardwood Total Softwood Total of Logs Native Plantation Hardwood (SW + HW)
'000 rff '000 m3 '000 m3 '000 m3 '000 m3
Saw and veneer 3491 149 3641 7341 10982 Pulpwood 6932 683 7615 3166 10781 Panel products 40 0 40 1490 1530 Sleeper 54 0 54 0 54 Other 178 6 184 478 662
Total 10695 839 11534 12475 24009
The volume of softwood logs harvested was slightly greater than that of hard woods, accounting for 52% of the total (Table 1). Softwoods represented the majority of saw and veneer logs (67%) and of panel products (approximately 97%). Hardwoods represented the majority of pulpwood harvested, with 70% of the total pulpwood volume harvested that year. The vast majority of the hardwood logs were harvested from native forests (approximately 93%). It is expected though that in the next years the volume of hardwood logs harvested from plantation forests will increase significantly.
An estimate of the percentage of the total volume of softwood saw and veneer log harvest in Australia by species is presented in Figure 1. The volume of softwood pulpwood harvest by species could not be estimated due to difficulties in quantifying the mix of species used as well as the exact use of the wood chips produced. The total softwood saw and veneer log production in Australia in 1999/2000 as calculated in this report was 7.4 million m3, which is approximately the same value reported by the ABARE (Table 1). Radiata pine is the main softwood used for saw and veneer logs, with 5.7 million m3 harvested (Figure 1). This represented 76% of the total volume of softwood saw and veneer logs harvested in Australia. Other softwood species of commercial importance include slash and Caribbean pine which, combined, account for nearly 12% of that resource. Hoop pine, cypress pine and maritime pine are the other commercially relevant species, accounting for a combined 10% of the total volume of softwood saw and veneer logs harvested (Figure 1).
FOREST RESOURCES RESEARCH TECHNICAL PAPER NO. 71
PRODUCTION AND USE OF FOREST PRODUCTS IN AUSTRALIA 5

IMari;me~1 r----~ Others
~4%1%3 ~ '------..... Cypress
5%
Figure 1. Percentage of the total volume of softwood saw and veneer log harvested by species in Australia in 1999/2000.
Table 2 shows the volume of hardwood saw and veneer logs by species harvested in Australia in 19991 2000.
Table 2. Volume of the main hardwood species harvested in Australia in 1999/2000 for saw and veneer logs.
Species Volume Percentage '000 rrz3 (%)
Tasmanian oak* 515 13.8 Mountain ash ** 400 10.8 Blackbutt 347 9.3 Jarrah 330 8.9 Alpine ash** 288.5 7.8 Messmate** 231.5 6.2 Spotted gum 221 5.9 Karri 177 4.8 Ironbark 130.5 3.5 Brown barrel 91.8 2.5 Flooded gum 84 2.3 Silvertop ash 75 2.0 Others 829 22.3 Total 3720
• Includes mountain ash, alpine ash and messmate • * Volume harvested from Victoria only - it does not include harvest from Tasmania
The degree of accuracy for hardwoods (Table 2) is likely to be considerably lower than for softwoods. This is partly due to the greater range of hardwood species harvested, as well as to other reasons already mentioned for each state in the Methods section. Some species are harvested in more than one State (eg blackbutt and messmate). In those cases, the volume presented is the sum of individual harvest volumes by State. The volumes of mountain ash, alpine ash and messmate are underestimated in Table 2, due to the lack of individual volume figures by species in Tasmania. The total volume of hardwood saw and
6 PRODUCTION AND USE OF FOREST PRODUcrS IN AUSTRALIA
FOREST RESOURCES RESEARCH TECHNICAL PAPER NO. 71

veneer logs calculated here (Table 2) was approximately the same as that published by the ABARE (Table 1).
Figure 2 shows the main saw and veneer log species in Australia when both softwoods and hardwoods are considered. Radiata pine represents slightly more than half the volume of saw and veneer logs produced in Australia. The other species each represent individually 2-5% of the total volume of saw and veneer logs harvested in Australia.
Messmate 2%
IIIpine ash 3%
Cypress 3%
Others
4% Tas oak
5%
Radiata 50%
m Radiata
DTas oak
m Caribbean
DSlash
• Mountain ash
liilHoop
DBlackbutt
o Jarrah
• Cypress
mAlpine ash
El Messmate
DOthers
Figure 2. Estimate of the percentage of the volume of harvested saw and veneer logs per species in Australia in 1999/2000.
The distribution of radiata pine saw and veneer logs harvest by State in Australia is given in Figure 3. The majority of the harvest of radiata pine in Australia is concentrated in the south and south-east areas of the country.
(b) Volume of Logs Harvested in Australia by State
The total volume oflogs harvested for each State in Australia by log use is presented in Table 3. The total volume of saw and veneer logs determined here as the sum of the data from the States was approximately the same as the figure quoted by the ABARE in Table 1. The volume of saw and veneer logs was slightly greater than that oflogs used for pulp and panel products (Table 3). This result differs somewhat from the ABARE numbers, which indicated that the combined volume oflogs used for pulp and panel products is greater than that for saw and veneer logs (Table 1). It was not possible to obtain separate volumes of pulpwood and panel product logs. New South Wales was the main producer of saw and veneer logs, followed closely by Victoria (Table 3). Approximately half the amount of pulpwood produced in Australia originated from Tasmania. South Australia is the main producer of "round" products which, for that State, includes mainly preservative-treated radiata pine posts. Detailed information on the production and use of electricity poles is provided in (i) Electricity poles (p. 16). Although estimates offirewood production are outside the scope of this report, the volumes harvested were included for each State when information was available. A more detailed breakdown in terms of wood type and uses for each State is given in 2. End Uses for Forest Products in Australia (pp. 18).
FOREST RESOURCES RESEARCH TECHNICAL PAPER NO. 71
PRODUCTION AND USE OF FOREST PRODUCTS IN AUSTRALIA 7

Figure 3. Percentage of the total volume of radiata pine saw logs for each State inAustralia in 1999/2000.
Table 3. Volume oflogs by use for each State in Australia in 1999/2000.
State Saw and Veneer Pulpwood* Round Firewood Others '000 m3 '000 m3 '000 m3 '000 m3 '000 m3
NSW 2927 1312 67 86 30 VIC 2861 1914 na na QLD 1830 468 90 na 33 SA 1418 891 104 TAS 1119 5404 12 171 WA 916 768 13 179 5.9 ACT 95 3 27**
Total 11167 10756 277 na na
• Includes wood chips used for panel production
•• Export grade (may be used either as saw logss or pulpwood)
Figures 4 and 5 compare the percentages of the total volume of hardwood and softwood saw and veneer logs harvested by State as calculated in this report and by the ABARE. The average figures were compiled by the ABARE for three years - fmancial year 1998/1999 until 2000/2001 (yainshet, pers.comm.). These figures are generally in agreement with the percentages calculated here.
8 PRODUCfION AND USE OF FOREST PRODUCfS IN AUSTRALiA
FOREST RESOURCES RESEARCH TECHNlCAL PAPER NO. 71

% of total volume
• This report (99/00)
o ABARE (98-99/00-01)
14.4 1
o o
NSW VIC QLD SA WA T AS ACT
States
Figure 4. Percentage of the total volume of hardwood saw and veneer logs by State in Australia in 1999/2000.
% of total volume
19.4 19.1
11 This report (99100)
8 ABARE (98-99/00-01)
1.3
NSW VIC QLD SA WA TAS ACT
States
Figure 5. Percentage of the total volume of softwood saw and veneer logs by State in Australia in 1999/2000.
(i) Volume of logs harvested in New South Wales
The volume oflogs harvested in New South Wales in 1999/2000 is shown in Table 4. The main saw and veneer log hardwood species in New South Wales and their harvested volumes in 1999/2000 are listed in Table 5. Saw and veneer logs represented 66% of the total volume oflogs harvested in New South Wales.
Table 4. Volume oflogs harvested in New South Wales in 1999/2000.
Log Type Softwood (public)* '000 m3
Saw and veneer 1821 Pulpwood 636 Poles/GirderslPiles Round 56 Firewood Other (fencing, 3.8
landscape, sleepers)***
Total 2518
State Forests of NSW (2000) Estimated from Clark (pers.comm.)
Hardwood (public)* '000 m3
856 586 34 11 86 3.8
1577
• •• ••• Total was divided equally to softwoods and hardwoods
FOREST RESOURCES RESEARCH TECHNICAL PAPER NO. 71
Softwood Hardwood Total (private)** (private)** '000 m3
'000 m3 '000 m3
60 190 2927 40 50 1312 na na 34 na na 67.5 na na 86 na na 7.6
100 240 4435
PRODUCTION AND USE OF FOREST PRODUCTS IN AUSTRALIA 9

.....
Table 5. Volume of hardwood saw and veneer logs harvested in New South Wales in 1999/2000.
Species Hardwood (pubJic)* Total '000 m3 '000 m3
Blackbutt 198 245 Spotted gum 123 153 Flooded gum 61.4 76.0 Messmate 45.5 56.4 River red gum 41.2 51.0 Blue gum 33.3 41.3 Silvertop stringybark 32.1 39.7 Alpine ash 27.6 34.2 New England blackbutt 27.5 34.1 Ironbark 24.6 30.5 Tallowwood 23.6 29.2 Brown barrel 18.4 22.8 Yellow stringybark 18.3 22.6 Silvertop ash 15.5 19.3 Brushbox 13.6 16.8 White mahogany 13.1 16.2 White stringybark 11.6 14.3 Turpentine 8.8 10.9 Diehard stringybark 9.1 11.3 Others 50.9 63.0
Total 797.4 987.3
* Calculated from Armistead (pers.comm.)
In Table 5 the estimated volumes of each species harvested from private land are included in the "Total" column. Blackbutt and spotted gum are the main hardwoods used for saw and veneer logs in New South Wales, accounting for 40% of the total volume. They are also the main species in hardwood plantations in New South Wales. Plantation hardwood saw logs accounted for 6.5% of the total volume of hardwood saw and veneer logs harvested in New South Wales in 1999/2000 (55,500 m3
). The only significant volumes of plantation hardwood saw and veneer logs harvested in Australia were in New South Wales and Victoria. An estimate of the volume of plantation blackbutt, spotted gum and flooded gum is included in the total volume quoted for those species in Table 2.
Radiata pine logs represented the vast majority of the softwood saw and veneer logs harvested in New South Wales (Table 6). Although there was a significant volume of cypress pine saw and veneer logs harvested (approximately 105,000 m3) , it accounted for only approximately 3% of the total volume of softwood saw and veneer logs harvested in New South Wales. The estimate of softwood harvest from private land is based on the proportion of radiata and cypress harvested in public land.
10 PRODUcrlON AND USE OF FOREST PRODUcrS IN AUSTRALIA
FOREST RESOURCES RESEARCH TECHNICAL PAPER NO. 71
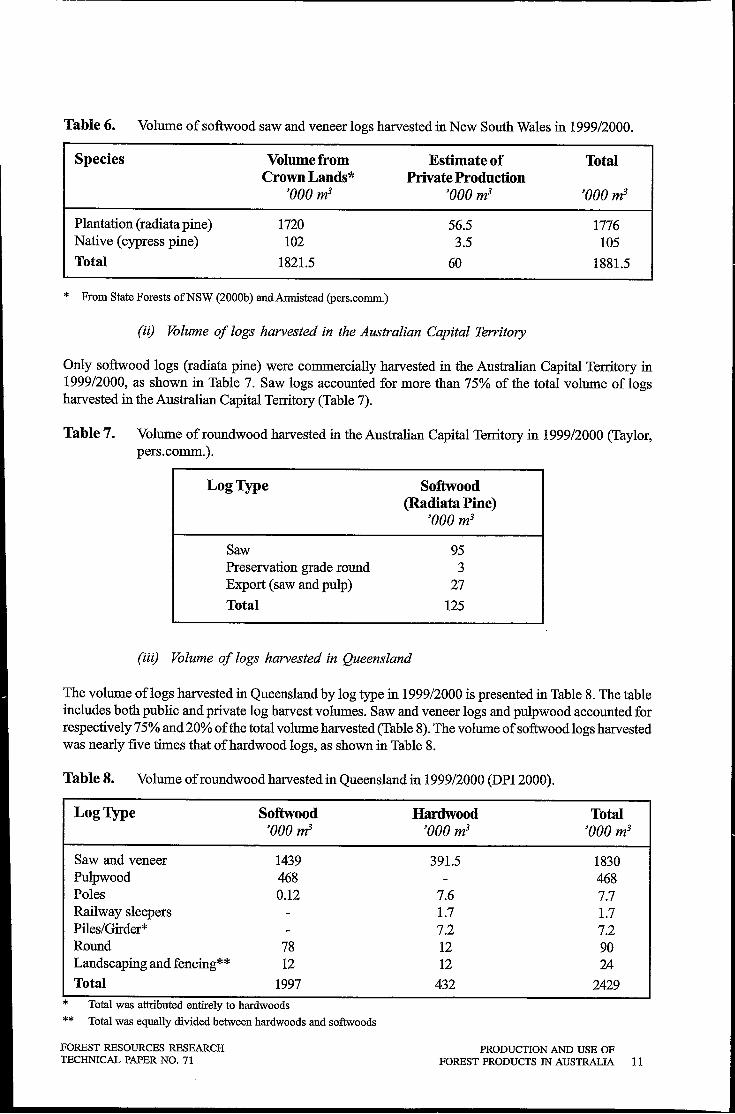
Table 6. Volume of softwood saw and veneer logs harvested in New South Wales in 1999/2000.
Species
Plantation (radiata pine) Native (cypress pine)
Total
Volume from Crown Lands*
'000 m3
1720 102
1821.5
* From State Forests of NSW (2000b) and Annistead (pers.comm.)
Estimate of Private Production
'000 m3
56.5 3.5
60
(ii) Volume of logs harvested in the Australian Capital Territory
Total
'000 m3
1776 105
1881.5
Only softwood logs (radiata pine) were commercially harvested in the Australian Capital Territory in 1999/2000, as shown in Table 7. Saw logs accounted for more than 75% of the total volume oflogs harvested in the Australian Capital Territory (Table 7).
Table 7. Volume of roundwood harvested in the Australil:tn Capital Territory in 1999/2000 (Taylor, pers.comm.).
Log Type
Saw Preservation grade round Export (saw and pulp)
Total
Softwood (Radiata Pine)
'000 m3
95 3
27
125
(iii) Volume of logs harvested in Queensland
The volume oflogs harvested in Queensland by log type in 1999/2000 is presented in Table 8. The table includes both public and private log harvest volumes. Saw and veneer logs and pulpwood accounted for respectively 75% and 20% of the total volume harvested (Table 8). The volume of softwood logs harvested was nearly five times that of hardwood logs, as shown in Table 8.
Table 8. Volume of round wood harvested in Queensland in 1999/2000 (DPI2000).
Log Type Softwood '000 m3
Saw and veneer 1439 Pulpwood 468 Poles 0.12 Railway sleepers Piles/Girder* Round 78 Landscaping and fencing** 12
Total 1997
* Total was attributed entirely to hardwoods
** Total was equally divided between hardwoods and softwoods
FOREST RESOURCES RESEARCH TECHNICAL PAPER NO. 71
Hardwood Total '000 m3 '000 m3
391.5 1830 468
7.6 7.7 1.7 1.7 7.2 7.2 12 90 12 24
432 2429
PRODUCTION AND USE OF FOREST PRODUCTS IN AUSTRALIA 11
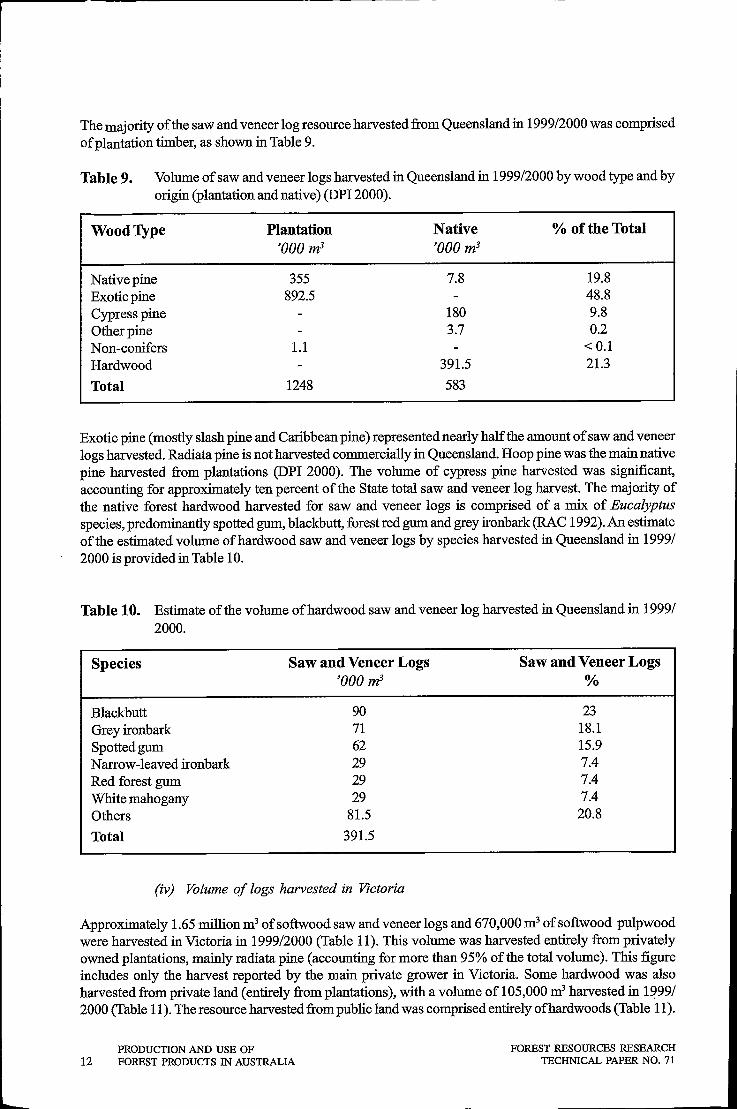
The majority of the saw and veneer log resource harvested from Queensland in 1999/2000 was comprised of plantation timber, as shown in Table 9.
Table 9. Volume of saw and veneerlogs harvested in Queensland in 1999/2000 by wood type and by origin (plantation and native) (DPI2000).
Wood Type Plantation Native % ofthe Total '000 m3 '000 m3
Native pine 355 7.8 19.8 Exotic pine 892.5 48.8 Cypress pine 180 9.8 Other pine 3.7 0.2 Non-conifers 1.1 <0.1 Hardwood 391.5 21.3
Total 1248 583
Exotic pine (mostly slash pine and Caribbean pine) represented nearly half the amount of saw and veneer logs harvested. Radiata pine is not harvested commercially in Queensland. Hoop pine was the main native pine harvested from plantations (DPI 2000). The volume of cypress pine harvested was significant, accounting for approximately ten percent of the State total saw and veneer log harvest. The maj ority of the native forest hardwood harvested for saw and veneer logs is comprised of a mix of Eucalyptus species, predominantly spotted gum, blackbutt, forest red gum and grey ironbark (RAC 1992). An estimate of the estimated volume of hardwood saw and veneer logs by species harvested in Queensland in 19991 2000 is provided in Table 10.
Table 10. Estimate of the volume of hardwood saw and veneer log harvested in Queensland in 19991 2000.
Species
Blackbutt Grey ironbark Spotted gum Narrow-leaved ironbark Red forest gum White mahogany Others
Total
Saw and Veneer Logs '000 m3
90 71 62 29 29 29
81.5
391.5
(iv) Volume of logs harvested in Victoria
Saw and Veneer Logs %
23 18.1 15.9 7.4 7.4 7.4
20.8
Approximately 1.65 million m3 of softwood saw and veneer logs and 670,000 m3 of softwood pulpwood were harvested in Victoria in 1999/2000 (Table 11). This volume was harvested entirely from privately owned plantations, mainly radiata pine (accounting for more than 95% of the total volume). This figure includes only the harvest reported by the main private grower in Victoria. Some hardwood was also harvested from private land (entirely from plantations), with a volume of 105,000 m3 harvested in 19991 2000 (Table 11). The resource harvested from public land was comprised entirely of hard woods (Table 11).
12 PRODUCTION AND USE OF FOREST PRODUCTS IN AUSTRALIA
FOREST RESOURCES RESEARCH TECHNICAL PAPER NO. 71
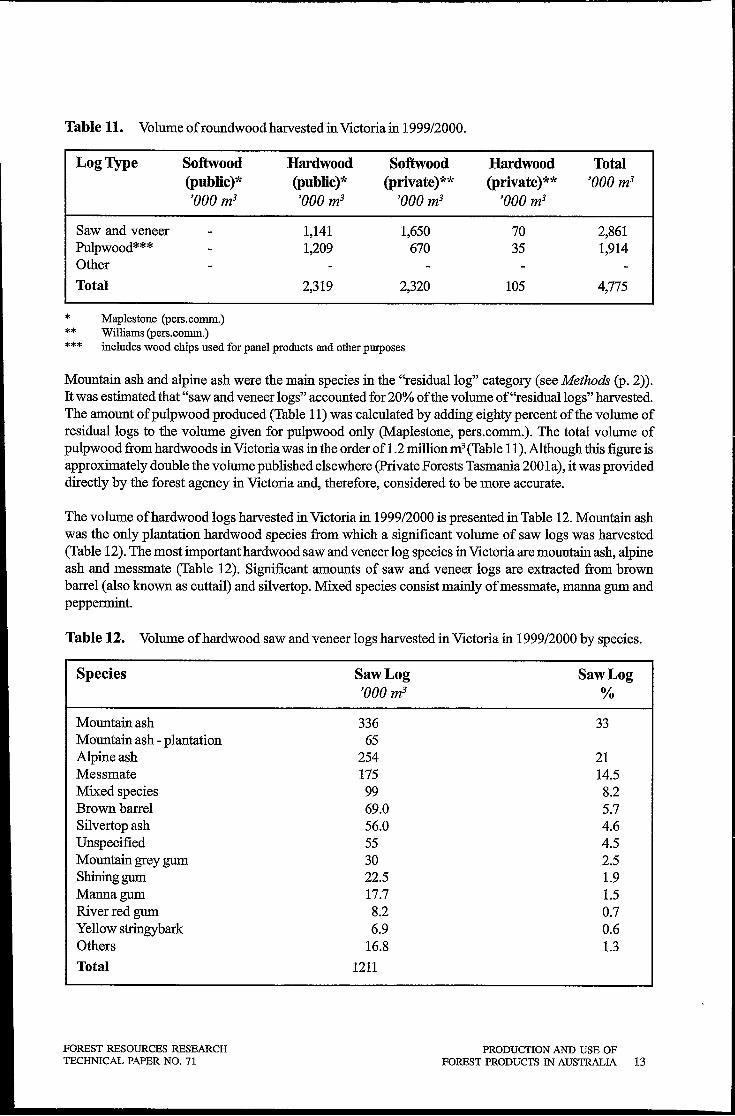
Table 11. Volume of roundwood harvested in Victoria in 1999/2000.
Log Type Softwood Hardwood Softwood Hardwood Total (public)* (public)* (private)** (private)** '000 m3
'000 m3 '000 m3 '000 m3 '000 m3
Saw and veneer 1,141 1,650 70 2,861 Pulpwood*** 1,209 670 35 1,914 Other
Total 2,319 2,320 105 4,775
* Maplestone (pers.comm.)
** Williams (pers.comm.)
*** includes wood chips used for panel products and other purposes
Mountain ash and alpine ash were the main species in the "residual log" category (see Methods (p. 2». It was estimated that "saw and veneer logs" accounted for 20% of the volume of "residual logs" harvested. The amount of pulpwood produced (Table 11) was -calculated by adding eighty percent of the volume of residual logs to the volume given for pulpwood only (Maplestone, pers.comm.). The total volume of pulpwood from hardwoods in Victoria was in the order of 1.2 million m3 (Table 11). Although this figure is approximately double the volume published elsewhere (private Forests Tasmania 200 la), it was provided directly by the forest agency in Victoria and, therefore, considered to be more accurate.
The volume of hardwood logs harvested in Victoria in 1999/2000 is presented in Table 12. Mountain ash was the only plantation hardwood species from which a significant volume of saw logs was harvested (Table 12). The most important hardwood saw and veneer log species in Victoria are mountain ash, alpine ash and messmate (Table 12). Significant amounts of saw and veneer logs are extracted from brown barrel (also known as cuttail) and silvertop. Mixed species consist mainly of messmate, manna gum and peppermint.
Table 12. Volume of hardwood saw and veneer logs harvested in Victoria in 1999/2000 by species.
Species
Mountain ash Mountain ash - plantation Alpine ash Messmate Mixed species Brown barrel Silvertop ash Unspecified Mountain grey gum Shining gum Manna gum River red gum Yellow stringybark Others
Total
FOREST RESOURCES RESEARCH TECHNICAL PAPER NO. 71
Saw Log '000 m3
336 65
254 175 99 69.0 56.0 55 30 22.5 17.7 8.2 6.9
16.8
1211
Saw Log %
33
21 14.5 8.2 5.7 4.6 4.5 2.5 1.9 1.5 0.7 0.6 1.3
PRODUCTION AND USE OF FOREST PRODUCTS IN AUSTRALIA 13
The level of detail provided in Table 12 for saw and veneer logs is not available for pulpwood. The most important pulpwood species in Victoria are mountain ash and alpine ash. Most of the pulpwood resource though is grouped in unspecified, ash unspecified and mixed species categories.
(v) Volume of logs harvested in Tasmania
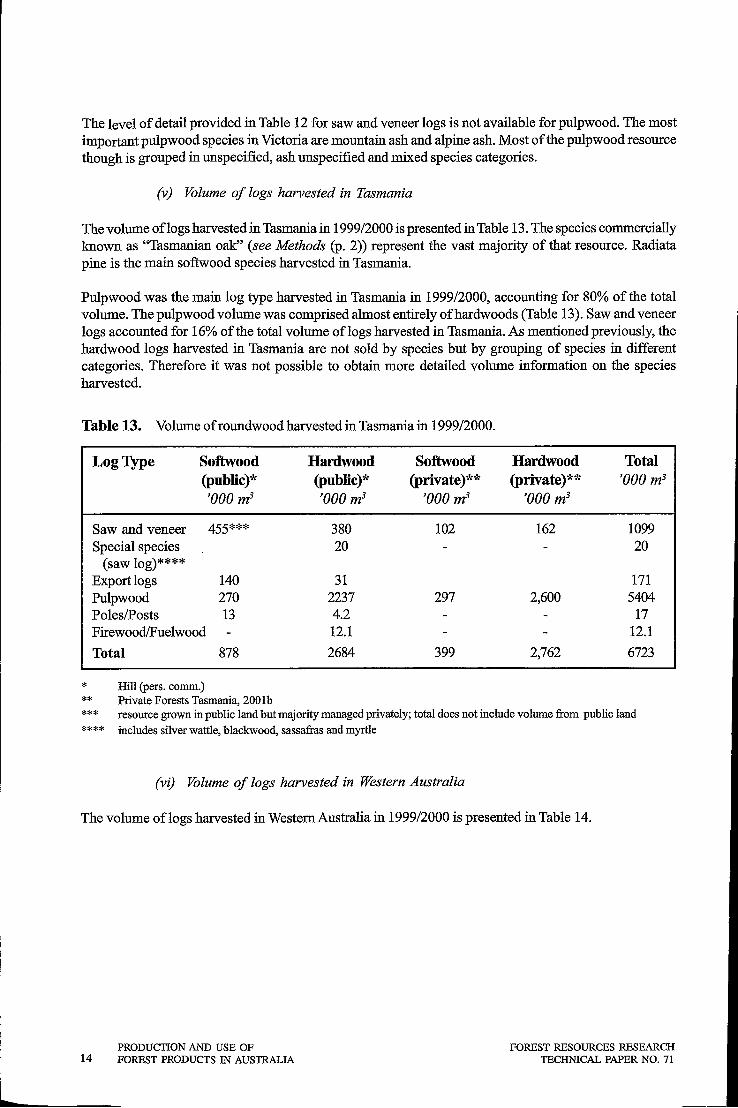
The volume oflogs harvested in Tasmania in 1999/2000 is presented in Table 13. The species commercially known as "Tasmanian oak" (see Methods (p. 2)) represent the vast majority of that resource. Radiata pine is the main softwood species harvested in Tasmania.
Pulpwood was the main log type harvested in Tasmania in 1999/2000, accounting for 80% of the total volume. The pulpwood volume was comprised almost entirely of hard woods (Table 13). Saw and veneer logs accounted for 16% of the total volume oflogs harvested in Tasmania. As mentioned previously, the hardwood logs harvested in Tasmania are not sold by species but by grouping of species in different categories. Therefore it was not possible to obtain more detailed volume information on the species harvested.
Table 13. Volume of round wood harvested in Tasmania in 1999/2000.
Log Type Softwood Hardwood Softwood Hardwood Total (public)* (public)* (private)** (private)** '000 m3
'000m3 '000 m3 '000 m3 '000 m3
Saw and veneer 455*** 380 102 162 1099 Special species 20 20
(saw log)**** Export logs 140 31 171 Pulpwood 270 2237 297 2,600 5404 PoleslPosts 13 4.2 17 FirewoodlFuelwood 12.1 12.1
Total 878 2684 399 2,762 6723
Hill (pers. comm.) Private Forests Tasmania, 2001b
* ** *** ****
resource grown in public land but majority managed privately; total does not include volume from public land
includes silver wattle, blackwood, sassafras and myrtle
(vi) Volume of logs harvested in Western Australia
The volume oflogs harvested in WestemAustralia in 1999/2000 is presented in Table 14.
14 PRODUCTION AND USE OF FOREST PRODUCTS IN AUSTRALIA
FOREST RESOURCES RESEARCH TECHNICAL PAPER NO. 71
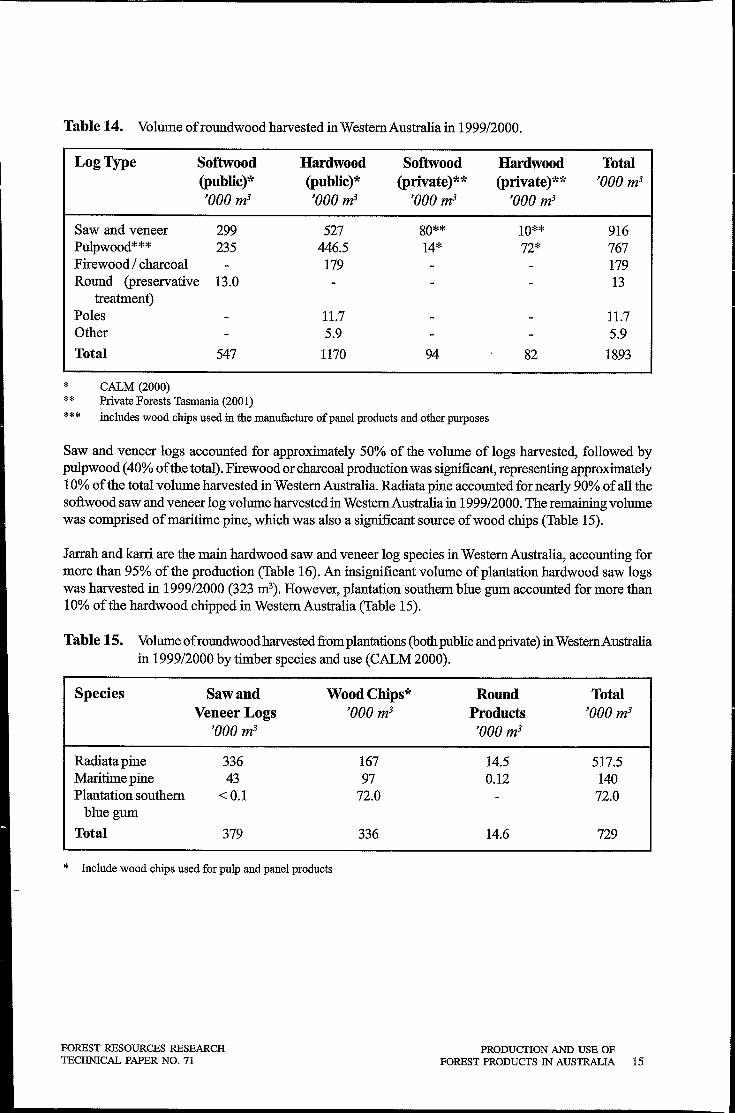
Table 14. Volume of round wood harvested in Western Australia in 1999/2000.
Log Type Softwood Hardwood Softwood Hardwood Total (public)* (public)* (private)** (private)** '000 m3
'000 m3 '000 m3 '000 m3 '000 m3
Saw and veneer 299 527 80** 10** 916 Pulpwood*** 235 446.5 14* 72* 767 Firewood 1 charcoal 179 179 Round (preservative 13.0 13
treatment) Poles 11.7 11.7 Other 5.9 5.9
Total 547 1170 94 82 1893
* CALM (2000)
** Private Forests Tasmania (2001)
*** includes wood chips used in the manufacture of panel products and other purposes
Saw and veneer logs accounted for approximately 50% of the volume of logs harvested, followed by pulpwood (40% of the total). Firewood or charcoal production was significant, representing approximately 10% of the total volume harvested in Western Australia. Radiata pine accounted for nearly 90% of all the softwood saw and veneer log volume harvested in Western Australia in 1999/2000. The remaining volume was comprised of maritime pine, which was also a significant source of wood chips (Table 15).
Jarrah and karri are the main hardwood saw and veneer log species in Western Australia, accounting for more than 95% of the production (Table 16). An insignificant volume of plantation hardwood saw logs was harvested in 1999/2000 (323 m3). However, plantation southern blue gum accounted for more than 10% of the hardwood chipped in Western Australia (Table 15).
Table 15. Volume of roundwoodharvested from plantations (both public and private) in Western Australia in 1999/2000 by timber species and use (CALM 2000).
Species Saw and WoodChips* Veneer Logs '000 m3
'000 m3
Radiata pine 336 167 Maritime pine 43 97 Plantation southern <0.1 72.0
blue ,gum
Total 379 336
* Include wood chips used for pulp and panel products
FOREST RESOURCES RESEARCH TECHNICAL PAPER NO. 71
Round Products '000 m3
14.5 0.12
14.6
Total '000 m3
517.5 140 72.0
729
PRODUCTION AND USE OF FOREST PRODUCTS IN AUSTRALIA 15
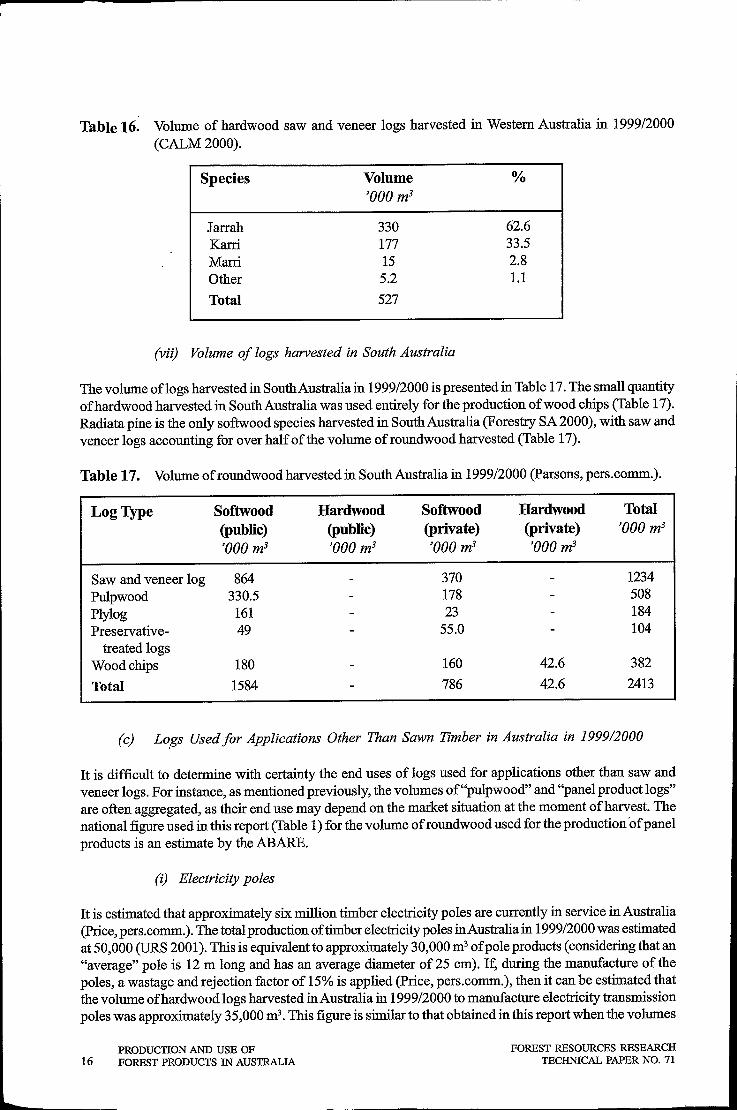
Table 16. Volume of hardwood saw and veneer logs harvested in Western Australia in 1999/2000 (CALM 2000).
Species Volume % '000 m3
Jarrah 330 62.6 Karri 177 33.5 Marri 15 2.8 Other 5.2 1.1
Total 527
(vii) Volume of logs harvested in South Australia
The volume oflogs harvested in South Australia in 1999/2000 is presented in Table 17. The small quantity of hardwood harvested in South Australia was used entirely for the production of wo od chips (Table 17). Radiata pine is the only softwood species harvested in South Australia (Forestry SA 2000), with saw and veneer logs accounting for over half of the volume of round wood harvested (Table 17).
Table 17. Volume of roundwood harvested in South Australia in 1999/2000 (parsons, pers.comm.).
Log Type Softwood Hardwood Softwood Hardwood Total (public) (public) (private) (private) '000 m3
'000 m3 '000 m3 '000 m3 '000 m3
Saw and veneer log 864 370 1234 Pulpwood 330.5 178 508 Plylog 161 23 184 Preservative- 49 55.0 104
treated logs Wood chips 180 160 42.6 382
Total 1584 786 42.6 2413
(c) Lo.gs Used for Applications Other Than Sawn Timber in Australia in 199912000
It is difficult to determine with certainty the end uses of logs used for applications other than saw and veneer logs. For instance, as mentioned previously, the volumes of "pulpwood" and "panel product logs" are often aggregated, as their end use may depend on the market situation at the moment of harvest. The national figure used in this report (Table 1) for the volume of roundwood used for the production 'of panel products is an estimate by the ABARE.
(i) Electricity poles
It is estimated that approximately six million timber electricity poles are currently in service in Australia (price, pers.comm.). The total production of timber electricity poles in Australia in 1999/2000 was estimated at 50,000 (URS 2001). This is equivalent to approximately 30,000 m3 of pole products (considering that an "average" pole is 12 m long and has an average diameter of 25 cm). If, during the manufacture of the poles, a wastage and rejection factor of 15% is applied (price, pers.comm.), then it can be estimated that the volume of hardwood logs harvested in Australia in 1999/2000 to manufacture electricity transmission poles was approximately 35,000 m3• This figure is similar to that obtained in this report when the volumes
16 PRODUCTION AND USE OF FOREST PRODUCTS IN AUSTRALIA
FOREST RESOURCES RESEARCH TECHNICAL PAPER NO. 71

of round wood harvested for pole production obtained for each State are added up (Table 18). However, it is considerably lower than the estimate by Jaakko Payry (1999) of75,000 m3 or 100,000 poles/year.
Table 18. Volume of round wood harvested to manufacture electricity poles (m3) in Australia in 1999/ 2000 by State and main species used.
State
NSW QLD TAS WA
Total
Production '000 rrr
17.8 7.7 4.2
11.8
41.5
Main Species
Spotted gum, tallowwood, ironbarks and blackbutt Spotted gum, ironbarks and blackbutt Messmate, alpine ash and mountain ash Jarrah and karri
It is difficult to accurately separate the volume of logs used for other round products such as piles and girders from those used for electricity poles. A breakdown of the estimated production of poles for each pole producing State in Australia is provided in Table 18. The figure for New South Wales is based on a yearly consumption of poles in the order of 16,000 (URS 2001), or approximately 9,600 m3 of poles. When a wastage and rejection factor is applied, this figure is increased to 11,040 m3 oflogs harvested to produce poles in New South Wales. It is estimated that 25% of that volume is harvested from private forests. Australia exports 10-15,000 shorter length poles/year, which are produced in New South Wales (URS 2001). This resource is equivalent to approximately 6,700 m3 of round wood.
Hardwood species are preferred in the production of electricity poles, as described in Table 18. However, an accurate breakdown of the volume of production on a species level is generally not available.
(ii) Roundwood used in the manufacture of other round products
Although the production of poles and other round products is still significant, it is decreasing as other alternative materials are increasingly preferred. Structures that in the past were predominantly made of wood (eg bridges, piles and wharves) have been increasingly replaced over the years with materials such as concrete and steel. This is mostly due to supply difficulties and to the perceived greater service life of alternative materials (BIS Shrapnel 2000). Therefore, it is predicted that the importance of that pool of products will continue to decrease.
(d) Production of Panel Products
The volume of panel products manufactured in Australia in 1999/2000 was approximately 1.8 million m3
(Table 19). Partic1eboard accounted for more than half of the total volume produced, followed by medium density fibreboard (MDF), with approximately a third of the production. Plywood accounted for approximately 10% of the total volume produced. Information on the production volumes is not available on a State level. The feedstock used in the production ofpartic1eboard and MDF consists oflower grade logs, forest and sawmill residues.
Table 19. Volume of panel products manufactured in Australia in 1999/2000 (ABARE 2001).
Type
Partic1eboard MDF Plywood
Total
FOREST RESOURCES RESEARCH TECHNICAL PAPER NO. 71
Volume '000 rrr
978 621 192
1791
% of Total
54.6 34.7 10.7
PRODUCTION AND USE OF FOREST PRODUCTS IN AUSTRALIA 17

Other panel products such as hardboard and softboard are also manufactured in Australia, although at a very small scale.
2. END USES FOR FOREST PRODUCTS IN AUSTRALIA
This section highlights the main uses of forest products in Australia (Figure 6). Consumption (Figure 7) rather than production figures (Figure 6) will be used since, in some cases, it is difficult to determine the origin of timber used in the manufacture of different products. However, the imported resource will often have similar uses to the locally grown resource (eg radiata pine imported from New Zealand). The main end uses for forest products consumed in Australia are summarised in Figure 7. Sawn timber accounts for more than 70% of the total volume of forest products consumed. Partic1eboard is the main type of panel product consumed in Australia, representing 15% of the total volume of forest products.
Figure 6. Production of forest products in Australia in 1999/2000.
(a) End Uses for Sawn Timber in Australia
Figure 7. Consumption of forest products in Australia in 1999/2000.
In Figure 8, the main uses for sawn timber and the proportion of the volume of sawn timber in Australia in 1999 used in each sector are presented. The residential sector accounted for 74% of the sawn timber market in 1999 (BIS Shrapnel 2000). The other uses - non-residential construction, furniture and others share approximately equal proportions (8-9%) of the sawn timber market (Figure 8).
(i) Sawn Timber in the Residential Sector
Most of the sawn timber consumed in Australia in 1999 was used in the construction of new dwellings in (53 %), followed by renovations and additions (39%), as shown in Figure 9 (BIS Shrapnel 2000). Only 8% of the sawn timber were used in the construction of multi-unit buildings.
18 PRODUCTION AND USE OF FOREST PRODUCTS IN AUSTRALIA
FOREST RESOURCES RESEARCH TECHNICAL PAPER NO. 71

Figure 8. End uses for sawn timber in Australia. Figure 9. End uses for sawn timber in the residential sector in Australia.
Table 20 lists the main building uses for sawn timber used in Australia in the residential sector in 1999. Although the quantities oflocal and imported sawn hardwoods are included in Table 20, this distinction is not made for softwoods. Large volumes ofradiata pine are imported from New Zealand and significant quantities of other species, such as Douglas-fir and western red cedar, are also imported.
Table 20. Volumes of sawn timber used in Australia in 1999 by timber type and building application in the residential sector, including detached houses, multi-unit dwellings and renovation / additions (BIS Shrapnel 2000).
Building
Application Australian Hardwood
'000 m3
Sub-flooring 201 Floor boards 67.7 Wall frames 56.5 Skirting/architraves 16.2 Facia 8.5 Windows 14.3 Doors 8.75 Roof frames/trusses 102 Ceiling frames 24.2 Fencing 210 Decks 13.2 Pergolas 6.2 Others 65.9 Total 794.5 % of the market 23.7
• includes radiata pine from New Zealand
•• mostly Douglas-fir and western red cedar
FOREST RESOURCES RESEARCH TECHNICAL PAPER NO. 71
Timber Type
Radiata Imported Other Total % Pine* Hardwood Pine** '000 m3
'000 m3 '000 m3 '000 m3
41.7 1.0 47.0 291 8.7 12.8 8.6 17.7 107 3.2 633 3.9 43 736.5 22.0 34.3 28.8 12.1 91.4 2.7 25.0 0.3 15.4 49.2 1.5 6.9 22.9 25.7 69.8 2.1 3.6 23.3 7.8 43.5 1.3 554 0.97 53.6 710 21.2 323 6.9 21.1 375 11.2 187 4.8 13.7 415 12.4 17.7 17.5 21.2 69.6 2.1 17.7 0.19 12.0 36.1 1.1 52.3 180 58.6 357 10.7 1,91 299 330 3350.5 57.0 8.9 10.4
PRODuerION AND USE OF FOREST PRODUerS IN AUSTRALIA 19

Wall frames and roofing applications constituted the main end uses for sawn timber in Australia in 1999 (fable 20). Other significant applications included fencing, ceiling framing and sub-flooring, sharing similar percentages of the market (10%). On a species level, radiata pine was by far the most popular timber used for residential construction in Australia, accounting for approximately 57% of the residential market in 1999 (Table 20). The main uses for radiata pine in that segment were wall and roof components, which combined accounted for approximately 80% of that market.
Although wall and roof components were also major uses for softwoods other than radiata pine (Figure 13), the variety of uses for that category was much greater than for radiata pine. For hardwoods, the main uses of locally produced resource were fencing and sub-flooring which, combined, accounted for more than 50% of that market (Figure 10). A considerable volume of Australian hardwoods was also used in the manufacture of roof and wall frames (approximately 20% of that market in 1999). The smaller imported hardwood market is much more varied in its applications, and its main end uses were, doors, skirting and architraves, windows and fencing (Figure 11). Other end uses included decks, joinery, floor bearers and floor boards.
~ ~9~
Trusses
Figure 10. Main uses for Australian hardwood in the residential sector.
I Fencing ( I
17%
~ Figure 12. Main uses for radiata pine in the residential sector.
20 PRODUCfION AND USE OF FOREST PRODUCfS IN AUSTRALIA
Figure 11. Main uses for imported hardwood in the residential sector.
Figure 13. Main uses for "other" pine in the residential sector.
FOREST RESOURCES RESEARCH TECHNICAL PAPER NO. 71

(ii) Sawn timber in the non-residential building sector
It is estimated that 9% (approximately 440,000 m3) of the sawn timber consumed in Australia in 19991 2000 was used in the non-residential building sector. An estimate of the volume of timber used in that sector by species is not available. The lower volume of wood used in non-residential buildings compared to the residential building sector was largely due to the fact that other materials account for a greater share of the wall and roof framing markets. Steel for instance, accounts for 35 and 78% of the nonresidential wall and roof framing markets, respectively (BIS Shrapnel 2000). Although sawn timber accounts for a smaller share of the wall and roof framing markets in non-residential buildings compared to residential buildings, they still represent a major component of the non-residential sector. Therefore, it is expected that radiata pine is the main species used in this sector as well. Another characteristic of the non-residential building sector is the greater proportion of panel products used, particularly as shop fittings, office benches and decorative wall pane ling.
(iii) Sawn timber in the furniture industry
Although a wide range of species is used in the manufacture of furniture in Australia, radiata pine accounted for approximately 80% of the volume of sawn timber used in the manufacture of furniture in 1999 (BIS Shrapnel 2000). Australian hardwoods represented 9% of the market, or 43,000 m3 in 1999 (Ong 2002). The total estimated volume of sawn timber used in the manufacture of furniture in Australia was 376,000 m3 (BIS Shrapnel 2000). In Figure 14 an estimate ofthe volume of the main timber types used in furniture manufacturing in Australia is provided. The use of Australian hardwoods has declined dramatically in a short period of time. According to the BIS Shrapnel (2000), the proportion of furniture manufacturers using Australian hardwoods dropped from 80% in 1997 to 9% in 2000. Jarrah is the main hardwood species used in furniture making (Figure 14). However, its use declined almost six-fold from 1997 to 2000. This decline was followed by a rapid increase in the use of radiata pine - from 43% to 80% of the total volume of timber used for furniture making from 1997 to 2000. This was mostly due to the price of radiata pine and its availability.
I Other hardwoods ~ 27.6
14
Figure 14. Volume ('000 m3) of the main sawn timber species used in furniture making in Australia in 1999.
(iv) Volume of timber used in the manufacture of railway sleepers and pallets in Australia
The amount of roundwood harvested to manufacture railway sleepers in Australia in 1999/2000 was 54,000 m3 (Table 1). This figure is slightly higher than the total volume of round wood used to manufacture electricity poles (Table 18). However, as is the case for bridge and wharf timbers, it is expected that the use of hard woods for the production of railway sleepers will continue to decline (in 1996/1997 the volume of roundwoood harvested to manufacture railway sleepers was 72,000 m3) . Problems with supply and
FOREST RESOURCES RESEARCH TECHNICAL PAPER NO. 71
PRODUCTION AND USE OF FOREST PRODUCTS IN AUSTRALIA 21

also the longer "in track" life of alternative materials are seen as the main reasons for this decline (BIS Shrapnel 2000).
The production of pallets in Australia is estimated to use approximately 200,000 m3 of sawn timber (150,000 m3 in the manufacture of new pallets and 50,000 m3 in repair work), (BIS Shrapnel 2000). If it is assumed that the recovery to product after processing of hardwood logs is 40%, then it can be estimated that approximately 500,000 m3 of roundwood was used in the manufacture of pallets. In New South Wales most of the resource is comprised of untreated hardwood from the north coast (Ridgley, pers.comm.). However, in other States, softwood species are also used. Although hard woods and softwoods share approximately equal portions of the market, it is expected that the use of hardwood will decline in the near future (BIS Shrapnel 2000).
It is estimated that an extra 50,000 m3 of sawn timber is used in the manufacture of wooden cases (BIS Shrapnel 2000).
(b) End Uses for Panel Products in Australia
Particleboard and MDF have similar uses, as shown in Table 21. The furniture and kitchen sectors, which are often included under the same category, account for more than 50% of the uses of both types of material. Most of the particleboard in the building industry is utilised in flooring applications. MDF is a major component in the manufacture of shopfitting.
Table 21. Uses ofMDF and particleboard in Australia in 2000 (derived from Steenson, pers.comm.).
Use % Particleboard %MDF
Furniture 33.4 24 Kitchens 25.8 28 Building industry (flooring, etc.) 19.3 8.8 Bathrooms 12.2 21 Shopfitting 5.9 15.9 Others 3.4 2.3
Total 100 100
Although there is a wide range of uses for plywood in Australia, the structural market (building applications) represented the main end use for plywood in 1999/2000 (Table 22), accounting for approximately 57% of the market.
Table 22. Consumption of plywood in Australia in 1999/2000 by end use (ABARE 2001 b).
22
End Use
Structural Exterior Overlaidlformwork Tongue and groove flooring Interior Marine
Total
PRODuerION AND USE OF FOREST PRODuers IN AUSTRALIA
1999/2000 '000 m3
110 31.5 30 15 3.9 1.2
192
%
57.3 16.5 15.7 7.9 2
0.6
100
FOREST RESOURCES RESEARCH TECHNICAL PAPER NO. 71

There is still considerable scope in Australia for an increase in the use of panel and engineered type products, as current markets are strengthened and new markets are found for such products.
(c) Consumption of Forest Products in the Furniture Industry
The furniture industry is a large consumer of forest products, being responsible for the use of approximately 8% of the sawn timber consumed in Australia. It is also one of the main end users of panel products, as outlined in Figure 8. Based on Australian Wood Panels Association CA WPA) and BIS Shrapnel estimates, it is possible to determine the main end uses of the sawn timber and panel products used in the furniture sector in Australia (Figure 15).
Particleboard (Kitchen)
MDF (Kitchen)
I Particleboard ~27%
Figure 15. Main end uses of the volume of sawn timber and panel products used in the furniture industry in Australia in 1999/2000.
lfthe volumes of particleboard and MDF used in the manufacture and renovation of kitchens are considered, then the total amount of forest products consumed in the furniture industry in Australia in 1999/2000 was approximately 1.1 million m3• This volume is equivalent to 15-20% of all forest products consumed in Australia in 1999/2000. The kitchen sector alone accounts for approximately 5% of the forest products market in Australia. A further breakdown of the volumes of materials used for each sub-sector of the furniture industry was not available. However, besides kitchen and bathroom uses, it is anticipated that outdoor, lounge and office furniture represent the main uses for forest products in the furniture sector.
FOREST RESOURCES RESEARCH TECHNICAL PAPER NO. 71
PRODUCTION AND USE OF FOREST PRODUCTS IN AUSTRALIA 23

GENERAL DISCUSSION
The forest products sector represents a diverse and significant carbon pool. The production of approximately six million m3 of processed forest products in Australia in 1999/2000 is equivalent to approximately 1.5 million tonnes of carbon or 5.5 million tonnes of CO
2-equivalents. This is equivalent to approximately 1 %
of Australia's total greenhouse gas emissions in 2002 (Australian Greenhouse Office 2004). Different products have different service lives, and depending on their end of life disposal options, may continue storing carbon for many years or indefinitely. The volume of forest products manufactured is increasing in the early 90s the annual production was approximately 5.2 million m3 (ABARE 2001b). It is predicted that production figures will continue increasing steadily in Australia, reaching 6.7 million m3 by 2010 and 7 million m3 by 2020 (Love et al. 1999).
The figures compiled on the volume of roundwood harvested from individual species confirm the dominance of radiata pine, which accounted for approximately half the total volume of saw and veneer logs harvested in Australia in 1999/2000. This dominance is unlikely to decrease in the near future - in fact it may increase if greater restrictions are imposed on the harvest of native hardwood resource. The volume of saw logs obtained from plantation hardwoods was very small and concentrated in only two States (New South Wales and Victoria). Although saw and veneer logs are obtained from a wide range of native hardwood species, the "ash" species from Victoria and Tasmania accounted for approximately 40% of the total volume of native hardwood saw and veneer logs harvested.
The significance of forest products such as electricity poles and railway sleepers as carbon reservoirs lies in the fact that they are long-lived and generally made of extremely dense and durable hardwoods. However, as mentioned earlier, production levels have been declining recently.
The consumption of sawn timber and panel products is expected to continue to increase. The large volume of sawn timber used in the residential market (3.6 million m3
) highlights the importance of understanding its applications. Those are extremely varied, as shown in section 7.1 , with different wood types dominating different market segments. Unfortunately the same level of information was not available for the non-residential building sector. However, it is understood that radiata pine also dominates that sector. Radiata pine has more recently become the most dominant species used in solid wood furniture making, accounting for 80% of that market. However, panel products (including particleboard and MDF used in kitchen furniture) account for over 70% of the total volume of forest products used in the furniture sector.
Different types of products used for the same application (e.g. kitchen benchtop made of timber or particleboard) have very different properties, carry different wastage factors in their manufacture and processing and may have very different service lives. The disposal options available may also vary according to the product type. Those factors will have important implications on the quantity and longevity of carbon in the various forest products used.
The difficulties in assembling all the necessary production data are discussed in this report. The figures were collected from different sources and, in some cases, we may have significantly underestimated the total volume of logs harvested. The harvested volumes of the main individual species were not always available, and were particularly difficult to obtain from the private sector. In some cases, important species were grouped (eg "Tasmanian oak" and "ash unspecified"), resulting in the need for estimates of individual volumes. Similar problems were found in the end use of logs, where the volume of logs used for panel products was grouped with the volume of logs used for pulp and paper manufacture.
24 PRODUcnON AND USE OF FOREST PRODUCTS IN AUSTRALIA
FOREST RESOURCES RESEARCH TECHNICAL PAPER NO. 71

The dynamic nature of the forestry market emphasises the importance of collecting production information on a regular basis, as the volume and proportion of the different types of logs harvested may change significantly in a short period of time. Although some relevant production information is currently publicly available, it does not contain sufficient detail to support accurate greenhouse gas inventories or carbon trading systems that include harvested wood products. Since the ABARE already publishes some production figures at a national level, they would be the ideal organisation to obtain the more detailed information on a regular basis. This would require a greater effort from both the public and private sectors to record the total volumes harvested at a species level (at least for the main commercial species) and also in terms of their end use (eg logs used for panel products or pulp). This is particularly relevant for logs harvested by the private sector, which can represent a significant volume in some States, such as in Victoria. A separate database would be necessary to record the main uses for the different classes of forest products. Apart from consultation with the industry, ideally independent surveys would be conducted, particularly of the building industry, which is the main user of sawn timber and panel products in Australia. Such information would greatly improve the quality of the data used and decrease the level of uncertainty in State and national greenhouse inventories as well as in any carbon trading systems that include harvested wood products.
FOREST RESOURCES RESEARCH TECHNICAL PAPER NO. 71
PRODUCTION AND USE OF FOREST PRODUCTS IN AUSTRALIA 25

CONCLUSIONS
The data presented in this report highlight the importance of detailed information on the manufacture and use of forest products. We hope that the report will be an useful tool in understanding the size and composition of the forest product pool inAustralia, as well as the future trends in the consumption of those products.
It is probable that forest products will be more realistically represented in carbon accounting schemes and carbon trading in the near future. It will be essential then to have the type of information compiled here available on a regular basis, especially considering the dynamic nature of the forestry and forest products sectors.
26 PRODUCTION AND USE OF FOREST PRODUCTS IN AUSTRALIA
FOREST RESOURCES RESEARCH TECHNICAL PAPER NO. 71

A CKNO WLED GMENTS
The authors gratefully acknowledge the information and advice provided by:
• Dr Rohan Nelson and Dr Alasebu Yainshet, ABARE Natural Resources Branch
• Bemard Neufeld, BIS Shrapnel Forestry Group
• Peter Armistead, Marketing Division, Forests NSW
• Jonathan Clark, NSW Office of Private Forestry
• Keith Maplestone, Department of Natural Resources and Environment, Victoria
• David Williams, Hancock Victorian Plantations, Victoria
• Hilton Taylor, ACT Forests
• Rod Hill, Forestry Tasmania
• Andy Warner, Private Forests Tasmania
• Lew Parsons, South Australia Forestry
• Dr Graeme Siemon, Forest Products Commision, Western Australia
• Peggy Casson and Martin Lutton, Department of Primary Industries, Queensland
• Dan Price, Consultant
• Bruce Steenson, Executive Director of the Australian Wood Panels Association
• James MacGregor, formerly from the Plywood Association of Australia
• Mark Parsons, formerly at URS Forestry and currently at the Bureau of Rural Sciences
• Paul Ridgley, CHEP Australia
Comments on the manuscript by Dr Annette Cowie from the NSW Department of Primary Industries, Forest Resources Research and by Dr John Raison, Chief Research Scientist of the CSIRO Forestry and Forest Products Division are gratefully acknowledged.
The authors thank Mark Parsons, from the Bureau of Rural Sciences, for his review of the report and helpful suggestions.
FOREST RESOURCES RESEARCH TECHNICAL PAPER NO. 71
PRODUCTION AND USE OF FOREST PRODUCTS IN AUSTRALIA 27

REFERENCES
ABARE. 2001. Australian Forest and Wood Products Statistics - March and June Quarters 2001.
ABARE. 2001b. Australian Commodity Statistics - Forestry, pp. 128-144.
ABARE. 2004. Australian Forest and Wood Products Statistics - March and June Quarters 2004.
Australian Greenhouse Office. 2004. Australia's National Greenhouse Gas Inventory Report 2002.
BIS Shrapnel. 2000. Sawn timber in Australia 2000-2015. B IS Shrapnel Forestry Group.
CALM (Department of Conservation and Land Management, Western Australia). 2000. Annual Report 1999-2000.
DPI (Department of Primary Industries, Queensland). 2000. DPI Forestry Yearbook 1999-2000.
Forestry SA. 2000. Annual Report 1999-2000.
International Panel on Climate Change (IPCC). 1997. Revised 1996 IPCC Guidelines for National Greenhouse Gas Inventories: Volume 3 Reference Manual. J.T. Houghton et al., IPCC/OECD/ lEA, Paris, France.
Jaakko Poyry Consulting. 1999. Usage and lifecyc1e of wood products. National Carbon Accounting System Technical Report No. 8, Australian Greenhouse Office.
Love G, YainshetA and Grist P. 1999. Forest products -long term consumption projections for Australia. ABARE Research Report 99.5.
Ong C. 2002. Furniture industry structure research study. J.W. Gottstein Memorial Trust Fund, 2001 Gottstein Fellowship Report.
Private Forests Tasmania 2001. Tasmanian market information update to farm forestry - pricing and market analysis. Number 1, Natural Heritage Trust, January 2001.
Private Forests Tasmania 2001b. Tasmanian market information update to farm forestry - pricing and market analysis update costing offarm forestry. Number 2, Natural Heritage Trust, April 2001.
RAC (Resource Assessment Commission). 1992a . A survey of Australia's forest resource, AGPS, Canberra.
RAC (Resource Assessment Commission). 1992b. Forest and timber inquiry - final report volume 1, AGPS, Canberra.
SA (South Australia) Forestry. 2000. Annual Report 1999-2000.
State Forests of New South Wales. 2000. Annual Report 1999-2000.
State Forests of New South Wales (2000b). Facts and Figures.
28 PRODUCTION AND USE OF FOREST PRODUCTS IN AUSTRALIA
FOREST RESOURCES RESEARCH TECHNICAL PAPER NO. 71

~~~~------------------------------=-------------------------------------------------------1
URS Forestry. 2001. Australia's hardwood pole industry - issues and opportunities, Stage 1. Report prepared for the Forest and Wood Products Research and Development Corporation.
Willis A and Tonkin C. 1998. Timber in context - a guide to sustainable use. NATSPEC 3 Guide. Construction Information Systems Australia Pty Ltd.
FOREST RESOURCES RESEARCH TECHNICAL PAPER NO. 71
PRODUCTION AND USE OF FOREST PRODUCTS IN AUSTRALIA 29
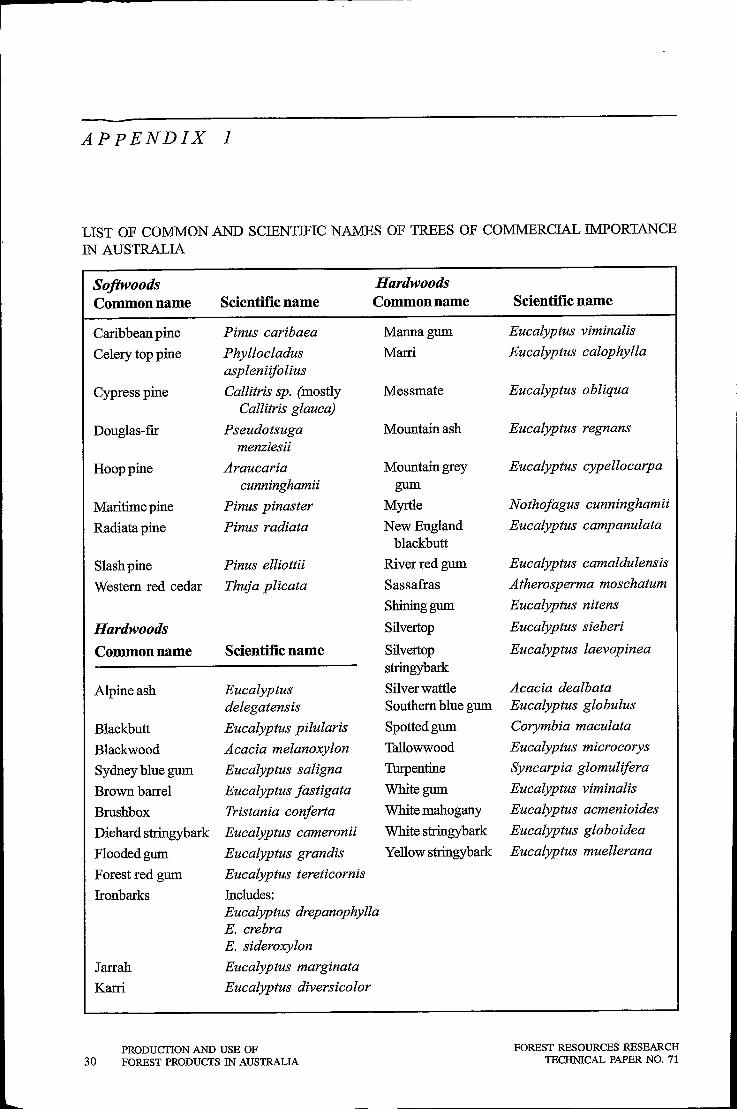
APpENDIX 1
LIST OF COMMON AND SCIENTIFIC NAMES OF TREES OF COMMERCIAL IMPORTANCE IN AUSTRALIA
Softwoods Hardwoods Common name Scientific name Common name
Caribbean pine Pinus caribaea Manna gum
Celery top pine Phyllocladus Marri aspleniifolius
Cypress pine Callitris sp. (mostly Messmate Callitris glauca)
Douglas-:fir Pseudotsuga Mountain ash menziesii
Hoop pine Araucaria Mountain grey cunninghamii gum
Maritime pine Pinus pinaster Myrtle
Radiata pine Pin us radiata New England blackbutt
Slash pine Pinus elliottii River red gum
Western red cedar Thuja plicata Sassafras
Shining gum
Hardwoods Silvertop
Common name Scientific name Silvertop stringybark
Alpine ash Eucalyptus Silver wattle delegatensis Southern blue gum
Blackbutt Eucalyptus pilularis Spotted gum
Blackwood Acacia melanoxylon Tallowwood
Sydney blue gum Eucalyptus saligna Turpentine
Brown barrel Eucalyptus Jastigata White gum
Brushbox Tristania conJerta White mahogany
Diehard stringybark Eucalyptus cameronii White stringybark
Flooded gum Eucalyptus grandis Yellow stringybark
Forest red gum Eucalyptus tereticornis
Ironbarks Includes: Eucalyptus drepanophyUa E. crebra E. sideroxylon
Jarrah Eucalyptus marginata
Karri Eucalyptus diversicolor
30 PRODUCTION AND USE OF FOREST PRODUCTS IN AUSTRALIA
Scientific name
Eucalyptus viminalis
Eucalyptus calophylla
Eucalyptus obliqua
Eucalyptus regnans
Eucalyptus cypellocarpa
NothoJagus cunninghamii
Eucalyptus campanulata
Eucalyptus camaldulensis
Atherosperma moschatum
Eucalyptus nitens
Eucalyptus sieberi
Eucalyptus laevopinea
Acacia dealbata Eucalyptus globulus
Corymbia maculata
Eucalyptus microcorys
Syncarpia glomulifera
Eucalyptus viminalis
Eucalyptus acmenioides
Eucalyptus globoidea
Eucalyptus muellerana
FOREST RESOURCES RESEARCH TECHNICAL PAPER NO. 71
L0001180
I
I - II