pesticides or pest repellents - Veterans Memorial Medical ...
This article appeared in a journal published by Elsevier. The attachedcopy is furnished to the author for internal non-commercial researchand education use, including for instruction at the authors institution
and sharing with colleagues.
Other uses, including reproduction and distribution, or selling orlicensing copies, or posting to personal, institutional or third party
websites are prohibited.
In most cases authors are permitted to post their version of thearticle (e.g. in Word or Tex form) to their personal website orinstitutional repository. Authors requiring further information
regarding Elsevier’s archiving and manuscript policies areencouraged to visit:
http://www.elsevier.com/copyright
Author's personal copy
Processes affecting the movement of organochlorine pesticides (OCPs)between soil and air in an industrial site in Turkey
Ayse Bozlaker *, Aysen Muezzinoglu, Mustafa OdabasiDepartment of Environmental Engineering, Faculty of Engineering, Dokuz Eylul University, Kaynaklar Campus, Buca 35160, Izmir, Turkey
a r t i c l e i n f o
Article history:Received 26 February 2009Received in revised form 7 September 2009Accepted 17 September 2009Available online 15 October 2009
Keywords:Organochlorine pesticidesDry deposition fluxDeposition velocityAir–soil exchange
a b s t r a c t
Soil and atmospheric concentrations, dry deposition and soil-air gas exchange of organochlorine pesti-cides (OCPs) were investigated at an industrial site in Aliaga, Izmir, Turkey. Current-use pesticides, endo-sulfan and chlorpyrifos, had the highest atmospheric levels in summer and winter. Summertime total(gas + particle) OCP concentrations in air were higher, probably due to increased volatilization at highertemperatures and seasonal local/regional applications of current-use pesticides. Particle deposition fluxeswere generally higher in summer than in winter. Overall average dry particle deposition velocity for allthe OCPs was 4.9 ± 4.1 cm s�1 (average ± SD). RDDXs (sum of p,p0-DDT, p,p0-DDD, and p,p0-DDE) were themost abundant OCPs in Aliaga soils (n = 48), probably due to their heavy historical use and persistence.Calculated fugacity ratios and average net gas fluxes across the soil-air interface indicated volatilizationfor a-CHL, c-CHL, heptachlorepoxide, cis-nonachlor, trans-nonachlor, and p,p0-DDT in summer, and for a-CHL, c-CHL, trans-nonachlor, endosulfan sulfate, and p,p0-DDT in winter. For the remaining OCPs, soilacted as a sink during both seasons. Comparison of the determined fluxes showed that dry particle,gas-phase, and wet deposition are significant OCP input mechanisms to the soil in the study area.
� 2009 Elsevier Ltd. All rights reserved.
1. Introduction
Many organochlorine pesticides (OCPs) (e.g. aldrin, chlordane,DDT, dieldrin, endrin, heptachlor, HCB, HCHs, and lindane) havebeen banned for decades in Turkey because of concerns on theenvironment and human health (Acara et al., 2006). However,banned OCPs are still found in different environmental compart-ments due to their persistence, illegal uses or emissions from cer-tain point sources. Restricted/banned or current-use pesticides aremainly released to the atmosphere by agricultural use, volatiliza-tion from contaminated terrestrial surfaces, and particulate matterre-entrainment by the wind at contaminated areas (Bidleman,1999).
OCPs are subject to dispersion, chemical conversion, transportover long distances, and removal by deposition in the atmosphere(Bidleman, 1999). Atmospheric deposition (i.e. gas exchange be-tween the air and soil/vegetation/water surfaces, dry and wetdeposition) is responsible for transferring chemicals from air tothe natural surfaces (Hippelein and McLachlan, 2000). Comparativeloading estimates for OCPs have indicated that gas absorptiondominates in many cases, followed by dry/wet deposition. But,the relative contributions of different mechanisms are variablefor the individual compounds depending on the compound proper-
ties (e.g. vapor pressure, Henry’ law constant, and atmosphericphase-partitioning) and environmental conditions (e.g. air temper-ature, wind speed, and precipitation amounts) (Bidleman, 1999;Asman et al., 2001; Gioia et al., 2005; Odabasi et al., 2008).
Soil-air gas exchange is a significant process affecting the fateand transport of OCPs in the environment (Meijer et al., 2003b).Soil-air gas exchange occurs via diffusion and magnitude anddirection of the diffusive flux is determined by the concentrationgradient in the soil and air (Hippelein and McLachlan, 1998). Otherparameters affecting this mechanism are the soil properties (i.e.texture, structure, porosity, water and organic matter contents),the physicochemical properties of the compounds (i.e. vapor pres-sure, water solubility, diffusion coefficients, and the soil-air equi-librium partition coefficient, KSA), and meteorological parameters(i.e. temperature and wind speed) (Backe et al., 2004). There havebeen a limited number of studies on soil-air gas exchange of OCPs(Hippelein and McLachlan, 1998, 2000; Meijer et al., 2003a,b;Bidleman and Leone, 2004; Kurt-Karakus et al., 2006; Daly et al.,2007; Wong et al., 2008). However, most of the previous studieshave focused on assessing the equilibrium status of OCPs betweenair and soil rather than quantifying the gas exchange fluxes.
The objective of this study was to investigate the processesaffecting the movement of OCPs between the soil and air at anindustrial site in Turkey. In this respect, soil and atmosphericconcentrations, particle-phase dry deposition fluxes and velocities,magnitude and direction of gas exchange fluxes and fugacity
0045-6535/$ - see front matter � 2009 Elsevier Ltd. All rights reserved.doi:10.1016/j.chemosphere.2009.09.032
* Corresponding author. Tel./fax: +90 232 4127080.E-mail address: [email protected] (A. Bozlaker).
Chemosphere 77 (2009) 1168–1176
Contents lists available at ScienceDirect
Chemosphere
journal homepage: www.elsevier .com/locate /chemosphere
Author's personal copy
gradients between soil and air were determined for individualOCPs. Effect of the meteorological parameters on the atmosphericgas-phase concentrations was also investigated. To locate possiblesources, related OCP levels in soils (n = 48) around the study areawere also measured and their spatial distributions were mapped.Dry particle, wet deposition, and gas exchange fluxes were com-pared to determine the relative importance of the processes affect-ing the soil and air OCP levels in the study area.
2. Experimental
2.1. Sample collection
Sampling was performed at a site located at the Horozgedigi vil-lage in the Aliaga industrial region, �5 km south of the Aliaga townand �50 km north of the metropolitan city of Izmir, Turkey. Thereare many industrial plants (e.g. a petroleum refinery, a petrochem-ical complex, a natural gas-fired power plant, and ferrous scrapprocessing steel plants with electric arc furnaces) as well as agri-cultural and residential areas in the region. Aliaga’s land surfacearea is 274 km2 and �44% of the area has been used for agriculturalcrops (e.g. olive trees, vegetables, vineyard, cotton, corn, barley,and wheat) (MARA, 2007).
Daily ambient air and dry deposition samples were concur-rently collected during two sampling campaigns between August2–17, 2004 and March 20–April 5, 2005. Both campaigns coin-cided with dry weather days. Meteorological data was providedfrom a station located at the study site. Average air temperatureswere 24 and 9 �C for the summer and winter periods, respec-tively. Wind speed ranged between 1.5–5.5 and 1.7–9.4 m s�1
during the same periods, respectively. Generally northerly winds(WNW, NW) have prevailed (except 4 d wind was from SE) dur-ing both periods.
Air samples were collected using a modified high-volume sam-pler (Model GPS-11, Thermo-Andersen Inc.). Particles were col-lected on a quartz filter (10.5 cm diameter) and the gas-phasecompounds were collected using a cartridge containing XAD-2 re-sin placed between polyurethane foam (PUF) plugs. Average sam-pling volumes were 257 ± 22 and 309 ± 21 m3 for the summerand winter periods, respectively. The particle dry deposition fluxwas measured using a smooth deposition plate (22 � 7.5 cm) witha sharp leading edge (10�) mounted on a wind vane. On the plates,glass fiber filter (GFF) sheets mounted with cellulose acetate stripswere used to collect the deposited particles. The dimensions of theGFF sheet’s deposition surface were 5.5 � 12.5 cm. Five plates andsheets with a total collection area of 344 cm2 were used forsampling.
Prior to sampling, quartz filters and GFF sheets were baked at450 �C overnight to remove any organic residues. Then, they wereallowed to cool to room temperature in a desiccator. PUF cartridgeswere cleaned by Soxhlet extraction using dichloromethane (DCM):petroleum ether (PE) mixture (20:80) for 24 h, dried in an oven at70 �C, and placed in glass jars capped with Teflon-lined lids. Aftersampling, PUF cartridges, GFF sheets, and quartz filters were storedat �20 �C in their containers.
Seven soil samples (n = 4 for summer, n = 3 for winter) were ta-ken from the study site during the air sampling campaigns. Addi-tional soil samples were also taken from 48 different sites in theregion in March 2006. At each site, multiple surface soil samples(n = 3–4, 0–5 cm depth) were manually collected over a �100 m2
area. Then, they were combined by taking equal amounts fromeach and the mixture was homogenized to obtain one representa-tive sample. Large particles and organic debris were removed usinga 0.5 mm mesh sieve. Soil samples were wrapped with aluminumfoil, placed in airtight plastic bags, and stored in a deep-freezer.
2.2. Sample preparation and analysis
Soil moisture and organic matter contents were determined aspreviously described (Bozlaker et al., 2008a,b). Collected ambientair and dry deposition samples were Soxhlet extracted with a mix-ture of DCM: PE (20:80) for 24 h. Soil samples (15 g) were soakedin a 1:1 acetone: hexane mixture overnight and then, they wereultrasonically extracted for 30 min. All sample extracts were con-centrated and transferred into hexane using a rotary evaporator.After volume reduction to 2 mL by a gentle flow of high purityN2, the samples were cleaned up and fractionated on an alu-mina-silicic acid column containing 3 g of silicic acid (deactivatedwith 3% water) and 2 g of alumina (deactivated with 6% water). Thecolumn was pre-washed with 20 mL of DCM followed by 20 mL ofPE. The sample in 2 mL of hexane was added to the top of thecolumn and p,p0-DDE, heptachlor, and aldrin were eluted with20 mL of PE (fraction 1). Then, 20 mL of DCM was added into thecolumn, and the eluent was collected (fraction 2). Fraction 2 con-tained the rest of the studied pesticides. After solvent exchangeinto hexane, the final sample volume was adjusted to 1 mL by N2
blow-down.Before analysis, samples were spiked with the internal standard
(BDE-77, 3,30,4,40-tetrabromodiphenyl ether). They were analyzedfor 21 OCPs including a,b,c,d-hexachlorocyclohexane isomers(a,b,c,d-HCH), chlorpyrifos (CHLPYR), heptachlor epoxide (HEPEPOX), a-chlordane (a-CHL), c-chlordane (c-CHL), cis-nonachlor(c-NONA), trans-nonachlor (t-NONA), endosulfan-I (ESLF-I), endo-sulfan-II (ESLF-II), endosulfan sulfate (ESLF SUL), dichlorodiphenyltrichloroethane (p,p0-DDT), tetrachlorodiphenylethane (p,p0-DDD),dichlorodiphenyl dichloroethane (p,p0-DDE), dieldrin (DIELD), end-rin (END), endrin aldehyde (END AL), endrin ketone (END KET),methoxychlor (MEOCL) using a gas chromatograph (GC, Agilent6890N) equipped with a mass selective detector (Agilent 5973 in-ert MSD). A capillary column (HP-5 ms, 30 m, 0.25 mm, 0.25 lm)was used. All the OCPs except p,p0-DDE were analyzed at electroncapture negative chemical ionization (ECNI) mode. The carriergas (helium) was used at constant flow mode (1.0 mL min�1) witha linear velocity of 36 cm s�1. The initial oven temperature washeld at 50 �C for 1 min, was raised to 100 �C at 25 �C min�1, to260 �C at 5 �C min�1, to 300 �C at 10 �C min�1, and was held for2 min. The injector, ion source, and quadrupole temperatures were250, 150, and 150 �C, respectively. High-purity methane was thereagent gas. p,p0-DDE was analyzed only for the soil samples takenduring the March 2006 sampling campaign (n = 48 samples) atelectron impact ionization mode. GC parameters were the sameas those used for the analysis of other OCPs except the ion sourcetemperature was 230 �C. The MSD was run in selected ion monitor-ing mode. Compounds were identified on the basis of their reten-tion times, target and qualifier ions, and were quantified usingthe internal standard calibration procedure.
2.3. Quality control
Procedural recoveries of OCPs were determined by matrix spik-ing experiments (n = 6) and they were generally >70% (overallaverage ± SD, 85 ± 21%). Since the recoveries were generally high,OCP amounts in the samples were not corrected.
Blank GFFs (dry deposition), PUF cartridges and quartz filters(air) were routinely placed in the field. Method blanks (solvent)were processed for the soil samples. All blanks (n = 4 for each) wereextracted and analyzed in the same manner as the samples todetermine if there was any contamination during sample handlingand preparation. Chlorpyrifos had the highest amount found inblanks with an average of 0.90 ± 0.12 ng for PUFs, 0.67 ± 0.08 ngfor quartz filters, 0.33 ± 0.21 ng for GFFs, and 0.66 ± 0.13 ng for soil.Average blank amounts for PUFs, quartz filters, GFFs, and soil were
A. Bozlaker et al. / Chemosphere 77 (2009) 1168–1176 1169
Author's personal copy
4 ± 7%, 12 ± 15%, 16 ± 19%, and 7 ± 13% of the sample amounts forall analyzed OCPs, respectively.
Instrumental detection limits (IDL) were determined from lin-ear extrapolation, based on the lowest standard in calibrationcurve and using the area of a peak having a signal/noise ratio of3. The quantifiable OCP amounts were between 0.02 (cis-nona-chlor)-0.35 pg (p,p0-DDT) for 1 lL injection. IDL was used for thecompounds that were not detected in blanks. The limit of detection(LOD, ng) was defined as the mean blank mass plus three standarddeviations. Sample quantities exceeding the LOD were quantifiedand blank-corrected by subtracting the mean blank amount fromthe sample amount.
3. Results and discussion
3.1. Ambient air concentrations and their variations withmeteorological parameters
Average atmospheric OCP concentrations measured in thisstudy are summarized in Table 1. Dieldrin, endrin, endrin alde-hyde, endrin ketone, and methoxychlor were not detected in anyof the air samples (n = 28). Average total (gas + particle) concentra-tions ranged from 0.2 ± 0.05 (cis-nonachlor) to 2152 ± 2974 pg m�3
(endosulfan-I) in summer, and from not detected (nd) (d-HCH, cis-nonachlor) to 121 ± 160 pg m�3 (chlorpyrifos) in winter (aver-age ± SD). Measured high and largely variable endosulfan andchlorpyrifos levels could be attributed to their ongoing use in thestudy area.
Average total OCP concentrations measured in this study werewithin the range of those previously reported. Atmospheric OCPlevels measured at a remote site in Germany (Wenzel et al.,2006), at the Arctic (Hung et al., 2005), and at a rural/forested sitein USA (Gioia et al., 2005) were lower than those measured in thepresent study. Ambient RHCH level (4170 pg m�3) around a metal-working/smelting plants in Germany was significantly higher thanthose measured at the present study (Wenzel et al., 2006). How-ever, p,p0-DDT and p,p0-DDD levels (21 and 3.5 pg m�3, respec-tively) measured in Germany were lower than those measured inAliaga during summer. At an urban/industrial site in USA, annualgas-phase concentrations of RHCHs (a and b isomers), Rchlord-anes, RDDTs (including six isomers), and Rendosulfans (endosul-
fan-I and endosulfan-II) were reported as 254, 127, 133, and104 pg m�3 (Gioia et al., 2005). At a coastal/urban site of Izmir,Odabasi et al. (2008) have reported generally higher atmosphericOCP concentrations in the summer and winter periods, exceptp,p0-DDT, p,p0-DDD, and a, b, d-HCH. Similar to those measured inthis study, chlorpyrifos and endosulfan were the most abundantOCPs in Izmir air (Odabasi et al., 2008; Sofuoglu et al., 2004).
Relationships between the total concentrations of related OCPsin the air samples (n = 28) were investigated and statistically sig-nificant correlations (p < 0.01) were found between a- and c-HCHisomers (r2 = 0.85), c-chlordane and other chlordane related pesti-cides (r2 = 0.71–0.85), endosulfan-I, endosulfan-II and endosulfansulfate (r2 = 0.92–0.98), p,p0-DDT and p,p0-DDD (r2 = 0.87). Thisindicates that the related OCPs in air have possibly been affectedby the same sources and/or meteorological conditions. However,there was a relatively weak correlation between a- and b-HCH iso-mers (p < 0.05, r2 = 0.23); a- and d-HCH isomers (p < 0.10,r2 = 0.26). c-HCH is released into the atmosphere both as lindane(pure c-HCH) and as a component of technical HCH. But, b- andd-HCH isomers have significantly lower contributions to thetechnical HCH mixture, and emitted to the environment mainlyas a result of technical HCH usage. Thus, these relatively weak cor-relations might be because of their much lower and less frequentlydetected air concentrations.
All of the summertime average total concentrations of OCPs inair were higher than the wintertime concentrations (Table 1).The summer/winter ratios were between 1.1 (chlorpyrifos) and93 (endosulfan-I). This increase in atmospheric OCP levels duringsummer may be related to increased volatilization of the previ-ously deposited compounds from terrestrial surfaces and seasonallocal/regional applications of current-use pesticides (i.e. endosul-fans and chlorpyrifos). Similar seasonal variations have been re-ported recently (Halsall et al., 1998; Cortes et al., 1999; Lee et al.,2000; Harrad and Mao, 2004; Gioia et al., 2005; Sun et al., 2006).
Generally, gas-phase OCP percentages were higher in summerthan in winter (Table 1). This may be mainly due to increasedpartitioning of compounds to gas-phase under higher tempera-tures in summer. Wind speed and direction are the other impor-tant parameters controlling atmospheric gas-phase levels ofpersistent organic pollutants (POPs). To assess the influence ofmeteorological variables on gas-phase OCP levels, multiple linear
Table 1Summary of atmospheric OCP concentrations (pg m�3, average ± SD) and MLR parameters for Eq. (1).
OCPsa Summer Winter Regression parameters r2 n
PPb GP T PP GP T m1 m2 m3
a-HCH 4.0 ± 2.0 102 ± 43 106 ± 43 0.5 ± 0.3 41 ± 32 41 ± 32 �3674c �0.22c 0.60c 0.71 28b-HCH 6.2 ± 6.0 12 ± 6.0 14 ± 9.1 nd 9.4 ± 5.2 9.4 ± 5.2 �1533 �0.07 0.73 0.2 18c-HCH 4.2 ± 2.1 44 ± 16 49 ± 16 1.0 ± 0.8 12 ± 6.3 13 ± 6.4 �6083c �0.14c 0.69c 0.81 28d-HCH 1.8 ± 1.3 2.6 ± 0.8 2.8 ± 1.9 nd nd nd nc nc nc nc 6CHLPYR 7.1 ± 3.7 135 ± 178 143 ± 181 86 ± 137 42 ± 54 121 ± 160 �6416c 0.01 0.18 0.23 28HEP EPOX 1.3 ± 1.1 5.0 ± 2.3 6.0 ± 3.0 1.1 ± 1.4 1.6 ± 1.3 2.2 ± 2.2 �7663c 0.09 0.44 0.59 28a-CHL 0.2 ± 0.1 2.9 ± 1.3 3.0 ± 1.4 0.07 ± 0.03 0.6 ± 0.2 0.6 ± 0.2 �8558c �0.05 0.21 0.86 26c-CHL 0.1 ± 0.07 1.6 ± 0.5 1.7 ± 0.6 0.06 ± 0.04 0.5 ± 0.2 0.6 ± 0.3 �5775c �0.08c 0.47c 0.78 28c-NONA nd 0.2 ± 0.05 0.2 ± 0.05 nd nd nd �22511d 0.22 �0.06 0.76 11t-NONA 0.05 ± 0.04 1.3 ± 0.4 1.3 ± 0.4 nd 0.4 ± 0.2 0.4 ± 0.2 �5801c �0.06c 0.06 0.85 28ESLF-I 9.9 ± 5.8 2142 ± 2970 2152 ± 2974 4.0 ± 4.0 19 ± 9.3 21 ± 11 �24116c 0.09 0.73d 0.89 28ESLF-II 29 ± 31 271 ± 338 300 ± 351 4.3 ± 3.6 2.2 ± 2.1 5.6 ± 3.9 �32458c �0.1 0.2 0.94 22ESLF SUL 4.2 ± 3.1 13 ± 14 17 ± 16 1.1 ± 0.8 0.2 ± 0.2 1.3 ± 0.9 �22751c 0.04 0.49 0.92 28p,p0-DDT 12 ± 8.5 46 ± 17 58 ± 16 5.1 ± 3.0 6.2 ± 4.1 11 ± 4.6 �11016c �0.05 0.22 0.88 28p,p0-DDD 2.8 ± 1.1 17 ± 5.3 19 ± 4.7 0.9 ± 0.3 2.4 ± 1.4 3.3 ± 1.5 �10674c �0.05 0.34 0.87 28
a a,b,c,d-Hexachlorocyclohexane isomers (a,b,c,d-HCH), chlorpyrifos (CHLPYR), heptachlor epoxide (HEP EPOX), a-chlordane (a-CHL), c-chlordane (c-CHL), cis-nonachlor (c-NONA), trans-nonachlor (t-NONA), endosulfan-I (ESLF-I), endosulfan-II (ESLF-II), endosulfan sulfate (ESLF SUL), dichlorodiphenyl trichloroethane (p,p0-DDT), tetrachlorodi-phenylethane (p,p0-DDD).
b PP: Particle-phase, GP: Gas-phase, T: Total (particle + gas), nd: Not detected, nc: Not calculated.c p < 0.05.d p < 0.10.
1170 A. Bozlaker et al. / Chemosphere 77 (2009) 1168–1176

Author's personal copy
regression (MLR) analysis was performed using the followingequation:
ln P ¼ m11T
� �þm2U þm3cosWDþ b ð1Þ
where P is the gas-phase partial pressure (atm) of compounds, T isthe average atmospheric temperature (K), U is the wind speed (ms�1), WD is the predominant wind direction averaged over the sam-pling period (degree), and m1, m2, m3 and b are the regressionparameters. Partial pressures of OCPs were calculated for each sam-ple using gas-phase concentrations and the ideal gas law. d-HCHwas detected in limited number of the samples and therefore, itwas excluded from MLR analysis. Temperature, wind speed, andwind direction, altogether, accounted for 20–94% of the variabilityin gas-phase OCP levels (Table 1). Negative m1 and m2 values indi-cated that the gas-phase concentrations increased with tempera-ture and decreased with wind speed, respectively. The m1 valueswere consistent with those derived from other recent studies (Hal-sall et al., 1998; Lee et al., 2000; Yeo et al., 2003; Harrad and Mao,2004) and generally, they were rather steep, suggesting that theirgas-phase concentrations were influenced by regional/short-rangetransport and by volatilization from contaminated surfaces. Endo-sulfans had the highest m1 and r2 values among the all OCPs. Thismay indicate the presence and variability of ongoing sources (i.e. in-creased agricultural use during the summer) in addition to increas-ing volatilization from terrestrial surfaces with temperature(Sofuoglu et al., 2004). Positive m3 values are associated with north-erly winds while negative ones point southerly directions for rela-tively higher gas-phase levels. However, m3 values for most of theOCPs were not significant, making impossible to draw a clear con-clusion on their source sectors.
3.2. Particle-phase dry deposition fluxes and velocities
Dry deposition fluxes (Fd) of OCPs in particle-phase were mea-sured experimentally using the deposition plates. Average Fd val-ues of individual pesticides ranged from 1.1 ± 1.2 (t-nonachlor) to503 ± 455 ng m�2 d�1 (endosulfan-I) in summer, and from0.3 ± 0.3 (t-nonachlor) to 110 ± 157 ng m�2 d�1 (chlorpyrifos) inwinter (Table 2). Current-use pesticides, endosulfan and chlorpyri-fos, were the leading compounds for particle OCPs fluxes, similar totheir air concentrations.
Generally, particle fluxes were higher in summer than in winter.Summer/winter ratios for the average Fd values of individual OCPswere between 0.4 (chlorpyrifos) and 32 (endosulfan-I). This is con-sistent with the measured higher particle-phase OCP concentra-tions in summer (except chlorpyrifos) (Table 1).
Odabasi et al. (2008) estimated particle fluxes of OCPs at acoastal/urban site in Izmir using their particle-phase concentra-tions and dry deposition velocities measured in Izmir. They re-ported Fd values ranging from 0.6 (c-nonachlor) to 388 ng m�2
d�1 (chlorpyrifos). Similar to the present study, the highest re-ported particle fluxes were for chlorpyrifos and endosulfan (Oda-basi et al., 2008). Gioia et al. (2005) have also calculated Fd
values for OCPs at different sites in New Jersey assuming a deposi-tion velocity of 0.5 cm s�1. The estimated fluxes of Rchlordanes,RDDTs, endosulfan-I, endosulfan-II, and endosulfan sulfate were2.8, 1.5, 0.9, 1.8, and 0.7 ng m�2 d�1 for urban/industrial site; 1.8,1.2, 0.2, 0.9, and 0.4 ng m�2 d�1 for suburban site; and 0.5, 0.3,0.4, 0.9, and 0.6 ng m�2 d�1 for rural/forested site, respectively(Gioia et al., 2005). These fluxes were generally lower than thosemeasured in the present study.
Particle-phase dry deposition velocities (Vd, cm s�1) were calcu-lated using the measured dry deposition fluxes (Fd, ng m�2 d�1)and atmospheric particle-phase concentrations (Cp, pg m�3)(Fd = Vd Cp). Average Vd values for individual OCPs ranged from2.3 ± 1.4 (a-HCH) to 11 ± 5.1 (t-nonachlor) cm s�1 in summer,and from 1.6 ± 1.0 (endosulfan-II) to 13 ± 4.7 (a-HCH) cm s�1 inwinter. The overall average Vd value for all the OCPs was 4.9 ±4.1 cm s�1 (Table 2). This value was 4.6 ± 3.6 and 5.3 ± 4.6 cm s�1
for the summer and winter periods, respectively. The seasonal dif-ferences in deposition velocities are probably due to variations inthe particle size distribution and the meteorological conditions(i.e. wind speed, air temperature, and atmospheric stability). Thedeposition velocity increases with wind speed (Zhang et al.,2001). Thus, elevated wintertime deposition velocities measuredin the present study might be related to the average wind speedthat was higher in winter (4.4 ± 2.5 m s�1) than in summer(2.8 ± 1.1 m s�1).
The correlations between the dry deposition fluxes andatmospheric particle-phase concentrations of OCPs (including allcompounds and their detected values during summer and wintersamplings) were statistically significant (r2 = 0.73, p < 0.01,n = 112 for summer; r2 = 0.88, p < 0.01, n = 98 for winter; and over-all r2 = 0.63, p < 0.01, n = 210). This indicated that the measuredOCP dry deposition fluxes were mainly affected by the atmosphericparticle-phase concentrations rather than meteorological parame-ters (i.e. wind speed, air temperature, and atmospheric stability).
Particulate deposition velocities for other POPs have been stud-ied extensively. Reported overall average Vd values were between0.4–6.7 cm s�1 for PAHs (Franz et al., 1998; Odabasi et al., 1999;Vardar et al., 2002; Tasdemir and Esen, 2007; Bozlaker et al.,2008a) and 0.7–7.2 cm s�1 for PCBs (Franz et al., 1998; Tasdemiret al., 2004; Tasdemir and Holsen, 2005; Cindoruk and Tasdemir,2007; Bozlaker et al., 2008b). The overall average Vd value for OCPsdetermined in this study (4.9 ± 4.1 cm s�1) was consistent withthose reported for other POPs.
3.3. Soil concentrations and soil-air gas exchange fluxes
p,p0-DDE was analyzed only for the soil samples taken from 48different sites in the region. c-HCH, a-CHL, c-CHL, trans-nonachlor,endosulfan-I, endosulfan-II, endosulfan sulfate, p,p0-DDT, p,p0-DDD,and p,p0-DDE were the most frequently detected (100%) com-pounds found in all samples (n = 48) and they were followed bya-HCH (98%), cis-nonachlor (96%), chlorpyrifos (92%), heptachlorepoxide (77%), b-HCH (27%), d-HCH, dieldrin (15%), and endrin(2%). Endrin aldehyde, endrin ketone, and methoxychlor were notdetected in any of the soil samples.
Soil OCP concentrations showed a large variation among thesampling points (n = 48), probably due to differences in past pesti-cide applications, their dissipation rates as well as other environ-mental conditions such as soil properties and meteorological
Table 2Particulate dry deposition fluxes (Fd) and velocities (Vd) of OCPs (average ± SD).
OCPs Vd (cm s�1) Fd (ng m�2 d�1)
Summer Winter
a-HCH 5.8 ± 5.8 6.3 ± 3.5 7.7 ± 6.0c-HCH 4.8 ± 3.1 9.7 ± 6.9 6.9 ± 3.9CHLPYR 5.4 ± 4.5 47 ± 57 110 ± 157HEP EPOX 4.6 ± 1.4 14 ± 14 9.5 ± 9.3a-CHL 10.1 ± 3.3 2.3 ± 1.5 0.6 ± 0.2c-CHL 8.1 ± 5.3 1.7 ± 3.3 0.7 ± 0.5t-NONA 11.5 ± 5.1 1.1 ± 1.2 0.3 ± 0.3ESLF-I 8.2 ± 5.3 503 ± 455 16 ± 13ESLF-II 4.4 ± 3.9 138 ± 133 6.5 ± 7.6ESLF SUL 2.8 ± 1.6 13 ± 10 1.6 ± 1.1p,p0-DDT 3.3 ± 2.5 31 ± 52 23 ± 41p,p0-DDD 4.6 ± 3.0 8.4 ± 12 4.4 ± 1.2
Overall for all OCPs 4.9 ± 4.1
A. Bozlaker et al. / Chemosphere 77 (2009) 1168–1176 1171
Author's personal copy
parameters (temperature, wind speed and direction). Soil OCP con-centrations ranged between 0.3–4157 for RDDXs (sum of p,p0-DDT,p,p0-DDD, p,p0-DDE), 0.09–26 for Rendosulfans (sum of endosulfan-I, endosulfan-II, endosulfan sulfate), 0.008–35 for Rchlordanes(sum of heptachlorepoxide, a-CHL, c-CHL, trans-nonachlor, cis-nonachlor), nd-6.8 for chlorpyrifos and 0.007–2.3 (lg kg�1 in dryweight) for RHCHs (sum of a, b, c, d isomers). Similar to the re-cently reported findings (Harner et al., 1999; Meijer et al., 2003a;Bidleman and Leone, 2004; Wong et al., 2008), the highest OCP lev-els were measured for RDDXs. As the use of DDT was restricted in1978, and then, prohibited in 1985 in Turkey (Acara et al., 2006),this result can be explained by their heavy historical use in the re-gion and their persistence in soil assuming that there was no illegaluse.
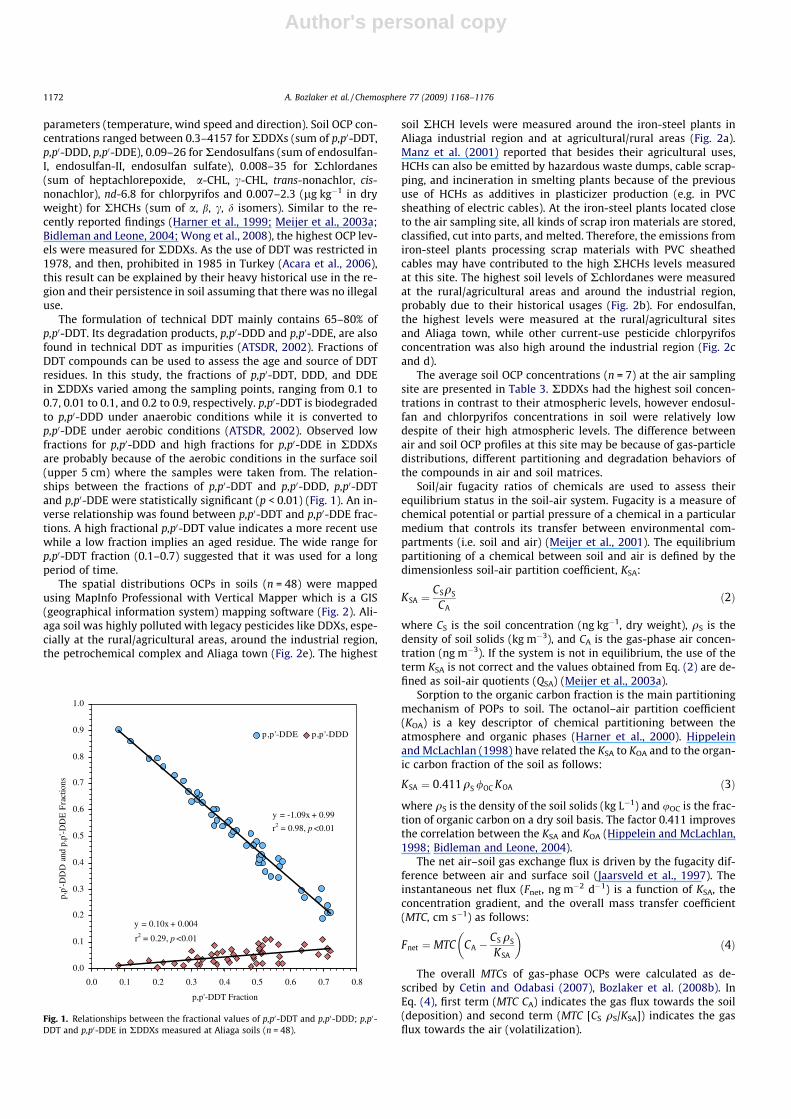
The formulation of technical DDT mainly contains 65–80% ofp,p0-DDT. Its degradation products, p,p0-DDD and p,p0-DDE, are alsofound in technical DDT as impurities (ATSDR, 2002). Fractions ofDDT compounds can be used to assess the age and source of DDTresidues. In this study, the fractions of p,p0-DDT, DDD, and DDEin RDDXs varied among the sampling points, ranging from 0.1 to0.7, 0.01 to 0.1, and 0.2 to 0.9, respectively. p,p0-DDT is biodegradedto p,p0-DDD under anaerobic conditions while it is converted top,p0-DDE under aerobic conditions (ATSDR, 2002). Observed lowfractions for p,p0-DDD and high fractions for p,p0-DDE in RDDXsare probably because of the aerobic conditions in the surface soil(upper 5 cm) where the samples were taken from. The relation-ships between the fractions of p,p0-DDT and p,p0-DDD, p,p0-DDTand p,p0-DDE were statistically significant (p < 0.01) (Fig. 1). An in-verse relationship was found between p,p0-DDT and p,p0-DDE frac-tions. A high fractional p,p0-DDT value indicates a more recent usewhile a low fraction implies an aged residue. The wide range forp,p0-DDT fraction (0.1–0.7) suggested that it was used for a longperiod of time.
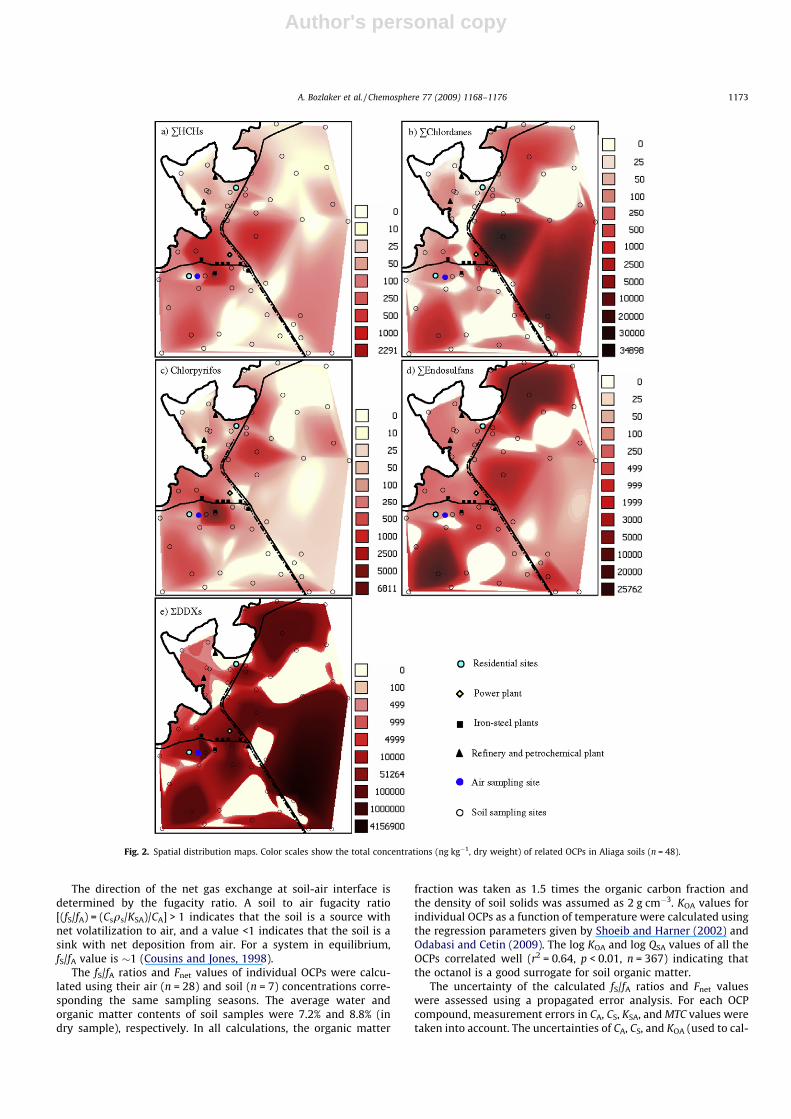
The spatial distributions OCPs in soils (n = 48) were mappedusing MapInfo Professional with Vertical Mapper which is a GIS(geographical information system) mapping software (Fig. 2). Ali-aga soil was highly polluted with legacy pesticides like DDXs, espe-cially at the rural/agricultural areas, around the industrial region,the petrochemical complex and Aliaga town (Fig. 2e). The highest
soil RHCH levels were measured around the iron-steel plants inAliaga industrial region and at agricultural/rural areas (Fig. 2a).Manz et al. (2001) reported that besides their agricultural uses,HCHs can also be emitted by hazardous waste dumps, cable scrap-ping, and incineration in smelting plants because of the previoususe of HCHs as additives in plasticizer production (e.g. in PVCsheathing of electric cables). At the iron-steel plants located closeto the air sampling site, all kinds of scrap iron materials are stored,classified, cut into parts, and melted. Therefore, the emissions fromiron-steel plants processing scrap materials with PVC sheathedcables may have contributed to the high RHCHs levels measuredat this site. The highest soil levels of Rchlordanes were measuredat the rural/agricultural areas and around the industrial region,probably due to their historical usages (Fig. 2b). For endosulfan,the highest levels were measured at the rural/agricultural sitesand Aliaga town, while other current-use pesticide chlorpyrifosconcentration was also high around the industrial region (Fig. 2cand d).
The average soil OCP concentrations (n = 7) at the air samplingsite are presented in Table 3. RDDXs had the highest soil concen-trations in contrast to their atmospheric levels, however endosul-fan and chlorpyrifos concentrations in soil were relatively lowdespite of their high atmospheric levels. The difference betweenair and soil OCP profiles at this site may be because of gas-particledistributions, different partitioning and degradation behaviors ofthe compounds in air and soil matrices.
Soil/air fugacity ratios of chemicals are used to assess theirequilibrium status in the soil-air system. Fugacity is a measure ofchemical potential or partial pressure of a chemical in a particularmedium that controls its transfer between environmental com-partments (i.e. soil and air) (Meijer et al., 2001). The equilibriumpartitioning of a chemical between soil and air is defined by thedimensionless soil-air partition coefficient, KSA:
KSA ¼CSqS
CAð2Þ
where CS is the soil concentration (ng kg�1, dry weight), qS is thedensity of soil solids (kg m�3), and CA is the gas-phase air concen-tration (ng m�3). If the system is not in equilibrium, the use of theterm KSA is not correct and the values obtained from Eq. (2) are de-fined as soil-air quotients (QSA) (Meijer et al., 2003a).
Sorption to the organic carbon fraction is the main partitioningmechanism of POPs to soil. The octanol–air partition coefficient(KOA) is a key descriptor of chemical partitioning between theatmosphere and organic phases (Harner et al., 2000). Hippeleinand McLachlan (1998) have related the KSA to KOA and to the organ-ic carbon fraction of the soil as follows:
KSA ¼ 0:411qS /OC KOA ð3Þ
where qS is the density of the soil solids (kg L�1) and uOC is the frac-tion of organic carbon on a dry soil basis. The factor 0.411 improvesthe correlation between the KSA and KOA (Hippelein and McLachlan,1998; Bidleman and Leone, 2004).
The net air–soil gas exchange flux is driven by the fugacity dif-ference between air and surface soil (Jaarsveld et al., 1997). Theinstantaneous net flux (Fnet, ng m�2 d�1) is a function of KSA, theconcentration gradient, and the overall mass transfer coefficient(MTC, cm s�1) as follows:
Fnet ¼ MTC CA �CS qS
KSA
� �ð4Þ
The overall MTCs of gas-phase OCPs were calculated as de-scribed by Cetin and Odabasi (2007), Bozlaker et al. (2008b). InEq. (4), first term (MTC CA) indicates the gas flux towards the soil(deposition) and second term (MTC [CS qS/KSA]) indicates the gasflux towards the air (volatilization).
y = -1.09x + 0.99
r2 = 0.98, p <0.01
y = 0.10x + 0.004
r2 = 0.29, p <0.01
0.0
0.1
0.2
0.3
0.4
0.5
0.6
0.7
0.8
0.9
1.0
0.0 0.1 0.2 0.3 0.4 0.5 0.6 0.7 0.8
p,p'-DDT Fraction
p,p'
-DD
D a
nd p
,p'-D
DE
Fra
ctio
ns
p ,p '-DDE p,p'-DDD
Fig. 1. Relationships between the fractional values of p,p0-DDT and p,p0-DDD; p,p0-DDT and p,p0-DDE in RDDXs measured at Aliaga soils (n = 48).
1172 A. Bozlaker et al. / Chemosphere 77 (2009) 1168–1176
Author's personal copy
The direction of the net gas exchange at soil-air interface isdetermined by the fugacity ratio. A soil to air fugacity ratio[(fS/fA) = (Csqs/KSA)/CA] > 1 indicates that the soil is a source withnet volatilization to air, and a value <1 indicates that the soil is asink with net deposition from air. For a system in equilibrium,fS/fA value is �1 (Cousins and Jones, 1998).
The fS/fA ratios and Fnet values of individual OCPs were calcu-lated using their air (n = 28) and soil (n = 7) concentrations corre-sponding the same sampling seasons. The average water andorganic matter contents of soil samples were 7.2% and 8.8% (indry sample), respectively. In all calculations, the organic matter
fraction was taken as 1.5 times the organic carbon fraction andthe density of soil solids was assumed as 2 g cm�3. KOA values forindividual OCPs as a function of temperature were calculated usingthe regression parameters given by Shoeib and Harner (2002) andOdabasi and Cetin (2009). The log KOA and log QSA values of all theOCPs correlated well (r2 = 0.64, p < 0.01, n = 367) indicating thatthe octanol is a good surrogate for soil organic matter.
The uncertainty of the calculated fS/fA ratios and Fnet valueswere assessed using a propagated error analysis. For each OCPcompound, measurement errors in CA, CS, KSA, and MTC values weretaken into account. The uncertainties of CA, CS, and KOA (used to cal-
Fig. 2. Spatial distribution maps. Color scales show the total concentrations (ng kg�1, dry weight) of related OCPs in Aliaga soils (n = 48).
A. Bozlaker et al. / Chemosphere 77 (2009) 1168–1176 1173
Author's personal copy
culate KSA) were assumed to be 15% (Harner and Bidleman, 1996;Meijer et al., 2003a) and uncertainty in the overall average MTC(used to calculate Fnet) was assumed as 40% (Cetin and Odabasi,2007).
A propagation of the errors associated with the calculation of fS/fA indicated that the equilibrium is represented by 1.0 ± 0.26 (i.e.within a range of 0.74–1.26). The fS/fA ratios especially for p,p-DDT, c-HCH, t-nonachlor, c-CHL, and a-CHL were inside this uncer-tainty range for some samples (constituting 25%, 29%, 39%, 43%,and 50% of the samples, respectively). For the whole data set,19% of the fugacity ratio (n = 366) fell inside the equilibrium range.For the rest (81%), soil and adjacent air were not in equilibrium.
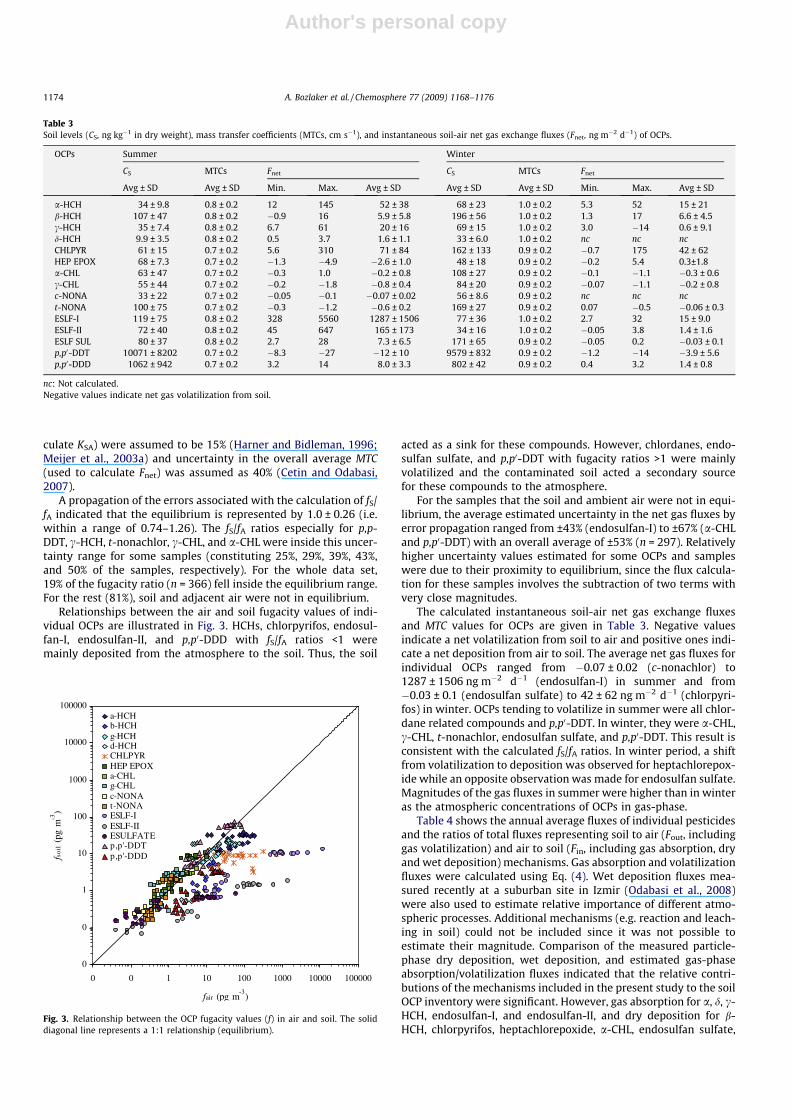
Relationships between the air and soil fugacity values of indi-vidual OCPs are illustrated in Fig. 3. HCHs, chlorpyrifos, endosul-fan-I, endosulfan-II, and p,p0-DDD with fS/fA ratios <1 weremainly deposited from the atmosphere to the soil. Thus, the soil
acted as a sink for these compounds. However, chlordanes, endo-sulfan sulfate, and p,p0-DDT with fugacity ratios >1 were mainlyvolatilized and the contaminated soil acted a secondary sourcefor these compounds to the atmosphere.
For the samples that the soil and ambient air were not in equi-librium, the average estimated uncertainty in the net gas fluxes byerror propagation ranged from ±43% (endosulfan-I) to ±67% (a-CHLand p,p0-DDT) with an overall average of ±53% (n = 297). Relativelyhigher uncertainty values estimated for some OCPs and sampleswere due to their proximity to equilibrium, since the flux calcula-tion for these samples involves the subtraction of two terms withvery close magnitudes.
The calculated instantaneous soil-air net gas exchange fluxesand MTC values for OCPs are given in Table 3. Negative valuesindicate a net volatilization from soil to air and positive ones indi-cate a net deposition from air to soil. The average net gas fluxes forindividual OCPs ranged from �0.07 ± 0.02 (c-nonachlor) to1287 ± 1506 ng m�2 d�1 (endosulfan-I) in summer and from�0.03 ± 0.1 (endosulfan sulfate) to 42 ± 62 ng m�2 d�1 (chlorpyri-fos) in winter. OCPs tending to volatilize in summer were all chlor-dane related compounds and p,p0-DDT. In winter, they were a-CHL,c-CHL, t-nonachlor, endosulfan sulfate, and p,p0-DDT. This result isconsistent with the calculated fS/fA ratios. In winter period, a shiftfrom volatilization to deposition was observed for heptachlorepox-ide while an opposite observation was made for endosulfan sulfate.Magnitudes of the gas fluxes in summer were higher than in winteras the atmospheric concentrations of OCPs in gas-phase.
Table 4 shows the annual average fluxes of individual pesticidesand the ratios of total fluxes representing soil to air (Fout, includinggas volatilization) and air to soil (Fin, including gas absorption, dryand wet deposition) mechanisms. Gas absorption and volatilizationfluxes were calculated using Eq. (4). Wet deposition fluxes mea-sured recently at a suburban site in Izmir (Odabasi et al., 2008)were also used to estimate relative importance of different atmo-spheric processes. Additional mechanisms (e.g. reaction and leach-ing in soil) could not be included since it was not possible toestimate their magnitude. Comparison of the measured particle-phase dry deposition, wet deposition, and estimated gas-phaseabsorption/volatilization fluxes indicated that the relative contri-butions of the mechanisms included in the present study to the soilOCP inventory were significant. However, gas absorption for a, d, c-HCH, endosulfan-I, and endosulfan-II, and dry deposition for b-HCH, chlorpyrifos, heptachlorepoxide, a-CHL, endosulfan sulfate,
Table 3Soil levels (CS, ng kg�1 in dry weight), mass transfer coefficients (MTCs, cm s�1), and instantaneous soil-air net gas exchange fluxes (Fnet, ng m�2 d�1) of OCPs.
OCPs Summer Winter
CS MTCs Fnet CS MTCs Fnet
Avg ± SD Avg ± SD Min. Max. Avg ± SD Avg ± SD Avg ± SD Min. Max. Avg ± SD
a-HCH 34 ± 9.8 0.8 ± 0.2 12 145 52 ± 38 68 ± 23 1.0 ± 0.2 5.3 52 15 ± 21b-HCH 107 ± 47 0.8 ± 0.2 �0.9 16 5.9 ± 5.8 196 ± 56 1.0 ± 0.2 1.3 17 6.6 ± 4.5c-HCH 35 ± 7.4 0.8 ± 0.2 6.7 61 20 ± 16 69 ± 15 1.0 ± 0.2 3.0 �14 0.6 ± 9.1d-HCH 9.9 ± 3.5 0.8 ± 0.2 0.5 3.7 1.6 ± 1.1 33 ± 6.0 1.0 ± 0.2 nc nc ncCHLPYR 61 ± 15 0.7 ± 0.2 5.6 310 71 ± 84 162 ± 133 0.9 ± 0.2 �0.7 175 42 ± 62HEP EPOX 68 ± 7.3 0.7 ± 0.2 �1.3 �4.9 �2.6 ± 1.0 48 ± 18 0.9 ± 0.2 �0.2 5.4 0.3±1.8a-CHL 63 ± 47 0.7 ± 0.2 �0.3 1.0 �0.2 ± 0.8 108 ± 27 0.9 ± 0.2 �0.1 �1.1 �0.3 ± 0.6c-CHL 55 ± 44 0.7 ± 0.2 �0.2 �1.8 �0.8 ± 0.4 84 ± 20 0.9 ± 0.2 �0.07 �1.1 �0.2 ± 0.8c-NONA 33 ± 22 0.7 ± 0.2 �0.05 �0.1 �0.07 ± 0.02 56 ± 8.6 0.9 ± 0.2 nc nc nct-NONA 100 ± 75 0.7 ± 0.2 �0.3 �1.2 �0.6 ± 0.2 169 ± 27 0.9 ± 0.2 0.07 �0.5 �0.06 ± 0.3ESLF-I 119 ± 75 0.8 ± 0.2 328 5560 1287 ± 1506 77 ± 36 1.0 ± 0.2 2.7 32 15 ± 9.0ESLF-II 72 ± 40 0.8 ± 0.2 45 647 165 ± 173 34 ± 16 1.0 ± 0.2 �0.05 3.8 1.4 ± 1.6ESLF SUL 80 ± 37 0.8 ± 0.2 2.7 28 7.3 ± 6.5 171 ± 65 0.9 ± 0.2 �0.05 0.2 �0.03 ± 0.1p,p0-DDT 10071 ± 8202 0.7 ± 0.2 �8.3 �27 �12 ± 10 9579 ± 832 0.9 ± 0.2 �1.2 �14 �3.9 ± 5.6p,p0-DDD 1062 ± 942 0.7 ± 0.2 3.2 14 8.0 ± 3.3 802 ± 42 0.9 ± 0.2 0.4 3.2 1.4 ± 0.8
nc: Not calculated.Negative values indicate net gas volatilization from soil.
0
0
1
10
100
1000
10000
100000
0 0 1 10 100 1000 10000 100000
fair (pg m-3
)
fsoi
l (p
g m
-3)
a-HCHb-HCHg-HCHd-HCHCHLPYR HEP EPOX a-CHLg-CHLc-NONAt-NONAESLF-I ESLF-IIESULFATEp,p'-DDTp,p'-DDD
Fig. 3. Relationship between the OCP fugacity values (f) in air and soil. The soliddiagonal line represents a 1:1 relationship (equilibrium).
1174 A. Bozlaker et al. / Chemosphere 77 (2009) 1168–1176
Author's personal copy
p,p0-DDT, and p,p0-DDD were dominating. The contribution of wetdeposition was important especially for chlorpyrifos and chlordanerelated pesticides. Fout/Fin ratios >1.0 suggest that there is a net vol-atilization from soil into the atmosphere while Fout/Fin ratios <1.0indicate that there is a net accumulation into the soil. The calcu-lated Fout/Fin ratios were <1.0 suggesting that for all OCPs therewas a net accumulation into the soil.
Acknowledgments
This study was supported in part by the scientific research fundof Dokuz Eylul University (Project No: 03.KB.FEN.101). We wouldlike to thank Faruk Dincer (Dokuz Eylul University) for his assis-tance in air sampling. We are also grateful to ENKA power stationin Aliaga, Izmir for allowing the use of their air pollution measure-ment station facilities and meteorological data generated at thissite.
References
Acara, A., Balli, B., Yeniova, M., Aksu, P., Duzgun, M., Dagli, S., 2006. Draft Turkishnational action plan for Stockholm convention on persistent organic pollutants(POPs), UNIDO-POPs project, Project No. GF/TUR/03/008.
Asman, W.A.H., Felding, G., Kudsk, P., Larsen, J., Mathiassen, S., Spliid, N.H. 2001.Pesticides in air and in precipitation and effects on plant communities.Pesticides Research No. 57, Danish Environmental Protection Agency.
Agency for Toxic Substances and Disease Registry (ATSDR), 2002. Toxicologicalprofile for DDT, DDE, and DDD. US Department of Health and Human Services,Public Health Service. Retrieved September 2002, from <http://www.atsdr.cdc.gov/toxprofiles/tp35.pdf>.
Backe, C., Cousins, I.T., Larsson, P., 2004. PCB in soils and estimated soil-air exchangefluxes of selected PCB congeners in the south of Sweden. Environ. Pollut. 128,59–72.
Bidleman, T.F., 1999. Atmospheric transport and air–surface exchange of pesticides.Water. Air Soil. Pollut. 115, 115–166.
Bidleman, T.F., Leone, A.D., 2004. Soil-air exchange of organochlorine pesticides inthe Southern United States. Environ. Pollut. 128, 49–57.
Bozlaker, A., Odabasi, M., Muezzinoglu, A., 2008a. Atmospheric concentrations, drydeposition and air–soil exchange of polycyclic aromatic hydrocarbons (PAHs) inan industrial region in Turkey. J. Hazard. Mater. 153, 1093–1102.
Bozlaker, A., Odabasi, M., Muezzinoglu, A., 2008b. Dry deposition and soil–air gasexchange of polychlorinated biphenyls (PCBs) in an industrial area. Environ.Pollut. 156, 784–793.
Cetin, B., Odabasi, M., 2007. Particle-phase dry deposition and air–soil gas exchangeof polybrominated diphenyl ethers (PBDEs) in Izmir, Turkey. Environ. Sci.Technol. 41, 4986–4992.
Cindoruk, S.S., Tasdemir, Y., 2007. Deposition of atmospheric particulate PCBs insuburban site of Turkey. Atmos. Res. 85, 300–309.
Cortes, D.R., Hoff, R.M., Brice, K.A., Hites, R.A., 1999. Evidence of current pesticideuse from temporal and clausius–clapeyron plots: a case study from theintegrated atmospheric deposition network. Environ. Sci. Technol. 33, 2145–2150.
Cousins, I.T., Jones, K.C., 1998. Air–soil exchange of semi-volatile organiccompounds (SOCs) in the UK. Environ. Pollut. 102, 105–118.
Daly, G.L., Lei, Y.D., Teixeria, C., Muir, D.C.G., Castillo, L.E., Jantunen, L.M.M., Wania,F., 2007. Organochlorine pesticides in the soils and atmosphere of Costa Rica.Environ. Sci. Technol. 41, 1124–1130.
Franz, T.P., Eisenreich, S.J., Holsen, T.M., 1998. Dry deposition of particulatepolychlorinated biphenyls and polycyclic aromatic hydrocarbons to LakeMichigan. Environ. Sci. Technol. 32, 3681–3688.
Gioia, R., Offenberg, J.H., Gigliotti, C.L., Totten, L.A., Du, S., Eisenreich, S.J., 2005.Atmospheric concentrations and deposition of organochlorine pesticides in theUS Mid-Atlantic region. Atmos. Environ. 39, 2309–2322.
Halsall, C.J., Bailey, R., Stern, G.A., Barrie, L.A., Fellin, P., Muir, D.C.G., Rosenberg, B.,Rovinsky, F.Ya., Pastukhov, B., 1998. Multi-year observations of organochlorinepesticides in the Arctic atmosphere. Environ. Pollut. 102, 51–62.
Harner, T., Bidleman, T.F., 1996. Measurements of octanol–air partition coefficientsfor polychlorinated biphenyls. J. Chem. Eng. Data. 41, 895–899.
Harner, T., Wideman, J.L., Jantunen, L.M.M., Bidleman, T.F., Parkhurst, W.J., 1999.Residues of organochlorine pesticides in Alabama soils. Environ. Pollut. 106,323–332.
Harner, T., Green, N.J.L., Jones, K.C., 2000. Measurements of octanol–air partitioncoefficients for PCDD/Fs: a tool in assessing air–soil equilibrium status. Environ.Sci. Technol. 34, 3109–3114.
Harrad, S., Mao, H., 2004. Atmospheric PCBs and organochlorine pesticides inBirmingham, UK: concentrations, sources, temporal and seasonal trends. Atmos.Environ. 38, 1437–1445.
Hippelein, M., McLachlan, M.S., 1998. Soil/air partitioning of semivolatile organiccompounds 1. Method development and influence of physical–chemicalproperties.. Environ. Sci. Technol. 32, 310–316.
Hippelein, M., McLachlan, M.S., 2000. Soil/air partitioning of semivolatile organiccompounds 2. Influence of temperature and relative humidity. Environ. Sci.Technol. 34, 3521–3526.
Hung, H., Blanchard, P., Halsall, C.J., Bidleman, T.F., Stern, G.A., Fellin, P., Muir, D.C.G.,Barrie, L.A., Jantunen, L.M., Helm, P.A., Ma, J., Konoplev, A., 2005. Temporal andspatial variables of atmospheric polychlorinated biphenyls (PCBs),organochlorine (OC) pesticides and polycyclic aromatic hydrocarbons (PAHs)in the Canadian Arctic: results from a decade of monitoring. Sci. Total Environ.342, 119–144.
Jaarsveld, J.A., Van Pul, W.A.J., De Leeuw, F.A.A.M., 1997. Modelling, transport anddeposition of organic pollutants in the European Region. Atmos. Environ. 31,1011–1024.
Kurt-Karakus, P.B., Bidleman, T.F., Staebler, R.M., Jones, K.C., 2006. Measurement ofDDT fluxes from a historically treated soil in Canada. Environ. Sci. Technol. 40,4578–4585.
Lee, R.G.M., Burnett, V., Harner, T., Jones, K.C., 2000. Short-term temperature-dependent air–surface exchange and atmospheric concentrations ofpolychlorinated naphthalenes and organochlorine pesticides. Environ. Sci.Technol. 34, 393–398.
Manz, M., Wenzel, K.D., Dietze, U., Schuurmann, G., 2001. Persistent organicpollutants in agricultural soils of central Germany. Sci. Total Environ. 277, 187–198.
MARA, 2007. Statistical report for 2006. Republic of Turkey, Ministry of Agricultureand Rural Affairs, Provincial Directorate of Izmir.
Meijer, S.N., Harner, T., Helm, P.A., Halsall, C.J., Johnston, A.E., Jones, K.C., 2001.Polychlorinated naphthalenes in UK soils: time trends, markers of source, andequilibrium status. Environ. Sci. Technol. 35, 4205–4213.
Meijer, S.N., Shoeib, M., Jantunen, L.M.M., Jones, K.C., Harner, T., 2003a. Air–soilexchange of organochlorine pesticides in agricultural soils 1. Fieldmeasurements using a novel in situ sampling device. Environ. Sci. Technol.37, 1292–1299.
Meijer, S.N., Shoeib, M., Jones, K.C., Harner, T., 2003b. Air–soil exchange oforganochlorine pesticides in agricultural soils 2. Laboratory measurements ofthe soil-air partition coefficient. Environ. Sci. Technol. 37, 1300–1305.
Odabasi, M., Sofuoglu, A., Vardar, N., Tasdemir, Y., Holsen, T.M., 1999. Measurementof dry deposition and air–water exchange of polycyclic aromatic hydro-carbons with the water surface sampler. Environ. Sci. Technol. 33, 426–434.
Odabasi, M., Cetin, B., Demircioglu, E., Sofuoglu, A., 2008. Air–water exchange ofpolychlorinated biphenyls (PCBs) and organochlorine pesticides (OCPs) at acoastal site in Izmir Bay, Turkey. Mar. Chem. 109, 115–129.
Odabasi, M., Cetin, B., 2009. Octanol–air partition coefficients of organochlorinepesticides (OCPs) as a function of temperature (unpublished results).
Shoeib, M., Harner, T., 2002. Using measured octanol–air partition coefficients toexplain environmental partitioning of organochlorine pesticides. Environ.Toxicol. Chem. 21, 984–990.
Sofuoglu, A., Cetin, E., Bozacioglu, S.S., Sener, G.D., Odabasi, M., 2004. Short-term variation in ambient concentrations and gas-particle partitioning oforganochlorine pesticides in Izmir, Turkey. Atmos. Environ. 38, 4483–4493.
Sun, P., Blanchard, P., Brice, K., Hites, R.A., 2006. Atmospheric organochlorinepesticide concentrations near the Great Lakes: temporal and spatial trends.Environ. Sci. Technol. 40, 6587–6593.
Tasdemir, Y., Odabasi, M., Vardar, N., Sofuoglu, A., Murphy, T.J., Holsen, T.M., 2004.Dry deposition fluxes and velocities of polychlorinated biphenyls (PCBs)associated with particles. Atmos. Environ. 38, 2447–2456.
Tasdemir, Y., Holsen, T.M., 2005. Measurement of particulate phase dry depositionfluxes of polychlorinated biphenyls (PCBs) with a water surface sampler. Atmos.Environ. 39, 1845–1854.
Table 4Annual fluxes (ng m�2 year�1) and Fout/Fin ratios of OCPs.
OCPs Wetdepositiona
Drydeposition
Gasabsorption
Gasvolatilization
Fout/Fin
a-HCH 351 2536 18,471 6600 0.3b-HCH nd 3258 3017 685 0.1c-HCH 408 3116 8622 4195 0.3d-HCH nd nd 707 135 0.2CHLPYR 18,885 29,639 23,090 1866 0.03HEP EPOX 2998 4458 711 1129 0.1a-CHL 361 477 366 460 0.4c-CHL 463 462 299 531 0.4c-NONA 89 nd 32 61 0.5t-NONA 335 308 188 328 0.4ESLF-I 820 105,208 239,150 1475 0.004ESLF-II 632 27,335 37,120 234 0.004ESLF SUL 348 2747 1681 121 0.03p,p0-DDT 477 9847 5578 8603 0.5p,p0-DDD nd 2404 2161 441 0.1
nd: Not detected.a Odabasi et al., 2008.
A. Bozlaker et al. / Chemosphere 77 (2009) 1168–1176 1175

Author's personal copy
Tasdemir, Y., Esen, F., 2007. Dry deposition fluxes and deposition velocities of PAHsat an urban site in Turkey. Atmos. Environ. 41, 1288–1301.
Vardar, N., Odabasi, M., Holsen, T.M., 2002. Particulate dry deposition and overalldeposition velocities of polycyclic aromatic hydrocarbons. J. Environ. Eng. –ASCE 128, 269–274.
Wenzel, K.D., Hubert, A., Weissflog, L., Kuhne, R., Popp, P., Kindler, A., Schuurmann,G., 2006. Influence of different sources on atmospheric organochlorine patternsin Germany. Atmos. Environ. 40, 943–957.
Wong, F., Alegria, H.A., Jantunen, L.M., Bidleman, T.F., Salvador-Figueroa, M., Gold-Bouchot, G., Ceja-Moreno, V., Waliszewski, S.M., Infanzon, R., 2008.
Organochlorine pesticides in soil and air of Southern Mexico: chemicalprofiles and potential for soil emissions. Atmos. Environ. 42, 7737–7745.
Yeo, H.G., Choi, M., Chun, M.Y., Sunwoo, Y., 2003. Concentration distribution ofpolychlorinated biphenyls and organochlorine pesticides and theirrelationship with temperature in rural air of Korea. Atmos. Environ. 37, 3831–3839.
Zhang, L., Gong, S., Padro, J., Barrie, L., 2001. A size-segregated particle drydeposition scheme for an atmospheric aerosol module. Atmos. Environ. 35,549–560.
1176 A. Bozlaker et al. / Chemosphere 77 (2009) 1168–1176
Copyright © 2022 FDOKUMEN