
Processability of a Hot Work Tool Steel Powder Mixture ... - MDPI
24
Materials 2022, 15, 2658. https://doi.org/10.3390/ma15072658 www.mdpi.com/journal/materials Article Processability of a Hot Work Tool Steel Powder Mixture in Laser-Based Powder Bed Fusion Nick Hantke 1, *, Felix Großwendt 2 , Anna Strauch 3 , Rainer Fechte-Heinen 3,4 , Arne Röttger 5 , Werner Theisen 2 , Sebastian Weber 2 and Jan Torsten Sehrt 1 1 Chair of Hybrid Additive Manufacturing, Ruhr-University Bochum, 44801 Bochum, Germany; [email protected] 2 Chair of Materials Technology, Ruhr-University Bochum, 44801 Bochum, Germany; [email protected] (F.G.); [email protected] (W.T.); [email protected] (S.W.) 3 Leibniz Institute for Materials Engineering—IWT, 28359 Bremen, Germany; [email protected] (A.S.); [email protected] (R.F.-H.) 4 MAPEX Center for Materials and Processes, University of Bremen, 28359 Bremen, Germany 5 Chair of New Manufacturing Technologies and Materials, University of Wuppertal, 42651 Solingen, Germany; [email protected] * Correspondence: [email protected] Abstract: Powder bed fusion of metals using a laser beam system (PBF-LB/M) of highly complex and filigree parts made of tool steels is becoming more important for many industrial applications and scientific investigations. To achieve high density and sufficient chemical homogeneity, pre-al- loyed gas-atomized spherical powder feedstock is used. For high-performance materials such as tool steels, the number of commercially available starting powders is limited due to the susceptibil- ity to crack formation in carbon-bearing steels. Furthermore, scientific alloy development in combi- nation with gas-atomization is a cost-intensive process which requires high experimental effort. To overcome these drawbacks, this investigation describes the adaption of a hot work tool steel for crack-free PBF-LB/M-fabrication without any preheating as well as an alternative alloying strategy which implies the individual admixing of low-cost aspherical elemental powders and ferroalloy particles with gas-atomized pure iron powder. It is shown that the PBF-LB/M-fabrication of this powder mixture is technically feasible, even though the partly irregular-shaped powder particles reduce the flowability and the laser reflectance compared to a gas-atomized reference powder. Moreover, some high-melting alloying ingredients of the admixed powder remain unmolten within the microstructure. To analyze the laser energy input in detail, the second part of the investigation focuses on the characterization of the individual laser light reflectance of the admixed alloy, the gas- atomized reference powder and the individual alloying elements and ferroalloys. Keywords: additive manufacturing; powder mixing; alloying strategies for powder bed fusion of metals using a laser beam system; tool steel; laser reflectance 1. Introduction PBF-LB/M has recently gained an increased scientific and economic importance and is, in many cases, considered to revolutionize current product design and development [1]. In the field of tool and mold making, additive manufacturing (AM) allows the pro- duction of complexly shaped tools and molds with minimal use of materials, and there- fore a high level of resource efficiency. In addition, these tools can be temperature-con- trolled optimally and locally through internal cooling or heating channels which are lo- cated below the functional surface [2,3]. This temperature control allows faster cycle times, which increases both the efficiency of the respective value chain and the surface quality of the products [4]. Tools for the processing of metals and plastics are made of tool Citation: Hantke, N.; Großwendt, F.; Strauch, A.; Fechte-Heinen, R.; Röttger, A.; Theisen, W.; Weber, S.; Sehrt, J.T. Processability of a Hot Work Tool Steel Powder Mixture in Laser-Based Powder Bed Fusion. Materials 2022, 15, 2658. https://doi.org/10.3390/ma15072658 Academic Editor: Amir Mostafaei Received: 23 February 2022 Accepted: 2 April 2022 Published: 4 April 2022 Publisher’s Note: MDPI stays neutral with regard to jurisdictional claims in published maps and institutional affiliations. Copyright: © 2022 by the authors. Li- censee MDPI, Basel, Switzerland. This article is an open access article distributed under the terms and con- ditions of the Creative Commons At- tribution (CC BY) license (https://cre- ativecommons.org/licenses/by/4.0/).
-
Upload
khangminh22 -
Category
Documents
-
view
0 -
download
0
Transcript of Processability of a Hot Work Tool Steel Powder Mixture ... - MDPI

Materials 2022, 15, 2658. https://doi.org/10.3390/ma15072658 www.mdpi.com/journal/materials
Article
Processability of a Hot Work Tool Steel Powder Mixture in
Laser-Based Powder Bed Fusion
Nick Hantke 1,*, Felix Großwendt 2, Anna Strauch 3, Rainer Fechte-Heinen 3,4, Arne Röttger 5, Werner Theisen 2,
Sebastian Weber 2 and Jan Torsten Sehrt 1
1 Chair of Hybrid Additive Manufacturing, Ruhr-University Bochum, 44801 Bochum, Germany;
[email protected] 2 Chair of Materials Technology, Ruhr-University Bochum, 44801 Bochum, Germany;
[email protected] (F.G.); [email protected] (W.T.); [email protected] (S.W.) 3 Leibniz Institute for Materials Engineering—IWT, 28359 Bremen, Germany; [email protected] (A.S.);
[email protected] (R.F.-H.) 4 MAPEX Center for Materials and Processes, University of Bremen, 28359 Bremen, Germany 5 Chair of New Manufacturing Technologies and Materials, University of Wuppertal,
42651 Solingen, Germany; [email protected]
* Correspondence: [email protected]
Abstract: Powder bed fusion of metals using a laser beam system (PBF-LB/M) of highly complex
and filigree parts made of tool steels is becoming more important for many industrial applications
and scientific investigations. To achieve high density and sufficient chemical homogeneity, pre-al-
loyed gas-atomized spherical powder feedstock is used. For high-performance materials such as
tool steels, the number of commercially available starting powders is limited due to the susceptibil-
ity to crack formation in carbon-bearing steels. Furthermore, scientific alloy development in combi-
nation with gas-atomization is a cost-intensive process which requires high experimental effort. To
overcome these drawbacks, this investigation describes the adaption of a hot work tool steel for
crack-free PBF-LB/M-fabrication without any preheating as well as an alternative alloying strategy
which implies the individual admixing of low-cost aspherical elemental powders and ferroalloy
particles with gas-atomized pure iron powder. It is shown that the PBF-LB/M-fabrication of this
powder mixture is technically feasible, even though the partly irregular-shaped powder particles
reduce the flowability and the laser reflectance compared to a gas-atomized reference powder.
Moreover, some high-melting alloying ingredients of the admixed powder remain unmolten within
the microstructure. To analyze the laser energy input in detail, the second part of the investigation
focuses on the characterization of the individual laser light reflectance of the admixed alloy, the gas-
atomized reference powder and the individual alloying elements and ferroalloys.
Keywords: additive manufacturing; powder mixing; alloying strategies for powder bed fusion of
metals using a laser beam system; tool steel; laser reflectance
1. Introduction
PBF-LB/M has recently gained an increased scientific and economic importance and
is, in many cases, considered to revolutionize current product design and development
[1]. In the field of tool and mold making, additive manufacturing (AM) allows the pro-
duction of complexly shaped tools and molds with minimal use of materials, and there-
fore a high level of resource efficiency. In addition, these tools can be temperature-con-
trolled optimally and locally through internal cooling or heating channels which are lo-
cated below the functional surface [2,3]. This temperature control allows faster cycle
times, which increases both the efficiency of the respective value chain and the surface
quality of the products [4]. Tools for the processing of metals and plastics are made of tool
Citation: Hantke, N.; Großwendt, F.;
Strauch, A.; Fechte-Heinen, R.;
Röttger, A.; Theisen, W.; Weber, S.;
Sehrt, J.T. Processability of a Hot
Work Tool Steel Powder Mixture in
Laser-Based Powder Bed Fusion.
Materials 2022, 15, 2658.
https://doi.org/10.3390/ma15072658
Academic Editor: Amir Mostafaei
Received: 23 February 2022
Accepted: 2 April 2022
Published: 4 April 2022
Publisher’s Note: MDPI stays
neutral with regard to jurisdictional
claims in published maps and
institutional affiliations.
Copyright: © 2022 by the authors. Li-
censee MDPI, Basel, Switzerland.
This article is an open access article
distributed under the terms and con-
ditions of the Creative Commons At-
tribution (CC BY) license (https://cre-
ativecommons.org/licenses/by/4.0/).

Materials 2022, 15, 2658 2 of 24
steels. In the case of hot forming or press hardening, hot work tool steels such as
X38CrMoV5-1 (AISI H11) and X40CrMoV5-1 (AISI H13) are commonly used because of
their high hardness, toughness, and wear resistance [5]. The material properties are deter-
mined by the microstructure in the heat-treated state. By hardening and tempering in the
regime of secondary hardness, a microstructure consisting of tempered martensite with
finely dispersed secondary carbides is formed [6].
The processing of these carbon martensitic tool steels using welding or additive man-
ufacturing is challenging due to the high tendency of forming cold cracks [7]. Cold cracks
form when the material cools locally from the process heat below the martensite start (MS)
temperature. The formed martensite possesses high strength, thus residual stresses can
only be reduced by local plastic deformation of the softer retained austenite (RA). If the
residual stresses locally exceed the strength of the RA, cold cracking occurs. To counteract
the cold crack formation of carbon martensitic steels during PBF-LB/M measures such as
preheating of the build platform or multiple exposures are used [7–9]. Counteracting cold
cracking by build platform preheating brings disadvantages such as pronounced oxygen-
uptake of the powder bed. This limits the reuse of the powder for subsequent AM-pro-
cesses [7,10]. Because of the challenging processability of carbon martensitic hot work tool
steels, tools and molds are preferably produced from precipitation hardening steels, such
as X5CrNiCuNb17-4-4 (17-4 PH) or X3NiCoMoTi18-9-5 (MS1) by PBF-LB/M [9,11]. How-
ever, these materials do not always provide the required hardness, toughness, and wear
resistance to guarantee sufficient durability of the hot forming tool and are cost-intensive
due to the high contents of alloying elements.
For this reason, there is a high need for the development of carbon martensitic steels
possessing good processability by AM without additional procedural measures and
which, for reasons of cost, have a low content of alloying elements. Such new carbon mar-
tensitic tool steels appropriate for AM processes can be derived using the concept of low
transition temperature (LLT) steels. The LTT concept utilizes a targeted reduced MS com-
pared to conventional tool steels such as H13 to avoid cold cracking during rapid cooling
conditions in welding or AM processes.
The martensite formation alone does not lead to cold cracks since the fcc → bcc trans-
formation causes material expansion, which is associated with the reduction in previously
formed residual tensile stresses during cooling. Moyer et al. investigated the volume ex-
pansion of this γ-α′-transformation by dilatometric measurements and found an increase
in the volume of the material by 2.0% (0.19 mass% C) to 3.1% (1.01 mass% C) [12]. With
an increase in the volume content of martensite, the expansion capacity of the entire ma-
trix decreases and only the softer RA undergoes a local plastic deformation, which is ac-
companied by cold crack formation if the strength of the RA is exceeded. It can be con-
cluded that the formation of martensite can be used to reduce the previously formed ten-
sile stresses. Therefore, the MS temperature must be adapted in such a manner that the
maximum effect of this transformation plasticity is close to room temperature (RT). The
reduction in the MS temperature can be achieved by alloying with the elements Cr, Mn,
and Ni [13]. Considering the work of Murata et al., Wang et al., and Eckerlid et al., residual
tensile stresses formed during cooling from the process heat can even be converted into re-
sidual compressive stresses by this transformation plasticity effect [14–16].
Now, to support a cost-efficient method for the development of further LTT tool
steels appropriate for AM and especially PBF-LB/M the use of admixed elemental and
ferroalloy particles as feed-stock material is investigated in this work. Thereby, low-cost
mechanically crushed particles possessing an aspherical shape are admixed with spherical
gas atomized iron powder.
As Attar et al. and Spierings et al. stated, density and the mechanical properties of
PBF-LB/M-fabricated parts are influenced by the homogeneity and the density of the ap-
plied powder layers and thus by the shape and particle size distribution of the used pow-
ders [17,18]. Spherical particles increase the packing density of powder particles and im-
prove the flow properties of the powder [19,20]. While a certain amount of small powder

Materials 2022, 15, 2658 3 of 24
particles improves the component properties, powders with a high proportion of small
particles can have a negative effect on flowability, as these particles tend to form irregu-
larly shaped agglomerates [18,19,21].
In general, a powder bed absorbs laser radiation better than a single powder particle
or a smooth surface [22,23]. Between the powder particles of a powder bed, the incident
laser beam is reflected multiple times, which increases the absorption [22–25]. With the
use of ray tracing calculations, Boley et al. showed that the laser light absorption of pow-
ders depends on the particle size distribution [22]. While large particles reflect more radi-
ation to the environment, small particles increase the absorption of the laser light [23,25].
The characteristics of the powder bed consisting of the considered powder mixture
are expected to be changed compared to a commonly used spherical pre-alloyed powder
feedstock. Until now, little research has been performed on the use of powder mixtures as
feedstocks for laser-based AM, especially for PBF-LB/M. Schwendner et al. investigated
the processing of elemental powder blends in a directed energy deposition process using
a laser beam [26]. Roberts et al. mixed spherical Al powder with aspherical Si powder and
processed this mixture via PBF-LB/M [27]. After the PBF-LB/M-process, Si particles were
not completely dissolved in the Al matrix, which made a subsequent heat treatment nec-
essary. Nevertheless, the work of Roberts et al. shows that the processing of powder mix-
tures in PBF-LB/M is possible [27].
In previous work, the nearly crack-free PBF-LB/M-fabrication of the considered hot
work tool steel could already be shown, but the PBF-LB/M-fabrication of tool steels from
powder mixtures has not been sufficiently investigated until now [28]. This work more
deeply investigates the possibility of the PBF-LB/M-fabrication of a hot work tool steel
powder mixture developed with the LTT alloy approach in mind. Powder properties and
powder bed homogeneity of this powder blend as well as the resulting microstructures of
the samples manufactured by PBF-LB/M are compared to those of gas-atomized pre-al-
loyed powder with the same alloy composition. In this investigation, the following scien-
tific questions are addressed:
1. Is admixing of gas-atomized spherical pure iron powder with aspherical elemental
powders and ferroalloys suitable for the PBF-LB/M fabrication of crack-free samples
with high density?
2. Does utilization of the admixed alloy significantly interfere with the homogeneous
powder particle distribution within the powder bed and the chemical homogeneity
of the as-built samples?
3. To what extent does the admixing of aspherical particles with spherical iron powder
influence the laser light reflection capacity of the powder bed? How much does pow-
der particle size reduction decrease the reflectance of the laser light?
2. Materials and Methods
2.1. Alloying Strategy
In this work, a suitable carbon martensitic tool steel alloy, hereinafter referred to as
H for hot work steel, was chosen for its low tendency for cold crack formation. The nom-
inal chemical composition and the actual composition of the PBF-LB/M materials pro-
duced are given in Table 1.

Materials 2022, 15, 2658 4 of 24
Table 1. Chemical composition in mass% of the used hot work tool steel.
Elements C Cr Si Mn Ni Mo Ti V W Fe
Nominal
composition 0.36 10.00 0.70 0.60 1.70 3.00 0.20 0.30 2.00 bal.
H-PRE 0.37
± 0.01
10.41
± 0.07
0.75
± 0.01
0.67
± 0.01
1.89
± 0.01
2.97
± 0.08
0.13
± 0.00
0.37
± 0.01
2.89
± 0.07 bal.
H-MIX 0.29
± 0.01
8.92
± 0.06
0.56
± 0.02
0.50
± 0.01
1.86
± 0.07
2.34
± 0.03
0.09
± 0.00
0.27
± 0.02
2.14
± 0.33 bal.
The mechanical and tribological properties should be comparable to the common
X40CrMoV5-1 hot work steel. The calculated MS temperature according to Andrew´s ap-
proach [29,30] (Equation (1)) for the considered LTT hot work tool steel is about 193 °C,
which is found to be suitable to counteract the formation of high residual tensile stresses
during PBF-LB/M fabrication.
The considered steel was subsequently processed into dense samples using PBF-
LB/M. Pre-alloyed powder was used for PBF-LB/M-fabrication and the gas-atomization
(melting under argon and atomization with nitrogen) was performed at the Leibniz Insti-
tute for Materials Technology. Samples manufactured from this pre-alloyed powder using
PBF-LB/M are referred to in the following as H-PRE (PRE = pre-alloyed). In addition, sam-
ples were generated from the powder mixture, which are referred to as H-MIX (MIX =
mixture). Pure iron was molten in an argon-atmosphere and gas-atomized using nitrogen
to a spherical powder. The iron powder was sieve-classified into a fraction of 20–63 µm
and subsequently admixed with mechanically broken and sieve-classified ferroalloy and
elemental particles (size 20–63 µm, see Table 2) to achieve the nominal chemical composi-
tion. Subsequently, the powder mixture was homogenized in a Turbula mixer (WAB
group, Muttenz, Switzerland) for two hours. The chemical composition of the PBF-LB/M-
processed powders was measured by optical emission spark spectrometry (type QSG750,
OBLF GmbH, Witten, Germany) and the average mean value of five measurements was
calculated.
𝑀𝑆 = 539 − 423 ∙ %𝐶 − 30.4 ∙ %𝑀𝑛 − 12.1 ∙ %𝐶𝑟 − 17.7 ∙ %𝑁𝑖 − 7.5 ∙ %𝑀𝑜 (1)
Table 2. Chemical composition of the used ferroalloy particles with a size of 20 to 63 µm in mass%,
calculated melting temperature Tm, and solidus temperature Tsol in °C, and the percentage of used
ferroalloys and pure elements.
Powder Circularity Fe Cr Mo W Ni V Mn C Al Si Ti Calculated Tm or
TLiq in °C
Content in
Mass%
Content
in Vol%
FeCrC 0.58 28.1 61.2 - - - - 0.3 7.5 - 2.9 - 1563 4.35 4.91
FeMo 0.55 20.3 - 69.7 - - - - - - - - 1895 4.36 3.87
FeW 0.59 19.0 - - 80.5 - - - - - 0.5 - 2719 2.62 1.95
FeV 0.51 17.2 - - - - 80.5 - 0.2 1.4 0.7 - 1447 0.38 0.47
FeTi 0.61 29.1 - - - - - - - - - 70.9 1117 0.28 0.40
FeSi 0.51 24.3 - - - - - - - 0.1 75.5 0.1 1191 0.85 1.80
Cr 0.54 - 99.9 - - - - - - - - - 1907 7.13 7.77
Ni 0.64 - - - - 99.9 - - - - - - 1455 1.69 1.47
Mn 0.55 - - - - - - 99.9 - - - - 1414 0.58 0.61
Fe 0.85 99.9 - - - - - - - - - - 1538 77.75 76.75

Materials 2022, 15, 2658 5 of 24
2.2. Thermodynamic Calculations
Thermodynamic calculations for the hot work steel considered here were carried out
using the ThermoCalc (TC) software (ThermoCalc AB, Stockholm, Sweden) in version
2017a. Calculations were performed with the database TCFE7 and the phases LIQUID
(liquid), M6C (W-rich M6C), FCC_A1 (γ -Fe), FCC_A1#2 (V- and Ti-rich MC), M7C3 (Cr-
rich M7C3), M23C6 (Cr-rich M23C6), M2C (Mo-rich M2C), and BCC_A2 (α-Fe). The SSOL4
database was used to calculate the solidus and melting temperatures of the ferroalloys
used with less than 50 mass% of Fe and for pure elements (all phases were allowed). All
calculations were carried out at an atmospheric pressure of 1000 mbar and a substance
quantity of 1 mol. To illustrate the solidification sequence of the hot work tool steel during
PBF-LB/M, solidification simulations were performed according to the approach by Scheil
and Gulliver with the thermodynamic database TCFE7. These calculations were also car-
ried out at a pressure of p = 1000 mbar and a quantity of 1 mol, beginning from a starting
temperature of 2000 °C. For each iteration step, the temperature was reduced by 1 K.
2.3. Powder Characterization
The particle size distribution in the range from 0.02 to 2000 µm was determined in
accordance with ISO 13320 (fineness characteristic diameter d) on the particle size meas-
uring device Mastersizer Hydro 2000 G (Malvern Instruments Ltd., Malvern, UK). The
device operated at a pressure of 2 bar and a frequency of 75 Hz using water as the disper-
sion medium. For determining the density distribution function, q3, a representative
amount of powder (300 g) was investigated. Four powder samples from different loca-
tions of the powder container were taken. The determined density distribution function
is related to the total amount of tested powder. In addition, the sphericity of the respective
ferro-particles and pure elements was approximated by quantitative image analysis by
calculating the circularity according to Riley [31]. The projection area of the powder par-
ticles was imaged at a magnification of 3500× by scanning electron microscopy (SEM) us-
ing MIRA3 (Tescan, Brno, Czech Republic). Bagheri et al. reported a yielded error of about
15.9% by approximating the sphericity by ϕRiley circularity [31].
An FT4 powder rheometer (Freeman Technology Ltd., Tewkesbury, UK) was used
for further powder characterization. Five values of the H-PRE and H-MIX powders were
compared: the conditioned bulk density (CBD), the basic flowability energy (BFE), the
specific energy (SE), the flow rate index (FRI), and the pressure drop (PD). Prior to each
measurement, a conditioning cycle was performed to remove precompaction and excess
air from the powder samples and to establish a reproducible initial state. To perform a
conditioning cycle, a rotating precision blade was moved into and out of a vessel contain-
ing the powder sample. The movement was carried out with a blade tip speed of 40 mm/s
and a helix angle of 5°. The CBD was calculated from the ratio of the sample mass to the
sample volume after a conditioning cycle has been performed. To measure the BFE and
the SE, after the first conditioning cycle, a test cycle was run in which the rotating blade
was moved into the powder sample at a blade tip speed of 100 mm/s and a helix angle of
5° and out of the powder sample with a blade tip speed of 40 mm/s and a helix angle of
−5°. Then a new conditioning cycle was performed. This procedure was repeated seven
times. The BFE represents the total energy needed to move the rotating precision blade
into a powder-filled vessel during the seventh test cycle. The total energy is composed of
the energy required for the rotary motion and the energy required for the axial movement
into the powder sample. The SE was calculated from the ratio of the mean value of the
energy required for the blade to move out of the powder-filled vessel during test cycles
six and seven and the mass of the powder sample. The test for the FRI was carried out
directly after the test for the BFE and the SE. After the last test cycle for the BFE and the
SE, a new conditioning cycle was performed. A test cycle with a blade tip speed of 100
mm/s followed. Three further test cycles followed, in which the blade tip speed was re-
duced step by step using a step size of 30 mm/s. After each test cycle, a conditioning cycle
Materials 2022, 15, 2658 6 of 24
was performed. The helix angle for all blade tip speeds was kept at 5° for the downwards
movement and at −5° for the upwards movement. The FRI was calculated from the ratio
of the energy needed to move the blade through the sample at blade tip speeds of 10 mm/s
and 100 mm/s. To measure the pressure drop through a powder sample, the powder sam-
ple was compressed under normal stress with a vented piston after three conditioning
cycles were performed. While the powder was compressed, air passed through the sample
from the bottom of the vessel at a constant flow rate of 2 mm/s. The powder was gradually
compressed at the normal stress of 1 kPa, 2 kPa, 4 kPa, 6 kPa, 8 kPa, 10 kPa, 12 kPa, and
15 kPa and the air pressure drop through the powder sample was recorded.
2.4. Laser Reflection Measurement
A Nicolet iS20 FTIR spectrometer (Thermo Fischer Scientific, Waltham, MA, USA)
equipped with a white light source, a XT-KBr beam splitter, a MCT/A detector and a Dif-
fusIR (Pike Technologies, Madison, WI, USA) was used to analyze the reflectance of the
powder samples at RT. Thirty-two scans with a spectral resolution of 4 cm−1 were per-
formed at MCT/A detector wavenumbers ranging from 4000 to 10,000 cm−1 in order to
record the spectra. The wavenumber is the reciprocal of the wavelength. Therefore, the
constant wavelength of 1070 nm of the utilized laser inside of the PBF-LB/M-system is
represented by the wavenumber of 9345.8 cm−1. To ensure repeatable measurements three
spectra were recorded for each sample. To gain information about the reflectance of dif-
ferent particle size fractions and the ingredients of the H-MIX powder each of the ingre-
dients of the H-MIX powder was sieved into the three fractions <28 µm, 28–45 µm, and
45–63 µm. The reflectance of the feedstocks H-PRE, H-MIX, and each of the fractions were
analyzed.
2.5. PBF-LB/M-Fabrication
For manufacturing of samples, the PBF-LB/M-system TruPrint 1000 (Trumpf GmbH
+ Co. KG, Ditzingen, Germany) equipped with a 200 W fiber laser with a wavelength of
1070 nm and a spot diameter of 30 µm was used. A rubber x-profile was used as recoating
device. The PBF-LB/M-process took place under a nitrogen atmosphere, which offers the
possibility to re-densify the fabricated samples by hot isostatic pressing (HIP) due to the
nitrogen solubility of steels, which is not given for argon gas [32]. The oxygen content of
the atmosphere was <0.1%.
Cube-shaped samples with an edge length of 4 mm were built to find suitable process
parameters for the processing of the two powders. An inverted pyramid shape with a
height of 1 mm and a base area of 3 × 3 mm2 was used to connect the cubic-shaped samples
to the build platform. For both powders, twelve samples with varying scanning speeds
and laser powers at a hatch distance of 60 µm and a layer thickness of 30 µm were manu-
factured. The scanning vectors followed a meandering shape, which was rotated by 90°
after each layer. The scanning speed was varied between 720 and 990 mm/s in 90 mm/s
increments and the nominal laser power was varied between 140 and 160 W in 10 W in-
crements.
2.6. Microscopy
The cross-sections of the PBF-LB/M-samples were ground stepwise with SiC grind-
ing paper from 320 to 1000 mesh and polished with diamond suspensions with a grain
size from 3 to 1 μm. To determine the relative density of the samples, image analysis using
a VHS 6000 digital microscope (Keyence Corporation, Osaka, Japan) was performed. Each
of the investigated samples was prepared in three different layers. The density of each
sample was determined from the mean value of the densities of these three layers. To
investigate the particle morphology of the powders and the microstructures of the PBF-
LB/M-densified samples a field-emission scanning electron microscopy of type MIRA3
(Tescan, Brno, Czech Republic) was used. The SEM operated at an acceleration voltage

Materials 2022, 15, 2658 7 of 24
UA = 20 kV and a working distance WD = 9 mm. Micrographs were taken in secondary
electron (SE) contrast if not stated otherwise. To determine inhomogeneities in the local
chemical composition, energy dispersive X-ray spectrometry (EDS) was performed using
an OXFORD X-Max 50 and the software Aztech in version AZtec 5.0 HF1 (Oxford instru-
ments, Abingdon, UK). The working distance for EDS was set to 15 mm.
2.7. Determination of the Residual Stresses and the Retained Austenite Content
For the determination of the residual stresses as well as the RA contents of the PBF-
LB/M-produced samples the X-ray diffractometer µx-360 (Pulstec, Hamamatsu, Japan)
with a Cr X-ray tube was used. The samples were ground and polished (1 µm). During
the measurement, the full Debye ring profiles from a single incident X-ray angle were
detected and these profiles were software-converted into an intensity/2θ diagram. With
the knowledge of the intensities of the martensite and austenite phases, the RA content
could be quantified according to the Rietveld method. The residual stresses were deter-
mined three times in the x and y directions by the cos-α method, and the arithmetic mean
was calculated from these results. A detailed description of this measurement method can
be found in [33].
3. Results and Discussion
3.1. Powder Morphology and Powder Properties
The morphologies of the H-PRE and H-MIX powders are shown in Figure 1. Most H-
PRE powder particles are spherical and show only a small number of satellites. However,
some particles deviate from the spherical shape and even show irregular shapes, which
could lead to decreased flowability (circularity S = 0.79). The gas-atomized Fe particles
included in H-MIX show fewer satellites than the pre-alloyed particles of the H-PRE pow-
der and are highly spherical with a circularity S = 0.85. These Fe particles are surrounded
in the H-MIX powder by sharp-edged broken ferroalloy and elemental particles. The cir-
cularity of the broken particles ranges from S = 0.51 to S = 0.61 (Table 2) and does not
depend on the respective particle size. Because of the high percentage of highly spherical
Fe the overall circularity of the powder mix was calculated as S = 0.78. The circularity of
the mixed powder measured by image analysis is S = 0.75 and correlates to the calcu-
lated mean value. Therefore, the circularity of H-MIX is only slightly inferior to the
circularity of the gas-atomized pre-alloyed powder H-PRE. This promotes a slightly in-
creased flowability of H-PRE.
Figure 1. H-PRE and H-MIX powder morphologies.
Materials 2022, 15, 2658 8 of 24
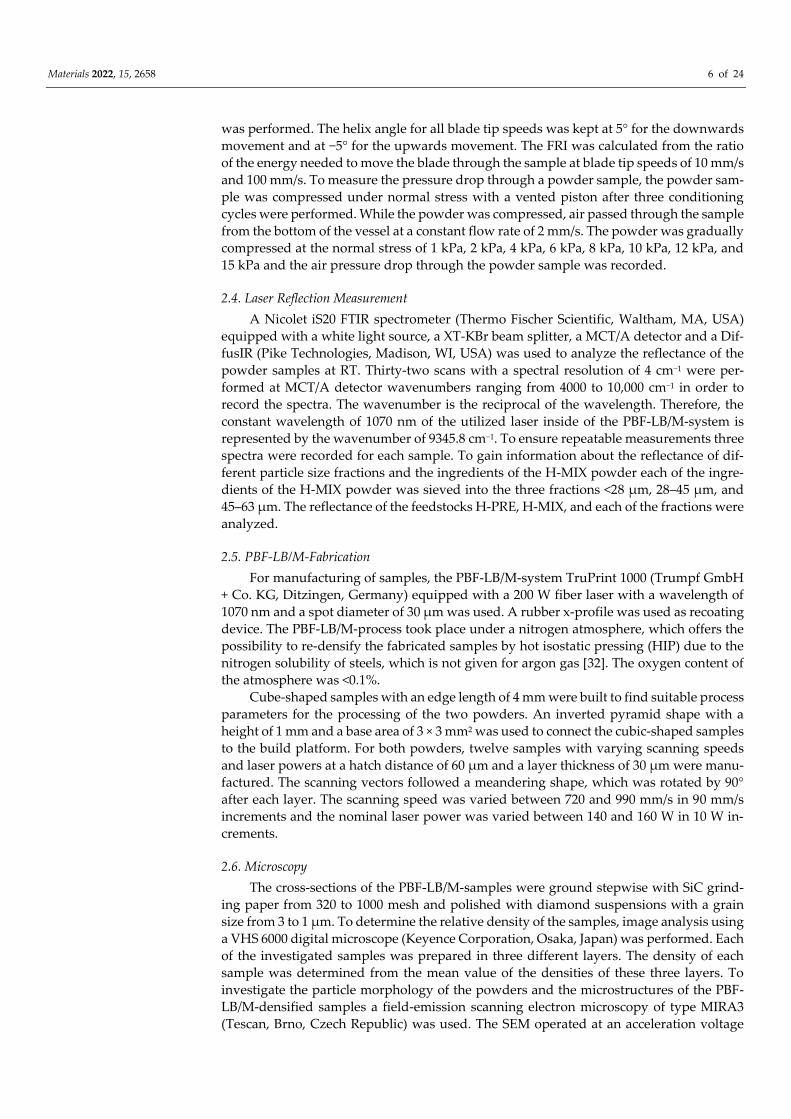
Adhering to the powder particles in H-MIX was a fine portion consisting of splinters
of the broken raw materials. These fine particles were not separated from the powder
mixture by sieving, which may be due to the tendency of fine particles to agglomerate
[33]. The broken particles were sieved into three fractions (<28 µm, 28–45 µm, and 45–63
µm) and examined. Figure 2a–c shows the three fractions of FeCrC. After sieving, no
smaller particles adhere to the particles of larger fractions, and between all three fractions
a clear difference in particle size is visible in the SEM images. The SEM images of the
fractions 28–45 µm and 45–63 µm of Mn (Figure 2d–f) do not show significant differences.
Pure Cr shows a behavior similar to Mn. FeW and FeTi include very fine particles in the
larger fractions after sieving which can be seen on the example of FeW in Figure 2g–i. As
the example of FeW shows, finer particles can remain in the larger fractions of some ma-
terials. The fractions sieved this way, therefore, do not correspond to the specified particle
sizes. For clarity, only the images of the FeCrC, Mn, and FeW particles are shown as ex-
amples in Figure 2 to describe the different distributions of particles sizes observed after
sieving.
Figure 2. SEM images of the sieved fractions: (a) FeCrC < 28 µm, (b) FeCrC 28–45 µm, (c) FeCrC 45–
63 µm, (d) Mn < 28 µm, (e) Mn 28–45 µm, (f) Mn 45–63 µm, (g) FeW < 28 µm, (h) FeW 28–45 µm,
and (i) FeW 45–63 µm.
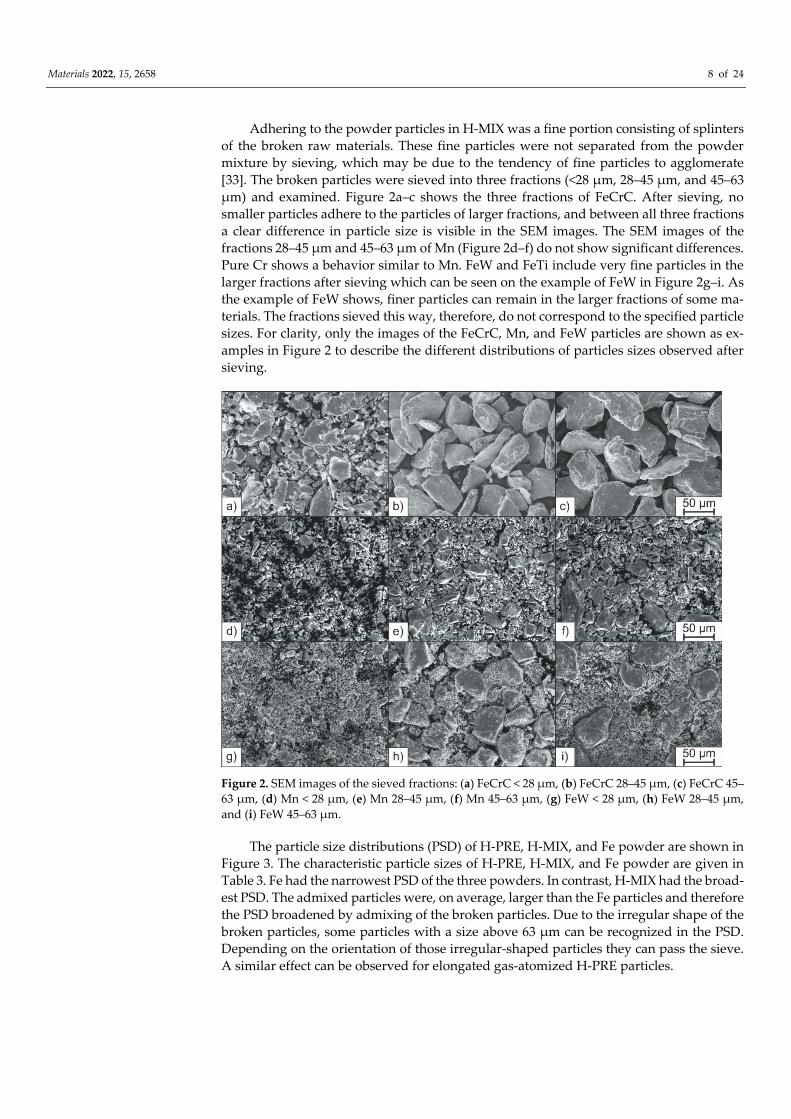
The particle size distributions (PSD) of H-PRE, H-MIX, and Fe powder are shown in
Figure 3. The characteristic particle sizes of H-PRE, H-MIX, and Fe powder are given in
Table 3. Fe had the narrowest PSD of the three powders. In contrast, H-MIX had the broad-
est PSD. The admixed particles were, on average, larger than the Fe particles and therefore
the PSD broadened by admixing of the broken particles. Due to the irregular shape of the
broken particles, some particles with a size above 63 µm can be recognized in the PSD.
Depending on the orientation of those irregular-shaped particles they can pass the sieve.
A similar effect can be observed for elongated gas-atomized H-PRE particles.
Materials 2022, 15, 2658 9 of 24
Figure 3. Particle size distributions of H-PRE, H-MIX, and Fe powder.
Table 3. Characteristic particle sizes of H-PRE, H-MIX, and Fe powder in µm.
H-PRE H-MIX Pure Fe
d (0.1) 31.60 29.10 25.21
d (0.5) 47.57 46.05 42.41
d (0.9) 71.28 72.33 69.49
In summary, the addition of milled particles to gas-atomized pure Fe leads to a re-
duction in circularity and a broadening of the PSD. Due to the high sphericity of the Fe
powder, the average sphericity of H-MIX is only slightly lower compared to H-PRE.
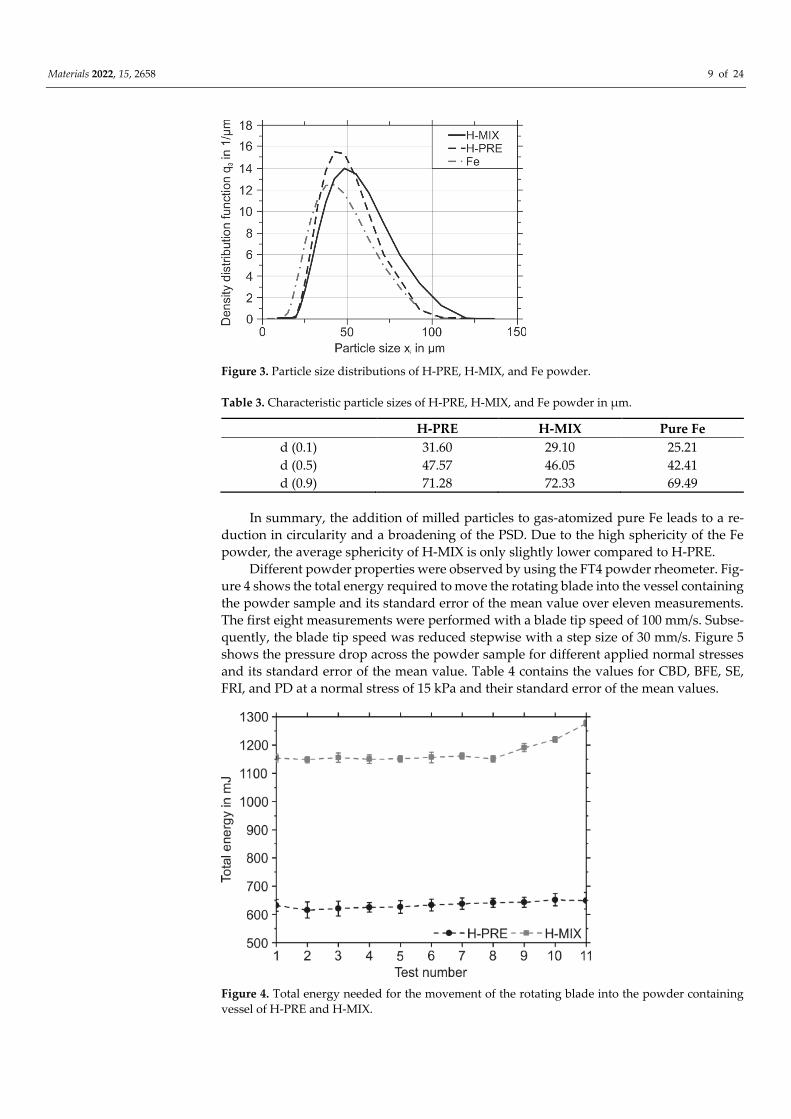
Different powder properties were observed by using the FT4 powder rheometer. Fig-
ure 4 shows the total energy required to move the rotating blade into the vessel containing
the powder sample and its standard error of the mean value over eleven measurements.
The first eight measurements were performed with a blade tip speed of 100 mm/s. Subse-
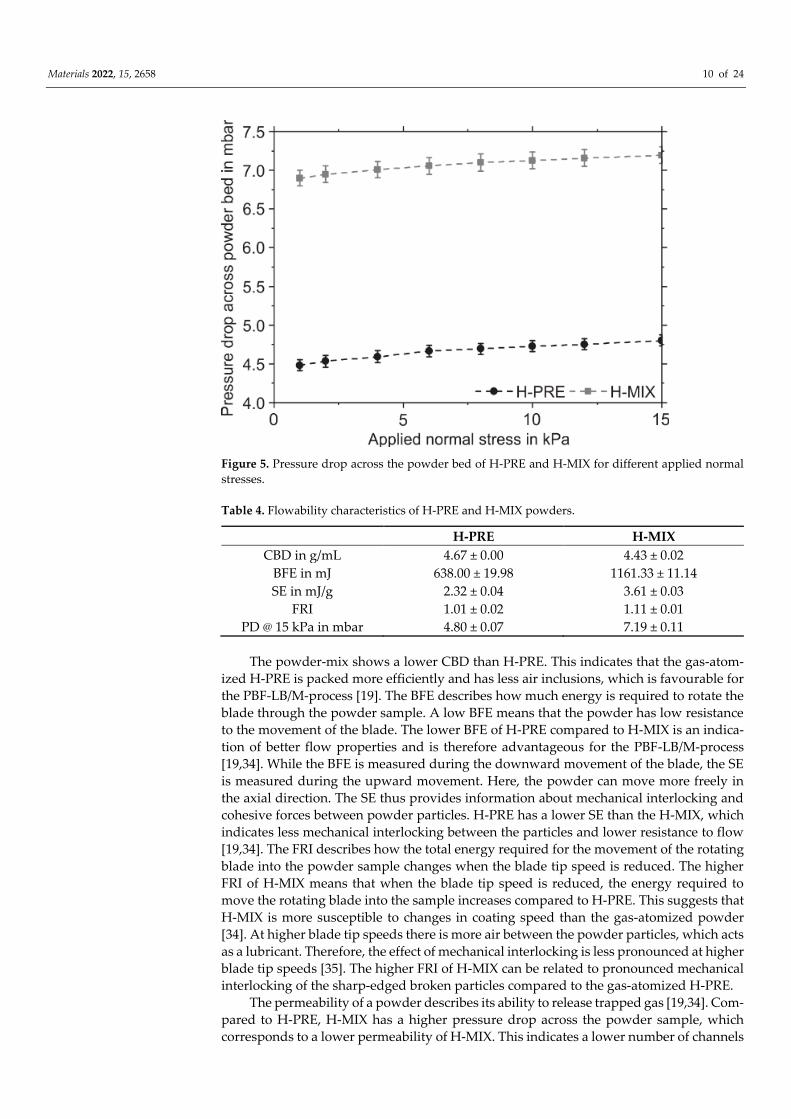
quently, the blade tip speed was reduced stepwise with a step size of 30 mm/s. Figure 5
shows the pressure drop across the powder sample for different applied normal stresses
and its standard error of the mean value. Table 4 contains the values for CBD, BFE, SE,
FRI, and PD at a normal stress of 15 kPa and their standard error of the mean values.
Figure 4. Total energy needed for the movement of the rotating blade into the powder containing
vessel of H-PRE and H-MIX.
Materials 2022, 15, 2658 10 of 24
Figure 5. Pressure drop across the powder bed of H-PRE and H-MIX for different applied normal
stresses.
Table 4. Flowability characteristics of H-PRE and H-MIX powders.
H-PRE H-MIX
CBD in g/mL 4.67 ± 0.00 4.43 ± 0.02
BFE in mJ 638.00 ± 19.98 1161.33 ± 11.14
SE in mJ/g 2.32 ± 0.04 3.61 ± 0.03
FRI 1.01 ± 0.02 1.11 ± 0.01
PD @ 15 kPa in mbar 4.80 ± 0.07 7.19 ± 0.11
The powder-mix shows a lower CBD than H-PRE. This indicates that the gas-atom-
ized H-PRE is packed more efficiently and has less air inclusions, which is favourable for
the PBF-LB/M-process [19]. The BFE describes how much energy is required to rotate the
blade through the powder sample. A low BFE means that the powder has low resistance
to the movement of the blade. The lower BFE of H-PRE compared to H-MIX is an indica-
tion of better flow properties and is therefore advantageous for the PBF-LB/M-process
[19,34]. While the BFE is measured during the downward movement of the blade, the SE
is measured during the upward movement. Here, the powder can move more freely in
the axial direction. The SE thus provides information about mechanical interlocking and
cohesive forces between powder particles. H-PRE has a lower SE than the H-MIX, which
indicates less mechanical interlocking between the particles and lower resistance to flow
[19,34]. The FRI describes how the total energy required for the movement of the rotating
blade into the powder sample changes when the blade tip speed is reduced. The higher
FRI of H-MIX means that when the blade tip speed is reduced, the energy required to
move the rotating blade into the sample increases compared to H-PRE. This suggests that
H-MIX is more susceptible to changes in coating speed than the gas-atomized powder
[34]. At higher blade tip speeds there is more air between the powder particles, which acts
as a lubricant. Therefore, the effect of mechanical interlocking is less pronounced at higher
blade tip speeds [35]. The higher FRI of H-MIX can be related to pronounced mechanical
interlocking of the sharp-edged broken particles compared to the gas-atomized H-PRE.
The permeability of a powder describes its ability to release trapped gas [19,34]. Com-
pared to H-PRE, H-MIX has a higher pressure drop across the powder sample, which
corresponds to a lower permeability of H-MIX. This indicates a lower number of channels

Materials 2022, 15, 2658 11 of 24
between the powder particles or smaller channel size and indicates stronger cohesion be-
tween the particles of H-MIX compared to H-PRE [34,36]. Low permeability can also result
from a high packing density of a powder, but CBD measurements showed that H-MIX
was less densely packed than H-PRE [19].
In summary, the flowability tests using the FT4 show that the H-MIX powder has
lower CBD, inferior flow properties, a greater dependence of flow properties on blade tip
speed, and lower permeability than the gas-atomized reference powder H-PRE. The as-
pherical particles result in a less efficient packing of the powder. Due to the aspherical
shape, there is more mechanical interlocking between the particles, which requires more
energy to move the rotating blade through the powder sample. Overall, the powder prop-
erties indicate that H-PRE powder is more suitable for the PBF-LB/M-process than H-MIX.
However, the application of dense powder layers could be achieved with both start-
ing powders H-PRE and H-MIX. Specimens of the H-MIX powder bed surface were ex-
tracted by using adhesive carbon pads. SEM images superimposed with EDS mappings
of these powder samples extracted from the powder bed after the application of 10 layers
are shown in Figure 6. The samples were taken from the front, the center and the rear area
of the build platform in relation to the direction of the powder application. No differences
in the distribution of the individual raw material particles between the three investigated
positions on the build platform were observed. However, the particles that were present
in smaller amounts than the Cr-rich or Fe particles, such as Ni and FeTi, were found only
sporadically inside the powder bed (compare Table 2). A small percentage combined with
a big particle size compared to the hatch distance of 60 µm and the laser focus diameter
of 30 µm may lead to inhomogeneous local chemical compositions of the PBF-LB/M man-
ufactured samples.
Figure 6. Qualitative EDS mappings of the H-MIX powder bed; (a) front, (b) centre, and (c) rear area
of the build platform.
3.2. Laser Reflectance Measurement
The laser reflectance of the elemental and ferroalloy powders in three different frac-
tions (<28 µm, 28–45 µm, and 45–63 µm) are shown in Figure 7. Figure 7b shows the av-
erage values for the reflectance of the three fractions considered and also contains the val-
ues for the Fe powder as well as H-MIX and H-PRE. It has been described in the literature
that smaller particles absorb laser radiation more efficiently than larger ones; therefore,
particles with a size < 28 µm are expected to reflect less laser radiation than particles of
28–45 µm, which in turn are expected to reflect less laser radiation than particles of 45–63
µm [23,25]. While Mn, FeV, FeMo, and FeCrC showed the behavior described in literature,
this behavior was not observed for all investigated materials.
Materials 2022, 15, 2658 12 of 24
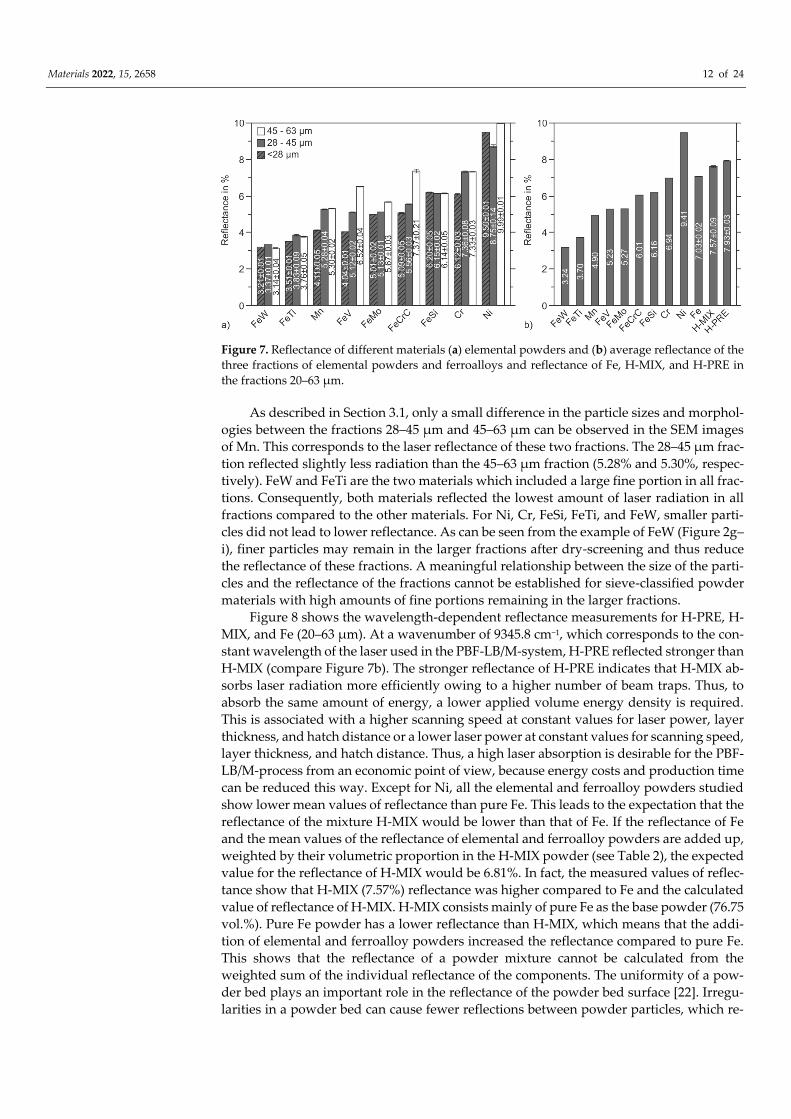
Figure 7. Reflectance of different materials (a) elemental powders and (b) average reflectance of the
three fractions of elemental powders and ferroalloys and reflectance of Fe, H-MIX, and H-PRE in
the fractions 20–63 µm.
As described in Section 3.1, only a small difference in the particle sizes and morphol-
ogies between the fractions 28–45 µm and 45–63 µm can be observed in the SEM images
of Mn. This corresponds to the laser reflectance of these two fractions. The 28–45 µm frac-
tion reflected slightly less radiation than the 45–63 µm fraction (5.28% and 5.30%, respec-
tively). FeW and FeTi are the two materials which included a large fine portion in all frac-
tions. Consequently, both materials reflected the lowest amount of laser radiation in all
fractions compared to the other materials. For Ni, Cr, FeSi, FeTi, and FeW, smaller parti-
cles did not lead to lower reflectance. As can be seen from the example of FeW (Figure 2g–
i), finer particles may remain in the larger fractions after dry-screening and thus reduce
the reflectance of these fractions. A meaningful relationship between the size of the parti-
cles and the reflectance of the fractions cannot be established for sieve-classified powder
materials with high amounts of fine portions remaining in the larger fractions.
Figure 8 shows the wavelength-dependent reflectance measurements for H-PRE, H-
MIX, and Fe (20–63 µm). At a wavenumber of 9345.8 cm−1, which corresponds to the con-
stant wavelength of the laser used in the PBF-LB/M-system, H-PRE reflected stronger than
H-MIX (compare Figure 7b). The stronger reflectance of H-PRE indicates that H-MIX ab-
sorbs laser radiation more efficiently owing to a higher number of beam traps. Thus, to
absorb the same amount of energy, a lower applied volume energy density is required.
This is associated with a higher scanning speed at constant values for laser power, layer
thickness, and hatch distance or a lower laser power at constant values for scanning speed,
layer thickness, and hatch distance. Thus, a high laser absorption is desirable for the PBF-
LB/M-process from an economic point of view, because energy costs and production time
can be reduced this way. Except for Ni, all the elemental and ferroalloy powders studied
show lower mean values of reflectance than pure Fe. This leads to the expectation that the
reflectance of the mixture H-MIX would be lower than that of Fe. If the reflectance of Fe
and the mean values of the reflectance of elemental and ferroalloy powders are added up,
weighted by their volumetric proportion in the H-MIX powder (see Table 2), the expected
value for the reflectance of H-MIX would be 6.81%. In fact, the measured values of reflec-
tance show that H-MIX (7.57%) reflectance was higher compared to Fe and the calculated
value of reflectance of H-MIX. H-MIX consists mainly of pure Fe as the base powder (76.75
vol.%). Pure Fe powder has a lower reflectance than H-MIX, which means that the addi-
tion of elemental and ferroalloy powders increased the reflectance compared to pure Fe.
This shows that the reflectance of a powder mixture cannot be calculated from the
weighted sum of the individual reflectance of the components. The uniformity of a pow-
der bed plays an important role in the reflectance of the powder bed surface [22]. Irregu-
larities in a powder bed can cause fewer reflections between powder particles, which re-
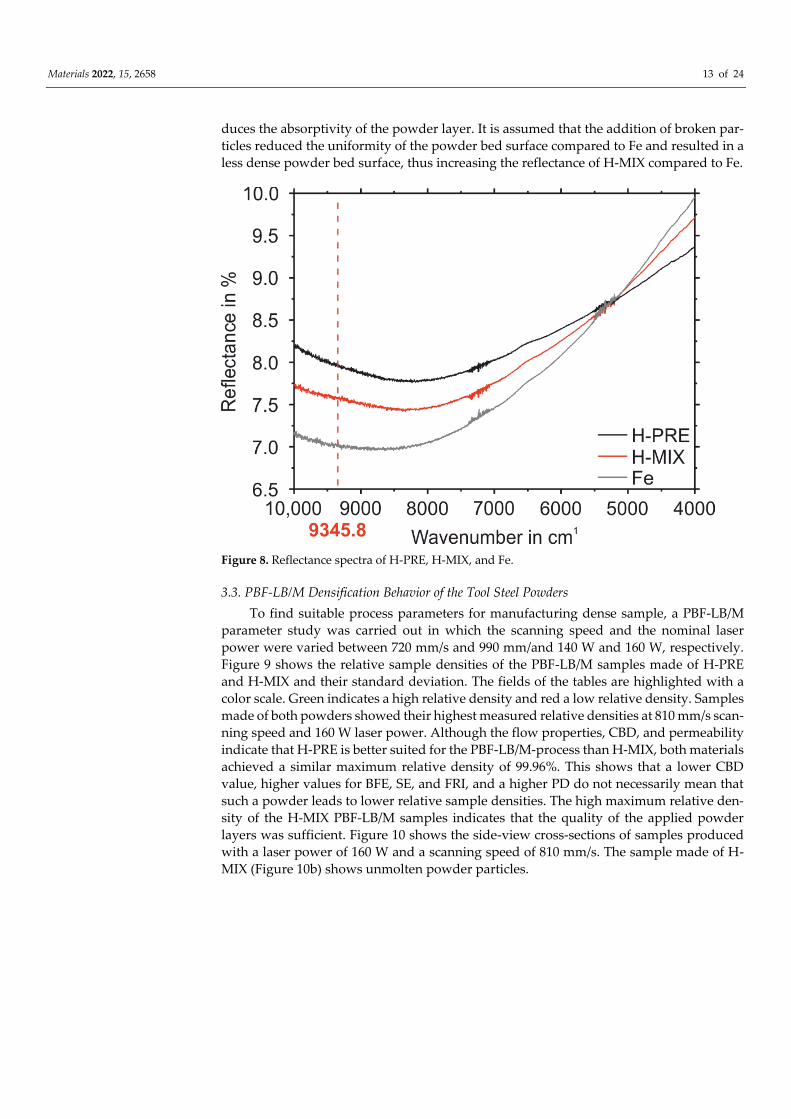
Materials 2022, 15, 2658 13 of 24
duces the absorptivity of the powder layer. It is assumed that the addition of broken par-
ticles reduced the uniformity of the powder bed surface compared to Fe and resulted in a
less dense powder bed surface, thus increasing the reflectance of H-MIX compared to Fe.
Figure 8. Reflectance spectra of H-PRE, H-MIX, and Fe.
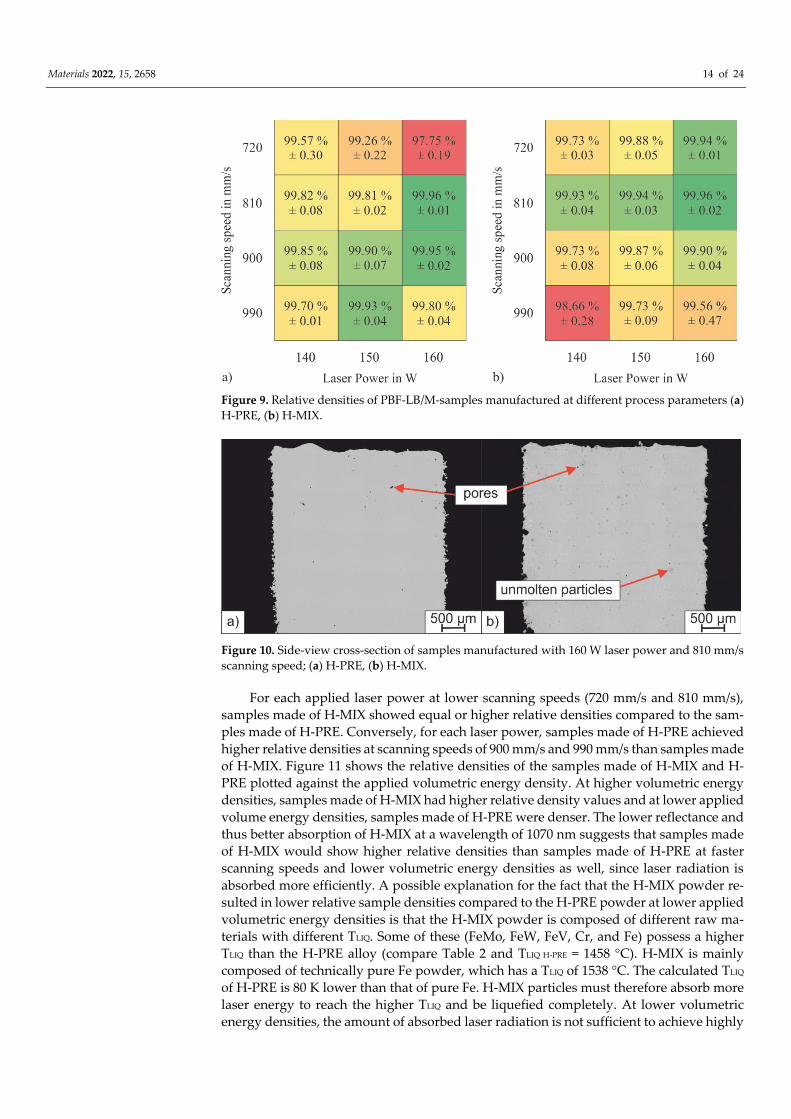
3.3. PBF-LB/M Densification Behavior of the Tool Steel Powders
To find suitable process parameters for manufacturing dense sample, a PBF-LB/M
parameter study was carried out in which the scanning speed and the nominal laser
power were varied between 720 mm/s and 990 mm/and 140 W and 160 W, respectively.
Figure 9 shows the relative sample densities of the PBF-LB/M samples made of H-PRE
and H-MIX and their standard deviation. The fields of the tables are highlighted with a
color scale. Green indicates a high relative density and red a low relative density. Samples
made of both powders showed their highest measured relative densities at 810 mm/s scan-
ning speed and 160 W laser power. Although the flow properties, CBD, and permeability
indicate that H-PRE is better suited for the PBF-LB/M-process than H-MIX, both materials
achieved a similar maximum relative density of 99.96%. This shows that a lower CBD
value, higher values for BFE, SE, and FRI, and a higher PD do not necessarily mean that
such a powder leads to lower relative sample densities. The high maximum relative den-
sity of the H-MIX PBF-LB/M samples indicates that the quality of the applied powder
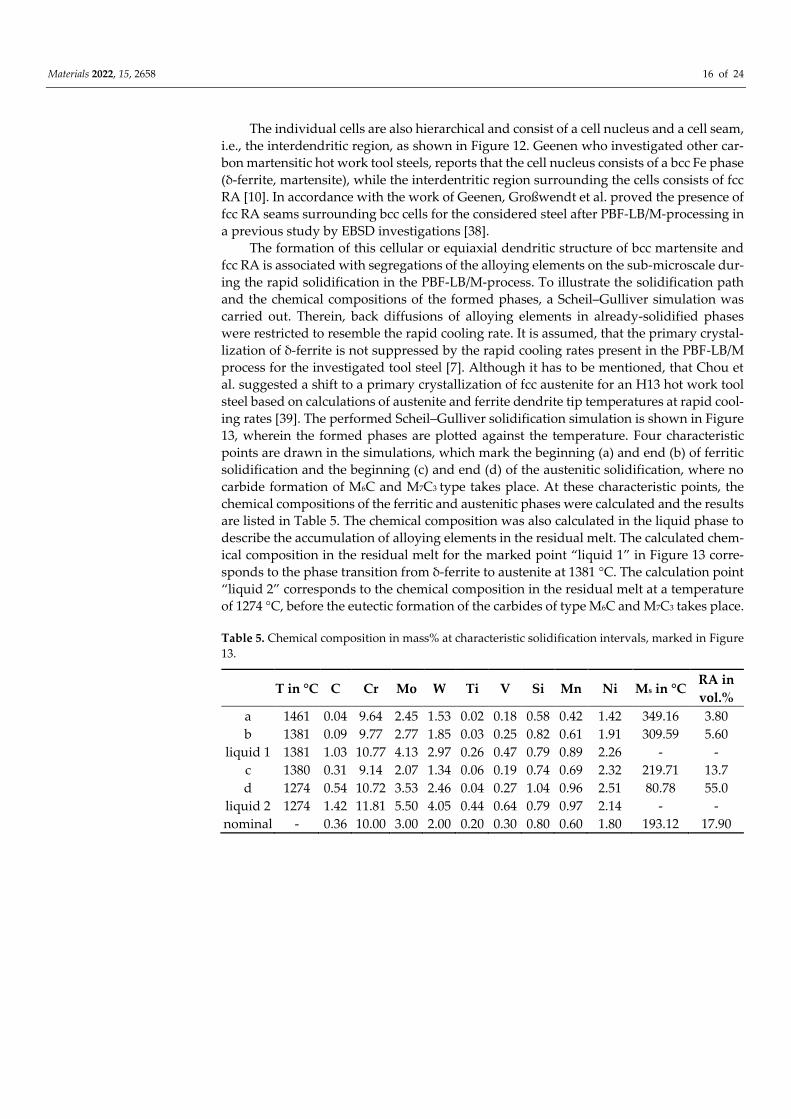
layers was sufficient. Figure 10 shows the side-view cross-sections of samples produced
with a laser power of 160 W and a scanning speed of 810 mm/s. The sample made of H-
MIX (Figure 10b) shows unmolten powder particles.
Materials 2022, 15, 2658 14 of 24
Figure 9. Relative densities of PBF-LB/M-samples manufactured at different process parameters (a)
H-PRE, (b) H-MIX.
Figure 10. Side-view cross-section of samples manufactured with 160 W laser power and 810 mm/s
scanning speed; (a) H-PRE, (b) H-MIX.
For each applied laser power at lower scanning speeds (720 mm/s and 810 mm/s),
samples made of H-MIX showed equal or higher relative densities compared to the sam-
ples made of H-PRE. Conversely, for each laser power, samples made of H-PRE achieved
higher relative densities at scanning speeds of 900 mm/s and 990 mm/s than samples made
of H-MIX. Figure 11 shows the relative densities of the samples made of H-MIX and H-
PRE plotted against the applied volumetric energy density. At higher volumetric energy
densities, samples made of H-MIX had higher relative density values and at lower applied
volume energy densities, samples made of H-PRE were denser. The lower reflectance and
thus better absorption of H-MIX at a wavelength of 1070 nm suggests that samples made
of H-MIX would show higher relative densities than samples made of H-PRE at faster
scanning speeds and lower volumetric energy densities as well, since laser radiation is
absorbed more efficiently. A possible explanation for the fact that the H-MIX powder re-
sulted in lower relative sample densities compared to the H-PRE powder at lower applied
volumetric energy densities is that the H-MIX powder is composed of different raw ma-
terials with different TLIQ. Some of these (FeMo, FeW, FeV, Cr, and Fe) possess a higher
TLIQ than the H-PRE alloy (compare Table 2 and TLIQ H-PRE = 1458 °C). H-MIX is mainly
composed of technically pure Fe powder, which has a TLIQ of 1538 °C. The calculated TLIQ
of H-PRE is 80 K lower than that of pure Fe. H-MIX particles must therefore absorb more
laser energy to reach the higher TLIQ and be liquefied completely. At lower volumetric
energy densities, the amount of absorbed laser radiation is not sufficient to achieve highly

Materials 2022, 15, 2658 15 of 24
dense samples with H-MIX powder. Insufficient amounts of liquid phase are formed to
achieve complete densification in the PBF-LB/M process. The need for higher laser energy
inputs to produce highly dense samples of H-MIX is not compensated for by its decreased
laser reflectance compared to H-PRE (compare Section 3.2).
Figure 11. Relative densities of PBF-LB/M samples plotted against the applied volume energy den-
sity for H-PRE and H-MIX.
3.4. Solidification and Microstructure of the PBF-LB/M-Fabricated Tool Steel
The microstructure formation of the investigated tool steel during PBF-LB/M fabri-
cation is described below. The microstructure of the PBF-LB/M samples which were man-
ufactured from the pre-alloyed powder is shown in Figure 12 at two different magnifica-
tions and has a hierarchical structure on different size scales. Figure 12a shows a light
microscopic image in cross-section in which the melt tracks resembling the alternating
scanning pattern are visible due to metallographic etching (the bright and dark areas are
etching effects; the melt tracks are marked with hatched lines). Figure 12b shows the cel-
lular substructure at a higher magnification, which is typical for PBF-LB/M-fabricated car-
bon martensitic hot work tool steels [7]. This substructure is characterized by a high dis-
location density, which forms appropriately arranged small-angle grain boundaries, as
demonstrated in the work of Geenen using TEM investigations [37].
Figure 12. (a) Layer-like microstructure of the PBF-LB/M-fabricated samples at lower magnification;
(b) cellular microstructure of the individual cells formed at a higher magnification, consisting of bcc
nuclei surrounded by fcc seams.
Materials 2022, 15, 2658 16 of 24
The individual cells are also hierarchical and consist of a cell nucleus and a cell seam,
i.e., the interdendritic region, as shown in Figure 12. Geenen who investigated other car-
bon martensitic hot work tool steels, reports that the cell nucleus consists of a bcc Fe phase
(δ-ferrite, martensite), while the interdentritic region surrounding the cells consists of fcc
RA [10]. In accordance with the work of Geenen, Großwendt et al. proved the presence of
fcc RA seams surrounding bcc cells for the considered steel after PBF-LB/M-processing in
a previous study by EBSD investigations [38].
The formation of this cellular or equiaxial dendritic structure of bcc martensite and
fcc RA is associated with segregations of the alloying elements on the sub-microscale dur-
ing the rapid solidification in the PBF-LB/M-process. To illustrate the solidification path
and the chemical compositions of the formed phases, a Scheil–Gulliver simulation was
carried out. Therein, back diffusions of alloying elements in already-solidified phases
were restricted to resemble the rapid cooling rate. It is assumed, that the primary crystal-
lization of δ-ferrite is not suppressed by the rapid cooling rates present in the PBF-LB/M
process for the investigated tool steel [7]. Although it has to be mentioned, that Chou et
al. suggested a shift to a primary crystallization of fcc austenite for an H13 hot work tool
steel based on calculations of austenite and ferrite dendrite tip temperatures at rapid cool-
ing rates [39]. The performed Scheil–Gulliver solidification simulation is shown in Figure
13, wherein the formed phases are plotted against the temperature. Four characteristic
points are drawn in the simulations, which mark the beginning (a) and end (b) of ferritic
solidification and the beginning (c) and end (d) of the austenitic solidification, where no
carbide formation of M6C and M7C3 type takes place. At these characteristic points, the
chemical compositions of the ferritic and austenitic phases were calculated and the results
are listed in Table 5. The chemical composition was also calculated in the liquid phase to
describe the accumulation of alloying elements in the residual melt. The calculated chem-
ical composition in the residual melt for the marked point “liquid 1” in Figure 13 corre-
sponds to the phase transition from δ-ferrite to austenite at 1381 °C. The calculation point
“liquid 2” corresponds to the chemical composition in the residual melt at a temperature
of 1274 °C, before the eutectic formation of the carbides of type M6C and M7C3 takes place.
Table 5. Chemical composition in mass% at characteristic solidification intervals, marked in Figure
13.
T in °C C Cr Mo W Ti V Si Mn Ni Ms in °C RA in
vol.%
a 1461 0.04 9.64 2.45 1.53 0.02 0.18 0.58 0.42 1.42 349.16 3.80
b 1381 0.09 9.77 2.77 1.85 0.03 0.25 0.82 0.61 1.91 309.59 5.60
liquid 1 1381 1.03 10.77 4.13 2.97 0.26 0.47 0.79 0.89 2.26 - -
c 1380 0.31 9.14 2.07 1.34 0.06 0.19 0.74 0.69 2.32 219.71 13.7
d 1274 0.54 10.72 3.53 2.46 0.04 0.27 1.04 0.96 2.51 80.78 55.0
liquid 2 1274 1.42 11.81 5.50 4.05 0.44 0.64 0.79 0.97 2.14 - -
nominal - 0.36 10.00 3.00 2.00 0.20 0.30 0.80 0.60 1.80 193.12 17.90

Materials 2022, 15, 2658 17 of 24
Figure 13. (a) Scheil–Gulliver simulation to describe the solidification sequence of the hot work tool
steel considered here; points represent calculation locations for determining the local chemical com-
position. (b) Schematic representation of the equiaxial dendritic cellular structure consisting of mar-
tensite cells surrounded by RA.
According to the Scheil–Gulliver simulation, primary δ-ferrite is formed when the
temperature falls below the liquidus temperature of TLIQ = 1461 °C. The primarily formed
δ-ferrite possesses a low C content at point a, as shown in Table 5. The other alloying
elements, in particular Mo and W, are also lower in the primarily formed δ-ferrite at point
a compared to the nominal composition of the steel under consideration. With increasing
solidification of δ-ferrite (from point a to point b), the residual melt accumulates prefer-
entially with the elements Cr, Mo, W, and Ni (compare Table 5, point liquid 1). When the
temperature falls below 1381 °C, the δ-ferrite, which is primarily formed, is transformed
into austenite. Subsequently, only the austenite phase solidifies, which has a higher C con-
tent of 0.41 mass% at 1380 °C (see Table 5, point c) compared to the ferrite formed previ-
ously. In the further course of solidification, austenite solidifies increasingly and the re-
sidual melt is further enriched in the elements Mo, Cr, W, V, Ti, and C. If the temperature
falls below 1274 °C, the residual melt has a C content of 1.42 mass% and enriched V- (0.64
mass%) and Ti concentrations (0.44 mass%) which promote the formation of MC carbides
(see point liquid 2). Further solidification is characterized by the formation of austenite
and V- and Ti-rich MC, until the eutectic concentrations to form Mo- and W-rich M6C at
1274 °C and Cr-rich M7C3 at 1240 °C are reached. Carbides preferably form in the triple
points of the cellular structure as marked in Figure 13b which depicts the spatial distribu-
tion of the calculated chemical compositions (points a–d) of the phases in a cross-section
of the equiaxial dendritic microstructure.
After complete solidification of the melt, the material cools down, considering the
respective process parameters (laser power, exposure strategy), the sample size (2D/3D
heat dissipation), and the material properties (thermal conductivity, heat capacity).
Thereby the previously formed δ-ferrite is transformed into austenite before the local for-
mation of martensite takes place if the material reaches a temperature below the local MS
temperatures [7]. The local MS temperatures in relation to the local chemical compositions
are approximated using the empirical approach of Andrews (EQU1). Accordingly, the
formation of the martensite phase starts in the centers of the cell nuclei, as illustrated sche-
matically in Figure 13b. This area solidified first and is rich in Fe but depleted of alloying
elements and therefore exhibits the highest local MS temperature of 309 to 349 °C (see
points a and b in Table 5). In contrast, the later crystallized intercellular region possesses
higher contents of the alloying elements C, Mn, and Ni, which are associated with a strong
local reduction in the MS temperature into the range from 81 °C to 220 °C (see points c and
d in Table 5). Here it must be taken into account that the martensite formation begins
below the MS temperature and is fully completed when the temperature falls below the
martensite finish (Mf) temperature. With these high alloy contents in the intercellular area,

Materials 2022, 15, 2658 18 of 24
the Mf temperature is below RT, so that unconverted austenite (RA) remains stable in the
microstructure. The amount of RA, depending on the chemical composition of the points
a, b c, and d, was roughly approximated with the Koistinen and Marburger approach
(Equation (2)) [40].
𝑓 = 𝑒𝑥𝑝−1[1.1∙10−2∙(𝑀𝑆−𝑇𝑈)] (2)
The calculated amount of RA is listed in Table 5. The volume fraction of RA increases
by decreasing the MS temperature from approximately 3.8–5.6 vol.% (points a and b = cell
nucleus) to 17.6–55.0 vol.% (points c and d = intercellular area). The observed cellular
structure can be understood via the formation of the RA depending on the local chemical
composition (segregations) and the associated MS and Mf temperatures. However, mar-
tensite transformation not only depends on the chemical driving force but also on local
stresses, grain size, and other factors. Additionally, it must also be considered that heat is
again inserted into previously solidified and cooled material due to the layer-wise depo-
sition of material, which results in a further austenitizing of areas which were previously
transformed into martensite. A heat insertion below the local Ac1 or Ac3 temperature can
cause recovery, recrystallization, the formation of secondary carbides, and partitioning
effects [41,42].
As a result of the described solidification sequence and solid-state transformations, a
microstructure consisting of martensitic cells surrounded by RA in which carbides are
located is formed. The overall RA content was determined using the X-ray diffraction on
the PBF-LB/M-produced samples of H-PRE to 21.74 vol.% (see Table 6). This experimental
RA volume content is higher than the calculated RA content in Table 5 using the approach
of Koistinen and Marburger. The differences can be attributed to the inadequate descrip-
tion of the effect of the elements W, Si, V, and Ti, which are not included in the empirical
approach for calculating the MS temperature according to Andrews’ approach, which is
used for the calculation of the RA content by Koistinen and Marburger.
Table 6. Experimentally measured residual stresses inside bcc martensite and retained austenite
content for H-PRE and H-MIX.
RA in Vol.% Compressive Residual Stress in MPa
H-PRE 21.74 ± 1.15 −142.00 ± 82.52
H-MIX 27.24 ± 2.00 −113.33 ± 57.38
The low MS temperature and the associated RA content are the reason why this car-
bon martensitic hot work steel can be processed by PBF-LB/M without cold cracking and
strong distortion. An explanation is provided by the schematic drawing in Figure 14,
which shows the residual stress development of two carbon martensitic steels (differing
in MS temperature) during cooling from the process heat. The solid curve corresponds to
a common hot work steel such as X40CrMoV5-1, which exhibits an MS temperature in the
range from 250 to 350 °C [7]. With such a steel, residual tensile stresses initially develop
as a result of the thermal dilatation during the rapid cooling of the before-formed austen-
ite phase. The formation of thermal residual stresses is more pronounced, the higher the
modulus of elasticity, the temperature difference, and the linear thermal expansion coef-
ficient are, and the less time the material has to reduce these thermal tensile stresses, which
are formed due to plastic flow during cooling. When the MS temperature is reached, mar-
tensite formation begins. Due to the lattice conversion from fcc (packing density 74%) to
tetragonally distorted bcc (packing density close to 68%), the material expands, which
counteracts the tensile residual stresses previously formed during cooling. This amount
of stress released by the formation of martensite represents the so-called transformation-
induced plasticity, as occurs in TRIP steels [42]. With further cooling, the martensite vol-
ume content increases steadily and thermal residual stresses develop again. Because of

Materials 2022, 15, 2658 19 of 24
the high strength of the martensite, these residual stresses, which have formed again, can-
not be reduced by the plastic flow of the martensitic microstructural areas. The stress re-
duction is therefore limited to the softer RA, which fails by cracking if the stresses are
exceed its lower strength. In the LTT concept considered here, the MS temperature is re-
duced in such a way that the maximum effect of the transformation-induced plasticity can
be exploited (compare the hatched line in Figure 14). Because no further thermal residual
tensile stresses develop if the MS temperature is set low enough, cold cracking or distor-
tion is avoided. As shown in Table 6, in the hot work tool steel considered here, residual
compressive stresses of −142 ± 83 MPa could be measured at RT using the cos-α method,
which underlines the justification presented above.
Figure 14. (a) Schematic description of the residual stress development in PBF-LB/M-fabrication of
carbon martensitic steels; (b) microstructure of the sample H-MIX with small cold crack formation.
So far, the solidification sequence and the associated microstructure that forms dur-
ing PBF-LB/M-fabrication of the considered hot work tool steel have been discussed based
on the H-PRE samples that were produced from a pre-alloyed gas-atomized feedstock.
The microstructure of the H-MIX samples is shown in Figures 14b and 15. Like H-PRE, H-
MIX exhibits a hierarchical microstructure consisting of melt tracks on the mesoscale and
a cellular microstructure on the microscale. However, in contrast to the microstructure of
H-PRE, the micrograph of H-MIX (Figure 15) reveals a bright irregularly shaped phase,
which turns out to be W-rich (85 mass% W) by EDS measurements.
Figure 15. Qualitative studies on the distribution of selected chemical elements in the H-MIX sample
using EDS mappings on the left side. Right side shows the area in back scatter electrons (BSE) con-
trast.

Materials 2022, 15, 2658 20 of 24
Analogous to the element W, EDS mappings in Figure 15 also illustrate the segrega-
tion of the other main alloying elements Mo, Ni, and Cr. The strong segregations observed
can be attributed to the high-melting ferroalloy particles FeW and FeMo as well as to the
pure Cr used for mixing the H-MIX feedstock. These materials possess high liquidus or
melting temperatures in the range of 1895–2719 °C (see Table 2). It can be deduced that on
one hand, the volumetric energy introduced into the powder bed during the PBF-LB/M-
process was sufficient to create a dense microstructure. On the other hand, the applied
energy input was inadequate to achieve complete intermixing of the individual alloying
elements in the melt pool. Contrary to pure Cr, the usage of pure Ni in the H-MIX feed-
stock results in less pronounced segregations, which can be linked to the lower melting
temperature of Ni of 1455 °C compared to Cr (1907 °C). Therefore, to avoid the observed
chemical inhomogeneities caused by insufficiently molten particles, the use of lower melt-
ing raw materials can be considered. Moreover, adapted exposure parameters (e.g., higher
energy density, multiple exposures) or the use of a laser beam with a larger focus diameter
can be considered [43]. Thereby, appropriate melt convection by a sufficient large melt
pool for enough time could be achieved [44]. At the same time, finer raw material particles
can be used, so that there is a better distribution of the elements in the applied powder
bed before exposure. If smaller particles are used, the increased laser absorption of those
particle fractions that were investigated in this study could also be utilized to further sup-
port the dissolution of higher melting raw materials (compare Section 3.2). Finally, the
chemical homogenization could also be increased by a subsequent heat treatment [27].
These measures for increasing the chemical homogeneity of the additively manufactured
hot work tool steel will be investigated in future works.
In addition to the undissolved raw material particles, increased numbers of fine car-
bides can be observed near the unmolten FeW and FeMo particles, as shown in Figure 16.
These carbides have a size of a few nm and therefore cannot be analyzed with the analytics
installed on the SEM used. In addition to the more inhomogeneous element distribution,
a higher RA content of 27 vol.% could be measured in the sample H-MIX compared to the
sample H-PRE using X-ray diffraction. According to the previous explanations regarding
the stress evolution in LTT steels during the cooling period from the process heat (see
Figure 14), this high RA-content is associated with the development of residual compres-
sive stresses because of the martensite formed at lower temperatures and the related trans-
formation-induced plasticity (TRIP) effect. However, because less austenite transforms to
martensite, this TRIP effect is less pronounced, which is associated with the formation of
lower residual compressive stresses (compare Table 6) [42]. Despite the high RA content,
local crack formation can be observed in the microstructure of the H-MIX sample (Figure
14b). The cracks propagate in the RA next to areas where increased martensite formation
took place. This locally increased martensite formation is also attributed to the inhomoge-
neous distribution of the chemical elements associated with the occurrence of incom-
pletely dissolved raw material particles, so that a locally increased chemical driving force
for martensite formation due to higher MS temperatures was present. However, the cracks
described above are limited to small sample volumes and do not propagate across several
melt tracks. The reason for this behavior is the macroscopic compressive stress state of the
sample, which counteracts crack growth.

Materials 2022, 15, 2658 21 of 24
Figure 16. Microstructure of H-MIX in the surroundings of a W-rich particle.
For a possible explanation for the overall higher RA content in sample H-MIX, the
unmolten ferroalloy particles and pure elements will be considered again. The elements
Cr, Mo, and W are strong carbide formers and form carbides of the types M23C6, M7C3,
M2C, and M6C. However, because the hard-phase-forming elements are heavily segre-
gated due to incomplete melting, only partially molten ferroalloy particles can react with
the C in the liquid to form carbides. It is assumed that a thin carbide seam is formed
around the individual ferroalloy particles. Further carbide formation is suppressed be-
cause of the reduced diffusion rate of C in these carbide seams. As a consequence, a
stronger enrichment of the residual melt by C of the sample H-MIX during solidification
can be assumed. This is accompanied by a higher C-content of the primarily crystallized
austenite phase, even if the overall C-content measured in sample H-MIX is lower com-
pared to sample H-PRE (see Table 1). MS temperatures are reduced locally and the
amount of RA is increased because of the enrichment of the residual melt by C during
solidification (see equation 1 and 2 and table 5).To confirm this assumption, the chemical
composition was measured selectively in a chemically homogenous metal matrix area in
the H-MIX PBF-LB/M sample by means of EDS. The results of such an EDS measurement
are listed in Table 7 as representative of a large number of analog measurements. Differ-
ences can be found in a reduced W and Mo content in the non-segregated area of the PBF-
LB/M sample H-MIX compared to the nominal chemical composition. To fully prove this
assumption, the C content in the metal matrix must be measured (e.g., local measurements
by wavelength-dispersive X-ray spectroscopy), which will be performed in subsequent
studies.
Table 7. EDS point analysis to measure the local chemical composition in the H-MIX sample in an
unmolten FeW particle and in the “homogeneous” metal matrix.
Cr Si Mn Ni Mo Ti V W Fe
Unmolten
FeW particles
0.60
± 0.20
0.00
± 0.00
0.17
± 0.09
0.99
± 0.33
0.00
± 0.00
0.14
± 0.14
0.07
± 0.07
85.30
± 0.74
7.84
± 0.73
Matrix 11.4
± 0.36
0.98
± 0.10
0.48
± 0.11
1.97
± 0.22
1.94
± 0.39
0.03
± 0.04
0.42
± 0.05
0.61
± 0.05
80.48
± 0.19
Nominal 10.00 0.70 0.60 1.80 3.00 0.15 0.30 2.00 Bal.

Materials 2022, 15, 2658 22 of 24
4. Conclusions
In this work, the processing of a carbon martensitic hot work tool steel using PBF-
LB/M was fundamentally examined. The alloy concept considered is based on the LTT
alloy approach. In this alloying concept, the MS temperature and thus the martensite for-
mation is influenced in such a way that samples with low warpage and residual stress can
be produced. Samples were produced on the one hand with pre-alloyed gas-atomized
powder and on the other hand from a low-cost powder mixture, where the alloying ele-
ments are added to a gas-atomized pure iron powder as mechanically broken ferroalloy
and elemental particles. This work focused on the reflectance of the laser radiation of the
different powders and the microstructure formation in the PBF-LB/M-fabrication. The fol-
lowing key statements can be drawn from the gained knowledge.
• Admixing of gas-atomized spherical Fe powder with aspherical elemental and fer-
roalloy particles is suitable for the PBF-LB/M-fabrication of highly dense parts.
• PBF-LB/M-samples made of the powder mixture tend to have higher relative densi-
ties at higher applied volumetric energy densities than samples made of the gas-at-
omized pre-alloyed feedstock.
• The powder mixture has a lower CBD, poorer flow properties and lower permeabil-
ity than the gas-atomized pre-alloyed reference material. Nevertheless, the fact that
samples with a high relative density of 99.961% could be manufactured shows that
the quality of the powder application during the PBF-LB/M-process is still sufficient.
• Mixing gas-atomized Fe powder with aspherical elemental and ferroalloy powders
increases the laser reflectance of the mixture compared to the single reflectance of the
components. Still, the mixed powder has a lower reflectance than the gas-atomized,
pre-alloyed reference material.
• Feedstocks consisting of very fine particles show the lowest reflectance. Fine portions
may remain in larger particle fractions after dry screening and thus reduce the reflec-
tance of those feedstocks.
• Taking the LTT alloy concept into account, hot work tool steels can be achieved which
can be processed by PBF-LB/M without preheating. The MS temperature should be
below 200 °C so that a RA content higher than 20 vol.% is achieved.
• When using the pre-alloyed gas-atomized powder, crack-free, distortion-free, and
low-stress specimens could be manufactured.
• The microstructure possesses a hierarchical built-up. A cellular substructure consist-
ing of martensitic cell nuclei surrounded by austenitic seams can be observed.
• Unmolten particles can be detected in the microstructure which was created from the
powder mixture. The energy introduced into the powder bed was not sufficient to
achieve a homogeneous element distribution by sufficient melt convection before so-
lidification. The chemical inhomogeneities can counteract the LTT alloying concept
and promote cold cracking.
In future work, it shall be investigated how a more homogeneous microstructure can
be achieved in PBF-LB/M processing of the tool steel powder mixture. Different exposure
strategies (e.g., double exposure), varied mixtures, decreased particles sizes, and post pro-
cess heat treatments will be considered.
Author Contributions: N.H.: methodology, data curation, formal analysis, investigation, writing—
original draft, visualization. F.G.: methodology, data curation, formal analysis, investigation, writ-
ing—original draft, visualization. A.S.: formal analysis. R.F.-H.: resources, supervision, writing—
review and editing, project administration. A.R.: conceptualization, methodology, data curation,
formal analysis, writing—original draft, supervision, project administration. W.T.: resources, super-
vision, project administration, funding acquisition. S.W.: resources, supervision, writing—review
and editing. J.T.S.: resources, writing—review and editing, supervision, project administration,
funding acquisition. All authors have read and agreed to the published version of the manuscript.
Materials 2022, 15, 2658 23 of 24
Funding: This research was funded by German Research Foundation (DFG) grant numbers
409651875 and 410107213. And The APC was funded by the Open Access Publication Fund of the
Ruhr-Universität Bochum.
Institutional Review Board Statement: Not Applicable.
Informed Consent Statement: Not Applicable.
Data Availability Statement: The data presented in this study are available on request from the
corresponding author.
Acknowledgments: The authors would like to thank the German Research Foundation (DFG) for
funding of the projects 409651875 and 410107213 within the priority program (SPP) 2122 “Materials
for Additive Manufacturing (MATframe)”. We acknowledge support by the Open Access Publica-
tion Fund of the Ruhr-Universität Bochum.
Conflicts of Interest: The authors declare no conflict of interest.
References
1. Klocke, F.; Arntz, K.; Teli, M.; Winands, K.; Wegener, M.; Oliari, S. State-of-the-art Laser Additive Manufacturing for Hot-work
Tool Steels. Procedia CIRP 2017, 63, 58–63. https://doi.org/10.1016/j.procir.2017.03.073.
2. Atzeni, E.; Salmi, A. Economics of additive manufacturing for end-usable metal parts. Int. J. Adv. Manuf. Technol. 2012, 62, 1147–
1155. https://doi.org/10.1007/s00170-011-3878-1.
3. Åsberg, M.; Fredriksson, G.; Hatami, S.; Fredriksson, W.; Krakhmalev, P.; Influence of post treatment on microstructure,
porosity and mechanical properties of additive manufactured H13 tool steel. Mater. Sci. Eng. A 2019, 742, 584–589.
https://doi.org/10.1016/j.msea.2018.08.046.
4. Mazur, M.; Leary, M.; McMillan, M.; Elambasseril, J.; Brandt, M. SLM additive manufacture of H13 tool steel with conformal
cooling and structural lattices. Rapid Prototyp. J. 2016, 22, 504–518. https://doi.org/10.1108/RPJ-06-2014-0075.
5. Haghdadi, N.; Laleh, M.; Moyle, M.; Primig, S. Additive manufacturing of steels: A review of achievements and challenges. J.
Mater. Sci. 2021, 56, 64–107. https://doi.org/10.1007/s10853-020-05109-0.
6. Deirmina, F.; Peghini, N.; AlMangour, B.; Grzesiak, D.; Pellizzari, M. Heat treatment and properties of a hot work tool steel
fabricated by additive manufacturing. Mater. Sci. Eng. A 2019, 753, 109–121. https://doi.org/10.1016/j.msea.2019.03.027.
7. Krell, J.; Röttger, A.; Geenen, K.; Theisen, W. General investigations on processing tool steel X40CrMoV5-1 with selective laser
melting. J. Mater. Processing Technol. 2018, 255, 679–688. https://doi.org/10.1016/j.jmatprotec.2018.01.012.
8. Mertens, R.; Dadbakhsh, S.; van Humbeeck, J.; Kruth, J.-P. Application of base plate preheating during selective laser melting.
Procedia CIRP 2018, 74, 5–11. https://doi.org/10.1016/j.procir.2018.08.002.
9. Cheruvathur, S.; Lass, E.A.; Campbell, C.E. Additive Manufacturing of 17-4 PH Stainless Steel: Post-processing Heat Treatment
to Achieve Uniform Reproducible Microstructure. JOM 2016, 68, 930–942. https://doi.org/10.1007/s11837-015-1754-4.
10. Geenen, K.; Röttger, A.; Feld, F.; Theisen, W. Microstructure, mechanical, and tribological properties of M3:2 high-speed steel
processed by selective laser melting, hot-isostatic pressing, and casting. Addit. Manuf. 2019, 28, 585–599.
https://doi.org/10.1016/j.addma.2019.05.028.
11. Kučerová, L.; Zetková, I.; Jandová, A.; Bystrianský, M. Microstructural characterisation and in-situ straining of additive-
manufactured X3NiCoMoTi 18-9-5 maraging steel. Mater. Sci. Eng. A 2019, 750, 70–80. https://doi.org/10.1016/j.msea.2019.02.041.
12. Moyer, J.M.; Ansell, G.S. The volume expansion accompanying the martensite transformation in iron-carbon alloys. Metall.
Trans. A 1975, 6, 1785–1791. https://doi.org/10.1007/BF02642308.
13. Zenitani, S.; Hayakawa, N.; Yamamoto, J.; Hiraoka, K.; Morikage, Y.; Kubo, T.; Yasuda, K.; Amano, K. Development of new low
transformation temperature welding consumable to prevent cold cracking in high strength steel welds. Sci. Technol. Weld. Join.
2007, 12, 516–522. https://doi.org/10.1179/174329307X213675.
14. Murata, H.; Kato, N.; Tamura, H. Effect of Transformation on Residual Stress in Welding. Stress Releasement by Transformation
Superplasticity (Part 5). Q. J. Jpn. Weld. Soc. 1993, 11, 545–550. https://doi.org/10.2207/qjjws.11.545.
15. Wang, W.; Huo, L.; Zhang, Y.; Wang, D.; Jing, H. New Developed Welding Electrode for Improving the Fatigue Strength of
Welded Joints. J. Mater. Sci. Technol. 2002, 18, 527–531.
16. Eckerlid, J.; Nilsson, T.; Karlsson, L. Fatigue properties of longitudinal attachments welded using low transformation
temperature filler. Sci. Technol. Weld. Join. 2003, 8, 353–359. https://doi.org/10.1179/136217103225005525.
17. Attar, H.; Prashanth, K.G.; Zhang, L.-C.; Calin, M.; Okulov, I.V.; Scudino, S.; Yang, C.; Eckert, J. Effect of Powder Particle Shape
on the Properties of In Situ Ti–TiB Composite Materials Produced by Selective Laser Melting. J. Mater. Sci. Technol. 2015, 31,
1001–1005. https://doi.org/10.1016/j.jmst.2015.08.007.
18. Spierings, A.B.; Herres, N.; Levy, G. Influence of the particle size distribution on surface quality and mechanical properties in
AM steel parts. Rapid Prototyp. J. 2011, 17, 195–202. https://doi.org/10.1108/13552541111124770.
19. Brika, S.E.; Letenneur, M.; Dion, C.A.; Brailovski, V. Influence of particle morphology and size distribution on the powder
flowability and laser powder bed fusion manufacturability of Ti-6Al-4V alloy. Addit. Manuf. 2020, 31, 100929.
https://doi.org/10.1016/j.addma.2019.100929.
Materials 2022, 15, 2658 24 of 24
20. Zou, R.P.; Yu, A.B. Evaluation of the packing characteristics of mono-sized non-spherical particles. Powder Technol. 1996, 88, 71–
79. https://doi.org/10.1016/0032-5910(96)03106-3.
21. Manfredi, D.; Calignano, F.; Krishnan, M.; Canali, R.; Ambrosio, E.P.; Atzeni, E. From Powders to Dense Metal Parts:
Characterization of a Commercial AlSiMg Alloy Processed through Direct Metal Laser Sintering. Materials 2013, 6, 856–869.
https://doi.org/10.3390/ma6030856.
22. Boley, C.D.; Khairallah, S.A.; Rubenchik, A.M. Calculation of laser absorption by metal powders in additive manufacturing,
Appl. Opt. 2015, 54, 2477–2482. https://doi.org/10.1364/AO.54.002477.
23. Zhang, J.; Gu, D.; Yang, Y.; Zhang, H.; Chen, H.; Dai, D.; Lin, K.; Influence of Particle Size on Laser Absorption and Scanning
Track Formation Mechanisms of Pure Tungsten Powder During Selective Laser Melting. Engineering 2019, 5, 736–745.
https://doi.org/10.1016/j.eng.2019.07.003.
24. Gusarov, A.V.; Kruth, J.-P. Modelling of radiation transfer in metallic powders at laser treatment. Int. J. Heat Mass Transf. 2005,
48, 3423–3434. https://doi.org/10.1016/j.ijheatmasstransfer.2005.01.044.
25. Yang, Y.; Gu, D.; Dai, D.; Ma, C. Laser energy absorption behavior of powder particles using ray tracing method during selective
laser melting additive manufacturing of aluminum alloy. Mater. Des. 2018, 143, 12–19.
https://doi.org/10.1016/j.matdes.2018.01.043.
26. Schwendner, K.I.; Banerjee, R.; Collins, P.C.; Brice, C.A.; Fraser, H.L. Direct laser deposition of alloys from elemental powder
blends. Scr. Mater. 2001, 45, 1123–1129. https://doi.org/10.1016/S1359-6462(01)01107-1.
27. Roberts, C.E.; Bourell, D.; Watt, T.; Cohen, J. A Novel Processing Approach for Additive Manufacturing of Commercial
Aluminum Alloys. Phys. Procedia 2016, 83, 909–917. https://doi.org/10.1016/j.phpro.2016.08.095.
28. Taruttis, A.; Hardes, C.; Röttger, A.; Uhlenwinkel, V.; Chehreh, A.B.; Theisen, W.; Walther, F.; Zoch, H.W. Laser additive
manufacturing of hot work tool steel by means of a starting powder containing partly spherical pure elements and ferroalloys.
Procedia CIRP 2020, 94, 46–51. https://doi.org/10.1016/j.procir.2020.09.010.
29. Andrews, K.W. Empirical formulae for the calculation of some transformation temperatures. J. Iron Steel Inst. 1965, 203, 721.
30. Barbier, D. Extension of the Martensite Transformation Temperature Relation to Larger Alloying Elements and Contents. Adv.
Eng. Mater. 2014, 16, 122–127. https://doi.org/10.1002/adem.201300116.
31. Bagheri, G.; Bonadonna, C. Aerodynamics of Volcanic Particles. In Volcanic Ash; Elsevier: Amsterdam, The Netherlands, 2016;
pp. 39–52.
32. Geenen, K.; Röttger, A.; Theisen, W. Corrosion behavior of 316L austenitic steel processed by selective laser melting, hot-
isostatic pressing, and casting. Mater. Corros. 2017, 68, 764–775. https://doi.org/10.1002/maco.201609210.
33. Parteli, E.J.; Pöschel, T. Particle-based simulation of powder application in additive manufacturing. Powder Technol. 2016, 288,
96–102. https://doi.org/10.1016/j.powtec.2015.10.035.
34. Mussatto, A.; Groarke, R.; A-Hameed, A.; Ahad, I.U.; Vijayaraghavan, R.K.; O'Neill, A.; McNally, P.; Delaure, Y.; Brabazon, D.
Evaluation via powder metallurgy of nano-reinforced iron powders developed for selective laser melting applications. Mater.
Des. 2019, 182, 108046. https://doi.org/10.1016/j.matdes.2019.108046.
35. Leturia, M.; Benali, M.; Lagarde, S.; Ronga, I.; Saleh, K. Characterization of flow properties of cohesive powders: A comparative
study of traditional and new testing methods. Powder Technol. 2014, 253, 406–423. https://doi.org/10.1016/j.powtec.2013.11.045.
36. Liravi, F.; Vlasea, M. Powder bed binder jetting additive manufacturing of silicone structures. Addit. Manuf. 2018, 21, 112–124.
https://doi.org/10.1016/j.addma.2018.02.017.
37. Geenen, K. Werkstofftechnische Charakterisierung Austenitischer und Martensitischer Stähle nach dem Selektiven
Laserschmelzen: Bildung der Mikrostruktur und Eigenschaften. Doctoral dissertation, Ruhr-Universität Bochum, Bochum,
Germany 2018.
38. Großwendt, F.; Röttger, A.; Strauch, A.; Chehreh, A.; Uhlenwinkel, V.; Fechte-Heinen, R.; Walther, F.; Weber, S.; Theisen, W.
Additive manufacturing of a carbon-martensitic hot-work tool steel using a powder mixture—Microstructure, post-processing,
mechanical properties. Mater. Sci. Eng. A 2021, 827, 142038. https://doi.org/10.1016/j.msea.2021.142038.
39. Chou, C.-Y.; Pettersson, N.H.; Durga, A.; Zhang, F.; Oikonomou, C.; Borgenstam, A.; Odqvist, J.; Lindwall, G. Influence of
solidification structure on austenite to martensite transformation in additively manufactured hot-work tool steels. Acta Mater.
2021, 215, 117044. https://doi.org/10.1016/j.actamat.2021.117044.
40. Koistinen, D.P.; Marburger, R.E. A general equation prescribing the extent of the austenite-martensite transformation in pure
iron-carbon alloys and plain carbon steels. Acta Metall. 1959, 7, 59–60. https://doi.org/10.1016/0001-6160(59)90170-1.
41. Gualco, A.; Svoboda, H.G.; Surian, E.S.; Vedia, L.A.d. Effect of welding procedure on wear behaviour of a modified martensitic
tool steel hardfacing deposit. Mater. Des. 2010, 31, 4165–4173. https://doi.org/10.1016/j.matdes.2010.04.026.
42. Bleck, W.; Guo, X.; Ma, Y. The TRIP Effect and Its Application in Cold Formable Sheet Steels. Steel Res. Int. 2017, 88, 1700218.
https://doi.org/10.1002/srin.201700218.
43. Huber, F.; Rasch, M.; Schmidt, M. Laser Powder Bed Fusion (PBF-LB/M) Process Strategies for In-Situ Alloy Formation with
High-Melting Elements. Metals 2021, 11, 336. https://doi.org/10.3390/met11020336.
44. Aota, L.S.; Bajaj, P.; Sandim, H.R.Z.; Jägle, E.A. Laser Powder-Bed Fusion as an Alloy Development Tool: Parameter Selection
for In-Situ Alloying Using Elemental Powders. Materials 2020, 13, 3922. https://doi.org/10.3390/ma13183922.