Process Mining Based on Clustering: A Quest for Precision
13
Process Mining Based on Clustering: A Quest for Precision Ana Karla Alves de Medeiros 1 , Antonella Guzzo 2 , Gianluigi Greco 2 , Wil M.P. van der Aalst 1 , A.J.M.M. Weijters 1 , Boudewijn F. van Dongen 1 , and Domenico Sacc`a 2 1 Eindhoven University of Technology, P.O. Box 513, 5600MB, Eindhoven, The Netherlands {a.k.medeiros, w.m.p.v.d.aalst, a.j.m.m.weijters, b.f.v.dongen}@tue.nl 2 University of Calabria, Via Bucci 41C, 187036 Rende (CS), Italy [email protected], [email protected], [email protected] Abstract. Process mining techniques attempt to extract non-trivial and useful information from event logs recorded by information systems. For example, there are many process mining techniques to automatically dis- cover a process model based on some event log. Most of these algorithms perform well on structured processes with little disturbances. However, in reality it is difficult to determine the scope of a process and typically there are all kinds of disturbances. As a result, process mining tech- niques produce spaghetti-like models that are difficult to read and that attempt to merge unrelated cases. To address these problems, we use an approach where the event log is clustered iteratively such that each of the resulting clusters corresponds to a coherent set of cases that can be adequately represented by a process model. The approach allows for different clustering and process discovery algorithms. In this paper, we provide a particular clustering algorithm that avoids over-generalization and a process discovery algorithm that is much more robust than the algorithms described in literature [1]. The whole approach has been im- plemented in ProM. Keywords: Process Discovery, Process Mining, Workflow Mining, Dis- junctive Workflow Schema, ProM Framework. 1 Introduction The basic idea of process mining is to discover, monitor and improve real pro- cesses (i.e., not assumed processes) by extracting knowledge from event logs [1]. Today many of the tasks occurring in processes are either supported or monitored by information systems (e.g., ERP, WFM, CRM, SCM, and PDM systems). However, process mining is not limited to information systems and can also be used to monitor other operational processes or systems (e.g., web services, care flows in hospitals, and complex devices like wafer scanners, com- plex X-ray machines, high-end copiers, etc.). All of these applications have in A. ter Hofstede, B. Benatallah, and H.-Y. Paik (Eds.): BPM 2007 Workshops, LNCS 4928, pp. 17–29, 2008. c Springer-Verlag Berlin Heidelberg 2008
-
Upload
independent -
Category
Documents
-
view
4 -
download
0
Transcript of Process Mining Based on Clustering: A Quest for Precision

Process Mining Based on Clustering:A Quest for Precision
Ana Karla Alves de Medeiros1, Antonella Guzzo2, Gianluigi Greco2,Wil M.P. van der Aalst1, A.J.M.M. Weijters1,
Boudewijn F. van Dongen1, and Domenico Sacca2
1 Eindhoven University of Technology, P.O. Box 513, 5600MB, Eindhoven,The Netherlands
{a.k.medeiros, w.m.p.v.d.aalst,a.j.m.m.weijters, b.f.v.dongen}@tue.nl
2 University of Calabria, Via Bucci 41C, 187036 Rende (CS), [email protected], [email protected], [email protected]
Abstract. Process mining techniques attempt to extract non-trivial anduseful information from event logs recorded by information systems. Forexample, there are many process mining techniques to automatically dis-cover a process model based on some event log. Most of these algorithmsperform well on structured processes with little disturbances. However,in reality it is difficult to determine the scope of a process and typicallythere are all kinds of disturbances. As a result, process mining tech-niques produce spaghetti-like models that are difficult to read and thatattempt to merge unrelated cases. To address these problems, we usean approach where the event log is clustered iteratively such that eachof the resulting clusters corresponds to a coherent set of cases that canbe adequately represented by a process model. The approach allows fordifferent clustering and process discovery algorithms. In this paper, weprovide a particular clustering algorithm that avoids over-generalizationand a process discovery algorithm that is much more robust than thealgorithms described in literature [1]. The whole approach has been im-plemented in ProM.
Keywords: Process Discovery, Process Mining, Workflow Mining, Dis-junctive Workflow Schema, ProM Framework.
1 Introduction
The basic idea of process mining is to discover, monitor and improve real pro-cesses (i.e., not assumed processes) by extracting knowledge from event logs[1]. Today many of the tasks occurring in processes are either supported ormonitored by information systems (e.g., ERP, WFM, CRM, SCM, and PDMsystems). However, process mining is not limited to information systems andcan also be used to monitor other operational processes or systems (e.g., webservices, care flows in hospitals, and complex devices like wafer scanners, com-plex X-ray machines, high-end copiers, etc.). All of these applications have in
A. ter Hofstede, B. Benatallah, and H.-Y. Paik (Eds.): BPM 2007 Workshops, LNCS 4928, pp. 17–29, 2008.c© Springer-Verlag Berlin Heidelberg 2008

18 A.K. Alves de Medeiros et al.
Table 1. Example of an event log (with 300 process instances) for the process of aone-day conference. Each row refers to process instances that follow a similar patternin terms of tasks being executed. The first row corresponds to 80 process instancesthat all followed the event sequence indicated.
Identifier Process instance Frequency1 Start, Get Ready, Travel by Car, Conference Starts, 80
Give a Talk, Join Guided Tour, Join Dinner, Go Home,Pay for Parking, Travel by Car, End.
2 Start, Get Ready, Travel by Train, Conference Starts, 68Give a Talk, Join Guided Tour, Join Dinner, Go Home,Travel by Train, End.
3 Start, Get Ready, Travel by Car, Conference Starts, 81Join Guided Tour, Join Dinner, Go Home, Pay for Parking,Travel by Car, End.
4 Start, Get Ready, Travel by Train, Conference Starts, 71Join Guided Tour, Join Dinner, Go Home, Travel by Train,End.
common that there is a notion of a process and that the occurrences of tasks arerecorded in so-called event logs. Assuming that we are able to log events, a widerange of process mining techniques comes into reach. The basic idea of processmining is to learn from observed executions of a process and it can be used to (1)discover new models (e.g., constructing a Petri net that is able to reproduce theobserved behavior), (2) check the conformance of a model by checking whetherthe modeled behavior matches the observed behavior, and (3) extend an existingmodel by projecting information extracted from the logs onto some initial model(e.g., show bottlenecks in a process model by analyzing the event log).
In this paper, we focus on process discovery. Concretely, we want to constructa process model (e.g., a Petri net) based on an event log where for each case(i.e., an instance of the process) a sequence of events (say tasks) is recorded.Table 1 shows an aggregate view of such a log. This log will be used as a runningexample and describes the events taking place when people attend a conference.It is a toy example, but it is particularly useful when explaining our approach.Note that in the context of ProM we have analyzed many real-life logs (cf.www.processmining.org). However, the corresponding processes are too diffi-cult to describe when explaining a specific process mining technique. Therefore,we resort to using this simple artificial process as a running example. Each pro-cess instance corresponds to a sequence of events (i.e., task executions). Processinstances having the same sequence are grouped into one row in Table 1. In totalthere are 300 process instances distributed over 4 possible sequences. Note thatall process instances start with task “Start” and end with task “End”. The pro-cess instances referred to by the first two rows contain task “Give a Talk” whilethis event is missing in process instances referred to by the last two rows. Thissuggests that some people give a talk while others do not. Rows 1 and 3 referto two occurrences of task “Travel by Car” and the other two rows (2 and 4)

Process Mining Based on Clustering: A Quest for Precision 19
EndGoHome
JoinDinner
JoinGuidedTour
Give aTalk
ConferenceStarts
GetReady
Start
Travel byTrain
Travel by Car
Pay forParking
Travel by Car
Travel byTrain
Fig. 1. Example of a mined model for the log in Table 1. This model correctly capturesthe right level of abstraction for the behavior in the log.
refer to two occurrences of task “Travel by Train”. This indicates that the peoplethat arrive by car (train) also return by car (train). People that come by car alsoexecute task “Pay for Parking”. Note that Table 1 shows only an aggregate viewof the real log. In fact, real logs typically contain much more information, e.g.,timestamps, transactional information, information on users, data attributes,etc. However, for the purpose of this paper, we can abstract from this informa-tion and focus in the information shown in Table 1.
A possible result of a process discovery mining algorithm for the log in Table 1is depicted in Figure 1. The process is represented in terms of a Petri net [6], i.e.,a bipartite directed graph with two node types: places and transitions. Places(circles) represent states while transitions (rectangles) represent actions (e.g.,tasks). A certain state holds in a system if it is marked (i.e., it contains at leastone token). Tokens flow between states by firing (or executing) the transitions. Atransition is enabled (or may fire) if all of its input places have at least one token.When a transition fires, it removes one token from each of its input places and itadds one tokens to each of its output places. More information about Petri netscan be found in [6]. Figure 1 shows that the process can be started by putting atoken in the source place at the left and firing the two leftmost transitions. Afterthis, there is a choice to fire “Travel by Train” or “Travel by Car”. Firing one ofthese two transitions results in the production of two tokens: one to trigger thenext step (“Conference Starts”) and one to “remember” the choice. Note thatafter task “Go Home” (later in the process) there is another choice, but thischoice is controlled by the earlier choice, e.g., people that come by train returnby train. Also note that after task “Conference Starts” there is a choice to givea talk or to bypass this task. The black transition refers to a “silent step”, i.e.,a task not recorded in the log because it does not correspond to a real activityand has only been added for routing purposes.
The model shown in Figure 1 allows for the execution of all process instancesin the original log (Table 1). Moreover, the model seems to be at the rightlevel of abstraction because it does not allow for more behavior than the onein the log (e.g., it explicitly portrays that attendees have used the same meansof transportation to go to and come back from the conference) and there doesnot seem to be a way to simplify it without destroying the fit between thelog and model. Note that in Figure 1 some of the tasks are duplicated, thereare the transitions labeled “Travel by Train” and “Travel by Car” that occurmultiple times. Most mining techniques do not allow for this. If we apply a

20 A.K. Alves de Medeiros et al.
EndTravel by Car
Pay forParking
GoHome
JoinDinner
JoinGuidedTour
Give aTalk
ConferenceStarts
Travel by Train
GetReady
Start
Fig. 2. Example of another mined model for the log in Table 1. This model is moregeneral than necessary.
mining algorithm that does not support duplicate tasks, the resulting modelcould look like the one in Figure 2. Note that, although this model captures(or can reproduce) the behavior in the log (cf. Table 1), it is more generalthan necessary because: (i) attendees can use different means of transportationto reach and leave the one-day conference, (ii) attendees can skip the wholeconference after traveling by car or by train, and (iii) attendees can return tothe conference after going home (cf. task “Go Home”). So, this model is not aprecise picture of the traces in the log. For such a small log, it is easy to visuallydetect the points of over-generalizations in the model in Figure 2. However, whenmining bigger logs, there is a need for a technique that can automatically identifythese points.
Figures 1 and 2 show that process mining algorithms may produce suitablemodels but also models that are less appropriate. In particular, the more robustalgorithms have a tendency to over-generalize, i.e., construct models that allowfor much more behavior than actually observed. A related problem is that eventlogs typically record information related to different processes. For example,there could be process instances related to the reviewing of papers mixed upwith the instances shown in Table 1. Note that the distinction between processesis sometimes not very clear and in a way arbitrarily chosen. In our example, onecould argue that there are two processes: one for handling people coming bycar and the other one for people coming by train. When processing insuranceclaims, one could argue that there is one process to handle all kinds of insuranceclaims. However, one could also have a separate process for each of the differenttypes of insurance policies (e.g., fire, flooding, theft, health, and car insurance).If one attempts to construct a single model for very different cases, the modelis likely to be too complex and existing mining techniques are unable to copewithout excessive over-generalization. This is the core problem addressed by theapproach presented in this paper.
To address problems related to over-generalization and mixing up differentprocesses in a single model, we propose to use clustering. We do not aim to con-struct one big model that explains everything. Instead we try to cluster similarcases in such a way that for every cluster it is possible to construct a rela-tively simple model that fits well without too much over-generalization. Theidea for such an approach was already mentioned in [4]. However, in this paperwe refine the technique and use a much more powerful process mining tech-nique. Moreover, we report on the implementation of this approach in ProM.
Process Mining Based on Clustering: A Quest for Precision 21
Both the ProM framework and the described plug-ins are publicly available atwww.processmining.org.
The remainder of this paper is organized as follows. Section 2 provides anoverview of the approach in this paper. Section 3 explains our implementationfor this approach and Section 4 describes how to use this implementation todiscover over-generalizations in mined models and common patterns in logs.Section 5 presents related work and Section 6 concludes this paper.
2 Approach
As explained in the introduction, the goal of this paper is to allow for the miningof processes with very diverse cases (i.e., not a homogeneous group of processinstances) while avoiding over-generalization. Consider for example the applica-tion of process mining to care flows in hospitals. If one attempts to construct asingle process model for all patients, the model will be very complex because itis difficult to fit the different kinds of treatments into the same model. The dif-ferent patient groups are ill-defined and share resources and process fragments.For example, what about the patient that was hit by a car after getting a hearthattack? This patient needs both a knee operation and hearth surgery and belongsto a mixture of patient groups. This example shows that it is not easy to definethe boundary of a process and that given the heterogeneity of cases it may beimpossible to find a clean structure. Moreover, process mining techniques that
cluster instances and partition logpartial event log model
qualityOK
L1
partial event log model
qualityNOK
L2
whole event log model
qualityNOK
L
qualityOK
L2.1
qualityOK
L2.3
qualityOK
L2.2
cluster instances and partition log
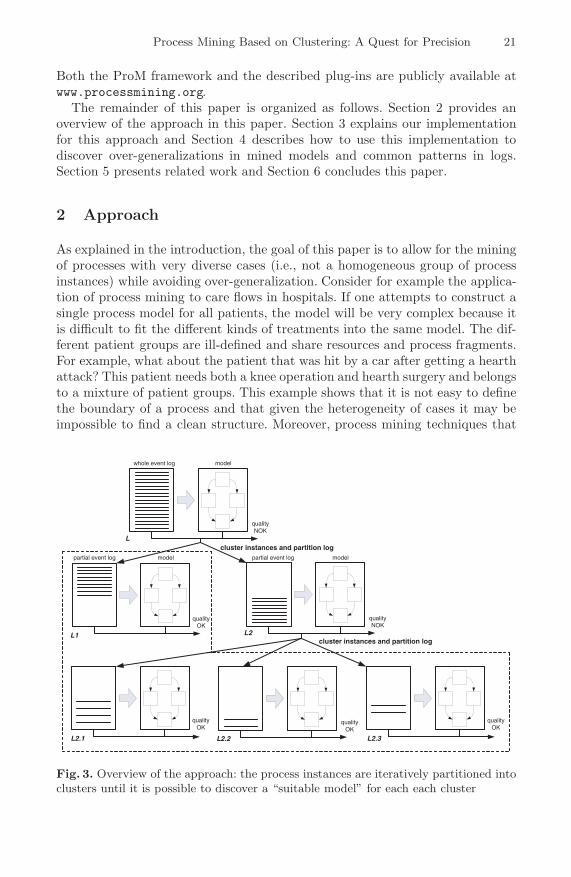
Fig. 3. Overview of the approach: the process instances are iteratively partitioned intoclusters until it is possible to discover a “suitable model” for each each cluster

22 A.K. Alves de Medeiros et al.
are able to deal with less structured processes have a tendency to over-generalize,i.e., the process instances fit into the model but the model allows for much morebehavior than what is actually recorded. To address this we suggest to iterativelysplit the log in clusters until the log is partitioned in clusters that allow for themining of precise models.
Figure 3 shows the basic idea behind this approach. First the whole log isconsidered (denoted by L in Figure 3). Using a discovery algorithm a processmodel is constructed. By comparing the log and the process model, the qualityof the model is measured. If the model has good quality and there is no way toimprove it, the approach stops. However, as long as the model is not optimal thelog is partitioned into clusters with the hope that it may be easier to constructa better process model for each of the clusters. In Figure 3 log L is split into twologs L1 and L2, i.e., each process instance of L appears in either L1 or L2. Thenfor each cluster, the procedure is repeated. In Figure 3, the quality of the modeldiscovered for cluster L1 is good and L1 is not partitioned any further. Thequality of the model discovered for cluster L2 is not OK and improvements arepossible by partitioning L2 into three clusters: L2.1, L2.2, and L2.3. As Figure 3shows it is possible to construct suitable process models for each of these threeclusters and the approach ends.
Note that the approach results in a hierarchy of clusters each represented by apartial log and a process model. This is quite different from conventional processmining approaches that produce a single model. The leaves of the tree presentedin Figure 3 (enclosed by dashed lines) represent clusters that are homogenousenough to construct suitable models.
When applying the approach illustrated by Figure 3, there are basically threedecisions that need to be made: (i) When to further partition a cluster? Theapproach starts with considering the whole log as a single cluster. Then thiscluster is partitioned into smaller clusters which again may be partitioned intoeven smaller clusters, etc. Note that this always ends because eventually allclusters contain only one process instance and cannot be split anymore. However,it is desirable to have as few clusters as possible, so a good stopping criterionis needed. Stopping too late, may result in a proces model for every processinstance. Stopping too early, may result in low quality process models that tryto describe a set of cases that is too heterogeneous;(ii) How to split a cluster intosmaller clusters? There are many ways to split a cluster into smaller clusters.An obvious choice is to cluster process instances that have a similar “profile”when it comes to task executions, e.g., split the log into a cluster where “A”occurs and a cluster where “A” does not occur. It is also possible to use morerefined features to partition process instances. It may also be possible to use dataelements, e.g., in case of hospital data it may be wise to cluster patients basedon the diagnosis. Different approaches known from the data mining field can beused here; (iii) What discovery algorithm to use? To extract a process modelfrom the process instances in the cluster different process mining algorithmscan be used. Some algorithms are very robust but yield models that allow fortoo much behavior. Other algorithms produce models that are unable to replay

Process Mining Based on Clustering: A Quest for Precision 23
the existing log, i.e., there are process instances whose behavior is not allowedaccording to the model.
The approach presented in this paper is inspired by the process mining algo-rithm described in [4]. Here the approach is termed Disjunctive Workflow Schema(DWS) and particular choices are made for the three questions listed above. Forexample, a rather weak algorithm is used for process discovery. The algorithmdescribed in [4] is unable to deal with loops, non-free-choice constructs (e.g., thecontrolled choice in Figure 1 forcing people to take the same means of transporta-tion home), etc. Moreover, the different parts of the approach are tightly coupledin [4]. In our view, it is essential to allow for different techniques to be pluggedinto the approach illustrated by Figure 3. Hence, this paper improves this earlierwork in several directions: (1) the approach is presented independent of a par-ticular algorithm, (2) several improvements have been made (e.g., replacing theprocess mining algorithm), and (3) the whole approach is implemented in ProMusing an architecture that makes it easy to plug-in new clustering algorithms orprocess discovery algorithms.
The remainder of this paper presents a particular choice for each of the threequestions stated before and describes the new plug-ins implemented in ProM.We use the combination of a very robust process mining algorithm (HeuristicsMiner) combined with a clustering approach focusing on over-generalization.
3 Implementation
This section explains how we have answered the questions raised in Section 2and describes the resulting plug-ins that were implemented in ProM.
3.1 When to Further Partition a Cluster?
A cluster should be further partitioned when its mined model allows for morebehavior than what is expressed by the traces in the cluster. So, in our approach,generalizations in the model are captured by selecting features (or structuralpatterns) that, while being in principle executable according to the model, havenever been registered in the log. If such discrepancies can be identified, thenthe model is not an accurate representation for the process underlying the log.Hence, we are given some evidence that the model has to be further specializedinto a set of different, more specific use cases.
To identify the relevant features, we use an A-priori [2] like approach. Theidea is to incrementally generate sequences of tasks by extending a sequence oflength n with another task, and to subsequently check for their frequency inthe log1. A relevant feature is basically a sequence for which this incrementalextension cannot be carried out by guaranteeing that the resulting sequence isas frequent as its two basic constituents. Hence, a relevant feature is a sequence,1 Note that log traces are projected while checking for the frequency of these sequences
in the log. During the projection, only the tasks that are in a sequence are kept inthe log traces.

24 A.K. Alves de Medeiros et al.
say t1, ..., tn, together with a task, say tn+1 such that (cf. Figure 4): (i) t1, ..., tnis frequent, i.e., the fraction of projected log traces in which the sequence occursis greater than a fixed threshold (called sigma); (ii) tn, tn+1 is also frequent withrespect to the same threshold sigma; but,(iii) the whole sequence t1, ..., tn, tn+1is not frequent, i.e., its occurrence is smaller than some threshold gamma.
t1, t2, ..., tn, tn+1
> sigma
> sigma
< gamma
Fig. 4. Feature selection. The subparts (“t1...tn” and “tntn+1”) of the feature shouldoccur more than sigma times in the projected log traces while the whole sequence(“t1...tn+1”) should occur at most gamma times.
3.2 How to Split a Cluster into Smaller Clusters?
We use the k-means method [5] to split a cluster into sub-clusters. k-means is aclustering algorithm based on Euclidian distance in vectorial spaces. It works byfinding central points (or centroids) over which a set of vectors are clustered. Everycluster has a centroid. The parameter k determines the number of centroids (and,therefore, the number of clusters). Consequently, to reuse the k-means clusteringmethod, we have designed an approach for producing a flat representation of thetraces by projecting each of them on the relevant features identified as outlinedin Section 3.1. In particular, only the most relevant m features are considered.The relevance of each feature is measured on the basis of the frequency of its oc-currences in the log (the more frequent, the more relevant). Once features havebeen selected, each trace in the log is processed and associated with a vector ina m-dimensional vectorial space: for each feature, the corresponding entry of thevector is set to a value that is proportional to the fraction of the feature actuallyoccurring in the trace. In the extreme case where the feature does not character-ize the trace, this value is set to 0. When the whole feature matches the trace, thisvalue is set to 1. After the log traces have been projected in the vectorial space,the k-means clustering method takes place.
3.3 What Discovery Algorithm to Use?
We have selected the Heuristics Miner (HM) [9] to use as the mining algorithmin our approach. The HM can deal with noise and can be used to express themain behavior (i.e., not all the details and exceptions) registered in an eventlog. It supports the mining of all common constructs in process models (i.e.,sequence, choice, parallelim, loops, invisible tasks and some kinds of non-free-choice), except for duplicate tasks. Therefore, the HM is a more robust algorithmthan the mining algorithm originally used in [4]. The HM algorithm has twomain steps. In the first step, a dependency graph is built. In the second step, the

Process Mining Based on Clustering: A Quest for Precision 25
semantics of the split/join points in the dependency graph are set. Due to thelack of space, in this paper we do not elaborate in the relation between these twosteps and the threshold values used by the HM. The interested reader is referredto [9].
The next subsection introduces the two plug-ins that were implemented inProM to support the choices explained so far in this section.
3.4 Implemented Plug-Ins
Two ProM plug-ins have been implemented to provide for the mining of precisemodels: DWS Mining and DWS Analysis. The DWS Mining plug-in implementsthe full-cycle of the approach in Figure 3. This plug-in starts with an eventlog and uses the Heuristic Miner (cf. Section 3.3) to mine a model for this log.Afterwards, the plug-in tries to detect relevant features for this model (cf. Sec-tion 3.1). If features are found, the plug-in clusters this log based on k-means (cf.Section 3.2). If further sub-clusters can be identified, a model is again automat-ically mined by the HM for each sub-cluster. This iterative procedure continuesuntil no further clustering is possible. Figure 5 shows a screenshot of applyingthe DWS Mining plug-in to the log in Table 1. As can be seen, the window forspecifying the settings has two parts: one for setting the parameters used by theHM (cf. Figure 5(a)) and another for setting the parameters for the feature se-lection and clustering (cf. Figure 5(b)). The parameters for the HM correspond
(a)
(b)
(c) (d)
(e)
Fig. 5. Screenshot of the DWS mining plug-in

26 A.K. Alves de Medeiros et al.
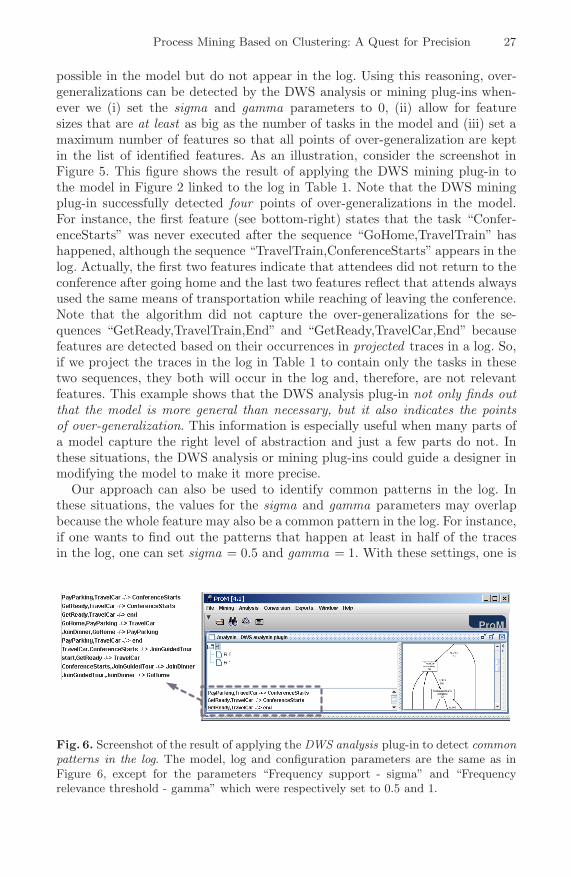
to the thresholds mentioned in Section 3.3. The first three parameters in thepanel in Figure 5(b) are respectively used to determine the sigma, gamma and kthreshold explained in sections 3.1 and 3.2. Note that other three extra parame-ters are provided ( “(Max.) Length of features”, “(Max.) Number of splits” and“(Max.) Number of features”) which allow for determining upper bounds to thealgorithm. The parameter “(Max.) Length of features” sets the length of the se-quences up to which the discovery of the frequent features is carried out. In manypractical situations, this parameter may be set to 2, meaning that one looks forfeatures of the form t1, t2 with a task t3 such that t1, t2, t3 is not frequent. Largervalues for this length may be desirable for models involving many tasks, espe-cially when the paths between the starting task and some final one involve lotsof tasks. The parameter “(Max.) Number of splits” is an upper bound on thetotal number of splits to be performed by the algorithm. The higher its value,the deeper the resulting hierarchy can be. The parameter “(Max.) Number offeatures” defines the dimension of the feature space over which the clusteringalgorithm is applied. Note that “(Max.) Number of features” should be greaterthan k (i.e. parameter “(Max.) Number of clusters per split”). In general, largervalues of “(Max.) Number of features” lead to higher quality in the clusteringresults but it requires more computational time. The window for showing theresults has three panels: the hierarchy of the found clusters (cf. Figure 5(c)), themodel mined for each cluster2 (cf. Figure 5(d)), and the set of relevant features(cf. Figure 5(e)) used to split each cluster. The subcomponents of each featureare separated by the symbol “-/->”. The substrings on the left and right side ofthis symbol respectively correspond to t1...tn and tn+1 in Figure 5. As can beseen at the bottom of this figure, four features have been found for the settingsin this example. These features reflect the generalizations already discussed inSection 1. The results in Figure 5 are discussed in Section 4. The DWS Analysisplug-in is very similar to the DWS mining one. However, it has the advantagethat the approach is decoupled from a specific mining plug-in. The input of theDWS Analysis plug-in is a log and a model. Its output is a set of partitions (orclusters) for this log. No sub-clusters are provided because the user can againchoose which mining plug-ins to use for each of the resulting clusters.
The next section describes how to use the parameters in these two plug-insto detect (i) over-generalizations in mined models and (ii) frequent patterns inthe log.
4 Detecting Over-Generalizations and Common Patterns
A (mined) model is over-general when it can generate behavior that cannotbe derived from the log. In other words, certain sequences (or features) are
2 The model mined by the HM for this example is just like the one in Figure 2.However, instead of Petri nets, the HM uses Heuristics nets as the notation torepresent models. Due to the lack of space and the fact that the two models allowfor the same behavior, we will not provide an explanation about Heuristics nets. Theinterested reader is referred to [9].
Process Mining Based on Clustering: A Quest for Precision 27
possible in the model but do not appear in the log. Using this reasoning, over-generalizations can be detected by the DWS analysis or mining plug-ins when-ever we (i) set the sigma and gamma parameters to 0, (ii) allow for featuresizes that are at least as big as the number of tasks in the model and (iii) set amaximum number of features so that all points of over-generalization are keptin the list of identified features. As an illustration, consider the screenshot inFigure 5. This figure shows the result of applying the DWS mining plug-in tothe model in Figure 2 linked to the log in Table 1. Note that the DWS miningplug-in successfully detected four points of over-generalizations in the model.For instance, the first feature (see bottom-right) states that the task “Confer-enceStarts” was never executed after the sequence “GoHome,TravelTrain” hashappened, although the sequence “TravelTrain,ConferenceStarts” appears in thelog. Actually, the first two features indicate that attendees did not return to theconference after going home and the last two features reflect that attends alwaysused the same means of transportation while reaching of leaving the conference.Note that the algorithm did not capture the over-generalizations for the se-quences “GetReady,TravelTrain,End” and “GetReady,TravelCar,End” becausefeatures are detected based on their occurrences in projected traces in a log. So,if we project the traces in the log in Table 1 to contain only the tasks in thesetwo sequences, they both will occur in the log and, therefore, are not relevantfeatures. This example shows that the DWS analysis plug-in not only finds outthat the model is more general than necessary, but it also indicates the pointsof over-generalization. This information is especially useful when many parts ofa model capture the right level of abstraction and just a few parts do not. Inthese situations, the DWS analysis or mining plug-ins could guide a designer inmodifying the model to make it more precise.
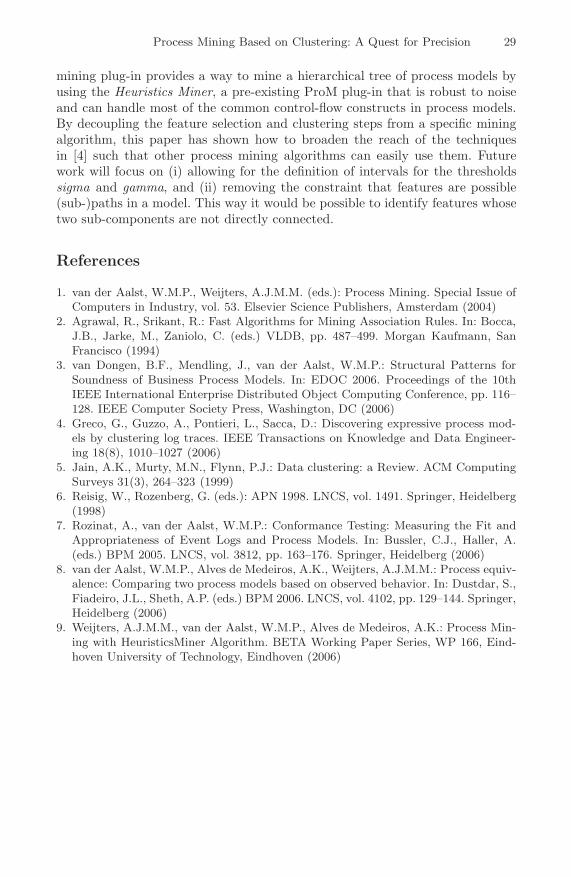
Our approach can also be used to identify common patterns in the log. Inthese situations, the values for the sigma and gamma parameters may overlapbecause the whole feature may also be a common pattern in the log. For instance,if one wants to find out the patterns that happen at least in half of the tracesin the log, one can set sigma = 0.5 and gamma = 1. With these settings, one is
Fig. 6. Screenshot of the result of applying the DWS analysis plug-in to detect commonpatterns in the log. The model, log and configuration parameters are the same as inFigure 6, except for the parameters “Frequency support - sigma” and “Frequencyrelevance threshold - gamma” which were respectively set to 0.5 and 1.

28 A.K. Alves de Medeiros et al.
saying that the subparts of the feature (i.e., “t1...tn” and “tntn+1”) happen inmore than 50% of the traces in the log and its combination (i.e., “t1...tntn+1”)happens in (i) all traces, (ii) some traces or (iii) none of the traces in the log.As an illustration, let us try to find out the most frequent patterns (above50%) in the log in Table 1. The results are in Figure 6. As expected, all thepatterns identified in the list of features returned by the DWS analysis plug-inoccur in process instances 1 and 3 in the log. Together, these process instancescorrespond to 53.6% of the behavior in the log (cf. Table 1). Based on the tenidentified features, the log was partitioned into two clusters: “R.0” contains theprocess instances 1 and 3, and “R.1” has the process instances 2 and 4.
5 Related Work
This section reviews the techniques that that have been used to detect over-general mined models in the process mining domain. Greco et al. [4] have definedthe soundness metric, which receives a model and a log as input and calculatesthe percentage of traces that a model can generate and are not in the log. Sincethe log is assumed to be exhaustive, this metric only works for acyclic models.Rozinat et al. [7] have created two notions of behavioral appropriateness (aB),both based on a model and a log. The simple aB measures the average numberof enabled tasks while replaying a log in a model. The problem with this metricis that it does not take into account which tasks are enabled. The complex aB
calculates the so-called “sometimes” predecessor and successor binary relationsfor tasks in a log and tasks in a model. The problem here is that the relationsare global and binary. So, the approach cannot identify over-generalizations thatinvolve more than two tasks. Alves de Medeiros et al. [8] have defined the behav-ioral precision (BP ) and behavioral recall (BR) metrics, which work by checkinghow much behavior two models have in common with respect to a given log. Al-though the metrics quantify the degree of over-generalization in a mined model,they have the drawback that they require a base model (in addition to the minedmodel and the log). Van Dongen et al. [3] have defined the causal footprint met-ric, which assesses behavior similarity of two models based on their structure.Like the behavioral precision/recall metrics, the problem with the causal foot-print is that a base model is also required. The approach presented in this paperdiffers from the previously discussed ones because it not only detects that amined model is over-general, but it also highlights where the over-general pointsare. Additionally, it only requires a log and a model to run (i.e., no need for abase model).
6 Conclusions and Future Work
This paper has introduced an approach for mining precise models by clusteringa log. The approach has been implemented as two ProM plug-ins: the DWSanalysis and the DWS mining. The DWS analysis plug-in can be used to detectpoints of over-generalization in a model or frequent patterns in a log. The DWS
Process Mining Based on Clustering: A Quest for Precision 29
mining plug-in provides a way to mine a hierarchical tree of process models byusing the Heuristics Miner, a pre-existing ProM plug-in that is robust to noiseand can handle most of the common control-flow constructs in process models.By decoupling the feature selection and clustering steps from a specific miningalgorithm, this paper has shown how to broaden the reach of the techniquesin [4] such that other process mining algorithms can easily use them. Futurework will focus on (i) allowing for the definition of intervals for the thresholdssigma and gamma, and (ii) removing the constraint that features are possible(sub-)paths in a model. This way it would be possible to identify features whosetwo sub-components are not directly connected.
References
1. van der Aalst, W.M.P., Weijters, A.J.M.M. (eds.): Process Mining. Special Issue ofComputers in Industry, vol. 53. Elsevier Science Publishers, Amsterdam (2004)
2. Agrawal, R., Srikant, R.: Fast Algorithms for Mining Association Rules. In: Bocca,J.B., Jarke, M., Zaniolo, C. (eds.) VLDB, pp. 487–499. Morgan Kaufmann, SanFrancisco (1994)
3. van Dongen, B.F., Mendling, J., van der Aalst, W.M.P.: Structural Patterns forSoundness of Business Process Models. In: EDOC 2006. Proceedings of the 10thIEEE International Enterprise Distributed Object Computing Conference, pp. 116–128. IEEE Computer Society Press, Washington, DC (2006)
4. Greco, G., Guzzo, A., Pontieri, L., Sacca, D.: Discovering expressive process mod-els by clustering log traces. IEEE Transactions on Knowledge and Data Engineer-ing 18(8), 1010–1027 (2006)
5. Jain, A.K., Murty, M.N., Flynn, P.J.: Data clustering: a Review. ACM ComputingSurveys 31(3), 264–323 (1999)
6. Reisig, W., Rozenberg, G. (eds.): APN 1998. LNCS, vol. 1491. Springer, Heidelberg(1998)
7. Rozinat, A., van der Aalst, W.M.P.: Conformance Testing: Measuring the Fit andAppropriateness of Event Logs and Process Models. In: Bussler, C.J., Haller, A.(eds.) BPM 2005. LNCS, vol. 3812, pp. 163–176. Springer, Heidelberg (2006)
8. van der Aalst, W.M.P., Alves de Medeiros, A.K., Weijters, A.J.M.M.: Process equiv-alence: Comparing two process models based on observed behavior. In: Dustdar, S.,Fiadeiro, J.L., Sheth, A.P. (eds.) BPM 2006. LNCS, vol. 4102, pp. 129–144. Springer,Heidelberg (2006)
9. Weijters, A.J.M.M., van der Aalst, W.M.P., Alves de Medeiros, A.K.: Process Min-ing with HeuristicsMiner Algorithm. BETA Working Paper Series, WP 166, Eind-hoven University of Technology, Eindhoven (2006)