Process and Product Testing of Three NCAW Core Samples ...
285
PNNL-11098 UC-810 Project Technical Information Comparison of Simulants to Actual Neutralized Current Acid Waste: Process and Product Testing of Three NCAW Core Samples from Tanks 101-AZ and 102-AZ E. V. Morrey J. M. Tingey April 1996 Prepared for the U.S. Department of Energy under Contract DE-AC06-76RLO 1830 Pacific Northwest National Laboratory Richland, Washington 99352
-
Upload
khangminh22 -
Category
Documents
-
view
7 -
download
0
Transcript of Process and Product Testing of Three NCAW Core Samples ...

PNNL-11098 UC-810
Project Technical Information
Comparison of Simulants to Actual Neutralized Current Acid Waste: Process and Product Testing of Three NCAW Core Samples from Tanks 101-AZ and 102-AZ
E. V. Morrey J. M. Tingey
April 1996
Prepared for the U.S. Department of Energy under Contract DE-AC06-76RLO 1830
Pacific Northwest National Laboratory Richland, Washington 99352
\
PNNL-11098 UC-810
Project Technical Information
,
Comparison of Simulants to Actual Neutralized Current Acid Waste: Process and Product Testing off Three NCAW Core Samples from Tanks 101-AZ and 102-AZ
EV Morrey JM Tingey
April 1996
Prepared for the U.S. Department of Energy under Contract DE-AC06-76RLO 1830
Pacific Northwest National Laboratory Richland, Washington 99352
Reprint of historical document PVIPC9Sm.03E. dated September 1995. Data. formaaing. and ocher mnvcntiom re f la standards at thc original dak of printing. Technical p a r review and cdilorii reviews may m have been pufamcd.

DISCLAIMER
This report was prepared as an account of work sponsored by a n agency of the United States Government. Neither the United States Government nor any agency thereof, nor Esnelle Memorial Institute, nor any of their employees, makes any warranty, express or implied, or assurnesany legal liability or responsibility forthe accuracy, completeness, or.usefulness of any information, apparatus, product, or process disclosed, or represents that its use would not infringe privately owned rights. Reference herein to any specific commercial product, process, or service by 'trade name, trzdemark, manufacturer, or othenvise h 2 s not necessarily constitute or imply its endorsement, recommendation, or favoring by the United States Government or any agency thereof, or Banelle Memorial Institute. The views and opinions of authors expressed herein do not necessarily state or reflect those ofthe United States Government or any agency thereof.
'
PACIFIC NORTHWEST NATIONAL LABORATORY operated by BATTELLE
for the UNITED STATES DEPARTMENT OF ENERGY
under Contract DE-AC06-76RLO 7830
Printed in the United States of America
Available to DOE and DOE contractors irom the Oriice o i k i e n t i k and Technicai iniormation, p . 0 . Sox 12, Oi'h KidgL, TS 3X3:;
prices-available from (615) 576-8401.
Available lo the public from the National Technical Information Service, US. Department of Commerce, 5285 Port Royal Rd., Springfield, VA 221 61
@ f i e document was printed on recycled paper.
t

I- Acknowledgements The process and product testing of the core. samples required contributions horn a large group
o1 scientists, engineers, and technicians. Garry Richardson was responsible for processing the waste samples through frit addition and drying; he also performed physical and rheological characterization along each step of the process. Ron Holeman, Jim Dunn, and Dewayne Smith were responsible for
’ calcining and vitrifying the waste/f’rit mixtures. Ron Holeman, Jim Dunn, Dewayne Smith, and Tim Reining performed sample preparation and durability testing of the resulting glasses. Chemical and
’ radiochemical characterizations were provided by Dale Archer, Rebecca Barrington, Simon Barsoum, Jeff Creium, John Ennen, Larry Greenwood, Clark Harvey, Shawn Homi, Vaughn Hoopes, Evan Jenson, Lloyd Kellogg, Anne Kozelisky, Pat h e y , John Rau, Don Rinehart, Danny Sanders, Sally Slate, Monte Smith, Rick Steele, Shannon Thompson, Mike Urie, Jerry Wagner, and Eric Wyse. Assistance with statistical treatment of the data was provided by Greg Piepel and Trish Redgate. Assistance with rheological data reduction was provided by Lynette Jagoda. Technical editing support was provided by Ann Fillion. The authors wish to thank these Pacific Northwest Laboratory staff members and others who contributed to this study.


summary -
A vitrification plant is planned to process the high-level waste (HLW) solids from Hanford Site tanks into canistered glass logs for disposk in a national repository. Programs have been established within the Pacific Northwest Laboratory Vitrification Technology Development (PVTD) Project to test and model simulated waste to support design, feed processibility, operations, permitting, safety, and waste-form qualification. Parallel testing with actual radioactive waste is being performed on a laboratory-scale to confirm the validity of using simulants and. glass property
. models developed from simulants.
Laboratory-scale testing has been completed on three radioactive core samples from tanks 101-AZ and 102-AZ containing neutralized.current ac.id waste (NCAW), which is one of the first waSte types to be.processed in the high-level waste vitrification plant under a privatization scenario. Properties of the radioactive waste measured during process and product testing were compared to simulant properties and model predictions to donfirm 'the validity of simulant and glass property models work. This repoh includes,re&s from the three NCAW core samples, comparable results from slurry and glass simulants, and comparisons to glass property model predictions.
Experimental Approach
'
The three NCAW samples were retrieved from the tanks in cylindrical segments 1 .inchin ' ' diameter and 19 inches long. Several segments representing a complete vertical sample of the settled
solids in the tank were combined and blended to make up a core sample. Solids from each core sample were pretreated using a water wash/settle/decant process, including a ferric-nitrate flocculent additive, settle/decant, and two water washes (3 volunies deionized water to 1 volume solids). The washed solids were then characterized chemically, radiochemically, physically, and rheologically (101-AZ Core 1 only). After adjusting the samples to 125 g waste oxide& the waste was trea'ted with formic acid to adjust the feed rheology and to reduce the redox-sensitive species for introduction into the melter,. Off-gas analysis during formic acid addition was performed on 102-AZ Core 2 and
. is described in a'separate report.") The formated slurry samples were characterized chemically, physically, and rheologically. Frit was added to each of the foryted s h i e s and samples were characterized chemically, radiochemically, physically, and rheologically. The frit/slurry mixtures were dried and melted at 115OOC in crucibles; resulting glass was characterized with respect to . chemical and radiochemical composition, durability (Product Consistency Test IpcT) and Materials Characterization Center MCC-l]), crystallinity, redox, and density.
1
Two types of simulants were prepared and tested for comparison with the actual waste glass. Process-based Slurry simulants were used to develop and tes't hot-cell'procedures and to provide a direct comparison with the core sample feed chemistry and rheology. Major and minor insoluble components were co-precipitated with NaOH from nitrate solutions and washed to remove the sodium
(a) Langowski, M.H., E.V. Morrey, J.M. Tingey, and M.R. Beckette. 1993. wgas Characteri~*onfrorn the Radioactive NCAW Core -le (102-AZ-Cl) and Simlant During Hwvp Feed Preparation Testing. Letter Report for US. Department of Energy. Pacific Northwest Laboratory. Richland, Washington.
iii

and nitrate. Soluble minor components were added separately, following washing. Glass simulants, similar to those used to develop glass property models, were prepared to provide a direct comparison with the actual waste-glass product quality. Three simulant glasses were prepared to match the chemical composition of the three actual waste glasses by batching and melting appropriate amounts of dry chemicals. The simulants were characterized the same as the actual waste samples, excluding radiochemical, to provide a direct comparison of simulant and actual waste.
Process and product behaviors of the actual waste were compared to simulant behavior, glass property models, slurry property correlations, and simulant behavior from other studies and larger scale tests. Statistical comparisons of simulant waste-glass durabilities and model predictions to actual waste-glass durabilities were made based on 95 % confidence t-tests. Other comparisons are primarily nonstatistical.
Results and Conclusions
Slurry Chemical Characterization. The chemical composition of the three NCAW core samples and simulants were similar. The major components in all three samples are Fe, Al, and Na 8s OH, C q - , NO;, and NO;. The pH of the washed solids were approximately 12.7 for the core samples from tank 101-AZ, 10.2 for tank 102-AZ, and 10.4 for the simulants. High washing efficiencies of the major cations as measured by the percentage of the analyte remaining in the washed solids slurries compared to the prewashed solids were only observed for Na (30%) and Cr (60%), but significant quantities of Al, Cr, K, Na, F, C1’, NO;, NO;, and SO: were removed from the sludge in the washing steps. Phosphate is the only measured anion in which p significant percentage remained in the sample. Comparison of the concentration of Na in the washed solids, the sludge prior to washing, and the reference nominal value for the previously planned HWVP indicates that acceptable washing efficiencies are being achieved on the laboratory-scale processes. A comparison of chemical composition of simulant 102-AZ Core 1 and the corresponding core sample indicates that accurate chemical simulants can be prepared.
During the formating process CO?, NO;, and NO; react to produce gas, and the concentrations of these anions in the sample decrease. Slurry chemistry and offgas generation reactions are similar between the core sample and simulants. Observed offgas differences between simulant and core sample could be explained by differences in testing conditions and slurry chemical composition.
Formated slurry was combined with frit to achieve melter feeds with waste oxide loadings of 25 to 28 percent; therefore, the major constituents in the melter feeds are the frit components. These major components include Si, Na, B, and Li. The frit components were added as the oxides; therefore, the majority of the elements in the melter feeds are as oxides. Other anions which are present in significant quantities are NO;, NO;, C1-, F, and SO:. The supekatant from the melter feeds contained only three cations in significant quantities (Na, IC, and Li). The major anions associated with the Supernatant are similar to those observed in the slurries with the exception of the oxides which are not soluble.
Slurry Radiochemical Charactex4zation. Handling and disposal of chemical simulants is much more cost effective than radiochemical simulants; therefore, no radiochemical simulants were prepared in these studies. The major radionuclides present in the core samples are lr’Cs, ‘OSr, ‘“Ce, and lMRu. All of the slurry sampks are transuranic (contain > 100 nCi/g transuranic isotopcs). The
iv

majority of the transuranic activity is due to americium and plutonium. None of the supernatant or wash solutions were transuranic, and 13'Cs is the primary radionuclide in the supematant. The only radionuclides affected by the washing steps were l3'Cs and *%b. The only radionuclide which may have been affected by the formating steps was lq. The data is not definitive, but it appears that some of the iodine may have been lost during the formating process. Measured radionuclide activities were within the previous HWW specifications with the exception of '3, 90Sr, and %o.
and simulants ranged from 1.04 to 1.14 g/mI. The density of the fomtod slurries was similar to that of the washed solids. As expected the density of the samples increased with increasing solids concentrations. A correlation between the density of the formated slurries and the solids concentration is observed, and simulants are representative of actual waste with respect to this correlation. The density of the melter feeds (1.28 to 1.47 glml) increases significantly from the formated slurry and washed solids density. This trend is also observed for the centrifuged solids density. The simulants have a significantly lower centrifuged solids density than is observed in the core samples. The density of the centrifuged liquid (1.02 f 0.03) was similar for all of the slurries and is comparable to the density of water.
Slurry Physical Characterization. The density of the washed solids from the core samples
The majority of the settling of the washed-solids and formated slurries occurs in the initial 10 hours of settling. The rate of settling increases with each ensuing wash, The settIing behavior of the simulants did not match the behavior of the core samples. This is also observed in the volume percent settled solids. The core samples settled much faster and achieved a significantly higher settled solids packing than was observed in the simulants. The settling behavior of the melter feed from NCAW simulant and the 101-AZ core samples are comparable, but the settling behavior of the 102- AZ Core 1 melter feed and the corresponding simulant did not match. The 102--M Core 1 simulant did not settle. Previous studies indicate that the frit blended with this simulant tends to gel. This is consistent with the behavior observed for this simulant. The 102-AZ Core 1 melter feed settled much quicker than was observed in the other core samples and simulants. The washed solids from this core dried prior to processing the sample. Previous results indicate that when some tank waste samples are allowed evaporate to dryness, the settling and rheological behavior of the sample are irreversibly altered.
The mean particle diameters of the washed soIids, formated slurries, and melter f& based on volume distribution and population distiibution are similar for the three core samples. The particle size of the solids in the core samples did not change significantly as the samples were processed. The majority of the particles were less than 5 microns in diameter with a significant number of the particles less than 1 micron in diameter. The analysis of 101-AZ Core 1 was performed with water as a diluent, and a Iarge portion of the solids may have gone into solution; therefore, the most representative sample for actual particle size in tank 101-AZ is Core 2.
Slurry Rheological Characterization. Actual. formated waste slurries exhibited lower yield stresses and apparent viscosities than simulant-formated waste slurries, which was attributed to differences in microstructure, Rheological behavior of the radioactive and simulant-formatted slurries was best represented as yield pseudoplastic with slight shear-thinning and hysteresis. Yield stresses of the radioactive formated slurry ranged from 0.085 Pa to 0.23 Pa, compared to shulant-formated slurry yield stresses of 1.2 Pa. Apparent viscosities of the actual waste samples at 50s" ranged from 3.8 CP to 7.2 CP compared to sirnutant viscosities of 32 cP. The rheology of both the formated waste samples and simulants were well below the design limit for the prior-planned Hanford Waste
V

and nitrate. Soluble minor components were added separately, following washing. Glass simulants, - ~ ~ _ ~-
Vitrification Plant (HWVP). After accounting for differences in concentration,' the simulated formated waste exhibited yield stresses and apparent viscosities roughly two times greater than those for actual formated waste. Act& f o h t e d waste samplesexhibited greater initial settling rates, greater degrees ofsettling, and deker &ntrifuged solids than simulant formated samples, indicating a difference in microstructure. A. comparison with rheological data fiom full-scale formated simulant tests showed essentially identical results with laboratory-scale formated simulant data from this study. A comparison with historical NCAW formated simulant data dating back to 1985 showed actual formated waste results to be equal to or lower than the weakest (i.e., lowest shear stress and apparent viscosity for given concentrations) simulants reported.
For melter feed samples, actual waste exhibited lower yield stresses and apparent viscosities than simulatgl waste, which again i'i; attributed to differences in microstructure. Rheological behhior at the radioactive @d simulant melter feed slurries was best represented as thixotropic, yield pseudoplastic with varying degrees of hysteresis. Yield stresses of the radioactive melter feed ranged from 1.4 Pa to 10.3 Pa compared to simulant melter feed yield stresses of 2.2 Pa and 12.4 Pa. Apparexit'viscosities*of the actual waste samples at 50s' ranged from 38 CP to 260 CP compared to simulant viscosities of 58 CP and 365 cP.
GIass Characterization. Initial chemical characterizations of the glass were inadequate, using the standard KOH/Na202 preparation methods for inductively coupled argon plasmalatomk emission spectrometry (ICP/AES) analysis. Analysis' of the first 'two radioactive glasses accounted for only 91 9%-93 % of the mass of &e glass. Additional analysis using an HF preparation and comparable standard glasses were required to arrive at a reasonable glass composition. Subsequent procedural improvements to the KOH/Na202 preparation methods resulted in satisfactory results for the third core-sample glass. For all three radioactive glasses, the measured major analytes were generally within 10% of calculated values, which were determined from washed solids composition, frit compositions, and assumed waste loadings. Achieved waste loadings were slightly greater than targeted (i.e., 2% to 5%), because of accuracy'limitations on slurry sampIing or total oxides analysis.
Glass redox for the actual waste glasses as measured by Fe+2/Fe+3 ratio ranged between 0.026 to 0.085.compared to a simulant redox of 0.005. Each of the glasses measured was within the design limit for the prior planned Hwvp plant. Glass redox of the actual waste compared well with historical simulant data correlating glass redox to formic acid added and initial nitrite and nitrate Compositions.
Radioactive glass samples were analyzed by X-ray diffraction to determine the extent and composition of crystalline phases. As predicted by models and simulant experience, no substantial crystallinity was found (Le., likely under 1%).
Density of the three radioactive glasses was measured to be 2.56 glcc for 101-AZ Core 1, 2.67 g/cc for 101-AZ Core 2, and 2.54 g/cc for 102-Az Core 1 at room temperature, values typical of simulant glass densities.
GIass Durability. Each of the three radioactive and simulant glass formulations produced highly durable glasses in all cases at least 20 tim& more durable than the Savannah River Environmental Assessment (EA) glass as measured by the PCT. Sevenday PCT boron releases for
. the radioactive glasses ranged from 0.13 to 0.21 g/m2 compared to simulant boron releases of 0.20 to 0.34 g/mz. The magnitude of the increase from radioactive to simulant releases ranged from 28 to
vi

67%. In each case the differences in boron release were found to be statistically significant to a 95 % confidence. Model predictions for each of the three glass formulations were greater than both actual and simulant waste glass releases. Over the limited amount of tests performed; the achal and simulant waste glass releases fell within the 95% prediction interval for the model 56% and 89% of the time, respectively. Twenty-eightday MCC-1 results for actual and simulant glasses showed similar results, however the differen& were greater. An indeterminate portion of the difference was attributed to differences in leach containers used for these tests.
Radiation dose has been shown to have a significant effect on glass corrosion in aqueous leach tests; however, the prediction and explanation of the radiolytic effects are complex. The durability differences between dctual and simulated waste glasses reported in this study were equal to or lower than differences observed by others, which was consistent with removing part of the radiolytic effect (Le., tests performed in Ar atmosphere). To the extent Ar backfilling of the leach containers was effective, the effect of radiolytic generation of nitric acid was 'eliminated. Based on the type of test performed and the relative durability of the glasses in this study, the dominant corrosion mechanism is expected to be network hydrolysk, which is favored under higher pHs. Had=the leach containers contained air, one would have predicted the radiolytic effect to be decreased pH and glass corrosion. With the absence of air in the system, it was not clear whether radiolytic affects shofld increase or decrease corrosion.
Sevenday PCT and 28day MCC-1 radionuclide releases were measured, calculated, and compared to results from prior studies. As with prior studies, Am had normalized releases significantly lower than B, ranging from 0.1% to 6% of B. Also consistent with prior studies, Tc, U, Np, and Cs were generally more soluble than Am (Le., 2 10% of B-normalized release). Not consistent with prior studies, Pu exhibited significant normalized releases near B. Strontium was relatively soluble in MCC-1 tests and insolubleh P c .
L1 .
e
vii

Contents
1.0 Introduction .................................................. 1.1 1.1 Objectives .............................................. 1.1 1.2 Background .............................................. 1.1 1.3 Report Contents ............................................ 1;5
2.0 Conclusions and Recommendations ............. ...................... 2.1 2.1 Conclusions .............................................. 2.1
2.1.1 Process-Related ..................................... 2.1 2.1.2 Product-Related ................... : .................. 2.2
2.2 Recommendations ........................................... 2.3
3.0 Experimental Method ............................................ 3.1 3.1 Test Objectives ........................................... 3.1 3.2 MethdApproach .......................................... 3.2
3.2.1 Simulant Preparation .................................. 3.2 3.2.2 Sampling and Pretreapnent ............................... 3.4 3.2.3 Formic Acid Addition ................................. 3.7 .3. 2.4 Frit Addition ................................ ; . . . . . . 3.7 3.2.5 Calcining and Vitrification .............................. 3.8 3.2.6 Glass Sample Preparation ............................... 3.8 3.2.7 Durability Testing ..................................... 3.11 3.2.8 Description of Analytical Methods .......................... 3.13 3.2.9 Analyses Performed .................................. 3.13
3.3 Test Equipment ............................................ 3.17 3.4 TestAnomalies ........................................... 3.20
3.4.1 pH Probe Broken into 101-AZ Core 2 Formated Slurry . . . . . . . . . . . . 3.20 3.4.2 Drying of 102-AZ Core 1 Washed Solids ..................... 3.20 3.4.3 In-Cell MCC-1 Testing Discrepancies ....................... 3.21
3.4.3.1 Investigation of Type of Container . . . . . . . . . . . . . . . . . . . 3.21 3.4.3.2 Investigation of Temperature Effects \ . . . . . . . . . . . . . . . . . 3.26
4.0 Results and Discussion ............................................ 4.1 4.1 Washed Solids ....................... ; .................... 4.1
4.3 4.1.1 Chemical Characterization .............................. -4.1 .4. 1.2 Radiochemical Characterization ............................ 4.1.3 Physical Characterization ................................ 4.3
4.2 Formated Sl~rry ............................................. 4.7 4.2.1 Chemical Characterization ... ; .......................... 4.7 4.2.2 Physical Characterization ............................... 4.11 4.2.3 Rheological Characterization ............................. 4.15 .
4.3.1 Chemical Characterization .............................. 4.21 4.3.2 Radiochemical Characterization ........................... 4.24 4.3.3 Physical Characterization ................................ 4.24
............................................. 4.3 MelterFeed 4.20
. _ ...... .I___I ...
viii
.......

4.3.4 Rheological Characterization ........... ................. 4.30 4.4 Glass Analysis ............................................. 4.34
4.4.1 Chemical Characterization ............................... 4.34 '4.4.2 Radiochemical Characterization .......... ................ 4.37 4.4.3 Crystallinity ; ...................................... 4.37 4.4.4 Physical Characterization ................................ 4.40
4.5 Durability ................................................ 4.40 4.5.1 Product Consistency Test Elemental Releases ...... : ........... 4.40
4.5.1.2 101-AZ Core 2 and Simulant ........................ 4.43 . . . 4.5.1.3 102-AZ Core 1 and Simulant ...................... 4.48
4.5.1.4 Comparison of Core Sample and Simulant PCT Results to Model Predictions .............................. 4.51 ....... 4.55 ........... 4.57
4.5.2 Materials Characterizatioh Center (MCC-1) Elemental Releases ........ 4.61 4.5.2.1 101-AZ Core 1 and Simulant ...................... 4.61
\ 4.5.2.2 101-AZ.Core 2 and Simulant ...................... 4.65 4.5.2.3 102-AZ Core 1 and Simulant ...................... 4.65 4.5.2.4 Comparison of Core Sample and Simulant MCC-1 Results to
Model Predictions .............................. 4.69 4.5.3 PCT Radiochemical Releases ............................. 4.73
4.5.3.1 101-AZCore 1 ................................ 4.73 4.5.3.2 101-AZCore2 ............................... 4.76 453 .3 102-A2 Core 1 ................................ 4.79
2 ............................................. 4.79 4.5.5 PCTAnionReleasesandpH .............................. 4.84 . . . 4.5.6 MCC-1 Anion Releases and pH ........................... 4.86
'and Comparison with Work by Others ...................... 4.87
415.1,l 101-AZ.Core 1 and Simulant ............ - ........... 4.41 . .
4.5.1.5 . Repeatability of Hot Cell and Laboratory PCT Tests . 4.5.1.6 Comparison of Leach Containers for PCT Tests
4.5.4 MCC-1 Radiochemical Releases for 101-AZ Core 1 and 101-AZ Core
4.5 .. 7 Reasons for Differences Between Radioactive and Simulant Durabilities
4.6 Mass.Balances ............................................ 4.91 . .
5.0 References ........ : ............................................ 5.1
Appendix A: Chemical Data ............................................. Appendix B: Radiochemical Data ........................................ Appendix C: Physical Data ............................................
A.l
B.l
C.l
Appendix D: Rheological Data ........................................... D.l
Appendix E: Summary of Test Plans and Procedures ............................ E.l
Appendix F Data Reduction Methods ..................................... F.l F . 1 Rheology Calculations (Theory and Calculations) ...................... F.l F.2 Normalized Release ......................................... F.3
ix

Appendix G: Description of Analytical Methods ................................. G.l G.l Physical Characterizations ..................................... G.l
G.l.l Density.; ........................................ G.l G.1.2 Solids Settling Rate and Volume Percent Settled Solids ............ G . 1 G.1.4 Volume Percent and Weight Percent Centrifuged Solids and
Supernatant ....................................... G.l G . 1.5 Weight Percent Total Solids, Total Oxides, and Dissolved Solids ..... G . 1 G.1.6 Particle Size ....................................... G.2 G.1.7 Shear Stress Versus Shear Rate ............................ G.2
G.2 Chemical Characterization ...................................... G.2 G.2.1 pH ............................................ G.3 G.2.2 Carbon Analyses ..................................... G.3 G.2.4 ICPIAES Anaiyses .................................... G.4 G.2.5 ICAnaly~es .......................................... G.4
G.3 Radiochemical Characterization ................................. G.4 G.3.1 Gamma Energy Analysis ................................ G.4 G.3.2 Total Q and Total 49 .................................. G.4 G.3.3 Alpha Energy Analysis ................................ G.4 G.3.4 Total Pu and Pu Isotopes ............................... G.4 G.3.5 Total U atid U Isotopes ................................ G.5 G.3.6 Tritium Analyses ................................... G.5 G.3.7 Other Radioisotopes ................................... 'G.5
1
\
. -. ...... .- . . . ...... -
X

Figures
3.1. Characterization Flowsheet for 101-AZ Core 1 .......................... 3.3 3.2. .. HLW Vitrification Process Steps for the NCAW Core Samples ................ 3.5 3.3. Hot Cell Method of Pouring and Quenching Molten Glass from Crucible ........... 3.9 3.4. Separation of Glass Bar from Mold Before Annealing .............. ; ....... 3.9 3.5. Actual Waste Glass from 101-kz Core 2 .............................. 3.10 3.6. MCC-1 Monolith Samples from 101-AZ Core 1 .......................... 3.10
. 3.7. 3.8. Hot Cell Equipment Setup for Formic Acid Addition and Offgas Analysis
on 102-AZ Core 1 .............................................. 3.19 3.9. Hot Cell Formic Acid Addition Fiquipment for 102-AZ Core 1 ................ 3.19 3.10. . In-Cell versus Out-of-Cell MCC-1 Discrep'ancy for NCAW Glass .' .............. 3.22 3.11. In-Cell versus Out-ofkell MCC-1 Discrepancy for ATM-10 .................. 3.22 . 3.12. Replicate Sample MCC-1 Variability for 101-AZ Core 1 .................... 3.23 3.13. Replicate Sample MCC-1 Variability for 101-AZ Core 2 .................... 3.23 3.14. Replicate Saniple MCC-1 Variability for NCAW Simulant .................... 3.24 q3.15. Replicate Sample MCC-1 Variability for ATM-10 ......................... 3.24 3.16. Comparison of Altermite Leach Vessels considered for MCC-1 ................ 3.26 3.17. Correlation of Oven Temperature Variation fo Release ...................... 3.28
4.2. Specific Activity of Radionuclides for Washed Solids ...................... 4.6 4.3. Chemical Composition of Formated Slurry ............................. 4.10 4.4. Specific Gravity of Formated NCAW .................................. 4.12 4.5. Settling Behavior of Formated Slurries ................................. 4.14 4.6. Rheobgy of Actual and Simulated Formated Slurry ....................... 4.17 4.7. Comparison of Formated Slurry Yield Stress with Historical Data .............. 4.19 4.8. Comparison of Formated Slurry Viscosity at 183s' with Historical Data .......... 4.20 .4. 9. Chemical Composition of Melter Feed ................................ 4.23 4.10. Specific Activity of Radionuclides for Melter Feed .. ........................ 4.28 4.11. Settling Behavior of Melter Feeds .................................... 4.29 4.12. Rheology of Actual and Simulated Melter Feed ........................... 4.30
. 1.1. HLW Vitrification Technology Development Support ...................... 1.3
Hot Cell Quipment Setup for Formic Acid Addition on 101-AZ Core Samples ....... 3.18
....
4.1. Chemical Composition of Washed Solids ......... : .................... 4.4
4.13. Comparison of Melter Feed Yield Stress with Historical Data: .................. 4.33 4.14. Comparison of Melter Feed Viscosity at 183~~' with Historical Data .............. 4.33 4.15. Comparison of Simulant Glass Redox to Radioactive Glass Redox ............... 4.38 4.16. PCT Results and Model Predictions for 101-AZ Core 1 and Simulant ............. 4.44 4.17 .. PCT Results and Model Predictions for 101-AZ Core 2 and Simulant ............. 4.47 4.18. PCT Results and Model Predictions for 102-AZ Core 1 and Simulant ............. 4.50 4.19. Measured versus Predicted PCT Boron Release for Core Sample. Simulant. and
StandardGIasses ............................................. 4.52 4.20. Measured versus Predicted PCT Lithium Release for Core Sample. Simulant. and
Standard Glasses ......................................... ; .... 4.53 4.21. Measured versus Predicted PCT Sodium Release for Core Sample. Shulant. and
Standard Glasses .............................................. 4.54 4.22. PCT Results and Model Predictions for Reference Glass CVS-IS-HW39-4 .......... 4.57
.
4.23. Comparison of Alternate Leach Vessels considered for PCT ................... 4.61
xi

4.24. MCC-1 Results and Model . Predictions for 101-AZ Core 1 and Simulant ............ 4.64 4.25. MCC-1 Results and Model Predictions for 10 l -M Core 2 and Simulant ........... 4.67 4.26. Measured versus Predicted MCC-1 Boron Release for Core Sample. Simulant. and
Standard Glasses ............................................. 4.70, 4.27. Measured versus Predicted MCC-1 Lithium Release for Core Sample. Simulant. and
4.28. Measured versus Predicted MCC-1 Sodium Release for Core Sample. Simulant. and StandardGIasses ............................................. 4.71
Standard Glasses ............................................. 4.72 4.29. PCT Radionuclide Releases for 101-AZ Core 1 ....................... ... 4.75 4.30. PCT Radionuclide Releases for 101-AZ Core 2 ........................... 4.77 4.31. PCT Radionuclide Releases for 102-AZ Core 1 ............................. 4.81 4.32. MCC-1 Radionuclide Normalized Releases for 101-AZ Core 1 ................. 4.83 4.33. MCC-1 Radionuclide’Normalized Releases for 101-AZ Core 2 ................. 4.83 4.34. Summary of Radionuclide Releases Ratioed to Boron for PCT and MCC-1 .......... 4.90 4.35. ‘Chemical Composition of 101-AZ Core 1 .............................. 4.92 4.36, Chemical Composition of 101-AZ Core 2 ..... I ........................ 4.93 4.37. Chemical Composition of 102-AZ Core 1 ............................... 4.94 4.38. Chemical Composition of NCAW Simulant ............................. 4.95 4.39. Chemical Composition of 102-AZ Core 1 Simulant ........................ 4 .. 96 4.40. Specific Activity of Radionuclides for 101-AZ Core 1 ....................... 4.97 4.41. Specific Activity of Radionuclides for 101-AZ Core 2 ....................... 4.98 4.42. Specific Activity of Radionuclides for 102-AZ Core 1 ....................... 4.99
. ”‘.)
\
xii
.....

Appendix Figures
D.l . Shear Stress versus Shear Rate of 101-AZ Core 1 Formated Slurry (Run 1)
D.2. Shear Stress versus Shear Rate of 101-AZ Core 1 Formated Slurry (All Runs)
D.3. Viscosity versus Shear Rate of 101-AZ Core 1 Formated Slurry (&I Runs)
D.4. Shear' Stress versus Shear Rate of 101-AZ Core 1 Formated Slurry (All Runs) .
D.5. Viscosity versus Shear Rate of 101-AZ Core 1 Formated Slurry (Ali Runs)
D.6. Shear Stress versus Shear Rate of 101-AZ Core 1 Melter Feed Slurry (Run 1)
D.7. Shear Stress versus Shear Rate of 101-AZ Core 1 Melter Feed Slurry (All Runs)
D.8. Viscosity versh Shear Rate of 101-AZ Core 1 Melter Feed Slurry (All Runs)
D.9. Shear Stress versus Shear Rate of 101-AZ Core'l Melter Feed Slurry (All Runs)
D.lO. Viscosity versus Shear Rate of 101-AZ Core 1 Melter Feed Slurry (All Runs)
D . l l . . Shear Stress versus Shear Rate of 101-AZ Core 2 Formated Slurry (Run 1)
D.12. Shear Stress versus Shear Rate of 101-AZ Core 2 Formated Slurry (All Runs)
D.13. Viscosity versus Shear Rate of 101-AZ Core 2 Formated Slurry (All Runs)
D.14. Shear Stress versus Shear Rate of 101-AZ Core 2 Formated Slurry (All Runs)
D.15. Viscosity versus Shear Rate of 101-AZ Core 2 Formated Slurry (All Runs)
D.16. Shear Stress versus Shear Rate of 101-AZ Core 2 Melter Feed Slurry (Run 1)
D.17. Shear Stress versus Shear Rate of 101-AZ Core 2 Melter Feed Slurry (All Runs)
D.18. Viscosity versus Shear Rate of 101-AZ Core 2 Melter Feed Slurry (All Runs)
D.19. Shear Stress versusShear Rate of 101-AZ Core 2 Melter Feed Slurry (All Runs)
D.20. Viscosity versus Shear Rate of 101-AZ Core 2 Melter Feed Slurry (All Runs)
D.21. Shear Stress versus Shear Rate of 102-AZ Core 1 Formated Slurry (Run 2)
D.22. Shear Stress versus Shear Rate of 102-a Core 1 Formated Slurry (All Runs)
with Yield-Pseudoplastic Model Fits and Corresponding Physical Properties ...... D.l
with Yield-Pseudoplastic Model Curve Fits ........................... D.2
with Yield-Pseudoplastic Model Curve Fits ........................... D.2
with Bingham Curve Fit ................. ; ..................... D.3
with Bingham Curve Fit ....................................... D.3
.
with Yield-Pseudoplastic Model Curve Fits and Corresponding Physical Properties . . D.4
with Yield-Pseudoplastic Model Curve Fits. ........................... D.5
with Yield-Pseudoplastic Model Curve Fits ............................ D.5
with Bingham Curve Fits ........................................ D.6
with Bingham Curve Fits ........................................ D.6
with Yield-Pseudoplastic Model Cun;e Fits apd Corresponding Physical Properties ... D.7 . -
. with Yield-Pseudoplastic Model Curve Fits ... ; ......................... D.8
with Yield-Pseudoplastic Model Curve Fits ............................ D.8
with Bingham Curve Fits ......................... : ............... D.9
with Bingham Curve Fits ........................................ D.9 *
with Yield-Pseudoplastic Model Curve Fits and Corresponding Physical Properties . . D.10
with Yield-Pseudoplastic Model Curve Fits ........................... D.11
with Yield-Pseudoplastic Model Curve Fits ............................ D. l l
with Bingham Curve Fits ....................................... with Bingham Curve Fits .......................................
D.12
D.12
with Yield-Pseudoplastic Model Curve Fits and Corresponding Physical Properties . . D.13
D.14 with Yield-Pseudoplastic Model Curve Fits ...........................
xiii
I I

_.-
D.23. Viscosity versus Shear Rate of 102-AZ Core 1 Formated Slurry (All Runs) with Yield-Pseudoplastic Model Curve Fits . . . . . . . . . . . . . . . . . . . . . . . . . . . D.14
D.24. Shear Stress versus Shear Rate of 102-AZ Core 1 Formated Slurry (All Runs) with Bingham Curve Fits . . . . . . . . . . . . . . . . . . . . . . . . . . . . . . . . . . . . . . . D.15
D.25. Viscosity versus Shear Rate of 102-AZ Core 1 Formated Slurry (All Runs) with Bingham Curve Fit . . . . . . . . . . . . . . . . . . . . . . . . . . . . . . . . . . . . . . . D.15
D.26. Shear Stress versus Shear Rate of 102-AZ Core 1 Melter Feed Slurry (Run 2) with Yield-Pseudoplastic Model Curve Fits and Corresponding Physical Properties.. . . D.16
D.27. Shear Stress versus Shear Rate of 102-AZ Core 1 Melter Feed Slurry (All Runs) with Yield-Pseudoplastic Model Curve Fits . . . . . . . . . . . . . . . . . . . . . . . . . . . D.17
D.28. Viscosity versus Shear Rate of 102-AZ Core 1 Melter Feed Slurry (AI Runs) with Yield-Pseudoplastic Model Curve Fits . . . . . . . . . . . . . . . . . . . . . . . . . . . D.17
D.29. Shear Stress versus Shear Rate of 102-AZ Core 1 Melter Feed Slurry (All Runs) with Bingham Curve Fits . . . , . . . . . . . . . . . . . . . . . . . . . . . . . . . . . . . . . . . D.18
D.30. Viscosity versus Shear Rate of 102-AZ Core 1 Melter Feed Slurry (All Runs) with Bingham .Curve Fits . . . . . . . . . . . . . . . . . . . . . . . . . . . . . . . . . . . . . . . D.18
D.31. Shear Stress versus Shear Rate of NCAW Simulant Formated Slurry (Run 1) with Yield-Pseudoplastic Model Curve Fits and Corresponding Physical Properties . . D.19
D.32. Shear Stress versus Shear Rate of NCAW Simulant Formated Slurry (All Runs) with Yield-Pseudoplastic Model Curve Fits . . . . . . . . . . . . . . . . . . . . . . . . . . . D.20
D.33. Viscosity versus Shear Rate of NCAW Simulant Formated Slurry (All Runs) with Yield-Pseudoplastic Model Curve Fits . . . . . . . . . . . . . . . . . . . . . . . . . . . D.20
D.34. Shear Stress versus Shear Rate of NCAW Simulant Formated Slurry (All Runs) with Bingham Curve Fits . . . . . . . . . . . . . . . . . . . . . . . . . . . . . . . . . . . . . . . D.21
D.35. Viscosity versus Shear Rate of NCAW Simulant Formated Slurry (All Runs) with Bingham Curve Fits . . . . . . . . . . . . . . . . . . . . . . . . . . . . . . . . . . . . . . . D.21
0.36. Shear Stress versus Shear Rate of NCAW Simulant Melter Feed Slurry (Run 1) with Yield-Pseudoplastic Model Curve Fits and Corresponding Physical Properties . . D.22
D.37. Shear Stress versus Shear Rate of NCAW Simulant Melter Feed Slurry (Runs 1, 3, and 5) with Yield-Pseudoplastic Model Curve Fits . . . . . . . . . . . . . . . . . . . . . . . . . . . D.23
D.38. Viscosity versus Shear Rate of NCAW Simulant Melter Feed Slurry (Runs 1, 3, and 5) with Yield-Pseudoplastic Model Curve Fits . . . . . . . . . . . . . . . . . . . . . . . . . . . D.23
D.39. Shear Stress versus Shear Rate of NCAW Simulant Melter Feed Slurry (Runs 1,3, and 5) '
with Bingham Curve Fits . . . . .. . . . . . . . . . . . . . . . . . . . . . . . . . . . . . . . . . . D.24 D.40. Viscosity versus Shear Rate of NCAW Simulant Melter Feed Slurry (Runs 1, 3, and 5)
with Singham Curve Fits. . . . . . . . . . . . . . . . . . . . . . . . . . . . . . . . . . . .J. . . D.24 D.41. Shear Stress versus Shear Rate of 102-AZ Core 1 Simulant Formated Slurry (Run 1)
with Yield-Pseudoplastic Model Curve Fits and Corresponding Physical Properties . . D.25 D.42. Shear Stress versus'shear Rate of 102-AZ Core 1 Simulant Formated Slurry (All Runs)
with Yield-Pseudoplastic Model Curve Fits . . . . . . . . . . . . . . . . . .. . . . . . . . . . D.26 D.43. Viscosity versus Shear Rate of 102-AZ Core 1 Simulant Formated Slurj (All Runs)
with Yield-Pseudoplastic Model Curve Fits . . . . . . . . . . . . . . . . . . . . . . . . . . . D.26 D.44. Shear Stress versus Shear Rate of 102-AZ Core 1 Simulant Formated Slurry (All Runs)
with Bingham Curve Fits . . . . . . . . . . . . . . . . . . . . . . . . . . . . . . . . . . . . . . . D.27 D.45. Viscosity versus Shear Rate of 102-AZ Core 1 Simulant Formated Slurry (All Runs)
with Singham Curve Fits. . . . . . . . . . . . . . . . . . . . . . . . . . . . . . . . . . . . . . . D.27 D.46. Shear Stress versus Shear Rate of 102-AZ Core 1 Simulant Melter Feed Slurry (Run 1)
with Yield-Pseudoplastic Model Curve Fits and Corresponding Physical Properties . . D.28 xiv

D.47. Shear Stress versus Shear Rate of 102-AZ Core 1 Simulant Melter Feed Slurry (All Runs)
D.48. Viscosity versus Shear Rate of 102-AZ Core 1 Simulant Melter Feed Slurry (All Runs) with Yield-Pseudoplastic Model Curve Fits ......................... .-. . D.29
D.49. Shear Stress versus Shear Rate of 102-AZ Core 1 Simulant Melter Feed Slurry (All Runs) with Bingham Curve Fits ....................................... D.30
D.50, Viscosity versus Shear Rate of 102-AZ Core 1 Simulant Melter Feed Slurry (All Runs) with Bingham Curve Fits ....................................... 0.30
with Yield-Pseudoplastic Model Curve Fits ........................... D.29
\

-F TabIes I-
3.1. 3.2. 3.3. 3.4. 4.1. 4.2. 4.3 4.4. 4.5. 4.6. 4.7. 4.8. 4.9.
Differences in Process Steps and Parameters ............................. 3.6 Summary of Durability Testing ................................. ; .... 3.12 Summary of Analyses Performed .................................... 3.15 MCC-1 Leach Test Results for NCAW Simulant Glass ...................... 3.25 Chemical Composition of Washed Solids Slurries .......................... 4.2 Washed Solids Slurries Physical Properties ........ ; ..................... 4.6 Anion Concentrations of the Washed Solids Slurries and Formated Slurries ...... '1 .... 4.9 Formated Slurries Physical Properties ................................. 4.11 Formated Slurries Settling Rate Behavior ................................ 4.13 Rheological and Physical Properties of Formated Slurry ...................... 4.16 Frit Cornsition ................................................ 4.21 . -Melter Feed Physical Properties ...................................... 4.25 Melter Feed Settling Rate Behavior ............. : ..................... 4.26
4.10: I&eological and Physical Properties of Melter Feed Slurry ..................... 4.31
4.13. Summary of Glass Redox Results .................................... 4.37 4.14. Radiochemical Composition of Actual Waste Glass ......................... 4.39 4.15. PCT . Leach Test Results for 101-AZ Core 1 (Hot Cell Test #4) . . . . . . . . . . . . . . . . . 4.42 4.16. PCT Leach Test Results for 101-AZ Core 1 Simulant ........................ 4.42
101-AZ Core 1 Radioactive Glass .................................... 4.44 4.18. PCT Leach Test Results for 101-AZ Core 2 (Hot Cell Test #3) . . . . . . . . . . . . . . . . . 4.46 4.19. PCT Leach Test Results for 101-AZ Core 2 Sitnulant ....................... 4.46
4.21. PCT Leach Test Results for 102-AZ Core 1 (Hot Cell Test #5) . . . . . . . . . . . . . . . . . 4.49 4.22. PCT Leach Test Results for 102-AZ Core 1 Simulant ....................... 4.49
102-AZ Core 1 Radioactive Glass ................................... 4.50
4.25. PCT Leach Test Results for CVS-IS-HW39-4 ............................ 4.56
CVS.IS.HW39-4 ............................................... 4.58 4.27. PCT Lqch Test Results for NCAW Simulant Glass ........................ 4.60 . 4.28. MCC-1 Leach Test Results for 101-AZ Core 1 (Hot Cell Test #1) ............... 4.63 4.29. MCC-1 Leach Test Results for 101-AZ Core 1 Simulant (Lab Test #7) ............ 4.63 4.30. MCC-1 Durability Comparison of 101-AZ Core 1 Simulant to
101-AZ Core 1'Radioactive Glass .................................. 4.64 4.31. MCC-1 Leach Test Results for 101-AZ Core 2 (Hot Cell Test #1) . . . . . . . . . . . . . . . 4.66
(Lab Test #9 inTeflon) ......................................... 4.66
101-AZ Core 2 Radioactive Glass ................................... 4.67
.
4.11. aemical Compostions of Actual and Simulant Glasses ...................... 4.35 4.12. Measured Versus Calculated Glass Compositions and Waste Oxide Loadings . . . . . . . . 4.36
4.17. PCT Durability Comparison of 101-AZ Core 1 Simulant to
4.20. PCT Durability Comparison of 101-AZ Core 2 Simulant to 101-AZ Core 2 Radioactive Glass ..................................................... 4.47
4.23. PCT Durability'Comparison of 102-AZ Core 1 Simulant to
4.24. Summarrzed . Comparison of PCT Model Prediction to Measured ................ 4.55
4.26. Comparison of Hot Cell Tests #3 and #5 Using Reference Glass
\
..
4.32. MCC-1 Leach Test Results for 101-AZ Core 2 Simulant
4.33. MCC-1 Durability Comparison of 101-AZ Core 2 Simulant-to
4.34. MCC-1 Leach Test Results for 102-AZ Core 1 Simulant MCC-1
xvi
. _ _ .

(Lab Test #12 in Teflon) ......................................... 4.68 4.35. Summarized Comparison of PCT’Model Prediction to Measured ................ 4.69 4.36. PCT Radionuclide Releases in Solution for 101-AZ Core 1 (Hot Cell Test #4) ....... 4.74 4.37. PCT Radionuclide Releases in Solution for 101-AZ Core 2 (Hot Cell Test #3) ....... 4.78 ........ 4.80 4.39. Summary of MCC-1 Radionuclide Releases Compared to Boron ................ 4.82 4.40. PCT Anion and pH Results for Core Sample and Simulant Glasses ............... 4.84 4.41. Simulant-to-Radioactive Comparisons for P and S Releases .................... 4.85 4.42. Affects of Minor Components on PCT Durability .......................... 4.86 4.43. MCC-1 w o n . and pH Results for Core Sample and Simulant Glasses .............. 4.87 4.44. Decay Corrected Specific Activity and Recovery Percent for 101-AZ Core 1 ....... 4.100 4.45. Decay Corrkcted Specific Activity and Recovery Percent for 101-AZ Core 2 ....... 4.101 4.46. Decay Corrected Specific Activity and Recovery Percent for 102-AZ Core 1 ....... 4.102
4.38. PCT Radionuclide Releases in Solution for 102-AZ Core 1 (Hot Cell Test #5)
.
\
..
c
xvii

Appendix Tables . 4 .
A.l. A.2. A.3. A.4. . A S . A.6 . A.7. A.8. A.9. A . 10 . A.ll. A . 12 . A.13. A.14. A.15. A.16. A . 17 . A.18.
A.19.
A.20.
A.21.
A.22.
A.23.
A.24. B.l. B.2.
B.4. B.5. B.6. c.1.
. B.3.
c.2. . ~
CAW
CI
CVS
Chemical Composition of 101-kz Core 1 Pr0ce.k Solutions and Product Glass ...... A.l Chemical Composition of 101-AZ Core 2 Process Solutions and Product Glass . . . . . . A.2 Chemical 'Composition of 102-AZ Core 1 Process Solutions and Product Glass ....... A.3 Chemical Composition of NCAW S&ulant Process Solutions and Product Glass ..... A.4 Cheipical Composition of 102-AZ Core 1 Simulant Process Solutions ............ A S . Chemical Composition of 101-AZ Core 1 Glass ........................... A.6 Chemical Composition of 10142 Core.2 Glass ............................ A.7 Evaluation of Sample Prepvation Methods Using ATM-10 Glass ............... A.8 Evaluation. of Sagple Preparation Methods Using NBS Basalt 688 Standard ........ A.9 Leach Test Information and Leachate Analysis for 101-AZ Core 1 ............. A.10
A . 11 A.12
Leach Test Infornkion and Leachate Analysis for 101-AZ Core 2 Simulant ....... A.14 Leach Test Information arid Leachate Analysis for 102-AZ Core 1 Simulant . . . . . . . A.15 Leach Test information and Leachate Analysis for CVS-IS-HW39-4 . . . . . . . . . . . . A . 16 Leach Test information and Leachate Analysis for NCAW Simulant ...... : . . . . . A.17 Leach'Test Information and Leachate Analysis for ATM-10 and Environmental Assessment Glass ............................................ A.18 .Analytical Laboratory-to-Analytical Laboratory comparison; 7-Day PCT (Lab Test #lo) .................................................... A.18 CVS Model Predictions and 95% Confidence Intervals for lOl4SZ Core 1
CVS Model Predictions and 95% Confidence Intervals for 101-AZ Core 2 .
CVS Model Predictions and 95% Confidence Intervals for 102-AZ Core 1
CVS Model Predictions and 95% Confidence Intervals for CVS-IS-HW39-4
. .
. Leach Test 'Information and k h a t e Analysis for 101-AZ Core 2 ............. . Leach Test Inforin?ion and Leachate Analysis for 102-AZ Core 1 . Leach Tes't Infomhion and Leachate Analysis for 101-AZ Core 1 Simulant ....... A.13
.............
Composition ............................................... A.19
Composition ........................................ . . . . . . A.20
Composition ................................................. A.21
Composition ................................................. A.22 Frit and Recycle Composition .................................... Radiochemical Data for 101-AZ Core 2 ...............................
\ A.23 Radiochemical Data for 101-AZ Core 1 ............................... B.l
B.2 Radiochemical Data for 102-AZ Core 1 ............................... B.3 Radiochemical Leachatehalysis of 101-AZ Core 1 ......................... B.4 Radiochemical 'Leachate Analysis of 101-AZ Core 2 ....................... B.5 Radiochemical Leachate Analysis of 102-AZ Core 1 ....................... B.6 Physical Properties of 101-AZ Core 1 Process Slurries ....................... C.l
physical Properties . of 101-AZ Core 2 Process Slurries ....................... ___.- ... C.2
Abbreviations
Current Acid W i t e
Confidence Interval
Comuosition Variability Study

PHTD
PNL
PUREX
PVTD
QA
RSD
TC
TDP
TEM
TIC
TOC
TRU
WAPS
WQR
ws XRD
PNL HWVP Technology Development
Pacific Northwest Laboratory
Plutonium and Uranium Extraction
PNL Vitrification Technology Development
Quality Assurance
Relative Standard Deviation
Total Carbon
Technical Data Package
Transmission Electron Microscopy
Total Inorgdc Carbon
Total Organic Carbon
Transuranic
Waste Acceptance Preliminary Specifications
.Waste Form Qualification Report
Washed Solids
X-Ray Diffraction
xxi

- . . . . .. - ..--.

1;o Introduction A High-Level Waste (HLW) Vitrification Plant is being planned to process Hanford high-level
and transuranic (TRU) tank waste into-canisterec! glass logs for disposal in a national repository. The
programs have been .established to develop and verify process technology using simulated waste. A parallel testing program'with radioactive waste is being performed to confirm the validity of using simulants and glass property models for waste form qualification and process testhg.
The type of HLW used in this study is pretreated neutralized current acid waste (NCAW). The NCAW is a neutralized HLW stream generated from the reprocessing of irradiated nuclear fuel in the Plutonium and Uranium Extraction (PUREX) Plant at Hanford. As part of the fuel reprocessing, the high-level waste generated in PUREX was denitrated with sugar to form current acid waste (CAW). ' Sodium hydroxide and sodium nitrite were added to the' CAW to minimize corrosion in the tanks, thus yielding neutralized CAW. The NCAW contains small amounts of plutonium, fission products from the irradiated fuel, stainless steel corrosion products, and iron and sulfate from the ferrous sulfamate reductant used in the PUREX process.
' Pacific Northwest Laboratory (PNL)(l) Vitrification Technology Development (PVTD) testing
The total inventory of NCAW is contained in two one-million-gallon double-shell tanks (DSTs). Three core samples from the two tanks have been characterized, pretreated, vitrified, and leach-tested. Properties of the radioactive waste mkured during laboratory process and product testing have been compared to simulant properties and model predictions to confirm the validity of simulants and glass property models.
1.1 Objectives
The radioactive process/product laboratory testing provides confirmation of the adequacy of nonradioactive feed simulants used in laboratory and pilot scale testing to support feed processability assessments, vitrification process development, and glass property model development. Small-scale process/product testing is being conducted in the hot cell using limited quantities (100-2OOml at 125 g of equivalent oxidesk) of actual tank waste materials derived from core samples and compare results to those obtained from similar testing using simulants.
1.2 Background
Radioactive waste samples and waste simulants are being tested to support the design, operation, and permitting of the HLW Vitrification Plant. The relationships between these test programs and the plant design efforts are described in this section. .
The laboratory-scale radioactive testing directly supports two of PNL's shulant-based, laboratory-scale testing programs. These programs, in turn, support the bench- and pilot-scale PNL test programs by determining appropriate simulant compositions and test conditions. The testing
(a) Pacific Northwest Laboratory is operated for the U.S. Department of Energy by Battelle Memorial Institute under Contract DE-AC06-76RLO 1830.
1.1
' - 1 I '
' I '

programs combine to support various aspects of the HLW Vitrification Plant design and, to some extent, the permitting requirements.
The flow of 'information between the various activities of the HLW vitrification project is shown schematically in Figure 1.j. The nonradioactive laboratory-scale through pilot-scale testing relies on waste s@nulants. The data from these tests are used in conjunction with waste .
characterization ixiformation to develop.the plint design and information flowsheet. Thus, it is essential that the simulant's chemical and physical behavior be representative of the actual radioactive waste.
The simulant development efforts form the foundation of the HLW vitrification designherifcation testing. Simulant development is, in turn, supported directly by a combination of process knowledge, characterization, estiniates of feed compositions, and core sample testing. Testing radioactive core samples provides the most defensible and direct link between the tank waste and the waste simulants. used for testing. Without radioactive sample testing, the use of simulants are not ' sufficiently defensible for process/equipment/product testing.
The simulant-based, laboratory-scale testing focuses on two different aspects of the HLW Vitrification Plant flowsheet. One focus area is the chemical and rheological characteristics of the plant feed as it is processed through the feed treatment portion of the flowsheet. This includes feed concentration and the addition of reductant and glass formers. The second focus area is the processabiiity and product quality of the vitrification portion of the flowsheet. The chemical and physical properties of the molten waste glass as well as the cooled glass product are of primary interest. Both focus areas are supported through radioactive sample testing.
The first of the two laboratory-scale test programs supported by radioactive core sample testing is the feed chemistry/rheology evaluation. This work determines the effects of changes in feed composition and treatment on the physical, chemical, and rheological.properties of the feed, using nonradioactive chemical simulants. These chemical simulants are developed based on the processes used to generate the waste, originally and on the cunently planned waste pretreatment processes (e.g. , water wash, caustic leach, filtration, etc.). These process-based simulants contain the bulk of the chemical species expected to be present in the actual waste with the exception of trace-quantity species and radioactive components.
The process-based simulants used by the Feed ChemistrylRheology Evaluation task are subjected to laboratory-scale tests desigqed to simulate various operating scenariosin the HLW Vitrification Plant feed treatment process. Variations in chemical additions, temperatures, and other operating parameters ate applied to the simuiants to determine the resulting off-gas generation, condensate composition, slurry chemistry, slkry physical properties, cold cap reactions, glass redox,
1.2

I .. -
A s
/
8
8
8
8
* . . ' 8
8
8
8
8
8
8
8
a P, 7 tn
3 c;] X
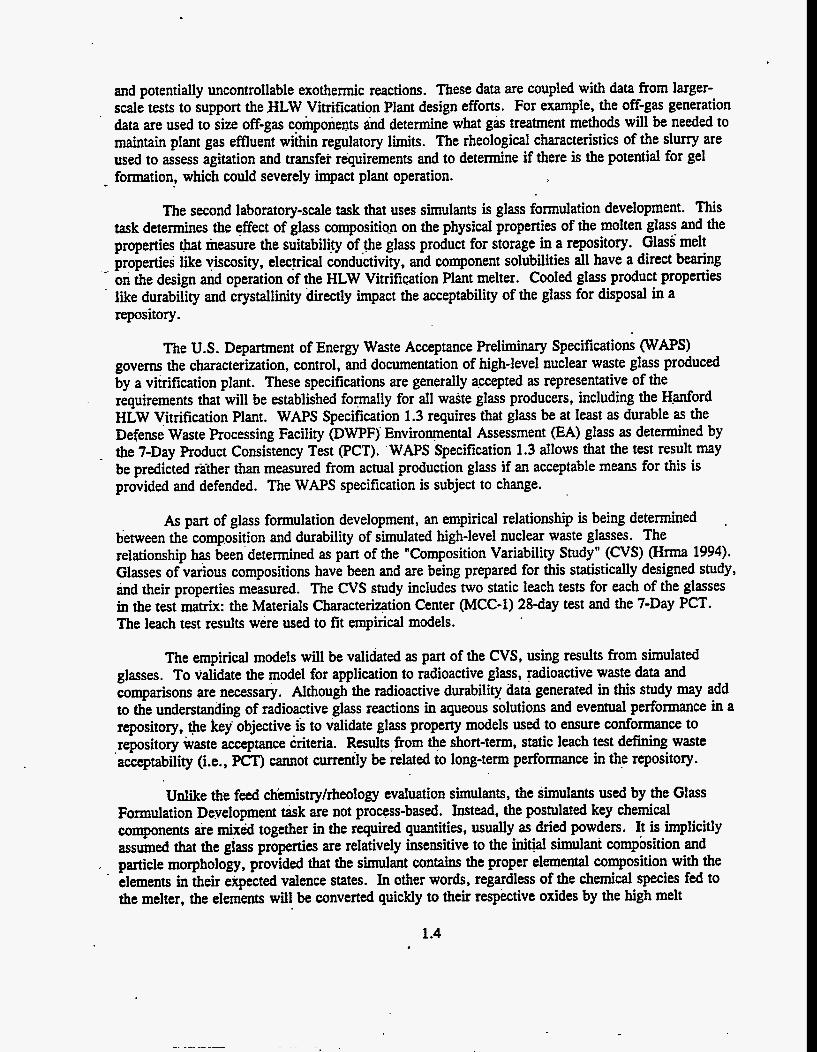
and potentially uncontrollable exothermic reactions. These data are coupled with data from larger- scale tests to support the HLW Vitrification Plant design efforts. For example, the off-gas generation data are used to size off-gas components &d determine what g k treatment methods will be needed to maintain plant gas effluent within regulatory limits. The rheological characteristics of the slurry are used to assess agitation a d transfer requirements and to determine if there is the potential for gel formation, which could severely impact plant operation.
The second laboratory-scale task that uses simulants is glass formulation development. This task determines the effect of glass composition on the physical properties of the molten glass and the properties that measure the suitabililty of the glass product for storage in a repository. Glass melt properties like viscosity, elecpical conductivity, and component solubilities all have a direct bearing on the design and operation of the HLW Vitrification Plant melter. Cooled glass product properties like durability and crystallinity directly impact the acceptability of the glass for disposal in a repository.
The U.S. Department of Energy Waste Acceptance Preliminary Specifications (WAPS) governs the characterization, control, and documentation of high-level nuclear waste glass produced by a vitrification plant. These specifications are generally accepted as representative of the requirements that will be established formally for all waite glass producers, including the H-anford HLW Vitrification Plant. WAPS Specification 1.3 requires that glass be at least as durable as the Defense Waste Processing Facility (DWPF)' Environmental Assessment (EA) glass as determined by
- the 7-Day Product Consistency Test (PCT). 'WAPS Specification 1.3 allows that the test result may be predicted rather than measured from actual production glass if an acceptable means for this is provided and defended. The WAPS specification is subject to change.
As part of glass formulation development, an empirical relationship is being determined ,
between the composition and durability of simulated high-level nuclear waste glasses. The relationship has been'determined as part of the "Composition Variability Study" (CVS) (Hrma 1994). Glasses of v&ous compositions have been and are being prepared for this statistically designed study, ikd their properties measured. The CVS study includes two static leach tests for each of the glasses in the test matrix: the Materials Characteriqtion Center (MCC-1) 28-day test and the 7-Day PCT. The leach test results were used to fit empirical models.
The empirical models will be validated as part of the CVS, using results from simulated glasses. To validate the model for application to radioactive glass, radioactive waste data and comparisons are necessary. Although the radioactive durability data generated in this study may add to the understanding of radioactive glass reactions in aqueous solutions and eventual performance in a repository, the key objective & to validate glass property models used to ensure conformance to repository waste acceptance &riteria. Results from the short-term, static leach test defining waste 'acceptability (Le., PCT) cannot currently be related to long-term performance in the repository.
Unlike the feed chimistry/rheology evaluation skulants, the simulants used by the Glass Formulation Development task are not process-based. Instead, the postulated key chemical components &e mixd together in the required quantities, usually as dried powders. It is implicitly assumed that the glass properties are relatively insensitive to the initial simulant composition and particle morphology, provided that the simulant contains the proper elemental composition with the elements in their expected valence states. In other words, regardless of the chemical species fed to the melter, the elements will be converted quickly to their respective oxides by the high melt
1.4

E
temperature. Process-based simulants are not used for this task because of thelarge number of different simulants required and the fact that the current, less-expensive approach is thought to be acceptable.
The laboratory-scale testing of radioactive samples supports both the glass formulation development and the feed chemistry/rheology evaluation. The radioactive testing provides a means for checking the results of simulant tests against the behavior of actual waste. Without this verification, there is no assurance that the process and product, using actual waste, will behave the 'same. With this verification, the simulant-based approach allows for the most cost-effective.plant design to be developed with a relatively low risk of failure. It is important to realize that for each estimated feed composition, two types of simulants need to be verified.. Both the process-based simulants and the dry powder simulants must be compared to actual waste.
.
1.3 * Report Contents
This report includes process/product testing results from the first and second radioactive core samples from Tank 241-AZ-101 and the first radioactive core sample from Tank 241-AZ-102. Data are provided for all steps of the process starting with washed solids characterization through characterization of the resulting glass.
Off-gas data were collected during formating, digestion, and recycle addition of the first core sample from Tank 214-AZ-102 and simulants. This data is not contained in this report but is fully documented.(')
Langowski, M.H., E.V. Morrey, J.M. Tingey, and M.R. Beckette. 1993. Wgas Characterization from the Radioactive NCAW Core Sample (102-AZ-Cl) and Simulant During HWW Feed Preparation Testing. Letter Report for U S . Department of Energy. Pacific Northwest Laboratory; Richland, Washington.
1.5
I


2.0 Conclusions and Recommendations
2.1 Conclusions
2.1.1 Process-Related
Analysis of ’the pretreated waste showed that chemical and radiochemical compositions are well within the design range established for the previously planned HWVP. A comparison of chemical composition of simulant 102-AZ Core 1 and the corresponding core sample indicates that accurate khemical simulants can be prepared.
Comparison of the concentration of Na in the washed solids, the sludge prior to washing, and the reference nominal value for the previously planned HWVP iqdicates that acceptable washing efficiencies are being achieved on the laboratory-scale processes. During the formating process CO$, NO;, and NO; react to produce gas,’arid‘the concentrations of these anions in the sample decrease. Slurry chemistry and offgas generation reactions are similar betuieen the core sampie and simulants. Observed offgas ‘differences between siinulant and core sample with the exception of H, could be explained by differences in testing conditions and slurry chemid composition. Peak and total H, generation in 102-AZ Core 1 was approximately one-third that generated by its simulant.
.
Specific activities indicate that the processed solids will be transuranic, and all of the liquid streams will be non-transuranic. The liquid streams will contain significant quantities of IS7Cs unless advanced processing of these liquid waste streams is incorporated. An offgas system for the formating process will be needed to trap the ‘r)r which may be lost during the formating process. Offgas systems will also be needed during the melter process to trap volatilized q c and .l9Cs. These radionuclides exhibited volatility in the laboratory-scale tests, but tests at this scale are not expected to be representative of full-scale systems.
The physical properties of the waslied-solids slurries vary significantly, but these differences are based upon variances in the solids concentrations. With few exceptions, when the slurry concentrations fell within the previous HWVP design range, the other physical and rheological properties were also within that same desi& range. A correlationbetween the density of the fofmated slurries and the solids concentration exists, and simulants are representative of actual waste with respect to this correlation.. The core samples settled much faster and achieved a significantly higher settled solids packing than, was observed in the simulants. Decreased solids packing in the simulants compared to the core samples is also observed in the centrifuged solids data.
Rheologic properties of the actual and simulant formated slurries were well below the design hnit for the prior-planned HSWP plant, and were measureably different from each other. After . accounting for differences in’ concentration, the simulant f o w e d waste exhibited yield stresses and apparent viscosities roughly two tht% greater than those for actual formated waste. A d formated waste samples exhibited greater iriitial settling rates, greater degrees of settling, and denser centrifuged solids than simulant samples, indidmg a difference in microstructure. A comparison with rheological data from full-scale simulant tests showed essentially identical results with laboratory-scale simulant data from this study.’ A ’comparison with historical NCAW formated simulant data dating back to 1985 showed actual formated waste results to be equal to or lower than the weakest (Le., lowest yield stresses and apparent viswsities) shulants reported.
2.1

Rheologic properties of the actual and simulant melter feed were below the design limit for the pri6r planned Hwvp plant, but were measureably different from each other. After accounting for differences in concentration, the simulated waste melter feed exhibited yield stresses and apparent . viscosities roughly 1.5 to 2 times greater than those for actual waste. Actual melter feed exhibited greater initial settling rates, equal or greater degrees of settling, and denser-centrifuged solids than simulant melter feed, indicating a difference in microstructure. A comparison with historical melter feed simulant data showed the actual melter feed rheology to be be within the range measured for
. simulant melter feed.
. Glass redox measurements (Fe+2/Fe+3) on the actual waste glasses were within the design limit for the prior planned HWVP plant and compared well with historical shulant data. *
2.1.2 Product-Related
Three NCAW core samples were characterized, prepared as melter feed, and vitrified into a glass product with acceptable properties relative to waste disposal. Durabilities of actual waste glasses as measured by PCT were between 20 and 100 times greater than the durability of environmental assessment (EA) glass. Crystallinity' in each of the three actual waste glasses were determined to be jess t h b 1 %.
1
Actual waste loadings in the radioactive glass were between 2% and 5 % greater than targeted values because of inaccuracies in total oxide measurements. Actual waste loadings were estimated to be between 27 96 and 30 % .
. Radionuclide releases from the actual waste glasses were generally consistent with results from other actyal waste glass studies. As with prior studies, Am-normalized releases were significantly lower than B (0.1 % to 6% of B); Tc, U,. Np, and Cs were generally more soluble than Am ( 2 10% of B normalized release). Not consistent with prior studies, Pu exhibited normalized releases near B. I
.
The durability of actual glass as measured by 7day PCT and 28-day MCC-1 was found to be siightly greater thzin simulant glasses of the same composition and model predictions. "he magnitude of the increase from radioactive to simulant PCT boron releases ranged from 28 to 67% of the lesser value and was statistically sign#cant. Actual and simulant waste glass releases were less than model predictions, and fell within the 95% prediction interval for the model 56% and 89% of,the time, respectively.
Biases in MCC-1 leach tests in the hot cell were attributed to temperature variations, temperature inaccuracies, and differences in leach containers. Small temperature variations in the MCC-1 test .ap&ar to affect dissolution rate of the glass significantly. A comparison between fused- silica aid TeflonN containers in a MCC;1.2&day test showed significant differences. The amount of silica released from the fused-silica liner is siaficant when cqmpared to Si released from the glass. Comparisons of results beween PCT 7day leach tests conducted in fused-silica, Teflon, and stainless- steel containers showed little or no differences between containers. The amount of silica released from the fused-silica l i i r during a PCT test was insignificant when compared to Si released from the glass. .
2.2

2.2 Recommendations .
a
a
a
a
a
a
Additional testing of actual waste representing different waste types should be performed to expand the envelope of validated shulant compositions and to broaden the properties being validated. Additional measurements should be made on the glass product to validate simulant behavior with respect to critical process properties (i.e., off-gas speciation during melting, glass liquidus temperamre, glass viscosity, radioisotope volatility, and fissile material distribution) and product properties (i.e., enhanced crystallinity measurement with scanning electron microscope [SEW, gel layer and secondary phase characterization of radioactive and simulant leached glasses by transmission electron microscope [TEM] to verify similarity of reactions).
Measure particle morphology in future slurry samples by "EM to increase understanding of physical and rheological differences between actual and simulated waste.
.
-7
Perform simple irradiation tests on NCAW simulant to determine radiation effects on rheology.
Perform irradiated leach tests on archived simulant glasses from thii study to determine if radiation effects are the cause of the increased durability of radioactive glasses.
Develop subsampling systems to obtain representative samples from the melter feeds.
Perform detailed study of the radionuclide versus surrogate volatility during formating and melting processes. The radionuclides of greatest interest are 'q, I3'Cs, and 99'rc.
* i c
2.3
I


3.0 Experimental Method
3.1 Test Objectives
The overall objective of the tests was to confirm that nonradioactive feed simulants and resulting glasses are adequate representations of actual radioactive feeds and glasses to support feed processibility assessments and glass property mode1 development. Specific objectives of the tests were as follows:
0 . Prepare and process test nonradioactive simulant slurries for compakon of chemical, rheological, physical, and off-gas behavior. Simulant slurries were also usd for development and verification of test procedures.
0
0
0
0
0
0
Perform feed concentration, formic acid addition, and recycle addition on the radioactive core samples and simulants and complete characterization of the fomted slurries. Compare properties of the radioactive and simulant samples to each other and to results from other studies.
Formulate, prepare, and add frit to the radioactive core samples and simulants and complete melter feed characterization.@) Compare properties of the radioactive and s&ulant melter feed samples to each other and to results from other studies.
Perform vitrification of the radioactive and simulant melter feeds and complete" characterization of the glass. Glass composition data is needed for preliminary supporting information for the Waste Foim Qualification Report (WQR), possible input to the Feed Processability Assessment, and CVS models and normalized release calculations.
Perform MCC-1 and PCT leach tests on radioactive and simulant glass for validation of the CVS models.
e. - .
Theorize observed differences between the Simdants, models, and radioactive data.
Provide a qualitative assessment of the adequacy of analytical techniques for process and glass characterization.
(a) This laboratory-scale test uses crucibles instead of a melter system for vitrification. The foimated sluny/frit mixture is referred to as "melter feed" throughout this report to be consistent with larger-scale terminology.
3.1
I

3.2 MethodIApproach'
Test plans were developed that detail the processing of the small-volume NCAW samples through 'retrieval, pretreatment, and vitrification process steps.(*)*'b) Physical, rheological, chemical, and radiochemical properties were measured throughout the process steps. Appropriate pretreatment and vitrification process steps were developed based on a wide range of nonradioactive simulant tests. The processing and characterization of NCAW simulants and actual tank samples are used to evaluate the operation of these processes. Figure 3.1 shows the flowsheet for the samplirig, processing, and testing performed on the 101-AZ Core 1 NCAW sample. C,haracterization flowsheets for the subsequent two core samples are essentially the same, with &or modifications. The HLW vitrification flowsheet has not'been finalized and has changed since these tests were performed. Current flowsheet plans include options for additional pretreatment steps, alternate reductant acid, and increased waste loading.
.
.
. .
3.2.1 Simdant Preparation
Process-based waste simulants were used in the laboratory-scale radioactive testing to develop and test hot cell procedures and to provide a direct comparison with the core sample feed chemistry and rheology. The slurry simulants were prepared using PNL procedure WTC-006-36, "Procedure for Preparation of Simulated Hwvp Feed for Laboratory-Scale Redofieology and Radioactive Process/koduct Tests," which simulates the waste-processing history. Major components, including Al, Fe, Mn, Ni, and Zr, were precipitated with NaOH from nitrate solutions and washed to'remove the sodium and nitrate. The insoluble minor components (Ag, Cd, Ce, Cr, La, Li, Mg, Nd, Pb, Pd, Rh, Ru, Si, Te, Ti, and Zn) were co-precipitated, washed, and blended with the major components. Soluble and slightly soluble minor components (B, Ba, Ca, CS, Cu, Na, and Sr) were added directly as oxides, hydroxides, fluorides or sulfates. Sodium was added in multiple forms to match the carbonate and anion (F, C1, NO,, NO3, PO,, OH and SO,) concentrations. The simulants were tested on the same apparatus and in the same manner as were the radioactive samples.
Glass simulants were prepared using PNL procedure PSL-417-GBM, "Procedure for Glass ' Batching and Melting, Rev. 0," to provide a direct comparison with the radioactive glass product
quality and characteristics. Simulant glasses were prepared to match the chemical composition of each core sample glass by batching and melting appropriate amounts of dry chemicals (e.g., F%03, Na2C03, ZrO,, A1203, SiO,, CaC03, MgO, H3Bo3, Li,C03, KCI). Each of the glasses-were melted at 1150°C for 1 hour in a platinum crucible, cooled, crushed in a tungsten carbide disc mill, remelted for two hours at 1150°C for better homogeneity, poured into bar forms, and annealed for 2 hours at 500°C.
Larson, D.E., May 1989. Laboratory Vitrification of Radioactive Pretreated Neutralized Current Acid Waste Test Plan, Report NO. HWVP-89-1VJ0030402B, Rev. 0.
Test Plan Laboratory-Scale Testing of the First Core Sample from Tank 102-AZ, Report No. PHTD-C92-05.05A, March 1992.
3.2

CHARACTERlUTKWJ OFTHE RRST CORE WPLE FRW DST 101-AT
Figure 3.1. Cha;acterization Flowsheet for 101-AZ Core 1 3.3

3.2.2 Sampling and Pretreaaent I x.
e
NCAW samples were retrieved from the double-shell tanks 241-k-101 (two core samples) and 241-AZ-102 (one core sainple), pretreatd, and processed according to the flowsheet shown in Figure 3.1. A specially designed and equipped core-sampling truck was used to retrieve samples of
. NCAW from the Hanford underground storage tanks. Cylhdrical segments of the waste, 1 in. in - diameter and 19 in. in length, were collected in stainless steel core samplers. The samplers were
designed to maintain the waste stratification present in the tanks.
Sludge depth measurements were taken before the tanks were sampled; the average sludge depth for tanks 101-AZ and 102-AZ before sampling were 17 and 33 in., respectively. The total waste depth in these tanks were 357 and 347 in. for tanks 101-AZ and 102-AZ; respectively; therefore, approximately 26 ft. of supernatant lies above the samples taken from these tanks. In the sampling process, waste from 38 in. to 19 in. above the tank bottom (segment 1) and 0 in. to 19 in.
'above the tank bobom (segment 2) were expected to be obtained; thus, both solids and supernatant would .be obtained from these samples. It was expected that sufficient supernatant would be obtained from these samples to characterize the entire supernatant layer in the tanks and perform the process testing needed for the vitrification processes; therefore, the entire depth of waste in the tanks was not sampled.
Each of the three core samples consisted of two 19-in.-long segments (245 ml) of waste. The samplers were transferred into the shielded facility (hot cell) where the samples were removed from the core samplers. Visual observations of the samples were recorded, and the samples were subsampled for chemical, radiochemical, and physical characterization. Core segments were homogenized and then composited to form a representative sample for use in process testing. The results of the characterization of these core samples and the detailed flow process of these samples are reported in the tank waste characterization reports for these cores (Peterson 1989).(a)*'b)
The NCAW pretreatment process consisted of adding ferric nitrate to the sample '(I .O M ferric nitrate was added to achieve 0.025 moles of ferric nitrate per liter of sample), stirring
, the sample for 30 minutes, and allowing the sample to settle for 62 hours. Based on the prior reference flowsheet, the waste enterhig the pretreatment facility was to contain 20 vol% settled solids, which formed the basis for establishing the laboratory pretreatment processing steps. Theabase pretreatment process included decanting the supernatant to achieve a target composition of 50 vol% settled solids. Only a limited amount of supernatant was obtained from the three NCAW core samples; therefore, snly enough supernatant necessary to characterize the sample was decanted from thesettled sample. m e remaining slurry was then washed with 3 volumes of deionized water per
(a) Gray, W.J., M.E. Peterson, R.D. Scheele, J.M. Tingey. 1991. "Characterization of the Second Core Sample of Neutralized Current Acid Waste from Double-Shell Tank 101-AZ." Letterreport for U.S. Department of Energy. Pacific Northwest Laboratory. Richland, Washington.
Gray, W.J., M.E. Peterson, R.D. Scheele, and J.M. Tingey. 1990. "Characterization of the First Core Sample of Neutralized'Acid Waste from Double-Shell Tank 102-AZ." Letter report for U.S. Department of Energy. Pacific Northwest Laboratory. Richland, Washington.
-(b)
3.4

LABORATORY OPERATIONS
PRETREATMENT . TESTINGAND ANALYSIS
. - *
. . . . . . . . . . I . . CESIUM NITR . . . CHARAC- TERlZATlON . . . . PROJECT Add NaOH and NaN03
. .
.- concentration ....... . . . .
sure Physical, Chemical, Rheological Properties
I - -
PLANT OPERATIONS 1
BOIL-OFF, - Concentrate Washed Solids To TBD g oxide/L slurry
Measure Physical, Chemical, and Rheological Properties
ADDREDUCTAM t 1
React with Reductant Acid and Digest
Measure Physical, Chemical, and Rheological Properties
Adjust Concentration and Add Frit or Glass Formers
Cakine Melter Feed and
I 1 1
OPERATIONS
. . . . . . .
I
- z - FEEDTANKS -
TO HLW MT. PLANT
I ..... ,, ..:.'J ..;..;.:... +:. . . . . - . i_ . . ..... : . . . . . . ..:
. . . , . . ,. . . .. . . . . . .
Figure 3.2. HLW Vitrification Process Steps for the NCAW Core Samples 3.5
I

Table 3.1. Differences in Process Steps and Parameters - 101-AZ-CI (1st core ) .
proctss 1014Z-C2 (2nd Core.) 102-AZ-C1 (3rd Core ) SterdPametcr NCAW Simulant 102-AZ-CI (Simulantl
Cesium Recycle Not Added
Washed Solids @ 80°C Concentration condensate to cell
Q 101”C,’” condensate collectcd and analyzed
sample sires Q 125g TOIL
Formic Acid (90 wt%) Addition Rate
0.164 L (101-Az-CI) 0.304 L (101-AZ-C2)
19.5 to 36.1 gallmin (plant scale equivalentR))
F o m k Acid Addition 3 (moles (moles)
5.7 moles N030) (core) NO3 + 2 (moles NOJ
Formating Temp. 95°C f 3°C
Digestion Temp. 95°C f 3°C
Digestion Penal 2 hours
- Recycle Digestion 0 hours, not added
Off-Gas Analysis None
Fo~mated Slurry Concentration
125 g total oxiden (125 g wane oxiden)
Target Want Loading 25 %
Added
0.115 L (102-Az~CI) in 0.058 L batches
2.0 gal/& (plant scale equivalent”’)
95” f 1°C
101°C f 1°C
4 hours
Formating. digestion, recycle addition
157 g’total oxiden (I40 g waste oxiden)
28 x
(I) Core sample was inadvertently dried during concentration. (2) Plant scale equivalent on volume basis. (3) Includes nitrate in washed solids and recycle;
volume of slurry. The diluted slurry was agitated for 1 hour and then allowed to settle for 6.5 hours. The wash solution (supernatant following the washing process) was decanted, and the washing and d w t h g process was repeated one additional time.
The washed solids (solids remaining after the second wash step) from the pretreatment of the I NCAW sample became the feed slurry for the HLW vitrification process. The HLW vitrification
process steps were concerpration, f o w c acid addition, and frit addition. Due to the evolution of the testing, the’first two core samples were processed under slightly different conditions than the third core sample. Differences between the prodess steps and parameters of these core samples and related simulants are shown in Table 3.1. Chemical additions of NaN03 and NaNO, were not required for the two core samples from 101-AZ, but were required for 102-AZ Core 1. Chemical additions of 1.711 g NaNO,, 0.966 g NaNO,, and 0.1105 g CsNO, were made to the as-received 102-AZ Core 1 washed solids sample containing 13.3 g of equivalent waste non-volatile oxides.
3.6

3.2.3 Formic Acid Addition '
Formic acid was added to the samples to adjust .the feed rheology and to reduce the redox- sensitive species in the melter feed. These species must be sufficiently reduced to avoid foaming in the melting process, but must not be'reduced to the extent that the metal oxides in the waste- precipitate'and fohn an electrically conductive sludge, which could lead to premature failure of the ceramic melter. The amount of formic acid added to the washed solids to achieve the appropriate properties was determined empirically.. This empirical relationship was based upon the.redox state of the glass as measured by the ferrous-to-femc ratio'in the vitrified product.
For the two core samples from Tank 101-AZ and the simulant for these core samples, 3 moles of formic acid per mole of nitrate plus 2 moles of formic acid per mole of nitrite in the washed solids were added to the whte to achieve an acceptable redox state in the glass. For the core sample from Tank 102-AZ and its simulant, excess formic acid was added to the sample (moles formic = 5.5 x moles NO{) to ensure hydrogen generation. The sample was heated to 95°C f3"C and maintained at this temperature while the formic acid (90 wt% solution) was add@ at a rate of 1 mL/min for the 101-AZ cores and 0.019 ml/min for the 102-AZ core. The equivalent formic acid addition rates on the plant scale are listed in Table 3.1. A range of addition rates is given for the 101-AZ sample because the addition rate (1 &/min) was held constant, but the sample size was varied. Following the addition of formic acid, the formated sample was digested at 95" or 101°C for a specified period of time (2 to 4 hours). A' simulated recycle stream was added to the 102-AZ core after the initial digestion period, and digestion was continued for another 2 hours. The composition of the simulated recycle stream is given in Appendix A, Table A.24. Offgases generated during the formic acid addition, digestion, and recycle addition were collected and analyzed from the Tank 102-AZ sample. The results of this analysis were reported previously.(')
3.2.4 Frit Addition
Following digestion, the samples were adjusted to concentrations of 125 to 157 g total non- volatile oxides& characterized, and combined with glass frit (glass formers) to achieve a waste oxide loading of 25 to 28 percent. Rkadily available baseline frits (HW394 and FY91 New Frit) and one specially designed frit were used to yield glasses with acceptable processing and. durability properties. The specific frit added to each core sample was as follows: HW39-4 frit to 101-AZ Core 1, specially designed frit to 101-AZ Core 2, and FY91 New Frit to 102-AZ Core 1. Compositions of the three frits are included in Table 4.1. Before melting each core sample, CVS model predictions of viscosity,. electrical conductivity, MCC-I and PCT durability, and liquidus temperature were evaluated for acceptability. A glass simulant of 101-AZ Core 1 (based on washed solids composition, targeted waste loading, and frit composition) was prepared and analyzed for c~$stallinity before melting the radioactive glass. To validate glass property models better, different frits were used with each core sample to produce glasses of significantly qfferent compositions. Water was removed by concentration from this frit/slurry mixture to achieve a total non-volatile oxide content of 500 grams per liter.
(a) Langowski, M.H., E.V. Money, J.M. Tingey, i d M.R. Beckette. 1993. o$gas characte&tionfiom the Radioactive NGIW Core Sample (102-AZCI) and Si- During Hwcrp Feed Preparation Testing. Letter Report for U.S. Department of Energy. Pacific Northwest Laboratory. Richland, Washington.
3.7
1 ' I I '

3.2.5 Calcining and Vitrification
Calcining and vitrification were performed to transform the melter feed into a homogeneous glass under conditions similar to those in a ce&c melter. The melter feed was calcined to drive off volatiles such as carbon-dioxide, nitrogen oxides, and water while converting elements into their oxide form, similai to the chemical. decompositions that occur in .the ceramic melter cold cap. * The calcine was then vitrified to'fuse the frit and waste into a homogeneous glass.
Dried melter feed was transferred to a Denver Fire Clay (DFC) crucible and calcink for two hours .at 600°C in a Lindberg muffle furnace. A low .heating . . rate was used for @ c k g to avoid solids loss from sudden volatilization. The solids were placed in a cold furnace, and the temperature of the furnace was increased to 20d0c over a 20-minute period. The solids were maintained at this temperature for 1 hour and then increased :to 400°C over a 15-minute pe$od, held for 1 hour, and then increased to 600°C over a 20-minute period. The solids were then held for 2 hours at W " C ,
' after which the furnace was turned off and allowed to cool with the door open. After cooling, the calcined feed was weighed and weight loss w& calculated. Weight loss ranged from 7.6 to 23 percent. The calcine was ground to -40 mesh for improved homogeneity and was split .into thirds for melting.
The feed was melted in a DFC crucible at 1150°C for two hours in a Lindberg muffle furnace. The first third of calcine was tiansferred to a DFC crucible and placed in the furnace at 1150°C for 30 minutes. The crucible was removed from the firnace and the second 'third of the calcine was added. This sequence Was repeated until all of the calcine was melted. After the last calcine addition the glass was held for 2 hours at 1150°C. Based on past experience with crucible melts, a No-hour soak was deemed sufficient to achieve glass homogeneity.
The molten glass was removed from the furnace and poured into a stainless steel bar mold . that had been preheated to 300°C on a hot plate (see Figure 3.3). The bar mold was preheated to avoid shocking the .glass and causing it to fracture. When the glass had solfdified, the sides of the bar mold were removed (see Figure 3.4) and the'glass bar was placed in an annealing furnace at 500°C. The bar was annealed for 2 hours, after which the power to the furnace was shut off and the glass was allowed to a h 1 slowly overnight. Approximately 35% glass weight loss was incurred because the glass stuck to the sides of the crucible. This weight loss is a disadvantage of making small quantities of glass in a radiochemical hot cell. The glass-pouring efficiency is low because of the time required to remove a sample from the furnace and pour the glass using a 10-foot hot cell manipulator. A photograph of glass from 101-AZ Core 1 is shown in Figure 3.5.
.
.
3.2.6 Glass Sample Preparation
In preparation for PCT leach and glass analytical testing, a section of each glass bar was crushed to <lo0 mesh. The cruslied glass particles were sieved to obtain samples of -1o0/+200 mesh for use in the PCT test. Portions of the -200 mesh glass were submitted for chemi.cal and radiochemical analysis. In preparation for MCC-1-type. leach testing, glass was cut into cubes using a low speed wafering saw with a diamond blade. Cubes were cut with surface areas between 220 and
3.8

Figure 3.3. Hot Cell Method of Pouring and Quenching Molten Glass from Crucible
x
Figure’3.4. Separation of Glass Bar from Mold Before Annealing 3.9
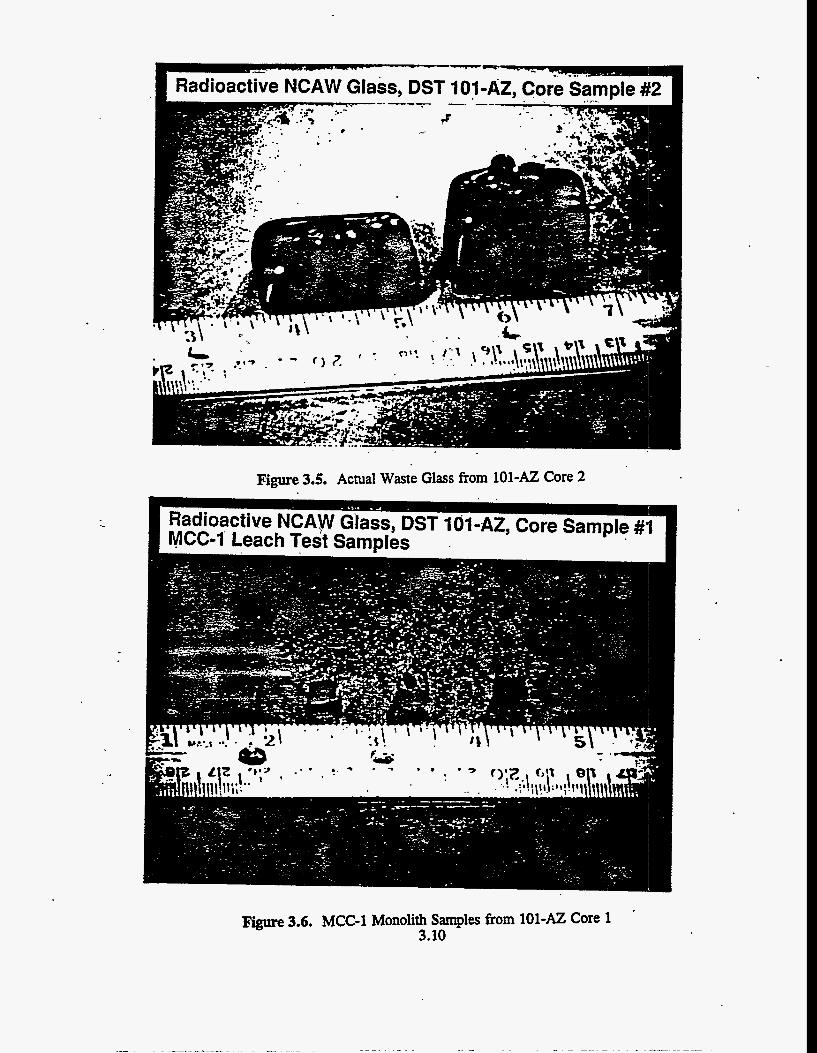
- __. . -- - . , Radioactive NCAW Glass, DST 101-AZ, Corekample #2 i
Figure 3.5. Actual Waste Glass from 101-AZ Core 2
161 4 2 , Core Sample #‘I
Figure 3.6. MCC-1 Monolith Samples from 101-AZ Core 1 ’
3.10

240 nun*. The final cube dimensions were measured by micrometer and were between 5 and 7 mm on each side (see Figure 3.6). Edges of the glass bars were trimmed so that none of the sides of the
3.2.7 Durability Testing
cubes originated from the glass-to-metal (Le., bar mold) interface. , I
5, 7s
* ' i c j '
Five hot cell and 12 laboratory durability tests involving 10 different glasses were conducted to comp,are simularit and predicted results to those of radioactive glasses. Three of the glasses were fully radioactive glasses prepared from the three core samples, 'three were direct simulants of the radioactive glasses and the remaining four were reference glasses. A summary of the tests p&fonned . . and the purpose of each sample is given in Table 3.2. 7 ..-
In hot-cell test #1, the radioactive giasses fim the first two core samples were leach-tested using a durability test procedure similar to MCC-1 (Materials Characterization Center, 1984). The procedure w k altered to allow leaching in a radioactive environment. Because of the highly radioactive environment, fused-silica-lined stainless-steel containers were used instead of Teflon' containers. The fused-silica-lined containers were used to prevent radionuclide plate-out on the stainless steel. The plenum space in the containers 'was backfilled with argon to prevent uranium complexation with CO, andnitric acid generation from the radiolytic production of NO,. The tests were conducted for 28 days at 90°C using de-aerated, deionized water as a leachant. The glass surface area-to-leachant volume ratio was 0.01 mm-' (220 mm2 glass surface area in 22 mL of water). The blocks of glass were suspended from the bottom of the leach container using a fused silica pedestal. The leach test was performed using three samples of each of the radioactive glasses, two
, samples of ATM-10 glks as a reference, two samples of NCAW simulant, and two blanks (i.e., containers of leachant without glass 'samples). The NCAW simulant glass was leached in the - radioactive environment to permit a comparison between leaching this glass b o t h h and out of a radiochemical hot cell.
Results from hot cell test #1 indicated an apparent bias and excessive intra-sample variability that was later attributed to differences in fused-silica lined k d Teflon' dontainers and to slightly reduced temperatlire control in the leach oven. A discussion of the efforts to resolve these issues is contained h Section 3.4 of this report. Laboratory tests #1 and #3 were conducted as part of the investigation to determine the cause of the discrepancies. Laboratory tests #2, #4, #5, and # lo and hot-cell test #2 were performed to select an appropriate container type for continued hot'cell PCT durability tests and to establish a basis for continuance of hot-cell testing. 3ecause of the unavoidable, potential differences between tests conducted in the hot cell and the laboratory (e.g., container type) and to minimize the long-term variability associated with the simulant to actual waste glass comparison, simulants of the core samples were tested in the laboratory and in the hot cell adjacent to radioactive samples. This allows a direct comparison between the simulant and the actual waste glass and a direct comparison between the laboratory-tested simulant and the model predictions. Provided hot cell and laboratory durability Pests are comparable, a direct comparison of actual waste glass to model
3.11
' I
I

Table 3.2. Summary of Durability Testing Test Number. Type and Container
Hot Cell Test #I (MCC-1 in fused-silica)
Hot Cell Test #2 (Pcr in stainless steel)
Hot Cell Test #3 (PCT m stainless steel)
Hot Cell Test #4 (PCT in stainless necl)
Hot Cell Test #S (PCT in stainless steel)
Labontory Test %1 (MCC-I in Teflon)
Laboratory Test #2 (PCT in Teflon)
fused-silica)
Laboratory Test #4 (PCT in fused-silica)
Laboratory Test #S (PCT in stainless steel)
Laboratory Test #6 (per in . Teflon)
Laboratory Test K' (PCT in Teflon)
Laboratory Test #8 (PCT in Teflon)
Teflon)
Laboratory Test 110 (PCT in suiuless steel)
Laboratory T e a #3 (MCC-1 in
h b o r a t o ~ Tea #9 (MCC-I in
Labontory Tcst 11 1. (PCT in Teflon)
Teflon) Lhratory Tat 112 (MCC-1 in
Glass Twe
101-AZ Core 1 101-AZ Core 2 NCAW Simulant ATM-10 Blanks
NCAW Simulant
101-AZ Core 2 IOI-AZ-c2 Simulant CVS-IS-HW39-4 Blanks
101-AZ Core 1 101-AZ-Cl Simulant cvs-IS-Hw39-4 Blanks
102-A2 Core 1 I02-AZ-Cl Simulant CVS-IS-HW39-4 Blanks
NCAW Simulant
NCAW Simulant
NCAW Simulant Blank
NCAW Simulant Blank
NCAW Simulant Blanks
101-AZ-Cl Simulant
101-AZ-CI Simulant
lOl-AZ-c2 simulant
101-AZ-c2 simulant
101-AZ-c2 SiUlant CVSIS-HW39-4 EA Glass Blvltr
102-AZ-CI Simulant
102-Az-c1 Simulant
Samules
3 3 2 2 2
3
3 3 3 2
3 -4 3 2
3 4 3 2
2
2
2 1
2 1
3 2
2
2
2
2
2 2 1 1
2
2
3.12
&E!.% Measure MCC-I durability of 101-AZ Core 1. Core 2 and hot cell processg simulant
Demonstrate hot cell PCT in stainless steel
Obtain di+ PCT comparison betwccn 101-AZ Core 2 and simulant
Obtain direct PCT comparison between 101-AZ Core 1 and simulant
Ob& direct PCT comparison between 102-AZ Core 1 and simulant
Obtain comparable laboratory MCC-I results
Obtain comparable laboratory PCT results
Investigate MCC-I biases from fused-silica containers
Comparison of candidate PCT leach container
,
Comparison of candidate PCT leach container
Obtain laboratory PCT results for direct d e l comparison
Obtain laboratory MCC-I results for direct model comparison
Obtain laboratory PCT results for direct model
Obtain labomtory MCC-I mults for d m t model comparison
Comparison of laboratory PCT in stainless steel to hot cell P q in stainless and laboratory PCT in teflon
comparison
Obtain laboratory PCT m u l u for d m t model comparison
Obtain laboratory MCC-I results for direct model comparison

predictions is also appropriate. .Hot cell tests #3, #4, and #5 and laboratory tests #6, #7, #8, #9, #11, and #12 were conducted to make these comparison for each of the three core samples.
3.2.8 Description of Analytical Methods
Extensive physical, rheological, chemical, and radiochemical characterizations were performed. Physical characterizations included:
e e e e e e e e e
e 0
e e e e
0
e e e e e e e e
density settling rate vol% settled solids vol% and wt% centrifuged solids wt% total solids wt% dissolved solids wt% total oxides particle size shear stress versus shear rate (apparent viscosity).
"-
Chemical analyses included:
PH elemental analyses by inductively coupled argon plasma atomic emission spectroscopy (ICP/AES) anions by ion chromatography (IC) total carbon (TC), total organic carbon (TOC), total inorganic carbon (TIC) total uranium by fluorescence X-ray diffraction.
Radiochemical analyses 'included:
gamma energy analysis (GEA) Cm-242, 243 & 244
Np-237 Am-24 1
1-129 TC-99 Sr-90 Se-79 C-14
. H-3 Pu-238, 239 & 240 Totala Totals.
The methods used for these characterizations and analyses are described in Appendix G.
3.2.9 Analyses Performed
Analyses completed on the core sample and simulants are summand in Table 3.3. Chemical, radiochemical, physical, ahd rheological analyses were generally performed on each of the
3.13
washed solids, formated slurry, and melter feed for each core sample. Similar analyses minus the radiochemical were performed on the simulant slurries. Radioactive glasses were characterized with respect to density, chemical, and radiochemical composition, redox (Fe+2/total Fe), crystallinity by X- ray diffraction, and durability. Nonradioactive glasses were characterized with respect to redox (Fe+2/total Fe [NCAW simulant only]), viscosity, electrical conductivity, and durability. Glass durabilities were measured using PCT and MCC-1-type leach tests.
Not shown in Table 3.3 are the number of replicate analyses. In most cases, physical and rheological analyses were performed in 'duplicate and chemical and radiochemical analyses were performed in single. A notable exception is with ICP analysis, which requires two preparations for each solids sample, and leachate analyses, which were performed in duplicate or triplicate. In the .
process of adjusting the washed solids, formated slurries, and melter feed samples to the proper concentration, additional sets of density, wt% solids, and wt% oxides data were obtained. Additional analyses related specifically to the offgas generation study (e.g., NH,, acid/base neutralization capacity) were performed on 10242 core 1 and Simulant but are not included in this report (see footnote on page 3.8).
3.14

Table 3.3. Summary of Analyses Performed . 101-Az core 2
Glass Simulant
X I Actual Waste 1 . X X
101-AZ Coni 1 Glass Simulant
x x x x 1 Actual Waste
x x x X X - - WS FS MF a MCC-1 pcT 0 MCC-1 pcT E MF 0 MCC-1 pcT 9 MCC-1 'pcT ArulvSCS
Anions by IC Elemental by ICP Carbon Analysis TC/TICnr)(: Fe'zIFe Total RH Fomk Acid pH Pmfile Crystallinity by XRD Electrical Conductivity
X B x x x
x x X
X
X
X X X x , x B x x
x x x
X
X
x ' X x . . x
X X X X X X ' X X
X X X X
X B X
X
X X X
X
X
X X X
G a m Energy Analysis Total Alpha Total Beta H-3 C-14 se-79 sr-90 Tc-99
. 1-129 Np-237 Am241
, Cm-242,243 + 244 RI-238. 239 + 240 Total U
X 'X X X X X X
X X X X X X X X X X X
X X
X X X X X X X X.
X X
x x x x x x x x x x x x x x x x x x x x x
x x x x x
X x x x x x
x x x x x x x * X ' x x x x x x x x x x
x x
X Density
Vo1% settled Solids Density Cent. Solids & Sup. Vol% & WtZ Cent. Solids Wt% Dissolved & Total Solids Wt% Total Oxides Particle size distribution Shur Stnss vs Shear Rate Viscosity
, Settlinghte
X X
WS = washed solids: Fs = formated slurry: MF = melhr feed; G = glass; MCC-1 = leachates from MCC-1; PCT = leachates from PCT, B = both slurry and supernatant; Cent. = centrifuged
I
3.15

~nalv?cs Anions by IC Elemental by ICP Carbon Analysis Tcfl'IC/'NX Fe*'IPe Total
Formic Acid pH Pmfile Cryshlliniv by XRD Electrical Conductivity
PH
Gamma Energy Analysh Total Alpha Total Bcta *
H-3 (2-14 Se-79 Sr-90 Tc-99 1- I29 Np-237 Am-241 Cm-242,243 + 244
Tom1 U Pu-238,239 +. 240
Density Settling Rate VOIR Senled Solids Density Cent. Solids & Sup. VOI % & Wt 96 Cent. Solids Wt% Dissolved & Total Solids Wt% Total Oxides Particle Site Distribudon Shear Smss vs Shear Rate . Viscosity
ws X X X
-
X X
X
X X X X X X
X X X X
x .
X
Table 3.3. (Continued) Summary of Analyses Performed , . I .
Actual Waste m B M F g
x x x X B B X
x x X
x x ! . i
X
102-AZ COW 1 Slurry Simulant
x x B * B
- - PCT G MCC-I a fi MF
x x
I Glass Simulant
X X X
I X x x
X X X X ' x 2
X X '
x x x x x x
X
x x x x
X X
, x X ' x x
B . x x x x
NCAW Simulant Run I Run 2 Run 3
I
x x x X X B
X x x x X
x x
i
x x x x x x x x x x x x x x x x x x x x x x x x x x x x x
x x x x
x x x x x x x . x X X ' x x
x x x x x x x x x x x x
x x x x x x x x x x
X
WS P wrshed solids; FS = formated slurry: MF = melhr feed; 0 = glass; MCC-I = leachates fmm MCC-I: PCT = leachates fmm PCT; B = both slurry and supematant : Cent. = centrifuged
3.16

3.3 Test Equipment
The equipment used for formic acid addition of the samples from cores 1 and 2 from Tank 101-AZ is shown in Figure 3.7, The sample is pEaced in the 500-ml reaction vessel; the temperature . and pH of the sample are monitored with a Type K thermocouple connected to a digital thermometer . and a combination pH electrode connected to a pH meter. The sample is stirred with a mechanical stirrer. A heating mantle surrounding the reaction vessel obtains the temperatures required for the digestion and formic acid addition steps. The temperature of the heating m t l e is controlled by a temperature controller in line with a variac. The heathg mantle temperature is monitored and controlled by a Type K thermocouple placed between the heating mantle and the reaction vessel. Formicsacid is pumped from the reservoir to 1 in. below the surface of the sample win a peristaltic pump. The flow rate of the pump was calibrated before the addition of f o m k acid. The vapor and
. offgases produced passes through a water-jacketed double condenser and the condensate runs back into the reaction vessel. The temperature of the cooling water was =25"C.
schematic of the equipment used for formic acid addition of the sample from Tank 102-AZ and related simulants is given in Figure 3.8. This system is significantly different than the previous system because off-gas measurement capabilities were added to the system. The volume of the reaction vessel is = 120 mL. The temperamre and pH of the sample in the reaction vessel is monitored with a thermistor and combination electrode connected to a pH meter, which records both temperature and pH. The pH is corrected for temperature effects. The formic acid is added through a line below the surface of the sample. The formic acid is pumped from a reservoir to the reaction vessel with a peristdtic pump. All gases produced during the digestion, formic acid addition, and recycle addition pass through a double condenser system where the condensate is trapped after each condenser. The temperature of the sample .is maintained with a heat tape wrapped around the reaction vessel. ' The temperature of the sample is controlled by a temperature controller and Type K thermocouple placed between the heat tape and the reaction vessel. This system is shown in Figure 3.9.
Radioactive calcining and vitrification were performed in a 1200°C capacity Lindberg muffle furbce with Type S thermocouple temperature measurement. The DFC crucibles measured atiout 2.5 in. in diameter. Crucibles were removed from the furnace with tongs and glass was poured onto a preheated stainless steel bar mold (sei Figures 3.10 b d 3.11). The glass bars were annealed in a 1200°C capacity Thermolyne muffle furnace with Type K thermocouple temperature measurement.
Glass sample crushing and sieving was performed with a Plattner style, stainless-steel mortar and pestle and 3-in.diameter stainless-steel sieves. Glass was cut with a Struers Miniton cutoff machine with diamond blades. The saw was equipped with a micrometer on the chuck to allow cuts to be made at precise locations.
Durability testing was performed in a Blue M ford-air convection oven with a customized rack for holding -up to 12 leach vessels. h c h vessels used were Parr Instrument Co. 45 ml screw cap bombs fabricated from 304L stainless steel and Teflon gasket. Fused-silica liners and pedestals were used in some hot cell and laboratory leach tests.
3.17

F’igure 3.7. Hot Cell Equipment Setup for Formic Acid Addition on IOl-AZ Core Samples
3.18
, . - . .

Figure 3.9. Hot Cell Formic Acid Addition Equipment for 102-AZ Core 1 3.19
b
Figure 3.8. Hot Cell Equipment Setup for Formic Acid Addition and Offgas Analysis on 102-AZ Core 1
c

3.4 Test Anomalies
Three anomalies in the processing and characterization of the core samples should be considered when hterpreting selected data. A pH probe broke into 101-AZ Core 2 formated slurry and resulted in additions of K and.C1 to the waste; but should not affect results or conclusions from that core spple . Inadvertent drying of the wished solids from 1 0 2 4 2 Core 1 probably resulted in altered physical and rheological propertiks, including higher than normal settling rates and lower than normal yield stress and apparent viscosity. The use of fused-silic&lined leach containers and less than optiinal temperature control in the MCC-1 testing of 101-AZ Core 1 and 2 probably resulted in decreased releases for all samples.present in Hot Cell Test #l.
3.4.1 pH Probe Broken into 101-AZ Core 2 Formated Slurry
During formating of the 101-AZ Core 2 washed solids, a pH electrode was broken in the reaction vessel, resulting in a 10 f 1 ml addition of 3.0M KCl to the waste slurry (309.3 ml of washed solids at 123'g total oxide (TO)/L). Impacts of the KCI addition on processability, final glass composition, and glass acceptability were assessed and judged to be acceptable before proceeding. The frit composition designed for this core sample was adjusted downward in Na to account for the addition of K. Sodium and K are both considered Estimated impacts to washed solids composition and projected glass composition resulting from the KCI addition are as follows:
Na for the purpose of CVS modelling.
Before KCI After KCI Addition ' Addition < DL 3450 mgkg ws
3170 mgkg ws 4-
40 mgkg ws 0.0 wt% 1.08 wt% 0.01 wt% 0.82 wt%
Comuosition
K in washed solids -' C1 in washed solids-?
K,O in glass at 30% waste !oading C1 in glass at 30% waste loading
Notes: kg ws = kilograms )of washed solids at 0.112 g waste oxide/g slurry <DL = less than detection limit
3.4.2 Drying of 102-AZ Core 1 Washed Solids
solids state. Radiolytic degradation'of the storage container lid allowed the slurry to dry at room temperature over a period of months. The problem .was discovered when the washed solids were retrieved for process,ing. Deionized water was added to the dried.solids to bring the slurry to 31g TO& before a boil-off and condensate-collection step. The s w l e was concentrated at boiling
-- (approximately l0loC) to,achieve a target concentration of 125g TO&. Because of evaporative losses in the system and the hbili ty to observe the slurry level in the reaction vessel visually, the sample was allowed to dry out again. 'Deionized water was added to the dried solids to achieve the desired concentration and the sample was processed as planned.
\ The 102-AZ Core 1 slurry was inadvertently allowed to dry out twice while in the washed
.
,
Experience in the hot cell with s.evcral tauk-waste samples that have bem dried and rewetted showed alteration to the physical and rheological properties' but no change to the chemical properties. For those'samples ,that have been dried and rewetted, settling rates increased substantially and
3.20

rheological strengths decreased significantly. These observations can also be seen with the 102-AZ Core 1 when compared to the other two core samples in this report.
One plausible explanation is that the small colloidal sized particles become close enough to other colloidal or larger sized particles to bond together. The ratio of bond strength to particle mass involved with these small particles is high enough to prevent breakage when diluting or mixing. Irreversible agglomeration of these small particles would tend to increase the settling rate and decrease the yield stress and apparent viscosity.
3.4.3 In-Cell MCC-1 Testing Discrepancies
An apparent bias and excessive replicate sample variability were experienced for all glasses in the MCC-1 test completed in the hot cell. Comparative in-ckll and out-of-cell data on non-radioactive glasses included in the test are provided in Figures 3.10 and 3.11. The in-cell releases for NCAW simulant were an average of 43% lower than those for the out-of-cell t&t. The differences for the ATM-10 glass were not as significint. The boron, lithium, and sodium releases were about 13% lower for the in-cell tests, while the silicon release was 24% higher. Variation between replicate samples of all glasses tested is illustrated in Figures 3.12 through 3.15. The 101-AZ Core 1 glass exhibited.the greatest replicate sample variability with sample #3 being an average of 43% lower than sample #1,
*
A number of hypotheses were developed to explain the discrepancies between in-cell and out- of-cell results and replicate samples. Possible contributions to one or both of the discrepancies include difference in container type, inaccurate temperature measurement, temperature gradients within the oven, inconsistency in leachability of silica liners, poor sample preparation, radiolysis of air within the leach container plenum, and analytical errors. Analytical errors were ruled out by examining standards run before and after test samples. Poor sample preparation was ruled out because the releases were low, not high. A poor washing would cause lines to be placed in the leachant, which would increase releases because of increased surface areas. Radiolysis from background sources is a possible contribution, but was not specifically investigated. The questions of container type, temperature variation within the oven, and inaccurate temperature measurement are discussed below.
'
3.4.3.1 Investigation of Type of Container
The most likely explanation for the difference between in-cell and, out-of-cell results is the fact that two sets of tests were conducted in different leach containers. The in-cell tests were conducted in fused-silica-lined stainless-steel c o r n e r s that were backfilled with argon; the out-of-cell tests were conducted in Teflon' containers with no backfilling. The blanks from the in-cell test had a significant background of Si (4.2 to 6.5pg/ml), between 16% and 42.76 of the total concentration of Si found in the radioactive 'samples. Dissolved silica is we11 known to decrease the rate of dissolution of nuclear waste glasses. The Si source in the bl& is the fused-silica liners and, pedestals. The leachants were checked for Si contamination before'the test and were found to be clean. To investigate the effect'of
. the liners, the outkf-cell test was repeated using fusd-silica-lined stainless-steel containers with argon backfilling to simulate the in-cell test. Results from this axid p&or MCC-1 tests on NCAW glass are shown in Table 3.4 and Figure 3.16. The laboratory test in fused-silica produced B, Li, and Na releases 20% lower than laboratory tests in Teflon. This bias is not of the same magnitude as the
3.21

Cell
B Li Na Si
Figure 3.10. In-Cell versus Out-of-Cell MCC-1 Discrepancy for NCAW Glass
-Of-Cell
Figure 3.11. In-Cell versus Out-of-Cell MCC-1 Discrepancy for ATM-10 3.22
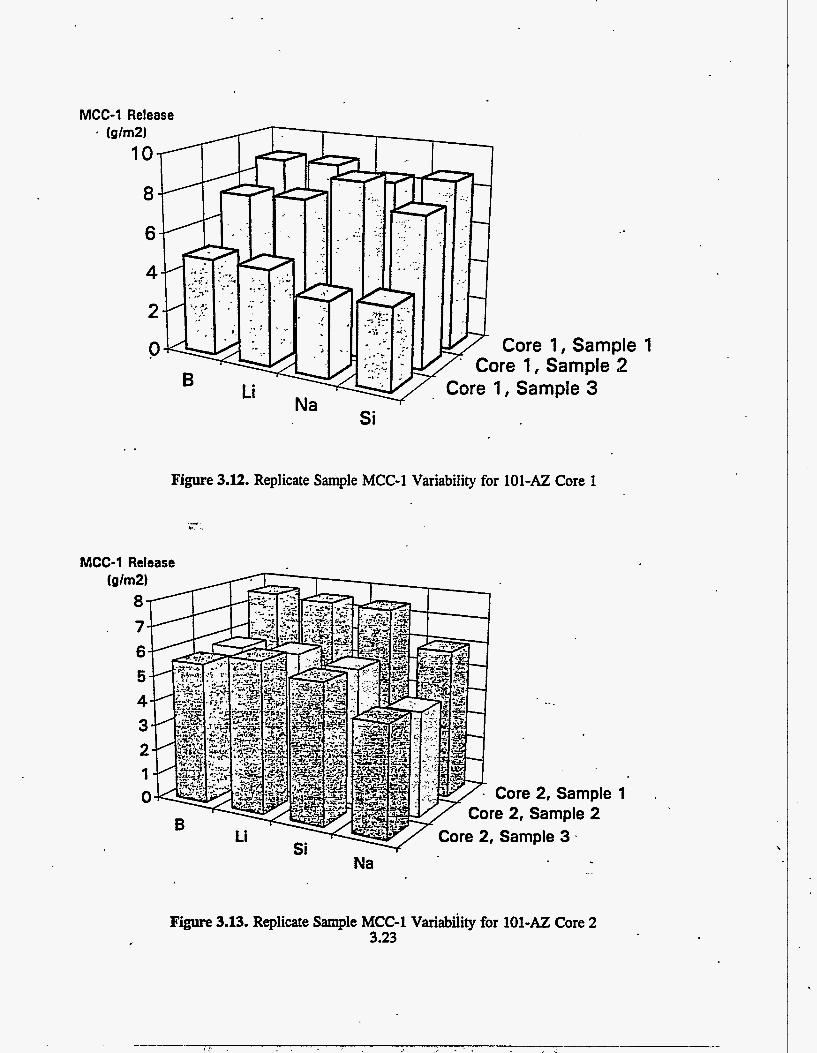
. .
Figure 3.12. Replicate Sample MCC-1 Variability for 101-AZ Core 1
-- e ,
MCC-1 Release
MCC-1 Release
Na
Figure 3.13. Replicate Sample MCC-1 Variabiiity for 101-AZ Core 2 3.23

.. MCC-1 Release
3, Sample 1 Sample 2 ’
Si
Figure 3.14. Replicate Sample MCC-1 Variability for NCAW Shulant
MCC-1 Release (glm2)
10, Sample A
Sample B Si
Figure 3.15. Replicate Sample MCC-1 Variability for ATM-10 3.24

Table 3.4. MCC-1 Leach Test Results for NCAW Simulant Glass
-Ln Transformed- -Exp Transformed- Mean MeanLn Upper Lower MeanLn - Upper Lower
Normalized Normalized Bound Bound Normalized Bound Bound Release Release (95% CI) (95% CI) Release (95% CI) (95% CI) /a/m21 %RSD In&~/m2) . In(a/m2) InWm2) @/m21 falm2) Jdm2)
(Lab Test #l in Teflon - based on sample size of 2) B 14.327 2.04 2.662 2.845 Li 16.149 0.00 2.782 2.782 Na 15.624 1.39 .2.749 2.873 Si 12.949 7.90 2.561 3.271
2.479 14.326 . 17.207 2.782 16.149 16.149 2.624 15.624 17.696 1.851 12.948 26.326
(Hot Cell Test #1 in fused-silica - based on sample size of 2) B 7.533 13.39 2.01 5 3.21 8 0.812 7.499 Li 8.403 10.57 2.126 . 3.075 1.176 8.380 Na 8.463 16.57 2.135 3.623 ' 0.646 8.456 Si 8.799 26.82 2.1 59 4.569 -0.250 8.665
(Lab Test #3 in fused-silica - based on sample size of 2) B 11.816 10.70 2.467 3.428 Li 12.261 10.35 2.504 3.433 Na 12.867 10.10 2.552 3.460 Si 17.292 10.19 2.849 3.765
1 SO5 1.574 1.645 1.933
CI = Confidence Interval MCC-1 = Materials Characterization Center (MCC-1) Exp Transformed = retransfomed data from In form to original form
3.25
11.783 12.228 12.834 17.273
24.966 21.659 37.463 96.41 5
30.820 30.984 31.807 43.163
11.928 16.149 13.794 6.368
2.253 3.242 1 .go9 0.779
4.505 4.826 5.179 6.912

50.0 0 NCAW Sirnotant in Teflon (lab test #l) R NCAW Sirnutant in Fused-Silica (hb test #3)
45.0 t NCAW Sirnulant in Fused-Silica (hot d l test #l)
40.0 - -
f =*O - - m n lu U
= 30.0 - -
p 25.0 -- - I 0
0 N - E 20.0
n T t I .m 5 15.0
10.0
5.0
0.0 Na si
Figure 3.16. Comparison of Alternate Leach Vessels considered for MCC-1 (Error Bars = Estimated 95% Confidence Interval)
43% bias experienced in the hot cell, but does indicate a probable contributing cause. Note also the rather large percent RSDs and confidence intervals for tests in fused-silica liners. A .
possible cause of this .is variability in the release of Si from the liners. The liners used in testing were fabricated in an onsite glass shop and certainly experienced non-uniform. temperature histories.
3.4.3.2 Investigation of Temperature Effects 1
A complete temperature map of the leach oven in the hot cell was performed after the fact to correlate the variation in oven temperature with the differences in releases from replicate samples. A temperature gradient of 2.6"C was measured from highest to lowest temperature sample location. These temperature measurements were done without vessels present, however. Subsequent testing in the hot cell indicated that the temperature gradient increased by approximately l0C when the oven was fully loaded with 12 vessels, which suggests the 2.6"C temperature gradient & understated by 1°C. This additional gradient is due to the sample tray design, which inhibits convection from top to
3.26

bottom when all sample locations are filled. Boron releases for replicate samples were plotted as a function of relative temperature to show any apparent variation due to temperature gradient (see 'Figure 3.17). The data indicate a possible variation in replicate samples due to oven temperature gradients. ,
Temperature dependence of glass corrosion reaction rates' are typically expressed through the . Arrhenius equation:
where k is the reaction rate constant, A is a constant, Ea is the activation energy, T is absolute temperature, and R is the gas constant. Several parameters, including glass composition, solution composition, and controlling reaction mechanism, will impact the activation energy. Activation energies have been reported for nuclear waste glass from 22 to 150 kJ/mol (Cunnane 1994).
Model simulations were performed on the radioactive glasses to estimate effects of temperature change on MCC-1 results. The concentration of Si in solution was so low that it had
. . little effect on dissolution rate. The dissolution rate is essentially the'forward rate and is nearly constant throughout the 28day test. Temperature effects were close to that defined by the Arrhenius Law. Based on this and an assumed activation energy of 80 kJ/mole, the estimated temperature dependencies are as follows:
90°C - 89°C = 7% reduction in reaction rate 90°C - 88°C = 14% reduction in reaction rate 90°C - 87°C = 20%.reduction in reaction rate 90°C - 86°C = 26% reduction in reaction rate 90°C - 85°C = 31 % reduction in reaction rate
' Due to the temperature .gradient in the oven, thermocouple placement, and minor thermocouple inaccuracy, actual sample temperatures for h e in-cell MCC-1 test were estimated to range between 86.5"C and 89.1"C. This is an average of 87.8"C or 2 2 ° C below.the set point for the test. This easily could have resulted in an average of 15% reduction in reaction d e . .
Based on the above investigations, the discrep*cies observed in the MCC-1 hot cell test were attributed to container type, temperature gradients within the oven, ad minor temperature measurement inaccuracies. To alleviate the discrepancies in future tests, stainless steel vessels were used instead of fused-silica, thermistors were used for temperature measurement instead of thermocouples to increase temperature accuracy, and a new hot cell oven was procured to minimize thermal gradients. Subsequent PCT tests were conducted in the hot cell with good agreement with outsf-cell results (see Section 4.5.1.5). No further MCC-1 hot cell tests were conducted.
I
I '
I
3.27

Table 4.1. Chemical Composition of Washed Solids Slurries ' ,
101 -M-c 1 17.0 0.2 1.0 1.3 0.8 38.0 0.6
. 0.6 1.9
0.03 15.0 1.2 2.7 NM
c 0.08 c 0.08 0.20
1 0 1 -M-C2 9.0 0.3 1.5 3.3 0.2 46.0 1.8 1.1 0.8 0.017 11.0 '
2.9 2.4
NM. c 0.19 0.34 0.16
1 02-Az-c 1 21.5 0.1 1.4 3.7 0.5 40.0' . 1.1 0.9 1 .o
c 0.038 12.0' 2.4 .
c 2.09 NM
. 0.12 c 0.13 0.07
Sirnutant #3 10.0 0.4 0.6 2.6 0.7 34.0 0.9 3.4 1.2 1.4 16.0 2.8 DL
c DL 0.82
Simulant(c) H W P Reference'') (10242-Cl) Nominal Minimum Maximum
18.7 9 2 26 0.1 0.4 0 20 0.8 0.3 0 20 3.2 3 0 10 0.4 0.5 0 2
35.0 28 8 60 1 .o 2.9 0 8 ' 2.4 1.6 0 8 0.5 0.6 0 20
1.2 0 8 25.8 18 4.5 22 2.0 2.3 0 8 1.5 0.88 0 4
0.13 0.2 0 1 0.11 0.2 0 1 0.40 0.6 0 1
1.2 0 6.9 0.5 0.65 0 . 2
Volatile Compcbnents
(g/lOOa oxides) ~
CI' 0.05 0.02 0.02 0.05 0.3 0 0.3 17 2.4 ' 30
NO; 6.09 3.68 1.89 8.76 2.4 0 36 6.24 1.87 0.69 19 0 36
11 NO;
' cot @) @) @) @)
TOC 9.70 0.25 . 0.98 . . 2 0
(a) (b) (c) (d) (e)
Hwvp reference composition from WHC-SD-HWV-DP-001, HWVP Technical Data Package, Section 13, Rev. 6. Carbonate analysis methods have been shown to be inaccurate for the waste matrix. Except when indicated, concentrations are measured values. Oxide basis ignores excess Na in total oxides. ., Excess sodium was added as Na2C03 to match CO2 value. In absence of measured concentrations or reliable measured values, theoretical valuesladded amounts are reported.
4.2
I

was removed in the washing process. Comparison of the concentration of sodium in the washed solids, the sludge before washing, and the reference nominal value for the previously planned Hwvp indicates khat acceptable washing efficiencies are being achieved on the laboratory-scale processes.
.The concentrations of the major components and those components of special interest for all three washed-solids slurries are within the limits of the previously planned HWVP reference.
In Figure 4.1 , the concentrations of the analyzed elements for each of the washed solids slurries are compared. A comparison of chemical composition of simulant 102-AZ Core 1 h i the corresponding core'sample indicates that accurate cliemical simulants can be prepared using the method described in Section 3.2.1. Significant differences in the concentration of the major analytes were observed between the three core samples and the NCAW simulant. It should be noted that the weight fraction of solids for each of the samples varied significantly. If the data are presented based on dried or calcined weight, the concentrations of the major analytes in the three actual waste samples correspond more closely than are observed on a wet-weight basis. The NCAW simulant does not match any of the actual waste samples because it was prepared to the previously planned Hwvp reference nominal values, with the exception of the nitrate and nitrite composition. The nitrate and nitrite concentrations were based on the concentrations of these analytes in the actual waste sample from 101-AZ Core 1.
Y
4.1.2 Radiochemical Characterization
The radionuclide compositions of the washed-solids slurries from the three core samples are reported in Appendix B, Tables B. 1 through B.3. The major radionuclides present in these samples are 137Cs, %, W e , and IMRu. All three samples are transuranic (they contain > 100 nCi/g transuranic isotopes). The majority of the transuranic activity is due to americium and plutonium. A comparison of the specific activity of the measured radionuclides in these three samples is given in Figure 4.2. The only radionuclides affected by the washing steps were lnCs and '%b. The activity of the wash solutions is due primarily to 137Cs. None of the supernatants or wash solutions were transuranic. Measured radionuclide activities were within the previous HWVP specifications, with the exception of lq, %r, and @Co.
The simulants were prepared as chemical simulants only and did not contain any radionuclides. The absence of radionuclides in the simulants eliminated many of the regulations and shielding necessary to handle radioactive samples, and allowed the simulant studies to be performed in a more timely and cost-efficient manner.
4.1.3 Physical Characterization
Physical properties for the three actual waste samples and the two simulants are reported in Appendix C. Tables C.l through C.5 present a summary of the physical properties measured in these samples. The particle-size distribution for the wished solids and the settling behavior were reported
It previously in the tank characterization reports (Peterson et al. 1989; see footnotes a and. b on page . 4.1). Particle-size distribution of the simulant-washed solids slurries was not measured. A
comparison of the physical properties of the Core sample and simulant washed-solids slurries is given inTable4.2. .
4.3

P.
c
9

I
x f x a f E c
f
a 0 c
9
x 4 5
sr a! r
v)
E e 0 LI)
E h (E!
Y .L.
.L. Y >
Y

.Table 4.2. Washed-Solids Slurries Physical Properties I - .
101-Az 101-Az 102-Az Core 1 - Core 2 Core 1
Density (g/ml): Slurry 1.04 1.14 1.11 Centrifuged Solids 1.40 1.53 1.52
0.99 Centrifuged . 0.98 0.98 ~~
NCAW Simulant
1.11
102-Az Core 1
Simulant
1.14
converted to other concentration units. The composition based on dry weight can be calculated from the weight-fraction solids reported in Appendix C, Tables C.l through C.5.
During the formating process, carbonate, nitrate, and nitrite may react to produce gas and the concek-ations of these anions in the sample will decrease. The data from these samples indicate that reductions in the carbonate, nitrate, and nitrite concentrations are observed. In Table 4.3, the concentrations of the anions @ the washed-solids slurries, melter feed, ,and formated slurries of the three NCAW core sampIes &hd the NCAW simulant are compaied. Note that elevated values of Ct, and F were measured in the formated slurry and melter feed of 101-Az Cores 1 and 2. Interferences, possibly from formic acid, were reported by the analyst.
During the formating of the washed solids from 102-AZ Core 1, the off-gases generated during this process were monitored and compared with similar studies using simulants. These results were reported previously (Langowski et al. 1993). A few simplified reaction mechanisms to account for a majority of the measured off-gases have been hypotliesized''). These hypothesized reactions are as follows:
CO: + 2H+ -> C02 + HzO(4.1)
3HN02 -> H+ + NO, + 2N0 + HzO(4.3) HCOOH -> H2 + C02 (Rh cataly~d)(4.4)
2NaN0, + 4HCOOH -> N20 + 2C02 + 2NaCOOH + 3H20(4.2)
NaN03 + 5HCOOH -> NH3 + 4C02 + NaCOOH + 3H20(4.5) 2NaN03 + SHCOOH -> 2N0 + 3C0, + 2NaCOOH + 4H20(4.6)
The carbonatedestruction reaction (equation 4.1) is the first phase of the reactions, and is represented by the first large CO, peak observed at the beginning of the formating procedure. The generation of CO, is followed by the production of N20 and NO,, as was postulated in equations 4.2 and 4.3. Hydrogen generation was observed during the digestion and recycle steps after the N20 and NO, concentrations had declined significantly. The ratio of N20/N0, and the limited amount of H2 observed for this sample is indicative of a feed with limited amounts of noble metals, or reduced effectiveness of the noble metals as catalysts for these reactions in this feed (Langowski, 1993).
The results indicate that sluny chemistry and off-gas generation reactions are similar between the core sample and simulants.

. Table 4.3 Anion Concentrations of the Washed-Solids Sturries and Formated Slurries
i
Washed Solids Formated Slurry Melta Fced I I
10242 core 1 Simulant 101-AZcOta 1 101-AZCon2 102-AZcOn 1 NCAW Simulant 101-Azcore 1 lOl-AzcOre2 102-AZCon 1 NCAW Simulant 101-MCorc 1 NCAW Simulant
(g/100iz Oxide) (d1Mln Oxide) lpllOOn Oxide) (~d100R Oxide) (d100n Oxide) ld100n Oxide) (d1OOa Oxide) fd100n Oxide] lpllOO~ Oxide) Ip/100~ Oxide) WlOOn Oxide)
6.09 *
6.24 0.20 0.05 1.61 034 I .97 9.70 I I .67
3.68 1.89 1.87 0.69 0.16 0.07 0.02 0.02 0.9 0.64 0.19 0.19 0.46 2.78 0.25 . 0.98 0.72 2.78
0.39 0.4
0.009 <0.019
0.138 0.01 1 0.149
8.75 NM NM 0.046
, 0.57 2.05 NM 0.86 NM
1 A5 5.90 6.90 7.27 1.27 <.36
4.0008 0.06 0.06
2.4 0.77 I .42 5.88 1.001 4.01
3.38 4.25
0.85
4.9
0.65' < 0.3 1 I .28 3.68 <0.9 0.19 4 . 2 <0.12
I 0.10 c.04 0.05 8.46 8.53
4.26 1.12 5.38
0.62 1.46 2.29 2.29 0.47
4.01 0.09 2.06 2.13
<0.11 1 .os 0.04
< 0.04
0.86 0.3 I 1.17

30.000' I 25.000 20.000 15.000 10.000 5.000 0.750
n
w 0.025 c
a, a. 0.500 CJ)
s v
r' .- 0.375
0.250
0.125
0.000
rrr
1-1 ~OI-AZ core 1
@$$$$$j 102-AZ core 1
EZj IO~-AZ core i Simulant
101-AZ Core 2 (Data not available)
NCAW Simulant (Data not available)
n ib
Il.n Ag AI A# B Ba Be BI Ch Cd Ce Co Cr Cu Dy Eu .Fe K La U Mg Mn Mo Na Nd NI P Pb Re Rh Ru S Sb Se SI Sn St Te lh TI TI U V Y Zn Zr
Figure 4.3. Chemical Composition of Formated Slurry 4.10

Table 4.4. Formated Slurries Physical Properties 102-Az Core 1
Simulant 101-Az Core 1
101-Az Core 2
102-Az Core 1
NCAW Simulant
Density (g/ml): Slurry Centrifuged Solids Centrifuged Liquid Weight Fraction: Solids Oxides g Total Oxiden, Settled Solids
' (vel%) Centrifuged . solids: (vol %) (.sa 5%)
1.10 1.44 1.04
1.19 1.50 1.01 '
1.12 1.65
. 1.04
1.11 1.27 1.01
1.14 1.34 1.04
.-
0.159 0.108 118
0.122 0.092 101
0.186 0.131 147
0.192 0.145 161
0.222 0.129 1.47
57 37 . 38 87 .84
21 28
19 25
18 26
40 46
42 48
4.2.2 Physical Characterization
Physical properties for the three actual waste samples and the two simulants are reported in Appendix C. Tables C.l through C.5 present a summary of the physical properties measured in these samples. A comparison of the physical properties of the core sample and simulant washed-solids slurries is given in Table 4.4. * .
The density of the formated slurries from the core samples and simulants ranged from 1.10 to 1.19 g/ml. In Figure 4.4, the deniity of the NCAW simulant and actual waste-formated slurries are plotted as a function of solids concentration. The curve fit on this data indicates that there is a correlation between the'density of the formated slurries and solids concentration, and that simulants are representative of actual waste with respect to this coirelation. The weight-fraction total solids of the formated slurries reported in Table 4.4 varied from 0.122 to 0.222. The density of the centrifuged liquid (1.03 f 0.02) was similar for all of the formated slurries and was comparable to the density of water, but the centiifuged solids density was significantly lower in &e simulants than in the core samples. The average centrifuge solids' density for the tbrck core samples was 1.53 f 0.11, and the simulants had an average centrifuged solids density of 1.3 1 With a reproducibility of 5 96.
4.11

>. I- > [I <3
- a
0 10 20 30
+
40
+ . -+ Si m u I an t s
SOLIDS CONCENTRATION - Wt%
A Actual Waste
50
Figure 4.4. Density of NCAW Simulants and Core Samples as a Function of wt% Solids
The oxide concentration in the formated slurries of the three core samples ranged from 101 to 147 grams of total oxideL .The oxide concentkion of the NCAW simulant (161 grams of total oxide/L) was signifiktly higher than the core saniples, but the oxide concentration of the 102-AZ Core 1 simulant was less than 2% lower than the 102-AZ Core 1 sample. The density, weight- fraction solids, and oxide concentration of all of $e samples were yithin the range for the previously planned HWW, except for the oxide concentration of the NCAW simulant and the density of the 101-AZ Core 2 sample.
The settling behavior of the formated slurries is shown in Figure 4.5. The settlixig behavior of the simulants did not match the behavior of the wre saqles. This is also observed in the vol% settled solids reported in Table 4.4. The core samples settled much faster and achieved a significantly higher settled-solids packing than wis observed in the simulants. The majority of the settling of the core samples occurs in the initial 10 hours of settling. ne settling behavior of 101-AZ Core 1 was slower than was observed in 101-AZ Core 2 and 102-AZ Core 1; the final vol% settled solids for 101-AZ Core 1 wasIhigher than w& observed for the other two cok samples. The initial settling
4.12

c
rates (average settling rate from 0 to 1 h) and the curve fits for the settling rate curves are shown in Table 4.5.
Figure 4.5. Fonnated Slurries Settling Rate Behavior
101-AZ Core 1 101-AZ Core 2 102-AZ Core 1
102-AZ Core 1 Simulant
.NCAW Simulant
Amount Settled (Curve Fit)
y = 3.07 + 3.89 - 2.54t e-*.& y' = 4.4 ea*" + 2.63 + 0.33 eaJt y = 4.37 eo." + 2.66 y = 0.89 + 6.05 y = 1.18 + 5.9
Average Settling Rate from T=O to T=l 0 . 1.i- 2.4 1.4 0.05 0.06
The particle-size distribution of the formated slurries, based on volume distribution and population distribution, are reported in Appendix C. The majority of the particles were less than 5 pm in diameter; a significant number of the particles were less than 2 pm in diameter. There were a significant number of particles larger than 5 pm, which tends to skew the volume distribution toward higher particle diameters. This was most apparent in 10242 Core 1 and the NCAW simulant. The largest particle diameter observed in the core samples was between 100 and 110 pm.
With few exceptions, when the slurry concentrations fell within the previously planned HWVP design range, the other physical and rheological properties were also within that same design .range. The properties of the actual waste samples are compared to those of simulants 'and simulant correlations to confirm the validity of using simulants to support design.
4.13
I '

I
101-AZ Core # l . 101 -A2 Core #2 A 102-AZ Core # l
NCAW Sirnulant 10242 Core #1 Sirnulant Calculated Cutve Fits
5 10 15 Time (hr9
Figure 4.5. Settling Behavior of Formated Slurries 4.14
20 . 25 30

4.2.3 Rheological Characterization
Rheological properties for the three actual waste samples and the two simulants are reported in Appendix D, Tables D.l through D.5 present a summary of the rheological properties measured in these samples. All of the samples exhibited yield pseudoplastic behavior.
These results and comparable simulant results from full-scale testing are summawxi * in Table 4.6 and Figure 4.7 below. Unless otherwise noted, references to simulants 'in the following . discussion refer to laboratory-scale simulants tested in this study and not the full-scale simulants reported in Table 4.6. The flow behavior ofthe radioactive and simulant samples was best represented as yield pseudoplastici as evidenced by me R2 values. Both radioactive and simulant samples were slightly shear-thhing (i.e., viscosities decreased with increasing shear rate). A small degree of hysteresis occurred in each of the three core samples and the NCAW simulant (see Appendix D, Figures D.l, D . l l , 0.21, D.31, and D.41), indicating some degree of agglomeration. Yield stresses for @e radioactive samples ranged f r m 0.085 Pa to 0.23 Pa compared to&nulant yield stresses of 1.2 Pa. Yield stresses of the radioactive samples are low enough that they could be an artifact of the equipment; that is, the shear stresses at the low shear rateswere at or below detection for the sensors. Apparent viscosities of the core samples at 50s' ranged from 3.8 CP to 7.2 CP compared to the simulant viscosities of 32 cP. The rheology of both the processed waste samples and the simulants were well below the design limits for the prior-planned HWVP plant (see Figure 4.6). Note that rheological data from 102-AZ Core 1 is suspect, because the washed solids from this core samples were inadvertently dried (see Section 3.4.2 for details).
4.15
I ' 1
I '
I

Table 4.6. Rheological and Physical Properties of Formated Slurry Full-Scale NCAW 102-AZ
Core 1 101-A2 - Core 1 101-AZ Core 2 - Simulantd"
w/o Recycle wlRecvcle 102-AZ Core I
NCAW Simulant Simulant pmpertv
Equation (Yield Pseudoplastic)@) r =.0558+ 7 = .036+ 7 =.0651+ 7 = .350+ 7=.9128+ 9.25E3ym .043y,5t* 3.63E3y*9M ,232~"' .04 1 4y.'16
.8544 .9862 .9887 ,9761 .9987
-- I
R'
Yield Stress, Pa (Bingham Plastic) R'
.164 .8528
.232 .9388
.085 .9874
1.20 .9141
1.21 .9889
1.19 1 .os - Apparent Vfscosity CP 50 s-' 100 s-' 250 s" 450 8'
5.9 4.8
, 3.8 3.4
7.2 5 .o 3.2 2.3
3.8 3.0 . 2.4 2.2
32.1 20.4 11.4 8 .O
32.4 20.8 12.8 9.8
30.8 18.5 12.9 12.1
29.7 16.9 12.0 11.5
Physical Propertla Total Solids, wt% Total Oxides, wt% Total Oxides, gWOL Slurry Density, glml ,
PH Mean Particle Size pm (volume dens.) Mean Particle Size pm (number dens.) Vol% Settled Solids Cenhilhged Solids Density glmL Initial Senling Rate, cm/h(@
15.9 10.8 118 1.10 5.3
' 9.0 1.27 56.8 1.44 1.1
12.2 9.2 101 1.10
5.4 1.42 37.4 150 2.4
--
18.6 13.1 147 1.12 5 .o 47.4 1.14 38.0 1.65 1.4
19.2 14.5 161 1.11 6.9 25.6 1.30 86.8 1.27 0.05
22.2 12.9 147 1.14 5.3 - - 84.4 1.34 0.06
19.6 13.5 154 1.14 6.0
20.5 13.9 158 1.14 6.1
0.29 -
0.29
(a) Beckette, M. R., L. K. Jagoda. 1994. Detailed Design Data Packagg NCAW Waste Simulant Properties (SIPT 2LFCM 8 Campaign). PHTDX1017, Rev.0. Pacific Northwest Laboratories, Richland, Washington.
(b) See Appendix F.l for definitions.
(c) Initial settling rates are average settling rates from time 0 to 1 h.
4.16

10
8 -
n .m e 3 6 - e! tj z a3 .c
Prior HWVP Maxirnurn (150)
; 101-AZ Core #l (119) (g TOR)
=. 1 01-AZ Core #2 (1 01)
v NCAW Sirnulant (160) 102-AZ Core #1 Sirnulant
*.
* 102-AZCOre#l (147)
1 1 0 100 200 300 400 500
Shear Rate (Us)
Figure 4.6. Rheology of Actual and Simulated Formated Slurry(')
A comparison of laboratory-scale to full-scale simulant results for formated slurry rheology yields essentially identical results (see Table 4.6). Rheology of the full-scale simulants was tested with a Haake Mw sensor that had,a larger gap size than the Haake MVI sensor used for laboratory- scale simulants. The concentrations and pH of the full-scale s'lmuants (154 and 158g W o k pH'of 6.0 and 6.1) were bracketed by laboratory-scale simulant cankntrations and pH (147 and 161g . WOK; 6.9 and 5.3), enabling a direct comparison of rheological results. Full-scale simulants produced yield stresses of 1.1 Pa and 1.2 Fa, compared to 1.2 Pa for the laboratory-scale shulants. Viscosities at 50s' for the full-scale simulants were between 30 CP and 31 cP, compared to laboratory-scale simulant viscosities of 32 cP.
Two minor differences were observed between the two sets of simulants, as follows: (1) an increased settling rate of 0.29 cm/hr was observed for full-scale simulants versus 0.05 to 0.06 Cmlhr for laboratory-scale simulants; and (2) a Newtonian flow behavior for the full-scale simulants was observed in the shear-rate range > 190s' versus a yield-pseudoplastic flow behavior throughout the entire shear-rate range for the laboratorykale simulants. Differen& in the test methods between the two simulant sets may have contributed to these differences. The height of the settling container for
(a) Prior HWW maximum values obtained from WHC-SD-HWV-DP-001, Hanford Waste Vitrification Plant Technical Data Package, Section 13, Rev. 6.
4.17
.I . . . _._. , ,,. - . . -

the full-scale simulant was 19 cm versus 12 cm for*the laboratory-scale simulants (differences in settling tube diameters are unknown).
Differences in concentration made it difficult to compare the simulant and radioactive : rheology data directly. Data fiom Thornton@) shows yield stress and apparent viscosity of formated :. slurries to be exponetially correlated to concentration in g WO/L. Using this correlation, one would
expect a 2.8-fold increase in yield stress with an increase in concentkion from lOlg W o k to 16Og W o k . Similarly, one would expect a 2.3-fold increase in apparent viscosity at 183s' with a similar increase in concentration. Actual increases in yield stress and apparent viscosity between 101-AZ Core 2 at lOlg W o k and NCAW s,imulant. at 16lg WO/L were 5.2-fold and 3.8-fold, respectively.
.. Using the Thornton correlation, the effect of concentration alone d o b not account for the differences in concentration observed between actual'waste and simulants.
.
A comparison of yield stress and apparent viscosity data from the core samples and simulants to historical data is shown in Figures.4.7 and 4.8. Radioative and simulant data from this study are superimposed on figures reported by Laming.@) The NCAW simulant and 102-AZ Core 1 simulant fit well within the historical data and are located near the midpoint of the data range. Rheological strength of the radioactive samples was equal to or less than' &e entire database of simulants reported. Although the historical data may be generally compared to the radioactive samples, the best comparison w& between the simulants tested in this study and the core samples. The NCAW simulant was formulated to have the same nitrite and nitrate composition as 101-AZ Core 1 and was
. processed in the same manner as the core sample (e.g., amount of formic acid added, digestion time). Similarly, 102-AZ Core 1 and its simulant had like compositions and were processed in the same manner.
Physical property data in Table 4.6 provides some insight into possible causes of the observed differences between raioactive and simulant rheology. Vol% settled solids and intial settling rates indicated differences in the microstruc~re of the radioactive and simulant samples. The radioactive -samples settled to a greater extent and at a greater initial rate than did the s@ulant samples. The density of centrifuged solids was greater in the core samples, iqdicating potentially denser aggregates with less interstitial fluid.
The particle-size distribution data provided little insight into the differences between actual and simulated formated sluriies. The numberdensity mean-particle size of the radioactive samples (1.14 pm to. 1.42 pm) are similar to'that of the'NCAW simulant (1.30 pm). The volumedensity mean-particle sizes indicated a broader distribution in the NCAW simulant and 102-AZ Core 1 than the cores from Tank 101-AZ. The large volumederkity mean-particle size for 102-AZ Core 1 ,
(47.4 pm) was consistent with anticipated agglomeration affects of drying out a slurry (see Section 3.4.2). The large volumedensity meiuEparticle size far NCAW simulant (25.6 pm) would make
(a) Thornton, G. T., Evaluation and Comparison of HWW-Reference Feed Composition and Updaed Neuttalized Current Acid Waste Composition Si&. Letter Report IHwvp-87- V110203C, Pacific Northwest Laboratory, 1987.
(b) Lanning, D.D., P.A. Smith, G. Terrones, D.E. Larson, Summary of Rheological Studies Related to HWVP Slurries, M e r Report PHTD-C93-Q3.02M9 Pacific Northwest Laboratory,
. November 1993.
4.18

sense if the larger particles or agglomerates were less dense than the simulant particles. This information, as well as particle morphology, is not known and is needed to understand differences in behavior. Additionally, the method of particle-size analysis used, which included dilution and shearing of the sample, may have broken weaker agglomerates prior to measurement. The particle sizes being measured may have been agglomerates, primary particles or a wmbination of both not representative of the original samples; Transmission electron microscopy (TEM) is recommended for future studies to increase understanding in this area.
The effects of radiation dose on the NCAW simulant is also recommended.to understand the observed rheological difference with actual wake. An analogous, although quite different, situation experienced at Savannah River Site is worth noting. The measured rheological properties of the actual potassium tetraphenylborate (KTPB) slurries yielded much lower values than those predicted by nonradioactive systems, prompting irradiahon studies on the simulant.(a) After gamma irradiation of 5 x lo' rad, the yield stress went to essentially zero, and the consistency decreased by a factor of six or more. The irradiation also increased settling rates and final maximum wt% solids upon settling. Microscopic examination indicated that de-agglomeration of the sludge resulted from irradiation. As
*
Figure 4.7. Comparison of Formated Slurry Yield Stress with Historical Data@)
Ebra, M. A. 1985. Technical Report: me Effects of Gumha Irradiation on the Rheology of K P B SZum'es, DPST-85-926, Dupont Savannah River Laboratory.
Lanning, D.D., P.A. Smith, G. Terrones, D.E. Larson, Summary of RheoZogicaZ Sludies Related to HWVP Slumks, Letter 'Rkport PHTD-C93-03.02M, Pacific Northwest Laboratory, November 1993.
4.19
I :

F .
WO Concentration, gR
Figure 4.8. Comparison of Formated Slurry Viscosity at 183s' with Historical Data*
\ .. a result of the study, requirements for the slurry transfer pumps were reduced. Although the mechanism forde-agglomeration was not determined, it could very possibly be related to the organic nature of the precipitate, a condition not relevant to NCAW. However, trausfonnations at the interfaces of NCAW padcles cauSed by radiation dose could feasibly affect agglomeration. Simple irradiation tests on NCAW simulants m y reveal an underlying cause of differences between actual and simulant waste rheology.
Another inherent difference ,in the actual and simulated waste is .the duration of aging. The waste has'been aged in a radioactive environment for many years. The NCAW simulant.preparation has been designed to mimic the process by which the NCAW waste was generated but does not account for aging effects. A closer study of the particle morphology and chemical composition of actual waste particles using TEM should be pursued to identify differences resulting from aging or other historical differences.
-4.3 MeIter Feed
Glass frit was blended ,with the formated slurries to produce &e melter feed. The glass frit was designed to yield a glass with acceptable processing and durability properties, as defined by 'linear correlations of propertie$ with glass komposition. These Correlations, which are based on extensive vitrification testing of nonradioactive shulants, predict viscosity, electrical conductivity, and release rate of glasses as a function of composition @Irma, 1994).
4.20

* Three different frit compositions were used for these five samples. The same frit was used for both the NCAW simulant and 101-AZ Core 1. The frit blended with 101-AZ Core 2 was designed specifically for the core-sample, including a modification to compensate for the potassium added to the sample when the pH probe broke during the addition of formic acid. The third frit was blended with both the core sample from tank 102-AZ and its corresponding simulant. The compositions of the glass frits blended with the three core samples and two simulants are reported in Table 4.7.
Table 4.7. Frit Compositions
* B203 CaO Li,O MgO Na,O SiO,
HW39-4 Frit 101-AZ Core 1 and NCAW Simulant
14.0 1 .o 5.0 1 .o 9.0 '
70.0
. Custom Frit
101-AZ Core 2 10.6 0.0 8.6 0.0 5.2 75.6
Frit Compositions (wt% oxides) FY91 New Frit
102-AZ Core 1 and 102-AZ Core 1 Simulant
20.45 0.0 7.29 0.0 0.0
72.26
The chemical and radiochemical composition and physica. anc. rhecwgical properties of the melter feeds from the three NCAW core samples (101-AZ Core 1, 101-AZ Core 2, and 102-AZ Core 1) and two simuliints (NCAW and 102-AZ Core 1 simulants) were determined and compared.
4.3.1 Chemical Composition . .
The chemical composition of the melter feeds from 101-AZ-Core 1, 101-AZ Core 2, and the NCAW simulant is reported in Appendix A, Tables A.l, A.2, and A.4. The chemical composition of the supernatant from dl three core samples and the NCAW simulant is also reported in Appendix A (Tables A.l through A.4). The compositions of the melter feeds from 102-AZ Core 1 and 102-AZ Core 1 simulant were not measured because, based on prior samples, the solids settled so quickly that it was difficult to obtain representative subs&ples.. The composition of these two samples can be determined from the glass composition or the formated slurryhit compositions; calculatd values are reported in Section 4.6. ,.'..
A comparison of the elemental composition of 101-AZ Core 1, 101-AZ Core 2, and.the NCAW simulant is shown in Figure 4.9. Formated slurry was combined with frit to achieve melter feeds with targeted waste oxide-loadings of 25 to 28 percent; therefore, the major constituents in the melter feeds are the frit components. These r6ajor components include Si, Na, B, and Li. Other major constituents which came from the waste include Fe, K, ill, U, and Zr.
*
*
The Erit components were added as the oxides; therefore, the majority of the elements in the melter feeds are as oxides. Other anions which are present in significant quantities are nitrate, nitrite, chloride, fluoride, and sulfate (see Table 4.3). The concentrhions of carbonate (as measured by total
4.21

- c inorganic carbon) and phosphate are significantly lower than the other measured anions. The majority of the carbon present in the samples is organic carbon, with the exception of the NCAW simulant. In
'this simufant, the concentration of carbonate is much higher than the carbonate observed in the core. samples; therefore, the ratio of total organic carbon to inorganic carbon in this simulant does not represent that which is observed in the core samples.
.. The supematant from the melter feeds contained only three cations in significant quantities
(Nay K, and Li). The major anions associated with the supernatant are similiar to those observed in the slurries with the exception of the oxides, which are not soluble.
The data are reported based on wet weight (wt%) and on the oxide weight (grams/lOO grams
converted to other concentration units. The composition based on dry weight can be calculated from the weight fraction solids reported in Appendix C, Tables C.l through C.5.
_ _ - oxide). The density and oxide-loading are @so repoited, so that the d y t e concentrations can be
4.22

.n s U
E cn .- 3
30.0
5.0 3.5
3.0
2.5
2.0
1.5
1 .o
0.5
0.0
* . I I 101-Ai! core 1 m 101-Azcore2
10242 Core 1 (Data not available) NCAW Simulant
(Data not available) IO~-AZ core 1 Simutant .* I a
Ag AI As B Bo Be Ca Cd Ce Co Cr Cu Dy Fe K La U Mg Mn Mo Na Nd NI P Pb Re Rh Ru Sb So SI Sr To Th Ti TI U V , Y Zn Zr
Figure 4.9. Chemical Composition of Melter Feed 4.23

4.3.2 Radiochemical Characterization - .-
The radionuclide compositions of the melter feeds from the two core samples from tank 101- AZ are reported in Appendix B, Tables B. 1 a d . B.2. The major. radionuclides present in these samples are InCs, %r, '%e, '06Ru, ISEu, 155Eu, '%b, and ?'Am. Both core samples are transuranic (they contain > 100 nCi/g transuranic isotopes) as is indicated by the activity of americium in the'melter feeds. Only limited radiochemical analysis was performed on the melter feeds, and no data are available on,the activity of PU in these samples. A comparison of the specific activity of the'measured radionuclides in these two samples is given in Figure 4.10.
The only radionuclide which may havebeen affected by the formating steps w k '291. The data are not defmitive, but it appears that some of the iodine may have been lost during the formating process.
The activity of the melter feed supernatint is due primarily to InCs. None.of the supernatants appear to be transuranic, since ulAm was not observed in the gamma energy analysis (GEA).
The simulants were prepared as chemical simulants only and did not contain any . radionuclides. The absence of radionuclides in the simulants eliminated many of the regulations and
shielding that are necessary to handle radioactive samples, and allowed the simulant studies to be performed in a more timely and cost-efficient manner. The radionuclide activities in the melter feed from 102-AZ Core' 1 were not analyzed because, based on prior samples, the solids settled so quickly that it was difficult to obtain representative subsamples.
4.3.3 Physical Characterization
Physical properties for the three actual waste samples and the two simulants are reported in Appendix C. Tables C.1 through C.5 present a summary of the physical properties measured in these samples. A comparison of the physical properties of the core sample and simulant washed-solids slurries is given in Table 4.8.
The density of the centrifuged liquid (1.04 f 0.03) is similar for all of the melter feeds and formated slurries, and is comparable to the density of water. The centrifuged solids density in the melter feeds from the core samples are also similiar, but the density of the centrifuged solids and slurry from the NCAW simulant was significantly lower than measured in the core samples. The behavior of the centrifuged 102-AZ Core 1 simulant was not measured because- of difficulties 'in obtaining a representative sample. The average centrifuge solids density for the three core samples is 1.69 f 0.05 g/ml; the NCAW simulant has a centrifuged solids density of 1.50 g/ml.
The oxide doncentration .in the melter feeds of the three core samples ranged from 438 to 600 '' grams of total oxidek. The weight fraction ratio of oxides to solids in the melter feeds is much
higher than that which was observed in the previous samples, because of the introduction of the frit to . the sample. The density, weight-fraction solids, and oxide concentration of all of the samples were
within the range for the previously planned Hwvp, except for the slurry density of the 101-AZ Core 1 sample.
4.24

Table 4.8. Melter Feed Physical Properties . .
101-A2 Core 1 . -
101-AZ- - Core 2 io2-piz - Core 1
NCAW ~ O ~ - A Z Core Simulaht ' 1 Simulant
Density (g/ml) Slurry Centrifuged Solids Centrifuged Liquid Weight Fraction Solids Oxides DissolvM Solids
1.47 1.74 1.09
1.36 ' 1.64
1.04
1.34 1.69 1.03
.' 1.28 1.42 1 S O Not Analyzed 1.01 d. Not .. Analyzed
0.47 0.41 0.068
0.43 ' 0.40 0,020
0.44 0.38 Not
515 Analyzed
0.37 0.34. 0.014
0.48 0.40
Not Analyzed
573 g Total Oxide/L settled solids (vol %) Centrifuged solids (vol %) (Wt %)
600 479 438 1
64 87 100 84 87
64 74
55 67
48 60
58 67
Not Analyzed Not Analyzed I
I
- ."
The density of the melter feeds from the core samples and simulants ranged from 1.28 to 1.47 g/ml. This is a significant increase from the densities observed in the fonnated slurries. This 'increase is due to increased solids-loading caused by the addition of the frit. The weight-fraction total solids of the melter feeds reported in Table 4.8 varied from 0.37-to 0.48. Only a s d l portion of the total solids are water soluble, is observed in the low dissolved-solids fraction (< 15% u%?] of the total solids). The density and oxide concentrations also increase with increased solids-loading.
I
I
The settling behavior of the melter feeds is shown in Figure 4.11. The settling behavior of the melter feed from NCAW,simulant and the 101-AZ core sample is comparable, but the settling behavior of the 10242 Core 1 melter feed and the corresponding simulant did not match. The initial settling rates (average settling rate from time 0 to 1 h) and the curve fits for the settling rate curves are given in Table 4.9.
The 102-AZ Core 1 simulant did not settle, & is s h o h in Figure 4.11 and Table 4.8. The settling behavior for this sample was measured approximately three weeks after the frit was blended
to gel after about 2 to 3 weeks time.(') This is consistent with the behavior observed for this simulant.
- , with the sample. Previous studies indicated that the frit used, when blended with this simulant, tends -
(a) Beckette, M.R. and L.K. Jagoda NCQW Waste SimuIant Properties (SZPT 2LFCM 8 Campaign Letter Report PHTD-IC1017 Rev. 0, Pacific Northwest Laboratories, May 1994.
4.25

The 102-AZ Core 1 melter feed settled much quicker than that which w k observed in the other core samples and simulants. The washed solids from this core dried prior to processing the 'sample. Previous results indicate that when some tank-waste samples are allow.ed evaporate to dryness, the settling and rheological behavior of the sample are irreversibly altered. In most cases, when the sample is dried and water is added to the sample to obtain the original water content, the sample settles much more quickly, the volume percent of settled solids decreases, and the weight percent of dissolved solids decreases significantly when compared to the sample before drying. The same frit was used in this sample as was blended with the 102-AZ Core 1 simulant, but significant gelling of this sample was not observed. The settling behavior and rheological properties of this sample were measured after two weeks of blending the frit.
-.
The particle-size distribution of the melter feeds, based on volume distribution and population distribution, are reported in Appendix C. Based on number density, the majority of the particles are less than 10 pm in diameter. There are a significant number of particles larger than 10 pm, which tends to skew the volume distribution toward'higher particle diameters. This was most apparent in 101-AZ Core 2. The largest particle diameter observed in the melter feeds was between 60 and 70 w-
Table 4.9. Melter Feed Settling Rate Behavior
101-AZ Core 1 101-AZ Core 2 102-AZ Core 1 NCAW Simulant 102-AZ Core 1 simulant
Amount Settled (Curve Fit) Average Settling Rate . from T=O to T=l
m y = 1.18 eo-u + 6.02 ' 0.1
y = 2.51 eo.4st + 4.57 0.9 '
y = 0.89 eo.'' + 6.05 y = 7.1 0
y =. 0.89 eo.951 + 6.11 0.4
0.06
4.26

w C
Q) i! a
3.5
25.0 20.0 1 15.0
(Data not available)
10.0 -I
1-1 101-AZ core 1 'IOI-AZ core 2 102-AZ Core 1 (Data not available) NCAW Slmulant
30.0
3.0
2.5
2.0
1.5
1 .o
0.5
0.0 1 1 1 1 1 1 1 1 1 1 1 I I
I
I - r t . . . . Ag A! As .B Ba Be Ca Cd Ce Co Cr Cu Dy Fe K La Ll Mg Mn Mo Na Nd NI P Pb Re Rh Ru Sb Se SI Sr Te Th TI TI U V Y Zn Zr
Figure 4.9. Chemical Composition of Melter Feed * 4.27

I
l
I a
0
I
I
d 0
,r - - .r;r I I U
0' Q, c -#. V I
Q, z v ) .
0
? I
B
h i;;;

7
6
E5 0 U
2
1
.O
I
101-AZ Core #1 9 101-AZ Core #2 . A 102-A2 Core #1
NCAW Sirnulant 6 102-AZ Core #1 Slmulant
Calculated Curve Fits
I 1
I . I I I I I
1
5
I
I O 15 '20 '' 25 30
Time (hr) Figure 4.11. Settling Behavior of Melter Feeds
4.29

4.3.4 Rheological Characterization
Rheograms, curve fits, and corresponding physical data for the melter feeds of the three core samples and two simulants are provided in detail in Appendix D. The results are summarized in Table 4.10 and Figure 4.12 below. The radioactive and simulant samples exhibited thixotropic, yield pseudoplastic behavior.' The up-curve rheograms fit well to the yield pseudoplastic model as . evidenced by the R2 values. Both radioactive and simulant samples were shear-thinning (Le., viscosities decreased with increasing shear rate) and exhibited varying degrees of hysteresis (see Appendix D, Figures D.6, D.16, D.26, D.36, and D.46).
Yield stresses for the radioactive melter feeds ranged from 1.4 Pa to 10.3 Pa compared to simulant melter feed yield stresses of 2.2 Pa to 12.4. Viscosities of the radioactive melter feeds at 50s' ranged from 38 CP to 260 CP compared to the simdant viscosities of 58 CP and 365 cP. The rheology of both the radioactive and simulants melter feeds. were well below the design limits for the prior-planned HWVP (see Figure 4.12). Note that rheological data from 102-AZ Core 1 was suspect, because the washed solids from this core samples were inadvertently dried (see Section 3.4.2 for details).
Figure 4.12. Rheology of Actual and Simulated Melter Feed")
. 3 5
30
5
0
4 6
0 0
0
. A v 4 0
0 0 0
101-AZ Core #I (609.5.8) (gTO/L, pH) 101-AZ Core #2 (479, 9.4) 102-A2 Core #1 (515.8.83) NCAW Simulant (438, 8.6) 102-E Core #i Simulant (51 5) Prior H W Maximum (600,8.0)
4 6
0
0 0 0
0 . 0
, O f 1 I 1 I
0 100 200 300
Shear Rate (lls)
400 500
(a) Prior HWVP maximum values obtained from WHC-SD-W-DP-01, Hanford Waste Vitrification Plant Technical Data Package, Section 13, Rev. .6.

Prouerty
Table 4.10. Rheological and Physical Properties of Melter Feed Slurry 102-Az
101-AZ 101-Az 102-Az * NCAW Core 1
Equation (Yield Pseudoplastic)(')
R2
Apparent Yield Stress, Pa (Bingham Plastic)
R2 .
Viscosity CP 50 s'I loo S'I 250 s-l 450 S-I
Physical Properties Total Solids, wt% Total Oxides, wt% Total Oxides, gWO/L Slurry Density, glml PH
Mean Particle Size pm (volume density) Mean Particle Size pm (number density)
Vol% Settled Solids Centrifuged Solids Density, g/mL Initial Settling Rate, Cm/h'b'
Core 1 - 7=2. 86E6+ ' 5 . 2 3 ~ ~
.9141
10.3
.7589
26 1 154 76 49
Core 2 - 7=3.28E1' + 1 .237yIs9 .9285
1.8
s564
46
12 7
26 .
47.0 41.0 600 1.47 5.8
4.3
1.22
84.0 1.74
0.1
42.9 39.9 479 1.20 9.4
15.3
1.41
87.0 1.64
0.4
Core 1 - 7= ,0635 + .79559'55
.9716
1.4 ,
.7996
38 22 . 11 7
43.6 38.4 515 1.34 8.8
- -
62.5 1.69
0.9
Simulant Simulant
7= 1.208+ 7=.1469+ .1089ym 10.3% 141*
.9287
2.2
.9144
58 39 25 20
37.0 34.1 438 1.28 8.6 .I.
- -
87.0 1 S O
0.06
-9890 -_ -
12.4
-6170
365 201 92 55
47.8 40.4 573 1.42 - - -
100.0 - 0.0
(a) See Appendix F.l for definition. (b) Initial settling rates are average settling rates from time 0 to 1 h.
AS with the formaied sIurry samples, differences in concentration made it d i f f id t to compare the simulant radioactive data directly. Comparing both the simulant and rad iohve with historical simulant data provided an indication of the expected increase in rheological strength with increasing concentration, and a comparison with a wider database of melter-feed &ta. Yield stress and apparent viscosity data from the core samples, simulants, and historical data are provided .in Figures 4.13 and 4.14.- The simulant and radioactive . data (with the exk t ion of 102-AZ Core 1) fit within the rather broad Spread of historical data. A-comparison of the simulant and radioactive data from this study indicated that the simulants have greater yield stresses and apparent viscosities than the actual waste melter feeds. .
4.31
. .. . , - - I . .
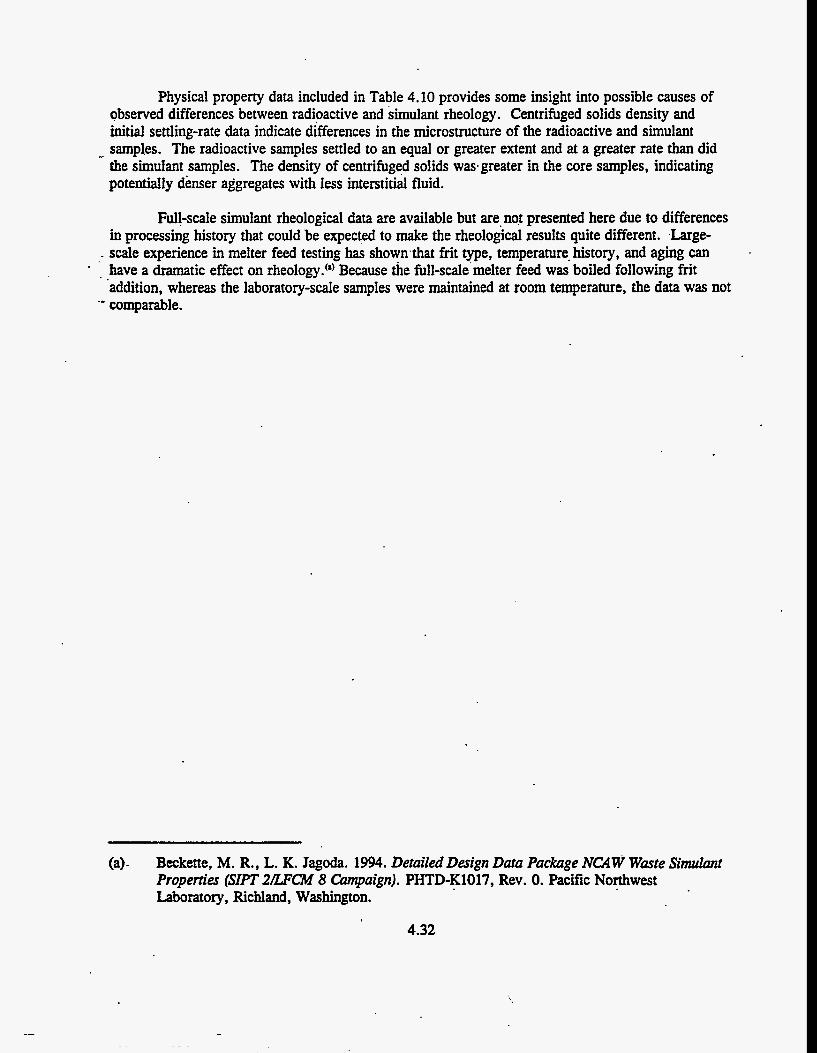
Physical property data included in Table 4.10 provides some insight into possible causes of observed differences between radioactive and simulant rheology. Centrifuged solids density and initial settling-rate data indicate differences in the microstructure of the radioactive and simulant
- samples. The radioactive samples settled to an equal or greater extent and at a greater rate than did the simulant samples. The density of centrifuged solids was.greater in the core samples, indicating potentially denser aggregates with less interstitial fluid.
Full-scale simulant rheological data are available but are, not presented here due to differences in processing history that could be expected to make the rheological results quite different. Large-
- scale experience in melter feed testing has showrthat frit type, temperature. history, and aging can 1 have a dramatic effect on rheology.") Because the full-scale'melter feed was boiled following frit
-= comparable. addition, whereas the laboratory-scale samples were maintained at room temperature, the data was not
(a). Beckette, M. R., L. K. Jagoda. 1994. Detailed Design Data Package NcllW Waste Simlant Properties (SIPT 21zFcM 8 Campaign). PHTD-K1017, Rev. 0. Pacific Northwest Laboratory, Richland, Washington.
4.32

..
Figure 4.13. Comparison of Melter Feed Yield Stress with Historical Data") -I - A,
2.4 . I
II e- I
l .6 I -
* I 0 12- -
2 I 0.8 m - 0 -
0.4
1 I I I o ! . I I I I
I 1 I
400 - 450 500 550 E grams WO per liter
o Actual Waste - This Study * Sirrmlant -This Study Figure 4.14. Comparison of Melter Feed Viscosity at 183s" with Historical Data''
400 450 500 . 550 600 grams wo per r i r
o Actual Waste - T h i s Study * S i d a n t -Thisstudy
(a) Lanning, D.D., P.A. Smith, G. Terrones, D.E. Larson, Summary ofRheoZogicuZ Studies ReZded to HWW SZumes, Letter Report PHTD-d93-03.02M, Pacific Northwest Laboratory, November 1993 (data at 4 and 6 pH from Farmworth et al. 1986, Appendix B).
4.33

4.4 Glass Analysis
4i4.1 Chemical Characterization
Chemical compositions of the three radioactive glasses and the NCAW sbulant are provided in Table 4.1.1.. Initial analyses of '101-AZ Core 1 and 2 glasses were less than adequate, only accounting for 92% to 93% of glass (see Appendix A, Tables A.6 and A.7). Consequently, further analysis of the glasses was ,pursued including re-analysis using standard preparations (Na202 and KOH fusions), analysis .using HF digestion preparation, and similar preparations/analyses on National Bureau of Standards (NBS) and internal standards (results are in Appendix A, Tables A.6 through A.9). Using this suite of data, more feasonable -"adjusted" compositions were calculated for each glass to allow simulant glass preparation. Ak aresult of the difficulties in these and other glass analyses, the'sample preparation procedures were refined, resulting in a greatly improved adys i s of 102-AZ Core 1 glass (accounted for 99.6% of the glass); The three core sample simulant glasses were batched to equal the composition of the respective core samples, but were not analyzed.
Table 4.12 compares -the measured glass compositions to compositions calculated from washed solids or formated slurry meaiured compositions, frit compositions, and estimated waste oxide loadings in the glass. The estimated waste loadings were generated by minimizing differences between the measured and calculated compositions (major. components only). After applying the estimated waste loadings, the measured and calculated compositions compared fairly well. In each case the estimated or calculated waste oxide loading was greater than targeted. The targeted waste loadings for 101-AZ Core s 1 and 2 were 25% and for 102-AZ Core 1 was 28%. The estimated loadings were 2 % , 5 % , and 2 % greater than targeted values, respectively.
4.34

Table 4.11. Chemical Compostions of Actual and Simulant Glasses
101-Az corc #I 101-Az dorr #2 Adjusted M j d . lozAzcac#l NCAW S i
( W Y O oxide) I (ut% oxide) (we? oxide) (*A Oxide)
Noca: ?. * b.
0.10' 5.22'
9.68' 0.05' 0.002' 0.9+ 0.30' 0.14' 0.10' 0.20' 0.oT 0.MC 10.lSb 212. 0.14' 3.5ab . 0 . e O.4Sb 0.01' 9.79' 0.16" 0.29. 0.55' 0.20'
51.97' 0.04'
0.12'
0.41''
0.09 1.99' 0.4OC 100.07
0.03' 285'
738e 0.07. 0.003' 0.35' 0.80'
0.06' 0.03'
12zb 1.65' 0.46' 5.Wb 0.12 0.21'
6.24' 0.42. 0.6s' 0.88' 0.11'
0.09'
53.09' 0.05' 0.05'
0.0s'
1.71'
0.02 . 4.4P . 0.32
100.31
(0.016) 6.2 NA 13
0.037 NA 0.48
I 0.08 NA 0.12
- N A 11 NA 0.27 4.6 . 0.1 1 0.3 NA 7.5 (0.l7) 0.69 (035) 0.11 0.01 NA 0.03 NA NA 51
0.0s NA
0.099 NA 0.85 0.01
(0.019)
(0.022)
0.02 1 9
99.4
NA 2.3 NA 11
0.085 NA 1.0
0.49 0.17 0.07 0.15
* 0.09 NA 6.2 0.7
0.265 3.6 0.9 0.36 0.24 8.8
0.62 0.51 NA NA NA NA 0.2 NA NA 53.2 0.1 NA NA 0.1 NA NA NA 0.05 0.15 3.5
s.t

Total
Table 4.12. Measured Versus Calculated Glass Compositions and Waste-Ox,ide Loadings
Estimated Waste % Oxide Loading
101 -AZ Core #1 101 -AZ Core #2 Glass Composition Glass Composition Glass Composition
(wt% oxides) (wt% oxides) (wt% oxides) Measured Calculated I Measured Calculated I Measured Calculated
5.2 4.6 2.9 2.7 6.2 6.1 9.7 10.2 7.4 7.5 13.0 . 13.6 1 .o 1 .o 0.4 0.5 0.5 ' 0.3 10.2 10.3 12.3 13.8 11.0 11.9 3.6 3.7 5.9 - 6.1 4.6 4.8 0.8 0.8 0.1 0.1 0.1 0.1 9.8 10.6 6.2 6.9 7.5 7.5 52.0 52.2 . 53.1 53.7 51 .O 50.4 2.0 2.1 4.4 4.0 1.9 2.0 5.9 4.5 7.4 3.9 4.2 3.2
102-AZ Core # l
100 100
27%
100 100
30%
100 100
.30%
4.36

Results of glass redox as measured by Fe+2/Fe+3 are in Table 4.13. All three radioactive samples were well within the prior-planned HWVP acceptable range; the NCAW simulant was at the lower limit. Glass redox resulting from vitrification of NCAW simulant waste has been shown to be somewhat correlated to the amount of formic acid added, initial nitrite, and initial nitrate concentrations.") A plot from Men showing this relationship is provided in Figure 4.15 and includes historical simulant data combined with radioactive data from this study. The radioactive results compared well with simulant data and fall well ,within the range of simulant results.
4.4.2 Radiochemical Characterization r
Radiochemical compositions of the actual waste glasses are provided in Table 4.14 with comparisons to the prior-planned HWVP maximum. Core sample compositions are decay-corrected to 1/1/90, whereas the design limit maximum for the HWVP assumed a plant start-up date of 1999 AD. All radionuclide concentrations were below the maximum, with the exception Co-60, Sr-90, Pu- 239+240 and Cm-242,. With an additional 9 years of decay, the Sr-90 concentration would decay below the maximum; but the Co-60, Pu-239+240 and Cm-242 would remain above the maximum.
4.4.3 Crystallinity
Samples of each radioactive glass were examined using X-ray diffraction ouu)) to determine the degree of crystallinity and to identify the crystalline phases, if any were present. The degree of crystallinity was low, likely under 1 %. No crystalline phases were detected in the glass produced from 101-AZ Core 1. Low concentrations (s 1 %) of crystalline phases were found in the glass made from 101-AZ Core 2. The presehce of ruthenium oxide was tentatively identified, at least one unidentified phase was present. One unidentified peak of low intensity was present in glass made from 102-AZ Core 2:' Based on comparative counts of the mount material (AI), a rough estimate of the crystalline concentration was calculated to be between 0.2 %I and 2 % . The low concentrations of crystalline phases were attributed to the fact that each of the glasses was airquenched before annealing to pass through the devitrification temperature zone (- 900OC). Each of the radioactive glasses was formulated to have liquidus temperatures below 900°C.
Table 4.13. 'Summary of Glass Redox Results
Fe+2/Fe+3
101-& Core 1
0.026
101-AZ Core 2
0.085
102-AZ NCAW 102-AZ-C1 Core 1 Simulant Simulant
0.047 0.005 Not Meas. J
Prior HWVP Accemble Range
0.005 to 0.30
(a) Men, M. D. 1994. A Summary Report on Feed Preparation Wgas and Glass Redox Data for Hanford Waste Vitriflcat'on Plqnr. Letter Report PHTD-C93-03.02L. Pacific Northwest Laboratory, Richland, Washington.
4.37

8E't
10'0
C'O.
f c
0 1

Nuclide CO-60 Sr-90 Tc-99 Ru- 106 Sb-125 I- 129 CS-134 CS-137 Ce-144 Eu- 1 54 ELI-155 Np-237 *
Pu-238 P~-239+240 Am-24 1 Cm-242 Cm-243+244
Notes:
. Table 4.14. Radiochemical Composition of Actual Waste Glass
101-Az 101-A2 102-Az Prior HWVP Core #1 ’ Core #2 Core #1 Maximum
2.57E+OO 1 (uCi/g)“ I (uCi/g)‘”’ I (uCig)”’ (uCi/g)‘”’
7.5 lE+OO 1.96E+O 1 1.03E+O 1 2.03E+04
’ 7.89E+02 1.45E+02
7.35E+OO 6.2 1E+02 1.33E+03 5.7 1 E+O 1 1.3 1E+02
3.15E-03
< 5.00E-04
4.50E-02 4.54E-02 2.40E-0 1 5.25E+O 1 6.58E-0 1 4.61E-01
2.99E+04 ’ 2.05E-02
1.80E+03 3.7 1E+02
’ < 4.37E-04
2.8 1E+02 3.98E+03 1.39E+02 3.44E+O2 5.68E-0 1 8.1 1E-02 4.32E-01 l.O5E+O2 2.14E+OO 1.18E+OO
(a) Decay corrected to 1/1/90. (b) Decay corrected to 1/1/2000
4.39
1.41E+04
2.06E+O3 2.61E+02
6.73E-03
2.21E4-02
2.OOE-0 1 .1.73E+OO 5.5 6E+O 1
2.50E+04 5.6OE+O 0
. 2.99E+03 l.O5E+O3
7.21E-tO2 3.05E-l-04 1.79E+04 2.0 1E+02 2.46E+02
. 9.75E-06
1.19E-01 4.6OE-0 1 1.1 6E+OO 3.46E-tO2 2.99E-01 -

4.4.4 Physical Characterization :*
. Density of the radioactive glasses was measured with a simple waterdisplacement test. The density of the cooled glass from 101-AZ Core 1 was 2.56 g/cc; from 101-AZ Core 2, 2.67 g/cc; and from 102-AZ Core 1, 2.54 g/cc.
4.5 Durability
Averaged normalized releases for the major elements and measurabl radionuclides with - estimated standard deviations and confidence intervals for tests in Table 3.2 are presented here. The - methods for calculating normalized releases and the associated statistics are described in Appendix F.2. A review of this appendix section is essential to understanding the limitations of the statistics provided in this section;' Model predictions for durability and model statistics gfe.provided in Appendix A, Tables A.20 thiough A.23. Test leachate analytical data, less radiochemistry, are provided in Appendix A, Tables A.10 through A.19. Leachate radiochemical data for the hot-cell tests only are provided in-Appendix B, Tables B.4 through B.6.
The statistics provided throughout this section, excluding model statistics, include only short- term uncertainty estimates. In effect, they represent the degree to which a given laboratory can be expected to reproduce results when using replicate specimens of a given glass under a specific set of conditions. The uncertainties accoimted for include short-term analytical Wcertainty in the glass, leachates, and blanks; short-term uncertainty introduced from test preparation (e.g., surface area-to- volume ratio); and short-term uncertainty introduced during testing (e.g., temperature gradient within oven, leachate-evaporative losses, test duration). The statistics account neither long-term nor inter- laboratory analytical and test uncertainties nor potential analytical biases in the glass or leachate. By design, the core samples and core-sample simulants were durability tested and analyzed at the same time and under the same conditions to allow comparison without consideration of long-term uncertainties.
Prior to generating statistics for the leach tests, the data were natural log transformed to . improve the normality.of the distribution and allow comparison with model results, which were
generated in the same transformed basis.
4.5.1 Product Consistency T M Elemental R e l w .
The PCT is astandard test that compares chemical durabilities of vaous HLW glasses and tests product consistency to assess acceptability of production glass. As discussed in Section 1.2, the WAPS currently specifies the acceptable glass durability criteria for the HLW repository in terms of the PCT (i.e., .glass must be at least as durable as EA glass as measured by ET) . Because this preliminary requirement continues to be the primary benchmark for glass acceptability, ahe PCT remains a critica~ test for a11 U.S. producers of HLW g k s . -
The PCT is a high surface area-to-volume ratio, static dissolution test that results in significant concentrations of glass components in solution. Over a seven day period, the reaction rate changes significantly as the concentration of silicic acid in solution builds up. The initial dissolution rate (or forward rate) is rapid compared to the final rate experienced in the test. Depending on the
.
4.40

glass and duration of the test, the fully saturated dissolution rate may be achieved. This rate would be expected to continue indefinitely unless conditions were achieved where silicic acid concentration is depleted by secondary phase formation. Results from PCT cannot be directly used to predict long- term performance in repository conditions.
4.5.1.1 101-AZ Core 1 and Simulant
Results from PCT of 101-AZ Core 1 are provided in Table 4.15. The durability of the glass as measured by boron release is 0.130 g/m2, which is approximately 50 to 100 times more durable than the EA glass limit. The Na release is comparable to.B, while Li is -70% greater and Si is -40% less than boron. The reduced level of Si releake is typical in PCT results and is due to low solubility
10.2% for B, which is reasonable considering the difficulties of hot-cell operations. The standard deviations are based on quadruplicate glass, triplicate leachate, and a single leachate blank'dyses. Confidence intervals are based on a sample size of three leachates. The natural log-transformed normalized releases and 95 % confidence intervals are used in statistical comparisons between simulant and radioactive samples and with model predictions. Exponential or retransformed data are provided to indicate approximate maxinium error estimates in untransfonned units. Note that the differences between the mean normalized releases and retransformed mean In normalized releases are insignificant.
, of Si in solution. The percent relative standard deviations WDs) range from 2.38% for Li and
Results from PCT of 101-AZ Core 1 simulant are provided in Table 4.16. Separate results are reported for two simulant samples washed, prepared, and durability-tested in the hot cell with the radioactive samples; two simulant samples washed and prepared in the laboratory and tested in the hot cell with the radioactive samples; pooled results from the above four simulant samples; and two simulant samples tested in the laboratory. Note that elemental analysis was not performed on the simulant glass and normalized releases are calculated from the "as-batched" composition. As
. discussed in Appendix F.2, a conservative estimate of glass analytical variance equivalent to 5% RSD was incorporated into overall RSD and confidence interval calculations. Note also that confidence intervals are strongly influenced by the number of replicate samples. For a given standard deviation, the confidence interval for duplicate samples is three times greater than for triplicate samples and four times greater than for quadruplicate samples. Given the assumed glass analytical uncertainty and limited replicate samples, the confidence intervals for these simulant results are conservative.
The mean normalized releases for the hot-cell simulant samples tested in stainlesssteel containers were essentially identical to the laboratory-tested samples in Teflon containers, with the exception of B, which was 0.200 g/m2 in hot cell tesp agd 0.233 g/m2 in laboratory tests. With the exception of B, releases of samples washed and prepared in the laboratory and tested in the hot cell were slightly higher than those tested in the laboratory; releases of samples prepared and tested in the ' hot cell were slightly lower than those tested in the laboratory. Hot-cell simulant samples were prepared both in the hot cell and in the laboratory to alIow for a comparison of results of the two preparation locations. Preparation in this . w e includes weighing and transferring the glass and leachant into the leach containers, sparging the container head space with argon, sealing the containers, swirling to dislodge bubbles,' and removing 'residual glass from the sides of the containers.
4.41

Table 4.15. PCT Leach Test Results for 101-AZ Core #1 (Hot Cell Test*#4)
-Ln Transformed- -Ex~T~~IIS~ORIK~- M a Mean Ln Upper Lower MeanLn
Normalized Normalized Bound Bound Normalized UpperBound Lower Release Release (95%CI) (95%CI) Release (95%CI) Bound(95% Jdm21 %RSD ln(dm2) ln(dm2) ln(dm2) . Wm2) &!!!a c u m
B 0.130 10.20 -2.046 -1.792 -2.299 0.129 . 0.167 .- 0.100 Li 0.226 2.38 -i.m -1.429 -1.547 0.226 0.240 0.213 Na 0.144 .5.70 -1.939 -1.797 -2.080 0.144 0.166 0.125 Si 0.077 3.42 -2.566 -2.481 -2.651 . 0.077 0.084 0.071
CI = Confidence Interval; Confidence interval is based on a sample size of 3 @e:, b1.0.0~2) = 4.303). PCI' = Product Consistency Test Exp Transformed = retransforrmed data from In form to original form
Table 4.16. PCT Leach Test Results for 101-AZ Core #1 Simulant
-Ln Transformed- -* -E~pTraIISf~rmed- M a MeanLn . Upper Lower MeanLn
Normalized Normalized Bound Bound Normalized UpperBound Lower 'Release Release (95%CI) (95%CI) Release
%RSD ln(dm2) lnWm2) ln(dm2) @,/m2.
(Laboratory Test #6 in Teflon - based on sample size of 2) B 0.233 5.00 -1.457 -1.008 -1.907 0.233 Li 0.246 5.07 -1.401 -0.945 -1.856 0.246 Na, 0.200 5.00 -1.611 -1.162 -2.060 0.200 Si 0.132 5.00 -2.027 -1.578 -2.476 0.132 (Hot Cell Test #4 in stainless steel -based on sample @ of 2 washed in laboratory) B 0.216 5.00 -1.532 . -1.082 -1.981 0.216 Li 0.263 5.26 -1.335 -0.863 -1.808 0.263 Na 0.216 5.48 -1.532 -1.039 -2.024 0.216 Si 0.140 5.00 -1.966 -1.517 -2.416 0.140 (Hot Cell Test #4 in stainless steel - sample size of 2 washed in hot cell) B 0.183 13.79 -1.703 -0.463 -2.942 0.182 Li 0.227 9.05 -1.485 -0.672 -2.298 0.226 Na 0.182 9.46 -1.707 -0.856 -2.557 0.181 Si 0.118 12.14 -2.137 -1.046 -3.228 0.118 (Hot Cell Test #4 in stainless steel - cqmbmed incell results based on Sample size of 4) B 0.200 12.80 -1.617 -1.439 . -1.795 0.198 Li 0.245 10.74 -1.410 -1.261 i1.559 0.244 Na 0.199 12.03 . -1.619 -1.452 -1.786 0.198
. Si 0.129 .l2.35 -2.052 -1.880 -2.223 0.129
cI=ConfidenceInw PCT = produa Consistency Test Exp Transformed = ntransformed data from In form to original form
J
(95% CI) Bound (95% &!!!a
0.365 0.389 0.3 13 0.206
0.339 0.422 0.354 0.219
0.629 0.511 0.425 0.351
0.237 0.283 0.234 0.153
CI) m
0.149 0.156 0327 0.084
0.138 0.164 0.132 0.089
0.053 0.100 0.078 0.040
0.166 0.210 0.168 0.108

Figure 4.16 is a comparison of elemental releases for 101-AZ Core 1 glass, simulant, and model prediction. General observations of the data are as follows: (1). the core sample and simulant releases for B, Li, and Na were significantly lower than model predictions; (2) the core sample . release for B, Na, and Si were lower than corresponding simulant releases; (3) the core sample release for Li was consistent with simulant release; and (4) simulant results in-cell and in-laboratory were within the experimental error. The data with large confidence intervals were those tests with duplicate samples only.
.
Table 4.17 provides a direct cornparkon of mean releases between lOl+lZ Core 1 and its in- cell tested simulant. Elemental releases from the simulant were 54% greater for B, 8% greater for Li, 38% greater for Na, and 68% greater for Si than corresponding releases in the actual waste glass. Statistical differences were found for B, Na, and Si to a 95% confidence interval between the simulant and core sample. No statistical difference was found for Li, which yielded an alpha error of 0.49. In other words, the confidence interval would have to be reduced to 50% before a statistical difference could be concluded for Li. A beta error, which would estimate the probability of not detecting a difference in the means when one exists, is not calculated for the test.
.
4.5.1.2 101-AZ Core 2 and Simulant
Results from PCT of 101-AZ Core 2 are provided in Table 4.18. The durability of the glass d measured by boron release was 0.203 g/m2, which is approximately 20 to 30 times more durable than the EA glass limit. As was observed with the first core, the Li release was greater than the B release ( -45 %), and Si release was less than the B release (-40%). The percent MDs ranged from 5% to 7%, except for Li, which has an RSD of 20.7%. The standard deviations are based on quadruplicate glass, triplicate leachate, and a duplicate leachate blank analyses. Confidence intervals were based on a sample size of three leachates.
Results from PCT testing of 101-AZ Core 2 simulant are provided in Table 4.19. Separate results are reported for three simulant samples washed and prepared in the laboratory and tested with the radioactive samples in the hot cell (skinless-steel containers); two simulant samples tested in the laboratory in stainless-steel containers; and two simulant samples tested in the laboratory in Teflon containers. As with 101-AZ Core 1 simulant, elemental analysis was not performed on the simulant glass and normalized releaies are calculated from the "as-batched" composition. Assumed glass analytical uncertainty and limited replicate samples resulted in conservative percent RSDs and confidence intervals.
4.43 .

1 -6
1 -4 . 12
h g 1.0
-: i '.W
- 2 0.8 - z
2 2 0.6 s 0.4
0 2
0.0
B
Li Na Si
Notes:
B
OCore Sample ( lOldt -Cl )
BSimulant (in hot cell -washed in lab)
Simulant [I lab - Tefbn)
Simuhnt (in hot cell -washed in all)
OShuhnt (in hot all - Combined)
13 cvs (2nd order Model #3)
Na Si
Figure 4.16. PCT Results and Model Predictions for 101-AZ Core #1 and Simulaut (error bars = estimated 95% confidence interval) '
Table 4.17. PCT Durability Comparison of 101-AZ Core 1 Simulant to 101-AZ Core 1 Radioactive Glass
Mean Normalized Release (e/m2)
Statistid Degrees of
Simulant Radioactive Jtadioactive 95% CI Al~ha {nl+n2-2) Ratio Simulant/ Difference at Freedom
0.200 0.130 1.54 YeS 0.005 5
0.245 0.226 1 .os No . 0.49 5 0.199 0.144 1.38 YeS 0.009 5 0.129 0.077 1;68 YeS 0.0016 5
PCT I= Product Consistency Test CI = Confidence Interval Mean releases become significantly different at a confidence interval of l-alpha. n = number of replicate leachate samples.
' 4.44

Releases from hot-cell simulant samples tested in stainless-steel containers were slightly greater than those observed in laboratory-tested samples in Teflon containers, but in all cases differences were less than 10% greater. The differences between releases in hot-cell samples and laboratory samples tested in stainless-steel containers showed no consistent trend, and in all cases the differences were less than 10%. For this simulant, hot-cell samples were. prepared in the laboratory, which included weighing and transferring of the glass and leachant into the leach containers, sparging the container head space with argon, sealing the containers, swirling to dislodge bubbles, and removing residual glass from sides of containers.
Figure 4.17 compares elemental releases for 101-AZ Core 2 glass, simulant, and model prediction. General observations of the data are as follows: (1) the simulant releases for By Li, and Na were slightly lower than model predictions; (2) the core sample releases were lower than corresponding simulant releases; and (3) simulant results in-cell and in-laboratory were within experimental error. The data yith large confidence intervals are those tests with duplicate samples. i;
Table 4.20 compares mean releases between 101-AZ Core 2 and its in-cell tested simulant. Elemental releases from the simulant were 67% greater for By 26% greater for Li, 136% greater for Nsr, and 30% greater for Si thai were corresponding releases in the actual
between the simulant and core sample. No statistical difference was found for Li, which yielded an error of 0.082. The confidence interval would have to have been reduced to 92% before a statistical difference could be concluded for Li. A beta error, which would estimate the probability of not detecting a difference in the means being comparedwhen one does exist, is not calculated for the test.
-waste glass. Statistical differences'were found for'B, Na, and Si to a 95% confidence interval
4.45

B Li Na Si
Table 4.18. PCT Leach Test Results for 101-AZ Core #2 (Hot CeIl Test #3)
L n Transformed- -E~pTransformed- Mean Mean Ln Upper Lower MeanLn
Normalized Normalized Bound Bound Normalited UpperBound Lower Release Release (95%CI) (95%CI) Release (95%CI) Bound(95% /dm21 .%RSD In(dm2) ln(dm2) ln(dm21 ldm2) f&!m c o r n 0.203 5.98 0.293 20.67 0.105 6.89 0.14 1 4.87
-1.596 -1.241 -2.249 -1.961
-1.448 -0.727 -2.078 '-1.841
-1.745 -1.754 -2.421 -2.082
0.203 0.289 0.105 0.141
0.235 .. 0.175 0.483 . 0.173 0.125 0.089 0.159 0.125
CI = Confidence Intend Confidence interval is based on a sample size of 3 (Le., ~SI.O.OSD) = 4.303). PCT = Product Consistency Test Exp Transformed.= retransformed data from In form to original form
Table 4.19. PCT Leach Test Results for 101-AZ Core #2 Simulant
L n Transformed- -E~pT&~rmed- Mean Mean Ln Upper Lower MeanLn
Release Release (95%CI) (95%CI) Release (95%CI) Bound(95% Normalized Normalized Bound Bound Normalized UpperBound Lower
Mm2) O/aRSD . ln(dm2) In(dm2) ln(dm2) /dm2) rn cI)&!!!a
(Lab Test #8 in Teflon - based on sample size of 2) B 0.327 5.00 -1.117 -0.668 Li 0.344 5,00 -1.066 -0.617 Na . 0.227 5.00 -1.484 -1.034 Si 0.171 5.00 -1.765 -1.315 (Lab Test #10 in stainless steel -based on Sample size of 2) B 0.371 9.7 1 -0.994 -0.122 Li 0.385 5.27 -0.954 -0.481
Si 0.185 5.87 -1.686 -1.158 (Hot CeIl Test #3 in stainless steel - based on sample.& of 3) B 0.338 6.38 -1.084 -0.925 Li 0.369 5.75 -0.998 -0.856 Na 0.248 6.63 -1.393 -1.229 Si . 0.184 5.41 -1.695 -1.560
Na 0.265 10.00 -1i331 -0.433
-1.566 -1.515 -1.933 -2.214
-1.866 -1.428 -2.230 -2.213
-1.242 -1.141 -1.558 -1.829
0.327 0.344 0.227 0.171
0.370 0.385 0.264 0.185
0.338 0.368 0.248 0.184
' 0.513 0.540 0.355 0.268
0.885 0.618 0.649 0.3 14
' 0.3% 0.425 . 0.293 0.210
0.209 0.220 0.145 0.109
0.155 0.240 0.108 0.109
0.289 0.3 19 0.211 0.161
CI = Confidence I n t d PCT =Product Consistency Test Exp Transformed = retransformed data from In form to on- form

1.6 - tl core Sample (10 I-Azcz) H Simulrnt (in lab -Teflon)
H Simullnt (in hot a l l - &d m lab) 0 CVS 2nd Ordcr Model #3
Simuht (im lab - SS A)
1.4 .
l.* t T T
Figure 4.17. PCI' Results and Model Predictions for 101-AZ Core #2 and Simulant (error bars = estimated 95% confidence interval)
'
Table 4.20. PCT Durability Comparison of 101-AZ Core 2 Simulant to 101-AZ Core 2 Radioactive Glass
Mean Normalized Release Wm2) Statistical . Degrees of
Simulant Radioactive Radioactive 95% CI Al~ha (nl+n2-2) Ratio Shulant/ Difference at Freedom
B 0.338 0.203 1.67 YeS 0.0012 4
Li 0.369 0.293 1.26 No 0.082 4
Na 0.248 0.105 2.36 . ' Yes O.OOO6 4
Si 0.184 0.141 . 1.30 YeS 0.0038 4
Notes: PCT = Product Consistency Test CI = Confidence Interval Mean releases become significantly different at a confidence mterval of 1-dpha. n = number of replicate leachate samples.
4.47

4.5.1.3 10242 Core 1 and Simulant i
Results from PCT of 102-AZ Core 1 are provided in Table 4.21. The durability of the glass as measured by boron release is 0.211 g/m2, which is approximately 20 to 30 times more durable than the EA glass limit. As was observed with the first two core samples, the Li release was greater than the B release (-43%) and Si release was less than the B release (-25%). The percent RSDs were around 2%. except for Li which had a 9% RSD. The standard deviations were based on duplicate glass, triplicate leachate, and duplicate leachate blank &lyses. Confidence intervals were based on a sample size of three leachates.
Results from PCT of 102-AZ Core 1 simulant are provided in Table 4.22. Separate results are reported for two simulant samples crushed, sieved, washed, prepared and tested with the radioactive samples in the hot cell (stainless-steel containers) and two simulant samples tested in the laboratory in Teflon containers. Two additional samples were prepared in the laboratory and tested in the hot cell (see Appendix A, Table A.15), but were not reported.. Following the in-cell durability test, it was determina that these two simulant samples were likely unwashed. Elemental analysis was not performed on the simulant glass, and normalized r e lkes were calculated from the "as-batched" composition. Assumed glass analytical uncertainty and limited replicate samples resulted in conservative percent RSDs and confidence intervals.
Releases from hot-cell simulant samples tested in stainless-steel containers were essentially equal to those observed in laboratory-teited samples in Teflon containers. Differences between in-cell and in-laboratory releases were within 2 %- for all reported elements except Na, which was within 8 % .
Figure 4.18 compares elemental releases for 102-AZ Core 1 glass, simulant, and model prediction. General observations of the data are as follows: (1) the simulant releases for B, Li, and Na were lower than model predictions; (2) the core sample releases were slightly lower than corresponding simulant releases; and (3) simulant results in-cell and in-laboratory were essentially identical. The data with large confidence intervals were those tests with only duplicite samples.
Table 4.23 compares mean releases between 102-AZ Core 1 and its in-cell tested shulant. Elemental releases from the simulant were 28% greater for B, 17% greater for Li, 165% greater for Na, Bnd 3% greater for Si than corresponding releases in the actual waste glass. Statistical differences were found for B, Li, and Na, to a 95% confidence interval between the simulant and core sample. No statistical difference was found for Si, which yielded an alpha error of 0.24. The confidence interval would have to have been reduced to 75% before a statistical difference could be concluded for Si. A beta error, which would estimate the probability of not detecting a difference in the means being compared when one exists, was not calculated for the test.
.
4.48

I
Table 4.21. PCT Leach Test Results for 102-AZ Core #1 (Hot Cell Test #5)
-Ln Transformed- -E~pTranSf~~ed---- Mean Mean Ln Upper Lower MeanLn
Normalized Normalized Bound Bound Normalized UpperBound Lower ReleaSe Release (95%CI) (95%CI) Release (95%CI) Bound(95% wm2) %RSD ln(dm2) ln(dm2.1 In(drn2) f&Ea c I ) m
-1.556 -1.201 -3.02 1 -1.846
-1.504 -1.151 -2.796 -1.792
-1.608 -1.252 -3.245 -1.900
B 0.211 2.10 Li 0.301 2.04 Na 0.049 9.04 Si 0.158 2.17
CI = Confidence Interval Confidence interval is based on a sample size of 3 (i.e., ~ S I . O . O S ~ ) = 4.303). PCT = Product Consistency Test Exp Transformed = retransformed data from In form to original form
0.211 0.301 0.049 0.158
Table 4.22. PCT Leach Test Results for 102-AZ Core #1 Simulant
0.222 .- 0.200 0.316 0.286 0.061 0.039 0.167 0.150
-Ln T&ormed- -E~pTransfor~~~ed--- Mean MeanLn Upper Lower MeanLn
Release Release (95%CI) (95%CI) Release (95%CI) Bound(95% Normalized Normalized Bound Bound Normalized UpperBound Lower - ?&SD In(dm2) ln(drn21 In(dm2) - Jnlm2) . c1)-
(Lab Test #11 in Teflon - based on sample size of 2) B 0.274 5.16 -1.296 -0.833 -1.759 Li 0.353 5.09 -1.042 -0.585 -1.499 Na 0.136 5.00 -1.992 -1.543 , -2.441 Si 0.161 5.03 -1.826 -1.374 . -2.278
B 0.269 5.25 -1.313 -0.841 -1.785 Li 0.349 5.02' . -1.052 -0.601 -1.504 Na 0.126 5.10 -2.075 -1.616 -2.533 Si . 0.165 5.08 -1.799 -1.343 -2.256
(Hot Cell Test #5 in stainless steel - based on sample size of 2)
CI=ConfidenctInted '
PCT = Product Consistency Test Exp Transformed = retran&ormed data from In fomto original form
0.274 0.353 0.136 0.161
0.269 0.349
. 0.126 0.165
0.435 0.557 0.214 . 0.253
0.431 0.548 0.199 0.26 1
0.172 0.223 0.087 0.103
0.168 0.222 0.079 0.105
I '

1.6 ..e
1.2 -- n
1.0 - - Y Y
I a ' 2 0.8 - - 1
0.6 - - z
0.4
0.2
0.0
B Li Na Si
Notes:
Li . NI Si
Figure 4.18. PCT Results and Model Predictions for 102-AZ Core #1 and Shdant (error bars = estimated 95% confidence interval)
B
.
Table 4.23. PCT Durability Comparison of 102-AZ Core 1 Simulant to 102-AZ Core 1 Radioactive Glass
Mean Normalized Release Cg/m2)
Statistical Ratio Simulant/ Difference. at .
Simulant Radioactive Radioactive 95% CI Alpha 0.271 0.21 1 1.28 YeS 0.004
0.351 0.301 1.17 YeS 0.016
0.130 0.049 2.65 YeS . o.Oo04
0.163 0.158 1.03 No 0.24
. - PCT = Product Consistency Test CI = Confidence Interval Mean releases become significantly different at a conMence interval of 1-alpha. n = number of replicate leachate samples.
4.50
Degrees of Freedom
in1 +n2-2) 3
3
3
3

4.5.1.4 Comparison of Core Sample and Simulant PCT Results to.-Model Predictions
Glass durability models as developed by Hrma, Piepel et al. (1994) were used to generate
.
PCT-normalized release predictions and statistics for each of the, core sample glass compositions and the CVS-IS%V39-4 composition. Model predictions for these compositions are provided in Appendix A, Tables A.20 through A.24. Results from four different models are included as follows: 1st order; 2nd order model #l; 2nd order model #2; and 2nd order model #3. The latter model, 2nd order model #3, provided the best fit for CVS glasses reported by Hrma and Piepel was selected for comparison with core sample results. ’
Figures 4.19, 4.20, and 4.21 provide a comparison of model predictions to results from actual ’
waste glasses, simulant glasses of same composition, internal standards used in these tests, and environmental assessment glass (upper limit glass). The data are plotted as measured In mean normalized release to predicted In normalized release. The diagonal line represents the ideal fit between measured and predicted. The error bars are 95% prediction intervals for the model, and are based on a sample size’of two. The prediction intervals for means of larger sample sizes, such ‘as the radioactive glasses with three replicates each are slightly smaller than shown. Boron, Li, and Na results are provided in Figures 4.19, 4.20, and 4.21 respectively. A characteristic of the model, verified during validation, is that it tended to over-predict release in highdurability glasses and under- predict release in low-durability glaSses. This was evident in each of these three figures. For B, measured results for all tests shown, except one core sample, were within the 95% prediction intervals of the model.’ For Li, all measured results were within the 95% prediction intervals of the model. All three core samples and one core sample shulant were outside the 95% prediction intervals of the model for Na. Where not specified, hot-cell tests were performed in stainless-steel containers and laboratory tests were performed in Teflon containers. ,
A summary by glass type of results fitting within the 95% prediction interval of the model is provided in Table 4.24. With the limited amount of data presented, the actual waste glass mean releases were within the model’s 95% prediction interval only 56% of the time and the simulant glass mean releases were within the interval 96% of the time.
4.51

'! i
2
I d k
1 4CorrSlmpla +Core Sample Simulmts (in lab -Teflon) A C m Sample Simulmts (m hot cell) XCVS-IS-HW39-4 (m lab -Teflon) OCVS-IS-HW39-4 (in hot cell) .EA Olau (in lib - Teflon) ~EAOlus(inhotcel1)
-2 -1 0 1 M e a s t ~ d Boron Rdctse IEno1
3 '
Figarc 4.19. M d Vcrsus Predicted PCT Boron Releasc for Core Sample, Simulant, and Standard Glasses' '+
I

3
2
I'
-1
-2
-3
I t *Core Samples +Con Sample Simulmts (in lab - Teflon) A C m Sample Simulants (in hot cell) XCVS-IS-HW39-4 (in lab - Teflon) OCVS-ISHW39-4 (in hot cell)
/ -3 -2 -1 1 2 3
Figure 4.20. Measured Versus Predicted PCT Lithium R e l a for Core Sample, Simulant, and Standard Glasses

2.5
1.5
I
' j
-25
.Cm Sunpla +Con Sunple Simulants (in lab - Teflon) ACue S&le Shulantr (m hot cell) XCVS-IS-HW39-4 (in lab -Teflon) OCVS-IS-HW39-4 (in hot cell) .EA Qlm (in lab - Teflon) .EA Olus (in hot cell)
3.5 3.5 -2.5 -1.5 0.5 1.5
Figure 4.21, Measured Versus Predicted PCT Sodlurn Release for Core Sample, Sirnulant, and Standard Glasses
2.5

Table 4.24. Summarized Comparison of PCT Model Prediction to Measured
(number of tests within prediction intervals/total number compared)
- Boron Lithium ’ Sodium - Total Core Sample Glasses.
Core Sample Simulants .
Reference Glass (CVS-IS-Hw39-4)
Environmental Assessment Glass
4.5.1.5 Repeatability of Hot Cell and Laboratory PCTs . Triplicate reference glass samples were tested in each of the hot-cell PCTs to verify
consistency between hot-cell tests and to compare them to laboratory tests. The CVS internal standard glass, CVS-IS-HW39-4, was used for this purpose, since considerable comparative laboratory PCT data already exist. ’
Results from hot-cell tests and one laboratory test in stainless-steel containers are provided in Table 4.25. The durability of the reference glass as measured by B release was around 1.6 g/m*, which was four to six times more durable than.EA glass. Elemental releases for the reference glass in hot-cell tests #3 and test #4 were essentially d e same, while hot-cell test #5 yielded slightly higher releases. Each of these tests were performed in stainless-steel containers. The percent RSDs for each of the elements were between 5 % and 7.5 % , and were based on sample sizes of three. Much of the percent RSD was a contribution from the 5% RSD assumed for glass analytical testing. The in- laboratory test performed in stainless steel yielded slightly higherreleases than hot-cell test #5, and resulted in percent RSDs of around 6 % to 9%.
Figure 4.22 compares elemental releases from the reference glass for each of the hot-cell PCTs, the in-laboratory test in stainless-steel containers, and prior laboratory tests in Teflon containers (Hrma 1994). Observations from the data are as follows: (1) the three hot-cell tests produced consistent results; (2) the hot-cell tests in stainless-steel containers produced results well within the range set by laboratory tests in Teflon containers; (3) all results were consistent with model predictions; and (4) the laboratory test in stainless-steel containers was well *thin the range of laboratory tests in Teflon containers. Each of the laboratory tests in Teflon containers (CVS2-19, CVS2151, CVS2-97) used five replicate glasses. Laboratory test #10 in stainless-steel containers included only two replicate glasses, resulting in large confidence intervals. Confidence intervals for the CVS tests were not readily available and are not included.
4.55

Table 4.25. PCT Leach Test Results for CVS-IS-HW39-4
L n Transfomed- Mean MeanLn Upper Lower
Normalized Normalized Bound Bound ReIeaSe Release (95%CI) (95%CI) -1 %RSD ln(dm2) . ln(dm2. lnWm21
(Hot Cell Test #3 in stainless steel - based on sample size of 3) B 1.53 1 5.01 0.426 0.551 0.302 Li 1.227 5.40 0.204 0.338 0.070 Na 1.174 5.80 0.160 0.304 0.016 Si 0.395 5.80 -0.930 -0.786 .-LO74
(Hot Cell Test #4 in stainless steel - based on sample size of 3) B 1.557 5.92 0.442 0.589 0.295 Li 1.241 6.42 0.215 0.375 0.056 Na 1.233 7.50 0.209 0.395 0.023 Si 0.388 5.82 -0.947 -0.802 -1.091
- E ~ p T r a n s f ~ ~ ~ ~ d - Mean Ln
ReIcast (95%CI) Bound(959i Normalized UpperBound Lower
f.g!!?m f.g!!?m cI)f&m
1.53 1 1.227 1.174 0.395
1.556 1.240 1.232 0.388
(Hot Cell Test #5 in stainless steel -based on sample size of 3) B 1.731 .7.38 0.547 0.73 1 0.364 1.729 Li 1.3 14 6.81 0.272 0.442 0.103 1.313 Na 1.296 7.3 1 0.258 0.440 0.077 1.295 Si . 0.43 1 6.22 -0.842 -0.687 -0.996 0.43 1
(Lab Test #10 in stainless steel - based on sample size of 2) B 1.820 9.23 0.598 1.427 -0.232 1.818 Li 1.384 8.3 1 0.324 1.070 -0.423 1.382 Na 1.322 8.62 0.278 1.052 -0.497 1.320 Si 0.415 6.06 -0.879 -0.335 -1.423 0.415
CI = Confidence Interval PCI' = Product Contistency Test Exp Transformed = retransformed data from In form to original fom
4.56
1.734 .- 1.403 1.356 0.456
1.803 1.455 1.485 0.448
2.077 1.555 1.553 0.503
ir.
4.165 2.916 2.865 0.715
1.352 1.073 1.016 0.342
1.343 1.058 1.023 0.336
1.439 1.109 1.080 0.369
0.793 ' 0.655 0.608 0.241

5.0
I
- - B Hot Cell T& #3 (1 O I - A z c 2 ) Irb Test #IO (in Mas) wcvsz-19 B CVS2-5 1
0 Hot a l l TaC #4 (101-AZ-CI) B HoI all Tcst #S (102-AZCI)
. 4.0
9 9 4 3.0
2 i 2.0.-
1.0 - -
0.0
mcvsz-97 .
- -
- -
7
’ I I I T
B Li N. Si
Figure 4.22. PCT Results and, Model Predictions for Reference Glass CVS-IS-HW39-4 (Error Bars = Estimated 95% Confidence Interval)
Table 4.26 provides a comparison of mean releases from the reference glasses in the two most widely variant hot-cell tests (tests #3 and #5). Elemental releases in test #5 were 13% greater for B, 7% greater for Li, 10% greater for Na, h d 9% greater for Si than corresponding releases in test #3. No statistical differences were found. Comparing the means from these two tests is not technically
’ correct for the following reasons: (1) test-to-test variability contributed to the difference between results in the two tests, but this uncertainty was ignored in calculation of the standard deviations. ’This factor will increase chances of concluding a statistical difference when one does not exist. (2) Conservative estimates for glass analysis (Le., 5% RSD) were included in the standard deviation for both tests, but should be ignored because glass samples were drawn from the same batch and a single glass cpmposition was used for calculation of normalized releases; This factor will hcrease chances of not concluding a statistical difference when one exists. The statistical comparison is presented, however, to’show that even when introducing test-to-test variability, the statistical comparison yielded the desired result when using the conservative estimate for glass analfical uncertainty.
4.5.1.6 Comparison of Leach Containers for PCTs
The PCT method (Jantzen 1992) requires use of PFA Teflon or 304L sta‘inless-steel leach vessels. Stainless-steel containers with Teflon gaskets %e used for testing nuclear waste glass or testing in radioactive fields. The two containek are dierent in two notable ways. First, Teflon is permeable to CO, and O,, which equilibrates with the leachate. The stainless-steel container provides a closed system to the atmosphere, except that which is left in the head space. Second, stainless steel
‘ I
4.57

Table 4.26. Comparison of Hot-Cell (HC) Tests #3 and #5 Using Reference Glass CVS-IS-HW39-4
Mean Normalized Release Wm2)
B
cvs-IS-Hw39-4 cvs-IS-Hw39-4 HC Test #3 HC Test #5
1.531 1.731
Statistical Ratio Difference at Degrees of
HC Test #5/ 95% CI Freedom HC Test #3 Abha Lnl +n2-2)
1.13 .072 4 - - No
Table 4.27. PCT Leach Test Results for NCAW Simulant Glass
%RSD
L n Transforpled- - E q T d o ~ m e d - MeanLn Upper Lower MeanLn
Release (95%CI) (95%CI) Release (95%CI) Bound(95% ln(dm2) In(dm2) ln(dm2) WEB CI)fg!m
Normalized Bound Bound Normalized UpperBound Lower
0 Test #2 in Teflon - based on sample size of 2) B 1.920 1.43 0.652 0.780 0.524 *
Li . 1.669 3.55 0.512 0.83 1 0.193 Na 1.762 0.00 0.566 0.566 0.566 Si 0.493 8.30 -0.708 0.038 -1.454
(Lab Test #5 in staid'ess steel - based on sample size of 3) B 1.698 6.3 1 0.528 1.0% Li 1.435 2.95 0.361 0.626 Na 1.301 0.00 0.263 0.263 Si 0.422 7.79 -0.863 -0.164
(Lab Test #4 in fused-silica - based on sample size of 2) B 1.992 15-80 0.683 . 2.102 Li 1.375 6.15 0.3 18 0.870 Na 1.340 4.04 0.292 0.655 Si 0.458 14.65 -0.784 0.532
-0.039 0.097 0.263 -1.563 .
-0.737 -0.235 -0.071 -2.100
1.920 1.668 1.762 0.493
1.6% 1.435 1.301 0.422
1.979 1.374 1.339 0.457
(Hot Cell Test #2 in stainless steel - based on sample size of 2) B 1.407 5.39 0.341 0.447 . 0.235 1.406 Li 1.298 4.89 0.260 0.356 0.164 1.297 Na 1.149 4.71 0.138 0.23 1 0.046 1.148 Si 0.443 8.49 -0.815 -0.649 -0.982 . 0.442
2.183 1.689 . 2.295 1.213 1.762 1.762 1.039 0.234
2.991 1.870 1.301 0.849
0.962 1.101 1.301 0.210
8.182 0.479 2.387 . 0.790
. 1.925 0.93 1 1.703 0.122
1.563 1.265 1.428 1.179 1.259 1.047 0.523 0.375
CI = Confidence Interval PCT = Product Consistency Test Exp Transformed = retransformed data from In form to original form

5.0
4.0
t3 s I 3.0 ez
1 .o
0.0
I
B
OHot cCllTd#4(lOl-AZ-CI) .HotCellTcst#J (102-AZCI) . cVs2-19~ . cvs2-51 R CVS 2nd Ordir Model #3
Ii N. Si
Figure 4.22. PCT Results and Model Predictions for Reference Glass CVS-IS-HW39-4 (Error Bars = Estimated 95% Confidence Interval)
e .
Table 4.26 provides a comparison of mean releases from the reference glasses in the two most widely variant hot-cell tests (tests #3 and #5). Elemental releases in test #5 were 13% greater for B, 7% greater for Li, 10% greater for Na, and 9% greater for Si than corresponding releases in test #3. No statisticd differences were found. Comparing the means from these two tests is not technically correct for the following reasons: (I) test-to-test variability contributed to the difference between results in the two tests, but this uncertainty was ignored in calculation of the standard deviations. This factor will increase chances of concluding a statistical difference when one does not exist. (2) Conservative estimates for glass analysis (Le., 5 % RSD) were included in the standard deviation for both tests, but should be ignored because glass samples were drawn'from the same batch and a single glass cpmposition was used for calculation of normalized releases; This factor will hcrease chances of not concluding a statistical difference when one exists. The statistical comparison is presented, however, to show that even when introducing test-to-test variability, the statistical comparison yielded the desired result when using the conservative estimate for glass analytjcal uncertainty.
4.5.1.6 Comparison of Leach Containers for PCTs
The PCT method (Jantzen 1992) requires use of PFA Teflon or 304L sta'inless-steel leach vessels. Stainless-steel containers with Teflon gaskets q e used for testing nuclear waste glass or testing in radioactive fields. The two containers are different in two notable ways. Fitst, Teflon is permeable to CO, and O,, which equilibrates with the leachate. The stainless-steel container provides a closed system to the atmosphere, except that which is left in the head space. Second, stainless steel
4.57

Table 4.26. Comparison of Hot-Cell (HC) Tests #3 and #5 Using Reference Glass CVS-IS-HW39-4
B Li
Na
Si
Notes:
cvs-IS-Hw39-4 HC Test #3
1.531
1.227
1.174
0.395
Mean Normalized Release Wm2)
Statistical
CVS-IS-HW39-4 HC Test #5/ 95% CI Ratio Difference at
HC Test #5 HC Test #3
1.731 1.13 No
1.314' 1.07 No 1.296 1.10 No 0.431 1.09 No
F'CT = Product Consistency Test CI = Confidence Interval Mean releases become significantly different at a confidence interval of 1-alpha. n = number of replicate leachate samples.
Degrees of Freed0.m
Albha in1 +n2-21
.072 4
.23 4
.13 4 .OS5 4
controls the system redox and forces a reducing environment. Although the Teflon container is chemically inert, the system is oxidized by virtue of the air atmosphere.
following reasons: (1)actinides plate out on the stainless-steel container walls, distorting the actinide , release .&ta (Le.,. altering the concentration of actinides in solution may affect the rate of certain mineral formations and elemental releases); and (2) the reducing atmosphere may not be representative of the repository environment, which is a function of design. Consequently, alternative container types were considered, including fused-silica and gold-plated.
. Initially, a redox-inert container was sought for testing radioactive glass the hot cell, for the
J
Results from a model simulation of the NCAW simulant glass reacted in deionized water at 90°C wing a fixed 0, and CO, gas fugacity showed a slightly different sequence of secondary mheral formation, compared with the closed-system simulations.(') Talc, Mg,Si,O,,,(OH),, which lowers the activity of silicic acid, was predicted to form. Consequently, the reaction rate for the simulant in Teflon containers was predicted to be slightly higher over a. finite range of reaction progress for the same glass in stainless-steel containers. This may result in slightly higher PCT releases for Teflon containers, but should have little effect on MCC-1 releases. Model simulations were not performed on the fused-silica containers.
Limited comparative PCT data of Teflon, stainless steel, and fused-silica-lin& leach containers were generated to support the decision of which leach container to use in the hot cell. Glhs specimens from a single batch of NCAW simulant glass were tested in the laboratory, using-all three container types, and in the hot cell using stainless steel. Results from these tests are reported in Table 4.27. Sample sizes for each of the tests were only two, resulting in large statistical confidence intervals. The
(a) Memo from Bernard P McGrail to Eugene V. Money, Pacific Northwest Laboratory, "Results for Teflon Containers," 2 January 1992.
4.58

calculated statistics represent only short-term variability and preclude a meaningful statistical comparison of means for each contains type. The ratio of minimum-measured release to maximum- measured release for the elements are as follows: 0.71 for B, 0.78 for Li, 0.65 for Na, and 0.86 for Si. Similar comparisons of CVS-IS-HW39-4 performed in Teflon containers but at different times , (CVS2-19 versus CVS2-97 [see Figure 4.221) yielded 0.72 for B, 0.64 for Li, 0.77 for Na, an3 0.87 for Si. The differences observed between the three leach containers are equivalent in magnitude to long-term differences observed in.the internal standard glass. The three leach containers may produce statistically different PCT results, but the limited amount of data generated in this study was insufficient to differentiate between the containers.
' Figure 4.23 provides a graphical representation of the NCAW simulant glass tested in the three containers. General observations of the data are that with the exception of B, the normalized releases for fused-silica, stainless steel in the laboratory and stainless steel in the hot cell were essentially identical; Teflon results were slightly higher than the other containers for Li and Na; and fused-silica produced the widest (variation in results. Again, each of these observations may or may not be significant, but the current data-was insufficient to differentiate between the results. Review of Fibres 4.16,4.17, and 4.18 showed additional comparative data between stainless steel and Teflon containers, except that the stainless-steel tests are also in the hot cell. In these tests, no consistent difference was observed between the two container types.
The decision to use stainless-steel. containers in hot-cell testing was made based on several considerations, as follows: . .
0
0
0
0
Uncertainties in the repository design make stainless steel as good of a choice as any. A forced reducing condition is easier to model than a system where the glass determines the redox state. Radioactive data obtained in stainless steel can be used to validate models of this type. Presently, an iron overpack is being consider& for use in the repository with special alloys' for the canisters, which may drive the system reducing. However, even with the overpack, conservative factors may prevent taking credit for the reducing atmosphere.
Teflon,, with its oxidizing condition, is technically preferable but is susceptible to radiolytic degradation. Expected dose from one sample of glass could be as high as lo' rad during a 7-day test.
To validate simulants, the simulant and radioactive glasses can be tested under the same conditions for direct comparison.
Results from in-cell PCT in stainless steel yielded low intra-sample variability and comparable results to outsf-cell PCT in stainless.
4.59
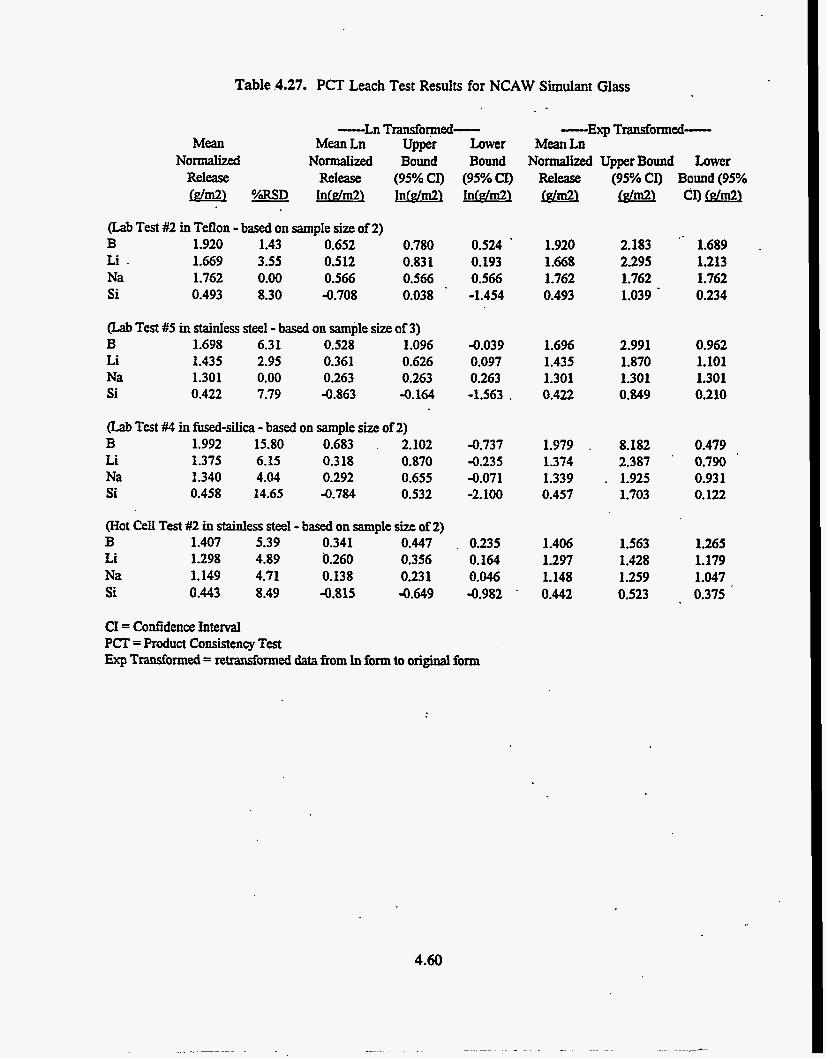
Table .4.27. PCT Leach Test Results for NCAW Simulant Glass
-Ln Transfoped- -Ex~T&oRW~- Mean MeanLn Upper Lower MeanLn
Normalized Normalized Bound Bound Normaliztd UpperBound Lower Release Release (95%CI) (95%CI) Release (95%CI) Bound(95%
YXSD In(dm.2) ln(dm2) ln(dm21 &!?!!a cI)&!!m (Lab Test #2 in Teflon - based on sample size of 2) B 1.920 1.43 0.652 0.780 0.524 * 1.920 Li . 1.669 3.55 0.5 12 0.83 1 0.193 1.668 Na 1.762 0.00 0.566 0.566 0.566 1.762 Si 0.493 8.30 -0.708 0.038 -1.454 0.493
(Lab Test #5 in stainless steel - based on sample size O f 3) B 1.698 6.3 1 0.528 1.0% -0.039 Li 1.435 2.95 0.361 0.626 0.091 Na 1.301 0.00 0.263 0.263 0.263 Si 0.422 7.79 -0.863 -0.164 -1.563 .
&ab Test #4 in fused-silica - based on sample size of 2) B 1.992 15.80 0.683 . 2.102 -0.737 Li 1.375 6.15 0.318 0.870 -0.235 Na 1.340 4.04 0.292 0.655 -0.071 Si 0.458 14.65 -0.784 0.532 -2.100
1.6% 1.435 1.301 0.422
1.979 . 1.374 1.339 0.457
(Hot Cell Test #2 in stainless steel - based on sample size of 2) B 1.407 5.39 0.341 0.447 . 0.235 1.406 Li 1.298 4.89 0.260 0.356 0.164 1.297 Na 1.149 4.71 0.138 0.23 1 0.046 1.148 Si 0.443 8.49 -0.815 -0.649 -0.982 . 0.442
2.183 2.295 1.762 1.039
2.991 1.870 1.301 0.849
1.689 1.213 1.762 0.234
0.962 1.101 1.301 0.210
8.182 0.479 2.387 . 0.790
. 1.925 0.93 1 1.703 0.122
1.563 1.428 1.259 0.523
1.265 1.179 1.047 0.375
CI = Confidence Interval PCT = Product Consistency Test Exp Transformed = retransformed data from In form to original form
4.60

4.0 1 I
3.5
3.0
8 2 5
t I 2o c 1.5
1 .o
0.5
0.0
0 NCAW Shulrnt in Teflon (lab test #2) B NCAW m strinlcss (lab test #S)
. mNCAW in Fusd-Silia (lab M #4) mNCAW m Stlinlm (hot cell tcrt #3)
rT,
B Li Na si
Figure 4.23. Comparison of Alternate Leach Vessels considered for PCT (Error Bars = Estimated 95% Confidence Interval)
4.5.2 Materials Characterization Center (MCC-1) Elemental Releases
The MCC-1 test was developed to compare durabilities of various HLW glasses. An extensive database of MCC-1 results (including CVS) has been created within the HLW glass research community. The ability to compare with this database was a driver for performing MCC-1 analysis on two of-the radioactive glasses in this report.
The MCC-1 test is a low surface area-to-volume ratio, static test that can often result in a fairly constant dissolution rate and'modest concentrations of silicic acid in solution over a 28day test period. Results from PCT tests cannot be directly used to predict long-term performance in repository conditions.
4.5.2.1 101-AZ Core 1 and Simulant
Results from MCC-1 testing of 101-AZ Core 1 are provided in Table 4.28. The durability of the glass as measured by MCC-1 boron release was 7.038 g/m2, which was approximately 7 to 13 , times more durable than'EA glass. Releases of the four reported elements (B, Li, Na, and Si) were essentially the same, ranging, from 7.04 to 6.76 g/m2. The percent RSDs were quite high, ranging from 28 % to 43 56. The standard deviations are based on quadruplicate glass, triplicate leachate, and duplicate leachate blank analyses. Confidence intervals were based on a sample size of thre leachates.
4.61

Note that the differences between the mean normalized releases and retransformed mean In normalized releases were more significant than the PCT results, because of greater variability in the data, but were still less than 5 % .
Results from MCC-1 testing of 101-AZ Core 1 simulant are provided in Table 4.29. Results are reported for two simulant samples tested in the laboratory in Teflon containers. In-cell MCC-1 tests were not performed on the core sample simulants and are therefore not available for direct . '
comparison. The practice of batching core sample simulants and testing them in the same test as the core sample w,as not begun until after these tests were performed. Elemental analysis was not performed on the simulant glass; normalized releases were calculated from the "as-batched" .. composition. Assumed analytical glass uncertainties and limited replicate samples resulted in conservative percent RSDs and confidence intervals.
,
Figure 4.24 compares MCC-1 elemental releas& for 101-AZ Core 1 glass, simulant, and model prediction. General observations of the data are as follows: (1) the simulant releases and model predictions matched quite well; (2) the core sample releases were consistently lower than corresponding simulant releases and model predictions; (3) simulant confidence limits were large due to the limited sample size; and (4) core sample confidence limits were large due to variability in the analyzed leachates.
Table 4.30 shows mean releases between 101-AZ Core 1 and its in-laboratory tested simulant. Elemental releases from the simulant were 99% greater for B, 66% greater for Li, 79% greater for Na, and 49% greater for Si than were corresponding releases in the actual waste glass. A statistical difference was found for B, to a 95% confidence interval between the simulant and core sample. No statistical differences were found for Li, Na, and Si, which yielded alpha errors of 0.265, 0.082, and 0.12, respectively. The beta errors, which would estimate the probability of not detecting a difference - in..the means when one exists, were not calculated for the test. Given the variability in the core sample and the limited sample set for the simulants, the beta error was certainly too high. The statistical cdinparison provided in Table 4.30 has lhited meaning, given that the two tests being compared were performed at different times and under different conditions (i.e.,'in the hot cell versus in the laboratory, and in fused-silica containers versus in Teflon containers).
4.62

i L n Transfomed- - E q T d ~ m d - I
Normalized Normalized Bound Bound Normalized UpperBound Lower I
Table 4.28. MCC-1 Leach Test Results for 101-AZ Core #1 (Hot Cell Test #1) ,
M a MeanLn Upper Lower MeanLn
&leaSe Releast (95%CI) (95%CI) Releast (95%Cl) Bound(95% I
ldm2. %RSD ln(dm2) In(dm2) In(dm2) &/m2) &ha c o r n B 7.038 28.26 1.922 2,624 1.220 6.834 13.790 - - 3.387 Li 7.099 28.73 1.929 2.643 1.215 6.884 14.055 3.372 . Na 6.971 43.17 1.877 2.949 0.805 6.534 19.095 2.236 Si 6.760 36.41 1.862 2.767 0.958 6.439 15.911 2.606
CI = Confidence Interval Confidence interval is based on a sample size of 3 @e., ~(SI,O.OSQ) = 4.303). MCC-1 = Materials Characterization Center (MCC-1) Exp Transformed = retransformed data from In form to original forin
Table 4.29. MCC-1 Leach Test Results for 101-AZ Core #1 Simulant (Lab Test #7)
L n Transformed- - E ~ ~ T d o m e d - MKUl Mean Ln Upper Lower MeanLn
Normalized Normalized Bound Bound Normalized UpperBound Lower Release Release (95%CI) (95%CI) Release (95%Cl) Bound(95%
. @/m2) %RSD ln(dtn21 ln(dm2) ln(dm2) fm2) le/m2) cI)f€&!a
B 13.971 6.03 2.637 3.178 2.095 131967 24.005 8.126 Li 11.794 6.18 2.467 3.022 1.912 11.790 20.537 6.769 Na 12.461 5.52 2.522 3.019 2.026 12.459 20.463 7.586 Si 10.085 5.77 2.3 11 2.830 1.792 10.083 16.938 '6.003
CI = Confidence Interval . Confidence interval is based on a sample size of 2 (Le., ~ . I , o . M ~ , = 12.706). MCC-1 = Materials Characterization Center (MCC-1) Exp Transformed = retramformed data from In form to original form

B Li Na Si
Notes:
2S.C
f 3 15.0
t L! 10.0
5.0
0.0
Table 4.30. MCC-1 Durability Comparison of 101-AZ Core 1 Simulant to 10l:AZ Core 1 Radioactive Glass
Mean Normalized Release CP/m2)
Simulant
13.971
11.794
12.461
10.085
Radioactive
7.038
7.099 6.971
6.760
Statistical Ratio Simulant/ Difference at
Radioactive 95% CI
1.99 YeS 1.66 1.79
1.49
No No
No
MCC-I = Materials Characterization Center (MCC-1) CI = Confidence Interval Mean releases become significantly different at a confidence interval of I-alpha. n = numbers of replicate leachate test samples.
Degrees of Freedom
Aluha In 1 + 112-2) 0.022 3
0.265 3 0.082 0.12
3
3
0 Corr Sample (fused-zilia contliner) E Simulsat (in Irb -Teflon) E CVS 2nd orda Modcl#3
T T T T '
T
B Ii N. Si
Figure 4.24. MCC-1 Results and Model Predictions for 101-AZ Core 1 and Simulant (Error Bars = Estimated 95% Confidence Interval)
4.64
. . -. .

4.5.2.2 101-AZ Core 2 and Simulant
Results from MCC-1 testing of 101-AZ Core 2 are provided in Table 4.31. The durability of the glass as measured by MCC-1 boron release was 6.236 g/m2, which was approximately 8 to 14 times more durable than EA glass. Normalized releases were similar for B, Li, and Si (ranging from 6.17 g/m2 to 6.45 g/mz) and 4.86 g/m2 for Na. The percent RSDs were quite high, ranging from 14%
‘to 43 % . The standard deviations were based on quadruplicate glass, triplicate leachate, and duplicate leachate blank analyses. Confidence intervals were based on a sample size of three leachates.
Results from MCC-1 testing of 101-AZ Core 2 simulant are provided in Table 4.32. Results are for two simulant sampIes tested in the laboratory in Teflon containers. In-cell MCC-1 tests were not performed on the core sample simulants and were therefore not .available for direct compq-kon. The practice of batchmg core sample simdants and testing them in the same test as the core sample was not begun until after these tests were performed. Elemental analysis was not performed on the simdant glass; normalized releases are calculated from the “as-batched” composition. Assumed glass analytical uncertainty and limited replicate resulted in conservative percent RSDs and confidence intervals.
Figure 4.25 compares.MCC-1 elemental releases for 101-AZ Core 2 glass, simulant, and model prediction, General observations of the data.are as follows: (1) the simulant releases and model predictions matched’ fairly well; (2) the core sample releases were lower than corresponding s@ulant releases and model predictions; (3) simulant confidence limits were large due to the limited sample size; and (4) core sample confidence limits were large due to variability in the analyzed leachates.
Table 4.33 compares mean releases between 101-AZ Core 2 and its in-laboratory tested simulant. Elemental releases from the simulant were 124% greater for B, 85% greater for Li, 158% greater for Na, and 63% greater for Si than Corresponding releases in the actual waste glass. A statistical difference was found for each of.the four elements, to a 95%’ confidence interval between the simulant and core sample. The statistical compyison provided in Table 4.30 has limited meaning given that the two tests being compared were performed at different times and under different conditions (Le., in the hot cell versus in the laboratory, and in fused-silica containers versus in Teflon containers).
4.5.2.3 102-AZ Core 1 and Simulant
Because of insufficient sample quantities of 102-AZ Core 1 glass, an MCC-1 test was not performed on the actual waste glass. An MCC-1 durability test was performed on the 102-AZ Core 1 simulant glass; the results are provided in Table 4.34. Comparisons with model predictions are discussed in Section 4.5.2.4.
4.65 .

Table 4.31. MCC-1 Leach Test Results for 101-AZ Core #2 (Hot Cell Test #1)
-Ln Transformed- MWl MeanLn Upper Lower MeanLn
Normalized Normalized Bound Bound N o d i e d UpperBound Lower Release Release (95%CI) (95%CI) Release' (95%CI) Bound(95% Jdm2) YWSD Iddm21 In(dm2) ln(dm2. fg!m fg!m cI)Ie/m2)
B 6.326 17.37 1.835 2.267 1.404 6.266 9.649 4.070 Li 6.452 13.92 1.858 2.204' 1.513 6.413 9.062 4.538 Na 4.855 43.25 1.568 2.642 0.493 4.795 14.045 1.637 Si 6.172 20.63 1.811 .. 2.323 1.298 6.114 10.208 3.662
CI = Confidence Interval Confidence interval is based on a Sample size of 3 @e., 43.1.0.0~n) = 4.303). MCC-1 = Materials Characterization Center (MCC-1) Exp Transformed = retransformed data fiom In form to original form
Table 4.32. MCC-I Leach Test Results for 101-AZ Core #2 Simulant (Lab Test #9 in Tenon)
L n Transfomed- -Ex~T~~IIs~OIILI~~- Mean MeanLn Upper Lower MeanLn
Normalized Normalized Bound Bound Normalized UpperBound Lower Release Release (95%cI) (95%CI)
YWSD In(dm21 In(dm21 ln(dm21
B 14.180 5.45 2.667 2.652 3.142 . Li 11.962 5.00 2.482 2.482 2.93 1
Na 12.529 5.00 2.528 2.528 2.977 . Si 10.074 5.00 2.3 10 2.310 2.759
CI = Confidence Interval Confidence intend is based on a Sample Size of 2 (Le., k-1,o.o~~) = 12.706). MCC-1 = Materials Characterization m t e r (MCC-1) Exp Transformed = retransformed data from In form to original form
Release (95%CI) Bound(95% @!!a @!!a cI).m!!a 2.162 14.178 23.141 2.033 11.962 18.746 2.079 12.529 . 19.635 1.861 10.074 15.787

30.0 .. 0 Core Sample (M-silica container) Simulint (in trb - Tdm) 0 CVS 2nd Ordcr Model #3
T I T . T
B Li Na Si 2 1 I
- i Figure 4.25. MCC-1 Results and Model Predictions for 101-AZ Core 2 and Simulant (Error Bars = Estimated 95% Confidence Interval)
Table’4.33. MCC-1 Durability Comparison of 101-AZ Core 2 Simulant to 101-AZ Core 2 Radioactive Glass
Mean Normalized Release (a/rn*) Statistical Degrees of
Radioactive Radioactive 95% CI A l ~ h a {nl+n2-2) Ratio Simulant/ Difference at Freedom
Simulant
14.180 B Li
. Na Si
6.326 , 2.24
1.85
2.58
1.63
YeS
YeS 0.016 3
11.962
12.529
10.074
0.004
0.030
0.025
6.452
4.855
. 6.172 . Yes
YeS
Notes: MCC-1 = Materials Characterization Center (MCC-1) CI = Confidence Interval Mean releases become significantly different at a confidence interval of 1-alpha. n = number of replicate leachate samples.
4.67

Table 4.34. MCC-1 Leach Test Results for 102-AZ Core 1 Simulant MCC-1 (Lab Test #12 in Teflon)
-Ln Transformed- -E~p' I 'd~rm&- Mean MeanLn Upper Lower MeanLn
Release Release (95%CI) (95%CI) Release (95%CI) Bound(95% Normalized Normalized Bound Bound Normalized UpperBound Lower
Wm2) %R!jD ln(dm2) ln(dm2) ln(dm2) f.dm21 Wm2) . . C I ) r n )
B 14.829 9.92 2.696 2.890 2.501 14.815 17.995 12.198 Li 14.919 . 9.24 2.702 . 2.883 2.521 14.908 17.869 12.437 Na 14.216 9.50 2.654 2.840 2.467 14.204 17.112 11.7% Si 13.025 9.52 I 2.566 2.753 2.379 13.015 15.685 10.799
CI = Confidence Interval Confidence interval is based on a sample sb% of 2 (Le., k2.~,o.osn) = 12.706). MCC-1 = Materials Characterization Center (MCC-1) Exp Transformed = retransformed data from In form to original form
4.68

4.5.2.4 Comparison of Core Sample and Simulant MCC-1 Results'to Model Predictions .
Glass durability models as developed by Hrma, Piepel et al. (1994) were used to generate MCC4 normalized release predictions and statistics for each of the core sample glass compositions and the CVS-IS-HW39-4 composition. Model predictions for these compositions are provided in Appendix A, Tables A.20 through A.24. Results from four different models are included as follows: 1st order;' 2nd order model #I; 2nd order model #2; and.2nd order model #3. The latter model, 2nd order model #3, provided the best fit for CVS glasses reported by Hrma and Piepel was'selected for comparison with core sample results.
Figures 4.26,'4.27, and 4.28 provide a comparison of model predictions to results from actual waste glasses, simulant glasses of sanie composition, and environmental, assessment glass. The data are plotted as measured In mean normalized release to predicted In normalized release. The diagonal line represents the ideal fit between measured and predicted results. The error bars represent 95% prediction intervals for the model and are based. on a sample size of two. The confidence intervals for means of larger sample sizes, such as the radioactive glasses with three replicates each, are slightly smaller than shown. Boron, Li, and Na results are provided in Figures 4.26, 4.27, and 4.28 respectively. A characteristic of the model verified during validation is that it tended to overpredict release in highly durable glasses and underpredict release in low durability glasses. For B, measured results for all tests shown, except one core sample test and one EA glass test, were within the 95% prediction intervals of the model. For Li, both core sample tests and one EA glass test were outside the 95% prediction intervals of the model, For Na, both core sample tests and one'EA glass tests were outside the 95% prediction intervals of the model. Where not specified, hot-cell tests were performed in fused-silica-lined containers and laboratory tests were performed in Teflon conkhers.
A summary by glass type of results fitting within the 95% prediction interval of the model is provided in Table 4.35. With the limited amount of data presented, the actual waste'giass mean releases were within the models' 95% prediction interval only 17% of the time; the simulant glass mean releases were within the confidence interval 80% of the time.
Table 4.35. S e ' Comparison of PCT Model Prediction to Measured
(#.of tests within prediction intervaldtotal # compared)
- Boron Lithium Sodium Core Sample Glasses
Core Sample Simulants Environmental Assessment Glass
4.69
- Total
I
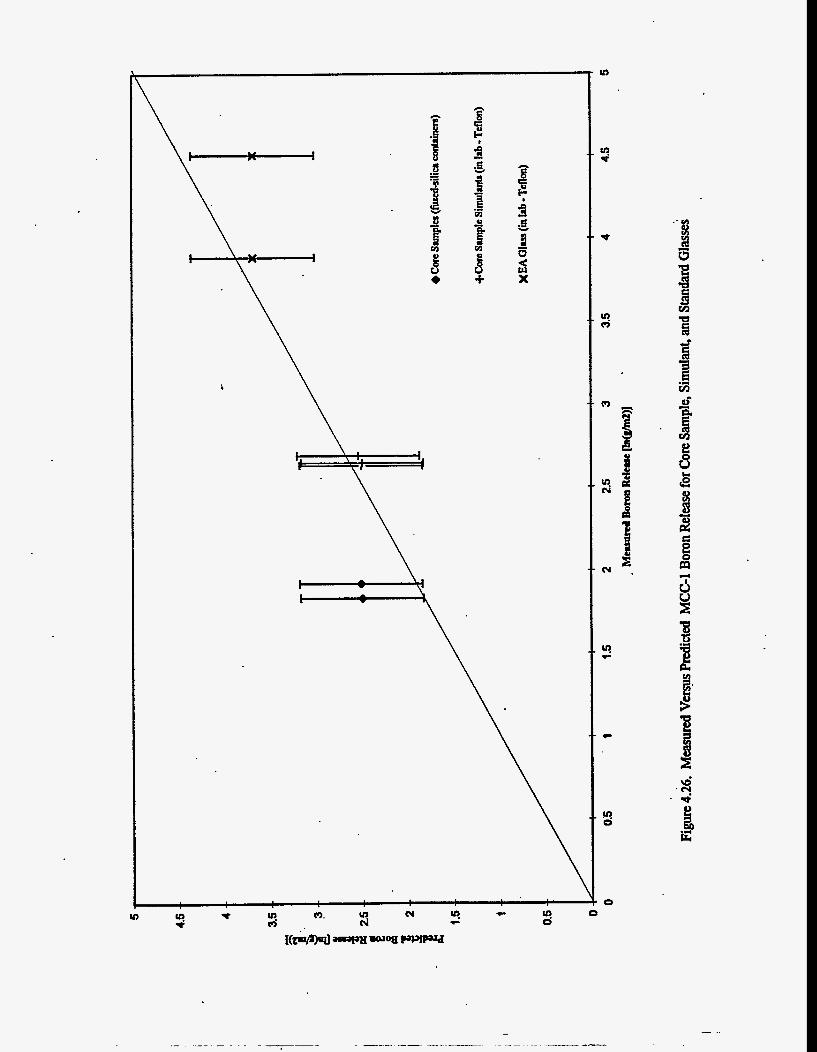
u! c

n
3
*
2
\
6 cu d
8 3 ' E

5
4.5
4
3.5
i 3 1 2.5 SI i . 1.5
1
0.5
0 0 0.5 1 4 1.5 2 2.5 3 3.5 4 4.5 5
M d Sodlmn Rckrae Wd)]
!
Figure 4.28. Measured Versus M c t e d MCC-1 Sodium Release for Core Sample, Simulant, and Standard G l d

4.5.3 PCT Radiochemical Releases
Radiochemical analysis was performed on each of the triplicate leachates for the three radioactive glasses. Leachates from nonradioactive glass samples (usually the in-cell prepared samples) were analyzed radioactive glass leach vessels and radiochemical blank vessels. The vessels were rinsed with deionized water to remove the glass, an amount of 1 vol% HNO, equal in volume to the original leachant was added, and the solution was maintained at 90°C for at least 12 hours. Radiochemical analysis was performed on the acid strip solutions to determine quantities of radionuclides precipitated onto the . stainless-steel surfaces. Analytical results from these samples are included in detail in Appendix B, Tables B.4 through B.6.
.
radiochemical blanks. Following each leach test, acid strips were performed on the
4.5.3.1 101-Az Core 1
PCT radiochemical releases for 101-AZ Core 1 leachate and acidmip are provided in Table 4.36. The normalized releases are compared by ratio to the B release of 0.130 g/m2. The normalized boron release is considered to be a good measure of the glass dissolution extent, because B remains in solution and does not precipitate in secondary mineral phases and B is released through dissolution of the glass network although it is generally released to nearly the same depth of alkali metals. Therefore, a ratio of total radionuclide release to B release significantly different than one indicates precipitation of the radionuclide into secondary mineral phases; selective leaching through a diffusion process; retention in the altered layer or analytical error. The estimated percent RSD and 95% confidence intervals for the retransformed mean In normalized releases are provided as a measure of the estimated minimum and maximum error associated with the measurements. The percent RSD for the leachate ranged from 9.3% for total U to 44.3% for Cm-243/244; the acid strip ranged from 25.3% for Co-60 to 70.1 % for
.
Sb-125.
Comparison of the ratios to boron in the leachate, acid strip, and total provide an indication of which radionuclides may have enhanced performance (Le., mobility retardation) due to secondary phase foxmation and reduction plate-out. General observations of the data are as follows: (1) U, Tc, Pu, Cm, Sb, and Cs were at least fairly soiuble in the leachate (i.e., leachate release within a factor of 3 of B); (2) of these elements, Pu was the only one that plates out on the container in substantial amounts; (3) Sr, Am, Co, Ru, Ce, and Eu were at least an order of magdtude leis soluble in’ the leachate, and (4) only 2% to 6 % of the amount of these elements released from the glass was retained in solution. Comparing the results from different isotopes of the same element (Le., Pu, Cs, and Eu) and isotopes measured by two different techniques (Le., Am-241) provides an additional indication of accuracy. Redundant measurements of Pu, Eu and Am show excellent agreement. . Differences in the Cs results were greater than estimated by the error estimates, but were within a factor of 2.5. The excessive error could have been contributed from the glass or leachate analysis.
.
* Figure 4.29 is a graphical representation of data in Table 4.36. Relative normalized releases in the leachate, acid strip, and total &e shown’with respect to the normalized B release. Similar observations as identified above are also evident in +e figure, with additions. Total U was sufficiently below B to suggest that some of the U was kmsumed in secondary mineral phases or retained in the glass alteration layer. The discrepancy between Cs-134 and Cs-137 could lead to the conclusion that Cs may or may not be solubility limited. The absence of error bars on Ru-106 is because of the three available samples, only one sample was above detection limits.
I i
‘ I
J
4.73

Table 4.36. PCT Rdionuclide Releucl in Sollaion fa 101-AZ Con # I (HOC Cell Tu1 M)
I I
-i I
TOtrlU TC-99 SI-90 Pu-238 Pu-239n40 Cm343n44 -241
. c o d 0 RU-106 sb-125
. @I34 -137 Ce-144 EU-154, Eurl55 Am-241
Relu~su Lnlm?)
0.039 0.876 0.004 0.058 0.058 0.005 0.004 0.008
0.102 0.1 05 0.043
0.004 0.004 0.003
9.3 74.6 14.9 19.2 12.1 44.3 19.7 13.4
8.7 19.0 6.2
19.7 17.2 34.9
0.30 6.74 0.03 0.44 0.44 0.04 0.03, 0.06
0.78 0.81 0.33
0.03 0.03 0.02
0.039 0.864 0.004 0.051 0.058 0.005 0.004 0.001
0.101 0.104 0.043
0.004 0.004 ,
0.003
0.049 5.508 0.006 0.092
0.016 0.001 0.01 1
0.1 26 0.167 0.050 .
0.006 0.006 0.007
o.on
0.031 0.135 0.003 . 0.036 0.043 0.002 0.003 0.006
0.082 0.065 0.031
0.002 0.003 0.001
0.001
0.004 0.109 0.099 0.010 0.005 0.009
O.ooO5 0.002 0.006 0.003 0.005 0.005 0.006 0.004’
32.7
52.6 28.7 25.4 51.9 55.0 25.3
70. I 43.4 66.8 59.6 44.6 47.8 53.5
0.05
0.03 0.84 0.76 0.08 0.04 0.07
0.02 0.04 0.02 0.04 0.04 0.04 0.03
0.001
0.003 0.106 0.097 0.009 0.005 0.009
0.002. 0.005 0.003 0.004 0.005 0.005 0.003
0.01 5
0.012 0.217 0.183 0.034 0.018 0.017
0.010 001s
0.020 0.015 0.017 0.012
0.015
0.003
0.001 0.052 0.052 0.003 0.001 0.005
0.OOO 0.002 0.001 ’ 0.001 0.002 0.002 0.001
0.046 0 876 0.008 0.166 0.156 0.015 0.009 0.017 O.OOO5 0.104 0.111 0.046 0.005 0.009 0.010 0.007
0.354 6.736 0.059 1.278 1.202 0.119 0.071 0.131 0.0038 0.798 0.851 0.355 0.038 0.071 0.074 0.052
0.046 0.864 0.007 0.164 0 .w 0.015 0.009 0.017
0.103 0.109 0.046 0.004 0.009 0.009 0.006
0.064 5.508 0.018 0.309 0.260 0.050 0.025 0.028
0.034 0. I35 0.004 0.088 0.094 0.004 0.004 0.010
0.136 0.082 0.182 0.067 0.065 0.037 0.020 0.001 0.021 0.004 0.023 0.004 0.020 0.001

10.0000
1.0000
0.1000
0.0100
0.0010
Figure 4.29. PCT Radionuclide Releases for 101-AZ Core 1
4.75

4.5.3.2 101-AZ Core 2
PCT radiochemical releases for 101-AZ Core 2 leachate and acid strip are provided in Table 4.37. The normalized releases are compared by ratio to the B release of 0.203 g/mz. The percent RSD for the leachate ranged from 45.6% for Am-241 to 230% for Pu-238; the acid strip ranged from 10.8% for Pu-239/240 to 90.2% for Cm-243/244. A potential reason for the excessive error was a problem experienced during shipping of the samples. Some of the sample containers used for leachate and acid strip samples leaked during shipping, creating a potential for crosscontamination. Radiochemid blank samples were at least an order of magnitude higher than the blanks in subsequent tests, yet were at k i s t order of magnitude lower than the leachates for most analytes. In addition, due to suspect data acid strip sample #2 was o ~ t t e d from the calculations. Acid strip #2 was approximately 2 orders of magnitude higher for the soluble radionuclides and 4 orders of magnitude higher for the less soluble radionuclides. The most likely reason for this discrepancy is that not all of the glass was removed before the acid strip of sample #2. Special precautions were taken to prevent these two problems in hot-cell tests #4 and #5.
Comparison of the ratios to boron in the leachate, acid strip, and total provide an indication of which radionuclides may have enhanced performance (Le., mobility retardation). General observations of the data are as follows: (1) U, Tc, Pu, Cm, Sb, and Cs were at least fairly solublein the leachate (i.e., same order of magnitude as B); (2) of these elements, Pu was &e only one that plates out on the container iqsubstantial amounts; (3) Sr, Am, Co, Ru, Ce, and Eu were at least an order of magnitude less soluble in the leachate than B; and (4) only 0.2% to 6% of the amount released from the glass for these elements was retained in solution. Comparing the results from different isotopes of the same element (i.e., Pu, and Eu) and isotopes measured by two different techniques (i.e., Am-241) provides an additional indication of accuracy. Redundant measurements of Eu and Am show very good agreement, whereas the Pu results for leachates differed by a factor of 6.
'
Figure 4.30 represents data in Table 4.37. Relative normalized releases in the leachate, acid strip, and total are shown with respect to the normalized B release. Similar observations as identified previously are also evident in the figure, with a few additions. U, Cm, Sb, and Cs were sufficiently below B to suggest reduced solubility. Variability in the h results would suggest that I91 may or may not be solubility limited. The absence of error bars on certain radionuclides is because only one sample was above detection limits.
4.76

. Figure 4.30. PCT Radionuclide Releases for 101-AZ Core 2
4.77

Tabla 437. PCT Radionuclide Relacs in Solulion fa 101-AZ Core #2 (Hot Cell T a t #3)
I
T d U T ~ 9 9 Sr-90 Fu-238 Pu-239n40 Cm243R44 Am.241 CQ-60 &IO6 SbIU Cl-I34 Cl-137 CC-I44 Eu-154 Eu-155 Am241
Mcm N d i d
ReluK kttm 0.101 0.050 0.001 0.291 0.046 0.0% 0.002 0.008
0.134
0.027 0.0005 0.001 0.002 0.001
Ratio to Relute (95% CI) Bound (95% Ratio to %i3a2€!mat
95.2
64.2 230.0 97.8 167.3 45.6 101.2
69.5
61.3
60.6 96.9 57.4
0.50 0.25 0.00 1.43 0.23 0.28 0.01 0.0)
0.66
0.13 0.002 0.01 0.01 0.01
Relesre wm2l
0.066
0.001 0.531 0.036 0.101 0.002 0.004
0.098 '
b.023
0.001 0.002 0.001
CI)[Plmu COLOlmz)
0.705 0.006
0.003 0.000 160.977 0.002 0.413 0.003 6 . W 0.002 0.005 0.001 0.044 0.000
0.551 0.017
0.107 0.005
0.006 0.0003 0.027 0.0002 0.005 0.0003
Release Lnlm?l
0.005
0.003 0.168 0.066 0.013 0.000 0.007
O.OOO9 O.OOO2
0.004 0.000 0.001 0.001 0.000
37.0
21.0 66.3 10.8 90.2 61.1 76.5 17.9
80.9 47.0 44.0 40.4 64.6
0.03
0.01 0.83 0.32 0.07 0.00 0.04 0.004 0.001
0.02 0.00 0.00 0.00 0.00
0.001
0.00) 0.224 0.099 0.016 0.001 0.009 0.001
0.219
0.026 86.801 0.261 51.208 0.121 9.106 0.007
0.004 6.351 0.001 0.039 0.001 0.046 0.001 0.029 0.001 0.173
C1) LPLm2)
0.00028
o.ooqs9 O.Oo058 0.03725 0.00000 0.00000 o.oooo1 0.00026
000000 o.oooo1 o.ooo02
0.00000 , o.ooo02
MCNl N o m a l i d
Rcleue Lolmu
0.106 0.050 0.003 0.459 0.112 0.069 0.002 0.015 0.001 0.134
0.031 0.001 0.002 0.002 0.002
- --Exp Ttan¶f~Cd---
McmLn Upper'
Mi0 to B2d
0.52 0.2.5 0.016 2.26 0.55 0.34 0.010 0.08 0.004 0.66
0.15 0.004 0.010 0.01 I 0.008
N m r l i m l R c l u ~ Lplmll
0.074
0.004 0.755 0.135 0.116 0.002 0.013 0.001 0.099
0.028 0.002 0.002 0.003 0.002
BMmd (95% CI) lOlm21
0.924
0.028
0.674 57.656 0. I26 9.1 so 0.007 0.552
6.458 0.041 0.052 0.0%
247.m
o.in
LoWCI Bo*
(95% CI) w 0.007
0.001 0.002 0.040 0.002 0.001 O.Oo0 0.000 0.018
0.00s' 0.001 0.000 0.000 O.OO0

4.5.3.3 102-AZ Core 1
PCT radiochemical releases for 102-AZ Core 1 leachate and acid strip are provided in Table 4.38. The normalized releases are compared by ratio to the B release of 0.211 g/m2. The estimated percent RSD and 95% confidence intervals for the retransformed.mean In normalized releases are provided as a measure of the estimated minimum and maximum error associated with the measurements. The percent RSD for the leachate ranged from 3.2% for ELI-155 to 34.4% for Tc-99 and for the acid strip ranged from 29.2% for Total U to 119.4%' for C0-60.
General observations of the data are as followsi (1) U, Tc, Pu; Sb, and Cs were at least fairly soluble in the leachate (Le., same order of magnitude as B); (2) of these elements, Pu was the only one that plates out on the container in substantial amounts; (3) Sr, Am, Co, and Eu were at least an order of magnitude less soluble in the leachate than B; ahd (4) only 2% to 7% of the amount released from the glass for these elements was retained in solution. Comparing the results from different isotopes of the same element (Le., Pu and ELI) provide an additional indication of accuracy. Redundant measurements of Pu and Eu show excellent agreement.
. .
Figure 4.31 is a graphical representation of data in Table 4.38. Relative normalized releases in the leachate, acid strip, and total are shown with respect to the normalized B release. Similar observations as identified previously are also evident in the figure, with one addition. U, Pu, and Cs were sufficiently below B to suggest that each of these elements were involved in secondary phase precipitations. The absence of error bars on the Tc-99 acid strip is because only one sample was above detection limits.
4.5.4 MCC-1 Radiochemical Releases for 101-AZ Core 1 and 101-AZ Core 2 .
Radiochemical analysis was performed on a single MCC-1 leachate sample from 101-AZ Core 1 and 101-AZ Core 2 and on one blank from the in-cell test. Acid strips were not performed on the fused-silica leach contihers. Analytical results from these samples are includixl in detail in Appendix B, Tables B.4 through B.6.
4.79

Tdd U TC-99 St-90 PlI-238 ptl-2391240 cod0 Sbl25 -137 Eu-156 EwI55 Am241
Mean Nomulizcd
R e l w 6zhIla
0.083 0.224 0.004 0.030 0.028 0.015 0.170
. 0.023 0.013 0.013 0.013
8 Table 438. PCT Radionuclide Releasea in Solution fa 102-AZ Core # I (Hot Cell Ted #5)
h5-a .--Exp Trmrformed.--
Mean MemLn Upper
R e l w Ralio b Relcue (95% CI) Bound (95% N d i z e d Normalized Bound Lower
fit!mzl liaspBsmo?. [olml) w c o w 8.4 0.39 '0.083 0.102 0.067 0.010 29.2 0.05 0.010 34.4 1.06 0.222 0.522 0.09s 0.006 0.03 10.5 0.02 0.004 0.005 0.003 0.002 44.5 0.01 0.001 13.1 0.14 0.030 0.041 0.022 0.021 32.5 0.10 0.020 11.3 0.13 0.027 0.036 0.021 0.016 44.6 0.08 0.015 9.4 0.07 0.015 0.019 0.012 0.003 119.4 0.01 0.003 3.8 0.80 0.170 0.186 0.154 0.0003 0.001 12.1 0.11 0.023 0.031 0.017 5.7 0.06 0.013 0.016 0.012 0.002 63.8 0.01 0.002 3.2 0.06 0.013 0.014 0.012 0.002 60.0 001 0.001 4.9 0.06 0.013 0.015 0.012 0.001 103.6 0.00 0.001
0.020 0.005 0.093 0.230
0.004 0.m 0.005 0.045 0.009 0.051 0.047 0.005 0.004 0.060 0 . m 0.018
0.170 0.023
0.008 0.m 0.015 0.006 om 0015 0.009 0.WO 0.014
- ---Exp T r m f d -
McmLn Upper Lower Ncimdized Borad Bound
Rlliob Relcw (95KCI) (9J%CI) B p r n n l w L o l m ? l w
0.44 0.093 0.122 0.072 1.09 0.239 0.539 0.112
0.005 0.009 0.003 0.02 0.24 0.050 0.086 0.031 0.21 0.043 0.083 0.026 0.09 0.018 0.078 0.012
0.170 0.187 0.155 0.80 0.11 0.023 0.031 0.017 0.07 0.015 0.023 0.012 0.07 0.015 0.021 0.012 0.07 0.014 0.024 0.012
:

0.0010 I Figure 4.31. PCT Radionuclide Releases for 102-AZ Core 1
Actual and relative MCC-1 radiochemical releases for 101-AZ Core 1 and 101-AZ Core 2 leachates are provided in Table 4.39. The normalized releases are compared by ratio to the B release of the particular samples analyzed (Le., 4.87 g/m2 for simple #3 of 101-AZ Core 1 and 7.59 glm2 for sample #1 of 101-A2 Core 2). A ratio of radionuclide release to B release significantly different than one indicated the following: (1) retention of the radionuclide in' the glass altehtion layer; (2) selective leaching through a diffusion process; (3) absorption of silicate.' forming. radionuclide onto the fused-silica liner; in secondary phase precipitation and/or (5) analytical error. The 28-day MCC-1 tests are typically well undersaturated and may be close to the forward reaction rate for glass dissolution. .
General observations of the data are that Pu, Sb, and Cs had releases similar to or greater than B; U, Sr, and Np had releases less than B but within the same order of magnitude; and Am, Co, and Cm had releases at least an order of magnitude less than B. Comparing the results from diffeient isotopes of the same element (Le., ht and Cs) provides an additional indication of accuracy. Two of the three pairs of data were within 30% and one differed by a factor of 3.5. Graphical representations of the data showing the same observations are provided 'in Figures 4.32 and 4.33.
. 4.81
t

Table 4.39. Summary of MCC-1 Radionuclide Releases Compared to Boron
Total U Sr-90
PU-238 PU-2391240 Cm-243124
Am-241 Np237 Co-60
'Sb-125 Cs-134 Cs-137
1 Ol-AZ Core #1 Mean
Normalized Release Ratio to &/m2) Boron.
1.21 0.25 3.35 , 0.69
22.67 4.66 6.37 1.31 0.30 0.06 0.02 0.003 2.36 0.48 0.46 0.09 4.81 0.99 7.03 1.44 4.87 1-00
101-AZ Core #2 Mean
Normalized Release {a/m2)
Ratio to Boron*
1.79 0.82 5.50 7.80 0.01 0.01 0.53
7.25
7.07
0.24 0.1 1 0.72 1.03 0.001 0.001 0.07
0.95
0.93
4.82

10.00 - -
1.00 - - -
0.10 - -
0.01 1
Normalized.Boron Release
1 I L O QI
vl I!.
0 0 m T
0, c! P pr)
I
Figure 4.32. MCC-1 Radionuclide Normalized Releases for 101-AZ Core 1 . .
I
Figure 4.33. MCC-1 Radionuclide Normalized Releases for 101-AZ Core 2
4.83
.

4.5.5 PCT Anion Releases and pH
Leachates from all in-cell PCTs were analyzed for anions by IC. Complete PCT IC results are provided in Appendix Tables A. 10 through A. 18. Summarized results from these tests are provided in Table 4.40 and include averaged results from the core sample glasses, simulants and the reference glass from each test. Observations of the data are as follows: (1) F was present in &or quantities (2.5 ppm - 2.8 ppmj in the radioactive glasses but was not detected in simulants; (2) NO;, NO,-, and Br- were not present in appreciable amounts in any of the glasses; (3) Poi3 and S0,‘Z were present in leachates from core samples and their siqulants in somewhat comparable kounts; (4) Ci- was greater in the core samples’ than in their simulants; and (5) the reproducibility as indicated by comparison of the reference samples was very good.
TabIe 4.40. PCT Anion and pH Results for Core Sample a d Simulant Glasses
Glass Tvoe
101-AZ Core 1
101-AZ Core 1 Simulant
101-AZ Core 2 101-AZ Core 2 Simulant
102-AZ Core 1
102-AZ Core 1 Simulant
cvs-IS-Hw39-4-3
DH 7.49 9.90
9.85 10.06
9.26
9.61
10.14
F 2.5
< 0.25
NA NA
2.8
< 0.25
NA
CVS-IS-Hw3944 10.24 <2 cvs-IS-Hw3945 10.23 C0.25 Notes:
- CI-
3 .O
0.3
NA NA
1.2
0.5
NA
1.1
0.7
1. Values reported are blankcorrected averaged values.
NQll
< 0.5
< 0.5
NA NA
< O S
< 0.5
NA
0.5
< 0.5
- Br-
< 0.25
< 0.25
NA
NA
< 0.2
< 0.25
NA
0.25 < 0.25
.N9; < 0.5 < o s
NA NA
I
< 0.5
NA
< 03 < 0.5
Po,” 1 .s 2.6
NA
NA
2.7
3.2
NA
7.8 7.6
sodj 2.1
1.8
NA .
NA
0.3 e ‘
0.7
NA
25.1
24.4
2. 3.
4.
NA = Not available. Due to problems in-shipping, IC samples h hot Cell test #3 w e n wb;it;lminatea with HN03. A NO,’ value for 102-AZ Core 1 is not reported since the only rnegurcd value above blank levels appeared to be an outlier. The suffix number appended to each CVS-IS-HW39-4 glass indicates &e hot cell test number.
4.84

Table 4.41. Simulant-to-Radioactive Comparisons for P and S. Releases
Relative SimulantRadioactive Relative SimulantBadioactive Ratio for Phosuhorus Release Ratio for Sulfur Release
101-AZ Core 1
101-AZ Core 2
0.6
NA 1.1
NA
102-AZ Core 1 . 1.8 0;9
Notes: 1. Relative ratios equal simulant-to-radioactive iatio for analyte release in leachate divided by same ratio for boron.
2. NA = not available
These results were consistent with "as-batched" simulant glass compositions. Additions of P and S were made to the simulant glasses to match measured compositions of the radioactive glasses; however, additions of C1 and F were'not made to the simulant glasses. As would be expected, PO, and SO3 leachate levels were somewhat comparable between simulant and radioactive glasses; C1 and F were easily measurable in the radioactive leachate, samples and near detection levels in the simulant leachate samples (the detection level for C1 is 0.25 pg/ml). Because the radioactive glasses are slightly more durable than their corresponding simulants, the leachate releases in the radioactive glass should be somewhat lower for P and S.
Table 4.41 compares relative anion results (Le., simulant-to-radioactive release ratios) to relative B results. A relative ratio near 1.0 indicates that the ratio of simulant-to-radioactive release for the analyte is equal to that same ratio for B, or that the concentration of the analyte in the simulant glass matches well with that in the radioactive glass. The Table 4.41 results indicate that the P concentrations in the simulant glass matched well with the radioactive glass, at least for two glasses. Review of the ICP leachate data for the PCT and MCC-1 indicates that the P concentrations are matched well for all three radioactive glasses. The S composition of 101-AZ Core 1 simulant may be too low; the 1 0 2 4 2 Core 1 simulant may be too high.
Minor component influences, including C1, F, P, and S at'and above solubility limits, were studied in LLW borosilicate glass('). Fluorine was shown to increase durability and lower pH in the PCT. This effect was quite dramatic at F concentrations above solubility limits in the glass, but was minor in the range of F levels found in the,radioactive glasses. Chlorine and P were shown to decrease durability in the PCT, although the difference attributed to C1 may be within experimental error. Sulfur had minor effects on durability at concentrations near or below solubility. The effect of each minor component can be a.Mbuted to more than one competing cause. For example, F was shown to decrease durability in a dynamic flow through leach test, which is attributed to weakening of the network bond strength (when F is substituted for oxygen in Si-0-Si). In the PCT, however, glass dissolution is a&ted by pH, which is buffered by F. Table 4.42 shows results from the Hong study
(a) Hong, L., J.D. Darab, P.A. Smith, X. Feng, and D.K. Peeler. 1995. "Chemical Durability of Low-Level Simulated Radioactive Waste Glasses with High-Concentrations of Minor Components." Pacific Norihwest Laboratory. Richland, Washington.
' 4.85
I
I
I I i
! I
I
I i j
j I
I
! I I
I I I !
I
I
I
j
!
I
1 I
I
I
I
1 I

Table 4.42. Effects of Minor Components on PCT Durability
Base Glass
Compo- sition
f E c a .09
0.21
1.19
0.32
Minor Component Glass
Comp. [wt %)
0.57
0.92
2.1
0.75
Leachate Concentration Change in
Difference PCT B Release ff%u -
2.2
4.4
0.7
. 1.0'
+13.2%
- 2.2%
Change iri PCT Na
Release
+ 12.2% - 9.4%
b
+29.4% . + 19.5 %
+ 4.0% + 7.6
Change in PCT Si Release
+ 8.7%
- 6.6% +26.7%
+ 2.1%
indicating potential causes for differences between the core samples and simulants. The increased level of C1- in the core sample leachates would tend to decrease durability in the radioactive glass slightly. The F- measured in the core samples would tend to increase durability slightly of the radioactive grasses relative to their simuhts. The consistent levels of P in the radioactive and simulant glasses should not affect the durability of one over the other; however, as can be seen in the table, small differences in P can influence durability significantly. The magnitude of the measured . anion difference3 (radioactive versus s:mulant glass) does not appear to be significant enough to account for observed differences in radioactive and simulant durability. However, the durability models, which do not account for independent variation in these minor components, may be difficult ... to use in predicting actual waste glass and simulant durability where the minor cdmponents do not conveniently match the "minor components mix" used in simulant preparation for model development.
' 4.5.6 MCC-1 Anion Releases and pH
Results of the IC analysis of the hot-cell MCC-1 leachates are shown in Table 4.43. The samples analyzed included one of the blanks; two of the leachates from Core 1, two of the leachates from Core 2, one leachate from the nokadioactive simulant; and one leachate from the Am-10 glass. f i e results indicated only slightly elevated levels of Cl- in the radioactive samples. A lox dilution on samples made before analysis decreased the sensitivity of the analysis. In subsequent tests, the researchers specifically requested no dilution of the samples, regardless-of limited sample volumes.
. 4.86

Table 4.43. MCC-1 Anion and pH Results for Core Sample and Simulant Glasses
orgld- Glass Tvoe DH F- - C1- Br NO_;
101-AZ Core #1 8.06 <2 2.5 c4 <2 <4 . c4 102-AZ Core 1 8.26 C2 . 2.5 <4 c2 <4 <4 * -
NCAW Simulant 8.73 c2 c 2 <4 e2 <4 c 4. ATM-10 8.91 <2 <2 c4 e 2 c 4 c4 Notei Values reported are blank-corrected averaged values.
S0,'z
c4
<4 c4
c4
4.5.7 Reasons for Differences Between Radioactive and Simulant Durabilities and Comparison with Work by Others
' Radionuclide decay in glass can affect durability by radiolysis of air and water in contact with the glass and damage to the glass itself. Irradiation of water, dissolved gases, and air creates several free radicals and new molecules that affect the pH and redox potential of leachant solutions. This in turn affects the durability of glass. Predominate species generated under gamma irradiation include hydrated electrons (e-& hydrogen ions (H+), hydroxyl (e OH), and hydrogen atoms (He), and under alpha irradiation include hydroperoxyl (HO,.), molecular hydrogen (HJ, and hydrogen peroxide (H20z) (Mendel 1984). Both gamma and alpha irradiation are known to reduce the pH of deionized water due to the radiolysis of air and formation of nitric acid (Cunnane 1994). Damage to the glass structure occurs through processes of displacement and ionization. Volume increases in HLW glass due to displacement damage is only expected gfter lo00 years in the repository and ionization damage may occur in the first 10 years after fabrication (Cunnane 1994). The glasses in this study were leach tested in argon atmospheres using deaerated and deionized water at times between 15 and 50 months following fabrication, thus minimizing radiation affects.
The evaluation, prediction, and'comparison of radiation effects on glass corrosion are complex because of the number of important variables and complex interactions (e.g., amount and type of radioactivity, composition of headspace and dissolved gas, duration of test, extent of glass corrosion reaction, composition of dissolved glass in solution, type of leachant). Results from several irradiated leach test studies using nonradioactive and doped, simdant glasses are referenced below.
Gamma-irradiated tests using PNL 76-78 glass in deionized and deaerated water at 20 m-' and deaerated brines at 10, 100, and lo00 m" showd an increase in pH.and release rats over udrradiated tests (McVay, 1981). Gamma irradiated tests using borosilicate glasses in deionized and deaerated water by several researchers showed three- to five-fold inc rqe in B, alkalis, Si, and actinides (Cunnane 1994). Irradiated tests in groundwater equilibrated with tuff-by several researchers showed no change to pH and glass dissolution rates, except in a few cases where dissolution rates decreased (Cunnane 1994). In irradiated tests designed to separately evaluate the effect of water radiolytic products (vacuumdegassed and Ar-sparged systems to remove nitric and carboxylic acid production), the increase in glass dissolution was about half that observed in similar
4.87

tests in air (McVay 1981; Pederson 1983). In companion tests where nitric acid was added but the tests were not irradiated, the increase in glass dissolution was again about half that observed in irradiated tests in air.
Studies comparing fully radioactive, actual waste glass and simulant waste glasses report both increased and decreased dissolution rates for the actual waste glass. Results from static tests in deionized water and Ar atmosphere at 11OOm-I showed a 50% increase in B and Si release in the radioactive glass (JSSlA) when compared to the simulant glass (ABS-118) during 91 and 180 days (Werme 1990; JSS 1988). This difference was within systematic error and was not observed at a duration of one year. Tests, which included 1 g of magnetite, showed release rates of the radioactive glass to be similar or significantly less than the simulant glass. Differences in radionuclide (Tc, Np, Pu, and Am) release between actual w$te glasses with Magnox and THORP compositions and doped glasses of similar compositions showed a release increase between two for Tc and 75 times for Am in the fully radioactive glass (Hall 1988; BouIt 1991; Marples 1991). Three Savannah River fully radioactive glasses, SRL 131111, 165142, and 200, were tested in EJ-13 solution at 340, 2,000, and 20,000m-1, respectively, and at various durations to evaluate differences with simulant glasses (Feng 1993). In all three glass pairs the radioactive glasses yielded leachates with lower pHs, which was attributed to radiolytic generation of .nitric acid from air and other acids. Two of the radioactive glasses exhibited decreased release that was attributed to a dominant corrosion mechanism of network hydrolysis, which is favored by higher solution pH. The most durable of the glass pairs exhibited the opposite behavior of increased radioactive glass release. This was attributed to a dominant corrosion mechanism of ion exchange, which is favored by low pH. Release rate differences between simulant and actual waste glasses were all within a factor of two to three for periods up to 182 days.
As mentioned above, the prediction and explanation of radiolytic effects on glass dissolution are complex. The results from this study showed a modest reduction in dissolution rates (22 to 40% for B in 7day PCT) for fulIy radioactive glasses whep compared to simulant glasses of the same composition. This difference was equal to or lower than differences observed by others, which is consistent with removing part of the radiolytic effect. To the extent argon back-filling of the leach containers was effective, the effect of radiolytic generation of nitric acid was eliminated. Based on the type of test performed and'the relative durability of the glasses in this study, the dominant corrosion mechanism was expectd to be network hydrolysis, which is favored under higher pHs. With the absence of air in the system, it was not clear whether radiolytic affects should have increased or decreased corrosion.
Release of radionuclides in leach test conditions is strongly influenced by solubility. SoIubiIities can be influenced by redox, presence of complexants, equilibrium with solid forms, and presence of competing elemexits for sorption; 'Geheralizations can be made but changes to the system such as leachant composition and redox can change solubilities significantly. In HLW glass, Tc, U, Np, and Cs are generally more soluble than Pu or Am under pH basic conditiops of most repositories and leach tests (Cimnane 1994). Laboratory testing of several glasses has shown higher releases for Tc, U, Np, and Cs than for the less-soluble Pu and Am. Teshg of R7T7 glass in static leach tests at 90°C in distilled water showed relative releases- of actinides as U > Np > Pu > Am (Vernaz 1992). Normalid releases of U and Np were roughly 10% of the normalized B release whereas Pu and Am were 3 !% and 0.3 %, respectively.
Results from this study were mostIy consistent with results from .Vernaz (1992) and other laboratory tests referenced by Cunnane (1%). Figure 4.34. provides a summary of radiochemical
4.88

releases for PCT and MCC-1 tests for selected radionuclides. The radionuclide-to-B ratio is the inverse of retention and indicates the fraction of corroded constituent that is released into solution. A log of radionuclide-to-B ratios near.0 indicates completely soluble constituents; -1 indicates normalized releases near 10% of B; -2 indicates normalized releases near 1% of B; and so forth. As with prior studies, Am had normalized releases significantly lower than B, ranging from 0.1 56 to 6% of B. Alsoxonsistent with prior studies, Tc, U, Np, and Cs were generally more soluble than Am &e., 2 10% of B normalized release). Not consistent with prior studies, Pu exhibited significant normalized releases near B. Strontium, which should behave similar to Ca, was soluble in MCC-1 tests and insoluble in PCT.
4.89

-4
U Uranium
S Sr-90 T 'Tc-99
. P8 Pu-238 , P9 Pu-239, 240
A Am-241 c cs-I37 N Np-237
A S
S
A
A
A N
99 U
.................................................................................................. ................"....-..~.......................................s..................~.........., C 6
P8
U
T
U
N S C P9
P8 T
1
, 101-1PCT 101-2 PCT 102-1 PCT 101-1 MCC-1 101-2 MCC-1
Figure 4.34. Summary of Radionuclide Releases Ratioed to Boron for PCT and MCC-1

4.6 MassBalances -
The elemental composition of each of the process slurries and glass for each core sample and the two simulants are shown in Figures 4.35 through 4.39. The concentrations of the analytes increase throughout the process because the solid to liquid ratio is increased at each step along the process. The K concentration in the formated slurry from 101-AZ Core 2 increases drastically during the formating process. This increase occurred when the pH probe broke into the sample during the formating process and a significant quantity of KCI was released into the sample. For each of the samples, a significant increase in the concentrations of the frit components is observed between the formated slany and melter feed.
In Figures 4.40 through 4.42, decay corrected specific activities of the major radionuclides present in the three core samples iruc plotted for each of the process slurries and the glass. The percent recoveries observed for the radionuclides &e also reported in Tables 4.44 through 4.46. Mass balances were performed on each core sample throughout the HWVP process including washed solids, formating, frit addition, and glass. Mass balances for the washing process were reported in the characterization reports for the three core samples(*)- @)(Peterson, et. al. 1989). Mass balances were performed on the major cations and radionuclides.
The mass balance results from all of these samples indicate that the analytical subsamples from the melter feeds are not representative of the bulk composition. The majority of the undissolved solids in the melter feeds settle very quickIy making it difficult to obtain representative subsamples unless the sample is being stirred. Even when the sample is stirred, the frit tends to settle to the bottom and collect along the edge of the container; therefore, nonrepresentative samples are often obtained even when the sample is being stirred.
This radionuclide data indicates that Tc is volatilized during the melt. This result is consistent with previous results observed hi simulant studies. The core sample results indicate that . approximately 98% of the Tc in the sample is volatilized during the melting processes. There also appears to be some Cs volatility as indicated by the recoveries from 101-AZ Core 1 and 102-AZ Core 1. The recoveries of Cs do not appear to correlate well with the chloride concentrations in the sample as was postulated from siniulant studies. Volatilization as high as 40% of the original Cs activity were observed, but no significant volatilization of Cs was observed in 101-AZ Core 2 which was expected to have the highest chloride concentrations. The radionuclide mass balances also indicate that '3 may have been lost during the formating process. The data is not definitive, but it appears t b t some of the iodine may have been lost during this process.
(a)Gray, W. J., M.E. Peterson, R.D. Scheele, and J.M. Tingey Charaaerkafion of the Second Core Sample of Neutralized Current Acid Waste From Dodle-Shell Tank 101-AZ, Letter Report to . Westinghouse Hanford Company, September 1993.
@)Gray, W. J., M. E. Peterson, R. D. Scheele, and J. M. Tingey Characterization of thefirst Core Sample of Nmralized Current Acid Waste From Double-Shell Tank 10242, Letter Report to Westinghouse Hanford Company, September 1993.
4.91
!

25.0
20.0 - 15.0 - 10.0 - 5.0 4 3.5
n
3.0
1.5
1 .o
0.5
0.0
T I Washed Solids
@@@ Formated Slurry
&$$$8d Melter Feed
Glass I
Ag A1 As B Ba Ca Cd Ct Co Cr Cu Fe K La Li Mg Mn Na Nd Ni P Pb Si Sr Th Ti U Zn Zr
Figure 4.35. Chemical Composition of 101-A2 Core 1
4.92

I
I
P \o w
p 0
p m
a
0 m
Weight Percent (%) P 0
P m
N -. I

30.0 I I 25.0 20.0 1 15.0
5.0 3.5
1.5
1 .o
0.5
0.0
n 1-1 Washed Solids * Formated Slurry
Glass
4
II I
SJ Ag AI As B B8 Be Ca Cd Ce Co Cr Cu Dy Fe K La LI Mg NM Mo Na Nd Ni P Pb Re Rh Ru Sb Sa Si Sr To Th TI TI U V t n Zr
Figure 4.37. Chemical Composition of 102-AZ Core 1
4.94 ..

L. 0 E (P
tu L
9

__ 30.00 1 25.00 20.00 15.00 10.00
5.00
0.45
C 0.40
Q) a 0.35
2 .P 0.30 - ’ 0.25 -
0.20 - 0.15 - 0.10 - 0.05 - 0.00
R i TI Washed Solids Formated Slurry Melter Feed (Data not available) Glass (D ta not available) w
Ag AI B Ba Ba BI Cs Cd Ce Co Cr Cu Dy Eu Fe K La LI Mg Mn Mo Na Nd Ni P Pb S SI Sn Sr Te TI V Y ‘Zn Zr
Figure 4.39. Chemical Composition of 102-AZ Core 1 Simulant
4.96

f
8 li
B n
a Y cc
0
3 .- .- Y * Y
J 2
I I 1 t 1 I 1
- _I- - -__ __

B
a 3 I t * t 8 h n 3 I R t -
X P
8 Ii
z I.

fn
0 cn E -
1 I I I I I I I
IC3 Q)
r f n f n f n
S d
s
l I
A a
r 0 + + ? r
a! T-
: c I I d
9 I I d
- t f
8
f
c. 1
I J - t
et"
? T-
7) P ? . ?
T-. ? *
v ? T-

Table 4.44. Decay Corrected Specific Activity and Recovery Percent for+lOl-AZ Core #1
H-3 C-14 c0-60 sc-79
. Tc-99 Ru-106 Sb-125 GI34 G 1 3 7 ce-144 Ell-154 EU-155 Sr-90 I-129 Am-241 Np-237 Pu-238
. Pu-239+240 Pu-239 Pu-240 PU-241 Cm-242 Cm-243+244
4.5E-07, 4.70E-07 1.13E-02
6.60E-05 2.55E-01 4.71E-02 3.33E-03 237E-01 3.49E-01 1.54E-02
c 4.00E-06
6.04E+OO 1.80E-07
1.20E-02 6.70E-06 l.ZOE-04 7.90E-04
8.82E-07 8.36E-06
l.skE-06.
3.19E-03 3.57E-07
1.OOE-04 '
4.03E-01 7.29E-02 8.91E-03 4.41E-01 6.5SE-01 2.82E-02 6.N-02 7.07E+OO 6.14E-01
292E-02
7.51E-03
3.15E-06 3.65E-03 7.89E-01
1.45E-01 1.14E-03 7.35E-03 7.66E-02 . 6.21E-01
1.33E+OO 5.71E-02 '
131E-01 203E+01
5 .2932 4.50E-05 4.54E-05 240E-04
5.00E-07
6.58E-04 4.61E-04
59
37
209 205 354 246 248 242
155 45 322
35
3 164 163 117 138 201 1% 73 178
232 355 20 16
39459 2915
3 78 79 33 M 11 81 73 115
72 355 20 16
39459 291s
4.100 .

Table 4.45. Decay Corrected Specific Activity and Recovery Percent for 101-AZ Core #2
Specific Activiy (mCi/g) - Decay Corrected to 1/1/90 Recovery (%)
Melter Feed Glass from Washed Melier Feed from Washed Glass from Washed
Nuclide I Solids Melter Feed Supernate Glass 1 Solids Melter Feed Solids
H-3 C-14 co-60 Se-79 Sr-90 TC-99 Ru-106 Sb-125 1-129 CS-134 CS-137 Ce-144 Eu-154 Eu-155 Np-237 Am-24 1 Cm-242 Cm-243,4 Total Pu Total U Pu-238 Pu-239,240
< 7.45E-05 1.54E-05 3.34E-07 1.38E-02 2.13E-02
< 3.90E-07 < 3.38E-05 2.01Ei-O 1 3.05E+O 1
,< 4.63E-03 < 3.76E-04 1,38E+00 1.99E+00 1.68E-01 3.23E.-01 1.27E-07 < 3.42E-06
2.31E-01 5.11E-01 2.81Ei-00 3,17E+00 9.70E-02 1.45E-0 1 2.43E-01 3.65E-01 3.45E-05 6.71E-02 1.45E-01
3.65E-03
1.14E-03 7.66E-02
1.96E-02
4:93E-04 3.'38E-03 4.50Ei-00 3.40E-04 3.04E-03
4.101
2.99Ei-01 2.05E-05 1.8OEi-00 3.71E-01
< 4.37E-07
2.81E-01 3.98E.f-00 1.39E-01 3.44E-01 5.68B-04 1.05E-01 2.14B-03 1.18E-03 5.13E-04 5.6OENO 8.1 1E-05 4.32E-04
311
302
291 -'
387
419
299 302 303
437
37
39 '
36 46
22 38 38 38
29
114
118
105 177
98 114 115 114 1322 126
193 12
100 19 11

Table 4.46. Decay corrected Specific Activity and Recovery Percent for 102-AZ Core #1
Specific Activity (mCi/g) - Decay Corrected to 1/1/90 Recovery (%)
Glass from Nuclide I Washed Solids Glass I Washed Solids
H-3 C-14 co-60 Se-79 TC-99 Ru-106 Sb-125 CS-137 Eu-154 €1.1-155 'Sr-90 1-129 Am-211 Np-237 Pu-238 Pu-239+240 Cm-242
. Cm-243+244
U U-234 U-235 U-236 U-238
7.5OE-07 2.10E-07 4.60E-03 c 4.20E-06. 1.25E-04 9.89E-01 6.18E-02 .
1.46E-01 2.4 9E-02 9.17E-02 5.75€+00 3.00E-08 2.51E-02 5.16E-06 8.77E-06 1.83E-02 2.06E-04 1 -07E-01
2.95€+00 1.96E-01 2.3 1E-02 1.32E-03 2.93€+00
1.03502 .
6.733506 2.06Ei-00 2.61E-01 2.21E-01 5.17E-02 1.89E-01 1.4 1E+0 1
5.56E-02
2.00E-04 1.73E-03
2.62E-04
1.49E+00 9.88E-05 1.17E-02 6.66E-04 1.48E+00
95
2 89 181 ' 65 89 88 105
95
r-
974 4
104
22 22 22 22
4.102

5.0 References. Boult, K.A., J.T. Dalton, A. Hough, J.A.C. Marples, G.P. Robertson, and R.I. Wilkins. 1991. Radionuclide Release fram Solidified High-Level Waste. EUR-13604, Commission of European Communities. .
Cunnane, J.C., ed. 1994: High-Level Waste Borosilicate Glass: A Compendium of Corrosion Characteristics. DOE-EM-0177, Vol. 2, U.S. Department of Energy, Washington, D.C. .-
'
Feng, X., J.K. Bates, E.C. Buck, C.R. Bradley, p d M. Gong. 1993. "Long-Term Cornpason of Dissolution Behavior Between Fully Radioactive and Simulated Nuclear Waste Glasses." Nuclear Technolo@ 104: 193-206.
Hall, A.R., A. Hough, and J.A.C. Marples. 1988. Leach Testing of Fully Active Mw Glass. AERE-R-1307 1, Harwell Laboratory, Oxfordshire, United Kingdom.
Hrma P.R., G.F. Piepel, M.J. Schweiger, D.E.'Smith, D.S. Kim, P.E. Redgate, J.D. Vienna, C.A. LoPresti, D.B. Simpson, D.K. Peeler, and M.H. Langowski. 1994. Property/Composition ' Relationships for Hanford High-Level Waste Glasses Melting at 1150 "C. PNL-10359, Pacific Northwest Laboratory, Richland, Washington.
Jantzen, C.M., N.E. Bibler, D.C. Beam, W.G. h e y , and B.J. Waters. 1992. Nuclear Waste Glass Product Consistency Test ( P o Version 5.0(U). WSRC-TR-90-539, Rev.2, Westinghoke S a v d River Company, Aiken, South Carolina.
Japanese Swiss Swedish (JSS) Project. 1988. JSS-Project Phase V: Final Report, Testing, and Modelling of the Corrosion of Simulated Nuclear Glass Powders in a Waste Package Environment. JSS-88-02, Japanese Swiss Swedish Project.
Marples, J.A.C., N. Godon, F. Lam, and P. Von beghem. 1991. "Radionuclide Release from High Level Waste Forms Under Repository Conditions in Ciay or Granite." In Raa7oactive Waste Management and Disposal, L. Cecille, ed. pp.287-301. Elsevier, Amsterdam, The Netherlands.
Materials Characterization Center. 1984. MCC-IP Static Leach Test Method. Pacific Northwest Laboratory, Richland, Washington.
McVay, G.,L., W.J. Weber, and L.R. Pederson. 1981. "Effects of Radiation on the Leaching Behavior of Nuclear Waste Forms." Nucl. qem. Waste Mgm. 2:103-108.
Mendel, J.E., compiler. 1984. Final Report of the Defense High-Lael Waste Leaching Mechanisms Program, PNL-5 157, Pacific Northwest Laboratory, Richland, Washington.
Pederson, L.R., and G.L. McVay. 1983. "Influence of Gamma Irradiation on Leaching of Simulated Nuclear Waste Glass: Temperature and Dose Rate Dependence in Deaerated Water." J.
, Am. Ceram. SOC. 66:863-867.
5.1
I

Peterson, M.E., R.D. Scheele, and J.M. Tingey.. 1989. Characterization of the First Core Sample of Neuatralized Current Acid Waste From Double-Shell Tank 1 Ol-AZ. PNL-7758, Pacific Northwest Laboratory, Richland, Washington.
Tingey, J.M., M.L. Elliott, and E.V. Money. 1991. "Laboratory Characterization and Vitrification of Hanford High-Level Waste." Ceramic Transactions Nuclear ,Waste Management N. E.G. Wicks, D.F. Bickford, ed., Vol. 23, pp. 15.
Vernaz, E.Y. 1992. "Leaching of Actinides from Nuclear Waste Glass: French Experience." Mat. Res. SOC. Symp. Proc. 25737-48.
Werme, L., I.K. Bjorner, G. Bart, H.U. Zwicky, B. Grambow, W. Lutze, R.C. Ewing, and C. Magrabi. 1990. "Chemical Corrosion of Highly Radioactive Borosilicate Nuclear Waste Glass under Simulated Repository Conditions." J. Mater. Res. 5: 1130-1 146.
5.2

APPENDIX A
Chemical Data


(0.048) 0.802
C 0.038 2.OE-03 1.5E-02
O.OE*OO 6.2842
0.10 0 034 O.02I 0.047
8.0E-03 I.5E-03
2.3 0.080 0045 0.0
0.013 0 IO
2.OE.03 0.97 0 044 0.080 0.10 0073 *.
0.0 0.0 0.0 0.0 0.0 0.17 0.01 1 0.0
(0.019) 4.0E-03
0.0 0.30 0.0
0.014 0.51
0.58 17 t l
0.073 0.19 (00 0.98 1.3
0 47 0.33 0.77 0 11 0 019
38 1.09 0.64 < 01 0.24 186
0 034
0 58 I15 2.7 0.88 < 01 < 08 t o 8 t 6 C.2 4.2 0.14 < I
0.24 0.076 4 . 4 3.9 c.01 0.19 7.7
I?
4.1 22 4.0 150
. 2.7 0.06 240 590 5 9 6.3 29 5 0 0 87 3 4
I7WO 9: 11s 61
400 0 30
29OOo 4 5 119 I4
4.2 0.49 6.4 3.6 5.3 9.4 120 36 2.6
' a . 7 0.23 21 670 0.67 1.7 1.0
0.- 5.2
0.W 9.3 0.1 0
1.65 0.30 (2 t 8 0.2
0.04 < 02 9 7 2 1 u i a 1 1 s c -0
0 47 coo3 9.6
0.13 0.30 C1.1 0.21 t o 3 t 2 t o 7 t l (3 48.1 0.039 t o 2 c 3 0.12
C1.6 t02 0.115 2.1
5 7
4% 1% NM
4.5% 1%
14% NM
4 . 5 % NM NM 1% 6% NM c0 5% SM 2%
..n s*.
.u +. 1%
NM NM 9% NM NM 10% . NM NM NM NM NM on 4% NM NM 2% N U NM NM 1% NM
6% 7% NM
a.5ln 9% NM NM 7%
279. 54% 6%
<O.Jh 67% 7% NM 9.- h'hl IS'.
<o 5% Nhl 18% N hi 329. 79. NM Nhl NM NM N hf 8% 10% NM 27h as% NM 24% NM 7% NM
n. .
0.056 1.36 0 OE-02
0.98 0.022
0 00035 0.33 0.149
c4 OE-02 c) 4E-02
0.073 0 010
C 6E-03 3 2 I08
O w 0 0 53 0 16 0 I5
0.3E-03 3 2 . 0016
012 *
19 3E-021 0 091
0 7E-03 C.IE-02 C9.2E-03
a.18 Q.IE-02
7.9 0.014
CI.8E-02 C.4Em-
0.024 4 . 4 3 0 47
Cl.7E-03 0.020 0.72
0.2 6.7 a. I 8.2 0. I 0.0 1.2 0.4 a. 1 a . 3 0.3 0 0
co 01 I2 3 4
0 IS .i I, IJ 6X 0 63 co 01
I I 0 I4 041 0.55 0 25 a 01 4 .07 a.03 a . 6 4 . 2 44 0.0
a . 0 6 . a.07 0.10 4 . 3 1.4
a.01 0066 2.5
10% I).
NM 39% 4% NM 66% 3% NM NM
G . S H 5% Fi hl I '.
Shl 3'.
:-a.
33'. 1'. h'M NM 16% NM 7, 8% NM NM NM NM Nhf 38% 18% NM NM 37% NM NM NM 8% NM
8% 13% N M 8%
113% NM 11% 5% NM NM I%
2% NM 12% 3% 5'. s-. 1.. 4% NM 6% N ht 3 0 NM NM NM NM NM NM N M 26% 4% NM N M N M N M 1%
35% 66% 45%
0.091 2 7
0.063 2.9
0.091 7.OE-M
1.02
4 . 1 9 C5.5E-02
0.136 0 029
< I 3E-02 6 1 I 73 0 1:
I r , I 1 ab
. 0 2 Y 0 0033
7 I4 10 I t ) 0.24 a . 5
(0.19) Q.IE-02
a 1 2 6.3E-02 Q1.9E-02
4 . 1 8 22
0.033 4.7E-02
4 . 2 4 . 0.069 4 . 6 4 . 4
4.3E-02 0.0921 1.5616
4 Al Aa B b Be Cl Cd cc c4 cr cu oy Fc K La L Mg Mn MO N i Nd Nl P Pb RC FiJl Ru Sb se Si Sr TC Th TI
U V zn zr
n
Washed Solids Formared Sluny M c h a F e d
N O j NO, F a. so;' Po." nc TOC TC PH
0.40 6.09 0.41 6.24 0.013 0.20 0.003 0.05 0.106 1.61 0.02 0.24 0.13 1.97 0.64 9.70 0.77 11.67
12.6
NM N hf NM NM NM NA NM NM NM
0.1S6 0.633 0 74 078
0 136 a . 0 3 9 c o.MxK)8
0.0066 0.0067
I45 5 9 0 690 I
7 27 I 27 c36
a.m. 0.06 0.06 .
5.3
N hl Y hl V hl NM NM N hi Nhd NM NM
0 253 0 62 0 SY4 I 46 0 933 2 19 0 933 2 29
COW38 cool 0 037 0.09 084 2.06 0.87 2.13
0 191 0 47
5.8
NA VA hA N A N A N A
25% 7% 8%
GLr Farmledshmy
1.1 118 NM
1.47 600 560
1.09 NM I9
2.56 2560 23ml 0.026
NUU:
A. 1 t

Table A.2. Chemical Composition of 101-AZ Core #2 Process Solutions and Producta Grass
WUllCdSOli& Meha Feed wsupsnm (iLp
(wt!4) (wt%oxidcl ( & i ' J (wlw) ( * A ~ d e ) (lmOddw)I bg /mil I ( wi%) (vrAw5dc) ( - i 0.017 0.11 31% (0.029) 0.04 24% a 2 (0.0261 (0.028) NM 0.84 4.024 4.020 0.061
4.1E-03 0.19 0.51
4.046 4.059 0.018 0.019
Q8E-03 5.6
4 . 1 0 0.27
0.1E-03 0.032 0.085
QlE-03 1.4
0.17 0.40
4 . 1 9 (0.022)
U.3E-03 4.027 (0.04s) 4.079 4 .026 0.22 0.031 4.017 4 .033
(3.8143) 4 . 4 2 (0.41)
Q4E-03 0.011 21
9.0 (18 (36 0.28 0.064
1.s 3.3 - 3 2 c 4 7 0.1s 0.14
t o 1 8 46
C71 1.81 to38 0.30 0.76 (017
11 1.1 2.9 4 . 4 0.14 to29 (19
(0.34 c 5 3 ( 2 1 2.7
0.2 1 (12 (21 0.036 Q7 2 7
(020 0.079
16
1.10 122 112
Wnbcdsdidc
18% NA NA
156% 58% 20% NA NA 16% 24% NA 20% NA 20% NA 22% 1896 NA NA 19% NA NA 35% NA NA 23% NA NA 21% 23% NA NA 37% NA 34% NA 4% NA
2o?c
1.U 4.038
22 0.067
l.2OE-03 0.36 0.75 G.24 4 .46
(0.032) 0.07
4 . 0 1 s 8.2
(1.S) O.& 2 5
0.062 0.13
4 .014 4.6
(0.26) 0.58 4 . 4 2
4 .074 4.017 4 . 1 3 4.078 4 . 1 2 0.30 21
0.046 4.072 4.18 0.014 0 . 4 (1.7)
4.012 0.0s 3.3
2 7 4 . 1 7.5
0.086 6.4E-4
0.22 1.0. c3 c7
(0.054) 0.07 (020
13 (2.0) 0.53 6.0
0.081 0.24 to25 6.8
(0.34) 0.79 4 . 1 (092 cop (19 4 2 c24 0.49 so
0.06 (10 (24 0.027 -3.4 (u) c020 0.07 S.2
1.20 479 1080
... NA 7% 1%
NA 1% NA NA 6%
59% NA 2% NA
I% 5% 10% NA NA 4% NA NA NA NA NA NA NA NA 1oH 11% NA NA NA NA 25% NA 71% NA
...
m
0 4 1 680 0.30 0
b 4 4 . 1 a 4 1 0 . 3 Q2 a 2 0.3 6900 Q2 1400 1.4
0.20 (25) lux, 4 1 Q2 u6 0 .7 e2 4 4 4 8 4 3 4 3 170 1.2
0 . 7 a0 4 . 1 0 7 0
4 .1 . 4 . 1
(1.7)
1.04 NM
om)
w4=-
. . 1.53
(0.047) 22 0.11
9.OE-04 0.5638 0.69965 4 1 9 4 5 5
(0.037) 0.034
4 . 0 1 3 8.1
(1.4) 0.39 2 7
0 . W 0.13
(4.4E-3) 4.6 0.25 0.55 4 . 5 a1
4.021 G.12 4,053 4.089 4 . 2 23
0.046 (0.043) 4 . 2 4 (0.02) 4 . 6 (1.7)
4 .013 0.066 3.4
. . 29
(0.06) 7. t 0.12 0.002 1.0
0.80 e <I
(0.0s) . 0.04
<Of 12
(1.7) 0.46 5.7
0.11 0.20
6.- 6.2 0.29 0.70 -3.1 c1
(03 t 2
(07 <I U 48
0.054 0.ou U
c 7 2 0 . (02 0.1 4.6
267 2670 2450 0.058
0.03
MdwM
0.2% 43%
1.3% 44% NM ...- NA NA 33% 6% NA
NA 2% 3% 2% 5% NA NA 28% NA NA NA NA NA NA NA NA
11% NA N A ' NA NA NA NA m NA
...
U.
...
N02- NO> F a-
soc2 -3
Toc n:
nc
PH
(HK) (#J looroxib) (tw=D+xiW ' J (HK) w 1 a k o I i d e c ~ i ) l hr !ml) I ( w%) (snak ( r S F d a c i W 0.61 3.68 NU 0.22 240 NU 0.14 0.14 NU NU 031 1.m NM - 0.071 0.11 NM 0.20 0.20 NM NM 0.026 0.16 NM 0.12 1.42 NM 0.23 0.23 m NM
4.0- 0.02 NM 0.w S.= NM 1.2 1.2 NM NM 0.15 0.90 NM 0.- 1.00 NM 0.22 NM NM 0.031 0.19 NM 4.m a 0 1 NM 0.m NM NM 0.076 0.46 12% 0.078 o s S% . N M am 0.25 31% 0.31 3 3 8% NM 0.12 0.72 19% 0.39 425 9 % ' - N M
127 . 4.0 NM 9.4 .

. .
Tablc A.3. Chemical Composition of 102-A% Core # 1 Proccss Solutions and Product Glass
A( 0.017 AI 1.175 AI co.01 B co.01 & a014 Be 4.11Eo) Q O.II1 U OJ6I Q c0.m c. eo009 Q 0.016 QI 0.016
Fr 1.111 K c0.W la 0.109 L t0.005 MJ 0025 L*l 0070 ua cow1 Na l.011 Nd 0.011 NI 0.115 P c012 ?b 0.016 Rr c 0 . W Rh coo11
Sa C 0 . W L cool; 0 0.114 L LlOMl Tr c0.01; lh c0.011 TI 0.m
u 0.100 v coo01 In 0.010
q co.001
Ilu . coo11
n co.1:
ZI 0.53
0.16 11.5
4 . 1 4 4.54 0.14 aoio
I A 1.7 -a4 co.11 015 0.1; cD 01
40 C0.19 1.14
c0 o(9 0 16 099 a 01;
I2 0 9 2.4
cm9 0.35
co 038 co 12 <O I3 co 42
. 4 2 1 a 4
009 SO I9 CO.20 0.053 cr.11 1.2
cDO16 0.11 6
1% 1% NA NA
3% 43% 4 n NA NA ow a h NA 4% HA 3 k NA I%
NA. NM h NU NA I% NA NA HA NA NA
6-w NA NA 3% NA NU NA
NU
m
m
n.
4 m
W I C a k .
UIE.01 caie co I I (0.101 (con
~ 3 . 3 L o l 0.60
cl.tLa1 a 1 1 -.I9 a011
=9.lLOl U J W 3
c.010 c0.13
CO 013 em1
009 001
coo13 3 41
c a o s U I I so 64 ‘U W‘ W O I Y CII unb
W U J b ‘UU.,.
C O 1 6 1.2
4 O U co 099 CUO76
C5 (E93 C0.57 C0.M
c 9 4 w 1 ( 0 01)
c7.9w1
0.201 0.016 0.001
.0.001 0 070 o m 0.305 0.IOI OJOJ
LIP 10.6 0.69 7.5 0.07 ULY 0.01 By QU cDod 0.19 a3 Z l l . w a n w m w
M1 . w
0.M 0.164 a 1 1
cD.0.24
-005 0 007 1.11 1.11
o.on
LIE41 1.2
(0.012) QOI5 alE.4 0.W 0 3
co.020 c0.017 0 030
I4.9EO-I) Cl.OE.01
29 co.061 . 0097
C I . 5 E 4 1 0 0 3 0 081
CZiE.01 1 0
U 06: cu (11:
c9 8E41 IU u:11
CJ4E.UJ ‘UUIb ,11111111
C94E.uJ <uulu 04%
7 I E 4 J CUUIY CUOl4
i4.5E.OII co11 eo11
eI.tM1 L W I
carno
0.53; ’
wl0466a)
a a 1- ( 0 9 a 0.10 <W 0.0s a44 8.53 5.0
F-*
1.12 I41 in
6% h NA NA 3% NA
h NA NA 3% 10% NA 3% HA a% NA 14% h NA l% h HA NA 2s NA 1 1 5 3. SA N A J S J S
- N A NA R NA HA NA 3%
m
m
Mrhn F a d
mL*rar
I 03 Nu Ib
NA 110 NA I1 1 9 01 470 uoo NA NA 2s 0.8 NA 2.1 240 16 NA I t 0 590 NA
2:wo NA b2U SA NA NA ?.A ..A J:, NA U J I NA NA NA NA
HA 4.1 NA
ai0
NA 26% NA oh ow m
aom aim uh NA ow 0% UA o* nb 0% WA
004% 02% NA
0- NA
0 0% NA NA SA SA SA a h
%A &
u I* NA NA NA NA
aoJIi NA LI XA
Mehn F a d
I14 SI5 NU
L Q L I . u
I 01 Fo* 4

Table Ad. Chemical Composition ofNCAW Simulant Process Solutions and product Gloss
0242 a.016 0.0049 0.0224 UE43 0 . a 1 0.129 0.03
Uu13 0.026 0.0172
4E-03 134 NM
0.006 0.oOts (0.011) 0.0416 0.09 0.674 0.162 123
CO.02 a.012
NA NA
(0.039 CO.010
NA 0.10 0.0149 G.01 NA
0.0023 NA NA
QEo3 0.0101 UE43
0.7
CDL 10 CDL Of8 0.44 CDL 0.62 2 6 0.76
' CDL 0.68 038
0 34 CDL 0.85 0.11 0 3 1.17 1 A 16 3.4 28
CDL CDL CDL CDL 0.82 CDL CDL 55 031 CDL CDL 0.068 CDL CDL CDL 0.23 0.00 17
WcrbodSdidS
at% Jloogojdde 0 3 9 . 593 0.4 6.09
0.009 0.13 C0.019 COl9 0.138 21 0.011 . 0 1 0.149 23
1.11 112 I31
10
NA 0.61 CDL I 3
0.041 NA 017 032 0.061 CDL 0.042 0.034 NA '23
0.4 0.11 0.68 0 1
0.067 0.096 1 7 03 0 1 NA CDL CDL CDL 0.0% CDL Q)L a3 0.027 CDL CDL 0.024 CDL CDL CDL CDL CDL I 3
NA 3.2 CDL I2
0.13 NA ' 1.05 0.71 0 1 1 CDL 0.17 0.12 NA 9.1 1.34 038 4.1 0.94 030 0.40 10
0.96
NA CDL CDL CDL 030 CDL CDL 49
0.089 CDL CDL 0.11 Q)L UIL CDL CDL CDL
5
0.n
-shrny (RM 3)
F n Jloogmdde Y 0 . W C U I
O S 3.68 0.028 0.19
0.61 4l6 0.16 1.12 0.n S38
1.11 161
W
caoii ~0.12
NA
NA 4% 2% NA 1% 3%
0.7% NA 9%
0.9% NA 3% NA 0.5% 8% 4% 3% 15% NA 1 .PA NA NA NA NA NA 17% NA NA 42% 0% NA NA 18% NA NA NA 2% NA NA
om 0.415 NA 1 3
0.027 NA 014 0.15
0.00 NA
0.029 0.022 NA I 3 NA
0.63 0.19 0.045 0.06 2 4 0.19 NA NA NA NA NA
0.031 NA NA 99
0.018 NA NA
0 . a NA NA NA
0.013 NA 0.85
o.on
M d r p F a d s U y -3)
<Qog co.11 037 I .01 0.014 0.w
<O.OIS co.04 029 OM 0.1 1 031 0.4 1.17
121 438
1 6
r t w Jloogmdde
NA 22 NA 12
O.o(u NA 0.93 0.48 0.15 NA 0.12 0.076 NA 6.0 NA O U 3.8 Om 010 0.25 9.1 0.a NA NA NA NA NA 0.11 NA NA 60
0.06 NA NA. 0.11 NA NA NA 0.W NA 31
NA G.6 Cl.6 240 131
C0.W I1
41118 a1 G.2 a . 4 19
a.m 22 100
C0.16 290
on. 150 13OOO a .4 a . 4 Q a13 NA NA 46
4 . 0 NA (8 3.4
C l l NA cw NA NA a2 (14 c 4
@.#)
NA N A ' 23 0% NA NA 11 2%
0.W 12% NA NA 1.0 NA
0.49 0% 0.17 12% 0.07 NA 0.15 40% 0.09 0% UA NA 6 1 8% 0.7 NA
0265 M 36 0% 0.9 2% 036 am 014 0% 8.8 NA 0.62 6 % . 031. NA NA NA NA NA NA NA NA NA 02 30% NA HA NA NA 531 11% 0.1 0% NA NA NA NA 0.1 9K NA NA NA NA NA NA 0.U 0% 0.1s NA 3.5 NA

Table AS. Chcmiul Composition of 102-AZ Corc #1 Simulxnr proccU Solutions
A0 AI 8 81 88 Bi C I Cd C. co cr cs cu DY Eu f a K
LI MO Mn Ma N I Nd Ni P Pb Pd Rs Ah flu
. s SI So Sr Te Ti V Y zn Zr
L8
NO; NO; F CI'
so;' Po;' nc roc TC PH
W n h d S d i , Formned Slw ) . FS Supern8
Iwr%oxidal Iwt%oxidal I Iwt%l Iwt%oxidel lw1%1 Iwf%oxidel i (uo lo1 8producibilifyl Tarost M 8 a 1 ~ d kU1y.i. 1. M y r a 2
0.14 0.13 0.02 0 0.01 0.07 < .06 HA 10.64 18.72 1.4 20.7 1 A 16.3 c .3 NA
0.34 NA 6.8 2% 0.12 0.1 1 0.016 0.1 0.02 0.14 0.37 26%
NA < .03 HA < .60 NA
0.00 0.84 0.088 1 . 0.1 0.00 22 79% . 3.36 3.26 0.40 4.4 0.43 3.46 0.1 8 NA 0.26 0.02 0.21 c A NA
0.0002 0 c.10 NA 0.43 0.41 0.037 0.4 0.04 0.42 C 9 0 NA 0.67 0.14 0.13 0.016 0.1 0.01 0.34 0.31 NA
NA <.OB NA C .04 NA
36.16 36.01 3.39 37.9 3.6 34.48 4.9 2% 0.1 1 1 ' . 86 81 %
1.04 0.1 1 0.91 C.10 NA NA C.06 NA
0.88 0.83 0.006 1.2 0.086 0.01 0.12 NA NA c.1 HA
26.78 2.24 23.6 2 19.7 26000 3% 2.46 0.28 2.26 1.6 NA 2.16 2.01 0.236 2.3 0.22 1.07 ' 3.7 17% 1 .so 1.63 0.032 0.6 0.24 3.87 12 0.6% 0.32 0.28 0.041 0.3 0.06 0.28 < .8 NA 0.13 0.03 NA 0.1 1 0.43
0.33 0.17 ,0.026 0.4 0.03 0.36 ' 8 6 8%
2.03
0.07 0.17 0.03
0.07 6.70
0.38 0.012 0.2
0.07
0.001 0 NA NA
0.06 0.0086 0.1 1.04 0.14 1.6
dariN bl TOx (nwr1 TOx (by T
W u h d solid. TU081 M8NUd I IO/~OOO oxide^ I IO/IOOO oxidel I 0.6 8.76 7.76 NM 0.086 NM 0.032 0.046 0.68 0.67 0.17 ,2.06' 0.72 NM 0.86 0.86
NM 10.8
1.68
IWlYI TBD TBD TBD TBD TBD TBD TBD TBD TED TBD
1.14
126.00
0.42
0.01 0.02
0.06 O M
Famitd S h y
IollOOp axidel lrmrcducibiliil TBD TBD TBD TBD TBD TBD TBD TBD TBD TBD TBD TBD
TBD TBD TED TED TBD TBD
TBD n D
F a m n d S l W . - 2 1.14 . -1
1.14 147 147 146 162
260 6.19 11
1.3 0.07. 1.4 0.14 < .6
<.03 C.l C.03
0.68 10 4.16 10 .
3% 18% NA 4% NA NA NA NA 21% 0.7%

Table A.6. Chemical Coniposition of 101-AZ Core $1 G I s
(Set 1 ) (Set 2) (Sct 1 ) (Set 2) (Set 1&2) (Set 2) Na20: Sa202 KO1 I KO14 NaK Ave. HF Adjusted Standud
(ut90 oside) (W?O osidz) (\\I% oside) (\\tO,o oxide) (\\I?,o oside) (\t~./a oxide) (HI% oxide) Deviation' %RSD
0.11 5.13
9.26 0.05
0.0024 0.90 0.30
0.20 0.04
9.64 2.08 0.15 3.42 0.73 0.46 0.01 NIA 0.16 0.26
0.25
48.14 0.03
0.12
0.05 NIA
93.01
0.11 5.03
9.35
0.0019 0.74 0.3 1
0.20 0.03
9.73 2.15 0.14 3.45 0.73 0.47
KIA 0.16 0.3 1
0.21
49.56 0.04
0.13
0.01 NIA
94.96
0.09 5.25
9.34 0.05
0.00 I3 0.98 0.30
0.19
9.61 N A 0.14 3.49 0.73 0.46
9.39 0.1 1 K I A
0.17
47.86 0.04
0.11
2.11
92.74
0.10 4.93
3.20
0.001 7 0.65 0.3 1
0.19 0.03
9.64 NIA 0.14 3.39 0.72 0.46
10.18 0.1 1 NiA
0.17
48.75 0.03
0.11
0.01 1.88
0.10 5.08
9.29 0.05
0.0018 0.82 0.30
0.20 0.02
9.67 2.12 0.14 3.44 0.73 0.46 0.0 1 9.79 0.13 0.29
0.20
48.58 0.04
0.12
0.03 199
93.46 93.58
0.1 1 5.22
s h 0.05
0.0023 0.97 0.33
0.20 0.03
10.18 2.03 0.15 3.56 0.77 0.48 0.01 10.68 0.20 0.29 0.55 0.2 1
0.01 0.09
46.43 0.04 0.07
0.12
0.69
0.05 1.97
94.76
0. IO' 5.22'
9.68' 0.05'
0.002' 0.9.T 0.30' 0.14' 0.10'
.0.20' 0.02' 0.06' 10.1e 2.12' 0.14. 336' 0 . e O.4Sb 0.0 1 ' 9.79' 0.16* 0.29'
0.20' 0.55;
51.97 0.04'
0.IY
0.41'
0.05' . 1.99'
0.40' 100.07
L Analysis by ICP-ES (Ne2@ and KOH fbsionldissolution) prepation methods. b. Analyis by ICP-Es (HF digestion) prrparation method c. Value calculated from washed solids analysis (same method as "a"). Below dataion limitr in glass. d Analysis by fluorcscncc (typically fluonxnce would be used for U; howem. the number appended
would be a ilia when compared 10 leached uranium in Core 1 and Core 2 and ICP-ES . ~ l y ~ s in glass urd washed solids.
e. A d j d value by dividing ICP-Es @a2@. KO11) result by % yield of consthuenl daermined
f. The toals includes values obtained from ahemate preparation technique for e l n e n ~ s loa during prepation. g The standard deviations arc bared on the number of Na:Oz and KOH samples present.
by Am-IO Md NBS 688 a~~+~Vsis.
A.6
0.010 0.137
0.069 0.00
0.150 0.006
0.0005
0.006 0.006
0.081 0.049 0.005 0.043 0.005 0.005
0.558 0.029 0.035
0.0311
0.754 0.006
0.010
0.023 0.163
9.34 2.70
0.75 0.00 25.06 18.32 1.92
2.96 28.87
0.84 2.34 3.51 1.24 0.69 1.08
5.70 22.21 12.41
19.15
1.55 16.50
8.15
76.98 8.17

I . i
Table A.7. Chemical Composition of 101-AZ Core #2 Glass
(Set 1 ) (Set 2) (Set 1 ) (Set 2) (Set 1&2) (Set 2) NazOl Na:O: KOH KOH NalI; Ave. HF -Adjus~cd Standard
(~1% osidc) (~1% oside) ( W ~ O oxide) ( ~ 1 9 0 oxide) (WI% oxide) (ut% oxide) (wt?! oxide) D e v i l & %MI)
I . ~
0.03 2.89
0.04 2.80
0.03 2.79
0.03 2.85
0.03 . 0.0s 3.16 2.85'
0.006 17.32 0.058 2.04 2.90
7.12 0.07
0.003 0.27 0.79
7.05 0.07
0.0046 ' 0.33
0.80
7.14 0.07
0.0021 0.31 . 0.80
7.00 0.07
0.0032 0.29 0.80
7.38. 0.065 0.or 0.000
0.003' '-0.001 0.35b 0.033 0.80' 0.005
7.08 0.07 . 0.07
0.0032 0.0036 0.3 1 0.35 0.80 0.85
0.13
0.91 0.00 32.06 10.74 0.63
0.06 0.04
0.05 0.0 I
0.05 0.04
0.06 0.03
0.06. 0.03'
0.010 0.015
16.65 46.15
0.07 0.04
0.06 0.04
11.45 1.65 0.46 5.68 0.08 0.20 0.01
1 1.73 11.41 12.25' 1.65' 0.46' 5.94b 0.12' 0.2 1b
0.143 1 1.55 11.53 1.65 0.46 5.71 0.08 0.20 0.01 6.24 0.42 0.69
12.25 1.55
. 0.47 5.94 .0.12 0.21
1.24
0.46 5.72 0.10 0.20
0.45 5.84 0.07 0.19
0.45 5.53 0.08 0.21
0.006 0.104 0.013 0.008
1.27 1.83
15.25 4.08
5.97 0.35
6.50 0.4 1
6.83 0.43 0.71 0.88 0.09
6.24' 0.42' 0.69' O.8Sb 0.11'
0.378 0.050 0.042
6.06 11.96 6.15
0.46 0.66
0.45 0.72
0.13 0.09 0.11 0.028 25.71
0.ogc
47.90 0.05 0.05
5 1.30 0.05
48.09 0.05
51.11 0.05
49.60 0.05 0.05
48.39 0.05 0.05
53.09' 0.05' 0.05'
1.857 0.000
3.74 0.00
0.03
1.39
0.02
0.03 0.0%. 0.24 0.04 0.08' 0.121 151.55
2.03 1.71 1.01 . 1.71' 0.453
0.02 0.03 4.26
0.02 4.42
0.02 0.02' 4.41 . 4.42'
032( 100.31
0.006 24.74 0.226 5.12 4.58
90.61 92.38 92.70 94.28 94.29 95.17
Notex L Analysis by ICP-ES (NalQ urd KOH hioddissolution) preparation mahodr b. Analysis by ICP-ES (HF digcdon) prepantion mahod. . c. Value calculated fr~m wufitd &lids analysis (same method q~). b l o w daeccion limits in glr~r d Analysis by fluoresmcc (typically fluoresmce would be uped for V; howeva, the number rppcaded
would be a flier u%en compared to leach& uranium in C m 1 and Core 2 m d ICP-ES analyses in glass and washed solids.
e. Adjusted value by dividing ICP-FS (Na,Ol. KOH) m l t by % yield of condituent &ermined
f. The totals includes values obtained from alternate preparation technique for elements lost during prepantion g. The s ~ ~ d a r d deviations are based on the number of Na:O: md KOH samples present
by ATM-IO m d NBS 688 analysk
A.7

Notes:
Table A.8. Evaluation of Sample Preparation Methods Using ATM-10 Glass
(Set 2) (Set 2) (Set 2) (Set 2) MCC Na202 KOH NalK Ave. HF Measured % Yield’ % Yield’
(wt% oxide) (wt% oxide) (wt% oxide) (wt% oxide) (wt% oxide) Nan< AVO. HF
0.01 6.33
8.82
0.28
0.27 0.01
i 0.89 3.37 0.03 2.72 1.09 1.21
0.1 7 0.34
0.02 1.81
0.09 42.94 0.03
3.14 0.90
0.01
95.76
6.34
8.79
0.26
0.26 0.01
10.88
0.02 2.70 1.09 1.21
10.88 0.14
2.22
42.75 0.03
3.13 0.88
0.40
95.70
0-0 1 6.34
8.81
0.27
0.26 0.01
10.89 3.37 0.03 2.71 1.09 1.21
i 0.88 0.1 6 0.34 2.02 0.02
0.09 42.85 0.03
3.14 0.89
0.01
0.40
95.82
6.77
0,03
0.60
0.1 3 0.01
11.35 3.22 0.02
1.16 1.24 0.01 11.45
0.30 2.61 0.02
2.85
0.1 a
0.09 41.44 0.03 0.05 1.62 0.93
. . 0.01
0.31
95.24
6.65
9.1 7 0.05
0.60
0.07
0.24
1 1.53 3.34 0.03
1.15 1.29
10.53 0.1 7 0.30 2.34
2.88
0.01 0.06
45.84
3.29
0.03
0.86
0.53
0.25 0.307 101.52
95%
96%
45 %
1 1 1 %
94% 101 % 102% 94% 95% 93%
103% 92% 116% 86%
94% 107%
95% 103%
162%
102%
58%
100%
54%
98% 96% 86% 99% 101% 96%
109% 107% 101% 11 1 %
91 % 112%
49% 108%
124%
a. The totals includes values obtained from alternate preparation technique for elements lost during preparation. b. % Yield = (Analytical MeasuredlMCC Measured) x 100%.

Tabla A.9. Evaluation of Sample Preparation Methods Using NBS Basalt 688 Standard
(Set 2) (Set 2) (Set 2) (Set 2) NBS Na202 KOH NalK Ave. H F Comp. % Yield' % YieldD (wt%) (wt%) (wt%) (wt%) (wt%) NalK Ave. H F
15.94
1 1.25
0.05 0.01'
9.59
7.96 0.1 9
0.1 2
45.40 0.02 .
1.12
0.03
93.89
16.06
1 1.27
0.50 0.05 0.01
9.69
8.01 0.20
2.21
43.56 0.02
1.11
0.03
92.72
16.00
1 1.26
0.50 0.05 0.01
9.64
7.99 0.20
. 2.21
0.1 2
44.48 0.02
1.1 1
0.03
93.31
8.26
0.01
5.91
0.04 0.01
7.22
3.22 0.12
1.17
0.02 0.34 0.01
0.01 0.07
42.20 0.01 0.01
1.17
0.03.
69.83
17.40
12.20
10.40 0.1 9
8.40 0.1 7
2.1 5
0.1 4
48.40
1.20
100.65
92%
92%
93%
95% 115%
103%
92%
93%
47%
48%
69%
38% 71 %
54%
243%
87%
97%
a. The totals includes values obtained from alternate preparation technique for elements lost during preparation. b. % Yield = (Analytical MeasuredlNBS Composition) x 100%.
A9

Table A.10. Luch Tat lnrormrtinn and LeJChJte Analysis for 101-AZ Core # I
A! AI B Ba Ca Cd Cr c u Fe K ti m Mn Mo Na Nd Ni P Pb Re Ru Si Sr Ti U zn zr
NOi NO; F a
' so; Po.' Bi
Inicirl pH Fd pH
Luch V d
a.70 7.50
0.600 0.200
0.060
0.500 6.720 4 0 4.00 7.50 7.60
0.300 0.020
0.400 21.0 21.0
0.300
38.0
4 . S a.5 290 ' 3.00 220 1.40
4 2 5
7.10
Stdnkrr 2000
7 3
38.0 0.030
a . 5 a.5 1.50 3.10 I .90 1.80
UI.25
7.10 7.49
SltinlCS Moo
7.20
0 . 2 0 0.020 0.050
O.ROO 3.00 7.30
0.040
21.0
0.300
36.0
a . 5 eo. 5 3.10 2.90 2.10 1.20
4 . 2 5
7.10 7.41
Stainless 2000
9443202 9443207
0.070
o.020
lI.llHl
11.5 4 . 5 r025 *'0.25 .:n 5 c0.5 <0.25
7.10 6.51
Stainlm NA
94-03194 94-03188
0.091
n. im
n.024
2.64
0.694
0.1192 0.011
I '>R 1.46
O.Il94 tI.Ol3 6.96
O.tI44 0.270 0.lI.lS
n.?tii
?.3IR
o.nn8 26.2
0.012 O.(HIS 0.311 0.038 0 . 0 3
c4 <4 a . 2
2.50 <4 e 4 <2
7.12 8.70
Fused-Silica 10.0
914199 90-9537
2.25 0 . 0 6
. 0.786
0.076 0.148
3.20 1.26
0.355 0.226
7.43
0.106
0.125
0.200
23.7 0.014 0.008
0.142 0.01 1
NM NM NM NM NM NM NM
7.12 7.92
Fwd-SEa 10.0
9 1-2781
1.4G 0 . 0 6 0.3R3 0 . 0 4
0.006
1.16 0.10 0.219 0.010
3.77
0.010
0.044
o.ox
0.009 .15.3 0.01 I
0.026
4 4 a
2.40 4 4 Q
7.12 7.56
FurcdSilicr 10.0
914200 90.9531
0.005 0.167 0.007
0.014 0.030 0.314
0.024 0.006
0.319
0.016
0.223 4.17 0.002 0.002
0.085 . .
4 <4 a a
6.60 4 a
7.12 5.70
Fused-SJiu NA
914198 90.9536
0.301
soia 0.031 0.091 2.30
0.051 0.425
1.60
0.104
6.47 0.002
0.070
NM NM NM NM NM NM NM
7.12 6.51
Fuud-Silica ., NA
91-2785

IIV
S8LZ-16 VN
n!l!s-P=nd 15.9 Zl'L
WN nN WN vu4 WN WN WN
OL00
ZOu.0 LP'9
PUI'U
09'1
SZP'U XSO'0
OE'L lGO'0
0 IOU
XUC'U
I w n
OPS6-06 OZ0-I6 001
'J!I!s'P=u SZ'8 . ZI'L
0
OB ' 092 z> P> V>
.9100
Z W O GOU'O 0'6 I
LOW0
6ES6-06. IOZ0-16
0 0 I =!l!s'P=nd
OS'S ZI'L
-0 p> p>
OP'Z z> ps O>
EO00 IZ00 6LCO OW0 EO00 L'EZ I100
EZZ'O z10'0
SL'E 800'0 z000 EZU'O 90'2 9P'I
8Su'O I 10'0 920'0 E000 601'0 I ou'o OL' I ILU'O
16E6-E6 VN
=lu!qs ZI'S E 0 1
WN WN WN rsN rsN WN w
0100
OSP'O
U090
P6WC6 0002
sJp!Cls P8'6 C0L
S'ZL
u'0I
0900
U'UZ
our0 U'IZ
0SL'U OOL'O u'o I
OOE'O 001
c6WE6 0002
=lu!r)s 88'6 C0L
n N w w WN w I.vN YVN
OOC'O
069
W 6
S'PI
U0'9
OSI'O o a t
SC'6
Z6f6-E6 0002
. =JlU!rlS €8'6 €01
. m m PIN m m PIN PIN
0020
089
OP'6
0'01
oosa
00'1
006

Tnhlc A.12. Leach T& Information and Lcacltate Analysis for 102-AZ Core #I
7 - h ~ PCI' (Ilot Cell Tcs! #5) Sat11ple I Sample 2 Sample 3 Sample Ave. Blaiik I Blank 2 (udml) (udml) (udml) ( u d n 4 (ughnl) (wdml)
9.29 9.04 11.97 N As B . . Ba Ca '
Cd Cr cu I:e ti I-i
hlg Mn Mo Na Nd Ni
rh Re Ru Si Sr Ti U zn zr
r
0.109 . 17.6
0.093 0.167 0.06 1 0.01 I 2.54
13.2
0.039
0.107 17.4
0.1 I3 16.9 17.3 0.016 0.009
0.057 0.165 0.075 0.013 2.49
0.052
0.0 I9
0.165 0.059 0.01 I 2.49
13.0
' 0.055
0.01 I
13.0 12.7
0.03R
0.003
0.068
0.2 I2
0.042
0.252
6.30 5.30
0.156 0.885 0.066
0 232
0.052
5.40
0. I53 0.946 0.062
5.67
0.144 I .02
0.078
76.5 7S.O
0.010
73.6 75.0 0.405 0. I24
0.0 IO 0.009
0.027 0.021 0.498
0.027 0.497
0.024 0.501
<os 2.60 2.77 1.77 I .03 2.73 <0.25
a p . 5 ' 0.5 '
' 0.25 0.600 0.800 *:0.5 0.25 ,
*:OS 0.60 2.80
. 1.70 1.10 2.70 C0.2S
6.16 9.33
Stainless 2000
95-002646 9S-02634
cos 6.60 2.80 I .60 I .oo 2.80 C0.2S
6.16 9.24
Stainless 2000
95-002647 95-02635
<0.5 0.600 2.70 2.00 I .oo 2.70
c0.25
c0.5 0.600 C0.25 0.600 0.600 c0.5 c0.25
Initial pli Final pli
Leach Vcswl SAN (m"j
sample Log t~ (tcr) Sample Log Ir (IC)
6.16 9.21
Skinless 2000
9S-002648 9S.02636
5.54 6.36
Stainless NA
95-002639 9542627
5.54 6.70
Stainleu NA
95-02628 9S-002640 '*
Nota: I. NM = not mcasud, NA - not applicable; PCT = M u d Consislency Test. 2. Boron spike ncovaia for blanks I md 2 wae 114% and 1279% respectively

A.r B Ba Ca Cd Cr CU
Ft E; 1.1
w L4n MIS
Nl Sd SI . P I* Rr Ru SI SI T$ I: 7s zr
13.0
0.080 0 010 u os0
1.50 400 860 0 200 0 063
31 0
13.0
0 070 0 010 0 050
I .40 4.00
0.200 0 053
320
a.80
0.900
12.0
0 080 0.007 0 os0
0.850 4.00 7.90
0.050
28.0
0.800
10.0
0090
0 (40
0.720 400 7.10
0 030
2s 0
0 loo
14 0 I4 0 I4 0 4.30 4 in
o oxn I t Il!nl 0 070 00x0 , 0 020 0.010
I I ? 4 M R 111 n 21ri n 114'1 I I ll?O
I 30 1.40 600 GOO x 10 8 20 0 LltD - 0 2 0 0
0.030 0 030 29 0 29.0
0 010 0 030
0 040 o o m
GOO x IS
It l l Y ,
29 0 R C l l l
OOOO n 1125 0900 09M
68.0 68.0
0008 0.007 .. 53.0. 62 x
nmtR
62.0 64.0 64.0 640 24 I t 2s 0
0.007 0.008
0.130
NM NM Nh4 NM NM Nh4 NM
5.82 10.07
Teflon 2000
92-06994
0.080
NM NM Nh4 NM NM NM NM
5.82 10.12
Teflon 2000
92-06995
4 . 5 4 . 5
4 .25 4 . 2 5 2 1 2 8 . 4 . 2 5
7.10 9.96
Stainleu 2Ooo
94-03195 9443189
4 . 5 4 . 5
4 . 2 5 4 2 5 %
I .9 2.1 4.25
7.10 9-96
ShinlUS 2ooo
54431% W 3 1 r O
4 . 5 4 . 5 4.25 0.3 1.4 2.'5 a25
7.10 9.80
Stainleu zoo0
w 0 3 m 91-03203
4 . 5 4 . 5
4 .25 .0.4
I .6 2.2
4 . 2 5
7.10 , 9.86
Stinleu 2000
94-03209 94-03204
NA NA Nh 0 4 I R 2 6 NA
9 %I
NM NM NM NM NM Nh4 NM
Nht NM NM Nht Nht NM NM
5.99 9 so
Tcflm 10 0
.92.01?87
lnilial pH . Final pH .
Lcnch Verwl SAW (nit)
Smplc Log Y (ICP) Sample lq Y (IC)
Nore$
7 I O 6 57
Stunless NA
94-03194
10.10
A I 3

Tible A.14 Lcich Test Information and Leachate Analysis for 101-A2 Core #2 Simulanl
7-Diy PCT (I101 Cell Test #3) 7-lhy PCT (IAb Test #8) Simple 1 Simple2 Sample3 Blank 1 Blank 2 Simple I Sample 2 Sample 1 Sample 2 Blank Sample I Sample2 (ugImI1 (udml) (ugM) (uglml) (ug/ml) I (uglrnl) (ug/mI) I (ug/mI) (ug1ntI) (ug/mI) I (uelml) (uglml)
7-Day I’CT ( Iah Test #la) 28 Day MCC-I (Lah Icnt #9)
A I ’ ’ 3.00 3.00 3.00 2.80 2.R0 2.00 2.50 I .60 I .611 A* B 16.0 16.0 15.0 0.300 15.0 15.0 16.0 11.0 3.20 3.30 Ba C l 0.700 1.00 I .oo 0.700 41.600 0.050 Cd 0.095 0.o10 0.010 0.001 Cr c u Fe 4.00 1.50 1.15 o.m 0.450 0.610 0.570 0.800 1 . 1 0 0.060 0.050 K 4.00 5.00 2A10 2.00 Li 20.0 21.0 20.0 19.0 19.0 21.0 21.5 3.30 3.30 M8 Mn Ma NI 24.0 23.0 22.0 21.0 21.0 23.0 26.0 5.80 5.80 Nd Ni
.P * 2.00 2.00 2.00 2.00 2.00 2.00 2.00 0.400 0.400 Pb Re Ru Si 92.5 92.0 89.0 85.0 85.0 90.0 94.0 25.0 25.0 Sr Ti U zn
(I.tl60 O.070 0.006 0.005
0.030 .
, a 0.050 0.050
lnitiil pH 7.03 . 7.03 7.03 7 0 3 7.03 5.82 5.82 6.12 6.12 6.12 5.99 5.99
SAN (me’) Zoo0 2000 2000 NA NA 2000 2000 2000 2000 NA 10.0 10.0
I
Final pH 10.02 10.07 10.09 5 7s 5. I2 10.34 10.34 . 10.03 9.98 7.xx 9.63 9.6 I Leach Vessel Shin lm Stainlccr Shinlcu Stainless Stainless Teflon Teflon Stainleu Stainless Stainless Icflon Teflon
Simple Log 1y (re) 93-9384 93-9385 93-9386 93-0390 93-9391 9246996 92-06997 93-10234 93-10235 93-1023 I 92-08089 92-08090
Nota: 1. Simpla #I-2 (hot ccll t a t ll3) were prepared and washed in the Iaborr tq . 2 SImpla KJ-4 (hot cell t a t W3) were wished in the hot ccll 3. Second FCT(h0t ccll (cd kr3) blank sample was spilled. 4. NM- not muMd, NA = not ipplicable; PCI I~mducl Consistency Test; MCC-I = Matdrli Chinc tdut ion Ccntcr (MCC-I) Test
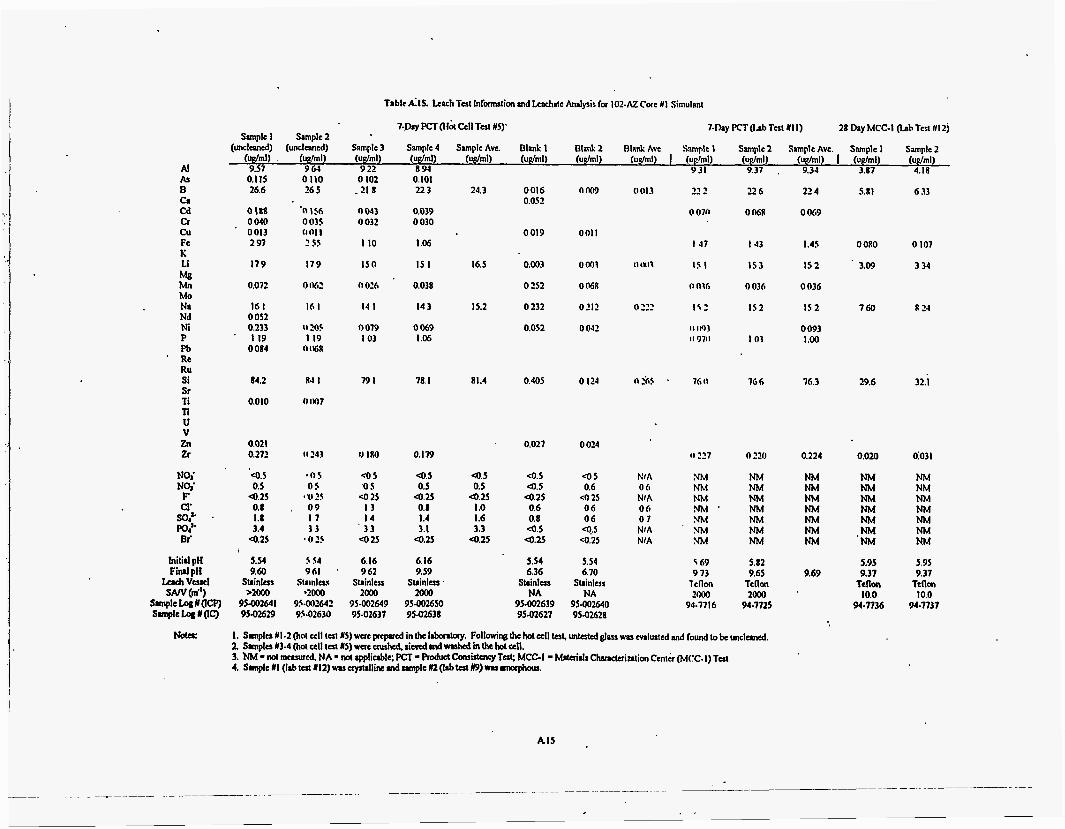
Table AIS. Leach T a l Inlormarion m d teachale Analysis for 102-/\z Core U I Simulani
7-plU PCT (If& Cell Ta l WS)' 7 - b y M ( l ~ b TCSI YII) 28 Day MCC-I (LshTcsl U12)
Sample 3 Sample 4 Simple Ave. Blank 1 Blank 2 Blank Ave Sample I Sample 2 Sample Ave. Sample 1 Sample 2 (u@ml) (up/ml) (qdml) (ughnl) ( u g h ! ) (ugml) I (uplml) (ug/mI) (ug/mI) I (ue/mI) (uvml) 9 22 894 9 31 9.37 . 9.34 3.87 4.18 0 102 0.101
- 2 1 8 22 3 24.3 0016 O M 0 0013 22 2 22 6 22 4 5.81 6 33
9043 0.039 (1 070 o nbn 0 069 0.052
0 032 0 030
I10 I .ob I41 I 4 3 1.4s 0 oxo 0 IO7 0019 0011
i
Smple 1 Smplc 2 (unclcnned) (unclervlcd)
(uglml) , (uphl) 9.57 964 0.115 0 110 26.6 26 5
0188 h i 5 6
' 0013 (I l l11 0 040 0 035
2 97 2 ss I1 9
0.072
16 I 0 052 0.133
I I9 0 084
84.2
0.0 I O
0.021 0.272
179 I 5 0
0 IH2 n o x 16 I I4 I
I1 205 9 0'19 I19 I 03
n IHR
XJ I 791
0 lw)?
IS I 16.5
0.038
14 3 15.2
0 069 I .ob
78.1 81.4
0.179
0.003 0 0 1 II ( Y I I 15 I 1 5 3 15 2 3.09 3 34
0 252 0 MR 11 nwi 0 036 0036
0 232 0212 0 2 2 1 5 3 IS 2 1s 2 760 I24
o.os2 0 04-2 olnj 0 093 II 0711 103 1.00
0.405 0 I24 I1 :i,z . 76tl 76 6 76.3 29.6 32.1
0.027 0 024 II 221 n 220 0.224 0.020 0:031
Q.3 . n s a5 4 . 5 4 . 5 4 . 5 <OS NIA NM NM NM 0.5 o s '0 s 0.5 0.5 4 . 5 0.6 06 NM NM NM
Q.25 * u 2 5 so 25 Q.25 4 . 2 5 4.25 -3 2s NlA NM NM NM 0.8 09 13 0.8 1 .o 0.6 06 0 6 N M ' NM NM 1.8 I 1 14 I .4 1.6 0.8 06 0 7 NM NM NM 3.4 3 3 . 3 3 3.1 3.3 4 . 5 4.s NIA ' m NM NM
4 . 2 5 * 0 2s a 25 4 .25 4 .25 4.25 <0.25 NIA m NM NM I
5.54 s 54 6.16 6.16 9.60 961 ' 962 9.59
Shinlas Simlcs Stsinless Shinlar I ~ 2 O O o '?ow 2000 m
95.002641 95.W2641 95.002649 95402650 95.02629 9S-02630 9592631 9542638
5.54 5.54 6.36 6.10
Stainless Shinless NA NA
95402639 95.002640 9s.02621 95.0~28
5 69 5.82 9 13 9.65 9.69
lcflon Tenon 2oOo 1000 .
94.1716 94-1725
AI5 .
NM NM NM NM NM NM 'NM
5.95 9.31
Teflon 10.0
94.7136
NM NM NM NM NM NM Nh4
5.95 9.31
10.0 94-1731
Tenon

Sample I Sample 2 Sample 3 Sample A=. . I h k (Udd) (Udd) (Udd) ( U p / m l ) (Udd)
B K . ti NJ Si
NOi NO; F Cl
so," Po? Ri
nlnnk AW. Sample I Sample 2 Sample 3 Blank I Rlink 2 (add) (udml) (udd (udml) (udnlb (Ildnll)
<0.5 <o. 5 <2 1.1
26.7 7.9 ' 0.25
7.10 10.26
0.5 c0.s 4. 5 <0.5 CL CL 1.3 I .o
24.4 24.1 7.6 7.8
a . 2 s 0.25
7.10 7.10 10.24 10.25
Stainless Stainless 2000 2000
94-03198 94-03199 9443192 94-03193
0.5 NM
' N M 1.1
25.1 7.1 0.25
7.10 10.25 .
<os &%I 4 . 5 h31
a 2 5 h3I '0.25 NhI *-os Mt 60.5 !nt .'0.25 KXl
7.10 7.03 6.57 I I). I4
Sfainlccrr Stninlcrs NA 2MHI
94-03194 9.3-9387 94-ll3111
Nhl NM Nhl Nhl Nhl NM Nhl Nhf Nhl ' Nhl Nkf NM h31 Nhl
NM Nhl NM NM NM Kh4 NM Nhl NM ' Nhf NM NM NM NM
Initial pl l Final pl I
Leach Vessel
7.03
Stainlcss 2lHN)
93-93RR
10.1s 7.03 10.12'
7.03 5.75
7.03 5.12
Stainless Nh
9.3-9.391
* Stainlcw
Sample Log (ICI') 95-03197 Sample l a # (IC) 94-03191
sm (m.9 2000 St.rinlca Stainless
20lm NA 93-9389 93-9390
7-lhy I'CT (Imh Test #'IO) Sample I Sample 2 (Udrnl) (Udml)
I30 110 -40 <IO 30.0 46.0 230 . 210 210 200
NM NM Nh4 NM NM NM NM NM NM NM NM NM NM NM
6.12 6.12 10.20 10.10
StrinlUl Stlinlcsl 2000 2000
93-10232 93-10233
7-Day PCT (Hot Cell Tesl#5) Sample 3 Sample Avc. R l m k I
106 I I3 O.ll16 NM NM NM 43.2 46 0.003 20s 217 0.232 206 21 5 0.405
(Udd) (udml) (W'ml) Blank
(cldml) ' c0.2
<IO 4 . 3 4 . 8 4.8
Hhnh 2
lLllll9 NM 0.on3 0.2 I2 0.124
Sample 2 (Udd)
114 NM 46.1 219 2lt
4. S 4 . S 4 . 2 5
. 1.2 2S.J 7.1
4 .25
Sample I f UUnnJ)
118 NM 47.3 228 221
CO.5 0.6 .
~0 .25 I .4
25.9 7.7
* 0.25
R K l i Na Si
NO,' No; F
. so,
8 i
Cl,
Po?
<o.s co.5 a . 2 5
1.3 24.1 7.3
4 . 2 5
4 . 5 4 . 5 3 4 . 2 5
1.3 25.1 7.6
4 . 2 5
COS e0.5 c0.25 0.6 0.1 c0.5
<o.zs
' 11.5
0.25 0.6 11.6 11.5
0.25
0.6 NM NM NM NM NM NM NM
6.12 fl.88
Sldnks, NA
93-10231
Initial plt 5.54 5.54 s.54 Finrl pli 10.22 10.26 . 10.22
L u c h Vessel Stainless Stri&¶ SCi ikU SAN (nit) 2000 2000 2000
Sxmpk Log (IW 95-002643 95-002644 9540264s SU~PIC n (it-) 9 5 - 0 2 ~ 1 95-02632 93-02633
5.U 5.54 5.54 6.36 9.70
Stainkn Slainlns NA NA
95402639 ')5*002640 95-02627 95-02628

T8hlc A.17. Leach Tat InfomUion and Leachate Analysis for NCAW Simulml
B E ; - Ll Na Si
N O i N 4 '
F CI'
SO,'. Po:: B i
Initial pH Final pH
L u c h Vessel SAN (nit)
fa,* . B i
lnitinl pll Final pl I
Ledr Vcuel SAN (m")
Sample Log I (ICP) Sunplc Log# (IC)'
28 Day MCC-I (W Tat # I ) . 28 DayMCC-I (ildCcllTcst#l) Sample 1 Sample2 Sample I Simple2 Blank 1 Blank2 (uglml) (WmI) I (udml) (ue/mI) (udrnI) (uRM)
4 9 4.8 2 79 2 31 coo1 . CO I NM NM 0 39 I 70 0 31 130 2.7 1 7 I SI I 30 a.OOO6 coo1 10 3 10 1 6 29 675 ' 039 160 32.3 31 9 31 0 1 3 4 4 I7 6 47
NM NM NM NM NM NM NM
6 41 9.29
Teflon 100
9o..Wl. 78YldSl
NM NM hW h U NM NM hi4
651 9 52
Teflnn 1110 w..w I -
7x211 I 4 2
mi mi Nhf NM Nh4
4 <4 Q c2 6 6
N?4 Nh4 NM NM NM
N!d Nht NM NM Nh4
A N 951 Whl SM N hl
NM <4 Nh4 hW NM !is1 NM <2 NM Nhi NM SM
7 12 7 12 7 I2 2x4 . 5x5 s s4 7 52 3.70 6.51-'. 922 9 35
1:uscd.Silicr Fused-Silica Fuscd.Silica I:u%ed.Silica I:iiscd.Stllca I:uwl-Siliea 100 NA NA 100 i n o .\'A
91.2189 91-0198 91-2785 91-09707 91-09708 9I.IW7Il9 . 90-9536
7-Dy PCT (trb Tat 12) Sample 1 Sample2 Sample I Sample 2 Sample 3 Blank I * Blank2 Sample 1 Sample2 Blank Satnplc I Smple 1 Hlank (ug/ml) (ue/mI) I (uglml) (uglml) (wml) (udml) (ue/rnl) I (J ml) (ue/ml) (ue/mI) I (ug/mI) (ug/mI) (up/ml)
I30 130 I IO I?@ I 20 006 0.0s . 120 130 (1 I6 '31 R 98 R 0 02 2.2 I .6 0.9 ' IO * 'OS <O 8 a . 8 0.8 0.9 IO0 c) ( co S cos s4:4 37.2 . 47.0 49 0 490 <o 01 a.01 44.0 48 0 0 02 JI 9 4-49 a.013 230 230 I 70 I 70 I70 0 20 '0.20 170 I80 0 10 145 I35 4 . 2 5
74hy IVl (Lah Test #S) 7-Day PCT (Lab Test #J) 7 4 h v IT1 (1101 Cell Test #2)
' m . 240 210 210 210 0 20 0.30 210 250 2M) ?I5 226 0.14 ,
NM NM NM NM NM Nh4 NM
NM NM NM Nh4 NM NM NM
Q <2 2 s 3.5 6.3 s.3 <I
6.30 6.50 3.80 S RO I, 80 10.09 . 10.11 10.09 1007 1009 Tda, Tctlm Stainless Strinlcs Stainless 200 2ooo 2ooo 2000 2000
90.3441- 90.3441-
Q Q <I <I Q Q <I
NM NM NM NM NM NM NM
NM NM NM NM NM NM NM
NM NM NM NM NM NM NM
NM NM NM NM NM NM NM
NM NM NM NM NM NM NM
3.80 3.80 3.84 5.84 5 85 3.90 3.31 10.03 10.08 'I 81 9 86 7.35
Stainleu Stainla F d - S i l i c a Fused-Silica Fured.Siltca Statnlqu Sh in lw SGnleu NA NA 2000 2000 NA 2oon 2000 NA
' SrmplcLogI(1CP) n2/1828 78Yl8M 91.9710 91-9711 91-9712 91-9713 91-9714 91-8398 91-8399 91-8600 92-7531 92.7432 92-7430 Sample La# I (IC) 91-9206 91-9207 91-9208 91-9259 91-9260
No(4: 1. NM=notmuwred. NA I notapplicclble;MCGI =MalairLChmctai~ l ia ,Centn(MCC-I)T~.
A.17

NOIU
Trhlc A.18. Leach Tu1 ltfonnnlim and Lenchate Analysis for ATM-In and Envimnnienfnl Assmrment Glhu
28-Day MCC-I nnATM.10 (lint Cell Tesf # I )
7.l)ay rCT on EA Glau (Lah Test #IO)
Sample I Sample 2 Rlanlt I Rlanl. 2 Sample I nlank I (uphi) (udml) (udml) (ugmI) I (iy'ml) (@ml)
E . 2 97 2 61 r.001 * 0 I J'LI to 02
LI 1.35 1.22 <0 W% , 111l1 I ?h 0 Oc)R Nn 8.35 7 % n 39 I (dl I-1(WI 0 62 SI 26 9 28 3 4 I7 t i -17 (77 0 14
K 3.27 3 42 0 31 2 711 * I 1 2 0 4
4 4 Q Q 4 4 Q
NM NM NM NM NM NM NM
. lnitinl pH 7.12 1.12 Final pli 8.91 8.75 Lach Veuel Fused-Silica Fused-Silica
. S A / V ( ~ " ) 10.0 10.0 Sample Log I (ICP) 91-0203 91-2788
Sample L47gr (IC) 90.9541
NX1 $\I Y11 SI4 M1 SS4 Mf
NM NM N U Nh4 XSf NM SXI NM si4 NM SM NM N M NM
7 I2 1 I ? 6 12 5 70 6 < I I I (11.
Fused-Silica Fused.Silitn Stainlcsr NA NA ?WO
91-0198 914279 93.1031? 90-9536
6 12 (1.88
Stainleu NA
93-10309
TablcL19. Arulyiiul ~bomlwy-lo-Anal~icdal Laboratory Comparison 7.l)av W'T (Lnh lest #IO)
I O I - A z c 2 Simulant Sample I Sample I Sample 2 Sample 2 Sample Ave. Sample Ave Sample I Sample I
Lab I I.& 2 Lab I Lab2 Lab I Lab 2 I.ah I Lnh 2 (Wrnl) (ugh!) (uglml) (uglrnl) (Ilplrnl) (uglml) I (uJml) (ughl)
B 16.0 zoo 1s.o 24.0 ' 17.0 22.0 131) I I6 Li 21.0 20 5 21 5 19.6 21.2 201 w u 37.1 Na 23 0 26 0 26.0 26.2 24.5 26. I 2311 223 Si 90.0 90 I1 940 894 .92.0 89.5 2111 I91
&tnpletqI(lCP) 93-10234 93*1031)1 93-10235 93.1031 1 93.10232 93-10308
1. I r b I = Jerry W q n a 325 Euildia h b 2 = K d Pool 314 Buildiq 2 PCT = Roduec Co~~isIcncy Test.
cvs-IS-Hw394 Sunple 2 Sample 2 Sample Ave Snmpk Ave
Lab I Lab2 Lab I I.ah 2 (Ighnl) (ugh!) (uglml) (ughl)
I IO IDQ 120.0 IIUO 46.0 41.4 48.0 443 210 194 220.0 tom 5 200 186 20s.o 191 5
93-10233 93-10310
I

Table AZO. CVS Model Predictions and 95% Prediction Intervals for 101-AZ Core #1 Composition .
. PCT 1st Order B Li Na PCT 2nd Order #1
Li Na PCT 2nd Order #2 B Li Na PCT 2nd Order #3 B Li Na MCC-1 1st Order B Li ’
Na MCC-12nd Order #1 B Li Na MCC-12nd Order #2
, B Li Na
B .
MCC-12nd Order #3 B Li Na
Model Standard Lower95% Upper95% Model Lowcr95% Upper95% Prediction Error Prediction Prediction Prediction Prediction Prediction In(g/m2) In(g/m2) ln(g/m2) ln(g/m2) (g/m2) (g/m2) (g/m2)
-0.41261 0.69719 -1.79386 0.96864 0.66192 0.16632 -0.46701 0.61035 -1.67610 0.74209 0.62687 0.18710.- -0.74496 0.60262 -1.93886 0.44894 0.47475 0.14387
-0.69248 0.59657 -1.87451 0.48954 0.50033 0.15343 -0.78643 0.47423 -1.72634 0.15348 0.45547 0.17793 -1.05625 0.49613 -2.03937 -0:07313 0.34776 0.13011
-0.75755 0.52064 -1.78966 0.27457 0.46881 0.16702 -0.66681 0.44084 -1.54082 0.20719 0.51334 0.21421 -0.99603 0.44897 -1.88606 -0.lOq.00 0.36934 0.15167
-0.73378 -0.69157 -1.02482
2.76819 2.70651 2.74538
2.61419 2.56718 2.58999
2.61572 2.56895 2.58593
0.49992 0.43116 0.43916
0.42338 0.41443 0.41042
0.33695 0.34015 0.32297
0.32381 0.32656 0.31074
2.51137 0.33862 2.57485 0.30512 2.54650 0.29573
-1.72503 -1.54648 -1.89551
1.92861 1.88468 1.93 151
1.94578 1.89241 1.94930
1.97321 1.92099 1.96936
1.83947 1.96894 1.95949
. A19
0.25747 0.16334 -0.15414
3.60778 3.52833 3.55925
3.28260 3.24194 3.23067
3.25822 3.21691 3.20251
3.18327 3.18076 3.13352
0.48009 0.17817 0.50079 0.21300 0.35886 0.15024
15.92978 14.97691 15.57053
13.65615 13.02903 13.32964
13.67706 13.0521 1 13.27563
6.87994 6.58425 6.89992
6.99909 6.63534 7.02377
7.19373 6.82771 7.16609
12.32180 . 6.29320 13.12935 7.16308 12.76236 7.09571
2.63436 2.10032 1.56665
1.63157 1.16588 0.92948
1.315% 1.23022 0.89942
1.29365 1.17744 0,85715
36.88408 34.06703 35.13683
26.64496 25.58331 25.29660
26.00321 24.95090 24.59418
24.12552 24.06504 22.95464

PCT 1st Order B
. Li Na PCT 2nd Order #1 B Li Na PCT 2nd Order #2 B Li Na PCT 2nd Order #3 B Li Na MCC-1 1st Order B Li Na MCC-12nd Order #1 B Li Na MCC-12nd Order #2 B Li Na MCC-12nd Order #3 B Li Na
Table k21. CVS Model Predictions and 95% Prediction Intends for 101-AZ Core #2 Compostion
Model Standard Lower 95% Upper 95% Model Lower 95% Upper 95%. Predictions Error Prediction Prediction Prediction Prediction Prediction
In(g/m2) In(n/m2) ln(g/m2) In(g/m2) (g/mz) (g/m2) (g/mz)
-0.56044 -0.61607 -1.08036
-0.59743 -0.70971 -1.05648
-0.75572 -0.85230 -1.20633
-0.82913 -0.86476 -1.22 129
2.73420 2.66098 2.73324
2.61199 2.54912 2.61122
2.59770 2.53334 2.58201
2.49661 2.58652 2.71595
0.70701 0.61795 0.61 1 11
0.60345 0.48040 0.50163
0.52884 0.44605 0.45534
0.50848 0.43449 0.44585
0.43 166 0.42253 0.41844
0.34254 0.34580 0.32833
0.32956 0.33236 0.31664
0.34491 0.3 1666 0.30576
-1:96115 -1.84022 -2.29108
-1.79310 -1.66184 -2.05050
-1.80408 -1.73663 -2.10898
-1.83736 -1.72627 -2.10523
1.87822 1.82309 1.90347
1.93248 1.86315 .1.95990
1.94378 1.87386 1.95373
1.81223 1.95769 2.10902
2.31702 0.84028 0.570% 0.14070 0.60807 0.54006 0.15878 1.83688 0.13036
0.59824 0.24243 -0.06247
0.29263 0.03203 -0.30367
0.17910 -0.00326 -0.33735
3.59019 3.49886 3.56301
3.29150 ' 3.23508 3.26254
3.25163 3.19283 3.21030
3.18099 3.21535 3.32288
0.33947
0.55022 0.49179 0.34768 .
0.46967 0.42643 0.29929
0.43643 0.421 15 0.29485
15.39742 14.3 103 1 15.38265
13.626 14 12.79584 13.61565
13.43281 12.59550 13.22369
12.14127 13.28346 15.11897
0.101 16
0.16644 0.18979 0.12867
0.16463 0.17611 0.12 136
0.15924 0.17795 0.12182
6.54185 6.19096 6.70913
6.90662 6.44400 7.09862
6.98510 6.51339 7.05495
6.12409 7.08295 8.24016
1.13924
1.81891 1.27434 0.93944
1.33995 1.03255 0.73810
1.19614 0.99675 0.71366
36.24096 33.07772 35.26920
26.883 16 25.40840 26.11579
25.83241 24.35726 24.78652
24.07057 24.9 1201 27.74013
A20

PCT 1st Order B Li Na PCT 2nd Order #1 B Li Na PCT 2nd Order #2 B Li Na PCT 2nd Order #3 B. Li Na MCC-1 1st Order B Li Na MCC-I 2nd Order #I B Li Na MCC-I 2nd Order #2 B Li Na MCC-12nd Order #3 B Li Na
Table A.22. CVS Model Predictions and 95% Prediction Intervals for 10242 Core #1 Composition
Model Standard Lower95% Upper95% Model Lower95% Upper95% Predictions Error Prediction Prediction Prediction Prediction Prediction
In(g/mz) In(g/m2) In(g/m’) In(g/mz) . (g/m2) (g/m2) (g/m2)
-0.38941 -0.45601 -0.92368
-0.78024 -0.77381 -1.32993
-0.81406 -0.62368 -1.23220
-0.76267 -0.64025 -1.22517
2.89737 2.82077 2.89913
2.72743 2.66855 2.72615
2.74271 2.68259 2.71184
2.53951 2.57043
. 2.56268
0.70143 0.61481 0.60628
0.60161 0.47848 0.50035
0.52534 0.448 16 0.45271
’ 0.50466 0.43739 0.443 11
0.42643 0.4 174 1 0.4 I3 3 7
0.34074 0.34398 0.32660
0.32805 0.33084 0,31546
0.34471 0.30878 0.30102
-1.77906 1.00024 -1;67393 0.76192 -2.12484 0.27748
-1.97226 0.41178 -1.72214 0.17452 -2.32139 -0.33846
-1.85548 0.22736 -1.51220 . 0.26484 -2.12965 -0.33475
-1.76332 0.23799 -1.50751 0.22701 -2.10368 -0.34665
2.05173 1.99302 2.07940
3.74300 3.64852 3.71886
2.05149 3.40336 1.98618 . 3.35091 2.07826 3.37405
2.09178 3.39364 2.02613 3.33905 2.08590 3.33777
1.85552 1.95727 1.96515
A21
3.22350 3.18360 3.16020
0.67746 0.63381 0.39706
0.45830 0.46125 0.26450
0.44306 0.53597 0.29165
0.46642 0.52716 0.29371
18.12641 16.78977 18.15834
15.29353 14.41905 15.27397
15.52901 14.62292 15.05695
12.67346 13.07 144 12.97053
0.16880 0.18751 0.11945
0.13914 0.17868 0.09814
0.15638 0.22042 0.11888
0.17147 0.22 146 0.12201
7.78135 7.33766 7.99967
7.77948 7.28764 7.99055
8.09932 7.58468 8.05183
6.39502 7.07997 7.13598
2.71893 2.14239 1.31980
1.50950 1.19067 0.71287
1.25528 1.30322 0.71552
1.26870 1.25484 0.70705 *
42.22447 38.41777 41.21738
30.06495 28.52868 29.19653
29.77413 28.19233 28.15627
25.1 1587 24.13348 23.5753 1
I

PCT 1st Order B Li Na PCT 2nd Order #1 B Li Na PCT 2nd Order #2 B Li Na PCT 2nd Order #3 B Li Na MCC-1 1st Order B Li Na MCC-12nd Order #1 B Li Na MCC-12nd Order #2 B Li Na MCC-12nd Order #3 B Li Na
Table A.23. CVS Model Predictions and 95% Prediction Intervals for CVS-IS-HW39-4 Composition
Model Standard Lower95% Upper95% Model Lower95% Upper95% Predictions , Error Prediction Prediction Prediction Prediction hediction
ln(g/m2) ln(g/m2) ln(g/m2) In(g/m2) (g/m2) (g/mz) (g/mz)
0.56924 0.40771 0.23470
0.62553 0.19795 0.11210
0.41449 0.21121 0.06974
0.40374 0.20228 0.003 18
3.01662 2.92352 2.97474
3.06113 2.96345 3.01998
3 -03 962 2.94187 3.02058
2.93261 2.88724 2.91581
0.69382 0.60783 0.59971
0.59224 0.473 10 0.49432
0.51895 0.43805 0.44720
0.49822 0.42810 0.43778
0.42106 0.41216 0.40817
0.33379 0.33697 0.31995
0.32086 0.32359 0.30800
0.33739 0.30177 0.29401
-0.80536 -0.79639 495345
4.54791 -0.73972 -0.86744
-0.61428 -0.65726 -0.81679
-0.58413 -0.64656 4.86477
2.18164 2.10620 2.16533
2.39898 2.29500 2.38529
2.40297 2.29981 2.40944
2.263 15 2.28798 2.33220
A22
1.42284
1.79898 1.13562 1.09163
1.44325 1.07969 0.95627
1.39161 1.05112 0.87113
3.85160 3.74084 3.78414
3.72328 3.63190 3.65466
3.67628 3.58394 3.63172
3.60208 3.48649 3.49941
1.26453 0.38541
1.86924 0.57816 1.21890 0.47725 1.11862 0.42003
1.94383 1.76692 0.44693 6.98545 1.61181 1.50337 0.45095 5.01187
1.51360 0.54103 1.23517 0.51827 1.07223 0.44185
1.49741 0.55759 1.22419 0.52384 1.00319 0.42115
20.42215 8.86083
19.58453 8.71748 18.60667 . .8.21696
21.35167 11.01194 19.36466 9.92444 20.49088 10.86221
20.89730 11.05596 18.95125 9.97229 20.50318 11.12773
18.77657 9.61332 17.94372 9.85501 18.46376 10.30058
4.14889
6.04348 3.1 13 10 2.97913
4.23444 2.94377 2.60197
4.02132
2.38961
47.0683 1 42.13337 43.99782
41.39996 37.78454 38.65438
3 9.499 18 36.01516 37.77774
36.67444 32.67107 33.09592
2,86085

Table A.24. Frit and Recycle Compositions
Frit Compositions (wt% oxides)
' 1 0 1 4 2 Core #1 and ,NCAW Simulant'
B2°3 14.0
CaO 1.0
MgO . 1 .o Na,O 9.0
Li,O 5.0
SiO, 70.0
101-AZ Core #2 10.6 .
0.0 8.6
0.0
5.2
75.6
102-AZ Core #1 and 102-AZ Core #1
Simulant 20.45 ~
0.0
7.29
0.0
0.0
72.26
Composition of Simulant Recycle Added to 102-AZ Core #1 Simulant
Oxide CdO MnO, Na20
'2O5 N O j c1- TOC Diatomaceous . Earth
' Zeolite (IE-96) .
Sum of Nonvolatiles
g Recycle Oxide per L of Recycle Simulant 2.01
0.60
25.17 ,
2.01
40.27
0.04 1.36
20.13
10.07
.60
A.23


Radiochemical Data


Table B.1. Radiochemical Data for 101-AZ Con #I
Analytc H-3 C-14 GEA Cr-5 1 Fc-59 cod0 sc-79 Nb95 zr-95 Ru-103 Ru-106 Sn-I 13 Sb-125 c s - i ~ CS-137 cc- 144 Eu-152 Eu-154 Eu-155
' Am-241 Sr-90 TC-99 1-129 Np237 Pu-238 P~-239+240 Total Pu
Cm-242 Cm-243+244
Totnl Beta
Am44 1
Total u (udg)
5.8%
Glass Washed Solids Mcltcr Fad Mclter Fad Glass Uncertainty
(uCilg) (uCig). sup. (uCig) , (uCi/g) (+/-I 4.5E-04 , .I S5E-03 4.70E-04
3.82EW 1.78E-01
12OE+Ol 3.19E+OO 1.59E-01 6.16E+OO < 4.0E-03 < 3.57E-04
1.43E-01 2.92E-01 5.65E-01 .
7.55E-01 3.50E+02 4.03E+02 2.52E+OO 2.79E92 1.5%
5.30E+01 7.29E+01 1.94E+OO 9.93E+01 22% 3.9OE+OO 8.9IE+OO 5.86E+Oo 4.44E+OO . 9.1% 2.40E+02 4.41E+02 4.52E+02 6.00E+02 0.5% 5.30E+02 6.55E+02 2.08E+OO 3.50E+02 1.5%
3.08E-01 1.60E+01 2.82E+Ol 1.71E-01 5.05E+01 1.9%
6.72E+01 9.54E-01 1.06E+02 1.6% 524E+Ol 4.8%
6.10E+03 6.86E+03 1.96E+04 6.5% 6.60E-02 4.02E-01 3.15E-03 70% 1.80E-04 614E-05 < 5.00E-04 6.70E-03 . 4.SOE-02 35% llOE-01 4.49E-02 12% 7.90E-01 2.4 OE-01 9%
2.85E-01 9% 13OE+O1 2.92E+01 3.62E+01 7% 1.70E-03 6.41E-02 . 10%
3 A 8EM3 5% 2.03E+04 431E44 33%
8.50E-03 435E-01 27%
Date of.Andysis 61201% - 4/6/91 6/19/90 7N91
Note: Error estimateS an onc4gma total .nalytiul errors, not including contributions h sampling or experimental m r . Calibration errors an ertimated at an additional 2%.
B.1

Table B.2. Radiochemical Data for 101-AZ Core #2
Glass Washed Solids MeIter Feed Melter Feed Sup. ‘ Glass Uncertainty
halyte (uCi/g) (uCilg) (UCiIe;) . (uCi/g) (+I-) H-3 C-14 GEA Cr-5 1 Fe-59 Co-60 Ser79 Nb-95 3-95 RU- 1 03 RU-106 Sn-113 Sb-125 0-134 CS-137 Ce-144 EU-152 EU-154 EU-155 Am-24 1
Sr-90 Tc-99 1-129 Np-237 PU-238 PU-239,240 Total Pu
. Cm-242 Am-24 1
Cm-243 + 244 Total u (ug/g) Total Alpha Total Beta
Date of Analysis
< 6.8OE-04 3.34E-04
1.3 8E# 1 3.90E-04
1.38E-i-03
1.68E-i-02
2.3 1E#2 2.81E-tO3
9.70Ei-01 2.43Ei-02
1.96Ei-04 4.60Ei-00 1.03E-02 3.45E-02
3.86Ei-0 1 6.71Ei-01
4.61E-01 4.50Ei-03 7.97Ei-01 5.34EW
1.43E-02
2.13E+01 3.38E-02
1.99Ei-03
3.23E+02
5.14Ei-02 4.17Ei-03
1.45Ei-02 3.65Ei-02 .
2.99Ei-04 (6.82E-01 Q.45E-03
1.45EM2
6.77Ei-04
1/9/91 - 4/6/91
1,62E+O 1
3.65Ei-00 6.67E-i-02
2.5 7EH2 1.14Ei-00 7.66E+Ol . 2.72Ei-02
1.09Ei-03
1.23Ei-02 2.80Ei-02 1.37E+02 2.92El-04 2.06E-02 4.41E-04 5.73E-0 1 8.09E-02 4.36E-01 5.18E-01 1.06E.tO2
’ 1.13EMO 3.14E+04
2.55E-01
6.81EM
1/1/91 7/2/91
3.4%
0.9%
1.0%
0.8% 0.7%
1.1% 0.8% 1.9% 6.5% 18%
9% 10% ‘8% 8% 7% 8% 15% 5.0%
3.2%
Note: Error estimates are one-sigma total analytical mors, not including contributions from sampling or experimental error. Calibration mors arc estimated at an additional 2%.
B.2

Table B.3. Radiochemical Data for 10242 Core #I
C-14 GEA Cr-5 1 Fe-59 c0-60 Se-79 Nb-95 zr-95 Ru-1 03 Ru-106. Sn-113 Sb-I25 *
CS-134 CS-137 Ce-144 EU-152 Eu-154 Eu-155 Am-24 1
Sr-90 TC-99 1-1 29 Np237 Pu-238 PU-23 9+240 Total Pu
Cm-242 Cm-243+244 Total U Total Alpha Total Beta
Am-241
H-3
Date of Analysis
Note:
6.80E-04 2.10E-04
c
4.6OEW 4 . 2 0 4 3
9.89E+02
6.1 8E+01
1.46EM2 5.48E+03
2.49E+01, 9.17E+01'
5.53E+03 1 .2501
< 3 . 0 5 5.16E-03 8.66E-03 1.83E+01 1.84EMl 2.5OEM1 1.40E-02 9.92E-02 2.95E+03
2.OOEi-02
3.64E+01. 1.03E+02 5.47EMI I .27E+04
. 6.73E-03
1.93E-01 TBD 1.73E+OO
5.56E+01
2.22E-01 1.49E+03 5.95E+01 2.44EM
4/21/94
3%
5%
3%
4%
2% 3% 3% 8%
31%
13% 1 W o
8%
28% 6% 4%
. 4%
Emor estimatq are me-sigma total analytical errors, not including Contributions hm sftmpling or experkmtal error. Calibration crzors are estimated at 811 additional 2%.

linniwn Totrl Beta
TC-99 Sr-90
Totnl Alpha 1'11.238
Pu.?39/?Jo Cm.?43/2U
Am-MI Sp.237 E a ( '0.60 Ru. IO6 Sh.115 (3- I 34 C f - I 37 cc-Is1 Eu. I54 Eu.155 h - 2 4 1
(mg/ml) (Ucilml) (Ucilml) (uciiml) (Ucilml) (UcUml) (Ucilml) (ucilml) (Uciml) (Ucilml) (Uciml) (Ucilml) (Ucilml) (Uciml) (Ucilml) (Ucilml) (UCVml) (Ucilml) (Ucihnl) (Ucilml)
h h l c 0.4. Rdinchemical I.cnchrte Analysis of 101-AZCnre # I
MCC-1 (HoICCIITCSI # I ) 7.w~ rcr (ifot CCII T C ~ I Sample 3 Blank I I Sample I Sample 2 Sample 3 Blank 1 Blank 2 AS Sample I AS Sample 2 AS Sample 3 AS Blank I AS Olank 1 4.2Oe-5 NM 2 8 3 ~ 4 1113~4 2 U ~ 4 C20e.6 CZ.Oe-6 4 ?Ye-s 3 99c.5 ci 74c-S 2 Yle.6 291e-6
1.28 CS.86e.S 6.60~-I 2.74~-5 1.02~-5 1.53~-5 1.31c-6 5.4sc-6 1.06c-6 CDL
2 . a - 5 CDL
5.36e-3 , 3.66c4.
2.96e-2 CDL CDL CDL Qx
Fused Silica 10.0
1/91 (for OEA) 4/91 (for oulcr)
1.48~-3 3 UC-1
NM 13Oe.1 NM 4 28e-6
NM 2 . 8 3 4 NM 4 59e.6 NM 2 61e.S NM 2 7k.6 NM 2 38c4 NM NM <DL CDL CDL 6.00~4 CDL CDL <DL I .07e-2
1.96e-6 4 . 3 8 ~ 4 7.05~-5 506e-1
<DL CDL 5.95~-7 2 . 5 3 ~ 4
*)L 4.53c-4 * 6 . ~ 8 ~ ~ 2 . i ~
Fuud S i b Stainless 10.0 2000 1191 4/94
39ue.I 6 19e.6 161~-I 3 6tie-l 5 Rlc.6 2 R7e-5 5 57e.6 3 2 c - l
vb4 1 3nc4 7 25c.s
* IIL 9 X k . 3 3 R L 4 4 95e.2
**DI. 3 4 l e 4 6 I?e4 4 J?e4
Stainles 2NMJ 404
4 I3c.l 6 llRc.6 l61c-1 3 9k.4 475c.6 2 Rlc.5 4 47e.6 3 1le.4
SM 8 37e.5 7 31e-s ' 111. 9 1%-3 3 27e-4 4 5 k - 2
<DI. 3 7 3 4 6 21e-4 3 JZe-4
Slalnlcss ?no0 4/94
1 5 9 4 C3 k.6. 1 ORe-5 cx oc-7 A N M ANM A N M A N M NM <DL <1)L <DL <DL cDL
1.46e-4 cDL <DL CDL <DL
Stainltu NA 4/94
' 2 3 2 4 e3 k .6 2 . 3 3 ~ 4 . CI.oc-6 A N M ANM ANM ANM NM cDL <DI. cDL CDL
2.15e-5 3.57c-t
CDL <DL <DL <DL
Stainleu NA 4194
2.13e.I 2 ok-l c4.oc.7 <4 k . 7 9 811~-2 8 57e-1 2 77e4 3 ?ne4 7.61~-6 8 7k.6 4 I5c.S 4 O7e-5
2 2!k4 2 78c-4 NM NM
6 5 1 ~ - 5 661e-5 I 2oc-4 CDL 9 . 8 1 ~ 4 I39e-4 I .48e-5 1.41~-5 2.26~-3 2 s k - 3 1 . 7 3 4 201c-4 2.9Qc.4 3 3 3 4 5.'%.4 6 1 2 4 2 . 3 2 4 2 8Rc4
1.37~-6 4 6 4 4
CD1. ai.
Stainless Stainless 2000 2000 4194 4m
4 93c. I .. . * 4 k - 7 .? rl9e-e.l 6 113.2-4 1 2c.s 5 %.2 I 13c-s 5 ')le-!
NM - DI. 9 7xe.2 .. 1)l.
3 S k - 4 2 R3c-s 6 4Rc.3 4 79e-l 6 31c-i I ??e-3
(8 Me4
Sirinless ?on0 4/94
9 02e4 <J oc-7 3 13e-4 3 4 9 ~ 6 ANM ANM ANM ANM NM <DL <DL CtiL cD1, CDL
2.ok-4 CDL CDL CIIL cDL
Sbinlcn NA 4/94

l’rhlc 11.5. Radiochemicnl Lcnchnte Analysis of 101-N. Corc H2
MCC- I ( I lot Ccll Test H I ) 7-lhy I’CT (1101 CCII TCS~ #3) Snniplc 131311k I Sample 1 Saniple 2 Saniplc 3 Ijlank I I3I:iiik 2 AS Siiniplc I AS Saniplc 2 AS Sniiiplc 3
Uranium (malml) I .ooc-4 NM 9.25e-4 2.34~-3 2 . 3 5 4 9.!>3C-6 0.O‘)C-5 6.xoc-s 8x1 I c-3 1.15c-4 Total Beta ( u & n l j
Tc-99 (uCilml) sr-90 (uCi/ml)
Total Nphn (ucilml) Pu-238 (ucilml)
Pu-239/240 (ucilml) Cm-243/244 (uCi/ml)
h - 2 4 I (uCi/ml) Np-237 (uCi/ml)
K-40 (ucilml) c0-60 (ucilml)
Ru-106 (uCi/ml) Sb-125 (uCi/ml) cs-134 (uCi/ml) cs-137 (uCi/ml) Cc-144 ’ (ucilml) Eu-1 54 (uCi/ml) Eu-l 55 (uCi/ml) Am-24 1 (uCi/ml)
Bv GEA Anelvsis;
.. 0.52 <I S8e-5 2.4 le4 4.34c-5 4 .46~4 3.40~-5 9.01c-8 6.35c-6 3 .02~4
*:DI. <DI. <DL
2.09~-2 2.Mc-4 I .95~-2 CDL cDI. cDL cDL
I .48c-3 NM NM NM NM NM NM NM NM
111. ‘ 111. ‘ 111. 4X
I .9&6 7.05~-’5
< 111. 5.95e-7 .! 111. 6.78e-7
Fused Silica Fusd Silico 10.0 10.0
1/91 (IorGEA) 1/91 4/91 (for other)
I . 8 3 d Gc-6
4.93~-2
4.89~-6 3.26~-5 2 .55~4 3.73e-4
NM
CDL 1.00e-4
cDL 5.43~-2
cDL I -70~-2
CDL 3.83e-4 1.31~-3 4.29c-l
Stoinless 2000 9/93
4.52e-4
I 1.88~-I
5.37~-2 I .25~-3 1.83c-4 9.70e-5 5.97c-6 5.8 I e-4
NM
6 .204
C5.40~-5 4.73e-4
cDL 5.69~-2
2.67~-2 2.77e-4
4.40e-4 4.86e-4 7 .714 5.58e-l
Stninless 2000 9/93
4.01~-2 84C-6
I . I sc-2 5.75c-4 I .06c-4 3.m-5 3.46c-4 2.784 NM
<DL 2.70c-4
<DI. 7.9%-3 1,.2 I c-4 9.73e-3
cDL . 1.46~4
I -29c-5 1.85c-4
Stainless 2000 9/93
5.63c-3 < I C 4
1.07~-3 7.27~-5 l.l2C-S 3.7 7c-6 3.1 IC-5 1.29c-s
NM
4 ) I . 5.68c-5
4 ) l .
I .06c4 3.3oc-3 411.
I .01 c-5 411.
1.07~-5
7.46c-5
Stoiiilcss NA 9/93
‘>.34C-3 I C 4
2.332-3 3.63C-J 9.23~-5
142c-J 8. I4c-5
NM
. 111. 1.24c-J
* 111. 111.
6.67c-5 4.38C-3 . 111.
7.21~-5 2.50~-5 8.4Re-5
Stainless N h 9r)3
Z.XOC-S
‘3.85c-1 ...3C-6
I .RRc-I 2.ooc-4 2. I 6 ~ - 5 8.35c-5 1 s4c-5 6.70~-5
NM
*.9L I .25c-4 3.44c-4
4 1 L I .69e-5 I .20e-3 I .27c-4 I .32c-4 2.31c-4 8.75c-5
Stninless 2000 9/93
7.36~1 ” 1.56c-4
3.78cl 1 S7c-I 8.7 1 c-4 4 . 2 3 ~ 3 I .38c-3 I .63c-I
NM
cDL *
1.78~-2 cDL .
2.1 IC-2 3.1 IC-3 3.66~-1 2.43~-1 1.4%-1
1 .6Sc-I 2.97~-1 ’
Stninless 2000 9/93
1. NM not m e a s u d , I\s n Acid Striv NA = not appliceblc; PCT Product Consistency Tcst; MCC-I 7 Matcriuls Clieracterizlltion Center (MCGI) Test. 2. Total Beta: (as SrY-90) 3. K.40 through‘h-241: by gamma energy analysis (GEA)
B.5
5.40~-I 42-7
2.47~-1 4 .29~4 5.86c-5 8.86~-5 6.70~-5 I .67c-4
NM
Cl1L 4 . 1 8 4 4.42c-4 I A2C-4 7.1 SC-5 4.40~3 2.53c-4 2.51c-4 4.15c-4 2.34e-4
Stainless 2000 9/93

Uranium (nighil) Total Rcta ( i iCihl)
Tc-99 (uCihl) ,Sr-YO (uCihnl)
Total Alpha (itCihiil) ' Pu-238 (uCilni1)
Pu-239R40 (uCilnil) Cm-2431244 (iiCi/nil)
Am-24 I (uCilni1) Np-237 (uCilnil)
K-40 (uCihiil) C0-60 (IiCiiiiil) Ru- I06 (iiCi/nil) Sb-I25 (uCi/nil) cs-134 (uCik l ) Cs-137 . (iicihl)
e Ce-144 (uCiAiil) ' Eu-154 (uCih l )
Eu-155 (uCihiiI) Am-24 I (iiCi/nil)
Bv GEA Annlvsis:
Notes:
I m c h Vcsscl S I \ N (nil)
AnalysidDate
Sniiiplc 1 2.62c-4 9
3.2701 3.5nc-6 9.90c-2
9 . 3 0 4
1.96c-3 I . I5e-5
NM N M * NM
. NM 1 *66c4
NM 2.43~-2 3.7%-5
, 1.04~-2 NM
8.82e-4 2.42~-3 I .45e3
Tnblc 8.6. Rndimhcniical laaclietc Analysis of 102-AZ Carc 11 I
7- lhy PCT (I101 Ccll T C S ~ H S ) Sample 2 Saniplc 3 Bl:ink 1 l3lalik 2 AS Saniplc I AS Sample 2 AS Sample 3 AS 13lank I AS fllatik 2 2 . 6 2 4 2.37c-4 <4.0~-6 6.7Oc-6 4.0 IC-5 2.5%-5 2.4%-5 *'4.5C-6 4.2c-(I 2.81~-I 2.62e-6 8.69~-2 1.70~-3 1.13e-5
N M NM N M
9 . 1 6 ~ 3
N M 1 . 7 8 ~ 4 NM
2.37~-2 4.49c-5 8.40~-3
NM 9.11e-4 2.4 le-3 1.4 1 e-3
3.03~- 1 2.92c-6 9.04~-2 I .77c3 1.16~-5 I.Ole-4
N M N M N M
I .94c4 NM
4 . 5 c - 5 3.06C-6 ANM ANM ANM ANM NM
N M NM 1.5oc-4 8.1 I C 8
N M NM 2.48~-2 NM 7.05~-5 NM 8.91~-3 I .09c4
N M NM 9.78e-4 N M 2.46~-3 N M 1.52~-3 , N M
Stainless Stainless Stainless Stninlcss 2000 2000 2000 NA
1131/95 1/31/95 * 1/31/95 1/31/95
2.s3c-4 NM
4.45c-5 I .25~-5 ANM ANM ANM ANM NM
NM 7 16c-h
NM NM NM
9.3fic-5 NM NM NM NM
I S3C-1 * . I SC-7 5.84~-2 3.8flC-4
8.47c-5 NM NM NM
o m - 6
7.2 IC-2
2.80c-2 I .23c-4 9.1 le-6 4.0ac-5
NM NM NM
m c - 7
NM NM 7. I ~ c - 5 5.35c-5
NM NM I 34c-4 NM 2.32~-5 NM I .6 IC-3 3 . 0 6 ~ 4
NM N M
5.13c-4 2 . 0 9 4 2.38c-4 5.81~-5
2.17c-4 9.84~-5
Stainless Stainless 2000 2000
113 1/95 In 1/95
7 . 0 7 ~ 2 c2.2~-7 3.16~-2 1.12c-4 5.25c-6 4.48c-5
N M NM N M
N M
N M '
N M N M . I S8c-4
N M 7.00e-5 2 . 0 8 ~ 4 5.65~-5
6.34~-5
4.9lc-4 NM
7.50c-5 7.fioc-6 ANM ANM NM NM NM
NM 5.68c-5
NM NM NM
1.78e-3 NM NM '
N M 2.3 IC-5
3.8Uc-3 NM
2.37~-3 I .22~-5 ANM ANM NM NM NM
NM 2.lOc-h
NM 7 .6OC.(l 5.52~-7 8.1 SC-5
NM I , . 13c-fl 1.05c-5 9.6lC-0 .
Stainless Stainless Stuinlcss 2000 , NA NA
1/31/95 1/31/95 11.1 I105
I . ANM = analysis not made due low alpha activity; NM = not measured; NA = not upplicuhlc. AS = Acid Strip; PCT = Prodyct Consistency Test;
2. Total Beta: (as SrY-90) 3. K-40 thrwgh Am-241: by gamma cncrgy analysis (OM)
MCC-I = Malerials Characterization Cater (MCC-I) Test. I
...

. APPENDIX c
Physical Data

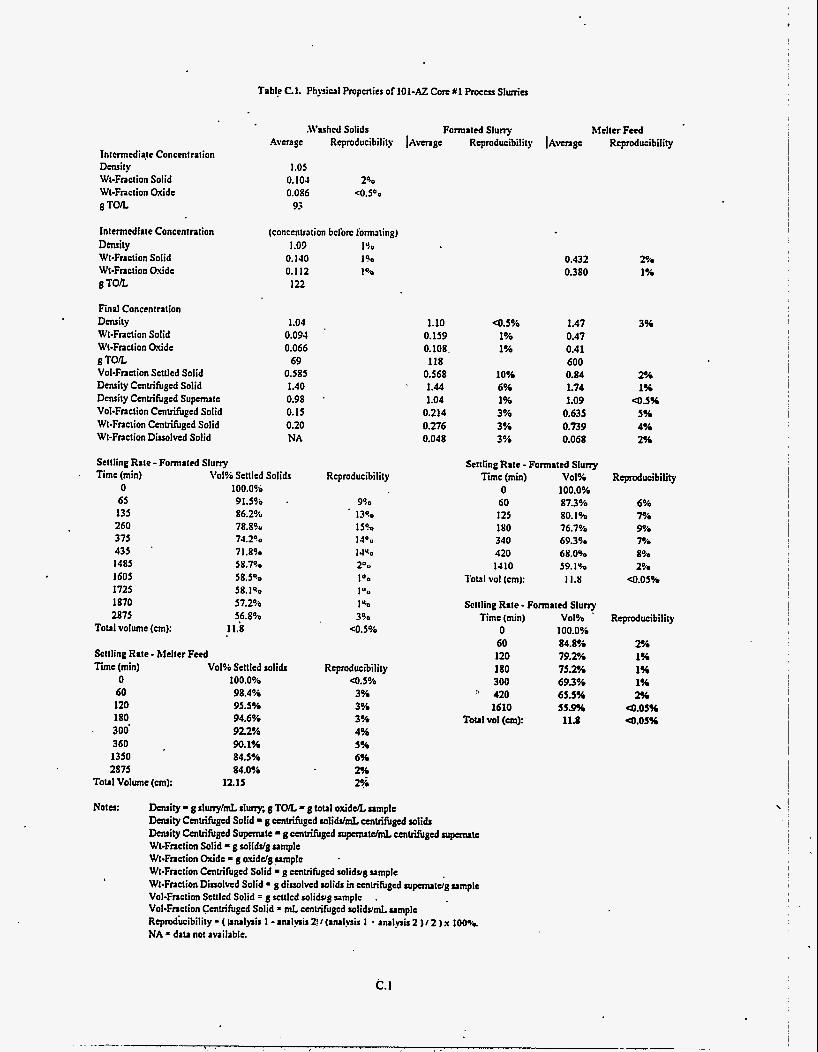
Tabl! C.l. Phpiwl Propniics of 101-Az Core Y1 &eo Slurries
.Washed Solids Formated Slurr). Mclta Feed .4vcragc Reproducibility IAvrnge Reproducibility IAvmge Reproducibility
Intcrmcdiaw Concentration Density Wt-Fraction Solid Wt-Fraction Oxide g TO&
1.05 0. 103 0.086
93
240 co.500
Intermediate Concentration Density Wt-Fraction Solid Wt-Fnction Oxide g TO5
Final Concentration Density WbFraction Solid Wt-Fraction Oxide g T O 5 Vol-Fraction Settled Solid Density Centrifuged Solid Density Centrifuged Supmate Vol-Fraction Centrifuged Solid WbFraction Centrifuged Solid Wt-Fraction Dissolved Solid
(concentration bclbrc fornuling) 1.09 1%
0.140 I40 0.112 1% 122
201. 1%
0.432 0.380
1.10 0.159 0.108. 118
0.568 1.44 1.04
0.214 0.276 0.048
4 . m o 1% 1%
1.47 0.47 0.41 600 0.84 1.74 1.09
0.739 0.068
0.635
3% 1.04 0.093 0.066
69 0.585 1.40 0.98 0.15 0.20 NA
10% 6% 1% 3% 3% 3%
2% 1%
aI.596 5% 4% 2%
Settling Rate - Formated Sluny Time (min) V019o Settled Solids
0 100.0?0 65 91.590 . 135 86.2% 260 78.8% 375 74.200 435 , 71.890 1485 s n . 7 ~ ~ 1605 58.5Jo 1725 58.140 1870 57.2% 2875 5,6.84u
TOM volume (an): 11.8
Setlling Rate - Melter Feed Time (min) V o l I Settled solids
0 100.0% 60 98.4% 120 95.5% 180 94.6Ya
. 300' 92.2% 360 , 90.1% 1350 84.5% 2875 84.0%
T o ~ l Volume (cm): 1215
Settling Rate - Formated Sluny Time (min) VOl%
0 100.0% 60 87.3% 125 80.1% in0 76.7% 340 69.390 420 68.0% I410 59. 190
l o h l vol (cm): I 1.8
Reproducibility Reproducibility
990 1340 I 5?.0
I4Ou 14% 2uu 100
I"u
I u.0
390 4.5010
6% 7% 9% 7% 8% 2%
4.05%
Settling Rate - Formated Sluny Time (min) Vol90 .
0 100.0% 60 84.809 120 79.2% 180 75.2% 300 69.3% 420 65.5% 1610 55.9%
TOM vol (em): 11.8
Reproducibility
2% 1% 1% I% 2%
4.05% aI.0594
Reproducibility a 5 9 6
3% 3% 3% 4% 5% 6% 2% 2%
Notes: Density = g sluny/mL rlurry; g TO& = g total oxid& sample Density Centrifuged Solid g centrifuged rolidrlmL centrifuged solids Density Centrifuged Supcmatc = g centrifuged arpanr(elmL centrifuged arpanrtc Wt-Fraction Solid = g rolidtlg sample Wt-Fraction Oxide = axiddg Vmpk Wt-Fraction Centrifuged Solid = g centrifuged rolidvg sample Wt-Fraction Dissolved Solid = g dissolved soli& in centrifuged rupemrt& sample Vol-Fraction Settled Solid = g settled rolidvg samplc Vol-Fraction Centn'fuged Solid * mL ccnlrifugcd solidmL sample Reprod.ucibility = ( bnalysir 1 - analysis 2! I (analysis I * analysis 2 ) I 2 ) x lWa NA = d i u not available.
.
c. 1

fab le C.2. Physical Propcntcs of 101-.42 Core a2 Process Slmks
Intermediate Concentration Dmsity Wt-Fraction Solid Wt-Fraction Oxide g T O h
Intermediate Concentration Density Wt-Fraction Solid Wt-Fraction Oxide g T O 5
Find Concentration Dmsity Wt-Fraction Solid Wt-Fraction Osidc g T O 5 Vol-Fraction Sctlled Solid Density Centrifuged Solid Density Centrifuged S u p m t e Vol-Fraction Centrifuged Solid Wt-Fraction Centrifuged Solid Wt-Fraction Diolvcd Solid
\Vashcd Solids Formaid Slurry hlelter Feed 'Avenge Reproducibility I Avenge Reproducibility I Avmgc Reproducibility
1.19 1 So 0.215 170 0.186 ' 2% 221
1.10 0.128 0.112 122
1.14 0.186 0.166 189 0.66 1.57 U.BS
0 3x N:\
0 . 2 ~
Settling Rate - Formated Slu- Time (min) 1'01-90 Settled Solids
0 100.0'30 60 58.8% 130 47.5% 320 41.6% 385 39.5Yo 435 38.5Yo
1570 37.4% 1430 37.6W
1690 37.4% Total Volume (cm): 11.9
Settling Rate - hklter Feed Time (min) Vo140 Seulcd Solids
0 100.0% ' 30 97.5%
60 94.1% '120 89.7Yo 270 87.4% 360 87.2'30 440 87.2% 1435 87.2%
Total Volume (an): 11.9
N o l a
2% 2% 1%
1.10 0.122 0.092 101
0.374 1.50 1.01
0.185 0.254 0.0252
Reproducibility 4 . 5 o i o
4Sb 5% 690 6So 5% 6%
4% 4 . 5 %
4%
Reproducibility Q.5% 4 .5%
1 Yo 4 . 5 % 4 . 5 % <0.50\, 4 . 5 % <0.50.0 4 . 5 %
1.201* 0.429 0.399 479 0.87 I .64 1.04
0.553 0.667 u.0202
Settling Rate - Formated Slurry Time (mi,) Vol%
0 iOO.O% 10 95.6W 22 87.4% 35 80.0% 45 72.5% 70 58.4%
Total Vol (an): 11.9
''I A second measurement ordcnsity before settling yielded 1.36 gad. Density = 8 s l u n y r d slurry; g Ton. = p tow1 oxid& sample &ity Centrifuged Solid = g centrifuged solidvml. centrifuged solids Density Centrifuged Superrue = g centrifuged utpcmrtdml centrifuged utpcmrte Wt-Fraction Solid = g mliddg sample WI-Fndon Oxide = g Oxidclg sample Wt-Fraction CenWuged Solid = g cmtrifugcd roliddg sample .Wt-Fraction I)itroh.ed Solid = g dirrohted solids in CenWuged rupmutdg umple Vol-Fraction Satled Solid = g Kulcd mliddg sample V o l - F n d e Centrihrgcd Solid -mL centrifuged mliddml sample Reproducibility=( b l y & l-analyrk21I(aruly.ir 1 + u u l y l i r Z ) / Z ) x 100% NA= data pot available.
.
'
1% 2% 2%
4.05% 4.05Yo
190 co.0590
2%
4.05%
Reproducibility 4 .5% 4 .5% Q.5%
4% 5% ??A
-3.5%
c2

Final CowcatnUoa Density WbFndim Solid WbFnuim Oxide g TO5
Density Chttif& Solid Density a e d Supcmw Vol-Fnctim Cuudiiged Solid Wt-FdCn ceatrifirscd Solid Wt-FndiCn Dissolved Solid
Vol-Fndi~n smlcd Solid
1.11 0.14 0.11 122 0.67 1.52 0.99 0.22 0.31 NA
S c t i l i ~ Ibtc - F 0 m t . d S l u r Time (min) Vol-% S d c d Solids
0 100.0% 15 96.6%
45 89.3%
120 64.3% 180 523% 240 47.9% 300 46.7%
420 41.6% 1430 38.0% 1550 38.UA
30 93.m
60 86.1%
360 43.19~
T0C.I Volume (a): 11.9
Time (min) Val.% S d c d Solids 0 100.PA 15 96.3% 30 90.6% 45 86.7% 60 84.4% 120 77.9% 180 74.0.A 3 5 70.7% ux) 68.7% 360 * 67.2% 1560 652% 1620 64.5% 2820 63.7% I uww) 635%
s c t t l l ~ R.(c - M h Fcsd
T d V o l w (a): 122
Rcpomwibityl
(estiuwdvllue) 4.5%
6%
Rcpdwiiiity 4.5% Q).5% 4 .5% 4 . 5 % 4 . 5 % 4%
. 1% 4.5% 4 . 5 % 4 . 5 % 4 . 5 %
1% 1% 45%
w=d=iw 4.5%
1% 1% 2% 3% 3% 2% 2% 1% 4.5% a*% 45%
1% . 1%
4.5%
AvrnsC
1.16 0.206 0.155 180
1.12 0.186 0.131 147 0.38 1.65 1.W 0.176 0.255 NA
4.5% 1% 2%'
1% 45% 4.36
4 .5% 4.3%
MeWaFeed Avenge R q d u c i i i t y
130 1% 0391 = . 0355 8% 461
1.34 0.436 45% 0.384 4 .5% 515
0.635 1% 1.69 45% 1.03 4 . 5 %
0.483 2% 0.603 1% NA
c3

Tabk C4. Physical Propacic oCNCAW Simulml Rocas Slmiu
RuDl Density W t - F d o n Solid
g TOIL
Ron 2
W t - F d C n Oxidc
MtY Wt-FdOn Solid W t - F d ~ n Oxide 8
Daaitr
8 Toll.
Hot Cell Run
W t - F d C n Solid W t - F d o n Oxide
Run 3 Danity W t - F d m Solid Wt-Frsaion Oxide g TOIL Vol-Frsctim Sded Solid Danity Cmbifugcd Solid D c m i t y ~ ~ d S u p c m P t c Vol-FnCti~n Cenhihrgtd Solid Wt-Fclion Centriifuged Solid Wt-FrsaiOnDiuolved Solid
1.13 N A
0.123 I39
1.14 N A
0.153 175
1.11 .
0.153 0.101 112
SttliqR~R.tc-F-trdSl~~~~ Time (min) VOl% S d e d Soli&
0 100.0% 80 98.8% 120 98.2%? I80 98.3% 270 97.3% 300 97.1% 1410 886? 1580 88.2% 1750 88.(r? 3165 a6 .m
T d Volumc (an): 11.85
Time (min) Vol% Sctlld soli& S&tlingRate-MetkrFad
0 100.0% 65 99.2% I20 98.1% 250 96.0% 370 93.m 430 92.8% 142s a7.5% 1600 a7.m 1695 87.1% I800 ' a7.1% m i 86.9%
'foul VO~QC (an): 11.8
2%
4 .5%
I%
4 . 5 % z??
4 .5% 26% 48%
Reprohucibility 4 . 5 % 4 . 5 %
2% 3% r? 2% 2%h 3% 3% 1% 3%
RcpmQaaiiity 4.5% 4.5% Q.S% 4.5%
1% 4.5% 4.5% Q5% 4.5% 4.5%
1% Q.5%
1.09 N A
0.102 111
QS%
1%
1.12 1% 0.158 I% 0.097 W? 109 4Ph
1.11 4 . 5 % 0.192 P? 0.145 Io?? 161 0.87 1 Ys 1.27 25 1.01 4 . 5 % 0.400 1% 0.462 1% 0.024 21%
1.32 0.41 1
499 0.3n
132 0.453 0.400 528
1.39 0.4% 0.430 597
1.28
0.341 438
0.870 1.50 1.01
0.583 0.672 0.014
0.370
m 2%
4% '
2%
Q.5% 1% 2% 2%
4.5% 2% 5% 2%h 1%
4 . 5 % 1% I% I% 11%
c.4

Ih.lcac&nth Dcadty WtFnCticaSOtid WtFtFnctiOaQddS IIm vol.FnctiaosdtlsdSOlid D a n i t y ~ s o l i d =Ycerpidppdslpcmte VOLF&CU&i@solid W t F n b i m w sdid wt4luhlDirohrrdSdid
SdhgLuI-TrrrtdSkrrJ. Ti (a) VOl%SUtkdSCdi&
0 100.0% 17 100.0%
’32 99.2% 47 99.2% 62 99.2% 127 98.3% 182 ’ 98.3% %2 99.2% 302 9a.m 362 979% I 2 7 l a9996 1397 s.0% 1517 8a.m
, I 637 88.2% ’ 1757 873% 2m 8s.m 2882 Ssm na 84.4% 7352 84.4%
Tohl Vohmo (an) 119
1.14
125
45% 4.5% 4.5% 4.5% 45% 4.5% as%
1% 1% 4.5%
1% 1% 1% 1% 1%
45% a596 as% 4%
1.16 0.239
170.2 aiu
1.14 0212
137 aim
1.14 0.212 - 0 . 1 2 139
1.14 0 a 0.129 147 0.84 1.34 I .04
0.421 0.484 NA
1% Q.5% 45%
45% 2% 1%
as% 1% 3%
1% 1% . ;nm
1 .a o m a* 573 1.00 NA NA NA NA NA
2% 4.5% 4.596
4 5 9 6
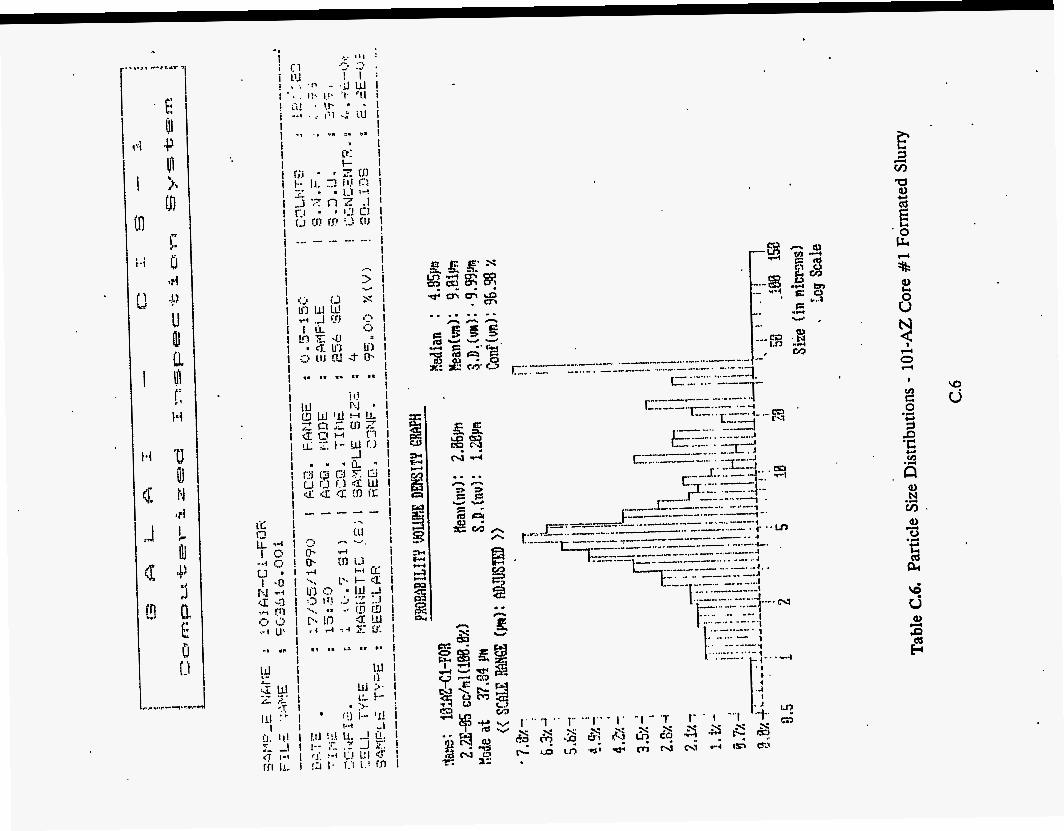
c
w - I -.
0 N v ) . .C

Table C.6. (continued) Particle Size Distributions - 101-AZ Core #1 Formated Slurry
c.7 -I

Table C.6. (continued) Particle Size Distributions - 101-AZ Core #1 Formated Slurry
. C.8

Table C.6. (continued) Particle Size Distributions - 101-AZ Core #1 Formated Slurry
c.9
i

Table C.7. Particle Size Distributions - 101-AZ Core #1 Melter Feed
c. 10

Tabie C.7. (continued) Particle Size Distributions - 101-AZ Core #1 Melter Feed
c.11
I I I I I I I i i I I I I I I ~
I
I j i ,
~

Table C.7. (continued) Particle Size Distributions - 101-AZ Core #1 Melter Feed
c. 12
.. . - . . .

Table C.7. (continued) Particle Size Distributions - 101-AZ Core #1 Melter Feed I
C. 13
____- , I , .
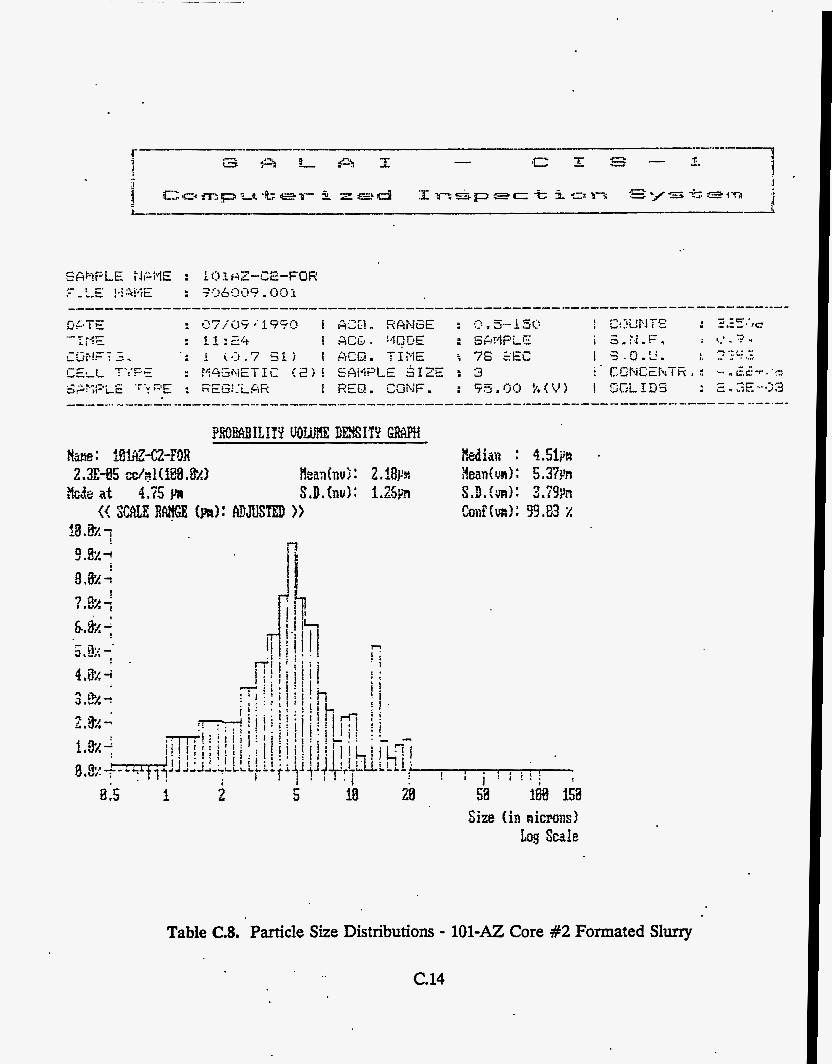
Table C.8. Particle Size Distributions - 1 0 1 4 2 Core #2 Formated Slurry
C.14

Table C.8. (continued) Particle Size Distributions - 10142 Core #2 Formated Slurry
c . 15

Table C.8. (continued) Particle Size Distributions - '101-AZ Coie #2 Formated Slurry
C.16
.-

Table C.8. (continued) Particle Size Distributions - 101-AZ Core #2 Formated Slurry
e. 17

2 .?:: ?
. . . . I
8 '5 i 1
2 19 28
Taijle C.9. Particle Size Distributions - 101-Az Core #2 Formated Slurry (Duplicate)
C. 18

I"... ...a. .*".y 2
Table C.9. (continued) Particle Size Dbtributions - 10142 Core #2 Formated Slurry (Duplicate)
c.19

Table C.9. (continued) Particle Size Distributions - 101-AZ Core #2 Formated Slurry (Duplicate)
c.20

Table C.9. (continued) Particle Size Distributions - 101-AZ Core #2 Formated Sluny (Duplicate),
c.2 1

n
5
r: t i !
i
Table C.10. Particle Size Distributions - 101-AZ Core #2 Melter Feed
c.22 -

1
k
5 19 20
Table C.10. (continued) Particle Size Distributions - 101-AZ Core #2 Melter Feed
c.23

Table C.10. (continued) Particle Size Distributions - 101-AZ Core 82 Melter Feed
c.24
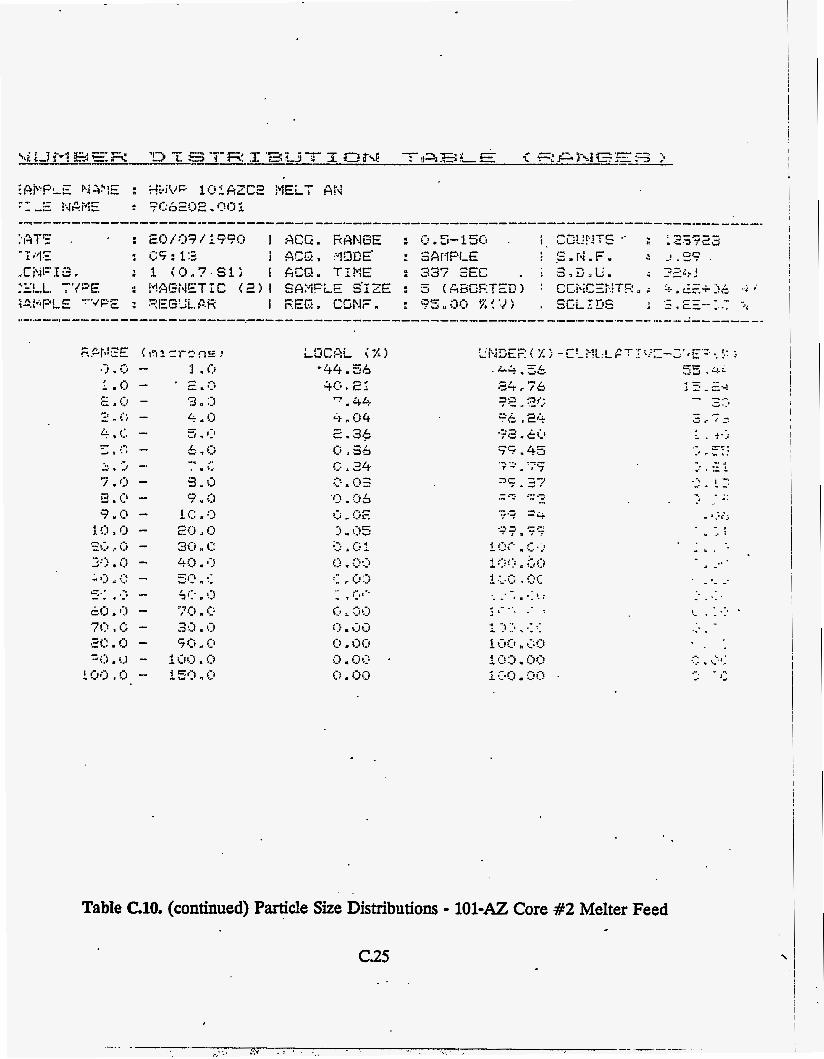
- .
Table C.10. (continued) Particle Size Distributions - 101-AZ Core #2 Melter Feed
c.25

Table C.ll. Particle Size Distributions - 10242 Core #1 Formated Slurry

Si= iin nicmns) tog &.le
I
i
I
I i i
~
i
I I I
Table C.ll. (continued) Particle Size Distributions - 102-A2 Core #1 Formated Slurry
C.27
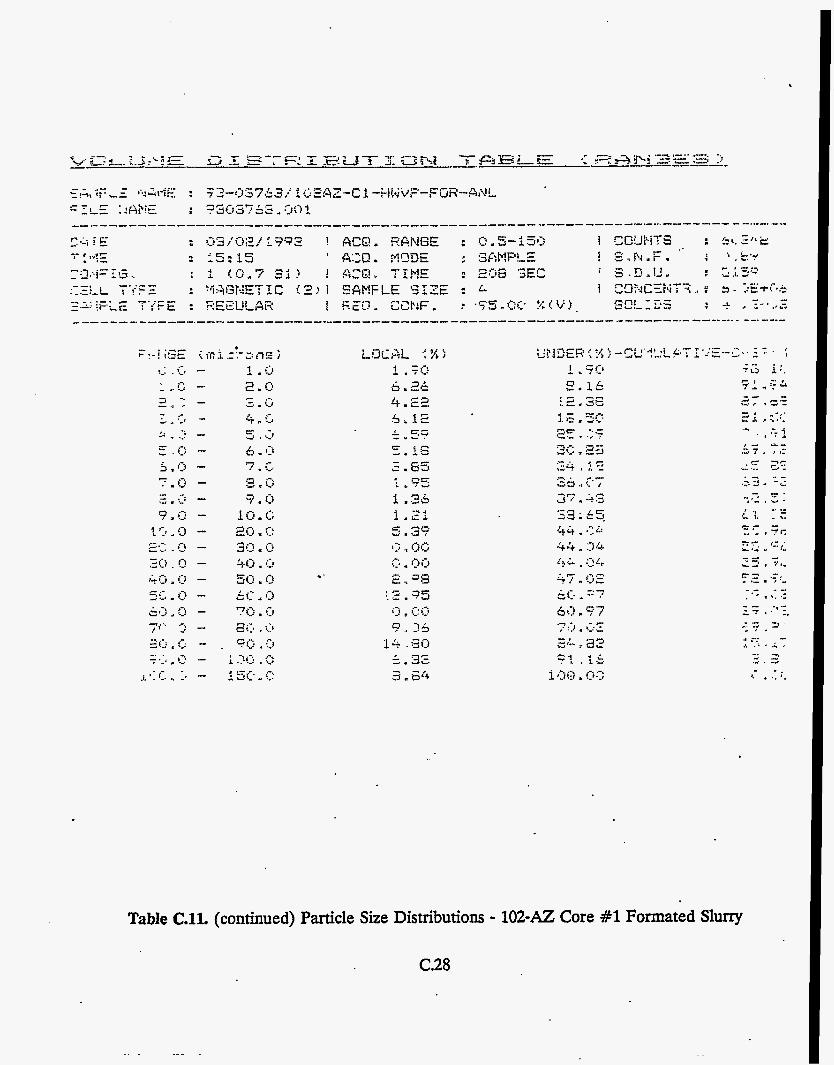
Table C.11. (continued) Particle Size Distributions - 10242 Core #1 Formated Slurxy
C.28

. Table C.ll. (continued) Particle Size Distributions - 102-AZ Core #1 Formated Slurry - .
C.29

Table. C.U. Particle Size Distributions - NCAW Simulant Formated Slurry
C.30

1 i
~
I I
i
i
~
i
I I
I
!
i i
I
Table C.12. (continued) Particle Size Distributions - NCAW Sixnulark Formated Slurry
C.3 1

Table C.12. (continued) Particle Size Distributions - NCAW Simulant Formated Slurry
C.32

Table C.12. (continued) Particle Size Distributions - NCAW Simulant Formated Slurry
c.33
.


.
APPENDIX D
Rheological Data


3
1
UpCurveData . DownCurveData
Up Curve Fit -- Down Curve Fh
a
0 0 100 200 300
Shear Rate (11s)
Density ' Wt-Fraction Solid ' Wt-Fraction Oxide ' g TOR Vol-Fraction Settled Solid ' Density Centrifuged Solid ' Density Centrifugefd Supemate ' Vol-Fraction Centrifuged Solid ' W-Fraction Centrifuged Solid ' Wt-Fraction Dissolved Solid Mean Particle Size Volume Denshy Mean Particle Size Number Density
Average 1.10
0.159 0.108 118
0.568 1 .u 1.04 0.214 0.276 0.048 . 9.01 1.27
400 500
Reproducibility ~0 .5%
1% 1%
10% . 6%
. 1% 3% 3% 3%
9.99 0.90
Notes: a. Refer to Table C.1. for more information b.' Complete partidle size distribution information is provided in Appendix C
' Figure D.L Shear Stress versus Shear Rate of 101-AZ Corc #1 Formated Slurry (Run 1) with Yield- PseudoplasticModel Fits and CorrespondingPhysicalPropaties
D. 1
i . I .

2
1
0
-
-
. 3 Run 1 Up Curve Data--- Run 1 Up Curve Fit
Run 3 Up Curve Data- - Run 3 Up Curve Fit
. Run 2 Up Curve Data- Ruh 2 Up Curve Fit A *
A h
.Y B
8 8
L m Q) 8 v)
I I I I 0 1 QO 200 300 400 500
Shear Rate (lls)
Figure D.2. Shear Stress versus Shear Rate of 101-AZ Core #1 Formated Slurry (All Runs) with Yield- Pstudoplastic Model Cum Fits @own C u m Data omitted for clarity)
- 10
E 4, 3 !s
1
- - 0 Run 1 Up Curve Data -..- Run 1 Up Curve Fit
Run 2 Up Curve Data - Run 2 Up Curve Fit Run 3 Up Curve Data - - Run 3 Up Curve Fit A
A
-
* . . 0 . . D . . . 'CI
- - -
I 1 1 I
Shear Rate (Us)
100 200 300 400 500 0
Figure D.3. Viscosity v m , Shear Rate of 101-AZ Core #1 Formated Slurry (AU Runs) with Yield- Pseudoplastic Model Cum Fits (Down Curve Data omitted for clarity)
D;2

... .
Run 1 Up Curve Data --.- Run 1 Up Curve Fit
Run 3 Up Curve Data - - Run3UpCurveFit
8 Run 2 Up Curve Data - Run 2 Up Curve Fit . . A
A . A
I 1 1 1 0 100’ 200 . 300 400 500
Shear Rate (11s)
Curve Fit (Down Cwe Data Omitted for Clarity) Fim D.4. Shcar Stnss vcfsu~ Sheat Rate of 101-AZ COR #1 Formated Sl~rry (All Runs) with Singham
. . Run 1 Up Curve Data -.a- Run 1 Up Curve Fit a Run2UpCurveData - Run 2 Up Curve Fit. A Run3UpCurveData -- Run 3 Up Curve.Pit
m - a ’
0 100 200 300 400 500
Shear Rate (11s)
CwcFit (Down aWeData Omitted fbr Clarity) Figure D.S. Viscosity vtrsus Sheat Rate of 101-AZ Con #1 Formated SI- (All m) with Singham
I D.3 .

0 -
0 100 200 300 400 500
Shear Rate (l/s)
Density ' Wt-Fraction 5olid ' Wt-Fraction Oxide ' g TOR ' VoCFradion Settled Solid ' Density Centrifuged Solid '
. Density Centrifuged Supernate
Average Reproducibility 1.47 3% 0.47 0.41 600 0.84 .2%
' 1.74 1% 1.09 <OS%
VoCFkdion Ceikrifuged Solid ' 0.635 . 5% Wt-Fraction Centrifuged Solid ' 0.739 4% WLFraction Dissolved Solid ' 0.068 2% Mean Particle Size Volume Density 4.26 2.48
L
Mean.Particle Size Number Density 1.22 0.79
Notes: ' a. Refer to Table C.l. for more information b. Complete particle size distribution infomation is provided in Appendix C
..
.
Figme D.6. Shear Stress versus Shear Rate of 101-AZ Con #I MeIter Feed Slurry (Run 1) with Yield- . . Pseudoplastic Model Curvt Fits and Comsponding Physical Propertits
. . . - 0.4

25 I
a Run 1 Down Curve Dat A Run 2 Up Curve Data
-e.- , , Average C u p Fit-Run 1 7. Run 2 Down Curve Dai Average Curve Fit-Run 2 + Run 3 Up Curve Data Average Curve Fit-Run 3 Run 3 Down Curve Dai
4 - --
4 I I 1 I 0 100 200 300 400 500
Shear Rate (l/s) Figure D.7. Shear Stress versus Shear Rate of 101-AZ Con #1 Melter Feed Slurry (All Runs) with Yield-
. PseudoplasticModelcurVeFits
-..- Run 1 Up Curve Fit - .Run 2 Up Curve Fit a Run 1 Up Curve Data Run 1 Down Curve Data
.Run 2 Down Curve Data Run 3 Up Curve Data G Run 3 Down Curve Data
-- . Run 3 Up Curve fit A Run 2 Up Curve Data
+ Y
.- h
- - -
J
. 10 I I 1 I I I' 0 100 200 300 400 500
Shear Rate (Vs) .
F'igun D.8. Viisity ve- S k u Rate of 101-AZ Core #1 Melter Fed Slurry (All Runs) with Yield- PseudoplasticModd -Fits
D.5

n 0 8
- 10
L. 0 a c v)
I I ' I I I
25
20
15
10
5
0
0 0 =. : =-> /- . .
I /- I , 4 . :;-
+ * 0.9 = / = A
. e / A v 0
- 0 we Run 1 Up Curve Data Run 1 Down Curve Data Run 2 Up Curve Data Run 2 Down Curve Data Run 3 Up Curve Data
*e- - A
Run 1 up Curve Fit v Run 2 Up Curve Fit
-..- - I Run 3 Up Curve Fit 'Run 3 Down Curve Datal --
I I 1 I 500
- 100 200 300 400 . 0
Shear Rate (Us)
Curve Fits Fignr~ D.9. Shear Strtss vcrsu~ S h w Ratc Of 101-AZ Con #1 Mdm FCed.Slw (AU Runs) with Singham
D.10. ViscoSity versu~ S h a Ratt of 101-AZ Con #1 Melter Feed S l e w (AU Runs) with Bhgham cwe Fi i
D.6
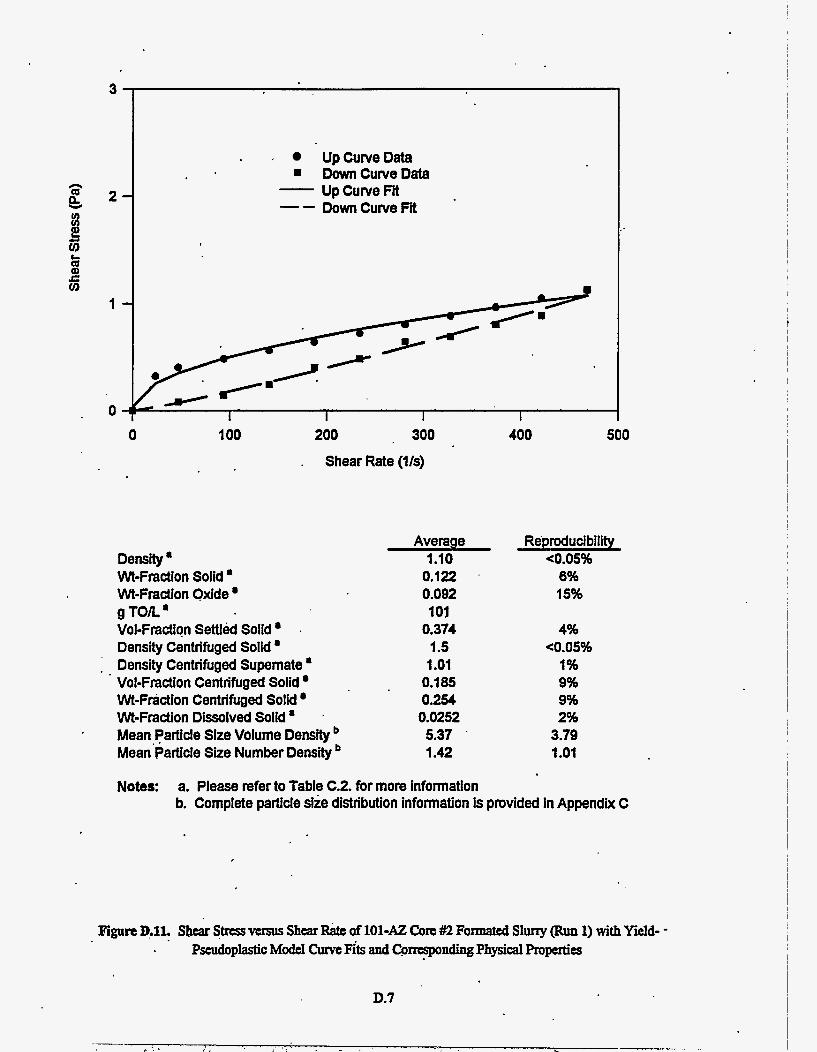
I UpCurveData DownCunreData Up Curve Fit Down Curve Fit
- --
3
2 -
0 100 200 300
Shear Rate (l/s)
Density ' Wt-Fraction Solid ' Wt-Fraction Oxide g TOh' Vol-Fradion Settld Solid . Density Centrifuged Solid ' Density Centrifuged Supernate '
' Vol-Fraction Centrifuged Solid Wt-Fraction Centrifuged Solid Wt-Fradion Dissolved Solid ' Mean Particle Size Volume Density Mean'Partlcle Size Number Density
*
Average 1.10
0.122 '
0.092 101
0.374 1 .5 1 .Ol
0.1 85 0.254 0.0252 5.37 '
1.42
400 500
Reproducibility c0.05%
6% 15%
4% <0.05%
1% 9% 9% 2%
3.79 1 .Ol
Notes: a. Please refer to Table C.2. for more informati on b. Complete particle siie distribution information is provided in Appendix C
Fism D.11. Shtar Stnss VC~SUS Shtar Rate Ot 101-AZ Con #2 Formated S l w (Run 1) with Yield- - . PseudoplasticModel CurveFits andCpficspondingPhysicalproperties
D.7
I
i

3
2
1
0
- - - - -
RunlUpCurveData - Run 1 Up Curve Fit .A Runl DownCurveData -- Run 2 Up Curve Fit a v
Run 2 Up Curve Data Run 2 Down Curve Data
Runl UpCurveData - Run 1 Up Curve Fit A Runl DownCurveData -- Run 2 Up Curve Fit
A
I 1 I I
1
I
200 300 400 0 100
'A A A
I I 1 I
500
Shear Rate ( lk) Figure D.U. Shear Stress versus Shear Ratk of 101-AZ Con #2 Formated Slurry (All Runs) with Yield-
pseudoplasticModelcwCFits
Figure D.13. Vityvtrsas Shear Rate of 101-AZ Con ##2 Formated Slurry (All Runs) with Yield- . PseudoplasticModel aWeFits
D.8'

Run 1 Up Curve Data Run 2 Up Cunre Data
A Run 1 Down Curve Data (I ' Run 2 Down Curve Data
- Run 1 Up Curve Fit Run 2 Up Curve Fit --
r I H - x 1 -
O f v I 1 I I 0 100 200 300 400 500
Shear Rate (Us)
Curve Fits Fig~re D.14 Shtar Stress S h Rate of 101-AZ Con #2 Fo& S l v (All Runs) with Singham
100
Run1 ~ p c u r v e ~ a t a - Run 1 Up C u m Fit A RunlDownCunreData -- Run 2 Up Cunre Fii
v : Run 2 Up Curve Data
Run 2 Down Curve Data
10 I
0 100
A .
200 300 -400 . 500
Shear Rate (l/s)
clme Fits Figure D.15. V i @ vcfsu~ Shear Rate af 101-AZ Cort #2 Fo& S l w (All Runs) with Bhgham
D.9
I
I

. .. 4
UpCurveData DownCufveData Up Curve Fit 7
-- Down Curve Fit
I I I 1 200 300 400 500 0 100
Shear Rate (Us)
Density ' Wt-Fraction Solid ' Wt-Fraction Oxide a g TOR VoEFraction Settled Solid ' Dens'@ Centrifuged Solid ' Density Centrifuged Supemate ' Vol-Fraction Centrifuged Solid a Wt-Fradion Centrifuged Solid ' Wt-Fraction Dissolved Solid ' Mean Particle Size Volume Density Mean Partlcle Size Number Density
Average 1.20
0.429 0.390 479 0.87 1.64 1.04
0.553 0.667
. 0.0202 15.34 . 1.41
Reproducibility 1% 2% 2%
*0.05% ~0.05% ~0.05%
1% ~0.05%
2% 17.86 1.07
. . Notes: a. Please refer to Table C.2. for more information
b. Complete particle size distribution information is provided in Appendix C
Figure D.16. S h q Stress versus Sheax Rate of 101-AZ Core #2 Melter Feed Slurry (Run 1) with Yield-_ Fm&piastic Model C u m Fits and Corresponding Physical Properties
D. 10

. - 4 1 1
A v
Run 1 Up Curve Data Run1 DownCurveData -- Run 2 Up Curve Fit Run 2 Up Curve Data Run 2 Down Curve Data
Run 1 Up Curve Fii
3 -
2 -
v v
v
300 0 100 200 400 500
Shear Rate (Us) Figure D.17. Shear Stress versus Shear Rate of 101-AZ Core #k2 Melter Feed Slurry (All Runs) with Yield-
PscudoplasticModclCwcFits
100 E b !I f
10
' A v.
Run 1 .Up Curve Data Run 1 Down Curve Data Run 2 Up Curve Data Run 2 Down Curve Data
. Run 1 Up Curve Fit Run 2 Up Curve Fit --
- - - - -
D.ll
0 100 200 300 400 500
Shear Rate ( lk) Figun D.18. Viscosity vtfsus Shear Ra!c of 101-AZ Corc #2 Melter Feed SI- (All Runs) with Yield-.
Pseudoplastic Model a W e Fits

v . . Run 1 Up Curve Data v 8 Run 1 Down' Curve Data
1 T A Run2UpCurveData - Run 1 Up Curve Fi v Run 2 Down Curve Data- - Run 2 Up Curve Fi
0 100 200 300 400 500
Shear Rate (l /s)
cwt Fits F i w ~ D.19. Shtar Stnss yersu~ Shear Rate of 101-AZ Core #2 Melter Feed S l w (All Runs) with Singham
0 RunlUpCurveData - Run 1 Up Curve Fit .8 Run 1 Down'Curve Data - - Run 2 Up Curve Fit A Run 2 Up Curve Data v Run 2 Down Curve Data.
m - - - - v I
I I I ' I 0 - 100 200 300.
Shear Rate (l /s)
400 500
Figure D.20.' Viscosity versus Shear Rate.& lOl-AZ'&re #2 Melter Feed Sluny (AU Runs) with Bingham cwt Fits
D.12

2
n QI 4
" 1 s l al C "
0
UpCuweData .DownCuweData . Up Cuwe Fii -
0 100 200 300 400 500 Shear Rate (11s)
Density ' Wt-Fraction Solid ' Wt-Fraction Oxide ' g TOR ' Vol-Fraction Settled Solid Density Centrifuged Solid Density Centrifuged supernate ' Vol-Fraction Centrifuged Solid '
.Wt-Fradion Centrifuged Solid ' Wt-Fraction Dissolved Solid Mean Padcle Size Volume Densityeb Mean Particle Size Number Density
'
Average 1.12
0.186 0.1 31 147 0.38 1.65 . . 1.04
0.176 0.255
. N A 47.36 1.14
Reproducibility *0.5%
1% 2%
1% ~0.5%
4% <0.5% <0.5%
40.24 0.85
Notes: a. Please refer to Table C.3. for more information b. Complete particle size distribution information is provided in Appendix C . . , .

2
Run1 UpCurveData - Run 1 Up Curve Fit '
A
v
RunlDownCurveData Run 2 Up Curve Data Run 2 Down Curve Data
-- Run 2 Up Cunre Fit
- 1
0 I .
100 200 300 400 500
Shear Rate (l/s) Figure D.22. Shear Stress versus Shear Rate of 10242 Core #1 Formated Slurry (All Runs) with Yield-
- Pseudoplastic Model Cuxve Fits
n
3
v
RunlUpCurveData - Run 1 Up Curve Fit -- Run 2 Up Curve Fit
A
v
RunlDownCurveData Run 2 Up Curve Data Run 2 Down Cunre Data
I
300 400 500 0. 100 200
Shear Rate (11s)
Figure D.23. V i t y m & s Shear Rate of 102-AZ Con #1 Formated Slmy (All Runs) with Yield- Pseudoplastic ModelCume Fits -
D. 14

0
1s - - - -
Runl UpCurveData - Run 1 Up Curve Fit . Runl DownCurveData -- Run 2 Up Curve Fit * v
Run 2 Up Curve Data Run 2 Dorm Curve Data
rn I
v
I I I I
T I 1 1 I 0 100 200 300 400 500
Shear Rate (Us) Figure D.24. Shear Stress versus Shear Rate of 10242 Con #1 Formated Slurry (All Runs) with Singham
Curve Fits
Figure D.25. V i t y vcfsus Shear Rate of 10242 Con #1 Formattd Slurry (All Runs) wjth Singham ' CurveFit
D.15
I i i I ~
i I I
I I !
i I
I ' i
- 1 I 1 % ! .

3 -
b
0 :: 1 I 1 I
UpCurveData - Up Curve Fit DownCurveData -- Down Cuwe Fit
0 100 200 300 400 500
Shear Rate (l/s)
Density ' Wt-Fraction Solid ' Wt-Fraction Oxide ' Vol-Fraction Settled Solid Density Centrifuged Solid ' Density Centrffuged Supemate Vol-Fraction Centrifuged Solld , Wt-Fraction Centrifuged Solid Wt-Fraction Dissolved Solid ' Mean Particle Size Volume Density Mean Particle Size Number Density
g TOIL'
Average 1.34
0.438 .
0.384 .
51 5 0.835 1.89 1.03
0.483 0.603 NA NA NA
Reprodud bit 'W <OS% *0.5% <0.5%
1% <OS% *0.5%
2% 1%
NA NA
Notes: a. Please refer to Table C.3. for more information
Figure D.26. Shear ScnsS ycrsu~ Shear Rate ,af 10242 Con X1 Melt& Feed Slurry (Ruo 2) with Yield- P d p M c Model M e Fie and Corresponding Physical Propertits
D. 16

8
7 - 6 -
n cp
e 5 -
O f 1 1 I 1 I 0 100 200 . 300 400 500 ~.
I Shear Rate (l/s) Figure D.27. Shear Strtss versus Shtar Rate of 102-AZ Core #1 Meltcr Feed Slurry (All Runs) with Yield-
P+oplastic Model Curve Fits
.e Run 1 Up Curve Data --.- Run 1 Up Curve Fit Run 1 Down Curve Data- Run 2 Up Curve Fit
*. Run2UpCurveData -- Run 3 Up Curve Fit Run 2 Down Curve Data
+ Run 3 Up Curve Data Run 3 Down Curve Data
.
1000 -I - - - - Run 1 Up Curve Data I --.- Run 1 Up Curve Fit Run 1 Down Curve Data - Run 2 Up Curve Fit
- Run2UpCurveData -- bun 3 up Curve ~ i i t
- - 0 Run 2 Down Curve Data
Run 3 Down Curve Data 4 ' Run 3 Up Cuke Data
W G 8 >I ...) - 5
*' - - -- -- . ,,. - A ? 4 - c - -
1 1 I I I 1
'0.. 100 200 300 400 500 .J
Shear Rate (Vs) Flgun D.28. Viscosity versus Shear Rate of 10242 Core #1 Melter Feed Slurry (AU Runs) with Yield-
Pscudoplastic Model Curve Fits
D.17

n 0 4
7 -
6 -
5 -
4 -
- . 8 1 I
-r
- 1
0 m A
I I I I .
. - Run 1 Up Curve Data ---- Run 1 Up Curve Fit Run 1 Down Cunie Data- Run 2 Up Curve Fit Run 2 Up Curve Data - - Run 3 Up Curve Fit Run 2 Down Curve Data Run 3 Up Curve Data Run 3 Down Curve Data
v
0
Shear Rate (lk) Figure D.29. Shtar Stress vefsus Shear Rate of 102-AZ Con #1 Meltcr Feed Slurry (All Runs) with Singham
Cwe Fits
1000 j - 0 RunlUpCurveD- --.- Run 1 Up Cuke Fit
Run 1 DownCurveData - Run 2 Up Curve Fit A. RunZUpCurveDm -- Run 3 Up Curve Fit 'v Run 2 Down Curve Data + Run 3 Up Curve Data 0 Run 3 Down Curve Data
- - -
5-- P- - - - A L m v V I 6 -
500 400 I
0 100 200 300
Shear Rate (l/s)
Figa~D.30. V ~ ~ ~ S h e a r R a t t a f 1 0 2 - A Z C o ~ # l M c l t a F e e d S l ~ ( A U R u n s ) w i ~ B i n ~ CwtFits
D.18

4
3
' 1
0
Density ' Wt-Fraction Solid Wt-Fraction Ogde ' g TOR ' VoCFraction Settled Solid ' Density Centrifuged SolM ' Density CeMfuged Supemate a . Vol-Fraction Centrifuged Solid Wt-Fraction Centrifuged Solid ' Wt-Fraction Dissolved Solid '
, Mean Particle Size Volume Density Mean Partlde Size Number Density
Average 1.11
0.192 0.145
0.87 1.27 1 .Ol
0.400 0.462
. 0.024 25.57 1.30
* 161
Reproducibility <0.5%
9% 10%
1% 2%
< O S % 1% 1%
. 21% 13.27 1.38
Notes: '
a. Please refer to Table C.4. for more information b. Complete partlcle size distribution information is provided in Appendix C
Figure D3L Shear Stnss VCISUS Shear R+ 0fNCAW Simulant Formated S l w (Run 1) with Yidd- . P+plastic Model C w e Fits and Corresponding Physical Properties -
D. 19

4 . Run.1 Up Curve Data .- Run 1 Up Curve Fit
8 Run 1 Down Curve Data - - A Run 2 Up Curve Data
Run 2 Down Curve Data 3 n
3 I 5 2 6 Q) r v)
1
7 f
O * I I I 1 0 100 200 . 300 400 500
Shear Rate (lis)
- -
Figure D.32 Shear Stress versgs Shear Rate of NCAW Simulant F o d Slurry (AU Runs) with Yield- Pseudoplastic Model Curve Fits
I I I I
- 8 Run1 DownCurveData -- *
Run 1 Up Curve Data
Run 2 Up Curve Data Run 2 Down Curve Data
. Run 1 Up Curve Fit Run 2 Up C u m Fit
- - -i
Flgure’D.33. V i i t y V- S h a Ratt 0fNCAW ShUlaIIt Fonnated Slurry (All Runs) with Yield- pseudoplasticModelcweFits
D.20
- . ....

5 1 0 - RunlUpCurveData - Run 1 Up Curve Fit . RunlDownCurveData’ -- . Run.2 Up Curve Fit A Run 2 Up Curve Data
Run 2 Down Curve Data -
- - - - - :I
1
Runl UpCurveData - Run 1 Up Curve Fit . Runl DownCurveData -- Run 2 Up Curve Fit
0 I I 1 I 0 100 200 300 400 500 .
Shear Rate (lls) Figure D.34. Shear Stress versus Shear Rate ofNCAW Simulant Formated Sluny (All Runs) with Singham
Curve Fits
1000
B 100
5 8
10
0 100 200 300 400 500 a Shear Rate (l/s)
Figure D.35. V j t y versus Shear Rate of NCAW Simnlant Formated Sluny (All Runs) with Singham Curve Fits
D.21

10
9 -
8 - n
g 7 -
f 5 -
3 I8- G
c v)
4 -
3 -
2 -
1
Density ' W-Fraction Solid ' Wt-Fraction Oxide ' g TOR ' VoCFraction Settled Solid ' Density Centrifuged Solid ' Density Centrifuged Supemate ' Vol-Fraction Centrifuged Solid ' Wt-Fraction Centiifuged Solid ' Wt-Fradion Dissolved Solid ' Mean Particle Size Volume Density Mean Particle Size Number Density
RunlUpCunreData - Run 1 Down CunreData --
I I I I 400 500
Average 1.28
0.370 0.341 438
0.870 1 S O 1 .Ol 0.583 0.672 0.01 4 25.57 1.30
Reproducibility ~0.5%
2% 5% 2% 1%
<OS% 1% 1% 1% 11%
13.27 1.38
Notes: a. Please refer to Table C.4. for more information b.' Complete particle'size distribution information is provided in Appendix C
.
figure D.36. Shear Stress versus Shear Rate of NCAW Simulant Milter Feed (Run 1) with Yield- PseudopWcModelCweFh
D.22

12
4
2
0 0
. A Run3UpCurveData -_ v 4 0
Run 1 Up Curve Data -..- Run 1 Up Curve Fit Run 1 DownCunreData - Run 3 Up Curve Fit
Run 5 Up Curve Fit Run 3 Down Curve Data Run 5 Up Curve Data Run 5 Down Curve Data
0
1 I I 1 loo 200 300 400 500
Shear Rate (l/s) Figure D.37. Shear Stress versus Shear Rate bf NCAW Simulant Melter Feed Slurry (Runs 1,3, & 5) with
Yield-Pseudoplastic Model Curve Fits
0 100
1000
. A v
0
Run 1 Up Cuwe Data Run 1 Down Curve Data Run 3 Up Curve Data Run 3 Down Cuwe Data
Run 5 Down Curve Data . RunSUpCuweData .
-..- Run 1 Up Curve Fit Run 3 Up Curve Fit -- Run 5 Up Curve Fit
10 I I I I 1 200 300
Shear Rate (Vs) 400 500
Figure D.38. Vi~*versus Shcar Rate of NCAW Simulant Melter Feed Slurrj (Runs 1,3, & 5) with Yicld-pseudoptastic Abdel C w e Fits
D.23
I :
I .

12 i . .
Run 1 Up Curve Data -..- Run 1 Down CurveData -
A Run3UpCurveData -- v Run 3 Down Curve Data 0 Run 5 Up Curve Data 0 Run 5 Down Curve Data
10 -
- - - -
2 / 1
0 Run1 UpCurveData .. Run 1 Down Curve Data
A Run 3 Up Curve Data - I
I I I I 400 500
0 200 300 0 100
Shear Rate (l/s) Figure D.39. Shear Stressversus Shear- afNCAW SimUtant Melter Fted Slurry (Runs 1,3, & 5) with
Singham C u m Fits
Run 1 Up Curve Fit Run 3 Up Curve Fit, -- Run 5 Up Cuwe Fit
-..- -
I I I I 400 500 200 300. 0 100
, Shear Rate (lls) Figure D.40. Viscosity versus Shear Rate of NCAW Sirnulaat Melter Feed Slurry (Runs 1,3, & 5) with
BinghamcWtFits *
D.24

4
3
2
0
. Run 1 Up Cuwe Data Run 1 Down Curve Data - - Down Curve Fit
- Up Cuwe Fit
50 100 150 200 Shear Rate (Vs)
250
Density Wt-Fraction Solid a Wt-Fraction Oxide g TOR Vol-Fraction Settled Solid . Density Centrifuged Solid Density Centrifuged Supernate * Vol-Fraction Centrifuged Solid Wt-Fraction Centn'fuged Solid Wt-Fraction Dissolved Solid Mean Particle Sire Volume Density Mean Particle Size Number Density
Average 1.14 .
0.222 0.129 147 0.84 1.34 1.0)
.0.421 0.484 NA NA NA
Notes: a. Please refer to Table C.S. for more information .
300 350
Reprodud bility 1% 1%
COS%
co.05 1% 1% 2%
<OS%
NA NA
Figurn D.41, Shcai Stnss vcw Shtar Rate af 10242 COR #€ Simulant Formated Sl~rry (Run 1) with Yield-Pseudoplastic Model Curve Fits and Corresponding Physical properties
D.25

. .
3 -
2 -
Run 1 Up Curve Data
Run2DormCurveData -- Run 2 Up Curve Fit
1 - Run 1 Down Curve Data I - Run2UpCurveData - Run 1 Up Curve Fit f
0 I I I 1 I I I I 0 50 100 150 200 250 300 350
Shear Rate (l/s) Figurn D.42 Shtar Stnss yersu~ Shtar Rate d 10242 cor^ #l Simulant F o ~ Slurry (All Runs) with
Pseudoplastic Model Cwe Fits
1000 4
Run2UpCurveData - Run 1 Up C u m Fit - Run2DownCurveData -- Run 2 Up Curve Fit
Run 1 Up Curve Data Run 1 Dom’ Curve Data h .
I I I I I I 250 300 350 0 50 100 150 200
Shear Rate (Vs)
.L
. . Figare D.43. Viscosity yctsus Sw Ratc of 102-AZ Con #l S i t Fonnated Sluny (u Runs) with Yield-
PsadoplmicModelCweFits
D.26

4
3 n Q e
1
0
,Run2UpCurveData - Run 1 Up Curve Fii Run 2 Down Curve Data - - Run 2 Up Curve Fit . .
I I 1 I - 1 I 0 50 100 150 200 250 300 * 350
Shear Rate (Vs) Figure D.44. Shear Stress y~flls Shear Rate of 10242 Corc #1 Simulant Formated Sluny (AU Runs) with
Singham Cunz Fits
-, - I -
RunZUpCurveData - Run 1 Up Cuwe Fit * Run2DownCurveData -- Run 2 Up Curve Fit
Run 1 Up Curve Data Run 1 Down Curve Data -
-
100 - - - - - - -
1 I 1 / I I I 10
0 50 100 150 200 250 300 350 Sheaf Rate (l/s) '
Figure D.45. Viscosity VCISUS Shtar Rate of 102-AZ Con #1 S h U h t Formattd Slurry (Ail Runs) with Singham CurVcFits
D.27

- Up Curve Fit Down Cuive Fit -- UpCurveData
8 DownCurveData
1 I I I
Density ' Wt-Fraction Solid ' Wt-Fraction Oxide g TOR' Vol-Fraction Settled Solid a Density Centrifuged Solid Density Centrifuged Supernate a . Vol-Fraction Centrifuged Solid ' Wt-Fraction Centrifuged Solid ' Wt-Fradion Dissolved Solid ' Mean Particle Sire Volume Density Mean Partide Sire Number Density
Average ReproducibilitY 1.42 2% 0.478 ~0 .5% 0.404 COS% 573 1 .oo COS% NA NA NA NA NA NA NA
Notes: a. Please refer to Table C.5. for more information
Figure D.46. Shear Stress versuS Shear Rate of 102-AZ Core #1 SimulantMelter F& Slurry (lb 1) with Yield-Pseudoplastic Model Cwe Fits
D.28

n m
30 I 1
25 ”- ? A
v v
20 -
15 -
RunlUpCurveData - Run 1 Up Curve Fit Run 2 Up Curve Fit . Run 1 Down Curve Data - -
A Run 2 Up Curve Data v Run2DownCurveData
I
0 100 200 300 400 500 Shear Rate (l/s)
Figure D.47. Shsar Stress versus Shear Rate of 10242 Con #1 Simulant Melter Feed Slurry (All Runs) with Yield-Pseudoplastic Mode1 Curve Fits
10000
E ! >, 1000
5
U .-
100
- -Run1 UpCurveData . Run 1 Up Cunre Fit . Run 2 Up Curve Fit Run1 DownCurveData -_
Run 2 Up Curve Data A v Run 2 Down Curve Data R >
I 1 I I I I 0 100 200 300 400 500
Shear Rate (lk)
Figure D.48. V i i t y vusus Shear Rate of 102-AZ Core #I Simulant Melter Feed S I e (AU Runs) with Yield-Pseudoplastic Model a W e Fits
D.29

35
J
- -
loo 7 1
I
- . \
1 I I I 500
It*. I ID
25 n
- - RunlUpCurveData - Runl up Run 2 Up Runl DownCurveData -- * ‘“I A Run2UpCurveData
C v Run 2 Down’Culve Data
1 I I I I 0
I
loo I
200 300 400 500
Shear Rate (11s) Figure D.49. Shear Stress versus Shear Rate of 10242 Core #1 Siulant Melter Feed Slurry (All Runs) with
Singham Curve Fits
10000 0 = Run 1 Up Curve Data
Run 1 Down Curve Data - Run 1 Up Curve Fit
Run 2 Up Curve FB -- A v
Run 2 Up Curve Data Run 2 Down Curve Data
- .
D.30

Table D.l. Table of Bi- and Yield-Pscuduphstic C u m Fits
Run No. Ref- Figure &Type k n so 9 so 4 3 101-1 FS
101-1 MF
101-2 FS
101-2 MJ?
102-1 FS
102-1 h4F
Figure 1 R1 -up R1 - d m
Figures25 R1 -up =-up B-UP
Figure 6 R1 -up R1 -down
Fi-7-10 R1 -up =-up W-up
Figure11 R1-up
Figures 12-15 R1 -up.
Figure16 R1-up
Fi- 17-20 R1 -up
Rl -down
=-up
R1 -down
=-up F-21 R1-up
R1- down Figures=-25’ R1 -up
Figm26 =-up
Figures 27-30 R1 -up m-up R3 -up
=-up
R 2 - d m
NCAW SimFS Figure 31 R 1 4 . . R1 do^
Figurey 32-35 R1 -up =-up R1 -up R1 -down
Figups 3740 R1 -up
NCAW Sim MF Figure 36
R3 -up =-up
R1 -h 102-1 SimFS F i w 4 1 R1 -up
Figures 42-45 R1 -up
102-lSimMP Figure46 R1-up
Figures 47-50 R1 -up
=-up
R1 - d m
=-up
9 . m 3 1.41E-03 9 . m 3 6.863347 0.0106 5.2303
. 2.2960 5.2303 3.5912 2.4803 0.0430
8.57E-04 0.0430
3.92E-03 1.2372
5.07E-03 1.2372 0.6640
3.633343 6.- 3.63303 2.50E-03 0.7955
4.27E.03 0.7955
9.71E-03 0.0516 0.2323 0.1134 0.2323 0.2671 0.1089 0.0864 0.1089
2.06E-07 0.0184 0.0414 0.0555 0.0414 0.0413 10.3945 5.2075 10.3945 9.*
0.8293 1.1216 0.8293 2.2136 0.8305 0.2335 0.3229 0.2335 0.2391 0.2434 0.5183 1.1600 0.5183 0.9302 0.1594 1.0095
0.17% 0.9046 1.1906 0.9046 0.9971 0.2155 1.0059 0.2155 0.8356 0.5821 0.4307 0.5407 0.4307 0.3948 0.6989 0.6979 0.6989 2.8092 0.9954. 0.7264 0.6807 0.7264 0.7244 0.1418 0.2597 0.1418 0.1565
0.1594
D.3 1
0.0558 3.71E-10 0.0558 0.3816 0.1340
2.863-08 4.39%
2.863-08 9.263-09 5.63E-09 0.0360
2.01E-11 0.0360 0.0672
3.28E-10 0.9416
’ 3.28E-10 0.0735 I
0.0651 4.13E-11 0.0651 0.0123 0.0635 1.1110 0.0635 0.4227 0.0982 0.3503 0.3651 0.3503 0.2023 1 2075 1.9392.
*1.2075 2.7675 24358 0.9128 0.8327 0.9128 0.9197 0.1469
3.053309 0.1469 ’
0.1626
0.854 0.868 0.854
. 0.188 0.900 0.914 0.997 0.914 0.927 0.924 0.986 0.991 0.986 0.991 0.929 0.991 0.929 0.887 0.989 0.9% 0,989 0.986 0.972 0.998 0.972 0.979 0.989 0.976 0.982 0.976 0.945 0.929 0.998 0.929 0.989 0.982 0.999 1 .Ooo 0.999 0.999 0.989 0.991 0.989 .0.991
- - 0.1638 0.2986 0.2573 - - 9.3782 6.3806 4.2537 - - 0.2323 0.0626 - - 1.8301. 9.5405 - - 0.0850 0.0132 - - 1.4289 0.4925 0.3527 - - 1.2033 1.0209 - -
- - - 3.083-03 l.lOE-03 3.55E-03 - - 0.0333 0.0235 0.0177 - -
2.00E-03 2.47E-03 - - 4.07E-03 3.12E-03 - - 2.01E-03 2.46E03 - - 4.39E-03 3.503-03 3.75E-03 - - 5.92E-03 5.aE-03 - -
2.2114 0.0157 ‘1.6551 0.0126 2.4476 0.0178 - - - - 1.2109 8.07E-03 1.2171 7.9SE-03 - - - - 12.4420 - 0.0343 12.0685 0.0354
- - 0.853 0.143 0.897
- 0.715 0.623 0.642 - - 0.874 0.981 - - 0.556 . 0.745 - - 0.987 0.986 - - 0.800 0.975 q.952 - . - 0.919 0.880 - - 0.914 0.852 0.982 - - 0.989 0.989 - - 0.617 0.641 -


APPENDIX E
Summary of Test Plans and Procedures

.

Table E.l. Summary List of Procedures
Leaching Tests of Radioactive . . Glass, Technical Prockdure MCC-TP-18, Rev. 0.
Leaching Tests Using the PCT Method, Technical Procedure MCC-TP-19, Rev. 1.
Operating Procedure for H W V W-Gas Anulyzers (Radioactive Lab-Scale), PNL Technical Procedure PHTD-WTC-006-37, Rev. 0.
Procedure for Treating Slurries. with Formic Acid Adding Glass Frit and Drying the Slurry for Vitrijkation, PNL Technical Procedure WTC-053-2, Rev. 0.
Preparation of .Special Sample Forms, MCC Technical Procedure MCC-TP-3, Rev. 0.
Laboratory Proceduri for Measurement of Physical and Rheological Properties of Solution, Slurries and Sludges, PNL Technical Procedure PNL-ALO-501, Rev. 0.
Glass Preparation, MCC Technical Procedure MCC-TP-2; Rev. 0.
Procedure for Treating Slurries with Formic Acid Adding Glass Frit and w i n g the Slurry for Vitrzjkation, PNL Technical Procedure PHTD-WTC-006-038, Rev. 0.
Procedure for Preparation of Simulated Hwyp Feed for Laboratory-Scale RedodRheology I and Radioactive ProcesdProduct Tests, Technical Procedure WTC-006-36, Rev. 0.
This list includes all technical procedures specifically relating to the radioactive testing in this sfudy. Standard tecfinical’procedures utilized by the analytical chemistry laboratory and CVS glass laboratory are not included in this list. .
E. 1
‘ I


APPENDIXF
. Data Reduction Methods
J

FJ Rheology Calculations (Theory and Calculations)
Apparent viscosity is shear stress divided by the shear rate at a given shear rate. In a Newtonian fluid this is a linear function; therefore, the ratio is the same at every point. Only Newtonian fluids have a single number viscosity. 'A fluid whose Warent viscosity varies with shear rate is non-Newtonian. In these fluids, apparent viscosity defines only the flow behavior at a fixed point.
To define a complete flow behavior, it is necessary to obtain a rheogram (or flow diagram). A rheogram'is a curve that plots shear stress vemk shear rate over a specified shear-rate range. The shape of this curve defines the flow behavior of the fluid. If the fluid behaves as a Newtonian fluid, the curve is linear. A non-Newtogkn curve is non-linear and can be difficult to fit mathematically. Most curves are a variation of a known behavior, for which mathematical models exist to fit the CurveS.
Theoretically, the yield stress or yield point is the amount of stress required to initiate fluid movement and begin flow. In practice, the yield stress is obtained from the stress value on the graph where the slope changes from ved.cal to horizontal. A curve fit is used to extrapolate this intersection back to the shear-stress'&. The measured yield stress is not a true yield stress because the Haake rheometer &ed was a controlled-rate instrument, not a controlled-stress. instrument; therefore, by definition it is forcing the material to flow for a reading to ocuu. A true yield stress is stressdependent only; the yield stresses obtained by this system will be both rate- and stressdependent. This measured yield stress is, however, often a good approximation of the desired data.
The rheometer "ramps up" the shear rate to a chosen value and records the resulting shear stress. The curve o b w e d from this test ii called a rheogram. From a rheogram, viscosity data, I
yield-stress data, and flow&e data can be o%tained. There are several types of flow curves that 'have been well studied Bnd have defined m a t h d c a l curve fits. These curve fits are usylly used to describe and predict the flow behaviors of fluids.
Two primary curve fits, yield pseudoplastic or Herschel-Bulkley and Bingham plastic, were used in data analysis. The Bingham Plastic model is a good model for obtaining yield points. It '
assumes a Newtonian flow after a threshold yield stress has been overcome..
where: 7 = shear stress 70 = yield stress factor qp = plastic viscosity 7 = shear rate.
(F.1) (Bingham Plastic)
The Herschel-Bulkley model describes a typical yield pseudoplastic. It is a modiiication of a power law fluid curve fit, which takes intb acC0uht.a yield stress. The exponential component of the equation quantifies the non-Newtonian behavior. ,The closer the exponent to 1.0, the more Newtonian the behavior. When n= 1, the equation becomes a Bingham fit,
F. 1
I . I

7 = T ~ + kv . (F.2) (Herschel-Bulkley)
where: T =shearstress . r0 = yield stress factor k = consistency factor y =shearrate n = measure of deviation from Newtonian flow.
Pseudoplastic liw, show an apparent viscosity decrease as the shear rate is increased. This is known as "shear thinning" and is a common fluid behavior for emulsions, suspensions, and dispersions. Under shear conditions, particl~/moldes acquire an orientation more conducive to flow, which lowers the viscosity. For a classic pseudoplastic liquid, shear t h h h g is reversible. As the shear rate drops, the apparent viscosity climbs with little or no lag time since the orientation of particles/moledes will be lost as quickly a i it was achieved. Thixotropy 6 more complex because it d y involves bonding, which creates a threedm ensional stnrctured network. This structure is
' easily broken down under the influence of shear, but will begin rebuilding as soon as the shear is removed. If a thixotropic liquid is m-ed at a'wnstant shear rate, the apparent viscosity will drop a(;ymptoticaIIy with time until it reaches the lowest viscosity achievable at that shear rate. This is called the sol-state. Tfie time to rebuild v&,es, depending on the material. In practical terms, it takes less energy to maintain a flow than the energy it took to achieve it.
Special Notes with Respect to Data
Scatter is evident in some of the rheograms. One of the most likely causes for this is that the solids loading the slurries prevented the%use of the most appropriate sensor. The measured viscosities of the slurries is. below .the recommended rahge of the sensor used over much of the shear-rate range. Data are particularly inaccUrat e when both the shear stress and the shear rate are low. For this reason apparent viscosity numbers below 50 s'' are suspect. The larger particles nhy.be responsible for the spiked nature of the scatter in some of the runs.
The small amounts of sample available, combined with the difficulty of hot cell measurements n&sitated that duplicates of samples originally measyed be rem. These duplicates usually showed a lower yield point and vkcosity. . In both types of slurries, this can be a result of particle sedimentation out of the measuring gap. In the melter feeds (fitted slurries) it caq also be attributed to the fact that melter feed is often a thixotropic yield pseudoplastic, which means that its rheological character changes after shear fora% have been applied.
Nonradioactive laboratory-scale testing with sirrmlants indicates that the rheology of formated slurries is fairly stable with respect to time. No significant change has been observed even when the slurries have been allowed to sit for severaI months (Bec€zette et al. 1994).
F.2

F.2 Normalized Release
Elemental and isotopic normalized releases were calculated for all glasses tested using the PCT and MCC-1 &rabidity tests. Calculated and predicted values from simulants and models were then cornpartd to data from the radioactive glass to determine whether or not the sixnulants and modeis'acame~y represented radioactive ws behior . ~lthough the limited quantity of radioactive glass available and the relatively hi& cost of performing radioactive tests l i m i t e d the amount of replicate samples and tests performed, a practid statistid cornpaiison of the s m and mdels to ridioactive glass was attemglted. Additional statistid comparisons were d e to determine if the difference in test conditio& between the laboratory and the hot cell was significant.
As shown in Appendix A, Tables A.10 through A.12, radioactive glasses were tested in triplicate using both PCT and MCC-1 durabiity tests. Duplicate blanks were also included in each test involving radio&ve glpss. (A blank is a test vessel Nled with leachant but with no glass specimen present.) Duplicate blanks were included primarily for redundancy in case one was spilled, but also provided a measure of variabiiity for blank concentrations. Due to difficulties in performing such work in the hot C'ell, one blank was spilled id hot-cell test #4.
Simulant glasses were tested in duplicate in 1-aboratory durability tests and in triplicate or quadruplicate in hot-cell tests. Quadruplicate samples resulted fiom duplicate simulant samples prepared in the hot cell and duplicate samples prepared in the laboratory but tested in the hot cell. This w& performed to check for differences in preparation techniques (i.e., crushing, sieving, .
washing, drying) that could af fec t results. Durability tests performed in the laboratory included either one or no blanks.
For each sample, the n o d i elemental mass loss of the i-th element was computed for the j-th specimen ushg the following equation
. (Cu- BJ NL- "-fi(sj /v>
where NL, = normalized loss of element i from specimen j
CiJ = concentration of element i observed in leachate from specimen j
B, = concentration of element i observed in leachate fiom blank (averaged before subtracting when there is more than one blank)
fi = average mass fraction of element i in the specimen
Sj =* surfkccareaofspccimenj
V, = initial vo~ume of leachant in test vessel wntainjnn specimen j.
F.3
(F.3)

Note in -on (2) that Cii aed S,Nj were measured fiom each specimen, whereas Bi and fi were'constant over the specimens at a partidar set of test corrditions: nus, if &e NL, values were substituted into the usual formuh for computing a standard deviation, the uncertainty due to the Bi and fi values. would not be determind.. It was nemsary to use a standard deviation estimate that accounted for the variability in all ofthe quantities in Equation (F.3). Additionally, it would be valuable to account for 1ong:term and inter-laboratory variabiIitied (i.e., variabilities resulting from andyses .and testing performed at different times and by different laboratories). Although we wanted
, to compare results of glasses tested at different times by Werent technicians, sufficient data were not collected to allow calculation of these types of qnceaainty.
By applying the propagation of errors method as presented by Bowen and Bennett (1988), an approximate formufa for the variance of NLii was derived"' and is giv.en by
I
Each term in &pation (F.4) provides a measure of the contribution of a particular source of random error to the variance of q. Vir (NLd is a measure of the single laboratory variance of NL,; that is, its square root (the stadyd deviation of &J is a measlire of the extent to which a single laboratory can be expected to reproduce its own results when using replicate specimens of the specified glass under a particular set of conditions. Note that this guantitY is not an indication of thez capability of a laboratory to reproduce its owp results when the test is repeated at Merent times, or - of the expected agreement among the results from multiple laboratories that apply the test method - under preicribexl similar conditions.
An estimate of Var (NL$ is given by
(a) Olson, K. M., M. L. Elliott, J. W. Shade, and H. D. Smith. 1990. Letter Report: Fabrication, C k r a c t a o n , and Evaluation of West Valley Sludge Glass-1, A Fulty Radioactive Glass Made with High-Level Wastefrom the Wesf Valley Demonstration Project. Prepared by the Pacific Northwest laboratory, Richlaad, Washington.
F.4

Vk (fJ/f?
= the average (over replicate specimens) of the NL, values
= the sample variance of the c, values
= the Sample variance O f the Bi values
‘on = the average (over replicate specimens of the blank-corrected w m values
= the relative sample variance of fi, which can be computed directly from replicate glass anaIytical data.or from prior computations of relative standard error (RSD). The value is equal to the square of the RSD of the mean wt% oxide value for the i-th element
= the sample variance of the S P j values over the replicate specimens
= the average (over the replicate specimens) of the S P j values
Note that there is a direct correspondence between the sample estimates in Equation (F.5) and the quantities.in Equation (F.4), with one exception. The last term in Equation (F.4) involves Cov (Crl , SPj), the wvariake of C, and S P , over the replicate specimens at a set of test conditions. For computational convenience, this term was neglected, which will result in slight overestimation of the standard d e m o n of the NL, values. This is because Cov~(Cii, SrNj) is positive; that is, when SJNJ increases, the concentration of the i-th element in the leachate should increase. Therefore, incl&g an estimate of this term in Equation (F.5) would result in subkction of a positive quantity, yielding a smaller standard deviation estimate than the computationally simpler estimate given by the above form of Equation (F.5).
computed from Equation (F.5). Estimated relative standard deviations are calculated as The estimated standard deviation for % is calculated as the square root of the v&ce
and percent relative standard deviations (96RSDs) is the same value expressed in percent.
present to make a dbmplete calculation or when the effect on V& OULij) was determiged to be insignificant.
S i m p l i i g assumptions were made in dculatihg V k (NI+J when idsufficient data were
(1) Some of the labo@ory tests did not ine1d.q blank samples,’preventhg the ‘calculation of V& (BJ. This pntributidn was ignored, because it is insignificant when compared to Vir (C$ and V k (fJ in the major components reported in laboratory tests (Le., B, Li, Na, Si); One
F.5

exception to this is silicon, in the case of fused-silica-lined leach containers. For this reason, the blank samples were included in all tests conducted with fused-silica liners.
Glass compositions were not measured for the three core sample simulants. In general, "as- batched" compositions are expected to be more accurate than memured compositions and are therefore used for fi in the Equation (F.3) calculations. Results from six replicate analyses of CVS1-19 glass (Hrma, Piepel, 1994, Table A.lO) show RSDs for B, Li, Na, and Si between 2 and 5 percent. A conservative value of 5% RSD was chosen in estimating VAr (fJ / ff for these three core sample simulants (i.e., V%r (fJ / ff is estimated at 0.0025).
Only single radiochemical analyses were performed on each of the radioactive glasses. In the absence of replicate data, apalyticd error estimates for count& calibration, and handling were used to calculate Viir (fJ / ff (see Appendix B, Tables B.l through B.3 for actual values).
Variance contributions from surface area-to-volume ratio were found to be insignificant (no change to RSD to three significant digits) when compared to other sources of variability and were consequently neglected. Similarly, this justifies neglecting the Cov (C, , S P $ term in Equation (F.4).
Statistical comparisons of core sample normalized release to those of the simulants were Hypothesis tests are performed to compare the mean In transformed normalized releases (mean
In NLd for B, Li, and Na, using their respective In transformed standard deviations (SD mean In NL&. The t-distribution was used to compare two means calculated from small samples sizes from populations with unknown variances. Implicit assumptions of this test were as follows: (1) normality for both populations; (2) populations with equal variances; and (3) statistically independent observations. The natural log transformed data were used instead of the untransformd data to satisfy the no-ity assumption of the t-test. Distributions of untransformed normalized release measurements are known to be non-normal (Le., skewed to the bigher releases). Transforming the data to the natural log'form produced a normal distribution, which can be used for statistical comparison. The mean In mi;) represented more of a median than a mean of the data, but in most cases was very close to the mean. The assumption of equal variance was reasonable but is not verified.
Calculation of the t statistic and degrees of freedom for performing a t-test was as follows:
F.6

where n, = number of replicate leachate samples for radioactive glass n, = number of replicate leachate samples for simulant glass.
Equation (F.7) is not strictly correct because the means being compared are actually calculated numbers that represent several sources of variability and the degrees of freedom were determined only from the number of leachate analyses. However, this method approximated a statistical comparison between sample means and was adequate for our application.
Similar comparisons of sample means were made between samples of similar glasses tested under different conditions (e.g., differing leach containers). In cases where the data being compared were generated from a single source of glass, the vk (f3 was ignored in equation (F.5). This was justified since the difference in the data was not in any way associated with dy t i ca l uncertainty of the glass.
Ninety-five percent confidence intervls were calculated for each of the In transformed means
using the following equation
The mean In Q and confidence intervals were then untransformed to be represented graphically. Although the untransformed m a n In NL8 values were slightly lower than the mean NL, values, the two were probably not discernibly different in graphical form and the confidence limits can be represented.
F.7

APPENDIXG
Description of Andytical Methods

. . G.1 Physical Characterizations
In addition to the quantitative physical characterizations described below, the physical .app&ance of the waste was documented after extrusion and throughout the processing steps. The descriptions included physical state (solution, slurry, or sludge), color, ability to hold its shape, and . any other observable physical characteristics.
G.1.1 Density
Solid samples were placed in preweighed, volumegradwed, centrifuge tubes where they were weighed and then centrifuged for 1 h at > lo00 gravities to remove voids. This ensured accurate volume measurements and allowed &vision of the sample mass by the sample volume to obtain density.
and the density Was calculated. Liquid samples were placed in a preweighed volumetric flask up to the volume line, weighed,
Reweighed glass bar samplk were placed in a graduated cylinder, volume measured from displacement, and density calculated.
6.1.2 Solids Settling Rate and Volume'Percent Settled Solids
Settling rates and vo~% settled solids measurements were conducted ii preweighed, volume ' graduated, cearifbge tubes where total volume and the volume of settled solids (i.e., level of visual interface were recorded periodically. The cross-sectional area in the upper portion of the centrifuge tube was constant, thus allowing the. conversion of settling rate data from mwh to Cmm.
After the settling rates were determined, the ~ 0 1 % settled solids were calculated by dividing the finat settled solids volume by the total sample volume.
6.1.4 Volume Percent and Weight Percent Centrifuged Solids and Supernatant
> lo00 gravities. Total sample volume and solids v o h e were determined using the graduations on the centrifuge tubes, thus allowing the volume percentagk of both solids and supernatant to be calculated.
Following the settling-me measurements above, the samples were centrifuged for 1 h at
Weight percentages of the centrifuged solids and supernatant were determind by.decanting or pipeting the centrifuged supernatant into a preweighed vial. This allowed weighing supernatant and the solids remaining in the centrifuge tubes independently. The weight percentages of each were then calculated.
G.1.5 Weight Percent Total Solids, Total Oxides, and Dissolved Solids
Samples were placed into preweighed crucibles, weigh&, and allowed to airdry overnight to' remove free liquid to prevent splattering in the oven. Then the samples were transferred to a drying oven at 105 f 5°C where they were dried for 24 h. The dried samples were removed from the oven,
G. 1
I :
1 '

placed in a desiccator to cool to mom temperature, reweighed, and the weight percent total solids was calculated.
Next, the dried solids were placed in a furnace at 1025 f 25°C for1 h to convert the chemicals in the sample to their stable oxide form. The samples were removed from the furnace, placed in a desiccator to ~601 to room temperature, reweighed, and the weight percent total oxides was calculated.
.
Determinations of the weight percent dissolved solids were performed with supernatant samples in the sape manner 'as described above for the measurement of wt% total solids slurry samples. The percent dissolved solids in the fllpernatant was multiplied by the percentage of supematant in the sample (1 - wt% centfifuged solids) to arrive at the percentage of dissolved solids in the total sample.
6.1.6 Particle Size
A Brinkman Mode1.2010 Particle Size Analyzer was used to determine the distribution of particle siies in the solid samples. This ht rymat determines particle sizes in the range 0.5 pm to 150 p u ~ by measuring the t h e required for a rapidly moving laser beam to traverse selected particles maintained in stirred suspension in a glyceridwater mixture. Two measurements on the same sample several days apart yielded nearly identical results, indicating that the glyceridwater mixture does not partially dissolve the sample and thus reduce the particle sizes.
6.1.7 Shear Stress Versus Shear Rate
Shear stress versus shear rate data were used to evaluate the viscosity of a fluid. The data were generated in the form of a'rheogram or flow curve, which is a plot of shear stress as a function of shear rate. The rheograms were obtained at room or hot cell temperature using a Haake RV 100 viscometer equipped with an M5 measuringdrive head and the MV1 sensor system.
The measurement of viscosity wi-th this instrument required that the sample be placed in the gap between two coaxial cylinders. About 40 mL of sample was thoroughly agitated and transferred into the cylinders. When the system was set in motion, a viscosity-related torque, caused by the sample's resistance to shea&g, acted on the inner cylinder; This torque deflected a measuring device which w& correlated to the shear stress value. A s l e with a yield stress "clamped" the rotor to the cup until the applied torque exceeded the yield stress.
6.2 Chemical Characterhation
Chemical and radiuchemical aualyses were performed on both liquids (e.g., supernatant) and solids (e.g., sludge). Analyses of liquid samples were performed .directly on the liquids or dilutions thereof. Analyses of solid samples were performed on solutionS prepared from the solids according to the following methods.
Solid samples were prepared for ICP/m analyses and most of the radiochemical analyst% by fusing the solids in molten salt and then dissoliring the fused solids in hydrochloric acid. Two fusions were made; one used N%02 in a Zr crucible (so-called NdZr fusion) and the other used a mixture of
G.2

KN03 and KOH in a Ni crucible (so-called WNi fusion). Thee tpvoseparak fusions were required to allow determination of Na, K, Ni, and Zr in the samples. Following fusion, the samples were dissolved in HCl solution and diluted to a known volume!.
Solids samples were prepared for IC and tritium analyses by leaching a weighed amount (- 1 g) of solids in a measured volume! (- 100 mL) 'of water for 1 h while agit'ating ultrasonically. The leachate was then Ntered using 0.45-pm filters qnd analyzed..' The ratiode for this method of preparation is that all of the anions that can be analyzed by the IC method, as well as the tritium, were expected to be dissolved nearly quantitatively from the solids by the water leaching treatment whenas fbsion . would have volatilized or destroyed some of the d y t e s .
6.2.1 pH
Standard laboratory procedure4 were used to measure .the pH of 'supernatants and slurries without any pretreatment. Before use, the pH electrode was calibrated employins a two-standard method that took i& account the temperatures ofthe standards and samples.
. 6.2.2 Carbon Analyses
Carbon analyses were performed directly on both solid and liquid samples. Liquid samples were adyzed by the ultraviolet-catalyzui persulfate oxidation method. First, they were acidified to drive off the inorganic carbon as CO,, which was swept away in a gas stream and measured in an infrared detector. Next, p o h i u m persulfate &S@J was added to the liquid samples where oxidation of the organic carbon to CO, was catalyzed, at ambient temperature, by ultraviolet light. The CO, was swept away in a gas stream and measured in an infrared detector, just as with the inorganic carbon.
persulfate oxidation method. *
600°C. The CO, thus formed was swept Bway by the gas stream and measured by a coulometric detector. Total carbon, both organic and inorganic, was determined by oxidizing the sample in an oxygen gas stream at 10000C, which not only oxidized the organic carbon but also decomposed the inorganic carbonates to yield CO,. Again, the CO, was swept away by the gas stream and measured by a coulometric detector.
Solid samples were analyzed by one of two methods, the total combustion method and the hot
In the total combustion method, the organic carbon was oxidized in an oxygen gas stream at
A hot persulfate oxidation method was used to analyze some of the solids samples. It was similar to the W-catalyzed oxidation method described above for liquids except that, after driving off the inorganic carbon withacid treatment, the organic carbon was oxidized by s i lve rdyzed persulfate at 90°C. Both the inorganic CO, and organic CO, were swept away in a gas'stream and measured in a coulometric detector.
As noted, some of the solid samples were analyzed by the combustion method and others by the persulfate method. After development and some experience wi@ the persulfate method, it was generally considered to yield more satisfactory d t s . However, because of the mix of methods and
I G.3
I
I I
I
j t .

initial inexperience with the persulfate method, some unsatisfactory results were obtained and have . not been r em. ~ h u , ' t h e reported data were not entirely complete and consistent.
Carbon-I4 analyses were conducted on separate samples to which silver-catalyzed K&08 and sulfuric acid were added simultaneously and heated to 90°C. Organic carbon-14 was thereby oxidized to "CO, which, along with any inorganic l'COz, was swept with carrier gas into a NaOH trap where it was quantitatively absorbed and analyzed using a liquid scintillation counter.
6.2.4 I C P I A J S Analyses
ICP/AES analyses were performed directly on liquid samples or dilutions thereof. In the case of solid samples, both fusions were analyzed by ICP/AES to circumvent the obvious interferences by Na and Zr in the NaZr fusion and by K and Ni in the K/Ni fusion.
6.2.5 IC Analyses
IC analyses were performed directly on liquid samples or dildons thereof. As stated in Section G.2, in the case of solid samples, IC analyses were performed on leachates from the solids.
6.3 Radiochemical Characterization In the following descriptions, "prepared solutions" refers to the solutions prepared as
described in Section G.2. .Frequently, the radioactivities of the prepared solutions were too high and required M e r dilution before analysis. In the case of samples prepared from fusions, asdescribed in Section G.2, radiochemical analyseg were sometimes performed on both the Na/Zr and the KMi fusions and other times on just one of the fusions.
6.3.1 Gamme Energy Analysis
Gamma' energy analysis (GEA) was used to measure the concentrations of most gamma- emitting isotopes in the prepared solutions. ,
6.3.2 T~talaandTotalP .
Aliquots of prepared solutions were evaporated onto discs and then counted on a or B proportional counters, as appropriate.
6.3.3 Alpha Energy AnaIysis
Alpha energy analysis (AEA) was used to dete&e the conm&ons of u3+u(cm, ='Am, z9+uopU, and W p . * Mquots of prepared solutions were evaporated onto discs and counted with a solid-state a detector.
6.3.4 Total Pu and Pu Isotopes
by ion exchange, The total a activity was measured using an a proportional counter, and AEA was To determine total Pu concentrations and Pu isotopic compositions, the Pu was first separated
G.4

used to determine the relative contributions of the different Pu CY emitters. When a Pu isotopic analysis was requested, the relative concentkitions of all of the Merent Pu isotopes were determined
. by mass spectrometry. Pu isotopic determinations were n o d y done only on samples with total Pu 'concentptions >0.4 &nL. Lower concamations &ked contamination and interference by p%u, which was normally present in much higher .concenrm 'om. if a small mount of =W was carried . along with the Pu in the ion exchange separation, the Pu isotopic results would be invalidated.
,
6.3.5 Total U and U Isotopes
composition was determined by mass spectrometry following separation of the uranium from solution using ion exchange.
6.3.6 Tritium Anqlysa
Total U was measured on the prepared solutions using laser fluorimetry. Uranium isotopic
Because tritium was expected to be present in the form of water, water from the prepared solutions was purified by double distillation and then analyzed by liquid scintillation' counting.
6.3.7 Other Radioisotopes
Each of the remaining radioisotopes ('q, q c , %r, and '%e) to be measured was separated individually from the prepared solutions ping either precipitation, ion exchange, or distillation methods and then measured by beta or gamma counting, or liquid scintillation counting.
G.5


![Testing Testing [Read-Only] - Czone - East Sussex](https://static.fdokumen.com/doc/165x107/6327b2a26d480576770d6757/testing-testing-read-only-czone-east-sussex.jpg)