Probing the crystalline environment of α-alumina via luminescence of metal ion impurities: an...
11
Materials Science and Engineering A281 (2000) 45 – 55 Probing the crystalline environment of a-alumina via luminescence of metal ion impurities: an optical method of ceramic flaw detection R. Jankowiak a,b,1 , K. Roberts a,b , P. Tomasik c , M. Sikora c , G.J. Small a,b , C.H. Schilling a,d, * a Ames Laboratory 2 , Iowa State Uni6ersity, Ames, IA 50011, USA b Department of Chemistry, Iowa State Uni6ersity, Ames, IA 50011, USA c Department of Chemistry, Uni6ersity of Agriculture, 31 120 Cracow, Poland d Department of Materials Science and Engineering, Iowa State Uni6ersity, Ames, IA 50011, USA Received 1 July 1999; received in revised form 29 October 1999 Abstract Optical studies of UV-excited, polycrystalline a-alumina were performed as a function of the sintering temperature. The luminscence intensity in the 600 – 750 nm region increased with alumina density and originated from trace amounts of Cr 3 + impurities residing in two different sites, labeled A and B. Since trace amounts of Cr 3 + exist in most aluminas that are used in commercial applications, this luminescent methodology has promise as a simple, nondestructive tool for detecting packing-density- gradients and microcracks in alumina-based ceramics at different stages of shape-forming and sintering. In high-density alumina, at T =300 K, sites A emit sharp R 1 /R 2 -lines at 14407.5/14436.5 cm -1 with DE (R 2 -R 1 ) splitting of 30 cm -1 , indicating a ruby-like high-field crystalline environment. The lower symmetry sites (B) are characterized by higher-energy, presumably 2 E 4 A 2 doublet transitions (at 14746.7 cm -1 and 14818 cm -1 ) and 2 E splitting of 71 cm -1 . The larger splitting is attributed to anisotropy in the electron repulsion energy for Cr 3 + ions residing in slightly larger volumes of the CrO 6 and/or due to tetragonal crystal symmetry distortion. Luminescence from B sites is revealed for the first time; excitation using an argon-ion laser at 514.5 nm only reveals luminescence from A sites. UV-excited, luminescence based density calibration curves and density-dependent, color images of alumina samples, along with methodologies for density gradient mapping and microcrack detection, are described. It is shown that density gradients and microcracks can be visualized either by imaging the inherent luminescence of a-alumina or by fluorescence from an appropriate staining dye. Published by Elsevier Science S.A. Keywords: Luminescence; Alumina; Density gradients; Fluorescence; Cracks; Green body www.elsevier.com/locate/msea 1. Introduction Alumina is the most prevalent ceramic material cur- rently used in advanced engineering applications includ- ing dielectric substrates, biomedical devices, automotive parts, and more [1–3]. Like most ceramics, the mechan- ical properties of sintered alumina are greatly compro- mised by microstructural heterogeneities introduced during shape forming by powder compaction, slip cast- ing, injection molding and other methods. Common heterogeneities are porosity gradients, isolated pores, cracks, and agglomerates [4,5]. Traditional methods of quality control, including pycnometry, mechanical property measurements, frac- tography, and mercury porosimetry, are difficult to use when attempting to optimize the many different pro- cessing variables that ordinarily affect microstructure- defect evolution in ceramic production [6]. These methods usually involve slow and costly trial-and-error procedures that are destructive and off-line in nature. * Corresponding author. Tel.: +1-515-2941214; fax: +1-515- 2945444. E-mail addresses: [email protected] (R. Jankowiak), [email protected] (C.H. Schilling) 1 Also corresponding author. 2 Ames Laboratory is operated by Iowa State University under the contract number W-7405-eng-82 with the US Department of Energy. 0921-5093/00/$ - see front matter Published by Elsevier Science S.A. PII:S0921-5093(99)00749-2
Transcript of Probing the crystalline environment of α-alumina via luminescence of metal ion impurities: an...

Materials Science and Engineering A281 (2000) 45–55
Probing the crystalline environment of a-alumina via luminescenceof metal ion impurities: an optical method of ceramic flaw
detection
R. Jankowiak a,b,1, K. Roberts a,b, P. Tomasik c, M. Sikora c, G.J. Small a,b,C.H. Schilling a,d,*
a Ames Laboratory 2, Iowa State Uni6ersity, Ames, IA 50011, USAb Department of Chemistry, Iowa State Uni6ersity, Ames, IA 50011, USA
c Department of Chemistry, Uni6ersity of Agriculture, 31 120 Cracow, Polandd Department of Materials Science and Engineering, Iowa State Uni6ersity, Ames, IA 50011, USA
Received 1 July 1999; received in revised form 29 October 1999
Abstract
Optical studies of UV-excited, polycrystalline a-alumina were performed as a function of the sintering temperature. Theluminscence intensity in the 600–750 nm region increased with alumina density and originated from trace amounts of Cr3+
impurities residing in two different sites, labeled A and B. Since trace amounts of Cr3+ exist in most aluminas that are used incommercial applications, this luminescent methodology has promise as a simple, nondestructive tool for detecting packing-density-gradients and microcracks in alumina-based ceramics at different stages of shape-forming and sintering. In high-density alumina,at T=300 K, sites A emit sharp R1/R2-lines at 14407.5/14436.5 cm−1 with DE(R2−R1) splitting of �30 cm−1, indicating aruby-like high-field crystalline environment. The lower symmetry sites (B) are characterized by higher-energy, presumably2E�4A2 doublet transitions (at 14746.7 cm−1 and �14818 cm−1) and 2E splitting of �71 cm−1. The larger splitting isattributed to anisotropy in the electron repulsion energy for Cr3+ ions residing in slightly larger volumes of the CrO6 and/or dueto tetragonal crystal symmetry distortion. Luminescence from B sites is revealed for the first time; excitation using an argon-ionlaser at 514.5 nm only reveals luminescence from A sites. UV-excited, luminescence based density calibration curves anddensity-dependent, color images of alumina samples, along with methodologies for density gradient mapping and microcrackdetection, are described. It is shown that density gradients and microcracks can be visualized either by imaging the inherentluminescence of a-alumina or by fluorescence from an appropriate staining dye. Published by Elsevier Science S.A.
Keywords: Luminescence; Alumina; Density gradients; Fluorescence; Cracks; Green body
www.elsevier.com/locate/msea
1. Introduction
Alumina is the most prevalent ceramic material cur-rently used in advanced engineering applications includ-ing dielectric substrates, biomedical devices, automotiveparts, and more [1–3]. Like most ceramics, the mechan-
ical properties of sintered alumina are greatly compro-mised by microstructural heterogeneities introducedduring shape forming by powder compaction, slip cast-ing, injection molding and other methods. Commonheterogeneities are porosity gradients, isolated pores,cracks, and agglomerates [4,5].
Traditional methods of quality control, includingpycnometry, mechanical property measurements, frac-tography, and mercury porosimetry, are difficult to usewhen attempting to optimize the many different pro-cessing variables that ordinarily affect microstructure-defect evolution in ceramic production [6]. Thesemethods usually involve slow and costly trial-and-errorprocedures that are destructive and off-line in nature.
* Corresponding author. Tel.: +1-515-2941214; fax: +1-515-2945444.
E-mail addresses: [email protected] (R. Jankowiak),[email protected] (C.H. Schilling)
1 Also corresponding author.2 Ames Laboratory is operated by Iowa State University under the
contract number W-7405-eng-82 with the US Department of Energy.
0921-5093/00/$ - see front matter Published by Elsevier Science S.A.PII: S0921 -5093 (99 )00749 -2

R. Jankowiak et al. / Materials Science and Engineering A281 (2000) 45–5546
The most common method involves cutting a ceramicpart into small, centimeter-sized pieces and then mea-suring the density of each piece by the Archimedesimmersion principle.
Many researchers are currently attempting to useultrasound and X-rays to map density gradients inceramics [6–8], but there are problems adapting thesemethods to ‘real world’ production environments. Forexample, X-ray methods are not always fast enough oraffordable in a production setting. A concern withultrasound is that it requires liquid coupling media,which often disintegrates green bodies. ‘Air-coupled’ultrasound is recently developed to overcome the prob-lem of disintegration, but so far this technology has notbeen fully developed for ceramic production [9,10].
This paper explores the potential of a new, opticalmethodology for ceramic defect detection. The methodutilizes luminescence of trace quantities of Cr3+ transi-tion metal ions that are present in many, commercially-available alumina materials. These impurities can beused as a probe for the crystalline environment given byits host material because of the high sensitivity ofchromium ions to variations in crystal field [11–13].
Luminescence of Cr3+ ions in crystalline environ-ments has been studied because of its intriguing fluores-cence properties. For example, Cr-doped sapphire(ruby; Al2O3:Cr3+) was studied extensively because ofits importance in laser applications [11,14,15]. Depend-ing on the strength of the crystal field, the emission caninclude either spin-forbidden (2E�4A2) or spin-allowed(4T2�4A2) transitions. The former corresponds to astrong crystal field, the latter to a weak crystal field[11]. The strong field emission consists (generally) ofsharp lines, whereas the weak field transition producesa broad band.
A variety of emission lines from chromium-dopedhosts have been observed. The most famous case wasthe 2E emission lines observed in ruby [14], while broad4T2 emissions have been reported for Sc2O3:Cr3+,ScBO3:Cr3+, and Cr3+ doped glasses. The broad 4T2
emissions result from the loose structure associatedwith these glasses (compared to crystals). As a result,their crystal field is much smaller [11,16,17]. 4T2 broad-band emission was also observed from Cr3+ ions inforsterite [18].
The discovery of these chromium emission lines (es-pecially in ruby) in various hosts has proven beneficialin studying physical properties of materials. For exam-ple, ruby luminescence is a convenient method formeasuring pressure, i.e. the shift of the R-lines is recog-nized as a pressure calibrant [19]. Likewise, the shift inthe R1 luminescence line in a ruby crystal was used tomonitor internal stresses around indentations inchromium-doped sapphire [20]. In the case of high-pu-rity polycrystalline alumina, Grabner [21] and Clarke etal. [22]. used R-line luminescence from trace Cr3+
impurities to measure residual stresses (a result of con-strained anisotropic thermal contraction) and their de-pendence on grain size.
In this work, room- and low-temperature lumines-cence spectra of polycrystalline alumina specimens wereinvestigated at different specimen densities and differentexcitation wavelengths. Additionally, luminescenceimaging as well as laser-based scanning of microcrackswere evaluated. Since trace amounts of Cr3+ exist inmost aluminas that are used in commercial applica-tions, we believe these luminescent methodologies havepromise for use as a simple, nondestructive means todetermine density, density fluctuations, and microc-racks. Thus, these approaches could be implemented asa new quality control technology that is, at the presenttime, needed by the ceramic industry. Finally, we wishto emphasize the relative nature of the measurement.Variations in the concentration of Cr3+ and/or thepresence of other optically active impurities make thistechnique useful for relative comparisons between ce-ramics made from the same powders.
2. Materials and methods
2.1. Sample preparation and density measurements ofceramic pellets
Slip casting was used to consolidate colloidal suspen-sions of a-alumina powder into pellets having a con-trolled range of bulk density. The bulk density wasregulated by controlling the sintering temperature andby altering the particle packing structure of the greenpellets, which, in turn, was controlled by the degree ofinterparticle repulsion/attraction in the slip casting sus-pension [4,5]. For comparison purposes, we also per-formed luminescence measurements on fully-dense,commercially-available specimens of polycrystalline a-alumina (Coors Ceramics, Golden, CO).
All experiments were performed with deionized waterand commercially available, a-Al2O3 powder having anequiaxed particle shape, an average particle size of 0.4mm, and a specific surface area of 8.5 m2 g−1 (A16-SG,Alcoa Corporation, Bauxite, AR). Two separate sets ofsuspensions were prepared: (1) dispersed; and (2) floc-culated. Dispersed suspensions were prepared by firstadding 20 vol.% alumina powder to an aqueous solu-tion of 0.01 M NaCl, followed by the dropwise additionof concentrated hydrochloric acid to achieve a pH of 4.Flocculated suspensions were prepared by simplyadding 20 vol.% alumina powder to an aqueous solu-tion of 0.01 M NaCl and 0.03 g maltodextrin galumina−1. Commercially-available maltodextrin wasused in the as-received condition (Maltrin M040, GrainProcessing Corporation, Muscatine, IA, average degreeof polymerization 22.1). All suspensions were poured

R. Jankowiak et al. / Materials Science and Engineering A281 (2000) 45–55 47
into sealed Nalgene bottles and placed on a shaker for24 h prior to slip casting.
Suspensions were slip cast onto a flat surface of aplaster mold. Cylindrical pellets were formed by firmlyplacing a flat sheet of acrylic (5.4 mm thick) onto thisplaster mold and then pouring the alumina suspensioninto an array of circular holes (14.3 mm diameter)previously drilled through the acrylic sheet. The pelletswere subsequently dried in open air for 24 h. Next, thedried pellets underwent sintering in open air. The sin-tering schedule involved a slow increase in temperatureto a maximum value, which was maintained for 3 hprior to a slow decrease to room temperature. Fivepellets of a given specimen type were held at a singlemaximum temperature. The following maximum tem-peratures were utilized: 1050, 1200, 1300, and 1500°C.Upon cooling, each alumina specimen underwent den-sity measurements, based on the Archimedes principle,using water or mineral oil immersion. Mineral oil wasused instead of water to avoid disintegration of thegreen pellets.
2.2. Luminescence spectroscopy
Laser-excited luminescence spectra were obtained atvarious excitation wavelengths using a Lextra 100 XeCl(lex=308 nm) and an Ar-ion laser at 351.1 and 514.5nm (Coherent, Santa Clara, CA). Emission was mea-sured in both CW and gated modes of detection. Forlow-temperature spectroscopy (77 and 4.2 K), sampleswere cooled in a glass cryostat with quartz opticalwindows. Luminescence was dispersed by a McPherson2061 1-m focal-length monochromator and detected byPrinceton Instruments IRY 1024/G/B intensified photo-diode array. For time-resolved detection, a PrincetonInstruments FG-100 pulse generator was employedwith various detector delay times and gate widths.
2.3. Scanning microcracks
Alumina heterogenieties (e.g. microcracks and frac-tures) created during pellet production were scannedvia automated translation of the pellets through the
optical plane of a semi-focused Argon ion laser operat-ing in the UV-excitation mode, i.e. lex=351.1 nm. Asthe alumina pellet translated through the laser’s path,the resultant luminescence was collected by a collimat-ing objective, focused into a 0.3 m model 210 McPher-son monochromator and detected by a Roper Scientificintensified-charge-coupled-device (ICCD). The result isa plot of integrated luminescence intensity as a funtionof sample position.
2.4. Imaging
Imaging was performed with a Research CompoundFluorescence Microscope (Leica Microsystems, Inc.).An Ozone free Xenon high pressure lamp (HB075) wasused for excitation with suitable filter sets for excita-tion. Imaging was performed in two modes: the firstwas based on natural luminescence of the Cr3+ ionspresent in alumina, while the second mode was basedon staining the alumina pellets with a Zyglo 2L-60Dfluorescent dye (Magnaflux Corp., Glenville, IL). Thestaining was performed for 3 min followed by washingthe sample thoroughly with deionized water to removeany non-absorbed dye and dried for subsequent analy-sis. The following sets of filters were used for fluores-cence based microscopy images: first, a UV filter set(excitation interference filter BP 360/40, dichroic mirrorat 400 nm, and suppression filter LP 425); second,violet filter set (excitation filter was 420–490, dichroicmirror 510 nm, and suppression filter LP 510); andthird, a green filter set (excitation filter BP 546-14,dichroic mirror 580, suppression filter 590).
3. Results and discussion
3.1. Density measurements
The results of the density measurements via theArchimedes principle are summarized in Table 1. Here,it can be seen that, as anticipated, the alumina densityincreased with increasing sintering temperature [4,5].Likewise, the nature of the starting suspension (i.e.dispersed or flocculated) affected the density of thesamples. For example, the dispersed, green specimenshave a higher density than the flocculated green speci-mens because of the higher electrostatic repulsive forcesbetween particles in the dispersed, slip-casting suspen-sion. In addition, the different sintering temperaturesused in this study produced a broad range of pelletdensities (�54–97%). Similar density measurementswere previously reported for specimens that were slipcast with the same alumina powder under nearly identi-cal dispersed and flocculated conditions [7].
Table 1Summary of density calculations
Sintering temperature (°C) Percent of theoretical densitya
Dispersed Flocculated
Not sintered 62.7 (90.1) 54.0 (90.8)54.4 (90.6)1050 64.5 (90.7)
1200 71.2 (91.7) 62.2 (91.6)1300 78.6 (91.7) 71.9 (91.4)1500 97.3 (91.7)96.0 (92.7)
a Standard deviations indicated in parentheses.

R. Jankowiak et al. / Materials Science and Engineering A281 (2000) 45–5548
Fig. 1. Room temperature fluorescence spectra of three aluminaspecimens obtained with an excitation wavelength of 351.1 nm. Curve(a) nonsintered (green) specimen (density 62%); (b) sintered at 1200°C(density 71%); and curve (c) sintered at 1500°C (density 97%). Allspecimens were slip cast from dispersed suspensions.
ple density. Moreover, spectral characteristics indicatethat the main luminescence originates from chromiumion (Cr3+) impurities naturally present in aluminas(6ide supra).
The large increase in luminescence from sinteredalumina is caused by several factors. One factor is thatphoton attenuation (resulting from light scattering) de-creases in samples with higher densities. In other words,the number of pores acting as scattering centers de-creases with increasing sintering temperature. In turn,this should increase transmission and/or excitationdepth, and therefore, the observation of higher lumines-cence intensity. It is also possible that a strain-inducedpiezoelectric effect in higher density samples may alsolead to increased luminescence. In addition, differencesin local symmetry may also play a role.
To the best of our knowledge none of these effectswere studied in polycrystalline alumina at differentstages of manufacturing. Rather, until now, all spectro-scopic studies of Cr3+-alumina compounds have fo-cused on sapphire crystals (ruby) [14,23] andpolycrystalline alumina [22], utilizing 514.5 nm excita-tion, for which only the presence of sharp R1 and R2
lines (at �693 nm) was reported.Spectrum b in Fig. 2 shows the typical luminescence
of a fully-dense specimen of polycrystalline aluminathat was obtained from a commercial supplier andexcited by a wavelength of 514.5 nm. An identicalspectrum was obtained from slip cast alumina speci-mens that were excited at 514.5 nm after sintering at1500°C (data not shown). Spectrum b in Fig. 2, inagreement with literature data, reveals only the stan-dard R-line (�693 nm) luminescence of Cr3+ ions inperfect octahedral environment. In contrast, UV excita-tion by a wavelength of 351.1 nm (spectrum a) shows amuch stronger luminescence at �678 nm.
The intensity of spectrum a in Fig. 2 is not identicalto spectrum c in Fig. 1, since the spectra were obtainedat different conditions and with different starting mate-rials. Nevertheless, a spectroscopic comparison can bemade. Two remarkable features are immediately ob-served: (1) the bands in spectrum a of Fig. 2 becomenarrower; and (2) two sharp lines with a splitting of3091 cm−1 are easily resolved. These sharp linescorrespond to the above discussed R1/R2 luminescence(DE(R2−R1)=29 cm−1) lines observed in ruby [14]and polycrystalline alumina [20,22]. The agreement ofthe data in Fig. 2 with earlier observations by Clarke etal. [20,22] indicate that some Cr3+ ions reside in aperfect crystalline environment in the highly-sinteredalumina. The degree of the ruby-like crystallinity can-not be established since the contribution at �693 nmdepends on the excitation wavelength. Finally, we notethat the splitting of the R1 and R2 lines in spectrum c ofFig. 1 (density �97%) is masked by large inhomoge-neous broadening resulting from variation in stress [22];
Fig. 2. Excitation-dependent spectra for high-density polycrystallinealumina obtained from a ceramic manufacturer (Coors Ceramics,Golden, CO). Spectra a and b were obtained at T=300 K usingexcitation wavelengths of 351.1 and 514.5 nm, respectively.
3.2. Luminescence spectra of alumina
Fig. 1 shows typical room-temperature luminescencespectra of alumina samples excited with an argon-ionlaser at 351.1 nm. Spectrum a corresponds to a nonsin-tered (green) sample (density �62%). Spectra b and ccorrespond to samples sintered at 1200°C (density 71%)and 1500°C (density 97%), respectively. The size of thelaser probe beam was �10 mm2.
The data in Fig. 1 clearly indicate that luminescenceintensity increases with sintering temperature and sam-

R. Jankowiak et al. / Materials Science and Engineering A281 (2000) 45–55 49
only a small number of samples sintered at 1500°Crevealed such splitting when excited with 351.1 nm(data not shown). However, spectral broadening, due toenergy transfer, can not be excluded at this point.
We propose that the band observed at 678.2 nm(solid arrow) and its shoulder at 674.8 nm in Fig. 2correspond to Cr3+ ions in different sites, i.e. Cr ionsin lower symmetry sites (a contribution from grainboundary sites cannot be excluded). Such lower symme-try sites, which to the best of our knowledge have notbeen observed, could arise from anisotropic electron
repulsion energies within slightly larger volumes of thequasi-octahedra in which some of the Cr3+ ions reside;although tetragonal crystal symmetry distortion is pos-sible (6ide supra). The band at �678 nm in curve a ofFig. 2 (solid arrow) is approximately 25% narrowerthan the same band in curve c of Fig. 1, suggesting thatthis particular sample has a smaller distribution of localstresses, i.e. a smaller stress gradient across the aluminaspecimen. This indicates that not only the luminescenceintensity, but also the spectral ‘fingerprint’, as shown inFigs. 1 and 2, might be useful in a manufacturingsetting.
Additionally, due to the partly disordered nature ofalumina ceramics, spectral broadening effects and emis-sion from different sites were observed. This is illus-trated in Fig. 3, which shows spectra a-c obtained at300, 77 and 4.2 K, respectively, with an excitationwavelength of 351.1 nm. The purpose of the measure-ments at 4.2 and 77 K was to minimize thermal broad-ening. The spectra are normalized so that the intensitiesof the most intense feature in each spectrum are equal.As proposed above, these spectra suggest that Cr3+
ions occupy different sites, which we label as A and B(6ide infra).
When Cr3+ ions are irradiated at 351.1 nm, high-en-ergy bands are excited, and some of the energy is lostthrough non-radiative transitions to the 2E state(s) [14].The 2E state decays by spontaneously emitting a dou-blet, the components of which are assigned as Ri (i=1,2) lines. Thus, Cr3+ impurity ions in both sites (A andB) fluoresce via vibronically structured 2E�4A2 transi-tions. Spectrum a in Fig. 3 shows that fluorescence(T=300 K) from B sites is broader than that from Asites. The much larger inhomogeneous broadening ob-served for B sites is most probably caused by morerandom crystal field distortion at each chromium ion.
Reduction in sample temperature to 77 K (spectrumb of Fig. 3) results in much narrower R1A, R2A, R1B,and R2B lines located at 693.27, 691.80, 676.10 and672.51 nm, respectively. The temperature shift of the Ri
lines is similar to that observed in ruby [24]. TheDE(R2−R1) splitting for sites A and B at T=77 K is�30 and �71 cm−1, respectively. Furthermore, sitesA and B emit from both sublevels (E and 2A) at highertemperatures, as illustrated in the energy level diagramof Fig. 4. At 4.2 K, only R1A and R1B emissions areobserved as shown in spectrum c of Fig. 3, since kT ismuch smaller than the DE(R2−R1) splitting. The weakRI-lines observed at �660–670 nm (T=4.2 K) mostprobably correspond to even lower symmetry sites,which, for simplicity, are not labeled. They could alsocorrespond to transitions of different impurities. Theinset of Fig. 3 shows an enlarged part of spectrum cwith clearly resolved R1A and R1B lines at 4.2 K. Thedashed arrow (at �14385 cm−1) indicates a band,which based on Ref. [20] could correspond to a stress-
Fig. 3. Temperature dependence of chromium-impurity fluorescenceof high-density, polycrystalline alumina obtained from a ceramicmanufacturer (Coors Ceramics, Golden, CO). Spectra a, b, and cwere respectively obtained at T=300, 77 and 4.2 K with an excita-tion wavelength of 351.1 nm. Sites A and B correspond to fluores-cence from two non-equivalent sites (see text). R1 and R2 corrspondto the E�4A2 and 2A�4A2 transitions, respectively. The inset showsthe two R1 lines observable at 4.2 K.
Fig. 4. A simplified energy diagram of the experimentally observedtransitions for fluorescence of Cr3+ metal ions in a-alumina. On theleft side the emission from two different sites (A and B) from2E�4A2 (narrow lines, see Fig. 2) is illustrated. 4A2 is the groundstate. The radiative transition from the quartet is assumed to beunsplit for simplicity (diagram based on Ref. [12]).
R. Jankowiak et al. / Materials Science and Engineering A281 (2000) 45–5550
induced shift of some of the R1A-lines. If stress-induced,the shift could correspond to a stress of �2.6 GPa.
As mentioned above, a schematic representation ofthe lower energy levels and splitting of the 2E transitionof Cr3+ ions in A and B sites is shown in Fig. 4. It iswell known that 3d3 ions prefer to occupy octahedralsites in ionic crystals; such sites, however, may undergodistortions, which could result in tetragonal, trigonal, ororthorombic symmetry. The result is that the lower thesymmetry the weaker the crystal field [25]. For example,a large degree of 2E splitting was observed in tetragonalCr3+ complexes of [Cr(NH3)5Br]Br2 [26], [Rh(NH3)5-Cl]Cl2:Cr3+, and MgO:Cr3+ [27]. The 2E splitting incis-[Cr(en)2F2]I (where en is ethylene) and MgO:Cr3+ is81 and 93 cm−1, respectively [28]. It has been suggested[29,30] that nonspherical contributions to the electronicrepulsion integrals could be responsible for the largesplitting observed in tetragonal Cr3+ complexes. Thelatter indicates that B sites could correspond to lowersymmetry sites, where a small anisotropy in the repulsionexists.
Other emissions (from yet unidentified transitionmetal ions), relatively stronger in the less dense samples,were also observed. The blue and blue/green emissionswith maxima at �430, �560 and �600 nm (data notshown) could originate from other metal cation impuri-ties present in alumina. The blue emission could origi-nate from impurities such as 56Fe (2.3 mg/g) and 48Ti (0.2mg/g) [31]. Moreover, besides 52Cr3+ (�0.08 mg/g),other impurities present in alumina, have been deter-mined by inductively coupled plasma mass spectrometry(ICP-MS). For example, Jakubowski et al. [32], usingICP-MS, showed alumina contained impurities such as:71Ga (0.48 mg/g), 11B (0.48 mg/g), 66Zn (0.32 mg/g), 140Ce(�0.001 mg/g), etc. However, identification of all impu-rities present in these alumina samples is beyond thescope of this paper.
3.3. Visual assessment of density by color
UV-excited luminescence in the ‘red’ wavelength re-gion (�600–750 nm) increases with alumina density inrelation to emission observed in the blue/green wave-length region. Thus we speculate that additive mixing ofvarious luminescence signals, depending on relative con-tributions, should lead to distinguishable hues of laser-excited aluminas sintered at different temperatures (6idesupra). This concept, which relies on the observation ofluminescence, could serve as a visual assessment ofalumina density based on color.
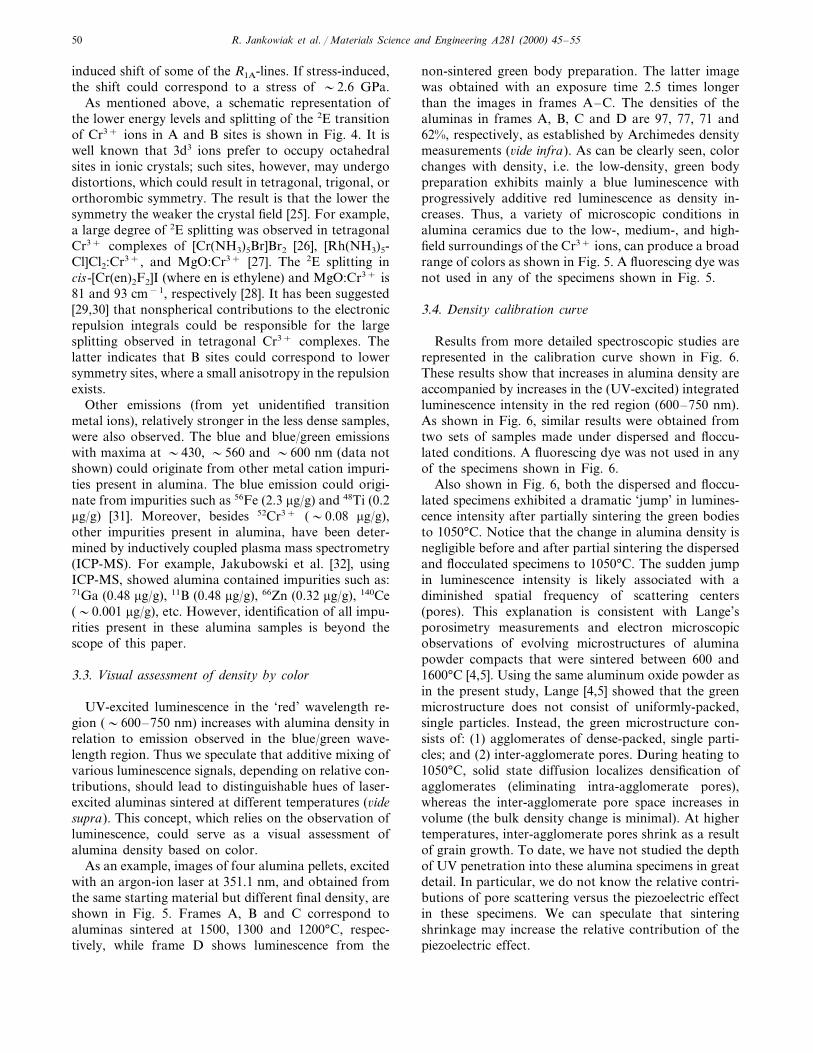
As an example, images of four alumina pellets, excitedwith an argon-ion laser at 351.1 nm, and obtained fromthe same starting material but different final density, areshown in Fig. 5. Frames A, B and C correspond toaluminas sintered at 1500, 1300 and 1200°C, respec-tively, while frame D shows luminescence from the
non-sintered green body preparation. The latter imagewas obtained with an exposure time 2.5 times longerthan the images in frames A–C. The densities of thealuminas in frames A, B, C and D are 97, 77, 71 and62%, respectively, as established by Archimedes densitymeasurements (6ide infra). As can be clearly seen, colorchanges with density, i.e. the low-density, green bodypreparation exhibits mainly a blue luminescence withprogressively additive red luminescence as density in-creases. Thus, a variety of microscopic conditions inalumina ceramics due to the low-, medium-, and high-field surroundings of the Cr3+ ions, can produce a broadrange of colors as shown in Fig. 5. A fluorescing dye wasnot used in any of the specimens shown in Fig. 5.
3.4. Density calibration cur6e
Results from more detailed spectroscopic studies arerepresented in the calibration curve shown in Fig. 6.These results show that increases in alumina density areaccompanied by increases in the (UV-excited) integratedluminescence intensity in the red region (600–750 nm).As shown in Fig. 6, similar results were obtained fromtwo sets of samples made under dispersed and floccu-lated conditions. A fluorescing dye was not used in anyof the specimens shown in Fig. 6.
Also shown in Fig. 6, both the dispersed and floccu-lated specimens exhibited a dramatic ‘jump’ in lumines-cence intensity after partially sintering the green bodiesto 1050°C. Notice that the change in alumina density isnegligible before and after partial sintering the dispersedand flocculated specimens to 1050°C. The sudden jumpin luminescence intensity is likely associated with adiminished spatial frequency of scattering centers(pores). This explanation is consistent with Lange’sporosimetry measurements and electron microscopicobservations of evolving microstructures of aluminapowder compacts that were sintered between 600 and1600°C [4,5]. Using the same aluminum oxide powder asin the present study, Lange [4,5] showed that the greenmicrostructure does not consist of uniformly-packed,single particles. Instead, the green microstructure con-sists of: (1) agglomerates of dense-packed, single parti-cles; and (2) inter-agglomerate pores. During heating to1050°C, solid state diffusion localizes densification ofagglomerates (eliminating intra-agglomerate pores),whereas the inter-agglomerate pore space increases involume (the bulk density change is minimal). At highertemperatures, inter-agglomerate pores shrink as a resultof grain growth. To date, we have not studied the depthof UV penetration into these alumina specimens in greatdetail. In particular, we do not know the relative contri-butions of pore scattering versus the piezoelectric effectin these specimens. We can speculate that sinteringshrinkage may increase the relative contribution of thepiezoelectric effect.

R. Jankowiak et al. / Materials Science and Engineering A281 (2000) 45–55 51
Fig. 5. Pellets of alumina ceramics sintered at (a) 1500°C; (b) 1300°C; (c) 1200°C; and (d) a nonsintered (green) pellet. All pellets were illuminatedwith an argon-ion laser at 351.1 nm; corresponding densities are (a) 97%, (b) 77%, (c) 71%, and (d) �71%. Note that the color depends on sampledensity.
3.5. Scanning microcracks
We observed that scanning a semi-focused laser beamacross polycrystalline alumina reveals an increase ofluminescence intensity whenever the beam encountersmicrocracks. When the laser probes a smooth portionof the specimen surface, only background luminescenceis observed. However, when an imperfection such as acrack is brought into the path of the laser, luminescence
increases because of a larger cross-section of the ce-ramic being exposed to the laser light and/or tighterfocus of the laser beam within the microcrack. Further-more, attempts to quantify the severity of the crackscould be made by measuring the relative luminescenceintensity observed by the detector. A ceramic specimen(partially sintered) was scanned in the forward direction(+X) followed by scanning the same distance in thereverse direction (−X) as shown in Fig. 7. A major

R. Jankowiak et al. / Materials Science and Engineering A281 (2000) 45–5552
increase in luminescence intensity was observed as thelaser probed a large crack, visible by the naked eye. Thisis the result of the laser probing a greater surface area.Similarly, minor increases in luminescence intensity (ob-served as small spikes in Fig. 7) are the result of lessblatant imperfections in the highly-sintered alumina.Furthermore, with an increase in scanning resolution(i.e. a proper translation stage), a more detailed profileof the surface microcracks could be obtained. A resolu-tion of several mm seems to be feasible. Thus the aboveapproach could have significant potential in nondestruc-tive evaluation of cracks/fractures and other produc-tion-caused heterogeneities in ceramic processing.
3.6. Imaging flaws in ceramics
Microcracks and density gradients can also be re-vealed via luminescence-based microscopy. Fig. 8 showstwo examples of flaw imaging. Frame A is an image ofthe inherent luminescence of a sintered alumina speci-
men without a fluourescent staining dye, whereas,Frame B shows the same region of the same aluminaspecimen as imaged with the fluorescent staining dye.The same (predominant) microcrack stretches diago-nally across each image. Additionally, density gradientsare easily distinguishable as light and dark regions onthe image in Frame B of Fig. 8.
Fig. 9 illustrates another example of the use of thismethod to image cracks and density gradients in sin-tered alumina. Both images in Fig. 9 were obtainedfrom the same, sintered alumina specimen that wasstained with fluorescent dye and imaged with a violetfilter. Frame A reveals distinct gradients in luminescentcolor arising from density gradients in the aluminaspecimen. Dark areas correspond to high density re-gions and the bright areas to low density regions. Inimage B, the violet excitation of the dye clearly showsthat microcracks are associated with low density regionswhere porosity is the greatest (bright regions in theimage).
3.7. Future studies
We believe that representative color images and lu-minescence based density calibration curves could beestablished for a large number of industrial standards.The latter should allow a quick assessment of density inunknown samples. Also spectral characteristics could beemployed to gain a better understanding of stress gradi-ents across the samples. The latter aspect could beaddressed via measurement of spectral broadening andstrain induced spectral shifts.
For detailed spectral characterization purposes andidentification of luminescence signals from other transi-tion metal ions, low temperature high resolution spec-troscopic studies will need to be performed. Forexample, fluorescence line-narrowing and hole-burningspectroscopy [33] could probe the variation of the Cr3+
environment at different stages of heat (sintering) treat-ment, providing more insight on microcrystallitesformed during sintering process.
4. Concluding remarks
UV fluorescence imaging, as opposed to traditionalArchimedes density measurements, provides a faster,more economical methodology for detecting densitygradients and microstructure flaws in both green andsintered alumina ceramics. The technology should en-able real-time, non-destructive mapping of surface den-sity gradients and surface cracks in a ceramicproduction environment or in the process developmentlaboratory. Again, we wish to emphasize the relativenature of the measurement. Variations in the concentra-tion of Cr3+ and/or the presence of other optically-
Fig. 6. Luminescence-density calibration curve for alumina (see textfor details).
Fig. 7. Integrated luminsecence intensity (I) as a function of sampleposition (X). Note the reproducibility when the sample is scanned inthe forward and reverse directions.

R. Jankowiak et al. / Materials Science and Engineering A281 (2000) 45–55 53
Fig. 8. Fluorescence images of the same region of a sintered alumina specimen. Luminescence in image A is from inherent Cr3+ impurities. ImageB luminescence is from a UV-excited staining dye. The same microcrack is visible in both images, whereas the staining dye provides more detailedimaging of density gradients.
active impurities make this technique useful for relativecomparisons between ceramics made from the samepowders.
Acknowledgements
We wish to thank the Office of Basic Energy Sciences

R. Jankowiak et al. / Materials Science and Engineering A281 (2000) 45–5554
at the US Department of Energy for funding thisresearch. We also wish to thank the office of the ViceProvost for Research and Advanced Studies at Iowa
State University for funding the imaging system. Weacknowledge Dr H-C. Lin and Dr Tonu Reinot fortheir help during the various stages of this project.
Fig. 9. Fluorescence images of sintered alumina. Density fluctuations (image A) and cracks (image B) are revealed on the surface of a sinteredalumina specimen that was stained with a UV-excited dye. Image B illustrates the presence of low-density regions (bright regions in the image)surrounding each crack.

R. Jankowiak et al. / Materials Science and Engineering A281 (2000) 45–55 55
References
[1] T. Abraham, Advanced ceramic powder and nano-sized ceramicpowder: an industry and market overview, in: J.J. Kingsley, C.H.Schilling, J.H. Adair (Eds.), Ceramic Transactions. Science,Technology, and Commercialization of Powder Synthesis andShape Forming Processes, vol. 62, American Ceramic Society,Westerville, OH, 1996, pp. 3–14.
[2] D. Segal, Chemical preparation of powders, in: R.J. Brook,R.W. Cahn, P. Haasen, I.J. Kramer (Eds.), Materials Science inTechnology. Processing of Ceramics, Part 1, vol. 17A, VCHVerlagsgesellschaft mbH, Weinheim, Germany, 1996, pp. 70–98.
[3] D. Segal, Chemical Synthesis of Advanced Ceramic Materials,Cambridge University Press, Cambridge, 1989.
[4] F.F. Lange, J. Am. Ceram. Soc. 72 (1) (1989) 3–15.[5] F.F. Lange, J. Am. Ceram. Soc. 67 (2) (1984) 83–89.[6] C.H. Schilling, J.N. Gray, Needs and opportunities for NDE in
ceramic processing, in: C.H. Schilling, J.N. Gray (Eds.), CeramicTransactions. Nondestructive Evaluation of Ceramics, vol. 67,American Ceramic Society, Westerville, OH, 1998, pp. 1–19.
[7] C.H. Schilling, V.J. Garcia, R.M. Smith, R.A. Roberts, J. Am.Ceram. Soc. 81 (10) (1998) 2629–2639.
[8] V.J. Garcia, C.H. Schilling, S.P. Huss, J.N. Gray, M. Sikora, P.Tomasik, C.P. Li, X-ray NDE of density gradients during alu-mina powder consolidation: effects of suspension chemistry, in:A. Jillavenkatesa, G.Y. Onoda (Eds.), Advances in ProcessMeasurements for the Ceramic Industry, American CeramicSociety, Westerville, OH, 1999, pp. 307–322.
[9] C.H. Schilling, V.J. Garcia, R.M. Smith, R.A. Roberts, J. Am.Ceram. Soc. 81 (10) (1998) 2629–2639.
[10] R.A. Roberts, Mater. Eval. 46 (May) (1988) 758–766.[11] H. Kitai, Solid State Luminescence: Theory, Materials and
Devices, Chapman Hill & Hall, London, 1995.
[12] Q. Ma, D.R. Clarke, J. Am. Ceram. Soc. 76 (1993) 1433.[13] S.E. Molis, D.R. Clarke, J. Am. Ceram. Soc. 73 (1990) 3189.[14] T.H. Maiman, Nature 4736 (1960) 493.[15] Szabo, Phys. Rev. Lett. 25 (1970) 924.[16] Henderson, G.F. Imbusch, Optical Spectroscopy of Inorganic
Solids, Clarendon, Oxford, 1989.[17] A. Kaminskii, Laser Crystals, Springer, Berlin, 1981.[18] W. Jia, H. Liu, S. Jaffe, W.M. Yen, Phys. Rev. B. 43 (1991)
5234–5242.[19] R.A. Forman, G.J. Piermarini, J.D. Barnett, S. Block, Science
176 (1972) 284–285.[20] S.E. Molis, D.R. Clarke, J. Am. Ceram. Soc. 73 (1990) 3189–
3194.[21] L. Grabner, J. Appl. Phys. 49 (1978) 580–583.[22] Q. Ma, D.R. Clarke, J. Am. Ceram. Soc. 77 (1994) 298–302.[23] R.S. Meltzer, J.E. Rives, W.C. Egbert, Phys. Rev. 25 (1982)
3026.[24] E. McCumber, M.D. Sturge, J. Appl. Phys. 34 (1963) 1682–
1684.[25] M. Yamaga, B. Henderson, K.P. O’Donnell, J. Lumin. 46 (1990)
397–418.[26] R. Lawn, S.W. Feiman, T.L. Baker, D.D. Cobb, A.C. Gonzalez,
J. Am. Ceram. Soc. 67 (1984) C67–C69.[27] P. Kislink, C.A. Moore, Phys. Rev. 160 (1967) 307.[28] H. Riesen, E. Krausz, L. Dubicki, J. Lumin. 44 (1989) 97–103.[29] D. Flint, A.P. Matthews, J. Chem. Soc. Faraday Trans. 269
(1973) 419.[30] D. Flint, A.P. Matthews, P.J. O’Grady, J. Chem. Soc. Faraday
Trans. 273 (1977) 655.[31] R. Moon, M.R. Phillips, J. Am. Ceram. Soc. 77 (1994) 356–367.[32] N. Jakubowski, W. Titter, D. Pollman, D. Stuewer, J.A.C.
Broekaert, J. Anal. Atomic Spectrom. 11 (1996) 797–803.[33] R. Jankowiak, J.M. Hayes, G.J. Small, Chem. Rev. 93 (1993)
1471–1502.
.