Private sector responses to climate change in the Global South
42
Article type: Advanced Review Private sector responses to climate change in the Global South Simone Pulver, [email protected] Environmental Studies, University of California at Santa Barbara Tabitha Benney, [email protected] Political Science, University of California at Santa Barbara Keywords Corporate responses, Clean Development Mechanism (CDM), Carbon Disclosure Project, Emerging economies, Emission trajectories Abstract What is the private sector response to climate change in the Global South and what has motivated action? The Carbon Disclosure Project and Clean Development Mechanism registries offer some systematic data in response to the first question. Despite limitations to both data sources, they show that private sector action on climate change clusters in the large industrializing countries of the Global South. A risk/opportunity framework integrating physical, regulatory, market and reputational drivers of private sector responses offers answers to the second question. The four drivers intersect to create particular national patterns in private sector responses to climate change. Corporate action in the large emerging economies is driven primarily by the prospect of domestic climate regulation—some large developing countries have pledged 1
Transcript of Private sector responses to climate change in the Global South
Article type: Advanced Review
Private sector responses to climate change in the Global SouthSimone Pulver, [email protected] Environmental Studies, University ofCalifornia at Santa BarbaraTabitha Benney, [email protected] Political Science, University of California at Santa Barbara
KeywordsCorporate responses, Clean Development Mechanism (CDM), Carbon Disclosure Project, Emerging economies, Emission trajectories
AbstractWhat is the private sector response to climate change in theGlobal South and what has motivated action? The Carbon Disclosure Project and Clean Development Mechanism registries offer some systematic data in response to the first question. Despite limitations to both data sources, they show that private sector action on climate change clusters in the large industrializing countries of the Global South. A risk/opportunity framework integrating physical, regulatory, market and reputational drivers of private sector responses offers answers to the second question. The four drivers intersect to create particular national patterns in private sector responses to climate change. Corporate action in the large emerging economies isdriven primarily by the prospect of domestic climate regulation—some large developing countries have pledged
1
greenhouse gas emissions reductions by 2020—and by the market opportunities created by the Clean Development Mechanism. In the less developed countries, barriers related to weak regulatory environments, low levels of industrialization and growth, restricted access to capital, and limited technical capacity intersect to limit private sector action on climate change. Looking to the future, thelack of depth and breadth in the push for corporate action on climate change in the Global South suggests reasons for concern.
2
Corporate awareness of climate change, perceptions of climate risks and benefits, efforts to mitigate greenhouse gas (GHG) emissions, and lobbying on climate regulation varysignificantly across developing-country contexts. Some firms in some countries in the Global South have been publicly reporting GHG emissions data since the early 2000s,actively invest to reduce emissions from their facilities, and consult with their home governments to craft GHG regulation. Others have never heard of climate change, understanding neither their contribution to the problem nor the opportunities created for them by carbon markets. The goals of this review are to characterize the heterogeneity in corporate responses, to identify major trends in private sector behavior, and to analyze the drivers of corporate climate action across the Global South.
The review contributes to a growing literature on role of developing countries in addressing the global climate challenge.1-2 In the early years of the international climate negotiations, the globe was divided into two categories, industrialized and developing countries. This binary distinction was formally enshrined in the 1992 UnitedNations Framework Convention on Climate Change (UNFCCC) as Annex 1 (industrialized) and Non-Annex 1 (developing) countries.3 It was perpetuated in 1997 Kyoto Protocol, which assigned GHG emissions reduction targets only to Annex-1 countries.4 However, by 2007 the balance of focus between Annex 1 and non-Annex 1 countries began to shift, reflecting changing global GHG emissions trajectories. Experts now estimate that over the next twenty-five years, 95% of the growth in global GHG emissions is expected to occur in non-Annex 1 economies.5 This shift in focus to theGlobal South has spurred interest in disaggregating the broad category of non-Annex 1 and highlighting the specific experiences of individual developing countries confronting climate change. Initial research on this topic documents that population dynamics and government policy will play a prominent role in developing countries’ transitions to low-carbon futures.6 The premise of this review article is thatthe private sector plays an equally prominent role, as an
3

emitter of GHGs, an investor in new energy infrastructure, aprovider of substitute technologies, and as powerful political actor.7
Our analysis follows a four-part structure. First, we summarize available data on corporate operational practices,political activities, and governance initiatives related to climate change across the Global South. Data collected through the Carbon Disclosure Project and the Clean Development Mechanism offer an overview of leaders and laggards in private sector responses in the developing world. Second, we examine four drivers of corporate climateaction—physical, regulatory, market, and reputational—and assess the contribution of each to broad patterns of privatesector responses to climate change. The third section profiles the intersection of the drivers in four country clusters—the large emerging economies of Brazil, China, India and Mexico, the less developed economies with a focus on Kenya and Pakistan, the highly vulnerable small island states and the oil-exporting countries of the Middle East—representing types of economies in the Global South. Finally, the review concludes with an assessment of the potential for private governance in the climate realm in theGlobal South.
Patterns in private sector responsesCharacterizing private-sector responses to climate
change in the Global South is a challenge because of the tremendous heterogeneity within the private sector. Privatesector actors represent the formal and informal economy, industrial and agricultural sectors, and small local to large multinational operations. The Indian cement industry serves as an example. There are over a hundred cement producers in India. They range from the Indian subsidiariesof the major cement multinationals, such as Lafarge and Holcim, to leading Indian companies, including Birla Cement and Gujarat Ambuja Cement, to state-run enterprises, to small firms operating mini-kilns.8 Multiplying this complexity both by the number of industries within an economy and by approximately 150 developing countries gives
4

a sense of the heterogeneity of the private sector across the Global South. Our review emphasizes large and medium-sized enterprises headquartered in developing countries, which are responsible for both the majority of economic production and GHG emissions in the Global South.
The phrase “responses to climate change” also encompasses a range of activities.9 For example, waste pickers whose livelihoods are jeopardized by methane captureprojects at landfills,10 global chemical multinationals earning millions in the carbon market through HFC destruction projects,11 wind energy start-ups,12 and carbon consultants advising corporations on climate strategy13 are all private-sectors actors responding to climate change. Wecategorize this range of activities into three types: 1) changes in operational practices; 2) activities in politicalarenas; and 3) change in corporate governance.14 Changes inoperational practices range from low-commitment strategies, such as corporate GHG emissions inventories, to the high commitment strategies, such as investment in new climate-friendly technology, product and market development. Corporate activities in political arenas include the strategies companies use to shape the organizational, informational, and regulatory contexts in which they operate.14 Finally, corporate governance relates to the ways in which climate concerns are integrated into corporatemanagement and decision making structures.15 Aggregating across these categories of action produces a typology of corporate actors, ranging from indifferent to climate active.16
Much data on private sector responses to climate changein the Global South comes from single-country, single-sectoror even single-company case studies. The focus of such research is often on controversial cases. Some highlight the windfall profits being earned by large corporations in carbon markets17 or the ways in which private-sector responses to climate change further impoverish poor communities.18 Others characterize private-sector actors asclimate leaders.19 Both perspectives shed light on the
5
range of corporate responses, but each offers only a partialview. A more systematic and comprehensive picture of private sector responses to climate change in the Global South emerges from the Carbon Disclosure Project (CDP) and Clean Development Mechanism (CDM) registries. The CDP is a voluntary climate reporting initiative, collecting data on operational, political and governance activities from over 2000 corporations from around the globe (www.cdproject.net).The CDM registry offers a comprehensive database of GHG-reducing projects initiated by firms in developing countriesunder the 1997 Kyoto Protocol. Through the CDM, GHG emissions reductions initiated in developing countries can be used by industrialized countries to meet the targets theyagreed to under the Kyoto Protocol. The UNEP Risø Centre maintains a global inventory of CDM projects. To date, over 9000 CDM projects have been submitted for review from the group of Non-Annex 1 economies (www.cdmpipeline.org). It should be underscored that both the CDP and CDM registry are voluntary initiatives. As such, they document action byleading firms, offering a picture of the private sector vanguard rather than a complete picture including leaders and laggards. The CDM and CDP are also biased towards larger firms. The CDP targets only large publicly traded corporations listed on national stock exchanges. The CDM isrestricted to a limited number of industries for which thereare pre-approved CDM project methodologies. Despite these limitations, both datasets provide the best available systematic information on corporate responses to climate change across countries within the Global South. The CDP Global 500 Report 2011
The CDP Global 500 Report 2011 offers a global trends summary of corporate climate activities, based on voluntary survey data organized by national/regional stock indices.20 Companies listed on the Global 500, European 200, US S&P 500, Emerging Markets 800, Latin American 50, Turkish 100, South African 100, South Korean 200, Brazilian 80, Indian 200, and Chinese 100 stock indices were surveyed. The Global 500 as well as the European 200 and the American S&P
6
500 offer reference points to evaluate the responses of various developing country indices. The CDP data showcase several trends. First, in terms of carbon disclosure, developing country firms tend to lag behind industrialized countries (Figure 1). European countries have the highest CDP response rate, at 89%, while China has the lowest, at 8%, meaning that only eight companies in the China 100 submitted a CDP survey questionnaire. The two exceptional developing country cases are South Africa and Brazil, with response rates of 81% and 67%, respectively.
In contrast to the clear North-South divide found in carbon disclosure, a more heterogeneous picture emerges looking at corporate GHG emissions reduction initiative and targets (Figure 2). With the exception of South Korea, 80% or more of all respondents had some active emissions reduction initiatives in the reporting year. However, across the various emerging economy indices, approximately athird or less had absolute emissions targets. Brazil and Turkey emerge as exceptional cases because their companies with emissions reductions targets tend to have absolute targets, while the more general trend among all respondents is that only half of those with targets have absolute targets. India represents the other end of the spectrum. Of the forty-nine respondents to the CPD survey from the India 200, only two companies had absolute emissions reduction targets. Figure 1 Figure 1: CPD survey response rates
Do not insert the image in this document; please supply as a separate file.
Figure 2 Figure 2: Corporate emissions reduction targets and initiatives
In the area of corporate climate governance (Figure 3),the majority of respondents from emerging economies matches
7

global averages and outpaces those from the United States interms of the percentage of responders with Board or other executive responsibility for climate change. Board or executive level responsibility is particularly high in SouthAfrica, at almost 90%. The US S&P companies score the lowest with just under 50%. A second metric of corporate climate governance—employee incentives for the management ofclimate issues—reveals a different pattern. With the exception of Turkey and China, management incentives tend tolag behind. Incentive programs are least popular in Latin America.
Do not insert the image in this document; please supply as a separate file. Figure 3 Figure 3: Corporate climate governance
Do not insert the image in this document; please supply as a separate file.
The CDM project registryThe CDM project registry offers a second source of
systematic data on corporate responses to climate change in the Global South. Each individual CDM project represents aninvestment by a developing country entity in either a clean energy technology, such as a wind farm or a solar array, or in a GHG emissions reducing efficiency upgrade. CDM projects are restricted to a limited number of project typesfor which the CDM Executive Board has approved a methodologyfor calculating emissions reductions. There are twenty-one categories of approved methodologies.21 While any type of organization can invest in a CDM project, the vast majority of projects have been initiated in the private sector. Figure 4 provides an overview of the number of CDM projects by country. As mentioned above, CDM is a voluntary initiative, but unlike CDP, there is a direct financial
8

benefit from participating in the CDM since the resulting emissions reduction credits can be sold on carbon markets.
CDM project distribution by country points to which developing country private sectors have taken an active rolein generating emissions reductions to sell on the carbon market. The majority of CDM projects are hosted in China, India, and Brazil. In fact, these countries plus Mexico andSouth Korea account for 95% of CDM projects.22 Internationally, the first CDM projects were approved in 2004. The market was first populated by projects hosted in Brazil. By late 2005, India overtook Brazil as CDM leader, claiming 53% of projects. India dominated the market until 2007, when it was surpassed by China, which is currently host to the majority of CDM projects, measured both in numbers of projects and total emissions projected to be reduced through the CDM. Analyzing CDM project types offer further insight into the specific industries investing in CDM (Figure 5). Wind energy projects are the most numerous at 2,597 projects, followed by hydro at 2,317 projects. In contrast, there have only been 164 industry energy efficiency projects initiated under the CDM. Further breaking down this broader category reveals that large, consolidated sectors such as chemicals, petrochemicals, paper, building materials, cement and iron & steel sectors account for 75% of the of industry energy efficiency projects.
Both the CDP reports and CDM registry provide an incomplete picture and do not capture the full range of private sector responses to climate change in the Global South. The CDP is incomplete because of its limited focus on larger firms and the CDM registry because it only tracks emissions reductions activities that qualify as CDM projects. In addition, neither database tracks political lobbying or adaptation activities, which are important aspects of corporate responses to climate change. Thus, efforts by small hotels in Barbados to protect local mangroves go unnoticed by both databases.23 Nevertheless, the CDP and CDM data reflect a larger truth. Of the 154
9

Non-Annex 1 countries identified in the UNFCCC, only a handful has active private sectors facing climate change. In particular, activity is clearly concentrated in the largeemerging economies.
Figure 4 Figure 4: Share of total global CDM projects by region, 2003-2012.
Do not insert the image in this document; please supply as a separate file.
Figure 5 Figure 5: Share of total CDM projects by type, 2012.
Do not insert the image in this document; please supply as a separate file.
Drivers of private sector responsesGiven the broad patterns in private sector responses to
climate change in the Global South suggested by the CDP and CDM data, the next analytic task is to understand the drivers of these patterns. Reviews of corporate climate action point to physical, regulatory, market and stakeholderdrivers operating at both domestic and international levels.24-25 From a firm perspective, such drivers translate into a risk/opportunity framework.26 The direct effects of climate change create physical risks and opportunities. Indirect effects of climate change, originating from governmental, market and societal initiatives to mitigate greenhouse gas emissions and/or to adapt to climate change, create regulatory, market and reputational risks and opportunities. Regulatory risks and opportunities reflect the likelihood of government intervention to control greenhouse gas emissions. Market risks and opportunities stem from rising energy prices and the need for energy-efficient, emissions-reducing, and adaptive technologies.
10
Reputational risks and opportunities relate to changes in brand value.
The climate risk/opportunity framework has been used inseveral global assessments of private sector responses to climate change. A 2008 meta-analysis of fifty reports on climate risks and opportunities, primarily from the US and Europe, conducted by the consulting group KPMG documented that firms identified regulatory and physical risks as priorities, compared to risk of reputation and risk of litigation.26 In contrast, a 2007 McKinsey survey of over 2000 global executives suggested that climate change was primarily a brand issue. Almost 70% of respondents said it was either very or somewhat important to consider climate change issues when managing corporate reputation. In contrast, only 48% rated considering climate change as very or somewhat important when developing a regulatory strategy.Likewise, 54% of respondents pointed to corporate reputationamong their top three factors spurring action on climate change, compared to 25% for regulation and 21% for investment opportunities. In the McKinsey survey, concern about physical threats to assets rated lowest at 7%.27
The risk/opportunity framework is also particularly relevant to the regional focus of this review. The physical, regulatory, market, and reputational risks and opportunities of climate change are the result of the historical evolution of international and national climate policies, of stakeholder concern, and of physical changes inregional, national and local climate systems. These vary both across the broad categories of Global North versus Global South and across the nations indiscriminantly groupedas the developing countries of the Global South. A closer analysis of the experience of climate impacts and efforts atclimate mitigation and adaption across the Global South helps to explain the variety of corporate responses and the clustering of action in the large emerging economies.
Before proceeding it should be noted that corporate responses to each type of climate-related risk and opportunity are further influenced by specific
11

organizational characteristics and by the degree of uncertainty of the risk/opportunity. Organizational characteristics influence how firms experience, interpret and respond to external drivers.28 For example, physical risks vary by sector and particular geographies of infrastructure.26 More generally, foreign ownership, firm size, export orientation, and financial performance all correlate with enhanced environmental performance and are likely organizational predictors of corporate engagement on climate change.25 Finally, all four sources of climate-related risk and opportunity are characterized by uncertainty,29 and in the face of uncertainty, inaction becomes an attractive strategy.30
Physical risks and opportunitiesThe physical impacts of climate change, effective
adaptation strategies, and the need for adaptation finance dominated early climate change dialogues in the Global South.3 Impact and adaptation research shows developing countries to be more vulnerable to climate change (http://index.gain.org/), with the most dramatic and tragic examples being small, low-lying islands and coastal nations.31 Disproportional vulnerabilities stem from the greater reliance on agriculture and other climate-sensitive economic sectors for livelihoods and from the absence of adaptive infrastructure.32 More generally, many developing countries are simply vulnerable because of their location. Countries in the low latitudes start with higher temperatures. Further warming pushes these countries ever further away from optimal temperatures for climate sensitiveeconomic sectors.33
While vulnerability is a prominent political concern ofdeveloping countries in the international climate negotiations, corporate action motivated by the physical risks of climate change has been limited. The lack of action has several explanations. First, physical threats toprivate-sector assets—such as the impact of weather-related events on infrastructure and associated increases in
12
insurance premiums, variation in water availability, and changes in commodity prices—tend to be underestimated. Thisis true of companies in both the Global North and South.26 Second, of the sectors most concerned about physical risks—agriculture, forestry, health care, insurance, pharmaceutical, and tourism26—only a few are sufficiently resourced to organize a coordinated corporate response. Forexample, most agricultural enterprises in the Global South are too small and too under-resourced for a coordinated response. The majority of dairy farms in India raise between one and five cows, and organizing a coordinated response among such disaggregated actors is a social and logistical challenge.34 Third, certain adaptive responses—such as the coping strategies of agricultural smallholders to deal with climate variability and change35—are simply notrecognized in the literature on private sector responses.
The tourism industry is a partial exception to this broader pattern of inaction. Tourism is a significant contributor to GDP in many developing countries,36 and some tourism operators are developing coordinated response strategies. For example, Belle and Bramwell23 find that tourism managers in Barbados are concerned about damages to coastal tourism facilities, beach changes, and adverse impacts on marine environments. Their primary response to these anticipated physical threats has been to call for morepublic awareness campaigns. Other resorts have invested in large-scale modular mangrove planting for coastal protectionand sand barriers to protect developed tourism areas from increasingly violent weather patterns.37 However, even in the tourism sector there has been little coordinated action across national borders, particularly in the Global South. For example, the World Tourism Organization’s 2008 report on“Climate Change and Tourism: Responding to global challenges” dedicates two of 269 pages to the role of tour operators and other organizations in climate mitigation.38
In addition to direct responses to physical risks, adaptation needs have also spurred some corporate action. Companies have identified an adaptation marketplace for new
13
technologies.39 For example, there has been some action by insurance companies to develop new micro-insurance products for adaptation to climate change. Both Swiss Re and Munich Re have experimented with index-based insurance for small farmers. Companies like Unilever and Siemens are investing in technologies to increase clean water availability. Information technology companies like Google and IBM are using sensor and mapping data to improve the ability to predict vulnerabilities.40 However, these initiatives have been pioneered by multinational corporations headquartered in the Global North, although they work through their southern subsidiaries.
Regulatory risks and opportunitiesIn contrast to concern about the physical risk of
climate change, concern about regulatory risk is a recent phenomenon in the Global South. Since climate change was first identified as an issue of global concern in the late 1980s, efforts at international GHG regulation have assignedresponsibility for emissions reductions to industrialized countries. The consequence of this regulatory approach is that GHG regulation has been a consideration for corporations operating in the Global North for the past twenty years while it has been mostly absent from the agendaof the private sector in the Global South.3 Country case studies are consistent with this global picture. Jeswani etal.’s16 research compares corporate responses to climate change in the U.K. and Pakistan. Based on a survey of 1028 companies in the UK and 450 companies in Pakistan, the authors document that the majority of UK firms are “active” or “emerging” in their response to climate change. In contrast, the majority of Pakistani firms cluster in the “indifferent” and “beginner” categories. The authors ascribe this pattern to the difference in pressure from regulatory agencies. They argue that regulatory action in Pakistan has been limited by “political instability, lack ofprogress in institution building, lack of awareness in the government administration, lack of political will and
14

underpaid environmental agency staff” (Reference 16, p.55). Such regulatory barriers to corporate action are widespread across the Global South.41
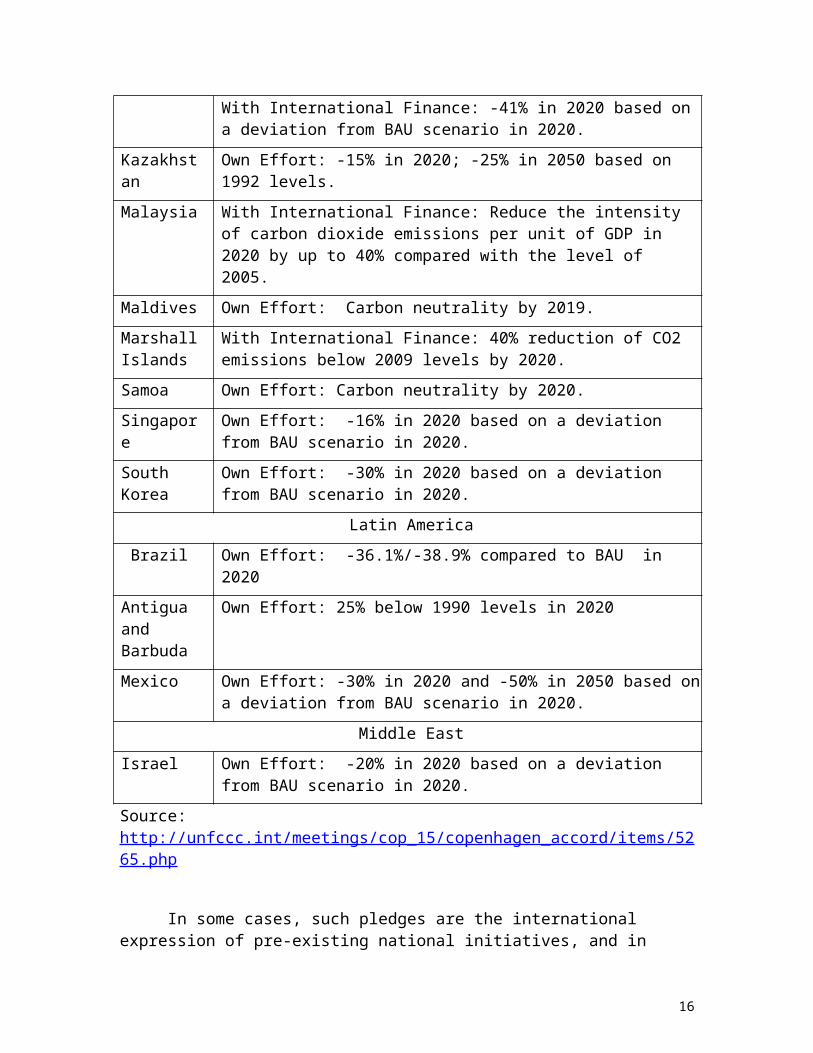
However, the regulatory risk picture for the private sector in some developing countries is changing. As total annual national GHG emissions in large developing countries began to rival those in industrialized countries, international efforts to mitigate climate change expanded toinclude the Global South.42 While there is not an international agreement on GHG reduction targets for developing countries, GHG regulation in the Global South hasbecome a reality as some developing countries have taken unilateral action to reduce their carbon emissions. Table 1provides a summary of voluntary mitigation commitments by Non-Annex 1 countries submitted under the provisions of the 2009 Copenhagen Accord. It is worth noting that only fifteen of 154 Non-Annex 1 countries have pledged a voluntary commitment.
Table 1 Table 1: Non-Annex 1 countries with quantitative GHG reduction pledges
Table 1: Non-Annex 1 countries with quantitative GHGreduction pledges.
Country GHG Emissions Reductions PledgeAfrica
South Africa
With International Finance: -34% compared to BAU in 2020
Asia PacificChina Own Effort: -8.5% compared to BAU in 2020.India Own Effort: India will endeavor to reduce the
emissions intensity of its GDP by 20-25% by 2020 in comparison to the 2005 level.
Indonesia
Own Effort: -26% in 2020 based on a deviation from BAU scenario in 2020
15
With International Finance: -41% in 2020 based ona deviation from BAU scenario in 2020.
Kazakhstan
Own Effort: -15% in 2020; -25% in 2050 based on 1992 levels.
Malaysia With International Finance: Reduce the intensity of carbon dioxide emissions per unit of GDP in 2020 by up to 40% compared with the level of 2005.
Maldives Own Effort: Carbon neutrality by 2019.MarshallIslands
With International Finance: 40% reduction of CO2 emissions below 2009 levels by 2020.
Samoa Own Effort: Carbon neutrality by 2020.Singapore
Own Effort: -16% in 2020 based on a deviation from BAU scenario in 2020.
South Korea
Own Effort: -30% in 2020 based on a deviation from BAU scenario in 2020.
Latin America Brazil Own Effort: -36.1%/-38.9% compared to BAU in
2020Antigua and Barbuda
Own Effort: 25% below 1990 levels in 2020
Mexico Own Effort: -30% in 2020 and -50% in 2050 based ona deviation from BAU scenario in 2020.
Middle EastIsrael Own Effort: -20% in 2020 based on a deviation
from BAU scenario in 2020.Source: http://unfccc.int/meetings/cop_15/copenhagen_accord/items/5265.php
In some cases, such pledges are the international expression of pre-existing national initiatives, and in
16
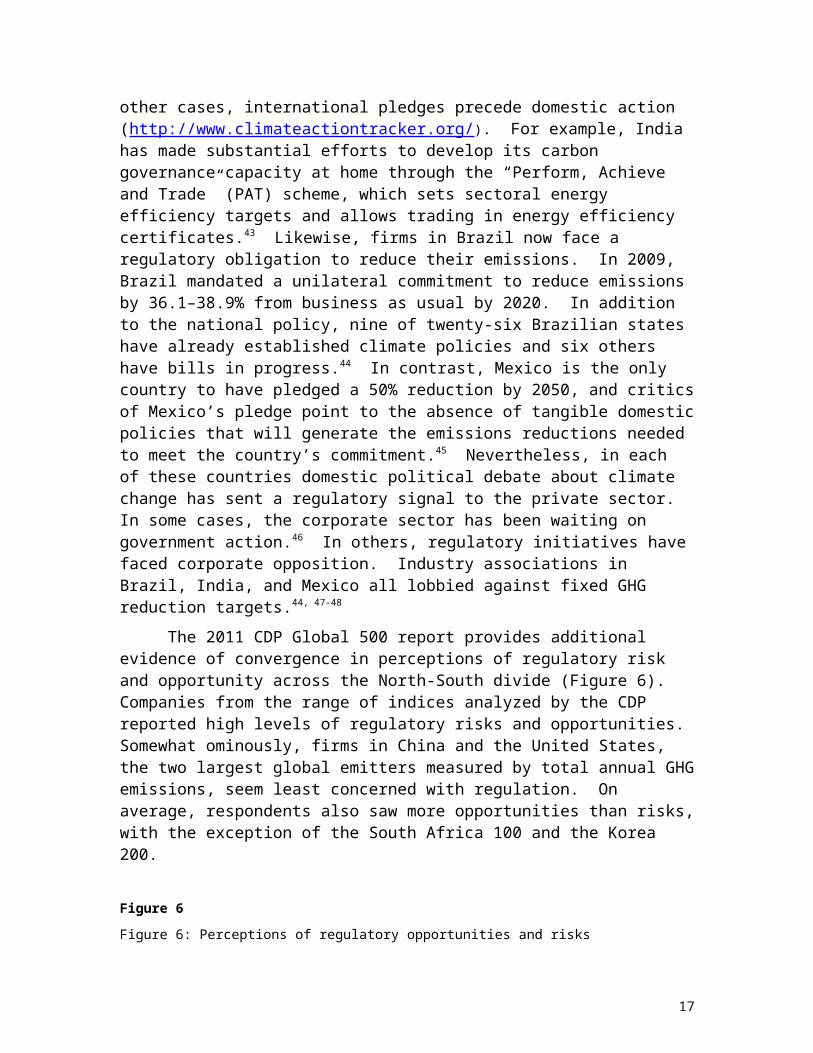
other cases, international pledges precede domestic action (http://www.climateactiontracker.org/). For example, India has made substantial efforts to develop its carbon governance capacity at home through the “Perform, Achieve and Trade” (PAT) scheme, which sets sectoral energy efficiency targets and allows trading in energy efficiency certificates.43 Likewise, firms in Brazil now face a regulatory obligation to reduce their emissions. In 2009, Brazil mandated a unilateral commitment to reduce emissions by 36.1–38.9% from business as usual by 2020. In addition to the national policy, nine of twenty-six Brazilian states have already established climate policies and six others have bills in progress.44 In contrast, Mexico is the only country to have pledged a 50% reduction by 2050, and criticsof Mexico’s pledge point to the absence of tangible domesticpolicies that will generate the emissions reductions needed to meet the country’s commitment.45 Nevertheless, in each of these countries domestic political debate about climate change has sent a regulatory signal to the private sector. In some cases, the corporate sector has been waiting on government action.46 In others, regulatory initiatives havefaced corporate opposition. Industry associations in Brazil, India, and Mexico all lobbied against fixed GHG reduction targets.44, 47-48
The 2011 CDP Global 500 report provides additional evidence of convergence in perceptions of regulatory risk and opportunity across the North-South divide (Figure 6). Companies from the range of indices analyzed by the CDP reported high levels of regulatory risks and opportunities. Somewhat ominously, firms in China and the United States, the two largest global emitters measured by total annual GHGemissions, seem least concerned with regulation. On average, respondents also saw more opportunities than risks,with the exception of the South Africa 100 and the Korea 200.
Figure 6 Figure 6: Perceptions of regulatory opportunities and risks
17

Do not insert the image in this document; please supply as a separate file.
Market risks and opportunitiesA third driver of corporate climate action comes from
market risks and opportunities. In particular, direct and indirect market drivers have motivated private-sector investments in GHG reductions. Carbon markets are a directdriver of corporate climate action. The opportunity to sellcarbon emissions reductions though carbon markets changes the financial feasibility of certain GHG reducing projects—for example methane capture from landfills—and amplifies interest in renewable and energy efficiency projects by offering an added revenue stream.49 Moreover, the CDM in particular has diffused awareness of and access to GHG reducing technologies across firms in the Global South.50 Rising energy costs act as an indirect driver of corporate climate action. In many emerging economies, energy demand outpaces supply, leading to energy shortages and increased costs. Firms respond by investing in new energy supplies (both conventional and renewable) and in energy efficiency improvements to seek relief from rising costs.51 The renewable and energy efficiency investments, though motivated by financial concerns, have the side-benefit of reducing GHG emissions.
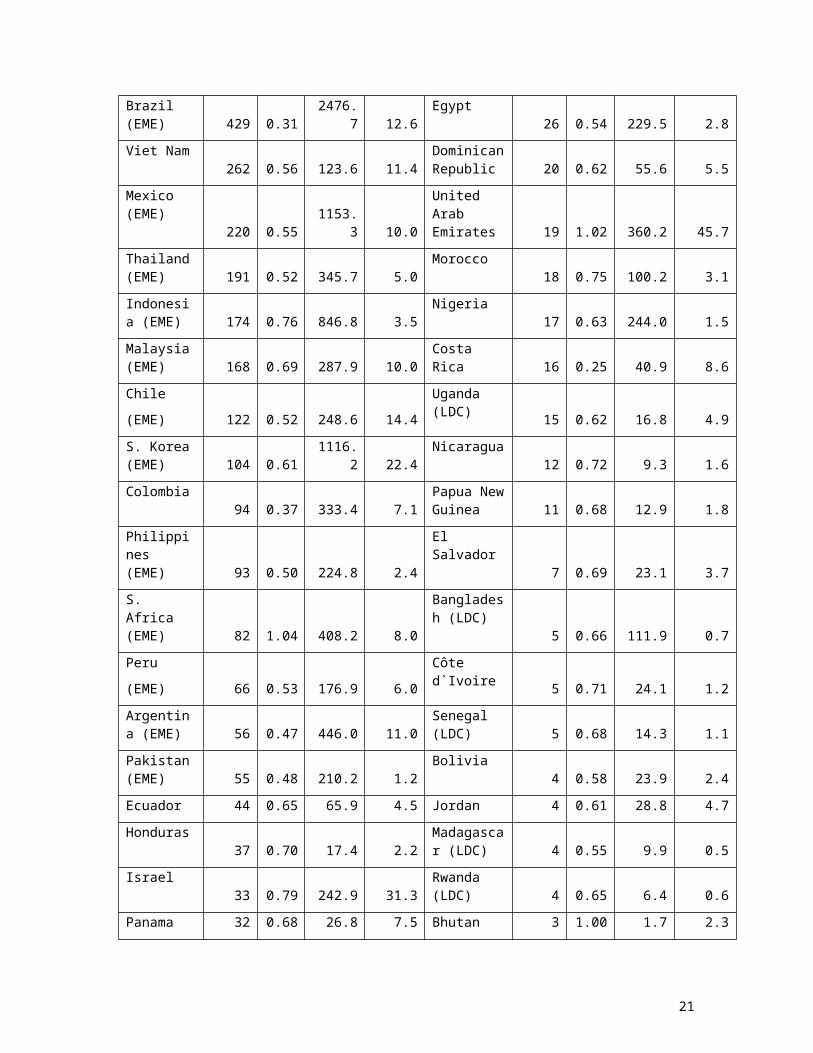
Market drivers, both direct and indirect, have the greatest impact in developing countries with larger private sectors and higher levels of economic development (Table 2).Those countries with a larger number of firms operating in the private sector have a greater potential to respond to market signals. For example, World Bank data on new businesses registered in 2009 ranges from 24 in Niger to over 315,000 in Brazil, different by a factor of over 10,000.52 These data suggest that the potential for Brazil’s private sector to respond to climate change is muchlarger than Niger’s, simply because there are more active firms in Brazil. Likewise, economies with higher throughput
18
offer more potential for investment in GHG reductions. The most common economic classifications within the Global Southare the emerging market economies (EMEs), describing the economic leaders of the developing world, and the least developed countries (LDCs), describing development laggards.Both metrics are ambiguous and controversial, with differentinternational organizations establishing different classification systems.53 Among EMEs, the BRIC countries (Brazil, Russia, India and China) are an oft cited sub-group. Within the climate policy literature, the BASICs (Brazil, South Africa, India, and China) are a more commonlyused sub-category, since Russia is an industrialized countryunder the UNFCCC.4
The broad classifications of EME versus LDC point to where market drivers of corporate climate action are most relevant. CDM investment clusters in the EMEs. China is host to the greatest number of CDM projects and the largest amount of projected emissions reductions, mirroring broader patterns in investment flows.54 China and India alone account for approximately 70% of projected GHG emissions viaCDM. In contrast, LCDs are host to only 98 CDM projects, 1%of total CDM projects under review.22 The EMEs are also home to the most dynamic energy sectors. For example, Chinais a world leader in both the construction of wind farms andcoal-fired power plants.55 Such countries see the highest rates of investments in renewable energy in part because they see the highest investment in the whole portfolio of energy sources. In contrast, energy sectors are stagnant inthe LDCs, with little investment in either traditional or renewable sources.51
In addition to general levels of economic development, a second predictor of the scope of market opportunities for GHG reductions is a country’s reliance on fossil fuels to meet heat, electricity and transportation needs, which can be measured via its Grid Emissions Factor (GEF). A GEF measures the carbon dioxide emitted per each unit of electricity provided by an electricity system.56 See Table 2 for a list of average combined margin GEFs for select
19

developing countries. South Africa has the most carbon intensive electricity grid, while Costa Rica’s national gridis least reliant on fossil fuels. Among EMEs, Brazil has the lowest GEF. GEFs are particularly relevant to CDM investment because equivalent projects that offset grid electricity will result in different GHG emissions reductions, depending the regional GEF. For example, a CDM project in India, with an electric grid relying primarily oncoal, will yield more GHG emissions reductions than the equivalent project in Brazil, where a large fraction of electricity is generated from hydropower. Such differences in GEFs help to explain the distribution of CDM projects across developing countries. While some CDM projects are developed in-house by corporations in the Global South, manyare the result of project development by global consulting companies, such as Ernst & Young and PriceWaterhouseCoopers.13 When deciding where to target their efforts, these consultancies reap greatest rewards perproject in countries with high GEFs. Overall, countries with higher GEFs tend to be more attractive for CDM investment than countries with lower GEFs, although this pattern is not absolute. For example, South Africa and the Arab United Emirates both have high GEFs, but the CDM marketin both countries has stalled due to a range of contractual issues.57
Table 2 Table 2: Indicators of market drivers
Country# ofCDM GEF
2011GDP
(US$b)
2011GDP/capit
a(US$k
) Country# ofCDM GEF
2011GDP
(US$b)
2011GDP/capit
a(US$k
)China (EME) 4028 0.93
7318.5 5.5
Guatemala28 0.68 46.9 3.2
India(EME) 2159 0.87
1848.0 1.5
Sri Lanka28 0.73 59.2 2.8
20
Brazil (EME) 429 0.31
2476.7 12.6
Egypt26 0.54 229.5 2.8
Viet Nam262 0.56 123.6 11.4
DominicanRepublic 20 0.62 55.6 5.5
Mexico (EME)
220 0.551153.
3 10.0
United Arab Emirates 19 1.02 360.2 45.7
Thailand(EME) 191 0.52 345.7 5.0
Morocco18 0.75 100.2 3.1
Indonesia (EME) 174 0.76 846.8 3.5
Nigeria17 0.63 244.0 1.5
Malaysia(EME) 168 0.69 287.9 10.0
Costa Rica 16 0.25 40.9 8.6
Chile(EME) 122 0.52 248.6 14.4
Uganda (LDC) 15 0.62 16.8 4.9
S. Korea(EME) 104 0.61
1116.2 22.4
Nicaragua12 0.72 9.3 1.6
Colombia94 0.37 333.4 7.1
Papua NewGuinea 11 0.68 12.9 1.8
Philippines (EME) 93 0.50 224.8 2.4
El Salvador
7 0.69 23.1 3.7S. Africa (EME) 82 1.04 408.2 8.0
Bangladesh (LDC)
5 0.66 111.9 0.7Peru(EME) 66 0.53 176.9 6.0
Côte d`Ivoire 5 0.71 24.1 1.2
Argentina (EME) 56 0.47 446.0 11.0
Senegal (LDC) 5 0.68 14.3 1.1
Pakistan(EME) 55 0.48 210.2 1.2
Bolivia4 0.58 23.9 2.4
Ecuador 44 0.65 65.9 4.5 Jordan 4 0.61 28.8 4.7Honduras
37 0.70 17.4 2.2Madagascar (LDC) 4 0.55 9.9 0.5
Israel33 0.79 242.9 31.3
Rwanda (LDC) 4 0.65 6.4 0.6
Panama 32 0.68 26.8 7.5 Bhutan 3 1.00 1.7 2.3
21
(LDC)Uruguay 32 0.61 46.7 14.0 Guyana 1 0.95 2.6 3.4Kenya
30 0.62 33.6 0.8Mali(LDC) 1 0.58 10.6 0.7
Sources: EME and LDC categorizations based on IMF (http://www.imf.org/external/data.htm) and UN (http://www.un.org/special-rep/ohrlls/ldc/list.htm); Number of CDM projects and GEF (average combined margin grid emissions factor) from www.cdmpipeline.org; GDP data from http://data.worldbank.org/.
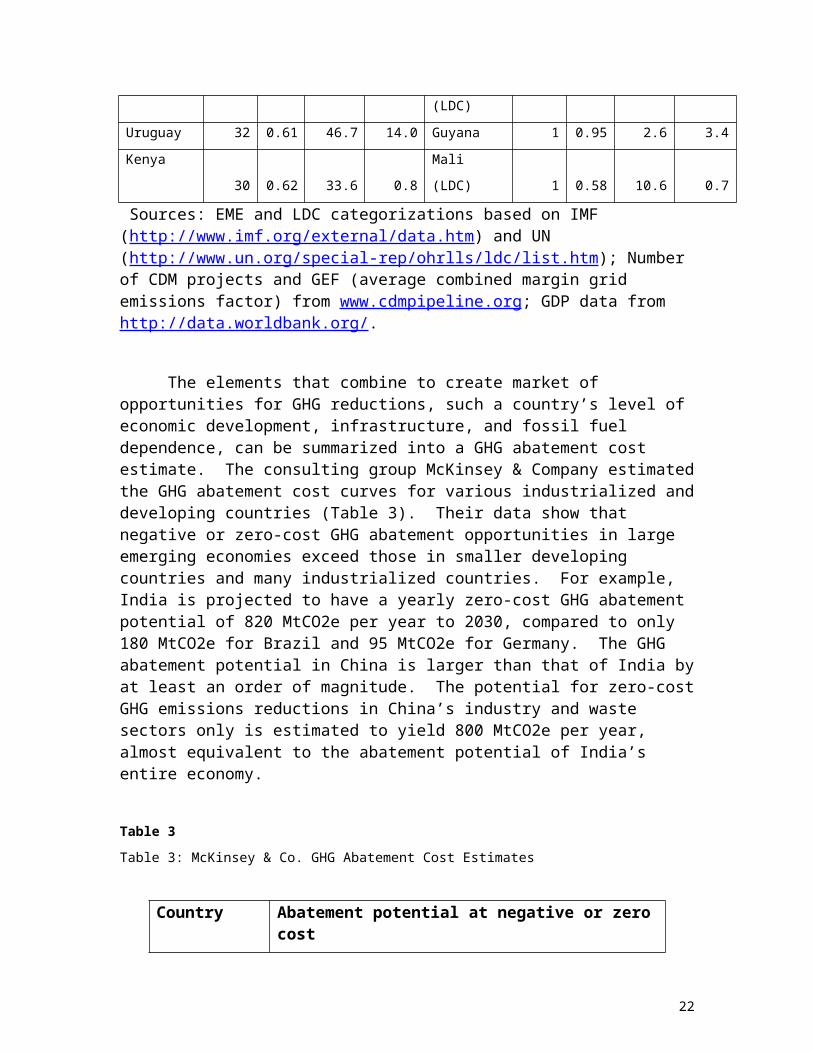
The elements that combine to create market of opportunities for GHG reductions, such a country’s level of economic development, infrastructure, and fossil fuel dependence, can be summarized into a GHG abatement cost estimate. The consulting group McKinsey & Company estimatedthe GHG abatement cost curves for various industrialized anddeveloping countries (Table 3). Their data show that negative or zero-cost GHG abatement opportunities in large emerging economies exceed those in smaller developing countries and many industrialized countries. For example, India is projected to have a yearly zero-cost GHG abatement potential of 820 MtCO2e per year to 2030, compared to only 180 MtCO2e for Brazil and 95 MtCO2e for Germany. The GHG abatement potential in China is larger than that of India byat least an order of magnitude. The potential for zero-costGHG emissions reductions in China’s industry and waste sectors only is estimated to yield 800 MtCO2e per year, almost equivalent to the abatement potential of India’s entire economy.
Table 3 Table 3: McKinsey & Co. GHG Abatement Cost Estimates
Country Abatement potential at negative or zerocost
22
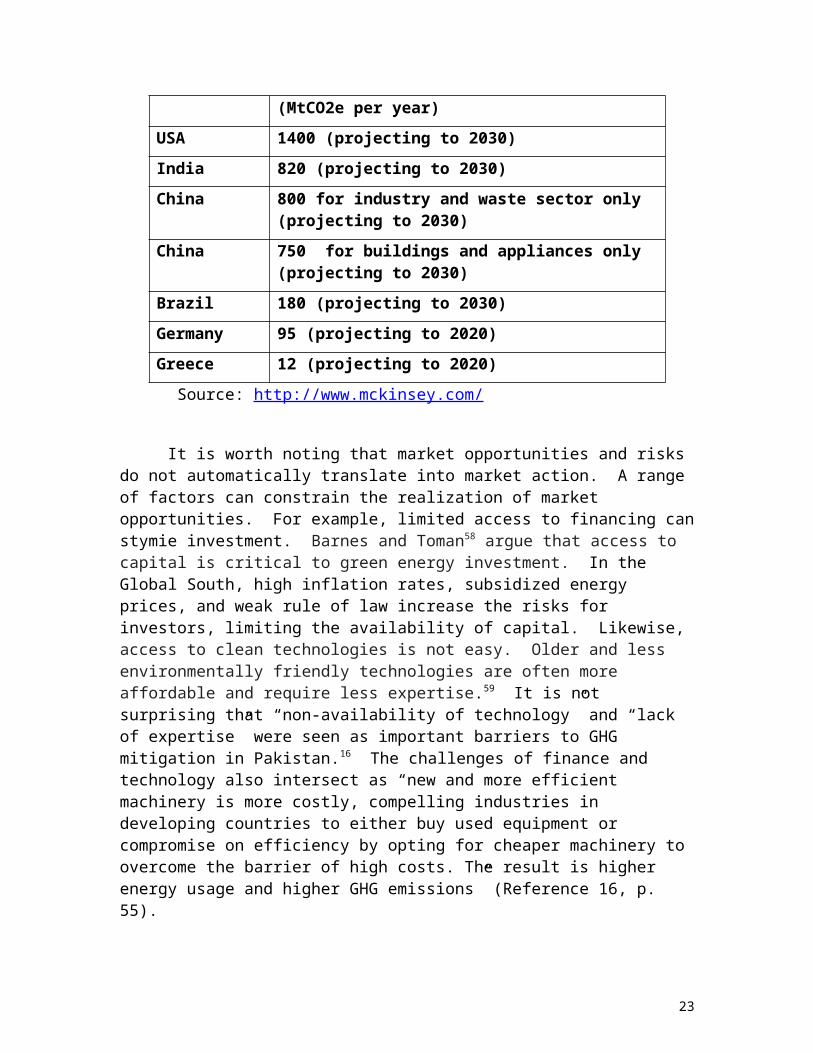
(MtCO2e per year)USA 1400 (projecting to 2030)India 820 (projecting to 2030)China 800 for industry and waste sector only
(projecting to 2030)China 750 for buildings and appliances only
(projecting to 2030)Brazil 180 (projecting to 2030)Germany 95 (projecting to 2020)Greece 12 (projecting to 2020) Source: http://www.mckinsey.com/
It is worth noting that market opportunities and risks do not automatically translate into market action. A range of factors can constrain the realization of market opportunities. For example, limited access to financing canstymie investment. Barnes and Toman58 argue that access to capital is critical to green energy investment. In the Global South, high inflation rates, subsidized energy prices, and weak rule of law increase the risks for investors, limiting the availability of capital. Likewise, access to clean technologies is not easy. Older and less environmentally friendly technologies are often more affordable and require less expertise.59 It is not surprising that “non-availability of technology” and “lack of expertise” were seen as important barriers to GHG mitigation in Pakistan.16 The challenges of finance and technology also intersect as “new and more efficient machinery is more costly, compelling industries in developing countries to either buy used equipment or compromise on efficiency by opting for cheaper machinery to overcome the barrier of high costs. The result is higher energy usage and higher GHG emissions” (Reference 16, p. 55).
23
Reputational risks and opportunitiesReputational concerns are a fourth driver of corporate
action on climate change. Companies see benefits in maintaining a good reputation with a range of stakeholders, including customers, investors, and regulators.60 Whereas regulatory and market drivers are designed to lead to concrete changes in operational practices, reputational concerns are sometimes addressed with superficial changes that are “neither strategic nor operational but cosmetic; public relations and media campaigns, the centre pieces of which are often glossy corporate social responsibility reports that showcase the companies’ environmental good deeds” (Reference 60, p.6). There is often a disconnect between emissions accounting and actual investment in emissions reductions (Figure 2). The boundaries between meaningful and cosmetic action are blurry. For example, while collecting carbon emissions data can be useful to strategic planning and assessing liability, disclosure of such data is often motivated by stakeholder management and reputational concerns.61
Empirical evidence on the importance of reputational drivers to corporations in the climate arena is mixed. In some global surveys, reputational risks are ranked of lowestconcern and in others they are the dominant motive for action.26-27 Data from the CDP, a voluntary disclosure initiative, also suggest a significant range in concern about reputation. In 2011, only eight firms in the China 100 provided data to the CDP while over eighty firms in the South Africa responded to the survey (Figure 1). A CDP report on the high rates of carbon disclosure by major SouthAfrican corporations argues that such transparency is in line with a broader commitment to sustainability reporting and governance standards.62 Across the various stock indices, response rates in developing countries were lower than those in industrialized countries. Case study data alsosuggest a complex picture. Hultman et al.’s49 analysis of the motivations of Indian and Brazilian sugar and cement firms regarding CDM investments reveal that reputational
24

considerations played a significant role in some sectors butnot in others. In the Indian cement industry, reputational benefits were rated on par with financial benefits. In interviews, firm managers revealed that being seen as proactive on climate change might facilitate permit approvals and smooth interactions with the Indian environmental ministry.
There are several reasons to expect less concern regarding corporate reputation in the Global South. First, levels of public awareness and understanding of climate change are lower in the Global South than in the Global North. 63 Likewise, Brechin and Bhandari find that publics in developing countries are also less likely to view climatechange as a threat, with the exception of Latin American countries. Second, media studies in various emerging economies document that responsibility for action on climatechange is ascribed to industrialized countries.64 Coverage in the Global South tends to focus on domestic vulnerabilityto climate impacts and international responsibility for mitigation.65 Publics in developing countries are not looking to local corporations to mitigate their GHG emissions. Even in industrialized countries, media coveragerarely singles out individual sectors or companies as responsible for climate change. Coverage is structured by debates over climate science and national and international climate politics.66
Finally, domestic climate advocacy is a relatively recent phenomenon in the Global South. Historically, environmental NGOs based in the Global South have focused their advocacy on the international arena, on the mitigationresponsibilities of the Global North, and on the need for adaptation financing for the Global South.67 Other environmental issues dominated local agendas. For example, Pulver’s68 analysis of climate politics in Mexico documents that environmental groups were more concerned with local issues, such as air pollution in Mexico City and deforestation in southern Mexico. While these issues can belinked to climate change, local NGOs did not frame them as
25

related to climate change. Moreover, it is rare for environmental groups in the Global South to directly target local corporations based on their climate policies and practices. Labor rights and industrial pollution are much more common concerns.69 Advocates in the climate justice movement are beginning to link equity and environmental concerns and target both states and corporations as perpetrators of climate injustices. However, the early corporate targets of climate justice campaigns were the global multinationals.70 As the climate justice movement has expanded, local corporations are becoming more frequent targets.18
Country profiles: Private sector responses in large EMEs, less developed countries, small islands and oil producers
In practice, the physical, regulatory, market, and reputational risks and opportunities created by climate change do not operate independently but overlap to create particular national and regional patterns in corporate responses. For example, firms in large, rapidly developing countries tend to face higher levels of regulatory risk, greater market opportunities, and some reputational risks, creating a complex terrain of climate-related risk and opportunity. In contrast, in less developed countries, physical risks are prominent, and regulatory, market and reputational risks are mostly absent. In this section, we describe patterns in corporate responses to climate change in four country clusters. We examine the concentration of corporate climate activity in the large, emerging economies of Brazil, China, India, Mexico, and South Africa. We then illustrate and explain the private sector inaction on climate change that is characteristic of the less developed countries, using Kenya and Pakistan as examples. Finally, we compare private sector responses in two regions at extreme ends of climate vulnerability, the Small Island Developing States (SIDS) and the Organization of Petroleum Exporting Countries (OPEC) of the Middle East. We focus on these four country groupings for two reasons. First, they represent distinct types of economies in the Global South.
26

Second, they have been vocal constituencies in the international climate debates and thus their domestic politics, including the activities of domestic economic interests, merit attention.Large EMEs: Brazil, China, India, Mexico and South Africa
Regulatory, market, reputational and physical drivers intersect to spur corporate action on climate change in the large emerging economies. Most EMEs have enacted legislation to reduce domestic GHG emissions over the next decades at federal and/or state levels. Their economies andenergy sectors are growing, providing extensive opportunities for investment in climate-friendly technology and for profiting from carbon markets. The climate issue generates some media and NGO attention. Finally, these countries face a complex physical risk picture. Despite economic growth, they are home to large populations vulnerable to climate change—among the BASICs, India is the most vulnerable—and have some domestic resources to mitigatevulnerability. Firms in the large rapidly developing countries have responded to these intersecting drivers with action on climate change. EME’s account for the bulk of private-sector low carbon investment under the CDM. Moreover, climate change is a sufficiently prominent domestic political issue that firms in Brazil, China, India,Mexico and South Africa are very aware of the issue and, in some cases, even lobbying their home governments on climate policy.44
Within this broad framework of common drivers, differences persist. For example, the rapid developers differ in the focus of state involvement in carbon governance.71 In China, the government has focused on climate change-related market opportunities rather than GHG regulation. China is the leading CDM host country worldwide, and the government has been highly successful in using the CDM to accomplish its own domestic environmental priorities by adding additional national requirements to CDMinvestment. This produces a form of Chinese carbon governance dominated by regulated markets, where the state
27
is closely involved with private actors from business.72 However, the Chinese government’s active involvement in CDM markets is not matched by a national commitment to reduce GHG emissions. Among emerging economies, it has the least aggressive GHG reduction target. In India, corporate responses to climate change reflect an active private sector. Benecke73 describes India as “a case of market-dominated carbon governance taking place under a weak shadowof hierarchy and with little civil society involvement” (Reference 73, p. 346). Indian companies have prioritized GHG accounting and reduction in the absence of government support for CDM and government GHG regulation, at least until recently. The corporate focus on energy efficiency and clean energy alternatives in India has been driven by concerns about fossil energy supplies and rising energy costs.47, 74
In Brazil, Mexico and South Africa, governments have been more active GHG regulators but have done relatively little to support private sector CDM activities. All three countries have pledged ambitious GHG reduction targets. Mexico made international headlines by passing a domestic law that set a long-term GHG emissions reductions target (a 50% reduction by 2050) for the country.48 Some argue that the Mexican government’s focus on target setting has come atthe expense of a plan for implementation and doubt the effectiveness of the law and the country’s ability to meet its target. This approach is reflected in the activities ofMexico’s private sector. Corporations are actively involvedin GHG accounting but have lagged in investing in GHG reductions.68 Similarly, South Africa has set an ambitiousGHG reduction target but private sector CDM activity is quite limited. A CDP report focused on South Africa points to a gap between companies’ disclosure strategies and their emission management processes, resulting in an unstructured system of carbon management.75 Finally, Brazil was considered an early mover and instrumental to the design andimplementation of the CDM.76 However, the Brazilian government saw its role as regulatory, focused on insuring the environmental integrity of proposed CDM projects.
28
Business experienced the Brazilian government’s involvement in climate change activities as a hindrance rather than as an advantage.49
Dechezlepretre et al.’s77 analysis of technology transfer under the CDM also offers comparative insight on how regulatory focus, technological infrastructure, and foreign investment intersect to create different climate-related market opportunities across the large emerging economies. They find that Brazil, China and Mexico are all characterized by higher levels of technology transfer under CDM; 40%, 59%, and 68%, respectively, of CDM projects have atechnology transfer component. In contrast, only 12% of Indian CDM projects included a technology transfer component. The higher rates in Mexico and Brazil are reflective of the countries’ abilities to promote foreign partnerships and to secure foreign buyers for carbon credits. Both countries have actively supported mechanisms for international financing and technology transfer related to climate change. In China, the government’s mandate for foreign partners on CDM and domestic firms’ technology capabilities foster technology exchange. India’s CDM projects are mostly self-financed by Indian firms and rely on installation of domestic technology.Less developed countries
In contrast to the high levels of corporate activity inemerging economies, in the less developed economies private sector responses to climate change are limited. Corporate climate action is discouraged by a combination of weak regulatory environments, limited economic activity, little or no domestic or foreign investment, and limited awareness of climate change. Africa, home to thirty of the forty-eight LDCs, provides an illustrative example. Of the fifty-four countries in Africa, only South Africa has submitted a GHG reduction pledge and developed domestic climate legislation.78 Likewise, the continent barely participates in the CDM. Of the over 9,000 projects in the CDM pipeline,261 are hosted by African countries, and 83 of those are in
29
South Africa. Africa’s thirty LDCs account for only 60 projects, less than 1% of the global total.22
Kapfudzaruwa’s41 study of corporate responses in Kenya versus South Africa offers some insight on the experience ofless developed countries. Of the forty-five Kenyan companies included in Kapfudzaruwa’s study, thirty-eight were non-performers on climate change. There was only one climate champion and another six companies whose climate activities were in an emergent or exploratory stage. Kapfudzaruwa argues that Kenyan companies do not face any threats of sanctions or pressures to respond to climate change, due to a weak regulatory environment and the absenceof normative pressure from civil society. Focusing more broadly on sub-Saharan Africa and the East African Communitycountries, Byigero, Clancy and Skutsch79 point to a range ofbarriers to explain the relatively low CDM penetration in the two regions. Particulars include an inadequate general investment climate, low levels of industrialization, and a lack of CDM capacity, especially with regard to institutional infrastructure. One example of this incapacity is the inability to prepare or implement credibleCDM proposals. Such proposals require detailed and complex project documents, construction of baselines, and project record keeping and accounting on a large scale.80 Another reason is that, within the CDM, “the approved methodologies for project selection are heavily biased towards energy, industrial and synthetic gas sectors, all areas in which Africa has relatively little presence”81 (Reference 81, p. 350).
Jeswani et al.16 come to a similar conclusion in their analysis of corporate responses to climate change in Pakistan. They point to high costs, lack of financial resources, lack of awareness, non-availability of technology, and absence of government policies as the main barriers to corporate climate action. Of the seventy-two Pakistani firms in the study, only four had an active climate program. Jeswani et al.’s research also highlights the role of international linkages. Examples of corporate
30
action on climate change in LDCs usually have a direct international connection. Of the companies active on climate in Pakistan, all were subsidiaries of multinational corporations. Likewise, in Kapfudzaruwa’s study, South Africa’s climate champions were mostly subsidiaries of multinational corporations. Exceptionally, Kenya’s single climate champion was a local sugar mill.41
Small island developing states and the oil producers in the Middle East
In emerging economies and less developed countries, thepresence or absence of regulatory and market drivers most directly shapes corporate responses to climate change. In our third and fourth country clusters, we assess how high versus low vulnerability to the physical risks of climate change combined with low versus high mitigation costs have shaped corporate responses. For the fifty-two small island developing nations, the physical risks of climate change dominate, and global mitigation efforts are necessary for national survival. In contrast, the oil producing countriesof the Middle East have been less concerned with physical adaptation and have actively sought to hinder the development of an international climate regime, seeing global mitigation as a threat to their core source of national income.4
The private sector response to climate change in SIDS has been limited and focused primarily on adaptation. Thisresponse reflects the unique combination of risks and opportunities related to climate change faced by firms in SIDS, including extensive physical risks, high regulatory risks, and limited market opportunities. SIDS extreme vulnerability to sea level rise and intensifying weather patterns have lead to active political mobilization in the UN climate negotiations. The Alliance of Small Island States (AOSIS) leads calls for limiting global temperature increases to 1.5 degrees Celsius, with the goal of minimizing the adverse impacts of climate change, and for adaption financing.4 Firms in SIDS have benefited from thismobilization. AOSIS has asked for an adaption fund on
31
behalf of its tourism and fishing industries to cover the costs of loss and damage from climate impacts.82 The physical risks of climate change have also motivated individual resorts to track the local impacts of climate change on revenue and to channel some investment towards reducing the impact of rising sea levels, although the tourism industry has not coordinated the industry-wide response.23, 37
Private sector actors in some SIDS also face a strong regulatory signal. Several SIDS are among the countries that have pledged to reduce national GHG emissions. The Maldives and Samoa set the most stringent target of carbon neutrality by 2019 and 2020, respectively (Table 1). The aggregate impact of these pledges is minimal since SIDS are not major GHG emitters. Nevertheless, private sector actors operating in SIDS must meet these reduction goals. The limited corporate climate action in SIDS is best explained by the small size of most SIDS economies. Several SIDS are LDCs and most have economies highly dependent on international trade.83 These limitations on the scope for private sector action are reflected in the low engagement inCDM. Twenty-eight SIDS have no CDM projects, while nine others are host to a total of forty-four projects. Twenty of these are located in the Dominican Republic and eleven inPapua New Guinea (www.cdmpipeline.org). Several are renewable energy projects. Access to energy is a key challenge facing all SIDS.83
In the oil producing countries of the Middle East, plentiful access to fossil fuel energy has created conditions that discourage private sector action on climate change. First, regulatory drivers of corporate climate action are absent in the oil-producing states. Rather, OPEChas asked for special consideration for their state-owned oil companies under the UNFCCC and the Kyoto Protocol, in order to extend the status quo and prevent global carbon mitigation efforts from adversely impacting oil revenues.4, 86
Second, while market opportunities for climate mitigation abound, they have not been realized. According to Karakosta
32

et al.84, “the majority of the Middle East and North Africa (MENA) countries possess substantial potential for the implementation of CDM projects. However, most of the MENA countries have a limited track record in regards to CDM projects in comparison with the major CDM-players in the Asia-Pacific regions and Latin America” (Reference 84, p. 2455). Market and technology barriers including “outdated power sector infrastructures, investment and technological constraints, minimal regional coordination of energy policies, and trading restrictions on renewable energy exchanges” (Reference 85, p. 4409) have stalled efforts to develop North Africa’s renewable energy resources. In addition, a lack of trust in surrounding governments and growing political instability has made cooperation in the region difficult.85
Only recently have OPEC countries begun exploring a wider range of options in their responses to climate change,recognizing the potential of carbon capture and storage (CCS) and renewable technologies.87 OPEC nations are emerging as sites for large-scale CCS projects88 and for solar energy investment due to their location along the African sun belt.85 A growing awareness of the region’s physical vulnerability to climate change may be partial driver of this shift. The Middle East faces one of the mostimportant water crises in the world. Eight out of the eleven countries in the region are water scarce and several studies predict that climate change will worsen the situation.89
Private governance of climate change in the Global South?Our analysis of private-sector responses to climate
change in emerging economies, less developed countries, and small-island and oil-producing states underscores both the range in corporate action and the complex interplay of drivers and barriers that results in private sector efforts to reduce GHG emissions and invest in climate-friendly energy sources. Most corporate engagement with climate change clusters in the rapidly emerging economies. Corporate climate action in Brazil, China, India and other
33
emerging economies is driven by the prospect of domestic climate regulation—many large developing countries have pledged greenhouse gas emissions reductions by 2020—and by the market opportunities created by the Clean Development Mechanism. In response to both pressures, companies are tracking their carbon emissions and investing in low-carbon technologies. In the rest of the developing world, barriersrelated to weak regulatory environments, low levels of industrialization and growth, restricted access to capital, and limited technical capacity intersect to limit private sector action on climate change.
Assessing the current patterns and drivers of private-sector responses suggests that the prospects for expanding private governance of climate change in the Global South arelimited. Unlike in industrialized countries, where climate change governance is multi-level90—city and state action fills the gaps and/or complements national and internationalaction—and crosses public-private divides,91 most impetus for climate action in developing countries traces back to the international arena. Corporate climate action in developing countries is primarily a response to opportunities created by the CDM and to developing country regulation of GHG emissions, inspired by action in the Global North. Both these drivers are limited in their current reach, and their continued impact is dependent on progress in the international effort to regulate GHGs.
Most companies in the Global South were first exposed to the climate issue via the CDM. Precursors of the currentCDM framework were pioneered in the mid 1990s, more than a decade prior to any discussion of GHG reduction targets by developing countries.92 While the CDM has motivated some action across the Global South, 95% of CDM activity is concentrated in five countries. Projecting into the future,it is also likely that CDM will be a diminishing driver of corporate action on climate change. The uncertain future ofthe Kyoto Protocol has undermined the CDM market.21 Moreover, restrictions on the purchase of CDM credits to projects originating in LDCs that meet strict sustainability
34
criteria diminish market liquidity. The CDM becomes more like an environmental aid mechanism and less like an investment market.93
It is also unlikely that national GHG targets in developing countries will replace the diminishing market driver created by CDM. Only fifteen of 154 Non-Annex 1 countries have pledged voluntary quantitative targets for GHG emissions reductions. On a positive note, the biggest GHG emitters have pledged action, unlike in the Global North, where regulatory action is weakest in the major emitter, i.e. the US. The voluntary targets pledged by China, India, South Africa, Mexico and Brazil all extend to 2020 and 2050. Pledges were thus made by national administrations which will no longer be in office when the deadlines to meet targets come due, and in many cases pledges were not linked to concrete legislative initiatives.The likelihood of such pledges becoming binding at the international and domestic levels is directly tied to actionin the Global North. Continuing efforts to regulate GHG emissions in developing countries are contingent on parallelefforts in the Global North.
Drivers related to physical and reputational risks and opportunities have played a more limited role. Both seem most relevant to multinational corporations operating in theGlobal South. Their subsidiaries have been active in providing adaptation technologies and in showcasing their climate commitments through projects in developing countries. However, these are the exceptions. In most developing countries, the private sector is concerned with other priorities and unaware of its contribution to climate change. Some argue that increased exposure to the physical risks of climate change will change this picture and motivate action,94 but to date, physical vulnerability to climate change has not motivated a coordinated private-sector response in any sector in the Global South. The importance of reputational drivers is more ambiguous, with empirical evidence pointing to both limited and extensive effects.
35

In conclusion, efforts to promote low-carbon growth in the Global South must go hand-in-hand with parallel efforts in the Global North. The continued stalemate in the international climate negotiations over responsibility for climate change, pitting industrialized against developing countries, undermines any push for private sector action in the Global South. Recasting the international negotiations as multi-polar dialogue between country groupings based on economic growth trajectories, fossil fuel resources, technological capabilities, and vulnerability to climate change may reanimate a blocked debate.
The necessary task of engaging corporate actors in developing countries in the shared global project of climateprotection will take leadership by industrialized countries and companies. Corporations in the Global South look to their industry peers for leadership. Climate leaders in developing countries tend to be embedded in international industry networks. Moreover, regulatory pressures and market opportunities are most likely to elicit a corporate response. Continuing efforts to regulate GHG emissions in developing countries are contingent of parallel efforts in the Global North. Likewise, efforts to promote low-carbon growth in the Global South go hand-in-hand with parallel efforts in the Global North.
References1. van Drunen, M.A., R. Lasage, and C. Dorland, eds. Climate Change in
Developing Countries. 2006, CAB International: Oxfordshire, Cambridge.2. Ravindranath, N.H. and J. Sathaye, Climate Change and Developing
Countries. 2002, Dordrecht: Kluwer Academic Publishing.3. Mintzer, I.M. and J.A. Leonard, eds. Negotiating Climate Change: The
Inside Story of the Rio Convention. 1994, Cambridge University Press and Stockholm Environment Institute: Cambridge, UK.
4. Oberthuer, S. and H. Ott, The Kyoto Protocol: International Climate Policy in the21st Century. 1999, Berlin: Springer.
5. EIA, International Energy Outlook. 2010, Energy Information Agency, US Department of Energy Washington, DC.
36

6. Rosa, E. and T. Dietz, Human Drivers of National Greenhouse-Gas Emissions. Nature Climate Change, 2012. 2: p. 581-586.
7. Levy, D., Business and International Environmental Treaties: Ozone Depletion and Climate Change. California Management Review, 1997(Spring).
8. CMA. Highlights of Indian Cement Industry. 2009 [cited 2009 11 November].
9. Kolk, A. and J. Pinkse, Business Responses to Climate Change: Identifying emergent strategies. California Management Review, 2005. 47(3): p. 6-20.
10. Forsyth, T., Promoting the "Developement Dividend" of Climate Technology Transfer: Can cross-sector partnerships help. World Development, 2007. 35(10):p. 1684-1698.
11. Wara, M. and D.G. Victor, A realistic policy on international carbon offsets, inProgram on Energy and Sustainable Development Working Paper #74. 2008, Stanford University: Stanford.
12. Purohit, P. and A. Michaelowa, Potential of Wind Power Project under the Clean Development Mechanism in India. Carbon Balance and Management, 2007. 2(8): p. 1-15.
13. Knox-Hayes, J., The Developing Carbon Financial Service Industry: Expertise, adaptation and complementarity in London and New York. Journal of Economic Geography, 2010. 9(6): p. 749-777.
14. Pulver, S., Corporate Responses, in Oxford Handbook of Climate Change and Society, J. Dryzek, R. Norgaard, and D. Shlosberg, Editors. 2011, Oxford University Press: Oxford, UK.
15. Cogan, D.G., Corporate Governance and Climate Change: Making the connection. 2006, Ceres, Inc.: Boston, MA.
16. Jeswani, H.K., W. Wehrmeyer, and Y. Mulugetta, How Warm is the Corporate Response to Climate Change? Evidence from Pakistan and the UK. BusinessStrategy and the Environment, 2008. 18: p. 46-60.
17. Wara, M., Measuring the clean development mechanism's performance and potential.UCLA Law Review, 2008. 55(6): p. 1759 - 1791.
18. Bond, P., Carbon Capital's Trial, the Kyoto Protocol's Demise, and Opening for Climate Justice. Capitalism, Nature, Socialism, 2011. 22(4): p. 3-17.
19. Dunn, S., Down to Business on Climate Change. Greener Management International, 2002. 39(Autumn): p. 27-41.
20. PWC, CDP Global 500 Report 2011: Accelerating Low Carbon Growth. 2011, Carbon Disclosure Project: London.
21. UNEP Risoe Center. Approved CDM Methodologies. 2013 1 March [cited 2013 2 March]; Available from: http://www.cdmpipeline.org/cdm-methodologies.htm.
37

22. UNEP Risø Centre. CDM/JI Pipeline Analysis and Database. 2012 [cited 2012 3 October]; Available from: http://cdmpipeline.org/.
23. Belle, N. and B. Bramwell, Climate Change and Small Island Tourism: Policy Maker and Industry Perspectives in Barbados. Journal of Travel Research, 2005. 44(1): p. 32-42.
24. Hoffman, A.J., Climate Change Strategy: The Business Logic Behind Voluntary Greenhouse Gas Reductions. California Management Review, 2005. 47(3): p. 21-46.
25. Pulver, S., Introduction: Developing-country firms as agents of environmental sustainability? Studies in Comparative International Development, 2007. 42(3/4): p. 191-207.
26. KPMG, Climate Changes Your Business: KPMG's review of the business risks and economic impacts at sector level. 2008, KPMG International: Netherlands.
27. Enkvist, P.-A. and H. Vanthournout, How Companies Think About Climate Change. 2007, McKinsey & Company: Geneva.
28. Pulver, S., Making Sense of Corporate Environmentalism: An environmental contestation approach to analyzing the causes and consequences of the climate change policy split in the oil industry. Organization & Environment, 2007. 20(1): p.44-83.
29. Jones, C.A. and D.L. Levy, North American Business Strategies Towards ClimateChange. European Management Journal, 2007. 25(6): p. 428-440.
30. Boiral, O., Global Warming: Should companies adopt a proactive strategy. Long Range Planning, 2006. 39: p. 315-330.
31. Parry, M.L., et al., eds. Climate Change 2007: Impacts, adapation, and vulnerability. 2007, Cambridge University Press: Cambridge, UK and New York, NY.
32. Wolf, J., Climate Change Adaptation as a Social Process. Advances in Global Change Research, 2011. 42(1): p. 21-32.
33. Mendelsohn, R., A. Dinar, and L. Williams, The Distributional Impact of Climate Change on Rich and Poor Countries. Environmenta and Development Economics, 2006. 11: p. 159-178.
34. Sirohi, S. and A. Michaelowa, Implementing CDM for the Indian Dairy Sector: Prospects and issues. Climate Policy, 2008. 8(1): p. 62-74.
35. Eakin, H. and A.L. Luers, Assessing the Vulnerability of Social-environmental Systems. Annual Review of Environment and Resources, 2006. 31: p. 365-394.
36. Oppermann, M. and K.-S. Chon, Tourism in Developing Countries. 1997, London, UK and Boston, MA: International Thomson Business Press.
38
37. Nurse, L. and G. Sem, Small Island States, in Climate Change 2001: Impacts, Adaptation, and Vulnerability, IPCC, Editor. 2001, Cmabridge University Press: Cambridge.
38. UNWTO, Climate Change and Tourism: Responding to global challenges. 2008, World Tourism Organization and United Nations Environment Program:Madrid.
39. Oxfam, The New Adaptation Marketplace: Climate change and opportunities for green growth. 2009, Oxfam America: Boston.
40. Forstater, M., S. Huq, and S. Zadeck, The Business of Adaptation. 2009, AccountAbility and International Institute for Environment and Development (IIED).
41. Kapfudzaruwa, F., Corporate Response to Climate Change in Areas of Limited Statehood: An outline of the organizational configurations in Kenya and South Africa, in International Studies Association Annual Conference. 2012: San Diego.
42. World Bank. Data - Climate Change. 2012 [cited 2012 5 May]; Available from: http://data.worldbank.org/topic/climate-change.
43. Singh, N., Bureau of Energy Efficiency's energy efficiency scheme hits hurdles, in The Times of India. 2012: New Delhi.
44. Hultman, N.E., et al., Carbon Markets and Low-Carbon Investment in Emerging Economies: A synthesis of parallel workshops. Energy Policy, 2011. 39: p. 6698-7000.
45. Ecofys and Climate Analytics, Climate Action Tracker Mexico. 2012: Potsdam, Germany.
46. Dagar, S.S., Too Hot to Handle: The government and industry aren't doing enough to tackle climate change, in Business Today. 2007. p. 17-19.
47. Pulver, S., Corporate Responses to Climate Change in India, in Handbook of Climate Change and India: Development, politics, and governance, N. Dubash, Editor. 2011, Oxford University Press: New Delhi.
48. Black, R., Inside Mexico's climate revolution, in BBC News - Science and Environment. 2012.
49. Hultman, N.E., et al., Carbon Market Risks and Rewards: Firm perceptions of CDM investment decisions in Brazil and India. Energy Policy, 2012. 40: p. 90-102.
50. Dechezlepretre, A., M. Glachant, and Y. Meniere, The Clean Development Mechanism and the International Diffusion of Technologies: An empritical study. Energy Policy, 2008. 36(4): p. 1273-1283.
51. Elzinga, D., Advantage Energy: Emerging economies, developing countries, and the private-public sector interface. 2011, International Energy Agency Energy Technology Policy Division: Paris.
39

52. World Bank. New businesses registered (number). 2009 [cited 2013 1 March]; Available from: http://data.worldbank.org/indicator.
53. No author, Acronyms BRIC out all over, in The Economist. 2008.54. Ellis, J., et al., CDM: Taking stock and looking forward. Energy Policy
2007. 35(1): p. 15-28.55. Lewis, J., Green Innovation in China: China’s wind power industry and the global
transition to a low-carbon economy. 2012, New York, NY: Columbia University Press.
56. Kuriyama, A. List of Grid Emissions Factor. 2013 [cited 2013 3 March]; Available from: http://enviroscope.iges.or.jp/modules/envirolib/view.php?docid=2136.
57. Bozmoski, A. and N.E. Hultman, Investment Decison-Making under the Clean Development Mechanism: South Africa's ammonium nitrate and steel sectors. no date. p. 33.
58. Barnes, D.F. and M.A. Toman, Energy, equity, and economic development, in Economic Development and Environmental Sustainability, R. Lopez and M.A. Toman, Editors. 2006, Oxford University Press: Oxford, UK. p. 245-272.
59. IPCC, Methodological and Technological Issues in Technology Transfer: Summary for policymakers. 2001, Cambridge, UK: Cambridge University Press.
60. Porter, M. and M. Kramer, Strategy and Society: The link between competitive advantage and corporate social responsibility, in Harvard Business Review. 2006. p. 17 pp.
61. Ceres, The 21st Century Corporation: A Ceres roadmap to sustainability. 2010, Cere: Boston, MA.
62. Incite Sustainability, CDP South Africa 100: South African business - shifting thefocus to performance. 2012, Carbon Disclosure Project: London.
63. Brechin, S.R. and M. Bhandari, Perceptions of Climate Change Worldwide. WIREs Climate Change, 2011. 2: p. 871-885.
64. Shanahan, M., Time to Adapt: Media Coverage of Climate Change in Non-industrialized Countries, in Climate Change and the Media, T. Boyce and J. Lewis, Editors. 2009: New York, NY: Peter Lang.
65. Billet, S., Dividing Climate Change: Global warming in the Indian mass media. Climatic Change, 2009: p. 1-16.
66. Boykoff, M., Flogging a Dead Norm? Newspaper coverage of anthropogenic climate change in the United States and United Kingdom, 2003-2006. Area, 2007. 39(4): p. 470-481.
67. Taalab, A., Rising Voices Against Global Warming. 1998: Informationszentral der Elektrizitaetswirtschaft IZE.
40

68. Pulver, S., Climate Change Politics in Mexico, in Changing Climates in North American Politics, H. Selin and S. VanDeveer, Editors. 2009, MIT Press: Cambridge, MA.
69. Guha, R. and J. Martinez-Alier, Varieties of Environmentalism: Essays North and South. 1997, London, UK: Earthscan.
70. Karliner, J., The Corporate Planet: Ecology and politics in the age of globalization.1997, San Francisco: Sierra Club Books.
71. Fuhr, H. and M. Lederer, Varieties of Carbon Governance in Newly Industrializing Countries. Journal of Environment & Development, 2009. 18(4): p. 327-345.
72. Schroeder, M., Varieties of Carbon Governance: Utilizing the Clean Development Mechanism for Chinese priorities. Journal of Environment & Development, 2009. 18(4): p. 371-394.
73. Benecke, G., Varieties of Carbon Governance: Taking stock of the local carbon market in India. Journal of Environment & Development, 2009. 18(4): p.346-370.
74. Schneider, M., V.H. Hoffmann, and B.R. Gurjar, Corporate Responses to the CDM: The Indian pulp and paper industry. Climate Policy, 2009. 9(3): p. 255-272.
75. KPMG, Carbon Disclosure Project: South Africa's carbon chasm. 2010, Carbon Disclosure Project: Parkview.
76. Friberg, L., Varieties of Carbon Governance: The Clean Development Mechanism in Brazil - A success story challenges. Journal of Environment & Development, 2009. 18(4): p. 395-424.
77. Dechezlepretre, A., M. Glachant, and Y. Meniere, Technology Transfer by CDM Projects: A comparison of Brazil, China, India, and Mexico. Energy Policy, 2009. 37: p. 703-711.
78. UNEP. Welcome to the UNEP Climate Pledges Site. 2010 23 November [cited 2012 5 May]; Available from: http://www.unep.org/climatepledges/Default.aspx?pid=1.
79. Byigero, A., J. Clancy, and M. Skutsh, CDM in Sub-Saharan Africa and the Prospects of the Nairobi Framework Initiative. Climate Policy, 2010. 10(2): p.181-189.
80. De Lopez, T., et al., Clean Development Mechanism and Least Developed Countries: Changing the rules for greater participation. Journal of Environment &Development, 2009. 18(4): p. 436-452.
81. Collier, P., G. Conway, and T. Venables, Climate Change and Africa. Oxford Review of Economic Policy, 2008. 24(2): p. 337-353.
82. AOSIS. AOSIS Presses Loss and Damage in Bangkok. 2012 [cited 2013 4 March]; Available from: http://aosis.org/category/matters-of-survival/.
41

83. Barnett, J. and J. Campbell, Climate Change and Small Island States: Power, knowledge and the South Pacific 2010, London: Earthscan.
84. Karakosta, C., H. Doukas, and P. John, EU-MENA Energy Technology Transfer under the CDM: Israel as a frontrunner? Energy Policy, 2010. 38(5): p. 2455-2462.
85. Mason, M. and D. Kumetat, At the Crossroads: Energy futures for North Africa. Energy Policy, 2011. 39(8): p. 4407-4410.
86. Depledge, J., Striving for No: Saudi Arabia in the climate change regime. Global Environmental Politics, 2008. 8(4): p. 9-35.
87. Michaelowa, A. and M. Luomi, From Climate Antagonists to Low-Carbon Protagonists? 2012, Fridtjof Nansen Institute: Lysaker, Norway. p. 1-8.
88. Lovell, B., Challenged by Carbon: The oil industry and climate change. 2010, Cambridge, UK: Cambridge University Press.
89. Agoumi, A., Vulnerability of North African Countries to Climatic Changes. 2003, International Institute for Sustianble Development: Winnipeg.
90. Betsill, M. and H. Bulkeley, Transnational Networks and Global Environmental Governance: The Cities for Climate Protection Program. InternationalStudies Quarterly, 2004. 48(2): p. 471-493.
91. Biermann, F., 'Earth Systems Governance' as a Crosscutting Theme of Global ChangeResearch. Global Environmental Change, 2007. 17(3-4): p. 326-337.
92. Michaelowa, A., Creating Foundations for Host Country Participation in the CDM: Experiences and challenges in CDM capacity building, in Climate Change and Carbon Markets: A handbook of emissions reduction mechanisms, F. Yamin, Editor. 2005, Earthscan: London, UK.
93. Lovell, H., Governing the Carbon Offset Market. WIREs Climate Change, 2012. 1(3): p. 353-362.
94. Grossman, D., Physical Risks from Climate Change: A guide for companies and investors on disclosure and management of climate impacts. 2011, Ceres with Oxfam America and Calvert Investment: Boston.
42