Physical Risk-Taking, Digit Ratio, and Circulating Testosterone
Upload
khangminh22Category
view
1download
0
Table 2. Private industry by 6-digit NAICS industry and government by level of government, 2002 annual averages: Establishments, employment, and wages,change from 2001
Industry/Ownership NAICS Code
Averageestablishments
Annual averageemployment
Total annual wages(in thousands)
Averageweekly wage
2002Change
from2001
2002Change
from2001
2002Change
from2001
2002Change
from2001
Total1 .................................................. 8,101,872 117,343 128,233,919 -1,401,881 $4,714,374,741 $19,149,618 $707 $10
Total private1 ...................................................... 7,839,903 114,938 107,577,281 -1,727,521 3,930,767,025 -21,385,129 703 8
Goods producing ......................................................... 1,305,526 2,912 23,554,614 -1,310,658 986,221,995 -33,627,885 805 16
Natural resources and mining ........................................ 126,446 -1,675 1,661,870 -43,889 54,703,409 -870,980 633 6
Agriculture, forestry, fishing and hunting ........................... 11 100,818 -1,517 1,155,890 -14,680 24,146,183 515,162 402 14
Crop production ....................................................................... 111 46,511 -870 555,075 -8,505 11,014,987 171,197 382 12Oilseed and grain farming ............................................... 1111 6,233 153 27,906 484 668,867 27,538 461 11
Soybean farming ......................................................... 11111 410 -10 2,263 -131 56,728 -483 482 22Oilseed, except soybean, farming ............................... 11112 50 3 305 17 11,955 1,341 753 45Dry pea and bean farming .......................................... 11113 89 1 302 -17 5,958 -337 380 0Wheat farming ............................................................. 11114 1,624 -26 4,012 -17 78,799 258 378 3Corn farming ............................................................... 11115 1,367 46 10,209 -49 272,178 3,851 513 10Rice farming ................................................................ 11116 870 -1 2,967 -1 69,764 3,187 452 21Other grain farming ..................................................... 11119 1,825 143 7,848 682 173,485 19,722 425 12
Oilseed and grain combination farming .................. 111191 1,066 82 4,709 450 103,740 12,053 424 10All other grain farming ............................................ 111199 759 61 3,139 232 69,745 7,670 427 16
Vegetable and melon farming ......................................... 1112 4,712 -144 99,539 958 1,844,912 74,802 356 11Vegetable and melon farming ..................................... 11121 4,712 -144 99,539 958 1,844,912 74,802 356 11
Potato farming ........................................................ 111211 946 -3 11,974 337 266,450 21,721 428 24Other vegetable and melon farming ....................... 111219 3,766 -141 87,565 621 1,578,463 53,081 347 10
Fruit and tree nut farming ................................................ 1113 13,618 -445 158,495 -3,304 2,716,452 45,983 330 13Orange groves ............................................................ 11131 674 -40 7,318 -334 159,494 -3,086 419 10Citrus, except orange, groves ..................................... 11132 375 -3 3,910 -242 91,123 3,998 448 44Noncitrus fruit and tree nut farming ............................. 11133 12,570 -401 147,268 -2,728 2,465,834 45,071 322 12
Apple orchards ....................................................... 111331 2,581 -163 30,511 -1,801 431,151 -15,832 272 6Grape vineyards ..................................................... 111332 3,539 -164 40,122 -2,149 740,451 -7,239 355 15Strawberry farming ................................................. 111333 489 -1 19,828 1,521 336,751 35,048 327 10Berry, except strawberry, farming ........................... 111334 823 -14 10,727 116 182,372 5,786 327 7Tree nut farming ..................................................... 111335 1,733 -45 11,027 -44 218,636 13,159 381 24Fruit and tree nut combination farming ................... 111336 380 -27 5,095 -120 91,397 -923 345 5Other noncitrus fruit farming ................................... 111339 3,026 13 29,958 -251 465,075 15,073 299 13
Greenhouse and nursery production ............................... 1114 9,026 50 172,964 -2,166 3,870,856 44,413 430 10Food crops grown under cover ................................... 11141 563 32 19,791 235 469,158 18,175 456 13
Mushroom production ............................................. 111411 228 -14 14,649 -568 365,784 -2,056 480 15Other food crops grown under cover ...................... 111419 335 46 5,141 802 103,375 20,231 387 18
Nursery and floriculture production ............................. 11142 8,464 19 153,173 -2,401 3,401,697 26,238 427 10Nursery and tree production ................................... 111421 5,494 26 97,912 -802 2,248,959 26,224 442 9Floriculture production ............................................ 111422 2,969 -8 55,262 -1,599 1,152,738 14 401 11
Other crop farming .......................................................... 1119 12,921 -486 96,171 -4,478 1,913,900 -21,539 383 13Tobacco farming ......................................................... 11191 498 6 4,077 -262 61,681 -5,986 291 -9Cotton farming ............................................................ 11192 3,493 -5 18,020 -393 334,528 946 357 9Sugarcane farming ...................................................... 11193 336 6 5,617 -26 165,630 2,433 567 11Hay farming ................................................................. 11194 1,149 79 5,768 377 130,390 13,363 435 18All other crop farming .................................................. 11199 7,446 -572 62,689 -4,173 1,221,672 -32,295 375 14
Sugar beet farming ................................................. 111991 259 2 1,480 157 29,437 3,280 383 3
See footnotes at end of table.
18

Table 2. Private industry by 6-digit NAICS industry and government by level of government, 2002 annual averages: Establishments, employment, and wages,change from 2001 — Continued
Industry/Ownership NAICS Code
Averageestablishments
Annual averageemployment
Total annual wages(in thousands)
Averageweekly wage
2002Change
from2001
2002Change
from2001
2002Change
from2001
2002Change
from2001
Peanut farming ....................................................... 111992 158 8 927 1 $17,311 $732 $359 $15All other miscellaneous crop farming ...................... 111998 7,030 -581 60,283 -4,331 1,174,923 -36,307 375 15
Animal production ................................................................ 112 21,037 153 205,806 3,499 4,847,767 203,153 453 11Cattle ranching and farming ............................................ 1121 13,064 227 112,949 4,649 2,536,206 157,259 432 10
Beef cattle ranching, farming, and feedlots ................. 11211 6,948 37 44,655 351 1,056,371 33,704 455 11Beef cattle ranching and farming ............................ 112111 5,895 67 29,724 871 654,436 40,820 423 14Cattle feedlots ......................................................... 112112 1,054 -29 14,930 -522 401,935 -7,116 518 9
Dairy cattle and milk production .................................. 11212 6,116 190 68,294 4,299 1,479,835 123,554 417 9Hog and pig farming ........................................................ 1122 1,965 55 24,189 422 603,135 22,125 480 10Poultry and egg production ............................................. 1123 1,771 -62 41,954 -748 1,083,458 22,819 497 19
Chicken egg production .............................................. 11231 506 -35 14,773 -454 362,901 3,792 472 18Broilers and meat type chicken production ................. 11232 345 9 8,220 263 220,414 15,709 516 21Turkey production ....................................................... 11233 448 -37 7,738 -303 215,126 1,581 535 24Poultry hatcheries ....................................................... 11234 325 4 9,207 -15 241,663 4,018 505 9Other poultry production ............................................. 11239 148 -2 2,017 -238 43,354 -2,281 413 24
Sheep and goat farming .................................................. 1124 273 8 1,330 25 25,242 504 365 1Sheep farming ............................................................. 11241 215 2 1,028 -8 19,587 -622 366 -9Goat farming ............................................................... 11242 58 6 301 32 5,655 1,126 361 38
Animal aquaculture ......................................................... 1125 767 9 6,028 -358 145,403 -5,641 464 9Animal aquaculture ..................................................... 11251 767 9 6,028 -358 145,403 -5,641 464 9
Finfish farming and fish hatcheries ......................... 112511 528 -5 4,546 -339 106,356 -6,555 450 6Shellfish farming ..................................................... 112512 162 22 1,128 63 31,557 2,230 538 9Other animal aquaculture ....................................... 112519 77 -8 354 -82 7,490 -1,316 407 18
Other animal production .................................................. 1129 3,198 -84 19,358 -489 454,323 6,087 451 17Apiculture .................................................................... 11291 286 -8 1,321 -97 31,201 920 454 43Horses and other equine production ........................... 11292 1,375 -9 7,377 -68 167,217 2,548 436 11Fur-bearing animal and rabbit production ................... 11293 107 3 911 36 17,203 1,008 363 7All other animal production ......................................... 11299 1,430 -71 9,749 -360 238,702 1,610 471 20
Forestry and logging ............................................................ 113 13,120 -644 75,135 -2,285 2,189,633 -19,969 560 11Timber tract operations ................................................... 1131 600 4 3,699 -226 151,921 -20,492 790 -55Forest nursery and gathering forest products ................. 1132 258 35 2,732 300 57,409 11,601 404 42Logging ........................................................................... 1133 12,262 -684 68,704 -2,359 1,980,302 -11,078 554 15
Fishing, hunting and trapping .............................................. 114 2,881 -135 11,022 -194 395,529 11,971 690 32Fishing ............................................................................. 1141 2,459 -90 7,429 -169 329,673 11,145 853 47
Fishing ........................................................................ 11411 2,459 -90 7,429 -169 329,673 11,145 853 47Finfish fishing .......................................................... 114111 1,406 -83 3,994 6 211,410 18,773 1,018 89Shellfish fishing ....................................................... 114112 1,042 -5 3,310 -183 114,853 -4,927 667 7Other marine fishing ............................................... 114119 11 -2 125 8 3,411 -2,701 527 -478
Hunting and trapping ....................................................... 1142 422 -45 3,593 -26 65,856 826 352 6Agriculture and forestry support activities ............................ 115 17,269 -22 308,853 -7,194 5,698,267 148,811 355 17
Support activities for crop production .............................. 1151 10,591 -161 266,888 -7,764 4,614,424 98,807 332 16Support activities for crop production .......................... 11511 10,591 -161 266,888 -7,764 4,614,424 98,807 332 16
Cotton ginning ........................................................ 115111 922 -24 10,000 -354 240,514 -8,833 463 0Soil preparation, planting, and cultivating ............... 115112 3,474 -53 23,373 -1,800 594,190 -8,230 489 29Crop harvesting, primarily by machine ................... 115113 956 -24 10,705 -1,063 219,406 -2,494 394 31Other postharvest crop activities ............................ 115114 1,777 -3 64,916 -8 1,405,569 46,367 416 13Farm labor contractors and crew leaders ............... 115115 2,415 -35 140,970 -4,060 1,767,725 71,870 241 16Farm management services ................................... 115116 1,048 -22 16,924 -478 387,020 127 440 12
Support activities for animal production .......................... 1152 4,415 78 25,502 415 612,189 34,283 462 19Support activities for forestry ........................................... 1153 2,263 61 16,463 154 471,654 15,721 551 13
Mining ................................................................................ 21 25,628 -158 505,979 -29,210 30,557,227 -1,386,142 1,161 13
See footnotes at end of table.
19

Table 2. Private industry by 6-digit NAICS industry and government by level of government, 2002 annual averages: Establishments, employment, and wages,change from 2001 — Continued
Industry/Ownership NAICS Code
Averageestablishments
Annual averageemployment
Total annual wages(in thousands)
Averageweekly wage
2002Change
from2001
2002Change
from2001
2002Change
from2001
2002Change
from2001
Oil and gas extraction .......................................................... 211 7,936 -273 121,124 -2,475 $11,269,829 - $189,990 $1,789 $6Oil and gas extraction ..................................................... 2111 7,936 -273 121,124 -2,475 11,269,829 -189,990 1,789 6
Oil and gas extraction ................................................. 21111 7,936 -273 121,124 -2,475 11,269,829 -189,990 1,789 6Crude petroleum and natural gas extraction .......... 211111 7,770 -239 116,559 -2,540 10,868,568 -173,692 1,793 10Natural gas liquid extraction ................................... 211112 166 -35 4,565 65 401,261 -16,298 1,690 -94
Mining, except oil and gas ................................................... 212 7,923 -206 209,567 -10,917 10,321,353 -394,573 947 12Coal mining ..................................................................... 2121 1,517 -94 73,611 -1,439 4,022,051 -55,812 1,051 6Coal mining .................................................................... 21211 1,517 -94 73,611 -1,439 4,022,051 -55,812 1,051 6
Bituminous coal and lignite surface mining ............ 212111 763 -42 33,763 853 1,879,221 76,530 1,070 17Bituminous coal underground mining ..................... 212112 694 -44 39,180 -2,194 2,117,783 -130,267 1,039 -6Anthracite mining .................................................... 212113 60 -9 668 -98 25,046 -2,075 721 40
Metal ore mining .............................................................. 2122 377 -53 28,546 -4,331 1,647,699 -206,191 1,110 26Iron ore mining ............................................................ 21221 34 -4 5,676 -694 280,783 -45,362 951 -34Gold ore and silver ore mining .................................... 21222 208 -41 9,752 -1,325 671,110 -45,381 1,323 79
Gold ore mining ...................................................... 212221 186 -40 8,864 -1,128 617,466 -38,388 1,340 78Silver ore mining ..................................................... 212222 22 -1 888 -197 53,644 -6,994 1,162 87
Copper, nickel, lead, and zinc mining ......................... 21223 59 -4 9,570 -2,037 492,466 -99,768 990 9Lead ore and zinc ore mining ................................. 212231 18 0 1,630 -582 84,905 -25,106 1,002 46Copper ore and nickel ore mining ........................... 212234 41 -4 7,940 -1,455 407,561 -74,662 987 0
Other metal ore mining ............................................... 21229 77 -4 3,548 -275 203,340 -15,679 1,102 0Uranium-radium-vanadium ore mining ................... 212291 33 -4 557 -91 28,638 -1,886 989 83All other metal ore mining ....................................... 212299 44 0 2,991 -184 174,702 -13,793 1,123 -19
Nonmetallic mineral mining and quarrying ...................... 2123 6,029 -59 107,410 -5,147 4,651,604 -132,570 833 16Stone mining and quarrying ........................................ 21231 2,575 3 48,363 -1,250 2,042,659 2,155 812 21
Dimension stone mining and quarrying .................. 212311 503 22 6,577 -17 219,072 3,357 641 12Crushed and broken limestone mining ................... 212312 1,241 -16 27,083 -757 1,161,542 2,963 825 25Crushed and broken granite mining ....................... 212313 255 13 5,293 114 238,323 8,223 866 12Other crushed and broken stone mining ................ 212319 576 -16 9,410 -590 423,722 -12,389 866 27
Sand, gravel, clay, and refractory mining .................... 21232 3,019 -44 44,453 -2,478 1,902,638 -64,417 823 17Construction sand and gravel mining ..................... 212321 2,598 -31 32,261 -1,177 1,351,069 -33,829 805 9Industrial sand mining ............................................. 212322 153 2 3,090 -148 133,744 66 832 38Kaolin and ball clay mining ..................................... 212324 81 -3 4,363 -403 230,236 -4,756 1,015 67Clay, ceramic, and refractory minerals mining ....... 212325 187 -13 4,739 -751 187,590 -25,898 761 13
Other nonmetallic mineral mining ............................... 21239 436 -17 14,594 -1,419 706,308 -70,308 931 -2Potash, soda, and borate mineral mining ............... 212391 26 -3 3,796 -143 227,741 -6,550 1,154 10Phosphate rock mining ........................................... 212392 23 -2 2,263 -388 112,278 -13,938 954 38Other chemical and fertilizer mineral mining .......... 212393 78 -8 2,828 -567 131,380 -45,423 893 -108All other nonmetallic mineral mining ....................... 212399 309 -4 5,706 -321 234,908 -4,396 792 28
Support activities for mining ................................................ 213 9,769 321 175,288 -15,818 8,966,044 -801,579 984 1Support activities for mining ............................................ 2131 9,769 321 175,288 -15,818 8,966,044 -801,579 984 1
Support activities for mining ........................................ 21311 9,769 321 175,288 -15,818 8,966,044 -801,579 984 1Drilling oil and gas wells ......................................... 213111 1,726 5 48,596 -13,416 2,563,128 -636,714 1,014 22Support activities for oil and gas operations ........... 213112 7,364 292 120,536 -2,884 6,125,560 -194,460 977 -8Support activities for coal mining ............................ 213113 314 19 3,558 366 146,785 19,903 793 29Support activities for metal mining .......................... 213114 215 -4 1,490 37 83,782 4,409 1,081 30Support activities for nonmetallic minerals ............. 213115 150 8 1,107 78 46,789 5,282 813 38
Construction ................................................................... 792,217 15,275 6,683,553 -89,959 260,841,814 661,048 751 12
Construction ....................................................................... 23 792,217 15,275 6,683,553 -89,959 260,841,814 661,048 751 12
Construction of buildings ..................................................... 236 236,856 5,707 1,564,085 -3,530 65,990,506 1,496,417 811 20
See footnotes at end of table.
20

Table 2. Private industry by 6-digit NAICS industry and government by level of government, 2002 annual averages: Establishments, employment, and wages,change from 2001 — Continued
Industry/Ownership NAICS Code
Averageestablishments
Annual averageemployment
Total annual wages(in thousands)
Averageweekly wage
2002Change
from2001
2002Change
from2001
2002Change
from2001
2002Change
from2001
Residential building construction ..................................... 2361 184,071 5,992 803,721 29,066 $30,194,613 $2,110,160 $722 $25Residential building construction ................................ 23611 184,071 5,992 803,721 29,066 30,194,613 2,110,160 722 25
New single-family general contractors .................... 236115 109,206 4,253 506,708 18,188 19,744,775 1,467,129 749 29New multifamily general contractors ....................... 236116 3,675 253 28,475 1,283 1,229,268 88,149 830 23New housing operative builders ............................. 236117 2,331 146 27,595 1,880 1,636,683 152,302 1,141 31Residential remodelers ........................................... 236118 68,860 1,341 240,944 7,716 7,583,887 402,579 605 13
Nonresidential building construction ............................... 2362 52,785 -285 760,364 -32,597 35,795,893 -613,742 905 22Industrial building construction .................................... 23621 7,660 -259 188,095 -11,586 8,998,173 -304,180 920 24Commercial building construction ............................... 23622 45,125 -27 572,269 -21,011 26,797,720 -309,562 901 22
Heavy and civil engineering construction ............................ 237 59,588 -802 924,699 -25,686 40,962,473 1,755 852 23Utility system construction ............................................... 2371 24,130 34 380,576 -17,054 16,106,938 -119,050 814 29
Water and sewer system construction ........................ 23711 13,687 1 181,906 -1,810 7,436,217 101,942 786 18Oil and gas pipeline construction ................................ 23712 2,647 -7 75,725 -900 3,391,573 96,331 861 34Power and communication system construction ......... 23713 7,797 41 122,945 -14,344 5,279,148 -317,323 826 42
Land subdivision ............................................................. 2372 12,933 -362 86,106 -3,102 4,538,897 -94,508 1,014 15Highway, street, and bridge construction ........................ 2373 12,936 -197 340,825 -3,220 15,087,695 198,857 851 19Other heavy construction ................................................ 2379 9,589 -277 117,193 -2,309 5,228,943 16,456 858 19
Specialty trade contractors .................................................. 238 495,773 10,369 4,194,768 -60,743 153,888,835 -837,125 705 6Building foundation and exterior contractors ................... 2381 108,881 2,227 916,684 -6,371 29,542,037 108,269 620 7
Poured concrete structure contractors ........................ 23811 18,705 766 188,599 -777 6,139,565 95,529 626 12Residential poured foundation contractors ............. 238111 13,518 568 111,314 2,380 3,377,432 115,351 583 7Nonresidential poured foundation contractors ........ 238112 5,186 197 77,286 -3,156 2,762,133 -19,822 687 22
Steel and precast concrete contractors ...................... 23812 5,960 -24 85,483 -4,326 3,468,413 -122,186 780 11Residential structural steel contractors ................... 238121 1,423 38 13,287 -184 494,353 -3,490 715 4Nonresidential structural steel contractors ............. 238122 4,537 -62 72,196 -4,142 2,974,059 -118,696 792 13
Framing contractors .................................................... 23813 16,778 210 124,365 1,137 3,590,214 70,915 555 6Residential framing contractors .............................. 238131 14,865 248 103,119 2,693 2,893,467 121,254 540 9Nonresidential framing contractors ......................... 238132 1,913 -38 21,246 -1,556 696,747 -50,338 631 1
Masonry contractors ................................................... 23814 28,894 329 220,619 -1,051 6,817,435 25,606 594 5Residential masonry contractors ............................ 238141 21,417 365 105,975 2,996 2,813,502 106,733 511 6Nonresidential masonry contractors ....................... 238142 7,477 -36 114,643 -4,048 4,003,933 -81,127 672 10
Glass and glazing contractors ..................................... 23815 5,711 65 53,439 267 2,056,522 20,723 740 4Residential glass and glazing contractors .............. 238151 3,053 48 19,820 556 640,425 30,381 621 12Nonresidential glass and glazing contractors ......... 238152 2,659 18 33,619 -289 1,416,097 -9,658 810 1
Roofing contractors ..................................................... 23816 20,386 24 175,431 -4,509 5,367,374 -78,211 588 6Residential roofing contractors ............................... 238161 14,597 83 83,313 780 2,226,432 56,489 514 8Nonresidential roofing contractors .......................... 238162 5,788 -60 92,118 -5,289 3,140,942 -134,700 656 9
Siding contractors ....................................................... 23817 7,890 432 35,444 2,435 1,023,452 96,950 555 15Residential siding contractors ................................. 238171 7,137 441 29,680 2,254 820,384 82,715 532 15Nonresidential siding contractors ........................... 238172 753 -9 5,764 181 203,068 14,235 678 28
Other building exterior contractors .............................. 23819 4,558 425 33,305 454 1,079,063 -1,056 623 -9Other residential exterior contractors ..................... 238191 2,234 248 13,056 813 388,383 22,373 572 -3Other nonresidential exterior contractors ............... 238192 2,324 177 20,249 -358 690,680 -23,429 656 -10
Building equipment contractors ....................................... 2382 182,384 3,551 1,829,800 -57,880 75,755,117 -1,595,410 796 8Electrical contractors ................................................... 23821 87,040 568 894,070 -57,009 37,656,524 -2,175,608 810 5
Residential electrical contractors ............................ 238211 46,532 1,044 292,054 -1,950 9,983,130 35,046 657 6Nonresidential electrical contractors ....................... 238212 40,509 -474 602,017 -55,058 27,673,394 -2,210,654 884 9
Plumbing and HVAC contractors ................................ 23822 86,684 2,792 829,301 442 33,025,988 557,145 766 13Residential plumbing and HVAC contractors ......... 238221 60,934 2,136 398,740 10,342 13,270,554 646,321 640 15Nonresidential plumbing and HVAC contractors .... 238222 25,750 656 430,561 -9,900 19,755,433 -89,176 882 16
Other building equipment contractors ......................... 23829 8,660 191 106,429 -1,314 5,072,604 23,053 917 16Other residential equipment contractors ................. 238291 966 187 9,172 1,632 316,698 46,828 664 -24Other nonresidential equipment contractors ........... 238292 7,694 4 97,258 -2,945 4,755,907 -23,775 940 23
See footnotes at end of table.
21

Table 2. Private industry by 6-digit NAICS industry and government by level of government, 2002 annual averages: Establishments, employment, and wages,change from 2001 — Continued
Industry/Ownership NAICS Code
Averageestablishments
Annual averageemployment
Total annual wages(in thousands)
Averageweekly wage
2002Change
from2001
2002Change
from2001
2002Change
from2001
2002Change
from2001
Building finishing contractors .......................................... 2383 128,093 3,242 869,794 -181 $28,275,540 $286,283 $625 $6Drywall and insulation contractors .............................. 23831 23,679 320 317,641 -2,582 10,880,218 -51,308 659 3
Residential drywall contractors .............................. 238311 15,357 319 145,470 4,698 4,338,068 177,851 573 5Nonresidential drywall contractors .......................... 238312 8,322 1 172,172 -7,279 6,542,150 -229,158 731 5
Painting and wall covering contractors ....................... 23832 40,859 455 214,958 -2,776 6,189,694 13,274 554 8Residential painting contractors ............................. 238321 31,835 444 123,404 331 3,037,174 51,221 473 6Nonresidential painting contractors ........................ 238322 9,024 11 91,554 -3,107 3,152,519 -37,946 662 14
Flooring contractors .................................................... 23833 15,104 519 78,488 1,425 2,708,913 72,779 664 6Residential flooring contractors .............................. 238331 11,781 534 50,624 2,248 1,615,997 102,359 614 12
Nonresidential flooring contractors .................................. 238332 3,323 -15 27,864 -823 1,092,916 -29,580 754 2Tile and terrazzo contractors .................................. 23834 9,377 525 55,709 1,742 1,826,369 76,765 630 7Residential tile and terrazzo contractors ................ 238341 7,631 505 37,292 2,106 1,128,098 68,284 582 3Nonresidential tile and terrazzo contractors ........... 238342 1,746 20 18,417 -365 698,272 8,481 729 23
Finish carpentry contractors ............................................ 23835 30,821 1,304 138,915 3,877 4,474,709 192,715 619 9Residential finish carpentry contractors .................. 238351 24,880 1,415 98,795 4,203 2,939,697 175,231 572 10Nonresidential finish carpentry contractors ............ 238352 5,941 -111 40,121 -325 1,535,012 17,484 736 14Other building finishing contractors ........................ 23839 8,255 120 64,082 -1,867 2,195,636 -17,943 659 14Other residential finishing contractors .................... 238391 4,489 -79 24,039 -370 720,766 11,820 577 18Other nonresidential finishing contractors .............. 238392 3,766 199 40,043 -1,497 1,474,870 -29,763 708 11Other specialty trade contractors ............................ 2389 76,415 1,349 578,490 3,689 20,316,141 363,733 675 7
Site preparation contractors ............................................ 23891 39,665 1,002 292,913 1,411 10,645,927 173,408 699 8Residential site preparation contractors ................. 238911 22,780 586 111,863 2,867 3,685,971 155,719 634 11Nonresidential site preparation contractors ............ 238912 16,885 416 181,050 -1,456 6,959,956 17,689 739 7
All other specialty trade contractors ............................ 23899 36,751 348 285,577 2,278 9,670,215 190,325 651 7All other residential trade contractors ..................... 238991 22,906 191 128,668 4,169 3,761,200 161,300 562 6All other nonresidential trade contractors ............... 238992 13,845 156 156,909 -1,891 5,909,015 29,025 724 12
Manufacturing .............................................................. 386,863 -10,689 15,209,192 -1,176,809 670,676,772 -33,417,953 848 22
Manufacturing .............................................................. 31-33 386,863 -10,689 15,209,192 -1,176,809 670,676,772 -33,417,953 848 22
Food manufacturing ............................................................. 311 29,284 -663 1,532,478 -22,127 50,084,788 352,846 629 14Animal food manufacturing ............................................. 3111 1,905 -15 50,869 -2,251 2,127,211 -235,806 804 -51
Animal food manufacturing ......................................... 31111 1,905 -15 50,869 -2,251 2,127,211 -235,806 804 -51Dog and cat food manufacturing ............................ 311111 272 5 18,036 -1,293 897,314 -235,351 957 -170Other animal food manufacturing ........................... 311119 1,633 -20 32,833 -958 1,229,898 -456 720 20
Grain and oilseed milling ................................................. 3112 970 -4 62,136 -1,401 3,120,666 79,976 966 46Flour milling and malt manufacturing .......................... 31121 494 -26 20,675 -377 838,266 5,030 780 19
Flour milling ............................................................ 311211 376 -16 15,118 -86 630,684 9,529 802 16Rice milling ............................................................. 311212 85 -5 4,457 -183 146,812 -1,587 633 18Malt manufacturing ................................................. 311213 34 -4 1,100 -108 60,770 -2,913 1,063 49
Starch and vegetable oil manufacturing ...................... 31122 406 15 27,686 -233 1,384,589 59,492 962 49Wet corn milling ...................................................... 311221 88 10 8,758 -401 532,854 21,372 1,170 96Soybean processing ............................................... 311222 141 2 10,591 353 504,593 38,404 916 40Other oilseed processing ........................................ 311223 78 -3 2,482 -74 94,077 2,008 729 36Fats and oils refining and blending ......................... 311225 99 6 5,855 -110 253,064 -2,293 831 8
Breakfast cereal manufacturing .................................. 31123 70 7 13,775 -791 897,811 15,455 1,253 88Sugar and confectionery product manufacturing ............ 3113 2,212 -63 86,329 -4,539 3,111,845 -33,239 693 27
Sugar manufacturing ................................................... 31131 114 -4 13,947 -1,248 609,329 -24,911 840 37Sugarcane mills ...................................................... 311311 38 -2 4,678 -164 194,321 678 799 30Cane sugar refining ................................................ 311312 28 -3 2,778 -181 164,083 -5,624 1,136 33Beet sugar manufacturing ...................................... 311313 48 0 6,492 -902 250,926 -19,965 743 38
Confectionery manufacturing from cacao beans ........ 31132 88 13 9,175 88 376,772 -20,226 790 -50
See footnotes at end of table.
22

Table 2. Private industry by 6-digit NAICS industry and government by level of government, 2002 annual averages: Establishments, employment, and wages,change from 2001 — Continued
Industry/Ownership NAICS Code
Averageestablishments
Annual averageemployment
Total annual wages(in thousands)
Averageweekly wage
2002Change
from2001
2002Change
from2001
2002Change
from2001
2002Change
from2001
Confectionery mfg. from purchased chocolate ........... 31133 1,479 -55 40,642 -2,279 $1,291,240 $7,188 $611 $36Nonchocolate confectionery manufacturing ................ 31134 531 -17 22,566 -1,099 834,504 4,711 711 37
Fruit and vegetable preserving and specialty .................. 3114 1,971 -84 190,501 -7,516 6,269,989 -45,451 633 20Frozen food manufacturing ......................................... 31141 756 -27 95,301 -3,827 2,927,772 -20,463 591 19
Frozen fruit and vegetable manufacturing .............. 311411 275 -27 41,408 -2,339 1,179,650 -57,028 548 4Frozen specialty food manufacturing ...................... 311412 481 0 53,893 -1,488 1,748,123 36,564 624 30
Fruit and vegetable canning and drying ...................... 31142 1,215 -57 95,200 -3,690 3,342,217 -24,987 675 20Fruit and vegetable canning ................................... 311421 924 -39 70,949 -1,037 2,450,116 16,912 664 14Specialty canning ................................................... 311422 93 -10 12,307 -828 516,862 -4,123 808 45Dried and dehydrated food manufacturing ............. 311423 198 -9 11,944 -1,825 375,239 -37,776 604 27
Dairy product manufacturing ........................................... 3115 1,792 -5 136,479 960 5,609,925 269,553 790 32Dairy product, except frozen, manufacturing .............. 31151 1,361 -23 113,056 315 4,717,063 199,259 802 31
Fluid milk manufacturing ......................................... 311511 563 0 56,501 -671 2,446,484 72,519 833 34Creamery butter manufacturing .............................. 311512 46 5 2,124 263 81,000 11,302 733 13Cheese manufacturing ........................................... 311513 535 -12 38,099 290 1,399,237 70,692 706 30Dry, condensed, and evaporated dairy products .... 311514 217 -16 16,332 432 790,342 44,746 931 29
Ice cream and frozen dessert manufacturing .............. 31152 432 19 23,423 645 892,862 70,294 733 39Animal slaughtering and processing ............................... 3116 4,263 -86 517,706 3,233 13,745,456 374,938 511 11
Animal slaughtering and processing ........................... 31161 4,263 -86 517,706 3,233 13,745,456 374,938 511 11Animal, except poultry, slaughtering ....................... 311611 1,971 -76 154,401 210 4,364,079 89,100 544 11Meat processed from carcasses ............................. 311612 1,491 -5 109,906 685 3,553,767 136,111 622 20Rendering and meat byproduct processing ............ 311613 233 -20 8,780 -196 328,313 308 719 16Poultry processing .................................................. 311615 569 16 244,619 2,535 5,499,297 149,419 432 7
Seafood product preparation and packaging .................. 3117 1,011 -77 43,533 -3,038 1,232,886 1,983 545 37Seafood product preparation and packaging .............. 31171 1,011 -77 43,533 -3,038 1,232,886 1,983 545 37
Seafood canning ..................................................... 311711 208 1 5,622 -550 168,277 -9,109 576 23Fresh and frozen seafood processing .................... 311712 803 -78 37,911 -2,489 1,064,609 11,093 540 39
Bakeries and tortilla manufacturing ................................. 3118 12,042 -287 294,740 -6,771 8,670,685 -128,167 566 5Bread and bakery product manufacturing ................... 31181 10,685 -286 219,158 -4,436 6,167,645 28,641 541 13
Retail bakeries ........................................................ 311811 7,765 -276 70,670 -1,190 1,098,703 17,162 299 10Commercial bakeries .............................................. 311812 2,759 -4 139,085 -3,287 4,772,292 4,713 660 16Frozen cakes and other pastries manufacturing .... 311813 161 -6 9,403 42 296,651 6,766 607 11
Cookie, cracker, and pasta manufacturing ................. 31182 934 -4 60,331 -2,701 2,144,127 -181,098 683 -26Cookie and cracker manufacturing ......................... 311821 411 6 36,359 -2,093 1,251,458 -184,429 662 -56Mixes and dough made from purchased flour ........ 311822 249 -6 15,238 -130 578,498 16,365 730 27Dry pasta manufacturing ........................................ 311823 274 -5 8,735 -478 314,170 -13,035 692 9
Tortilla manufacturing ................................................. 31183 424 4 15,250 365 358,913 24,290 453 21Other food manufacturing ............................................... 3119 3,119 -41 150,185 -804 6,196,124 69,058 793 13
Snack food manufacturing .......................................... 31191 539 -24 45,314 -437 1,660,981 12,751 705 12Roasted nuts and peanut butter manufacturing ..... 311911 200 -3 10,594 -541 341,361 -6,191 620 20Other snack food manufacturing ............................ 311919 339 -21 34,719 104 1,319,620 18,942 731 8
Coffee and tea manufacturing ..................................... 31192 339 21 12,615 380 528,062 27,202 805 18Flavoring syrup and concentrate manufacturing ......... 31193 193 0 11,537 87 973,497 -71,209 1,623 -132Seasoning and dressing manufacturing ...................... 31194 709 -23 27,505 -508 1,214,983 40,339 849 43
Mayonnaise, dressing, and sauce manufacturing .. 311941 290 -20 12,149 -612 464,406 -2,322 735 32Spice and extract manufacturing ............................ 311942 419 -2 15,357 105 750,577 42,662 940 47
All other food manufacturing ....................................... 31199 1,340 -15 53,214 -328 1,818,602 59,975 657 25Perishable prepared food manufacturing ............... 311991 673 22 23,939 1,267 607,354 31,763 488 0All other miscellaneous food manufacturing ........... 311999 667 -37 29,275 -1,595 1,211,248 28,211 796 59
Beverage and tobacco product manufacturing .................... 312 4,233 -16 205,816 -1,469 9,564,632 98,600 894 16Beverage manufacturing ................................................. 3121 3,795 51 173,457 -1,994 7,495,141 127,352 831 23
Soft drink and ice manufacturing ............................ 31211 2,107 -109 112,001 -3,368 4,431,635 -26,730 761 18Soft drink manufacturing ......................................... 312111 748 -13 86,007 -2,394 3,576,889 5,959 800 23
See footnotes at end of table.
23
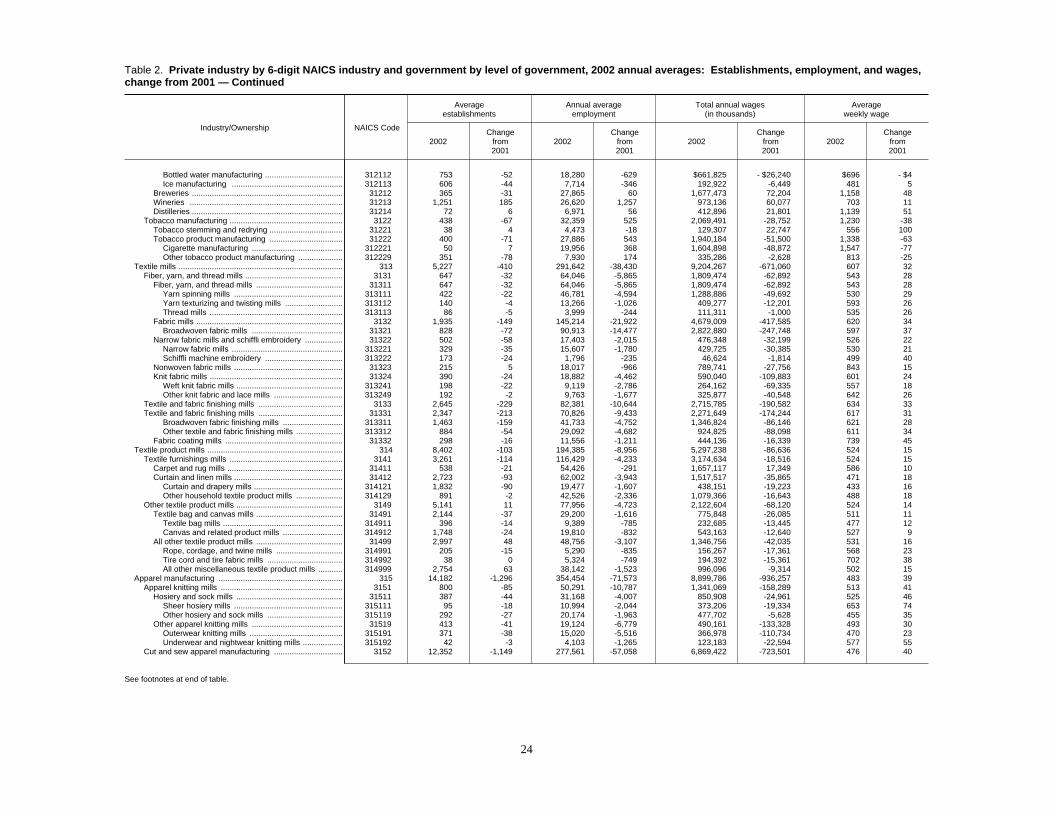
Table 2. Private industry by 6-digit NAICS industry and government by level of government, 2002 annual averages: Establishments, employment, and wages,change from 2001 — Continued
Industry/Ownership NAICS Code
Averageestablishments
Annual averageemployment
Total annual wages(in thousands)
Averageweekly wage
2002Change
from2001
2002Change
from2001
2002Change
from2001
2002Change
from2001
Bottled water manufacturing ................................... 312112 753 -52 18,280 -629 $661,825 - $26,240 $696 - $4Ice manufacturing .................................................. 312113 606 -44 7,714 -346 192,922 -6,449 481 5
Breweries .................................................................... 31212 365 -31 27,865 60 1,677,473 72,204 1,158 48Wineries ..................................................................... 31213 1,251 185 26,620 1,257 973,136 60,077 703 11Distilleries .................................................................... 31214 72 6 6,971 56 412,896 21,801 1,139 51
Tobacco manufacturing ................................................... 3122 438 -67 32,359 525 2,069,491 -28,752 1,230 -38Tobacco stemming and redrying ................................. 31221 38 4 4,473 -18 129,307 22,747 556 100Tobacco product manufacturing ................................. 31222 400 -71 27,886 543 1,940,184 -51,500 1,338 -63
Cigarette manufacturing ......................................... 312221 50 7 19,956 368 1,604,898 -48,872 1,547 -77Other tobacco product manufacturing .................... 312229 351 -78 7,930 174 335,286 -2,628 813 -25
Textile mills .......................................................................... 313 5,227 -410 291,642 -38,430 9,204,267 -671,060 607 32Fiber, yarn, and thread mills ............................................ 3131 647 -32 64,046 -5,865 1,809,474 -62,892 543 28
Fiber, yarn, and thread mills ....................................... 31311 647 -32 64,046 -5,865 1,809,474 -62,892 543 28Yarn spinning mills ................................................. 313111 422 -22 46,781 -4,594 1,288,886 -49,692 530 29Yarn texturizing and twisting mills .......................... 313112 140 -4 13,266 -1,026 409,277 -12,201 593 26Thread mills ............................................................ 313113 86 -5 3,999 -244 111,311 -1,000 535 26
Fabric mills .................................................................. 3132 1,935 -149 145,214 -21,922 4,679,009 -417,585 620 34Broadwoven fabric mills ......................................... 31321 828 -72 90,913 -14,477 2,822,880 -247,748 597 37
Narrow fabric mills and schiffli embroidery ................. 31322 502 -58 17,403 -2,015 476,348 -32,199 526 22Narrow fabric mills .................................................. 313221 329 -35 15,607 -1,780 429,725 -30,385 530 21Schiffli machine embroidery ................................... 313222 173 -24 1,796 -235 46,624 -1,814 499 40
Nonwoven fabric mills ................................................. 31323 215 5 18,017 -966 789,741 -27,756 843 15Knit fabric mills ............................................................ 31324 390 -24 18,882 -4,462 590,040 -109,883 601 24
Weft knit fabric mills ................................................ 313241 198 -22 9,119 -2,786 264,162 -69,335 557 18Other knit fabric and lace mills ............................... 313249 192 -2 9,763 -1,677 325,877 -40,548 642 26
Textile and fabric finishing mills ...................................... 3133 2,645 -229 82,381 -10,644 2,715,785 -190,582 634 33Textile and fabric finishing mills ...................................... 31331 2,347 -213 70,826 -9,433 2,271,649 -174,244 617 31
Broadwoven fabric finishing mills ........................... 313311 1,463 -159 41,733 -4,752 1,346,824 -86,146 621 28Other textile and fabric finishing mills ..................... 313312 884 -54 29,092 -4,682 924,825 -88,098 611 34
Fabric coating mills ..................................................... 31332 298 -16 11,556 -1,211 444,136 -16,339 739 45Textile product mills ............................................................. 314 8,402 -103 194,385 -8,956 5,297,238 -86,636 524 15
Textile furnishings mills ................................................... 3141 3,261 -114 116,429 -4,233 3,174,634 -18,516 524 15Carpet and rug mills .................................................... 31411 538 -21 54,426 -291 1,657,117 17,349 586 10Curtain and linen mills ................................................. 31412 2,723 -93 62,002 -3,943 1,517,517 -35,865 471 18
Curtain and drapery mills ........................................ 314121 1,832 -90 19,477 -1,607 438,151 -19,223 433 16Other household textile product mills ..................... 314129 891 -2 42,526 -2,336 1,079,366 -16,643 488 18
Other textile product mills ................................................ 3149 5,141 11 77,956 -4,723 2,122,604 -68,120 524 14Textile bag and canvas mills ....................................... 31491 2,144 -37 29,200 -1,616 775,848 -26,085 511 11
Textile bag mills ...................................................... 314911 396 -14 9,389 -785 232,685 -13,445 477 12Canvas and related product mills ........................... 314912 1,748 -24 19,810 -832 543,163 -12,640 527 9
All other textile product mills ....................................... 31499 2,997 48 48,756 -3,107 1,346,756 -42,035 531 16Rope, cordage, and twine mills .............................. 314991 205 -15 5,290 -835 156,267 -17,361 568 23Tire cord and tire fabric mills .................................. 314992 38 0 5,324 -749 194,392 -15,361 702 38All other miscellaneous textile product mills ........... 314999 2,754 63 38,142 -1,523 996,096 -9,314 502 15
Apparel manufacturing ........................................................ 315 14,182 -1,296 354,454 -71,573 8,899,786 -936,257 483 39Apparel knitting mills ....................................................... 3151 800 -85 50,291 -10,787 1,341,069 -158,289 513 41
Hosiery and sock mills ................................................ 31511 387 -44 31,168 -4,007 850,908 -24,961 525 46Sheer hosiery mills ................................................. 315111 95 -18 10,994 -2,044 373,206 -19,334 653 74Other hosiery and sock mills .................................. 315119 292 -27 20,174 -1,963 477,702 -5,628 455 35
Other apparel knitting mills ......................................... 31519 413 -41 19,124 -6,779 490,161 -133,328 493 30Outerwear knitting mills .......................................... 315191 371 -38 15,020 -5,516 366,978 -110,734 470 23Underwear and nightwear knitting mills .................. 315192 42 -3 4,103 -1,265 123,183 -22,594 577 55
Cut and sew apparel manufacturing ............................... 3152 12,352 -1,149 277,561 -57,058 6,869,422 -723,501 476 40
See footnotes at end of table.
24

Table 2. Private industry by 6-digit NAICS industry and government by level of government, 2002 annual averages: Establishments, employment, and wages,change from 2001 — Continued
Industry/Ownership NAICS Code
Averageestablishments
Annual averageemployment
Total annual wages(in thousands)
Averageweekly wage
2002Change
from2001
2002Change
from2001
2002Change
from2001
2002Change
from2001
Cut and sew apparel contractors ................................ 31521 6,814 -406 112,416 -21,675 $2,108,539 - $278,643 $361 $19Men’s cut and sew apparel contractors .................. 315211 1,190 -69 28,931 -6,127 638,547 -94,587 424 22Women’s cut and sew apparel contractors ............. 315212 5,624 -337 83,486 -15,547 1,469,992 -184,056 339 18
Men’s cut and sew apparel manufacturing ................. 31522 1,829 -298 75,564 -21,969 1,881,147 -288,303 479 51Men’s underwear and nightwear manufacturing ..... 315221 44 -5 2,196 -1,105 60,423 -16,495 529 81Men’s suit, coat, and overcoat manufacturing ........ 315222 745 -149 15,826 -3,170 365,364 -44,940 444 29Men’s shirt, except work shirt, manufacturing ........ 315223 383 -55 11,076 -2,946 299,189 -29,634 519 68Men’s pants, except work pants, manufacturing .... 315224 131 -34 19,539 -6,734 463,318 -84,840 456 55Men’s work clothing manufacturing ........................ 315225 204 -8 14,694 -4,918 366,908 -66,884 480 55Other men’s outerwear manufacturing ................... 315228 323 -46 12,234 -3,095 325,945 -45,509 512 46Women’s cut and sew apparel manufacturing ........ 31523 2,838 -363 66,169 -11,148 2,248,736 -154,850 654 56Women’s lingerie and nightwear manufacturing ..... 315231 198 -18 8,320 -1,460 285,089 -5,462 659 88Women’s blouse and shirt manufacturing .............. 315232 217 -40 6,012 -1,221 241,784 -4,945 773 117Women’s dress manufacturing ............................... 315233 879 -74 13,201 -1,636 511,061 -34,254 744 37Women’s suit, coat, jacket, and skirt mfg. .............. 315234 199 -37 5,886 -1,537 263,758 -20,763 862 125Other women’s outerwear manufacturing ............... 315239 1,346 -193 32,750 -5,294 947,045 -89,427 556 32
Other cut and sew apparel manufacturing .................. 31529 872 -81 23,412 -2,266 630,999 -1,706 518 44Infants’ cut and sew apparel manufacturing ........... 315291 109 -2 3,284 -425 94,649 -10,464 554 9Fur and leather apparel manufacturing .................. 315292 174 -10 1,711 -515 51,776 -9,024 582 57All other cut and sew apparel manufacturing ......... 315299 589 -70 18,417 -1,326 484,574 17,782 506 51
Accessories and other apparel manufacturing ................ 3159 1,030 -62 26,602 -3,728 689,295 -54,467 498 26Accessories and other apparel manufacturing ............ 31599 1,030 -62 26,602 -3,728 689,295 -54,467 498 26
Hat, cap, and millinery manufacturing .................... 315991 228 -16 8,836 -1,571 197,778 -33,232 430 3Glove and mitten manufacturing ............................. 315992 104 -5 3,551 -829 91,809 -12,740 497 38Men’s and boys’ neckwear manufacturing ............. 315993 63 -5 2,051 -632 66,341 -9,440 622 79
All other accessory and apparel manufacturing .............. 315999 635 -36 12,164 -696 333,368 945 527 30Leather and allied product manufacturing ........................... 316 1,611 -124 49,636 -9,935 1,460,802 -243,080 566 16
Leather and hide tanning and finishing ........................... 3161 290 -9 8,674 -1,261 302,804 -28,250 671 30Footwear manufacturing ................................................. 3162 364 -36 21,075 -5,150 613,555 -154,339 560 -3
Footwear manufacturing ............................................. 31621 364 -36 21,075 -5,150 613,555 -154,339 560 -3Rubber and plastics footwear manufacturing ......... 316211 38 -3 2,597 -372 76,425 -16,181 566 -34House slipper manufacturing .................................. 316212 16 -3 742 -302 29,977 -5,590 777 122Men’s nonathletic footwear manufacturing ............. 316213 158 -14 9,821 -3,254 267,781 -99,011 524 -15Women’s nonathletic footwear manufacturing ........ 316214 68 -6 5,270 -581 151,692 -10,536 554 21Other footwear manufacturing ................................ 316219 85 -9 2,645 -642 87,679 -23,021 638 -10
Other leather product manufacturing .............................. 3169 957 -80 19,887 -3,524 544,443 -60,491 526 29Other leather product manufacturing .......................... 31699 957 -80 19,887 -3,524 544,443 -60,491 526 29
Luggage manufacturing .......................................... 316991 242 -21 6,565 -1,383 187,695 -30,233 550 23Women’s handbag and purse manufacturing ......... 316992 122 -15 2,135 -412 75,127 -9,559 677 38Other personal leather good manufacturing ........... 316993 146 4 2,436 -420 55,386 -5,117 437 30All other leather good manufacturing ...................... 316999 447 -48 8,752 -1,308 226,235 -15,582 497 35
Wood product manufacturing .............................................. 321 18,487 -559 553,919 -16,377 16,952,331 -60,928 589 15Sawmills and wood preservation ..................................... 3211 4,698 -215 120,382 -4,299 3,818,777 -29,816 610 16
Sawmills and wood preservation ................................ 32111 4,698 -215 120,382 -4,299 3,818,777 -29,816 610 16Sawmills ................................................................. 321113 4,175 -196 107,817 -4,506 3,406,772 -49,170 608 16Wood preservation ................................................. 321114 523 -19 12,565 207 412,005 19,355 631 20
Plywood and engineered wood product mfg. .................. 3212 2,058 10 115,434 -1,121 3,837,127 37,960 639 12Plywood and engineered wood product mfg. .............. 32121 2,058 10 115,434 -1,121 3,837,127 37,960 639 12
Hardwood veneer and plywood manufacturing ...... 321211 367 -7 24,427 -1,492 736,854 -30,516 580 11Softwood veneer and plywood manufacturing ........ 321212 185 6 23,121 4 841,822 11,105 700 9Engineered wood member manufacturing .............. 321213 174 -19 8,506 -243 294,573 438 666 19Truss manufacturing ............................................... 321214 1,067 20 39,953 1,063 1,190,346 55,957 573 12Reconstituted wood product manufacturing ........... 321219 265 9 19,427 -453 773,533 976 766 19
See footnotes at end of table.
25

Table 2. Private industry by 6-digit NAICS industry and government by level of government, 2002 annual averages: Establishments, employment, and wages,change from 2001 — Continued
Industry/Ownership NAICS Code
Averageestablishments
Annual averageemployment
Total annual wages(in thousands)
Averageweekly wage
2002Change
from2001
2002Change
from2001
2002Change
from2001
2002Change
from2001
Other wood product manufacturing ................................. 3219 11,731 -354 318,104 -10,956 $9,296,427 - $69,073 $562 $15Millwork ....................................................................... 32191 4,882 -97 152,126 -1,794 4,692,509 62,783 593 15
Wood window and door manufacturing .................. 321911 1,482 -9 71,674 1,065 2,316,583 74,114 622 11Cut stock, resawing lumber, and planing ................ 321912 794 -36 20,407 -786 538,211 -283 507 18Other millwork, including flooring ............................ 321918 2,606 -52 60,044 -2,074 1,837,715 -11,049 589 17
Wood container and pallet manufacturing .................. 32192 3,549 -145 60,371 -4,314 1,461,806 -56,027 466 15All other wood product manufacturing ........................ 32199 3,300 -113 105,607 -4,849 3,142,112 -75,828 572 12
Manufactured home, mobile home, manufacturing 321991 519 -30 51,000 -2,110 1,578,460 -48,750 595 6Prefabricated wood building manufacturing ........... 321992 808 -9 24,170 -387 769,587 12,365 612 19Miscellaneous wood product manufacturing .......... 321999 1,974 -73 30,438 -2,351 794,065 -39,443 502 13
Paper manufacturing ........................................................... 322 6,828 -155 543,379 -33,651 25,744,232 -658,570 911 31Pulp, paper, and paperboard mills .................................. 3221 951 -3 165,200 -12,707 9,776,669 -452,914 1,138 32
Pulp mills ..................................................................... 32211 53 -4 7,280 -429 453,126 -8,058 1,197 47Paper mills .................................................................. 32212 602 2 117,571 -10,883 6,983,069 -423,004 1,142 33
Paper, except newsprint, mills ................................ 322121 537 0 106,423 -9,483 6,271,669 -316,249 1,133 40Newsprint mills ....................................................... 322122 65 2 11,149 -1,399 711,399 -106,755 1,227 -27
Paperboard mills ......................................................... 32213 296 -1 40,349 -1,395 2,340,474 -21,852 1,116 28Converted paper product manufacturing ......................... 3222 5,877 -152 378,179 -20,944 15,967,563 -205,656 812 33
Paperboard container manufacturing .......................... 32221 3,031 -50 202,376 -9,503 8,499,251 -38,578 808 33Corrugated and solid fiber box manufacturing ........ 322211 1,983 -10 127,526 -6,013 5,477,674 -14,043 826 35Folding paperboard box manufacturing .................. 322212 494 -12 39,897 -1,354 1,688,825 -2,553 814 26Setup paperboard box manufacturing .................... 322213 145 -11 6,066 -480 195,596 -8,549 620 20Fiber can, tube, and drum manufacturing ............... 322214 309 -11 13,478 -480 563,804 -389 804 27Nonfolding sanitary food container mfg. ................. 322215 102 -4 15,410 -1,175 573,352 -13,045 716 36
Paper bag and coated and treated paper mfg. ........... 32222 1,380 -40 80,214 -5,025 3,377,356 -99,781 810 26Coated and laminated packaging materials mfg. ... 322221 269 0 17,343 -849 785,529 -201 871 40Coated and laminated paper manufacturing .......... 322222 694 -15 34,073 -2,482 1,563,020 -64,357 882 26Plastics, foil, and coated paper bag mfg. ................ 322223 153 -15 10,517 -963 391,461 -17,562 716 31Uncoated paper and multiwall bag mfg. ................. 322224 152 -5 13,820 -517 467,517 -11,570 651 8Flexible packaging foil manufacturing .................... 322225 27 2 1,759 -370 70,893 -15,142 775 -2Surface-coated paperboard manufacturing ............ 322226 86 -7 2,702 156 98,937 9,051 704 25
Stationery product manufacturing ............................... 32223 669 -21 39,257 -3,004 1,498,274 -48,432 734 30Die-cut paper office supplies manufacturing .......... 322231 271 -5 12,357 -819 450,631 -16,250 701 20Envelope manufacturing ......................................... 322232 277 -12 20,969 -1,666 828,007 -29,622 759 30Stationery and related product manufacturing ........ 322233 121 -5 5,930 -520 219,637 -2,560 712 49
Other converted paper product manufacturing ........... 32229 797 -41 56,332 -3,411 2,592,682 -18,864 885 44Sanitary paper product manufacturing ................... 322291 199 -22 36,052 -2,355 1,841,410 1,089 982 61All other converted paper product mfg. .................. 322299 599 -18 20,280 -1,056 751,272 -19,953 712 17
Printing and related support activities .................................. 323 41,029 -1,492 707,566 -57,692 26,457,610 -1,469,110 719 17Printing and related support activities ............................. 3231 41,029 -1,492 707,566 -57,692 26,457,610 -1,469,110 719 17
Printing ........................................................................ 32311 37,428 -1,242 645,502 -50,092 23,997,646 -1,223,595 715 18Commercial lithographic printing ............................ 323110 13,194 -456 280,174 -27,154 11,261,190 -837,845 773 16Commercial gravure printing .................................. 323111 448 -35 18,106 -1,544 698,403 -46,162 742 13Commercial flexographic printing ........................... 323112 1,665 -104 42,897 -2,377 1,678,673 -31,925 753 26Commercial screen printing .................................... 323113 4,862 12 66,363 -2,844 1,875,939 -41,789 544 11Quick printing .......................................................... 323114 10,912 -688 78,974 -4,993 2,437,461 -99,169 594 13Digital printing ......................................................... 323115 1,188 103 18,533 -805 761,984 -22,636 791 11Manifold business forms printing ........................... 323116 990 -50 44,850 -4,248 1,844,563 -46,955 791 50Books printing ......................................................... 323117 592 -5 34,790 -2,416 1,320,210 -34,687 730 30Blankbook and looseleaf binder manufacturing ...... 323118 233 -17 11,881 -1,989 392,467 -41,759 635 33Other commercial printing ...................................... 323119 3,345 -3 48,934 -1,723 1,726,755 -20,667 679 16
Support activities for printing ....................................... 32312 3,601 -250 62,063 -7,601 2,459,964 -245,516 762 15Tradebinding and related work ............................... 323121 1,155 -23 23,872 -2,791 648,026 -58,620 522 12
See footnotes at end of table.
26

Table 2. Private industry by 6-digit NAICS industry and government by level of government, 2002 annual averages: Establishments, employment, and wages,change from 2001 — Continued
Industry/Ownership NAICS Code
Averageestablishments
Annual averageemployment
Total annual wages(in thousands)
Averageweekly wage
2002Change
from2001
2002Change
from2001
2002Change
from2001
2002Change
from2001
Prepress services ................................................... 323122 2,447 -226 38,191 -4,810 $1,811,938 - $186,895 $912 $18Petroleum and coal products manufacturing ....................... 324 2,525 -81 118,669 -2,298 7,891,082 44,140 1,279 32
Petroleum and coal products manufacturing ................... 3241 2,525 -81 118,669 -2,298 7,891,082 44,140 1,279 32Petroleum refineries .................................................... 32411 818 -19 73,911 -1,066 5,676,392 67,265 1,477 38Asphalt paving and roofing materials mfg. .................. 32412 1,191 -19 28,729 554 1,377,740 43,043 922 11
Asphalt paving mixture and block mfg. ................... 324121 905 -12 15,115 137 728,163 6,050 926 -1Asphalt shingle and coating materials mfg. ............ 324122 286 -7 13,614 417 649,577 36,994 918 25
Other petroleum and coal products mfg. ..................... 32419 516 -42 16,029 -1,786 836,950 -66,168 1,004 29Petroleum lubricating oil and grease mfg. .............. 324191 408 -35 10,455 -894 565,563 -28,400 1,040 33All other petroleum and coal products mfg. ............ 324199 109 -6 5,574 -892 271,387 -37,768 936 17
Chemical manufacturing ...................................................... 325 15,650 -212 924,737 -29,467 57,322,150 -483,837 1,192 27Basic chemical manufacturing ........................................ 3251 2,624 -7 169,076 -10,446 11,502,157 -588,163 1,308 13
Petrochemical manufacturing ..................................... 32511 192 -5 34,199 -1,868 2,640,613 -64,010 1,485 43Industrial gas manufacturing ....................................... 32512 676 19 23,619 -1,391 1,715,968 -119,849 1,397 -15Synthetic dye and pigment manufacturing .................. 32513 296 -11 21,065 -1,785 1,211,657 -103,367 1,106 -1
Inorganic dye and pigment manufacturing ............. 325131 157 -4 11,672 -843 655,530 -54,612 1,080 -11Synthetic organic dye and pigment mfg. ................ 325132 139 -7 9,393 -942 556,127 -48,755 1,139 13
Other basic inorganic chemical manufacturing ........... 32518 778 -16 46,821 -2,929 3,008,031 -165,441 1,235 8Alkalies and chlorine manufacturing ....................... 325181 69 -4 8,996 -332 588,993 -7,781 1,259 29Carbon black manufacturing ................................... 325182 39 -2 2,123 -99 138,333 -1,024 1,253 47All other basic inorganic chemical mfg. .................. 325188 670 -11 35,701 -2,499 2,280,705 -156,636 1,229 2
Other basic organic chemical manufacturing .............. 32519 682 6 43,372 -2,473 2,925,889 -135,495 1,297 13Gum and wood chemical manufacturing ................ 325191 74 -14 1,886 -148 74,466 -3,640 759 21Cyclic crude and intermediate manufacturing ........ 325192 38 -2 2,121 -348 128,720 -27,997 1,167 -54Ethyl alcohol manufacturing ................................... 325193 107 20 3,637 383 246,733 22,670 1,304 -20All other basic organic chemical mfg. ..................... 325199 463 1 35,728 -2,360 2,475,971 -126,528 1,333 19
Resin, rubber, and artificial fibers mfg. ............................ 3252 1,435 20 113,751 -11,600 6,670,361 -519,295 1,128 25Resin and synthetic rubber manufacturing ................. 32521 1,214 20 75,621 -5,910 4,699,304 -229,384 1,195 32Plastics material and resin manufacturing .................. 325211 1,002 19 61,552 -4,479 3,910,395 -176,102 1,222 32
Synthetic rubber manufacturing .............................. 325212 212 1 14,068 -1,432 788,909 -53,282 1,078 33Artificial fibers and filaments manufacturing ............... 32522 221 0 38,130 -5,690 1,971,058 -289,910 994 2
Cellulosic organic fiber manufacturing .................... 325221 56 2 11,264 -1,260 639,753 -67,194 1,092 6Noncellulosic organic fiber manufacturing .............. 325222 165 -2 26,867 -4,429 1,331,305 -222,717 953 -2
Agricultural chemical manufacturing ............................... 3253 1,157 -67 44,025 -1,918 2,469,251 -36,957 1,079 30Fertilizer manufacturing .............................................. 32531 857 -41 25,223 -1,176 1,222,630 -21,218 932 26
Nitrogenous fertilizer manufacturing ....................... 325311 210 -20 8,977 -481 507,489 -25,576 1,087 3Phosphatic fertilizer manufacturing ........................ 325312 88 -1 7,795 -226 406,538 2,958 1,003 35Fertilizer, mixing only, manufacturing ..................... 325314 560 -20 8,451 -469 308,603 1,399 702 40
Pesticide and other ag. chemical mfg. ........................ 32532 299 -27 18,802 -742 1,246,622 -15,739 1,275 33Pharmaceutical and medicine manufacturing ................. 3254 2,536 14 293,179 12,514 21,449,705 1,131,260 1,407 15
Pharmaceutical and medicine manufacturing ............. 32541 2,536 14 293,179 12,514 21,449,705 1,131,260 1,407 15Medicinal and botanical manufacturing .................. 325411 395 8 23,529 -764 1,619,370 -149,244 1,324 -76Pharmaceutical preparation manufacturing ............ 325412 1,441 19 230,436 11,184 17,512,814 1,132,943 1,462 25In-vitro diagnostic substance manufacturing .......... 325413 298 5 13,606 373 797,398 40,972 1,127 28Other biological product manufacturing .................. 325414 402 -19 25,608 1,721 1,520,124 106,589 1,142 4
Paint, coating, and adhesive manufacturing ................... 3255 2,118 -53 71,328 -3,270 3,598,442 -64,911 970 26Paint and coating manufacturing ................................ 32551 1,394 -24 47,238 -2,287 2,345,223 -37,651 955 30Adhesive manufacturing ............................................. 32552 724 -29 24,090 -984 1,253,219 -27,261 1,000 18
Soap, cleaning compound, and toiletry mfg. ................... 3256 2,701 -66 120,764 -6,059 5,931,311 -64,924 945 36Soap and cleaning compound manufacturing ............. 32561 1,807 -53 65,862 -3,603 3,504,030 -36,123 1,023 43
Soap and other detergent manufacturing ............... 325611 680 6 30,108 -1,693 1,615,205 -80,015 1,032 7Polish and other sanitation good mfg. .................... 325612 948 -57 28,657 -1,291 1,506,066 49,639 1,011 76Surface active agent manufacturing ....................... 325613 179 -2 7,098 -619 382,760 -5,748 1,037 69
See footnotes at end of table.
27

Table 2. Private industry by 6-digit NAICS industry and government by level of government, 2002 annual averages: Establishments, employment, and wages,change from 2001 — Continued
Industry/Ownership NAICS Code
Averageestablishments
Annual averageemployment
Total annual wages(in thousands)
Averageweekly wage
2002Change
from2001
2002Change
from2001
2002Change
from2001
2002Change
from2001
Toilet preparation manufacturing ................................ 32562 894 -14 54,902 -2,456 $2,427,280 - $28,801 $850 $27Other chemical product and preparation mfg. ................. 3259 3,081 -51 112,614 -8,688 5,700,922 -340,847 974 16
Printing ink manufacturing .......................................... 32591 586 -16 13,038 -961 666,134 -24,756 983 34Explosives manufacturing ........................................... 32592 113 -6 6,159 -291 279,534 -46,693 873 -100All other chemical preparation manufacturing ............. 32599 2,382 -29 93,417 -7,436 4,755,254 -269,398 979 21
Custom compounding of purchased resins ............ 325991 504 -9 23,534 -1,310 979,015 -9,563 800 35Photographic film and chemical manufacturing ...... 325992 508 -23 32,803 -5,336 1,785,453 -243,450 1,047 24Other miscellaneous chemical product mfg. ........... 325998 1,371 4 37,080 -790 1,990,787 -16,385 1,032 13
Plastics and rubber products manufacturing ....................... 326 15,554 -476 846,766 -48,035 31,202,697 -535,071 709 27Plastics product manufacturing ....................................... 3261 13,023 -376 664,392 -30,210 23,615,649 -75,854 684 28
Plastics packaging materials, film and sheet .............. 32611 1,315 -27 90,391 -3,257 3,672,020 12,427 781 29Plastics bag manufacturing .................................... 326111 383 -6 26,544 -797 951,731 6,114 690 25Plastics packaging film and sheet mfg. .................. 326112 107 7 5,596 25 228,127 16,254 784 53Nonpackaging plastics film and sheet mfg. ............ 326113 825 -28 58,250 -2,485 2,492,161 -9,940 823 31
Plastics pipe, fittings, and profile shapes .................... 32612 1,325 -38 60,999 -4,667 2,228,497 -96,247 703 22Unlaminated plastics profile shape mfg. ................. 326121 656 -26 30,038 -2,974 1,161,458 -72,276 744 25Plastics pipe and pipe fitting manufacturing ........... 326122 669 -12 30,960 -1,694 1,067,039 -23,971 663 20
Laminated plastics plate, sheet, and shapes .............. 32613 476 -21 22,933 -3,571 894,655 -108,361 750 22Polystyrene foam product manufacturing ................... 32614 561 4 28,285 22 962,023 11,429 654 7Urethane and other foam product manufacturing ....... 32615 640 9 31,865 -1,101 1,086,315 30,135 656 40Plastics bottle manufacturing ...................................... 32616 460 -2 36,575 279 1,355,460 89,724 713 42Other plastics product manufacturing ......................... 32619 8,248 -299 393,344 -17,916 13,416,679 -14,961 656 28
Plastics plumbing fixture manufacturing ................. 326191 537 -19 22,367 1,089 665,944 55,756 573 22Resilient floor covering manufacturing ................... 326192 80 11 7,364 180 411,637 29,865 1,075 53All other plastics product manufacturing ................. 326199 7,631 -292 363,613 -19,185 12,339,099 -100,581 653 28
Rubber product manufacturing ........................................ 3262 2,531 -100 182,373 -17,826 7,587,048 -459,218 800 27Tire manufacturing ...................................................... 32621 771 -43 75,145 -8,375 3,730,486 -333,441 955 19
Tire manufacturing, except retreading .................... 326211 168 -12 66,735 -8,026 3,467,741 -333,080 999 21Tire retreading ........................................................ 326212 603 -32 8,410 -349 262,744 -361 601 23
Rubber and plastics hose and belting mfg. ................. 32622 377 4 26,979 -1,676 1,004,949 2,659 716 43Other rubber product manufacturing ........................... 32629 1,384 -60 80,249 -7,774 2,851,613 -128,436 683 32
Rubber product mfg. for mechanical use ................ 326291 626 1 48,505 -3,551 1,710,314 -42,823 678 30All other rubber product manufacturing .................. 326299 758 -62 31,744 -4,224 1,141,300 -85,613 691 35
Nonmetallic mineral product manufacturing ........................ 327 17,766 -232 517,217 -25,825 20,543,618 -305,874 764 26Clay product and refractory manufacturing ..................... 3271 2,474 -115 71,768 -5,589 2,663,915 6,643 714 53
Pottery, ceramics, and plumbing fixture mfg. .............. 32711 1,645 -88 35,593 -4,201 1,156,866 -118,212 625 9Vitreous china plumbing fixture manufacturing ....... 327111 74 -4 9,017 -88 375,472 9,598 801 28Vitreous china and earthenware articles mfg. ........ 327112 1,445 -78 18,962 -1,962 469,779 -44,981 476 3Porcelain electrical supply manufacturing .............. 327113 127 -5 7,614 -2,151 311,615 -82,829 787 10
Clay building material and refractories mfg. ................ 32712 830 -27 36,176 -1,387 1,507,049 124,855 801 93Brick and structural clay tile manufacturing ............ 327121 188 -1 13,202 -463 457,445 405 666 23Ceramic wall and floor tile manufacturing ............... 327122 218 -7 8,217 329 417,805 177,949 978 393Other structural clay product manufacturing ........... 327123 61 -6 2,219 -159 76,779 -3,311 666 18Clay refractory manufacturing ................................ 327124 171 -2 5,506 -454 228,850 -16,485 799 7Nonclay refractory manufacturing ........................... 327125 192 -11 7,033 -639 326,169 -33,703 892 -10
Glass and glass product manufacturing .......................... 3272 2,555 -84 124,839 -10,413 5,133,712 -270,552 791 23Glass and glass product manufacturing ...................... 32721 2,555 -84 124,839 -10,413 5,133,712 -270,552 791 23
Flat glass manufacturing ........................................ 327211 198 -23 14,012 -459 626,468 -17,404 860 4Other pressed and blown glass and glassware ...... 327212 602 -13 32,983 -5,875 1,418,514 -215,653 827 18Glass container manufacturing ............................... 327213 121 -1 20,038 -550 951,489 -7,147 913 18Glass product mfg. made of purchased glass ........ 327215 1,634 -47 57,807 -3,528 2,137,241 -30,347 711 31
Cement and concrete product manufacturing ................. 3273 9,538 -48 229,962 -5,961 9,019,215 4,081 754 19Cement manufacturing ................................................ 32731 205 0 16,444 -378 893,228 14,387 1,045 40
See footnotes at end of table.
28
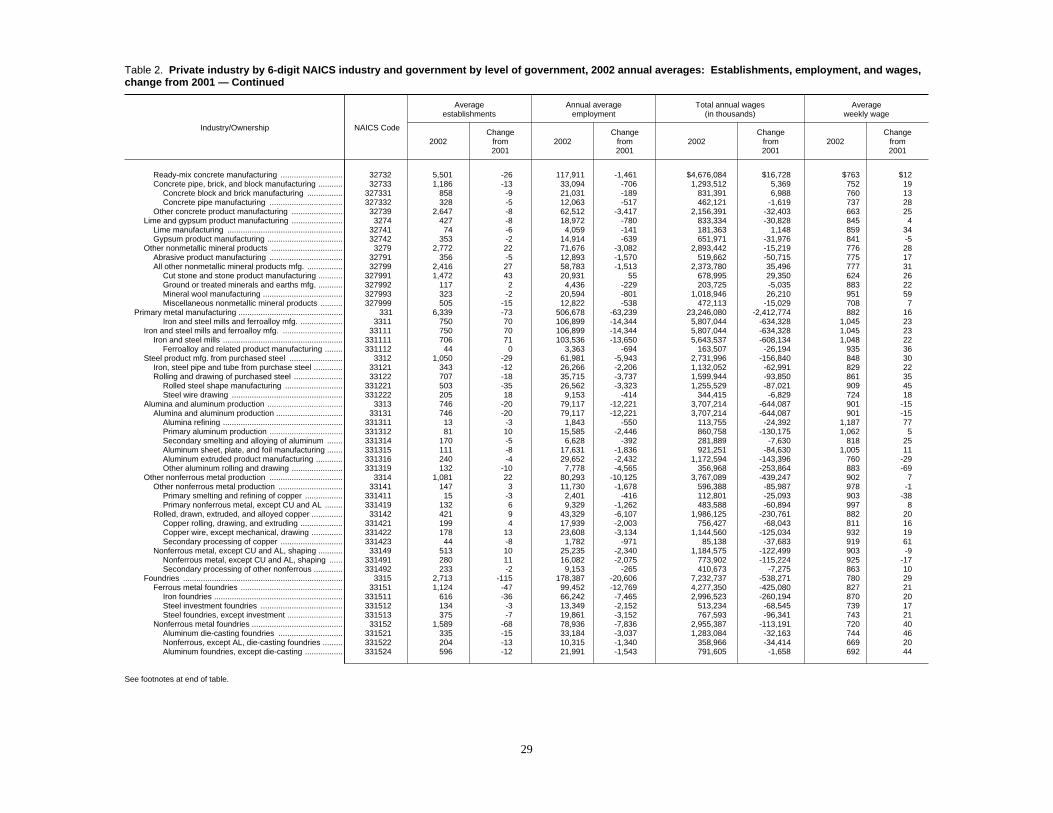
Table 2. Private industry by 6-digit NAICS industry and government by level of government, 2002 annual averages: Establishments, employment, and wages,change from 2001 — Continued
Industry/Ownership NAICS Code
Averageestablishments
Annual averageemployment
Total annual wages(in thousands)
Averageweekly wage
2002Change
from2001
2002Change
from2001
2002Change
from2001
2002Change
from2001
Ready-mix concrete manufacturing ............................ 32732 5,501 -26 117,911 -1,461 $4,676,084 $16,728 $763 $12Concrete pipe, brick, and block manufacturing ........... 32733 1,186 -13 33,094 -706 1,293,512 5,369 752 19
Concrete block and brick manufacturing ................ 327331 858 -9 21,031 -189 831,391 6,988 760 13Concrete pipe manufacturing ................................. 327332 328 -5 12,063 -517 462,121 -1,619 737 28
Other concrete product manufacturing ....................... 32739 2,647 -8 62,512 -3,417 2,156,391 -32,403 663 25Lime and gypsum product manufacturing ....................... 3274 427 -8 18,972 -780 833,334 -30,828 845 4
Lime manufacturing .................................................... 32741 74 -6 4,059 -141 181,363 1,148 859 34Gypsum product manufacturing .................................. 32742 353 -2 14,914 -639 651,971 -31,976 841 -5
Other nonmetallic mineral products ................................ 3279 2,772 22 71,676 -3,082 2,893,442 -15,219 776 28Abrasive product manufacturing ................................. 32791 356 -5 12,893 -1,570 519,662 -50,715 775 17All other nonmetallic mineral products mfg. ................ 32799 2,416 27 58,783 -1,513 2,373,780 35,496 777 31
Cut stone and stone product manufacturing ........... 327991 1,472 43 20,931 55 678,995 29,350 624 26Ground or treated minerals and earths mfg. ........... 327992 117 2 4,436 -229 203,725 -5,035 883 22Mineral wool manufacturing .................................... 327993 323 -2 20,594 -801 1,018,946 26,210 951 59Miscellaneous nonmetallic mineral products .......... 327999 505 -15 12,822 -538 472,113 -15,029 708 7
Primary metal manufacturing ............................................... 331 6,339 -73 506,678 -63,239 23,246,080 -2,412,774 882 16Iron and steel mills and ferroalloy mfg. ................... 3311 750 70 106,899 -14,344 5,807,044 -634,328 1,045 23
Iron and steel mills and ferroalloy mfg. ........................... 33111 750 70 106,899 -14,344 5,807,044 -634,328 1,045 23Iron and steel mills ...................................................... 331111 706 71 103,536 -13,650 5,643,537 -608,134 1,048 22
Ferroalloy and related product manufacturing ........ 331112 44 0 3,363 -694 163,507 -26,194 935 36Steel product mfg. from purchased steel ........................ 3312 1,050 -29 61,981 -5,943 2,731,996 -156,840 848 30
Iron, steel pipe and tube from purchase steel ............. 33121 343 -12 26,266 -2,206 1,132,052 -62,991 829 22Rolling and drawing of purchased steel ...................... 33122 707 -18 35,715 -3,737 1,599,944 -93,850 861 35
Rolled steel shape manufacturing .......................... 331221 503 -35 26,562 -3,323 1,255,529 -87,021 909 45Steel wire drawing .................................................. 331222 205 18 9,153 -414 344,415 -6,829 724 18
Alumina and aluminum production .................................. 3313 746 -20 79,117 -12,221 3,707,214 -644,087 901 -15Alumina and aluminum production .............................. 33131 746 -20 79,117 -12,221 3,707,214 -644,087 901 -15
Alumina refining ...................................................... 331311 13 -3 1,843 -550 113,755 -24,392 1,187 77Primary aluminum production ................................. 331312 81 10 15,585 -2,446 860,758 -130,175 1,062 5Secondary smelting and alloying of aluminum ....... 331314 170 -5 6,628 -392 281,889 -7,630 818 25Aluminum sheet, plate, and foil manufacturing ....... 331315 111 -8 17,631 -1,836 921,251 -84,630 1,005 11Aluminum extruded product manufacturing ............ 331316 240 -4 29,652 -2,432 1,172,594 -143,396 760 -29Other aluminum rolling and drawing ....................... 331319 132 -10 7,778 -4,565 356,968 -253,864 883 -69
Other nonferrous metal production ................................. 3314 1,081 22 80,293 -10,125 3,767,089 -439,247 902 7Other nonferrous metal production ............................. 33141 147 3 11,730 -1,678 596,388 -85,987 978 -1
Primary smelting and refining of copper ................. 331411 15 -3 2,401 -416 112,801 -25,093 903 -38Primary nonferrous metal, except CU and AL ........ 331419 132 6 9,329 -1,262 483,588 -60,894 997 8
Rolled, drawn, extruded, and alloyed copper .............. 33142 421 9 43,329 -6,107 1,986,125 -230,761 882 20Copper rolling, drawing, and extruding ................... 331421 199 4 17,939 -2,003 756,427 -68,043 811 16Copper wire, except mechanical, drawing .............. 331422 178 13 23,608 -3,134 1,144,560 -125,034 932 19Secondary processing of copper ............................ 331423 44 -8 1,782 -971 85,138 -37,683 919 61
Nonferrous metal, except CU and AL, shaping ........... 33149 513 10 25,235 -2,340 1,184,575 -122,499 903 -9Nonferrous metal, except CU and AL, shaping ...... 331491 280 11 16,082 -2,075 773,902 -115,224 925 -17Secondary processing of other nonferrous ............. 331492 233 -2 9,153 -265 410,673 -7,275 863 10
Foundries ........................................................................ 3315 2,713 -115 178,387 -20,606 7,232,737 -538,271 780 29Ferrous metal foundries .............................................. 33151 1,124 -47 99,452 -12,769 4,277,350 -425,080 827 21
Iron foundries .......................................................... 331511 616 -36 66,242 -7,465 2,996,523 -260,194 870 20Steel investment foundries ..................................... 331512 134 -3 13,349 -2,152 513,234 -68,545 739 17Steel foundries, except investment ......................... 331513 375 -7 19,861 -3,152 767,593 -96,341 743 21
Nonferrous metal foundries ......................................... 33152 1,589 -68 78,936 -7,836 2,955,387 -113,191 720 40Aluminum die-casting foundries ............................. 331521 335 -15 33,184 -3,037 1,283,084 -32,163 744 46Nonferrous, except AL, die-casting foundries ......... 331522 204 -13 10,315 -1,340 358,966 -34,414 669 20Aluminum foundries, except die-casting ................. 331524 596 -12 21,991 -1,543 791,605 -1,658 692 44
See footnotes at end of table.
29

Table 2. Private industry by 6-digit NAICS industry and government by level of government, 2002 annual averages: Establishments, employment, and wages,change from 2001 — Continued
Industry/Ownership NAICS Code
Averageestablishments
Annual averageemployment
Total annual wages(in thousands)
Averageweekly wage
2002Change
from2001
2002Change
from2001
2002Change
from2001
2002Change
from2001
Copper foundries, except die-casting ..................... 331525 291 -14 8,187 -989 $299,358 - $8,145 $703 $59Other nonferrous foundries, exc. die-casting .......... 331528 164 -14 5,260 -926 222,373 -36,811 813 7
Fabricated metal product manufacturing ............................. 332 62,828 -992 1,540,867 -127,233 59,352,280 -3,119,699 741 21Forging and stamping ..................................................... 3321 2,703 -22 111,968 -11,835 4,517,758 -311,620 776 26
Forging and stamping ................................................. 33211 2,703 -22 111,968 -11,835 4,517,758 -311,620 776 26Iron and steel forging .............................................. 332111 511 0 26,333 -2,119 1,146,038 -64,522 837 19Nonferrous forging .................................................. 332112 104 -2 7,666 -882 363,352 -30,323 911 25Custom roll forming ................................................ 332114 130 -8 6,055 -519 248,528 -9,722 789 33Crown and closure manufacturing .......................... 332115 35 -7 3,456 -433 149,998 -11,290 835 38Metal stamping ....................................................... 332116 1,768 6 57,985 -6,198 2,224,057 -140,027 738 30Powder metallurgy part manufacturing ................... 332117 157 -9 10,473 -1,685 385,785 -55,736 708 10
Cutlery and handtool manufacturing ............................... 3322 1,748 -67 64,448 -7,188 2,680,050 -162,932 800 37Cutlery and handtool manufacturing ........................... 33221 1,748 -67 64,448 -7,188 2,680,050 -162,932 800 37
Cutlery and flatware, except precious, mfg. ........... 332211 164 -7 9,985 -610 572,823 10,130 1,103 82Hand and edge tool manufacturing ........................ 332212 1,312 -49 42,883 -5,370 1,664,505 -153,374 746 21Saw blade and handsaw manufacturing ................. 332213 185 -1 6,952 -669 262,751 -11,708 727 34Kitchen utensil, pot, and pan manufacturing .......... 332214 88 -9 4,628 -540 179,971 -7,980 748 49
Architectural and structural metals mfg. .......................... 3323 14,563 -70 396,054 -22,119 14,366,567 -490,966 698 15Plate work and fabricated structural products ............. 33231 6,247 -6 172,890 -10,076 6,658,087 -232,765 741 17
Prefabricated metal buildings and components ...... 332311 962 12 31,431 -1,174 1,128,962 23,380 691 39Fabricated structural metal manufacturing ............. 332312 3,504 13 94,067 -4,677 3,623,422 -148,843 741 6Plate work manufacturing ....................................... 332313 1,781 -30 47,392 -4,225 1,905,703 -107,302 773 23
Ornamental and architectural metal products ............. 33232 8,316 -64 223,164 -12,043 7,708,480 -258,201 664 13Metal window and door manufacturing ................... 332321 1,610 -66 84,910 -1,755 2,737,358 2,360 620 13Sheet metal work manufacturing ............................ 332322 4,053 11 98,284 -8,491 3,570,909 -219,909 699 16Ornamental and architectural metal work mfg. ....... 332323 2,653 -10 39,970 -1,797 1,400,213 -40,652 674 11
Boiler, tank, and shipping container mfg. ........................ 3324 2,112 -97 95,306 -7,271 4,160,268 -127,651 839 35Power boiler and heat exchanger manufacturing ....... 33241 321 -1 20,327 -1,468 953,796 -28,364 902 35Metal tank, heavy gauge, manufacturing .................... 33242 665 -18 24,127 -1,713 954,680 -40,060 761 21Metal can, box, and other container mfg. .................... 33243 1,125 -79 50,852 -4,090 2,251,793 -59,227 852 43
Metal can manufacturing ........................................ 332431 295 -8 25,768 -600 1,376,109 19,762 1,027 38Other metal container manufacturing ..................... 332439 830 -71 25,084 -3,489 875,684 -78,989 671 28
Hardware manufacturing ..................................................... 3325 763 -17 42,142 -4,155 1,565,644 -75,042 714 32Spring and wire product manufacturing .......................... 3326 1,861 -89 70,891 -4,985 2,477,819 -83,194 672 23
Spring and wire product manufacturing ...................... 33261 1,861 -89 70,891 -4,985 2,477,819 -83,194 672 23Spring, heavy gauge, manufacturing ...................... 332611 144 -3 4,739 226 176,048 6,826 714 -7Spring, light gauge, manufacturing ......................... 332612 351 -1 12,427 -588 490,448 -1,088 759 33Other fabricated wire product manufacturing ......... 332618 1,366 -85 53,726 -4,623 1,811,323 -88,933 648 22
Machine shops and threaded product mfg. .................... 3327 24,733 -338 315,856 -28,512 11,998,352 -914,164 731 10Machine shops ............................................................ 33271 22,064 -255 226,773 -19,397 8,421,216 -674,925 714 3Turned product and screw, nut, and bolt mfg. ............ 33272 2,670 -82 89,083 -9,114 3,577,136 -239,239 772 25
Precision turned product manufacturing ................. 332721 1,687 -49 43,813 -4,193 1,599,978 -120,106 702 13Bolt, nut, screw, rivet, and washer mfg. .................. 332722 983 -33 45,270 -4,921 1,977,158 -119,133 840 37
Coating, engraving, and heat treating metals ................. 3328 7,526 -146 148,505 -15,905 5,097,952 -373,996 660 20Coating, engraving, and heat treating metals ............. 33281 7,526 -146 148,505 -15,905 5,097,952 -373,996 660 20
Metal heat treating .................................................. 332811 743 -9 17,923 -851 742,442 -14,633 797 21Metal coating and nonprecious engraving .............. 332812 2,651 57 50,331 -4,198 1,697,768 -74,996 649 24Electroplating, anodizing, and coloring metal ......... 332813 4,133 -193 80,250 -10,857 2,657,742 -284,367 637 16
Other fabricated metal product manufacturing ................ 3329 6,820 -147 295,698 -25,263 12,487,870 -580,133 812 29Metal valve manufacturing .......................................... 33291 1,655 -74 105,900 -9,460 4,609,641 -235,218 837 29
Industrial valve manufacturing ................................ 332911 461 -24 24,050 -1,151 1,080,580 -30,644 864 16Fluid power valve and hose fitting mfg. .................. 332912 625 -30 39,881 -5,213 1,822,629 -146,613 879 39Plumbing fixture fitting and trim mfg. ...................... 332913 185 -4 17,890 -780 775,804 9,487 834 45
See footnotes at end of table.
30
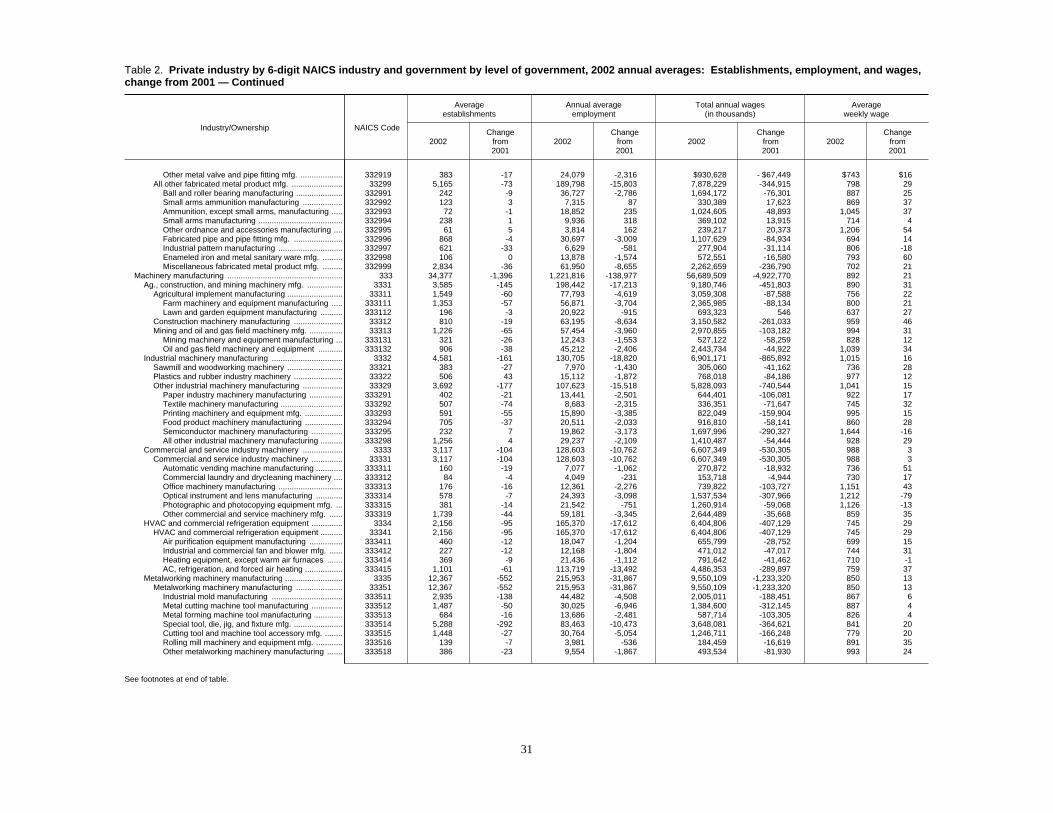
Table 2. Private industry by 6-digit NAICS industry and government by level of government, 2002 annual averages: Establishments, employment, and wages,change from 2001 — Continued
Industry/Ownership NAICS Code
Averageestablishments
Annual averageemployment
Total annual wages(in thousands)
Averageweekly wage
2002Change
from2001
2002Change
from2001
2002Change
from2001
2002Change
from2001
Other metal valve and pipe fitting mfg. ................... 332919 383 -17 24,079 -2,316 $930,628 - $67,449 $743 $16All other fabricated metal product mfg. ....................... 33299 5,165 -73 189,798 -15,803 7,878,229 -344,915 798 29
Ball and roller bearing manufacturing ..................... 332991 242 -9 36,727 -2,786 1,694,172 -76,301 887 25Small arms ammunition manufacturing .................. 332992 123 3 7,315 87 330,389 17,623 869 37Ammunition, except small arms, manufacturing ..... 332993 72 -1 18,852 235 1,024,605 48,893 1,045 37Small arms manufacturing ...................................... 332994 238 1 9,936 318 369,102 13,915 714 4Other ordnance and accessories manufacturing .... 332995 61 5 3,814 162 239,217 20,373 1,206 54Fabricated pipe and pipe fitting mfg. ...................... 332996 868 -4 30,697 -3,009 1,107,629 -84,934 694 14Industrial pattern manufacturing ............................. 332997 621 -33 6,629 -581 277,904 -31,114 806 -18Enameled iron and metal sanitary ware mfg. ......... 332998 106 0 13,878 -1,574 572,551 -16,580 793 60Miscellaneous fabricated metal product mfg. ......... 332999 2,834 -36 61,950 -8,655 2,262,659 -236,790 702 21
Machinery manufacturing .................................................... 333 34,377 -1,396 1,221,816 -138,977 56,689,509 -4,922,770 892 21Ag., construction, and mining machinery mfg. ................ 3331 3,585 -145 198,442 -17,213 9,180,746 -451,803 890 31
Agricultural implement manufacturing ......................... 33311 1,549 -60 77,793 -4,619 3,059,308 -87,588 756 22Farm machinery and equipment manufacturing ..... 333111 1,353 -57 56,871 -3,704 2,365,985 -88,134 800 21Lawn and garden equipment manufacturing .......... 333112 196 -3 20,922 -915 693,323 546 637 27
Construction machinery manufacturing ...................... 33312 810 -19 63,195 -8,634 3,150,582 -261,033 959 46Mining and oil and gas field machinery mfg. ............... 33313 1,226 -65 57,454 -3,960 2,970,855 -103,182 994 31
Mining machinery and equipment manufacturing ... 333131 321 -26 12,243 -1,553 527,122 -58,259 828 12Oil and gas field machinery and equipment ........... 333132 906 -38 45,212 -2,406 2,443,734 -44,922 1,039 34
Industrial machinery manufacturing ................................ 3332 4,581 -161 130,705 -18,820 6,901,171 -865,892 1,015 16Sawmill and woodworking machinery ......................... 33321 383 -27 7,970 -1,430 305,060 -41,162 736 28Plastics and rubber industry machinery ...................... 33322 506 43 15,112 -1,872 768,018 -84,186 977 12Other industrial machinery manufacturing .................. 33329 3,692 -177 107,623 -15,518 5,828,093 -740,544 1,041 15
Paper industry machinery manufacturing ............... 333291 402 -21 13,441 -2,501 644,401 -106,081 922 17Textile machinery manufacturing ............................ 333292 507 -74 8,683 -2,315 336,351 -71,647 745 32Printing machinery and equipment mfg. ................. 333293 591 -55 15,890 -3,385 822,049 -159,904 995 15Food product machinery manufacturing ................. 333294 705 -37 20,511 -2,033 916,810 -58,141 860 28Semiconductor machinery manufacturing .............. 333295 232 7 19,862 -3,173 1,697,996 -290,327 1,644 -16All other industrial machinery manufacturing .......... 333298 1,256 4 29,237 -2,109 1,410,487 -54,444 928 29
Commercial and service industry machinery .................. 3333 3,117 -104 128,603 -10,762 6,607,349 -530,305 988 3Commercial and service industry machinery .............. 33331 3,117 -104 128,603 -10,762 6,607,349 -530,305 988 3
Automatic vending machine manufacturing ............ 333311 160 -19 7,077 -1,062 270,872 -18,932 736 51Commercial laundry and drycleaning machinery .... 333312 84 -4 4,049 -231 153,718 -4,944 730 17Office machinery manufacturing ............................. 333313 176 -16 12,361 -2,276 739,822 -103,727 1,151 43Optical instrument and lens manufacturing ............ 333314 578 -7 24,393 -3,098 1,537,534 -307,966 1,212 -79Photographic and photocopying equipment mfg. ... 333315 381 -14 21,542 -751 1,260,914 -59,068 1,126 -13Other commercial and service machinery mfg. ...... 333319 1,739 -44 59,181 -3,345 2,644,489 -35,668 859 35
HVAC and commercial refrigeration equipment .............. 3334 2,156 -95 165,370 -17,612 6,404,806 -407,129 745 29HVAC and commercial refrigeration equipment .......... 33341 2,156 -95 165,370 -17,612 6,404,806 -407,129 745 29
Air purification equipment manufacturing ............... 333411 460 -12 18,047 -1,204 655,799 -28,752 699 15Industrial and commercial fan and blower mfg. ...... 333412 227 -12 12,168 -1,804 471,012 -47,017 744 31Heating equipment, except warm air furnaces ....... 333414 369 -9 21,436 -1,112 791,642 -41,462 710 -1AC, refrigeration, and forced air heating ................. 333415 1,101 -61 113,719 -13,492 4,486,353 -289,897 759 37
Metalworking machinery manufacturing .......................... 3335 12,367 -552 215,953 -31,867 9,550,109 -1,233,320 850 13Metalworking machinery manufacturing ..................... 33351 12,367 -552 215,953 -31,867 9,550,109 -1,233,320 850 13
Industrial mold manufacturing ................................ 333511 2,935 -138 44,482 -4,508 2,005,011 -188,451 867 6Metal cutting machine tool manufacturing .............. 333512 1,487 -50 30,025 -6,946 1,384,600 -312,145 887 4Metal forming machine tool manufacturing ............. 333513 684 -16 13,686 -2,481 587,714 -103,305 826 4Special tool, die, jig, and fixture mfg. ...................... 333514 5,288 -292 83,463 -10,473 3,648,081 -364,621 841 20Cutting tool and machine tool accessory mfg. ........ 333515 1,448 -27 30,764 -5,054 1,246,711 -166,248 779 20Rolling mill machinery and equipment mfg. ............ 333516 139 -7 3,981 -536 184,459 -16,619 891 35Other metalworking machinery manufacturing ....... 333518 386 -23 9,554 -1,867 493,534 -81,930 993 24
See footnotes at end of table.
31

Table 2. Private industry by 6-digit NAICS industry and government by level of government, 2002 annual averages: Establishments, employment, and wages,change from 2001 — Continued
Industry/Ownership NAICS Code
Averageestablishments
Annual averageemployment
Total annual wages(in thousands)
Averageweekly wage
2002Change
from2001
2002Change
from2001
2002Change
from2001
2002Change
from2001
Turbine and power transmission equipment mfg. ........... 3336 1,152 -35 100,328 -5,845 $5,161,150 - $170,265 $989 $23Turbine and power transmission equipment mfg. ....... 33361 1,152 -35 100,328 -5,845 5,161,150 -170,265 989 23
Turbine and turbine generator set units mfg. .......... 333611 213 -2 23,394 782 1,535,607 81,832 1,262 26Speed changer, drive, and gear manufacturing ..... 333612 330 -8 13,483 -1,613 597,667 -58,857 852 16Mechanical power transmission equipment mfg. .... 333613 343 -19 17,234 -1,149 687,702 -29,717 767 16Other engine equipment manufacturing ................. 333618 265 -7 46,217 -3,866 2,340,174 -163,524 974 13
Other general purpose machinery manufacturing ........... 3339 7,420 -305 282,415 -36,859 12,884,177 -1,264,056 877 25Pump and compressor manufacturing ........................ 33391 1,066 -32 54,445 -4,280 2,695,663 -114,420 952 32
Pump and pumping equipment manufacturing ....... 333911 613 -17 29,460 -1,700 1,465,612 -40,030 957 28Air and gas compressor manufacturing .................. 333912 391 -10 21,758 -1,975 1,076,220 -60,919 951 30Measuring and dispensing pump manufacturing .... 333913 63 -4 3,227 -605 153,831 -13,472 917 77
Material handling equipment manufacturing ............... 33392 2,040 -80 79,822 -13,172 3,389,220 -452,657 817 23Elevator and moving stairway manufacturing ......... 333921 187 -6 9,241 -550 409,574 -9,568 852 29Conveyor and conveying equipment mfg. .............. 333922 983 -45 32,611 -5,274 1,441,619 -188,466 850 23Overhead cranes, hoists, and monorail systems .... 333923 403 -11 14,549 -3,163 612,063 -116,975 809 17Industrial truck, trailer, and stacker mfg. ................. 333924 468 -18 23,421 -4,185 925,964 -137,647 760 19
All other general purpose machinery mfg. .................. 33399 4,314 -193 148,148 -19,407 6,799,294 -696,979 883 23Power-driven handtool manufacturing .................... 333991 279 -8 15,921 -1,583 694,659 -46,516 839 25Welding and soldering equipment manufacturing .. 333992 338 2 14,738 -2,668 707,223 -154,595 923 -29Packaging machinery manufacturing ..................... 333993 675 -28 18,945 -2,777 914,405 -98,947 928 31Industrial process furnace and oven mfg. ............... 333994 507 -22 13,767 -2,476 605,408 -83,191 846 31Fluid power cylinder and actuator mfg. ................... 333995 424 -17 16,188 -1,695 675,684 -34,187 803 40Fluid power pump and motor manufacturing .......... 333996 272 -23 21,142 -1,911 1,083,605 -70,427 986 23Scale and balance, except laboratory, mfg. ........... 333997 154 0 4,696 -566 187,870 -20,969 769 6Miscellaneous general purpose machinery mfg. .... 333999 1,666 -96 42,751 -5,732 1,930,442 -188,146 868 28
Computer and electronic product manufacturing ................. 334 21,397 -969 1,498,244 -249,890 98,045,569 -14,953,637 1,258 15Computer and peripheral equipment mfg. ....................... 3341 2,164 -142 246,993 -39,240 21,097,293 -3,423,245 1,643 -4
Computer and peripheral equipment mfg. .................. 33411 2,164 -142 246,993 -39,240 21,097,293 -3,423,245 1,643 -4Electronic computer manufacturing ........................ 334111 919 -80 138,469 -19,170 12,881,994 -2,101,715 1,789 -39Computer storage device manufacturing ................ 334112 253 -6 33,413 -2,849 2,766,718 -216,707 1,592 10Computer terminal manufacturing .......................... 334113 133 -3 19,851 -4,766 1,645,840 -358,109 1,594 29Other computer peripheral equipment mfg. ............ 334119 858 -56 55,262 -12,452 3,802,741 -746,715 1,323 31
Communications equipment manufacturing ................... 3342 2,715 -181 183,072 -53,836 12,063,555 -3,288,374 1,267 21Telephone apparatus manufacturing .......................... 33421 736 -66 67,127 -31,634 4,899,024 -2,087,737 1,403 43Broadcast and wireless communications equip. ......... 33422 1,368 -75 86,777 -18,307 5,465,773 -969,973 1,211 33Other communications equipment manufacturing ...... 33429 611 -40 29,168 -3,896 1,698,758 -230,665 1,120 -2
Audio and video equipment manufacturing ..................... 3343 701 -50 41,702 -5,657 2,035,534 -180,528 939 39Semiconductor and electronic component mfg. .............. 3344 6,670 -271 523,680 -119,672 31,087,733 -7,014,938 1,142 3
Semiconductor and electronic component mfg. .......... 33441 6,670 -271 523,680 -119,672 31,087,733 -7,014,938 1,142 3Electron tube manufacturing ................................... 334411 124 -13 15,927 -2,747 945,414 -141,676 1,142 22Bare printed circuit board manufacturing ................ 334412 1,650 -242 82,179 -38,744 3,292,450 -1,384,496 770 26Semiconductors and related device mfg. ............... 334413 1,642 2 251,107 -41,038 19,079,079 -3,946,788 1,461 -55Electronic capacitor manufacturing ........................ 334414 106 -13 10,659 -3,727 402,356 -101,686 726 52Electronic resistor manufacturing ........................... 334415 95 -1 6,401 -1,921 229,052 -67,645 688 2Electronic coils, transformers, and inductors .......... 334416 368 -24 13,012 -2,982 404,370 -87,178 598 7Electronic connector manufacturing ....................... 334417 288 -10 18,631 -4,821 799,562 -127,859 825 64Printed circuit assembly manufacturing .................. 334418 931 51 50,166 -9,789 2,406,881 -467,965 923 1Other electronic component manufacturing ............ 334419 1,467 -20 75,599 -13,903 3,528,570 -689,645 898 -8
Electronic instrument manufacturing ............................... 3345 7,326 -121 447,091 -24,626 28,296,895 -635,390 1,217 38Electronic instrument manufacturing ........................... 33451 7,326 -121 447,091 -24,626 28,296,895 -635,390 1,217 38
Electromedical apparatus manufacturing ............... 334510 754 13 53,890 77 3,370,644 93,280 1,203 32Search, detection, and navigation instruments ....... 334511 845 -1 147,140 -1,248 10,690,688 367,395 1,397 59Automatic environmental control manufacturing .... 334512 484 -10 32,214 -639 1,397,448 9,143 834 21
See footnotes at end of table.
32

Table 2. Private industry by 6-digit NAICS industry and government by level of government, 2002 annual averages: Establishments, employment, and wages,change from 2001 — Continued
Industry/Ownership NAICS Code
Averageestablishments
Annual averageemployment
Total annual wages(in thousands)
Averageweekly wage
2002Change
from2001
2002Change
from2001
2002Change
from2001
2002Change
from2001
Industrial process variable instruments ................. 334513 1,808 -41 60,787 -6,388 $3,251,893 - $260,441 $1,029 $23Totalizing fluid meters and counting devices .......... 334514 378 -23 16,715 138 755,376 9,138 869 3Electricity and signal testing instruments ................ 334515 1,011 24 53,665 -12,080 3,966,165 -651,844 1,421 70Analytical laboratory instrument mfg. ..................... 334516 648 -29 34,453 -744 2,244,535 -32,613 1,253 9Irradiation apparatus manufacturing ....................... 334517 220 -12 11,094 -475 771,322 -28,705 1,337 7Watch, clock, and part manufacturing .................... 334518 175 -11 7,265 -433 345,141 -19,840 914 2Other measuring and controlling device mfg. ......... 334519 1,004 -31 29,869 -2,834 1,503,684 -120,903 968 13
Magnetic media manufacturing and reproducing ............ 3346 1,822 -204 55,707 -6,858 3,464,559 -411,161 1,196 5Magnetic media manufacturing and reproducing ........ 33461 1,822 -204 55,707 -6,858 3,464,559 -411,161 1,196 5
Software reproducing ............................................. 334611 1,022 -158 23,544 -4,315 2,176,379 -318,853 1,778 56Audio and video media reproduction ...................... 334612 590 -39 25,650 -1,727 968,563 -47,939 726 12Magnetic and optical recording media mfg. ............ 334613 210 -8 6,514 -816 319,617 -44,369 944 -11
Electrical equipment and appliance mfg. ............................. 335 7,722 -245 494,201 -57,812 20,479,516 -1,816,028 797 20Electric lighting equipment manufacturing ...................... 3351 1,628 -79 71,979 -6,449 2,813,090 -98,351 752 38
Electric lamp bulb and part manufacturing .................. 33511 279 -14 16,559 -1,588 853,546 -26,858 991 58Lighting fixture manufacturing ..................................... 33512 1,348 -66 55,420 -4,861 1,959,544 -71,493 680 32
Residential electric lighting fixture mfg. .................. 335121 615 -41 17,516 -2,167 537,745 -30,482 590 35Nonresidential electric lighting fixture mfg. ............. 335122 408 -6 25,947 -1,523 973,438 -8,795 721 33Other lighting equipment manufacturing ................. 335129 326 -18 11,957 -1,171 448,361 -32,216 721 17
Household appliance manufacturing ............................... 3352 526 -24 97,123 -3,446 3,735,456 15,796 740 29Small electrical appliance manufacturing .................... 33521 244 -2 24,367 -1,403 914,560 19,260 722 54
Electric housewares and household fan mfg. ......... 335211 191 -3 14,860 -570 555,922 16,538 719 47Household vacuum cleaner manufacturing ............ 335212 53 1 9,507 -833 358,638 2,722 725 63
Major appliance manufacturing ................................... 33522 282 -21 72,756 -2,042 2,820,896 -3,464 746 20Household cooking appliance manufacturing ......... 335221 129 -5 18,871 416 590,048 18,604 601 6Household refrigerator and home freezer mfg. ....... 335222 42 -5 23,942 -1,661 898,787 -54,630 722 6Household laundry equipment manufacturing ........ 335224 42 -12 17,803 -306 853,243 33,770 922 52Other major household appliance manufacturing ... 335228 70 1 12,140 -491 478,818 -1,208 758 27
Electrical equipment manufacturing ................................ 3353 3,112 -91 174,007 -21,394 7,466,758 -644,766 825 27Electrical equipment manufacturing ............................ 33531 3,112 -91 174,007 -21,394 7,466,758 -644,766 825 27
Electric power and specialty transformer mfg. ........ 335311 424 -31 30,058 -4,241 1,236,479 -72,001 791 57Motor and generator manufacturing ....................... 335312 748 -4 58,028 -6,517 2,183,291 -168,633 724 23Switchgear and switchboard apparatus mfg. ......... 335313 777 -10 38,669 -4,930 1,767,681 -184,639 879 18Relay and industrial control manufacturing ............ 335314 1,164 -46 47,252 -5,706 2,279,306 -219,493 928 21
Other electrical equipment and component mfg. ............ 3359 2,457 -51 151,093 -26,522 6,464,211 -1,088,707 823 5Battery manufacturing ................................................. 33591 258 -21 30,085 -4,793 1,325,002 -149,763 847 34
Storage battery manufacturing ............................... 335911 179 -18 17,204 -3,325 790,843 -107,408 884 43Primary battery manufacturing ............................... 335912 79 -3 12,881 -1,468 534,160 -42,356 797 24
Communication and energy wire and cable mfg. ........ 33592 375 0 25,170 -8,593 1,177,351 -349,928 900 30Fiber optic cable manufacturing ............................. 335921 170 0 13,376 -6,718 689,811 -275,824 992 68Other communication and energy wire mfg. ........... 335929 205 1 11,795 -1,874 487,540 -74,104 795 5
Wiring device manufacturing ....................................... 33593 839 -38 61,832 -9,443 2,498,930 -344,458 777 10Current-carrying wiring device manufacturing ........ 335931 645 -30 47,785 -7,987 1,970,190 -295,592 793 12Noncurrent-carrying wiring device mfg. .................. 335932 194 -8 14,047 -1,457 528,741 -48,866 724 8
Other electrical equipment and component mfg. ........ 33599 986 8 34,006 -3,692 1,462,928 -244,558 827 -44Carbon and graphite product manufacturing .......... 335991 138 0 7,587 -1,114 320,391 -41,020 812 13Miscellaneous electrical equipment mfg. ................ 335999 848 8 26,419 -2,578 1,142,537 -203,538 832 -61
Transportation equipment manufacturing ............................ 336 15,624 -255 1,820,170 -104,168 97,025,663 -404,016 1,025 51Motor vehicle manufacturing ........................................... 3361 476 15 266,633 -11,220 17,691,315 -43,859 1,276 49
Automobile and light truck manufacturing ................... 33611 337 22 234,160 2,144 16,090,425 737,661 1,321 48Automobile manufacturing ...................................... 336111 264 16 159,795 -8,441 11,111,650 -101,025 1,337 55Light truck and utility vehicle manufacturing ........... 336112 73 7 74,365 10,586 4,978,776 838,686 1,288 40
Heavy duty truck manufacturing ................................. 33612 139 -7 32,473 -13,364 1,600,889 -781,520 948 -52
See footnotes at end of table.
33

Table 2. Private industry by 6-digit NAICS industry and government by level of government, 2002 annual averages: Establishments, employment, and wages,change from 2001 — Continued
Industry/Ownership NAICS Code
Averageestablishments
Annual averageemployment
Total annual wages(in thousands)
Averageweekly wage
2002Change
from2001
2002Change
from2001
2002Change
from2001
2002Change
from2001
Motor vehicle body and trailer manufacturing ................. 3362 2,407 -96 153,920 -5,674 $5,745,548 $135,724 $718 $42Motor vehicle body and trailer manufacturing ............. 33621 2,407 -96 153,920 -5,674 5,745,548 135,724 718 42
Motor vehicle body manufacturing .......................... 336211 969 -41 69,120 -5,850 2,920,854 -37,829 813 54Truck trailer manufacturing ..................................... 336212 517 -20 28,294 -2,735 896,556 -74,319 609 7Motor home manufacturing ..................................... 336213 100 -25 18,371 784 681,979 81,692 714 58Travel trailer and camper manufacturing ................ 336214 821 -11 38,135 2,127 1,246,158 166,180 628 51
Motor vehicle parts manufacturing .................................. 3363 6,765 -77 728,766 -39,131 35,142,266 358,063 927 56Motor vehicle gasoline engine and parts mfg. ............ 33631 1,112 9 91,941 -2,605 4,895,312 205,842 1,024 70
Carburetor, piston, ring, and valve mfg. ................. 336311 187 -7 19,064 -1,891 848,520 -6,151 856 72Gasoline engine and engine parts mfg. .................. 336312 925 15 72,877 -713 4,046,792 211,994 1,068 66
Motor vehicle electric equipment ................................ 33632 1,124 -26 109,758 -9,250 4,980,243 -224,454 873 32Vehicular lighting equipment manufacturing ........... 336321 138 0 16,923 -843 768,038 -22,815 873 17Other motor vehicle electric equipment mfg. .......... 336322 987 -25 92,835 -8,407 4,212,205 -201,640 873 35
Motor vehicle steering and suspension parts .............. 33633 286 8 47,660 -2,940 2,750,699 23,111 1,110 73Motor vehicle brake system manufacturing ................ 33634 313 -2 44,829 -1,895 2,034,607 15,487 873 42Motor vehicle power train components mfg. ............... 33635 598 5 89,509 -6,467 5,383,894 -7,777 1,157 77Motor vehicle seating and interior trim mfg. ................ 33636 519 -17 61,486 -4,022 2,422,918 80,114 758 70Motor vehicle metal stamping ..................................... 33637 756 -34 105,648 -5,443 5,241,407 -4,432 954 46Other motor vehicle parts manufacturing .................... 33639 2,057 -19 177,935 -6,510 7,433,187 270,173 803 56
Motor vehicle air-conditioning manufacturing ......... 336391 104 1 14,992 -2,363 707,621 -55,244 908 63All other motor vehicle parts manufacturing ........... 336399 1,953 -20 162,943 -4,146 6,725,566 325,417 794 57
Aerospace product and parts manufacturing .................. 3364 2,788 -63 465,922 -40,080 30,009,156 -570,886 1,239 77Aerospace product and parts manufacturing .............. 33641 2,788 -63 465,922 -40,080 30,009,156 -570,886 1,239 77
Aircraft manufacturing ............................................ 336411 480 6 217,433 -20,311 14,705,104 -148,194 1,301 100Aircraft engine and engine parts mfg. ..................... 336412 587 -20 86,951 -7,559 5,317,411 -304,249 1,176 32Other aircraft parts and equipment ......................... 336413 1,520 -51 88,153 -9,481 4,574,944 -300,489 998 38Guided missile and space vehicle mfg. .................. 336414 78 4 53,477 147 4,121,755 350,104 1,482 122Space vehicle propulsion units and parts mfg. ....... 336415 53 3 12,678 625 834,587 67,907 1,266 43Other guided missile and space vehicle parts ........ 336419 71 -5 7,230 -3,501 455,355 -235,965 1,211 -28
Railroad rolling stock manufacturing ............................... 3365 277 12 22,077 -5,688 1,007,900 -198,466 878 42Ship and boat building ..................................................... 3366 2,033 -37 143,604 -2,718 5,530,753 -125,442 741 -2
Ship and boat building ................................................ 33661 2,033 -37 143,604 -2,718 5,530,753 -125,442 741 -2Ship building and repairing ..................................... 336611 641 6 91,142 139 3,871,569 -116,477 817 -26Boat building ........................................................... 336612 1,391 -44 52,462 -2,856 1,659,184 -8,966 608 28
Other transportation equipment manufacturing ............... 3369 879 -9 39,248 342 1,898,725 40,850 930 12Other transportation equipment manufacturing .......... 33699 879 -9 39,248 342 1,898,725 40,850 930 12
Motorcycle, bicycle, and parts manufacturing ........ 336991 461 -22 18,593 -84 934,539 -22,925 967 -19Military armored vehicles and tank parts mfg. ........ 336992 42 -1 5,464 9 375,258 14,701 1,321 50All other transportation equipment mfg. .................. 336999 375 12 15,191 416 588,928 49,074 746 43
Furniture and related product manufacturing ...................... 337 25,033 -664 601,929 -40,891 18,107,133 -606,915 578 18Household and institutional furniture mfg. ....................... 3371 19,472 -550 398,687 -18,310 11,256,565 7,024 543 24
Wood kitchen cabinet and countertop mfg. ................. 33711 11,848 -354 149,754 113 4,410,722 177,957 566 22Other household and institutional furniture ................. 33712 7,624 -196 248,933 -18,423 6,845,843 -170,934 529 24
Upholstered household furniture manufacturing ..... 337121 1,642 -136 91,098 -2,405 2,563,128 64,993 541 27Nonupholstered wood household furniture mfg. ..... 337122 4,279 -94 105,159 -11,467 2,680,120 -164,279 490 21Metal household furniture manufacturing ............... 337124 383 17 11,542 -1,932 331,899 -32,871 553 32Household furniture, exc. wood or metal, mfg. ....... 337125 285 6 6,124 -932 175,534 -17,806 551 24Institutional furniture manufacturing ....................... 337127 738 -31 32,550 -1,152 1,029,585 -11,864 608 14Wood TV, radio, and sewing machine housings .... 337129 297 42 2,461 -534 65,576 -9,107 512 32
Office furniture and fixtures manufacturing ..................... 3372 4,267 -101 149,553 -21,384 5,164,774 -627,717 664 12Office furniture and fixtures manufacturing ................. 33721 4,267 -101 149,553 -21,384 5,164,774 -627,717 664 12
Wood office furniture manufacturing ....................... 337211 722 -3 29,053 -4,695 953,576 -122,560 631 18Custom architectural woodwork and millwork ........ 337212 884 41 13,024 -269 509,300 739 752 16
See footnotes at end of table.
34

Table 2. Private industry by 6-digit NAICS industry and government by level of government, 2002 annual averages: Establishments, employment, and wages,change from 2001 — Continued
Industry/Ownership NAICS Code
Averageestablishments
Annual averageemployment
Total annual wages(in thousands)
Averageweekly wage
2002Change
from2001
2002Change
from2001
2002Change
from2001
2002Change
from2001
Office furniture, except wood, manufacturing ......... 337214 457 -7 33,073 -7,840 $1,333,282 - $317,871 $775 - $1Showcases, partitions, shelving, and lockers ......... 337215 2,205 -132 74,404 -8,578 2,368,616 -188,025 612 20
Other furniture related product manufacturing ................ 3379 1,295 -12 53,689 -1,197 1,685,794 13,778 604 18Mattress manufacturing .............................................. 33791 723 -5 30,513 -274 994,969 19,367 627 18Blind and shade manufacturing .................................. 33792 572 -7 23,176 -924 690,826 -5,589 573 17
Miscellaneous manufacturing .............................................. 339 32,768 -276 684,625 -28,764 27,105,787 -227,274 761 24Medical equipment and supplies manufacturing ............. 3391 13,449 27 307,661 -3,403 13,952,557 250,171 872 25
Medical equipment and supplies manufacturing ......... 33911 13,449 27 307,661 -3,403 13,952,557 250,171 872 25Laboratory apparatus and furniture mfg. ................ 339111 353 -12 14,713 -1,188 704,465 -9,300 921 58Surgical and medical instrument manufacturing ..... 339112 1,317 -14 106,757 -282 5,713,263 214,300 1,029 41Surgical appliance and supplies manufacturing ..... 339113 2,257 81 89,331 -1,617 4,115,615 20,647 886 20Dental equipment and supplies manufacturing ...... 339114 571 -34 15,963 -185 675,153 2,962 813 12Ophthalmic goods manufacturing ........................... 339115 1,191 -58 32,966 -1,061 1,268,477 -49,195 740 -5Dental laboratories ................................................. 339116 7,762 65 47,932 930 1,475,584 70,756 592 17
Other miscellaneous manufacturing ................................ 3399 19,319 -303 376,964 -25,361 13,153,230 -477,445 671 19Jewelry and silverware manufacturing ........................ 33991 3,362 -158 49,922 -3,465 1,615,265 -57,033 622 20
Jewelry, except costume, manufacturing ............... 339911 2,075 -78 33,264 -2,529 1,118,658 -56,116 647 16Silverware and hollowware manufacturing ............. 339912 159 10 3,111 -338 93,240 -7,183 576 16Jewelers’ material and lapidary work mfg. .............. 339913 394 -29 4,726 -179 144,805 1,840 589 29Costume jewelry and novelty manufacturing .......... 339914 735 -60 8,821 -419 258,563 4,426 564 35
Sporting and athletic goods manufacturing ................. 33992 2,304 -124 62,559 -3,262 2,175,121 -29,943 669 25Doll, toy, and game manufacturing ............................. 33993 1,065 -60 22,935 -3,648 1,021,767 -141,190 857 16
Doll and stuffed toy manufacturing ......................... 339931 213 -32 3,547 -494 195,342 -1,227 1,059 124Game, toy, and children’s vehicle mfg. ................... 339932 851 -29 19,388 -3,154 826,426 -139,963 820 -4
Office supplies, except paper, manufacturing ............. 33994 1,000 -35 29,718 -2,626 1,015,889 -51,597 657 22Pen and mechanical pencil manufacturing ............. 339941 106 -8 7,408 -766 283,798 -23,474 737 14Lead pencil and art good manufacturing ................ 339942 208 0 10,727 -637 350,451 -1,033 628 33Marking device manufacturing ................................ 339943 578 -13 7,342 -849 240,210 -21,607 629 14Carbon paper and inked ribbon manufacturing ...... 339944 109 -13 4,242 -373 141,430 -5,483 641 29
Sign manufacturing ..................................................... 33995 6,271 97 69,622 -2,440 2,377,998 -41,750 657 11All other miscellaneous manufacturing ....................... 33999 5,317 -23 142,208 -9,920 4,947,189 -155,932 669 24
Gasket, packing, and sealing device mfg. .............. 339991 737 -3 38,779 -1,926 1,496,366 -1,608 742 34Musical instrument manufacturing .......................... 339992 623 -3 14,956 -1,216 509,098 -20,779 655 25Fastener, button, needle, and pin mfg. ................... 339993 279 -23 7,348 -1,400 264,398 -36,634 692 30Broom, brush, and mop manufacturing .................. 339994 326 -12 13,746 -1,337 455,220 -19,879 637 31Burial casket manufacturing ................................... 339995 163 -13 6,703 -433 258,722 17,426 742 92All other miscellaneous manufacturing ................... 339999 3,189 31 60,677 -3,607 1,963,384 -94,459 622 6
Service producing1 ....................................................... 6,534,378 112,027 84,022,667 -416,863 2,944,545,030 12,242,756 674 6
Trade, transportation, and utilities ................................. 1,852,073 4,355 25,217,313 -430,778 812,302,492 -450,179 619 10
Wholesale trade ................................................................. 42 583,672 8,455 5,617,456 -112,838 276,607,852 -2,981,372 947 9
Merchant wholesalers, durable goods ................................. 423 272,705 -1,336 2,981,513 -126,204 149,750,685 -6,334,167 966 0Motor vehicle and parts merchant wholesalers ............... 4231 24,948 -96 342,767 -2,346 13,132,127 135,468 737 13
Motor vehicle merchant wholesalers ........................... 42311 6,007 23 123,091 -2,326 4,878,143 -170,982 762 -12New motor vehicle parts merchant wholesalers ......... 42312 13,849 -19 176,380 604 6,860,098 304,303 748 31Tire and tube merchant wholesalers ........................... 42313 1,555 17 17,922 33 705,348 64 757 -1Used motor vehicle parts merchant wholesalers ........ 42314 3,538 -115 25,375 -656 688,537 2,083 522 15
Furniture and furnishing merchant wholesalers .............. 4232 11,093 139 107,968 -3,773 4,767,630 -85,955 849 14Furniture merchant wholesalers .................................. 42321 4,793 89 44,255 -2,782 1,973,125 -160,534 857 -15Home furnishing merchant wholesalers ...................... 42322 6,300 50 63,712 -992 2,794,505 74,579 843 35
See footnotes at end of table.
35

Table 2. Private industry by 6-digit NAICS industry and government by level of government, 2002 annual averages: Establishments, employment, and wages,change from 2001 — Continued
Industry/Ownership NAICS Code
Averageestablishments
Annual averageemployment
Total annual wages(in thousands)
Averageweekly wage
2002Change
from2001
2002Change
from2001
2002Change
from2001
2002Change
from2001
Lumber and const. supply merchant wholesalers ........... 4233 18,382 366 222,851 3,676 $9,487,989 $366,524 $819 $19Lumber and wood merchant wholesalers ................... 42331 8,728 20 122,931 -455 5,256,287 107,227 822 19Masonry material merchant wholesalers .................... 42332 4,795 188 49,171 3,222 2,066,764 144,487 808 3Roofing and siding merchant wholesalers .................. 42333 2,481 53 29,330 378 1,311,663 70,598 860 36Other const. material merchant wholesalers ............... 42339 2,378 104 21,418 530 853,275 44,212 766 21
Commercial equip. merchant wholesalers ...................... 4234 55,333 -389 655,475 -34,750 44,014,223 -3,153,729 1,291 -23Photographic equip. merchant wholesalers ............... 42341 1,486 -23 17,495 -894 1,066,924 -16,718 1,173 40Office equipment merchant wholesalers ..................... 42342 5,818 -21 122,439 -6,376 6,319,479 -139,336 993 29Computer and software merchant wholesalers ........... 42343 18,681 -563 263,316 -29,856 22,346,912 -3,606,090 1,632 -70Other commercial equip. merchant wholesalers ......... 42344 5,533 -81 49,478 -1,571 2,095,643 -23,018 815 17Medical equipment merchant wholesalers .................. 42345 18,295 267 156,465 5,301 9,834,991 722,018 1,209 50Ophthalmic goods merchant wholesalers ................... 42346 2,247 -17 19,991 -615 846,331 -8,830 814 16Other professional equip. merchant wholesalers ........ 42349 3,274 48 26,291 -738 1,503,943 -81,754 1,100 -28
Metal and mineral merchant wholesalers ........................ 4235 9,340 -121 124,803 -8,316 5,882,084 -204,170 906 27Metal merchant wholesalers ....................................... 42351 8,988 -119 122,650 -8,190 5,721,965 -210,815 897 25Coal and other mineral merchant wholesalers ............ 42352 353 -2 2,153 -126 160,118 6,645 1,430 135
Electric goods merchant wholesalers .............................. 4236 31,730 -328 362,369 -40,086 21,416,674 -2,482,826 1,137 -5Elec. equip. and wiring merchant wholesalers ............ 42361 12,374 -115 147,458 -8,815 7,530,147 -315,671 982 17Electric appliance merchant wholesalers .................... 42362 2,849 3 30,623 -357 1,604,127 50,068 1,007 42Other electronic parts merchant wholesalers .............. 42369 16,507 -216 184,289 -30,913 12,282,399 -2,217,223 1,282 -14
Hardware and plumbing merchant wholesalers .............. 4237 20,642 112 232,704 -4,824 10,410,312 57,324 860 22Hardware merchant wholesalers ................................ 42371 6,887 118 79,747 -3,477 3,328,874 -52,016 803 22Plumbing equip. merchant wholesalers ...................... 42372 7,572 -12 85,458 -1,516 3,733,880 37,160 840 23HVAC equip. merchant wholesalers ........................... 42373 4,875 -7 55,318 426 2,799,779 63,218 973 14Refrigeration equip. merchant wholesalers ................. 42374 1,309 15 12,181 -257 547,778 8,962 865 32
Machinery and supply merchant wholesalers ................. 4238 69,437 -1,118 667,203 -31,057 30,302,788 -1,070,814 873 9Construction equipment merchant wholesalers .......... 42381 5,121 -29 80,495 -4,254 3,798,251 -162,517 907 8Farm and garden equip. merchant wholesalers .......... 42382 9,256 -197 100,435 -1,931 3,559,196 64,750 681 25Industrial machinery merchant wholesalers ................ 42383 35,849 -971 319,487 -19,344 15,680,660 -914,229 944 2Industrial supplies merchant wholesalers ................... 42384 8,148 169 66,887 -2,255 3,014,676 -29,021 867 20Service estab. equip. merchant wholesalers .............. 42385 7,298 -19 66,221 -1,305 2,436,827 18,472 708 19Other transport. goods merchant wholesalers ............ 42386 3,766 -71 33,678 -1,969 1,813,177 -48,269 1,035 31Misc. durable goods merchant wholesalers ................ 4239 31,800 98 265,373 -4,730 10,336,859 104,011 749 20Sporting goods merchant wholesalers ........................ 42391 5,567 -37 48,454 1,652 1,969,061 103,221 781 14Toy and hobby goods merchant wholesalers ............. 42392 2,262 2 21,236 -666 989,511 7,644 896 34Recyclable material merchant wholesalers ................. 42393 7,861 -323 94,965 -5,105 3,128,647 -67,266 634 20Jewelry merchant wholesalers .................................... 42394 7,119 -31 43,771 91 1,826,175 51,737 802 21All other durable goods merchant wholesalers ........... 42399 8,991 486 56,948 -701 2,423,465 8,675 818 12
Merchant wholesalers, nondurable goods ........................... 424 146,492 588 2,006,466 -9,463 90,491,052 2,066,045 867 23Paper and paper product merchant wholesalers ............ 4241 12,877 -146 158,923 -8,040 7,170,929 -193,212 868 20
Printing and writing paper merch. whls. ...................... 42411 1,123 28 16,708 -1,094 981,446 -46,649 1,130 19Office supplies merchant wholesalers ........................ 42412 5,837 -38 74,855 -3,967 2,860,897 -40,104 735 27Industrial paper merchant wholesalers ....................... 42413 5,917 -136 67,360 -2,980 3,328,586 -106,460 950 11
Druggists’ goods merchant wholesalers ......................... 4242 10,310 122 209,668 8,440 14,694,172 880,757 1,348 28Apparel and piece goods merchant wholesalers ............ 4243 15,445 -390 150,412 -2,366 7,358,484 214,349 941 42
Piece goods merchant wholesalers ............................ 42431 3,737 13 26,750 -1,351 1,165,045 -54,357 838 4Men’s and boys’ clothing merchant wholesalers ......... 42432 2,894 -78 36,291 -470 1,559,208 -573 826 10
Women’s and children’s clothing merch. whls. ....... 42433 6,090 -182 62,088 -724 3,132,697 132,726 970 52Footwear merchant wholesalers ................................. 42434 2,725 -142 25,283 180 1,501,534 136,553 1,142 96
Grocery and related product wholesalers ....................... 4244 34,650 330 675,786 493 27,228,424 877,965 775 25General line grocery merchant wholesalers ................ 42441 5,580 17 217,169 -1,146 9,238,498 330,605 818 33Packaged frozen food merchant wholesalers ............. 42442 1,659 4 29,014 -88 1,177,464 7,366 780 7Dairy product merchant wholesalers ........................... 42443 2,118 29 35,911 1,769 1,389,899 86,687 744 10
See footnotes at end of table.
36

Table 2. Private industry by 6-digit NAICS industry and government by level of government, 2002 annual averages: Establishments, employment, and wages,change from 2001 — Continued
Industry/Ownership NAICS Code
Averageestablishments
Annual averageemployment
Total annual wages(in thousands)
Averageweekly wage
2002Change
from2001
2002Change
from2001
2002Change
from2001
2002Change
from2001
Poultry product merchant wholesalers ........................ 42444 677 -16 11,943 161 $419,144 $9,073 $675 $6Confectionery merchant wholesalers .......................... 42445 3,532 79 46,136 1,435 1,838,353 93,792 766 15Fish and seafood merchant wholesalers .................... 42446 2,446 32 22,983 350 830,120 40,504 695 24Meat and meat product merchant wholesalers ........... 42447 2,480 -6 35,609 -136 1,412,053 66,369 763 39Fruit and vegetable merchant wholesalers ................. 42448 3,811 24 71,723 -900 2,533,409 70,200 679 27Other grocery product merchant wholesalers ............. 42449 12,348 167 205,299 -952 8,389,485 173,368 786 20
Farm product raw material merch. whls. ......................... 4245 6,767 -153 74,687 -2,478 2,168,004 -2,234 558 17Grain and field bean merchant wholesalers ................ 42451 4,254 -121 43,383 -1,644 1,566,985 9,846 695 30Livestock merchant wholesalers ................................. 42452 1,502 -5 22,427 -759 251,847 -3,594 216 4Other farm product raw material merch. whls. ............ 42459 1,012 -27 8,877 -75 349,172 -8,485 756 -12
Chemical merchant wholesalers ..................................... 4246 15,628 -182 131,153 -2,703 7,413,590 -4,381 1,087 21Plastics materials merchant wholesalers .................... 42461 3,446 -60 25,395 -484 1,223,769 3,659 927 20Other chemicals merchant wholesalers ...................... 42469 12,182 -122 105,758 -2,219 6,189,821 -8,040 1,126 22
Petroleum merchant wholesalers .................................... 4247 9,178 -59 109,446 -3,010 5,102,645 -142,205 897 0Petroleum bulk stations and terminals ........................ 42471 2,935 59 36,983 -391 1,650,914 81,789 858 51Other petroleum merchant wholesalers ...................... 42472 6,242 -119 72,463 -2,619 3,451,731 -223,994 916 -25
Alcoholic beverage merchant wholesalers ...................... 4248 4,341 71 130,540 959 6,156,644 254,375 907 31Beer and ale merchant wholesalers ............................ 42481 2,164 -44 80,707 314 3,350,933 129,866 798 27Wine and spirit merchant wholesalers ........................ 42482 2,177 115 49,833 645 2,805,711 124,508 1,083 35
Misc. nondurable goods merchant wholesalers .............. 4249 37,295 993 365,852 -759 13,198,161 180,632 694 11Farm supplies merchant wholesalers ......................... 42491 11,951 121 110,072 -1,480 3,869,067 10,262 676 11Book and periodical merchant wholesalers ................ 42492 3,250 -51 56,659 -578 2,060,575 -43,235 699 -8Nursery and florist merchant wholesalers ................... 42493 3,914 79 50,834 164 1,372,171 16,647 519 5Tobacco and tobacco product merch. whls. ............... 42494 1,562 11 31,142 -600 1,222,545 33,661 755 35Paint and supplies merchant wholesalers ................... 42495 3,018 -67 26,388 -324 1,191,352 17,932 868 23Other nondurable goods merchant wholesalers ......... 42499 13,600 899 90,757 2,058 3,482,451 145,365 738 14
Electronic markets and agents and brokers ........................ 425 164,475 9,203 629,478 22,831 36,366,114 1,286,750 1,111 -1Electronic markets and agents and brokers .................... 4251 164,475 9,203 629,478 22,831 36,366,114 1,286,750 1,111 -1
Business to business electronic markets .................... 42511 9,611 -478 82,491 -7,203 4,515,572 -613,146 1,053 -47Wholesale trade agents and brokers .......................... 42512 154,865 9,682 546,988 30,035 31,850,543 1,899,896 1,120 6
Retail trade ................................................................... 44-45 1,042,686 -4,044 15,018,588 -161,165 348,909,029 4,832,286 447 11
Motor vehicle and parts dealers .......................................... 441 118,662 303 1,874,006 17,942 70,380,452 1,978,225 722 13Automobile dealers ......................................................... 4411 50,010 -55 1,248,174 20,747 52,944,969 1,406,287 816 9
New car dealers .......................................................... 44111 25,794 -451 1,136,513 18,914 49,452,365 1,298,806 837 8Used car dealers ......................................................... 44112 24,217 397 111,662 1,834 3,492,604 107,482 602 9
Other motor vehicle dealers ............................................ 4412 15,345 174 142,512 6,507 4,619,204 373,935 623 23Recreational vehicle dealers ....................................... 44121 2,812 -42 33,590 1,659 1,207,909 137,787 692 48Motorcycle, boat, and other vehicle dealers ............... 44122 12,534 217 108,922 4,848 3,411,296 236,148 602 15
Motorcycle dealers ................................................. 441221 4,917 230 54,087 5,042 1,720,058 186,146 612 11Boat dealers ........................................................... 441222 5,477 -33 41,835 -141 1,277,468 45,371 587 23All other motor vehicle dealers ............................... 441229 2,140 21 13,001 -52 413,770 4,631 612 9
Auto parts, accessories, and tire stores .......................... 4413 53,307 183 483,320 -9,312 12,816,279 198,002 510 17Automotive parts and accessories stores ................... 44131 35,590 352 324,950 -7,475 7,916,826 103,169 469 17Tire dealers ................................................................. 44132 17,717 -169 158,369 -1,838 4,899,453 94,833 595 18
Furniture and home furnishings stores ................................ 442 58,610 -215 539,759 1,793 15,021,485 256,915 535 7Furniture stores ............................................................... 4421 26,790 -174 280,128 -1,765 8,270,258 70,294 568 9Home furnishings stores ................................................. 4422 31,820 -42 259,632 3,559 6,751,227 186,621 500 7
Floor covering stores .................................................. 44221 15,231 -123 102,155 350 3,571,692 69,119 672 10Other home furnishings stores .................................... 44229 16,589 81 157,476 3,208 3,179,534 117,502 388 6
Window treatment stores ........................................ 442291 2,787 -71 12,593 -388 315,372 -3,815 482 9All other home furnishings stores ........................... 442299 13,802 152 144,884 3,597 2,864,162 121,318 380 7
See footnotes at end of table.
37

Table 2. Private industry by 6-digit NAICS industry and government by level of government, 2002 annual averages: Establishments, employment, and wages,change from 2001 — Continued
Industry/Ownership NAICS Code
Averageestablishments
Annual averageemployment
Total annual wages(in thousands)
Averageweekly wage
2002Change
from2001
2002Change
from2001
2002Change
from2001
2002Change
from2001
Electronics and appliance stores ......................................... 443 55,942 -1,486 527,907 -28,743 $19,165,244 - $1,443,984 $698 - $14Electronics and appliance stores .................................... 4431 55,942 -1,486 527,907 -28,743 19,165,244 -1,443,984 698 -14
Appliance, TV, and other electronics stores ............... 44311 33,642 181 327,420 -3,428 9,189,345 -9,751 540 5Household appliance stores ................................... 443111 10,620 -702 84,083 -2,568 2,375,151 7,668 543 18Radio, TV, and other electronics stores ................. 443112 23,022 883 243,337 -860 6,814,194 -17,419 539 1
Computer and software stores .................................... 44312 19,625 -1,530 178,905 -23,788 9,457,272 -1,427,963 1,017 -16Camera and photographic supplies stores ................. 44313 2,676 -136 21,582 -1,527 518,628 -6,269 462 25
Building material and garden supply stores ......................... 444 77,485 -911 1,177,982 37,998 31,223,206 669,785 510 -5Building material and supplies dealers ............................ 4441 59,608 -575 1,026,036 41,828 27,722,973 674,385 520 -9
Home centers .............................................................. 44411 11,331 -293 539,666 48,573 12,732,048 436,357 454 -27Paint and wallpaper stores .......................................... 44412 6,688 -142 42,366 -876 1,293,129 25,948 587 23Hardware stores .......................................................... 44413 17,044 -378 169,255 -2,339 3,621,792 48,974 412 12Other building material dealers ................................... 44419 24,545 237 274,750 -3,529 10,076,005 163,105 705 20
Lawn and garden equipment and supplies stores ........... 4442 17,877 -336 151,946 -3,831 3,500,233 -4,600 443 10Outdoor power equipment stores ................................ 44421 5,233 -217 30,596 -1,096 794,736 -1,232 500 17Nursery, garden, and farm supply stores .................... 44422 12,644 -119 121,350 -2,735 2,705,497 -3,368 429 9
Food and beverage stores ................................................... 445 140,165 482 2,869,978 -68,662 55,206,273 633,157 370 13Grocery stores ................................................................. 4451 85,865 738 2,469,400 -62,658 46,378,101 580,268 361 13
Supermarkets and other grocery stores ...................... 44511 60,974 111 2,323,927 -60,836 44,321,154 537,599 367 14Convenience stores .................................................... 44512 24,891 627 145,473 -1,823 2,056,947 42,669 272 9
Specialty food stores ....................................................... 4452 29,206 -373 259,712 -5,976 5,868,988 -21,600 435 9Meat markets .............................................................. 44521 6,587 -2 51,433 -360 1,061,261 21,384 397 11Fish and seafood markets ........................................... 44522 2,433 -10 15,140 158 323,587 11,171 411 10Fruit and vegetable markets ....................................... 44523 4,158 -69 46,680 -1,453 1,119,236 -1,527 461 13Other specialty food stores ......................................... 44529 16,029 -292 146,459 -4,321 3,364,904 -52,628 442 6
Baked goods stores ................................................ 445291 2,696 16 20,038 -319 436,379 -6,698 419 0Confectionery and nut stores .................................. 445292 3,327 -193 22,351 -2,348 370,415 -54,946 319 -12All other specialty food stores ................................. 445299 10,006 -116 104,070 -1,653 2,558,110 9,015 473 9
Beer, wine, and liquor stores ........................................... 4453 25,095 117 140,867 -26 2,959,184 74,489 404 10Health and personal care stores .......................................... 446 76,349 -224 930,536 -7,644 24,721,509 1,083,494 511 26
Health and personal care stores ..................................... 4461 76,349 -224 930,536 -7,644 24,721,509 1,083,494 511 26Pharmacies and drug stores ....................................... 44611 39,999 -170 678,111 -8,261 18,145,339 891,741 515 32Cosmetic and beauty supply stores ............................ 44612 10,440 373 94,183 1,971 2,000,369 42,841 408 0Optical goods stores ................................................... 44613 10,783 -327 66,012 -311 1,752,319 38,559 510 13Other health and personal care stores ........................ 44619 15,126 -101 92,230 -1,043 2,823,482 110,354 589 30
Food, health, supplement stores ............................ 446191 7,888 -52 44,604 -1,232 940,374 18,434 405 18All other health and personal care stores ............... 446199 7,239 -48 47,625 189 1,883,108 91,920 760 34
Gasoline stations ................................................................. 447 108,010 -37 895,547 -24,385 14,330,141 -69,991 308 7Gasoline stations ............................................................. 4471 108,010 -37 895,547 -24,385 14,330,141 -69,991 308 7
Gasoline stations with convenience stores ................. 44711 89,920 483 758,426 -15,661 11,785,252 66,899 299 8Other gasoline stations ............................................... 44719 18,090 -520 137,122 -8,723 2,544,889 -136,890 357 3
Clothing and clothing accessories stores ............................ 448 128,753 -747 1,317,932 -6,078 23,979,961 722,149 350 12Clothing stores ................................................................ 4481 74,551 -221 965,054 4,295 16,344,766 673,981 326 12
Men’s clothing stores .................................................. 44811 8,108 -5 76,269 -1,921 1,641,459 4,604 414 11Women’s clothing stores ............................................. 44812 23,585 -216 243,612 2,336 3,923,210 84,974 310 4Children’s and infants’ clothing stores ........................ 44813 4,801 -46 59,334 1,732 908,369 71,563 294 15Family clothing stores ................................................. 44814 17,378 387 434,504 4,507 7,135,759 429,530 316 16Clothing accessories stores ........................................ 44815 6,281 -46 38,966 30 694,787 30,854 343 15Other clothing stores ................................................... 44819 14,399 -295 112,369 -2,389 2,041,181 52,457 349 16
Shoe stores ..................................................................... 4482 25,202 -174 182,473 -6,371 3,285,645 -19,555 346 9Jewelry, luggage, and leather goods stores .................... 4483 29,000 -352 170,405 -4,003 4,349,551 67,723 491 19
Jewelry stores ............................................................. 44831 26,848 -329 155,748 -2,390 4,034,900 90,859 498 18Luggage and leather goods stores ............................. 44832 2,152 -23 14,657 -1,614 314,651 -23,136 413 14
See footnotes at end of table.
38
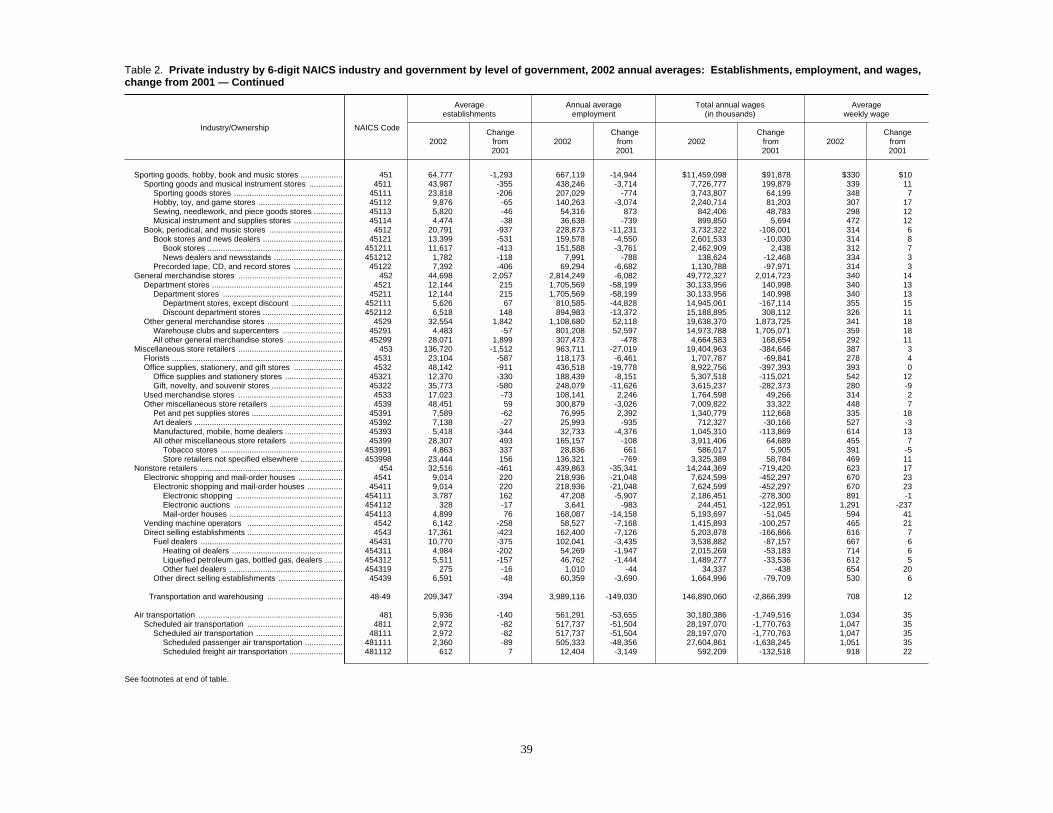
Table 2. Private industry by 6-digit NAICS industry and government by level of government, 2002 annual averages: Establishments, employment, and wages,change from 2001 — Continued
Industry/Ownership NAICS Code
Averageestablishments
Annual averageemployment
Total annual wages(in thousands)
Averageweekly wage
2002Change
from2001
2002Change
from2001
2002Change
from2001
2002Change
from2001
Sporting goods, hobby, book and music stores ................... 451 64,777 -1,293 667,119 -14,944 $11,459,098 $91,878 $330 $10Sporting goods and musical instrument stores ............... 4511 43,987 -355 438,246 -3,714 7,726,777 199,879 339 11
Sporting goods stores ................................................. 45111 23,818 -206 207,029 -774 3,743,807 64,199 348 7Hobby, toy, and game stores ...................................... 45112 9,876 -65 140,263 -3,074 2,240,714 81,203 307 17Sewing, needlework, and piece goods stores ............. 45113 5,820 -46 54,316 873 842,406 48,783 298 12Musical instrument and supplies stores ...................... 45114 4,474 -38 36,638 -739 899,850 5,694 472 12
Book, periodical, and music stores ................................. 4512 20,791 -937 228,873 -11,231 3,732,322 -108,001 314 6Book stores and news dealers .................................... 45121 13,399 -531 159,578 -4,550 2,601,533 -10,030 314 8
Book stores ............................................................. 451211 11,617 -413 151,588 -3,761 2,462,909 2,438 312 7News dealers and newsstands ............................... 451212 1,782 -118 7,991 -788 138,624 -12,468 334 3
Precorded tape, CD, and record stores ...................... 45122 7,392 -406 69,294 -6,682 1,130,788 -97,971 314 3General merchandise stores ............................................... 452 44,698 2,057 2,814,249 -6,082 49,772,327 2,014,723 340 14
Department stores ........................................................... 4521 12,144 215 1,705,569 -58,199 30,133,956 140,998 340 13Department stores ...................................................... 45211 12,144 215 1,705,569 -58,199 30,133,956 140,998 340 13
Department stores, except discount ....................... 452111 5,626 67 810,585 -44,828 14,945,061 -167,114 355 15Discount department stores .................................... 452112 6,518 148 894,983 -13,372 15,188,895 308,112 326 11
Other general merchandise stores .................................. 4529 32,554 1,842 1,108,680 52,118 19,638,370 1,873,725 341 18Warehouse clubs and supercenters ........................... 45291 4,483 -57 801,208 52,597 14,973,788 1,705,071 359 18All other general merchandise stores ......................... 45299 28,071 1,899 307,473 -478 4,664,583 168,654 292 11
Miscellaneous store retailers ............................................... 453 136,720 -1,512 963,711 -27,019 19,404,963 -384,646 387 3Florists ............................................................................. 4531 23,104 -587 118,173 -6,461 1,707,787 -69,841 278 4Office supplies, stationery, and gift stores ...................... 4532 48,142 -911 436,518 -19,778 8,922,756 -397,393 393 0
Office supplies and stationery stores .......................... 45321 12,370 -330 188,439 -8,151 5,307,518 -115,021 542 12Gift, novelty, and souvenir stores ................................ 45322 35,773 -580 248,079 -11,626 3,615,237 -282,373 280 -9
Used merchandise stores ............................................... 4533 17,023 -73 108,141 2,246 1,764,598 49,266 314 2Other miscellaneous store retailers ................................. 4539 48,451 59 300,879 -3,026 7,009,822 33,322 448 7
Pet and pet supplies stores ......................................... 45391 7,589 -62 76,995 2,392 1,340,779 112,668 335 18Art dealers ................................................................... 45392 7,138 -27 25,993 -935 712,327 -30,166 527 -3Manufactured, mobile, home dealers .......................... 45393 5,418 -344 32,733 -4,376 1,045,310 -113,869 614 13All other miscellaneous store retailers ........................ 45399 28,307 493 165,157 -108 3,911,406 64,689 455 7
Tobacco stores ....................................................... 453991 4,863 337 28,836 661 586,017 5,905 391 -5Store retailers not specified elsewhere ................... 453998 23,444 156 136,321 -769 3,325,389 58,784 469 11
Nonstore retailers ................................................................ 454 32,516 -461 439,863 -35,341 14,244,369 -719,420 623 17Electronic shopping and mail-order houses .................... 4541 9,014 220 218,936 -21,048 7,624,599 -452,297 670 23
Electronic shopping and mail-order houses ................ 45411 9,014 220 218,936 -21,048 7,624,599 -452,297 670 23Electronic shopping ................................................ 454111 3,787 162 47,208 -5,907 2,186,451 -278,300 891 -1Electronic auctions ................................................. 454112 328 -17 3,641 -983 244,451 -122,951 1,291 -237Mail-order houses ................................................... 454113 4,899 76 168,087 -14,158 5,193,697 -51,045 594 41
Vending machine operators ........................................... 4542 6,142 -258 58,527 -7,168 1,415,893 -100,257 465 21Direct selling establishments ........................................... 4543 17,361 -423 162,400 -7,126 5,203,878 -166,866 616 7
Fuel dealers ................................................................ 45431 10,770 -375 102,041 -3,435 3,538,882 -87,157 667 6Heating oil dealers .................................................. 454311 4,984 -202 54,269 -1,947 2,015,269 -53,183 714 6Liquefied petroleum gas, bottled gas, dealers ........ 454312 5,511 -157 46,762 -1,444 1,489,277 -33,536 612 5Other fuel dealers ................................................... 454319 275 -16 1,010 -44 34,337 -438 654 20
Other direct selling establishments ............................. 45439 6,591 -48 60,359 -3,690 1,664,996 -79,709 530 6
Transportation and warehousing .................................. 48-49 209,347 -394 3,989,116 -149,030 146,890,060 -2,866,399 708 12
Air transportation ................................................................. 481 5,936 -140 561,291 -53,655 30,180,386 -1,749,516 1,034 35Scheduled air transportation ........................................... 4811 2,972 -82 517,737 -51,504 28,197,070 -1,770,763 1,047 35
Scheduled air transportation ....................................... 48111 2,972 -82 517,737 -51,504 28,197,070 -1,770,763 1,047 35Scheduled passenger air transportation ................. 481111 2,360 -89 505,333 -48,356 27,604,861 -1,638,245 1,051 35Scheduled freight air transportation ........................ 481112 612 7 12,404 -3,149 592,209 -132,518 918 22
See footnotes at end of table.
39

Table 2. Private industry by 6-digit NAICS industry and government by level of government, 2002 annual averages: Establishments, employment, and wages,change from 2001 — Continued
Industry/Ownership NAICS Code
Averageestablishments
Annual averageemployment
Total annual wages(in thousands)
Averageweekly wage
2002Change
from2001
2002Change
from2001
2002Change
from2001
2002Change
from2001
Nonscheduled air transportation ..................................... 4812 2,965 -57 43,555 -2,150 $1,983,316 $21,247 $876 $50Nonscheduled air transportation ................................. 48121 2,965 -57 43,555 -2,150 1,983,316 21,247 876 50
Nonscheduled air passenger chartering ................. 481211 1,993 -15 32,259 -697 1,490,136 48,624 888 47Nonscheduled air freight chartering ........................ 481212 562 -15 7,471 -1,466 333,655 -46,359 859 41Other nonscheduled air transportation ................... 481219 410 -28 3,825 13 159,525 18,982 802 93
Rail transportation2 .............................................................. 482 62 13 348 30 10,869 -1,154 601 -127Rail transportation2 .......................................................... 4821 62 13 348 30 10,869 -1,154 601 -127
Rail transportation2 ..................................................... 48211 62 13 348 30 10,869 -1,154 601 -127Line-haul railroads2 ................................................. 482111 44 12 153 -12 5,290 -2,355 666 -227Short line railroads2 ................................................ 482112 18 2 195 42 5,579 1,201 550 0
Water transportation ............................................................ 483 1,440 47 53,003 190 2,793,556 35,131 1,014 10Sea, coastal, and Great Lakes transportation ................. 4831 843 19 32,671 -517 1,864,457 -29,290 1,097 0
Sea, coastal, and Great Lakes transportation ............. 48311 843 19 32,671 -517 1,864,457 -29,290 1,097 0Deep sea freight transportation .............................. 483111 383 -6 13,575 -61 935,587 14,426 1,325 26Deep sea passenger transportation ....................... 483112 98 2 4,080 21 174,829 -7,464 824 -40Coastal and Great Lakes freight transport. ............. 483113 235 14 7,424 -45 468,428 -12,224 1,213 -25Coastal and Great Lakes passenger transport. ...... 483114 127 8 7,592 -431 285,613 -24,028 723 -19
Inland water transportation .............................................. 4832 598 29 20,332 707 929,098 64,421 879 32Inland water transportation ......................................... 48321 598 29 20,332 707 929,098 64,421 879 32
Inland water freight transportation .......................... 483211 420 20 16,732 166 805,265 42,378 926 40Inland water passenger transportation ................... 483212 178 9 3,600 540 123,833 22,042 661 21
Truck transportation ............................................................. 484 113,427 -277 1,337,057 -45,934 46,824,531 -639,717 673 13General freight trucking ................................................... 4841 68,188 -886 947,189 -38,738 34,410,891 -562,971 699 17
General freight trucking, local ..................................... 48411 27,602 -197 230,560 -7,785 7,787,448 -35,554 650 19General freight trucking, long-distance ....................... 48412 40,586 -689 716,629 -30,953 26,623,443 -527,417 714 16
General freight trucking, long-distance TL .............. 484121 34,046 -657 509,069 -25,119 18,034,781 -556,561 681 12General freight trucking, long-distance LTL ............ 484122 6,540 -32 207,560 -5,834 8,588,662 29,144 796 25
Specialized freight trucking ............................................. 4842 45,239 609 389,868 -7,195 12,413,640 -76,745 612 7Used household and office goods moving .................. 48421 7,441 -34 100,938 -5,577 2,927,423 -124,723 558 7Other specialized trucking, local ................................. 48422 29,884 334 185,766 943 5,796,276 121,879 600 10Other specialized trucking, long-distance ................... 48423 7,914 308 103,165 -2,561 3,689,941 -73,902 688 3
Transit and ground passenger transportation ...................... 485 17,535 13 372,420 866 7,787,298 142,701 402 6Urban transit systems ..................................................... 4851 731 5 35,750 214 1,124,840 29,219 605 12
Urban transit systems ................................................. 48511 731 5 35,750 214 1,124,840 29,219 605 12Mixed mode transit systems ................................... 485111 157 -14 9,347 400 258,766 21,874 532 23Commuter rail systems ........................................... 485112 19 3 233 -20 9,744 -460 804 29Bus and other motor vehicle transit systems .......... 485113 526 14 25,803 -209 845,388 6,451 630 10Other urban transit systems ................................... 485119 30 2 367 43 10,941 1,354 574 5
Interurban and rural bus transportation ........................... 4852 561 3 22,846 -261 634,390 -3,823 534 3Taxi and limousine service .............................................. 4853 7,251 -24 67,136 -4,009 1,386,713 -44,789 397 10
Taxi service ................................................................. 48531 3,147 -88 31,776 -1,435 614,414 -8,801 372 11Limousine service ....................................................... 48532 4,105 65 35,360 -2,574 772,300 -35,988 420 10
School and employee bus transportation ........................ 4854 4,479 -19 157,781 4,630 2,728,801 106,012 333 4Charter bus industry ........................................................ 4855 1,577 -59 34,483 -2,847 767,946 -41,912 428 11Other ground passenger transportation .......................... 4859 2,936 106 54,425 3,139 1,144,608 97,995 404 12
Other ground passenger transportation ...................... 48599 2,936 106 54,425 3,139 1,144,608 97,995 404 12Special needs transportation .................................. 485991 1,783 74 34,365 2,884 739,458 88,400 414 16All other ground passenger transportation ............. 485999 1,153 32 20,060 255 405,150 9,595 388 4
Pipeline transportation ......................................................... 486 2,486 -115 42,462 -2,334 3,277,932 -958,046 1,485 -333Pipeline transportation of crude oil .................................. 4861 467 -9 7,447 -371 552,581 8,632 1,427 89Pipeline transportation of natural gas .............................. 4862 1,545 -78 29,699 -2,052 2,373,011 -985,237 1,537 -497Other pipeline transportation ........................................... 4869 473 -29 5,317 90 352,340 18,558 1,274 46
Refined petroleum product pipeline transport. ............ 48691 434 -26 4,919 80 327,778 16,571 1,281 44
See footnotes at end of table.
40

Table 2. Private industry by 6-digit NAICS industry and government by level of government, 2002 annual averages: Establishments, employment, and wages,change from 2001 — Continued
Industry/Ownership NAICS Code
Averageestablishments
Annual averageemployment
Total annual wages(in thousands)
Averageweekly wage
2002Change
from2001
2002Change
from2001
2002Change
from2001
2002Change
from2001
All other pipeline transportation .................................. 48699 40 -2 398 10 $24,563 $1,987 $1,188 $69Scenic and sightseeing transportation ............................ 487 3,055 -17 27,348 -3,334 596,497 -84,219 419 -8
Scenic and sightseeing transportation, land ........................ 4871 741 7 9,683 -1,625 206,772 -45,865 411 -19Scenic and sightseeing transportation, water ................. 4872 2,064 -10 15,279 -926 320,177 -29,429 403 -12Scenic and sightseeing transportation, other .................. 4879 250 -14 2,386 -783 69,547 -8,925 561 85
Support activities for transportation ..................................... 488 37,411 -140 514,560 -15,896 19,328,529 -127,929 722 17Support activities for air transportation ............................ 4881 5,645 17 137,039 -3,955 4,430,120 -36,833 622 13
Airport operations ........................................................ 48811 1,813 -51 64,892 -262 1,668,624 30,956 494 11Air traffic control ...................................................... 488111 197 -27 3,241 -1,980 119,321 -48,315 708 91Other airport operations .......................................... 488119 1,616 -24 61,651 1,718 1,549,302 79,272 483 11
Other support activities for air transport. ..................... 48819 3,833 69 72,147 -3,692 2,761,496 -67,789 736 19Support activities for rail transportation ........................... 4882 1,017 32 19,052 -530 659,518 23,082 666 41Support activities for water transportation ....................... 4883 3,082 -88 91,234 -3,276 4,390,074 61,336 925 44
Port and harbor operations ......................................... 48831 321 -8 20,388 -905 1,191,999 16,358 1,124 62Marine cargo handling ................................................ 48832 733 0 38,442 -552 1,713,839 75,844 857 49Navigational services to shipping ................................ 48833 1,192 -47 21,314 -969 1,008,127 -18,567 910 24Other support activities for water transport. ................ 48839 837 -33 11,090 -851 476,109 -12,299 826 39
Support activities for road transportation ........................ 4884 9,209 300 70,840 3,934 1,847,047 100,313 501 -1Motor vehicle towing ................................................... 48841 7,367 246 43,887 768 1,105,409 40,512 484 9Other support activities for road transport. .................. 48849 1,842 54 26,953 3,166 741,638 59,802 529 -22
Freight transportation arrangement ................................. 4885 16,460 -321 166,905 -11,109 7,174,200 -293,991 827 20Other support activities for transportation ...................... 4889 1,997 -82 29,490 -960 827,571 18,163 540 29
Other support activities for transportation ................... 48899 1,997 -82 29,490 -960 827,571 18,163 540 29Packing and crating ................................................ 488991 1,361 -52 19,178 -1,051 505,182 -6,262 507 21All other support activities for transport. ................. 488999 636 -30 10,312 91 322,389 24,425 601 40
Postal service ...................................................................... 491 621 149 2,799 748 79,386 18,917 545 -22Couriers and messengers ................................................... 492 14,624 91 567,288 -29,611 19,176,419 51,400 650 34
Couriers ........................................................................... 4921 9,585 -167 516,129 -27,672 17,958,201 68,602 669 36Local messengers and local delivery .............................. 4922 5,040 259 51,159 -1,940 1,218,218 -17,201 458 11
Warehousing and storage ................................................... 493 12,750 -19 510,539 -101 16,834,658 446,034 634 17Warehousing and storage ............................................... 4931 12,750 -19 510,539 -101 16,834,658 446,034 634 17
General warehousing and storage .............................. 49311 8,927 61 420,986 -2,052 13,750,382 249,421 628 14Refrigerated warehousing and storage ....................... 49312 1,241 -8 43,465 1,111 1,485,754 79,356 657 18Farm product warehousing and storage ..................... 49313 828 -40 8,756 -63 266,759 7,134 586 20Other warehousing and storage .................................. 49319 1,755 -31 37,332 902 1,331,763 110,122 686 41
Utilities ............................................................................... 22 16,368 337 592,152 -7,747 39,895,551 565,306 1,296 35
Utilities ................................................................................. 221 16,368 337 592,152 -7,747 39,895,551 565,306 1,296 35Power generation and supply .......................................... 2211 7,818 188 430,107 -5,548 30,380,617 655,527 1,358 46
Electric power generation ........................................... 22111 3,889 51 270,983 -7,404 20,085,890 112,843 1,425 45Hydroelectric power generation .............................. 221111 1,317 4 67,461 -1,885 5,208,635 67,935 1,485 59Fossil fuel electric power generation ...................... 221112 1,994 28 148,471 -5,120 10,703,275 90,797 1,386 57Nuclear electric power generation .......................... 221113 153 7 45,457 145 3,503,657 137,293 1,482 53Other electric power generation ............................. 221119 425 12 9,594 -544 670,324 -183,183 1,344 -275
Electric power transmission and distribution ............... 22112 3,930 137 159,124 1,856 10,294,727 542,685 1,244 52Electric bulk power transmission and control ......... 221121 510 -2 26,895 -1,724 1,855,511 -11,011 1,327 73Electric power distribution ....................................... 221122 3,420 139 132,229 3,579 8,439,216 553,696 1,227 48
Natural gas distribution ................................................... 2212 2,924 11 114,154 -2,994 7,680,927 -159,117 1,294 7Water, sewage and other systems .................................. 2213 5,626 139 47,892 796 1,834,006 68,896 736 15
Water supply and irrigation systems ........................... 22131 4,731 145 36,917 798 1,353,019 52,862 705 13Sewage treatment facilities ......................................... 22132 751 -18 8,866 -14 360,921 11,792 783 27Steam and air-conditioning supply .............................. 22133 143 10 2,109 12 120,066 4,242 1,095 33
See footnotes at end of table.
41

Table 2. Private industry by 6-digit NAICS industry and government by level of government, 2002 annual averages: Establishments, employment, and wages,change from 2001 — Continued
Industry/Ownership NAICS Code
Averageestablishments
Annual averageemployment
Total annual wages(in thousands)
Averageweekly wage
2002Change
from2001
2002Change
from2001
2002Change
from2001
2002Change
from2001
Information ..................................................................... 150,107 -2,120 3,364,485 -227,510 $188,758,526 - $17,018,207 $1,079 - $23
Information ......................................................................... 51 150,107 -2,120 3,364,485 -227,510 188,758,526 -17,018,207 1,079 -23
Publishing industries, except Internet .................................. 511 36,170 -355 958,746 -55,536 55,970,149 -4,899,156 1,123 -31Newspaper, book, and directory publishers .................... 5111 25,205 -83 708,833 -34,186 31,122,521 -1,314,693 844 4
Newspaper publishers ................................................ 51111 9,287 -13 387,333 -16,739 13,908,093 -269,677 691 16Periodical publishers ................................................... 51112 8,263 132 155,649 -8,584 8,989,476 -830,964 1,111 -39Book publishers .......................................................... 51113 3,806 21 83,472 -2,078 4,268,286 -15,278 983 20Directory and mailing list publishers ........................... 51114 2,324 -221 50,884 -4,656 2,654,864 -177,897 1,003 22Other publishers .......................................................... 51119 1,525 -3 31,495 -2,130 1,301,802 -20,877 795 39
Greeting card publishers ........................................ 511191 120 18 14,672 -1,500 629,837 -6,888 826 69All other publishers ................................................. 511199 1,405 -21 16,823 -630 671,965 -13,989 768 12
Software publishers ......................................................... 5112 10,966 -271 249,912 -21,351 24,847,628 -3,584,463 1,912 -104Motion picture and sound recording industries .................... 512 27,415 -881 384,838 18,049 17,879,785 647,809 893 -10
Motion picture and video industries ................................. 5121 23,159 -741 357,738 20,195 16,302,890 817,954 876 -6Motion picture and video production ........................... 51211 15,455 -564 187,443 14,721 12,929,492 793,721 1,327 -24Motion picture and video distribution .......................... 51212 715 -57 10,365 -1,169 659,707 -5,049 1,224 116Motion picture and video exhibition ............................. 51213 5,009 -144 138,789 7,028 1,362,882 84,465 189 2
Motion picture theaters, except drive-ins ................ 512131 4,718 -132 135,553 6,864 1,318,905 81,984 187 2Drive-in motion picture theaters .............................. 512132 291 -12 3,236 164 43,977 2,481 261 1
Postproduction and other related industries ............... 51219 1,979 21 21,141 -385 1,350,809 -55,183 1,229 -27Teleproduction and postproduction services .......... 512191 1,446 25 15,573 -181 1,027,316 -53,709 1,269 -51Other motion picture and video industries .............. 512199 533 -4 5,568 -204 323,493 -1,475 1,117 34
Sound recording industries ............................................. 5122 4,256 -139 27,100 -2,146 1,576,896 -170,144 1,119 -30Record production ....................................................... 51221 656 -45 2,551 -50 163,653 689 1,234 29Integrated record production and distribution ............. 51222 312 -17 4,996 -948 549,047 -107,339 2,114 -10Music publishers ......................................................... 51223 729 0 4,457 -297 272,799 -369 1,177 72Sound recording studios ............................................. 51224 1,872 -47 9,239 -1,232 396,240 -42,318 825 20Other sound recording industries ................................ 51229 688 -30 5,858 380 195,156 -20,807 641 -117
Broadcasting, except Internet .............................................. 515 10,109 -78 332,981 -9,340 17,743,579 -357,365 1,025 8Radio and television broadcasting .................................. 5151 8,143 -98 242,569 -5,554 12,510,699 -318,365 992 -2
Radio broadcasting ..................................................... 51511 5,798 -94 111,543 -1,547 4,721,831 6,355 814 12Radio networks ....................................................... 515111 1,251 -1 24,830 -499 1,231,615 -16,256 954 7Radio stations ......................................................... 515112 4,548 -92 86,713 -1,048 3,490,216 22,611 774 14
Television broadcasting .............................................. 51512 2,344 -5 131,026 -4,007 7,788,868 -324,719 1,143 -12Cable and other subscription programming .................... 5152 1,966 20 90,412 -3,786 5,232,880 -39,000 1,113 37
Internet publishing and broadcasting ................................... 516 3,460 -343 33,770 -9,843 2,336,940 -792,875 1,331 -49Telecommunications ............................................................ 517 43,582 1,436 1,170,991 -121,351 66,920,882 -6,086,343 1,099 13
Wired telecommunications carriers ................................. 5171 19,577 6 641,759 -84,021 39,018,536 -3,997,683 1,169 29Wireless telecommunications carriers ............................. 5172 9,636 929 195,914 -5,319 10,475,139 -789,239 1,028 -48
Wireless telecommunications carriers ........................ 51721 9,636 929 195,914 -5,319 10,475,139 -789,239 1,028 -48Paging .................................................................... 517211 1,926 -55 26,302 -5,009 1,264,629 -318,842 925 -48Cellular and other wireless carriers ........................ 517212 7,710 984 169,612 -309 9,210,509 -470,397 1,044 -52
Telecommunications resellers ......................................... 5173 9,003 501 177,890 -30,950 10,097,475 -1,411,715 1,092 32Satellite telecommunications ........................................... 5174 1,027 -31 18,539 -2,673 1,228,035 -77,295 1,274 91Cable and other program distribution .............................. 5175 3,751 19 127,674 1,702 5,545,709 184,863 835 17Other telecommunications .............................................. 5179 589 12 9,215 -92 555,989 4,726 1,160 21
ISPs, search portals, and data processing .......................... 518 25,758 -2,029 436,750 -49,904 26,237,565 -5,543,543 1,155 -101ISPs and web search portals .......................................... 5181 12,407 -1,910 135,983 -35,274 9,459,890 -4,770,063 1,338 -260
ISPs and web search portals ...................................... 51811 12,407 -1,910 135,983 -35,274 9,459,890 -4,770,063 1,338 -260Internet service providers ....................................... 518111 11,227 -1,747 122,837 -31,910 8,500,593 -4,451,485 1,331 -279
See footnotes at end of table.
42
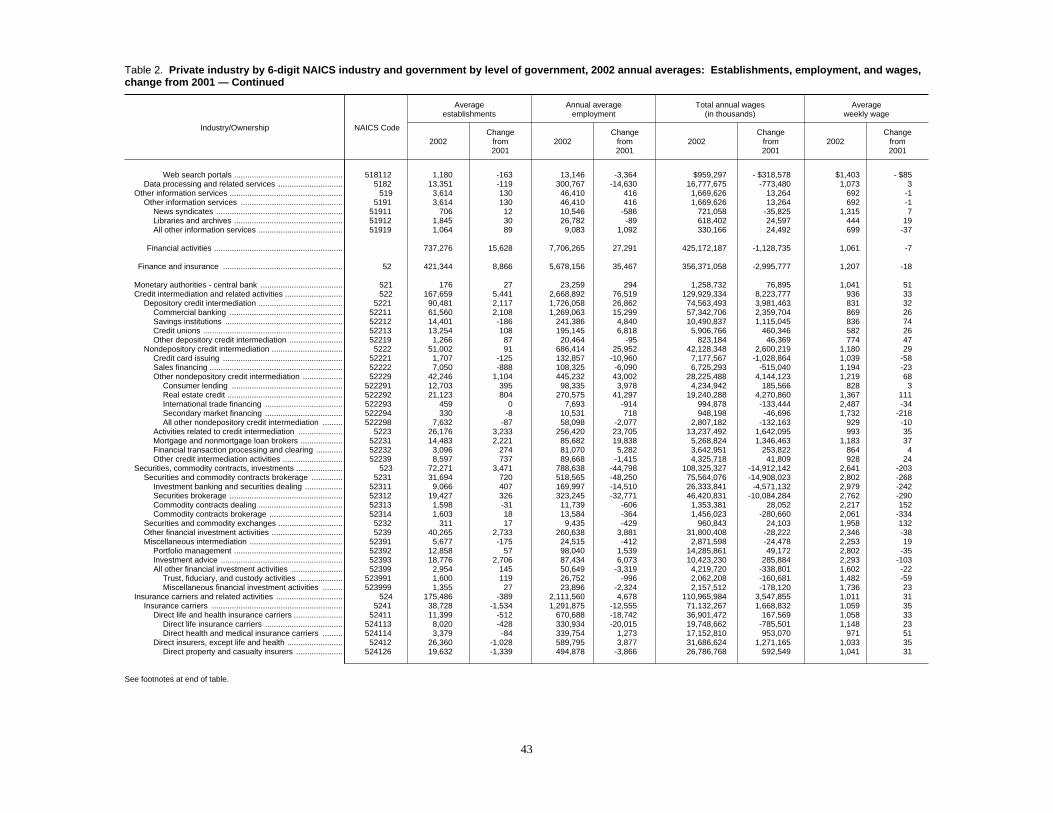
Table 2. Private industry by 6-digit NAICS industry and government by level of government, 2002 annual averages: Establishments, employment, and wages,change from 2001 — Continued
Industry/Ownership NAICS Code
Averageestablishments
Annual averageemployment
Total annual wages(in thousands)
Averageweekly wage
2002Change
from2001
2002Change
from2001
2002Change
from2001
2002Change
from2001
Web search portals ................................................. 518112 1,180 -163 13,146 -3,364 $959,297 - $318,578 $1,403 - $85Data processing and related services ............................. 5182 13,351 -119 300,767 -14,630 16,777,675 -773,480 1,073 3
Other information services ................................................... 519 3,614 130 46,410 416 1,669,626 13,264 692 -1Other information services .............................................. 5191 3,614 130 46,410 416 1,669,626 13,264 692 -1
News syndicates ......................................................... 51911 706 12 10,546 -586 721,058 -35,825 1,315 7Libraries and archives ................................................. 51912 1,845 30 26,782 -89 618,402 24,597 444 19All other information services ...................................... 51919 1,064 89 9,083 1,092 330,166 24,492 699 -37
Financial activities .......................................................... 737,276 15,628 7,706,265 27,291 425,172,187 -1,128,735 1,061 -7
Finance and insurance ...................................................... 52 421,344 8,866 5,678,156 35,467 356,371,058 -2,995,777 1,207 -18
Monetary authorities - central bank ..................................... 521 176 27 23,259 294 1,258,732 76,895 1,041 51Credit intermediation and related activities .......................... 522 167,659 5,441 2,668,892 76,519 129,929,334 8,223,777 936 33
Depository credit intermediation ...................................... 5221 90,481 2,117 1,726,058 26,862 74,563,493 3,981,463 831 32Commercial banking ................................................... 52211 61,560 2,108 1,269,063 15,299 57,342,706 2,359,704 869 26Savings institutions ..................................................... 52212 14,401 -186 241,386 4,840 10,490,837 1,115,045 836 74Credit unions ............................................................... 52213 13,254 108 195,145 6,818 5,906,766 460,346 582 26Other depository credit intermediation ........................ 52219 1,266 87 20,464 -95 823,184 46,369 774 47
Nondepository credit intermediation ................................ 5222 51,002 91 686,414 25,952 42,128,348 2,600,219 1,180 29Credit card issuing ...................................................... 52221 1,707 -125 132,857 -10,960 7,177,567 -1,028,864 1,039 -58Sales financing ............................................................ 52222 7,050 -888 108,325 -6,090 6,725,293 -515,040 1,194 -23Other nondepository credit intermediation .................. 52229 42,246 1,104 445,232 43,002 28,225,488 4,144,123 1,219 68
Consumer lending .................................................. 522291 12,703 395 98,335 3,978 4,234,942 185,566 828 3Real estate credit .................................................... 522292 21,123 804 270,575 41,297 19,240,288 4,270,860 1,367 111International trade financing ................................... 522293 459 0 7,693 -914 994,878 -133,444 2,487 -34Secondary market financing ................................... 522294 330 -8 10,531 718 948,198 -46,696 1,732 -218All other nondepository credit intermediation ......... 522298 7,632 -87 58,098 -2,077 2,807,182 -132,163 929 -10
Activities related to credit intermediation .................... 5223 26,176 3,233 256,420 23,705 13,237,492 1,642,095 993 35Mortgage and nonmortgage loan brokers ................... 52231 14,483 2,221 85,682 19,838 5,268,824 1,346,463 1,183 37Financial transaction processing and clearing ............ 52232 3,096 274 81,070 5,282 3,642,951 253,822 864 4Other credit intermediation activities ........................... 52239 8,597 737 89,668 -1,415 4,325,718 41,809 928 24
Securities, commodity contracts, investments ..................... 523 72,271 3,471 788,638 -44,798 108,325,327 -14,912,142 2,641 -203Securities and commodity contracts brokerage .............. 5231 31,694 720 518,565 -48,250 75,564,076 -14,908,023 2,802 -268
Investment banking and securities dealing ................. 52311 9,066 407 169,997 -14,510 26,333,841 -4,571,132 2,979 -242Securities brokerage ................................................... 52312 19,427 326 323,245 -32,771 46,420,831 -10,084,284 2,762 -290Commodity contracts dealing ...................................... 52313 1,598 -31 11,739 -606 1,353,381 28,052 2,217 152Commodity contracts brokerage ................................. 52314 1,603 18 13,584 -364 1,456,023 -280,660 2,061 -334
Securities and commodity exchanges ............................. 5232 311 17 9,435 -429 960,843 24,103 1,958 132Other financial investment activities ................................ 5239 40,265 2,733 260,638 3,881 31,800,408 -28,222 2,346 -38Miscellaneous intermediation .......................................... 52391 5,677 -175 24,515 -412 2,871,598 -24,478 2,253 19
Portfolio management ................................................. 52392 12,858 57 98,040 1,539 14,285,861 49,172 2,802 -35Investment advice ....................................................... 52393 18,776 2,706 87,434 6,073 10,423,230 285,884 2,293 -103All other financial investment activities ....................... 52399 2,954 145 50,649 -3,319 4,219,720 -338,801 1,602 -22
Trust, fiduciary, and custody activities .................... 523991 1,600 119 26,752 -996 2,062,208 -160,681 1,482 -59Miscellaneous financial investment activities ......... 523999 1,355 27 23,896 -2,324 2,157,512 -178,120 1,736 23
Insurance carriers and related activities .............................. 524 175,486 -389 2,111,560 4,678 110,965,984 3,547,855 1,011 31Insurance carriers ........................................................... 5241 38,728 -1,534 1,291,875 -12,555 71,132,267 1,668,832 1,059 35
Direct life and health insurance carriers ...................... 52411 11,399 -512 670,688 -18,742 36,901,472 167,569 1,058 33Direct life insurance carriers ................................... 524113 8,020 -428 330,934 -20,015 19,748,662 -785,501 1,148 23Direct health and medical insurance carriers ......... 524114 3,379 -84 339,754 1,273 17,152,810 953,070 971 51
Direct insurers, except life and health ......................... 52412 26,360 -1,028 589,795 3,877 31,686,624 1,271,165 1,033 35Direct property and casualty insurers ..................... 524126 19,632 -1,339 494,878 -3,866 26,786,768 592,549 1,041 31
See footnotes at end of table.
43
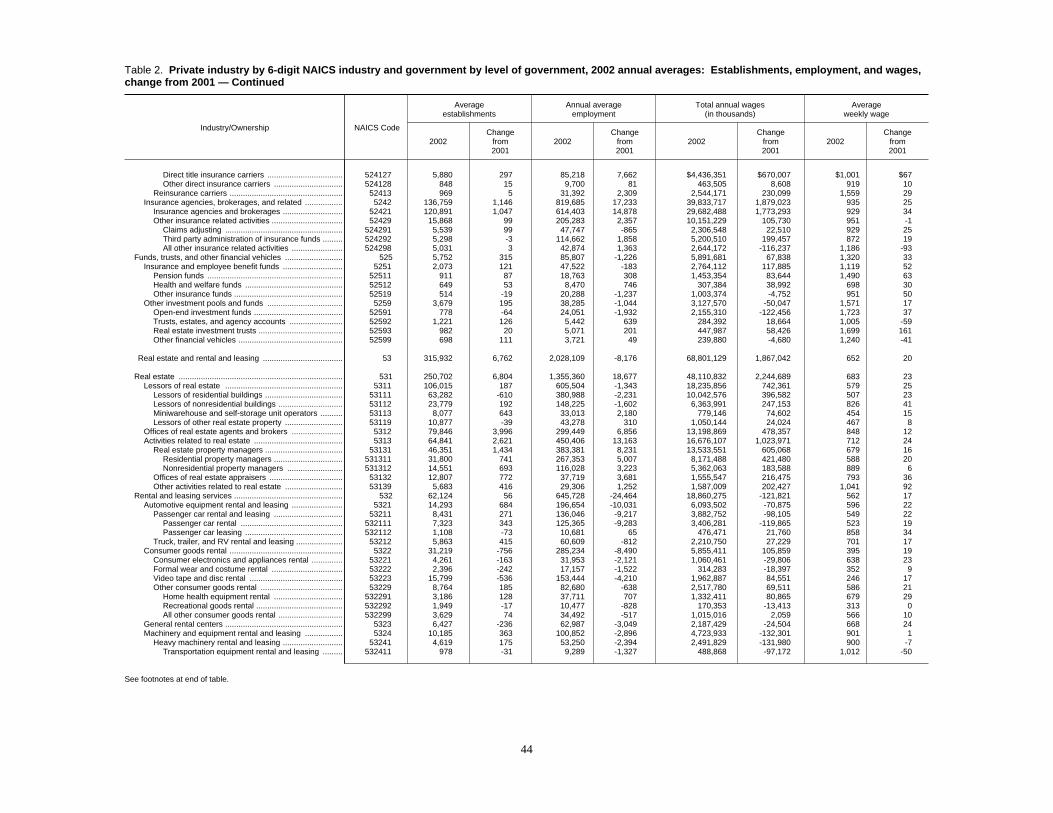
Table 2. Private industry by 6-digit NAICS industry and government by level of government, 2002 annual averages: Establishments, employment, and wages,change from 2001 — Continued
Industry/Ownership NAICS Code
Averageestablishments
Annual averageemployment
Total annual wages(in thousands)
Averageweekly wage
2002Change
from2001
2002Change
from2001
2002Change
from2001
2002Change
from2001
Direct title insurance carriers .................................. 524127 5,880 297 85,218 7,662 $4,436,351 $670,007 $1,001 $67Other direct insurance carriers ............................... 524128 848 15 9,700 81 463,505 8,608 919 10
Reinsurance carriers ................................................... 52413 969 5 31,392 2,309 2,544,171 230,099 1,559 29Insurance agencies, brokerages, and related ................. 5242 136,759 1,146 819,685 17,233 39,833,717 1,879,023 935 25
Insurance agencies and brokerages ........................... 52421 120,891 1,047 614,403 14,878 29,682,488 1,773,293 929 34Other insurance related activities ................................ 52429 15,868 99 205,283 2,357 10,151,229 105,730 951 -1
Claims adjusting ..................................................... 524291 5,539 99 47,747 -865 2,306,548 22,510 929 25Third party administration of insurance funds ......... 524292 5,298 -3 114,662 1,858 5,200,510 199,457 872 19All other insurance related activities ....................... 524298 5,031 3 42,874 1,363 2,644,172 -116,237 1,186 -93
Funds, trusts, and other financial vehicles .......................... 525 5,752 315 85,807 -1,226 5,891,681 67,838 1,320 33Insurance and employee benefit funds ........................... 5251 2,073 121 47,522 -183 2,764,112 117,885 1,119 52
Pension funds ............................................................. 52511 911 87 18,763 308 1,453,354 83,644 1,490 63Health and welfare funds ............................................ 52512 649 53 8,470 746 307,384 38,992 698 30Other insurance funds ................................................. 52519 514 -19 20,288 -1,237 1,003,374 -4,752 951 50
Other investment pools and funds .................................. 5259 3,679 195 38,285 -1,044 3,127,570 -50,047 1,571 17Open-end investment funds ........................................ 52591 778 -64 24,051 -1,932 2,155,310 -122,456 1,723 37Trusts, estates, and agency accounts ........................ 52592 1,221 126 5,442 639 284,392 18,664 1,005 -59Real estate investment trusts ...................................... 52593 982 20 5,071 201 447,987 58,426 1,699 161Other financial vehicles ............................................... 52599 698 111 3,721 49 239,880 -4,680 1,240 -41
Real estate and rental and leasing .................................... 53 315,932 6,762 2,028,109 -8,176 68,801,129 1,867,042 652 20
Real estate .......................................................................... 531 250,702 6,804 1,355,360 18,677 48,110,832 2,244,689 683 23Lessors of real estate ..................................................... 5311 106,015 187 605,504 -1,343 18,235,856 742,361 579 25
Lessors of residential buildings ................................... 53111 63,282 -610 380,988 -2,231 10,042,576 396,582 507 23Lessors of nonresidential buildings ............................. 53112 23,779 192 148,225 -1,602 6,363,991 247,153 826 41Miniwarehouse and self-storage unit operators .......... 53113 8,077 643 33,013 2,180 779,146 74,602 454 15Lessors of other real estate property .......................... 53119 10,877 -39 43,278 310 1,050,144 24,024 467 8
Offices of real estate agents and brokers ....................... 5312 79,846 3,996 299,449 6,856 13,198,869 478,357 848 12Activities related to real estate ........................................ 5313 64,841 2,621 450,406 13,163 16,676,107 1,023,971 712 24
Real estate property managers ................................... 53131 46,351 1,434 383,381 8,231 13,533,551 605,068 679 16Residential property managers ............................... 531311 31,800 741 267,353 5,007 8,171,488 421,480 588 20Nonresidential property managers ......................... 531312 14,551 693 116,028 3,223 5,362,063 183,588 889 6
Offices of real estate appraisers ................................. 53132 12,807 772 37,719 3,681 1,555,547 216,475 793 36Other activities related to real estate .......................... 53139 5,683 416 29,306 1,252 1,587,009 202,427 1,041 92
Rental and leasing services ................................................. 532 62,124 56 645,728 -24,464 18,860,275 -121,821 562 17Automotive equipment rental and leasing ....................... 5321 14,293 684 196,654 -10,031 6,093,502 -70,875 596 22
Passenger car rental and leasing ............................... 53211 8,431 271 136,046 -9,217 3,882,752 -98,105 549 22Passenger car rental .............................................. 532111 7,323 343 125,365 -9,283 3,406,281 -119,865 523 19Passenger car leasing ............................................ 532112 1,108 -73 10,681 65 476,471 21,760 858 34
Truck, trailer, and RV rental and leasing ..................... 53212 5,863 415 60,609 -812 2,210,750 27,229 701 17Consumer goods rental ................................................... 5322 31,219 -756 285,234 -8,490 5,855,411 105,859 395 19
Consumer electronics and appliances rental .............. 53221 4,261 -163 31,953 -2,121 1,060,461 -29,806 638 23Formal wear and costume rental ................................ 53222 2,396 -242 17,157 -1,522 314,283 -18,397 352 9Video tape and disc rental .......................................... 53223 15,799 -536 153,444 -4,210 1,962,887 84,551 246 17Other consumer goods rental ..................................... 53229 8,764 185 82,680 -638 2,517,780 69,511 586 21
Home health equipment rental ............................... 532291 3,186 128 37,711 707 1,332,411 80,865 679 29Recreational goods rental ....................................... 532292 1,949 -17 10,477 -828 170,353 -13,413 313 0All other consumer goods rental ............................. 532299 3,629 74 34,492 -517 1,015,016 2,059 566 10
General rental centers ..................................................... 5323 6,427 -236 62,987 -3,049 2,187,429 -24,504 668 24Machinery and equipment rental and leasing ................. 5324 10,185 363 100,852 -2,896 4,723,933 -132,301 901 1
Heavy machinery rental and leasing ........................... 53241 4,619 175 53,250 -2,394 2,491,829 -131,980 900 -7Transportation equipment rental and leasing ......... 532411 978 -31 9,289 -1,327 488,868 -97,172 1,012 -50
See footnotes at end of table.
44

Table 2. Private industry by 6-digit NAICS industry and government by level of government, 2002 annual averages: Establishments, employment, and wages,change from 2001 — Continued
Industry/Ownership NAICS Code
Averageestablishments
Annual averageemployment
Total annual wages(in thousands)
Averageweekly wage
2002Change
from2001
2002Change
from2001
2002Change
from2001
2002Change
from2001
Other heavy machinery rental and leasing ............. 532412 3,641 206 43,961 -1,067 $2,002,961 - $34,808 $876 $6Office equipment rental and leasing ........................... 53242 1,525 -83 11,701 -1,396 700,925 -66,614 1,152 25Other machinery rental and leasing ............................ 53249 4,042 272 35,901 894 1,531,180 66,293 820 15
Lessors of nonfinancial intangible assets ............................ 533 3,106 -98 27,021 -2,389 1,830,021 -255,826 1,302 -62
Professional and business services ............................... 1,293,929 36,364 15,939,596 -385,294 699,737,624 -11,471,379 844 6
Professional and technical services ................................... 54 851,777 23,984 6,654,743 -216,698 390,450,138 -13,281,252 1,128 -2
Professional and technical services .................................... 541 851,777 23,984 6,654,743 -216,698 390,450,138 -13,281,252 1,128 -2Legal services ................................................................. 5411 175,664 2,057 1,114,651 26,950 69,875,728 2,899,443 1,206 22
Offices of lawyers ........................................................ 54111 166,288 1,447 1,044,711 17,910 66,959,979 2,318,104 1,233 22Other legal services .................................................... 54119 9,376 610 69,940 9,040 2,915,749 581,340 802 65
Title abstract and settlement offices ....................... 541191 6,865 574 55,107 8,175 2,346,441 504,386 819 64All other legal services ............................................ 541199 2,512 37 14,833 866 569,308 76,954 738 60
Accounting and bookkeeping services ............................ 5412 116,169 9,744 841,669 -36,813 38,767,560 -2,192,458 886 -11Accounting and bookkeeping services ........................ 54121 116,169 9,744 841,669 -36,813 38,767,560 -2,192,458 886 -11
Offices of certified public accountants .................... 541211 54,201 204 394,979 -19,944 22,059,233 -818,420 1,074 14Tax preparation services ........................................ 541213 20,364 8,519 84,885 9,687 1,610,534 20,998 365 -41Payroll services ...................................................... 541214 5,582 149 125,128 -31,816 5,471,021 -1,550,978 841 -19Other accounting services ...................................... 541219 36,023 872 236,678 5,260 9,626,771 155,942 782 -5
Architectural and engineering services ........................... 5413 115,391 1,661 1,241,616 -26,738 71,342,744 406,008 1,105 29Architectural services .................................................. 54131 23,047 320 183,671 -5,795 10,365,365 -180,807 1,085 15Landscape architectural services ................................ 54132 7,608 118 42,420 -113 1,515,208 49,551 687 24Engineering services ................................................... 54133 58,102 594 774,271 -25,074 47,357,774 -280,627 1,176 30Drafting services ......................................................... 54134 2,984 37 10,817 -447 457,999 -23,788 814 -9Building inspection services ........................................ 54135 4,441 364 14,738 772 510,712 40,323 666 18Geophysical surveying and mapping services ............ 54136 1,569 -25 12,688 -397 582,931 -1,131 884 26Other surveying and mapping services ....................... 54137 8,921 127 58,018 649 2,095,090 98,408 694 25Testing laboratories .................................................... 54138 8,719 125 144,993 3,666 8,457,666 704,079 1,122 67
Specialized design services ............................................ 5414 32,255 934 122,391 -7,021 5,427,700 -427,752 853 -17Interior design services ............................................... 54141 11,182 636 34,209 172 1,346,635 -9,094 757 -9Industrial design services ............................................ 54142 1,757 163 8,582 496 418,422 45,448 938 51Graphic design services .............................................. 54143 17,111 71 70,430 -8,407 3,274,311 -490,833 894 -24Other specialized design services .............................. 54149 2,206 65 9,170 718 388,332 26,727 814 -9
Computer systems design and related services ............. 5415 145,973 1,150 1,140,411 -138,420 83,897,952 -11,807,374 1,415 -24Computer systems design and related services ......... 54151 145,973 1,150 1,140,411 -138,420 83,897,952 -11,807,374 1,415 -24
Custom computer programming services ............... 541511 62,893 2,408 499,802 -57,219 38,010,260 -5,182,479 1,463 -28Computer systems design services ........................ 541512 60,436 142 456,541 -52,620 34,278,536 -4,391,517 1,444 -17Computer facilities management services .............. 541513 2,063 112 57,877 -6,975 3,518,821 -606,700 1,169 -54Other computer related services ............................ 541519 20,582 -1,512 126,191 -21,607 8,090,335 -1,626,679 1,233 -31
Management and technical consulting services .............. 5416 142,965 6,538 733,926 -14,994 46,829,017 -1,025,041 1,227 -2Management consulting services ................................ 54161 119,171 3,297 621,880 -21,306 40,749,579 -1,533,596 1,260 -4
Administrative management consulting services .... 541611 53,064 2,905 276,279 -1,420 19,875,033 -58,213 1,383 3Human resource consulting services ...................... 541612 14,998 -228 100,527 -13,361 5,976,509 -948,405 1,143 -26Marketing consulting services ................................ 541613 20,996 1,792 87,494 -1,452 5,060,795 -94,058 1,112 -3Process and logistics consulting services .............. 541614 8,678 128 64,475 2,862 3,785,677 127,363 1,129 -13Other management consulting services ................. 541618 21,435 -1,300 93,105 -7,934 6,051,565 -560,283 1,250 -8
Environmental consulting services .............................. 54162 8,751 278 60,472 630 3,121,628 98,568 993 22Other technical consulting services ............................ 54169 15,043 2,962 51,574 5,682 2,957,811 409,987 1,103 35
Scientific research and development services ................ 5417 19,760 154 532,218 1,386 36,713,348 652,037 1,327 21Physical, engineering and biological research ............ 54171 15,507 329 462,198 916 33,381,300 647,969 1,389 24
Social science and humanities research ................................. 54172 4,252 -176 70,020 470 3,332,049 4,068 915 -5
See footnotes at end of table.
45

Table 2. Private industry by 6-digit NAICS industry and government by level of government, 2002 annual averages: Establishments, employment, and wages,change from 2001 — Continued
Industry/Ownership NAICS Code
Averageestablishments
Annual averageemployment
Total annual wages(in thousands)
Averageweekly wage
2002Change
from2001
2002Change
from2001
2002Change
from2001
2002Change
from2001
Advertising and related services ..................................... 5418 47,179 -224 439,502 -36,283 $23,436,441 - $2,277,575 $1,025 - $14Advertising agencies ................................................... 54181 18,418 -360 173,716 -18,788 11,540,399 -1,356,056 1,278 -10Public relations agencies ............................................ 54182 8,023 3 47,384 -5,074 3,224,119 -313,139 1,309 12Media buying agencies ............................................... 54183 899 21 7,854 -222 503,732 -8,916 1,233 12Media representatives ................................................. 54184 3,398 -41 30,963 -2,179 1,862,009 -229,022 1,156 -57Display advertising ...................................................... 54185 2,861 96 28,006 -253 1,184,922 -20,179 814 -6Direct mail advertising ................................................. 54186 3,288 -19 77,858 -5,227 2,931,756 -180,396 724 4Advertising material distribution services .................... 54187 1,529 -34 15,080 -3,064 491,385 -96,358 627 4Other services related to advertising .......................... 54189 8,765 110 58,642 -1,475 1,698,118 -73,508 557 -10
Other professional and technical services ...................... 5419 56,421 1,970 488,360 15,236 14,159,648 491,459 558 2Marketing research and public opinion polling ............ 54191 6,113 398 113,399 -457 4,443,857 -205,490 754 -31Photographic services ................................................. 54192 17,200 264 83,971 214 1,834,575 909 420 -1
Photography studios, portrait .................................. 541921 13,243 233 72,067 700 1,366,484 21,729 365 3Commercial photography ....................................... 541922 3,957 32 11,904 -486 468,092 -20,821 756 -3
Translation and interpretation services ....................... 54193 1,602 134 8,433 -74 308,835 4,105 704 15Veterinary services ..................................................... 54194 25,179 283 241,950 9,132 5,857,333 465,782 466 21All other professional and technical services .............. 54199 6,328 891 40,607 6,421 1,715,049 226,153 812 -26
Management of companies and enterprises ...................... 55 37,688 588 1,695,554 -20,576 117,462,176 -889,891 1,332 6
Management of companies and enterprises ....................... 551 37,688 588 1,695,554 -20,576 117,462,176 -889,891 1,332 6Management of companies and enterprises ................... 5511 37,688 588 1,695,554 -20,576 117,462,176 -889,891 1,332 6
Management of companies and enterprises ............... 55111 37,688 588 1,695,554 -20,576 117,462,176 -889,891 1,332 6Offices of bank holding companies ......................... 551111 963 50 15,125 -1,250 1,372,645 -294,623 1,745 -213Offices of other holding companies ........................ 551112 10,456 -324 81,517 -4,050 10,432,929 426,057 2,461 212Managing offices .................................................... 551114 26,268 861 1,598,912 -15,276 105,656,602 -1,021,326 1,271 0
Administrative and waste services ..................................... 56 404,465 11,793 7,589,300 -148,020 191,825,310 2,699,764 486 16
Administrative and support services .................................... 561 384,295 11,437 7,271,717 -150,080 178,563,429 2,199,250 472 15Office administrative services ......................................... 5611 30,203 2,867 285,602 20,834 16,194,995 1,337,811 1,090 11Facilities support services ............................................... 5612 1,967 94 100,623 2,055 3,708,595 177,177 709 20
Employment services .................................................. 5613 61,959 2,230 3,250,958 -160,770 71,840,501 -2,234,898 425 7Employment placement agencies ............................... 56131 12,825 323 281,342 -25,700 7,651,537 -727,372 523 -2Temporary help services ............................................. 56132 35,959 674 2,179,838 -140,092 43,482,426 -2,460,914 384 3Professional employer organizations .......................... 56133 13,176 1,234 789,778 5,022 20,706,538 953,388 504 20Business support services .......................................... 5614 41,180 1,058 758,047 -12,958 21,488,470 544,177 545 23Document preparation services .................................. 56141 6,418 208 37,002 -1,389 1,077,683 -6,593 560 17Telephone call centers ................................................ 56142 6,906 49 372,513 -18,782 8,617,600 -161,403 445 14
Telephone answering services ............................... 561421 2,325 -75 52,960 9 1,284,266 5,596 466 2Telemarketing bureaus ........................................... 561422 4,581 124 319,553 -18,791 7,333,334 -166,999 441 15
Business service centers ............................................ 56143 9,665 317 87,000 -2,733 2,429,729 9,112 537 18Private mail centers ................................................ 561431 4,588 157 24,314 952 555,993 39,131 440 15Other business service centers .............................. 561439 5,077 159 62,686 -3,685 1,873,736 -30,019 575 23
Collection agencies ..................................................... 56144 6,237 11 141,905 4,853 4,504,831 295,020 610 19Credit bureaus ............................................................ 56145 1,685 -77 28,934 -531 1,443,155 56,734 959 54Other business support services ................................. 56149 10,269 549 90,693 5,623 3,415,472 351,307 724 31
Repossession services ........................................... 561491 1,037 49 8,994 -102 314,209 -1,591 672 4Court reporting and stenotype services .................. 561492 2,940 46 12,315 253 444,069 36,345 693 43All other business support services ........................ 561499 6,293 454 69,383 5,471 2,657,194 316,553 736 32
Travel arrangement and reservation services ................. 5615 29,760 -2,091 254,389 -29,203 8,660,067 -370,958 655 43Travel agencies ........................................................... 56151 21,760 -1,812 135,648 -22,195 4,879,552 -273,010 692 64Tour operators ............................................................ 56152 3,516 -183 31,157 -5,599 1,010,087 -179,263 623 1
See footnotes at end of table.
46

Table 2. Private industry by 6-digit NAICS industry and government by level of government, 2002 annual averages: Establishments, employment, and wages,change from 2001 — Continued
Industry/Ownership NAICS Code
Averageestablishments
Annual averageemployment
Total annual wages(in thousands)
Averageweekly wage
2002Change
from2001
2002Change
from2001
2002Change
from2001
2002Change
from2001
Other travel arrangement services .............................. 56159 4,484 -96 87,584 -1,410 $2,770,428 $81,315 $608 $27Convention and visitors bureaus ............................ 561591 840 32 8,671 -560 259,338 -20,901 575 -9All other travel arrangement services ..................... 561599 3,644 -128 78,913 -849 2,511,090 102,217 612 31
Investigation and security services ................................. 5616 25,050 478 729,599 26,779 16,389,976 1,497,046 432 24Security and armored car services ............................. 56161 15,395 327 623,929 25,574 12,650,350 1,296,899 390 25
Investigation services ............................................. 561611 5,113 32 46,635 -2,511 1,252,766 36,418 517 41Security guards and patrol services ....................... 561612 9,598 302 543,243 27,496 10,428,839 1,225,039 369 26Armored car services .............................................. 561613 683 -9 34,051 590 968,745 35,442 547 11
Security systems services ........................................... 56162 9,656 152 105,671 1,206 3,739,626 200,147 681 29Security systems services, except locksmiths ........ 561621 5,727 153 89,316 1,271 3,250,551 199,760 700 34Locksmiths .............................................................. 561622 3,929 -1 16,354 -66 489,075 387 575 3
Services to buildings and dwellings ................................ 5617 168,363 4,684 1,604,289 -2,767 31,169,971 885,907 374 12Exterminating and pest control services ..................... 56171 11,192 185 89,499 1,260 2,680,122 118,189 576 18Janitorial services ....................................................... 56172 55,759 1,120 862,852 -17,472 13,111,165 98,914 292 8Landscaping services ................................................. 56173 80,920 2,687 533,772 11,879 12,505,501 548,571 451 10Carpet and upholstery cleaning services .................... 56174 9,306 221 47,707 826 1,091,331 59,804 440 17Other services to buildings and dwellings ................... 56179 11,187 472 70,459 740 1,781,853 60,430 486 11
Other support services .................................................... 5619 25,813 2,116 288,210 5,951 9,110,853 362,989 608 12Packaging and labeling services ................................. 56191 2,585 88 56,318 1,582 1,583,436 162,354 541 42Convention and trade show organizers ...................... 56192 4,187 75 47,253 -1,722 1,708,124 -130,484 695 -27All other support services ............................................ 56199 19,041 1,952 184,639 6,090 5,819,294 331,119 606 15
Waste management and remediation services ................... 562 20,170 356 317,583 2,060 13,261,881 500,514 803 25Waste collection .............................................................. 5621 7,614 113 102,909 3,406 3,783,815 256,218 707 25
Waste collection .......................................................... 56211 7,614 113 102,909 3,406 3,783,815 256,218 707 25Solid waste collection ............................................. 562111 5,808 166 84,401 4,034 3,098,950 253,479 706 25Hazardous waste collection .................................... 562112 483 1 8,559 -426 338,487 -4,256 761 27Other waste collection ............................................ 562119 1,323 -54 9,949 -202 346,378 6,995 670 27
Waste treatment and disposal ......................................... 5622 3,861 19 117,727 -1,094 5,650,927 181,227 923 38Waste treatment and disposal .................................... 56221 3,861 19 117,727 -1,094 5,650,927 181,227 923 38
Hazardous waste treatment and disposal .............. 562211 1,176 -76 48,195 -1,213 2,608,402 96,735 1,041 63Solid waste landfill .................................................. 562212 1,665 89 47,426 780 2,051,246 95,303 832 26Solid waste combustors and incinerators .............. 562213 234 21 5,753 539 305,071 27,903 1,020 -2Other nonhazardous waste disposal ...................... 562219 787 -14 16,353 -1,201 686,208 -38,714 807 13
Remediation and other waste services ........................... 5629 8,695 224 96,947 -252 3,827,139 63,069 759 14Remediation services .................................................. 56291 3,986 152 61,723 -725 2,631,457 10,734 820 13Materials recovery facilities ......................................... 56292 463 -24 7,628 -405 295,201 -7,351 744 20All other waste management services ........................ 56299 4,246 95 27,596 878 900,481 59,686 628 23
Septic tank and related services ............................. 562991 3,235 62 19,392 594 616,248 39,792 611 21Miscellaneous waste management services .......... 562998 1,011 32 8,204 284 284,233 19,894 666 24
Educational and health services ................................... 705,573 18,730 15,346,718 497,052 520,730,914 34,876,262 653 24
Educational services .......................................................... 61 69,402 2,986 1,951,003 67,439 64,700,545 4,301,962 638 21
Educational services ............................................................ 611 69,402 2,986 1,951,003 67,439 64,700,545 4,301,962 638 21Elementary and secondary schools ................................ 6111 13,590 366 536,094 22,274 14,376,494 1,204,055 516 23Junior colleges ................................................................ 6112 618 11 40,676 -468 1,330,220 51,308 629 31Colleges and universities ................................................ 6113 3,055 147 933,718 31,327 37,065,824 2,649,128 763 30Business, computer and management training ............... 6114 10,135 16 83,865 -3,719 3,363,821 -189,320 771 -9
Business and secretarial schools ................................ 61141 512 -21 15,404 441 410,719 32,523 513 27Computer training ....................................................... 61142 3,436 -44 23,770 -4,167 1,077,290 -235,553 872 -32Management training .................................................. 61143 6,187 81 44,691 8 1,875,812 13,709 807 6
Technical and trade schools ........................................... 6115 7,646 94 95,758 1,887 3,188,314 159,419 640 19
See footnotes at end of table.
47
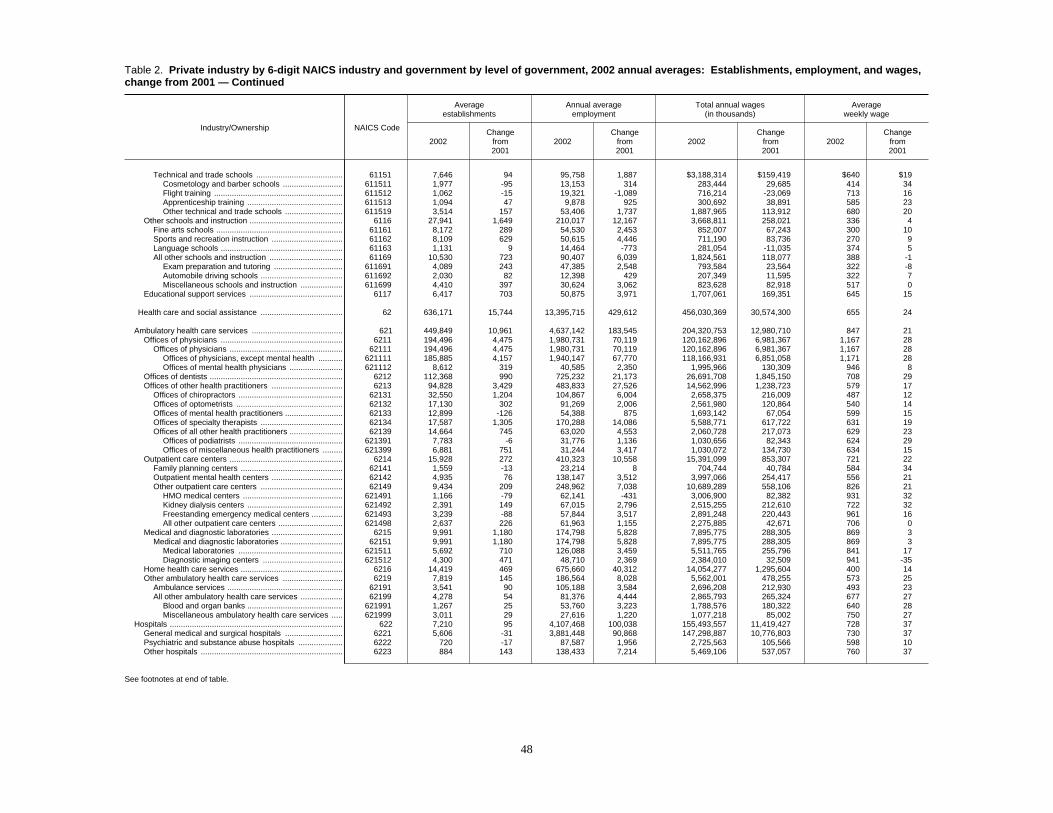
Table 2. Private industry by 6-digit NAICS industry and government by level of government, 2002 annual averages: Establishments, employment, and wages,change from 2001 — Continued
Industry/Ownership NAICS Code
Averageestablishments
Annual averageemployment
Total annual wages(in thousands)
Averageweekly wage
2002Change
from2001
2002Change
from2001
2002Change
from2001
2002Change
from2001
Technical and trade schools ....................................... 61151 7,646 94 95,758 1,887 $3,188,314 $159,419 $640 $19Cosmetology and barber schools ........................... 611511 1,977 -95 13,153 314 283,444 29,685 414 34Flight training .......................................................... 611512 1,062 -15 19,321 -1,089 716,214 -23,069 713 16Apprenticeship training ........................................... 611513 1,094 47 9,878 925 300,692 38,891 585 23Other technical and trade schools .......................... 611519 3,514 157 53,406 1,737 1,887,965 113,912 680 20
Other schools and instruction .......................................... 6116 27,941 1,649 210,017 12,167 3,668,811 258,021 336 4Fine arts schools ......................................................... 61161 8,172 289 54,530 2,453 852,007 67,243 300 10Sports and recreation instruction ................................ 61162 8,109 629 50,615 4,446 711,190 83,736 270 9Language schools ....................................................... 61163 1,131 9 14,464 -773 281,054 -11,035 374 5All other schools and instruction ................................. 61169 10,530 723 90,407 6,039 1,824,561 118,077 388 -1
Exam preparation and tutoring ............................... 611691 4,089 243 47,385 2,548 793,584 23,564 322 -8Automobile driving schools ..................................... 611692 2,030 82 12,398 429 207,349 11,595 322 7Miscellaneous schools and instruction ................... 611699 4,410 397 30,624 3,062 823,628 82,918 517 0
Educational support services .......................................... 6117 6,417 703 50,875 3,971 1,707,061 169,351 645 15
Health care and social assistance ..................................... 62 636,171 15,744 13,395,715 429,612 456,030,369 30,574,300 655 24
Ambulatory health care services ......................................... 621 449,849 10,961 4,637,142 183,545 204,320,753 12,980,710 847 21Offices of physicians ....................................................... 6211 194,496 4,475 1,980,731 70,119 120,162,896 6,981,367 1,167 28
Offices of physicians ................................................... 62111 194,496 4,475 1,980,731 70,119 120,162,896 6,981,367 1,167 28Offices of physicians, except mental health ........... 621111 185,885 4,157 1,940,147 67,770 118,166,931 6,851,058 1,171 28Offices of mental health physicians ........................ 621112 8,612 319 40,585 2,350 1,995,966 130,309 946 8
Offices of dentists ............................................................ 6212 112,368 990 725,232 21,173 26,691,708 1,845,150 708 29Offices of other health practitioners ................................ 6213 94,828 3,429 483,833 27,526 14,562,996 1,238,723 579 17
Offices of chiropractors ............................................... 62131 32,550 1,204 104,867 6,004 2,658,375 216,009 487 12Offices of optometrists ................................................ 62132 17,130 302 91,269 2,006 2,561,980 120,864 540 14Offices of mental health practitioners .......................... 62133 12,899 -126 54,388 875 1,693,142 67,054 599 15Offices of specialty therapists ..................................... 62134 17,587 1,305 170,288 14,086 5,588,771 617,722 631 19Offices of all other health practitioners ........................ 62139 14,664 745 63,020 4,553 2,060,728 217,073 629 23
Offices of podiatrists ............................................... 621391 7,783 -6 31,776 1,136 1,030,656 82,343 624 29Offices of miscellaneous health practitioners ......... 621399 6,881 751 31,244 3,417 1,030,072 134,730 634 15
Outpatient care centers ................................................... 6214 15,928 272 410,323 10,558 15,391,099 853,307 721 22Family planning centers .............................................. 62141 1,559 -13 23,214 8 704,744 40,784 584 34Outpatient mental health centers ................................ 62142 4,935 76 138,147 3,512 3,997,066 254,417 556 21Other outpatient care centers ..................................... 62149 9,434 209 248,962 7,038 10,689,289 558,106 826 21
HMO medical centers ............................................. 621491 1,166 -79 62,141 -431 3,006,900 82,382 931 32Kidney dialysis centers ........................................... 621492 2,391 149 67,015 2,796 2,515,255 212,610 722 32Freestanding emergency medical centers .............. 621493 3,239 -88 57,844 3,517 2,891,248 220,443 961 16All other outpatient care centers ............................. 621498 2,637 226 61,963 1,155 2,275,885 42,671 706 0
Medical and diagnostic laboratories ................................ 6215 9,991 1,180 174,798 5,828 7,895,775 288,305 869 3Medical and diagnostic laboratories ............................ 62151 9,991 1,180 174,798 5,828 7,895,775 288,305 869 3
Medical laboratories ............................................... 621511 5,692 710 126,088 3,459 5,511,765 255,796 841 17Diagnostic imaging centers .................................... 621512 4,300 471 48,710 2,369 2,384,010 32,509 941 -35
Home health care services .............................................. 6216 14,419 469 675,660 40,312 14,054,277 1,295,604 400 14Other ambulatory health care services ........................... 6219 7,819 145 186,564 8,028 5,562,001 478,255 573 25
Ambulance services .................................................... 62191 3,541 90 105,188 3,584 2,696,208 212,930 493 23All other ambulatory health care services ................... 62199 4,278 54 81,376 4,444 2,865,793 265,324 677 27
Blood and organ banks ........................................... 621991 1,267 25 53,760 3,223 1,788,576 180,322 640 28Miscellaneous ambulatory health care services ..... 621999 3,011 29 27,616 1,220 1,077,218 85,002 750 27
Hospitals .............................................................................. 622 7,210 95 4,107,468 100,038 155,493,557 11,419,427 728 37General medical and surgical hospitals .......................... 6221 5,606 -31 3,881,448 90,868 147,298,887 10,776,803 730 37Psychiatric and substance abuse hospitals .................... 6222 720 -17 87,587 1,956 2,725,563 105,566 598 10Other hospitals ................................................................ 6223 884 143 138,433 7,214 5,469,106 537,057 760 37
See footnotes at end of table.
48

Table 2. Private industry by 6-digit NAICS industry and government by level of government, 2002 annual averages: Establishments, employment, and wages,change from 2001 — Continued
Industry/Ownership NAICS Code
Averageestablishments
Annual averageemployment
Total annual wages(in thousands)
Averageweekly wage
2002Change
from2001
2002Change
from2001
2002Change
from2001
2002Change
from2001
Nursing and residential care facilities .................................. 623 61,135 1,085 2,737,473 79,656 $59,897,294 $3,708,205 $421 $14Nursing care facilities ...................................................... 6231 16,528 -76 1,567,825 28,271 35,721,280 2,023,184 438 17Residential mental health facilities .................................. 6232 20,402 365 474,994 17,845 10,127,525 587,123 410 9
Residential mental retardation facilities ...................... 62321 15,078 216 327,914 12,715 6,625,117 371,661 389 7Residential mental and substance abuse care ........... 62322 5,324 150 147,081 5,131 3,502,408 215,461 458 13
Community care facilities for the elderly ......................... 6233 17,989 614 529,686 31,147 10,177,243 934,196 369 12Community care facilities for the elderly ..................... 62331 17,989 614 529,686 31,147 10,177,243 934,196 369 12
Continuing care retirement communities ................ 623311 3,185 219 233,397 13,859 4,896,372 476,726 403 16Homes for the elderly ............................................. 623312 14,804 395 296,289 17,288 5,280,871 457,470 343 11
Other residential care facilities ........................................ 6239 6,216 181 164,969 2,395 3,871,247 163,703 451 12Social assistance ................................................................. 624 117,977 3,604 1,913,632 66,373 36,318,766 2,465,958 365 13
Individual and family services ......................................... 6241 37,386 2,250 769,159 47,511 16,217,788 1,349,005 405 9Child and youth services ............................................. 62411 7,936 267 146,048 951 3,456,374 198,694 455 23Services for the elderly and disabled .......................... 62412 11,002 868 337,281 31,685 5,829,605 599,051 332 3Other individual and family services ........................... 62419 18,449 1,116 285,830 14,874 6,931,810 551,261 466 13
Emergency and other relief services ............................... 6242 8,207 258 126,707 3,017 3,013,694 236,295 457 25Community food services ............................................ 62421 2,590 -3 28,240 -2,871 550,871 -19,924 375 22Community housing services ...................................... 62422 4,041 232 70,210 5,072 1,606,142 176,202 440 18
Temporary shelters ................................................. 624221 2,473 110 48,987 3,155 1,071,457 103,463 421 15Other community housing services ........................ 624229 1,568 122 21,223 1,917 534,685 72,740 484 24
Emergency and other relief services ........................... 62423 1,576 29 28,257 816 856,681 80,017 583 39Vocational rehabilitation services .................................... 6243 9,428 -122 306,094 2,658 6,302,050 276,051 396 14Child day care services ................................................... 6244 62,957 1,219 711,672 13,187 10,785,233 604,606 291 11
Leisure and hospitality ................................................... 648,249 13,719 11,995,950 110,984 189,259,101 5,920,397 303 6
Arts, entertainment, and recreation ................................... 71 108,451 3,028 1,798,621 14,291 47,050,671 1,828,144 503 16
Performing arts and spectator sports .................................. 711 39,862 1,525 379,014 886 21,844,929 1,168,555 1,108 56Performing arts companies ............................................. 7111 10,350 -337 121,708 -5,171 3,674,343 -87,320 581 11
Theater companies and dinner theaters ..................... 71111 3,439 -206 65,507 -3,772 1,639,721 10,770 481 29Dance companies ....................................................... 71112 466 19 7,719 -344 255,058 1,707 635 31Musical groups and artists ......................................... 71113 5,814 -147 44,081 -1,378 1,630,501 -86,063 711 -15Other performing arts companies ............................... 71119 631 -3 4,401 322 149,063 -13,735 651 -116
Spectator sports .............................................................. 7112 6,023 34 130,871 -1,624 10,588,262 746,094 1,556 127Spectator sports .......................................................... 71121 6,023 34 130,871 -1,624 10,588,262 746,094 1,556 127
Sports teams and clubs .......................................... 711211 1,521 33 59,616 918 8,798,927 778,325 2,838 210Racetracks .............................................................. 711212 1,216 -22 48,283 -2,529 994,524 -48,203 396 1Other spectator sports ............................................ 711219 3,286 23 22,972 -14 794,811 15,972 665 13
Promoters of performing arts and sports ......................... 7113 4,435 363 70,795 4,210 2,154,628 69,926 585 -17Promoters with facilities .............................................. 71131 1,856 96 48,919 2,359 1,364,974 7,175 537 -24Promoters without facilities ......................................... 71132 2,579 267 21,876 1,851 789,654 62,752 694 -4
Agents and managers for public figures .......................... 7114 3,357 101 15,416 293 1,404,333 54,575 1,752 36Independent artists, writers, and performers ................... 7115 15,697 1,365 40,223 3,177 4,023,363 385,280 1,924 35
Museums, historical sites, zoos, and parks ......................... 712 4,791 166 114,952 156 2,808,032 71,940 470 12Museums, historical sites, zoos, and parks ..................... 7121 4,791 166 114,952 156 2,808,032 71,940 470 12
Museums .................................................................... 71211 3,190 84 69,010 185 1,759,463 62,647 490 16Historical sites ............................................................. 71212 512 37 12,648 -144 294,091 -14,369 447 -17Zoos and botanical gardens ........................................ 71213 529 25 26,219 3 623,543 19,335 457 14Nature parks and other similar institutions .................. 71219 561 20 7,075 111 130,934 4,328 356 6
Amusements, gambling, and recreation .............................. 713 63,798 1,336 1,304,656 13,250 22,397,710 587,648 330 5Amusement parks and arcades ...................................... 7131 2,808 -6 153,594 -6,588 3,030,676 -57,297 379 8
Amusement and theme parks ..................................... 71311 770 16 134,470 -5,769 2,696,225 -41,936 386 11
See footnotes at end of table.
49

Table 2. Private industry by 6-digit NAICS industry and government by level of government, 2002 annual averages: Establishments, employment, and wages,change from 2001 — Continued
Industry/Ownership NAICS Code
Averageestablishments
Annual averageemployment
Total annual wages(in thousands)
Averageweekly wage
2002Change
from2001
2002Change
from2001
2002Change
from2001
2002Change
from2001
Amusement arcades ................................................... 71312 2,038 -22 19,125 -818 $334,451 - $15,361 $336 - $1Gambling industries ........................................................ 7132 2,165 136 135,959 -2,268 3,385,154 84,969 479 20
Casinos, except casino hotels .................................... 71321 448 -2 107,141 -5,524 2,829,873 -7,072 508 24Other gambling industries ........................................... 71329 1,717 137 28,818 3,256 555,281 92,042 371 22
Other amusement and recreation industries ................... 7139 58,826 1,207 1,015,103 22,105 15,981,881 559,976 303 4Golf courses and country clubs ................................... 71391 10,493 211 293,198 9,471 5,342,534 285,279 350 7Skiing facilities ............................................................ 71392 366 5 32,728 -677 524,683 -17,937 308 -4Marinas ....................................................................... 71393 3,983 55 29,847 1,617 769,000 60,720 495 13Fitness and recreational sports centers ...................... 71394 23,886 831 457,966 9,493 6,516,560 181,827 274 2Bowling centers ........................................................... 71395 4,812 -102 79,176 -453 952,944 17,950 231 5All other amusement and recreation industries ........... 71399 15,287 207 122,188 2,654 1,876,160 32,136 295 -2
Accommodation and food services .................................... 72 539,798 10,690 10,197,329 96,693 142,208,429 4,092,254 268 5
Accommodation ................................................................... 721 61,077 988 1,772,296 -55,025 36,805,629 -264,015 399 9Traveler accommodation ................................................. 7211 52,321 1,041 1,710,078 -54,385 35,773,322 -289,693 402 9
Hotels and motels, except casino hotels ..................... 72111 46,881 990 1,405,390 -47,778 27,536,850 -359,635 377 8Casino hotels .............................................................. 72112 417 5 278,148 -6,503 7,866,940 60,145 544 17Other traveler accommodation .................................... 72119 5,023 45 26,540 -103 369,532 9,796 268 8
Bed-and-breakfast inns .......................................... 721191 3,130 92 16,559 -425 212,499 -1,546 247 5All other traveler accommodation ........................... 721199 1,893 -47 9,981 321 157,033 11,342 303 13
RV parks and recreational camps ................................... 7212 6,468 -9 50,346 -365 852,466 29,363 326 14RV parks and recreational camps ............................... 72121 6,468 -9 50,346 -365 852,466 29,363 326 14
RV parks and campgrounds ................................... 721211 3,855 20 24,003 87 383,113 16,438 307 12Recreational and vacation camps ......................... 721214 2,613 -30 26,344 -451 469,354 12,925 343 15
Rooming and boarding houses ....................................... 7213 2,288 -44 11,872 -275 179,840 -3,684 291 0Food services and drinking places ...................................... 722 478,721 9,703 8,425,033 151,718 105,402,801 4,356,268 241 6
Full-service restaurants ................................................... 7221 184,696 5,270 3,981,716 103,465 53,313,590 2,545,945 257 5Limited-service eating places .......................................... 7222 214,370 5,574 3,543,037 48,183 39,308,503 1,609,490 213 6
Limited-service eating places ...................................... 72221 214,370 5,574 3,543,037 48,183 39,308,503 1,609,490 213 6Limited-service restaurants .................................... 722211 175,671 3,665 3,088,393 25,084 33,802,638 1,238,548 210 6Cafeterias ............................................................... 722212 6,681 186 135,306 4,493 1,812,864 74,965 258 3Snack and nonalcoholic beverage bars .................. 722213 32,018 1,723 319,338 18,606 3,693,001 295,977 222 5
Special food services ...................................................... 7223 26,710 209 512,428 5,269 8,422,206 165,642 316 3Food service contractors ............................................. 72231 14,511 398 358,429 12,354 6,130,710 279,734 329 4Caterers ...................................................................... 72232 11,088 -340 149,118 -7,462 2,220,887 -117,058 286 -1Mobile food services ................................................... 72233 1,112 152 4,881 376 70,609 2,967 278 -11
Drinking places, alcoholic beverages .............................. 7224 52,946 -1,350 387,852 -5,199 4,358,501 35,191 216 4
Other services ................................................................ 1,017,685 41,872 4,246,011 39,666 100,987,088 3,316,583 457 10
Other services, except public administration ..................... 81 1,017,685 41,872 4,246,011 39,666 100,987,088 3,316,583 457 10
Repair and maintenance ..................................................... 811 229,049 520 1,238,075 -11,490 36,092,295 368,299 561 11Automotive repair and maintenance ............................... 8111 167,066 336 897,814 -1,231 23,801,027 498,189 510 12
Automotive mechanical and electrical repair .............. 81111 98,805 -436 410,481 -6,818 11,555,600 78,288 541 12General automotive repair ...................................... 811111 76,884 332 311,023 -1,622 8,694,967 161,247 538 13Automotive exhaust system repair ......................... 811112 4,901 -116 21,757 -1,234 602,432 -26,070 532 6Automotive transmission repair .............................. 811113 6,844 -6 29,139 -1,082 874,423 -14,202 577 12Other automotive mechanical and elec. repair ....... 811118 10,176 -646 48,562 -2,880 1,383,778 -42,687 548 15
Automotive body, interior, and glass repair ................. 81112 43,887 108 264,384 1,234 8,558,928 227,535 623 14Automotive body and interior repair ........................ 811121 37,453 -33 226,789 1,184 7,415,113 211,916 629 15Automotive glass replacement shops ..................... 811122 6,434 141 37,595 50 1,143,815 15,618 585 7
See footnotes at end of table.
50

Table 2. Private industry by 6-digit NAICS industry and government by level of government, 2002 annual averages: Establishments, employment, and wages,change from 2001 — Continued
Industry/Ownership NAICS Code
Averageestablishments
Annual averageemployment
Total annual wages(in thousands)
Averageweekly wage
2002Change
from2001
2002Change
from2001
2002Change
from2001
2002Change
from2001
Other automotive repair and maintenance .................. 81119 24,374 663 222,948 4,352 $3,686,499 $192,366 $318 $11Automotive oil change and lubrication shops ......... 811191 7,055 288 60,751 2,661 1,146,157 100,599 363 17Car washes ............................................................. 811192 14,169 190 143,295 1,546 2,058,757 65,957 276 6All other automotive repair and maintenance ......... 811198 3,150 185 18,902 145 481,586 25,811 490 23
Electronic equipment repair and maintenance ................ 8112 15,966 -12 103,684 -3,301 4,378,776 -93,762 812 8Electronic equipment repair and maintenance ............ 81121 15,966 -12 103,684 -3,301 4,378,776 -93,762 812 8
Consumer electronics repair and maintenance ...... 811211 3,217 -209 15,066 -1,223 432,011 -39,726 551 -6Computer and office machine repair ...................... 811212 6,087 116 45,386 -1,375 1,988,322 -78,956 842 -8Communication equipment repair ........................... 811213 1,817 -38 18,013 -1,736 803,158 -61,773 857 15Other electronic equipment repair .......................... 811219 4,846 120 25,220 1,034 1,155,286 86,693 881 31
Commercial machinery repair and maintenance ............. 8113 25,092 25 154,021 -4,898 5,679,233 -6,961 709 21Household goods repair and maintenance ..................... 8114 20,925 170 82,556 -2,061 2,233,259 -29,168 520 6
Home and garden equip. and appliance repair ........... 81141 5,572 100 28,509 -1,179 943,509 -23,416 636 10Home and garden equipment repair ....................... 811411 1,075 108 3,614 342 104,343 263 555 -57Appliance repair and maintenance ......................... 811412 4,497 -8 24,895 -1,521 839,166 -23,679 648 20
Reupholstery and furniture repair ............................... 81142 5,849 -139 21,775 -1,138 518,430 -23,102 458 4Footwear and leather goods repair ............................. 81143 1,339 -81 3,236 -204 54,922 -3,164 326 1Other household goods repair and maintenance ........ 81149 8,165 289 29,036 460 716,397 20,513 474 6
Personal and laundry services ............................................ 812 177,528 2,102 1,256,066 5,962 24,530,972 502,632 376 6Personal care services .................................................... 8121 92,657 2,228 526,391 21,552 8,723,939 438,269 319 3
Hair, nail, and skin care services ................................ 81211 79,520 1,412 442,930 12,705 7,591,160 363,158 330 7Barber shops .......................................................... 812111 3,270 16 9,686 -28 176,773 365 351 2Beauty salons ......................................................... 812112 68,261 717 409,592 10,964 7,103,292 335,851 334 8Nail salons .............................................................. 812113 7,988 678 23,652 1,769 311,095 26,943 253 3
Other personal care services ...................................... 81219 13,138 817 83,461 8,847 1,132,779 75,111 261 -12Diet and weight reducing centers ........................... 812191 2,589 6 31,961 3,445 438,724 62,700 264 10Other personal care services .................................. 812199 10,549 811 51,500 5,401 694,055 12,411 259 -25
Death care services ........................................................ 8122 18,961 41 140,730 -120 3,975,143 116,672 543 16Funeral homes and funeral services ........................... 81221 13,908 95 103,405 1,575 3,002,031 123,825 558 14Cemeteries and crematories ....................................... 81222 5,052 -55 37,325 -1,695 973,112 -7,152 501 18
Drycleaning and laundry services ................................... 8123 39,928 -397 365,783 -11,475 7,175,356 23,143 377 12Coin-operated laundries and drycleaners ................... 81231 10,221 -239 40,715 -483 572,182 12,124 270 9Drycleaning and laundry services ............................... 81232 26,979 -169 195,869 -6,852 3,066,405 -46,413 301 6Linen and uniform supply ............................................ 81233 2,728 11 129,198 -4,141 3,536,769 57,432 526 24
Linen supply ........................................................... 812331 1,601 -5 74,105 -1,851 1,938,826 24,697 503 18Industrial launderers ............................................... 812332 1,127 15 55,093 -2,290 1,597,942 32,735 558 33
Other personal services .................................................. 8129 25,983 231 223,162 -3,994 4,656,535 -75,453 401 0Pet care, except veterinary, services .......................... 81291 8,182 513 35,411 2,067 545,053 25,382 296 -4Photofinishing ............................................................. 81292 4,885 -770 54,123 -7,755 1,424,586 -163,874 506 12
Photofinishing laboratories, except one-hour ......... 812921 2,905 -366 42,896 -5,462 1,212,920 -127,521 544 11One-hour photofinishing ......................................... 812922 1,980 -405 11,228 -2,292 211,666 -36,354 363 10
Parking lots and garages ............................................ 81293 5,892 96 97,718 2,503 1,766,081 93,767 348 10All other personal services .......................................... 81299 7,025 392 35,911 -809 920,814 -30,727 493 -5
Membership associations and organizations ....................... 813 130,892 1,747 1,298,569 25,582 33,806,387 1,918,385 501 19Religious organizations ................................................... 8131 17,996 706 166,785 7,573 3,311,106 262,783 382 14Grantmaking and giving services .................................... 8132 11,210 270 125,198 1,636 4,602,755 294,446 707 36
Grantmaking and giving services ................................ 81321 11,210 270 125,198 1,636 4,602,755 294,446 707 36Grantmaking foundations ....................................... 813211 4,738 342 44,396 2,316 1,852,235 187,318 802 41Voluntary health organizations ............................... 813212 2,799 -34 37,295 -500 1,318,150 63,755 680 42Other grantmaking and giving services .................. 813219 3,673 -38 43,508 -179 1,432,371 43,373 633 22
Social advocacy organizations ........................................ 8133 14,004 653 158,580 4,719 4,347,118 374,632 527 30Social advocacy organizations .................................... 81331 14,004 653 158,580 4,719 4,347,118 374,632 527 30
Human rights organizations .................................... 813311 3,281 102 43,282 1,326 1,185,290 72,295 527 17
See footnotes at end of table.
51

Table 2. Private industry by 6-digit NAICS industry and government by level of government, 2002 annual averages: Establishments, employment, and wages,change from 2001 — Continued
Industry/Ownership NAICS Code
Averageestablishments
Annual averageemployment
Total annual wages(in thousands)
Averageweekly wage
2002Change
from2001
2002Change
from2001
2002Change
from2001
2002Change
from2001
Environment and conservation organizations ......... 813312 3,143 229 30,235 2,244 $821,763 $89,748 $523 $20Other social advocacy organizations ...................... 813319 7,580 322 85,063 1,149 2,340,065 212,590 529 41
Civic and social organizations ......................................... 8134 29,830 -321 419,690 8,011 6,059,991 213,129 278 5Professional and similar organizations ....................... 8139 57,853 439 428,317 3,645 15,485,417 773,394 695 29Business associations ................................................. 81391 19,099 142 119,146 -2,086 5,632,034 163,718 909 42Professional organizations .......................................... 81392 6,166 248 72,333 2,626 3,697,591 214,892 983 22Labor unions and similar labor organizations ............. 81393 16,255 -292 141,300 -921 3,721,212 149,474 506 23Political organizations ................................................. 81394 2,043 307 9,395 3,529 316,572 114,241 648 -15Other similar organizations ......................................... 81399 14,290 33 86,143 497 2,118,007 131,068 473 27
Private households .............................................................. 814 480,216 37,503 453,302 19,612 6,557,435 527,267 278 11
Total government ....................................... 261,969 2,404 20,656,638 325,640 783,607,715 40,534,747 730 27
Federal ............................................................... 50,755 -238 2,758,627 6,008 143,587,523 8,873,680 1,001 60
State .................................................................. 64,447 -136 4,485,071 32,834 175,866,492 7,508,160 754 27
Local .................................................................. 146,767 2,778 13,412,941 286,798 464,153,701 24,152,907 665 20
1 Includes data for unclassified establishments, not shown separately.
2 Most railroad employees are covered by unemployment programs under the Railroad Retirement Act andthus are not included in this bulletin.
NOTE: Data are final. Detail may not add to total due to rounding.
52
Copyright © 2022 FDOKUMEN