PRISM TOOLKIT FOR EVALUATING THE OUTCOMES AND ...
404
Dickson, I. M., Butchart, S. H. M., Dauncey, V., Hughes, J., Jefferson, R., Merriman, J. C., Munroe, R., Pearce-Higgins, J. P., Stephenson, P. J., Sutherland, W. J., Thomas, D. H. L., & Trevelyan, R., (2017) PRISM – Toolkit for evaluating the outcomes and impacts of small/medium-sized conservation projects. Version 1. Available from www.conservationevaluation.org PRISM TOOLKIT FOR EVALUATING THE OUTCOMES AND IMPACTS OF SMALL/MEDIUM-SIZED CONSERVATION PROJECTS
-
Upload
khangminh22 -
Category
Documents
-
view
0 -
download
0
Transcript of PRISM TOOLKIT FOR EVALUATING THE OUTCOMES AND ...

Dickson, I. M., Butchart, S. H. M., Dauncey, V., Hughes, J., Jefferson, R., Merriman, J. C.,
Munroe, R., Pearce-Higgins, J. P., Stephenson, P. J., Sutherland, W. J.,
Thomas, D. H. L., & Trevelyan, R., (2017) PRISM – Toolkit for evaluating the outcomes
and impacts of small/medium-sized conservation projects. Version 1. Available
from www.conservationevaluation.org
PRISM
TOOLKIT FOR EVALUATING
THE OUTCOMES AND IMPACTS
OF SMALL/MEDIUM-SIZED
CONSERVATION
PROJECTS

0:2
Dickson, I. M., Butchart, S. H. M., Dauncey, V., Hughes, J., Jefferson, R., Merriman, J. C.,
Munroe, R., Pearce-Higgins, J. P., Stephenson, P. J., Sutherland, W. J.,
Thomas, D. H. L., & Trevelyan, R., (2017) PRISM – Toolkit for evaluating the outcomes
and impacts of small/medium-sized conservation projects. Version 1. Available
from www.conservationevaluation.org
Users can reproduce content based on the information in this
toolkit for non-commercial purposes, so long as appropriate credit
is given (see front cover for suggested citation). The exceptions
to this are materials that have been reproduced/adapted from
other sources, in these cases the necessary permissions should be
sought from the original source.
TERMS OF USE PRISM
TOOLKIT FOR EVALUATING
THE OUTCOMES AND IMPACTS
OF SMALL/MEDIUM-SIZED
CONSERVATION
PROJECTS

INTRODUCTION & KEY CONCEPTS
DESIGNING & IMPLEMENTING THE EVALUATION
PRISM MODULES
METHOD FACTSHEETS & ANNEXES
PRISM - TOOLKIT FOR EVALUATING THE OUTCOMES AND IMPACTS OF SMALL/MEDIUM-SIZED CONSERVATION PROJECTS3
Acknowledgements:
Principal Authors:
Iain Dickson (Birdlife International)
Stuart Butchart (BirdLife International)
Victoria Dauncey (Fauna and Flora International)
Joelene Hughes (Royal Society for the Protection of Birds)
Rebecca Jefferson (Royal Society for the Protection of Birds)
Jenny Merriman (BirdLife International)
Robert Munroe (UNEP-WCMC)
James Pearce Higgins (British Trust for Ornithology)
David Thomas (BirdLife International)
PJ Stephenson (WWF International)
Bill Sutherland (University of Cambridge/Conservation Evidence)
Rosie Trevelyan (Tropical Biology Association)
PRISM has been developed by:
Reviewers/Contributing Authors:
Tris Allinson , Helen Anthem, Tomos Avent, Will Beale, Hannah Becker,
Rick Davies, Abigail Entwistle, Kay Farmer, Tiburtius Hani, Nicolas Heard,
Mike Hoffmann, Lisa M Howes, Julia Jones, Nigel Leader-Williams,
Katie Lee Brooks, Nina Marshall, Simon Mickleburgh, Kiragu Mwangi,
Nisha Owen, Victoria Price, Dave Pritchard, Dilys Roe, Roger Safford,
Nick Salafsky, Chris Sandbrook, Sarah Thomas, David Wallis, Emily
Woodhouse, Claire Wordley.
Particular thanks also to the Zoological Society of London (ZSL), the
Rufford Foundation, the Conservation Leadership Programme (CLP),
participants of the PRISM expert workshop, held in April 2016, the
students from the University of Cambridge MPhil in conservation
leadership (2016/17) and all others involved in field-testing methods,
reviewing drafts and providing additional content.
With Financial support from:
0:3

INTRODUCTION & KEY CONCEPTS
DESIGNING & IMPLEMENTING THE EVALUATION
PRISM MODULES
METHOD FACTSHEETS & ANNEXES
PRISM - TOOLKIT FOR EVALUATING THE OUTCOMES AND IMPACTS OF SMALL/MEDIUM-SIZED CONSERVATION PROJECTS4
This toolkit is divided into three main sections:
Section 1 introduces the toolkit and outlines some of the
key concepts relating to evaluation of outcomes
and impacts that are likely to be relevant to small/
medium-sized conservation projects.
Section 2 is designed to guide you through a step-by-step
process for evaluating project outcomes and
impacts.
Section 3 provides detailed guidance and methods to
measure outcomes and impacts relating to each of
PRISM’s five thematic modules, each one covering
a different category of conservation action.
Icons have been used throughout the PRISM Toolkit to
aid navigation. Solid colour icons indicate active
page content and greyed out indicates an inactive
state. The Contents icon is active throughout.
Sections 1 & 2 should be read before the information in Section 3.
However, we are aware that some users will already have a good
idea of what they want to evaluate and will be seeking guidance
on specific evaluation needs for certain actions. Where this is the
case, users are able to go directly to the appropriate module of
Section 3 to identify suitable methods. In the interactive version of
this toolkit, you can use the relevant hyperlinks to navigate to the
relevant pages.
Methods are laid out in a factsheet format. The factsheets include
general methods (applicable to all modules) and methods that
are specific to a particular module. Factsheets are included in the
annexes and via hyperlinks within the interactive version of the
toolkit.
Whilst trying to make this resource as generically applicable as
possible, we recognise that the guidance and methods may need to
be adapted to specific projects and/or local context.
For ease of use we would highly recommend adding the “previous
view” button to your PDF viewer. In Adobe Acrobat you can do
this by right clicking on the toolbar, select page navigation tools
and make sure that there is a tick next to “previous view”. This
will add a back button to the toolbar. Pressing alt+right arrow
provides the same function.
OVERVIEW
0:4
Required steps
Contents Examplesare shown
Tipsavailable
Checkliststo complete
Downloadsavailable
Availableas Excel

INTRODUCTION & KEY CONCEPTS
DESIGNING & IMPLEMENTING THE EVALUATION
PRISM MODULES
METHOD FACTSHEETS & ANNEXES
PRISM - TOOLKIT FOR EVALUATING THE OUTCOMES AND IMPACTS OF SMALL/MEDIUM-SIZED CONSERVATION PROJECTS5
DECISION TREE
0:5
Go to STEP 2: Whatdata do you need to collect?
PRISM Modules
Go to STEP 1: What do you need to know?
YES
YES
YES
YES
NO
NO
NO
NO
NO
I understand the theory behindevaluating project outcomes/
impacts and why it is important
I know what I need to evaluate
I have already collectedmy evaluation data
I have analysed my evaluationdata and interpreted the results
I have my evaluationresults and I know how they
should be applied
Go to Introduction & Key Concepts
&
Go to STEP 3: What can you learn from the results?
Go to STEP 4: What should be done next?

INTRODUCTION & KEY CONCEPTS
DESIGNING & IMPLEMENTING THE EVALUATION
PRISM MODULES
METHOD FACTSHEETS & ANNEXES
PRISM - TOOLKIT FOR EVALUATING THE OUTCOMES AND IMPACTS OF SMALL/MEDIUM-SIZED CONSERVATION PROJECTS6
Section 1 Introduction and Key Concepts
What is this toolkit for?
Who can use this toolkit?
When to use this toolkit
What do we mean by evaluation?
What do we mean by outcomes and impacts?
Why focus on outcomes & impacts?
Does the project’s design allow for evaluation of
outcomes/impacts?
Unintended outcomes & impacts
Was the change recorded caused by the project?
Be realistic and focus on interpreting, rather than
just presenting results
Tips for effective evaluation in small/medium-sized
projects
Section 2 Step by step guide for evaluating project
outcomes and impacts
How to use this toolkit to evaluate your project’s
outcomes and impacts
STEP 1 What do you need to know?
What is the project trying to achieve?
Why do you want to evaluate?
What questions do you need to answer?
STEP 2 What data do you need to collect?
How will you know which outcomes/impacts can
be attributed to the project?
How will you collect evaluation data?
STEP 3 What can you learn from the results?
How will you analyse your data?
What do the results show?
STEP 4 What should be done next?
How will you use the evaluation results?
CONTENTS
0:6

INTRODUCTION & KEY CONCEPTS
DESIGNING & IMPLEMENTING THE EVALUATION
PRISM MODULES
METHOD FACTSHEETS & ANNEXES
PRISM - TOOLKIT FOR EVALUATING THE OUTCOMES AND IMPACTS OF SMALL/MEDIUM-SIZED CONSERVATION PROJECTS7
Section 3 Thematic Modules
Attitudes & Awareness
Capacity Development
Livelihoods & Governance
Policy
Species & Habitat Management
Method Factsheets and Annexes
General Method Factsheets
Completing a Theory of Change
Identifying why you want to evaluate
Evaluation feasibility checklist
Completing a prioritisation matrix
Completing an evaluation plan
Developing ethical protocols for an evaluation
Developing gender protocols for an evaluation
Entering, organising and cleaning data
Analysing quantitative data
Analysing qualitative data
Evaluation report template
Evaluating outcomes and impacts of projects aiming to maintain or increase the values of ecosystem services
Questionnaires
Key informant interviews
Focus groups
Direct observation
Documentary evidence
CONTENTS
0:7

INTRODUCTION & KEY CONCEPTS
DESIGNING & IMPLEMENTING THE EVALUATION
PRISM MODULES
METHOD FACTSHEETS & ANNEXES
PRISM - TOOLKIT FOR EVALUATING THE OUTCOMES AND IMPACTS OF SMALL/MEDIUM-SIZED CONSERVATION PROJECTS8
Evaluation Design Factsheets
Participatory Impact Assessment
Interviewing key informants
Theory-based designs
Matching designs
Before and after designs
Decision tree for selecting an evaluation design
Attitudes & Awareness Factsheets and Annexes
Sample questions and scales for evaluating attitudes and
awareness actions
Planning a successful attitudes/awareness action
Capacity Development Factsheets and Annexes
Training evaluation form: example questions and scales
Organisational Capacity Assessment tool
Network health scorecard
Livelihoods & Governance Factsheets and Annexes
Participatory Impact Assessment (PIA)
o PIA Method 1: Before and after scoring
o PIA Method 2: Proportional piling
o PIA Method 3: Tally method
o PIA Method 4: Matrix scoring
o PIA Method 5: Before and after impact calendars
Community-based Organisational Capacity Assessment
Community mapping
Basic Necessities Survey (BNS)
Participatory Governance Assessment
Questions for assessment meeting
Governance Assessment scoring sheet
CONTENTS
0:8

INTRODUCTION & KEY CONCEPTS
DESIGNING & IMPLEMENTING THE EVALUATION
PRISM MODULES
METHOD FACTSHEETS & ANNEXES
PRISM - TOOLKIT FOR EVALUATING THE OUTCOMES AND IMPACTS OF SMALL/MEDIUM-SIZED CONSERVATION PROJECTS9
Policy Factsheets and Annexes
Media tracking
Media scorecards
Observation checklist for documenting meetings
Policymaker ratings
Bellwether methodology
Civil society tracking tool
Species & Habitat Management Factsheets and Annexes
Scorecard for evaluating knowledge gaps
Scorecard for degree of completion of an action plan
Scorecard for adequacy of an action plan
Threat reduction scoring
Scorecard for evaluating changes in species status
Scorecard for evaluating changes in habitat status
Field surveys for evaluating changes in species’ status
Remote assessment methods for evaluating changes in
habitat status
Field assessment methods for evaluating changes in habitat
status
Field methods for species monitoring
Sampling approaches for evaluating changes in species status
Analytical issues when estimating abundance, distribution,
survival and reproduction
Sampling approaches for habitat monitoring
Glossary
CONTENTS
0:9

PRISM - TOOLKIT FOR EVALUATING THE OUTCOMES AND IMPACTS OF SMALL/MEDIUM-SIZED CONSERVATION PROJECTS10
SECTION 1 INTRODUCTION &KEY CONCEPTS
PRISM - TOOLKIT FOR EVALUATING THE OUTCOMES & IMPACTS OF SMALL/MEDIUM-SIZED CONSERVATION PROJECTS
1:0

INTRODUCTION & KEY CONCEPTS
DESIGNING & IMPLEMENTING THE EVALUATION
PRISM MODULES
METHOD FACTSHEETS & ANNEXES
PRISM - TOOLKIT FOR EVALUATING THE OUTCOMES AND IMPACTS OF SMALL/MEDIUM-SIZED CONSERVATION PROJECTS11
CONTENTS SECTION 1
Section 1 Introduction and Key Concepts
What is this toolkit for?
Who can use this toolkit?
When to use this toolkit
What do we mean by evaluation?
What do we mean by outcomes and impacts?
Why focus on outcomes & impacts?
Does the project’s design allow for evaluation of
outcomes/impacts?
Unintended outcomes & impacts
Was the change recorded caused by the project?
Be realistic and focus on interpreting, rather than
just presenting results
Tips for effective evaluation in small/medium-sized
projects
This section introduces the toolkit and outlines some of the key
concepts relating to evaluation of outcomes and impacts that are
likely to be relevant to small/medium-sized conservation projects.
1:0

INTRODUCTION & KEY CONCEPTS
DESIGNING & IMPLEMENTING THE EVALUATION
PRISM MODULES
METHOD FACTSHEETS & ANNEXES
PRISM - TOOLKIT FOR EVALUATING THE OUTCOMES AND IMPACTS OF SMALL/MEDIUM-SIZED CONSERVATION PROJECTS12
What is this toolkit for?
Conservationists are increasingly looking to improve the ways in
which they evaluate the outcomes and impacts of their work. Good
evaluation practice is essential for demonstrating achievements,
avoiding wasted effort and modifying projects to improve delivery.
In addition, sharing evidence of what works and what doesn’t
allows other conservationists to learn from experience, make
decisions and design projects and actions that are better informed
by available evidence.
Existing monitoring frameworks used by small to medium sized
conservation projects often focus on how well the project has
delivered on actions and outputs (what the project has done);
however, these do not always effectively evaluate the outcomes
and impacts of these actions (the short, medium and long
term changes brought about by the project). Equally, it is often
extremely challenging for smaller projects to establish their
long-term conservation impact, as this may take years to become
measurable.
This toolkit aims to help practitioners overcome these challenges
by describing some of the practical approaches and methods
that can be used to evaluate the outcomes and impacts of small/
medium-sized conservation projects. Overall, PRISM aims to help
practitioners to go beyond only measuring actions & outputs, and
to begin to evaluate outcomes & impacts, in a way that promotes
learning, while still remaining within the capacity and resource
limits of the project team.
SPECIFICALLY, THIS TOOLKIT IS DESIGNED TO HELP
YOU ANSWER THE FOLLOWING QUESTIONS:
What do you need to know?
Identify which of the project’s outcomes/impacts to focus
on in an evaluation, and the questions you will try to
answer
What data to you need to collect?
Design your data collection and select appropriate
methods that will provide you with the data you need to
answer your evaluation questions
What can you learn from the results?
Examine your data to provide answers to your evaluation
questions, determine what lessons can be learnt and
what the results mean in relation to the overall aim of the
project
What should be done next?
Apply results to improve practice and share results the
wider conservation community
WHAT IS THIS TOOLKIT FOR?
1:1

INTRODUCTION & KEY CONCEPTS
DESIGNING & IMPLEMENTING THE EVALUATION
PRISM MODULES
METHOD FACTSHEETS & ANNEXES
PRISM - TOOLKIT FOR EVALUATING THE OUTCOMES AND IMPACTS OF SMALL/MEDIUM-SIZED CONSERVATION PROJECTS13
Who can use this toolkit?
This toolkit has been designed primarily for use by practitioners
carrying outsmall/medium-sized conservation projects and those
who work to support these projects. Many evaluation methods
require considerable investment in time and resources, making
them unsuitable for small/medium-sized projects. This toolkit
focuses instead on some of the methods and approaches that are
more relevant for smaller projects.
There is no set definition for a small/medium-sized project. As a
rough guide this toolkit has been designed to apply to projects with
some or all of the characteristics listed below (although much of
the guidance it contains will be appropriate for other projects too).
• Budget between $5,000 - $100,000
• Short timeframe (<5 years)
• Small project team, often with limited capacity in
relation to evaluation
• Limited resources available for evaluation
• Projects taking place in complex environments, where
it can be difficult to separate project outcomes and
impacts from other factors.
There is also no set requirement for how much a small/medium-
sized project should evaluate. For some projects minimal
evaluation of specific actions may be sufficient, whereas others
would be better off investing considerable time and resources in
understanding some of the specific change(s) brought about by the
project.
A key point to remember is that small/medium-sized projects
should not expect, or be expected to carry out a full and
comprehensive evaluation of all their outcomes and impacts.
How you evaluate will depend on your time, your budget and
on what you and your audience need to know. This toolkit is
designed to help you develop and carry out an appropriate
evaluation based on these criteria – including careful
consideration of the project and its design, identification
of the key elements to be evaluated and selection of
appropriate methods for collecting the information needed.
WHO CAN USE THIS
TOOLKIT?
1:2
Photo credit: Iain Dickson

INTRODUCTION & KEY CONCEPTS
DESIGNING & IMPLEMENTING THE EVALUATION
PRISM MODULES
METHOD FACTSHEETS & ANNEXES
PRISM - TOOLKIT FOR EVALUATING THE OUTCOMES AND IMPACTS OF SMALL/MEDIUM-SIZED CONSERVATION PROJECTS14
When to use this toolkit
It is useful to think of conservation action as a cyclical process,
where learning and experience is captured and used to inform
future decision making. Evaluating your project’s outcomes and
impacts allows you to complete the cycle by looking at what
difference the project has made, what the key lessons are and
what actions should be taken next. Above all, evaluation should
not be seen as a standalone activity - instead it should be seen as
an essential component which allows you to complete the project
cycle.
In an ideal world, all projects would build in evaluation from the
start. We recognise however that many users may be picking
up this toolkit mid-way through a project, towards the end of a
project or after the project has ended. If this is the case, then the
recommended steps (see Section 2) are still the same, although
note that assessments can be more challenging if evaluation is not
built into the project from the start (note also that some methods
will only apply to projects that have considered evaluation at the
outset).
WHEN TO USE THIS TOOLKIT
Capture results,learn and share
experience
Planproject
Implementproject
Capture results,learn and share
experience
Planproject
Implementproject
Capture results,learn and share
experience
Planproject
Implementproject
Capture results,learn and share
experience
Planproject
Implementproject
FIGURE 1: CONSERVATION PROJECT CYCLE
POINTS IN THE PROJECT CYCLE
Plan project
Implement project
Capture results, learn & share
experience
USE THIS TOOLKIT TO
Identify the key outcomes/
impacts to evaluate and how
data will be collected
Collect the data required
Decide how to analyse, interpret,
learn from and communicate
results
THIS TOOLKIT CAN BE USED AT THE FOLLOWING
POINTS IN THE PROJECT CYCLE:
1:3

INTRODUCTION & KEY CONCEPTS
DESIGNING & IMPLEMENTING THE EVALUATION
PRISM MODULES
METHOD FACTSHEETS & ANNEXES
PRISM - TOOLKIT FOR EVALUATING THE OUTCOMES AND IMPACTS OF SMALL/MEDIUM-SIZED CONSERVATION PROJECTS15
What do we mean by evaluation?
Evaluation involves looking at a project, or specific elements of
a project, to understand what difference it has made and what
lessons have been learnt. Evaluation can look at a project of any
size and at any stage; however this toolkit is specifically concerned
with how to evaluate the outcomes and impacts of small/medium-
sized conservation projects.
Evaluating project outcomes and impacts is not just about
measuring “success”. It is about measuring change - which can
be positive or negative, intended or unintended (see Figure 4).
This change can be brought about by a single project action or a
number of different actions.
What about monitoring and learning?
The term monitoring is often used alongside evaluation (often as
a single phrase – Monitoring & Evaluation or M&E). Increasingly
organisations also include learning (Monitoring, Evaluation &
Learning or MEL).
Rather than treating these elements separately, it is often useful
to view them as parts of the same process: monitoring refers to
the collection of data over the course of the project, evaluation is
when you examine this data to make a judgement about an aspect
of the project, and learning is when you use these judgements to
make decisions about what could or should be done next.
Evaluation needs relevant data. That said, collecting data without
a purpose in view (making judgements, applying results) is a waste
of time and resources that could be used elsewhere in the project.
In order to ensure that you are making the best use of your time
and resources it is usually necessary to include a step before you
begin collecting data, where you consider what questions need
to be answered, and use these to guide your data collection, your
interpretation of results and your application of those results.
This toolkit is designed to help you design and implement an
evaluation to reflect this process:
STEP 1 Start by identifying what you need to evaluate,
consider the project’s design and identify the
questions that you need to answer.
STEP 2 The questions from Step 1 then inform what data
you need to collect, when they will need to be
collected and the methods you will use.
STEP 3 These data then inform your interpretation of
the results and the judgements you make when
answering your questions.
STEP 4 The judgements in Step 3 are then used to develop
recommendations, inform practice and share
results.
WHAT DO WE MEAN BY
EVALUATION?
1:4

INTRODUCTION & KEY CONCEPTS
DESIGNING & IMPLEMENTING THE EVALUATION
PRISM MODULES
METHOD FACTSHEETS & ANNEXES
PRISM - TOOLKIT FOR EVALUATING THE OUTCOMES AND IMPACTS OF SMALL/MEDIUM-SIZED CONSERVATION PROJECTS16
What do we mean by outcomes and impacts?
When planning to evaluate a conservation project it is useful to
think of the project as a series of different stages. Throughout this
toolkit we use the following definitions and framework as shown in
Figure 21 to refer to these stages.
Actions – What the project does to bring about change. For
example conducting biodiversity surveys, training workshops,
education/outreach campaigns.
Outputs – What is produced by the project’s actions. These are
usually measured in terms of quantity and quality of delivery, for
example the number of reports produced from survey data or the
number of individuals trained.
Outcomes – The change(s) brought about by the project’s actions.
For a conservation project these can be further divided into:
• Intermediate outcomes which show progress towards
subsequent outcomes/impacts (see Figure 2);
• Threat reduction outcomes which represent the final
change(s) that need to happen in order to impact a
conservation target (see Figure 2).
Impacts – The long-term, lasting change(s) brought about by the
project’s actions. For conservation projects these typically relate
to changes in the status of species and/or habitats.
Assumptions – The links between each of the stages above are
underpinned by assumptions. For example a project focused on
training park rangers to carry out anti-poaching patrols makes
the assumption that training park guards will result in more
effective patrols. A project will also make assumptions about
external factors that the project does not have control over, but
that may influence the project’s results if they do not remain true.
For example, in order for training to be successful, park rangers
need to have sufficient resources to carry out their work (e.g.
equipment, salary). These kind of assumptions are particularly
important for a small/medium-sized project to consider, as there
will often be a large number of factors that could influence the
project’s outcomes/impacts and they will form an integral part of
the story you will use to explain and contextualise your results.
Are these definitions always used in the same way?
Different organisations may use different terminology when they
mean the same thing. For example “actions” may be referred to as
“activities” or “interventions”, “outcomes” may be referred to as
“results” or “intermediate results”, and “impacts” may be referred to
as “goals”, “aims” or “ultimate outcomes”. We would encourage you
not to spend too much time focusing on any differences between
the terms used in PRISM and those used in other frameworks.
What is most important is that you understand what the terms
given above represent, and that you are able to relate them to your
own project.
Please refer to the Glossary for a list of key terms and definitions
used in PRISM.
WHAT DO WE MEAN BY
OUTCOMES AND IMPACTS?
1Colours, shapes and wordings in the boxes are designed to reflect those used by the
Conservation Measures Partnership http://www.conservationmeasures.org/ and the Miradi
Conservation Planning software www.miradi.org/ .
1:5

INTRODUCTION & KEY CONCEPTS
DESIGNING & IMPLEMENTING THE EVALUATION
PRISM MODULES
METHOD FACTSHEETS & ANNEXES
PRISM - TOOLKIT FOR EVALUATING THE OUTCOMES AND IMPACTS OF SMALL/MEDIUM-SIZED CONSERVATION PROJECTS17
WHAT DO WE MEAN BY
OUTCOMES AND IMPACTS?
FIGURE 2: DEFINITIONS OF PROJECT STAGES (ACTIONS,
OUTPUTS, INTERMEDIATE OUTCOMES, THREAT
REDUCTION OUTCOMES AND IMPACTS) USED IN PRISM.
Threat reductionoutcome
Impact onbiodoversity
Action
Examples
Biodiversity surveysTraining workshops
Education/Outreachcampaigns
Advocating for changes in policy
Examples
# of reports producedfrom survey data
# number of individualstrained
Examples
Information in reportsused to inform decision making
Individuals trained applynew skills to conservation
target
Examples
Decrease in poaching due toeducation campaign
Predation of native specieseliminated after eradication of
invasive predators
Examples
Species populationincreases
Habitat status of targetedsites improves
Assumptions
ExamplesPolitical events do not
affect fieldworkWeather conditions
remain constantLocal commodity prices
Outputs Intermediateoutcome
Poachingdecreases
Hunted speciespopulationincreases
Training park guards
to conduct anti-poaching
patrols
Assumptions
Park guards have adequate resources to carry out their workPark guards are able to access the areas needed to patrol
Hunted species populations do not decrease due to disease or other external factors
Simplified example of conservation action and resulting outcomes, impacts and assumptions
Trainingprovided to 24
park guards
Park guardsconduct more
effective patrols
More effectivepatrols deter
poachers
ActionsImpact on Biodiversity
Intermediateoutcomes
Threat reduction outcomesOutputs
1:5

INTRODUCTION & KEY CONCEPTS
DESIGNING & IMPLEMENTING THE EVALUATION
PRISM MODULES
METHOD FACTSHEETS & ANNEXES
PRISM - TOOLKIT FOR EVALUATING THE OUTCOMES AND IMPACTS OF SMALL/MEDIUM-SIZED CONSERVATION PROJECTS18
Why focus on outcomes & impacts?
Project reporting often requires information relating to
actions and outputs to assess whether you have done
what you planned. These measures are useful for tracking
project progress and delivery, but they do not effectively
demonstrate what difference the project has made (see
Figure 3). The latter requires information on what has
changed as a result of the project (its outcomes & impacts).
However while actions and outputs are events that
are under our control and thus somewhat predictable,
outcomes and impacts are not, which can make measuring
these changes more challenging.
Why not just focus on impacts?
Ideally every project would evaluate its impacts (see
Figure 3) as these provide the most reliable measure of
the project’s success. However in practice, impacts can
sometimes be challenging to evaluate, for example some
conservation impacts may not become measurable until
after the project has finished while others may be too
costly to measure with the resources available. In these
cases outcomes – shorter-term changes resulting from the
project – can be used to indicate the likelihood of future
impacts. There is a trade-off involved, in the sense that
the further away from impacts you measure, the more
challenging it is to be certain about the conclusions you are
reaching. Effective evaluation therefore requires a balance
between trying to obtain the most useful results and
tackling questions that are feasible to measure.
WHY FOCUS ON OUTCOMES &
IMPACTS?
FIGURE 3: Links between project stages, typical ease
of measurement vs utility as a predictor of impact, and
the stages that PRISM’s guidance and methods focus
on (adapted from USFWS (2014) Standard Measures of
Effectiveness and Threats for Wildlife Conservation in
Central Africa, Version 1.0).
ACTIONS
OUTPUTS
INTERMEDIATEOUTCOMES
THREAT REDUCTIONOUTCOMES
IMPACT
Focus of PRISM methods
Stro
ng
Wea
k
Simple Challenging
Ease of measurement
Pre
dic
tor
of i
mpa
ct
Number of trainingworkshops
Number of park guards trained
Trained park guards applynew skills to conduct more effective patrols
More effective patrols result in decreased poaching
Population of huntedspecies increases
ActionsImpact on Biodiversity
Intermediateoutcomes
Threat reduction outcomesOutputs
1:6

INTRODUCTION & KEY CONCEPTS
DESIGNING & IMPLEMENTING THE EVALUATION
PRISM MODULES
METHOD FACTSHEETS & ANNEXES
PRISM - TOOLKIT FOR EVALUATING THE OUTCOMES AND IMPACTS OF SMALL/MEDIUM-SIZED CONSERVATION PROJECTS19
EXAMPLE
Example: A project is aiming to reduce chimpanzee poaching
by providing training to park rangers to conduct more effective
patrols. The desired impact is to see an increase in the number
of chimps. However, since chimps reproduce relatively slowly,
this is not measurable within the project’s lifetime. Equally,
simply counting how many rangers were trained does not
indicate whether the training has made patrols more effective.
Instead, it might be best to evaluate whether better patrolling
resulted in a decrease in the number of snares being set (the
main cause of chimp mortality), compared to other areas,
or to the number of snares present before training. In time,
a reduction in the number of snares might be expected to
contribute to decreased mortality and thus to an increase in
chimp numbers.
WHY FOCUS ON OUTCOMES &
IMPACTS?
1:6
Photo credit: Emily Wroblewski (Stanford University)

INTRODUCTION & KEY CONCEPTS
DESIGNING & IMPLEMENTING THE EVALUATION
PRISM MODULES
METHOD FACTSHEETS & ANNEXES
PRISM - TOOLKIT FOR EVALUATING THE OUTCOMES AND IMPACTS OF SMALL/MEDIUM-SIZED CONSERVATION PROJECTS20
Does the project’s design allow for evaluation of outcomes/
impacts?
Whether or not you can effectively evaluate your project’s
outcomes/impacts will often depend on whether the project
has a clear and logical design2. This should be based on a good
understanding of both the conservation issue being addressed and
how the project’s actions could be expected to bring about the
intended conservation impacts.
Another way of framing this is to ask the question “why do you
think this project will work?”
For example, the design of the chimpanzee project outlined in the
previous section could be illustrated like this:
If the project has a clear and logical design this makes it much more
straightforward to come up with clear questions and hypotheses
that can be tested during the evaluation, and allows you to make
effective judgements on the project’s success and lessons learnt.
For example:
Project design: If the project can decrease poaching by
training park guards, then chimpanzee
populations should recover
Questions: Did training help park guards to prevent
poaching from occurring?
Did chimpanzee populations recover?
Equally if the project design lacks a clear rationale this makes it
extremely challenging to identify which aspects of the project
should be evaluated and to make any kind of judgement on
whether or not the project has been a success.
DOES THE PROJECT’S
DESIGN ALLOW FOR EVALUATION
OF OUTCOMES/IMPACTS?
2Although good project design is crucial for effective evaluation, please note that PRISM is
not a resource for designing a conservation project or project actions. Instead this toolkit is
focused on how to evaluate project outcomes & impacts. Several excellent resources exist for
designing and implementing conservation actions. The Open Standards for the Practise of
Conservation: cmp-openstandards.org/ is one of the most useful and widely applied of these.
Train park guards to
conduct anti-poaching
patrols
Park guards will conduct more
effective patrols
More effectivepatrols will
deter hunters
Poaching willdecrease
Increase inchimpanzeepopulation
If we then then then resultingin
ActionsImpact on Biodiversity
Intermediateoutcomes
Threat reduction outcomesOutputs
1:7
INTRODUCTION & KEY CONCEPTS
DESIGNING & IMPLEMENTING THE EVALUATION
PRISM MODULES
METHOD FACTSHEETS & ANNEXES
PRISM - TOOLKIT FOR EVALUATING THE OUTCOMES AND IMPACTS OF SMALL/MEDIUM-SIZED CONSERVATION PROJECTS21
DOES THE PROJECT’S
DESIGN ALLOW FOR EVALUATION
OF OUTCOMES/IMPACTS?
EXAMPLE: CONSIDER THE
FOLLOWING TWO PROJECTS:
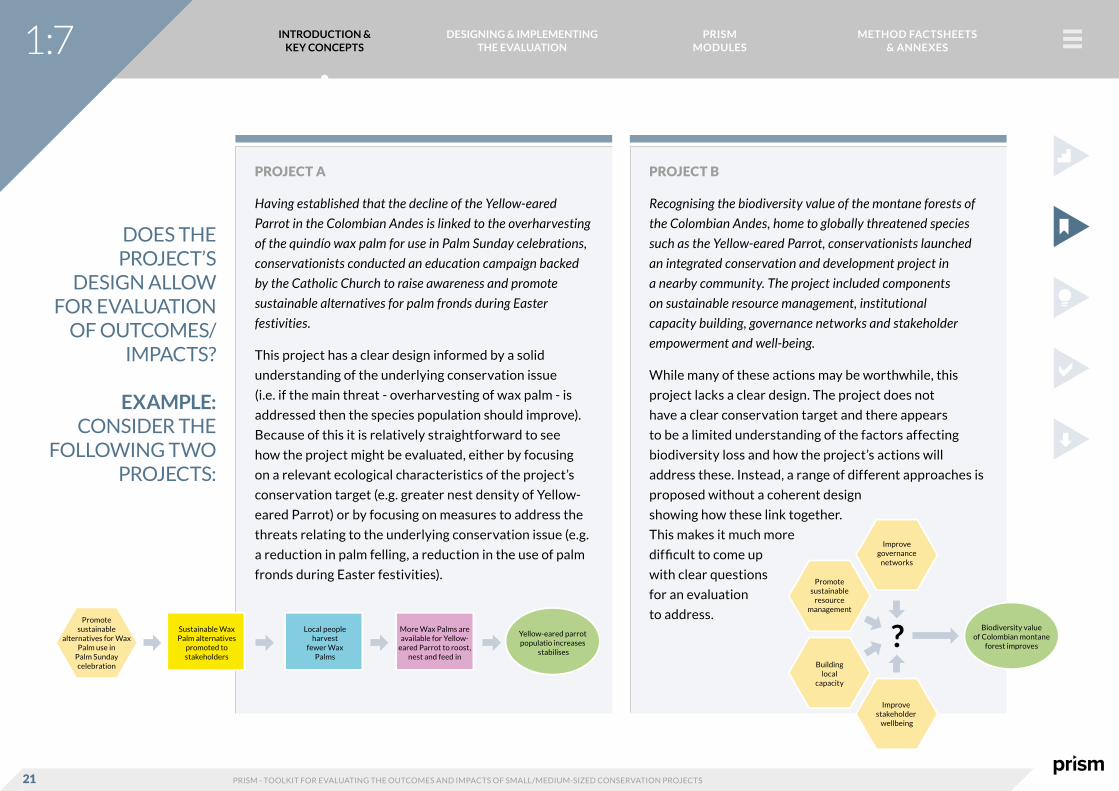
PROJECT A
Having established that the decline of the Yellow-eared
Parrot in the Colombian Andes is linked to the overharvesting
of the quindío wax palm for use in Palm Sunday celebrations,
conservationists conducted an education campaign backed
by the Catholic Church to raise awareness and promote
sustainable alternatives for palm fronds during Easter
festivities.
This project has a clear design informed by a solid
understanding of the underlying conservation issue
(i.e. if the main threat - overharvesting of wax palm - is
addressed then the species population should improve).
Because of this it is relatively straightforward to see
how the project might be evaluated, either by focusing
on a relevant ecological characteristics of the project’s
conservation target (e.g. greater nest density of Yellow-
eared Parrot) or by focusing on measures to address the
threats relating to the underlying conservation issue (e.g.
a reduction in palm felling, a reduction in the use of palm
fronds during Easter festivities).
PROJECT B
Recognising the biodiversity value of the montane forests of
the Colombian Andes, home to globally threatened species
such as the Yellow-eared Parrot, conservationists launched
an integrated conservation and development project in
a nearby community. The project included components
on sustainable resource management, institutional
capacity building, governance networks and stakeholder
empowerment and well-being.
While many of these actions may be worthwhile, this
project lacks a clear design. The project does not
have a clear conservation target and there appears
to be a limited understanding of the factors affecting
biodiversity loss and how the project’s actions will
address these. Instead, a range of different approaches is
proposed without a coherent design
showing how these link together.
This makes it much more
difficult to come up
with clear questions
for an evaluation
to address.
1:7
Yellow-eared parrotpopulatio increases
stabilises
Promotesustainable
alternatives for WaxPalm use in
Palm Sundaycelebration
Sustainable WaxPalm alternatives
promoted tostakeholders
Local peopleharvest
fewer WaxPalms
Biodiversity valueof Colombian montane
forest improves
Improvegovernance
networks
Promotesustainable
resourcemanagement
Buildinglocal
capacity
Improve stakeholder
wellbeing
More Wax Palms areavailable for Yellow-
eared Parrot to roost,nest and feed in
?

INTRODUCTION & KEY CONCEPTS
DESIGNING & IMPLEMENTING THE EVALUATION
PRISM MODULES
METHOD FACTSHEETS & ANNEXES
PRISM - TOOLKIT FOR EVALUATING THE OUTCOMES AND IMPACTS OF SMALL/MEDIUM-SIZED CONSERVATION PROJECTS22
Unintended outcomes & impacts
Sometimes projects result in changes that were not anticipated in
the original project plan.
Often evaluation is focused on the intended consequences
of a project, i.e. whether the project’s results match what was
expected. However, conservation settings are often complex and
thus conservation actions frequently have unintended outcomes/
impacts, which can be positive or negative (see Figure 4).
Learning from these unintended outcomes is extremely
valuable; even when things go wrong, this information is
important for developing successful projects in future.
UNINTENDED OUTCOMES &
IMPACTS
FIGURE 4: EXAMPLE OF CONSERVATION ACTION
SHOWING A RANGE OF OUTCOMES AND IMPACTS.
Negative Unintended
Intended
Positive Unintended
More effectivepatrols deter
huntersPoaching decreases
Hunted speciespopulationincreases
Conflict with local communities
increasesPoaching increases
Hunted speciespopulationdecreases
Park guards providetraining for guards
on other parks
Poaching decreasesin other parks
Hunted speciespopulation
increases inother parks
Training parkguards to conduct
ranger patrols
Training providedto park guards
Park guards conduct more
effective patrols
ActionsImpact on Biodiversity
Intermediateoutcomes
Threat reduction outcomesOutputs
1:8

INTRODUCTION & KEY CONCEPTS
DESIGNING & IMPLEMENTING THE EVALUATION
PRISM MODULES
METHOD FACTSHEETS & ANNEXES
PRISM - TOOLKIT FOR EVALUATING THE OUTCOMES AND IMPACTS OF SMALL/MEDIUM-SIZED CONSERVATION PROJECTS23
Conservation and impacts on human well-being
Conservation actions can have complex and socially-differentiated
impacts on people: some people might benefit, others might
find that they are negatively affected; or the project may offer
long-term benefits but in the short term may make people more
vulnerable. Even when project actions do not involve working
directly with people the project may still have outcomes and
impacts that affect those living and working nearby.
Where unintended outcomes/impacts occur they are often felt
most by those living closest to the project or those who rely on the
area’s natural resources. As such, it is often necessary to identify
and, wherever possible, minimise any negative social impacts.
Projects can do this by incorporating questions relating to human
well-being into their evaluation. For example whether the project
has affected any of the following:
• Material well-being - the material circumstances of a
person’s life (such as housing, income, livelihood, health
and the environment).
• Relational well-being - how people engage with others
to meet their needs (for example through community
networks and social institutions).
• Subjective well-being - how people feel, and their
satisfaction with different aspects of their life.
More information and methods for evaluating well-being can be
found in the Livelihoods & Governance module.
For more detailed information on evaluating well-being impacts
of conservation projects you should refer to the following
publication: http://pubs.iied.org/14667IIED/.
Learning as a project outcome/impact
Unintended outcomes and impacts are particularly valuable
for capturing lessons and applying these to inform future
conservation work. In addition to evaluating the project’s
conservation outcomes, this learning should be seen as a
project outcome in itself.
Perceptions of unintended outcomes/impacts
Whilst everyone likes to tell donors about their successes, in reality
many donors are more interested in seeing the realities of projects,
and are keen to see how project leaders learn from unintended
outcomes. Even if these results are not shared externally they are
invaluable for learning and for adapting a project so that it will have
a greater chance of success in the future. See Step 4. What should
be done next? for more information on how best to use and apply
the results of your evaluation.
UNINTENDED OUTCOMES &
IMPACTS
1:8
Woodhouse, E et al. (2016) Evaluating the impacts of conservation interventions on human
wellbeing. Guidance for practitioners. IIED, London

INTRODUCTION & KEY CONCEPTS
DESIGNING & IMPLEMENTING THE EVALUATION
PRISM MODULES
METHOD FACTSHEETS & ANNEXES
PRISM - TOOLKIT FOR EVALUATING THE OUTCOMES AND IMPACTS OF SMALL/MEDIUM-SIZED CONSERVATION PROJECTS24
Was the change recorded caused by the project?
As well as identifying outcomes & impacts that have occurred, it is
usually the aim of evaluation to investigate whether these changes
resulted from the actions of the project, rather than from other
external factors. Evaluation often therefore requires not only
measuring changes that happened during the project, but also
identifying which changes were due to the project and which were
not. This process is called attribution.
Many evaluations only measure conditions before and after
the project: while this might be acceptable for some outcomes/
impacts, it will not distinguish changes that were caused by other
external factors. Thankfully, there are several options available to
small/medium-sized projects to help in attributing change to the
actions of the project itself, and to control for external factors –
see the section on designing your evaluation for more information.
WAS THE CHANGE RECORDED
CAUSED BY THE PROJECT?
FIGURE 5: ATTRIBUTION IN A PROJECT ACTION
(ADAPTED FROM CATLEY ET AL., 2014).
EXAMPLE
Example: A project attempted to reduce poaching by
undertaking patrols to remove snares. By the end of the
project the team recorded that there had been a reduction in
the frequency of snares in the area being patrolled. However
the team quickly realised that there were a number of other
factors that could potentially explain the reduction in numbers
of snares, for example the reduction could have been caused
by the patrols or alternatively the reduction could have been
caused by falling food prices and a consequent reduction of
demand for bushmeat; or it could be a combination of the two.
The team then collected additional data that allowed them to
compare the number of snares from neighbouring areas with
similar characteristics to the project site that were not subject
to the patrols. This gave the team a better understanding of
whether the observed reduction in snares could be attributed
to the project.
Projectfactors
Non-projectfactors
Situation afterproject action
Situation beforeproject action
1:9
Catley, A., Burns, J., Abebe, D., Suji, O. (2013). Participatory Impact Assessment: A Design
Guide. Feinstein International Center, Tufts University, Somerville http://fic.tufts.edu/
assets/PIA-guide_revised-2014-3.pdf
INTRODUCTION & KEY CONCEPTS
DESIGNING & IMPLEMENTING THE EVALUATION
PRISM MODULES
METHOD FACTSHEETS & ANNEXES
PRISM - TOOLKIT FOR EVALUATING THE OUTCOMES AND IMPACTS OF SMALL/MEDIUM-SIZED CONSERVATION PROJECTS25
Be realistic and focus on interpreting, rather than just
presenting results
Evaluation requires you to make judgements based on the available
information. While ideally you would have all relevant information
available to you, in the real world the amount of information
available may only provide a partial explanation of the project’s
results.
There can be a temptation to be overly scientific and to focus on
presenting quantitative results (e.g. in the form of numbers or
graphs). However, the most useful evaluations are typically those
that carefully consider the information available, and then use
this information to develop an interpretation which explains the
project’s results.
For example the fact that long term impacts are not measurable
within the project’s timeframe means that you will often need to
use information collected on outcomes to explain the likelihood
of future impacts. Equally you may find it impossible to isolate
and collect data on all the different factors, risks and assumptions
which may influence the project’s outcomes and impacts, so you
may often need to rely on qualitative evidence (e.g. interviews),
both from participants and from your own observations and
understanding of the situation, to explain and contextualise the
project’s results.
A good evaluation therefore usually requires two kinds of thinking.
It requires the ability to think like a scientist when designing
the evaluation and collecting data, and then to think more like a
detective or an investigative journalist to interpret results and
make judgements based on the information available.
PRISM’s step by step process is designed to help you design and
carry out your evaluation in this way. See Section 2: Step by step
guide for evaluating project outcomes and impacts for more
information.
BE REALISTIC AND FOCUS ON INTERPRETING,
RATHER THAN JUST PRESENTING
RESULTS
1:10
Photo credit: Tsubasa Iwabuchi
INTRODUCTION & KEY CONCEPTS
DESIGNING & IMPLEMENTING THE EVALUATION
PRISM MODULES
METHOD FACTSHEETS & ANNEXES
PRISM - TOOLKIT FOR EVALUATING THE OUTCOMES AND IMPACTS OF SMALL/MEDIUM-SIZED CONSERVATION PROJECTS26
TIPS FOR EFFECTIVE
EVALUATION IN SMALL/MEDIUM-
SIZED PROJECTS
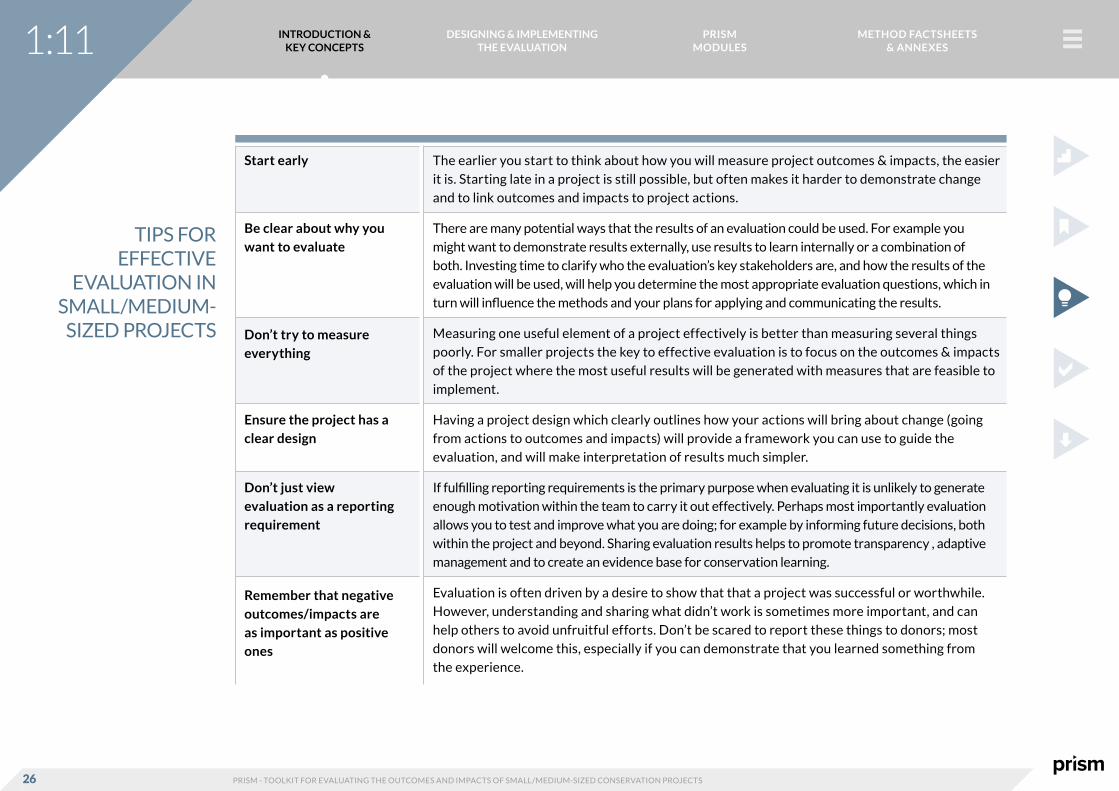
Start early
Be clear about why you
want to evaluate
Don’t try to measure
everything
Ensure the project has a
clear design
Don’t just view
evaluation as a reporting
requirement
Remember that negative
outcomes/impacts are
as important as positive
ones
The earlier you start to think about how you will measure project outcomes & impacts, the easier
it is. Starting late in a project is still possible, but often makes it harder to demonstrate change
and to link outcomes and impacts to project actions.
There are many potential ways that the results of an evaluation could be used. For example you
might want to demonstrate results externally, use results to learn internally or a combination of
both. Investing time to clarify who the evaluation’s key stakeholders are, and how the results of the
evaluation will be used, will help you determine the most appropriate evaluation questions, which in
turn will influence the methods and your plans for applying and communicating the results.
Measuring one useful element of a project effectively is better than measuring several things
poorly. For smaller projects the key to effective evaluation is to focus on the outcomes & impacts
of the project where the most useful results will be generated with measures that are feasible to
implement.
Having a project design which clearly outlines how your actions will bring about change (going
from actions to outcomes and impacts) will provide a framework you can use to guide the
evaluation, and will make interpretation of results much simpler.
If fulfilling reporting requirements is the primary purpose when evaluating it is unlikely to generate
enough motivation within the team to carry it out effectively. Perhaps most importantly evaluation
allows you to test and improve what you are doing; for example by informing future decisions, both
within the project and beyond. Sharing evaluation results helps to promote transparency , adaptive
management and to create an evidence base for conservation learning.
Evaluation is often driven by a desire to show that that a project was successful or worthwhile.
However, understanding and sharing what didn’t work is sometimes more important, and can
help others to avoid unfruitful efforts. Don’t be scared to report these things to donors; most
donors will welcome this, especially if you can demonstrate that you learned something from
the experience.
1:11

PRISM - TOOLKIT FOR EVALUATING THE OUTCOMES AND IMPACTS OF SMALL/MEDIUM-SIZED CONSERVATION PROJECTS27
SECTION 2 STEP BY STEP GUIDE FOR EVALUATING PROJECT OUTCOMES AND IMPACTS
PRISM - TOOLKIT FOR EVALUATING THE OUTCOMES & IMPACTS OF SMALL/MEDIUM-SIZED CONSERVATION PROJECTS
2:0

INTRODUCTION & KEY CONCEPTS
DESIGNING & IMPLEMENTING THE EVALUATION
PRISM MODULES
METHOD FACTSHEETS & ANNEXES
PRISM - TOOLKIT FOR EVALUATING THE OUTCOMES AND IMPACTS OF SMALL/MEDIUM-SIZED CONSERVATION PROJECTS28
CONTENTS SECTION 2
Section 2 Step by step guide for evaluating project
outcomes and impacts
How to use this toolkit to evaluate your project’s
outcomes and impacts
STEP 1 What do you need to know?
What is the project trying to achieve?
Why do you want to evaluate?
What questions do you need to answer?
STEP 2 What data do you need to collect?
How will you know which outcomes/impacts can
be attributed to the project?
How will you collect evaluation data?
STEP 3 What can you learn from the results?
How will you analyse your data?
What do the results show?
STEP 4 What should be done next?
How will you use the evaluation results?
2:0

INTRODUCTION & KEY CONCEPTS
DESIGNING & IMPLEMENTING THE EVALUATION
PRISM MODULES
METHOD FACTSHEETS & ANNEXES
PRISM - TOOLKIT FOR EVALUATING THE OUTCOMES AND IMPACTS OF SMALL/MEDIUM-SIZED CONSERVATION PROJECTS29
How to use this toolkit to evaluate your project’s outcomes and
impacts
For any project, evaluating outcomes & impacts involves finding a
balance between focusing on the outcomes/impacts of the project
where evaluation will be most useful, and designing an evaluation
that is feasible to implement. So like a glass prism is designed to
separate white light so that you can see the different colours of the
spectrum, the PRISM toolkit is designed to help conservationists to
separate out the different elements of a project, focus on the key
outcomes/impacts to evaluate and then use methods appropriate
for smaller projects to design and carry out an effective evaluation
(see Figure 6).
HOW TO USE THIS TOOLKIT TO EVALUATE
YOUR PROJECT’S OUTCOMES AND
IMPACTS
2:0
Photo credit: Glenn Ehmke

INTRODUCTION & KEY CONCEPTS
DESIGNING & IMPLEMENTING THE EVALUATION
PRISM MODULES
METHOD FACTSHEETS & ANNEXES
PRISM - TOOLKIT FOR EVALUATING THE OUTCOMES AND IMPACTS OF SMALL/MEDIUM-SIZED CONSERVATION PROJECTS30
Outcome
Outcome
Outcome
Output
Output
Output
ProjectAction
ConservationProblem
Conservation
project
Outcome
Identifyquestions
Designevaluation& collectdata
Analyse & interpret results
Decidewhat shouldbe donenext
Outcome
ProjectAction
ProjectAction
ConservationImpact
ConservationProblem
Conservation
project
ConservationImpact
HOW TO USE THIS TOOLKIT TO EVALUATE
YOUR PROJECT’S OUTCOMES AND
IMPACTS
FIGURE 6
ActionsImpact on Biodiversity
Intermediateoutcomes
Threat reduction outcomesOutputs
2:0

INTRODUCTION & KEY CONCEPTS
DESIGNING & IMPLEMENTING THE EVALUATION
PRISM MODULES
METHOD FACTSHEETS & ANNEXES
PRISM - TOOLKIT FOR EVALUATING THE OUTCOMES AND IMPACTS OF SMALL/MEDIUM-SIZED CONSERVATION PROJECTS31
In this toolkit, the process of designing and implementing an
evaluation is broken down into four main steps. This section of
the toolkit has been colour-coded according to the steps outlined
below:
HOW TO USE THIS TOOLKIT TO EVALUATE
YOUR PROJECT’S OUTCOMES AND
IMPACTSIdentify which of the
project’s outcomes/
impacts to focus on, and
the evaluation questions
that you will try to
answer.
Design the evaluation
and select appropriate
data collection methods
that will allow you to
answer your evaluation
questions.
Analyse and visualise
data then examine the
data to find out what
can be learnt from the
results, and what the
results mean in relation
to the overall goal of the
project.
Apply results to
improve practice and
share results with the
wider conservation
community.
STEP 1
WHAT DO YOU NEED TO KNOW?
STEP 2
WHAT DATA DO YOU NEED
TO COLLECT?
STEP 3
WHAT CAN YOU LEARN FROM
THE RESULTS?
STEP 4
WHAT SHOULD BE DONE NEXT?
2:0

INTRODUCTION & KEY CONCEPTS
DESIGNING & IMPLEMENTING THE EVALUATION
PRISM MODULES
METHOD FACTSHEETS & ANNEXES
PRISM - TOOLKIT FOR EVALUATING THE OUTCOMES AND IMPACTS OF SMALL/MEDIUM-SIZED CONSERVATION PROJECTS32
HOW TO USE THIS TOOLKIT TO EVALUATE
YOUR PROJECT’S OUTCOMES AND
IMPACTS
STEP 1
WHAT DO YOU NEED TO KNOW?
STEP 2
WHAT DATA DO YOU NEED
TO COLLECT?
STEP 3
WHAT CAN YOU LEARN FROM
THE RESULTS?
STEP 4
WHAT SHOULD BE DONE NEXT?
QUESTIONS ADDRESSED
What is the project trying to
achieve?
Why do you want to evaluate?
What questions to you need
to answer?
• What questions could
be considered in the
evaluation?
• Which questions should I
focus on?
• Are there any unintended
outcomes/impacts I need to
consider?
QUESTIONS ADDRESSED
How will you know which
outcomes/impacts can be
attributed to the project?
• What is evaluation design?
• Which evaluation design
should I use?
• Am I measuring attribution
or contribution?
How will you collect evaluation
data?
• What kind of data is
needed?
• Can any existing data be
used?
• Do I need to control for
bias?
• Are the methods ethically
sound?
• What sampling strategy
should I use?
• What data collection
methods should I use?
QUESTIONS ADDRESSED
How will you analyse your data?
• How should I enter, organise
and clean data?
• What is the unit of analysis?
• What data analysis methods
should I use?
• How should I compare data
collected using different
methods?
• How should I present
evaluation data?
What do the results show?
• How should I interpret
evaluation results?
QUESTIONS ADDRESSED
How will you use the evaluation
results?
• Developing
recommendations
• Can results be used to
improve the project?
• How will results be
communicated to external
audiences?
• Can results be shared with
the wider conservation
community?
2:0

INTRODUCTION & KEY CONCEPTS
DESIGNING & IMPLEMENTING THE EVALUATION
PRISM MODULES
METHOD FACTSHEETS & ANNEXES
PRISM - TOOLKIT FOR EVALUATING THE OUTCOMES AND IMPACTS OF SMALL/MEDIUM-SIZED CONSERVATION PROJECTS33
Step 1 What do you need to know?
There are many different things that could be looked at in an
evaluation and it’s likely that you will not be able to measure all of
them. Therefore, before collecting any data it is usually necessary
to focus the evaluation to ensure that the effort and resources
used will deliver the most useful results. This involves looking
carefully at your project’s outcomes and impacts and trying to find
the right balance between trying to gain answers that are as useful
as possible while still being feasible to measure.
This section will help you to outline the project’s outcomes and
impacts then to use this outline to identify and prioritise which
outcomes/impacts you want to measure, and to come up with a set
of questions that you will try to answer during the evaluation.
STEP 1
WHAT DO YOU NEED TO KNOW?
STEP 1
QUESTIONS ADDRESSED IN THIS SECTION:
• What is the project trying to achieve?
• Why do you want to evaluate?
• What questions do you need to answer?
o What questions could be considered in the
evaluation?
o Which questions should I focus on?
o Are there any unintended outcomes/impacts I
need to consider?
2:1

INTRODUCTION & KEY CONCEPTS
DESIGNING & IMPLEMENTING THE EVALUATION
PRISM MODULES
METHOD FACTSHEETS & ANNEXES
PRISM - TOOLKIT FOR EVALUATING THE OUTCOMES AND IMPACTS OF SMALL/MEDIUM-SIZED CONSERVATION PROJECTS34
What is the project trying to achieve?
Before you begin to develop your questions you first need to make
sure that the project’s design allows you to evaluate the outcomes
and impacts.
This involves checking your project’s design by examining the
links between each stage of the project from actions and outputs
through to outcomes and impacts. The project design should show
a clear and logical path demonstrating how the project’s actions
could be expected to lead to the project’s desired impacts. The
logic underpinning the project’s design should be based on a clear
understanding of the conservation issue(s) being addressed and
any relevant assumptions that have been made. This should allow
you to answer yes to the following questions:
Does the project have a clear intended impact? – e.g.
improvement in status of a particular species, change in
stakeholder behaviour relating to a conservation target.
Is it clear how the project’s action(s) will bring about these
impacts, i.e. if we do X is it reasonable to expect that Y will
happen? – e.g. if we train park rangers, is it likely that this will lead
to a decrease in poaching?
Have you considered what other factors could potentially affect
the project’s results? – e.g. if we train park rangers, are there any
additional factors that could affect the target species populations
at the project site?
Projects often find it useful to have a visual depiction outlining
the project’s design and rationale. This outline then enables
you to focus on the key outcomes/impacts to address in the
evaluation. There are several different approaches you can use
for this: Theory of Change, results chains, logic models and logical
frameworks (logframes) all serve this purpose and are widely used
in conservation projects.
As a rough guide:
Approach Description
Results chain/logic model Flow diagram showing how the
project’s actions are expected
to lead to subsequent outputs,
outcomes & impacts
Theory of Change Similar to a results chain but also
outlines risks and assumptions
which are relevant to the
achievement of the project’s
outcomes & impacts
Logical framework Shows information similar to
that in a Theory of Change but
presented in a table, rather than
a flow diagram
STEP 1
WHAT IS THE PROJECT TRYING
TO ACHIEVE?
2:1

INTRODUCTION & KEY CONCEPTS
DESIGNING & IMPLEMENTING THE EVALUATION
PRISM MODULES
METHOD FACTSHEETS & ANNEXES
PRISM - TOOLKIT FOR EVALUATING THE OUTCOMES AND IMPACTS OF SMALL/MEDIUM-SIZED CONSERVATION PROJECTS35
Although PRISM refers primarily to Theory of Change we would
encourage you not to spend too much time worrying about the
difference between these different approaches. The aim of all
of the above is to map out the project’s design and to provide a
framework showing how your project will bring about change, and
this is then used to design and plan the evaluation.
If the links between any stages of the project are unclear, then
the project’s design may need to be re-visited and adjusted
accordingly. If the project has already finished, then these design
factors should be recorded as something which may affect the
evaluation results.
See the Open Standards: http://cmp-openstandards.org/ for more
information on developing and improving project design.
Refer to the factsheet Completing a Theory of Change for
information on how to construct a simple Theory of Change.
STEP 1
WHAT IS THE PROJECT TRYING
TO ACHIEVE?
2:1
Photo credit: David Thomas

INTRODUCTION & KEY CONCEPTS
DESIGNING & IMPLEMENTING THE EVALUATION
PRISM MODULES
METHOD FACTSHEETS & ANNEXES
PRISM - TOOLKIT FOR EVALUATING THE OUTCOMES AND IMPACTS OF SMALL/MEDIUM-SIZED CONSERVATION PROJECTS36
ActionsImpact on Biodiversity
Intermediateoutcomes
Threat reduction outcomesOutputs
FIGURE 7: EXAMPLE OF A SIMPLE THEORY OF
CHANGE FOR A CONSERVATION PROJECT
STEP 1
EXAMPLE OF A SIMPLE THEORY
OF CHANGE FOR A CONSERVATION
PROJECT
Local peopleadopt moresustainable
practices
Local peoplemanage forest
resources moresustainably
Informingstakeholders
about sustainableforest
managementpractices
Stakeholdersare informed
aboutsustainable
practices
Local people havean improved
understanding ofsustainable
practices
Trainedindividuals apply
new skills
Training stakeholders on
sustainable extraction
of NTFP
Individualstrained
Trained individualshave new skills for
sustainableextraction
Householdlivelihood/wellbeingimproves
Provide directinvestment for
rattan enrichment
Householdsreceive
investment forrattan
enrichment
Rattan providesadditionalincome to
households
Local peoplehave right toutilise forest
resources
Local people areincentivised tomanage forest
more sustainably
Forest lossslowed/
reversed
Status of native forestspecies (including
Edward’s Pheasant)improves
Forest protectionagreements in
exchange for NTFPextraction rights
Agreements in place
2:1
Critical Assumptions
Price of NTFPs remain stable or increase
Weather conditions remain stable enough
for rattan to grow
Populations of native forest species do not
decrease due to disease or other natural
factors

INTRODUCTION & KEY CONCEPTS
DESIGNING & IMPLEMENTING THE EVALUATION
PRISM MODULES
METHOD FACTSHEETS & ANNEXES
PRISM - TOOLKIT FOR EVALUATING THE OUTCOMES AND IMPACTS OF SMALL/MEDIUM-SIZED CONSERVATION PROJECTS37
Why do you want to evaluate?
Once you have reviewed the project’s design
you should set out why you want to evaluate
in the first place. The best way to do this is
to briefly spend some time to identify how
evaluation results will be used, and by whom.
Note that there will typically be a large
number of stakeholders who could potentially
benefit from the results of the evaluation.
However for the purposes of deciding what to
evaluate, it is best to stick to the stakeholders
who need to know the results of the
evaluation. Typically this includes:
• The project team and/or the
implementing organisation
• The project donor(s)
• Other key stakeholders whose
involvement is crucial to the
success of the project (e.g. key
decision makers being targeted by
the project, community members
involved in the project).
Note that this is not meant to be an exercise
for identifying all the potential ways in which
the results of an evaluation could be used,
but is instead meant to help to focus on the
key outcomes and impacts to address in the
evaluation.
See the factsheet Identifying why you want to
evaluate for advice on how to do this.
STEP 1
WHY DO YOU WANT TO
EVALUATE?
STAKEHOLDER GROUP
Project team
Donors
Key decision makers
(e.g. Local authorities,
Politicians, Law enforcement,
Private sector)
Wider conservation community
WHAT DO THEY NEED TO KNOW?
Was the action successful?
Why/how was the action
successful?
Did the project deliver as
expected?
What lessons were learnt?
What was the impact on local
people?
What lessons were learnt?
HOW WILL THEY USE THE INFORMATION?
Modifying the project
Demonstrating results to donors
External communications
Guiding future investment and
programme design
Informing management/policy
decisions
Distributing results
Using results to inform
conservation practice
EXAMPLES OF EVALUATION USES AND USERS INCLUDE:
2:1

INTRODUCTION & KEY CONCEPTS
DESIGNING & IMPLEMENTING THE EVALUATION
PRISM MODULES
METHOD FACTSHEETS & ANNEXES
PRISM - TOOLKIT FOR EVALUATING THE OUTCOMES AND IMPACTS OF SMALL/MEDIUM-SIZED CONSERVATION PROJECTS38
STEP 1
WHAT QUESTIONS DO YOU NEED TO
ANSWER?
2:1
What questions do you need to answer?
Once you have considered the project’s design and the evaluation
audience, the next task is to use this information to identify and
prioritise which outcomes/impacts you want to focus on, and come
up with a set of guiding questions that you will try to answer during
the evaluation.
The process of identifying appropriate questions determines
what data need to be collected. Answering these questions then
guides the interpretation of the evaluation results and the process
of deciding what to do next. A good set of evaluation questions
will therefore greatly enhance your chances of producing useful
results. Equally, evaluation questions that are poorly thought out
risk wasting valuable time and/or producing unreliable results.
What questions could be considered in the evaluation?
Start by asking yourself “what do I need to know in relation to the
project?”.
The table on the following page lists some of the different kinds
of questions that could be asked during an evaluation, along with
some specific examples.
A good way to approach this process is to look at your project’s
outcomes & impacts (as outlined in your Theory of Change or
equivalent) and, in a small group, brainstorm potential
evaluation questions that could be addressed. At this
stage it is recommended that you keep the
questions quite broad - later you will
be able to break them down into
sub-questions to use as
you are collecting
data.
Photo credit: Iain Dickson

INTRODUCTION & KEY CONCEPTS
DESIGNING & IMPLEMENTING THE EVALUATION
PRISM MODULES
METHOD FACTSHEETS & ANNEXES
PRISM - TOOLKIT FOR EVALUATING THE OUTCOMES AND IMPACTS OF SMALL/MEDIUM-SIZED CONSERVATION PROJECTS39
STEP 1
TYPES OF QUESTIONS
Process questions *
Descriptive questions
Causal questions
Synthesis questions
Learning questions
Action questions
• Is the project proceeding as expected?
• Does the project need to change anything to ensure successful
delivery?
• Has the number of migrant shorebirds using the target site
increased since the project began?
• Have household incomes increased since the start of the project?
• Did the project improve the habitat quality for shorebirds at the
project site?
• Did the project improve the income of participating households?
• What other factors may have influenced the results?
• What do the project’s results mean for regional populations of
shorebirds?
• What difference has the project made to the lives of participants?
• Did the method(s) used by the project work as planned? If not, why
not?
• Were there any unintended impacts? If so, what were they?
• Did the project have any negative outcomes? If so, how could these
be avoided in future?
• Should the project continue? Should it be scaled up?
• Should the project’s approach be used in other areas?
• Which project results could be shared with other conservationists
and/or other relevant stakeholders?
Is the project delivering
as expected?
What change(s) have
occurred since the
project began?
To what extent are any
change(s) due to the
project?
What do any changes
mean in relation to the
overall aim of the project?
What can we learn from
the results?
What should be done
next?
TYPE OF QUESTION DESCRIPTION EXAMPLES
2:1
* Note that process questions are not
sufficient to evaluate outcomes/impacts,
but they are useful for tracking project
progress, making changes to on-going
actions and reporting to donors

INTRODUCTION & KEY CONCEPTS
DESIGNING & IMPLEMENTING THE EVALUATION
PRISM MODULES
METHOD FACTSHEETS & ANNEXES
PRISM - TOOLKIT FOR EVALUATING THE OUTCOMES AND IMPACTS OF SMALL/MEDIUM-SIZED CONSERVATION PROJECTS40
Which questions should I focus on?
Although the ideal scenario might be to try to answer questions
relating to all your project’s outcomes and impacts this is rarely
possible in practice. For example some outcomes/impacts may
not be measurable with the time and resources available, while
others may be less important to the success of the overall project.
Instead it is usually far more valuable to focus on obtaining reliable
answers to a smaller number of questions (aim for no more than
five).
Choosing which questions to answer in your evaluation will depend
largely on the following:
• Which questions will provide the most useful
information?
• Are the questions feasible to answer?
Which questions will provide the most useful information?
Looking at the project’s outcomes/impacts, ask the following:
Which outcomes/impacts are most important to the success of
the project? - Consider the project’s design, your understanding of
the underlying conservation issue and the needs of your evaluation
audience. Try to identify and focus on the outcomes and impacts
that are particularly important to the success of the project and
the questions you need to know in relation to these.
STEP 1
WHICH QUESTIONS
SHOULD I FOCUS ON?
EXAMPLE
Example: A project aimed to increase the population of a
threatened species of orchid threatened by overharvesting
for the domestic flower trade. To achieve this the project
carried out surveys to map the remaining populations of
orchids, workshops with wild flower collectors on sustainable
harvesting techniques and awareness raising presentations in
local schools.
Intended outcomes: Increased awareness of orchids among
local schoolchildren, improved knowledge of the location of
remaining populations of orchids and reduced harvesting of
orchids by local people
Evaluation questions: The team decided that the evaluation
questions that would provide the most useful information were
those relating to whether the project had been successful in
reducing the harvesting rate of wild orchids by local people, as
these would show whether the project had addressed the main
threat affecting the conservation target.
2:1

INTRODUCTION & KEY CONCEPTS
DESIGNING & IMPLEMENTING THE EVALUATION
PRISM MODULES
METHOD FACTSHEETS & ANNEXES
PRISM - TOOLKIT FOR EVALUATING THE OUTCOMES AND IMPACTS OF SMALL/MEDIUM-SIZED CONSERVATION PROJECTS41
How well known is the action being evaluated? - One of the main
reasons to evaluate is that it enables the sharing of experience and
evidence across the conservation sector. Equally, when prioritising
your evaluation questions you should research whether the
project’s approach has been applied elsewhere and in similar
contexts.
If the action that you are measuring has been thoroughly tested
and its outcomes and impacts are well known, then an evaluation
may be of limited use. For example if the action has been regularly
applied and tested in similar contexts, or the project is scaling up
actions that have previously been trialled at the target site, in these
cases you may be better off measuring a different action or simply
measuring project delivery, and thereby saving resources.
Conversely an evaluation may be particularly useful in the
following situations:
- Innovative (untested) schemes
- Pilot actions that are due to be scaled up
- Actions for which there is a lack of solid evidence of
impact in the given context
- Generalisable actions that an organisation is planning to
adopt widely.
There are several places where you can find information on
different conservation approaches that have been tested and the
results of which have been shared. CMP’s Miradi-CAML database:
http://cmp-openstandards.org/tools/caml/ and Conservation
Evidence: http://www.conservationevidence.com/ are two
particularly useful resources.
Are the questions feasible to answer?
Once you have identified and developed questions for the
outcomes and/or impacts where an evaluation would be most
useful, the next step is to check whether these questions are
feasible to measure. Feasibility should be measured against the
following three criteria:
Available time - Many long-term outcomes (such as changes in
biodiversity status) can take a long time for results to show. You
need to ensure that the outcome(s) you are evaluating will be
measurable with the time available.
Available data - Are the necessary data already available? If not
then you need to be able to collect these data over the course of
the project.
Available resources - Ensure that your plans are realistic in light of
the time, skills and resources available.
Refer to the factsheet Evaluation feasibility checklist for a set of
criteria that you can use to judge whether a particular evaluation
question will be feasible to evaluate.
STEP 1
HOW WELL KNOWN IS THE ACTION BEING
EVALUATED?
2:1

INTRODUCTION & KEY CONCEPTS
DESIGNING & IMPLEMENTING THE EVALUATION
PRISM MODULES
METHOD FACTSHEETS & ANNEXES
PRISM - TOOLKIT FOR EVALUATING THE OUTCOMES AND IMPACTS OF SMALL/MEDIUM-SIZED CONSERVATION PROJECTS42
STEP 1
TIP FOR PRIORITISING
QUESTIONS
Tip for prioritising questions - The ultimate aim of most
conservation projects is to have an impact on the status of a
particular species or habitat. So when prioritising evaluation
questions, one way to approach this is to begin with your project’s
impacts, develop appropriate questions and then apply the criteria
above to see whether the questions are feasible to measure.
If evaluation of conservation impact is not feasible then move back
down the chain to look at threat reduction outcomes (e.g. reduced
consumption of a hunted species following an education programme,
reduction in invasive species population), and if this is not possible
move the focus to intermediate outcomes. Then when interpreting
and applying the results these should be explained in the context of
how changes relating to these outcomes can be expected to lead to
subsequent outcomes & impacts.
Feasible to measure
Intermediateoutcome
Threat reductionoutcome
Impact onbiodoversity
Action Outputs
Focus of evaluation
Intermediateoutcome
Feasible to measure
Intermediateoutcome
Threat reductionoutcome
Impact onbiodoversity
Action Outputs
Focus of evaluation
Intermediateoutcome
Feasible to measure
Intermediateoutcome
Threat reductionoutcome
Impact onbiodoversity
Action Outputs
Focus of evaluation
Intermediateoutcome
2:1

INTRODUCTION & KEY CONCEPTS
DESIGNING & IMPLEMENTING THE EVALUATION
PRISM MODULES
METHOD FACTSHEETS & ANNEXES
PRISM - TOOLKIT FOR EVALUATING THE OUTCOMES AND IMPACTS OF SMALL/MEDIUM-SIZED CONSERVATION PROJECTS43
Prioritisation matrix
A very useful exercise that can help to prioritise evaluation
questions is to complete a prioritisation matrix. This helps you
to review the usefulness and feasibility of each of the project’s
outcomes & impacts and to prioritise evaluation questions based
on the criteria outlined in this section. See below for a completed
example. Refer to the factsheet Completing a prioritisation matrix
for more information.
STEP 1
PRIORITISATION MATRIX
2:1

INTRODUCTION & KEY CONCEPTS
DESIGNING & IMPLEMENTING THE EVALUATION
PRISM MODULES
METHOD FACTSHEETS & ANNEXES
PRISM - TOOLKIT FOR EVALUATING THE OUTCOMES AND IMPACTS OF SMALL/MEDIUM-SIZED CONSERVATION PROJECTS44
EVALUATION QUESTION(S)
To what extent have populations of
native forest species changed since the
project began and if so to what extent
can this be attributed to the project?
Has there been a change in the rate of
forest loss since the project began and if
so can this change be expected to persist
Has there been a change in the way local
people manage forest resources and if
so to what extent can this be attributed
to the project?
Have the project’s actions given local
people more of an incentive to manage
forest resources sustainably and if so
can this be expected to persist?
Have agreements provided local people
with the right to utilise forest resources?
Have household livelihoods and/or
wellbeing status improved as a result of
the project’s actions
Has the rattan planted with support
from the project provided (or will
provide) households with additional
income?
Are trained individuals applying any of
the skills learnt?
OUTCOME/IMPACT
Status of native
forest species
improves
Forest loss
slowed/reversed
Local people
manage forest
resources more
sustainably
Local people are
incentivised to
manage forest
more sustainably
Local people have
right to utilise
forest resources
Household
livelihood/
wellbeing
improves
Rattan provides
additional income
to households
Trained
individuals apply
new skills
WHICH STAKEHOLDERS CARE ABOUT THIS?
Participating households
Local authorities;
Project team
Project funder
Participating households
Local authorities;
Project team
Project funder
Participating households
Local authorities;
Project team
Project funder
Participating households;
Local authorities
Participating households
Local authorities
Participating households
Local community
Project Funder
Participating households
Local community
Project team
Participating households
IMPORTANCE TO USERS
High
Med
High
Med
High
High
Med
Med
IMPORTANCE TO PROJECT SUCCESS
High
High
High
High
High
High
High
Med
HOW WELL KNOWN IS THE ACTION BEING EVALUATED?
Low
Low
Low
Low
Med
Med
Med
Med
EASE OF DATA COLLECTION
Low
Low
Med
Med
High
Low
Med
Med
CAN THIS BE ANSWERED GIVEN YOUR TIME & RESOURCES
No
No
Yes
Yes
Yes
Partially
Partially
Yes
PRIORITY
Eliminate – Not
possible to measure
within project
timeline
Eliminate – Not
possible to measure
within project
timeline
High - Crucial to
project success and
measurable with avail-
able time / resources
High - Crucial to
project success and
measurable with avail-
able time / resources
High - Crucial to
project success and
measurable with avail-
able time / resources
High - Crucial to
project success and
measurable with avail-
able time / resources
Med – Rattan yet to
be harvested which
means income can
only be estimated.
Low – Not as
important as other
questions
STEP 1
PRIORITISATION MATRIX
Prioritisation matrix
2:1

INTRODUCTION & KEY CONCEPTS
DESIGNING & IMPLEMENTING THE EVALUATION
PRISM MODULES
METHOD FACTSHEETS & ANNEXES
PRISM - TOOLKIT FOR EVALUATING THE OUTCOMES AND IMPACTS OF SMALL/MEDIUM-SIZED CONSERVATION PROJECTS45
Identifying sub-questions & indicators
Once you have your list of priority evaluation questions it will often
be necessary to break each of these down into a number of sub
questions that will suggest what data need to be collected (see
below for an example). Then for each sub-question you will need
to identify indicators that will allow you to know whether you have
answered each question.
An indicator is a variable that provides a reliable means of measuring a
particular outcome or impact.
Indicators should be simple and specific, and can be numerical
(quantitative) or non-numerical (qualitative). The table below
outlines potential indicators for the high priority questions listed in
the matrix above. See the summary tables in the module chapters
for further examples of potential indicators as well as guidance on
how to identify appropriate indicators for each module. STEP 1
IDENTIFYING SUB-QUESTIONS &
INDICATORS
OUTCOME
Local people manage forest
resources more sustainably
EVALUATION QUESTION
Has the project changed the
way local people manage forest
resources?
SUB- QUESTIONS
Do local people now monitor
areas covered by agreements?
Do local people report
infractions to the forest
protection department?
Are local households converting
less of the forest for pasture
than before the project?
Do the forest protection
department feel that the
forest is being managed more
sustainably than before?
INDICATORS
Number of monitoring patrols
carried out by households
Number of infractions reported
50% reduction in annual area
of land converted to pasture
compared to before the project
Key informant interviews
report that forest protection
department staff feel that more
sustainable management is
taking place
2:1

INTRODUCTION & KEY CONCEPTS
DESIGNING & IMPLEMENTING THE EVALUATION
PRISM MODULES
METHOD FACTSHEETS & ANNEXES
PRISM - TOOLKIT FOR EVALUATING THE OUTCOMES AND IMPACTS OF SMALL/MEDIUM-SIZED CONSERVATION PROJECTS46
It is important not just to choose questions & indicators that are
the easiest to use, for example because the data already exist or
other people have used them in the past. Instead, always think
back to why you are doing the evaluation in the first place, and
consider whether the questions and indicators selected will give
you the information that you want. In many cases, it may be better
to have a more ambiguous qualitative answer than to persist
with using an indicator that may be misleading, for the sake of
generating a number. For example, if an action claims to improve
local participation in land use governance, a common indicator
is attendance at community meetings, but this does not capture
whether people had a voice in the meetings or whether their
contributions were taken into account in decision-making, for
which more qualitative data is needed.
Note that many standardised lists of indicators exist for conservation
actions, however it is almost always far more useful to develop
indicators yourself based on your project’s specific outcomes/
impacts and the evaluation questions you are trying to answer.
Indicators for project actions & outputs
It is generally good practice (and often the minimum requirement
for reporting to donors) for all projects to develop indicators and
to record information on their outputs and the delivery of actions.
These are typically recorded in the form of quantity and quality of
delivery (e.g. number of stakeholders reached, number of surveys
carried out, immediate reaction to a training workshop). As PRISM
is focused on evaluation of outcomes & impacts, guidance on
developing indicators and collecting information on outputs and
delivery of project actions is not covered in detail here. However,
when designing your project it is important to consider how this
information will be collected, when and by whom.
STEP 1
IDENTIFYING SUB-QUESTIONS &
INDICATORS
2:1

INTRODUCTION & KEY CONCEPTS
DESIGNING & IMPLEMENTING THE EVALUATION
PRISM MODULES
METHOD FACTSHEETS & ANNEXES
PRISM - TOOLKIT FOR EVALUATING THE OUTCOMES AND IMPACTS OF SMALL/MEDIUM-SIZED CONSERVATION PROJECTS47
Are there any unintended outcomes/impacts I need to consider?
Capturing information on unintended outcomes & impacts is
immensely valuable (see Section 1), however because there are
so many ways in which a project or action could potentially bring
about unintended outcomes & impacts it is often difficult to know
where to start. There are two main ways you can approach this:
1. Work internally within the project team before,
during and after the project to think about
unintended outcomes/impacts. This can include
an initial risk assessment and then having points
during the implementation of the project where
the team meet to discuss possible unintended
outcomes/impacts and how data on these can be
collected. Exploring assumptions in the project’s
Theory of Change can also help to identify
unintended outcomes/impacts.
2. Include a participatory element in your evaluation
where you ask project stakeholders what they feel
the main outcomes and impacts of the project will
be/are/were.
If possible you should aim to use a combination of both of these
approaches. If you decide that the outcomes/impacts identified
are significant enough to warrant further investigation, you can
build questions into your evaluation that are designed to capture
relevant information on them. In any case it is usually good practice
to include questions in your evaluation that are open-ended in
order to explore why, and how, changes have occurred and what
they mean in the context of the project.
STEP 1
ARE THERE ANY UNINTENDED
OUTCOMES/IMPACTS I NEED
TO CONSIDER?
2:1

INTRODUCTION & KEY CONCEPTS
DESIGNING & IMPLEMENTING THE EVALUATION
PRISM MODULES
METHOD FACTSHEETS & ANNEXES
PRISM - TOOLKIT FOR EVALUATING THE OUTCOMES AND IMPACTS OF SMALL/MEDIUM-SIZED CONSERVATION PROJECTS48
WHAT DO YOU NEED TO KNOW?
CHECKLIST
• Have you outlined your project’s outcomes &
impacts in a Theory of Change (or equivalent)?
• Have you identified your evaluation uses &
users?
• Have you identified potential evaluation
questions for the project’s outcomes/impacts?
• Have you prioritised the most important
questions to answer, based on usefulness &
feasibility?
• Have you developed indicators that will allow
you to know when you have answered each
question?
• Have you considered potential unintended
outcomes/impacts?
POTENTIAL WAY OF REDUCING COSTS
Reduce number of evaluation questions
WHAT DO YOU NEED TO KNOW? – TIPS FOR REDUCING TIME/COSTS
CHALLENGES
Evaluation may no longer meet the needs of audience
SOLUTIONS
Carefully prioritise evaluation questions
2:1

INTRODUCTION & KEY CONCEPTS
DESIGNING & IMPLEMENTING THE EVALUATION
PRISM MODULES
METHOD FACTSHEETS & ANNEXES
PRISM - TOOLKIT FOR EVALUATING THE OUTCOMES AND IMPACTS OF SMALL/MEDIUM-SIZED CONSERVATION PROJECTS49
Step 2 What data do you need to collect?
This is where you design your evaluation in a way that will allow
you to answer your evaluation questions and to select appropriate
methods that will allow you to collect the data required.
For this step note the difference between evaluation design and
data collection methods. Your data collection methods are the
tools you will use to collect data (questionnaires, interviews etc.).
Your evaluation design outlines how the data collection will be
structured in a way that will allow you to answer your evaluation
questions.
STEP 2
WHAT DATA DO YOU NEED TO
COLLECT?
STEP 2
QUESTIONS ADDRESSED IN THIS SECTION:
• How will you know which outcomes/impacts can be
attributed to the project?
o What is evaluation design?
o Which evaluation design should I use?
o Am I measuring attribution or contribution?
• How will you collect evaluation data?
o What kind of data are needed?
o Can any existing data be used?
o Do I need to control for bias?
o Are the methods ethically sound?
o What sampling strategy should I use?
o What data collection methods should I use?
2:2

INTRODUCTION & KEY CONCEPTS
DESIGNING & IMPLEMENTING THE EVALUATION
PRISM MODULES
METHOD FACTSHEETS & ANNEXES
PRISM - TOOLKIT FOR EVALUATING THE OUTCOMES AND IMPACTS OF SMALL/MEDIUM-SIZED CONSERVATION PROJECTS50
How will you know which outcomes/impacts can be attributed
to the project?
What is evaluation design?
In any area where a project is implemented, changes will take place
over time. Some of these changes will have occurred as a result of
the project, while other changes may have nothing to do with the
project and would have happened regardless of whether or not
the project existed. Therefore it is usually the aim of an evaluation
to try to find out whether any observed changes were due to the
project.
In order to find this out your data collection needs to be designed
in a way that will allow you to distinguish the amount of change
that can be claimed by the project, or by a particular project action,
from the total change that takes place (i.e. how much of a particular
outcome or impact is the direct result of the project’s actions). This
is known as attribution.
A good evalaution design should allow you to address the following
questions:
• What difference did the action/project make?
• How did it make this difference?
• What other factors were relevant?
Evaluations that consider these questions produce stronger and
more useful findings. This is because the emphasis is on finding out
what difference the project has made, rather than just looking at
what has happened. On the other hand a flawed evaluation design
can lead to results that can be misinterpreted or can cast doubt on
the validity of the results.
STEP 2
HOW WILL YOU KNOW WHICH
OUTCOMES/IMPACTS CAN BE
ATTRIBUTED TO THE PROJECT?
= –
2:2
Project outcomes/
impacts
Total changesChanges not due
to the project

INTRODUCTION & KEY CONCEPTS
DESIGNING & IMPLEMENTING THE EVALUATION
PRISM MODULES
METHOD FACTSHEETS & ANNEXES
PRISM - TOOLKIT FOR EVALUATING THE OUTCOMES AND IMPACTS OF SMALL/MEDIUM-SIZED CONSERVATION PROJECTS51
The approach you choose for addressing attribution will depend
largely on the availability of the following:
Theory of Change – A strong Theory of Change gives you a
framework with which to test whether particular outcomes/
impacts have been achieved. Evaluations produce stronger
findings if they not only test the links between actions and impacts,
but also test the steps between intermediate outcomes. See
PRISM Step 1 for more information.
Counterfactual – A counterfactual is an estimate of what would
have happened without the project. What a counterfactual gives
you is a measure of the results that would have been observed
if the project had not taken place and all other conditions had
remained the same. In practice these can be real world scenarios
based on a control group/control site or constructed from
participants’ or experts’ knowledge.
Baseline – A starting point, or a baseline, in order to assess change
over time. If the project did not establish a baseline at the outset
this can sometimes be constructed retrospectively (ex-post) from
secondary data (e.g. local records) or carefully designed surveys
that make use of participant recall or expert opinion.
The following resource contains useful guidance on
how to construct a baseline retrospectively: http://
siteresources.worldbank.org/INTPOVERTY/
Resources/335642-1276521901256/premnoteME4.pdf .
STEP 2
HOW WILL YOU KNOW WHICH
OUTCOMES/IMPACTS CAN BE
ATTRIBUTED TO THE PROJECT?
EXAMPLE OF A BAD EVALUATION DESIGN
A project measured the height of all the trees in a patch of
forest, then erected a fence around all the trees and measured
them again after a period of three years. The project found that
most of the trees were taller at the end than they were at the
start. The project concluded that the fence had made the trees
taller.
In this example the main flaw in the evaluation design was
that the project gave no basis for comparing the fenced trees’
growth with that of non-fenced trees in other patches of forest,
nor did it consider other factors that may promote tree growth.
2:2

INTRODUCTION & KEY CONCEPTS
DESIGNING & IMPLEMENTING THE EVALUATION
PRISM MODULES
METHOD FACTSHEETS & ANNEXES
PRISM - TOOLKIT FOR EVALUATING THE OUTCOMES AND IMPACTS OF SMALL/MEDIUM-SIZED CONSERVATION PROJECTS52
Which evaluation design should I use?
The most rigorous option is to view the evaluation as an
experiment, for example by treating some patches of an invasive
plant in one manner and other patches in another, then comparing
the results. However this kind of approach is often challenging
for smaller projects. Small/medium-sized conservation projects
must therefore often consider other options which are feasible to
implement but still deliver meaningful results.
The table below outlines some lower cost approaches for
attributing outcomes & impacts to project actions. Each of the
following methods is outlined in more detail in the dedicated
evaluation design factsheets.
STEP 2
WHICH EVALUATION
DESIGN SHOULD
I USE?
2:2
Photo credit: Tsubasa Iwabuchi

INTRODUCTION & KEY CONCEPTS
DESIGNING & IMPLEMENTING THE EVALUATION
PRISM MODULES
METHOD FACTSHEETS & ANNEXES
PRISM - TOOLKIT FOR EVALUATING THE OUTCOMES AND IMPACTS OF SMALL/MEDIUM-SIZED CONSERVATION PROJECTS53
TABLE: POTENTIAL EVALUATION DESIGNS FOR SMALL/MEDIUM-SIZED PROJECTS.
DESIGN TYPE
Participatory Impact Assessment
Interviewing Key Informants
Theory-based designs
Matching designs
Before - after designs
DESCRIPTION
Asking project participants
questions about what changes have
occurred and then discussing the
reasons for the answers given
Asking certain key individuals
about what they believe caused
any observed change and why/how
these changes happened
Checking that results support the
project’s Theory of Change (ToC)
Comparing the results of the action
to a real world control group/control
site that is not subject to the action.
Control group/site selected to be as
similar as possible to the group/site
targeted by the project
Measuring the situation before
the action and then again after the
action
EXAMPLES
Asking project participants to score
indicators relating to forest resource
use and discussing the reasons for
the answers given
Asking national park staff if they feel
the project improved species status
within the project target area
Checking achievement of
intermediate outcomes
Contribution analysis
Comparing the trends in status of
species within an area that received
project support with a similar area
that did not receive project support
Comparing the knowledge/
awareness of participants before
and after a training workshop
CHALLENGES
Participants’ memories can change
over time
Key informants need to be familiar
with the project and the outcome/
impact being evaluated
Requires a thorough understanding
of the mechanisms that drive change
and the species/habitats impacted
(e.g. well-developed ToC)
Potential to focus only on expected
impacts and ignore unintended or
negative impacts
Often higher cost & require more
resources than other designs
Often more resource intensive and
subject to a number challenges
relating to logistics and ethics
Does not provide firm proof of
attribution
Can only imply (rather than prove)
that change occurred due to the
project
ADVANTAGES
Relatively cheap, does not require a
baseline study or control group
Usually the best way of
understanding how the project has
affected participants
Relatively cheap, does not require a
baseline study or control group
Useful for verifying results collected
from other methods
Utilises pre-existing Theory of
Change
Often less resource intensive
and not subject to many of the
challenges associated with
traditional matching designs (see
below)
If done properly, matching designs
eliminate many of the potential
sources of bias that could affect the
validity of an evaluation
Can be useful if the outcome/impact
is short term or is part of a simple
causal chain
2:2

INTRODUCTION & KEY CONCEPTS
DESIGNING & IMPLEMENTING THE EVALUATION
PRISM MODULES
METHOD FACTSHEETS & ANNEXES
PRISM - TOOLKIT FOR EVALUATING THE OUTCOMES AND IMPACTS OF SMALL/MEDIUM-SIZED CONSERVATION PROJECTS54
Selecting an appropriate design involves looking at the following
three factors. Remember that every project is different, therefore
it is up to you and your team to think about these factors and to
choose the evaluation design that is most appropriate for your
particular project.
Nature of the action being evaluated
o Complexity of the action
o What project outcomes/impacts will be measurable?
o Are there gaps or inconsistencies in the project’s Theory
of Change that would make evaluation difficult?
Nature of the evaluation
o Who are the evaluation users and what do they want to
know?
o What are the key questions being evaluated?
Available resources and constraints
o Existing evidence available (e.g. baseline data)
o Resources (e.g. time, money, expertise within the team/
organisation)
The PRISM module chapters each contain further guidance on
which evaluation designs are suitable for particular conservation
outcomes & impacts. Refer to the evaluation design factsheets for
more information on each design type.
Remember that none of the designs outlined in this section is
inherently better than any of the others. In choosing a design you
need to think carefully about your particular situation and choose
a design or a combination of designs that is appropriate for your
needs.
See also the Decision tree for selecting an evaluation design for
more help in selecting a design appropriate for your project.
STEP 2
WHICH EVALUATION
DESIGN SHOULD
I USE?
DESIGN APPROACHES FOR EACH OF PRISM’S MODULES
Table: Design approaches for each of PRISM’s modules. Solid circles = most appropriate,
empty circles = sometimes appropriate, no circle = less appropriate.
AWARENESS & ATTITUDES
CAPACITY BUILDING
LIVELIHOODS & GOVERNANCE
POLICY SPECIES & HABITAT
MANAGEMENT
Participatory Impact Assessment
Interviewing Key Informants
Theory-based designs
Matching Designs
Before-After Designs
2:2

INTRODUCTION & KEY CONCEPTS
DESIGNING & IMPLEMENTING THE EVALUATION
PRISM MODULES
METHOD FACTSHEETS & ANNEXES
PRISM - TOOLKIT FOR EVALUATING THE OUTCOMES AND IMPACTS OF SMALL/MEDIUM-SIZED CONSERVATION PROJECTS55
Am I measuring attribution or contribution?
In some cases it will be possible to attribute an outcome/impact
directly to the project’s actions. However, in many conservation
project settings, and particularly for smaller projects, achievement
of outcomes & impacts will often be dependent on other actions,
projects, policies or programmes. This is often referred to as
contribution.
Although the two terms are presented as separate categories it
is perhaps most useful to think of this as a spectrum from “effects
directly and solely attributable to the project” at one extreme,
to “effects achieved indirectly and/or in combination with other
influences” at the other.
Many projects struggle when trying to evaluate an action that
contributed towards a wider outcome/impact. However the
basic questions are still the same - what difference did the action/
project make? How did it make this difference, and what other
factors were relevant? Although you may not be able to quantify
accurately the amount of change the project was responsible
for, you can still learn an enormous amount by considering these
questions. All the design options listed in this section can be used
to evaluate an outcomes/impacts that can be directly and solely
attributed to the project as well as outcomes/impacts to which the
project made an indirect or partial contribution.
STEP 2
AM I MEASURING ATTRIBUTION OR CONTRIBUTION?
EXAMPLE - PROJECT OUTCOME THAT CAN BE
DIRECTLY ATTRIBUTED TO THE PROJECT:
The amount of firewood used by participating households
reduced after the introduction of fuel-efficient stoves.
Households that were not involved in the project were still
using the same amount of firewood as all households in the
community had done before the project. No other actions were
targeting firewood use, meaning that any change(s) in this after
the introduction of stoves could likely be directly attributed to
the project.
EXAMPLE - CONTRIBUTING TO A WIDER OUTCOME/
IMPACT:
A new environmental law was passed, upholding a ban on
development in a national park. The project team had carried
out meetings and extensive lobbying & campaigning in support
of the new law. The passing of the law had also been supported
by several other NGOs, community groups and businesses.
This meant that it was likely that the project contributed
to a portion of the overall change, rather than being solely
responsible for it.
2:2

INTRODUCTION & KEY CONCEPTS
DESIGNING & IMPLEMENTING THE EVALUATION
PRISM MODULES
METHOD FACTSHEETS & ANNEXES
PRISM - TOOLKIT FOR EVALUATING THE OUTCOMES AND IMPACTS OF SMALL/MEDIUM-SIZED CONSERVATION PROJECTS56
How will you collect evaluation data?
When you have identified an appropriate design for your
evaluation you then need to identify methods that will allow you to
collect the data required to answer your evaluation questions. This
section outlines several key considerations that are relevant to all
data collection methods before describing how PRISM’s thematic
modules can be used to select methods that are relevant to specific
types of conservation actions.
What kind of data are needed?
When selecting methods you will need to decide whether you
need data that are quantitative, qualitative or both. Quantitative
data is numerical (numbers or answers to closed questions)
while qualitative data is non-numerical (observations, answers
to open questions, written, audio, visual or video evidence).
Quantitative data are more straightforward to measure using
standard statistical analysis methods. However qualitative data
can provide extremely useful insights and information that cannot
be captured by quantitative data, for example the underlying
reasons, opinions and motivations behind a change in participant
behaviour. Increasingly, many evaluations collect both quantitative
and qualitative data: this is called a mixed methods approach.
Some methods will only deliver one kind of data while others can
be adapted to provide both. Where possible it is recommended to
try to gather data (both quantitative and qualitative) using a range
of different methods and then to “triangulate” the findings. This
enables conclusions to be drawn from smaller sample sizes. See
Step 3. What can you learn from the results? for more information
on triangulation and how to combine and analyse data from
multiple sources.
STEP 2
HOW WILL YOU COLLECT
EVALUATION DATA?
2:2

INTRODUCTION & KEY CONCEPTS
DESIGNING & IMPLEMENTING THE EVALUATION
PRISM MODULES
METHOD FACTSHEETS & ANNEXES
PRISM - TOOLKIT FOR EVALUATING THE OUTCOMES AND IMPACTS OF SMALL/MEDIUM-SIZED CONSERVATION PROJECTS57
TYPE OF DATA
Quantitative
(numeric)
Qualitative
(narrative based)
Mixed method (quantitative &
quantitative)
MOST USEFUL FOR
Measuring magnitude of changes
Collecting objective, measurable data
Statistical analysis
Reporting to external interest groups (donors,
governments)
Contextual knowledge
Processes of change
Providing basis for quantitative questions
Uncertain outcomes, outcomes that are difficult
to measure (e.g. social relations, political
change),
Adaptive management and understanding
mechanisms
Combining strengths of both approaches for
different insights and audiences
Triangulation of understandings based on
information from different approaches
Reporting to external interest groups (donors,
governments)
SPECIFIC TOOLS AND METHODS
Structured questionnaires (closed questions) –
interviews or self-completed
Field survey data (transects, point counts etc.)
Direct measurements
Some participatory methods which involve ranking
and scoring
Focus group discussions
Field observation notes
Key informant interviews
Participant observation
Combining the collection of different data
types within single methods (e.g. qualitative and
quantitative questions within a household survey), or
using a range of methods within the evaluation (e.g.
focus groups and key informant interviews prior to a
household survey).
Some specific tools described in this toolkit use mixed
methods e.g. PIA methods, Basic Necessities Survey
DIFFERENCES BETWEEN QUANTITATIVE, QUALITATIVE AND MIXED DATA
COLLECTION (ADAPTED FROM WOODHOUSE ET AL. 2016)
STEP 2
HOW WILL YOU COLLECT
EVALUATION DATA?
2:2
Woodhouse, E et al. (2016) Evaluating the
impacts of conservation interventions
on human wellbeing. Guidance for
practitioners. IIED, London

INTRODUCTION & KEY CONCEPTS
DESIGNING & IMPLEMENTING THE EVALUATION
PRISM MODULES
METHOD FACTSHEETS & ANNEXES
PRISM - TOOLKIT FOR EVALUATING THE OUTCOMES AND IMPACTS OF SMALL/MEDIUM-SIZED CONSERVATION PROJECTS58
Can any existing data be used?
Start planning your data collection by reviewing the extent to
which existing data can be used. For example data from official
statistics, programme monitoring data, project records (project
proposal, a theory of change, minutes from relevant meetings,
etc.), formal policy documents, programme implementation plans
and progress reports may all be helpful. Data that can be used as
a baseline to track change over time are particularly useful. While
making use of existing data can save a lot of time and effort, it is
essential that data are of sufficient quality to still provide useful
information in relation to your evaluation questions. If data are
not of sufficient quality it may compromise the validity of the
evaluation results.
Do I need to control for bias?
Bias refers to errors during data collection or interpretation that
can affect the reliability of the evaluation results. For example
it may be difficult to compare reliably the results of bird surveys
conducted by two observers with very different levels of
ability. With most methods some level of bias is unavoidable. By
identifying the sources of this it is possible to work out whether it
will have a significant effect on the reliability of your conclusions
and whether or not it can be minimised, reduced or measured and
allowed for during analysis. If bias cannot be controlled in these
ways then a different method should be used. The table³ on the
following page covers some (but by no means all!) potential sources
of bias and strategies for addressing them.
STEP 2
CAN ANY EXISTING DATA BE USED?
³Cambridge handbook of ecological survey methods https://sunsetridgemsbiology.
wikispaces.com/file/view/Biodiversity+Handbook.pdf
2:2

INTRODUCTION & KEY CONCEPTS
DESIGNING & IMPLEMENTING THE EVALUATION
PRISM MODULES
METHOD FACTSHEETS & ANNEXES
PRISM - TOOLKIT FOR EVALUATING THE OUTCOMES AND IMPACTS OF SMALL/MEDIUM-SIZED CONSERVATION PROJECTS59
TARGET
Species & habitats
Stakeholders
STRATEGIES FOR MINIMISING/REDUCING BIAS
Record as much detail as possible and use the same methods, approach, analysis etc. across years, surveys & sites
Agree & record definitions (e.g. sample size, type population unit) beforehand
Calibrate observers against each other before & during data collection
Identify potential sources of bias and develop a sampling strategy that works to minimise these (see section on developing an appropriate sampling strategy)
Use the same observers/facilitators if possible, or calibrate observers against each other beforehand
Test the survey methods beforehand with a sample of the target audience
Use a timeline with participants to help them recall earlier conditions
TABLE: EXAMPLES OF POTENTIAL SOURCES OF BIAS AND STRATEGIES FOR MINIMISING THEM
POTENTIAL SOURCES OF BIAS
Some species/habitats may be easier to survey than others
Observers have differing levels of expertise
Variation in observer effort
Local conditions may affect data collection (e.g. weather)
Stakeholders with a particular viewpoint (e.g. favourable/ unfavourable to the project) are more likely to be involved in the evaluation
Some stakeholders may be easier to reach than others
Loaded or leading questions make certain responses more likely
Observers/facilitators have differing levels of experience
Some groups may be less likely to respond (e.g. based on age, gender, social status, etc.)
Participants’ memories can change over time
Participants may be unwilling to share certain pieces of information
STEP 2
DO I NEED TO CONTROL FOR
BIAS?
2:2
INTRODUCTION & KEY CONCEPTS
DESIGNING & IMPLEMENTING THE EVALUATION
PRISM MODULES
METHOD FACTSHEETS & ANNEXES
PRISM - TOOLKIT FOR EVALUATING THE OUTCOMES AND IMPACTS OF SMALL/MEDIUM-SIZED CONSERVATION PROJECTS60
Are the methods ethically sound?
Before implementing any data collection method it is important
that you go through an ethical review procedure to ensure that you
have thought about potential issues of this kind that the chosen
methods may raise in relation to the species, habitat or stakeholder
group being targeted. Failing to consider ethics can have severe
consequences for the validity of evaluation results and runs the
risk of having a negative effect on the project target, while also
potentially posing serious reputation risks for the organisation(s)
responsible for the project.
Refer to the factsheet: Developing ethical protocols for an
evaluation for more information.
Gender
Many conservation actions will have outcomes and impacts that
affect male and female stakeholders differently. Building gender
into your evaluation can therefore provide extremely useful
information and insights that would not be captured otherwise.
Refer to the factsheet: Developing gender protocols for an
evaluation for more information.
STEP 2
ARE THE METHODS
ETHICALLY SOUND?
2:2

INTRODUCTION & KEY CONCEPTS
DESIGNING & IMPLEMENTING THE EVALUATION
PRISM MODULES
METHOD FACTSHEETS & ANNEXES
PRISM - TOOLKIT FOR EVALUATING THE OUTCOMES AND IMPACTS OF SMALL/MEDIUM-SIZED CONSERVATION PROJECTS61
What sampling strategy should I use?
Adapted from Mwebaze, T (2014) - “How To”: Choose Sampling
Techniques for Evaluations: https://ecduganda.files.wordpress.
com/2014/08/how-to-choose-sampling-techniques-for-
evaluations.pdf
Sampling is the process of selecting units (e.g. people, sites, species)
from a population of interest, studying these in greater detail,
and then drawing conclusions about the larger population. The
evaluator collects data from a subset – a sample – and uses these
to make inferences about the entire story. For this to be reliable
however the key thing is that the characteristics of the sample
must reflect the characteristics of the population targeted by the
action.
STEP 2
WHAT SAMPLING STRATEGY SHOULD
I USE?
2:2
Photo credit: M. K. Poulsen

INTRODUCTION & KEY CONCEPTS
DESIGNING & IMPLEMENTING THE EVALUATION
PRISM MODULES
METHOD FACTSHEETS & ANNEXES
PRISM - TOOLKIT FOR EVALUATING THE OUTCOMES AND IMPACTS OF SMALL/MEDIUM-SIZED CONSERVATION PROJECTS62
TABLE: SAMPLING STRATEGIES FOR EVALUATION
DESCRIPTION
All units in the population have an equal opportunity of being selected, using a method that selects units completely at random.
Divide the population into meaningful homogenous or similar groups based on a given characteristic (e.g. age, gender, race, socioeconomic status), and then select a random sample from within each group.
Samples are drawn by starting at a randomly selected element in the sampling frame and then taking every nth element. This is easier to perform and hence is less subject to researcher errors than simple random sampling.
The sample is selected in stages, first selecting groups of elements, or clusters (e.g. city blocks, census tracts, schools), and then selecting individual elements from within each cluster (e.g. randomly or by systematic sampling).
The population is divided into groups according to important population characteristics. Then people familiar with the population choose individuals they believe can adequately represent that population’s characteristics (e.g. their viewpoints).
Sampling with a purpose in mind. Usually one or more specific target groups would be pre-defined. Purposive sampling can be very useful for situations where you need to reach a targeted sample quickly and where proportionality in sampling is not the primary concern.
A type of purposive sampling where existing participants recruit further subjects from among their acquaintances. A few potential respondents are contacted and asked whether they know of anyone else with the same required characteristics for the evaluation.
SAMPLING METHOD
Simple random sampling
Stratified sampling (random within target groups)
Systematic sampling (every nthperson)
Cluster sampling
Quota sampling
Purposive sampling
Snowball sampling (asking forrecommendations)
BEST WHEN
The whole population is available.
There are specific sub-groups to investigate (e.g. demographic groupings/ target sites).
A stream of subjects is available (e.g. people in the street).
Population groups are separated and access to all of them is difficult, e.g. in remote communities.
Time is limited, a sampling frame is not available and detailed accuracy is not important.
You are studying particular groups.
You are targeting subjects with something in common (e.g. hunters in a community).
STEP 2
WHAT SAMPLING STRATEGY SHOULD
I USE?
2:2

INTRODUCTION & KEY CONCEPTS
DESIGNING & IMPLEMENTING THE EVALUATION
PRISM MODULES
METHOD FACTSHEETS & ANNEXES
PRISM - TOOLKIT FOR EVALUATING THE OUTCOMES AND IMPACTS OF SMALL/MEDIUM-SIZED CONSERVATION PROJECTS63
What data collection methods should I use?
This section provides details on how to select appropriate data
collection methods from PRISM’s thematic modules.
With most outcomes/impacts there will be range of different
methods that could potentially be used to collect data. The PRISM
module chapters are designed to guide you towards methods that
are appropriate and feasible for the outcome/impact you are trying
to measure.
Start by taking each of the outcomes/impacts you identified in
steps 1 & 2 and see which of PRISM’s modules they relate to (see
table on following page). You can use the framework and summary
information within each module to guide you towards methods for
measuring change in relation to the outcome/impact of interest.
The first four modules focus on project stakeholders and
specifically on different dimensions of behaviour change by
stakeholders.
The fifth module, Species & Habitat Management, relates to
actions that are directly focused on restoring and/or reducing
threats to species and habitat(s), while also covering how to
evaluate the impact of conservation research and how to measure
changes in species & habitat status.
Projects looking at ecosystem services should refer to the
factsheet: Evaluating ecosystem services.
These modules have been selected because they cover a range
of outcomes and impacts that are commonly aimed for by small/
medium-sized conservation projects. Please remember that,
while the module chapters are designed to cover a wide range of
outcomes and impacts, they do not cover all the possible outcomes
and impacts that a small/medium-sized project may have. If the
particular outcome or impact you are trying to measure does not
feature in the module chapters it is still worth looking through
the methods, as many of them can be adapted to suit particular
scenarios and contexts.
Conservation actions will typically have multiple outcomes and
impacts, some of which may relate to different modules. For
example, training park rangers to conduct patrols may have
outcomes that relate to capacity development, attitudes &
awareness and/or species & habitat management. When selecting
methods it is important to focus on the primary outcomes and
impacts that any action is expected to achieve, and to look for
methods for each of them in the relevant module chapter.
STEP 2
WHAT DATA COLLECTION
METHODS SHOULD I USE?
2:2

INTRODUCTION & KEY CONCEPTS
DESIGNING & IMPLEMENTING THE EVALUATION
PRISM MODULES
METHOD FACTSHEETS & ANNEXES
PRISM - TOOLKIT FOR EVALUATING THE OUTCOMES AND IMPACTS OF SMALL/MEDIUM-SIZED CONSERVATION PROJECTS64
POSSIBLE MODULE
Attitudes and awareness
Capacity development
Livelihoods and governance
Policy
Species and habitat management
TABLE: THEMATIC MODULES SHOWING OUTCOMES AND IMPACTS COVERED
DESCRIPTION
Measuring changes in levels of stakeholder awareness and attitudes and whether these lead to changes in behaviour that benefit conservation.
Measuring changes in the ability of people, organisations or society to perform better, solve problems or manage their affairs successfully.
Measuring changes in relation to people’s livelihoods, well-being status and the governance arrangements that affect the lives of project stakeholders.
Measuring changes to rules, regulations and agreements that govern conservation targets.
Measuring changes in relation to the direct management of species or habitats.
SPECIFIC TOOLS AND METHODS
• Messages received by target audience• Audience has desired attitude• Audience has desired awareness/ knowledge• Audience adopts desired behaviour
• Individuals have improved skills• Individuals have greater confidence• Individuals apply new skills• Organisational performance improves• Networks and alliances have been formed/strengthened• Conservation actions are implemented more effectively
• Uptake of new or improved practices/ livelihoods activities• Progress towards secure tenure or resource rights for
communities• Community institutions have increased capacity• Governance arrangements give increased recognition/ respect• Well-being goals met• Damaging occupation/ livelihood abandoned or reduced
• Improved policy influence in government or multilateral institutions
• Improved policy influence in private sector• Environmental movement strengthened• New/improved policy and/or associated practice implemented.
• Knowledge improved• Action plan(s) developed & disseminated• Threats reduced• Recovery of species/habitats promoted• Species status improved• Habitat status improved
STEP 2
WHAT DATA COLLECTION
METHODS SHOULD I USE?
2:2

INTRODUCTION & KEY CONCEPTS
DESIGNING & IMPLEMENTING THE EVALUATION
PRISM MODULES
METHOD FACTSHEETS & ANNEXES
PRISM - TOOLKIT FOR EVALUATING THE OUTCOMES AND IMPACTS OF SMALL/MEDIUM-SIZED CONSERVATION PROJECTS65
Module chapter structure
Each module chapter contains an introduction, a diagrammatic
outcome/impact framework, a table of indicators & methods and
written summaries for each stage in the framework.
Each outcome/impact framework diagram illustrates how actions
lead to particular outcomes and impacts within each module (see
Figure 8). These frameworks are designed to:
1. demonstrate how your project’s actions and outcomes
might relate to overall conservation impact;
2. identify which stage of outcome or impact you want to
measure;
3. help to identify methods that are appropriate for your
particular actions.
Most projects will not measure change across all possible
outcomes and impacts in these frameworks; once you have
identified the stage in the framework that is most relevant to
the outcome/impact you are trying to evaluate, you can use
the information in the table and written summaries to select
appropriate methods. The frameworks help to explain how the
outcome/impact being measured relates to expected overall, long-
term conservation impact.
Methods are laid out in a factsheet format. Factsheets are located
in the appendices and via hyperlinks within the interactive toolkit.
STEP 2
MODULE CHAPTER STRUCTURE
CAPACITYDEVELOPMENT
ACTIONS
e.g. Training,Mentoring
Providing information,Forming alliances
& networks
1. Individualshave improved
skills
2. Individualshave greater
confidence
3. Individualsapply new
skills
4. Organizationalperformance
improves
6. Conservationactions are
implemented moreeffectively
Threats decrease Improvement inbiodiversity status
5. Networks & alliances formed /
strengthened
FIGURE 8: EXAMPLE FRAMEWORK (TAKEN FROM
PRISM CAPACITY DEVELOPMENT MODULE)
ActionsImpact on Biodiversity
Intermediateoutcomes
Threat reduction outcomesOutputs
2:2

INTRODUCTION & KEY CONCEPTS
DESIGNING & IMPLEMENTING THE EVALUATION
PRISM MODULES
METHOD FACTSHEETS & ANNEXES
PRISM - TOOLKIT FOR EVALUATING THE OUTCOMES AND IMPACTS OF SMALL/MEDIUM-SIZED CONSERVATION PROJECTS66
Completing your evaluation plan
Once you have identified your evaluation questions and methods
it is important to plan and map out how data will be collected,
specifically when it will be collected, who will collect it and an
estimate of how much it will cost.
See Factsheet: Completing an evaluation plan for a simple template
that you can use, modify or adapt to your particular project to map
out and plan your evaluation data collection.
2:2
STEP 2
COMPLETING YOUR EVALUATION
PLAN

INTRODUCTION & KEY CONCEPTS
DESIGNING & IMPLEMENTING THE EVALUATION
PRISM MODULES
METHOD FACTSHEETS & ANNEXES
PRISM - TOOLKIT FOR EVALUATING THE OUTCOMES AND IMPACTS OF SMALL/MEDIUM-SIZED CONSERVATION PROJECTS67
WHAT DO YOU NEED TO KNOW?
CHECKLIST
• Have you reviewed potential evaluation
designs?
• Have you selected an appropriate design for
your project?
• Have you decided what kind of data you will
need (quantitative, qualitative or both)?
• Have you considered potential sources of bias
and how these can be minimised, reduced or
controlled for?
• Have you developed a sampling strategy?
• Have you developed ethical and gender
protocols?
• Have you selected appropriate methods from
PRISM’s modules?
POTENTIAL WAY OF REDUCING COSTS
Use smaller sample sizes
Make more use of existing data
Reconstruct baseline data (e.g. by using participant recall)
Simplify evaluation design(e.g. one that does not require a baseline/counterfactual)
Use less resource intensive data collection methods(e.g. focus groups/direct observation instead of questionnaires)
WHAT DATA DO YOU NEED TO COLLECT? – TIPS FOR REDUCING TIME/COSTS
CHALLENGES
- May result in reduced accuracy
- Existing data may be insufficient to answer evaluation questions
- People’s memories can change over time
- Often a trade-off between design simplicity and quality/validity of results
- Often a trade-off between low-intensity methods and quality/validity of results
SOLUTIONS
- Check at regular intervals to ensure sufficient data are being collected
- Only use if quality, relevance and accessibility of data are sufficient
- Use a systematic approach for collecting data e.g. PIA, interviewing key informants, focus groups
- Review design options and ensure that the chosen option will still produce useful results
- Once methods have been chosen, return to the evaluation questions and ask again: will the chosen methods collect the data needed to answer these?
2:2

INTRODUCTION & KEY CONCEPTS
DESIGNING & IMPLEMENTING THE EVALUATION
PRISM MODULES
METHOD FACTSHEETS & ANNEXES
PRISM - TOOLKIT FOR EVALUATING THE OUTCOMES AND IMPACTS OF SMALL/MEDIUM-SIZED CONSERVATION PROJECTS68
Step 3 What can you learn from the results?
This is the stage of the evaluation where you analyse and interpret
your data and then interpret the data to find out what you can
learn from the results, and what the results mean in relation to the
overall aim of the project.
STEP 3
WHAT CAN YOU LEARN FROM THE
RESULTS?
STEP 3
QUESTIONS ADDRESSED IN THIS SECTION:
• How will you analyse your data?
o How should I enter, organise and clean data?
o What is the unit of analysis?
o What data analysis methods should I use?
o How should I compare data collected using
different methods?
o How should I present evaluation data?
• What do the results show?
o How should I interpret evaluation results?
2:3

INTRODUCTION & KEY CONCEPTS
DESIGNING & IMPLEMENTING THE EVALUATION
PRISM MODULES
METHOD FACTSHEETS & ANNEXES
PRISM - TOOLKIT FOR EVALUATING THE OUTCOMES AND IMPACTS OF SMALL/MEDIUM-SIZED CONSERVATION PROJECTS69
How will you analyse your data?
How should I enter, organise and clean data?
Adapted from Evaluation toolkit – Pell Institute: http://toolkit.
pellinstitute.org/evaluation-guide/analyze/enter-organize-clean-
data/
Once you have collected your data it will typically be in “raw” form,
for example:
• completed hardcopy questionnaires;
• field survey data;
• recordings of interviews or focus groups;
• video recordings of observations.
Typically, raw data are not very illuminating in this form. So before
you begin analysis, you will need to enter, organise and clean your
data.
Refer to the factsheet Entering, organising and cleaning data for
more information on how to do this.
What is the unit of analysis?
The first thing to that will determine how you analyse your data will
be your unit of analysis. A unit of analysis is the who, or what, that
is being analysed. For conservation projects the unit of analysis
could be sites, habitats, communities or individuals. Note that this
is different from your unit of data collection, for example you might
collect data from individuals, but for analysis these individuals are
grouped according to specific criteria (e.g. gender, age, job).
Examples: Action: Restore mangrove habitat at three coastal
sites.
Evaluation question: Has the project successfully
restored habitat at the target sites?
Unit of analysis: Site.
Action: Develop capacity of park staff to conduct
anti-poaching patrols.
Evaluation question: Has the project raised the
capacity of park staff to carry out more effective
patrols?
Unit of analysis: Individual park staff.
STEP 3
WHAT CAN YOU LEARN FROM THE
RESULTS?
2:3

INTRODUCTION & KEY CONCEPTS
DESIGNING & IMPLEMENTING THE EVALUATION
PRISM MODULES
METHOD FACTSHEETS & ANNEXES
PRISM - TOOLKIT FOR EVALUATING THE OUTCOMES AND IMPACTS OF SMALL/MEDIUM-SIZED CONSERVATION PROJECTS70
What data analysis methods should I use?
Options for analysing quantitative data
Analysing quantitative data involves examining numeric data (data
collected in the form of numbers) to look for patterns and trends
that can help you to answer your evaluation questions. Refer to the
Factsheet: Analysing quantitative data for more information and
examples.
STEP 3
WHAT DATA ANALYSIS
METHODS SHOULD I USE?
2:3

INTRODUCTION & KEY CONCEPTS
DESIGNING & IMPLEMENTING THE EVALUATION
PRISM MODULES
METHOD FACTSHEETS & ANNEXES
PRISM - TOOLKIT FOR EVALUATING THE OUTCOMES AND IMPACTS OF SMALL/MEDIUM-SIZED CONSERVATION PROJECTS71
Options for analysing qualitative data
Analysing qualitative data involves turning written or other kinds
of narrative data (such as interviews and field observation notes)
into results.
Refer to the factsheet Analysing qualitative data for guidance on
how to code and analyse qualitative data.
Qualitative evaluation data such as notes from focus group
discussions are often quite detailed and variable in structure.
Qualitative data analysis does not happen in a linear way; it is
often not a quick process but it can produce instructive and useful
results. The process of analysis involves critically reading and
interpreting your data, perhaps through a series of iterations, to
reach a shared understanding.
Mixed methods analyses - combining and comparing
quantitative & qualitative data
Adapted from Introduction to mixed method evaluations
(Bamberger 2012): https://www.interaction.org/sites/default/
files/Mixed%20Methods%20in%20Impact%20Evaluation%20
(English).pdf
Often in an evaluation you will want to use a mixture of data
from both quantitative and qualitative sources. Using such a
combination of data types can improve an evaluation by ensuring
that the limitations of one type are balanced by the strengths of
another. For example it is common to use quantitative data to
test whether a change has occurred, then to use qualitative data
to try to explain how the change happened. This will improve
understanding by integrating different ways of knowing. Most
evaluations will collect both quantitative data (numbers) and
qualitative data (text, images), however it is important to plan in
advance how these will be combined.
STEP 3
WHAT DATA ANALYSIS
METHODS SHOULD I USE?
Enriching
Exploring
Explaining
Exemplifying
Triangulating
Using qualitative data sources to identify issues or obtain information about variables that cannot be obtained by quantitative approaches
Generating hypotheses from qualitative data to be tested through the quantitative data
Where one set of options sheds light on unexpected findings derived from another set of options
Providing a case study to illustrate by example what is happening
Confirming or rejecting results from one data source using results from another
FIVE MAIN REASONS FOR COMBINING DATA SOURCES:
2:3

INTRODUCTION & KEY CONCEPTS
DESIGNING & IMPLEMENTING THE EVALUATION
PRISM MODULES
METHOD FACTSHEETS & ANNEXES
PRISM - TOOLKIT FOR EVALUATING THE OUTCOMES AND IMPACTS OF SMALL/MEDIUM-SIZED CONSERVATION PROJECTS72
How should I compare data collected using different methods?
Adapted from Equal Access Participatory Monitoring &Evaluation
toolkit: http://betterevaluation.org/toolkits/equal_access_
participatory_monitoring
In many evaluations data will be collected from a range of different
sources. Triangulation is the process that involves combining
multiple methods and perspectives with various types of data
sources in order to cross-check the results of your research. This
forms a crucial step in the evaluation process as it helps to reduce
the risk of bias associated with using a single data source.
Triangulation could involve any of the following:
• Drawing on qualitative data to cross-check the findings
from your analysis of quantitative data and to indicate
how widespread certain impacts and outcomes are.
• Using different participatory techniques to measure the
same indicator and then comparing the results. If the
results are similar they are more likely to be accurate.
• Comparing the themes in your field observations with
the themes in interviews and noting any changes over
time. Ask participants to explain these changes.
• Checking the consistency of what people say about the
same topic over time.
• Comparing the perspectives of people who have
different points of view (for example community
members, staff of local government agencies, and
conservation professionals familiar with the species/
site.
• Checking interview data against programme
documentation and other written evidence that can
verify what participants reported.
STEP 3
HOW SHOULD I COMPARE DATA
COLLECTED USING DIFFERENT
METHODS?FIGURE 10: TRIANGULATION USING MULTIPLE DATA
SOURCES
Field surveys
Questionnaire surveys
Key informant interviews
2:3

INTRODUCTION & KEY CONCEPTS
DESIGNING & IMPLEMENTING THE EVALUATION
PRISM MODULES
METHOD FACTSHEETS & ANNEXES
PRISM - TOOLKIT FOR EVALUATING THE OUTCOMES AND IMPACTS OF SMALL/MEDIUM-SIZED CONSERVATION PROJECTS73
How should I present evaluation data?
In order for data to be understood it needs to be displayed in a way
that allows you to identify trends and patterns within the data.
The way you visualise your data will depend on the kind of data you
have and what you are trying to show. See the Table right for some
options. A key point to make is that you will not need to visualise all
of your project’s results.
Refer to www.betterevaluation.org/plan/describe/visualise_data
and http://labs.juiceanalytics.com/chartchooser/index.html for
more information on each of the options listed in table.
STEP 3
HOW SHOULD I PRESENT
EVALUATION DATA?
TABLE: OPTIONS FOR VISUALISING DATA
USE THIS TOOLKIT TO
Scatterplot
Matrix chart
Network diagram
Bar chart
Block histogram
Bubble chart
Dot plot
Line graph
Stacked graph
Pie chart
Icon array
Treemap
Word cloud
Phrase net
Word tree
Species/habitat maps
Geotagging
GIS mapping
WHAT ARE YOU TRYING TO SHOW?
Relationship among data points
Compare sets of values
Changes over time
See parts of a whole
Analyse a text
See the world
2:3

INTRODUCTION & KEY CONCEPTS
DESIGNING & IMPLEMENTING THE EVALUATION
PRISM MODULES
METHOD FACTSHEETS & ANNEXES
PRISM - TOOLKIT FOR EVALUATING THE OUTCOMES AND IMPACTS OF SMALL/MEDIUM-SIZED CONSERVATION PROJECTS74
What do the results show?
How should I interpret evaluation results?
This involves looking at the results to determine what lessons
can be learnt and what the results mean in relation to the overall
success of the project.
Interpreting your results is part science, part art. It requires the
ability to think critically to make judgements in relation to your
evaluation questions, based on the information you have gathered,
your understanding of the risks, assumptions and external factors
that may influence the project’s outcomes and impacts and any
potential sources of bias (see the controlling bias section of Step 2)
There is a temptation to be overly scientific and to focus too much
on quantitative results (e.g. numbers or graphs). However, the most
useful interpretations are typically those that carefully consider
the information available, and then use this information to provide
an interpretation of what happened to explain the project’s results.
For example, the fact that long term impacts are not measurable
within the project’s timeframe means that you will often need to
use information collected on intermediate outcomes to explain
the likelihood of future impacts. Equally you may find it impossible
to isolate and collect data on all the different factors, risks and
assumptions that may influence the project’s outcomes and
impacts, so you may often need to examine qualitative evidence
(interpretations) both from participants and from your own
observations and understanding of the situation, to explain and
contextualise the project’s results.
STEP 3
WHAT DO THE RESULTS SHOW?
2:3
Photo credit: Jeremy Madeiros
INTRODUCTION & KEY CONCEPTS
DESIGNING & IMPLEMENTING THE EVALUATION
PRISM MODULES
METHOD FACTSHEETS & ANNEXES
PRISM - TOOLKIT FOR EVALUATING THE OUTCOMES AND IMPACTS OF SMALL/MEDIUM-SIZED CONSERVATION PROJECTS75
EXAMPLE
Project: A team in the Quang Tri province of Vietnam aimed
to protect and restore forest in the buffer zone of Dakrong
Nature Reserve. The project encouraged households to sign
10 year forest protection agreements that, in exchange for
preserving the forest, provided households with the right
to extract rattan and other non-timber forest products, and
provided additional funding to enrich a one hectare patch with
rattan seedlings for future harvesting.
Evaluation questions:
• How much income is expected by rattan cultivation?
• Has the project had an impact on stakeholder livelihoods/
wellbeing?
• Has the project given local people more of an incentive to
manage forest resources more sustainably?
• To what extent has the project brought about a change in
the way local people manage forest resources?
Evaluation methodology: The team used a mixed methods
approach, combining an economic evaluation (to estimate
future income from rattan), Participatory Impact Assessment
(to evaluate householders’ perceptions of the project’s impact)
and Key Informant Interviews with key community members
and employees of the local forest protection department.
Results: The economic evaluation suggested that, once ready
for harvesting, rattan has the potential to provide participating
households with a valuable secondary source of income by
providing, at current market rates, the equivalent of 10 days’
paid work per year. Despite this, participatory evaluation
showed that many households regarded the economic benefits
of rattan as relatively limited, with the main limiting factors
being the long time it takes rattan to grow large enough to
harvest (5-10 years) and the availability of local rattan markets.
Combining rattan enrichment with forest protection contracts
proved popular among participating households, with results
suggesting that this approach helps to give participating
households an increased feeling of ownership over the land
covered by the agreements and an increased incentive to
manage the forest in a sustainable way. Furthermore the
contracts led to a change in behaviour where participating
households now actively monitor the areas under contract.
Contracts were found to be very popular with interviewed
forest protection department staff, who see them as having
made their work a lot easier by compelling households to
monitor the areas under contract.
Interpretation: The team interpreted the results as suggesting
that pairing rattan enrichment with long-term forest protection
contracts can help to deliver positive results where contracts
provide an immediate benefit to households by giving them an
incentive to conserve the land under contract and to adopt new
behaviours that prevent further degradation. This evaluation
suggests that this approach may offer significant advantages
over a project that only provides support for rattan enrichment
where benefits to households will not be felt until rattan has
grown large enough to harvest.
STEP 3
WHAT DO THE RESULTS SHOW?
2:3
INTRODUCTION & KEY CONCEPTS
DESIGNING & IMPLEMENTING THE EVALUATION
PRISM MODULES
METHOD FACTSHEETS & ANNEXES
PRISM - TOOLKIT FOR EVALUATING THE OUTCOMES AND IMPACTS OF SMALL/MEDIUM-SIZED CONSERVATION PROJECTS76
Capturing learning
As well as the project’s results it is also important to capture
learning, by documenting it properly. During the project, everyone
may think that their learning is well understood, successfully
shared and built into adaptive responses, and there may be little
incentive for them to be conscientious about recording it, as long
as simply “getting on with the project” is the priority. But such a
record will be an important part of the legacy of the project, and
some discipline about this should be encouraged.
Ideally evaluations should be a two-way process, providing an
extremely useful opportunity for information exchange on the
context, situation or community the project is working in.
STEP 3
WHAT DO THE RESULTS SHOW?
WHAT CAN YOU LEARN FROM THE RESULTS?
CHECKLIST
• Have you analysed your data?
• Have you interpreted your results to answer
your evaluation questions?
2:3

INTRODUCTION & KEY CONCEPTS
DESIGNING & IMPLEMENTING THE EVALUATION
PRISM MODULES
METHOD FACTSHEETS & ANNEXES
PRISM - TOOLKIT FOR EVALUATING THE OUTCOMES AND IMPACTS OF SMALL/MEDIUM-SIZED CONSERVATION PROJECTS77
Step 4 What should be done next?
This is where you use the judgements you have made while
interpreting your results to make decisions about what should be
done next. If the project is on-going then you will usually want to
use the results to make improvements to the project. Results and
recommendations could also be shared with relevant stakeholders
to inform their decision making. Finally, you should also consider
whether the evaluation results could be shared more widely to
inform the work of other conservationists.
STEP 4
WHAT SHOULD BE DONE NEXT?
STEP 4
QUESTIONS ADDRESSED IN THIS SECTION:
• How will you use the evaluation results?
o Developing recommendations
o Can results be used to improve the project?
o How will results be communicated to external
audiences?
o Can results be shared with the wider
conservation community?
2:4

INTRODUCTION & KEY CONCEPTS
DESIGNING & IMPLEMENTING THE EVALUATION
PRISM MODULES
METHOD FACTSHEETS & ANNEXES
PRISM - TOOLKIT FOR EVALUATING THE OUTCOMES AND IMPACTS OF SMALL/MEDIUM-SIZED CONSERVATION PROJECTS78
How will you use the evaluation results?
Once interpreted, the results will then need to be written up so
that they can be communicated and, ultimately, applied. How you
do this will depend on which of the following you are trying to do:
1) use results to learn internally within the project; 2) communicate
results to external audiences, or 3) share results to inform the
wider conservation community. When beginning the process of
applying your results, a good place to start is by reminding yourself
who the evaluation stakeholders are and how the results will be
useful to them (see Step 1).
Developing recommendations
Evaluations often make recommendations about how a project or
project action can be improved, how the risk of project failure can
be reduced and whether a project should continue.
When developing recommendations, it is good practise to try and
involve stakeholders in developing and/or reviewing them as this
will help contribute to the use of the evaluation findings. If possible,
aim to follow up recommendations with evaluation users, e.g.
through annual reviews.
STEP 4
HOW WILL YOU USE THE EVALUATION
RESULTS?
2:4
INTRODUCTION & KEY CONCEPTS
DESIGNING & IMPLEMENTING THE EVALUATION
PRISM MODULES
METHOD FACTSHEETS & ANNEXES
PRISM - TOOLKIT FOR EVALUATING THE OUTCOMES AND IMPACTS OF SMALL/MEDIUM-SIZED CONSERVATION PROJECTS79
Can results be used to improve the project?
Adapted from – CDC Brief 7: Applying policy evaluation results
-http://www.cdc.gov/injury/pdfs/policy/Brief%207-a.pdf
One of the most significant benefits of an evaluation is that it
enables you to adapt and improve the action or project being
evaluated. This should be seen within the context of the project
cycle (see Section 1: when to use this toolkit) where your
evaluation results enable you to complete the cycle by informing
decision making. If possible, you should aim to re-visit the project’s
Theory of Change (or equivalent) and use your evaluation results
to make changes that take into account the lessons learnt from the
evaluation.
Unlike communicating evaluation results for external audiences
(which is usually done towards the end of the project), internal
learning from results can occur at any stage of the project cycle.
Evaluation results can be used for internal learning in the
following ways (among others):
- providing continuous feedback on project
implementation;
- identifying gaps in project implementation;
- eliminating or modifying project actions that are not
producing the desired results;
- adding further actions;
- identifying training and technical assistance needs;
- providing support for long-term planning;
- building support for future project actions;
- building support for acquiring resources;
- increasing communication between project
stakeholders.
Methods for applying your results internally can include:
- reflection meetings;
- developing an improvement action plan;
- annual reviews.
STEP 4
CAN RESULTS BE USED TO IMPROVE
THE PROJECT?
2:4

INTRODUCTION & KEY CONCEPTS
DESIGNING & IMPLEMENTING THE EVALUATION
PRISM MODULES
METHOD FACTSHEETS & ANNEXES
PRISM - TOOLKIT FOR EVALUATING THE OUTCOMES AND IMPACTS OF SMALL/MEDIUM-SIZED CONSERVATION PROJECTS80
How will results be communicated to external audiences?
Much of the guidance in this section has been informed by
the Better Evaluation page: report and support use: http://
betterevaluation.org/plan/reportandsupportuse
Identify requirements
When planning how you will communicate your results it is useful
to re-visit the section in step 1 where you identified the main uses
and users of the evaluation results. You can then design reporting
to address each use and each user.
Communicating with donors – A report presented to a funder/
donor will often be one of the main (and in some cases the only)
communication outputs of a project. Reporting should not be seen
as a box-ticking exercise to fulfil funding requirements. It should
instead be seen as an opportunity to communicate your findings
to show both what has been achieved and what has been learnt.
Many projects are reluctant to report results of actions that
produce unintended/negative results. The overwhelming majority
of funders however understand that conservation project actions
can be subject to a number of external influences, and they are
happy for projects to report unintended negative results, provided
that learning can be demonstrated. To get the most out of the
reporting process you should aim to maintain communication with
your donors, make use of any reporting guidelines/templates, and
develop reporting media that will be useful both to you and to the
donor.
Reporting timescales - A common challenge is that reporting
timeframes often require teams to report before the project’s long-
term outcomes and impacts become measurable. In this situation
it will be necessary to report on relevant intermediate outcomes
and include in your report an explanation of how these act as
predictors of outcomes and impacts further down the project’s
Theory of Change.
Design reporting media
Options for reporting media include:
Written materials (e.g. reports, news bulletins, website
communications) - The most important information should come
first, to allow readers to access easily the things they are most
interested in. This will often be the findings and recommendations,
which should thus appear early in the report. Less crucial details,
such as the evaluation background and methodology, belong in
an appendix or can even be posted elsewhere (e.g. online) for
reference.
See the factsheet Evaluation report template for a template that
can be used for an evaluation report.
Presentations (e.g. posters, Powerpoint, video) – Presentation
audiences are likely to be most interested in only a portion of
the full evaluation report, such as the key findings or a lesson
learnt about evaluation methods. Thus, it is wise to focus the
presentation on that portion, while making the full report available
to anyone interested.
STEP 4
HOW WILL RESULTS BE
COMMUNICATED TO EXTERNAL
AUDIENCES?
2:4
INTRODUCTION & KEY CONCEPTS
DESIGNING & IMPLEMENTING THE EVALUATION
PRISM MODULES
METHOD FACTSHEETS & ANNEXES
PRISM - TOOLKIT FOR EVALUATING THE OUTCOMES AND IMPACTS OF SMALL/MEDIUM-SIZED CONSERVATION PROJECTS81
Creative (e.g. infographics, cartoons, photographic reporting)
- Presenting your report in a creative manner may be the most
effective means to get your information across if the context
allows for it. You may consider working with an artist or a graphic
recorder to produce creative displays.
Ensure that results are simply presented and are accessible to a
wide range of different users
Techniques for increasing accessibility:
• Use plain language
• Remove visual elements that don’t contribute to the main
message
• Use visual techniques to draw attention to certain bits of
information
• Use descriptive chart titles to highlight key pieces of
information
• Use the one – three – twenty five principle where the
report takes the following format: a 1 page outline, a 3 page
executive summary and 25 pages to present the findings and
methodology.
STEP 4
HOW WILL RESULTS BE
COMMUNICATED TO EXTERNAL
AUDIENCES?
2:4

INTRODUCTION & KEY CONCEPTS
DESIGNING & IMPLEMENTING THE EVALUATION
PRISM MODULES
METHOD FACTSHEETS & ANNEXES
PRISM - TOOLKIT FOR EVALUATING THE OUTCOMES AND IMPACTS OF SMALL/MEDIUM-SIZED CONSERVATION PROJECTS82
Develop a narrative
However you synthesise your results your evaluation will have a
much wider reach if you are able to build a narrative that can be
easily understood by readers who may not be familiar with the
project. Remember that a good narrative does not just present
results, but uses these results to tell a story.
A simple narrative can be built using your evaluation questions:
STEP 4
DEVELOP A NARRATIVE
EXAMPLE 1
What change(s) occurred? - Over the course of the project,
the number of poaching snares found per patrol went from an
average of 3 to 0.5
To what extent were any change(s) due to the project? - An
evaluation design, which measured the difference between
patrols at the project site and a similar area not targeted by the
project suggested that the majority of the observed change
in the number of snares being found was due to the project’s
training and outreach work
What do these results mean in relation to the project’s
overall aim? - These results are likely to have positive
implications for the project’s goal of increasing hunted species
populations by reducing poaching
What should be done next? - In light of these results
we recommend that the project’s actions be scaled up to
incorporate similar, neighbouring areas
EXAMPLE 2
What change(s) occurred? - Over the course of the project,
the perceived impact of Rattan on local livelihoods did not
change significantly
To what extent were any change(s) due to the project? - A
Participatory Impact Assessment found that local people
felt that Rattan was growing too slowly to deliver a regular
improvement to livelihoods
What do these results mean in relation to the project’s
overall aim? - These results mean that using Rattan as a sole
incentive is unlikely to deliver the project’s overall aim of
preventing further deforestation
What should be done next? - In light of these results we
recommend that projects that intend to use Rattan as an
incentive for forest protection should either find a way to
make Rattan grow faster, e.g. through training on cultivation
techniques) or provide additional incentives that delivers a
greater perceived benefit to stakeholders
2:4

INTRODUCTION & KEY CONCEPTS
DESIGNING & IMPLEMENTING THE EVALUATION
PRISM MODULES
METHOD FACTSHEETS & ANNEXES
PRISM - TOOLKIT FOR EVALUATING THE OUTCOMES AND IMPACTS OF SMALL/MEDIUM-SIZED CONSERVATION PROJECTS83
Can results be shared with the wider conservation community?
Why is it important to share results?
In addition to your main evaluation users, you should give thought
to whether your evaluation results can be shared in support of
evidence-based conservation more generally. This is particularly
relevant for projects that are carrying out:
• innovative/novel actions;
• actions that have not been applied in a similar setting
before;
• evaluation results which produced particularly
interesting/unexpected findings;
Sharing results and recommendations outside your organisation
allows the conservation community to learn from your successes
and failures, improving how well conservation works overall and
enables your project to extend its impact far beyond its particular
location or context.
It is particularly important to share the results of projects that did
not work as intended, to prevent others from wasting resources on
actions that are unlikely to be successful. Sharing ‘negative’ results
is increasingly common: in the Conservation Evidence journal, 31%
of the interventions whose success could be judged did not deliver
the hoped-for result.
As the success of conservation interventions may often be
context-specific, having more publicly available studies of a given
conservation action puts planners of future projects in a better
position to assess the likelihood of that action working for their
own project. It also enables actions to be compared, to assess
which of them are likely to work best in a given context.
STEP 4
CAN RESULTS BE SHARED WITH
THE WIDER CONSERVATION
COMMUNITY?
EXAMPLE
Sharing results publicly can have wide-ranging and unexpected
benefits for other conservationists. In early 2007, the
Conservation Evidence journal published a paper on Critically
Endangered Echo parakeets in Mauritius. Chicks in nest holes
were dying after being covered in slime from giant African land
snails, so conservationists put copper bands around nest
trees, which appeared to reduce chick deaths as the snails
were reluctant to cross the copper. Conservationists in the UK
read this paper and decided to apply it to a different problem
– the herbivory of the Critically Endangered red helleborine
in the UK. In May and June 2007 they tested the use of cages
with copper bands around the plants, and the plants with
copper bands were not damaged by slugs and snails. These
findings were published in the Conservation Evidence journal
in late 2007.
2:4
Williams, D.R., Child, M.F., Dicks, L.V., Ockendon, N., Pople, R.G., Showler, D.A., Walsh, J.C.,
zu Ermgassen, E.K.H.J. & Sutherland, W.J. (2017) Bird Conservation. Pages 95-244 in: W.J.
Sutherland, L.V. Dicks, N. Ockendon & R.K. Smith (eds) What Works in Conservation 2017.
Open Book Publishers, Cambridge, UK

INTRODUCTION & KEY CONCEPTS
DESIGNING & IMPLEMENTING THE EVALUATION
PRISM MODULES
METHOD FACTSHEETS & ANNEXES
PRISM - TOOLKIT FOR EVALUATING THE OUTCOMES AND IMPACTS OF SMALL/MEDIUM-SIZED CONSERVATION PROJECTS84
How can I share my results?
There are several ways in which you can share the results of your
work with the wider conservation community. One route is to
publish in traditional academic journals. However, this process is
often time consuming and expensive, and results may be rejected
for lack of scientific interest or lack of novelty.
A more straightforward option is to publish in the dedicated
practitioner journal run by the Conservation Evidence project
http://www.conservationevidence.com/collection/view , which
aims to share globally the experience of those in the front line
of conservation practice on the effectiveness of particular
conservation actions. The journal is free to publish in, and is also
open-access, so is free for other practitioners to read. To publish in
Conservation Evidence you must have:
• directly and quantitatively tested a conservation action;
• measured the results appropriately;
• made some kind of comparison, such as with the earlier
situation or with a control site. There is no need for the
study to be scientifically novel.
Studies are welcome in the journal on all aspects of conservation
action and do not need to be scientifically novel. Examining the
consequences of small interventions, such as changing the wording
on a sign or comparing different techniques for eradicating an
invasive species, is of particular interest. Broad programmes, such
as a large scale projects with multiple interventions, will usually
be of less interest, as they are harder to interpret. Conservation
Evidence does not include studies solely on monitoring methods,
species ecology or threats to biodiversity.
Full details, author guidelines and a template article can be found
at http://www.conservationevidence.com/collection/view.
A further such resources is the CMP Conservations Actions
& Measures Library (CAML), an open-source library of results
chains for the most common conservation actions: http://cmp-
openstandards.org/tools/caml/
STEP 4
HOW CAN I SHARE MY RESULTS?
WHAT SHOULD BE DONE NEXT?
CHECKLIST
• Have you developed recommendations?
• Have you developed a plan for applying results
internally?
• Do you know how you will communicate
results to external audiences
• Have you considered whether your
recommendations and results should
be shared with the wider conservation
community?
2:4

PRISM - TOOLKIT FOR EVALUATING THE OUTCOMES AND IMPACTS OF SMALL/MEDIUM-SIZED CONSERVATION PROJECTS85
SECTION 3 THEMATIC MODULES
PRISM - TOOLKIT FOR EVALUATING THE OUTCOMES & IMPACTS OF SMALL/MEDIUM-SIZED CONSERVATION PROJECTS
MODULE 1 AWARENESS & ATTITUDES
MODULE 2 CAPACITY DEVELOPMENT
MODULE 3 LIVELIHOODS & GOVERNANCE
MODULE 4 POLICY
MODULE 5 SPECIES & HABITAT MANAGEMENT
3:0

INTRODUCTION & KEY CONCEPTS
DESIGNING & IMPLEMENTING THE EVALUATION
PRISM MODULES
METHOD FACTSHEETS & ANNEXES
PRISM - TOOLKIT FOR EVALUATING THE OUTCOMES AND IMPACTS OF SMALL/MEDIUM-SIZED CONSERVATION PROJECTS86
CONTENTS SECTION 3
Section 3 Thematic Modules
Attitudes & Awareness
Capacity Development
Livelihoods & Governance
Policy
Species & Habitat Management
This section provides detailed guidance and methods to
measure outcomes and impacts relating to each of PRISM’s five
thematic modules, each of which covers a different category of
conservation action.
Use the framework and summary information within each module
to guide you towards specific methods for measuring change in
relation to the outcome/impact you are trying to evaluate.
3:0

INTRODUCTION & KEY CONCEPTS
DESIGNING & IMPLEMENTING THE EVALUATION
PRISM MODULES
METHOD FACTSHEETS & ANNEXES
PRISM - TOOLKIT FOR EVALUATING THE OUTCOMES AND IMPACTS OF SMALL/MEDIUM-SIZED CONSERVATION PROJECTS87
Attitudes & Awareness
Summary
In this chapter we provide guidance on how to evaluate the impact
of project actions that aim to affect attitudes and awareness of
stakeholders.
ATTITUDES & AWARENESS FACTSHEETS & ANNEXES
• Sample questions and scales for evaluating attitudes
and awareness actions
• Planning a successful attitudes/awareness action
SPECIFICALLY THIS MODULE COVERS:
What do we mean by attitudes and awareness?
What to consider when evaluating attitudes &
awareness outcomes/impacts.
Understanding how your project actions aim to change
attitudes and awareness.
Methods for evaluating attitudes & awareness
outcomes/impacts:
1. Messages disseminated to/received by target
audience(s).
2. Audience has desired attitude.
3. Audience has desired awareness/knowledge.
4. Audience adopts desired behaviour.
3:1

INTRODUCTION & KEY CONCEPTS
DESIGNING & IMPLEMENTING THE EVALUATION
PRISM MODULES
METHOD FACTSHEETS & ANNEXES
PRISM - TOOLKIT FOR EVALUATING THE OUTCOMES AND IMPACTS OF SMALL/MEDIUM-SIZED CONSERVATION PROJECTS88
What do we mean by attitudes and awareness?
Actions aimed at influencing attitudes and awareness, and which
ultimately lead to behaviour change, are important in many
conservation projects. When planning the evaluation, during the
design of the action, it is crucial to consider the ethical requirement
for these actions (see factsheet Developing ethical protocols for an
evaluation). Attitudes and awareness actions may be essential for
achieving the biodiversity target, for example, previous research
may have identified negative attitudes or low awareness as integral
to a threat: actions in this area can be a way of engaging with
the community and can be a source of unexpected information.
However, projects that target attitudes & awareness without
identifying a specific need, risk wasting time, being unethical and
not providing useful data.
Refer to the factsheet Planning a successful attitudes/awareness
action for more information.
Attitudes
The concept of attitude has had many definitions but is generally
accepted to be the evaluative judgement that a person makes
about a particular object or situation, with a key aspect being the
evaluation.
Attitudes are made up of three main parts:
• Knowledge (cognitive)
• Emotion (affective)
• Behaviour
Hence an attitude represents a summary of what a person
knows about something, how they feel about it and how they act.
Attitudes can be positive or negative and can vary in strength
(how resistant the attitude is to change, how strongly it influences
the way the individual thinks about other information, and how
important it is in guiding the individual’s behaviour). Research
suggests that stronger attitudes are primarily driven by the
emotional (affective) component.
ATTITUDES & AWARENESS
WHAT DO WE MEAN BY
ATTITUDES AND AWARENESS?
EXAMPLE
A person may have a negative attitude towards bats because
of: bats carrying diseases in their country (knowledge),
Halloween or vampire stories heard as a child (emotion) and/
or, the person having regularly been required to sweep up bat
droppings at their home or church (behaviour). A negative
attitude may make it difficult to persuade them that bats are
worth conserving. However, the negative attitude may also
not be a conservation concern - someone may think negatively
about going inside a cave because bats may be present, but
they may never do any harm to bats.
3:1
INTRODUCTION & KEY CONCEPTS
DESIGNING & IMPLEMENTING THE EVALUATION
PRISM MODULES
METHOD FACTSHEETS & ANNEXES
PRISM - TOOLKIT FOR EVALUATING THE OUTCOMES AND IMPACTS OF SMALL/MEDIUM-SIZED CONSERVATION PROJECTS89
Attitudes can be explicit or implicit. Explicit attitudes operate
on a conscious level with the holder being aware of their attitude
and adjusting their manner accordingly, while implicit attitudes
act at a subconscious level without the person being aware of the
reason for the attitude they hold. Dual attitudes may also be held,
where people hold an old implicit attitude that co-exists with a new
explicit attitude (or vice-versa).
Linking attitudes and behaviours
The link between attitudes and behaviours is potentially
contentious. It is generally accepted that attitudes can influence
behaviour, but when evaluating an attitude-behaviour link it is
essential to determine the correct target attitude to measure (it is
not always obvious) and acknowledge that there may also be many
other influential factors involved, for example perceived barriers
to action, habits, identity and social norms (see box on “Challenges
when measuring attitudes” below).
The factors influencing behaviour may differ between situations
and it is necessary to consider the numerous factors affecting
behaviour. Several behavioural theory models have been
developed to try to explain how attitudes link to behaviour, but
there is no single model that fully explains the attitude-behaviour
relationship.
ATTITUDES & AWARENESS
WHAT DO WE MEAN BY
ATTITUDES AND AWARENESS?
CHALLENGES WHEN MEASURING ATTITUDES
Although someone may be explicitly concerned about climate
change, they may drive a short distance to work if it is raining
rather than get out an umbrella or get their shoes wet; they
may take a short flight to see friends or family rather than
drive; or they may use a lot of energy for heating their home.
In these scenarios the individual’s attitude to climate change
has been surpassed by their attitude towards getting wet on
the way to work, or spending time with friends/family rather
than using slower forms of transport, or the cost and trouble of
installing home insulation.
Although it seems logical to promote positive environmental
behaviours by linking a person’s attitude towards climate
change with behaviours such as car sharing, public transport
or home insulation, these scenarios show how difficult it can
be to determine the specific attitudes that are influencing a
given behaviour. Therefore it can be difficult to identify which
attitude a project action should address and what needs to be
measured to evaluate the action.
3:1

INTRODUCTION & KEY CONCEPTS
DESIGNING & IMPLEMENTING THE EVALUATION
PRISM MODULES
METHOD FACTSHEETS & ANNEXES
PRISM - TOOLKIT FOR EVALUATING THE OUTCOMES AND IMPACTS OF SMALL/MEDIUM-SIZED CONSERVATION PROJECTS90
Awareness
Awareness raising actions within a conservation project may be
carried out for a variety of reasons. For example, awareness raising
initiatives may be used to:
• provide information and raise awareness within a
project team about the social context the project is
working within;
• integrate the project and staff within the local
community;
• initiate/support a desired behaviour change to reach a
particular project outcome;
• inform the community about general, local or global
conservation priorities not specific to the project but
potentially gaining support for future conservation
action.
A note of caution arises from the “knowledge deficit model”. This
is the idea that a negative behaviour is performed because the
individual is unaware of its negative consequences, and that if
this “knowledge deficit” is corrected, the behaviour will change.
However, increasing awareness or knowledge of an issue does
not necessarily lead to a change in attitudes or behaviours, since
there are normally many variables affecting whether a particular
behaviour occurs or not.
Social marketing
Conservation projects are increasingly using social marketing
approaches to influence behaviours in order to achieve
conservation goals. Emerging as a discipline in the 1970s, social
marketing is most widely used in the health sector, where it
influences behaviours such as smoking and alcohol use. Social
marketing applies the ideas and methods used in marketing to
“sell” attitudes, values and behaviours that benefit society at the
individual, local, national or broader scale, specifically aiming to
change behaviours, not just the attitudes or awareness about
an issue. The timeframe of intervention and behavioural effect
would limit the possibilities for use of social marketing within most
small/medium-sized conservation projects. An intervention aimed
only at changing attitudes or raising awareness would not be
considered as a social marketing intervention.
Social marketing in conservation may be used to promote positive
conservation behaviours where none existed before, or to reduce
the occurrence of negative behaviours. In social marketing there
is a strong emphasis on evaluation and particularly on the use of
quantitative data.
ATTITUDES & AWARENESS
AWARENESS
3:1

INTRODUCTION & KEY CONCEPTS
DESIGNING & IMPLEMENTING THE EVALUATION
PRISM MODULES
METHOD FACTSHEETS & ANNEXES
PRISM - TOOLKIT FOR EVALUATING THE OUTCOMES AND IMPACTS OF SMALL/MEDIUM-SIZED CONSERVATION PROJECTS91
What to consider when evaluating attitudes & awareness
outcomes/impacts
Check project design
Evaluating the effects of interventions designed to influence
attitudes and awareness is a critical part of a project and should be
planned at the design stage. The effects of these interventions may
be seen both within the project or among the audience, and may
occur over a variety of timescales.
It is important to identify the appropriate audience for the
message, which may be the individuals whose behaviour could
influence the success of the conservation goal, an influential peer
group around these people, or influential groups in the wider
community.
If possible you should aim to develop a robust Theory of Change
to associate the intervention with the target outcome. Although
it may not be possible to evaluate the effect of the intervention
on the desired biodiversity outcome, intermediate outcomes
can be evaluated, provided there is a clear link to the eventual
conservation target.
Timing of events is also important. For example, it is necessary
to consider the timing of the evaluation in relation to other
community activities, avoiding clashes with other activities or work
e.g. so that events maximise attendances, and to consider timing of
the message in relation to the target behaviour.
ATTITUDES & AWARENESS
WHAT TO CONSIDER WHEN
EVALUATING ATTITUDES & AWARENESS OUTCOMES/
IMPACTS
3:1
Photo credit: Iain Dickson

INTRODUCTION & KEY CONCEPTS
DESIGNING & IMPLEMENTING THE EVALUATION
PRISM MODULES
METHOD FACTSHEETS & ANNEXES
PRISM - TOOLKIT FOR EVALUATING THE OUTCOMES AND IMPACTS OF SMALL/MEDIUM-SIZED CONSERVATION PROJECTS92
Attributing outcomes & impacts to actions targeting attitudes
and awareness
The most appropriate evaluation designs for attitudes and
awareness are given below:
1) Matching designs - Identifying two or more groups of people,
one of which is subject to the project’s actions while the
other/s is/are not, then recording any changes. Evaluating
the effect of an intervention is achieved through assessing
attitudes or levels of awareness in each situation both prior to
the intervention and post intervention. A single comparison
of groups post intervention may also show some differences
between the groups, but this is less robust as there is no
information on an attitudes/awareness baseline for the
groups or on how similar the groups were to start with.
Data to demonstrate similarities in target audiences for the
different populations need to be collected in the pre-test. A
time series design can also be employed to assess persistence
of the attitudes or awareness within the target population.
Issues:
• Itisnormallyimpossibletofindtwogroupswithexactly
matchingcharacteristicsoutsideofarigorousscientific
experiment. However, similar groups may be found by
looking at broad characteristics such as type of employment,
ethnicity,ageorgender.Ifitisimpossibletofindsimilar
groups of people, it may be better to match people within
each group and evaluate their similarities/differences rather
than assessing the whole group. If there is the potential for
mixing of the people e.g. students who sit in two different
classes but who meet during playtimes, attitudes and/or
awareness can spread between the treatment population
and the control population, reducing the differences
seen between the two groups at the post intervention
assessment.
• Pre-testing can sensitise people to the attitudes/awareness
you are interested in and can affect the results they give in
subsequent surveys, e.g. if they know you are interested in
aparticularspeciesbecauseofsomequestionsinthefirst
survey, they may answer more positively about this species
in the second survey.
• Depending on the intervention, withholding activities
from one population while undertaking them with another
may be perceived to be unethical. This might be solved by
undertaking the activity with the control population at a
later date, after testing is complete.
ATTITUDES & AWARENESS
ATTRIBUTING OUTCOMES
& IMPACTS TO ACTIONS TARGETING
ATTITUDES AND AWARENESS
3:1

INTRODUCTION & KEY CONCEPTS
DESIGNING & IMPLEMENTING THE EVALUATION
PRISM MODULES
METHOD FACTSHEETS & ANNEXES
PRISM - TOOLKIT FOR EVALUATING THE OUTCOMES AND IMPACTS OF SMALL/MEDIUM-SIZED CONSERVATION PROJECTS93
2) Before-after designs
Time series design. Assessments of the attitudes/
awareness of the target audience are carried out prior to the
intervention, shortly after the intervention and several weeks
after the intervention. This series of assessments records
any change in attitudes/awareness and the persistence of
that change. People are likely to respond well immediately
post intervention, but the response may erode over time as
they revert to their usual social life and habits. This kind of
assessment is best performed using a comparison with a “no-
intervention” control group.
Single case before-after. If long-term follow up is not
possible, recording baseline information about people’s
attitudes/awareness before an intervention and repeating
a similar assessment after the intervention can give some
measure of whether the information has been understood
by the audience, and whether it has influenced attitudes and
awareness in the short-term.
Issues:
• Pre-testing can sensitise people to the attitudes/awareness
you are interested in and can affect the results they give in
subsequent surveys.
• Events apart from the intervention may affect people’s
attitudes/awareness in relation to a topic, for example if
the national news media pick up a story about an issue
similar to the one being addressed by the local project, this,
rather than the project intervention, may be the cause of an
influenceonpeople’sattitudes/awareness.
• With the single case before-after design, there is no
information about whether the attitude/awareness persists
inthelongerterm,soitisdifficulttolinkittoanypermanent
effect.
3) Participatory Impact Assessment - Asking people whether
they perceive that a change in their attitudes and awareness
has occurred between the time before and the time after the
intervention. The assessment can be made post-intervention
and can provide an indication of change.
Issues:
• PIA relies on people accurately and honestly recalling
their attitudes and awareness before the intervention. The
intervention may not have addressed an attitude they had
ever thought about, so there may be bias associated with
their perception of your desired results. Their recall also may
beinfluencedbyinputfromapeergroup.
ATTITUDES & AWARENESS
ATTRIBUTING OUTCOMES
& IMPACTS TO ACTIONS TARGETING
ATTITUDES AND AWARENESS
3:1

INTRODUCTION & KEY CONCEPTS
DESIGNING & IMPLEMENTING THE EVALUATION
PRISM MODULES
METHOD FACTSHEETS & ANNEXES
PRISM - TOOLKIT FOR EVALUATING THE OUTCOMES AND IMPACTS OF SMALL/MEDIUM-SIZED CONSERVATION PROJECTS94
Identifying questions and indicators for evaluating attitudes
and awareness outcomes/impacts
The type of questions asked and the manner in which they are
asked depends on the target attitude. It is important to make sure
that the indicator actually measures what you need to monitor
and is not just an indicator used in other projects in slightly similar
circumstances. Learning from other projects is valuable but the
information you collect needs to be specific to your project. Many
indicators may be unique to your situation, and choosing these is
justified if well-planned.
Considerations for selecting indicators for attitudes include:
• Sensitive data. Asking people to declare their feelings,
thoughts and opinions on a topic can be difficult, particularly
if the topic concerns sensitive or illegal behaviour. Cultural
differences between interviewer and respondent may
mean that there are unknown sensitivities about a topic,
there may be social pressures to present a particular
opinion to outsiders and/or there may be consequences
for the respondent outside the scope of the project. It is
crucial to seek guidance on the topic, establish whether any
sensitivities exist and adapt the intervention accordingly.
Special techniques exist for assessing sensitive questions
where the respondents’ information is anonymous, for
example the Randomized Response Technique. These
techniques require audience buy-in and trust in the
interviewer to ensure that the respondent does not feel they
are being tricked.
• Retrieval. People store memories in different ways.
Differences exist between short-term and long-term
memory, with long-term memories being episodic (about
life events), semantic (facts about the world) or procedural
(how to do actions, e.g. ride a bicycle). Memories are subject
to decay, where they are increasingly likely to be forgotten
as time passes, and interference, where the more frequently
something happens, the more difficult it is to distinguish the
memory of an individual event. For example, if you were to
ask what someone had for dinner two weeks ago they may
have trouble remembering specifically, due to decay and
because they had eaten several meals since, so potentially
confusing the information.
• Ability to judge and estimate. People compensate for
imprecise or incomplete memories by estimating. A concept
called the ‘availability heuristic’ has shown that the more
memories a person has on a subject, the more common
they think it is. The reverse is also true, where people think
something is rare if they cannot remember many events. This
translates into problems for trying to remember or assess
attitudes relating to events. For example, if you ask someone
to name six times they did something, such as ways they save
energy, they may find it easy and therefore have a positive
attitude about themselves and their ability to save energy.
However if you asked them to recall 12 times they did it,
they would find it harder and therefore have a more negative
attitude towards their energy saving abilities. These attitudes
may affect their answers to subsequent questions. People
also have a tendency to estimate rather than remembering
ATTITUDES & AWARENESS
IDENTIFYING QUESTIONS AND INDICATORS FOR
EVALUATING ATTITUDES AND
AWARENESS OUTCOMES/
IMPACTS
3:1

INTRODUCTION & KEY CONCEPTS
DESIGNING & IMPLEMENTING THE EVALUATION
PRISM MODULES
METHOD FACTSHEETS & ANNEXES
PRISM - TOOLKIT FOR EVALUATING THE OUTCOMES AND IMPACTS OF SMALL/MEDIUM-SIZED CONSERVATION PROJECTS95
accurately, so when asking someone for example how often
they collect wood in the forest, the person may think of it as a
daily task, forgetting all the days when they have not done it.
• Attitude construction. Historically there was an idea that
attitudes were pre-existing, stable, predictable and resistant
to persuasion. However a more modern outlook suggests
they are not stable, can frequently change and, importantly,
may be constructed on the spot. People may form an opinion
on a topic as a result of being asked about it. This constitutes
an attitude, but it may not be a strongly held one or one that
is influential on the desired behaviour, so an assessment
has to be made of whether this is relevant data for the
intervention.
Identifying indicators for awareness is less difficult than for
attitudes, but still holds several challenges. Again, the type of
questions asked and the manner in which they are asked depends
on the target answer. Considerations for selecting indicators for
awareness include:
• The type of awareness required. The awareness someone
has about a topic can be locally focused or more general. For
example, does the intervention intend to improve knowledge
about the lion population in the local area or about lions in
general?
• External context. Consider whether another organisation
or event informs the target audience about the topic outside
the scope of the intervention but within the timescale of
assessment. This is particularly important with time-series
designs where measurements a few weeks or months after
the intervention may be affected by events external to
the project. For example a coincidental television or radio
programme focusing on the same topic as the conservation
project may influence awareness in a way that the project
actions haven’t been able to do.
ATTITUDES & AWARENESS
IDENTIFYING QUESTIONS AND INDICATORS FOR
EVALUATING ATTITUDES AND
AWARENESS OUTCOMES/
IMPACTS
3:1

INTRODUCTION & KEY CONCEPTS
DESIGNING & IMPLEMENTING THE EVALUATION
PRISM MODULES
METHOD FACTSHEETS & ANNEXES
PRISM - TOOLKIT FOR EVALUATING THE OUTCOMES AND IMPACTS OF SMALL/MEDIUM-SIZED CONSERVATION PROJECTS96
Identifying indicators for behaviour change also presents
challenges. As discussed earlier, the link between attitudes/
awareness and behaviour change is typically indirect and non-
linear, affected by other factors such as social norms, perceived
barriers and actual barriers, which all influence whether a person
undertakes a desired action – their intention to undertake it is only
one factor, and the intention may be overridden by these other
factors. Behavioural change following an attitude or awareness
intervention may, therefore, be difficult to observe without other
interventions to deal with the other factors. However on occasions
behaviour change can occur directly and in a short time frame,
for example, a strong marketing exercise promoting the plight
of a species may cause a measurable response in the form of
increased donations or increased volunteer activity to support the
conservation of the species.
Considerations for selecting indicators for behaviour change
include:
• The behaviour required. The desired behaviour can be the
stopping of a negative behaviour (for example reducing
the exploitation of a species), or the pursuit of a positive
behaviour (for example growing more appropriate plants
for wildlife). Monitoring and evaluating whether a behaviour
has stopped often requires different methods from those
required for evaluating whether a behaviour has started.
For example, people may be reluctant to admit they were
doing something that negatively affected biodiversity as they
may think this makes them look bad, while people may be
very willing to say they are doing something positive to help
biodiversity as they may think this will make them look good.
• The scope and scale of the behaviour. A behaviour may
be locally specific to the biodiversity target or more
broadly related to conservation. For example very specific
indicators may be identified if the aim was to get a beach
clean (e.g. do people assist in events to remove rubbish, are
bins used, is there less rubbish over a particular period).
However, if people are being encouraged to take up a more
general behaviour, for example supporting conservation
organisations, they may become active members of a
range of organisations in different areas and support them
in different ways (e.g. financially, politically or practically
through volunteering), so it is difficult in these circumstances
to identify how many people have changed their behaviour.
• External context. As with the other indicators, if another
organisation or event informs the target audience about the
topic of interest outside the scope of the intervention but
within the timescale of assessment, this can affect the ability
to attribute change. This is particularly important with time-
series designs where the third measurement a few weeks
or months after the intervention may be affected by events
between intervention and assessment.
ATTITUDES & AWARENESS
IDENTIFYING QUESTIONS AND INDICATORS FOR
EVALUATING ATTITUDES AND
AWARENESS OUTCOMES/
IMPACTS
3:1

INTRODUCTION & KEY CONCEPTS
DESIGNING & IMPLEMENTING THE EVALUATION
PRISM MODULES
METHOD FACTSHEETS & ANNEXES
PRISM - TOOLKIT FOR EVALUATING THE OUTCOMES AND IMPACTS OF SMALL/MEDIUM-SIZED CONSERVATION PROJECTS97
Understanding how your project actions aim to change
attitudes and awareness
The Attitudes and Awareness Framework illustrates the route for
how interventions focussed on attitudes and awareness may lead
to a positive change in the conservation target for a project.
ATTITUDES & AWARENESS
UNDERSTANDING HOW YOUR
PROJECT ACTIONS AIM TO CHANGE ATTITUDES AND
AWARENESS
ACTIONS TO INFLUENCE
ATTITUDES AND AWARENESS:
e.g. Personal communication,public relations exercises,
environmentaleducation,
social marketing
1. Messagesreceived by target
audience
2. Audiencehas desired
attitude
3. Audience hasdesired awareness /
knowledge
4. Audience adoptsor ceases
targetbehaviour(s)
Threat(s) reduced Improvement inbiodiversity status
FIGURE 1: ATTITUDES AND AWARENESS OUTCOME
AND IMPACT FRAMEWORK
ActionsImpact on Biodiversity
Intermediateoutcomes
Threat reduction outcomesOutputs
3:1

INTRODUCTION & KEY CONCEPTS
DESIGNING & IMPLEMENTING THE EVALUATION
PRISM MODULES
METHOD FACTSHEETS & ANNEXES
PRISM - TOOLKIT FOR EVALUATING THE OUTCOMES AND IMPACTS OF SMALL/MEDIUM-SIZED CONSERVATION PROJECTS98
Framework notes
This framework is a simple Theory of Change that may work
over different timescales. Within the project’s lifetime, a social
marketing exercise to reduce a damaging behaviour caused by
attitudes that are not strongly held could bring about a change
in behaviour and subsequent improvement in the biodiversity
target quite rapidly. Over a longer timescale, changing something
like farming or hunting practices could take many years of effort
before an improvement in the target species population or habitat
is seen, so the complete Theory of Change may not be observed
within the lifetime of the project.
Where a rapid effect of an intervention on attitudes can be
observed, a project may detect a measureable improvement in
biodiversity status as an indicator of intervention impact. However,
it is much more likely that the project will be focused on one small
section of the framework presented.
For attitude and awareness actions, the observation of
behavioural change is usually the most desirable measure of
impact, particularly as people’s self-reported attitudes may differ
from their actions. However, given short timescales, observing
behavioural change may not achievable within the lifetime of
a small to medium-sized project. Furthermore, attitude and
awareness actions are commonly part of a complex programme of
activities that include policy, capacity, livelihoods and governance
actions. For example, laws may be put in place to stop a negative
behaviour, but if there is insufficient capacity or willingness to
enforce the laws, influencing people’s attitudes and awareness
about the behaviour would be necessary.
Although it may be difficult to be sure that the attitudes or
awareness being targeted by the intervention are crucial for
affecting the behaviour, well-executed preliminary investigations,
detailed project planning, and piloting the evaluation methods
should greatly increase the effectiveness of the evaluation.
ATTITUDES & AWARENESS
FRAMEWORK NOTES
3:1

INTRODUCTION & KEY CONCEPTS
DESIGNING & IMPLEMENTING THE EVALUATION
PRISM MODULES
METHOD FACTSHEETS & ANNEXES
PRISM - TOOLKIT FOR EVALUATING THE OUTCOMES AND IMPACTS OF SMALL/MEDIUM-SIZED CONSERVATION PROJECTS99
ATTITUDES & AWARENESS
METHODS FOR EVALUATING ATTITUDES & AWARENESS OUTCOMES/
IMPACTS
TABLE 1: EXAMPLES OF INDICATORS AND SUGGESTED METHODS
EXAMPLE INDICATORS
Project changes in response to audience feedback
Increased awareness of project by audience
Increased awareness of project by audience peers
Change in target attitude by audience
Change in associated, but not target, behaviour by audience
Change in target attitude by audience peers
Change in target awareness by audience
Change in target awareness by audience peers
Change in occurrence of target behaviour
OUTCOMES/ IMPACT
1. Messages received by target audience
2. Audience has desired attitude
3. Audience has desired awareness/ knowledge
4. Audience adopts desired behaviour
METHODS
Questionnaire
Key informant interview
Direct observation survey
Documentary evidence
Participatory photo evaluation
Questionnaire
Key informant interview
Direct observation survey
Questionnaire
Key informant interview Questionnaire
Direct observation survey
Indirect evidence
3:1

INTRODUCTION & KEY CONCEPTS
DESIGNING & IMPLEMENTING THE EVALUATION
PRISM MODULES
METHOD FACTSHEETS & ANNEXES
PRISM - TOOLKIT FOR EVALUATING THE OUTCOMES AND IMPACTS OF SMALL/MEDIUM-SIZED CONSERVATION PROJECTS100
Information relevant to all stages in the attitudes & awareness
framework
There are several methods for evaluating attitudes & awareness
outcomes. These vary in robustness, cost, effort and timescale.
Most evaluations relating to attitudes & awareness currently
use questionnaires but applied in different ways. Questions in
questionnaires can either be open, allowing the respondent scope
for providing free text answers, or closed, where the respondent
is asked to select from prescribed answers, or a mix of closed and
open options.
Piloting of any method is essential to assess its validity. Piloting is
a small-scale test of what will happen in the full evaluation. Piloting
assesses whether the approach for the evaluation is realistic
and is going to achieve the desired goal of accurately measuring
attitudes and awareness. A good pilot test will reveal problems
that can be addressed before the main evaluation takes place
(e.g. do people get bored and give up because the questionnaire
is too long? Are some questions unnecessary? Is the selected
interview approach a good method?). The pilot can also be used
for specific feedback on the evaluation process, to assess whether
a range of responses is being given, whether people are replying
with the required information and whether the evaluation can
be shortened. Importantly, the pilot can also help to reveal
whether the questionnaire is “internally valid”. An internally valid
questionnaire is one where the questions are understood by the
respondent, the questions gather the data required by the project,
and there are no alternative explanations for the results observed.
For example, asking someone what they feel about the statement
“I like wildlife” is open to many interpretations of the words “like”
and “wildlife”. A better way of approaching this would be to ask
questions that specify the object in question, for example (feeling)
“I think ladybirds are lovely to look at” combined with (behaviour)
“I have let a ladybird walk on my hand”.
Novel evaluation methods. Traditional methods may not be
appropriate in situations where literacy is low. There are also
more engaging ways to interact with an audience that can be more
fun. Examples of these include inviting people to draw pictures
representing scenes and examining prominence of specific objects,
or photo/video evaluation techniques where people are provided
with a camera and asked to photograph/film things representing
a proposed topic. Comparisons can be made in the subjects of the
drawings or photos before and after the intervention, or between
groups involved in the intervention and groups who are not.
ATTITUDES & AWARENESS
INFORMATION RELEVANT TO ALL STAGES IN
THE ATTITUDES & AWARENESS FRAMEWORK
3:1

INTRODUCTION & KEY CONCEPTS
DESIGNING & IMPLEMENTING THE EVALUATION
PRISM MODULES
METHOD FACTSHEETS & ANNEXES
PRISM - TOOLKIT FOR EVALUATING THE OUTCOMES AND IMPACTS OF SMALL/MEDIUM-SIZED CONSERVATION PROJECTS101
The numbers below relate to the boxes in Table 1 and Figure 1.
Refer to the Species & Habitat Management Module for methods
for evaluating changes in biodiversity status.
Outcome 1. Messages disseminated to/received by target
audience(s)
Potential data collection methods at this level include
Documentary evidence, key informant interviews &
questionnaires. Potential measures of impact include:
• qualitative records of information gained;
• project progress records highlighting changes in project
action.
Social media activity can provide data on spread of information,
while the distribution and occurrence of information materials
can give some indication of the spread of information throughout
a community. This information can be captured in the form of an
activity log or activity tracking sheet(s).
Potential measures include:
• location of leaflets/materials distributed;
• number of Facebook “likes”;
• number of hits on a website;
• sign-up rates to a campaign or organisation.
Main issues:
• With regard to audience attitudes and awareness,
any evaluation at this stage provides a very short-
term measure with no indication of the persistence
of the intervention effect. This means it is difficult to
be certain that the intervention will have an effect on
behaviour.
• Social media “likes” or website hits give some indication
of interest in the general population, but they are very
simple measures that may not engender any particular
change in behaviour within the population. Signing up
to organisations, events or campaigns demonstrates
interest in the topic, although this doesn’t necessarily
always mean it is positive.
• The social media measures are likely to be biased to the
younger portion of the population and therefore may
not necessarily indicate that the message is reaching
the target audience (unless those young people are the
target!).
ATTITUDES & AWARENESS
OUTCOME 1. MESSAGES
DISSEMINATED TO/RECEIVED
BY TARGET AUDIENCE(S)
3:1

INTRODUCTION & KEY CONCEPTS
DESIGNING & IMPLEMENTING THE EVALUATION
PRISM MODULES
METHOD FACTSHEETS & ANNEXES
PRISM - TOOLKIT FOR EVALUATING THE OUTCOMES AND IMPACTS OF SMALL/MEDIUM-SIZED CONSERVATION PROJECTS102
Outcome 2. Audience has desired attitude
Evaluation at this level looks at the uptake of the message by the
target audience. This should be assessed in the medium to long
term to validate persistence of the attitude.
Potential measures include:
• questionnaires on attitude held by audience;
• Participatory photo evaluation to determine how
people perceive the subject of interest, for example if
asked to take photos that represent the protected area,
do the photos hold positive or negative content;
• in the medium or long-term, questionnaires or key
informant interviews to assess the attitude held by
peers (family, friends, neighbours, colleagues) due
to dissemination of the message by members of the
audience.
Refer to the factsheet Sample questions and scales for evaluating
attitudes and awareness actions for some specific examples of the
type of questions that can be used to evaluate changes in attitudes.
Main issues:
• If no baseline information has been recorded (i.e. when
surveys are only carried out after the action), it will be
difficult (but not impossible) to assess any change in
attitude attributable to the intervention.
• People may express an attitude they do not actively
hold, either to meet perceived social expectations or
because their explicit attitude opposes the implicit
attitude that may actually affect their actions. For
example, if general attitudes are being assessed at
a meeting, people who think in opposition to the
prevailing attitude may not be willing to speak up or
agree with the main group attitude, in order to appear
to be in agreement with their friends, colleagues or
elders.
• A change in attitude does not necessarily determine a
change in behaviour.
• The context within which the information about the
attitude is gathered may affect the results of the
assessment. For example if carrying out a survey
in the local Wildlife Office, people may be more
attuned to presenting wildlife-friendly and positive
management attitudes than if in their own home; and
filling out a questionnaire may elicit different results
from those obtained by an interview. In a before &
after comparison, timing in relation to the seasons may
affect attitudes about plants or animals that are only
seasonally present in the area.
• With assessment of peers it may be difficult to separate
the attitude previously held from that gained from the
target audience member.
ATTITUDES & AWARENESS
OUTCOME 2. AUDIENCE
HAS DESIRED ATTITUDE
3:1

INTRODUCTION & KEY CONCEPTS
DESIGNING & IMPLEMENTING THE EVALUATION
PRISM MODULES
METHOD FACTSHEETS & ANNEXES
PRISM - TOOLKIT FOR EVALUATING THE OUTCOMES AND IMPACTS OF SMALL/MEDIUM-SIZED CONSERVATION PROJECTS103
Outcome 3. Audience has desired awareness/knowledge
Evaluation at this level looks at the uptake of the message by the
target audience, and should be assessed in the medium to long
term to validate persistence of the awareness.
Potential measures include:
• quizzes, questionnaires or non-literary assessments
of awareness held by the audience, for example asking
people to draw a woodland scene before and after
an event, then comparing the details included in the
pictures;
• in the medium or long term, key informant interview
assessments of the awareness of peers (family, friends,
neighbours, colleagues) about the message resulting
from dissemination by the members of the audience.
Refer to the factsheet Sample questions and scales for evaluating
attitudes and awareness actions for some specific examples of
the type of questions that can be used to evaluate changes in
awareness/knowledge.
Main issues:
• An absence of baseline information will make it difficult
to assess any change in awareness attributable to the
intervention.
• A change in awareness does not necessarily determine a
change in behaviour.
• Other awareness-raising activities, for example
television or radio shows, may affect results if there is
a gap between intervention and assessment, making it
difficult to attribute all knowledge, except the specific
situation awareness, to the intervention.
• With assessment of peers it may be difficult to separate
the awareness previously held from that gained from
the target audience member.
• The potential for negative side effects, for example
informing people about the uses of various species,
may mean the species gets exploited even more.
For example if the project is trying to stop people
harvesting a particular plant and selling it at market,
raising awareness may cause more people to go out to
find and harvest the plant.
ATTITUDES & AWARENESS
OUTCOME 3. AUDIENCE
HAS DESIRED AWARENESS/KNOWLEDGE
3:1

INTRODUCTION & KEY CONCEPTS
DESIGNING & IMPLEMENTING THE EVALUATION
PRISM MODULES
METHOD FACTSHEETS & ANNEXES
PRISM - TOOLKIT FOR EVALUATING THE OUTCOMES AND IMPACTS OF SMALL/MEDIUM-SIZED CONSERVATION PROJECTS104
Outcome 4. Audience adopts desired behaviour
Changing attitudes and/or awareness is one of the most
commonly used strategies for changing behaviour. It is important
to remember that changes to attitudes do not necessarily lead
to changes in behaviour, so if you are using this as your main
unit of measurement for assessing impact, you must be clear
about what evidence or theory you are relying on to suggest that
changing attitudes will lead to behaviour change and the desired
conservation effect. What makes this challenging to evaluate is
that, while a change in knowledge/attitudes/values can happen
relatively quickly (sometimes immediately) after an intervention,
changes in behaviour take longer to become apparent.
Indicators of behaviour change may also be evaluated through
questionnaires that assess people’s reports of their own or others’
behaviour, or through direct observation of the behaviour and
indirect information from other sources. Measuring behaviour
change is generally a much stronger predictor of conservation
success than changes in attitudes/awareness, so if at all possible,
efforts should be made to evaluate changes in behaviour.
Potential measures include:
• changes in attitudes and awareness will most commonly
be evaluated through questionnaires and interviews;
• objective observation of behaviour through observation
surveys (direct) or related signs (indirect). For example
it is possible to see whether people change their use of
cars by doing traffic surveys, or whether there is a rise
in volunteer work for local charities by interviewing
charity staff;
• Key informant interviews or focus groups to discuss the
occurrence of the target behaviour.
Refer to the factsheet Sample questions and scales for evaluating
attitudes and awareness actions for some specific examples of
the type of questions that can be used to evaluate changes in
behaviour.
Main issues:
• People misreporting the occurrence of the behaviour.
• The potential for a negative behaviour side effect of
the intervention, for example people swapping one
resource use behaviour (collecting wood from the
forest) for another behaviour (burning toxic rubbish
indoors).
ATTITUDES & AWARENESS
OUTCOME 4. AUDIENCE
ADOPTS DESIRED BEHAVIOUR
3:1

INTRODUCTION & KEY CONCEPTS
DESIGNING & IMPLEMENTING THE EVALUATION
PRISM MODULES
METHOD FACTSHEETS & ANNEXES
PRISM - TOOLKIT FOR EVALUATING THE OUTCOMES AND IMPACTS OF SMALL/MEDIUM-SIZED CONSERVATION PROJECTS105
ATTITUDES & AWARENESS
EXAMPLES
EXAMPLE OF AN INDIRECT INDICATOR
An intervention focused on increasing recycling behaviour by
raising awareness and changing attitudes. In order to evaluate
this intervention it would be possible to ask people how much
or what they were recycling. However the evaluation could
be strengthened by also counting the number of bins being
put out for recycling before and after the intervention, and
possibly by examining records of recycling volumes calculated
by the organisation involved in collection. These would give
an indication of whether the change in attitudes/awareness
resulted in a change in behaviour.
EXAMPLE OF EVALUATION DESIGN
It is can be difficult to establish the attitudes that influence
a particular behaviour, and the other factors that may be
involved in stopping someone with the desired attitude
performing the targeted behaviour. For example, the required
action may be to stop people visiting a forest where they are
impacting a local species or a valuable habitat. Interviews and
surveys may reveal that the reason people are visiting the
forest is to collect wood. Finding an alternative wood source
may be one proposed solution. If the alternative wood source is
provided and people are willing to use it, they may nevertheless
still visit the forest to exercise their dogs. The dog walking
hadn’t been the explicit primary aim of visits to the wood, but
it may come to be so, since the dogs still need walking and the
owners’ attitude to their pets’ health overrides their attitude
towards the wildlife or habitat. Despite the project’s success in
finding the new wood source, it now has a different problem to
deal with and must start again. Projects in complex situations
like these can be improved with good planning and design,
but also proper evaluation can demonstrate what has worked
and the value of information gained, in this case why the
wood collection was considered the primary forest use, how
that challenge was met and the additional lessons that were
learned.
EXAMPLE OF NEGATIVE BEHAVIOUR CHANGE
A project carried out an awareness raising campaign within the
range of a threatened species of beetle. One of the campaign
interventions explained how rare the beetle was, and that
it was under threat mostly from being harvested to be sold
to collectors, who would pay a lot of money for a specimen.
Very unfortunately the campaign had the negative impact of
increasing the harvesting rates, by informing people how they
could profit from harvesting.
3:1

INTRODUCTION & KEY CONCEPTS
DESIGNING & IMPLEMENTING THE EVALUATION
PRISM MODULES
METHOD FACTSHEETS & ANNEXES
PRISM - TOOLKIT FOR EVALUATING THE OUTCOMES AND IMPACTS OF SMALL/MEDIUM-SIZED CONSERVATION PROJECTS106
Capacity Development
Summary
This chapter contains methods for evaluating the outcomes and
impacts of capacity development actions being implemented by
small/medium-sized conservation projects. Areas covered:
CAPACITY DEVELOPMENT
FACTSHEETS & ANNEXES
• Example questions and scales for training evaluation
• Organisational capacity assessment tool
• Network health scorecard
SPECIFICALLY THIS MODULE COVERS:
What do we mean by capacity development?
What to consider when evaluating capacity
development actions
Understanding how capacity development actions
benefit conservation targets
Methods for evaluating capacity development
outcomes & impacts:
1. Improved skills/ knowledge
2. Improved empowerment/ confidence
3. Individuals apply new skills
4. Organisational performance improves
5. Networks and alliances have been formed/
strengthened
6. Conservation actions are implemented more
effectively
3:2

INTRODUCTION & KEY CONCEPTS
DESIGNING & IMPLEMENTING THE EVALUATION
PRISM MODULES
METHOD FACTSHEETS & ANNEXES
PRISM - TOOLKIT FOR EVALUATING THE OUTCOMES AND IMPACTS OF SMALL/MEDIUM-SIZED CONSERVATION PROJECTS107
What do we mean by capacity development?
There are many definitions of capacity development or capacity
building, all of which are very broad. Here we define capacity
development as:
Processes that improve the ability of people, organisations, or society to
perform better, solve problems or manage their affairs successfully.
Most projects tend to focus on just one level of capacity
development – usually the individual or organisation level.
Projects that develop individual capacity may still be contributing
to organisational capacity, since organisations need individuals
with the capacity to achieve their aims. Typical aims of individual
capacity development include increased skills and knowledge,
while typical aims of organisational capacity development include
improved governance, fundraising or strategic planning. It is useful
to understand how the different levels of capacity development
are interconnected, as shown in Figure 1.
CAPACITY DEVELOPMENT
WHAT DO WE MEAN BY
CAPACITY DEVELOPMENT?
Capacity development covers a variety of actions, including:
• training – to build skills and knowledge;
• building confidence;
• gaining practical experience or placements;
• mentoring and coaching;
• building networks and partnerships or alliances;
• providing resources such as funding, tools, or equipment.
Individual• Knowledge & skills• Confidence• Attitudes
Organisational• Strategic planning• Management• Resources
Enablingenvironment
• Policies• Social capital• Legal & regulatory
FIGURE 1: CATEGORIES OF CAPACITY
DEVELOPMENT ADAPTED FROM UNESCO IHE.
3:2
INTRODUCTION & KEY CONCEPTS
DESIGNING & IMPLEMENTING THE EVALUATION
PRISM MODULES
METHOD FACTSHEETS & ANNEXES
PRISM - TOOLKIT FOR EVALUATING THE OUTCOMES AND IMPACTS OF SMALL/MEDIUM-SIZED CONSERVATION PROJECTS108
What to consider when evaluating capacity development
actions
Check project design
Before carrying out capacity development actions it is important
to understand and assess what capacity needs exist among the
individuals or groups you will be working with. This may require an
initial data-gathering phase. The results will inform your Theory of
Change, and ideally these groups should be involved in designing
your Theory of Change.
You also need to understand how ready any organisation (or
individual) is to adopt the new knowledge or skills into their
practice. You may need to incorporate some preparatory work
into your action plan to understand this and to modify the plan
accordingly.
An evaluation programme should be designed as part of your
overall project planning in the beginning rather than at the end.
You can use the Theory of Change process to choose measures –
or indicators – that will assess the change – or outcome – that each
or your project steps aims to bring about. Questions to ask are:
1. What is the conservation goal that you wish to achieve
through capacity development?
2. How will your activities lead to this goal – and how will
you measure the changes you are bringing about – what
indicators will you use?
3. Do you need a baseline (using the indicators in 2 above)?
4. How will you be sure that the changes you are
measuring are the result of your actions rather than
other factors?
5. What resources and length of time do you need to do
this?
Practitioners often ask for tools to measure their capacity
development outcomes & impacts, whereas the most important
first step is to ask what you are trying to achieve, and therefore
which indicators are best suited to measure the change you are
aiming to bring about. This module includes examples of indicators
and methods that you can adapt for your own purposes, and we
suggest that you involve your team in this process. Indicators
developed by projects and organisations are likely to be more
relevant and useful to their own practices. Moreover, research has
shown that organisations are more likely to change how they do
things based on the results of their own evaluations.
CAPACITY DEVELOPMENT
WHAT TO CONSIDER WHEN
EVALUATING CAPACITY
DEVELOPMENT ACTIONS
3:2

INTRODUCTION & KEY CONCEPTS
DESIGNING & IMPLEMENTING THE EVALUATION
PRISM MODULES
METHOD FACTSHEETS & ANNEXES
PRISM - TOOLKIT FOR EVALUATING THE OUTCOMES AND IMPACTS OF SMALL/MEDIUM-SIZED CONSERVATION PROJECTS109
Attributing outcomes and impacts to capacity development
actions
You need to be able to show that the changes you are measuring
are a result of your capacity development activities as opposed to
other factors. Indeed, you need to consider whether your capacity
development actions brought about any change at all! In principle
you could use a matching design, comparing the capacities of
individuals or groups targeted by the project with those who were
not. However, in practice it is rarely possible to find a control group
that allows you to make a meaningful comparison, and so other
methods are a better use of time and resources.
For most evaluations of capacity development actions, data
collection will be carried out in the form of a before and after
design. This shows differences that your capacity action has made,
by measurements taken before you begin and then again at the
end. For example using pre- and post-course questionnaires to test
for an increase in knowledge or level of confidence resulting from a
training course.
The fact that most capacity development actions target specific
skills and capabilities means that they are more suited to before
& after designs than the other modules included in this toolkit,
particularly when carried out shortly after the action itself has
been carried out. These measurements can also be carried out at
a later date to track longer term outcomes & impacts, however in
this case it is essential to consider that other factors will come into
play with time. See the factsheet on before-after designs for more
information.
Key issues to consider when evaluating capacity development
actions
• Decide on the timeframe over which you will
measure your impact. The interval between capacity
development actions and end results in conservation
can be very long, and you need to select the timeframe
appropriate to your project.
• Results may be influenced by several different
organisations or projects, and will evolve over time.
Your project will need to understand this wider context
and then measure and report on the outcomes that are
a result of your capacity development activities within
the context of these other influences.
• You should aim to ensure that there is good ownership
of the process among the groups or individuals you are
working with – ideally they should be involved both in
the design of the capacity development activities and in
the evaluation process.
CAPACITY DEVELOPMENT
ATTRIBUTING OUTCOMES
AND IMPACTS TO CAPACITY
DEVELOPMENT ACTIONS
3:2

INTRODUCTION & KEY CONCEPTS
DESIGNING & IMPLEMENTING THE EVALUATION
PRISM MODULES
METHOD FACTSHEETS & ANNEXES
PRISM - TOOLKIT FOR EVALUATING THE OUTCOMES AND IMPACTS OF SMALL/MEDIUM-SIZED CONSERVATION PROJECTS110
CAPACITYDEVELOPMENT
ACTIONS
e.g. Training,Mentoring
Providing information,Forming alliances
& networks
1. Individualshave improved
skills
2. Individualshave greater
confidence
3. Individualsapply new
skills
4. Organizationalperformance
improves
6. Conservationactions are
implemented moreeffectively
Threats decrease Improvement inbiodiversity status
5. Networks & alliances formed /
strengthened
FIGURE 2: CAPACITY DEVELOPMENT OUTCOME/
IMPACT FRAMEWORK
CAPACITY DEVELOPMENT
UNDERSTANDING HOW CAPACITY DEVELOPMENT
ACTIONS BENEFIT CONSERVATION
TARGETS
ActionsImpact on Biodiversity
Intermediateoutcomes
Threat reduction outcomesOutputs
3:2

INTRODUCTION & KEY CONCEPTS
DESIGNING & IMPLEMENTING THE EVALUATION
PRISM MODULES
METHOD FACTSHEETS & ANNEXES
PRISM - TOOLKIT FOR EVALUATING THE OUTCOMES AND IMPACTS OF SMALL/MEDIUM-SIZED CONSERVATION PROJECTS111
Framework notes
• How will your capacity development lead to
conservation outcomes? The Theory of Change (or
equivalent) approach that we propose for projects
implementing PRISM (see factsheet Completing a
Theory of Change) asks you to be clear about the link
between your actions and the conservation impacts you
expect to happen as a result. By doing so, you explain
what assumptions you are making that lead you to
expect that your actions will bring about that desired
result. For example, if you are developing skills and
confidence among natural resource managers, your
Theory of Change (or equivalent) will show just how
and why you expect this to lead to improvements in
biodiversity status.
• Outcomes 1, 2, and 3 all relate to dimensions of
individual capacity development (as does stage 5 in
some cases). Stages 4 and 5 relate to dimensions of
organisational capacity development, while outcome 6
relates to the effect these changes in capacity have on
the delivery of conservation actions.
• Outcomes 1 and 2 can be evaluated immediately after
the capacity development action – for example by
using before-and-after questionnaires. Outcomes 3, 4,
5 and 6 are more complex to evaluate and can only be
evaluated some time after the capacity development
action has taken place.
CAPACITY DEVELOPMENT
FRAMEWORK NOTES
3:2
Photo credit: Jenny Merriman

INTRODUCTION & KEY CONCEPTS
DESIGNING & IMPLEMENTING THE EVALUATION
PRISM MODULES
METHOD FACTSHEETS & ANNEXES
PRISM - TOOLKIT FOR EVALUATING THE OUTCOMES AND IMPACTS OF SMALL/MEDIUM-SIZED CONSERVATION PROJECTS112
CAPACITY DEVELOPMENT
METHODS FOR EVALUATING
CAPACITY DEVELOPMENT
OUTCOMES & IMPACTS
TABLE 1: EXAMPLES OF INDICATORS AND SUGGESTED METHODS AT EACH STAGE (NUMBERS CORRESPOND TO
OUTCOMES AND IMPACTS LISTED IN THE FRAMEWORK ABOVE (FIGURE 1).
EXAMPLE INDICATORS
• Number & percentage of individuals that demonstrate an increase in desired knowledge and/or skills
• Number & percentage of individuals that demonstrate an increase in confidence to apply their knowledge or to solve a particular problem
• Number & percentage of individuals that demonstrate that they are applying their acquired skills or knowledge
• Number & percentage of individuals that can describe changes they have made to their practice as a result of the support received
• Number and description of cases where individuals have applied new skills
• Organisation demonstrating enhanced capacity in governance, leadership, etc.
• Organisation has improved strategic planning• Organisation demonstrates improved fundraising
capability
• Organisation demonstrates enhanced capacity in building and maintaining relationships with stakeholders
• Number of organisations/alliances collaborating• Number and percentage of supported CSOs
demonstrating improved support for citizens communities to take collective action
• Evidence of threat reduced or habitat managed as intended
OUTCOMES/ IMPACT
1. Individuals have improved skills
2. Individuals have greater confidence
3. Individuals apply new skills
4. Organisational performance improves
5. Networks and alliances have been formed/strengthened
6. Conservation actions are implemented more effectively
METHODS
Before & after questionnaire feedback form
Before & after questionnaire Training evaluation form
Before & after questionnaire
Organisational capacity self-assessment tool
Organisational capacity self-assessment tool
Network Health Scorecard
Threat reduction scoring
3:2

INTRODUCTION & KEY CONCEPTS
DESIGNING & IMPLEMENTING THE EVALUATION
PRISM MODULES
METHOD FACTSHEETS & ANNEXES
PRISM - TOOLKIT FOR EVALUATING THE OUTCOMES AND IMPACTS OF SMALL/MEDIUM-SIZED CONSERVATION PROJECTS113
Outcome 1. Individuals demonstrate that they have
acquired the desired knowledge and/or skills
Your Theory of Change and discussions on project aims will already
have revealed what kind of knowledge and skills your project aims
to develop. Therefore, the methods and indicators you use will be
based on measuring changes in these specific areas. For example,
you may wish to increase skills in a particular survey technique or
enhance knowledge of anti-poaching laws and regulations.
The most common method used to evaluate changes in knowledge
and skills is a before and after questionnaire or feedback form.
Questionnaires will ask individuals about their level of knowledge
or skills before and then after the training. It is important to note
that self-assessments are not objective (an individual may assess
their skill levels to be much higher or lower than they actually are).
A paired before and after test partially accounts for this, since it
is the same individual making both evaluations. A second type
of question could be a factual one – on the individuals’ level of
knowledge on the topic you are training in – such as knowledge
of policy or of threats to a habitat. Again it is preferable for
these questions to be asked before and then after the training.
However, there will be situations when this is not appropriate –
the individuals participating may feel threatened by being tested
on their knowledge, and this may create a poor environment for
the training. Note that testing for practical skill levels before and
after training can be time consuming, costly and in many cases is
not suitable, which is why questionnaire surveys are typically used
instead.
A powerful measure is a follow-up survey at a later date to evaluate
whether people are still applying the skills – i.e. to see whether any
change in skill level has persisted. This is covered under outcome 3
below.
Refer to the factsheet Example questions and scales for training
evaluation for some examples of the type of questions that can be
used to evaluate skills and knowledge.
CAPACITY DEVELOPMENT
OUTCOME 1. INDIVIDUALS
DEMONSTRATE THAT THEY
HAVE ACQUIRED THE DESIRED
KNOWLEDGE AND/OR SKILLS
3:2

INTRODUCTION & KEY CONCEPTS
DESIGNING & IMPLEMENTING THE EVALUATION
PRISM MODULES
METHOD FACTSHEETS & ANNEXES
PRISM - TOOLKIT FOR EVALUATING THE OUTCOMES AND IMPACTS OF SMALL/MEDIUM-SIZED CONSERVATION PROJECTS114
Outcome 2. Individuals demonstrate that they have
acquired the confidence and/or motivation to
apply the desired knowledge and/or skills
Confidence and motivation are an integral part of capacity
development. An individual may gain new skills through a training
course, but they also need to have the confidence or motivation to
apply these skills later. Before and after questionnaires, or if this
is not possible, post-training feedback forms. are normally used to
evaluate changes in confidence and motivation. Measuring levels
of confidence through self-assessments should avoid “leading
questions” but instead ask questions that elicit the respondent’s
own view of their confidence. Sometimes it is good to use several
methods to triangulate your results, you can check whether you
are getting a consistent answer. Carrying out surveys some time
after training is preferable, in order to evaluate whether any
change in levels of confidence/motivation has persisted –this is
covered in outcome 3 below.
Refer to the factsheet Example questions and scales for training
evaluation for some examples of the type of questions that can be
used to evaluate confidence and motivation.
Outcome 3. Individuals apply new skills or knowledge
This is a longer-term measure which is usually based on the same
questions and indicators used for evaluating outcomes 1 and 2,
but in this case is examining whether the change you have brought
about persists into the longer term. It requires following up with
individuals after the capacity development action has taken
place. Indicators will tell you whether individuals are using the
skills and knowledge they gained through your action. The most
common method for doing this is to use a follow-up questionnaire,
preferably paired with the questionnaire you used for measuring
immediate changes, because then you can compare the same
indicators over time.
Refer to the factsheet Example questions and scales for training
evaluation for some examples of the type of questions that can be
used to evaluate the application of skills.
The Most Significant Change method (MSC) is another, more
descriptive technique for exploring the ways in which new skills or
knowledge are applied.
Details concerning MSC and its use can be can be downloaded
here: http://www.mande.co.uk/docs/MSCGuide.pdf
CAPACITY DEVELOPMENT
METHODS FOR EVALUATING
CAPACITY DEVELOPMENT
OUTCOMES & IMPACTS
3:2

INTRODUCTION & KEY CONCEPTS
DESIGNING & IMPLEMENTING THE EVALUATION
PRISM MODULES
METHOD FACTSHEETS & ANNEXES
PRISM - TOOLKIT FOR EVALUATING THE OUTCOMES AND IMPACTS OF SMALL/MEDIUM-SIZED CONSERVATION PROJECTS115
Outcome 4. Organisational performance improves
Many projects focus on developing the capacity of organisations
rather than developing the technical capacity of individuals. This
is often the case where the main barrier to achieving conservation
goals is not a lack of technical capacity among individuals but
rather an organisational lack of capacity in areas such as planning,
leadership or fundraising.
The way you evaluate changes in organisational capacity will
depend on the scale of the organisation.
For evaluating changes in the organisational capacity of
community based organisations (CBOs) refer to the factsheet:
Community-based Organisational Capacity Assessment which
details a simple tool for evaluating changes in the capacity of CBOs
For evaluating changes in the organisational capacity of NGOs,
please refer to the factsheet: Organisational Capacity Assessment
Tool
As for the other evaluations, we recommend that you carry out the
assessment before and after the capacity development action. If
the action is only targeting specific areas of organisational capacity
(e.g. leadership, fundraising) then the assessment can be restricted
just to these areas.
Other resources
For another list of organisational capacity indicators and
associated tools, look up the following resource from BOND (a UK
membership body for NGOs). They group organisational capacity
issues under the following headings:
• Improved internal organisation;
• Improved programme management;
• Improved external relationships.
BOND – Assessing effectiveness in building the capacity of
organisations & institutions: https://my.bond.org.uk/sites/default/
files/impact-builder/CapacityDevelopment.pdf
CAPACITY DEVELOPMENT
METHODS FOR EVALUATING
CAPACITY DEVELOPMENT
OUTCOMES & IMPACTS
3:2

INTRODUCTION & KEY CONCEPTS
DESIGNING & IMPLEMENTING THE EVALUATION
PRISM MODULES
METHOD FACTSHEETS & ANNEXES
PRISM - TOOLKIT FOR EVALUATING THE OUTCOMES AND IMPACTS OF SMALL/MEDIUM-SIZED CONSERVATION PROJECTS116
Outcome 5. Networks and alliances have been formed/
strengthened
Evaluation at this stage involves looking at the networks & alliances
that have been formed/strengthened as a result of the project’s
actions. For example, alliances may have been formed with other
NGOs, government institutions or with local community groups/
networks.
Before evaluating the effect the project has had on networks it is
crucial that you first clarify what it the main aim of the network
is. E.g. strengthening communication with local or national
government, promoting/strengthening advocacy work or
promoting good practise in a particular sector.
Evaluations can be made using Questionnaire surveys,
administered to those within the network. Other options include
completing a network health scorecard (See Network health
scorecard) before and after the project. The partnerships &
networks section of the Organisational Capacity Assessment
tool, used before and after the project, can also be applied in this
context.
Outcome 6. Conservation actions are implemented more
effectively
Evaluation of this stage involves looking at whether improvements
in capacity then led to subsequent changes in the delivery of
conservation actions. Most capacity development actions are
aimed at creating the conditions for further conservation actions,
which in many cases will not form part of the project. For example
a project training park rangers to carry out more effective patrols
will not be involved in ensuring that the skill delivered in the
training are applied in other day to day management activities of
the park.
This makes evaluating these outcomes/impacts beyond the
reach of most small/medium-sized projects carrying out capacity
development actions. However it may sometimes be possible,
particularly if the capacity development action was targeting a
specific practise or behaviour linked to a conservation threat,
to evaluate whether or not the capacity delivered had an effect
on the delivery of actions relating to that threat. In these cases
a threat reduction assessment (See factsheet Threat reduction
scoring) can be used to gauge the effectiveness of the delivery
of the capacity delivered. Although care will need to be taken to
ensure that any change is due to the capacity delivered by the
project and not due to factors not due to the project.
Further reading
Capacity for Conservation: http://capacityforconservation.org/
M&E of Capacity Building, is it really that difficult?: https://www.
intrac.org/wpcms/wp-content/uploads/2016/09/Praxis-Paper-23-
Monitoring-and-Evaluating-Capacity-Building-Nigel-Simister-with-
Rachel-Smith.pdf
PILAC – Manual on Training Evaluation: http://www.jica.go.jp/
project/cambodia/0601331/pdf/english/5_TrainingEvaluation.pdf
CAPACITY DEVELOPMENT
METHODS FOR EVALUATING
CAPACITY DEVELOPMENT
OUTCOMES & IMPACTS
3:2

INTRODUCTION & KEY CONCEPTS
DESIGNING & IMPLEMENTING THE EVALUATION
PRISM MODULES
METHOD FACTSHEETS & ANNEXES
PRISM - TOOLKIT FOR EVALUATING THE OUTCOMES AND IMPACTS OF SMALL/MEDIUM-SIZED CONSERVATION PROJECTS117
Livelihoods & Governance Summary
This chapter contains methods for evaluating the outcomes
and impacts of conservation projects attempting to improve
stakeholder livelihoods and/or improve governance. Areas
covered:
LIVELIHOODS & GOVERNANCE
FACTSHEETS & ANNEXES
• Participatory Impact Assessment (PIA) methods
• PIA Method 1: Before and after scoring
• PIA Method 2: Proportional piling
• PIA Method 3: Tally method
• PIA Method 4: Matrix scoring
• PIA Method 5: Before and after impact calendars
• Community Based Organisation Capacity
Assessment
• Community Mapping
• Basic Necessities Survey (BNS)
• Participatory Governance Assessment
• Participatory photo evaluation
SPECIFICALLY THIS MODULE COVERS:
What do we mean by livelihoods & governance?
What should I consider when evaluating livelihoods & governance outcomes and impacts?
Understanding how your project actions aim to change livelihoods & governance issues to benefit conservation
Methods for evaluating livelihoods & governance outcomes/impacts:
1. Uptake of new or improved practices/ livelihoods activities
2. Progress towards secure tenure or resource rights for communities
3. Governance arrangements give increased recognition/ respect
4. Community institutions have increased capacity
5. Well-being goals met
6. Damaging occupation/ livelihood abandoned or
reduced
3:3

INTRODUCTION & KEY CONCEPTS
DESIGNING & IMPLEMENTING THE EVALUATION
PRISM MODULES
METHOD FACTSHEETS & ANNEXES
PRISM - TOOLKIT FOR EVALUATING THE OUTCOMES AND IMPACTS OF SMALL/MEDIUM-SIZED CONSERVATION PROJECTS118
What do we mean by Livelihoods & Governance?
Livelihoods
Livelihoods are the means by which people seek to achieve their
life’s goals and other conditions which contribute to well-being
(see Section 1). Understanding people’s livelihoods is important to
knowing how to evaluate a project’s impact on the relationships
that people have with their environment and the choices they
make.
The ‘Sustainable Livelihoods Approach’ (SLA)4 is one framework
for understanding the complexity of people’s livelihoods, and the
impacts that conservation and development projects can have on
different people’s livelihoods and well-being.
A livelihood comprises the following elements:
• Capabilities are what people can do or what they can be
– this is often strongly influenced by their entitlements;
• Entitlements refer to people’s human rights, which
include economic, social, cultural and political rights;
• Assets are the resources people have access to, and
include both material and social resources;
• Activities are everything that people do with their
capabilities and assets as they strive to achieve desired
outcomes.
People require a range of assets to achieve positive livelihood
outcomes. Natural resources are just one set of the assets on
which livelihoods depend – if they are depleted or degraded,
people’s livelihoods will be threatened. No single category of
assets on its own is sufficient for people to survive, to live fulfilled
lives, and to achieve the varied livelihood outcomes that different
people seek. This is particularly true for poor people, whose access
to any given category of assets tends to be very limited.
People’s livelihoods are usually influenced by external factors
outside their direct control, and they are dependent on wider
policies, institutions and processes. These affect the complex
social, cultural, economic and political context within which
people pursue their livelihood strategies, and they may constrain
or broaden people’s options. A livelihood is sustainable when
it can cope with and recover from trends, stresses and shocks;
can maintain and enhance its capabilities and assets, both now
and in the future; and can do so without undermining the natural
resource base of present and future generations.
Livelihood strategies are the combination of activities that
people choose to undertake (or those that are left open to them
when the opportunity to pursue others is constrained) in order to
achieve their livelihood goals or outcomes. Livelihood outcomes
are what people achieve as a result of their livelihood strategies.
Different people will be motivated by achieving different livelihood
outcomes – not all of us want to achieve the same things.
LIVELIHOODS & GOVERNANCE
WHAT DO WE MEAN BY
LIVELIHOODS & GOVERNANCE?
4DFID (1999) Sustainable Livelihoods Guidance Sheets, No.2 – Framework. DFID. http://
www.eldis.org/vfile/upload/1/document/0901/section2.pdf
3:3

INTRODUCTION & KEY CONCEPTS
DESIGNING & IMPLEMENTING THE EVALUATION
PRISM MODULES
METHOD FACTSHEETS & ANNEXES
PRISM - TOOLKIT FOR EVALUATING THE OUTCOMES AND IMPACTS OF SMALL/MEDIUM-SIZED CONSERVATION PROJECTS119
FIGURE 1: COMPONENTS OF A LIVELIHOODS
FRAMEWORK
Figure 1: Components of a livelihoods framework. From: Bennett,
N.J and Dearden, P. (2014). Why local people do not support
conservation: Community perceptions of marine protected area
livelihood impacts, governance and management in Thailand.
Marine Policy, Volume 44, Pages 107–116. doi:10.1016/j.
marpol.2013.08.017
LIVELIHOODS & GOVERNANCE
WHAT DO WE MEAN BY
LIVELIHOODS & GOVERNANCE?
Capital Assets
• Natural Capital• Human Capital• Physical Capital• Financial Capital• Social Capital• Cultural Capital• Political Capital
Policies, Institutions and Processes
• Government (State & Local)• Private Sector• NGOs and CBOs• Laws and Policies• Governance• Management• Culture and Norms• Social Relations (Gender, Age, Class, Ethnicity)
History, Trendsand Shocks
• History• Politics• Markets• Population• Migration• Climate• Ecology• Environmental Change• Demography• Disease• Conflict• Technology
LivelihoodStrategies
NR-Based activities• Fishing and Collection• Agriculture and Plantations• Livestock• Eco-tourism
Non NR-Based• Rural Trade• Other services• Manufacture• Remittances• Other transfers
Livelihood Outcomes
Socio-Economic• Working days• Wealth/poverty• Well-being• Capabilities• Diversification• Food Security
Environmental• Habitats• Biodiversity• Productivity – fisheries• Ecosystem services• Sustainable natural resource base
LivelihoodPlatform
Influence and Accessmodified by
In contextof
Resultingin
With effectson
3:3

INTRODUCTION & KEY CONCEPTS
DESIGNING & IMPLEMENTING THE EVALUATION
PRISM MODULES
METHOD FACTSHEETS & ANNEXES
PRISM - TOOLKIT FOR EVALUATING THE OUTCOMES AND IMPACTS OF SMALL/MEDIUM-SIZED CONSERVATION PROJECTS120
Governance
A wide range of stakeholders, with various levels of power and
authority, may be involved in decisions on how land and natural
resources are managed. Governance is the means by which
society defines and makes decisions on goals and priorities, and
the mechanisms and roles through which different stakeholders
work to achieve them. It includes guiding principles, policies, laws,
social norms, and the institutions, at all levels, involved in making
decisions. These aren’t only government or legal institutions –
governance may involve informal institutional arrangements such
as voluntary codes of conduct for private businesses.
Good governance has eight major characteristics (see box).
There is evidence that good governance helps to provide
conditions for sustainable management of environmental
resources (as well as delivering a range of other social and rights-
related outcomes). For local communities, participation in decision-
making can help ensure that their knowledge is acknowledged and
valued, their needs are recognised, and that they have the power,
rights and capacity to control and make decisions on use and
access to land and resources.
LIVELIHOODS & GOVERNANCE
WHAT DO WE MEAN BY
LIVELIHOODS & GOVERNANCE?
CHARACTERISTICS OF GOOD GOVERNANCE
Good governance is participatory, consensus oriented,
accountable, transparent, responsive, effective and efficient,
equitable and inclusive and follows the rule of law. It assures
that corruption is minimised, the views of minorities are taken
into account, and that the voices of the most vulnerable in
society are heard in decision-making.
UNESCO
3:3
Photo credit: John Bett

INTRODUCTION & KEY CONCEPTS
DESIGNING & IMPLEMENTING THE EVALUATION
PRISM MODULES
METHOD FACTSHEETS & ANNEXES
PRISM - TOOLKIT FOR EVALUATING THE OUTCOMES AND IMPACTS OF SMALL/MEDIUM-SIZED CONSERVATION PROJECTS121
What should I consider when evaluating livelihoods &
governance outcomes and impacts?
Attributing outcomes and impacts to livelihood and governance
actions
The main guidance on this is located in the section on Choosing
an evaluation design. The designs likely to be of most value to
livelihoods & governance actions are:
1) Participatory Impact Assessment - This is an under-used
approach in conservation, but for small projects aiming to
evaluate complex interventions and likely to impact on a
range of indicators (such as those involving livelihood or
governance interventions), participatory designs can be
effective, affordable and practical. This type of approach can
be used to explore stakeholders’ perspectives of the impact
of the project on indicators selected by the project, or it can
be used in a very open way to explore what matters locally
and how the project has impacted more locally defined
indicators. (see Catley et al., 2013: http://fic.tufts.edu/assets/
PIA-guide_revised-2014-3.pdf for more information)
2) Theory-based designs - This approach depend on a very good
understanding of the mechanisms which drive change in
communities. It has potential limitations in that it is perhaps
less likely to detect issues which project implementers are
not aware of but which may be extremely important to local
stakeholders.
3) Before and after designs – The most commonly applied
design. However because of the complexity of social
responses to interventions on livelihoods, and the long-term
nature of projects and their impacts, there are real difficulties
with using this approach to attribute change to the livelihoods
& governance actions (although if conducted alongside a
participatory design, these difficulties can be overcome to
some extent).
LIVELIHOODS & GOVERNANCE
WHAT SHOULD I CONSIDER WHEN
EVALUATING LIVELIHOODS &
GOVERNANCE OUTCOMES AND
IMPACTS?
3:3

INTRODUCTION & KEY CONCEPTS
DESIGNING & IMPLEMENTING THE EVALUATION
PRISM MODULES
METHOD FACTSHEETS & ANNEXES
PRISM - TOOLKIT FOR EVALUATING THE OUTCOMES AND IMPACTS OF SMALL/MEDIUM-SIZED CONSERVATION PROJECTS122
Identifying questions and indicators for livelihoods &
governance outcomes/impacts
For some outcomes (e.g. uptake of new and improved resource
management practices) the questions and indicators can be
objective (i.e. they are based on fact, and aren’t influenced by an
individual’s emotions, opinions, or personal feelings). For example,
the simplest question would be one that focuses on measuring
the number of people who have adopted a new/improved/more
efficient resource management/harvesting practice. The type
and scale of the project - and the interests of the users of the
evaluation - will determine whether the questions and indicators
need to be targeted at the community level, the household level
or the individual level. In some cases it might be appropriate to
disaggregate information even further and have questions and
indicators that measure separately the different rates of uptake by,
for example, women compared to men; richer people compared to
poorer people; young people compared to elders etc. A judgement
- depending on the nature of the intervention (and the types of
people it targets) and the interests of the users of the evaluation -
will be needed to determine exactly how to focus the more generic
indicators given in Table 1.
For other outcomes (e.g. stakeholder well-being) the use of
pre-defined indicators is likely to be problematic, since well-
being relates to the perspective of the individual (their tastes,
values, feelings, etc.) and different individuals/households will
have different interpretations of what well-being means to
them. In these cases it will be usually be necessary to ask project
participants what changes in their lives they expect to occur (or if
the project has already taken place, what changes have occurred).
This is true also of many livelihoods outcomes, as impacts of
projects can be complex and indirect, and the choices people make
will vary – e.g. a small-scale horticulture project may increase farm
output, but increased production may be used to feed the family,
sold to raise cash to pay for school fees, or stored to reduce risk in
times of drought.
Well-being is conceptualised in three interacting dimensions:
material/objective wellbeing; relational wellbeing; and subjective
wellbeing (see Section 1); and these should form the basis of
question and indicator selection. The Social Assessment for
Protected Areas (SAPA)5 initiative measures household well-being
against the following indicators6:
- food security (material well-being);
- assets, for example quality of housing, ownership of a
radio or TV (material well-being);
- influence on decision-making at village level (relational
well-being);
- feeling of security (subjective well-being);
- the question “how’s life?” (overall well-being).
Participatory Impact Assessment methods (PIA Methods 1-5)
typically include a stage during which indicators are described and
refined with the participants.
LIVELIHOODS & GOVERNANCE
IDENTIFYING QUESTIONS AND INDICATORS FOR
LIVELIHOODS & GOVERNANCE
OUTCOMES/IMPACTS
5Franks, P and Small, R (2016). Social Assessment for Protected Areas (SAPA). Methodology Manual
for SAPA Facilitators. IIED, London. http://pubs.iied.org/14659IIED.html .
6Projects use different indicators according to their objectives, expected outcomes, and the specific
social context. For examples see the indicators in some of the following project documents:
• http://awsassets.panda.org/downloads/wwf_livelihood_booklet_final__july8_08.pdf
• http://portals.wi.wur.nl/files/docs/ppme/LMP_Indicators.pdf
• http://careclimatechange.org/files/toolkit/CBA_Framework.pdf
3:3

INTRODUCTION & KEY CONCEPTS
DESIGNING & IMPLEMENTING THE EVALUATION
PRISM MODULES
METHOD FACTSHEETS & ANNEXES
PRISM - TOOLKIT FOR EVALUATING THE OUTCOMES AND IMPACTS OF SMALL/MEDIUM-SIZED CONSERVATION PROJECTS123
Understanding how your project actions aim to change
livelihoods & governance issues to benefit conservation
LIVELIHOODS & GOVERNANCE
UNDERSTANDING HOW YOUR
PROJECT ACTIONS AIM TO CHANGE
LIVELIHOODS & GOVERNANCE
ISSUES TO BENEFIT CONSERVATION
GOVERNANCEACTIONS
e.g. Securing tenure, building capacity of
community organisations, Supporting recognition
of community orgs
LIVELIHOODSACTIONS
e.g. Developing alternative / diversified livelihoods, Maximising
value of resources, Introducing /
developing new technology
2. Progress towards secure tenure orresource rights for communities
1. Uptake of newor improved practices/ livelihood activities
3. Governancearrangements give
increasedrecognition/respect
5. Wellbeinggoals met
6. Damagingoccupation/livelihood
abandonedor reduced
Improvement inbiodiversity status
4. Community institutions have
increased capacity
FIGURE 2: LIVELIHOODS & GOVERNANCE OUTCOME
& IMPACT FRAMEWORK
ActionsImpact on Biodiversity
Intermediateoutcomes
Threat reduction outcomesOutputs
3:3

INTRODUCTION & KEY CONCEPTS
DESIGNING & IMPLEMENTING THE EVALUATION
PRISM MODULES
METHOD FACTSHEETS & ANNEXES
PRISM - TOOLKIT FOR EVALUATING THE OUTCOMES AND IMPACTS OF SMALL/MEDIUM-SIZED CONSERVATION PROJECTS124
Framework notes
Figure 2 illustrates some of the potential pathways by which
actions addressing local livelihoods and governance of natural
resources may help to achieve biodiversity impacts. This is a
generic framework for such actions, and any individual small
project is likely to address (or may need to address) only one or two
of the pathways illustrated.
In all cases, the overall objective and impact that is sought is the
same – to provide local people with the means to make their
living and achieve their well-being objectives with less negative
impact (and where possible more positive impact) on the targeted
environment and its biodiversity.
You will need to think carefully about what you can assess to give
an indication of the impact of your project. In the short-term it
may only be possible to assess levels of uptake of new practices
(outcome 1), or direct changes in tenure, institutional capacity or
governance arrangements (outcomes 2, 3 and 4). You may also be
able to assess the impact on people’s well-being (outcome 5), since
many impacts of this kind (especially those related to relational
and subjective dimensions) may be achieved in the short-term.
Material changes to well-being may take longer. In the longer term
you should aim to assess changes in the behaviours that were
causing harm to the targeted biodiversity or ecosystem (outcome
6); and ultimately to assess improvements in the conservation
status of habitats or species. At whatever outcome stage in the
framework you undertake your assessment, it is important to test
(or be open about) the assumptions in your own Theory of Change
(or equivalent) so that it is clear how (or whether) the livelihoods
and well-being impacts have led, or are expected to lead, to
conservation outcomes.
LIVELIHOODS & GOVERNANCE
FRAMEWORK NOTES
3:3

INTRODUCTION & KEY CONCEPTS
DESIGNING & IMPLEMENTING THE EVALUATION
PRISM MODULES
METHOD FACTSHEETS & ANNEXES
PRISM - TOOLKIT FOR EVALUATING THE OUTCOMES AND IMPACTS OF SMALL/MEDIUM-SIZED CONSERVATION PROJECTS125
LIVELIHOODS & GOVERNANCE
METHODS FOR EVALUATING
LIVELIHOODS & GOVERNANCE
OUTCOMES/IMPACTS
TABLE 1: EXAMPLES OF INDICATORS AND SUGGESTED DATA COLLECTION METHODS
EXAMPLE INDICATORS
Number of groups/households/individuals carrying out new practices and/or using new technologies
Change in policy, rights or responsibilities – e.g. levels of devolution of authority and decision-making to local communities
Formal recognition of customary tenure
Number of groups/households/individuals with secure land title or secure resource rights
Key (community) stakeholders engaged in processes to secure rights/tenure; a formally agreed action plan
Change in selected indicators (individually or as part of a score sheet) relevant to the attributes of good governance, for example: o Number of people involved in decision making, and
their level of influence o Accountability of representatives and effectiveness
of reporting back o Inclusion of different members of society o Effective and fair enforcement of laws
OUTCOME/ IMPACT
1. Uptake of new or improved practices/ livelihood activities
2. Progress towards secure tenure or resource access rights for communities
3. Governance arrangements give increased recognition / respect
METHODS
Documentary evidence
Questionnaires
Key informant interviews
Participatory Impact Assessment (PIA)
Participatory Impact Assessment (PIA)
Community mapping
Documentary evidence
Community or focus group meetings; (supplemented by documentary evidence)
Participatory Governance Assessment
Questionnaires
Table 1 summarises available
methods for assessing the
outcomes in the impact
pathway in Figure 2, including
methods for data collection.
3:3

INTRODUCTION & KEY CONCEPTS
DESIGNING & IMPLEMENTING THE EVALUATION
PRISM MODULES
METHOD FACTSHEETS & ANNEXES
PRISM - TOOLKIT FOR EVALUATING THE OUTCOMES AND IMPACTS OF SMALL/MEDIUM-SIZED CONSERVATION PROJECTS126
LIVELIHOODS & GOVERNANCE
METHODS FOR EVALUATING
LIVELIHOODS & GOVERNANCE
OUTCOMES/IMPACTS
TABLE 1: EXAMPLES OF INDICATORS AND SUGGESTED DATA COLLECTION METHODS CONTINUED
EXAMPLE INDICATORS
Community institution has key organisational capacity requirements for sustainable NRM – this will vary according to the context (see capacity module). Capacity may be assessed against a suite of indicators (e.g. using tool for Organisational Capacity Assessment) or in relation just to the particular dimension(s) addressed by the project.
Well-being has material, relational and subjective dimensions. These are very context, project, and culture specific (and may also change over time). Specific indicators need to be developed with the community (see above). For example, they may include: o Number of meals skipped by an individual in the
previous week (food security) o Number of households with an effective strategy for
coping with unexpected shock o Feelings of security regarding access and resources
(e.g. land) in the next 10 years o Number of person-days of employment created o Net gains in income (per person/day) and number of
local beneficiaries
Number of groups/households/individuals abandoning or reducing damaging practices
OUTCOME/ IMPACT
4. Community institutions have increased capacity
5. Well-being goals met
6. Damaging occupation/ livelihood abandoned or reduced
METHODS
Community Based Organisational Capacity Assessment
Participatory Impact Assessment (PIA)
Participatory Impact Assessment (PIA)
Basic Necessities Survey (BNS)
Questionnaires
Focus groups
Direct observation (e.g. of housing quality)
Documentary evidence
Participatory Impact Assessment (PIA)
Questionnaires
Direct observation
Threat reduction scoring
3:3

INTRODUCTION & KEY CONCEPTS
DESIGNING & IMPLEMENTING THE EVALUATION
PRISM MODULES
METHOD FACTSHEETS & ANNEXES
PRISM - TOOLKIT FOR EVALUATING THE OUTCOMES AND IMPACTS OF SMALL/MEDIUM-SIZED CONSERVATION PROJECTS127
Outcome 1. Uptake of new or improved practices/
livelihoods activities
Evaluation of uptake involves looking at the extent to which a
particular practice or livelihood activity that has been promoted by
the project has been taken up by the project’s target audience.
Projects might adopt one or more of the following approaches:
• Providing an alternative resource to the one that is
being exploited, for example by developing fish ponds as
an alternative to lake fishing.
• Providing alternative occupations which substitute for
the income obtained from unsustainable resource use.
• Adding to or enhancing the value of the resource or
natural habitat to local communities, so that they are
incentivised to protect it and manage it sustainably,
e.g. through development of ecotourism, or providing
new markets for resources so that communities benefit
from their conservation – e.g. payments for ecosystem
services.
• Promoting the adoption of technologies which support
more efficient, less damaging use of resources.
Examples include fuel-efficient stoves, technologies
that reduce post-harvest losses such as drying or
freezing of fish or solar-drying of forest mushrooms.
A simple method is to use documentary evidence (E.g. Project
records, direct and indirect observation surveys) or direct
observation surveys to verify whether, and the extent to which, a
particular practice has been taken up.
Another simple method is to use a questionnaire survey at
household or individual level to assess the level of uptake. A
simple ‘yes/no’ response to a question asking about adoption of
the new activity will provide evidence of impact. If information is
disaggregated according to one or more socio-economic variables
(age, gender, level of education, wealth, household size, etc.) this
will help you understand how the introduced activity has been
adopted, and show the way to increase levels of adoption in future
initiatives. Providing opportunities for qualitative responses
(e.g. regarding the reasons for uptake) will provide additional
information relevant to understanding why your project has or has
not had the impact you expected.
See the Basic Necessities Survey (BNS factsheet for an example
of a household survey template with the kind of questions you
could include to assess uptake under a programme to introduce
fuel-efficient stoves to improve post-harvest smoking of fish and
reduce collection of fuelwood.
Participatory Impact Assessment (PIA) methods can be used
very effectively to compare before/after situations, and they use
the community’s judgement to attribute uptake to the project. In
addition to looking at whether uptake has occurred (yes/no) these
can also include questions looking at why uptake has/has not
happened (e.g. looking at motivation, factors limiting uptake, etc.)
and whether there is an expectation of any continuation of uptake
in the future.
Key informant interviews can also be used to evaluate uptake.
LIVELIHOODS & GOVERNANCE
OUTCOME 1. UPTAKE OF NEW
OR IMPROVED PRACTICES/
LIVELIHOODS ACTIVITIES
3:3

INTRODUCTION & KEY CONCEPTS
DESIGNING & IMPLEMENTING THE EVALUATION
PRISM MODULES
METHOD FACTSHEETS & ANNEXES
PRISM - TOOLKIT FOR EVALUATING THE OUTCOMES AND IMPACTS OF SMALL/MEDIUM-SIZED CONSERVATION PROJECTS128
Main issues:
• Documentary evidence: Try to make sure that the
observations/documents are independently verifiable.
Project reports and records may suffice if alternatives
aren’t available, but records kept by a third party are
preferable.
• Direct observation surveys: Not all uptake will be
immediately and easily visible, especially if it takes place
inside the home, or within closed family compounds (e.g.
uptake of fuel efficient stoves). Choose this method for
changes that can be easily observed.
• Questionnaire surveys: If your project has targeted a
specific sector of the community (e.g. hunters, women,
ethnic minorities) then select your sample from the
target group – you don’t need to take a random sample
from the entire community.
• Key informant interviews: Relying on key informants
for a quantitative assessment of the level of uptake may
be unreliable, especially for medium-sized projects or
dispersed/large communities. However, key informants
can provide useful insights into who (which social
groups in a community) has or has not taken up the
livelihood activity, what the barriers are, whether the
livelihood has been adapted, etc.
• Participatory Impact Assessment: PIA methods can
be used very effectively to compare before/after
situations, and they use the community’s judgement to
attribute uptake to the project.
Outcome 2. Progress towards secure tenure or resource
access rights for communities
Secure tenure and rights of access to and use of land and resources
can provide people with an incentive to protect or manage these
resources sustainably in the long term.
Evaluating security of tenure or resource rights generally
requires a written, published record showing who (community
or individuals) owns the land or has rights of access and rights to
harvest or otherwise use resources. Evaluation of these outcomes
generally involves the use of documentary evidence.
Participatory Impact Assessment (PIA) (e.g. participatory mapping)
can also be used to assess changes in land ownership or in rights to
resources.
Main issues:
Documentary evidence: To assess project impact you will
probably be looking for new documents assigning tenure or
resource rights (i.e. dated after your project start date). Even
where such documents exist you will need to use interviews
with key informants to gather evidence that changes are
attributable to the project. It may take time to secure rights
to land and resources, and especially for small projects, the
main impact of the project may have been simply to initiate
a process. Impact can be assessed through documentary
evidence of this process – creation and membership of
committees, records of meetings, interim decisions, etc.
LIVELIHOODS & GOVERNANCE
OUTCOME 2.PROGRESS
TOWARDS SECURE TENURE OR
RESOURCE ACCESS RIGHTS FOR
COMMUNITIES
3:3

INTRODUCTION & KEY CONCEPTS
DESIGNING & IMPLEMENTING THE EVALUATION
PRISM MODULES
METHOD FACTSHEETS & ANNEXES
PRISM - TOOLKIT FOR EVALUATING THE OUTCOMES AND IMPACTS OF SMALL/MEDIUM-SIZED CONSERVATION PROJECTS129
Outcome 3. Governance arrangements give increased
recognition/respect
Recognition of the legitimacy of community institutions, devolving
management responsibility to them and/or involving them in
management decisions at an appropriate level, helps to ensure that
resources are managed sustainably and in partnership (outcome 3).
Your project may be aiming to address one or several
characteristics of governance. Table 2 below describes some
possible indicators and methods which could be used to assess
change relating to eight commonly recognised characteristics of
good governance. These may apply at landscape level (e.g. land
use decisions within an administrative district), site level (e.g.
decision-making in a protected area) or community level (e.g.
how a community council makes decisions on resource use and
access). Governance could be assessed against just one of the
characteristics, or against combination of them that is relevant to
the specific context.
The Participatory Governance Assessment method uses a
score card to assess governance of an organisation in relation
to a number of these attributes. If repeated (before and after a
project) the results can be displayed graphically to show change in
governance, and interviews (e.g. with a focus group) can discuss the
reasons for any significant changes and identify those attributable
to the project.
Main issues:
• Governance is a multi-dimensional concept, and
perceptions of what is acceptable or good governance
can be culturally very specific. For example, in
some cultures patronage is normal and expected;
religious beliefs or social convention may exclude the
participation of women; and it may be disrespectful
to challenge top-down decisions made by traditional
leaders. Many of the indicators of governance also
require a subjective assessment, and the assessors’ own
cultural background is likely to affect the way they view
and report outcomes. It may be important to have the
intended changes and their indicators clearly articulated
at the start of the project, and to involve the community
and affected stakeholders in this.
LIVELIHOODS & GOVERNANCE
OUTCOME 3. GOVERNANCE
ARRANGEMENTS GIVE INCREASED
RECOGNITION/RESPECT
3:3

INTRODUCTION & KEY CONCEPTS
DESIGNING & IMPLEMENTING THE EVALUATION
PRISM MODULES
METHOD FACTSHEETS & ANNEXES
PRISM - TOOLKIT FOR EVALUATING THE OUTCOMES AND IMPACTS OF SMALL/MEDIUM-SIZED CONSERVATION PROJECTS130
LIVELIHOODS & GOVERNANCE
OUTCOME 3. GOVERNANCE
ARRANGEMENTS GIVE INCREASED
RECOGNITION/RESPECT
TABLE 2: POSSIBLE INDICATORS AND METHODS FOR MEASURING GOVERNANCE OUTCOMES/IMPACTS
POSSIBLE INDICATORS
Change in levels of participation (in decision-making processes) by, for
example:
• women and men;
• minorities; those who are vulnerable.
Number and quality of forums/meetings/consultation meetings
between communities and authorities. “Quality” might be measured in
terms of levels of attendance, representation, levels of participation in
discussion, opportunities to present, documentation and transparency
of decisions, language used and accessibility, availability of information
(before and after), etc.
The degree to which civil society participation in decision-making is
effectively organised
Change in the extent to which indigenous and local knowledge is
respected and applied to management decision-making.
Change in the extent to which the points of view of different
stakeholders are effectively mediated.
Change in the extent to which institutions and representatives
(government and CBOs) report back to their members and
constituencies.
ATTRIBUTE OF GOOD GOVERNANCE
PARTICIPATIVE
CONSENSUS-ORIENTED
ACCOUNTABLE
MEASURES / SOURCES OF INFORMATION / METHODS
Documentary evidence (e.g. of meetings and
participation, e.g. attendance lists; minutes –
who spoke?).
Direct observation (e.g. of participation levels
at meetings - who was present? Who spoke?
How was the meeting organised - seating
arrangements; choice of chairperson etc.?
What information was made available? What
language was used? How was the meeting
documented and by whom?).
Documentary evidence (e.g. of consensus-
building among civil-society forums).
Documentary evidence (e.g of management
plans; management decisions and their
acknowledgement, application of local
knowledge).
Documentary evidence: Likely to be subjective
– e.g. based on records of meetings, decision-
making processes, and the basis/justification
for any decisions.
Documentary evidence
Questionnaires.
Focus groups.
3:3

INTRODUCTION & KEY CONCEPTS
DESIGNING & IMPLEMENTING THE EVALUATION
PRISM MODULES
METHOD FACTSHEETS & ANNEXES
PRISM - TOOLKIT FOR EVALUATING THE OUTCOMES AND IMPACTS OF SMALL/MEDIUM-SIZED CONSERVATION PROJECTS131
TABLE 2: POSSIBLE INDICATORS AND METHODS FOR MEASURING GOVERNANCE OUTCOMES/IMPACTS CONTINUED
POSSIBLE INDICATORS
Change in the availability, frequency, adequacy and accessibility (easily
understandable forms and media, appropriate language) of information
to those who will be affected by decisions and their enforcement, where
aplicable.
Change in the time taken for institutions to respond or act (e.g. on
requests for information; requests for intervention).
Change in the level of resources (e.g. time, funding, materials) needed to
produce desired results (resources are used sustainably; equipment is
well maintained and lasts longer; materials are re-used and recycled).
Change in the extent to which all members of society feel that they have
a stake in the community, and feel included.
Change in the extent to which laws are enforced impartially.
Good roles and practices in decision-making process, e.g. adoption of
key principles for decision-making process.
Change in the extent to which full human rights, particularly those of
minorities, are protected.
ATTRIBUTE OF GOOD GOVERNANCE
TRANSPARENT
RESPONSIVE
EFFECTIVE AND EFFICIENT
EQUITABLE AND INCLUSIVE
RULE OF LAW
MEASURES / SOURCES OF INFORMATION / METHODS
Documentary evidence: Subjective assessment
of available information on decisions and the
decision-making process (language, media,
accuracy).
Questionnaires & Focus groups (e.g. to assess
who received information, who understood
information, who felt information was
adequate).
Documentary evidence.
Questionnaires.
Documentary evidence: Where records
are kept, use these (e.g. financial records,
procurement records, maintenance and
servicing records for equipment). Otherwise
base on interviews with key informants.
Questionnaires
Focus groups
Focus groups.
Questionnaires.
Participatory Impact Assessment.
LIVELIHOODS & GOVERNANCE
OUTCOME 3. GOVERNANCE
ARRANGEMENTS GIVE INCREASED
RECOGNITION/RESPECT
3:3

INTRODUCTION & KEY CONCEPTS
DESIGNING & IMPLEMENTING THE EVALUATION
PRISM MODULES
METHOD FACTSHEETS & ANNEXES
PRISM - TOOLKIT FOR EVALUATING THE OUTCOMES AND IMPACTS OF SMALL/MEDIUM-SIZED CONSERVATION PROJECTS132
Outcome 4. Community institutions have increased capacity
Where communally-shared property or resources are concerned,
the capacity of community institutions for regulating, managing
and policing access is key to achieving positive outcomes and
impacts.
Evaluation of the capacity of community institutions involves
either the use of a capacity assessment tool or evaluation of an
organisation in relation to specific dimensions of capacity that
have been the focus of the project (e.g. financial management
procedures or legal status). See the factsheet: Community-based
Organisational Capacity Assessment for an example of a relatively
simple tool that can be used to evaluate changes in the capacity of
a community-based organisation.
Use of the tool could also be combined with a Participatory Impact
Assessment (PIA), e.g. at a group meeting, to score an institution’s
capacity before and after the project and explore the reasons for
any changes, and whether they can be attributed to the project.
Main issues
• Community-based Organisational Capacity
Assessment largely depends on self-assessment by
the organisation. However, many of the dimensions
of organisational capacity can (and ideally should) be
verified through documentary evidence – e.g. minutes
of meetings, membership lists, bank accounts, audits,
legal registrations, business plans and organisational
strategies, observed equipment and office space, etc.
LIVELIHOODS & GOVERNANCE
OUTCOME 4. COMMUNITY
INSTITUTIONS HAVE INCREASED
CAPACITY
3:3

INTRODUCTION & KEY CONCEPTS
DESIGNING & IMPLEMENTING THE EVALUATION
PRISM MODULES
METHOD FACTSHEETS & ANNEXES
PRISM - TOOLKIT FOR EVALUATING THE OUTCOMES AND IMPACTS OF SMALL/MEDIUM-SIZED CONSERVATION PROJECTS133
Outcome 5. Well-being goals met
The concept of livelihoods is concerned with how people make
a living, including the assets that they have available (e.g. land,
equipment, education, social networks and employment). Their
decisions are affected by their well-being objectives – their vision of
what constitutes a “good life”. For some, this may be a high income,
for some it may be the safety and security of their children, and for
others it may be about belonging to social and cultural networks.
People’s well-being objectives will affect their decisions about how
they use natural resources, and this in turn may affect the outcome
of projects that are concerned with livelihoods.
The dimensions of well-being that are relevant will vary from place
to place, and so the aspects that need to be assessed for a given
project will depend on the context. Relevant well-being dimensions
may be suggested by the project’s Theory of Change.
The main purpose of a project that addresses people’s livelihoods is
to bring about changes in the well-being of individuals, households
or the wider community, in such a way that they cease or reduce
activities that are damaging the environment (or adopt activities
that benefit the environment). Well-being has been described as
having three main dimensions (see Conservation and impacts on
human well-being in Section 1), and within each dimension there
may be many contributing factors, often specific to a particular
community or household.
The design stages of your project should have explored this with the
community, in order to identify:
• whose activities are damaging the environment/
biodiversity (so that the project can be effectively
targeted);
• which well-being dimensions need to be addressed
(through livelihoods initiatives) to allow (or encourage)
the damaging activities to be stopped.
This will help you to identify appropriate indicators, and to select
suitable methods for assessing impact. More than one method may
be required, depending on the specific indicator(s) chosen. Potential
methods include Participatory Impact Assessment (PIA), Basic
Necessities Survey (BNS), questionnaires, focus groups, direct
observation and documentary evidence e.g. (e.g. clinic records;
school attendance; stores and supplies sales).
Main issues:
• Focusing on certain target villages or specific livelihood
groups within a community may be the most direct and
obvious approach for maximising conservation value
from the project (and for impact assessment); but it is
also important to assess any indirect impact on the wider
community. For example, if the distribution of well-being
support and benefit is perceived to be inequitable, this
may lead to a breakdown in community relationships,
which could in-turn have an impact on governance of
natural resources. Increasing the value and marketability
of natural resources may lead to appropriation of benefits
by a minority (“elite capture”) and marginalisation or
exclusion of traditional users. Efforts should be made to
assess these less tangible and more indirect impacts of
livelihood and well-being projects.
LIVELIHOODS & GOVERNANCE
OUTCOME 5.WELL-BEING GOALS MET
3:3
INTRODUCTION & KEY CONCEPTS
DESIGNING & IMPLEMENTING THE EVALUATION
PRISM MODULES
METHOD FACTSHEETS & ANNEXES
PRISM - TOOLKIT FOR EVALUATING THE OUTCOMES AND IMPACTS OF SMALL/MEDIUM-SIZED CONSERVATION PROJECTS134
Outcome 6. Damaging occupation/livelihood abandoned or
reduced
Evaluation at this outcome stage involves assessing and comparing
the levels of damaging activity before and after the project
intervention. Where feasible, direct observation surveys may
be the most reliable method as they overcome problems such as
people’s unwillingness to reveal participation in illegal activity. The
module on species & habitat management describes methods for
assessing levels of some of the most common damaging activities,
including hunting (by snares, firearms and poisons), live trapping,
agricultural encroachment, overharvesting of non-timber forest
products, disturbance, pollution, and timber and fuelwood
extraction.
Aside from direct observation, you can use questionnaires to
assess levels of damaging or illegal use by individuals. Participatory
Impact Assessment (PIA) methods can also be used to investigate
people’s livelihood strategies, and the contribution being made by
the damaging activity, at community level.
Main issues:
• Although you may have identified a particular target
group for your livelihoods intervention (e.g. households
clearing forest for farmland, a sector of the community
involved in hunting or trapping, etc.) your survey may
need to sample from the wider community. This is to
assess whether those who cease hunting are not just
being replaced by “‘new” farmers/hunters etc. with no
net impact on the damaging activity.
• Information on illegal or anti-social activities may be
very sensitive, and people may not give honest answers
about these issues in responses to questionnaires or in
focus group discussions, even if they are interviewed in
private and if questionnaires are anonymised. Where
this difficulty is likely or is suspected, direct observation
methods, expert opinion and people’s perceptions may
give more accurate results.
These methods can only be used to assess impact on damaging
and/or illegal activities if you are confident that people are
willing to discuss matters freely and honestly. Ideally, in order to
assess whether your project has been the cause of any changed
behaviour, you need to include questions about uptake of the
introduced livelihood activity, changed governance and/or changes
in well-being. These questions could all be included in the same
questionnaire (in different sections).
LIVELIHOODS & GOVERNANCE
OUTCOME 6. DAMAGING
OCCUPATION/LIVELIHOOD
ABANDONED OR REDUCED
3:3

INTRODUCTION & KEY CONCEPTS
DESIGNING & IMPLEMENTING THE EVALUATION
PRISM MODULES
METHOD FACTSHEETS & ANNEXES
PRISM - TOOLKIT FOR EVALUATING THE OUTCOMES AND IMPACTS OF SMALL/MEDIUM-SIZED CONSERVATION PROJECTS135
Policy
Summary
This chapter addresses methods for evaluating the outcomes and
impacts of conservation projects attempting to influence policy, in
order to contribute to improvements in the conservation status of
biodiversity/ecosystem/habitat targets. Areas covered include:
POLICYFACTSHEETS & ANNEXES
• Media tracking
• Media scorecards
• Observation checklist for documenting meetings
• Policymaker ratings
• Bellwether methodology
• Civil society tracking tool
SPECIFICALLY THIS MODULE COVERS:
What do we mean by policy outcomes & impacts?
What should I consider when evaluating policy outcomes & impacts?
Understanding how your project actions aim to change policy to benefit conservation targets.
Data collection methods for evaluating policy outcomes & impacts:
1. Improved policy influence7 in government or multilateral institutions;
2. Improved policy influence in private sector;
3. Environmental movement strengthened;
4. Evaluating implementation of policy and associated practice.
Further reading
7Influence can include: developing, changing, adopting, blocking, defending or
implementing policy. These objective categories build on those used in WWF (2009a):
“Resources for Implementing the WWF Project and Programme Standards: Monitoring
Advocacy Work”, January 2009.
3:4

INTRODUCTION & KEY CONCEPTS
DESIGNING & IMPLEMENTING THE EVALUATION
PRISM MODULES
METHOD FACTSHEETS & ANNEXES
PRISM - TOOLKIT FOR EVALUATING THE OUTCOMES AND IMPACTS OF SMALL/MEDIUM-SIZED CONSERVATION PROJECTS136
What do we mean by policy outcomes & impacts?
The term “policy” is often used to capture a diverse range of
instruments (e.g. laws, regulations, strategies, plans, programmes,
budgets, declarations, procedures, multilateral environmental
agreements).
When evaluating policy outcomes & impacts it is crucial first to
clarify the policy/ advocacy objective(s) which will outline who
exactly (i.e. individuals, groups, organisations, policy fora) the
project is trying to have impact on.
In doing so, it is important to remember that policy/decision
makers are not a homogenous group, and that policy/decision-
making happens at multiple levels (e.g. international, regional,
national and/or local). Without clarifying this beforehand, an
evaluation that allows you accurately to describe progress towards
the desired impact(s) will be impossible.
POLICY
WHAT DO WE MEAN BY POLICY
OUTCOMES & IMPACTS?
3:4
Photo credit: SPNL

INTRODUCTION & KEY CONCEPTS
DESIGNING & IMPLEMENTING THE EVALUATION
PRISM MODULES
METHOD FACTSHEETS & ANNEXES
PRISM - TOOLKIT FOR EVALUATING THE OUTCOMES AND IMPACTS OF SMALL/MEDIUM-SIZED CONSERVATION PROJECTS137
What should I consider when evaluating policy outcomes &
impacts?
Main challenges
Attribution - It can be very difficult to determine links between
policy influencing actions, changes in policy and any subsequent
changes relating to conservation targets.
o Multiple factors may have an influence on policy.
o Lack of a credible counterfactual means that
traditional matching evaluation designs will seldom
be applicable (although key informant interviews
or wider stakeholder questionnaires/surveys can
provide this in some form).
o Policymakers may be unwilling to admit that their
decisions were influenced by one group.
• Policy influence is highly complex, non-linear and can
be irrational - with policies shaped by a multitude of
interacting forces and actors. This makes it very difficult
to predict with confidence the likely consequences
(and the timeframe) of a set of activities on policy
development and implementation.
• Evaluation designs using control groups are usually
unsuitable for policy influencing work, as it is difficult
to establish a plausible counterfactual because of the
specificity of policy systems (and also the difficulty to
separate a ‘control group’ geographically from the policy
impact or ‘sphere of influence’).
• It may also be contentious to attempt overtly to affirm
attribution/influence over a particular policy process or
outcome. Even the terminology itself can put advocacy/
policy partners and targets off. It may be best to use
alternative terms or approaches, such as “contribution
assessment”, “partnership” or “effectiveness”.
Timeframes can be unpredictable - Changes in policies, laws,
regulations and their enforcement can take years (and the time
required for those policies themselves to have impact on the
conservation targets concerned may be much longer still), but
evaluation data are often required before goals are achieved.
Similarly strategies and milestones may shift with the dynamic
external policy context.
Contribution is more likely than attribution - This is partly
because of the complexity of the environments that policy
outcomes occur in, but also because policy influence is often most
effectively achieved through alliances, coalitions and networks.
Hidden decision-making processes may be used by bureaucracies
and politicians - This creates disincentives for sharing good
practice: if one organisation/community of practice found the
“magic bullet” to influence and shared it, then they would be faced
with greater competition for influence.
POLICY
WHAT SHOULD I CONSIDER WHEN
EVALUATING POLICY
OUTCOMES & IMPACTS?
3:4

INTRODUCTION & KEY CONCEPTS
DESIGNING & IMPLEMENTING THE EVALUATION
PRISM MODULES
METHOD FACTSHEETS & ANNEXES
PRISM - TOOLKIT FOR EVALUATING THE OUTCOMES AND IMPACTS OF SMALL/MEDIUM-SIZED CONSERVATION PROJECTS138
What can small/medium-sized projects do to evaluate policy
outcomes and impacts effectively?
Use a theory-based approach - The specific challenges associated
with attribution mean that theory-based evaluation designs are
often the most feasible for projects with policy components.
Developing a robust Theory of Change (or equivalent) can be
particularly useful, as this forms a road-map of how the policy
influencing activities are envisaged to result in the desired changes
in policy, which then allows you to identify the points where data
need to be collected, and acts as a framework to explain how
observed changes may or may not result in subsequent policy
and/or conservation outcomes and impacts. These approaches
can be complemented by information from Participatory Impact
Assessments and/or interviewing key informants.
Focus on the process, not just the intended result - Policy
evaluation typically focuses on the journey rather than just the
destination. In addition to demonstrating progress, this approach
reduces the risk that the evaluation will conclude that the whole
advocacy effort was a failure if advocacy goals are not achieved
within the project’s timeframe. It is also likely that unintended
outcomes may be identified, particularly if the external policy
environment has altered significantly since the start of the
project. Sometimes original policy/advocacy goals may need to be
reviewed in light of changing contexts, as they may no longer be
considered viable or to be the most effective approach.
Focus more on qualitative indicators, rather than quantitative -
These may need to be “proxy” indicators (i.e. providing an indirect
measure or sign of change), since results of policy actions are often
less tangible than others.
It is important to consider what the project’s main contribution
is intended to be, and to focus assessment on that. Therefore,
standard methods that identify an independent variable and a
specific set of dependent variables likely to affect change are not
often well suited for measurement of advocacy and policy work.
Be flexible - As policy work is highly complex and is influenced by
multiple interacting forces/actors, policy influencing strategies
need to evolve over time, and therefore data collection and
interpretation needs to be flexible to adapt to this.
POLICY
WHAT CAN SMALL/MEDIUM-SIZED
PROJECTS DO TO EVALUATE POLICY
OUTCOMES AND IMPACTS EFFECTIVELY?
3:4

INTRODUCTION & KEY CONCEPTS
DESIGNING & IMPLEMENTING THE EVALUATION
PRISM MODULES
METHOD FACTSHEETS & ANNEXES
PRISM - TOOLKIT FOR EVALUATING THE OUTCOMES AND IMPACTS OF SMALL/MEDIUM-SIZED CONSERVATION PROJECTS139
Understanding how your project actions aim to change policy to
benefit conservation targets
POLICY
UNDERSTANDING HOW YOUR
PROJECT ACTIONS AIM TO CHANGE POLICY
TO BENEFIT CONSERVATION
TARGETS
POLICYACTIONS
e.g. Providing evidence to policymakers, Lobbying
& negotiating with stakeholders, Public
campaigns & advocacy
1. Improved policy influence in
government or multilateral institutions
2. Improved policy influence in
private sector
4. New/improved policy and/or
associated practice implemented
Threat(s) reduced Improvement inbiodiversity status
3. Environmental movement
strengthened�
FIGURE 1: POLICY OUTCOMES & IMPACTS
FRAMEWORK
The framework below illustrates how actions focused on policy
may lead to a positive change in the conservation target.
ActionsImpact on Biodiversity
Intermediateoutcomes
Threat reduction outcomesOutputs
3:4

INTRODUCTION & KEY CONCEPTS
DESIGNING & IMPLEMENTING THE EVALUATION
PRISM MODULES
METHOD FACTSHEETS & ANNEXES
PRISM - TOOLKIT FOR EVALUATING THE OUTCOMES AND IMPACTS OF SMALL/MEDIUM-SIZED CONSERVATION PROJECTS140
Framework notes
Outcome 1 refers to actions where a group (or groups) work to
influence laws, strategies, programmes or budgets at national
or local government levels, and/or in intergovernmental
processes that influence such national/local level policy (through
declarations, statements/communiqués, decisions, resolutions,
etc.).
Outcome 2 refers to actions that focus on influencing the policies
and the institutional behaviour of the private sector. This may
involve work to encourage environmentally friendly practices as
part of sustainable development.
Specific actions for both outcomes 1 and 2 are likely to involve a
combination of providing evidence and advice to key influencers,
carrying out public campaigns and advocacy, and lobbying and
negotiating.
Outcome 3 relates to actions to increase the capacity of the
environmental movement to influence policy processes, to hold
decision-makers to account, to present options to policy-makers
and to keep the public informed of shortcomings. Actions include
increasing capacity to work together effectively in networks/
alliances/coalitions at the local, national and international levels.
Outcome 4 relates to evaluating the implementation of policy and
associated practice that has been adopted/changed/blocked as a
result (or partly as a result) of the project. In many cases, policies
are already in place but have not yet been fully implemented and
evaluated. Actions aimed at supporting the evaluation of policies
or at building capacity for implementation would be included in
this category.
POLICY
FRAMEWORK NOTES
3:4

INTRODUCTION & KEY CONCEPTS
DESIGNING & IMPLEMENTING THE EVALUATION
PRISM MODULES
METHOD FACTSHEETS & ANNEXES
PRISM - TOOLKIT FOR EVALUATING THE OUTCOMES AND IMPACTS OF SMALL/MEDIUM-SIZED CONSERVATION PROJECTS141
POLICY
METHODS FOR EVALUATING
POLICY OUTCOMES &
IMPACTS
TABLE 1: SUMMARY OF METHODS FOR ASSESSING THE OUTCOMES AND IMPACTS OF PROJECT ACTIVITIES RELATED TO
POLICY INFLUENCE
EXAMPLE INDICATORS
• Engagement of key influencers in development of action plan• Changes in rhetoric• Changes in wording of policies or conventions• Ratification of conventions• Changes in legislation (or legislation maintained, or negative changes prevented)• Changes in budget allocations• Monitoring procedures in place for the policy
• Changes in particular company practices/ policies or engagement/ rhetoric on the issue
• Changes in sector-wide consensus and Codes of Practice• Finance sector investment in the sector/company change• Introduction of labelling or certification systems• Environmental and social impacts of the above, e.g. market share of sustainable
products and resulting impact• Transparency and impact of change (e.g. triple bottom line introduced in company
accounts, natural capital accounting, public auditing and reporting)
• Increase in NGO advocacy and policy skills, capacity, knowledge and effectiveness
• Greater synergy of aims/activities in environmental networks/ movements• Increase in collaboration, trust, unity and sustainability between movement
members• Increase in size of movement (number of organisations, size of organisations)
• Change in decision-makers’ awareness of pros and cons of existing policies and practices
• Change in capacity of government officials to implement policies• Extent to which policies are implemented• Extent to which implemented policies achieve the desired effect• Environmental and social impacts of implemented policies
OUTCOMES/ IMPACT
1. Improved policy influence in government or multilateral institutions
2. Improved policy influence in private sector
3. Environmental movement strengthened
4. New/improved policy and/or associated practice implemented
METHODS
Media trackingMedia scorecardDocumentation of meetingsPolicymaker ratingsKey informant interviewsFocus groups
Bellwether methodologyQuestionnairesKey informant interviews
Civil Society Tracking ToolNetwork health scorecard
Key informant interviewsPolicy tracking
Informed by: WWF (2009a): “Resources
for Implementing the WWF Project
and Programme Standards: Monitoring
Advocacy Work”, January 2009.
3:4

INTRODUCTION & KEY CONCEPTS
DESIGNING & IMPLEMENTING THE EVALUATION
PRISM MODULES
METHOD FACTSHEETS & ANNEXES
PRISM - TOOLKIT FOR EVALUATING THE OUTCOMES AND IMPACTS OF SMALL/MEDIUM-SIZED CONSERVATION PROJECTS142
The numbers and corresponding notes below relate to the
outcomes in Table 1 above. See the PRISM Species/Habitat
Management chapter for methods for evaluating the change in the
target biodiversity outcome.
Outcome 1. Improved policy influence in government or
multilateral institutions
This involves looking at the processes by which your project is
working to influence public decision-making, either by targeting
governments (local, regional or national) or multilateral institutions
(organisations formed between several nations to work on issues
that relate to all the countries involved, for example the EU, OECD
or UN agencies). These processes could include laws, the creation
of programmes, allocation of resources and implementation.
Potential data collection methods
The most basic data collection method is simply to keep a record
(for example a written log, email inbox or database) where
comments, anecdotes and examples of “uptake” or influence are
recorded. For example the log could track: public messaging;
monitoring; parliamentary committee meetings; key individuals’
participation; and tracking of key phrases/rhetoric throughout.
This would be essentially a collection of largely informal and
anecdotal evidence about the use of research or advice, which
can provide useful ongoing monitoring and contribute to deeper
analyses once a number of instances or patterns are accumulated.
Media tracking, media scorecards and observation checklists are
all useful data collection methods that can be used to track change
and inform the judgements you make in relation to this outcome.
Periodic key informant interviews or focus groups with relevant
experts, decision-makers and other key stakeholders could also be
used.
At a more advanced stage, policymaker ratings can be used to
gauge political will on a particular policy issue or in relation to
proposals under discussion among a defined group of policymakers
(e.g. legislature, council).
POLICY
OUTCOME 1. IMPROVED POLICY
INFLUENCE IN GOVERNMENT OR
MULTILATERAL INSTITUTIONS
3:4

INTRODUCTION & KEY CONCEPTS
DESIGNING & IMPLEMENTING THE EVALUATION
PRISM MODULES
METHOD FACTSHEETS & ANNEXES
PRISM - TOOLKIT FOR EVALUATING THE OUTCOMES AND IMPACTS OF SMALL/MEDIUM-SIZED CONSERVATION PROJECTS143
Outcome 2. Improved policy influence in the private sector
The focus here is on looking at the effect of the project on the
policies, practices and institutional behaviour of the private
sector. It may involve work to change particular bad practice,
work to encourage the introduction of environmental monitoring
and policies, or “rewards” or incentives for good practice such as
labelling/certification schemes.
Possible data sources include: reviews of company reports/
data; tracking public rhetoric (e.g. public and company media);
participation, rhetoric and commitments in partner meetings
(e.g. roundtables), as well as reviewing secondary literature (e.g.
company, sector or public records; consumer groups/reports,
such as FSC (Forest Stewardship Council); industry association
reports and on-the-ground evidence of implementation (e.g.
Environmental Impact Assessments).
Key informant interviews, questionnaires and bellwether
methodology are all relevant methods for monitoring and
reviewing/evaluating this type of outcome.
Outcome 3. Environmental movement strengthened
Here evaluation is focused on increasing the capacity of the
environmental movement: to influence the policy process; to
monitor government enforcement of existing laws and policies;
to keep the public and policy makers informed of shortcomings;
and to demand transparency and accountability. It also includes
increasing capacity to work together effectively in networks/
alliances/coalitions at the local, national and international levels.
Sources of data include: records of action taken (e.g. description/
minutes of meetings or engagement in policy processes); numbers
of proposals made to power holders, and numbers of approaches
solicited from power holders and the media.
The Civil Society Tracking Tool and network health scorecards
are relevant tools that can be used to collect data to inform
evaluations.
POLICY
OUTCOME 2. IMPROVED
POLICY INFLUENCE IN THE PRIVATE
SECTOR
OUTCOME 3. ENVIRONMENTAL
MOVEMENT STRENGTHENED
3:4

INTRODUCTION & KEY CONCEPTS
DESIGNING & IMPLEMENTING THE EVALUATION
PRISM MODULES
METHOD FACTSHEETS & ANNEXES
PRISM - TOOLKIT FOR EVALUATING THE OUTCOMES AND IMPACTS OF SMALL/MEDIUM-SIZED CONSERVATION PROJECTS144
Outcome 4. New/improved policy and/or associated practice
implemented
The focus here is on evaluating the effect of the project’s
policy action(s) on the adoption, modification and subsequent
implementation of targeted policies. Evaluating outcomes and
impacts at this stage is a significant challenge for small/medium-
sized conservation projects due to the length of time that it takes
for these outcomes & impacts to become measurable.
Some countries, however, have online searchable databases that
can be used to track the adoption and implementation of policies.
Key informant interviews with relevant decision makers can also
sometimes be used to track the process of changes in policy,
although be aware that many decision makers may be unwilling
to admit that a specific factor influenced a particular decision.
References to evidence provided by the project or by related
networks (in speeches, meetings or documents related to the
policy) can provide a proxy indicator of contribution.
POLICY
OUTCOME 4. NEW/IMPROVED
POLICY AND/OR ASSOCIATED
PRACTICE IMPLEMENTED
3:4

INTRODUCTION & KEY CONCEPTS
DESIGNING & IMPLEMENTING THE EVALUATION
PRISM MODULES
METHOD FACTSHEETS & ANNEXES
PRISM - TOOLKIT FOR EVALUATING THE OUTCOMES AND IMPACTS OF SMALL/MEDIUM-SIZED CONSERVATION PROJECTS145
Further reading
This chapter has been informed by the following resources:
• ODI - Background Note - A guide to measuring policy
& advocacy influence http://www.odi.org/sites/odi.org.
uk/files/odi-assets/publications-opinion-files/6453.pdf .
• UNICEF Advocacy Toolkit - http://www.unicef.org/
evaluation/files/Advocacy_Toolkit.pdf .
• BOND - Assessing effectiveness in influencing power
holders https://my.bond.org.uk/sites/default/files/
impact-builder/Advocacy.pdf .
• Annie E Casey Foundation – A guide to measuring
advocacy and policy http://www.aecf.org/m/
resourcedoc/aecf-aguidetomeasuringpolicyandadvoca
cy-2007.pdf .
• WWF (2009a). “Resources for Implementing the
WWF Project and Programme Standards: Monitoring
Advocacy Work”, January 2009.
• WWF (2009b). “Resources for Implementing the
WWF Project and Programme Standards: Monitoring
Advocacy Work – Appendices”, January 2009.
Additional resources and reading to consider:
o http://www.betterevaluation.org/ - good,
accessible materials and webinars on designing
evaluations.
o https://www.intrac.org/what-we-do/monitoring-
evaluation-learning/ - accessible materials and
resources on monitoring and evaluation. The
Theory of Change materials are particularly
helpful.
o http://www.evaluationinnovation.org/sites/
default/files/Pathways%20for%20Change.pdf - a
really useful paper outlining ten models or types
of Theories of Change which could apply to and
be adapted for various projects/programmes.
The Evaluation Innovation site http://www.
evaluationinnovation.org/ is also very useful in
itself.
POLICY
FURTHER READING
3:4

INTRODUCTION & KEY CONCEPTS
DESIGNING & IMPLEMENTING THE EVALUATION
PRISM MODULES
METHOD FACTSHEETS & ANNEXES
PRISM - TOOLKIT FOR EVALUATING THE OUTCOMES AND IMPACTS OF SMALL/MEDIUM-SIZED CONSERVATION PROJECTS146
Species & Habitat Management
Summary
This chapter contains methods for evaluating the outcomes
and impacts of conservation projects attempting to facilitate or
implement direct management of species or habitats.
SPECIES & HABITAT MANAGEMENT
METHOD FACTSHEETS
• Scorecard for evaluating changes in knowledge gaps
• Scorecard for evaluating action plan completion
• Scorecard for evaluating action plan adequacy
• Threat reduction scoring
• Scorecard for evaluating changes in species’ status
• Scorecard for evaluating changes in habitat status
• Using field assessment methods for evaluating changes in species’ status
• Using remote assessment methods evaluating changes in habitat status
• Using field assessment methods for evaluating changes in habitat status
ANNEXES
• Field methods for species monitoring
• Sampling approaches for monitoring different species to assess their status
• Analytical issues when estimating abundance, distribution, survival and reproduction
• Field methods for habitat monitoring
• Sampling approaches for monitoring habitat status
SPECIFICALLY THIS MODULE COVERS:
What should I consider when evaluating species and habitat management outcomes/impacts?
Understanding how project actions contribute to improving the status of a species or habitat
Methods for evaluating species and habitat management outcomes and impacts:
1. Knowledge improved
2. Conservation action plan developed and disseminated
3. Threats to species/habitats reduced
4. Recovery of species/habitats promoted
5. Species status improved (population size, trends, range size, extinction risk)
6. Habitat status improved (extent, condition, fragmentation)
3:5

INTRODUCTION & KEY CONCEPTS
DESIGNING & IMPLEMENTING THE EVALUATION
PRISM MODULES
METHOD FACTSHEETS & ANNEXES
PRISM - TOOLKIT FOR EVALUATING THE OUTCOMES AND IMPACTS OF SMALL/MEDIUM-SIZED CONSERVATION PROJECTS147
What should I consider when evaluating species and habitat
management outcomes/impacts?
Time-lags. It often takes time for species populations and habitats
to recover once threats have been reduced and/or barriers to
recovery have been removed/reduced. Small projects usually
have a short duration, and direct improvements to species or
habitat status may not be detectable within the timeframe of the
project. In many cases, monitoring and evaluation should focus
only on the outcomes that will occur during the lifetime of the
project, unless post-project evaluation is possible, in which case
measuring improvements to species or habitat status may be
worth considering.
Evaluation focus. It may not be appropriate to attempt to assess
the impact of a single project’s actions directly on species or
habitat status because of time-lags and the complexities of
identifying cause and effect. Instead, consider more targeted
measurement and monitoring of the outcomes and impacts of
particular interventions that contribute to species or habitat
outcomes, for example by filling a key knowledge gap or reducing a
specific threat.
Project scale. The scale of the evaluation should be in line with the
size of the project. Sometimes the most robust approaches are not
the most appropriate ones to use, especially if you have limited
resources in terms of time or people. Good evaluation design will
take into account the size of the project in determining the amount
of monitoring effort that is appropriate.
Baseline data. In many cases, baseline data may be available
in the form of existing species/habitat monitoring data. Check
beforehand to see what information is available. The potential for
using certain methods will be affected by whether baseline data
(e.g. population estimates) are available. If not, techniques that
involve retrospectively assessing the project should be used.
SPECIES & HABITAT MANAGEMENT
WHAT SHOULD I CONSIDER WHEN
EVALUATING SPECIES AND
HABITAT MANAGEMENT
OUTCOMES/IMPACTS?
3:5

INTRODUCTION & KEY CONCEPTS
DESIGNING & IMPLEMENTING THE EVALUATION
PRISM MODULES
METHOD FACTSHEETS & ANNEXES
PRISM - TOOLKIT FOR EVALUATING THE OUTCOMES AND IMPACTS OF SMALL/MEDIUM-SIZED CONSERVATION PROJECTS148
Attributing outcomes/impacts to species and habitat
management actions
Detailed guidance on evaluation designs is provided in the section
on choosing an evaluation design. Here we consider the designs
likely to be of greatest relevance to evaluating the outcomes and
impact of project actions on species and habitat management.
Interviewing key informants - Use the opinion of relevant
individuals/experts to score the relevant variable (e.g. level of
knowledge, magnitude of threat, category of extinction risk, etc)
at the beginning of the project, at the end of the project, and in
either an actual or a hypothetical situation in which the project
had not taken place (a “counterfactual scenario”). The difference
between the actual change measured, and the situation in the
“no-project” scenario, represents the outcome or impact of the
project. This may be the only feasible approach for many small
and medium-sized conservation projects. Judgements should be
made as objectively as possible, and notes provided to justify the
scores selected. Where multiple informants provide scores, use
the mean. The scorecard methods outlined in this chapter are all
designed to be used in this way. Informants can also be asked to
rule out alternative explanations as a way of investigating further
the reasons behind any observed changes and the extent to which
these can be attributed to the project.
Matching designs - Compare the outcomes (e.g. habitat condition)
at the project location with those at a control location. The
compared sites must have similar environmental and socio-
economic conditions (e.g. habitat type, human influence, etc.)
allowing for differences in outcomes/impacts to be attributed
to project actions. This requires monitoring of both project and
comparison locations in the same way, and will require additional
time and resources. The power of this approach is improved if
populations are also monitored before the start of the project. In
practice, small projects will often struggle to identify control sites
and to devote the necessary resources needed to monitor them,
so before using a matching design to evaluate species and habitat
management outcomes/impacts, you will need to ensure that you
have the necessary resources to do so.
Before-after designs - Monitor the parameter of interest (e.g.
population size) over time to compare its position before and after
project interventions. This requires an evaluation of the situation
before project actions are implemented and a further evaluation
once they have been completed. As biological systems are often
extremely complex and subject to many external factors, this
approach should generally be limited to short-term effects where it
is easy to rule out alternative explanations.
SPECIES & HABITAT MANAGEMENT
ATTRIBUTING OUTCOMES/IMPACTS TO
SPECIES AND HABITAT
MANAGEMENT ACTIONS
3:5

INTRODUCTION & KEY CONCEPTS
DESIGNING & IMPLEMENTING THE EVALUATION
PRISM MODULES
METHOD FACTSHEETS & ANNEXES
PRISM - TOOLKIT FOR EVALUATING THE OUTCOMES AND IMPACTS OF SMALL/MEDIUM-SIZED CONSERVATION PROJECTS149
SPECIES & HABITAT MANAGEMENT
UNDERSTANDING HOW PROJECT
ACTIONS CONTRIBUTE TO IMPROVING THE
STATUS OF A SPECIES OR HABITAT
FIGURE 1: SPECIES AND HABITAT MANAGEMENT
OUTCOME AND IMPACT FRAMEWORK8
8Colours, shapes and terms for the boxes match those used by the Conservation Measures
Partnership and Miradi Conservation Planning software www.miradishare.org/actions.
ActionsImpact on Biodiversity
Intermediateoutcomes
Threat reduction outcomesOutputs
DEVELOPINGSPECIES/HABITAT/SITE ACTION PLAN
e.g. convene stakeholders, prioritise interventions,
agree timelines, disseminate plan
RESEARCH & MONITORINGTO IMPROVEKNOWLEDGE
e.g. survey population, study ecology, identify
threats, assess extinction risk
PROMOTING SPECIES/HABITAT
RECOVERY
e.g. increased habitat extent, improved habitat
condition, enhanced habitat
connectivity
DIRECTLYREDUCING THREATS
TO SPECIES/HABITATSe.g. enforcing regulations,
removing snares, controlling invasive
species, reducing habitat loss/degradation
1. Knowledge improved to
prioritise action for species/habitat
2. Species/site/habitat action
plan(s) developed
4. Recovery of species/habitats
promoted
3. Threats to species/habitat
reduced 5. Improved species status e.g. increased
population size, slowerpopulation declines, increased
reproductive success, increased distribution
size
6. Improved habitat status e.g. increased habitat
extent, improved habitat condition, enhanced habitat connectivity
3:5

INTRODUCTION & KEY CONCEPTS
DESIGNING & IMPLEMENTING THE EVALUATION
PRISM MODULES
METHOD FACTSHEETS & ANNEXES
PRISM - TOOLKIT FOR EVALUATING THE OUTCOMES AND IMPACTS OF SMALL/MEDIUM-SIZED CONSERVATION PROJECTS150
Framework notes
The framework is designed to help you to understand how the
actions implemented by a conservation project may benefit
one or more species or habitats. It is useful to clarify this before
considering which outcomes or impacts to measure.
Conservation projects may attempt to improve the status of
species or habitats in a number of ways, either indirectly by
increasing knowledge (for example of the distribution, threats, or
biological requirements relating to a species), developing action
plans, or directly by tackling threats or promoting the recovery
of a species. Figure 1 illustrates these different types of actions
and shows how they link together in a logical pathway to lead
ultimately to an improvement in the status of species or habitats.
Small- and medium-sized projects typically involve actions
addressing just one or two of these steps. The numbers for each
outcome correspond to the categories of information in Table 1
and in the summaries below. These will direct you to appropriate
methods for assessing outcomes and impacts.
Outcomes 1 and 2 are focused on creating the conditions for
further conservation actions to take place, while outcomes 3 and
4 relate to actions addressing the threats and barriers to species/
habitat recovery. Outcome 3 results from directly addressing
the scope or severity of threats (e.g. searching for and removing
snares, erecting signs and fences to discourage encroachment,
protecting nests from trappers, eradicating invasive species, etc.),
whereas outcome 4 results from actions that reduce barriers to
recovery by overcoming the ecological limitations imposed by
existing threats (e.g. providing nest boxes for species that utilise
tree-holes if availability of holes limits population size, planting
trees to promote habitat restoration, etc.). Often projects involve a
combination of these two types of action. Outcomes 5 and 6 relate
to changes in the status of species and habitats. It is usually the aim
of a conservation project to have an effect at this species/habitat
status level.
SPECIES & HABITAT MANAGEMENT
FRAMEWORK NOTES
3:5

INTRODUCTION & KEY CONCEPTS
DESIGNING & IMPLEMENTING THE EVALUATION
PRISM MODULES
METHOD FACTSHEETS & ANNEXES
PRISM - TOOLKIT FOR EVALUATING THE OUTCOMES AND IMPACTS OF SMALL/MEDIUM-SIZED CONSERVATION PROJECTS151
SPECIES & HABITAT MANAGEMENT
UNDERSTANDING HOW PROJECT
ACTIONS CONTRIBUTE
TO IMPROVING THE STATUS OF
A SPECIES OR HABITAT
EXAMPLE
Target site: Three projects are all working to support the
conservation of a coral reef, areas of which have been severely
degraded by the activities of dive operators. On the reef it
takes around ten years for coral to recolonise an area that has
been degraded.
Project A was a six-month project surveying a previously
unstudied section of the reef in order to discover the extent
and diversity of coral present and to make recommendations
for future conservation efforts.
Project B was a two-year project aiming to reduce the impact
of dive boats visiting a well-studied section of the reef, by
promoting the implementation of a set of good-practice
standards for dive operators to follow.
Project C was a three-month effort to carry out follow-up
surveys of an area that had previously been surveyed at regular
intervals over a ten-year period following the establishment of
a marine reserve.
While the eventual goal of all three projects was to see an
improvement in the status of the reef, there is a difference in
what they can expect to measure with the time and resources
available.
Project A focused on gathering and communicating
the information needed to make future conservation
decisions. A successful outcome required that the project’s
recommendations were taken up by policymakers and
subsequently put into action, something the team decided
was not measureable in the six-month timeline of the project.
Therefore they decided to focus evaluation on how effectively
the project had addressed the identified knowledge gap, and to
assess their contribution to the development of an action plan
for the site (outcomes 1 & 2).
Project B was aiming to mitigate or reduce the intensity of
threat. While this should lead directly to improvements in
habitat status, the team decided, given the time it takes for
coral to recolonise a degraded area, that such outcomes were
unlikely to be measurable within the two-year timeline of the
project. Therefore the team decided to focus on evaluating
whether the project had been successful in reducing any of the
threats (outcome 3) targeted by the good practice standards
(e.g. ensuring that dive operators were tethering boats to
buoys rather than directly on to the reef).
Project C also could have focused on threats (outcome 3) or
recovery (outcome 4), but given that the project length covered
the amount of time it takes for degraded areas of reef to show
signs of recovery, the team decided to focus on measuring
whether or not any recovery had taken place (outcome 6).
3:5

INTRODUCTION & KEY CONCEPTS
DESIGNING & IMPLEMENTING THE EVALUATION
PRISM MODULES
METHOD FACTSHEETS & ANNEXES
PRISM - TOOLKIT FOR EVALUATING THE OUTCOMES AND IMPACTS OF SMALL/MEDIUM-SIZED CONSERVATION PROJECTS152
TABLE 1. SUMMARY OF THE METHODS COVERED IN THIS CHAPTER
METHOD
Knowledge gaps scorecardScore 1-5 for level of knowledge for 6 types of knowledge
Action plan completion scorecardScore 1-10 for completion
Action plan adequacy scorecardScore 1-3 for adequacy
Threat reduction scoringScore 0-3 for each of timing, scope and severity
Assess productivity, survival, population size, habitat restoration, etc.
Species status scorecardScorecard for change in species abundance
Field assessment methods for speciesAssess changes in species status (population size, trends, range size, etc.)
Habitat status scorecardScorecard for change in habitat quality
Remote assessment methodsAssess changes in habitat status using remote sensing data
Field assessment methods for habitatsAssess changes in habitat status using field surveys
OUTCOMES/ IMPACT
1. Knowledge improved
2. Action plan(s) developed & disseminated
3. Threats reduced
4. Recovery of species/habitats promoted
5. Species status improved
6. Habitat status improved
EXAMPLES OF INDICATORS PRODUCED
Score for knowledge of threats
Score for action plan completion
Score for action plan adequacy
Magnitude of threat to species or habitat
Survival rate; population size; area of habitat restored
Score for change in species abundance
Population size, number of locations
Score for change in habitat quality
Forest cover; deforestation rate
Mean tree diameter at breast height; population presence/ abundance
HOW ATTRIBUTED TO PROJECT
Score at beginning, at end and for counterfactual
Score at beginning, at end and for counterfactual
Score at beginning, at end and for counterfactual
Score at beginning, at end and for counterfactual
Estimate % change owing to project
Score at beginning, at end and for counterfactual
Estimate % change owing to project
Score at beginning, at end and for counterfactual
Estimate % change owing to project
Estimate % change owing to project
EVALUATION DESIGN
Interviewing key informants
Interviewing key informants
Interviewing key informants
Interviewing key informants
Matching design or before-after design
Interviewing key informants
Matching design or before-after design
Interviewing key informants
Matching design or before-after design
Matching design or before-after design
REQUIRES BASELINE?
No
No
No
No
Yes
No
Yes
No
Yes
Yes
EFFORT
Low
Low
Low
Low
Med-high
Low
Med-high
Low
Med
Med-high
3:5

INTRODUCTION & KEY CONCEPTS
DESIGNING & IMPLEMENTING THE EVALUATION
PRISM MODULES
METHOD FACTSHEETS & ANNEXES
PRISM - TOOLKIT FOR EVALUATING THE OUTCOMES AND IMPACTS OF SMALL/MEDIUM-SIZED CONSERVATION PROJECTS153
First choose which outcome/impact in the framework (Figure 1)
you judge to be most appropriate to evaluate. Then use Table 1 and
the correspondingly numbered sections below to choose the most
appropriate monitoring and evaluation method (considering the
time and resources available, among other factors), and refer to the
specific Methods factsheets and associated annexes.
For several types of species/habitat management outcomes and
impacts, evaluation is challenging and requires time and resources
that may exceed the capacities of many small and medium-sized
conservation projects. Therefore, in addition to more robust
methods, we also provide simpler, quicker “scorecard” methods.
These can be applied using observed data collected during the
project or as part of an Interviewing key informants evaluation
design where the experience and knowledge of key individuals is
used to assess the project’s outcomes and impacts. Respondents
should provide explanatory notes and justifications for each score
selected.
SPECIES & HABITAT MANAGEMENT
METHODS FOR EVALUATING SPECIES AND
HABITAT MANAGEMENT
OUTCOMES AND IMPACTS
3:5
Photo credit: By Scdnr via Wikimedia Commons

INTRODUCTION & KEY CONCEPTS
DESIGNING & IMPLEMENTING THE EVALUATION
PRISM MODULES
METHOD FACTSHEETS & ANNEXES
PRISM - TOOLKIT FOR EVALUATING THE OUTCOMES AND IMPACTS OF SMALL/MEDIUM-SIZED CONSERVATION PROJECTS154
Outcome 1. Knowledge improved
Many conservation projects involve actions that attempt to
improve knowledge of the status of a species or habitat (in order,
ultimately, to identify and prioritise appropriate conservation
actions). Lack of knowledge may mean that project actions are
ineffective or even damaging, so it may be necessary for projects
to focus on (or to contain an element of) improving knowledge in
order to inform subsequent conservation actions.
Types of knowledge gaps that a project might address include:
• distribution;
• population size;
• trends (e.g. in population size, distribution, habitat
extent);
• threats;
• ecology;
• extinction risk;
• solutions (i.e. which responses are most appropriate/
effective).
Use the factsheet Scorecard for evaluating knowledge gaps to
evaluate the degree to which project actions filled knowledge gaps.
This method uses a scoring system that can be conducted before
and after the action and for a hypothetical scenario in which the
project did not take place.
It is worth noting that projects may generate important knowledge
about one or more of the aspects listed above as an unintended
consequence of project actions (for example surveys to assess
the population size of one species may discover additional species
of conservation importance not previously known to occur in
an area). This can still be reported as an outcome/impact of the
project, and the level of knowledge for the aspect concerned can
be scored using the method above.
It is important to appreciate that projects often present
good opportunities for testing the effectiveness of particular
interventions, but these opportunities are frequently missed,
meaning that important information is not generated or shared
with the wider conservation community. For example, a small-
scale conservation project may provide nest boxes for a critically
endangered bird species, but there is some uncertainty about
the most appropriate height at which the nest boxes should be
deployed. To test this, a project could simply place half of the
boxes at 2 m height and the other half at 6 m, and then monitor
the proportion of each set of boxes that is occupied by the target
species (and ideally also the success rate of the nests). Reporting
the results of such a test (in the peer-reviewed literature, or at
http://www.conservationevidence.com/) would add to the body of
evidence about the effectiveness of nest boxes and their utility for
the particular species of concern, thus facilitating more effective
conservation in future.
See the Scorecard for evaluating knowledge gaps for an example.
SPECIES & HABITAT MANAGEMENT
OUTCOME 1. KNOWLEDGE
IMPROVED
3:5

INTRODUCTION & KEY CONCEPTS
DESIGNING & IMPLEMENTING THE EVALUATION
PRISM MODULES
METHOD FACTSHEETS & ANNEXES
PRISM - TOOLKIT FOR EVALUATING THE OUTCOMES AND IMPACTS OF SMALL/MEDIUM-SIZED CONSERVATION PROJECTS155
Outcome 2. Species/site/habitat action plan(s) developed
This section addresses projects working towards the development
of species action plans or site management plans. It presents
simple methods for scoring the degree of completion of a plan
(on a 1-10 scale) and the adequacy of a plan (on a 1-9 scale). The
change in these scores during the course of a project is compared
to a hypothetical scenario in which the project did not take place, in
order to estimate the outcome and impact of project actions.
A key outcome in conserving species and habitats is often the
compilation of an Action Plan. Terms used for such plans include
Species Action Plan, Species Recovery Plan, Site Management
Plan, Habitat Recovery Plan, and Habitat Conservation Plan. These
are essentially blueprints for conserving one or more populations,
species or habitats, and the process of compiling them can be
effective in bringing all stakeholders to agree and prioritise actions
required9.
Small and medium-sized conservation projects may have as an
objective the compilation of such an action plan (and often the
implementation of at least part of it), or they may aim to contribute
to the compilation of a plan which is being developed by others.
Such projects can evaluate their outcomes and impacts according
to the degree of completion of the action plan and/or the adequacy
of the action plan. The factsheets below give guidance and
examples for evaluating the impact of project actions on both of
these aspects.
Factsheet: Scorecard for degree of completion of an action plan
Factsheet: Scorecard for adequacy of an action plan
SPECIES & HABITAT MANAGEMENT
OUTCOME 2. SPECIES/
SITE/HABITAT ACTION PLAN(S)
DEVELOPED
9Action plans typically compile information on the status of the species or habitat (historic and
current distribution, population size/abundance, habitat extent/condition), the threats that
are relevant, and the conservation actions required, locations for these, the implementers
involved and the timeframe for completion. For more information see:
• IUCN’s Strategic Planning for Species Conservation: A Handbook: http://cmsdata.
iucn.org/downloads/scshandbook_2_12_08_compressed.pdf,
• BirdLife International’s Species Action Plan Development Manual: http://www.
birdlife.org/sites/default/files/species_action_plan_manual.pdf
• TNC’s Conservation Action Planning (CAP) Handbook: https://www.
conservationgateway.org/Documents/Cap%20Handbook_June2007.pdf.
3:5

INTRODUCTION & KEY CONCEPTS
DESIGNING & IMPLEMENTING THE EVALUATION
PRISM MODULES
METHOD FACTSHEETS & ANNEXES
PRISM - TOOLKIT FOR EVALUATING THE OUTCOMES AND IMPACTS OF SMALL/MEDIUM-SIZED CONSERVATION PROJECTS156
Outcome 3. Threats to species/habitat reduced
This section describes a simple method for assessing changes in
the impacts of individual threats to one or more species or habitats
brought about by project actions.
Many conservation projects attempt to reduce the threats
impacting on a biodiversity target, for example by establishing or
enhancing anti-poaching patrols, guarding against illegal habitat
destruction, eradicating or managing invasive alien species, etc.
Guidelines exist from various sources for implementing detailed
monitoring of particular threats. Approaches commonly used in
international conservation such as SMART or HCV10 are usually
too demanding on time and resources for smaller projects, instead,
we recommend using an evaluation design that involves scoring of
the type and magnitude of threats affecting the species or habitat.
This is based on the “threats” component of BirdLife International’s
Important Bird and Biodiversity Area site monitoring protocol11.
Use the factsheet Threat reduction scoring to evaluate changes
in the magnitude of threats to species or habitats. The change
in the level of threats during the course of a project is compared
to a hypothetical scenario in which the project did not take
place, in order to estimate the outcome and impact of project
actions. Justifications for scores selected should be provided, and
quantitative data on threat scope, severity (intensity) and impact
should be used if available.
SPECIES & HABITAT MANAGEMENT
OUTCOME 3. THREATS TO
SPECIES/HABITAT REDUCED
10The Spatial Monitoring and Reporting Tool (SMART) is a data collection tool for protected
area rangers and provides a systematic approach for documenting incidents of threats at
sites: http://www.smartconservationtools.org/
The HCV Threat Monitoring Protocol is designed to standardise the monitoring of
anthropogenic threats to High Conservation Value areas within oil palm landscapes, and
contains detailed advice on how establish and run patrol teams to detect and monitor
different threats.
11(BirdLife International 2008): http://datazone.birdlife.org/userfiles/file/IBAs/
MonitoringPDFs/IBA_Monitoring_Framework.pdf .
3:5

INTRODUCTION & KEY CONCEPTS
DESIGNING & IMPLEMENTING THE EVALUATION
PRISM MODULES
METHOD FACTSHEETS & ANNEXES
PRISM - TOOLKIT FOR EVALUATING THE OUTCOMES AND IMPACTS OF SMALL/MEDIUM-SIZED CONSERVATION PROJECTS157
Outcome 4. Recovery of species/habitats promoted
Conservation actions may aim to promote the recovery of species
(for example by supplementary feeding or manual pollination)
or habitats (for example by habitat restoration or creation), or
both (for example by planting native seedlings). This section gives
examples of suitable indicators for monitoring different types of
project actions, but these should be tailored as appropriate for any
particular project action. Guidance under outcomes 6 and 7 can be
used for species and habitats respectively to identify appropriate
methods for monitoring these indicators at project location(s) and
at comparable location(s) in order to evaluate the outcomes and
impacts of project actions.
Conservation project actions may attempt to promote the
recovery of species or habitats directly in a number of ways (rather
than via efforts to reduce threats, which is the subject of section 3).
These can be broadly categorised into six groups (Table 2):
• Directly increasing reproductive success;
• Directly increasing survival;
• Establishing or strengthening ex-situ conservation
programmes;
• Attempting reintroduction, benign introduction, or
translocation;
• Increasing genetic diversity;
• Accelerating habitat recovery (e.g. through seedling
planting) to create or restore habitat.
Such actions aim to remove or overcome barriers to species/
habitat recovery, such as limits on breeding sites, food supplies,
available habitat for species, or unsuitable conditions for habitat
recovery. All may be relevant to projects aimed at the conservation
of particular species, while the last may also be relevant to projects
aimed at conserving particular habitats.
It is important to appreciate the distinction between removing
barriers to recovery (the focus of this section) and reducing
threats (section 3). In some cases, there may be long time-lags
between removing or reducing a threat and the species or habitat
recovering. Separate actions to promote recovery may reduce
these time-lags. In other cases, it may not be feasible to remove
or reduce threats sufficiently, and promoting recovery may be an
effective short-term strategy.
SPECIES & HABITAT MANAGEMENT
OUTCOME 4. RECOVERY OF
SPECIES/HABITATS PROMOTED
3:5

INTRODUCTION & KEY CONCEPTS
DESIGNING & IMPLEMENTING THE EVALUATION
PRISM MODULES
METHOD FACTSHEETS & ANNEXES
PRISM - TOOLKIT FOR EVALUATING THE OUTCOMES AND IMPACTS OF SMALL/MEDIUM-SIZED CONSERVATION PROJECTS158
SPECIES & HABITAT MANAGEMENT
POSSIBLE INDICATORS
AND METHODS FOR MEASURING
PROJECT ACTIONS
TABLE 2: POSSIBLE INDICATORS AND METHODS FOR MEASURING PROJECT ACTIONS AIMED AT REMOVING OR OVERCOMING BARRIERS TO SPECIES/HABITAT RECOVERY
AIM OF PROJECT ACTIONS
Increase
reproductive
success
Increase survival
Establish/
strengthen ex-situ
conservation
Reintroduction,
benign introduction,
translocation
Increase genetic
diversity within
population
Habitat restoration,
habitat creation
METHODS
Field surveys for evaluating
changes in species status
Field surveys for evaluating
changes in species status
Collate data from all
relevant ex-situ programme
institutions/ agencies/
locations
Field surveys for evaluating
changes in species status
Collate data on the origin
of introduced individuals/
breeding stock. See also
Field surveys for evaluating
changes in species status
Field surveys for evaluating
changes in species status and
Field assessment methods
for evaluating changes in
habitat status
BIODIVERSITY TARGET
Species
Species
Species
Species
Species
Species/
habitats
EXAMPLES OF PROJECT ACTIONS
Nest box provision, clutch
manipulation, protection from
predators, supplementary feeding of
breeders, manual pollination
Supplementary feeding, disease/
pathogen/parasite management
(e.g. vaccination), seedling aftercare
(watering, weeding)
Removal of individuals (including seeds)
from the wild for captive breeding
or artificial propagation, increasing
productivity of captive breeding or
artificial propagation
Reinforcement of wild plant & animal
populations, assisted movement of
individuals between locations or
subpopulations
Sourcing genes from multiple
populations, collecting pollen from
multiple trees, connecting habitat
fragments
Planting seedlings, removal of
competitors, management of
succession, water management (e.g.
flooding, re-flooding)
EXAMPLE INDICATORS TO MONITOR
Number of occupied nest boxes, clutch/
brood/litter survival, number of viable seeds,
or indirect measures such as changes in
population abundance
Adult mortality, longevity (for short-lived
species), survival rates or indirect measures
such as changes in abundance
Number of (mature) individuals in ex-situ
conservation, programmes, number of
seedlings, breeding success/ productivity of
captive population
Population estimates, number of locations
occupied, area of habitat occupied, number of
sub-populations, extent of distribution
Number of new breeding stock introduced
Area of habitat restored/created, abundance
of target or indicator species
3:5

INTRODUCTION & KEY CONCEPTS
DESIGNING & IMPLEMENTING THE EVALUATION
PRISM MODULES
METHOD FACTSHEETS & ANNEXES
PRISM - TOOLKIT FOR EVALUATING THE OUTCOMES AND IMPACTS OF SMALL/MEDIUM-SIZED CONSERVATION PROJECTS159
Determining the outcome and impact of project actions aimed
at removing or overcoming barriers to species/habitat recovery
requires an assessment of the relevant indicators at the beginning
and end of a project. For some parameters, such as numbers of
individuals in ex-situ conservation programmes, or numbers of
locations occupied, it may be possible to assess retrospectively
their value at the beginning of the project period. For others, such
as population abundance or adult survival rate, this may not be
possible, and establishing a baseline at the beginning of a project
is critical. Choosing which indicator to measure will depend on the
species or habitat that is targeted, the size of the site, the resources
available, the project duration, and the likely magnitude of change
resulting from project activities relative to background variation.
SPECIES & HABITAT MANAGEMENT
POSSIBLE INDICATORS
AND METHODS FOR MEASURING
PROJECT ACTIONS
EXAMPLE
A project aimed to promote recovery of a threatened species of
cavity-nesting songbird by providing nest boxes. A total of 50
wooden nest boxes were erected at a height of 3–4 m on trees
within ten test plots (five boxes per plot).
Test plots and ten similar control plots (which were not
provided with nest boxes) were subsequently visited four times
during the breeding season. The proportion of boxes occupied
and the population density of the target species within each
plot were measured.
The team found that 32% of boxes were used by the target
species for nesting. A further 28% had nesting material in
them, but no active nest. The breeding population densities of
the target species were significantly higher in the test plots,
compared to the ten control plots (4.2 songbirds/ha vs. 1.4/ha
for control plots).
The team interpreted results as showing that the introduction
of nest boxes had a potential positive outcome on breeding
population densities.
3:5

INTRODUCTION & KEY CONCEPTS
DESIGNING & IMPLEMENTING THE EVALUATION
PRISM MODULES
METHOD FACTSHEETS & ANNEXES
PRISM - TOOLKIT FOR EVALUATING THE OUTCOMES AND IMPACTS OF SMALL/MEDIUM-SIZED CONSERVATION PROJECTS160
Outcome 5. Species status improved
This section provides a simple scorecard approach using the
informed opinion of certain individuals (key informants) to
assess the impact of project actions on species status. Where
project resources allow for more detailed and robust evaluation,
we summarise the most relevant field methods for monitoring
different groups of species, and give guidance on sampling
approaches.
The ultimate aim of most conservation projects is to improve the
status of one or more species or habitats. However, attempting
to detect and/or quantify such impacts will not be appropriate
for many small- and medium-sized projects because of time-lags,
the resources required to measure such impacts directly, and the
challenge of attributing changes to project actions.
A relatively low-cost measure is to use the Factsheet: Scorecard
for evaluating changes in species status, either based on data
collected during the project or used as part of an interviewing key
informants evaluation design, to estimate the impact of the project
on species status.
To help inform such scores, or to evaluate changes in species status
more directly, robust and repeatable field surveys are typically
required. See the Factsheet: Field surveys methods for evaluating
changes in species status for more information.
Deciding on an appropriate field survey method will depend on
the taxonomic group being surveyed, for example surveying birds
requires a very different approach compared with monitoring
aquatic insects. The Annex: Field methods for species monitoring
summarises the approaches that are most commonly used for
different taxonomic groups, and provides links to further sources
of information12.
As well as the method by which individuals are detected and
counted, it is also important to consider sampling strategies.
Although it may be possible to undertake a complete survey in
which all individuals in the area of interest are counted, changes
in population size or range extent will typically be estimated from
sample surveys in which only a proportion of the population is
recorded. The Annex: Sampling approaches for evaluating changes
in species status provides further details on both full and sample
surveys, and lists sources of more detailed methods.
Species status may also be assessed in terms of extinction risk
using the IUCN Red List Categories and Criteria, which involves
applying data on parameters such as population and range size and
trend to a set of criteria with quantitative thresholds. As the Red
List categories are relatively broad measures of extinction risk,
actions implemented by small- and medium-sized conservation
projects will rarely lead to a change in the status of a target species
that is of sufficient magnitude to cross the thresholds for a lower
Red List category, so this approach is less useful for measuring
outcomes and impacts. Population Viability Analysis is an
alternative and more quantitative approach, but typically requires
input data that are too detailed to be feasible to mobilise in a small-
to medium-sized project.
SPECIES & HABITAT MANAGEMENT
OUTCOME 5. SPECIES STATUS
IMPROVED
12More detailed information on the methods outlined here can be found in the Cambridge
Handbook of Biodiversity Methods: https://sunsetridgemsbiology.wikispaces.com/file/view/
Biodiversity+Handbook.pdf .
3:5

INTRODUCTION & KEY CONCEPTS
DESIGNING & IMPLEMENTING THE EVALUATION
PRISM MODULES
METHOD FACTSHEETS & ANNEXES
PRISM - TOOLKIT FOR EVALUATING THE OUTCOMES AND IMPACTS OF SMALL/MEDIUM-SIZED CONSERVATION PROJECTS161
Outcome 6. Habitat status improved
This section provides a simple scorecard approach using the
informed opinion of certain individuals (key informants) to assess
the impact of project actions on habitat status. Where resources
allow more detailed and robust evaluation, we provide guidance
on how to measure the impact of project actions on habitat status
using remote sensing (e.g. for habitat extent and fragmentation)
and field methods (e.g. for habitat condition via indicator species or
vegetation structure).
Note that measuring changes in habitat status and attributing
changes to project actions is challenging, and attempting to
detect and/or quantify such impacts will not be appropriate for
many small- and medium-sized projects because of time-lags,
the resources required to measure such impacts directly, and the
challenge of attributing changes to project actions.
A relatively low-cost measure is to use the Factsheet: Scorecard
for evaluating changes in habitat status, either based on data
collected during the project or used as part of an interviewing key
informants evaluation design to estimate the impact of the project
on habitat status.
To underpin such scores, or to evaluate habitat status more
directly, two approaches can be used:
The Factsheet: Remote assessment methods for evaluating
changes in habitat status uses remote sensing data (images
obtained through satellite imagery or aerial photography), typically
in the form of maps of land cover or land use.
The Factsheet: Field assessment methods for evaluating changes
in habitat status involves gathering relatively simple data from
the field on stressors (e.g. roads, pollutants) or condition (e.g.
connectivity, indicator species abundance, vegetation structure)13.
This section is most relevant to project actions that attempt to
improve habitat extent, condition and connectivity at a local
scale. Project actions aimed at improving habitat status at the
regional scale tend to involve policy interventions (such as the
establishment of protected areas), for which the guidance in the
PRISM Policy module is relevant; or they tend to be beyond the
small- and medium-scale project budgets and durations considered
here.
SPECIES & HABITAT MANAGEMENT
OUTCOME 6. HABITAT STATUS
IMPROVED
13More detailed information on the methods outlined here can be found in the Cambridge
Handbook of Biodiversity Methods: https://sunsetridgemsbiology.wikispaces.com/file/view/
Biodiversity+Handbook.pdf .
3:5
INTRODUCTION & KEY CONCEPTS
DESIGNING & IMPLEMENTING THE EVALUATION
PRISM MODULES
METHOD FACTSHEETS & ANNEXES
PRISM - TOOLKIT FOR EVALUATING THE OUTCOMES AND IMPACTS OF SMALL/MEDIUM-SIZED CONSERVATION PROJECTS162
Further Reading
A number of publications cover these issues in more detail. In
particular, we recommend the following.
Cambridge Handbook of Biodiversity Survey Methods - Survey,
Evaluation & Monitoring: provides an overview of methods for
all taxa. . https://sunsetridgemsbiology.wikispaces.com/file/view/
Biodiversity+Handbook.pdf
Sutherland WJ (2006). Ecological census techniques, 2nd Edition.
Cambridge University Press, Cambridge.
Bibby CJ, Burgess ND, Hill DA and Mustoe SH (2000). Bird Census
Techniques, 2nd Edition. Academic Press, London.
Sutherland W, Newton I and Green RE (eds) (2004). Bird Ecology
and Conservation: A Handbook of Techniques. Oxford University
Press, Oxford.
Chartered Institute of Ecology and Environmental Management:
Sources of survey methods. http://www.cieem.net/sources-of-
survey-methods-sosm- .
Gill D and Daltry J (2014). Brief 3: How to make a monitoring
plan for threatened tree species. Global Trees Campaign http://
globaltrees.org/wp-content/uploads/2015/03/GTC-Brief-3-
monitoring-plan-lo-res.pdf .
SPECIES & HABITAT MANAGEMENT
FURTHER READING
3:5

INTRODUCTION & KEY CONCEPTS
DESIGNING & IMPLEMENTING THE EVALUATION
PRISM MODULES
METHOD FACTSHEETS & ANNEXES
PRISM - TOOLKIT FOR EVALUATING THE OUTCOMES AND IMPACTS OF SMALL/MEDIUM-SIZED CONSERVATION PROJECTS163
SECTION 4 METHOD FACTSHEETS AND ANNEXES
PRISM - TOOLKIT FOR EVALUATING THE OUTCOMES & IMPACTS OF SMALL/MEDIUM-SIZED CONSERVATION PROJECTS
4:0

INTRODUCTION & KEY CONCEPTS
DESIGNING & IMPLEMENTING THE EVALUATION
PRISM MODULES
METHOD FACTSHEETS & ANNEXES
PRISM - TOOLKIT FOR EVALUATING THE OUTCOMES AND IMPACTS OF SMALL/MEDIUM-SIZED CONSERVATION PROJECTS164
METHOD FACTSHEETS
AND ANNEXES
General Method Factsheets
General Method Factsheets
Completing a Theory of Change
Identifying why you want to evaluate
Evaluation feasibility checklist
Completing a prioritisation matrix
Developing ethical protocols for an evaluation
Developing gender protocols for an evaluation
Entering, organising and cleaning data
Analysing Quantitative data
Analysing qualitative data
Evaluation report template
Evaluating outcomes and impacts of projects aiming to
maintain or increase the values of ecosystem services
Questionnaires
Key informant interviews
Focus groups
Direct observation
Documentary evidence
4:0

INTRODUCTION & KEY CONCEPTS
DESIGNING & IMPLEMENTING THE EVALUATION
PRISM MODULES
METHOD FACTSHEETS & ANNEXES
PRISM - TOOLKIT FOR EVALUATING THE OUTCOMES AND IMPACTS OF SMALL/MEDIUM-SIZED CONSERVATION PROJECTS165
Factsheet: Completing a Theory of Change
Summary:
This factsheet outlines the steps required to construct a simple
“Theory of Change” for a conservation action or project. A
Theory of Change is an articulation of the change you expect your
project to achieve within the context you are working, showing
each logical step along the way. A well thought-out Theory of
Change provides a framework that will enable you to map out
how the project will bring about change, identify the steps where
an evaluation can and should take place and to develop the key
questions the evaluation will address.
If your project is already underway and you did not develop
these aspects at the outset you can use a Theory of Change (or
equivalent) retrospectively or mid-way through the project. While
completing a full, detailed Theory of Change can be quite a large
undertaking involving consultation with multiple stakeholders,
for the purposes of evaluating a small- medium sized project it is
usually enough to take a simplified approach.
Introduction
Theory of Change is a tool for:
• well considered project planning, underpinned by
robust and credible project design;
• ongoing project monitoring, providing a framework for
effective evaluation;
• communicating and fundraising for your projects.
What does a Theory of Change do?
• Identifies the long-term change you want to achieve and
works backwards to show how you will get there.
• Asks how and why change will happen, helping to clarify
why you are doing what you plan to do.
• Looks at the larger context within which your project
will operate.
• Articulates the individual logic steps between project
elements, clearly showing cause and effect.
• Clarifies known assumptions necessary for success.
GENERALFACTSHEETS
COMPLETING A THEORY OF
CHANGE
4:0

INTRODUCTION & KEY CONCEPTS
DESIGNING & IMPLEMENTING THE EVALUATION
PRISM MODULES
METHOD FACTSHEETS & ANNEXES
PRISM - TOOLKIT FOR EVALUATING THE OUTCOMES AND IMPACTS OF SMALL/MEDIUM-SIZED CONSERVATION PROJECTS166
When to develop a Theory of Change
Spending time on a Theory of Change when designing a project
helps to ensure that the project has a clear logic behind it. If one
is not developed when a project is planned, it can still be done at
a later stage; and it provides a useful framework for an interim
review, re-design or evaluation of project progress and impact.
What does a Theory of Change look like?
A Theory of Change can look however you would like it to look,
depending on what is most useful for your project team. Most
Theories of Change (including the examples given in PRISM) are
flow diagrams. These can be single strands or complex webs,
depending on the size and complexity of the project and the level
of detail you have chosen to present.
There are several methods for thinking through a Theory of
Change process. Some of the terms you may know are situation
analysis, problem trees and objective trees. All of these end up
with a flow diagram type of output. Focusing on the changes you
are aiming for or have achieved, as opposed to the problems you
are trying to tackle (such as in a situation analysis or problem tree),
is what distinguishes the Theory of Change from other project
planning approaches.
Definitions of project stages used in PRISM
Actions – What the project does to bring about change. For
example conducting biodiversity surveys, training workshops,
education/outreach campaigns.
Outputs – What is produced by the project’s actions. These are
usually measured in terms of quantity and quality of delivery, for
example the number of reports produced from survey data or the
number of individuals trained.
Outcomes – The changes brought about by the project’s actions.
For a conservation project these can be further divided into:
• intermediate outcomes which show progress towards
subsequent outcomes/impacts; and
• threat reduction outcomes which represent the final
change(s) that need to happen in order to impact on a
conservation target.
Impacts – The long-term, lasting change(s) brought about by the
project’s actions. For conservation projects these typically relate
to changes in species and/or habitat status.
Assumptions – The links between each of the stages above are
underpinned by assumptions. For example a project focused on
training park rangers to carry out anti-poaching patrols makes
the assumption that training park guards will result in more
effective patrols. A project will also make assumptions about
external factors that the project does not have control over, but
that may influence the project’s results if they do not remain true.
For example, in order for training to be successful, park rangers
need to have sufficient resources to carry out their work (e.g.
equipment, salary). These kind of assumptions are particularly
important for a small/medium-sized project to consider, as there
will often be a large number of factors that could influence the
project’s outcomes/impacts and they will form an integral part of
the story you will use to explain and contextualise your results.
GENERALFACTSHEETS
COMPLETING A THEORY OF
CHANGE
4:0

INTRODUCTION & KEY CONCEPTS
DESIGNING & IMPLEMENTING THE EVALUATION
PRISM MODULES
METHOD FACTSHEETS & ANNEXES
PRISM - TOOLKIT FOR EVALUATING THE OUTCOMES AND IMPACTS OF SMALL/MEDIUM-SIZED CONSERVATION PROJECTS167
GENERALFACTSHEETS
COMPLETING A THEORY OF
CHANGE
FIGURE 1: DEFINITION OF PROJECT STAGES USED IN
PRISM
Threat reductionoutcome
Impact onbiodoversity
Action
Examples
Biodiversity surveysTraining workshops
Education/Outreachcampaigns
Advocating for changes in policy
Examples
# of reports producedfrom survey data
# number of individualstrained
Examples
Information in reportsused to inform decision making
Individuals trained applynew skills to conservation
target
Examples
Decrease in poaching due toeducation campaign
Predation of native specieseliminated after eradication of
invasive predators
Examples
Species populationincreases
Habitat status of targetedsites improves
Assumptions
ExamplesPolitical events do not affect fieldwork
Weather conditions remain constantLocal commodity prices remain stable
Outputs Intermediateoutcome
4:0

INTRODUCTION & KEY CONCEPTS
DESIGNING & IMPLEMENTING THE EVALUATION
PRISM MODULES
METHOD FACTSHEETS & ANNEXES
PRISM - TOOLKIT FOR EVALUATING THE OUTCOMES AND IMPACTS OF SMALL/MEDIUM-SIZED CONSERVATION PROJECTS168
Required steps
Step 1. Identify the long term change the project is
trying to bring about.
Start by thinking about the problem that the project is trying
to address, then identify the long-term change your project
will contribute towards to address this problem. Usually in a
conservation project the intention will be to have an impact on the
status of a particular species and/or habitat.
GENERALFACTSHEETS
COMPLETING A THEORY OF
CHANGE
STEP 1
EXAMPLE
A project aims to reverse
a decline in a population of
chimpanzees, therefore the
ultimate impact the project
is trying to bring about is an
increase in the number of
chimpanzees.
Chimpanzee population increases
4:0

INTRODUCTION & KEY CONCEPTS
DESIGNING & IMPLEMENTING THE EVALUATION
PRISM MODULES
METHOD FACTSHEETS & ANNEXES
PRISM - TOOLKIT FOR EVALUATING THE OUTCOMES AND IMPACTS OF SMALL/MEDIUM-SIZED CONSERVATION PROJECTS169
Step 2. Identify and connect outcomes.
Work backwards to identify the outcomes that need to happen
during your project in order to achieve the desired impact. In a
conservation project a good place to start is to look at your desired
impact (see above) and then use the IUCN threat classifications
(http://www.iucnredlist.org/technical-documents/classification-
schemes/threats-classification-scheme) to work out which threats
need to be addressed in order for the impact to be achieved.
Once the primary threat(s) have been identified you can then
continue to work backwards to identify the intermediate outcomes
that need to be achieved in order to reduce/mitigate these threats.
Another approach to this is to re-write the project’s objectives
(as outlined in the project proposal) to turn them into outcome
statements (statements that reflect the change they are trying to
bring about).
GENERALFACTSHEETS
COMPLETING A THEORY OF
CHANGE
STEP 2EXAMPLE
The project identified several
factors that could potentially
affect the target population,
however in this case the
primary threat that needed
to be addressed in order for
the chimpanzee population
to increase was poaching.
Working backwards, the team
identified the intermediate
outcomes that needed to
happen in order to bring about
a decrease in poaching.
Chimpanzee population increases
Poaching decreases
More effective patrols
deter hunters
Park guards conduct more
effective patrols
4:0

INTRODUCTION & KEY CONCEPTS
DESIGNING & IMPLEMENTING THE EVALUATION
PRISM MODULES
METHOD FACTSHEETS & ANNEXES
PRISM - TOOLKIT FOR EVALUATING THE OUTCOMES AND IMPACTS OF SMALL/MEDIUM-SIZED CONSERVATION PROJECTS170
Step 3. Identify outputs & actions.
Based on the outcomes and impacts you have identified, the next
step is to identify the action (or group of actions) that you will carry
out in order to make these outcomes and impacts happen.
If you are at the development stage of the project there are several
resources you can use to help to identify the most appropriate
actions and approaches for achieving particular conservation
outcomes and impacts. Two particularly useful resources are
Conservation Evidence and the CMP/IUCN conservation actions
classification.
If your project is already underway or completed you should insert
the action(s) you have carried out during the project.
GENERALFACTSHEETS
COMPLETING A THEORY OF
CHANGE
STEP 3
EXAMPLE
Based on the outcomes defined, the project team identified
training to park guards as a crucial action that the project could
undertake in order to bring about the necessary outcomes/
impacts.
Chimpanzee population increases
Poaching decreases
More effective patrols
deter hunters
Park guards conduct more
effective patrols
Training provided to park
guards
Training park guards to conduct
ranger patrols
4:0

INTRODUCTION & KEY CONCEPTS
DESIGNING & IMPLEMENTING THE EVALUATION
PRISM MODULES
METHOD FACTSHEETS & ANNEXES
PRISM - TOOLKIT FOR EVALUATING THE OUTCOMES AND IMPACTS OF SMALL/MEDIUM-SIZED CONSERVATION PROJECTS171
Step 4. Test the logic.
Test the logic linking the project stages from actions – outputs
– outcomes – impacts. At each stage, ask: why will this change
lead to the desired change at the end of the project, or this action
lead to that change? i.e. “If X happens, does Y happen? Is anything
missing?” This process also helps to start discussions about
assumptions (step 5).
Many projects involve multiple actions and results chains which
should be linked together to show how they interact, and how
they contribute to the achievement of the project’s outcomes and
impacts. Refer to the end of this factsheet for some examples of
Theories of Change for projects involving multiple actions.
GENERALFACTSHEETS
COMPLETING A THEORY OF
CHANGE
STEP 4
4:0

INTRODUCTION & KEY CONCEPTS
DESIGNING & IMPLEMENTING THE EVALUATION
PRISM MODULES
METHOD FACTSHEETS & ANNEXES
PRISM - TOOLKIT FOR EVALUATING THE OUTCOMES AND IMPACTS OF SMALL/MEDIUM-SIZED CONSERVATION PROJECTS172
Step 5. Identify assumptions.
Assess whether any assumptions are being made about things
that have to be in place for you to achieve the desired outcomes
and impacts, but which you will not work on. For example a critical
assumption for a livelihoods project involving the growing of crops
might be that weather conditions remain stable enough for
crops to grow. This is not something that the project will address,
but the project may need to be adjusted if this assumption is no
longer true. GENERALFACTSHEETS
COMPLETING A THEORY OF
CHANGE
STEP 5
EXAMPLE
The team identified (a) the resources and access required by park
guards, and (b) the absence of other factors that might lead to a
decline in the chimpanzee population, as the assumptions which
need to remain in place in order for the project’s actions to bring
about the necessary change.
ASSUMPTIONS
• Park Guards have adequate resources to carry out their work
• Park Guards are able to access areas needed to patrol
• Hunted species populations do not decrease due to disease or
other natural factors
Chimpanzee population increases
Poaching decreases
More effective patrols
deter hunters
Park guards conduct more
effective patrols
Training provided to park
guards
Training park guards to conduct
ranger patrols
4:0

INTRODUCTION & KEY CONCEPTS
DESIGNING & IMPLEMENTING THE EVALUATION
PRISM MODULES
METHOD FACTSHEETS & ANNEXES
PRISM - TOOLKIT FOR EVALUATING THE OUTCOMES AND IMPACTS OF SMALL/MEDIUM-SIZED CONSERVATION PROJECTS173
Step 6. Review Theory of Change with project team and
key stakeholders.
Show the Theory of Change to the project’s key stakeholders,
invite feedback on the following questions and make any necessary
changes:
• Does the logic make sense (i.e. will one stage lead to
another)?
• Have any critical assumptions been missed?
Step 7. Use the Theory of Change to design and plan
your evaluation.
Use your Theory of Change to identify and prioritise what you
will measure at each stage of your project to determine progress
towards your desired impact and outcomes, and to assess the
performance of your actions. Refer to PRISM step 1 for more
information on how to do this.
Further reading
Please note that this factsheet outlines how to construct a very
simple Theory of Change to help guide and focus the development
of an evaluation. For further reading on how to conduct a
more detailed Theory of Change you can refer to the following
resources:
Conservation International: Constructing Theories of Change for
ecosystem based adaptation projects http://www.conservation.
org/publications/Documents/CI_IKI-ToC-Guidance-Document.pdf
Margoulis et al. (2013). Results Chains: a tool for conservation
action design, management and evaluation: http://www.
ecologyandsociety.org/vol18/iss3/art22/ .
USAID TIPS factsheet: Building a results framework. http://pdf.
usaid.gov/pdf_docs/Pnadw113.pdf .
Center for Theory of Change: http://www.theoryofchange.org/
what-is-theory-of-change/ .
http://www.evaluationinnovation.org/sites/default/files/
Pathways%20for%20Change.pdf - a really useful paper outlining
ten models or types of Theories of Change which could apply to
and be adapted for various projects/programmes.
The Evaluation Innovation site http://www.evaluationinnovation.
org/ is also very useful in itself.
GENERALFACTSHEETS
COMPLETING A THEORY OF
CHANGE
STEPS 6 & 7
4:0

INTRODUCTION & KEY CONCEPTS
DESIGNING & IMPLEMENTING THE EVALUATION
PRISM MODULES
METHOD FACTSHEETS & ANNEXES
PRISM - TOOLKIT FOR EVALUATING THE OUTCOMES AND IMPACTS OF SMALL/MEDIUM-SIZED CONSERVATION PROJECTS174
GENERALFACTSHEETS
COMPLETING A THEORY OF
CHANGE
EXAMPLE THEORIES OF
CHANGE FROM PROJECTS
INVOLVING MULTIPLE ACTIONS
ActionsImpact on Biodiversity
Intermediateoutcomes
Threat reduction outcomesOutputs
EXAMPLE THEORIES OF CHANGE FROM PROJECTS
INVOLVING MULTIPLE ACTIONS:
ActionsImpact on Biodiversity
Intermediateoutcomes
Threat reduction outcomesOutputs
Local peopleadopt moresustainable
practices
Local peoplemanage forest
resources moresustainably
Informingstakeholders
about sustainableforest
managementpractices
Stakeholdersare informed
aboutsustainable
practices
Local people havean improved
understanding ofsustainable
practices
Trainedindividuals apply
new skills
Training stakeholders on
sustainable extraction
of NTFP
Individualstrained
Trained individualshave new skills for
sustainableextraction
Householdlivelihood/wellbeingimproves
Provide directinvestment for
rattan enrichment
Householdsreceive
investment forrattan
enrichment
Rattan providesadditionalincome to
households
Local peoplehave right toutilise forest
resources
Local people areincentivised tomanage forest
more sustainably
Forest lossslowed/
reversed
Status of native forestspecies (including
Edward’s Pheasant)improves
Forest protectionagreements in
exchange for NTFPextraction rights
Agreements in place
4:0
Critical Assumptions
Price of NTFPs remain stable or increase
Weather conditions remain stable enough
for rattan to grow
Populations of native forest species do not
decrease due to disease or other natural
factors

INTRODUCTION & KEY CONCEPTS
DESIGNING & IMPLEMENTING THE EVALUATION
PRISM MODULES
METHOD FACTSHEETS & ANNEXES
PRISM - TOOLKIT FOR EVALUATING THE OUTCOMES AND IMPACTS OF SMALL/MEDIUM-SIZED CONSERVATION PROJECTS175
GENERALFACTSHEETS
COMPLETING A THEORY OF
CHANGE
EXAMPLE THEORIES OF
CHANGE FROM PROJECTS
INVOLVING MULTIPLE ACTIONS
The price ofagriculture product
especially the candlenut getting increase
Income ofcooperative
member / farmerincreased
Cooperative becomerepresentativeorganisation in
promotingconservation area
Member ofcooperative
continuouslyincreaded
Cooperative applyan accountable,
transparent, credibleand professional
management
Sustainability of Mbeliling Productive
Landscape reached due to the improvement of
local livelihood
Joint marketing business plan
operated
Regular shipmentof candle nut toJava carried out
Local partnershipdeveloped
Agreement with inter-island
buyer reached
Support of stakeholder increased
Total of memberincreased
Total of capital increased
Capacity for organizational
development increasedCapacity for
administrationmanagement
increased
Number of internalagreements
reached
Opening new farm landdecreased
Impact on thearea/habitat
Threat reductionOutcome(s)
IntermediateOutcome(s)
Outputs
Actions
Collecting of forestresources to support
income decreased
Cash injectionas capital support
for cooperative
Implementationof joint marketing
Series of meetingand study to develop
partnership
Socialization andpromotion of
cooperative andthe activities
Series of training and
accompaniment tobuild the capacity of
cooperative
Series ofmeeting withcooperative
member
4:0
ActionsImpact on Biodiversity
Intermediateoutcomes
Threat reduction outcomesOutputsActions
Impact on Biodiversity
Intermediateoutcomes
Threat reduction outcomesOutputs
Critical Assumptions
Unsupported program/
project coming into the
area will be controlled
by the cooperative,
refers to the agreed
management plan of
Mbeliling Landscape

INTRODUCTION & KEY CONCEPTS
DESIGNING & IMPLEMENTING THE EVALUATION
PRISM MODULES
METHOD FACTSHEETS & ANNEXES
PRISM - TOOLKIT FOR EVALUATING THE OUTCOMES AND IMPACTS OF SMALL/MEDIUM-SIZED CONSERVATION PROJECTS176
Factsheet: Identifying why you want to evaluate
Summary
There are many reasons to evaluate and many potential ways in
which the results of an evaluation could be used. For example you
might want to demonstrate results externally, use results to learn
internally or a combination of both. You may also want to clarify
whether you are most interested in what change has happened,
or whether you are more interested in how and why change has
happened.
One of the most common mistakes in an impact evaluation is not
identifying why you want to evaluate and what the evaluation
results will be used for. This is critical because being clear about the
purpose and the stakeholders who will ultimately use the results
helps to determine the questions, evaluation design and methods
you will use to carry out the evaluation.
GENERALFACTSHEETS
IDENTIFYING WHY YOU WANT TO
EVALUATE
4:0

INTRODUCTION & KEY CONCEPTS
DESIGNING & IMPLEMENTING THE EVALUATION
PRISM MODULES
METHOD FACTSHEETS & ANNEXES
PRISM - TOOLKIT FOR EVALUATING THE OUTCOMES AND IMPACTS OF SMALL/MEDIUM-SIZED CONSERVATION PROJECTS177
Required steps
Step 1 Identify evaluation stakeholders
As a project team, ask the following questions:
1. Who are the main evaluation stakeholders? - Typically
your evaluation stakeholders will involve the project
team/implementing organisation, the project donor(s)
s and other key stakeholders whose involvement is
crucial to the success of the project. However you
should also consider the following:
• Which groups/individuals are most likely to be
affected by the evaluation?
• Which groups/individuals are most likely to make
decisions about the project?
• Whose actions and/or decisions will be influenced
by their engagement with the evaluation process
and/or the evaluation findings?
2. How can the main stakeholders of the evaluation be
involved?
3. What challenges/barriers might prevent/restrict the
involvement of stakeholders?
4. Who are the target audiences for the evaluation
(i.e. those who are interested in knowing about the
evaluation findings, but are not among the primary
evaluation users)?
Step 2 Identify what the stakeholders want to know, and
how they will use the results of the evaluation
Ask the following questions both as the project team and (if
possible) to all other identified evaluation stakeholders:
1. How could the evaluation results contribute to the
improvement of the project?
2. How could the evaluation results contribute to making
decisions about the project?
3. What outcomes do you expect from the evaluation
process (what would success look like)?
4. What could be done differently as a result of
answering these questions?
GENERALFACTSHEETS
IDENTIFYING WHY YOU WANT TO
EVALUATE
STEPS 1 & 2
4:0

INTRODUCTION & KEY CONCEPTS
DESIGNING & IMPLEMENTING THE EVALUATION
PRISM MODULES
METHOD FACTSHEETS & ANNEXES
PRISM - TOOLKIT FOR EVALUATING THE OUTCOMES AND IMPACTS OF SMALL/MEDIUM-SIZED CONSERVATION PROJECTS178
GENERALFACTSHEETS
IDENTIFYING WHY YOU WANT TO
EVALUATE
STEP 3
EXAMPLE
STEP 3 - COMPILE INFORMATION IN THE FOLLOWING TABLE:
WHAT DO THEY WANT TO KNOW?
Was the action successful?
Why/how was the action successful?
Was the project a success?
What was the impact on local people?
What lessons were learnt?
WHAT DO THEY WANT TO KNOW?
STAKEHOLDER GROUP
Project team/implementing NGO
Donors
Local authorities
Wider conservation community
STAKEHOLDER GROUP
Project Team
Donors
Other key stakeholders (e.g. local authorities, politicians, law enforcement agencies, local community)
Add others as necessary
HOW WILL THEY USE THE INFORMATION?
Modifying the projectDemonstrating results to donors
External communications
Informing management/policy decisions
Distributing resultsUsing results to inform conservation practice
HOW WILL THEY USE THE INFORMATION?
4:0
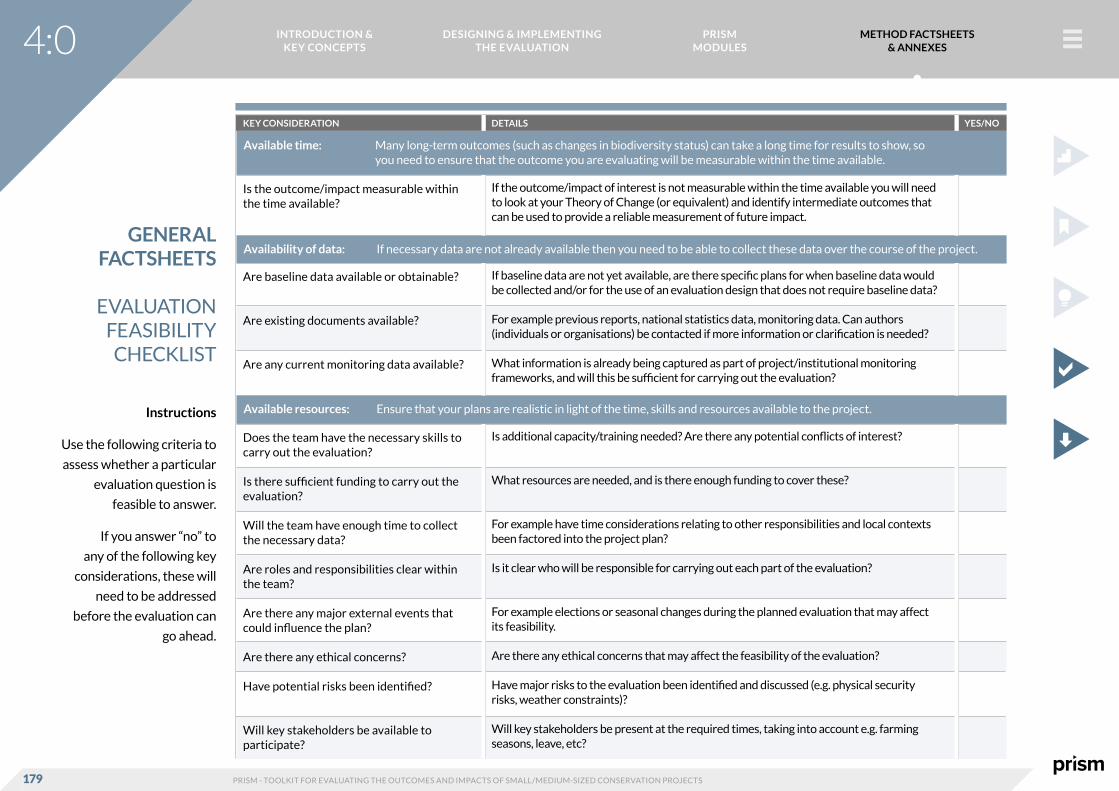
INTRODUCTION & KEY CONCEPTS
DESIGNING & IMPLEMENTING THE EVALUATION
PRISM MODULES
METHOD FACTSHEETS & ANNEXES
PRISM - TOOLKIT FOR EVALUATING THE OUTCOMES AND IMPACTS OF SMALL/MEDIUM-SIZED CONSERVATION PROJECTS179
GENERALFACTSHEETS
EVALUATION FEASIBILITY CHECKLIST
YES/NO
Available time: Many long-term outcomes (such as changes in biodiversity status) can take a long time for results to show, so you need to ensure that the outcome you are evaluating will be measurable within the time available.
Availability of data: If necessary data are not already available then you need to be able to collect these data over the course of the project.
Available resources: Ensure that your plans are realistic in light of the time, skills and resources available to the project.
KEY CONSIDERATION
Is the outcome/impact measurable within the time available?
Are baseline data available or obtainable?
Are existing documents available?
Are any current monitoring data available?
Does the team have the necessary skills to carry out the evaluation?
Is there sufficient funding to carry out the evaluation?
Will the team have enough time to collect the necessary data?
Are roles and responsibilities clear within the team?
Are there any major external events that could influence the plan?
Are there any ethical concerns?
Have potential risks been identified?
Will key stakeholders be available to participate?
DETAILS
If the outcome/impact of interest is not measurable within the time available you will need to look at your Theory of Change (or equivalent) and identify intermediate outcomes that can be used to provide a reliable measurement of future impact.
If baseline data are not yet available, are there specific plans for when baseline data would be collected and/or for the use of an evaluation design that does not require baseline data?
For example previous reports, national statistics data, monitoring data. Can authors (individuals or organisations) be contacted if more information or clarification is needed?
What information is already being captured as part of project/institutional monitoring frameworks, and will this be sufficient for carrying out the evaluation?
Is additional capacity/training needed? Are there any potential conflicts of interest?
What resources are needed, and is there enough funding to cover these?
For example have time considerations relating to other responsibilities and local contexts been factored into the project plan?
Is it clear who will be responsible for carrying out each part of the evaluation?
For example elections or seasonal changes during the planned evaluation that may affect its feasibility.
Are there any ethical concerns that may affect the feasibility of the evaluation?
Have major risks to the evaluation been identified and discussed (e.g. physical security risks, weather constraints)?
Will key stakeholders be present at the required times, taking into account e.g. farming seasons, leave, etc?
Instructions
Use the following criteria to
assess whether a particular
evaluation question is
feasible to answer.
If you answer “no” to
any of the following key
considerations, these will
need to be addressed
before the evaluation can
go ahead.
4:0

INTRODUCTION & KEY CONCEPTS
DESIGNING & IMPLEMENTING THE EVALUATION
PRISM MODULES
METHOD FACTSHEETS & ANNEXES
PRISM - TOOLKIT FOR EVALUATING THE OUTCOMES AND IMPACTS OF SMALL/MEDIUM-SIZED CONSERVATION PROJECTS180
Factsheet: Completing a prioritisation matrix
Summary
This factsheet outlines a simple method which provides a template
for the organisation, prioritisation and selection of evaluation
questions. A prioritisation matrix allows you to organise the
project’s outcomes & impacts, develop questions relating to each
outcome and apply a set of criteria to guide you in prioritising the
questions to address in the evaluation.
Introduction
The guidance in this factsheet is meant to complement the
information given in PRISM Step 1 -– What do you need to know?.
The criteria applied in the matrix shown on the next page below
are as follows:
• Importance to project users;
• Importance to project success;
• How well known is the action being evaluated?
• Time required (for outcome/impact to become feasible
to measure);
• Ease of data collection;
• Resources required.
Ideally the matrix should be completed by the project team, then
reviewed in conjunction with the project’s stakeholders and
revised if necessary to ensure that all are happy with the questions
the evaluation will address.
GENERALFACTSHEETS
COMPLETING A PRIORITISATION
MATRIX
4:0

INTRODUCTION & KEY CONCEPTS
DESIGNING & IMPLEMENTING THE EVALUATION
PRISM MODULES
METHOD FACTSHEETS & ANNEXES
PRISM - TOOLKIT FOR EVALUATING THE OUTCOMES AND IMPACTS OF SMALL/MEDIUM-SIZED CONSERVATION PROJECTS181
Required steps
Step 1. Start with the project’s outcomes & impacts.
Take the outcomes & impacts from your Theory of Change (or
equivalent) and insert them into the following matrix. Put the
project’s longer-term outcomes and impacts at the top and work
your way down. See example below.
GENERALFACTSHEETS
COMPLETING A PRIORITISATION
MATRIX
STEP 1 Local peoplemanage forest
resources moresustainably
Trainedindividuals apply
new skills
Training stakeholders on
sustainable extraction
of forestproducts
Individualstrained
Householdlivelihood/wellbeingimproves
Payinghouseholds
10 year forestprotection fee and
persuading them to invest part of it
on rattanenrichment
Householdsreceive
investment forrattan
enrichment
Rattan providesadditionalincome to
households
Local peoplehave right toutilise forest
resources
Local people areincentivised tomanage forest
more sustainably
Forest lossslowed/
reversed
Status of native forestspecies (including
Edward’s Pheasant)improves
Forest protectionagreements in
exchange for forest product extraction
rights
Agreements in place
4:0
ActionsImpact on Biodiversity
Intermediateoutcomes
Threat reduction outcomesOutputsActions
Impact on Biodiversity
Intermediateoutcomes
Threat reduction outcomesOutputs
Critical Assumptions
Prices for forest products remain stable or increase
Weather conditions remain stable enough for
rattan to grow
Populations of native forest species do not
decrease due to disease or other natural factors

INTRODUCTION & KEY CONCEPTS
DESIGNING & IMPLEMENTING THE EVALUATION
PRISM MODULES
METHOD FACTSHEETS & ANNEXES
PRISM - TOOLKIT FOR EVALUATING THE OUTCOMES AND IMPACTS OF SMALL/MEDIUM-SIZED CONSERVATION PROJECTS182
GENERALFACTSHEETS
COMPLETING A PRIORITISATION
MATRIX
STEP 1
EVALUATION QUESTION(S)
OUTCOME/IMPACT
Status of native
forest species
improves
Forest loss
slowed/reversed
Local people
manage forest
resources more
sustainably
Local people are
incentivised to
manage forest
more sustainably
Local people have
right to utilise
forest resources
Household
livelihood/
wellbeing
improves
Rattan provides
additional income
to households
Trained
individuals apply
new skills
WHICH STAKEHOLDERS CARE ABOUT THIS?
IMPORTANCE TO USERS
(High, Med,
Low)
IMPORTANCE TO PROJECT SUCCESS
(High, Med,
Low)
HOW WELL KNOWN IS THE ACTION BEING EVALUATED?
(High, Med,
Low)
EASE OF DATA COLLECTION
(High, Med,
Low)
CAN THIS BE ANSWERED GIVEN YOUR TIME & RESOURCES
(Yes, No,
Partially)
PRIORITY
(High, Medium, Low,
Eliminate)
Provide justification
for the answers)
4:0

INTRODUCTION & KEY CONCEPTS
DESIGNING & IMPLEMENTING THE EVALUATION
PRISM MODULES
METHOD FACTSHEETS & ANNEXES
PRISM - TOOLKIT FOR EVALUATING THE OUTCOMES AND IMPACTS OF SMALL/MEDIUM-SIZED CONSERVATION PROJECTS183
Step 2. Develop potential evaluation questions for each
outcome/impact and identify who will use the results.
Refer to step 1 in section 2 of the Toolkit for more information
on how to develop evaluation questions and how to identifying
evaluation stakeholders.
EVALUATION QUESTION(S)
To what extent have populations of
native forest species changed since the
project began and if so to what extent
can this be attributed to the project?
Has there been a change in the rate of
forest loss since the project began and if
so can this change be expected to persist
Has there been a change in the way local
people manage forest resources and if
so to what extent can this be attributed
to the project?
Have the project’s actions given local
people more of an incentive to manage
forest resources sustainably and if so
can this be expected to persist?
Have agreements provided local people
with the right to utilise forest resources?
Have household livelihoods and/or
wellbeing status improved as a result of
the project’s actions
Has the rattan planted with support
from the project provided (or will
provide) households with additional
income?
Are trained individuals applying any of
the skills learnt?
OUTCOME/IMPACT
Status of native
forest species
improves
Forest loss
slowed/reversed
Local people
manage forest
resources more
sustainably
Local people are
incentivised to
manage forest
more sustainably
Local people have
right to utilise
forest resources
Household
livelihood/
wellbeing
improves
Rattan provides
additional income
to households
Trained
individuals apply
new skills
WHICH STAKEHOLDERS CARE ABOUT THIS?
Participating households
Local authorities;
Project team
Project funder
Participating households
Local authorities;
Project team
Project funder
Participating households
Local authorities;
Project team
Project funder
Participating households;
Local authorities
Participating households
Local authorities
Participating households
Local community
Project Funder
Participating households
Local community
Project team
Participating households
IMPORTANCE TO USERS
(High, Med,
Low)
IMPORTANCE TO PROJECT SUCCESS
(High, Med,
Low)
HOW WELL KNOWN IS THE ACTION BEING EVALUATED?
(High, Med,
Low)
EASE OF DATA COLLECTION
(High, Med,
Low)
CAN THIS BE ANSWERED GIVEN YOUR TIME & RESOURCES
(Yes, No,
Partially)
PRIORITY
(High, Medium, Low,
Eliminate)
Provide justification
for the answers)
GENERALFACTSHEETS
COMPLETING A PRIORITISATION
MATRIX
STEP 2
4:0

INTRODUCTION & KEY CONCEPTS
DESIGNING & IMPLEMENTING THE EVALUATION
PRISM MODULES
METHOD FACTSHEETS & ANNEXES
PRISM - TOOLKIT FOR EVALUATING THE OUTCOMES AND IMPACTS OF SMALL/MEDIUM-SIZED CONSERVATION PROJECTS184
Step 3. Populate the matrix based on the following criteria:
Importance to users, importance to project success, how well
known the action is and the level of time, data and resources
required. Refer to section 2 of PRISM for more information on how
to apply these criteria.
GENERALFACTSHEETS
COMPLETING A PRIORITISATION
MATRIX
STEP 3
EVALUATION QUESTION(S)
To what extent have populations of
native forest species changed since the
project began and if so to what extent
can this be attributed to the project?
Has there been a change in the rate of
forest loss since the project began and if
so can this change be expected to persist
Has there been a change in the way local
people manage forest resources and if
so to what extent can this be attributed
to the project?
Have the project’s actions given local
people more of an incentive to manage
forest resources sustainably and if so
can this be expected to persist?
Have agreements provided local people
with the right to utilise forest resources?
Have household livelihoods and/or
wellbeing status improved as a result of
the project’s actions
Has the rattan planted with support
from the project provided (or will
provide) households with additional
income?
Are trained individuals applying any of
the skills learnt?
OUTCOME/IMPACT
Status of native
forest species
improves
Forest loss
slowed/reversed
Local people
manage forest
resources more
sustainably
Local people are
incentivised to
manage forest
more sustainably
Local people have
right to utilise
forest resources
Household
livelihood/
wellbeing
improves
Rattan provides
additional income
to households
Trained
individuals apply
new skills
WHICH STAKEHOLDERS CARE ABOUT THIS?
Participating households
Local authorities;
Project team
Project funder
Participating households
Local authorities;
Project team
Project funder
Participating households
Local authorities;
Project team
Project funder
Participating households;
Local authorities
Participating households
Local authorities
Participating households
Local community
Project Funder
Participating households
Local community
Project team
Participating households
IMPORTANCE TO USERS
High
Med
High
Med
High
High
Med
Med
IMPORTANCE TO PROJECT SUCCESS
High
High
High
High
High
High
High
Med
HOW WELL KNOWN IS THE ACTION BEING EVALUATED?
Low
Low
Low
Low
Med
Med
Med
Med
EASE OF DATA COLLECTION
Low
Low
Med
Med
High
Low
Med
Med
CAN THIS BE ANSWERED GIVEN YOUR TIME & RESOURCES
No
No
Yes
Yes
Yes
Partially
Partially
Yes
PRIORITY
(High, Medium, Low,
Eliminate)
Provide justification
for the answers)
4:0
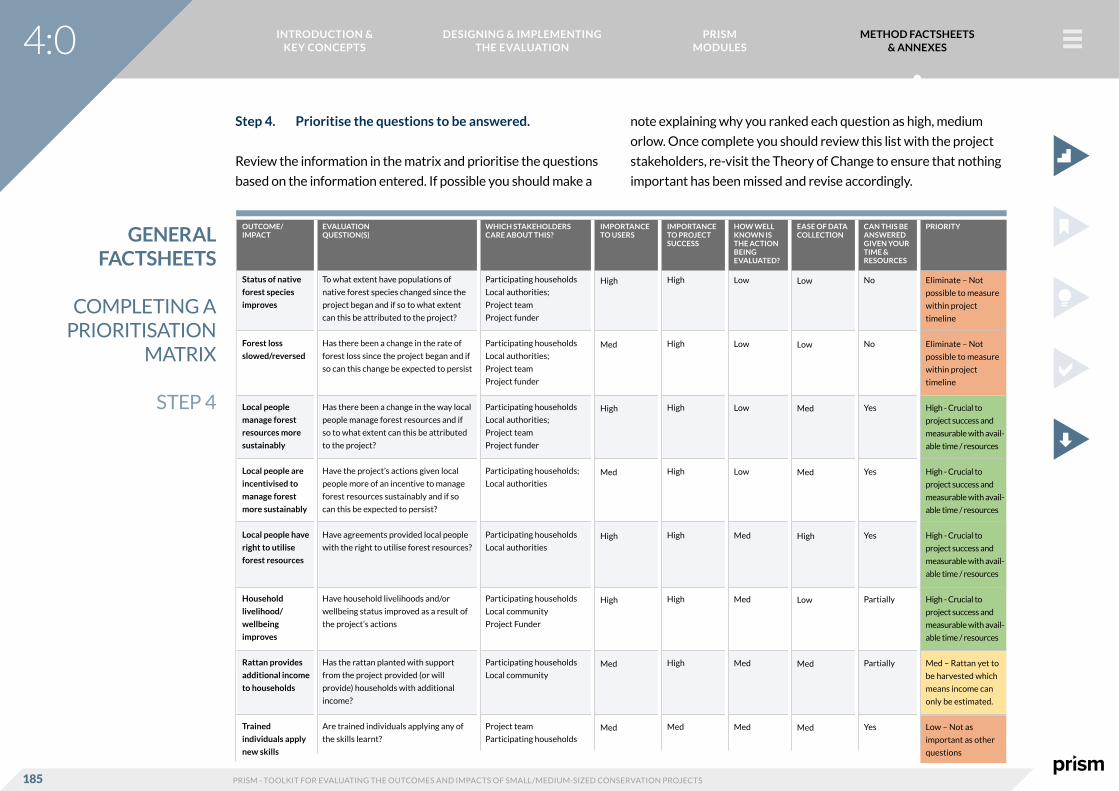
INTRODUCTION & KEY CONCEPTS
DESIGNING & IMPLEMENTING THE EVALUATION
PRISM MODULES
METHOD FACTSHEETS & ANNEXES
PRISM - TOOLKIT FOR EVALUATING THE OUTCOMES AND IMPACTS OF SMALL/MEDIUM-SIZED CONSERVATION PROJECTS185
Step 4. Prioritise the questions to be answered.
Review the information in the matrix and prioritise the questions
based on the information entered. If possible you should make a
note explaining why you ranked each question as high, medium
orlow. Once complete you should review this list with the project
stakeholders, re-visit the Theory of Change to ensure that nothing
important has been missed and revise accordingly.
GENERALFACTSHEETS
COMPLETING A PRIORITISATION
MATRIX
STEP 4
4:0
EVALUATION QUESTION(S)
To what extent have populations of
native forest species changed since the
project began and if so to what extent
can this be attributed to the project?
Has there been a change in the rate of
forest loss since the project began and if
so can this change be expected to persist
Has there been a change in the way local
people manage forest resources and if
so to what extent can this be attributed
to the project?
Have the project’s actions given local
people more of an incentive to manage
forest resources sustainably and if so
can this be expected to persist?
Have agreements provided local people
with the right to utilise forest resources?
Have household livelihoods and/or
wellbeing status improved as a result of
the project’s actions
Has the rattan planted with support
from the project provided (or will
provide) households with additional
income?
Are trained individuals applying any of
the skills learnt?
OUTCOME/IMPACT
Status of native
forest species
improves
Forest loss
slowed/reversed
Local people
manage forest
resources more
sustainably
Local people are
incentivised to
manage forest
more sustainably
Local people have
right to utilise
forest resources
Household
livelihood/
wellbeing
improves
Rattan provides
additional income
to households
Trained
individuals apply
new skills
WHICH STAKEHOLDERS CARE ABOUT THIS?
Participating households
Local authorities;
Project team
Project funder
Participating households
Local authorities;
Project team
Project funder
Participating households
Local authorities;
Project team
Project funder
Participating households;
Local authorities
Participating households
Local authorities
Participating households
Local community
Project Funder
Participating households
Local community
Project team
Participating households
IMPORTANCE TO USERS
High
Med
High
Med
High
High
Med
Med
IMPORTANCE TO PROJECT SUCCESS
High
High
High
High
High
High
High
Med
HOW WELL KNOWN IS THE ACTION BEING EVALUATED?
Low
Low
Low
Low
Med
Med
Med
Med
EASE OF DATA COLLECTION
Low
Low
Med
Med
High
Low
Med
Med
CAN THIS BE ANSWERED GIVEN YOUR TIME & RESOURCES
No
No
Yes
Yes
Yes
Partially
Partially
Yes
PRIORITY
Eliminate – Not
possible to measure
within project
timeline
Eliminate – Not
possible to measure
within project
timeline
High - Crucial to
project success and
measurable with avail-
able time / resources
High - Crucial to
project success and
measurable with avail-
able time / resources
High - Crucial to
project success and
measurable with avail-
able time / resources
High - Crucial to
project success and
measurable with avail-
able time / resources
Med – Rattan yet to
be harvested which
means income can
only be estimated.
Low – Not as
important as other
questions

INTRODUCTION & KEY CONCEPTS
DESIGNING & IMPLEMENTING THE EVALUATION
PRISM MODULES
METHOD FACTSHEETS & ANNEXES
PRISM - TOOLKIT FOR EVALUATING THE OUTCOMES AND IMPACTS OF SMALL/MEDIUM-SIZED CONSERVATION PROJECTS186
Step 5. Plan the evaluation around the prioritised evaluation
questions.
Plan the evaluation around the questions identified, starting with
the highest priority questions and working your way down. Aim to
answer no more than five main questions during the evaluation.
For the example given above, the team selected the following
three questions to answer during the evaluation:
• Has there been a change in the way local people manage
forest resources and if so to what extent can this be
attributed to the project?
• Have the project’s actions given local people more of an
incentive to manage forest resources sustainably and if
so can this be expected to persist?
• Have agreements provided local people with the right
to utilise forest resources?
• Have household livelihoods and/or wellbeing status
improved as a result of the project’s actions
Once the questions have been identified you can then develop
indicators for each of them, insert this information into the PRISM
evaluation and select appropriate methods and evaluation designs
that will enable you to answer the identified questions. Refer to
PRISM step 2 for more information on how to do this.
Acknowledgements
Guidance in this section is based on Sharp L and Frechtling J (1997).
Overview of the design process for mixed method evaluation. In L
Sharp and J Frechtling (eds.), User-Friendly Handbook for Mixed
Method Evaluations.
Retrieved from http://www.nsf.gov/pubs/1997/nsf97153/start.
htm .
GENERALFACTSHEETS
COMPLETING A PRIORITISATION
MATRIX
STEP 5
4:0

INTRODUCTION & KEY CONCEPTS
DESIGNING & IMPLEMENTING THE EVALUATION
PRISM MODULES
METHOD FACTSHEETS & ANNEXES
PRISM - TOOLKIT FOR EVALUATING THE OUTCOMES AND IMPACTS OF SMALL/MEDIUM-SIZED CONSERVATION PROJECTS187
Once you have identified your evaluation questions and methods it
is important to plan and map out how data will be collected, when
it will be collected, who will collect it and estimate how much it will
cost.
Below is a simple template that you can use, modify or adapt to
your particular project to map out and plan your data collection.
See Step 1. What do you need to know for guidance on completing
columns 1-4
See Step 2. What data do you need to collect? and the Module
Chapters for information on completing columns 5-9
For column 10 (key assumptions) see factsheet: Completing a
Theory of Change for more information on identifying and dealing
with assumptions
4:0
GENERALFACTSHEETS
COMPLETING AN EVALUATION PLAN
COMPLETING AN EVALUATION PLAN
OUTCOME/IMPACT (FROM THEORY OF CHANGE OR EQUIVALENT)
EVALUATION QUESTION
SUB-QUESTION(S)
INDICATOR(S) DATA COLLECTION METHOD(S)
EVALUATION DESIGN
PERSON(S) RESPONSIBLE FOR DATA COLLECTION
WHEN WILL DATA BE COLLECTED?
ESTIMATED COSTS
KEY ASSUMPTIONS(FACTORS THAT MAY AFFECT THE PROJECT’S RESULTS IF NO LONGER TRUE)

INTRODUCTION & KEY CONCEPTS
DESIGNING & IMPLEMENTING THE EVALUATION
PRISM MODULES
METHOD FACTSHEETS & ANNEXES
PRISM - TOOLKIT FOR EVALUATING THE OUTCOMES AND IMPACTS OF SMALL/MEDIUM-SIZED CONSERVATION PROJECTS188
4:0
GENERALFACTSHEETS
EXAMPLE: COMPLETED EVALUATION
PLAN
EXAMPLE: COMPLETED EVALUATION PLAN
OUTCOME/IMPACT (FROM THEORY OF CHANGE OR EQUIVALENT)
EVALUATION QUESTION
SUB-QUESTION(S) INDICATOR(S) DATA COLLECTION METHOD(S)
EVALUATION DESIGN
PERSON(S) RESPONSIBLE FOR DATA COLLECTION
WHEN WILL DATA BE COLLECTED?
ESTIMATED COSTS
KEY ASSUMPTIONS(FACTORS THAT MAY AFFECT THE PROJECT’S RESULTS IF NO LONGER TRUE)
Small group of local people are actively engaged in conservation at the site
Is there a small group of local people who are actively engaged in conservation at the site?
Have local people been informed about conservation at the project site?
Number of local people attending a meeting
Local people’s level of knowledge regarding conservation at project site after meetings/presentations
Focus group Before - After Social surveyor March 2017 & May 2018
Salary of social surveyor ($30/day for 14 days data collection + 7 days analysis and reporting)
Local people’s work schedules allow them to attend focus groups
Are local people more interested in engaging in conservation at the site and if so, is this due to the project?
Establishment of a local conservation group
Local people’s level of interest in engaging in conservation at the site
Direct observation
Focus group
Before - After Social surveyor March 2017 & May 2018
Local people’s work schedules allow them to attend focus groups
Local communities appreciate the importance of birds at project site are positive about birdwatching at the site.
How has the project affected local communities perceptions of birdwatching and the importance of birds at the project site?
Has the project affected local perceptions towards birdwatchers
Community perceptions before and after the project
Questionnaire - Baseline
Focus group - Baseline
Participatory Impact Assessment (PIA)
Survey stakeholders before - after - Social surveyor
Participatory Impact Assessment
Social surveyor Baseline surveys - March 2017
Follow-up survey and PIA - May 2018
Local people’s work schedules allow them to attend focus groups
Local people are willing to provide honest answers regarding their perceptions
Project timeline is long enough for economic benefits to become visible to local people
Is there a perceived economic benefit to local communities (e.g. bird tourism revenues)
Social surveyor Baseline surveys - March 2017
Follow-up survey and PIA - May 2018
Has the project made people more positive about birds and the importance of the site in general
Social surveyor Baseline surveys - March 2017
Follow-up survey and PIA - May 2018
Habitat at managed part of project site is improved for shorebirds
Has the habitat being managed by the project been improved for shorebirds, compared to neighbouring salt pans?
Has the frequency of SBS and the diversity of shorebird species in BCST managed salt pans increased, compared to other salt pans?
Frequency and diversity of shorebird populations at both managed salt pans and neighbouring salt pans
Shorebird Survey Matching design -Measure at project site & neighbouring salt pans
Local bird surveyor
Weekly - During winter months
Baseline data to be collected March 2017
Salary of local surveyor ($20/day for 30 days)
Other than those managed by the project, environmental conditions do not significantly affect shorebird numbers or behaviour
Have other indicators of habitat quality (e.g. salinity, invertebrate density) at project site improved
Indicators of habitat quality at managed salt pans
Habitat surveys (salinity, invertebrate diversity etc)
Measure before-after at project site
Project Coordinator
Researcher
Baseline survey - June 2017
Follow-up survey - June 2018
Stipend for researcher ($20/day for 10 days data collection + 5 days analysis and reporting)
Other than those managed by the project, environmental conditions are similar at survey times

INTRODUCTION & KEY CONCEPTS
DESIGNING & IMPLEMENTING THE EVALUATION
PRISM MODULES
METHOD FACTSHEETS & ANNEXES
PRISM - TOOLKIT FOR EVALUATING THE OUTCOMES AND IMPACTS OF SMALL/MEDIUM-SIZED CONSERVATION PROJECTS189
Factsheet: Developing ethical protocols for an evaluation
Many organisations that conduct conservation projects,
and organisations that fund projects, have their own ethical
review process that any activities will need to adhere to. Such
ethical standards will apply to evaluation methods as well.
Some conservation projects may have no formal ethical review
requirements but it is still essential that work conducted, both
in the project itself and in the assessment of impacts, is ethically
sound. This factsheet provides some guidance on the things that
should be considered when conducting activities involving people.
There are also important ethical considerations for undertaking
any evaluation involving species populations, habitats or
stakeholders involved outside the main part of the project (e.g.
as part of a control group). For example a particular method may
damage a particular habitat or a method can cost the participants
time that could otherwise be spent working, earning money, being
active within their community or with family/friends. Poorly-
planned evaluations can be unethical, can waste people’s time and
can damage both the project and the perception of conservation
work in the local community and beyond.
There are ethical considerations that apply to activity design,
during implementation and after the activity has been completed.
These considerations may require preparation on behalf of the
team before the project starts (for example, finding a secure
storage unit for data).
Considerations for the design phase
Minimise harm - There is an obligation to minimise any potential
psychological or physical risk to participants from taking part in
the study. As well as direct risks there may be indirect ones, for
example by asking people to take part in the research you may be
reducing the time they have to spend with family and friends or at
work, or you may be affecting their status in the local community.
It may not be possible to avoid all harm, but risks need to be
balanced against expected benefits.
GENERALFACTSHEETS
DEVELOPING ETHICAL
PROTOCOLS FOR AN
EVALUATION
4:0

INTRODUCTION & KEY CONCEPTS
DESIGNING & IMPLEMENTING THE EVALUATION
PRISM MODULES
METHOD FACTSHEETS & ANNEXES
PRISM - TOOLKIT FOR EVALUATING THE OUTCOMES AND IMPACTS OF SMALL/MEDIUM-SIZED CONSERVATION PROJECTS190
Considerations when collecting data
Consent - Participation needs to be voluntary, with the
participants being informed that they are contributing to a
research project and given details of what they are required to do.
They must give their consent to this, either verbally or in writing.
Projects are increasingly being encouraged to adopt the principle
of Free, Prior and Informed Consent (FPIC)14.
o Free - Consent for involvement in the evaluation should
be given voluntarily and without coercion, intimidation,
manipulation or bribery.
o Prior - Consent should be sought sufficiently far in
advance of the beginning of the evaluation, i.e. in the
early stages of planning the evaluation, and should
respect the time requirements of the participants.
o Informed - Information on the evaluation should be
delivered in appropriate language and in a culturally
appropriate way, in sufficient time to be understood.
Information must be provided in a way that is clear,
consistent, accurate, constant and transparent.
Information must reach all relevant participating
communities and any marginalised groups, and be
provided on an ongoing basis throughout the process.
o Consent - Communities and individuals have the
freedom to grant or withhold their consent at any stage
of the evaluation. It must be accepted that the project
will not proceed and/or that engagement must be
stopped if participants decide that they do not want to
begin or to continue, or if they decide to withhold their
consent at any time.
Right to withdraw - During the survey the participants need to
be informed that they can choose not to partake in part of the
study or can stop participation at any time, or can ask for their
information to be deleted.
Confidentiality - The participants need to be informed that their
data will be collected, stored and used in confidence; and their data
should be anonymised so that individuals cannot be identified in
any analysis or written output.
Transparency - The participants need to be informed that they can
contact the study leaders to ask questions or express concerns
regarding the study; and they should be provided with contact
details of the study leader to enable this.
Debrief - Participants should formally agree with the information
that is being attributed to them and should be able to edit or delete
their data.
GENERALFACTSHEETS
DEVELOPING ETHICAL
PROTOCOLS FOR AN
EVALUATION
4:0
14Adapted from: UN-REDD Programme (2013): Guidelines on Free,Prior and Informed Consent.

INTRODUCTION & KEY CONCEPTS
DESIGNING & IMPLEMENTING THE EVALUATION
PRISM MODULES
METHOD FACTSHEETS & ANNEXES
PRISM - TOOLKIT FOR EVALUATING THE OUTCOMES AND IMPACTS OF SMALL/MEDIUM-SIZED CONSERVATION PROJECTS191
Considerations following data collection
• Data storage – Hard copies should be kept in a locked
cupboard and electronic data must be stored in a secure
way, being accessible only by named project members,
to protect the participants.
• Returning study findings – The participants should
be thanked for their participation and be provided
with a suitable debrief on the study’s findings and its
implications at the time of completion.
• Anonymity – Data used in reporting should be
anonymised so that the participants cannot be
identified.
Important questions to consider
What is being asked?
Is the evaluation activity possibly going to cause any physical
or psychological harm? Harm may occur in many ways, either
directly (for example if a participant is stressed by questioning) or
indirectly (for example through repercussions in the community if a
participant is blamed for negative reports). Potential consequences
are obviously a consideration for the person and whether they
agree to participate, but they may also be balancing this with the
desire to co-operate. It is, therefore, a responsibility of the project
team to minimise negative consequences for the participants.
Does the evaluation activity aim to deceive participants about the
information they are providing? In some situations the questions
being asked may be getting information out of people in an indirect
or less than honest way. Deceiving people may be unethical
and unjustified, particularly if the information being obtained is
sensitive, personal or if it potentially implicates people in negative
or illegal behaviours.
Does the evaluation activity involve actions or questions
concerned with sensitive or illegal behaviour? Although in some
circumstances a project may be trying to gather information on
sensitive/illegal behaviour, are you collecting any identifying or
personal information that links any individuals to this behaviour?
Do you have an obligation to report illegal behaviour and do the
participants know this?
GENERALFACTSHEETS
DEVELOPING ETHICAL
PROTOCOLS FOR AN
EVALUATION
4:0
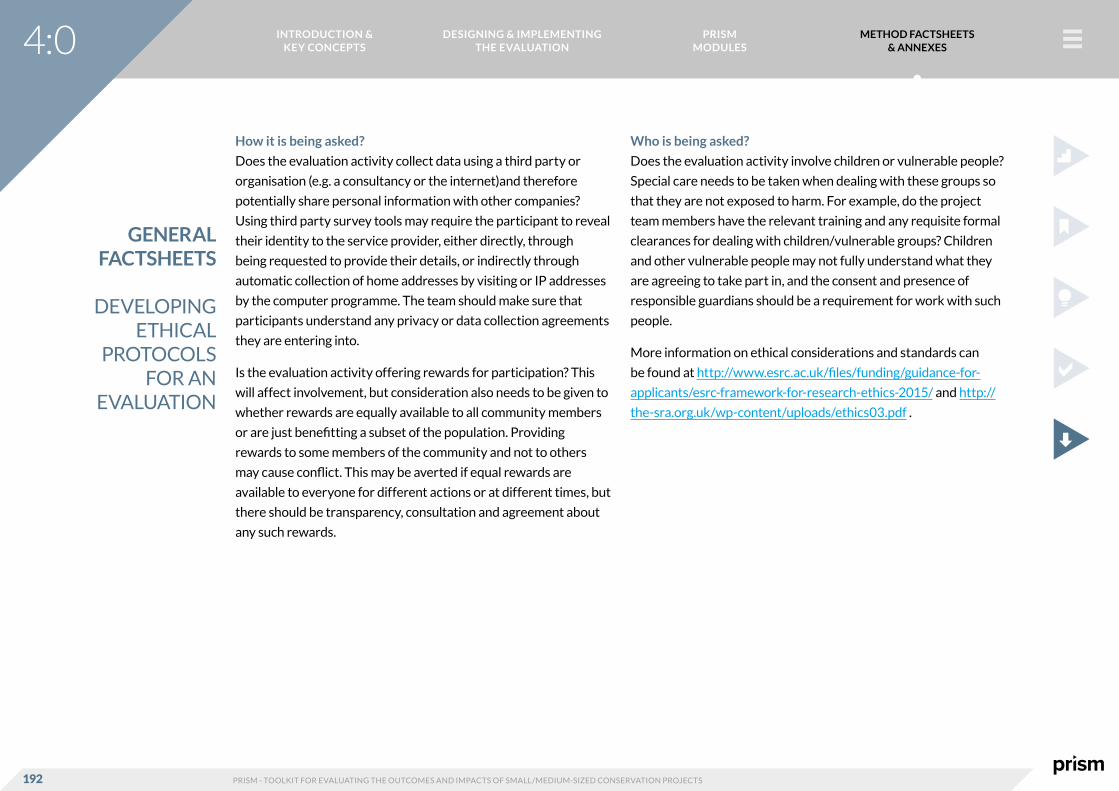
INTRODUCTION & KEY CONCEPTS
DESIGNING & IMPLEMENTING THE EVALUATION
PRISM MODULES
METHOD FACTSHEETS & ANNEXES
PRISM - TOOLKIT FOR EVALUATING THE OUTCOMES AND IMPACTS OF SMALL/MEDIUM-SIZED CONSERVATION PROJECTS192
How it is being asked?
Does the evaluation activity collect data using a third party or
organisation (e.g. a consultancy or the internet)and therefore
potentially share personal information with other companies?
Using third party survey tools may require the participant to reveal
their identity to the service provider, either directly, through
being requested to provide their details, or indirectly through
automatic collection of home addresses by visiting or IP addresses
by the computer programme. The team should make sure that
participants understand any privacy or data collection agreements
they are entering into.
Is the evaluation activity offering rewards for participation? This
will affect involvement, but consideration also needs to be given to
whether rewards are equally available to all community members
or are just benefitting a subset of the population. Providing
rewards to some members of the community and not to others
may cause conflict. This may be averted if equal rewards are
available to everyone for different actions or at different times, but
there should be transparency, consultation and agreement about
any such rewards.
Who is being asked?
Does the evaluation activity involve children or vulnerable people?
Special care needs to be taken when dealing with these groups so
that they are not exposed to harm. For example, do the project
team members have the relevant training and any requisite formal
clearances for dealing with children/vulnerable groups? Children
and other vulnerable people may not fully understand what they
are agreeing to take part in, and the consent and presence of
responsible guardians should be a requirement for work with such
people.
More information on ethical considerations and standards can
be found at http://www.esrc.ac.uk/files/funding/guidance-for-
applicants/esrc-framework-for-research-ethics-2015/ and http://
the-sra.org.uk/wp-content/uploads/ethics03.pdf .
GENERALFACTSHEETS
DEVELOPING ETHICAL
PROTOCOLS FOR AN
EVALUATION
4:0
http://www.esrc.ac.uk/files/funding/guidance-for-applicants/esrc-framework-for-research-ethics-2015/

INTRODUCTION & KEY CONCEPTS
DESIGNING & IMPLEMENTING THE EVALUATION
PRISM MODULES
METHOD FACTSHEETS & ANNEXES
PRISM - TOOLKIT FOR EVALUATING THE OUTCOMES AND IMPACTS OF SMALL/MEDIUM-SIZED CONSERVATION PROJECTS193
Factsheet: Developing gender protocols for an evaluation
Many conservation actions will have outcomes and impacts
that differ according to the gender of the project’s stakeholders.
Mainstreaming (or otherwise addressing) gender in your
evaluation can therefore provide extremely useful information
and insights that would not be captured if participants are viewed
as a gender-homogenous group. Reference to gender is also a
requirement for many donors in the development sector.
What is gender?
Gender is a social construct that refers to relations between
and among women and men, based on their relative roles. It
encompasses the economic, political and socio-cultural attributes,
constraints and opportunities associated with being male or
female. As a social construct, gender varies across cultures, is
dynamic and open to change over time. Because of the variation
in gender roles across cultures and over time, these roles should
not be assumed, but investigated. Gender is also a rights issue,
so for example women’s rights are laid down in the Convention
on the Elimination of all Forms of Discrimination Against Women
(CEDAW). In the development community there is often a
requirement for a Human Rights Based Approach.
Tips for incorporating gender into an evaluation
Ideally a project will have carried out a gender analysis at the
beginning, or a social survey which clearly distinguishes data
only applicable to women from data only applicable to men. The
evaluation can then measure impacts and changes affecting each
group separately if necessary. In many projects however, such
data do not exist or they are inadequate. In order to focus the
evaluation it is recommended to:
• identify whether gender has been addressed in all of the
project’s outcomes & impacts related to communities
and local empowerment, and to what extent the
outcomes & impacts affect particularly either women or
men;
• (if there are no baseline data) develop questions and
formulate indicators that are sex-disaggregated and
gender-sensitive, such as numbers and percentages
of men and women (not just “community members”).
Questions and indicators could refer to the roles that
women and men play in natural resource management,
or to and attitudes and practices concerning female
participation and leadership (e.g. how women
participate in community decision making).
GENERALFACTSHEETS
DEVELOPING GENDER
PROTOCOLS FOR AN
EVALUATION
4:0

INTRODUCTION & KEY CONCEPTS
DESIGNING & IMPLEMENTING THE EVALUATION
PRISM MODULES
METHOD FACTSHEETS & ANNEXES
PRISM - TOOLKIT FOR EVALUATING THE OUTCOMES AND IMPACTS OF SMALL/MEDIUM-SIZED CONSERVATION PROJECTS194
Designing the evaluation and collecting data
• Apply gender sensitivity to methods, e.g. disaggregate
questionnaire responses by gender.
• When appropriate, try to ensure gender balance among
evaluation participants.
• Use both male and female data collectors, and ensure
they have received gender-sensitive training.
• Ensure confidentiality and sensitivity, e.g. participants
may provide different answers depending on the gender
makeup of the group. It is often useful to organise focus
group meetings solely with women, to ensure that their
voice is heard.
Analysing and interpreting results
• During analysis, disaggregate data by gender.
• Use the data to evaluate whether and how the project’s
results affected men and women differently.
Questions to ask
• How did the project respond to the identified specific
interests and needs of women and men?
• How did the project address the rights of men and
women?
• Is the purpose and outcome of the intervention in
keeping with the goals of gender equity and beneficial
outcomes for women and men?
Key Resources
Conservation and Gender. Fauna & Flora International: http://
www.fauna-flora.org/initiatives/conservation-and-gender/
Guidelines for integrating gender into conservation.
Conservation International:
English: https://docs.google.com/file/
d/0B23PUHp4FJPZb3AzNUZWNENkLVk/edit
French: https://docs.google.com/file/
d/0B23PUHp4FJPZNHR0N2VlMDNqY1k/edit
Spanish: https://docs.google.com/file/
d/0B23PUHp4FJPZVnFYb1BTTVd5UUU/edit .
Conservation Leadership Programme - Tips for Integrating
Gender
http://www.conservationleadershipprogramme.org/
media/2014/09/CLP-Gender-Integration-Tips_Final.pdf .
Addressing gender in impact evaluation
https://www.odi.org/sites/odi.org.uk/files/odi-assets/publications-
opinion-files/9934.pdf .
GENERALFACTSHEETS
DEVELOPING GENDER
PROTOCOLS FOR AN
EVALUATION
4:0

INTRODUCTION & KEY CONCEPTS
DESIGNING & IMPLEMENTING THE EVALUATION
PRISM MODULES
METHOD FACTSHEETS & ANNEXES
PRISM - TOOLKIT FOR EVALUATING THE OUTCOMES AND IMPACTS OF SMALL/MEDIUM-SIZED CONSERVATION PROJECTS195
Factsheet: Entering, organising and cleaning data
Step 1. Enter and organise data
With both quantitative and qualitative data, it is important that
data are entered in a logical format that can be easily understood
and analysed.
• For quantitative data, use Microsoft Excel or another
spreadsheet software package to enter your data into
an electronic format.
• For qualitative data, type up all the data into a word
processing program such as Microsoft Word.
Before you being entering, develop a system to organise your data.
• For example, if you administered a survey to
schoolchildren and students, it would probably be best
to create one data spreadsheet for the parent survey
and another spreadsheet for the student survey.
• Make sure that each participant’s responses are
assigned to a unique participant identifier and that
responses are organised by survey item/question.
You would use a similar organisational approach for qualitative
data.
• Create a file for each interview, observation site, focus
group, etc.
• Within each file, organise the data by question, time
interval, and/or topic (depending on which method
makes most sense).
GENERALFACTSHEETS
ENTERING, ORGANISING
AND CLEANING DATA
STEP 1
4:0

INTRODUCTION & KEY CONCEPTS
DESIGNING & IMPLEMENTING THE EVALUATION
PRISM MODULES
METHOD FACTSHEETS & ANNEXES
PRISM - TOOLKIT FOR EVALUATING THE OUTCOMES AND IMPACTS OF SMALL/MEDIUM-SIZED CONSERVATION PROJECTS196
Step 2. Clean data
No matter what type of data or method you use, be sure always to
go back and review for errors.
Checking data for errors is commonly called “cleaning”. Cleaning
data is critical because “dirty” data can severely influence your
results.
Three commonly used cleaning methods are:
Spot-checking - Comparing the raw data with the
electronically-entered data to check for data-entry and
coding errors. To spot-check quantitative survey data, you
would for example randomly select several participants’
completed paper questionnaires and compare them with
the data in the electronic spreadsheet. For qualitative data
you would use this approach to check whether participants’
words were recorded accurately and attributed to the right
individuals.
If you find an error in your first round of spot-checking you
should randomly check another round of the raw data. If you
continue to find errors, and it is clear that they are more than
just isolated incidents, you will need to go over all of the raw
data to ensure that each record has been entered correctly.
Eye-balling - Reviewing the data for errors that may have
resulted from a data-entry or coding mistake. For example,
a survey question might read: “Did you attend one of the
project’s workshops?” Participants can only respond to this
question with a “no” or “yes.” “No” is assigned a value of 0,
while “yes” responses are assigned a value of 1. Therefore,
any number other than a 0 or 1 in the associated column on
the spreadsheet would be an obvious error.
Logic checks - Carefully reviewing the electronically-
entered data to make sure that the answers to the questions
“make sense.” For example, if participant 1 in a spreadsheet
indicated that they did not attend a project workshop,
it would be illogical for this participant to have provided
a satisfaction rating for the workshop. The only logical
response for this participant would be something equivalent
to “not applicable”.
If you find any errors using the techniques above, you will need to
go back to the original raw data for the participant(s) concerned
and enter the correct data.
Acknowledgement
Guidance in this factsheet is based on the Pell Institute’s Evaluation
Toolkit http://toolkit.pellinstitute.org/evaluation-guide/analyze/
enter-organize-clean-data/ .
GENERALFACTSHEETS
ENTERING, ORGANISING
AND CLEANING DATA
STEP 2
4:0

INTRODUCTION & KEY CONCEPTS
DESIGNING & IMPLEMENTING THE EVALUATION
PRISM MODULES
METHOD FACTSHEETS & ANNEXES
PRISM - TOOLKIT FOR EVALUATING THE OUTCOMES AND IMPACTS OF SMALL/MEDIUM-SIZED CONSERVATION PROJECTS197
Factsheet: Analysing quantitative data
Analysing quantitative data involves examining numeric data
(data collected in the form of numbers) to look for patterns and
trends that can help you to answer your evaluation questions.
This factsheet outlines some simple analyses that you can use to
describe your data along with some links to resources that can help
you to perform more complex analyses.
Step 1. Identify what kind of data you have
Examples of quantitative data include:
Step 2. Organise your data
The first and most simple analysis you can undertake is to organise
your data according to the different variables in your dataset,
for example by gender, species, site or income bracket. Adding a
percentage allows you to see what proportion of your total sample
are represented in each category.
Sample size = 30
GENERALFACTSHEETS
ANALYSING QUANTITATIVE
DATA
STEPS 1 & 2
4:0
DATA TYPE CATEGORICAL/CONTINUOUS
DESCRIPTION EXAMPLE
Nominal data Categorical Basic classification data. Data has no logical order
Male/FemaleSpeciesSites
Ordinal data Categorical Data has a logical order, but differences between values are not constant
Juvenile - Adult
Interval data Continuous Data has a logical order and differences between values are standardised. There is no natural zero
Likert scale: (1=strongly agree, 2= agree slightly, 3=neither agree or disagree, 4=slightly disagree, 5=Strongly disagree)
Ratio data Continuous Data is ordered, has standardised differences between values and a natural zero
Species population sizeHousehold income
Gender Female = 16 (53%)Male = 14 (47%)
Target community Village A = 15 (50%)Village B = 15 (50%)
Primary source of household income
Coffee = 10 (33%)Livestock = 10 (33%)Plantain = 5 (17%)Tomatoes = 3 (10%)Fruit = 2 (7%)
How important is the long term sustainability of local areas of forest to your household?
Very important = 15 (50%)Quite important = 2 (7%)Neutral = 3 (10%)Not very important = 8 (26%)Not important at all = 2 (7%)

INTRODUCTION & KEY CONCEPTS
DESIGNING & IMPLEMENTING THE EVALUATION
PRISM MODULES
METHOD FACTSHEETS & ANNEXES
PRISM - TOOLKIT FOR EVALUATING THE OUTCOMES AND IMPACTS OF SMALL/MEDIUM-SIZED CONSERVATION PROJECTS198
Frequency tables are a good visual way of summarising nominal or
numeric data by displaying the count of observations (number of
times a value of a variable occurred) in a table.
More information: http://www.betterevaluation.org/en/
resources/guides/frequency_tables
Step 3. Describe your data
Use simple calculations to describe your data. The most commonly
used calculations are:
Mean – Average of scores for a particular variable
Minimum & Maximum values – Highest & lowest value for a
particular variable
Median – The middle point in the dataset.
Mode – The most common number score
So the following dataset could be described in the following way:
GENERALFACTSHEETS
ANALYSING QUANTITATIVE
DATA
STEP 3
4:0
NUMBER OF CHILDREN PER
HOUSEHOLDTALLY FREQUENCY
1 II 2
2 IIII 4
3 I 1
4+ II 2
NUMBER OF CHILDREN PER
HOUSEHOLDTALLY
1 II Households = 9Total Children = 21
Mean = 2.3Max = 4Min = 1
Mode = 2Median = 2
2 IIII
3 I
4 II

INTRODUCTION & KEY CONCEPTS
DESIGNING & IMPLEMENTING THE EVALUATION
PRISM MODULES
METHOD FACTSHEETS & ANNEXES
PRISM - TOOLKIT FOR EVALUATING THE OUTCOMES AND IMPACTS OF SMALL/MEDIUM-SIZED CONSERVATION PROJECTS199
Step 4. Disaggregate your data
Further explore your data by separating out and disaggregating
the data across your different variables.
Cross-tabulations are a simple method of showing how frequently
two variables (e.g. gender and bustmeat consumption) occur
together.
Cross tabulations can then be used to make simple graphic to
visualise your results:
More information: Emery Evaluation - How to analyse pivot tables
in excel https://youtu.be/rybcOdIbH6g
GENERALFACTSHEETS
ANALYSING QUANTITATIVE
DATA
STEP 4
4:0
HOW OFTEN DO YOU EAT BUSHMEAT? MALES FEMALES
At least once a week 6 3
At least once a month 21 10
At least once a year 9 9
Never 1 12
0 5 10 15 20 25
How often do you eat bushmeat?
Never
At least once a year
At least once a month
At least once a week

INTRODUCTION & KEY CONCEPTS
DESIGNING & IMPLEMENTING THE EVALUATION
PRISM MODULES
METHOD FACTSHEETS & ANNEXES
PRISM - TOOLKIT FOR EVALUATING THE OUTCOMES AND IMPACTS OF SMALL/MEDIUM-SIZED CONSERVATION PROJECTS200
More advanced data analysis methods
There are a wide range of more advanced analysis methods that
you can perform on your dataset. A selection of these are outlined
in the table below along with some links to relevant resources.
Most of these analyses require the use of a statistical software
package (e.g. R or SPSS)GENERALFACTSHEETS
ANALYSING QUANTITATIVE
DATA
4:0
METHOD DESCRIPTION MORE INFORMATION
Correlation Determining how strongly two or more variables are related to each other. A positive correlation (+1.0 to 0) indicates that the variables will either increase or decrease together, while a negative correlation (0 to -1.0) indicates that as one variable increases, the other(s) will decrease.
http://betterevaluation.org/evaluation-options/
correlation
Multivariate regression
Identifying what combinations of variables best predict another variable of interest. For example, what combinations of household enterprises best predict their overall income levels.
http://betterevaluation.org/resources/guide/
descriptive_multivariate_statistics
Decision or classification tree
Identifying what combinations of attributes best predict another attribute of interest. Useful where only binary data are available (e.g. male versus female, group member or not). For example identifying the simplest predictors of a household’s poverty status.
EvalC3 – an Excel tool for developing decision
tree models https://evalc3.net/
Clustering Identifying any natural groupings in the cases being examined, e.g. households or villages based on data about their multiple attributes.
http://www.betterevaluation.org/evaluation-
options/multivariatedescriptive
Anomaly / outlier detection
Finding exceptions to common patterns (such as the main types of households). http://www.betterevaluation.org/evaluation-
options/multivariatedescriptive
T-test Test for comparing the means (averages) of two samples. http://wise.cgu.edu/wise-tutorials/tutorial-t-test/

INTRODUCTION & KEY CONCEPTS
DESIGNING & IMPLEMENTING THE EVALUATION
PRISM MODULES
METHOD FACTSHEETS & ANNEXES
PRISM - TOOLKIT FOR EVALUATING THE OUTCOMES AND IMPACTS OF SMALL/MEDIUM-SIZED CONSERVATION PROJECTS201
Acknowledgements
This factsheet is based on the following resources:
Pell Institute Evaluation Toolkit: http://toolkit.pellinstitute.org/
evaluation-guide/analyze/analyze-quantitative-data/
Better Evaluation page: http://www.betterevaluation.org/en/
plan/describe/look_for_patterns
Useful resources for quantitative data analysis
WISE: Web Interface for Statistics Education – Website that
organises and hosts a large amount of statistics resources
including tutorials, demonstrations and excel templates http://
wise.cgu.edu/
Analysing data in Excel – Useful guidance on how to conduct
simple data entry and analyses using t-tests http://www.centenary.
edu/academics/religion/dotto/rel308/Measure.pdf
Emery Evaluation – Short videos explaining how to perform basic
functions in Excel for interpreting and analysing evaluation data
http://emeryevaluation.com/excel-for-evaluation/
GENERALFACTSHEETS
ANALYSING QUANTITATIVE
DATA
4:0

INTRODUCTION & KEY CONCEPTS
DESIGNING & IMPLEMENTING THE EVALUATION
PRISM MODULES
METHOD FACTSHEETS & ANNEXES
PRISM - TOOLKIT FOR EVALUATING THE OUTCOMES AND IMPACTS OF SMALL/MEDIUM-SIZED CONSERVATION PROJECTS202
Factsheet: Analysing qualitative data
Summary
Qualitative data is text or narrative based, not numerical. It is
gathered through methods such as questionnaires, interviews,
focus groups and observations. Analysing and reporting qualitative
data requires approaches that are different from those used for
numerical data. The type of analysis to be carried out should be
planned during the design phase of the project, to make sure
you have collected all the correct data you need. This factsheet
describes how to code and analyse qualitative evaluation data.
Required steps
Step 1 Prior to fieldwork: preparing your metadata
- Create a database (also known as an archive) to record
details of the types of data you are collecting, for
example datasheets, audio files or digital records. It
is essential to have such a database to link the results
of analyses to the raw data and identify where data is
stored.
- The database should include:
• data identification details e.g. unique identifying
codes, the format (audio, video, paper etc.), the
method of collection.
• data source details, for example the source (e.g.
interviews, focus groups, social media, books,
websites), date, location, project members who
collected the data.
• the stages of data processing, to keep track
of analysis phases. For example, record the
dates when the following stages happen: “data
collected”, “transcription started”, “transcription
completed” (transcription is when paper/audio/
visual data are converted to an electronic format,
so you will need to include “file names” and “file
location”), “analysed” (again you may need new “file
names” and “file location”), “reported” (record the
report name and location).
- Ensure that data storage meets data protection
requirements. This relates to original data collection
notes and electronic copies of transcribed information.
- Prepare data collection equipment, e.g. label sheets,
memos, notepads.
- Code and label any tapes or digital files (if you are going
to make audio and/or visual recordings) with their
unique identification number, and record this in the
database,
GENERALFACTSHEETS
ANALYSINGQUALITATIVE
DATA
STEP 1
4:0

INTRODUCTION & KEY CONCEPTS
DESIGNING & IMPLEMENTING THE EVALUATION
PRISM MODULES
METHOD FACTSHEETS & ANNEXES
PRISM - TOOLKIT FOR EVALUATING THE OUTCOMES AND IMPACTS OF SMALL/MEDIUM-SIZED CONSERVATION PROJECTS203
Step 2. Immediately after an event/interview
− After each event or interview, make general notes
about any details you recall that could be relevant or
interesting but may not have been captured by your
data collection method, for example comments made or
behaviour observed.
− Prepare memos (short notes, about two lines long,
that capture the essence of what you learned) from an
activity based on an initial analysis by the data collector.
− Gather any materials developed during participatory
activities and make sure they are correctly labelled.
− Update the database with any changes and record that
the data have been collected.
− Make data copies as soon as possible in case anything
should happen to your raw data (your master data).
This means copying up field notes and data sheets, and
downloading audio/video/picture files. Ensure all copies
are stored in a suitably secure manner.
o If no access to computers is available, paper files
should be copied into another notebook or folder.
This is especially important if the same notebook
is used for several events before information is
recorded on a computer. In such situations, if the
original notebook gets lost, the copied notes will
remain and the entire season’s work will not be
lost.
o If intending to delete original files after
downloading them (e.g. to reuse memory cards),
make sure the files have transferred correctly (e.g.
listen to the middle, the end and a couple of other
random points within an audio file). Also create
a second backup copy of the digital file and store
each of them on different memory drives, so if one
drive becomes corrupted or deleted, there will be
a copy of the raw data.
− After copying paper files they should be stored in a
separate, secure (dry/safe/locked) location.
Step 3. Transcribe material
− Audio/video files and paper records should (if not
already done) be fully and completely transcribed into a
digital format to make analysis easier.
− This may done by an assistant or third party not
involved in the research, so that they do not emphasise
particular points or select sections of data for
transcription It is on the other hand also a good way for
the researcher to get to know their data. In some cases
an exact transcription will be made, where all captured
information is included in the electronic version, as close
to the original conversation as possible.
GENERALFACTSHEETS
ANALYSINGQUALITATIVE
DATA
STEPS 2 & 3
4:0

INTRODUCTION & KEY CONCEPTS
DESIGNING & IMPLEMENTING THE EVALUATION
PRISM MODULES
METHOD FACTSHEETS & ANNEXES
PRISM - TOOLKIT FOR EVALUATING THE OUTCOMES AND IMPACTS OF SMALL/MEDIUM-SIZED CONSERVATION PROJECTS204
Step 4. Double-check data
− This is an essential part of the process for both
qualitative and quantitative data so that errors in
transcription can be minimised.
− Transcripts of audio files should be checked by listening
to the file while reading the transcript.
− This can be done by a person who did not enter the
data and, if it is the researcher who is carrying out
the analysis, this is a good opportunity to note any
interesting quotations that can be used later to illustrate
key findings in your Monitoring & Evaluation report.
Step 5. Review your evaluation questions
Before analysing your data, you should always start by reviewing
your main evaluation questions, i.e. the reason you undertook the
evaluation in the first place. This will help you to organise your data
and focus your analysis.
When reviewing your evaluation questions you should remind
yourself of the theoretical basis for why you thought the
intervention was suitable (the details behind your Theory of
Change framework) and what you thought it would achieve (the
outcomes).
Step 6. Analyse contextual and demographic data
It is important to have a good understanding of the participants
from whom the data were collected, the tools used to collect the
data, and the local context. This information will help your analysis
and interpretation of the data, and it is particularly important
if your data are collected by different researchers in various
locations.
Demographic data about research participants can be put into a
table such as the example shown in Table 1, and then statistics can
be prepared on the age, gender, occupation, education level and
other relevant details relating to your research participants. This
information can be related to qualitative analyses, for example it
may reveal that people from particular age groups or occupations
had particular responses to the project intervention.
GENERALFACTSHEETS
ANALYSINGQUALITATIVE
DATA
STEPS 4, 5 & 6
4:0
PARTICIPANT NUMBER
1
2
3
LOCATION AGE GENDER OCCUPATION EDUCATION
TABLE 1: TEMPLATE FOR COLLECTING DEMOGRAPHIC DATA

INTRODUCTION & KEY CONCEPTS
DESIGNING & IMPLEMENTING THE EVALUATION
PRISM MODULES
METHOD FACTSHEETS & ANNEXES
PRISM - TOOLKIT FOR EVALUATING THE OUTCOMES AND IMPACTS OF SMALL/MEDIUM-SIZED CONSERVATION PROJECTS205
Step 7. Code the data
Coding data is the process of looking for recurring ideas, concepts,
themes, topics, phrases, comments or even single words which
emerge from the data. When the analyst identifies these items a
code is given to classify a particular group of ideas. This could be
within the contributions of a single respondent, for example in an
unstructured interview a person may repeatedly comment on the
same topic, or it could be derived from the contributions of several
respondents. Patterns of codes and emergent themes can then be
identified.
Coding can either be done by stipulating codes in advance (a
priori) or letting codes be suggested by the data (grounded
theory). A priori codes can be suggested by the theoretical basis
for the intervention and by what is expected to be affected or to
have changed. For example, if you want to know whether your
intervention has affected hunting rates and whether people have
changed their behaviour, you might code for terms you deem to be
relevant such as “food”, “hunting”, “income”, “traditions” or “habits”.
Alternatively you can be data-led, and code recurring themes in
the data, but for this it is important to set aside any pre-conceived
expectations. It is important to ask yourself what is being
described, what is happening or being said, what is being assumed
by the interviewee and how their demographic status may affect
their statements.
You are likely to use many codes - some general, and some more
specific. For instance, a general code might be “income” and you
could use it to identify data that are relevant to the subjects’ level
of education. A more specific code might be “income from hunting”
which you might choose because the data refer to understanding
levels of hunting. You will need to go through your data in detail,
coding it according to the types of themes and issues that emerge.
By coding data as “income” or “awareness” you are marking it in a
way that means you can find it and return to it later, knowing that
this particular piece of data is about income or awareness (it could
be about both, in which case you will have applied both codes to it).
In this way the code will help you to identify relevant items of data
that you can pull together later to say something about income
and/or awareness.
When developing a coding scheme, either a priori or particularly
for data defined codes, it is essential to pilot-test the coding
scheme. Test the codes on a subset of the responses, and adjust
the coding categories if necessary. Develop clear definitions
for what does and does not fall into a particular code. This will
ensure that the analysis process is clear to other users. Multiple
analysts should be involved in coding, to reduce the subjectivity
of the process, and to ensure that the codes are being applied
consistently. When the final set of coding categories has been
defined, the full data set is then coded. The first coded data files
should then be re-coded, as a way of testing whether the coding
categories were being used in the same way at the end of the
coding as they were at the beginning. If the re-coding leads to
different results from the first pass, then a review of the process
needs to be conducted, as this implies that the coding definitions
have changed during the coding process.
GENERALFACTSHEETS
ANALYSINGQUALITATIVE
DATA
STEP 7
4:0

INTRODUCTION & KEY CONCEPTS
DESIGNING & IMPLEMENTING THE EVALUATION
PRISM MODULES
METHOD FACTSHEETS & ANNEXES
PRISM - TOOLKIT FOR EVALUATING THE OUTCOMES AND IMPACTS OF SMALL/MEDIUM-SIZED CONSERVATION PROJECTS206
Coding helps to work out what the data are telling you and
the relationships and patterns in your data. As your research
develops you may define many codes, building up an increasingly
detailed understanding of the data. If you are working as a team
on the process of coding, it is important to develop a shared
understanding and agreement on the names of the codes and what
they mean. The codes you develop are likely to change as your
research proceeds and as you develop new understandings of the
topics you are researching.
− Carefully read through your records and make
comments about the key patterns, themes and issues in
the data.
− Highlight similar data in the same colour and give each
colour-group a descriptive code that suggests what it is
referring to.
− As you read more records, different codes may suggest
themselves. It will then be necessary to re-read earlier
records to compare things to see whether relevant
statements have been missed or previous codes should
be renamed. Coding data requires detailed analysis of
data and constant comparisons of text, so each record
may need to be read several times.
− Keep a list of your codes and their definitions. During
the coding process, codes may be added/deleted and
their definitions refined. Notes should be kept on why
codes are being changed and on your thoughts and
ideas about the coding.
Step 8. Identify and summarise codes
Once you have an initial list of codes, and agreed definitions of
these codes, you can begin organising your data into hierarchies,
with similar codes grouped under a broad title. For example,
negative and positive comments about the project could come
under “feedback on project”, while people’s ideas about how the
project may change their lives in the future could come under
“perceived project impacts”, and suggestions for changes to
project logistics, financing, resources and scope etc. could come
under “suggested improvements”. These headings can be used
later when you prepare a report on your findings. Next, you can
summarise the main themes, drawing on contextual data and other
information that can help you to better understand your findings.
Note how frequently each pattern or theme occurs and who talked
about this theme, for example people of a particular gender, age
group or occupation. It is usually best to look for the range of
views expressed by participants rather than trying to quantify the
responses. However, if your data clearly show which participants
made particular comments, some quantification of responses may
be appropriate.
GENERALFACTSHEETS
ANALYSINGQUALITATIVE
DATA
STEP 8
4:0

INTRODUCTION & KEY CONCEPTS
DESIGNING & IMPLEMENTING THE EVALUATION
PRISM MODULES
METHOD FACTSHEETS & ANNEXES
PRISM - TOOLKIT FOR EVALUATING THE OUTCOMES AND IMPACTS OF SMALL/MEDIUM-SIZED CONSERVATION PROJECTS207
Step 9. Interpret findings, assess contributions to
outcomes and impacts, and summarise
This involves putting your data into a wider perspective. That
means comparing your results with what you expected, and
with your original project objectives, indicators and research
questions. You would then summarise your main findings, under
broad headings such as “Listening Patterns” and “Project Impacts”.
Interpretation goes beyond description. It means attaching
significance to what your data are telling you, making sense of your
findings, offering explanations, drawing conclusions and lessons
learnt, and imposing order onto a complex and messy picture. Your
findings should:
1. be led by the data, not by preconceived ideas or
assumptions;
2. get rid of any misconceptions, if this is possible;
3. illuminate important things that you didn’t know but
should know.
You also need to consider the extent to which your project may
have contributed to the impacts identified, based on the evidence
that you have collected and analysed. This means understanding
how various aspects of your project work in combination with
other activities to produce certain outcomes and impacts.
You may start with very limited data, which only tell you about
a certain group of people in a certain place. This is fine as a
beginning, as long as you make it clear in your reports that the
findings are limited to these people in this place. Gradually, over
time, you can increase the scope of your research, talk to more
people from different backgrounds and in different locations. The
important point is to be aware of the limitations of the research
you have done, and to make this clear to readers of your reports.
The next step is to investigate issues of interest further.
It is always best to take a cautious approach to the interpretation
of your data. This means avoiding leaping to conclusions or making
assumptions about why something happened. It is always useful
to discuss your interpretations at length with others. Learning
how to produce a good interpretation of qualitative data can be
challenging and is likely to take some time. However, it is worth
persevering with, as an effective and rigorous interpretation can
really improve your project reports. Seeking feedback and support
from others with more experience in this area should help you to
improve more quickly.
Acknowledgements
This factsheet is based on the following resources:
Equal Access Participatory M&E toolkit: http://www.
betterevaluation.org/toolkits/equal_access_participatory_
monitoring .
GENERALFACTSHEETS
ANALYSINGQUALITATIVE
DATA
STEP 9
4:0

INTRODUCTION & KEY CONCEPTS
DESIGNING & IMPLEMENTING THE EVALUATION
PRISM MODULES
METHOD FACTSHEETS & ANNEXES
PRISM - TOOLKIT FOR EVALUATING THE OUTCOMES AND IMPACTS OF SMALL/MEDIUM-SIZED CONSERVATION PROJECTS208
Factsheet: Evaluation report template
After you have decided who you report to and in what format, you
should create a detailed evaluation report that addresses all of
your evaluation questions. You can then take the detailed report
and extract summary information for relevant audiences and
adapt the report into the most appropriate format(s).
Your detailed report should include the following section headings
and content:
Cover page and title
Your title should be descriptive of your project, and you may want
to relate it to your project’s overall goals.
An appropriate image will add visual appeal to your report.
Executive summary
This is summary of the main findings, lessons and
recommendations from your evaluation. Some people, depending
on how busy they are, will only read the executive summary. It
should generally not be longer than two pages.
Introduction
• Overview of the project and its goals.
• Key stakeholders and target audience.
• Intervention logic.
This should include an overview of the project that is being
evaluated, including the timeframe, main stakeholders, and project
goals. It is good to provide an intervention logic that outlines what
you sought to achieve and what you did along the way. You may
want to describe in greater detail particular activities that were
critical in delivering outcomes.
Evaluation framework
• Purpose of the evaluation.
• Key evaluation questions.
• Evaluation team.
• Evaluation method (including limitations).
You should also outline the purpose of the evaluation, including
the evaluation audience and what they want to know. This includes
highlighting the key evaluation questions. You may want to include
the full monitoring and evaluation (M&E) plan as an appendix. It is
important to note who made up the evaluation team. You should
also provide an overview of the evaluation method (you can link
this back to the M&E plan in the appendix) and any limitations
applying to the methodology. You may want to use a table that
highlights the quantitative and qualitative methods used in the
evaluation.
GENERALFACTSHEETS
EVALUATION REPORT
TEMPLATE
4:0

INTRODUCTION & KEY CONCEPTS
DESIGNING & IMPLEMENTING THE EVALUATION
PRISM MODULES
METHOD FACTSHEETS & ANNEXES
PRISM - TOOLKIT FOR EVALUATING THE OUTCOMES AND IMPACTS OF SMALL/MEDIUM-SIZED CONSERVATION PROJECTS209
Evaluation findings
• Evaluation question 1.
• Evaluation question 2.
• Evaluation question 3 etc.
A good way to present your evaluation findings is to use your
key evaluation questions as the main sub-headings (e.g. “was the
delivery model effective in changing participants’ behaviours?”).
You would then use the information collected through your project
to make a judgement and answer the key question. Remember
that you do not want simply to present information, but rather
to interpret the information and make a value judgement. Use
graphics where appropriate, and remember that you do not have
to present all the information you have collected. You may present
some of the information from your monitoring in an appendix.
Conclusion and recommendations
This is where you may want to do a high-level summary of the
successes and lessons of your project based on your evaluation
findings. You may also want to communicate how the evaluation
findings will be used (in terms of information for future projects,
changes in policy, etc.). You should also make a list of key
recommendations (which are also presented in the executive
summary).
References
Provide details of any other publications or sources of information
that you have used in your report.
Appendices
This is where you provide detailed information that some of your
audience members may want to refer to. This includes your full
M&E plan, questionnaires that were used, detailed results and
information, statistical analyses, etc.
Acknowledgement
Adapted from Evaluation Toolbox: Detailed Evaluation Report:
http://evaluationtoolbox.net.au/index.php?option=com_content&
view=article&id=48&Itemid=60.
GENERALFACTSHEETS
EVALUATION REPORT
TEMPLATE
4:0

INTRODUCTION & KEY CONCEPTS
DESIGNING & IMPLEMENTING THE EVALUATION
PRISM MODULES
METHOD FACTSHEETS & ANNEXES
PRISM - TOOLKIT FOR EVALUATING THE OUTCOMES AND IMPACTS OF SMALL/MEDIUM-SIZED CONSERVATION PROJECTS210
Factsheet: Evaluating outcomes and impacts of projects aiming
to maintain or increase the values of ecosystem services
Some conservation projects include actions that aim to maintain
or improve the delivery of ecosystem services (the benefits that
people derive from nature) as part of a strategy to conserve
species and/or habitats more effectively. Evaluation of the
outcomes and impacts of conservation projects on ecosystem
services is not covered by this manual because an entire toolkit
exists with guidance on how changes in ecosystem services at a
site can be measured.
The Toolkit for Ecosystem Service Site-based Assessment (TESSA):
http://www.birdlife.org/worldwide/science/assessing-ecosystem-
services-tessa can be used to compare the values of ecosystem
services (in either biophysical or economic units) for a site under
two scenarios: (a) with the project and (b) without the project (see
Figure right).
For example, a project may carry out activities that aim to restore
a wetland site for migratory birds. As part of this project, the
restoration may also protect people’s homes and farmland from
flooding. The impact of the intervention on flood protection
value can be demonstrated by measuring the actual impact of
the created wetland at the end of the project, compared with the
value without the project (i.e. if the intervention had not taken
place). The value of that impact can be demonstrated in monetary
($) or non-monetary terms (e.g. number of houses protected from
flooding; area of land protected from flooding).
GENERALFACTSHEETS
EVALUATING OUTCOMES
AND IMPACTS OF PROJECTS
AIMING TO MAINTAIN OR
INCREASE THE VALUES OF
ECOSYSTEM SERVICES
‘withproject’
‘withoutproject’
Quantify andvalue ecosystem
sevices
Include costs ofintervention
Quantify andvalue ecosystem
sevices
NET ECONOMICVALUE
e.g. value of homesand land protected
from flooding
CONSERVATIONINTERVENTION
e.g. restorationof wetland
habitat
Subtract
4:0

INTRODUCTION & KEY CONCEPTS
DESIGNING & IMPLEMENTING THE EVALUATION
PRISM MODULES
METHOD FACTSHEETS & ANNEXES
PRISM - TOOLKIT FOR EVALUATING THE OUTCOMES AND IMPACTS OF SMALL/MEDIUM-SIZED CONSERVATION PROJECTS211
This requires identification of the “without project” comparison.
In TESSA this is done by using a counterfactual approach whereby
data on ecosystem services are collected from a similar site (in
terms of environmental and social context) and extrapolated to the
project site to provide alternative values from those obtained as a
result of the project. It may also be applicable to use a before and
after comparison if the state before the project is representative
of what would happen without the project. Other approaches
outlined in Step 2 could be used for the “without project”
comparison provided the assumptions are made explicit.
Livelihoods & Governance module: This module in PRISM
could be used to measure changes in some ecosystem services –
specifically the benefits obtained from harvested wild goods (e.g.
fuelwood, medicinal plants, fish) or cultivated goods (e.g. rattan,
coffee) in relation to livelihoods. For example, see Participatory
Impact Assessment Method 1 - Before and after scoring for
guidance on how changes in income might be measured.
GENERALFACTSHEETS
EVALUATING OUTCOMES
AND IMPACTS OF PROJECTS
AIMING TO MAINTAIN OR
INCREASE THE VALUES OF
ECOSYSTEM SERVICES
4:0

INTRODUCTION & KEY CONCEPTS
DESIGNING & IMPLEMENTING THE EVALUATION
PRISM MODULES
METHOD FACTSHEETS & ANNEXES
PRISM - TOOLKIT FOR EVALUATING THE OUTCOMES AND IMPACTS OF SMALL/MEDIUM-SIZED CONSERVATION PROJECTS212
Factsheet: Questionnaires
Summary
Questionnaires are one of the most commonly applied methods
for gathering data from project participants. They can be more
complex and time consuming to produce than is anticipated.
However, thorough planning and piloting, ensuring questions
relate to the aims of the evaluation, having a clearly identified
strategy for securing responses and good preparation for data
analysis can ensure that questionnaires are extremely valuable
tools for action evaluation.
Questionnaire surveys can be carried out by telephone, post,
or in person, and they have the potential to record information
from a large sample of respondents. Interviews can be i) fully
structured, using set questions that the interviewer sticks to, or ii)
semi-structured, using open-ended questions with the interviewer
following up interesting responses with supplementary questions,
or iii) respondent-led conversations, with the interviewer having
prepared some areas for discussion but allowing the conversation
to unfold as the respondent wishes. The choice of which of these
variants to use depends on the type and aim of the intervention
and the resources available. For example if an intervention is
focused on influencing the attitudes of a small number of herders
in the mountains, it is not worthwhile to use a postal survey
of the entire village to evaluate effectiveness. Conversely if
the intervention is trying to raise awareness of a conservation
threat throughout a community, in-depth and time-consuming
interviewing of a very few select people is unlikely to indicate
whether the message has been received across the community.
Some sub-sampling will often be necessary because of time and
money restrictions, and there is the possibility that key community
members may be aware of attitudes in the wider community.
Main questionnaire survey types
Pre–post questionnaires: Surveys that require participants to
complete two questionnaires, one before the project and one after
the project.
Retrospective pre-post questionnaires: Surveys that require
participants to complete a single questionnaire after the project
action which asks them to compare their answers with the
situation before the project.
Post activity questionnaires: Questionnaires comprising a set
of questions asking participants to rate the effectiveness of a
particular activity (e.g. a training workshop, a presentation, a
community engagement event).
Post project questionnaires: Questionnaires that ask participants
to self-report on changes that have occurred as a result of the
project. This is similar to a retrospective pre-post questionnaire
except that it does not ask participants to rate their knowledge/
attitudes/behaviours before the project.
4:0
GENERAL EVALUATION
METHOD FACTSHEETS
QUESTIONNAIRES

INTRODUCTION & KEY CONCEPTS
DESIGNING & IMPLEMENTING THE EVALUATION
PRISM MODULES
METHOD FACTSHEETS & ANNEXES
PRISM - TOOLKIT FOR EVALUATING THE OUTCOMES AND IMPACTS OF SMALL/MEDIUM-SIZED CONSERVATION PROJECTS213
Required steps
Step 1. Determine the purpose
Before creating a questionnaire, start by answering a few
important questions:
• What do I need to know?
• Why do I need to know it?
• What will happen as a result of this questionnaire?
• Can I get the information from existing sources instead
of conducting a survey?
• Are there any ethical issues associated with the data
collection?
• Is the topic covering sensitive issues e.g illegal wildlife
trade, culturally sensitive topics, etc? If so, this will affect
the methods used.
It is a good idea to start with your evaluation objectives and
questions. Here are some examples:
Evaluation objectives:
• To determine the level of bushmeat consumption in
households in the project area and in control area(s).
• To determine the average number of patrols carried out
by rangers before and after a training programme.
• To determine the average cost per meal in the
households of project participants.
Evaluation questions:
• How many households in the community hunt on a
weekly basis?
• What new skills do project participants possess after a
training course?
• What is the monthly income of households involved in
the project?
Step 2. Decide what you are measuring
As with determining the purpose, this should be based on the
objectives of your action and the evaluation of its outcomes and
impact. Consider which of the following you are aiming to measure:
• Attitude
• Knowledge
• Skills
• Goals, intentions, aspirations
• Behaviours and practices
• Perceptions of knowledge, skills, or behaviour.
4:0
GENERAL EVALUATION
METHOD FACTSHEETS
QUESTIONNAIRES
STEPS 1 & 2

INTRODUCTION & KEY CONCEPTS
DESIGNING & IMPLEMENTING THE EVALUATION
PRISM MODULES
METHOD FACTSHEETS & ANNEXES
PRISM - TOOLKIT FOR EVALUATING THE OUTCOMES AND IMPACTS OF SMALL/MEDIUM-SIZED CONSERVATION PROJECTS214
Step 3. Decide who should be asked
The population you sample from, as well as the sampling method
you use, affects how your research findings can be generalised. In
other words, for whom do the results apply? This is an indication of
the external validity of the study.
• What is the appropriate population (group of people/
subjects) to be studied or questioned?
• A population is the complete set of subjects that can be
studied: people, objects, animals, plants, etc.
• A sample is a sub-set of subjects that can be studied
to make the evaluation/research project more
manageable.
Once a target audience is defined, the questionnaire development
may be influenced by features of that audience, for example:
• the age of respondents, particularly if working with
children;
• familiarity with tests and questionnaires;
• potential cultural or language barriers;
• ethical considerations for engaging with this group of
participants;
• gender, including restrictions and hierarchies. For
example, can you interview people of the opposite
sex, can you interview people that are not head of the
household (power dynamics), etc? How can responses
be gathered from disadvantaged voices (e.g. women)?
4:0
GENERAL EVALUATION
METHOD FACTSHEETS
QUESTIONNAIRES
STEP 3

INTRODUCTION & KEY CONCEPTS
DESIGNING & IMPLEMENTING THE EVALUATION
PRISM MODULES
METHOD FACTSHEETS & ANNEXES
PRISM - TOOLKIT FOR EVALUATING THE OUTCOMES AND IMPACTS OF SMALL/MEDIUM-SIZED CONSERVATION PROJECTS215
Step 4. Understand the audience
It is important to know about the target audience for the
questionnaire. This will inform the decisions made at Step 5 about
how to collect responses. Factors which may help to define the
audience for the questionnaire include:
• The likelihood of interaction with the people the project
is aiming to influence, e.g. do you want to question
people who attend a certain event, use a particular
habitat or location, or interact with a target species?
• A representative public sample requires a broad range
of respondents, and data from a census could be useful
in assessing whether the sample really represents the
population. For example, if all hunters are young males,
their attitudes may not represent those of the older or
female members of the population.
• Employment may be important, for example selecting
people working in fisheries to monitor relevant
behavioural responses.
• Hobbies – some questionnaires will target people who
have connections with a particular subject through the
way they spend their free time, rather than their paid
employment.
• Finding out when are people most easily engaged. For
example trying to sample parents with young children
in the evening may mean they are distracted by family
responsibilities; in which case weekends may be a better
time.
Step 5. Choose an appropriate means of data collection
The sampling method can then be decided, depending on the
population sample selected:
• Should a census or sampling be used?
• If a large enough random sample is taken, the results
can be statistically similar to taking a census of an entire
population, yet involving less effort and cost.
There is a variety of ways in which samples can be chosen from a
population:
• Simple random (e.g. pulling names from a hat).
• Systematic random (e.g. every fifth name – but
be careful that the system you choose does not
accidentally match a pattern in the population being
sampled).
• Stratified random (separate samples for each subgroup).
• Cluster sampling (treating intact groups that cannot
be broken up, such as classrooms, as subjects to be
sampled).
Whatever population is studied and whichever sampling method
is used, it is important to cover a sufficiently high percentage of
respondents to ensure that the sample is truly representative
of the population being studied. Non-response error affects the
validity of the study, and a plan for recording non-responses then
dealing with them, should be determined in advance.
4:0
GENERAL EVALUATION
METHOD FACTSHEETS
QUESTIONNAIRES
STEPS 4 & 5

INTRODUCTION & KEY CONCEPTS
DESIGNING & IMPLEMENTING THE EVALUATION
PRISM MODULES
METHOD FACTSHEETS & ANNEXES
PRISM - TOOLKIT FOR EVALUATING THE OUTCOMES AND IMPACTS OF SMALL/MEDIUM-SIZED CONSERVATION PROJECTS216
Other possible errors can be avoided with simple procedures:
“sampling error” is reduced by using a large, random sample or
conducting a census; “frame error” is minimised by making sure
that the list of potential subjects is current and accurate; and
“selection error” is avoided by eliminating duplication from these
lists.
Two further elements of data collection need to be considered:
i) what format the questionnaire will take and ii) how it will
be distributed. Formats can include personal (face-to-face)
interviews, online questionnaires, telephone interviews and mailed
questionnaires. Consider the literacy level of the respondents
when choosing a format for data collection, and ensure that
intended respondents are not excluded by the format you
choose. Distributing a questionnaire is a vital link in ensuring that
data is collected. The channels through which a questionnaire
or interview is made available could skew the types of people
surveyed.
Step 6. Establish Free, Prior and Informed Consent (FPIC)
This lets the respondents know they are participating in a
study and how their information will be treated. “Passive”
consent is assumed if the respondent completes and returns the
questionnaire, but contact details should be provided to give the
respondent the option of withdrawing their data after submission.
“Active” consent requires a participant to give formal approval (e.g.
by signing a form declaring that the respondent explicitly agrees
to participate, or allows his or her minor child to take part). See
Factsheet: Developing ethical protocols for an evaluation for more
information on FPIC.
4:0
GENERAL EVALUATION
METHOD FACTSHEETS
QUESTIONNAIRES
STEPS 5 & 6

INTRODUCTION & KEY CONCEPTS
DESIGNING & IMPLEMENTING THE EVALUATION
PRISM MODULES
METHOD FACTSHEETS & ANNEXES
PRISM - TOOLKIT FOR EVALUATING THE OUTCOMES AND IMPACTS OF SMALL/MEDIUM-SIZED CONSERVATION PROJECTS217
Step 7. Choose a collection procedure: confidential vs.
anonymous
Confidential
• Names or other identifiers collected in the
questionnaire or interview can be used for follow-up
data collection or to match data from pre-action with
data from post-action.
• Individual data are not shared with anyone. Information
is not used for any purpose other than that stated in the
project.
• Confidentiality is never breached. This pledge is crucial
for data protection purposes and for obtaining consent
and ethical approval; in addition to obtaining honest,
complete answers from respondents.
• Identifying information is anonymised for storage and
analysis purposes (essential for anything that could in
any way negatively impact the interviewee). Information
should be destroyed after the survey is completed or, if
the information needs to be stored for publication, this
should be held on an encrypted hard drive and deleted
once the publication is completed.
Anonymous
• Names and other identifiers are not asked of
respondents.
• As no other identifying codes are used, the researcher
is unable to follow up with non-respondents or to match
data from pre-action with data from post-action. This
may not be a problem when doing random interviews
(such as exit surveys).
• Collecting basic descriptive information about
respondents is still useful for comparing respondents
with the population.
• One possible way of maintaining anonymity while also
keeping track of non-respondents is to send a separate
post-card along with the questionnaire. The respondent
can return this card separately, enabling him or her
to declare that “John/Mary Doe has returned the
questionnaire”.
4:0
GENERAL EVALUATION
METHOD FACTSHEETS
QUESTIONNAIRES
STEP 7

INTRODUCTION & KEY CONCEPTS
DESIGNING & IMPLEMENTING THE EVALUATION
PRISM MODULES
METHOD FACTSHEETS & ANNEXES
PRISM - TOOLKIT FOR EVALUATING THE OUTCOMES AND IMPACTS OF SMALL/MEDIUM-SIZED CONSERVATION PROJECTS218
Step 8. Choose measurement scale and scoring
Use scales that provide the information needed and are
appropriate for respondents. Some options include:
Closed questions – quantitative data
A yes/no answer – e.g. Did you attend the workshop? Yes/No.
Agree/disagree with a statement – e.g. Do you agree or disagree
with the following statement? Seabird populations on island X are
healthy. Agree/Disagree.
Choose from a list of options – e.g. Which of the following
resources is most important to your household? Rattan
(cultivated), rattan (wild harvested), banana, rice, pineapple,
cassava, timber, other forest products (e.g. honey, medicinal plants,
mushrooms).
Rank order – e.g. From the following list choose the THREE which
are the most important to your household: 1 = most important, 2
= second most often important 3 = third most important. Rattan
(cultivated), rattan (wild harvested), banana, rice, pineapple,
cassava, timber, other forest products (e.g. honey, medicinal plants,
mushrooms).
Degree of agreement and disagreement: the Likert Scale – e.g.
The training provided skills that I did not have before. Strongly
agree, Agree, Neutral, Disagree, Strongly disagree, neither agree
or disagree.
Rate Items – How useful would you rate the training element of the
workshop? Not useful at all – Very useful: 1-7.
Feeling about a topic – e.g. Did you find the training workshop:
Boring (1-5), Interesting (1-5), Unlikely (1-5), Likely (1-5), Risky (1-5),
Safe (1-5), Important (1-5), Unimportant (1-5), Difficult (1-5), Easy
(1-5).
Open questions – qualitative data
A statement – e.g. How has your relationship with park authorities
changed since the project began?
List – e.g. Please list the main reasons why you visit the forest.
See the following factsheets for some further examples of
questions and scales that can be used as part of a questionnaire
survey:
Sample questions and scales for evaluating attitudes and
awareness actions
Training evaluation form: example questions and scales
4:0
GENERAL EVALUATION
METHOD FACTSHEETS
QUESTIONNAIRES
STEP 8

INTRODUCTION & KEY CONCEPTS
DESIGNING & IMPLEMENTING THE EVALUATION
PRISM MODULES
METHOD FACTSHEETS & ANNEXES
PRISM - TOOLKIT FOR EVALUATING THE OUTCOMES AND IMPACTS OF SMALL/MEDIUM-SIZED CONSERVATION PROJECTS219
Step 9. Provide a cover letter and instructions
• A cover letter or verbal introduction to the project
should include:
o a brief statement of the purpose of the study and
its usefulness (one sentence or phrase);
o the identity of any sponsor of the study;
o a promise of confidentiality and an explanation
of identification methods (e.g. code number on
questionnaire);
o free, prior and informed consent - the cover letter
should include all of the information needed to
gain FPIC, which is required for most research
involving human subjects.
o a deadline for returning the survey;
o advice on what to do if questions arise or if the
respondent wishes to withdraw after submitting
their response;
o thanks to the respondents.
• Include simple instructions on how to complete each
section (e.g. how to mark answers: pen/pencil, circle,
check, etc.).
Step 10. Pilot test
To ensure that the survey instrument you develop is appropriate
for your audience, “field test” your questionnaire with other people
similar to your respondents before administering the final version.
This will allow you to improve any unclear questions or procedures
and detect any errors. Following recommendations in this Toolkit
concerning questionnaire design and wording of questions will
reduce systematic measurement error, and this will improve the
reliability of your study.
Tips for designing and implementing a good questionnaire
Use plain language
• Be direct and unambiguous.
• Use the simplest language necessary.
• Avoid jargon and acronyms.
• Include definitions if needed.
Be brief
• Keep the questionnaire as short as possible (without
jeopardising reliability).
• Focus on “need to know” questions and minimise “nice
to know” information.
• Put the most important questions up front (respondents
may get fatigued or hurried by later questions).
• Include questions about demographic information at
the end, so the questionnaire is focused on the topic at
hand.
4:0
GENERAL EVALUATION
METHOD FACTSHEETS
QUESTIONNAIRES
STEPS 9 & 10

INTRODUCTION & KEY CONCEPTS
DESIGNING & IMPLEMENTING THE EVALUATION
PRISM MODULES
METHOD FACTSHEETS & ANNEXES
PRISM - TOOLKIT FOR EVALUATING THE OUTCOMES AND IMPACTS OF SMALL/MEDIUM-SIZED CONSERVATION PROJECTS220
Make sure questions match the measurement scale selected,
and that the answer categories are precise
• Make sure answer choices correspond to the questions,
both in substance and syntax.
• Be consistent in arranging the answers. While it is
conventional to read English from left to right, and to
go from “low” to “high,” the most important rule is to
explain clearly the “rule” being used in this respect, and
to apply it consistently throughout the questionnaire.
• Define timeframes when necessary. Instead of
“recently,” specify e.g. “during August 2015”. When
doing this it is helpful to give the respondent something
to relate to (e.g. last monsoon).
• Make sure answer categories do not overlap e.g. having
age categories for “20-30” and “30-40” means that
someone who is 30 could tick either box.
• If you are using a continuum scale with numbers to
represent concepts, make sure to “anchor” at least the
top and bottom of the scale with terms that describe the
meanings of the numbers (e.g. 1 = low, 10 = high).
• Balance the “negative” or “low” answer choices (both in
number and degree) with “positive” or “high” choices on
the scale. For example, don’t give only positive answer
choices or five degrees of “positive” (e.g. great, excellent,
super, fantastic, awesome) and only one extreme
“negative” response choice (e.g. terrible). Be aware, if
0 is used in the middle of the scale people will centre
there, so a scale of -2 to +2 is different from 1 to 5.
• An even number of answer choices doesn’t give the
respondent an easy, “middle” choice. If you want to offer
a “neutral” or “no opinion” choice, then do it by design,
not by accident.
• Determine in advance how questions will be scored,
what to do with missing data, incomplete or unclear
responses, etc.
Ask only one question at a time
Do not use “double-barrelled” questions that may confuse the
respondent into not knowing how to answer.
Consider the confusion created by these examples:
• Do you hunt pigs and monkeys?
• Do you grow coffee and rice?
• Have you seen any logging and hunting in the national
park?
4:0
GENERAL EVALUATION
METHOD FACTSHEETS
QUESTIONNAIRES
STEP 10

INTRODUCTION & KEY CONCEPTS
DESIGNING & IMPLEMENTING THE EVALUATION
PRISM MODULES
METHOD FACTSHEETS & ANNEXES
PRISM - TOOLKIT FOR EVALUATING THE OUTCOMES AND IMPACTS OF SMALL/MEDIUM-SIZED CONSERVATION PROJECTS221
Avoid loaded or leading questions
Minimise bias or misinterpretation in questions by consulting
experts and pilot-testing the questions with a sample of
participants.
Examples of loaded questions:
o Do you treat your environment with kindness like
a good person should?
o Do you feel you get enough support from the
useless government?
Examples of leading questions:
o Do you agree that illegal forest clearance is a bad
thing?
Arrange questions in a logical order
• Group similar questions together (e.g. by topic or
scoring method).
• Number each question.
Provide space to tell more
• Give respondents room to comment on individual
questions or on the survey as a whole.
• Ask for additional comments or suggestions.
Check readability
• Proof-read text before distributing it to participants.
• Test readability in the pilot-testing step.
Other resources:
Survey Monkey: https://www.surveymonkey.co.uk/ – online tool
for developing, distributing and analysing questionnaire surveys.
Acknowledgements:
Guidance in this factsheet is based on the following resources:
RCRE factsheet: A step-by-step guide to developing effective
questionnaires and survey procedures for program evaluation
& research - http://cahnrs.wsu.edu/fs/wp-content/uploads/
sites/4/2015/09/A-Step-By-Step-Guide-to-Developing-Effective-
Questionnaires.pdf .
Community Sustainability Engagement Evaluation Toolbox:
Questionnaires - http://evaluationtoolbox.net.au/index.
php?option=com_content&view=article&id=58&Itemid=154 .
4:0
GENERAL EVALUATION
METHOD FACTSHEETS
QUESTIONNAIRES
STEP 10

INTRODUCTION & KEY CONCEPTS
DESIGNING & IMPLEMENTING THE EVALUATION
PRISM MODULES
METHOD FACTSHEETS & ANNEXES
PRISM - TOOLKIT FOR EVALUATING THE OUTCOMES AND IMPACTS OF SMALL/MEDIUM-SIZED CONSERVATION PROJECTS222
Factsheet: Key informant interviews
Summary
A key informant interview is a conversation between an
interviewer and a person who can provide a well-informed picture
of the issue being evaluated - often a leader in his or her field or
community. Key informant interviews follow a script or guide,
which may include prompts, called probing questions, that delve
more deeply into an issue or ensure that informants answer
questions in a way that is useful to the evaluation. Questions are
open-ended and often require that the informants talk about their
perceptions, experiences, and beliefs.
Interviews may be recorded (with participants’ permission) and
transcribed for later analysis. Where recording and transcription
are not practical or acceptable, someone can take detailed notes.
Key informant-interview data are usually qualitative. However,
some quantitative data may be collected, as well; for example, the
key informant’s gender, age, and location or their estimate of the
size of a community population.
What are key informant interviews useful for?
Key informant interviews are an affordable way to understand a
community or an issue in a deep, nuanced way. They are flexible
and allow new ideas and issues to emerge. They are also often
relatively quick and affordable. On the other hand, there is the
potential for an interviewer to influence informants’ responses.
Because key informant interviews can generate a large amount of
qualitative data - data that must be reviewed systematically so as
to maintain the findings’ credibility - key informant interviews can
be time-consuming and costly to analyse. Finally, key informants
must be selected carefully so that they accurately represent the
different viewpoints that may exist in relation to a project.
4:0
GENERAL EVALUATION
METHOD FACTSHEETS
KEY INFORMANT INTERVIEWS
Photo credit: David Thomas

INTRODUCTION & KEY CONCEPTS
DESIGNING & IMPLEMENTING THE EVALUATION
PRISM MODULES
METHOD FACTSHEETS & ANNEXES
PRISM - TOOLKIT FOR EVALUATING THE OUTCOMES AND IMPACTS OF SMALL/MEDIUM-SIZED CONSERVATION PROJECTS223
This method is useful in all phases of the project cycle -
identification, planning, implementation, and evaluation. For
example, it can provide information on the setting for a planned
activity that might influence project design; or it could reveal why
intended beneficiaries aren’t using services offered by a project.
Specifically, it is useful in the following situations:
• when qualitative, descriptive information is sufficient
for decision-making;
• when there is a need to understand motivation,
behaviour, and perspectives of customers and
partners. In-depth interviews of programme
planners and managers, service providers, host
government officials and beneficiaries concerning their
attitudes and behaviours about an activity can help
to explain its successes and shortcomings. •
when a main purpose is to generate recommendations.
Key informants can help to formulate recommendations
that can improve a programme’s performance.
• when quantitative data collected through other
methods need to be interpreted. Key informant
interviews can illuminate the “how” and “why” of what
happened: for example if a sample survey showed that
farmers were failing to make loan repayments, key
informant interviews could uncover the reasons for this.
• when preliminary information is needed to design
a comprehensive quantitative study. Key informant
interviews can help to frame the issues before the
survey is undertaken.
Advantages:
• Provides information directly from knowledgeable
people.
• Provides flexibility to explore new ideas and issues not
anticipated during planning.
• Relatively inexpensive and simple to conduct.
Limitations:
• Not appropriate if quantitative data are needed.
• May be biased if informants are not carefully selected.
• Can be susceptible to interviewer biases.
• May be difficult to prove validity of findings.
4:0
GENERAL EVALUATION
METHOD FACTSHEETS
KEY INFORMANT INTERVIEWS

INTRODUCTION & KEY CONCEPTS
DESIGNING & IMPLEMENTING THE EVALUATION
PRISM MODULES
METHOD FACTSHEETS & ANNEXES
PRISM - TOOLKIT FOR EVALUATING THE OUTCOMES AND IMPACTS OF SMALL/MEDIUM-SIZED CONSERVATION PROJECTS224
Required steps
Step 1. Formulate study questions
These relate to specific concerns of the study. Study questions
generally should be limited to five or fewer.
Step 2. Prepare a short interview guide
Key informant interviews do not use rigid questionnaires, since
these inhibit free discussion. However, interviewers must have an
idea of what questions to ask. The guide should list major topics
and issues to be covered under each study question. Because
the purpose is to explore a few issues in depth, guides are usually
limited to 12 items. Different guides may be necessary for
interviewing different groups of informants.
Step 3. Select key informants
The number should not be too large. It is preferable to start with a
small number, since often more people end up being interviewed
than is initially planned. Key informants should be selected
for their specialised knowledge and insightful perspectives
on a topic. Planners should take care to select informants that
represent range of different points of view. Selection consists
of two tasks. First, identify the groups and organisations from
which key informants should be drawn - for example, host
government agencies, project implementing agencies, contractors,
beneficiaries. It is best to include all major stakeholders so that a
diversity of interests and perceptions can be captured. Second,
select a few people from each category after consulting with
people familiar with the groups under consideration. Snowball
sampling can also be used, where interviewed individuals are
asked at the end of the interview for their suggestions for the next
person you can interview about the same subject.
Step 4. Establish Free, Prior & Informed Consent (FPIC)
This lets the informants know they are participating in a study
and how their information will be treated. Establishing FPIC
requires a participant to give formal approval (e.g. by signing a form
declaring that the informant explicitly agrees to participate). See
Factsheet: Developing ethical protocols for an evaluation for more
information on FPIC.
4:0
GENERAL EVALUATION
METHOD FACTSHEETS
KEY INFORMANT INTERVIEWS
STEPS 1 TO 4
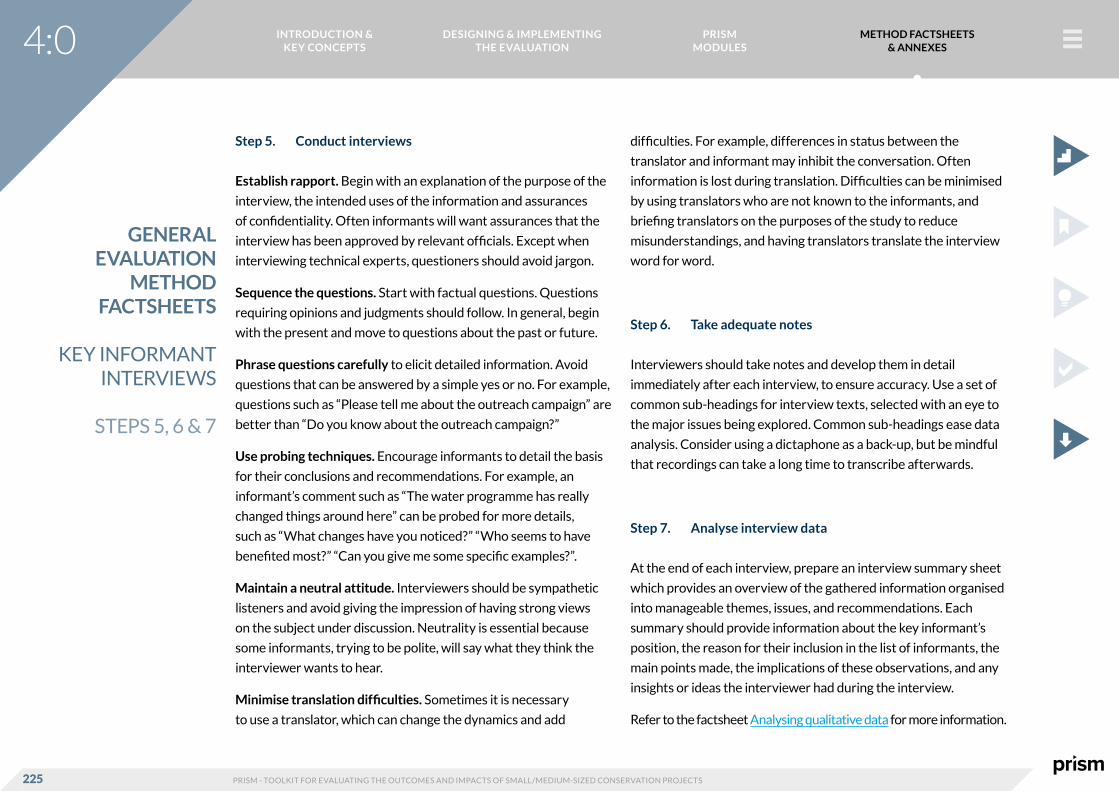
INTRODUCTION & KEY CONCEPTS
DESIGNING & IMPLEMENTING THE EVALUATION
PRISM MODULES
METHOD FACTSHEETS & ANNEXES
PRISM - TOOLKIT FOR EVALUATING THE OUTCOMES AND IMPACTS OF SMALL/MEDIUM-SIZED CONSERVATION PROJECTS225
Step 5. Conduct interviews
Establish rapport. Begin with an explanation of the purpose of the
interview, the intended uses of the information and assurances
of confidentiality. Often informants will want assurances that the
interview has been approved by relevant officials. Except when
interviewing technical experts, questioners should avoid jargon.
Sequence the questions. Start with factual questions. Questions
requiring opinions and judgments should follow. In general, begin
with the present and move to questions about the past or future.
Phrase questions carefully to elicit detailed information. Avoid
questions that can be answered by a simple yes or no. For example,
questions such as “Please tell me about the outreach campaign” are
better than “Do you know about the outreach campaign?”
Use probing techniques. Encourage informants to detail the basis
for their conclusions and recommendations. For example, an
informant’s comment such as “The water programme has really
changed things around here” can be probed for more details,
such as “What changes have you noticed?” “Who seems to have
benefited most?” “Can you give me some specific examples?”.
Maintain a neutral attitude. Interviewers should be sympathetic
listeners and avoid giving the impression of having strong views
on the subject under discussion. Neutrality is essential because
some informants, trying to be polite, will say what they think the
interviewer wants to hear.
Minimise translation difficulties. Sometimes it is necessary
to use a translator, which can change the dynamics and add
difficulties. For example, differences in status between the
translator and informant may inhibit the conversation. Often
information is lost during translation. Difficulties can be minimised
by using translators who are not known to the informants, and
briefing translators on the purposes of the study to reduce
misunderstandings, and having translators translate the interview
word for word.
Step 6. Take adequate notes
Interviewers should take notes and develop them in detail
immediately after each interview, to ensure accuracy. Use a set of
common sub-headings for interview texts, selected with an eye to
the major issues being explored. Common sub-headings ease data
analysis. Consider using a dictaphone as a back-up, but be mindful
that recordings can take a long time to transcribe afterwards.
Step 7. Analyse interview data
At the end of each interview, prepare an interview summary sheet
which provides an overview of the gathered information organised
into manageable themes, issues, and recommendations. Each
summary should provide information about the key informant’s
position, the reason for their inclusion in the list of informants, the
main points made, the implications of these observations, and any
insights or ideas the interviewer had during the interview.
Refer to the factsheet Analysing qualitative data for more information.
4:0
GENERAL EVALUATION
METHOD FACTSHEETS
KEY INFORMANT INTERVIEWS
STEPS 5, 6 & 7

INTRODUCTION & KEY CONCEPTS
DESIGNING & IMPLEMENTING THE EVALUATION
PRISM MODULES
METHOD FACTSHEETS & ANNEXES
PRISM - TOOLKIT FOR EVALUATING THE OUTCOMES AND IMPACTS OF SMALL/MEDIUM-SIZED CONSERVATION PROJECTS226
Step 8. Check for reliability and validity
Key informant interviews are susceptible to error, bias and
misinterpretation, which can lead to flawed findings or
recommendations.
Check representativeness of the key informants. Take a second
look at the key informant list to ensure that no significant groups
were overlooked.
Assess reliability of the key informants. Assess the informants’
knowledge, credibility, impartiality, willingness to respond, and the
presence of any outsiders who may have inhibited or otherwise
influenced their responses. Greater weight can be given to
information provided by more reliable informants.
Check for interviewer or investigator bias. One’s own biases
as an investigator should be examined, including tendencies to
concentrate on information that confirms preconceived notions
and hypotheses, to seek consistency too early, to overlook
evidence that is inconsistent with earlier findings and to be partial
to the opinions of elite key informants.
Check for negative evidence. Make a conscious effort to look for
evidence that questions preliminary findings. This brings out issues
that may have been overlooked.
Get feedback from informants. Ask the key informants for
feedback on major findings. A summary report of the findings
might be shared with them, along with a request for written
comments. Often a more practical approach is to invite them to
a meeting where key findings are presented, and to ask for their
feedback.
Acknowledgements
Guidance in this factsheet is based on the following resources:
PACT - Field Guide for Evaluation (2014) - http://betterevaluation.
org/sites/default/files/Field%20Guide%20for%20Evaluation_
Final.pdf .
USAID Center for Development Information and Evaluation
(1996). Conducting yey informant interviews. Performance
monitoring & evaluation tips. Washington DC, USAID - http://pdf.
usaid.gov/pdf_docs/PNABS541.pdf .
4:0
GENERAL EVALUATION
METHOD FACTSHEETS
KEY INFORMANT INTERVIEWS
STEP 8
INTRODUCTION & KEY CONCEPTS
DESIGNING & IMPLEMENTING THE EVALUATION
PRISM MODULES
METHOD FACTSHEETS & ANNEXES
PRISM - TOOLKIT FOR EVALUATING THE OUTCOMES AND IMPACTS OF SMALL/MEDIUM-SIZED CONSERVATION PROJECTS227
Factsheet: Focus groups
Summary
In a focus group, a facilitator guides a group of people in a
discussion of their experiences, feelings, and preferences in
relation to the project or project action. The facilitator raises issues
identified in a discussion guide and uses probing techniques to
solicit views, ideas, and other information.
What are focus groups useful for?
Focus group can be used to solicit views, insights, and
recommendations of programme staff, customers, stakeholders,
technical experts, or other groups.
Advantages:
• Can be low cost (but not in all situations).
• Provides results in a short time period (once arranged).
• Flexible format can allow the facilitator to explore
unanticipated issues and encourages interaction among
participants.
• In a group setting participants may be able to provide
checks and balances on each other, reducing false or
extreme views.
Limitations:
• Flexible format makes it susceptible to facilitator bias,
which can undermine the validity and reliability of
findings.
• Discussions can be side-tracked or dominated by a few
vocal individuals.
• Generates relevant qualitative information, but no
quantitative data for making generalisations for the
whole population.
4:0
GENERAL EVALUATION
METHOD FACTSHEETS
FOCUS GROUPS

INTRODUCTION & KEY CONCEPTS
DESIGNING & IMPLEMENTING THE EVALUATION
PRISM MODULES
METHOD FACTSHEETS & ANNEXES
PRISM - TOOLKIT FOR EVALUATING THE OUTCOMES AND IMPACTS OF SMALL/MEDIUM-SIZED CONSERVATION PROJECTS228
Required steps
Step 1. Select the team
Decide who will facilitate the workshop and who will take notes.
Ideally the facilitator should be a native speaker who can put
people at ease. The team should have substantive knowledge of
the topic under discussion.
If the discussions are to be conducted by someone without
previous experience in focus group techniques, training is
suggested. This training can take the form of role playing,
formalised instruction on topic sequencing and probing for
generating and managing group discussions, as well as pre-testing
discussion guides in pilot groups.
Step 2. Select the participants
First, identify the types of groups and institutions that should be
represented (such as local people who are involved/affected by
the project, project staff, partners, technical experts, government
officials) in the focus groups. Often separate focus groups are
held for each type of audience. Second, identify the most suitable
people in each group. One of the best approaches is to consult
key informants who know about local conditions ahead of time to
select suitable focus groups.
Participants in each group should be reasonably homogenous,
from similar socioeconomic and cultural backgrounds. They should
also share common traits related to the discussion topic. For
example, in a discussion on hunting, participants from households
who engage in hunting and park rangers responsible for enforcing
regulations should participate in separate focus groups. Household
members may be reluctant to discuss hunting in front of rangers,
as they may be concerned about potential repercussions. Ideally,
people should not know each other. Anonymity lowers inhibition
and prevents the formation of cliques.
Step 3. Establish Free, Prior & Informed Consent (FPIC)
This lets the informants know they are participating in a study
and how their information will be used. Establishing FPIC requires
a participant to give formal approval (e.g. by signing a form
declaring that the informant explicitly agrees to participate). See
Factsheet: Developing ethical protocols for an evaluation for more
information on FPIC.
Step 4. Decide on timing and location
Discussions should last around one to two hours and should be
conducted in a location that is easy for participants to reach, and
with some degree of privacy.
4:0
GENERAL EVALUATION
METHOD FACTSHEETS
FOCUS GROUPS
STEPS 1 TO 4

INTRODUCTION & KEY CONCEPTS
DESIGNING & IMPLEMENTING THE EVALUATION
PRISM MODULES
METHOD FACTSHEETS & ANNEXES
PRISM - TOOLKIT FOR EVALUATING THE OUTCOMES AND IMPACTS OF SMALL/MEDIUM-SIZED CONSERVATION PROJECTS229
Step 5. Prepare a list of discussion topics
In advance, prepare a brief outline that covers the topics to be
discussed. It should contain a limited number of topics, allowing
some time and flexibility to pursue unanticipated but relevant
issues. The outline provides a framework for the facilitator to use
in exploring, probing and asking questions. Use carefully worded
questions to introduce each topic and to keep the discussion
focused. Comments raised can still be explored when needed.
Step 6. Conduct the discussion
Establish rapport. Often participants do not know what to expect
from focus group discussions. It is helpful for the facilitator to
outline the purpose and format of the discussion at the beginning
of the session, and to set the group at ease. Participants should be
told that the discussion is informal, that everyone is expected to
participate and that divergent views are welcome.
Phrase questions carefully. Certain types of questions impede
group discussions. For example, yes-or-no questions are one-
dimensional and do not stimulate discussion. “Why” questions put
people on the defensive and can cause them to take “politically
correct” sides on controversial issues.
Use open-ended questions where possible. These are more useful
because they allow participants to tell their story in their own
words and to add details that can result in unanticipated findings.
For example:
- How do you feel the project has affected the
community?
- What do you think about the national park?
If the discussion is too broad, the facilitator can narrow responses
by asking such questions as:
- How do you feel the project’s education programme has
affected the community?
- What do you think about the number of tourists visiting
the national park?
Use probing techniques. When participants give incomplete or
irrelevant answers, the facilitator can use the following techniques
to try to gain fuller, clearer responses:
• Repeat the question.
• Say you have limited understanding of the issue, and ask
for specific details.
• Pause for the answer.
• Repeat the reply - hearing it again sometimes stimulates
conversation. Ask “when”, “what”, “where”, “which”, and
“how” questions to provoke more detailed information.
• Use neutral comments - “Anything else?” “Why do you
feel this way?”.
4:0
GENERAL EVALUATION
METHOD FACTSHEETS
FOCUS GROUPS
STEPS 5 & 6

INTRODUCTION & KEY CONCEPTS
DESIGNING & IMPLEMENTING THE EVALUATION
PRISM MODULES
METHOD FACTSHEETS & ANNEXES
PRISM - TOOLKIT FOR EVALUATING THE OUTCOMES AND IMPACTS OF SMALL/MEDIUM-SIZED CONSERVATION PROJECTS230
Try to control the discussion. In most groups, a few individuals
tend to dominate the discussion. To encourage more balanced
participation:
- Address questions to individuals who are reluctant to
talk.
- Give non-verbal cues (look in another direction or stop
taking notes when an individual talks for an extended
period).
- Intervene, politely summarise the point, then re-focus
the discussion.
- Take advantage of a pause and say “Thank you for that
interesting idea, perhaps we can discuss it in a separate
session. Meanwhile with your consent, I would like to
move on to another item”.
Minimise group pressure. When an idea is being adopted without
any general discussion or disagreement, more than likely group
pressure is occurring. To minimise group pressure the facilitator
can probe for alternate views. For example, the facilitator can raise
another issue, or say “We had an interesting discussion but let’s
explore other alternatives.”
Step 7. Record the discussion
Tape recordings and written notes are useful. Notes should be
extensive and reflect the content of the discussion as well as non-
verbal behaviour (facial expressions, hand movements).
Shortly after each group interview, the team should summarise
the information, the team’s impressions, and implications of
the information for the study. Ideally, the discussion should be
reported in participants’ language, retaining their phrases and
grammatical usage.
4:0
GENERAL EVALUATION
METHOD FACTSHEETS
FOCUS GROUPS
STEPS 6 & 7

INTRODUCTION & KEY CONCEPTS
DESIGNING & IMPLEMENTING THE EVALUATION
PRISM MODULES
METHOD FACTSHEETS & ANNEXES
PRISM - TOOLKIT FOR EVALUATING THE OUTCOMES AND IMPACTS OF SMALL/MEDIUM-SIZED CONSERVATION PROJECTS231
Step 8. Analyse results
After each session, the team should assemble the interview notes
(transcripts of each focus group interview), the summaries, and any
other relevant data to analyse trends and patterns. Refer to the
factsheet Analysing qualitative data for more information.
When analysing the results, the team should consider:
- Words. Weigh the meaning of words participants used.
Can a variety of words and phrases categorise similar
responses?
- Framework. Consider the circumstances in which a
comment was made (context of previous discussions,
tone and intensity of the comment).
- Internal agreement. Consider whether shifts in opinions
during the discussion were caused by group pressure.
- Precision of responses. Decide which responses
were based on personal experience and give them
greater weight than those based on vague impersonal
impressions.
- The big picture. Pinpoint major ideas. Allocate time to
step back and reflect on major findings.
Purpose of the report. Consider the objectives of the study and
the information needed for decision making. The type and scope
of reporting will guide the analytical process. For example, focus
group reports typically are: (1) brief oral reports that highlight key
findings; (2) descriptive reports that summarise the discussion; or
(3) analytical reports that reveal trends, patterns.
Acknowledgement
Guidance in this factsheet is based on USAID Center for
Development Information and Evaluation (2011): Conducting
focus group interviews.
Performance monitoring & evaluation tips. Washington DC,
USAID - http://pdf.usaid.gov/pdf_docs/Pnadw110.pdf .
4:0
GENERAL EVALUATION
METHOD FACTSHEETS
FOCUS GROUPS
STEP 8

INTRODUCTION & KEY CONCEPTS
DESIGNING & IMPLEMENTING THE EVALUATION
PRISM MODULES
METHOD FACTSHEETS & ANNEXES
PRISM - TOOLKIT FOR EVALUATING THE OUTCOMES AND IMPACTS OF SMALL/MEDIUM-SIZED CONSERVATION PROJECTS232
Factsheet: Direct observation
Summary
Most evaluation teams conduct some fieldwork, observing what’s
actually going on at activity sites. Often this is done informally,
without much thought to the quality of data collection. Direct
observation techniques allow for a more structured process.
What is direct observation useful for?
Direct observation techniques allow for a systematic, structured
process, using well-designed observation record forms.
Advantages:
• An event, institution, facility, or process can be studied
in its natural setting, thereby providing a richer
understanding of the subject.
Limitations:
• Susceptible to observer bias. The very act of
observation also can affect the behaviour being studied.
Required steps
Step 1. Determine the focus
Because of time and resource constraints, direct observation has
to be selective, looking at a few actions, events, or assumptions
that are central to the evaluation questions. For example, suppose
you want to evaluate a project which is working to promote
alternative sources of fuelwood. Here, evaluation could look at a
variety of areas - e.g. community knowledge, fuelwood harvesting
rates, whether these groups are working more effectively or levels
of awareness among members of the public. The team should
narrow the focus to one or two of the areas that are likely to
generate the most useful information and insights.
Next, break down each action, event, or assumption into sub-
components. For example, if the team decides to look at capacity
of local conservation groups, prepare a list of the tasks to observe,
such as preparation of vaccine, consultation with mothers, and
vaccine administration.
Each task may be further divided into sub-tasks; for example,
local conservation groups might carry out habitat restoration,
awareness raising or advocacy work.
If you also want to assess physical facilities and surroundings,
prepare an inventory of items to be observed.
4:0
GENERAL EVALUATION
METHOD FACTSHEETS
DIRECT OBSERVATION
STEP 1

INTRODUCTION & KEY CONCEPTS
DESIGNING & IMPLEMENTING THE EVALUATION
PRISM MODULES
METHOD FACTSHEETS & ANNEXES
PRISM - TOOLKIT FOR EVALUATING THE OUTCOMES AND IMPACTS OF SMALL/MEDIUM-SIZED CONSERVATION PROJECTS233
Step 2. Develop direct observation forms
The observation record form should list the items to be observed
and should provide spaces to record observations. These forms
are similar to survey questionnaires, but investigators record their
own observations, not respondents’ answers. Observation record
forms help to standardise the observation process and to ensure
that all important items are covered. They also facilitate better
aggregation of data gathered from various sites or by various
investigators.
When preparing direct observation forms, consider the following:
1. Identify in advance the possible response categories for
each item, so that the observer can answer with a simple
yes or no, or by checking the appropriate answer. Closed
response categories help to minimise observer variability, and
therefore improve the quality of data.
2. Limit the number of items in a form. Forms should normally
not exceed 40–50 items. If necessary, it is better to use two
or more smaller forms than a single large one that runs to
several pages.
3. Provide adequate space for recording additional observations
for which response categories were not determined.
4. Use of computer software designed to create forms can be
very helpful. It can help to create a neat, unconfusing form
that is easily completed.
Step 3. Select the site(s)
Observations at a single site may be justified if the site can be
treated as a typical case or if it is unique. Consider a situation in
which all five local conservation groups established by a project have
not been performing well. Here, observation of a single group may
be justified as a typical case. Observations at a single group may
also be justified when the case is unique; for example, if only one of
five groups have been having major problems, and the purpose of
the evaluation is to discover why. However, single site observations
should generally be avoided, because cases which the team assumes
to be typical or unique may not be. As a rule, several sites are
necessary to obtain a reasonable understanding of a situation.
In most cases, teams select sites based on expert advice. The
investigator develops criteria for selecting sites, then relies on
the judgment of knowledgeable people. For example, if a team
evaluating a project decides to observe three local conservation
groups - one highly successful, one moderately successful, and one
struggling - you may request project staff, local experts or other
informants to suggest a few groups for each category. You will then
choose three after examining their recommendations. Using more
than one expert reduces individual bias in selection.
Alternatively, sites can be selected based on data from performance
monitoring. For example, activity sites can be ranked from best to
worst based on performance measures, and then a sample can be
drawn from them.
4:0
GENERAL EVALUATION
METHOD FACTSHEETS
DIRECT OBSERVATION
STEPS 2 & 3

INTRODUCTION & KEY CONCEPTS
DESIGNING & IMPLEMENTING THE EVALUATION
PRISM MODULES
METHOD FACTSHEETS & ANNEXES
PRISM - TOOLKIT FOR EVALUATING THE OUTCOMES AND IMPACTS OF SMALL/MEDIUM-SIZED CONSERVATION PROJECTS234
Step 4. Decide on the best timing
Timing is critical in direct observation, especially when events
are to be observed as they occur. Poor timing can distort findings.
For example, participation in local conservation groups can vary
depending on the time of year (e.g. when people are needed for
planting/harvesting crops or a time of year when many people go
on holiday). If Local Conservation Group activities are observed
during these times then an inaccurate picture of its activities may
result.
Similarly people and organisations often follow daily routines
associated with set times. For example, credit institutions may
accept loan applications in the morning; farmers in tropical
climates may go to their fields early in the morning and return
home by noon. Observation periods should reflect these rhythms.
Step 5. Establish Free, Prior & Informed Consent (FPIC)
This lets the informants know that they are participating in a
study and how their information will be used. Establishing FPIC
requires a participant to give formal approval (e.g. by signing a form
declaring that the informant explicitly agrees to participate). See
Factsheet: Developing ethical protocols for an evaluation for more
information on FPIC.
Step 6. Conduct the field observation
Establish rapport. Before embarking on direct observation, a
certain level of rapport should be established with the people,
community, or organisation to be studied. The presence of outside
observers, especially officials or experts, may generate some
anxiety among those being observed. Often informal, friendly
conversations can reduce anxiety levels.
Also, let them know the purpose of the observation is not to report
on individuals’ performance, but to find out what kind of problems
in general are being encountered.
Allow sufficient time for direct observation. Brief visits can be
deceptive, partly because people tend to behave differently in the
presence of observers. It is not uncommon, for example, for health
workers to become more caring or for extension workers to be
more persuasive when being watched. However, if observers stay
for relatively longer periods, people become less self-conscious
and gradually start behaving more naturally. It is essential to stay
at least two or three days on a site to gather valid, reliable data.
Use a team approach. If possible, two observers should observe
together. A team can develop more comprehensive, higher quality
data, and reduce individual bias.
Train observers. If many sites are to be observed, non-experts can
be trained as observers, especially if observation forms are clear,
straightforward, and mostly closed-ended.
4:0
GENERAL EVALUATION
METHOD FACTSHEETS
DIRECT OBSERVATION
STEPS 4, 5 & 6

INTRODUCTION & KEY CONCEPTS
DESIGNING & IMPLEMENTING THE EVALUATION
PRISM MODULES
METHOD FACTSHEETS & ANNEXES
PRISM - TOOLKIT FOR EVALUATING THE OUTCOMES AND IMPACTS OF SMALL/MEDIUM-SIZED CONSERVATION PROJECTS235
Step 7. Complete forms
Take notes as inconspicuously as possible. The best time for
recording is during observation. However, this is not always
feasible because it may make some people self-conscious or may
disturb the situation. In these cases, recording should take place as
soon as possible after observation.
Step 8. Analyse the data
Data from closed-ended questions from the observation form can
be analysed using basic procedures such as frequency counts and
cross-tabulations. Statistical software packages such as SAS or
SPSS facilitate such statistical analysis and data display.
Analysis of any open-ended interview questions can also provide
extra richness of understanding and insights. Here, use of database
management software with text storage capabilities, such as
dBase, can be useful.
Step 9. Check for reliability and validity
Direct observation techniques are susceptible to error and bias
that can affect reliability and validity. This can be minimised by
following some of the procedures suggested, such as checking the
representativeness of the sample of sites selected; using closed-
ended, unambiguous response categories on the observation
forms; recording observations promptly; and using teams of
observers at each site
Acknowledgement
Guidance in this factsheet is based on USAID (2011): Using direct
observation techniques.
Performance monitoring & evaluation tips factsheet. Washington
DC, USAID - http://pdf.usaid.gov/pdf_docs/pnadw104.pdf .
4:0
GENERAL EVALUATION
METHOD FACTSHEETS
DIRECT OBSERVATION
STEPS 7, 8 & 9

INTRODUCTION & KEY CONCEPTS
DESIGNING & IMPLEMENTING THE EVALUATION
PRISM MODULES
METHOD FACTSHEETS & ANNEXES
PRISM - TOOLKIT FOR EVALUATING THE OUTCOMES AND IMPACTS OF SMALL/MEDIUM-SIZED CONSERVATION PROJECTS236
Factsheet: Documentary evidence
Summary
Documentary evidence refers to the use of anything constituting a
“document” which provides a record of the variables used to assess
change in indicators.
Various types of document may be used as sources of evidence,
including public records (from schools, clinics); publications
(magazines, newspapers); private papers (diaries, letters); minutes
and records of meetings (NGOs, CBOs, government); legal
documents; financial records, budgets and records of trade and
marketing; websites and webpages (including social media); and
visual documents (e.g. videos, films and photographs). When
planning to use documentary methods to assess impacts, it is
important to be aware of what documents are available, and
whether you can have access to them.
Documentary evidence can be used in three main ways:
Direct use of documentary data/information: In many cases the
content of documents (or the documents themselves) provide a
direct indication of change relevant to a project’s objectives. For
example, legal documents which show changes in tenure or rights
to use land and resources or attendance records of meetings which
show increased attendance by women.
Content analysis / quantitative analysis: Content analysis is a
method for summarising any form of content by counting various
aspects of the content. This enables objective evaluation. Content
analysis, although it often analyses written words, is a quantitative
method, and the results are numbers and percentages. For
example, a project that seeks to change awareness of the need to
prevent bushfires may analyse the content of newspapers over a
12-month period to see how often key words such as “bushfire”,
“erosion”, and “climate change” appear.
Analytical reading: This involves thinking carefully, critically and
deeply when reading documents – even for example quantitative
records. As noted below, any author of a document has a
background, experiences and views which may affect the way
they present information – what is included and what is left out.
Reading documents analytically and critically aims to make sense
of this, and to interpret documents in the context of other issues,
previously gained knowledge and information.
Documentary data need to be interpreted with caution – it is
important to be aware of how documents have been used and
developed – by whom and for what purpose. Is the information
contained in the document credible and representative; is it
trustworthy? For example, can attendance records at a school be
trusted if the teacher who compiles them is paid according to the
number of pupils?
GENERAL EVALUATION
METHOD FACTSHEETS
DOCUMENTARY EVIDENCE
4:0

INTRODUCTION & KEY CONCEPTS
DESIGNING & IMPLEMENTING THE EVALUATION
PRISM MODULES
METHOD FACTSHEETS & ANNEXES
PRISM - TOOLKIT FOR EVALUATING THE OUTCOMES AND IMPACTS OF SMALL/MEDIUM-SIZED CONSERVATION PROJECTS237
METHOD FACTSHEETS
AND ANNEXES
Evaluation Design Factsheets
Participatory Impact Assessment
Interviewing key informants
Theory-based designs
Matching designs
Before and after designs
Decision tree for selecting an evaluation design
4:0

INTRODUCTION & KEY CONCEPTS
DESIGNING & IMPLEMENTING THE EVALUATION
PRISM MODULES
METHOD FACTSHEETS & ANNEXES
PRISM - TOOLKIT FOR EVALUATING THE OUTCOMES AND IMPACTS OF SMALL/MEDIUM-SIZED CONSERVATION PROJECTS238
Evaluation design: Participatory Impact Assessment
Summary
This is type of design that focuses on asking project participants
about their perceptions of what changes have occurred. It results
in both quantitative and qualitative data, with participants
being asked direct questions about the kinds of outcomes and
impacts the project has brought about. It is particularly useful for
evaluating the ways in which the project has affected stakeholders.
For many small/medium-sized conservation projects that involve
people, this is likely to be the most feasible way of attributing
change to the project. This type of design is attractive in that it can
be relatively cheap, data are relatively easy to obtain and a baseline
study does not need to have been carried out. However care must
be taken in order to generate results that are useful and valid.
For further reading refer to Catley et al. (2013): p45–50: http://fic.
tufts.edu/assets/PIA-guide_revised-2014-3.pdf which provides a
number of examples of three different ways in which participatory
methods can be used to evaluate social outcomes and impacts.
Process
Participatory Impact Assessment (PIA) is based on the recognition
that “local people are capable of identifying and measuring their
own indicators of change” (Catley et al. 2013: 5). PIA aims to
answer three key questions:
• What changes have there been in the community since the
start of the project?
• Which of these changes are attributable to the project?
• What difference have these changes made to people’s lives?
EVALUATION DESIGN
FACTSHEETS
EVALUATION DESIGN:
PARTICIPATORY IMPACT
ASSESSMENT
4:0

INTRODUCTION & KEY CONCEPTS
DESIGNING & IMPLEMENTING THE EVALUATION
PRISM MODULES
METHOD FACTSHEETS & ANNEXES
PRISM - TOOLKIT FOR EVALUATING THE OUTCOMES AND IMPACTS OF SMALL/MEDIUM-SIZED CONSERVATION PROJECTS239
Eight main steps are proposed in the PIA approach:
Step 1. Define the questions to be answered - Many
impact assessments and evaluations try to answer
too many questions, leading to superficial or
inconclusive results on a wide range of issues and
hence uncertainty about how to use this information.
Although it is tempting to try and capture as much
information about a project as possible, it is usually
better to limit the impact assessment to a maximum
of five key questions, and answer these questions
with confidence. If you have already worked with
communities to identify their impact indicators at the
beginning of the project, the assessment questions
will be framed according to these indicators. More
likely, you will be using a retrospective approach, and
working with project participants jointly to define the
assessment questions.
Step 2. Define the geographical and time limits of the project
- Defining the geographical (spatial) boundaries of a
project aims to ensure that everyone understands the
physical limits of the area in which impact is supposed
to take place. Defining the project’s time boundaries
aims to ensure that everyone is clear about the time
period being assessed. Participatory (or community)
mapping is a useful visualisation method to use
at the beginning of an assessment to define the
geographical boundary of the project area (see
factsheet: Community mapping). It also acts as a good
“ice-breaker”, since many people can be involved.
A timeline is an interviewing method that captures
the important historical events in a community, as
perceived by the community itself, and it positions
the project start date and end date against these
events. This method helps to ensure that everyone
involved in the assessment understands which
project is being assessed as well as the project
timeframe, and it helps people to recall events and
changes that occurred during the project.
EVALUATION DESIGN
FACTSHEETS
EVALUATION DESIGN:
PARTICIPATORY IMPACT
ASSESSMENT
STEPS 1 & 2
4:0

INTRODUCTION & KEY CONCEPTS
DESIGNING & IMPLEMENTING THE EVALUATION
PRISM MODULES
METHOD FACTSHEETS & ANNEXES
PRISM - TOOLKIT FOR EVALUATING THE OUTCOMES AND IMPACTS OF SMALL/MEDIUM-SIZED CONSERVATION PROJECTS240
Step 3. Identify and prioritise locally defined impact
indicators - PIA proposes the use of indicators
identified by community participants, since they have
their own priorities for improving their lives, and
their own ways of measuring change.
• One way of collecting community indicators
of impact is simply to ask project participants,
when the project starts, what changes in their
lives they expect to occur as a direct result of the
project. Alternatively, in cases where the project
has already been implemented, you can ask what
changes have already occurred. This should be
done separately for each project activity that you
plan to assess. If the project has a technical focus,
for example natural resource management, the
provision of agricultural inputs or livestock, ask the
participants how they benefit from the ownership
or use of the resources in question. These benefits
are impact indicators.
• When collecting community indicators it is
important to capture the views of different groups
of people within the community. Women will
often have different priorities and expectations of
project impact compared with those of men.
• If the community or participants produce many
impact indicators, ask them to prioritise the
indicators using ranking. It is important not to have
too many indicators: as with the key assessment
questions, it is better to have a few good indicators
than too many poor ones.
• An understanding of the context is essential in
deriving meaning from these indicators. Simply
measuring changes in livelihoods impact indicators
will not tell us much about impact unless you
understand the reasons behind those changes.
An understanding of livelihoods and context
is therefore an important part of any impact
assessment.
• One of the strengths of participatory methods,
if used correctly, is that they can help to reveal
important contextual factors (the complex social,
political and economic contexts that affect project
outcomes) and so improve understanding of the
mechanisms through which change has or has
not been achieved. Participatory selection of
indicators is an important part of this process.
EVALUATION DESIGN
FACTSHEETS
EVALUATION DESIGN:
PARTICIPATORY IMPACT
ASSESSMENT
STEP 3
4:0

INTRODUCTION & KEY CONCEPTS
DESIGNING & IMPLEMENTING THE EVALUATION
PRISM MODULES
METHOD FACTSHEETS & ANNEXES
PRISM - TOOLKIT FOR EVALUATING THE OUTCOMES AND IMPACTS OF SMALL/MEDIUM-SIZED CONSERVATION PROJECTS241
Step 4. Decide which methods to use, and test them - This
refers to the data collection methods used to
measure the indicators. The following factsheets
outline methods that can be used as part of a PIA:
• PIA Method 1: Before and after scoring
• PIA Method 2: Proportional piling
• PIA Method 3: Tally method
• PIA Method 4: Matrix scoring
• PIA Method 5: Before and after impact calendars
Each method has its strengths and weaknesses, and
some are more appropriate in certain cultures. Where
methods produce numerical measurements it is
essential that they are conducted alongside a semi-
structured interview process, in order to understand
the reasons for any observed changes.
Step 5. Decide which sampling method and sample size to
use - The sampling method is likely to be purposive
(e.g. “typical” villages) or random sampling. There
is no simple answer to the question of what sample
size to use: this depends on the type and number of
questions and the methods used. In most situations,
the important thing is to capture the overall trend,
and this can usually be done with a reasonably small
sample size as long as the methods are applied
consistently.
Step 6. Assess project attribution - Participatory ranking and
scoring methods can be used to assess attribution: in
general, the preferred approach is to try to separate
the project and non-project causative factors, and
to find the relative importance of these factors in
the explanation of an identified positive or negative
outcome or impact. By identifying what changes
(if any) can be specifically attributed to project
activities, PIA places the project activities within the
wider economic, social and environmental context of
an area, alongside a range of non-project factors that
influence livelihood strategies and outcomes.
EVALUATION DESIGN
FACTSHEETS
EVALUATION DESIGN:
PARTICIPATORY IMPACT
ASSESSMENT
STEPS 4, 5 & 6
4:0

INTRODUCTION & KEY CONCEPTS
DESIGNING & IMPLEMENTING THE EVALUATION
PRISM MODULES
METHOD FACTSHEETS & ANNEXES
PRISM - TOOLKIT FOR EVALUATING THE OUTCOMES AND IMPACTS OF SMALL/MEDIUM-SIZED CONSERVATION PROJECTS242
Step 7. Triangulate - Triangulation (using multiple methods
and/or data sources to increase the credibility
and validity of results) is important for all data
collection methods, including participatory methods.
Information and numbers from PIA can be cross-
checked by:
• reading secondary reports, statistics and literature
related to the project area, and to similar past
projects;
• using different PIA methods to measure the same
indicator;
• asking the same question in different ways within
a given PIA, e.g. combining ranking or scoring with
an informal interview.
Step 8. Feed back and verify the results with the community
- It is essential to discuss the results of the analysis
with communities and other stakeholders. This is a
last opportunity to “ground–truth” the results, and
the discussions usually reveal further insights into
project outcome and impact processes. Focus groups,
e.g. by gender, are advisable for getting the best
feedback quality.
With all participatory methods there is a danger that
respondents are more likely to cite project-related
factors if someone from the project is administering
the survey. It is better, therefore, if you can get an
independent third party to carry out the assessments.
EVALUATION DESIGN
FACTSHEETS
EVALUATION DESIGN:
PARTICIPATORY IMPACT
ASSESSMENT
STEPS 7 & 8
4:0

INTRODUCTION & KEY CONCEPTS
DESIGNING & IMPLEMENTING THE EVALUATION
PRISM MODULES
METHOD FACTSHEETS & ANNEXES
PRISM - TOOLKIT FOR EVALUATING THE OUTCOMES AND IMPACTS OF SMALL/MEDIUM-SIZED CONSERVATION PROJECTS243
Evaluation design: Interviewing key informants
This approach uses key informant interviews to ask certain key
individuals for information to gain a measure of what conditions
were like before the project, what changes have occurred, what
would have happened in the absence of the project, to identify
other possible explanations and, if feasible, to assess whether
these explanations can be ruled out. Examples of key informants
include experts with particular knowledge of the project’s target
site/species or the particular action that the project is carrying
out. Individual experts can be consulted, but it is usually preferable
to consult several so that a wide range of experience can be
drawn on. The scorecards in the species and habitat management
module are designed to be used in this way. See Factsheet: Key
informant interviews for more information on how to conduct a
key informant interview.
EVALUATION DESIGN
FACTSHEETS
EVALUATION DESIGN:
INTERVIEWING KEY
INFORMANTS
4:0

INTRODUCTION & KEY CONCEPTS
DESIGNING & IMPLEMENTING THE EVALUATION
PRISM MODULES
METHOD FACTSHEETS & ANNEXES
PRISM - TOOLKIT FOR EVALUATING THE OUTCOMES AND IMPACTS OF SMALL/MEDIUM-SIZED CONSERVATION PROJECTS244
EXAMPLE
Example: Using key informant interviewing in socioeconomic
assessment of Ebiil MPA in Palau
Established in 2000, Ebiil became the first legislated Marine
Protected Area of Palau. Located in Ngarchelong State, the
area is an important aggregation site for groupers and is
traditionally a trochus sanctuary. The Ebiil Conservation Act
of 2000 closed this channel and surrounding reefs to all fishing
activities and prohibited unauthorised entry. Socioeconomic
assessments were conducted by the Palau International
Coral Reef Center in 2005 and 2010 to generate information
to improve the management of Ebiil and to ensure that the
local community would benefit from the MPA. In the 2010
assessment, key informant interviews were conducted
in addition to a survey that covered 279 households of
Ngarchelong resource users. A combination of purposive
and snowball sampling schemes was used to select 15 key
informants, consisting of community and traditional leaders,
related state governmental officers, and fishers and harvesters
of marine life in the Ngarchelong reef areas. Purposive
sampling is commonly used in qualitative research. A purposive
sample includes people of interest to serve a very specific need
or purpose of the study. Snowball sampling is where individuals
are interviewed and asked at the end of the interview for their
suggestions for the next person to be interviewed about the
same subject.
While the results of the household survey provided
quantitative data (such as proportions of people engaged
in fishing and marine harvesting, proportion of ratings
for perceived changes of marine life and catch effort, and
perception of changes in and benefits for the community),
the interviews were used to collect more in-depth data
on changes in marine life and fishing patterns, benefits
of Ebiil to the community, the effectiveness of the MPA
management, and alternative ways of conserving the natural
resources of Ngarchelong and supporting the well-being of
the communities. The key informant interviews revealed
that many traditional fishing methods, such as spear and trap
fishing, are no longer practised. This seems to be the result of
a combination of new technologies, loss of interest in using
local methods, and a decline in fish numbers. The key informant
interviews also highlighted the need for better enforcement
and appreciation of the traditional “bul” (restrictions placed
by traditional leaders and in this case a closed marine area) for
conservation, and political conflicts (power struggles) between
traditional leaders and state authorities. Despite the potential
for better conservation results if the bul and the MPA were
operated in a mutually supportive way, there are existing
conflicts that would need to be addressed and resolved for this
to happen.
Source: https://www.conservationgateway.org/Documents/
Measures%20Case%20Study%20Ebiil%20MPA,%20Palau.pdf
EVALUATION DESIGN
FACTSHEETS
EVALUATION DESIGN:
INTERVIEWING KEY
INFORMANTS
4:0

INTRODUCTION & KEY CONCEPTS
DESIGNING & IMPLEMENTING THE EVALUATION
PRISM MODULES
METHOD FACTSHEETS & ANNEXES
PRISM - TOOLKIT FOR EVALUATING THE OUTCOMES AND IMPACTS OF SMALL/MEDIUM-SIZED CONSERVATION PROJECTS245
Evaluation design: Theory-based designs
A theory-based design uses the project’s Theory of Change to test
whether the project’s actual results match the results that are
mapped out in the Theory of Change. First the project is mapped
out in a Theory of Change and then data are collected at each stage
in the chain. If the results match what was expected then this can
be an indication that the change observed is due to the project
(see Figure 1). Conversely if the results do not match the Theory
of Change, this casts doubt on the ability to attribute any changes
to the project (see Figure 2). In the case of Figure 2 you would then
look to investigate the reasons why the outcomes laid out in the
Theory of Change did not occur as expected.
These approaches are popular because they are not do not require
a control/comparison group and they are often less resource-
intensive than most designs that use a counterfactual. However,
using this type of design effectively requires care, and above all a
thorough understanding of the mechanisms that drive change and
the systems being impacted.
An evaluation using a theory-based design might include the
following (Adapted from UNICEF Impact Evaluation Brief 10:
Strategies for Causal Attribution): https://www.unicef-irc.org/
publications/pdf/brief_6_overview_strategies_causal_attribution_
eng.pdf
• Achievement of intermediate outcomes – checking
whether all cases that achieved the final impacts also
achieved the intermediate outcomes identified in the
Theory of Change.
• Checking results against expert predictions – making
predictions based on the Theory of Change or an
emerging theory of wider contributors to outcomes, and
then following up on whether or not these predictions
actually materialise over time.
• Checking timing of impacts – determining whether the
timing of impacts is consistent with a causal relationship,
again with reference to the Theory of Change. For
example, whether the impact occurs a reasonable time
after the programme or policy has taken effect.
• Checking consistency with existing literature –
checking results against what is known from reviewing
the literature in the area of interest, to identify
consistencies/inconsistencies. This must be done
cautiously and with explicit mention of any limitations in
the existing literature.
EVALUATION DESIGN
FACTSHEETS
EVALUATION DESIGN:
THEORY-BASED DESIGNS
4:0

INTRODUCTION & KEY CONCEPTS
DESIGNING & IMPLEMENTING THE EVALUATION
PRISM MODULES
METHOD FACTSHEETS & ANNEXES
PRISM - TOOLKIT FOR EVALUATING THE OUTCOMES AND IMPACTS OF SMALL/MEDIUM-SIZED CONSERVATION PROJECTS246
EVALUATION DESIGN
FACTSHEETS
EVALUATION DESIGN:
THEORY-BASED DESIGNS
4:0
Poachingdecreases
Hunted speciespopulationincreases
Training park guardsto conduct
rangerpatrols
Trainingprovided topark guards
Park guardsapply new skillsduring patrols
Park guardsconduct more
effective patrols
Training delivered Evidence that newskills are being
applied
Evidence thatmore effective
patrols are beingcarried out
Evidence fordecrease in
poaching
Evidence for speciespopulation
increase
Poachingdecreases
Hunted speciespopulationincreases
Training park guardsto conduct
rangerpatrols
Trainingprovided topark guards
Park guardsapply new skillsduring patrols
Park guardsconduct more
effective patrols
Training delivered If there is no evidence that new
skills are beingapplied
Then further outcomes/impacts can’t be attributed to the action, even if thereis evidence for a decrease in poaching or an increase in species population
FIGURE 2: THEORY OF CHANGE WHERE RESULTS DO
NOT SUPPORT CAUSAL ATTRIBUTION.
Poachingdecreases
Hunted speciespopulationincreases
Training park guardsto conduct
rangerpatrols
Trainingprovided topark guards
Park guardsapply new skillsduring patrols
Park guardsconduct more
effective patrols
Training delivered Evidence that newskills are being
applied
Evidence thatmore effective
patrols are beingcarried out
Evidence fordecrease in
poaching
Evidence for speciespopulation
increase
Poachingdecreases
Hunted speciespopulationincreases
Training park guardsto conduct
rangerpatrols
Trainingprovided topark guards
Park guardsapply new skillsduring patrols
Park guardsconduct more
effective patrols
Training delivered If there is no evidence that new
skills are beingapplied
Then further outcomes/impacts can’t be attributed to the action, even if thereis evidence for a decrease in poaching or an increase in species population
FIGURE 1: THEORY OF CHANGE WHERE RESULTS
SUPPORT CAUSAL ATTRIBUTION.

INTRODUCTION & KEY CONCEPTS
DESIGNING & IMPLEMENTING THE EVALUATION
PRISM MODULES
METHOD FACTSHEETS & ANNEXES
PRISM - TOOLKIT FOR EVALUATING THE OUTCOMES AND IMPACTS OF SMALL/MEDIUM-SIZED CONSERVATION PROJECTS247
• Interviewing key informants – this is not about asking
key informants whether they believe the action has
produced the impacts (which can be affected by their
level of knowledge of causal processes and their
intentions regarding the continuation of the action).
It is instead about asking them to explain the causal
processes following their involvement. For example,
in a programme that aims to support the national
government to develop new evidence-based policies,
a key informant interview might ask about the process
of developing the policies, and work backwards to the
programme, avoiding leading questions that assume the
programme has been the major cause. These interviews
can provide evidence to explain, for example, how
a training programme made a difference in terms of
the government’s subsequent ability to develop and
negotiate particular policies.
A related but slightly different approach involves identifying and
considering possible alternative explanations for the achievement
of outcomes and impacts and then gathering data to see if these
can be ruled out.
Interviewing key informants – Asking experts in the specific
type of programme, community members or other stakeholders
to identify other possible explanations and, if feasible, to assess
whether these explanations can be ruled out.
General elimination methodology – this is carried out in two
stages:
(1) Identifying possible explanations (including that the
observed changes are indeed due to the action, plus
as many alternative explanations as possible) using
a combination of options such as those listed above
(e.g. key informant interviews and brainstorming, and
reviewing previous evaluations/research); and
(2) Gathering and analysing data to see if the possible
alternative explanations can be ruled out. This option
for causal attribution is most effective when used in
combination with the other strategies.
EVALUATION DESIGN
FACTSHEETS
EVALUATION DESIGN:
THEORY-BASED DESIGNS
4:0
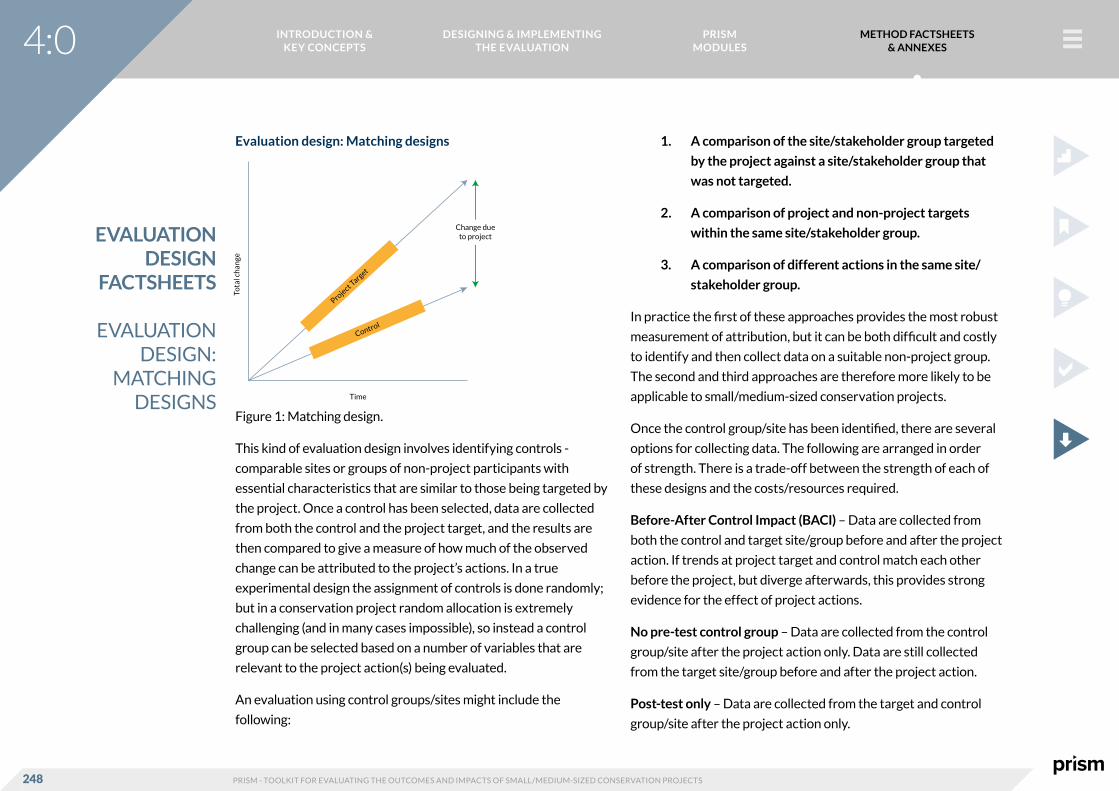
INTRODUCTION & KEY CONCEPTS
DESIGNING & IMPLEMENTING THE EVALUATION
PRISM MODULES
METHOD FACTSHEETS & ANNEXES
PRISM - TOOLKIT FOR EVALUATING THE OUTCOMES AND IMPACTS OF SMALL/MEDIUM-SIZED CONSERVATION PROJECTS248
Evaluation design: Matching designs
Figure 1: Matching design.
This kind of evaluation design involves identifying controls -
comparable sites or groups of non-project participants with
essential characteristics that are similar to those being targeted by
the project. Once a control has been selected, data are collected
from both the control and the project target, and the results are
then compared to give a measure of how much of the observed
change can be attributed to the project’s actions. In a true
experimental design the assignment of controls is done randomly;
but in a conservation project random allocation is extremely
challenging (and in many cases impossible), so instead a control
group can be selected based on a number of variables that are
relevant to the project action(s) being evaluated.
An evaluation using control groups/sites might include the
following:
1. A comparison of the site/stakeholder group targeted
by the project against a site/stakeholder group that
was not targeted.
2. A comparison of project and non-project targets
within the same site/stakeholder group.
3. A comparison of different actions in the same site/
stakeholder group.
In practice the first of these approaches provides the most robust
measurement of attribution, but it can be both difficult and costly
to identify and then collect data on a suitable non-project group.
The second and third approaches are therefore more likely to be
applicable to small/medium-sized conservation projects.
Once the control group/site has been identified, there are several
options for collecting data. The following are arranged in order
of strength. There is a trade-off between the strength of each of
these designs and the costs/resources required.
Before-After Control Impact (BACI) – Data are collected from
both the control and target site/group before and after the project
action. If trends at project target and control match each other
before the project, but diverge afterwards, this provides strong
evidence for the effect of project actions.
No pre-test control group – Data are collected from the control
group/site after the project action only. Data are still collected
from the target site/group before and after the project action.
Post-test only – Data are collected from the target and control
group/site after the project action only.
EVALUATION DESIGN
FACTSHEETS
EVALUATION DESIGN:
MATCHING DESIGNS Time
Change dueto project
Tota
l ch
ange
Project Target
Control
4:0

INTRODUCTION & KEY CONCEPTS
DESIGNING & IMPLEMENTING THE EVALUATION
PRISM MODULES
METHOD FACTSHEETS & ANNEXES
PRISM - TOOLKIT FOR EVALUATING THE OUTCOMES AND IMPACTS OF SMALL/MEDIUM-SIZED CONSERVATION PROJECTS249
EXAMPLES
Example 1 - Human-tiger conflict in Nepal (comparison of
stakeholder groups)
Recovering tiger populations in Nepal, along with a growing
human population, are leading to increased human-wildlife
conflict, and undermining conservation efforts by threatening
lives and livelihoods in poor communities. The intended
outcome of a three-year Darwin Initiative funded project,
designed and implemented by Chester Zoo and Green
Governance Nepal, is to reduce human-tiger conflict by
improving livestock husbandry, alleviating poverty through
alternative livelihood options, conducting actions focused on
changing behaviours, and building capacity in User Community
Groups. The project is administering surveys pre-, mid-, and
post-action to project sites, and at pre- and post-action stages
to control groups (i.e. communities that do not receive project
actions) to help in assessing whether changes seen in project
communities can be attributed to the project’s activities
and/or to other factors. Comparison groups were selected
by matching relevant key variables (e.g. livelihoods, natural
resource use, tiger incidents) to project treatment groups. The
results of the project will be communicated to comparison
groups to facilitate learning and possible uptake of successful
strategies.
Example 2 - Human-elephant conflict in Assam, India
(comparison of different actions)
The growing human population in Assam and increasing
demand for land has led to fragmented habitat, forcing
elephants into conflict with people. The raiding of crops by
elephants is one of the major components of human-elephant
conflict, causing loss of life and livelihoods, and retaliation
against elephants. Chester Zoo and Eco-Systems India as
part of the Assam Haathi Project (AHP) conducted a rigorous
assessment of the efficacy of action methods (provided by
AHP) in use by communities, by analysing the “probability of
crop damage” and “area of crops damaged” against each action.
The effectiveness of the actions was analysed in two parts:
their ability to prevent damage, and their ability to minimise
damage (when elephants are already in the crop fields).
Spotlights, chili fences and electric fences were found to be
the most effective methods for preventing crop damage when
used in isolation, but when used in combination with noise,
their efficacy was compromised. No actions were found to
reduce the extent of damage caused. AHP concluded that the
communities should focus on using chili fences, electric fences
and spotlights, reduce the use of kunkies (trained domesticated
elephants used to round up wild elephants and drive them
away from villages) and chili smoke, and minimise the use of
noise to increase the effectiveness of spotlights and fences
(Davies et al., 2011).
EVALUATION DESIGN
FACTSHEETS
EVALUATION DESIGN:
MATCHING DESIGNS
4:0

INTRODUCTION & KEY CONCEPTS
DESIGNING & IMPLEMENTING THE EVALUATION
PRISM MODULES
METHOD FACTSHEETS & ANNEXES
PRISM - TOOLKIT FOR EVALUATING THE OUTCOMES AND IMPACTS OF SMALL/MEDIUM-SIZED CONSERVATION PROJECTS250
Evaluation design: Before–after designs
Figure 1: Before-after design.
These designs rely on comparing the situation before the action
with the one after the action.
Single case before and after study
This is the simplest and most commonly used type of before and
after design. It involves simply collecting relevant data on the
project target group/site (e.g. stakeholder awareness, species
population size, resource use), carrying out the project action, then
measuring again. These designs are most useful if the outcome/
impact being measured is short-term, for example the immediate
effect of a presentation/workshop on participant attitudes.
However, these designs are poor at evaluating complex or long-
term changes, such as changes in community behaviour or in
species populations. That said, it should be noted that using these
designs is better than not measuring anything at all.
Time series design
This is a more robust form of before-after design where data are
collected prior to the action, shortly after the action and several
weeks after the action. This series of assessments records any
change that has taken place and the persistence of that change.
For example actions that involve people are likely to respond well
immediately after the action but the change may erode over time
as the people revert to their usual social life and habits. Note that
pre-testing can sensitise people to the outcome you are interested
in and can affect the results of subsequent surveys. For example
if the subjects know you are interested in a particular species as
a result of questions in the first survey, they may answer more
positively about this species in the second survey. Events apart
from the action may affect people’s responses to a topic, for
example if the national media pick up a story about an issue that
is similar to the one being addressed by the local project, this may
influence people’s responses.
EVALUATION DESIGN
FACTSHEETS
EVALUATION DESIGN:
BEFORE–AFTER DESIGNS Time
ObservedChange
Tota
l ch
ange
Project Target
Baseline
4:0

INTRODUCTION & KEY CONCEPTS
DESIGNING & IMPLEMENTING THE EVALUATION
PRISM MODULES
METHOD FACTSHEETS & ANNEXES
PRISM - TOOLKIT FOR EVALUATING THE OUTCOMES AND IMPACTS OF SMALL/MEDIUM-SIZED CONSERVATION PROJECTS251
EVALUATION DESIGN
FACTSHEETS
EVALUATION DESIGN:
BEFORE–AFTER DESIGNS
EXAMPLE
Example: Human-elephant conflict in Assam, India
The growing human population in Assam and increasing
demand for land has led to fragmentation of habitat, forcing
elephants into conflict with people. This conflict has become
an annual occurrence resulting in loss of crops, destruction
of houses, and loss of human lives, and in turn, retaliation
against elephants. The main aim of the three-year Assam
Haathi Project (developed and delivered by Chester Zoo and
EcoSystems-India) was to reduce this conflict in two of the
worst-affected areas, and to stabilise local people’s tolerance
of wildlife and their willingness to participate in conservation.
The short-term effects of the project are evident in the data
gathered (before, during and after conflict-mitigation measures
were introduced) on depredation, damage and attitudes. The
extent of crop-raiding and damage to property decreased
considerably in both study sites (e.g. crop damage in Area 1
reduced from 113 ha in 2006 to 25 ha in 2009), there were no
human injuries or deaths and no elephant deaths. People in
project villages feel that the conflict situation had “improved”,
and that they are now “more able” to deal with depredation
than before.
4:0

INTRODUCTION & KEY CONCEPTS
DESIGNING & IMPLEMENTING THE EVALUATION
PRISM MODULES
METHOD FACTSHEETS & ANNEXES
PRISM - TOOLKIT FOR EVALUATING THE OUTCOMES AND IMPACTS OF SMALL/MEDIUM-SIZED CONSERVATION PROJECTS252
EVALUATION DESIGN
FACTSHEETS
DECISION TREE FOR SELECTING
AN EVALUATION DESIGN
4:0
DECISION TREE FOR
SELECTING AN
EVALUATION DESIGN
Decision tree for selecting evaluation design (adapted from
Woodhouse et al. 2016).
YES
YES NO
NO
NO
NO
YES
YES YES OR
YES
YES
NO NO
NO
OR
YES
YES
YES YES
YES
Monitorproject progresswith no measure
of attribution
DON’T KNOW?Refer back toPRISM Step 2
Is an evaluationneeded?
Would an evaluationof outcome(s)/
impact(s) at this stage be useful
and feasible?
Are you?Most interestedin what changehas happened?
Is a real-lifecounterfactualavailable? (e.g.control group/
comparison site) and is this feasible
to measure?
MatchingDesign
Before – AfterDesign
Refer back toPRISM Step 1
Are you?Most interested
in how/whychange hashappened?
Mostinterested in
how change hasaffected
participants?
ParticipatoryDesign
ParticipatoryDesign
Is a strongTheory of
Changeavailable?
Theory-basedDesign
Is it possibleto constructa baseline/
counterfactualusing knowledge
of:
Baselinedata available/
will beavailable?
Projectparticipants
Keystakeholdersfamiliar withthe project
InterviewingKey Informants
Is the outcome/impact relativelyshort term and unlikely to be influenced by
external factors?

INTRODUCTION & KEY CONCEPTS
DESIGNING & IMPLEMENTING THE EVALUATION
PRISM MODULES
METHOD FACTSHEETS & ANNEXES
PRISM - TOOLKIT FOR EVALUATING THE OUTCOMES AND IMPACTS OF SMALL/MEDIUM-SIZED CONSERVATION PROJECTS253
AWARENESS & ATTITUDES
FACTSHEETS AND ANNEXES
Awareness & Attitudes factsheets and annexes
Sample questions and scales for evaluating attitudes and
awareness actions
Planning a successful attitudes/awareness action
4:1

INTRODUCTION & KEY CONCEPTS
DESIGNING & IMPLEMENTING THE EVALUATION
PRISM MODULES
METHOD FACTSHEETS & ANNEXES
PRISM - TOOLKIT FOR EVALUATING THE OUTCOMES AND IMPACTS OF SMALL/MEDIUM-SIZED CONSERVATION PROJECTS254
Factsheet: Sample questions and scales for evaluating attitudes
and awareness actions
This factsheet provides guidance on developing questionnaires for
evaluating actions targeting attitudes and awareness. It outlines
different types of questions and scales that can be considered
in designing a questionnaire. This guidance is to be used in
conjunction with the information in the factsheet: Questionnaires
and the module chapter on Attitudes and awareness that gives
details on designing this aspect of evaluation.
Two main types of questions are included in questionnaires:
• Closed questions have a pre-defined set of possible
answers, and they generate quantitative data.
They include questions which give tick boxes or ask
respondents to mark a position on a scale. Closed
questions can be used to gather responses from large
numbers of respondents, and to provide data sets
which are analysed using standard descriptive or more
complex statistical methods.
• Open questions ask participants to use their own words
to answer the question, and they generate qualitative
data. These questions give greater insight into why
respondents have particular attitudes, awareness
or behaviours, because they allow the researcher to
explore the subject in more detail. Closed questions
could constrain the respondent to a given set of
answers which may not include all the possible answers,
therefore missing a valuable finding.
• It is entirely possible to have a questionnaire which
includes both closed and open questions.
A good questionnaire should be reliable and valid. Reliability
refers to whether the questionnaire consistently measures the
intended attitude, and validity refers to whether the questionnaire
measures the attitude it is designed for rather than something else.
Reliability can be assessed by calculating Chronbach’s alpha (which
is possible in any basic statistics programme). Chronbach’s alpha is
a calculation that measures the correlation between items (usually
over 10 items) and gives a score between 0 and 1. Questionnaires
with a higher alpha score show that the questions are measuring
the same underlying concept. As a rule of thumb, an alpha score of
over 0.8 is generally considered good. The inter-item correlations,
the correlation between pairs of items, should also be examined.
For the inter-item correlation, one rule of thumb is that the score
should be between 0.2 and 0.5 (it should be noted that there is
some variation in advice on this, with researchers historically
recommending anything from 0.15 to 0.7). If items are highly
correlated this suggests that one of them may be redundant, since
they are probably both recording very similar things. If items are
poorly correlated they may be unrelated. If high or low correlation
is revealed, then it is worth investigating how the overall
Chronbach’s alpha changes when one of the items is removed.
Validity is difficult to assess. It is usually done by examining the
correlation between the results of the questionnaire and results
from other questionnaires addressing the same concept. High
correlation between two different measures indicates that they
are both designed to measure the same construct. Validity can
ATTITUDES & AWARENESS
FACTSHEET
SAMPLE QUESTIONS AND
SCALES FOR EVALUATING
ATTITUDES AND AWARENESS
ACTIONS
4:1

INTRODUCTION & KEY CONCEPTS
DESIGNING & IMPLEMENTING THE EVALUATION
PRISM MODULES
METHOD FACTSHEETS & ANNEXES
PRISM - TOOLKIT FOR EVALUATING THE OUTCOMES AND IMPACTS OF SMALL/MEDIUM-SIZED CONSERVATION PROJECTS255
also be assessed by looking at measures related to the concept
being investigated. For example if the questionnaire is related to
behaviour and is accurately detecting the attitude determining
behaviour, then the questionnaire results should have a strong
relationship with behavioural observations (e.g. in a questionnaire
about people’s attitude towards recycling, you would expect
more positive scores to correlate with people that are observed to
recycle the most).
Pilot-testing the questionnaire is crucial to help you understand
how your questions are interpreted and how reliable the
questionnaire is. Testing should be conducted in as similar a setting
as possible to the main survey, with participants who are as similar
as possible to the target audience. This will test whether the
participant recruitment strategy is likely to succeed and will give
an indication of response rate. A pilot test should reveal whether
any unnecessary questions have been included (if two questions
asking about the same subject are very highly correlated then one
of them could be removed since they may both be detecting the
same effect). Piloting will also show whether questions are being
interpreted as intended, or whether they need to be rewritten.
Pilot testing also provides a practice dataset (albeit small) which
should be used for testing the analytical approaches. It may be
necessary to conduct more than one pilot test of a questionnaire,
depending on the number of changes made at each test. You may
find that you ask questions!
A useful approach in a questionnaire is to ask a number of
questions which are all assessing the same concept. For example,
assessing attitudes towards a species simply by asking “Do you like
snow leopards?” may only get the answer the respondent thinks
you want to hear. Further questions may clarify their attitude: Do
you think snow leopards are an important wildlife species to have
in the local area? Do you think snow leopards cause problems for
people? Would you like to see a snow leopard in the wild? Should
there be more snow leopards in the area?
Single item measures are common in research and obviously allow
you to cover more in one questionnaire, but their reliability may
be low. When an item is scored (for example using the 1-5 Likert
scale described in the next section) the score will reflect the
attitude combined with a random error-risk component. When the
questionnaire has multiple items all addressing the same concept,
this error risk is reduced in the overall score, giving greater overall
reliability than the single item approach.
ATTITUDES & AWARENESS
FACTSHEET
SAMPLE QUESTIONS AND
SCALES FOR EVALUATING
ATTITUDES AND AWARENESS
ACTIONS
4:1

INTRODUCTION & KEY CONCEPTS
DESIGNING & IMPLEMENTING THE EVALUATION
PRISM MODULES
METHOD FACTSHEETS & ANNEXES
PRISM - TOOLKIT FOR EVALUATING THE OUTCOMES AND IMPACTS OF SMALL/MEDIUM-SIZED CONSERVATION PROJECTS256
Closed questions
Types of scale
There are several ways of asking questions and measuring the
responses. The type of scale you use will depend on the response
required.
Dichotomous scale
One of the simplest scales is the dichotomous scale, where
respondents are only able to give one of two opposing answers.
This is obviously unsuitable for more complex situations where
there may be a range of attitudes, but it can be useful for
determining awareness or for some aspects of determining
attitudes towards a subject.
The example below is a question taken from Kellert SR (1984).
American attitudes toward and knowledge of animals: An update.
In MW Fox and LD Mickley (eds.), Advances in animal welfare
science 1984/85, pp. 177-213. Washington, DC: The Humane
Society of the United States.
ATTITUDES & AWARENESS
FACTSHEET
SAMPLE QUESTIONS AND
SCALES FOR EVALUATING
ATTITUDES AND AWARENESS
ACTIONS Traditional native hunting (e.g. by Eskimos and Indians)
Hunting game animals for recreation and sport
Hunting waterfowl for recreation and sport
Hunting for meat
Hunting for recreation and meat
Hunting for a trophy
LOCATION APPROVE OPPOSE
Q. OF THE FOLLOWING REASONS FOR HUNTING, WHICH DO YOU APPROVE OF OR OPPOSE?
4:1

INTRODUCTION & KEY CONCEPTS
DESIGNING & IMPLEMENTING THE EVALUATION
PRISM MODULES
METHOD FACTSHEETS & ANNEXES
PRISM - TOOLKIT FOR EVALUATING THE OUTCOMES AND IMPACTS OF SMALL/MEDIUM-SIZED CONSERVATION PROJECTS257
Likert scales
Another common approach to scales is to provide a statement
and then ask participants to rate their dis/agreement on a scale
from “Strongly Agree” to “Strongly Disagree”. The results can then
be coded numerically, for example from 1-5 or even 1-7 if the end
points are “Very Strongly Agree” and “Very Strongly Disagree”.
A five- or seven-point scale is useful because it allows the
respondent to give more detail than the dichotomous scale, and
to add an element of relationship to each answer (for example in
the hunting question above, a respondent may have been more
opposed to hunting for a trophy than they would for meat, but the
questionnaire results only informed the project that they were
opposed to both). These scales give a score to each answer which
allows quantitative analysis of the results, and comparisons can
be represented graphically. It must be recognised that these are
ordinal data. Scoring 4 is not twice as high as 2 because “agree”
is not twice as good as “disagree”. The scores are ranks, so a low
score indicates that the respondent disagrees with the statement
while a high score indicates agreement. When multiple statements
are given, it is important to vary the positive and negative framing
so that all the “agree” answers do not align with one attitude.
If the hunting questions above were asked on a 5-point Likert
scale, a statement “hunting of wild animals should be banned”
would have the “strongly disagree” response reflecting the same
pro-hunting values of the “strongly agree” responses to the other
statements. This helps to prevent the respondent disengaging
from the questions and automatically selecting the same answer
throughout the questionnaire. In the example cited, the scoring of
the responses must be reversed to ensure that the final analysis
aligns the same values with the higher scores.
The example below is the short-form Nature Relatedness Scale
developed by Nisbet and Zelenski (2013) in “The NR-6: a new brief
measure of nature relatedness” which was developed to measure
people’s connection to nature. This examines attitudes towards
nature, and has been used in a number of studies, but it was
piloted and developed in Canada so it may not be equally reliable
in other cultures. It is also a medium to long-term measure that
will not detect changes before or after a short intervention – an
individual’s answer about an ideal vacation spot or to any of the
other statements is unlikely to change between the time before
a workshop and the time immediately after it, but answers may
change over a year while volunteering on a project.
ATTITUDES & AWARENESS
FACTSHEET
SAMPLE QUESTIONS AND
SCALES FOR EVALUATING
ATTITUDES AND AWARENESS
ACTIONS
4:1

INTRODUCTION & KEY CONCEPTS
DESIGNING & IMPLEMENTING THE EVALUATION
PRISM MODULES
METHOD FACTSHEETS & ANNEXES
PRISM - TOOLKIT FOR EVALUATING THE OUTCOMES AND IMPACTS OF SMALL/MEDIUM-SIZED CONSERVATION PROJECTS258
Likert scales
Example
A. My ideal vacation spot would be a remote, wilderness area
B. I always think about how my actions affect the environment
C. My connection to nature and the environment is a part of my spirituality
D. I take notice of wildlife wherever I am
E. My relationship to nature is an important part of who I am
F. I feel very connected to all living things and the earth
Please state the extent to which you agree or disagree with the following statements (tick one per statement).
AGREE DISAGREESTRONGLYAGREE
STRONGLYDISAGREE
NEITHER
Q1.
ATTITUDES & AWARENESS
FACTSHEET
SAMPLE QUESTIONS AND
SCALES FOR EVALUATING
ATTITUDES AND AWARENESS
ACTIONS
4:1

INTRODUCTION & KEY CONCEPTS
DESIGNING & IMPLEMENTING THE EVALUATION
PRISM MODULES
METHOD FACTSHEETS & ANNEXES
PRISM - TOOLKIT FOR EVALUATING THE OUTCOMES AND IMPACTS OF SMALL/MEDIUM-SIZED CONSERVATION PROJECTS259
Semantic differential scale
Another method is the semantic differential. This type of scale
presents objects and asks the respondent to rate them on a 7-point
scale which has pairs of opposite words at either end. This can
give a further detail on the aspects of a particular subject that the
respondent favours or dislikes.
The following example is taken from an assessment of photographs
that represent different landscapes. The research was carried
out in Japan by Natori and Chenoweth (2008) in “Differences in
rural landscape perceptions and preferences between farmers
and naturalists” (Journal of Environmental Psychology 28(3)
250-267). Students and farmers were asked to score ten semantic
pairs in relation to how they rated each landscape represented by
the photograph they were presented with. (As the research was
conducted in Japanese, the translations below may have changed
the meanings slightly). The pilot results showed that the individual
pairs (items) and relationships between items (correlation of one
pair with another) represented the variables: preference (pair
1), naturalness (2, 3), openness (4), vastness (5), stewardship (6,
7), peacefulness (8, 9) and biodiversity (10). Responses to these
questions may change in the short term, for example following
the viewing of video or reading information about the landscape
concerned.
ATTITUDES & AWARENESS
FACTSHEET
SAMPLE QUESTIONS AND
SCALES FOR EVALUATING
ATTITUDES AND AWARENESS
ACTIONS
Like
Natural
Following nature’s rule
Open
Vast
Well cared for
Tidy
Peaceful
Calm
Seems rich in life
Dislike
Artificial
Against nature’s rule
Enclosed
Compact
Deserted
Cluttered
Not peaceful
Rough
Seems poor in life
1
2
3
4
5
6
7
8
9
10
1
1
1
1
1
1
1
1
1
1
2
2
2
2
2
2
2
2
2
2
3
3
3
3
3
3
3
3
3
3
4
4
4
4
4
4
4
4
4
4
5
5
5
5
5
5
5
5
5
5
6
6
6
6
6
6
6
6
6
6
7
7
7
7
7
7
7
7
7
7
Please imagine you are in the landscape represented in the photograph and circle the number you think describes the landscape. Circle 4 if you find it difficult to rate or if you are indifferent to the landscape. Q1. Photograph of landscape
Q.
4:1

INTRODUCTION & KEY CONCEPTS
DESIGNING & IMPLEMENTING THE EVALUATION
PRISM MODULES
METHOD FACTSHEETS & ANNEXES
PRISM - TOOLKIT FOR EVALUATING THE OUTCOMES AND IMPACTS OF SMALL/MEDIUM-SIZED CONSERVATION PROJECTS260
Open questions
Open questions are less easy to quantify or compare than closed
questions, but they can generate more detailed information
which can explore why certain attitudes or awareness exist.
Open questions can be very useful for getting information about
perceptions and ideas that the project team may be unaware of.
As with choosing any question that you wish to use, think about
how you will interpret and analyse the answers you receive. Some
examples of open questions are given below, along with some
key points to consider in relation to their wording and structure.
(These points may also be relevant to the wording and structure of
closed questions).
Q1. Since the training event, have there been occasions when
you have had conversations with others (e.g. friends or
family) about anything you learned?
This question:
• aims to understand how the information from training
may have spread through the community;
• gives a defined timeframe instead of using ambiguous
words that people may understand in different ways.
For example some people understand the word “week”
to mean since Monday, while others may take it to mean
the past seven days. This may also depend on which day
they are asked.
• carefully tries to ask whether people have talked to
others. Some may think they were not meant to pass
information on, and therefore feel guilty, while others
may not want to divulge what they talk about with their
friends and family.
• does not lead the respondent to give an answer
by proposing possible situations where they may
have talked to people. Some questions may require
suggestions, but this question is aiming to assess
voluntary behaviour, so it is better to avoid suggesting
possible answers.
ATTITUDES & AWARENESS
FACTSHEET
SAMPLE QUESTIONS AND
SCALES FOR EVALUATING
ATTITUDES AND AWARENESS
ACTIONS
4:1

INTRODUCTION & KEY CONCEPTS
DESIGNING & IMPLEMENTING THE EVALUATION
PRISM MODULES
METHOD FACTSHEETS & ANNEXES
PRISM - TOOLKIT FOR EVALUATING THE OUTCOMES AND IMPACTS OF SMALL/MEDIUM-SIZED CONSERVATION PROJECTS261
Q2. Please describe what improvements, if any, you would make
totheleafletthathasbeenhandedout.
This question:
• asks for improvements, to frame the question
in a positive light rather than asking about what
may be wrong and hence inviting criticisism of the
project. People may feel uncomfortable about being
judgemental and negative about anything to do with
the project or the project team, so it is better to frame a
question positively.
Q3. Do you think you will change your practice as a result of this
training? Please tell us how (we may be able to use this to
help others).
This question:
• tries to evaluate future behaviour by seeking an
estimate of intention;
• frames the response in an impersonal way (it may help
others) in order to mitigate any reluctance to respond
either because reporting of personal behaviour is
involved or because a positive response could otherwise
be interpreted as a commitment for action.
Question examples
QUESTIONS ABOUT ATTITUDES
Questions about attitudes investigate the individual’s feelings and
emotions in relation to the subject.
1. Do you like/dislike [the subject]?
2. Do you approve/oppose ...?
3. To what extent do you think [the subject] is beautiful/
ugly/useful/useless/ boring/enjoyable/easy/difficult...?
4. Does this make you feel happy/sad/excited/calm/
restless/worried...?
5. Which of these [places/pictures/options] is your
preferred one, and why...?
QUESTIONS ABOUT AWARENESS
Questions about awareness investigate how much someone
knows about the subject.
1. Please match these [species] names and [species]
pictures.
2. Are any of these [species] found in the local area?
3. Have you seen these [species]?
4. What, if any, threats to [subject] are you aware of?
ATTITUDES & AWARENESS
FACTSHEET
SAMPLE QUESTIONS AND
SCALES FOR EVALUATING
ATTITUDES AND AWARENESS
ACTIONS
4:1

INTRODUCTION & KEY CONCEPTS
DESIGNING & IMPLEMENTING THE EVALUATION
PRISM MODULES
METHOD FACTSHEETS & ANNEXES
PRISM - TOOLKIT FOR EVALUATING THE OUTCOMES AND IMPACTS OF SMALL/MEDIUM-SIZED CONSERVATION PROJECTS262
5. In what ways do people in this community benefit
from...?
6. Does this activity affect you...?
QUESTIONS ABOUT BEHAVIOUR
Questions about behaviour try to get people honestly to report
what they do and how it may have changed.
1. In the last seven days, have you...?
2. Do you have a bird feeder/pond/wood fire in the
garden/house...?
3. Since [the action] have you had the opportunity to do
[requested behaviour]...?
4. Trying to recall what you did in [month before project
started] did you ever [behaviour]...?
5. In the last summer/winter/wet season did you...?
Where possible, it may be better to measure behaviour using
methods that observe either the behaviour or indicators of
the behaviour unobtrusively. For example, changes in hunting
practices may be observed by measuring changes in the types
of meat available at the local market. Monitoring the count of
footprints on a path may help you find out how many people are
using the woodland, and recording the locations of domestic
livestock may reveal changes in herding practices.
Evaluation design
Pre–post (before-after) questionnaire
A “before and after” questionnaire asks participants to rate (for
example) their level of knowledge before the action and again
afterwards.
It is also possible to ask participants after the action to describe
how they felt prior to it, but this is dependent on the reliability of
the participants’ memory.
The focus of the questions should reflect the aims of the
action that you have identified at the beginning of the project.
Questionnaires that are perceived as irrelevant (or as too long)
may reduce the response rate you achieve.
Post only (after) questionnaire
A questionnaire which is only delivered after an event, rather than
both before and after the event, is a post only questionnaire. This
may provide a snapshot of participant awareness, attitudes or
behaviour. Again the length and relevance of the questionnaire
need to be considered carefully if you are to achieve the best rate
of response.
Post questionnaires can be administered immediately after an
attitudes or awareness action and then at intervals afterwards.
To get a good response rate, the best approach is to ask people to
complete the questionnaire while they are still at the event venue.
If you wish to carry out a post questionnaire some time after the
action, then you should consider how you will encourage people to
fill in their responses and return them.
ATTITUDES & AWARENESS
FACTSHEET
SAMPLE QUESTIONS AND
SCALES FOR EVALUATING
ATTITUDES AND AWARENESS
ACTIONS
4:1

INTRODUCTION & KEY CONCEPTS
DESIGNING & IMPLEMENTING THE EVALUATION
PRISM MODULES
METHOD FACTSHEETS & ANNEXES
PRISM - TOOLKIT FOR EVALUATING THE OUTCOMES AND IMPACTS OF SMALL/MEDIUM-SIZED CONSERVATION PROJECTS263
Annex: Planning a successful attitudes/awareness action
Conservation projects targeting biodiversity outcomes may
include actions to raise people’s awareness of a subject, or change
public or stakeholder attitudes. This is often in an effort to
catalyse a behaviour change, which can be essential to achieving
biodiversity outcomes. Increasing awareness or changing
attitudes can lead to behaviour changes, but the relationships
between these elements are complex and behaviour change is
difficult to achieve. Behaviour change models attempt to explain
these relationships, and they can be used to guide attitude and
awareness actions. Such models may include adaptations of the
Theory of Reasoned Action, Theory of Planned Behaviour, Social
Cognitive Theory, Social Norms Theory, the Stages of Change
Model and other integrative models. Three components of a
successful action are design, planning and communication. A useful
acronym for these actions is MAST: Message, Audience, Strategy,
Timing; and this can be useful for structuring your thinking about
each of the three components.
The message of the action will be defined by the desired outcome.
The message should be shaped to resonate with the target
audience, relating to their interests, values and culture.
It is crucial to identify the appropriate audience for the message,
which may be the individual people whose behaviour could
influence the success of the conservation goal, the influential
peer group around these people, or influential groups in the wider
community.
The communication strategy will be affected by a number of
factors including the method (for example spoken or visual), the
messenger (for example credibility, personality, culture) and
environmental factors that may have little to do with the message
(for example indoor or outdoor setting, lighting, seating, noise,
prior audience understanding of the topic).
Timing of events is also crucial both in terms of the event
itself, for example avoiding clashes with other activities, and in
terms of message timing, for example it may not be effective
to try to change a behaviour that occurs in winter by means of
communications delivered in summer.
Evaluating the effect of actions designed to influence attitudes
and awareness is a critical part of a project and should ideally
be planned in the design stage. The effect of the actions may
be seen both within the project and within the audience, and it
may occur over a variety of timescales. It is critical that a robust
Theory of Change is used to associate the action with the target
outcome. Although it may not be possible to evaluate the effect
of the action on the desired biodiversity outcome, interim stages
can be evaluated and can provide useful intelligence for internal
effectiveness monitoring and for reporting.
ATTITUDES & AWARENESS
ANNEX
PLANNING A SUCCESSFUL ATTITUDES/
AWARENESS ACTION
4:1

INTRODUCTION & KEY CONCEPTS
DESIGNING & IMPLEMENTING THE EVALUATION
PRISM MODULES
METHOD FACTSHEETS & ANNEXES
PRISM - TOOLKIT FOR EVALUATING THE OUTCOMES AND IMPACTS OF SMALL/MEDIUM-SIZED CONSERVATION PROJECTS264
Framework for attitudes and awareness action planning
The framework (Figure 1, Attitudes & awareness module) provides
a structure for developing a Theory of Change for attitude and
awareness actions in any project. As with any action planning
it is necessary to go through several steps to identify the best
approach. The planning steps below work backwards along the
Theory of Change, using current understanding of behaviour and
preliminary research, to ensure each step is linked to the desired
final outcome.
Step 1. Identify the outcome of interest for the project (i.e.
the desired improvement in biodiversity status).
This is the final (green) box in the framework and the
ultimate goal of the project. With high-impact actions
and a rapidly responding biodiversity goal, there may
be effects seen at this level, however it is unlikely that
most attitude and awareness actions in small- medium
sized projects will be able to detect ultimate effects on
biodiversity.
Step 2. Identify the threat to biodiversity which needs to be
reduced, and any human behaviours which cause the
threat.
This refers to the pink box in the framework, identifying
the factors that need to be altered if the biodiversity
goal is to be achieved.
Step 3. Identify the desired human behaviour outcome.
Point 4 in the framework requires you to identify the
behaviour that is causing the threat to biodiversity.
Change in this behaviour will then be the outcome
for the attitude/awareness action. This requires an
understanding of the links between the behaviour
and the impact on biodiversity, and how a change in
behaviour can contribute to a change in this impact.
Step 4. Identify target audience linked to behaviour.
In order to influence attitudes, awareness or knowledge
(points 2 and 3 in the framework) successfully, it is
necessary to identify the audience. Most awareness and
attitude interventions will need to focus on a particular
audience. Even seemingly ubiquitous behaviours need
to have a target audience identified, e.g. plastic carrier
bags are used by many people, but different messages
and catalysts are likely to be required to produce a
response in different groups. It is necessary to focus
the action on the correct audience to ensure the
appropriate link to the desired behaviour change.
ATTITUDES & AWARENESS
ANNEX
PLANNING A SUCCESSFUL ATTITUDES/
AWARENESS ACTION
4:1

INTRODUCTION & KEY CONCEPTS
DESIGNING & IMPLEMENTING THE EVALUATION
PRISM MODULES
METHOD FACTSHEETS & ANNEXES
PRISM - TOOLKIT FOR EVALUATING THE OUTCOMES AND IMPACTS OF SMALL/MEDIUM-SIZED CONSERVATION PROJECTS265
Step 5. Investigate why the behaviour occurs, by means of
research, for example using interviews with people
who exhibit the behaviour.
Research should investigate attitudes and awareness
relating to the target biodiversity issue, other related
behaviour and its impacts, and potential alternative
behaviours. This will aim to address the motivations for
the current behaviour, barriers to adopting a different
behaviour, and potential enablers for adopting a new
behaviour. Collecting appropriate observational
data can provide an additional (often more objective)
assessment of current behaviour.
Points 2 and 3 in the framework also require an
understanding of the change in attitude, awareness or
knowledge that is required to influence the behaviour
at issue. In many situations, unexpected factors may
drive behaviour in complex ways, and these will not
be discovered without discussions with the people
involved. This also requires an open mind on the part
of the researchers who may be focused on biodiversity
conservation but who may encounter many other values
and motives in this phase of research. After gathering
ideas and data from several sources, similarities in
perceptions and suggestions for the behaviour can
highlight issues that need to be addressed.
Step 6. Develop an appropriate behaviour model for
achieving the desired outcome(s).
Building a theoretical model which describes the
factors driving the behaviour will enable the project
to be planned more effectively in complex situations,
helping it to clarify the objective of the action and to
be more relevant to other work in future. This model
should be developed using the information gathered in
the previous steps, and should be informed by existing
behaviour change models such as those mentioned
previously.
Step 7. Develop action to address the target attitude/
awareness issue.
This is point 1 in the framework. Once a specific
behaviour change and target audience have been
defined, it is necessary to design the best method of
communicating to the audience, so that the action has
the best chance of achieving the intended behaviour
change. This should increase the chance of success
happening in accordance with the defined pathway from
action> target behaviour> desired behaviour change>
reduction in threat> improvement in biodiversity status.
ATTITUDES & AWARENESS
ANNEX
PLANNING A SUCCESSFUL ATTITUDES/
AWARENESS ACTION
4:1

INTRODUCTION & KEY CONCEPTS
DESIGNING & IMPLEMENTING THE EVALUATION
PRISM MODULES
METHOD FACTSHEETS & ANNEXES
PRISM - TOOLKIT FOR EVALUATING THE OUTCOMES AND IMPACTS OF SMALL/MEDIUM-SIZED CONSERVATION PROJECTS266
CAPACITY DEVELOPMENT
FACTSHEETS AND ANNEXES
Capacity Development factsheets and annexes
Example questions and scales for training evaluation
Organisational capacity assessment tool
Network health scorecard
4:2

INTRODUCTION & KEY CONCEPTS
DESIGNING & IMPLEMENTING THE EVALUATION
PRISM MODULES
METHOD FACTSHEETS & ANNEXES
PRISM - TOOLKIT FOR EVALUATING THE OUTCOMES AND IMPACTS OF SMALL/MEDIUM-SIZED CONSERVATION PROJECTS267
Factsheet: Training evaluation form: example questions and
scales
Training evaluation surveys tend to be short - a good guide is to
make sure that it takes no more than five minutes to complete. Try
it out yourself first! There are two types of questions: quantitative
questions are closed-ended (tick the box, or scales), while open-
ended questions ask for written feedback. Quantitative questions
are extremely useful because they provide numbers that you can
analyse as part of your evaluation, with scope to compare across
years or sites, for example. Qualitative questions provide more
detail – they can help you judge why participants thought the
training was useful/not useful; but they are less easy to analyse. It
is best to have a combination of the two types of questions.
The template below provides examples of different types of
questions and scales that can be considered in designing a training
evaluation form. You can modify the questions to suit your
particular training programme or event. You may not want to
ask all the questions in each section -choose those that are most
appropriate to your aims. See the factsheet Questionnaires for
general guidance on designing and implementing a questionnaire
survey.
Post-only surveys (Feedback forms)
A post-training evaluation form asks participants to rate the
effectiveness of various aspects of the training. The focus of the
questions should reflect the aims of the training that you have
identified at the beginning of the project. Asking questions that do
not relate to the evaluation of your capacity development actions
is a waste of time and effort. Questionnaires that are too long (or
are perceived as irrelevant) may also affect response rates you
achieve.
It is recommended that you keep to one type of scale so as not to
confuse the respondents.
You can cut and paste the question formatting into a new
document and modify as needed.
Five-point scale
The example below uses a five-point scale from “strongly agree”
(SA) to “strongly disagree” (SD).
A five-point scale is useful because it allows people to choose a
score that is likely to match their true position. Using numbers
allows you to carry out analyses and to present them graphically.
CAPACITY DEVELOPMENT
FACTSHEET
TRAINING EVALUATION
FORM: EXAMPLE QUESTIONS AND
SCALES
4:2

INTRODUCTION & KEY CONCEPTS
DESIGNING & IMPLEMENTING THE EVALUATION
PRISM MODULES
METHOD FACTSHEETS & ANNEXES
PRISM - TOOLKIT FOR EVALUATING THE OUTCOMES AND IMPACTS OF SMALL/MEDIUM-SIZED CONSERVATION PROJECTS268
CAPACITY DEVELOPMENT
FACTSHEET
TRAINING EVALUATION
FORM: EXAMPLE QUESTIONS AND
SCALES
A. The presenter communicated the information clearly.
B. The presenter engaged the audience.
C. The presenter made the subject matter compelling.
D. The presented was able to answer questions.
E. The content was presented in a well-structured manner.
F. The pace of the presentation was right for me.
G. The handouts/supporting material were useful.
AGREE(2)
DISAGREE(4)
STRONGLYAGREE (1)
STRONGLYDISAGREE (5)
NEITHER(3)
QUESTIONS ABOUT THE PRESENTER AND MATERIALS
Please state the extent to which you agree or disagree with the following statements, where 1 is Strongly Agree and 5 is Strongly Disagree (tick one choice per statement).
A. The training was relevant to my work.
B. The training content was meaningful to my work.
C. The training met my purpose in attending.
D. The training content was related to the skills and knowledge I needed.
E. The training made me think about my own work.
F. The training motivated me to change how I deliver my work.
G. I want to tell others about the useful things that were presented.
H. I have the confidence to use the knowledge gained from the training in my work.
AGREE(2)
DISAGREE(4)
STRONGLYAGREE (1)
STRONGLYDISAGREE (5)
NEITHER(3)
QUESTIONS ABOUT THE EFFECTIVENESS OF THE TRAINING
Please state the extent to which you agree or disagree with the following statements, where 1 is Strongly Agree and 5 is Strongly Disagree (tick one choice per statement).
4:2

INTRODUCTION & KEY CONCEPTS
DESIGNING & IMPLEMENTING THE EVALUATION
PRISM MODULES
METHOD FACTSHEETS & ANNEXES
PRISM - TOOLKIT FOR EVALUATING THE OUTCOMES AND IMPACTS OF SMALL/MEDIUM-SIZED CONSERVATION PROJECTS269
Open Questions
Open questions are less easy to quantify or compare than closed
ones, but they can give you more depth of useful information.
Think about how you will interpret and analyse the answers when
you are choosing the open questions you are going to use.
Q1
Choose one of these:
What was the most useful aspect of the training to you?
What was the best aspect of the training?
What did you learn that you did not know before?
Q2
Choose one of these:
What aspect of the training would you like to see improved?
What could we have done differently?
What else would you like to see included in the training?
Q3
How do you hope to change your practice as a result of this
training?
Before and after questionnaire
A before and after questionnaire asks participants to rate their
level of knowledge before the training and again afterwards. The
focus of the questions should reflect the aims of the training that
you have identified at the beginning of the evaluation. Asking
questions that do not relate to the evaluation of your capacity
development actions is a waste of time and effort. Questionnaires
that are too long (or are perceived as irrelevant) may also affect the
response rates you achieve.
These questionnaires are best completed anonymously, which
requires a level of organisation and planning that people do not
always have. For example, you could give everyone a numbered
questionnaire and ask them to remember the number allocated
to them (this is done in some school exams, for example).
Alternatively you could use an on-line method such as Survey
Monkey.
CAPACITY DEVELOPMENT
FACTSHEET
TRAINING EVALUATION
FORM: EXAMPLE QUESTIONS AND
SCALES
4:2

INTRODUCTION & KEY CONCEPTS
DESIGNING & IMPLEMENTING THE EVALUATION
PRISM MODULES
METHOD FACTSHEETS & ANNEXES
PRISM - TOOLKIT FOR EVALUATING THE OUTCOMES AND IMPACTS OF SMALL/MEDIUM-SIZED CONSERVATION PROJECTS270
Post-only questionnaire
Post-training questionnaires can be administered straight after the
event and then at intervals afterwards. The best way to get people
to fill in a questionnaire immediately after the training is to ask
them to do it while they are still at the venue. If you wish to carry
out a post-training questionnaire some time after the training, then
it is useful to consider how you will encourage people to fill in and
return the forms.
Try to keep the questionnaire as short as possible - a good
guide is to make sure that it takes no more than five minutes
to complete. Try it out yourself first! There are two types of
questions: quantitative questions are closed-ended (tick the box,
or scales), while open-ended questions ask for written feedback.
Quantitative questions are extremely useful because they provide
numbers that you can analyse as part of your evaluation, with
scope to compare across years or sites, for example. Qualitative
questions provide more detail – they can help you judge why
participants thought the training was useful/not useful; but they
are less easy to analyse. It is best to have a combination of the two
types of questions.
You can cut and paste the question formatting into a new
document and modify as needed.
Scales
The examples below show a series of scales and different options
for presenting questions in a before and after questionnaire.
When you are designing your own questionnaire it is
recommended that you keep to one type of scale so as not to
confuse the respondents.CAPACITY
DEVELOPMENTFACTSHEET
TRAINING EVALUATION
FORM: EXAMPLE QUESTIONS AND
SCALES
4:2

INTRODUCTION & KEY CONCEPTS
DESIGNING & IMPLEMENTING THE EVALUATION
PRISM MODULES
METHOD FACTSHEETS & ANNEXES
PRISM - TOOLKIT FOR EVALUATING THE OUTCOMES AND IMPACTS OF SMALL/MEDIUM-SIZED CONSERVATION PROJECTS271
I rate my knowledge in (fill in topic here but make it specific)
I rate my skills in (fill in topic here but make it specific)
QUESTION BEFORE THE TRAINING AFTER THE TRAINING
QUESTIONS ABOUT KNOWLEDGE AND SKILLS
Using a scale of 1 to 5 where 1 = none at all and 5 = a lot, please rate the following:
I feel motivated to apply skill X in my work
I have the confidence to make the right decisions about my conservation work
…….
STRONGLYDISAGREE
QUESTION DISAGREE AGREESTRONGLYAGREE
STRONGLYDISAGREE
BEFORE TRAINING AFTER TRAINING
STRONGLYAGREE
DISAGREEAGREE
QUESTIONS ABOUT CONFIDENCE AND MOTIVATION
This questionnaire needs to be distributed before the training and then again after the training.
CAPACITY DEVELOPMENT
FACTSHEET
TRAINING EVALUATION
FORM: EXAMPLE QUESTIONS AND
SCALES
4:2

INTRODUCTION & KEY CONCEPTS
DESIGNING & IMPLEMENTING THE EVALUATION
PRISM MODULES
METHOD FACTSHEETS & ANNEXES
PRISM - TOOLKIT FOR EVALUATING THE OUTCOMES AND IMPACTS OF SMALL/MEDIUM-SIZED CONSERVATION PROJECTS272
QUESTIONS ON THE APPLICATION OF SKILLS AND THE IMPACT OF THIS IN YOUR WORK
Question 1
a) What conservation contribution have you made since returning to work?
b) How influential was [insert specific training provision] in you making this contribution?
Extremely influential, very influential, neutral, not influential.
Question 2
How important has the training from us been in your career?
Extremely important, very important, neutral, not important.
Question 3
Compared to the time before the project, have you used any of the skills/knowledge acquired during the training? (Yes/No).
If yes, please provide at least one example. If no, please explain why not.
Question 4
Compared to the time before the project, do you see a change in your work as a result of applying your new skills?
If yes, please provide at least one example. If no, please explain why not.
CAPACITY DEVELOPMENT
FACTSHEET
TRAINING EVALUATION
FORM: EXAMPLE QUESTIONS AND
SCALES
4:2

INTRODUCTION & KEY CONCEPTS
DESIGNING & IMPLEMENTING THE EVALUATION
PRISM MODULES
METHOD FACTSHEETS & ANNEXES
PRISM - TOOLKIT FOR EVALUATING THE OUTCOMES AND IMPACTS OF SMALL/MEDIUM-SIZED CONSERVATION PROJECTS273
CAPACITY DEVELOPMENT
FACTSHEET
TRAINING EVALUATION
FORM: EXAMPLE QUESTIONS AND
SCALES
4:2
Example of a before & after questionnaire used to evaluate
changes in skills and knowledge:
Action: A project in Munnar, Kerala conducted two one-day
amphibian identification workshops aiming to improve the
amphibian identification skills of Forest Department employees.
Workshops consisting of classroom and field sessions, were
conducted in Munnar, Kerala with 26 participants from three
regional Forest Departments. Classroom sessions consisted of
visual presentations detailing the importance of amphibians and
their diversity in the Western Ghats, specifically focusing on
five amphibians in Munnar: W. phrynoderma and Rhacophorus
pseudomalabaricus (both critically endangered), Micrixalus
adonis (not evaluated), Ghatixalus asterops (data-deficient) and
Raorchestes beddomii (near threatened).
Evaluation: A survey was conducted before the workshop
to record participants’ prior knowledge of the five species.
Information on whether they recognized the species, its common
name in Malayalam and the habitat it was found in were requested
after showing them photographs of the species. An identical
survey was repeated four months later with 14 respondents to
understand whether the workshop had improved their skills. The
remaining 12 workshop participants were not available after being
transferred to work within other forest departments.
Results and interpretation: Four months after the workshop,
Forest Department employees had improved their recognition
skills for W. phrynoderma, R. pseudomalabaricus, M. adonis and R.
beddomii and the habitats they occurred in (Table 1).
The team concluded that these species were relatively easy
to distinguish and should act as focal species during official
monitoring of amphibian populations. Participants also had
substantial previous knowledge of R. pseudomalabaricus and M.
adonis. There was less improvement in identifying G. asterops
as it was probably not sufficiently distinct or characteristic.
The team found that the common name of all species was not
retained by most respondents (Table 1), possibly because
common names were difficult to memorize and folk taxonomy
for most amphibians is generic and not specific to the species
level. This could be improved through a greater encouragement
from the higher officials of the Forest Department for their staff
to equip themselves with such knowledge. Overall, workshops
improved the knowledge of Forest Department employees and,
if undertaken annually, could consistently improve their skills in
identifying amphibians and eventually conserving them.
TABLE 1.
Number of Forest Department employees without prior knowledge that successfully identified amphibians and related information four months after attending an education workshop (n=14, those with prior knowledge excluded).
SPECIES RECOGNITION COMMON NAME HABITAT
YES NO YES NO YES NO
W. phrynoderma 14 0 2 12 11 3
R. pseudomalabaricus 2 1 2 12 10 4
M. adonis 5 3 3 11 9 2
G. asterops 3 8 0 14 6 8
R. beddomii 5 7 2 12 6 8
A. Kanagavel, S. Parvathy & N. Divakar,
Education workshops improve the ability of
Forest Departments to identify amphibians
in Western Ghats, India Conservation
Evidence (2017) 14, 21

INTRODUCTION & KEY CONCEPTS
DESIGNING & IMPLEMENTING THE EVALUATION
PRISM MODULES
METHOD FACTSHEETS & ANNEXES
PRISM - TOOLKIT FOR EVALUATING THE OUTCOMES AND IMPACTS OF SMALL/MEDIUM-SIZED CONSERVATION PROJECTS274
Factsheet: Organisational Capacity Assessment tool
Summary and introduction
Organisational capacity assessment tools (OCAs) can be used to
produce a baseline against which an organisation may be tracked,
and the impact of projects that aim to build its capacity can be
evaluated. Used at the start of a project, an OCA also helps to
identify areas for improvement, and it can be used to inform
the development of an action plan to address key institutional
weaknesses.
This factsheet explains how to use the in-built Organisational
Capacity Assessment tool on the Capacity for Conservation
(CfC) website to evaluate actions that aim to develop and improve
organisational capacity.
CfC is a growing resource, developed and managed by several of
the world’s foremost international conservation organisations
and designed to support NGOs to develop their organisational
capacity. As well as the Organisational Capacity Assessment
tool, CfC also provides a template and guide for developing an
organisational plan, an extensive toolkit of capacity development
resources and a list of indicators that can be used to track changes
in organisational capacity.
Here we specifically describe how this resource can be used as part
of a before and after evaluation design which uses scores assigned
to key areas of organisational capacity, to show change. The scores
should be supplemented with justifications based on discussions
with those who completed the assessment and, if necessary, other
relevant stakeholders.
Required steps
Step 1. Familiarise yourself with the tool.
The OCA tool can be accessed on the CfC website http://
capacityforconservation.org .
If you are not already signed up then you can register the
organisation and create a username and password for each
individual who completes the assessment.
Signing up also allows you to access the CfC development plan,
toolkit and draft indicators.
The tool can be completed online or can be downloaded as an
Excel file and uploaded to the site at a later date. The tool stores
assessment results automatically and aggregates responses across
all organisation staff who complete the assessment.
CAPACITY DEVELOPMENT
FACTSHEET
ORGANISATIONAL CAPACITY
ASSESSMENT TOOL
STEP 1
4:2

INTRODUCTION & KEY CONCEPTS
DESIGNING & IMPLEMENTING THE EVALUATION
PRISM MODULES
METHOD FACTSHEETS & ANNEXES
PRISM - TOOLKIT FOR EVALUATING THE OUTCOMES AND IMPACTS OF SMALL/MEDIUM-SIZED CONSERVATION PROJECTS275
Step 2. Identify the key areas of organisational capacity to be
evaluated.
This will typically address the areas that were targeted by the
capacity development action. The CfC tool covers the following
areas of organisational capacity development:
• Organisational planning and management
• Governance
• Human resources and staff management
• Leadership
• Internal communications
• Fundraising
• Finance management
• Monitoring, evaluation and learning
• Project Planning and Management
• Constituency
• External communications
• Partnerships and networking.
Under each of these headings the tool contains a series of
questions which each relate to a different aspect of organisational
capacity. It allows users to score each question as “not there”,
“getting there”, “good” or “NA” (see below).
CfC tool section on internal communications.
CAPACITY DEVELOPMENT
FACTSHEET
ORGANISATIONAL CAPACITY
ASSESSMENT TOOL
STEP 2
4:2

INTRODUCTION & KEY CONCEPTS
DESIGNING & IMPLEMENTING THE EVALUATION
PRISM MODULES
METHOD FACTSHEETS & ANNEXES
PRISM - TOOLKIT FOR EVALUATING THE OUTCOMES AND IMPACTS OF SMALL/MEDIUM-SIZED CONSERVATION PROJECTS276
Step 3. Establish a baseline.
Ideally this should be based on an assessment carried out before
the project begins. Such an assessment can also be vital in
identifying the aspects of capacity to target during the project and
in focusing effort where it is most needed.
To complete the online tool, individuals can complete the full
assessment, or can focus on a limited number of the areas that are
applicable to the organisation and/or the capacity development
action concerned (fundraising, internal communications, etc.).
If possible the assessment should be completed by multiple
individuals from across the organisation. Care should be taken to
ensure that the scoring is completed as honestly and as objectively
as possible.
Once completed, the tool aggregates scores from across the
organisation and displays the results as percentage scores for each
area of organisational capacity assessed.
You can then click on the link “view detailed breakdown” to see a
disaggregation of the overall score for each area.
If this is the first time that someone in the organisation has
completed the tool then this will act as a baseline for the
evaluation. If scores for the organisation have previously been
entered into the site then you should use the scores recorded
immediately before the capacity development action begins as
your baseline.
If an assessment was not carried out before the capacity
development action, the scoring can still be carried out
retrospectively (after the project), although greater care must
be taken to ensure the accuracy of the results. Users can also
contact the site’s administrators who can download and provide
a breakdown of individual scores given at a specific time and by
specific individuals.
CAPACITY DEVELOPMENT
FACTSHEET
ORGANISATIONAL CAPACITY
ASSESSMENT TOOL
STEP 3
4:2

INTRODUCTION & KEY CONCEPTS
DESIGNING & IMPLEMENTING THE EVALUATION
PRISM MODULES
METHOD FACTSHEETS & ANNEXES
PRISM - TOOLKIT FOR EVALUATING THE OUTCOMES AND IMPACTS OF SMALL/MEDIUM-SIZED CONSERVATION PROJECTS277
Step 4. Carry out the post-project assessment.
Once the capacity development action is complete, fill in the tool
again to describe the situation after the action. Ideally the same
individuals who carried out the baseline assessment should also
complete the scoring after the project, so as to reduce bias and
enhance the validity of the results.
Rather than completing the entire tool again you can complete
the sections that are most relevant to the evaluation. Note that
changes in capacity in one area will often have knock-on effects in
other areas, so you should bear this in mind when deciding which
sections to complete in the post-project assessment.
Step 5. Compare and discuss scoring.
Compare and contrast the scores given before and after the
capacity development project to see whether or not there has
been a change in capacity since the project began. The change in
the scores (if any) indicates whether the project had a positive,
negative or neutral effect on organisational capacity.
Scores should be discussed with the individuals who completed the
assessment, and a justification should be provided for any changes
(or lack of change). The justifications are just as important as the
scoring, as they helps to clarify how any change has come about,
whether it can be attributed to the project and what lessons can be
learnt.
This information can be summarised in the table below.
Step 6. Complete follow-up assessments to track changes
over time.
It is recommended that individuals in the organisation should plan
to review and complete the assessment at agreed points in the
future, so as to track long term changes in capacity and to continue
to identify areas for development.
CAPACITY DEVELOPMENT
FACTSHEET
ORGANISATIONAL CAPACITY
ASSESSMENT TOOL
STEPS 4, 5 & 6
CAPACITY AREA % SCORE BEFORE % SCORE AFTER CHANGE JUSTIFICATION (REASONS FOR CHANGE)
COMPARE AND DISCUSS SCORING
This information can be summarised in the table below.
4:2

INTRODUCTION & KEY CONCEPTS
DESIGNING & IMPLEMENTING THE EVALUATION
PRISM MODULES
METHOD FACTSHEETS & ANNEXES
PRISM - TOOLKIT FOR EVALUATING THE OUTCOMES AND IMPACTS OF SMALL/MEDIUM-SIZED CONSERVATION PROJECTS278
Example
Project: The Forest Protection League (FPL) is an organisation
that works to support small NGOs which campaign against the
conversion of tropical forest to timber plantations in South East
Asia. FPL carried out a project to support another NGO, Jambi
Forest Alliance (JFA), to develop their organisational capacity.
Establishing the baseline: An initial organisational capacity
assessment completed by individuals across JFA identified a
specific lack of capacity in relation to fundraising. This then
helped FPL to design and implement appropriate actions to help
build JFA’s fundraising capacity, including training in proposal
development, identifying and engaging with donors and
developing a fundraising plan for the organisation. This initial
assessment also provided a baseline for the evaluation.
Jambi Forest Alliance organisational fundraising capacity
scores - before the project.
Post–project assessment: After the FPL project had taken place,
the same individuals who completed the organisational assessment
before the project were asked to complete the assessment again,
this time to reflect the situation after the project.
Jambi Forest Alliance organisational fundraising capacity
scores - after the project.
CAPACITY DEVELOPMENT
FACTSHEET
ORGANISATIONAL CAPACITY
ASSESSMENT TOOL
4:2

INTRODUCTION & KEY CONCEPTS
DESIGNING & IMPLEMENTING THE EVALUATION
PRISM MODULES
METHOD FACTSHEETS & ANNEXES
PRISM - TOOLKIT FOR EVALUATING THE OUTCOMES AND IMPACTS OF SMALL/MEDIUM-SIZED CONSERVATION PROJECTS279
Comparing and discussing scoring: Discussion with the individuals
who completed the before and after assessment provided
justification for the scores. The main reasons provided for the
changes in scores all related to the capacity development actions
implemented by the FPL project.
Acknowledgements
Capacity for Conservation: http://capacityforconservation.org
CAPACITY AREA % SCORE BEFORE % SCORE AFTER CHANGE JUSTIFICATION (REASONS FOR CHANGE)
COMPARE AND DISCUSS SCORING
The changes in scores all related to the capacity development actions implemented by the FPL project
Fundraising - Overall
Fundraising – Policy on donors
Fundraising – Fundraising plan
Fundraising – Proposal development
Fundraising – Donor diversification
Fundraising – Unrestricted fundraising plan
Fundraising – Donor reporting
Improvement in percentage scores for all aspects of fundraising capacity by 50+
Policy on donors now exists, awaiting approval from board
Comprehensive fundraising plan now in place and fully agreed by the organisation
Relevant staff given training in proposal development
Fundraising plan now targets a wider range of donors, both national and international
Fundraising plan now includes strategy for unrestricted funding
Fundraising plan assigns roles and responsibilities for meeting reporting requirements agreed across the organisation
14
0
33
0
17
0
25
68
50
100
50
67
50
75
+54
+50
+67
+50
+50
+50
+50
CAPACITY DEVELOPMENT
FACTSHEET
ORGANISATIONAL CAPACITY
ASSESSMENT TOOL
4:2

INTRODUCTION & KEY CONCEPTS
DESIGNING & IMPLEMENTING THE EVALUATION
PRISM MODULES
METHOD FACTSHEETS & ANNEXES
PRISM - TOOLKIT FOR EVALUATING THE OUTCOMES AND IMPACTS OF SMALL/MEDIUM-SIZED CONSERVATION PROJECTS280
CAPACITY DEVELOPMENT
ANNEX
NETWORK HEALTH
SCORECARD
4:2
Available from: http://networkimpact.
org/downloads/NH_Scorecard.pdf

INTRODUCTION & KEY CONCEPTS
DESIGNING & IMPLEMENTING THE EVALUATION
PRISM MODULES
METHOD FACTSHEETS & ANNEXES
PRISM - TOOLKIT FOR EVALUATING THE OUTCOMES AND IMPACTS OF SMALL/MEDIUM-SIZED CONSERVATION PROJECTS281
LIVELIHOODS AND GOVERNANCE
FACTSHEETS AND ANNEXES
Livelihoods and Governance factsheets and annexes
Participatory Impact Assessment (PIA) methods
PIA Method 1: Before and after scoring
PIA Method 2: Proportional piling
PIA Method 3: Tally method
PIA Method 4: Matrix scoring
PIA Method 5: Before and after impact calendars
Community Based Organisation Capacity Assessment
Community Mapping
Basic Necessities Survey (BNS)
Participatory Governance Assessment
Participatory photo evaluation
4:3

INTRODUCTION & KEY CONCEPTS
DESIGNING & IMPLEMENTING THE EVALUATION
PRISM MODULES
METHOD FACTSHEETS & ANNEXES
PRISM - TOOLKIT FOR EVALUATING THE OUTCOMES AND IMPACTS OF SMALL/MEDIUM-SIZED CONSERVATION PROJECTS282
PIA Method 1: Before and after scoring
Introduction
This method is designed to be used as part of a Participatory
Impact Assessment (PIA) evaluation design. Refer to the factsheet
Evaluation Design: Participatory Impact Assessment for more
information on how to use this method as part of a PIA.
Simple scoring requires informants to use counters such as seeds,
stones, nuts or beans to assign a specific score to each item or
indicator in a list. For example, ten counters per item might be
made available and people asked to assign scores of between 0 and
10 depending on the importance of the item.
Before and after scoring adapts and expands simple scoring to
compare impacts or items at two points in time, typically before a
project and then during or after the project. Definitions of “before”,
“after” or “during” are derived from project timelines. This method
is particularly useful for measuring impact where project baseline
data are weak or non-existent.
If the method is standardised and repeated with a sufficient
number of informants it is possible to present results from
before and after scoring using conventional statistics, with mean
scores and 95% confidence intervals for statistically significant
differences.
Required steps
The choice of scoring method used for before and after scoring
has a considerable effect on the interpretation of the results. In
general, two main approaches are used:
Option 1: using the same number of counters “before” and
“after”.
Step 1. Give the informant a number of counters, e.g. 20,
and ask them to assign these counters to show the
importance of different sources of income (or other
indicator of project impact) before the project.
Step 2. When they have finished, give the informant another
20 counters and ask them to distribute them to show
the situation after the project. Note that because this
method uses the same number of counters before
and after, it cannot therefore indicate whether
the total income increased, decreased, or
stayed the same during the project.
Step 3. Discuss with the informant the
reasons for any changes
between “before”
and “after”.
LIVELIHOODS & GOVERNANCE
FACTSHEET
PIA METHOD 1: BEFORE AND
AFTER SCORING
OPTION 1STEPS 1, 2 & 3
4:3
Photo credit: Iain Dickson

INTRODUCTION & KEY CONCEPTS
DESIGNING & IMPLEMENTING THE EVALUATION
PRISM MODULES
METHOD FACTSHEETS & ANNEXES
PRISM - TOOLKIT FOR EVALUATING THE OUTCOMES AND IMPACTS OF SMALL/MEDIUM-SIZED CONSERVATION PROJECTS283
Option 2: allowing informants to select the number of counters
for scoring “after”.
Step 1. Give the informant 20 counters, and asked them to
assign these counters to show the importance of
different sources of income (or other indicator of
project impact) before the project.
Step 2. When they have finished, ask the informant to choose
a total number of counters to show the situation after
the project – they can select 20 counters again, or opt
for more or fewer counters in total.
Step 3. Ask them to distribute the counters to show the
situation after the project. This scoring system allows
changes in total income to be assessed, as well as
the relative importance of the different sources of
income. The 20 counters at the start of the project
represent a nominal baseline.
Step 4. Discuss with the informant the reasons for any
changes between “before” and “after”.
Scoring against a nominal baseline can be useful for measuring
changes in sensitive impact indicators such as income, livestock
numbers or crop yields. People may be unwilling or uncomfortable
discussing exact amounts in these cases, but with this scoring
method, sensitive questions such as “How much money did you
make?” or, “How many cattle do you own?” are not necessary.
LIVELIHOODS & GOVERNANCE
FACTSHEET
PIA METHOD 1: BEFORE AND
AFTER SCORING
OPTION 2STEPS 1 TO 4
4:3
EXAMPLE
A forest in Kabale District of Uganda was heavily used
by local communities, who depended on sales of forest
products for cash income, especially to pay school fees and
for medicines. However, extraction of timber for the sale
of fuelwood and charcoal in the District’s capital was at
levels that were unsustainable and which were degrading
the forest, reducing its value for biodiversity (including a
small population of chimpanzees) and ecosystem services
(watershed protection, with Kabale being a highland area
with steep hill slopes). A project implemented by a local
NGO sought to introduce alternatives to charcoal and
fuelwood as sources of income. The alternatives included
beekeeping, ecotourism (focused on the chimps), craft-
making and processing of mushrooms harvested from the
forest under licence from the Forest Department.

INTRODUCTION & KEY CONCEPTS
DESIGNING & IMPLEMENTING THE EVALUATION
PRISM MODULES
METHOD FACTSHEETS & ANNEXES
PRISM - TOOLKIT FOR EVALUATING THE OUTCOMES AND IMPACTS OF SMALL/MEDIUM-SIZED CONSERVATION PROJECTS284
Scoring
Having used a timeline to define “before” and “after”, a scoring
exercise assessed the impact of the project on off-farm income,
using a nominal baseline of 20 counters. Results for an individual
household are shown in the table below.
Total Before (Nominal baseline): 20
Total After: 24 (20% increase from baseline).
LIVELIHOODS & GOVERNANCE
FACTSHEET
PIA METHOD 1: BEFORE AND
AFTER SCORING
SOURCE OF OFF-FARM INCOME SCORE
SCORING
Honey from hives
Tour guiding (ecotourism)
Crafts
Charcoal making
Fuelwood sales
Dried mushroom sales
Before
After
Before
After
Before
After
Before
After
Before
After
Before
After
***
********
**
*****
*
*
********
***
*****
**
*
*****
4:3

INTRODUCTION & KEY CONCEPTS
DESIGNING & IMPLEMENTING THE EVALUATION
PRISM MODULES
METHOD FACTSHEETS & ANNEXES
PRISM - TOOLKIT FOR EVALUATING THE OUTCOMES AND IMPACTS OF SMALL/MEDIUM-SIZED CONSERVATION PROJECTS285
Discussion
Discussions based on the responses were revealing, and were as
important as the scores themselves. For example, respondents
explained that they had been unable to secure additional markets
for their crafts (mainly baskets made to local designs). Tourists,
mainly back-packers, were not interested in purchasing such
bulky items. Dried mushrooms had been especially popular and
successful – a five-fold increase compared to “before”. Households
were exploring ways of increasing production (through cultivation)
in order to meet demand and to reduce reliance on wild-harvested
mushrooms.
The exercise was repeated for 80 households, which allowed
the calculation of means and 95% confidence levels as shown in
Figure 1.
Acknowledgements
Catley A, Burns J, Abebe D and Suji O (2013). Participatory Impact
Assessment: A Design Guide. Feinstein International Center, Tufts
University, Somerville.
Available from http://fic.tufts.edu/assets/PIA-guide_
revised-2014-3.pdf
FIGURE. 1:
LIVELIHOODS & GOVERNANCE
FACTSHEET
PIA METHOD 1: BEFORE AND
AFTER SCORING
4:3

INTRODUCTION & KEY CONCEPTS
DESIGNING & IMPLEMENTING THE EVALUATION
PRISM MODULES
METHOD FACTSHEETS & ANNEXES
PRISM - TOOLKIT FOR EVALUATING THE OUTCOMES AND IMPACTS OF SMALL/MEDIUM-SIZED CONSERVATION PROJECTS286
PIA Method 2 - Proportional piling
Introduction
This method is designed to be used as part of a Participatory
Impact Assessment (PIA) evaluation design. Refer to the factsheet
Evaluation Design: Participatory Impact Assessment for more
information on how to use this method as part of a PIA.
Community participants are asked to score the importance of
different possible causal factors for a given impact or outcome by
placing counters (e.g. seeds or stones) on representations of each
potential causal factor provided by picture cards or other visual
aids, ideally made with local materials.
Required steps
Step 1. Before embarking on proportional piling of the
project and non-project factors, it is important
to have an informed discussion about the range
of possible explanatory factors or “independent
variables”. This discussion could be summarised in the
form of a “causal diagram” showing all the potential
project and non-project factors. Some kind of clear
visual image is then needed for each of these factors
– it may be helpful to have a local artist produce this.
Step 2. Community participants should then be divided
into different focus groups, e.g. women and men.
Individual members of each group can then distribute
20, 50 or 100 stones or seeds among the potential
explanatory factors (as represented by the visual
images). It should be noted that the greater the
number of counters, the longer the exercise takes
– fewer counters can be used if there are fewer
variables. The results can be aggregated across
the focus groups, or analysed separately to reveal
socially-differentiated impacts.
Example
Scoring
An example of proportional piling is presented in Table 1 which
shows the scoring (using 100 counters) of project and non-project
factors that were judged to have contributed to positive change
in incomes and sustainability of a local fishery, including through
abandonment of fine-mesh nylon nets and implementation of a
closed season whilst fish were spawning.
The focus group was asked to list and rank the factors (project and
non-project) that had contributed to the changes, and then scored
these factors using the counters. The conclusion was that the
project-related factors made a 34% (22+8+4) relative contribution
to sustainability of the fishery.
LIVELIHOODS & GOVERNANCE
FACTSHEET
PIA METHOD 2: PROPORTIONAL
PILING
STEPS 1 & 2
4:3

INTRODUCTION & KEY CONCEPTS
DESIGNING & IMPLEMENTING THE EVALUATION
PRISM MODULES
METHOD FACTSHEETS & ANNEXES
PRISM - TOOLKIT FOR EVALUATING THE OUTCOMES AND IMPACTS OF SMALL/MEDIUM-SIZED CONSERVATION PROJECTS287
Discussion of scores
As with any PIA method, the discussion that takes place in
relation to the scoring is an important part of the method, as it
provides explanations for changes and can help to reveal socially
differentiated impacts. For example, the discussion in this example
revealed that whilst secure tenure over the fishery had benefited
the community, giving them more control and an incentive to
manage resources for the long-term, there were also some
negative social and environmental impacts. A group of migrants
who had settled in the village several years previously were not
being given the same rights and had been excluded. As a result
they had turned to alternative sources of income, and there were
unconfirmed reports that the incidence of snare-setting in a
nearby forest reserve had increased.
In this example the scoring was done as a group. However, the
exercise could be done at individual or household level, which
would allow the calculation of means and confidence levels.
Acknowledgements
Catley A, Burns J, Abebe D and Suji O (2013). Participatory Impact
Assessment: A Design Guide. Feinstein International Center, Tufts
University, Somerville.
Available from http://fic.tufts.edu/assets/PIA-guide_
revised-2014-3.pdf.
Richards M (2011). Social and Biodiversity Impact Assessment
(SBIA) Manual for REDD+ Projects: Part 2 – Social Impact
Assessment Toolbox. Climate, Community & Biodiversity Alliance
and Forest Trends, with Rainforest Alliance and Fauna & Flora
International. Washington, DC.
Enforcement byGovernment
Secure tenure over fishing grounds
Organisation of a fishing cooperative
Government extension service Provision of larger mesh nets
Provision of improved fish smoking ovens
Non-project
Non-project
Project
Non-project
Project
Project
1
2
3
4
5
6
1
2
3
4
5
6
QUESTION PROJECT OR NON-PROJECT FACTOR
RANK SCORE
TABLE 1: ATTRIBUTION BY RANKING AND SCORING FOR A FOOD SECURITY PROJECT.
LIVELIHOODS & GOVERNANCE
FACTSHEET
PIA METHOD 2: PROPORTIONAL
PILING
4:3

INTRODUCTION & KEY CONCEPTS
DESIGNING & IMPLEMENTING THE EVALUATION
PRISM MODULES
METHOD FACTSHEETS & ANNEXES
PRISM - TOOLKIT FOR EVALUATING THE OUTCOMES AND IMPACTS OF SMALL/MEDIUM-SIZED CONSERVATION PROJECTS288
PIA Method 3: Tally method
Introduction
This method is designed to be used as part of a Participatory
Impact Assessment (PIA) evaluation design. Refer to the factsheet
Evaluation Design: Participatory Impact Assessment for more
information on how to use this method as part of a PIA.
The tally method involves asking participants to identify the
factors that have caused changes in e.g. specified aspects of their
livelihoods or well-being. One advantage of this method is that
by not pre-defining the potential factors that have contributed to
change in the community, there is less risk of influencing people’s
responses. On the other hand there may be a bias towards
mentioning project-related factors and omitting important non-
project factors, especially if the participants know the study is
being carried out to analyse project impacts. Note that a large
sample is needed to be confident when using the tally method.
Required steps
Step 1. Select a sample of participants to take part in the
survey.
Step 2. Ask individual respondents in the sample to list all
the factors they think have contributed to a specific
project outcome or impact. Do not prompt them – it
is important that they are allowed to generate the list
of factors. Interview each respondent on his/her own
(it is important that they haven’t heard how others
have responded).
Step 3. When everyone in your sample has been asked, add
up the number of times each potential cause was
mentioned.
Step 4. Identify which causes are linked to the project and
which are not, and tabulate the results.
LIVELIHOODS & GOVERNANCE
FACTSHEET
PIA METHOD 3: TALLY METHOD
STEPS 1 TO 4
4:3

INTRODUCTION & KEY CONCEPTS
DESIGNING & IMPLEMENTING THE EVALUATION
PRISM MODULES
METHOD FACTSHEETS & ANNEXES
PRISM - TOOLKIT FOR EVALUATING THE OUTCOMES AND IMPACTS OF SMALL/MEDIUM-SIZED CONSERVATION PROJECTS289
Example
74 project participants were asked the open-ended question
“What has contributed to reduced encroachment into the forest
by farmers?”. Based on their responses, a number was added every
time each factor was mentioned. The results showed that five of
the top six most frequently mentioned factors relating to reduced
forest encroachment were directly related to the project.
Acknowledgement
Catley A, Burns J, Abebe D and Suji O. (2013). Participatory Impact
Assessment: A Design Guide. Feinstein International Center, Tufts
University, Somerville.
Available from http://fic.tufts.edu/assets/PIA-guide_
revised-2014-3.pdf.
Introduction of water harvesting methods Introduction of agroforestry Local cooperative for village processing of farm-produce Increased penalties for forest clearance Training in vegetable production
Clear demarcation of forest boundary
New road improving access to markets
Government advice on preventing crop pests and diseases Better than average rainfall in last 3 years
Project
Project
Project
Non-project
Project
Project
Non-project
Non-project
Non-project
68
59
50
46
38
30
10
8
5
QUESTION PROJECT OR NON-PROJECT FACTOR
NO. OF RESPONSES(N = 74)
TABLE 1: REASONS FOR REDUCED FOREST ENCROACHMENT FOR AGRICULTURE.
LIVELIHOODS & GOVERNANCE
FACTSHEET
PIA METHOD 3: TALLY METHOD
4:3

INTRODUCTION & KEY CONCEPTS
DESIGNING & IMPLEMENTING THE EVALUATION
PRISM MODULES
METHOD FACTSHEETS & ANNEXES
PRISM - TOOLKIT FOR EVALUATING THE OUTCOMES AND IMPACTS OF SMALL/MEDIUM-SIZED CONSERVATION PROJECTS290
PIA Method 4 - Matrix scoring
Introduction
This method is designed to be used as part of a Participatory
Impact Assessment (PIA) evaluation design. Refer to the factsheet
Evaluation Design: Participatory Impact Assessment for more
information on how to use this method as part of a PIA.
Matrix scoring involves the comparison of different items, project
activities or services using a list of indicators (characteristics or
qualities of the items). In cases where project and non-project
items, impacts, activities or services are compared, the comparison
can often be a powerful way of understanding project impacts in
the context of pre-existing services or activities.
Like other scoring methods, matrix scoring can be standardised
and repeated with different individual informants or groups of
informants. Also in common with other methods, matrix scoring
uses semi-structured interviews to understand the reasoning
behind people’s scores.
Required steps
Designing the matrix - identifying the items to compare, and the
indicators (features for comparison)
Step 1. Identify the items to be compared (relevant to your
project’s objectives). They might be different types of
food, different service providers, different crops, or
different types of income-generating activity. Where
possible, include some items or activities that are not
part of the project or are not related to it.
Step 2. Use pair-wise comparisons to identify the indicators,
as follows:
• Select two items and ask people which item
is more important and why. They will state a
preference and give reasons why one item is more
important than another. These reasons are your
indicators, showing differences between items.
• Repeat the comparison using different pairs of
items, until the informants are no longer offering
new indicators (reasons for differences), but are
referring back to the indicators/reasons they have
already identified. You will now have a full list of
indicators to use.
LIVELIHOODS & GOVERNANCE
FACTSHEET
PIA METHOD 4: MATRIX SCORING
STEPS 1 & 2
4:3

INTRODUCTION & KEY CONCEPTS
DESIGNING & IMPLEMENTING THE EVALUATION
PRISM MODULES
METHOD FACTSHEETS & ANNEXES
PRISM - TOOLKIT FOR EVALUATING THE OUTCOMES AND IMPACTS OF SMALL/MEDIUM-SIZED CONSERVATION PROJECTS291
Conducting the scoring
Step 3. Prepare pictures (or find objects) that depict the
items to be scored and the indicators.
Step 4. Place the pictures of the items in a row on the
ground. Verify the meaning of each picture with the
informant(s).
Step 5. Select one of the indicator pictures and verify its
meaning with the informant(s); place the picture
adjacent to the item pictures.
Step 6. Using a pile of around 30 stones or seeds, ask
informants to score the items against the indicator,
using all of the stones. The scores are then checked
and questions are asked to reveal the reasons behind
the scoring.
Step 7. Select the second indicator and place this below
the first, and repeat the scoring process with this
indicator (with the same number of stones). Again,
ask questions to check the scores and show the
reasons for the scores.
Step 8. Taking each indicator in turn, repeat the scoring and
gradually add more rows to the matrix until all of the
indicators have been scored.
Step 9. Ask further questions to clarify, probe and explore
the scores, so that the reasons for each set of scores
are explained fully.
Example
A project implemented by a local NGO sought to introduce
alternatives to charcoal and fuelwood sales as sources of income.
The alternatives included beekeeping, ecotourism (focused
on chimpanzees), craft-making and processing of mushrooms
harvested from the forest under licence from the Forest
Department.
Table 1 shows the reasons given for preferences among different
income-generating activities in a project which sought to provide
alternatives to fuelwood production and charcoal-making (see
example in L&G Method 1).
Table 2 shows how matrix scoring was then used to assess the
characteristics of the income-generating activities – both those
that were introduced by the project and those already existing in
the community.
LIVELIHOODS & GOVERNANCE
FACTSHEET
PIA METHOD 4: MATRIX SCORING
STEPS 3 TO 9
4:3

INTRODUCTION & KEY CONCEPTS
DESIGNING & IMPLEMENTING THE EVALUATION
PRISM MODULES
METHOD FACTSHEETS & ANNEXES
PRISM - TOOLKIT FOR EVALUATING THE OUTCOMES AND IMPACTS OF SMALL/MEDIUM-SIZED CONSERVATION PROJECTS292
Discussion of scores
It is clear from this exercise that fuelwood meets many of the
desirable characteristics of a useful source of income – locality
of markets, immediacy of income, little investment required,
etc. However, discussions revealed that its illegality and the risk
associated with being caught is a key factor encouraging people
to switch to alternatives (especially honey and dried mushrooms)
when these are offered, and when technical and financial support
is made available to help in overcoming any barriers to adoption.
Note that this method does not assess impact (in terms of level
of uptake of the alternative livelihood) but it can help improve
understanding of the issues underpinning people’s choices and
behaviours.
Acknowledgements
Catley A, Burns J, Abebe D and Suji O. (2013). Participatory Impact
Assessment: A Design Guide. Feinstein International Center, Tufts
University, Somerville.
Available from http://fic.tufts.edu/assets/PIA-guide_
revised-2014-3.pdf.
Richards M (2011). Social and Biodiversity Impact Assessment
(SBIA) Manual for REDD+ Projects: Part 2 – Social Impact
Assessment Toolbox. Climate, Community & Biodiversity Alliance
and Forest Trends, with Rainforest Alliance and Fauna & Flora
International. Washington, DC.
Honey vs crafts
Honey vs ecotourism
Honey vs charcoal
Fuelwood vs charcoal
Dried mushrooms vs honey
We prefer honey, as markets are local – people even in the village are willing to pay a good price.
We prefer honey because it is more reliable – we can’t predict when tourists will come to the forest.
We prefer honey because it is legal – with tourism we are at risk of being fined or imprisoned if we are caught.
We prefer fuelwood because the benefits are immediate and don’t require investment; for charcoal it can take many days to create the kiln, etc.
We prefer dried mushrooms because the product can be managed and it gives income year-round; honey can only be harvested in the dry season.
TABLE 1: REASONS GIVEN FOR INCOME-GENERATING ACTIVITY PREFERENCES.
Locality of markets
Reliability of income
Legality – reduced risk
Immediacy of income
Little investment needed
Year-round income
*****
***
****
****
**
**
*
**
****
**
**
*
*
*
***
*
***
*
**
***
*
*
***
***
***
*****
*****
****
***
***
****
**
**
****
TABLE 2: MATRIX SCORING OF DIFFERENT INCOME-GENERATING ACTIVITIES. PARTICIPANTS WERE GIVEN 15 COUNTERS TO SCORE FOR EACH INDICATOR. THE NUMBER OF DOTS INDICATES THE DEGREE TO WHICH EACH AN INCOME GENERATING ACTIVITY SHOWS THE CHARACTERISTIC CONCERNED.
INDICATOR DRIED MUSHROOMSHONEY ECOTOURISM CRAFTS CHARCOAL FUELWOOD
4:3

INTRODUCTION & KEY CONCEPTS
DESIGNING & IMPLEMENTING THE EVALUATION
PRISM MODULES
METHOD FACTSHEETS & ANNEXES
PRISM - TOOLKIT FOR EVALUATING THE OUTCOMES AND IMPACTS OF SMALL/MEDIUM-SIZED CONSERVATION PROJECTS293
PIA Method 5 - Before and after impact calendars
Introduction
This method is designed to be used as part of a Participatory
Impact Assessment (PIA) evaluation design. Refer to the factsheet
Evaluation Design: Participatory Impact Assessment for more
information on how to use this method as part of a PIA.
Impact calendars can be useful for measuring impacts against
seasonally variable indicators. A comparison of the “before” and
“after” project situation, when combined with semi-structured
interviews on the reasoning behind people’s scores, can help to
demonstrate and understand project impact.
Required steps
Step 1. Give project participants a set number of counters
(e.g. 30 stones).
Step 2. Draw a 12-month calendar on the ground (or use
cards, one for each month of the year).
Step 3. Ask participants to distribute their counters between
the months to show the annual distribution of the
indicator before the project, for example:
• use of their harvested crop;
• use of cash savings;
• incidence of sickness in the village/household;
• attendance of children at school;
• absence of community members on migration;
• availability of water for drinking/livestock.
Step 4. If there are differences in the timing of fluctuations/
events between women and men, each variable
should be considered separately for women and for
men (and clearly marked). Alternatively, the group
may decide to prepare separate calendars for women
and for men.
LIVELIHOODS & GOVERNANCE
FACTSHEET
PIA METHOD 5: BEFORE AND
AFTER IMPACT CALENDARS
STEPS 1 TO 5
4:3

INTRODUCTION & KEY CONCEPTS
DESIGNING & IMPLEMENTING THE EVALUATION
PRISM MODULES
METHOD FACTSHEETS & ANNEXES
PRISM - TOOLKIT FOR EVALUATING THE OUTCOMES AND IMPACTS OF SMALL/MEDIUM-SIZED CONSERVATION PROJECTS294
Step 5. Leave the stones in place, and ask the participants to
repeat the exercise, this time to show the situation
after the project. Start by providing them with the
same number of stones (30 – your nominal baseline)
but before they begin distributing the counters tell
them that they can add or take away stones to show
any net change.
Step 6. Record the results and discuss the reasons for the
way the counters have been distributed, and the
differences before and after the project. Look for
any patterns that can be seen, and cross-check and
probe for possible inconsistencies. It is important to
note different perspectives being represented among
different participants. If there are several different
groups, ask each group to present its calendar
to the others for their reactions and comments.
The following questions can be used to guide the
discussion, but these should be adapted according to
the focus of the exercise.
• Are there significant differences between
the “before” and “after” calendars? Are these
differences attributed to the project, or is there
some other explanation?
• How do women’s calendars compare with men’s?
• What are the key linkages or “cause and effect”
relationships? For example income and food
supply, or rainfall and labour, or weather and
disease?
• Are the indicators fairly stable or do they show
great seasonal variations?
• Which are the most difficult or high-risk times
in the year? How do people plan for these and
respond to any risks?
• Are there any differences compared with the
situation 10/20/30 years ago?
• What are the possible implications of these
findings for any future intervention?
Example
A project aimed to improve the ecotourism facilities at a
community in an area adjacent to a newly designated forest
reserve popular with birdwatchers, in order to extend the season
for tourists. Discussions had shown that income was concentrated
in just three months (June-August) and that the community was
generally unhappy with the restrictions which the reserve placed
on their access to resources, threatening their long-term support
for its protection.
Participants were given 20 counters representing the total
income received from ecotourism in a given year. Using 12 cards
to represent each month of the year, participants were asked to
distribute the counters along a 12-month calendar to show how
the monthly income from ecotourism was spread over the course
of the year.
LIVELIHOODS & GOVERNANCE
FACTSHEET
PIA METHOD 5: BEFORE AND
AFTER IMPACT CALENDARS
STEP 6
4:3

INTRODUCTION & KEY CONCEPTS
DESIGNING & IMPLEMENTING THE EVALUATION
PRISM MODULES
METHOD FACTSHEETS & ANNEXES
PRISM - TOOLKIT FOR EVALUATING THE OUTCOMES AND IMPACTS OF SMALL/MEDIUM-SIZED CONSERVATION PROJECTS295
Before the project, tourists visited the area mostly in high season
(June-August). After the project the community was receiving
income from tourists over a longer period. This was not the case
for communities that were not part of the project, suggesting
that the project had the outcome of attracting tourists to the
community outside the traditional high season.
Other resources
Catley A, Burns J, Abebe D and Suji O. (2013). Participatory
Impact Assessment: A Design Guide. Feinstein International
Center, Tufts University, Somerville.
Available from http://fic.tufts.edu/assets/PIA-guide_
revised-2014-3.pdf.
Richards M (2011). Social and Biodiversity Impact Assessment
(SBIA) Manual for REDD+ Projects: Part 2 – Social Impact
Assessment Toolbox. Climate, Community & Biodiversity Alliance
and Forest Trends, with Rainforest Alliance and Fauna & Flora
International. Washington, DC.
Fauna & Flora International (2013). Seasonal Calendar.
Conservation, Livelihoods and Governance Programme, tools for
participatory approaches.
PDF download: http://www.fauna-flora.org/wp-content/uploads/
Seasonal-Calendar.pdf .
Year before project
Year after project
Year after project (non-participating community)
** ****
**
***
*
*****
***
*****
*****
***
******
*****
***
******
***
**
*
INDICATOR DECEMBERNOVEMBEROCTOBERSEPTEMBERAUGUSTJULYJUNEMAYAPRILMARCHFEBRUARYJANUARY
EXAMPLE
LIVELIHOODS & GOVERNANCE
FACTSHEET
PIA METHOD 5: BEFORE AND
AFTER IMPACT CALENDARS
4:3

INTRODUCTION & KEY CONCEPTS
DESIGNING & IMPLEMENTING THE EVALUATION
PRISM MODULES
METHOD FACTSHEETS & ANNEXES
PRISM - TOOLKIT FOR EVALUATING THE OUTCOMES AND IMPACTS OF SMALL/MEDIUM-SIZED CONSERVATION PROJECTS296
Factsheet: Community-based Organisational Capacity
Assessment
Introduction
Organisational capacity assessment (OCA) can be used to produce
a baseline against which performance of a community-based
organisation (CBO) may be tracked and the impact of actions
that aim to build their capacity can be assessed. In addition to
evaluations, an OCA carried out at the start of a project also helps
to identify areas for improvement, and can be used to inform
development of an action plan to address key weaknesses in the
CBO.
Many different tools for OCA exist and NGOs and CBOs vary
widely in purpose, type, location, external context and other
factors. It is important, therefore, to target aspects of an
organisation for assessment that are relevant. See the Table 1:
CBO Assessment Questionnaire for a simple questionnaire-based
tool, which can be adapted to evaluate specific aspects of CBO
capacity.
The evaluation design described below uses a before and after
scorecard-based assessment of the capacity of the CBO being
targeted by the project to show change. This is combined with
focus group discussions to identify reasons for change and any
attribution to the project.
Required steps
Step 1. Familiarise yourself with the tool, the aspects of
organisational capacity covered and the scoring
system outlined in Table 1: Community Based
Organisation Assessment tool
Step 2. Meet with the CBO and explain the process at least
two weeks before the actual assessment date.
Provide the questionnaire (Table 1) and give an
overview of the purpose of the exercise, explaining
any terms and identifying whether the CBO will
complete the whole questionnaire or focus on
specific sections that are relevant to the actions
being implemented by the project. It is recommended
that one or two of the CBO office-holders should be
well versed in the process and should be the ones to
lead the group’s assessment together with the main
(external) assessor.
Step 3. Encourage the group to organise a consultative
meeting with a few selected members of the group to
go through the questionnaire in advance.
Step 4. Convene a meeting to conduct the assessment. A
participatory approach is encouraged in which not
just the members of the CBO are involved but also
representatives from other stakeholders such as
relevant government personnel, other groups, NGOs,
and private sector companies working in the area.
4:3
LIVELIHOODS & GOVERNANCE
FACTSHEET
COMMUNITY-BASED
ORGANISATIONAL CAPACITY
ASSESSMENT
STEPS 1 TO 4

INTRODUCTION & KEY CONCEPTS
DESIGNING & IMPLEMENTING THE EVALUATION
PRISM MODULES
METHOD FACTSHEETS & ANNEXES
PRISM - TOOLKIT FOR EVALUATING THE OUTCOMES AND IMPACTS OF SMALL/MEDIUM-SIZED CONSERVATION PROJECTS297
Step 5. Go through the questions one at a time, allowing
plenty of time for clarification and discussion.
When attaching a score to any of the questions,
encourage the participants to write down reasons
for their scores – this is very helpful for the analysis
and discussions that follow. A space is provided for
entering this information. Explain to participants that
they should mark the box that is closest to describing
the situation at hand: descriptions do not need
to be perfect. Consensus must be reached by the
participants before the score is recorded.
Step 6. When all relevant aspects have been scored, work
out the weakest points in the CBO where capacity
needs to be built, as well as the strongest aspects
which can sustain the CBO. Confirm with the
members that the results are a true reflection of the
situation in the organisation, and where necessary
work out any changes to the assessment through
group discussion.
Take the averages of the scores for each of the capacity
areas and enter them into the following table in the
“scores before column”
LIVELIHOODS & GOVERNANCE
FACTSHEET
COMMUNITY-BASED
ORGANISATIONAL CAPACITY
ASSESSMENT
STEPS 5 & 6
4:3
CAPACITY ASPECT SCORE BEFORE SCORE AFTER CHANGE REASONS FOR CHANGE EVIDENCE
CBO ASSESSMENT SCORECARD

INTRODUCTION & KEY CONCEPTS
DESIGNING & IMPLEMENTING THE EVALUATION
PRISM MODULES
METHOD FACTSHEETS & ANNEXES
PRISM - TOOLKIT FOR EVALUATING THE OUTCOMES AND IMPACTS OF SMALL/MEDIUM-SIZED CONSERVATION PROJECTS298
Step 7. If the assessment is being done at the start of
the project (to establish a baseline), discuss with
participants how they think capacity will be built,
what resources will be needed, where they think
they could get the resources, and what the role of the
project should be.
Step 8. Compile all this information (assessment results,
explanations, plan of action) into a report and share it
with the CBO and other stakeholders.
Step 9. At the end of the project carry out the assessment
in the same way and enter the average of the scores
in the “scores after” column in the CBO assessment
scorecard, also complete the remaining columns to
show the change in scores, the reasons for change
and the evidence to support the scoring. These last
two columns are particularly important for assessing
attribution (determining whether any change can
be attributed to the project). See the example on
the following pages for an example of a completed
scorecard.
Example
South Mara Water Users Association is a Local Conservation
Group (LCG) working in the Masurura Swamp, Mara, in Tanzania,
one of the critical wetlands in the Lake Victoria Basin.
A project aiming to develop the capacity of the LCG held an
initial Participatory Meeting with North Mara Water Users
Association representatives. Under coordination of 2 project team
members 17 participants (4 women and 12 men from the LCG
and 1 participant from the Ward Extension Office) completed
Organizational Capacity Assessment tool questionnaires.
Capacity areas were rated from 0-4 where: Highly satisfactory = 4
(High level of capacity in place); Satisfactory = 3 (Moderate level of
capacity in place); Unsatisfactory with positive signs = 2 (Basic level
of capacity in place); Unsatisfactory = 1 (Clear need for increased
capacity); Nothing positive = 0 (No capacity, completely urgent
action required).
After the project the same individuals were asked to complete the
questionnaire again. Scores from before and after the project were
compared to show changes in the capacity of the group. The table
below shows a summary of the scores from the full assessment
based on the different capacity areas.
4:3
LIVELIHOODS & GOVERNANCE
FACTSHEET
COMMUNITY-BASED
ORGANISATIONAL CAPACITY
ASSESSMENT
STEPS 7 TO 10

INTRODUCTION & KEY CONCEPTS
DESIGNING & IMPLEMENTING THE EVALUATION
PRISM MODULES
METHOD FACTSHEETS & ANNEXES
PRISM - TOOLKIT FOR EVALUATING THE OUTCOMES AND IMPACTS OF SMALL/MEDIUM-SIZED CONSERVATION PROJECTS299
Acknowledgements
BirdLife International (2008). Capacity Assessment Tool for Site
Support Groups. Nairobi, Kenya.
http://www.birdlife.org/sites/default/files/attachments/BirdLife_
Africa_SSG_Capacity_Assessemen_%20Tool_v4_1.pdf
Bond (undated) Assessing effectiveness in building the capacity of
organisations and institutions. Bond, UK.
https://my.bond.org.uk/sites/default/files/impact-builder/
CapacityDevelopment.pdf
CAPACITY ASPECT SCORE BEFORE SCORE AFTER CHANGE REASONS FOR CHANGE EVIDENCE
TABLE 1. SUMMARY OF ORGANISATIONAL CAPACITY ASSESSMENT RESULTS.
Aspirations and strategy
Organisation skills
Human resources
Systems and infrastructure
Organisational structure Mean score
The project designed and ran a programme of training on organisational management, including budgeting, good governance and leadership. It also led a process, with Board members and senior staff, to put in place a clear strategy with vision and goals. However, as a result of staff turnover, capacity gaps still remain. With funding from a local charitable foundation the organisation was able to recruit a communications officer to fill a critical staffing gap. This change cannot be attributed to the project.
The project’s focus was on improving systems for financial management (which were poor) and accounting. These are now fully in place.
• Organisational strategy• Meetings of the Board• Records of staff attendance at
training courses
• Staff list, job description and organigram
• Financial management handbook• Democratically elected treasurer
on the Board• Audited accounts available
3
2
3
2
2
2.6
3
3
4
4
2
3.2
0
+1
+1
+2
0
4:3

INTRODUCTION & KEY CONCEPTS
DESIGNING & IMPLEMENTING THE EVALUATION
PRISM MODULES
METHOD FACTSHEETS & ANNEXES
PRISM - TOOLKIT FOR EVALUATING THE OUTCOMES AND IMPACTS OF SMALL/MEDIUM-SIZED CONSERVATION PROJECTS300
4:3
LIVELIHOODS & GOVERNANCE
FACTSHEET
COMMUNITY-BASED
ORGANISATIONAL CAPACITY
ASSESSMENT
Name of CBO: Location:
Date of assessment: Name of assessor:
(If applicable)
Total score from any previous assessment
Date of previous assessment:
Names of participants in assessment meeting and where they are from (external stakeholder participation is encouraged)
1. 2.
3. 4.
5. 6.
7. 8.
9. 10.
Number of staff members of CBO:
CBO budget for last 12 months:
Number of CBO members (non-staff):
TABLE 3: COMMUNITY BASED ORGANISATION CAPACITY ASSESSMENT QUESTIONNAIRE

INTRODUCTION & KEY CONCEPTS
DESIGNING & IMPLEMENTING THE EVALUATION
PRISM MODULES
METHOD FACTSHEETS & ANNEXES
PRISM - TOOLKIT FOR EVALUATING THE OUTCOMES AND IMPACTS OF SMALL/MEDIUM-SIZED CONSERVATION PROJECTS301
4:3
LIVELIHOODS & GOVERNANCE
FACTSHEET
COMMUNITY-BASED
ORGANISATIONAL CAPACITY
ASSESSMENT
MAIN CAPACITY AREAS
ASPECTS BEING ASSESSEDSCORE(0-4)*
BRIEFLY EXPLAIN THE REASONS FOR YOUR SCORE
ASPIRATIONS & STRATEGY
Mission, Vision and Strategic Goals
1. Values and Purpose: the CBO has a clear understanding of the purpose of their mission and strategic goals, and what it aspires to achieve, and adheres to the values of the group.
2. Risk assessment: the CBO understands and responds to the risks to which the group is exposed, including likelihood, impacts and potential solutions/mitigation measure.
3. Information about CBO: The entire membership is well informed about the group’s programmes, to the level that they can contribute effectively in the group’s objectives and plans.
4. Overarching Goals: CBO’s vision translated into clear, bold set of (up to three goals) that the group aims to achieve specified by a well-defined time frame for attaining goals.
Conservation Goals 5. Involvement in Conservation: the CBO has a demonstrable interest in conservation, has projects and activities that relate to the conservation issues at their IBA site.
Overall Strategy 6. Strategic Focus: the CBO has a strategic action plan complete with clear objectives, achievable targets and clear focus on environmental conservation.
Organizational Review
7. Group Review: the CBO leadership periodically reviews the structure and programmes of the group to ensure effectiveness and best use of resource.
Program Development
8. Projects Development: the CBO understands the project development process, implementation procedures, including work planning, how donors work, reporting and accounting.
Fundraising and Revenue Generation
9. Sustainability Measures: the CBO has reliable sources of income, and is able to mobilize resources through proposal writing and/or has established (or has the potential of establishing) income generating nature-based enterprises.
Goals/performance targets
10. Monitoring: The CBO together with the entire membership keeps track of the implementation of plans against the group’s objective.
Total score (Aspirations &
Strategy)
Average score (Aspirations &
Strategy)

INTRODUCTION & KEY CONCEPTS
DESIGNING & IMPLEMENTING THE EVALUATION
PRISM MODULES
METHOD FACTSHEETS & ANNEXES
PRISM - TOOLKIT FOR EVALUATING THE OUTCOMES AND IMPACTS OF SMALL/MEDIUM-SIZED CONSERVATION PROJECTS302
4:3
LIVELIHOODS & GOVERNANCE
FACTSHEET
COMMUNITY-BASED
ORGANISATIONAL CAPACITY
ASSESSMENT
MAIN CAPACITY AREAS
ASPECTS BEING ASSESSEDSCORE(0-4)*
BRIEFLY EXPLAIN THE REASONS FOR YOUR SCORE
ORGANISATION SKILLS
Operational Planning
1. Planning Process: The CBO has a clearly documented and well understood process for how it should plan and review its work.
2. Resources: planning within the CBO takes into account financial and human resources available.
Internal Communication
3. Communication within CBO: planning and all other activities within the group are properly communicated. Key information is effectively and timely shared with all the officials and entire CBO membership.
4. Meetings: meetings are convened regularly, involving the entire membership (always meeting the quorum regulations). The agenda is circulated well in advance to ensure effective contribution and deliberations are recorded in written minutes available to all members.
External Relationships
5. Learning from Others/Collaboration and Partnerships: the CBO takes time to learn and draw lessons from other partners and stakeholders who have relevant knowledge and experience before undertaking work. The CBO has agreed guidelines on collaboration.
6. External Communication: all communications from outside including letters, e-mails and phone calls are dealt with promptly by the officials.
Performance Analysis and
program adjustments
7. Managing Change: where major changes takes place in the program adjustments group, i.e. in management, projects, partners etc.—the organization’s leadership works together as a team to institute necessary management interventions.
Knowledge/Data Management
8. Filing System: the CBO has a filing system that ensures all documents are well organized making it easy to access and track information.
9. Sharing Knowledge: the CBO encourages openness and transparency in sharing of knowledge/data amongst the group members.
Total score (Organisational
skills)
Average score (Organisational
skills)

INTRODUCTION & KEY CONCEPTS
DESIGNING & IMPLEMENTING THE EVALUATION
PRISM MODULES
METHOD FACTSHEETS & ANNEXES
PRISM - TOOLKIT FOR EVALUATING THE OUTCOMES AND IMPACTS OF SMALL/MEDIUM-SIZED CONSERVATION PROJECTS303
4:3
LIVELIHOODS & GOVERNANCE
FACTSHEET
COMMUNITY-BASED
ORGANISATIONAL CAPACITY
ASSESSMENT
MAIN CAPACITY AREAS
ASPECTS BEING ASSESSEDSCORE(0-4)*
BRIEFLY EXPLAIN THE REASONS FOR YOUR SCORE
HUMAN RESOURCES
Membership composition and
commitment
1. Commitment and Involvement: CBO membership commitment to conservation, to the needs of the entire membership and widely involves the membership in group’s activities, consistent with individual’s skills, experience and availability.
Membership/Governance
2. Governance: responsibilities are shared amongst officials. Members assist the leader in establishing and articulating the CBO’s objectives, plans and in reviewing the CBO’s performance.
3. Leadership: The CBO’s leaders are democratically elected and are answerable to members.
Professionalism and Skills
4. Members’ Skills and Experiences: members of the CBO handling different aspects are properly trained and experienced to deliver effectively and efficiently.
5. Knowledge and Expertise on Conservation: the CBO has scientific and technical expertise on biodiversity issues (e.g. botanists, ecologists etc.) and socio-economic issues (lawyers, economists, sociologists etc.).
6. Learning Opportunities: the CBO provides opportunities for its membership to increase knowledge, skills and experience.
Co-ordination Team/Process
7. Delegation and Co-ordination: the CBO leadership delegates wisely, giving other members an opportunity to take responsibility in the running of the group. The leadership ensures co-ordination of activities of the group.
8. Conflict Management: the CBO has laid down procedures for conflict management and resolution. Members can appeal in case when they feel they have been treated unfairly.
Motivation and Rewards
9. Member’s Motivation: the CBO leadership understands its membership and takes time to encourage, develop, congratulate, reward and recognize, etc., to ensure the members are motivated at all times.
Decision Making Framework
10. Decision Making: the CBO leadership takes into account the views of its membership and other stakeholders, the risks, financial situations, etc. before making any decisions on behalf of the group.
Total score (Human resources)
Average score (Human resources)

INTRODUCTION & KEY CONCEPTS
DESIGNING & IMPLEMENTING THE EVALUATION
PRISM MODULES
METHOD FACTSHEETS & ANNEXES
PRISM - TOOLKIT FOR EVALUATING THE OUTCOMES AND IMPACTS OF SMALL/MEDIUM-SIZED CONSERVATION PROJECTS304
4:3
LIVELIHOODS & GOVERNANCE
FACTSHEET
COMMUNITY-BASED
ORGANISATIONAL CAPACITY
ASSESSMENT
MAIN CAPACITY AREAS
ASPECTS BEING ASSESSEDSCORE(0-4)*
BRIEFLY EXPLAIN THE REASONS FOR YOUR SCORE
SYSTEMS, INFRASTRUCTURE AND ORGANISATIONAL STRUCTURE
Monitoring Systems1. Monitoring System: A basic monitoring system is in place where information is recorded about projects, inputs and outputs against objectives and activities.
Financial Operations
Management
2. Financial Management: the CBO has a bank account, and a treasurer who is democratically elected, and is responsible for managing the group’s finances.
3. Accounting Procedures: the CBO keeps books of accounts and has reliable procedures to ensure that resources are managed properly and the records properly kept.
4. Financial Transparency: the CBO’s financial management and reporting is transparent and the leadership is open to discuss financial matters with the membership as appropriate.
5. Budgeting: the CBO members are involved in developing and monitoring the budget annually.
Infrastructure6. Building and Office Space: The CBO owns or has access to an office to conduct meetings, carries out group operations and stores the group’s resources. The CBO also has access toreliable communication facilities- telephone, computers etc.
Total score (Systems and
infrastructure)
Average score (Systems and
infrastructure)
ORGANISATIONAL STRUCTURE
Organisational Structure
1. Participation of Members: the CBO’s leadership encourages members to express their opinions about the group’s work and operation and is open to different points of view.
2. Constitution/Bye Laws: The CBO’s meets all legal requirements. A constitution is developed in a participatory manner, which clearly defines the roles and responsibilities of the officials.
Organisational Design
3. Organizational Design: the CBO has a structure that ensures effective and best use of resources.
4. CBO Operational Structure: the CBO structure chart shows the line of responsibility between the different positions in the group.
Total score (Organisational
skills)
Average score (Organisational
skills)

INTRODUCTION & KEY CONCEPTS
DESIGNING & IMPLEMENTING THE EVALUATION
PRISM MODULES
METHOD FACTSHEETS & ANNEXES
PRISM - TOOLKIT FOR EVALUATING THE OUTCOMES AND IMPACTS OF SMALL/MEDIUM-SIZED CONSERVATION PROJECTS305
Factsheet: Community mapping
Introduction
In many countries, land rights are determined by complex and
often overlapping systems of formal law and customary norms.
The most accurate information regarding land use, access,
resource rights and ownership is often held by local communities.
Participatory mapping is therefore an appropriate method for
assessing impacts on rights to land and resources, as well as other
spatial changes. The method can be used to show information
regarding the occurrence, distribution, access to and use of
resources; topography; human settlements; land tenure; and
livelihoods activities. Cartographic precision is not important, as
this tool is not designed for demarcating boundaries or calculating
areas under a particular land use. It can however be used to
identify ownership of land, and the location, access and use of
key natural resources. By repeating the mapping exercise for
different time periods it can be used to monitor changes in tenure
and resource rights. This tool is most suitable for a geographically
limited area. For larger areas it may be appropriate to produce
more than one map.
Required steps
Step 1. Ask participants to select a suitable place in which to
draw the map and the medium they will use, which
could be on the ground using stones, seeds, sticks and
coloured powder; on the floor using chalk; or directly
onto a large sheet of paper using pencils and pens.
Step 2. Agree with participants exactly what area the map
will cover, such as a village a river basin, etc.
Step 3. Explain that the quality of the drawing is not
important and it does not matter if the map is not
entirely accurate or to scale. If any of the participants
are illiterate it is important to use symbols and
drawings, with a key to interpret the symbols into
the local language (and where necessary, into (a)
relevant language(s) for other intended users of the
information).
Step 4. Ask participants to start by preparing the outline or
boundary of the map and then identify the central
point or an important landmark within the area (such
as a mosque, school or market place).
Step 5. Other important landmarks can now be drawn.
Participants should develop the content of the map
according to what they think is most important. The
map does not need to show every individual house,
shop, field, etc., but rather the area where they are
located. Local landmarks and features might include:
• infrastructure and services (e.g. roads, houses,
bridges, schools, health clinics, bus stops, shops
and markets);
• special places (e.g. location of medicinal plants,
places of worship, sacred sites, cemeteries);
• water sites and sources;
LIVELIHOODS & GOVERNANCE
FACTSHEET
COMMUNITY MAPPING
STEPS 1 TO 5
4:3

INTRODUCTION & KEY CONCEPTS
DESIGNING & IMPLEMENTING THE EVALUATION
PRISM MODULES
METHOD FACTSHEETS & ANNEXES
PRISM - TOOLKIT FOR EVALUATING THE OUTCOMES AND IMPACTS OF SMALL/MEDIUM-SIZED CONSERVATION PROJECTS306
• agricultural land (e.g. crop varieties and locations,
grazing areas), soils, slopes, elevations;
• natural resources (e.g. areas of forest, rivers,
location of species of specific interest) and areas of
eg. predation or crop raiding;
• hazards/areas prone to risk (e.g. floodplains,
infrastructure vulnerable to floods, drought-prone
areas).
Step 6. Although it might take some time to get going, the
process should not be rushed. Once the mapping is
underway, sit back and observe, and only interrupt if
absolutely necessary in order to clarify something or
to help participants if they get stuck.
Step 7. If the map is being drawn on the ground, once the
broad outline has been established, participants
can start making a copy on to paper (indicating
which direction is north). This process is important
because extra information and corrections can often
emerge as a result. Also it is important that a copy
or permanent record of the map is available if the
contributors want it.
Step 8. If the focus of your assessment is on tenure and rights
to resources, ask relevant information to be entered
onto the map.
Step 9. Discuss and analyse the map(s). Ask participants to
describe what they have produced and ask questions
about anything that is unclear. If there are several
different groups, each group should present and
describe its map to the others for their reactions and
comments. Are there major differences? If so, note
these and whether a consensus is reached. Note that
a consensus is not necessarily a desired outcome –
differences in perceptions of land use can be a very
useful basis for further discussions
Step 10. To assess a project’s impact (e.g. land tenure or rights
to resources), complete the mapping exercise at the
start (baseline) and at the end of the project. If you
don’t have a baseline then ask participants to draw
a series of maps to illustrate changes. Ask questions
about the map to help you understand the causes
of any changes and about the contribution of your
project.
Ackowledgement
Reproduced with permission (and with minor adaptations only)
from: Fauna & Flora International (2013). Guidance sheet on
Community Resource Mapping. Conservation, Livelihoods and
Governance Programme, Tools for participatory approaches.
Available at: http://www.fauna-flora.org/wp-content/uploads/
Community-Resource-Mapping.pdf .
LIVELIHOODS & GOVERNANCE
FACTSHEET
COMMUNITY MAPPING
STEPS 6 TO 10
4:3

INTRODUCTION & KEY CONCEPTS
DESIGNING & IMPLEMENTING THE EVALUATION
PRISM MODULES
METHOD FACTSHEETS & ANNEXES
PRISM - TOOLKIT FOR EVALUATING THE OUTCOMES AND IMPACTS OF SMALL/MEDIUM-SIZED CONSERVATION PROJECTS307
Factsheet: Basic Necessities Survey (BNS)
Introduction
If poverty can be defined broadly as “the lack of basic necessities”,
a valid approach to poverty assessment is to check whether a
project has resulted in a change in the extent to which people’s
“basic necessities” are being met. Unlike income-based approaches
to poverty assessment (e.g. numbers of people living on less than
US$2/day), there is no a priori definition of “basic necessities”,
partly since what can be considered as a basic necessity is likely to
vary both with location (different communities and cultures) and
over time.
The Basic Necessities Survey (BNS) method15 has been adapted
to a number of contexts, most comprehensively by the Wildlife
Conservation Society (WCS) for social impact monitoring in
conservation landscapes16. The BNS method measures poverty
change over time according to whether community members think
they are getting more or less of their basic necessities than before
the project, or since the last time that the BNS was carried out.
The BNS method can be implemented in control and treatment
(project) communities in order to assess attribution, and is
therefore a very useful method when used in conjunction with a
quasi-experimental approach, assuming that the project expects
to have an impact on the general poverty level of the project
communities. Alternatively, and in the absence of any control
communities, it could be used in conjunction with participatory
impact assessment methods or the Theory of Change approach
(see Factsheet: Completing a Theory of Change) to assess the
causation of any changes in poverty levels.
The BNS is undertaken in three main steps:
Step 1. Identification of possible basic necessities via focus
groups;
Step 2. Application of the survey;
Step 3. Analysis of the data collected.
Required steps
Step 1. Identification of possible basic necessities via focus
groups
Use focus group discussions to generate an initial list of
goods (e.g. TV, bicycle, radio, wheelbarrow, machete) and
services (e.g. all school age children attending school; walking
distance to a health clinic) that the participants may or may
not think are basic necessities. In focus group discussions
some individuals may dominate the discussion, e.g. women may
not talk much in front of men and minorities may not talk when in
LIVELIHOODS & GOVERNANCE
FACTSHEET
BASIC NECESSITIES SURVEY (BNS)
STEP 1
4:3
15The BNS method was developed in 1998 by Rick Davies (http://www.mande.co.uk/
welcome), an independent monitoring and evaluation expert working for ActionAid. This
description of the BNS method is adapted from a version in: Richards M (2011). Social and
Biodiversity Impact Assessment (SBIA) Manual for REDD+ Projects: Part 2 – Social Impact
Assessment Toolbox. Climate, Community & Biodiversity Alliance and Forest Trends, with
Rainforest Alliance and Fauna & Flora International. Washington, DC (http://www.forest-
trends.org/documents/files/doc_2981.pdf) which has itself been adapted from a version
licensed under the Creative Commons Attribution-Noncommercial-Share Alike 3.0 Licence.
To view a copy of this licence, visit: http://creativecommons.org/licenses/by-nc-sa/3.0/ .
16Wilkie D, Wieland M and Detoeuf D (2015). A guide to the modified Basic Necessities
Survey: Why and how to conduct BNS in conservation landscapes. WCS, New York, USA
(http://programs.wcs.org/carbon/Communities/WCS-Resources/Publications.aspx) .

INTRODUCTION & KEY CONCEPTS
DESIGNING & IMPLEMENTING THE EVALUATION
PRISM MODULES
METHOD FACTSHEETS & ANNEXES
PRISM - TOOLKIT FOR EVALUATING THE OUTCOMES AND IMPACTS OF SMALL/MEDIUM-SIZED CONSERVATION PROJECTS308
a group composed mostly of the ethnic majority. Also women
may have different views from those of men about what the basic
necessities for life are, and young people may also have different ideas
about basic needs compared with those of older people. A mixed age
and mixed gender focus group may be adequate to capture these
differences, but more often you will need to conduct several groups
composed of different community members:
• men-only and women-only groups;
• groups of young people and groups of older people;
• groups of ethnic minorities.
It is important that the list includes items which almost everyone
would agree are basic necessities (e.g. enough food each day),
and others where there are likely to be different views (e.g.
having a TV). The list should include between 20 and 30 village-
defined goods and services (about equal numbers of each).
This should include some items that only a few people in the
group think are current necessities, but which could become
necessities in the future. At this point it is a list of possible basic
necessities, not a final list of agreed basic necessities.
Ensuring your list is clear and easily measurable
• Goods should be durable goods that can be used multiple
times. Consumable goods (e.g. food, beverages, petrol)
can run out and should not be included in the list. If one of
these consumable items is very important, turn it into a
service, for example “meal three times a day”.
• The list should not have services that can be easily
misinterpreted, those that are difficult to record with a
yes or no answer (e.g. “a healthy family” or “well trained
teachers”), or that cannot be reliably observed by different
people. Keep in mind that for each element of your final list,
people will have to answer two simple questions: “Do you
have it?” “Is it really necessary (a basic necessity)?” It is very
important for a yes or no answer to be given easily and
with confidence.
• If the description of a good or service is too vague, it will
take too much time for people to answer the question. For
example, asking whether someone has “access to a good
school” can be very complicated: the school might be good,
but the household may not have the money to send their
children to this school. Be very specific about services, e.g.
by defining what type of school you are talking about, what
is “good”, and how you define having access to it, in order
to ensure that your question is understood in the way you
intend it to be.
LIVELIHOODS & GOVERNANCE
FACTSHEET
BASIC NECESSITIES SURVEY (BNS)
STEP 1
4:3
WHAT IS ACCESS?
Access to a service is sometimes difficult to define, so it is
important to think about what this means. Does it just mean
the service is available? Or does it mean that it is available and
the household has the ability to purchase/use the service? For
example a secondary school may be in a town nearby, but if a
household doesn’t have the money to pay for accommodation,
do they really have access to it? For the BNS, access means that
a household is actually able to use the service, not that the service
simply exists in the village.

INTRODUCTION & KEY CONCEPTS
DESIGNING & IMPLEMENTING THE EVALUATION
PRISM MODULES
METHOD FACTSHEETS & ANNEXES
PRISM - TOOLKIT FOR EVALUATING THE OUTCOMES AND IMPACTS OF SMALL/MEDIUM-SIZED CONSERVATION PROJECTS309
Step 2. Application of the survey
Meet with village leaders
Before conducting a BNS survey, talk with the village elders
and residents to explain the purpose of the study and to
ask their permission to conduct surveys in the village. It
is extremely important to take the time to explain to the
authorities and to the participants why you are conducting
the BNS, detailing the process, showing how they can
benefit from the results of the survey and ensuring that
they completely understand the objective of your presence
in the village. For more guidance on conducting surveys,
including selecting a sample to survey, see the Factsheet:
Questionnaires.
Define “basic necessity”
If people don’t understand what a basic necessity is, they may
answer “yes” to the entire set of questions, making it very
difficult for you to analyse the answers. A common mistake
is to think that”necessity” is the same as “important”. It is
not. Here is the definition of a basic necessity: “Something all
families should be able to have and no family should have to
live without”.
The interviewee must understand that a basic need is more
than just something they would like to have to make their
lives better, and it is more than something that is important
to have. It is something that you can’t live without, something
essential to life. The problem is, in some languages, words like
“necessary” or “essential” don’t exist. So before going into the
field, sit with your team to define “basic necessity” in the local
language.
After you finish your explanation, to check whether the
person you are interviewing understands the difference
between a basic need and something important, you can ask
two questions, using goods or services that are not in your
list. For example, if in your final list you don’t have a pair of
shoes and sunglasses, you can ask: “Do you think a pair of
shoes is a necessity?” It most likely is, and most people would
answer “yes” if they understood the explanation you gave
them. If they don’t, then you will have to explain it again. If
they do, then you can ask another question: “Do you think
a pair of sunglasses is a necessity?” It is most likely not, and
most people, if they understood the explanation you gave
them, should answer “no”. If they don’t, you will have to
explain the definition of a basic necessity again. If they do, it
means you can start your survey.
Conducting the survey - questions to ask
Ask each male or female household head (picked randomly) in
your survey sample two basic questions:
• Which items on the list do you consider are basic
necessities that everyone should have, and no-one
should have to do without?
• Which items on the list does your household possess
now?
LIVELIHOODS & GOVERNANCE
FACTSHEET
BASIC NECESSITIES SURVEY (BNS)
STEP 2
4:3

INTRODUCTION & KEY CONCEPTS
DESIGNING & IMPLEMENTING THE EVALUATION
PRISM MODULES
METHOD FACTSHEETS & ANNEXES
PRISM - TOOLKIT FOR EVALUATING THE OUTCOMES AND IMPACTS OF SMALL/MEDIUM-SIZED CONSERVATION PROJECTS310
LIVELIHOODS & GOVERNANCE
FACTSHEET
BASIC NECESSITIES SURVEY (BNS)
4:3
INFORMATION IN THE DATA SHEET
Survey information
• The date on which the survey was conducted.
• The name of the village.
• The name of the person in the household who
participated in the survey.
• The name of the head of the household.
• The unique ID number of the household
surveyed (this is vital to keep the surveys
separate from each other).
Household demography
For each member of the family, record information such
as their gender, the number of years they spent in school,
their year of birth and ethnicity.

INTRODUCTION & KEY CONCEPTS
DESIGNING & IMPLEMENTING THE EVALUATION
PRISM MODULES
METHOD FACTSHEETS & ANNEXES
PRISM - TOOLKIT FOR EVALUATING THE OUTCOMES AND IMPACTS OF SMALL/MEDIUM-SIZED CONSERVATION PROJECTS311
The list of items can be read out to respondents or typed on cards
which are then sorted in response to the two questions above.
Table 1 presents an example of a completed household BNS form.
As well as basic survey information, it is also helpful to collect some
demographic information about each household that you interview.
This will help you to understand differences in impacts of your
project within the communities where you are working (see box).
Step 3. Analysis of the data collected
Data analysis involves the following steps (see Tables 2 and
3):
• Determine which items are “basic necessities”
– these are defined as items which over 50%
of the households interviewed think are basic
necessities;
• Calculate a weighting (fraction) for each item
based on the percentage of households who
think it is a basic necessity. For example if 350
out of 420 households interviewed think it is a
basic necessity, the weighting is 350/420 = 0.833
(Tables 2 and 3);
• Calculate a maximum possible score for a
household with all the basic necessities (this is the
sum of all the weighting scores for the items in the
“basket” of basic necessities – Column A in Table
1);
• For each household, calculate a poverty index
(%) by adding up the weighted scores for that
household (Column B) and dividing this by the
maximum score (Column A), as shown in Table 2.
1 hectare of land per person
Electric light
Bicycle
Concrete rice drying yard
Wooden rice chest
3 meals a day
Buffalo or cow
All children studying to level 2
Well with well head
Stone built house
Thick cotton blanket
Doctor visiting house when sick
Electric fan
A new set of clothes each year
Livestock vaccination
Meat once a week
Pesticide pump
Watch
Access to loans
Radio
Toilet - built of stone
Table made of good wood
Two-compartment wood wardrobe
TV
Bathroom
Motorbike
Asset
Asset
Asset
Asset
Asset
Service
Asset
Service
Asset
Asset
Asset
Service
Asset
Service
Service
Service
Asset
Asset
Service
Asset
Asset
Asset
Asset
Asset
Asset
Asset
0
1
1
1
1
1
0
0
0
0
1
1
0
1
0
0
0
0
0
0
0
1
0
0
0
0
1
1
0
0
1
1
1
1
1
0
1
1
0
1
0
1
0
0
1
0
1
1
0
0
0
0
ITEM
TABLE 1: EXAMPLE OF A COMPLETED HOUSEHOLD BNS FORM.
HAVE NOW?YES = 1, NO = 0
ARE BASIC NECESSITIES?YES = 1, NO = 0
ASSET OR SERVICE
LIVELIHOODS & GOVERNANCE
FACTSHEET
BASIC NECESSITIES SURVEY (BNS)
STEP 3
4:3

INTRODUCTION & KEY CONCEPTS
DESIGNING & IMPLEMENTING THE EVALUATION
PRISM MODULES
METHOD FACTSHEETS & ANNEXES
PRISM - TOOLKIT FOR EVALUATING THE OUTCOMES AND IMPACTS OF SMALL/MEDIUM-SIZED CONSERVATION PROJECTS312
1 hectare of land per person
Electric light
Bicycle
Concrete rice drying yard
Wooden rice chest
3 meals a day
Buffalo or cow
All children studying up to level 2
Well with well head
Stone built house
Thick cotton blanket
Doctor visiting the house when sick
Electric fan
A new set of clothes each year
Livestock vaccination
Meat once a week
Pesticide pump
Watch
Access to loans
Radio
Toilet - built of stone
Table and chairs made of good wood
Two-compartment wooden wardrobe
TV
Bathroom
Motorbike
418
418
418
415
414
413
412
412
411
410
408
399
391
388
386
350
336
325
322
312
188
175
135
88
78
32
99.5%
99.5%
99.5%
98.8%
98.6%
98.3%
98.1%
98.1%
97.9%
97.6%
97.1%
95.0%
93.1%
92.4%
91.9%
83.3%
80.0%
77.4%
76.7%
74.3%
44.8%
41.7%
32.1%
21.0%
18.6%
7.6%
ITEM
TABLE 2. AN EXAMPLE OF A BASIC NECESSITIES WEIGHTING TABLE FROM A BNS DATASET. THOSE ITEMS NOT CONSIDERED TO BE A BASIC NECESSITY BY MORE THAN 50% OF THE 420 PEOPLE SURVEYED ARE HIGHLIGHTED IN RED.
# WHO CONSIDER NECESSITY
% WHO CONSIDER NECESSITY (WEIGHTING)
1 hectare of land per person
Electric light
Bicycle
Concrete rice drying yard
Wooden rice chest
3 meals a day
Buffalo or cow
All children studying up to level 2
Well with well head
Stone built house
Thick cotton blanket
Doctor visiting the house when sick
Electric fan
A new set of clothes each year
Livestock vaccination
Meat once a week
Pesticide pump
Watch
Access to loans
Radio
Total
Poverty score 7.793
Maximum possible score 18.471
Poverty index 43.29%
0
1
1
1
1
1
0
0
0
0
1
1
0
1
0
0
0
0
0
0
0.995
0.995
0.995
0.988
0.986
0.983
0.981
0.981
0.979
0.976
0.971
0.950
0.931
0.924
0.919
0.833
0.800
0.774
0.767
0.743
18.471
0.000
0.995
0.995
0.988
0.986
0.983
0.000
0.000
0.000
0.000
0.971
0.950
0.000
0.924
0.000
0.000
0.000
0.000
0.000
0.000
7.793
ITEM
TABLE 3: EXAMPLE OF A HOUSEHOLD BNS POVERTY SCORE FOR BASIC NECESSITIES
HAVE NOW?YES = 1, NO = 0
COLUMN AWEIGHTING (FRACTION)
COLUMN BPOVERTY SCORE
LIVELIHOODS & GOVERNANCE
FACTSHEET
BASIC NECESSITIES SURVEY (BNS)
4:3

INTRODUCTION & KEY CONCEPTS
DESIGNING & IMPLEMENTING THE EVALUATION
PRISM MODULES
METHOD FACTSHEETS & ANNEXES
PRISM - TOOLKIT FOR EVALUATING THE OUTCOMES AND IMPACTS OF SMALL/MEDIUM-SIZED CONSERVATION PROJECTS313
4:3
LIVELIHOODS & GOVERNANCE
FACTSHEET
BASIC NECESSITIES SURVEY (BNS)
TO LEAD A GOOD BNS INTERVIEW:
• Take gender into account
• Take 30 minutes maximum
• Use local language
• Interview in private
• Use women to survey women; minorities to
survey minorities
• Provide a clear and concise introduction
• Define basic necessity
• Ensure BNS is NOT a wish list
• Don’t influence answers
• Look around you
• Estimate ages if they don’t know
Household demography
For each member of the family, record information such
as their gender, the number of years they spent in school,
their year of birth and ethnicity.
REPEAT SURVEYS AND BASIC NECESSITIES
Perceptions of “basic necessities” can change over
time. When conducting a second BNS (with the same
households) if significant time has elapsed since the
previous survey (e.g. more than 2 years), the focus group
exercise should be repeated to see if any additional items
need to be added to the list or old ones deleted (since
by now nearly all households may have an item on the
original list). Scores can be calculated for each household
both on the basis of a new extended list and, after
excluding the new items, on the basis of the old list.

INTRODUCTION & KEY CONCEPTS
DESIGNING & IMPLEMENTING THE EVALUATION
PRISM MODULES
METHOD FACTSHEETS & ANNEXES
PRISM - TOOLKIT FOR EVALUATING THE OUTCOMES AND IMPACTS OF SMALL/MEDIUM-SIZED CONSERVATION PROJECTS314
The poverty index can range from 0% when the family possesses
none of the basic necessities to 100% when it has all of them.
If poverty scores are recalculated using all items (even those not
considered basic necessities) and the poverty index recalculated
using the maximum score from only the basic necessity items, then
a score of greater than or equal to 100% denotes households living
at or above the poverty line (i.e. those that have all or more than
the basic necessities)17.
Differentiation
By collecting basic social information about households that
you interview it is possible to investigate how your project has
impacted on the poverty levels of different groups of stakeholders
(based on e.g. female-headed households; ethnicity; age of
household head; level of education; ownership of land, etc.).
LIVELIHOODS & GOVERNANCE
FACTSHEET
BASIC NECESSITIES SURVEY (BNS)
1 hectare of land per person
Electric light
Bicycle
Concrete rice drying yard
Wooden rice chest
3 meals a day
Buffalo or cow
All children studying to level 2
Well with well head
Stone built house
Thick cotton blanket
Doctor visiting house when sick
Electric fan
A new set of clothes each year
Frame broke, can’t afford repairs
Project loan allowed purchase
Constructed by local government – not project
Purchased with earnings from sale of milk
Asset
Asset
Asset
Asset
Asset
Service
Asset
Service
Asset
Asset
Asset
Service
Asset
Service
0
1
0
1
1
1
1
0
1
0
1
1
1
1
1
1
0
0
1
1
1
1
1
0
1
1
0
1
1
1
0
0
1
1
1
1
1
0
1
1
0
1
ITEM
TABLE 4. HOUSEHOLD BNS FORM – FOLLOW-UP SURVEY.
HAVE NOW?YES = 1, NO = 0
ARE BASIC NECESSITIES?YES = 1, NO = 0
HAD IN PREVIOUS SURVEY?YES = 1, NO = 0
REASON GIVEN FOR CHANGEASSET OR SERVICE
4:3
17To rank order households by wealth
and to differentiate between households
that own all goods and have access to all
services on the BNS list (i.e. those that
are at or above the poverty line), it is
necessary to calculate the total value of all
the goods they own. To do that, you must
record the number of each asset owned
by the household and the village price for
all the goods in the list. Details on how to
do this are contained in the original source
document (Wilkie et al., 2015).

INTRODUCTION & KEY CONCEPTS
DESIGNING & IMPLEMENTING THE EVALUATION
PRISM MODULES
METHOD FACTSHEETS & ANNEXES
PRISM - TOOLKIT FOR EVALUATING THE OUTCOMES AND IMPACTS OF SMALL/MEDIUM-SIZED CONSERVATION PROJECTS315
Impact and attribution
One approach to assessing the impact of a project, and determine
attribution, is to carry out the survey in “matched” control villages.
For small and medium sized projects this is unlikely to be possible
or cost effective. There are also likely to be problems in matching,
as each community may have its own definition of its basic needs.
An alternative is to add columns to the BNS form. This would ask
respondents if they think that any change in ownership of a basic
necessity was due to the project, and if yes, why they think this
(Table 4).
Alternatively, results could be summarised at community level,
and any significant changes (e.g. in overall poverty levels, or in the
number of households with access to particular assets and services
in the list of basic necessities) can be discussed at community
or focus group meetings, using PIA methods (see factsheet:
Participatory Impact Assessment).
Further resources
Richards M (2011). Social and Biodiversity Impact Assessment
(SBIA) Manual for REDD+ Projects: Part 2 – Social Impact
Assessment Toolbox. Climate, Community & Biodiversity Alliance
and Forest Trends, with Rainforest Alliance and Fauna & Flora
International. Washington, DC (http://www.forest-trends.org/
documents/files/doc_2981.pdf) .
Wilkie D, Wieland M and Detoeuf D (2015). A guide to the
modified Basic Necessities Survey: Why and how to conduct
BNS in conservation landscapes. WCS, New York, USA (http://
programs.wcs.org/carbon/Communities/WCS-Resources/
Publications.aspx) .
Wildlife Conservation Society (2007). Household Surveys - a tool
for conservation design, action and monitoring. Technical Manual
4. http://global.wcs.org/DesktopModules/Bring2mind/DMX/
Download.aspx?EntryId=5369&PortalId=0&DownloadMethod=a
ttachment .
LIVELIHOODS & GOVERNANCE
FACTSHEET
BASIC NECESSITIES SURVEY (BNS)
4:3

INTRODUCTION & KEY CONCEPTS
DESIGNING & IMPLEMENTING THE EVALUATION
PRISM MODULES
METHOD FACTSHEETS & ANNEXES
PRISM - TOOLKIT FOR EVALUATING THE OUTCOMES AND IMPACTS OF SMALL/MEDIUM-SIZED CONSERVATION PROJECTS316
Factsheet: Participatory Governance Assessment
Introduction
Many factors can play a role in whether or not a group will be able
to govern access and use of natural resources sustainably, and
thus effectively. The Natural Resource Governance Tool, NRGT18
focuses on three key attributes of governance: authority, capacity,
and power. If a governance group lacks authority to govern (i.e.
people do not trust them to represent and protect their interests),
it will fail to be effective over the long term. If a governance group
has insufficient capacity to govern (i.e. to decide what to do and
implement those decisions), then, even if it is perceived to be
legitimate in the eyes of key resource users and rights holders, it is
unlikely to be able to govern access to and use of natural resources.
Lastly, even when a governance group is perceived as being the
legitimate authority, and even when it has the capacity to plan and
to act, if it does not have the political, economic, or policing power
to exert its authority, it will be unable to govern effectively.
Participatory Governance Assessment (PGA) can be used to assess
good governance practices in local organisations, community
groups, etc. The method involves meeting with a group of selected
participants who evaluate the extent to which the decision making
and management practices in a community group conform to the
attributes of good governance.
LIVELIHOODS & GOVERNANCE
FACTSHEET
PARTICIPATORY GOVERNANCE
ASSESSMENT
DEFINITIONS OF THE THREE KEY ATTRIBUTES OF
EFFECTIVE GOVERNANCE
Authority is the perception by natural resource users
and rights holders that a governance group genuinely
represents their interests and has legal or customary
jurisdiction to govern “their” natural resources.
Capacity refers to the skills, abilities, or other resources
that allow a group to govern natural resources
effectively.
Power is the ability to influence behaviours or decisions.
Aspects of authority (such as legitimacy) and capacity
(financial resources) can enhance a group’s power.
4:3
18Wilkie D, Detoeuf D, Wieland M and Cowles P (2015). Guidelines for learning and applying
the Natural Resource Governance Tool (NRGT) in landscapes and seascapes. Page 55. USAID,
Washington, D.C. and WCS, Bronx NY. USA https://programs.wcs.org/DesktopModules/
Bring2mind/DMX/Download.aspx?EntryId=28641&PortalId=97&DownloadMethod=attac
hment .

INTRODUCTION & KEY CONCEPTS
DESIGNING & IMPLEMENTING THE EVALUATION
PRISM MODULES
METHOD FACTSHEETS & ANNEXES
PRISM - TOOLKIT FOR EVALUATING THE OUTCOMES AND IMPACTS OF SMALL/MEDIUM-SIZED CONSERVATION PROJECTS317
Required steps
Preparatory phase
Step 1. Initiate preliminary discussions with the local
organisation to identify who will take part in the
assessment. Ideally, at least 75% of the organisation’s
members should take part. If the organisation is very
diverse in its membership then different categories
of member should be proportionally represented.
Make sure that women, marginalised groups and
disadvantaged caste and ethnic groups take part.
Step 2. External stakeholders from government (e.g. District
Forest Officers), NGOs, local representatives from
political parties, and members of other community
groups could also be invited.
Step 3. Agree a time and date for the assessment meeting
and send out invitations.
Step 4. Prepare the necessary documentation/forms.
THE IMPORTANCE OF LOCAL LANGUAGE
Governance involves some complex issues. The
interviewer should speak in the local language to make
it easier for local people to understand the questions
and the concepts of governance. Before going into the
field, the team needs to work together to translate the
questionnaire into the local language and to ensure that
all interviewers present the questions in the same way.
LIVELIHOODS & GOVERNANCE
FACTSHEET
PARTICIPATORY GOVERNANCE
ASSESSMENT
4:3

INTRODUCTION & KEY CONCEPTS
DESIGNING & IMPLEMENTING THE EVALUATION
PRISM MODULES
METHOD FACTSHEETS & ANNEXES
PRISM - TOOLKIT FOR EVALUATING THE OUTCOMES AND IMPACTS OF SMALL/MEDIUM-SIZED CONSERVATION PROJECTS318
The assessment phase
Step 5. At the start of the meeting, explain very carefully
the purpose of the Participatory Governance
Assessment, how the tool works and that it aims
to help them improve their natural resources
governance. Make sure that everyone understands.
Step 6. Using the list of questions, (Table 1) facilitate a
discussion among the participants, leading to an
evaluation of the group’s governance performance.
Step 7. Make detailed notes of the discussion and responses,
taking particular note of the views of women,
the poor and marginalised, and people from
disadvantaged caste and ethnic groups. Final scores
should be agreed by consensus.
Step 8. It is extremely important that the scores are
supported by a narrative analysis, to help explain
the ratings for each governance attribute. This
allows a more nuanced evaluation of opportunities
for strengthening the ability of the group to govern
the conservation and sustainable use of natural
resources within the landscape or seascape, and lays
the foundation for evaluating whether such actions
resulted in strengthened governance.
Step 9. Once all the questions are completed, transfer the
results to a spider-web diagram and display it for
all to see. Spider (or radar) diagrams help people
to visualise and interpret the results (See example
below).
Step 10. If the PGA is carried out at the start of the project,
this forms your baseline against which impacts on
governance can be assessed. To assess the impact
of your project on an organisation’s governance,
repeat the steps above at the end of the project, and
compare the “before” and “after” spider diagrams. As
governance gets better, the triangles/cobwebs get
bigger. Discuss the reasons for any changes in order
to identify those which can be attributed to your
project.
Step 11. If you don’t have a “before project” baseline then you
could add extra columns to your Assessment Scoring
Sheet. Ask respondents to recall the “before project”
situation (and the reasons for any changes compared
with the current (“after project”) situation. Ask
whether they can be attributed to the project. See
example in Table 1.
LIVELIHOODS & GOVERNANCE
FACTSHEET
PARTICIPATORY GOVERNANCE
ASSESSMENT
4:3

INTRODUCTION & KEY CONCEPTS
DESIGNING & IMPLEMENTING THE EVALUATION
PRISM MODULES
METHOD FACTSHEETS & ANNEXES
PRISM - TOOLKIT FOR EVALUATING THE OUTCOMES AND IMPACTS OF SMALL/MEDIUM-SIZED CONSERVATION PROJECTS319
The group has no legal or
traditional authority
The process of legal or
traditional recognition of the
group is underway
The group has a legal or
traditional recognition but
its role is not accepted by all
stakeholders
The group has legal or
traditional recognition only to
determine what resource and
land use is permitted
The group is officially
recognised by a legal act
of traditionally as having
jurisdiction
When the project
started the group was
an informal assemblage
of households using the
forest. Their status was
not formally recognised
by government although
they had legitimacy in
the community. The
project has supported
their legal registration
as a Forest User Group.
When the project
started the group was
an informal assemblage
of households using the
forest. Their status was
not formally recognised
by government although
they had legitimacy in
the community. The
project has supported
their legal registration
as a Forest User Group.
Legitimacy
Responsibility
-2
-1
0
1
2
X
CRITERIA
TABLE 1: ASSESSMENT SCORING SHEET ADAPTED FOR BEFORE AND AFTER IMPACT ASSESSMENT.
ASSESSMENT SCORE (CURRENT -
AFTER PROJECT)
COMMENTS/ EXPLANATION FOR CURRENT SCORE
ASSESSMENT SCORE BEFORE
PROJECT
REASONS FOR CHANGE (BEFORE-AFTER PROJECT)
ATTRIBUTES
LIVELIHOODS & GOVERNANCE
FACTSHEET
PARTICIPATORY GOVERNANCE
ASSESSMENT
4:3

INTRODUCTION & KEY CONCEPTS
DESIGNING & IMPLEMENTING THE EVALUATION
PRISM MODULES
METHOD FACTSHEETS & ANNEXES
PRISM - TOOLKIT FOR EVALUATING THE OUTCOMES AND IMPACTS OF SMALL/MEDIUM-SIZED CONSERVATION PROJECTS320
Example
Acknowledgement
The method described here is a modified version that comprises
elements of the Natural Resource Governance Tool (structure
of attributes, questions, scoring sheet) and the PGA method
developed by the WWF Hariyo Ban Program in Nepal19 (which
has a focus on assessing the governance of individual community-
based organisations, rather than on governance within a
landscape).
PARTICIPATORY GOVERNANCE ASSESSMENT AS A
PLANNING TOOL
Note that a PGA can also be used as a planning tool.
Following an initial assessment, participants go on to
identify what the group must do in order to improve
performance against each indicator, and agreed actions
are recorded in a Governance Improvement Plan.LIVELIHOODS & GOVERNANCE
FACTSHEET
PARTICIPATORY GOVERNANCE
ASSESSMENT
4:3
19WWF-Nepal (2013). Internal Governance Tool 3. Participatory Governance Assessment
(PGA). WWF-Nepal, Hariyo Ban Program. http://pdf.usaid.gov/pdf_docs/PA00K352.pdf .

INTRODUCTION & KEY CONCEPTS
DESIGNING & IMPLEMENTING THE EVALUATION
PRISM MODULES
METHOD FACTSHEETS & ANNEXES
PRISM - TOOLKIT FOR EVALUATING THE OUTCOMES AND IMPACTS OF SMALL/MEDIUM-SIZED CONSERVATION PROJECTS321
Factsheet: Participatory photo evaluation
Introduction
In some cases, photographs can be used to find out how a project
has affected livelihoods and well-being within a community.
This photographic method can be used as an impact assessment
exercise in its own right or can be used to identify key well-being
indicators for longer term monitoring and assessment.
Required steps
Step 1. Provide members of the community with one or more
digital cameras, and leave the cameras with them
for a week or more. Ask them to take photographs
that illustrate how the project has affected them –
positively or negatively.
Step 2. Collect the photos and show them to participants,
asking them to discuss the pictures collectively.
Step 3. Compare images taken by different people – men,
women, elders, youth, farmers, fishermen – to see
how different groups of people have been affected,
and what they consider to be key indicators of change
brought about by the project. Comparison of the
pictures taken will allow differences and similarities
to be observed. The photographs also provide a
useful starting point for discussion – what changes/
impacts do the pictures symbolise, do others agree
or disagree with the opinion of whoever took the
picture, how widespread is the impact, what was the
pathway to that particular impact etc? Also, do the
impacts recorded by the community correspond to
your expectations and assumptions according to your
Theory of Change?
Further reading
http://www.participatorymethods.org/method/participatory-
visual-methods-case-study .
LIVELIHOODS & GOVERNANCE
FACTSHEET
PARTICIPATORY PHOTO
EVALUATION
STEPS 1 TO 3
4:3

INTRODUCTION & KEY CONCEPTS
DESIGNING & IMPLEMENTING THE EVALUATION
PRISM MODULES
METHOD FACTSHEETS & ANNEXES
PRISM - TOOLKIT FOR EVALUATING THE OUTCOMES AND IMPACTS OF SMALL/MEDIUM-SIZED CONSERVATION PROJECTS322
Annex: Questions for assessment meeting
1. Legitimacy
1.1 What does the group do? What is its job?
1.2 Does it have the right to do this job? (De facto
community authority or de jure governmental
authority).
1.3 If yes, where did the right come from? (From the
community, from the State, etc.).
1.4 If no, who does have the right to do this job? Who should
be doing it?
2. Accountability
2.1 Who does the group answer to?
2.2 If it makes a mistake, or does not do its job the way that
it is supposed to, who can tell the group to change?
3. Transparency
3.1 Does the group do a good job of letting people know
what it does? (Does the group communicate what it is
doing?) Do most people feel like they know what the
group is doing?
3.2 If yes, how does it keep people informed of its activities?
What does the group do to make sure that people know
what they are doing?
3.3 If no, what are the weaknesses and what should the
group be doing to make sure that people are well
informed about what it is doing?
4. Participation
4.1 Are people living around here able to tell the group
when they have a suggestion about how it could do its
job better, or more fairly? Can people complain if they
feel that the group is not doing a good job and expect
that someone will pay attention?
4.2 If yes, what does it do to make sure people have a
chance to make suggestions and proposals or complain
about problems?
4.3 If no, what could or should it do to make sure that
people have a chance to make suggestions, proposals
and complaints?
5. Fairness
5.1 Does the group treat everyone in a fair way? Or does it
seem to favour some people over others?
5.2 If fair, what is it about how the group works that makes
it seem fair to you?
5.3 If not fair, what is not fair about how the group works?
5.4 What could it do to be more fair in the way it does its
job?
6. Knowledge/skills
6.1 Do people who work for the group know how to do
their jobs well? Do they have the technical knowledge to
manage resource use or monitor natural resources, for
example? Do they know the policies? Examples?
LIVELIHOODS & GOVERNANCE
ANNEX
QUESTIONS FOR ASSESSMENT
MEETING
4:3

INTRODUCTION & KEY CONCEPTS
DESIGNING & IMPLEMENTING THE EVALUATION
PRISM MODULES
METHOD FACTSHEETS & ANNEXES
PRISM - TOOLKIT FOR EVALUATING THE OUTCOMES AND IMPACTS OF SMALL/MEDIUM-SIZED CONSERVATION PROJECTS323
7. Resources
7.1 Does the group have the equipment it needs to do a
good job? Examples?
7.2 Does the group have the personnel it needs to do its
job? Examples?
7.3 Does the group have the finances it needs to do its job?
Examples?
8. Institutional framework
8.1 Are there laws or rules that are written down so that
the people who work for the group and local people all
know what it is supposed to be doing and why?
9. Motivation
9.1 Do you think the group tries to do a good job? What
makes you say that?
10. Enacting decisions
10.1 When the group makes a decision to adopt a rule, do
authorities (for example chiefs, mayors, governors, civil
servants) respect the decision? Or do they just do what
they want to anyway? Why do you think that is?
10.2 Can the group protect, more or less, resources from
illegal use (for example from military poachers,
neighbouring jurisdictions or the population
themselves)? Explain.
11. Being held accountable
11.1 If people whose resource use is managed think that the
group is doing a bad job, is there anything the people
themselves can do to make it do better?
11.2 If yes, what can they do?
11.3 If no, what should people be able to do if the group is
doing a bad job?
12. Diversity
12.1 Are women represented equally in the group?
12.2 If yes, are their ideas listened to and adopted by the
group?
12.3 If no, why is this?
12.4 Are minority peoples represented equally in the group?
12.5 If yes, are their ideas listened to and adopted by the
group?
12.6 If no, why is this?
Resources
Wilkie D, Detoeuf D, Wieland M and Cowles P (2015). Guidelines
for learning and applying the Natural Resource Governance
Tool (NRGT) in Landscapes and Seascapes. Page 55. USAID,
Washington, D.C. and WCS, Bronx NY. USA https://programs.wcs.
org/DesktopModules/Bring2mind/DMX/Download.aspx?EntryId
=28641&PortalId=97&DownloadMethod=attachment .
WWF-Nepal (2013). Internal Governance Tool 3. Participatory
Governance Assessment (PGA). WWF-Nepal, Hariyo Ban
Program. http://pdf.usaid.gov/pdf_docs/PA00K352.pdf .
LIVELIHOODS & GOVERNANCE
ANNEX
QUESTIONS FOR ASSESSMENT
MEETING
4:3

INTRODUCTION & KEY CONCEPTS
DESIGNING & IMPLEMENTING THE EVALUATION
PRISM MODULES
METHOD FACTSHEETS & ANNEXES
PRISM - TOOLKIT FOR EVALUATING THE OUTCOMES AND IMPACTS OF SMALL/MEDIUM-SIZED CONSERVATION PROJECTS324
Annex: Governance Assessment scoring sheet
Reproduced with permission from:
Wilkie D, Detoeuf D, Wieland M and Cowles P (2015). Guidelines
for learning and applying the Natural Resource Governance
Tool (NRGT) in Landscapes and Seascapes. Page 55. USAID,
Washington, D.C. and WCS, Bronx NY. USA https://programs.wcs.
org/DesktopModules/Bring2mind/DMX/Download.aspx?EntryId
=28641&PortalId=97&DownloadMethod=attachment .
LIVELIHOODS & GOVERNANCE
ANNEX
GOVERNANCE ASSESSMENT
SCORING SHEET
4:3
Developed by:
African Wildlife Foundation
World Wildlife Fund Wildlife
Conservation Society
Wildlife Conservation Society
ATTRIBUTES CRITERIA ASSESSMENT SCORE
COMMENTS/ EXPLANATIONS
RECOMMENDATIONS
AUTHORITY
Legitimacy
The group has no legal or traditional authority to define rules or the ability to follow through with implementation of plans.
-2
The process of legal or traditional recognition of the group to define the rules and implement procedures is underway but not yet completed.
-1
The group has no legal or official recognition to participate in the process of creating rules and monitoring procedures to ensure enforcement, but its role is not accepted by all local stakeholders (if customary) or there are disagreements over attribution (in the case of the government).
0
The group has legal or traditional recognition only to determine what resource and land use is permitted, to define who has access to certain resources, or can implement certain land use practices. Its legitimacy in relation to enforcement, however, is not recognized.
+1
The group is officially recognised by a legal act or traditionally as having jurisdiction to determine what resources or land use is permitted, to determine resource access. It can also decide what penalties will be imposed for violation of these rules.
+2

INTRODUCTION & KEY CONCEPTS
DESIGNING & IMPLEMENTING THE EVALUATION
PRISM MODULES
METHOD FACTSHEETS & ANNEXES
PRISM - TOOLKIT FOR EVALUATING THE OUTCOMES AND IMPACTS OF SMALL/MEDIUM-SIZED CONSERVATION PROJECTS325
LIVELIHOODS & GOVERNANCE
ANNEX
GOVERNANCE ASSESSMENT
SCORING SHEET
4:3
ATTRIBUTES CRITERIA ASSESSMENT SCORE
COMMENTS/ EXPLANATIONS
RECOMMENDATIONS
Responsibility
The group has no set specifications or clearly defined structure and no action is taken to guide the management of natural resources on behalf of the communities it is supposed to represent.
-2
The group has no specifications, no structure and takes no active responsibility in decision-making (they are just there in name and do not operate in practice,).
-1
The group has a clearly defined set of specifications and a clearly defined structure, but its members do not take any initiative in decision-making related to the management.
0
The group has a set of specifications and a clearly defined structure and is actively involved in the management, and decision-making, but ignores the interest of the communities they represent.
+1
The group has a set of specifications and a clearly defined structure, and is actively involved in management decisions while taking into account the interested of the communities they represent.
+2
Participation
Indigenous and traditional peoples have no impact on the process of developing policies that limit access and use of resources, or in deciding penalties for those who do fail to meet the standards sets.
-2
Indigenous and traditional people have little impact on decisions regarding the management of the area, and play no role in management.
-1
The participation of indigenous and traditional people in decision-making and management of the area is random and on an ad hoc basis.
0
Indigenous and traditional people directly contribute to some important decisions related to management but their involvement should be improved.
+1
Indigenous and traditional people directly participate in all relevant decisions concerning the management and suggestions, proposals and complaints are considered (continuous and constant interaction).
+2

INTRODUCTION & KEY CONCEPTS
DESIGNING & IMPLEMENTING THE EVALUATION
PRISM MODULES
METHOD FACTSHEETS & ANNEXES
PRISM - TOOLKIT FOR EVALUATING THE OUTCOMES AND IMPACTS OF SMALL/MEDIUM-SIZED CONSERVATION PROJECTS326
LIVELIHOODS & GOVERNANCE
ANNEX
GOVERNANCE ASSESSMENT
SCORING SHEET
4:3
ATTRIBUTES CRITERIA ASSESSMENT SCORE
COMMENTS/ EXPLANATIONS
RECOMMENDATIONS
Transparency
People have no information on the group’s activities and decisions. Authorities are using the system for their own interest.
-2
People receive information that is filtered, from a small number of sources, and is of little use to different member of the governance group.
-1
People receive scattered, irregular, information from the governance group.
0
The group shares decisions and informs the population about their activities through regular forums without giving them the opportunity to access all the information. There is less possibility for the authorities to abuse the system for their own interests.
+1
The meetings of the governance group are open to the press and the public, budgets can be found easily, and the laws and decisions made are open for discussion.
+2
Equity
Rules and enforcement standards set by the group do not provide fair management standards in defining rules, their application, and the sharing of benefits arising from the management of natural resources
-2
The group blatantly discriminates against stakeholders in defining rules, their application, and the sharing of benefits arising from the management of natural resources
-1
Standards of fairness are provided in the rules put in place, but are never enforced or applied to the “client’s head”.
0
Standards of fairness are provided in the rules put in place but are only partially implemented. +1
The rules governing access and use of natural resources are fair in terms of who benefits and who bears the costs and are applied equally to all individuals and groups. ie the costs and benefits are evenly distributed, equal rights under the law and equal application of the law.
+2

INTRODUCTION & KEY CONCEPTS
DESIGNING & IMPLEMENTING THE EVALUATION
PRISM MODULES
METHOD FACTSHEETS & ANNEXES
PRISM - TOOLKIT FOR EVALUATING THE OUTCOMES AND IMPACTS OF SMALL/MEDIUM-SIZED CONSERVATION PROJECTS327
LIVELIHOODS & GOVERNANCE
ANNEX
GOVERNANCE ASSESSMENT
SCORING SHEET
4:3
ATTRIBUTES CRITERIA ASSESSMENT SCORE
COMMENTS/ EXPLANATIONS
RECOMMENDATIONS
CAPACITY
Knowledge and Skills
The group has no competence and knowledge of a) factors biological, economic, historical, socio-political and know what could jeopardize long-term viability of the use of natural resources; b) policies and practices that would be needed to remedy the situation so that the resources of value are kept and used in a sustainable manner; and c) means of a group to monitor the effectiveness of the implementation of their conservation plans.
-2
The group has low skills and knowledge of a) factors- biological, economic, historical, sociopolitical and know what could jeopardize the long-term viability of the use of natural resources; b) policies and practices that would be needed to remedy the situation so that the resources of value are kept and used in a sustainable manner; and c) a means of monitoring the effectiveness of the implementation of their conservation plans.
-1
The group has good skills and knowledge of a) factors- biological, economic, historical, sociopolitical and know what could jeopardize the long-term viability of the use of the natural resources, but not b) policies and practices that would be needed to remedy the situation so that the resources of value are kept and used in a sustainable manner.
0
The group has good skills and knowledge of a) factorsbiological, economic, historical, sociopolitical and know what could jeopardize the long-term viability of the use of natural resources and b) policies and practices that would be needed to remedy the situation so that the resources of value are kept and used in a sustainable manner, but not c) means a group can monitor the effectiveness of the implementation of their conservation plans.
+1
The group has good skills and knowledge of a) factors-biological, economic, historical, sociopolitical and what could jeopardize the long –term viability of the use of natural resources, b) polices and practices that would be needed to remedy the situation so that resources of value are kept so that the resources of value are kept and used and used in a sustainable manner; and c) the means to monitor the effectiveness of the implementation of their conservation plans.
+2

INTRODUCTION & KEY CONCEPTS
DESIGNING & IMPLEMENTING THE EVALUATION
PRISM MODULES
METHOD FACTSHEETS & ANNEXES
PRISM - TOOLKIT FOR EVALUATING THE OUTCOMES AND IMPACTS OF SMALL/MEDIUM-SIZED CONSERVATION PROJECTS328
LIVELIHOODS & GOVERNANCE
ANNEX
GOVERNANCE ASSESSMENT
SCORING SHEET
4:3
ATTRIBUTES CRITERIA ASSESSMENT SCORE
COMMENTS/ EXPLANATIONS
RECOMMENDATIONS
Resources
There is no material or financial means, staff numbers are not sufficient -2
The budget, material and the staff available are inadequate to meet the needs of the group. -1
The budget and the material are inappropriate but the staff is adequate to respond to the basic needs of the group’s mission. 0
The budget, the material, and the staff available are acceptable to meet the basic needs of the group’s mission, but it is not able to meet all the basic needed.
+1
The budget, material and personnel available is sufficient to cover all the needs of the group and to measure the plans that they put into place and to evaluate and communicate the results and the impacts of their efforts.
+2
Regulatory Framework
There are no laws or traditional customs that define the rules of management -2
There is a profusion of laws with often-contradictory rules for management -1
There are national laws and regulations or customary principles, which are not adapted to the context managed by the governance group resources
0
There are specific rules and management standards, which are not used to drive the management by governance group. +1
The actions of the governance group are based on a set of rules and regulations that explicitly engage the informal or customary law on who has access to what resources and to what these resources are and how these resources can be used, though their actions are unlikely to be effective in the long term.
+2

INTRODUCTION & KEY CONCEPTS
DESIGNING & IMPLEMENTING THE EVALUATION
PRISM MODULES
METHOD FACTSHEETS & ANNEXES
PRISM - TOOLKIT FOR EVALUATING THE OUTCOMES AND IMPACTS OF SMALL/MEDIUM-SIZED CONSERVATION PROJECTS329
LIVELIHOODS & GOVERNANCE
ANNEX
GOVERNANCE ASSESSMENT
SCORING SHEET
4:3
ATTRIBUTES CRITERIA ASSESSMENT SCORE
COMMENTS/ EXPLANATIONS
RECOMMENDATIONS
Motivation
Members of the group have no initiative and spontaneity. The group exists in name only and even when support is given the expected outcome is not obtained.
-2
Members of the group perform their duties sporadically because they do not receive financial, material and technical assistance. Once they have this support in the future, they will be able to act more effectively.
-1
More than 20% of group members are willing to give their all in the work duties without external input (material, financial, technical) 0
More than half of the group members have taken initiatives to give body and soul and engage personally and unwavering commit to do whatever is necessary to accomplish their mission with or without external input (material, financial or other).
+1
With or without external input (material, financial, technical), the group and its members give body and soul and engage personally with unwavering commitment to do whatever is necessary to accomplish their mission.
+2
POWER
Implementa-tion of group decisions
The group cannot make and enforce decisions.-2
The group takes management decisions theoretically but never implements them. -1
The group has the power to make decision and implement them on a portion of the species that exist on the resources it governs. 0
The group makes management decisions and implements and enforces them in harmony with the users and rights holders. +1
The group makes management decisions, has the authority and autonomy to enforce and apply all the rules in harmony with users and right holders.
+2

INTRODUCTION & KEY CONCEPTS
DESIGNING & IMPLEMENTING THE EVALUATION
PRISM MODULES
METHOD FACTSHEETS & ANNEXES
PRISM - TOOLKIT FOR EVALUATING THE OUTCOMES AND IMPACTS OF SMALL/MEDIUM-SIZED CONSERVATION PROJECTS330
LIVELIHOODS & GOVERNANCE
ANNEX
GOVERNANCE ASSESSMENT
SCORING SHEET
4:3
ATTRIBUTES CRITERIA ASSESSMENT SCORE
COMMENTS/ EXPLANATIONS
RECOMMENDATIONS
Accountability
Users and rights holders of the resources under control of the governance group do not have access to management have no opportunity to access management information, make requests or demand accountability.
-2
A platform for public access to information and formulation of questions to governance groups was planned but was never made operational.
-1
A public platform for information and formulation of questions to the governance group exists, but users and resource rights holders do not have the knowledge, time or financial resources to exploit and vice versa.
0
A public platform for information and formulation of questions to the governance groups exists, users and rights holders have the knowledge, time and financial resources to operate, but are not informed of the opportunity.
+1
There is a statutory or customary framework in place to facilitate public access to information about the group’s work, to make requests and to get answers in response.
+2

INTRODUCTION & KEY CONCEPTS
DESIGNING & IMPLEMENTING THE EVALUATION
PRISM MODULES
METHOD FACTSHEETS & ANNEXES
PRISM - TOOLKIT FOR EVALUATING THE OUTCOMES AND IMPACTS OF SMALL/MEDIUM-SIZED CONSERVATION PROJECTS331
POLICY FACTSHEETS
AND ANNEXES
Policy factsheets and annexes
Media tracking
Media scorecards
Observation checklist for documenting meetings
Policymaker ratings
Bellwether methodology
Civil society tracking tool
4:4

INTRODUCTION & KEY CONCEPTS
DESIGNING & IMPLEMENTING THE EVALUATION
PRISM MODULES
METHOD FACTSHEETS & ANNEXES
PRISM - TOOLKIT FOR EVALUATING THE OUTCOMES AND IMPACTS OF SMALL/MEDIUM-SIZED CONSERVATION PROJECTS332
Factsheet: Media tracking
Summary
Used to evaluate media strategies that often are part of advocacy
efforts, this method examines whether media coverage of an
issue changes over time. Basic media tracking reveals whether
advocacy issues or messages are mentioned more often but says
little else about their coverage. This method could also be used
where media strategies are not expressly employed – to evaluate/
gauge the level of media and public awareness and attention raised
for the policy area/campaign. This need not be done as an isolated
event or evaluation, but could provide a system/methodology for
ongoing monitoring of media coverage.
Required steps
Step 1. Identify the types of sources to track (print,
broadcast or electronic).
Step 2. Choose the specific media outlets to track.
Step 3. Select the relevant time periods to search.
Step 4. Select the specific search terms (the advocacy
messages). All of these must be carefully chosen and
tested. Search terms, for example, must be broad
enough to uncover relevant articles but specific
enough to have value and be manageable.
Step 5. Count the number of times the search terms or
phrases appear.
Acknowledgement
Based on guidance in Annie E Casey Handbook of data collection
tools (pages 21-23).
http://dmeforpeace.org/sites/default/files/AEF_Data%20
Collection%20Tools.pdf
POLICY FACTSHEET
MEDIA TRACKING
STEPS 1 TO 5
4:4

INTRODUCTION & KEY CONCEPTS
DESIGNING & IMPLEMENTING THE EVALUATION
PRISM MODULES
METHOD FACTSHEETS & ANNEXES
PRISM - TOOLKIT FOR EVALUATING THE OUTCOMES AND IMPACTS OF SMALL/MEDIUM-SIZED CONSERVATION PROJECTS333
Factsheet: Media scorecards
Summary
Media scorecards are a method for comparing the media
coverage generated by different issues or organisations over time.
Combined with traditional media tracking that searches media
outlets for key words or phrases, media scorecards help to assess
very quickly the extent to which particular issues or organisations
are referenced in specific outlets, compared with the extent to
which other issues or organisations (allies or opponents) are also
referenced in those outlets. The “scorecard” in the title refers to
these comparisons.
Introduction
Many tools and services are available to access news content
rapidly via the internet. They range from free to expensive,
and from quick to time-intensive. Some evaluators use a paid
subscription service offered by the online news database
LexisNexis (www.lexisnexis.com/en-us/gateway.page ), which
allows easy searching of hundreds of local, regional, national and
international media sources. Another option is to use free search
tools such as Google News Search (news.google.com), which makes
it possible to search for specific terms from a specific online news
source. Searches can be set up for multiple sources and used to
create ‘Google Alerts’, which automatically email updated results
on a pre-set basis. Although online media databases and search
engines return results very quickly, they are not instantaneous.
Depending on the source, there may be slight delays; it may take
a day or two for news databases to upload new articles from
certain sources. Really Simple Syndication (RSS) readers do not
receive instant updates, and even Google can take a few hours to
index new web pages. Delays, however, are usually not significant
in terms of the requirements and timeframes for overall project
monitoring and evaluation.
Required steps
Step 1. Identify the types of sources to track (web-pages,
broadcasts), the specific media outlets to track, the
relevant time periods to search and the specific
search terms to use.
Step 2. Identify the issues or organisations to track as a
comparison. The sources, outlets and timeframe
remain the same. Patterns and trends for the issue or
organisation of interest are then examined alongside
the comparison, to identify for example who or what
is generating more coverage, who is generating it first
and where the coverage is located.
Examples include:
• total number of stories;
• total area or time allotted to each story;
• total number of news stories above average length;
• total stories with pictures and graphics;
• total stories on the front page or in the local TV news
programme.
Acknowledgements
Based on guidance in UNICEF Monitoring and Evaluating
Advocacy Toolkit (page 26) http://www.unicef.org/evaluation/
files/Advocacy_Toolkit_Companion.pdf .
POLICY FACTSHEET
MEDIA SCORECARDS
STEPS 1 & 2
4:4

INTRODUCTION & KEY CONCEPTS
DESIGNING & IMPLEMENTING THE EVALUATION
PRISM MODULES
METHOD FACTSHEETS & ANNEXES
PRISM - TOOLKIT FOR EVALUATING THE OUTCOMES AND IMPACTS OF SMALL/MEDIUM-SIZED CONSERVATION PROJECTS334
Factsheet: Observation checklist for documenting meetings
Summary
This method can be used to gauge the degree to which community
members, key individuals or groups change their beliefs or
priorities about a particular issue. A simple observation checklist
can help to capture how often a particular issue is on a meeting
agenda, whether the issue was discussed, what the main
content or emphasis was, the length or depth of the discussion
and perceptions of seriousness. See the example of a meeting
observation checklist below. It could also be used to record
whether or not a particular policy issue, organisations/network or
campaign was referenced or discussed. Checklists should then be
entered into an observation database, perhaps shared between
network partners, to track changes and influence over time.
Acknowledgement
Based on guidance in Annie E Casey Handbook of data collection
tools (pages 21-23). http://dmeforpeace.org/sites/default/files/
AEF_Data%20Collection%20Tools.pdf
POLICY FACTSHEET
OBSERVATION CHECKLIST FOR DOCUMENTING
MEETINGS
Observation Checklist
For meetings
Date: __________________________ Length of meeting: ______________________
Setting: ________________________ # of male attendees: ____ # of female attendees: ____
1. What were the main issues discussed during this meeting (e.g. resource use, species conservation, climate change, etc.)? __________________________________________________________________________
2. Was conservation on the agenda? YES NO
3. Was conservation discussed? YES NO
(If answered "yes" for question 3, please continue; if answered "no" for question 3, please skip to question 8.)
4. What was the main content of the policy discussion?
__________________________________________________________________________
5. Was agreement reached in this discussion? YES NO What was the length of the discussion? ______________________________________
6. Would you say that the issue(s) discussed were taken seriously by the attendees?
YES NO
Please explain: ____________________________________________________________
7. Was any action planned related to conservation? YES NO
Please explain:
_________________________________________________________________________
8. Additional notes or comments:
_________________________________________________________________________
4:4

INTRODUCTION & KEY CONCEPTS
DESIGNING & IMPLEMENTING THE EVALUATION
PRISM MODULES
METHOD FACTSHEETS & ANNEXES
PRISM - TOOLKIT FOR EVALUATING THE OUTCOMES AND IMPACTS OF SMALL/MEDIUM-SIZED CONSERVATION PROJECTS335
Factsheet: Policymaker ratings
Summary
This is a method for gauging political will or support for a
particular advocacy issue or proposal amongst a defined group
of policymakers (e.g. legislature, council). The approach was
developed in response to the perceived inadequacy of indicators
commonly used to gauge policymaker support on issues (e.g.
number of new policies introduced on the issue; number of votes
for or against a specific policy). This method takes a different
approach to measuring such support, and capitalises on advocates’
insider knowledge about individual policymakers’ stances on policy
issues. It does not create extra work for advocates, but instead
usefully transfers what they already know through their regular
intelligence-gathering and outreach. This method thus contains
an element of subjectivity, as it relies on individual advocate
knowledge, experience and judgement (although the “confidence
ratings” do go some way to ameliorating this); hence why it is
advised that a minimum of three project team members/advocates
should make an input to the rating process.
Required steps
Step 1. Identify the issue.
Step 2. Select specific policymakers/policymaking body for
analysis.
For example parliament, council, organisation, etc.
Step 3. Familiarise yourself with the scoring system and
criteria.
Policymakers are rated according to three criteria.
Policymaker level of support — Individual policymaker
support for an issue based on his or her public
behaviours or actions in relation to the issue.
Policymaker level of influence — Policymaker influence
on the policy issue of interest (similar to the idea of
a power analysis). Ratings are based on criteria that
research shows relate to policymaker influence (see
table below).
Rater level of confidence — Confidence in the accuracy
of ratings on the first two scales.
POLICY FACTSHEET
POLICYMAKER RATINGS
STEPS 1, 2 & 3
4:4

INTRODUCTION & KEY CONCEPTS
DESIGNING & IMPLEMENTING THE EVALUATION
PRISM MODULES
METHOD FACTSHEETS & ANNEXES
PRISM - TOOLKIT FOR EVALUATING THE OUTCOMES AND IMPACTS OF SMALL/MEDIUM-SIZED CONSERVATION PROJECTS336
POLICY FACTSHEET
POLICYMAKER RATINGS
SCALE RATING DEFINITION
Support 1Not at all supportive
No evidence that this person has spoken or taken any action in support of the policy issue (includes opposition)
2Somewhat supportive
Has indicated being favourably disposed to the policy issue (e.g. expresses support for the issue or mentions it in one-to-one or small group conversations)
3Supportive
Occasionally takes action either publicly or behind the scenes beyond voting in support of the policy issue (e.g. speaks out at public hearings, gets quoted in the media, includes it in speeches, assigns bills to a power legislator, encourages colleagues to support policies, plays a role in budget negotiations)
4Extremely supportive
Has a well-known reputation for being a champion of the policy issue and regularly takes leadership in advancing it (e.g. makes it a key part of their platform or agenda)
InfluenceCriteria:1. Majority party member2. Relevant content expertise3. Seniority/experience (record of
public service)4. Reputation/respect (e.g. has
been able to exercise some power/ leadership in the legislature)
5. Key committee member6. Formal leadership position
(chairs a key committee or is a Senate or Assembly leader)
1Not very
influential
Meets none or only one criterion
2Somewhat influential
Meets at least two criteria
3Influential
Meets three or four criteria and/or is on a key committee
4Extremely influential
Meets five or six criteria and/or holds a formal leadership position in the legislature or and/or chairs a key committee
Confidence 1Not very confident
Ratings are a guess, based on third-hand, unverifiable or unreliable information about the policymaker and their related interest or lack of interest (e.g. the policymaker or their staff saying they “love the issue” in a small meeting where they feel pressure to speak positively)
2Somewhat confident
Ratings are a fairly well informed guess (e.g. advocates have picked up consistent information from more than one source, but sources may not be 100% verifiable or reliable, or the information collected is somewhat vague)
3Confident
Ratings are based on advocates’ direct contact with the individual or information from a trusted and reliable source
POLICYMAKER RATINGS SCORING CRITERIA
4:4

INTRODUCTION & KEY CONCEPTS
DESIGNING & IMPLEMENTING THE EVALUATION
PRISM MODULES
METHOD FACTSHEETS & ANNEXES
PRISM - TOOLKIT FOR EVALUATING THE OUTCOMES AND IMPACTS OF SMALL/MEDIUM-SIZED CONSERVATION PROJECTS337
Step 4. Rate targeted policymakers on the three scales that
assess support, influence and confidence using the
scorecard and criteria above. Brief notes as to the
reason/evidence behind the ratings would be useful.
At least three project team members (the more the
better, to increase robustness of the assessment) should
participate in the rating process. Advocates either
undertake the ratings as a group (arriving at a consensus
group rating), or do it independently and then average
their ratings.
Step 5. Discuss and provide some justification for the
reasons behind the scores given in each completed
scorecard. It would be useful to note briefly the main
points of evidence used to inform this rating.
Step 6. Once ratings are complete, composite ratings are
calculated and aggregated across policymakers. Data,
such as individual policymakers’ party affiliation,
district representation or community membership,
can be added to enable different ways of looking at
the analysis. This method is repeatable over time to
determine whether and how indicators shift.
POLICY FACTSHEET
POLICYMAKER
RATINGS
STEPS 4, 5 & 6
4:4
POLICYMAKER RATINGS SCORECARD
Policymaker/policymaking body:
Issue:
Scale Rating Definition
Support
Influence
Confidence
Total
Notes/justification
POLICYMAKER RATINGS SCORECARD.
Acknowledgement:
Based on guidance in
Innovation Network Unique
Methods in Advocacy
Evaluation Brief. Examples
on pages 5-6. http://www.
innonet.org/resources/files/
Unique_Methods_Brief.pdf .

INTRODUCTION & KEY CONCEPTS
DESIGNING & IMPLEMENTING THE EVALUATION
PRISM MODULES
METHOD FACTSHEETS & ANNEXES
PRISM - TOOLKIT FOR EVALUATING THE OUTCOMES AND IMPACTS OF SMALL/MEDIUM-SIZED CONSERVATION PROJECTS338
Factsheet: Bellweather methodology
Introduction
This method was developed specifically for the evaluation of policy
advocacy efforts. It determines where a policy issue or proposal is
positioned on the policy agenda, how decision makers and other
influential actors are thinking and talking about it, and how likely
policymakers are to act on it.
The method involves structured interviews with “bellwethers”:
influential people in the public and private sectors whose positions
require that they be politically informed and that they track a
broad range of policy issues. Bellwethers are knowledgeable and
innovative thought leaders, and political insiders whose opinions
about policy issues carry substantial weight and predictive value.
The bellwether methodology returns data that indicate how
effective advocates have been in communicating their messages,
and whether they have been successful in moving their issue onto
the policy agenda or in increasing its importance. Bellwether
data also informs advocates about specific gaps in bellwether
knowledge.
Required steps
Step 1. Select the types of bellwethers to interview.
Categories might include: policymakers; media;
donors; UN agencies; other NGOs/CBOs;
researchers; and business and trade experts.
Categories should represent the types of individuals
whose opinions are important or influential on the
policy issue of interest.
Step 2. Selecting the bellwether sample requires the
development of criteria for selecting individual
bellwethers.
At least half of the sample should include bellwethers
who do not have a specific connection to the policy issue
being explored. This increases the probability that issue
awareness or knowledge detected during interviews
can be linked to advocacy efforts, rather than being
the result of personal experiences or other extraneous
variables. Other selection criteria might include gender,
cultural and geographical diversity. Once selection
criteria are developed, subject matter experts nominate
bellwethers who fit the criteria.
POLICY FACTSHEET
BELLWEATHER
METHODOLOGY
STEPS 1 & 2
4:4

INTRODUCTION & KEY CONCEPTS
DESIGNING & IMPLEMENTING THE EVALUATION
PRISM MODULES
METHOD FACTSHEETS & ANNEXES
PRISM - TOOLKIT FOR EVALUATING THE OUTCOMES AND IMPACTS OF SMALL/MEDIUM-SIZED CONSERVATION PROJECTS339
Step 3. Set up the interviews. Bellwethers must be unaware
before the interview begins that the interview will
focus on the specific policy issue. They are informed
about what the interview will generally cover but
they do not receive specific details. This helps to
ensure that bellwethers’ responses are authentic and
unprompted.
Step 4. Conduct interviews with questions that determine
what bellwethers know and think about the policy
of interest. The interview might start by asking
bellwethers what issues they think are at the top of
the policy agenda.
Their responses (which will be unprompted because
they do not know beforehand which specific policy issue
you are exploring) indicate whether the advocacy issue
of interest shows up in that agenda, and if so where,
and along with what other issues. Later questions can
get more specific and ask about bellwethers’ familiarity
with the issue of interest and probe what they know,
allowing later content analysis to determine whether
advocates’ messages surface in bellwether discourse
about the issue. Bellwethers might also be asked to
predict whether they think the issue will advance in the
near future or in the longer term.
Acknowledgement:
Based on guidance in UNICEF Monitoring and Evaluating
Advocacy Toolkit (page 26). http://www.unicef.org/evaluation/
files/Advocacy_Toolkit_Companion.pdf .
POLICY FACTSHEET
BELLWEATHER METHODOLOGY
STEPS 3 & 4
4:4

INTRODUCTION & KEY CONCEPTS
DESIGNING & IMPLEMENTING THE EVALUATION
PRISM MODULES
METHOD FACTSHEETS & ANNEXES
PRISM - TOOLKIT FOR EVALUATING THE OUTCOMES AND IMPACTS OF SMALL/MEDIUM-SIZED CONSERVATION PROJECTS340
Annex: Civil society tracking tool
Goal
Local and national civil society groups dedicated to global
conservation priorities collectively possess sufficient
organisational and technical capacity to be effective advocates for,
and agents of, conservation and sustainable development for at
least the next 10 years.
Criteria
i. Human resources. Local and national civil society
groups collectively possess technical competencies
of critical importance to conservation, on topics that
include protected areas management; conservation
monitoring and analysis; sustainable financing; policy
analysis and influence; environmental education and
media outreach; and threat mitigation and adaptation.
ii. Management systems and strategic planning. Local
and national civil society groups collectively possess
sufficient institutional and operational capacity and
structures to raise funds for conservation and to ensure
the efficient management of conservation projects and
strategies.
iii. Partnerships. Effective mechanisms (e.g. discussion
forums, round tables, mutual support networks,
alliances, etc.) exist for conservation-focused civil
society groups to work in partnership with one
another and through networks with local communities,
governments, the private sector, donors and other
important stakeholders, in pursuit of common
conservation and development objectives.
iv. Financial resources. Local civil society organisations
have access to long-term funding sources to maintain
the conservation results achieved via funding grants
and/or other initiatives, through access to new donor
funds, conservation enterprises, memberships,
endowments, and/or other funding mechanisms.
v. Transboundary cooperation. In multi-country
situations, mechanisms exist for collaboration across
political boundaries at site, corridor and/or national
scales.
POLICY ANNEX
CIVIL SOCIETY
TRACKING TOOL
4:4

INTRODUCTION & KEY CONCEPTS
DESIGNING & IMPLEMENTING THE EVALUATION
PRISM MODULES
METHOD FACTSHEETS & ANNEXES
PRISM - TOOLKIT FOR EVALUATING THE OUTCOMES AND IMPACTS OF SMALL/MEDIUM-SIZED CONSERVATION PROJECTS341
Indicators
• Criterion (i) will be considered to have been partially
met if knowledge and capacity within local civil society
organisations is rated as satisfactory or above in at
least 50% of the technical competencies considered as
priorities.
• Criterion (i) will be considered to have been fully met
if knowledge and capacity within local civil society
organisations is rated as satisfactory or above in at
least 90% of the technical competencies considered as
priorities.
• Criterion (ii) will be considered to have been partially
met if at least 50% of the priority areas concerned have
at least one local, national, or international civil society
organisation dedicated to their conservation with at
least satisfactory institutional and operational capacity.
• Criterion (ii) will be considered to have been fully met
if at least 90% of the priority areas concerned have at
least one local, national, or international civil society
organisation dedicated to their conservation with at
least satisfactory institutional and operational capacity.
• Criterion (iii) will be considered to have been
partially met if fully institutionalised and sustainable
partnerships are dedicated to coordinating
conservation and development actions among key
stakeholder groups in at least 50% of the priority areas
concerned.
• Criterion (iii) will be considered to have been fully met
if fully institutionalised and sustainable partnerships
are dedicated to coordinating conservation and
development actions among key stakeholder groups in
at least 90% of the priority areas concerned.
• Criterion (iv) will be considered to have been partially
met if 50% of the priority areas concerned have access
to stable and diversified long-term funding sources
for conservation through support to local civil society
organisations.
• Criterion (iv) will be considered to have been fully met
if 90% of the priority areas concerned have access to
stable and diversified long-term funding sources for
conservation through support to local civil society
organisations.
• Criterion (v) will be considered to have been partially
met if effective mechanisms for transboundary
collaboration exist in at least 50% of the countries
concerned.
• Criterion (v) will be considered to have been fully met if
effective mechanisms for transboundary collaboration
exist in at least 90% of the countries concerned.
Acknowledgement:
Based on CEPF “tracking tool” for use in systematically monitoring
the impact of CEPF on civil society development. Available from:
http://www.cepf.net/resources/publications/Pages/monitoring_
and_evaluation.aspx
POLICY ANNEX
CIVIL SOCIETY TRACKING TOOL
4:4

INTRODUCTION & KEY CONCEPTS
DESIGNING & IMPLEMENTING THE EVALUATION
PRISM MODULES
METHOD FACTSHEETS & ANNEXES
PRISM - TOOLKIT FOR EVALUATING THE OUTCOMES AND IMPACTS OF SMALL/MEDIUM-SIZED CONSERVATION PROJECTS342
POLICY ANNEX
CIVIL SOCIETY TRACKING TOOL
CRITERION BASELINE (YEAR) MID TERM (YEAR)
FINAL (YEAR) COMMENTS
i. Human resources. Local and national civil society groups collectively possess technical competencies of critical importance to conservation,, on topics that include protected areas management; conservation monitoring and analysis; sustainable financing; policy analysis and influence; environmental education and media outreach; and threat mitigation and adaptation..
Not met Not met Not met
Partially met
Partially met
Partially met
Fully met Fully met Fully met
ii. Management systems and strategic planning. Local and national civil society groups collectively possess sufficient institutional and operational capacity and structures to raise funds for conservation and to ensure the efficient management of conservation projects and strategies.
Not met Not met Not met
Partially met
Partially met
Partially met
Fully met Fully met Fully met
iii. Partnerships. Effective mechanisms exist for conservation-focused civil society groups to work in partnership with one another, and through networks with local communities, governments, the private sector, donors, and other important stakeholders, in pursuit of common objectives.
Not met Not met Not met
Partially met
Partially met
Partially met
Fully met Fully met Fully met
iv. Financial resources. Local civil society organisations have access to long-term funding sources to maintain the conservation results achieved via funding grants and/or other initiatives, through access to new donor funds, conservation enterprises, memberships, endowments, and/or other funding mechanisms.
Not met Not met Not met
Partially met
Partially met
Partially met
Fully met Fully met Fully met
v. Transboundary cooperation. In multi-country situations, mechanisms exist for collaboration across political boundaries at site, corridor and/or national scales.
Not met Not met Not met
Partially met
Partially met
Partially met
Fully met Fully met Fully met
CIVIL SOCIETY TRACKING TOOL WORKSHEET
4:4

INTRODUCTION & KEY CONCEPTS
DESIGNING & IMPLEMENTING THE EVALUATION
PRISM MODULES
METHOD FACTSHEETS & ANNEXES
PRISM - TOOLKIT FOR EVALUATING THE OUTCOMES AND IMPACTS OF SMALL/MEDIUM-SIZED CONSERVATION PROJECTS343
SPECIES AND HABITAT
MANAGEMENT FACTSHEETS AND
ANNEXES
Method factsheets
Scorecard for evaluating changes in knowledge gaps
Scorecard for evaluating action plan completion
Scorecard for evaluating action plan adequacy
Threat reduction scoring
Scorecard for evaluating changes in species’ status
Scorecard for evaluating changes in habitat status
Using field assessment methods for evaluating changes in
species’ status
Using remote assessment methods evaluating changes in
habitat status
Using field assessment methods for evaluating changes in
habitat status
Annexes
Field methods for species monitoring
Sampling approaches for monitoring different species to
assess their status
Analytical issues when estimating abundance, distribution,
survival and reproduction
Field methods for habitat monitoring
Sampling approaches for monitoring habitat status
4:5

INTRODUCTION & KEY CONCEPTS
DESIGNING & IMPLEMENTING THE EVALUATION
PRISM MODULES
METHOD FACTSHEETS & ANNEXES
PRISM - TOOLKIT FOR EVALUATING THE OUTCOMES AND IMPACTS OF SMALL/MEDIUM-SIZED CONSERVATION PROJECTS344
Factsheet: Scorecard for evaluating knowledge gaps
Summary
This factsheet describes a simple method for assessing the
outcomes and impacts of project actions on knowledge gaps. This
involves first identifying the knowledge gaps relating to different
aspects of species/habitat status that the project actions aim to
address, and then scoring the level of knowledge. The change
in scores during the course of a project can be compared to a
hypothetical scenario in which the project did not take place, in
order to estimate the outcome and impact of project actions.
Required steps
Step 1. Identify knowledge gaps.
The main components of knowledge that project
actions may address can be summarised as follows:
• Distribution (including locations of populations,
distribution limits, altitudinal preferences, occupancy
patterns, habitat extent). This is fundamental to
identifying the locations where conservation action may
benefit particular species or habitats, as well as helping
to prioritise where conservation action may best be
targeted.
• Population size (including global/national/local
population size, relative abundance, population
density and territory/home range size). Variation in the
abundance of populations at particular sites can be used
to identify the most important locations for particular
species or habitats, and to help prioritise which actions
to implement at which locations.
• Trends (trends over time in population size/distribution/
habitat extent, etc.). Trends in the distribution or
abundance of species, or in the extent of particular
habitat-types, provides important context to inform
conservation action, for example by prioritising
locations where populations are suffering the greatest
rate of decline, or by identifying core areas of stability
for protection.
• Threats (types of threats and their scope/area, severity/
intensity, timing/urgency, and hence impact/magnitude).
Identifying the cause of species population or range
decline is a key precursor to effective conservation
action.
• Ecology (habitat requirements, resource needs e.g. diet,
nest-sites, etc., predators, social structure, reproductive
behaviour, movement patterns, phenology). A good
understanding of the ecology of a species can inform
conservation action, by identifying limiting factors and
the ways in which management may be used to counter
the impact of constraints. An assessment of habitat
requirements may be used to test whether changes in
habitat availability or quality may be limiting. Ecological
understanding is particularly important where species
are being actively managed, or to inform the creation of
new habitats or reintroductions of species.
SPECIES & HABITAT MANAGEMENT
FACTSHEET
SCORECARD FOR EVALUATING
KNOWLEDGE GAPS
STEP 1
4:5

INTRODUCTION & KEY CONCEPTS
DESIGNING & IMPLEMENTING THE EVALUATION
PRISM MODULES
METHOD FACTSHEETS & ANNEXES
PRISM - TOOLKIT FOR EVALUATING THE OUTCOMES AND IMPACTS OF SMALL/MEDIUM-SIZED CONSERVATION PROJECTS345
• Extinction risk (typically assessed using the IUCN Red
List categories and criteria (IUCN 2014), although other
systems are also used in different national contexts).
Quantifying extinction risk is an important component
of conservation prioritisation and a means of tracking
conservation success. It involves collating information
on distribution, population size, trends and ecology (life-
history parameters) in particular.
• Solutions (effectiveness of conservation action,
management, etc.). The most successful conservation
actions are based on interventions which are known to
work. This often requires research to test effectiveness,
for example through experimental or monitoring
approaches.
Step 2. Score the degree to which project actions improved
the knowledge base.
Once knowledge gaps have been identified, each should
be scored using Table 1 and following the scoring
criteria in Table 2. Scores should reflect:
• the knowledge base at the beginning of the project
(scored retrospectively if not assessed at the beginning);
• the knowledge base at the end of the project; and
• an estimate of what the knowledge base would
have been if the project had not taken place (the
counterfactual scenario).
Ideally the scoring should be carried out both by the project team
and by certain key informants who have relevant knowledge of the
project’s conservation target (e.g. experts on the species/site being
targeted). See the factsheet Key informant interviews for more
information on this approach. If scoring is only being carried out
by the project team you should attempt to do this as objectively as
possible, and justify the scores selected.
SPECIES & HABITAT MANAGEMENT
FACTSHEET
SCORECARD FOR EVALUATING
KNOWLEDGE GAPS
STEP 2
4:5

INTRODUCTION & KEY CONCEPTS
DESIGNING & IMPLEMENTING THE EVALUATION
PRISM MODULES
METHOD FACTSHEETS & ANNEXES
PRISM - TOOLKIT FOR EVALUATING THE OUTCOMES AND IMPACTS OF SMALL/MEDIUM-SIZED CONSERVATION PROJECTS346
Table 1. Knowledge gaps scorecard. The criteria for scoring each
knowledge aspect are given in Table 2.
The difference between (a) the change over time in the actual
project scores and (b) the hypothetical scores demonstrates the
outcome/impact of the project’s actions. The estimate without
the project is important to account for the fact that knowledge
may have improved due to external factors (e.g. work by other
individuals/organisations that may have increased the knowledge
base for the species or ecosystem), rather than through the
project. Note that most projects do not address all of the
knowledge gaps outlined in the table, and many only address one
or two (see examples below).
ASPECT OF KNOWLEDGE BEFORE THE PROJECT AFTER THE PROJECT ESTIMATE WITHOUT THE PROJECT
Distribution
Abundance
Trend
Threats
Actions/interventions
Extinction risk
Justification:
TABLE 1. KNOWLEDGE GAPS SCORECARD.
SPECIES & HABITAT MANAGEMENT
FACTSHEET
SCORECARD FOR EVALUATING
KNOWLEDGE GAPS
4:5

INTRODUCTION & KEY CONCEPTS
DESIGNING & IMPLEMENTING THE EVALUATION
PRISM MODULES
METHOD FACTSHEETS & ANNEXES
PRISM - TOOLKIT FOR EVALUATING THE OUTCOMES AND IMPACTS OF SMALL/MEDIUM-SIZED CONSERVATION PROJECTS347
SPECIES & HABITAT MANAGEMENT
FACTSHEET
SCORECARD FOR EVALUATING
KNOWLEDGE GAPS
ASPECT OF KNOWLEDGE SCORE
Distribution 1 – species/habitat distribution is unknown or based upon a small number of historical (>25 years old) records. 2 – some recent (<25 years old) location records or confirmed absences, or a large amount of historical data.3 – large number of recent location records or confirmed absences, or an expert-based description of likely distribution is available.4 – sample surveys from across a species or habitat’s potential range provide a good indication of the extent and spread of recent
location records or absences within the project area. 5 – published distribution model with good model fit covering entire project area, or extensive data across the project area produce
robust distribution information.
Abundance 1 – population size unknown.2 – some abundance records exist but these are partial, unvalidated or old (>25 years).3 – large number of recent (<25 years) abundance records exist from unstructured surveys, or unvalidated expert-based assessments of
population size within the project area. 4 – abundance quantified, but based on potentially biased methods (non-random locations, failing to account for detectability, etc.). 5 – Robust population estimate exists based on high quality methods (random sample locations, detectability accounted for, etc.).
Trend 1 – population/range trend/habitat extent unknown (i.e. data from one period only).2 – some time-series of records or counts exists, but insufficient to infer more than anecdotal trend information, or data span 25 years
or less. 3 – large number of comparable records/counts exist from the project area, sufficient for at least some analysis of occurrence/
abundance between two time-periods to assess change through time over at least 25 years. 4 – monitoring scheme established and able to produce trends or change between at least two time-periods of 25 years or more, but
associated with some methodological biases (e.g. non-random locations, changes in methods, variation in effort). 5 –robust population and/or range change estimates over 25 or more years, derived from high quality methods.
Threats (for studies of a single threat, or of a species/habitat to examine a range of threats)
1 – threats unknown.2 – some ad hoc data or expert judgement about the importance of potential threat(s) is available.3 – limited analysis of a single threat is available, but from a limited sample or a small proportion of the project area (i.e. may not be
representative) or large-scale expert-based assessment of key threats (e.g. IUCN Red List assessment).4 – robust analysis of threats undertaken but key threat(s) still not identified.5 –published analysis has identified key threats to species/habitat with high confidence.
Actions/interventions 1 – solutions untested.2 – some anecdotal information about responses to interventions at one or a small number of locations.3 – some quantitative information or expert-based assessment on the effectiveness of action. 4 – some formal analytical tests undertaken on the success of intervention from at least one location. 5 – analysis of the impact of intervention and solutions upon populations and distributions at multiple locations, which may be
synthesised using meta-analyses.
Extinction risk 1 – extinction risk unknown.2 – some information gathered to assess extinction risk.3 – complete set of information available for extinction risk assessment. 4 – IUCN Red List assessment or equivalent categorical approach undertaken. 5 –quantitative assessment of extinction risk undertaken (e.g. Population Viability Analysis).
TABLE 2. SCORES FOR THE LEVEL OF KNOWLEDGE ABOUT DIFFERENT ASPECTS OF INFORMATION ABOUT SPECIES/HABITATS.
4:5

INTRODUCTION & KEY CONCEPTS
DESIGNING & IMPLEMENTING THE EVALUATION
PRISM MODULES
METHOD FACTSHEETS & ANNEXES
PRISM - TOOLKIT FOR EVALUATING THE OUTCOMES AND IMPACTS OF SMALL/MEDIUM-SIZED CONSERVATION PROJECTS348
Step 3. Discuss and provide justification for the scores given.
Discuss and record reasons for the scores given. This
is just as important as the scoring itself, and provides
useful insights into how the project brought about (or in
some cases did not bring about) the observed change.
SPECIES & HABITAT MANAGEMENT
FACTSHEET
SCORECARD FOR EVALUATING
KNOWLEDGE GAPS
STEP 3
4:5

INTRODUCTION & KEY CONCEPTS
DESIGNING & IMPLEMENTING THE EVALUATION
PRISM MODULES
METHOD FACTSHEETS & ANNEXES
PRISM - TOOLKIT FOR EVALUATING THE OUTCOMES AND IMPACTS OF SMALL/MEDIUM-SIZED CONSERVATION PROJECTS349
SPECIES & HABITAT MANAGEMENT
FACTSHEET
SCORECARD FOR EVALUATING
KNOWLEDGE GAPS
EXAMPLE 1
Project: A threatened species was known to occur within a
protected area from one or two historical records only. In
order to inform the future development of an action plan
for the area, a project to re-survey the protected area for
the species was carried out. The specific aim of the project
was to confirm the continued persistence or absence of the
species. By using a robust sampling approach, the project
confirmed the species persistence, and, using modelling of
widely-available remote-sensing data, successfully predicted
the occurrence and abundance of the species across
the protected area, with the results being subsequently
published in a local journal.
Evaluation: In order to evaluate this, the project team asked
key informants with experience of the species and the
target site to use the criteria in the PRISM knowledge gaps
factsheet to score the level of knowledge on the species
distribution and abundance before and after the project, and
to estimate what the level of knowledge would have been
without the project (see table below).
ASPECT OF KNOWLEDGE BEFORE THE PROJECT AFTER THE PROJECT ESTIMATE WITHOUT THE PROJECT
Distribution 1 – species/habitat distribution is unknown or based upon a small number of historical (>25 years old) records.
5 – published distribution model with good model fit covering entire project area, or extensive data across the project area produce robust distribution information.
1 – species/habitat distribution is unknown or based upon a small number of historical (>25 years old) records.
Abundance 1 – population size unknown. 5 – robust population estimate exists, based on high quality methods.
1 – population size unknown.
Justification: Key informants scored the level of knowledge after the project as 5, highlighting the project’s publication of a model predicting occurrence and abundance. They also scored the level of knowledge before the project and the estimate of what would have happened without the project as 1, as no other projects or studies had looked at the target area or species in that time. Given that the original project goal was to improve the score for distribution from 1 to 2 this represents a greater impact than originally anticipated, and it would not have been achieved without the project.
4:5

INTRODUCTION & KEY CONCEPTS
DESIGNING & IMPLEMENTING THE EVALUATION
PRISM MODULES
METHOD FACTSHEETS & ANNEXES
PRISM - TOOLKIT FOR EVALUATING THE OUTCOMES AND IMPACTS OF SMALL/MEDIUM-SIZED CONSERVATION PROJECTS350
EXAMPLE 2
Project: A conservation project converted some historically
farmed land to re-create wetland habitat adjacent to a
small protected area supporting a population of critically
endangered frogs. It was not known whether the approach
produced habitat of sufficient quality for the frogs to
colonise, although the approach had been shown to work for
other species in other contexts.
Evaluation: To evaluate the success of this action the project
team monitored habitat quality on the re-created habitat,
comparing it to the quality within the protected area, and
checked for the occurrence of the frogs within the re-
created habitat, assuming that in the absence of habitat
restoration, the target species would not occur on farmland.
The project team undertook an evaluation both to assess
the project results and to assess whether they had been
able to fill the knowledge gap concerning whether or not
the approach worked for encouraging frogs to re-colonise a
restored area.
ASPECT OF KNOWLEDGE BEFORE THE PROJECT AFTER THE PROJECT ESTIMATE WITHOUT THE PROJECT
Actions/interventions 2 – some anecdotal information about responses to interventions at one or a small number of locations.
4 – formal analytical tests, including of counterfactuals, of the success of intervention undertaken at least one location.
2 – some anecdotal information about responses to interventions at one or a small number of locations.
Justification: The restored habitat differed in water quality from habitat in the protected area, and the restored area was not colonised by frogs. The conservation element of the project was therefore unsuccessful, but the research to fill the knowledge gap was successful, achieving an actions/interventions score of 4. In the absence of the project, the level of information about the quality of the re-created habitat and about the occurrence of the amphibians would have remained the same.
SPECIES & HABITAT MANAGEMENT
FACTSHEET
SCORECARD FOR EVALUATING
KNOWLEDGE GAPS
4:5

INTRODUCTION & KEY CONCEPTS
DESIGNING & IMPLEMENTING THE EVALUATION
PRISM MODULES
METHOD FACTSHEETS & ANNEXES
PRISM - TOOLKIT FOR EVALUATING THE OUTCOMES AND IMPACTS OF SMALL/MEDIUM-SIZED CONSERVATION PROJECTS351
Factsheet: Scorecard for degree of completion of an action plan
Summary
This factsheet describes a simple method for evaluating project
actions that aim to develop or contribute to the compilation of
species action plans or habitat conservation plans. It presents
a 1-10 scale for scoring the degree of completion of a plan. The
change in scores during the course of a project is compared to a
hypothetical scenario in which the project did not take place, in
order to estimate the outcome and impact of project actions.
Required steps
Step 1. Familiarise yourself with the scoring criteria.
Typically, compiling an action plan involves the ten
steps outlined in Table 1 (note that in some cases, action
plans may be compiled by soliciting stakeholder input
remotely, rather than in person at a workshop).
SPECIES & HABITAT MANAGEMENT
FACTSHEET
SCORECARD FOR DEGREE OF
COMPLETION OF AN ACTION PLAN
STEP 1
STAGE OF COMPLETION SCORE
No existing action plan 0
Stakeholders identified 1
Background information compiled 2
Workshop conducted with key stakeholders reviewing background information, agreeing status, threats and actions
3
Action plan drafted 4
Action plan reviewed by workshop participants 5
Acton plan reviewed by wider stakeholder network
6
Action plan finalised 7
Action plan published, launched, and distributed 8
Action plan officially recognised e.g. by IUCN-SSC, government, multi-lateral environmental agreement, other stakeholder groups
9
Action plan implemented (confirmed by monitoring & evaluation)
10
TABLE 1: SCORES FOR EACH STAGE IN CREATING A SPECIES ACTION PLAN.
4:5

INTRODUCTION & KEY CONCEPTS
DESIGNING & IMPLEMENTING THE EVALUATION
PRISM MODULES
METHOD FACTSHEETS & ANNEXES
PRISM - TOOLKIT FOR EVALUATING THE OUTCOMES AND IMPACTS OF SMALL/MEDIUM-SIZED CONSERVATION PROJECTS352
Step 2. Score the degree to which project actions
contributed towards the completion of the
action plan.
Following the scoring criteria in Table 1, fill in the scorecard in
Table 2 to categorise the degree to which the project contributed
to the completion of the species/site action plan. Scores should
reflect:
• the degree of completion at the beginning of the project
(scored retrospectively if not assessed at the beginning);
• the degree of completion at the end of the project; and
• the estimated degree of completion if the project had
not taken place (the counterfactual scenario).
Ideally the scoring should be carried out both by the project team
and by certain key informants who have relevant knowledge of the
project’s conservation target (e.g. experts on the species/site being
targeted). See the factsheet Key informant interviews for more
information on this approach. If scoring is only being carried out
by the project team you should attempt to do this as objectively as
possible and justify the scores selected.
SPECIES & HABITAT MANAGEMENT
FACTSHEET
SCORECARD FOR DEGREE OF
COMPLETION OF AN ACTION PLAN
STEP 2ACTION PLAN DEGREE OF COMPLETION
BEFORE THE PROJECT AFTER THE PROJECT ESTIMATED SITUATION IF THE PROJECT HAD NOT HAPPENED
Insert name of action plan here
Justification:
TABLE 2. ACTION PLAN COMPLETION SCORECARD.
4:5

INTRODUCTION & KEY CONCEPTS
DESIGNING & IMPLEMENTING THE EVALUATION
PRISM MODULES
METHOD FACTSHEETS & ANNEXES
PRISM - TOOLKIT FOR EVALUATING THE OUTCOMES AND IMPACTS OF SMALL/MEDIUM-SIZED CONSERVATION PROJECTS353
Step 3. Discuss and provide justification for the scores given.
Discuss and record reasons for the scores given: this is just as
important as the scoring, and it provides useful insights into how
the project brought about (or in some cases did not bring about)
the observed change.
Note that many small/medium-sized projects, rather than
completing a full action plan themselves, will instead generate
new information on a species population size and distribution, and
feed this into the action plan. In such cases, the scoring criteria
remain the same, with the difference between the scores given
for the situation after the project and those given for the estimate
of what would have happened without the project reflecting the
degree to which the project contributed towards the action plan’s
completion (see example 2 below). In these cases it is particularly
important to provide justification and explain in as much detail as
possible how the project’s actions contributed to the production of
the wider plan.
Step 4. Present the results.
The final difference between the actual scores and the
hypothetical scenario can be presented to stakeholders either as
a narrative or as quantitative scores (see example 1) in a table or
diagram.
SPECIES & HABITAT MANAGEMENT
FACTSHEET
SCORECARD FOR DEGREE OF
COMPLETION OF AN ACTION PLAN
STEPS 3 & 4
4:5

INTRODUCTION & KEY CONCEPTS
DESIGNING & IMPLEMENTING THE EVALUATION
PRISM MODULES
METHOD FACTSHEETS & ANNEXES
PRISM - TOOLKIT FOR EVALUATING THE OUTCOMES AND IMPACTS OF SMALL/MEDIUM-SIZED CONSERVATION PROJECTS354
EXAMPLE 1
Project: A project aimed to produce a species action plan for
a rare plant.
Scoring and justification: This can either be stated as a
narrative or scored as follows: score at start of project =
0, score at end = 8, score in the absence of the project = 0;
outcome of project is 8-0 = 8.
SPECIES & HABITAT MANAGEMENT
FACTSHEET
SCORECARD FOR DEGREE OF
COMPLETION OF AN ACTION PLAN
ACTION PLAN DEGREE OF COMPLETION
BEFORE THE PROJECT AFTER THE PROJECT ESTIMATED SITUATION IF THE PROJECT HAD NOT HAPPENED
Species action plan for rare plant
0 – No existing action plan 8 – Action plan published, launched, and distributed
0 – No existing action plan
Justification: No action plan existed at the start of a project. The project implemented actions that resulted in publication of the plan and its distribution, but no official recognition or implementation happened within the project timeframe. No other efforts by non-project actors to produce an action plan occurred during the project timeframe.
EXAMPLE 1.
4:5

INTRODUCTION & KEY CONCEPTS
DESIGNING & IMPLEMENTING THE EVALUATION
PRISM MODULES
METHOD FACTSHEETS & ANNEXES
PRISM - TOOLKIT FOR EVALUATING THE OUTCOMES AND IMPACTS OF SMALL/MEDIUM-SIZED CONSERVATION PROJECTS355
EXAMPLE 2
Project: An action planning process was already underway
to produce a species action plan for a critically endangered
shorebird along a migratory flyway. To support this process,
a project carried out shorebird surveys at an important
staging point on the flyway. This generated new information
on the species’ population size and distribution, which was
then fed into the action plan.
Scoring and justification:
SPECIES & HABITAT MANAGEMENT
FACTSHEET
SCORECARD FOR DEGREE OF
COMPLETION OF AN ACTION PLAN
ACTION PLAN DEGREE OF COMPLETION
BEFORE THE PROJECT AFTER THE PROJECT ESTIMATED SITUATION IF THE PROJECT HAD NOT HAPPENED
Species action plan for shorebird
0 – No existing action plan 6 – Action plan reviewed from wider stakeholder network
5 – Action plan reviewed by workshop participants
Justification: While the action plan had successfully completed its initial stages without the input of the project, the information gathered by the project played an important role in allowing the action plan to progress to the next stages of development. This is reflected by the difference in scores between those given after the project and for the estimate of what would have happened without the project.
EXAMPLE 2.
4:5

INTRODUCTION & KEY CONCEPTS
DESIGNING & IMPLEMENTING THE EVALUATION
PRISM MODULES
METHOD FACTSHEETS & ANNEXES
PRISM - TOOLKIT FOR EVALUATING THE OUTCOMES AND IMPACTS OF SMALL/MEDIUM-SIZED CONSERVATION PROJECTS356
Factsheet: Scorecard for adequacy of an action plan
Summary
This factsheet describes a simple method for evaluating project
actions that aim to develop or contribute to the development of
species action plans or habitat conservation plans. It presents a
1-9 scale for scoring the adequacy of a plan. The change in scores
during the course of a project is compared to a hypothetical
scenario in which the project did not take place, in order to
estimate the outcome and impact of project actions.
Required steps
Step 1. Familiarise yourself with the scoring criteria.
The adequacy of an action plan can be judged in three ways:
1. How comprehensively does it assess the status, threats
and actions needed?
2. Does it have wide stakeholder buy-in and/or official
endorsement?
3. Is it being used?
Each of these parameters can be scored as low (1), medium (2) or
high (3) using the criteria in Table 1, with the sum of the scores
giving a maximum of 9 across all three parameters.
SPECIES & HABITAT MANAGEMENT
FACTSHEET
SCORECARD FOR ADEQUACY OF AN
ACTION PLAN
STEP 1ADEQUACY OF ACTION PLAN
SCORING CRITERIA
Comprehensiveness of assessment of the status, threats and actions needed
1 - Based only on a single source or missing many key sources of information.2 - Missing some key sources of information.3 - Fully comprehensive.
Breadth of stakeholder buy-in and official endorsement
1 - Based on limited stakeholder inputs. Some key stakeholder groups not consulted.2 - At least one key stakeholder group not consulted or endorsement lacking by at least one key authority.3 - Based on wide stakeholder inputs. Endorsed by relevant authorities (e.g. local/national government, international
bodies).
Degree of application to coordinate actions being implemented
1 - Action plan not being used. No actions being implemented, or those that are being implemented are done without reference to the action plan.2 - Action plan being partly used to define, prioritise and coordinate actions that are being implemented, but some actions or actors operating without reference to the action plan.3 - Action plan being explicitly used to define, prioritise and coordinate actions that are being implemented.
TABLE 1. SCORES FOR THE ADEQUACY OF AN ACTION PLAN.
4:5

INTRODUCTION & KEY CONCEPTS
DESIGNING & IMPLEMENTING THE EVALUATION
PRISM MODULES
METHOD FACTSHEETS & ANNEXES
PRISM - TOOLKIT FOR EVALUATING THE OUTCOMES AND IMPACTS OF SMALL/MEDIUM-SIZED CONSERVATION PROJECTS357
Step 2. Using the scoring criteria in Table 1, score the
adequacy of the action plan.
Ideally the scoring should be carried out both by the project team
and by certain key informants who have relevant knowledge of the
project’s conservation target (e.g. experts on the species/site being
targeted). See the factsheet Key informant interviews for more
information on this approach. If scoring is only being carried out
by the project team you should attempt to do this as objectively as
possible and justify the scores selected.
Fill in the scorecard in Table 2 following the scoring criteria in Table
1 to categorise the degree to which the project contributed to the
completion of the species/site action plan. Score the situation:
(1) at the beginning of a project (this can be done
retrospectively if necessary);
(2) at the end of the project; and
(3) for a hypothetical scenario in which the project did not
take place (i.e. a counterfactual scenario). SPECIES & HABITAT
MANAGEMENTFACTSHEET
SCORECARD FOR ADEQUACY OF AN
ACTION PLAN
STEP 2
ADEQUACY OF ACTION PLAN BEFORE THE PROJECT AFTER THE PROJECT ESTIMATED SITUATION IF THE PROJECT HAD NOT HAPPENED
Comprehensiveness of assessment of the status, threats and actions needed
Breadth of stakeholder buy-in and official endorsement
Degree of application to coordinate actions being implemented
Total
Justification:
TABLE 2. ACTION ADEQUACY SCORECARD.
4:5

INTRODUCTION & KEY CONCEPTS
DESIGNING & IMPLEMENTING THE EVALUATION
PRISM MODULES
METHOD FACTSHEETS & ANNEXES
PRISM - TOOLKIT FOR EVALUATING THE OUTCOMES AND IMPACTS OF SMALL/MEDIUM-SIZED CONSERVATION PROJECTS358
Step 3. Compare the difference between (a) the actual
change over time in scores and (b) the change in
scores for the hypothetical scenario, to represent the
outcome and impact of project actions.
This third step is to account for the fact that scores may have
increased during the period of the project owing to external
factors (e.g. work by other individuals/organisations may have
increased the knowledge base for the species or ecosystem).
Justification notes should be provided for all scores given, in order
to support the assessment and to make it as objective as possible.
SPECIES & HABITAT MANAGEMENT
FACTSHEET
SCORECARD FOR ADEQUACY OF AN
ACTION PLAN
STEP 3
4:5

INTRODUCTION & KEY CONCEPTS
DESIGNING & IMPLEMENTING THE EVALUATION
PRISM MODULES
METHOD FACTSHEETS & ANNEXES
PRISM - TOOLKIT FOR EVALUATING THE OUTCOMES AND IMPACTS OF SMALL/MEDIUM-SIZED CONSERVATION PROJECTS359
SPECIES & HABITAT MANAGEMENT
FACTSHEET
SCORECARD FOR ADEQUACY OF AN
ACTION PLAN
EXAMPLE
Project: A project aimed to support the implementation
of a site action plan for a small nature reserve. The action
plan had been developed as part of a previous project, but
reports from conservationists working at the site indicated
that it was not being implemented. The aim of the new
project was therefore to review the action plan and make
suggestions for its improvement and to promote uptake.
The project found the action plan to be sufficiently
comprehensive, having been reviewed and accepted by
experts on the target site. The action plan was also found
to have significant buy-in from the reserve authorities.
However the project identified that local communities were
either unaware of the plan or were unsure about
its implementation. The project worked with this key
stakeholder group to find ways of improving the plan and to
promote its uptake. As a result, the action plan came to be
implemented at several of the target communities within the
reserve, although logistical issues meant that not all target
communities could be reached.
Scoring and justification: Reserve managers and
conservationists working at the site were asked to use the
criteria in the scorecard to rate the adequacy of the action
plan before and after the project and for a hypothetical
scenario where the project did not take place. Scoring
showed an increase in total score for action plan adequacy
from 5 to 8. If the project hadn’t happened, the score was
likely to have remained at 5.
ADEQUACY OF ACTION PLAN BEFORE THE PROJECT AFTER THE PROJECT ESTIMATED SITUATION IF THE PROJECT HAD NOT HAPPENED
Comprehensiveness of assessment of the status, threats and actions needed
3 - Fully comprehensive. 3 - Fully comprehensive. 3 - Fully comprehensive.
Breadth of stakeholder buy-in and official endorsement
2 - At least one key stakeholder group not consulted or endorsement lacking from at least one key authority.
3 - Based on wide stakeholder inputs. Endorsed by relevant authorities.
2 - At least one key stakeholder group not consulted or endorsement lacking from at least one key authority.
Degree of application to coordinate actions being implemented
1 - Action plan not being used. No actions being implemented, or those that are being implemented are done without reference to the action plan.
2 - Action plan being partly used to define, prioritise and coordinate actions that are being implemented, but some actions or actors operating without reference to the action plan.
1 - Action plan not being used. No actions being implemented, or those that are being implemented are done without reference to the action plan.
Total 5 8 5
Justification: Increase in stakeholder buy-in and the fact that the action plan is now being implemented at some of the target communities are the main reasons for the increase in score.
4:5

INTRODUCTION & KEY CONCEPTS
DESIGNING & IMPLEMENTING THE EVALUATION
PRISM MODULES
METHOD FACTSHEETS & ANNEXES
PRISM - TOOLKIT FOR EVALUATING THE OUTCOMES AND IMPACTS OF SMALL/MEDIUM-SIZED CONSERVATION PROJECTS360
Factsheet: Threat reduction scoring
Summary
This factsheet describes a simple method for assessing the
magnitude of threats to species or habitats. It involves identifying
the relevant threats, scoring the timing, scope and severity of each
threat, and summing these to calculate threat magnitude. The
change in the magnitude of threats during the course of a project
is compared to a hypothetical scenario in which the project did not
take place, in order to estimate the outcome and impact of project
actions.
Required steps
Step 1. Classify which types of threats affect the species
or habitat, preferably using the IUCN/CMP Threats
classification scheme.
Step 2. Familiarise yourself with the scoring criteria.
The impact of a threat can be scored using the following criteria:
a. Scope - the estimated proportion of the population of
the species in the project area or the proportion of the
habitat in the project area that the threat affects.
b. Severity - the rate of population decline of the species
or the rate of degradation of the habitat, within the area
of the project that is affected by the threat, over ten
years (or for species, three generations, if this is longer).
c. Timing - whether the threat is happening currently, has
happened in the past or may happen in the future.
SPECIES & HABITAT MANAGEMENT
FACTSHEET
THREAT REDUCTION
SCORING
STEPS 1 & 2
4:5

INTRODUCTION & KEY CONCEPTS
DESIGNING & IMPLEMENTING THE EVALUATION
PRISM MODULES
METHOD FACTSHEETS & ANNEXES
PRISM - TOOLKIT FOR EVALUATING THE OUTCOMES AND IMPACTS OF SMALL/MEDIUM-SIZED CONSERVATION PROJECTS361
Table 1. Scores for the scope, severity’ and timing of threats
affecting a species or habitat. (Figures given in brackets are for
guidance, rather than implying that quantitative data are essential
for applying this method).
Step 3. Score the scope, severity and timing of each threat at
the beginning of the project.
Ideally the scoring should be carried out both by the project team
and by certain key informants who have relevant knowledge of the
project’s conservation target (e.g. experts on the species/site being
targeted). See the factsheet Key informant interviews for more
information on this approach. If scoring is only being carried out
by the project team you should attempt to do this as objectively as
possible and justify the scores selected.
Use the scorecard in Table 2 and the scoring criteria in Table 1.
Scores can be assigned retrospectively if they were not assessed at
the beginning of the project.
THREAT PARAMETER SCORING CRITERIA
Scope of threat (% of population or area)
0 - Few individuals/small area (<10%)1 - Some of population/area (10-49%)2 - Most of population/area (50-90%)3 - Whole population/area (>90%)
Severity of threat (% decline over 10 years or 3 generations)
0 - No or imperceptible deterioration (<1%)1 - Slow deterioration (1–9.9%)2 - Moderate deterioration (10–30%)3 - Rapid deterioration (>30%)
Timing/risk of threat 0 - Past (and unlikely to return) and no longer limiting1 - Likely in long term (beyond 4 years)2 - Likely in short term (within 4 years)3 - Happening now
TABLE 1. SCORES FOR THE SCOPE, SEVERITY’ AND TIMING OF THREATS AFFECTING A SPECIES OR HABITAT.
SPECIES & HABITAT MANAGEMENT
FACTSHEET
THREAT REDUCTION
SCORING
STEP 3
4:5

INTRODUCTION & KEY CONCEPTS
DESIGNING & IMPLEMENTING THE EVALUATION
PRISM MODULES
METHOD FACTSHEETS & ANNEXES
PRISM - TOOLKIT FOR EVALUATING THE OUTCOMES AND IMPACTS OF SMALL/MEDIUM-SIZED CONSERVATION PROJECTS362
Sum the scores to produce an overall “impact score” for each
threat at the beginning of the project (note that if any of the scores
for scope, severity or timing for a given threat = 0, then the impact
score for that threat is set to 0, regardless of the scores for either
of the other two parameters for that threat).
Step 4. Score the scope, severity and timing of the threat at
the end of the project.
The change (if any) in the scores indicates whether the project had
a positive or negative impact (and its magnitude) or alternatively
that there was no impact that is quantifiable.
Step 5. Estimate a score for what the scope, severity and
timing of each threat would have been if the project
had not taken place (the counterfactual scenario).
Step 6. Compare and discuss the differences between
the scores to identify whether there has been a
change in threat level and whether the change can
be attributed to project actions. Justification notes
should be provided for all scores given, in order to
support the assessment and to make it as objective as
possible.
THREAT BEFORE THE PROJECT AFTER THE PROJECT ESTIMATED SITUATION IF THE PROJECT HAD NOT HAPPENED
Scope of threat (% of population or area)
Severity of threat (% decline over 10 years or 3 generations)
Timing/risk of threat
Total
Justification:
TABLE 2. THREAT ASSESSMENT SCORECARD.
SPECIES & HABITAT MANAGEMENT
FACTSHEET
THREAT REDUCTION
SCORING
STEPS 4, 5 & 6
4:5

INTRODUCTION & KEY CONCEPTS
DESIGNING & IMPLEMENTING THE EVALUATION
PRISM MODULES
METHOD FACTSHEETS & ANNEXES
PRISM - TOOLKIT FOR EVALUATING THE OUTCOMES AND IMPACTS OF SMALL/MEDIUM-SIZED CONSERVATION PROJECTS363
SPECIES & HABITAT MANAGEMENT
FACTSHEET
THREAT REDUCTION
SCORING
EXAMPLE
Project: A forest dwelling ungulate was known to be
threatened by hunting, primarily with snares (IUCN threat
class 5.1.1: “Hunting and collecting terrestrial animals
(intentional use)”). The project targeted a national park
where the species was estimated to be declining rapidly.
The park contains several communities, and poor relations
between communities and park rangers mean that rangers
were unable to patrol effectively >90% of the park. The
project aimed to reduce the threat by working to build
relationships between rangers and communities to allow
rangers to conduct patrols. This was largely successful,
allowing patrols to resume over 75% of the park area.
Subsequently the number of snares found by patrols
reduced from an average of six per patrol to two.
Evaluation: At the beginning of the project the team asked
key informants familiar with the species and the site to rate
the scope, severity and timing of the threat from hunting
at the beginning of the project, and this gave a threat score
of 9. They were asked to repeat this scoring at the end of
the project and also for a hypothetical scenario where the
project had not taken place.
Informants rated the scope and severity of the threat
as being lower after the project, while timing remained
unchanged; giving a total threat score of 6. This contrasted
with the estimate for the “no-project” scenario where scope,
severity and timing remained the same.
THREAT HUNTING AND COLLECTING TERRESTRIAL ANIMALS (INTENTIONAL USE)
BEFORE THE PROJECT AFTER THE PROJECT ESTIMATED SITUATION IF THE PROJECT HAD NOT HAPPENED
Scope of threat (% of population or area)
3 - Whole population/area (>90%)
1 - Some of population/area (10-49%)
3 - Whole population/area (>90%)
Severity of threat (% decline over 10 years or 3 generations)
3 - Rapid deterioration (>30%) 2 - Moderate deterioration (10–30%)
3 - Rapid deterioration (>30%)
Timing/risk of threat 3 - Happening now 3 - Happening now 3 - Happening now
Total 9 6 9
Justification: Hunting is probably still occurring in some areas so the timing of the threat remains the same. The fact that rangers are able to patrol a much larger area, and the fact that snares are being identified and removed, means that both the scope and severity of the threat from hunting could be scored lower after the project.
4:5

INTRODUCTION & KEY CONCEPTS
DESIGNING & IMPLEMENTING THE EVALUATION
PRISM MODULES
METHOD FACTSHEETS & ANNEXES
PRISM - TOOLKIT FOR EVALUATING THE OUTCOMES AND IMPACTS OF SMALL/MEDIUM-SIZED CONSERVATION PROJECTS364
Factsheet: Scorecard for evaluating changes in species status
Summary
This factsheet describes a simple method that can be used to
categorise a change in species status (a) that is estimated or
inferred to have occurred during the course of a project designed
to conserve the species, and (b) that would have occurred in a
hypothetical scenario in which the project did not take place.
Comparing these provides a simple assessment of the project’s
outcomes and impacts and their magnitude. The scoring method
can be applied using information from observed data and/or
from information obtained from interviews with key informants.
Justification notes should be provided for the categories chosen, in
order to demonstrate objectivity.
Required steps
Step 1. Identify the species whose status you want to
evaluate. You should only evaluate one species at a
time using this method.
Step 2. Familiarise yourself with the scoring criteria in
Table 1.
Step 3. Using the criteria outlined in Table 1 and the
scorecard shown in Table 2, score the change in the
abundance of the species since the project began
and for a hypothetical scenario in which the project
did not take place (and in which all other factors
remained the same). Species distribution extent or
occupancy can be used as proxies for abundance.
Ideally the scoring should be carried out both by the project team
and by key informants who have relevant knowledge of the species
population being assessed. See the factsheet Key informant
interviews for more information on this approach. If scoring is only
being carried out by the project team you should attempt to do this
as objectively as possible and justify the scores selected.
SPECIES & HABITAT MANAGEMENT
FACTSHEET
SCORECARD FOR EVALUATING CHANGES IN
SPECIES STATUS
STEPS 1, 2 & 3
4:5

INTRODUCTION & KEY CONCEPTS
DESIGNING & IMPLEMENTING THE EVALUATION
PRISM MODULES
METHOD FACTSHEETS & ANNEXES
PRISM - TOOLKIT FOR EVALUATING THE OUTCOMES AND IMPACTS OF SMALL/MEDIUM-SIZED CONSERVATION PROJECTS365
HOW DID THE SPECIES’ ABUNDANCE CHANGE DURING THE COURSE OF THE PROJECT?
LARGE DECREASE (>30%)
MODERATE DECREASE (10-30%)
STABLE (<10% CHANGE)
MODERATE INCREASE (10-30%)
LARGE INCREASE (>30%)
Ho
w w
ou
ld t
he
spec
ies’
ab
un
dan
ce h
ave
chan
ged
in t
he
abse
nce
of t
he
pro
ject
?Large decrease (>30%) Project action had
little or no impact and failed to combat a large decrease in abundance
Project action had a minor positive impact by changing a large decrease in abundance into a moderate decrease in abundance
Project action had a moderately positive impact by halting a large decrease in abundance, resulting in stable trends in abundance
Project action had a substantial positive impact by reversing a large decrease in abundance, resulting in a moderate increase in abundance
Project action had a very substantial positive impact by reversing a large decrease in abundance, resulting in a large increase in abundance
Moderate decrease (10-30%)
Project action had a minor negative impact by changing a moderate decrease in abundance into a large decrease in abundance
Project action had little or no impact and failed to combat a large decrease in abundance
Project action had a moderately positive impact by halting a moderate decrease in abundance, resulting in a stable trend
Project action had a moderately positive impact by reversing a moderate decrease in abundance resulting in a moderate increase in abundance
Project action had a substantial positive impact by reversing a moderate decrease in abundance, resulting in a large increase in abundance
Stable (<10% change) Project action had a moderately negative impact by causing a large decrease in abundance
Project action Had a moderately negative impact by causing a moderate decline in abundance
Project action had little or no impact and the species continued in a stable trend
Project action had a moderately positive impact by causing a moderate increase in abundance
Project action had a moderately positive impact by causing a large increase in abundance
Moderate increase (10-30%)
Project action had a substantial negative impact by reversing a moderate increase in abundance, resulting in a large decrease in abundance
Project action Had a moderately negative impact by reversing a moderate increase in abundance, resulting in a moderate decline in abundance
Project action Had a moderately negative impact by halting a moderate increase in abundance, resulting in a stable trend
Project action had little or no impact and the species continued to undergo a moderate increase in abundance
Project action had a moderately positive impact by increasing the observed rate of change from a moderate to a large increase in abundance
Large increase (>30%) Project action had a very substantial negative impact by reversing a large increase in abundance, resulting in a large decrease in abundance
Project action had a substantial negative impact by reversing a large increase in abundance, resulting in a moderate decline in abundance
Project action Had a moderately negative impact by halting a large increase in abundance, resulting in a stable trend
Project action had a moderately negative impact by reducing the observed rate of change from a large to moderate increase in abundance
Project action had little or no impact and the species continued to undergo a large increase in abundance
TABLE 1: SCORING CRITERIA FOR EVALUATING CHANGES IN SPECIES STATUS.
SPECIES & HABITAT MANAGEMENT
FACTSHEET
SCORECARD FOR EVALUATING CHANGES IN
SPECIES STATUS
4:5

INTRODUCTION & KEY CONCEPTS
DESIGNING & IMPLEMENTING THE EVALUATION
PRISM MODULES
METHOD FACTSHEETS & ANNEXES
PRISM - TOOLKIT FOR EVALUATING THE OUTCOMES AND IMPACTS OF SMALL/MEDIUM-SIZED CONSERVATION PROJECTS366
Step 4. Use the values in Table 1 to score for the impact of
project actions on species status based on comparing
the observed change with the estimate for a
hypothetical scenario in which the project did not
take place.
Dark green cells Cases where project actions had
a substantial or very substantial
positive impact.
Light green cells Cases where project actions had
a minor or moderately positive
impact.
Amber cells Cases where project actions had
a minor or moderately negative
impact.
Red cells Cases where project actions had
a substantial or very substantial
negative impact.
Note that you would not normally carry out a project where it is
known in advance that the species targeted by the project will
increase in the absence of the project (lower two rows in Table 1),
but a species may increase for reasons unrelated to the project
once the project has started.
Step 5. Compare the scores given by the different
experts engaged, and develop conclusions and
recommendations. When asking your chosen experts
to score you should also ask for and record their
justifications for the answers given.
SPECIES & HABITAT MANAGEMENT
FACTSHEET
SCORECARD FOR EVALUATING CHANGES IN
SPECIES STATUS
STEPS 4 & 5
SPECIES HOW DID THE SPECIES’ ABUNDANCE CHANGE DURING THE COURSE OF THE PROJECT?
HOW WOULD THE SPECIES’ ABUNDANCE HAVE CHANGED IN THE ABSENCE OF THE PROJECT?
PROJECT IMPACT
Insert species name
Justification:
TABLE 2. SPECIES STATUS SCORECARD.
4:5

INTRODUCTION & KEY CONCEPTS
DESIGNING & IMPLEMENTING THE EVALUATION
PRISM MODULES
METHOD FACTSHEETS & ANNEXES
PRISM - TOOLKIT FOR EVALUATING THE OUTCOMES AND IMPACTS OF SMALL/MEDIUM-SIZED CONSERVATION PROJECTS367
Factsheet: Scorecard for evaluating changes in habitat status
Summary
This method should be used to categorise a change in habitat
status (a) that is estimated or inferred to have occurred during
the course of a project designed to conserve the habitat, and (b)
that would have occurred in a hypothetical scenario in which the
project did not take place. Comparing these provides a simple
assessment of the project’s outcomes and impacts and their
magnitude. The scoring method can be applied using information
from observed data and/or expert opinion. Justification notes
should be provided for the categories chosen, in order to
demonstrate objectivity.
Required steps
Step 1. Identify the habitat you want to evaluate. You should
only evaluate one type of habitat at a time using this
method.
Step 2. Familiarise yourself with the scoring criteria in
Table 1.
Step 3. Using the criteria outlined in Table 1 and the
scorecard shown in table 2, score the change in
habitat quality since the project began and for a
hypothetical scenario in which the project did not
take place (and in which all other factors remained
the same).
Ideally the scoring should be carried out both by the project team
and by certain key informants who have relevant knowledge of the
habitat being assessed. See the factsheet Key informant interviews
for more information on this approach. If scoring is only being
carried out by the project team you should attempt to do this as
objectively as possible and justify the scores selected.
Step 4. Use the values in Table 1 to score the impact of
project actions on habitat status, based on comparing
the observed change with the estimate for a
hypothetical scenario in which the project did not
take place.
Dark green cells Cases where project actions had
a substantial or very substantial
positive impact.
Light green cells Cases where project actions
had a minor or moderately
positive impact.
Amber cells Cases where project actions had
a minor or moderately negative
impact.
Red cells Cases where project actions had
a substantial or very substantial
negative impact.
SPECIES & HABITAT MANAGEMENT
FACTSHEET
SCORECARD FOR EVALUATING CHANGES IN
HABITAT STATUS
STEPS 1, 2, 3 & 4
4:5

INTRODUCTION & KEY CONCEPTS
DESIGNING & IMPLEMENTING THE EVALUATION
PRISM MODULES
METHOD FACTSHEETS & ANNEXES
PRISM - TOOLKIT FOR EVALUATING THE OUTCOMES AND IMPACTS OF SMALL/MEDIUM-SIZED CONSERVATION PROJECTS368
SPECIES & HABITAT MANAGEMENT
FACTSHEET
SCORECARD FOR EVALUATING CHANGES IN
HABITAT STATUS
HOW DID THE HABITAT QUALITY OF THE PROJECT SITE(S) CHANGE DURING THE COURSE OF THE PROJECT?
LARGE DETERIORATION
(>30%)
MODERATE DETERIORATION (10-
30%)
STABLE (<10% CHANGE)
MODERATE IMPROVEMENT
(10-30%)
LARGE IMPROVEMENT (>30%)
Ho
w w
ou
ld t
he
hab
itat
sta
tus
of t
he
pro
ject
sit
e(s)
hav
e ch
ange
d in
th
e ab
sen
ce o
f th
e p
roje
ct?
Large deterioration (>30%)
Project action had little or no impact and failed to combat a large deterioration in habitat quality
Project action had a minor positive impact by changing a large deterioration in habitat quality into a moderate deterioration in habitat quality
Project action had a moderately positive impact by halting a large deterioration in habitat quality, resulting in a stable trend in habitat quality
Project action had a substantial positive impact by reversing a large deterioration in habitat quality, resulting in a moderate improvement in habitat quality
Project action had a very substantial positive impact by reversing a large deterioration in habitat quality, resulting in a large improvement in habitat quality
Moderate deterioration (10-30%)
Project action had a minor negative impact by changing a moderate deterioration in habitat quality into a large deterioration in habitat quality
Project action had little or no impact and failed to combat a large deterioration in habitat quality
Project action Had a moderately positive impact by halting a moderate deterioration in habitat quality, resulting in a stable trend in habitat quality
Project action had a moderately positive impact by reversing a moderate deterioration in habitat quality, resulting in a moderate improvement in habitat quality
Project action had a substantial positive impact by reversing a moderate deterioration in habitat quality, resulting in a large improvement in habitat quality
Stable (<10% change)
Project action had a moderately negative impact by causing a large deterioration in habitat quality
Project action Had a moderately negative impact by causing a moderate deterioration in habitat quality
Project action had little or no impact and stable trends in habitat quality continued
Project action Had a moderately positive impact by causing a moderate improvement in habitat quality
Project action had a moderately positive impact by causing a large increase in habitat quality
Moderate improvement (10-30%)
Project action had a substantial negative impact by reversing a moderate improvement in habitat quality, resulting in a large deterioration in habitat quality
Project action had a moderately negative impact by reversing a moderate improvement in habitat quality, resulting in a moderate deterioration in habitat quality
Project action had a moderately negative impact by halting a moderate improvement in habitat quality, resulting in a stable trend in habitat quality.
Project action had little or no impact and habitat continued to undergo a moderate improvement in quality
Project action Had a moderately positive impact by increasing the observed rate of change from a moderate to large improvement in habitat quality
Large improvement (>30%)
Project action had a very substantial negative impact by reversing a large improvement in habitat quality, resulting in a large deterioration in habitat quality
Project action had a substantial negative impact by reversing a large improvement in habitat quality, resulting in a moderate deterioration in habitat quality
Project action had a moderately negative impact by halting a large improvement in habitat quality, resulting in a stable trend in habitat quality
Project action had a moderately negative impact by reducing the observed rate of change from a large to moderate improvement in habitat quality
Project action had little or no impact and habitat continued to undergo a large improvement in quality
TABLE 1: SCORING TABLE FOR EVALUATING CHANGES IN HABITAT STATUS
4:5
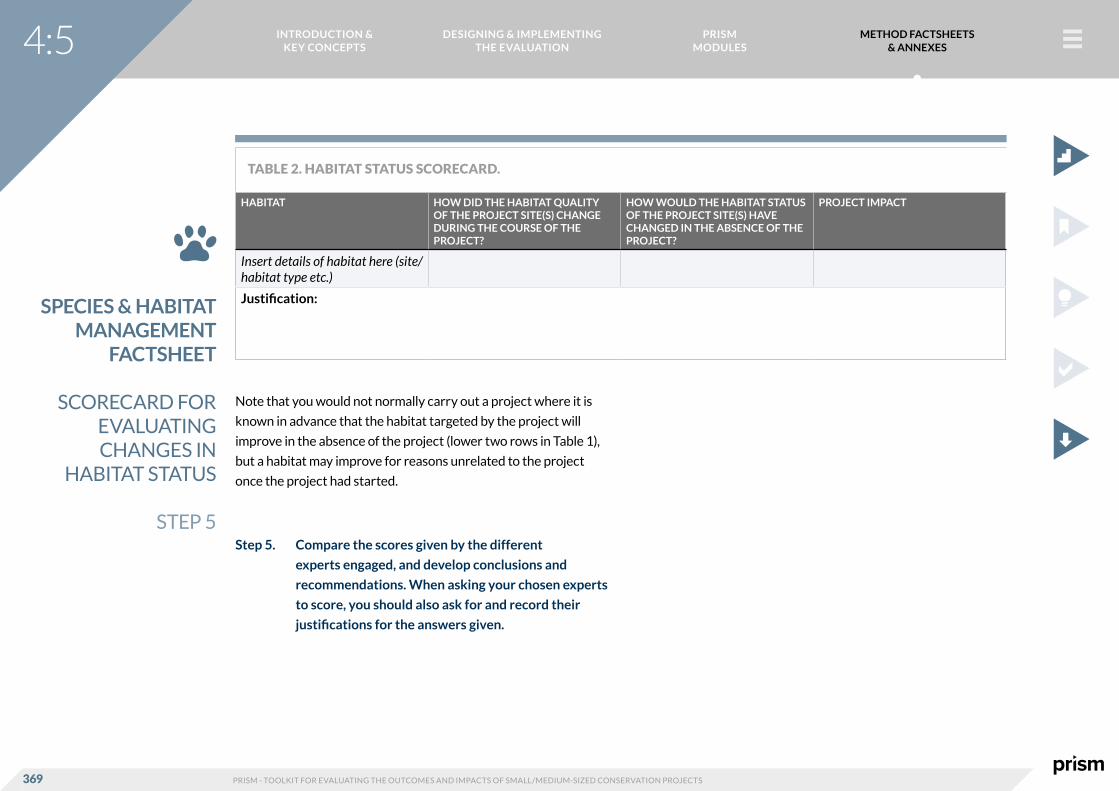
INTRODUCTION & KEY CONCEPTS
DESIGNING & IMPLEMENTING THE EVALUATION
PRISM MODULES
METHOD FACTSHEETS & ANNEXES
PRISM - TOOLKIT FOR EVALUATING THE OUTCOMES AND IMPACTS OF SMALL/MEDIUM-SIZED CONSERVATION PROJECTS369
Note that you would not normally carry out a project where it is
known in advance that the habitat targeted by the project will
improve in the absence of the project (lower two rows in Table 1),
but a habitat may improve for reasons unrelated to the project
once the project had started.
Step 5. Compare the scores given by the different
experts engaged, and develop conclusions and
recommendations. When asking your chosen experts
to score, you should also ask for and record their
justifications for the answers given.
HABITAT HOW DID THE HABITAT QUALITY OF THE PROJECT SITE(S) CHANGE DURING THE COURSE OF THE PROJECT?
HOW WOULD THE HABITAT STATUS OF THE PROJECT SITE(S) HAVE CHANGED IN THE ABSENCE OF THE PROJECT?
PROJECT IMPACT
Insert details of habitat here (site/habitat type etc.)
Justification:
TABLE 2. HABITAT STATUS SCORECARD.
SPECIES & HABITAT MANAGEMENT
FACTSHEET
SCORECARD FOR EVALUATING CHANGES IN
HABITAT STATUS
STEP 5
4:5

INTRODUCTION & KEY CONCEPTS
DESIGNING & IMPLEMENTING THE EVALUATION
PRISM MODULES
METHOD FACTSHEETS & ANNEXES
PRISM - TOOLKIT FOR EVALUATING THE OUTCOMES AND IMPACTS OF SMALL/MEDIUM-SIZED CONSERVATION PROJECTS370
Factsheet: Field surveys for evaluating changes in species status
Summary
To evaluate changes in species status directly, robust and
repeatable field surveys are typically required. Deciding on an
appropriate field survey method will depend on the taxonomic
group being surveyed, for example surveying birds requires a very
different approach to that for monitoring aquatic insects. Note
that it often takes a long time for changes in species status to
become measurable, so you must be confident that enough time
has passed to allow you to measure such changes.
Required steps
Step 1. Identify the species/taxonomic group(s) you want to
measure
The species you want to measure will typically fall into one of the
following categories:
• The species being targeted by the project (e.g. surveying
the number of Snow Leopards in a particular area where
the conservation of this species is a priority).
• Species important to the species being targeted by the
project (e.g. surveying species preyed upon by Snow
Leopards).
• Species whose presence/abundance acts as an
indicator of habitat quality (e.g. sampling freshwater
invertebrates to indicate water quality).
SPECIES & HABITAT MANAGEMENT
FACTSHEET
FIELD SURVEYS FOR EVALUATING
CHANGES IN SPECIES STATUS
STEP 1
4:5

INTRODUCTION & KEY CONCEPTS
DESIGNING & IMPLEMENTING THE EVALUATION
PRISM MODULES
METHOD FACTSHEETS & ANNEXES
PRISM - TOOLKIT FOR EVALUATING THE OUTCOMES AND IMPACTS OF SMALL/MEDIUM-SIZED CONSERVATION PROJECTS371
Step 2. Define the species attributes you want to measure
Examples of species attributes that could be measured in a field
survey include20 :
Occurrence – Which species occur (e.g. presence/absence).
Distribution – Where the species occur (e.g. area, physical
attributes).
Abundance – How many individuals/pairs of a species occur in a
given area (e.g. frequency, density).
Population structure – Composition of the species population
being targeted (e.g. age, sex ratio, fragmentation or isolation).
Population dynamics – Recruitment, mortality, emigration,
immigration, seasonal factors.
Always think back to the main aims of the project and the question
you are trying to answer. For example if you want to know whether
a species is recolonising an area it had disappeared from, you may
wish to focus on its distribution. If the project involves eradicating
an invasive species that preys on the juveniles of a species of
conservation concern, you may wish to know whether successful
breeding of the target species is occurring (e.g. evidence of
hatchling success in albatross chicks).
Step 3. Define the sample area.
If you are not able to measure change across the whole population
of interest, then you should select a sampling approach (see below)
that will give you a representative measure.
If you are using a matching evaluation design which compares
changes in the species population being targeted by the project
with a control population, then you need to ensure that the
populations are similar enough to allow you to draw useful
comparisons, or that you have sufficient samples from across a
range of sites that are likely to be representative.
Step 4. Select data collection methods.
The methods available to you will depend on the species and the
species attributes you are attempting to measure.
While it is not possible to cover all the available methods for
monitoring and evaluating species status in this Toolkit, the Annex
Field methods for species monitoring describes some of the most
commonly used methods and sampling approaches for different
taxonomic groups.
When selecting methods remember to consider potential sources
of bias and how these could be reduced or minimised.
SPECIES & HABITAT MANAGEMENT
FACTSHEET
FIELD SURVEYS FOR EVALUATING
CHANGES IN SPECIES STATUS
STEPS 2, 3 & 4
4:5
20Further details of these characteristics can be found on pages 10-13 of the Cambridge
Handbook of Biodiversity Methods: https://sunsetridgemsbiology.wikispaces.com/file/view/
Biodiversity+Handbook.pdf .

INTRODUCTION & KEY CONCEPTS
DESIGNING & IMPLEMENTING THE EVALUATION
PRISM MODULES
METHOD FACTSHEETS & ANNEXES
PRISM - TOOLKIT FOR EVALUATING THE OUTCOMES AND IMPACTS OF SMALL/MEDIUM-SIZED CONSERVATION PROJECTS372
Step 5. Select the sampling approach.
As well as the method by which individuals are detected and
counted, it is also important to consider the sampling approach.
Although it may be possible to undertake a complete survey in
which all individuals in the area of interest are counted, changes
in population size or range extent will typically be estimated from
sample surveys in which only a proportion of the population is
recorded. Table 2 outlines several different approaches to this.
The Annex Sampling approaches for evaluating changes in species
status provides further details on each of these and sources of
more detailed methods for them.
POTENTIAL SOURCE OF BIAS STRATEGIES FOR MINIMISING/REDUCING THE BIAS
Observers have different levels of expertise
Use standard methodologies across years, surveys and sites.
Ensure all observers are trained to a certain standard. Calibrate observers against each other before and during data collection
Record observer identity, allowing subsequent correction of bias analytically.
Variation in observer effort between surveys
Use standard methodologies across years, surveys and sites.
Record observer effort during sampling periods, allowing analytical correlation of bias.
Certain species/habitats may be more difficult to survey than others
Consider approaches that account for variation in detectability between species. Stratify samples across habitats to increase coverage in difficult habitats.
Local conditions may affect data collection (weather, political events, etc.)
Record as much detail on local conditions as possible during surveys, allowing analytical correction.
Lack of standardisation between sites/observers
Agree and record definitions (e.g. sample size, type population unit) beforehand.
Ensure all observers are trained to a certain standard.
TABLE 1. POTENTIAL SOURCES OF BIAS DURING FIELD SURVEYS, AND POTENTIAL STRATEGIES FOR MINIMISING/REDUCING THESE
SPECIES & HABITAT MANAGEMENT
FACTSHEET
FIELD SURVEYS FOR EVALUATING
CHANGES IN SPECIES STATUS
STEP 5
4:5

INTRODUCTION & KEY CONCEPTS
DESIGNING & IMPLEMENTING THE EVALUATION
PRISM MODULES
METHOD FACTSHEETS & ANNEXES
PRISM - TOOLKIT FOR EVALUATING THE OUTCOMES AND IMPACTS OF SMALL/MEDIUM-SIZED CONSERVATION PROJECTS373
SPECIES & HABITAT MANAGEMENT
FACTSHEET
FIELD SURVEYS FOR EVALUATING
CHANGES IN SPECIES STATUS
SAMPLING APPROACH NOTES AND CAVEATS
Complete counts Rarely feasible unless individuals are easily detected and are concentrated within a relatively small area. May use field counts or photos. Consider the most appropriate life stage.
Area-based sampling Sample defined area and extrapolate to unsurveyed areas. Methods include point counts, line transects and counts from fixed points. May need to correct for imperfect detectability. Samples should be randomly distributed or appropriately stratified.
Timed sampling Record numbers per unit time (e.g counts of migrating individuals, camera traps, passive acoustic recording devices). Most appropriate for species that have low detectability, are widely dispersed, or require methods that are difficult to standardise. More appropriate for estimating relative abundance than population size.
Live trapping Mist nets (for birds/bats), mammal traps, fish nets, moth traps, invertebrate pitfall traps etc. to estimate relative abundance in a similar manner to timed sampling. Rings/bands (birds), microchips (vertebrates), colour marks (invertebrates) or unique appearance can be used to identify individuals for demographic monitoring, and to estimate population size from the ratio of the number of individuals caught and marked to those recaptured in a subsequent sample.
Removal trapping21 A wide range of trapping approaches can be used if individuals must be killed for identification purposes (e.g. pitfall, malaise or water traps for insects, netting for fish, snap traps for small mammals), to estimate relative abundance in a similar manner to live trapping. Data can also be used to estimate initial abundance from the decay in numbers of individuals trapped through time, although this depletes the target population and needs to standardise survey effort over time.
Sampling eDNA A developing technique for detecting occurrence or (with considerable caveats) abundance of species, from DNA extracted from environmental or biological samples. May be particularly useful for taxa that are difficult to survey using other approaches, such as amphibians or fish in freshwater environments, cryptic mammals or micorrhizal fungi in soil. May be more relevant for small and medium-sized conservation projects in future as technology develops.
TABLE 2. SUMMARY OF SAMPLING APPROACHES FOR ASSESSING THE STATUS OF SPECIES.
4:5
21These approaches may raise ethical issues. See Factsheet: Developing ethical protocols for
an evaluation for more details

INTRODUCTION & KEY CONCEPTS
DESIGNING & IMPLEMENTING THE EVALUATION
PRISM MODULES
METHOD FACTSHEETS & ANNEXES
PRISM - TOOLKIT FOR EVALUATING THE OUTCOMES AND IMPACTS OF SMALL/MEDIUM-SIZED CONSERVATION PROJECTS374
Step 6. Plan for data management and analysis.
As a final step before you begin collecting data you should consider
how you will manage and analyse the data you collect.
To prepare for data analysis and presentation, think about the
following questions:
• Do you need datasheets and databases, and how should
they be designed?
• Who will carry out the analysis, and when?
• How will the data be analysed?
• What other data are required prior to analysis?
• What statistical tests are appropriate for analysing the
data?
• What statistical packages are available for the analysis
of data?
• When should data analysis and presentation take place?
Refer to the PRISM section Analyse data (in Step 3) for more
information.
Refer to the Species/Habitat Annex: Analytical issues when
estimating abundance, distribution, survival and reproduction
for specific guidance on analysis in relation to estimating species
abundance, distribution, survival and reproduction.
SPECIES & HABITAT MANAGEMENT
FACTSHEET
FIELD SURVEYS FOR EVALUATING
CHANGES IN SPECIES STATUS
STEP 6
4:5

INTRODUCTION & KEY CONCEPTS
DESIGNING & IMPLEMENTING THE EVALUATION
PRISM MODULES
METHOD FACTSHEETS & ANNEXES
PRISM - TOOLKIT FOR EVALUATING THE OUTCOMES AND IMPACTS OF SMALL/MEDIUM-SIZED CONSERVATION PROJECTS375
Factsheet: Remote assessment methods for evaluating changes
in habitat status
Summary
Remote sensing data can be used to assess changes in land cover
extent and fragmentation, and in some cases, condition (e.g. %
canopy cover, vegetation structure). These measures can be used
as indicators of habitat status. (Remote sensing is also useful for
detecting some threats, so may be relevant to evaluation of threat-
related issues)
Required Steps
Step 1. Identify the area(s) you want to evaluate.
If you are not able to measure change across the whole area of
interest then you need to adopt a sampling approach (see below)
that will give you a representative measure of change across the
area of interest.
If you are using a matching evaluation design which compares
changes at the project site with a control site, then ensure that the
sites are similar enough to allow you to draw useful comparisons
between them.
Step 2. Identify the habitat characteristics you want to
measure.
Examples of habitat characteristics that could be measured using
remote sensing include:
Extent – Area, physical attributes.
Composition – Extent, cover.
Structure – Vertical (e.g. tree layer topography).
Dynamics – e.g. regeneration, succession, cyclic change, patch
dynamics.
Threats/stresses – e.g. evidence of grazing, burning, erosion.
SPECIES & HABITAT MANAGEMENT
FACTSHEET
REMOTE ASSESSMENT
METHODS FOR EVALUATING CHANGES IN
HABITAT STATUS
STEPS 1 & 2
4:5

INTRODUCTION & KEY CONCEPTS
DESIGNING & IMPLEMENTING THE EVALUATION
PRISM MODULES
METHOD FACTSHEETS & ANNEXES
PRISM - TOOLKIT FOR EVALUATING THE OUTCOMES AND IMPACTS OF SMALL/MEDIUM-SIZED CONSERVATION PROJECTS376
Step 3. Select data source.
There are three main sources of remote sensing assessment data:
DATA SOURCE NOTES AND CAVEATS
Satellite imagery This is the most readily available form of remote sensing data. Many USGS LANDSAT images are freely available to download and range in date back to the 1970s. ESA’s Copernicus programme provides data every 3-4 days and started in 2015: it includes radar data which means for example that forest under cloud can be monitored. Other potential sources include images from France’s SPOT satellites, and commercial satellites IKONOS, Quickbird and Orbview; although these may require purchase. NASA has produced a detailed introduction to the use of satellite remote sensing data, available at http://arset.gsfc.nasa.gov/ . The section of this at http://arset.gsfc.nasa.gov/land explains how to obtain images, process them in an appropriate way before classification and undertake some basic classifications. Analysing satellite images can be time-consuming and requires considerable GIS expertise, so it may be worth considering academic collaboration with a university or research organisation to achieve this efficiently.
Aerial photography Small and medium-sized conservation projects are unlikely to have the funds to carry out an aerial survey. There may however be sources of existing data that can be used, for example from relevant government agencies or Google Earth.
Unmanned aerial surveys using “drones”
Unmanned aerial vehicles are increasingly used in monitoring for conservation. These tools are becoming cheaper and may represent an efficient way to survey the impact of small/medium-sized conservation projects, especially if the cost can be shared across a number of projects. See
https://conservationdrones.org/ for further information.
STEP 3. SELECT DATA SOURCE.
SPECIES & HABITAT MANAGEMENT
FACTSHEET
REMOTE ASSESSMENT
METHODS FOR EVALUATING CHANGES IN
HABITAT STATUS
STEP 3
4:5

INTRODUCTION & KEY CONCEPTS
DESIGNING & IMPLEMENTING THE EVALUATION
PRISM MODULES
METHOD FACTSHEETS & ANNEXES
PRISM - TOOLKIT FOR EVALUATING THE OUTCOMES AND IMPACTS OF SMALL/MEDIUM-SIZED CONSERVATION PROJECTS377
Step 4. Collect/download data.
Remote sensing assessment data can be used to measure change
in the extent of a particular land cover type which is representative
of a habitat (e.g. forest), or to compare rates of land cover loss/gain
before and after project interventions.
For satellite imagery and aerial photography this typically involves
downloading images from two or more points in time over the
period for which you wish to evaluate change, for example a
point before the project, one during the project and one after the
project. For an unmanned aerial survey this will involve carrying
out a drone survey of the required area.
In addition to measuring change before and after the project, it
is also important to consider what the land-cover extent or rate
of change would have been in the absence of project actions
(the counterfactual). To estimate this typically requires matching
the project location to suitable comparison sites selected to
be as similar as possible to the target site (similarity is based on
all available data and is tested by comparing average values of
covariates). Once selected, the comparison sites will be compared
with the project target sites to give a measurement of the project’s
outcomes and impacts.
Step 5. Identify the parameters you want to measure, and
analyse data.
All three of the data sources listed in the previous step require
some post-collection processing to assess changes in habitat.
At a minimum they require visual assessment to determine the
extent of each land-cover type and changes in them. A range of
increasingly complicated methods can be used on these data to
classify them into land-cover types, to quantify land-cover change,
and to assess vegetation structure. Some knowledge of remote
sensing is required for many of these analyses, but most are
straightforward.
There are open source software packages in which images can be
manipulated and analysed. These include QGIS http://www.qgis.
org/en/site/ (which has a wide range of free tutorials available
and an active online community to help new users). In addition, R
(https://cran.r-project.org/) has spatial analysis functionality, and
many of the functions are described, with code, by Wegman et al.
(2016)22 . The European Commission’s Joint Research Centre (EC-
JRC) has developed a simple, semi automated land-cover and land-
cover change mapping tool which is open source and is targeted
towards protected areas and important sites for biodiversity
(such as Important Bird and Biodiversity Areas and other Key
Biodiversity Areas (http://onlinelibrary.wiley.com/doi/10.1002/
rse2.14/full). A mostly automated system for classification of
forest cover and change is available through http://claslite.
carnegiescience.edu/en/index.html .
SPECIES & HABITAT MANAGEMENT
FACTSHEET
REMOTE ASSESSMENT
METHODS FOR EVALUATING CHANGES IN
HABITAT STATUS
STEPS 4 & 5
4:5
22Palumbo I, Rose, RA, Headley RMK, Nackoney J, Vodacek A and Wegmann M (2016).
Building capacity in remote sensing for conservation: present and future challenges. Remote
Sens Ecol Conserv. doi:10.1002/rse2.31 .

INTRODUCTION & KEY CONCEPTS
DESIGNING & IMPLEMENTING THE EVALUATION
PRISM MODULES
METHOD FACTSHEETS & ANNEXES
PRISM - TOOLKIT FOR EVALUATING THE OUTCOMES AND IMPACTS OF SMALL/MEDIUM-SIZED CONSERVATION PROJECTS378
There is an increasing number of post-processing products derived
from remote sensing which could also be useful to small- and
medium-sized projects. For example, the Global Forest Watch
website: http://www.globalforestwatch.org/ presents data on
tree cover at 30 m resolution globally at annual intervals from
2000 onwards. The dataset is updated annually. Users can carry
out basic online analyses of tree cover and change in this over time
at a project site (either by uploading their own site boundary or,
for projects implementing actions within a protected area, using
the relevant boundary which is available within the tool); or they
can download data to carry out more detailed analyses. Other
products are in development, including a water bodies dataset
which will be presented online, and an urban extent layer.
Fragmentation of habitat can be inferred from fragmentation
indices derived from categorical land-cover maps. Multiple
measures of fragmentation (and its inverse, connectivity), exist
and can be implemented in QGIS, R, or Arcmap.
For QGIS, http://conefor.org can be used as a plugin. This software
can undertake the majority of calculations needed.
Aerial photographs can be treated in a similar way to satellite
images. In addition to processing in dedicated software, both
types of data can be interpreted visually. Polygons can be digitised
around areas of land cover of interest by the user, rather than
having to classify images. This approach is valid if the focal land
cover type is distinct, or can be easily recognised by the human eye
and is comparable between images. The easiest way to do this is
using on-screen digitations, which can be carried out in QGIS.
Comparing results between sites
Simple t-tests on difference in means and cross-sectional
regression are two of the most common statistical methods for
comparing results between sites.
Jones and Lewis (2015) describe in more detail the steps to take in
selecting a comparison site using remote sensing data, and how to
build this into an evaluation design - see http://journals.plos.org/
plosone/article/asset?id=10.1371%2Fjournal.pone.0141380.PDF .
Further reading
Vihervarra et al. (2015) – combining remote and field assessment
data.: https://link.springer.com/article/10.1007/s10980-014-0137-
5
Gottingen Forest Inventory Wiki (an excellent source of
information regarding forest plot design and monitoring).:
http://wiki.awf.forst.uni-goettingen.de/wiki/index.php/AWF-
Wiki:Community_Portal
SPECIES & HABITAT MANAGEMENT
FACTSHEET
REMOTE ASSESSMENT
METHODS FOR EVALUATING CHANGES IN
HABITAT STATUS
4:5

INTRODUCTION & KEY CONCEPTS
DESIGNING & IMPLEMENTING THE EVALUATION
PRISM MODULES
METHOD FACTSHEETS & ANNEXES
PRISM - TOOLKIT FOR EVALUATING THE OUTCOMES AND IMPACTS OF SMALL/MEDIUM-SIZED CONSERVATION PROJECTS379
Factsheet: Field assessment methods for evaluating changes in
habitat status
Summary
Field assessment methods can be used to confirm observations
made through remote sensing or to evaluate change in their own
right. They can generate a highly effective measure of project
impact, but note that there is often a trade-off between reliability
of results and the amount of time and resources required.
Required Steps
Step 1. Identify the habitat characteristics that you want to
measure.
There are often multiple habitat characteristics that could be
looked at, but it is typically most useful to focus on those that are
being targeted by the project.
First, think carefully about the question you are trying to answer.
For example if you want to know whether restoring habitat by
planting trees is working, you may wish to focus your evaluation
on whether the trees are growing as expected. If the project has
involved dealing with an invasive species, you may wish to know
whether the habitat is showing a decrease in characteristics
relating to the impact of the species (e.g. evidence of browsing by
introduced goats).
You should also think carefully about what the defining
characteristics/attributes of the habitat are, try to determine what
the target habitat should look like when in good condition, and its
status when the project began.
Examples of habitat characteristics:
Extent – Area, physical attributes.
Composition – e.g. communities, richness or diversity,
indicator species, cover, biomass.
Structure – Horizontal (e.g. plant community mosaics,
patches of short/tall vegetation), vertical (ground, shrub and
tree layer topography).
Dynamics – e.g. regeneration, succession, reproduction,
cyclical change, patch dynamics.
Threats/stresses – e.g. evidence of grazing, burning, erosion.
Taking these factors into account, identify the habitat
characteristic(s) that you want to measure.
Step 2. Define the sample area.
If you are not able to measure change across the whole area of
interest then you should select a sampling approach (see below)
that will give you a representative measure of change across the
area or habitat of interest.
If you are using a matching evaluation design which compares
changes at the project site with a control site, then ensure that the
sites are similar enough to allow you to draw useful comparisons
between them.
SPECIES & HABITAT MANAGEMENT
FACTSHEET
FIELD ASSESSMENT METHODS FOR
EVALUATING CHANGES IN
HABITAT STATUS
STEPS 1 & 2
4:5
23Further details of these characteristics can
be found on pages 10-13 of the Cambridge
Handbook of Biodiversity Methods - https://
sunsetridgemsbiology.wikispaces.com/file/
view/Biodiversity+Handbook.pdf .

INTRODUCTION & KEY CONCEPTS
DESIGNING & IMPLEMENTING THE EVALUATION
PRISM MODULES
METHOD FACTSHEETS & ANNEXES
PRISM - TOOLKIT FOR EVALUATING THE OUTCOMES AND IMPACTS OF SMALL/MEDIUM-SIZED CONSERVATION PROJECTS380
Step 3. Select data collection methods.
The methods you choose will depend on the habitat and the
specific characteristics you are attempting to measure.
While it is not possible to cover all the possible methods for
monitoring and evaluating habitat status in this Toolkit, the Annex:
Field methods for habitat monitoring describes some of the most
commonly used methods and sampling approaches for different
habitats and habitat characteristics.
Step 4. Select a sampling approach.
In some cases it may be possible to measure change across an
entire habitat (for example in an isolated stand of woodland).
However in most cases the project will require an appropriate
sampling strategy, where measurements are taken for a subset of
the entire area potentially affected by project actions. The Annex
Sampling approaches for habitat monitoring outlines some of the
most commonly used sampling strategies for habitat monitoring.
Step 5. Plan for data management and analysis.
As a final step before you begin collecting data, you should
consider how you will manage and analyse the data you collect.
To prepare for data analysis and presentation, think about the
following questions:
• Do you need datasheets and databases?
• Who will carry out the analysis, and when?
• How will the data be analysed?
• What statistical tests are appropriate for analysing the
data?
• Is transformation of the data necessary before
statistical analysis can take place?
• What statistical packages are available for the analysis
of data?
• When should data analysis and presentation take place?
Refer to the PRISM section Analyse data (in Step 3) for more
information
SPECIES & HABITAT MANAGEMENT
FACTSHEET
FIELD ASSESSMENT METHODS FOR
EVALUATING CHANGES IN
HABITAT STATUS
STEPS 3, 4 & 5
4:5

INTRODUCTION & KEY CONCEPTS
DESIGNING & IMPLEMENTING THE EVALUATION
PRISM MODULES
METHOD FACTSHEETS & ANNEXES
PRISM - TOOLKIT FOR EVALUATING THE OUTCOMES AND IMPACTS OF SMALL/MEDIUM-SIZED CONSERVATION PROJECTS381
SPECIES & HABITAT MANAGEMENT
FACTSHEET
FIELD ASSESSMENT METHODS FOR
EVALUATING CHANGES IN
HABITAT STATUS
EXAMPLE
Example: A matched sites, before-and-after trial in
1995-2001 in a Mediterranean Black Pine (Pinus nigra)
forest in the Pyrenees, Spain (Casasús et al. 2007)
found that grazing exclusion increased the biomass of
herbaceous plants and shrubs. Six years after treatment,
herbaceous plant and shrub biomasses (kg dry matter/
ha) had increased in fenced areas (herbaceous plant: 501
to 1,730; shrub: 1,902 to 5,073) but not in grazed areas
(herbaceous plant: 417 to 679; shrub: 1,120 to 1,207). At
the beginning of the study herbaceous plant and shrub
biomasses were similar in the grazed and fenced areas,
while six years later, both parameters were higher in
fenced areas.
Casasús I, Bernués A, Sanz A, Villalba D, Riedel J and
Revilla R (2007). Vegetation dynamics in Mediterranean
forest pastures as affected by beef cattle grazing.
Agriculture, Ecosystems & Environment 121: 365-370.
4:5
INTRODUCTION & KEY CONCEPTS
DESIGNING & IMPLEMENTING THE EVALUATION
PRISM MODULES
METHOD FACTSHEETS & ANNEXES
PRISM - TOOLKIT FOR EVALUATING THE OUTCOMES AND IMPACTS OF SMALL/MEDIUM-SIZED CONSERVATION PROJECTS382
Annex: Field methods for species monitoring
This annex gives a very brief summary of field methods for
monitoring different taxa that are relevant for small and medium-
sized conservation projects. To indicate the level of expertise and
equipment required, each method is categorised as: 1 (method
fairly simple to use i.e. does not require formal training or specialist
equipment), 2 (method requires some training and/or specialist
equipment), or 3 (method requires highly-specialised training and
equipment).
More information on the methods in this annex can be found
in the Cambridge handbook of ecological survey methods
https://sunsetridgemsbiology.wikispaces.com/file/view/
Biodiversity+Handbook.pdf
SPECIES & HABITAT MANAGEMENT
ANNEX
FIELD METHODS FOR SPECIES
MONITORING
4:5

INTRODUCTION & KEY CONCEPTS
DESIGNING & IMPLEMENTING THE EVALUATION
PRISM MODULES
METHOD FACTSHEETS & ANNEXES
PRISM - TOOLKIT FOR EVALUATING THE OUTCOMES AND IMPACTS OF SMALL/MEDIUM-SIZED CONSERVATION PROJECTS383
TAXA COMPLETE SURVEY AREA-BASED SAMPLING TIMED SAMPLING LIVE TRAPPING REMOVAL TRAPPING EDNA
Fungi Mapping or counting of fruiting bodies within study area during peak fruiting period. 1
Occurrence or counts of fruiting bodies within quadrats or strip transects. Distance-sampling along transects allows greater coverage, useful for rarer species. Fixed-point photos may help assess abundance. 1
Searches for fruiting bodies within a defined period may be useful for rarer species. 1
Important new approach for recording occurrence without requiring fruiting. 1
Lichens Mapping or counting individuals possible where species occupies small area. Fixed-point photos may be used to monitor changes in % cover. 1
Counts or occurrence within cells of quadrat. Line-transects with distance sampling allows greater coverage and estimates density / true abundance. Fixed-point photos may be used to monitor changes in % cover. 1
Searches for individuals within a defined period may be useful for rarer species. 1
Bryophytes Mapping or counting individuals possible where species occupies small area. Fixed point photos can be used to assess changes in % cover or the number of colonies. 1
Visual estimates of cover or abundance possible within defined areas, quadrats or strip transects. Fixed point photos can be used to assess changes in % cover or the number of colonies. 1
Aquatic plants Mapping extent of particular species may be possible, for example using fixed-point photos. 1
Visual estimates of cover or abundance possible within defined areas, quadrats or strip transects. This can be visual assessment, fixed-point photos or from substrate samples of known area. 1
Timed water samples can provide estimates of phytoplankton abundance. 2
Colonisation of artificial substrates left in the water used to identify occurrence. 2
Samples of water can be used to identify occurrence of species. 3
SPECIES & HABITAT MANAGEMENT
ANNEX
FIELD METHODS FOR SPECIES
MONITORING
4:5

INTRODUCTION & KEY CONCEPTS
DESIGNING & IMPLEMENTING THE EVALUATION
PRISM MODULES
METHOD FACTSHEETS & ANNEXES
PRISM - TOOLKIT FOR EVALUATING THE OUTCOMES AND IMPACTS OF SMALL/MEDIUM-SIZED CONSERVATION PROJECTS384
SPECIES & HABITAT MANAGEMENT
ANNEX
FIELD METHODS FOR SPECIES
MONITORING
TAXA COMPLETE SURVEY AREA-BASED SAMPLING TIMED SAMPLING LIVE TRAPPING REMOVAL TRAPPING EDNA
Vascular plants
Mapping or counting individuals only possible for small populations. Fixed point photos monitor changes in cover of the growth and survival of individual large plants. 1
Selected colonies could be monitored. Quadrats, strip-transects widely used to estimate abundance and cover. Line transects can be used to count individual plants. Fixed point photos monitor changes in cover of the growth and survival of individual large plants. 1 Quadrats with pin frames provide more robust information on cover and structure. 2
Searches for individuals within a defined period may be useful for rarer species. 1
Marking individual plants can be used to monitor recruitment and mortality. 1
Trees Mapping or counting entire populations may only be feasible for small populations. Fixed point photos monitor changes in cover of the growth and survival of individual large plants. 1
Remote techniques such as LiDAR and aerial photography may allow all individuals within large areas to be counted, although it may be difficult to separate species in the majority of circumstances. 23
Populations can be monitored using quadrats, strip and line transects which are widely used to estimate localised abundance. Aerial or fixed-point photography can be used to count emergent canopy species (or those readily identified when flowering/fruiting) and through time, to monitor the survival and recruitment of individual trees within a study area. Accompanying this with measurements of individual trees (such as the diameter at breast height), can provide information about population age structure. 1
Techniques using drones to survey canopy trees are in development. 3
Searches for individuals within a defined period may be useful for rarer species. 1
Trees can easily be measured and marked, allowing age-structure, survival rates and recruitment to be monitored. 1
Repeated monitoring of areas of ground of known area can be useful for seed predation/dispersal studies. 1
4:5

INTRODUCTION & KEY CONCEPTS
DESIGNING & IMPLEMENTING THE EVALUATION
PRISM MODULES
METHOD FACTSHEETS & ANNEXES
PRISM - TOOLKIT FOR EVALUATING THE OUTCOMES AND IMPACTS OF SMALL/MEDIUM-SIZED CONSERVATION PROJECTS385
TAXA COMPLETE SURVEY AREA-BASED SAMPLING TIMED SAMPLING LIVE TRAPPING REMOVAL TRAPPING EDNA
Corals Aerial photography or satellite imagery can be used to map large-scale reef geomorphology. 2
Mapping techniques can be used to map cover of different species along transects (e.g. manta tow) or in quadrats (although physical quadrats can be challenging given vertical coral structure), whilst both video and still photography have been used to map coral along transects or in quadrats respectively. Alternatively, the line-point intercept method allows divers to record species occurrence at intervals along line-transects. Various scoring systems have been developed to score condition along transects. 2
Odonata Counts of exuviae provide index of adult abundance that can be linked to the quality of a site for supporting a viable population. Counts of adults within strip transects surveyed in good conditions, particularly along the waters’ edge, can be used to monitor trends, and may work better for rare species, but may not separate source/sink populations. 1
Timed aquatic sampling (sweep netting or kick sampling) for larvae, and timed counts for adults surveyed in good conditions, where strip transects not possible. 1
Butterflies Quadrats or strip transects give egg or larval density. 5m wide strip transect surveyed in good conditions used as standard Butterfly Monitoring Scheme method in UK. 1
Timed counts for eggs / larvae can identify presence / give index of abundance. 1
Live-trapped adults, for example by searching for adults in suitable habitats with a hand-net, can be marked, and survival and dispersal monitored from recaptures. 2
SPECIES & HABITAT MANAGEMENT
ANNEX
FIELD METHODS FOR SPECIES
MONITORING
4:5

INTRODUCTION & KEY CONCEPTS
DESIGNING & IMPLEMENTING THE EVALUATION
PRISM MODULES
METHOD FACTSHEETS & ANNEXES
PRISM - TOOLKIT FOR EVALUATING THE OUTCOMES AND IMPACTS OF SMALL/MEDIUM-SIZED CONSERVATION PROJECTS386
TAXA COMPLETE SURVEY AREA-BASED SAMPLING TIMED SAMPLING LIVE TRAPPING REMOVAL TRAPPING EDNA
Moths Quadrats or strip transects give egg or larval density. 5m wide strip transect surveyed in good conditions used as standard Butterfly Monitoring Scheme method in UK. 1
Light trapping provides quantitative information on species abundance, and occurrence for rare species. Abundances between species not necessarily comparable depending on attraction to light. Pheremone traps can be used for specific species. Scented lures (sugaring and wine ropes) can also attract species. Live-trapped adults of larger species can be marked, and survival and dispersal monitored from recaptures. 2
Other terrestrial invertebrates
Quadrats may be used for searches for specialist species where habitats can be identified. Some trapping devices are area-based, such as emergence traps. Strip transects may be used to monitor pollinating insects on flowers. Sweep nets can be used to infer relative abundance within a particular area. 1
Provides index of abundance for may species groups with complex or non-standard protocols. 1
Passive sound recording may detect insects with auditory displays, such as crickets and cicadas. 2
Artificial refugia can be used to attract individuals to count them e.g. for slugs and snails. Where appropriate, individuals may be marked allowing mark-recapture studies. 1
A wide range of lethal trapping approaches exist for different insect groups e.g. pitfall traps, water traps, malaise traps etc. and may be used to estimate abundance as the number of individuals caught per period of sampling. 12
Other aquatic invertebrates
Vegetation samples may be taken and the number of individuals per unit of vegetation assessed. Counts of adults of some emergent insects within strip transects surveyed in good conditions, particularly along the waters’ edge, can provide estimates of abundance e.g. for mayflies and stoneflies. 1
Timed aquatic sampling (sweep netting or kick sampling) can provide estimates of relative abundance. 1
Artificial refugia can be used to attract individuals to count them, and for some species, mark-recapture studies may be possible. Light traps may attract certain emergent insect groups, e.g. caddis flies. 2
Colonisation of artificial substrates left in the water used to identify occurrence. 2
Samples of water can be used to identify occurrence of species. 3
SPECIES & HABITAT MANAGEMENT
ANNEX
FIELD METHODS FOR SPECIES
MONITORING
4:5

INTRODUCTION & KEY CONCEPTS
DESIGNING & IMPLEMENTING THE EVALUATION
PRISM MODULES
METHOD FACTSHEETS & ANNEXES
PRISM - TOOLKIT FOR EVALUATING THE OUTCOMES AND IMPACTS OF SMALL/MEDIUM-SIZED CONSERVATION PROJECTS387
SPECIES & HABITAT MANAGEMENT
ANNEX
FIELD METHODS FOR SPECIES
MONITORING
TAXA COMPLETE SURVEY AREA-BASED SAMPLING TIMED SAMPLING LIVE TRAPPING REMOVAL TRAPPING EDNA
Marine invertebrates
Line transects or quadrats can be used to count the abundance of large and detectable marine invertebrates, using distance sampling to estimate density. 2
Timed sampling can provide estimates of relative abundance or occurrence for less detectable species. 2
Artificial refugia can be used to attract individuals to count them, and for some species, mark-recapture studies may be possible. 2
Colonisation of artificial substrates left in the water used to identify occurrence. 2
Fish in slow-flowing or still waters
Underwater counts can be made along transects or using point counts, allowing for distance sampling to correct for detectability. 2
Hydroacoustic sampling (sonar) estimates abundance of shoaling fish. Electrofishing can be used to estimate total population size using multiple catches between stop nets across a river and analysis using the removal method, or to provide an index of abundance based on a single catch. Note it is highly dangerous and requires training. 3
Counts from banks in shallow waters may provide a crude index of abundance, under-estimated for most species. 1
Timed counts underwater will provide better estimates of relative abundance. 2
Wide range of fish-trapping methods available for mark-recapture studies or to index abundance. 12
Gill, seine and trawl netting, and angling, can be used to provide catch returns (fish caught per unit effort) as an index of population size. This may vary with season, conditions and migratory status. Effort may be difficult to record if from commercial fishing / angling data. 23
Techniques to identify species occurrence from water samples are being developed. 3
Fish in running waters
Underwater counts can be made along transects or using point counts, allowing for distance sampling to correct for detectability. 2
Hydroacoustic sampling (sonar) estimates abundance of shoaling fish. 3
Counts from banks in shallow waters may provide a crude index of abundance, under-estimated for most species. 1Timed counts underwater will provide better estimates of relative abundance. 2Electronic counters can provide effective estimates for migratory fish through narrow channels / passes. 3
Wide range of fish-trapping methods available for mark-recapture studies, (dye or tagging) or to index abundance. Traps on weirs or fish ladders catch migrating individuals. 2
Angling can be used to provide catch returns (fish caught per unit effort) as an index of population size. This may vary with season, conditions and migratory status. Effort may be difficult to record. 2
Techniques to identify species occurrence from water samples are being developed. 3
4:5

INTRODUCTION & KEY CONCEPTS
DESIGNING & IMPLEMENTING THE EVALUATION
PRISM MODULES
METHOD FACTSHEETS & ANNEXES
PRISM - TOOLKIT FOR EVALUATING THE OUTCOMES AND IMPACTS OF SMALL/MEDIUM-SIZED CONSERVATION PROJECTS388
SPECIES & HABITAT MANAGEMENT
ANNEX
FIELD METHODS FOR SPECIES
MONITORING
TAXA COMPLETE SURVEY AREA-BASED SAMPLING TIMED SAMPLING LIVE TRAPPING REMOVAL TRAPPING EDNA
Marine fish Underwater counts can be made along transects or using point counts, allowing for distance sampling to correct for detectability. 2
Hydroacoustic sampling (sonar) estimates abundance of shoaling fish. 3
Counts of large species from boats or shore (e.g. basking sharks) may provide an index of abundance. 1
Wide range of fish-trapping methods available for mark-recapture studies (dye or tagging), or to index abundance. 2
Gill, seine and trawl netting can be used to provide catch returns (fish caught per unit effort) as an index of population size. This may vary with season, conditions and migratory status. Effort may be difficult to record if from commercial fishing / angling data. 23
Amphibians Distance-sampling may be used to correct counts along transects to produce densities, although individuals hiding in refugia may be undetectable. 1
Many amphibians are active at night, so searching for individuals by torchlight in suitable habitat can provide an index of abundance, particularly of breeding individuals (on land or underwater). Given their sensitivity to environmental conditions and date, surveys should be conducted on ideal nights, or under a range of conditions. Searching of refuges during the day may also work. Underwater sweep netting may provide an index of adult and larval abundance, depending on time of year. Occurrence or an index of breeding abundance may be obtained from egg searches. 1 Passive sound recording may detect species with auditory displays, such as many frogs and toads. 2
Fences and pitfall traps may be used to trap and intercept individuals traveling to or from a breeding site, and should be checked at least daily. Estimates of dispersing juvenile abundance from breeding ponds, or of egg abundance, may be used to estimate productivity / fecundity. Artificial refugia can be used to attract individuals to count them, either during hibernation or during the day. 1
Underwater traps (e.g. funnel traps) can be submerged or partially submerged in marginal habitat, and used to catch individuals. They should be checked regularly (at least every 6 hrs) in warm weather. Live-caught amphibians may be suitable for mark-recapture studies to estimate abundance or survival, by photographing unique markings (e.g. belly marks), using skin stains (safe in some toads), or PIT tagging, (although this may increase the risk of disease transmission). 2
Techniques to identify species occurrence from water samples are being developed. 3
4:5

INTRODUCTION & KEY CONCEPTS
DESIGNING & IMPLEMENTING THE EVALUATION
PRISM MODULES
METHOD FACTSHEETS & ANNEXES
PRISM - TOOLKIT FOR EVALUATING THE OUTCOMES AND IMPACTS OF SMALL/MEDIUM-SIZED CONSERVATION PROJECTS389
SPECIES & HABITAT MANAGEMENT
ANNEX
FIELD METHODS FOR SPECIES
MONITORING
TAXA COMPLETE SURVEY AREA-BASED SAMPLING TIMED SAMPLING LIVE TRAPPING REMOVAL TRAPPING EDNA
Reptiles Transects of known length can be walked to count individuals, e.g. basking individuals. For some species it may be possible to correct for detection. 1
Timed transects can be walked to count individuals, e.g. basking individuals. 1
Artificial refugia can be used to attract individuals to count them. The precise nature of the refugia will vary with the environment. Refugia should be visited frequently during the main period of activity (7 times to determine occurrence and 15-20 times to estimate abundance). Fences and pitfall traps, or baited funnel traps, may be used to trap and intercept individuals, and should be checked at least daily. 1
Mark-recapture studies may be undertaken to estimate abundance. Live-caught individuals may be suitable for mark-recapture studies by photographing unique markings (e.g. head marks on snakes), using nail polish / paint on scales, or PIT tags. 2
Marine reptiles
Nests can be counted along breeding beaches. 1
Early morning transects along breedwing beaches can be used to count turtle tracks, and those which end in nests give greater accuracy. 1
4:5

INTRODUCTION & KEY CONCEPTS
DESIGNING & IMPLEMENTING THE EVALUATION
PRISM MODULES
METHOD FACTSHEETS & ANNEXES
PRISM - TOOLKIT FOR EVALUATING THE OUTCOMES AND IMPACTS OF SMALL/MEDIUM-SIZED CONSERVATION PROJECTS390
SPECIES & HABITAT MANAGEMENT
ANNEX
FIELD METHODS FOR SPECIES
MONITORING
TAXA COMPLETE SURVEY AREA-BASED SAMPLING TIMED SAMPLING LIVE TRAPPING REMOVAL TRAPPING EDNA
Birds Possible where individuals are concentrated (e.g. at breeding colony or non-breeding aggregation) and counted or photographed. 1
Territory mapping from repeat visits (usually 5-10) within known areas used to estimate the abundance of breeding birds based upon the interpretation of multiple maps. This doesn’t work for non-territorial species. Indices of abundance can be derived from a smaller number of visits. Line-transects with distance sampling allow coverage of a greater area than area-based samples and work well in open habitats. Point-counts work better in closed habitats (e.g. woodland). 1
High-definition aerial photography can be used for strip-transect surveys of larger species in open habitats (sea, freshwater, grassland). 2
Estimates of abundance using timed counts can be useful for rapid assessment of relative abundance. 1
Passive sound-recording may be used to detect singing or calling birds. Researchers are developing algorithms for automatic identification from sound recording. Individuals of some species can be recognised from their song, enabling accurate estimates of abundance. 2
A range of methods exist for catching birds, ranging from mist-netting to trapping individuals on nests. Techniques require training and in many cases, licensing. Some of these can be standardised (e.g. constant effort site (CES) mist netting), allowing robust estimates of abundance to be derived. Ringing (banding) schemes are widely used for demographic studies in birds, allowing estimation of survival and recruitment. Some countries also run nest record schemes to monitor breeding success. 3
Bats Complete surveys of roots possible when individuals emerge at dusk. 1 Automatic devices may be used. Counts may also be undertaken at hibernation sites, although as usage varies with temperature and the availability of other sites, rarely can such counts be regarded as complete. 2
Line-transects may be used to record flying and foraging bats at night, using a bat detector to aid identification. Data will provide an index of relative abundance, but counts are highly variable depending upon date and conditions. 2
Passive sound recording may be used to detect and estimate relative abundance of many species, depending on the extent to which their sonograms are known. Algorithms are continually being developed to allow automated recognition. 2
Bat boxes may be installed and used to estimate relative abundance. Repeat visits are required as abundance may vary with conditions and date. Mist-netting may also be used with care to estimate occurrence and relative abundance. Techniques require training and in many cases, licensing. Ringing can be used to estimate abundance from mark-recapture techniques. 3
4:5

INTRODUCTION & KEY CONCEPTS
DESIGNING & IMPLEMENTING THE EVALUATION
PRISM MODULES
METHOD FACTSHEETS & ANNEXES
PRISM - TOOLKIT FOR EVALUATING THE OUTCOMES AND IMPACTS OF SMALL/MEDIUM-SIZED CONSERVATION PROJECTS391
TAXA COMPLETE SURVEY AREA-BASED SAMPLING TIMED SAMPLING LIVE TRAPPING REMOVAL TRAPPING EDNA
Large diurnal mammals
Possible where individuals are concentrated (e.g. at breeding colony or non-breeding aggregation) and counted or photographed. 1
Line-transects with distance sampling allow coverage of a greater area than area-based samples and work well in open habitats and for low-density populations. 1 For large species, aerial photography can be used for strip-transect surveys.
Estimates of abundance using timed counts can be useful for rapid assessment of relative abundance for common species. 1 Camera traps can be deployed widely to estimate the frequency of occurrence and provide an index of abundance. 2
Individuals may be captured and marked using a range of techniques including recording unique marks, fur clipping (which only lasts a few weeks), using dyes and tagging. PIT tags and microchips are increasingly being used. 3
Mortality data from hunting or other lethal methods can be used to estimate trends in population size, or removal techniques analysis can be applied. 3
Arboreal mammals
Breeding sites or other signs (e.g. nests or roost sites) may be counted within particular areas. Other signs, such as droppings, feeding signs, tracks and hairs may all be counted to infer an index of abundance. Line-transects with distance sampling allow coverage of a greater area than area-based samples but this is challenging in forest conditions. 1
Estimates of abundance using timed counts can be useful for rapid assessment of relative abundance for common species. 1
Passive sound recording has the potential to be used to detect and estimate relative abundance of vocal species. 2
Individuals may be marked using a range of techniques including recording unique marks, fur clipping (which only lasts a few weeks), using dyes and tagging. PIT tags and microchips are increasingly being used. 3
Mortality data from hunting or other lethal methods can be used to estimate trends in population size, or removal techniques analysis can be applied. 3
Cryptic or nocturnal mammals
Possible where individuals are concentrated (e.g. at breeding colony or non-breeding aggregation) and counted or photographed. 1
Breeding sites (e.g. burrows) may be counted within particular areas. Other signs, such as droppings, feeding signs, tracks and hairs may all be counted to infer an index of abundance. Line-transects with distance sampling allow coverage of a greater area than area-based samples and work well in open habitats and for low-density populations.1 Spotlight counts at night can be effective for nocturnal or crepuscular species. 2
Estimates of abundance using timed counts can be useful for rapid assessment of relative abundance for common species. 1
Passive sound recording has the potential to be used to detect and estimate relative abundance of vocal species. Camera traps can be deployed widely to estimate the frequency of occurrence and provide an index of abundance. 2
Live trapping using a range of traps provide quantitative information on species abundance, and occurrence for rare species. Individuals may be marked using a range of techniques including recording unique marks, fur clipping (which only lasts a few weeks), using dyes and tagging. PIT tags and microchips are increasingly being used. 3
Mortality data from hunting or other lethal methods can be used to estimate trends in population size, or removal techniques analysis can be applied. 3
SPECIES & HABITAT MANAGEMENT
ANNEX
FIELD METHODS FOR SPECIES
MONITORING
4:5

INTRODUCTION & KEY CONCEPTS
DESIGNING & IMPLEMENTING THE EVALUATION
PRISM MODULES
METHOD FACTSHEETS & ANNEXES
PRISM - TOOLKIT FOR EVALUATING THE OUTCOMES AND IMPACTS OF SMALL/MEDIUM-SIZED CONSERVATION PROJECTS392
TAXA COMPLETE SURVEY AREA-BASED SAMPLING TIMED SAMPLING LIVE TRAPPING REMOVAL TRAPPING EDNA
Marine mammals
Where individuals are concentrated (e.g. at breeding colony or non-breeding aggregation), they may be counted or photographed. 1
Aerial photography can be used for strip-transect surveys to provide estimates of relative abundance. 2
Counts of cetaceans from boats or shore may provide an index of abundance. 2 Acoustic recording may detect cetaceans over large distances, and may be used to identify individuals. 3
In species with individual markings, photography may be used to monitor abundance and demographic parameters. 2
SPECIES & HABITAT MANAGEMENT
ANNEX
FIELD METHODS FOR SPECIES
MONITORING
4:5

INTRODUCTION & KEY CONCEPTS
DESIGNING & IMPLEMENTING THE EVALUATION
PRISM MODULES
METHOD FACTSHEETS & ANNEXES
PRISM - TOOLKIT FOR EVALUATING THE OUTCOMES AND IMPACTS OF SMALL/MEDIUM-SIZED CONSERVATION PROJECTS393
Complete counts - In some cases it will be possible to count
accurately all the individuals within a population. This is most likely
to be achievable where the individuals are easily detected and
concentrated within a relatively small area. Complete surveys can
be undertaken using counts in the field (although even counting by
an observer can be subject to a degree of error), or from images,
such as fixed-point photographs or aerial photographs, providing a
more repeatable approach. When undertaking complete surveys
for a mobile species, it is important to do so at a time when the
individuals will be concentrated within the count location, such as
at breeding colonies or roost sites; otherwise counts will have to
be corrected for the likely proportion of the population present.
For species with multiple life-stages, it is important to identify the
most effective life-stage to count, which is often the adult stage.
Area-based sampling - (e.g. quadrats, fixed transects). Area-based
sampling approaches involve sampling or surveying defined areas,
from which the results are extrapolated to unsurveyed areas.
Areas may be surveyed using a variety of techniques from sample-
based approaches such as point counts and line-transects, mapping
methods such as common bird census techniques, and complete
counts using fixed-point photography. To identify true abundance
it may be necessary to correct for imperfect detectability, such
as using distance sampling or using data from repeat visits for
occupancy modelling. It is important that the locations of the
samples are randomly distributed across the area of interest, or
are appropriately stratified, in order to generate robust results.
If species abundance is highly variable between locations, it is
important to ensure that there are sufficient samples to produce
robust population estimates. Correctly delimiting the sampling
area is also important to ensure that all potentially suitable areas
are covered. To assist with design, it may be helpful to conduct
some initial trials to estimate mean abundance and variance across
a range of sites, before determining the sample size and power of
any final approach. Modelling the results appropriately will also be
important in order to estimate uncertainty correctly.
Timed sampling - The abundance of species with low detectability,
that are widely dispersed, that require searching using methods
that are difficult to standardise, or for which abundance cannot
be easily related to a particular area, may be best estimated using
timed counts. Here the number of individuals is recorded per
unit of time, rather than per unit area. This makes it difficult to
use this approach to estimate true population size, but it can be
used to estimate relative abundances. Examples include counting
migratory individuals moving through particular bottlenecks,
or recording encounters using passive devices such as camera
traps and listening devices. Passive devices may be particularly
valuable for detecting the occurrence of rare and difficult to detect
(particularly nocturnal) species. As there is likely to be temporal
variation in the numbers of individuals recorded, either within a
day, or across a season, it is important to ensure that any samples
are appropriately timed within that range, and that this is done in
a comparable way between sites or visits. If an entire population
passes through a location during a particular period, then an
appropriate sample of timed counts may estimate true population
size.
Live trapping - (trapping, netting etc.). It is possible to live-trap
individuals of many species using a wide range of different
methods, including mist-netting birds, trapping small mammals,
SPECIES & HABITAT MANAGEMENT
ANNEX
SAMPLING APPROACHES
FOR EVALUATING CHANGES IN
SPECIES STATUS
4:5

INTRODUCTION & KEY CONCEPTS
DESIGNING & IMPLEMENTING THE EVALUATION
PRISM MODULES
METHOD FACTSHEETS & ANNEXES
PRISM - TOOLKIT FOR EVALUATING THE OUTCOMES AND IMPACTS OF SMALL/MEDIUM-SIZED CONSERVATION PROJECTS394
netting fish, and light-trapping nocturnal insects. Trapping sessions
can be used to provide estimates of relative abundance in much
the same way as the timed samples discussed above. As with all
trapping techniques, care has to be taken that the efficacy of the
trap does not vary between habitats or locations, and therefore
that such estimates of abundance are not subject to bias as a
result of other factors. Where it is possible to mark individuals,
for example by using rings (bands) on birds, PIT tags, microchips
in other vertebrates or colour marks on some invertebrates, or to
recognise individuals from their appearance, then mark-recapture
techniques can be used to estimate the size of the population from
the ratio of the number of individuals caught and marked which are
then recaptured in a subsequent sample. There can be challenges
in defining the area which the population of sampled individuals
is from, and the extent to which a particular population is “open”
or “closed”, or includes transient or mobile individuals, and the
extent to which the “trappability” of individuals varies between
then, or even after capture. However, analytical solutions exist for
at least some of these issues, allowing this approach to provide
relatively robust estimates of abundance that should exclude many
potential biases. It can be the most effective way of estimating
the abundance of cryptic species, although it is resource-intensive
relative to other survey methods. Care needs to be taken that
trapping does not adversely affect the survival or behaviour of the
individuals that are caught.
Removal trapping - A greater range of trapping approaches is
available if individuals do not have to be caught alive. These can
be used to provide estimates of relative abundance in much the
same was as live-trapping samples or timed samples as outlined
above, based purely on the number of individuals caught. Thus,
invertebrate sampling techniques such as pitfall traps or water
traps, which generally involve the death of the individuals caught,
or snap traps for small mammals, are widely used to estimate
the relative abundance of groups such as these. If such trapping
approaches are carefully planned, or specific methodologies are
adopted, then the data can be used to estimate abundance more
robustly, for example from the decay in the numbers of individuals
trapped through time.
eDNA - The field of documenting the occurrence or even the
abundance of species within particular areas by means of the
extraction of DNA from environmental or biological samples
is currently expanding rapidly. Broadly speaking, samples from
the environment, such as water or soil, are collected and then
processed to extract the DNA, which is then multiplied and
replicated sufficiently for processing. The resulting DNA profiles
can then be compared with databases of known species in order to
identify the occurrence of those species within the environment.
This can prove particularly effective for monitoring taxa that
are difficult to survey, such as amphibians and fish in freshwater
environments, or micorrhizal fungi in the soil. Alternatively, these
approaches can be used for rapid processing of biodiversity
samples, such as those obtained by destructive sampling, including
invertebrate samples: samples can be homogenised and processed
to identify the species present. This is an emerging technology
which may become more relevant for small and medium-sized
conservation projects as it develops further.
SPECIES & HABITAT MANAGEMENT
ANNEX
SAMPLING APPROACHES
FOR EVALUATING CHANGES IN
SPECIES STATUS
4:5

INTRODUCTION & KEY CONCEPTS
DESIGNING & IMPLEMENTING THE EVALUATION
PRISM MODULES
METHOD FACTSHEETS & ANNEXES
PRISM - TOOLKIT FOR EVALUATING THE OUTCOMES AND IMPACTS OF SMALL/MEDIUM-SIZED CONSERVATION PROJECTS395
Annex: Analytical issues when estimating abundance,
distribution, survival and reproduction
Estimating distribution - Information about species distribution
may be gained from a range of sources, from unstructured species
records to the results of standardised surveys. There are particular
problems associated with the interpretation of unstructured
records, as the distribution of these may be as much a function of
where people have looked for the species as its actual distribution.
Qualitatively, the location of records can be used to estimate a
species range, and where it has particular habitat or elevation
associations, to describe likely occurrence within that range
from maps of suitable habitat extent. Where possible, it will be
preferable to use statistical modelling approaches (e.g. species
distribution models, occupancy models) to develop quantitative
predictions from these records, which can be extrapolated across
the remainder of the project area, although in cases where survey
effort is non-random, care needs to be taken to ensure that this is
done robustly.
If at all possible, it is advisable to make use of information about
the absence or inferred absence of a species to improve model
predictions. This can be done using the occurrence of other
species likely to be recorded at the same time as the focal species,
to identify null records or to indicate survey effort. A range of
statistical techniques exists for modelling species distributions
from a series of occurrences and from underlying environmental
and spatial data. These techniques will produce the most robust
predictions when based upon a well-structured survey, where
effort is standardised or is well measured so it can be accounted
for.
Ultimately, a rigorous survey across an entire project area (e.g. an
atlas approach) will provide the best distribution data without the
need for statistical inference.
Estimating abundance - Abundance is more challenging
to estimate than occurrence. For many species, imperfect
detectability will reduce the number of individuals counted
relative to the true number present (see Borchers et al. 2001 for
a consideration of these issues). A range of potential approaches
exists to account for this potential for under-estimation, ranging
from distance sampling to mark-recapture, each of which is
accompanied by its own assumptions and challenges. Providing
that comparable methods are used to compare variation in
abundance in space and time, these issues should have a limited
impact on the ability to monitor project outcomes compared to a
situation where the monitoring methods vary, either through time
or between sites.
Often extrapolation will have to be made from sample data to
unsurveyed locations. Final estimates should be associated with
an estimate of error (uncertainty) in order to identify whether
changes observed between repeat surveys are likely to be
meaningful. Any such extrapolation should take account of
potential biases in the location of samples.
Estimating change - Changes in the occurrence or abundance of
a species may be inferred from unstructured data, or measured
more accurately from the collection of specific monitoring data.
The approaches described above for estimating distribution
and abundance may be used separately to assess occurrence
and population size in two or more time periods, and to quantify
change; or this may be more elegantly achieved in a single model
SPECIES & HABITAT MANAGEMENT
ANNEX
ANALYTICAL ISSUES WHEN ESTIMATING
ABUNDANCE, DISTRIBUTION, SURVIVAL AND
REPRODUCTION
4:5

INTRODUCTION & KEY CONCEPTS
DESIGNING & IMPLEMENTING THE EVALUATION
PRISM MODULES
METHOD FACTSHEETS & ANNEXES
PRISM - TOOLKIT FOR EVALUATING THE OUTCOMES AND IMPACTS OF SMALL/MEDIUM-SIZED CONSERVATION PROJECTS396
to test for statistical differences between time-periods. In order
to attribute any observed changes to conservation intervention, it
will be necessary to examine differences in trend between site(s)
subject to conservation intervention and control site(s).
Formal analysis of change should take account of the likely power
of such monitoring to detect significant change. This will be a
function of count accuracy, natural variability and the magnitude of
impact of the conservation intervention. In general, a larger sample
of data is required where count accuracy is low, natural variability
is high, or the magnitude of impact is low. In order to assess this, we
would recommend conducting a pilot study to identify the most
effective monitoring regime for a given resource, in order to detect
a particular magnitude of effect.
Figure 1. The sampling effort required to detect a particular effect
increases with both uncertainty / error at the site level (where
samples are taken from) and the degree of variability between
sites.
Uncertainty at site level
Effort required todetect a particular
effect
Var
iab
ility
bet
wee
n s
ites
Hig
hLo
w
Low High
SPECIES & HABITAT MANAGEMENT
ANNEX
ANALYTICAL ISSUES WHEN ESTIMATING
ABUNDANCE, DISTRIBUTION, SURVIVAL AND
REPRODUCTION
4:5

INTRODUCTION & KEY CONCEPTS
DESIGNING & IMPLEMENTING THE EVALUATION
PRISM MODULES
METHOD FACTSHEETS & ANNEXES
PRISM - TOOLKIT FOR EVALUATING THE OUTCOMES AND IMPACTS OF SMALL/MEDIUM-SIZED CONSERVATION PROJECTS397
Annex: Field methods for habitat monitoring
This annex gives a very brief summary of field methods for
monitoring different habitat types that are relevant for small
and medium-sized conservation projects. To indicate the level of
expertise and equipment required, each method is categorised as:
1 (method fairly simple to use i.e. does not require formal training
or specialist equipment), 2 (method requires some training and/
or specialist equipment), or 3 (method requires highly-specialised
training and equipment).
More information on the methods in this annex can be found
in the Cambridge handbook of ecological survey methods
https://sunsetridgemsbiology.wikispaces.com/file/view/
Biodiversity+Handbook.pdf
SPECIES & HABITAT MANAGEMENT
ANNEX
FIELD METHODS FOR HABITAT
MONITORING
4:5

INTRODUCTION & KEY CONCEPTS
DESIGNING & IMPLEMENTING THE EVALUATION
PRISM MODULES
METHOD FACTSHEETS & ANNEXES
PRISM - TOOLKIT FOR EVALUATING THE OUTCOMES AND IMPACTS OF SMALL/MEDIUM-SIZED CONSERVATION PROJECTS398
HABITAT CHARACTERISTIC
HABITAT TYPE EXTENT COMPOSITION STRUCTURE REGENERATION EFFECTS OF EXTERNAL PRESSURE
Forest, woodland and scrub
Satellite imagery to measure area of individual forest stand and boundaries. 2
Aerial photography/ drones to measure extent and location of open spaces. 3
Plots, transects or plotless sampling to measure changes in species composition, richness and diversity. 1
Use distance sampling to monitor specific indicator species or trees in more open habitats. 2
Plots or plotless sampling to measure horizontal and vertical structural diversity, thinning extent and deadwood. 1
Aerial photography/ drones measure extent and location of open spaces. 3
Measure seedling regeneration and composition using ground survey methods. 1
Use plots to measure effects of harvesting timber and non-timber forest products (NTFPs). Measure height, condition etc. before & after harvesting and within/outside areas of harvesting. 3
Measure grazing pressure by comparing difference in tree mortality/condition between grazed and ungrazed areas. 2
Grassland Satellite imagery to measure extent of area. 2
Aerial photography or drone imagery. 3
Quadrat surveys for specific vegetation types. 1
Use line transects or quadrats to measure species richness, diversity and/or presence/absence of indicator species. 1
Quadrats/point samples to measure height, density and percentage cover in different height categories. 1
Use vegetation height/condition to monitor grazing intensity. 1
Mountain habitats Satellite imagery to measure extent of area. 2
Aerial photography/ drones to measure extent and location of area. 3
Quadrats/transects to measure exposed rock, scree, bare soil or snow cover. 1
Quadrats or transects to measure species/ species communities characteristic of the habitat, species composition and/or richness. 1
Total counts, quadrats or transects to measure presence/absence of indicator species. 1
Quadrats/point samples to measure height, density and percentage cover in different height categories. 1
Use vegetation height/condition to monitor grazing intensity. 1
Use occurrence/indicator species to monitor changes in nutrient status. 2
SPECIES & HABITAT MANAGEMENT
ANNEX
FIELD METHODS FOR HABITAT
MONITORING
4:5

INTRODUCTION & KEY CONCEPTS
DESIGNING & IMPLEMENTING THE EVALUATION
PRISM MODULES
METHOD FACTSHEETS & ANNEXES
PRISM - TOOLKIT FOR EVALUATING THE OUTCOMES AND IMPACTS OF SMALL/MEDIUM-SIZED CONSERVATION PROJECTS399
SPECIES & HABITAT MANAGEMENT
ANNEX
FIELD METHODS FOR HABITAT
MONITORING
HABITAT CHARACTERISTIC
HABITAT TYPE EXTENT COMPOSITION STRUCTURE REGENERATION EFFECTS OF EXTERNAL PRESSURE
Still/slow-flowing wetlands
Satellite imagery to measure extent of area. 2
Aerial photography/ drones measure extent and location of area. 3
Quadrats or transects to measure species/ species communities characteristic of the habitat, species richness, diversity and/or presence/absence of indicator species. 1
Fixed point survey to measure vegetation height and/or invasion by non-wetland species. 1
Use macroinvertebrate indicator species to measure pollution. 2
Rivers & streams Satellite imagery to measure extent of individual area. 2
Aerial photography/ drones to measure extent and location of area. 3
Use macroinvertebrate indicator species to measure water chemistry. 2
Quadrats or transects to measure bankside and emergent vegetation species richness, and abundance of vegetation and macrophytes. 1
General surveys, quadrats or transects to measure features of river morphology: channel width, shape, pools etc. 1
Fixed point survey, transect or quadrat methods to measure vegetation height and/or coverage of banks. 1
Use macroinvertebrate indicator species to measure pollution. 2
Coral reefs Belt transects or long swim method to survey indicator species. 2
Point intercept transects to measure cover of sessile benthic invertebrates. 2
Before/after or Before-After Control-Impact (BACI) belt transects or long swim method to survey cover/indicator species. 3
4:5

INTRODUCTION & KEY CONCEPTS
DESIGNING & IMPLEMENTING THE EVALUATION
PRISM MODULES
METHOD FACTSHEETS & ANNEXES
PRISM - TOOLKIT FOR EVALUATING THE OUTCOMES AND IMPACTS OF SMALL/MEDIUM-SIZED CONSERVATION PROJECTS400
Annex: Sampling approaches for habitat monitoring
Plots
Plots are pre-defined square, rectangular or circular areas that are
used to delineate an area of interest. These plots are then sampled
at one or more subsequent time points to provide data on changes
taking place. Care must be taken when using permanent plots to
estimate wider-scale changes. Unrepresentative plots, or too few
plots, will give unreliable estimates of compositional and structural
change, so it is important to define the locations of plots in a way
that minimises bias (preferably by locating them randomly). This
can be challenging in remote areas, but it is important that less
accessible areas are sampled sufficiently, as habitat quality will
typically decline with ease of access.
Larger plots (>0.25 ha) are (1) better for validating satellite
imagery, (2) associated with lower variance between plots, (3)
produce more representative estimates of vegetation parameters,
(4) are better for measuring small-scale ecological processes, and
(5) suffer less from “edge effects” (because they have a lower
perimeter : area ratio).
Smaller plots (<0.25 ha) provide (1) better landscape-level
representation, but suffer from (2) higher random variation
between plots, (3) less representative vegetation parameters,
and (4) greater edge-effects.
For further information, see Condit R (1996) http://www.stri.
si.edu/sites/publications/PDFs/Condit.TREE1995.pdf .
Plotless sampling
This is generally a much faster method for estimating attributes
than using permanent or temporary plots. However serious bias
can result if the distribution of species is not random (i.e. if it is
either clumped or uniformly distributed).
Types of plotless sampling include:
“Bitterlich sampling” - Most commonly used for estimating tree
density, but any other information that can be recorded about
individual trees can be measured and averaged. It is rapid and
unbiased, provided that the correct Basal Area Factor prism is
selected. Too many trees counted systematically underestimates
the basal area; too few counted generates too much error.
For full details see http://wiki.awf.forst.uni-goettingen.de/wiki/
index.php/Bitterlich_sampling .
Other plotless methods include the Nearest Individual method, the
Point-centred Quarter method and the T-square sample method.
(Full details of these methods can be found in pages 233-234 of the
Cambridge Handbook of Biodiversity Methods).
SPECIES & HABITAT MANAGEMENT
ANNEX
SAMPLING APPROACHES FOR HABITAT
MONITORING
4:5

INTRODUCTION & KEY CONCEPTS
DESIGNING & IMPLEMENTING THE EVALUATION
PRISM MODULES
METHOD FACTSHEETS & ANNEXES
PRISM - TOOLKIT FOR EVALUATING THE OUTCOMES AND IMPACTS OF SMALL/MEDIUM-SIZED CONSERVATION PROJECTS401
Transects
Transects are linear plots that are usually straight, but may follow
a natural course such as an existing footpath or river. They can
be treated as a long thin plot, e.g. 1 km long by 20 metres wide,
and only features within the transect boundary are counted and
measured. Distance sampling is a form of transect which is useful
for assessing features of high quality habitat that are too rare
to be effectively sampled using plot methods, e.g. frequency of
large trees, or particular non-timber forest products. The method
involves measuring the distance of observed trees or other
features from a straight transect line. Formulae, or the software
DISTANCE™, are used to calculate density.
Monitoring indicator species
This involves monitoring species that are characteristic of
particular habitats. Their abundance (or in some cases, presence/
absence) can act as an indicator of habitat condition, for example
the perennial plants Mercurialis perennis and Anemone nemorosa
are indicators of ancient woodland in a European context, while
the abundance of “disturbance-responsive species” (such as
grasses, herbs, ferns, bamboo, lianas and pioneer tree species) can
be useful for quantifying forest degradation. The Annex Sampling
approaches for evaluating changes in species status provides
specific guidance on monitoring species abundance.
Dominance indices
These can be used to provide a statistical measure for tracking
change over time and/or to make comparisons between sites.
Dominance indices are very quick to assess but they rely on having
staff who really understand the underlying principle and have good
experience with the range of different abundances of disturbance-
responsive species.
Typically, habitat condition in forests is assessed by quantifying
the number of trees within particular size classes of “Diameter at
Breast Height” (DBH). The thresholds for these classes must be
calibrated to the forest type and condition in order to optimise
sensitivity and to be able to detect change over time: if they are
too high, few trees will be recorded in the class; if they are too low,
the effort required to count all the trees within the size class will be
excessively time-consuming.
References
The Cambridge Handbook of Biodiversity Methods - Survey,
Evaluation & Monitoring provides an overview of methods for all
taxa - https://sunsetridgemsbiology.wikispaces.com/file/view/
Biodiversity+Handbook.pdf .
Swinfield T and Harrison RD (2016). Optimising forest resource
assessments for ecosystem restoration: ftp://ftp.biotrop.org/
International_Conference_on_Tropical_Biology_2015/ORAL_
PRESENTATION/SUB%20TEMA%201/S1ST1-O-02_Tom%20
Swinfield_lowres.pdf
The Gottingen Forest Inventory Wiki is an excellent source of
information regarding forest plot design and monitoring - http://
wiki.awf.forst.uni-goettingen.de/wiki/index.php/Main_Page .
Gill D and Daltry J (2014). Brief 3: How to make a monitoring
plan for threatened tree species. Global Trees Campaign http://
globaltrees.org/wp-content/uploads/2015/03/GTC-Brief-3-
monitoring-plan-lo-res.pdf .
SPECIES & HABITAT MANAGEMENT
ANNEX
SAMPLING APPROACHES FOR HABITAT
MONITORING
4:5

INTRODUCTION & KEY CONCEPTS
DESIGNING & IMPLEMENTING THE EVALUATION
PRISM MODULES
METHOD FACTSHEETS & ANNEXES
PRISM - TOOLKIT FOR EVALUATING THE OUTCOMES AND IMPACTS OF SMALL/MEDIUM-SIZED CONSERVATION PROJECTS402
GLOSSARY
TERM DEFINITION
Action A specific activity or process undertaken over a specific period of time by a project in order to bring about change.
Assumption Expression of the logic underpinning the links between different stages of a project (e.g. why a particular output could be expected to result in a subsequent outcome) or the external factors which could positively or negatively influence project results.
Attribution Ascribing a causal link between observed changes and project actions, taking into account the effects of other actions and possible confounding factors.
Baseline Information collected before or at the start of a project that provides a basis for planning and/or assessing subsequent progress and outcomes/impacts.
Control group/site A group or site that is not targeted by the actions of the project being evaluated.
Counterfactual A hypothetical estimate of what would have happened (or not) had the project not been implemented.
Evaluation The systemic assessment of an ongoing or completed project or project action. This involves looking at specific elements of the project to see what difference the project has made and what lessons have been learnt.
Evaluation design The methodology selected for collecting and analysing data in order to reach conclusions about project results.
Impact The long-term change(s) brought about by the project’s action(s).
Indicator Quantitative or qualitative variable that provides a reliable means of measuring a particular outcome or impact.
Logic model Often a visual representation, this provides a “road map” showing the sequence of related events connecting the need for a planned project with the project’ desired outcomes and results.
Logical framework (Logframe)
A management tool used to improve the design and evaluation of actions that is widely used by development agencies. It is a type of logic model that identifies strategic project elements (inputs, outputs, outcomes, impact) and their causal relationships, indicators, and the assumptions or risks that may influence success and failure.
Monitoring The performance and analysis of routine measurements to detect changes in project status. Used to inform the project team about the progress of an ongoing action or project, and to detect problems that may be addressed through corrective actions.
Outcome The change(s) brought about by the project’s actions.
Output What is directly produced by the project’s actions.
4:0
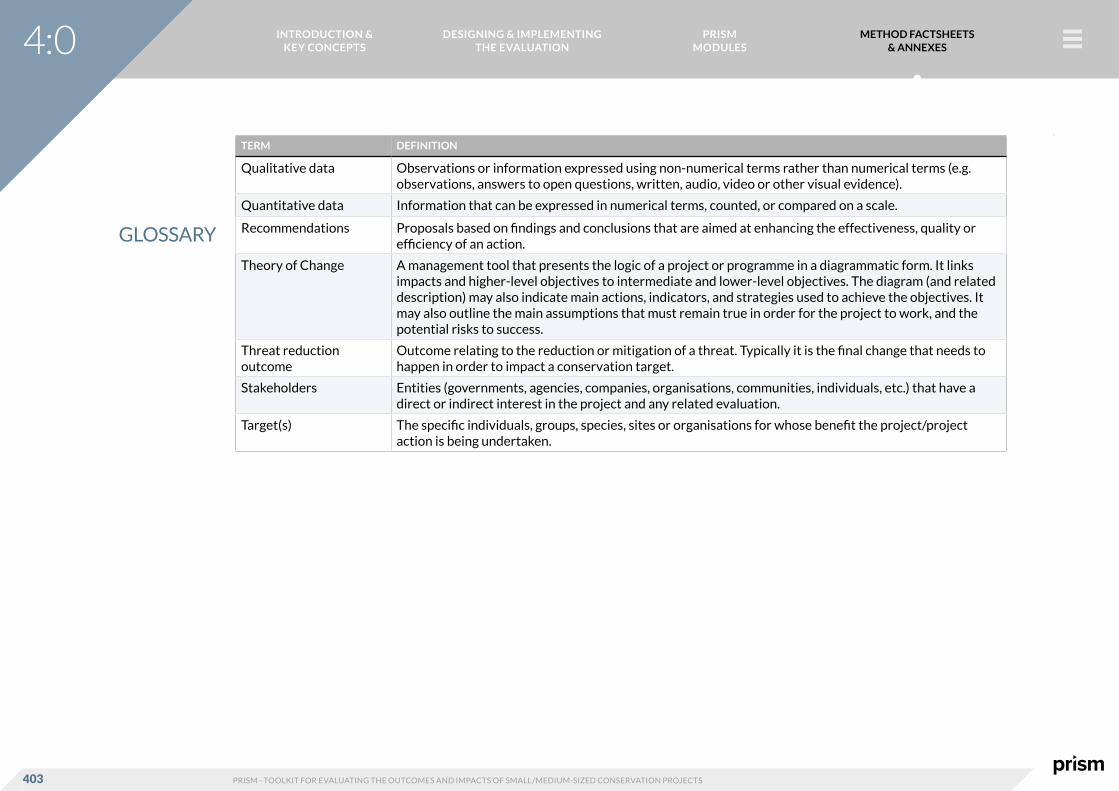
INTRODUCTION & KEY CONCEPTS
DESIGNING & IMPLEMENTING THE EVALUATION
PRISM MODULES
METHOD FACTSHEETS & ANNEXES
PRISM - TOOLKIT FOR EVALUATING THE OUTCOMES AND IMPACTS OF SMALL/MEDIUM-SIZED CONSERVATION PROJECTS403
TERM DEFINITION
Qualitative data Observations or information expressed using non-numerical terms rather than numerical terms (e.g. observations, answers to open questions, written, audio, video or other visual evidence).
Quantitative data Information that can be expressed in numerical terms, counted, or compared on a scale.
Recommendations Proposals based on findings and conclusions that are aimed at enhancing the effectiveness, quality or efficiency of an action.
Theory of Change A management tool that presents the logic of a project or programme in a diagrammatic form. It links impacts and higher-level objectives to intermediate and lower-level objectives. The diagram (and related description) may also indicate main actions, indicators, and strategies used to achieve the objectives. It may also outline the main assumptions that must remain true in order for the project to work, and the potential risks to success.
Threat reduction outcome
Outcome relating to the reduction or mitigation of a threat. Typically it is the final change that needs to happen in order to impact a conservation target.
Stakeholders Entities (governments, agencies, companies, organisations, communities, individuals, etc.) that have a direct or indirect interest in the project and any related evaluation.
Target(s) The specific individuals, groups, species, sites or organisations for whose benefit the project/project action is being undertaken.
GLOSSARY
4:0

INTRODUCTION & KEY CONCEPTS
DESIGNING & IMPLEMENTING THE EVALUATION
PRISM MODULES
METHOD FACTSHEETS & ANNEXES
PRISM - TOOLKIT FOR EVALUATING THE OUTCOMES AND IMPACTS OF SMALL/MEDIUM-SIZED CONSERVATION PROJECTS404
PRISM - TOOLKIT FOR EVALUATING THE OUTCOMES & IMPACTS OF SMALL/MEDIUM-SIZED CONSERVATION PROJECTS