Prioritizing Land for Habitat Protection: Using GIS for efficient habitat conservation in...
144
iii Prioritizing Land for Habitat Protection: Using GIS for efficient habitat conservation in Southampton, NY. By Jared Margolis B.A., Colgate University, 1998. Thesis Submitted in partial fulfillment of the requirements for the degree of Masters in Environmental Studies At Brown University Providence, Rhode Island May 2002
Transcript of Prioritizing Land for Habitat Protection: Using GIS for efficient habitat conservation in...

iii
Prioritizing Land for Habitat Protection: Using GIS for efficient habitat conservation in Southampton, NY.
By
Jared Margolis
B.A., Colgate University, 1998.
Thesis Submitted in partial fulfillment of the requirements for the degree of
Masters in Environmental Studies At
Brown University
Providence, Rhode Island May 2002

iv
Acknowledgments
This work would not have been possible without the support
of a number of people. I would like to thank Saleem Ali, who has
been incredibly supportive, and whose faith in me has allowed me
to do my best. I could not ask for a better advisor. Jill
Ozarski, my TNC contact, has provided me with an incredible
amount of information, and has been not only supportive of my
work, but has kept my vision of helping the area I love alive.
Lynn Carlson, a.k.a. GIS guru, is without a doubt a
goldmine of information, and she has not only helped me through
the GIS aspect of this project, she has become a wonderful friend
as well. Melanie Harlow started as a great boss, and her
expertise in the GIS field has been a tremendous help. I am proud
to have her help as a reader for my thesis. Barnaby Friedman, GIS
coordinator for TNC, has helped guide me through much of the data
available for this analysis, and has been a wonderful friend and
GIS buddy.
To all those agencies and groups who have sent me data -
Town of Southampton, Suffolk County, Natural Heritage, Army
Corps, and FEMA - many thanks for making this possible.
To my friends, thanks for listening to me drone on and on
about Southampton. My ski buddies in VT, my friends in
Providence, and scattered others all over the world, thanks for
everything.
To my two loves Jobi and Alex. I love you both so much,
and you’ve been here for me every day of the year. I couldn’t
have done it without you. Rock Us.
Finally, my wonderful, supportive parents and sister.
Thanks so much for everything you do for me. I love you guys. The
support you have shown me is unreal, and I can’t thank you
enough.

v
Table of Contents
iii. Acknowledgments v. Tables and Figures vi. Executive Summary 1. Introduction
1.1 Study Area 1.1a Southampton Physical Characteristics 1.1b Land Use and Demographic Trends
1.2 Management Options 1.3 Target Audience 1.3a Private Organizations and Government in Conservation
1.3b Land Protection on LI - Working with The Nature Conservancy
1.3c The Nature Conservancy Approach to Land Protection 1.4 Geographic Information Systems 1.4a GIS Scope and Previous Application
2. Methodology 2.1 Criteria and Coverage’s
2.1a 100 yr. Flood Plane 2.1b Wetlands -Wetland Buffers -Wetland Coverages 2.1c Barrier Beach Overwash 2.1d Protected Land 2.1e Beach Dependent Species 2.1f Coastal Erosion Hazard Area 2.1g Community Preservation Fund Areas 2.1h Parcel Size 2.1I Land Availability
2.2 Prioritization Scheme
3. Results 3.1 Vacant Land Results 3.2 Residential Easement Results 3.2 Structure Relocation Results
4. Discussion 5. Constraints 6. Further Research 7. Conclusions 8. References 9. Appendix A
Criteria Maps Result Maps

vi
Tables
1. The Nature Conservancy Criteria and Related Coverage’s P.41
2. Coverage’s and Sources P.72
3. Table of Results - Vacant Parcels P.80
4. Table of Results - Easements P.82
5. Table of Results - Structure Relocation P.85
6. Summation of Results P.85
Figures
1. Location map of Long Island P.5
2. Prioritization Criteria P.73
3. Map of Results - Vacant Parcels P.81
4. Map of Results - Easements P.83
5. Map of Results - Structure Relocation P.84

vii
Executive Summary
Introduction
Southampton stands at a crossroads in time. With
about one third of available land already built upon,
another third protected, and a third up for grabs, fast
action needs to be taken to accumulate land for habitat
protection. Both local government and private conservation
organizations are involved with this issue, with very
different goals in mind. This case study will show the
possibilities which new technology allows for the
prioritization of land for habitat preservation.
The extensive and important habitat areas in
Southampton are increasingly threatened by human
encroachment. Any activity that would disturb or eliminate
natural beach and dune-land plant communities (or alter the
water quality) would result in a loss of valuable habitat
for a number of important wildlife species. Shorebirds in
particular are very vulnerable to disturbance by humans.
Development of the area for residential or extensive
recreational use would result in a direct loss of valuable
habitats and increased human disturbance impacts on certain
species.

viii
Much of Southampton’s growth has occurred along the
southern and coastal region. Future growth is expected to
occur primarily along the coastal regions as well, focusing
along the bays and estuaries. This will blur the boundaries
between the traditional hamlets and village centers as
build-out occurs away from these now concentrated centers
of activity. A fast growing population, especially within
the seasonal summer residents, has lead to an incredible
increase in housing prices, and a lack of available land.
While density of housing remains low, it is essential to
keep development from taking over the valuable ecosystems
that provide habitat for local species.
A number of questions have surrounded the research
presented here, and have helped me to focus on ways to help
make the conservation effort on Long Island more efficient.
I have looked into what technologies exist for spatial
analysis, and the management options available for habitat
protection, which could benefit from such analysis. I have
researched the different agencies and groups involved, and
looked at which has the most potential to affect change,
and provide goals I agree with and can work with. Finally,
in looking to the actual ground level of prioritizing
lands, I have done extensive research into the criteria and
coverage’s that exist, and have selected those that are the

ix
most relevant for prioritization on the parcel level. This
has lead me to my thesis question, ‘How can Geographic
Information Systems (GIS) be used to prioritize parcels for
efficient habitat protection in a well developed coastal
zone?’
My research has shown that while local government has
a number of protective laws and land management strategies,
development pressure and economic influence makes private
conservation groups role in land acquisition an important
part of habitat protection. Due to the fact That
Southampton is so developed, and contains such a variety of
sensitive and locale specific habitat areas, I feel that
the ability of private groups to work quickly within both
the public and private sector is essential for this
region’s conservation. The Nature Conservancy has worked
extensively within this area, and their goals are
consistent with my own vision of targeted habitat
preservation. TNC expertise has provided me with a platform
on which my methodology is based, and a target audience
that will make use of my results in their continuing effort
to protect land on Long Island.
Previous projects have focused on analyzing land
cover data for the identification of sensitive or habitat

x
rich lands for acquisition. Southampton provides an
important case study, because it involves an extremely
difficult area to test the powers of GIS. Analyzing and
prioritizing on the parcel level in a well-developed and
extremely expensive coastal zone, with very sensitive
habitat, is at the boundaries of what GIS has been used for
in the past. The ability to include a variety of management
options and test the usefulness of GIS within these
alternatives will help to push this technology forward. My
hope is to arm conservation groups with a methodology for
prioritizing parcels in an extreme context, which can then
be applied to a variety of situations.
Methodology
This project will focus on three management options,
outright purchase of vacant lands, targeting residential
land for easements, and relocation of homes from the
Coastal Erosion Hazard Area. These management options have
been chosen because they relate directly to the location of
parcels and structures within the landscape, and are thus
compatible with GIS related techniques of spatial analysis.
The ability to manage a variety of management options
is one of the benefits of using GIS for prioritizing
preservation efforts. While previous similar projects have

xi
focused on identifying those lands that would be most
beneficial for preservation within larger, undeveloped
regions, this case study must take on a new set of options,
due to the high level of development within the town.
Prioritizing residential lots for easements and structures
for relocation are management tools that have not been
extensively analyzed within such a context, making this
project a unique case study that will hopefully open up new
avenues for GIS within the land protection world.
GIS has allowed me to assess the proximity of parcels
to a number of landscape criteria. These criteria were
selected for analysis after extensive research into the
coastal landscape of Southampton, including discussions
with local experts and journal articles concerning coastal
processes. This research has allowed me to select data that
will target the species and processes that are most
essential for protection of habitat in Southampton. The
table below details the coverage’s that were used for the
prioritization process.

xii
Criteria and Coverage’s used for Prioritization
Data Set Source Usefulness Comments
Base Parcel Map Suffolk County Provides the actual parcels to be prioritized.
Some ownership Data needs updating
Wetlands Coverage
Town of Southampton
Target habitat – provides breeding, feeding, and nesting for rare birds.
Town GIS office created coverage from
ground data Protected Land Suffolk County Tax
Map Build on protected land to create larger areas of habitat – reduce
fragmentation
Government ownership very
accurate Community Preservation
Fund
Town of Southampton
Open space habitat areas selected by town for protection – allows for
partnership
Covers forest and grassland areas in
North of study area Coastal Erosion
Hazard Area NY Department of
Environmental Conservation
Indicates natural protective features along coast - dunes
Historic Barrier Beach Overwash
Historic overwash site map in DGEIS
Shows past areas of overwash
Possible Barrier Beach Overwash
Army Corps Digital Elevation Model
Coastal process necessary for dune and estuary health
Needs Bathymetry data and better
modeling Beach Dependent
Species Natural Heritage
Program Target species of birds and plants
found along beach areas. Number of individuals present not associated
Results
Within my study area, there exist 2,531 parcels
listed as vacant and available for development.
Prioritizing these parcels based upon the criteria
described within this paper has yielded a distribution of
scores where a select few parcels have scored very high,
while the majority scored very low. The results of the
prioritization also indicate a few areas where preservation
reserves may be possible due to clusters of high scoring
vacant parcels coinciding.
While only two of the parcels fulfilled all six
criteria, 123 of the parcels received a score of three or

xiii
higher. Those parcels with higher scores represent lands
that contain enough attributes to make them worthy of
immediate attention. Roughly half of the parcels scored a
zero, indicating those parcels that are not in need of
attention at this time.
Groupings of high scoring parcels represent possible
reserve areas that can be established. One such area, at
Tiana beach, is already under investigation by TNC, and
these findings will help TNC staff to present the
conservation needs for this area to raise funds for
acquisition of parcels.
Within the study area there are 13,176 parcels listed
as low, medium, or high density residential built lands.
After selecting out only those parcels with enough un-built
land to warrant easement purchase, 4,552 parcels remained
for prioritization. The distribution of scores indicates a
large number of parcels that do not cover multiple criteria
for preservation, while only a handful scored very high.
Using a score of three as a cutoff for those parcels
that are in need of immediate attention, we can see that
159 of the 4,552 parcels are in need of immediate concern.
As with vacant parcels, roughly half of the parcels scored

xiv
a zero, allowing efforts to be targeted to those that have
significant resource value.
The results show that most high scoring parcels occur
along the waters’ edge, specifically along many of the
tidal creeks that are associated with wetland communities.
This is especially significant, due to the fact that these
are probably the most sensitive areas to human disturbance,
and can benefit greatly from conservation efforts that
would keep density of housing, and associated water and
waste needs, down.
604 structures currently exist within the Coastal
Erosion Hazard Area in the town of Southampton. Of these,
26 scored a three or higher, indicating that very few of
these structures have the possibility of relocation.
Clusters of high scoring parcels do exist, with areas along
specific beaches, and distinct sections along bays showing
promise for management.
Most of these high scoring parcels are associated
with barrier beach overwash sites, and thus the results
indicate not only houses that are ripe for relocation, but
those that are in danger of destruction as well. The
results show large stretches of structures that are in a

xv
precarious straight, and thus can help to target both
preservation and education efforts in the future.
The Table Below summarizes the scores for each
management option. I have categorized the parcel score
results into high, mid, and low ranges, and have indicated
the score that is applicable for each range. Since not all
criteria were pertinent for each management option, these
ranges differ.
Results of Prioritization
(0-1)
364 (2)
214 (3-4)
26 Structure
Relocation (Total:604)
(0-1)
3899 (2-3)
598 (4-5)
55 Residential Easements
(Total: 4,552)
(0-1)
2031 (2-3)
478 (4-6)
22 Vacant Parcels
(Total: 2,531)
Low Range Scoring
(score)
Mid Range Scoring
(score)
High Range Scoring
(score)

xvi
Conclusions
The distribution of scores which occurred, with very
few parcels scoring high and many scoring low, will allow
preservation efforts to be more effective by targeting
those few parcels which contribute greatly to habitat. With
only a handful of parcels fulfilling multiple target goals,
conservation efforts can be proactive, making the land
grabbing tactics of the past obsolete.
Clusters of vacant parcels that obtained high scores,
as well as clusters of high scoring possible easement
parcels and structures for relocation, are of particular
importance because they may allow for the creation of new
reservation sites and targeted community efforts. Clusters
of protected land will help to create corridor areas for
migratory bird species, and reduce fragmentation by
increasing the size of protected habitat. It may also be
possible to work with local, federal or state government on
creating new reservation areas, thus reducing the financial
strain inherent in large-scale acquisition efforts. This
can help build partnerships, and allow for public
participation within a directed campaign.
Clusters of easement areas and structures for
relocation are of significance because of the potential
these areas have for linking landowners together in

xvii
community conservation efforts. These clusters can be
linked to TNC to provide management and technical
information and education so that the landowners in these
areas can learn to protect valuable natural resources. The
results of this study indicate that GIS can target
education and management related projects that will provide
community based support for preservation.
The ability to quickly and efficiently analyze large
amounts of spatial data is now a reality and a necessity
for habitat protection. GIS technology allows for a variety
of preservation methods to be analyzed, and thus arms
preservation minded groups with a whole new array of tools
to target preservation efforts.
The methodology and results of this study are
indicative of the usefulness of GIS for land-use planning.
While my focus is on the Nature Conservancy and habitat
protection, other groups will be able to learn from this
project, and apply it to other aspects of land management.
Other criteria could be applied for different goals, such
as rural character preservation for farmland and purchase
of development rights studies. Likewise, other areas can be
similarly analyzed, such as towns with similar
characteristics to Southampton.
xviii
This study will in fact provide a foundation for
prioritizing conservation efforts, and a methodology that
will allow for more effective allocation of funds for
habitat protection. I am very proud to be able to help the
area that I love so much, and to see the future of GIS and
land protection unfolding in front of me.

1
1. Introduction
Long Island stands at a crossroads in time. With
about one third of available land already built upon,
another third protected, and a third up for grabs, fast
action needs to be taken to accumulate land for protection.
Both local government and private conservation
organizations are involved with this issue, with very
different goals in mind. Protecting biodiversity,
supporting local economies, Protecting rural character, and
providing adequate recreation are just some of the
priorities involved.
The public looks to these government and
environmental groups to work with limited funds to protect
the natural landscape. The rural character of Long Island
depends upon the wetlands, dunes, and other open space
areas of this dynamic region. These areas, in turn, depend
upon the biodiversity that feed, breed, nest, and grow in
the ever-changing coastal zone. The Nature Conservancy sees
this need to protect biodiversity as the key to
preservation on LI. That is why protecting the most diverse
and ecologically significant lands, rather than economic
and recreation concerns, are the focus of TNC efforts.
The question remains how can conservation efforts be
prioritized for more efficient land protection? Landscape

2
scale strategies identify areas that are in need of
protection, but with limited funding can we rely upon land
grabbing strategies that simply target available land for
immediate acquisition? The answer is no, especially when we
are dealing with areas with high land values and heavy
development in sensitive areas.
A number of questions have surrounded the research
presented here, and have challenged me to focus on ways to
help make the conservation effort on Long Island more
efficient. I have looked into what technologies exist for
spatial analysis, and the management options available for
habitat protection, which could benefit from such analysis.
I have researched the different agencies and groups
involved, and looked at which has the most potential to
affect change, and provide goals I agree with and can work
with. Finally, in looking to the actual ground level of
prioritizing lands, I have done extensive research into the
criteria and coverages that exist, and have selected those
that are the most relevant for prioritization on the parcel
level. This has lead me to my thesis question, ‘How can
Geographic Information Systems (GIS) be used to prioritize
parcels for efficient habitat protection in a well
developed coastal zone?’

3
When efficient use of funds is necessary,
prioritizing purchases and management options quickly and
precisely is what conservation groups must strive for. New
technology is allowing us to do just this, with spatial
analyzation methods only possible with Geographic
Information System technology. GIS computer systems allow
conservation-minded organizations to overlay data and
organize their efforts to protect the most beneficial land
possible.
This case study will show the possibilities that GIS
technology allows for the prioritization of land for
habitat preservation. Prioritizing vacant parcels for
acquisition, the more common use of this technology by
private groups, is only the first step. I will apply this
technology to other management options as well including
built parcels for the possibility of easement, and the
management of structures within the sensitive coastal zone
within this heavily developed area.
1.1 Study Area

4
I have chosen to work within the town of Southampton
because it has long been my home and a place that has meant
so much to my career in environmental studies. Paddling
along the green and brown edge of Mecox bay where the swans
hide in the reeds and the mud smells of salt and life, one
can see as many as thirty different birds. Terns, plovers,
osprey, and black backed skimmers whose bills cut through
the glassy surface sending up a spray that catches the
light off the water. Snapping turtles and box turtles poke
their heads up to see who has invaded their tranquil
hunting grounds, while herons and egrets carefully plot
their next move as they so delicately step through the oily
mud without making the slightest ripple. Cormorants pray
to the sun, wings outstretched, as they dry their oil-free
feathers in the breeze, which carries the mosquitoes
towards the waiting fish. Crabs scurry by your toes sending
a shiver of excitement up your spine at the recollection of
being pinched, and thanks for getting away untouched.
I truly love this area, and I hope that the case study
detailed here will aid local conservation groups in the
struggle to protect the dwindling resources that have
defined my childhood.
1.1a Southampton, LI - Physical Characteristics

5
Long Island was formed by the advance and retreat of
glaciers during the last ice age, which deposited glacial
till in moraine ridges that formed this geographically
distinct narrow landform jutting off the eastern coast into
the Atlantic Ocean (see map). Southampton itself lies
towards the eastern end of Long Island, and is surrounded
by water, with the Great Peconic Bay to the North, and the
Atlantic Ocean to the South. The town is comprised of some
102,539.2 acres, and stretches 35 miles from east to west,
and is around 15 miles wide. (Town of Southampton Comp
Plan, 2001)
Fig.1 Location Map of Long Island
The undulating character of the moraine ridges, also
known as kame-and-kettle topography (Town of Southampton
Comp. Plan, 2001), is one of the qualities that add to the
New York
Connecticut
New Jersey
Long Island Suffolk County
Southampton
6
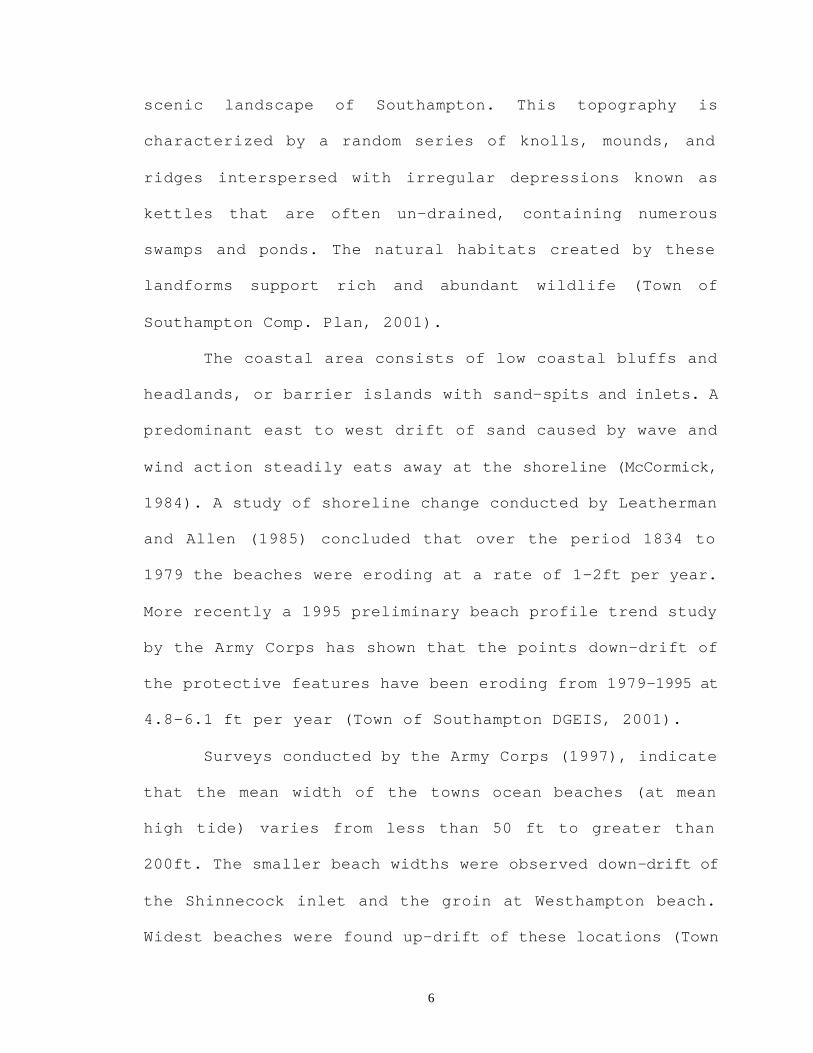
scenic landscape of Southampton. This topography is
characterized by a random series of knolls, mounds, and
ridges interspersed with irregular depressions known as
kettles that are often un-drained, containing numerous
swamps and ponds. The natural habitats created by these
landforms support rich and abundant wildlife (Town of
Southampton Comp. Plan, 2001).
The coastal area consists of low coastal bluffs and
headlands, or barrier islands with sand-spits and inlets. A
predominant east to west drift of sand caused by wave and
wind action steadily eats away at the shoreline (McCormick,
1984). A study of shoreline change conducted by Leatherman
and Allen (1985) concluded that over the period 1834 to
1979 the beaches were eroding at a rate of 1-2ft per year.
More recently a 1995 preliminary beach profile trend study
by the Army Corps has shown that the points down-drift of
the protective features have been eroding from 1979-1995 at
4.8-6.1 ft per year (Town of Southampton DGEIS, 2001).
Surveys conducted by the Army Corps (1997), indicate
that the mean width of the towns ocean beaches (at mean
high tide) varies from less than 50 ft to greater than
200ft. The smaller beach widths were observed down-drift of
the Shinnecock inlet and the groin at Westhampton beach.
Widest beaches were found up-drift of these locations (Town

7
of Southampton DGEIS, 2001). This shows the long-term
detrimental effects that erosion control devices have on
the stability of the beach, and is indicative of the need
to protect parcels along the beach so that no erosion
control is necessary.
The barrier beaches and associated tidal marshes of
the south shore are of relatively recent geological
development, formed by oceanic littoral drift (Town of
Southampton Comp. Plan, 2001). Tidal surface waters
constitute about 19,310 acres of tidal areas alone, which
are distributed among bays, coves, ponds and creeks (Town
of Southampton Comp. Plan, 2001). Estuarine waters within
these tidal areas are among the most productive of natural
environments in Long Island. The estuaries circulate
nutrients and fresh water that combine to create a highly
productive environment (NYDEC Salt Marsh Restoration and
Monitoring Guidelines, 2000).
The salt marshes, which make up about 15% of the
total estuarine acreage, are a significant source of
primary productivity and provide critical foraging, nursery
and nesting habitat for many coastal species (SSER Wetland
Technical Report, 2001). Though greatly reduced and
substantially degraded by development, the salt marshes

8
offer a wealth of opportunities for restoration of
ecological functions and living resource value (NYDEC Salt
Marsh Restoration and Monitoring Guidelines, 2000). Many
Rare or Endangered birds, such as piping plover, roseate
tern, least tern, and common tern, rely upon these marsh
areas, and their presence can be used as indicators of
estuary health (SSER Wetland Technical Report, 2001).
For many of these species, a major consequence of
human disturbance has been a shift in populations to more
isolated or protected locations (US Fish and Wildlife SSER
Coastal Colonial Waterbirds: Draft Technical Report, 1998).
Salt marsh islands or protected areas of the barrier beach
are in need of recognition, protection and management so
that key feeding and nesting areas critical for these
groups of bird species are available for the future. (US
Fish and Wildlife SSER Coastal Colonial Waterbirds: Draft
Technical Report, 1998)
These coastal wetlands and estuaries are an important
part of the Atlantic flyway as well. As many as twenty
species of wintering waterfowl use the open water and
nearby wetland and grassland areas which support thousands
of Canadian Geese, swans, ducks and other waterfowl (SSER
Technical Report on Shorebirds, 1998). These areas are
essential for feeding and resting during the long yearly

9
migrations. Many of these species are susceptible to
disturbance by humans, and need large, protected wetland
areas to be able to congregate and refuel for the long
journey (SSER Technical Report on Shorebirds, 1998).
Tidal wetlands also serve as the buffers between the
coastal waters and the land. Wetlands can act as a filter
for nutrients, and can help to keep local groundwater clean
(NYDEC Salt Marsh Restoration and Monitoring Guidelines,
2000). However, because many of the soil types found in SH
have high water tables and rapid permeability, they are
vulnerable to contamination from septic systems and
leaching fields (Town of Southampton Comp. Plan, 2001).
This makes human encroachment a serious issue, with the
possibility of contamination of groundwater a direct threat
to aquatic life.
The marine ecosystems, while incredibly productive,
are not the only species rich and development threatened
elements of the LI landscape. Maritime beach communities,
with sparse vegetation on unstable sand, are important
nesting areas for shorebirds such as piping plover, and
terns (Town of Southampton DGEIS, 2001; Elias, 2000).
Beachgrass, sandwort and knotweed stands within the
Maritime Dune community, along with higher grasses and low
shrubs on active and stabilized dunes also provide

10
essential habitat areas (Town of Southampton DGEIS, 2001).
Within these areas the composition and structure of the
vegetation is variable and is dependent on the stability of
the dunes, amount of sand deposition, erosion, and distance
from the ocean (Town of Southampton DGEIS, 2001).
The Salt Shrub ecozone between salt marsh and upland
vegetation, with low salinity and higher elevation than
adjacent salt marsh, provides sheltered areas along the
seacoast. These areas are periodically flooded by spring
tides and storm surges (Town of Southampton DGEIS, 2001).
Beyond these lie the extensive back-bay areas of open water
and contiguous tidal wetlands and mud flats. In this
estuary, environmental conditions are less harsh than in
the ocean, and thus provide a considerably more diverse
habitat. Eelgrass beds reduce wave action, and provide food
and shelter for a diverse community of bay plants and
animals (Town of Southampton DGEIS, 2001).
Within the Town of Southampton there exist six
Department of State designated significant coastal fish and
wildlife habitats (Town of Southampton DGEIS, 2001). The
following areas exemplify the diverse ecosystems of the
south shore, and are not directly protected as of yet.

11
• Sagaponack inlet, with 25 acres of sparsely
vegetated dunes, sand beach, and a small channel
connecting sag pond to the ocean, contains
nesting sites for shorebirds, but is greatly
affected by human recreational disturbances.
Mecox bay and beach, with 1,100 acres including
the bay, adjoining wetlands, and beach, provides
slightly brackish, shallow coastal waters with
nesting and feeding areas for terns and plovers.
(Town of Southampton DGEIS, 2001)
• Mecox bay is also one of the key Waterfowl
wintering areas, with average concentrations of
more than 1,500 birds including 1,200 Canada
Goose, 100 Black Ducks, and 100 Scaup. Numbers
can be six times that in peak years, with large
concentrations of Mallards, Goldeneye, Wigeon,
Canvasback, and Mute Swan. (Town of Southampton
DGEIS, 2001)
• Shinnecock bay contains 9,000 acres, including
Tiana bay, Heady creek, Halsey neck pond, and
Shinnecock inlet. Undeveloped salt marsh and
mudflats provide one of the largest estuarine
ecosystems in NYS. This area is another
important waterfowl wintering area with as many

12
as 3,500 birds visiting each year. The bays and
estuarine waters provide essential nursery and
feeding area for fish, and as many 30-40 Harbor
seals can be found there each year. (Town of
Southampton DGEIS, 2001)
• Southampton beach is a three miles stretch of
barrier beach south of Shinnecock bay, which
includes 285 acres. The open beach and extensive
primary dune zone sees heavy disturbance due to
fishing and camping areas (Town of Southampton
DGEIS, 2001). This important segment of the
undeveloped barrier beach ecosystem contains 22
species of breeding birds, 8 mammals, and 1
amphibian (US Fish and Wildlife SSER Coastal
Colonial Waterbirds: Draft Technical Report,
1998).
• Dune road marsh, a 6.5-mile stretch along the
Tiana beach Barrier Island, contains 1,500 acres
of habitat. Undeveloped salt marshes, tidal
mudflats, dredge spoil islands, and shallow open
water areas, provide a large undeveloped coastal
ecosystem with tern nesting on many small
islands in the area. In 1985 nearly 5,000
breeding pairs of common terns nested on this
13
site. Lanes island is also an important black
skimmer nesting site, with as many as 55 pairs
nesting. The bay serves as a nursery and feeding
area for bluefish, winter flounder, fluke,
weakfish, and other finfish. (Town of
Southampton DGEIS, 2001)
• Tiana beach is a 7-mile segment of the Tiana
Barrier Island that forms the southern border of
Shinnecock bay, west of the inlet. The area
contains nearly continuous primary dunes, up to
18ft in elevation, and an open sandy beach, with
extensive back-dune areas. Several small wet
meadows dominated by cordgrass are present in
the inter-dune zone. (Town of Southampton DGEIS,
2001)
Portions of the Tiana area have been
designated as part of the national Coastal
Barrier Resource System. The beaches provide
very important areas for migratory bird species,
and are a significant part of fall migration
corridor for raptors. As many as seven tern
nesting sites, with more than 400 pairs of least
terns, and 15 pairs of piping plovers exist at
Tiana beach. (Town of Southampton DGEIS, 2001)

14
These extensive and important habitat areas are
increasingly threatened by human encroachment. ‘Any
activity that would disturb or eliminate natural beach and
dune-land plant communities (alter the water quality) would
result in a valuable loss of habitat for a number of
important wildlife species’ (Town of Southampton DGEIS,
2001). Development of the area for residential or extensive
recreational use would result in a direct loss of valuable
habitats and increased human disturbance impacts on certain
species (Town of Southampton DGEIS, 2001). This project
will be looking at the parcels surrounding these vital
habitat areas, and will prioritize these parcels in order
to protect the natural processes and target species that
make them special. These specific areas can be seen in the
result maps in the appendix of this work, and I hope to
provide a foundation for protecting these essential habitat
areas of Southampton. In the next section, we will look at
how the Town of Southampton has grown and changed, and why
protecting habitat in this area is a necessity.

15
1.1b Southampton Land Use and Demographic Trends - The Need
for Land Protection
A result of the coming of the railroad in the 1850’s
was the development of the summer resort industry in
Southampton. 70,000 acres of parkland and 986 miles of
shoreline make it an attractive place to visit and summer
(Town of Southampton Comp. Plan, 2001). Beginning in the
1860’s, beach resorts were developed at Westhampton Beach,
Quogue, and Southampton village (Town of Southampton Comp.
Plan, 2001). This summer resort trend has continued to the
present day, resulting in an expansion of the second home
market, along with an economy influenced by weekend
visitors and day-trippers from New York.
Demographics
Southampton is blessed with a very high average
income and low poverty. Low unemployment and good economic
growth are a function of the seasonal wealthy population
that has grown at an incredible rate. Suffolk County
currently has over 12,500 housing units being occupied
seasonally, with this number expected to increase by 43% to
almost 18,000 seasonal units at saturation (Suffolk County
Planning Department Demographic, economic, and development
trend report, 2001). The largest number of potential new

16
seasonal housing units in eastern Suffolk exists in
Southampton, with a projected 5,400 additional units to be
built to saturation (Suffolk County Planning Saturation
Population Analysis, 2001).
Southampton’s year round population is expected to
reach almost 80,000 at saturation, an increase of 44% over
current figures (Suffolk County Planning Saturation
Population Analysis, 2001). This is the largest potential
increase in population in Suffolk County, with a possible
increase of more than 46,000 persons (Suffolk County
Planning Saturation Population Analysis, 2001). A similar
rise is expected to occur in housing, with 51,419 housing
units expected at saturation. This would be a 43% increase
from the present 36,000 that currently exist (Suffolk
County Planning Saturation Population Analysis, 2001).
Current trends indicate that this increase will be seen
mostly in the Senior citizen population, with many retirees
moving in to take advantage of the easy lifestyle and
recreational opportunities (Town of Southampton Comp. Plan,
2001).
Southampton’s population is relatively affluent. The
town’s median household income is 38% greater than that of
the nation as a whole, and its per capita income is 47%

17
higher (Suffolk County Planning Department Demographic,
economic, and development trend report, 2001). Affluent
second homeowners who spend more time in Southampton will
provide support for increased cultural activities and place
a greater demand on local services. Water availability and
waste disposal along the coast will become more salient
issues as the coastal population expands. (Town of
Southampton Comp. Plan, 2001)
The conversion of seasonal homes into primary
residences also tends to create upwards pressure on home
and land prices, which may further the affordability
problem in Southampton. Suffolk County housing prices,
after tripling in the 1980’s, declined by about 12% between
1989 and 1995. Prices have been increasing steadily for the
past 5 years, and as land becomes increasingly scarce,
prices are expected to skyrocket (Suffolk County Planning
Department Demographic, economic, and development trend
report, 2001).
Of those living in the town, most are white, with
small Latino, Black, and Asian populations1 (Town of
Southampton Comp. Plan, 2001). High housing prices have not
1 Percentage data is only available for the county as a whole. The 200 census data indicates: Black population – 6.9%. Asian population – 2.4%. American Indian population – 0.3%. Hispanic population – 10.5%. These numbers are much lower for my study area (based on personal knowledge).

18
allowed middle-income areas to develop a strong presence,
and thus the socio-economic reality of this small expensive
area has led to a racially uniform population.
Long Island has a very high percentage of owner
occupied housing. In 2000, 80% of LI’s housing units were
occupied by their owners, far above the nationwide average
of 66% (Suffolk County Planning Department Demographic,
economic, and development trend report, 2001). LI also has
one of the lowest housing vacancy rates in the country. The
homeowner vacancy rate in Suffolk was 0.9% in 2000 and the
vacancy rate in rented housing units was 3.4% indicating a
tight housing market. (Suffolk County Planning Department
Demographic, economic, and development trend report, 2001)
Of 3,141 counties in the United States, Suffolk ranks
22nd highest in population. In fact, from 1950-1970 the
population quadrupled, making it the most populated
suburban county in the US. Suffolk County has a larger
population than 12 US states. (Suffolk County Planning
Department Demographic, economic, and development trend
report, 2001) This concentration of people means housing is
very dense throughout the county. 2,292 people per square
mile exist in western Suffolk. Eastern Suffolk is much less
dense and built up, with only 362 persons per square mile

19
(Suffolk County Planning Department Demographic, economic,
and development trend report, 2001). The goal of
conservation groups is to keep this number stable, and not
allow the dense development that has destroyed habitat in
other parts of LI. Previous plans have identified needs to
place limits on net density as the key goal for future land
use. (Town of Southampton Comp. Plan, 2001)
There is some good news however for the struggle to
protect this area. The saturation population2 for Suffolk is
1.6 million, which may be reached by 2020. This has changed
dramatically since conservation efforts have begun. In 1962
the saturation population was projected at 3.4 million, but
due to zoning changes, land preservation efforts, and
declining household sizes, a much lower saturation
population is now expected. (Suffolk County Planning
Saturation Population Analysis, 2001)
Land use trends
Southampton is comprised of some 102,539.2 acres,
only 34% of which is unused or undeveloped (Suffolk County
Planning Saturation Population Analysis, 2001). The amount
2 A Saturation Population Analysis models population and building trends to estimate the total population and number of structures that the area will have at total build out. It is an estimate of the full extent of possible development in the region.

20
of undeveloped land has dropped significantly, down from
73% in 1960. From 1980 to 1994 the amount of residentially
developed land doubled, and today residential land accounts
for nearly 24% of the total land area of the town. (Suffolk
County Planning Saturation Population Analysis, 2001)
Construction activity peaked between 1984 and 1990,
and has had a resurgence since 1994 (Suffolk County
Planning Saturation Population Analysis, 2001).
Agricultural land now only occupies 8% of the total acreage
of the town and represents less than 2% of the individually
owned properties. Even a slight change in land use or
ownership on an individual parcel basis from agriculture to
residential or commercial can have a tremendous impact on
the overall balance between developed land and the rural
character of Southampton. (Suffolk County Planning
Saturation Population Analysis, 2001)
Much of this growth has occurred along the southern
and coastal region, in and around the many bays. Future
growth is expected to occur primarily along the coastal
regions, as well, focusing along the bays and estuaries
(Suffolk County Planning Saturation Population Analysis,
2001). This will blur the boundaries between the
traditional hamlets and village centers as build-out occurs
away from these now concentrated centers of activity

21
(Suffolk County Planning Saturation Population Analysis,
2001). This is one of the reasons why this project will
focus on the coastal area for prioritizing preservation
efforts in the region.
Within this coastal area, there is no land type more
endangered than the wetland ecosystem. The direct physical
loss of wetlands has long been associated with LI’s
eastward expansion of residential and commercial
development (SSER Wetland Technical Report, 2001). Since
the 1950’s, thousands of acres of wetland have been
obliterated by canal excavation, roadway construction, and
channel dredging. Huge amount of spoil were disposed by
directly filling wetlands, much of which was subsequently
developed (SSER Wetland Technical Report, 2001). The sum of
these activities is a staggering loss of wetlands, which
has been documented by USDOI (1965) and Smith et al.
(1970). The Regional Marine Resources Council in its early
report on wetland loss (RMRC, 1973) estimated that wetlands
in 1954 took up at least 20,590 acres of Suffolk County,
whereas in 1971 only 12,725 acres remained.
Wetlands associated with creeks that drain to the
south shore bays are of particular concern, due to these
areas being centers of human activity. The altered

22
geography caused by development, including an increase in
impervious surfaces and removal of erosion controlling
vegetation, has led to an increasingly destructive invasion
of human induced hardships on the local systems. With the
humans come invasive species, such as common reed and
phragmites australis, which alter habitat, making some
small areas of protected land useless. (SSER Wetland
Technical Report, 2001)
Market demand and high prices for waterfront and
water-view homes have driven the filling of marshes for the
creation of real estate. Not yet built-out areas hold many
acres of wetland interspersed among dredge spoil sites on
creeks and shorelines with much privately owned land in
danger of development. (RMRC 1973) Fill in development has
been fought with CR-200 category zoning (4.5 acre plots)
and cluster zoning which forces open space retention, but
these have not as of yet played a forceful role in the
protection of sensitive areas (Town of Southampton DGEIS,
2001). These wetland areas continue to be threatened by
development and growth.
1.2 Management Options

23
A number of strategies exist for preserving habitat
on Long Island. Purchasing land outright, while a popular
method of protecting habitat in perpetuity, is not the only
way to protect valuable land. Laws at both the local and
Federal level may be employed to protect specific natural
features, or control the density and distribution of
development through zoning ordinances and overlay
districts. This, however, has not proved effective for
Southampton. The wetland overlay district, in direct
opposition to wetland protection laws, states that 10% of a
wetland may be filled for development if title can be
proven (Southampton Town Code Ch. 330). This opens the door
for the destruction of areas that should otherwise be
unbuildable.
Purchase of development rights and easements may
also limit growth in sensitive areas, and provide a means
of community involvement in land protection efforts.
Stricter interpretations of laws and enforcement and
management of protected land will also serve to more
efficiently protect habitat within Southampton. Lobbying
government for stricter laws, more complete enforcement,
and increased funding for conservation are tools that
private groups employ to work towards their goals. (Hall,
1999)

24
Within this coastal zone an additional management
option exists, the relocation of structures from sensitive
areas to protect both habitat and natural processes.
Dwelling relocation is an approach that can be applied at
each individual site. Its principal purpose is to provide a
wider buffer between development and the ocean through
inland relocation of existing structures where development
is at risk, or to raise the structure on piles above the
flood zone. Using hydraulic lifts, a house can be raised
off the existing foundation, put on rollers, and moved
landward. This option has been identified within the Town’s
Draft Generic Environmental Impact Statement3 (DGEIS) as
being one of the least invasive and costly methods of
dealing with the erosion issue, and is seen as worthy of
consideration (Town of Southampton DGEIS, 2001).
In areas already heavily impacted by human use,
restoration and protection from further encroachment is
necessary. Replanting useful vegetation may not be enough,
however, if invasive species have been introduced.
(Safford, 1998) Direct acquisition is the most biologically
appealing strategy for the small acres that support most
3The Draft Generic Environmental Impact Statement for Southampton’s Atlantic Coastline is not a project specific EIS, but rather was conceived within the Town’s Comprehensive Plan as a necessity for establishing a best management policy for the highly sensitive and overdeveloped coastline. It details methods for structure protection, and outlines erosion control, structure relocation, and beach nourishment options.
25
rare species. Especially in small tight areas, edge effects
and human encroachment become serious issues, and
controlling access is essential. (Press, 1996)
Politically, acquisition is also ideal because
protected areas are permanent and not open for discussion
as to use. Purchase of land can also be more cost effective
than continual easement payments and monitoring costs.
(Hall, 1999) Other conservation options, such as special
area zoning with regulated development rights, transferable
development rights where development options are spatially
shifted, and easements donated by landowners may be subject
to change or sold when development pressure builds. (Press,
1996)
This project will focus on three management options;
Outright purchase of vacant lands, working with landowners
for easements, and relocation of homes from the Coastal
Erosion Hazard Area. These management options have been
chosen because they relate directly to the location of
parcels and structures within the landscape, and are thus
compatible with GIS related techniques of spatial analysis.
As will be discussed in greater detail in the section
on GIS, the ability to manage a variety of management

26
options is one of the benefits of using GIS for
prioritizing preservation efforts. While previous similar
projects have focused on identifying those lands that would
be most beneficial to set aside within larger, undeveloped
regions, this case study must take on a new set of options
due to the high level of development within the town.
Prioritizing residential lots for easements and structures
for relocation are management tools that have not been
extensively analyzed within such a context, making this
project a unique case study that will hopefully open up new
avenues for GIS within the land protection world.
1.3 Target Audience
The methodology and results of this study will be
useful to a variety of organizations at both the state,
local, and private levels. Similar methods may be employed
to aid in the permit process, or to prioritize other areas
for land protection. My focus, however, and thus my target
audience will be private preservation groups, specifically
The Nature Conservancy. The Next sections will discuss the
role of private organizations and local government, and
specifically the reasons why I chose to use The Nature
Conservancy as my focal audience.
27
1.3a Private Organizations vs. Government in Conservation
For many, centralizing authority at the State or
regional level is seen to provide stronger tools and
greater authority to shape growth and deal with
environmental impacts. According to porter (1992) all state
growth management laws have set more rigorous standards for
growth management by local governments than have localities
themselves. While I doubt this is the case throughout the
entire country, regional regulations do provide protection
for open access resources by stipulating use, and providing
solid protection from development, which can stand strong
in the face of development pressure. (Steelman, 2000)
Within the Long Island Coastal area, the Federal
Coastal Zone Management Act (CZMA) has lead to some very
effective regulatory measures. Through CZMA the state has
established the Coastal Erosion Hazard Area, which provides
a zone of enforcement for coastal protection laws, and a
number of policies relating directly to coastal resource
protection (Ozarski - CEHA Overview, 2000). The laws
controlling development and access to the LI coastline have
been necessary due to the fact that so much land is
privately owned (Town of Southampton DGEIS, 2001).
Shoreline setbacks, protecting critical habitat, regulation
of stabilization projects, restricting pedestrian and

28
vehicle use, designated protected areas, and controlling
beach nourishment projects have been key to protecting
habitat through regulatory measures. (Bernd-Cohen, 1999)
Regional programs can also promote easements through
tax deductions, and establish zoning and tax laws to
promote management goals and protect habitat (Green, 1999).
Many areas also look to regional government for education
programs, and other public outreach to provide technical
assistance for those wishing to protect land. Large amounts
of money, especially funds from bond measures, allow State
and regional programs to buy large or expensive land, and
having an area of concern included in State management plan
may be the only way for many areas acquisition needs to be
met. (Purdue, 1994)
In addition, areas that have large amounts of land
dedicated to agriculture have found conservation efforts
not possible without long-term political support. Working
landscape owners depend upon land for a living. A clear
challenge to protecting working landscapes is enabling
landowners to continue to realize a profit from the land,
along with meeting preservation goals (Peconic Land Trust,
2001). This way, landowners will be able to better resist
the temptation to sell land for development, particularly

29
in the face of significant development pressure. Some of
the tools that local government may employ to overcome this
are lowering property taxes for farmers, and zoning laws to
protect commercial land, along with purchase of development
rights (Daniels, 2000)
Many States, however, have had trouble raising money
for areas that are not charismatic, are too small to engage
the grassroots community, or are in areas too far from
donors to be of significance to them. (Flicker, 1984)
Centralized laws have the problem of not being specific to
certain unique locations, and incentives for private
landowners are sometimes not adequate to provide regional
protection in heavily developed areas. Local land
acquisition projects can be more effective in ensuring
long-term protection in these areas.
Groups like TNC can pursue its goal of protecting
natural places without statutory homogenization that can
hobble public agency efforts (Committee on Scientific and
Technical Criteria for Federal Acquisition of Lands for
Conservation, 1993). Private organizations have the ability
to work with landowners that do not wish to deal with
government agencies due to time or monetary constraints.
They can respond to sudden crises by acting quickly,
30
without red tape, to arrange complicated transfers of land,
and even provide services to the agencies that may
eventually manage the land. (Committee on Scientific and
Technical Criteria for Federal Acquisition of Lands for
Conservation, 1993)
Private individuals are also more apt to work with
private groups on conservation efforts. Landowners utilize
groups such as TNC for tax deductions from land donations,
land purchases, easements, and land swaps (Grove, 1992;
Weeks, 1997). People and corporations work with non-
profit/non-government organizations such as TNC on joint
holdings, and look to them to provide technical assistance
for land management (Decker, 1991). Overcoming the all or
nothing vision that separated environmental groups and
corporations has been a success that the hindrances of
government red tape would not be able to overcome. Land
trusts can work faster than government, and can apply
different tactics to different situations. Even though much
land eventually ends up in the hands of government through
transferring of ownership, many corporations would rather
deal with NGO’s than government directly. (Patney, 2000)
Private groups working within the community may also
be more willing to take the time to work with local
residents on easement acquisition. Easements are important

31
because they may provide somewhat permanent protection, and
are suitable for landowners that wish to retain title and
use of property in combination with protection (Hall,
1999). Easements restrict land use and can be very cost
effective in saving important marginal habitat. Regional
government, in most cases, does not have the means or
programs in place to establish easements, and the marginal
or edge property which easements may protect are not
commonly included in Statewide protection plans. Private
groups like TNC are more able to dedicate funds and
personnel to monitoring of easement property, and see these
areas as important for buffering areas for habitat
protection. (Hall, 1999)
My research has shown that while local government has
a number of protective laws and land management strategies,
development pressure and economic influence makes private
conservation groups role in land acquisition an important
part of habitat protection. (Weeks, 1997; Beatley, 1994;
Decker, 1991; Poiani, 1998) Due to the fact That Southampton
is so developed, and contains such a variety of sensitive
and locale specific habitat areas, I feel that the ability
of private groups to work quickly within both the public
and private sector is essential for this region’s

32
conservation. In the following section I will go into
further detail concerning The Nature Conservancy, and why I
have chosen to work with them on this project.
1.3b Land Protection on LI - Working with the Nature
Conservancy
In the preceding section, I discussed the benefits
and hindrances that both large-scale and small-scale,
public and private, conservation efforts may face. The
immediate need for land protection, due to increasing
development pressure and limited remaining open space in
Southampton (discussed earlier) make the local, privately
funded ability of TNC a true necessity if we hope to save
habitat in this region. While regulatory measures are
indeed necessary to ensure the long-term protection of many
of LI’s wetlands and barrier beaches, it is only through
immediate conservation minded purchasing and management
that enough land can be set aside to preserve biodiversity.
I have aligned my goals with TNC’s for these reasons,
and I have woven their concept of conservation into my
prioritization methodology. The Nature Conservancy has the
expertise to provide information on funding, partnership,
outreach, and research, and will make use of my projects
results as it looks to protect more land in this region.

33
The Nature Conservancy, while having State offices
that act as local environmental groups, has a monetary
advantage over other small-scale NGO’s. TNC has a national
Land Preservation Fund that state offices can borrow from
and eventually pay back when immediate action is necessary
(O’brien, 2000). This allows TNC to be flexible in that in
the absence of state agency cooperation, they can work on
their own from private funding. When dealing with an area
such as Southampton, where property values are high and
availability of land for purchase is scarce, having a large
amount of money available quickly may mean the difference
between a successful purchase and loss of essential land to
continued development. (O’Brien, 2000)
The Nature Conservancy, however, does not rely solely
on funding from its main office. Fund raising campaigns,
including a large dinner event every summer held at the
Easthampton office, are important because they not only
provide funding for land management and acquisition, but
they are used to educate the public and get local residents
involved in preservation efforts.
TNC also taps into federal funds, such as wetland
protection money, as well as funds allocated for protection
of endangered species. These are used for direct
34
acquisition and easement purchase (Weeks, 1997). Even when
TNC uses their own money for a property acquisition they
can get their money back from the purchase with a transfer
of land to Fish and Wildlife or local government, with
accompanying tax breaks or outright monetary compensation
(Weeks, 1997). This allows TNC to work quickly without
having to worry too much about funding when extremely
essential land becomes available for purchase.
Within Southampton, TNC very often acts as a broker,
purchasing land for local government and utilizing town and
county funds for habitat protection (Ozarski – personal
communication, 2002). This partnership process can be seen
at many levels of TNC’s work, including not only funding
and acquisition, but sharing of research, management
techniques and personnel, as well as education programs
(Grove, 1992).
The Nature Conservancy cannot possibly accomplish its
landscape scale goals on its own. While their broad vision
of habitat and biodiversity protection is more eco-
centrally focused than most other land protection groups
and government programs, they must still rely on partnering
with these other entities to achieve their ends. As David
Weekes put it, ‘Our triumphs are only as great as our

35
partnerships, be they multi-faceted alliances with foreign
organizations or voluntary agreements with local
landowners.’ (Weekes, 1990)
The Nature Conservancies partnerships include all
levels of government. In some cases TNC gets lobbied by
government to purchase land that the state may want
protected but which do not fall within purchase plans
(Weeks, 1997). TNC not only buys land, it leases and
manages land owned by others for preservation, and buys
easements for development. Working with universities,
museums, botanical gardens, corporations, as well as
government agencies and private landowners allows for many
levels of public and private involvement. (Weeks, 1997) The
Department of Defense has even allowed TNC to identify,
document, and maintain biological diversity on 900 DOD
installations throughout the world. (Grove, 1992)
TNC is seen as a clearinghouse for information, and
has expert staff concerning negotiations with landowners on
large easement or purchase projects (Decker, 1991). TNC can
connect conservation minded landowners with local
conservation efforts, and provides education and
stewardship opportunities to energize the local population.
TNC develops cooperative programs with local civic groups,
county planning commissions, and board of supervisors to

36
promote balanced growth management and to work towards
improving local zoning ordinances. (Decker, 1991)
Specifically within New York State, TNC works with
New York State Department of Environmental Control (NYSDEC)
and the NY Natural Heritage Program to identify rare and
endangered species communities. In NY a public/private land
trust network facilitates cooperation between NYDEC, TNC,
and the Trust for Public Lands on land protection issues.
(Decker, 1991) These cooperative species protection
efforts, with support from local, state and federal
government, have been essential to large-scale projects.
Working with foundations for fund raising, as well as local
wildlife and recreation coalitions and other NGO’s has
allowed TNC to match grants from corporations and the US
Fish and Wildlife Service Foundation to make these
preservation efforts possible. (Weekes, 1990)
These cooperative agreements are not solely centered
around funding. Sharing of data, as well as management
planning techniques, is central to a solid relationship
between TNC and government. For example, TNC’s preserve
selection and design criteria are often used by government
agencies for management plans. (Committee on Scientific and
Technical Criteria for Federal Acquisition of Lands for

37
Conservation, 1993) US Fish and Wildlife utilizes data,
such as the Natural Heritage Site coverages, for habitat
analysis studies, and local governments are constantly in
contact with the local biology and planning experts
employed by TNC. (Grumbine, 1994)
TNC does not limit its cooperative efforts to local
and regional government. Working with the community is just
as necessary to find success in preservation projects.
‘Local communities hold the key to conservation success;
without their support, we can never achieve our goals.’
(Sawhill, 1999) Making the projects a community effort
allows TNC to tap into a community’s love of place, and get
local landowners involved in the future of their land.
The Nature Conservancy is involved in a variety of
community related projects. Their land protection and
stewardship experts:
• Work with landowners around reserves to educate
and attempt to manage land use.
• Provide technical support and educational
materials to local landowners, working to rally
them to join together for land protection
efforts.

38
• Host workshops, sometimes in conjunction with
NYDEC Endangered Species Unit, for example
Species-specific propagation and planting
programs.
• Work with local areas to support local
economies. The Conservancy Center for Compatible
Economic Development (CCED) tries to tie
together community, economy, and environment.
(Sawhill, 1998)
Because of the above advantages and expertise which
TNC has established over its history, this project is being
undertaken in cooperation with, and using many of their
guidelines of habitat protection. Besides being my primary
target audience, TNC literature and past work within this
project area, as well as their work in other regions, has
provided a framework for preservation, from which I have
borrowed to a degree. From journal articles written about
TNC’s procedures (conservation blueprint) to in-house
publications such as ‘Conservation by design’ and
‘Designing a Geography of Hope’ TNC has provided a concrete
and very logical approach to preservation.
1.3c The Nature Conservancy Approach to Land Protection

39
TNC advocates a systematic approach to designating
sites for preservation. These areas, called Action Sites,
are selected using the following key criteria:
• The areas current conservation Status (how threatened)
• Complimentarity to other sites (more efficient
preservation)
• Diversity and viability of target species
• Urgency and degree of threat to targets
• Feasibility or opportunity to abate threats.
This allows TNC to move away from an opportunistic, land-
grabbing mentality, to a ‘conservation by design’ approach.
(Valutis, 2000)
The Conservation by Design approach is summed up by
TNC in what it refers to as the five S’s. Once the
blueprint described above identifies areas of concern, the
five ‘S’ approach provides a framework for thinking through
conservation within an action site. The five S’s are as
follows: (TNC Conservation by Design, 2000)
• Systems: Identify the key conservation targets and
supporting ecological processes.
• Stresses: ID the most serious types of destruction or
degradation affecting the targets.
• Source of stress: What are the causes or agents of the
stress.
• Strategies: Go through the full array of actions
necessary to abate the threats, or enhance the viability
of the conservation targets.

40
• Success Measures: Monitor the processes and improve upon
plan.
Both States and private organizations have discovered
the concept of critical area campaigns, which group areas
together as consolidated conservation efforts. (Flicker,
1984) The Nature Conservancy was a forerunner in developing
these regional campaigns, and this has lead to the
development of large reserves that protect biodiversity
more securely.
My study site is of importance to TNC because it fits
into the Atlantic Ocean Beaches and Bays (AOBB) critical
area defined by TNC as a significant action site (Ozarski -
Personal Communication, 2002). Using the TNC approach of
defining conservation targets (wetlands, rare birds etc.)
and protecting the specific parcels that provide the most
protection for these targets is exactly what this project
attempts to do. The following section will look at GIS
technology, which will make this type of analysis over a
large area more efficient than any tool previously
available to conservation groups.
Table 1 outlines the Nature Conservancy Criteria that
I utilized to focus my efforts, and details the coverage’s
that are essential to implementing this strategy.

41
Table 1. The Nature Conservancy Criteria and Related Coverage’s
The Nature Conservancy Criteria Data to be used Comments
Key criteria for Action Sites Complimentarity to other sites (more efficient preservation)
Protected land coverage – part of zoning map. Community Preservation Fund Areas
Not completely updated – some errors have been identified as to
TNC lands. Diversity and viability of target
species Beach dependent species habitat;
Wetlands coverage. Only covers target species.
Numbers not associated with site locations
Urgency and degree of threat to target
Elevation model – Bathymetry – for washover sites. Structure
Inventory.
Waste disposal, pollution from houses.
Feasibility or opportunity to abate threats
Zone map (area size, connectivity)
Census data (still being figured out) Other social data.
The areas current conservation Status (how threatened)
Beach dependent species habitat, coupled with zoning (roads, protection status), structure
inventory.
Future plans for development not included
The Conservation by Design approach
Systems: Identify the key conservation targets and
supporting ecological processes
Wetland coverage; Overwash coverage; beach dependent
species coverage; CEHA coverage
Criteria for prioritization
Stresses: ID the most serious types of destruction or
degradation affecting the targets
Zoning map; Structure inventory; CEHA and Overwash Coverages
Identify those areas where development will have greatest
impact – reduce Army Corps need for erosion control projects
Source of stress: What are the causes or agents of the stress
Zoning map; Structure inventory, overwash sites (blocked)
Septic systems, non point sources not included.
Strategies: Go through the full array of actions necessary to
abate the threats, or enhance the viability of the conservation
targets
All Coverages Utilize multiple management options – purchase vacant land,
easements, and structure relocation.

42
1.4 Geographic Information Systems
This project aims to take one of the most powerful
tools available to land protection efforts, Geographic
Information Systems, and to use this tool to analyze the
landscape for a variety of management options. Geographic
Information System technology is a spatial organization
program that allows the user to organize, compile and
analyze relevant data to provide a medium for working with
many layers of data. This section will provide some insight
as to why GIS is necessary to perform these tasks, what
such a system is capable of, and previous work that shows
the accomplishments that GIS has made possible.
By definition, a geographic information system (GIS)
is a tool for organizing and analyzing data, both spatial
and tabular. It can improve data quality by allowing
multiple layers of data to be analyzed simultaneously,
making it easier to find patterns, look at the proximity of
specific features, and document this information for
management decision-making. (US Fish and Wildlife, 2001 -
GIS Strategic Plan, 2001) GIS is a powerful tool for
analyzing spatial patterns, helping to organize large
databases, and presenting results in a manner not otherwise
possible. GIS can greatly assist managers in the decision-
43
making process regarding the disposition of natural
resources. (US Fish and Wildlife Service: GIS Update, 2001)
According to the US Fish and Wildlife Service, ″In the
near future, GIS will be so prevalent in natural resource
management, that those organizations without some
capability in this area will be extremely handicapped.″ (US
Fish and Wildlife - GIS Overview, 2001) This is because of
the incredible variety of data that can be utilized within
GIS, and the specific tools available in software packages
for data analyzation.
Types of data which can be worked with in GIS include
coverages of protected areas, elevation, land-cover, roads,
Census data layers, zoning maps, water bodies, watersheds,
political boundaries, geology, species and habitat
occurrences, soil types, and demographics. Other coverages
can be created from these maps in conjunction with other
data, including hazardous sites, species range, and change
detection. (US Fish and Wildlife Service: GIS Update, 2001;
TNC GIS Strategic Plan, 2001)
GIS also allows land management at a variety of
levels. Large-scale projects that are meant to analyze land
use at a regional scale can utilize satellite imagery,
aerial photos, and coverages containing data over a large
area. For this project, the ability of GIS to focus in on

44
the parcel level allows for the precise identification of
features and analyzation of data that can indicate the
actual plots that would be useful for protection. This
would be impossible without the benefit of GIS software,
which has allowed government to create coverages of parcels
for tax purposes.
One of the most powerful aspects of using GIS for
preservation efforts on the part of private environmental
groups is the ability of these groups to analyze government
issued data. Coverages created by US Fish and Wildlife,
NOAA, and local Departments of Environmental Management are
readily available for analysis. This allows the results to
be consistent with both local and regional government, and
allows for more efficient lobbying and use of funds.
(Friedman - Personal Communication, 2002)
Without GIS technology the visualization of multiple
layers of data is not possible. Early efforts to overlay
data using drawings on clear plastic paper were extremely
difficult, inefficient, and imprecise. GIS has indeed
changed the face of land protection by providing even
small, local environmental groups with a tool that can map,
analyze, and display information to manage protection
efforts.

45
There are a number of benefits in implementing GIS
technology for landscape scale analysis, including cost
reduction by improving map and database management,
improved efficiency in spatial analysis methods, improved
credibility by using accurate spatial data, and improved
habitat and land-cover information (US Fish and Wildlife
Service - GIS Update, 2001). GIS can also be used to
communicate with other public and private groups, as well
as improve and make internal communication more efficient,
as well as allow for more sharing of data within
organizations. (US Fish and Wildlife - GIS Update, 2001)
The Nature Conservancy itself has big plans for
incorporating GIS into every level of their work. TNC’s GIS
enterprise plan outlines the role of GIS in their Site
Conservation Planning and Implementation Model, which is
the corps of their planning methodology. GIS will be used
to map the location of conservation targets, analyze
natural processes, and find correlations between targets
and features. Nature Conservancy will utilize GIS to
analyze habitat destruction, including fragmentation,
pollution, and invasive species. (TNC GIS Strategic Plan,
2001)
GIS will also be used to locate Sources of stress.
Historic and current land use, ownership, zoning and

46
political boundaries that affect placement of sources of
stress will be used to effectively target management
practices. By pinpointing generating areas, TNC can create
management plans that are more effective, and protect areas
that will provide for higher levels of biodiversity. (TNC
GIS Strategic Plan, 2001)
Finally, TNC will use GIS to strategize and map out
conservation activities. One such project, taking place in
North Carolina, will similar methodology to this study to
identify areas worthy of protection, specifically for
easement purchases and vacant land acquisition. Using GIS,
protection specialists are able to prioritize action sites,
and show different plans that may be possible by estimating
the costs and benefits of potential activities. As they
move forward, they will measure progress and use GIS to
create maps for continued fund requests and grant writing.
(TNC GIS Strategic Plan, 2001; Ozarski – personal
communication, 2002)
1.4a GIS Scope and Application
GIS technology has been put to the test in a variety
of situations. There are numerous projects in existence
that utilize GIS for land management and habitat
protection. This section will briefly discuss some of the

47
previous applications of GIS, and the role it has played in
making large-scale spatial analysis possible.
Beginning in the late 70’s and early 80’s, GIS was
used for refuge planning, and wetland mapping by the US
Fish and Wildlife Service. Since then USFWS, as well as
many other government, private, and university groups
involved in land management have used GIS for endangered
species and critical habitat decisions. (US Fish and
Wildlife Service - GIS strategic plan, 2001)
The US Fish and Wildlife Service currently uses GIS
in a variety of fashions. Within many National Wildlife
Reserves, GIS has been used in recording and mapping
nesting sites and tracking endangered species movement
through the reserve, helping to protect specific vulnerable
sites, and reduce the effects of human disturbance on
sensitive species. Global Positioning Systems allow for the
mapping of specific locations that provide landscape needs
of specific species, which can be viewed and analyzed using
GIS technology. (US Fish and Wildlife Service - GIS
strategic plan, 2001)
Wetlands mapping from sat imagery as well as health
and landscape change analysis has played a significant role
in managing the Delaware Bay region. Land cover mapping and

48
species distribution have been used to create an Endangered
species database that can be used for planning efficient
protection efforts. Similar projects in Florida assessed
species distribution within wetland environments for
planning efforts. (US Fish and Wildlife Service - GIS
strategic plan, 2001)
Most current GIS projects within USFWS are concerned
with specific species and range of habitat studies. GIS
coverages, such as land cover maps, zoning maps, DEC
wetland maps, rare element, and biotic communities maps,
have been used to assess the proximity of land to important
natural features. Land purchasing is then based upon
habitat needs, and thus funds are utilized more
efficiently. (US Fish and Wildlife - GIS Applications,
2001)
My research indicates that this is the most common
use of GIS data in the land protection field. The
identification of areas that are in need of protection, and
thus should be acquired or protected under law is a very
powerful and useful tool that GIS makes readily accessible
to both government agencies and private groups. Land cover,
elevation, roads and streams, animal and plant locations,
protected land, zoning and every aspect of the landscape
available can be mapped and used for this purpose.

49
GIS is often used before development occurs to plan
for habitat areas which should be set aside. One such
project by Weber (2000) in Maryland used GIS to identify
large blocks of intact habitat, sometimes referred to as
Hubs, that contain sensitive plant or animal species and
provide enough viable habitat to support large enough
populations of species to be significant for long-term
preservation. GIS allows planners to delineate these areas
prior to development occurring, thus creating corridors and
habitat areas to support large populations. (TNC GIS
Strategic Plan, 2001; Maryland Dept. of Natural Resources,
2001)
Other projects have dealt with GIS in similar
fashions. In a study by Xiang (1996) which aimed to utilize
GIS for riparian buffer analysis, GIS made the
identification of inadequately regulated areas within the
buffer zone possible, and allowed for the estimation of
land acquisition costs. By implementing scientifically
tested models on generally available data sets in a GIS
framework, the study accomplished a series of tasks that
would have been extremely difficult if done in a
conventional way. After identifying areas in need of
protection (based on identifying unprotected areas within

50
the buffer zone) they assessed a average land value ($/KM)
based on tax parcels and land value appraisals provided by
county tax office. (Xiang, 1996)
Other studies have focused on satellite imagery, and
using GIS in creating coverages that depict landscape
features such as wetlands. An excellent example of this is
the work by Ramachandran (1998) on Andaman and Nicobar
Islands in the Indian Ocean. Visual interpretation, looking
at tone, texture, color, pattern, and location of features
created a key used to identify each habitat type. This
information was then Ground-truthed to establish a
classification scheme to perform a digital analysis.
The results of this study clearly demonstrate the use
of satellite-based sensors in the mapping and monitoring of
coastal ecosystems. ‘This study also shows that remote
sensing and GIS could be used effectively in mapping,
monitoring and management of natural resources’.
(Ramachandran, 1998)
Another good example of a project using a GIS system
for data analysis is the work by Cummiskey (2001) that used
GIS to plan land acquisition strategies for a Cape Cod land
bank. This project stemmed from a county vote that provided
funds to establish a land bank to protect public drinking
water supplies, acquire open space and conservation lands,

51
and provide recreational opportunities for Cape Cod
residents. Maps of agricultural land, wetlands, aquifer
recharge areas, protected land, and recreational activities
were created from aerial photographs and ground-truthed
data. This project also suggested a system of hotel tax
payments so that local tourist moneys could be put toward
land acquisition. (Cummiskey, 2001)
Adopting GIS in the land preservation field has been
a bottom up procedure, with no GIS program really in place.
Data sharing and standards for data have not yet been
established, and professional GIS users have a tendency to
work separate from other less computer savvy protection
experts. (US Fish and Wildlife, 2001 -GIS Strategic Plan)
Many methodology sections of GIS technical papers are not
telling of the true methods used, but rather provide only a
rudimentary outline of procedures used. This is due to both
a lack of standardization in the technical language, but
also to the fact that much of this is very new, and
researchers are staking a claim to methods they invent.
In contrast, this study aims to make explicit one of
the many ways GIS can be used to help private preservation
efforts. As my research has indicated, previous efforts
have focused on using GIS to analyze large, undeveloped

52
regions for protection of vital habitat. This case study is
important because it involves an extremely difficult area
to test the powers of GIS. Analyzing and prioritizing on
the parcel level in a well-developed and extremely
expensive coastal zone, with very sensitive habitat, is at
the boundaries of what GIS has been used for in the past.
The ability to include a variety of management options and
test the usefulness of GIS within these alternatives will
help to push this technology forward. My aim is to arm
conservation groups with a methodology for prioritizing
parcels in an extreme context, which can then be applied to
a variety of situations.
53
2. Methodology
2.1 Criteria and Coverages
The following section describes the criteria that
were used to prioritize parcels within my study area, and
discusses the associated GIS coverages used. A map
displaying these criteria is included, and for more
information on the sources of these data please see the
matrix at the end of the section.
2.1a 100 Year Flood Plain
The focus of this study is the fragile and habitat
rich coastal zone of Southampton’s south shore. In order to
target those parcels that contribute to the coastal area,
and encompass the entire coastal region including the
coastline, back bays, and tidal wetlands, the study area
has been defined using flood plain maps. The Federal
Emergency Management Act (FEMA) uses flood plain maps to
delineate insurance rates for the National Flood Insurance
Program. Zones V and A encompass the 100-year flood plain,
and extend past the Back Bay areas to include parcels
susceptible to coastal processes. This creates a natural
limit to my study area, and ensures that all coastal
attributes and the parcels affecting them are considered
for prioritization.

54
Using these flood plain maps as a guide, I have
created an outline of my study area that conforms to the
natural barriers of the coastal region. In some areas the
100-yr. flood plain goes beyond major roads, due to the
fact that the flood plain coverage is created from
elevation models and does not take into account man made
features. In these cases, I have used the roads as a limit
to my study area.
2.1b Wetlands
The proximity of parcels to wetlands is a key factor
in how a parcel may contribute to the overall Biodiversity
of this region. Wetlands and salt marshes have been shown
to be ecologically significant as nurseries for young
aquatic life, and to provide habitat for native and
migratory bird species. (Hoel, 1986; Hecht, 1990; Kaufman,
1979; Kopper, 1979; Teal, 1969; Elias, 2000) The Target
species that have been identified for this region by TNC
(Terns, Plovers) rely on coastal wetland areas as feeding
and nesting grounds. There are many other NYS listed animal
species dependent on salt marshes for food, shelter,
breeding, rearing of young, or other critical life stage
needs. (Hoel, 1986; Hecht, 1990; Kaufman, 1979; Kopper,

55
1979; Teal, 1969; Elias, 2000; US Fish and Wildlife SSER
Coastal Colonial Waterbirds Technical Report, 1998)
According to the South Shore Estuary Reserve technical
report on wetlands, (SSER, 2001) attention should be
focused on those species listed as endangered, threatened
and of special concern in NY. These species include black
rail (endangered), least tern (Threatened), common tern
(threatened), least bittern (threatened), and osprey
(special concern), all of which rely on fragile wetland
areas. Also, a number of rare and protected plants
including saltmarsh loostrife, slender marsh-pink, and
swamp sunflower exist in LI salt marshes.
The states Coastal Management program has several
specific charges to restore degraded habitat for the
purposes of maintaining the health and viability of fish
and wildlife populations (ECL title 3, 0301.1(n); title 11,
0303.2(b)(1); title 13, 0105.1, Executive Law Article 42,
913). Tidal wetlands, including salt marsh habitats, are
protected in the State of New York under article 25 of
Environmental Conservation Law, the Tidal Wetlands Act.
This requires permits for any changes, and a 100-ft setback
for building. This, however, has not kept people from
filling and developing wetlands, both illegally and with
valid permits given under intense development pressure.

56
In order to protect the commonly recognized functions
of salt marshes, such as food chain production, provision
of fish and wildlife habitat, barrier to waves and erosion,
storm and floodwater storage, and nutrient and chemical
uptake, wetland and wetland buffer areas need to be
protected. Wetlands data will thus be key to prioritizing
parcels for habitat protection.
Wetland Buffers
The necessary buffer width will vary according to
individual site by type of wetland, sensitivity to
disturbance, intensity of adjacent land use, slope and soil
characteristics, species present, and surrounding
vegetation types (Brown et al 1990; North Carolina State
University, 1998). Brown et al (1990) recommend varying
buffer widths for wetlands in different landscapes of east
Central Florida. The distance to minimize groundwater
drawdown varied from 20 to 550 ft, to control
sedimentation, 75 to 375 ft, and to protect wildlife 322 to
732 ft. A buffer of 550 ft is recommended for forested
wetlands. A literature search of studies on specific buffer
performance found that for species distribution and
diversity protection, 3 to 110 m was required (North
Carolina State University, 1998). I will be using a buffer

57
of 500 ft, which is adequate to protect all functions of
wetland areas, and provide enough land to provide viable
habitat for the large numbers of wetland dependent bird
species within the coastal region.
Wetland Coverages
The importance of wetlands for habitat and commercial
needs has made the study and documentation of wetland areas
a widespread practice. In fact, this is the only situation
within my study where a variety of coverages exist, and
choosing the most apt data source will be important for
efficient habitat protection. All available coverages have
their limitations as well as advantages, including scale
differences and inclusion issues.
The first options comes from the National Wetlands
Inventory (NWI) which is put together by the US Fish and
Wildlife Department, and is considered by most other
institutions to be extremely imprecise, but contain the
best evaluation of wetland types. The 1:24,000 scale maps
from which these wetland areas are devised make local
small-scale analyses almost impossible. The next option is
a wetlands coverage that is put together by the NYDEC,
which is at a much more locally significant scale of
1:2,400. While this scale makes local analysis possible,

58
the wetlands on these maps are derived from 1974 data, and
are extremely out of date. These coverages also do not
include all of the wetland types that occur along the
coast, with reed marsh and other marginal marshlands not
included.
Southampton has gone beyond what other towns have
been capable of. When GIS was allocated for in the town
budget, a huge amount of money was set aside to create a
land-type coverage, which used ground crews to survey the
town for mapping. The resulting coverage is a very concise
and up-to-date map of all of the habitat types in
Southampton, including wetland information. While most
towns would rely on the NWI or other state level data
sources, Southampton is very lucky to have a habitat
complex map of such precision. I have chosen to use this
Southampton habitat complex map for my wetland coverage,
due to the fact that it is extremely precise and locally
significant.
2.1c Barrier Beach Overwash
Overwash and breaching of barrier islands plays an
important role in maintaining the health of this region’s
ecosystems. (Hecht, 1990; Dunn, 2000; Luoma, 1998) Beach

59
migration is a natural occurrence, which is hindered by
human influence, and the protection of private property.
Overwashing of barrier beaches has been shown to be an
important factor in maintaining piping plover habitat, one
of the targets for this region. ‘(Areas) preferred by
piping plovers are naturally created or maintained by
overwash and/or scouring by waves. Additionally, without
overwash, dense vegetation may grow between beach nesting
habitats and bay tidal flats, preventing broods from
walking to these foraging areas.’ (Elias, 2000)
Tern, plover, and shorebird areas created by the
breach at Pikes Beach in 1993 illustrate the importance of
this natural process for establishing habitat. The lack of
plover habitat on the undeveloped Wilderness Area of Fire
Island is thought to be due in part to lack of inlets and
suitable overwash feeding and brooding areas (Elias-Gerken,
1994)
Besides being important for salt marsh habitat
protection, overwash plays a vital role to other coastal
processes. ‘Overwash allows sand to be shunted into the
interior of the barrier beach, which builds the secondary
dunes, providing shelter from the salt spray so that swales
and maritime forest can develop.’ (Hoel, 1986)
The consensus in the scientific literature is that

60
overwashing is a natural and important process in beach
migration and the formation of viable habitat, and houses
should be moved out of zones of overwash. (Hoel, 1986;
Hecht, 1990; McCormick, 1984) The real issue is that, ‘No
erosion problems exist until people lay out property lines
and build. Beach changes only trouble people who have a
strong attachment to immovable objects and fixed lines.
Shoreline engineers are rarely, if ever, called in to
stabilize a wild beach.’ (Kaufman, 1979)
Creating a coverage of overwash sites to be used for
prioritizing parcels has proved extremely difficult.
Sophisticated modeling dealing with Bathymetry and
elevation data is necessary to produce useful information.
These two data types are often both difficult to obtain,
and can be significantly different due to methodologies in
data collection and temporal changes in coastal areas. My
attempts to use a Digital Elevation Model (DEM) for
watershed modeling (flow accumulation and direction) were
not successful. This may be due to the rough DEM data, or
the Arcview watershed modeling functions, which are not
designed for coastal areas.
The grid model produced from the DEM did however help
me to identify visually those sites that appear low enough
for overwash to occur. I was able to digitize these areas,
61
and combine them with a map of historic overwash sites, to
provide a data set of possible overwash sites. While this
may not be the best methodology, it does provide a useful
set of low elevation and susceptible sites, and I believe
will serve its purpose to select parcels that should be
kept free from development so that overwash of barrier
beaches can occur.
2.1d Protected Land
Literature on coastal wetlands and the associated
barrier islands suggests that landscape fragmentation is
one of the greatest threats to the long-term health of
coastal biota. (Teal, 1969) Experts at TNC agree that
protecting large areas is the key to effective habitat
protection. (TNC Conservation by Design, 2001) The focus of
TNC’s efforts is to identify and reduce the stresses that
face a region. With the target species in this area being
mostly birds, large intact and even corridor areas are
necessary to maintain viable habitat. Thus protecting areas
close to already protected sites will increase the
viability of sites that already have a vested interest and
a role in habitat protection.
Many studies have shown that larger patches support a
larger variety of habitats, contain larger populations of

62
species and are less vulnerable to disturbance. (Brown,
1990; Hanski, 1997) Small patches in fragmented landscapes
may act as ecological traps by concentrating populations of
birds in areas with insufficient resources. (Heske, 1999)
Landscapes with a few, small, isolated patches can be
dominated by edge effects, and provide little viable
habitat for interior species. (With and King, 1999) The
fact is, species become extinct faster in small patches
than larger ones (MacArthur and Wilson, 1967; Harris, 1984;
Hanski, 1997.) The Southampton Town Plan echoes these
sentiments by indicating that the proximity to existing
protected land (in order to establish continuity) was
considered an important aspect of land protection efforts
for the town. (Town of Southampton Community Preservation
Fund Project Plan, 1998)
For all of these regions, building upon already
protected land will be a vital aspect to prioritizing land
for management in my study area. Coverages of Federal,
State, Local, as well as TNC protected land have all been
created using the tax parcel map, which lists these lands
separately, by ownership. Discussions with TNC and other
area experts has shown that priority should not be given to
land adjacent to any specific type of protected land (Fed,

63
State, Local). All of these groups have been partners with
TNC in the past, and all protected areas are important due
to the fragmented nature of the landscape. (Ozarski
Personal Communication, 2002)
2.1e Habitat and Target Areas - Beach Dependent Species
Part of TNC’s approach to land protection is to
identify target species, and then to protect the land that
those species depend upon. Colonial nesting marine birds
and wading birds are important and conspicuous components
of coastal ecosystems (US Fish and Wildlife Colonial
Waterbirds Technical Report, 1998). Nineteen species of
colonial Waterbirds nest in the South Shore Estuary
Reserve. Two species of shorebirds are considered of
special importance, the threatened piping plover, and the
endangered American Oystercatcher. Colonial nesters usually
concentrate in small areas and are vulnerable to
disturbance and habitat destruction that can eliminate
large numbers of birds. (US Fish and Wildlife Colonial
Waterbirds Technical Report, 1998)
Because shorebirds concentrate in just a few areas
during migration, loss or degradation of key sites could
devastate these populations. Many species have in fact been
declining due to losses of these sensitive lands (US Fish

64
and Wildlife Colonial Waterbirds Technical Report, 1998).
Shorebird habitat use directly competes with human
activities that often result in destruction, degradation,
and disturbance of wetlands, beaches, estuaries, and
grasslands. (Town of Southampton Comp Plan, 2001)
In an effort to document the distribution of
sensitive shorebirds, the NY Natural Heritage Program has a
data set, which it calls Beach Dependent Species Habitat,
which delineates Breeding and nesting sites for target bird
species. The proximity of parcels to these sites is key for
efficient habitat protection.
Another facet of the Beach Dependent Species Study is
the location of sites where seabeach amaranth and seabeach
knotweed exist, both being beach dependent rare plant
species identified as targets for protection by the Natural
Heritage Program. Their status as threatened endemic
species makes the proximity of parcels to these stretches
of beach a necessary component of the prioritization study.
(Ozarski Personal Comm., 2002)
These data sets have been digitized by The Natural
Heritage Group, and indicate stretches of beach where team
members doing site analysis have recorded target species as
present. The data is thus ground-truthed, and very
reliable. It should be noted, however, that large stretches
65
are indicated as having target species present, but are not
associated with numbers of species. However, because the
data represents rare or endangered species, any number of
individuals may be considered significant and worthy of
protection. Because of the reputation of Natural Heritage,
and the experts they employ in this area, this data set may
be considered very applicable for prioritization efforts.
2.1f Coastal Erosion Hazard Area (CEHA)
The CEHA area, which extends up the coast of Long
Island and encompasses the barrier islands, beaches and
dunes, will be used to identify those parcels along the
coast that have been designated as worthy of protection
under state law. The state coastal policies are directly
descended from the Federal Coastal Zone Management Act
(CZMA) of 1972, which mandates that states develop state
coastal policies about land and water uses, and the CEHA
designation creates an area of enforcement for the state
coastal policies under state law. (Ozarski CEHA Overview,
2001)
While CEHA is a State administered act enforced by
the New York Department of Environmental Control (NYDEC),
it can be handed over to municipalities for implementation
if so desired. (Ozarski CEHA Overview, 2001) Southampton

66
has an approved community enforcement program, which allows
the municipality to enforce CEHA laws. This includes
defining regulated activities, and applying a permit
process to enforce minimum standards and restrictions for
the CEHA area. (Ozarski CEHA Overview, 2001)
CZMA was designed to balance and protect a broad
range of land uses on the coast, specifically:
‘...Industry, commerce, residential
development, recreation, extraction of
mineral resources and fossil fuels,
transportation and navigation, waste
disposal, and harvesting of fish,
shellfish, and other living marine
resources, wildlife...’ (Ozarski CEHA
Overview, 2001 – from CZMA section 1)
The CEHA act, which was signed in 1981, attempts to
spatially identify the region necessary to protect these
aspects of the landscape. The area is determined by a 40-
yr-erosion study, and aims to protect natural protective
features, such as dunes and bluffs, and identifies
structural hazard areas, which are areas landward of the
natural protective features that may be endangered.
(Ozarski CEHA Overview, 2001)

67
While CEHA contains strong regulatory language
specific to the placement of structures within the zone and
the fact that structures damaged by coastal flooding or
erosion by 50% or more are not to be rebuilt, variances are
available if there is no reasonable, prudent, alternative
to a site. Because CEHA does allow for hard erosion control
structures (dikes, jetties) as a means of stabilization,
there are ways for permits to be given even when the
prudent course of action would be to deny development
rights within the fragile coastal zone. ((Ozarski CEHA
Overview, 2001; Article 34 CEHA law, 2002; Ozarski CEHA
enforcement sheet, 2001; Ozarski CEHA Permit Process Sheet,
2001)
Because this sensitive area is still susceptible to
development pressure, I have chosen to use the CEHA zone as
a component of my prioritization strategy. The digitized
line, which has been supplied to me by the NYDEC, will
indicate those parcels that are in need of protection under
New York State law, but due to development pressure will
surely be built upon in the future if not protected.
I will also use the line to indicate those structures
that are in front of the CEHA line, and target those
structures for relocation from the area. The Town of
Southampton Draft Generic EIS for the south shore has

68
indicated that tax incentives for relocation of structures
from the CEHA are a recommended solution to the growing
problems surrounding development in the coastal area. This
allows me to efficiently focus my efforts on the CEHA zone
for a prioritization of those structures that could be
relocated by providing an incentive framework at the town
level. Without this endorsement, this management option
would be impossible.
2.1g Community Preservation Fund Areas
In June 1998, Governor Pataki established state
legislation that provides revenues from a 2% real estate
transfer tax for preservation of lands in the Peconic Bay
region to protect open space and rural character (Peconic
Bay Region Community Preservation Act – State Assembly law
#9696). The town of Southampton has established a list of
parcels for which this money can be used, based upon the
contribution that the parcels play in maintaining
agricultural lands, open space and greenbelts, wetlands,
and recreational areas throughout the town.
The areas deemed worthy of this protection money were
identified using a similar GIS inventory to what I am
attempting. Town land-cover maps, along with Natural
Heritage, protected land, DEC wetlands maps, and other

69
historical and cultural coverages were utilized to assess
the conditions and evaluate individual parcels. A total of
28,668 acres have been included in the preservation plan. I
have chosen to include the Open Space areas selected from
these coverages as part of my prioritization scheme.
The Open Space areas selected for preservation will
serve as large protected intact natural areas and
ecological core preserves. The plan is to protect, buffer,
and link these areas to provide a functional network of
interconnected reserves for the South Shore region. The
headwaters, tidal marshes, ponds, and woodlands that these
areas contain are vital to providing habitat to the many
rare and endangered species living in the fragile coastal
area.
I am including the CPF areas as part of my
prioritization scheme for another, more economically minded
reason. The National Fund that The Nature Conservancy can
use for timely land acquisitions may allow land that
becomes available in the CPF area to be bought by TNC
without the red tape that can stall a government purchase.
The land can then be transferred to local government and
TNC can reclaim their funds, a common practice within the
field of preservation. This makes the CPF areas ideal sites
for TNC to use their speed of acquisition in order to

70
partner with local government and support local land
preservation efforts.
2.1h Parcel Size - Easements
According to the Peconic Land Trust and the Town of
Southampton Community Preservation Fund, properties
selected for easements should be of sufficient size such
that significant features are likely to remain intact in
spite of adjacent development. Thus one-acre plots that
contain structures are not likely to provide any useful
habitat, and are susceptible to nearby development
pressure.
For this reason I have chosen to focus my efforts for
prioritizing easements on those parcels which contain at
least 1.5 acres of open space, not including the structure
itself. This will remove any parcels that will most
certainly not provide the necessary amount of land for
easements to be effective, and will allow for a more
efficient analysis of the possibilities that exist for
easement purchase in my study area.
2.1I Land Availability - Structure Relocation
In order to efficiently prioritize structures for
relocation from the CEHA zone, the location of the

71
structure within the parcel and the availability of land on
which to move these structures behind the CEHA line must be
ascertained. Some structures may be prime for relocation.
They could be in a possible overwash area, and within a
dune or breeding bird site. However, if there is no space
behind the CEHA line to remove the structure to, then the
possibility of any changes occurring drops sharply.
Of course the lack of immediate land does not
entirely rule out relocation of the structure. Damage of
the house by more than 50% requires the structure to be
discarded and house moving technology does allow houses to
be moved significant distances, making it important to
still keep structures without significant room directly
behind them in mind when analyzing the situation. Thus I am
not throwing out parcels that do not have room behind the
CEHA line or vacant land behind them for structures to be
removed to, but will be visually analyzing each structure
to assess the room for relocation as a criterion for
prioritization.

72
Table 2. Coverage’s and Sources
Data Set Source Data Type Accuracy Comments
Base Parcel Map Suffolk County Digitized from county tax maps
Last updated Winter 2001
Some ownership Data needs updating –TNC inf. not exact
Wetlands Coverage Town of Southampton
Ground crew GPS Very accurate Unique to SH Most rely on NWI
or DEC Protected Land Suffolk County Tax
Map Parcel level
ownership data Mostly accurate –
some inconsistencies on TNC owned land
Government ownership very
accurate
Community Preservation Fund
Town of Southampton
Parcels delineated by town within CPF
project plan
Exact parcel level data
Coastal Erosion Hazard Area
NY Department of Environmental Conservation
Digitized line delineates sensitive
coastal area – ie. Dunes
Perfectly accurate – digitized by
NYDEC
Historic Barrier Beach Overwash
Historic overwash site map in Draft
Generic Environmental
Impact Statement
Digitized from Paper map
High accuracy – paper map was very
accurate, thus digitized points
should be as well
Possible Barrier Beach Overwash
Army Corps Digital Elevation Model
Digital Elevation Model (DEM) from Satellite Imagery
Not accurate enough
Needs Bathymetry data and better
modeling Beach Dependent
Species Natural Heritage
Program Beach expanses
based upon digitized maps of
survey results
Very Accurately digitized – lack of data association
Number of individuals present not associated with
maps

73
Table 2. Prioritization Criteria

74
2.2 Prioritization Scheme
The above criteria are being applied to my study area
in order to prioritize parcels in three distinct layers of
analysis. Using arcview software, I assess the location of
parcels relative to the target areas and natural processes
my research has deemed pertinent to habitat protection
within the coastal zone. The three layers include
prioritizing vacant land for acquisition, identifying those
residential lots with structures that may be suitable for
easements, and looking into the Coastal Erosion Hazard Area
to ascertain structures that may be removed from this
sensitive area. (See the section on management options). I
will now go into some detail as to how this was
accomplished.
In order to prioritize vacant lots for acquisition, I
first selected out from the Southampton Tax Map all vacant
parcels that exist within the study area. Arcview provides
a number of tools for selecting out certain components of
coverages, and allows the user to query for attributes that
may be of interest. One such tool is the ‘select by theme’
function, which allows the user to ask the computer to
display all vacant lots which may intersect, be contained
within, or be a certain distance from the criteria

75
discussed above. This allows my to score the parcels based
upon their location in the landscape.
There exist two types of scoring techniques that have
been employed in similar studies. A linear scoring gives
each parcel 1 point if they fall within the designated
limits of a particular criterion. For example, parcels that
are adjacent to already protected land would receive 1
point for that category. The alternative method would be to
weight the criteria so that parcels adjacent to already
protected land might receive 1 point each, while parcels
buffering wetlands might receive 2 points, depending upon
the importance one gives to wetlands versus protected land.
I have decided to go with the former approach for two
reasons. The first being that the expertise needed to
decide upon weighting scales is not within my immediate
grasp, and the local experts and literature I have
consulted with are not in agreement on which aspects of the
landscape are of more import than others. The second reason
is that this is the first such study being done within this
area. I hope that this prioritization and the results I get
continue to grow and influence local land protection
efforts. A linear scoring rule allows for enhancement in
the future, when more is known about specific areas and
landscape characteristics. As the use of this technology

76
matures, weighted scoring may play a role in future
planning efforts, but for now it seems pertinent to keep it
simple and allow for room to grow.
Points were allocated to parcels that provide the
most protection to the habitat they may contain, the areas
they might border, or the ecosystem functions that in
protecting the land will be allowed to continue. Those
parcels within 500 ft of wetlands were given a point
because buffering these fragile areas will protect the
habitat they contain and allow them to move and change as
conditions shift. One point was awarded to the parcels
bordering already protected land, so that we may reduce
fragmentation, and provide larger intact habitat areas.
Likewise, 1 point was given to those parcels that fall
within the beach dependent species habitat coverage areas,
and 1 point for those parcels that fall within the intact
dune area. One point was also awarded to those parcels that
fell within the Coastal Erosion Hazard Area, and an
additional point to parcels in possible barrier beach
overwash areas.
Residential lots with structures on them were
prioritized in much the same fashion, except analyses of

77
these lots was limited to those which contain at least 1.5
acres excluding the structures themselves. This was
accomplished by selecting out the residential lots from the
tax map, and unioning the structure inventory to the
residential lot coverage. This allows the structures area
to be subtracted from the lot, and I was then able to query
for those areas bigger than 1.5 acres, with the structure
area removed. The result was a coverage containing only
those residential lots which provide enough land for an
easement to be warranted, due to the ability of landowners
to develop or sell off at least 1 acre of their owned land.
These lots were prioritized in the same fashion as
the vacant lands, with a linear scoring rule that assessed
their spatial role in the landscape, and awarded points
based on their proximity to the aforementioned criterion.
For easement prioritization, barrier beach overwash was not
used as a criteria, as these areas are being singled out
for structure removal, and thus would not be beneficial for
easements.
Parcels containing structures within the Coastal
Erosion Hazard Area were then analyzed for the possibility
of relocation from the coastal zone. The CEHA line cuts
through most of the ocean front properties, with many

78
parcels containing adequate room for structures on either
side of the limit. The prioritization of these structures
focused not only on their proximity to overwash areas,
dunes, and habitat, but also included a visual analysis of
the room that may or may not exist for structures to be
moved to. Structures that were in front of the CEHA line
but had room enough behind the line on the same property,
as well as those structures that had vacant land behind
them, were given a point.

79
3. Results
In this section, I will describe the results of the
prioritization process, and provide maps displaying some
exemplary findings. A complete set of maps detailing the
results can be found in Appendix A.
3.1 Vacant Land
Within my study area, there exist 2,531 parcels
listed as vacant and available for development.
Prioritizing these parcels based upon the criteria
described within this paper has yielded a distribution of
scores where a select few parcels have scored very high,
while the majority scored very low. The results of the
prioritization also indicate a few areas where preservation
reserves may be possible due to clusters of high scoring
vacant parcels coinciding.
Table 3. shows the number of parcels for each score
0-6. As can be seen, while only two of the parcels scored a
six, 123 of the parcels received a score of three or
higher. Those parcels with higher scores represent lands
that contain enough attributes to make them worthy of
immediate attention. Roughly half of the parcels scored a
zero, indicating those parcels which are not in need of
attention at this time.
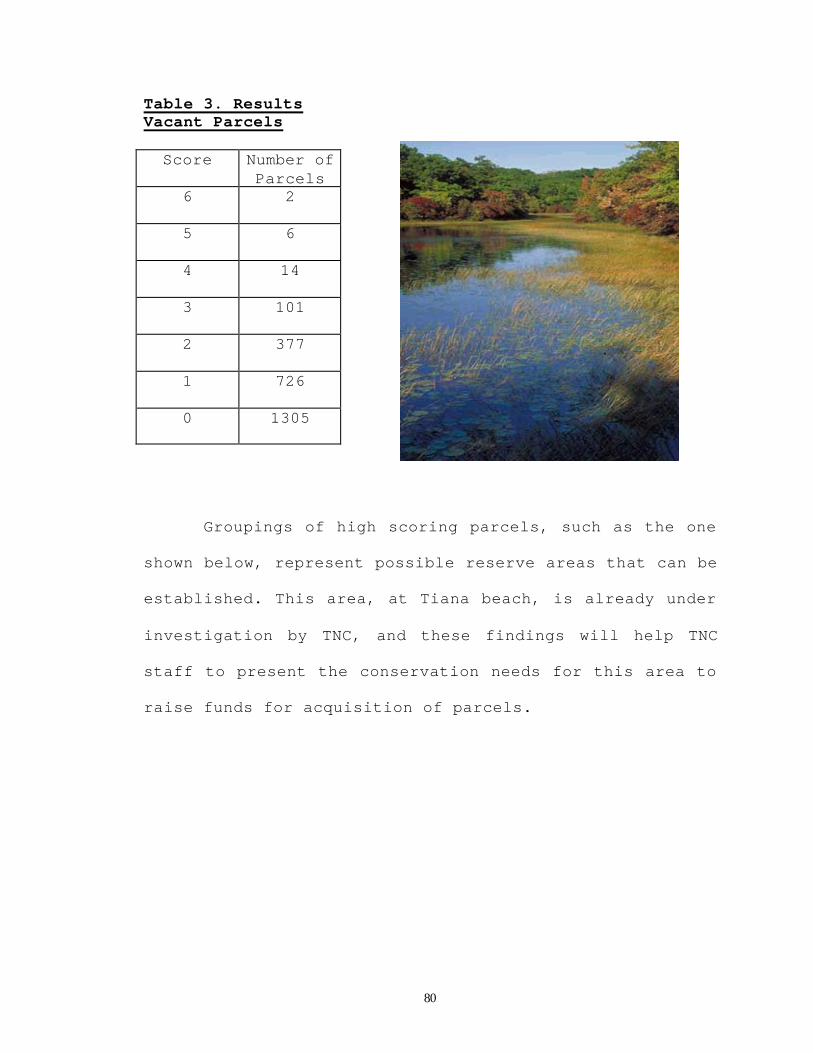
80
Table 3. Results Vacant Parcels Score Number of
Parcels 6 2
5 6
4 14
3 101
2 377
1 726
0 1305
Groupings of high scoring parcels, such as the one
shown below, represent possible reserve areas that can be
established. This area, at Tiana beach, is already under
investigation by TNC, and these findings will help TNC
staff to present the conservation needs for this area to
raise funds for acquisition of parcels.
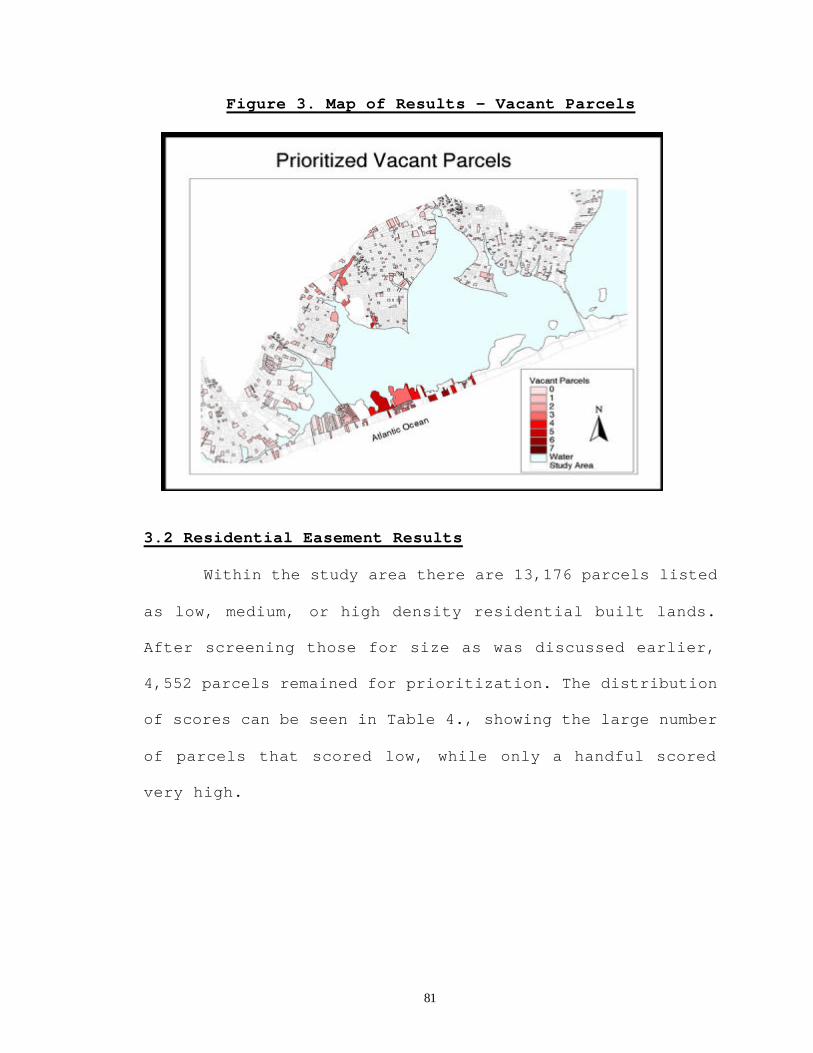
81
Figure 3. Map of Results – Vacant Parcels
3.2 Residential Easement Results
Within the study area there are 13,176 parcels listed
as low, medium, or high density residential built lands.
After screening those for size as was discussed earlier,
4,552 parcels remained for prioritization. The distribution
of scores can be seen in Table 4., showing the large number
of parcels that scored low, while only a handful scored
very high.

82
Table 4. Results Easement Parcels Score Number
of Parcels
0 2307
1 1592
2 494
3 104
4 52
5 3
Using a score of three as a cutoff for those parcels
that are in need of immediate attention, we can see that
159 of the 4,552 parcels are in need of immediate concern.
As with vacant parcels, roughly half of the parcels scored
a zero, allowing efforts to be targeted to those that have
significant resource value.
The figure below shows the results of prioritizing
residential parcels for easements within this region. As
can be seen, most high scoring parcels occur along the
waters’ edge, specifically along many of the tidal creeks
that are associated with wetland communities. This is
especially significant, due to the fact that these are
probably the most sensitive areas to human disturbance, and
can benefit greatly from conservation efforts that would

83
keep density of housing, and associated water and waste
needs, down.
Figure 4. Map of Results - Easements
3.3 Results Structure Relocation
604 structures currently exist within the Coastal
Erosion Hazard Area in the town of Southampton. Of these,
26 scored a three or higher, indicating that very few of
these structures have the possibility of relocation.
Clusters of high scoring parcels do exist, (fig. 8) with
areas along specific beaches, and even distinct sections
along bays showing promise for management.

84
Figure 5. Map of Results – Structure Relocation
Most of these high scoring parcels are associated
with barrier beach overwash sites, and thus the results
indicate not only houses that are ripe for relocation, but
those that are in danger of destruction as well. The
results show large stretches of structures, see below, that
are in a precarious straight, and thus can help to target
both preservation and education efforts in the future.

85
Table 5. Results Structure Relocation Score Number
of Parcels
0 131
1 233
2 214
3 24
4 2
Table 6 summarizes the scores for each management
option. I have categorized the parcel score results into
high, mid, and low ranges, and have indicated the score
that is applicable for each range. Since not all criteria
were pertinent for each management option, these ranges
differ.
Table 6. Summation of Results
(0-1)
364 (2)
214 (3-4)
26 Structure
Relocation (Total:604)
(0-1)
3899 (2-3)
598 (4-5)
55 Residential Easements (Total: 4,552)
(0-1)
2031 (2-3)
478 (4-6)
22 Vacant Parcels
(Total: 2,531)
Low Range Scoring
(score)
Mid Range Scoring
(score)
High Range Scoring
(score)

86
4. Discussion
At this time Southampton, as with Long Island as a
whole, has about one third of its land protected, one third
developed, and one third up for grabs. The oversimplified
goal of The Nature Conservancy is to see half of that last
third preserved within the next ten to fifteen years. The
results of this study provide not only some direction as to
how to achieve this, but also the order in which lands
should be dealt with. It will allow funds and attention to
be focused on those lands deemed most valuable in order to
protect them in a timely manner. Interestingly enough,
about half of the vacant lands available received a score
of zero, indicating that these are the parcels that can be
sacrificed to development as long as efforts to protect the
remaining half continue.
The distribution of scores which occurred, with very
few parcels scoring high and many scoring low, will allow
preservation efforts to be more effective by targeting
those few parcels which contribute greatly to habitat. With
only a handful of parcels fulfilling multiple target goals,
conservation efforts can be proactive, making the land
grabbing tactics of the past obsolete.

87
Since very few structures within the CEHA zone were
indicated as worthy of possible relocation, purchasing
vacant land along the coast becomes essential to habitat
protection. The Army Corps of Engineers will continue to
work within this area to protect houses and human lives,
with little thought given to habitat and long term erosion
issues. If we do not want to see Southampton become the
Jersey shore, we must limit the need for hard erosion
control structures by not allowing development along the
coast. Removing structures from harms way may prove to be
an effective means for reducing the need for erosion
control in the future, but the natural coastal processes
that maintain the health of this area necessitate more than
can be achieved by these means. Purchasing coastal land,
where parcels remain vacant, seems to be the only way to
truly protect the coastal area.
Clusters of high scoring structures within the
Coastal Erosion Hazard Area can be of significance for
other reasons beyond lobbying for relocation landward.
Since these areas are in the most danger of flooding, and
are thus targeted for erosion control by the Corps,
education programs must be employed so that the residents
can be informed as to the drawbacks of hard erosion
control. These areas, through TNC, can be formed into

88
community action groups, where the community as a whole can
then have a say in the protection of the natural resources
that surround them. A community level program such as this
will hopefully garner local landowner support because
citizens may feel more involved in a large-scale
preservation effort if the other homeowners are partners
with them. By providing a neighborhood feel to the project,
TNC can work for strong opposition to needless destruction
of the environment.
Clusters of vacant parcels that obtained high scores,
as well as clusters of high scoring possible easement
parcels, are of importance as well, because they may allow
for the creation of new reservation sites. Clusters of
protected land will help to create corridor areas for
migratory bird species, and reduce fragmentation by
increasing the size of protected habitat. It may also be
possible to work with local, federal or state government on
creating new reservation areas, thus reducing the financial
strain inherent in large-scale acquisition efforts. This
can help build partnerships, and allow for public
participation within a directed campaign.
Clusters of easement areas can also be of
significance because of the potential these areas have for
89
linking landowners together in community conservation
efforts. These clusters, where adequate open space exists
for habitat value, can be linked to TNC to provide
management and technical information so that these areas
are continue to provide valuable natural resources. Even if
easement purchase does not become a widespread reality, GIS
has allowed for targeted education and management related
projects that will provide community based support for
preservation.
One of the lessons that I would like TNC and other
conservation groups to take from this study concerns the
types of data available for GIS analysis. While government
issued data, at both local and regional scales, is readily
available and allows for consistency in analysis, GIS
allows users to create data sets, which can provide
valuable information beyond that which is available from
agencies. A perfect example of this is the possible Barrier
Beach Overwash Site coverage that I created from the Army
Corps Digital Elevation Model. Further watershed modeling
would allow for a more accurate pinpointing of locations,
but with limited technology and software packages I was
still able to make a useable coverage not available
anywhere else.

90
This is only an example of what can be done to create
new data sets for analysis. Satellite and aerial photo
imagery could help private groups to actually check the
validity of government data, and create newer, more
accurate coverages for analysis. Thus in areas where the
town does not have an accurate land cover data set like
Southampton, groups like TNC no longer have to rely on
coarse National Wetland Inventory or outdated DEC
coverages. New software allows these other coverages to be
updated, or simply replaced by GIS staff.

91
5. Constraints
When relying on government and private organizations
for data, the acronym BAD, which stands for Best Available
Data, is not simply a GIS related play on words. The
creation of coverages from aerial photographs, as well as
from paper maps, requires resource intense ground-truthing,
as well as constant updating. The tax maps on which I am
relying for parcel level data are quite possibly filled
with errors, especially when one considers the speed at
which land changes hands in Southampton. Ground-truthing
this large data set is a job for which resources simply do
not exist, an aerial photographs are not consistently
available for updating such a large area. Therefore, many
of the vacant lots that I am prioritizing may no longer be
vacant, and recent changes in ownership will not be
reflected in this study.
This holds true for much of the data that is
available to GIS users. When dealing specifically with a
well-developed coastal zone, these delays in updated data
availability can mean extreme shifts in coastal processes
will not be noted in the study. This is especially true in
elevation and wetland depiction. While this does not
undermine the process I am establishing here, it creates

92
more work on the part of the land protection groups, which
need to recheck specific parcels for true availability and
their role within the landscape once the overall
prioritization has been done. For this study, I must assume
that the most up-to-date data available from the town and
local government and environmental groups is as accurate as
can be, and correctly depicts all aspects of the landscape.
Available data may have some shortcoming due to
resources and landscape changes, but this is much less of a
hindrance than when data that could be very useful is
simply not available. For example, barrier beach overwash
is one of the most important aspects of the coastal
landscape, and is vital to my prioritization criteria. It
is also one of the most difficult data sets to create, with
Bathymetry as well as elevation data needed to form a
precise view of the processes that lead to overwash. These
data need to be from a similar point in time, as the
conditions are continually changing along the coast. Even
if these data sets are available, it takes complicated
watershed modeling to identify overwash sites correctly.
This, unfortunately, was not possible for this
project. Bathymetry data was not available to match the
only Digital Elevation Model I could obtain. An attempt to

93
model the watershed using the DEM was undertaken, but this
proved extremely difficult, and the software package used
was not designed for the slight elevation changes of a
coastal area, and thus concrete flow information was not
generated. I was able to use the DEM to look for points
that were indicated as low enough to be susceptible to
overwash, and this combined with a digitized map of
historic overwash sites provided some information on
possible overwash sites. This limitation could be overcome
in the future with better data and software packages.
The high density, value and pressure of development
in this region have proved many forms of protection
obsolete. Wetland laws are routinely ignored, and permits
are granted to build on lands that may be unsuitable for
development within the sensitive coastal zone. Lands that
may be listed as vacant but are truly undevelopable should
in fact be removed from the list of available vacant land.
This, however, would be a mistake because so much of this
land has succumbed to development in the past. This is a
difficult balancing act. One does not wish to waste funds
on lands that are not buildable if they are listed as
necessary for protection within a prioritization scheme.
The experts from The Nature Conservancy and The Group for
the South Fork recommend keeping these lands listed as

94
available for my prioritization. While this may help to
adequately include all lands that are susceptible to
development, it means more ground-truthing will have to
occur on those lands that are marginal for development.
One possible criticism of this methodology is that
double counting may occur when coverages displaying similar
types of information provide multiple points for a parcel.
The beach dependent species coverage and the dune coverage
exhibit much the same information. In many areas the dunes
are providing the breeding habitat or the land type
necessary for rare plant species. Thus while dunes are also
necessary for beach protection and health, and do not
always directly coincide with the species coverage, overlap
in use of these data sets is most definitely occurring.
This cannot be truly corrected for, because of the
multi-faceted roles that these coverages play. I would not
want to discount the role of a parcel just because of
possible overlap, and the coverages themselves are not
completely dependent upon each other. The possibility of
double counting will only add points to already important
parcels, allowing those parcels to receive more scrutiny in
the future.

95
One of the other areas that could be improved upon is
in the social prioritization of developed land being
targeted for management. Age and income data available from
the census bureau provide a framework for identifying
certain segments of the population that may be interested
in working with private organizations or government on
easements or structure relocation. However, a more precise
set of data could be employed for identifying those
households with specific economic concerns that may make
them willing to cooperate. I am referring to tax
delinquency and debt information, which could be employed
by government agencies to target households for
preservation efforts. Tax incentive and purchase programs
could provide much needed economic relief to these
households, and allow for more efficient use of
conservation funds.

96
6. Further Work
While Southampton is far beyond many other similarly
sized towns in its use of GIS for planning, and its
attention to the natural resources which make it special,
more can be done on both fronts to further preservation
efforts. Programs providing incentives for homeowners to
transfer development rights or remove their homes from the
CEHA area are only possible through precise and up-to-date
data, as well as public education programs.
Precision data is the key to efficient management
techniques. Data such as the structure inventory can be
very well displayed, with little or no spatial errors, but
can limit the analysis if the associated information for
the structures is lacking. Future work could focus creating
more data layers associated with the structures, including
the type of structure, how long it has been in its place,
the foundation type, and the building materials (brick,
wood etc.) so that a more detailed analysis of potential
for relocation may be considered.
Other types of data could lead to prioritization
schemes for different management techniques. Enforcing the
CEHA laws, which deal with limiting the ability of
97
landowners to reconstruct damaged structures, could be
dealt with by mapping storm events and using the structure
inventory to prioritize site visits for inventorying and
enforcement.
This type of time and resource intensive field
checking would improve upon other aspects of the study as
well, and should be undertaken for future efforts. Ground-
truthing residential lots listed as priority for easements
may be time consuming, but a worthy endeavor for efficient
allocation of resources. The creation of more precise land
cover maps, and using aerial photos and satellite imagery
to determine potential corridor networks and the usefulness
of specific lots for easements will be the next steps in
creating a precise prioritization of management potential.
There are a number of homeowners whom may be interest
in working with TNC or local government on easements or
relocation of land from the sensitive coastline. There are
also a number of areas where wealthy landowners may wish to
form a community preservation fund, in order to jointly
purchase land for preservation, thus saving it from
development and a possible overcrowding or loss of value of
their own land. These people need to be connected and
informed of the possibilities that exist, and an extensive

98
education program will be key for the future of land
protection in this region.
The data that I have collected here would be a good
start in the effort to educate the public as to both the
coastal processes which make this area special, and the way
their own home may affect the future of habitat in this
area. ArcIMS, which allows for interactive viewing of
arcview coverages on the Internet, would allow homeowners
to take a broad look at the wetlands, breeding areas, and
protected land that exist on Long Island. It would also
allow them to focus in on their homes to see what they can
do to help protect these fragile areas. Such a website
could act as a clearinghouse for GIS data, and a forum for
discussion on land protection along the coast. This is the
future of land protection on LI.
The further uses of the data, methodology and results
of this study have a variety of outlets that will enhance
land preservation efforts in this region. This study
itself, however, can be worked on to create a more precise
and up-to-date model for preservation. As I have discussed,
other data sets can be employed and new technology will
allow for better watershed modeling and coverages that are
more accurate. Beyond that, the study can be replicated

99
using a variety of different criteria, or leaving certain
criteria out, so that data needs can be better analyzed.
Performing this study using other data or secluding
certain data sets would allow for a more precise view of
those parcels that provide high levels of habitat
significance, even when prioritization criteria are more
limited. If a parcel scores high under a variety of
circumstances, it can be accepted as worthy of conservation
on a more rigorous statistical level. This may allow for
better interaction between private groups and government,
where the accuracy of the data may be questioned. The next
steps that TNC might undertake for this study include a
preliminary ground-truthing of results with a randomly
selected set of parcels to be checked for validity of
findings.
While the above bio-geographic data are essential to
prioritizing parcels in respect to the natural coastal
processes and biota that are the focus of this study, it
must be noted that management options such as easements and
structure relocation rely upon individual landowners
willingness to work with government or local environmental
groups. It may be possible to utilize census data in a
similar manner to bio-geographic coverages to further

100
prioritize parcels based upon relevant household
information.
For this area, it may be useful to use census data to
prioritize residential parcels for easements based upon
whether or not the residence is occupied by the owner, or
rented out. Research and discussions with local
environmental advocates including TNC staff has shown that
landowners are more willing to work with conservation
groups on projects such as easements if they live on the
land, and are thus more closely linked to their
environment. (Ozarski personal communication, 2002;
Friedman personal communication, 2002; Kitchell, 2000)
Absentee owners, who make money from the land already and
have little direct association with it, would be less
likely to make the effort to see land protected by
conservation groups.
Other types of data that were available from the
Census Bureau include information on age, race, income, and
education. While my research indicates that there are
certain types of people more willing to work with groups
like TNC, such as higher income, well educated, older
people, this characterizes such a large percentage of the
population within my study area that analyzing this data

101
would not be particularly useful. (Solecki, 1998; Elconin,
1998; Kitchell, 2000; Chawla, 1999)
102
7. Conclusions
Southampton is blessed with a variety of incredible
habitat complexes that support a myriad of local Flora and
Fauna, and provide essential habitat for incredible numbers
of birds, mammals, amphibians, and aquatic life. An ever-
changing sensitive coastal area, the results of human
encroachment are direct and obvious. Wetland areas have
decreased, colonial nesting birds have been forced into
smaller, more isolated areas, and coastal development has
lead to hard erosion control structures that aggravate
erosion problems.
Development in this area is not expected to taper any
time soon. The older, wealthy population of the Hamptons’
continues to expand, with most development occurring along
the coastal areas that are the focus of this study. Housing
prices are increasing rapidly, with land becoming scarce.
Development pressure is thus intense, with local government
unable to effectively stem the flood of seasonal users who
are apt to fill wetlands or build on sensitive habitat.
Protecting land through public and private efforts is thus
essential for the long-term preservation of habitat in this
area.

103
A variety of methods and technologies exist for
confronting this issue, and I hope to have shown
conservation-minded groups a methodology for prioritizing
their efforts. This project is about moving beyond the more
obvious uses of GIS to include multiple forms of management
possibilities, and to introduce new data for prioritizing
preservation efforts. Parcel level data and the ability to
work with structure databases and precise local land-cover
information allows GIS to be used for easement and
structure relocation as viable management options.
Working with The Nature Conservancy has provided key
expertise, and a sound structure for examining this issue.
The conservation by design approach has allowed me, through
extensive research, to identify the criteria that are most
prudent for prioritizing land based upon protecting target
aspects of the local ecosystems. The results of this study
indicate that GIS does indeed allow groups such as TNC to
prioritize preservation efforts, and target those parcels
that are in need of protection.
The ability to quickly and efficiently analyze large
amounts of spatial data is now a reality and a necessity
for habitat protection. GIS technology allows for a variety
of preservation methods to be analyzed and thus arms

104
preservation minded groups with a whole new array of tools
to target preservation efforts.
Previous projects have focused on analyzing land
cover data for the identification of sensitive or habitat
rich lands for acquisition. Southampton provides an
important case study, because it involves an extremely
difficult area to test the powers of GIS. Analyzing and
prioritizing on the parcel level in a well-developed and
extremely expensive coastal zone, with very sensitive
habitat, is at the boundaries of what GIS has been used for
in the past. The ability to include a variety of management
options and test the usefulness of GIS within these
alternatives will help to push this technology forward. My
hope is to arm conservation groups with a methodology for
prioritizing parcels in an extreme context, which can then
be applied to a variety of situations.
The methodology and results of this study are
indicative of the usefulness of GIS for land-use planning.
While my focus is on the Nature Conservancy and habitat
protection, other groups will be able to learn from this
project, and apply it to other aspects of land management.
Other criteria could be applied for different goals, such
as rural character preservation for farmland and purchase

105
of development rights studies. Likewise, other areas can be
similarly analyzed, such as towns with similar
characteristics to Southampton.
The Southampton Town Board performs a similar
balancing act of information when they consider building
permits within sensitive areas. I hope to go before the
town board and present my findings in order to communicate
the power of such analysis when defining the proximity of
parcels to specific landscape concerns. The town board can
use my methodology along with their own criteria to aide in
the permit process, and hopefully this will allow them to
take into account landscape and habitat concerns when
deciding on development of sensitive areas.
This study will in fact provide a foundation for
prioritizing conservation efforts, and a methodology that
will allow for more effective allocation of funds for
habitat protection. I am very pleased to help the area that
I love so much, and to see the future of GIS and land
protection unfolding before me.
106
Bibliography
1. Antenen, S. AOBB Project description - in house. 2000.
2. Art, H. Ecological Studies of the sunken forest Fire
Island. National Sea Shore Program, NY. National Park
Service Scientific Monograph Series. 1976.
3. Bateson, Emily. Just buy it: Sweet Water Trust saves
wildlands in New England. Wild Earth, V8 N2. Summer, 1998.
4. Beatley, Timothy. Habitat Conservation Planning: Endangered
Species and Urban Growth. University of Texas Press,
Austin. 1994.
5. Breese, Gregory. Natural Habitat Focus Area Study by the
Habitat and Living Resources Implementation Team. US Fish
and Wildlife Service, 7/12/99.
6. Bernd-Cohen, T. State coastal program effectiveness in
protecting natural beaches, dunes, bluffs, and rocky
shores. Coastal Management:27. December, 1999.
7. Chawla, L. Life Paths into effective environmental action.
The Journal of Environmental Education. Vol 31 N 1. 1999.
8. Committee on Scientific and Technical Criteria for Federal
Acquisition of Lands for Conservation. Setting Priorities
for Land Conservation. National Research Council,
Washington DC. 1993.
9. Cook, J. The Least Tern; The Conservationist V49 June 1995

107
10. Cornforth, IS. Selecting indicators for assessing
sustainable land management. Journal of Environmental
Management, V56 N1. 1999.
11. Cummiskey, J. The Cape Cod land bank: the use of a land
acquisition strategy to preserve a Massachusetts coastal
region. Ocean and Coastal Management, V44. 2001.
12. Daniels, Tom. Integrated working landscape protection: the
case of Lancaster County, Penn. Society and Natural
Resources, V13. 2000.
13. Decker, Daniel. Challenges in the Conservation of
Biological Resources. Westview Press, San Francisco. 1991
14. Dunn, Steve. Coastal Erosion: evaluating the risk;
Environment V42 N7 Sept 2000.
15. Elconin, P. Landowner Satisfaction with Conservation
Easements. Wild Earth. Summer, 1998.
16. Elias, S. Piping plover nesting and habitat threats;
Journal of Wildlife Management V64 N2 April 2000.
17. Fink, Richard. Public land acquisition for environmental
protection: Structuring a program for the Lake Tahoe Basin.
Ecology Law Quarterly, V18 N3. 1991.
18. Flicker, John. A state by state protection strategy. The
Nature Conservancy News, V34 N6. 1984.
19. Gomes, Glynn. The Review of the NOAA National Coastal Zone
Management Programs for Estuary and Coastal Wetland
Protection. www.ocrm.nos.noaa.gov/pdf/efwet.pdf accessed
12/3/01.

108
20. Governors Coastal Erosion Task Force Findings. September,
1994.
21. Green, Martha. A less taxing approach. The Nature
Conservancy, V49 N4. July, 1999.
22. Grove, Noel. Preserving Eden. Harry N. Abrams Publisher,
New York. 1992.
23. Grumbine, Edward. Environmental Policy and Biodiversity.
Island Press, Washington DC. 1994.
24. Hall, David. Incentives and land acquisition: key tools for
restoring fish and wildlife habitat. Endangered Species
Update, V16 N3. 1999.
25. Halsey, J. The 2001 Private Land Conservation Incentive
Program. www.peconiclandtrust.org/fall2001/private.htm
Accessed 1/17/02.
26. Handmer, J.W. Guidelines for floodplain acquisition.
Applied Geography, V7. 1987.
27. Hecht, J. Shifting Shores – rising seas, retreating
coastlines. Charles Scribners sons, NY. 1990.
28. Hoel, M. Land’s Edge – A natural history of barrier
beaches. Little Book Publishers. Newbury, MA. 1986.
29. Kaufman, W. The Beaches are Moving. Anchor Press. Garden
City, NY. 1979.

109
30. Kavenagh, K. Vanishing Tidelands: Land use and the law in
Suffolk County 1650-1979. Sea Grant Institute. Albany, NY.
1980
31. Kitchell, A. Identities and actions within environmental
groups. Research in Human Ecology. V7 N2, 2000.
32. Klyza, CM. Land protection in the United States, 1864-1997.
Wild Earth, V8 N2. Summer 1998.
33. Kopper, P. The wild edge – life and lore of the great
Atlantic beaches. Times Books. New York, NY. 1979.
34. Kruckenberg, Larry. Public perceptions of land acquisition.
Renewable Resources Journal, V3 N4. 1985.
35. Leadon, Christopher. Land acquisition criteria for the
Sawannee river estuary, Florida. Coastal Zone Management
Journal, V14 N3. 1986.
36. Long Island South Shore Estuary Reserve – Comprehensive
Management Plan. www.estuary.cog.ny.us accessed 11/10/01.
37. Long Island South Shore Hazard Management Program. LI
Regional Planning Board. Happague, NY. 1989.
38. Luoma, J. Shoreline preservation; Audobon V100 N4 July/Aug
1998.
39. Maddock, Ant. Identification of conservation worthy areas
in northern Zululand, South Africa. Conservation Biology,
V14 N1. 2000.
40. Maryland’s GreenPrint Program: Summary of Methods to
Identify and Evaluate Maryland’s Green Infrastructure.

110
Maryland Department of Natural Resources. Chesapeake and
Coastal Watershed Services. Spring, 2001.
41. McCormick, Steve. Mapping a new geography of hope. The
Nature Conservancy, V51 I3. May, 2001.
42. McCormick, L. Living with Long Island’s south shore. Duke
University Press. Durham, NC. 1984.
43. McDonald, A. A socio-economic-ecological simulation model
of land acquisition to expand a national wildlife refuge.
Ecological Modeling V140, 2001.
44. Medlin, Kim. Where to build. Builder (National Association
of HomeBuilders) V21 N9. July 1998.
45. Menon, Shaily. Identifying conservation priority areas in
the tropics: A land use change modeling approach. The
Journal of the Society for Conservation Biology. 15(2)
2000.
46. Murali, N.S. Application of information technology in plant
protection in Denmark: From vision to reality. Computers
and Electronics in Agriculture, V22. 1999.
47. New York State Department of Environmental Conservation.
New York State Salt Marsh Restoration and Monitoring
Guidelines. New York State DOS Division of Coastal
Resources. December 1, 2000.
48. New York Department of State. Long Islanders and the
Environment of the South Shore: A Survey of Public Opinion.
www.state.ny.us/DOS accessed 1/15/02.

111
49. O’brien, Anne. Purchasing Power: Why we still buy land.
Nature Conservancy. V49 N6 Nov/Dec, 2000.
50. O’Neill, Michael P. Identifying sites for riparian wetland
restoration: Application of a model to the upper Arkansas
River basin. Restoration Ecology, V5 N45. December 1997.
51. Ozarski TNC in-house documents: 2000
52. CEHA Information: CEHA Law (complete)
53. CEHA Overview
54. CEHA Authority Sheet
55. CEHA Permit Sheet
56. Patney, Arjun. Saving lands and wildlife: Corporations and
conservation groups in partnership. Corporate Environmental
Strategy. V7 N4, 2000.
57. Peconic Land Trust: Criteria for Conservation Projects
58. Personal Communication with:
59. Friedman, B. TNC-LI GIS Technician. All summer.
60. Ozarski, J. AOBB projects director. All Year.
61. Poiani, Karen. A scale-independent, site conservation
planning framework in The Nature Conservancy. Landscape and
Urban Planning 43 (1998) 143-156.
62. Poiani, Karen. Identifying conservation priority areas in a
fragmented Minnesota landscape based on the umbrella
species concept and selection of large patches of natural
vegetation.
63. Press, Daniel. The role of local government in the
conservation of rare species. Conservation Biology, V10 N6.
December 1996.

112
64. Pressey, RL. Opportunism in acquiring land for reserves –
why it’s a bad idea. National Parks Journal, V36 N4. August
1992.
65. Purdue, Richard B. Land Acquisition in the Adirondacks.
Adirondack Journal of Environmental Studies, V1 N2. 1994.
66. Ramsey, Christine. Facilitating a multiparcel land
acquisition project in western big cypress region of
collier county Florida. Natural Areas Journal. V16 N1,
1996.
67. Ramachandran, S. Application of remote sensing and GIS to
coastal wetland ecology of Tamil Nadu and Andaman and
Nicobar groups of islands with special reference to
mangroves. Current Science. V75 N3, August 1998.
68. Safford, RJ. Strategies for land-bird conservation on
Mauritius. Conservation Biology, V12 N1. February 1998.
69. Sawhill, John. The Good-Neighbor Policy: Working people to
people, we make conservation happen. Nature Conservancy,
V48 N1. 1998.
70. Sawhill, John. Conservation in the commons. The Nature
Conservancy, V49 N6. November 1999.
71. Scheberle, Denise. Moving toward community based
environmental management. American Behavioral Scientist,
V44 N4. December 2000.
72. Smardon, Richard. Pixels and Plovers: Using Remote Sensing
and GIS Technology for CZM. Great Lakes Research Consortium

113
and SUNY College of Environmental Science and Forestry,
Syracuse, New York. 2001.
73. Solecki, W. Local attitudes on regional ecosystem
management: A study of New Jersey Pinelands residents.
Society and Natural Resources. V11, 1998.
74. South Shore Estuary Reserve. Technical report series:
Shorebirds. NYS Department of State and US Fish and
Wildlife Service, coastal ecosystems program. July 1998.
75. SSER Wetland report
76. SSER inventory of lands identified for acquisition.
77. Steelman, T. Innovation in land use governance and
protection. American Behavioral Scientist, V44 N4. December
2000.
78. Suffolk County Planning Department. Demographic, economic
and development trends in Suffolk County, New York. July
31, 2001.
79. Suffolk County Department of Planning. Saturation
Population Analysis: Eastern Suffolk County. June, 2001
80. Suffolk County Planning Department. Suffolk County Land
Acquisition Programs.
www.co.suffolk.ny.us/PLANNING/PUBLICATIONS/SC_LAND_ACQ_PROG
S accessed 1/21/02.
81. Swinn, B. Keeping sand on your favorite beach; The
Conservationist V49 Feb 1995.

114
82. Teal, J. Life and Death of the Salt Marsh. Atlantic Monthly
Press. Boston, MA. 1969.
83. The Nature Conservancy Preserving our natural heritage:
Vol. III Private, academic and local government activities.
Prepared for the United States Department of the Interior.
1982.
84. The Nature Conservancy. Designing a Geography of Hope.
Volume 1 Second Addition. April 2000.
85. TNC GIS Strategic Plan. www.tnc.gis.org Accessed 11/10/01
86. Town of Southampton Community Preservation Fund. Community
Preservation Project Plan 1998-2001. Department of Land
Management, August 25, 1998.
87. Town of Southampton. Shinnecock Canal.
www.town.soutampton.ny.us accesses 11/15/01.
88. Town of Southampton. Town of Southampton Comprehensive
Plan. www.town.southampton.ny.us/comprehensive accessed
11/15/01
89. Town of Southampton. Atlantic Ocean Shoreline Draft Generic
Environmental Impact Statement. February 2001.
90. UNESCO. Ensuring Wise Practices in Coastal Management: Role
of Remote Sensing. Environment and Development in Coastal
Regions and Small Islands. www.unesco.org/csi/wise3.htm
Accessed 1/17/02.
91. US Army Corps of Engineers. Fire Island to Montauk Point:
Breach Contingency Plan. NY District. August 1995.

115
92. US Census Bureau: Introduction to Census 2000 data
products. US Department of commerce, Economics and
Statistics Administration. June, 2001.
93. US Fish and Wildlife. South Shore Estuary Reserve Coastal
Colonial Waterbirds: Draft Technical Report. USFWS Southern
New England – New York Bight Coastal Ecosystems Program;
NYDOS Division of Coastal Resources, 1998.
94. US Fish and Wildlife Service. GIS strategic plan for
managing GIS and spatial data in the US Fish and Wildlife
Service, with the focus on 2001-2004. www.fws.gov accessed
11.27.01
95. US Fish and Wildlife Service: GIS Applications - abstracts.
www.fws.gov accessed 11/15/01.
96. US Fish and Wildlife Service: GIS Success Stories.
www.fws.gov accessed 11/15/01.
97. US Fish and Wildlife Service: GIS Update. www.fws.gov
accessed 11/15/01.
98. US Fish and Wildlife Service. GIS Overview in FWS (where
are we know and where are we going)
www.fws.gov/data/gisback.html accessed 11/20/01.
99. Valutis, L. The Nature Conservancies Approach to
Prioritizing Conservation Action. Environmental Science and
Policy. V. 3, 2000.
100. Weatherly, Mark. Save what you can, when you can: A reply
to Bob Pressey. National Parks Journal, V37 N1. February
1993.

116
101. Weber, Theodore. Maryland’s green infrastructure - using
landscape assessment tools to identify a regional
conservation strategy. Environmental Monitoring and
Assessment, V63. 2000.
102. Weekes, David. Of partnerships and protection. The Nature
Conservancy Annual Report. V40 N6 Nov/Dec 1990.
103. Weeks, William. Beyond the Ark. Island Press. Washington,
DC. 1997.
104. Wenig, J. The ecology of LI. Environmental Publications
Associates. Plainview, NY. 1976.
105. Xiang, Wei-Ning. GIS-based riparian buffer analysis:
injecting geographic information into landscape planning.
Landscape and Urban Planning, V34 1996.
Personal Communications
1. Annette DesRochers. GIS Coordinator. Town of Southampton –
Division of Information Services. 631-283-6030 ext. 296.
2. Barnaby Friedman. Land Preservation Specialist -
Geographic Information Systems. The Nature Conservancy,
Easthampton Office. [email protected]
3. Jill Ozarski. Coastal Policy Specialist. The Nature
Conservancy, Long Island Chapter Office. 631-367-3384
ext33. [email protected]
4. Kirsten Saleen. New York State GIS Coordinator. The Nature
Conservancy. [email protected]

117
5. Lynn Carlson. GIS Guru. Brown University.
6. Melanie Harlow. Affiliated Research Center, Brown
University. 401-863-3825. [email protected]

118
Appendix A
Criteria and Result Maps

119

120

121
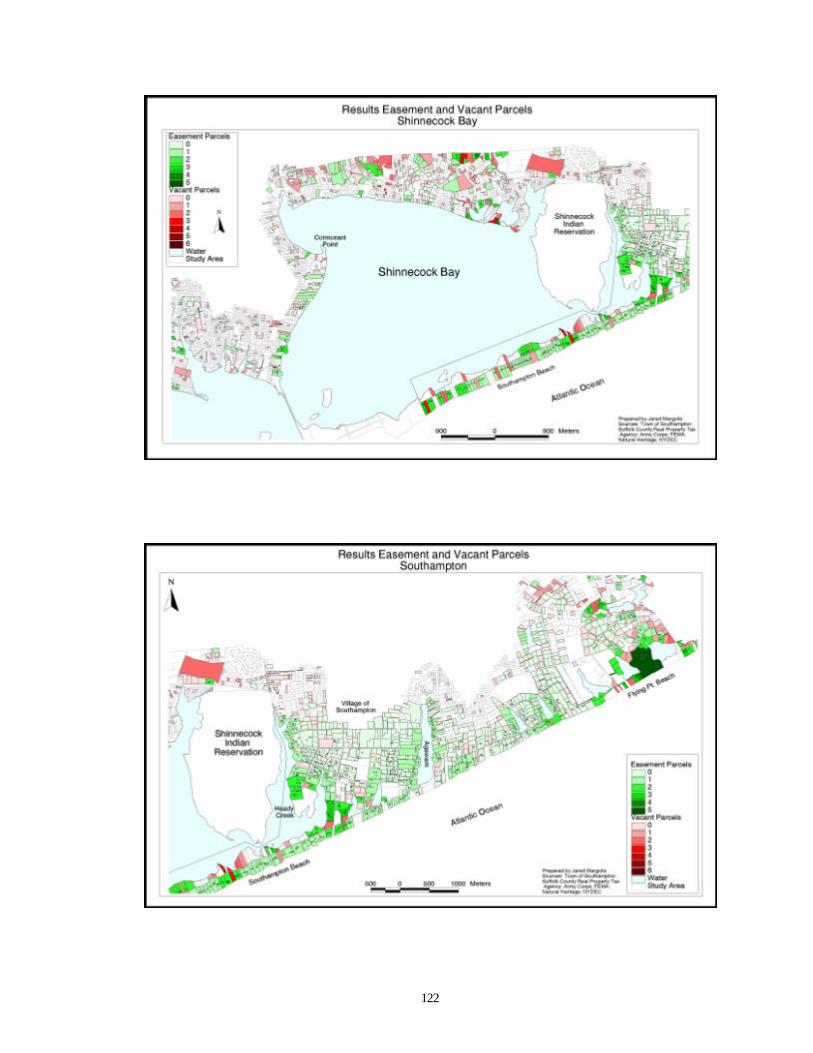
122

123
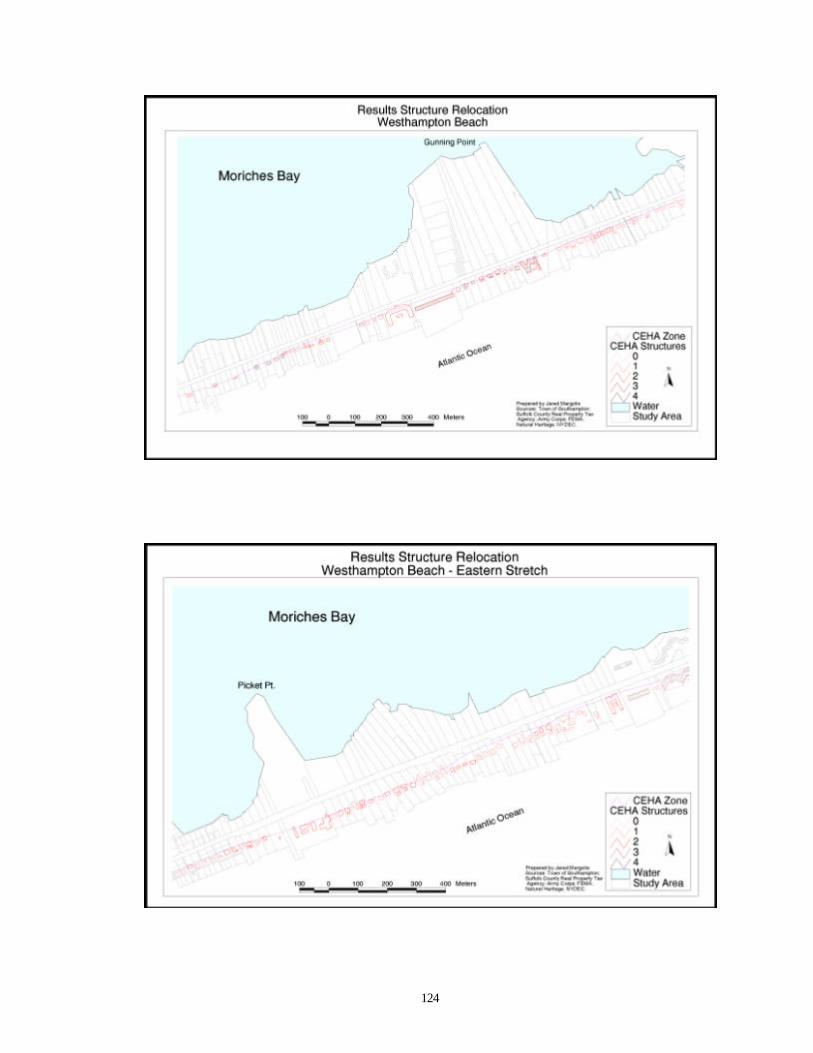
124

125

126

127

128