Principles for successful long-term investing
28
RETIREMENT INSIGHTS MARKET INSIGHTS Principles for successful long-term investing Using Insights to achieve better client outcomes U.S. | 2020
-
Upload
khangminh22 -
Category
Documents
-
view
0 -
download
0
Transcript of Principles for successful long-term investing
RETIREMENT INSIGHTSMARKET INSIGHTS
Principles for successful long-term investingUsing Insights to achieve better client outcomes
U.S. | 2020

THE KEY TO SUCCESSFUL INVESTING ISN’T PREDICTING THE FUTURE, IT’S LEARNING FROM THE PAST
AND UNDERSTANDING THE PRESENT. IN “PRINCIPLES FOR SUCCESSFUL LONG-TERM INVESTING,”
WE PRESENT SEVEN TIME-TESTED STRATEGIES FOR GUIDING INVESTORS AND THEIR PORTFOLIOS
THROUGH TODAY’S CHALLENGING MARKETS AND TOWARD TOMORROW’S GOALS. YOU WILL FIND
SLIDES FROM OUR INDUSTRY-LEADING GUIDE TO THE MARKETS AND GUIDE TO RETIREMENT, ALONG
WITH COMMENTARY PROVIDING ADDITIONAL PERSPECTIVE AND ACTION STEPS.

1 PLAN ON LIVING A LONG TIME
2 CASH ISN’T ALWAYS KING
7 STAYING INVESTED MATTERS
6 DIVERSIFICATION WORKS
3 HARNESS THE POWER OF DIVIDENDS AND COMPOUNDING
4 AVOID EMOTIONAL BIASES BY STICKING TO A PLAN
5 VOLATILITY IS NORMAL; DON’T LET IT DERAIL YOU
PRINCIPLES FOR SUCCESSFUL LONG-TERM INVESTING

1 USING INSIGHTS TO ACHIEVE BETTER CLIENT OUTCOMES
1 PLAN ON LIVING A LONG TIME
LEFT: We are living longer
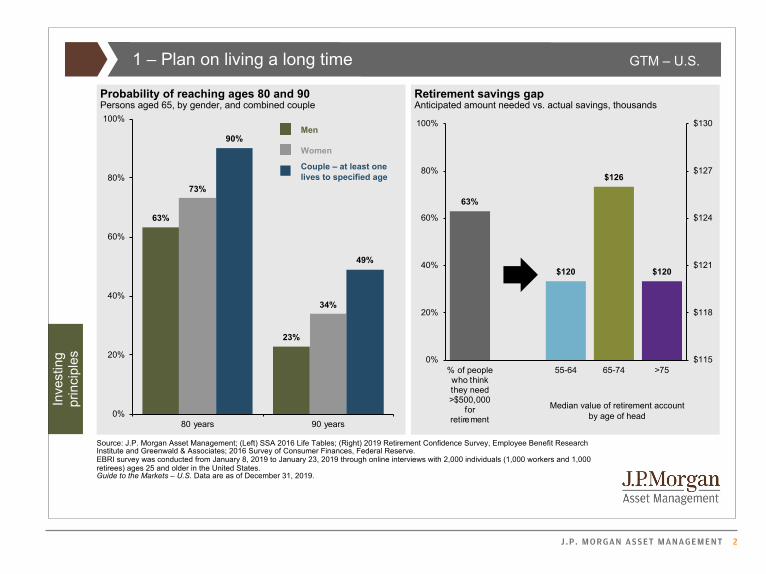
Thanks to advances in medicine and healthier lifestyles, people who are 65 today have a very good chance of reaching ages 80 or 90. A 65-year-old couple might be surprised to learn that at least one of them has a 49% probability of living another 25 years and needing investments to last until age 90.
RIGHT: Many of us have not saved enough
Studies reveal that individuals do not feel adequately prepared for retirement. Investors should start early by saving more, investing with discipline and having a plan for their future.
PRINCIPLES FOR SUCCESSFUL LONG-TERM INVESTING
J .P. MORGAN ASSET MANAGEMENT 2
4
GTM – U.S.
Source: J.P. Morgan Asset Management; (Left) SSA 2016 Life Tables; (Right) 2019 Retirement Confidence Survey, Employee Benefit Research Institute and Greenwald & Associates; 2016 Survey of Consumer Finances, Federal Reserve. EBRI survey was conducted from January 8, 2019 to January 23, 2019 through online interviews with 2,000 individuals (1,000 workers and 1,000 retirees) ages 25 and older in the United States. Guide to the Markets – U.S. Data are as of December 31, 2019.
1 – Plan on living a long time
Probability of reaching ages 80 and 90Persons aged 65, by gender, and combined couple
Retirement savings gapAnticipated amount needed vs. actual savings, thousands
Men
Women
Couple – at least onelives to specified age
Inve
stin
gpr
inci
ples
Median value of retirement accountby age of head
63%
23%
73%
34%
90%
49%
0%
20%
40%
60%
80%
100%
80 years 90 years
63%
$120
$126
$120
$115
$118
$121
$124
$127
$130
0%
20%
40%
60%
80%
100%
% of peoplewho thinkthey need>$500,000
forretirement
55-64 65-74 >75
3 USING INSIGHTS TO ACHIEVE BETTER CLIENT OUTCOMES
CASH CHANGING SHAPE2
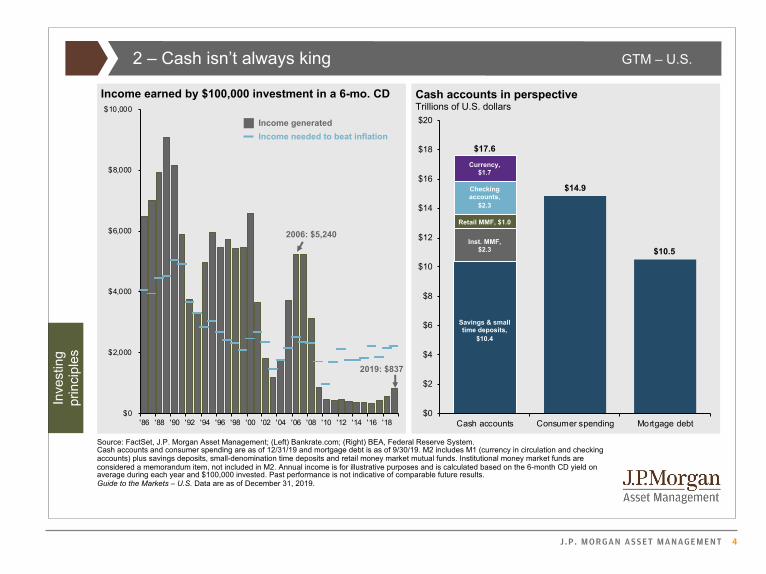
LEFT: Cash pays less
Investors often think of cash as a safe haven during volatile times, or even as a source of income. But the ongoing era of ultra-low interest rates has depressed the yields on most cash instruments—well below the rate of inflation. With rates expected to stay range bound as the Federal Reserve is unlikely to change monetary policy, investors should be sure an allocation to cash does not undermine their long-term investment objectives.
RIGHT: There is a lot of it
More than $17 trillion of cash—greater than total consumer spending in the U.S. and mortgage debt—still sits on the “sidelines,” earning next to nothing and largely missing out on a truly historic bull market.
PRINCIPLES FOR SUCCESSFUL LONG-TERM INVESTING
J .P. MORGAN ASSET MANAGEMENT 4
GTM – U.S.
5
$0
$2
$4
$6
$8
$10
$12
$14
$16
$18
$20
Cash accounts Consumer spending Mortgage debt $0
$2,000
$4,000
$6,000
$8,000
$10,000
'86 '88 '90 '92 '94 '96 '98 '00 '02 '04 '06 '08 '10 '12 '14 '16 '18
Income earned by $100,000 investment in a 6-mo. CD
Source: FactSet, J.P. Morgan Asset Management; (Left) Bankrate.com; (Right) BEA, Federal Reserve System.Cash accounts and consumer spending are as of 12/31/19 and mortgage debt is as of 9/30/19. M2 includes M1 (currency in circulation and checking accounts) plus savings deposits, small-denomination time deposits and retail money market mutual funds. Institutional money market funds are considered a memorandum item, not included in M2. Annual income is for illustrative purposes and is calculated based on the 6-month CD yield on average during each year and $100,000 invested. Past performance is not indicative of comparable future results. Guide to the Markets – U.S. Data are as of December 31, 2019.
2 – Cash isn’t always king
2019: $837
2006: $5,240
Inve
stin
gpr
inci
ples
Income generated
Income needed to beat inflation$17.6
Savings & small time deposits,
$10.4
Currency, $1.7
$10.5
Cash accounts in perspectiveTrillions of U.S. dollars
$14.9Checking accounts,
$2.3
Retail MMF, $1.0
Inst. MMF, $2.3
5 USING INSIGHTS TO ACHIEVE BETTER CLIENT OUTCOMES
3 HARNESS THE POWER OF DIVIDENDS AND COMPOUNDING
PRINCIPLES FOR SUCCESSFUL LONG-TERM INVESTING
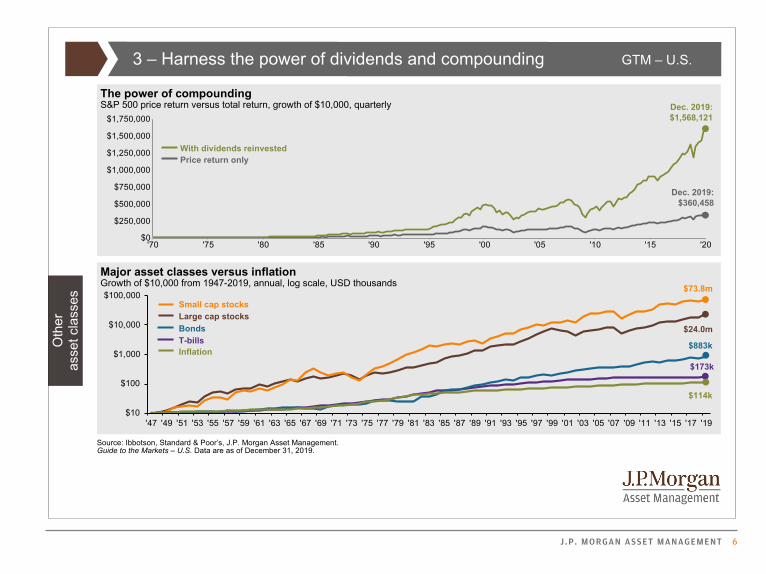
TOP: The power of dividends and compounding
In this simple illustration, an initial investment of $10,000 in the S&P 500 price return index would have grown to more than $360,000 since 1970. But if dividend payments were included, reinvested and allowed to compound over time, that same $10,000 investment would be worth more than $1,500,000 today.
BOTTOM: Investing in risk assets is critical
Many investors shy away from the stock market, unwilling to take on added risk. But this chart shows a staggering difference in the value of $10,000 invested in a variety of different asset classes over time, ranging from low-risk T-bills to U.S. small cap stocks.
There is no guarantee that companies will declare, continue to pay or increase dividends.
J .P. MORGAN ASSET MANAGEMENT 6
GTM – U.S.
$10
$100
$1,000
$10,000
$100,000
'47 '49 '51 '53 '55 '57 '59 '61 '63 '65 '67 '69 '71 '73 '75 '77 '79 '81 '83 '85 '87 '89 '91 '93 '95 '97 '99 '01 '03 '05 '07 '09 '11 '13 '15 '17 '19
$173k
$883k
3 – Harness the power of dividends and compounding
Source: Ibbotson, Standard & Poor’s, J.P. Morgan Asset Management.Guide to the Markets – U.S. Data are as of December 31, 2019.
Major asset classes versus inflationGrowth of $10,000 from 1947-2019, annual, log scale, USD thousands
The power of compoundingS&P 500 price return versus total return, growth of $10,000, quarterly Dec. 2019:
$1,568,121
Dec. 2019: $360,458
With dividends reinvestedPrice return only
Small cap stocksLarge cap stocksBondsT-billsInflation
$73.8m
$24.0m
$114k
Oth
eras
set c
lass
es
4 AVOID EMOTIONAL BIASES BY STICKING TO A PLAN
7 USING INSIGHTS TO ACHIEVE BETTER CLIENT OUTCOMES
4 AVOID EMOTIONAL BIASES BY STICKING TO A PLAN
PRINCIPLES FOR SUCCESSFUL LONG-TERM INVESTING
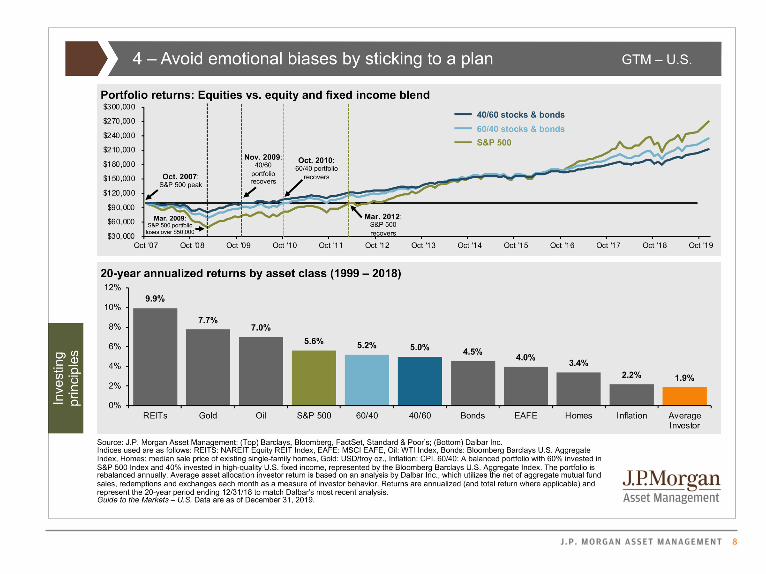
TOP: In good times and bad, stick to a plan
Some investors lament the fact that a diversified portfolio has failed to keep up with the raging bull market since 2009. This is only half of the story! As the chart shows, a portfolio that included bonds saw reduced losses during the financial crisis, enabling these diversified portfolios shown to recover much faster than a portfolio of stocks alone.
BOTTOM: The heavy cost of market timing
This chart is based on the famous Dalbar study titled “Quantitative Analysis of Investor Behavior.” This study estimates that over the last 20 years, the average investor has achieved a scant 1.9% annualized return as compared to over 5.5% in a 60/40 stock/bond portfolio, thanks in part to badly timed (and often emotionally driven) investment decisions.
Diversification does not guarantee investment returns and does not eliminate the risk of loss. Diversification among investment options and asset classes may help to reduce overall volatility.
J .P. MORGAN ASSET MANAGEMENT 8
4 AVOID EMOTIONAL BIASES BY STICKING TO A PLAN (PART 2)
9 USING INSIGHTS TO ACHIEVE BETTER CLIENT OUTCOMES
PRINCIPLES FOR SUCCESSFUL LONG-TERM INVESTING
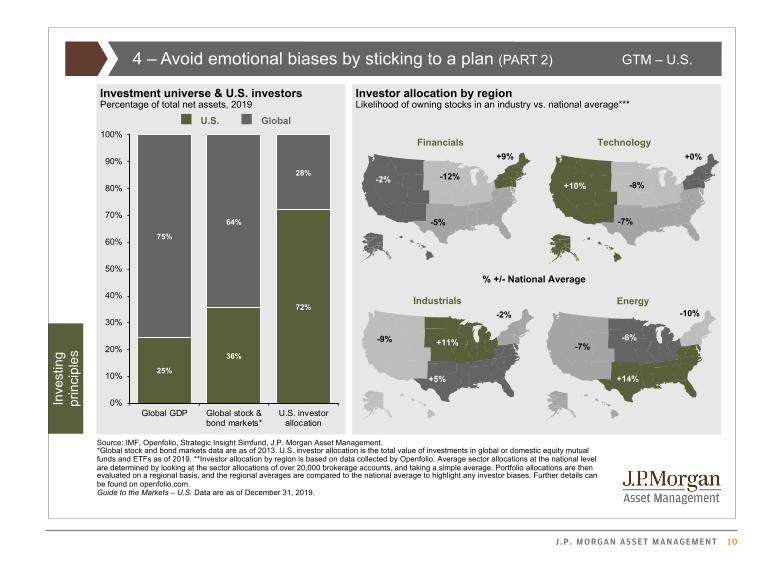
LEFT: Home-country bias
While the United States still boasts the single largest economy in the world, it accounts for only a small fraction of global GDP and just over 35% of the world’s capital markets. Yet, statistics show that U.S. investors have 70% of their investments in U.S.-based assets.
RIGHT: Familiarity bias and concentrated positions
Our investment biases show up in other ways too. Where we live, and even our field of expertise, can influence the way we allocate our assets. It is important that investors are aware of these biases and employ a disciplined investment plan that can help minimize their influence.
J .P. MORGAN ASSET MANAGEMENT 10
GTM – U.S.
8
Source: IMF, Openfolio, Strategic Insight Simfund, J.P. Morgan Asset Management.*Global stock and bond markets data are as of 2013. U.S. investor allocation is the total value of investments in global or domestic equity mutual funds and ETFs as of 2019. **Investor allocation by region is based on data collected by Openfolio. Average sector allocations at the national level are determined by looking at the sector allocations of over 20,000 brokerage accounts, and taking a simple average. Portfolio allocations are then evaluated on a regional basis, and the regional averages are compared to the national average to highlight any investor biases. Further details can be found on openfolio.com. Guide to the Markets – U.S. Data are as of December 31, 2019.
4 – Avoid emotional biases by sticking to a plan (PART 2)
Investor allocation by regionLikelihood of owning stocks in an industry vs. national average***
Investment universe & U.S. investorsPercentage of total net assets, 2019
Inve
stin
gpr
inci
ples
Financials Technology
Industrials Energy
+10%
-7%
-8%
+0%
-10%
+14%
-6%-7%
+9%
-5%
-12%-2%
+11%
-2%
+5%
-9%
U.S. Global
% +/- National Average
25%
36%
72%
75%
64%
28%
0%
10%
20%
30%
40%
50%
60%
70%
80%
90%
100%
Global GDP Global stock &bond markets*
U.S. investorallocation
5 VOLATILITY IS NORMAL; DON’T LET IT DERAIL YOU
11 USING INSIGHTS TO ACHIEVE BETTER CLIENT OUTCOMES
PRINCIPLES FOR SUCCESSFUL LONG-TERM INVESTING
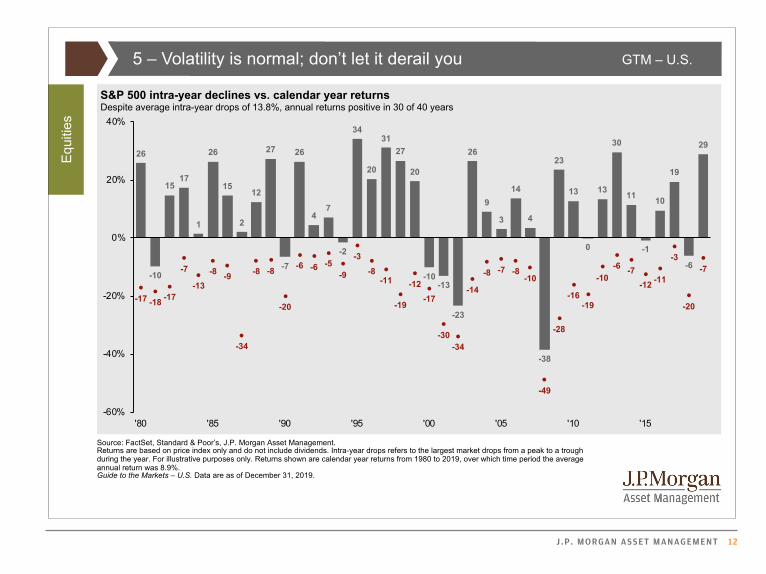
Seeing through the noise
Every year has its rough patches. The red dots on this chart represent the maximum intra-year decline in every calendar year for the S&P 500, since 1980. While these pull-backs can’t be predicted, they can be expected; after all, markets suffered double-digit declines in 22 of the last 40 years.
But despite the many pull-backs, roughly 75% of those years ended with positive returns, as reflected by the gray bars. Investors need a plan for riding out volatile periods instead of reacting emotionally.
J .P. MORGAN ASSET MANAGEMENT 12
GTM – U.S.
9
5 – Volatility is normal; don’t let it derail you
Source: FactSet, Standard & Poor’s, J.P. Morgan Asset Management.Returns are based on price index only and do not include dividends. Intra-year drops refers to the largest market drops from a peak to a trough during the year. For illustrative purposes only. Returns shown are calendar year returns from 1980 to 2019, over which time period the average annual return was 8.9%.Guide to the Markets – U.S. Data are as of December 31, 2019.
S&P 500 intra-year declines vs. calendar year returnsDespite average intra-year drops of 13.8%, annual returns positive in 30 of 40 years
Equ
ities
26
-10
1517
1
26
15
2
12
27
-7
26
47
-2
34
20
3127
20
-10-13
-23
26
9
3
14
4
-38
23
13
0
13
30
11
-1
10
19
-6
29
-17 -18 -17
-7
-13-8 -9
-34
-8 -8
-20
-6 -6 -5-9
-3-8
-11
-19
-12-17
-30-34
-14
-8 -7 -8-10
-49
-28
-16-19
-10-6 -7
-12 -11
-3
-20
-7
-60%
-40%
-20%
0%
20%
40%
'80 '85 '90 '95 '00 '05 '10 '15
6 DIVERSIFICATION WORKS
13 USING INSIGHTS TO ACHIEVE BETTER CLIENT OUTCOMES
PRINCIPLES FOR SUCCESSFUL LONG-TERM INVESTING
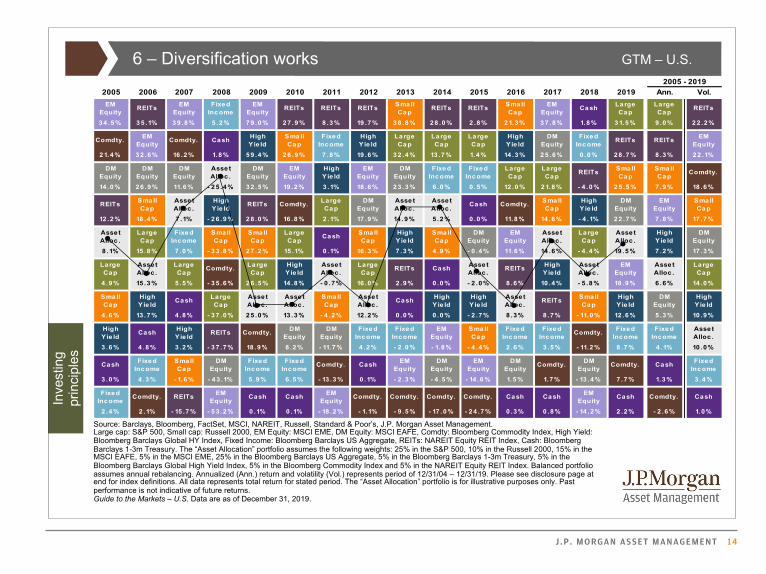
Diversification has served its purpose
The last 15 years have provided a volatile and tumultuous ride for investors, with multiple natural disasters, numerous geopolitical conflicts and two major market downturns.
Yet despite these difficulties, cash was among the worst performing asset classes shown here. Meanwhile, a well-diversified portfolio of stocks, bonds and other uncorrelated asset classes returned over 6% per year over this time period (and over 150% on a cumulative total return basis).
J .P. MORGAN ASSET MANAGEMENT 14
GTM – U.S.
10
6 – Diversification works
Source: Barclays, Bloomberg, FactSet, MSCI, NAREIT, Russell, Standard & Poor’s, J.P. Morgan Asset Management. Large cap: S&P 500, Small cap: Russell 2000, EM Equity: MSCI EME, DM Equity: MSCI EAFE, Comdty: Bloomberg Commodity Index, High Yield: Bloomberg Barclays Global HY Index, Fixed Income: Bloomberg Barclays US Aggregate, REITs: NAREIT Equity REIT Index, Cash: Bloomberg Barclays 1-3m Treasury. The “Asset Allocation” portfolio assumes the following weights: 25% in the S&P 500, 10% in the Russell 2000, 15% in the MSCI EAFE, 5% in the MSCI EME, 25% in the Bloomberg Barclays US Aggregate, 5% in the Bloomberg Barclays 1-3m Treasury, 5% in theBloomberg Barclays Global High Yield Index, 5% in the Bloomberg Commodity Index and 5% in the NAREIT Equity REIT Index. Balanced portfolio assumes annual rebalancing. Annualized (Ann.) return and volatility (Vol.) represents period of 12/31/04 – 12/31/19. Please see disclosure page at end for index definitions. All data represents total return for stated period. The “Asset Allocation” portfolio is for illustrative purposes only. Past performance is not indicative of future returns. Guide to the Markets – U.S. Data are as of December 31, 2019.
Inve
stin
gpr
inci
ples
2005 2006 2007 2008 2009 2010 2011 2012 2013 2014 2015 2016 2017 2018 2019 Ann. Vol.
EM Equity
REITsEM
EquityFixe d
Inc omeEM
EquityREITs REITs REITs
Sma ll Ca p
REITs REITsSma ll Ca p
EM Equity
Ca shLa rge Ca p
La rge Ca p
REITs
3 4 .5 % 3 5 .1% 3 9 .8 % 5 .2 % 7 9 .0 % 2 7 .9 % 8 .3 % 19 .7 % 3 8 .8 % 2 8 .0 % 2 .8 % 2 1.3 % 3 7 .8 % 1.8 % 3 1.5 % 9 .0 % 2 2 .2 %
Comdty.EM
EquityComdty. Ca sh
High
Y ie ld
Sma ll
Ca p
Fixe d
Inc ome
High
Y ie ld
La rge
Ca p
La rge
Ca p
La rge
Ca p
High
Y ie ld
DM
Equity
Fixe d
Inc omeREITs REITs
EM
Equity
2 1.4 % 3 2 .6 % 16 .2 % 1.8 % 5 9 .4 % 2 6 .9 % 7 .8 % 19 .6 % 3 2 .4 % 13 .7 % 1.4 % 14 .3 % 2 5 .6 % 0 .0 % 2 8 .7 % 8 .3 % 2 2 .1%
DM
Equity
DM
Equity
DM
Equity
Asse t
Alloc .
DM
Equity
EM
Equity
High
Y ie ld
EM
Equity
DM
Equity
Fixe d
Inc ome
Fixe d
Inc ome
La rge
Ca p
La rge
Ca pREITs
Sma ll
Ca p
Sma ll
Ca pComdty.
14 .0 % 2 6 .9 % 11.6 % - 2 5 .4 % 3 2 .5 % 19 .2 % 3 .1% 18 .6 % 2 3 .3 % 6 .0 % 0 .5 % 12 .0 % 2 1.8 % - 4 .0 % 2 5 .5 % 7 .9 % 18 .6 %
REITsSma ll
Ca p
Asse t
Alloc .
High
Y ie ldREITs Comdty.
La rge
Ca p
DM
Equity
Asse t
Alloc .
Asse t
Alloc .Ca sh Comdty.
Sma ll
Ca p
High
Y ie ld
DM
Equity
EM
Equity
Sma ll
Ca p
12 .2 % 18 .4 % 7 .1% - 2 6 .9 % 2 8 .0 % 16 .8 % 2 .1% 17 .9 % 14 .9 % 5 .2 % 0 .0 % 11.8 % 14 .6 % - 4 .1% 2 2 .7 % 7 .8 % 17 .7 %
Asse t
Alloc .
La rge
Ca p
Fixe d
Inc ome
Sma ll
Ca p
Sma ll
Ca p
La rge
Ca pCa sh
Sma ll
Ca p
High
Y ie ld
Sma ll
Ca p
DM
Equity
EM
Equity
Asse t
Alloc .
La rge
Ca p
Asse t
Alloc .
High
Y ie ld
DM
Equity
8 .1% 15 .8 % 7 .0 % - 3 3 .8 % 2 7 .2 % 15 .1% 0 .1% 16 .3 % 7 .3 % 4 .9 % - 0 .4 % 11.6 % 14 .6 % - 4 .4 % 19 .5 % 7 .2 % 17 .3 %
La rge Ca p
Asse t Alloc .
La rge Ca p
Comdty.La rge Ca p
High Y ie ld
Asse t Alloc .
La rge Ca p
REITs Ca shAsse t Alloc .
REITsHigh Y ie ld
Asse t Alloc .
EM Equity
Asse t Alloc .
La rge Ca p
4 .9 % 15 .3 % 5 .5 % - 3 5 .6 % 2 6 .5 % 14 .8 % - 0 .7 % 16 .0 % 2 .9 % 0 .0 % - 2 .0 % 8 .6 % 10 .4 % - 5 .8 % 18 .9 % 6 .6 % 14 .0 %
Sma ll
Ca p
High
Y ie ldCa sh
La rge
Ca p
Asse t
Alloc .
Asse t
Alloc .
Sma ll
Ca p
Asse t
Alloc .Ca sh
High
Y ie ld
High
Y ie ld
Asse t
Alloc .REITs
Sma ll
Ca p
High
Y ie ld
DM
Equity
High
Y ie ld
4 .6 % 13 .7 % 4 .8 % - 3 7 .0 % 2 5 .0 % 13 .3 % - 4 .2 % 12 .2 % 0 .0 % 0 .0 % - 2 .7 % 8 .3 % 8 .7 % - 11.0 % 12 .6 % 5 .3 % 10 .9 %
High
Y ie ldCa sh
High
Y ie ldREITs Comdty.
DM
Equity
DM
Equity
Fixe d
Inc ome
Fixe d
Inc ome
EM
Equity
Sma ll
Ca p
Fixe d
Inc ome
Fixe d
Inc omeComdty.
Fixe d
Inc ome
Fixe d
Inc ome
Asse t
Alloc .
3 .6 % 4 .8 % 3 .2 % - 3 7 .7 % 18 .9 % 8 .2 % - 11.7 % 4 .2 % - 2 .0 % - 1.8 % - 4 .4 % 2 .6 % 3 .5 % - 11.2 % 8 .7 % 4 .1% 10 .0 %
Ca shFixe d
Inc ome
Sma ll
Ca p
DM
Equity
Fixe d
Inc ome
Fixe d
Inc omeComdty. Ca sh
EM
Equity
DM
Equity
EM
Equity
DM
EquityComdty.
DM
EquityComdty. Ca sh
Fixe d
Inc ome
3 .0 % 4 .3 % - 1.6 % - 4 3 .1% 5 .9 % 6 .5 % - 13 .3 % 0 .1% - 2 .3 % - 4 .5 % - 14 .6 % 1.5 % 1.7 % - 13 .4 % 7 .7 % 1.3 % 3 .4 %
Fixe d
Inc omeComdty. REITs
EM
EquityCa sh Ca sh
EM
EquityComdty. Comdty. Comdty. Comdty. Ca sh Ca sh
EM
EquityCa sh Comdty. Ca sh
2 .4 % 2 .1% - 15 .7 % - 5 3 .2 % 0 .1% 0 .1% - 18 .2 % - 1.1% - 9 .5 % - 17 .0 % - 2 4 .7 % 0 .3 % 0 .8 % - 14 .2 % 2 .2 % - 2 .6 % 1.0 %
2005 - 2019
STAYING INVESTED MATTERS7
15 USING INSIGHTS TO ACHIEVE BETTER CLIENT OUTCOMES
PRINCIPLES FOR SUCCESSFUL LONG-TERM INVESTING
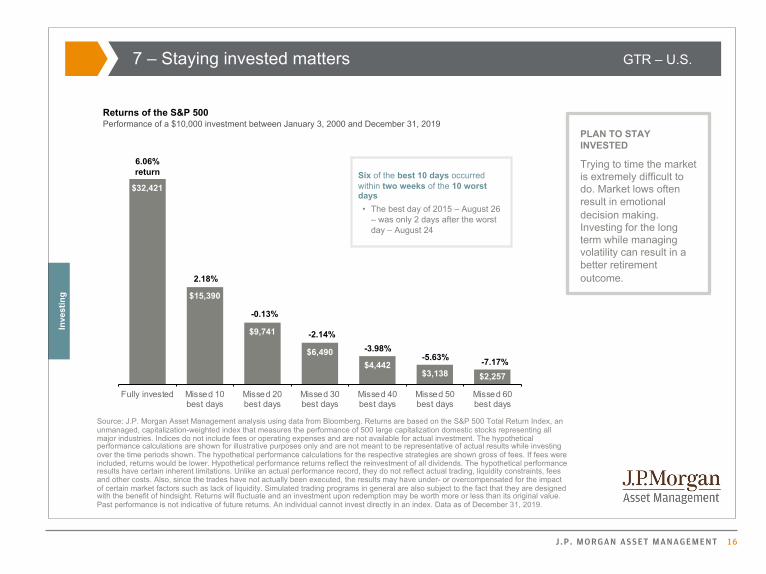
It’s always darkest just before dawn
Market timing can be a dangerous habit. Sometimes, investors think they can outsmart the market; other times, fear and greed push them to make emotional, rather than logical, decisions.
From our Guide to Retirement, this chart is a sobering reminder of the potential costs of market timing. By missing some of the market’s best days, investors can lose out on critical opportunities to grow their portfolio, with devastating results. Importantly, as the slide also notes, “Six of the 10 best days occurred within two weeks of the 10 worst days.”
J .P. MORGAN ASSET MANAGEMENT 16
GTR – U.S.In
vest
ing
$32,421
$15,390
$9,741
$6,490 $4,442
$3,138 $2,257
Fully invested Missed 10best days
Missed 20best days
Missed 30best days
Missed 40best days
Missed 50best days
Missed 60best days
7 – Staying invested matters
Source: J.P. Morgan Asset Management analysis using data from Bloomberg. Returns are based on the S&P 500 Total Return Index, anunmanaged, capitalization-weighted index that measures the performance of 500 large capitalization domestic stocks representing all major industries. Indices do not include fees or operating expenses and are not available for actual investment. The hypothetical performance calculations are shown for illustrative purposes only and are not meant to be representative of actual results while investing over the time periods shown. The hypothetical performance calculations for the respective strategies are shown gross of fees. If fees were included, returns would be lower. Hypothetical performance returns reflect the reinvestment of all dividends. The hypothetical performance results have certain inherent limitations. Unlike an actual performance record, they do not reflect actual trading, liquidity constraints, fees and other costs. Also, since the trades have not actually been executed, the results may have under- or overcompensated for the impact of certain market factors such as lack of liquidity. Simulated trading programs in general are also subject to the fact that they are designed with the benefit of hindsight. Returns will fluctuate and an investment upon redemption may be worth more or less than its original value. Past performance is not indicative of future returns. An individual cannot invest directly in an index. Data as of December 31, 2019.
Returns of the S&P 500Performance of a $10,000 investment between January 3, 2000 and December 31, 2019
6.06% return
2.18%
-0.13%
-2.14%-3.98%
-5.63% -7.17%
Six of the best 10 days occurred within two weeks of the 10 worst days• The best day of 2015 – August 26
– was only 2 days after the worst day – August 24
PLAN TO STAY INVESTED
Trying to time the market is extremely difficult to do. Market lows often result in emotional decision making. Investing for the long term while managing volatility can result in a better retirement outcome.
17 USING INSIGHTS TO ACHIEVE BETTER CLIENT OUTCOMES
PRINCIPLES FOR SUCCESSFUL LONG-TERM INVESTING
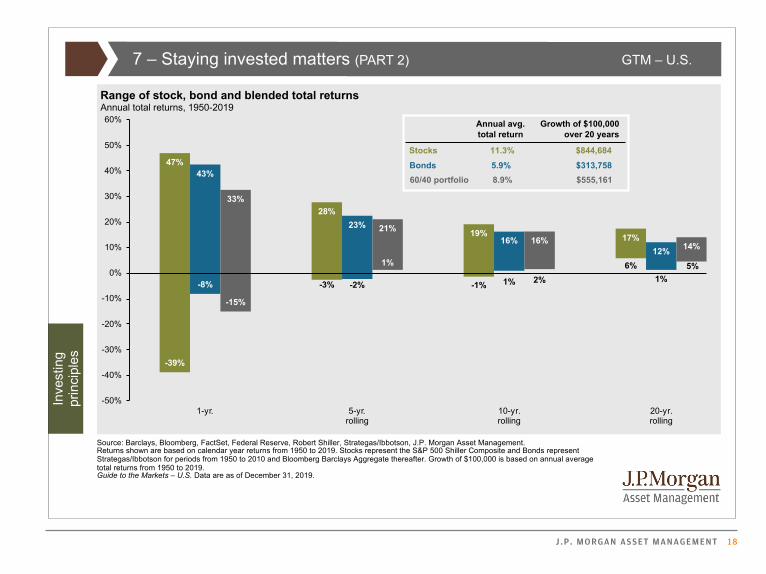
Good things come to those who wait
While markets can always have a bad day, week, month or even year, history suggests investors are less likely to suffer losses over longer periods.
This chart illustrates the concept. While one-year stock returns have varied widely since 1950 (+47% to -39%), a blend of stocks and bonds has not suffered a negative return over any five-year rolling period in the past 70 years.
Important disclaimer: Investors should not necessarily expect the same rates of return in the future as we have seen in the past, particularly from bonds, which are starting with very low yields today.
STAYING INVESTED MATTERS (PART 2)7
J .P. MORGAN ASSET MANAGEMENT 18
GTM – U.S.
12
7 – Staying invested matters (PART 2)
Source: Barclays, Bloomberg, FactSet, Federal Reserve, Robert Shiller, Strategas/Ibbotson, J.P. Morgan Asset Management.Returns shown are based on calendar year returns from 1950 to 2019. Stocks represent the S&P 500 Shiller Composite and Bonds represent Strategas/Ibbotson for periods from 1950 to 2010 and Bloomberg Barclays Aggregate thereafter. Growth of $100,000 is based on annual average total returns from 1950 to 2019.Guide to the Markets – U.S. Data are as of December 31, 2019.
Range of stock, bond and blended total returnsAnnual total returns, 1950-2019
60/40 portfolio 8.9% $555,161
Bonds 5.9% $313,758
Stocks 11.3% $844,684
Annual avg. total return
Growth of $100,000 over 20 years
Inve
stin
gpr
inci
ples -39%
-8%
-15%
-3% -2%
1%
-1% 1% 2%6%
1%5%
47%43%
33%28%
23% 21% 19%16% 16% 17%
12% 14%
-50%
-40%
-30%
-20%
-10%
0%
10%
20%
30%
40%
50%
60%
1-yr. 5-yr.rolling
10-yr.rolling
20-yr.rolling

PUTTING IT ALL TOGETHER
19 USING INSIGHTS TO ACHIEVE BETTER CLIENT OUTCOMES
PRINCIPLES FOR SUCCESSFUL LONG-TERM INVESTING
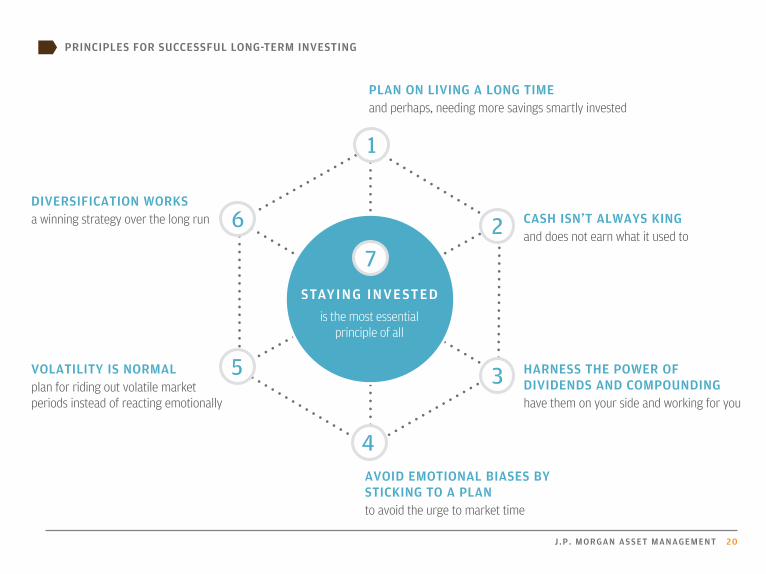
Each of the PRINCIPLES FOR SUCCESSFUL LONG-TERM INVESTING is vital to help investors navigate today’s challenging markets to reach their financial goals. Important as they are alone, they are most effective and powerful when used together. And they all depend on staying invested—the most essential principle of all.
J .P. MORGAN ASSET MANAGEMENT 20
STAYING INVESTEDis the most essential
principle of all
PRINCIPLES FOR SUCCESSFUL LONG-TERM INVESTING
1
2
PLAN ON LIVING A LONG TIME and perhaps, needing more savings smartly invested
CASH ISN’T ALWAYS KING and does not earn what it used to
3 HARNESS THE POWER OF DIVIDENDS AND COMPOUNDING have them on your side and working for you
VOLATILITY IS NORMAL plan for riding out volatile market periods instead of reacting emotionally
DIVERSIFICATION WORKS a winning strategy over the long run
4 AVOID EMOTIONAL BIASES BY STICKING TO A PLAN to avoid the urge to market time
5
6
7

NOTES
21 USING INSIGHTS TO ACHIEVE BETTER CLIENT OUTCOMES

J .P. MORGAN ASSET MANAGEMENT 22

FOR MORE INFORMATION ABOUT THE INSIGHTS PROGRAMS, INCLUDING ACCESS TO THE ENTIRE GUIDE TO THE MARKETS AND GUIDE TO RETIREMENT, PLEASE VISIT: WWW.JPMORGANFUNDS.COM/INSIGHTS

The Market Insights program provides comprehensive data and commentary on global markets without reference to products. Designed as a tool to help clients understand the markets and support investment decision-making, the program explores the implications of current economic data and changing market conditions.
For the purposes of MiFID II, the JPM Market Insights and Portfolio Insights programs are marketing communications and are not in scope for any MiFID II/MiFIR requirements specifically related to investment research. Furthermore, the J.P. Morgan Asset Management Market Insights and Portfolio Insights programs, as non-independent research, have not been prepared in accordance with legal requirements designed to promote the independence of investment research, nor are they subject to any prohibition on dealing ahead of the dissemination of investment research.
This document is a general communication being provided for informational purposes only. It is educational in nature and not designed to be as advice or a recommendation for any specific investment product, strategy, plan feature or other purpose in any jurisdiction, nor is it a commitment from J.P. Morgan Asset Management or any of its subsidiaries to participate in any of the transactions mentioned herein. Any examples used are generic, hypothetical and for illustration purposes only. This material does not contain sufficient information to support an investment decision and it should not be relied upon by you in evaluating the merits of investing in any securities or products. In addition, users should make an independent assessment of the legal, regulatory, tax, credit, and accounting implications and determine, together with their own professional advisers, if any investment mentioned herein is believed to be suitable to their personal goals. Investors should ensure that they obtain all available relevant information before making any investment. Any forecasts, figures, opinions or investment techniques and strategies set out are for information purposes only, based on certain assumptions and current market conditions and are subject to change without prior notice. All information presented herein is considered to be accurate at the time of production, but no warranty of accuracy is given and no liability in respect of any error or omission is accepted. It should be noted that investment involves risks, the value of investments and the income from them may fluctuate in accordance with market conditions and taxation agreements and investors may not get back the full amount invested. Both past performance and yields are not reliable indicators of current and future results.
J.P. Morgan Asset Management is the brand for the asset management business of JPMorgan Chase & Co. and its affiliates worldwide.
To the extent permitted by applicable law, we may record telephone calls and monitor electronic communications to comply with our legal and regulatory obligations and internal policies. Personal data will be collected, stored and processed by J.P. Morgan Asset Management in accordance with our privacy policies at https://am.jpmorgan.com/global/privacy.
This communication is issued by the following entities: in the United Kingdom by JPMorgan Asset Management (UK) Limited, which is authorized and regulated by the Financial Conduct Authority; in other European jurisdictions by JPMorgan Asset Management (Europe) S.à r.l.; in Hong Kong by JF Asset Management Limited, or JPMorgan Funds (Asia) Limited, or JPMorgan Asset Management Real Assets (Asia) Limited; in Singapore by JPMorgan Asset Management (Singapore) Limited (Co. Reg. No. 197601586K), or JPMorgan Asset Management Real Assets (Singapore) Pte Ltd (Co. Reg. No. 201120355E); in Taiwan by JPMorgan Asset Management (Taiwan) Limited; in Japan by JPMorgan Asset Management (Japan) Limited which is a member of the Investment Trusts Association, Japan, the Japan Investment Advisers Association, Type II Financial Instruments Firms Association and the Japan Securities Dealers Association and is regulated by the Financial Services Agency (registration number “Kanto Local Finance Bureau (Financial Instruments Firm) No. 330”); in Australia to wholesale clients only as defined in section 761A and 761G of the Corporations Act 2001 (Cth) by JPMorgan Asset Management (Australia) Limited (ABN 55143832080) (AFSL 376919); in Brazil by Banco J.P. Morgan S.A.; in Canada for institutional clients’ use only by JPMorgan Asset Management (Canada) Inc., and in the United States by JPMorgan Distribution Services Inc. and J.P. Morgan Institutional Investments, Inc., both members of FINRA; and J.P. Morgan Investment Management Inc.
In APAC, distribution is for Hong Kong, Taiwan, Japan and Singapore. For all other countries in APAC, to intended recipients only.
Copyright 2020 JPMorgan Chase & Co. All rights reserved
Unless otherwise stated, all data are as of December 31, 2019.
MI-FB-PRINCIPLES | 0903c02a81d91a90