price-quality paths for electricity distribution businesses from 1 ...
470
3605676.11 ISBN 978-1-869457-68-6 Project no. 14.07/16504 PUBLIC version Default price-quality paths for electricity distribution businesses from 1 April 2020 – Final decision Reasons paper Date of publication: 27 November 2019
-
Upload
khangminh22 -
Category
Documents
-
view
0 -
download
0
Transcript of price-quality paths for electricity distribution businesses from 1 ...
3605676.11
ISBN 978-1-869457-68-6
Project no. 14.07/16504
PUBLIC version
Default price-quality paths for electricity distribution businesses from 1 April 2020 – Final decision
Reasons paper
Date of publication: 27 November 2019
2
3605676.11
Associated documents Publication date Reference Title
31 January 2019 ISSN 1178-2560 Electricity Distribution Services Input Methodologies Determination 2012 – Consolidated as of 31 January 2019
28 November 2014 ISBN 978-1-869454-12-8 Default price-quality paths for electricity distributors from 1 April 2015 to 31 March 2020 – Main Policy paper
28 November 2014 [2014] NZCC 33 Electricity Distribution Services Default Price-Quality Path Determination 2015
9 November 2017 Our priorities for the electricity distribution sector for 2017/18 and beyond
14 June 2018 ISBN 978-1-869456-42-9 Default price-quality paths for electricity distribution businesses from 1 April 2020 – Proposed Process
23 August 2018 ISBN 978-1-869456-53-5 Proposed amendments to Electricity Distribution Services Input Methodologies Determination in relation to accelerated depreciation – Draft reasons paper
6 September 2018 Default price-quality paths for electricity distribution businesses from 1 April 2020 – Process Update Paper
8 November 2018 [2018] NZCC 19 Amendment to Electricity Distribution Services Input Methodologies Determination in relation to accelerated depreciation
15 November 2018 ISBN 978-1-869456-70-2 Default price-quality paths for electricity distribution businesses from 1 April 2020 – Issues Paper
29 May 2019 ISBN 978-1-869457-00-6 [DRAFT] Electricity Distribution Services Default Price-Quality Path Determination 2020
29 May 2019 ISBN 978-1-869456-98-6 Proposed amendments to Input Methodologies for electricity distributors and Transpower New Zealand Limited: Reasons paper
29 May 2019 ISBN 978-1-869456-99-3 [DRAFT] Electricity Distribution Services Input Methodologies Amendments Determination 2019
25 September 2019 ISBN 978-1-869457-63-1 Default price-quality paths for electricity distribution businesses from 1 April 2020 – Updated draft models – Companion Paper
7 October 2019 ISBN 978-1-869457-66-2 EDB DPP3 – Recording of successive interruptions for SAIFI
26 November 2019 ISBN 978-1-869456-71-6 Amendments to electricity distribution services input methodologies determination – Reasons paper
26 November 2019 [2019] NZCC 20 Electricity Distribution Services Input Methodologies Amendments Determination (No. 2)
27 November 2019 [2019] NZCC 21 Electricity Distribution Services Default Price-Quality Path Determination 2020
Commerce Commission Wellington, New Zealand
3
3605676.11
Foreword Our focus during the EDB DPP3 reset has been on providing a stable regulatory platform that makes incremental improvements, drawing on what we have learned across the Part 4 portfolio and on the expertise of stakeholders. At the same time, we have aimed to provide sufficient flexibility to accommodate increasing uncertainty and change across the distribution sector.
As we said at the outset of this process, our view was that we were setting DPP3 within the context of a maturing regulatory regime.
The 2020 reset is the third time we have reset prices and quality standards for the distribution sector, and the eighth price-quality path reset overall. The 2016 and 2017 review of the Input Methodologies had given us the opportunity to reconsider whether the fundamentals of economic regulation for the distribution sector remained fit for purpose. This process served to promote greater certainty for distributors and customers over the medium and long term, albeit at the cost of some short-term flexibility.
Over the reset process, our engagement with stakeholders and other factors confirmed for us that we were also setting DPP3 within a context of change.
The Electricity Price Review process gave all sector participants an opportunity to reflect on the performance of the sector as a whole. From the findings of the Review, and from the DPP consultation process, we came to see that the DPP3 period will likely involve significant change and heightened uncertainty.
Changes in the way consumers and other industry participants make use of distribution networks, innovations in the way distributors deliver services, electrification driven by decarbonisation, and the risk of increasingly severe weather events all have the potential to reshape investment needs and quality expectations in unpredictable ways.
Part of our response to this has involved ensuring the DPP does not impose barriers to positive changes for consumers. Implementing a revenue cap (as opposed to the previous price cap) will give distributors the flexibility to price in ways that offer more choice to consumers and that enhance incentives for energy efficiency and demand-side management. At the same time, the revenue cap will give distributors greater certainty about revenue recovery.
Introducing reopeners for significant unforeseen or uncertain capital expenditure projects will allow distributors to undertake investments in response to changing conditions without risking capital under-recovery.
Ultimately, it is distributors who will have to respond to these changes while delivering outcomes for their consumers. Our role is to create incentives for them to do so in a way that promotes the long-term benefit of those consumers.
Equalising the retention factors for operating and capital expenditure – while seemingly a detailed technical change – gives distributors an better incentive to find the most efficient solution to meet their customers’ needs, regardless of the form it takes.
4
3605676.11
While the regime already provided incentives for innovations that improve the efficiency and the quality of distribution services, and distributors are already delivering a range of innovations, we have bolstered these incentives for DPP3. We anticipate that the innovation project allowance will encourage distributors to try new ways of doing business where they might not otherwise have done so.
Quality of service incentives have also been a major focus for us. Based on the evidence we have, we concluded that a ‘no material deterioration’ approach remained the right one. Aligning reliability incentives to the value consumers place on reliability frees distributors (within certain bounds) to target the level of reliability and of price that best meets the expectations of their consumers. Additionally, our new approach to normalisation is intended to prevent the effects of severe storms being mistaken for signs of deterioration.
The most obvious change for DPP3, the reduction in the weighted-average cost of capital, is not one that results from our DPP3 decisions, but instead reflects the current state of the broader economy. Record low global interest rates have led to lowered profitability expectations across many sectors. Given the purpose of our regime is to promote outcomes that are consistent with competitive markets, it is appropriate that distribution consumers market share in the benefits of a lower cost of capital through lower prices.
As we look forward, it is worth remembering that the DPP is only one of the tools we have to influence the performance of the distribution sector. At its core, the DPP provides a ‘one-size-fits most’ approach, based on historic levels of price and quality.
Where distributors either want to make substantial changes to the quality of the services they deliver (including the way they deliver them) or need to make substantial investments to maintain quality over and above ‘business as usual’, customised paths provide a key opportunity for individual distributors to have alternative price-quality paths that better meet their particular circumstances.
Finally, we would like to thank all stakeholders for the constructive ways they have engaged in the reset process. Through workshops, working groups, and targeted consultation processes, the decisions we present here are all the better for your involvement.
Kind regards
Sue Begg
Deputy Chair
John Crawford
Associate Commissioner
Stephen Gale
Commissioner
Elisabeth Welson
Commissioner
5
3605676.11
Contents
Executive Summary .......................................................................................................... 9
Chapter 1 Introduction................................................................................................. 40
Chapter 2 Impact on allowable revenue ....................................................................... 45
Chapter 3 Framework .................................................................................................. 59
Chapter 4 Responding to changes in the electricity sector ............................................ 70
Chapter 5 Starting prices .............................................................................................. 90
Chapter 6 Revenue path during the period ................................................................. 115
Chapter 7 Quality standards and incentives ............................................................... 129
Attachments Part 1 - Starting prices
Attachment A Forecasting operating expenditure ..................................................... 149
Attachment B Forecasting capital expenditure .......................................................... 195
Attachment C Forecasts of other inputs .................................................................... 239
Attachment D Accelerated depreciation .................................................................... 245
Attachments Part 2 - Revenue path during the period
Attachment E Incentives to improve efficiency ......................................................... 245
Attachment F Incentives for innovation .................................................................... 290
Attachment G Reopeners for large unforeseen capex ................................................ 298
Attachment H Revenue cap with wash-up ................................................................. 304
Attachment I Interactions between the DPP and CPPs ............................................. 340
Attachments Part 3 - Quality standards and incentives
Attachment J Approach to setting the quality path ................................................... 348
Attachment K Identification and treatment of major events...................................... 375
Attachment L Quality standards ............................................................................... 397
Attachment M Reliability incentives ........................................................................... 419
Attachment N Other measures of quality of service ................................................... 445
Attachment O Revenue and expenditure changes for individual distributors ............. 464
6
3605676.11
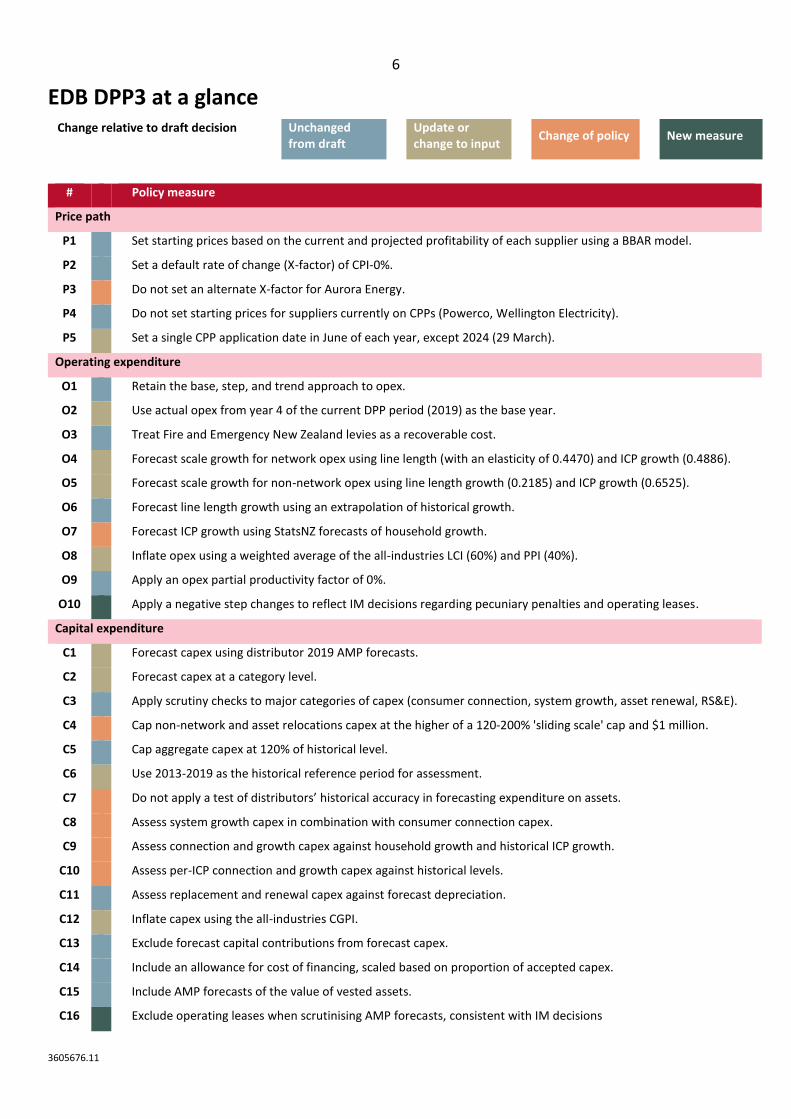
EDB DPP3 at a glance Change relative to draft decision Unchanged
from draft
Update or change to input
Change of policy New measure
#
Policy measure
Price path
P1
Set starting prices based on the current and projected profitability of each supplier using a BBAR model.
P2
Set a default rate of change (X-factor) of CPI-0%.
P3
Do not set an alternate X-factor for Aurora Energy.
P4
Do not set starting prices for suppliers currently on CPPs (Powerco, Wellington Electricity).
P5
Set a single CPP application date in June of each year, except 2024 (29 March).
Operating expenditure
O1
Retain the base, step, and trend approach to opex.
O2
Use actual opex from year 4 of the current DPP period (2019) as the base year.
O3
Treat Fire and Emergency New Zealand levies as a recoverable cost.
O4
Forecast scale growth for network opex using line length (with an elasticity of 0.4470) and ICP growth (0.4886).
O5
Forecast scale growth for non-network opex using line length growth (0.2185) and ICP growth (0.6525).
O6
Forecast line length growth using an extrapolation of historical growth.
O7
Forecast ICP growth using StatsNZ forecasts of household growth.
O8
Inflate opex using a weighted average of the all-industries LCI (60%) and PPI (40%).
O9
Apply an opex partial productivity factor of 0%.
O10
Apply a negative step changes to reflect IM decisions regarding pecuniary penalties and operating leases.
Capital expenditure
C1
Forecast capex using distributor 2019 AMP forecasts.
C2
Forecast capex at a category level.
C3
Apply scrutiny checks to major categories of capex (consumer connection, system growth, asset renewal, RS&E).
C4
Cap non-network and asset relocations capex at the higher of a 120-200% 'sliding scale' cap and $1 million.
C5
Cap aggregate capex at 120% of historical level.
C6
Use 2013-2019 as the historical reference period for assessment.
C7
Do not apply a test of distributors’ historical accuracy in forecasting expenditure on assets.
C8
Assess system growth capex in combination with consumer connection capex.
C9
Assess connection and growth capex against household growth and historical ICP growth.
C10
Assess per-ICP connection and growth capex against historical levels.
C11
Assess replacement and renewal capex against forecast depreciation.
C12
Inflate capex using the all-industries CGPI.
C13
Exclude forecast capital contributions from forecast capex.
C14
Include an allowance for cost of financing, scaled based on proportion of accepted capex.
C15
Include AMP forecasts of the value of vested assets.
C16
Exclude operating leases when scrutinising AMP forecasts, consistent with IM decisions
7
3605676.11
Change relative to draft decision Unchanged from draft
Update or change to input
Change of policy New measure
#
Policy measure
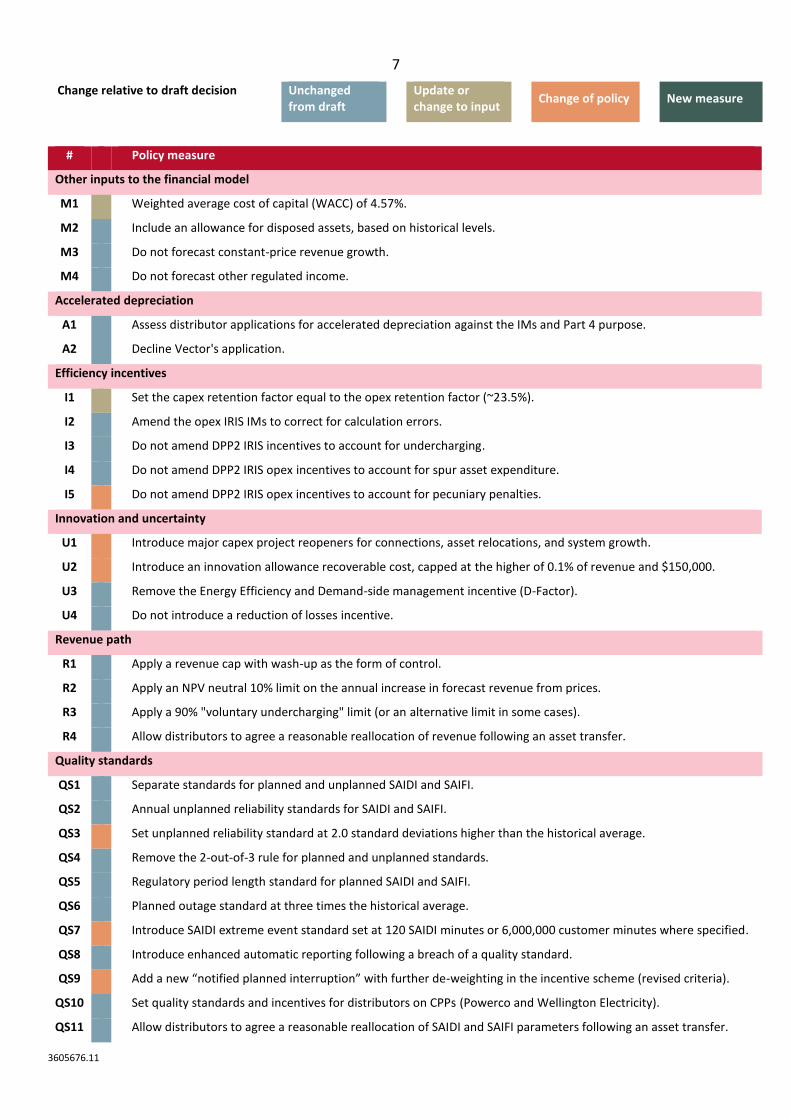
Other inputs to the financial model
M1
Weighted average cost of capital (WACC) of 4.57%.
M2
Include an allowance for disposed assets, based on historical levels.
M3
Do not forecast constant-price revenue growth.
M4
Do not forecast other regulated income.
Accelerated depreciation
A1
Assess distributor applications for accelerated depreciation against the IMs and Part 4 purpose.
A2
Decline Vector's application.
Efficiency incentives
I1
Set the capex retention factor equal to the opex retention factor (~23.5%).
I2
Amend the opex IRIS IMs to correct for calculation errors.
I3
Do not amend DPP2 IRIS incentives to account for undercharging.
I4
Do not amend DPP2 IRIS opex incentives to account for spur asset expenditure.
I5
Do not amend DPP2 IRIS opex incentives to account for pecuniary penalties.
Innovation and uncertainty
U1
Introduce major capex project reopeners for connections, asset relocations, and system growth.
U2
Introduce an innovation allowance recoverable cost, capped at the higher of 0.1% of revenue and $150,000.
U3
Remove the Energy Efficiency and Demand-side management incentive (D-Factor).
U4
Do not introduce a reduction of losses incentive.
Revenue path
R1
Apply a revenue cap with wash-up as the form of control.
R2
Apply an NPV neutral 10% limit on the annual increase in forecast revenue from prices.
R3
Apply a 90% "voluntary undercharging" limit (or an alternative limit in some cases).
R4
Allow distributors to agree a reasonable reallocation of revenue following an asset transfer.
Quality standards
QS1
Separate standards for planned and unplanned SAIDI and SAIFI.
QS2
Annual unplanned reliability standards for SAIDI and SAIFI.
QS3
Set unplanned reliability standard at 2.0 standard deviations higher than the historical average.
QS4
Remove the 2-out-of-3 rule for planned and unplanned standards.
QS5
Regulatory period length standard for planned SAIDI and SAIFI.
QS6
Planned outage standard at three times the historical average.
QS7
Introduce SAIDI extreme event standard set at 120 SAIDI minutes or 6,000,000 customer minutes where specified.
QS8
Introduce enhanced automatic reporting following a breach of a quality standard.
QS9
Add a new “notified planned interruption” with further de-weighting in the incentive scheme (revised criteria).
QS10
Set quality standards and incentives for distributors on CPPs (Powerco and Wellington Electricity).
QS11
Allow distributors to agree a reasonable reallocation of SAIDI and SAIFI parameters following an asset transfer.
8
3605676.11
Change relative to draft decision Unchanged from draft
Update or change to input
Change of policy New measure
#
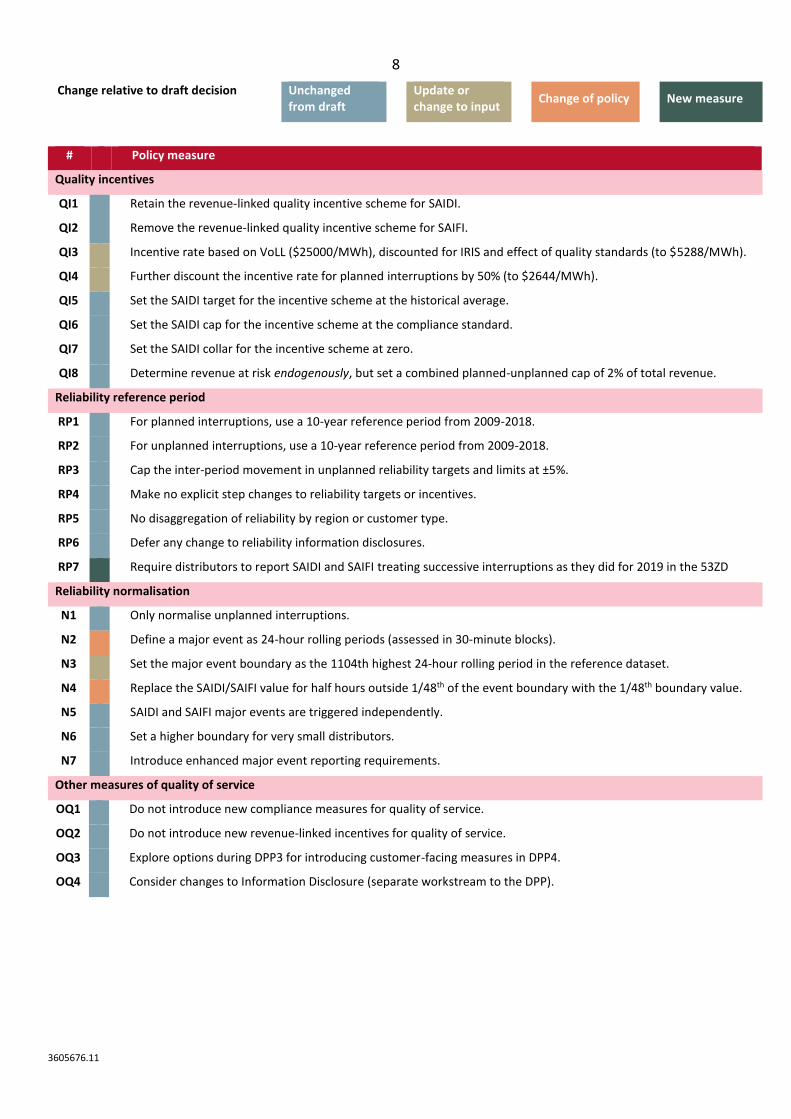
Policy measure
Quality incentives
QI1
Retain the revenue-linked quality incentive scheme for SAIDI.
QI2
Remove the revenue-linked quality incentive scheme for SAIFI.
QI3
Incentive rate based on VoLL ($25000/MWh), discounted for IRIS and effect of quality standards (to $5288/MWh).
QI4
Further discount the incentive rate for planned interruptions by 50% (to $2644/MWh).
QI5
Set the SAIDI target for the incentive scheme at the historical average.
QI6
Set the SAIDI cap for the incentive scheme at the compliance standard.
QI7
Set the SAIDI collar for the incentive scheme at zero.
QI8
Determine revenue at risk endogenously, but set a combined planned-unplanned cap of 2% of total revenue.
Reliability reference period
RP1
For planned interruptions, use a 10-year reference period from 2009-2018.
RP2
For unplanned interruptions, use a 10-year reference period from 2009-2018.
RP3
Cap the inter-period movement in unplanned reliability targets and limits at ±5%.
RP4
Make no explicit step changes to reliability targets or incentives.
RP5
No disaggregation of reliability by region or customer type.
RP6 U
Defer any change to reliability information disclosures.
RP7
Require distributors to report SAIDI and SAIFI treating successive interruptions as they did for 2019 in the 53ZD
Reliability normalisation
N1
Only normalise unplanned interruptions.
N2
Define a major event as 24-hour rolling periods (assessed in 30-minute blocks).
N3
Set the major event boundary as the 1104th highest 24-hour rolling period in the reference dataset.
N4
Replace the SAIDI/SAIFI value for half hours outside 1/48th of the event boundary with the 1/48th boundary value.
N5
SAIDI and SAIFI major events are triggered independently.
N6
Set a higher boundary for very small distributors.
N7
Introduce enhanced major event reporting requirements.
Other measures of quality of service
OQ1
Do not introduce new compliance measures for quality of service.
OQ2
Do not introduce new revenue-linked incentives for quality of service.
OQ3
Explore options during DPP3 for introducing customer-facing measures in DPP4.
OQ4
Consider changes to Information Disclosure (separate workstream to the DPP).
9
3605676.11
Executive Summary
Purpose of this paper
X1 This paper sets out the default price-quality paths (DPP) for non-exempt electricity
distribution businesses (distributors) from 1 April 2020 (DPP3). It also explains the
changes we have made to these decisions since the draft in response to the
submissions we have received throughout the consultation process.
X2 This summary sets out:
X2.1 the key decisions we have made on prices and on quality;
X2.2 the purpose and context that help explain these decisions; and
X2.3 our high-level approaches to the main components of the DPP:
X2.3.1 starting prices,1 including forecasts of operating (opex) and capital
expenditure (capex);
X2.3.2 the revenue path and incentives during the DPP3 period; and
X2.3.3 quality standards and incentives.
X3 In summarising these decisions, it also highlights areas of significant change relative
to the draft decision.
Key decisions
X4 When setting a DPP, we must determine:
X4.1 the ‘price path’ (shown in Table X1) composed of:
X4.1.1 ‘starting prices’ – the net allowable revenues each distributor can
earn in the first year of the period; and
X4.1.2 the rate of change in revenues each distributor can charge over
the DPP period; an
X4.2 the quality standards each distributor must meet (shown in Table X2).
1 While the term used in section 53M of the Act is “prices”, the Act defines ‘prices’ as including revenues, and allows us to set a revenue cap. In DPP3, distributors will be subject to a revenue cap, so we will generally refer to “revenues” in this document for the sake of clarity.
10
3605676.11
X5 We may also determine incentives for distributors to maintain or improve the quality
of service they deliver, and the ways in which distributors must demonstrate
compliance with the price-quality path.
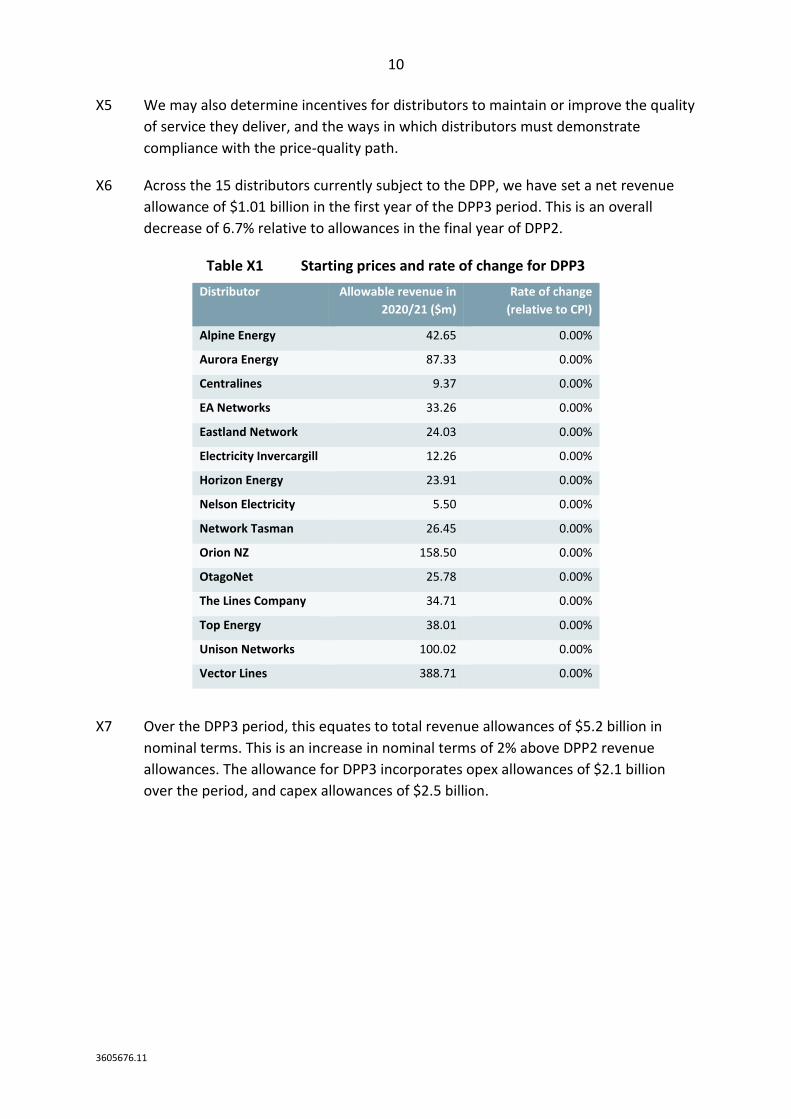
X6 Across the 15 distributors currently subject to the DPP, we have set a net revenue
allowance of $1.01 billion in the first year of the DPP3 period. This is an overall
decrease of 6.7% relative to allowances in the final year of DPP2.
Table X1 Starting prices and rate of change for DPP3
Distributor Allowable revenue in
2020/21 ($m)
Rate of change
(relative to CPI)
Alpine Energy 42.65 0.00%
Aurora Energy 87.33 0.00%
Centralines 9.37 0.00%
EA Networks 33.26 0.00%
Eastland Network 24.03 0.00%
Electricity Invercargill 12.26 0.00%
Horizon Energy 23.91 0.00%
Nelson Electricity 5.50 0.00%
Network Tasman 26.45 0.00%
Orion NZ 158.50 0.00%
OtagoNet 25.78 0.00%
The Lines Company 34.71 0.00%
Top Energy 38.01 0.00%
Unison Networks 100.02 0.00%
Vector Lines 388.71 0.00%
X7 Over the DPP3 period, this equates to total revenue allowances of $5.2 billion in
nominal terms. This is an increase in nominal terms of 2% above DPP2 revenue
allowances. The allowance for DPP3 incorporates opex allowances of $2.1 billion
over the period, and capex allowances of $2.5 billion.
11
3605676.11
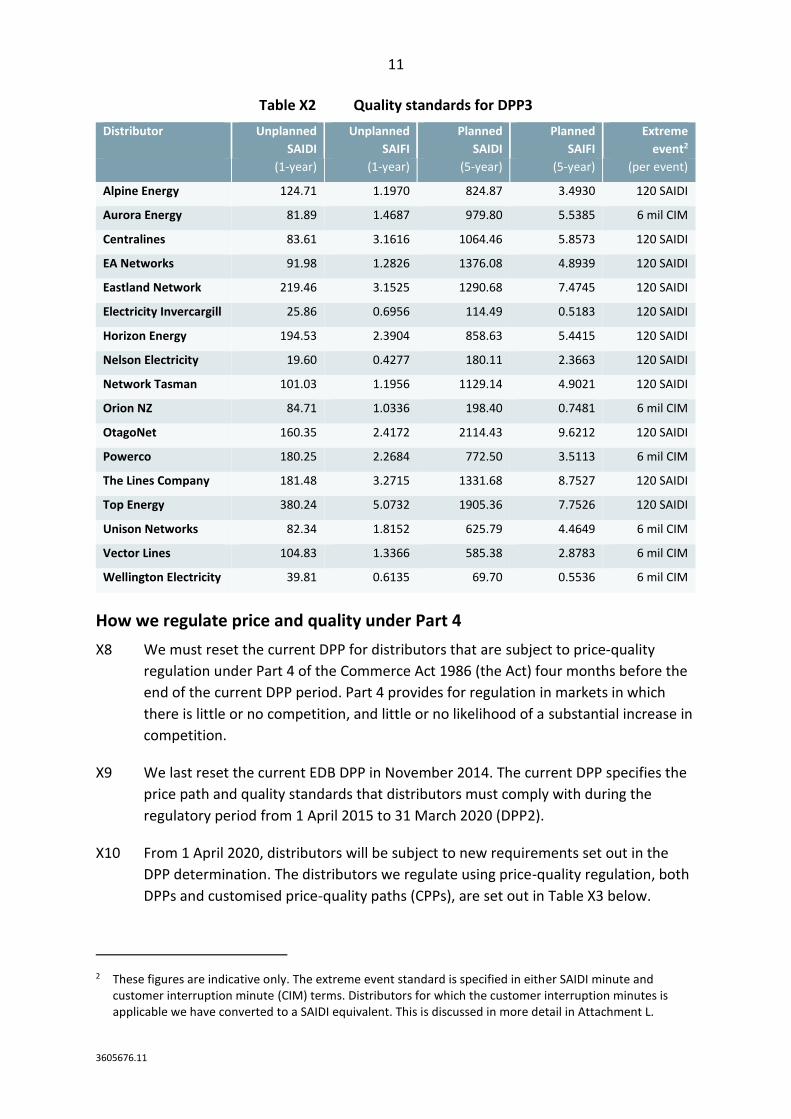
Table X2 Quality standards for DPP3
Distributor Unplanned
SAIDI
Unplanned
SAIFI
Planned
SAIDI
Planned
SAIFI
Extreme
event2
(1-year) (1-year) (5-year) (5-year) (per event)
Alpine Energy 124.71 1.1970 824.87 3.4930 120 SAIDI
Aurora Energy 81.89 1.4687 979.80 5.5385 6 mil CIM
Centralines 83.61 3.1616 1064.46 5.8573 120 SAIDI
EA Networks 91.98 1.2826 1376.08 4.8939 120 SAIDI
Eastland Network 219.46 3.1525 1290.68 7.4745 120 SAIDI
Electricity Invercargill 25.86 0.6956 114.49 0.5183 120 SAIDI
Horizon Energy 194.53 2.3904 858.63 5.4415 120 SAIDI
Nelson Electricity 19.60 0.4277 180.11 2.3663 120 SAIDI
Network Tasman 101.03 1.1956 1129.14 4.9021 120 SAIDI
Orion NZ 84.71 1.0336 198.40 0.7481 6 mil CIM
OtagoNet 160.35 2.4172 2114.43 9.6212 120 SAIDI
Powerco 180.25 2.2684 772.50 3.5113 6 mil CIM
The Lines Company 181.48 3.2715 1331.68 8.7527 120 SAIDI
Top Energy 380.24 5.0732 1905.36 7.7526 120 SAIDI
Unison Networks 82.34 1.8152 625.79 4.4649 6 mil CIM
Vector Lines 104.83 1.3366 585.38 2.8783 6 mil CIM
Wellington Electricity 39.81 0.6135 69.70 0.5536 6 mil CIM
How we regulate price and quality under Part 4
X8 We must reset the current DPP for distributors that are subject to price-quality
regulation under Part 4 of the Commerce Act 1986 (the Act) four months before the
end of the current DPP period. Part 4 provides for regulation in markets in which
there is little or no competition, and little or no likelihood of a substantial increase in
competition.
X9 We last reset the current EDB DPP in November 2014. The current DPP specifies the
price path and quality standards that distributors must comply with during the
regulatory period from 1 April 2015 to 31 March 2020 (DPP2).
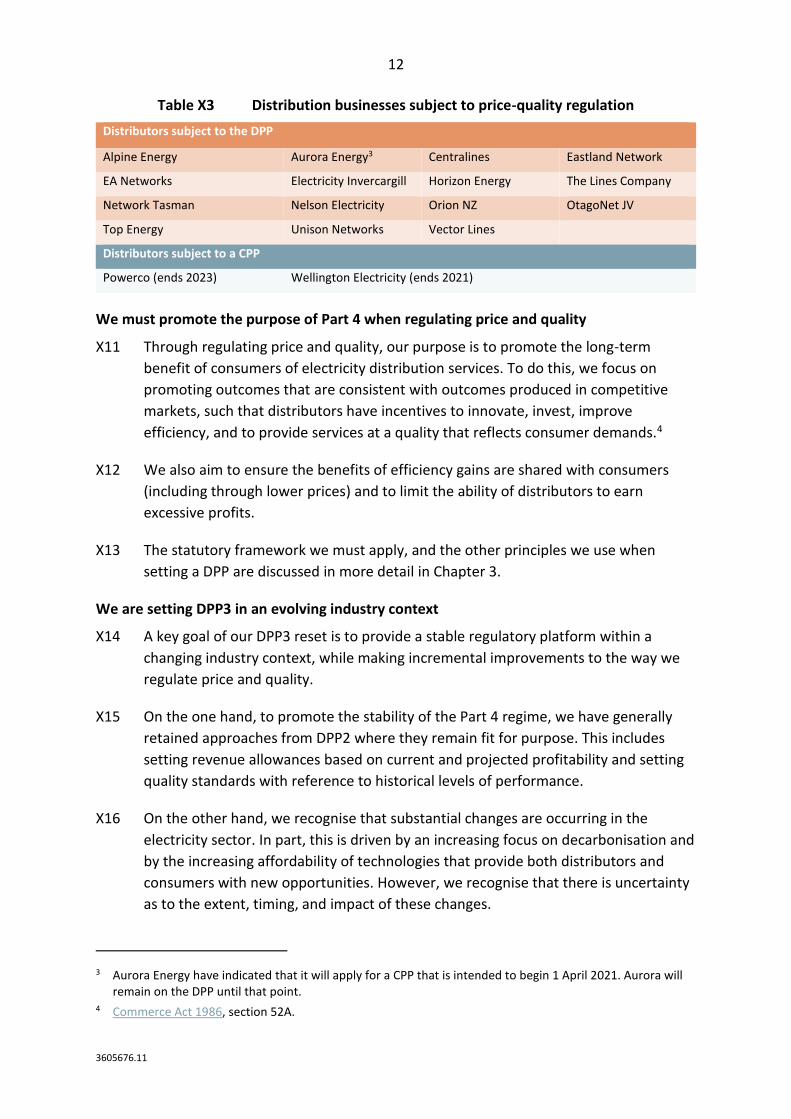
X10 From 1 April 2020, distributors will be subject to new requirements set out in the
DPP determination. The distributors we regulate using price-quality regulation, both
DPPs and customised price-quality paths (CPPs), are set out in Table X3 below.
2 These figures are indicative only. The extreme event standard is specified in either SAIDI minute and customer interruption minute (CIM) terms. Distributors for which the customer interruption minutes is applicable we have converted to a SAIDI equivalent. This is discussed in more detail in Attachment L.
12
3605676.11
Table X3 Distribution businesses subject to price-quality regulation
Distributors subject to the DPP
Alpine Energy Aurora Energy3 Centralines Eastland Network
EA Networks Electricity Invercargill Horizon Energy The Lines Company
Network Tasman Nelson Electricity Orion NZ OtagoNet JV
Top Energy Unison Networks Vector Lines
Distributors subject to a CPP
Powerco (ends 2023) Wellington Electricity (ends 2021)
We must promote the purpose of Part 4 when regulating price and quality
X11 Through regulating price and quality, our purpose is to promote the long-term
benefit of consumers of electricity distribution services. To do this, we focus on
promoting outcomes that are consistent with outcomes produced in competitive
markets, such that distributors have incentives to innovate, invest, improve
efficiency, and to provide services at a quality that reflects consumer demands.4
X12 We also aim to ensure the benefits of efficiency gains are shared with consumers
(including through lower prices) and to limit the ability of distributors to earn
excessive profits.
X13 The statutory framework we must apply, and the other principles we use when
setting a DPP are discussed in more detail in Chapter 3.
We are setting DPP3 in an evolving industry context
X14 A key goal of our DPP3 reset is to provide a stable regulatory platform within a
changing industry context, while making incremental improvements to the way we
regulate price and quality.
X15 On the one hand, to promote the stability of the Part 4 regime, we have generally
retained approaches from DPP2 where they remain fit for purpose. This includes
setting revenue allowances based on current and projected profitability and setting
quality standards with reference to historical levels of performance.
X16 On the other hand, we recognise that substantial changes are occurring in the
electricity sector. In part, this is driven by an increasing focus on decarbonisation and
by the increasing affordability of technologies that provide both distributors and
consumers with new opportunities. However, we recognise that there is uncertainty
as to the extent, timing, and impact of these changes.
3 Aurora Energy have indicated that it will apply for a CPP that is intended to begin 1 April 2021. Aurora will remain on the DPP until that point.
4 Commerce Act 1986, section 52A.
13
3605676.11
X17 As such, we have made changes to the DPP3 settings where we consider that change
will better promote the long-term benefit of consumers, consistent with the purpose
of Part 4.
X18 Examples of such changes include:
X18.1 allowing reopeners for some major capex projects (such as new sources of
demand or generation, or relocation of distribution assets to respond to
other infrastructure projects) as it will create better incentives for
distributors to make these investments;
X18.2 equalising the incremental rolling incentive scheme (IRIS) incentive rates for
opex and capex, to reduce or remove barriers to innovation;
X18.3 introducing a targeted innovation project allowance, to improve the
incentives distributors have to innovate; and
X18.4 refining our approach to normalising major interruptions, to reduce the
impact on reliability incentives due to the frequency of major events, and
creating clearer incentives for distributors to manage the underlying quality
they deliver.
X19 We discuss our view of changes in the electricity sector, and our responses to them,
in Chapter 4.
Starting prices
X20 This section explains:
X20.1 our high-level approach to setting starting prices;
X20.2 the drivers of change in net allowable revenue, relative to net allowable
revenue in DPP2; and
X20.3 the key decisions (on expenditure and accelerated depreciation) that inform
them.
X21 It also sets out significant changes relative to our draft DPP3 decision, and the
impacts these have on allowable revenue.
X22 Our approach to starting prices is discussed in more detail in Chapter 5.
How we approach setting starting prices
X23 ‘Starting prices’ refer to the revenue distributors can earn in the first year of a
regulatory period. The starting prices for each distributor are set out in Table X1
above.
14
3605676.11
X24 We have set allowable revenues based on the current and projected profitability of
each distributor. To do this, we add together forecasts of each distributor’s over the
DPP3 period (‘building blocks allowable revenue’ or ‘BBAR’). We then spread this
revenue out over the period such that they increase at a consistent rate of forecast
CPI-X, resulting in the ‘maximum allowable revenue’ (MAR).
X25 The maximum gross revenue each distributor can recover in each year is: MAR for
each year, plus an allowance for any pass-through and recoverable costs. References
in this decision paper to ‘allowable revenues’ and ‘net allowable revenues’ are to
annual maximum revenues net of pass-through and recoverable costs. References to
‘gross allowable revenues’ include pass-through and recoverable costs.
X26 Setting revenue limits means that profitability depends on the extent to which
distributors control costs. Actual costs may differ from allowances for a variety of
reasons, but in any case, the incentive to increase profits creates an incentive for
distributors to improve efficiency, consistent with section 52A(1)(b) of the Act.
The net allowable revenues for DPP3 are different from DPP2 allowable revenues
X27 Over time, the revenue allowance we set at the start of a regulatory period may
cease to reflect a distributors’ costs and the level of demand on its network.
X28 Were we to roll over current revenue allowances, distributors’ revenues for the
DPP3 period may not reflect their costs. In some cases, this would result in
distributors earning excessive profits, contrary to section 52(A)(1)(d). In other cases,
it may hinder their ability to invest in their networks to provide services at a level
which reflects consumer demand, contrary to sections 52(A)(1)(a) and (b).
X29 Changes in the revenue allowances may have been caused by changes in a
distributor’s costs (including its cost of capital), or, under the price cap that applied
during DPP2 changes in demand on the distributor’s network.
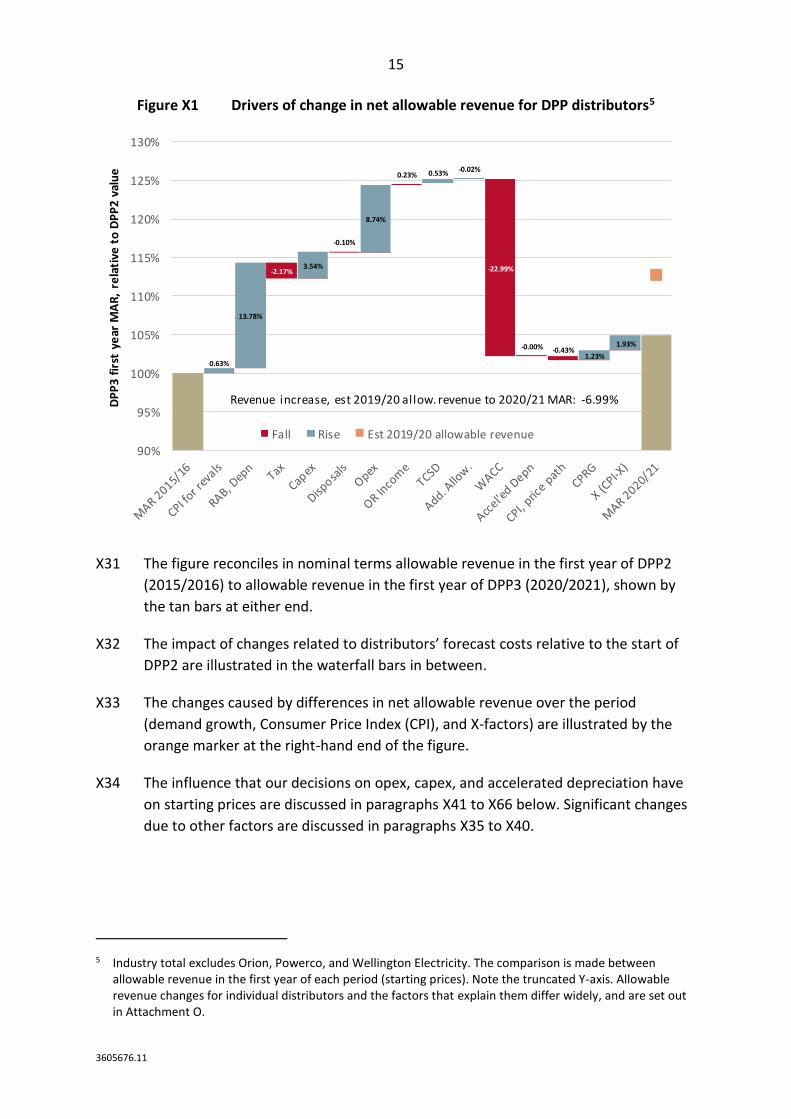
X30 The influence of these factors at an industry-wide level is illustrated in Figure X1. This
analysis is presented for each distributor on both DPP2 and DPP3 in Attachment O.
15
3605676.11
Figure X1 Drivers of change in net allowable revenue for DPP distributors5
X31 The figure reconciles in nominal terms allowable revenue in the first year of DPP2
(2015/2016) to allowable revenue in the first year of DPP3 (2020/2021), shown by
the tan bars at either end.
X32 The impact of changes related to distributors’ forecast costs relative to the start of
DPP2 are illustrated in the waterfall bars in between.
X33 The changes caused by differences in net allowable revenue over the period
(demand growth, Consumer Price Index (CPI), and X-factors) are illustrated by the
orange marker at the right-hand end of the figure.
X34 The influence that our decisions on opex, capex, and accelerated depreciation have
on starting prices are discussed in paragraphs X41 to X66 below. Significant changes
due to other factors are discussed in paragraphs X35 to X40.
5 Industry total excludes Orion, Powerco, and Wellington Electricity. The comparison is made between allowable revenue in the first year of each period (starting prices). Note the truncated Y-axis. Allowable revenue changes for individual distributors and the factors that explain them differ widely, and are set out in Attachment O.
-2.17%
-0.10%
-0.02%
-22.99%
-0.00% -0.43%
0.63%
13.78%
3.54%
8.74%
0.23% 0.53%
1.23%
1.93%
90%
95%
100%
105%
110%
115%
120%
125%
130%
DP
P3
fir
st y
ear
MA
R,
rela
tive
to
DP
P2
val
ue
Fall Rise Est 2019/20 allowable revenue
Revenue increase, est 2019/20 allow. revenue to 2020/21 MAR: -6.99%
16
3605676.11
The cost of capital estimate we use has changed since 2014
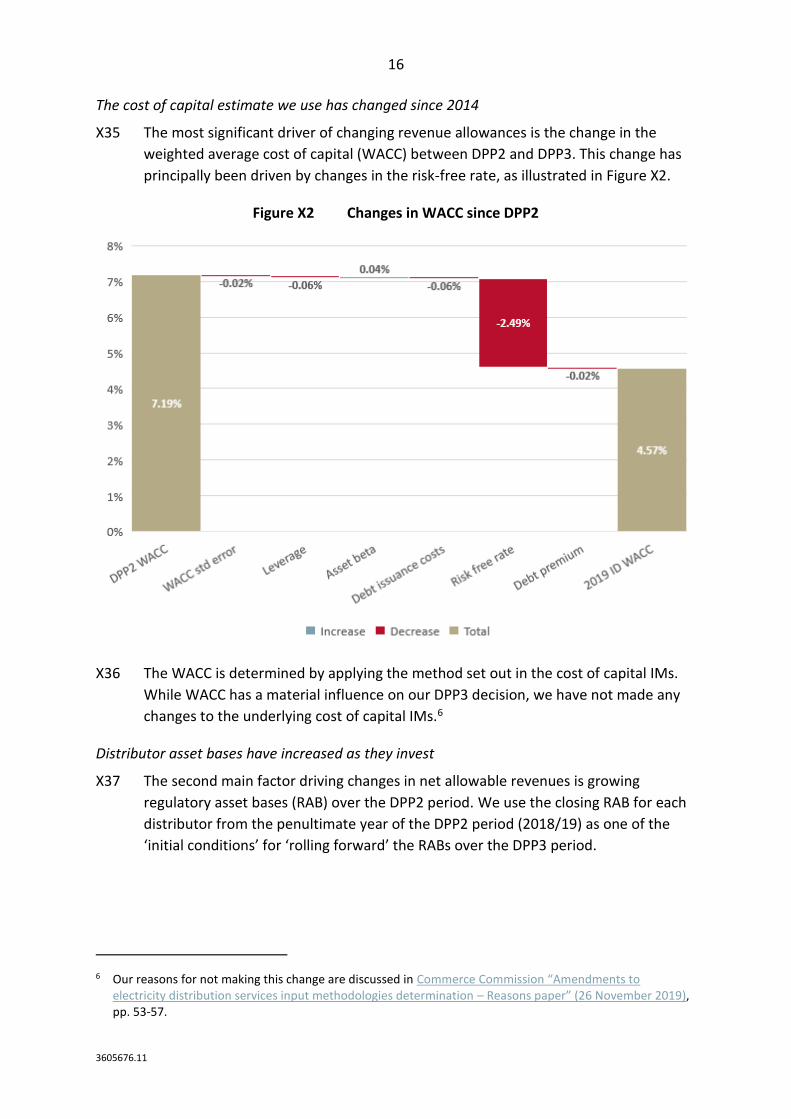
X35 The most significant driver of changing revenue allowances is the change in the
weighted average cost of capital (WACC) between DPP2 and DPP3. This change has
principally been driven by changes in the risk-free rate, as illustrated in Figure X2.
Figure X2 Changes in WACC since DPP2
X36 The WACC is determined by applying the method set out in the cost of capital IMs.
While WACC has a material influence on our DPP3 decision, we have not made any
changes to the underlying cost of capital IMs.6
Distributor asset bases have increased as they invest
X37 The second main factor driving changes in net allowable revenues is growing
regulatory asset bases (RAB) over the DPP2 period. We use the closing RAB for each
distributor from the penultimate year of the DPP2 period (2018/19) as one of the
‘initial conditions’ for ‘rolling forward’ the RABs over the DPP3 period.
6 Our reasons for not making this change are discussed in Commerce Commission “Amendments to electricity distribution services input methodologies determination – Reasons paper” (26 November 2019), pp. 53-57.
17
3605676.11
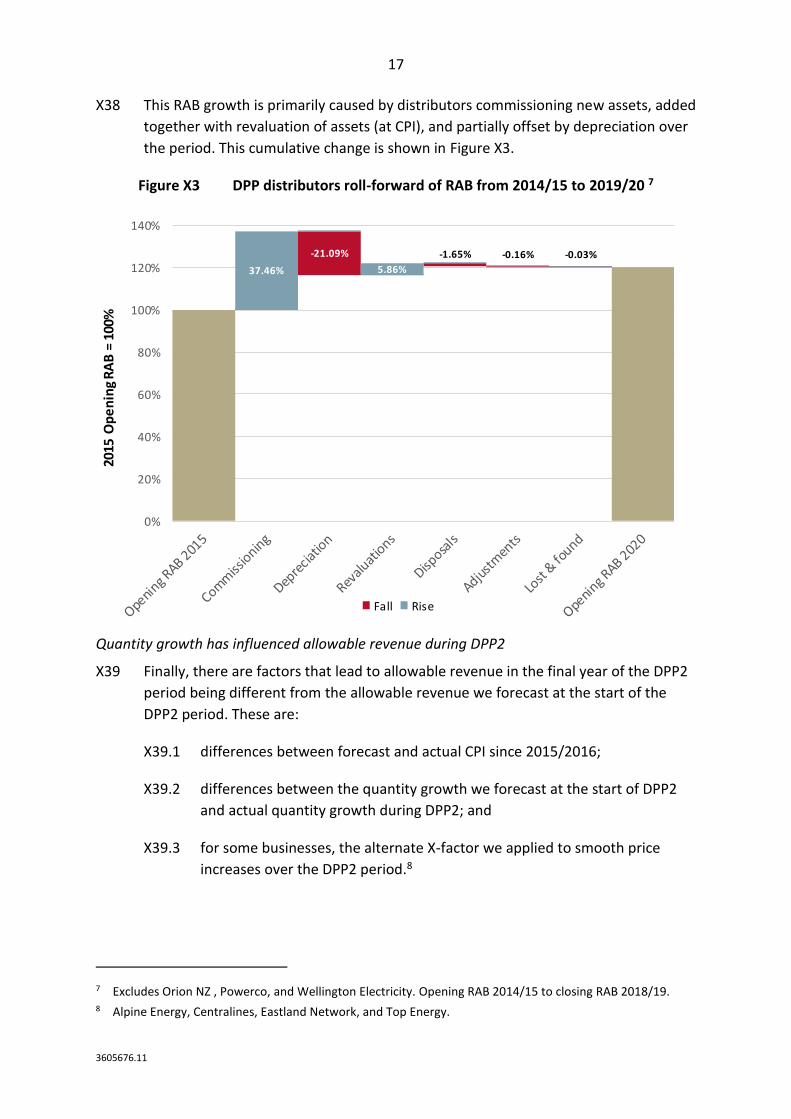
X38 This RAB growth is primarily caused by distributors commissioning new assets, added
together with revaluation of assets (at CPI), and partially offset by depreciation over
the period. This cumulative change is shown in Figure X3.
Figure X3 DPP distributors roll-forward of RAB from 2014/15 to 2019/20 7
Quantity growth has influenced allowable revenue during DPP2
X39 Finally, there are factors that lead to allowable revenue in the final year of the DPP2
period being different from the allowable revenue we forecast at the start of the
DPP2 period. These are:
X39.1 differences between forecast and actual CPI since 2015/2016;
X39.2 differences between the quantity growth we forecast at the start of DPP2
and actual quantity growth during DPP2; and
X39.3 for some businesses, the alternate X-factor we applied to smooth price
increases over the DPP2 period.8
7 Excludes Orion NZ , Powerco, and Wellington Electricity. Opening RAB 2014/15 to closing RAB 2018/19. 8 Alpine Energy, Centralines, Eastland Network, and Top Energy.
-21.09% -1.65% -0.16% -0.03%
37.46% 5.86%
0%
20%
40%
60%
80%
100%
120%
140%
2015
Op
en
ing
RA
B =
100
%
Fall Rise
18
3605676.11
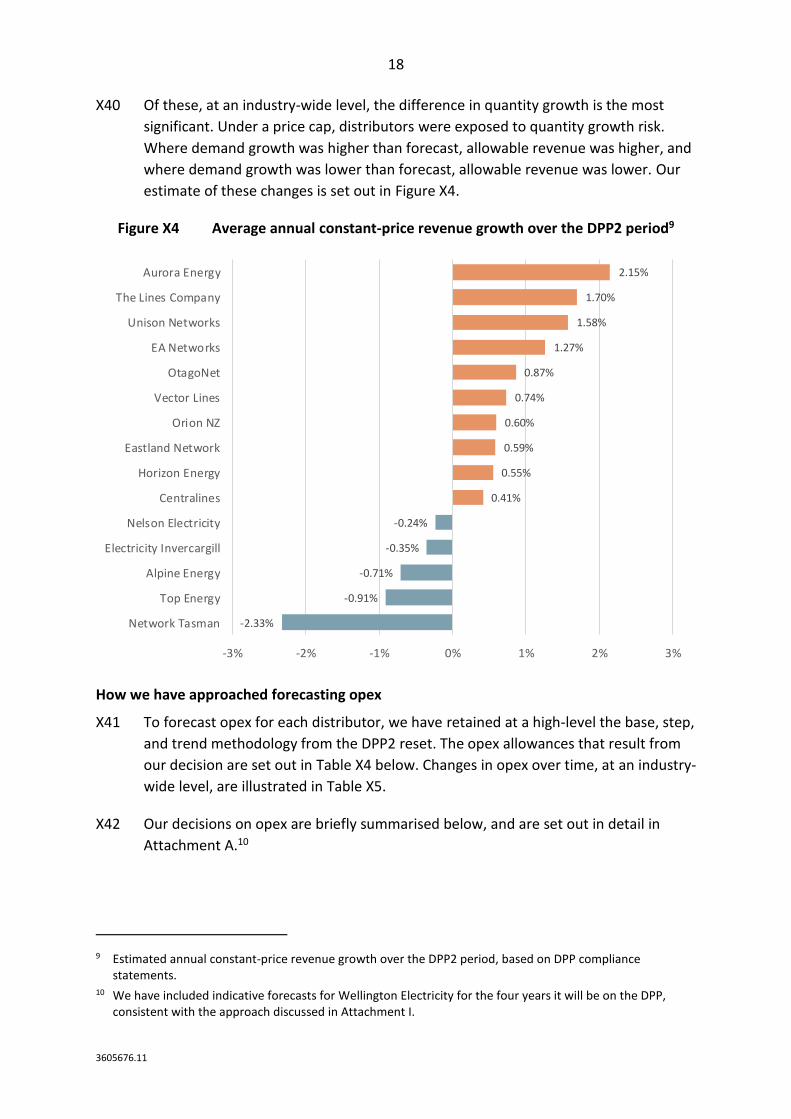
X40 Of these, at an industry-wide level, the difference in quantity growth is the most
significant. Under a price cap, distributors were exposed to quantity growth risk.
Where demand growth was higher than forecast, allowable revenue was higher, and
where demand growth was lower than forecast, allowable revenue was lower. Our
estimate of these changes is set out in Figure X4.
Figure X4 Average annual constant-price revenue growth over the DPP2 period9
How we have approached forecasting opex
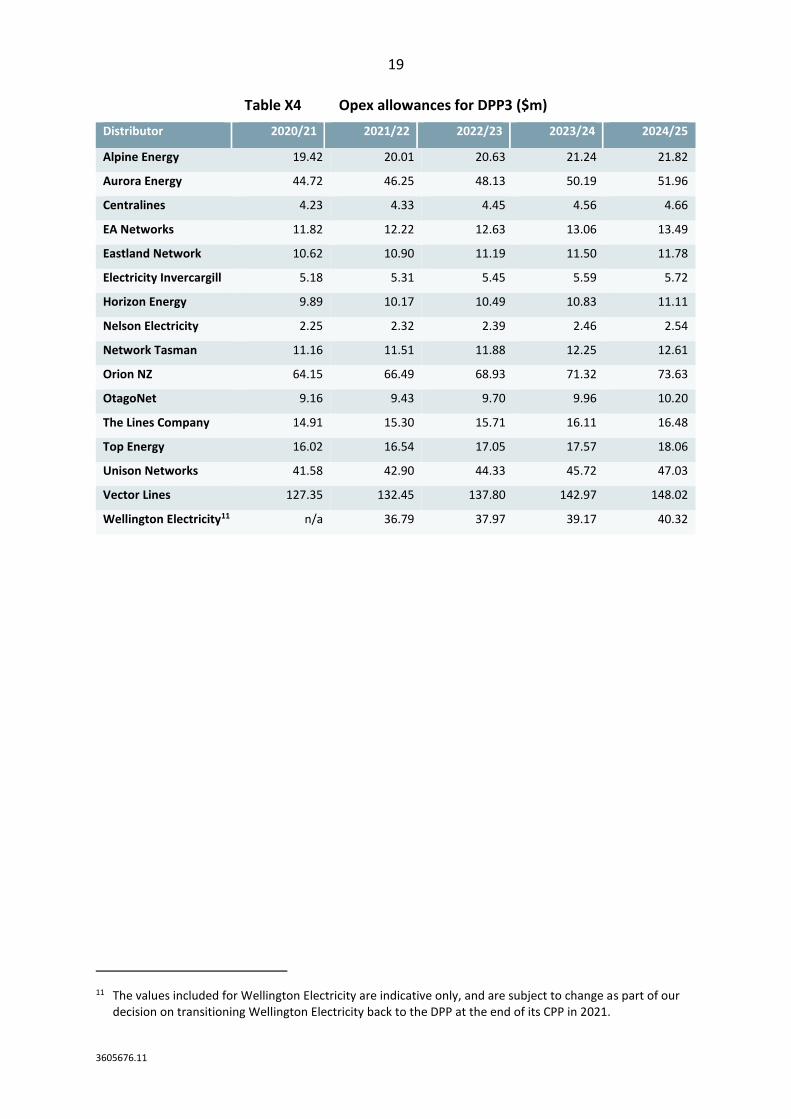
X41 To forecast opex for each distributor, we have retained at a high-level the base, step,
and trend methodology from the DPP2 reset. The opex allowances that result from
our decision are set out in Table X4 below. Changes in opex over time, at an industry-
wide level, are illustrated in Table X5.
X42 Our decisions on opex are briefly summarised below, and are set out in detail in
Attachment A.10
9 Estimated annual constant-price revenue growth over the DPP2 period, based on DPP compliance statements.
10 We have included indicative forecasts for Wellington Electricity for the four years it will be on the DPP, consistent with the approach discussed in Attachment I.
-2.33%
-0.91%
-0.71%
-0.35%
-0.24%
0.41%
0.55%
0.59%
0.60%
0.74%
0.87%
1.27%
1.58%
1.70%
2.15%
-3% -2% -1% 0% 1% 2% 3%
Network Tasman
Top Energy
Alpine Energy
Electricity Invercargill
Nelson Electricity
Centralines
Horizon Energy
Eastland Network
Orion NZ
Vector Lines
OtagoNet
EA Networks
Unison Networks
The Lines Company
Aurora Energy
19
3605676.11
Table X4 Opex allowances for DPP3 ($m)
Distributor 2020/21 2021/22 2022/23 2023/24 2024/25
Alpine Energy 19.42 20.01 20.63 21.24 21.82
Aurora Energy 44.72 46.25 48.13 50.19 51.96
Centralines 4.23 4.33 4.45 4.56 4.66
EA Networks 11.82 12.22 12.63 13.06 13.49
Eastland Network 10.62 10.90 11.19 11.50 11.78
Electricity Invercargill 5.18 5.31 5.45 5.59 5.72
Horizon Energy 9.89 10.17 10.49 10.83 11.11
Nelson Electricity 2.25 2.32 2.39 2.46 2.54
Network Tasman 11.16 11.51 11.88 12.25 12.61
Orion NZ 64.15 66.49 68.93 71.32 73.63
OtagoNet 9.16 9.43 9.70 9.96 10.20
The Lines Company 14.91 15.30 15.71 16.11 16.48
Top Energy 16.02 16.54 17.05 17.57 18.06
Unison Networks 41.58 42.90 44.33 45.72 47.03
Vector Lines 127.35 132.45 137.80 142.97 148.02
Wellington Electricity11 n/a 36.79 37.97 39.17 40.32
11 The values included for Wellington Electricity are indicative only, and are subject to change as part of our decision on transitioning Wellington Electricity back to the DPP at the end of its CPP in 2021.
20
3605676.11
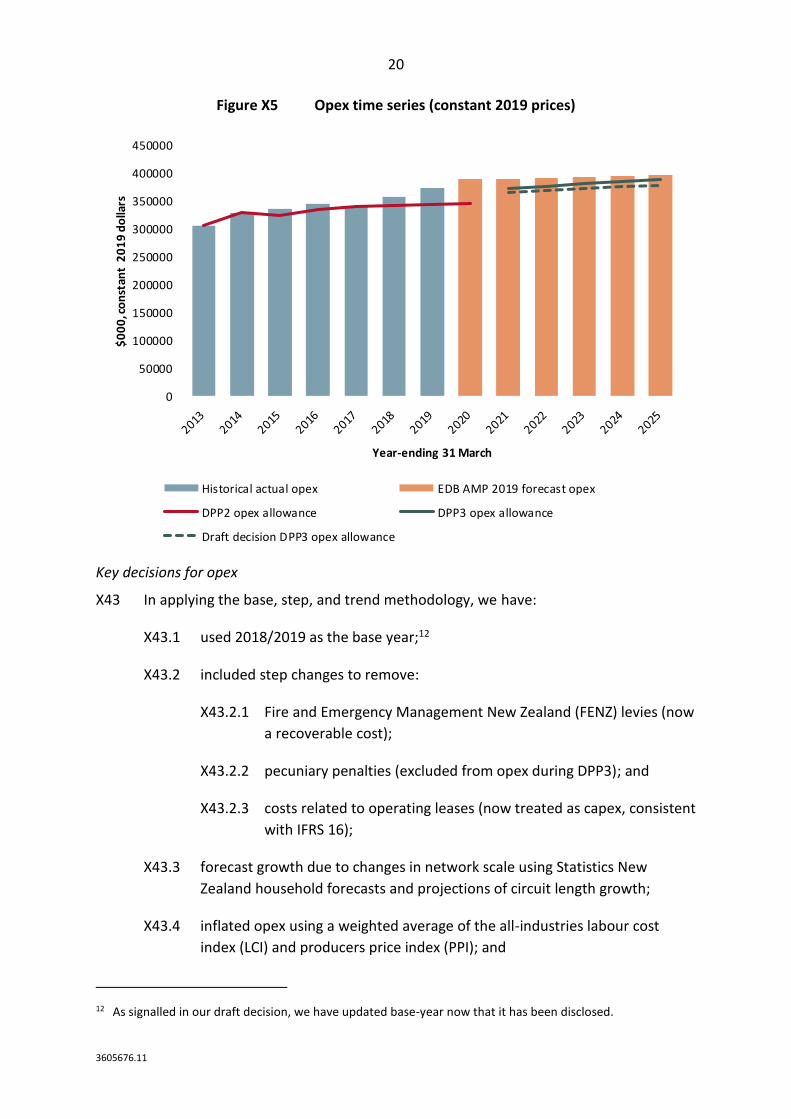
Figure X5 Opex time series (constant 2019 prices)
Key decisions for opex
X43 In applying the base, step, and trend methodology, we have:
X43.1 used 2018/2019 as the base year;12
X43.2 included step changes to remove:
X43.2.1 Fire and Emergency Management New Zealand (FENZ) levies (now
a recoverable cost);
X43.2.2 pecuniary penalties (excluded from opex during DPP3); and
X43.2.3 costs related to operating leases (now treated as capex, consistent
with IFRS 16);
X43.3 forecast growth due to changes in network scale using Statistics New
Zealand household forecasts and projections of circuit length growth;
X43.4 inflated opex using a weighted average of the all-industries labour cost
index (LCI) and producers price index (PPI); and
12 As signalled in our draft decision, we have updated base-year now that it has been disclosed.
0
50000
100000
150000
200000
250000
300000
350000
400000
450000
$0
00
, co
nst
ant
20
19
do
llars
Year-ending 31 March
Historical actual opex EDB AMP 2019 forecast opex
DPP2 opex allowance DPP3 opex allowance
Draft decision DPP3 opex allowance
21
3605676.11
X43.5 applied a partial productivity factor of 0%.
X44 We have taken this approach because we consider that, when combined with the
IRIS incentive scheme, it creates the right incentives for distributors to improve
efficiency while at the same time providing an ex-ante expectation of a normal
return.
X45 By linking future opex allowances to distributors’ current revealed level of costs and
predictable future changes, distributors should expect a normal return ex-ante,
incentivising investment. By allowing distributors to keep a portion of any savings,
they have an incentive to improve efficiency.
Changes to opex forecasts since our draft decision
X46 The majority of the changes to opex allowances since the draft decision relate to the
updated input data we have used. Specifically, we have used updated data from
2019 Information Disclosure (ID) and updated forecasts of input price inflation.
X47 To forecast Installation Control Point (ICP) growth, we have used forecasts of
household growth, rather than population growth. This is because our analysis
suggests it is a better predictor of ICP growth, and because submissions resolved our
concerns about data availability.
X48 We have not accepted any step changes proposed by stakeholders. In general, this is
because we have not been able to verify the quantities involved, or because other
DPP tools (such as reopeners or recoverable costs) are better at managing any
potential increases or decreases in expenditure.
X49 We have retained a partial productivity factor of 0%. This is because on balance,
between the evidence of historical productivity in the electricity sector in New
Zealand, comparable overseas jurisdictions, and other industries in New Zealand, we
consider a neutral setting is appropriate for DPP3. We remain unconvinced that
declining productivity in the past is predictive of future declines.
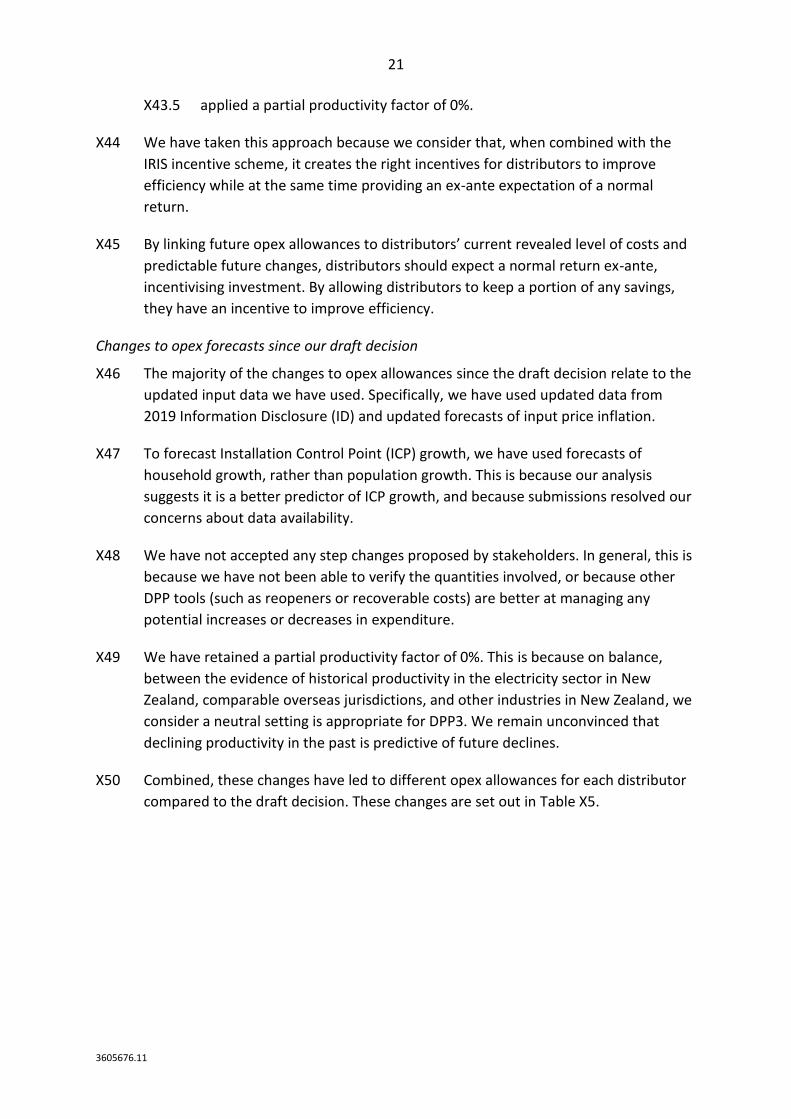
X50 Combined, these changes have led to different opex allowances for each distributor
compared to the draft decision. These changes are set out in Table X5.
22
3605676.11
Table X5 Changes in opex allowances relative to draft decision
Distributor Opex allowance
($m)
Draft opex
allowance ($m)
Change ($m) Change (%)
Alpine Energy 103.11 100.51 2.61 2.60%
Aurora Energy 241.25 216.50 24.75 11.43%
Centralines 22.22 19.67 2.55 12.99%
EA Networks 63.21 72.29 -9.07 -12.55%
Eastland Network 55.99 57.14 -1.16 -2.03%
Electricity Invercargill 27.24 26.22 1.02 3.87%
Horizon Energy 52.49 59.44 -6.95 -11.70%
Nelson Electricity 11.96 11.27 0.68 6.05%
Network Tasman 59.41 64.16 -4.74 -7.39%
Orion NZ 344.53 327.43 17.10 5.22%
OtagoNet 48.45 42.19 6.26 14.83%
The Lines Company 78.52 70.37 8.15 11.57%
Top Energy 85.24 93.52 -8.27 -8.85%
Unison Networks 221.56 225.81 -4.25 -1.88%
Vector Lines 688.59 693.18 -4.59 -0.66%
Wellington Electricity 189.91 195.31 -5.39 -2.76%
Total 2,293.68 2,275.01 18.67 0.82%
How we have approached forecasting capex
X51 We have used distributors’ 2019 asset management plans (AMPs) as the starting
point for our capex allowances. However, we have made changes to the way we
assess distributors’ AMP capex for DPP3 compared to DPP2.
X52 Unlike DPP2, where we capped each distributors’ AMP forecasts based on historical
levels of expenditure, we have instead applied a series of tests of the reliability of
AMP forecasts.
X53 We have made these changes because:
X53.1 we consider this kind of scrutiny of AMPs creates better incentives for
distributors to invest, through allowing expenditure where it appears
reasonable and deliverable, but not where it does not;
X53.2 it strikes the right balance between the low-cost scrutiny of a DPP, and the
need to limit significant expenditure increase absent the proportionately
higher scrutiny of a CPP; and
23
3605676.11
X53.3 the other changes we have made (the introduction of the capex reopener
and the increase in the capex IRIS retention factor) mean distributors will
still have incentives to invest efficiently.
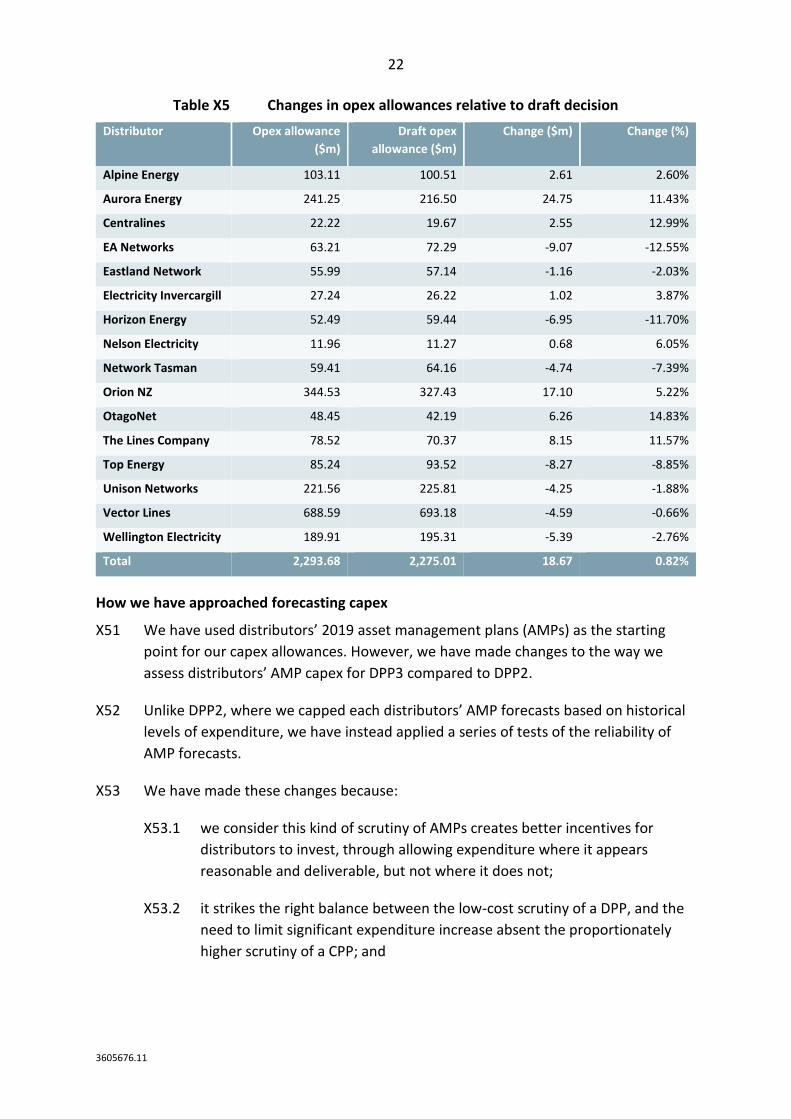
X54 The resulting capex forecasts for each supplier are set out in Table X6. Our decisions
on capex are discussed in detail in Attachment B.
Table X6 Capex allowances for each distributor
Distributor 2020/21 2021/22 2022/23 2023/24 2024/25
Alpine Energy 16.66 16.98 15.38 14.67 14.15
Aurora Energy 50.95 50.75 48.25 38.77 43.21
Centralines 6.06 2.77 3.97 2.84 2.96
EA Networks 18.05 17.94 17.80 15.71 14.72
Eastland Network 9.68 10.14 8.98 9.38 10.05
Electricity Invercargill 4.66 5.05 5.57 5.58 5.13
Horizon Energy 8.32 6.72 8.08 8.52 8.57
Nelson Electricity 1.63 1.71 1.66 1.67 1.67
Network Tasman 10.29 12.26 9.04 10.07 8.47
Orion NZ 72.17 63.78 89.62 79.93 84.44
OtagoNet 13.99 13.50 18.00 23.07 13.93
The Lines Company 18.32 16.92 15.87 16.56 15.25
Top Energy 14.59 15.13 16.51 16.26 16.60
Unison Networks 46.75 52.52 50.53 46.85 48.04
Vector Lines 211.12 209.60 213.42 209.52 197.13
Wellington Electricity13 n/a 35.51 37.68 39.91 42.08
Key decisions for capex
X55 To forecast capex allowances for each distributor, we have used an amended version
of the approach we took in DPP2 – using each distributor’s 2019 AMP as the starting
point for our forecasts, but applying a series of caps or tests to assess whether the
forecast expenditure is likely to be required and deliverable.
X56 In particular, the approach seeks to determine whether the AMP forecasts:
X56.1 are internally consistent – for example, that a forecast increase in
expenditure is supported by a corresponding increase in activity, and/or a
realistic increase in costs; and
13 The values included for Wellington Electricity are indicative only, and are subject to change as part of our decision on transitioning Wellington Electricity back to the DPP at the end of its CPP in 2021.
24
3605676.11
X56.2 identify large step changes in the planned level of investment, which may be
more appropriate for us to consider under a CPP application.
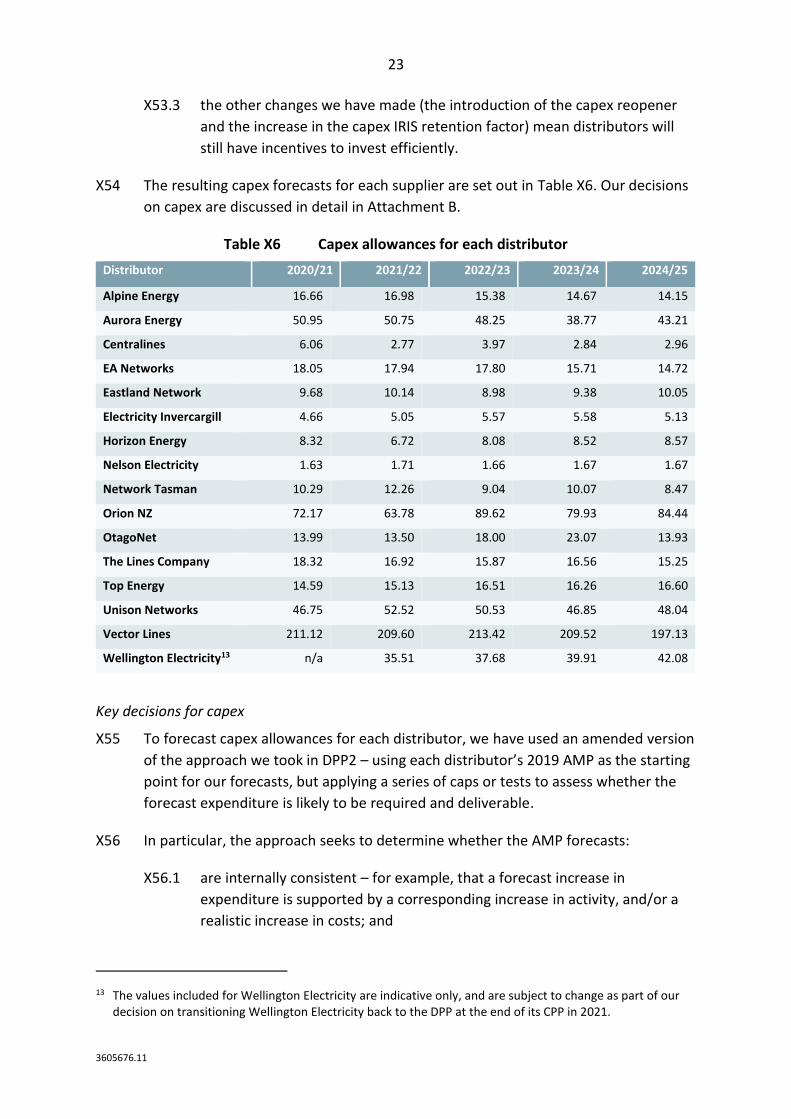
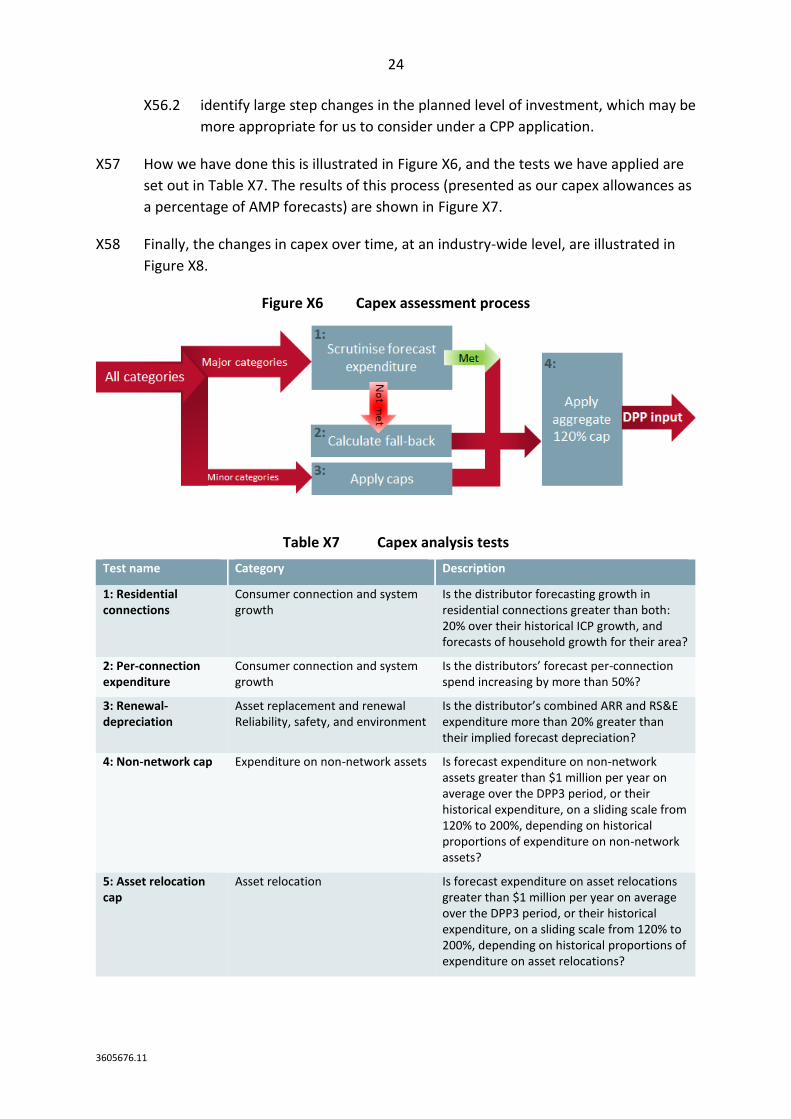
X57 How we have done this is illustrated in Figure X6, and the tests we have applied are
set out in Table X7. The results of this process (presented as our capex allowances as
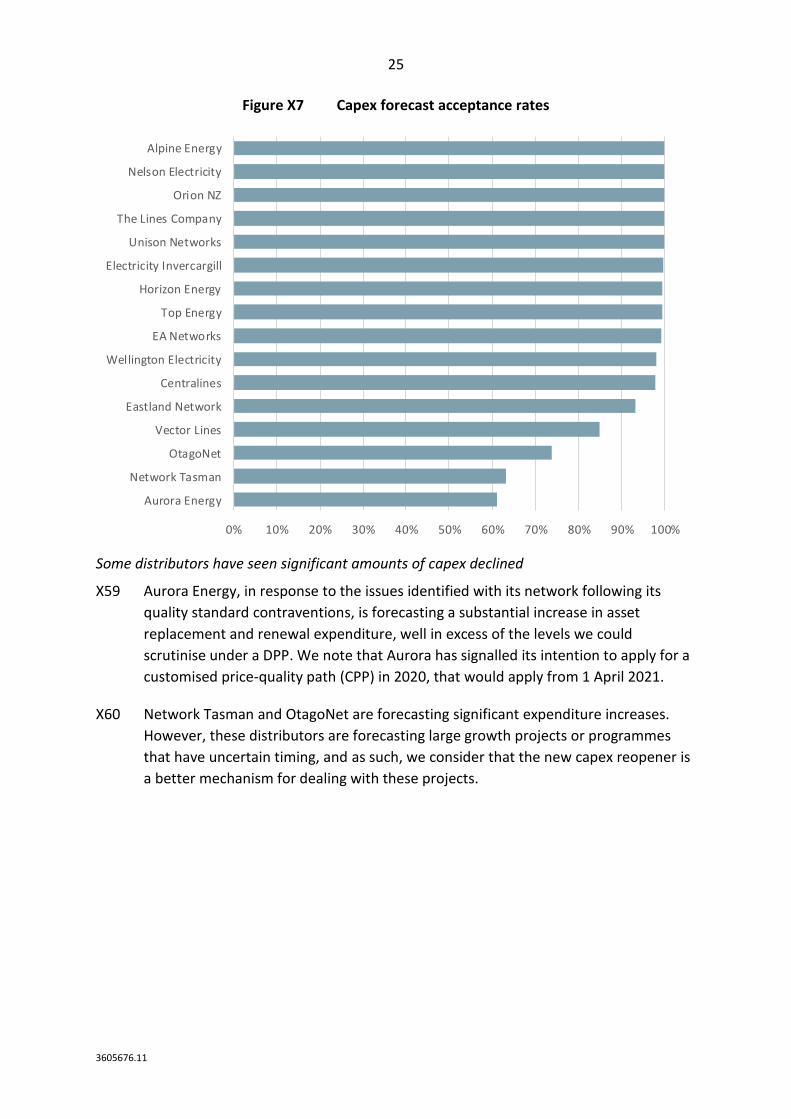
a percentage of AMP forecasts) are shown in Figure X7.
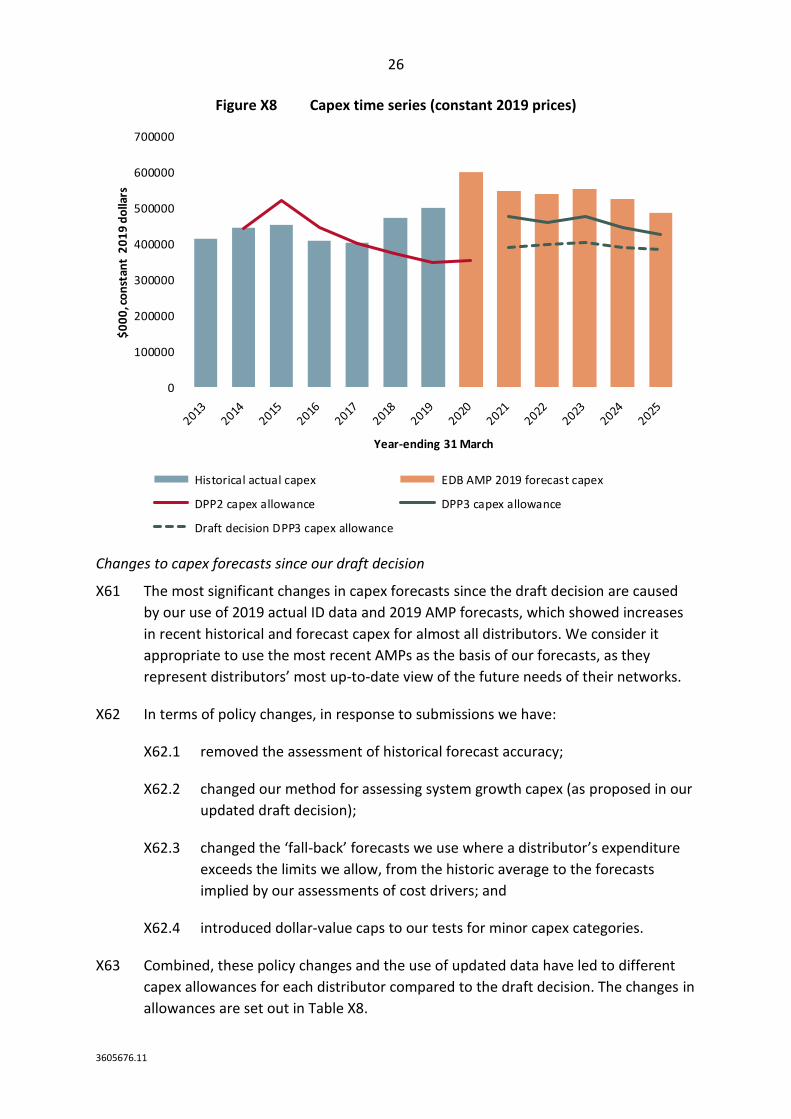
X58 Finally, the changes in capex over time, at an industry-wide level, are illustrated in
Figure X8.
Figure X6 Capex assessment process
Table X7 Capex analysis tests
Test name Category Description
1: Residential connections
Consumer connection and system growth
Is the distributor forecasting growth in residential connections greater than both: 20% over their historical ICP growth, and forecasts of household growth for their area?
2: Per-connection expenditure
Consumer connection and system growth
Is the distributors’ forecast per-connection spend increasing by more than 50%?
3: Renewal-depreciation
Asset replacement and renewal Reliability, safety, and environment
Is the distributor’s combined ARR and RS&E expenditure more than 20% greater than their implied forecast depreciation?
4: Non-network cap Expenditure on non-network assets Is forecast expenditure on non-network assets greater than $1 million per year on average over the DPP3 period, or their historical expenditure, on a sliding scale from 120% to 200%, depending on historical proportions of expenditure on non-network assets?
5: Asset relocation cap
Asset relocation Is forecast expenditure on asset relocations greater than $1 million per year on average over the DPP3 period, or their historical expenditure, on a sliding scale from 120% to 200%, depending on historical proportions of expenditure on asset relocations?
25
3605676.11
Figure X7 Capex forecast acceptance rates
Some distributors have seen significant amounts of capex declined
X59 Aurora Energy, in response to the issues identified with its network following its
quality standard contraventions, is forecasting a substantial increase in asset
replacement and renewal expenditure, well in excess of the levels we could
scrutinise under a DPP. We note that Aurora has signalled its intention to apply for a
customised price-quality path (CPP) in 2020, that would apply from 1 April 2021.
X60 Network Tasman and OtagoNet are forecasting significant expenditure increases.
However, these distributors are forecasting large growth projects or programmes
that have uncertain timing, and as such, we consider that the new capex reopener is
a better mechanism for dealing with these projects.
0% 10% 20% 30% 40% 50% 60% 70% 80% 90% 100%
Aurora Energy
Network Tasman
OtagoNet
Vector Lines
Eastland Network
Centralines
Wellington Electricity
EA Networks
Top Energy
Horizon Energy
Electricity Invercargill
Unison Networks
The Lines Company
Orion NZ
Nelson Electricity
Alpine Energy
26
3605676.11
Figure X8 Capex time series (constant 2019 prices)
Changes to capex forecasts since our draft decision
X61 The most significant changes in capex forecasts since the draft decision are caused
by our use of 2019 actual ID data and 2019 AMP forecasts, which showed increases
in recent historical and forecast capex for almost all distributors. We consider it
appropriate to use the most recent AMPs as the basis of our forecasts, as they
represent distributors’ most up-to-date view of the future needs of their networks.
X62 In terms of policy changes, in response to submissions we have:
X62.1 removed the assessment of historical forecast accuracy;
X62.2 changed our method for assessing system growth capex (as proposed in our
updated draft decision);
X62.3 changed the ‘fall-back’ forecasts we use where a distributor’s expenditure
exceeds the limits we allow, from the historic average to the forecasts
implied by our assessments of cost drivers; and
X62.4 introduced dollar-value caps to our tests for minor capex categories.
X63 Combined, these policy changes and the use of updated data have led to different
capex allowances for each distributor compared to the draft decision. The changes in
allowances are set out in Table X8.
0
100000
200000
300000
400000
500000
600000
700000$
00
0, c
on
stan
t 2
01
9 d
olla
rs
Year-ending 31 March
Historical actual capex EDB AMP 2019 forecast capex
DPP2 capex allowance DPP3 capex allowance
Draft decision DPP3 capex allowance
27
3605676.11
X64 Some distributors have seen significant changes. Increases for three distributors
contribute to most of the total change in forecasts, largely reflecting increases in
their AMP forecast capex.14
Table X8 Changes in capex allowances
Distributor Capex allowance
($m)
Draft capex
allowance ($m)
Change ($m) Change (%)
Alpine Energy 77.84 71.70 6.14 8.56%
Aurora Energy 231.93 147.99 83.93 56.71%
Centralines 18.61 14.76 3.84 26.02%
EA Networks 84.22 88.48 -4.26 -4.82%
Eastland Network 48.24 40.90 7.34 17.94%
Electricity Invercargill 25.98 20.80 5.18 24.88%
Horizon Energy 40.21 36.84 3.37 9.14%
Nelson Electricity 8.34 8.27 0.06 0.78%
Network Tasman 50.14 27.68 22.46 81.12%
Orion NZ 389.95 340.15 49.79 14.64%
OtagoNet 82.50 79.82 2.68 3.36%
The Lines Company 82.92 60.35 22.57 37.41%
Top Energy 79.10 90.26 -11.17 -12.37%
Unison Networks 244.69 232.94 11.75 5.04%
Vector Lines 1,040.79 953.59 87.21 9.15%
Wellington Electricity 192.92 181.52 11.40 6.28%
Total 2,698.38 2,396.08 302.30 12.62%
Accelerated depreciation
X65 As part of the Input Methodology (IM) review in 2016, we introduced the option for
distributors to apply for accelerated depreciation of their existing assets where there
is a plausible risk of network stranding due to emerging technologies.
X66 For this DPP reset, we received one application, from Vector. We have decided not
to apply an adjustment factor in response to Vector’s application, based on our
assessment of Vector’s application against the formal IM requirements, the risk of
economic stranding, section 52A of the Act and our exercise of our overall discretion.
14 Aurora Energy, Orion NZ, Vector Lines. Wellington Electricity have also seen a large dollar-value increase, but these forecasts are only indicative, due to Wellington’s CPP transition.
28
3605676.11
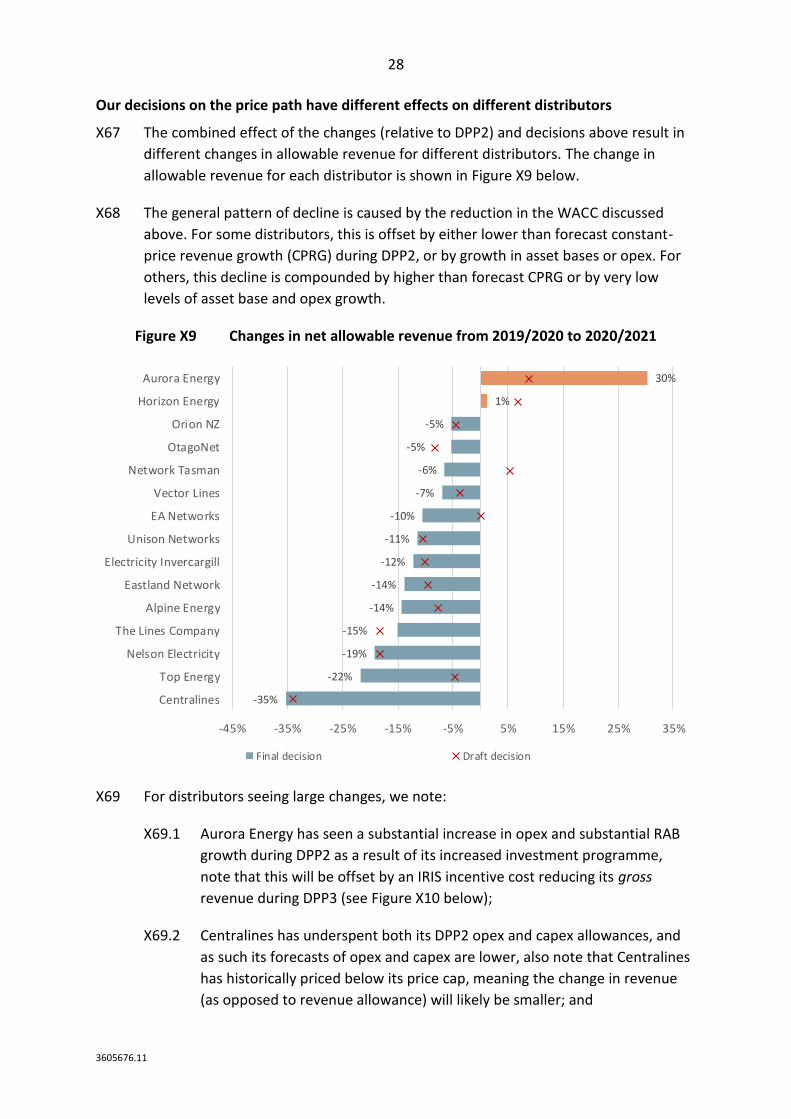
Our decisions on the price path have different effects on different distributors
X67 The combined effect of the changes (relative to DPP2) and decisions above result in
different changes in allowable revenue for different distributors. The change in
allowable revenue for each distributor is shown in Figure X9 below.
X68 The general pattern of decline is caused by the reduction in the WACC discussed
above. For some distributors, this is offset by either lower than forecast constant-
price revenue growth (CPRG) during DPP2, or by growth in asset bases or opex. For
others, this decline is compounded by higher than forecast CPRG or by very low
levels of asset base and opex growth.
Figure X9 Changes in net allowable revenue from 2019/2020 to 2020/2021
X69 For distributors seeing large changes, we note:
X69.1 Aurora Energy has seen a substantial increase in opex and substantial RAB
growth during DPP2 as a result of its increased investment programme,
note that this will be offset by an IRIS incentive cost reducing its gross
revenue during DPP3 (see Figure X10 below);
X69.2 Centralines has underspent both its DPP2 opex and capex allowances, and
as such its forecasts of opex and capex are lower, also note that Centralines
has historically priced below its price cap, meaning the change in revenue
(as opposed to revenue allowance) will likely be smaller; and
-35%
-22%
-19%
-15%
-14%
-14%
-12%
-11%
-10%
-7%
-6%
-5%
-5%
1%
30%
-45% -35% -25% -15% -5% 5% 15% 25% 35%
Centralines
Top Energy
Nelson Electricity
The Lines Company
Alpine Energy
Eastland Network
Electricity Invercargill
Unison Networks
EA Networks
Vector Lines
Network Tasman
OtagoNet
Orion NZ
Horizon Energy
Aurora Energy
Final decision Draft decision
29
3605676.11
X69.3 Top Energy has been on a ‘sloped’ price path during DPP2 that deferred
revenue recovery until later in the DPP2 period, increasing the step down at
the end of DPP2, additionally, it has seen lower RAB growth than forecast,
and only modest opex growth.
X70 We also note that distributors who have underspent on opex relative to our DPP2
forecasts will generally see gains in gross revenue during DPP3, as a result of IRIS
efficiency incentives, as discussed in Attachment E. We have estimated the impact
these IRIS incentive payments on the 2020 to 2021 change in allowable revenue. This
is presented in Figure X10.
Figure X10 Change in allowable revenue accounting for IRIS incentives
X71 For most distributors, the impact of the IRIS is modest (with the difference between
net of IRIS changes and gross of IRIS changes averaging around ±5%). However, it is
significant for Aurora Energy (-28%), given a significant opex and capex overspend.
Changes in allowable revenue since the draft decision
X72 Changes in input data and in policy decisions since the draft decision have led to
changes in revenue allowance for the final DPP3 decision. These changes are set out
in Table X9 below. The factors driving this change (for distributors on the DPP as a
whole) are shown in Figure X10.
-29%
-23%
-22%
-19%
-18%
-17%
-12%
-11%
-8%
-7%
-7%
-5%
-5%
-3%
3%
-45% -35% -25% -15% -5% 5% 15% 25% 35%
Centralines
Top Energy
The Lines Company
Alpine Energy
Eastland Network
EA Networks
Unison Networks
Nelson Electricity
Network Tasman
OtagoNet
Vector Lines
Orion NZ
Electricity Invercargill
Horizon Energy
Aurora Energy
30
3605676.11
Table X9 Allowable revenue in 2020/21 relative to DPP3 draft decision
Distributor Allowable revenue in
2020/21 ($m)
Draft allowable revenue in
2020/21 ($m)
Change ($m) Change (%)
Alpine Energy 42.65 45.36 -2.71 -5.97%
Aurora Energy 87.33 72.03 15.30 21.25%
Centralines 9.37 9.40 -0.03 -0.34%
EA Networks 33.26 37.70 -4.44 -11.77%
Eastland Network 24.03 25.06 -1.03 -4.10%
Electricity Invercargill 12.26 12.29 -0.03 -0.28%
Horizon Energy 23.91 25.01 -1.10 -4.38%
Nelson Electricity 5.50 5.59 -0.09 -1.55%
Network Tasman 26.45 28.78 -2.33 -8.09%
Orion NZ 158.50 161.17 -2.67 -1.66%
OtagoNet 25.78 25.08 0.69 2.77%
The Lines Company 34.71 33.94 0.76 2.25%
Top Energy 38.01 42.19 -4.17 -9.90%
Unison Networks 100.02 102.25 -2.23 -2.18%
Vector Lines 388.71 403.35 -14.64 -3.63%
Total 1,010.49 1,029.20 -18.70 -1.82%
Figure X11 Drivers of change between draft and final decisions
-1.76%
-4.64%
0.63%
0.13%
1.51%
0.02% 0.36%
0.47%
0.13%
1.35%
95%
96%
97%
98%
99%
100%
101%
102%
DP
P3
Up
dat
ed
dra
ft f
irst
ye
ar M
AR
, re
lati
ve t
o D
raft
val
ue
Fall Rise
31
3605676.11
Revenue path
X73 In addition to allowable revenue in the first year of the period, we have also made
decisions that affect how the revenue path will operate during the period. These
decisions include:
X73.1 rates of change (relative to CPI);
X73.2 implementing the revenue cap with wash-up;
X73.3 incentives for improving efficiency and innovation;
X73.4 new recoverable costs; and
X73.5 circumstances in which the DPP can be reopened.
How allowable revenues will change over the period
X74 As shown in Table X1, we have implemented a default rate of change for all suppliers
of CPI-0%. This is not a change from our draft decision for most suppliers, but is a
change for Aurora Energy. We have moved to an X-factor of 0% for Aurora because,
as Aurora identified in its submission, once IRIS incentive payments are accounted
for, any price shock to consumers in 2021 is likely to be minimal.15
X75 We have not set any alternate X-factors. On the one hand, most distributors will see
declines in allowable revenue, meaning there is limited risk of price shocks to
consumers. On the other hand, revenue decreases notwithstanding, we have not
identified any distributor who would face financial hardship as a result of our
decision.
We will apply a revenue cap with wash-up in DPP3
X76 As part of the IM review in 2016, we changed the form of control for distributors
from a weighted average price cap to a revenue cap, including a wash-up for over-
and under-recovery of revenue.
X77 As part of implementing the revenue cap in the DPP3 determination, we have
implemented:
X77.1 a 10% limit on the annual increase in each distributor’s ‘forecast revenue
from prices’; and
X77.2 a limit on the accrual of wash-up balances from ‘voluntary undercharging’,
which is the lesser of either:
15 Aurora have formally signalled their intention to apply for a CPP, with an intended commencement date of 1 April 2021. In this instance, the DPP would only apply to Aurora for a single year.
32
3605676.11
X77.2.1 90% of forecast allowable revenue for the year; or
X77.2.2 110% of the previous year’s forecast revenue from prices.
X78 The voluntary undercharging limit does not prevent distributors from charging less
than they are allowed to by the revenue cap; it merely prevents any undercharging
beyond a certain point being accrued as a wash-up balance that is then used to
increase allowable revenue in future years.
X79 None of these decisions have changed significantly from our draft decision. Our
approach to the revenue cap, and our reasons for related policy decisions are
discussed in more detail in Attachment H.
We have updated incentives for efficiency
X80 For the DPP3, we have made changes to the IRIS efficiency incentives. The most
significant change is to the incentive rate for the capex IRIS. We have set a capex
retention factor equal to the opex retention factor, or 23.5%.
X81 To ensure distributors have a consistent incentive to spend both opex and capex,
and do not favour capital solutions over operating ones, we have equalised the
capex retention factor with the opex one.
X82 We consider that this change will reduce or remove barriers to innovation. We do
not want to disincentivise any potential emerging technologies from being used by
distributors due to a lower capex incentive rate. Equalising rates will create a more
level playing field to allow distributors to avoid spending capex through investing in
innovative solutions that may include partnering with third parties to deliver
services.
We have introduced new incentives for innovation
X83 In addition to equalising IRIS incentives, to further promote innovation, we have
introduced a new targeted innovation recoverable cost.
X84 We have set the limit of the funding available for DPP3 at the greater of either 0.1%
of our forecast of allowable revenue for the period or $150,000, and a requirement
for half the funding to come from a distributor’s regular opex or capex expenditure.
In total, this would equate to $11 million of spending on innovation as part of this
scheme.
X85 The introduction of the $150,000 limit, in addition to the 0.1% limit, is in response to
submissions that a percentage-based limit alone would mean the incentive would be
insufficient for smaller distributors to take advantage of it.
33
3605676.11
X86 We have set this conservatively, as there will be only limited scrutiny over how the
allowance is spent. In response to submissions, we have made changes to the criteria
that will apply, and the process for approving the relevant recoverable cost.
X87 Circumstances where a distributor wishes to undertake substantial changes to the
way it manages its network are more appropriately considered as part of a CPP
application. A CPP allows us the ability to apply greater scrutiny, and to vary the way
the price-quality path functions to account for innovative approaches.
We have introduced new costs distributors can recover from their customers
X88 We have amended the IMs to introduce two new recoverable costs:
X88.1 one to implement the innovation project allowance described above; and
X88.2 one to allow for FENZ levies to be passed through to consumers.
X89 We have also made an amendment to clarify and extend the scope of the
recoverable cost relating to charges payable by a distributor to Transpower in
respect of a ‘new investment contract’ between those parties, or any equivalent
contract with another transmission provider. The amendment will allow a distributor
to use a third-party option to finance the new investment contract between the
distributor and Transpower (or equivalent contract with another transmission
provider). This amendment was proposed by Transpower in response to our draft
DPP decision.16
X90 All of these changes required amendments to the IMs, which are described in the IM
amendments reasons paper which was published on 26 November 2019.17
Circumstances in which the DPP can be reopened
X91 Given the increasing uncertainties in the industry (as discussed above at X18), we
have reconsidered ways in which the price-quality path can be amended part way
through the regulatory period. In general, we consider the existing reopeners (and in
particular the change and catastrophic event reopeners) make adequate allowance
for most unforeseeable events beyond the reasonable control of distributors.
X92 However, in addition to the existing reopeners, we have introduced new reopeners
for some major capex projects and programmes.18
16 Transpower “Submission on IM amendments for DPP and IPP” (5 July 2019). 17 Commerce Commission “Amendments to electricity distribution services input methodologies
determination – Reasons paper” (26 November 2019). 18 For the purposes of the reopeners “unforeseen” includes expenditure that was included in a suppliers AMP,
but not included in DPP3 capex allowances, and projects that were foreseen but whose timing or scale has changed.
34
3605676.11
X93 There is potential for increases in process heat electrification, connection of new
sources of distributed generation, or relocation of assets in response to other
infrastructure investment activity. This could have a significant impact on
distributors’ investment needs. Given this, and the difficulties in predicting the
timing of these developments, we consider reopeners are the best way to enable
distributors to undertake any such investments.
X94 In response to submissions, since the draft decision, we have expanded the scope of
these reopeners, so that now, in addition to major new connections and alterations
to existing connections, it includes:
X94.1 major relocations of assets not able to be funded through capital
contributions; and
X94.2 major system growth capex, such as network reconfiguration in response to
new connections to Transpower’s grid.
X95 We have also changed the thresholds that apply to the reopeners in response to
submissions. In addition to the percentage threshold proposed in the draft decision,
we have implemented a dollar-value threshold and a maximum value cap.
Quality standards and incentives
X96 As part of the Commission’s 2018/19 priorities, we committed to focusing on quality
standards and incentives as part of the DPP3 reset. Quality was also an area of
intense interest in submissions. In particular, our decisions discussed below build on
work undertaken by the Electricity Networks Association (ENA) Quality of Service
Working Group, and on analysis undertaken by NZIER on behalf of the Major
Electricity Users Group (MEUG).
X97 Given the statutory requirement to promote quality incentives and the areas for
improvement in quality standards and incentives that we have identified through
consultation so far, we consider that while the package of changes for DPP3 is
substantial, it is proportionate to the importance of the issue, and the scale of
change in the industry as a whole.
X98 We have made a number of changes to the quality standards and incentives scheme,
relative to the draft decision. In part, this is in response to submissions on the draft
and updated draft decisions. However, it is also in response to data quality issues
identified through the section 53ZD information gathering process, specifically to do
with the calculation of system average interruption frequency index (SAIFI) values.
35
3605676.11
High-level approach to quality of service
X99 Consistent with our overall low-cost DPP principles, our starting point for a DPP is
that distributors should at least maintain the levels of quality that they have
provided historically, all else being equal. We refer to this principle as ‘no material
deterioration’.
X100 The reliability standards and targets we have set are based on distributors historical
performance, and are intended to give effect to this principle. Similarly, the absence
of a historical data series for other measures of quality is part of the reason we are
considering gathering more data on these measures through ID before setting any
binding standards.
X101 While no material deterioration is a starting point for our approach to quality, we
also acknowledge the need for distributors to make trade-offs about the level of
quality they deliver, and the cost incurred in doing so. We also note that – as with
revenue allowances – our quality standards only apply at an aggregate. We expect
individual distributors to consider the needs and expectations of difference
customers and customer groups when making trade-offs about quality on different
parts of their networks. This consideration drives many of the changes to the quality
incentive scheme.
X102 Even in a relatively stable industry environment, it would be important for
distributors to consider price-quality trade-offs at the margins, and to have the
ability to move towards a level of quality that better reflects:
X102.1 consumers’ demands and willingness to pay; and
X102.2 the distributors cost to serve those consumer demands.
X103 Given the inconsistencies in the way distributors have calculated SAIFI values
historically, we have changed the basis on which distributors report SAIDI and SAIFI
for compliance purposes. These changes in effect mean that distributors will
continue to report SAIDI and SAIFI in the way they did when calculating values in the
section 53ZD response for the year-ending 31 March 2019. This is to preserve the
comparability of future assessment with the historic data the standards were based
on.
We have made changes to reliability standards
X104 We have retained the quality standards based on reliability, as measured by the
system average interruption duration index (SAIDI) and SAIFI. However, we have
made the following changes (relative to DPP2):
X104.1 separating planned and unplanned reliability standards;
36
3605676.11
X104.2 setting the unplanned reliability standards at 2 standard deviations above
the normalised historical average, and defining contraventions on an annual
basis, rather than a ‘two-out-of-three’ year basis;
X104.3 setting the planned reliability standard at three times the historical average,
and assessing it on a regulatory period basis;
X104.4 capping the inter-period (DPP2 to DPP3) movement in unplanned standards
at ±5%; and
X104.5 implementing a new ‘extreme event’ SAIDI standard, set at either 120 SAIDI
minutes or 6 million customer interruption minutes, and excluding specified
events that we consider are predominantly caused by external factors.
X105 We have not set quality standards for other dimensions of service quality, or
enhanced reliability standards (such as regional disaggregation).
X106 These changes are discussed in detail in Attachment L.
We have made refinements to revenue-linked reliability incentives
X107 We have retained the revenue-linked reliability incentive scheme. However, we are
making the following changes to the scheme (relative to DPP2):
X107.1 applying the scheme to SAIDI only, to reduce complexity and to avoid
double-counting the impact of SAIFI;
X107.2 setting the incentive rates with reference to value of lost load (VoLL) using a
figure of $25,000/MWh so that consumer preferences are better reflected
in the price/quality trade-off decisions distributors make;
X107.3 reducing the incentive rates by 76.5% to approximate a five-year retention
of the benefits by distributors;
X107.4 reducing the incentive rate by a further 10% to account for the existing
incentives created by quality standards (to $5,288/MWh);
X107.5 for planned interruptions, reducing the incentive rate a further 50% to
reflect the fact that these are generally less disruptive to consumers (to
$2,644 MWh); and
X107.6 for planned interruptions where certain notification criteria are met,
reducing the incentive rate by a further 50% (to $1,322/MWh).
X108 These changes are discussed in detail in Attachment M.
37
3605676.11
Other changes for quality standards
X109 To better manage the impact that major events can have on reliability standards and
incentives, we are proposing changes to the normalisation methodology we use:
X109.1 defining major events on a 24-hour basis, rolling in 30-minute intervals; and
X109.2 capping the assessed SAIDI or SAIFI value for any half-hour period within a
major event at 1/48th of the boundary value.
X110 To improve our ability to assess compliance with the price-quality path, and to
reduce the cost and uncertainty involved when a distributor contravenes its quality
standards, we are proposing additional reporting requirements related to:
X110.1 major events; and
X110.2 the effects of and the circumstances which lead to a contravention of a
quality standard.
X111 Given the importance to consumers of communications around planned
interruptions, we have introduced an additional ‘notified’ level of planned
interruption, with further reductions to the incentive rate (to $1,300/MWh) and to
the impact on quality standards where certain conditions are met. In response to
submissions, we have made significant changes to these conditions to avoid
potential perverse incentives.
We will consider changes to the information we gather on other measures of quality during DPP3
X112 We have not implemented any new dimensions or measures of quality of service, or
any detailed expansions of reliability standards or incentives (such as regional
disaggregation or low voltage monitoring).
X113 This is not because we consider these measures unimportant. It is because we need
to develop a better understanding of distributors’ current performance before
imposing any new price-quality path obligations.
X114 As such, we intend to consider these matters as part of ID, in a project to be
undertaken in 2020, after the DPP3 setting process is complete.
X115 Our reasons for this, and the additional measures of quality we have considered are
discussed in Attachment N.
38
3605676.11
Abbreviations used in this document Abbreviation Definition
ACOT Avoided cost of transmission
ADR Annual Delivery Report
AER Australian Energy Regulator
AMP Asset management plans
ARR Asset replacement and renewal
BBAR Building blocks allowable revenue
CAB Customer advisory board
CGPI Capital goods price index
CMA Competition and Markets Authority
CPI Consumer price index
CPP Customised price-quality path
CPRG Constant-price revenue growth
DER Distributed energy resources
DPP Default price-quality path
EGWW Electricity, gas, waste, and water
ENA Electricity Networks Association
ERANZ Electricity Retailers Association of New Zealand
FCM Financial capital maintenance
FENZ Fire and Emergency Management New Zealand
GPB Gas pipeline businesses
GSL Guaranteed service level
HSWA Health and Safety Work Act
HV High voltage
ID Information disclosure
IEEE Institute of Electrical and Electronics Engineers
IM Input Methodology
IPAG Innovation and Participation Advisory Group
IPP Individual Price-Quality Path
IRIS Incremental rolling incentive scheme
LCI Labour cost index
LV Low voltage
MAR Maximum allowable revenue
MBIE Ministry for Business, Innovation, and Employment
MED Major event days
MEUG Major Electricity Users Group
NPV Net present value
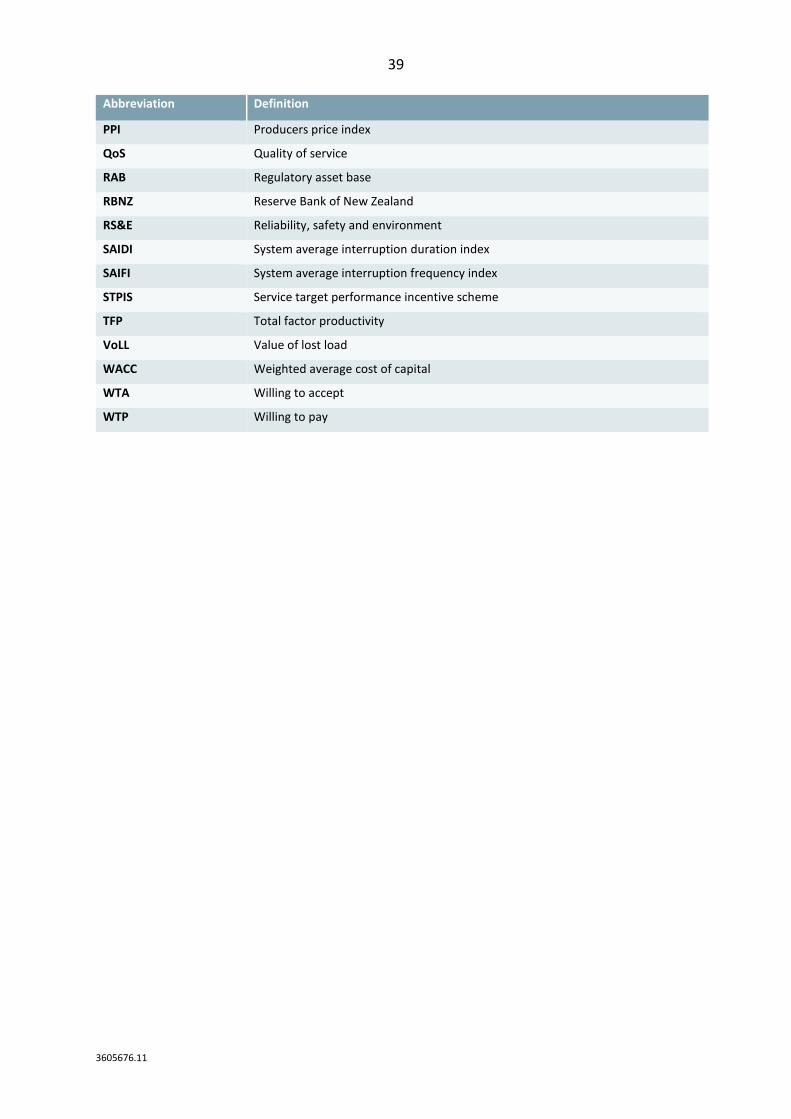
39
3605676.11
Abbreviation Definition
PPI Producers price index
QoS Quality of service
RAB Regulatory asset base
RBNZ Reserve Bank of New Zealand
RS&E Reliability, safety and environment
SAIDI System average interruption duration index
SAIFI System average interruption frequency index
STPIS Service target performance incentive scheme
TFP Total factor productivity
VoLL Value of lost load
WACC Weighted average cost of capital
WTA Willing to accept
WTP Willing to pay
40
3605676.11
Chapter 1 Introduction
Purpose of this paper
1.1 This paper sets out the final default price-quality paths (DPPs) for electricity
distribution businesses (distributors) from 1 April 2020 to 31 March 2025 (DPP3).
Resetting the current default price-quality paths
1.2 We are required to reset the DPPs for those electricity distributors that are subject
to price-quality regulation under Part 4 of the Commerce Act 1986. Part 4 provides
for regulation in markets in which there is little or no competition, and little or no
likelihood of a substantial increase in competition.
1.3 Each distributor’s DPP specifies the maximum allowable revenues and the quality
standards that these distributors must comply with during a regulatory period. The
current DPP was reset in 2015 and will expire on 31 March 2020. From 1 April 2020
the new DDP3 will come into effect until 31 March 2025.
1.4 15 distributors will be subject to these revenue and quality requirements. Two other
distributors – Wellington Electricity and Powerco – are currently subject to
customised price-quality paths (CPPs). These CPPs will end in 2021 and 2023
respectively. We have determined the quality standards that will apply to Wellington
Electricity and Powerco if they transition back on to the DPP.19
The process we have followed
1.5 This section explains the process we have followed in arriving at the final decision
and determination, and the relationship of the DPP3 setting process to the Input
Methodology (IM) amendment process we have run in parallel.
Issues paper and initial stakeholder workshops
1.6 On 15 November 2018, we published an issues paper that explained our framework
for considering changes when resetting the DPP and consulted on potential issues
we identified in advance of the DPP3 draft decision.
1.7 In early 2019, we held two workshops with stakeholders to discuss specific issues
relevant to the DPP3 reset:
1.7.1 The first workshop focused on quality of service issues and was held on 28
February 2019.
19 As discussed in Attachment I, we have the power under section 53X of the Act to determine starting prices for distributors transitioning from a CPP to the DPP, but this does not apply to quality standards. As such, we have determined quality standards as part of this reset.
41
3605676.11
1.7.2 The second focused on uncertainty and innovation and was held on 8 March
2019.
1.8 Distributors were entitled to apply for a discretionary shortening of asset lives
(accelerated depreciation) before 28 February 2019. We received one application
(from Vector Lines) and accepted comments on this application up until 22 March
2019.
Draft decision and updated draft decision
1.9 The draft decision was released on 29 May 2019. Additional models to support the
draft decision were provided on 21 June 2019.
1.10 Submissions and cross-submission on the draft reasons paper and models were
sought by 18 July 2019 and 12 August 2019 respectively.
1.11 An information gathering request (section 53ZD request) for information relating to
quality of service was made on 28 June 2019. This was followed by a targeted quality
workshop on 16 August 2019.
1.12 Updated draft models and an accompanying companion paper were released on 25
September 2019. Submissions and cross-submissions on the companion paper were
sought during October 2019.
1.13 All the consultation material, along with submissions, are available on our website
at: https://comcom.govt.nz/regulated-industries/electricity-lines/electricity-lines-
price-quality-paths/electricity-lines-default-price-quality-path/2020-2025-default-
price-quality-path.
Submissions not considered
1.14 To ensure a fair process for stakeholders, and to enable us time to properly consider
matters raised in submissions, in the context of determining the DPP reset we have
not had regard to submissions received:
1.14.1 after 16 October 2019 for matters raised in the updated models companion
paper and 25 October 2019 for matters raised in the SAIFI consultation
paper; and 20
20 These were the dates on which cross-submissions were due for the updated draft and SAIFI consultations respectively.
42
3605676.11
1.14.2 that was outside the ambit of consultation we had set for the updated
models and the SAIFI consultation paper, unless it addressed a material
element of our DPP reset decisions that was communicated for the first time
in those publications.21
Process for amending IMs
1.15 Alongside the DPP3 reset process, we have also consulted on a package of
amendments to the EDB IMs. These amendments fall into two broad categories:
1.15.1 changes we considered necessary to support implementation of incremental
improvements to the way the DPP is set (such as new recoverable costs or
reopeners); and
1.15.2 changes we considered to enhance certainty about the rules or correct errors
ahead of the DPP reset (for example, correcting implementation errors in the
IRIS drafting).
Process for DPP-related IM amendments
1.16 We issued notices of intention to amend the EDB IMs on 15 November 2018 and 16
May 2019, which set out the scope of the changes we were considering, and the
indicative process we intended to follow.
1.17 Alongside the DPP3 draft decision, on 29 May 2019, we published a draft IM
amendment decision, and a reasons paper setting out the reasons for our proposed
changes. Submissions and cross-submissions on IM amendments were sought by 5
July 2019 and 19 July 2019 respectively.
1.18 In response to additional correspondence from the Electricity Networks Association
(ENA) received on 5 September 2019, on 18 October 2019 the Commission published
an open letter regarding our decision not to amend the IMs for cost of capital or
asset valuation.
1.19 A final decision on the IM amendments necessary to implement the DPP was
published on 26 November 2019.22
21 The scope of the consultation on the Updated Models Companion Paper was set out in: Commerce Commission, “Default price-quality paths for electricity distribution businesses from 1 April 2020 – Updated draft models – Companion Paper” (25 September 2019), para 1.3. The scope of the SAIFI consultation was set out in: Commerce Commission “Default price-quality paths for electricity distribution businesses from 1 April 2020 – Recording of successive interruptions for SAIFI – Consultation Paper” (7 October 2019), para 3.
22 Commerce Commission “Amendments to electricity distribution services input methodologies determination – Reasons paper” (26 November 2019).
43
3605676.11
1.20 All the consultation material for the IM amendments, along with submissions, are
available on our website at: https://comcom.govt.nz/regulated-industries/input-
methodologies/projects/amendments-necessary-to-implement-the-2020-electricity-
distribution-default-price-quality-path.
Process for operating leases IM
1.21 As part of a separate but related process, we have made amendments to the EDB
IMs to respond to changes in the accounting treatment of operating leases. We
published a final decision on these changes on 13 November 2019. The relevant
consultation material and submissions are available on our website at:
https://comcom.govt.nz/regulated-industries/input-
methodologies/projects/operating-leases.
What we have published alongside this paper
1.22 Alongside this paper we have published:
1.22.1 the suite of final financial and other models used to either determine final
starting prices and quality standards or to inform the analysis in this paper;
and
1.22.2 a final version of the EDB DPP determination.
1.23 Immediately prior to the publication of this paper, we have published:
1.23.1 final amendments to the EDB IMs necessary to implement our draft DPP3
decisions; and
1.23.2 a reasons paper explaining changes to the EDB IMs.
1.24 Finally, at the same time but as part of a separate consultation process, we have
published a final decision on resetting Transpower’s Individual Price-Quality Path
(IPP).23
How we have structured this paper
1.25 The chapters of this paper:
1.25.1 summarise our decision;
1.25.2 explain the framework we have applied to reach these decisions and the
context in which we are making them; and
23 This material can be found on our website at: https://comcom.govt.nz/regulated-industries/electricity-lines/electricity-transmission/transpowers-price-quality-path/setting-transpowers-price-quality-path-from-2020.
44
3605676.11
1.25.3 explain each of the key components that affect starting prices, revenue
during the period, and quality standards.
1.26 The attachments to this paper explain our final decisions in detail and respond to
submissions stakeholders have made throughout the consultation process and in our
stakeholder workshops. We have structured the attachments into three parts:
1.26.1 Part 1 deals with decisions affecting starting prices for each distributor;
1.26.2 Part 2 deals with decisions affecting the revenue path during DPP3; and
1.26.3 Part 3 deals with decisions affecting quality standards and incentives.
Further inquiries and feedback on process
1.27 Inquiries on the final determination and its associated published documents should
be addressed to:
Dane Gunnell (Manager, Price-Quality regulation) c/o [email protected]
Feedback on process for setting DPP3
1.28 In early 2020, we will invite feedback on the process we have followed to set DPP3,
and on ways this process could be improved in future.
45
3605676.11
Chapter 2 Impact on allowable revenue
Purpose of this chapter
2.1 This chapter sets out the key decisions we have made and estimates their potential
impact on distributors’ allowable revenue and customers’ lines charges.
2.2 It starts by briefly explaining the regulatory framework under Part 4 of the
Commerce Act, and the role of price-quality regulation. It then explains the key
decisions we have made as they relate to the price path.
Regulation of price and quality under Part 4
2.3 Part 4 of the Commerce Act provides for the regulation of the price and quality of
goods or services in markets where there is little or no competition, and little or no
likelihood of a substantial increase in competition.24 For distributors, it sets out two
forms of regulation:
2.3.1 Information disclosure (ID) regulation, under which regulated suppliers are
required to publicly disclose information relevant to their performance.25
2.3.2 Default/customised price-quality regulation, under which price-quality paths
set the maximum average price or total allowable revenue that the regulated
supplier can charge. They also set standards for the quality of the services
that each regulated supplier must meet. This ensures that businesses do not
have incentives to reduce quality to maximise profits under their price-
quality path.26
2.4 All businesses which provide electricity distribution services are regulated under
Part 4 of the Commerce Act.27 Of the 29 distributors, 12 are exempt from price-
quality regulation because they are consumer-owned.28
2.5 The “non-exempt” distributors which are subject to either a DPP or a CPP are set out
in the table and map below.
24 Commerce Act 1986, section 52. 25 Commerce Act 1986, section 52B and 54F. As per section 54, information disclosure applies to all EDBs
subject to Part 4. 26 Commerce Act 1986, sections 52B and 54G. As per section 54G, default/customised price-quality regulation
applies only to EDBs who do not meet the consumer-owned criteria set out in section 54D. EDBs subject to a default price-quality path have the option of applying for a customised price-quality path to better meet their particular circumstances (section 53Q).
27 Commerce Act 1986, section 54E. 28 ‘Consumer-owned’ is defined in Commerce Act 1986, section 54D.
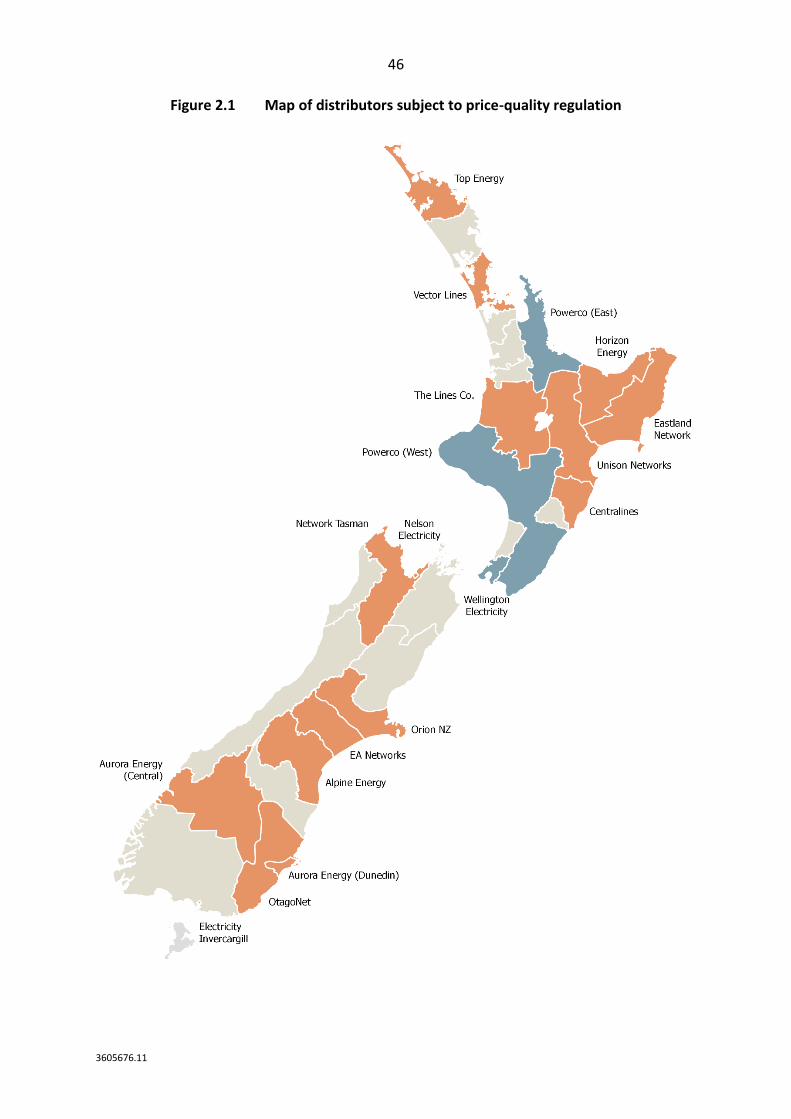
46
3605676.11
Figure 2.1 Map of distributors subject to price-quality regulation
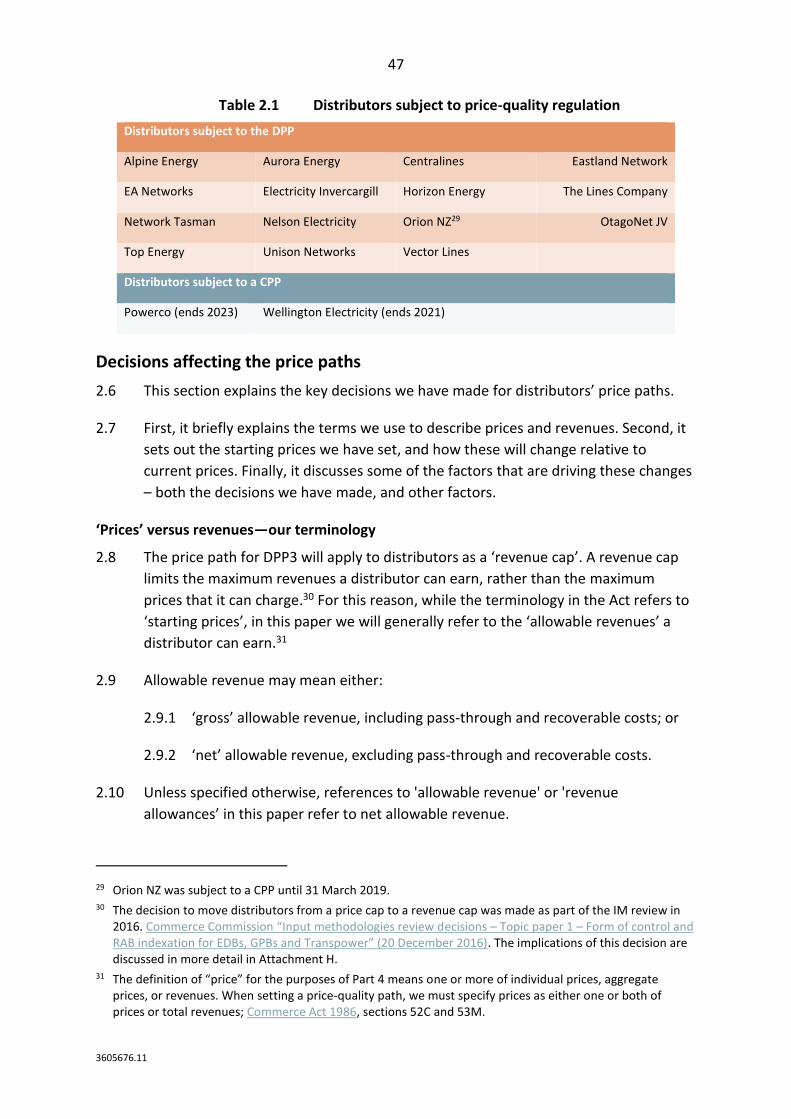
47
3605676.11
Table 2.1 Distributors subject to price-quality regulation
Distributors subject to the DPP
Alpine Energy Aurora Energy Centralines Eastland Network
EA Networks Electricity Invercargill Horizon Energy The Lines Company
Network Tasman Nelson Electricity Orion NZ29 OtagoNet JV
Top Energy Unison Networks Vector Lines
Distributors subject to a CPP
Powerco (ends 2023) Wellington Electricity (ends 2021)
Decisions affecting the price paths
2.6 This section explains the key decisions we have made for distributors’ price paths.
2.7 First, it briefly explains the terms we use to describe prices and revenues. Second, it
sets out the starting prices we have set, and how these will change relative to
current prices. Finally, it discusses some of the factors that are driving these changes
– both the decisions we have made, and other factors.
‘Prices’ versus revenues—our terminology
2.8 The price path for DPP3 will apply to distributors as a ‘revenue cap’. A revenue cap
limits the maximum revenues a distributor can earn, rather than the maximum
prices that it can charge.30 For this reason, while the terminology in the Act refers to
‘starting prices’, in this paper we will generally refer to the ‘allowable revenues’ a
distributor can earn.31
2.9 Allowable revenue may mean either:
2.9.1 ‘gross’ allowable revenue, including pass-through and recoverable costs; or
2.9.2 ‘net’ allowable revenue, excluding pass-through and recoverable costs.
2.10 Unless specified otherwise, references to 'allowable revenue' or 'revenue
allowances’ in this paper refer to net allowable revenue.
29 Orion NZ was subject to a CPP until 31 March 2019. 30 The decision to move distributors from a price cap to a revenue cap was made as part of the IM review in
2016. Commerce Commission “Input methodologies review decisions – Topic paper 1 – Form of control and RAB indexation for EDBs, GPBs and Transpower” (20 December 2016). The implications of this decision are discussed in more detail in Attachment H.
31 The definition of “price” for the purposes of Part 4 means one or more of individual prices, aggregate prices, or revenues. When setting a price-quality path, we must specify prices as either one or both of prices or total revenues; Commerce Act 1986, sections 52C and 53M.
48
3605676.11
Price path
2.11 The price path is composed of three elements:
2.11.1 starting prices, expressed as maximum allowable revenue (MAR) for the first
year of the period (2020/21);
2.11.2 the annual rate of change in revenues (CPI, plus or minus an ‘X-factor’); and
2.11.3 pass-through and recoverable costs.
2.12 Our decision to set starting prices on the basis of current and projected profitability
(discussed more in Chapter 5) will lead to a change in the net revenue each
distributor can recover.
2.13 On top of this our decision on Transpower’s IPP, the results of the incremental rolling
incentive scheme (IRIS) efficiency incentives during DPP2, and other changes in pass-
through and recoverable costs will affect the gross revenue distributors may recover
from their customers.
Starting prices
2.14 Starting prices determine distributors’ net allowable revenue in the first year of the
DPP3 regulatory period. When combined with the rate of change, they also
determine revenues in each subsequent year. Allowable revenues for the first year
of the DPP3 period are set out in Table 2.2 below, and are discussed in more detail in
Chapter 5.
Rate of change (CPI-X)
2.15 The rate of change in revenues (relative to CPI) for each subsequent year is also set
out below, and is discussed in more detail in Chapter 6.
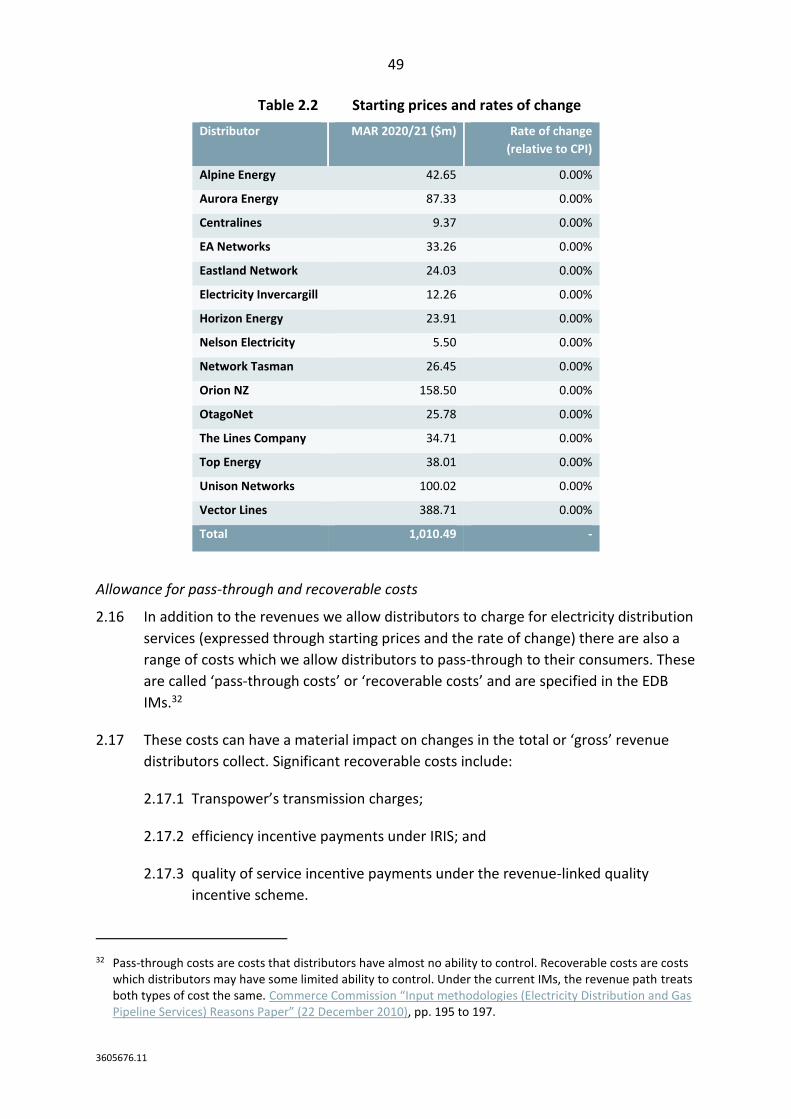
49
3605676.11
Table 2.2 Starting prices and rates of change
Distributor MAR 2020/21 ($m) Rate of change
(relative to CPI)
Alpine Energy 42.65 0.00%
Aurora Energy 87.33 0.00%
Centralines 9.37 0.00%
EA Networks 33.26 0.00%
Eastland Network 24.03 0.00%
Electricity Invercargill 12.26 0.00%
Horizon Energy 23.91 0.00%
Nelson Electricity 5.50 0.00%
Network Tasman 26.45 0.00%
Orion NZ 158.50 0.00%
OtagoNet 25.78 0.00%
The Lines Company 34.71 0.00%
Top Energy 38.01 0.00%
Unison Networks 100.02 0.00%
Vector Lines 388.71 0.00%
Total 1,010.49 -
Allowance for pass-through and recoverable costs
2.16 In addition to the revenues we allow distributors to charge for electricity distribution
services (expressed through starting prices and the rate of change) there are also a
range of costs which we allow distributors to pass-through to their consumers. These
are called ‘pass-through costs’ or ‘recoverable costs’ and are specified in the EDB
IMs.32
2.17 These costs can have a material impact on changes in the total or ‘gross’ revenue
distributors collect. Significant recoverable costs include:
2.17.1 Transpower’s transmission charges;
2.17.2 efficiency incentive payments under IRIS; and
2.17.3 quality of service incentive payments under the revenue-linked quality
incentive scheme.
32 Pass-through costs are costs that distributors have almost no ability to control. Recoverable costs are costs which distributors may have some limited ability to control. Under the current IMs, the revenue path treats both types of cost the same. Commerce Commission “Input methodologies (Electricity Distribution and Gas Pipeline Services) Reasons Paper” (22 December 2010), pp. 195 to 197.
50
3605676.11
Drivers of net allowable revenue changes between DPP2 and DPP3
2.18 This section discusses changes in allowable revenue between the current DPP period
(DPP2) and the next DPP period (DPP3). Changes between the draft DPP3 decision
and the final DPP3 decision are discussed in the next section.
2.19 Changes in net allowable revenue are the result of:
2.19.1 decisions we have made (principally on opex and capex forecasts);
2.19.2 changes in other parameters we use in assessing current and projected
profitability, but which are not part of our decision (principally in the
weighted average cost of capital (WACC)) and the ‘initial conditions’ for each
distributor; and
2.19.3 changes that have applied to allowable revenues during the DPP2 period (CPI,
alternate X-factors, and changes in quantities).
2.20 Figure 2.2 below shows the drivers of changes in net allowable revenues for all
distributors on the DPP between the DPP2 and DPP3 periods, in nominal terms.33
This analysis is presented on a distributor-specific basis in Attachment O.
2.21 The figure begins with MAR in the first year of the DPP2 period (2015/16), and shows
the progressive impact of changes in each variable used in our current and projected
profitability modelling (the “financial model” that we have published alongside this
paper), ending with MAR in the first year of the DPP3 period (2020/21).
33 This excludes Powerco and Wellington Electricity, who are currently on CPPs, and Orion who was on a CPP until 2019/20, and for who we have no comparable DPP2 values.
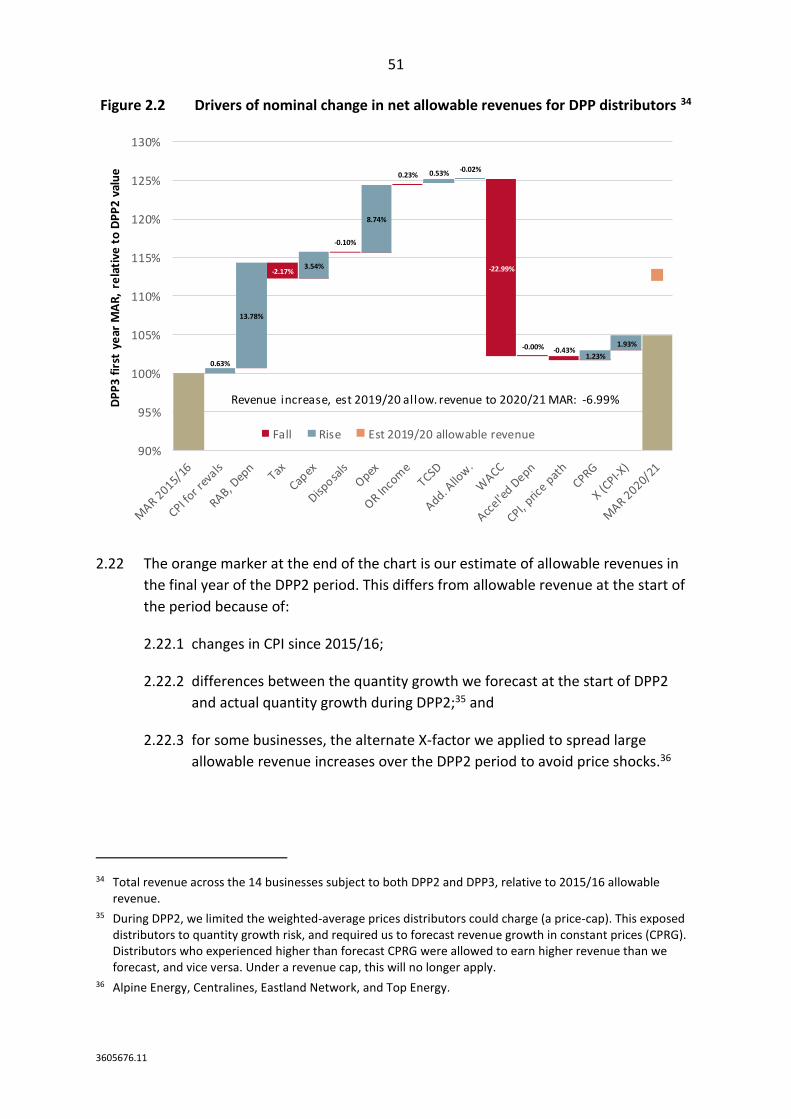
51
3605676.11
Figure 2.2 Drivers of nominal change in net allowable revenues for DPP distributors 34
2.22 The orange marker at the end of the chart is our estimate of allowable revenues in
the final year of the DPP2 period. This differs from allowable revenue at the start of
the period because of:
2.22.1 changes in CPI since 2015/16;
2.22.2 differences between the quantity growth we forecast at the start of DPP2
and actual quantity growth during DPP2;35 and
2.22.3 for some businesses, the alternate X-factor we applied to spread large
allowable revenue increases over the DPP2 period to avoid price shocks.36
34 Total revenue across the 14 businesses subject to both DPP2 and DPP3, relative to 2015/16 allowable revenue.
35 During DPP2, we limited the weighted-average prices distributors could charge (a price-cap). This exposed distributors to quantity growth risk, and required us to forecast revenue growth in constant prices (CPRG). Distributors who experienced higher than forecast CPRG were allowed to earn higher revenue than we forecast, and vice versa. Under a revenue cap, this will no longer apply.
36 Alpine Energy, Centralines, Eastland Network, and Top Energy.
-2.17%
-0.10%
-0.02%
-22.99%
-0.00% -0.43%
0.63%
13.78%
3.54%
8.74%
0.23% 0.53%
1.23%
1.93%
90%
95%
100%
105%
110%
115%
120%
125%
130%
DP
P3
fir
st y
ear
MA
R,
rela
tive
to
DP
P2
val
ue
Fall Rise Est 2019/20 allowable revenue
Revenue increase, est 2019/20 allow. revenue to 2020/21 MAR: -6.99%
52
3605676.11
2.23 The cumulative effect of these changes is that total estimated net allowable
revenues (for the 14 businesses analysed) in the final year of the DPP2 period
(2019/20) are 5% higher than they were at the start of the DPP2 period. As a result,
the estimated change in net allowable revenue between 2019/2020 and 2020/21 is a
decrease of -7%.
Effect of our decisions
2.24 The change in our opex forecasts relative to our DPP2 forecasts directly impacts
allowable revenues, as all opex is recovered in the year it is forecast to occur.37
These changes account for a +9% change in overall revenue.
2.25 Changes in our capex forecasts, again relative to our forecasts for DPP2, have a
lesser impact on starting prices than opex does.38 This is because capex does not
directly impact revenue, but rather impacts each distributors’ forecast RAB, and is
recovered over multiple regulatory periods. These changes account for a +4% change
in overall revenue.
Effect of changes in other parameters
2.26 Changes in the WACC are the largest driver of changes in distributor revenue,
accounting for a -23% overall change. The WACC value used to set starting prices for
DPP2 was 7.19%. The estimate we have used for this decision is 4.57%.39
2.27 The financial model for the DPP depends on a set of initial conditions for each
distributor. These initial conditions are sourced from each distributor’s ID data, and
reflect accumulated changes since the DPP was last reset in 2014. Changes in these
initial conditions account for +14% of the overall change, with the majority explained
by RAB growth over the DPP2 period.40
37 Changes in actual opex relative to our DPP2 forecasts also have an impact on future gross revenues, however this is delivered through the opex IRIS mechanism. These effects are discussed in Attachment E.
38 Changes in actual capex relative to our DPP2 forecasts also have an impact on future revenues, however this is delivered through the capex IRIS mechanism. These effects are discussed in Attachment E.
39 Commerce Commission Cost of capital determination for electricity distribution businesses’ 2020-2025 default price-quality paths and Transpower New Zealand Limited’s 2020-2025 individual price-quality path [2019] NZCC 12 (25 September 2019).
40 This increase includes spur assets purchased by some distributors from Transpower. These purchases have contributed approximately 2% of total commissioned assets for the period.
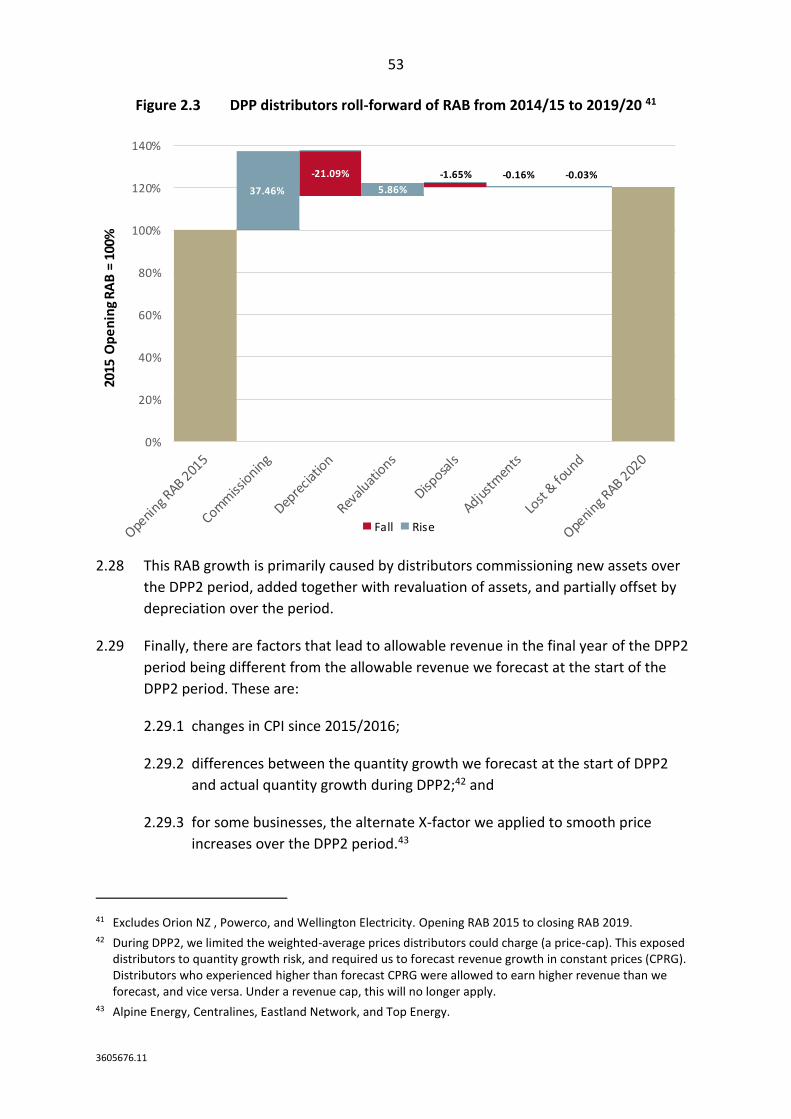
53
3605676.11
Figure 2.3 DPP distributors roll-forward of RAB from 2014/15 to 2019/20 41
2.28 This RAB growth is primarily caused by distributors commissioning new assets over
the DPP2 period, added together with revaluation of assets, and partially offset by
depreciation over the period.
2.29 Finally, there are factors that lead to allowable revenue in the final year of the DPP2
period being different from the allowable revenue we forecast at the start of the
DPP2 period. These are:
2.29.1 changes in CPI since 2015/2016;
2.29.2 differences between the quantity growth we forecast at the start of DPP2
and actual quantity growth during DPP2;42 and
2.29.3 for some businesses, the alternate X-factor we applied to smooth price
increases over the DPP2 period.43
41 Excludes Orion NZ , Powerco, and Wellington Electricity. Opening RAB 2015 to closing RAB 2019. 42 During DPP2, we limited the weighted-average prices distributors could charge (a price-cap). This exposed
distributors to quantity growth risk, and required us to forecast revenue growth in constant prices (CPRG). Distributors who experienced higher than forecast CPRG were allowed to earn higher revenue than we forecast, and vice versa. Under a revenue cap, this will no longer apply.
43 Alpine Energy, Centralines, Eastland Network, and Top Energy.
-21.09% -1.65% -0.16% -0.03%
37.46% 5.86%
0%
20%
40%
60%
80%
100%
120%
140%
2015
Op
en
ing
RA
B =
100
%
Fall Rise
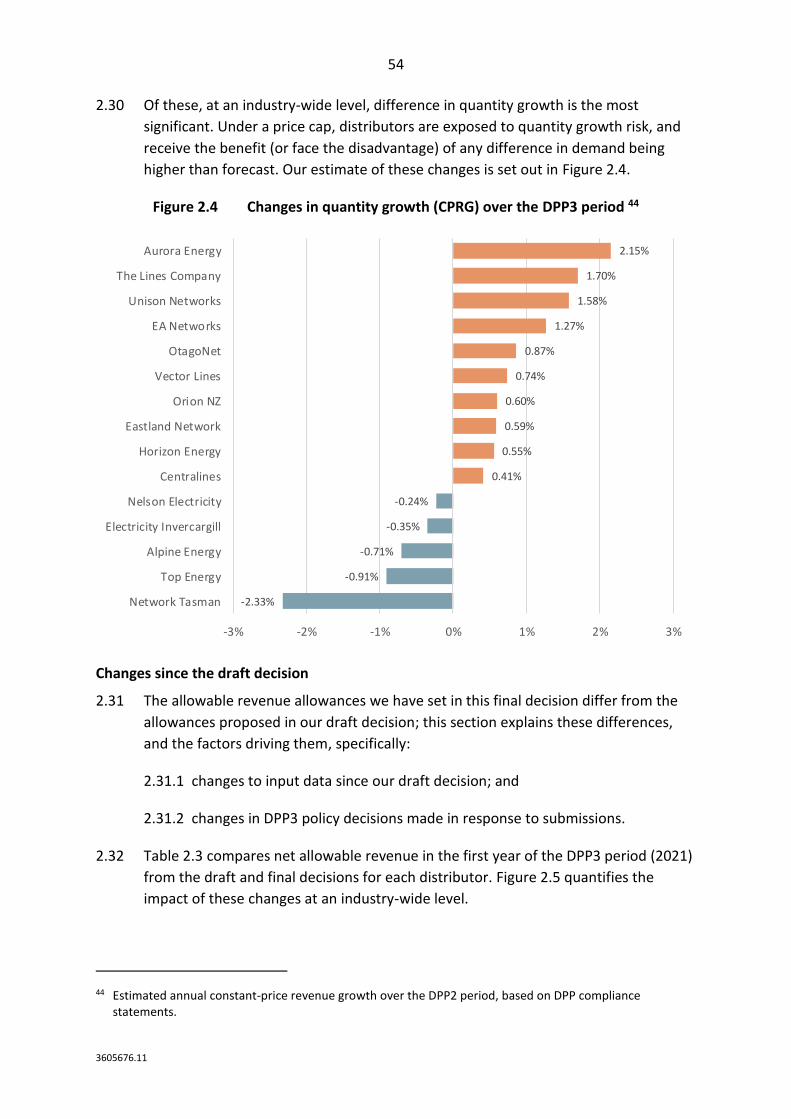
54
3605676.11
2.30 Of these, at an industry-wide level, difference in quantity growth is the most
significant. Under a price cap, distributors are exposed to quantity growth risk, and
receive the benefit (or face the disadvantage) of any difference in demand being
higher than forecast. Our estimate of these changes is set out in Figure 2.4.
Figure 2.4 Changes in quantity growth (CPRG) over the DPP3 period 44
Changes since the draft decision
2.31 The allowable revenue allowances we have set in this final decision differ from the
allowances proposed in our draft decision; this section explains these differences,
and the factors driving them, specifically:
2.31.1 changes to input data since our draft decision; and
2.31.2 changes in DPP3 policy decisions made in response to submissions.
2.32 Table 2.3 compares net allowable revenue in the first year of the DPP3 period (2021)
from the draft and final decisions for each distributor. Figure 2.5 quantifies the
impact of these changes at an industry-wide level.
44 Estimated annual constant-price revenue growth over the DPP2 period, based on DPP compliance statements.
-2.33%
-0.91%
-0.71%
-0.35%
-0.24%
0.41%
0.55%
0.59%
0.60%
0.74%
0.87%
1.27%
1.58%
1.70%
2.15%
-3% -2% -1% 0% 1% 2% 3%
Network Tasman
Top Energy
Alpine Energy
Electricity Invercargill
Nelson Electricity
Centralines
Horizon Energy
Eastland Network
Orion NZ
Vector Lines
OtagoNet
EA Networks
Unison Networks
The Lines Company
Aurora Energy
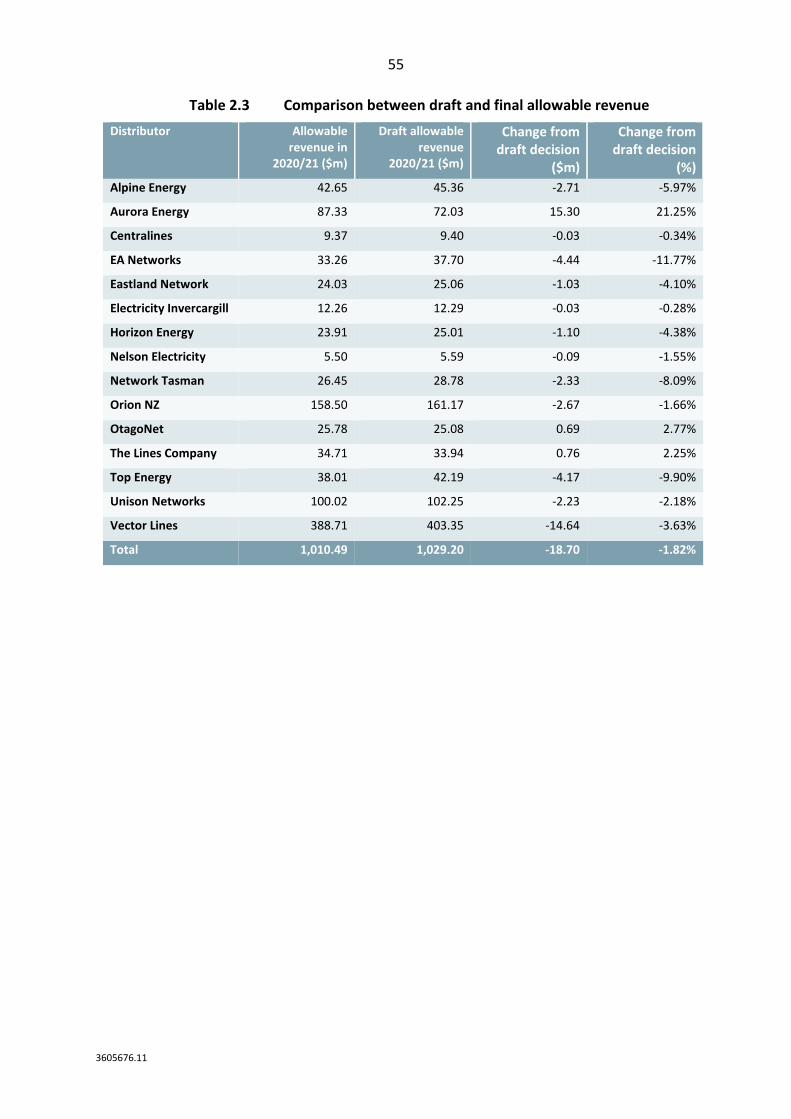
55
3605676.11
Table 2.3 Comparison between draft and final allowable revenue
Distributor Allowable revenue in
2020/21 ($m)
Draft allowable revenue
2020/21 ($m)
Change from draft decision
($m)
Change from draft decision
(%)
Alpine Energy 42.65 45.36 -2.71 -5.97%
Aurora Energy 87.33 72.03 15.30 21.25%
Centralines 9.37 9.40 -0.03 -0.34%
EA Networks 33.26 37.70 -4.44 -11.77%
Eastland Network 24.03 25.06 -1.03 -4.10%
Electricity Invercargill 12.26 12.29 -0.03 -0.28%
Horizon Energy 23.91 25.01 -1.10 -4.38%
Nelson Electricity 5.50 5.59 -0.09 -1.55%
Network Tasman 26.45 28.78 -2.33 -8.09%
Orion NZ 158.50 161.17 -2.67 -1.66%
OtagoNet 25.78 25.08 0.69 2.77%
The Lines Company 34.71 33.94 0.76 2.25%
Top Energy 38.01 42.19 -4.17 -9.90%
Unison Networks 100.02 102.25 -2.23 -2.18%
Vector Lines 388.71 403.35 -14.64 -3.63%
Total 1,010.49 1,029.20 -18.70 -1.82%
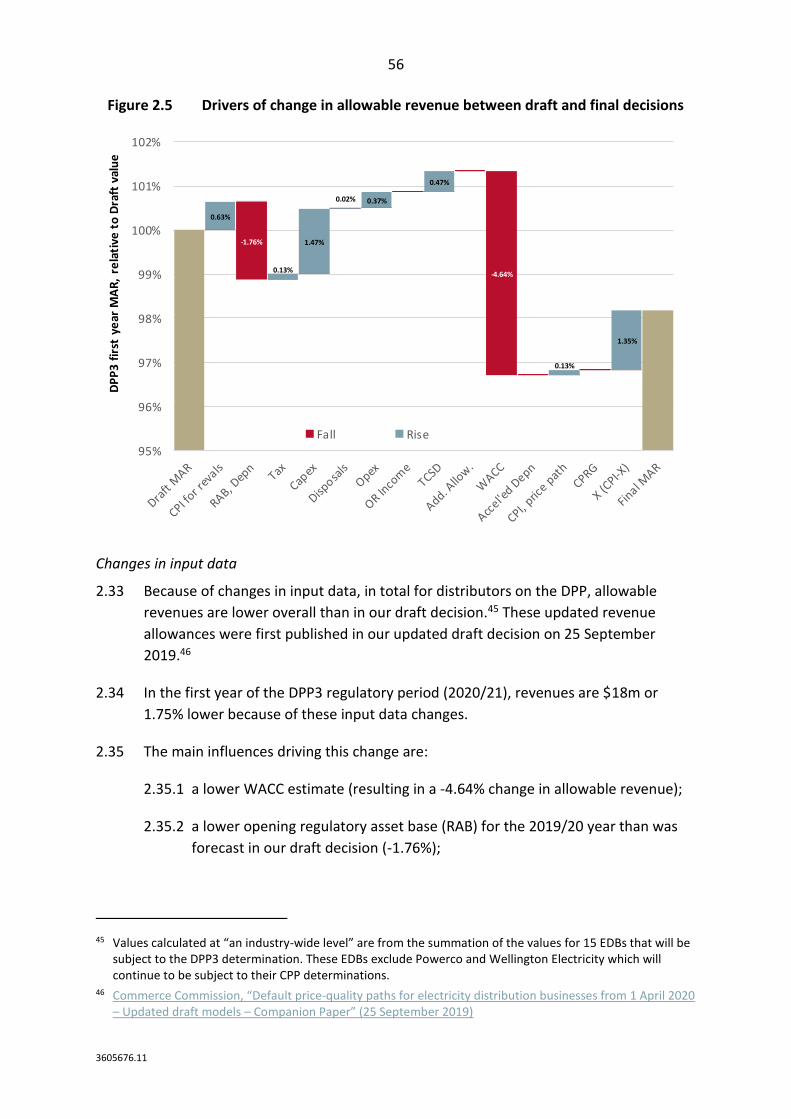
56
3605676.11
Figure 2.5 Drivers of change in allowable revenue between draft and final decisions
Changes in input data
2.33 Because of changes in input data, in total for distributors on the DPP, allowable
revenues are lower overall than in our draft decision.45 These updated revenue
allowances were first published in our updated draft decision on 25 September
2019.46
2.34 In the first year of the DPP3 regulatory period (2020/21), revenues are $18m or
1.75% lower because of these input data changes.
2.35 The main influences driving this change are:
2.35.1 a lower WACC estimate (resulting in a -4.64% change in allowable revenue);
2.35.2 a lower opening regulatory asset base (RAB) for the 2019/20 year than was
forecast in our draft decision (-1.76%);
45 Values calculated at “an industry-wide level” are from the summation of the values for 15 EDBs that will be subject to the DPP3 determination. These EDBs exclude Powerco and Wellington Electricity which will continue to be subject to their CPP determinations.
46 Commerce Commission, “Default price-quality paths for electricity distribution businesses from 1 April 2020 – Updated draft models – Companion Paper” (25 September 2019)
-1.76%
-4.64%
0.63%
0.13%
1.47%
0.02% 0.37%
0.47%
0.13%
1.35%
95%
96%
97%
98%
99%
100%
101%
102%
DP
P3
fir
st y
ear
MA
R,
rela
tive
to
Dra
ft v
alu
e
Fall Rise
57
3605676.11
2.35.3 for capex, the use of 2019 AMP forecasts and 2019 actual data (+1.47%); and
2.35.4 for opex, use of updated cost escalator and base year data (+0.37%).
2.36 Input data changes since the draft decision are not uniform across all distributors. In
particular, changes that affect opex and capex allowances, and changes in the
opening RAB for each distributor result in significant differences.
Changes to DPP3 policy decisions
2.37 In addition to the changes in input data, changes in policy decisions since the draft
have also affected revenue allowances. These changes relate to forecasts of opex
and capex, and in one case, the X-factor we have applied.
2.38 For opex forecasts, the principle changes affecting revenue allowances are:
2.38.1 the removal of FENZ levies, pecuniary penalties and operating leases from
forecast opex;
2.38.2 use of household growth forecasts, rather than population growth forecasts;
and
2.38.3 updates to the elasticities for network and non-network opex.
2.39 For capital expenditure, the most material change is to how we calculate the ‘fall-
back’ for suppliers where their AMP forecasts do not pass a gating test. Beyond that,
our updated approach to system growth, and the introduction of dollar-amount caps
on non-network and asset relocation capex affect certain suppliers’ allowances.
Impact on consumer bills
2.40 Our decision is likely to impact the prices that end-consumers will pay because of the
effects on the revenues that distributors can recover. Electricity distribution charges
compose 27% of an average consumer’s bill, and electricity transmission charges
compose a further 11%.47 The combined effect on consumer bills of changes to
distributor and Transpower allowed charges is estimated in Figure 2.6 below.
2.41 Note that this presents the change based on distributors’ revenue allowances, not
on the actual revenue they have been recovering. Where a distributor is pricing
below its revenue cap, the change will be less significant.
47 Electricity Authority “What makes up my power bill?” (as of 15 November 2019).
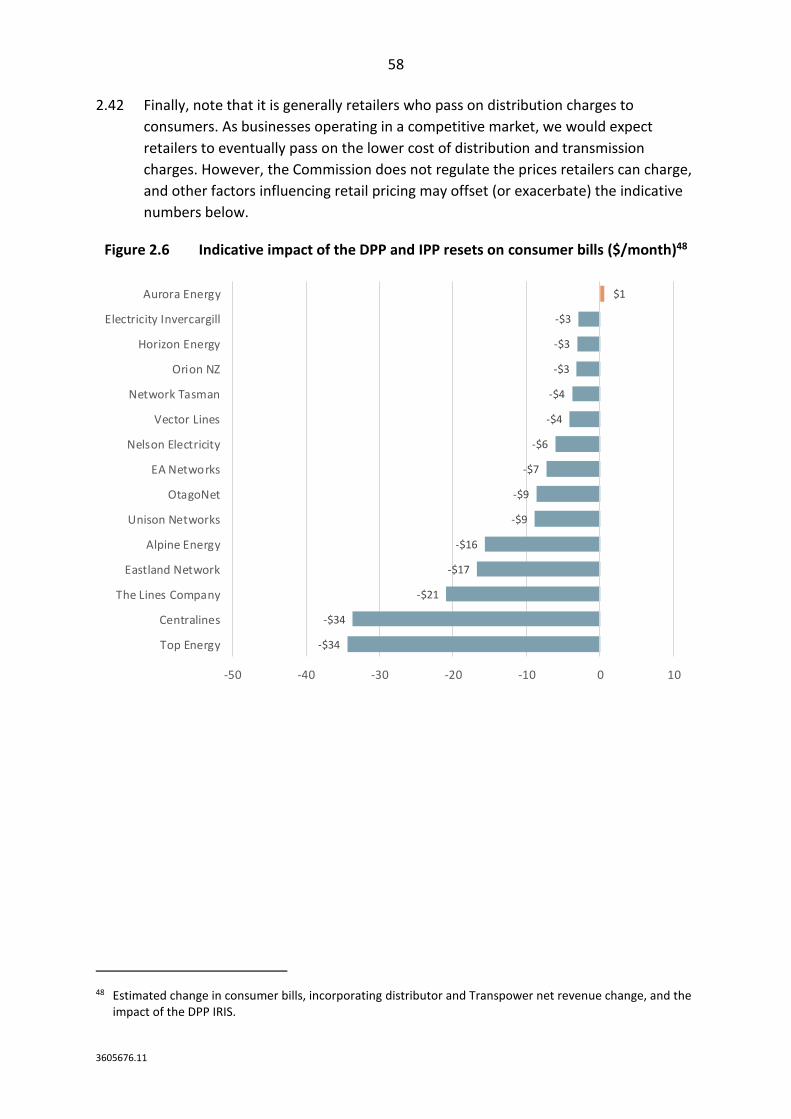
58
3605676.11
2.42 Finally, note that it is generally retailers who pass on distribution charges to
consumers. As businesses operating in a competitive market, we would expect
retailers to eventually pass on the lower cost of distribution and transmission
charges. However, the Commission does not regulate the prices retailers can charge,
and other factors influencing retail pricing may offset (or exacerbate) the indicative
numbers below.
Figure 2.6 Indicative impact of the DPP and IPP resets on consumer bills ($/month)48
48 Estimated change in consumer bills, incorporating distributor and Transpower net revenue change, and the impact of the DPP IRIS.
-$34
-$34
-$21
-$17
-$16
-$9
-$9
-$7
-$6
-$4
-$4
-$3
-$3
-$3
$1
-50 -40 -30 -20 -10 0 10
Top Energy
Centralines
The Lines Company
Eastland Network
Alpine Energy
Unison Networks
OtagoNet
EA Networks
Nelson Electricity
Vector Lines
Network Tasman
Orion NZ
Horizon Energy
Electricity Invercargill
Aurora Energy
59
3605676.11
Chapter 3 Framework
Purpose of this chapter
3.1 This chapter describes the high-level framework we have applied in making our DPP3
decisions. To do this, this chapter explains:
3.1.1 the requirements for setting DPPs under Part 4 of the Act;
3.1.2 the economic principles we have developed to aid in applying Part 4;
3.1.3 the incentives that give effect to these;
3.1.4 the low-cost DPP principles we use to help define the balance between DPP
and CPP regulation; and
3.1.5 our framework for making decisions on DPP3.
3.2 It also summarises submissions on our draft decisions that were relevant to our
regulatory framework, and responds to them.
Statutory purpose
3.3 Part 4 provides for the regulation of the price and quality of goods or services in
markets where there is little or no competition, and little or no likelihood of a
substantial increase in competition.49 For electricity distributors, it sets out that
regulation should apply in two forms:
3.3.1 ID regulation, under which regulated suppliers are required to publicly
disclose information relevant to their performance.50
3.3.2 Default/customised price-quality regulation, under which price-quality paths
set the maximum average price or total allowable revenue that the regulated
supplier can charge. They also set standards for the quality of the services
that each regulated supplier must meet. This ensures that businesses do not
have incentives to reduce quality to maximise profits under their price-
quality path.51
49 Commerce Act 1986, section 52. 50 Commerce Act 1986, sections 52B and 54F. As per section 54, information disclosure applies to all EDBs
subject to Part 4. 51 Commerce Act 1986, sections 52B and 54G. As per section 54F, default/customised price-quality regulation
applies only to EDBs who do not meet the consumer-owned criteria set out in section 54D. EDBs subject to a default price-quality path have the option of applying for a customised price-quality path to better meet their particular circumstances (section 53Q).
60
3605676.11
3.4 To set a DPP, Part 4 specifies a number of requirements and limitations which we
must follow:
3.4.1 the scope and application of the regulatory rules and processes, referred to
as IMs, which we are required to set for Part 4 regulation;52
3.4.2 the content and timing of price-quality paths;53
3.4.3 what the determinations used to set DPPs must specify;54
3.4.4 requirements when resetting DPPs;55 and
3.4.5 how we consider incentives and the avoidance of disincentives for energy
efficiency, demand-side management, and the reduction of losses.56
3.5 We must also consider the Part 4 purpose and what default/customised price-quality
regulation is intended to achieve when making our decisions.
Purpose of Part 4
3.6 Section 52A of the Act sets out the purpose of Part 4 regulation:
(1) The purpose of this Part is to promote the long-term benefit of consumers in markets referred to in section 52 by promoting outcomes that are consistent with outcomes produced in competitive markets such that suppliers of regulated goods or services—
(a) have incentives to innovate and to invest, including in replacement, upgraded, and new assets; and
(b) have incentives to improve efficiency and provide services at a quality that reflects consumer demands; and
(c) share with consumers the benefits of efficiency gains in the supply of the regulated goods or services, including through lower prices; and
(d) are limited in their ability to extract excessive profits.
3.7 The key component of this statement is that we are to promote the long-term
benefit of consumers, and this is our primary concern in achieving the purpose of
Part 4. Section 52A guides us that this is to be achieved by promoting outcomes that
are consistent with outcomes produced by competitive markets, and gives us four
objectives to pursue that are considered consistent with those of competitive
markets.
52 Commerce Act 1986, section 52P(3). 53 Commerce Act 1986, section 53M. 54 Commerce Act 1986, section 53O. 55 Commerce Act 1986, section 53P. 56 Commerce Act 1986, section 54Q.
61
3605676.11
3.8 In practice, when setting a DPP, it is important to note:
3.8.1 We do not focus on replicating all the potential outcomes or mechanisms of
workably competitive markets; we focus on promoting the section 52A
outcomes.
3.8.2 None of the objectives listed in section 52A(a) to (d) are more important than
the others, and they are not separate and distinct from each other, nor from
section 52A(1) as a whole. Rather, we must balance the section
52A(1)(a) to (d) outcomes, and exercise judgement in doing so.57
3.8.3 When exercising this judgement we are guided by what best promotes the
long-term benefit of consumers.58
3.9 In submitting on our issues paper, Meridian raised concerns that:
the Issues Paper does not place sufficient emphasis on alignment of distribution sector
outcomes with those occurring in competitive markets. The Issues Paper states the
Commission will balance the section 52A(1)(a) to (d) outcomes and exercise judgment in
doing so, but does not appear to acknowledge that each of those outcomes needs to be
pursued to a degree consistent with that which occurs in competitive markets…
… it is not enough, for example, that distribution businesses have some degree of incentive
to pursue efficiency, or that they have some incentive to share efficiencies, or that they face
some limitations in their ability to make excessive profits. 59
3.10 In general, we agree with Meridian that it is important to highlight the importance of
outcomes in workable competitive markets as a benchmark against which to
measure the incentives we create for suppliers. However, we caution that this
comparison cannot be done with precision in all cases, and that we must weigh the
relative risks to the long-term benefit of consumers when faced with this uncertainty
(for example, when considering the risk of under-investment – below a level which
would be expected in a competitive market – and over-investment).
57 Wellington International Airport Ltd & others v Commerce Commission [2013] NZHC 3289, paras 684. 58 See the discussion of our decision to adopt the 75th percentile for WACC in Wellington International Airport
Ltd & others v Commerce Commission [2013] NZHC 3289, paras 1391-1492. 59 Meridian Energy “2020-2025 Distribution default price-quality path – Issues paper” (20 December 2018),
p. 2.
62
3605676.11
3.11 In its submission on the draft decision, Entrust focused on the investment limb of the
purpose, saying:
Care is needed to ensure Part 4 regulation does not inhibit needed investment: The
Commission faces a difficult balancing act between operating Default Price-Quality Path
(DPP) regulation in a low-cost manner, while recognising ‘one size does not fit all’. Particular
care is needed around elements of price-quality regulation which impact the extent lines
companies can invest and maintain or improve network resilience and reliability.60
3.12 We share Entrust’s view that promoting incentives for distributors to invest is
important, and several of the decisions discussed later in this paper (such as
provision for reopeners, our approach to capex forecasting, and quality incentives)
have been made with this in mind. However, while the approach we take to setting
the DPP should not be characterised as ‘one-size-fits-all’, there is a limit to the extent
and materiality of distributor-specific circumstances we can account for under a DPP.
Purpose of DPP/CPP regulation
3.13 Section 53K of the Act sets out the purpose of default/customised price-quality
regulation:
The purpose of default/customised price-quality regulation is to provide a relatively low-cost
way of setting price-quality paths for suppliers of regulated goods or services, while allowing
the opportunity for individual regulated suppliers to have alternative price-quality paths that
better meet their particular circumstances.
3.14 We have taken this purpose to mean that:
3.14.1 DPPs are to be set in a relatively low-cost way, and are not intended to meet
all the circumstances that a distributor may face; and
3.14.2 CPPs are intended to be tailored to meet the particular circumstances of an
individual distributor.
3.15 To meet the relatively low-cost purpose of DPP regulation, we must take into
account the efficiency, complexity, and costs of the price-quality regime as a whole
when resetting the DPP. What this means in practice will vary over time and
between sectors.
3.16 In the DPPs we have set since we determined the IMs, we have developed a
combination of low-cost principles:
3.16.1 applying the same or substantially similar treatment to all suppliers on a DPP;
60 Entrust "Submission on EDB DPP reset draft decisions paper" (18 July 2019), p. 1.
63
3605676.11
3.16.2 setting starting prices and quality standards or incentives with reference to
historical levels of expenditure and performance;
3.16.3 where possible, using existing information disclosed under ID regulation,
including suppliers’ own AMP forecasts; and
3.16.4 limiting the circumstances in which we will reopen or amend a DPP during
the regulatory period.
3.17 In its submission on our issues paper, when discussing the relationship between
DPPs and CPPs, Mercury Energy noted that “distributors are increasingly applying for
CPPs which calls into question the effectiveness of the DPP regime”.61
3.18 We do not agree with this framing of CPP applications. In some cases, distributors
will face unique circumstances which require changes to the prices they charge their
consumers, the quality they deliver (including how this is measured), or the
incentives they face which we cannot properly assess under the DPP. In these cases,
a CPP is the right outcome, and should not be considered a sign of regulatory failure.
3.19 This is demonstrated in the CPP applications we have received to date.
3.19.1 The CPP that applied to Orion was in direct response to the Canterbury
earthquakes that had a catastrophic effect on its network in particular.
3.19.2 In the case of Wellington Electricity its CPP was to cater specifically for
resilience preparedness, the timing and extent of which had a particular
impact on the Wellington region, and for which we were able to implement
specific mechanisms to incentivise the delivery of the programme of work.
3.19.3 Powerco’s CPP application was to deal with a specific need to renew ageing
assets while at the same time addressing specific rapid growth across its
Eastern network, which involved a level of expenditure and price increase not
proportionate to the scrutiny we can apply under a DPP.62
3.20 However, we agree that it is important to avoid unnecessary CPP applications which
address issues that could be accommodated for under a DPP.
61 Mercury “Default Price-Quality Paths for Electricity Distribution Businesses from 1 April 2020” (20 December 2018), p. 2.
62 The specific details of our CPP decisions in respect of these businesses can be found on our website at: https://comcom.govt.nz/regulated-industries/electricity-lines/electricity-lines-price-quality-paths/electricity-lines-customised-price-quality-path.

64
3605676.11
3.21 The ENA and its members, in their submissions on the draft decision, pointed to the
balance between CPPs and DPPs when considering solutions to particular issues
facing the sector:63
ENA members have been considering there may be an intermediate way (between the DPP
and a CPP) of bringing medium sized investment projects into the regulatory process without
the expense and time involved in a CPP. Wellington Electricity showed the way with its
earthquake readiness CPP, founded on a government policy statement. Responding to the
government ICCC electrification policy seems like a similar situation, where an ‘in-between’
business case/project regulatory structure is established to leverage off the low-cost DPP
process but avoid the expensive CPP process.
The solution may fall under the existing DPP process, but the business case evaluation could
take place at any time within a DPP timeline (not just at reset dates) providing the flexibility
to EDBs to respond to government/NZ Inc policy objectives.
3.22 Vector noted:
Equating the low-cost principle underpinning the DPP framework with applying a ‘one-size-
fits-all’ approach to setting allowances – as the draft DPP3 decision appears to do – unfairly
penalises EDBs that are facing circumstances like we are and have put significant effort into
preparing their AMPs.64
3.23 Wellington Electricity expressed support for the decision-making framework (while
at the same time noting instances where it thought the decisions could be
improved):
WELL supports the Commission’s key goal of the Default Price/Quality Path (DPP) framework
of providing a stable (consistent and predictable) regulatory platform by retaining the low
cost approach by making incremental improvements to the DPP2 model.65
3.24 We have considered the ways the DPP can be improved to respond to these kinds of
challenges. Examples of this include an expanded capex reopener, and the approach
we have taken to assessing AMP capex, taking more account of distributor
circumstances than in DPP2. However, there is a limit to our ability to do this without
deeper scrutiny.
3.25 We do not agree with Vector’s assertion that the DPP framework unfairly penalises
distributors facing specific circumstances. Our consistent approach to DPP/CPP
regulation – based on section 53K of the Act – is that CPPs are the appropriate tool
for responding to circumstances that are specific to an individual distributor and that
cannot be accommodated in a low-cost way. DPPs by contrast deal with issues facing
distributors generally, in a relatively low-cost way and applying a generic approach.
63 ENA "Submission on EDB DPP reset draft decisions paper" (18 July 2019), p. 39. 64 Vector “Submission on EDB DPP reset draft decisions paper” (18 July 2019), p. 6. 65 Wellington Electricity “Submission on EDB DPP reset draft decisions paper” (18 July 2019), p. 2.
65
3605676.11
3.26 A DPP is not intended to deal with circumstances that require significant scrutiny of
costs and/or quality targets of a particular distributor. Where a DPP cannot be
sufficiently tailored to meet specific distributor circumstances, two additional
options already exist within the existing Part 4 regulatory framework to
appropriately cater for these.
3.27 The first of these is a DPP quality reopener where a distributor believes it may not be
able to meet the quality standards set under a DPP. The precise requirements for
seeking a quality standard variation are set out in the existing regulatory
framework.66
3.28 The second option is for a distributor to consider applying for a CPP. A CPP can be
tailored to meet the specific needs of a distributor’s customers, and also provides
the flexibility to generally deal with uncertainties that an individual distributor may
encounter.67
Our framework for making decisions on DPP3
3.29 In addition to the section 52A and 53K purpose statements, we use a decision-
making framework and set of economic principles that we have developed over time
to support our decision-making under Part 4. These have been consulted on and
used as part of prior processes, and help provide consistency and transparency to
support our decision making in giving effect to the statutory purpose.
Decision-making framework for DPP3
3.30 For this decision, we have in general retained approaches from the second EDB DPP
(DPP2) where they remain fit for purpose.68 We have made changes to the DPP2
approaches where those changes would:
3.30.1 better promote the purpose of Part 4;69
3.30.2 better promote the purpose of default/customised price-quality path
regulation;70
66 Commerce Commission Electricity Distribution Services Input Methodologies Determination 2012 [2012] NZCC 26 (Consolidated as at 31 January 2019), clauses 4.5.5.
67 Commerce Act 1986, section 53Q 68 These DPP2 approaches are discussed in the relevant attachments to this paper. However, a full discussion
of the DPP2 decision can be found in: Commerce Commission “Default price-quality paths for electricity distributors from 1 April 2015 to 31 March 2020 – Main Policy paper“ (28 November 2014).
69 Commerce Act 1986, section 52A. 70 Commerce Act 1986, section 53K.
66
3605676.11
3.30.3 better promote incentives for suppliers of electricity lines services to invest in
energy efficiency and demand-side management, and to reduce energy
losses (or better avoid disincentives for the same);71 and
3.30.4 reduce unnecessary complexity and compliance costs.
3.31 This approach has been adapted from the 2016 IM review framework, and a similar
framework was applied when resetting the DPP for gas pipeline businesses in 2017.
We consider it will help ensure consistency with the low-cost purpose of the DPP.72
3.32 Submitters were generally supportive of this framework, and in particular the
benefits it creates in terms of regulatory certainty.73
3.33 The ENA, while supportive of the framework overall, cautioned that we must not
impose changes to quality standards without considering the impact on costs (and
therefore revenues).74
3.34 Unison in its submission highlighted the importance of not only consistency, but of
change in response to future circumstances:
In general, we support the incremental approach being adopted – building on DPP2, and also
note the constraints on the Commission looking at the detailed circumstances of each
business under DPP Regulation…
Overall, we think it is important that the reset is not just a mechanical application of models,
but that where necessary adjustments are made to accommodate a reasonable forecast of
the likely operating environment for EDBs in the 2020 to 2025 period and beyond.75
3.35 We agree with this sentiment, and as discussed in Chapter 4 below, our decisions
have been made in many cases to respond to a changing industry context.
3.36 In addition to the above, we have also made changes that:
3.36.1 implement any required changes as a result of the 2016 IM review; and
71 Commerce Act 1986, section 54Q. 72 Commerce Commission “Default price-quality paths for gas pipeline businesses from 1 October 2017 – Final
reasons paper“ (31 May 2017) paras 2.19-2.22. 73 Mercury “Default Price-Quality Paths for Electricity Distribution Businesses from 1 April 2020” (20
December 2018), p. 3; Fonterra “Consultation Paper EDB DPP3 Issue Paper” (20 December 2018); page 1.
74 Electricity Networks Assoc (ENA) “DPP3 April 2020 Commission Issues paper( Part One Regulating capex, opex & incentives)” (20 December 2018), p. 10.
75 Unison “Submission on default price-quality paths for electricity distribution businesses from 1 April 2020 Issues paper” (21 December 2018), p. 2.
https://comcom.govt.nz/__data/assets/pdf_file/0015/62250/Gas-DPP-2017-Reasons-Paper-31-May-2017-.pdf
67
3605676.11
3.36.2 where appropriate, carry across new approaches developed during the DPP
we set in 2017 for gas pipeline businesses and for recent CPPs.76
3.37 Our goal when applying this framework to DPP3 has been to provide a stable
regulatory platform within a changing industry context, while making incremental
improvements to the way we regulate price and quality.
3.38 This includes revenue allowances set based on current and projected profitability
and setting quality standards with reference to historical levels of performance.
3.39 In its submission on the draft decision, the ENA did not believe the decisions as
presented in the draft “struck the right balance in the draft decision for this goal”.77
3.40 We have recognised that substantial changes are occurring in the electricity sector.
In part, this is driven by an increasing focus on decarbonisation and by the increasing
affordability of technologies that provide both distributors and consumers with new
opportunities. However, we recognise that there is uncertainty as to the extent,
timing, and impact of these changes.
3.41 We have endeavoured to improve the balance between consistency and incremental
improvement from the draft decision. Specific changes we have made are discussed
in the relevant chapters and attachments of this paper.
Economic principles
3.42 We also have three key economic principles that we have regard to in setting the
DPP. These are useful analytical tools when determining how we might best promote
the Part 4 purpose.
3.42.1 Real financial capital maintenance (FCM): we provide regulated suppliers the
ex-ante expectation of earning their risk-adjusted cost of capital (a ‘normal
return’). This provides suppliers with the opportunity to maintain their
financial capital in real terms over timeframes longer than a single regulatory
period. However, price-quality regulation does not guarantee a normal return
over the lifetime of a regulated supplier’s assets.
3.42.2 Allocation of risk: ideally, we allocate particular risks to suppliers or
consumers depending on who is best placed to manage the risk, unless doing
so would be inconsistent with section 52A.
76 Commerce Commission “Wellington Electricity’s customised price-quality path – Final Decision“ (28 March 2018); Commerce Commission “Powerco's customised price-quality path – Final Decision“ (28 March 2018).
77 ENA "Submission on EDB DPP reset draft decisions paper" (18 July 2019), p. 4.

68
3605676.11
3.42.3 Asymmetric consequences of over- and under-investment: we apply FCM
recognising the asymmetric consequences to consumers of regulated energy
services, over the long-term, of under-investment (versus over-investment).
3.43 We elaborated on each of these principles and how they should be applied in the
context of price-quality regulation in our 2016 IM review framework paper.78
Incentives framework
3.44 When seeking to promote the statutory purposes and apply the DPP and economic
principles above, the tools we have are the incentives the Part 4 regime directs us to
create. These are set out in Table 3.1 below.
78 Commerce Commission “Input methodologies review decisions: Framework for the IM review“ (20 December 2016), pages 38-49.
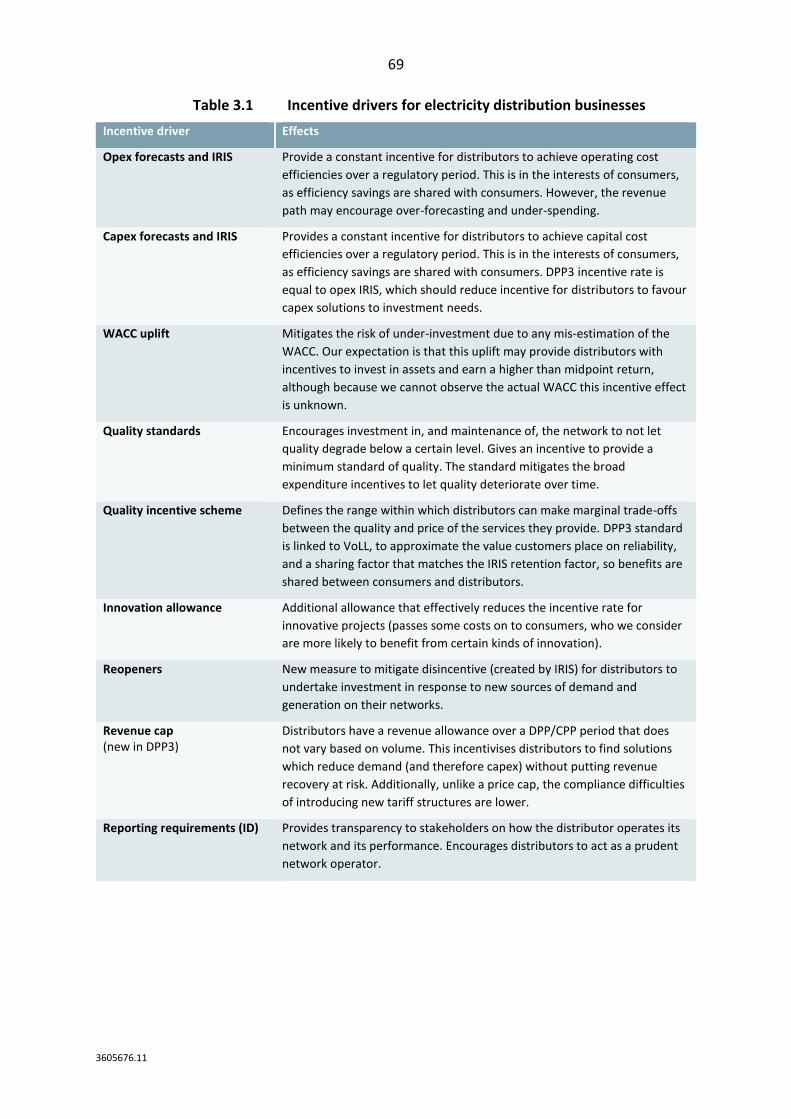
69
3605676.11
Table 3.1 Incentive drivers for electricity distribution businesses
Incentive driver Effects
Opex forecasts and IRIS Provide a constant incentive for distributors to achieve operating cost
efficiencies over a regulatory period. This is in the interests of consumers,
as efficiency savings are shared with consumers. However, the revenue
path may encourage over-forecasting and under-spending.
Capex forecasts and IRIS Provides a constant incentive for distributors to achieve capital cost
efficiencies over a regulatory period. This is in the interests of consumers,
as efficiency savings are shared with consumers. DPP3 incentive rate is
equal to opex IRIS, which should reduce incentive for distributors to favour
capex solutions to investment needs.
WACC uplift Mitigates the risk of under-investment due to any mis-estimation of the
WACC. Our expectation is that this uplift may provide distributors with
incentives to invest in assets and earn a higher than midpoint return,
although because we cannot observe the actual WACC this incentive effect
is unknown.
Quality standards Encourages investment in, and maintenance of, the network to not let
quality degrade below a certain level. Gives an incentive to provide a
minimum standard of quality. The standard mitigates the broad
expenditure incentives to let quality deteriorate over time.
Quality incentive scheme Defines the range within which distributors can make marginal trade-offs
between the quality and price of the services they provide. DPP3 standard
is linked to VoLL, to approximate the value customers place on reliability,
and a sharing factor that matches the IRIS retention factor, so benefits are
shared between consumers and distributors.
Innovation allowance
Additional allowance that effectively reduces the incentive rate for
innovative projects (passes some costs on to consumers, who we consider
are more likely to benefit from certain kinds of innovation).
Reopeners New measure to mitigate disincentive (created by IRIS) for distributors to
undertake investment in response to new sources of demand and
generation on their networks.
Revenue cap (new in DPP3)
Distributors have a revenue allowance over a DPP/CPP period that does
not vary based on volume. This incentivises distributors to find solutions
which reduce demand (and therefore capex) without putting revenue
recovery at risk. Additionally, unlike a price cap, the compliance difficulties
of introducing new tariff structures are lower.
Reporting requirements (ID) Provides transparency to stakeholders on how the distributor operates its
network and its performance. Encourages distributors to act as a prudent
network operator.
70
3605676.11
Chapter 4 Responding to changes in the electricity sector
Purpose of this chapter
4.1 We recognise that substantial changes are occurring in the electricity sector, driven
by an increasing focus on decarbonisation as well as increasing affordability of
certain technologies that provide new opportunities to distributors and consumers.
However, there is uncertainty as to the extent, timing, and impact of these changes.
This was highlighted in a number of submissions on the issues paper, such as those
from the ENA and Unison.79
4.2 This chapter outlines our consideration of these changes and the potential effects on
distributors and our regulatory settings during the DPP3 period. Specifically, this
chapter includes:
4.2.1 our view of electricity sector changes;
4.2.2 views from submissions on the issues paper;
4.2.3 consumer engagement in the changing electricity sector;
4.2.4 our response to the changing electricity sector, in terms of: uncertainty,
innovation, and responses outside the DPP.
4.3 More detail on the relevant new mechanisms of the DPP reset are provided in the
attachments to this paper.
4.4 The changes to the sector are also receiving focus from us outside of DPP resets,
including our cooperation and collaboration with other agencies, such as the
Ministry for Business, Innovation, and Employment and the Electricity Authority. This
collaborative work is particularly focused on issues relating to distributors’
involvement in contestable markets, and in better understanding the likely impacts
of future industry changes.
4.5 The government has also noted in its response thus far to the Electricity Price Review
that innovation in the electricity sector should be prioritised.80
79 ENA “DPP3 April 2020 Commission Issues paper (Part One Regulating capex, opex & incentives)” (20 December 2018); Unison “Submission on default price-quality paths for electricity distribution businesses from 1 April 2020 Issues paper” (21 December 2018).
80 MBIE “Electricity Price Review: Government Response to Final Report” (3 October 2019).
71
3605676.11
Our view of electricity sector changes
4.6 An increasing focus on decarbonisation will likely lead to an increase in the
electrification of the transport and industrial sectors because of the low carbon
intensity of electricity compared to fossil fuels. This change will be furthered by the
increasing availability and affordability of relevant technologies, like electric vehicles.
4.7 The changes in demand patterns and potential increase in demand may require
additional traditional investment in the networks. However, networks may also be
able to meet some of these changes through more flexible solutions offered by
smart grid technologies.
Submissions on the issues paper and draft decision
4.8 Many of the submissions on the issues paper and draft decision reasons paper
discussed emerging technologies, such as electric vehicles, and some linked these
changes to decarbonisation. Submissions raised emerging technology as both an
opportunity (particularly for consumers) and a challenge (particularly for
distributors). The main challenge raised from emerging technology was uncertainty,
particularly uncertainty in demand forecasts.
4.9 For example, the ENA said:
Emerging technology presents both uncertainty and opportunity for asset management and
investment decisions by EDBs. The Commission should work in partnership with EDBs by
providing incentives that support innovative and efficient approaches to asset management,
system management and customer interfaces.81
4.10 Electricity Retailers Association of New Zealand (ERANZ) recognises the possibility of
similar issues, saying:
Some of this investment assumes that emerging technologies (distributed generation
technologies such as solar PV systems and batteries, and electric vehicles) will be adopted en
masse by consumers. Rapid adoption at scale - coupled with the uptake of applications
enabled by emergent technology such as peer- to-peer trading, demand side response, and
home energy management systems - would change traditional network demand patterns.82
81 ENA “DPP3 April 2020 Commission Issues paper (Part One Regulating capex, opex & incentives)” (20 December 2018), p. 6.
82 ERANZ “Submission on the default price-quality paths for electricity distribution businesses from 1 April 2020 (DPP) Issues paper” (21 December 2018), p. 3.
72
3605676.11
4.11 However, ERANZ also submitted that:
Most businesses facing the risk of disruptive technology change operate in a competitive
market and therefore bear the risks – both positive and negative - of investing for a future
that may or may not eventuate. This is not the case for lines monopolies. Consumers will pay
for network upgrades regardless of whether the demand forecasts underpinning those
investments eventuate.82
4.12 Many submissions also addressed the new reopener and innovation incentive
mechanisms that we proposed in the draft decision. Submissions generally
supported the introduction of an innovation incentive mechanism but submitted
that it needed to be scaled up to be effective. Submissions were also supportive of
the new reopeners, but proposed increasing their scope.83
Consumer engagement in the changing electricity market
4.13 As new technologies and the progress towards decarbonisation make the electricity
market more flexible and dynamic, the relationships and communication between
the different parties will become increasingly complex and important. This means
that both distributors and the Commission will need to do more work in engaging
consumers.84
4.14 Facilitating a greater consumer voice in the electricity market is also clearly
evidenced and supported in the final paper published by the Electricity Price
Review.85
4.15 While we regularly receive useful input from some consumer parties and
representatives like ERANZ, MEUG, and retailers, we have found that the views of
end-use electricity distribution service consumers could be better represented in our
regulatory processes. In part, this may be due to the complexity of the regulatory
regime and competing priorities for consumers and their representatives. We will be
working to improve this over time outside of this reset of DPP settings.
4.16 We also consider that transparency and accountability of distributors is an important
part of our regulatory regime, that works alongside financial incentives, and supports
consumer engagement. We consider that increased focus on the delivery of network
investment and maintenance would be helpful in improving the performance of
electricity distributors. This would help make them more accountable to their
customers and better demonstrate how they are responding to changes in the
sector. This is described further in Attachment N.
83 See for example: Powerco “Submission on EDB DPP reset draft decisions paper” (18 July 2019) and Vector “Submission on EDB DPP reset draft decisions paper” (18 July 2019).
84 We note that the relationship between EDBs and consumers is complicated by the lack of commercial arrangement, with end-consumers generally only contracting to an electricity retailer.
85 Electricity Price Review “Final Report” (21 May 2019)
73
3605676.11
Our response to the changing electricity sector
4.17 The remainder of this chapter explains:
4.17.1 our consideration of uncertainty from the changes in the electricity sector;
4.17.2 our view of innovation by distributors; and
4.17.3 potential regulatory responses outside of the DPP settings.
4.18 In consideration of uncertainty, we are introducing new reopeners for large system
growth and new connection projects and programmes, which may increase in the
near future due to decarbonisation initiatives. We are also including asset
relocations in the reopener because asset relocations can be driven by external
circumstances and thus cause significant uncertainty to the future level of
expenditure required by distributors.
4.19 Innovation is specifically referred to in the purpose of Part 4.86 The changes
happening in the electricity sector are creating new opportunities for innovation
with new technology, as well as requiring innovative responses to the new
challenges faced by distributors. We are introducing a new recoverable cost to help
incentivise ongoing innovation.
4.20 We have made these changes primarily through amendments to the input
methodologies, so these changes are also explained in our reasons paper for the IM
amendments that we have made to enable this DPP reset.87
4.21 Our regulatory responses outside of the DPP settings are likely to include
performance analysis, compliance, and collaboration with other organisations.
Uncertainty
4.22 We recognise there are always uncertainties about what will happen during a
regulatory period. However, changes in the electricity sector are meaning that there
is an increased uncertainty in the level of electricity demand, distributed generation,
new connections, and the way distribution networks will need to be managed.
86 Commerce Act 1986, section 52A(1)(a). 87 Commerce Commission “Amendments to electricity distribution services input methodologies
determination – Reasons paper” (26 November 2019).
74
3605676.11
4.23 One of the key issues for DPP3 is how steps taken to transition to a low carbon
future will affect the networks. Distributors will need to allow for potentially large
volumes of local generation (such as battery storage, solar and wind) and low carbon
demand (such as electric vehicles and heat pumps) to connect efficiently and quickly.
4.24 Some of these may be large connection projects, such as a connection to enable
conversion of a dairy plant from coal boilers to electric boilers.
4.25 Distributors have also submitted that asset relocation projects can be the cause of
significant uncertainty.88
4.26 One of the concerns raised in submissions to our issues paper and draft decision
reasons paper was the unknown impacts of increased demand with particular focus
on the impact of electric vehicles.89 There were a variety of suggestions and views on
the best way to address these uncertainties.
4.27 Submissions on the issues paper raised the issue of the impact of demand
uncertainty being greater because of the shift from a weighted average price cap to
a revenue cap. For example, Alpine said:90
We support the change to a revenue cap. However, we remain concerned around the form
that the revenue cap will take. There is no mention in the issues paper of the mechanism for
new growth for example.
Our consideration of uncertainty for DPP3
4.28 Prior to the amendments to the IMs published on 26 November 2019, the IMs and
the settings for DPP2 already had a number of mechanisms to address uncertainty,
particularly areas of uncertainty that significantly impacted distributors despite
being largely outside their control.
4.29 There are reopeners available to distributors for:91
4.29.1 catastrophic events;
4.29.2 regulatory or legislative changes not accounted for when the DPP was set;
4.29.3 errors in setting the DPP;
4.29.4 major transactions;
88 See for example: Vector "Submission on EDB DPP reset draft decisions paper" (18 July 2019) 89 See for example: Wellington Electricity “Default price-quality paths for electricity distribution businesses
from 1 April 2020 Issues Paper” (20 December 2018). 90 Alpine Energy "Submission on EDB DPP3 Issues paper" (20 December 2018), p. 2. 91 Commerce Commission Electricity Distribution Services Input Methodologies Determination 2012 [2012]
NZCC 26 (Consolidated as at 31 January 2019), clauses 4.5.1 to 4.5.7.

75
3605676.11
4.29.5 the provision of false or misleading information; and
4.29.6 quality standard variations that better reflect the realistically achievable
performance of the distributor.
4.30 In 2016 we decided to set future EDB DPPs and CPPs as revenue caps rather than
weighted average price caps.92 Part of the rationale for this change was to reduce
the impact of uncertainty in demand growth (and thus revenue growth), which the
Commission was required to forecast under a weighted average price cap.
4.31 We note that costs treated as recoverable costs and pass-through costs are not an
issue for distributors in terms of uncertainty because the distributor can recover the
full costs without the application of IRIS, regardless of whether the costs are greater
or smaller than expected. So any uncertainty in these types of costs, which are
generally outside the control of the distributor such as levies, do not result in
uncertainty in the distributors’ profitability.
Large externally driven events
4.32 Significant, externally driven, and unforeseeable events are generally covered by the
reopeners other within our DPP framework. However, while large consumer
connections, system growth requirements, and asset relocations may also be
significant, externally driven, and unforeseeable, none of the reopeners allow for
them, prior to the IM amendments published on 26 November 2019.
4.33 Given there is limited ability for distributors to control the demand for this kind of
capex, we consider that there is little incentive benefit in exposing them to this risk.
The financial impact on distributors of these projects is potentially heightened given
our increase to the capex IRIS retention rate.93
4.34 The impact of large individual consumer connections may also be greater in DPP3
because of the move to a revenue cap, which means that no additional revenue
(outside of capital contributions) will be made available from unforeseen increases in
demand.
92 Commerce Commission “Input methodologies review decisions – Consolidated reasons papers” (19 December 2016).
93 Our increase to the IRIS incentive rate for capex is explained in Attachment E.
76
3605676.11
We have introduced new reopeners for large new connections, system growth, and asset relocation projects
4.35 At our DPP workshop on uncertainty and innovation, one distributor raised the
financial impact that it and other distributors face in facilitating large single
consumer connections onto its network.94 The concern is that this activity is often
unforeseen at the outset of a DPP period, and can be particularly burdensome on
smaller distributors where such costs represent a significant component of their
overall revenue allowances. It was suggested that a specific reopener be considered
to alleviate this uncertainty in DPP3.
4.36 We have introduced new reopeners in the IMs in line with the suggestion.95 The
reopeners are similar to the existing CPP ‘unforeseen projects’ reopener, but are
targeted specifically at projects or programmes which require major capex for:
4.36.1 new connection (including alterations to existing connections);
4.36.2 system growth;
4.36.3 a combination of new connections (including alterations to existing
connections) and system growth; and
4.36.4 asset relocations. 96
4.37 The aim of the reopeners is to ensure, where possible, that distributors are able and
incentivised to undertake the investment required to meet the one-off sporadic and
changing needs of external stakeholders. In particular, this will ensure that
distributors can connect and manage significant new demand and low carbon
technologies as New Zealand increases its focus on decarbonisation, while
maintaining network reliability and meeting the long-term interests of consumers.
This is consistent with the Part 4 purpose, specifically in providing incentives for
distributors to invest.97
4.38 The new reopeners, in applying to new connections, may also reduce any current
incentive of distributors to encourage new connections to be arranged directly with
Transpower despite connection to the distributor being a potentially more efficient
option.
94 Commerce Commission “Notes on EDB DPP3 Workshop on innovation and dealing with uncertainty” (8 March 2019)
95 Commerce Commission Electricity Distribution Services Input Methodologies Amendments Determination (No.2) 2010 [2019] NZCC 20 (26 November 2019).
96 The ‘unforeseen projects’ reopener for CPPs and its application is described in 5.6.6 and 5.6.7(6) of the Commerce Commission “Electricity Distribution Services Input Methodologies Determination 2012, consolidated as of 31 January 2019” (31 January 2019).
97 Commerce Act 1986, section 52A(1)(a).
77
3605676.11
4.39 We do not intend for this mechanism to cover general growth in demand due to
decarbonisation, such as high uptake of electric vehicles. Introducing a reopener for
general demand growth would undermine the IMs, which require the use of a
revenue cap rather than a weighted average price cap. Furthermore, we consider
that the risk of out-turn network expenditure based on demand growth differing
from forecast can be positive or negative, whereas a reopener would be asymmetric;
the reopener would only result in a distributor potentially receiving more revenue
allowance, not less.
4.40 While not included in our draft decision, Vector and Powerco also submitted that
asset relocation projects have the same characteristics and should be added to the
scope of the reopener that we proposed in our draft decision. 98 We accepted this in
our final IM amendments decision, and have included asset relocation projects and
programmes. Vector in particular sees this as a significant uncertainty and risk for
them, explaining:99
Driven principally by third-parties, relocations appear to meet the criteria articulated by the
Commission for proposing a reopener for unforeseen major connections. Relocation activity
is hard to forecast. Third-party plans such as Auckland Transport and the New Zealand
Transport Agency tend not to coincide with AMP forecasting periods nor DPP setting. Activity
driven by traffic authorities generally requires a standard capital contribution depending on
the type of transport asset affected – however, the designation of transport assets can and
do change which affects the contribution and network capex affected.
Relocations could be significant over the upcoming DPP3 period given the volume of
transport infrastructure development forecasted to occur. For Vector, the proposed
Auckland Light Rail Transit corridor is expected to trigger a significant volume of cable
relocations from 110 kV to 11 kV.
4.41 The addition of asset relocations to the reopeners was supported by Orion in cross-
submissions on our draft decision.100
4.42 Our reopeners for large new connections, system growth requirements, and asset
relocations would apply if the project, or increase in size of the project:
4.42.1 is not catered for in our forecasts of capital expenditure used to set starting
prices;
98 Vector "Submission on EDB DPP reset draft decisions paper" (18 July 2019); and Powerco "Submission on EDB DPP reset draft decisions paper" (18 July 2019).
99 Vector “Submission to Commerce Commission on changes to the input methodologies for electricity distributors and Transpower due 5th July” (5 July 2019).
100 Orion “Cross submission on EDB DPP reset draft decisions paper” (12 August 2019)
78
3605676.11
4.42.2 is not covered through capital contributions, the approach taken to capital
contributions is reasonable, and there is reasonable justification for the way
in which the cost is going to be allocated to consumers;
4.42.3 requires additional expenditure (net of the capital contributions) by the
distributor of at least 1% of revenue (excluding pass-through and recoverable
costs) over the regulatory period or two million dollars per project or
programme – whichever is less for the distributor; 101
4.42.4 does not exceed the reopener cap of $30 million for additional expenditure;
and
4.42.5 is evidenced as being required to a high degree of certainty.
4.43 While the new reopeners should help prevent unnecessary CPPs, we have also
included a cap on the reopeners, which is important so that proportionate scrutiny
can be given to larger changes in expenditure through the CPP process. We intend to
reject reopener applications for which the cumulative additional expenditure is
greater than the cap, even if the distributor has only applied to reopen its DPP for a
portion of that expenditure.
4.44 Further detail on the requirements of the reopeners are provided in Attachment G,
and are specified in the IM amendments determination.102
4.45 We note that the reopeners encompass increased capacity of existing connections.
For example, the conversion of an existing dairy plant from coal boilers to electric
boilers may be a substantial increase in capacity of the existing connection rather
than a new connection.
We have set a regulatory period of five years
4.46 For DPP3 we have also considered whether we should set the DPPs to a four-year
regulatory period because of the increased level of uncertainty, and the ability for us
to adjust our policy settings sooner in response.103
101 ‘Additional’ expenditure refers to expenditure that is not required by the EDB in the absence of the connection project.
102 Commerce Commission Electricity Distribution Services Input Methodologies Amendments Determination (No.2) 2010 [2019] NZCC 20 (26 November 2019), clause 4.5.5A and 4.5.5B.
103 Section 53M(4) of the Commerce Act 1986 states that the length of a DPP must be five years. However, section 53M(5) provides for the Commission to set a period of between four and five years, if we consider it would better meet the purpose of Part 4.
79
3605676.11
4.47 In our issues paper the option was put to stakeholders of transitioning to a four-year
regulatory period. No potential compensation for impacts were raised in the paper,
but, in practice, compensation would be considered for costs of additional hedging
and swaps and we would likely include some mitigations to address stakeholder
concerns. In our draft decision, we proposed retaining a five-year regulatory period.
4.48 None of the submissions on our issues paper expressed a preference for either a
four-year or five-year regulatory period, and we received few submissions on the
topic in consultation on our draft decision.
4.49 We specifically raised this topic at our second DPP3 stakeholder workshop in March
2019.104 Attendees expressed no interest to move to a four-year regulatory period
for the following reasons.
4.49.1 Changing the regulatory period creates increased interest rate hedging risk
which is a major concern for distributors. A longer reset period provides more
certainty for distributors in managing this risk as it is locked-in for longer. It
would also require more resource to be allocated to this activity which will be
conducted more frequently.
4.49.2 Distributors will find it harder to secure capital for long-term capex projects
because creditors will have less certainty as to what settings will be in four-
and ten years’ time.
4.49.3 There are major concerns on the implications of how IRIS adjustments would
be calculated and applied.
4.49.4 The WACC would need to be re-calculated, creating uncertainty.
4.49.5 Distributors require the certainty of a longer price control period to fully
consider investing in longer term innovation projects during the period.
4.49.6 More frequent DPP resets would increase compliance costs.
4.49.7 In combination, the above factors are likely to result in more uncertainty for
distributors and the wider electricity sector.
104 Commerce Commission “Notes on EDB DPP3 Workshop on innovation and dealing with uncertainty” (8 March 2019).
80
3605676.11
4.50 MEUG submitted on our draft submission that a four-year regulatory period would
help support their proposal to delay the introduction of any innovation incentive
mechanism until DPP4. However, we consider that this minor potential benefit
would not justify over-riding significant concerns raised in the workshop. Further,
this benefit will not fully occur because we have introduced an innovation incentive
mechanism for DPP3.105
4.51 Given the above reasons, we are not transitioning to a four-year regulatory period
because we consider that any potential benefits are outweighed by the
complications caused by applying a four-year regulatory period. At this stage, we do
not consider a four-year regulatory period for DPP3 would better meet the purposes
of Part 4 of the Act. In particular, our assumption is that distributors have in place
swap contracts for the next regulatory period assuming a five-year term for the
WACC, and that any change to a four-year regulatory period is likely to disrupt that
process.
Innovation
4.52 We expect there to be more scope for innovation and its potential benefits now than
in the recent past. Changes in technology have increased opportunities for electricity
distributors to innovate as well as creating challenges that distributors may address
through new practices. Innovation is an important consideration for us as it is one of
the performance areas referred to in the purpose of Part 4.106
4.53 We consider innovation to be the practice of distributors putting technologies,
processes, or approaches, which have not been used in similar circumstances in New
Zealand by distributors before, into practice for the benefit of the electricity
distribution service.
4.54 We accept there is some evidence that suggests the level of innovation is currently
insufficient to realise all of the potential benefits, although this evidence is not
completely clear and does not relate solely to electricity distributors. For example:
4.54.1 Only 7% of energy sector businesses are conducting research and
development, which is much less than other sectors.107
4.54.2 Energy sector expenditure on research and development decreased between
2007 and 2016.107
105 MEUG "Submission on EDB DPP reset draft decisions paper" (18 July 2019), p. 6. 106 Commerce Act 1986, section 52A(1). 107 Vic Crone, Callaghan Innovation “Driving Clean, Smart Energy and Radical Services Integration”—
presentation at Downstream 2018 conference.
81
3605676.11
4.54.3 For the 2018 regulatory year, distributors reported a total of less than $10m
expenditure on research and development (compared to total lines charges
of around $2.5b).108
4.54.4 New Zealand businesses focused solely on domestic markets are less likely to
innovate and any innovation results in lower levels of productivity
improvement.109
4.55 However, we also note that we have already seen several examples of beneficial
innovative practices by distributors through our programme of distributor site visits
and through the distributors’ AMPs. For example, we noted the introduction of
incipient fault waveform recognition technology as an innovative practice that could
help distributors prevent interruptions.110
Our consideration of innovation in DPP3
4.56 While innovation can be very beneficial to consumers, it typically requires
expenditure by the distributor, and may also require additional incentives that are
ultimately paid for by consumers. It is difficult in practice to pinpoint the optimal
level of expenditure on innovative practices, weighing up the costs and possible
benefits. On balance, we consider that there is a material risk that the existing
incentives for innovation are insufficient and that more expenditure on innovative
practices would likely be in the long-term interests of consumers.
4.57 We received several submissions on innovation on our issues paper, held a workshop
on 8 March 2019 to discuss the issues of innovation and uncertainty with
stakeholders, and consulted on a proposed new innovation mechanism in our draft
decision. The main points made in submissions on the need for stronger incentives
for innovation were covered submissions from Unison, the ENA, and Vector.
108 From information disclosure, although there may be under-reporting. 109 Productivity Commission “Innovation and the Performance of New Zealand Firms—Staff working paper
2017/2” (November 2017). 110 This innovative practice, along with others, was noted in the report: Commerce Commission “Observations
from our review of Electricity Distribution Businesses’ 2016 and 2017 Asset Management Plans” (31 July 2018).
82
3605676.11
4.58 Unison’s submission explained its position that the incentives through IRIS are
sometimes insufficient for innovation because the benefits may not be expected
until future regulatory periods.111 Vector and the ENA provided reports by
consultants FTI Consulting and The Brattle Group respectively, which focused on
incentives for innovation in overseas regulatory regimes.112
4.59 The Brattle Group report provides an overview of the relevant regulatory measures
in Great Britain, Australia, New York, Illinois, and California. It reflects on the
implications of these for the DPP reset in New Zealand. Specifically for innovation,
the report explains that the additional mechanisms (particularly the use of additional
pass-through cost mechanisms) in other jurisdictions suggests that the basic
regulatory regime is insufficient to incentivise innovation, so an additional change
should be considered. It also suggests that incentive equalisation for capital
expenditure and operating expenditure is important too.
4.60 Similarly, the FTI Consulting report suggested that additional regulatory tools are
required and provided case studies of tools used overseas. Great Britain and Norway
were included as case studies of direct mechanisms for customers to fund
innovation. In Great Britain, three pass-through cost mechanisms are in place with
greater levels of scrutiny and complexity for the greater amounts of expenditure
(including a competitive pooled fund). In Norway, a simpler limited pass-through
cost, which requires external validation by an appropriate body, is in place.112
4.61 The FTI Consulting report concluded that we should:
Consider introducing incremental targeted innovation-focused incentives (e.g. an allowance
subject to cost-benefit analysis) in the short term, to support customer expectation of
innovation but also to improve customer experience. Reserve more complex innovation tools
(e.g. competition for funding) for the longer term, so that EDBs have time to prepare and to
avoid undue regulatory disruption in the industry.113
111 In its submission on the Issues Paper, Unison said “there are no incentives or compensation for EDBs to undertake research and development unless benefits can be realised within the regulatory period”— Unison “Submission on default price-quality paths for electricity distribution businesses from 1 April 2020 Issues paper” (21 December 2018), para 20.
112 FTI Consulting (commissioned by Vector) “Regulatory Blueprint to meet today’s customer expectations, Final Report” (9 November 2018); The Brattle Group (commissioned by the Electricity Networks Association) “Incentive Mechanisms in Regulation of Electricity Distribution: Innovation and Evolving Business Models” (October 2018).
113 FTI Consulting (commissioned by Vector) “Regulatory Blueprint to meet today’s customer expectations, Final Report” (9 November 2018), p. 11.
83
3605676.11
4.62 Meridian stated in its cross-submission on the issues paper that it does not accept
the assertions that new innovation allowances may be needed.114 Meridian’s
reasoning was that future needs should not distract from regulatory issues that are
more certain and more of a priority.
4.63 We also received suggestions in submissions on the issues paper and at the
workshop on 8 March 2019 that were outside the remit of the DPP reset, such as a
suggestion that section 52A (the purpose of Part 4) should be amended to take into
account issues like climate change mitigation. There was significant discussion in our
workshop about the more technical details of what innovative projects might be,
such as low voltage network monitoring.
4.64 Submitters also discussed the context giving rise to a greater need for innovation—
particularly the need for climate change mitigation, the expected steep uptake of
electric vehicles, and the increase of two-way flows on the networks from
distributed energy resources including solar photovoltaics and batteries.115
There are several incentive mechanisms already available to promote innovation
4.65 There are several funding mechanisms already available to distributors for
innovation investment, including:
4.65.1 increased returns through the IRIS mechanism from efficiency gains;
4.65.2 non-regulated income can be generated if an innovation can be sold to other
businesses; and
4.65.3 external funds and support are also available (some would require partnering
with other organisations), such as the Endeavour Fund, Callaghan Innovation
funding and/or services, Research and Development Tax Credits, the
Provincial Growth Fund, the Energy Efficiency and Conservation Authority,
and the Green Investment Fund, and through the Energy Development
Centre.
4.66 IRIS provides an incentive for distributors to innovate where innovation reduces
capital or operating expenditure. We recognise that there are other incentives for
distributors to innovate, including some outside of the regulatory regime.
114 Meridian Energy “2020-2025 Distribution default price-quality path – Issues paper” (20 December 2018). 115 For example, in ENA “DPP3 April 2020 Commission Issues paper (Part One Regulating capex, opex &
incentives)” (20 December 2018).
84
3605676.11
4.67 There may also be some incentive for research and development and innovation
from the ability for distributors to sell the intellectual property or resulting products
and services in other contestable markets. However, we expect that the cost
allocation rules will be correctly applied so that the consumers of distribution
services are not paying for these benefits that accrue to others.
4.68 We note that if the innovative practices are developed by third parties supplying the
distributor, then the income from future sales of the innovation are likely to accrue
to the third-party rather than the distributor.
4.69 We expect that the introduction of a new innovation incentive mechanism may
provide seed funding that supports innovative projects that gather finance and funds
from the other sources listed above in addition to the recoverable cost.
4.70 We also consider that the move to a revenue cap, as decided in the 2016 IMs review,
better promotes innovation for distributors. The change to a revenue cap means
that distributors are not penalised through reduced revenues by implementing
solutions that lower demand. The revenue cap will also simplify the process of tariff
reform, allowing more innovation in pricing.
We are introducing a new recoverable cost for innovative expenditure
4.71 Despite the existing funding already available to distributors for innovation, they
may be insufficient because in some instances the potential benefits of the
investment may go to third parties, be uncertain, or may not eventuate until future
regulatory periods.116 Distributors may be more likely to invest in options (like
traditional poles and wires investments) that have clearer benefits that can be more
easily quantified.
4.72 This is particularly the case for small projects where the direct benefits are
uncertain, but the greater benefit may be in the learning that can result. These
greater benefits can be from the distributor introducing the innovative practice more
extensively across its network and from other distributors introducing this practice.
In such a situation, a lot of the greater benefits may not occur until later regulatory
periods, and thus may not be recognised as greater returns for the distributors,
particularly if the savings are from capital expenditure.
116 In its submission on the Issues Paper, Unison said “there are no incentives or compensation for EDBs to undertake research and development unless benefits can be realised within the regulatory period—Unison “Submission on default price-quality paths for electricity distribution businesses from 1 April 2020 Issues paper” (21 December 2018).
85
3605676.11
4.73 Distributors may be less likely to envisage commercialising any benefits of innovation
through selling to other distributors or other industries. This would result in lower
incentives to innovate than if such opportunities were pursued. We expect that cost
allocation rules would be correctly applied so that consumers only pay for the
portion of expenditure that benefits the network service.
4.74 We are seeking to promote further innovation in a relatively low-cost way by
introducing a new limited recoverable cost term as a change to the IMs. We consider
that having some of the cost of a potential innovative practice covered by a
recoverable cost will encourage greater innovation by distributors. We have decided
to introduce this for DPP3 based on the range of factors outlined above.
4.75 The new recoverable cost term will:
4.75.1 target expenditure on innovative projects;
4.75.2 require a 50% contribution from the distributor;117
4.75.3 be limited to the amounts specified in Figure F1 in Attachment F, which adds
up to approximately $6 million across all non-exempt distributors over the
DPP3 regulatory period, excluding those currently on CPPs; and
4.75.4 require a report from an independent engineer or suitable specialist that the
planned expenditure meets a simple list of criteria to show that the project is
expected to be innovative and potentially benefit consumers.118
4.76 We received a number of submissions on our draft decision that our proposed limits
on the recoverable cost were too low.119 Vector also submitted that a two-tiered
approach could be used with stricter regulation of the distributors that choose a
higher level of innovation incentive.120 The limits in the draft decision were similar to
that in this final decision, except that we have set a minimum of $150,000 in our final
decision, which increases the potential size of the recoverable cost for smaller
distributors.
117 The contribution from EDBs should be treated as regular capital or operating expenditure, while any capital expenditure under the recoverable cost will not enter the regulated asset base to avoid double recovery.
118 The recoverable cost would be specified in the EDB IMs. The criteria we have set out here would be included in the EDB DPP determination.
119 Such as Entrust “Submission on EDB DPP reset draft decisions paper” (18 July 2019). 120 Vector “Submission to Commerce Commission on changes to the Input Methodologies for Electricity
Distributors and Transpower due 5th July”.
86
3605676.11
4.77 We have considered these submissions, but still consider that it is best at this stage
to introduce the new recoverable cost in DPP3 with a low limit and a requirement of
substantial co-funding with regular operating or capital expenditure because of the
substantial risks and downsides of the new recoverable cost.
4.77.1 The innovation recoverable cost may cover expenditure that would have
happened without its introduction, resulting in a higher cost for consumers
without any additional long-term benefit.
4.77.2 There is some compliance cost involved for independent assessment of
projects, which may prevent uptake given the relatively small limit on the
recoverable cost.
4.77.3 The innovation recoverable cost does not directly facilitate collaboration
between industry participants.
4.77.4 Consumers will pay for a substantial proportion of the projects (up to a the
recoverable cost limit plus the IRIS impact of regular capital or operating
expenditure), even if the projects do not end up being successful, which is
not consistent with the incentives present in competitive markets.121
4.78 ETNZ submitted that they “find it difficult to see how providing the incentives
required by 54Q would in any way compromise the purpose of Part 4”.122 We
disagree because of the risks explained above. For example, if the recoverable cost is
used for expenditure that would have otherwise been undertaken anyway, it will
increase the distributor’s returns, which is contrary to the purpose of Part 4 of the
Act. So, we have been required to balance the benefits and risks of introducing an
innovation incentive mechanism in terms of the purpose of Part 4 of the Act.
4.79 In addition to submitting, like a number of others, that the limits of the recoverable
cost should be significantly higher, the ENA also provided a useful explanation of
how a larger scheme could be administered. The ENA’s submission that such a
scheme should be a pooled fund with competitive applications by distributors was
supported by other submissions as well.
4.80 However, we have not chosen to implement the ENA’s suggested approach because
we are of the view that creating an external fund would be beyond the scope of a
low-cost DPP framework, requiring significant administrative costs and oversight
while adding complexity and risks to the DPPs and consumers.
121 We note that Meridian re-iterated this risk in its submission on our draft decision: Meridian “Submission on EDB DPP reset draft decisions paper” (18 July 2019).
122 ETNZ "Submission on EDB DPP reset draft decisions paper" (16 July 2019), p. 4.
87
3605676.11
4.81 A CPP may be more appropriate for a large innovative step change in a distributor’s
practices. While this would not initially benefit the other distributors directly, the
learnings from the distributor on the CPP may be beneficial for other distributors in
the longer term.
4.82 We also weighed up the submissions supporting a larger pooled fund against the
submission from MEUG:123
MEUG sees no reason why:
a) EDB cannot continue to collectively pool resources under the banner of ENA, or any subset
of EDB that see merit in collaborating, on further innovation projects using their discretion
on how to allocate existing regulated revenue sources; and
b) If the cost of future projects is substantially greater than work undertaken to date, then
EDB could consider joint ventures with non-EDB parties and or seek funding from various
government research grant schemes.
4.83 In its submission on the draft decision, MEUG explained that it did not support a new
innovation incentive mechanism because there is insufficient evidence of under-
investment in innovation to warrant it. We partially agree with MEUG on this point,
acknowledging that there is weakness in the evidence base on innovation. However,
we consider that it would be costly and impractical to collect such evidence, so it is
reasonable to introduce an innovation incentive mechanism at a low level that we
consider is likely to benefit consumers without risking a large additional cost.
4.84 We also note that part of the Open Access project of the Innovation and
Participation Advisory Group and the Electricity Authority, and our own
contestability project that is a joint project with the Electricity Authority (named
Project Spotlight) is to look at the concerns of potential competitors that distributors
may leverage their monopoly position to gain a competitive advantage in other
competitive markets. This can include recovery of costs from consumers and we
note that, although cost allocation rules should protect against this, they may be
difficult to apply correctly in practice for research and development activities. The
active work in this area means that there is less risk that any new additional
incentives to innovate could result in less innovation by competitive market players.
4.85 Finally, we note that innovative projects could have benefits in terms of incentives to
promote energy efficiency and demand-side management. New innovations in
demand-side management technologies may allow distributors to reduce peak loads,
and therefore avoid system growth capex investments. This has the benefit of
increasing cost efficiency, but also helps promote the objectives considered under
section 54Q of the Act.
123 MEUG "Cross-submission on EDB DPP reset draft decisions paper" (12 August 2019), p.2.
88
3605676.11
4.86 We note that we have also made a change to the input methodologies to remove
the now-redundant scheme for compensating for demand-side management
initiatives. The scheme is now redundant because the compensation was for the
revenue impact of reductions in demand, but this will be nil during DPP3 because of
the move to revenue caps (as opposed to price caps).
4.87 Further information on the recoverable cost for innovative practices is provided in
Attachment F, including a description of the requirements, and the alternatives that
we considered.
We are equalising capital and operating expenditure incentives
4.88 We are simultaneously equalising the incentive rates of efficiency savings from
operating and capital expenditure to also help reduce an aspect of the risk of
insufficient innovation. Our equalisation of incentive rates is described further in
Attachment E.
4.89 The reason that equalising the incentive rates may remove a barrier to innovation is
that some of the potential innovative practices that are made available by new
technologies and business models involve additional operating expenditure to
reduce capital expenditure. Without the equalisation of incentive rates, the
distributor’s profits could be reduced by innovative action that reduces overall costs.
Non-DPP responses to sector changes
4.90 Outside of this DPP reset we are continuing to work on better understanding
emerging technology and how our regulatory settings can best support the
opportunities and challenges from emerging technology.124
4.91 We have been cooperating with the Innovation and Participation Advisory Group
(IPAG) of the Electricity Authority, which is looking at issues of open access,
particularly in relation to changes to the electricity sector from emerging
technologies. IPAG’s final recommendations on open access were published in
April.125 We are also undertaking a related joint project with the Electricity Authority
on emerging technology and open access to the networks.126
124 This work follows on from our consideration of the issue within the 2016 input methodologies review—Commerce Commission “Input methodologies review decisions – Consolidated reasons papers” (19 December 2016).
125 Innovation and Participation Advisory Group (IPAG) “Advice on creating equal access to networks” (April 2019).
126 Electricity Authority and Commerce Commission “Spotlight on emerging contestable services – a joint Electricity Authority-Commerce Commission project” (7 May 2019).

89
3605676.11
4.92 As new technologies offer new opportunities that may span the regulated and non-
regulated markets, our cost allocation rules are increasingly important. We revised
these rules in 2016 as part of the IMs review. We have also requested information
from distributors on their investments in emerging technologies and how they have
applied cost allocation rules. We have published this information on our website.127
127 See: https://comcom.govt.nz/regulated-industries/electricity-lines/electricity-distributor-performance-and-data/impact-of-emerging-technologies-in-monopoly-parts-of-electricity-sector?target=documents&root=100658.
90
3605676.11
Chapter 5 Starting prices
Purpose of this chapter
5.1 This chapter explains the starting prices we have set, how we have determined
them, and our reasons for the decisions we have made. It also explains how these
decisions have changed since the draft decision, our reasons for those changes, and
how they affect allowable revenue. It is supported by the detailed material on our
approach to forecasting, discussed in Attachments A to D.
Structure of this chapter
5.2 The first section of this chapter sets out the starting prices we have set, and explains
our decision to set prices on the basis of current and projected profitability. The
second section explains our building blocks approach to setting starting prices. The
third section summarises the decisions we have made which affect starting prices.
Starting prices
5.3 The price path for DPP3 will apply to distributors as a ‘revenue cap’. A revenue cap
limits the maximum revenues a distributor can earn, rather than the maximum
prices that it can charge.128 For this reason, while the terminology in the Act refers to
a ‘price path’ and to ‘starting prices’, in this paper we will generally refer to
‘allowable revenues’ a distributor can earn.129
5.4 Starting prices for each distributor are listed in Table 5.1 below.
128 The decision to move distributors from a price cap to a revenue cap was made as part of the IM review in 2016. Commerce Commission “Input methodologies review decisions – Topic paper 1 – Form of control and RAB indexation for EDBs, GPBs and Transpower” (20 December 2016). The implications of this decision are discussed in more detail in Attachment H.
129 The definition of “price” for the purposes of Part 4 includes “individual prices, aggregate prices, or revenues”. When setting a price-quality path, we must specify prices as either or both of prices or total revenues; Commerce Act 1986, sections 52C and 53M.
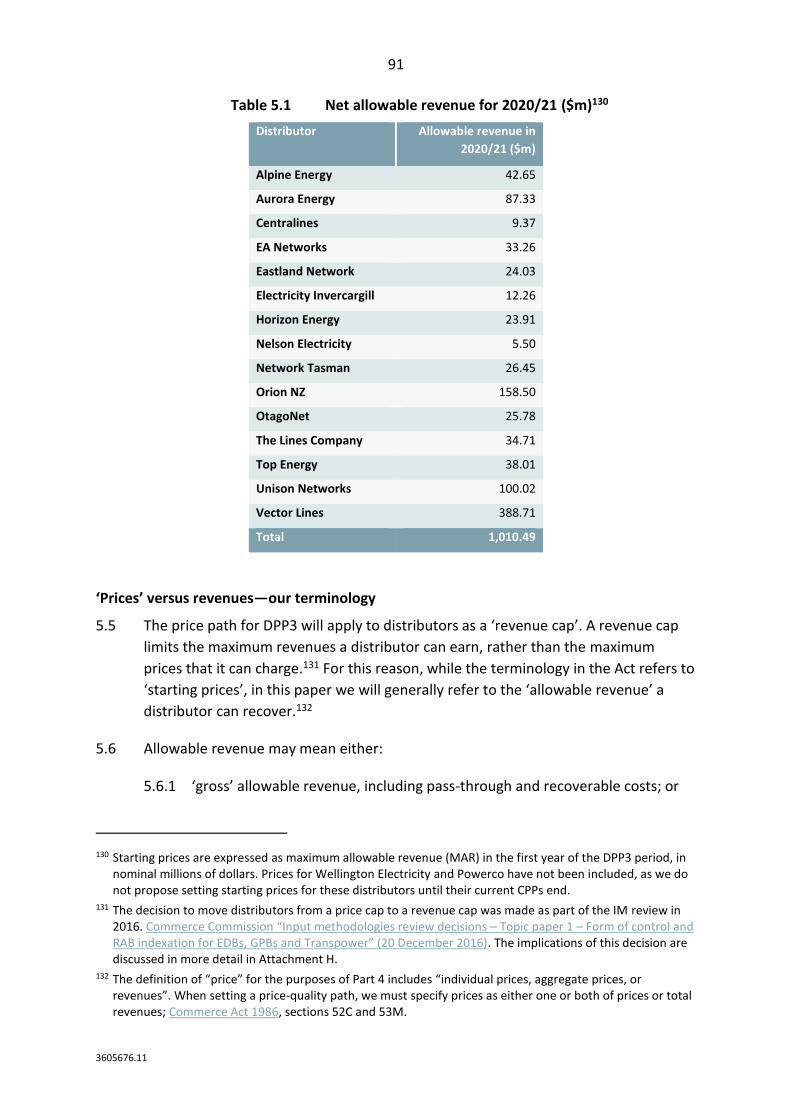
91
3605676.11
Table 5.1 Net allowable revenue for 2020/21 ($m)130
Distributor Allowable revenue in
2020/21 ($m)
Alpine Energy 42.65
Aurora Energy 87.33
Centralines 9.37
EA Networks 33.26
Eastland Network 24.03
Electricity Invercargill 12.26
Horizon Energy 23.91
Nelson Electricity 5.50
Network Tasman 26.45
Orion NZ 158.50
OtagoNet 25.78
The Lines Company 34.71
Top Energy 38.01
Unison Networks 100.02
Vector Lines 388.71
Total 1,010.49
‘Prices’ versus revenues—our terminology
5.5 The price path for DPP3 will apply to distributors as a ‘revenue cap’. A revenue cap
limits the maximum revenues a distributor can earn, rather than the maximum
prices that it can charge.131 For this reason, while the terminology in the Act refers to
‘starting prices’, in this paper we will generally refer to the ‘allowable revenue’ a
distributor can recover.132
5.6 Allowable revenue may mean either:
5.6.1 ‘gross’ allowable revenue, including pass-through and recoverable costs; or
130 Starting prices are expressed as maximum allowable revenue (MAR) in the first year of the DPP3 period, in nominal millions of dollars. Prices for Wellington Electricity and Powerco have not been included, as we do not propose setting starting prices for these distributors until their current CPPs end.
131 The decision to move distributors from a price cap to a revenue cap was made as part of the IM review in 2016. Commerce Commission “Input methodologies review decisions – Topic paper 1 – Form of control and RAB indexation for EDBs, GPBs and Transpower” (20 December 2016). The implications of this decision are discussed in more detail in Attachment H.
132 The definition of “price” for the purposes of Part 4 includes “individual prices, aggregate prices, or revenues”. When setting a price-quality path, we must specify prices as either one or both of prices or total revenues; Commerce Act 1986, sections 52C and 53M.
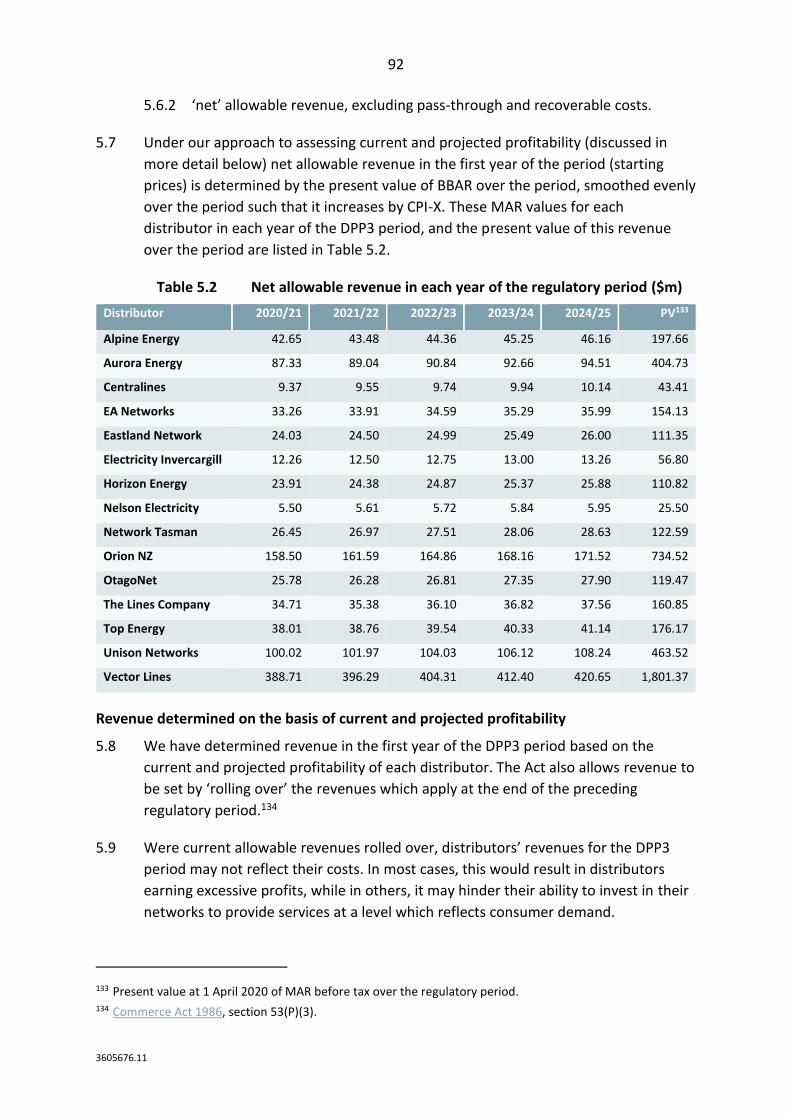
92
3605676.11
5.6.2 ‘net’ allowable revenue, excluding pass-through and recoverable costs.
5.7 Under our approach to assessing current and projected profitability (discussed in
more detail below) net allowable revenue in the first year of the period (starting
prices) is determined by the present value of BBAR over the period, smoothed evenly
over the period such that it increases by CPI-X. These MAR values for each
distributor in each year of the DPP3 period, and the present value of this revenue
over the period are listed in Table 5.2.
Table 5.2 Net allowable revenue in each year of the regulatory period ($m)
Distributor 2020/21 2021/22 2022/23 2023/24 2024/25 PV133
Alpine Energy 42.65 43.48 44.36 45.25 46.16 197.66
Aurora Energy 87.33 89.04 90.84 92.66 94.51 404.73
Centralines 9.37 9.55 9.74 9.94 10.14 43.41
EA Networks 33.26 33.91 34.59 35.29 35.99 154.13
Eastland Network 24.03 24.50 24.99 25.49 26.00 111.35
Electricity Invercargill 12.26 12.50 12.75 13.00 13.26 56.80
Horizon Energy 23.91 24.38 24.87 25.37 25.88 110.82
Nelson Electricity 5.50 5.61 5.72 5.84 5.95 25.50
Network Tasman 26.45 26.97 27.51 28.06 28.63 122.59
Orion NZ 158.50 161.59 164.86 168.16 171.52 734.52
OtagoNet 25.78 26.28 26.81 27.35 27.90 119.47
The Lines Company 34.71 35.38 36.10 36.82 37.56 160.85
Top Energy 38.01 38.76 39.54 40.33 41.14 176.17
Unison Networks 100.02 101.97 104.03 106.12 108.24 463.52
Vector Lines 388.71 396.29 404.31 412.40 420.65 1,801.37
Revenue determined on the basis of current and projected profitability
5.8 We have determined revenue in the first year of the DPP3 period based on the
current and projected profitability of each distributor. The Act also allows revenue to
be set by ‘rolling over’ the revenues which apply at the end of the preceding
regulatory period.134
5.9 Were current allowable revenues rolled over, distributors’ revenues for the DPP3
period may not reflect their costs. In most cases, this would result in distributors
earning excessive profits, while in others, it may hinder their ability to invest in their
networks to provide services at a level which reflects consumer demand.
133 Present value at 1 April 2020 of MAR before tax over the regulatory period. 134 Commerce Act 1986, section 53(P)(3).
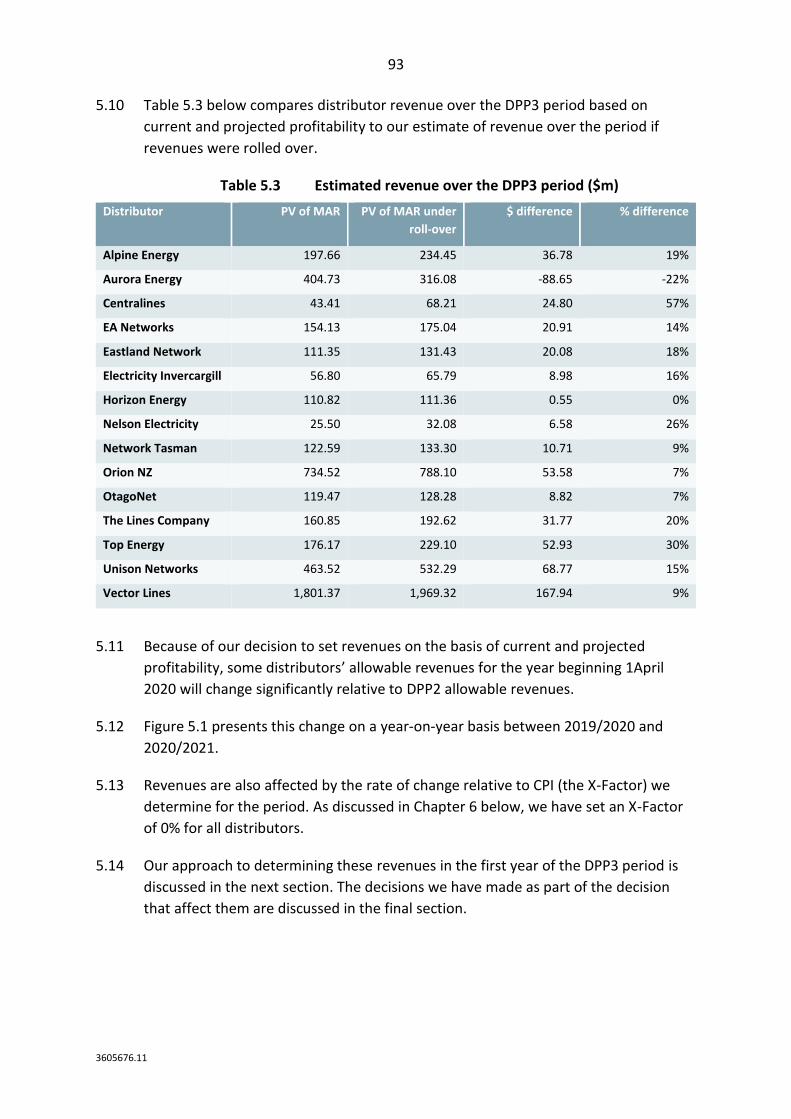
93
3605676.11
5.10 Table 5.3 below compares distributor revenue over the DPP3 period based on
current and projected profitability to our estimate of revenue over the period if
revenues were rolled over.
Table 5.3 Estimated revenue over the DPP3 period ($m)
Distributor PV of MAR PV of MAR under
roll-over
$ difference % difference
Alpine Energy 197.66 234.45 36.78 19%
Aurora Energy 404.73 316.08 -88.65 -22%
Centralines 43.41 68.21 24.80 57%
EA Networks 154.13 175.04 20.91 14%
Eastland Network 111.35 131.43 20.08 18%
Electricity Invercargill 56.80 65.79 8.98 16%
Horizon Energy 110.82 111.36 0.55 0%
Nelson Electricity 25.50 32.08 6.58 26%
Network Tasman 122.59 133.30 10.71 9%
Orion NZ 734.52 788.10 53.58 7%
OtagoNet 119.47 128.28 8.82 7%
The Lines Company 160.85 192.62 31.77 20%
Top Energy 176.17 229.10 52.93 30%
Unison Networks 463.52 532.29 68.77 15%
Vector Lines 1,801.37 1,969.32 167.94 9%
5.11 Because of our decision to set revenues on the basis of current and projected
profitability, some distributors’ allowable revenues for the year beginning 1April
2020 will change significantly relative to DPP2 allowable revenues.
5.12 Figure 5.1 presents this change on a year-on-year basis between 2019/2020 and
2020/2021.
5.13 Revenues are also affected by the rate of change relative to CPI (the X-Factor) we
determine for the period. As discussed in Chapter 6 below, we have set an X-Factor
of 0% for all distributors.
5.14 Our approach to determining these revenues in the first year of the DPP3 period is
discussed in the next section. The decisions we have made as part of the decision
that affect them are discussed in the final section.
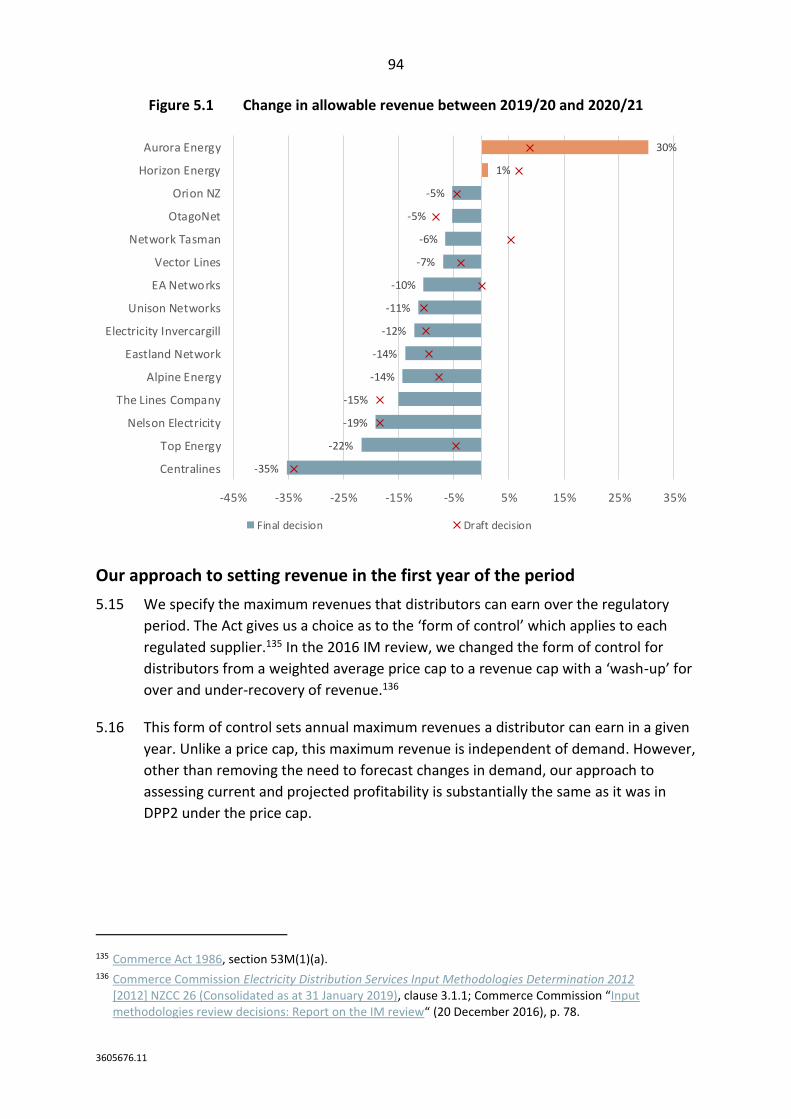
94
3605676.11
Figure 5.1 Change in allowable revenue between 2019/20 and 2020/21
Our approach to setting revenue in the first year of the period
5.15 We specify the maximum revenues that distributors can earn over the regulatory
period. The Act gives us a choice as to the ‘form of control’ which applies to each
regulated supplier.135 In the 2016 IM review, we changed the form of control for
distributors from a weighted average price cap to a revenue cap with a ‘wash-up’ for
over and under-recovery of revenue.136
5.16 This form of control sets annual maximum revenues a distributor can earn in a given
year. Unlike a price cap, this maximum revenue is independent of demand. However,
other than removing the need to forecast changes in demand, our approach to
assessing current and projected profitability is substantially the same as it was in
DPP2 under the price cap.
135 Commerce Act 1986, section 53M(1)(a). 136 Commerce Commission Electricity Distribution Services Input Methodologies Determination 2012
[2012] NZCC 26 (Consolidated as at 31 January 2019), clause 3.1.1; Commerce Commission “Input methodologies review decisions: Report on the IM review“ (20 December 2016), p. 78.
-35%
-22%
-19%
-15%
-14%
-14%
-12%
-11%
-10%
-7%
-6%
-5%
-5%
1%
30%
-45% -35% -25% -15% -5% 5% 15% 25% 35%
Centralines
Top Energy
Nelson Electricity
The Lines Company
Alpine Energy
Eastland Network
Electricity Invercargill
Unison Networks
EA Networks
Vector Lines
Network Tasman
OtagoNet
Orion NZ
Horizon Energy
Aurora Energy
Final decision Draft decision
95
3605676.11
The limit on revenue provides incentives to focus on controllable costs
5.17 Setting price or revenue limits means that profitability depends on the extent to
which distributors control costs. Actual costs may differ from forecasts for a variety
of reasons, but the incentive to increase profits helps to create an incentive for
suppliers to reduce costs. This incentive is a key to the way the DPP creates
efficiency incentives, consistent with section 52A(1)(b).
5.18 There is a risk that suppliers may find these cost savings by reducing investment or
maintenance. Quality standards (discussed in Chapter 7) play an important role in
reducing the risk of this occurring. This maintains incentives to invest (consistent
with section 52A(1)(a)) and to maintain quality of supply (consistent with section
52A(1)(b)).
5.19 Costs that suppliers have little or no control over are recovered through separate
allowances for ‘pass-through costs’ and ‘recoverable costs.’ The items that qualify
for these categories are set out in the IMs.137 The changes we are proposing to
recoverable costs are discussed in Chapter 6.
The revenue limit setting process
5.20 The DPP must specify allowable revenues and quality standards for each distributor
for the regulatory period, as set out in section 53M of the Act. The gross revenue
allowances each distributor can recover include an allowance for pass-through and
recoverable costs. However, our BBAR analysis does not include pass-through and
recoverable costs.138 As such, the two main components of net revenue limits are:
5.20.1 the ‘starting price’ – revenue allowed in the first year of the regulatory
period; and
5.20.2 the ‘rate of change’ relative to the CPI, that is allowed in later parts of the
regulatory period.
5.21 When setting this starting price under a DPP, the Act provides for two approaches:
5.21.1 rolling over the prices applying at the end of the preceding regulatory
period; or
5.21.2 based on the current and projected profitability of each distributor, as
determined by the Commission.
137 Commerce Commission Electricity Distribution Services Input Methodologies Determination 2012 [2012] NZCC 26 (Consolidated as at 31 January 2019), clause 3.1.3.
138 Pass-through and recoverable costs are included as separate items in the revenue path formula. For a detailed discussion, see Attachment H.
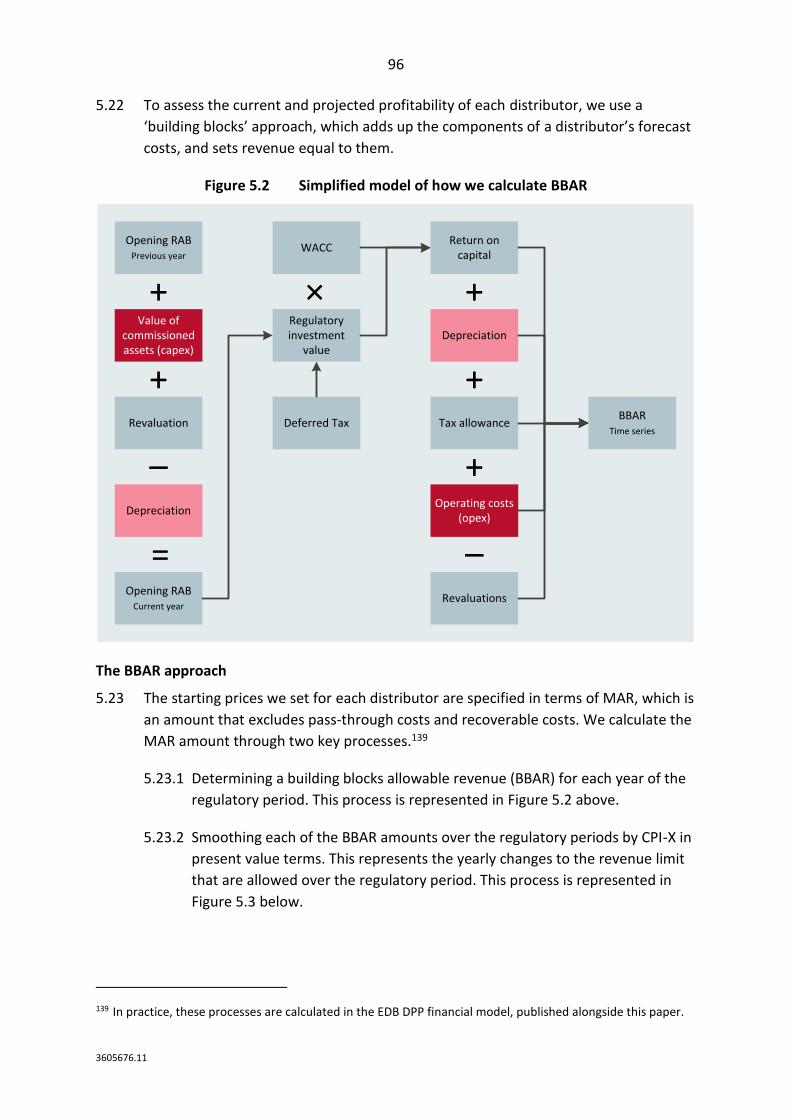
96
3605676.11
5.22 To assess the current and projected profitability of each distributor, we use a
‘building blocks’ approach, which adds up the components of a distributor’s forecast
costs, and sets revenue equal to them.
Figure 5.2 Simplified model of how we calculate BBAR
The BBAR approach
5.23 The starting prices we set for each distributor are specified in terms of MAR, which is
an amount that excludes pass-through costs and recoverable costs. We calculate the
MAR amount through two key processes.139
5.23.1 Determining a building blocks allowable revenue (BBAR) for each year of the
regulatory period. This process is represented in Figure 5.2 above.
5.23.2 Smoothing each of the BBAR amounts over the regulatory periods by CPI-X in
present value terms. This represents the yearly changes to the revenue limit
that are allowed over the regulatory period. This process is represented in
Figure 5.3 below.
139 In practice, these processes are calculated in the EDB DPP financial model, published alongside this paper.
Opening RABPrevious year
Value of commissioned assets (capex)
+
Revaluation
+
Depreciation
–
Opening RABCurrent year
=
WACC
Deferred Tax
Regulatory investment
value
×
Return on capital
Depreciation
Tax allowance
Operating costs (opex)
Revaluations
+
+
+
–
BBARTime series
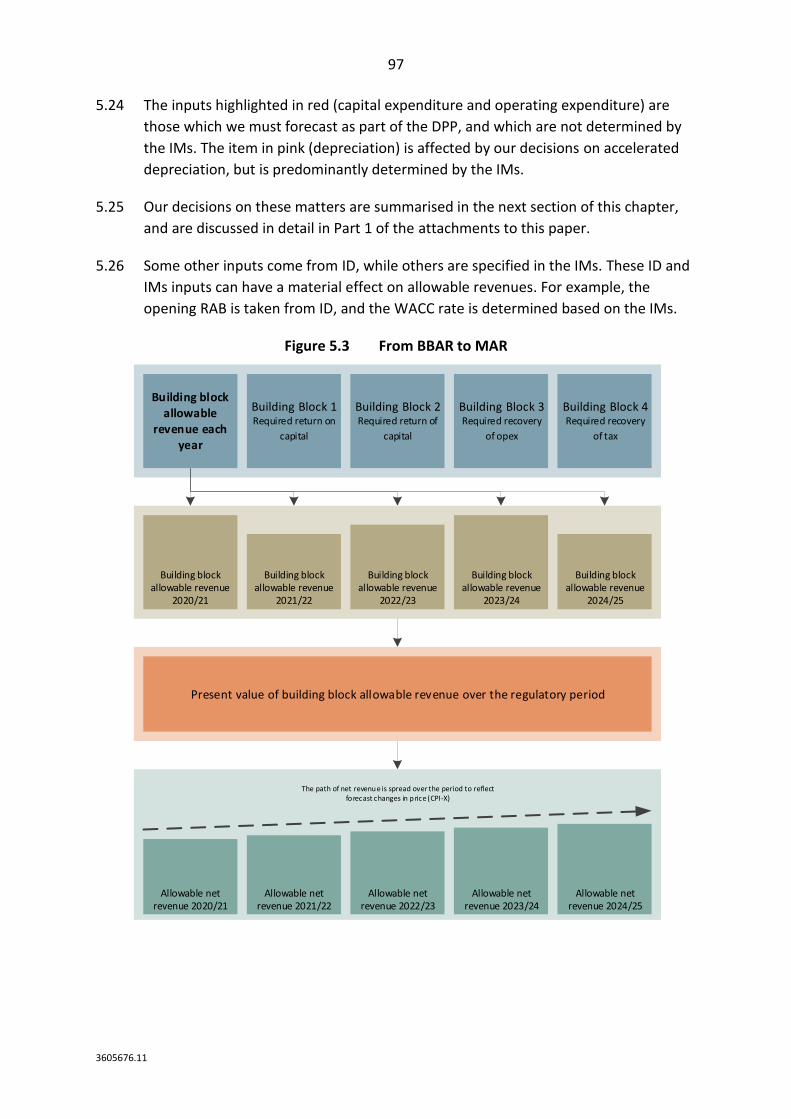
97
3605676.11
5.24 The inputs highlighted in red (capital expenditure and operating expenditure) are
those which we must forecast as part of the DPP, and which are not determined by
the IMs. The item in pink (depreciation) is affected by our decisions on accelerated
depreciation, but is predominantly determined by the IMs.
5.25 Our decisions on these matters are summarised in the next section of this chapter,
and are discussed in detail in Part 1 of the attachments to this paper.
5.26 Some other inputs come from ID, while others are specified in the IMs. These ID and
IMs inputs can have a material effect on allowable revenues. For example, the
opening RAB is taken from ID, and the WACC rate is determined based on the IMs.
Figure 5.3 From BBAR to MAR
Building Block 1Required return on
capital
Building Block 2Required return of
capital
Building Block 3Required recovery
of opex
Building Block 4Required recovery
of tax
Building block allowable
revenue each year
Building block allowable revenue
2020/21
Building block allowable revenue
2021/22
Building block allowable revenue
2022/23
Building block allowable revenue
2023/24
Building block allowable revenue
2024/25
Present value of building block allowable revenue over the regulatory period
Allowable net revenue 2020/21
Allowable net revenue 2021/22
Allowable net revenue 2022/23
Allowable net revenue 2023/24
Allowable net revenue 2024/25
The path of net revenue is spread over the period to reflect forecast changes in price (CPI-X)
98
3605676.11
From building blocks to starting prices
5.27 The components in Figure 5.2 combine as building blocks to provide total BBAR for
each year of the regulatory period. BBAR is then spread over the regulatory period
into annual MAR figures, that increase at a consistent rate of CPI-X.
5.28 We do this in such a way that the present value of BBAR and MAR are the same.
Figure 5.3 below illustrates this process.
5.29 A key difference between the price cap we applied in DPP2 and the revenue cap
which we will apply for DPP3 is how the revenue smoothing shown in the final box in
Figure 5.3 is calculated.
5.29.1 Under the price cap, revenues were spread out to reflect both forecast
changes in prices (CPI-X) and forecast changes in quantities (CPRG).
5.29.2 Under the revenue cap, revenues are only spread out to reflect the forecast
change in CPI-X.
Key decisions affecting allowable revenue in the first year of the DPP3 period
5.30 As shown in Figure 5.2 above, there are certain parameters of the BBAR model that
we determine as part of setting the DPP. This section discusses these parameters,
and changes to them since the draft decision. These parameters are:
5.30.1 opex forecasts;
5.30.2 capex forecasts; and
5.30.3 whether to allow distributors who have applied for it to accelerate the
depreciation of their assets.
5.31 Additionally, there are other inputs to the financial model which can have a material
impact on starting prices (for example, WACC or forecast CPI) but that we do not
make decisions about as part of the DPP. These other inputs are discussed in
Attachment C.140
Forecasts of opex
5.32 To forecast opex for each distributor, we have retained at a high level the ‘base,
step, and trend’ methodology from the 2014 DPP2 reset. The opex allowances that
result from our decision are set out in Table 5.4 below.
140 We also received submissions on changes to the EDB IMs that would have changed the way these parameters are calculated. Our reasons for not making these changes are discussed in: Commerce Commission “Amendments to electricity distribution services input methodologies determination – Reasons paper” (26 November 2019), pp. 26-31 and 57-61.
99
3605676.11
5.33 Consistent with the DPP decision-making framework set out in paragraphs 3.29-3.30
in Chapter 3 above, we have retained the base-step-trend approach because we do
not consider any alternatives (such as using AMP forecasts) would meaningfully
improve the incentives distributors face in terms of section 52A, or would better
promote the section 53K purpose of DPP/CPP regulation.
5.34 Our decision to retain the base-step-trend model is consistent with the low-cost DPP
principles set out in Chapter 3 because it makes use of existing ID data that reflects
each distributors’ current level of performance, while at the same time making
broad adjustments for distributor-specific differences in growth where reliable
independent data is available.
5.35 Providing an opex allowance ensures that distributors have sufficient resources to
fund recurring activities that are not capital expenditure. The opex allowance funds a
variety of recurring activities that are essential for the operation of distribution
networks, such as maintenance and planning activities.141
5.36 Opex has a direct effect on the starting price and the MAR. Opex represents
approximately 44% of BBAR. From an efficiency point of view, the opex allowance
we set is the baseline against which any opex IRIS gains and losses are measured.
141 We would also generally expect distributors to fund innovation activities from this opex allowance or from the capex allowance discussed below. However, given incentives to avoid expenditure, and the risk that innovation will not deliver immediate efficiency or quality benefits (as discussed in Chapter 4), we consider that additional funding outside of the opex and capex allowances is in the long-term benefit of consumers.
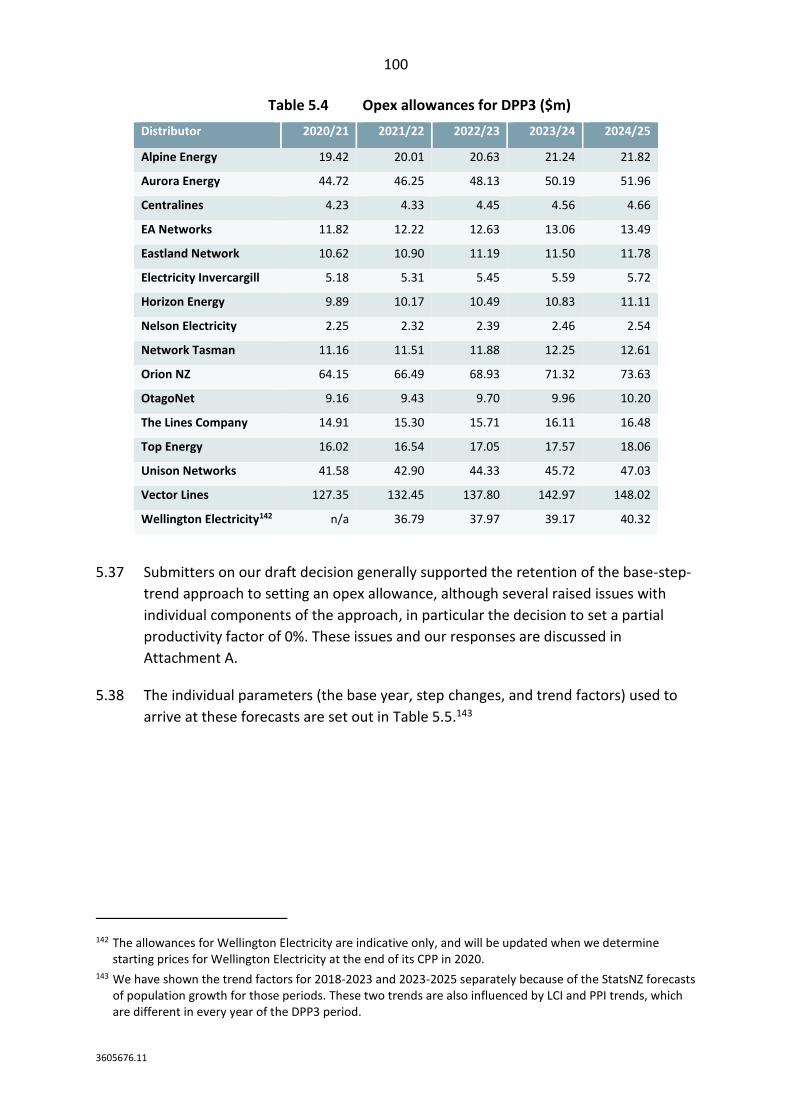
100
3605676.11
Table 5.4 Opex allowances for DPP3 ($m)
Distributor 2020/21 2021/22 2022/23 2023/24 2024/25
Alpine Energy 19.42 20.01 20.63 21.24 21.82
Aurora Energy 44.72 46.25 48.13 50.19 51.96
Centralines 4.23 4.33 4.45 4.56 4.66
EA Networks 11.82 12.22 12.63 13.06 13.49
Eastland Network 10.62 10.90 11.19 11.50 11.78
Electricity Invercargill 5.18 5.31 5.45 5.59 5.72
Horizon Energy 9.89 10.17 10.49 10.83 11.11
Nelson Electricity 2.25 2.32 2.39 2.46 2.54
Network Tasman 11.16 11.51 11.88 12.25 12.61
Orion NZ 64.15 66.49 68.93 71.32 73.63
OtagoNet 9.16 9.43 9.70 9.96 10.20
The Lines Company 14.91 15.30 15.71 16.11 16.48
Top Energy 16.02 16.54 17.05 17.57 18.06
Unison Networks 41.58 42.90 44.33 45.72 47.03
Vector Lines 127.35 132.45 137.80 142.97 148.02
Wellington Electricity142 n/a 36.79 37.97 39.17 40.32
5.37 Submitters on our draft decision generally supported the retention of the base-step-
trend approach to setting an opex allowance, although several raised issues with
individual components of the approach, in particular the decision to set a partial
productivity factor of 0%. These issues and our responses are discussed in
Attachment A.
5.38 The individual parameters (the base year, step changes, and trend factors) used to
arrive at these forecasts are set out in Table 5.5.143
142 The allowances for Wellington Electricity are indicative only, and will be updated when we determine starting prices for Wellington Electricity at the end of its CPP in 2020.
143 We have shown the trend factors for 2018-2023 and 2023-2025 separately because of the StatsNZ forecasts of population growth for those periods. These two trends are also influenced by LCI and PPI trends, which are different in every year of the DPP3 period.
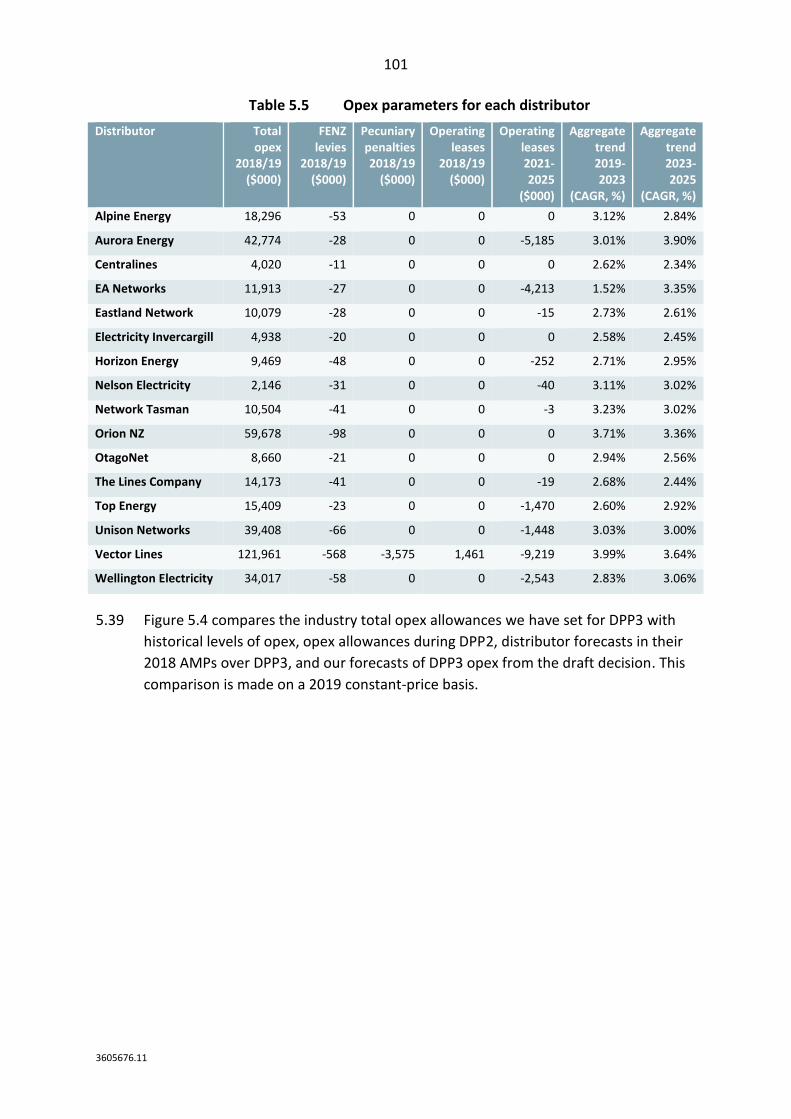
101
3605676.11
Table 5.5 Opex parameters for each distributor
Distributor Total opex
2018/19 ($000)
FENZ levies
2018/19 ($000)
Pecuniary penalties 2018/19
($000)
Operating leases
2018/19 ($000)
Operating leases 2021-2025
($000)
Aggregate trend 2019-2023
(CAGR, %)
Aggregate trend 2023-2025
(CAGR, %)
Alpine Energy 18,296 -53 0 0 0 3.12% 2.84%
Aurora Energy 42,774 -28 0 0 -5,185 3.01% 3.90%
Centralines 4,020 -11 0 0 0 2.62% 2.34%
EA Networks 11,913 -27 0 0 -4,213 1.52% 3.35%
Eastland Network 10,079 -28 0 0 -15 2.73% 2.61%
Electricity Invercargill 4,938 -20 0 0 0 2.58% 2.45%
Horizon Energy 9,469 -48 0 0 -252 2.71% 2.95%
Nelson Electricity 2,146 -31 0 0 -40 3.11% 3.02%
Network Tasman 10,504 -41 0 0 -3 3.23% 3.02%
Orion NZ 59,678 -98 0 0 0 3.71% 3.36%
OtagoNet 8,660 -21 0 0 0 2.94% 2.56%
The Lines Company 14,173 -41 0 0 -19 2.68% 2.44%
Top Energy 15,409 -23 0 0 -1,470 2.60% 2.92%
Unison Networks 39,408 -66 0 0 -1,448 3.03% 3.00%
Vector Lines 121,961 -568 -3,575 1,461 -9,219 3.99% 3.64%
Wellington Electricity 34,017 -58 0 0 -2,543 2.83% 3.06%
5.39 Figure 5.4 compares the industry total opex allowances we have set for DPP3 with
historical levels of opex, opex allowances during DPP2, distributor forecasts in their
2018 AMPs over DPP3, and our forecasts of DPP3 opex from the draft decision. This
comparison is made on a 2019 constant-price basis.
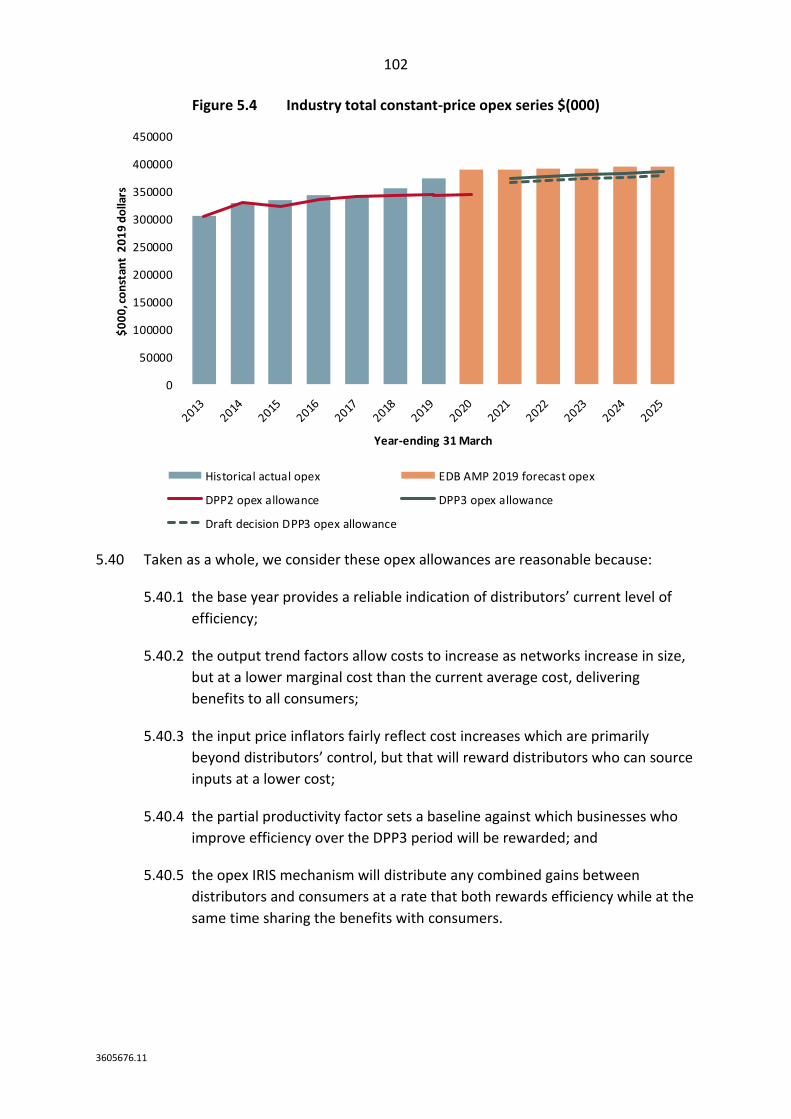
102
3605676.11
Figure 5.4 Industry total constant-price opex series $(000)
5.40 Taken as a whole, we consider these opex allowances are reasonable because:
5.40.1 the base year provides a reliable indication of distributors’ current level of
efficiency;
5.40.2 the output trend factors allow costs to increase as networks increase in size,
but at a lower marginal cost than the current average cost, delivering
benefits to all consumers;
5.40.3 the input price inflators fairly reflect cost increases which are primarily
beyond distributors’ control, but that will reward distributors who can source
inputs at a lower cost;
5.40.4 the partial productivity factor sets a baseline against which businesses who
improve efficiency over the DPP3 period will be rewarded; and
5.40.5 the opex IRIS mechanism will distribute any combined gains between
distributors and consumers at a rate that both rewards efficiency while at the
same time sharing the benefits with consumers.
0
50000
100000
150000
200000
250000
300000
350000
400000
450000
$0
00
, co
nst
ant
20
19
do
llars
Year-ending 31 March
Historical actual opex EDB AMP 2019 forecast opex
DPP2 opex allowance DPP3 opex allowance
Draft decision DPP3 opex allowance
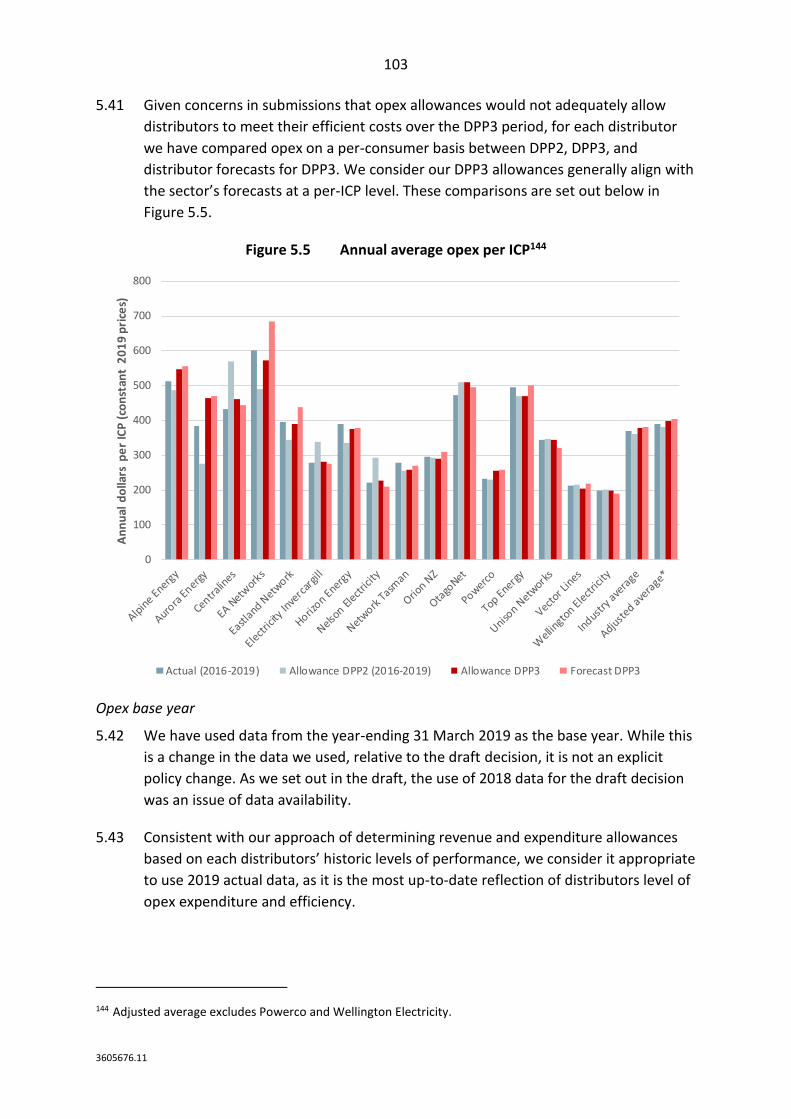
103
3605676.11
5.41 Given concerns in submissions that opex allowances would not adequately allow
distributors to meet their efficient costs over the DPP3 period, for each distributor
we have compared opex on a per-consumer basis between DPP2, DPP3, and
distributor forecasts for DPP3. We consider our DPP3 allowances generally align with
the sector’s forecasts at a per-ICP level. These comparisons are set out below in
Figure 5.5.
Figure 5.5 Annual average opex per ICP144
Opex base year
5.42 We have used data from the year-ending 31 March 2019 as the base year. While this
is a change in the data we used, relative to the draft decision, it is not an explicit
policy change. As we set out in the draft, the use of 2018 data for the draft decision
was an issue of data availability.
5.43 Consistent with our approach of determining revenue and expenditure allowances
based on each distributors’ historic levels of performance, we consider it appropriate
to use 2019 actual data, as it is the most up-to-date reflection of distributors level of
opex expenditure and efficiency.
144 Adjusted average excludes Powerco and Wellington Electricity.
0
100
200
300
400
500
600
700
800
An
nu
al d
olla
rs p
er
ICP
(co
nst
ant
20
19
pri
ces)
Actual (2016-2019) Allowance DPP2 (2016-2019) Allowance DPP3 Forecast DPP3
104
3605676.11
5.44 To the extent that 2019 data is not fully representative of a distributor’s current
performance, the opex IRIS mechanism (specifically the base year adjustment term)
accounts for this by sharing any temporary efficiency gains or losses between
consumers and the distributor at the same uniform retention rate as savings in any
other year of a DPP period.
5.45 Put another way, while increases or decreases in the opex base year affect the net
allowable revenue we determine at the start of the DPP period, due to the IRIS
mechanism they will have a reduced impact on the gross allowable revenue
distributors can recover over the DPP3 period, with any reductions in base year opex
offset by an increase in the opex incentive payments the distributor receives under
IRIS.
Step changes
5.46 We have included three step changes in distributor opex allowances for DPP3:
5.46.1 an adjustment to account for FENZ levies now being treated as a recoverable
cost;
5.46.2 the removal of pecuniary penalties from future opex allowances, to account
for these no longer being treated as opex; and
5.46.3 the removal of operating leases from future opex allowances, as it will be
classed as capex following a change in accounting standards.
5.47 Treating FENZ levies as a recoverable cost was first proposed in submissions on our
issues paper. We have made this change because we consider FENZ levies meet the
criteria we generally apply when determining what should be included as a
recoverable cost (as discussed in Chapter 6), and that there is no incentive benefit to
exposing distributors to any difference between forecast and actual FENZ levies.
5.48 As discussed in our draft decision and in the IM Amendments reasons paper, we
considered that the current definition of operating costs may allow distributors to
share the cost of any penalty with its consumers, rather than the distributor bearing
the whole cost. In response to submissions, we do not to apply any adjustment to
opex for the DPP2 period, consistent with our approach of not changing the
underlying incentives distributors face after the fact. We have applied this
adjustment on a forward-looking basis to ensure this issue is not repeated.
5.49 As discussed in our draft decision and in the IM Amendments reasons paper, we
consider operating leases to be classed as capex instead of opex following the
implementation of a new financial reporting standard – NZ IFRS 16.
5.50 Other proposed step changes that we have not implemented are discussed in
Attachment A.
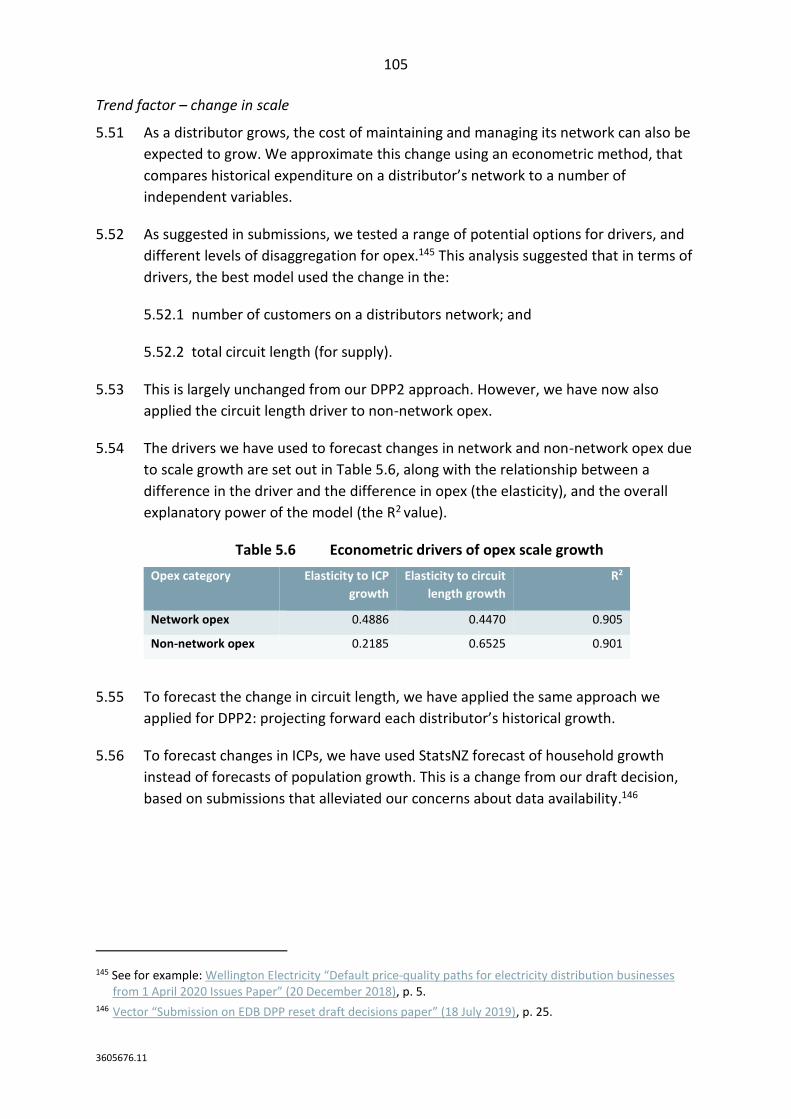
105
3605676.11
Trend factor – change in scale
5.51 As a distributor grows, the cost of maintaining and managing its network can also be
expected to grow. We approximate this change using an econometric method, that
compares historical expenditure on a distributor’s network to a number of
independent variables.
5.52 As suggested in submissions, we tested a range of potential options for drivers, and
different levels of disaggregation for opex.145 This analysis suggested that in terms of
drivers, the best model used the change in the:
5.52.1 number of customers on a distributors network; and
5.52.2 total circuit length (for supply).
5.53 This is largely unchanged from our DPP2 approach. However, we have now also
applied the circuit length driver to non-network opex.
5.54 The drivers we have used to forecast changes in network and non-network opex due
to scale growth are set out in Table 5.6, along with the relationship between a
difference in the driver and the difference in opex (the elasticity), and the overall
explanatory power of the model (the R2 value).
Table 5.6 Econometric drivers of opex scale growth
Opex category Elasticity to ICP
growth
Elasticity to circuit
length growth
R2
Network opex 0.4886 0.4470 0.905
Non-network opex 0.2185 0.6525 0.901
5.55 To forecast the change in circuit length, we have applied the same approach we
applied for DPP2: projecting forward each distributor’s historical growth.
5.56 To forecast changes in ICPs, we have used StatsNZ forecast of household growth
instead of forecasts of population growth. This is a change from our draft decision,
based on submissions that alleviated our concerns about data availability.146
145 See for example: Wellington Electricity “Default price-quality paths for electricity distribution businesses from 1 April 2020 Issues Paper” (20 December 2018), p. 5.
146 Vector “Submission on EDB DPP reset draft decisions paper” (18 July 2019), p. 25.
106
3605676.11
Trend factor – Input prices
5.57 The cost of the inputs that distributors require to deliver the outputs expected of
them also changes over time. These changes are predictable and are largely beyond
distributors’ control. Put another way, the opex allowances we produce in constant-
price terms must be converted to nominal dollars, to be incorporated into the
financial model.
5.58 We have used the same weighted average inflation series used for DPP2:
5.58.1 NZIER’s forecast of the all-industries labour cost index (LCI) (60%); and
5.58.2 NZIER’s forecast of the all-industries producer price index (40%).
5.59 As suggested in submissions, we have considered whether an industry-specific sub-
index (specifically StatsNZ’s electricity, gas, waste, and water (EGWW) sub-index)
would better predict changes in distributors’ costs.147
5.60 Historically, over the medium term, there have not been substantial differences
between the all-industries index and the EGWW sub-index.
5.61 Furthermore, a substantial proportion of the EGWW producer price index is
composed of the cost of electricity distribution and transmission services, which
both creates an endogeneity problem, and does not reflect distributors’ input
costs.148
5.62 We confirm that NZIER’s forecasts of the LCI account for factors relevant to
distributors. These include wage inflation in the public and private sector,
employment rates, the increase in the minimum wage, an ageing workforce and
business outlook.
5.63 Several distributors recommend that we reconsider using NZIER’s forecasts. We
investigated whether NZIER’s forecasts are appropriate for distributors, by
considering:
5.63.1 what factors NZIER forecasts include; and
5.63.2 other macroeconomic commentary and forecasts.
147 ENA “DPP3 April 2020 Commission Issues paper (Part One Regulating capex, opex & incentives)” (20 December 2018), The Lines Company “Default price-quality paths for electricity distribution businesses from 1 April 2020” (21 December 2018), and Wellington Electricity “Default price-quality paths for electricity distribution businesses from 1 April 2020 Issues Paper” (20 December 2018) favoured the EGWW.
148 35% of the EGWW is composed of the cost of transmission and distribution services. Statistics New Zealand “Producers Price Index: March 2017 quarter – supplementary tables of new industry weights” (17 May 2017).
107
3605676.11
5.64 We engaged with NZIER to discuss what factors their forecast of LCI includes. We
thought this was important following stakeholders’ recommendations to seek advice
and overall concern around NZIER’s forecast of LCI. Distributors thought the draft
forecast of LCI was too low for several macroeconomic reasons and some provided
evidence of wage growth forecasts.
Trend factor – opex partial productivity
5.65 The final component of our trend methodology is a measure of the ratio between
the outputs a distributor produces to the cost of the inputs it uses to do so – a
measure called opex partial productivity.
5.66 We have retained a partial productivity factor of 0% for the DPP3 period.
5.67 NERA provides strong evidence to show that historic partial productivity is
negative.149 However, we remain unconvinced that declining productivity in the past
is predictive of future declines. We consider improvements in productivity are
achievable due to:
5.67.1 evidence of positive productivity in electricity distribution sectors across the
world, including productivity studies which take quality of outputs into
account;150
5.67.2 evidence of positive productivity in comparable sectors within New Zealand;
and
5.67.3 a changing policy environment with a greater focus on innovation and
technology.
5.68 The reason we do not set the partial productivity factor based on historic
performance is because continually decreasing productivity is generally not
associated with workably competitive markets. Adopting a negative growth rate may
entrench declines in partial productivity and weaken incentives to improve
efficiency.
5.69 Similarly, however, we do not consider it appropriate to use a high productivity
factor to ‘incentivise’ distributors to find gains. This would have the effect of passing
gains onto consumers in anticipation of their discovery, which is not the purpose of
the productivity factor.
149 NERA Economic consulting on behalf of ENA “Submission on EDB DPP reset draft decisions paper” (18 July 2019)
150 For example, customer minutes lost, interruptions, energy losses and customer satisfaction
108
3605676.11
Forecast of capital expenditure
5.70 To forecast capex allowances for each distributor, we have used an amended version
of the DPP2 approach – still using each supplier’s AMP as the starting point for our
forecasts, but applying a series of caps and tests to supplier forecasts to assess
whether the forecasts are reasonable.
5.71 In particular, the approach seeks to determine whether the AMP forecasts:
5.71.1 are internally consistent – for example, that a forecast increase in
expenditure is supported by a corresponding increase in activity, and/or a
realistic increase in costs;
5.71.2 identify large step changes in the planned level of investment, which may be
more appropriate for us to consider under a CPP application or as part of a
reopener.
5.72 We have made this change from our DPP2 approach because:
5.72.1 we think it meaningfully improves the incentives distributors’ face to invest in
replacing and upgrading assets, consistent with section 52A(1)(a); and
5.72.2 due to the scrutiny we apply and the change to the capex IRIS retention
factor (discussed in Chapter 6), it maintains incentives for distributors to
invest efficiently, consistent with section 52A(1)(b).
5.73 In terms of the DPP/CPP regulatory framework, our approach to forecasting requires
a balance between:
5.73.1 on the one hand, accounting for distributor-specific circumstances where
there is a low-cost way of doing so; and
5.73.2 on the other hand, avoiding the excess cost of detailed scrutiny of individual
distributors’ forecasts where a CPP remains the appropriate solution.
5.74 The capex allowances which result from our forecasting approach are set out in
Table 5.7. An industry-wide comparison of DPP3 allowances to DPP2 allowances,
historical actual capex, and supplier AMP forecasts is shown in Figure 5.6. This
comparison is in 2019 constant prices.
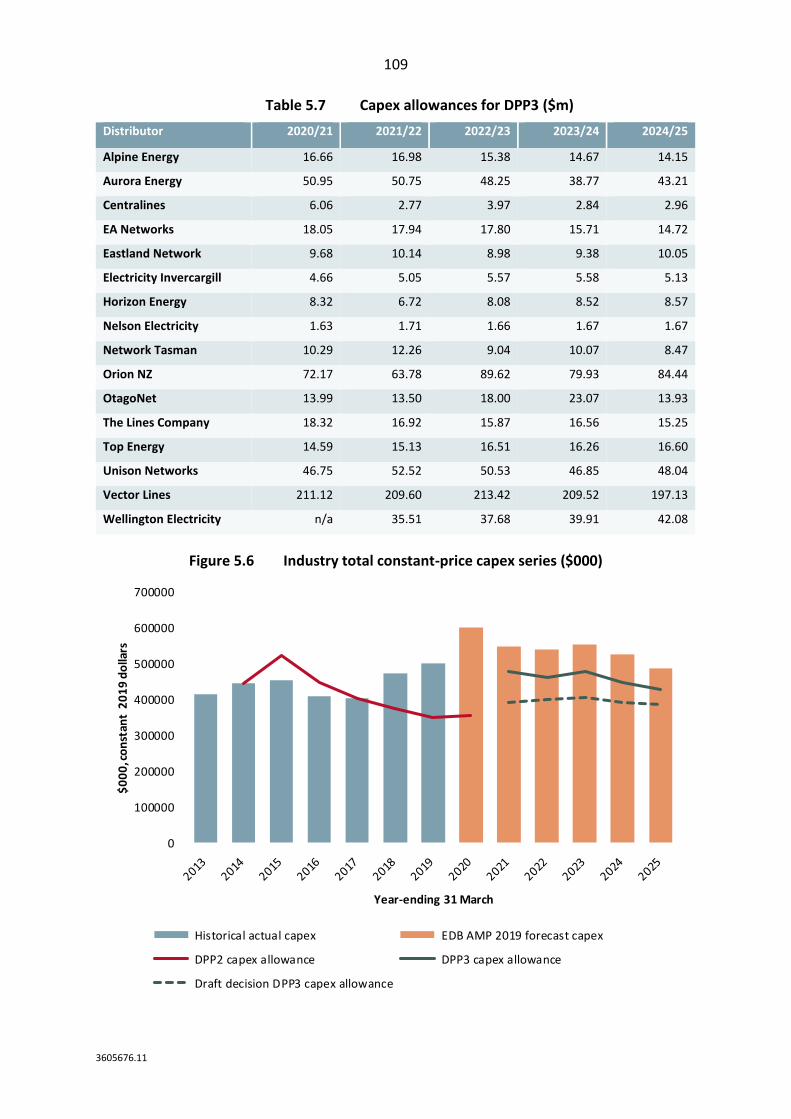
109
3605676.11
Table 5.7 Capex allowances for DPP3 ($m)
Distributor 2020/21 2021/22 2022/23 2023/24 2024/25
Alpine Energy 16.66 16.98 15.38 14.67 14.15
Aurora Energy 50.95 50.75 48.25 38.77 43.21
Centralines 6.06 2.77 3.97 2.84 2.96
EA Networks 18.05 17.94 17.80 15.71 14.72
Eastland Network 9.68 10.14 8.98 9.38 10.05
Electricity Invercargill 4.66 5.05 5.57 5.58 5.13
Horizon Energy 8.32 6.72 8.08 8.52 8.57
Nelson Electricity 1.63 1.71 1.66 1.67 1.67
Network Tasman 10.29 12.26 9.04 10.07 8.47
Orion NZ 72.17 63.78 89.62 79.93 84.44
OtagoNet 13.99 13.50 18.00 23.07 13.93
The Lines Company 18.32 16.92 15.87 16.56 15.25
Top Energy 14.59 15.13 16.51 16.26 16.60
Unison Networks 46.75 52.52 50.53 46.85 48.04
Vector Lines 211.12 209.60 213.42 209.52 197.13
Wellington Electricity n/a 35.51 37.68 39.91 42.08
Figure 5.6 Industry total constant-price capex series ($000)
0
100000
200000
300000
400000
500000
600000
700000
$0
00
, co
nst
ant
20
19
do
llars
Year-ending 31 March
Historical actual capex EDB AMP 2019 forecast capex
DPP2 capex allowance DPP3 capex allowance
Draft decision DPP3 capex allowance
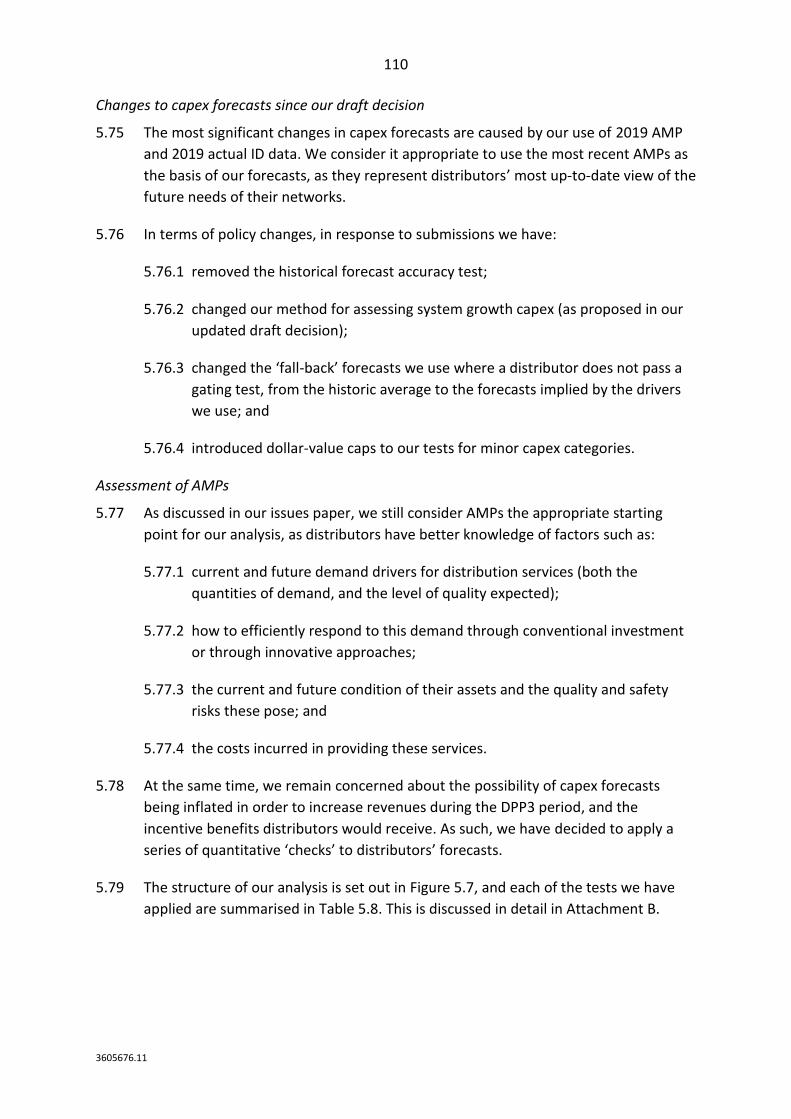
110
3605676.11
Changes to capex forecasts since our draft decision
5.75 The most significant changes in capex forecasts are caused by our use of 2019 AMP
and 2019 actual ID data. We consider it appropriate to use the most recent AMPs as
the basis of our forecasts, as they represent distributors’ most up-to-date view of the
future needs of their networks.
5.76 In terms of policy changes, in response to submissions we have:
5.76.1 removed the historical forecast accuracy test;
5.76.2 changed our method for assessing system growth capex (as proposed in our
updated draft decision);
5.76.3 changed the ‘fall-back’ forecasts we use where a distributor does not pass a
gating test, from the historic average to the forecasts implied by the drivers
we use; and
5.76.4 introduced dollar-value caps to our tests for minor capex categories.
Assessment of AMPs
5.77 As discussed in our issues paper, we still consider AMPs the appropriate starting
point for our analysis, as distributors have better knowledge of factors such as:
5.77.1 current and future demand drivers for distribution services (both the
quantities of demand, and the level of quality expected);
5.77.2 how to efficiently respond to this demand through conventional investment
or through innovative approaches;
5.77.3 the current and future condition of their assets and the quality and safety
risks these pose; and
5.77.4 the costs incurred in providing these services.
5.78 At the same time, we remain concerned about the possibility of capex forecasts
being inflated in order to increase revenues during the DPP3 period, and the
incentive benefits distributors would receive. As such, we have decided to apply a
series of quantitative ‘checks’ to distributors’ forecasts.
5.79 The structure of our analysis is set out in Figure 5.7, and each of the tests we have
applied are summarised in Table 5.8. This is discussed in detail in Attachment B.
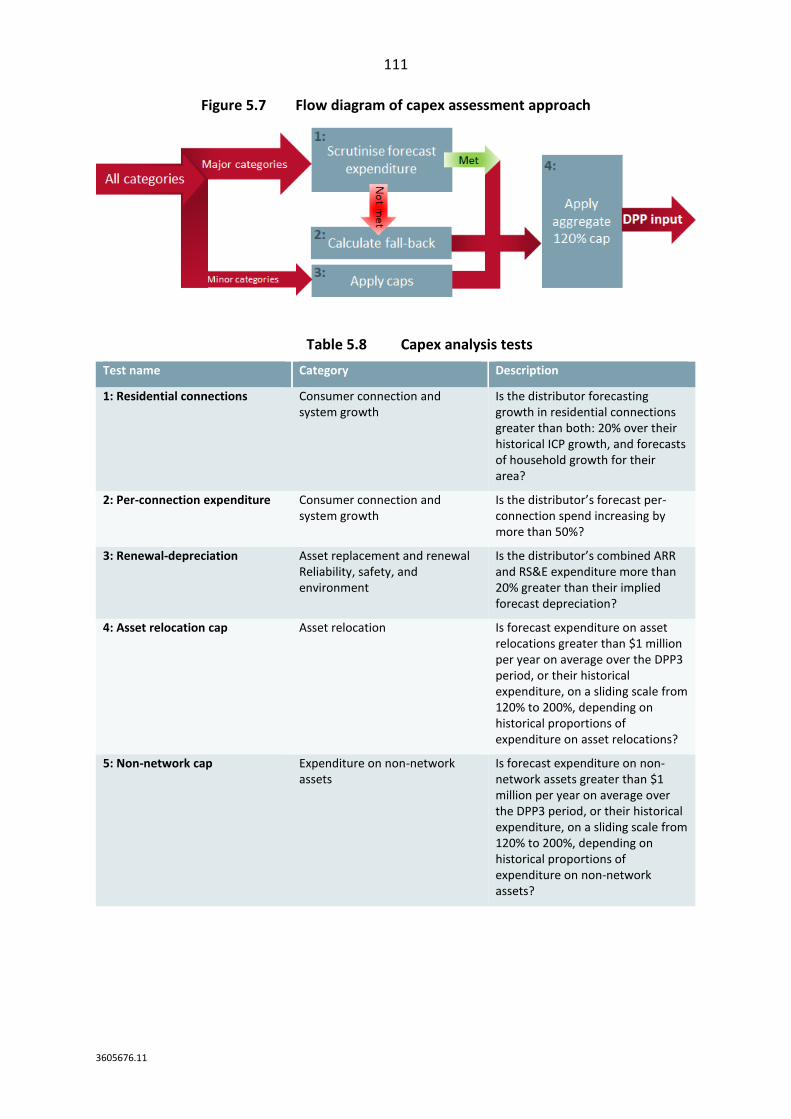
111
3605676.11
Figure 5.7 Flow diagram of capex assessment approach
Table 5.8 Capex analysis tests
Test name Category Description
1: Residential connections Consumer connection and system growth
Is the distributor forecasting growth in residential connections greater than both: 20% over their historical ICP growth, and forecasts of household growth for their area?
2: Per-connection expenditure Consumer connection and system growth
Is the distributor’s forecast per-connection spend increasing by more than 50%?
3: Renewal-depreciation Asset replacement and renewal Reliability, safety, and environment
Is the distributor’s combined ARR and RS&E expenditure more than 20% greater than their implied forecast depreciation?
4: Asset relocation cap Asset relocation Is forecast expenditure on asset relocations greater than $1 million per year on average over the DPP3 period, or their historical expenditure, on a sliding scale from 120% to 200%, depending on historical proportions of expenditure on asset relocations?
5: Non-network cap Expenditure on non-network assets
Is forecast expenditure on non-network assets greater than $1 million per year on average over the DPP3 period, or their historical expenditure, on a sliding scale from 120% to 200%, depending on historical proportions of expenditure on non-network assets?
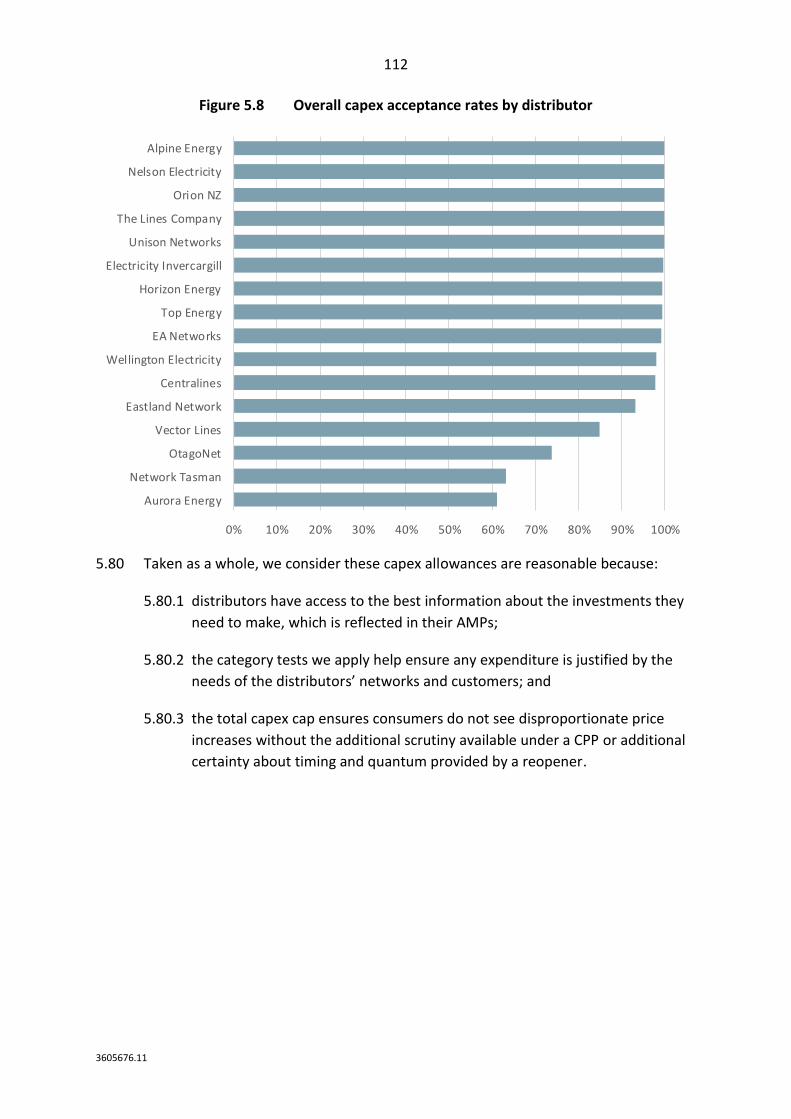
112
3605676.11
Figure 5.8 Overall capex acceptance rates by distributor
5.80 Taken as a whole, we consider these capex allowances are reasonable because:
5.80.1 distributors have access to the best information about the investments they
need to make, which is reflected in their AMPs;
5.80.2 the category tests we apply help ensure any expenditure is justified by the
needs of the distributors’ networks and customers; and
5.80.3 the total capex cap ensures consumers do not see disproportionate price
increases without the additional scrutiny available under a CPP or additional
certainty about timing and quantum provided by a reopener.
0% 10% 20% 30% 40% 50% 60% 70% 80% 90% 100%
Aurora Energy
Network Tasman
OtagoNet
Vector Lines
Eastland Network
Centralines
Wellington Electricity
EA Networks
Top Energy
Horizon Energy
Electricity Invercargill
Unison Networks
The Lines Company
Orion NZ
Nelson Electricity
Alpine Energy
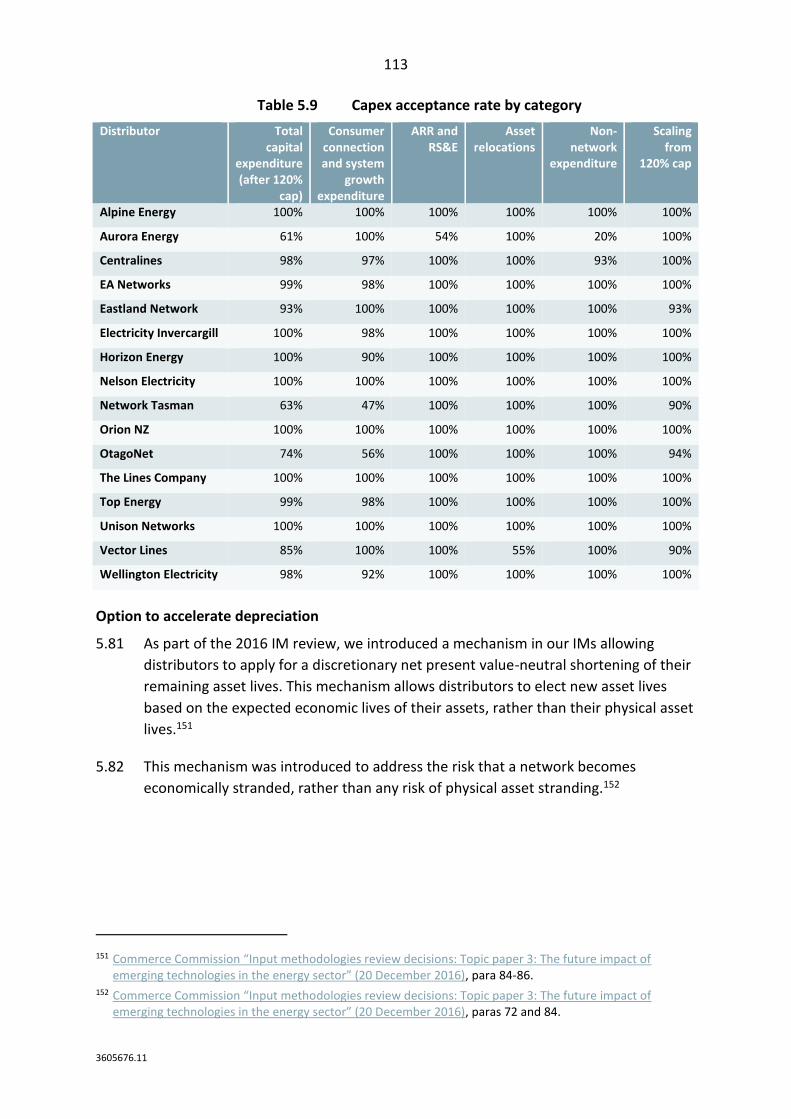
113
3605676.11
Table 5.9 Capex acceptance rate by category
Distributor Total capital
expenditure (after 120%
cap)
Consumer connection and system
growth expenditure
ARR and RS&E
Asset relocations
Non-network
expenditure
Scaling from
120% cap
Alpine Energy 100% 100% 100% 100% 100% 100%
Aurora Energy 61% 100% 54% 100% 20% 100%
Centralines 98% 97% 100% 100% 93% 100%
EA Networks 99% 98% 100% 100% 100% 100%
Eastland Network 93% 100% 100% 100% 100% 93%
Electricity Invercargill 100% 98% 100% 100% 100% 100%
Horizon Energy 100% 90% 100% 100% 100% 100%
Nelson Electricity 100% 100% 100% 100% 100% 100%
Network Tasman 63% 47% 100% 100% 100% 90%
Orion NZ 100% 100% 100% 100% 100% 100%
OtagoNet 74% 56% 100% 100% 100% 94%
The Lines Company 100% 100% 100% 100% 100% 100%
Top Energy 99% 98% 100% 100% 100% 100%
Unison Networks 100% 100% 100% 100% 100% 100%
Vector Lines 85% 100% 100% 55% 100% 90%
Wellington Electricity 98% 92% 100% 100% 100% 100%
Option to accelerate depreciation
5.81 As part of the 2016 IM review, we introduced a mechanism in our IMs allowing
distributors to apply for a discretionary net present value-neutral shortening of their
remaining asset lives. This mechanism allows distributors to elect new asset lives
based on the expected economic lives of their assets, rather than their physical asset
lives.151
5.82 This mechanism was introduced to address the risk that a network becomes
economically stranded, rather than any risk of physical asset stranding.152
151 Commerce Commission “Input methodologies review decisions: Topic paper 3: The future impact of emerging technologies in the energy sector” (20 December 2016), para 84-86.
152 Commerce Commission “Input methodologies review decisions: Topic paper 3: The future impact of emerging technologies in the energy sector” (20 December 2016), paras 72 and 84.
114
3605676.11
5.83 We have decided not to apply an adjustment factor in response to Vector’s
application, based on weighing up our assessment of Vector’s application against the
formal IM requirements, the risk of economic stranding, section 52A of the Act and
exercising our overall discretion. Having assessed Vector’s application against our
framework (which is set out below), we found that:
5.83.1 it was not clear to us whether Vector’s application has met the criteria set
out in clause 4.2.2 of our IMs because Vector did not explain how it had
taken into account any issues raised in consultation, nor specified that no
relevant issues were raised, however we did not have to resolve this because
we declined Vector’s application for other reasons;
5.83.2 we did not find evidence of a material risk to partial capital recovery with
respect to Vector, which was the underlying purpose of the IMs providing for
the adjustment factor;
5.83.3 we did not find that applying the adjustment factor Vector sought promoted
the purpose of Part 4 of the Act; and
5.83.4 in considering our overall discretion we had regard to the interests of
avoiding an initial pricing increase and not adding complexity
5.84 Our reasons for this decision are discussed in more detail in Attachment D.
Parameters we no longer need to forecast
Constant-price revenue growth
5.85 Given the move to a revenue cap, where supplier revenue is not dependent on
changes in demand, we no longer need to forecast constant-price revenue growth
(CPRG).
Other regulated income
5.86 As part of the move to the revenue cap, we have now included other regulated
income as an item which is subject to the revenue wash-up. As such, we no longer
need to forecast other regulated income.
115
3605676.11
Chapter 6 Revenue path during the period
Purpose of this chapter
6.1 This chapter explains ways in which distributors’ revenues can change during the
DPP3 regulatory period, and the policy decisions we have made which will affect
them. This includes:
6.1.1 the rate of change that will apply during the period;
6.1.2 a brief description of the how the revenue cap with wash-up functions;
6.1.3 the incentives that will apply during the period;
6.1.4 newly introduced or modified recoverable costs;
6.1.5 circumstances in which the revenue path can be reopened;
6.1.6 how transactions between distributors will be treated; and
6.1.7 the dates for distributors to apply for CPPs.
Rates of change during the period
6.2 The revenues distributors can earn in the first year of the DPP3 period (before taking
account of pass-through and recoverable costs) are determined by the starting prices
we set, as described in Chapter 5. In the remaining years of the period, net allowable
revenues are determined by the prior year’s net allowable revenue and a ‘rate of
change’.
6.3 The rate of change is expressed in the form CPI-X, where ‘CPI’ reflects general
inflation, and X is a percentage differential known as the ‘X-factor’.
6.4 In determining the X-factor, we are required to determine a default rate of change in
price that is based on the long-run average productivity improvement rate of
distributors. We may consider the long-run average productivity improvement rate
achieved by distributors in New Zealand and/or comparable countries.153
6.5 This rate of change will apply to each distributor, unless it is necessary or desirable
to set an alternative rate of change, either to minimise any undue financial hardship
to the distributor or to mitigate price shocks to consumers.154
153 Commerce Act 1986, section 53P(6). 154 Commerce Act 1986, section 53P(8)(a).
116
3605676.11
X-factor generally applicable to distributors
6.6 A default X-factor of 0% will apply to all distributors for the DPP3 regulatory period.
6.7 Based on our analysis of partial factor productivity in Attachment A we consider 0%
appropriate.
6.8 Because starting prices are based on the current and projected profitability of each
supplier, the rate of change will not affect the present value of revenue the
distributor can expect to recover over the regulatory period.155
6.9 This is because we use the rate of change when setting expected revenues equal to
expected costs over the regulatory period. The rate of change will affect the timing
of revenue recovery over the period, or in other words the slope of the revenue
path.
Alternative X-factors to avoid price shocks or financial hardship
6.10 We have not implemented any alternative rates of change for DPP3. We have
assessed whether alternative rates of change were necessary based on:
6.10.1 whether a distributor’s increase in allowable revenue – including any IRIS
incentives – would otherwise exceed +10% in real terms; and
6.10.2 whether a decrease in a distributor’s allowable revenue would cause financial
hardship due to the change in cashflow profile between DPP2 and DPP3.
6.11 This is a change from the approach we took in the draft decision. In the draft
decision, we assessed price shocks to consumers net of any IRIS effects. In its
submission on the draft decision, Aurora Energy highlighted that once IRIS
recoverable costs were accounted for, its change in allowable revenue would be
much less significant.156
6.12 As the purpose of an alternate rate of change is to prevent either price shocks to
consumers or revenue shocks to distributors, we agree that the need for an
alternative rate of change should be assessed (to the extent possible) on a gross
allowable revenue basis. As the IRIS incentive costs are known with certainty for Year
1 of DPP3, we have factored these into our assessment.
155 The relevance of the X-factor to setting allowable revenues under a BBAR model is explained well in Pat Duignan “Attachment - The role of the “X” in the EDB Default Price-quality Path decision” (20 December 2018).
156 Aurora "Submission on EDB DPP reset draft decisions paper" (18 July 2019), p. 14.
117
3605676.11
6.13 In our companion paper to the updated draft, we sought feedback from distributors
on whether the updated revenue allowances we proposed would create financial
hardship.157 No alternative rates of change were suggested in response to this.
6.14 Vector submitted that the we could “adopt a common X factor across all five years,
spreading out any changes over the DPP period rather than leaving it in a single
upfront hit.”158
6.15 We interpret Vector’s suggestion as each distributor having its own separately
calculated X. We would calculate the X such that it would, along with changes in CPI,
govern the change in net allowable revenue through five year-on-year changes in
revenue. Those five changes would be the change in net allowable revenue from the
last year of DPP2 to the first year of DPP3 and also the four CPI-X annual changes in
net allowable revenue during DPP3.
6.16 While we agree that, where possible, minimising volatility in revenue and price is
important, we have not adopted Vector’s suggestion. If we were to adopt the
suggestion of a single X for each of the five revenue changes for each distributor,
then each distributor would have a different X. This would not be compliant with
section 53P(5) of the Act. Applying a single X for each of the five revenue changes is
effectively an approach we already consider for a single distributor to which
section 53P(8)(a) applies.
Revenue cap with wash-up
6.17 As a result of the IM review in 2016, we changed the form of control for distributors
from a weighted average price cap to a revenue cap, including a wash-up for
over- and under-recovery of revenue.159
6.18 How the revenue cap will operate and policy decisions related to it are discussed in
more detail in Attachment H.
157 Commerce Commission, “Default price-quality paths for electricity distribution businesses from 1 April 2020 – Updated draft models – Companion Paper” (25 September 2019), p. 4.
158 Vector “Submission on EDB DPP reset draft decisions paper” (18 July 2019) paras 254 – 257. 159 Commerce Commission “Input methodologies review decisions: Report on the IM review” (20 December
2016), p. 78.
118
3605676.11
How the revenue cap will apply
6.19 With the move to a revenue cap, we are now required to limit distributors’ net
revenues in a way that is independent of changes in demand for electricity
distribution services. Distributors’ forecast net allowable revenue for the period is
set through starting prices at the start of the period, and then changes each year by
CPI and the X-factor. It does not increase or decrease based on increases or
decreases in demand, such as increased numbers of ICPs, or increases in volume of
energy transported.
6.20 The wash-up mechanism is designed to make distributors or their customers whole
for revenue under- or over-recovery due to differences between expected quantities
when distributors set prices for a given year and when the revenue is actually
recovered (forecast error). The wash-up works by allowing distributors to increase
revenue in a subsequent year where it has under-recovered, or forces them to
recover less revenue where they have over-recovered.
6.21 Because of the introduction of the wash-up mechanism, during the regulatory period
distributors no longer have to recover the entirety of their revenue allowance for a
given year in that year. Subject to the limitations discussed below, this allows
distributors more flexibility to smooth the recovery of their revenue over the period.
6.22 Our DPP3 determination generally implements the revenue cap in the same way that
the Powerco CPP did. Three exceptions to this are:
6.22.1 the introduction and application of a limit on how much a distributor’s
forecast allowable revenue can increase from one year to the next;
6.22.2 the application of a limit on the accrual of wash-up balances due to voluntary
undercharging; and
6.22.3 The method of accounting for the residual ‘pass-through balance’ from the
last year of DPP2.
Limit on the annual increase in forecast revenue from prices
6.23 We have applied a +10% limit on the annual increase in a distributor’s gross ‘forecast
revenue from prices’ (revenue including pass-through and recoverable costs). This
limit will apply when distributors are setting prices in every year of the DPP period,
except for the 2020/21 year.160
160 The limit would not apply for the 2020/21 year as there will be no value of ‘forecast revenue from prices’ for the 2019/20 year in DPP2, and that value would be required for applying the limit.
119
3605676.11
6.24 The limit works in a present value-neutral way, with any under-recovery of revenue
deferred to subsequent years of the DPP (or until the next DPP) via the wash-up
mechanism.
6.25 The introduction of this limit requires an amendment to the EDB IMs. This
amendment is discussed in more detail in Attachment H and in the accompanying IM
amendment reasons paper.
6.26 In their submissions on the draft decision, Wellington Electricity and Vector
proposed that the ‘limit on the annual increase in forecast revenue from prices’ only
apply to forecast allowable revenue, rather than forecast revenue from prices.161
6.27 We have not implemented this change. The purpose of the limit is to mitigate the
risk of price shocks to consumers. Excluding potential sources of such shocks would
reduce the effectiveness of the limit and not be in consumers’ interests. This
decision is discussed in more detail in Attachment H.
We have not implemented the limit on an increase in revenue as a function of demand
6.28 We have not specified “an annual maximum increase in ‘forecast allowable revenue
as a function of demand.” This control is provided for in s3.1.1(2) of the IM. We
consider that this mechanism is not workable to implement in DPP3 in the event of
certain price restructurings.
6.29 The ‘function of demand’ limit was intended to deal with price shocks to consumers
caused by both changes in gross revenues and changes in quantities. While we have
not been able to address price shocks arising from changes in quantities, we have
addressed shocks arising from changes in gross revenues by implementing the limit
on the annual increase in forecast revenue from prices.
Limit on voluntary undercharging
6.30 We have implemented a limit on distributors’ ability to accrue a substantial wash-up
balance as a result of charging below their revenue cap. The limit that we have
implemented (termed the ‘voluntary undercharging revenue floor’) is the lesser of
either:
6.30.1 90% of forecast allowable revenue; or
6.30.2 110% of the previous year’s forecast revenue from prices.
161 Wellington Electricity "Submission on EDB DPP reset draft decisions paper" (18 July 2019); Vector “Submission on IM amendments for DPP and IPP“ (5 July 2019).
120
3605676.11
6.31 A distributor that prices below this limit permanently foregoes this revenue.
Between the revenue cap and the undercharging floor, distributors will be able to
roll over that revenue, and recover it in future years through the wash-up
mechanism.
6.32 Under the price path for the current (DPP2) period, a distributor that charges below
its price cap permanently foregoes that revenue.
6.33 Under the revenue cap with wash-up, distributors may carry forward under-
recovered revenue in a wash-up account. Absent a mechanism to limit accumulation
of the ‘wash-up balance’, a distributor that prices below the revenue cap may accrue
a large balance, which could then create a price shock when it is passed through to
consumers. To prevent this situation, we included a limit on this accumulation in the
specification of price IMs.
6.34 The 90% limit was chosen to allow distributors some flexibility to smooth revenue
recovery, while at the same time minimising the risk of future price shocks. The
setting of the ‘voluntary undercharging revenue floor’ as described in paragraph 6.30
was included to allow for unusual situations where, because of the limit on the
annual increase in forecast revenue from prices, a distributor would be ‘forced’ to
price below the 90% limit.
6.35 We did not receive any submissions on the limit on voluntary undercharging and
have not made any changes since our draft decision.
Revenue cap and incentives under 54Q
6.36 A key benefit to a revenue cap over a price cap is it removes any disincentives for
measures to promote energy efficiency and demand-side management.162 As
distributors are no longer exposed to quantity risk, they can take steps to reduce
demand (and therefore potentially defer capex) without incurring revenue losses.
6.37 Furthermore, moving to a revenue cap will allow distributors to restructure their
prices to be more service-based and cost-reflective without the complexities of price
restructures that are currently caused by the lagged prices in the compliance
formula for weighted average price caps. Improved pricing may better support
demand-side management.163
162 These benefits were part of our motivation for the change to the revenue cap when reviewing the input methodologies. Commerce Commission “Input methodologies review decisions – Topic paper 1 – Form of control and RAB indexation for EDBs, GPBs and Transpower” (20 December 2016), pp. 24-25.
163 Work on distribution pricing is currently being undertaken by the Electricity Authority, through its Distribution Pricing Review.
121
3605676.11
Incentives during the period
6.38 During the DPP3 period, distributors will be subject to explicit incentives that are
intended to promote behaviour consistent with the long-term benefit of consumers.
This section deals with two of these incentives:
6.38.1 incentives to improve efficiency (IRIS); and
6.38.2 incentives for innovation.
6.39 We have also retained a modified revenue-linked quality incentive scheme, which
we discuss in Chapter 7.
Incentives to improve efficiency
6.40 For the DPP3, we have made changes to the IRIS mechanism. The most significant
change is to the incentive rate for the capex IRIS. We have set a capex retention
factor equal to the opex retention factor, or for the DPP3 period 23.5%.
6.41 We have also made minor amendments to the opex IRIS IMs, to ensure they are
consistent with the original policy intent of the mechanism. These changes are
discussed in Attachment E.
Retention factors for IRIS
6.42 Our regime provides incentives for distributors to improve opex and capex efficiency,
and provides for these savings to be shared between distributors and consumers. To
ensure these incentives are consistent throughout a regulatory period, we apply an
IRIS mechanism, with a defined ‘retention factor’, which determines what proportion
of any increase or decrease in efficiency is kept by the distributor.
6.43 Opex and capex are subject to different IRIS mechanisms. The retention factor for
opex is defined by the IMs, and approximates a five-year retention of any savings or
losses by the distributor. For the DPP2 period, this equated to a 34% retention
factor. For capex, we determine the retention factor at each reset as part of the DPP
determination. For DPP2, we determined a retention factor of 15%.
6.44 Because of the change in the WACC, the retention factor for opex for has reduced to
23.5%.164 To ensure distributors have a consistent incentive to spend both opex and
capex, and do not favour capital solutions over operating ones, we have equalised
the capex retention factor with the opex one.
164 For the draft decision, this amount was 26%. A further reduction in the final WACC for the DPP has resulted in it lowering further.
122
3605676.11
6.45 We also consider that this change will reduce or remove barriers to innovation. We
do not want to disincentivise any potential emerging technologies from being used
by distributors due to a lower capex incentive rate. Equalising rates will create a
more level playing field to allow distributors to avoid spending capex through
investing in innovative solutions using third parties.
Changes to IRIS incentives during DPP2
6.46 We have not made any distributor-specific changes to the IRIS incentives distributors
faced during DPP2 (and which will affect allowable revenue during DPP3). This
includes not making changes:
6.46.1 to the treatment of pecuniary penalties;
6.46.2 to deal with distributors that have priced below their allowable revenue
during DPP2; and
6.46.3 to deal with additional opex related to spur assets purchased from
Transpower.
6.47 The specific reasons for these decisions are discussed in Attachment E. In general,
we have not made changes to DPP2 incentives because firstly, these changes have
limited incentive benefits, as distributors cannot change past conduct. Additionally
because such changes undermine the certainty the regime is intended to provide.
6.48 We have made a modification to deal with the change in the accounting treatment
of operating leases. This change is distinct from the changes listed above because:
6.48.1 it affects most or all distributors on the DPP; and
6.48.2 it relates not to any conduct distributors have undertaken, but to a change in
accounting rules that risks creating perverse outcomes.
6.49 This change is discussed in more detail in our operating leases final decisions
paper.165
Incentives for innovation
6.50 We have introduced a targeted innovation allowance for distributors during the
DPP3 period, in addition to the existing incentives for innovation created by the IRIS
mechanism and the quality incentive scheme.
165 Commerce Commission “Treatment of operating leases – Final decision” (13 November 2019).
123
3605676.11
6.51 As discussed in Chapter 4, possibilities for innovation in how regulated services are
delivered (and the uncertainties it can create) are a major contextual theme for our
DPP3 decision. We consider that the existing incentives in the DPP should be the
main driver of innovation, specifically:
6.51.1 where adopting an innovative approach leads to lower costs, distributors will
retain a portion of the savings (23.5%) and share the rest with consumers
through the IRIS mechanism; and
6.51.2 where adopting an innovative approach leads to improved quality,
distributors will keep a portion (23.5%) of the value of that improvement (as
measured by the discounted VoLL we apply) through our quality incentive
scheme.
6.52 However, as the benefits of innovation may be uncertain and may not be realised
until future DPP periods, we consider that an additional incentive that enables
distributors to undertake innovation projects could lead to better outcomes for
consumers in the long term.
6.53 We have set the limit of the funding available at the greater of either 0.1% of
allowable revenue or $150,000 over the period. We have set this conservatively, as
there will be only limited scrutiny over how the allowance is spent. In response to
submissions, we have introduced a dollar cap in addition to the percentage cap
proposed in the draft decision.
6.54 Where a distributor seeks to make substantial innovations in the way it manages its
network, and those innovations have a significant price or quality impact for
consumers, a CPP is the more appropriate response. This will allow us to apply
greater scrutiny, and to vary the way the price-quality path functions to account for
innovative approaches.
6.55 The incentive will be given effect to via a recoverable cost, (discussed briefly below
at paragraph 6.63), and be subject to a set of criteria discussed in Attachment F.
Allowance for pass-through and recoverable costs
6.56 The starting prices we determine through the BBAR methodology described in
Chapter 4, and the net allowable revenues distributors can earn during the period,
are determined ‘net’ of pass-through and recoverable costs.
6.57 Pass-through and recoverable costs are costs which distributors face that are
substantially beyond their control, and are specified in the specification of price IMs.
Distributors may pass on these costs to their consumers.
6.58 We are have introduced two new recoverable costs for the DPP3 period:
124
3605676.11
6.58.1 Fire and Emergency New Zealand (FENZ) levies; and
6.58.2 a recoverable cost to implement the innovation project allowance.
6.59 We have also made an amendment to clarify and extend the scope of the
recoverable cost relating to charges payable by a distributor to Transpower in
respect of a ‘new investment contract’ between those parties, or any equivalent
contract with another provider. The amendment will allow a distributor to use a
third-party option to finance the new investment contract between the distributor
and Transpower (or equivalent contract with another provider). This amendment
was proposed by Transpower in response to our draft DPP decision.166
6.60 All of these changes required amendments to the IMs, which are described in the IM
amendments reasons paper which was published on 26 November 2019.167
Recoverable cost for FENZ levies
6.61 In submissions on the issues paper, the ENA identified FENZ levies as likely to change
substantially in the DPP3 period, in a way that it is not possible to forecast.168 We
agree with this view, especially as the uncertainty involved may extend to the levies
ceasing to apply altogether, one of the options which is currently under
consideration.169
6.62 As payment of these levies is substantially beyond a distributor’s control, we
consider it appropriate for them to be moved from regular opex to a recoverable
cost.
Recoverable cost to implement the innovation project allowance
6.63 As discussed above in paragraphs 6.50 to 6.53, we have implemented a new
innovation project allowance. This will be given effect to by allowing distributors to
pass on the cost of these innovation projects to their consumers through a
recoverable cost. The criteria a distributor would have to meet to include this
recoverable cost in their allowable revenue are specified in the DPP determination.
166 Transpower “Submission on IM amendments for DPP and IPP” (5 July 2019). 167 Commerce Commission “Amendments to electricity distribution services input methodologies
determination – Reasons paper” (26 November 2019). 168 Electricity Networks Assoc (ENA) “DPP3 April 2020 Commission Issues paper( Part One Regulating capex,
opex & incentives)” (20 December 2018), p. 16. 169 Office of the Minister of Internal Affairs “Fire and Emergency New Zealand: a funding review” (released 25
March 2019).
125
3605676.11
Circumstances in which the price path can be reopened
6.64 To deal with certain unforeseeable changes during a DPP regulatory period, the IMs
include provision for reopening a DPP. We have implemented new reopeners for
‘major unforeseeable capex projects’ and major foreseeable capex projects’, as in
certain circumstances they share relevant characteristics with existing reopeners.
6.65 Specifically, expenditure on major new connections (including alterations to existing
connections), system growth, or asset relocations can be:
6.65.1 significant;
6.65.2 unforeseeable at the time the path is set;
6.65.3 beyond the control of distributors; and
6.65.4 not accounted for through other mechanisms.
6.66 Existing reopeners apply to situations like catastrophic events, legislative and
regulatory change, or major transactions.
Reopeners for major capex
6.67 In submissions on the issues paper, parties identified major consumer connection
capex as a material source of uncertainty, and suggested a ‘listed projects’ type
mechanism to deal with this contingency.170 Given decarbonisation efforts on the
part of major energy consumers and the potential for increased distributed
generation, or relocation of distribution assets to accommodate other infrastructure
projects it is possible that there will be an increase in this type of activity in the
future.
6.68 The specific conditions a distributor would have to meet to qualify for these
reopeners are discussed in Attachment G. We have imposed these conditions to:
6.68.1 limit the number of applications over the period, to ensure the
administration of the DPP remains relatively low-cost;
6.68.2 ensure the interests of existing consumers are protected;
170 Electricity Networks Assoc (ENA) “DPP3 April 2020 Commission Issues paper( Part One Regulating capex, opex & incentives)” (20 December 2018) , pp. 17-18; Unison “Submission on default price-quality paths for electricity distribution businesses from 1 April 2020 Issues paper” (21 December 2018), para 13. We note that Transpower’s listed projects mechanism covers replacement and renewal projects whose exact timing and cost is uncertain when the IPP is set, rather than consumer connection or system growth capex where the need is uncertain when the DPP is set.
126
3605676.11
6.68.3 enable a fast approval process, given the time constraints involved in such
projects, including connected parties operating in competitive markets; and
6.68.4 to ensure the reopener is not used in circumstances where the higher level of
scrutiny possible under a CPP is required.
6.69 In response to submissions on our draft decision, we have expanded the scope of
these reopeners to include:
6.69.1 asset relocations; and
6.69.2 system growth projects or programmes.
6.70 We have also modified the threshold and limit for when the reopeners are available
in response to submissions. Projects or programmes will qualify for the reopeners
where they involve capex that is at least $2 million or 1% of a distributor’s forecast
net allowable revenue over the regulatory period – whichever is less.
6.70.1 We have also included a maximum cap of $30 million for the aggregate for all
projects and programmes that can be applied for under these reopeners in
any one disclosure year.
6.71 The other specific requirements for this reopener are discussed in Attachment G.
Transactions
6.72 When a distributor engages in a transaction where it transfers assets to another
entity, and this transfer results in consumers no longer being served by the
transferring distributor, an adjustment needs to be made to both the transferring
and receiving distributors’ price path.171
6.73 Where this transfer occurs by way of a complete amalgamation or merger of two
price-quality regulated distributors, the IMs provide for their price-quality paths to
be aggregated.172 Where the transfer affects more than 10% of a distributor’s
opening RAB, the Commission may reopen the price-quality path (referred to as a
‘major transaction’).173
171 Another entity in this case could include: another price-quality regulated distributor, an exempt distributor, or a non-distributor purchaser, who – following the completion of the transaction – becomes a distributor.
172 Commerce Commission Electricity Distribution Services Input Methodologies Determination 2012 [2012] NZCC 26 (Consolidated as at 31 January 2019), clause 3.2.1.
173 Commerce Commission Electricity Distribution Services Input Methodologies Determination 2012 [2012] NZCC 26 (Consolidated as at 31 January 2019), clause 4.5.4.
127
3605676.11
6.74 Where a transaction is not an amalgamation, and affects less than 10% of a
distributor’s opening RAB, the DPP determination may specify how distributors are
to adjust their revenue. To deal with these situations, which we refer to as
‘transfers’, we have adopted a principles-based approach to adjusting the revenue
path and quality standards.
6.75 We did not receive any submissions on the treatment of transactions, and have
made no changes from the draft decision.
Treatment of revenue path following a transfer
6.76 Our approach is one based on the principle that, in aggregate, consumers should be
no worse-off, in terms of total revenue, than they would have been had the
transaction not occurred.
6.77 Under this approach, distributors will have to agree an allocation of revenues to
produce a new ‘forecast net allowable revenue’ and ‘wash-up amount’ for the
transferring and receiving distributor. The amount transferred must be:
6.77.1 reasonable; and
6.77.2 supported by robust and verifiable evidence.
6.78 We have also adopted the requirement for distributors to notify the Commission of
any transaction (amalgamation, merger, major transaction, or asset transfer) within
30 working days of the transaction occurring.
Treatment of quality standards and incentives following a transfer
6.79 We have taken a similar treatment for each of the parameters of the quality
standards (for example: boundary values, reliability limits) and quality incentives (for
example: targets and caps).
6.80 We note that when demonstrating whether adjustments to quality standards were
reasonable, we would look to the ICP weighted-sums of SAIDI and SAIFI before and
after the transactions, rather than the absolute amount of SAIDI and SAIDI.174
174 Put another way, a distributor would need to demonstrate its reallocation was reasonable on a ‘customer minute’ basis, rather than a system average basis.
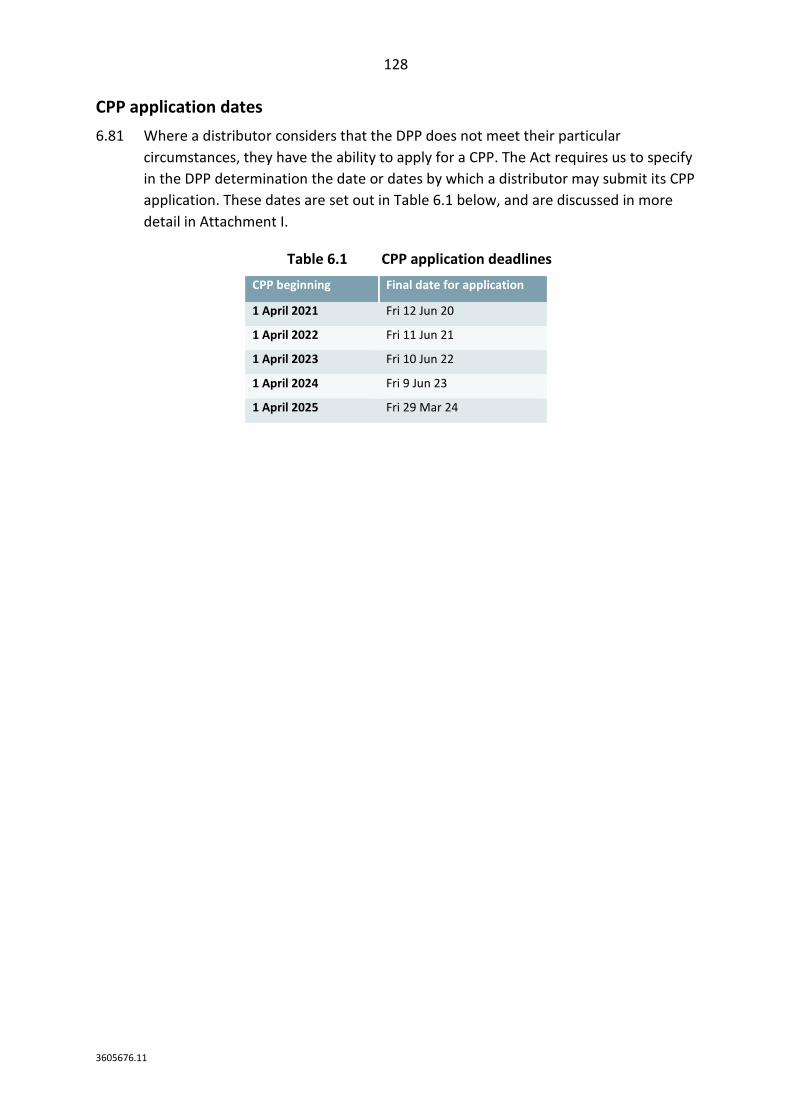
128
3605676.11
CPP application dates
6.81 Where a distributor considers that the DPP does not meet their particular
circumstances, they have the ability to apply for a CPP. The Act requires us to specify
in the DPP determination the date or dates by which a distributor may submit its CPP
application. These dates are set out in Table 6.1 below, and are discussed in more
detail in Attachment I.
Table 6.1 CPP application deadlines
CPP beginning Final date for application
1 April 2021 Fri 12 Jun 20
1 April 2022 Fri 11 Jun 21
1 April 2023 Fri 10 Jun 22
1 April 2024 Fri 9 Jun 23
1 April 2025 Fri 29 Mar 24

129
3605676.11
Chapter 7 Quality standards and incentives
Purpose of this chapter
7.1 This chapter explains the changes we have made to the quality standards
distributors must comply with and the quality incentives distributors will be subject
to for the DPP3 period.
How we have structured this chapter
7.2 This chapter starts by explaining our high-level approach to quality by:
7.2.1 summarising the decisions we have made;
7.2.2 discussing the statutory requirements we must meet, and how we are
promoting the purpose of Part 4;
7.2.3 setting out the reasons for our general ‘no material deterioration’ approach;
and
7.2.4 discussing the importance in a changing environment of allowing distributors
to make trade-offs where they are in the long-term interest of consumers.
7.3 The following sections then explain:
7.3.1 the quality standards we have set and our approach to setting these;
7.3.2 changes (relative to DPP2) to the revenue-linked quality incentive scheme;
7.3.3 updates to our approach for normalising major events;
7.3.4 the enhanced reporting requirements; and
7.3.5 how we have treated measures of quality other than reliability.
7.4 These topics, submissions we have received on them, and our responses to those
submissions are explained in detail in Part 3 of the Attachments to this paper
(Attachments J to N).
7.5 The determination that implements these standards and incentives can be found in
Clause 9 and Schedules 3.1 to 4 of the accompanying DPP determination.175
175 Commerce Commission Electricity Distribution Services Default Price-Quality Path Determination 2020 [2019] NZCC 21 (27 November 2019), clause 9.
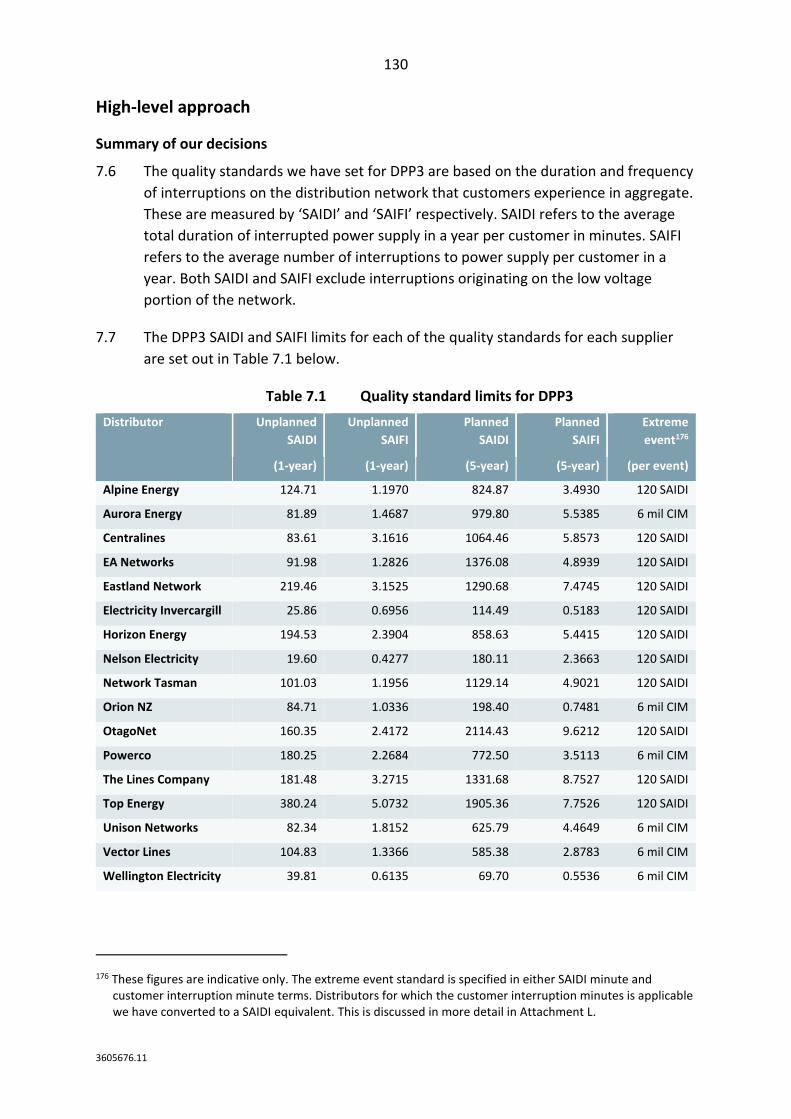
130
3605676.11
High-level approach
Summary of our decisions
7.6 The quality standards we have set for DPP3 are based on the duration and frequency
of interruptions on the distribution network that customers experience in aggregate.
These are measured by ‘SAIDI’ and ‘SAIFI’ respectively. SAIDI refers to the average
total duration of interrupted power supply in a year per customer in minutes. SAIFI
refers to the average number of interruptions to power supply per customer in a
year. Both SAIDI and SAIFI exclude interruptions originating on the low voltage
portion of the network.
7.7 The DPP3 SAIDI and SAIFI limits for each of the quality standards for each supplier
are set out in Table 7.1 below.
Table 7.1 Quality standard limits for DPP3
Distributor Unplanned
SAIDI
Unplanned
SAIFI
Planned
SAIDI
Planned
SAIFI
Extreme
event176
(1-year) (1-year) (5-year) (5-year) (per event)
Alpine Energy 124.71 1.1970 824.87 3.4930 120 SAIDI
Aurora Energy 81.89 1.4687 979.80 5.5385 6 mil CIM
Centralines 83.61 3.1616 1064.46 5.8573 120 SAIDI
EA Networks 91.98 1.2826 1376.08 4.8939 120 SAIDI
Eastland Network 219.46 3.1525 1290.68 7.4745 120 SAIDI
Electricity Invercargill 25.86 0.6956 114.49 0.5183 120 SAIDI
Horizon Energy 194.53 2.3904 858.63 5.4415 120 SAIDI
Nelson Electricity 19.60 0.4277 180.11 2.3663 120 SAIDI
Network Tasman 101.03 1.1956 1129.14 4.9021 120 SAIDI
Orion NZ 84.71 1.0336 198.40 0.7481 6 mil CIM
OtagoNet 160.35 2.4172 2114.43 9.6212 120 SAIDI
Powerco 180.25 2.2684 772.50 3.5113 6 mil CIM
The Lines Company 181.48 3.2715 1331.68 8.7527 120 SAIDI
Top Energy 380.24 5.0732 1905.36 7.7526 120 SAIDI
Unison Networks 82.34 1.8152 625.79 4.4649 6 mil CIM
Vector Lines 104.83 1.3366 585.38 2.8783 6 mil CIM
Wellington Electricity 39.81 0.6135 69.70 0.5536 6 mil CIM
176 These figures are indicative only. The extreme event standard is specified in either SAIDI minute and customer interruption minute terms. Distributors for which the customer interruption minutes is applicable we have converted to a SAIDI equivalent. This is discussed in more detail in Attachment L.
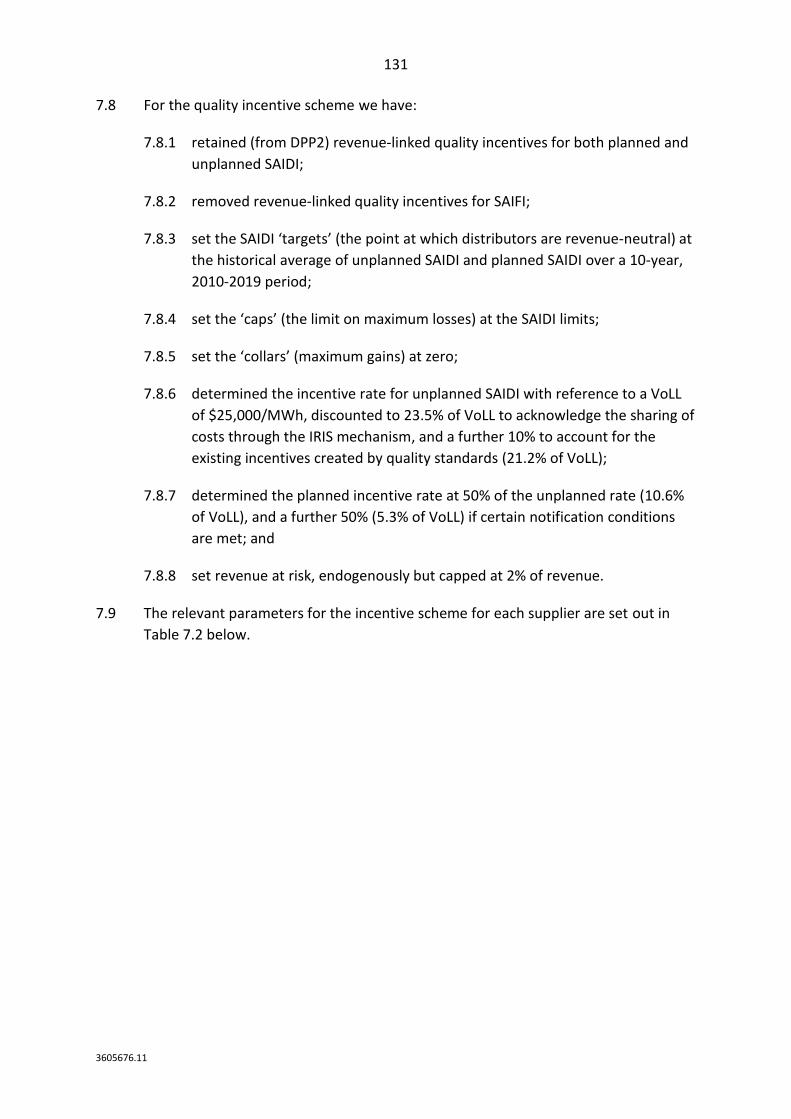
131
3605676.11
7.8 For the quality incentive scheme we have:
7.8.1 retained (from DPP2) revenue-linked quality incentives for both planned and
unplanned SAIDI;
7.8.2 removed revenue-linked quality incentives for SAIFI;
7.8.3 set the SAIDI ‘targets’ (the point at which distributors are revenue-neutral) at
the historical average of unplanned SAIDI and planned SAIDI over a 10-year,
2010-2019 period;
7.8.4 set the ‘caps’ (the limit on maximum losses) at the SAIDI limits;
7.8.5 set the ‘collars’ (maximum gains) at zero;
7.8.6 determined the incentive rate for unplanned SAIDI with reference to a VoLL
of $25,000/MWh, discounted to 23.5% of VoLL to acknowledge the sharing of
costs through the IRIS mechanism, and a further 10% to account for the
existing incentives created by quality standards (21.2% of VoLL);
7.8.7 determined the planned incentive rate at 50% of the unplanned rate (10.6%
of VoLL), and a further 50% (5.3% of VoLL) if certain notification conditions
are met; and
7.8.8 set revenue at risk, endogenously but capped at 2% of revenue.
7.9 The relevant parameters for the incentive scheme for each supplier are set out in
Table 7.2 below.
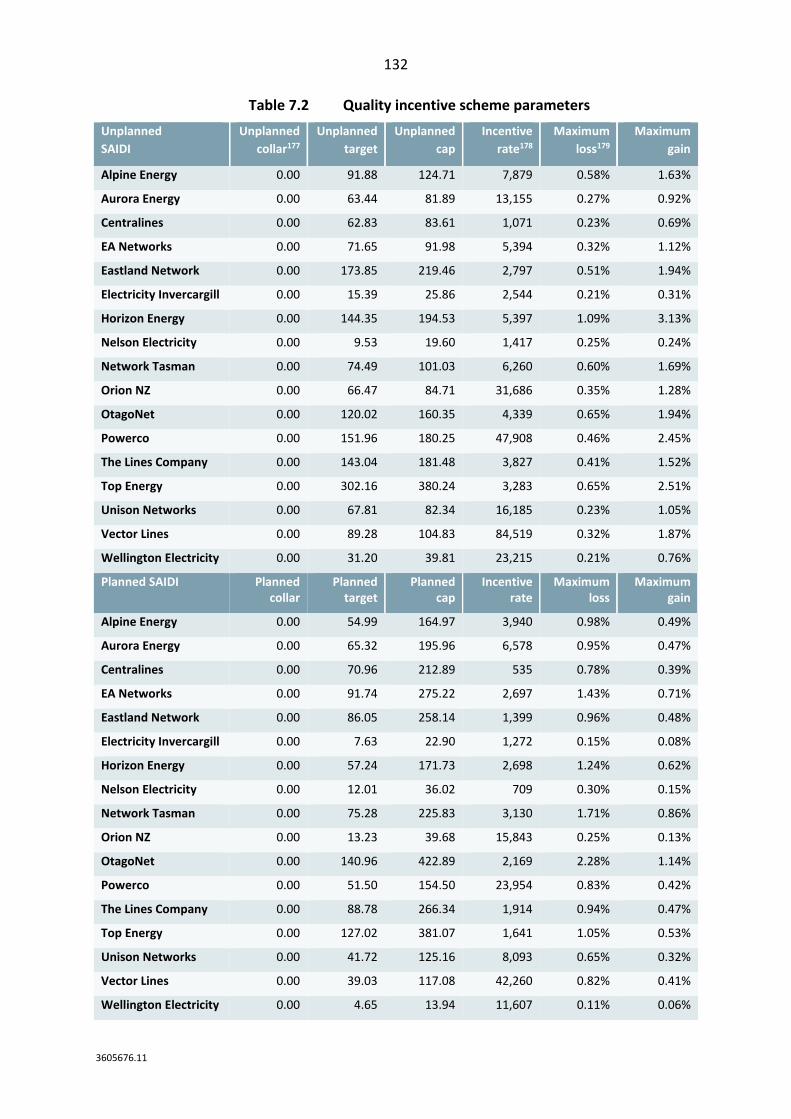
132
3605676.11
Table 7.2 Quality incentive scheme parameters
Unplanned
SAIDI
Unplanned
collar177
Unplanned
target
Unplanned
cap
Incentive
rate178
Maximum
loss179
Maximum
gain
Alpine Energy 0.00 91.88 124.71 7,879 0.58% 1.63%
Aurora Energy 0.00 63.44 81.89 13,155 0.27% 0.92%
Centralines 0.00 62.83 83.61 1,071 0.23% 0.69%
EA Networks 0.00 71.65 91.98 5,394 0.32% 1.12%
Eastland Network 0.00 173.85 219.46 2,797 0.51% 1.94%
Electricity Invercargill 0.00 15.39 25.86 2,544 0.21% 0.31%
Horizon Energy 0.00 144.35 194.53 5,397 1.09% 3.13%
Nelson Electricity 0.00 9.53 19.60 1,417 0.25% 0.24%
Network Tasman 0.00 74.49 101.03 6,260 0.60% 1.69%
Orion NZ 0.00 66.47 84.71 31,686 0.35% 1.28%
OtagoNet 0.00 120.02 160.35 4,339 0.65% 1.94%
Powerco 0.00 151.96 180.25 47,908 0.46% 2.45%
The Lines Company 0.00 143.04 181.48 3,827 0.41% 1.52%
Top Energy 0.00 302.16 380.24 3,283 0.65% 2.51%
Unison Networks 0.00 67.81 82.34 16,185 0.23% 1.05%
Vector Lines 0.00 89.28 104.83 84,519 0.32% 1.87%
Wellington Electricity 0.00 31.20 39.81 23,215 0.21% 0.76%
Planned SAIDI Planned collar
Planned target
Planned cap
Incentive rate
Maximum loss
Maximum gain
Alpine Energy 0.00 54.99 164.97 3,940 0.98% 0.49%
Aurora Energy 0.00 65.32 195.96 6,578 0.95% 0.47%
Centralines 0.00 70.96 212.89 535 0.78% 0.39%
EA Networks 0.00 91.74 275.22 2,697 1.43% 0.71%
Eastland Network 0.00 86.05 258.14 1,399 0.96% 0.48%
Electricity Invercargill 0.00 7.63 22.90 1,272 0.15% 0.08%
Horizon Energy 0.00 57.24 171.73 2,698 1.24% 0.62%
Nelson Electricity 0.00 12.01 36.02 709 0.30% 0.15%
Network Tasman 0.00 75.28 225.83 3,130 1.71% 0.86%
Orion NZ 0.00 13.23 39.68 15,843 0.25% 0.13%
OtagoNet 0.00 140.96 422.89 2,169 2.28% 1.14%
Powerco 0.00 51.50 154.50 23,954 0.83% 0.42%
The Lines Company 0.00 88.78 266.34 1,914 0.94% 0.47%
Top Energy 0.00 127.02 381.07 1,641 1.05% 0.53%
Unison Networks 0.00 41.72 125.16 8,093 0.65% 0.32%
Vector Lines 0.00 39.03 117.08 42,260 0.82% 0.41%
Wellington Electricity 0.00 4.65 13.94 11,607 0.11% 0.06%
133
3605676.11
7.10 The SAIDI and SAIFI major event boundary values for each supplier are set out in
Table 7.3.
Table 7.3 Major event boundary values (24-hour)
Distributor SAIDI boundary SAIFI boundary
Alpine Energy 9.17 0.0671
Aurora Energy 5.69 0.0737
Centralines 6.79 0.1442
EA Networks 6.25 0.0729
Eastland Network 13.10 0.1765
Electricity Invercargill 4.13 0.0804
Horizon Energy 14.69 0.1170
Nelson Electricity 8.68 0.1430
Network Tasman 7.22 0.0688
Orion NZ 7.60 0.0668
OtagoNet 11.81 0.1776
Powerco 9.82 0.0628
The Lines Company 11.17 0.1596
Top Energy 27.92 0.2284
Unison Networks 4.48 0.0735
Vector Lines 4.83 0.0371
Wellington Electricity 2.16 0.0313
7.11 We have made the following changes to the way we normalise unplanned
interruptions:
7.11.1 defining major events on a 24-hour rolling basis (assessed in 30-minute
rolling blocks), rather than as calendar days;
7.11.2 setting the major event boundary value as the 1104th highest assessed rolled
24-hour period within the historical data set, rather than as the 23rd highest
calendar day;180
7.11.3 replacing any half-hour within a major event that is above 1/48th of the
boundary value with the 1/48th of the boundary value; and
177 Collar, cap, and target values are in SAIDI minute terms. 178 In $ per SAIDI minute terms. 179 Estimated maximum incentive as a percentage of allowable revenue. 180 This value is approximately equivalent to the 23rd highest calendar day approach applied in DPP2.
134
3605676.11
7.11.4 adjusting the major event boundary for distributors with smaller networks
which can expect fewer major events each year.
7.12 Finally, we have:
7.12.1 introduced incentives for better notification of planned interruptions (as part
of the reliability incentive scheme);
7.12.2 expanded major event reporting requirements;
7.12.3 introduced automatic reporting following any quality standard contravention;
and
7.12.4 not introduced standards for other measures of quality of service.
Our approach to quality
The Act requires us to set quality standards
7.13 We are required by the Act to set quality standards that must be met by regulated
suppliers when setting price-quality paths.181 We may also set financial incentives for
an individual supplier to maintain or improve its quality of supply.182
7.14 These quality standards and incentives are a crucial part of promoting the purpose of
Part 4 of the Act. Most directly, they are important for ensuring distributors have
incentives to provide services at a quality that reflects consumer demands. However,
as distributors’ revenues are constrained by the price path, quality standards are
also important for ensuring distributors have incentives to invest, and are
constrained in their ability to earn excessive profits at the expense of quality.
7.15 Where quality standards are not met, we may seek a range of remedies in Court
against the distributor for that underperformance, including the imposition of
pecuniary penalties, or an order that compensation be paid to parties that
experienced loss or damage, under Part 6 of the Commerce Act. We may also bring
secondary liability proceedings against directors, shareholders, or other entities
associated with the business if their actions contributed to, or they were otherwise
closely involved in, the quality standard contraventions.
Commission focus on quality
7.16 The quality of service provided by electricity distributors was one of the
Commission’s organisation-wide priorities for the 2018/19 year.
181 Commerce Act 1986, section 53M(1)(b). 182 Commerce Act 1986, section 53M(2).

135
3605676.11
7.17 As we said in announcing those priorities:
We will be consulting with stakeholders on the revenue limits and quality standards that
should apply to electricity distribution networks for the five years from 1 April 2020, with our
final decision due in November 2019. We continue to improve the efficiency and
effectiveness of each reset. In the next reset we will consider whether ‘no material
deterioration’ remains the appropriate basis for the minimum reliability standards. We will
also consider whether other dimensions of quality should be monitored alongside the
existing reliability measures, such as communication to customers during outages.
In addition to this work, we will be seeking to better understand why some distributors have
previously failed to comply with the minimum standards for network reliability and what this
tells us about the state of their network.183
7.18 Submissions on our issues paper indicated that stakeholders did not agree on which
quality measures should be implemented for DPP3. We received a submission from
the ENA who convened a Quality of Supply Working Group,184 but some distributors
and non-distributor stakeholders disagreed with the recommendations put forward
by the ENA.
7.19 Our decisions discussed below build on work undertaken by the ENA Quality of
Service Working Group, and on analysis undertaken by NZIER on behalf of MEUG.185
They are also the result of ongoing collaboration with industry stakeholders to
develop a set of proposals that promote the Part 4 purpose, but that are also
workable.
7.20 Given these priorities, and the areas for improvement in quality standards and
incentives that we have identified through consultation, we consider that while the
package of changes we are proposing is substantial, it is proportionate to the
importance of the issue, and the scale of change in the industry as a whole.
No material deterioration
7.21 Consistent with the DPP principles discussed in Chapter 3 at paragraph 3.16, our
starting point for a DPP is that distributors should at least maintain the levels of
reliability that they have provided historically, all other things being equal. We refer
to this principle as ‘no material deterioration’.
183 Commerce Commission “Priorities 2018/19” (8 August 2018), p. 3. 184 Electricity Networks Assoc. “ENA Working Group on quality of service regulation – Interim report to the
Commerce Commission” (1 October 2018). 185 Major Electricity Users' Group “NZIER on behalf of MEUG EDB DPP reset issues paper” (21 December 2018).
136
3605676.11
7.22 The planned and unplanned reliability standards and targets we have implemented
are based on distributors’ historical performance, and are intended to give effect to
the no material deterioration principle.186
7.23 The exception to this approach is the setting of the extreme event standard, which
has been set at a fixed amount for all distributors. This is because, we consider that it
is not possible to set a limit based on the reference period for an expectation of no
material deterioration because of the infrequency of such events. This is not reason
enough to avoid introducing an extreme event standard, although it has influenced
us in introducing it at a with conservatively high level.
Reliability in a changing environment
7.24 While no material deterioration is the starting point for our approach to quality, we
also acknowledge the need for distributors to make trade-offs about the level of
quality they deliver, and the cost they incur in doing so. This consideration drives
many of the changes we have made to the quality incentive scheme for DPP3
relative to DPP2.
7.25 Even in a relatively stable industry environment, it would be important for
distributors to consider price-quality trade-offs at the margins, and to have the
ability to move towards a level of quality that better reflects consumers’ demands
and the distributor’s cost to serve those consumers.
7.26 However, as discussed in Chapter 4, we see potential for change over the DPP3
period, but with significant uncertainty about the scale of change. These future
changes could be driven by:
7.26.1 changes in a distributor’s cost to serve, driven by factors like improved
technology or a changing climate;
7.26.2 changes in consumer expectations, whether that is a willingness to accept
more interruptions, given the availability of self-supply (solar PV, batteries,
microgrids) or a greater willingness to pay to avoid interruptions as more
services (most prominently transport) depend on the grid; and/or
7.26.3 better understanding on the part of distributors about customer expectations
from an improved level of customer engagement.
186 We used a reference period from 1 April 2010 to 31 March 2019 to assess against historical performance. However, we limit inter-period reliability movements of unplanned interruption parameters to 5%, as discussed in Attachment J.
137
3605676.11
7.27 This potential for changes makes it even more important that we give distributors
some flexibility to change the level of reliability that they target, while we still
protect consumers’ interests by ensuring:
7.27.1 there are minimum standards beyond which greater scrutiny is required
before changes are made;
7.27.2 the changes distributors make in some way reflect the value consumers place
on reliability through a quality incentive scheme; and
7.27.3 consumers share in the benefits of either improved efficiency or improved
reliability.
7.28 We consider distributors are best placed to make decisions around these trade-offs,
so long as they are incentivised to act in a way that is aligned with the long-term
interests of consumers. This is consistent with our approach to capex (discussed
above in Chapter 5 at paragraph 5.77).
Quality standards
7.29 This section summarises the quality standards we have set, and briefly discusses our
reasons for setting them. More detail on these standards, including submissions and
our response to them can be found in Attachment L.
7.30 We have separated planned and unplanned interruptions for the purposes of
standards and revenue-linked incentives. Separation eliminates the ability of
distributors to avoid contravening their unplanned reliability standard by deferring
planned work when it forecasts that it is otherwise likely to contravene. Separation
better promotes the purpose of Part 4 because it does not create an incentive
against investment at the most appropriate and efficient time and better reveals
deterioration of network performance to be assessed against the quality standards.
Unplanned reliability standard
7.31 Given the network-wide aggregate nature of the SAIDI and SAIFI metrics used to
assess reliability, setting an unplanned reliability standard at a level that perfectly
reflects consumer preferences is not possible at this stage. In the absence of better
information, we consider that an unplanned reliability standard should identify
instances of material deterioration in overall reliability.
7.32 There was general support from submitters for the 'no material deterioration'
standard, but diverging views on implementation (for example, reference periods,
data adjustments, and normalisation). For example, the ENA submitted that
“customer feedback to date strongly suggests that declining reliability standards are
not generally acceptable”.
138
3605676.11
7.33 This is consistent with our decision to base the quality standards on the historical
average, with a buffer added to reduce the inherent risks due to random year-to-
year volatility of the SAIDI and SAIFI metrics and to allow for moderate declines
where it results in lower prices for customers via the revenue-linked quality incentive
scheme.
7.34 With the decision to separate planned and unplanned interruptions for setting
quality standards, an unplanned reliability standard is required to be specified for
SAIDI and SAIFI. The unplanned reliability standard is:
7.34.1 assessed annually for unplanned SAIDI and SAIFI, removing the previous two-
out-of-three-year rule; and
7.34.2 set with limits for unplanned SAIDI and SAIFI of 2.0 standard deviations above
the reference period average, an increase from 1.0 standard deviation under
DPP2.
7.35 Our decision is to replace the current two-out-of-three-year rule with a simpler
annual limit for unplanned SAIDI and SAIFI. This decision is informed by other
reliability standard settings (reducing the impact of major events and the buffer
above the historical mean) that we consider are more effective means of reducing
the risk of false-positives and false negatives.
7.36 We consider that using the historical mean with an additional buffer works well in
capturing material deterioration in reliability. The current quality standards have
resulted in contraventions that investigations have shown to be, at least in part,
caused by failure of those distributors to act consistently with good industry
practice. Conversely, we have not yet found contraventions of the quality standard
in the current regulatory period to be caused only by random volatility.
Planned reliability standard
7.37 With the decision to separate planned and unplanned interruptions for setting
quality standards, a planned reliability standard is required to be specified for SAIDI
and SAIFI. The planned reliability standard is:
7.37.1 assessed once for the regulatory period for planned SAIDI and SAIFI
(assessment is against a five-year total); and
7.37.2 set at three times the historical level of planned SAIDI and SAIFI.
139
3605676.11
7.38 Our decision to set the planned reliability standard over the full regulatory period
will allow distributors to schedule planned works in a way that works best for their
business and consumers, rather than to comply with an annual planned reliability
standard. For example, previous settings may have incentivised distributors to
inefficiently defer or bring forward work to avoid contravention. We consider that
revenue-linked incentives are a better mechanism to encourage each distributor to
manage its planned interruptions appropriately, allowing distributors to undertake
planned interruptions for investment like replacement of aged assets where it is in
the interests of consumers to do so.
7.39 We have implemented a large buffer for setting the planned reliability standard. We
consider that a buffer of 200%, or triple the historical average, is appropriately less
stringent than the quality standard set for DPP2 given the long-term benefits to
consumers of the network investment and maintenance that is associated with
planned interruptions.187 It will also allow for some flexibility in work practices that
may increase the impact of planned works on SAIDI or SAIFI, for example, changes in
live lines working practices.
Extreme event standard
7.40 We have introduced a new ‘extreme event standard’ to deal with extreme one-off
events that may cause serious inconvenience for consumers. The standard is set at
the lower of either 120 SAIDI minutes or 6 million customer interruption minutes
and it applies to events not caused by major external factors.
7.41 This is a change from our draft decision, where the extreme event standard was set
at three times the major event boundary value. Submitters highlighted that this led
to disproportionate outcomes for different distributors, given the different boundary
values they faced. In response to this, we have set the extreme event standard at a
consistent level across all distributors.
7.42 Normalising major events means that particularly large interruptions are unlikely to
contribute to a contravention unless the assessed unplanned SAIDI or SAIFI is high
enough for other reasons.
7.43 Major events are assessed on a statistical basis, rather than based on their causes.
This means that with normalisation the unplanned reliability standard may miss large
interruption events that are caused by not applying good electricity industry practice
or under-spending on network maintenance and investment. Such interruption
events can have a substantial impact on consumers and we consider that it is in the
long-term interests of consumers to set a quality standard relating to extreme
events.
187 We note the revenue-linked incentives will also apply up to 200% above the target.
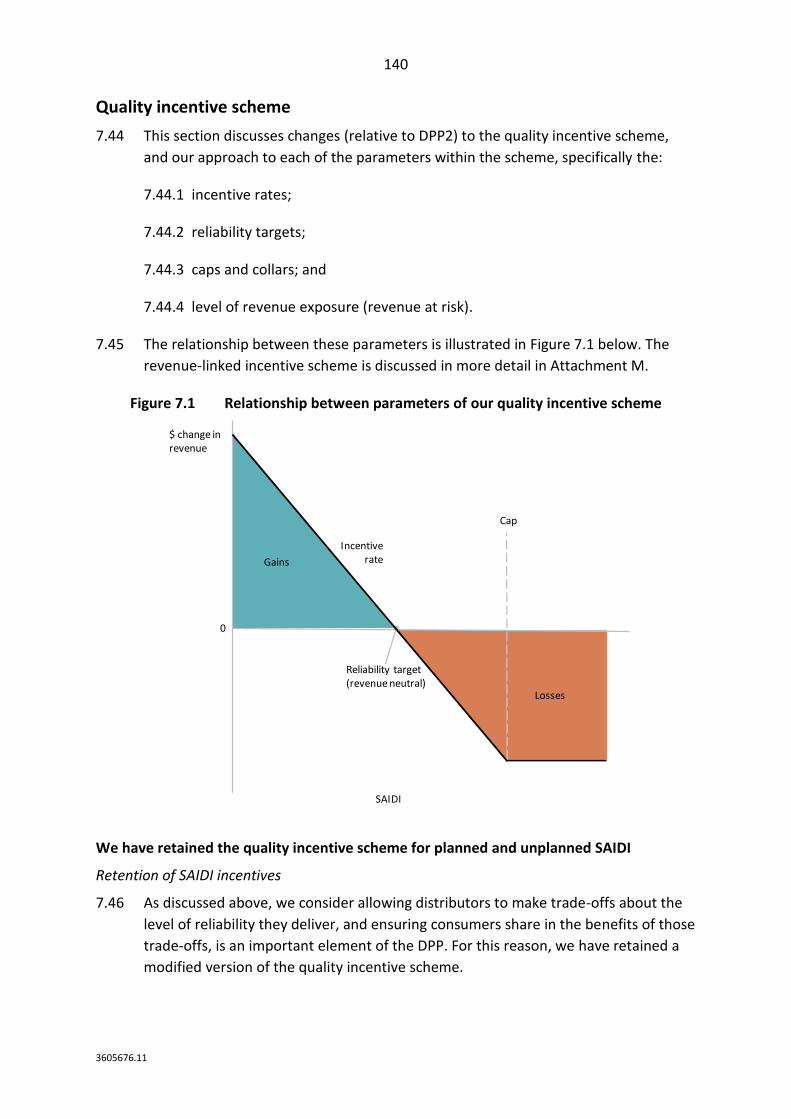
140
3605676.11
Quality incentive scheme
7.44 This section discusses changes (relative to DPP2) to the quality incentive scheme,
and our approach to each of the parameters within the scheme, specifically the:
7.44.1 incentive rates;
7.44.2 reliability targets;
7.44.3 caps and collars; and
7.44.4 level of revenue exposure (revenue at risk).
7.45 The relationship between these parameters is illustrated in Figure 7.1 below. The
revenue-linked incentive scheme is discussed in more detail in Attachment M.
Figure 7.1 Relationship between parameters of our quality incentive scheme
We have retained the quality incentive scheme for planned and unplanned SAIDI
Retention of SAIDI incentives
7.46 As discussed above, we consider allowing distributors to make trade-offs about the
level of reliability they deliver, and ensuring consumers share in the benefits of those
trade-offs, is an important element of the DPP. For this reason, we have retained a
modified version of the quality incentive scheme.
Cap
Reliability target (revenue neutral)
$ change in revenue
SAIDI
0
Incentive rate
Losses
Gains
141
3605676.11
Removal of SAIFI incentives
7.47 Given the approach to the VoLL that we use for the DPP we were concerned that
applying the scheme to both SAIDI and SAIFI risks double-counting the SAIFI impact.
This is because SAIDI is a function of interruption frequency (SAIFI) and interruption
length (CAIDI). Put another way, SAIDI is the product of SAIFI and CAIDI. We
therefore considered that reducing or removing SAIFI from incentives was
appropriate.
7.48 Our decision to remove SAIFI from the incentive scheme was driven by the following
considerations:
7.48.1 SAIFI will still be subject to compliance standards;
7.48.2 SAIFI, as well as CAIDI, are indirectly captured through SAIDI incentives; and
7.48.3 SAIFI incentives may place undue priority on short-term mitigations rather
than preventing long-term deterioration.
Improvements to the incentive rate
7.49 The incentive rates determine the level of financial exposure distributors have to a
marginal change in reliability. The most material change we have implemented to
the incentive scheme is to the incentive rates.
7.50 We have set SAIDI incentives rates that are informed by a VoLL of $25,000 per
megawatt hour (MWh), and discounted to reflect expenditure incentives, quality
standard incentives, and the different impact of planned and unplanned
interruptions on consumers:
7.50.1 for unplanned interruptions, the discount is to 21.2% of VoLL, to reflect an
IRIS-like five-year retention of the value of improvements or declines in
reliability;
7.50.2 for planned interruptions, the discount is to 10.6% of VoLL (half the rate for
unplanned interruptions), to reflect the lesser inconvenience planned
interruptions cause consumers; and
7.50.3 for notified planned interruptions, the discount is to 5.3% of VoLL, to
incentivise distributors to provide consumers with better notice of
interruptions.
142
3605676.11
7.51 These decisions are largely unchanged from our draft decision. We have altered the
percentage discount necessary to achieve a five-year retention of benefits by the
distributor to reflect the change in the IRIS retention factor (to 76.5% from 74%).
Since the draft decision, we have reduced the size of the additional discount we
apply to account for the effects of the quality standard from 20% to 10%. This is to
mirror the extension of the unplanned reliability standard buffer from 1.5 standard
deviations to 2 standard deviations.
7.52 This is a significant change from DPP2, where the incentive rate was set
endogenously. Consequently, for more reliable distributors, the narrower bands
between caps and collars may have created incentives beyond that which consumers
value. Conversely, less reliable distributors with wider bands had much weaker
incentives. The quality incentives were up to five times stronger for the most reliable
distributors as they were for the least reliable, a counterintuitive outcome we have
corrected.
7.53 We have set a lower incentive rate for planned interruptions where additional
notification criteria have been met, as discussed in Attachment M. This is to
acknowledge that adequate notification of planned interruptions is important for
consumers to mitigate the impact of the interruption. We consider these further
incentives for planned interruptions that exceed the currently required 24 hours’
notice for planned interruptions is an appropriate way to encourage better and
meaningful notification for consumers.
7.54 In response to submissions that raised concerns about the workability of the
definition of notified planned interruptions we proposed, and the perverse
incentives that could result, we have made significant changes to the draft approach.
These include:
7.54.1 removing the maximum notification window length;
7.54.2 allowing for the provision of alternative days; and
7.54.3 giving distributors the option of including particular planned interruptions as
qualifying for this additional discount.
7.55 These are discussed further in Attachment L.
Quality targets
7.56 The quality target is the level of reliability performance at which the revenue impact
of a distributor’s performance is zero. Put another way, it is the point at which losses
turn into gains and vice versa.
143
3605676.11
7.57 Consistent with the no material deterioration principle, we have set the target at the
10-year historical average level of SAIDI (normalised and limited to 5% movement
between regulatory periods for unplanned interruptions). Absent of better
information about the level of reliability consumers demand, we consider historical
reliability, with prices determined with reference to historic levels of expenditure,
provides an appropriate outcome for a default path.
7.58 This approach ensures that:
7.58.1 where reliability improves or declines over time, the distributor faces a
proportionate incentive; and
7.58.2 where there is random variation in performance, over time these random
variations can be expected to cancel out, leaving the distributor in a neutral
position.
7.59 We have considered setting the target higher or lower than historical levels; in effect
setting an ‘improvement path’ or a ‘glide path’. However, we do not consider we
have sufficient information about each distributors’ customers preferences to do this
at this point in the regime’s evolution.188
Caps and collars
7.60 The reliability caps are the points at which no further incentive losses are applicable
to the revenue-linked incentive scheme. Conversely, reliability collars are the point
at which no further incentive gains are applicable.
Reliability caps
7.61 We have set planned and unplanned SAIDI caps equal to the applicable limit for
compliance standards, subject to maximum revenue exposure of 2%. These are set:
7.61.1 2 standards deviations above the target for unplanned interruptions; and
7.61.2 triple the target for planned interruptions.
7.62 We consider that it is not appropriate to allow distributors to continue to make
trade-offs beyond the minimum level of reliability determined by the quality
standard, so a cap above the limit is inappropriate.
188 We are unable to determine these levels by making comparisons between the performance of different distributors, given the prohibition on comparative benchmarking in section 53P(10) of the Commerce Act 1986.
144
3605676.11
7.63 On the other hand, we consider that it is appropriate for distributors to consider
trade-offs all the way up to the limit, as this preserves the marginal incentive to
improve reliability (or avoid further declines) regardless of their performance up to
that point in the assessment period.
Reliability collars
7.64 We have set planned and unplanned SAIDI collars at zero, subject to maximum
revenue exposure of 2%. In other words, we have removed the collars in our
incentive scheme. This means that financial incentives for reliability will always apply
below the SAIDI limits.
7.65 As reliability improves, we expect the marginal cost of further improvements will
increase. Rational distributors will look for the least-cost improvements in reliability
before pursuing more expensive improvements. As SAIDI approaches zero, we
anticipate that the cost of further improvement would far outweigh the conservative
incentive rates we have set, and so do not consider this will lead to improvements
beyond what consumers expect.
Asymmetry of caps and collars
7.66 With setting the reliability caps equal to the applicable SAIDI limit and the reliability
collars at zero, at the extremes the revenue-linked quality incentive scheme is
asymmetric. However, within a reasonable range we expect it is largely symmetric.
For example, we would expect it would be rare for unplanned interruptions to fall
more than two standard deviations below the annual target. We consider it
appropriate that the cost-quality trade-off is always in place up to the applicable
SAIDI limit.
Revenue at risk
7.67 Revenue at risk is the total pool of incentives a distributor may gain or lose based on
its performance. It can be expressed in both dollar terms, and as a percentage of
distributors’ total revenue.
7.68 Given our decision to explicitly set SAIDI incentive rates and the SAIDI bounds for
which incentives apply, the revenue exposure to the revenue-linked incentive
scheme is set endogenously. In some cases, this may create an excessive level of
exposure, so we have capped distributors’ total exposure across planned and
unplanned interruptions at 2% of allowable revenue each year.
7.69 This decision does not affect all distributors. Less reliable distributors will generally
be exposed to a higher revenue at risk than more reliable distributors. However, we
consider it appropriate that the least reliable distributors are subject to more
revenue exposure, as they have the largest scope for improvements in reliability.
145
3605676.11
7.70 In theory, seven distributors could be impacted by the 2% cap on penalties.
However, this is largely driven by the planned SAIDI cap being three times the
historical average. Conversely, nine distributors could be impacted by the 2% cap on
rewards, however, this would require a significant reduction in interruptions.
Approach to normalisation
7.71 This section discusses our approach to normalisation. It covers:
7.71.1 the reasons we apply normalisation;
7.71.2 changes to the definition of major events; and
7.71.3 changes to the treatment of major events.
Why we normalise reliability
7.72 SAIDI and SAIFI, particularly for unplanned interruptions, are highly volatile, and are
strongly influenced by major individual interruptions.
7.73 For this reason, in DPP3 we have applied a filter both to historical reliability and to
the way reliability performance will be assessed during the DPP3 period. This applies
to both the unplanned reliability standards and to the incentive scheme for
unplanned SAIDI.
Definition of major events
7.74 We have changed the definition of a ‘major event’ from a calendar day that is over a
given boundary value, to a 24-hour rolling period that is over a given boundary value.
The major event boundary is the equivalent of the 1104th highest 24-hour rolling
period within the 10-year reference period.
7.75 The move to a rolling approach is driven by;
7.75.1 the arbitrary nature of calendar days when it comes to major events; and
7.75.2 the availability of sufficiently accurate recording of the start times of
interruptions.189
7.76 For DPP2, we adapted the Institute of Electrical and Electronics Engineers (IEEE)
methodology for normalisation. This methodology was based on the expectation of
2.3 major events per year. Over a 10-year period, this implied the 23rd highest day
represented a reasonable boundary for a major event.
189 This information was collected for the 2009-2019 period through a section 53ZD request issued in June of 2019. We anticipate that distributors will be able to continue recording this information on an ongoing basis.
146
3605676.11
7.77 Our intent is to retain this approach. However, because there are more rolling 24-
hour periods that fixed 24-hour periods (days) in the reference period, we use the
1104th highest as a reference point.
Treatment of major events
7.78 When a SAIDI major event or SAIFI major event is identified, the half-hours within
the major event period that are over 1/48th of the boundary value will be replaced
with a SAIDI or SAIFI value that is 1/48th of the boundary value.
7.79 This is a significant change from the draft decision, where any three-hour rolling
period that was assessed as a major event would have been replaced with a pro-
rated boundary value, based on the proportion of the day.
7.80 On balance, we considered that a change to replace identified major events with a
reduced replacement value is appropriate given that:
7.80.1 expanded major event reporting requirements will provide more
transparency and incentives around the main cause of these events;
7.80.2 reducing a large source of volatility may provide a clearer indication of the
underlying reliability of the network;
7.80.3 the introduction of an extreme event standard will place further onus on
distributors to minimise and respond appropriately to high impact events
that are not caused by adverse weather or other external impacts; and
7.80.4 there are other incentives at play such as customer complaints and
reputational risk when major events occur.
Updated reporting requirements
7.81 Consistent with our overall intention to provide for greater accountability of
distributors for their performance, and in order to increase predictability for
suppliers following the contravention of any quality standard, we have implemented
two enhanced reporting requirements relating to:
7.81.1 quality standard contravention self-reporting; and
7.81.2 major event reporting.
7.82 The quality contravention self-reporting requirements are largely based on the
information gathering (section 53ZD) requests sent to distributors who contravened
quality standards in 2018, and are set out in Table 7.4.
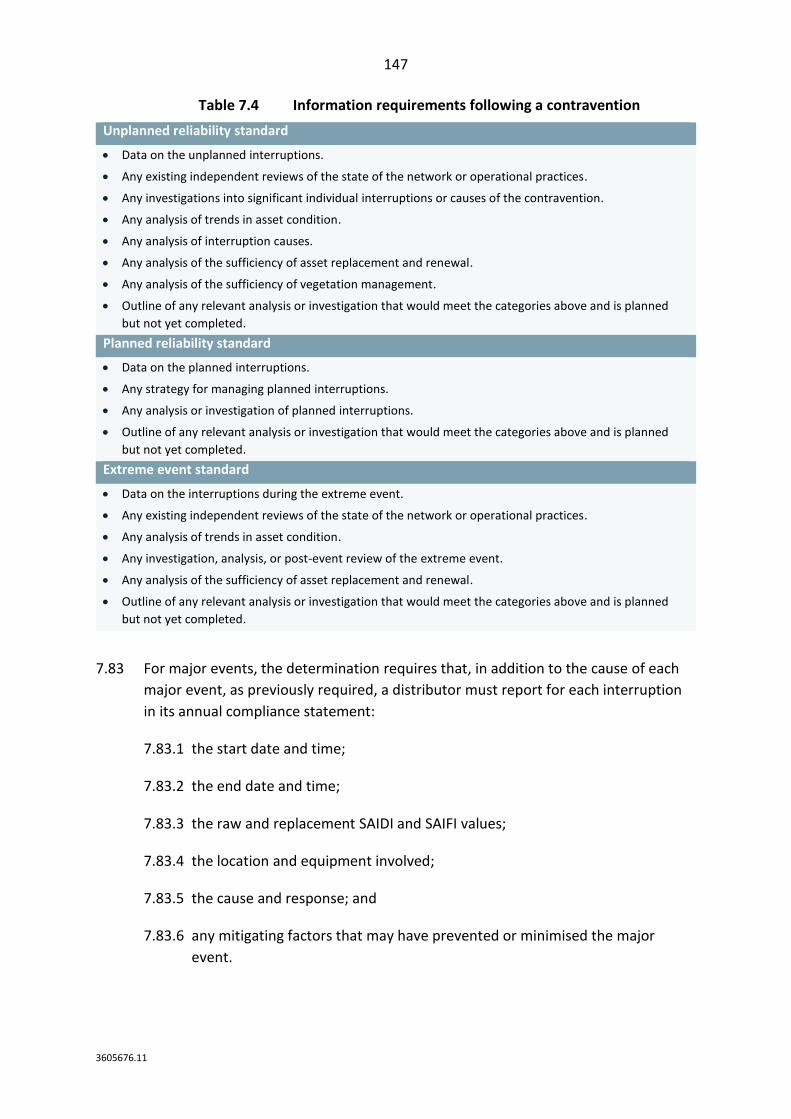
147
3605676.11
Table 7.4 Information requirements following a contravention
Unplanned reliability standard
• Data on the unplanned interruptions.
• Any existing independent reviews of the state of the network or operational practices.
• Any investigations into significant individual interruptions or causes of the contravention.
• Any analysis of trends in asset condition.
• Any analysis of interruption causes.
• Any analysis of the sufficiency of asset replacement and renewal.
• Any analysis of the sufficiency of vegetation management.
• Outline of any relevant analysis or investigation that would meet the categories above and is planned
but not yet completed.
Planned reliability standard
• Data on the planned interruptions.
• Any strategy for managing planned interruptions.
• Any analysis or investigation of planned interruptions.
• Outline of any relevant analysis or investigation that would meet the categories above and is planned
but not yet completed.
Extreme event standard
• Data on the interruptions during the extreme event.
• Any existing independent reviews of the state of the network or operational practices.
• Any analysis of trends in asset condition.
• Any investigation, analysis, or post-event review of the extreme event.
• Any analysis of the sufficiency of asset replacement and renewal.
• Outline of any relevant analysis or investigation that would meet the categories above and is planned
but not yet completed.
7.83 For major events, the determination requires that, in addition to the cause of each
major event, as previously required, a distributor must report for each interruption
in its annual compliance statement:
7.83.1 the start date and time;
7.83.2 the end date and time;
7.83.3 the raw and replacement SAIDI and SAIFI values;
7.83.4 the location and equipment involved;
7.83.5 the cause and response; and
7.83.6 any mitigating factors that may have prevented or minimised the major
event.
148
3605676.11
Other measures of quality
7.84 Our decisions on new measures of quality for DPP3 are:
7.84.1 that no new measures are introduced as part of the compliance quality
standards applying in DPP3;
7.84.2 that no new measures are introduced as part of the revenue-linked quality
incentive scheme in DPP3.
7.85 Additional quality standards that reflect consumer demands should be explored
further during the DPP3 period and with a view to potentially considering them for
future resets. As discussed further in Attachment N, we generally require a historic
dataset of any new measure to set a standard against.
7.86 From 2020, we intend to consider changes to our ID requirements for distributors to
report data that may be required for the future setting of additional quality
standards.
7.87 These additional measures could include relate to its:
7.87.1 ordering and provisioning of new connections;
7.87.2 management and restoration of faults (including the number and duration of
faults);
7.87.3 service performance, reflecting technical characteristics of the service such as
voltage stability; and
7.87.4 customer service (such as the time taken to respond to customer complaints
or enquiries).
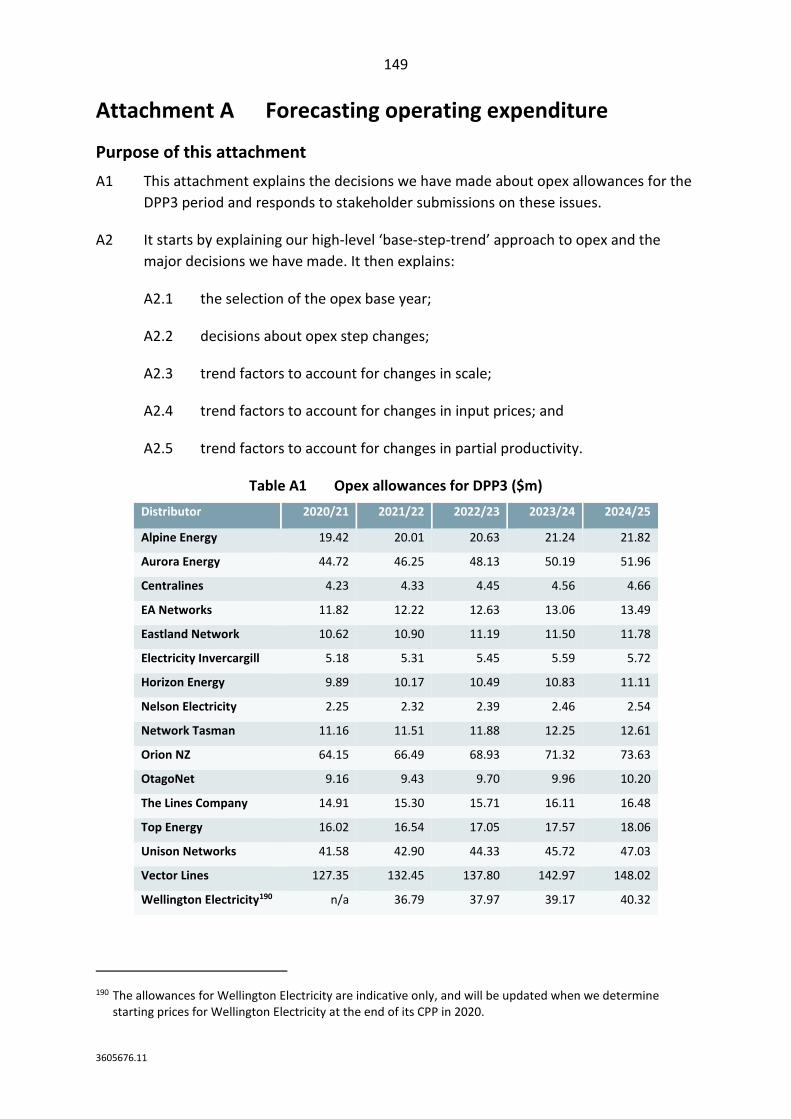
149
3605676.11
Attachment A Forecasting operating expenditure
Purpose of this attachment
A1 This attachment explains the decisions we have made about opex allowances for the
DPP3 period and responds to stakeholder submissions on these issues.
A2 It starts by explaining our high-level ‘base-step-trend’ approach to opex and the
major decisions we have made. It then explains:
A2.1 the selection of the opex base year;
A2.2 decisions about opex step changes;
A2.3 trend factors to account for changes in scale;
A2.4 trend factors to account for changes in input prices; and
A2.5 trend factors to account for changes in partial productivity.
Table A1 Opex allowances for DPP3 ($m)
Distributor 2020/21 2021/22 2022/23 2023/24 2024/25
Alpine Energy 19.42 20.01 20.63 21.24 21.82
Aurora Energy 44.72 46.25 48.13 50.19 51.96
Centralines 4.23 4.33 4.45 4.56 4.66
EA Networks 11.82 12.22 12.63 13.06 13.49
Eastland Network 10.62 10.90 11.19 11.50 11.78
Electricity Invercargill 5.18 5.31 5.45 5.59 5.72
Horizon Energy 9.89 10.17 10.49 10.83 11.11
Nelson Electricity 2.25 2.32 2.39 2.46 2.54
Network Tasman 11.16 11.51 11.88 12.25 12.61
Orion NZ 64.15 66.49 68.93 71.32 73.63
OtagoNet 9.16 9.43 9.70 9.96 10.20
The Lines Company 14.91 15.30 15.71 16.11 16.48
Top Energy 16.02 16.54 17.05 17.57 18.06
Unison Networks 41.58 42.90 44.33 45.72 47.03
Vector Lines 127.35 132.45 137.80 142.97 148.02
Wellington Electricity190 n/a 36.79 37.97 39.17 40.32
190 The allowances for Wellington Electricity are indicative only, and will be updated when we determine starting prices for Wellington Electricity at the end of its CPP in 2020.
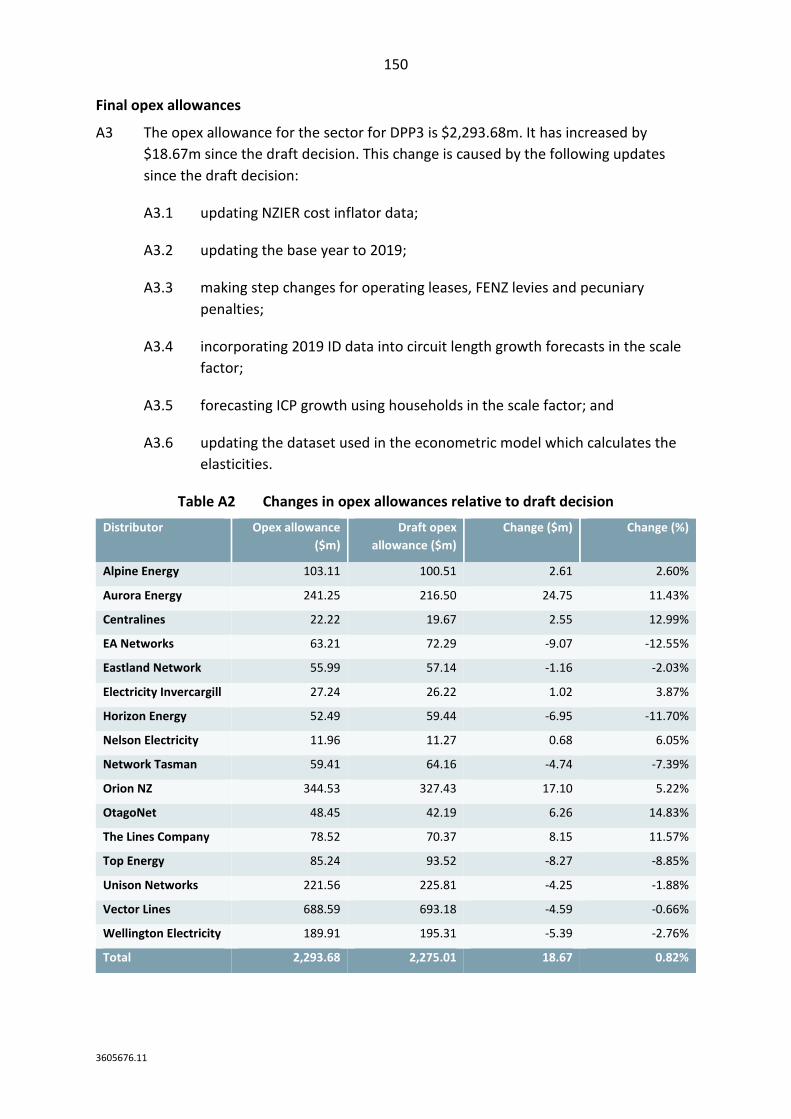
150
3605676.11
Final opex allowances
A3 The opex allowance for the sector for DPP3 is $2,293.68m. It has increased by
$18.67m since the draft decision. This change is caused by the following updates
since the draft decision:
A3.1 updating NZIER cost inflator data;
A3.2 updating the base year to 2019;
A3.3 making step changes for operating leases, FENZ levies and pecuniary
penalties;
A3.4 incorporating 2019 ID data into circuit length growth forecasts in the scale
factor;
A3.5 forecasting ICP growth using households in the scale factor; and
A3.6 updating the dataset used in the econometric model which calculates the
elasticities.
Table A2 Changes in opex allowances relative to draft decision
Distributor Opex allowance
($m)
Draft opex
allowance ($m)
Change ($m) Change (%)
Alpine Energy 103.11 100.51 2.61 2.60%
Aurora Energy 241.25 216.50 24.75 11.43%
Centralines 22.22 19.67 2.55 12.99%
EA Networks 63.21 72.29 -9.07 -12.55%
Eastland Network 55.99 57.14 -1.16 -2.03%
Electricity Invercargill 27.24 26.22 1.02 3.87%
Horizon Energy 52.49 59.44 -6.95 -11.70%
Nelson Electricity 11.96 11.27 0.68 6.05%
Network Tasman 59.41 64.16 -4.74 -7.39%
Orion NZ 344.53 327.43 17.10 5.22%
OtagoNet 48.45 42.19 6.26 14.83%
The Lines Company 78.52 70.37 8.15 11.57%
Top Energy 85.24 93.52 -8.27 -8.85%
Unison Networks 221.56 225.81 -4.25 -1.88%
Vector Lines 688.59 693.18 -4.59 -0.66%
Wellington Electricity 189.91 195.31 -5.39 -2.76%
Total 2,293.68 2,275.01 18.67 0.82%
151
3605676.11
High-level approach
A4 We have retained the base-step-trend approach to setting distributors' opex
allowances for DPP3. The formula we use is shown in Box A1. This is consistent with
the approach signalled in the Draft Reasons Paper.
Box A1: Formula for calculating opex
opext = opext-1 ×
(1 + Δ due to network scale effects) ×
(1 + Δ input prices) ×
(1 – Δ partial productivity for opex) ±
step changes
A5 It is appropriate to forecast opex in this way because most opex relates to activities
that recur. As such, the expenditure is likely to be repeated regularly, and can be
expected to be influenced by certain known and predictable factors.
Reasons for addressing this issue
A6 Providing an opex allowance ensures that distributors have sufficient resources to
fund recurring activities that are not capex. The opex allowance funds a variety of
recurring activities that are essential for the operation of distribution networks, such
as maintenance and planning activities.
A7 Opex has a direct effect on the revenue distributors can earn. Opex represents
approximately 40% of the BBAR, as forecast opex is recovered in the year it is
forecast to be spent. From an efficiency point of view, the opex allowance we set is
the baseline against which any opex IRIS gains and losses are measured.
Overall response in submissions
A8 Some submitters supported the retention of the base-step-trend approach to setting
an opex allowance. However most had caveats that our draft allowance would not
provide sufficient opex in DPP3. There were particular concerns around uncertainty
and change, growth assumptions, input inflators, and partial productivity.191
191 Alpine Energy “Submission on EDB DPP reset draft decisions paper” (18 July 2019) p. 3; Aurora “Submission on EDB DPP reset draft decisions paper” (18 July 2019) p. 7; ENA “Submission on EDB DPP reset draft decisions paper” (18 July 2019) p. 5; Orion “Submission on EDB DPP reset draft decisions paper” (17 July 2019) p. 1; PowerNet “Submission on EDB DPP reset draft decisions paper” (18 July 2019) p. 2.
152
3605676.11
A9 Others commented that the opex model can be inaccurate. This is due to differences
between DPP2 allowances and actual opex, and differences between distributors’
perception of forecasts and allowances.192 The majority of distributors thought our
draft allowance was insufficient to cover for further reductions in productivity,
inflation, and costs unrelated to scale during DPP3.
A10 Orion’s cross-submission reiterated its recommendation to use AMPs for
forecasting.193 Vector commented that significant effort goes into preparing AMPs,
so it would be reasonable to use forecasts as a starting point or a cross-check at a
minimum.194
A11 Vector also highlighted that it is important that the base step and trend method
aligns with the capex allowance and quality standards. An inconsistency could result
in distributors making decisions that are not aligned with customers’ long-term
interests. Consistent with our low-cost DPP framework, our decisions on opex, capex
and quality standards are – in general – all based on distributors’ current
performance. Therefore, we have the ex-ante expectation that distributors will be
able to earn a normal return while being able to fund their operations and
investments. Our assumption is that the current relationships between these factors
will persist.
Alternatives considered and analysis of those alternatives
A12 Instead of a base-step-trend approach, we also considered using opex forecasts
disclosed from the latest AMP available to inform the DPP opex allowance.
A13 In assessing the two alternatives we have had regard to the principles discussed in
our framework chapter. We have relied on the purpose of Part 4 as set out at
paragraphs 3.5 and 3.6 in Chapter 3 above, and the purpose of DPP regulation which
is set out at paragraphs 3.12 to 3.15 in Chapter 3 above.
A14 Relying on AMPs to set the opex allowance would have the following advantages:
A14.1 This approach would be consistent with our approach to setting capex
allowances under the DPP and setting opex in the gas and transmission
space.
A14.2 This approach would tailor opex allowances to the circumstances of
individual distributors, rather than applying a blanket approach to all
distributors.
192 Centralines “Submission on EDB DPP reset draft decisions paper” (18 July 2019) p. 7; Orion “Submission on EDB DPP reset draft decisions paper” (17 July 2019) p. 2.
193 Orion “Cross submission on EDB DPP reset draft decisions paper” (12 August 2019) p. 1. 194 Vector “Submission on EDB DPP reset draft decisions paper” (18 July 2019), p. 36.
153
3605676.11
A14.3 This approach is forward-looking so would potentially allow for changes in
distributors’ operating environment.
A15 Relying on historic opex performance to set the opex allowance would have the
following advantages:
A15.1 The AMP-based approach may create perverse incentives to inflate costs.
The risk of perverse incentives appears greater for opex than capex because
opex recovery is more immediate than capex recovery. The base-step-trend
approach mitigates that risk.
A15.2 Opex costs generally recur year-on-year so a method based on historical
expenditure is likely to be a good predictor of future opex expenditure.
Capex is more irregular and is not predictable from price reset to price reset
which is why AMPs are more appropriate for forecasting capex expenditure.
A15.3 Any AMP-based approach would require more individual scrutiny than we
consider is warranted. It would also be against our purpose of setting a DPP
in a relatively low-cost way.195
A15.4 Our analysis at sector level (as shown in Figure A1 and Figure A2, below)
indicates base-step-trend performed relatively well in DPP2, and that the
DPP2 opex allowance was closer to actual expenditure than distributors’
forecasts in their AMPs.
A16 Having regard to the above we have decided the base-step-trend approach is more
appropriate for operating costs for the following reasons:
A16.1 We consider that the potential perverse incentives to inflate costs is
contrary to the long-term interests of consumers, and more particularly the
reference in section 52A(1)(b) of the Act to incentivising improved
efficiency.196
A16.2 Opex costs are recurring and so a method based on historic expenditure is
appropriate as we expect these costs to be incurred in the future. Our
analysis at sector level indicates the base step and trend method had been a
more accurate predictor of opex than distributors’ forecasts in DPP2.
195 See paragraph 3.13 in Chapter 3 above. 196 See paragraph 3.5 in Chapter 3 above.
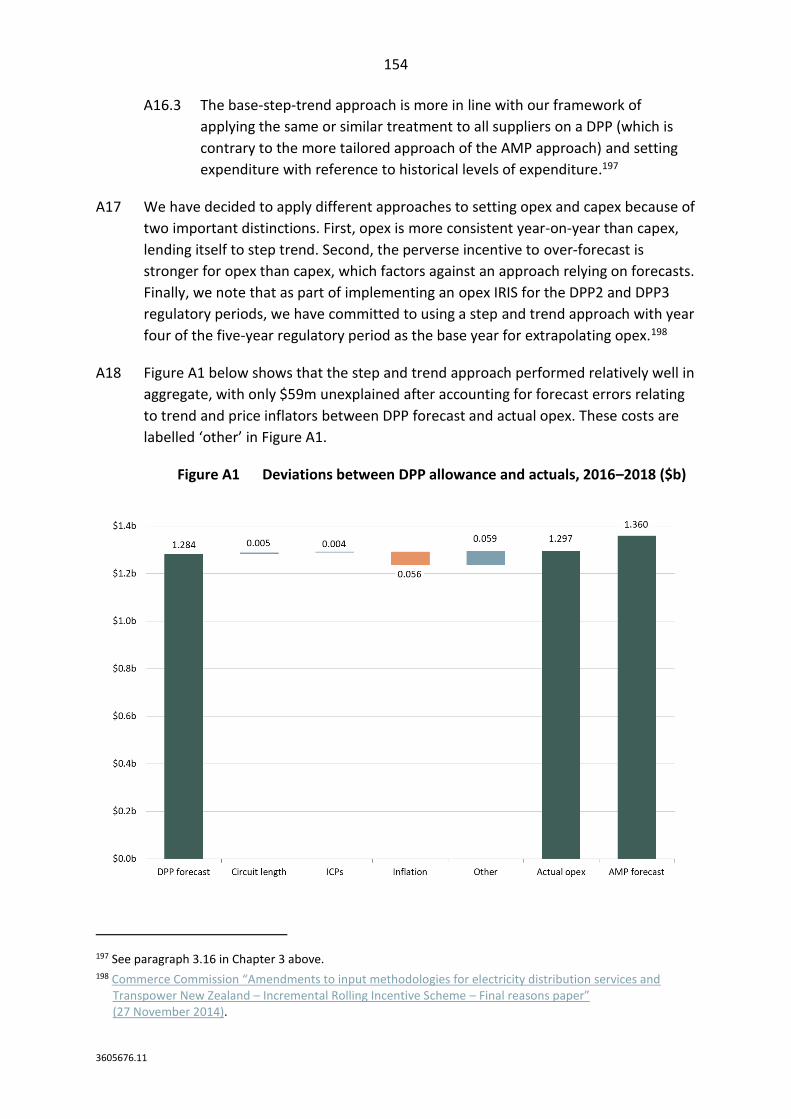
154
3605676.11
A16.3 The base-step-trend approach is more in line with our framework of
applying the same or similar treatment to all suppliers on a DPP (which is
contrary to the more tailored approach of the AMP approach) and setting
expenditure with reference to historical levels of expenditure.197
A17 We have decided to apply different approaches to setting opex and capex because of
two important distinctions. First, opex is more consistent year-on-year than capex,
lending itself to step trend. Second, the perverse incentive to over-forecast is
stronger for opex than capex, which factors against an approach relying on forecasts.
Finally, we note that as part of implementing an opex IRIS for the DPP2 and DPP3
regulatory periods, we have committed to using a step and trend approach with year
four of the five-year regulatory period as the base year for extrapolating opex.198
A18 Figure A1 below shows that the step and trend approach performed relatively well in
aggregate, with only $59m unexplained after accounting for forecast errors relating
to trend and price inflators between DPP forecast and actual opex. These costs are
labelled ‘other’ in Figure A1.
Figure A1 Deviations between DPP allowance and actuals, 2016–2018 ($b)
197 See paragraph 3.16 in Chapter 3 above. 198 Commerce Commission “Amendments to input methodologies for electricity distribution services and
Transpower New Zealand – Incremental Rolling Incentive Scheme – Final reasons paper” (27 November 2014).
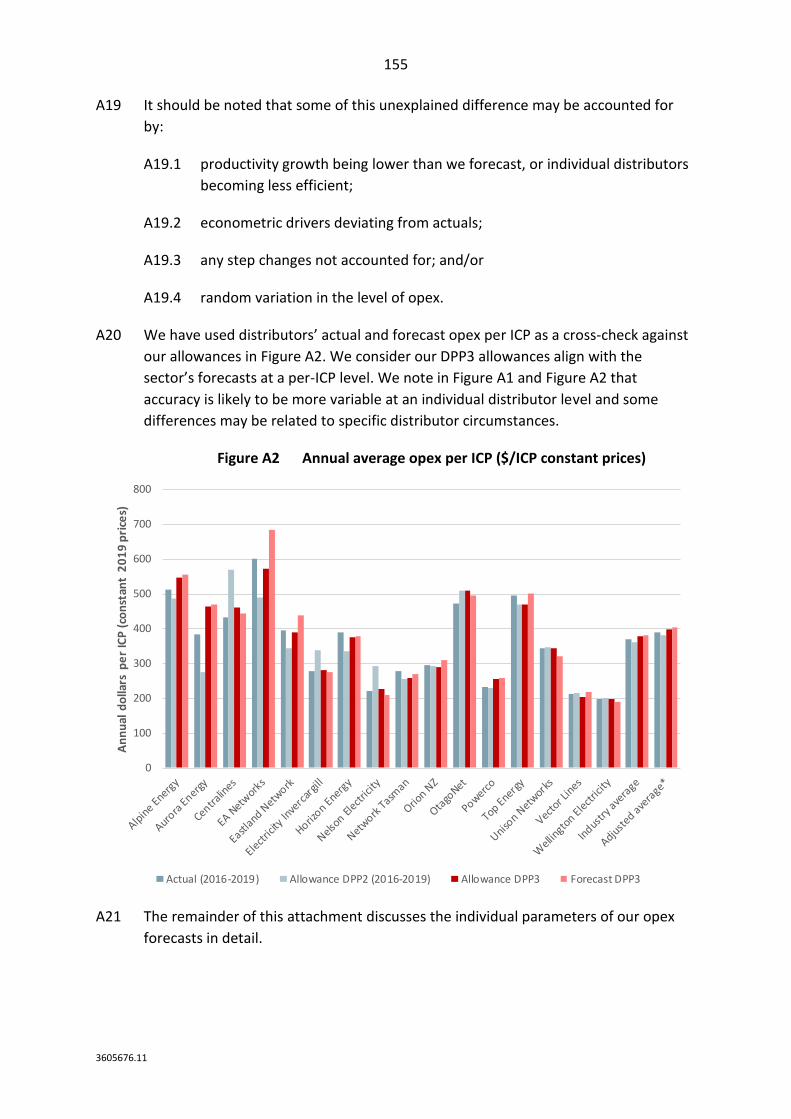
155
3605676.11
A19 It should be noted that some of this unexplained difference may be accounted for
by:
A19.1 productivity growth being lower than we forecast, or individual distributors
becoming less efficient;
A19.2 econometric drivers deviating from actuals;
A19.3 any step changes not accounted for; and/or
A19.4 random variation in the level of opex.
A20 We have used distributors’ actual and forecast opex per ICP as a cross-check against
our allowances in Figure A2. We consider our DPP3 allowances align with the
sector’s forecasts at a per-ICP level. We note in Figure A1 and Figure A2 that
accuracy is likely to be more variable at an individual distributor level and some
differences may be related to specific distributor circumstances.
Figure A2 Annual average opex per ICP ($/ICP constant prices)
A21 The remainder of this attachment discusses the individual parameters of our opex
forecasts in detail.
0
100
200
300
400
500
600
700
800
An
nu
al d
olla
rs p
er
ICP
(co
nst
ant
20
19
pri
ces)
Actual (2016-2019) Allowance DPP2 (2016-2019) Allowance DPP3 Forecast DPP3
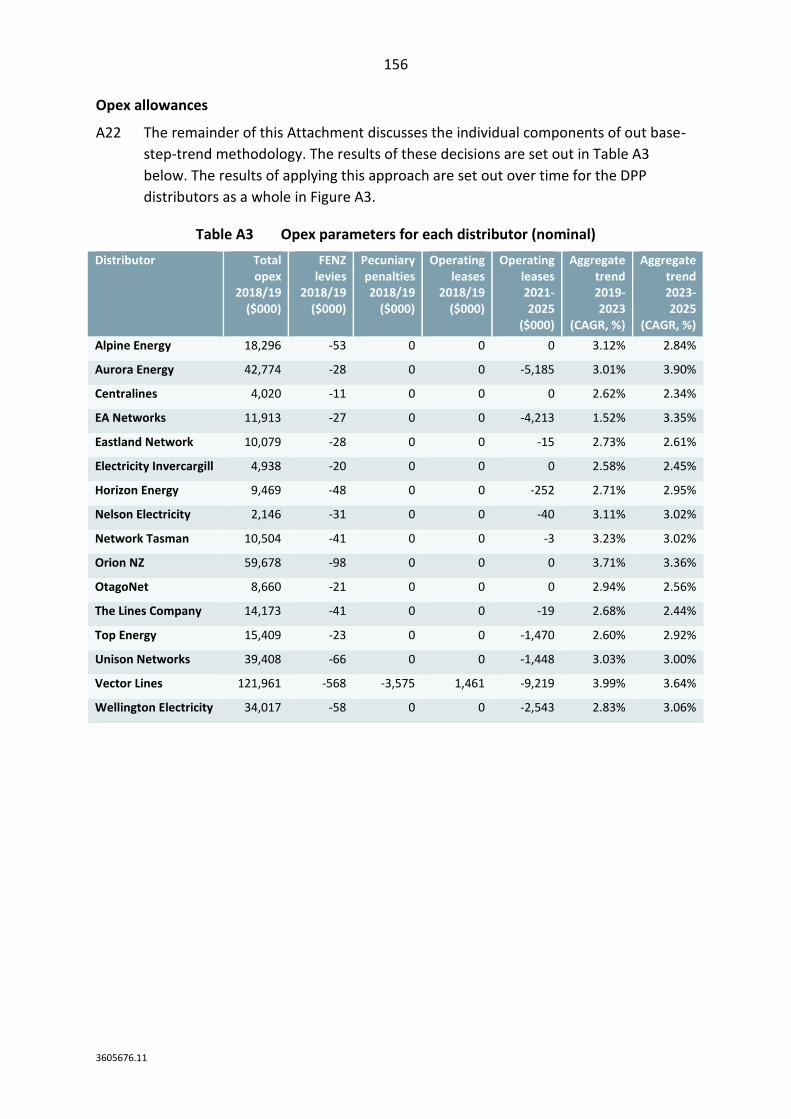
156
3605676.11
Opex allowances
A22 The remainder of this Attachment discusses the individual components of out base-
step-trend methodology. The results of these decisions are set out in Table A3
below. The results of applying this approach are set out over time for the DPP
distributors as a whole in Figure A3.
Table A3 Opex parameters for each distributor (nominal)
Distributor Total opex
2018/19 ($000)
FENZ levies
2018/19 ($000)
Pecuniary penalties 2018/19
($000)
Operating leases
2018/19 ($000)
Operating leases 2021-2025
($000)
Aggregate trend 2019-2023
(CAGR, %)
Aggregate trend 2023-2025
(CAGR, %)
Alpine Energy 18,296 -53 0 0 0 3.12% 2.84%
Aurora Energy 42,774 -28 0 0 -5,185 3.01% 3.90%
Centralines 4,020 -11 0 0 0 2.62% 2.34%
EA Networks 11,913 -27 0 0 -4,213 1.52% 3.35%
Eastland Network 10,079 -28 0 0 -15 2.73% 2.61%
Electricity Invercargill 4,938 -20 0 0 0 2.58% 2.45%
Horizon Energy 9,469 -48 0 0 -252 2.71% 2.95%
Nelson Electricity 2,146 -31 0 0 -40 3.11% 3.02%
Network Tasman 10,504 -41 0 0 -3 3.23% 3.02%
Orion NZ 59,678 -98 0 0 0 3.71% 3.36%
OtagoNet 8,660 -21 0 0 0 2.94% 2.56%
The Lines Company 14,173 -41 0 0 -19 2.68% 2.44%
Top Energy 15,409 -23 0 0 -1,470 2.60% 2.92%
Unison Networks 39,408 -66 0 0 -1,448 3.03% 3.00%
Vector Lines 121,961 -568 -3,575 1,461 -9,219 3.99% 3.64%
Wellington Electricity 34,017 -58 0 0 -2,543 2.83% 3.06%
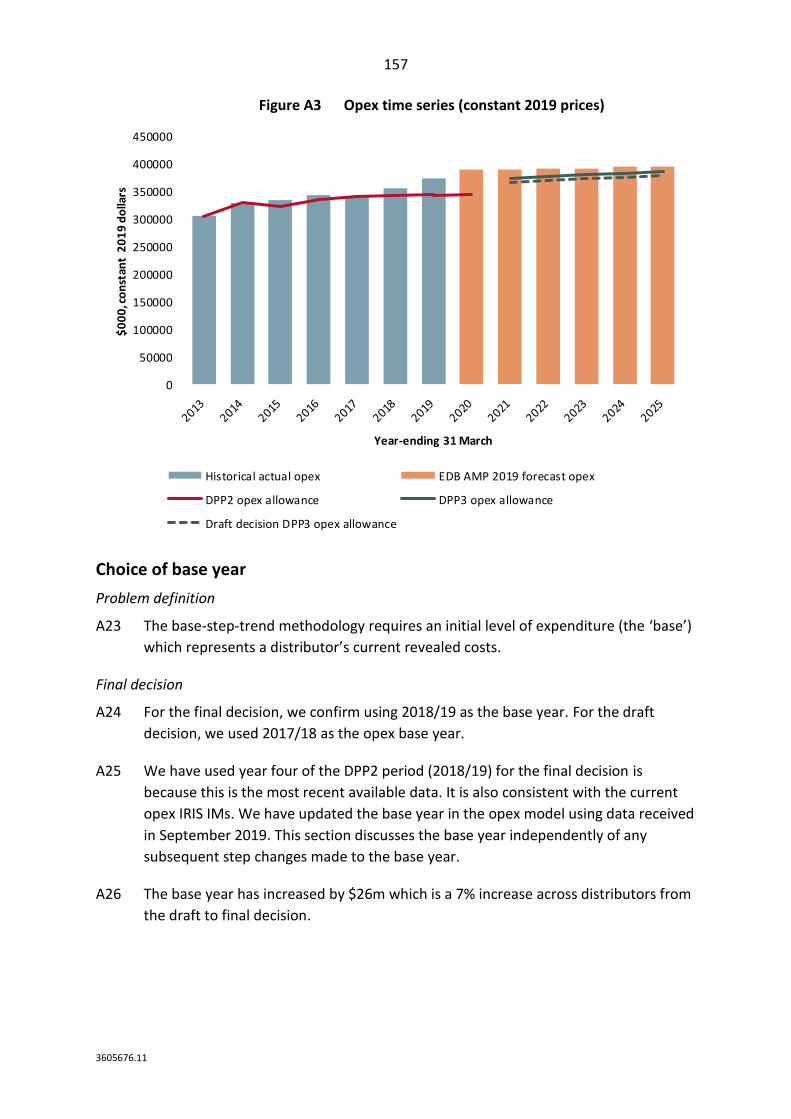
157
3605676.11
Figure A3 Opex time series (constant 2019 prices)
Choice of base year
Problem definition
A23 The base-step-trend methodology requires an initial level of expenditure (the ‘base’)
which represents a distributor’s current revealed costs.
Final decision
A24 For the final decision, we confirm using 2018/19 as the base year. For the draft
decision, we used 2017/18 as the opex base year.
A25 We have used year four of the DPP2 period (2018/19) for the final decision is
because this is the most recent available data. It is also consistent with the current
opex IRIS IMs. We have updated the base year in the opex model using data received
in September 2019. This section discusses the base year independently of any
subsequent step changes made to the base year.
A26 The base year has increased by $26m which is a 7% increase across distributors from
the draft to final decision.
0
50000
100000
150000
200000
250000
300000
350000
400000
450000
$0
00
, co
nst
ant
20
19
do
llars
Year-ending 31 March
Historical actual opex EDB AMP 2019 forecast opex
DPP2 opex allowance DPP3 opex allowance
Draft decision DPP3 opex allowance
158
3605676.11
Analysis
A27 The base year determines the initial level of opex that is trended forward. Any
efficiencies or inefficiencies contained within the base year will therefore be
captured in the baseline opex for DPP3.
A28 Because of the IRIS mechanism, using year four as the base year ultimately has no
impact on the gross revenues a distributor will be able to recover over the DPP3
period: it only affects the balance between starting prices and the adjustment
component of IRIS. The ‘base year adjustment term’ for the opex IRIS reverses out
the net-benefit of any increases or decreases in opex in year four of the preceding
period.
A29 To the extent that distributors make efficiency gains during the DPP period, they will
retain a portion of these, and they are incentivised to do so. Using the most recent
year as a base year means we are reflecting the distributors’ most recent level of
efficiency and operating practices.
Stakeholder views
A30 Orion and Wellington Electricity supported the use of 2018/19 as the base year.
Orion commented that using 2019 as the base year helps reflect distributors’ current
operating environment. However, there were concerns that the base year does not
capture unanticipated changes in costs during DPP3. We discuss these concerns in
more detail under step changes.
Response
A31 Whichever year we use as the base year, the concerns about unanticipated DPP3
costs may be realised. However, there is a risk that customers would pay for
inefficient expenditure with uncertain outcomes if we were to make an ex-ante
adjustment. Distributors have ways to mitigate their risks via reopeners, applying for
a CPP, passing on a portion of the cost to consumers through IRIS, and through the
innovation allowance recoverable cost.
Step changes
A32 This section discusses step changes in opex. It starts by assessing the criteria we
apply to considering step changes, then discusses some of the step changes we have
considered in detail. It finishes by addressing all step changes raised in submissions.
159
3605676.11
Assessment criteria for step changes
Problem definition
A33 Setting opex allowances by trending forward the base year does not capture “step
changes” in expenditure expected during the regulatory period. These step changes
can have a material impact on distributors’ revenue, and distributors have an
incentive to seek the inclusion of as many (positive) step changes as possible. As
such, we need to have a robust basis for considering whether to include them.
Final decision
A34 We have retained the step change criteria set out in the draft decision. We also
clarify the rationale in the analysis.
A35 We require step changes to be:
A35.1 significant;
A35.2 robustly verifiable;
A35.3 not captured in other components of our projection (base year, trend factors,
capex or recoverable costs);
A35.4 largely outside of the control of distributors; and
A35.5 be applicable to most, if not all distributors.199
Alternatives considered
A36 Submitters suggested in response to the issues paper that the criteria be altered to
reflect a lower threshold for allowing a step change. Specifically, distributors took
issue with the “robustly verifiable” criterion and suggested it be replaced with a
lower threshold such as “reasonably likely”.200 In response to the draft paper,
Wellington Electricity recommended allowing known cost increases that were
suggested in response to the issues and draft paper.
A37 Wellington Electricity also recommended allowing step changes for individual
distributors rather than the majority. This would relax the “applicable to most, if not
all, distributors” criterion.201
199 These criteria have been developed to be consistent with the low-cost DPP forecasting principles set out in paragraphs 3.16.1 to 3.16.4 in Chapter 3 above.
200 Vector “Submission to Commerce Commission Default Price Quality Path Issues Paper” (21 December 2018), p. 13; Powerco “Cross submission on EDB DPP3 reset issues paper” (31 January 2019), p. 2; ENA “Cross submission on EDB DPP3 reset issues paper” (31 January 2019), p. 2.
201 Wellington Electricity “Submission on EDB DPP reset draft decisions paper” (18 July 2019), p. 9.
160
3605676.11
A38 We also considered step changes for cumulatively material costs. Several submitters
are concerned that new costs during DPP3 might be individually too small to justify a
step adjustment or a reopener. There is a risk these costs could be cumulatively
material and remain unfunded for.202 We discuss these alternatives below.
Analysis
A39 Step changes are implemented to adjust distributors’ opex allowances for additional
expenditure they will incur (or will stop incurring) during the regulatory period. Each
additional dollar of opex corresponds to approximately one additional dollar of
allowable revenue.
A40 We have set a high threshold for evidence due to the information asymmetry over
positive and negative step changes that are likely to occur during DPP3. Distributors
are better placed to identify actual cost changes during DPP3 due to their
understanding of how their networks work. However, there might be an incentive
for distributors to only reveal step changes which result in higher allowances.
A41 In our decision to set a high threshold for evidence, we recognised that this risk is
reflected by price resets in other jurisdictions. The Competition and Markets
Authority (CMA) provided commentary on Ofwat’s price determination. The
feedback was given in response to Bristol Water appealing Ofwat’s final
determination to the CMA. The CMA commented that Ofwat’s equivalent tool to a
step change, a special cost factor, may act to the detriment of consumers if it is
skewed towards companies’ requests for upwards adjustments without considering
whether there may be other offsetting areas where a company may have received a
higher allowance than necessary. 203
A42 The risk to consumers is twofold:
A42.1 if we accept a step change, and the expected event/driver does not
materialise, consumers will overpay; and
A42.2 if we reject the step change, and the event does materialise, then
distributors may reprioritise their expenditure to maintain profitability, and
consumers will miss out on the benefits from expenditure that the
distributor would have pursued had it been funded to do so.
202 Centralines “Submission on EDB DPP reset draft decisions paper” (18 July 2019) pp 7; ENA “Submission on EDB DPP reset draft decisions paper” (18 July 2019), p. 4; Unison “Submission on EDB DPP reset draft decisions paper” (18 July 2019), p. 14; Vector “Submission on EDB DPP reset draft decisions paper” (18 July 2019) p. 18; Wellington Electricity “Submission on EDB DPP reset draft decisions paper” (18 July 2019) p. 2.
203 Bristol Water’s final determination by the Competition and Markets Authority (October 2015), p. 46.
161
3605676.11
A43 The risk to a distributor is that it does not have sufficient opex and makes trade-offs
between taking on additional risk (for example quality of service, operational, or
regulatory risks), or bearing the extra expense. In the latter case, the IRIS mechanism
should result in consumers bearing approximately three-quarters of the overspend.
A44 Distributors have other mechanisms to mitigate their risks:
A44.1 reopening the price path for legislative changes or catastrophic events;204
A44.2 applying for a CPP for material, business-specific changes;205
A44.3 incurring the expense and passing a portion of the cost onto consumers
through the IRIS mechanism;206 or
A44.4 expenditure could be included within the innovation allowance recoverable
cost, which is discussed in Attachment F.
A45 In contrast, consumers do not have such options. In this context, a high threshold
better promotes the long-term benefit of consumers.
A46 We have assessed step changes against criteria which align with the purposes of
section 52A of the Commerce Act. 207 We describe the criteria and explain why we
have set this standard below. We also give examples of the types of evidence which
we could consider. It is important to note that distributors are not limited by these
examples.
Significance
A47 We consider a step change to be significant if our allowances are insufficient to cover
the costs without a step change. We would consider evidence to show that
distributors have taken reasonable steps to control the cost. We only consider
significant costs due to the principle that the DPP should be a low-cost regime.208
204 Commerce Commission Electricity Distribution Services Input Methodologies Determination 2012 [2012] NZCC 26 (Consolidated as at 31 January 2019), clause 4.5.6.
205 Commerce Act 1986, section 53Q. 206 Commerce Commission Electricity Distribution Services Input Methodologies Determination 2012
[2012] NZCC 26 (Consolidated as at 31 January 2019), clause 3.3.1. 207 See paragraph 3.5 in Chapter 3 above. 208 See paragraph 3.14.1 in Chapter 3 above.
162
3605676.11
Robustly verifiable
A48 For a proposed step change to be robustly verifiable, the evidence distributors have
provided us must be such that we can establish whether the key elements of our
criteria have been met with sufficient confidence. In particular, this includes knowing
with reasonable certainty the quantity of costs involved.
A49 For example, distributors could provide third-party assurance or a range of quotes as
evidence. We consider both the likelihood and efficiency of a step change to be
important in relation to the purposes of Part 4 that suppliers are limited in their
ability to extract excessive profits and that they are incentivised to improve
efficiency, consistent with section 52A(1)(2).
Not captured in other components
A50 We consider whether costs are not captured elsewhere in our projection. An
example could be a new cost which would not be captured in the base year. This is
to prevent distributors from being remunerated twice for the same cost within their
allowances. This criterion links to the purposes of Part 4 that suppliers are limited in
their ability to extract excessive profits, consistent with section 52A(1)(4)
Outside the control of the distributor.
A51 We consider whether step changes are outside of management control and that are
largely unavoidable. Examples include new legislation and macroeconomic factors.
The reason we do not consider costs under management control is because
distributors are able to choose how to spend their allowed revenue. This criterion
relates to the purposes of Part 4 that suppliers have incentives to improve efficiency
and share the benefits with consumers, consistent with section 52A(1)(3).
Applicable to most or all distributors
A52 This is in line with “applying the same or substantially similar treatment to all
suppliers on a DPP.”209 As mentioned above, there are other mechanisms for
distributors to mitigate individual risks.
209 See paragraph 3.16.1 in Chapter 3 above.
163
3605676.11
A53 For the final decision, we have not made any step change adjustments for
cumulatively material costs. This is due to the lack of information around the
significance and robustly verifiable criteria of individual small changes that might
make up a cumulative step change. As well, we are not able to treat cumulatively
material costs as step changes, reopeners or recoverable costs under the current
IMs. At this stage we do not consider that it is proportionate to amend the IMs
speculatively. If costs are cumulatively material, distributors are protected by the
option of a CPP and are able to mitigate this risk through the options discussed
above. We also note the prospect of offsetting downward cost pressures which
suppliers are not incentivised to draw to our attention.
A54 We have not made individual adjustments to distributors’ allowances either. This
aligns with the principles we have adopted for setting DPPs. A key principle is
“applying the same or substantially similar treatment to all suppliers on a DPP.” We
are also mindful that this change in approach would increase the compliance burden.
Step changes proposed for DPP3
Problem definition
A55 Given the above criteria, we sought reasons and evidence for likely step changes
applicable to distributors as part of submissions on our issues paper. In response to
the draft paper, we received further reasons and evidence from distributors around
likely step changes.
Final decisions
A56 We have decided to make the following step changes:
A56.1 A negative step change to the base year for FENZ levies to account for the
creation of a new FENZ levy recoverable cost.210
A56.2 A negative step change to the base year for pecuniary penalties, which will
not be included in opex from 1 April 2020.
A56.3 A negative step change to DPP3 allowances for operating leases, which will
not be included in opex.
210 ENA “DPP3 April 2020 Commission Issues paper( Part One Regulating capex, opex & incentives)” (20 December 2018), pp. 12-13; Eastland Network “2020 DDPP Reset Issues Paper” (20 December 2018), p. 4; Wellington Electricity “Default price-quality paths for electricity distribution businesses from 1 April 2020 Issues Paper” (21 December 2018), p. 6; Orion “Submission on EDB DDP3 Reset “ (20 December 2018) p. 5.
210 Vector “Submission to Commerce Commission Default Price Quality Path Issues Paper” (21 December 2018), pp. 13 and 38.

164
3605676.11
A57 The materiality of these step changes is shown in Table A4.
A58 We have not made any step changes in response to submissions. Submissions were
largely qualitative, so we lacked information to show if step changes proposed by
submitters met the significance or robustly verifiable criteria. We appreciated
receiving cost evidence from Wellington Electricity and Vector as this helps build our
evidence base. However, we were unable to tell whether these costs were efficient
for the duration of DPP3.211
A59 We did not make step changes with respect to the following suggestions by
submitters:
A59.1 health and safety (for example, reducing live lines work);212
A59.2 vegetation management regulation (tree regulations);213
A59.3 smart meter data, low voltage (LV) network monitoring, and ID
enhancement;214
A59.4 FENZ levy changes;215
A59.5 guaranteed service levels schemes;216
211 Wellington Electricity “Submission on EDB DPP reset draft decisions paper” (18 July 2019) appendix A; Vector “Cross-submission on EDB DPP reset draft decisions paper” (12 August 2019) Attachment A.
212 ENA “DPP3 April 2020 Commission Issues paper (Part One Regulating capex, opex & incentives)” (20 December 2018), pp. 12-13; The Lines Company “Default price-quality paths for electricity distribution businesses from 1 April 2020” (21 December 2018), pp. 4-5.
213 ENA “DPP3 April 2020 Commission Issues paper (Part One Regulating capex, opex & incentives)” (20 December 2018), p. 14; Vector “Submission to Commerce Commission Default Price Quality Path Issues Paper” (21 December 2018), p. 13; Powerco “Submission on DDP reset issues paper” (21 December 2018), p. 5.
214 Vector “Submission to Commerce Commission Default Price Quality Path Issues Paper” (21 December 2018), pp. 14-15; Powerco “Submission on DDP reset issues paper” (21 December 2018), p. 5.
215 ENA “DPP3 April 2020 Commission Issues paper( Part One Regulating capex, opex & incentives)” (20 December 2018), pp. 12-13; Eastland Network “2020 DDPP Reset Issues Paper” (20 December 2018), p. 4; Wellington Electricity “Default price-quality paths for electricity distribution businesses from 1 April 2020 Issues Paper” (21 December 2018), p. 6; Orion “Submission on EDB DDP3 Reset “ (20 December 2018) p. 5.
215 Vector “Submission to Commerce Commission Default Price Quality Path Issues Paper” (21 December 2018), pp. 13 and 38.
216 Vector “Submission to Commerce Commission Default Price Quality Path Issues Paper” (21 December 2018), pp. 13 and 38.
165
3605676.11
A59.6 new pricing methodology;217
A59.7 preparation for the future state of the network;218
A59.8 labour skills shortages potentially exacerbated by the increased demand
from Powerco’s CPP capex programme;219
A59.9 customer service lines; 220and
A59.10 the ongoing trend towards ‘Software as a Service’.221
A59.11 regulatory requirements (from IPAG, EA, pricing reform and Part 4
requirements including meeting new quality standards);222
A59.12 cyber security costs;223
A59.13 insurance costs;224
A59.14 traffic management and congestion;225
217 The Lines Company “Default price-quality paths for electricity distribution businesses from 1 April 2020” (21 December 2018), p. 5; ENA “DPP3 April 2020 Commission Issues paper( Part One Regulating capex, opex & incentives)” (20 December 2018), p. 12.
218 Powerco “Submission on DDP reset issues paper” (21 December 2018), p. 5. 219 The Lines Company “Default price-quality paths for electricity distribution businesses from 1 April 2020” (21
December 2018), p. 5; Orion “Submission on EDB DDP3 Reset “ (20 December 2018), p. 6. 220 ENA “DPP3 April 2020 Commission Issues paper (Part One Regulating capex, opex & incentives)”
(20 December 2018), p. 13 221 Powerco “Submission on DDP reset issues paper” (21 December 2018), p. 5. 222 Centralines “Submission on EDB DPP reset draft decisions paper” (18 July 2019), p. 4; Eastland Network
“Submission on EDB DPP reset draft decisions paper” (18 July 2019) p. 6; ENA “Submission on EDB DPP reset draft decisions paper” (18 July 2019), p. 17; PowerNet “Submission on EDB DPP reset draft decisions paper” (18 July 2019), p. 3; Wellington Electricity “Submission on EDB DPP reset draft decisions paper” (18 July 2019), p. 22; Vector “Submission on EDB DPP reset draft decisions paper” (18 July 2019), p. 23; Unison “Submission on EDB DPP reset draft decisions paper” (18 July 2019), p. 13; Orion “Submission on EDB DPP reset draft decisions paper” (17 July 2019), pp 2-3.
223 Centralines “Submission on EDB DPP reset draft decisions paper” (18 July 2019), p. 10; ENA “Submission on EDB DPP reset draft decisions paper” (18 July 2019), p. 17; Unison “Submission on EDB DPP reset draft decisions paper” (18 July 2019), p. 13; Orion “Submission on EDB DPP reset draft decisions paper” (17 July 2019), p. 13; Vector “Submission on EDB DPP reset draft decisions paper” (18 July 2019), p. 34; PowerNet “Submission on EDB DPP reset draft decisions paper” (18 July 2019), p. 2.
224 Centralines “Submission on EDB DPP reset draft decisions paper” (18 July 2019), p. 10; ENA “Submission on EDB DPP reset draft decisions paper” (18 July 2019), p. 17; Orion “Cross submission on EDB DPP reset draft decisions paper” (12 August 2019), p. 3; Unison “Submission on EDB DPP reset draft decisions paper” (18 July 2019), p. 13; Wellington Electricity “Submission on EDB DPP reset draft decisions paper” (18 July 2019), p. 10; PowerNet “Submission on EDB DPP reset draft decisions paper” (18 July 2019), p. 2.
225 Centralines “Submission on EDB DPP reset draft decisions paper” (18 July 2019), p. 8; ENA “Submission on EDB DPP reset draft decisions paper” (18 July 2019), p. 17; Vector “Submission on EDB DPP reset draft
166
3605676.11
A59.15 maintaining assets as they reach the end of their lives;226
A59.16 Employment Relations Amendment Act;227
A59.17 climate change e.g. meeting Interim Climate Change Committee’s
electrification outcomes and responding to the climate change response
amendment bill;228
A59.18 feasibility studies and trials;229
A59.19 new technology230 and;
A59.20 adjustments for CPPs.
Stakeholder views
A60 All distributors who responded to our draft decision considered that our draft
decision would undercompensate them during DPP3. Distributors recommended
that we take account of a range of non-scale costs that they suggested are not
accounted for in the draft opex allowance.231
decisions paper” (18 July 2019), p. 6; PowerNet “Submission on EDB DPP reset draft decisions paper” (18 July 2019), p. 2; Unison “Submission on EDB DPP reset draft decisions paper” (18 July 2019), p. 30.
226 Centralines “Submission on EDB DPP reset draft decisions paper” (18 July 2019), p. 4. 227 ENA “Submission on EDB DPP reset draft decisions paper” (18 July 2019), p. 17. 228 Orion “Submission on EDB DPP reset draft decisions paper” (17 July 2019), p. 6; ENA “Submission on EDB
DPP reset draft decisions paper” (18 July 2019), p. 17. 229 Orion “Submission on EDB DPP reset draft decisions paper” (17 July 2019), p. 3. 230 PowerNet “Submission on EDB DPP reset draft decisions paper” (18 July 2019), p. 2. 231 Alpine Energy “Submission on EDB DPP reset draft decisions paper” (18 July 2019), p. 1; Aurora “Submission
on EDB DPP reset draft decisions paper” (18 July 2019), p. 4; Centralines “Submission on EDB DPP reset draft decisions paper” (18 July 2019), pp. 4 and 7; ENA “Submission on EDB DPP reset draft decisions paper” (18 July 2019), p. 14 and 17; Orion “Cross submission on EDB DPP reset draft decisions paper” (12 August 2019), p. 3; Unison “Submission on EDB DPP reset draft decisions paper” (18 July 2019), p. 10; Vector “Cross-submission on EDB DPP reset draft decisions paper” (12 August 2019), p. 18; Wellington Electricity “Submission on EDB DPP reset draft decisions paper” (18 July 2019), p. 2; Eastland Network “Submission on EDB DPP reset draft decisions paper” (18 July 2019), p. 6; PowerNet “Submission on EDB DPP reset draft decisions paper” (18 July 2019), p. 3.
167
3605676.11
A61 Submitters agreed with treating FENZ levies as a recoverable cost.232 Distributors
also commented about the treatment of pecuniary penalties incurred in the past.233
In particular, Orion asked for clarification of the impact on past profit.234
Response
A62 In this section, we discuss the costs we have made step changes for, and those step
changes where we consider a detailed response to the issue raised in submissions is
warranted (either via a step change or another mechanism such as a future
reopener) below.
A63 Our responses to the other suggested step changes and our reasons for not
proposing to implement them are set out in the table at the end of this section.
Vegetation management (tree regulations)
A64 Vector, Powerco, and ENA submitted in response to the issues paper that changes to
the Electricity (Hazards from Trees) Regulations 2003 are expected to drive higher
vegetation management expenditure.235
A65 In response to the draft paper, the ENA, Unison, Wellington Electricity, Orion and
Vector’s cross-submission reiterate that a step change should be allowed for
anticipated tree regulation changes.236
A66 As we set out in our draft decision:
We consider that given that any change will stem from regulations that are yet to be
promulgated, any step change would be speculative. It would be improper for us to pre-empt
a decision yet to be taken by Cabinet.
232 Aurora “Submission on EDB DPP reset draft decisions paper” (18 July 2019), p. 7; Orion “Submission on EDB DPP reset draft decisions paper” (17 July 2019), p. 3; PowerNet “Submission on EDB DPP reset draft decisions paper” (18 July 2019), p. 1.
233 ENA “Submission on EDB DPP reset draft decisions paper” (18 July 2019), p. 23; Centralines “Submission on EDB DPP reset draft decisions paper” (18 July 2019), p. 16.
234 Orion “Submission on EDB DPP reset draft decisions paper” (17 July 2019), p. 4. 235 ENA “DPP3 April 2020 Commission Issues paper(Part One Regulating capex, opex & incentives)”
(20 December 2018), p. 14; Vector “Submission to Commerce Commission Default Price Quality Path Issues Paper” (21 December 2018), p. 13; Powerco “Submission on DDP reset issues paper” (21 December 2018), p. 5.
236 ENA “Submission on EDB DPP reset draft decisions paper” (18 July 2019), p. 6; Unison “Submission on EDB DPP reset draft decisions paper” (18 July 2019), p. 20; Wellington Electricity “Submission on EDB DPP reset draft decisions paper” (18 July 2019), p. 10; Orion “Submission on EDB DPP reset draft decisions paper” (17 July 2019), p. 3.
168
3605676.11
It is not certain that this change would increase opex costs in aggregate for distributors.
Overall, the changes may lead to more efficient management of vegetation-related
expenditure, with increased vegetation management expenditure more than offset by lower
system interruptions and emergency expenditure.237
A67 While we do not consider this meets the criteria for a step change in opex because
the change is not quantified, we suggest that reopening the price path could be
considered if tree regulations change.
FENZ levies
A68 Our final decision is to introduce a new recoverable cost to cover FENZ levies. Given
the level of uncertainty surrounding the changes we do not consider this is
appropriate for an upwards step change in expenditure, as any forecasts could not in
this case be robustly verified.
A69 However, because of this change, we have removed existing FENZ levy payments
from distributors’ base opex, based on information received in response to a
section 53ZD information gathering request.238
LV line monitoring
A70 Greater visibility of the LV network is said to be increasingly important as it is likely
to be the first part of the network impacted by emerging technologies, such as
electric vehicles or battery storage. Submitters argue that accessing smart meter
data to monitor these networks is likely to be a step change cost.239
A71 The ENA, Orion, Wellington Electricity and Vector reiterated that LV network
monitoring should be a step change.240
237 Commerce Commission, “Default price-quality paths for electricity distribution businesses from 1 April 2020 – Draft reasons paper” (29 May 2019), p. 133.
238 Commerce Commission, “Notice to supply information to the Commerce Commission under section 53ZD(1)(e) and 53ZD(1)(f) of the Commerce Act 2986” June 2019.
239 Vector “Submission to Commerce Commission Default Price Quality Path Issues Paper” (21 December 2018), pp. 14-15; Powerco “Submission on DDP reset issues paper” (21 December 2018), p. 5.
240 ENA “Submission on EDB DPP reset draft decisions paper” (18 July 2019), p. 17; Wellington Electricity “Submission on EDB DPP reset draft decisions paper” (18 July 2019), p. 9; Orion “Cross submission on EDB DPP reset draft decisions paper” (12 August 2019), p. 3; Vector “Cross-submission on EDB DPP reset draft decisions paper” (12 August 2019), p. 18.
169
3605676.11
A72 We do not consider LV monitoring satisfies the step change criteria. This is because
we lack evidence to determine the significance, to robustly verify the expense, or to
know how applicable this cost is to most distributors. We note that one distributor
quantifies the costs in a confidential submission. However, given the uncertainties
involved, we do not consider it appropriate to allow this (or any other amount) ex-
ante.
A73 Where LV monitoring is achieved using methods or technologies that are innovative
(in the New Zealand context) this expenditure is likely to qualify for inclusion within
the innovation allowance recoverable cost, which is discussed in Attachment F.
A74 Furthermore, there are two cases where we may amend the DPP during the period
to account for these costs, when the need, timing, and quantities are involved are
more certain:
A74.1 where acquisition of smart meter data or other LV monitoring is required by
a change to our ID regulations, we would have the option of a change event
reopener to amend opex allowances (provided the 1% materiality threshold
is met); or
A74.2 where the Electricity Authority makes regulatory changes to the terms on
which distributors can access smart meter data from metering providers (as
proposed by the Electricity Price Review), the Authority would be able to
request the Commission reconsider the DPP under section 54V of the
Commerce Act.
Cyber security costs
A75 Several distributors raised concerns about growing cyber security costs and
threats.241 Unison commented that it is only a matter of time before distributors are
expected to meet the Voluntary Cyber Security Standards for Industrial Control
Systems Operators (VCSS-CSO) which have been introduced this year.
A76 We do not consider that cyber security costs meet our step change criteria. This is
due to lack of information if costs are robustly verifiable and if there will be
significant increases. In addition, we expect some cyber security costs to be included
in our allowances as cyber security costs are usual costs for any business.
241 ENA “Submission on EDB DPP reset draft decisions paper” (18 July 2019), p. 4; Centralines “Submission on EDB DPP reset draft decisions paper” (18 July 2019), p. 7; PowerNet “Submission on EDB DPP reset draft decisions paper” (18 July 2019), p. 2; Vector “Cross-submission on EDB DPP reset draft decisions paper” (12 August 2019), p. 18; Orion “Cross submission on EDB DPP reset draft decisions paper” (12 August 2019), p. 3.
170
3605676.11
A77 Vector suggested there is a benefit in having a shared resilience strategy rather than
individual distributors adopting several different approaches. We acknowledge that
there are public benefits to cyber security, and we support the sector sharing
knowledge and working together in the long-term interests of customers.242
Adjustments for CPPs
A78 Wellington Electricity recommended updating their base year costs to include
Wellington’s earthquake readiness operating costs. These costs fall in the last two
years of their CPP and after 2018/19. It is worth highlighting that we do not set a
price path for Wellington Electricity and Powerco until their CPPs end. We will
review Wellington Electricity’s situation when we set their DPP next year.243
Penalties and fines not to be passed on
A79 We made a step change in the base year for penalties and fines. This means that
opex allowances for DPP3 do not allow for future penalties and fines. Pecuniary
penalties are fines or penalties imposed by a court, or by any other body with a
statutory power to impose such fines or penalties. For the avoidance of doubt, on a
forward-looking basis, we have amended the IMs to make it clear that fines and
penalties do not qualify as opex for DPP purposes.
A80 Were these costs included in a distributors’ ID opex, absent other changes, ~76% of
the cost would be passed through to consumers via the IRIS mechanism. This is a
perverse outcome; pecuniary penalties and fines are intended to penalise
distributors (or other parties) for conduct contravening standards that apply to
them. Penalties are also largely under a distributors’ control, so it is appropriate that
distributors bear the risk. There is no policy reason for these costs to be shared with
consumers.
A81 Our final decision is that fines and penalties will not qualify as opex from 1 April
2020. IRIS rewards and penalties paid after 1 April 2020 which are based on profits
made during DPP2 will not be retrospectively adjusted for pecuniary penalties
incurred before 1 April 2020. For example, if a distributor incurred a pecuniary
penalty during DPP2 before 1 April 2020, its IRIS payment in five years’ time, after
1 April 2020 would not be adjusted to exclude those pecuniary penalties. This
decision is a change from our IM reasons paper where we considered excluding
pecuniary penalties from opex as a clarification. We thought it was implicit in the
definition of operating costs that pecuniary penalties were excluded.
242 Vector “Submission on EDB DPP reset draft decisions paper” (18 July 2019), p. 34. 243 Wellington Electricity “Submission on EDB DPP reset draft decisions paper” (18 July 2019), p. 4.
171
3605676.11
A82 After considering the submissions received on our draft IMs reasons paper and to
provide greater regulatory certainty, we felt that it is more appropriate that we
amend the IMs and apply the changes from 1 April 2020 for the final decision. We
consider that the possible long-term benefits of regulatory certainty outweigh the
costs of making retrospective adjustments. Making a retrospective adjustment may
reduce distributors’ confidence in future regulatory decisions and could potentially
hold up investment. A retrospective adjustment also adds complexity to the IRIS
mechanism which could reduce its effectiveness.
A83 Our final decision means that distributors can pass on the costs of penalties incurred
before 1 April 2020 via the IRIS mechanism. Vector’s recent breaches of its quality
standards resulted in a court-imposed penalty.244 It is within Vector’s discretion
whether it chooses to pass on the costs of these pecuniary penalties to its
customers.
A84 A full discussion of our reasons for this IM amendment are available in our final IM
amendments reasons paper.
Operating leases
A85 We have made a step change in the base year for operating leases. This ensures that
forecast opex does not include operating lease costs. This is an IM amendment
which follows the implementation of a new financial reporting standard – NZ IFRS 16
where operating leases are treated as capex instead of opex.
Table A4 Analysis of step changes
Step change Description Assessment
Health and safety
Higher expenditure said to result from the Health and Safety and Work Act 2015. This relates to changes to work on electrified (live) lines.
Does not meet the significance or robustly verifiable tests as change is not quantified. In addition, past cost increases are already included in the base year.
Tree Regulations
Expected changes to the regulations governing vegetation management are said to result in higher expense.
Does not meet the significance or robustly verifiable tests as change is not quantified.
FENZ levies FENZ are partially funded by a levy over certain insurance contracts. The government is in the process of reforming how the organisation is funded, including how this levy operates. This is likely to impact the amount distributors pay in insurance premiums.
FENZ levies are treated as a recoverable cost.
LV network monitoring
Increased information about LV networks is said to be important to understanding the impact of emerging. Collecting this data would involve a cost.
Costs are not able to be verified at the stage.
May qualify for innovation recoverable cost.
244 Commerce Act 1986, section 87.
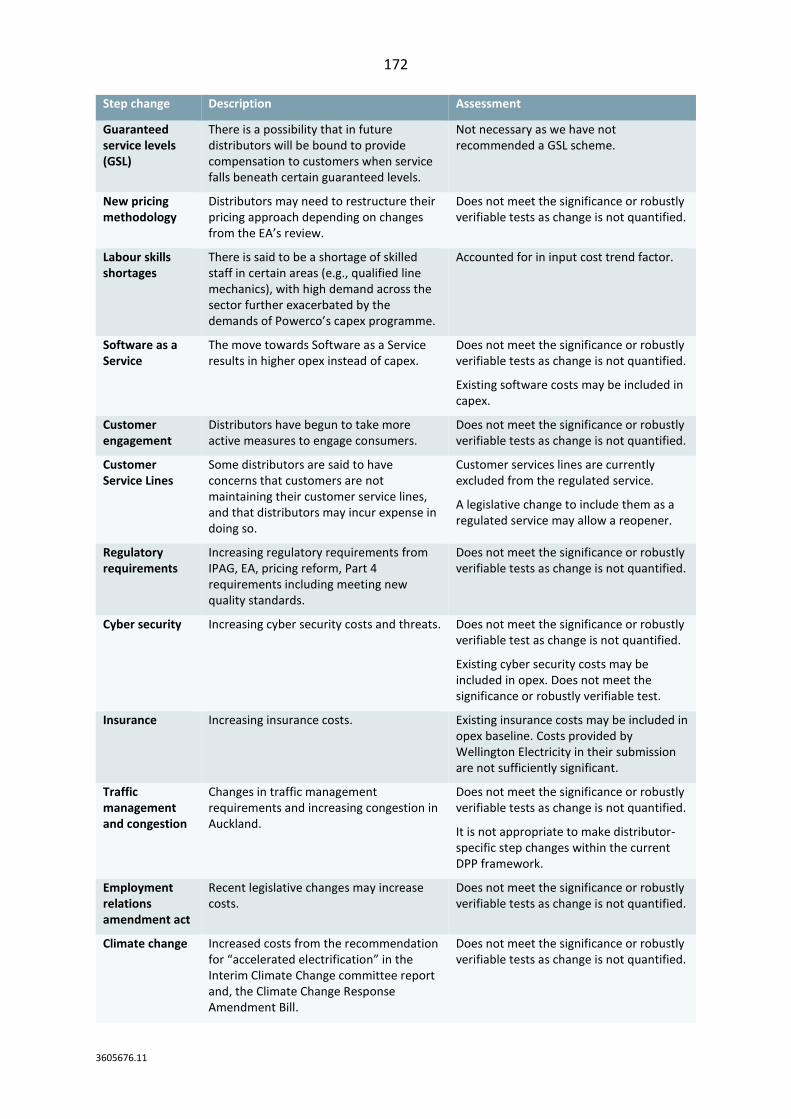
172
3605676.11
Step change Description Assessment
Guaranteed service levels (GSL)
There is a possibility that in future distributors will be bound to provide compensation to customers when service falls beneath certain guaranteed levels.
Not necessary as we have not recommended a GSL scheme.
New pricing methodology
Distributors may need to restructure their pricing approach depending on changes from the EA’s review.
Does not meet the significance or robustly verifiable tests as change is not quantified.
Labour skills shortages
There is said to be a shortage of skilled staff in certain areas (e.g., qualified line mechanics), with high demand across the sector further exacerbated by the demands of Powerco’s capex programme.
Accounted for in input cost trend factor.
Software as a Service
The move towards Software as a Service results in higher opex instead of capex.
Does not meet the significance or robustly verifiable tests as change is not quantified.
Existing software costs may be included in capex.
Customer engagement
Distributors have begun to take more active measures to engage consumers.
Does not meet the significance or robustly verifiable tests as change is not quantified.
Customer Service Lines
Some distributors are said to have concerns that customers are not maintaining their customer service lines, and that distributors may incur expense in doing so.
Customer services lines are currently excluded from the regulated service.
A legislative change to include them as a regulated service may allow a reopener.
Regulatory requirements
Increasing regulatory requirements from IPAG, EA, pricing reform, Part 4 requirements including meeting new quality standards.
Does not meet the significance or robustly verifiable tests as change is not quantified.
Cyber security Increasing cyber security costs and threats. Does not meet the significance or robustly verifiable test as change is not quantified.
Existing cyber security costs may be included in opex. Does not meet the significance or robustly verifiable test.
Insurance Increasing insurance costs. Existing insurance costs may be included in opex baseline. Costs provided by Wellington Electricity in their submission are not sufficiently significant.
Traffic management and congestion
Changes in traffic management requirements and increasing congestion in Auckland.
Does not meet the significance or robustly verifiable tests as change is not quantified.
It is not appropriate to make distributor-specific step changes within the current DPP framework.
Employment relations amendment act
Recent legislative changes may increase costs.
Does not meet the significance or robustly verifiable tests as change is not quantified.
Climate change Increased costs from the recommendation for “accelerated electrification” in the Interim Climate Change committee report and, the Climate Change Response Amendment Bill.
Does not meet the significance or robustly verifiable tests as change is not quantified.
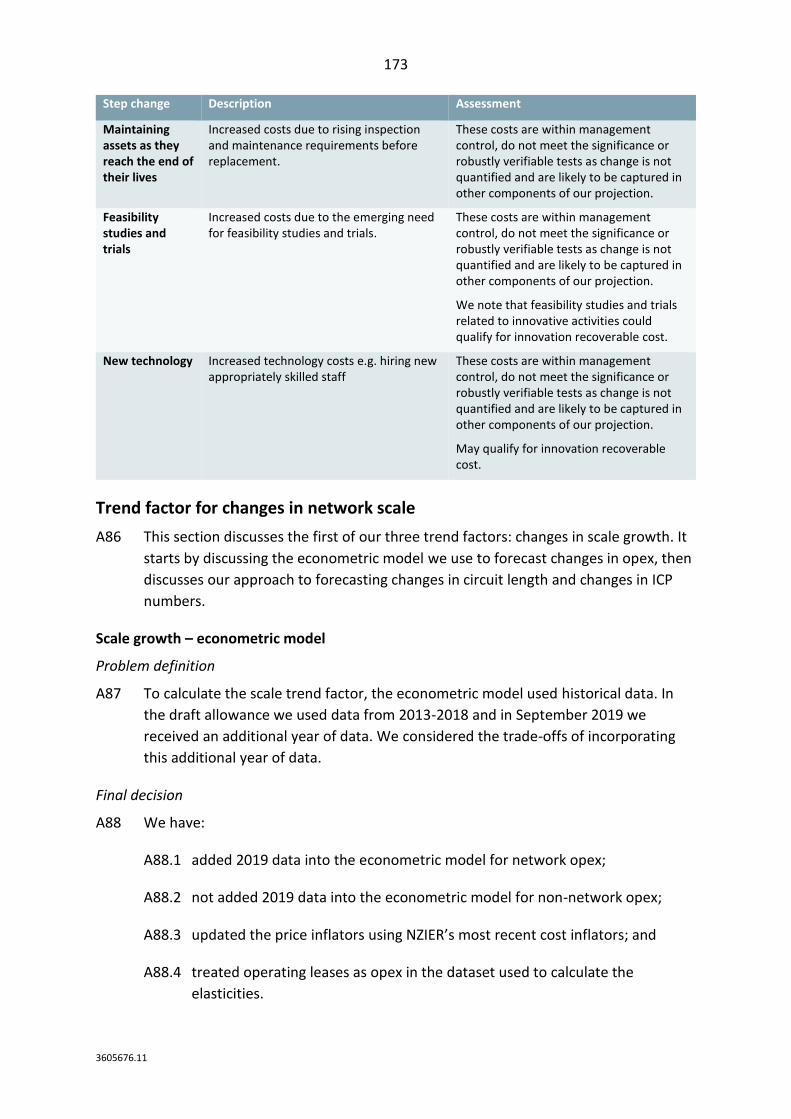
173
3605676.11
Step change Description Assessment
Maintaining assets as they reach the end of their lives
Increased costs due to rising inspection and maintenance requirements before replacement.
These costs are within management control, do not meet the significance or robustly verifiable tests as change is not quantified and are likely to be captured in other components of our projection.
Feasibility studies and trials
Increased costs due to the emerging need for feasibility studies and trials.
These costs are within management control, do not meet the significance or robustly verifiable tests as change is not quantified and are likely to be captured in other components of our projection.
We note that feasibility studies and trials related to innovative activities could qualify for innovation recoverable cost.
New technology Increased technology costs e.g. hiring new appropriately skilled staff
These costs are within management control, do not meet the significance or robustly verifiable tests as change is not quantified and are likely to be captured in other components of our projection.
May qualify for innovation recoverable cost.
Trend factor for changes in network scale
A86 This section discusses the first of our three trend factors: changes in scale growth. It
starts by discussing the econometric model we use to forecast changes in opex, then
discusses our approach to forecasting changes in circuit length and changes in ICP
numbers.
Scale growth – econometric model
Problem definition
A87 To calculate the scale trend factor, the econometric model used historical data. In
the draft allowance we used data from 2013-2018 and in September 2019 we
received an additional year of data. We considered the trade-offs of incorporating
this additional year of data.
Final decision
A88 We have:
A88.1 added 2019 data into the econometric model for network opex;
A88.2 not added 2019 data into the econometric model for non-network opex;
A88.3 updated the price inflators using NZIER’s most recent cost inflators; and
A88.4 treated operating leases as opex in the dataset used to calculate the
elasticities.
174
3605676.11
Analysis
A89 We have decided to incorporate distributors’ most recent disclosures into the
dataset used to calculate the elasticities for network opex. This is because network
opex costs are consistent over time and using distributors’ most recent data means
the elasticities take account of distributors’ current operating environment.
A90 We decided not to use distributors’ most recent disclosure data in 2019 to calculate
the elasticities for non-network opex. This is due to inconsistencies in the data which
could cause potential bias in the elasticities.
A91 We could not remove FENZ levies and pecuniary penalties from non-network opex as
we only had data for non-exempt distributors in 2019. If we deducted FENZ levies
and pecuniary penalties from non-exempt distributors’ non-network opex in 2019,
this could have created an inconsistency between exempt and non-exempt
distributors in 2019, and across all distributors over time. As the inconsistency is not
random, this could potentially lead to bias in the elasticities.
A92 If we included FENZ levies and pecuniary penalties in non-network opex in 2019 this
could also create bias in our elasticities. This is because there is a large penalty in
2019 for one distributor. We considered this penalty to be an anomaly and not
representative of costs over time for most distributors.
A93 We have also decided to treat operating leases as opex in the econometrics dataset
to ensure consistency over time and across distributors. This is because we do not
have information on historic operating lease costs for exempt distributors.
A94 We acknowledge that the econometrics dataset includes operating leases, FENZ
levies and pecuniary penalties and so the elasticities are calculated based on some
costs which will not be part of opex in the future. We do not consider this to have a
material impact on elasticities due to the size of these costs and our econometric
testing shows that our models are robust to changes in the sample period and
sample of distributors. This is as expected as opex costs, ICP numbers and circuit
length numbers have a stable trend over time and we do not see a reason why they
could change significantly over a short period of time.
Scale growth – selection of variables
Problem definition
A95 As a distributor grows, the cost of maintaining and managing its network can also be
expected to grow. We approximate this ‘output’ change using an econometric
method, and to do this we need to determine:
A95.1 what level of disaggregation in opex we use as the dependant variable(s);
and
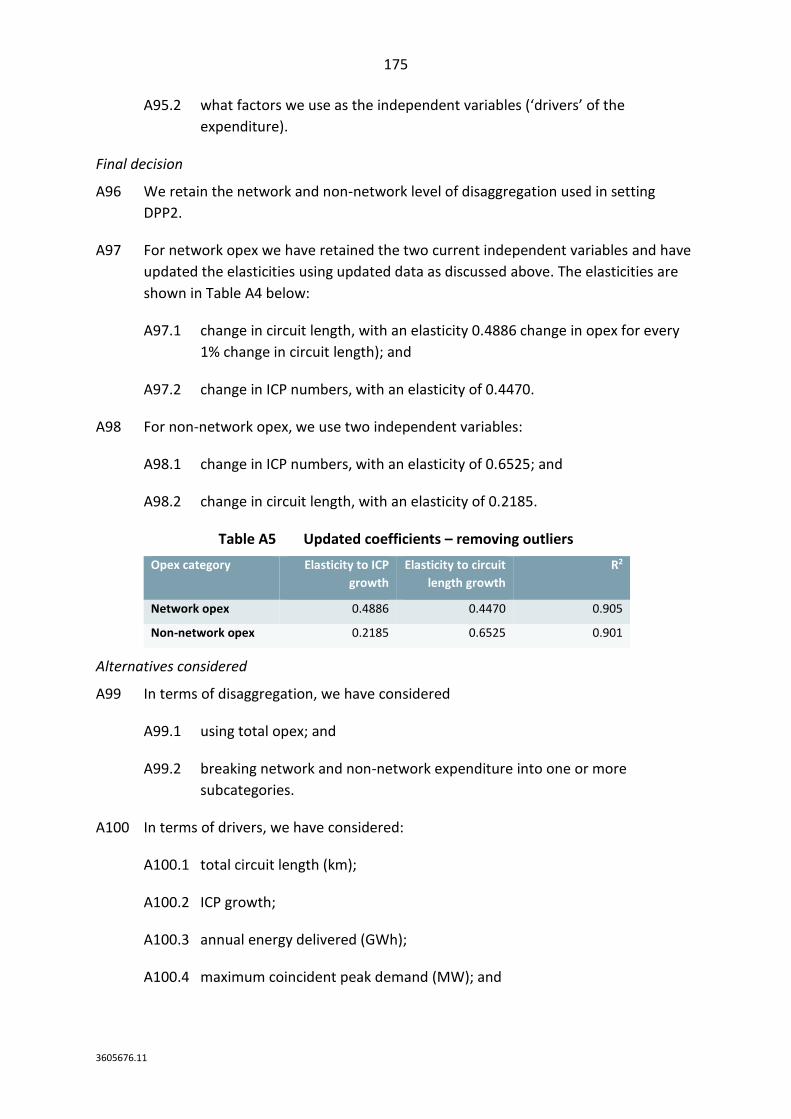
175
3605676.11
A95.2 what factors we use as the independent variables (‘drivers’ of the
expenditure).
Final decision
A96 We retain the network and non-network level of disaggregation used in setting
DPP2.
A97 For network opex we have retained the two current independent variables and have
updated the elasticities using updated data as discussed above. The elasticities are
shown in Table A4 below:
A97.1 change in circuit length, with an elasticity 0.4886 change in opex for every
1% change in circuit length); and
A97.2 change in ICP numbers, with an elasticity of 0.4470.
A98 For non-network opex, we use two independent variables:
A98.1 change in ICP numbers, with an elasticity of 0.6525; and
A98.2 change in circuit length, with an elasticity of 0.2185.
Table A5 Updated coefficients – removing outliers
Opex category Elasticity to ICP
growth
Elasticity to circuit
length growth
R2
Network opex 0.4886 0.4470 0.905
Non-network opex 0.2185 0.6525 0.901
Alternatives considered
A99 In terms of disaggregation, we have considered
A99.1 using total opex; and
A99.2 breaking network and non-network expenditure into one or more
subcategories.
A100 In terms of drivers, we have considered:
A100.1 total circuit length (km);
A100.2 ICP growth;
A100.3 annual energy delivered (GWh);
A100.4 maximum coincident peak demand (MW); and
176
3605676.11
A100.5 overhead line length (km).
A101 The results of the econometric analysis are presented in detail below.
Analysis
A102 We looked at three things when comparing the results of our econometric analysis:
A102.1 whether the model had good explanatory value;
A102.2 evidence that the relationship between the variables is real, and not merely
random/coincidental; and
A102.3 whether the relationship between the independent and dependant variables
makes intuitive sense in terms of the way distributors manage their
networks.
A103 In terms of explanatory power, the models we use explain approximately 90% of the
variation in network and non-network opex.245 Our analysis at the draft decision
found that our models perform better on this measure than all other models we
have analysed except one. The results are shown in Table A6 and Table A7 below.
We tested models suggested by submissions and found our chosen models
performed best using our updated dataset as well. We discuss in our response to
stakeholder views below.
A104 A model which uses ICP growth and line length growth to explain total opex did
result in a slightly higher R2 value (it explained 94% of the variation in total opex).
However, given the compositional differences between distributors network/non-
network expenditure, we consider applying this model inappropriate.246
245 For network opex, the combined line length-ICP model explains 90.5% of variation. For non-network, the combined line length-ICP model explains 90.1%.
246 Network opex ranges from 24% (Unison) to 58% (OtagoNet) of total opex over the 2013-2018 period.
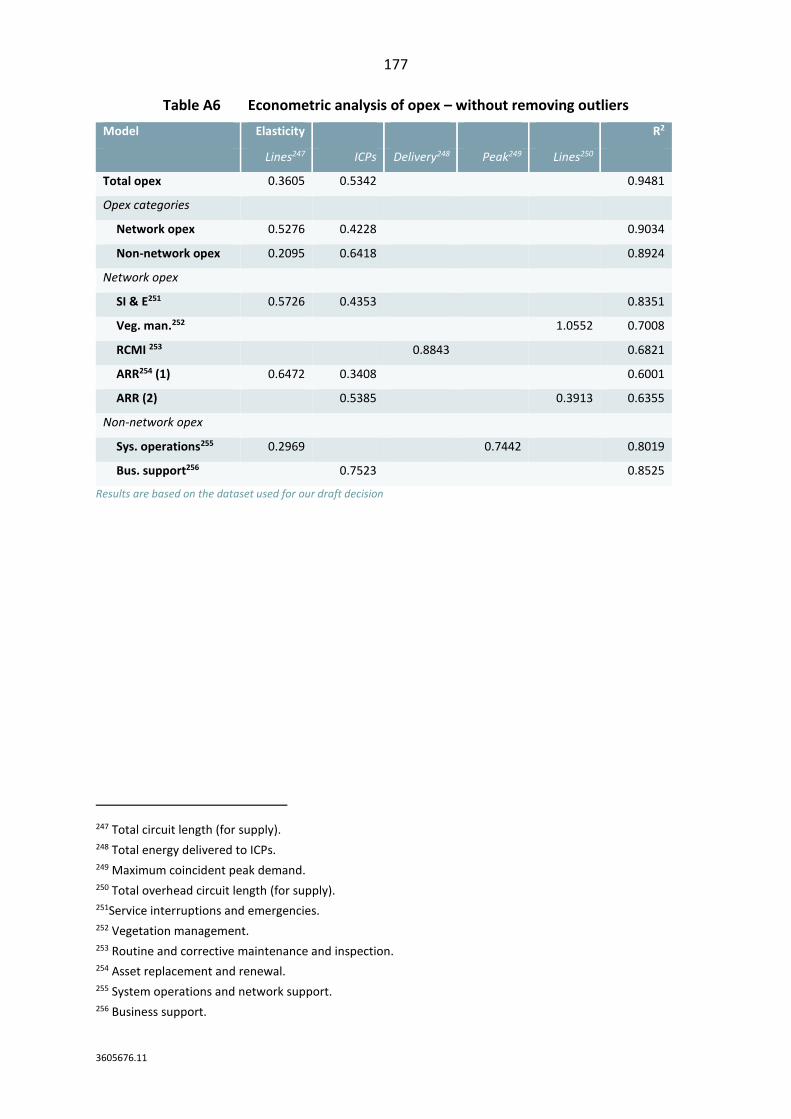
177
3605676.11
Table A6 Econometric analysis of opex – without removing outliers
Model Elasticity R2
Lines247 ICPs Delivery248 Peak249 Lines250
Total opex 0.3605 0.5342 0.9481
Opex categories
Network opex 0.5276 0.4228 0.9034
Non-network opex 0.2095 0.6418 0.8924
Network opex
SI & E251 0.5726 0.4353 0.8351
Veg. man.252 1.0552 0.7008
RCMI 253 0.8843 0.6821
ARR254 (1) 0.6472 0.3408 0.6001
ARR (2) 0.5385 0.3913 0.6355
Non-network opex
Sys. operations255 0.2969 0.7442 0.8019
Bus. support256 0.7523 0.8525
Results are based on the dataset used for our draft decision
247 Total circuit length (for supply). 248 Total energy delivered to ICPs. 249 Maximum coincident peak demand. 250 Total overhead circuit length (for supply). 251Service interruptions and emergencies. 252 Vegetation management. 253 Routine and corrective maintenance and inspection. 254 Asset replacement and renewal. 255 System operations and network support. 256 Business support.
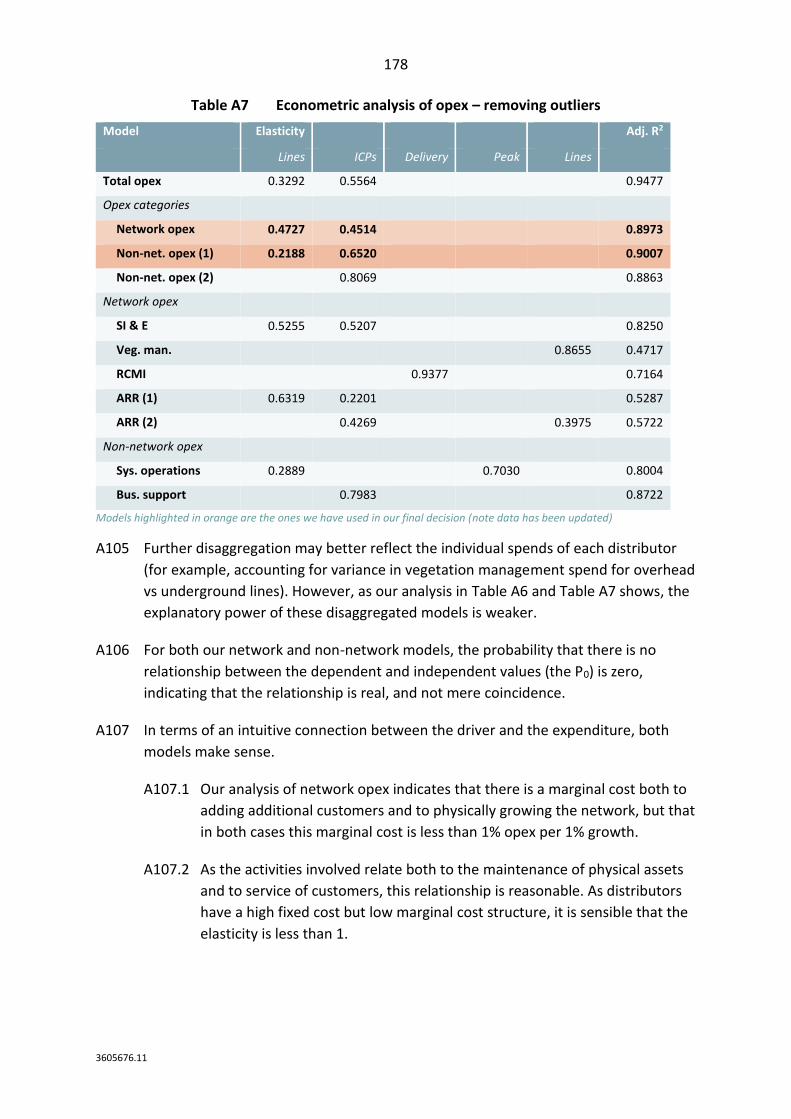
178
3605676.11
Table A7 Econometric analysis of opex – removing outliers
Model Elasticity Adj. R2
Lines ICPs Delivery Peak Lines
Total opex 0.3292 0.5564 0.9477
Opex categories
Network opex 0.4727 0.4514 0.8973
Non-net. opex (1) 0.2188 0.6520 0.9007
Non-net. opex (2) 0.8069 0.8863
Network opex
SI & E 0.5255 0.5207 0.8250
Veg. man. 0.8655 0.4717
RCMI 0.9377 0.7164
ARR (1) 0.6319 0.2201 0.5287
ARR (2) 0.4269 0.3975 0.5722
Non-network opex
Sys. operations 0.2889 0.7030 0.8004
Bus. support 0.7983 0.8722
Models highlighted in orange are the ones we have used in our final decision (note data has been updated)
A105 Further disaggregation may better reflect the individual spends of each distributor
(for example, accounting for variance in vegetation management spend for overhead
vs underground lines). However, as our analysis in Table A6 and Table A7 shows, the
explanatory power of these disaggregated models is weaker.
A106 For both our network and non-network models, the probability that there is no
relationship between the dependent and independent values (the P0) is zero,
indicating that the relationship is real, and not mere coincidence.
A107 In terms of an intuitive connection between the driver and the expenditure, both
models make sense.
A107.1 Our analysis of network opex indicates that there is a marginal cost both to
adding additional customers and to physically growing the network, but that
in both cases this marginal cost is less than 1% opex per 1% growth.
A107.2 As the activities involved relate both to the maintenance of physical assets
and to service of customers, this relationship is reasonable. As distributors
have a high fixed cost but low marginal cost structure, it is sensible that the
elasticity is less than 1.
179
3605676.11
A107.3 Our analysis of non-network opex suggest a stronger relationship between
customer numbers and opex than between circuit length and opex. As only
a portion of non-network opex relates to the management of physical
assets, whereas most of it relates to managing customers, this difference
makes sense.
A108 This result is supported by the elasticities at the next level of disaggregation, where
network support opex (which relates to the planning and management of the
physical network) shows a stronger relationship to line length than business support
opex, which is principally driven by the overall size of the business in customer
terms.
Stakeholder views
A109 Wellington Electricity supported using ICP growth and change in circuit length as cost
drivers to capture traditional network growth. It commented that the draft
regression model shows these to be strong indicators.257
A110 However, some distributors are concerned that the econometric model does not
capture all costs. Orion commented that opex is not always related to scale factors
or historical performance and Unison stated that the model failed to account for any
time dimension capturing the impact of non-scale variables on distributors’ costs.258
NERA considered that the econometric model persistently missed something, as
evidenced by negative productivity growth for the last 16 years.259
A111 Alpine remarked that its growth involves an increasing size of connections rather
than an increasing number of connections. This is due to dairy conversions and
expansions. Alpine recommends using a measure to explain change in systems
demand and transformer capacity instead of growth of circuit length and ICPs.260
Our response
A112 In response to distributors’ concern that the econometric model does not capture all
costs, it is important to state that the econometric model aims to explain recurring
costs related to scale only. Non-scale costs are discussed under step changes.
257 Wellington Electricity “Submission on EDB DPP reset draft decisions paper” (18 July 2019), p. 11. 258 Unison “Submission on EDB DPP reset draft decisions paper” (18 July 2019), p. 10. 259 Orion “Submission on EDB DPP reset draft decisions paper” (17 July 2019), p. 2; NERA Economic consulting
on behalf of ENA “Submission on EDB DPP reset draft decisions paper” (18 July 2019), p. 6. 260 Alpine Energy “Submission on EDB DPP reset draft decisions paper” (18 July 2019), pp. 3-4.
180
3605676.11
A113 In response to Alpine, we have retained using ICP and circuit length growth based on
the statistical results shown in the draft decision and the statistical results using a
dataset that includes distributors’ most recent information disclosures, and the
relevance of these cost drivers to the majority of distributors’ cost activities. Our
econometric testing found that ICP and circuit length growth perform better in terms
of the r-squared and significance of the coefficients than annual energy delivered
(GWh) and maximum coincident peak demand (MW). This implies that distributors’
opex costs are explained more by growth in the number of connections, rather than
growth of the size of connections.
Forecasting circuit length growth
Problem definition
A114 Our results show there is a robust historical relationship between circuit length and
opex growth (as discussed above). We then need a means of forecasting circuit
length changes in the future.
Final decision
A115 We retain our DPP2 approach of forecasting future circuit length growth based on
projecting distributors’ historical line length growth into the future. We have
updated our forecasts of circuit length growth using 2019 ID data.
Analysis
A116 Trends in circuit length growth (for most distributors) have been relatively stable
over time, and we see no fundamental reason why this growth rate would change
significantly over the DPP3 period. We received an additional year of circuit length
data in September 2019 which shows the data continues to have a stable trend.
ERANZ comments that over DPP2 circuit length and the number of ICPs has not
materially deviated from expectations.261
A117 We did not consider requesting forecast data as an appropriate or proportionate
option given the incentive for distributors to overestimate their forecast circuit
length growth, the lack of a reliable metric to check the validity of their forecasts,
and the regulatory costs to all parties.
261 ERANZ “Submission on EDB DPP reset draft decisions paper” (18 July 2019), p. 3.
181
3605676.11
Stakeholder views
A118 Wellington Electricity was comfortable with projecting distributors’ historic circuit
length growth for DPP3 due to the cost of collecting the additional data to use
distributors’ forecasts. If there was not a cost to collecting additional data,
Wellington would prefer using distributors’ forecasts as they have local knowledge
and expertise to develop accurate forecasts.262
Forecasting ICP growth
Problem definition
A119 Our results show there is a robust historical relationship between ICP growth and
opex growth (as discussed above). We need a means of forecasting ICP growth in the
future.
Final decision
A120 We forecast ICP growth based on StatsNZ forecasts of household growth in each
distributor’s network area. For the draft decision, we used StatsNZ forecasts of
population growth.
Alternatives considered
A121 We considered retaining the use of StatsNZ population growth data as per the draft
decision.
Analysis
A122 Growth in ICP numbers ultimately depends on new construction in a distributors’
catchment.263 As such, forecast of population growth and household growth, are in
theory both sensible predictors of future ICP growth.
A123 Over the long-term, population has grown at a much faster rate than both
households and ICPs as shown in Figure A4, since 2013.
262 Wellington Electricity “Submission on EDB DPP reset draft decisions paper” (18 July 2019), p. 11. 263 While some ICP growth will relate to industrial and agricultural activity, these make up a small proportion of
distributors total new connections. As the econometrics relate to total ICP growth, total growth in ICPs is what we are interested in.
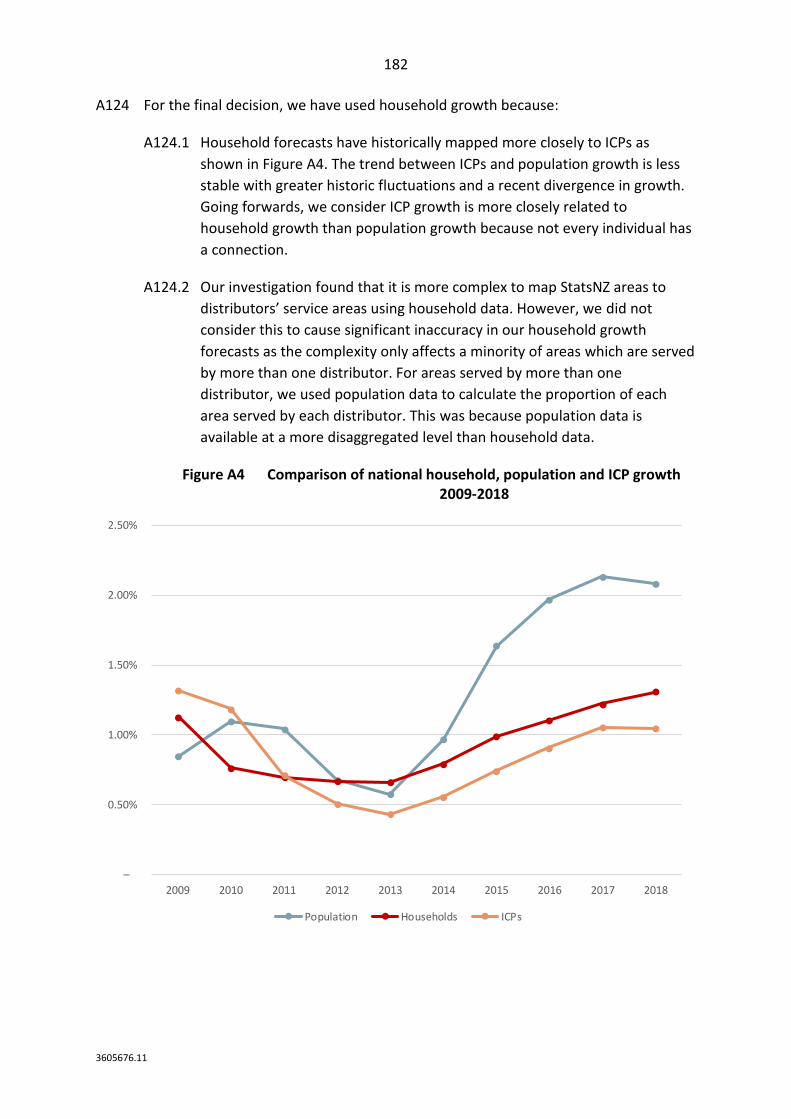
182
3605676.11
A124 For the final decision, we have used household growth because:
A124.1 Household forecasts have historically mapped more closely to ICPs as
shown in Figure A4. The trend between ICPs and population growth is less
stable with greater historic fluctuations and a recent divergence in growth.
Going forwards, we consider ICP growth is more closely related to
household growth than population growth because not every individual has
a connection.
A124.2 Our investigation found that it is more complex to map StatsNZ areas to
distributors’ service areas using household data. However, we did not
consider this to cause significant inaccuracy in our household growth
forecasts as the complexity only affects a minority of areas which are served
by more than one distributor. For areas served by more than one
distributor, we used population data to calculate the proportion of each
area served by each distributor. This was because population data is
available at a more disaggregated level than household data.
Figure A4 Comparison of national household, population and ICP growth 2009-2018
–
0.50%
1.00%
1.50%
2.00%
2.50%
2009 2010 2011 2012 2013 2014 2015 2016 2017 2018
Population Households ICPs
183
3605676.11
Stakeholder views
A125 Vector supported using household growth forecasts instead of population growth
forecasts. This is due to household growth being more accurate as not every
individual has a connection. Vector considered that any inaccuracy between
mapping disaggregated household data to distributors’ service areas is likely to be
small. This is the case for Vector’s service area. It commented on the risk of us
incorrectly mapping Stats NZ areas to distributors’ areas and this risk applies both to
population and household data. We note that no distributor submitted on whether
we map disaggregated StatsNZ data to the right service areas.264
A126 Wellington Electricity commented that household growth is a better predictor of ICP
growth than population growth, but they would need a better understanding of how
effective household growth is at predicting ICP growth on specific networks. We
note that distributors are also protected by reopeners for large unforeseen new
connections, as discussed in Attachment G.
Input price inflators
Problem definition
A127 The cost of the inputs distributors require to deliver the outputs expected of them
also changes over time, for predictable reasons beyond their control. Put another
way, the opex allowances we produce in constant-price terms must be adjusted for
inflation, to be incorporated into the financial model.
Final decision
A128 We use a weighted average of two inflators:
A128.1 NZIER forecasts of the all-industries LCI (60%); and
A128.2 NZIER forecasts of the all-industries producer price index (40%).
A129 This is consistent with the approach taken in DPP2 and suggested in our EDB DPP3
issues paper. We have updated our draft forecasts using NZIER’s most recent
forecasts from August 2019.
264 Vector “Submission on EDB DPP reset draft decisions paper” (18 July 2019), pp. 24-25 and 35.
184
3605676.11
Alternatives considered
A130 We have considered the following suggestions made in submissions in our analysis.
A130.1 Alpine suggested altering the weighting of LCI and PPI as the draft decision
might not be appropriate for distributors experiencing load growth.265
A130.2 Making a specific adjustment for distributors or regions.266
A130.3 Centralines suggested using private sector wage inflation to inflate labour
costs instead of LCI.267
A130.4 Seeking advice and reconsidering NZIER’s forecasts for electricity
distribution.268
Analysis
A131 The purpose of these inflators is to allow distributors the costs of changes in the real
prices of inputs that are outside of their control. This ensures a nominal opex
allowance that is suitably adjusted for price rises in future years.
A132 Alpine recommends placing more weight on PPI than LCI as distributors with
increasing load growth will spend more on materials than labour.
A133 We did not alter the weighting of LCI and PPI as we considered the majority of
distributors will experience growth of the number of the connections rather than
growth at existing connections. Distributors with growth of number of connections
are likely to incur a higher proportion of labour costs than those with increasing
growth of existing connections. The latter can achieve economies of scale. For
example, if a distributor increases its load at a connection, it does not necessarily
need to increase its labour input by the same proportion. We currently lack the
information to make an evidence-based adjustment to the weighting of cost inflators
for this price reset.
265 Alpine Energy “Submission on EDB DPP reset draft decisions paper” (18 July 2019), p. 3. 266 Vector “Submission on EDB DPP reset draft decisions paper” (18 July 2019), p. 35; PowerNet “Submission
on EDB DPP reset draft decisions paper” (18 July 2019), p. 2; Unison “Submission on EDB DPP reset draft decisions paper” (18 July 2019), p. 16; Wellington Electricity “Submission on EDB DPP reset draft decisions paper” (18 July 2019), p. 12; Vector “Submission on EDB DPP reset draft decisions paper” (18 July 2019), p. 35.
267 Centralines “Submission on EDB DPP reset draft decisions paper” (18 July 2019), p. 12. 268 Centralines “Submission on EDB DPP reset draft decisions paper” (18 July 2019), p. 4; ENA “Submission on
EDB DPP reset draft decisions paper” (18 July 2019), p. 6; Unison “Submission on EDB DPP reset draft decisions paper” (18 July 2019), pp. 5 and 16; Wellington Electricity “Submission on EDB DPP reset draft decisions paper” (18 July 2019), p. 12; Orion “Cross submission on EDB DPP reset draft decisions paper” (12 August 2019), p. 2.
185
3605676.11
A134 Several distributors suggested that labour costs are higher in particular regions.
Vector provided evidence that labour costs are higher in Auckland relative to the rest
of the country and PowerNet, Unison and Wellington Electricity highlighted that
labour costs could be higher in the South Island due to a higher demand for labour
by Aurora and other infrastructure demands.269
A135 We considered that the impact of regional labour costs can be largely mitigated by
distributors hiring nationally and investing in their workforce. This is particularly
applicable to non-network labour costs which are less bound by location than
network labour costs. It is also not appropriate to make one-off adjustments under
the DPP principle of “applying the same or substantially similar treatment to all
suppliers on a DPP.”270
A136 Centralines suggested that private sector wage inflation is a more appropriate
inflator than the LCI. This is because wage inflation takes account of the quality of
employees which it suggests reflects that competency grows over time; whereas the
LCI measures the change in the cost of labour that is required to produce the same
quantity and quality of work.271
A137 We do not adopt the wage inflation index because the LCI already takes wage
inflation into account. The LCI also measures other types of labour costs that
employers incur such as non-wage labour costs like medical insurance, motor
vehicles, annual leave and ACC employer premiums. We note that changes in costs
caused by the quality of labour are reflected in the productivity factor, and changes
in costs caused by labour cost growth are captured in the scale factor. Distributors
also have a choice over the quality and quantity of labour they use. Our allowance
for inflation aims to protect distributors only from labour cost inflation as this cost is
largely outside of distributors’ control.
269 Vector “Submission on EDB DPP reset draft decisions paper” (18 July 2019), p. 35; PowerNet “Submission on EDB DPP reset draft decisions paper” (18 July 2019), p. 2; Unison “Submission on EDB DPP reset draft decisions paper” (18 July 2019), p. 16; Wellington Electricity “Submission on EDB DPP reset draft decisions paper” (18 July 2019), p. 12; Vector “Submission on EDB DPP reset draft decisions paper” (18 July 2019), p. 35.
270 See paragraph 3.16.1 in Chapter 3 above. 271 Centralines “Submission on EDB DPP reset draft decisions paper” (18 July 2019), p. 12.
186
3605676.11
A138 Several distributors recommend that we reconsider using NZIER’s forecasts.272 We
investigated whether NZIER’s forecasts are appropriate for distributors, by
considering:
A138.1 what factors NZIER forecasts include; and
A138.2 other macroeconomic commentary and forecasts.
A139 We engaged with NZIER to discuss what factors their forecast of LCI includes. We
thought this was important following stakeholders’ recommendations to seek advice
and the overall concern around NZIER’s forecast of LCI. Distributors thought the draft
forecast of LCI was too low for several macroeconomic reasons and some provided
evidence of wage growth forecasts.
A140 We confirm that NZIER’s forecasts of the LCI account for factors relevant to
distributors. These include wage inflation in the public and private sector,
employment rates, the increase in the minimum wage, an ageing workforce and the
business outlook.
A141 Several distributors thought actual labour cost inflation for distributors would be
higher due to a heavily unionised workforce.273 Unions are not a new phenomenon
and do not represent a change in circumstances compared to previous DPPs. The LCI
covers all industries and all occupations except private households employing
staff.274 Therefore, NZIER’s forecasts include the electricity distribution sector and
other sectors with unions. An adjustment for unions has not been made in the past
and distributors have been sufficiently compensated for labour cost inflation. For
these two reasons, we do not consider that it is appropriate to adjust the LCI for
unions in DPP3.
A142 We surveyed a range of macroeconomic commentary and forecasts to see how
NZIER’s macroeconomic outlook compared to other independent forecasts. Figure
A5 shows NZIER’s forecasts are in line with other forecasts of all sectors LCI from
Infometrics and Westpac.
272 Centralines “Submission on EDB DPP reset draft decisions paper” (18 July 2019), p. 4; ENA “Submission on EDB DPP reset draft decisions paper” (18 July 2019), p. 6; Unison “Submission on EDB DPP reset draft decisions paper” (18 July 2019), pp. 5 and 16; Wellington Electricity “Submission on EDB DPP reset draft decisions paper” (18 July 2019), p. 12; Orion “Cross submission on EDB DPP reset draft decisions paper” (12 August 2019), p. 2.
273 ENA “Submission on EDB DPP reset draft decisions paper” (18 July 2019), p. 17; PowerNet “Submission on EDB DPP reset draft decisions paper” (18 July 2019), p. 1; Unison “Submission on EDB DPP reset draft decisions paper” (18 July 2019), p. 15; Centralines “Submission on EDB DPP reset draft decisions paper” (18 July 2019), p. 4.
274 Stats NZ “Labour Cost Index Quarterly Data Collection”.
187
3605676.11
A143 Westpac275, ASB276, ANZ277, NZIER,278 and Infometrics’279 commentaries provide
reasons why there will be slack in the labour market in upcoming years. For example,
ASB comments that “With labour demand cooling as business confidence remains
weak, the degree of slack may start to increase going forwards.”280 And Westpac
“doubts unemployment will remain this low and it could rise over the coming year.
There are signs of a softening labour market, with forward-looking indicators such as
job ads falling in recent months. And now we face the prospect of an export
downturn due to the escalating US-China trade-war which will affect employment in
New Zealand.”281
A144 It is also worth highlighting that BNZ, ANZ, and NZIER commented that labour market
data typically lags other indicators. 282 Figure A4 displays a rolling average of inflation
over time. It shows that LCI has historically lagged behind CPI inflation over a long
time-frame. CPI has been persistently low over the past 5 years and the current
policy target does not suggest future increases. The policy target is to “keep annual
CPI inflation between 1% and 3% over the medium term, with a focus on keeping
future inflation near the 2% per cent midpoint.”283
A145 In summary, historic evidence and a variety of independent forecasts suggest there
will not be significant increases in labour cost inflation over DPP3.
275 Westpac “NZ labour market review, June quarter 2019” (August 2019), p. 2. 276 ASB “Quarterly Economic Forecast” (August 2019), p. 3. 277 ANZ “Labour Market Statistics – 2019Q1” (May 2019), p. 2. 278 NZIER “Quarterly Predictions” (September 2019) pp 7. 279 Infometrics “Cost adjusters 2019-2025 for the Commerce Commission” (September 2019), pp 2-3. 280 ASB “Quarterly Economic Forecast” (August 2019), p. 2. 281 Westpac “NZ labour market review, June quarter 2019” (August 2019), p. 2. 282 BNZ “NZ’s Bolshy Labour Market” (August 2019), p. 2; ANZ “Labour Market Statistics – 2019Q1” (May 2019),
p. 2. 283 Parliament “Monetary Policy and the Policy Targets Agreement” (March 2019).
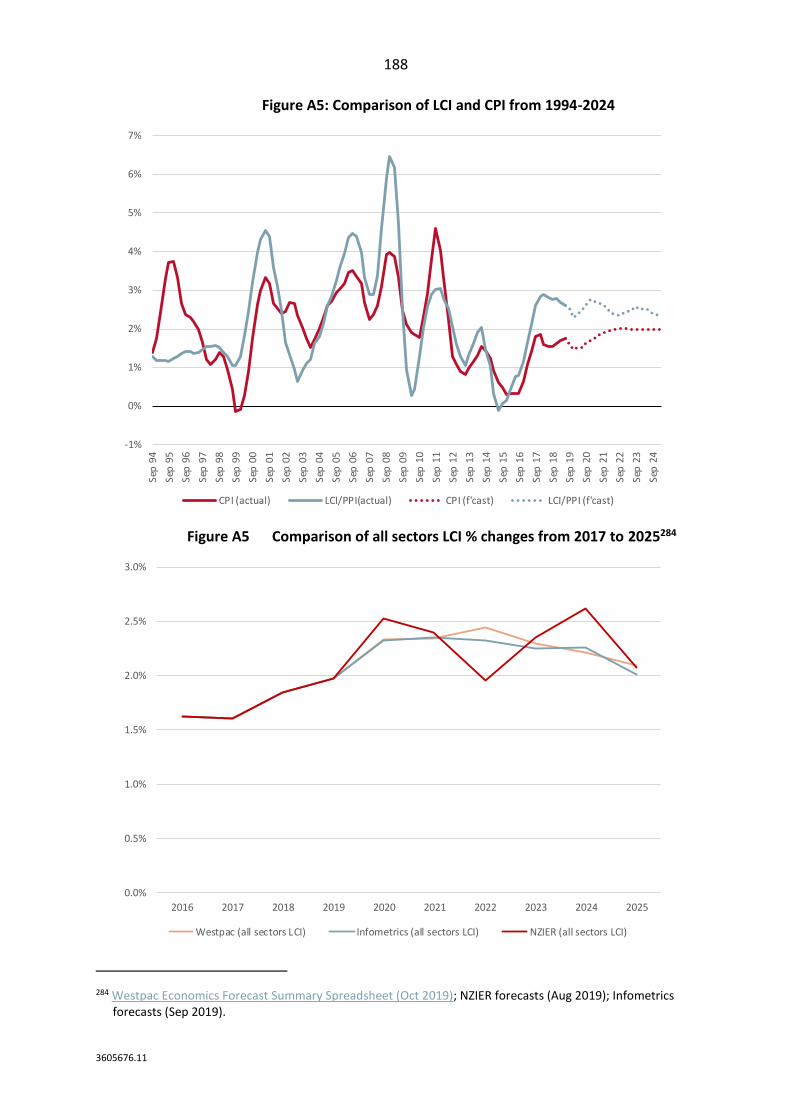
188
3605676.11
Figure A5: Comparison of LCI and CPI from 1994-2024
Figure A5 Comparison of all sectors LCI % changes from 2017 to 2025284
284 Westpac Economics Forecast Summary Spreadsheet (Oct 2019); NZIER forecasts (Aug 2019); Infometrics forecasts (Sep 2019).
-1%
0%
1%
2%
3%
4%
5%
6%
7%
Sep
94
Sep
95
Sep
96
Sep
97
Sep
98
Sep
99
Sep
00
Sep
01
Sep
02
Sep
03
Sep
04
Sep
05
Sep
06
Sep
07
Sep
08
Sep
09
Sep
10
Sep
11
Sep
12
Sep
13
Sep
14
Sep
15
Sep
16
Sep
17
Sep
18
Sep
19
Sep
20
Sep
21
Sep
22
Sep
23
Sep
24
CPI (actual) LCI/PPI(actual) CPI (f'cast) LCI/PPI (f'cast)
0.0%
0.5%
1.0%
1.5%
2.0%
2.5%
3.0%
2016 2017 2018 2019 2020 2021 2022 2023 2024 2025
Westpac (all sectors LCI) Infometrics (all sectors LCI) NZIER (all sectors LCI)
189
3605676.11
Stakeholder views
A146 In relation to our method of forecasting labour cost inflation, some stakeholders
showed support. Wellington Electricity supported using an independent agency such
as NZIER and using LCI and PPI as a starting point.285
A147 There were few comments on our method for forecasting producer price input
inflation. Centralines thought NZIER’s forecast of PPI did not appear unreasonable.286
However Alpine suggested that PPI should be given more weight for distributors that
have steady or increasing load growth and that distributors could provide evidence
of load growth to inform our decision.287
A148 Most stakeholders thought NZIER’s forecast of labour cost inflation was too low after
taking CPI into account. This was due to factors relating to distributors’ operating
environment such as high unionisation and wage pressures from infrastructure
deficits and CPPs. Several distributors cited macroeconomic reasons such as an
increase in the minimum wage, an ageing workforce, above average public sector
wage settlements and the economy being at full employment. Stakeholders also
submitted macroeconomic evidence to explain why labour cost inflation might be
higher than forecast. Evidence was provided by submitters on wage growth,
employment rates, participation rates and business outlook. We discuss our
response in our analysis above.
Opex partial productivity factor
Problem definition
A149 Industry-wide changes in productivity can result in more (or less) output per unit of
input. To reduce the risk of general productivity changes giving distributors windfall
gains or losses, the opex allowance should be adjusted by a productivity factor.
Final decision
A150 We have set the opex partial productivity factor at 0%, based on an assessment of
overseas productivity trends in electricity distribution, productivity trends in
comparable sectors within New Zealand and a changing policy environment relative
to DPP2.
285 Wellington Electricity “Submission on EDB DPP reset draft decisions paper” (18 July 2019), p. 12. 286 Centralines “Submission on EDB DPP reset draft decisions paper” (18 July 2019), p. 5. 287 Alpine Energy “Submission on EDB DPP reset draft decisions paper” (18 July 2019), p. 3.
190
3605676.11
Alternatives considered
A151 We have considered the following alternative:
A151.1 Setting a productivity factor based on historic performance.288
Analysis
A152 We clarify that the 0% productivity factor we have set reflects our view that we
expect distributors to improve their productivity during DPP3 relative to historic
performance. We consider improvements in productivity are achievable due to:
A152.1 evidence of positive productivity in electricity distribution sectors across the
world, including productivity studies which take non-scale variables such as
quality of outputs into account;289
A152.2 evidence of positive productivity in comparable sectors within New Zealand;
and;
A152.3 a changing policy environment with a greater focus on innovation and
technology.
A153 We consider it is appropriate to compare New Zealand’s electricity distribution
sector to other electricity distribution sectors across the world such as the UK,
Norway and Canada. These sectors have similar regulatory regimes to New Zealand
and so they face similar incentives. They also have similar value chains and thus have
similar inputs and outputs to distributors in New Zealand. It is important to note that
this evidence only informs our decision as we acknowledge that international
electricity distribution sectors are not perfect comparators. Further, much of the
international productivity evidence available is based on total factor productivity
(TFP) which does not distinguish between capex and opex.
A154 A recent long-term study by the Energy Policy Research Group at the University of
Cambridge prepared for Ofgem in 2018 finds evidence of positive TFP growth of 1%
p.a. from 1990/91 to 2016/17. Their analysis accounts for ‘non-measurable’ outputs
including customer minutes lost, interruptions, energy losses and customer
satisfaction. Their results align with other studies that find a positive TFP growth rate
between 1 and 2% in the UK (Giannakis et al, 2005; Hattori et al., 2004) and with
studies from other countries (Edvarsen et al., 2006; Senyonga and Berlgland, 2018;
Ramos-Real et al., 2009).290
288 See paragraph 3.16.2 in Chapter 3 above. 289 For example, customer minutes lost, interruptions, energy losses and customer satisfaction. 290 A report prepared by the Energy Policy Research Group at the University of Cambridge for OFGEM
“Productivity growth in electricity and gas networks since 1990” (December 2018), p. 64.
191
3605676.11
A155 We also considered productivity from comparable sectors within New Zealand.
These are largely competitive sectors which means firms not at the frontier would in
theory be driven out of the market.
A156 Figure A6 shows that the Electricity, gas water and waste services sector lags
significantly behind a selection of similar competitive sectors in terms of TFP. It is
important to note that we are using TFP as an indicator of partial productivity.
A157 We considered the manufacturing, construction and services sectors to be
comparable to distributors because these sectors have similar inputs, operate and
maintain a network or involve large scale equipment. These sectors align with
several independent economic consultancies’ views of comparable sectors to the
water sector which is also a network utility.291 Therefore, there are likely to be
opportunities for distributors to adopt practices from these sectors to improve their
productivity during DPP3.
A158 We have concluded that the value in relying on historic performance is outweighed
by other considerations with respect to the productivity factor. By basing the
productivity factor on the past behaviour of regulated suppliers, we risk creating
perverse incentives which may undermine efficiency incentives in a way that is
inconsistent with section 52A(1)(2) by compensating distributors for past efficiency
losses, or effectively penalising distributors for efficiency gains, in subsequent
periods.
A159 Lastly, the policy environment is different in DPP3 relative to DPP2 in light of the
Electricity Price Review.292 In addition DPP3 has a greater emphasis on innovation
and technology as our innovation allowance aims to incentivise distributors to take
up innovative activities.
291 Europe Economics “Real Price Effects and Frontier Shift – Updated Assessment” (July 2019), p. 66-68. 292 Electricity Price Review “Final Report” (May 2019).
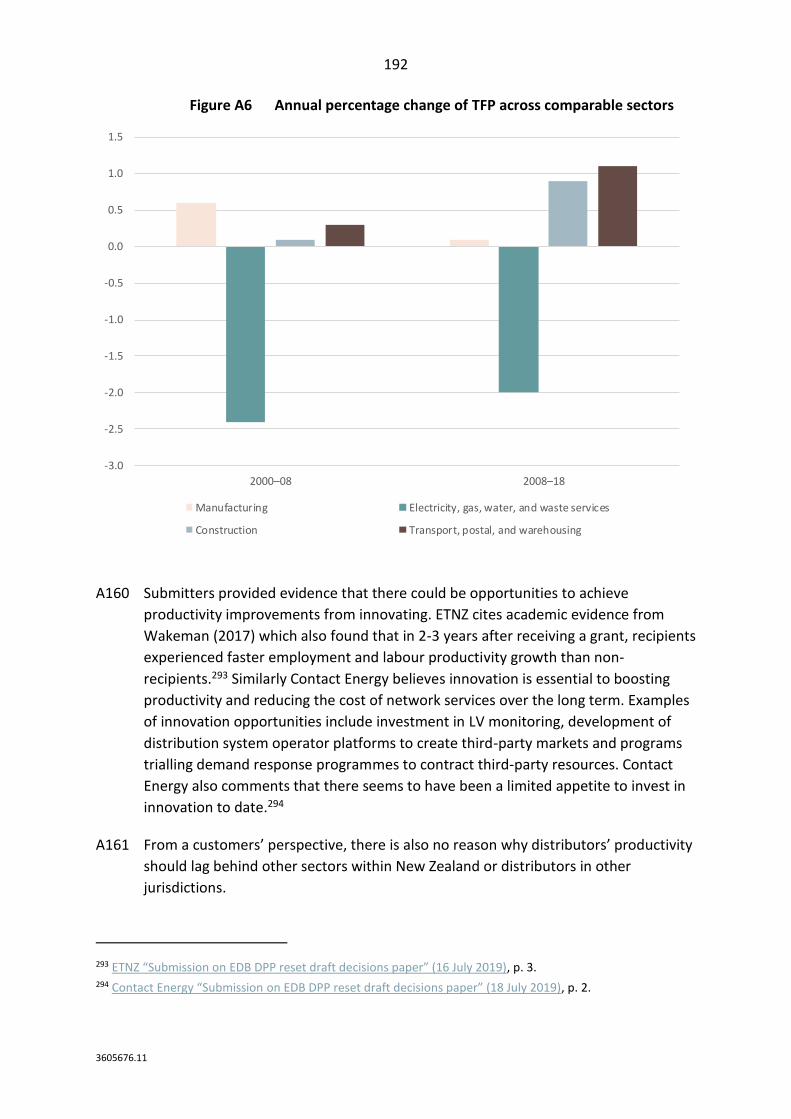
192
3605676.11
Figure A6 Annual percentage change of TFP across comparable sectors
A160 Submitters provided evidence that there could be opportunities to achieve
productivity improvements from innovating. ETNZ cites academic evidence from
Wakeman (2017) which also found that in 2-3 years after receiving a grant, recipients
experienced faster employment and labour productivity growth than non-
recipients.293 Similarly Contact Energy believes innovation is essential to boosting
productivity and reducing the cost of network services over the long term. Examples
of innovation opportunities include investment in LV monitoring, development of
distribution system operator platforms to create third-party markets and programs
trialling demand response programmes to contract third-party resources. Contact
Energy also comments that there seems to have been a limited appetite to invest in
innovation to date.294
A161 From a customers’ perspective, there is also no reason why distributors’ productivity
should lag behind other sectors within New Zealand or distributors in other
jurisdictions.
293 ETNZ “Submission on EDB DPP reset draft decisions paper” (16 July 2019), p. 3. 294 Contact Energy “Submission on EDB DPP reset draft decisions paper” (18 July 2019), p. 2.
-3.0
-2.5
-2.0
-1.5
-1.0
-0.5
0.0
0.5
1.0
1.5
2000–08 2008–18
Manufacturing Electricity, gas, water, and waste services
Construction Transport, postal, and warehousing
193
3605676.11
Stakeholder views
A162 All distributors who responded to the draft decision opposed the productivity factor
being set at 0% and thought we should allow for non-scale factors that they consider
will drive higher opex in DPP3.295
A163 Many of these distributors recommended a negative productivity allowance based
on historic evidence from NERA which showed a negative long-term trend of
productivity. Several distributors supported NERA’s suggestion of reframing the
productivity factor as the ‘residual opex factor.’296 This suggests a negative
productivity factor does not necessarily mean negative productivity growth. Instead
it is caused by the growth of unmeasured outputs such as resilience or quality,
offsetting any productivity gains. For the reasons set out above, we do not consider
it is appropriate to use historic performance to set the partial productivity factor.
A164 Only ERANZ thought 0% was too generous and provided little incentive for
distributors to boost their productivity. ERANZ attributed distributors’ decline in
productivity from 2004-2014 due to growth in capital investment and provided
evidence that one ‘un-measurable output’ has declined on average. They showed
that SAIDI and SAIFI figures from 2013 and 2018 have deteriorated.297
A165 ENA’s cross-submission asks for clarity over what the partial productivity factor
allowance is for.298 We address this in our analysis.
295 Alpine Energy “Submission on EDB DPP reset draft decisions paper” (18 July 2019), p. 4; Aurora “Submission on EDB DPP reset draft decisions paper” (18 July 2019), p. 8; Centralines “Submission on EDB DPP reset draft decisions paper” (18 July 2019), p. 9; ENA “Submission on EDB DPP reset draft decisions paper” (18 July 2019), p. 4; Orion “Submission on EDB DPP reset draft decisions paper” (17 July 2019), p. 4; PowerNet “Submission on EDB DPP reset draft decisions paper” (18 July 2019), p. 3; Eastland Network “Submission on EDB DPP reset draft decisions paper” (18 July 2019), p. 1; Unison “Submission on EDB DPP reset draft decisions paper” (18 July 2019), p. 14; Vector “Submission on EDB DPP reset draft decisions paper” (18 July 2019), p. 35; Wellington Electricity “Submission on EDB DPP reset draft decisions paper” (18 July 2019), p. 2.
296 NERA Economic consulting on behalf of ENA “Submission on EDB DPP reset draft decisions paper” (18 July 2019).
297 ERANZ “Submission on EDB DPP reset draft decisions paper” (18 July 2019), pp. 3-6. 298 ENA “Cross submission on EDB DPP reset draft decisions paper” (12 August 2019), p. 4.

194
3605676.11
A166 Going forward, Aurora noted that an approach that is objective and stable is
needed.299 MEUG suggested comparing performance relative to international best
practice300 and ERANZ thought we should move away from using historical studies in
the same jurisdiction as this can create perverse incentives.301 Wellington Electricity
warned that overseas jurisdictions may not reflect New Zealand distributors’
operating environment.302
299 Aurora “Submission on EDB DPP reset draft decisions paper” (18 July 2019), p. 8. 300 MEUG “Submission on EDB DPP reset draft decisions paper” (18 July 2019), p. 5. 301 ERANZ “Submission on EDB DPP reset draft decisions paper” (18 July 2019), p. 6. 302 Wellington Electricity “Cross-submission on EDB DPP reset draft decisions paper” (12 August 2019), p. 6.
195
3605676.11
Attachment B Forecasting capital expenditure
Purpose of this attachment
B1 This attachment outlines and explains our approach to forecasting capital
expenditure (capex) for the DPP3 period.303
B2 Under the EDB IMs we must set a “forecast aggregate value of commissioned assets”
for each distributor so that we can set starting prices and apply the capex IRIS
incentive during the DPP3 period.304 This forecast is material in determining the
revenues distributors may earn; affecting their profitability, incentives to invest, and
ability to deliver services.
B3 The EDB IMs provide that the forecast aggregate value of commissioned assets is
equal to forecast capex for the relevant year as determined by us.
B4 The approach we have taken to forecasting capex reflects that the DPP is intended to
be a relatively low-cost form of regulation catering for a wide group of businesses
using a generic approach.305 A DPP is not intended to deal with circumstances that
require significant scrutiny of costs of an individual business. However, there are two
mechanisms within the existing Part 4 regulatory framework to appropriately cater
for the challenges distributors face in delivering to customer expectations.
B5 The first of these are reopeners. We have introduced a reopener that covers
expenditure under three capex expenditure categories. This increases the flexibility
available to distributors and reduces the potential for unintended consequences
from a high-level approach.
B6 The second mechanism is CPP, which distributors can apply for if they consider an
alternative price-quality path would better meet their particular circumstances. A
CPP can be tailored to meet the specific needs of distributor and their consumers,
and also provides the flexibility to generally deal with uncertainties that distributors
may encounter.
303 Under the ID definitions, capital expenditure comprises ‘expenditure on assets’ plus ‘cost of financing’ less ‘value of capital contributions’ plus ‘value of vested assets’. We outline our proposed treatment of all of these components within this attachment.
304 Commerce Commission Electricity Distribution Services Input Methodologies Determination 2012 [2012] NZCC 26 (Consolidated as at 31 January 2019), clause 4.2.5 defines “forecast aggregate value of commissioned assets”.
305 See the framework discussion under paragraphs 3.13 - 3.28.
196
3605676.11
B7 Increases in capex beyond what we have allowed for under a DPP have, and will
likely continue to be, a primary driver of CPP applications from regulated suppliers.
As such, the forecasts we set have wider implications for the workings of the price-
quality regime.
B8 Our approach to forecasting capex for the DPP3 period draws on the approaches we
have used in the past. This attachment will summarise the basic elements of those
past approaches. It will then explain our approach, with reference to the discussion
in the Reasons Paper supporting our draft decision, the Companion Paper to the
Updated Models, and the feedback we received from submitters on both papers.
B9 We outline our approach first at a high level, illustrating how the different
components of it are intended to work together, and outlining the key changes we
have made since the draft decision. We then step through and discuss the details of
our approach. This discussion is broken out into the following into three sections.
B9.1 The key design elements of our approach, which determine the extent to
which we rely on distributors’ own AMP forecasts of their capital
expenditure in undertaking our capex forecasting.
B9.2 The tests that we have used to scrutinise distributors’ AMP forecasts, and
the caps on expenditure that we have applied.
B9.3 Other implementation issues.
B10 The capex allowances for each distributor that result from our approach are set out
in Table B1.
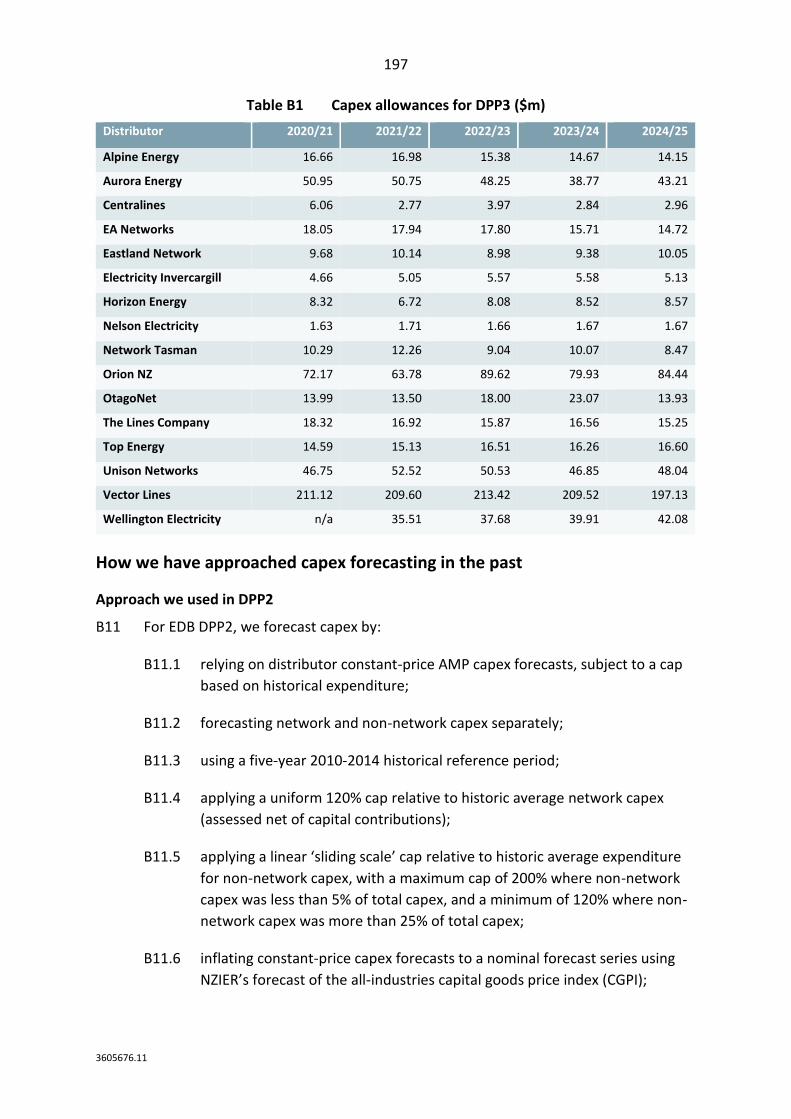
197
3605676.11
Table B1 Capex allowances for DPP3 ($m)
Distributor 2020/21 2021/22 2022/23 2023/24 2024/25
Alpine Energy 16.66 16.98 15.38 14.67 14.15
Aurora Energy 50.95 50.75 48.25 38.77 43.21
Centralines 6.06 2.77 3.97 2.84 2.96
EA Networks 18.05 17.94 17.80 15.71 14.72
Eastland Network 9.68 10.14 8.98 9.38 10.05
Electricity Invercargill 4.66 5.05 5.57 5.58 5.13
Horizon Energy 8.32 6.72 8.08 8.52 8.57
Nelson Electricity 1.63 1.71 1.66 1.67 1.67
Network Tasman 10.29 12.26 9.04 10.07 8.47
Orion NZ 72.17 63.78 89.62 79.93 84.44
OtagoNet 13.99 13.50 18.00 23.07 13.93
The Lines Company 18.32 16.92 15.87 16.56 15.25
Top Energy 14.59 15.13 16.51 16.26 16.60
Unison Networks 46.75 52.52 50.53 46.85 48.04
Vector Lines 211.12 209.60 213.42 209.52 197.13
Wellington Electricity n/a 35.51 37.68 39.91 42.08
How we have approached capex forecasting in the past
Approach we used in DPP2
B11 For EDB DPP2, we forecast capex by:
B11.1 relying on distributor constant-price AMP capex forecasts, subject to a cap
based on historical expenditure;
B11.2 forecasting network and non-network capex separately;
B11.3 using a five-year 2010-2014 historical reference period;
B11.4 applying a uniform 120% cap relative to historic average network capex
(assessed net of capital contributions);
B11.5 applying a linear ‘sliding scale’ cap relative to historic average expenditure
for non-network capex, with a maximum cap of 200% where non-network
capex was less than 5% of total capex, and a minimum of 120% where non-
network capex was more than 25% of total capex;
B11.6 inflating constant-price capex forecasts to a nominal forecast series using
NZIER’s forecast of the all-industries capital goods price index (CGPI);
198
3605676.11
B11.7 including an explicit allowance for forecast cost of financing and forecast
value of vested assets; and
B11.8 assuming forecast aggregate value of commissioned assets is the same as
forecast capex as required in the IMs.306
Approach we used for the gas pipeline DPP in 2017
B12 The majority of gas pipeline businesses (GPB) (distribution and transmission
businesses) are also subject to a DPP which requires us to produce capex forecasts.
In forecasting capex for the 2017 GPB DPP reset, we took an approach which applied
scrutiny to AMP forecasts. This approach is detailed in our GPB final reasons paper
and included:307
B12.1 comparing category level AMP forecasts to a historical baseline;
B12.2 a series of quantitative and qualitative assessments of material contained in
the AMP;
B12.3 an opportunity for GPBs to provide further information where the AMP did
not justify the forecast expenditure; and
B12.4 the use of a ‘fall-back’ to historical levels of expenditure where the forecast
expenditure could not be justified.
High-level overview of our approach for DPP3
B13 We have taken an approach to capex forecasting for DPP3 that draws on the
approach we used in DPP2 and our experience with the GPB DPP in 2017.
B14 Our approach to capex forecasting utilises distributors’ own AMP forecasts.
However, it scrutinises those AMP forecasts, and calculates an allowance drawing on
historical spending and an assessment of cost drivers where the AMP forecasts
appear out of step with those cost drivers.
306 Commerce Commission Electricity Distribution Services Input Methodologies Determination 2012 [2012] NZCC 26 (Consolidated as at 31 January 2019), clause 4.2.5.
307 Commerce Commission, “Default price-quality paths for gas pipeline businesses from 1 October 2017, Final Reasons Paper” (31 May 2017).
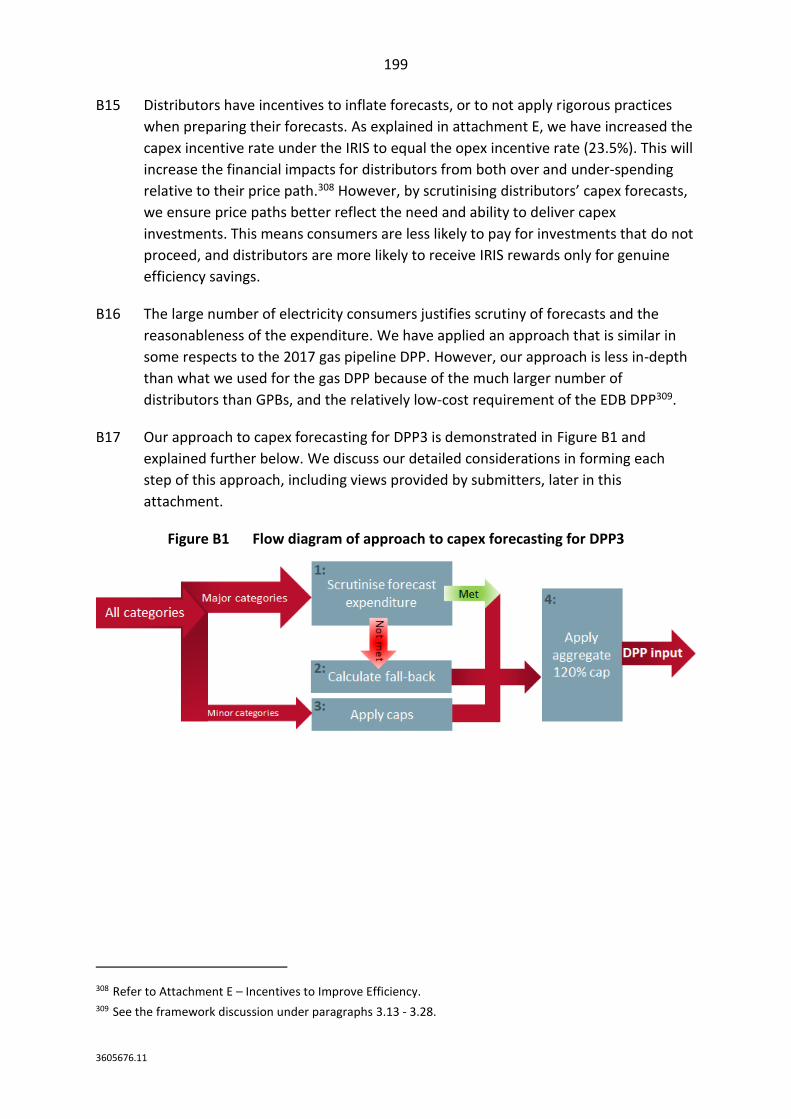
199
3605676.11
B15 Distributors have incentives to inflate forecasts, or to not apply rigorous practices
when preparing their forecasts. As explained in attachment E, we have increased the
capex incentive rate under the IRIS to equal the opex incentive rate (23.5%). This will
increase the financial impacts for distributors from both over and under-spending
relative to their price path.308 However, by scrutinising distributors’ capex forecasts,
we ensure price paths better reflect the need and ability to deliver capex
investments. This means consumers are less likely to pay for investments that do not
proceed, and distributors are more likely to receive IRIS rewards only for genuine
efficiency savings.
B16 The large number of electricity consumers justifies scrutiny of forecasts and the
reasonableness of the expenditure. We have applied an approach that is similar in
some respects to the 2017 gas pipeline DPP. However, our approach is less in-depth
than what we used for the gas DPP because of the much larger number of
distributors than GPBs, and the relatively low-cost requirement of the EDB DPP309.
B17 Our approach to capex forecasting for DPP3 is demonstrated in Figure B1 and
explained further below. We discuss our detailed considerations in forming each
step of this approach, including views provided by submitters, later in this
attachment.
Figure B1 Flow diagram of approach to capex forecasting for DPP3
308 Refer to Attachment E – Incentives to Improve Efficiency. 309 See the framework discussion under paragraphs 3.13 - 3.28.
200
3605676.11
B18 As shown in Figure B1, our approach consists of the following four main
components:
B18.1 Step 1 – scrutinise forecast expenditure: Our approach scrutinises
categories of capex within the current AMP forecasts, utilising the
expenditure categories within ID. We have applied scrutiny to expenditure
used for meeting growth—comprising ‘consumer connection’ and ‘system
growth’ capex—and expenditure used to renew or improve existing
capabilities—comprising ‘asset replacement and renewals’ (ARR) and
‘reliability, safety and environment’ (RS&E) capex. We have identified cost
drivers for these bundled categories, and have assessed whether the
expenditure for each category appears consistent with those cost drivers—
within a tolerance commensurate with the high-level nature of the analysis.
B18.2 Step 2 – calculate fall-back expenditure where necessary: Where we
concluded that the forecasts for the capex categories we have scrutinised
do not reflect their cost drivers, we calculated an expenditure allowance for
that category that is more consistent with those cost drivers.
B18.3 Step 3 - cap ‘other’ expenditure: We have capped the remaining, minor
categories of expenditure—being asset relocations and non-network
expenditure. We have used the higher of a dollar cap and a percent-based
cap on growth over historic average expenditure. The percent-based cap
uses the same ‘sliding scale’ that was used for expenditure on non-network
assets in DPP2.
B18.4 Step 4 – apply an aggregate cap: As a final step, we have capped our
aggregate capex forecasts for each distributor at 120% of its historical
average expenditure. This is like DPP2 where we capped expenditure for
network assets at 120% of historical average levels. This overall cap is
intended to reflect the point at which we consider the cost impact on
consumers justifies further scrutiny of expenditure.
B19 Our final decision does not include the forecast accuracy test that was proposed as
part of our draft decision. We explain our decision to exclude that test in paragraphs
B147 – B160.
B20 A key issue that we considered in forming our approach to forecasting capex was
how to deal with instances where our analysis suggested distributors may be under-
forecasting their capex requirements. We identified several instances of this, but
recognised that:
B20.1 distributors do not have an incentive to under-forecast their expenditure;
and
201
3605676.11
B20.2 providing distributors with a calculated amount based on cost drivers could
result in us allowing them to recover revenue they may have no intention of
spending.
B21 Therefore, our approach only focusses on distributors’ incentive to over-forecast by
scaling back expenditure that appears to be too high.
We have modified the approach put forward in our draft decision
We have maintained the significant features of the approach in our draft decision
B22 Our approach to capex forecasting is broadly consistent with the approach proposed
in our draft decision and explained in the accompanying Reasons Paper. However,
having considered submitter feedback, we have made some changes from the draft.
B23 Parties that submitted on the draft decision supported our approach at a conceptual
level. Submitters particularly supported an approach that relied on the AMP
forecasts. For example, Centralines stated:
At a general level, Centralines is supportive of the Commission’s approach, including its use
of forward-looking Asset Management Plans.310
B24 Submitters generally accepted our approach of scrutinising AMP forecasts, though
they considered our approach to scrutinising them needed refinement. For example,
Unison stated:
Unison supports the general approach, but recognises that the approach may require
refinement over time as improved tests are developed to assess the reasonableness of
expenditure projections.311
B25 Our approach to capex forecasting maintains the significant features from the draft
decision. Specifically, we have disaggregated forecasts below the network and non-
network level, applied scrutiny to the AMP forecasts, and capped the amount of
uplift we’ll allow relative to historic expenditure.
310 Alpine Energy “Submission on EDB DPP reset draft decisions paper” (18 July 2019), p. 5-6; Also see: ENA “Submission on EDB DPP reset draft decisions paper” (18 July 2019), p. 6.
311 Unison “Submission on EDB DPP reset draft decisions paper” (18 July 2019), p. 17. Also see: ENA “Submission on EDB DPP reset draft decisions paper” (18 July 2019), p. 18; PowerNet “Submission on EDB DPP reset draft decisions paper” (18 July 2019), p. 4; Network Tasman “Submission on EDB DPP reset draft decisions paper” (18 July 2019), p. 5.
202
3605676.11
We have adopted the proposal included in the Companion Paper to the Updated Models
B26 In our draft decision we proposed using a series of tests to scrutinise forecasts. We
proposed a test for scrutinising system growth expenditure that utilised the
supporting information in Schedule 12(b) of AMPs. That test sought to identify
whether each distributor’s forecast expenditure for zone substations for system
growth implied cost increases for additional zone substation capacity of more than
20%.
B27 After considering feedback we received on that proposal, we subsequently proposed
a different approach and sought feedback on that revised proposal in the
Companion Paper to the Updated Models. Under the revised proposal, we would
scrutinise system growth expenditure together with consumer connections
expenditure.
B28 Most submitters on our Companion Paper to the Updated Models were broadly
comfortable with us extending this test to system growth expenditure. For example,
comments included:
Overall we support the paper’s adjusted approach to assessing system growth capex by
treating system growth expenditure together with consumer connections expenditure. –
Orion
We support the proposed changes to the scrutiny test for system growth expenditure…
There is a stronger relationship between system growth expenditure and population growth,
coupled with historic ICP growth, when compared with the relationship to zone substation
capacity, which makes the proposed test more suitable. - Aurora312
B29 However, submitters suggested some changes to the tests and/or that we should
undertake qualitative scrutiny of AMPs where forecast expenditure exceeds the
limits of the tests. For example, ENA stated:
Therefore, we submit that a two-step gating test should be applied to system growth
expenditure, as follows:
Apply the system growth test against connections growth as proposed and accept the system
growth forecasts for those EDBs which pass this test […]
For those EDBs which fail the test, examine their AMPs, and assess whether the forecast
system growth expenditure is adequately justified, based on the information presented in
the AMP, and discussions with EDBs where necessary. - ENA313
312 Orion “Submission on EDB DPP3 Updated Draft Models Paper Sep19Final” (09 October 2019), p. 2; Aurora “2019 Aurora submission on Updated DPP3 draft - FINAL” (09 October 2019), p. 7.
313 ENA “Submission on Updated draft DPP3 decision - 9 Oct final” (09 October 2019), p. 5.
203
3605676.11
B30 For our final decision, we have adopted the proposal that was put forward in the
Companion Paper to the Updated Models with some changes. We discuss those
changes in more detail and respond to comments in submissions later in this paper.
Key changes to the approach since the draft decision
B31 The key changes we have made from our draft decision are:
B31.1 We have removed the initial analysis scrutinising distributors’ past accuracy
in forecasting their expenditure.
B31.2 We have adopted the proposal made in the Companion Paper to the
Updated Models to scrutinise system growth capex by bundling it in with
consumer connection capex.
B31.3 We have made changes to the design of the analytical tools we have used in
scrutinising forecasts, including:
B31.3.1 using household growth instead of population growth when
scrutinising distributors’ forecasts of new connections;
B31.3.2 including consistent thresholds of 120% above historic
expenditure in all cases, except for consumer connection and
system growth costs, which retains the threshold of 150% that
was used in the draft decision;
B31.3.3 small technical changes that do not impact allowances.
B31.4 Where our scrutiny suggests a distributor’s AMP forecast appears out of
step with cost drivers, we have calculated an allowance based on those cost
drivers, rather than relying purely on historic expenditure to determine an
allowance.
B31.5 In addition to the percent-based caps that we applied to asset relocations
and non-network expenditure, we have included a fixed dollar cap. This
reflects that a per cent-based cap does not accommodate reasonable
variations in expenditure where a distributor’s historic expenditure under
these categories has been low.
B32 We discuss submitters’ comments on the specific aspects of our capex forecasting
approach in the subsequent sections of this attachment.
The key design elements of our approach
B33 We have used distributor’s 2019 AMPs as the starting point for our capex forecasts.
204
3605676.11
B34 Our draft decisions reasons paper stated our view that, given the relatively low-cost
nature of the DPP regime and distributors’ better knowledge of their own networks,
their AMPs provide a better overall basis for capex forecasts than what we could
derive ourselves. However, it also stated that allowing distributors to set their own
capex forecasts creates a risk of inflated forecasts, investments that might not be
delivered, and excessive prices for consumers.
B35 All submitters that commented on our draft approach to forecasting capex
supported using distributor AMP forecasts. Submissions did not provide any
information that would cause us to change our draft decision.
We have disaggregated forecasts into expenditure categories
B36 We can more accurately forecast capex and better scrutinise supplier AMPs by
examining forecasts for disaggregated expenditure categories. Some categories of
expenditure have relatively predictable drivers, and there are reliable external cross-
checks available in some cases. However, disaggregating expenditure comes with
more complex decisions around how to cap or limit expenditure in setting the capex
forecasts.
B37 For our final decision, we have disaggregated forecasts into the following four
categories;
B37.1 Growth – comprising consumer connection and system growth expenditure.
B37.2 Renewal and improvement – comprising asset replacement and renewal
(ARR) and RS&E expenditure.
B37.3 Asset relocation expenditure.
B37.4 Non-network expenditure.
B38 This differs from our draft decision, in which we proposed disaggregating forecasts
into the following expenditure categories:
B38.1 Consumer connection.
B38.2 System growth.
B38.3 ARR.
B38.4 RS&E.
B38.5 Other expenditure, comprising of asset relocations and non-network
expenditure.
205
3605676.11
B39 For our draft decision, we sought to be selective in our level of disaggregation and
focus our attention on the categories of capex (consumer connection, system growth
and ARR), which have the most discernible cost drivers. Doing this limits the costs
and risks involved with complex analysis. However, we also separated out RS&E
because it is closely related to ARR in some instances—within the ID definitions,
there is substantial scope for variation, and in many cases, expenditure may be
undertaken for more than one purpose.
B40 Only two submitters commented on this aspect of our proposal, with both
supporting the approach. Specifically, their comments were:
WELL also supports the level of disaggregation applied. As outlined in the submission to the
issues paper, WELL supports limiting disaggregation to the larger capital expenditure classes,
(asset replacement, system growth and consumer connections) as this will help maintain a
low cost approach. – Wellington Electricity314
We do not oppose the proposed disaggregation of capital expenditure (capex) forecasts into
five expenditure categories. We agree that this is an appropriate evolution of the light-
handed scrutiny applied in DPP2. – Aurora Energy315
B41 However, we have changed the disaggregation given other changes to our approach
to capex forecasting, as follows:
B41.1 We have adopted our proposal in the companion paper to the updated
models to assess consumer connection and system growth expenditure
together. This reflects that these categories are closely related and share an
underlying cost driver. Therefore, we have bundled them together into a
single category reflecting network growth.
B41.2 For consistency with that bundled approach, we have also bundled together
ARR and RS&E expenditure into a single category reflecting network
renewal and improvement.
B41.3 We have separated out asset relocations and non-network expenditure.
Because asset relocations have been incorporated within a reopener
provision (see attachment G), keeping the items separate gives a clearer
delineation between what has and has not been captured within our capex
allowances. Again, this is largely a technical change, and there is no effect
on the quantum of our capex forecasts.
314 Wellington Electricity “Submission on EDB DPP reset draft decisions paper” (18 July 2019), p. 13. 315 Aurora “Submission on EDB DPP reset draft decisions paper” (18 July 2019), p. 8.
206
3605676.11
B42 There were no submitters that suggested we scrutinise forecasts beyond the
category level using the detailed sub-category forecasts. We stated in the Reasons
Paper supporting our draft decision that in scrutinising AMP forecasts, it may in
some instances be appropriate to draw on ID information at that more detailed
level. There is one instance where we did this for our final decision. In scrutinising
consumer connection capex, we excluded capex associated with major consumers
where we could identify them.
We have scrutinised the AMP forecasts and calculated default fall-back allowances
B43 Using supplier AMPs without challenge creates the risk of over-forecasting and/or
under-delivering. Distributors have incentives to inflate forecasts, or to not apply
rigorous practices when preparing their forecasts. We therefore must consider the
risk that their forecasts may not be entirely reliable. Using a consistent approach
from DPP to DPP increases this risk – as distributors could target their forecasts at
the level of any uplift we allow, without going over.
B44 We therefore do not consider it appropriate to use distributor AMPs without some
form of limit or scrutiny. Furthermore, the AMPs are important documents for our
work, and for stakeholders. Scrutinising these documents signals to distributors the
importance of developing AMPs of high quality.
B45 In the draft decision, we outlined the scrutiny framework we proposed to apply to
scrutinise expenditure increases that distributors have forecast for key expenditure
categories. Where a distributor’s forecast did not come within the limits we applied,
we proposed to base our forecast on their historical average expenditure, but noted
the potential to alternatively derive an amount based on an external assessment of
cost drivers (where available).
B46 The scrutiny we proposed was high-level, and we acknowledged that it was
imperfect. We suggested this was appropriate to an extent, given the relatively low-
cost nature of the DPP, though it also comes with a heightened risk of unintended
consequences compared to a more in-depth approach.
B47 Our approach to scrutinising AMP forecasts was a key aspect of our proposal that
attracted comments from submitters, and we have made changes to our approach
having considered the issues that were raised.
B48 Several submitters suggested our approach may be too high-level. For example,
comments included:

207
3605676.11
We are concerned, however, that the blunt nature of proposed scrutiny will violate the
purpose of DPP/CPP regulation by encouraging more distributors to apply for CPPs. -
Aurora316
The draft DPP3 decision rejects a large portion of that proposed expenditure by applying a
range of somewhat arbitrary caps without further investigating whether that expenditure is
prudent and efficient or otherwise satisfies the Section 52A purpose. That is a flawed
approach as it does not consider whether consumers would benefit from it. - Vector317
B49 There were concerns that the outcome of our approach would have negative
consequences for consumers. For example, comments included:
When assessing forecast risk across the key elements making up the cost building blocks
calculations, Centralines’ assessment is that downside risk (potential for negative impact on
returns) is much greater than upside risk. - Centralines318
There is a concern that too much capex has been capped out for some EDBs, with
detrimental long-term impacts on consumers. - ENA319
If Network Tasman’s current capex forecast is accurate (and we spend what we have forecast
for DPP3) and the Commission retains its existing capex allowance for Network Tasman,
Network Tasman would incur an average annual capex IRIS penalty of $3.2m in years 2-5 of
DPP4. This is more than 10% of Network Tasman’s revenue cap in period 5 of DPP3. –
Network Tasman320
We consider that any reduction in forecast capital expenditure would compromise the
reliability improvements that we can achieve over the coming years, which would limit our
ability to comply with the Commission’s quality standards.- The Lines Company321
If these tests are retained without the flexibility that we propose above, then there is a real
risk that capex that is essential for our network is not funded by the regulatory regime –
leading to difficult trade-offs being made that are unlikely to be in the long- term interests of
our consumers. - Vector322
316 Aurora “Submission on EDB DPP reset draft decisions paper” (18 July 2019), p. 9. 317 Vector “Submission on EDB DPP reset draft decisions paper” (18 July 2019), p. 21. 318 Centralines “Submission on EDB DPP reset draft decisions paper” (18 July 2019), p. 3. 319 ENA “Submission on EDB DPP reset draft decisions paper” (18 July 2019), p. 6. 320 Network Tasman “Submission on EDB DPP reset draft decisions paper” (18 July 2019), p. 4. 321 The Lines Company “Submission on EDB DPP reset draft decisions paper” (18 July 2019), p. 3. 322 Vector “Submission on EDB DPP reset draft decisions paper” (18 July 2019), p. 29.
208
3605676.11
B50 Submitters also suggested the caps we applied on expenditure were arbitrary and
unfair for small distributors. Comments included:
We disagree with the proposal to limit each category’s expenditure to the historical average
when a distributor’s AMP forecast is considered to fail scrutiny. While we agree some
limitation should apply to failed scrutiny, we consider that capping the expenditure
allowance at historical average:
can lead to expenditure being capped well below levels that cost drivers would suggest is
reasonable;
can lead to a substantial reduction in the capex allowance for the category relative to
forecast, even if the distributor only fails scrutiny by a small margin; and
is a harsh penalty where scrutiny is imprecise in nature. - Aurora323
The proposed cap on capex appears to be based on subjective judgement, rather than
evidence and we consider it warrants further attention. - Entrust324
The capital expenditure (capex) allowance for all EDBs, for instance, is capped at 120% of the
historical average and further limited by various gates. Such tests may help reduce
Commission effort in setting such allowances. However, given that their values are largely
arbitrary they should not act as caps. - Vector325
B51 Submitters encouraged us to qualitatively analyse AMPs and other information that
might validate the AMP forecasts. For example, comments included:
Where the Commission has less than 100% confidence in an EDBs AMP forecasts the EDB be
permitted to submit its capex forecasts to the Commission based on the principles in the
customised price-quality path (CPP) IM. – Alpine326
The ENA supports basing forecast allowances to some degree on AMP forecasts and
providing the opportunity to EDBs to submit alternative methods and additional evidence to
supplement the high-level scrutiny tests applied to capex. - ENA327
If the current approach is retained, Network Tasman submits that the Commission should
apply an overarching risk based assessment of its capex forecasts that includes an explicit
assessment of not only the risk of distributor over-forecast error, but also of Commission
over/under-forecast error. – Network Tasman328
323 Aurora “Submission on EDB DPP reset draft decisions paper” (18 July 2019), p. 9. 324 Entrust “Submission on EDB DPP reset draft decisions paper” (18 July 2019), p. 2. 325 Vector “Submission on EDB DPP reset draft decisions paper” (18 July 2019), p. 6. 326 Alpine Energy “Submission on EDB DPP reset draft decisions paper” (18 July 2019), p. 6. 327 ENA “Submission on EDB DPP reset draft decisions paper” (18 July 2019), p. 18 328 Network Tasman “Submission on EDB DPP reset draft decisions paper” (18 July 2019), p. 5.
209
3605676.11
Rather, if failed, they should trigger further investigation or at least allow an EDB to justify
their expenditure as part of a second pass assessment. Otherwise the somewhat arbitrary
gates and caps can lead to arbitrary allowances – which is not good regulatory practice and
can undermine consumer interests. - Vector329
B52 Submitters also supported alternatives to capping forecasts at historic levels.
Specifically:
If the proposed test is retained, then we consider that any distributor that fails the test
should have expenditure capped at 125% of forecast depreciation. We note that the
Commission suggests this alternative in its Reasons Paper. - Aurora330
Falling back to the historical average if a capex test is failed does not work for asset classes
where work programmes are erratic or lumpy. The historic average is less likely to provide a
sensible substitute for the AMP forecast. Alternatively, an EDB may have to invest in critically
important asset replacements or respond to changes to meet quality standards, at a level of
investment that is higher than the historic average. Reverting back to the historic average
could result in necessary investments being foregone. As outlined in section 6.1, WELL
recommends reverting back to the AMP until the capex tests are further refined. –
Wellington Electricity331
WELL suggests that as the capex gates are refined and tested, a staged approach is taken to
how they are applied:
Apply the first, overall forecasting accuracy test, as proposed. This will provide consumers
with confidence that EDBs are delivering what they forecast.
Apply the proposed secondary gates and publish the results. However, don’t revert to the
historical average if an EDB fails.
A staged approach will allow the tests to be refined and for EDBs to adjust their internal
process and forecast methods to the new gates. – Wellington Electricity332
B53 For our final decision, we have maintained an approach that relies on high-level
analysis. However, we have made several changes to improve our approach, as
summarised in paragraph B31 and explained in detail in the remainder of this
attachment.
329 Vector “Submission on EDB DPP reset draft decisions paper” (18 July 2019), p. 6. 330 Aurora “Submission on EDB DPP reset draft decisions paper” (18 July 2019), p. 12. 331 Wellington Electricity “Submission on EDB DPP reset draft decisions paper” (18 July 2019), p. 16. 332 Wellington Electricity “Submission on EDB DPP reset draft decisions paper” (18 July 2019), p. 13.
210
3605676.11
B54 We acknowledge submitters’ concern about paring back their expenditure forecasts
based on high-level analysis, and their desire for us to qualitatively analyse AMPs or
other material supporting forecasts. However as noted in Chapter 3, we consider
that high-level scrutiny is appropriate for the DPP. The DPP is intended to be a
relatively low-cost form of regulation that is designed to cater for a wide group of
businesses using a generic approach. While there is potentially some scope within a
DPP for tailoring where it can be done without significantly increasing cost, a DPP is
not intended to deal with circumstances that require significant scrutiny of costs of a
particular business.333
B55 We have analysed AMPs in developing our approach so that we understand what is
driving outcomes and the results. Forecasts within AMPs should be internally
consistent—ie, forecast expenditure increases should be explained by comparable
forecast increases in cost drivers. Those documents are distributors’ opportunity to
explain and justify expenditure – not just to us, but to wider stakeholders. However,
given variation in the quality and content of AMPs, it is not low-cost for us to
undertake detailed scrutiny of the qualitative material in AMPs for the 15
distributors currently subject to a DPP.
B56 Further, we do not support providing distributors an opportunity to submit
additional supporting information to justify their forecasts. This is the purpose of the
AMPs. Furthermore, the issues paper signalled our intention to analyse the AMP
forecasts for internal consistency. We would therefore anticipate that distributors
will have prepared their 2019 AMPs with this in mind.
B57 Beyond testing AMPs for internal coherence, we have compared forecasts with
independent drivers of investment. This provides greater assurance that the forecast
expenditure is necessary.
B58 Given the difficulty in accounting for the variety in distributors’ individual networks
and circumstances through simple analysis, we have introduced a reopener that can
cover three categories of capex—consumer connection, system growth and asset
relocations. These categories can be particularly volatile and are often driven by
consumer requirements. The reopener increases the flexibility available to
distributors and reduces the potential for unintended consequences from our high-
level approach.
333 See the framework discussion under paragraphs 3.13 - 3.28.
211
3605676.11
B59 Submitters that responded to our Companion Paper to the Updated Models
suggested that we should undertake detailed scrutiny of AMPs for distributors that
do not come within the limits set by our high-level scrutiny approach.334 We consider
that the new reopener reduces the need for detailed scrutiny of AMPs and avoids us
undertaking detailed scrutiny where it is not actually required or proportionate.
B60 Distributors also have the option of applying for a CPP if they consider it would
better meet their particular circumstances than the DPP. A CPP can be tailored to
meet the specific needs of distributor and their consumers, and also provides the
flexibility to generally deal with uncertainties that distributors may encounter. For
example, the standard CPP provisions provide for a 'contingent project' mechanism,
which is intended to deal with projects with uncertain timing and cost.
B61 In this broader context, we consider our revised approach to scrutinising AMP
forecasts is appropriate.
We have capped expenditure for asset relocations and non-network expenditure
B62 The minor categories of expenditure (asset relocations and non-network capex) do
not have clear, quantitative drivers disclosed in AMPs, so scrutinising this
expenditure would require qualitative assessment of the information in the body of
the AMP. This would go beyond relatively low-cost scrutiny, and as these categories
only compose 6% and 8% of capex respectively, it is not merited under our
proportionate scrutiny approach.
B63 However, distributors could still inflate their forecasts of expenditure under these
categories.
B64 In our Draft Decisions Paper we proposed to apply a linear ‘sliding scale’ cap for the
more minor categories of capex, with a maximum cap of 200% where the
expenditure is less than 5% of total capex, and a minimum of 120% where it is more
than 25% of total capex.
B65 A ‘sliding scale’ cap has precedent in that it was used in DPP2 and is an approach
that was supported by submitters.
334 Orion “Submission on EDB DPP reset draft decisions paper” (17 July 2019), p. 2, ENA “Submission on EDB DPP reset draft decisions paper” (18 July 2019), p. 5.
212
3605676.11
B66 Submitters were broadly supportive of the sliding scale cap for minor categories of
expenditure. For example, comments included:
We support the proposed approach of using a sliding scale cap of 120-200% for other
categories of capex. We note that this approach is consistent with the approach taken in
DPP2.- Aurora335
WELL supports the Commission’s approach to applying a sliding cap to the minor assets
categories.- Wellington Electricity336
B67 However, submitters were also concerned that use of a percent cap limits
reasonable variation in expenditure by distributors that have historically spent small
amounts. For example, comments included:
In Centralines’ 2019 AMP we identify a required uplift in expenditure to build a new depot
and administration building. These expenditures will push Centralines capital expenditure
requirements above the 120% cap on total capex, and above the sliding scale cap on non-
network capex expenditure. Centralines submits that the Commission needs to consider an
alternative methodology that provides for smaller EDBs to reasonably undertake such
activities without requirement to apply for a CPP. - Centralines337
As noted in section 4.3 of our submission we are concerned regarding non-network capex
where one off expenditure is incurred, such as a one in 50 year property rebuild required due
to building code earthquake rating issues, where no material non-network expenditure has
been incurred in the past. For non-network capital expenditure we recommend the approval
of one off non-network capex without passing a gating test. A gating test simply cannot work
effectively when past expenditure has been immaterial especially when a one off safety led
investment in the region of 5% of RAB is encountered. Alternatively we recommend non-
network expenditure is able to be treated as the basis of a reopener. - PowerNet338
B68 Vector also submitted that a cap on expenditure does not allow for consideration of
the reasonableness of forecasts.339 We refer to our discussion in the previous section
in response to Vector’s comment.
B69 We agree with submitters that a percent-based cap is unduly restrictive on
distributors where their historic expenditure has been immaterial. Both asset
relocations and non-network expenditure are categories where expenditure can be
sporadic. We have therefore included a dollar cap for these categories of $1 million
per year, as a secondary cap on expenditure. We would allow each distributor their
AMP forecast amount for asset relocations and non-network expenditure up to the
higher of $1 million or their sliding scale percent cap.
335 Aurora “Submission on EDB DPP reset draft decisions paper” (18 July 2019), p. 13. 336 Wellington Electricity “Submission on EDB DPP reset draft decisions paper” (18 July 2019), p. 16. 337 Centralines “Submission on EDB DPP reset draft decisions paper” (18 July 2019), p. 13. 338 PowerNet “Submission on EDB DPP reset draft decisions paper” (18 July 2019), p.4. 339 Vector “Submission on EDB DPP reset draft decisions paper” (18 July 2019), p. 28.
213
3605676.11
B70 We acknowledge that this dollar cap is not a precise measure. We noted instances
where forecasts for asset relocations and non-network expenditure categories
appeared high relative to historic spending while being below the dollar cap.
However, scrutiny of expenditure under these categories is not merited under our
proportionate scrutiny approach.
B71 Given submitters’ support for a sliding scale cap, we have retained the scale
approach, even though a flat cap would be more straightforward and could be
justified given the inclusion of a secondary dollar-based cap.
B72 Under our final decision, non-network expenditure is capped for two distributors,
and asset relocations expenditure is capped for one distributor.
We have capped forecasts in aggregate at 120% of historical expenditure
B73 CPPs are the appropriate mechanism to address material business-specific step
changes in investment and manage large price shocks for consumers.
B74 For our draft decision we proposed capping distributors’ capex expenditure in
aggregate at 120% of their historical expenditure levels to ensure large price shocks
for consumers will only occur under the detailed scrutiny of the CPP process.
B75 The alternatives to applying a 120% cap to the aggregate forecast expenditure are
to:
B75.1 not apply a final cap;
B75.2 apply a higher or lower cap than 120%; or
B75.3 apply a different form of cap.
B76 The scrutiny framework we discuss from paragraph B95 would have the effect of
limiting expenditure increases where these do not appear consistent with supporting
information. Therefore, we anticipate the potential for a distributor to have a
forecast that appears relatively consistent with cost drivers based on high-level
analysis, while still projecting a large increase in expenditure. Our scrutiny is
necessarily high-level, and the tolerances we have applied in our analysis reflect the
volatility of capex, variability in distributor circumstances, and forecasting
challenges.
B77 We therefore consider it appropriate to include a final step in our approach that
identifies any large steps-up in forecast expenditure that would result in price shocks
for consumers that justify further scrutiny.
214
3605676.11
B78 We do not consider it appropriate to use the AMP forecasts without any overarching
limit, as it may reduce the incentives to achieve efficiencies in capex. A distributor
would be able earn an acceptable return without achieving efficiencies in the
amount of capex incurred in providing electricity lines services.
B79 Furthermore, we consider a 120% cap applying across the five-year period has the
advantage that it retains familiar aspects of the DPP2 approach, which submitters on
the issues paper were broadly comfortable with.340 This has been tried and tested
and is straightforward to apply.
B80 Some submitters agreed with the approach of including an overarching limit. For
example, Aurora stated:
In principle, and assuming an absence of other information that the Commission might have
to hand that it may rely on, we agree with the proposal to cap aggregate capex forecasts at
120% of historical expenditure. As a final scrutiny proxy, this remains consistent with the
approach taken in DPP2. - Aurora341
B81 Others considered it arbitrarily limited expenditure. For example:
Although less affected than other smaller EDBs we are cautious about the 120% cap on total
capex and the sliding scale cap on more minor expenditure categories. There are some
investments that are lumpy in profile and can create significant percentage movements. This
is likely to disproportionately impact on smaller EDBs, but may also affect EDBs at Unison’s
scale. - Unison342
WELL does not support the final adjustment of applying a 120% cap on the residual capex
after all of the tests are applied. As outlined in WELL’s submission to the Issues Paper,
smoothing or limiting capital expenditure can produce sub-optimal investment decisions.
Asset investment is timed with asset deterioration, customer connections with new
developments and system growth with energy demand requirements. Limiting how much
capital can be spent within a year or pricing period can result in assets being replaced too
early or late, delays to new connections or the network not augmented to meet increasing
capacity demands. – Wellington Electricity343
340 See For example: Wellington Electricity “Default price-quality paths for electricity distribution businesses from 1 April 2020 Issues Paper” (21 December 2018), p. 11; ENA “DPP3 April 2020 Commission Issues paper (Part One Regulating capex, opex & incentives)” (20 December 2018), p. 18; Orion “Submission on EDB DDP3 Reset “ (20 December 2018), p. 8.
341 Aurora “Submission on EDB DPP reset draft decisions paper” (18 July 2019), p. 8. 342 Unison “Submission on EDB DPP reset draft decisions paper” (18 July 2019), p. 17. 343 Wellington Electricity “Submission on EDB DPP reset draft decisions paper” (18 July 2019), p. 16.
215
3605676.11
The Commission has capped any increase from past expenditure at 20%. That ‘bright line’
test is somewhat arbitrary – and it does not appear to be supported by any particular
analysis of why it shouldn’t be higher or lower than 20%. Moreover, it is hard to see how
such a limit can possibly ensure consistency with the quality standard and / or deliver
outcomes that consumers value because it was set without regard to those outcomes. -
Vector344
B82 Further, as in the previous discussion, some submitters expressed that a percent-
based cap unduly limits expenditure by small distributors because their expenditure
is typically low. For example, comments included:
For the small to medium EDBs projects like substation refurbishment, which is standard
capex, could easily exceed the 120% cap if no similar sized projects were undertaken in the
prior regulatory period. A cap of 120% could result in EDBs needing to apply to the
Commission for a CPP for what is routine and expected expenditure… However, an increase
in Capex of more than 120% is not necessarily indicative of a step change in Capex; rather it
could simply be replacement of material assets on the network (e.g. sub-transmission assets)
during the EDBs life cycle management. A CPP should be the exception and not the rule,
particularly for foreseen asset replacement. - Alpine345
Accordingly, when confronted with lumpy capital expenditure requirements which are
invariant to EDB scale, small EDBs are disproportionately impacted and face the options of:
Applying for a CPP; or
Absorbing the excess in capex over the allowance; or
Taking more risk by cutting back other areas of expenditure.
Realistically, Centralines is not in a position to apply for a CPP (it does not have the resource
capability to put together an application and Unison, Centralines Management Service
provider, does not have the current capacity to provide this service), and very likely the costs
of a CPP would exceed the reduced return under option 2. Option 3 would not be in the long-
term interests of consumers, and is impractical, as Centralines could not temporarily lay-off
workers while the one-off expenditures are being undertaken. - Centralines346
B83 We acknowledge submitters’ concerns that a 120% cap cuts off expenditure they
consider they may need.
344 Vector “Submission on EDB DPP reset draft decisions paper” (18 July 2019), p. 22. 345 Alpine Energy “Submission on EDB DPP reset draft decisions paper” (18 July 2019), p. 6. 346 Centralines “Submission on EDB DPP reset draft decisions paper” (18 July 2019), p. 13.

216
3605676.11
B84 A 20% increase above historic expenditure represents a significant uplift and should
be sufficient for most businesses. Our approach does not prevent distributors from
undertaking investment beyond 120% of historic expenditure. However, we do not
consider it appropriate to approve full cost recovery for that kind of forecast
expenditure uplift without more detailed scrutiny given the impact it could have on
consumers. This may mean we seek greater assurances around the timing of an
investment—particularly very large investment projects—or a distributor’s ability to
deliver it before we approve them charging consumers for it.
B85 As previously noted, there are other options available to distributors that consider
their allowance is insufficient for them to fund necessary investment. This includes a
reopener covering consumer connection, system growth and asset relocation capex,
that we have introduced as part of this decision (see attachment G).
B86 We considered the potential to include a dollar-based cap on aggregate expenditure
or take a different approach for small distributors. However, we consider that these
concerns are significantly addressed by:
B86.1 incorporating dollar-based caps of $1 million per year on average for asset
relocation and non-network expenditure; and
B86.2 a reopener for expenditure driven by customer demand.
B87 Further, consumers connected to a small distributor’s network are in no better
position to absorb large price increases than those connected to larger networks. We
do not consider consumers should be presumed to absorb the consequences of
distributors’ decisions regarding the scale of their business.
B88 We therefore consider a percent cap remains appropriate.
We have used a historical reference period of 2013-19
B89 Our approach to setting capex forecasts requires an assessment of historical average
expenditure.
B90 We have used the average of the years 2013 to 2019 as the historical reference
period against which we have scrutinised and capped forecasts.
B91 Capex can be volatile in any given year (especially for smaller suppliers). This would
preference using as long a historical reference period as possible.
B92 ID data at the expenditure category level is available from 2010. However, we
decided to only use data from 2013 after considering submissions on our November
issues paper. Those submissions suggested that data from before 2013 may not be
comparable with forecasts in the 2019 AMP since it was prepared prior to the
introduction of the current ID rules. We agreed with that concern.
217
3605676.11
B93 Aurora supported using a shorter historic reference period, stating:
The use of an historic reference period is premised on the proposition that the most
informative guide to future capex requirements is past capex requirements. However, the
approach does not adequately capture cyclical changes in capital investment requirements.
Specifically, in Aurora’s case the use of a seven-year reference period significantly
understates Aurora’s future capex requirements. This is because of Aurora’s low level of
historic investment, which has resulted in deterioration of network assets that now requires
remediation - Aurora347
B94 We do not agree with Aurora’s statement. Aurora’s current circumstances lead it to
preference a shorter reference period. Aurora’s circumstances are unlike other
distributors, and we understand that it intends to apply for a CPP. More generally,
the volatility of capex means that recent expenditure is not necessarily more
representative of future expenditure. We consider that using the period from 2013
to 2019 for the final decision appropriately balances the priority of using consistent
data, but as long a time series as possible to account for that volatility.
We have used three tests to scrutinise capex forecasts
Scrutinising distributors’ forecasts of new consumer connections
B95 Distributors’ capex requirements are affected by population and economic growth
that causes new consumers to seek connection to, and use of a distributor’s
network.
B96 Distributors disclose forecasts of new connections in Schedule 12C of the EDB ID
requirements.
B97 Our draft decision included a gating test in the EDB DPP3 reset that would check that
forecast expenditure associated with consumer connections is not based on an
assumed number of new connections that is greater than both a distributor’s
historical average connection growth and StatsNZ population growth statistics. In
our Companion Paper to the Updated Models we proposed using this test to
scrutinise both consumer connections and system growth.
B98 Having considered the feedback we received from submitters on both papers, we
have applied this test for scrutinising system growth and consumer connection
expenditure. However, we have made the following three amendments to the design
of this test for the final decision:
B98.1 We have used Stats NZ projections of household growth instead of
population growth. This change is discussed in detail in attachment A.
347 Aurora “Submission on EDB DPP reset draft decisions paper” (18 July 2019), p. 2.

218
3605676.11
B98.2 We have allowed a 20% buffer on historic connections to account for
reasonable variability in how a distributor might forecast connections and
the expenditure driven by those connections.
B98.3 Where a distributor’s forecast connections are higher than these
comparative metrics, we have calculated an allowance commensurate with
the higher of household growth or 120% of their historic connection
growth.
B99 Submitters were broadly comfortable with this test as outlined in our draft decision.
For example, comments included:
We support the proposed scrutiny of consumer connection capex forecasts. When forecasts
of population growth and historical ICP growth are combined with the per-connection
expenditure test, a reasonably balanced view of the adequacy of the consumer connection
capex forecast is obtained. - Aurora348
WELL supports the Commission’s approach of assessing per-connection expenditure. The
150% cap takes into account cost differences between different connection types. - WELL
B100 However, Unison suggested we should treat consumer connections as a pass-
through cost. It stated:
In Unison’s view the balance of benefits and costs would suggest that customer capex should
be treated more like a pass-through cost. There is strong public interest in EDBs connecting
customers, so there should be no incentive for EDBs not to do so. Although we assume that
the Commission would be concerned about the efficiency of customer capex expenditure
under a pass-through or ex post washup scenario, the much greater interest is that
consumers are connected without undue barriers. The current proposal leaves a gap. Unison
submits that the Commission needs to give further consideration to mechanisms that
compensate EDBs for the full costs of their customer connection capex (including
mechanisms to recover un-spent allowances if customer demand does not materialise).349
B101 We acknowledge Unison’s point. However, we consider that consumer connection
expenditure should not be treated as a pass-through because:
B101.1 distributors do have some influence around consumer connection
expenditure, and so it would be inappropriate to treat it as a full pass-
through; and
348 Aurora “Submission on EDB DPP reset draft decisions paper” (18 July 2019), p. 10. 349 Unison “Submission on EDB DPP reset draft decisions paper” (18 July 2019), p. 18.
219
3605676.11
B101.2 distributors have flexibility in how they categorise expenditure—particularly
noting the blurred line between consumer connection and system growth
expenditure. Treating consumer connection expenditure as a pass-through
cost could hence affect the incentives around how EDBs categorise
expenditure.
B102 We also refer to Attachment G where we discuss the reopener provision that we
included in our draft decision.
B103 PowerNet submitted that we should consider the unique circumstances that mean
OtagoNet should not be subject to this test. It said:
OtagoNet is also in a situation where it is competing with Aurora Energy in the Frankton
(Queenstown) and Wanaka areas. Running a gate test for connection expenditure using past
connection growth and forecast population growth cannot be applied to OtagoNet as
OtagoNet chooses to compete with Aurora Energy for new connections.350
B104 As discussed in Attachment A, we have considered areas that are served by more
than one distributor when determining household growth numbers. We also
consider the reopener mechanism may suit OtagoNet’s circumstances, given the
number of connections it expects, and the potential need for a new GXP.351
B105 We suggested in draft decision that we were considering using Stats NZ projections
of household growth rather than population growth. Wellington Electricity
supported use of household growth:
Population growth does not appear to be correlated with consumer connection growth and
therefore would not be useful as an external driver. Local Government building consent
applications or other indicators of new developments might be useful.352
B106 Vector also supported use of household growth, and suggested we assess all three
metrics given neither metric is perfect. It stated:
The Commission has understandably raised the concern that the household data available
does not align exactly with EDB network areas – and so there is a risk that this reduces the
accuracy of any household projections. This is a little short-sighted for two key reasons:
The mismatch between the household data and EDB network areas is small in most cases – in
our case, the two can be aligned almost entirely, with the only exception being about 6,000
households in the Papakura ward – and so any inaccuracy that results is likely to be small;
and
350 PowerNet “Submission on EDB DPP reset draft decisions paper” (18 July 2019), p. 4. 351 OtagoNet “Asset Management Plan Update 2019 – 2029” (March 2019). 352 Wellington Electricity “Submission on EDB DPP reset draft decisions paper” (18 July 2019), p. 13.
220
3605676.11
Population growth itself is an imperfect predictor of connection growth – although the
Commission has acknowledged this, it implicitly decides without robust analysis that that risk
is palatable while the risk of a slight mismatch in EDB boundaries is not – which does not
appear well-reasoned. - Vector353
B107 These submissions were echoed in those received in response to our revised
proposal for scrutinising system growth, put forward in the companion paper to the
update models.
B108 As discussed in Attachment A, we agree that household growth is a closer proxy to
connection growth than population growth as it accounts for changes in occupancy
rates. We have therefore replaced population growth statistics with household
growth statistics in our final decision, based on Stats NZ’s midpoint projection.354 We
have not included it as a third metric as Vector suggested, given its lower correlation
with connection growth, and because it would not change the results of the test.
B109 For our final decision, this test:
B109.1 takes the total end-of-year connections in 2012, and cumulatively adds new
connections in each year until 2024 to derive an approximate series of total
connections (noting this ignores disconnections); and
B109.2 compares the compound annual growth rate that distributors have forecast
in Schedule 12C(i) for the period 2020-2024,355 with the compound annual
growth rate:
B109.2.1 over the historical reference period of 2013-2019; and
B109.2.2 of households over the same future period, based on Stats NZ
projections.
B109.3 Accepts any forecast new connection growth that is not greater than both
household growth or 120% what has been observed historically.
B110 The results of this analysis are shown in Figure B2. It shows that seven distributors
are forecasting growth above both metrics.
353 Vector “Submission on EDB DPP reset draft decisions paper” (18 July 2019), p. 25-56 354 Vector also noted in its submission that Stats NZ projections are given as a range. We do not consider there
is any rationale for using something other than a midpoint estimate. 355 We note that we have used the period forecast 2020-2024 because EDBs only forecast this information out
five years, so we are unable to assess the DPP3 period itself. As this test is a check of the quality of the forecast itself, rather than the expenditure per se, we consider this reasonable.
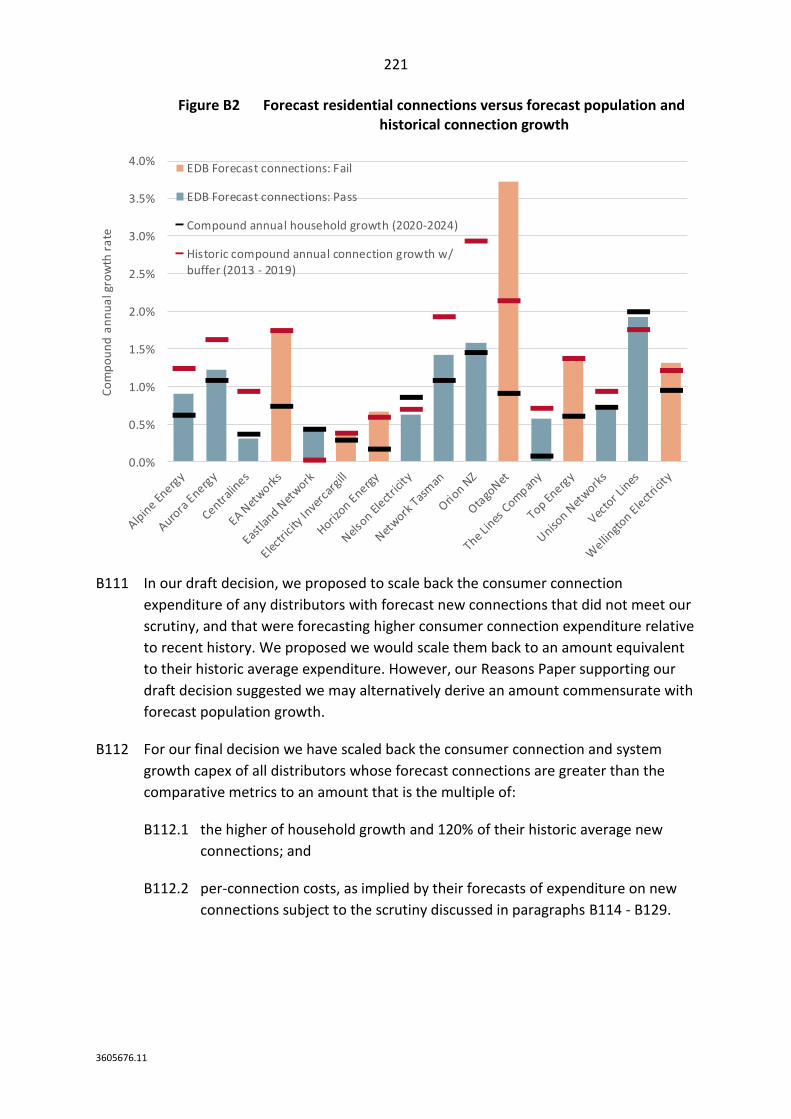
221
3605676.11
Figure B2 Forecast residential connections versus forecast population and historical connection growth
B111 In our draft decision, we proposed to scale back the consumer connection
expenditure of any distributors with forecast new connections that did not meet our
scrutiny, and that were forecasting higher consumer connection expenditure relative
to recent history. We proposed we would scale them back to an amount equivalent
to their historic average expenditure. However, our Reasons Paper supporting our
draft decision suggested we may alternatively derive an amount commensurate with
forecast population growth.
B112 For our final decision we have scaled back the consumer connection and system
growth capex of all distributors whose forecast connections are greater than the
comparative metrics to an amount that is the multiple of:
B112.1 the higher of household growth and 120% of their historic average new
connections; and
B112.2 per-connection costs, as implied by their forecasts of expenditure on new
connections subject to the scrutiny discussed in paragraphs B114 - B129.
0.0%
0.5%
1.0%
1.5%
2.0%
2.5%
3.0%
3.5%
4.0%
Co
mp
ou
nd
an
nu
al g
row
th r
ate
EDB Forecast connections: Fail
EDB Forecast connections: Pass
Compound annual household growth (2020-2024)
Historic compound annual connection growth w/
buffer (2013 - 2019)
222
3605676.11
B113 In our draft decision, we did not scale back the expenditure of distributors that were
forecasting decreases in consumer connection expenditure, even where our scrutiny
found it to be higher than suggested by our comparative metrics. However, we
consider it would be inconsistent to provide some distributors with an allowance
that we have assessed to be out of step with cost drivers, just because it is lower
than what has historically been experienced. Therefore, for our final decision, we
have scaled back the expenditure of all distributors whose forecasts are inconsistent
with our comparative metrics.
Scrutinising distributors’ forecast per-connection expenditure
B114 Each new consumer creates connection costs. Some of these are realised
immediately from physically connecting them to the network. Some will be realised
over time as the incremental effect of the associated demand requires increases in
the network’s capacity at various levels. Forecast expenditure should therefore
reflect both the number of new connections and the incremental cost of those
connections.
B115 Our draft decision included a test to assess each distributor’s per-connection
forecast expenditure for consumer connections against their historical average per-
connection expenditure. The test assessed the implied price-aspect of the price-
times-quantity equation that makes up consumer connection expenditure. The
Companion Paper to the Updated Models also included a proposal to extend this test
to system growth expenditure, which we have adopted following consultation.
B116 Submitters were broadly comfortable with using this proposed test for consumer
connection expenditure. For example, comments included
We note that the proposed 150% threshold (150% of historic per-connection expenditure (in
real terms)) appears somewhat arbitrary; however, we agree that a wide tolerance is needed
to account for variation in per-connection costs across different connection types. - Aurora356
WELL supports the Commission’s approach of assessing per-connection expenditure. The
150% cap takes into account cost differences between different connection types. –
Wellington Electricity357
B117 Submitters that responded to the Companion Paper to the Updated Models had
some concerns about this method of scrutinising system growth expenditure without
further qualitative assessment.
356 Aurora “Submission on EDB DPP reset draft decisions paper” (18 July 2019), p. 10. 357 Wellington Electricity “Submission on EDB DPP reset draft decisions paper” (18 July 2019), p. 14.
223
3605676.11
B118 For example, ENA stated:
We consider that the alternative proposal, to scrutinise both forecast customer connection
and system growth expenditure against connection growth is a useful approach for an initial
gating test. However, we do not think it is reasonable to rely solely on this test, because of
the lumpiness of system growth expenditure. This would not be expected to line up with
connections growth in the short to medium term.358
B119 Network Tasman considered that a 150% increase above historic expenditure would
not allow reasonable increases in system growth expenditure. It stated:
The Commission’s test universally accepts any reduction in system growth expenditure –
irrespective of the magnitude. For example, having recently completed an efficient major
network investment programme it is reasonable for this distributor’s system growth
expenditure to fall by 2,000%. However, the test does not accept that a distributor heading
into a comparable major capex programme could experience an increase in system growth
expenditure of a similar magnitude.359
B120 We acknowledge the test is imperfect and may favour distributors that have recently
been through a period of growth. However, the test is not intended to suggest
expenditure beyond 150% of what has been spent historically is inefficient or should
not proceed. Rather, it is intended to identify distributors that may be planning a
large capex programme or project, and ensure that those investments receive a
proportionate level of scrutiny.
B121 In its submission on our Companion Paper to the updated models, Network Tasman
referred to Transpower’s average capex spend during 2006-07 to 2011-12 as an
example of a large investment programme that represented more than 150% growth
compared to historic expenditure.360 However, that investment programme received
significantly more scrutiny than it would have under a DPP.
B122 A CPP is one option for scrutinising step changes in expenditure. However, we have
also introduced a reopener as another option that may be available to distributors
seeking approval to recover the costs of significant investments. This is discussed
further in Attachment G.
B123 In isolation, we agree our high-level scrutiny could have unintended consequences
for consumers on networks like Network Tasman that are experiencing growth.
However, in combination with the other changes we have made as part of this
decision, we consider any such unintended consequences are mitigated.
358 ENA “Submission on EDB DPP reset draft decisions paper” (18 July 2019), p. 4-5. 359 Network Tasman “DPP3 updated draft paper submission” (09 October 2019), p. 1. 360 Network Tasman “DPP3 updated draft paper submission” (09 October 2019), p. 3.
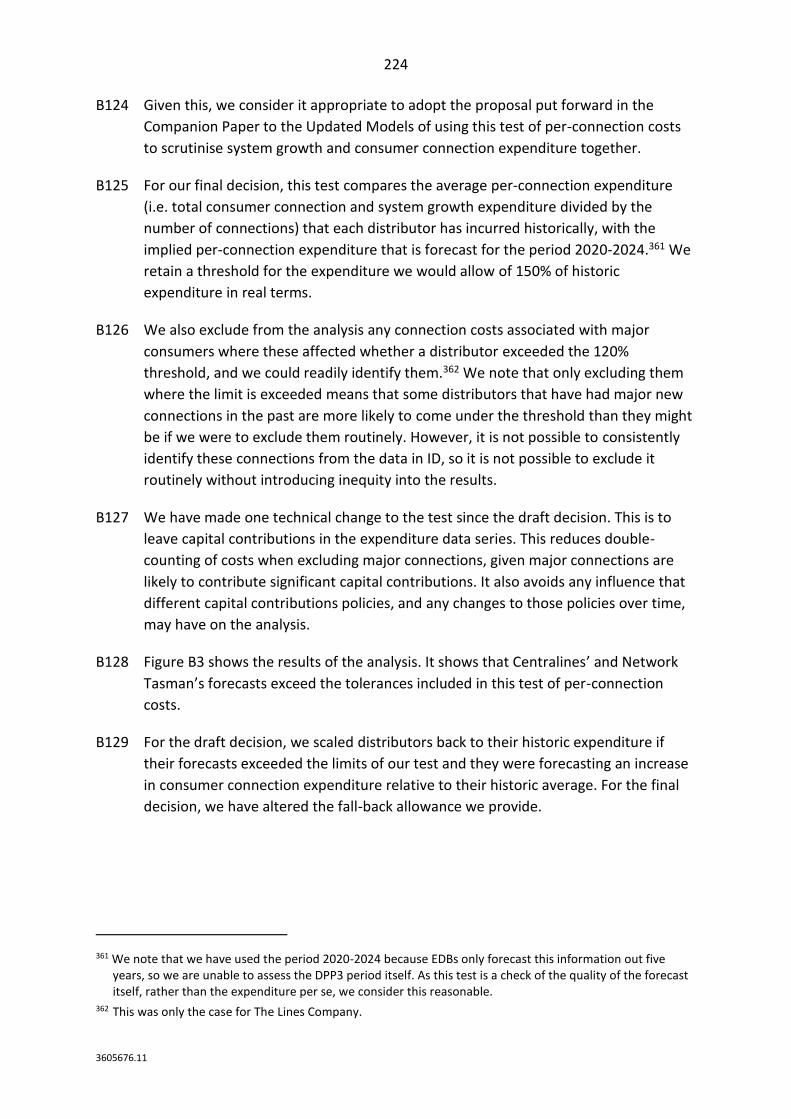
224
3605676.11
B124 Given this, we consider it appropriate to adopt the proposal put forward in the
Companion Paper to the Updated Models of using this test of per-connection costs
to scrutinise system growth and consumer connection expenditure together.
B125 For our final decision, this test compares the average per-connection expenditure
(i.e. total consumer connection and system growth expenditure divided by the
number of connections) that each distributor has incurred historically, with the
implied per-connection expenditure that is forecast for the period 2020-2024.361 We
retain a threshold for the expenditure we would allow of 150% of historic
expenditure in real terms.
B126 We also exclude from the analysis any connection costs associated with major
consumers where these affected whether a distributor exceeded the 120%
threshold, and we could readily identify them.362 We note that only excluding them
where the limit is exceeded means that some distributors that have had major new
connections in the past are more likely to come under the threshold than they might
be if we were to exclude them routinely. However, it is not possible to consistently
identify these connections from the data in ID, so it is not possible to exclude it
routinely without introducing inequity into the results.
B127 We have made one technical change to the test since the draft decision. This is to
leave capital contributions in the expenditure data series. This reduces double-
counting of costs when excluding major connections, given major connections are
likely to contribute significant capital contributions. It also avoids any influence that
different capital contributions policies, and any changes to those policies over time,
may have on the analysis.
B128 Figure B3 shows the results of the analysis. It shows that Centralines’ and Network
Tasman’s forecasts exceed the tolerances included in this test of per-connection
costs.
B129 For the draft decision, we scaled distributors back to their historic expenditure if
their forecasts exceeded the limits of our test and they were forecasting an increase
in consumer connection expenditure relative to their historic average. For the final
decision, we have altered the fall-back allowance we provide.
361 We note that we have used the period 2020-2024 because EDBs only forecast this information out five years, so we are unable to assess the DPP3 period itself. As this test is a check of the quality of the forecast itself, rather than the expenditure per se, we consider this reasonable.
362 This was only the case for The Lines Company.
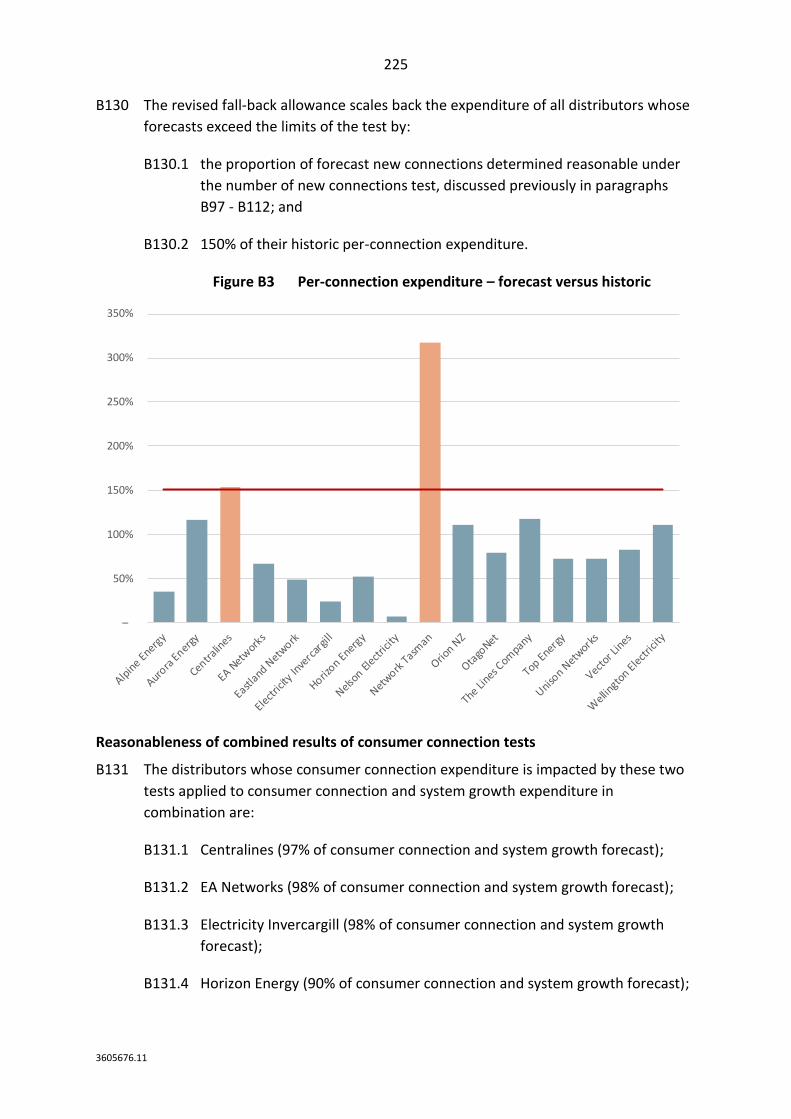
225
3605676.11
B130 The revised fall-back allowance scales back the expenditure of all distributors whose
forecasts exceed the limits of the test by:
B130.1 the proportion of forecast new connections determined reasonable under
the number of new connections test, discussed previously in paragraphs
B97 - B112; and
B130.2 150% of their historic per-connection expenditure.
Figure B3 Per-connection expenditure – forecast versus historic
Reasonableness of combined results of consumer connection tests
B131 The distributors whose consumer connection expenditure is impacted by these two
tests applied to consumer connection and system growth expenditure in
combination are:
B131.1 Centralines (97% of consumer connection and system growth forecast);
B131.2 EA Networks (98% of consumer connection and system growth forecast);
B131.3 Electricity Invercargill (98% of consumer connection and system growth
forecast);
B131.4 Horizon Energy (90% of consumer connection and system growth forecast);
–
50%
100%
150%
200%
250%
300%
350%
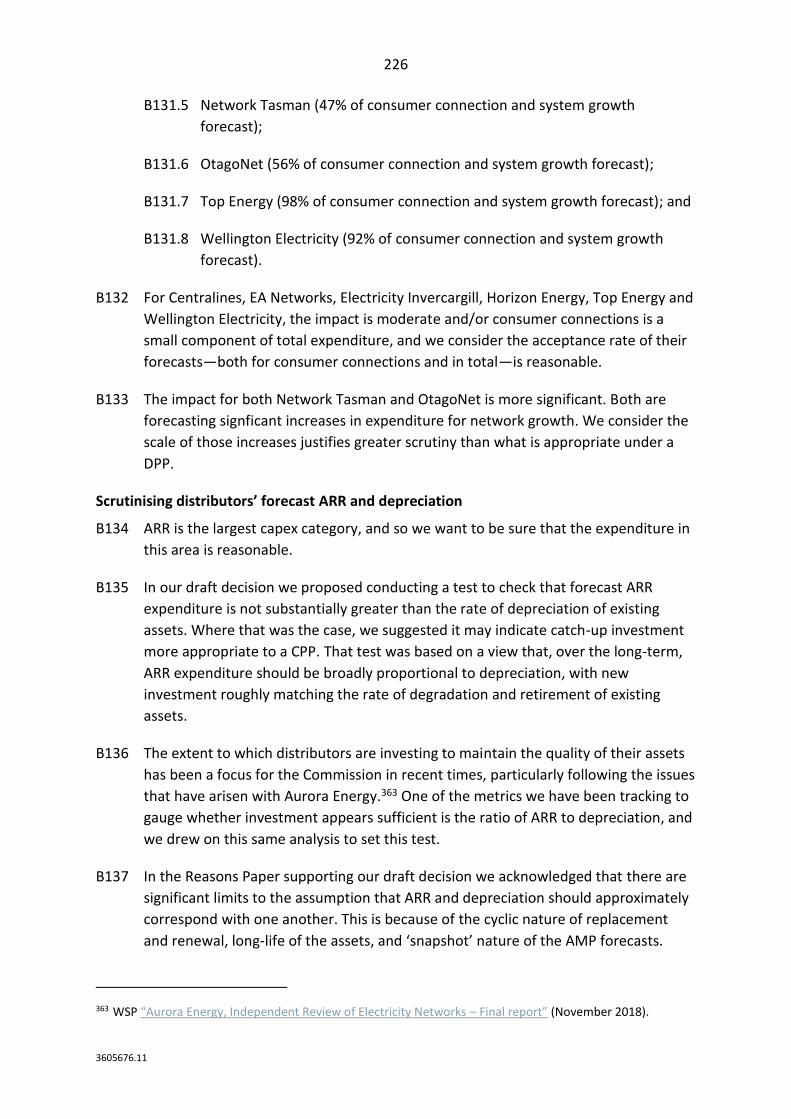
226
3605676.11
B131.5 Network Tasman (47% of consumer connection and system growth
forecast);
B131.6 OtagoNet (56% of consumer connection and system growth forecast);
B131.7 Top Energy (98% of consumer connection and system growth forecast); and
B131.8 Wellington Electricity (92% of consumer connection and system growth
forecast).
B132 For Centralines, EA Networks, Electricity Invercargill, Horizon Energy, Top Energy and
Wellington Electricity, the impact is moderate and/or consumer connections is a
small component of total expenditure, and we consider the acceptance rate of their
forecasts—both for consumer connections and in total—is reasonable.
B133 The impact for both Network Tasman and OtagoNet is more significant. Both are
forecasting signficant increases in expenditure for network growth. We consider the
scale of those increases justifies greater scrutiny than what is appropriate under a
DPP.
Scrutinising distributors’ forecast ARR and depreciation
B134 ARR is the largest capex category, and so we want to be sure that the expenditure in
this area is reasonable.
B135 In our draft decision we proposed conducting a test to check that forecast ARR
expenditure is not substantially greater than the rate of depreciation of existing
assets. Where that was the case, we suggested it may indicate catch-up investment
more appropriate to a CPP. That test was based on a view that, over the long-term,
ARR expenditure should be broadly proportional to depreciation, with new
investment roughly matching the rate of degradation and retirement of existing
assets.
B136 The extent to which distributors are investing to maintain the quality of their assets
has been a focus for the Commission in recent times, particularly following the issues
that have arisen with Aurora Energy.363 One of the metrics we have been tracking to
gauge whether investment appears sufficient is the ratio of ARR to depreciation, and
we drew on this same analysis to set this test.
B137 In the Reasons Paper supporting our draft decision we acknowledged that there are
significant limits to the assumption that ARR and depreciation should approximately
correspond with one another. This is because of the cyclic nature of replacement
and renewal, long-life of the assets, and ‘snapshot’ nature of the AMP forecasts.
363 WSP “Aurora Energy, Independent Review of Electricity Networks – Final report” (November 2018).
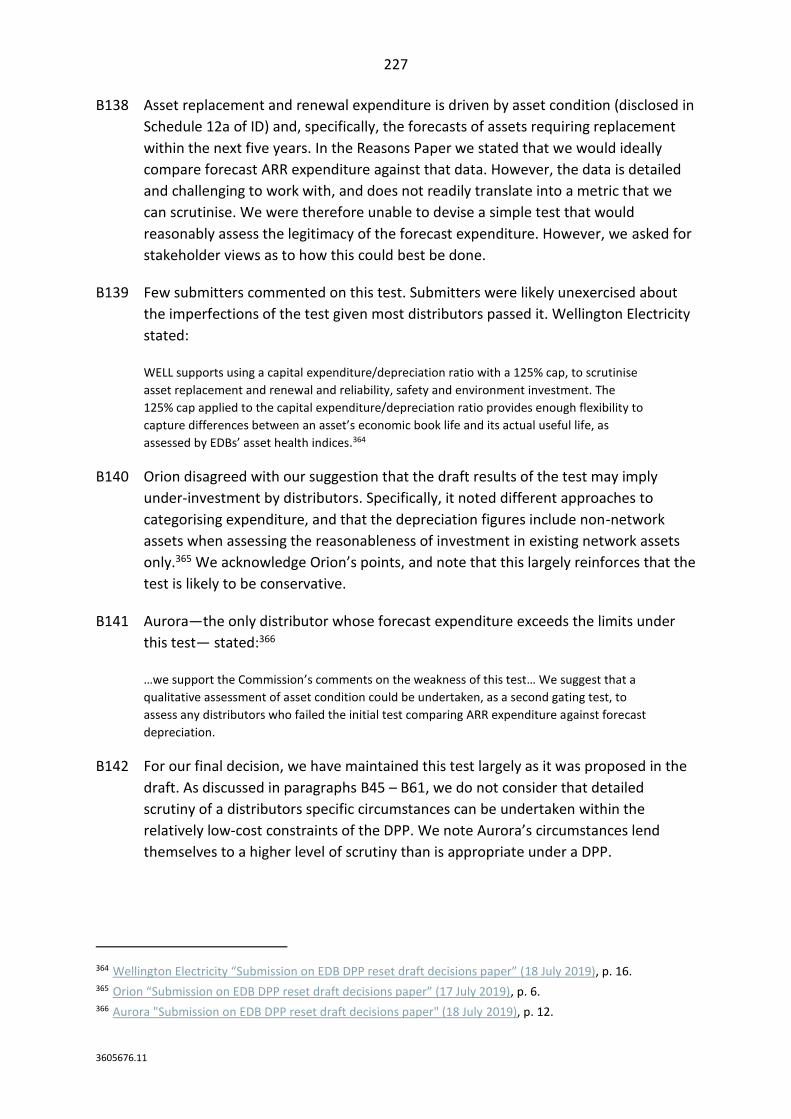
227
3605676.11
B138 Asset replacement and renewal expenditure is driven by asset condition (disclosed in
Schedule 12a of ID) and, specifically, the forecasts of assets requiring replacement
within the next five years. In the Reasons Paper we stated that we would ideally
compare forecast ARR expenditure against that data. However, the data is detailed
and challenging to work with, and does not readily translate into a metric that we
can scrutinise. We were therefore unable to devise a simple test that would
reasonably assess the legitimacy of the forecast expenditure. However, we asked for
stakeholder views as to how this could best be done.
B139 Few submitters commented on this test. Submitters were likely unexercised about
the imperfections of the test given most distributors passed it. Wellington Electricity
stated:
WELL supports using a capital expenditure/depreciation ratio with a 125% cap, to scrutinise
asset replacement and renewal and reliability, safety and environment investment. The
125% cap applied to the capital expenditure/depreciation ratio provides enough flexibility to
capture differences between an asset’s economic book life and its actual useful life, as
assessed by EDBs’ asset health indices.364
B140 Orion disagreed with our suggestion that the draft results of the test may imply
under-investment by distributors. Specifically, it noted different approaches to
categorising expenditure, and that the depreciation figures include non-network
assets when assessing the reasonableness of investment in existing network assets
only.365 We acknowledge Orion’s points, and note that this largely reinforces that the
test is likely to be conservative.
B141 Aurora—the only distributor whose forecast expenditure exceeds the limits under
this test— stated:366
…we support the Commission’s comments on the weakness of this test… We suggest that a
qualitative assessment of asset condition could be undertaken, as a second gating test, to
assess any distributors who failed the initial test comparing ARR expenditure against forecast
depreciation.
B142 For our final decision, we have maintained this test largely as it was proposed in the
draft. As discussed in paragraphs B45 – B61, we do not consider that detailed
scrutiny of a distributors specific circumstances can be undertaken within the
relatively low-cost constraints of the DPP. We note Aurora’s circumstances lend
themselves to a higher level of scrutiny than is appropriate under a DPP.
364 Wellington Electricity “Submission on EDB DPP reset draft decisions paper” (18 July 2019), p. 16. 365 Orion “Submission on EDB DPP reset draft decisions paper” (17 July 2019), p. 6. 366 Aurora "Submission on EDB DPP reset draft decisions paper" (18 July 2019), p. 12.
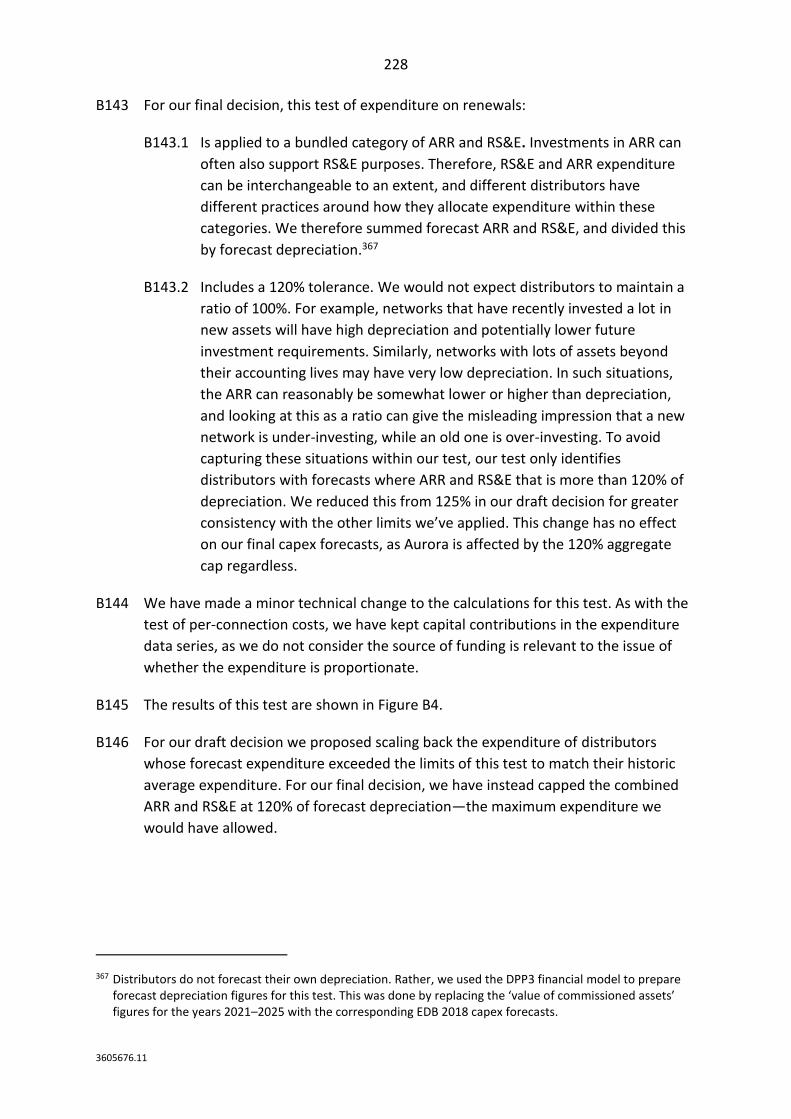
228
3605676.11
B143 For our final decision, this test of expenditure on renewals:
B143.1 Is applied to a bundled category of ARR and RS&E. Investments in ARR can
often also support RS&E purposes. Therefore, RS&E and ARR expenditure
can be interchangeable to an extent, and different distributors have
different practices around how they allocate expenditure within these
categories. We therefore summed forecast ARR and RS&E, and divided this
by forecast depreciation.367
B143.2 Includes a 120% tolerance. We would not expect distributors to maintain a
ratio of 100%. For example, networks that have recently invested a lot in
new assets will have high depreciation and potentially lower future
investment requirements. Similarly, networks with lots of assets beyond
their accounting lives may have very low depreciation. In such situations,
the ARR can reasonably be somewhat lower or higher than depreciation,
and looking at this as a ratio can give the misleading impression that a new
network is under-investing, while an old one is over-investing. To avoid
capturing these situations within our test, our test only identifies
distributors with forecasts where ARR and RS&E that is more than 120% of
depreciation. We reduced this from 125% in our draft decision for greater
consistency with the other limits we’ve applied. This change has no effect
on our final capex forecasts, as Aurora is affected by the 120% aggregate
cap regardless.
B144 We have made a minor technical change to the calculations for this test. As with the
test of per-connection costs, we have kept capital contributions in the expenditure
data series, as we do not consider the source of funding is relevant to the issue of
whether the expenditure is proportionate.
B145 The results of this test are shown in Figure B4.
B146 For our draft decision we proposed scaling back the expenditure of distributors
whose forecast expenditure exceeded the limits of this test to match their historic
average expenditure. For our final decision, we have instead capped the combined
ARR and RS&E at 120% of forecast depreciation—the maximum expenditure we
would have allowed.
367 Distributors do not forecast their own depreciation. Rather, we used the DPP3 financial model to prepare forecast depreciation figures for this test. This was done by replacing the ‘value of commissioned assets’ figures for the years 2021–2025 with the corresponding EDB 2018 capex forecasts.
229
3605676.11
Figure B4 ARR and RS&E relative to depreciation
Scrutinising distributors’ past forecast performance
B147 Distributors’ AMP forecasts provide a good starting point for our capex forecasts
because distributors have access to the best information on their networks and
circumstances. However, our November 2018 issues paper noted persistent over-
forecasting of capital expenditure by regulated and exempt distributors
collectively.368 At an individual level, over-forecasting may result in those distributors
earning excessive profits.
B148 In our draft decision, we proposed using a test that identifies whether the distributor
has a track record of forecasting their total capex expenditure, on average, within
125% of actual in real terms.
B149 If we are to use AMP forecasts for our capex forecasts, we should be doing so on the
basis that they are a reasonable reflection of likely expenditure.
B150 In the Reasons Paper supporting our draft decision we explained why we considered
our proposed test appropriate, despite a similar assessment of forecasting accuracy
being ultimately dismissed for DPP2.
368 Commerce Commission, “Default price-quality paths for electricity distribution businesses from 1 April 2020 – Issues Paper” (15 November 2018), paras B22-23.
–
50%
100%
150%
200%
250%
230
3605676.11
B151 We stated our view that we have a sufficiently long and robust sample size from
which to assess the performance of distributors’ forecasts. The specific analysis we
proposed for this test used data from the 2014 to 2019 AMPs. All these AMPs were
prepared under the IM requirements. We proposed excluding the 2013 forecast on
the basis that it was the first year, and distributors would likely have been
establishing their forecasting processes at that time.
B152 We also considered that distributors could have reasonably expected that their
forecasts would be used for this purpose, as we had made it clear during the DPP2
reset that we would carefully look at performance against AMPs when setting future
DPP prices. We referred to our DPP2 decision paper, which stated:
Despite some concerns outlined by submissions we are still of the view that evaluating asset
management plans against out-turn expenditure could serve a useful purpose in assessing
distributor performance.
Although in theory it could lead to some distortion of pure cost minimisation objectives, this
has to be considered against the benefits from improving forecasting accuracy across non-
exempt distributors. Our draft decision also permitted a relatively high difference between
the forecast and out-turn expenditure before applying the lower capital expenditure cap.369
B153 Consistent with that comment, our proposed test allowed some tolerance in terms
of the level of accuracy required—assessing if forecasts were within 125% of actual
expenditure on average over time.
B154 Some submitters were comfortable with our proposed test. For example, comments
included:
"We support the proposal to test distributors’ forecast accuracy within a broad boundary.
We consider that if a distributor fails this test, some multiple of historical average
expenditure should be used as a fall-back for all expenditure categories where the distributor
is forecasting a relative increase in expenditure. We believe this approach provides a
reasonable gateway test that incentivises improvement in forecast accuracy." - Aurora370
WELL also understands the Commission wanting to scrutinise the capital expenditure
forecast and supports the general approach of first applying a test of overall forecast
accuracy, before cost driver based tests are applied to the major capex categories. –
Wellington Electricity371
369 Commerce Commission, “Default price-quality paths for electricity distributors from 1 April 2015 to 31 March 2020 - Low cost forecasting approaches”, (28 November 2014), para 4.39.
370 Aurora “Submission on EDB DPP reset draft decisions paper” (18 July 2019), p. 10. 371 Wellington Electricity “Submission on EDB DPP reset draft decisions paper” (18 July 2019), p. 13.
231
3605676.11
B155 Each of the distributors that were impacted by the test submitted that they should
not be captured by it. For example, their comments included:
The key reason for the variance in prior period forecasts is the transmission asset purchase.
We relied on Transpower information when preparing our AMPs prior to 2015, when we
acquired the asset. It was only once we had acquired the assets and completed our own
evaluation of them that we were able to prepare more realistic forecasts. Our actual capex is
more closely aligned to these later forecasts. - Eastland372
Network Tasman submits that the Commission should remove the costs of constructing the
GXP from its assessment of Network Tasman’s forecasting performance… Network Tasman’s
deferral of the GXPs construction has been the economically efficient thing to do. – Network
Tasman373
Including 2019 actual capital expenditure (as is intended in the final decision) results in TLC
passing the Gate 1 test, and as a result, no scaling should be applied to TLC’s capital
expenditure… Following the implementation of the governance and management changes in
2017-18, we have been steadily improving the delivery of our works programme.– The Lines
Company374
B156 Some submitters further suggested the test would result in perverse outcomes. They
stated:
The lower actual capex than the capex that Transpower had planned for the assets is a
significant efficiency benefit which is in the long-term interests of consumers. As the decision
stands, Eastland Network is penalised for deferring this expenditure. This is inconsistent with
the regulatory purpose. - Eastland375
Those members with higher historical forecast variance are classified as poor forecasters and
their capex is adjusted down as a result rather than undergo scrutiny. Those members with
lower forecasting variance are scrutinised at the capex category level. - ENA376
The Commission’s DPP3 capex allowance represents a 43% reduction from what Network
Tasman spent in DPP2… Network Tasman would be relatively comfortable if this reduction
was in response to an objective assessment of Network Tasman’s capex needs... It is not.
Rather, the driver of this change is the Commission’s assessment of Network Tasman’s ability
to accurately forecast its capex spending. – Network Tasman377
In the event Network Tasman, or any other distributor failing the Commission’s capex
forecast test, now produces more accurate capex forecasts, the Commission’s approach to
capex forecasting would still scale back that forecast, based on historical forecasting
performance. – Network Tasman378
372 Eastland Network “Submission on EDB DPP reset draft decisions paper” (18 July 2019), p. 6. 373 Network Tasman “Submission on EDB DPP reset draft decisions paper” (18 July 2019), p. 6. 374 The Lines Company “Submission on EDB DPP reset draft decisions paper” (18 July 2019), p. 3 and 8. 375 Eastland Network “Submission on EDB DPP reset draft decisions paper” (18 July 2019), p. 6. 376 ENA “Submission on EDB DPP reset draft decisions paper” (18 July 2019), p. 18. 377 Network Tasman “Submission on EDB DPP reset draft decisions paper” (18 July 2019), p. 3. 378 Network Tasman “Submission on EDB DPP reset draft decisions paper” (18 July 2019), p. 6.
232
3605676.11
B157 Our expectation remains that distributors’ capex forecasts should be accurate to
within 125% over time. Performance beyond this level likely indicates that a
distributor takes few, if any, risks on the forecasting ‘unders’ compared to the
‘overs’, with those risks instead falling on consumers.
B158 We agree with Network Tasman that deferring investments can be efficient and in
the long-term benefit of consumers. However, we note that deferring assets is one
way distributors can game forecasts. Further, we question whether deferring
forecast expenditure that was based on prudent peak demand forecasts (as Network
Tasman suggests it does) can practically be considered efficient deferral for these
purposes, since, by definition, there is a low probability it will be required when
forecast.
B159 Despite this, we have decided not to include the forecasting accuracy test when
setting capex allowances for DPP3. Our reasons for this are as follows:
B159.1 We acknowledge that large one-off investments can overwhelm forecasting
performance, as well as Eastland’s point that it relied on information from
Transpower when forecasting expenditure for the asset it purchased. Were
we to keep the test, we consider it would be appropriate to exclude
transmission asset purchases from the data. However, untangling these
purchases from past forecasts would have been difficult.
B159.2 We consider that our other tests, in combination with a cap on aggregate
expenditure, adequately limits expenditure.
B159.3 The consequences of exceeding our forecast accuracy limits were
significant—particularly for Network Tasman because it was forecasting a
change in expenditure focus (i.e. decreases in expenditure under some
categories that were accepted and increases that were not). Further, we are
no longer falling back on historic expenditure under our other tests.
B159.4 The test did not account for improved forecasting over time, and Figure B4
in the Reasons Paper supporting our draft decision showed Network
Tasman’s forecasting accuracy has improved (though still tends to be high).
B159.5 We determined that including all years of the 2014 AMP forecasts in the
test would be inappropriate, as DPP2 was set based on those forecasts and
distributors may have reasonably revised their expenditure plans in line
with their DPP2 allowance. Excluding this AMP would have seen all
distributors come within the 125% limit if the test was otherwise
unchanged.
233
3605676.11
B160 For these reasons, we no longer intend to include this analysis as a test within our
approach to setting capex forecasts. However, we still consider there is value in
providing transparency around forecasting performance, and we intend to monitor
distributors’ forecast performance over time.
We have retained the DPP2 approach for several implementation issues
Using CGPI to escalate costs into the future
B161 Our assessment of AMP forecasts and any caps are applied on a constant-price basis.
However, the DPP itself requires forecasts set on a nominal basis. As such, we need
to determine a cost escalator to derive them.
B162 For DPP2 we used the all-industries CGPI forecasts from NZIER. The issues paper
discussed how differences in the cost of distributors’ inputs contributed $31 million
of the $119 million difference between our DPP2 forecasts and distributors’ actual
expenditure to 2018.379 However, despite this, we consider a nation-wide all-
industries CGPI forecast from an independent source (e.g. NZIER) is the preferred
option for converting the constant-price capex forecast series to a nominal series.
B163 The alternative options we considered in the issues paper were:
B163.1 using an all-industries CGPI forecasts from another provider;
B163.2 using an industry- or region-specific index (for example, EGWW);
B163.3 using the CPI;
B163.4 using distributors’ own implied inflation from their AMPs.
B164 Few submitters commented on this issue. Wellington Electricity supported our
approach stating:
WELL supports the Commission’s proposed approach of using all-industries CGPI to forecast
capital expenditure cost inflation. Consistent with our view of which operating cost inflators
to use, all industry forecasts are less volatile than the industry or regional specific forecasts. –
Wellington Electricity380
B165 Conversely, Centralines stated:
379 Commerce Commission, “Default price-quality paths for electricity distribution businesses from 1 April 2020 – Issues Paper” (15 November 2018), pp. 73-75.
380 Wellington Electricity “Submission on EDB DPP reset draft decisions paper” (18 July 2019), p 17.
234
3605676.11
Centralines does not consider that this is likely to be a credible pattern of CGPI movements
because around 50% of capital works are comprised of labour costs… Centralines submits
that the Commission should seek updated forecasts for the Final Decision and make a
specific request of NZIER to consider the factors impacting on the labour market confronting
EDBs.381
B166 For our final decision we have retained the use of NZIER’s CGPI forecasts for inflating
capex allowances. We refer to our detailed consideration of this issue discussed in
Attachment A under ‘input price inflators’.
Excluding capital contributions from capex forecasts
B167 Capital contributions are a substantial part of many distributors’ expenditure on
assets. In previous DPPs, we have set capex forecasts as forecast expenditure on
assets net of capital contributions, and not applied any scrutiny to the level of
contributions suppliers are forecasting. However, changes in the forecast level of
contributions can have a material effect on forecast capex.
B168 In our draft decision, we proposed to explicitly consider capital contributions when
assessing the capex forecasts, as we had done in DPP2.
B169 The issues paper considered two broad options for DPP3: continuing to assess all
capex net of distributors’ forecasts of capital contributions, and including capital
contributions within the scope of our analysis.
B170 This issue attracted little comment from submitters. Aurora Energy stated:
We support the proposal to not independently scrutinise capital contribution forecasts.
Separate scrutiny would, in our view, increase the likelihood of forecast error. In addition,
our experience is that capital contributions are difficult to forecast with precision and are
impacted by external factors over which distributors have limited control. – Aurora382
B171 While total contributions vary widely year-on-year, for each distributor and within in
each expenditure category, the portion of expenditure covered by contributions is
relatively consistent over time. As such, we would only have concerns where a
distributor is forecasting a much lower portion of forecast expenditure to be covered
by contributions, relative to historical levels.
381 Centralines “Submission on EDB DPP reset draft decisions paper” (18 July 2019), p. 15. 382 Aurora “Submission on EDB DPP reset draft decisions paper” (18 July 2019), p. 13.

235
3605676.11
B172 Figure B5 shows the percentage change in forecast capital contributions as a
proportion of total expenditure on assets. It shows the forecast proportion of
expenditure on assets covered by capital contributions during the DPP3 period
compared to the historical average proportion for each distributor. It is shown for
the consumer connection category—which, for most distributors, is the major and
most predictable source of capital contributions—and for total expenditure on
network assets. A value above 100% suggests capital contributions would fund more
expenditure than they have historically, and vice versa.
Figure B5 Capital contributions as a proportion of expenditure on assets—forecast versus historical average
B173 Figure B5 suggests that distributors are variously forecasting that capital
contributions will fund a similar, higher or lower proportion of expenditure as they
have historically. Any under-forecasting is more significant for total network assets
than for consumer connections, for which capital contributions are more
predictable.
0%
20%
40%
60%
80%
100%
120%
140%
160%
180%
200%
Consumer connection Total network assets
Restricted axis:Alpine 233%Eastland 2138%Horizon 1,433%
236
3605676.11
B174 These results suggest some distributors may be being conservative in their approach
to forecasting capital contributions. However, we did not consider that it was
consistent with our low-cost approach to setting DPPs to further develop this
analysis as part of the DPP3 reset.383
Allowance for forecast cost of financing and vested assets
B175 In our draft decision we proposed to explicitly consider the cost of financing works
under construction when assessing the capex forecasts, and providing for the value
of any vested assets.
B176 We proposed retaining the approach used in DPP2, where we included distributors’
forecasts of these components in our forecasts. However, we proposed that where
we apply a cap or some other limit to capex, we would scale back cost of financing
by a proportional amount—as we did in the 2017 gas DPP.
B177 Aurora was the only submitter that commented on this topic, and supported our
approach.384
B178 For our final decision, we have maintained this approach as proposed, given there
were no issues raised by submitters on this issue, and it is simple for us to implement
following our experience with DPP2 and the 2017 gas DPP. Practically speaking, this
means that a distributor’s cost of financing is impacted by how they perform under
our approach to scrutinising forecasts, including the 120% cap we apply on
expenditure in aggregate. However, we have not applied any scaling to the value of
vested assets.
Using forecast capex as a forecast of commissioned assets
B179 To set the revenue cap over the DPP period, our financial model relies on a forecast
of distributor’s aggregate value of commissioned assets, and the “capex” incentive
mechanism also works by comparing forecast with actual commissioned assets. The
EDB IMs direct us to forecast commissioned assets as equal to capex for the relevant
year.385
383 Refer to 3.13.1 of framework chapter. 384 Aurora “Submission on EDB DPP reset draft decisions paper” (18 July 2019), p. 13. 385 Commerce Commission Electricity Distribution Services Input Methodologies Determination 2012
[2012] NZCC 26 (Consolidated as at 31 January 2019), clause 4.2.5.
237
3605676.11
B180 The issues paper highlighted some rare instances that cause our assumption that
forecast aggregate value of commissioned assets can be proxied through a forecast
of capex to break down. These are when a distributor acquires assets from related
parties or other regulated suppliers. We asked distributors to identify if they were
contemplating making such transactions in the next five years, so that we could
assess the materiality of this issue.
B181 There were no comments from submitters on this issue. Distributors did not flag that
they would be acquiring any assets from related parties or regulated suppliers in the
next five years. Therefore, for our final decision we have maintained the approach of
forecasting commissioned assets using capex for the relevant year, with no further
adjustment.
Treatment of spur asset purchases
B182 On occasion, Transpower has sold ‘non-core’ transmission grid assets (referred to as
spur assets) to the distributor that connects to these assets. For our draft decision
we proposed retaining the approach we used in DPP2 for dealing with these
transactions, which involved:
B182.1 A ‘transmission asset wash-up adjustment’ recoverable cost in the IMs,
which allows us to include spur asset purchases in capex forecasts, but also
allows the return on/of these assets to be removed from distributor
revenue if the purchase is cancelled.
B182.2 Excluding this transmission asset capex from our assessment of forecast
capex, as the scale of the purchase and future maintenance costs
represented a significant increase above historical levels.
B183 Submitters did not comment on our proposed approach to forecast purchases. We
note that no distributor has indicated that it intends to undertake transmission asset
purchases during the DPP3 period. Therefore, we see no reason to depart from this
approach in theory.
B184 The Reasons Paper supporting our draft decision also considered our treatment of
historical transmission asset purchases. For the draft decision, we did not capture
transmission asset purchase expenditure for two reasons.
B185 Firstly, we lacked a complete dataset of historical capex associated with transmission
asset acquisitions, so we were unable to make a full and accurate accounting of it
within our forecasting approach.
B186 Secondly, we needed to further consider the extent to which we excluded these
purchases from our assessment of forecast capex. We note that two of the issues we
were contemplating as to how to capture transmission assets are no longer relevant
because our final decision:
238
3605676.11
B186.1 Does not include a test scrutinising distributor’s forecast accuracy.
Removing these purchases from forecasts would have been difficult, but
also necessary—the combination of which largely contributed to our
reasons for excluding the test in the final decision.
B186.2 Includes a different approach to scrutinising system growth expenditure.
Our draft approach focused on only a subset of system growth expenditure,
and considering transmission asset purchases reasonably within that
approach would have required a detailed breakdown of the allocation of
those purchase costs within subcategories.
B187 The remaining issue we discussed in the Reasons Paper remains relevant to the final
decision. Specifically, we considered whether the expenditure should be excluded
from the historical expenditure series where we ‘fall-back’ on this because of our
scrutiny tests, or cap aggregate expenditure at 120% of historical levels.
B188 Submitters did not comment on this issue. Prior to our final decision, we asked
stakeholders to confirm whether they had purchased transmission assets since 2013
and provide data on those purchases where necessary. For our final decision we
have drawn on that data to:
B188.1 exclude transmission asset costs during the year of acquisition from historic
and forecast expenditure series when scrutinising expenditure;
B188.2 exclude transmission asset costs during the year of acquisition from historic
and forecast expenditure series when scaling and capping forecasts; and
B188.3 add back in any costs during the year of acquisition of a transmission asset
for inclusion in the final allowance.
B189 This approach reflects that the transmission asset purchases can distort the historic
expenditure series of distributors, given their magnitude. Removing them for
scrutinising and capping forecasts is appropriate, as not doing so would imply
greater historic expenditure than would be representative of expenditure going
forward and cloud our ability to scrutinise their business as usual expenditure.
Further, these purchases represent an expansion of the network, so it is appropriate
to add the associated expenditure back in to the final allowances.
239
3605676.11
Attachment C Forecasts of other inputs
Purpose of this attachment
C1 This attachment explains the inputs to the financial model we must include in
addition to our forecasts of opex and capex discussed in the preceding attachments.
It discusses:
C1.1 the WACC estimate we have used to set the DPP decision;
C1.2 the forecast of CPI we have used for the revaluation rate and as an element
of the price path; and
C1.3 forecasts of disposed assets.
High-level approach
C2 The inputs discussed in this attachment are primarily determined in accordance with
the EDB IMs (specifically the cost of capital and asset valuation IMs).386 As such, our
high-level approach to these issues is to apply the relevant EDB IMs. Our decision not
to amend these IMs is discussed in Chapters 3 and 4 of our IM amendment reasons
paper.387
Cost of capital estimate
C3 For the final DPP decision, we have used a WACC of 4.57%. This figure was
determined as at 1 September 2019.388 Figure C1 below sets out changes in the
WACC since prices were last reset in 2014.
386 The exception is our approach to forecasting asset disposals. These are discussed separately at the end of this attachment.
387 Commerce Commission “Amendments to electricity distribution services input methodologies determination – Reasons paper” (26 November 2019).
388 Commerce Commission Cost of capital determination for electricity distribution businesses’ 2020-2025 default price-quality paths and Transpower New Zealand Limited’s 2020-2025 individual price-quality path [2019] NZCC 12 (25 September 2019).
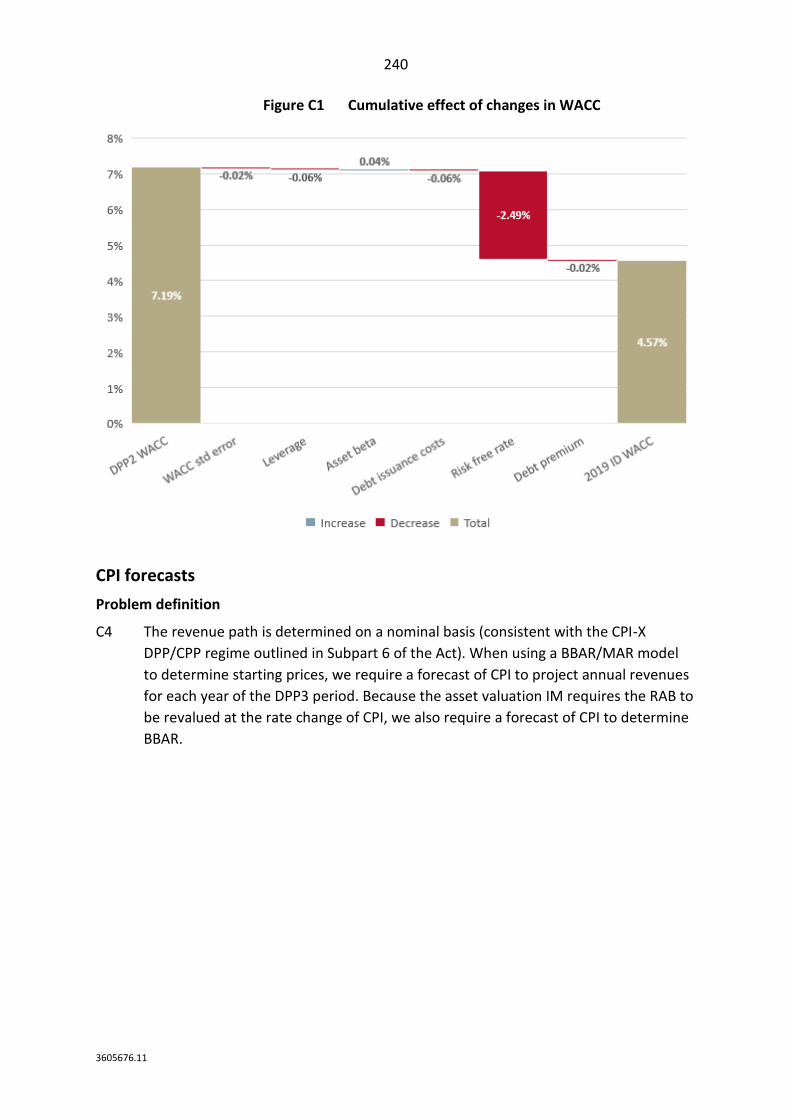
240
3605676.11
Figure C1 Cumulative effect of changes in WACC
CPI forecasts
Problem definition
C4 The revenue path is determined on a nominal basis (consistent with the CPI-X
DPP/CPP regime outlined in Subpart 6 of the Act). When using a BBAR/MAR model
to determine starting prices, we require a forecast of CPI to project annual revenues
for each year of the DPP3 period. Because the asset valuation IM requires the RAB to
be revalued at the rate change of CPI, we also require a forecast of CPI to determine
BBAR.
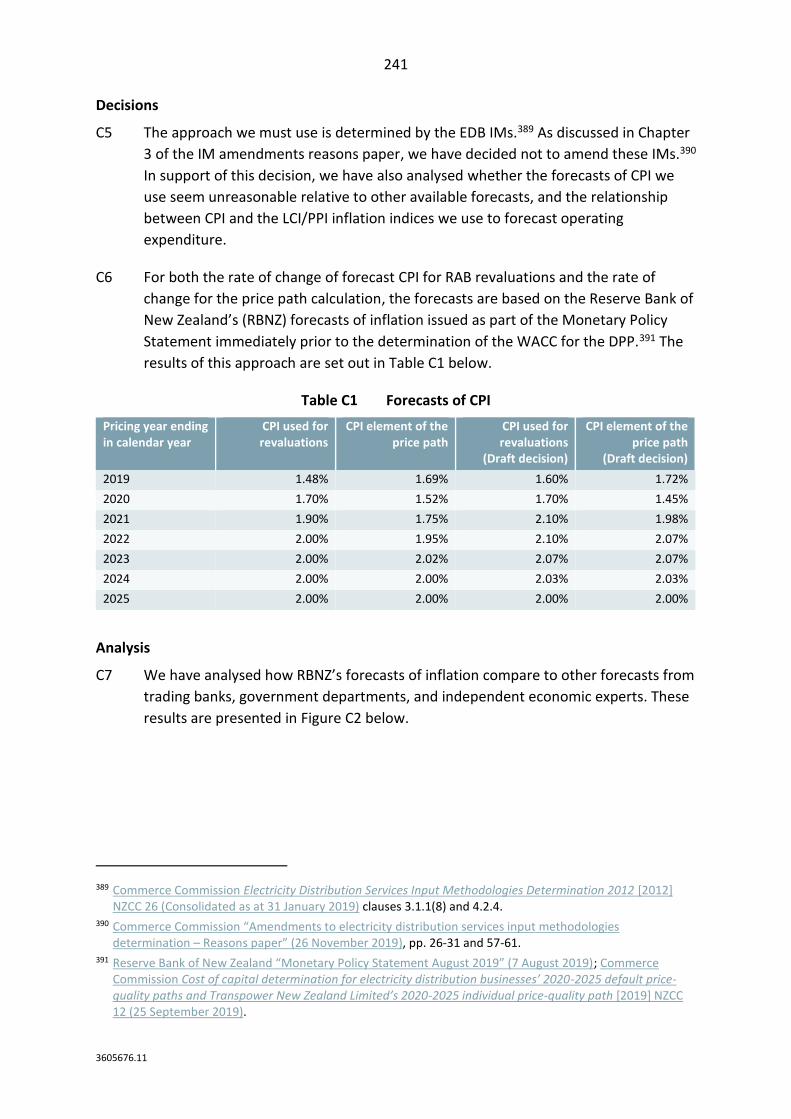
241
3605676.11
Decisions
C5 The approach we must use is determined by the EDB IMs.389 As discussed in Chapter
3 of the IM amendments reasons paper, we have decided not to amend these IMs.390
In support of this decision, we have also analysed whether the forecasts of CPI we
use seem unreasonable relative to other available forecasts, and the relationship
between CPI and the LCI/PPI inflation indices we use to forecast operating
expenditure.
C6 For both the rate of change of forecast CPI for RAB revaluations and the rate of
change for the price path calculation, the forecasts are based on the Reserve Bank of
New Zealand’s (RBNZ) forecasts of inflation issued as part of the Monetary Policy
Statement immediately prior to the determination of the WACC for the DPP.391 The
results of this approach are set out in Table C1 below.
Table C1 Forecasts of CPI
Pricing year ending in calendar year
CPI used for revaluations
CPI element of the price path
CPI used for revaluations
(Draft decision)
CPI element of the price path
(Draft decision)
2019 1.48% 1.69% 1.60% 1.72%
2020 1.70% 1.52% 1.70% 1.45%
2021 1.90% 1.75% 2.10% 1.98%
2022 2.00% 1.95% 2.10% 2.07%
2023 2.00% 2.02% 2.07% 2.07%
2024 2.00% 2.00% 2.03% 2.03%
2025 2.00% 2.00% 2.00% 2.00%
Analysis
C7 We have analysed how RBNZ’s forecasts of inflation compare to other forecasts from
trading banks, government departments, and independent economic experts. These
results are presented in Figure C2 below.
389 Commerce Commission Electricity Distribution Services Input Methodologies Determination 2012 [2012] NZCC 26 (Consolidated as at 31 January 2019) clauses 3.1.1(8) and 4.2.4.
390 Commerce Commission “Amendments to electricity distribution services input methodologies determination – Reasons paper” (26 November 2019), pp. 26-31 and 57-61.
391 Reserve Bank of New Zealand “Monetary Policy Statement August 2019” (7 August 2019); Commerce Commission Cost of capital determination for electricity distribution businesses’ 2020-2025 default price-quality paths and Transpower New Zealand Limited’s 2020-2025 individual price-quality path [2019] NZCC 12 (25 September 2019).
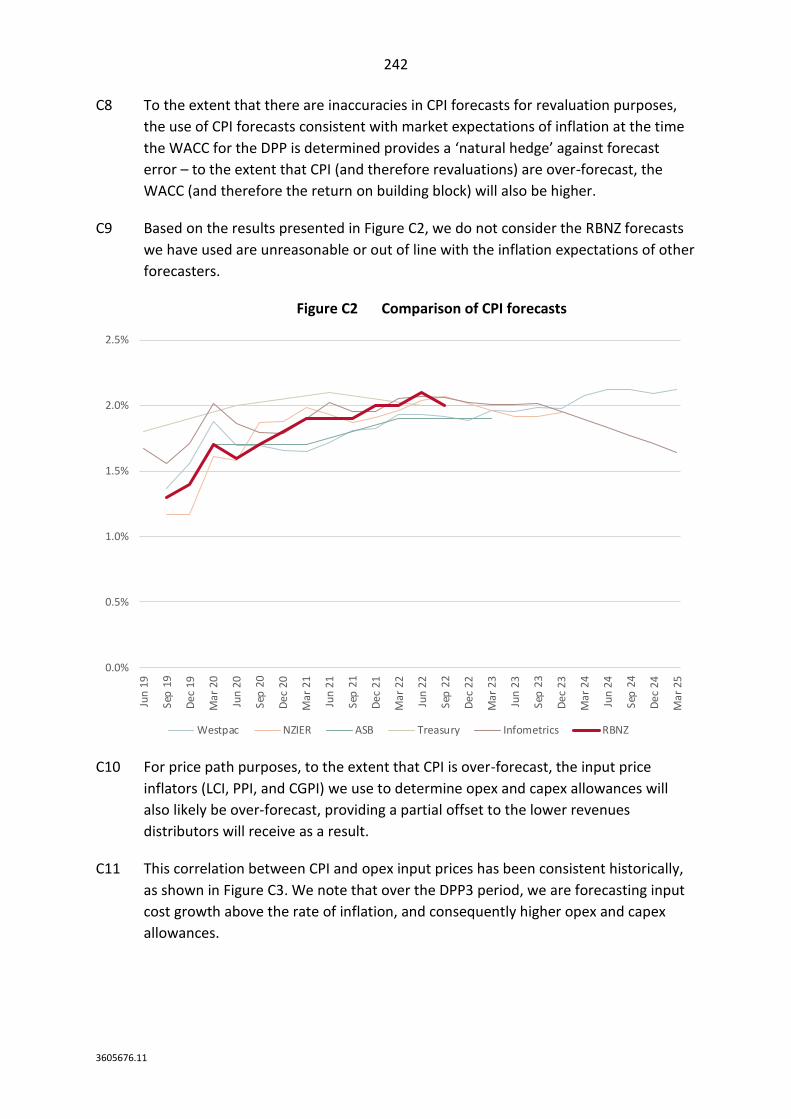
242
3605676.11
C8 To the extent that there are inaccuracies in CPI forecasts for revaluation purposes,
the use of CPI forecasts consistent with market expectations of inflation at the time
the WACC for the DPP is determined provides a ‘natural hedge’ against forecast
error – to the extent that CPI (and therefore revaluations) are over-forecast, the
WACC (and therefore the return on building block) will also be higher.
C9 Based on the results presented in Figure C2, we do not consider the RBNZ forecasts
we have used are unreasonable or out of line with the inflation expectations of other
forecasters.
Figure C2 Comparison of CPI forecasts
C10 For price path purposes, to the extent that CPI is over-forecast, the input price
inflators (LCI, PPI, and CGPI) we use to determine opex and capex allowances will
also likely be over-forecast, providing a partial offset to the lower revenues
distributors will receive as a result.
C11 This correlation between CPI and opex input prices has been consistent historically,
as shown in Figure C3. We note that over the DPP3 period, we are forecasting input
cost growth above the rate of inflation, and consequently higher opex and capex
allowances.
0.0%
0.5%
1.0%
1.5%
2.0%
2.5%
Jun
19
Sep
19
Dec
19
Mar
20
Jun
20
Sep
20
Dec
20
Mar
21
Jun
21
Sep
21
Dec
21
Mar
22
Jun
22
Sep
22
Dec
22
Mar
23
Jun
23
Sep
23
Dec
23
Mar
24
Jun
24
Sep
24
Dec
24
Mar
25
Westpac NZIER ASB Treasury Infometrics RBNZ
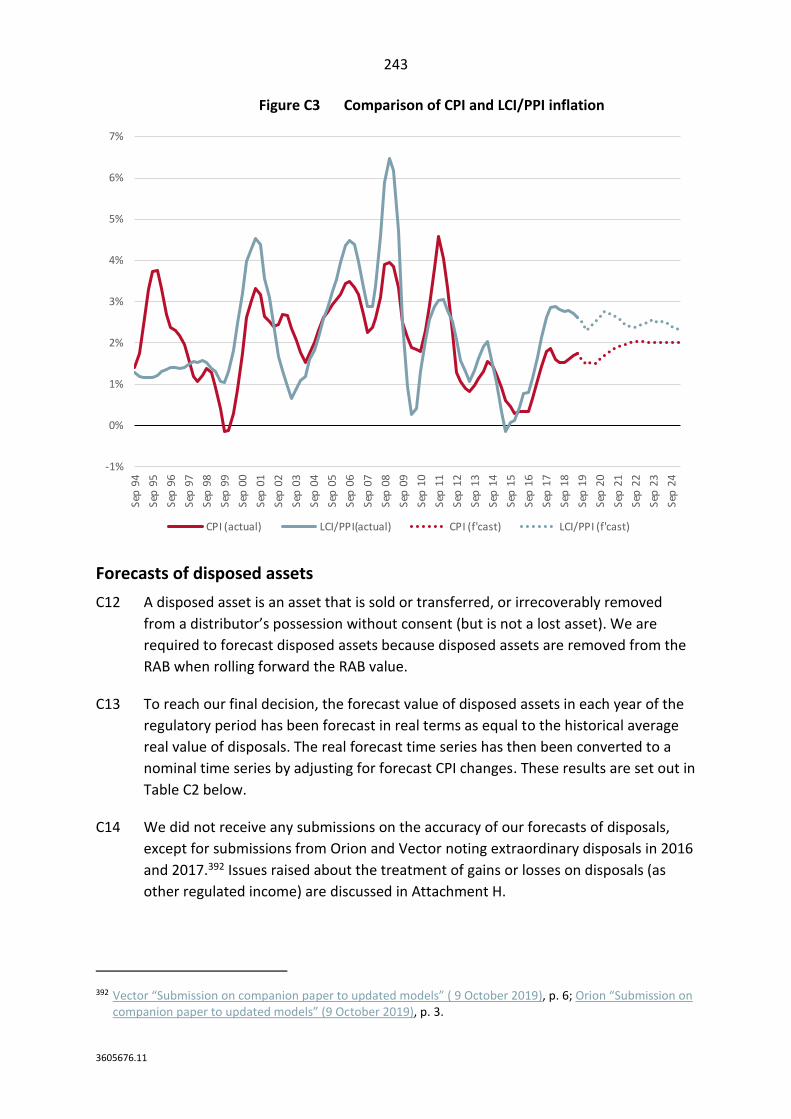
243
3605676.11
Figure C3 Comparison of CPI and LCI/PPI inflation
Forecasts of disposed assets
C12 A disposed asset is an asset that is sold or transferred, or irrecoverably removed
from a distributor’s possession without consent (but is not a lost asset). We are
required to forecast disposed assets because disposed assets are removed from the
RAB when rolling forward the RAB value.
C13 To reach our final decision, the forecast value of disposed assets in each year of the
regulatory period has been forecast in real terms as equal to the historical average
real value of disposals. The real forecast time series has then been converted to a
nominal time series by adjusting for forecast CPI changes. These results are set out in
Table C2 below.
C14 We did not receive any submissions on the accuracy of our forecasts of disposals,
except for submissions from Orion and Vector noting extraordinary disposals in 2016
and 2017.392 Issues raised about the treatment of gains or losses on disposals (as
other regulated income) are discussed in Attachment H.
392 Vector “Submission on companion paper to updated models” ( 9 October 2019), p. 6; Orion “Submission on companion paper to updated models” (9 October 2019), p. 3.
-1%
0%
1%
2%
3%
4%
5%
6%
7%Se
p 9
4
Sep
95
Sep
96
Sep
97
Sep
98
Sep
99
Sep
00
Sep
01
Sep
02
Sep
03
Sep
04
Sep
05
Sep
06
Sep
07
Sep
08
Sep
09
Sep
10
Sep
11
Sep
12
Sep
13
Sep
14
Sep
15
Sep
16
Sep
17
Sep
18
Sep
19
Sep
20
Sep
21
Sep
22
Sep
23
Sep
24
CPI (actual) LCI/PPI(actual) CPI (f'cast) LCI/PPI (f'cast)
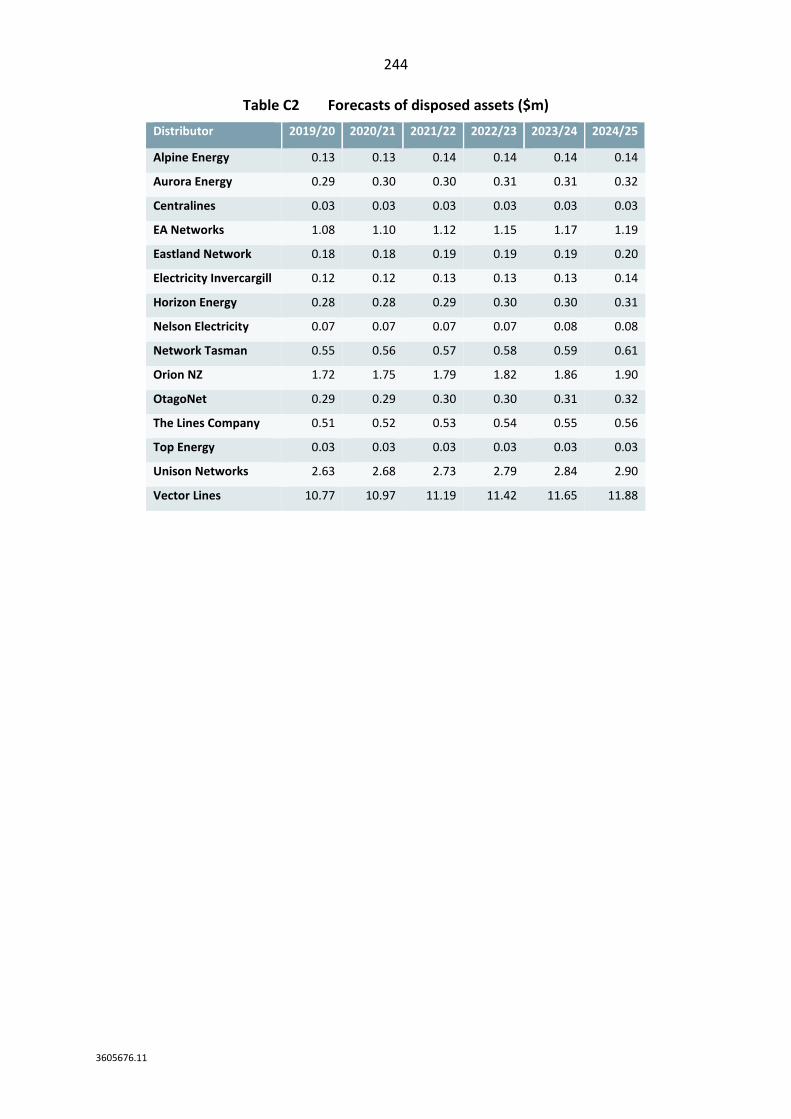
244
3605676.11
Table C2 Forecasts of disposed assets ($m)
Distributor 2019/20 2020/21 2021/22 2022/23 2023/24 2024/25
Alpine Energy 0.13 0.13 0.14 0.14 0.14 0.14
Aurora Energy 0.29 0.30 0.30 0.31 0.31 0.32
Centralines 0.03 0.03 0.03 0.03 0.03 0.03
EA Networks 1.08 1.10 1.12 1.15 1.17 1.19
Eastland Network 0.18 0.18 0.19 0.19 0.19 0.20
Electricity Invercargill 0.12 0.12 0.13 0.13 0.13 0.14
Horizon Energy 0.28 0.28 0.29 0.30 0.30 0.31
Nelson Electricity 0.07 0.07 0.07 0.07 0.08 0.08
Network Tasman 0.55 0.56 0.57 0.58 0.59 0.61
Orion NZ 1.72 1.75 1.79 1.82 1.86 1.90
OtagoNet 0.29 0.29 0.30 0.30 0.31 0.32
The Lines Company 0.51 0.52 0.53 0.54 0.55 0.56
Top Energy 0.03 0.03 0.03 0.03 0.03 0.03
Unison Networks 2.63 2.68 2.73 2.79 2.84 2.90
Vector Lines 10.77 10.97 11.19 11.42 11.65 11.88
245
3605676.11
Attachment D Accelerated depreciation
Purpose of this attachment
D1 Vector provided the Commission with a notice on 28 February 2019 proposing an
adjustment factor under clause 4.2.2(5) of the electricity distribution business IMs
for an accelerated rate of depreciation.
D2 This attachment provides a brief background, explaining that we introduced in our
2016 IM review a mechanism allowing distributors to apply for a discretionary
adjustment factor reflecting the net present value-neutral shortening of their
remaining asset lives to mitigate risks of partial capital recovery and outlines our
consideration of Vector’s application and reasoning for choosing not to apply an
adjustment factor.
High-level approach
D3 Clause 4.2.2 of the Input Methodologies provides that the Commission may apply an
adjustment factor for accelerated depreciation on the application of a party.
D4 We have decided not to apply an adjustment factor in response to Vector’s
application, based on weighing up our assessment of Vector’s application against the
formal IM requirements, the risk of economic stranding, section 52A of the Act and
exercising our overall discretion. Having assessed Vector’s application against our
framework (which is set out below), we found that:
D4.1 it was not clear to us whether Vector’s application has met the criteria set
out in clause 4.2.2 of our IMs because Vector did not explain how it had
taken into account any issues raised in consultation, nor specified that no
relevant issues were raised, however we did not have to resolve this because
we declined Vector’s application for other reasons;
D4.2 we did not find evidence of a material risk to partial capital recovery with
respect to Vector, which was the underlying purpose of the IMs providing for
the adjustment factor;
D4.3 we did not find that applying the adjustment factor Vector sought promoted
the purpose of Part 4 of the Act; and
D4.4 in considering our overall discretion we had regard to the interests of
avoiding a price increase (or reduction in the price decrease) and not adding
complexity
246
3605676.11
Background
D5 As a result of our 2016 IM review, we introduced a mechanism in our IMs allowing
distributors to apply for a discretionary net present value-neutral shortening of their
remaining asset lives. This mechanism allows distributors to apply for new asset lives
based on their assets’ expected economic lives, rather than their physical asset
lives.393
D6 In 2018, we made further IM implementation changes to better give effect to our
2016 IM review decision.394
D7 No later than 13 months prior to the commencement of DPP3, distributors may
apply to us for ‘an adjustment factor’.395
D8 On 28 February 2019 Vector submitted a notice to us requesting that we apply a 0.85
adjustment factor under our IMs.396 On 14 March 2019, we sought feedback on
Vector’s application, and we received comments from several interested parties.397
D9 On 29 May 2019 we made the draft decision to decline Vector’s application for
accelerated depreciation. We received submissions on our draft decisions, including
five submissions that specifically referred to our draft decision on Vector’s
application from the following parties:398
D9.1 Major Electricity Users Group (MEUG);
D9.2 Contact;
D9.3 Entrust;
D9.4 ERANZ; and
393 Commerce Commission “Input methodologies review decisions: Topic paper 3: The future impact of emerging technologies in the energy sector” (20 December 2016), para 84-86.
394 Commerce Commission Electricity Distribution Services Input Methodologies (Accelerated Depreciation) Amendments Determination 2018 [2018] NZCC19 (8 November 2018).
395 Commerce Commission Electricity Distribution Services Input Methodologies Determination 2012 [2012] NZCC 26 (Consolidated as at 31 January 2019), clause 4.2.2(5).
396 Vector “Notice to Commerce Commission for Accelerated Depreciation Adjustment Factor” (28 February 2019)
397 ENA “Vector – Accelerated depreciation application” (29 March 2019); MEUG “Vector – accelerated depreciation application” (28 March 2019); Mercury “Vector – Accelerated depreciation application” (1 April 2019); Meridian Energy “Vector – Accelerated depreciation application” (29 March 2019); Powerco “Comments on Vector’s application for accelerated depreciation” (29 March 2019) Vector “Vector – Accelerated depreciation application” (29 March 2019).
398 MEUG “Submission on EDB DPP reset draft decisions paper” (18 July 2019); Contact Energy “Submission on EDB DPP reset draft decisions paper” (18 July 2019); Entrust “Submission on EDB DPP reset draft decisions paper” (18 July 2019); ERANZ “Submission on EDB DPP reset draft decisions paper” (18 July 2019); and Vector “Submission on EDB DPP reset draft decisions paper” (18 July 2019).
247
3605676.11
D9.5 Vector.
D10 Vector’s submission on our draft decision did not sufficiently clarify the basis of
suggesting that there is a heightened risk of partial capital recovery in the future or
otherwise persuade us to alter our position. While the submission from Vector and
its major shareholder Entrust disagreed with our draft decision to decline its
application, the other submissions above supported our draft decision. The specific
points raised in these submissions are responded to throughout this attachment.
Our framework for assessing adjustment factor applications
D11 The Commission has overall discretion in deciding whether to accept an application
to apply an adjustment factor at what level because the input methodologies state
that “…the Commission may apply adjustment factors…”. In exercising that
discretion, we have considered the following factors:
D11.1 Our assessment of whether the application has met the specified criteria set
out at clause 4.2.2(5) of the IMs;
D11.2 Our assessment of whether there is a material risk of partial economic
recovery, by which we mean a situation in which the level of demand or
willingness to pay for distribution services across its network means that the
distributor is unable to fully charge up to the level of revenue allowed for
under its price path;
D11.3 Whether making the adjustment factor applied for would advance the
purpose of Part 4 as set out in section 52A399; and
D11.4 Whether as a matter of overall discretion the Commission should approve
the adjust factor applied for.
Criteria specified in the IMs
D12 The first factor that we consider is whether the application for an adjustment met
the specific IM requirements. To meet those requirements, a distributor must submit
a notice meeting each of the requirements in clauses 4.2.2(5)(a)(i), 4.2.2(5)(a)(ii) and
4.2.2(5)(a)(iii) of the EDB IMs; namely:
D12.1.1 proposing an adjustment factor of not lower than 0.85, nor higher
than 1, as required under clause 4.2.2(5)(a)(i) of the EDB IMs;
399 Our framework for decision making for the DPP, particularly through consideration of the purpose of Part 4 of the Act, is described in Chapter 3.
248
3605676.11
D12.1.2 explaining why applying an adjustment factor of the level
proposed would be consistent with section 52A of the Act, as
required under clause 4.2.2(5)(a)(ii) of the EDB IMs; and
D12.1.3 describing any consultation it has undertaken with interested
persons on the proposed adjustment factor and, if relevant,
explaining how it has taken into account any issues raised, as
required under clause 4.2.2(5)(a)(iii) of the EDB IMs; and
D12.2 we must not have previously applied adjustment factors, as specified in
clause 4.2.2(5)(b) of the EDB IMs.
Material risk of partial economic recovery
D13 In assessing whether there is a material risk of partial economic recovery we mean a
situation in which the level of demand or willingness to pay for distribution services
across its network is such that the distributor is unable to fully charge up to the level
of revenue allowed for under its price path (which we call economic stranding, in
contrast to physical stranding).
D14 It was economic stranding that our accelerated depreciation IM changes were
intended to address. We explained its purpose in the 2016 IMs review reason paper:
We have decided to implement a ‘net present value (NPV) neutral’ risk mitigation measure.
We consider that the best way to reflect the higher uncertainty attached to the magnitude
and direction of the risk of partial capital recovery is to allow EDBs to apply for a
discretionary NPV-neutral shortening of their remaining asset lives. This would happen at the
time of the DPP reset.400
D15 We were specific that the IM mechanism was to address the risk of economic
stranding, rather than any risk of physical asset stranding:
The IMs allow for assets to stay in the RAB even though they have ceased to be used (ie,
become physically stranded). Therefore, physical asset stranding is not the risk under
consideration. Rather, it is the risk that the network becomes economically stranded. That is,
the risk is that at some future point enough consumers elect to disconnect from EDBs’
networks such that the revenue EDBs are able to recover from the remaining customer base
is insufficient to allow them to fully recover their historic capital investment (hence the title
‘risk of partial capital recovery’). This is because prices to those remaining consumers would
need to rise beyond their willingness to pay given their economic alternatives (or beyond
politically acceptable levels).401
400 Commerce Commission “Input methodologies review decisions - Consolidated reasons paper” (20 December 2016), p. 576
401 Commerce Commission “Input methodologies review decisions - Topic paper 3: The future impact of emerging technologies in the energy sector” (20 December 2016), paras 72 and 84.
249
3605676.11
D16 In its comments on Vector’s notice, ENA indicated that adjustment factors should be
used “wherever it is needed to mitigate stranding risk and to maintain investor
confidence”.402 In our draft decision, we explained that we agreed with this framing.
D17 However, MEUG disagreed with this in its submission on our draft decision,
submitting that “Using “wherever” is too absolute given future stranding risk and
investor confidence is uncertain and should be considered in a probabilistic range of
possible outcomes”.403 We accept MEUG’s submission, and as such point and
reiterate that we assess applications for accelerated depreciation against the risk of
economic stranding, not physical stranding.
D18 While our consideration is that of the risk of future partial recovery of capital to
support an ex-ante expectation of real financial capital maintenance, we also note
that we explained in the IMs reasons paper that we did not intend for the
mechanism to eliminate all risk of partial capital recovery in the IMs reasons
paper.404
Promote the purpose of Part 4
D19 In exercising our discretion under clause 4.2.2(4) of the EDB IMs, we must consider
whether applying any adjustment factor (and if so, what level of adjustment factor)
would promote the outcomes specified in section 52A of the Act, where suppliers of
regulated goods or services:
D19.1 have incentives to innovate and to invest, including in replacement,
upgraded, and new assets;405
D19.2 have incentives to improve efficiency and provide services at a quality that
reflects consumer demands;406
D19.3 share with consumers the benefits of efficiency gains in the supply of the
regulated goods or services, including through lower prices;407 and
D19.4 are limited in their ability to extract excessive profits.408
402 ENA “Vector – Accelerated depreciation application” (29 March 2019), p. 1. 403 MEUG “Submission on EDB DPP reset draft decisions paper” (18 July 2019), paragraph 28. 404 Commerce Commission “Input methodologies review decisions - Consolidated reasons paper” (20
December 2016) 405 Commerce Act 1986, section 52A(1)(a). 406 Commerce Act 1986, section 52A(1)(b). 407 Commerce Act 1986, section 52A(1)(c). 408 Commerce Act 1986, section 52A(1)(d).
250
3605676.11
Overall discretion
D20 In exercising our overall discretion, we will look at whether there are any other
factors (outside the IM criteria, the risk of partial economic recovery and the
purpose of Part 4) that means we should or should not make an adjustment.
D21 An example of a factor we may consider in applying our overall discretion is pricing
impact, which is in line with our statement at the time of the IM review that “We will
then review this proposal, giving consideration to its impact on pricing.”409
General comments on the application
D22 Overall, we consider that despite a relatively low level of evidence being required
given the low-cost nature of the DPP, Vector did not include sufficiently convincing
evidence in its application.
D23 In its application, Vector’s key reasoning for the appropriateness of an adjustment
factor was its view of a material risk of partial economic recovery. However, the
application did not include the basis of the scenarios which it modelled. Given that it
is the outputs of this scenario modelling that was provided as evidence of the risk,
the application should have laid out the basis of the different scenarios to show
whether they are at all likely and whether actions by the distributor could avoid
these scenarios (such as through pricing reform). It also should have included the
numeric outputs of the modelling.
D24 Also, as described above, Vector’s application did not clearly state whether any
specific issues were raised in consultation and if so, what these issues were.
Our assessment of Vector’s application against the specific IM requirements
D25 This section describes how Vector’s application generally met the specific
requirements of the IMs for applications for accelerated depreciation, consisting of:
D25.1 Adjustment factor: The application must propose an adjustment factor of
not lower than 0.85, nor higher than 1, as required under clause
4.2.2(5)(a)(i) of the EDB IMs;
D25.2 Consistency with Part 4 purpose: The application must explain why applying
an adjustment factor of the level proposed would be consistent with section
52A of the Act, as required under clause 4.2.2(5)(a)(ii) of the EDB IMs; and
409 Commerce Commission “Input methodologies review decisions: Report on the IM review” (20 December 2016), paragraph 94.
251
3605676.11
D25.3 Consultation: The application must describe any consultation it has
undertaken with interested persons on the proposed adjustment factor
and, if relevant, explaining how it has taken into account any issues raised,
as required under clause 4.2.2(5)(a)(iii) of the EDB IMs; and
D25.4 Previous adjustment factor: We must not have previously applied
adjustment factors, as specified in clause 4.2.2(5)(b) of the EDB IMs.
D26 However, we note that it was difficult to completely assess whether all of the
consultation requirements have been met.
Adjustment factor
D27 To meet clause 4.2.2(5)(a)(i) of the EDB IMs, Vector must have proposed an
adjustment factor of not lower than 0.85, nor higher than 1.
D28 Our decision is that Vector has met clause 4.2.2(5(a)(i) as it has proposed in its notice
an adjustment factor of 0.85.410
Consistency with Part 4 purpose
D29 To meet clause 4.2.2(5)(a)(ii) of the EDB IMs, Vector must have explained why
applying an adjustment factor of 0.85 would be consistent with section 52A of the
Act.
D30 Our decision is that Vector has met clause 4.2.2(5)(a)(ii) of the EDB IMs as its notice
provides an explanation of why it considers that applying an adjustment factor of
0.85 would be consistent with section 52A of the Act. It has described each of the
outcomes that Part 4 of the Act promotes and has explained why it considers that its
adjustment factor proposed is consistent with those outcomes.411 For the avoidance
of doubt, we note that by deciding that Vector has met clause 4.2.2(5)(a)(ii) we are
not providing any indication on whether an adjustment factor would be consistent
with section 52A of the Act.
D31 In paragraphs D58 to D83, we identify the text Vector has used to explain why it
considers that the adjustment factor it has proposed is consistent with the outcomes
that Part 4 of the Act promotes.
D32 Section 52A(1)(a) of the Act promotes an outcome where suppliers of regulated
goods or services have incentives to innovate and to invest, including in
replacement, upgraded, and new assets.
410 Vector “Notice to Commerce Commission for Accelerated Depreciation Adjustment Factor” (28 February 2019), p 3.
411 Vector “Notice to Commerce Commission for Accelerated Depreciation Adjustment Factor” (28 February 2019), paras 73-84.
252
3605676.11
D33 Vector has said that:
As discussed above, applying the depreciation adjustment lever will provide confidence for EDB
investors to make investments in long-life physical assets with the expectation that NPV=0 and FCM
will be adhered to. Otherwise replacing long-life physical structures cannot be financed economically
if this expectation does not hold. This is especially important where greater technology adoption is
anticipated to compromise capital recovery.412
D34 Section 52A(1)(b) of the Act promotes an outcome where suppliers of regulated
goods or services have incentives to improve efficiency and provide services at a
quality that reflects consumer demands. Vector has said that:
The Notice notes a significant driver for capital programs is the prescribed regulatory quality
standards applied onto EDBs. Accordingly, it is important for these standards to reflect customer
expectations and for investment to ensure standards are indeed a fair reflection of customer
expectations. EDBs are at risk of quality regulations becoming out-of-step with customer expectations
especially in an era of energy technology change. Therefore, investing to meet quality regulations
does increase the risk for EDBs, as has been shown from quality regulations applied in NSW and QLD,
discussed later in this notice, where reliability standards were found to be out-of-step with customer
expectations.413
D35 Section 52A(1)(c) of the Act promotes an outcome where suppliers of regulated
goods or services share with consumers the benefits of efficiency gains in the supply
of the regulated goods or services, including through lower prices. Vector has said
that:
The use of the depreciation adjustment lever is NPV neutral, however we demonstrate in this Notice
the application of the lever will deliver intergenerational equity for customers at a time when
technology adoption may cause price increase for customers and so will moderate any price increase
from technology scenarios where this occurs. The use of the lever will also deliver greater fairness
between customers as deprivation from new technology adoption where current technology trends
continue is expected to exacerbate over time. Therefore, the lever will moderate the extent of any
bifurcation between technology adopters and customers unable to access the new options.414
412 Vector “Notice to Commerce Commission for Accelerated Depreciation Adjustment Factor” (28 February 2019), para 84(a).
413 Vector “Notice to Commerce Commission for Accelerated Depreciation Adjustment Factor” (28 February 2019), para 84(b).
414 Vector “Notice to Commerce Commission for Accelerated Depreciation Adjustment Factor” (28 February 2019) para 84(c).
253
3605676.11
D36 Section 52A(1)(d) of the Act promotes an outcome where suppliers of regulated
goods or services are limited in their ability to extract excessive profits. Vector has
said that:
As noted above, the use of the depreciation adjustment lever is still consistent with the Part 4
concept of NPV=0 which ensures EDBs can earn no more than a normal return on their investment.
Rather the use of the lever will ensure greater inter-generational equity and fairness across
customers to moderate the impact technology change is expected to have on network cost
recovery.415
Consultation
D37 To meet clause 4.2.2(5)(a)(iii) of the EDB IMs, Vector should have described any
consultation it has undertaken with interested persons on its proposed adjustment
factor and, if relevant, explained how it has taken into account any issues raised.
D38 Vector has described the consultation it has undertaken with interested persons on
the proposed adjustment factor in its application. However, Vector’s notice has not
identified any issues raised by interested persons as part of its consultation, making
it difficult to determine:
D38.1 whether any relevant issues were raised by interested persons on the
proposed adjustment factor; and
D38.2 whether Vector has taken into account any relevant issues raised by
interested persons on the proposed adjustment factor.
D39 Vector’s application describes:
D39.1 how it raised the topic of our depreciation adjustment factor with its
customer advisory board (CAB), where the CAB “recognised the merits of
the technology risk to capital recovery and acknowledged the Vector case
for lodging a Notice”;416 and
D39.2 how it undertook a customer survey focused on the residential customer
segment of Vector’s network, representing over 85% of ICPs,417 which:
D39.2.1 asked customers to determine their views on whether:
415 Vector “Notice to Commerce Commission for Accelerated Depreciation Adjustment Factor” (28 February 2019), para 84(d).
416 Vector “Notice to Commerce Commission for Accelerated Depreciation Adjustment Factor” (28 February 2019), para 106.
417 Vector “Notice to Commerce Commission for Accelerated Depreciation Adjustment Factor” (28 February 2019), para 109.
254
3605676.11
“a) New technology was creating more uncertainty for future demand for
networks and if they agreed this was increasing the risk for network
investment; and
b) They would be prepared to pay more for their electricity network now to
support the intergenerational equity for networks.”418; and
D39.2.2 found that 66 percent of respondents agreed that investing in
networks is riskier than before;419 and
D39.2.3 found that 68 percent of respondents were prepared to pay more
for the network today to avoid intergenerational inequity”.420
D40 Clause 4.2.2(5)(a)(iii) of the EDB IMs also requires, “if relevant”, an explanation in the
notice of how the applicant “has taken into account any issues raised” by interested
persons during the proposed adjustment factor consultation.
D41 Vector’s notice has not identified any specific issues raised by interested persons as
part of the consultation summarised in paragraphs D32.1-D33.2, nor confirmed
whether no relevant issues were raised. This makes it difficult to determine:
D41.1 whether any relevant issues were raised by interested persons on the
proposed adjustment factor; and
D41.2 whether Vector has taken into account any relevant issues raised by
interested persons on the proposed adjustment factor.
D42 If relevant issues were raised by interested persons on the proposed adjustment
factor, Vector’s notice would have needed to explain how it had taken those issues
into account.
D43 Given the lack of detail provided by Vector, we found it difficult to assess this
criterion. We are inclined to the view that the applicant has not established that
clause 4.2.2(5)(a)(iii) is satisfied. However, we do not find it necessary to reach a final
conclusion given our conclusions on the other factors.
D44 Vector outlined concerns in its submission on our draft decision about our
expectations for applications:
418 Vector “Notice to Commerce Commission for Accelerated Depreciation Adjustment Factor” (28 February 2019), para 107.
419 Vector “Notice to Commerce Commission for Accelerated Depreciation Adjustment Factor” (28 February 2019), para 109.
420 Vector “Notice to Commerce Commission for Accelerated Depreciation Adjustment Factor” (28 February 2019), para 109.
255
3605676.11
we are concerned with the lack of clarify about what is required to support an accelerated
depreciation application. Given that that option is intended to operate under the low cost
DPP framework, preparing such an application should also be low cost and the Commission’s
consideration of it should reflect that.421
D45 We appreciate Vector’s concerns and intend to issue further guidance on the matter
on the future.
Previous adjustment factor
D46 To meet clause 4.2.2(5)(b) of the EDB IMs, we must not have used clause 4.2.2(4) of
the EDB IMs to apply adjustment factors for Vector.
D47 As we have not used clause 4.2.2(4) of the EDB IMs to apply adjustment factors for
any distributor, our decision is that this requirement is satisfied.
Assessment of whether there is a material risk of partial economic recovery
D48 We have considered the material in Vector’s notice and the submissions received
following our consultation and draft decision. This material has not convinced us that
there is a sufficient risk of partial economic recovery to warrant application of
accelerated depreciation now.
D49 In Vector’s notice it suggests that:
D49.1 network stranding puts financial capital maintenance at risk; and
D49.2 only partial capital recovery is likely on the basis of its scenario modelling.422
D50 Based on the information provided in Vector’s notice and subsequent consultation,
our decision is that there is insufficient evidence to demonstrate that Vector faces a
material risk of economic stranding.
D51 Vector’s customer technology scenario modelling is essential to providing evidence
for its assertion that its adjustment factor should be applied. The modelling evidence
needs to be reasonably persuasive that network stranding is a sufficiently
established risk.
421 Vector “Submission on EDB DPP reset draft decisions paper” (18 July 2019), paragraph 42. 422 Vector “Notice to Commerce Commission for Accelerated Depreciation Adjustment Factor” (28 February
2019), para 74-83.
256
3605676.11
D52 Paragraphs 83, 99 and 101 of Vector’s notice provide some of the key outputs of the
scenario analysis. They are that:
The modelling shows multiple scenarios where partial capital recovery is likely.
The review found that three scenarios produced significant year-on-year price increases for
customers. The price rebalancing by accelerating depreciation would provide some reprieve
to the sustained price increases expected by customers in some scenarios.
Importantly, the review found the magnitude of the expected sustained price will not be
adequately rebalanced by the depreciation adjustment factor capped at a maximum of 15
percent.
D53 There is no support in Vector’s notice for the statements of key outputs quoted
above. There is no quantification of any partial capital recovery, no quantification of
price rises, or what an adequate rebalancing would be.
D54 When we commenced work on our IM review that was completed in 2016, there
was much discussion of the risk for distribution networks of many disconnections as
consumers go off-grid. This reduction in use of the assets could result in a price for
use that becomes greater than consumers’ willingness to pay, exacerbating the
exodus or requiring a reduction in price below that which results in a normal return.
It was in that context that we consulted on and implemented the adjustment factor
provision in the IMs.
D55 The industry emerging view would now seem to be that distribution networks will
continue to be essential for most consumers, and that the prospect of high market
share for electric vehicles reinforces this. However, the nature of the use of
electricity distribution services may change for some consumers, increasing the
importance of tariff reform towards cost-reflective and service-based pricing.
D56 It is not clear from Vector’s notice or from its AMPs how its network would become
economically stranded in this wider context.
Our assessment of Vector’s application against the purpose of Part 4
D57 Our assessment of Vector’s notice and the submissions received following our
consultation and draft decision is that applying an adjustment factor would not
promote the outcomes specified in section 52A of the Act.
Would applying an adjustment factor for Vector promote the outcome specified in section 52A(1)(a) of the Act?
D58 Section 52A(1)(a) of the Act specifies an outcome where suppliers of regulated goods
or services have incentives to innovate and to invest, including in replacement,
upgraded, and new assets.
257
3605676.11
D59 In Vector’s notice it suggests that:
D59.1 network stranding puts financial capital maintenance at risk; and
D59.2 only partial capital recovery is likely on the basis of its scenario modelling.423
D60 Accordingly, Vector’s rationale under section 52A(1)(a) is to assert the risk of
economic stranding.
D61 As explained in paragraphs D48-D56, it is our view that Vector has not provided
evidence to show sufficiently increased risk of partial economic stranding, so we
have not found this to contribute to promoting the outcome specified in
section 52A(1)(a).
D62 In its submission on our draft decision, Vector also suggested that we should
consider the financeability of the planned network investment in assessing whether
accelerated depreciation would better support the purpose of Part 4 of the Act.424
D63 We disagree that accelerated depreciation should be applied to support
financeability because we consider that the primary incentives for investment
through the price path remain through time and changes in investment levels. We
expect that the ex-ante expectation of normal returns enables sufficient financing of
the business.
D64 The Commission does not consider that enabling distributors to maintain a relatively
constant level of equity in absolute terms is required to support the purpose of
Part 4 of the Act. Consistent with businesses in competitive markets, we expect that
an ex-ante expectation of a real return is sufficient to garner finance and that the
business may choose to increase equity (for example through reduced dividend
payments) or debt.
D65 If faced with lumpy investment profiles, it is not uncommon for businesses to raise
additional capital, through debt or equity, to fund that investment rather than being
able to finance it solely from operating cash flows. If an individual distributor’s
unique situation requires means that a regulatory response to financeability is
instead required, we consider that a CPP would be a more appropriate instrument.
423 Vector “Notice to Commerce Commission for Accelerated Depreciation Adjustment Factor” (28 February 2019), para 74-83.
424 Vector “Submission on EDB DPP reset draft decisions paper” (18 July 2019).
258
3605676.11
D66 In terms of financial structuring, we note that we seek to incentivise distributors to
maintain an investment grade credit rating (by estimating our debt premium with
reference to an investment grade bond), and distributors can adopt any financial
structuring approach that is consistent with that.
D67 Accordingly, we do not consider that Vector’s notice demonstrates that applying an
adjustment factor for Vector promote the outcome specified in section 52A(1)(a) of
the Act.
D68 We have also considered whether accelerated depreciation would better promote
the other limbs of the section 52A of the Act, as explained below.
Would applying an adjustment factor for Vector promote the outcome specified in section 52A(1)(b) of the Act?
D69 Section 52A(1)(b) of the Act specifies an outcome where suppliers of regulated
goods or services have incentives to improve efficiency and provide services at a
quality that reflects consumer demands.
D70 In its notice, Vector suggests that an adjustment factor is needed, in part, because of
the risk that quality regulation becomes “out-of-step with customer expectations”,
where investing to meet quality regulations increases the risk for distributors.425 In
Vector’s view, examples from Australia (New South Wales and Queensland) indicate
that investment is needed “where reliability standards were found to be out-of-step
with customer expectations.”426
D71 Based on the information provided in Vector’s notice and subsequent consultation,
our decision is that applying an adjustment factor would not promote an outcome of
Vector having:
D71.1 incentives to improve efficiency; and
D71.2 incentives to provide services as a quality that reflects consumer demands.
D72 While we must always remain wary of imposing quality standards that lead to
inefficient levels of investment, as we discuss in Attachment L, we have
implemented several measures in setting quality incentives to avoid this.
425 Vector “Notice to Commerce Commission for Accelerated Depreciation Adjustment Factor” (28 February 2019), para 84(b).
426 Vector “Notice to Commerce Commission for Accelerated Depreciation Adjustment Factor” (28 February 2019), para 84(b) and 111-118.
259
3605676.11
D73 Furthermore, the examples cited from the Australian context concern deterministic
grid planning standards (akin to those used by Transpower), and not the outcome-
based measures of reliability we use for the DPP, we do not consider this risk applies.
D74 We also consider that the Part 4 framework offers the flexibility to deal with specific
circumstances that a distributor may encounter that cannot be catered for under a
DPP approach. This includes the option of applying for a CPP or a variation of its
quality standards where this would be a more appropriate response to delivering the
long-term interests of consumers. However, this is a decision that each distributor
will need to make based upon its own circumstances and specific needs of its
business and the long-term interests of its consumers.
D75 Accordingly, we do not consider that Vector’s notice demonstrates that applying an
adjustment factor for Vector promote the outcome specified in section 52A(1)(b) of
the Act.
Would applying an adjustment factor for Vector promote the outcome specified in section 52A(1)(c) of the Act?
D76 Section 52A(1)(c) of the Act specifies an outcome where suppliers of regulated goods
or services share with consumers the benefits of efficiency gains in the supply of the
regulated goods or services, including through lower prices. According to Vector:
The use of the depreciation adjustment lever is NPV neutral, however we demonstrate in this Notice
the application of the lever will deliver intergenerational equity for customers at a time when
technology adoption may cause price increase for customers and so will moderate any price increase
from technology scenarios where this occurs. The use of the lever will also deliver greater fairness
between customers as deprivation from new technology adoption where current technology trends
continue is expected to exacerbate over time. Therefore, the lever will moderate the extent of any
bifurcation between technology adopters and customers unable to access the new options.427
D77 We do not consider that intergenerational equity or fairness in respect of customer
deprivation from new technology adoption are relevant to our consideration of
whether applying adjustment factors would promote an outcome of Vector sharing
with consumers the benefits of efficiency gains in the supply of electricity lines
services, including through lower prices.
D78 Our position on intergenerational equity not being relevant is supported by ERANZ’s
submission on our draft decision.428
427 Vector “Notice to Commerce Commission for Accelerated Depreciation Adjustment Factor” (28 February 2019) para 84(c).
428 ERANZ “Submission on EDB DPP reset draft decisions paper” (18 July 2019)
260
3605676.11
D79 We note that the assumptions in Vector’s scenario quoted above depend on pricing
structures that reflect current volumetric charges. As noted in our discussion on
innovation in Chapter 4, the Electricity Authority and distributors are currently
undertaking work to examine how pricing structures may need to change in the
future. Such changes may be as or more effective at mitigating these risks than
accelerated recovery of assets.
D80 Based on the information provided in Vector’s notice and subsequent consultation,
our decision is that applying an adjustment factor would not promote an outcome of
Vector sharing with consumers the benefits of efficiency gains in the supply of the
regulated goods or services, including through lower prices.
Would applying an adjustment factor for Vector promote the outcome specified in section 52A(1)(d) of the Act?
D81 Section 52A(1)(d) of the Act specifies an outcome where suppliers of regulated
goods or services are limited in their ability to extract excessive profits. Vector states
that:
As noted above, the use of the depreciation adjustment lever is still consistent with the Part 4
concept of NPV=0 which ensures EDBs can earn no more than a normal return on their investment.
Rather the use of the lever will ensure greater inter-generational equity and fairness across
customers to moderate the impact technology change is expected to have on network cost
recovery.429
D82 As noted above, we do not consider that intergenerational equity and ‘fairness’
between customers are relevant to the limitation of excessive profits.
D83 While Vector’s point that the adjustment is net present value neutral means that it
would not be contrary to the purpose of limiting Vector’s ability to extract excessive
profits, nor would it promote that purpose.
D84 Based on the information provided in Vector’s notice and subsequent consultation,
our decision is that applying an adjustment factor would not promote an outcome of
Vector being limited in its ability to extract excessive profits.
429 Vector “Notice to Commerce Commission for Accelerated Depreciation Adjustment Factor” (28 February 2019), para 84(d).
261
3605676.11
Our overall exercise of discretion
D85 In its submission on our draft decision to not apply an adjustment factor, Entrust said
that it “considers that Vector provided strong and compelling evidence, specific to
Auckland’s circumstances, which justify accelerated depreciation”.430 We disagree
that Vector has provided strong and compelling evidence, as explained in the
remainder of this attachment.
D86 Our view is that applying an adjustment factor would not provide long-term benefit
to consumers. On the contrary, we consider there is a risk that it might be to the
detriment of consumers, because it may lead to:
D86.1 a short-term relative increase in prices for consumers; or
D86.2 increased complexity of the regulatory settings.
D87 Vector did not provide a forecast of the effect of its proposed adjustment factor on
its prices. However, our initial estimates were applying the maximum accelerated
depreciation (ie, using a factor 0.85) would initially increase a distributor’s prices by
4% to 7%. We consider that such an immediate price increase for consumers is
against their interests in a direct sense, which we have considered against any
potential benefits of an adjustment factor.
D88 We explicitly noted in our issues paper on DPP3 that reducing unnecessary
complexity and compliance costs is a consideration for our decision making. We
consider that the application of an adjustment factor to a distributor’s assets will
create additional complexity, which is a relevant for our consideration of Vector’s
application. For example, it could make performance analysis of the distributors
(particularly comparative analysis) more difficult.
430 Entrust “Submission on EDB DPP reset draft decisions paper” (18 July 2019), page 5.
262
3605676.11
Attachment E Incentives to improve efficiency
Purpose of this attachment
E1 This attachment sets out our final decisions relating to expenditure incentives under
the IRIS.
Summary of our decisions
E2 Our decisions for expenditure incentives are summarised below:
E2.1 the capex incentive rate be equalised with the opex incentive rate.431 Based
on the WACC used for DPP3 (as calculated at September 2019),432 the opex
incentive rate will be approximately 23.5% (updated from draft decision);
E2.2 not introduce any additional opex smoothing mechanisms to the current
mechanism in the EDB IM to smooth opex incentive payments (unchanged
from draft decision);433
E2.3 not neutralise the impact of the IRIS adjustments for distributors who have
purchased transmission assets (for which they have received avoided cost of
transmission (ACOT) incentive payments) (unchanged from draft decision);
and
E2.4 no change be made from DPP2 on how we treat deliberate undercharging in
lieu of future expenditure incentive payments with the introduction of the
undercharging ‘banking’ mechanism in the revenue cap for DPP3
(unchanged from draft decision).
431 The opex incentive rate is based on an EDB being able to retain the benefit of any efficiency saving for 5 years. This has not changed from DPP2, but the incentive rate will reduce with a lower WACC because the NPV value of 5 years of savings will be lower as a proportion of the NPV of the total value of the saving.
432 Commerce Commission Cost of capital determination for electricity distribution businesses’ 2020-2025 default price-quality paths and Transpower New Zealand Limited’s 2020-2025 individual price-quality path [2019] NZCC 12 (25 September 2019).
433 Commerce Commission Electricity Distribution Services Input Methodologies Determination 2012 [2012] NZCC 26 (Consolidated as at 31 January 2019), clause 3.3.2(2)(b)(i).
263
3605676.11
IRIS IM amendments
E3 We have made amendments to the EDB IMs to give effect to the original policy
intention of the opex IRIS mechanism. These drafting changes include a correction to
the time value of money adjustment applied when smoothing the opex IRIS
adjustment term.434 We have also amended the language in clause 3.3.2 of the EDB
IM.435 This amendment is detailed in the IM changes reasons paper.
Analysis of expenditure during DPP2
E4 We consider it is important to present and analyse distributors’ historical
performance against opex and capex allowances to gain an understanding of how
the industry is performing and how this may influence our decision making. This may
give us an indication on how the current incentive settings in place during DPP2 for
opex and capex are impacting suppliers.
E5 Figure E1 shows for each distributor the opex under- and overspends for the 2015-
2020 regulatory period. We have included distributors’ forecasts from AMPs as a
proxy for Year 5 of the period (2020).
E6 Figure E2 shows how the under- and overspends accumulated to date translate to
revenue impacts for the next regulatory period (including distributors’ 2020 AMP
forecast). This demonstrates that generally there is no clear trend as to whether
distributors have under- or overspent in comparison to the opex allowances. There
are, however, a few large individual negative IRIS revenue adjustments from
distributors that have overspent during DPP2.
434 The formula error came to light after releasing the final determination for the Wellington Electricity and Powerco CPPs. The issue relates to the adjustment made to accommodate for the time value of money resulting in the correct retention factor under the IRIS mechanism.
435 Clause 3.3.2 of the EDB IMs references the ‘DPP regulatory period’ instead of ‘regulatory period’. Amendments were included in the CPP determinations for Wellington Electricity and Powerco to correct for this.
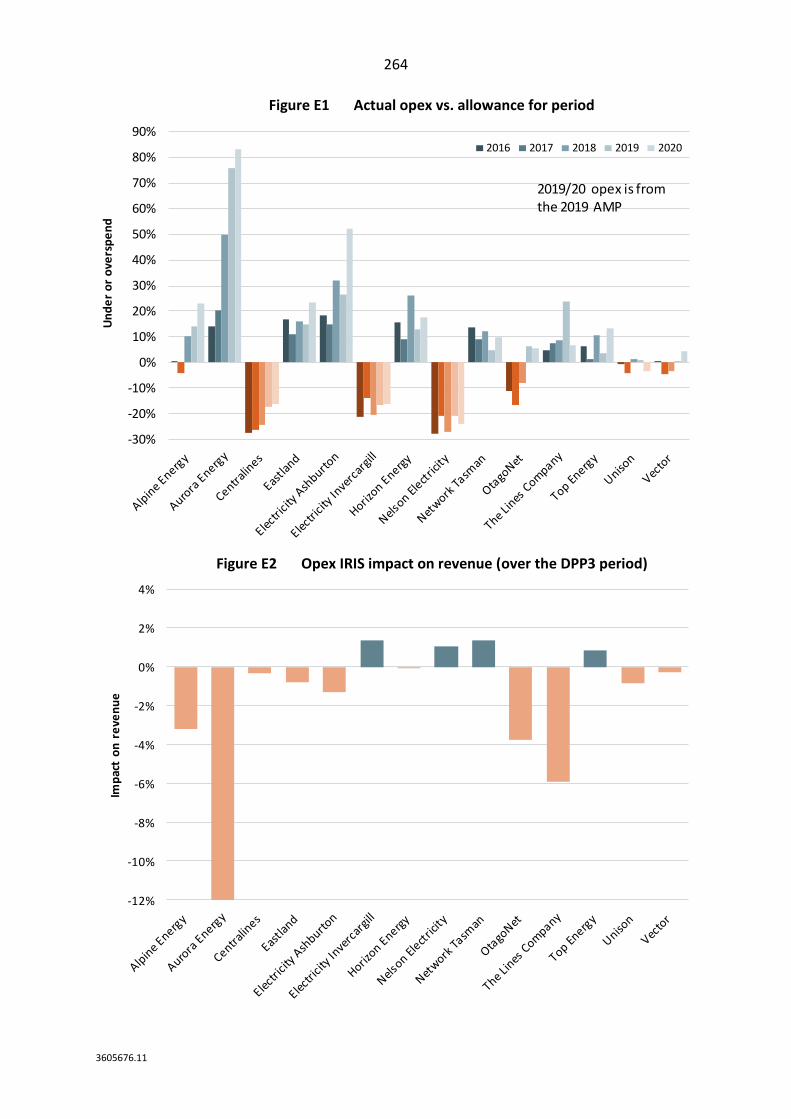
264
3605676.11
Figure E1 Actual opex vs. allowance for period
Figure E2 Opex IRIS impact on revenue (over the DPP3 period)
-30%
-20%
-10%
0%
10%
20%
30%
40%
50%
60%
70%
80%
90%
Un
de
r o
r o
vers
pe
nd
2016 2017 2018 2019 2020
2019/20 opex is from the 2019 AMP
-12%
-10%
-8%
-6%
-4%
-2%
0%
2%
4%
Imp
act
on
re
ven
ue
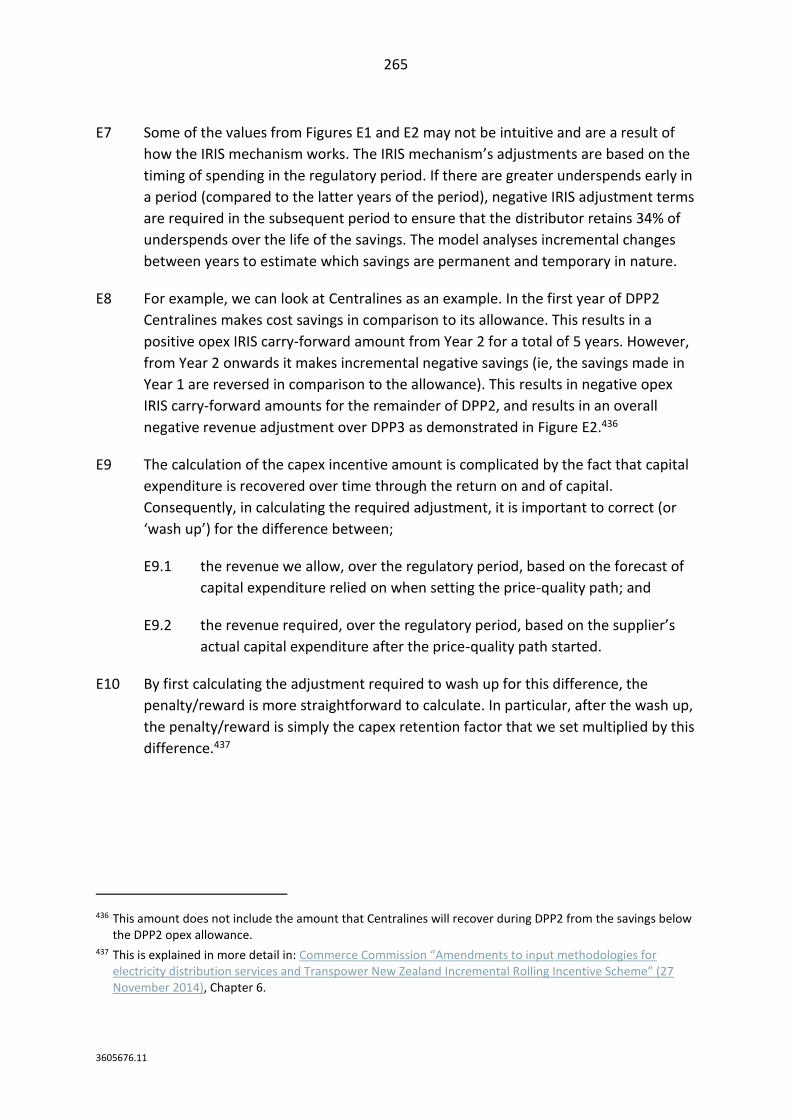
265
3605676.11
E7 Some of the values from Figures E1 and E2 may not be intuitive and are a result of
how the IRIS mechanism works. The IRIS mechanism’s adjustments are based on the
timing of spending in the regulatory period. If there are greater underspends early in
a period (compared to the latter years of the period), negative IRIS adjustment terms
are required in the subsequent period to ensure that the distributor retains 34% of
underspends over the life of the savings. The model analyses incremental changes
between years to estimate which savings are permanent and temporary in nature.
E8 For example, we can look at Centralines as an example. In the first year of DPP2
Centralines makes cost savings in comparison to its allowance. This results in a
positive opex IRIS carry-forward amount from Year 2 for a total of 5 years. However,
from Year 2 onwards it makes incremental negative savings (ie, the savings made in
Year 1 are reversed in comparison to the allowance). This results in negative opex
IRIS carry-forward amounts for the remainder of DPP2, and results in an overall
negative revenue adjustment over DPP3 as demonstrated in Figure E2.436
E9 The calculation of the capex incentive amount is complicated by the fact that capital
expenditure is recovered over time through the return on and of capital.
Consequently, in calculating the required adjustment, it is important to correct (or
‘wash up’) for the difference between;
E9.1 the revenue we allow, over the regulatory period, based on the forecast of
capital expenditure relied on when setting the price-quality path; and
E9.2 the revenue required, over the regulatory period, based on the supplier’s
actual capital expenditure after the price-quality path started.
E10 By first calculating the adjustment required to wash up for this difference, the
penalty/reward is more straightforward to calculate. In particular, after the wash up,
the penalty/reward is simply the capex retention factor that we set multiplied by this
difference.437
436 This amount does not include the amount that Centralines will recover during DPP2 from the savings below the DPP2 opex allowance.
437 This is explained in more detail in: Commerce Commission “Amendments to input methodologies for electricity distribution services and Transpower New Zealand Incremental Rolling Incentive Scheme” (27 November 2014), Chapter 6.
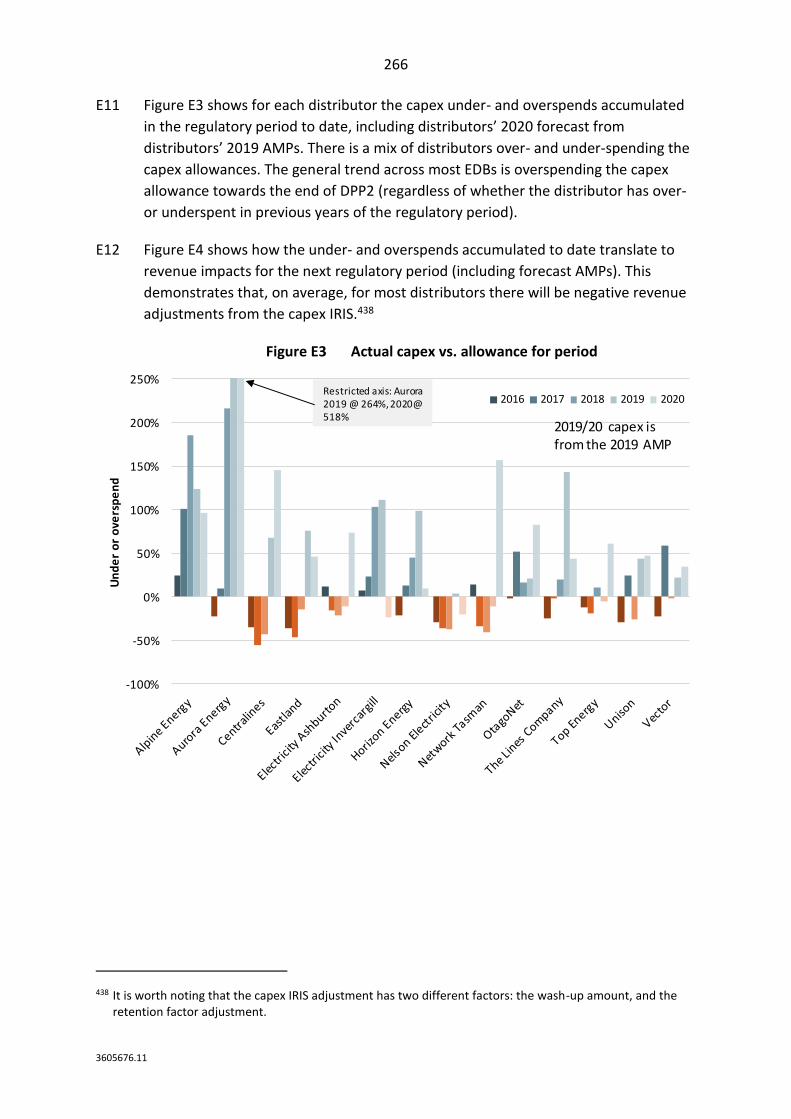
266
3605676.11
E11 Figure E3 shows for each distributor the capex under- and overspends accumulated
in the regulatory period to date, including distributors’ 2020 forecast from
distributors’ 2019 AMPs. There is a mix of distributors over- and under-spending the
capex allowances. The general trend across most EDBs is overspending the capex
allowance towards the end of DPP2 (regardless of whether the distributor has over-
or underspent in previous years of the regulatory period).
E12 Figure E4 shows how the under- and overspends accumulated to date translate to
revenue impacts for the next regulatory period (including forecast AMPs). This
demonstrates that, on average, for most distributors there will be negative revenue
adjustments from the capex IRIS.438
Figure E3 Actual capex vs. allowance for period
438 It is worth noting that the capex IRIS adjustment has two different factors: the wash-up amount, and the retention factor adjustment.
-100%
-50%
0%
50%
100%
150%
200%
250%
Un
de
r o
r o
vers
pe
nd
2016 2017 2018 2019 2020Restricted axis: Aurora 2019 @ 264%, 2020@ 518%
2019/20 capex is from the 2019 AMP
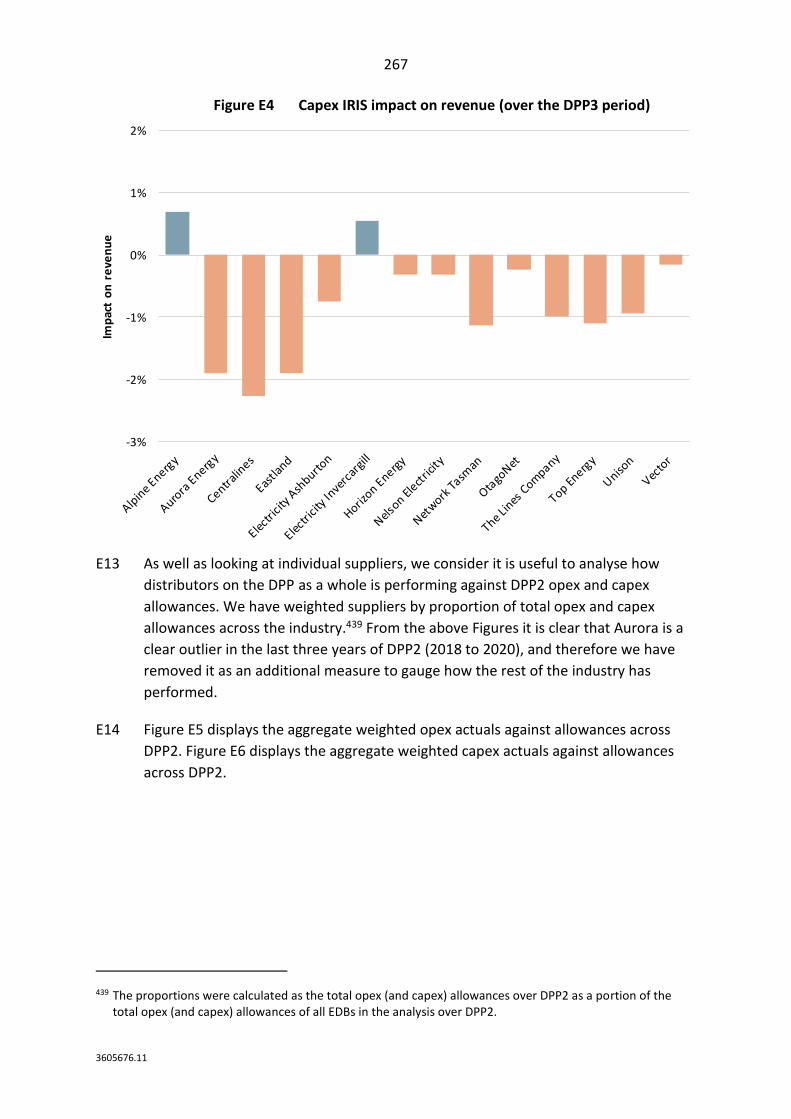
267
3605676.11
Figure E4 Capex IRIS impact on revenue (over the DPP3 period)
E13 As well as looking at individual suppliers, we consider it is useful to analyse how
distributors on the DPP as a whole is performing against DPP2 opex and capex
allowances. We have weighted suppliers by proportion of total opex and capex
allowances across the industry.439 From the above Figures it is clear that Aurora is a
clear outlier in the last three years of DPP2 (2018 to 2020), and therefore we have
removed it as an additional measure to gauge how the rest of the industry has
performed.
E14 Figure E5 displays the aggregate weighted opex actuals against allowances across
DPP2. Figure E6 displays the aggregate weighted capex actuals against allowances
across DPP2.
439 The proportions were calculated as the total opex (and capex) allowances over DPP2 as a portion of the total opex (and capex) allowances of all EDBs in the analysis over DPP2.
-3%
-2%
-1%
0%
1%
2%
Imp
act
on
re
ven
ue
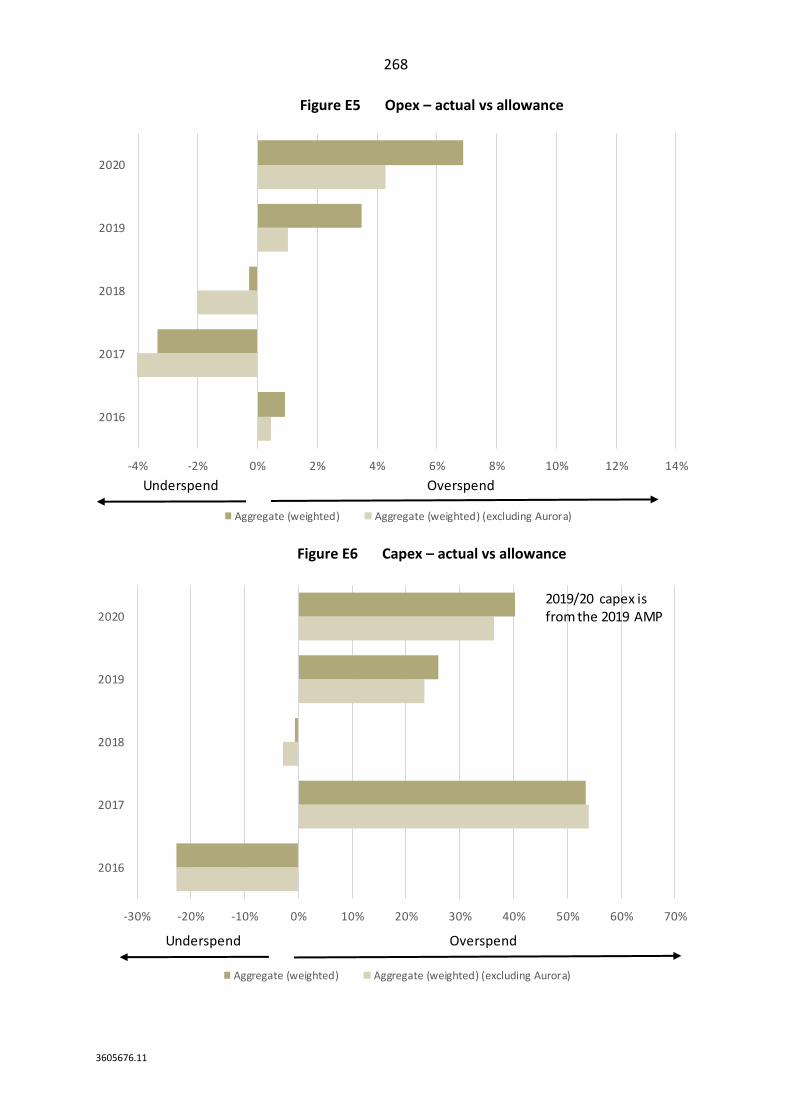
268
3605676.11
Figure E5 Opex – actual vs allowance
Figure E6 Capex – actual vs allowance
-4% -2% 0% 2% 4% 6% 8% 10% 12% 14%
2016
2017
2018
2019
2020
Aggregate (weighted) Aggregate (weighted) (excluding Aurora)
OverspendUnderspend
-30% -20% -10% 0% 10% 20% 30% 40% 50% 60% 70%
2016
2017
2018
2019
2020
Aggregate (weighted) Aggregate (weighted) (excluding Aurora)
OverspendUnderspend
2019/20 capex is from the 2019 AMP
269
3605676.11
E15 At an aggregate level it appears that the industry is approximately neutral in terms of
opex spend compared with allowances over DPP2. There was greater under-
spending across the industry earlier in the period with subsequent overspends in the
latter years. This may indicate that distributors have tried to find efficiencies early in
the period but were required to spend more later in the period to cover necessary
costs.
E16 On the capex side there has generally been overspending of allowances by
distributors during DPP2. This could be due to a number of factors (increases in
unexpected costs through the period, setting of DPP2 allowances etc) and could
indicate that the weaker incentive rate was not leading to efficiencies being created.
E17 There are also a number of external factors that can lead to a preference for
spending capex over opex (such as preferring to build or replace assets, as this has
historically been the solution, rather than maintaining current assets or contracting a
third-party solution).
Setting the expenditure incentive rates
E18 The expenditure incentives for opex and capex are part of a suite of incentives that
may impact on distributors’ expenditure and quality decision-making processes. The
expenditure incentives are closely related to incentives on distributors to maintain or
improve quality through the quality incentive scheme and to meet their associated
quality standards enforceable under the Act.
E19 Our regime provides incentives for distributors to improve opex and capex cost
efficiency and provides for these savings to be shared between distributors and
consumers.
E20 To achieve this, we set incentive rates for opex and capex, which determine the
proportion of any cost savings (or efficiency losses) that the distributors can retain
(or bear in the case of a reduction in efficiency). Consumers benefit from improved
efficiencies through lower network prices in future regulatory control periods.
E21 Under DPP2, the incentive rate that applied to opex differed from the incentive rate
that applied to capex. The opex incentive rate is determined in the EDB IMs and is
derived from the length of retention of cost under- or overspends and the WACC
value.440 This is based on the distributor’s ability to retain the saving for five years
(equivalent to the length of the regulatory period), with savings being discounted at
the current WACC rate over the life of the saving.
440 Commerce Commission Electricity Distribution Services Input Methodologies Determination 2012 [2012] NZCC 26 (Consolidated as at 31 January 2019), clause 3.3.2.
270
3605676.11
E22 The capex incentive rate is determined as part of a DPP reset and is outlined in the
EDB DPP determination.
E23 The opex incentive rate that applied under DPP2 was approximately 34%. The
incentive rate for capex under DPP2 was 15%.
E24 Equalising the opex and capex incentive rates can help to provide distributors with
equal incentives to find efficiencies regardless of whether these are through opex or
capex solutions. Many submissions on our Issues and Draft Decisions paper called for
the differential in incentive rates between opex and capex to be reduced or
eliminated.441 Some distributors also agreed with our proposal to equalise incentive
rates conditional on receiving appropriate expenditure allowances.442
Reasons for addressing this issue
E25 We have an IRIS to ensure constant incentive rates for distributors to pursue opex
and capex efficiencies over the regulatory period. By setting the incentive rates in
advance, suppliers have certainty around the strength of the marginal incentives on
efficiencies achieved. Consumers will share any benefits from any under- or
overspends through lower or higher network prices in future regulatory control
periods.
E26 As we noted in the issues paper, applying different incentive rates for opex and
capex may create a preference or bias towards the type of expenditure that is
subject to the lower incentive rate.443 In addition to different incentive rates, there
may be other factors which contribute to a preference towards particular types of
expenditure.444
E27 In DPP2 there was a significant differential between the incentive rates applying to
opex and capex, and this asymmetric treatment of opex and capex savings may
contribute to a capex bias. This may have distorted decisions such as whether to
consider non-wire (opex) solutions. Reducing or removing this differential will reduce
this distortion.
441 For example, see: Contact Energy “Default price-quality paths for electricity distribution businesses from 1 April 2020 “ (18 December 2018), p. 1; Unison “Submission on default price-quality paths for electricity distribution businesses from 1 April 2020 Issues paper” (21 December 2018), p. 5; and MEUG “MEUG to CC EDB DPP3 reset 18 Jul 19” (18 July 2019), p. 5.
442 For example, see: Orion "Submission on EDB DPP reset draft decisions paper" (17 July 2019), p. 6 and Aurora "Submission on EDB DPP reset draft decisions paper" (18 July 2019), p. 15.
443 Commerce Commission, “Default price-quality paths for electricity distribution businesses from 1 April 2020 – Issues Paper” (15 November 2018), para E23.
444 For example, Frontier refer to a number of factors that could result in a capex bias, including a WACC uplift; company culture where capex solutions are favoured; and a preference to control assets rather than contracting with third parties. Frontier Economics “Total expenditure frameworks: a report prepared for the Australian Energy Market Commission” (December 2017), section 4.3.3.
271
3605676.11
E28 Also relevant to this topic are other workstreams such as the level of scrutiny applied
to capex forecasts, the strength of any quality incentive scheme, incentives for
innovation, and mitigating uncertainty.
Opex incentive rate
Decision
E29 Our decision is to not make a change to how the opex incentive rate is determined.
Background
E30 To provide distributors with an incentive to pursue efficiency savings through the
period, the incentive rate that suppliers retain or bear from making efficiency gains
(or efficiency losses) is set in the EDB IMs.445 The opex incentive rate is derived from
the length of retention of cost under- or overspends and the WACC value. This is
based on the distributor’s ability to retain the saving for five years (equivalent to the
length of the regulatory period), with savings being discounted at the current WACC
rate over the life of the saving.
E31 As previously noted, the opex incentive rate is derived from the length of retention
of cost under- or overspends and the WACC value. This is based on the distributor’s
ability to retain the saving for five years (equivalent to the length of the regulatory
period), with savings being discounted at the current WACC rate over the life of the
saving.
What we said in our issues paper and draft decision
E32 In our issues paper we considered that the IRIS mechanism used in DPP2 to
determine the operating expenditure incentive rate for DPP3 was appropriate
because we considered that there was no substantial reason to deviate from the
methodology that applied to DPP2.446
E33 We noted that our intended approach for DPP3 was to use the IRIS mechanism using
the DPP3 WACC value, so that the distributors have certainty around the retention
factor applied to operating expenditure efficiencies achieved throughout the
regulatory period.
445 Commerce Commission Electricity Distribution Services Input Methodologies Determination 2012 [2012] NZCC 26 (Consolidated as at 31 January 2019), clause 3.3.2.
446 As part of the input methodologies review, we decided not to amend the DPP IRIS. Commerce Commission “Input methodologies review decisions: Report on the IM review” (20 December 2016), Chapter 9 and Chapter 17.
272
3605676.11
E34 In our draft decision we reiterated how the opex incentive rate is calculated and
demonstrated how EDBs had performed against their allowances during DPP2.
Stakeholder views
E35 In a personal submission on our draft decision, Pat Duignan considers that the opex
incentive rate in DPP2 has not been high enough to elicit opex efficiency savings
during DPP2.447
E36 In its cross-submission, ENA responded to Mr Duignan’s submission rejecting the
assertion that the opex incentive scheme has been ineffective during DPP2.448
Our view
E37 As Figure E5 demonstrates, at an aggregate level it appears that distributors are
approximately neutral in terms of opex spend compared with allowances over DPP2.
In comparison to the capex outcomes from DPP2 (which had a lower incentive rate
of 15%), EDBs have performed better against allowances for opex (with a DPP2
incentive rate of 34%).
E38 The opex incentive rate is one of the factors that influences EDBs’ expenditure
decisions during a period. Other factors such as the opex allowance that we set,
projects that arise, level of substitutability, for example, can affect the level of opex
savings. There is not likely to be an ‘optimal’ opex incentive rate that will result in
savings to all suppliers (without putting reliability and necessary maintenance at risk
for consumers).
E39 We consider that the methodology for determining the opex incentive rate, as
specified in the EDB IM, is appropriate and reflects the time value of money (and
external financial conditions) through our WACC estimate.
E40 As part of the 2016 input methodologies review we decided not to amend the DPP
IRIS.449 We can consider whether the current method for setting the opex incentive
rate is appropriate during the next IM review.
Capex incentive rate
Decision
E41 Our decision is to set the capex incentive rate at the same rate as the opex incentive
rate (which is based on the WACC and the length of the regulatory period).
447 Pat Duignan "Submission on EDB DPP reset draft decisions paper" (18 July 2019), pp 3-4. 448 ENA "Cross submission on EDB DPP reset draft decisions paper" (12 August 2019), p. 3. 449 Commerce Commission “Input methodologies review decisions: Report on the IM review” (20 December
2016), Chapter 9 and Chapter 17.
273
3605676.11
E42 Our decision is not to have different incentive rates for different types of capex in
the IRIS mechanism.
Background
E43 To provide distributors with an incentive to pursue efficiency savings through the
period, we determine a capex incentive rate that sets the proportion of any
efficiency gains (or efficiency losses) that distributors can retain (or bear). The capex
incentive rate is required to be determined by the Commission at each DPP reset.
Distributors therefore have certainty that the incentive rate will be specified in
advance of any efficiency improvements being achieved throughout the regulatory
period.
E44 During DPP2 there was a significant differential between the opex and capex
incentive rates. This differential can create incentives to increase capex spend and
reduce opex, as the proportion of any opex savings that are retained by the
distributor is more than twice that of any capex savings (34% incentive rate versus
15%). This potential preference for increasing capex may also result from other
external factors.450
E45 Reducing the differential in incentive rates between opex and capex can have an
impact on reducing any disincentive to consider non-wire (opex) solutions.
What we said in our issues paper and draft decision
E46 In our issues paper we considered whether the reasons for setting the capital
expenditure retention factors at 15% in DPP2 remain valid for DPP3. For the capex
IRIS incentive rate, we noted that the incentive rate should be broadly similar to the
opex incentive rate, except where there are good reasons to prefer different values.
E47 We therefore reviewed the reasons that led us to set a lower capex incentive rate in
2014, to see if those reasons remain valid for DPP3 and sought views on what the
applicable capex incentive rate should be.
E48 In our draft decision we considered having a ‘blended incentive rate’ approach based
on the ENA’s submission stating that not all categories of capex are substitutable
with opex.451 The ENA considered that there should be different incentive rates
applying to different types of capex; system growth capex could face a 34% incentive
rate (as the ENA consider that there are greater opportunities for substitution) and
the rest of capex could face the current 15% rate.
450 External factors that may lead to a preference for capex solutions outside of our regime may include EDBs preferring to own their assets rather than procuring through a third party or the status quo of using capex solutions without considering opex alternatives.
451 ENA "DPP3 April 2020 Commission Issues paper (Part One Regulating capex, opex & incentives)" (20 December 2018), p. 19.
274
3605676.11
E49 In response to the suggestion of having different capex incentive rates for different
capex categories we noted that this could lead to an ‘intra-capex bias’ where
distributors prefer certain types of capex over others based on the applicable
incentive rates.452 We also noted that there is a grey area in how some types of
capex projects can be classified, for example, certain projects could be classified as
multiple capex categories. This could lead to gaming of the incentive rates based on
how projects are classified.
E50 In our draft decision we proposed equalising the capex incentive rate with the opex
incentive rate. We considered that increasing the capex incentive rate was
appropriate given our proposal to increase the level of scrutiny applied to distributor
capex forecasts. This mitigates concerns that a higher capex rate might encourage
distributors to over-forecast capex (whether deliberate or not).
E51 We noted that unless rates are equalised across opex and capex, there could be
incentives to favour one type of expenditure type over another.
Stakeholder views
E52 A number of distributors did not support the proposed equalisation of the capex
incentive rate with the opex rate (which is determined in the IMs based on the
WACC and length of the period).
E53 Wellington Electricity does not support the increase due to the risk of penalising
distributors for genuine capital expenditure, for example, additional capex costs
during the period that do not come within the capex allowance.453
E54 Powerco does not support the increase in capex rate because there is no evidence
that the current IRIS settings are creating a problem and may incentivise distributors
to defer network investment at a time when it is needed. Powerco also note that
tying the capex incentive rate to the opex incentive rate (which varies with WACC)
introduces inter-regulatory period inconsistency for capex (ie, $1 capex avoided in
one period to be worth more or less than $1 avoided in a different period).454
452 Commerce Commission, “Default price-quality paths for electricity distribution businesses from 1 April 2020 – Draft reasons paper” (29 May 2019), E38 to E43.
453 Wellington Electricity "Cross-submission on EDB DPP reset draft decisions paper" (12 August 2019), p. 17. 454 Powerco "Submission on EDB DPP reset draft decisions paper" (18 July 2019), p. 20.
275
3605676.11
E55 Some submitters noted that there is currently a bias towards capex due to the
different incentive rates,455 and submissions generally supported our draft decision
to equalise rates.456
E56 Unison supports neutralising trade-offs between opex and capex, as increasingly
non-wire alternatives will become available to distributors which can effectively
substitute opex for capex. Unison suspects that it is necessary to move to a totex
regime to fully achieve this and note that the current settings of the allowances
continue to favour capex over opex because opex is based on historical performance
whereas capex is forward-looking.457
E57 ENA notes that members are not yet persuaded that the simple equalising of the
proportion of NPV benefits addresses the concern that distributors do not face a
neutral trade-off between opex and capex and suggests that this may only be
addressed through a totex approach.458
E58 A number of distributors were supportive of equalising incentive rates conditional on
receiving appropriate opex and capex allowances.459
E59 ERANZ support the equalisation of rates but raise the question as to whether the
draft decision incentive rate of 26% was high enough. ERANZ states:460
We support the equalisation of the rates and believe that it is a useful change to aid in
aligning incentives on decisions of capital and operational spending.
However, we raise the question as to whether the retention rate of 26% should be higher. In
our judgement, the 26% retention rate does not give a large incentive for an EBD to become
more efficient. A higher retention rate may incentivise greater productivity growth in the
sector by rewarding underspending and penalising overspending to a greater degree.
E60 Mr Duignan considers that the capex incentive rate should be increased because the
effective capex incentive rate is reduced by the WACC uplift.461
455 For example: Contact Energy “Default price-quality paths for electricity distribution businesses from 1 April 2020 “ (18 December 2018), p. 1; ENA “DPP3 April 2020 Commission Issues paper (Part One Regulating capex, opex & incentives)” (20 December 2018), p. 19; and Unison “Submission on default price-quality paths for electricity distribution businesses from 1 April 2020 Issues paper” (21 December 2018), p. 5.
456 IEGA "Submission on EDB DPP reset draft decisions paper" (05 July 2019), p. 2; MEUG "Submission on EDB DPP reset draft decisions paper" (18 July 2019), p. 5.
457 Unison "Submission on EDB DPP reset draft decisions paper" (18 July 2019), p. 19. 458 ENA "Submission on EDB DPP reset draft decisions paper" (18 July 2019), p. 20. 459 Orion "Submission on EDB DPP reset draft decisions paper" (17 July 2019), p. 6. 460 ERANZ "Submission on EDB DPP reset draft decisions paper" (18 July 2019), p. 7-8. 461 Pat Duignan "Submission on EDB DPP reset draft decisions paper" (18 July 2019), p. 5.
276
3605676.11
E61 In its cross-submission, ENA responded to Mr Duignan’s submission on the effect of
the WACC uplift on the capex incentive rate stating:462
In effect, it is assumed that EDBs regard the 50th percentile WACC as representing their true
cost of capital. ENA members submit that this assumption is erroneous. ENA members
consider that a WACC of 5.13% (real return of 3.13% that is dropping and likely to be around
4.7%, 2.7% real, in the final decision) is not in any way, an incentive for investment, given the
long-term risks of the business.
At these levels of WACC, (where the real risk-free rate is now negative) there is strong risk of
incentivising under-investment during this regulatory period. We note Duignan’s comment
that with a low risk-free rate, EDBs would be more incentivised to invest. We can assure the
Commission that the situation is very much the opposite!
E62 Some distributors considered that the Commission should consider different
incentive rates applying to different categories of capex. Unison suggested that:463
As variations in customer capex are likely to be driven more by the volume and size of
customers seeking connections, than variations in efficiency in connecting customers, we
question the validity of the 26% capex IRIS adjustment. It is unclear what policy reason exists
that either EDBs or existing customers should bear the volume/size risks on customer capex,
compared with an approach of simply providing a wash-up that makes EDBs and existing
customers neutral to the volume/size of customer connections.
E63 Powerco also suggest removing consumer connection, system growth and asset
relocation expenditure from capex IRIS calculations to remove incentives for
distributors to alter the timing and quantum of customer-initiated capex so that
customers connections are not distorted.464
Our view
E64 As previously noted, unless rates are equalised across opex and capex, there could
be incentives to favour one type of expenditure over another because of the
incentive rate settings. Our decision is to equalise incentive rates so that distributors
have generally consistent incentives to choose solutions and make savings that are
most efficient for consumers, rather than preferring one type of expenditure over
another.
462 ENA "Cross submission on EDB DPP reset draft decisions paper" (12 August 2019), p. 3. 463 Unison "Submission on EDB DPP reset draft decisions paper" (18 July 2019), para 57. 464 Powerco "Submission on EDB DPP reset draft decisions paper" (18 July 2019), p. 18.
277
3605676.11
E65 We note Unison’s submission suggesting that a totex regime may be necessary to
fully achieve substitutability between opex and capex. Our decision to equalise rates
reduces the differential between types of expenditure for DPP3, and we will consider
the option of moving to a totex approach in the future.465
E66 We note points from Vector stating that some types of capex have limited
substitution with opex.466 However, attempting to identify all capex categories with
the potential to be substituted for opex could be arbitrary and may not be consistent
across distributors.
E67 Some distributors submitted on our issues paper and draft decision that the capex
incentive rate should not be increased because of uncertainty around the
expenditure allowance and the risk that the incentive rate settings could encourage
distributors to defer necessary capex investment.467
E68 The setting of the capex incentive rate is linked to how we set capex allowances - the
higher the incentive rate, the higher the incentive to inflate forecasts. Given the
constraints of a low-cost DPP, our capex allowances are our best estimate of
required costs over the period and so this is the baseline to compare actual capex
costs to.
E69 Our approach to forecasting the capex requirements of the distributors starts with
the distributors’ AMP forecasts, and then applies the scrutiny tests described in
Attachment B. This can help mitigate the risk that distributors are over-rewarded for
over-forecasting capex (whether deliberate or not) through the capex IRIS.
E70 We have also included additional reopeners specifically for certain types of projects,
as set out in Chapter 4. This mitigates some of the concerns that distributors have
expressed in terms of uncertainty as a reason to not support equalising of rates.
E71 Another issue is around promoting emerging technologies and innovative solutions
to network problems. We do not want to disincentivise any potential emerging
technologies from being used by distributors due to a lower capex incentive rate.
Equalising rates will create a more level playing field to allow distributors to avoid
spending capex through investing in innovative solutions using third parties (these
solutions will generally be through opex).
465 We note that a move to a full totex approach would be a significant change in regulatory approach for EDBs. According to advice prepared by Frontier Economics for the AEMC, the transition to a totex framework would require significant development work and would likely take two to three years. See Frontier Economics “Total expenditure frameworks” (December 2017), p. 80.
466 Vector “Key issues for DPP3” (21 December 2018), p. 12. 467 For example, see: Powerco "Submission on EDB DPP reset draft decisions paper" (18 July 2019), p. 6.
278
3605676.11
E72 For example, the ENA Energy Efficiency Incentives Working Group also noted in 2014
that inconsistent incentives for capital expenditure relative to operating expenditure
are: 468
particularly relevant to efficiency options that involve greater operating expenditure relative
to traditional solutions. For example, EDBs may prefer capital expenditure solutions such as
expanding substation capacity, over operating expenditure solutions such as contracting for
demand-side response if there is a greater incentive to undertake capital expenditure.
E73 Some distributors have expressed concerns around increasing the capex incentive
rate.469 We note that with the opex incentive rate expected to fall for DPP3 (based
on the lower WACC value), this could partially mitigate concerns around distributors
having to bear proportions equal to the current 34% rate. As noted above, the opex
incentive rate is 23.5%, based on the DPP3 WACC.
E74 In the DPP2 reset, one of the reasons for setting a low capex incentive rate (15%)
was because distributors had significantly underspent capex allowances. It appears
from the analysis at the beginning of the Attachment (see Figure E3) that this is not
such a concern for the DPP3 reset with distributors expected to overspend their
capex allowances on average over DPP2.
E75 In response to the inter-regulatory inconsistency raised by Powerco for the capex
incentive rate, we note that the opex incentive rate varies between periods to reflect
the time value of money reflected in the WACC being updated between regulatory
periods.
E76 The changing discount rate is intended to reflect financial conditions during the
period (and subsequently impacts the retention factor). In principle it may be
desirable to maintain a constant capex incentive rate between periods so there
exists no incentive to inefficiently defer (or move forward) expenditure between
periods.
E77 However, this would come with a loss of flexibility for the rate to change between
periods based on how distributors appear to be reacting to incentives or external
financial conditions (as reflected in the WACC). Maintaining a constant capex rate
between periods would also lead to the same issue of the capex rate being
inconsistent with the opex rate as previously discussed.
468 ENA Energy Efficiency Incentives Working Group “Options and Incentives for Electricity Distribution Businesses to Improve Supply and Demand-Side Efficiency: Report to the Commerce Commission” (April 2014), p. v.
469 For example, Aurora Energy “Default price-quality paths for electricity distribution businesses from 1 April 2020 Issues Paper” (20 December 2018), p. 10; and Wellington Electricity “Default price-quality paths for electricity distribution businesses from 1 April 2020 Issues Paper” (21 December 2018), p. 4.
279
3605676.11
E78 We note the submission from Mr Duignan suggesting that the capex incentive rate
should be increased because the IRIS benefit will be partially offset by the WACC
uplift.470 We agree that this is one factor that will impact the effective incentive
faced by distributors to reduce capex costs. There are also a number of other factors
(some also mentioned in Mr Duignan’s submission) such as the effect of quality
incentives and quality standards that may impact the effective incentive to make
capex savings.
E79 We are not trying to set the capex rate to mathematically take every relevant factor
into account as it will likely be impossible to include all relevant factors and may
differ between conditions affecting different distributors. We are aiming to reduce
the differential in incentives for opex and capex as is currently the case and provide a
general equalisation of incentive rates for distributors.
E80 We have a WACC uplift to take into account the asymmetric risk of providing
suppliers with a WACC that is too low. Therefore, adjusting for this in the capex
incentive rate and essentially providing distributors with an even greater incentive to
reduce capex seems counterintuitive and against the original purpose of the uplift.
E81 As noted previously, we consider that introducing different incentive rates for
different categories of capex would introduce further complexity to a mechanism
that is already complex. We also note that there is a grey area in categorisation of
different types of capex, so having different incentive rates could introduce an intra-
capex bias. Having a zero-incentive rate for certain categories of capex could lead to
inefficiency where costs are controllable and issues of categorisation of capex.
Smoothing of opex incentive payments
Decision
E82 Our decision is to not introduce any additional smoothing adjustments to opex IRIS
amounts.
What we said in our issues paper and draft decision
E83 In our issues paper we considered it is possible that ‘opex incentive amounts’ could
be sufficiently large to cause price shocks to consumers and/or revenue shocks to
distributors.
470 Pat Duignan "Submission on EDB DPP reset draft decisions paper" (18 July 2019), p. 5.
280
3605676.11
E84 In our draft decision we considered whether the IRIS opex incentive amounts
themselves could be smoothed over the period. We decided that this would involve
distributors forecasting the incentive amount values for the remainder of the period
and smoothing to ensure NPV neutrality and would require an IM change and
introduce additional complexity to the regime. Therefore, we decided not to pursue
the option.
E85 Our draft decision was not to propose any additional smoothing adjustments to the
opex incentive amounts. We noted that the current mechanism in the EDB IMs
smooths the ‘base year adjustment term’ which is calculated in year 2 of the DPP
period.471 This mechanism smooths this lumpy adjustment term in the IRIS between
periods.
E86 As part of our draft decision on the revenue cap we proposed a smoothing
mechanism for the overall revenue path that limits the change in revenue from year
to year. This would help control any significant volatility from IRIS incentive
payments throughout a period.
Stakeholder views
E87 Wellington Electricity supported the concept of a net present value (NPV) neutral
smoothing mechanism if the mechanism is low-cost to implement and operate.472
The Lines Company and Orion also agreed.473
E88 Aurora supported the proposal in principle subject to understanding the detail of the
proposal, agreeing that it could help alleviate price shocks for consumers.474
E89 We received no submissions on this point on our draft decision.
Our decision
E90 We consider that the current mechanisms in place to smooth certain IRIS amounts as
well as general revenue smoothing are appropriate to reduce the risk of price shocks
to consumers or revenue shocks to distributors.
471 Commerce Commission Electricity Distribution Services Input Methodologies Determination 2012 [2012] NZCC 26 (Consolidated as at 31 January 2019), clause 3.3.2(2)(b)(i).
472 Wellington Electricity “Default price-quality paths for electricity distribution businesses from 1 April 2020 Issues Paper” (21 December 2018), p. 21.
473 The Lines Company “Default price-quality paths for electricity distribution businesses from 1 April 2020” (21 December 2018), p. 11; and Orion “Submission on EDB DDP3 Reset “ (20 December 2018), p. 9.
474 Aurora Energy “Default price-quality paths for electricity distribution businesses from 1 April 2020 Issues Paper” (20 December 2018), p. 10.
281
3605676.11
Purchased transmission assets
Decision
E91 Our decision is to not allow any IRIS adjustments from opex costs in DPP2.
Background
E92 Eastland and Wellington Electricity have raised issues relating to how the IRIS
interacts with transmission asset purchases.475
E93 Eastland and Network Tasman both purchased assets on 31 March 2015. As part of
our process for setting the 2015-2020 DPP, distributors submitted that they should
retain the 5 years of ACOT charges provided for in the IMs as an incentive to
purchase transmission assets and receive an allowance for capex and opex
associated with the transmission assets over the period.476
E94 In DPP2, distributors are able to recover, for a period of five years, the value of
transmission charges that are avoided by purchasing an asset from Transpower.477
We adopted this for DPP2 as we considered that the intention of the ACOT incentive
mechanism was to cover the costs of asset purchase and any subsequent capital
expenditure on the transferred asset until the next regulatory reset.478 At the next
reset any such expenditure will enter the RAB. We also noted that there would be no
specifically identified allowance for operating expenditure associated with purchased
assets.479
E95 We previously considered that if the distributors retain the ACOT payments as well
as the allowances under opex and capex for the assets they would likely be
overcompensated.
475 Eastland Network “2020 DDPP Reset Issues Paper” (20 December 2018), p. 6; Wellington Electricity “Default price-quality paths for electricity distribution businesses from 1 April 2020 Issues Paper” (21 December 2018), p. 13.
476 Eastland Network “Default price-quality paths from 1 April 2015 for 17 electricity distributors” (29 August 2014), paras 27–31; and PwC “Submission to the Commerce Commission on Proposed Default Price-Quality Paths for Electricity Distributors From 1 April 2015 – Made on behalf of 19 Electricity Distribution Businesses” (15 August 2014), para 69.
477 Commerce Commission Electricity Distribution Services Input Methodologies Determination 2012 [2012] NZCC 26 (Consolidated as at 31 January 2019), clauses 3.1.3(1)(b) and 3.1.3(1)(e).
478 Commerce Commission “Default price-quality paths for electricity distributors from 1 April 2015 to 31 March 2020: Main Policy Paper” (28 November 2014), para D38.
479 Commerce Commission “Default price-quality paths for electricity distributors from 1 April 2015 to 31 March 2020: Main Policy Paper” (28 November 2014), paras D44-D48.
282
3605676.11
E96 In our final DPP2 reasons paper we provided a view on providing distributors an opex
allowance for the transmission (spur) assets in addition to the ACOT payments:480
Including an additional adjustment for operating expenditure associated with spur assets
would likely over-compensate distributors. This expenditure would not therefore meet the
objective of avoiding double-counting as it is captured in other components of the price-
quality path. We were also not able to robustly verify the information provided by
distributors on their additional expenditure for spur assets. It is therefore not clear whether
the suggested amount reflects efficient expenditure.
E97 During the DPP2 reset, Network Tasman stated that they acknowledge that any
shortfall in opex should be adequately covered through the ACOT payments:481
“…we acknowledge the 5 year avoid cost allowance within recoverable costs under the IMs
may provide adequate offset…”
What we said in our issues paper and draft decision
E98 In our draft decision we noted the decision we made in 2015 to not include the
operating costs in the opex allowances of the distributors as we considered that
distributors were already compensated through the capex allowance and ACOT
payments.482
E99 As we did not allow the operating costs associated with the transmission assets into
the distributors’ opex allowances in DPP2, the decision for the DPP3 reset is whether
we should neutralise the impact of the IRIS adjustments for distributors who have
purchased transmission assets (for which they have received ACOT incentive
payments).
E100 We sought views from stakeholders on whether we should neutralise the impact of
the opex IRIS adjustments for distributors who have purchased transmission assets
(for which they have received ACOT incentive payments).
480 Commerce Commission “Default price-quality paths for electricity distributors from 1 April 2015 to 31 March 2020” Low cost forecasting approaches” (28 November 2014), paras 3.51-3.52.
481 Commerce Commission “Default price-quality paths for electricity distributors from 1 April 2015 to 31 March 2020: Main Policy Paper” (28 November 2014), para D49.2.
482 Commerce Commission “Default price-quality paths for electricity distributors from 1 April 2015 to 31 March 2020: Main Policy Paper” (28 November 2014), Attachment D.
283
3605676.11
Stakeholder views
Submissions on the issues paper
E101 In its submission on our issues paper, Eastland stated that the operating costs of
these transmission assets are considered under the IRIS scheme to be an inefficiency
and revenue losses will be incurred.483
E102 Wellington Electricity also suggested in its submission that the IRIS mechanism
should be adjusted to exclude any expenditure relating to the operation of a newly
purchased transmission asset.484
Submissions on our draft decision
E103 Eastland consider that the opex IRIS penalties are overstated because they include
penalties for opex which was deliberately excluded from the opex allowance.
Eastland considers that the implementation of the DPP opex IRIS scheme, after the
ACOT incentive scheme had been in operation for some time, retrospectively
changed the operation of the ACOT scheme, and is not consistent with the policy
intent of the IRIS or ACOT incentives. Eastland states that it is of concern that one
incentive should be used to offset the benefits of another.
E104 Network Tasman considers that if an aspect of regulation overcompensates
distributors, then the Commission should modify that aspect of the framework
directly rather than tinker with other aspects of the regime. Network Tasman
considers that we have already ring-fenced opex costs relating to transmission
investments. Rather, Network Tasman suggests that the Commission could amend
the opex allowance specified for IRIS to include newly acquired transmission assets.
E105 Horizon and ENA also suggested that we neutralise the impact of the opex IRIS
adjustments.
Our decision
E106 We consider that the purpose of the ACOT payments is to cover the costs of the
transmission assets (ie, the opex costs and the return on and of capital).485 We want
distributors to purchase transmission assets where it is more efficient for the
distributor to own than Transpower.
483 Eastland Network “2020 DDPP Reset Issues Paper” (20 December 2018), p. 6. 484 Wellington Electricity “Default price-quality paths for electricity distribution businesses from 1 April 2020
Issues Paper” (21 December 2018), p. 13. 485 Commerce Commission, “Default price-quality paths for electricity distribution businesses from 1 April 2020
– Draft reasons paper” (29 May 2019), para D38–D48.
284
3605676.11
E107 We decided that opex costs of transmission assets should be funded through the
recoverable costs of the ACOT payments (but not included in the opex allowance). In
DPP2 we decided that opex IRIS adjustments from transmission assets to not be
accounted for.
E108 The additional opex spent on transmission assets will become part of the baseline
opex level, so will form part of forecast opex for future periods. Therefore, there will
only be an opex IRIS adjustment for one regulatory period and these will be reflected
in future forecasts. We have also allowed a capex allowance on top of the ACOT
payments.
E109 Overall, we consider that distributors will be compensated appropriately, and if we
allowed an opex allowance on top of the ACOT payment this would likely
overcompensate distributors – we consider that this is not in the best interests of
consumers.
E110 Based on analysis undertaken as part of the DPP3 reset, for Eastland the ACOT
payments more than covered the operating costs during DPP2 and the opex IRIS
adjustments combined. Eastland receives ACOT payments of $3,746,000 for each
year in DPP2.486 The ACOT payments for DPP2, less the operating costs and future
opex IRIS adjustment result in a remainder of approximately $6 million for Eastland.
E111 ACOT is a relatively unsophisticated mechanism, which is intended to cover the
avoided transmission costs. Making changes to this mechanism requires
amendments to the IMs rather than changing the determination of the DPP3.
E112 Taking the value of the transmission assets out of the opex IRIS mechanism could set
a precedent for other requests to ringfence expenditure outside of the IRIS
mechanism. The original intent of the IRIS was to be a mechanism that we set and do
not adjust during the period unless we need to.
E113 The Commission has a general policy for not making retroactive changes to the
incentives that distributors face during a period. Allowing for distortions to
incentives after savings (or overspends) have been incurred reduces certainty and
the intention of the incentive regime.
Undercharging
Decision
E114 Our decision is not to make an adjustment for the capex or opex IRIS outcome from
undercharging.
486 These can be found on Eastland’s disclosures on its website under ‘Pricing Methodology’.
285
3605676.11
Background
E115 Under the current price cap for DPP2, distributors cannot recover any undercharging
relative to its MAR. This means that to the extent a distributor chooses to bring
forward any IRIS payments due to consumers in the next regulatory period through
lower prices in the current regulatory period, the distributor will still be subject to
IRIS payments in the next regulatory period. This arises because the IRIS effectively
assumes that distributors charge up to their allowance when calculating the
incentive adjustments.
E116 The implication is that distributors will not recover some revenue from consumers
(undercharging) for which they would have been entitled to, and then essentially pay
a refund to consumers which had not been paid for in the first place (ie, for revenue
that had not been collected). Distributors bear a proportion of this ‘refund’ through
the IRIS and cannot recover these costs in subsequent years under the current price
cap methodology.
E117 This issue has been raised by Centralines who have undercharged consumers during
DPP2.487
E118 In assessing voluntary undercharging in DPP2, we considered that a retroactive
change was not appropriate. We considered that it should be known what rules
were in place during DPP2, so any undercharging should have been undertaken
anticipating the incentive outcome. In the case of Centralines, we cannot be sure
there was a direct link between the undercharging and lower capex spend, or
whether the undercharging was for other reasons.
What we said in our draft decision
E119 In our draft decision we considered that the introduction of the revenue cap
undercharge ‘banking’ mechanism addressed most of the concerns around any
future undercharging by allowing IRIS payments to consumers to be brought
forward.
487 Centralines underspent its capex allowance by approximately 50%.
286
3605676.11
Stakeholder views
E120 Centralines submitted that in its case, the lower expenditure has been more than
matched by pricing significantly under the allowed DPP price path (while network
performance has consistently been within SAIDI and SAIFI limits). According to
Centralines, it will have to reduce revenues below the level required to deliver a
reasonable return in DPP3.488 Centralines would effectively have to make refunds to
customers in DPP3 for money that it has not collected from consumers during DPP2.
E121 Centralines submits that the Commission's approach is inconsistent with the long-
term interests of consumers, suggesting that our draft decision focused on
implementation of rules rather than the genuine long-term interests of
consumers.489
E122 Centralines submits that:490
… the only reasonable outcome is to adjust Centralines’ revenue allowance to offset the
capex IRIS adjustment. We note that the Commission has stated that it would make a step
change adjustment for any EDB that has included pecuniary penalties in opex to ensure that
the opex IRIS mechanism does not allow the EDB to pass-through 74% of the penalty to
consumers – an outcome that it considers would be perverse (para A60). Centralines submits
that it would be similarly perverse for the Commission to insist Centralines provides refunds
to consumers for money it has not actually collected. A step change should therefore be
provided on the same basis.
E123 Centralines submitted that this is not the intended outcome from the IRIS, and that
this would be inconsistent with the Commission’s FCM principle.
Our view
E124 For future voluntary undercharging, the introduction of the revenue cap
undercharge ‘banking’ mechanism provides flexibility to distributors for any future
undercharging by allowing undercharged amounts (up to a certain limit) to be
recovered in the future. This is implemented through a timing adjustment for the
value of undercharging. This is explained further in Attachment H.
E125 Under the current price cap, distributors that voluntarily undercharged could not
recover the undercharge amount in subsequent periods. Consequently, there may
have been a potential disincentive to undercharge consumers without such a
mechanism to allow recovery (up to a certain level) of undercharging.
488 Centralines "Submission on DPP Reset Issues Paper" (21 December 2018), p. 1. 489 Centralines "Submission on EDB DPP reset draft decisions paper" (18 July 2019), p. 16. 490 Centralines "Submission on EDB DPP reset draft decisions paper" (18 July 2019), p. 16.
287
3605676.11
E126 In the case of Centralines undercharging its price cap during DPP2, this is a
retrospective issue. The rules in place on undercharging and the impact on IRIS have
not changed during DPP2.
E127 Centralines are requesting that we provide a step change to its revenue allowance to
offset the capex IRIS adjustment. We cannot identify what the undercharging was
due to (efficiency, deferred expenditure, or inflated forecasts), and therefore making
a retroactive adjustment for this under-spending would undermine the credibility of
the incentive regime. Any change to revenues for capex IRIS adjustments would also
need to apply to other distributors that have undercharged their price cap in DPP2,
which impacts all distributors to varying degrees.
E128 We want distributors to continue to undercharge their allowable revenue where it is
in the best interests of consumers and the wider community. However, distributors
looking to undercharge should consider the IRIS impact when considering the level of
undercharging.
E129 In response to Centralines’ submission point around comparisons to pecuniary
penalties in the opex allowance, we note that our approach is consistent. We have
not adjusted DPP2 incentives for either undercharging or for pecuniary penalties.
E130 On the other hand, undercharging is undertaken voluntarily by the supplier
(benefitting consumers) but leads to loss of incentives to achieve efficiency savings
throughout the period. If we provide Centralines with additional revenue to offset
the IRIS adjustment, it would be very difficult to disentangle any efficiency savings
from the amount undercharged.
E131 We note that our decision on undercharging is consistent with our decision on
pecuniary penalties. Pecuniary penalties will only be excluded from the application
of the IRIS mechanism in future periods, as we consider consumers should not bear a
proportion of these costs. The treatment of undercharging is consistent with
pecuniary penalties in that it does not involve retrospective adjustments to the IRIS
carry-forward adjustments (as the IRIS adjustments in DPP3 are based on values
from DPP2).
E132 We consider that our decision will provide guidance which should help ensure that if
a distributor wishes to underspend, that it takes the IRIS impact into account when
doing so. As previously noted, the Commission has a general policy for not making
retroactive changes to the incentives that distributors face during a period. Allowing
for distortions to incentives after savings (or overspends) have been incurred
reduces certainty and the intention of the incentive regime.
288
3605676.11
Other technical issues raised in submissions
IRIS model
E133 As part of the DPP2 reset we published an ‘illustrative’ model that was simplified to
give an indication of how the capex IRIS model works. We understand that some
distributors are using this illustrative model to calculate what their IRIS adjustments
will be for the following period.
E134 As part of our draft decision package we published a comprehensive capex IRIS
model for stakeholders to engage with.491
E135 We will publish an updated IRIS model prior to DPP3 beginning to assist distributors
in complying with its obligations. We note that Vector and ENA have raised some
minor technical corrections which we will take into account in the final model.492
E136 The ENA also noted that the remaining life values in the IRIS model published with
our draft decision contained a minor calculation error.493 We consider that the
application of the remaining asset lives in the IRIS model published with the draft
decision is appropriate and consistent with our DPP2 and DPP3 financial model, and
any change to these values would create an inconsistency between the capex IRIS
adjustments and suppliers’ RABs.
E137 Vector and the ENA have also raised concerns around including actual asset lives for
commissioned assets in the capex IRIS model.494 We consider that this is an
important step in calculating the capex IRIS incentive amounts to be consistent with
the IMs, but do not consider that including the template for this in the formal capex
IRIS model is appropriate. We want to provide distributors with flexibility to apply
actual asset lives, in line with the IMs, using its own systems and asset profiles to
calculate the correct capex IRIS retention.495
491 See: https://comcom.govt.nz/__data/assets/excel_doc/0028/155836/Calculations-of-IRIS-recoverable-costs-for-DPP3-EDB-DPP3-draft-21-June-2019.xlsx.
492 Vector “Submission on companion paper to updated models” (9 October 2019), para 110; ENA “Submission on companion paper to updated models” (9 October 2019), p. 9.
493 ENA “Submission on companion paper to updated models” (9 October 2019), p. 9. 494 Vector “Submission on companion paper to updated models” (9 October 2019), p. 5-6; and ENA
“Submission on companion paper to updated models” (9 October 2019), p. 9-10. 495 We note that this would involve EDBs inputting the asset lives of newly commissioned assets into the capex
IRIS model to calculate the capex incentive amount.
289
3605676.11
Discount factor used in IRIS model
E138 Mr Duignan considers that the midpoint level of the WACC (50th percentile) should
be used rather than the 67th percentile for the discount rate used in calculating the
strength of the relevant IRIS and WACC incentives.496
E139 We agree that technically the 50th percentile WACC could be an appropriate
discount factor to be used to present value cash flows in the IRIS mechanism. This is
a wider issue than just the IRIS calculation and would impact a range of different
models. Introducing different WACCs for different purposes within the regulatory
regime may introduce confusion.
E140 Mr Duignan also suggested that the Commission provide a view on whether a post-
tax WACC should be used (rather than the vanilla WACC that we currently use) as the
relevant discount rate in the opex IRIS:497
It is possible, depending on the exact way tax is treated in the operation of the Opex IRIS,
that the post-tax WACC rather than the vanilla WACC could be the relevant discount rate to
use in assessing a distributor’s incentives regarding expenditure decisions. I hope that the
Commission will provide its view on this issue.
E141 The WACC is used in the opex IRIS only as a discount rate to calculate the retention
factor between distributors and consumers to reflect external financial conditions.
We apply a vanilla WACC to calculate the opex retention factor to be consistent with
how the retention factor has been applied in DPP2 as well as for the opex incentive
rate and base capex incentive rate for Transpower. As part of the IM review we can
look at whether a post-tax WACC is more appropriate for discounting in terms of
IRIS.
496 Pat Duignan "Submission on EDB DPP reset draft decisions paper" (18 July 2019), p. 2. 497 Pat Duignan "Submission on EDB DPP reset draft decisions paper" (18 July 2019), p. 2.
290
3605676.11
Attachment F Incentives for innovation
Purpose of this attachment
F1 This attachment explains the details of our new mechanism to further incentivise
innovation.
F2 Our reasoning for introducing this new mechanism is provided in Chapter 4.
Recoverable cost for expenditure on innovative projects
F3 We have introduced a recoverable cost term in the EDB IMs and specified the criteria
and limits in this DPP so that the recoverable cost:
F3.1 is targeted for expenditure on innovative projects;498
F3.2 requires at least 50% contribution from the distributor;499
F3.3 is limited to the amounts specified in Table F1, which was calculated as the
higher of 0.1% of our forecast of allowable revenue (excluding pass-through
and recoverable costs) or $150,000 over DPP3;
F3.4 requires a report from an independent engineer or other suitable specialist
that the planned expenditure on the project meets the set of criteria for it
to be considered an innovation project and potentially benefits consumers.
498 Innovation project means a project that is focussed on the creation, development or application of a new or improved technology, process, or approach in respect of the provision of electricity lines services in New Zealand.
499 The contribution from the EDB should be treated as capital or operating expenditure of the contributing EDB, while any capital expenditure treated under this mechanism as a recoverable cost would not enter the regulated asset base.
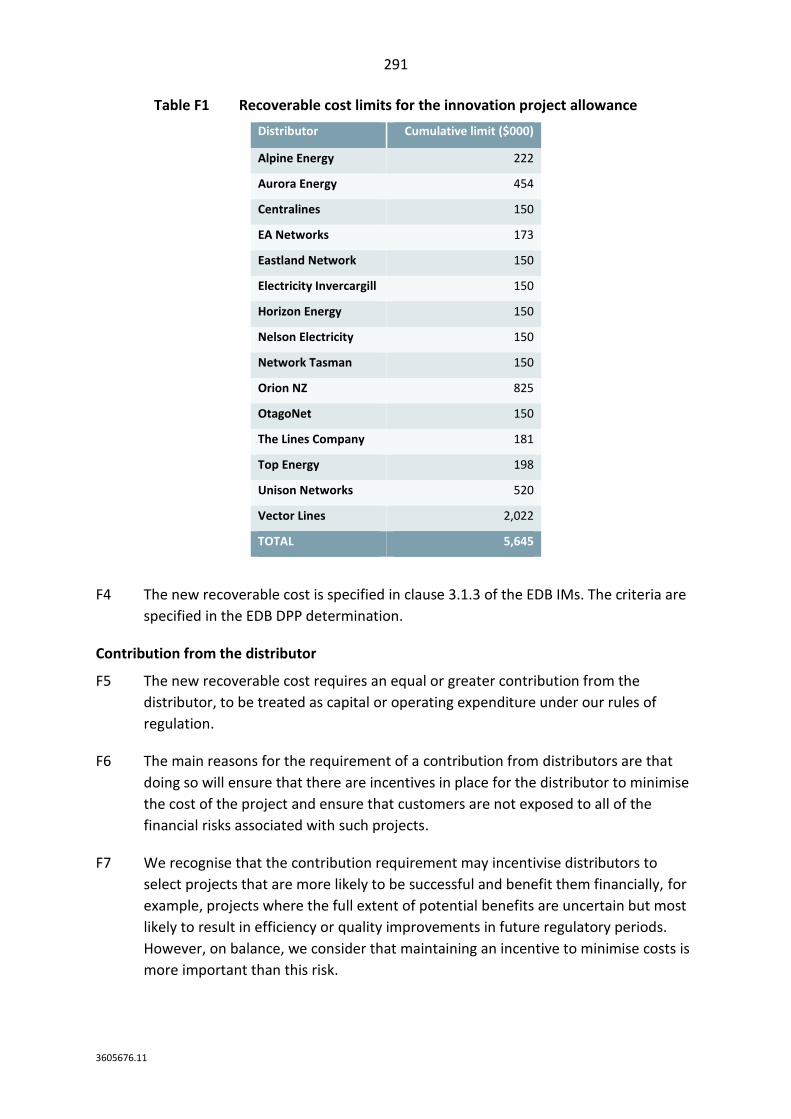
291
3605676.11
Table F1 Recoverable cost limits for the innovation project allowance
Distributor Cumulative limit ($000)
Alpine Energy 222
Aurora Energy 454
Centralines 150
EA Networks 173
Eastland Network 150
Electricity Invercargill 150
Horizon Energy 150
Nelson Electricity 150
Network Tasman 150
Orion NZ 825
OtagoNet 150
The Lines Company 181
Top Energy 198
Unison Networks 520
Vector Lines 2,022
TOTAL 5,645
F4 The new recoverable cost is specified in clause 3.1.3 of the EDB IMs. The criteria are
specified in the EDB DPP determination.
Contribution from the distributor
F5 The new recoverable cost requires an equal or greater contribution from the
distributor, to be treated as capital or operating expenditure under our rules of
regulation.
F6 The main reasons for the requirement of a contribution from distributors are that
doing so will ensure that there are incentives in place for the distributor to minimise
the cost of the project and ensure that customers are not exposed to all of the
financial risks associated with such projects.
F7 We recognise that the contribution requirement may incentivise distributors to
select projects that are more likely to be successful and benefit them financially, for
example, projects where the full extent of potential benefits are uncertain but most
likely to result in efficiency or quality improvements in future regulatory periods.
However, on balance, we consider that maintaining an incentive to minimise costs is
more important than this risk.
292
3605676.11
F8 If the innovative project involves capital expenditure, the expenditure treated as a
recoverable cost would not be eligible to be placed in the regulated asset base
because doing so would allow for over-recovery of the costs. The IMs have therefore
been amended to specifically exclude any capital expenditure portion of the
recoverable cost from the definitions of value of commissioned assets and forecast
value of commissioned assets. 500
F9 The contribution from the distributor is a minimum requirement, so greater
contributions from the distributor or other parties are possible and encouraged.
F10 Distributors are also able to seek contributions from other sources such as
innovation and science funds in addition to their contribution. We understand that
some third-party funding sources require a contribution from the recipient, and the
innovation mechanism will support this. Distributors may also use the funds for joint
projects with other distributors or other businesses or organisations, which may
result in greater innovation benefits for the sector.
F11 Unison has suggested that the innovation mechanism should be a pooled mechanism
to allow for larger projects than individual distributors will be able to afford.501
However, we consider that distributors are able to manage the arrangement of joint
projects, as suggested by MEUG, without the mechanism forcing the pooling of the
mechanism funds.502
Limit: calculated as the higher of 0.1% of revenue or $150,000
F12 The cumulative total of the recoverable cost is limited for each distributor to the
amounts specified in Table F1, which was calculated as the greater of 0.1% of our
forecast of net allowable revenue or $150,000 over the regulatory period. This
equates to approximately $6m across the non-exempt distributors if fully used,
excluding distributors that are currently on CPPs.503
F13 The limit applies cumulatively over the full regulatory period rather than on an
annual basis to avoid distributors needing to spread the project(s) over the full
regulatory period. It may be the case that distributors wish to undertake higher
levels of investment in particular years given the nature of the projects funded
through this incentive mechanism.
500 Commerce Commission Electricity Distribution Services Input Methodologies Amendments Determination (No. 2) [2019] NZCC 20 (26 November 2019), clause 2.2.11(1)(k).
501 Unison “Submission on EDB DPP reset draft decisions paper” (18 July 2019). 502 MEUG “Cross-submission on EDB DPP reset draft decisions paper” (12 August 2019). 503 However, we note that the recoverable cost will not be available to distributors that are currently under a
CPP until they enter a new DPP or CPP.
293
3605676.11
F14 We have used our judgement to calculate the limits at the higher of 0.1% or
$150,000. Although we recognise that this limit is lower than some of the
mechanisms in other countries and that there may be significant benefits from a
larger scheme, we consider that this level is an appropriate starting point because it
recognises that there are several risks and downsides of the new mechanism (as
described in paragraphs 4.76 to 4.83), and so balances the benefits and risks. The
moderate limit also means that we can set the approval and compliance
requirements in a relatively simple and low-cost way.
F15 As detailed in Chapter 4, there was no consensus in submissions on our draft
decision on the introduction and scale of the innovation mechanism. Submitters that
supported an innovation mechanism submitted that the limit should be higher, while
others submitted that it should not be introduced at all. This aligns with our view
that there are a range of benefits and risks, reinforcing our decision to introduce the
mechanism with a moderate limit.
F16 In its submission on our draft decision, MEUG also noted these uncertainties and
suggested that there was insufficient evidence of lower than optimal levels of
innovation to support such a mechanism. 504 We agree that it would be beneficial to
regulation-setting to have more evidence on innovation in the sector. However, we
do not consider that it is feasible to thoroughly research this without significant
research costs, which may not be proportionate to the scale of the issue, and
consistent with the relatively low-cost nature of the DPP. We consider that this is
consistent with our decision to introduce the mechanism at the level of funding we
have implemented.
F17 We have set the limit as a maximum of a percentage of revenue or an absolute value
to ensure that the mechanism is relevant to the smaller distributors to support
diversity of innovation, without creating an excessive price burden for consumers.
This decision is in line with several submissions that we received on the draft
decision (which only set the limit at 0.1% of revenue) that the amount would be too
small to be of any use for smaller distributors, such as Centralines:505
The Commission proposes an innovation allowance of 0.1% of revenues, subject to the EDB
contributing an equal amount and having an engineer verify the innovation. For Centralines,
the innovation allowance would amount to $10,000 per annum, which would be insufficient
allowance to fund any innovation project, let alone make any contribution to an engineering
report.
504 MEUG "Submission on EDB DPP reset draft decisions paper" (18 July 2019). 505 Centralines “Submission on EDB DPP reset draft decisions paper” (18 July 2019), page 17.
294
3605676.11
F18 For the smallest distributor, Nelson Electricity, the $150,000 over the regulatory
period equates to approximately 0.5% of forecast net allowable revenue. Several
submissions argued for a larger increase in the limits, however, we do not think that
this is appropriate at this time under the DPP framework. We also note the concerns
of MEUG, which considers that distributors should be able to adequately fund
innovation projects from existing funding and by partnering with third parties. 506
F19 Circumstances where a distributor wishes to undertake substantial changes to the
way it manages its network are beyond the scope of the innovation recoverable cost
and are more appropriately considered as part of a CPP application. A CPP allows us
the ability to apply greater scrutiny, and to vary the way the price-quality path
functions to account for innovative approaches.
Ex-post approval by Commission and ex-ante confirmation by a suitable specialist
F20 Our ex-post approval requirements for the recoverable cost is that the Commission
must be provided with a report by a registered engineer or other suitable specialist
that the ex-ante criteria are met
F21 The IMs and DPP determination also require that:
F21.1 the amount would not make the cumulative innovation recoverable cost
amount over the regulatory period greater than the specified limit;
F21.2 the distributor has made a contribution to the project of at least the same
amount as the recoverable cost; and
F21.3 a report that covers the findings of the project is made public after the
completion of the project.
F22 The inclusion of the requirement to publicly share project findings is a change from
our draft decision, and is in response to several submissions that raised the
importance of doing so in order to achieve the benefits of innovation across the
sector.507
F23 Our ex-ante criteria for the recoverable cost, to be confirmed by an independent
specialist to the best of their knowledge, are:
F23.1 The specialist making the report is independent of the distributor(s) and is
registered as an engineer (New Zealand CPEng), or is a suitable specialist;
506 MEUG "Cross-submission on EDB DPP reset draft decisions paper" (12 August 2019). 507 Such as ENA “Submission on EDB DPP reset draft decisions paper” (18 July 2019).
295
3605676.11
F23.2 the planned expenditure is solely aimed at either or both of:
F23.2.1 delivering the electricity distribution service at a lower cost; or
F23.2.2 delivering the electricity distribution service at a higher level of
quality; and
F23.3 the planned expenditure is focused on the creation, development, or
application of a new or improved technology, process, or approach in
respect of the provision of electricity lines services in New Zealand; and
F23.4 the focus of the planned expenditure has a reasonable prospect of being
scaled up within the distributor or to other distributors if it is successful, i.e.
the benefits are of general application to that distributor or other distributors
F24 The requirement for the projects to be solely focused on the cost and quality of the
electricity distribution services is to reduce any risk of distorting investment in
adjacent markets. This requirement may be able to be altered in future regulatory
periods if this risk is found to be minimal or is otherwise reduced.
F25 The requirement for ex-ante reporting by an independent engineer or other suitable
specialist is for them to state that, in their opinion, the project planned by the
distributor as evidenced by a published business case meets the Commission’s
criteria. We consider that this relatively low-cost and simple requirement is
proportionate to the limit of the recoverable cost.
F26 The signed statement by the independent engineer or suitable specialist and the
business case are required to be published and provided to the Commission. The
business cases may be provided to the Commission on a confidential basis if required
for reasons of commercial sensitivity, in which case we would require an explanation
of the cost allocation approach if the commercial sensitivity relates to the distributor
itself, or a statement of commercial sensitivity from a third-party provider if the
sensitivity relates to the third-party provider
F27 We may be open to engaging with distributors on the kinds of projects they are
seeking to put the allowance towards, and the suitability of proposed specialists. Any
view provided ex-ante by the Commission would be non-binding, but we understand
that such a view may be useful to distributors to provide an indication of the
outcomes of the approvals process.
296
3605676.11
F28 We have tightened the definition of innovation in the criteria as we have accepted
MEUG’s submission that including the words “in that type of situation” would have
made the definition too broad and may have covered projects that were not true
innovation.508 We note that Orion objected to this suggestion by MEUG, but we
consider that the change makes the requirements more clear and reduces the risk of
non-innovative projects being covered by the recoverable cost.509
F29 We have added “suitable specialist” to the people that could write a report
confirming that the innovation project criteria have been met in response to the
following submission by emhTrade, which we agree with:
While subtle, the draft paper makes reference to an ‘independent engineer’. If this
mechanism for independent scrutiny is retained, we suggest this wording could better reflect
that the innovations of tomorrow may not be those traditionally considered engineering
solutions (whilst many will be). Part of encouraging more rapid uptake of innovation is
changing cultures. The electricity distribution industry is going through a period of
unprecedented change; ‘independent technical expert’ might better reflect that and
promote wider thinking about potential solutions or efficiency measures.510
F30 A specialist should have the following attributes to be suitable and approved by the
Commission, which can be evidenced to the Commission by provision of a curriculum
vitae:511
F30.1 Specialist skills or knowledge in a relevant field (which could be a field
outside of electrical engineering, such as robotics or computer science)
based on training, study, or experience; and
F30.2 Independence from the distributor.
F31 In terms of the independence attribute, we would expect that the specialist is not
employed by the distributor and would not directly benefit from the Commission’s
approval of the recoverable cost. However, we accept that the specialist may have
previously worked for the distributor under contract given the relatively small size of
the relevant fields in New Zealand.
508 MEUG “Submission on EDB DPP reset draft decisions paper” (18 July 2019), paragraph 23. 509 Orion “Cross submission on proposed amendments to input methodologies for electricity distributors and
Transpower NZ Ltd” (18 July 2019). 510 emhTrade “Submission on EDB DPP reset draft decisions paper” (18 July 2019), page 1. 511 We note that the role of specialist could be undertaken by a group of people that collectively have the
appropriate attributes.
297
3605676.11
F32 Some submissions on our draft decision suggested that the innovation mechanism
should involve a greater level of scrutiny directly by the Commission or through a
competitive tender process.512 We recognise that this may produce better
innovation projects, but administering such a scheme would not be proportionate to
the scale and relatively low-cost nature of the DPP3 regime. We also note that, given
the distributor bears half the cost of delivering the project, ordinary efficiency
incentives will apply. As such, distributors may decide to deliver the project through
a competitive tender if doing so would lead to a lower cost outcome.
F33 The approval requirements that we have set do not mitigate all the risks to
consumers of the innovation recoverable cost. However, we consider that the level
of approval and remaining risk is proportionate to the relatively low limit.
Balance of rules between IMs and DPPs
F34 We have defined the recoverable cost term in the IMs because all recoverable cost
terms are defined under the specification of price in the IMs, which supports long-
term certainty of the regulatory regime.
F35 However, the criteria, distributor contribution, and limits are defined in the section
52P DPP determination so that the limit and contribution can be increased or
decreased in future DPP resets depending on the required strength of the incentive
at the time and the success of the incentive during DPP3. If the limit is changed, then
the approval criteria should also be reconsidered to maintain an approach that is
proportionate to the size of the limit. The criteria may also need to be revised to take
account of changing needs in the sector.
512 Such as ENA “Submission on EDB DPP reset draft decisions paper” (18 July 2019); and First Gas “Submission on EDB DPP reset draft decisions paper” (18 July 2019).
298
3605676.11
Attachment G Reopeners for large unforeseen capex
Purpose of this attachment
G1 This attachment explains the details of our two new reopener mechanisms for major
capex projects or programmes in respect of:
G1.1 large connections (including alterations to existing connections);
G1.2 large system growth;
G1.3 combination of large connections and system growth; and
G1.4 large asset relocation.
G2 Our reasoning for introducing this new mechanism is provided in Chapter 4, while
the detail is provided in this attachment.
New reopeners for large new connections, system growth, and asset relocations
G3 We have introduced two new reopeners in the EDB IMs that apply to individual
projects or programmes relating to large connections, system growth, and to asset
relocation capex. The reopeners have been introduced for the following types of
situations:
G3.1 Projects and programmes that were unforeseen at the time of publishing
the expenditure forecasts that the Commission based its allowances on;
G3.2 Projects and programmes that were foreseen but resulted in the
Commission setting allowances at less than the distributors’ forecast
because the project is a one-off large project meaning it is out of step with
historic expenditure or household growth rates;
G3.3 Projects and programmes that were foreseen, but changes in circumstances
mean that the cost is expected to be significantly greater than that forecast
in the disclosures used by the Commission for setting allowances; or
G3.4 Projects and programmes that were foreseen for later regulatory periods,
but changes in circumstances mean that the project or programme is
brought forward into the current regulatory period.
299
3605676.11
G4 The more specific requirements of the reopeners are:
G4.1 The reopeners only apply to the portion of the additional expenditure that
is not covered through the distributor’s capital contributions policy (which
must be reasonable) and there must be reasonable justification of the
distributor’s intended approach to allocating costs to consumers;
G4.2 The value of the reopeners in terms of additional expenditure allowance513
must be at least 1% of forecast net allowable revenue for the regulatory
period or two million dollars (whichever is less); however, the cumulative
additional expenditure from all reopeners under this provision cannot
exceed $30 million dollars in any disclosure year.
G4.3 The distributor must show a high level of confidence in the requirement for
the expenditure, for example through a firm request and commitment from
a new connecting party that this investment is required.
G5 The reopeners have a minimum threshold because we consider that distributors are
able to manage small changes in expenditure requirements within the DPPs set for
them. A minimum threshold is also required to avoid situations where the cost of
administering the reopener is greater than the benefits to consumers. We have also
put a cap in place because it is our view that larger projects and programmes that
are out of step with historic expenditure or forecasts require a level of scrutiny that
is not consistent with DPPs, so a CPP would be more appropriate, particularly in the
case of system growth projects and programmes (which has been added to the
reopeners following consultation).
G6 Some submitters have suggested that the issue could be solved by making these
types of projects recoverable costs or making the IRIS retention rate zero for
them.514 We appreciate these suggestions and note that they would have the benefit
of ensuring that consumers only pay for projects that are actually undertaken.
513 The project or programme may include a combination of related system growth and connection expenditure. However, asset relocation expenditure cannot be combined with system growth or connection expenditure in one reopener application. However, a reopener application may also be for a project of system growth expenditure alone, which is not tied to a specific new connection.
514 Powerco “Submission on EDB DPP reset draft decisions paper” (18 July 2019); and Unison “Submission on EDB DPP reset draft decisions paper” (18 July 2019).
300
3605676.11
G7 However, we consider that it is more appropriate to introduce reopeners because
this is more in line with our approach to DPPs and maintains incentives upon the
distributor to minimise costs. It does this because the reopeners will, if appropriate,
add additional allowable revenue to the distributor’s price path through increased
expenditure allowances. If the distributor makes efficiency gains and delivers the
project or programme for a lower cost than forecast, then these efficiency benefits
will be shared between the distributor and its consumers via the IRIS.
Unforeseen, under forecasted, or under-funded
G8 The reopeners apply to projects and programmes that are unforeseen, under-
forecasted, or under-funded.
G9 We consider that it is appropriate to apply the reopeners to unforeseen projects and
programmes because we acknowledge that these projects and programmes can
arise without the ability for distributors to accurately forecast them. The scale and
nature of these projects and programmes mean that a reopener would promote
investment. This is more of a case for DPP3 than it has been for previous regulatory
periods because the shift to revenue caps means that distributors cannot gain
additional revenue from a higher than expected increase in demand. Unison
explained this in their submission:515
The reality for Unison is that once the customer capex allowance has been spent, there is not
any financial incentive to undertake customer works because the NPV>0 test cannot be met.
The major customer capex reopener addresses large works, but anything less would mean a
loss to Unison, and would fail board approval processes.
G10 The issue that would arise without such a reopener may also be greater during DPP3
than in the past because of the potential changes in the electricity sector described
in Chapter 4, with a greater focus on electrification of industry and transport to
support the decarbonisation of the economy.
G11 We consider that unforeseen projects and programmes include incorrectly
forecasted projects and programmes with unforeseen timing or extent. By this, we
mean that the reopeners also cover projects and programmes that were broadly
foreseeable but not expected until future regulatory periods or reasonably expected
to be significantly less costly. That is because these situations have the same
implications for distributors and consumers as projects and programmes that were
entirely unforeseen.
515 Unison “Submission on EDB DPP reset draft decisions paper” (18 July 2019); paragraph 53.
301
3605676.11
G12 For example, a distributor may have expected a new dairy plant to be constructed
during the period, and so included the costs of a new connection in its forecasts.
However, the new customer might decide after the forecasts were made that they
would like the dairy plant to be double the original planned size, requiring a new
connection with a much greater capacity.
G13 In a change between the draft decision and the final decision, we have expanded the
reopeners to potentially apply to under-funded projects and programmes, ie, those
that were included in a distributor’s forecast but where we limited the expenditure
allowance for that expenditure category. We consider that this is appropriate
because our capital expenditure forecasting approach for consumer connections and
system growth is focused on expected broad growth (eg, through the relationship
with forecast household growth) and not scrutiny of individual large projects such as
a new dairy plant.
G14 Our understanding is that access to new connections and increased capacity of
connections is an important feature of quality to consumers and is investment that
should be incentivised. So, we consider that this decision better promotes the
purpose of Part 4 of the Commerce Act.
Not covered by the distributor’s capital contributions policy
G15 The reopeners will not apply to the portion of a project or programme that is
covered by the distributor’s current capital contributions policy because these costs
should not need to be recovered from consumers under the distributors’ revenue
cap.
G16 We expect distributors to take a reasonable approach to allocating the costs of the
project or programme to customers through a reasonable capital contributions
policy and future pricing, ideally in line with the pricing principles published by the
Electricity Authority.
G17 MEUG proposed a further requirement on distributors when they seek these new
reopeners. MEUG suggested that a distributor must also attest, in seeking the
reopener that it is fully complying with the pricing principles published by the
Electricity Authority, or has a development plan to move to compliance at a rate
expected of a reasonable and prudent distributor.516 Orion in its cross-submission on
our draft decision disagreed and did not believe that it is appropriate to have a
stand-alone requirement in this regard and it being codified in the IMs.517
516 MEUG “Submission on IM amendments for DPP and IPP” (5 July 2019). 517 Orion “Cross submission on proposed amendments to input methodologies for electricity distributors and
Transpower NZ Ltd” (18 July 2019).
302
3605676.11
G18 We expect distributors to take a reasonable approach to allocating the costs of the
project or programme to customers through a reasonable capital contributions
policy and future pricing, ideally in line with the pricing principles published by the
Electricity Authority. As such, we may consider a distributor’s planned pricing in
relation to the project or programme when considering whether a reopener should
be granted. We consider that this addresses the points raised on this issue by MEUG
and Orion.518
G19 We recognise that recovery of costs for connection and system growth projects and
programmes under the revenue cap (rather than capital contributions) exposes
other customers to the risk of disconnection of the major customer because the
costs would be borne by existing consumers. However, on balance, we consider that
this risk is outweighed by the benefits of these new reopeners.
Threshold of 1% of revenue or two million dollars
G20 We have set the threshold for the reopeners as at least 1% of forecast net allowable
revenue over the regulatory period or two million dollars per project or
programme—whichever is less for the distributor. We are also capping the
reopeners at $30m of aggregate expenditure across all projects and programmes
applied for in any one disclosure year. The threshold relates to the amount of
additional expenditure (net of capital contributions) that the distributor includes in
its reopener application (rather than the calculated effect on revenue).
G21 We have set the threshold to ensure that the benefits of the reopeners outweigh the
administrative and compliance costs associated with distributors making the
application and us assessing that application. The incentives of the DPP mean that
consumers will still pay for the majority of any additional expenditure without a
reopener.519
G22 We have set the threshold as a percentage and an absolute value—whichever is the
lesser for a distributor—because, as several submitters raised, the percentage
threshold may be unrealistic for the largest distributors to be able to meet on
individual projects or programmes.
518 MEUG “Submission on IM amendments for DPP and IPP” (5 July 2019); and Orion “Cross submission on proposed amendments to input methodologies for electricity distributors and Transpower NZ Ltd” (18 July 2019).
519 This is because of the capex IRIS incentive rate shares most of the cost of any overspend with consumers. See Attachment E for a more detailed discussion of the IRIS mechanism.

303
3605676.11
G23 We have introduced a cap to the reopeners because we consider that, particularly
with the addition of system growth and asset relocations, the reopeners could
otherwise apply to situations for which a CPP is more appropriate. The limited level
of scrutiny applied under these reopeners, in line with the relatively low-cost nature
of DPPs, is not appropriate for larger projects and programmes that are out of step
with original forecasts or historic expenditure. It is our view that 30 million dollars is
the appropriate level to achieve this.
G24 To further ensure that the reopener is not used when a CPP would be the
appropriate mechanism, we will not allow reopeners where the application relates
to a project (or part thereof) that is better viewed as part of a larger project or
programme, where that wider project or programme would not be under the cap. In
those circumstances we consider that a CPP would be the more appropriate
mechanism.
Sufficient certainty of the project or programme
G25 We are proposing a requirement for sufficient certainty of the project or
programme. Where appropriate, this should be commitment from the connecting
party or party requesting the asset relocation to reduce the risk that other
consumers face paying for the project or programme without benefit if the other
party decides to no longer connect to the network or require the relocation.
G26 Where the application is due to a range of factors—such as system growth projects
resulting from growing demand and operational requirements leading to a likely
exceedance of capacity in the near future—we would expect a thorough explanation
of these factors and why they result in the need for the project, similar to what
would typically be included in a business case. We will consider requesting
independent verification for this aspect on a case-by-case basis.
G27 We note that this requirement affects the timeliness of the project or programme,
and risks delaying large consumer projects like transport projects that require asset
relocations by the distributor. However, we consider that the requirement is
necessary to avoid other customers paying for a project or programme that is
ultimately not required.
G28 We are open to working with distributors in providing an initial non-binding view on
applications, particularly for the initial applications and particularly in regard to the
certainty requirements. This will support the process if any distributors are uncertain
of the criteria that we will apply in considering a reopener and the level of evidence
required (which should be proportionate to the scale of the reopener).
304
3605676.11
Attachment H Revenue cap with wash-up
Purpose of this attachment
H1 This attachment sets out our decisions relating to the price setting and wash-up
processes to be applied by distributors subject to DPP3.
Structure
H2 Implementing the revenue cap wash-up takes place through the price setting and
wash-up processes discussed in this attachment. We set out below our decisions on
the price setting and the wash-up processes under the following sections:
H2.1 Process sequence and timing: This section sets out the sequence and timing of the price setting and compliance assessment process and the wash-up calculations.
H2.2 Price setting process and assessing compliance: This section outlines the price setting process and how compliance for price setting will be assessed against the DPP3 determination. The flowcharts presented in Figure H1 and H2 at the end of this attachment also set out these processes.
H2.3 Limit on the percentage annual increase in forecast revenue from prices: This section outlines a regulatory control we have not previously used. We have adopted this control to limit price shocks to consumers arising from step increases in forecast revenue from prices. It also discusses submissions on this topic.
H2.4 Voluntary undercharging: This section outlines another regulatory control we have not previously used. We have adopted this control, again to limit price shocks to consumers.
H2.5 Wash-up calculation: This section outlines our approach for calculating the wash-up and the relevant inputs to the wash-up calculation. The flowchart presented in Figure H2 at the end of this attachment also sets out this process.
H2.6 Changes suggested in submissions on the draft decision: This section is outlined in more detail in the following paragraph.
H3 We discuss our response (other than those referred to at H2.3 above) to submissions
in the section “Response to submissions on the draft default price path decision”,
starting at Paragraph H129 under the following headings:
H3.1 New investment contract charges
H3.2 Definition of other regulated income
305
3605676.11
H3.3 Compliance reporting date for the Annual Compliance Statement
H3.4 Changes in the schedules to the draft default price path determination
relating to price and wash-up calculations
H3.5 Rate of change (X-factor) for Aurora
H3.6 Setting rates of change (X) for 5 years
H3.7 Applying a forecast of other regulated income when determining starting
prices
H3.8 Submission of an annual compliance statement during 2020/21
H3.9 Protection of distributors against retailer bad debts
H3.10 Revenue foregone as a result of a major Transpower interruption
H3.11 The proportion of total electricity charges to consumers that are distributor
charges.
Background
Purpose of the wash-up mechanism
H4 The IMs for distributors provide that the form of control must be a pure revenue cap
with a wash-up of under- and over-recovery of revenue. The purpose of the wash-up
is to ensure that revenue is not under- or over-recovered over time.
Summary of decisions
H5 Key decisions we have made as part of the DPP decision are:
H5.1 retained the draft decision to amend the IM to introduce a “limit on the percentage increase in forecast allowable revenue from prices” from one assessment period to the next, and setting the limit to 10%
H5.2 retained the draft decision to not specify the use of the IM control “annual maximum percentage increase in forecast allowable revenue as a function of demand” from one assessment period to the next
H5.3 retained the draft decision to set the limit on voluntary undercharging at 90%
H5.4 changed the draft decision to set an alternative X-factor for Aurora at -8.9% to not setting an alternative X-factor for Aurora, which results in the X-factor being the default value of 0%.
306
3605676.11
H5.5 introduced a limit on the percentage increase in “forecast revenue from prices” from one assessment period to the next.520 This is discussed in paragraphs H28 to H62.
H5.6 implemented a voluntary undercharging regime which limits the cumulative amount a distributor may undercharge before it starts to permanently forego revenues.521 This means if a distributor undercharges to the extent that the cumulative undercharge limit is exceeded, the distributor will not be able to fully recover its undercharging through the wash-up mechanism. This is discussed in paragraphs H69 to H98.
Process sequence and timing
H6 In this section we set out the sequence and timing of the price setting and
compliance assessment process and the wash-up calculations by going through the
process steps for what must occur in each of the five assessment periods of the next
regulatory period. This approach is generally consistent with our approach used for
the current DPP for gas transmission businesses522.
H7 Figure H1 sets out the price setting and compliance setting process and Figure H2
sets out the wash-up calculations. These figures are near the end of this attachment
after paragraph H178.
The process - first and second assessment periods of the regulatory period
H8 Only the price setting and compliance assessment process will be performed when
setting prices for the first and second assessment periods of the next regulatory
period. This is because, as outlined below for the third and subsequent assessment
periods, setting prices and taking into account any amounts to be washed up
requires two prior assessment periods.
520 Electricity Distribution Services Input Methodologies Amendments Determination 2019 (November 2019). 521 Commerce Commission Electricity Distribution Services Input Methodologies Determination 2012 [2012]
NZCC 26 (Consolidated as at 31 January 2019), clause 3.1.3(12)(b) and clause 3.1.3(13)(a). 522 Gas Transmission Services Default Price-Quality Path Determination 2017 [2017], NZCC 14 (consolidated 18
December 2018).
307
3605676.11
The process - third and subsequent assessment periods of the regulatory period
H9 When setting prices for the each of the third, fourth, and fifth assessment periods of
the regulatory period, the wash-up calculation of a prior assessment period will be
taken into account. Three consecutive assessment periods will feature in each of
these wash-up calculations. For this attachment we define names for each of these
three assessment periods as follows:
H9.1 the ‘assessment period to be washed up’, will be the earliest of these three assessment periods;
H9.2 the ‘calculation assessment period’, will be the second of these three assessment periods; 523 and
H9.3 the ‘assessment period for which prices are to be set’, will be the last of these three assessment periods.
H10 The table below shows the three consecutive assessment periods. For the calculation
assessment period it shows that this assessment period comprises four phases:
H10.1 waiting for data from the prior assessment period (such as quantities supplied) to become available;
H10.2 doing the wash-up calculation;
H10.3 setting prices for the subsequent assessment period once the results of the wash-up calculation are available; and
H10.4 the notice period for prices, which is from the time that finalised prices are published by the distributors to the time they take effect. This notice period includes the time required for retailers to set their prices and the notice period for retail prices.
523 Prices are calculated, set, and notified by the distributor in advance of the assessment period in which those prices apply.
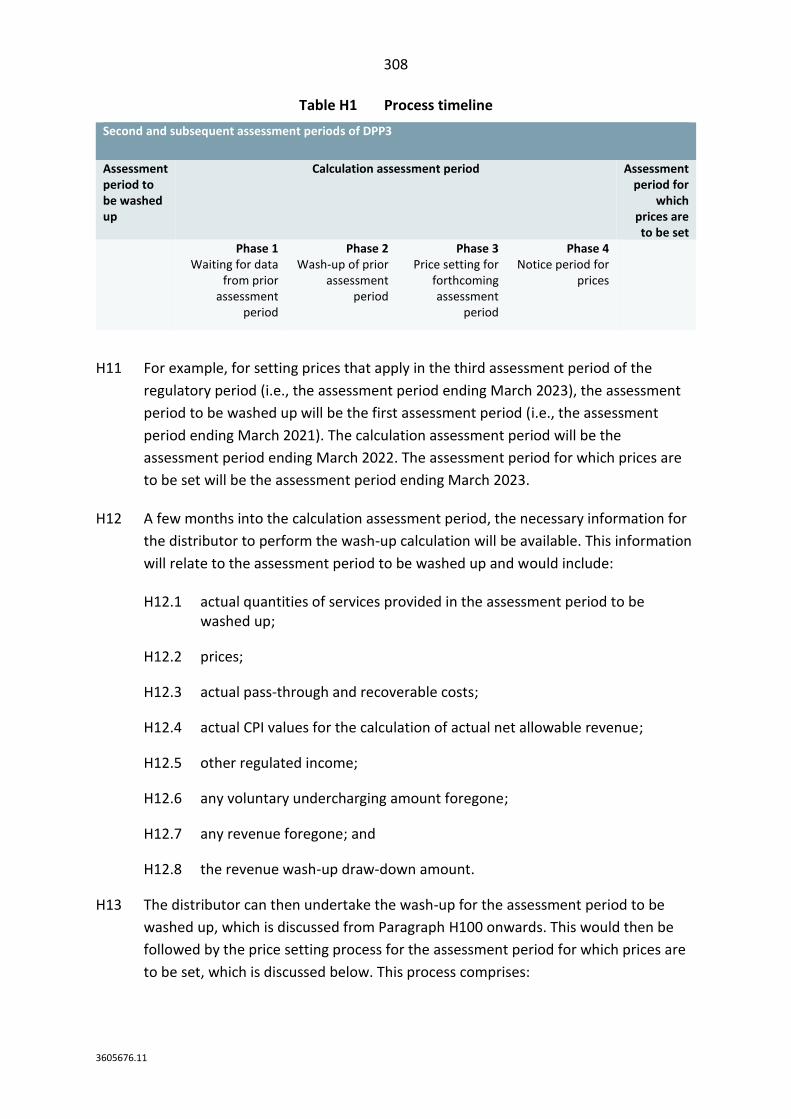
308
3605676.11
Table H1 Process timeline
Second and subsequent assessment periods of DPP3
Assessment period to be washed up
Calculation assessment period Assessment period for
which prices are to be set
Phase 1 Waiting for data
from prior assessment
period
Phase 2 Wash-up of prior
assessment period
Phase 3 Price setting for
forthcoming assessment
period
Phase 4 Notice period for
prices
H11 For example, for setting prices that apply in the third assessment period of the
regulatory period (i.e., the assessment period ending March 2023), the assessment
period to be washed up will be the first assessment period (i.e., the assessment
period ending March 2021). The calculation assessment period will be the
assessment period ending March 2022. The assessment period for which prices are
to be set will be the assessment period ending March 2023.
H12 A few months into the calculation assessment period, the necessary information for
the distributor to perform the wash-up calculation will be available. This information
will relate to the assessment period to be washed up and would include:
H12.1 actual quantities of services provided in the assessment period to be washed up;
H12.2 prices;
H12.3 actual pass-through and recoverable costs;
H12.4 actual CPI values for the calculation of actual net allowable revenue;
H12.5 other regulated income;
H12.6 any voluntary undercharging amount foregone;
H12.7 any revenue foregone; and
H12.8 the revenue wash-up draw-down amount.
H13 The distributor can then undertake the wash-up for the assessment period to be
washed up, which is discussed from Paragraph H100 onwards. This would then be
followed by the price setting process for the assessment period for which prices are
to be set, which is discussed below. This process comprises:
309
3605676.11
H13.1 forecasting quantities of services provided in the assessment period for which prices are to be set;
H13.2 forecasting pass-through and recoverable costs;
H13.3 calculating the forecast allowable revenue;
H13.4 setting individual prices so that the forecast revenue from these prices is not more than the forecast allowable revenue; and
H13.5 determining the ‘revenue account draw-down amount’. (See paragraph H102.)
Price setting process and assessing compliance
H14 In this section we outline the price setting process and the process for how
compliance is assessed against the DPP3 determination.
Assessing compliance with the DPP Determination
H15 Compliance with the DPP3 determination requires “forecast allowable revenue”
(including the recovery of forecast pass-through and recoverable costs) to be
calculated, and a set of prices to be developed such that the “forecast revenue from
prices” does not exceed the “forecast allowable revenue”.524
Price setting methodology
Forecast allowable revenue
H16 The forecast allowable revenue must be the sum of:525
H16.1 the “forecast net allowable revenue”; 526
H16.2 the forecast pass-through and recoverable costs (excluding any revenue account draw-down amount);
H16.3 the opening balance of the wash-up account; and
H16.4 pass-through balance allowance.
524 Commerce Commission Electricity Distribution Services Input Methodologies Determination 2012 [2012] NZCC 26 (Consolidated as at 31 January 2019), clause 3.1.1(1).
525 Commerce Commission Electricity Distribution Services Input Methodologies Determination 2012 [2012] NZCC 26 (Consolidated as at 31 January 2019), clause 3.1.1(4).
526 Commerce Commission Electricity Distribution Services Input Methodologies Determination 2012 [2012] NZCC 26 (Consolidated as at 31 January 2019), clause 3.1.1(6) or clause 3.1.1 (7).
310
3605676.11
H17 We have calculated values for the forecast net allowable revenue for each
assessment period of the regulatory period in the financial model, so these values
are now available.527 Each of the five values is listed in Schedule 1.4 of the DPP3
determination. 528
H18 The distributor will prepare a forecast of the pass-through and recoverable costs
during each price setting process. These forecasts will exclude a revenue account
draw-down amount (which will itself be a recoverable cost).
H19 There may be pass-through and recoverable costs from the regulatory period ending
31 March 2020 that will remain unrecovered at the end of that regulatory period.
H20 The Powerco CPP determination provided, at Schedule 1.6, for a specified amount of
$264,000 as the estimated amount of the pass-through balance as at the start of the
CPP period. We have implemented a similar provision for the pass-through balance
as at 31 March 2020, except that the amount would not be quantified in the DPP3
determination but instead would be specified in the DPP3 determination as the
amount reasonably estimated by the distributor.
Forecast revenue from prices
H21 The distributor will prepare a schedule of prices and forecast quantities. From these
the distributor will calculate the forecast revenue from prices as the total of each
price multiplied by its corresponding forecast quantity.529 Distributors will need to
take account of the two mechanisms discussed in the next two sections:
H21.1 Limit on the percentage annual increase in forecast revenue from prices;
and
H21.2 Voluntary undercharging.
527 The methodology for calculating the forecast net allowable revenue for the second and subsequent assessment periods, given the first assessment period value, is set out in clause 3.1.1(7) of the EDB IM on a CPI-X basis. The financial model applies this methodology. Forecast net allowable revenues for each non-exempt distributor subject to DPP3 for the whole of the regulatory period are specified in Schedule 4 of the DPP3 determination. This can be done because the forecast CPI values and the forecast net allowable revenues are all set at the time the path is set.
528 For clarification, we note that the forecast net allowable revenue is referred to in the draft financial model as the maximum allowable revenue before tax, or MAR.
529 Commerce Commission Electricity Distribution Services Input Methodologies Determination 2012 [2012] NZCC 26 (Consolidated as at 31 January 2019), clause 3.1.1(3).
311
3605676.11
Limit on the percentage annual increase in forecast revenue from prices
H22 We have amended the IMs to apply a limit on the percentage annual increase in
forecast revenue (the limit) from prices during the regulatory period for DPP3.530
This amount goes towards calculating the maximum revenues that may be recovered
by a distributor for the purposes of section 53M(1)(a) of the Act. We apply this limit
to respond to increases in the gross revenue distributors can earn, which is one of
the causes of potential price volatility in DPP3.
H23 This is not the primary control on distributors’ revenues. It applies as well as the
primary control which is the determination Clause 8.3 requirement that “the
forecast revenue from prices for each assessment period must not exceed the
forecast allowable revenue for that assessment period.”
H24 The EDB IMs also contain an optional mechanism to control the other major source
of price volatility – changes in total demand on the network – which we refer to as
the ‘limit in price increase as a function of demand’. However, because of workability
concerns, we have not made use of this mechanism in DPP3.
H25 As discussed further in paragraphs H39 to H47, new sources of price volatility are:
H25.1 The change in the form of control from a weighted average price cap to a
revenue cap means that any reduction in quantities supplied will generally
translate into price increases as a distributor seeks to restore its revenue to
the allowable limit.
H25.2 Some recoverable costs of significant magnitude will apply for the first time,
such as IRIS recoverable costs.531
H25.3 If a new Transmission Pricing Methodology is applied during DPP3, the
Transpower New Zealand Limited (Transpower) transmission charge
recoverable cost could cause a significant revenue increase for some
distributors as a result of a reallocation of some portions of those
charges.532
H25.4 Annual wash-up draw-down amounts could contribute to volatility.
530 Commerce Commission Electricity Distribution Services Input Methodologies Amendments Determination (No. 2) [2019] NZCC 20 (26 November 2019), clause 3.1.1(1)(b).
531 Commerce Commission Electricity Distribution Services Input Methodologies Determination 2012 [2012] NZCC 26 (Consolidated as at 31 January 2019), clause 3.1.3(1)(a).
532 Commerce Commission Electricity Distribution Services Input Methodologies Determination 2012 [2012] NZCC 26 (Consolidated as at 31 January 2019), clause 3.1.3(1)(b).
312
3605676.11
H26 The limit would mitigate the risks from several drivers of price volatility for
consumers. Applying this limit should have a low compliance cost, as it is based on
just two numbers which are calculated by distributors in any event.
H27 These two numbers are the ‘forecast revenue from prices’ for:
H27.1 the assessment period for which prices are being set; and
H27.2 the assessment period prior to that.
H28 To implement the limit, we have made an amendment to the EDB IMs allowing us to
specify in a DPP or CPP a “limit or limits on the percentage annual increase in
forecast revenue from prices”. 533
H29 We have implemented the limit for DPP3 by including a mechanism that limits, with
one exception, every change in forecast revenue from prices from one assessment
period to the next, including the increase to the first assessment period of a new
regulatory period from the last assessment period of the prior regulatory period.
H30 The exception is that on transition to this new rule, the limit would not apply to the
price setting by distributors for the assessment period ending 31 March 2021. We
discuss this exception below at paragraph H33.
H31 We discuss the choice of 10% as the value of the default limit starting at Paragraph
H53.
H32 We have specified a value of 10% for the default value of the limit in the DPP3
determination. This was the value proposed in the draft decision, and we did not
receive any submission suggesting a different default value.
Managing price shocks in the first assessment period of a regulatory period
H33 The limit will not apply to the price setting by distributors for the first assessment
period of DPP3 (the assessment period ending 31 March 2021). This is because
applying the limit would require a forecast revenue from prices for the assessment
period ending 31 March 2020, but that forecast will not exist as it was not required
under the DPP2 form of control.
533 Commerce Commission Electricity Distribution Services Input Methodologies Amendments Determination (No. 2) [2019] NZCC 20 (26 November 2019), clause 3.1.1(1)(b).
313
3605676.11
H34 To manage price shock risk for that first assessment period of DPP3, we considered
using X values as levers to adjust the MARs for the first assessment period. We
estimated increases in revenues between 2019/20 and 2020/21 and consider that
none of the increases are large enough to warrant applying an alternative X value to
manage price shock risk.
H35 While have not applied the limit to the first assessment period of DPP3, we consider
that for future price-quality path resets, using the limit may be the most effective
way of managing price shocks for the first assessment period of a regulatory period.
Distributors will have the better information on any revenue wash-up draw-down
amount and will have better forecasts of quantities, pass-through costs and
recoverable costs when setting prices than we will have.
H36 A distributor will apply this better information when making its forecasts as part of
its price setting process, and this will inform the application of the limit.
Alternative values of the limit
H37 In the draft decision reasons paper, we proposed specifying the default value of the
limit as 10%, and also considered that that for the final decision we may specify
alternative values for the limit for specified distributors.
H38 We have not set an alternative value of the limit for any specified distributor. We did
not receive any submissions suggesting we should set an alternative limit for a
specified distributor.
Volatility in allowable revenue
H39 Volatility of prices will be driven by a combination of volatility in allowable revenue
and volatility of quantities. We discuss volatility in allowable revenue in this section
and volatility in quantities in the next section.
H40 IRIS recoverable costs, particularly the ‘opex incentive amount’ component of the
‘IRIS incentive adjustment’,534 could significantly increase from one assessment
period to the next as distributors recover their incentive amounts through prices.
H41 We received submissions that we should apply a limit on Transpower similar to the
limit on distributors. Wellington Electricity and Vector submitted concerns that they
would carry the cash flow burden of smoothing prices for Transpower, rather than
Transpower carrying that burden.
534 Commerce Commission Electricity Distribution Services Input Methodologies Determination 2012 [2012] NZCC 26 (Consolidated as at 31 January 2019), clause 3.3.1 and clause 3.3.2.
314
3605676.11
H42 Any issue as to whether Transpower should smooth its revenues is not a DPP issue.
Transpower’s RCP3 proposal includes price smoothing without annual updates to its
MAR.535 We consider that this should remove the necessity of having to apply a
similar limit to Transpower, and therefore, make submitters’ concerns moot.
H43 We consider that the limit will address these sources of volatility as well as volatility
from wash-up draw-down amounts, and all pass-through and recoverable costs,
including IRIS and quality incentive adjustment recoverable costs.
Volatility in forecast quantities
H44 The change in the form of control from a weighted average price cap to a revenue
cap which was implemented in the 2016 IM review will tend to increase the volatility
of allowable prices. The revenue cap means that any reduction in forecast quantities
supplied will generally translate into price increases as a distributor seeks to restore
its revenue to the allowable limit. The current weighted average price cap does not
result in price increases arising from quantity reductions.
H45 Ideally, we would specify an “annual maximum percentage increase in forecast
allowable revenue as a function of demand”536 as that could effectively mitigate
price volatility risk from quantities volatility as well as allowable revenue volatility.
However, we consider that this mechanism is not workable to implement in DPP3 in
the event of certain price restructurings.
H46 We have therefore not applied an “annual maximum percentage increase in forecast
allowable revenue as a function of demand”. We discuss the implementation
workability in the next section.
H47 A catastrophic event could cause a significant reduction in quantities supplied, with a
corresponding step increase in prices to restore revenues. We consider that the
existing EDB IM provisions provide an appropriate mechanism for responding to a
significant reduction in quantities caused by a catastrophic event. These mechanisms
are:
• that we may reconsider a DPP if a catastrophic event has occurred
• the risk sharing provision in the cap on the wash-up amount.537
535 Transpower “Regulatory Control Period 3 Proposal” (November 2018), p. 49. 536 As allowed under Commerce Commission Electricity Distribution Services Input Methodologies
Determination 2012 [2012] NZCC 26 (Consolidated as at 31 January 2019), clause 3.1.1(2). 537 Commerce Commission Electricity Distribution Services Input Methodologies Determination 2012
[2012] NZCC 26 (Consolidated as at 31 January 2019), clauses 3.1.3(13)(c), 4.5.1, 4.5.6(1)(a)(i), 4.5.6(2) and 4.5.7.
315
3605676.11
Workability of the implementation of the limit on forecast allowable revenue as a function of demand
H48 We have not been able to develop a workable mechanism for a limit on forecast
allowable revenue as a function of demand for DPP3 in the event of a distributor
carrying out certain types of price restructure.
H49 We consulted on an illustrative implementation of that mechanism in the draft
decision for the 2017 reset of the gas transmission DPP.538 That illustrative
implementation avoids some of the problems that can arise from price
restructurings, but it still relies on the continuity of several pricing metrics from one
assessment period to the next.
H50 We decided not to apply it to the 2017 gas transmission DPP reset, given the
proposed price restructuring that First Gas is contemplating in a new gas
transmission access code. As noted in the reasons paper for the final gas
transmission decision, we considered that the revenue class approach would not be
workable in the context of the First Gas proposed access code.539
H51 We were concerned that similar challenges could emerge if we were to apply that
illustrative implementation to distributors for DPP3. For example, a change from the
grid exit point pricing (GXP) structures used by some distributors to the pricing
structures used by most distributors (ICP pricing) could be particularly problematic.
H52 For such a price restructuring from GXP pricing to ICP pricing, we consider that very
few pricing metrics (such as $/day, $/kWh, $/monthly maximum kVA demand) would
have effective continuity through the pricing restructuring.540
The default 10% limit on the annual percentage increase in forecast revenue from prices
H53 Setting the limit was a judgement call. We have set a limit of 10% in nominal terms
because we consider this a reasonable balance between what might be considered
upper and lower bounds for our setting of this limit.
H54 If a distributor’s pricing was at this 10% revenue limit but also reflected a reduction
in quantities, then the pricing change could be higher than 10%.
538 The illustrative implementation was set out in Schedule 6 to the draft determination that formed part of the consultation papers for the draft decision. Commerce Commission, “Draft Gas Transmission Services Default Price-Quality Path Determination 2017” (10 February 2017), Schedule 6.
539 Commerce Commission, “Default price-quality paths for gas pipeline businesses from 1 October 2017, Final Reasons Paper” (31 May 2017), paras F21 – F27.
540 A $/kWh metric may not have effective continuity because distributed generation will be netted off consumption at a grid exit point, while ICP pricing would charge without the netting off effect. $/kVA of maximum demand may also not have continuity because of diversity of demand.
316
3605676.11
H55 We have in the past used both 5% and 10% as indicators of target maximum real
price increases. For the assessment periods ending 31 March 2014 and 31 March
2015, we restricted price increases to 10% real.541 For DPP2, we tried to restrict price
increases to the first assessment period of the regulatory period (assessment period
ending 31 March 2016) to 5% by applying a negative X value for some distributors,
but in practice allowed for real price increases of up to 11% by setting X at -11% for
one distributor.542
H56 We wish to see the limit on the annual percentage increase in forecast revenue from
prices to bind only as an exception, which also implies a lower bound on the
percentage increase. We consider this lower bound on the limit should be set high
enough to allow for routine changes, such as the CPI change, the usual volatility of
recoverable costs, and the usual volatility of quantities, to occur without triggering
the limit on the annual percentage increase in forecast revenue from prices.
H57 In the draft decision, we suggested the lower bound be 8%, which left a range from
8% to 10% for the limit. The value of 10% for the limit on distribution charges
translates into an increase in a consumer’s total electricity charge in the order of 3%.
H58 We did not receive any submissions suggesting a value of other than 10%.
Smoothing price shocks into future assessment periods in a present value-neutral manner
H59 The discussion above on the limit on the percentage annual increase in forecast
revenue from prices (from paragraph H22 to this paragraph) focuses on limiting
allowable revenues in an assessment year in which a price shock might otherwise
occur. We must also consider how these revenue reductions may be recovered by
the distributor in subsequent years to achieve the objective that the mechanism is
present value neutral.
H60 The EDB IM provisions for the wash-up of the revenue cap and the way in which this
was implemented in the three determinations to date with a revenue cap have been
implemented to provide for the recovery of the revenue reductions with little
modification and low additional compliance costs.543
541 Commerce Commission “Resetting the 2010-15 Default Price-Quality Paths for 16 Electricity Distributors” (30 November 2012), p. 49.
542 Commerce Commission “Default price-quality paths for electricity distributors from 1 April 2015 to 31 March 2020: Main Policy Paper” (28 November 2014), pp. 73-75.
543 The three determinations to date with a revenue cap are the gas transmission DPP and the CPPs for Powerco and Wellington Electricity Lines Limited (Wellington Electricity).
317
3605676.11
H61 When the limit binds, the distributor will earn less revenue in the applicable
assessment period than it would without the limit. This reduced revenue will
increase the wash-up amount for the assessment period, which will in turn allow for
a higher revenue in a future assessment period.
H62 The consequential NPV neutral impact on the wash-up will be dealt with through the
established methodology for the revenue cap with wash-up. A time value of money
adjustment will be applied per the IMs at a discount rate of the post-tax WACC, so
the mechanism as a whole will be NPV neutral.
Submissions on the limit on the percentage annual increase in forecast revenue from prices to exclude pass-through and recoverable costs
H63 We have not adopted Orion’s, Wellington Electricity’s and Vector’s submissions that
the limit on the percentage annual increase in forecast revenue from prices be
applied to only the distributor’s costs and not to the component of revenues related
to the recovery of pass-through and recoverable costs.544
H64 The purpose of the limit is to mitigate the risk of price shocks to consumers.
Excluding potential sources of such shocks would reduce the effectiveness of the
limit and not be in consumers’ interests.
H65 Wellington Electricity’s concern relates particularly to the possibility of large changes
in Transpower charges. We have considered two drivers of Transpower charge
volatility:
H65.1 In the Electricity Authority’s July 2019 paper “Transmission pricing
methodology: 2019 issues paper”, Table 12 lists the 2022 change in charges
that would result from adopting a proposed transmission pricing
methodology.545 The increase for Horizon Energy, relative to the 2022 MAR,
would be 11.9% of the MAR. This would be the largest such percentage.
Network Tasman would have the second highest percentage at 9.0%.
H65.2 Transpower’s RCP3 proposal includes price smoothing without annual
updates to its MAR, and we expect this to limit changes in Transpower
charges during DPP3.
544 Wellington Electricity "Submission on EDB DPP reset draft decisions paper" (18 July 2019), p. 18; Orion "Cross submission on EDB DPP reset draft decisions paper" (12 August 2019); Vector "Submission on EDB DPP reset draft decisions paper" (18 July 2019), para 257.
545 Electricity Authority, Transmission pricing methodology: 2019 issues paper, 30 July 2019
318
3605676.11
H66 We consider that the level of potential volatility to be acceptable. If the limit binds,
then the distributor’s cash flows will be delayed, but any revenue reduction will be
able to be recovered in future years along with a time value of money adjustment.
Limit on the percentage annual increase in forecast revenue from prices to be applied in constant-price terms
H67 Aurora submitted for the ‘limit on the percentage annual increase in forecast
revenue from prices’ be applied in constant-price terms, rather than in nominal
terms.546
H68 We have not adopted this approach because:
H68.1 the approach would not make a very material impact on the operation of
the limit;
H68.2 the approach would add complexity to both the specification of the limit
and to the calculations relating to the limit; and
H68.3 we expect that the limit will bind relatively infrequently.
Voluntary undercharging
Purpose of the voluntary undercharging mechanism
H69 The purpose of the voluntary undercharging mechanism for DPP3 is to mitigate the
risk of price shocks that could arise from voluntary undercharging.
H70 Under the revenue cap with wash-up, distributors may carry forward under-
recovered revenue in a wash-up account.547 Absent a mechanism to limit
accumulation of the wash-up balance, a distributor that prices below the revenue
cap may accrue a large balance, which could then create price shocks when it is
passed through to consumers.
H71 While the limit on the percentage annual increase in forecast revenue from prices
could significantly mitigate this risk, an accumulation of a large credit balance in the
wash-up could result in increases in forecast revenue from prices at the 10% limit
value for multiple consecutive assessment periods. We consider this would be
undesirable, and we therefore applied the voluntary undercharging mechanism to
avoid the building up of a large credit balance in the first place.
546 Aurora "Submission on EDB DPP reset draft decisions paper" (18 July 2019), para 8.3.
547 Commerce Commission Electricity Distribution Services Input Methodologies Determination 2012 [2012] NZCC 26 (Consolidated as at 31 January 2019), clause 3.1.3(12)(b) and clause 3.1.3(13)(a).
319
3605676.11
IM requirement for calculating a “voluntary undercharging amount foregone”
H72 Under the current DPP, which applies a weighted average price cap with no wash-up,
a distributor that charges below its price cap immediately and permanently foregoes
that revenue. In the 2016 IM review, the form of control for distributors changed
from a weighted average price cap to a revenue cap with wash-up.548
H73 To implement the revenue cap mechanism, we introduced an IM requirement for us
to specify within a DPP a method for distributors to calculate and record any
“voluntary undercharging amount foregone”.
Implementing the voluntary undercharging mechanism
H74 Part of the process for the wash-up account is the calculation of a “closing wash-up
balance”. To calculate this amount, a distributor must, for each disclosure year,
calculate and record any “voluntary undercharging amount foregone”.549
H75 Under the revenue cap, when a distributor is undertaking its annual price setting
exercise, it must calculate its “forecast revenue from prices” for the forthcoming
assessment period. The primary revenue control of an EDB DPP will be that the
“forecast revenue from prices” must be no higher than the “forecast allowable
revenue”.550
H76 The voluntary undercharging regime sets a more stringent control, but it is not a
mandatory limit. It sets a value of “forecast revenue from prices” that is a threshold
for triggering a permanent foregoing of revenue.
H77 If prices are set higher than this threshold but nevertheless result in an undercharge,
then there will be a temporary foregoing of revenue in the assessment period to
which the prices apply. The loss of revenue to this level of undercharging will be fully
recovered, with financing costs, in later assessment periods through the wash-up
mechanism.
548 Commerce Commission Electricity Distribution Services Input Methodologies Determination 2012 [2012] NZCC 26 (Consolidated as at 31 January 2019), clause 3.1.1; Commerce Commission “Input methodologies review decisions: Report on the IM review” (20 December 2016), p. 78.
549 Commerce Commission Electricity Distribution Services Input Methodologies Determination 2012 [2012] NZCC 26 (Consolidated as at 31 January 2019), clause 3.1.3(12)(b).
550 Commerce Commission Electricity Distribution Services Input Methodologies Determination 2012 [2012] NZCC 26 (Consolidated as at 31 January 2019), clause 3.1.1(1).
320
3605676.11
H78 We must specify in our DPP3 determination how a voluntary undercharging amount
foregone must be calculated.551 The approach is set out below starting at paragraph
H80.
H79 We have specified in our DPP3 determination how a “voluntary undercharging
amount foregone” will be taken into account in the wash-up mechanism. This will be
done through the calculation of the closing wash-up account balance.
Calculation of voluntary undercharging amount foregone in DPP3
H80 We have applied the following methodology for a distributor to calculate, when
setting its prices, any voluntary undercharging amount foregone:552
H81 Defining “voluntary undercharging revenue floor” as the lesser of
H81.1 90% of forecast allowable revenue, and
H81.2 (1 +10%) × the previous assessment period’s forecast revenue from
prices.553
H82 If a distributor is to avoid any permanent foregoing of revenue from undercharging,
it will choose to set its prices such that its “forecast revenue from prices” is greater
than the “voluntary undercharging revenue floor”.
H83 If a distributor sets its prices such that the “forecast revenue from prices” is less than
the “voluntary undercharging revenue floor”, then:
H83.1 “voluntary undercharging amount foregone” = “voluntary undercharging
revenue floor” less “forecast revenue from prices”.
H84 The floor is not a mandatory level below which a distributor must not charge. It is
instead a threshold below which the distributor will permanently forego revenue
because of its undercharging.
H85 A numerical example of the process is provided starting at Paragraph H179.
551 Commerce Commission Electricity Distribution Services Input Methodologies Determination 2012 [2012] NZCC 26 (Consolidated as at 31 January 2019), clause 3.1.3(13)(a).
552 Commerce Commission Electricity Distribution Services Default Price-Quality Path Determination 2020 [2019] NZCC 21 (27 November 2019), clause 9.
553 This amount of 110% of the previous assessment period’s forecast revenue from prices is the limit imposed through the “limit on the percentage annual increase in forecast revenue from prices”. The 90% and 10% values in Paragraph H80 are references to the proposed “voluntary undercharging amount foregone” and the “limit on the annual percentage increase in forecast revenue from prices” respectively.
321
3605676.11
Approach proposed in the draft decision
H86 The approach proposed in the draft decision was the same as the approach
described in this attachment.
Response in submissions
H87 We received no submissions on voluntary undercharging in response to our
discussion of this in our draft decision.
Relevant considerations
H88 The approach reflects the cumulative undercharge of revenues because “forecast
allowable revenue” includes the “balance of the wash-up account available for draw-
down”,554 and that balance includes the cumulative undercharging from previous
assessment periods.555
H89 If a distributor consistently sets prices such that in each assessment period its actual
revenue is less than that assessment period’s costs, the distributor would have an
ever-increasing wash-up balance which would eventually result in an amount of
“voluntary undercharging amount foregone”.
H90 The IM definition of “voluntary undercharging amount foregone” refers to
undercharging being intentional and voluntary.556 Each of the parameters used to
calculate the voluntary undercharging amount foregone will be precisely known
when prices are being set, so any undercharging would be intentional.
H91 Foregoing of revenue will be voluntary. The approach avoids a distributor being
forced to set its forecast revenue from prices so low that it foregoes revenue, as
discussed in the next section.
Avoiding a perverse outcome from the limit on increases in forecast revenue from prices
H92 The definition of “voluntary undercharging revenue floor” includes the sub-
paragraph at H81.2 above which ensures that the floor will be no higher than the
ceiling, the ceiling being the level of the limit on annual price increases.
554 Commerce Commission Electricity Distribution Services Input Methodologies Determination 2012 [2012] NZCC 26 (Consolidated as at 31 January 2019), clause 3.1.1(4)(d).
555 Commerce Commission Electricity Distribution Services Input Methodologies Determination 2012 [2012] NZCC 26 (Consolidated as at 31 January 2019), the definition of ‘wash-up account’ in clause 1.1.4(2) and clause 3.1.3(12)(b).
556 Commerce Commission Electricity Distribution Services Input Methodologies Determination 2012 [2012] NZCC 26 (Consolidated as at 31 January 2019), clause 3.1.3(13)(a) refers to situations where “the EDB has intentionally and voluntarily undercharged…”.
322
3605676.11
H93 If we were to set the price floor definition without this restriction, it would be simply
set at 90% of forecast allowable revenue. In unusual circumstances, a perverse
outcome could arise in which the “voluntary undercharging amount foregone”
would be incurred involuntarily.
H94 With this simplified definition, the limit on price increases could force a distributor to
limit its forecast revenue from prices to a level so low that the distributor would
incur a “voluntary undercharging amount foregone”.
H95 The approach resolves this by keeping the limit on price increases intact and
reducing the level of the “voluntary undercharging revenue floor”.
H96 The “unusual circumstances” referred to above are when the forecast allowable
revenue for the assessment period for which prices are being set is greater than
1.222 times the forecast revenue from prices from the previous assessment period’s
price setting.557
H97 This 1.222 ratio of revenues should be unusual. There are, however, several possible
independent drivers of such a ratio, and if they happen to drive in the same
direction, such a ratio might be possible. Those drivers include each forecast of a
pass-through and recoverable cost, and quantity forecasting.
The 90% value of the voluntary undercharging threshold
H98 We have specified the voluntary undercharging threshold at 90% in our DPP3
determination. We consider that values significantly lower or higher than 90% could
give rise to problems. We examine this through the following two examples:
H98.1 If a distributor were to set prices for a lower threshold of 85% rather than
90%, consumers could subsequently have at least a 17.6% average price
increase from the distributor fully recovering this undercharge alone in a
later assessment period.558
H98.2 If a distributor were to set prices for a higher threshold of 95% rather than
90%, then this would give the distributor only a narrow range (from 95% to
100%) in which to set its forecast revenue from prices. This might restrict
the distributor’s ability to manage the many sources of price volatility.
557 This value applies for the 10% value for the “limit on the annual percentage increase in forecast revenue from prices”, and the 90% value for the voluntary undercharging threshold. For values other than the 10% and 90% proposals, the ratio is (1 + limit on annual increases in forecast allowable revenue) / forecast revenue from pricest-1.
558 The value of 17.6% is 1/85% -1. This represents the increase in revenue that could occur in the assessment period after undercharging from a distributor that could occur if we were to set the threshold at 85% and all other parameters remained constant. The change from setting prices such that forecast revenue from
323
3605676.11
H99 We proposed the value of 90% in our draft decision and did not receive any
submissions suggesting a different value.
Wash-up calculation
H100 In this section we outline the approach for how the wash-up is calculated and how
the relevant inputs to the calculation are determined.
Revenue wash-up draw-down amount
H101 If the distributor has built up a positive balance in its wash-up account, it may use
some or all this balance when setting prices, such that the prices would be higher
than if it did not use any of this balance. This is generally referred to as drawing
down the account.
H102 If the wash-up account has a negative balance, then the balance will reduce the
distributor’s forecast allowable revenue.
H103 For calculating the actual allowable revenue and for calculating the closing wash-up
account balance, we have set the revenue account draw-down amount to the
opening balance of the wash-up account. This means that actual allowable revenue
will be set each assessment period based on fully drawing down the wash-up
balance.
H104 However, the requirement to set the draw-down amount equal to the opening
balance of the wash-up account does not mean that the distributor must price up to
its maximum limit.
H105 The distributor may price lower than it is allowed to. If it does, the undercharging
will increase its wash-up amount for that assessment period. That increase will in
turn increase (via the wash-up balance) the actual allowable revenue for the
assessment period two assessment periods after prices had been set lower than
allowed.
H106 Through this mechanism, the distributor will generally be able to recover previous
undercharging two assessment periods after the undercharging, together with a
time value of money adjustment. If, however the distributor has undercharged to
the extent of incurring a voluntary undercharging amount foregone, then it will not
fully recover its undercharging.
prices is 85% of forecast allowable revenue to 100% of forecast allowable revenue will be the amount 1-1/85% referenced above. This ignores time value of money effects which would increase the revenue by more than this.
324
3605676.11
Wash-up amount
H107 The wash-up amount will be calculated as the actual allowable revenue, less actual
revenue, less revenue foregone.559
H108 The difference between the actual allowable revenue and the actual revenue reflects
to what extent a distributor has under or over-recovered. Whether the difference is
added to, or subtracted from, the wash-up account depends on whether the
difference is a positive or negative amount.
H109 An amount of ‘revenue foregone’ may be subtracted from the difference to be
applied to the wash-up account if the cap on the wash-up amount (as specified in
the EDB IM) binds.560
Actual net allowable revenue
H110 The value of actual net allowable revenue for the first assessment period of the
regulatory period is provided in Schedule 1.4 of the DPP3 determination. For
subsequent assessment periods, it is to be calculated on a CPI-X basis from the
previous assessment period’s value. The actual CPI increase will be required for this
calculation. It will be able to be calculated from CPI values published by StatsNZ in
time for the wash-up calculations to be done.
Actual pass-through and recoverable costs
H111 In a similar way, actual values of pass-through and recoverable costs will be available
in time for the wash-up calculations during each calculation assessment period.
Actual allowable revenue
H112 The actual allowable revenue will be calculated as the sum of the actual net
allowable revenue and the actual pass-through and recoverable costs. The
recoverable costs in this instance include the draw-down amount applicable to the
assessment period to be washed up.
H113 All the amounts discussed in this ‘wash-up process’ section up to this point relate to
the assessment period to be washed up. We will now discuss maintaining the
balance of the wash-up account.
559 This method of calculating the wash-up amount is specified in EDB IM clause 3.1.3(13)(b). Note that the “revenue foregone” refers to the IM defined term and relates to the sharing of risk discussed below starting at paragraph H123. It does not relate to the voluntary undercharging amount foregone.
560 Commerce Commission “Input methodologies review decisions: Report on the IM review” (20 December 2016).
325
3605676.11
Maintaining the wash-up account
H114 As discussed in paragraphs H9 to H11, the relevant assessment period for updating
the wash-up account will be the assessment period for which prices are to be set.
The opening balance of this account for the first and second assessment periods of
the regulatory period will be nil, while the opening balance for the third and
subsequent assessment periods will be the closing balance of the previous
assessment period.
H115 The closing balance of the wash-up account for the second and subsequent
assessment periods will be:
(the wash-up amount for the previous assessment period - any voluntary
undercharging amount foregone) × (1 + 67th percentile estimate of post-tax
WACC)2
H116 The time value of money adjustment relates to the two-year delay between the
wash-up amount being incurred and the assessment period in which it will be able to
be taken into account in future prices.
H117 The discount rate for the time value of money adjustments is the 67th percentile
estimate of the post-tax WACC as at 1 September 2019. Its value is 4.23% and is set
out in the DPP determination.
H118 A positive wash-up amount indicates that the actual revenue received (plus any
amount of revenue foregone) has been less than the actual allowable revenue. That
positive balance would lead to a positive balance in the wash-up account, which
would be in favour of the supplier.
H119 For calculating the actual allowable revenue and for calculating the closing wash-up
account balance, the revenue account draw-down amount has been set to the
opening balance of the wash-up account.
H120 The calculation of the closing wash-up account balance in the flow chart below could
alternatively be specified as:
H120.1 opening wash-up account balance
H120.2 less revenue wash-up account draw-down amount
H120.3 plus wash-up amount
H120.4 plus time value of money adjustment for wash-up amount
326
3605676.11
H121 The first two terms of this calculation cancel each other out, which has allowed the
formula in the determination to be simplified by deleting these two terms. This
simplified approach is also shown in the flow chart below.
H122 The actual allowable revenue for the first assessment period will include an
additional term in the formula stated in the flow chart below. It shall account for any
unrecovered pass-through and recoverable costs in the regulatory period ending 31
March 2020 that were not recovered in that regulatory period. The amount of the
additional term shall be the amount not recovered plus a time value of money
adjustment for one assessment period on that amount. The discount rate for time
value of money adjustment shall be post-tax WACC.
Cap on the wash-up amount
H123 As set out in the IMs, there is a cap on the wash-up amount.561 The aim of this cap is
to provide a sharing of risk between the distributor and consumers when the
quantities of services provided are significantly lower than forecast quantities. The
implementation of this cap is through ‘revenue foregone’, which is the amount of
permanent loss the distributor will incur if the cap binds.
H124 Calculating revenue foregone requires another parameter to be defined and
determined: the ‘revenue reduction percentage’. This reflects the extent to which
actual revenue from prices are less than forecast revenue from prices. It is, in turn,
the average reduction in quantities between forecast and actual values, using the
prices as weights in the weighted average calculation.
H125 The formula for revenue reduction percentage is:
Revenue reduction percentage = 1 - (actual revenue from prices ÷ forecast revenue from
prices)
H126 The formula for revenue foregone is:
Revenue foregone = actual net allowable revenue × (revenue reduction percentage - 20%),
subject to the revenue foregone being nil if revenue reduction percentage is not greater than
20%.
H127 In this formula, the actual net allowable revenue is the value for the assessment
period being washed up.
561 Commerce Commission “Input methodologies review – Topic paper 1” (20 December 2016), p. 34.
327
3605676.11
H128 This amount of revenue foregone will be subtracted from the amount that would
otherwise be the wash-up amount. In other words, the wash-up amount will be
actual allowable revenue less actual revenue less revenue foregone. This has the
effect of capping the wash-up amount.
Response to submissions on the draft default price path decision
H129 We set out our response to topics raised in submissions on the draft decision below.
There were two submissions on the ‘limit on the percentage annual increase in
forecast revenue from prices’, and those submissions are discussed above in the
section discussing that limit, starting at paragraph H63.
New investment contract charges
H130 We have clarified and extended the scope of the recoverable cost relating to charges
for a ‘new investment contract’ (as defined in the Electricity Industry Participation
Code). A distributor will be able to use a third-party financier to finance a new
investment contract between the distributor and Transpower or an equivalent
contract with another Transmission provider.562
H131 We have made an IM amendment very similar to one suggested by Transpower in its
submission on our draft decision. Transpower submitted that:
In our view, the Electricity Distribution IM should be amended to provide the costs of third
party finance contracts with unrelated third parties to fund costs under investment contracts
are a recoverable cost. We suggest drafting for clause 3.1.3(1)(c) as follows:
A recoverable cost is…
… (c) a charge payable:
by an EDB to Transpower in respect of a new investment contract (as ‘new investment
contract’ is defined in the Electricity Industry Participation Code) between those parties, or
an equivalent type of contract; or
by an EDB to a non-related party financer of the amounts payable to Transpower in respect
of a new investment contract (as ‘new investment contract’ is defined in the Electricity
Industry Participation Code) between an EDB and Transpower, or an equivalent type of
contract …
provided that in respect of a new investment contract an EDB may only treat as recoverable
costs the charges in (i) or (ii); 563
562 Commerce Commission Electricity Distribution Services Input Methodologies Amendments Determination (No. 2) [2019] NZCC 20 (26 November 2019), clause 3.1.3(1)(c).
563 Transpower "Submission on EDB DPP reset draft decisions paper" (18 July 2019), p. 1.
328
3605676.11
H132 Network Tasman submitted that it expects to have a new GXP serving its growing
demand during DPP3 and that the GXP would be built by Transpower using a new
investment contract with Transpower.564
H133 Network Tasman would prefer to be able to spread its repayment of the GXP capital
cost over a longer period than may be available from Transpower and has
considered using a third-party financier to do this. However the IM recoverable cost
provision before we extended its scope would have not allowed for this and still
allow for the total cost to be recovered.
H134 Network Tasman submitted that the rate of return Transpower would require if it
were to finance the GXP would be higher than Network Tasman’s cost of debt.
H135 The IM amendment extends the scope of the recoverable cost to remove a barrier to
distributors making necessary network enhancements and possibly to reduce the
financing costs of enhancements. The barrier was that Transpower has generally
only offered financing for up to 5 years, which could result in repayments that could
be unsustainably high for the distributor.
Definition of other regulated income
H136 We have amended the EDB IM to clarify that the EDB IM definition of ‘other
regulated income’ includes gains/(losses) on disposals.
H137 We received submissions from Orion and Powerco seeking this clarification. It has
been both our intention and our practice to include gains/(losses) on disposal in
other regulated income since 2014.565
Compliance reporting date for the Annual Compliance Statement
H138 We have extended the date by which the annual compliance statement from each
distributor must be provided to us from the 50 working days proposed in the draft
decision to 5 months after the end of each assessment period.
H139 We received submissions from Orion, Aurora, Powerco and ENA, each submitting
that the 50 working day timing could be problematic.566
564 Network Tasman "Submission on EDB DPP reset draft decisions paper" (18 July 2019) 565 Orion "Submission on EDB DPP reset draft decisions paper" (17 July 2019), p. 20; Powerco "Submission on
EDB DPP reset draft decisions paper" (18 July 2019), p. 6. 566 Orion "Submission on EDB DPP reset draft decisions paper" (17 July 2019), p. 18; Aurora "Submission on
EDB DPP reset draft decisions paper" (18 July 2019), p. 16; Powerco "Submission on EDB DPP reset draft decisions paper" (18 July 2019), p. 6; ENA "Submission on EDB DPP reset draft decisions paper" (18 July 2019), p. 22.
329
3605676.11
H140 We have adopted Orion’s suggestion that the date for publishing the compliance
statement be amended to align with the publication date for Schedules 1 to 10 of
the distributor’s disclosures.
H141 The change should allow distributors to more accurately report some parameters,
and reduce compliance costs by aligning the audit timing of the annual compliance
statement and ID. We consider these benefits outweigh any downside to the later
reporting.
H142 The discussion in this attachment of the change in reporting date is in the context of
reporting on the revenue wash-up. The annual compliance statement must also
include information on quality standards and transactions.
H143 The information required to be provided on transactions in the annual compliance
statement includes information on an adjustment to a distributor’s forecast
allowable revenue and information on the wash-up calculation for a part-year ending
on the date of the transaction. We consider the later reporting of this information to
be acceptable.
Changes in the schedules to the draft default price path determination relating to price and wash-up calculations
H144 We have made changes to the draft determination schedules 1.3 to 1.7 to correct for
mechanical errors in the price setting and wash-up mechanism and to make the
drafting more intuitive and easier to apply.
H145 Orion submitted on the draft determination noting errors in allowing for the time
value of money in taking account of the DPP2 residual pass-through balance. We
agree with Orion and have addressed the issue it raised.567 The issue was that the
2019/20 pass-through balance should be adjusted for one year's time value of
money when applying it to the 2020/21 assessment period.
H146 We noted a further issue in the draft determination in the accounting for the pass-
through balance. The draft determination did not recognise that a positive pass-
through balance represents money owed by the distributor to consumers, whereas a
positive wash-up account balance has the reverse sense, ie, a positive balance
represents money owed by consumers to the distributor.
H147 As well as taking these issues into account, we have made some changes to make
the determination more intuitive and easier to apply, as discussed in the next three
paragraphs.
567 Orion "Submission on EDB DPP reset draft decisions paper" (17 July 2019), p. 19.
330
3605676.11
H148 We have changed the definition of "actual pass-through costs and recoverable costs"
in Clause 4.2 to reflect the natural meaning of the defined phrase, ie, it no longer
includes a cost that is neither a pass-through cost nor a recoverable cost.
H149 We have changed the opening wash-up account balance for first and second
assessment periods to nil, because the third assessment period will be the first
assessment period that will take a wash-up into account.
H150 We have amended Schedules 1.3 and 1.5 to directly apply the transitional issues that
arise from the residual DPP2 pass-through balance.
H151 We tested the outcomes of the price setting and wash-up process in the final version
of the DPP3 determination and found that it results in a present value of revenues
that would be the same as if the distributor had had perfect foresight for all
forecasts it must make in the price setting and wash-up process.
Rate of change (X-factor) for Aurora
H152 We have not set an alternative rate of change (X-factor) for Aurora, which is a
change from our draft decision in which we set an alternative rate of change of -
8.9%.
H153 Aurora submitted that the draft decision X value of -8.9% would likely lead to price
reductions for consumers in 2020/21, once the forecast 2020/21 IRIS incentive
adjustment is accounted for.568 This would be potentially followed by substantial
price increases in subsequent years.
H154 Aurora submitted that its increase in allowable revenue between 2020 and 2021
would be much closer to zero if we were to take the IRIS incentive adjustment into
account, which could mean that no alternative X may be required.
H155 We agree with Aurora’s submission. Since the draft decision we have received
information disclosures that have allowed us to calculate the IRIS incentive
adjustment. We estimate the combined effect of the increase in the net allowable
revenue and IRIS incentive adjustment would result in a revenue increase of 2.7%
between 2019/20 and 2020/21.
H156 This increase is modest, and we have not set an alternative X. The default X of 0%
will apply.
568 Aurora "Submission on EDB DPP reset draft decisions paper" (18 July 2019), p. 14.
331
3605676.11
Setting rates of change (X) for 5 years
H157 Vector submitted that our mechanism for setting X values is simplistic and suggested
we apply an X-factor to the revenue change from 2019/20 to 2020/21 as well as to
the four revenue changes within DPP3.569
H158 We have not adopted this submission because:
H158.1 If we were to adopt a single X across all five revenue changes for each
distributor, then each distributor would have a different X. This would
breach section 53P(5) of the Act.
H158.2 Section 53P (5) requires us (with an exception in section 53P(8)) to “set only
1 rate of change per type of regulated goods or services (for example, if the
rate of change (x) is 1% in a CPI−x path, 1% must be the rate for all goods or
services of that type).”570
H158.3 Our approach in the DPP2 and DPP3 resets has been to consider
section 53P(8) for particular suppliers, and in those cases we take account
of the change in revenue between the last assessment period of one
regulatory period to the first assessment period of the next regulatory
period.
H158.4 When applying section 53P(8), we are not constrained to one methodology.
For example, when setting the X value for Aurora in the DPP3 final decision,
we took account of Aurora’s 2020/21 IRIS incentive adjustment. Our
methodology allows us the flexibility to avoid perverse outcomes.
Applying a forecast of other regulated income when determining starting prices
H159 Vector, Powerco, and ENA submitted for us to forecast other regulated income, and
to take this into account in setting starting prices. The forecast would be washed up
in the revenue cap wash-up.571
H160 We have not adopted this suggestion because:
H160.1 Our analysis of historical levels of other regulated income indicated that
their magnitude was generally too small to cause significant levels of
volatility.
569 Vector "Submission on EDB DPP reset draft decisions paper" (18 July 2019), p68 570 Commerce Act 1986, Paragraph 53P(5) 571 Vector "Submission on EDB DPP reset draft decisions paper" (18 July 2019), p. 70; Powerco "Submission on
EDB DPP reset draft decisions paper" (18 July 2019), p. 6; ENA "Submission on EDB DPP reset draft decisions paper" (18 July 2019), p. 7.
332
3605676.11
H160.2 We do not have a forecasting method that can deal with outlier values in a
particular historical assessment period. Using an average of historical values
of other regulated income would not address this issue.
H160.3 We considered a forecasting approach based on the average of the 2016 to
2019 information disclosure values of other regulated income of the 15
distributors for which we are setting starting prices. To obtain a materiality
indicator of other regulated income, we divided this average by the average
disclosed line charge revenues.
H160.4 The largest materiality indicator was for Vector and was 1.05%. The second
and third largest indicators were 0.68% and 0.33% for EA Networks and
Electricity Invercargill respectively.
H160.5 These average values for EA Networks and Electricity Invercargill are largely
driven by their 2016 values, which were -4.36% and -1.07% respectively.
These values, relative to the averages for these distributors, indicate that
other regulated income is highly volatile. A simple average of historical values
is unlikely to be a reasonable forecast.
H160.6 The materiality is not significant for any of the distributors in the context of
other more significant drivers of revenue volatility.
H160.7 We considered whether there are forecasting methods other than a simple
average of nominal or real historical values of other regulated income. We do
not have any such alternative methods that would fit with the low-cost DPP
framework.
Applying a forecast of disposals or a forecast of other regulated income when setting the forecast net allowable revenue
H161 In its submission on the Updated Models Companion Paper, Vector submitted (in
effect) that we should allow a distributor to take its forecast of disposals into
account when determining its forecast allowable revenue.572 Vector submitted that
without such a forecast, the magnitude of wash-ups will be unnecessarily significant.
H162 We have not implemented Vector’s submission because of the impact on
distributors’ price setting process during December 2019 and January 2020 and
because of the low level of materiality anticipated.
572 Vector “Submission on companion paper to updated models” ( 9 October 2019), p. 6.
333
3605676.11
H163 Distributors will need to have largely completed their draft price schedules by
Christmas 2019, which gives them less than a month to do this from the publication
of our DPP3 decision. We consider our decision should not include an unanticipated
requirement to develop a forecast of loss on disposals or a forecast of other
regulated income.
H164 We do not consider that the magnitude of wash-ups will be unnecessarily significant.
We discuss the materiality of other regulated income in the previous section and
note in that section that it is generally low for the 15 distributors for which we are
setting starting prices.
Accounting for extraordinary values of historical disposals
H165 In Orion’s submission on the draft decision, it submitted that when we forecast
Orion’s disposals, we should exclude $1.6m of its $3.055m disclosed 2016 disposals,
as the $1.6m amount was extraordinary.573
H166 We have not excluded the extraordinary $1.6m as Orion suggested. The impact of
excluding the extraordinary amount would have increased Orion’s net allowable
revenues by 0.042%, which would have been immaterial.
H167 Vector cross-submitted that it also had high one-off disposals and that we should
ensure that “our forecasts for disposals reflect the anticipated level of disposals per
annum for the DPP3 period”.574 Vector did not quantify the level of its one-off
disposals or how one-off disposals should be distinguished from business as usual
disposals. It did not propose an alternative forecasting methodology.
H168 We consider our forecasting method to be appropriate, given the generally low
materiality of the impact of disposals on starting prices and given the low-cost
nature of a default price path.
Submission of an annual compliance statement during 2020/21
H169 Orion submitted that it was not clear whether an “annual compliance statement” is
required to be submitted during the 2020/21 assessment period.575
573 Orion “Submission on companion paper to updated models” (9 October 2019), p. 3. 574 Vector “Cross-submission on companion paper to updated models” (16 October 2019), p.2. 575 Orion "Submission on EDB DPP reset draft decisions paper" (17 July 2019), p. 18.
334
3605676.11
H170 We clarify that an “annual compliance statement” is not required during the first
assessment period of DPP3 (2020/21) from the compliance reporting requirements
in the DPP3 determination. An “annual price setting compliance statement” that
reports on 2020/21 is required to be submitted during 2019/20. This statement is to
demonstrate ex-ante that the price path will be complied with. The DPP2
determination (published November 2014) does require an “annual compliance
statement” in accordance with that determination to be submitted during 2020/21,
and that statement would report on the 2019/20 assessment period.
Protection of distributors against retailer bad debts
H171 Orion submitted for a change in the IM definition of ‘revenue from prices’ to
effectively exclude revenues not collected because of bad debts.576
H172 We have not adopted this submission because:
H172.1 doing so would remove the incentive for distributors to pursue bad debts
H172.2 we are not aware of significant historical retailer default events
H172.3 the Electricity Authority has developed processes for managing retailer
default.
Revenue foregone as a result of a major Transpower interruption
H173 Wellington Electricity submitted against a ‘revenue foregone’ amount applying as a
result of a major Transpower interruption.577 It noted that the interruption would be
outside a distributor’s control and the distributor may be still required to pay
Transpower charges and Use of Network Agreement payment obligations to
consumers.
H174 We have not adopted this submission because:
H174.1 The purpose of the revenue foregone provision (“cap on wash-up amount”)
in the input methodologies was “… to ensure that suppliers bear some of
the risk if a major demand event occurs (for example, a catastrophic event).
We consider that a principle established in the Orion CPP decision should be
applied; consumers and suppliers should share the risk of catastrophic
events.”578
576 Orion “Submission on companion paper to updated models” (9 October 2019), p. 19. 577 Wellington Electricity "Submission on EDB DPP reset draft decisions paper" (18 July 2019), p. 18. 578 Commerce Commission, “Input methodologies review decisions Topic paper 1 Form of control and RAB
indexation for EDBs GPBs and Transpower” (20 December 2016)
335
3605676.11
H174.2 A Transpower interruption would need to be unusually large to cause the
“revenue reduction percentage” to exceed 20%, which is the threshold for a
revenue foregone amount to apply. If a distributor’s entire supply of
electricity were to be interrupted for a whole month, the revenue reduction
percentage would not come close to 20%.579
The proportion of total electricity charges to consumers that are distributor charges
H175 Aurora submitted when we were setting Aurora’s draft decision X value, no
consideration seems to have been given to the fact that the prices charged by
distributors make up just a proportion of the total charges that consumers face for
electricity.580
H176 When making our draft decision, we had been well aware that distributor charges
are just a proportion that of the total charges. We quantified estimates of several
measures of revenue and charges in our revenue change model and consumer bills
impact model in our draft decision.
H177 The modelling includes consideration of the charges for distributor’s costs,
Transpower’s costs and retailer charges. These models have been updated for the
updated draft and final decisions.
Flow charts for the revenue cap with wash-up
H178 These flow charts (H1 and H2) do not show the transitional provisions to account for
the residual pass-through balance from DPP2.
579 Commerce Commission Electricity Distribution Services Input Methodologies Determination 2012 [2012] NZCC 26 (Consolidated as at 31 January 2019), clause 3.1.3(13)(c ) and 3.1.3(13)(j).
580 Aurora "Submission on EDB DPP reset draft decisions paper" (18 July 2019), p. 14.
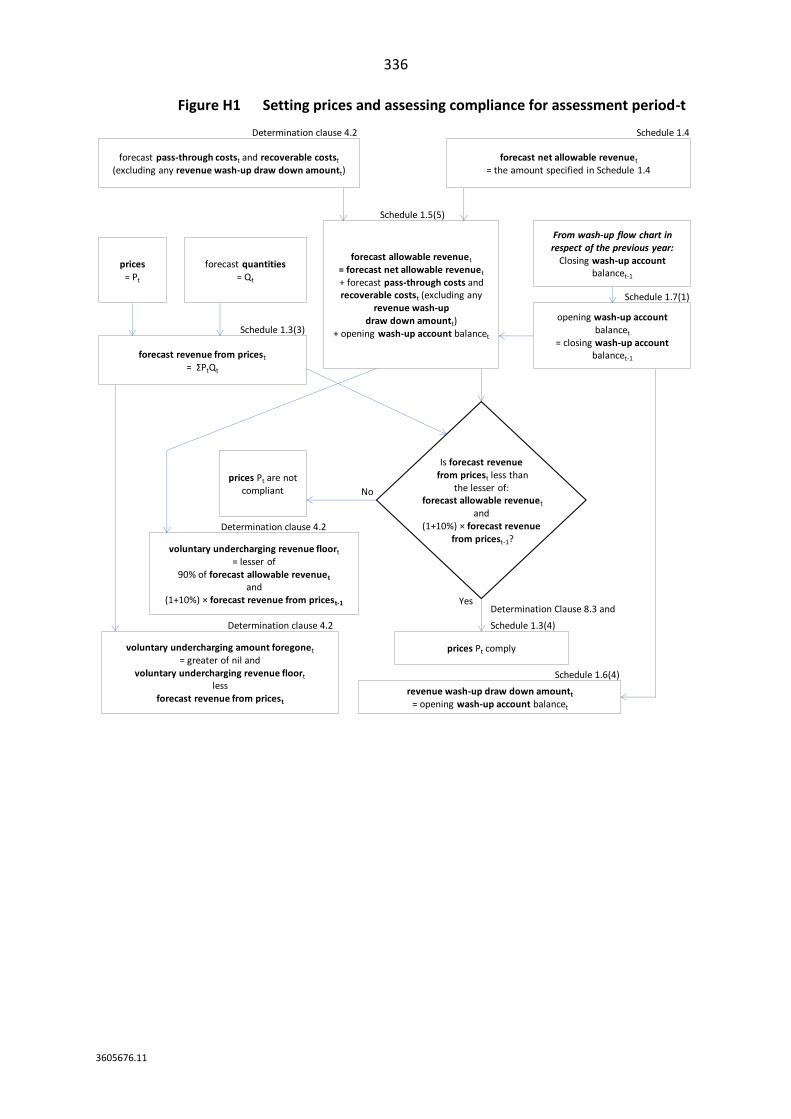
336
3605676.11
Figure H1 Setting prices and assessing compliance for assessment period-t
Determination clause 4.2 Schedule 1.4
Schedule 1.5(5)
Schedule 1.7(1)
Schedule 1.3(3)
Determination clause 4.2
Determination Clause 8.3 and
Determination clause 4.2 Schedule 1.3(4)
Schedule 1.6(4)
forecast net allowable revenuet
= the amount specified in Schedule 1.4forecast pass-through costst and recoverable costst
(excluding any revenue wash-up draw down amountt)
forecast allowable revenuet
= forecast net allowable revenuet
+ forecast pass-through costs and recoverable costst (excluding any
revenue wash-updraw down amountt)
+ opening wash-up account balancet
prices= Pt
forecast quantities= Qt
forecast revenue from pricest
= ΣPtQt
Is forecast revenuefrom pricest less than
the lesser of:forecast allowable revenuet
and(1+10%) × forecast revenue
from pricest-1?
prices Pt comply
prices Pt are not compliant
Yes
No
From wash-up flow chart in respect of the previous year:
Closing wash-up account balancet-1
revenue wash-up draw down amountt
= opening wash-up account balancet
opening wash-up account balancet
= closing wash-up account balancet-1
voluntary undercharging revenue floort
= lesser of90% of forecast allowable revenuet
and(1+10%) × forecast revenue from pricest-1
voluntary undercharging amount foregonet
= greater of nil andvoluntary undercharging revenue floort
lessforecast revenue from pricest
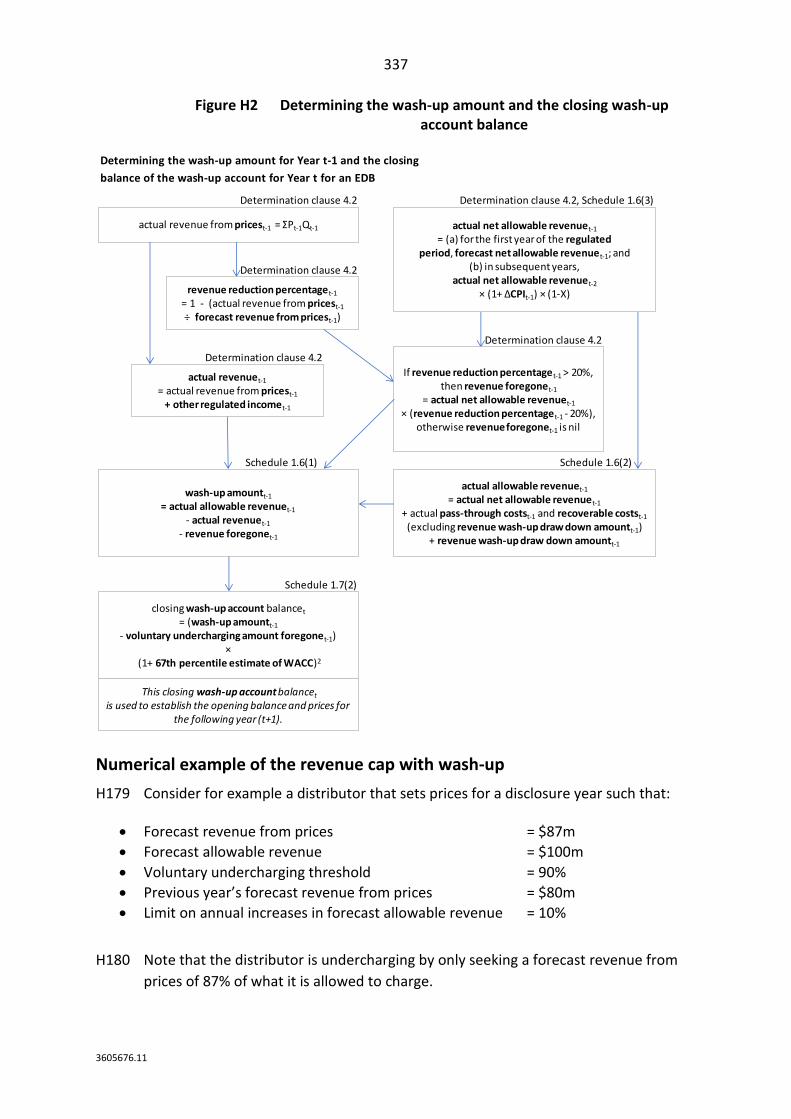
337
3605676.11
Figure H2 Determining the wash-up amount and the closing wash-up account balance
Numerical example of the revenue cap with wash-up
H179 Consider for example a distributor that sets prices for a disclosure year such that:
• Forecast revenue from prices = $87m
• Forecast allowable revenue = $100m
• Voluntary undercharging threshold = 90%
• Previous year’s forecast revenue from prices = $80m
• Limit on annual increases in forecast allowable revenue = 10%
H180 Note that the distributor is undercharging by only seeking a forecast revenue from
prices of 87% of what it is allowed to charge.
Determining the wash-up amount for Year t-1 and the closing
balance of the wash-up account for Year t for an EDB
Determination clause 4.2 Determination clause 4.2, Schedule 1.6(3)
Determination clause 4.2
Determination clause 4.2
Determination clause 4.2
Schedule 1.6(1) Schedule 1.6(2)
Schedule 1.7(2)
actual allowable revenuet-1
= actual net allowable revenuet-1
+ actual pass-through costst-1 and recoverable costst-1
(excluding revenue wash-up draw down amountt-1)+ revenue wash-up draw down amountt-1
wash-up amountt-1
= actual allowable revenuet-1
- actual revenuet-1
- revenue foregonet-1
actual net allowable revenuet-1
= (a) for the first year of the regulated period, forecast net allowable revenuet-1; and
(b) in subsequent years,actual net allowable revenuet-2
× (1+ ∆CPIt-1) × (1-X)
actual revenue from pricest-1 = ΣPt-1Qt-1
closing wash-up account balancet
= (wash-up amountt-1
- voluntary undercharging amount foregonet-1)×
(1+ 67th percentile estimate of WACC)2
revenue reduction percentaget-1
= 1 - (actual revenue from pricest-1
÷ forecast revenue from pricest-1)
actual revenuet-1
= actual revenue from pricest-1
+ other regulated incomet-1
If revenue reduction percentaget-1 > 20%, then revenue foregonet-1
= actual net allowable revenuet-1
× (revenue reduction percentaget-1 - 20%),otherwise revenue foregonet-1 is nil
This closing wash-up account balancet
is used to establish the opening balance and prices for the following year (t+1).
338
3605676.11
H181 The methodology for calculating the voluntary undercharging revenue floor is to
define a “voluntary undercharging revenue floor” as the lesser of:
• 90% of forecast allowable revenue, and
• (1 +10%) × the previous year’s forecast revenue from prices
H182 The first of these bullet point amounts is 90% of $100m, i.e., $90m.
H183 The second of these bullet point amounts is 110% of $80m, i.e., $88m.
H184 The lesser of these two amounts is $88m, so that is the floor.
H185 If a distributor sets its prices such that the forecast revenue from prices is less than
the voluntary undercharging revenue floor, it will permanently forego revenue
(“voluntary undercharging amount foregone”) to the extent the forecast revenue
from prices is below the floor.
H186 The distributor has set its prices such that the forecast revenue from prices is $87m,
which is $1m less than the floor of $88m. It will therefore incur a “voluntary
undercharging amount foregone” of $1m. The wash-up amount will be reduced by
this $1m, which will in turn mean that the distributor will not be able to recover the
$1m.
H187 If the distributor had instead set its forecast revenue from prices at the floor value of
$88m, it would have avoided the foregoing of revenue. The $88m is also the
maximum amount under the “limit on annual increases in forecast allowable
revenue” (being 110% of $80m). The distributor must therefore set its prices such
that its forecast revenue from prices is at $88m, no more and no less, if it is to both
avoid the foregoing of revenue under this mechanism and to be compliant with the
10% uplift, i.e., the 10% “limit on the annual percentage increase in forecast revenue
from prices”.
Perverse floor > ceiling issue
H188 As noted above, the “voluntary undercharging revenue floor” will be defined as the
lesser of 90% of forecast allowable revenue, and (1 +10%) × the previous year’s
forecast revenue from prices.
H189 If we were not to have the second limb of this definition, and simply set the
“voluntary undercharging revenue floor” as 90% of forecast allowable revenue, then
the floor would be $90m. This was the regime we proposed in the issues paper.
H190 The distributor would however have a hard ceiling of $88m, being the maximum
amount of forecast revenue from prices that would be allowed under the 10% limit
on annual increases in forecast allowable revenue.

339
3605676.11
H191 We would then have a non-mandatory floor of $90m and a mandatory ceiling of
$88m. This would be a perverse situation of the floor being higher than the ceiling.
The highest the distributor may set its prices at is such that its forecast revenue from
prices is $88m. This will mean that it will involuntarily incur a “voluntary
undercharging revenue foregone” of $90m – $88m, or $2m.
340
3605676.11
Attachment I Interactions between the DPP and CPPs
Purpose of this attachment
I1 This attachment explains how we have treated Powerco and Wellington Electricity in
the DPP3 reset, and the dates for any future CPP applications. After briefly
summarising our decisions and explaining the reasons why we are addressing this
issue, the attachment discusses:
I1.1 starting prices for Powerco;
I1.2 starting prices for Wellington Electricity;
I1.3 forecasts of opex and capex for IRIS purposes for Powerco and Wellington;
I1.4 quality standards and incentives for both Powerco and Wellington
Electricity; and
I1.5 the dates by which distributors may apply for CPPs during DPP3.
High-level approach
Summary of our decisions
I2 We have:
I2.1 not set starting prices now for Powerco (but will do so in 2022);
I2.2 not set starting prices now for Wellington Electricity, but have provided
guidance on how we will set the starting price in 2020, based on the same
methodology applied to all other distributors;
I2.3 not determined opex and capex forecasts for Powerco or Wellington
Electricity for the purposes of calculating IRIS incentives; and
I2.4 set quality standards for Powerco and Wellington Electricity using the same
methodology applied to all other distributors; and
I2.5 determined a single final CPP application date in each year of the DPP3
period.
341
3605676.11
Statutory framework for considering CPP-DPP transitions
I3 What happens when a CPP ends is governed by section 53X of the Act. Section
53X(2) of the Act gives the Commission two options for determining starting prices
for the CPP-DPP transition:
I3.1 rolling over the starting prices which applied at the end of the CPP period;
or
I3.2 with at least four months’ notice to the supplier prior to the end of the CPP
period, determining different starting prices that will apply.
I4 Under this provision, we may determine starting prices for a distributor when they
transition, but it does not give us the power to determine quality standards and
incentives when a distributor transitions off a CPP.
Starting prices for Powerco
Problem definition
I5 If Powerco does not apply for a new CPP following its current CPP, it will return to
the DPP, and we will need to determine what starting prices apply.581 Powerco will
transition off its current CPP on 31 March 2023.
Decision
I6 Consistent with the position we set out in the draft decision, we have not set starting
prices for Powerco in the DPP3 reset, and instead will address the matter closer to
the end of its CPP.
Alternatives considered
I7 As alternatives, we considered:
I7.1 setting binding starting prices in the DPP3 reset; or
I7.2 setting an indicative starting price, and then formalising it closer to the end
of the CPP under section 53X of the Act.
Analysis
I8 The DPP reset occurs too far in advance of Powerco’s transition for us to reliably
forecast what its starting prices should be in the year starting 1 April 2023, and the
availability of setting prices at a later date under section 53X makes this
unnecessary.
581 Commerce Act 1986, section 53X(1).
342
3605676.11
I9 Orion’s transition during the current DPP period gives us a useful precedent for how
to manage the transition following Powerco’s current CPP. We anticipate engaging
with Powerco later in the EDB DPP3 period in advance of deciding how we will set its
prices from 1 April 2023.
Stakeholder views
I10 Powerco, in its submission on the draft decision, supported this approach.582
Starting prices for Wellington Electricity
Problem definition
I11 Wellington Electricity’s current CPP ends on 31 March 2021. Wellington Electricity is
not on a ‘full’ CPP, but one which took the existing DPP revenue and expenditure
allowances as a base and added an increment for additional resilience work. As such,
the existing CPP is not a suitable base for future revenue allowances.
Decision
I12 We have not set starting prices for Wellington Electricity but have provided guidance
on the starting price we will set in 2020, based on the same methodology applied to
all other distributors. Indicative opex allowances for Wellington Electricity are
discussed in Attachment A, and indicative capex allowances are discussed in
Attachment B.
Analysis
I13 Unlike Powerco and Orion, Wellington Electricity’s CPP only overlaps the DPP by a
single year. This means that forecasting its revenue requirements for the DPP3
period posed only limited additional difficulty over and above other distributors on
the DPP.
I14 Furthermore, Wellington Electricity’s unique CPP circumstances – where the DPP2
revenue allowance was used as a base, with an increment for resilience investments
– means that a roll-over is not an appropriate means of transitioning them off the
CPP. We considered that a roll-over was not appropriate as this would effectively
lock-in the revenue allowance first set in 2015 (and increased in 2018) until 2025.
I15 We intend to determine the starting price that applies from 1 April 2021, once more
up-to-date information is available.
582 Powerco "Submission on EDB DPP reset draft decisions paper" (18 July 2019), p. 6.
343
3605676.11
Stakeholder views
I16 Wellington Electricity supported this approach in its submission on the draft
decision, noting:
An additional adjustment will be needed to ensure CPP operating costs are included in the
DPP operating cost allowance (which are excluded from the current draft DPP operating
allowance). WELL’s current CPP determination includes on-going operating costs for the
continued operation of its earthquake readiness programme. The CPP operating costs will
not be fully captured in the base year used to forecast DPP – there are operating costs which
fall in the last two years of the CPP programme and will fall after the selected base year.583
IRIS opex and capex forecasts for Powerco and Wellington Electricity
I17 We can determine opex and capex forecasts for the purposes of IRIS at the time
when we determine starting prices under section 53X(2).
I18 Under clause 3.3.3(8)(a) of the EDB IMs, “forecast opex” for the purposes of
calculating opex incentive amounts where we determine starting prices under
section 53X (2) is “the amount of forecast operating expenditure specified by the
Commission for the relevant disclosure year in the DPP determination.584
I19 Under clause 3.3.11(1)(b), “forecast aggregate value of commissioned assets” for the
purposes of calculating the capex incentive amounts is the amount of capex
determined by the Commission when setting starting prices.585
I20 The relevant capex and opex forecast values which will apply for each distributor for
IRIS purposes are set out in Table I1
583 Wellington Electricity "Submission on EDB DPP reset draft decisions paper" (18 July 2019), p. 4.
584 Commerce Commission Electricity Distribution Services Input Methodologies Determination 2012 [2012] NZCC 26 (Consolidated as at 31 January 2019), clause 3.3.3(8)(a).
585 Commerce Commission Electricity Distribution Services Input Methodologies Determination 2012 [2012] NZCC 26 (Consolidated as at 31 January 2019), clauses 3.3.11(1)(b) and 4.2.5
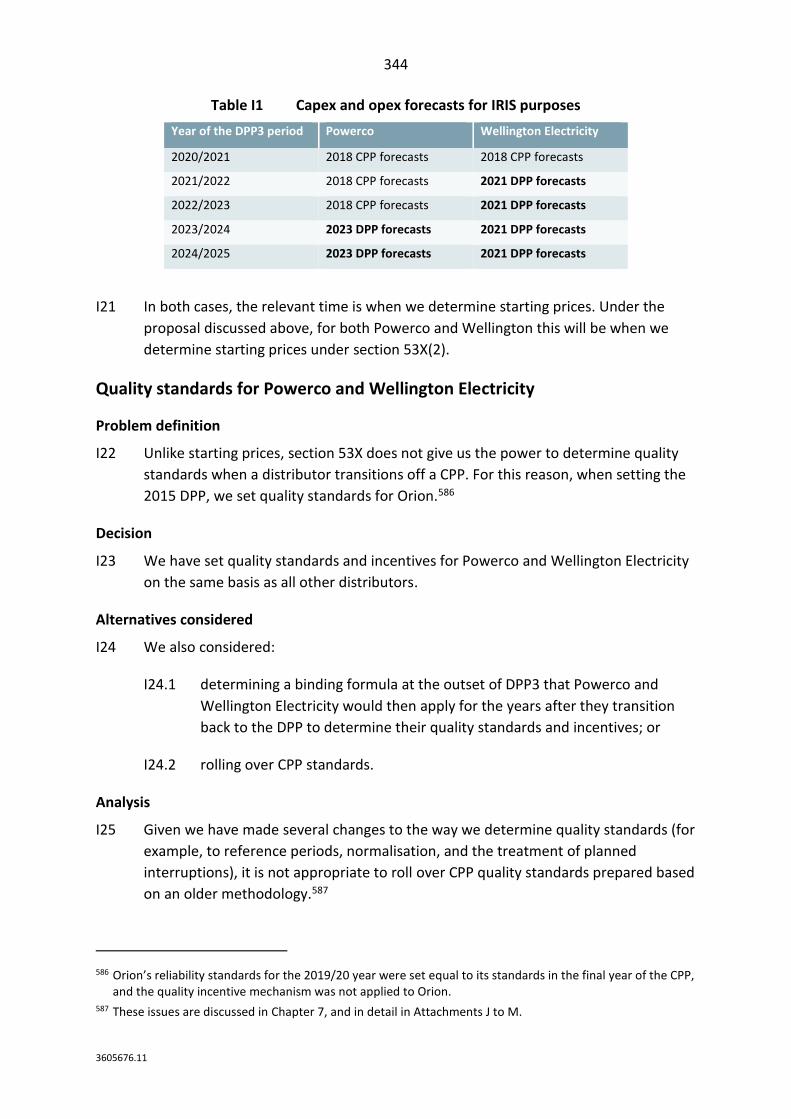
344
3605676.11
Table I1 Capex and opex forecasts for IRIS purposes
Year of the DPP3 period Powerco Wellington Electricity
2020/2021 2018 CPP forecasts 2018 CPP forecasts
2021/2022 2018 CPP forecasts 2021 DPP forecasts
2022/2023 2018 CPP forecasts 2021 DPP forecasts
2023/2024 2023 DPP forecasts 2021 DPP forecasts
2024/2025 2023 DPP forecasts 2021 DPP forecasts
I21 In both cases, the relevant time is when we determine starting prices. Under the
proposal discussed above, for both Powerco and Wellington this will be when we
determine starting prices under section 53X(2).
Quality standards for Powerco and Wellington Electricity
Problem definition
I22 Unlike starting prices, section 53X does not give us the power to determine quality
standards when a distributor transitions off a CPP. For this reason, when setting the
2015 DPP, we set quality standards for Orion.586
Decision
I23 We have set quality standards and incentives for Powerco and Wellington Electricity
on the same basis as all other distributors.
Alternatives considered
I24 We also considered:
I24.1 determining a binding formula at the outset of DPP3 that Powerco and
Wellington Electricity would then apply for the years after they transition
back to the DPP to determine their quality standards and incentives; or
I24.2 rolling over CPP standards.
Analysis
I25 Given we have made several changes to the way we determine quality standards (for
example, to reference periods, normalisation, and the treatment of planned
interruptions), it is not appropriate to roll over CPP quality standards prepared based
on an older methodology.587
586 Orion’s reliability standards for the 2019/20 year were set equal to its standards in the final year of the CPP, and the quality incentive mechanism was not applied to Orion.
587 These issues are discussed in Chapter 7, and in detail in Attachments J to M.
345
3605676.11
I26 Given the intricate suite of calculations required to set reliability targets and limits,
including normalisation, we do not consider specifying a formula to determine
quality standards and incentives closer to the transition time desirable. We note that
if the quality standards we set prove to be inappropriate by the time either
distributor transitions, they have the option of proposing a quality standard
variation.
I27 We have not made additional adjustments to Powerco’s standards, as contemplated
in our draft decision, as we consider that our reliability methodology does not
produce an outcome inconsistent with the goals of Powerco’s CPP.588
Stakeholder views
I28 Powerco and Wellington Electricity supported this approach (while also identifying
concerns with the overall approach to quality standards).589
CPP application dates
Problem definition
I29 Where a distributor considers that the DPP does not meet their particular
circumstances, they may apply for a CPP. The Act requires us to specify in the DPP
determination the date or dates by which a distributor may submit its CPP
application.
Decision
I30 We have set a final application date 190 working days prior to the start of the next
pricing year for the first four years of the DPP period (prior to the 31 March year-
end).590 In the final year of the DPP period, we have set a final application date of 29
March, as there is a statutory prohibition on CPP applications in the final year of the
DPP period (1 April 2024 – 31 March 2025).591 The dates that result from this
approach are set out in Table 6.1 below.
588 Commerce Commission, “Default price-quality paths for electricity distribution businesses from 1 April 2020 – Draft reasons paper” (29 May 2019), para I22
589 Powerco "Submission on EDB DPP reset draft decisions paper" (18 July 2019), p. 4; Wellington Electricity "Submission on EDB DPP reset draft decisions paper" (18 July 2019), p. 4.
590 For consistency, we rounded each date to the preceding Friday. 591 Commerce Act 1986, section 53Q(3).
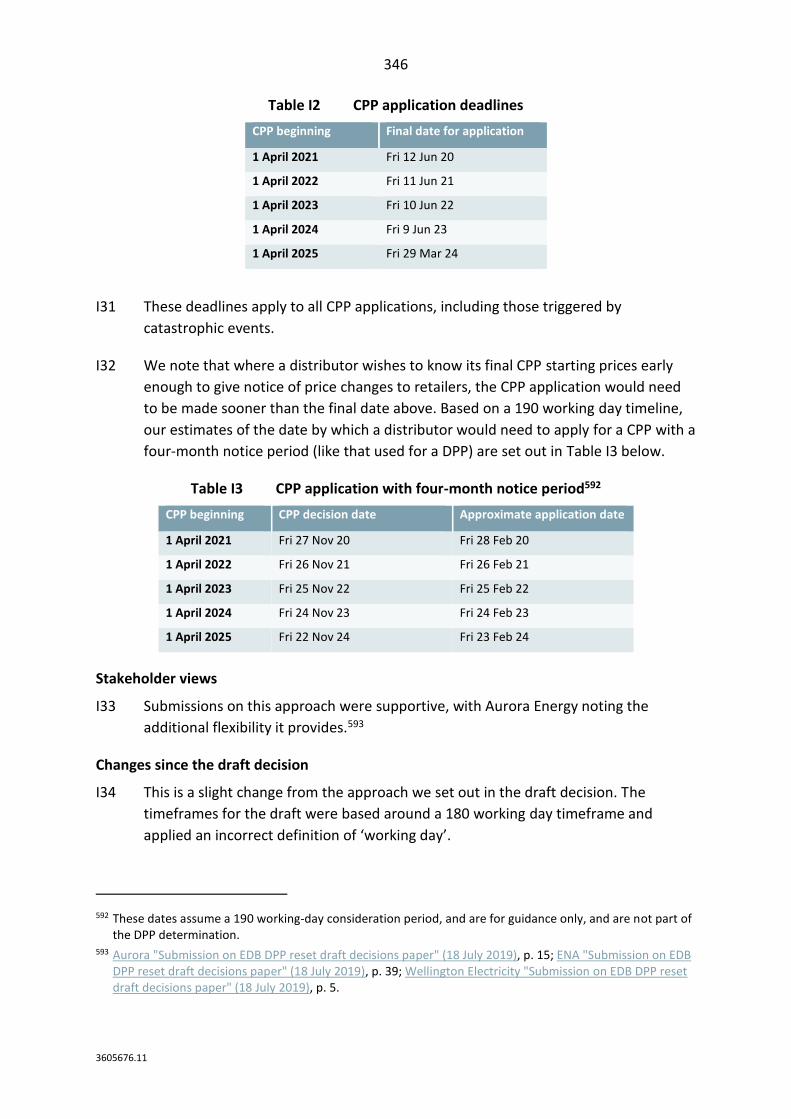
346
3605676.11
Table I2 CPP application deadlines
CPP beginning Final date for application
1 April 2021 Fri 12 Jun 20
1 April 2022 Fri 11 Jun 21
1 April 2023 Fri 10 Jun 22
1 April 2024 Fri 9 Jun 23
1 April 2025 Fri 29 Mar 24
I31 These deadlines apply to all CPP applications, including those triggered by
catastrophic events.
I32 We note that where a distributor wishes to know its final CPP starting prices early
enough to give notice of price changes to retailers, the CPP application would need
to be made sooner than the final date above. Based on a 190 working day timeline,
our estimates of the date by which a distributor would need to apply for a CPP with a
four-month notice period (like that used for a DPP) are set out in Table I3 below.
Table I3 CPP application with four-month notice period592
CPP beginning CPP decision date Approximate application date
1 April 2021 Fri 27 Nov 20 Fri 28 Feb 20
1 April 2022 Fri 26 Nov 21 Fri 26 Feb 21
1 April 2023 Fri 25 Nov 22 Fri 25 Feb 22
1 April 2024 Fri 24 Nov 23 Fri 24 Feb 23
1 April 2025 Fri 22 Nov 24 Fri 23 Feb 24
Stakeholder views
I33 Submissions on this approach were supportive, with Aurora Energy noting the
additional flexibility it provides.593
Changes since the draft decision
I34 This is a slight change from the approach we set out in the draft decision. The
timeframes for the draft were based around a 180 working day timeframe and
applied an incorrect definition of ‘working day’.
592 These dates assume a 190 working-day consideration period, and are for guidance only, and are not part of the DPP determination.
593 Aurora "Submission on EDB DPP reset draft decisions paper" (18 July 2019), p. 15; ENA "Submission on EDB DPP reset draft decisions paper" (18 July 2019), p. 39; Wellington Electricity "Submission on EDB DPP reset draft decisions paper" (18 July 2019), p. 5.
347
3605676.11
Preliminary assessment of CPP proposals
I35 The 180-working day lead time was based on the CPP assessment timeframes set out
in the Act:
I35.1 the Commission has 150-working days to assess a CPP and determine
starting prices and quality standards;594
I35.2 and by agreement with the distributor, may apply a 30-working day
extension.595
I36 However, this did not account for the process of preliminary assessment of a CPP
proposal, as contemplated by section 53S of the Act. This provision allows the
Commission 40 working days to assess whether a CPP proposal complies with the
relevant IMs.
I37 To account for this, we have extended the timeframe to 190 working days.
Correction to dates for application
I38 In working out the application date based on the lead time above, our draft decision
applied an incorrect definition of working days. This error has been corrected in our
final decision.
594 Commerce Act 1986, section 53T(2). 595 Commerce Act 1986, section 53U. This option to extend remains available, however may result in a final
decision date after 1 April the following year.
348
3605676.11
Attachment J Approach to setting the quality path
Purpose of this attachment
J1 This attachment sets out our final decisions on our high-level approach to setting the
quality path for EDB DPP3. Attachments K to N provides more detail on setting the
components of the quality standards and incentives.
Summary of our final decision
J2 The quality path for distributors for DPP3 consists of three quality standards and a
quality incentive mechanism as summarised below:
J2.1 unplanned and planned interruptions will be assessed separately for the
purposes of quality standards and revenue-linked incentives (unchanged
from draft);
J2.2 a reference period from 1 April 2009 to 31 March 2019 is used as a baseline
against which material deterioration is measured, and the baseline for
distributors making quality trade-offs (updated one year from draft);
J2.3 the movement in unplanned SAIDI and SAIFI targets between regulatory
period is limited to 5% (unchanged from draft);
J2.4 unplanned major interruptions, assessed on a rolling 24-hour period, are
largely normalised out and reported on, which is discussed further in
Attachment K;
J2.5 three quality standards which are discussed further in Attachment L, these
are:
J2.5.1 an annual reliability standard for unplanned interruptions based
on SAIDI and SAIFI (modified from draft);
J2.5.2 a regulatory period reliability standard for planned interruptions
based on SAIDI and SAIFI (unchanged from draft); and
J2.5.3 an extreme event standard set at 120 SAIDI minutes or 6,000,000
customer minutes for interruptions predominantly caused by
specified external factors (changed from draft);
J2.6 SAIDI and SAIFI will be recorded on the same basis as that disclosed in the
distributor’s audited interruption data in response its section 53ZD request,
namely its treatment of successive interruptions;
349
3605676.11
J2.7 introduce automatic reporting requirements following a contravention of
any quality standard, which is discussed further in Attachment L (modified
from draft);
J2.8 revenue-linked quality incentives will be applied to SAIDI, with an additional
incentive to meet minimum notification requirements for planned
interruptions, which is discussed further in Attachment M (modified from
draft); and
J2.9 no new quality metrics are introduced as part of the quality standard or
revenue-linked quality incentive scheme, which is discussed further in
Attachment N (unchanged from draft).
High-level approach
J3 Section 53M(1)(b) of the Act requires us to determine the quality standards that
must be met by regulated suppliers. Additionally, section 53M(2) permits us to
include incentives for suppliers to maintain or improve quality of supply.
J4 Our overall approach to setting quality standards and incentives that relate to the
duration and frequency of interruptions (SAIDI and SAIFI) experienced by customers
begins with a principle of “no material deterioration” in network performance.
J5 This approach is consistent with our low-cost DPP forecasting principles, in that
future revenues and quality are set with reference to historical levels of
performance. At the same time, our incentive arrangements (discussed in
Attachment M) do allow for distributors to – within certain limits – target a lower
level of reliability at a lower cost to consumers.
J6 To apply this, we need a period of historical data against which distributors’ future
performance is assessed. Given changes in distributors’ operating environment,
network performance, and maintenance practices, the choice of reference period
can have a significant impact on the standards we set.
J7 The extreme event standard is the exception to the use of historic baseline data
because these events are too rare to be able to reliably set a limit based on historic
data. Applying the DPP3 extreme event standards to the past ten years would have
resulted in just two instances over all of the non-exempt distributors.
J8 Effective reliability standards and incentives are necessary in the first instance to
encourage distributors to supply electricity distribution services at a level that
reflects consumer demands. However, the standards and incentives also work to
mitigate the risk that distributors – facing a revenue constraint – under-invest in
their networks in order to maximise profitability.

350
3605676.11
Quality standards and revenue-linked incentives
J9 Quality standards, with the potential for prosecution of contraventions, up to a point
provide an incentive for distributors to not let quality degrade. However, the
incentives relating to reliability standards are strongest as the risk of contravention
increases, which may vary during the year depending on performance. Performance
can also analysis shine a light on degrading quality, providing an incentive to avoid it.
J10 The revenue-linked incentive scheme for reliability is designed to provide
distributors with incentives to consider cost-quality trade-offs in their decision-
making. In the absence of adequate incentives, distributors may be incentivised to
reduce expenditure, at the expense of quality, to increase profitability.
J11 As noted by Castalia when critiquing the Commission’s setting of the IMs in 2012, on
behalf of Vector:596
…the evidence from overseas suggests a well-designed regulatory system of penalties and
rewards is needed to translate customer expectations into reality. Regulation should provide
incentives to achieve true efficiency…
Revenue-linked incentives vs. quality standards incentives
J12 We consider that the quality standards associated with reliability do not provide
sufficient incentives to move towards a price-quality trade-off that better reflects
both consumer willingness to pay and distributor cost to serve. The incentives of the
standards largely depend on the risk of contravening and the consequences of
contravening. Specifically:
J12.1 as the risk of contravening the quality standard grows the incentives to
improve reliability grows, most likely in a non-linear manner which is not
reflective of the consumers’ willingness to pay; and conversely
J12.2 if there is little to no risk of contravening, especially as the assessment
period nears its end, there is minimal financial incentive to maintain
reliability.
J13 This means that with quality standards alone, distributors are not exposed to a
consistent cost-quality trade-off in the decisions they make regarding reliability
throughout the year and over the long term. Distributors are likely to focus more on
the expenditure impact in addressing reliability when contravention risk is low.
596 Castalia Strategic Advisors “Evidence on the Impacts of Regulatory Incentives to Improve Efficiency and Service Quality – Report to Vector Limited” (April 2012), pp. 18 to 19.
351
3605676.11
J14 Furthermore, these standards have a buffer above historical performance built in to
reduce false-positives. This means that to the extent these standards incentivise
reliability, it may be to a lower level of performance than experienced during the
reference period.
J15 However, a quality standard can help capture a concerning level of deterioration
beyond which we might accept under a revenue-linked incentive scheme. Where a
distributor believes quality delivered below this level is in the long-term benefit of its
consumers, we consider a quality standard variation reopener or a CPP, and the
greater scrutiny we can apply to them, is the better response.
J16 We consider that revenue-linked incentives on reliability provide useful incentives to
manage the price-quality relationship, as long as the incentives are not too strong.
With conservative revenue-linked incentive settings profit maximising distributors
will be:
J16.1 encouraged to find inexpensive solutions to improve reliability as marginal
benefits will outweigh the marginal costs for both distributors and
consumers;
J16.2 encouraged to find solutions up to the point where marginal benefits equal
marginal costs for both distributors and consumers, assuming incentives are
reflective of the consumers value of quality; and
J16.3 discouraged to find expensive solutions to improve reliability such that
marginal costs exceed the marginal benefits for distributors, and therefore
consumers.597
J17 However, if the revenue-linked incentives are too strong, then distributors may be
encouraged to find solutions where the costs to consumers can exceed the benefit
to consumers―that is marginal benefits could exceed marginal costs for distributors
but not for consumers.
J18 Conversely, if the revenue-linked incentives are too weak, or zero, then distributors
will not be encouraged to find all solutions that would optimise marginal costs and
benefits for both distributors and consumers.
597 Marginal benefit (MB) for EDBs is the revenue-linked incentive payment and for consumers is the value of improved reliability. Marginal cost (MC) for EDBs is the increased expenditure (net of IRIS paybacks) and for consumers is the incentive payments (including IRIS).
352
3605676.11
J19 As discussed in Attachment M, we use VoLL as a proxy for consumers cost-quality
preferences. On balance, we consider the revenue-linked incentive scheme for
reliability that we have recommended is conservative.598 However, we consider that
this is more appropriate than providing no incentive or too high an incentive.
Are the revenue-linked incentives working?
J20 Our analysis suggests that the revenue-linked incentives may be working.
J21 As discussed further in Attachment M, a consequence of setting revenue-linked
incentives based on setting the revenue at risk (0.5% each for SAIDI and SAIFI) and
setting the incentive range (caps and collars) is that incentive rates varied
substantially between distributors. This resulted in distributors with a relatively
narrow cap and collar band having much stronger incentives via the implied
incentive rate.
J22 Nelson Electricity and Electricity Invercargill, which were exposed to greater
incentives relative to other distributors, made among the best improvements in
SAIDI and SAIFI. A third, Wellington Electricity, also submitted that the incentive
scheme does impact distributors’ decisions.599
J23 Also, we have noted that for most distributors SAIFI has performed much better than
SAIDI. We consider that reducing SAIFI may have been more cost-efficient for the
distributor, for example, through the installation of reclosers.
J24 Ultimately, as a regulator, our role is to ensure distributors face incentives that align
its interests with the long-term interests of consumers. Whether a distributor
prioritises responding to those incentives is a decision for each distributor and it is
for investors to make, relative to other priorities they may have.
Consideration of an asymmetric incentive scheme
J25 Our decision is to retain a symmetric incentive scheme where the incentive rate is
constant below the quality standard we have set.
598 This is due to the greater long-term risk of EDBs over investing in quality beyond what consumers want, the availability of a CPP for situations where EDBs want to significantly improve quality (and provide evidence that doing so meets consumers’ demand), and existing measures to account for the probability of underinvestment (for example, the WACC uplift).
599 Wellington Electricity “Default price-quality paths for electricity distribution businesses from 1 April 2020 Issues Paper” (21 December 2018), p. 15.
353
3605676.11
J26 Consumers may have more aversion to a deterioration in reliability than they have a
desire for improvements in reliability. In other words, consumers are willing to
accept (WTA) a higher level of payment for lower reliability than they are willing to
pay (WTP) for higher reliability. For example, London Economics, in advising Ofgem,
considered that:600
… When consumers are used to enjoying a service that they pay for, they typically want
greater payment in order to bear a loss of that service than they are willing to pay to retain
it. This is because individuals feel a sense of ownership (property rights) for something they
already have (in this case a secure electricity service). Psychologically, the loss from giving
something up feels greater than the gain from keeping it and avoiding the loss.
J27 PricewaterhouseCooper (PwC) undertook a consumer survey to assess how
consumers value lost electricity. The results suggested that the value consumers
place on supply when asked to accept an interruption (WTA) is significantly higher
than the value they place on it when asked about paying for avoiding an interruption
(WTP), typically two to five times as much (although this varies depending on several
factors).601
J28 Furthermore, we have heard from distributors that their ‘consumers do not accept
deteriorating reliability and are not prepared to pay for improved reliability’,
implying that consumers always want the status quo. However, we note that the
‘status quo’ reliability experienced by consumers does change over time.
J29 This assumption in some ways informs our overall approach to the DPP – a status
quo-based approach, with low-cost optimisations (to efficiency and quality) at the
margins, and with a CPP available either where the distributor wishes to change the
status quo or is unable to maintain current quality at something approaching current
cost.
J30 To the extent it is true that this asymmetry extends to overall reliability, this would
lend itself to an asymmetric (or even one with negative incentives only) incentive
scheme. We generally accept the notion the consumers may be more willing to
accept payment to have an interruption than to pay to avoid an interruption.
However, it is unclear how this translates into a deterioration or improvement in
overall reliability.
600 London Economics “The Value of Lost Load (VoLL) for Electricity in Great Britain – Final report for Ofgem and DECC” (July 2013), p. xii.
601 PwC “Estimating the Value of Lost Load in New Zealand” (March 2018).
https://www.ofgem.gov.uk/ofgem-publications/82293/london-economics-value-lost-load-electricity-gbpdf
354
3605676.11
J31 There are some other drawbacks of applying an asymmetric incentive scheme:
J31.1 it may erode the expectation of a normal return unless other parameters
are adjusted, for example, the reliability ‘target’ or the revenue
allowance;602
J31.2 it requires us to make a further assumption about where the inflection point
from ‘material’ deterioration is;
J31.3 cost-quality trade-off complications for a distributor, in that a distributor
may not know the marginal incentive of any reliability decision during the
year or effects in the long-term;
J31.4 setting the separate incentive rates, revenue at risk, and/or caps and collars;
and
J31.5 consumer quality preferences are likely to change over time as better or
worse reliability is experienced.
Consideration of a consumer compensation scheme
J32 Consumer compensation is something we are specifically empowered to implement
by section 53M of the Act.
J33 A consumer compensation scheme is similar to a negative incentive-only incentive
scheme, the principal difference is that each consumer is compensated directly for
interruptions they experience, rather than the losses being pooled and distributed
less directly. One appealing feature of a compensation scheme is that there can be a
more direct relationship between the price a consumer pays and the reliability they
experience.
J34 However, like an asymmetric or negative incentive-only incentive scheme, or like the
quality standards, it may erode the expectation of a normal return unless revenue is
adjusted upwards.
J35 As discussed in Attachment N, we are not introducing a consumer compensation
scheme for DPP3, but it may be something that we revisit for DPP4. To determine
the appropriate settings for a consumer compensation scheme would require
significant analysis and further information, and we may ask for that additional
information during DPP3.
602 Where we, and the distributor, expect as a matter of ordinary volatility, that the distributor has half its assessment periods above the mean and half below, the greater losses for underperformance will outweigh the rewards for overperformance, thus not creating the ex-ante expectation of a normal return, even when quality standards are met.
355
3605676.11
J36 In particular, given the interposition of retailers between distribution businesses and
consumers, we decided that it was likely not possible to develop the mechanisms
that allow payments to reach affected consumers in time for this DPP3 reset.
Why should consumers pay for reliability beyond the historical norm?
J37 We recognise that the nature of the SAIDI and SAIFI metrics we use are aggregate in
nature. This can result in individual consumers receiving a service level higher or
lower than they desire relative to the cost of lines services. This is true for both
financial incentives and quality standards.
J38 However, we also note that in the DPP:
J38.1 the revenue allowance (net of all financial incentives) is pooled, which a
distributor can recover from consumers as it sees fit;
J38.2 expenditure allowances are pooled, which a distributor can spend on
consumers as it sees fit; and
J38.3 reliability targets and limits are pooled, which will be distributed among
consumers.
J39 In any case, it would likely be difficult for a distributor to tailor different reliability
outcomes for the preferences of each individual consumer on shared infrastructure.
J40 For DPP3, we are setting incentives at a conservative level tailored to each
distributor. In our view, the incentives that we are implementing do not exceed the
value consumers place on lost load, at an aggregate level. This is consistent with all
other substantial DPP settings.
J41 We also consider it is important that distributors are not disincentivised to provide
improved reliability for those consumers who want it. Without an incentive scheme,
and with the move to a revenue cap, there is little financial incentive for a distributor
to make even the lowest cost improvement to reliability even if desired by
consumers because:
J41.1 the distributor will not receive additional revenue, as it is capped;
J41.2 there is a cost, which the distributor must bear a portion of; and
J41.3 as a result, the distributor’s profitability would be reduced.
356
3605676.11
J42 The opposite is also true ― distributors may be incentivised to allow deterioration in
reliability, within the bounds of any quality standard as:
J42.1 distributors may have an expectation that we would re-align their quality
target in DPP4 to account for their poor performance in DPP3 by including
DPP3 in the reference period;
J42.2 they will not lose revenue as distributors can still recover up to the cap;603
J42.3 they can reduce costs, of which they will keep a portion of; and therefore
J42.4 it will increase its profitability.
J43 Our decision is not aimed at setting the price-quality optimum for each consumer (or
group of consumers). However, given the aggregate nature of the settings in the
DPP, it is important to ensure that distributors face improved price-quality trade-
offs. In order to do this, between the standards and incentive scheme, we have
attempted to set reasonable limits on quality, within which it is up to each
distributor to decide what best meets their consumers’ needs and expectations.
J44 To the extent we wish to set the parameters of prices and quality at a more
disaggregated level, enhanced ID requirements and performance analysis is likely to
be required.
Setting quality standards without revenue-linked incentives?
J45 We have considered whether setting standards and incentives that are reflective of
consumers’ current demands and also in the long-term interest of consumers would
still require the need for a revenue-linked incentive scheme.
J46 There are several barriers to setting 'optimal' standards that make it not feasible, for
example:
J46.1 distributors have different network characteristics that will require different
price-quality settings;
J46.2 each consumer (or consumer group) will implicitly have different views of
what the optimal price and optimal quality is, and furthermore, there may
also be a temporal dimension where future consumers have different
preferences;
603 This is exacerbated under a revenue cap with a wash-up, as distributors will be able to recover the revenue for quantities not delivered on a two-year lag.
357
3605676.11
J46.3 even with normalisation, there is inherent volatility within any reliability
metric we use to assess standards, and unless all events beyond the
distributors’ reasonable control that cause the volatility can be filtered out,
this makes an assessment against an 'optimal' standard
unrealistic―although even where the event is outside of the distributors’
control, it will have at least control over the extent of interruptions arising
from it;
J46.4 distributors cannot have precise control over interruptions so as to precisely
meet such a given standard consistently; and
J46.5 a restriction on benchmarking for setting quality standards in a DPP prevent
adequately accounting for network and consumer characteristics.
J47 There are also issues with setting 'optimal' penalties for contravening the standards,
for example:
J47.1 by law, we are limited to financial penalties of $5m for each standard
contravened, and this may not be enough to deter some contraventions;
J47.2 specifying the 'optimal' penalty for contravening each standard for each
distributor, recognising that they will be different;
J47.3 the cost (to the Commission) of administering the enforcement standards
needs to be taken into account; and
J47.4 penalties do not get distributed back to consumers.
J48 As previously noted, we consider that revenue-linked incentives on quality will
better facilitate the movement towards a price-quality balance that consumers
prefer at an aggregate level.
Setting the baseline planned and unplanned SAIDI and SAIFI
J49 To set reliability parameters for the DPP3 period, we require a baseline that informs
those parameters. Previously, we have considered the distributors’ historical
performance to provide that baseline. Without reliable external evidence about
customers’ preferred level of quality and without the ability to use benchmarking to
identify a more ‘optimal’ level of reliability we take the same approach for DPP3.
J50 Our decision is to set quality standards and financial incentives separately for
planned and unplanned interruptions. As such, we considered the two reference
periods separately (although ultimately, we use the same reference period for both).
358
3605676.11
J51 The specific decisions we have implemented are:
J51.1 SAIDI and SAIFI are measured consistently with how the distributor
measured them as at 31 March 2019 within its audited section 53ZD
response;604
J51.2 an unplanned reference period from 1 April 2009 to 31 March 2019;
J51.3 a cap of 5% on the inter-regulatory period movement in unplanned quality
parameters; and
J51.4 a planned reference period from 1 April 2009 to 31 March 2019.
Measuring SAIDI and SAIFI
J52 SAIDI and SAIFI are the reliability measures that form the basis of the quality
standards and incentives. By definition:
J52.1 SAIDI is the sum of the minutes customers are not supplied with electricity
due to an interruption divided by the number of customers on the network;
and
J52.2 SAIFI is the sum of the number of interruptions experienced by customers
divided by the number of customers on the network.
J53 Only interruptions to customers caused by a failure of the distributor’s assets
(excluding LV lines) is assessed for the purpose of the quality standards and
incentives.605
J54 Normally, we would expect that a unique interruption, for the purposes of
measuring SAIDI and SAIFI, will be triggered every time supply is interrupted to any
customer. For example, where a customer is interrupted twice as part of the same
“event”:
J54.1 no SAIDI would be accumulated between the end of the first interruption
and the beginning of the second interruption; and
J54.2 two interruptions would occur for the purpose of calculating SAIFI, rather
than one.
604 Commerce Commission “Notice to supply information for 2020 DPP reset under section 53ZD” (28 June 2019).
605 These are sometimes referred to as Class B (planned interruptions on the network) and Class C (unplanned interruptions on the network) interruptions.
359
3605676.11
J55 However, we were made aware that many distributors were not applying a
consistent definition of interruption, and subsequently SAIDI and SAIFI, consistent
with this. For example, some distributors were defining an interruption on an
“event” basis where multiple interruptions as part of the same event would be
treated as one continuous interruption.
J56 Due to data problems, distributors may face substantial costs realigning their SAIDI
and SAIFI historical values in order to be consistent, we therefore require for DPP3
that SAIDI and SAIFI is measured consistently with the approach applied in the
audited interruption dataset each distributor provided to the Commission.606 We
plan to consult with stakeholders after the DPP3 reset to ensure that in the future
the definition of an interruption is applied consistently by distributors, firstly as part
of ID.
J57 Submitters to our SAIFI consultation paper generally accepted our proposed
approach requiring distributors to use the same methodology for calculating SAIFI
during DPP3 as that applied on 31 March 2019.607 However, Aurora Energy
submitted that it had restated its historic SAIFI data to be better aligned with the
definition of an interruption after 31 March 2019.608 We agree with Aurora that this
is appropriate and for this reason we have also tied the SAIFI definition to the
methodology applied within its audited section 53ZD response.
J58 For consistency we will require that SAIDI is also measured consistently with the
approach that applied in each distributor’s audited section 53ZD interruption data.
Unplanned interruptions
J59 We use the 10 years from 1 April 2009 to 31 March 2019 as the reference period to
set unplanned reliability parameters for the final decision.
606 See Commerce Commission “Default price-quality paths for electricity distribution businesses from 1 April 2020 – Recording of successive interruptions for SAIFI: Consultation paper” (7 October 2019) for more information on this issue and the options we considered for setting quality standards and incentives in lieu of inconsistent interruption data across distributors.
607 ENA “Comments on SAIFI successive interruptions consultation” (18 October 2019), p. 2; Orion “Submission on EDB DPP3 Recording of Successive Interruptions for SAIFI” (18 October 2019), para 5-6; Vector “EDB DPP3 reset - SAIFI consultation” (18 October 2019), para 11; The Lines Company submission on the SAIFI consultation paper (16 October 2019), p. 2; Wellington Electricity “EDB DPP3 reset-SAIFI consultation” (18 October 2019), p. 1.
608 Aurora Energy “Submission to Commerce Commission: Recording of successive interruptions for SAIFI” (18 October 2018), p. 1.
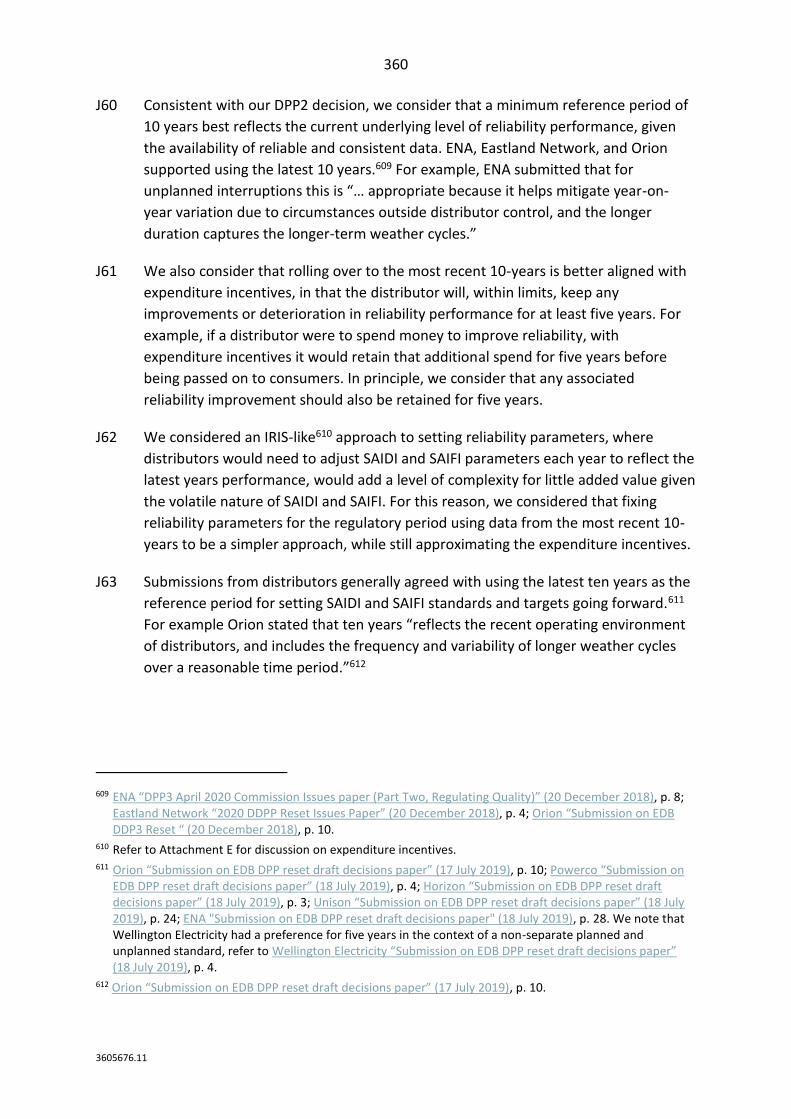
360
3605676.11
J60 Consistent with our DPP2 decision, we consider that a minimum reference period of
10 years best reflects the current underlying level of reliability performance, given
the availability of reliable and consistent data. ENA, Eastland Network, and Orion
supported using the latest 10 years.609 For example, ENA submitted that for
unplanned interruptions this is “… appropriate because it helps mitigate year-on-
year variation due to circumstances outside distributor control, and the longer
duration captures the longer-term weather cycles.”
J61 We also consider that rolling over to the most recent 10-years is better aligned with
expenditure incentives, in that the distributor will, within limits, keep any
improvements or deterioration in reliability performance for at least five years. For
example, if a distributor were to spend money to improve reliability, with
expenditure incentives it would retain that additional spend for five years before
being passed on to consumers. In principle, we consider that any associated
reliability improvement should also be retained for five years.
J62 We considered an IRIS-like610 approach to setting reliability parameters, where
distributors would need to adjust SAIDI and SAIFI parameters each year to reflect the
latest years performance, would add a level of complexity for little added value given
the volatile nature of SAIDI and SAIFI. For this reason, we considered that fixing
reliability parameters for the regulatory period using data from the most recent 10-
years to be a simpler approach, while still approximating the expenditure incentives.
J63 Submissions from distributors generally agreed with using the latest ten years as the
reference period for setting SAIDI and SAIFI standards and targets going forward.611
For example Orion stated that ten years “reflects the recent operating environment
of distributors, and includes the frequency and variability of longer weather cycles
over a reasonable time period.”612
609 ENA “DPP3 April 2020 Commission Issues paper (Part Two, Regulating Quality)” (20 December 2018), p. 8; Eastland Network “2020 DDPP Reset Issues Paper” (20 December 2018), p. 4; Orion “Submission on EDB DDP3 Reset “ (20 December 2018), p. 10.
610 Refer to Attachment E for discussion on expenditure incentives. 611 Orion “Submission on EDB DPP reset draft decisions paper” (17 July 2019), p. 10; Powerco “Submission on
EDB DPP reset draft decisions paper” (18 July 2019), p. 4; Horizon “Submission on EDB DPP reset draft decisions paper” (18 July 2019), p. 3; Unison “Submission on EDB DPP reset draft decisions paper” (18 July 2019), p. 24; ENA "Submission on EDB DPP reset draft decisions paper" (18 July 2019), p. 28. We note that Wellington Electricity had a preference for five years in the context of a non-separate planned and unplanned standard, refer to Wellington Electricity “Submission on EDB DPP reset draft decisions paper” (18 July 2019), p. 4.
612 Orion “Submission on EDB DPP reset draft decisions paper” (17 July 2019), p. 10.
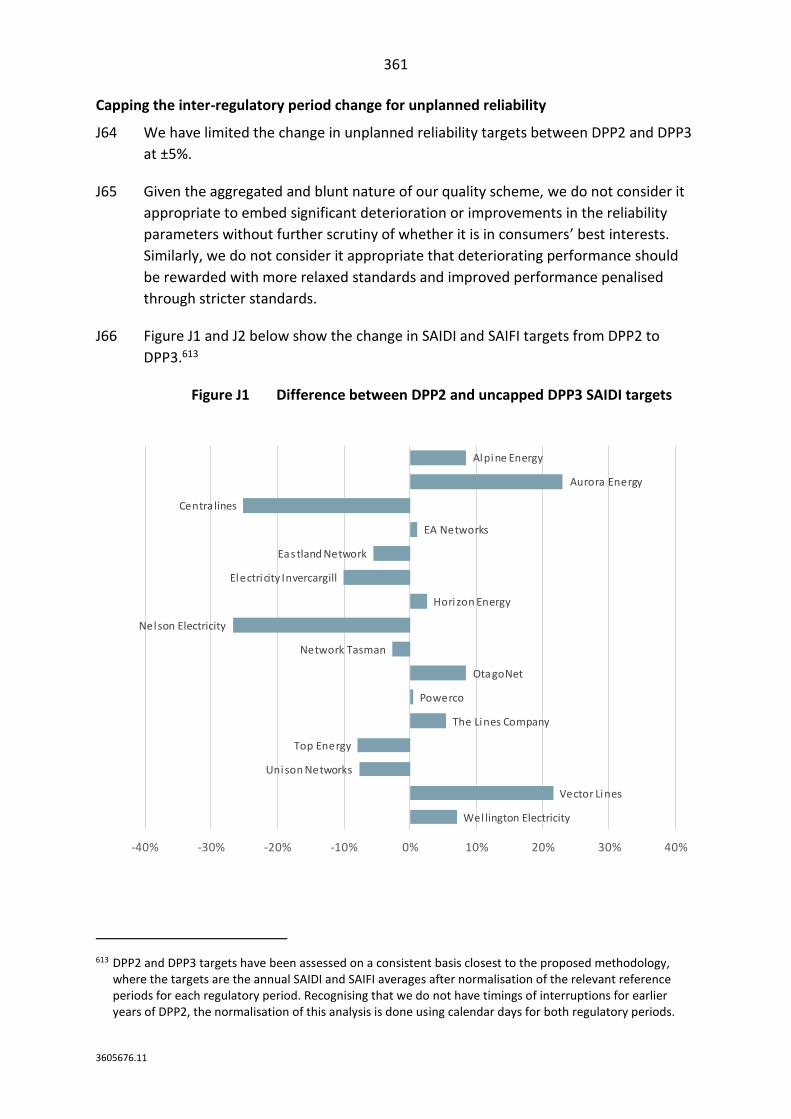
361
3605676.11
Capping the inter-regulatory period change for unplanned reliability
J64 We have limited the change in unplanned reliability targets between DPP2 and DPP3
at ±5%.
J65 Given the aggregated and blunt nature of our quality scheme, we do not consider it
appropriate to embed significant deterioration or improvements in the reliability
parameters without further scrutiny of whether it is in consumers’ best interests.
Similarly, we do not consider it appropriate that deteriorating performance should
be rewarded with more relaxed standards and improved performance penalised
through stricter standards.
J66 Figure J1 and J2 below show the change in SAIDI and SAIFI targets from DPP2 to
DPP3.613
Figure J1 Difference between DPP2 and uncapped DPP3 SAIDI targets
613 DPP2 and DPP3 targets have been assessed on a consistent basis closest to the proposed methodology, where the targets are the annual SAIDI and SAIFI averages after normalisation of the relevant reference periods for each regulatory period. Recognising that we do not have timings of interruptions for earlier years of DPP2, the normalisation of this analysis is done using calendar days for both regulatory periods.
Alpine Energy
Aurora Energy
Centra lines
EA Networks
Eastland Network
Electricity Invercargill
Horizon Energy
Nelson Electricity
Network Tasman
OtagoNet
Powerco
The Lines Company
Top Energy
Unison Networks
Vector Lines
Wel lington Electricity
-40% -30% -20% -10% 0% 10% 20% 30% 40%
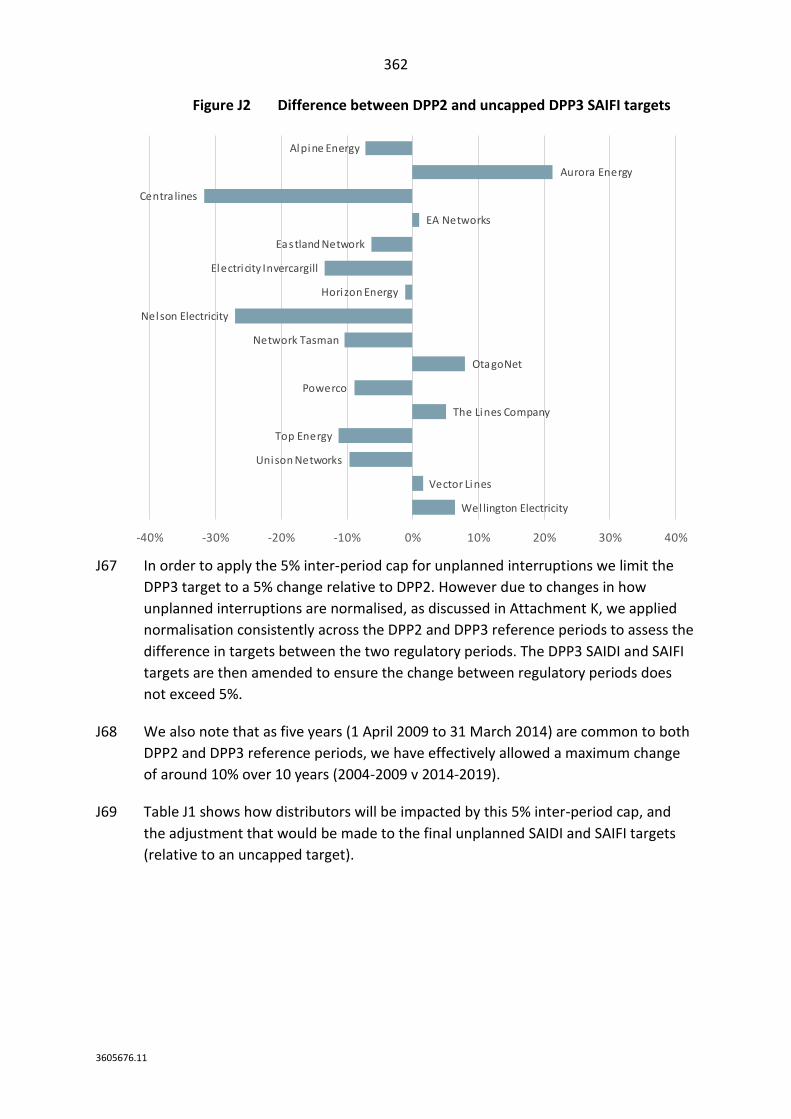
362
3605676.11
Figure J2 Difference between DPP2 and uncapped DPP3 SAIFI targets
J67 In order to apply the 5% inter-period cap for unplanned interruptions we limit the
DPP3 target to a 5% change relative to DPP2. However due to changes in how
unplanned interruptions are normalised, as discussed in Attachment K, we applied
normalisation consistently across the DPP2 and DPP3 reference periods to assess the
difference in targets between the two regulatory periods. The DPP3 SAIDI and SAIFI
targets are then amended to ensure the change between regulatory periods does
not exceed 5%.
J68 We also note that as five years (1 April 2009 to 31 March 2014) are common to both
DPP2 and DPP3 reference periods, we have effectively allowed a maximum change
of around 10% over 10 years (2004-2009 v 2014-2019).
J69 Table J1 shows how distributors will be impacted by this 5% inter-period cap, and
the adjustment that would be made to the final unplanned SAIDI and SAIFI targets
(relative to an uncapped target).
Alpine Energy
Aurora Energy
Centra lines
EA Networks
Eastland Network
Electricity Invercargill
Horizon Energy
Nelson Electricity
Network Tasman
OtagoNet
Powerco
The Lines Company
Top Energy
Unison Networks
Vector Lines
Wel lington Electricity
-40% -30% -20% -10% 0% 10% 20% 30% 40%
363
3605676.11
Table J1 Adjustments to DPP3 targets based on 5% cap
Distributor SAIDI Adjustment
SAIFI Adjustment
Alpine Energy -3.19% 2.25%
Aurora Energy -14.66% -13.51%
Centralines 26.84% 39.16%
EA Networks 0.00% 0.00%
Eastland Network 0.54% 1.32%
Electricity Invercargill 5.57% 9.68%
Horizon Energy 0.00% 0.00%
Nelson Electricity 29.68% 30.23%
Network Tasman 0.00% 5.88%
Orion NZ 0.00% 0.00%
OtagoNet -3.17% -2.81%
Powerco 0.00% 4.20%
The Lines Company -0.42% -0.17%
Top Energy 3.11% 6.96%
Unison Networks 2.88% 5.12%
Vector Lines -13.65% 0.00%
Wellington Electricity -1.94% -1.37%
Stakeholder views
J70 Most distributors that submitted agreed that some limit on the degree to which
standards could increase or decrease between regulatory period was appropriate.
However, they had divergent views as to what the limit should be that was largely
determined by the impact such a cap would have on them. These submissions can be
summarised as:
J70.1 Centralines, Horizon Energy, Powerco, and Unison agreed with the 5%
limit;614
614 Centralines “Submission on EDB DPP reset draft decisions paper” (18 July 2019), p. 18; Horizon “Submission on EDB DPP reset draft decisions paper” (18 July 2019), p. 3; Powerco “Submission on EDB DPP reset draft decisions paper” (18 July 2019), p. 3; and Unison “Submission on EDB DPP reset draft decisions paper” (18 July 2019), pp. 22-23.
364
3605676.11
J70.2 Alpine Energy (10%), Aurora Energy (15%), and Wellington Electricity (1
standard deviation) suggested the limit should be increased;615 and
J70.3 Vector disagreed with having any limit.616
J71 We note that distributors appeared to be more receptive to this symmetric limit on
inter-regulatory period movement in reliability standards and incentives than our
issues paper approach of removing the most extreme years from the reference
period.
J72 Wellington Electricity submitted that 5% represents a small absolute movement for
more reliable networks and suggests the caps and collars (one standard deviation
above and below the historical average) as an acceptable range of movement. It also
considers that a 5% limit reduces “predictability and certainty expected from a low-
cost price-quality regime.”617
J73 We disagree with Wellington Electricity on both fronts. Firstly, we consider that
consistently averaging one standard deviation above or below the normalised
historical average for five years represents significant deterioration or improvement.
This would rarely impact distributors except in extreme cases.618 Secondly, we
consider that reduced inter-period volatility in reliability standards would provide
more certainty to distributors and consumers as to the degree in which deterioration
or improvements will be captured over time.
J74 Aurora Energy submitted that the 5% limit “exposes EDBs to too much risk of quality
standards with which they cannot reasonably comply” and “it would be
inappropriate to set limits that essentially entailed a future breach of the price-
quality path.”619
615 Alpine Energy “Submission on EDB DPP reset draft decisions paper” (18 July 2019), p. 12; Aurora “Submission on EDB DPP reset draft decisions paper” (18 July 2019), p. 3; and Wellington Electricity “Submission on EDB DPP reset draft decisions paper” (18 July 2019), pp. 22-23.
616 Vector “Submission on EDB DPP reset draft decisions paper” (18 July 2019), pp. 42,54. 617 Wellington Electricity “Submission on EDB DPP reset draft decisions paper” (18 July 2019), pp. 22-23. 618 Our analysis suggests that using one standard deviation as the inter-period cap will only impact three
distributors for SAIDI (Aurora, Centralines, and Vector) and SAIFI (Aurora, Centralines, and Powerco). 619 Aurora “Submission on EDB DPP reset draft decisions paper” (18 July 2019), p. 3.
365
3605676.11
J75 We emphasise that the 5% limit is relative to a performance standard that was
historically achieved, namely between 2004 and 2014. Furthermore, as noted in
Attachment L, unplanned standards have a further 2.0 standard deviation buffer
before a contravention is triggered. To the extent that inadequate asset
management has led to a deterioration such that a distributor is unlikely to comply
given this, we consider that it is appropriate that the distributor should improve its
performance. An option to apply for a quality standard variation is available to
distributors. We can assess whether a less stringent quality path is in the long-term
interests of consumers.
J76 Alpine Energy submitted that the limit should increase to 10% citing that it would
better reflect the natural variability of reliability.620 In response, we consider that the
10-year reference periods that are used, along with normalisation, absorbs a
significant portion of the random variability in SAIDI and SAIFI metrics, and as such,
we consider 5% represents an appropriate balance of accepting some variability in
reliability over time and not rewarding or penalising deteriorating or improving
network performance.
Planned interruptions
J77 We also use the 10 years from 1 April 2009 to 31 March 2019 as the reference period
to set planned reliability parameters. However, we do not apply any inter-period
limit as we do not consider planned interruptions are as closely tied to the
deterioration of network assets.
J78 ENA, in response in the issues paper, submitted specifically on a reference period for
planned interruptions, proposing the latest five years.621 This was widely supported
by distributors at the quality workshop held 28 February.622 ENA submitted that:
An alternative to the forecast approach for setting the standard for planned outages
described above, is to use a five-year historical reference dataset for setting planned outage
targets. A shorter, more recent dataset than for unplanned outages will better reflect current
operating environments and the benchmark expenditure levels which influence DPP revenue
paths. This may also be a default option available for EDBs who have insufficient certainty
over future planned outages at the time the 2020 DPP is reset.
620 Alpine Energy “Submission on EDB DPP reset draft decisions paper” (18 July 2019), p. 12. 621 ENA “DPP3 April 2020 Commission Issues paper (Part Two, Regulating Quality)” (20 December 2018), p. 8. 622 Commerce Commission “Notes on EDB DPP3 Workshop on quality and consumer outcomes” (27 February
2019).
366
3605676.11
J79 We undertook analysis to assess the changes in planned interruptions over time. We
note that there is substantial volatility, both up and down. For example, four
distributors more than tripled their planned SAIDI and SAIFI in the last five years
relative to the five years before. Conversely, there was one distributor which
significantly reduced its planned SAIDI over the same period. On balance, we
consider using the same reference period as for unplanned reliability is most
appropriate. To the extent distributors have recently made operational changes this
will be partially captured in the reference period.623
Stakeholder views
J80 Several distributors disagreed with a 10-year reference period for planned
interruption with many citing a misalignment with current work practices (such as
increased de-energised works).624 Distributors suggest that if there is no explicit
adjustment in planned SAIDI and SAIFI for reductions in live lines work then the
planned reference period should be shorter, for example four or five years.
J81 We considered operating practices relating to live lines work as a potential step
change in the draft decision and our views are outlined in more detail below. In
summary, we do not support an explicit step change nor an implicit step change
through shortening the reference period to reflect only recent operating practices.
J82 As discussed in Attachment L, our decision is to set the compliance standard for
planned interruptions at triple the historical average. As a result, the decision about
which reference period to use is less material for the purposes of assessing
compliance.
623 As noted in Attachment L, we consider the separation of planned and unplanned interruptions and the wide planned standard we have adopted accommodate distributors who have changed their operating practices with sufficient flexibility.
624 ENA "Submission on EDB DPP reset draft decisions paper" (18 July 2019), pp. 25-26; Orion "Submission on EDB DPP reset draft decisions paper" (17 July 2019), p. 10; Eastland Network "Submission on EDB DPP reset draft decisions paper" (18 July 2019), p. 10; Powerco "Submission on EDB DPP reset draft decisions paper" (18 July 2019), p. 4; Unison "Submission on EDB DPP reset draft decisions paper" (18 July 2019), p. 20; The Lines Company "Submission on EDB DPP reset draft decisions paper" (18 July 2019), p. 4.
367
3605676.11
J83 Furthermore, as discussed in Attachment M, with adequate notification to
consumers the weighting of planned interruptions for assessment purposes can be
halved relative to those interruption not adequately notified. We consider this
asymmetric incentive that is to distributors’ benefit will allow them to adequately
manage their planned interruptions without being unduly penalised.
J84 We consider that operating practices that are not binding may be reversed by the
distributor at its discretion. Furthermore, a distributor may consider alternative ways
of mitigating the reliability impact of planned work, for example, by meshing, back-
feed, or generation.
Step changes
J85 The scope to include step changes for setting the reliability parameters applicable to
standards and incentives may capture operational or situational changes outside the
control of the distributor.
J86 We considered the step change criteria for operating expenditure was a useful
starting point for assessing step changes for reliability, namely that any changes:
J86.1 be significant;
J86.2 be robustly verifiable;
J86.3 be largely outside the control of the distributor;
J86.4 in principle, affect the reliability of most, if not all, distributors; and
J86.5 not be captured in the other components of our reliability parameters
(reference period, normalisation methodology).
J87 Submitters to the issues paper raised a few potential step changes that may be
considered, for example:
J87.1 decreased live lines work resulting from harsher Health and Safety Work Act
(HSWA) penalties;625
J87.2 increased incidence of weather events, potentially arising from climate
change;626
625 Unison “Submission on default price-quality paths for electricity distribution businesses from 1 April 2020 Issues paper” (21 December 2018), p. 4.
626 Orion “Submission on EDB DDP3 Reset “ (20 December 2018), para 51.
368
3605676.11
J87.3 increased third-party interruptions, for example third-party vehicle damage
incidents;627 and
J87.4 increased asset investment plans.628
J88 Of these requested step changes, we had identified that only the HSWA/live lines
issue was supported by extensive evidence demonstrating their existence and effect.
While the other potential changes may be serious (climate change, third-party
interruptions, investment) given the lack of evidence about their effect on quality,
they do not meet the verifiable criterion.
J89 Further, changes due to increased investment on the network are likely to be
distributor-specific, and more properly the subject of either a quality standard
variation reopener or – where the investment increase itself is significant – a CPP
proposal.
J90 In response to our draft decision, Unison submitted that we should:
consider a further adjustment to align planned SAIDI targets with the capex allowances, by
indexing the allowance to the increase in capex on replacement expenditure. There seems
little point in providing EDBs with increased capex allowances, but at the same time
penalising them for undertaking the approved additional replacement work with no
additional minutes to undertake the work.
J91 We acknowledge that increased replacement and renewal expenditure will likely
require increased planned interruptions However, we do not consider it feasible at
this stage, in the context of a low-cost DPP, to estimate a direct link between these.
For example:
J91.1 the volatility of planned works due to factors outside of asset replacement
and renewal distorts this relationship; and
J91.2 the nature of those assets to be replaced or renewed are likely to have
different expenditure and interruption impacts.
J92 Nonetheless, we consider it is appropriate that consumers are compensated, via the
incentive scheme, for an increased level of planned interruption due to increased
allowed replacement and renewal expenditure (which consumers are also paying
for).
627 Vector “Submission to Commerce Commission Default Price Quality Path Issues Paper” (21 December 2018), paras 129 to 130.
628 Unison “Submission on default price-quality paths for electricity distribution businesses from 1 April 2020 Issues paper” (21 December 2018), p. 4; and Unison “Submission on EDB DPP reset draft decisions paper” (18 July 2019), p. 24.
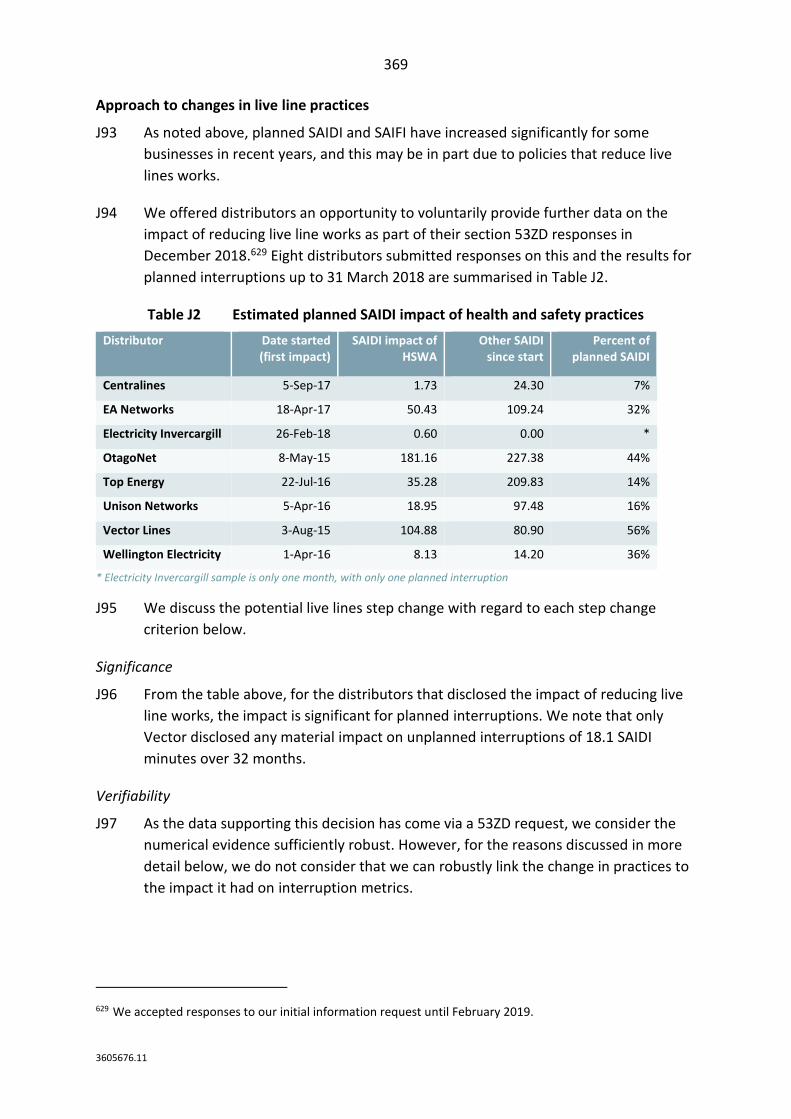
369
3605676.11
Approach to changes in live line practices
J93 As noted above, planned SAIDI and SAIFI have increased significantly for some
businesses in recent years, and this may be in part due to policies that reduce live
lines works.
J94 We offered distributors an opportunity to voluntarily provide further data on the
impact of reducing live line works as part of their section 53ZD responses in
December 2018.629 Eight distributors submitted responses on this and the results for
planned interruptions up to 31 March 2018 are summarised in Table J2.
Table J2 Estimated planned SAIDI impact of health and safety practices
Distributor Date started (first impact)
SAIDI impact of HSWA
Other SAIDI since start
Percent of planned SAIDI
Centralines 5-Sep-17 1.73 24.30 7%
EA Networks 18-Apr-17 50.43 109.24 32%
Electricity Invercargill 26-Feb-18 0.60 0.00 *
OtagoNet 8-May-15 181.16 227.38 44%
Top Energy 22-Jul-16 35.28 209.83 14%
Unison Networks 5-Apr-16 18.95 97.48 16%
Vector Lines 3-Aug-15 104.88 80.90 56%
Wellington Electricity 1-Apr-16 8.13 14.20 36%
* Electricity Invercargill sample is only one month, with only one planned interruption
J95 We discuss the potential live lines step change with regard to each step change
criterion below.
Significance
J96 From the table above, for the distributors that disclosed the impact of reducing live
line works, the impact is significant for planned interruptions. We note that only
Vector disclosed any material impact on unplanned interruptions of 18.1 SAIDI
minutes over 32 months.
Verifiability
J97 As the data supporting this decision has come via a 53ZD request, we consider the
numerical evidence sufficiently robust. However, for the reasons discussed in more
detail below, we do not consider that we can robustly link the change in practices to
the impact it had on interruption metrics.
629 We accepted responses to our initial information request until February 2019.
370
3605676.11
Control
J98 While all distributors must comply with relevant health and safety laws, the safety
management system or policies they apply, the practices they undertake as a result,
and the reliability mitigations they put in place to limit the impact on consumers are
all within the control of the distributor.630 In this regard, we note the different
interpretations of and approaches to the Health and Safety at Work Act different
distributors have taken.631
Affects most or all distributors
J99 There is widespread disagreement as to what extent health and safety laws require
reduced live lines work (and whether they do at all).632 Accordingly, distributors have
altered their health and safety policies to differing extents, and we have been
advised that some distributors have increased the extent to which they work on live
lines during recent years.
J100 Accordingly, neither the option of applying a step change consistently across all
distributors or applying a step change selectively to different distributors depending
on the extent of their live lines work is attractive, for the following reasons:
J100.1 Applying a step change consistently to all distributors would mean those
who have not reduced their live lines work would receive an easier planned
SAIDI target and reliability standard. Accordingly, by continuing their
practices (which include live lines work), all else being equal, these
distributors could receive financial rewards by outperforming their target
without improving the quality of service to consumers and be less likely to
contravene their compliance limit;
630 This issue was discussed in our response to Vector’s health and safety reconsideration request and in the legal advice we received in considering Vector’s request. Letter from Sue Begg (Commerce Commission) to Richard Sharp (Vector Lines) responding to Vector’s request that the DPP be re-opened (5 September 2018).
631 As an example, Wellington Electricity cite that they have spent $600,000 per year on mobile generation to limit the impact of interruptions from planned interruptions. Wellington Electricity “Default price-quality paths for electricity distribution businesses from 1 April 2020 Issues Paper” (21 December 2018), p. 14.
632 It is not a binary decision to do live lines work or not, instead, EDBs differ in the circumstances they will do live lines work based on their different views as to what is safe.
371
3605676.11
J100.2 Applying a step change to only those distributors who have decreased their
live lines practices (with the size of the step change differing depending on
the distributors self-reporting of the impact of their changes) would create
difficulties in the likely event that live lines policies continue to evolve.
Distributors who have received a step change allowance may reverse their
live lines reductions (as they are a matter of distributor policy, not
regulatory directive), resulting in easier targets and standards referred to in
the previous paragraph (with the added inequity that distributors who
never reduced their live lines work in the first place would not receive the
step change). In addition, some of the distributors who have not reduced
their live lines work may decide to do so in the future, but would do so
under the constraint of a different planned SAIDI target than those who
have already made that decision.
J101 We also consider that it is not the Commission’s place to dictate whether live line
work is appropriate or not. Choosing either of these paths would effectively mean
that the Commission is endorsing live lines work.633
J102 Not making a step change does not mean we are endorsing the view that health and
safety law does not require reduced live lines work. Rather we are allowing each
distributor to determine what live lines policy is required by law and is appropriate
for it. We are doing this by allowing the effects of live lines practices to filter into the
historical average over time,634 and by structuring quality standards such that live
lines practices are unlikely to lead to a contravention.
Capture by other components
J103 Operational changes that distributors have made to reflect their health and safety
policies will be captured within our reference period, although those changes will be
diluted by the inclusion of earlier years before such changes were implemented.
Accordingly, to some extent the effects of distributors live lines practices has been
incorporated into distributor’s SAIDI and SAIFI targets.
633 Worksafe do not have a publicly stated position on live-lines, instead they will assess whether an incident when working on live lines was contrary to the law after the fact.
634 If we take the same approach to having a ten-year reference period in DPP4, companies’ planned SAIDI target will largely incorporate their live lines approach.
372
3605676.11
J104 In addition, our changes to the structure of the quality standards mean that an
increase in SAIDI or SAIFI due to live lines practices will unlikely cause a
contravention of the quality standards, all else being equal. Planned interruptions
are treated as a separate quality standard, and the threshold for that standard is set
three times the distributor’s historical average. Vector reported the highest
proportion of planned SAIDI due to live lines practices at 56%, but this on its own
would not cause it to contravene the planned SAIDI limit under our approach, which
is 200% higher than its historical average.
J105 Our approach (as discussed in Attachment L) greatly reduces distributors’ exposure
to quality standard contraventions for planned interruptions, even in circumstances
where strict live lines policies are implemented. Accordingly, we consider that our
approach will address distributors’ concerns about exposure to quality standard
contravention due to live lines policies.
J106 We consider that the planned reliability standard is sufficient to accommodate
changes to live lines practices. We acknowledge that the incentive scheme will
continue to apply to interruptions related to live lines practices, although to some
extent this is offset by them being captured in the historical reference period.
Furthermore, the incentives for planned interruptions have been set at a
conservative level and can be further reduced if distributors meet the notification
criteria (as discussed in Attachment M). Our view is that this approach will allow
distributors flexibility in making cost-quality trade-offs, including to account for their
live lines policies.
Stakeholder views
J107 ENA proposed in its Working Group report, and reiterated in its submissions that
adjustments are made:
… to address the impact of changes in operational environments which have occurred during
the current regulatory period and which have impacted the reference periods for SAIDI and
SAIFI target setting … the ENA proposes that the adjustments are EDB-specific, limited to a
value that can be supported by quantified evidence provided by the EDB and approved by
the Commission … [they] caution against the Commission making judgements about
operational risk for EDBs.635
635 Electricity Networks Assoc. “ENA Working Group on quality of service regulation – Interim report to the Commerce Commission” (1 October 2018), p. 14.
373
3605676.11
J108 They also noted that:
… there is precedent for EDB-specific adjustments being incorporated into the DPP (for
example for spur asset purchases) and therefore do not consider the fact that some EDBs are
more affected by the legislative change than others should prevent this matter being
addressed in the DPP reset.636
J109 Furthermore, ENA rejected that a DPP reopener is an appropriate option to resolve
distributor-specific circumstances stating that it does:
… not consider that it is consistent with the legislative intent to rely on a DPP reopener to
address circumstances which are well understood and a consequence of legislative change,
at the time a DPP is set.637
J110 Wellington Electricity and Vector endorse the views of ENA.638 For example, Vector
submitted on the reasons and impacts of minimising live lines work and other
operating issues impacting reliability, for example:
… by suggesting EDBs are taking a “more risk-averse approach” the Commission is taking an
active role in articulating the appropriate safety precautions to execute tasks on or near
energised assets. We believe EDBs are the best judge as to when different hazard prevention
approaches should be adopted. Accordingly, the regulatory framework should not limit the
judgement of EDBs to make safety related decisions for their staff, contractors and public
safety. This includes financial [incentives] such as the Service Quality Incentive mechanisms
encouraging safety precautions to be lowered. 639
J111 Mercury Energy submitted that no adjustment should be made to recompense
distributors for more risk-averse operating practices.640 Furthermore, they consider
an application process to adjust the reference dataset would create a risk of
asymmetric information bias, as described in the ENA’s working group paper.
However, to the extent that there is a material and unavoidable change in the
operating environment, they consider the quality standards may be reset.
636 ENA “DPP3 April 2020 Commission Issues paper (Part Two, Regulating Quality)” (20 December 2018), p. 9. 637 ENA “DPP3 April 2020 Commission Issues paper (Part Two, Regulating Quality)” (20 December 2018), p. 9. 638 Wellington Electricity “Default price-quality paths for electricity distribution businesses from 1 April 2020
Issues Paper” (21 December 2018), p. 14; Vector “Submission to Commerce Commission Default Price Quality Path Issues Paper” (21 December 2018), pp. 22 to 29.
639 Vector “Submission to Commerce Commission Default Price Quality Path Issues Paper” (21 December 2018), pp. 22 to 29.
640 Mercury “Default Price-Quality Paths for Electricity Distribution Businesses from 1 April 2020” (20 December 2018), pp. 5 to 6.
374
3605676.11
Enhanced reliability
J112 We recognise the aggregate and limited nature of SAIDI and SAIFI as reliability
metrics. As such, the issues paper proposed further reliability metrics and
disaggregation of current metrics as future ID requirements, which could be
considered for DPP4.
J113 The issues paper proposed several reliability metrics that may provide a fuller picture
of reliability experienced by consumers including:
J113.1 reliability on the LV network;
J113.2 momentary average interruption frequency – MAIFI;
J113.3 SAIDI and SAIFI by customer type (residential, commercial, industrial);
J113.4 SAIDI and SAIFI by network type (urban, rural, remote);
J113.5 SAIDI and SAIFI by location;
J113.6 worst served customers; and
J113.7 electricity not served from interruptions.
J114 Looking forward, we consider that most, if not all, of these metrics will better
facilitate setting reliability standards and incentives in the future. However, whether
these benefits in terms of the purpose of ID regulation outweigh the additional costs
to suppliers in collecting the information needs to be carefully considered.641 As with
the other measures of quality discussed in Attachment N, given time and resource
required by distributors and the Commission, and the impact on exempt distributors,
we consider updating ID at a later date appropriate.
641 Commerce Act 1986, section 53A. “The purpose of information disclosure regulation is to ensure that sufficient information is readily available to interested persons to assess whether the purpose of this Part is being met.”
375
3605676.11
Attachment K Identification and treatment of major events
Purpose of this attachment
K1 This attachment explains our approach to identifying and normalising major
interruption events to deal with volatility in the reliability measures we use to assess
quality.
Purpose of normalisation
K2 Reliability and the metrics we use to measure it (SAIDI and SAIFI) are inherently
volatile. Year-on-year volatility in total SAIDI or SAIFI may be the result of major
events, rather than the result of underlying declines or improvements in network
performance. Specifically, the size and number of major events a distributor
experiences in a given year can have a material impact on its total SAIDI or SAIFI
performance.
K3 The purpose of normalisation is to limit the impact of these major events, so that the
unplanned standards we impose, and the incentives distributors face are not merely
reflecting unpredictable events, such as severe weather events. This attachment sets
out our detailed final decisions on normalising out unplanned major events for EDB
DPP3.
Summary of our final decision
K4 Our final decisions on identifying major events for EDB DPP3 are summarised below:
K4.1 major events are only attributable to unplanned interruptions (unchanged
from draft);
K4.2 the major event boundary value has been identified as the 1104th highest
half-hourly rolled 24-hour period for SAIDI and SAIFI over the 10-year
reference period―which is approximately in line with 2.3 major event days
per year used in DPP2 (modified from draft);
K4.3 the number of expected major events for the smallest distributors is
reduced (unchanged from draft);
K4.4 a major event may extend for as long as the 24-hour rolled period exceeds
the boundary value (unchanged from draft); and
K4.5 SAIDI and SAIFI major events are triggered independently (unchanged from
draft).
376
3605676.11
K5 Our final decisions for treating an unplanned major event when identified are
summarised below:
K5.1 replace any half-hour within an identified major event that is greater than
1/48th of the boundary value with 1/48th of the boundary value (changed
from draft); and
K5.2 distributors must provide additional reporting for each unplanned major
event in its compliance statement relative to DPP2 (unchanged from draft).
K6 We note that regardless of which methodology we use to determine the major event
threshold (boundary value), the resulting values are applied consistently to the
reference dataset that determines the reliability parameters we set for the standards
and financial incentives, as well as the distributor’s assessment of reliability going
forward.
Approach raised in the Draft Reasons Paper
K7 Our draft decision for DPP3 was to identify a major event on a rolled three-hour
basis and, in principle, the ‘boundary value’ was the 25th highest unplanned SAIDI or
the 25th highest unplanned SAIFI three-hour period over a 10-year historical dataset.
This was a substantial change from DPP2 where major events were assessed on a
calendar day basis. We considered this appropriate to counter the arbitrary nature
of a fixed calendar day, for example, major events extending both sides of midnight.
K8 Once a major event was triggered, these would then be normalised down to a pro-
rated ‘boundary value’, reducing the impact of major events on assessed SAIDI and
SAIFI for compliance and incentive purposes. This was largely consistent with our
approach in DPP2, however, major events were replaced with a fraction of the
boundary value, rather than the entire boundary value. We considered this
appropriate as to reduce the volatility of SAIDI and SAIFI caused by the frequency of
major events.
Response in submissions
K9 In general, submissions were supportive of the concept of a rolling approach,642
although Eastland Network and ENA raised concerns that the extra complexity would
require investment in outage recording systems.643
642 See for example: Wellington Electricity "Submission on EDB DPP reset draft decisions paper" (18 July 2019), pp. 18-19; ENA "Submission on EDB DPP reset draft decisions paper" (18 July 2019), p. 32.
643 Eastland Network "Submission on EDB DPP reset draft decisions paper" (18 July 2019), p. 9; ENA "Submission on EDB DPP reset draft decisions paper" (18 July 2019), p. 23.
377
3605676.11
K10 Many distributors also supported reducing the impact the frequency of major events
has on compliance and financial incentive outcomes, although some suggested it did
not go far enough.644
K11 Distributors submitted concern in shortening the length of a major event from 24
hours (or a calendar day) to three hours. It was noted that even though major events
may often not last longer than three hours, their effects can continue for a longer
period.645 Furthermore, they also expressed concern that our draft decision deviated
from the IEEE methodology in a way that would change the expected frequency of
major events and create a risk of unforeseen outcomes.646
Updated approach
K12 In response to submissions on the draft decision and the targeted quality of service
workshop, we outlined an alternative methodology for identifying and normalising
major events in our updated draft models’ companion paper.647 Our final decision on
normalisation is largely consistent with that proposed in that companion paper.
K13 Submissions to the draft and updated decisions, and our responses, are outlined in
more detail under the relevant decision below.
Major events are initiated by unplanned interruptions only
K14 Distributors are occasionally exposed to major and unpredictable events. These
major events can be caused by extreme weather, and defective equipment, among
other things. Consequently, major events, due to their large impact on measuring
network reliability, can disproportionately skew SAIDI and SAIFI metrics.
K15 Consistent with DPP2 and our draft DPP3 decision, the final decision is that major
events are initiated by unplanned interruptions only. We consider this is appropriate
as unforeseen major events that severely disrupt the network cannot be planned for.
K16 Across the industry we identified that of the largest periods of interruptions, around
93% of SAIDI and 95% of SAIFI are attributable to unplanned interruptions. Figure K1
and Figure K2 shows the proportion SAIDI and SAIFI attributable to unplanned
interruptions during identified major events for each distributor.
644 See for example: ENA "Submission on EDB DPP reset draft decisions paper" (18 July 2019), pp. 32-33. 645 Centralines "Submission on EDB DPP reset draft decisions paper" (18 July 2019), pp. 18-19; Unison
"Submission on EDB DPP reset draft decisions paper" (18 July 2019), p. 23. 646 See for example: ENA "Submission on EDB DPP reset draft decisions paper" (18 July 2019), p. 31. 647 Commerce Commission, “Default price-quality paths for electricity distribution businesses from 1 April 2020
– Updated draft models – Companion Paper” (25 September 2019), Chapter 5.
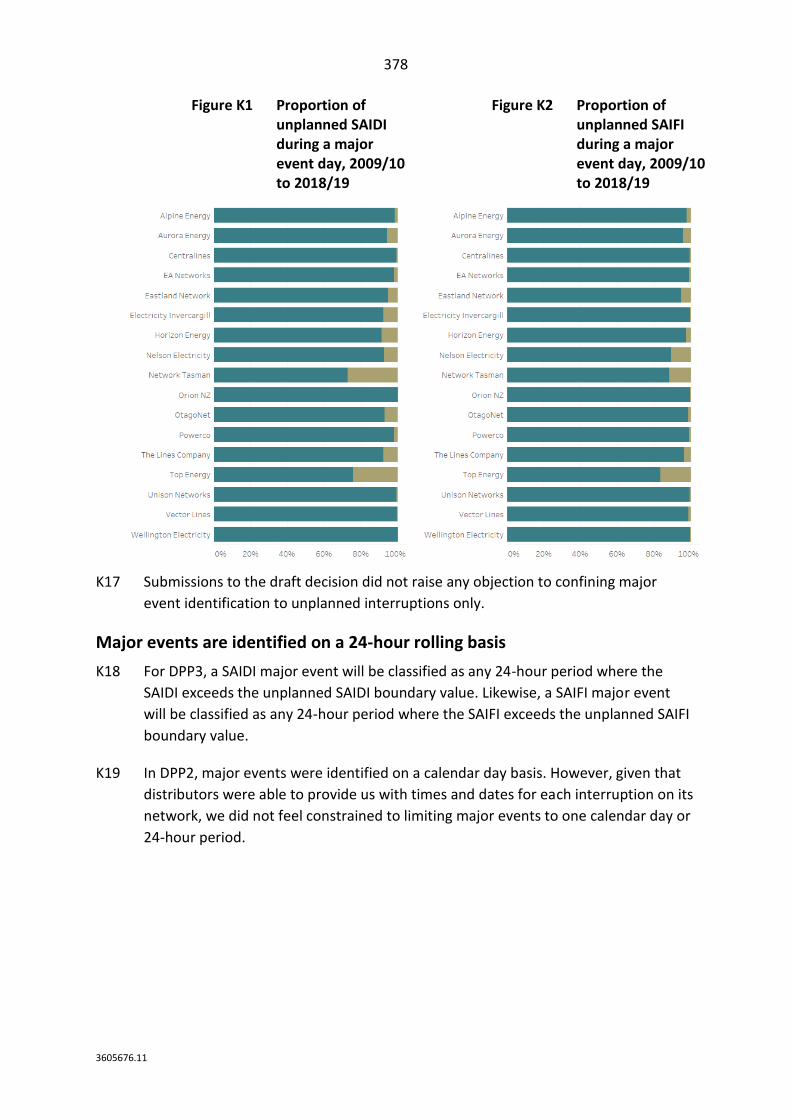
378
3605676.11
Figure K1 Proportion of unplanned SAIDI during a major event day, 2009/10 to 2018/19
Figure K2 Proportion of unplanned SAIFI during a major event day, 2009/10 to 2018/19
K17 Submissions to the draft decision did not raise any objection to confining major
event identification to unplanned interruptions only.
Major events are identified on a 24-hour rolling basis
K18 For DPP3, a SAIDI major event will be classified as any 24-hour period where the
SAIDI exceeds the unplanned SAIDI boundary value. Likewise, a SAIFI major event
will be classified as any 24-hour period where the SAIFI exceeds the unplanned SAIFI
boundary value.
K19 In DPP2, major events were identified on a calendar day basis. However, given that
distributors were able to provide us with times and dates for each interruption on its
network, we did not feel constrained to limiting major events to one calendar day or
24-hour period.
379
3605676.11
K20 For the draft DPP3 decision, we adopted a three-hour rolling approach. We
considered that the use of a fixed calendar day is somewhat arbitrary and means
that significant events that span two calendar days may not be captured adequately,
as discussed from paragraph K26. In shortening the length of a major event, we
considered that major events typically occurred within a much shorter timeframe
than 24 hours.648 In changing from using a calendar day to a rolling three-hour
approach for identifying major events, we noted that:
K20.1 some interruptions that previously would have been classified as a major
event day will no longer be classified as a major event;
K20.2 some major events would not have previously triggered a major event day;
K20.3 it is possible that calendar days can have multiple distinct major events
within that day; and
K20.4 some major events can last longer than three hours.
Assessing major events on a 24-hour basis
K21 Submitters questioned whether the move to a three-hour window risked creating
false-positives and false negatives, highlighting that certain events that were major
events under the calendar day DPP2 methodology were not captured under the draft
methodology and vice versa.649 In discussions at the quality of service workshop,
attendees highlighted that we should consider not only how many major events are
triggered in a given period, but the properties of those major events.650
K22 Over the reference period across all distributors, around 15% of major events
captured by the DPP2 methodology were not captured by the draft methodology,
and around 15% of the major events not captured by the DPP2 methodology were
captured. While we acknowledge that the different methodologies do change the
profile of what is considered a major event, we consider a longer window is more
likely to trigger ‘false positive’ major events that are driven by the accumulation of
coincidental smaller events, we did not consider this difference was reason to revert
to a 24-hour approach.
648 In the draft, we observed that of the major, or near major, event days across 17 distributors, over 80% of the total SAIDI impact occurred within a three-hour period, and similarly for SAIFI. Refer Commerce Commission, “Default price-quality paths for electricity distribution businesses from 1 April 2020 – Draft reasons paper” (29 May 2019), paras K20 and K21.
649 Horizon “Submission on EDB DPP reset draft decisions paper” (18 July 2019), pp. 4-6; and ENA "Submission on EDB DPP reset draft decisions paper" (18 July 2019), p. 32.
650 Commerce Commission “EDB DPP3 – Targeted Workshop on Quality of Service” (16 August 2019).
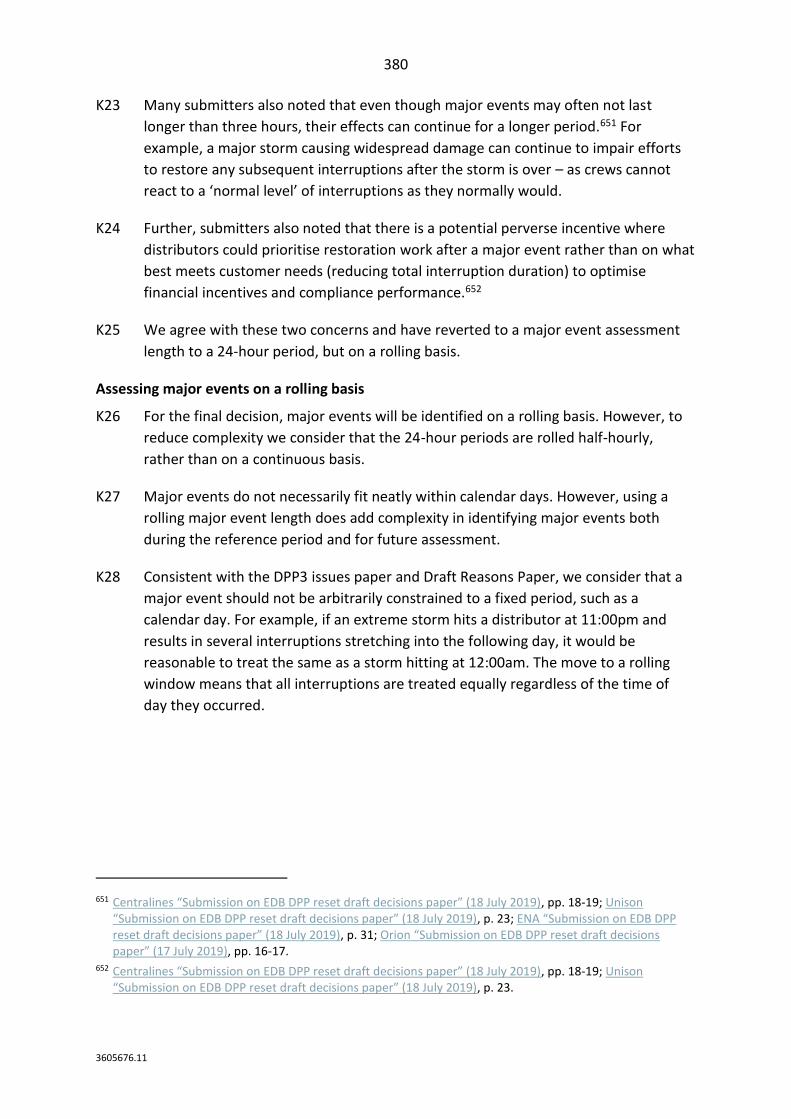
380
3605676.11
K23 Many submitters also noted that even though major events may often not last
longer than three hours, their effects can continue for a longer period.651 For
example, a major storm causing widespread damage can continue to impair efforts
to restore any subsequent interruptions after the storm is over – as crews cannot
react to a ‘normal level’ of interruptions as they normally would.
K24 Further, submitters also noted that there is a potential perverse incentive where
distributors could prioritise restoration work after a major event rather than on what
best meets customer needs (reducing total interruption duration) to optimise
financial incentives and compliance performance.652
K25 We agree with these two concerns and have reverted to a major event assessment
length to a 24-hour period, but on a rolling basis.
Assessing major events on a rolling basis
K26 For the final decision, major events will be identified on a rolling basis. However, to
reduce complexity we consider that the 24-hour periods are rolled half-hourly,
rather than on a continuous basis.
K27 Major events do not necessarily fit neatly within calendar days. However, using a
rolling major event length does add complexity in identifying major events both
during the reference period and for future assessment.
K28 Consistent with the DPP3 issues paper and Draft Reasons Paper, we consider that a
major event should not be arbitrarily constrained to a fixed period, such as a
calendar day. For example, if an extreme storm hits a distributor at 11:00pm and
results in several interruptions stretching into the following day, it would be
reasonable to treat the same as a storm hitting at 12:00am. The move to a rolling
window means that all interruptions are treated equally regardless of the time of
day they occurred.
651 Centralines “Submission on EDB DPP reset draft decisions paper” (18 July 2019), pp. 18-19; Unison “Submission on EDB DPP reset draft decisions paper” (18 July 2019), p. 23; ENA “Submission on EDB DPP reset draft decisions paper” (18 July 2019), p. 31; Orion “Submission on EDB DPP reset draft decisions paper” (17 July 2019), pp. 16-17.
652 Centralines “Submission on EDB DPP reset draft decisions paper” (18 July 2019), pp. 18-19; Unison “Submission on EDB DPP reset draft decisions paper” (18 July 2019), p. 23.
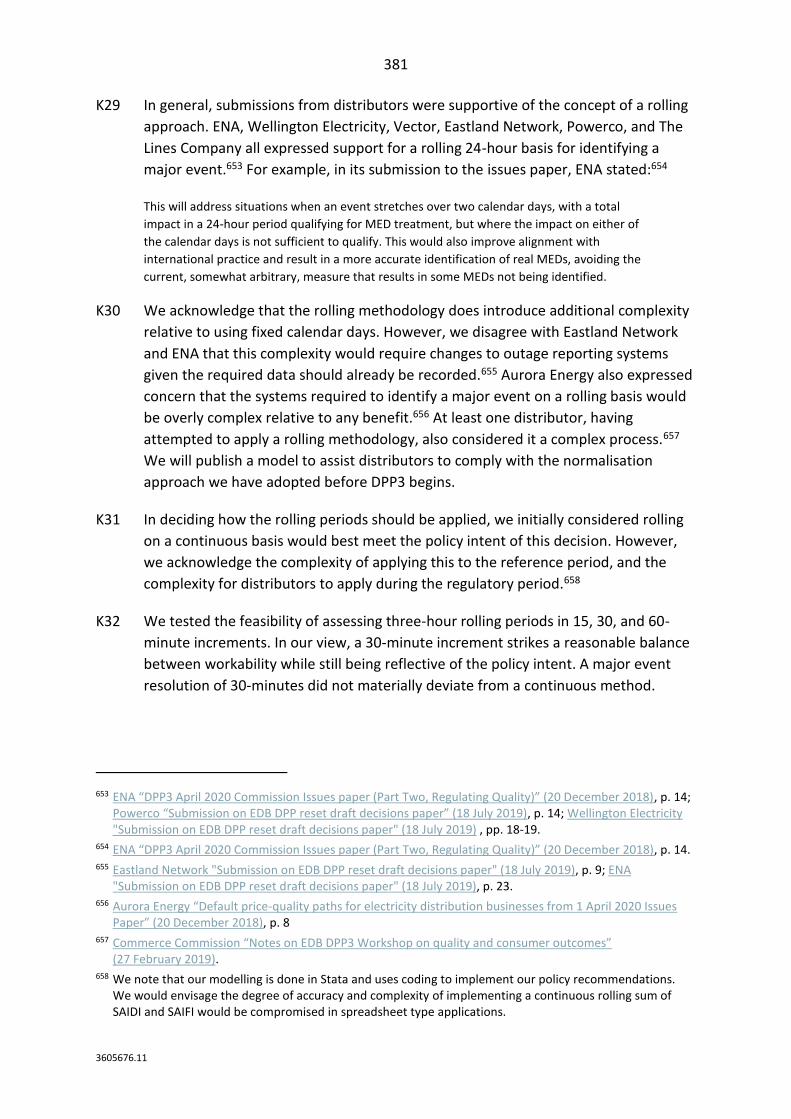
381
3605676.11
K29 In general, submissions from distributors were supportive of the concept of a rolling
approach. ENA, Wellington Electricity, Vector, Eastland Network, Powerco, and The
Lines Company all expressed support for a rolling 24-hour basis for identifying a
major event.653 For example, in its submission to the issues paper, ENA stated:654
This will address situations when an event stretches over two calendar days, with a total
impact in a 24-hour period qualifying for MED treatment, but where the impact on either of
the calendar days is not sufficient to qualify. This would also improve alignment with
international practice and result in a more accurate identification of real MEDs, avoiding the
current, somewhat arbitrary, measure that results in some MEDs not being identified.
K30 We acknowledge that the rolling methodology does introduce additional complexity
relative to using fixed calendar days. However, we disagree with Eastland Network
and ENA that this complexity would require changes to outage reporting systems
given the required data should already be recorded.655 Aurora Energy also expressed
concern that the systems required to identify a major event on a rolling basis would
be overly complex relative to any benefit.656 At least one distributor, having
attempted to apply a rolling methodology, also considered it a complex process.657
We will publish a model to assist distributors to comply with the normalisation
approach we have adopted before DPP3 begins.
K31 In deciding how the rolling periods should be applied, we initially considered rolling
on a continuous basis would best meet the policy intent of this decision. However,
we acknowledge the complexity of applying this to the reference period, and the
complexity for distributors to apply during the regulatory period.658
K32 We tested the feasibility of assessing three-hour rolling periods in 15, 30, and 60-
minute increments. In our view, a 30-minute increment strikes a reasonable balance
between workability while still being reflective of the policy intent. A major event
resolution of 30-minutes did not materially deviate from a continuous method.
653 ENA “DPP3 April 2020 Commission Issues paper (Part Two, Regulating Quality)” (20 December 2018), p. 14; Powerco “Submission on EDB DPP reset draft decisions paper” (18 July 2019), p. 14; Wellington Electricity "Submission on EDB DPP reset draft decisions paper" (18 July 2019) , pp. 18-19.
654 ENA “DPP3 April 2020 Commission Issues paper (Part Two, Regulating Quality)” (20 December 2018), p. 14. 655 Eastland Network "Submission on EDB DPP reset draft decisions paper" (18 July 2019), p. 9; ENA
"Submission on EDB DPP reset draft decisions paper" (18 July 2019), p. 23. 656 Aurora Energy “Default price-quality paths for electricity distribution businesses from 1 April 2020 Issues
Paper” (20 December 2018), p. 8 657 Commerce Commission “Notes on EDB DPP3 Workshop on quality and consumer outcomes”
(27 February 2019). 658 We note that our modelling is done in Stata and uses coding to implement our policy recommendations.
We would envisage the degree of accuracy and complexity of implementing a continuous rolling sum of SAIDI and SAIFI would be compromised in spreadsheet type applications.
382
3605676.11
K33 Figure K3 below shows an illustrative example of where the timing of the raw SAIDI
or SAIFI (orange bars) means that no major event is triggered using calendar days, as
neither calendar day aggregates (light green bars) the applicable raw SAIDI or SAIFI
to be more than the boundary value (black line). Conversely, the same interruptions
will trigger a major event on a rolling 24-hour basis (dark green bars).
Figure K3 Illustrative example of rolled 24-hour vs. calendar day
K34 Orion queried in its submission whether the rolling was intended to be backward- or
forward-looking.659 The draft decision was intended to capture any three-hour
period that exceeded the major event boundary value, and therefore, was
essentially both backwards- and forward-looking in recognition that major events
can have interruption profiles. However, as noted in the update draft models
companion paper, the degree to which a major event is normalised depended on the
profile of the major event. For example, a major event that was triggered in a single
half-hour is normalised for 5.5 hours rather than 3.0 hours. So even though both
events in Figure K4 and Figure K5 below had the same raw SAIDI, one was
normalised to 1/8th of the boundary value with the other almost double that.
659 Orion “Submission on EDB DPP reset draft decisions paper” (17 July 2019), p. 17.
383
3605676.11
Figure K4 DPP3 draft normalisation (1)
Figure K5 DPP3 draft normalisation (2)
K35 The rolling methodology for the final decision is done on the same basis albeit for a
longer period. Consequently, it is possible that if one half-hour period of
interruptions exceeds the full boundary value the major event will last 47.5 hours, as
the 23.5 hours before and after will also be part of a 24-hour period that exceeds the
boundary value. This means that it is possible for half-hours to be normalised which
are by definition part of the major event but some time from the initial cause of the
major event. While we consider that this is not ideal, we have implemented this for
practical reasons, namely, to capture major events of different profiles without
adding increased complexity. However, as noted below, only those half-hours that
exceed 1/48th of the boundary value are normalised down.
K36 Submissions from distributors generally agreed with extending the time frame of a
major event to 24 hours.660 However, ENA questioned the half-hour granularity of
assessing major events.661 Aurora submitted the approach was still unnecessarily
complicated and preferred reverting back to the calendar day approach.662
K37 The method has been applied to the reference period and will be used during the
assessment period.
660 ENA “DPP for EDBs from 1 April 2020 Updated draft models – companion paper: Submission to the Commerce Commission” (9 October 2019), pp. 8-9; Orion “Submission on EDB DPP3 Updated Draft Models” (9 October 2019), p. 3; Wellington Electricity “Submission on Default price-quality paths for electricity distribution businesses from 1 April 2020 - Draft Decision Update” (9 October 2019), p. 5; Powerco “Powerco submission on the updated DPP3 Draft Decision” (9 October 2019), p. 2; Unison “Submission on Default Price-Quality Paths – Updated Draft Models” (9 October 2019), p. 2; and Centralines “Submission on Default Price-Quality Paths – Updated Draft Models” (9 October 2019), p. 3.
661 ENA “DPP for EDBs from 1 April 2020 Updated draft models – companion paper: Submission to the Commerce Commission” (9 October 2019), p. 8.
662 Aurora “Submission to Commerce Commission: Default price-quality paths for electricity distribution businesses from 1 April 2020 – Updated draft models: Companion Paper” (9 October 2019), p. 8.
384
3605676.11
Statistical expectation of a major event
K38 In DPP1 and DPP2, it was considered that 2.3 major event days per year was an
appropriate benchmark, based on the IEEE expectation of a major event day.663 We
still consider this a reasonable benchmark for a calendar day or 24-hour assessment
of a major event.
K39 In summary, to determine the boundary value we:
K39.1 use the IEEE expectation of 2.3 major event days per year as a base;
K39.2 multiply by 48 (half-hours per day) to reflect our move to a rolling half-
hourly assessment―110.4 ‘half-hours’ per year; and
K39.3 multiply by ten (years) to the length of the reference period―1104th highest
half-hourly rolled 24-hour SAIDI and SAIFI over the reference period.
K40 Given that we now assess major events half-hourly, and there being 48 half-hours
within each day, we consider the 1104th highest assessed SAIDI or SAIFI half-hour,
based off the rolling 24-hour sum, over the 10-year reference period as a broadly
similar outcome to the 23rd highest major event calendar day.
Stakeholder views
K41 ENA, Eastland Network, and Meridian Energy were supportive of using the historical
dataset to identify the highest values. For example, using the 23rd highest SAIDI and
SAIFI values for a 10-year reference period to define the boundary value for major
event days.664 ENA noted that this approach aligns with the intent of the IEEE’s
method which is to allow for 2.3 major event days (MEDs) per year on average.665
663 Institute of Electrical and Electronics Engineers “IEEE 1366 Guide for Electric Power Distribution Reliability Indices” 2012. The IEEE methodology is premised on the assumption that daily reliability follows a log-normal distribution whereby major event days are identified as those days more than 2.5 standard deviations above the average day (as considered appropriate by a Distribution Design Working Group). This translates to an expectation of the top 0.63 percentile days, or 2.3 days per year, being major event days.
664 Eastland Network “2020 DDPP Reset Issues Paper” (20 December 2018), p. 5; ENA “DPP3 April 2020 Commission Issues paper (Part Two, Regulating Quality)” (20 December 2018), p. 13; Meridian Energy “2020-2025 Distribution default price-quality path – Issues paper” (20 December 2018), p. 4.
665 ENA “DPP3 April 2020 Commission Issues paper (Part Two, Regulating Quality)” (20 December 2018), p. 13.
385
3605676.11
K42 Orion has submitted that due to climate change, there is more exposure to major
events, citing NIWA climate projections suggesting a slow increase in extreme wind
events and wet days over the next century.666 Similarly, Wellington Electricity cited
an Insurance Council report indicating that storms are becoming more frequent.667
We noted in the draft decision that NIWA climate projections suggesting increases in
extreme wind events for some parts of the country are on a 90-year horizon, rather
than five years.
K43 Aurora Energy had submitted reverting back to the modified IEEE methodology as
proposed in the 2014 draft decision.668 They state that this may provide more
realistic boundary values than the current methodology which saw them with more
MEDs than anticipated. We note that Aurora Energy was an outlier and do not
consider reverting to the IEEE methodology appropriate on this basis. We also note
that the IEEE methodology does not facilitate our approach for normalisation.
Reduced frequency of major events for small networks
K44 Smaller networks, all else being equal, can expect to have fewer interruptions
relative to larger networks. This is because there is less equipment than can fail at
any given time, and consequently less equipment at risk of truly experiencing a
major event.
K45 Electricity Invercargill and Nelson Electricity have significantly less interruptions than
any other price-quality regulated distributor. This is largely because they are much
smaller networks, rather than because they are reliable networks. Consequently,
without modification, a high proportion of the interruptions that take place would
be considered a major event.
K46 Our final decision reduces the expected frequency of major events if a distributor
has less than 1,000 kilometres of circuit length. As outlined in Table K1 this impacts
only the two distributors above, Electricity Invercargill (658 km) and Nelson
Electricity (298 km), with the next smallest price-quality regulated distributor being
Centralines (1,807 km).
666 Orion “Submission on EDB DDP3 Reset “ (20 December 2018), pp. 11 to 12 667 Wellington Electricity “Default price-quality paths for electricity distribution businesses from 1 April 2020
Issues Paper” (21 December 2018), p. 17. 668 Aurora Energy “Default price-quality paths for electricity distribution businesses from 1 April 2020 Issues
Paper” (20 December 2018), p. 8
386
3605676.11
Table K1 Reduced frequency of major events
Distributor 2019 Circuit length
(km)
Major events
(compared to 23)
‘Major half-hours’
(compared to 1104)
Electricity Invercargill 658 15.1 726
Nelson Electricity 298 6.8 328
K47 As an extreme example, if a small distributor experiences less interruptions than the
frequency of major events we allow, this will result in a major event threshold of
zero for SAIDI and SAIFI, that is every interruption would be considered a major
event. We do not consider that this would meet the intention of major event
normalisation, and therefore would be inappropriate. This is further exaggerated
given our decision to reduce major events to a pro-rated value for assessment
purposes.
K48 While no distributor falls within this extreme scenario, Nelson Electricity comes very
close. Nelson Electricity had only around 60 unplanned interruptions over the 10-
year reference period. Without modification, around 40% of its unplanned
interruptions and 95% of its unplanned SAIDI would be normalised. Furthermore,
most of Nelson Electricity’s interruptions did not relate to adverse weather or
environmental factors.
K49 We did not receive any submissions opposing this adjustment.
SAIDI and SAIFI major events are triggered independently
K50 For the final decision SAIDI or SAIFI major events will be triggered independently,
consistent with the current DPP.
K51 Over the previous two resets we have considered three different approaches for
determining whether SAIDI or SAIFI major events should be prerequisites for
triggering any major event, or whether they should be triggered independently.
K52 For the final DPP1 decision the SAIDI boundary value needed to be exceeded to
trigger any major event. We said:669
The Commission notes that the IEEE Standard specifies the use of SAIDI (and not SAIFI) when
identifying MEDs, as SAIDI better reflects the total cost of reliability events including utility
repair costs and customer losses. In keeping with the IEEE Standard, the Commission retains
its view that SAIDI data should be used to identify MEDs.
669 Commerce Commission “Initial Reset of the Default Price-Quality Path for Electricity Distribution Businesses: Decisions Paper” (30 November 2009), para 6.31.
387
3605676.11
K53 For the draft DPP2 decision we favoured using SAIFI as the trigger for a major event.
We said:670
Using SAIFI to trigger a major event day is appropriate as extreme events are most likely to
affect a large number of customers, which distributors have no control over … Distributors
do have some control over the duration time of any outage resulting from a major event. We
therefore consider that it may be inappropriate to use SAIDI as a trigger, given that there
would be no incentive within this scheme to minimise the duration of an event once the
boundary has exceeded.
K54 In our final DPP2 decision SAIDI and SAIFI were independently used to trigger major
events. We consider that our reasons for assessing major events independently for
SAIDI and SAIFI remains valid and is supported by distributors.671 For the final DPP2
decision we said:672
[Major events] may affect a large number of customers in an urban area for a relatively short
period of time and therefore triggering SAIFI but not SAIDI; or … a relatively small number of
customers may be affected for a significant length of time and therefore triggering SAIDI but
not SAIFI, for example a severe storm in a remote area.
Replacing SAIDI and SAIFI values during a major event
K55 Consistent with our draft decision, major events that are identified will be replaced
with a pro-rated boundary value, however, only those half-hour SAIDI or SAIFI raw
values that exceed 1/48th of the respective boundary value will be replaced. In
principle, this approach is broadly consistent with that currently applied in DPP2
where a major event day is replaced with the boundary value. However, with the
decision to identify major events on a 24-hour basis and replacing major events with
a pro-rated boundary value, the impact of major events will generally be much lower
than replacing with the full boundary value.
K56 Normalisation of major events is intended to limit the impact of the most substantial
interruptions on underlying reliability data. We considered that replacing the entire
major event with the full boundary value may create too big a driver for standards
and incentives. However, we do not consider removing the impact completely would
be appropriate. Therefore, our final decision replaces major events with something
between the boundary value and the half-hourly average.
670 Commerce Commission “Proposed Quality Targets and Incentives for Default Price-Quality Paths From 1 April 2015” (18 July 2014), paras 3.20 to 3.21.
671 ENA "Submission on EDB DPP reset draft decisions paper" (18 July 2019), p. 31. 672 Commerce Commission “Default price-quality paths for electricity distributors from 1 April 2015 to 31
March 2020 : Quality standards, targets, and incentives” (28 November 2014), para 5.23.
388
3605676.11
K57 With replacing only those half-hours within a major event that exceed 1/48th of the
boundary value with 1/48th of the boundary value, the impact of a major event will
be capped. However, given that a pro-rated boundary value is still relatively large
compared to a normal half-hour, distributors would still face some exposure to the
frequency of major events.
K58 Distributors disagreed with our DPP2 approach of replacing MEDs with a boundary
value.673 They note that the frequency of major events was a large driver of volatility
in SAIDI and SAIFI, and therefore contribute largely to compliance contraventions
and incentive scheme gains and losses. For example, Wellington Electricity submitted
to the issues paper that a more than average number of MEDs almost guarantees
that the reliability limits will be exceeded and would likely require uneconomic
investment to avoid.
K59 In the context of MEDs, many distributors suggest that they should be replaced with
either the daily average or zero. The ENA suggested that increased reporting
requirements of major events can provide extra transparency to the extent the
Commission has concerns with any potential perverse incentives. Distributors were
generally supportive of reducing the impact of major events on compliance and
financial incentive outcomes in our draft approach, although some suggested it did
not go far enough.674
K60 While some major events (such as those caused by extreme weather) are somewhat
beyond the control of distributors, the degree of controllability is not always clear.
The underlying performance of the network does have some effect on how well
networks respond to significant events. For example, the engineering advice we have
received with respect to many recent contraventions suggests that there were
operational decisions distributors could have made to minimise the impact of
external events.
K61 However, we recognise that to some extent the effects of extreme external events
may be beyond the control of distributors, and this can cause some variability in
reliability performance which distributors will not be able to eliminate. We agree
with distributors that replacing major events with the full boundary value may make
the frequency of major events too large a driver of underlying reliability
performance.
673 ENA “DPP3 April 2020 Commission Issues paper (Part Two, Regulating Quality)” (20 December 2018), p. 13; Unison “Submission on default price-quality paths for electricity distribution businesses from 1 April 2020 Issues paper” (21 December 2018), p. 4; Vector “Submission to Commerce Commission Default Price Quality Path Issues Paper” (21 December 2018), p. 34; Wellington Electricity “Default price-quality paths for electricity distribution businesses from 1 April 2020 Issues Paper” (21 December 2018), p. 18.
674 See for example: ENA “Submission on EDB DPP reset draft decisions paper” (18 July 2019), pp. 32-33.
389
3605676.11
K62 For the final decision, any 24-hour rolling period that is identified as a major event
will be replaced with a pro-rated boundary value for only those half-hours that
exceed 1/48th of the boundary value. However, a major event can last longer than 24
hours, so a pro-rated approach will account for those ‘longer’ major events and will
bear a bigger impact.
K63 On balance, we considered that a change to replace identified major events with a
reduced replacement value is appropriate, given that:
K63.1 enhanced major event reporting requirements, as discussed from
paragraph K79, will provide more transparency and incentives around the
main cause of events.
K63.2 reducing a large source of volatility may provide a clearer indication of the
underlying reliability of the network;
K63.3 the introduction of an extreme event standard, as discussed in
Attachment L, will place further onus on distributors to take practicable
steps to minimise the likelihood of high impact, low probability events that
are within its control as well as mitigating the extent of them; and
K63.4 there are other incentives at play which may mitigate some of the above
risks, such as customer complaints and reputational risk.
K64 However, we still do not consider it appropriate to completely remove the major
event impact for assessment purposes, or replace it with a daily (or half-hourly)
average, as this would completely remove variation caused by major events,
regardless of the extent to which the event was outside the distributor’s control, and
potentially create assessed values which ignore an aspect underlying reliability.
K65 We note that Unison Networks submitted that it rejects the inference from the 2014
draft decision that distributors may be incentivised to trigger a major event day if
they were removed. They state that:675
EDBs take clear pride in restoring power as quickly as possible following outages – the
concept of network controllers being directed to delay restorations to obtain regulatory
benefits would run against the strong public service ethic in EDBs and their recognised role
as essential service providers.
675 Unison “Submission on default price-quality paths for electricity distribution businesses from 1 April 2020 Issues paper” (21 December 2018), p. 4.
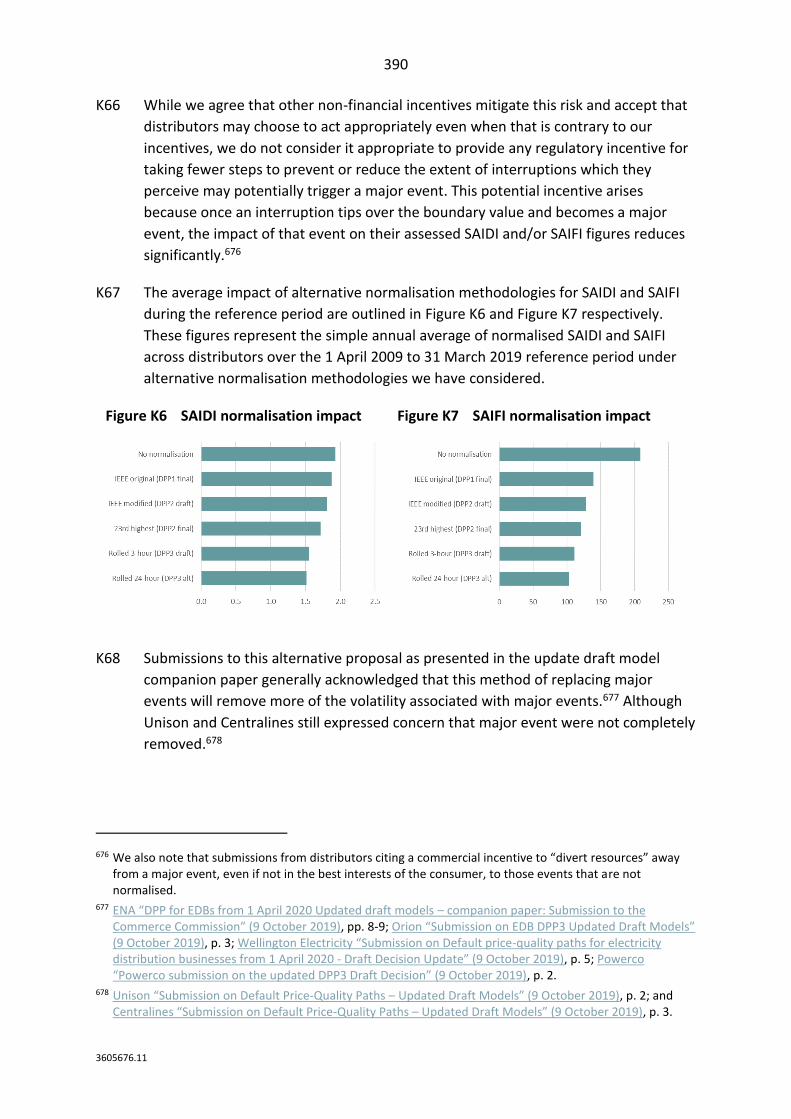
390
3605676.11
K66 While we agree that other non-financial incentives mitigate this risk and accept that
distributors may choose to act appropriately even when that is contrary to our
incentives, we do not consider it appropriate to provide any regulatory incentive for
taking fewer steps to prevent or reduce the extent of interruptions which they
perceive may potentially trigger a major event. This potential incentive arises
because once an interruption tips over the boundary value and becomes a major
event, the impact of that event on their assessed SAIDI and/or SAIFI figures reduces
significantly.676
K67 The average impact of alternative normalisation methodologies for SAIDI and SAIFI
during the reference period are outlined in Figure K6 and Figure K7 respectively.
These figures represent the simple annual average of normalised SAIDI and SAIFI
across distributors over the 1 April 2009 to 31 March 2019 reference period under
alternative normalisation methodologies we have considered.
Figure K6 SAIDI normalisation impact Figure K7 SAIFI normalisation impact
K68 Submissions to this alternative proposal as presented in the update draft model
companion paper generally acknowledged that this method of replacing major
events will remove more of the volatility associated with major events.677 Although
Unison and Centralines still expressed concern that major event were not completely
removed.678
676 We also note that submissions from distributors citing a commercial incentive to “divert resources” away from a major event, even if not in the best interests of the consumer, to those events that are not normalised.
677 ENA “DPP for EDBs from 1 April 2020 Updated draft models – companion paper: Submission to the Commerce Commission” (9 October 2019), pp. 8-9; Orion “Submission on EDB DPP3 Updated Draft Models” (9 October 2019), p. 3; Wellington Electricity “Submission on Default price-quality paths for electricity distribution businesses from 1 April 2020 - Draft Decision Update” (9 October 2019), p. 5; Powerco “Powerco submission on the updated DPP3 Draft Decision” (9 October 2019), p. 2.
678 Unison “Submission on Default Price-Quality Paths – Updated Draft Models” (9 October 2019), p. 2; and Centralines “Submission on Default Price-Quality Paths – Updated Draft Models” (9 October 2019), p. 3.
391
3605676.11
Extended major events and follow-up interruptions
K69 Major events can last longer than the specified length of a major event. For the final
DPP3 decision, major events can last longer than 24 hours as long as the major event
criteria is met.
K70 In the issues paper we also considered whether when a distributor acts to restore an
unplanned interruption quickly but is then followed by a planned interruption to
complete the fix, that follow-up interruption should also be normalised.
Extended major events
K71 As noted above, for the final decision, any half-hour which falls within any 24-hour
period that exceeds the applicable boundary value will be considered as part of a
major event. This approach naturally ensures that events can last for as long as the
major event criterion is met.
K72 In the issues paper we acknowledged that extreme weather events or natural
disasters, for example, can last multiple days and, in principle, we considered
whether it is appropriate for such events to be normalised as one event. Our final
decision to allow major events to last longer than 24 hours is based on the same
logic. We consider it reasonable that a major event can last for as long as the 24-
hour rolling SAIDI or SAIFI exceeds the major event boundary value.
K73 Distributors were supportive of further consideration of allowing aggregation of
major events lasting longer than one day.679
K74 Mercury Energy submitted that aggregating multi-day events would create
inconsistency as to whether interruptions are part of the initial major event.680 We
consider that the approach, which assesses events half-hourly, will somewhat
alleviate this concern.
Follow-up planned interruptions
K75 We noted in the issues paper that not allowing normalisation of follow-up planned
interruption may discourage distributors from quickly restoring major interruptions if
subject to further losses for follow-up interruptions.
679 Eastland Network “2020 DDPP Reset Issues Paper” (20 December 2018), p. 5; ENA “DPP3 April 2020 Commission Issues paper (Part Two, Regulating Quality)” (20 December 2018), p. 14; The Lines Company “Default price-quality paths for electricity distribution businesses from 1 April 2020” (21 December 2018), p. 9; Vector “Submission to Commerce Commission Default Price Quality Path Issues Paper” (21 December 2018), p. 33; Wellington Electricity “Default price-quality paths for electricity distribution businesses from 1 April 2020 Issues Paper” (21 December 2018), p. 18.
680 Mercury “Default Price-Quality Paths for Electricity Distribution Businesses from 1 April 2020” (20 December 2018), p. 5
392
3605676.11
K76 Eastland Network and Wellington Electricity were supportive of considering
normalisation of follow-up planned interruptions resulting from a prior major
event.681 For example, Eastland Network cited an example where they temporarily
restored power following a plane crash disrupting supply on a high voltage circuit in
2016. This was followed-up with planned works to fully repair the circuit and was not
subject to any normalisation.
K77 For the final decision, follow-up interruptions will not be subject to normalisation.
This is purely from a practical perspective, namely we:
K77.1 do not have enough information to apply on a backwards-looking basis; and
K77.2 have concerns that this would be difficult to implement and manage on a
forward-looking basis.
K78 However, with the other decisions relating to assessing reliability, we consider that
any potential perverse incentive is somewhat mitigated with:
K78.1 unplanned follow-up interruptions able to be replaced with a pro-rated
boundary value if a new major event is triggered;
K78.2 less risk of contravening the quality standard due to a planned interruption,
as discussed in Attachment L; and
K78.3 adequately notified follow-up interruptions weighted one-quarter of an
unplanned interruption for revenue-linked incentive purposes, as discussed
in Attachment M.
Major event reporting
K79 We consider that when a major event is identified, there should be full transparency
as to when and why the major event happened, and the impact of normalising the
major event. This is important given our final decision to replace major events with a
pro-rated boundary value, rather than the full boundary value.
K80 The final decision requires that in addition to reporting the cause of each major
event, as required in DPP2, a distributor must report for each major event in its
annual compliance statement:
K80.1 the start date and time;
K80.2 the end date and time;
681 Eastland Network “2020 DDPP Reset Issues Paper” (20 December 2018), p. 5; Wellington Electricity “Default price-quality paths for electricity distribution businesses from 1 April 2020 Issues Paper” (21 December 2018), p. 18.
393
3605676.11
K80.3 the raw SAIDI and SAIFI values;
K80.4 the normalised SAIDI and SAIFI values;
K80.5 the location and equipment involved;
K80.6 the event cause and response to the event; and
K80.7 any mitigating factors that may have prevented or minimised the major
event.
K81 As per clause 11.5(f) of the 2015-2020 EDB DPP Determination, the only current
requirement with respect to major event reporting is that “the cause of each major
event day within the assessment period” is included in the annual compliance
statement. Without transparency, we are unable to assess when the major events
occur, the magnitude and causes of these major events, and whether there were any
preventative measures that could have minimised the major event.
K82 However, despite the lack of requirements, many distributors have voluntarily
provided additional information within their compliance statements. Therefore, we
do not consider that there would be significant regulatory burden to increase the
requirements for those distributors that do not.
K83 We consider that increased transparency of major events is essential to mitigate
against any risk that distributor may be encouraged to trigger a major event given
our decision to replace major events that are identified with a lower SAIDI and/or
SAIFI value. Furthermore, increased reporting will allow us to cross-check the causes
of any extreme event, as discussed in Attachment L.
K84 The ENA, Wellington Electricity, and Orion were generally receptive of enhanced
reporting on major events, as a compromise for removing major events from
assessment.682 For example, Wellington Electricity submits that “substituting major
event days with the average SAIDI and SAIFI will require more transparent
information”.
682 ENA “DPP3 April 2020 Commission Issues paper (Part Two, Regulating Quality)” (20 December 2018), p. 13; Wellington Electricity “Default price-quality paths for electricity distribution businesses from 1 April 2020 Issues Paper” (21 December 2018), p. 18; and Orion “Submission on EDB DPP reset draft decisions paper” (17 July 2019), p. 17.
394
3605676.11
Overview of methodology for identifying and replacing major events
K85 We recognise that our final decisions for identifying and replacing a major event
represents a major change from the DPP2 methodology. The purpose of this section
is to provide:
K85.1 clarity on how we practically derive the boundary values; and
K85.2 guidance for distributors to identify and replace major events for unplanned
reliability assessment purposes.
K86 We intend to publish an Excel template before 1 April 2020 to assist distributors with
normalising its annual interruptions for the purpose of assessing compliance and
financial incentives.
Deriving the boundary values for SAIDI and SAIFI
K87 To identify the trigger for what is considered a major event, or the major event
boundary value, for the reference period for unplanned interruptions only, we:
K87.1 aggregate the raw SAIDI and SAIFI values from each unplanned interruption
in to half-hour blocks (rounding each interruption down to the nearest half-
hour);
K87.2 sum the raw SAIDI and SAIFI values of each half-hour block with the
respective SAIDI and SAIFI values of the following 47 half-hour blocks (to
create a rolled 24-hour value for SAIDI and SAIFI); and
K87.3 separately identify the 1104th highest rolled half-hour values for SAIDI and
SAIFI to determine the respective SAIDI and SAIFI boundary values for all
distributors except for the following small networks:
K87.3.1 Electricity Invercargill where the 726th highest rolled 24-hour
SAIDI and SAIFI values are used; and
K87.3.2 Nelson Electricity where the 328th highest rolled 24-hour SAIDI
and SAIFI values are used.
K88 Table K2 shows the boundary values for unplanned SAIDI and SAIFI for each price-
quality regulated distributor for DPP3.
395
3605676.11
Table K2 Unplanned boundary values
Distributor SAIDI boundary SAIFI boundary
Alpine Energy 9.17 0.0671
Aurora Energy 5.69 0.0737
Centralines 6.79 0.1442
EA Networks 6.25 0.0729
Eastland Network 13.10 0.1765
Electricity Invercargill 4.13 0.0804
Horizon Energy 14.69 0.1170
Nelson Electricity 8.68 0.1430
Network Tasman 7.22 0.0688
Orion NZ 7.60 0.0668
OtagoNet 11.81 0.1776
Powerco 9.82 0.0628
The Lines Company 11.17 0.1596
Top Energy 27.92 0.2284
Unison Networks 4.48 0.0735
Vector Lines 4.83 0.0371
Wellington Electricity 2.16 0.0313
Identifying and replacing major events for SAIDI and SAIFI
K89 To normalise the dataset over the reference period, and for each assessment period,
for unplanned interruptions only, we replace each half-hour with 1/48th of the
boundary value if:
K89.1 that half-hour is part of any 24-hour rolled period that exceeds the
applicable SAIDI or SAIFI major event boundary value; and
K89.2 that half-hour exceeds 1/48th of the applicable SAIDI or SAIFI boundary
value.
K90 Figure K8 illustrates the identification and normalisation of major events, where the
raw half-hourly SAIDI (red bars) is normalised to 1/48th of the boundary value
(dotted line) if it is part of any 24-hour period (green bars) that exceeds the
boundary value (black line).
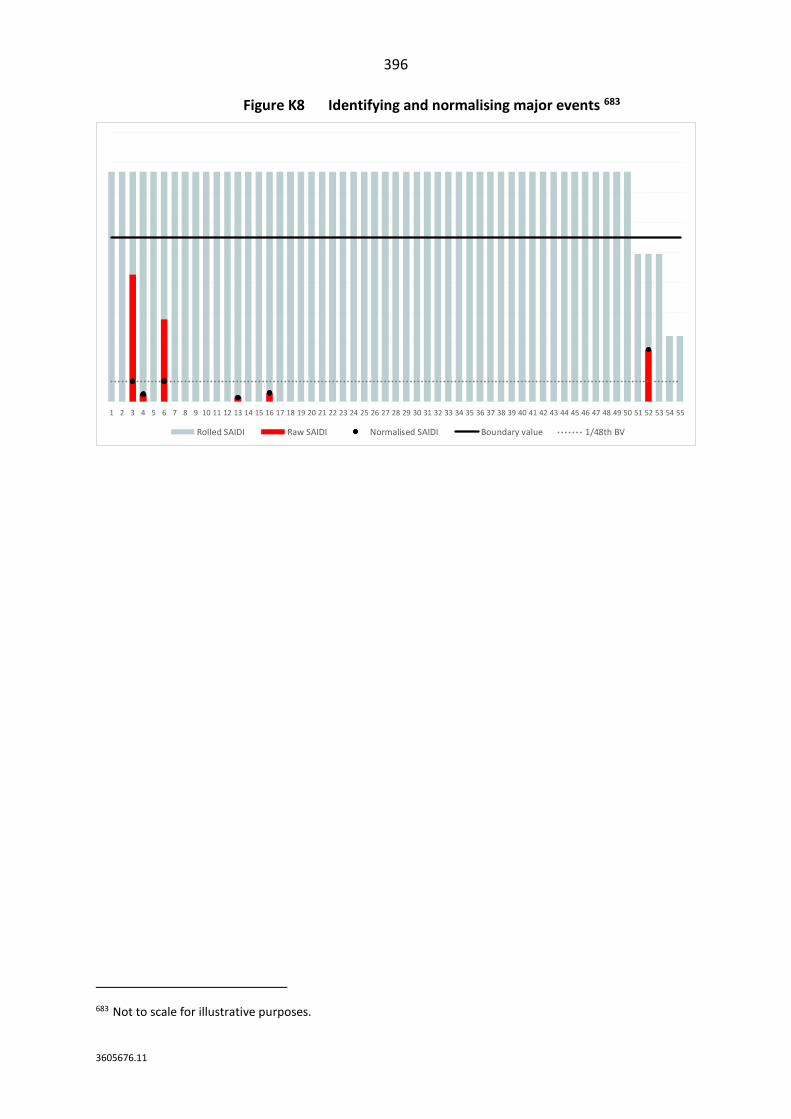
396
3605676.11
Figure K8 Identifying and normalising major events 683
683 Not to scale for illustrative purposes.
1 2 3 4 5 6 7 8 9 10 11 12 13 14 15 16 17 18 19 20 21 22 23 24 25 26 27 28 29 30 31 32 33 34 35 36 37 38 39 40 41 42 43 44 45 46 47 48 49 50 51 52 53 54 55
Rolled SAIDI Raw SAIDI Normalised SAIDI Boundary value 1/48th BV
397
3605676.11
Attachment L Quality standards
Purpose of this attachment
L1 This attachment sets out our detailed decisions on setting the quality standards for
EDB DPP3 and responds to the submissions on our draft decisions for quality
standards.
Purpose of quality standards
L2 Section 53M of the Commerce Act 1986 requires that every DPP must specify “the
quality standards that must be met by the regulated supplier.”
L3 However, the description of quality standards in the Act is broad, leaving the
Commission with significant discretion for setting quality standards. In setting quality
standards, we should have regard to the purpose of Part 4. This includes promoting
outcomes such that suppliers have incentives to provide services at a quality that
reflects consumer demands and to invest. This should be weighed against the other
performance areas that we are required to promote under section 52A of the Act.
The Act explains quality standards as follows:
Quality standards may be prescribed in any way the Commission considers appropriate (such
as targets, bands, or formulae) and may include (without limitation)—
(a) responsiveness to consumers; and
(b) in relation to electricity lines services, reliability of supply, reduction in energy losses, and
voltage stability or other technical requirements.684
Summary of our decision
L4 Our decisions on setting the quality standards for EDB DPP3 are summarised below:
L4.1 quality standards will be based on SAIDI, SAIFI, and customer interruption
minutes;
L4.2 unplanned and planned interruptions will be assessed separately;
L4.3 unplanned SAIDI and SAIFI standards are set 2.0 standard deviations above
the normalised reference period average and are assessed annually;
L4.4 planned SAIDI and SAIFI standards are set at three times the reference
period average and are assessed for the regulatory period;
684 Commerce Act 1986, section 53M(3).
398
3605676.11
L4.5 there is a new extreme event standard, to be set at 120 SAIDI minutes or six
million customer interruption minutes, excluding specified events that we
consider are predominantly caused by external factors; and
L4.6 there are new automatic reporting requirements that are triggered by a
contravention of any quality standard.
L5 Quality standards and the quality incentive scheme have been an area of particular
focus for the Commission in this reset of the DPPs, partially in response to feedback
from stakeholders. This has resulted in a relatively large number of changes from the
DPP2 settings.
Changes from draft decision
L6 Our final decisions on quality standards include the following changes from the draft
decision:
L6.1 The limit for the extreme event standard is 120 SAIDI minutes or six million
customer interruption minutes, in comparison to the draft limit which was
three times the normalisation boundary value;
L6.2 The unplanned SAIDI and SAIFI standards have been set at the historic
average plus a buffer of 2.0 standard deviations, an increase from the draft
decision of 1.5 standard deviations.
Overview of quality standards
L7 Our overall approach to the quality path, which includes quality standards and a
quality incentive scheme, and is underpinned by the normalisation methodology and
selection of a historic reference period, is described in Attachment J. In particular,
Attachment J explains that, given the aggregate nature of the SAIDI and SAIFI metrics
used to assess reliability, setting an unplanned standard at a level that perfectly
reflects consumer preferences is not possible at this stage. In the absence of better
information, we consider that the unplanned standard should identify instances of
material deterioration in overall reliability performance.
L8 This section provides an overview of the quality standards that form part of the
overall package of the quality paths for distributors.
L9 The quality standards are a key aspect of the DPPs that we set. They promote
outcomes consistent with competitive markets in terms of providing the level of
quality demanded by consumers.
399
3605676.11
L10 Quality standards are required to counter any incentive to under-invest created by
the price path that incentivises distributors to minimise expenditure. If there was no
counter-measure like quality standards, then distributors may be incentivised to
reduce expenditure such that the quality level expected by customers is not being
met, to pursue excessive profits.
L11 For DPP3, we have set three standards, focused on the reliability of supply. They are:
L11.1 a standard for unplanned interruptions to avoid material deterioration of
network performance, similar to the DPP2 quality standards;
L11.2 a standard for planned interruptions that is set over the regulatory period to
eliminate any perverse incentives for distributors to avoid network
investment or maintenance (which could occur with a combined planned
and unplanned standard), and give distributors greater flexibility on the
timing of work requiring planned interruptions; and
L11.3 a new extreme event standard to incentivise distributors to minimise the
likelihood of high impact and low probability events as well as to mitigate
the scale of them, as these have a large impact on consumers experience of
reliability but are not adequately covered by the unplanned interruption
standard.
L12 We have set these standards in the way and level that we think best supports the
long terms interests of consumers, balancing a number of considerations. We have
sought to balance the costs of compliance against the benefits of the standards, and
have considered how the standards fit within the whole quality path (as described in
Attachment J).
L13 Along with the other parts of the quality path described in Attachment J, we have
made a number of simultaneous changes to the quality standards compared to
DPP2. We recognise that this may make it more difficult for stakeholders to
understand the implications of the whole package of standards and incentives, as
suggested by Centralines.685 Wellington Electricity also suggested in its submission
that the scale of change in this area undermines the certainty in the DPP regime.686
L14 However, we consider that the changes are a significant improvement, better
promoting the purpose of Part 4 of the Act and are justified as a focus area of this
DPP reset.
685 Centralines “Submission on EDB DPP reset draft decisions paper” (18 July 2019), p. 18. 686 Wellington Electricity “Default price-quality paths for electricity distribution businesses from 1 April 2020
Issues Paper” (21 December 2018).
400
3605676.11
SAIDI and SAIFI as quality standards
L15 We consider that SAIDI and SAIFI cover the main aspects of reliability for consumers.
Network reliability is considered as being one of the most important dimensions of
quality for consumers of electricity distribution services. SAIDI and SAIFI remain
important metrics for quality standards for distributors in that they are:
L15.1 standard and internationally recognised measures;
L15.2 measures that the distributors already collect and monitor;
L15.3 measures for which we have significant historical data for each distributor
to aid setting the limits;687
L15.4 measures that cover the main impact of unreliability across all consumers of
the network; and
L15.5 closely tied to the physical condition of the network (albeit on a ‘lagged’
basis).
L16 While SAIDI and SAIFI are not perfect measures of the reliability delivered to
consumers, we are not aware of any better measures, especially when considering
the importance of the availability of data. To the extent we wish to add additional
reliability metrics to the quality standards in the future, we consider it appropriate to
acquire the necessary data through either ID or a section 53ZD notice (if appropriate
to use section 53ZD) first as to set a baseline. Submissions generally agreed that
additional metrics should be added to ID requirements first. The topic of other
potential measures of reliability and quality more generally is covered in
Attachment N.
L17 One of the limits for the extreme event standard is measured in terms of customer
interruption minutes rather than SAIDI or SAIFI. However, we note that this is a
similar measure to SAIDI and can easily be converted to SAIDI for each distributor
based on the number of customers connected to the network.
L18 Our reliance on SAIDI and SAIFI measures for the quality standards is consistent with
the previous two regulatory periods.
687 However, as noted in Attachment J, there has been some inconsistency in approaches to recording SAIFI.
401
3605676.11
Separation of planned and unplanned interruption standards
L19 For DPP3 we are separating planned and unplanned interruption standards, with a
larger buffer above the reference period average for planned interruptions. Likewise,
as discussed in Attachment M, revenue-linked incentives for planned and unplanned
interruptions will be assessed separately. This is in contrast to the DPP2 quality
standards, for which planned and unplanned interruptions are combined into one
assessed SAIDI value and one assessed SAIFI value, although the planned
interruptions are de-weighted by 50% to reduce their impact on the quality standard
results.
L20 We are separating them for DPP3 because we consider that the integration of
planned and unplanned interruptions into a single standard have the potential to
create incentives to unnecessarily defer asset maintenance or other work on the
network where a distributor is nearing a potential compliance contravention (and to
bring work forward if a contravention is unlikely). This situation could cause
inefficiency or deter investment, which goes directly against the purpose of Part 4 of
the Act.
L21 Planned interruptions are also less inconvenient for consumers because, as long as
they are notified of planned work, they can plan accordingly, and planned
interruptions are also generally required by the distributor to perform maintenance
and investment that benefits consumers in the long run. These different factors
mean that separation is beneficial so that we can set the parameters of the
standards differently (such as the annual limits for unplanned SAIDI and SAIFI in
comparison to the five-year limit for planned SAIDI and SAIFI).
L22 There was no consensus in submissions on our draft decision whether to separate
the planned interruption standard from the unplanned interruption standard.
L23 Some distributors supported the separation. For example, Powerco supports
separating the standards for planned and unplanned interruptions because “It
supports delivery of maintenance and investment programmes that benefits
consumers in the long run” and “It removes perverse incentives to reduce planned
construction and maintenance to manage unplanned interruptions”.688
688 Powerco “Submission on EDB DPP reset draft decisions paper” (18 July 2019), p. 2.
402
3605676.11
L24 Wellington Electricity did not consider separation appropriate, because it says it
works hard to minimise the number and impact of planned interruptions for its
consumers.689 However, the ENA supported separating them to remove the current
incentive to reduce planned interruptions in years with a high number of unplanned
interruptions.690 The ENA reiterated its support for the separation of quality
standards for planned and unplanned interruptions in its submission on our draft
decision.691
L25 In adopting the separation of planned and unplanned interruptions, we considered
that this will eliminate the ability of distributors to avoid contravening the quality
standard by deferring planned work when it forecasts that it is otherwise likely to
contravene. We are aware that this may be happening under the current settings.
This may mask deteriorating unplanned quality performance and is unlikely to be in
the long-term interests of consumers. Also, separating the planned and unplanned
interruptions means that a contravention due to a high level of planned
interruptions can be investigated as such, with a suitably narrow investigation.
L26 We note that this less stringent standard for planned interruptions compared to
DPP2 does mean that there will be less incentive on distributors to minimise the
frequency and duration of planned interruptions while still undertaking the
necessary maintenance and investment work. For example, the planned standard
provides less incentive for distributors to use mobile generators to avoid planned
interruptions.
L27 However, we consider that there are limitations with quality standards, and so
quality incentive schemes are retained to supplement the standards. This is
especially true for planned interruptions, for which the buffer over the historic
average is higher. The collar for the quality incentive scheme for planned
interruptions will be zero, so the incentive will apply to most interruptions, which we
consider is a more appropriate way to disincentivise inefficient planned
interruptions.
689 Wellington Electricity “Default price-quality paths for electricity distribution businesses from 1 April 2020 Issues Paper” (21 December 2018), p. 14; Wellington Electricity "Submission on EDB DPP reset draft decisions paper" (18 July 2019), p. 20.
690 ENA “DPP3 April 2020 Commission Issues paper (Part Two, Regulating Quality)” (20 December 2018), p. 6. 691 ENA "Submission on EDB DPP reset draft decisions paper" (18 July 2019), p. 25.
403
3605676.11
L28 We previously considered whether to further separate SAIDI and SAIFI interruptions
into separate standards for unplanned and/or planned interruptions. Given there is
some crossover between the SAIDI and SAIFI metrics as every interruption
contributes to both measures, we consider that combining into a single standard for
unplanned interruptions and a single standard for planned interruptions is
appropriate.
Setting the unplanned interruption standard
L29 There was general support for the 'no material deterioration' standard, but diverging
views on implementation (for example, reference periods, data adjustments, and
normalisation). For example, the ENA submitted that “customer feedback to date
strongly suggests that declining reliability standards are not generally acceptable”.692
This is consistent with our recommendation to base the quality standards on the
historical average, with a buffer added to reduce the risks from random year-to-year
volatility of the SAIDI and SAIFI metrics.
L30 With our decision to separate planned and unplanned interruptions for setting
quality standards, an unplanned interruption standard is required to be specified for
SAIDI and SAIFI. In summary, for DPP3 the unplanned interruption standard is:
L30.1 assessed annually (based on the reliability performance for that one year)
for unplanned SAIDI and SAIFI standards, removing the current two-out-of-
three-year test; and
L30.2 set with limits for unplanned SAIDI and SAIFI of 2.0 standard deviations
above the reference period average, an increase from 1.0 standard
deviation under the current DPPs.
Annual unplanned standard
L31 We have replaced the current two-out-of-three-year rule of DPP2 with a simpler
annual limit for unplanned SAIDI and SAIFI. We consider that the other quality
standard settings—namely, reducing the impact of major events and the buffer
above the historical mean—are more effective means of reducing the risk of false-
positives.
L32 We have made this change because it simplifies the standard while still achieving its
purpose. This simplification will allow for more timely compliance investigations and
enforcement action. We consider that the simplicity and more prompt response will
be better for consumers engaging with the regulation of their local distributor.
692 ENA “DPP3 April 2020 Commission Issues paper (Part Two, Regulating Quality)” (20 December 2018), p. 6.
404
3605676.11
L33 The two-out-of-three-year rule required distributors to exceed SAIDI or SAIFI limits in
any two-out-of-three years to contravene the quality standard, and it was put in
place to reduce the number of ‘false-positives’ where contraventions were caused by
random volatility. However, this meant that significantly high levels of unreliability
over a single year were not considered to be contravention on their own.
L34 A change to an annual standard on its own would make this quality standard more
stringent on distributors. However, we consider that the difference is offset by our
decision to increase the buffer between the historical mean and the limit.
L35 We recognise the volatility issue, and have only removed the two-out-of-three-year
rule because we have simultaneously made other changes that will reduce volatility
and the chance of ‘false-positives’. However, we do not consider that unplanned
interruptions triggered by external events beyond the immediate control of
distributors as a satisfactory reason for keeping the two-out-of-three-year rule.
While external events may be outside of a distributors’ control, how well a network
mitigates or responds to those events is often within the distributors’ control.
L36 The improvements that we have made to the normalisation methodology will also
reduce the volatility of SAIDI and SAIFI. An increase to the buffer—in terms of the
standard deviation multiplier—is still required because the reduction in volatility is
reflected in a lowered standard deviation.
L37 In theory, the change from a two-out-of-three-year-test to an annual test could see
contraventions from distributors with a single year of poor performance, which
would not have contravened under the DPP2 quality standards. At the same time
distributors with mildly decreased reliability performance for multiple years may not
contravene when they would have under the DPP2 quality standards because of the
larger buffers. In practice, however, we consider that this effect is relatively small
and in general the same distributors will contravene the quality standards under
either an annual or two-out-of-three-year approach (so long as the buffer is suitably
increased for the annual standard).
405
3605676.11
L38 Most distributors submitted that one year of poor performance does not represent
deterioration because it is not a long-term trend and so we should retain the two-
out-of-three-year rule.693 Wellington Electricity for example submitted that it may
take three or four years for asset deterioration to properly reveal itself in reliability
trends. Horizon also suggested extending the standard to a three-out-of-five-year
standard to ensure it is focused on longer-term trends of deterioration.694 However,
we consider that consumers experiencing poor performance for a year is a significant
enough deterioration in performance to warrant investigation and potential
compliance action.
L39 Horizon submitted that the reporting requirements mean that an unplanned
interruption standard that is assessed once at the end of a regulatory period is
appropriate despite the potential time lag between poor performance and
enforcement response.695 However, we disagree with Horizon—the new automatic
reporting requirements are triggered by contraventions so would also not occur until
after the end of the regulatory period and so would not offset the time lag caused by
only assessing contraventions at the end of the regulatory period.
Unplanned standard set 2.0 standard deviations above historical annual average
L40 We consider that using the historical mean with an additional buffer is working well
in capturing material deterioration in reliability. The Commission has investigated
and publicly commented on three distributors who have contravened the DPP2
quality standards and in each case it has found that the contraventions were, at least
in part, caused by failure of those distributors to act consistently with good industry
practice. 696 Conversely, we have not found contraventions of the quality standard so
far in the current regulatory period to be caused by random volatility alone.
L41 Our decision to increase the buffer above the historical average to 2.0 standard
deviations is to provide a suitable level of protection against random volatility. This
increase from DPP2 is required to offset the decision to move to an annual standard.
We consider that a 2.0 standard deviation buffer, when combined with our other
recommendations, will result in a similar expectation of contravention as the current
settings. That is, the increased buffer helps offset the removal of the two-out-of-
three-year rule.
693 Eastland Network “Submission on EDB DPP reset draft decisions paper” (18 July 2019); Alpine Energy “Submission on EDB DPP reset draft decisions paper” (18 July 2019); and Powerco “Submission on EDB DPP reset draft decisions paper” (18 July 2019).
694 Horizon “Submission on EDB DPP reset draft decisions paper” (18 July 2019). 695 Horizon “Submission on EDB DPP reset draft decisions paper” (18 July 2019). 696 Other EDBs have contravened the DPP2 quality standards, but the Commission’s investigation into them is
not yet complete, and some also contravened prior to DPP2.
406
3605676.11
L42 Several distributors submitted that the change from the two-out-of-three-year rule
to an annual test with a buffer of 1.5 standard deviations would result in too many
contraventions.697 Specifically, it was submitted that there would be more
contraventions than under the DPP2 quality standards. Some submitters also noted
the significant expense involved for the distributors and the Commission in
investigating any contraventions.698
L43 While most distributors’ preferred position is to retain the two-out-of-three-year
rule of DPP2, we have instead responded to these submissions by raising the buffer
to 2.0 standard deviations. This is in line with the submission by PowerNet, which
suggested that we increase the buffer if retaining the annual standard that we
proposed in the draft decision.699
L44 We compared the outcomes of annual standards (with a 2.0 standard deviation
buffer) and two-out-of-three-year standards (using a 1.0 standard deviation buffer).
For this analysis, we applied the normalisation approach set for DPP3 and the DPP3
SAIDI and SAIFI limits to the 2012 to 2018 interruptions experienced on the 17 non-
exempt distributors. We found that there were 16 hypothetical contraventions of
the annual quality standard (from ten unique distributors) compared to 18 under the
two-out-of-three-year standard (from 11 unique distributors).
L45 This analysis suggests that the DPP3 quality standards provide a similar likelihood of
contravention (all else being equal) as a two-out-of-three-year quality standard with
a 1.0 standard deviation buffer. However, we note that there are several
assumptions required for this analysis, such as applying the updated normalisation
approach and removing planned interruptions.
L46 Nine of the ten distributors that hypothetically contravened under the annual
standard (with a buffer of two times the standard deviation) also hypothetically
contravened under the two-out-of-three-year standard (with a buffer of one-times
the standard deviation), while just one did not.
697 See for example: Wellington Electricity “Submission on EDB DPP reset draft decisions paper” (18 July 2019); and Powerco “Submission on EDB DPP reset draft decisions paper” (18 July 2019).
698 See for example: Horizon “Submission on EDB DPP reset draft decisions paper” (18 July 2019). 699 PowerNet “Submission on EDB DPP reset draft decisions paper” (18 July 2019), p. 4.
407
3605676.11
L47 In its submission on our draft decision the ENA said that we should retain the two-
out-of-three-year rule from DPP2 and apply the higher buffer from the draft decision
of 1.5 standard deviations. However, we disagree and consider that such an
approach would result in a loosening of the quality standards. We consider that
would not be in the long-term interests of consumers because it would risk the
standards missing poor performance that should be addressed. As noted in
paragraph L40, contraventions that we have so far investigated and published
findings on have all found the distributor to be at least partially responsible for
failing to meet good electrical industry practice.
Deriving the standard deviation
L48 For DPP3 we have calculated the historic standard deviations of SAIDI and SAIFI by
annualising daily data. This is the same method that was used to set the previous
two regulatory periods.
L49 We used half-hourly data to calculate the standard deviations in our updated draft
(published September 2019) because we had calculated the half-hourly data for
normalisation. However, Powerco requested in its submission on our updated draft
that we keep the methodology the same as for previous regulatory periods.700
L50 We have decided to return to the use of daily data as suggested by Powerco because
it has sufficient data points for statistical robustness and there is a risk that half-
hourly data will produce errant results because they may not be independent (eg,
during storm events that last several hours).
L51 Table L1 shows the standard for unplanned SAIDI and SAIFI for each price-quality
regulated distributor for DPP3.
700 Powerco “Powerco submission on the updated DPP3 Draft Decision” (9 October 2019), p. 2.
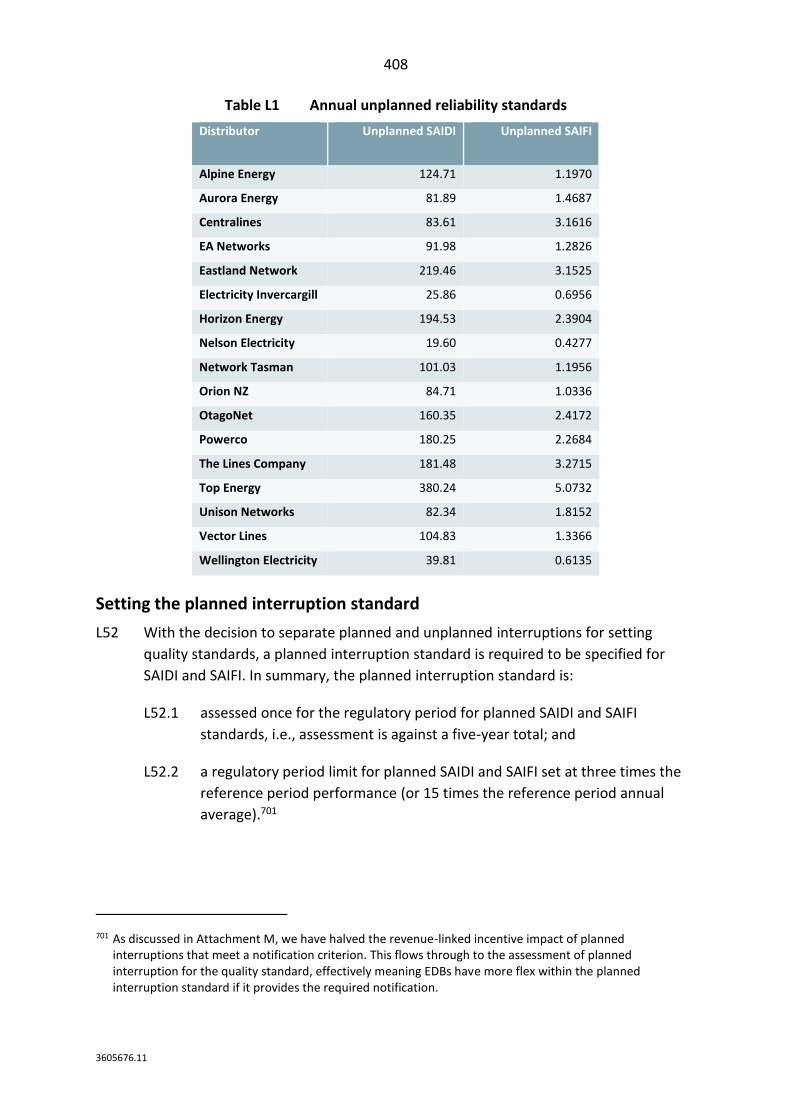
408
3605676.11
Table L1 Annual unplanned reliability standards
Distributor Unplanned SAIDI Unplanned SAIFI
Alpine Energy 124.71 1.1970
Aurora Energy 81.89 1.4687
Centralines 83.61 3.1616
EA Networks 91.98 1.2826
Eastland Network 219.46 3.1525
Electricity Invercargill 25.86 0.6956
Horizon Energy 194.53 2.3904
Nelson Electricity 19.60 0.4277
Network Tasman 101.03 1.1956
Orion NZ 84.71 1.0336
OtagoNet 160.35 2.4172
Powerco 180.25 2.2684
The Lines Company 181.48 3.2715
Top Energy 380.24 5.0732
Unison Networks 82.34 1.8152
Vector Lines 104.83 1.3366
Wellington Electricity 39.81 0.6135
Setting the planned interruption standard
L52 With the decision to separate planned and unplanned interruptions for setting
quality standards, a planned interruption standard is required to be specified for
SAIDI and SAIFI. In summary, the planned interruption standard is:
L52.1 assessed once for the regulatory period for planned SAIDI and SAIFI
standards, i.e., assessment is against a five-year total; and
L52.2 a regulatory period limit for planned SAIDI and SAIFI set at three times the
reference period performance (or 15 times the reference period annual
average).701
701 As discussed in Attachment M, we have halved the revenue-linked incentive impact of planned interruptions that meet a notification criterion. This flows through to the assessment of planned interruption for the quality standard, effectively meaning EDBs have more flex within the planned interruption standard if it provides the required notification.
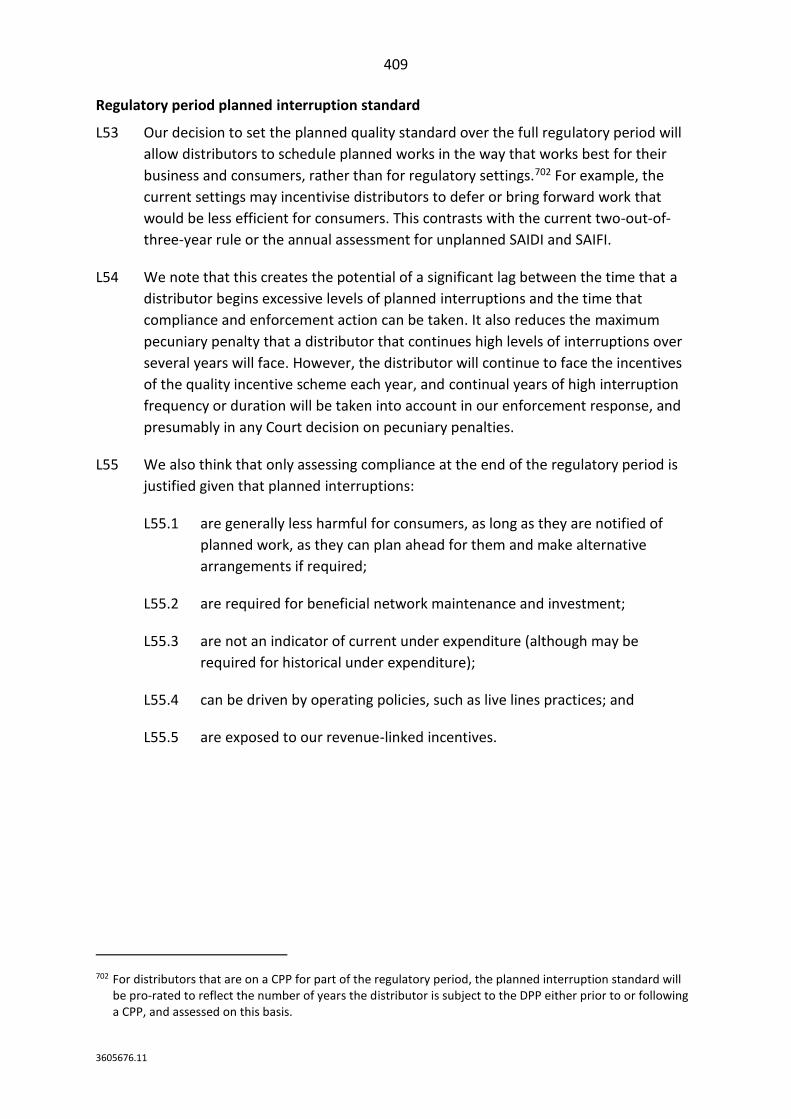
409
3605676.11
Regulatory period planned interruption standard
L53 Our decision to set the planned quality standard over the full regulatory period will
allow distributors to schedule planned works in the way that works best for their
business and consumers, rather than for regulatory settings.702 For example, the
current settings may incentivise distributors to defer or bring forward work that
would be less efficient for consumers. This contrasts with the current two-out-of-
three-year rule or the annual assessment for unplanned SAIDI and SAIFI.
L54 We note that this creates the potential of a significant lag between the time that a
distributor begins excessive levels of planned interruptions and the time that
compliance and enforcement action can be taken. It also reduces the maximum
pecuniary penalty that a distributor that continues high levels of interruptions over
several years will face. However, the distributor will continue to face the incentives
of the quality incentive scheme each year, and continual years of high interruption
frequency or duration will be taken into account in our enforcement response, and
presumably in any Court decision on pecuniary penalties.
L55 We also think that only assessing compliance at the end of the regulatory period is
justified given that planned interruptions:
L55.1 are generally less harmful for consumers, as long as they are notified of
planned work, as they can plan ahead for them and make alternative
arrangements if required;
L55.2 are required for beneficial network maintenance and investment;
L55.3 are not an indicator of current under expenditure (although may be
required for historical under expenditure);
L55.4 can be driven by operating policies, such as live lines practices; and
L55.5 are exposed to our revenue-linked incentives.
702 For distributors that are on a CPP for part of the regulatory period, the planned interruption standard will be pro-rated to reflect the number of years the distributor is subject to the DPP either prior to or following a CPP, and assessed on this basis.
410
3605676.11
Planned interruption standard set 200% above historical average
L56 We have implemented a large buffer for setting the planned interruption standard.
We have decided to apply a buffer of 200%, or triple the historical average, which is
less stringent than in DPP2, because of the long-term benefits to consumers of the
network investment and maintenance that is associated with planned interruptions.
It will also allow for some flexibility in work practices that may impact the level of
SAIDI or SAIFI, such as changes implemented by some distributors to reduce the
amount of live lines works it undertakes.
L57 We consider that the revenue-linked incentive scheme is a better mechanism than
quality standards to ensure that planned interruptions are managed appropriately
because it allows for flexibility so long as they are within a reasonable range, as
discussed in Attachment M. This approach of a relatively high-quality standard limit
combined with an incentive scheme will provide distributors with improved flexibility
to increase their level of planned interruptions for network maintenance and
investment, without affecting the requirements for unplanned interruptions. The
high limit for the planned interruption standard is complemented with a high cap
associated with the revenue-linked incentive scheme. The incentive scheme also
includes incentives to improve the notification of planned interruptions.
L58 Some distributors have submitted that the 200% buffer for planned interruptions is
not sufficient and that we should have more regard for each distributors’ planned
level of investment.703 Wellington Electricity also noted that if a distributor expects
to contravene the standard, then there are no marginal incentives from the quality
incentive scheme.704
L59 We do not consider that it is appropriate to set individual planned interruption
quality standards based on a full assessment of planned investment for the
regulatory period and operational approaches to planned interruptions within the
context of a low-cost DPP, particularly when a large buffer is already given. However,
distributors could apply for a quality standard variation or a CPP if they consider that
their particular circumstances, such as a high level of investment, requires it and we
would consider such an application under the appropriate rules and processes.
L60 Table L2 shows the standard for unplanned SAIDI and SAIFI for each price-quality
regulated distributor for DPP3.
703 Unison “Submission on EDB DPP reset draft decisions paper” (18 July 2019). 704 Wellington Electricity "Submission on EDB DPP reset draft decisions paper" (18 July 2019).
411
3605676.11
Table L2 Regulatory period planned reliability standards (5-year total)
Distributor Planned SAIDI
Planned SAIFI
Alpine Energy 824.87 3.4930
Aurora Energy 979.80 5.5385
Centralines 1064.46 5.8573
EA Networks 1376.08 4.8939
Eastland Network 1290.68 7.4745
Electricity Invercargill 114.49 0.5183
Horizon Energy 858.63 5.4415
Nelson Electricity 180.11 2.3663
Network Tasman 1129.14 4.9021
Orion NZ 198.40 0.7481
OtagoNet 2114.43 9.6212
Powerco 772.50 3.5113
The Lines Company 1331.68 8.7527
Top Energy 1905.36 7.7526
Unison Networks 625.79 4.4649
Vector Lines 585.38 2.8783
Wellington Electricity 69.70 0.5536
Introducing and setting an extreme event standard
L61 We have introduced the new extreme event standard for distributors, which will be
contravened if—for any 24-hour period—a distributor’s SAIDI is greater than 120
minutes or if its count of customer interruption minutes is greater than six million.
We have decided that a contravention will only occur if the interruptions are not the
result of a major external factor. However, we note that all major events can be
cross-checked against the enhanced major event reporting requirements, as
discussed in Attachment K.
L62 The introduction of an extreme event standard is intended to incentivise distributors
to take practicable steps to minimise the likelihood of high impact, low probability
events that are within its control as well as mitigating the extent of them. Currently
under the quality standards used in DPP2, there may be little incentive from our
regulatory settings to appropriately guard against such events as most of the impact
on reliability will be removed through normalisation. Our approach to normalisation
is described in Attachment K.
412
3605676.11
L63 Normalisation of major event interruptions means that particularly large
interruptions will unlikely contribute to a contravention unless the assessed
unplanned SAIDI or SAIFI is high enough for other reasons. As major events are
assessed on a statistical basis, rather than based on cause, the unplanned
interruption standard may miss large interruption events that are caused by not
applying good electricity industry practice or under-spending on network
maintenance and investment. So, we consider that it is in the long-term interests of
consumers to set a quality standard relating to extreme events.
L64 Centralines’ submission on our draft decision suggested that one reason an extreme
event standard is not required is because distributors are exposed to incentives for
such events through the quality incentive scheme. However, for the same reason
cited above, the exposure of major event interruptions to revenue-linked incentives
is very low.
L65 Several submissions claimed that it is not appropriate to introduce an extreme event
standard because it is not consistent with a principle of maintaining no material
deterioration.705 We acknowledge that the standard is not based on deviation from
historic outcomes. However, we consider that it is not possible to set a limit based
on the reference period for an expectation of no material deterioration because of
the infrequency of such events. This is not reason enough to avoid introducing an
extreme event standard, although it has influenced us in introducing it with
conservatively high limits.
L66 Several submissions on our draft decision suggested that we should introduce the
extreme event standard as an ID requirement for DPP3 before considering it as a
quality standard in future regulatory periods. However, we do not consider that this
is necessary as we have sufficient historic information already, including from the
information requirements in annual compliance statements for MEDs.
Extreme event standard excludes events largely triggered by external forces
L67 We have opted for the standard to only be contravened by interruptions that were
not triggered by external factors like a severe wind storm. To be clear, we mean that
at least 120 SAIDI minutes or six million customer interruption minutes must be
attributed to causes other than major external factors for a contravention to occur.
L68 We consider it would likely not be in the long-term interests of consumers for
distributors to upgrade their networks to a level of resilience against major external
factors such that they would never exceed the extreme event threshold, because of
the expense in doing so.
705 Such as Eastland Network “Submission on EDB DPP reset draft decisions paper” (18 July 2019), p. 10.
413
3605676.11
L69 We note that there may well be instances of consumer harm from large interruption
events triggered by external factors like a severe storm, but which could have been
significantly mitigated had the distributor applied good industry practice resulting in
more resilience. However, we do not consider that it is possible at this stage to
create a quality standard that differentiates based on the practices of the distributor
without a level of compliance burden that is not in the long-term interests of
consumers.
L70 In the draft decision, the exclusions to the extreme event standard related to the
cause categories used in ID. However, we have decided to apply separate criteria
because further analysis has shown inconsistency in the application of cause
categories in ID in the past. For example, the majority of historic interruption events
that would have exceeded the limit and not been excluded due to its cause category
under ID, were actually events that we would have intended to be excluded,
particularly due to storms.
L71 Powerco submitted that an extreme event standard is unsuitable because including
unknown causes may incorrectly capture events unrelated to asset management
because these interruptions can be triggered by uncontrollable events. This concern
should be partially assuaged by our new definition of extreme event, which no
longer refers to the ID categories of cause. However, there is still a chance that some
events with a truly unknown cause may be included. We consider that situations like
this are appropriate to be considered in more detail under a compliance
investigation.
Extreme event standard set at 120 SAIDI minutes, or 6 million customer interruption minutes
L72 We have set the extreme event standard at 120 SAIDI minutes or six million
customer interruption minutes because we consider that a stricter threshold could
result in too many contraventions, when the purpose of this standard is to focus on
the events that have the largest impact on customers and because it is the first
regulatory period in which we have introduced this standard. Applying this limit to
the past ten years would have resulted in two clear contraventions. They are:
L72.1 a substation fire on Vector’s network in 2014 (SAIDI of 217 and customer
interruption minutes of 117 million); and
L72.2 a substation fire on Alpine’s network in 2009 (SAIDI of 169 and customer
interruption minutes of five million).706
706 There was also an interruption event in 2012 on what is now the Eastland network but was at the time part of the Transpower network, which may have been over the limit and not caused by external factors.
414
3605676.11
L73 We have used SAIDI and customer interruption minutes to set the standard because
they better represent the objective of the standard—capturing extremely large
interruption events. We do not consider that it would be appropriate to use SAIDI
alone because the SAIDI result of extreme events in large distributors, especially
those with multiple networks, are diluted by the large number of ICPs on the
network.
L74 Using a multiplier of the major event boundary, as proposed in our draft decision,
unnecessarily references the limit to the past level and volatility of each distributors’
reliability.
L75 Wellington Electricity submitted that a simple comparison of VoLL of the minimum
size of an extreme event (as proposed in the draft decision) against the court-
imposed penalty was out of balance with the VoLL being much smaller. In our final
decision, the limits of the extreme event standard are generally much higher than
those proposed in our draft decision.
L76 We consider that these higher targets will better target the interruption events with
the largest impact on consumers, while reducing the risk of incentivising the over-
investment that several submissions noted concern about.
L77 This risk of over-investment will also be reduced by our publication of enforcement
response guidelines next year and we note that this was referred to in some
submissions.707 The case register of our past decisions, available on our website,
should also aid distributors understanding of our enforcement response.708
L78 However, we note that this does leave a ‘gap’ where some major interruption events
are normalised for the unplanned interruption standard, but too small to be covered
by the extreme event standard.
L79 As explained in our draft decision reasons paper, we also considered setting the
extreme event standard based on the frequency or SAIDI attributable to major
events across each whole assessment year. However, we consider that basing the
standard on individual events best reflects the purpose of this standard, which is to
identify the interruptions will have the most impact on consumers and largely within
the distributors’ control.
707 Such as Centralines “Submission on EDB DPP reset draft decisions paper” (18 July 2019), p. 19. 708 https://comcom.govt.nz/case-register
415
3605676.11
Specification of the three quality standards
L80 We have set three distinct quality standards relating to network reliability which are
summarised as:
L80.1 A non-exempt distributor must, in respect of each assessment period:
L80.1.1 have an assessed unplanned SAIDI below the limit; and
L80.1.2 have an assessed unplanned SAIFI below the limit.
L80.2 A non-exempt distributor must, in respect of the DPP3 regulatory period:
L80.2.1 have a total assessed planned SAIDI below the limit; and
L80.2.2 have a total assessed planned SAIFI below the limit.
L80.3 A non-exempt distributor must not have an extreme event, unless it was the
result of one or more of the major external factors set out below having
occurred, where an extreme event is one in which exceeds the following
over a 24-hour period:
L80.3.1 120 SAIDI minutes; or
L80.3.2 Six million customer interruption minutes.
L81 For the purposes of the extreme event standard, major external factors means:
L81.1 natural disaster;
L81.2 third-party interference;
L81.3 a fire that does not originate on the non-exempt distributor’s network; or
L81.4 wildlife.
Automatic reporting requirements for quality contraventions
L82 In DPP2, when a distributor contravenes the quality standard we typically require
information from the distributor to inform our enforcement response to the
contravention. However, due to the time lag between the distributor contravening,
the Commission being informed of the contravention and issuing an information
request, and the distributor responding to the request, it may take some time to
receive the information required to aid our investigation of the nature and
circumstances of the contravention.
416
3605676.11
L83 To speed up this process and allow interested parties to better understand the
contravention, we have introduced additional reporting requirements for any
distributor that contravenes a quality standard. The required information is in line
with the initial information requests made in 2018 for the distributors that
contravened their 2018 quality standards, which is summarised in Table L3 below.
We note that this is not as fulsome as the information requests including full
engineering reports that were required for quality standard contraventions.709
L84 As requested by Vector in its submission, the information provided would likely be
considered in the Commission’s investigation of the contravention.710 Further
information may be required depending on the nature of the contravention, but it
would be additional information rather than a repeat of the information already
provided by the distributor under the automatic reporting requirements.
L85 Submissions on the draft decision that addressed the automatic reporting
requirements were generally supportive of their introduction.711 However, we have
made the information requirements following contraventions of the extreme event
standard more targeted in response to the ENA’s submission on our draft decision:
If information is to be provided about extreme events associated with these selected causes,
the information requirements must be more targeted than those included in the Draft
Determination.712
L86 The changes from the draft decision to the final in making the requirements more
targeted include limiting the timeframes in particular, so that only recent
information is required to be published.
709 Such as our recent investigation of Alpine for contravening its quality standard, see: https://comcom.govt.nz/case-register/case-register-entries/alpine-energy-limited.
710 Vector “Submission on EDB DPP reset draft decisions paper” (18 July 2019), p. 59. 711 Such as Orion “Submission on EDB DPP reset draft decisions paper” (17 July 2019), p. 17. 712 ENA “Submission on EDB DPP reset draft decisions paper” (18 July 2019), para 155.
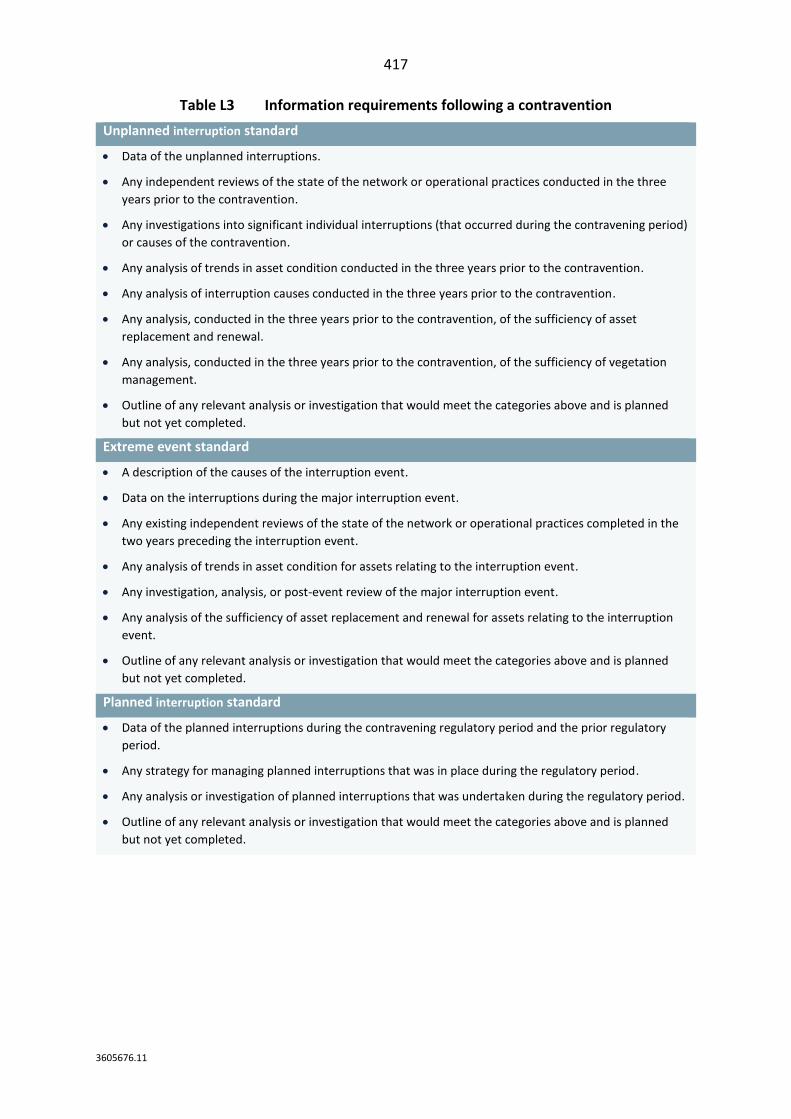
417
3605676.11
Table L3 Information requirements following a contravention
Unplanned interruption standard
• Data of the unplanned interruptions.
• Any independent reviews of the state of the network or operational practices conducted in the three
years prior to the contravention.
• Any investigations into significant individual interruptions (that occurred during the contravening period)
or causes of the contravention.
• Any analysis of trends in asset condition conducted in the three years prior to the contravention.
• Any analysis of interruption causes conducted in the three years prior to the contravention.
• Any analysis, conducted in the three years prior to the contravention, of the sufficiency of asset
replacement and renewal.
• Any analysis, conducted in the three years prior to the contravention, of the sufficiency of vegetation
management.
• Outline of any relevant analysis or investigation that would meet the categories above and is planned
but not yet completed.
Extreme event standard
• A description of the causes of the interruption event.
• Data on the interruptions during the major interruption event.
• Any existing independent reviews of the state of the network or operational practices completed in the
two years preceding the interruption event.
• Any analysis of trends in asset condition for assets relating to the interruption event.
• Any investigation, analysis, or post-event review of the major interruption event.
• Any analysis of the sufficiency of asset replacement and renewal for assets relating to the interruption
event.
• Outline of any relevant analysis or investigation that would meet the categories above and is planned
but not yet completed.
Planned interruption standard
• Data of the planned interruptions during the contravening regulatory period and the prior regulatory
period.
• Any strategy for managing planned interruptions that was in place during the regulatory period.
• Any analysis or investigation of planned interruptions that was undertaken during the regulatory period.
• Outline of any relevant analysis or investigation that would meet the categories above and is planned
but not yet completed.
418
3605676.11
L87 To ensure a timely production of this information, we are introducing this as a
standing reporting requirement with respect to any quality contravention over the
regulatory period. This approach will ensure:
L87.1 timely production of information, without requiring additional resources
and processes for the Commission;
L87.2 consistency in the information required from distributors;
L87.3 signal to distributors of the types of activities and analysis we expect; and
L87.4 the information will be public, unless considered commercially sensitive or
confidential.
L88 The information will be required to be provided in the same timeframe as the annual
compliance statement.
L89 The cost to distributors of this standing request for additional information is
negligible given it is information that we would usually request anyway.
L90 There was general support in submissions from distributors for our proposal to
introduce automatic reporting requirements for distributors that contravene their
quality standards. For example, Orion said the following:
When EDBs contravene limits we think it appropriate and helpful to EDBs and the
Commission’s investigation process for a quality report with predetermined requirements as
described in the Issues Paper.713
L91 The proposal also received support from electricity retailers, such as Meridian, who
“strongly support additional reporting requirements”.714
713 Orion “Submission on EDB DDP3 Reset “ (20 December 2018), para 54. 714 Meridian Energy “2020-2025 Distribution default price-quality path – Issues paper” (20 December 2018),
p. 4.
419
3605676.11
Attachment M Reliability incentives
Purpose of this attachment
M1 As discussed in Attachment J, the revenue-linked incentive scheme for reliability is
designed to provide distributors with incentives to consider cost-quality trade-offs in
their decision making. In the absence of other adequate incentives, distributors may
be incentivised to reduce expenditure, at the expense of quality, to increase
profitability.
M2 This attachment sets out our detailed decisions on setting the revenue-linked quality
incentives for EDB DPP3 and responds to submissions regarding incentives we
received in response to our issues paper and Draft Decisions.
Summary of our final decision
M3 Our decisions on setting the revenue-linked quality incentives for EDB DPP3 are
summarised below:
M3.1 revenue-linked incentives to apply to unplanned and planned SAIDI only,
SAIFI is excluded (unchanged from draft decision);
M3.2 unplanned incentive rates are informed by the value of lost load (VoLL),
discounted by 76.5% to reflect expenditure incentives, and a further 10% to
reflect quality standard incentives (updated from draft decision);
M3.3 planned incentive rates are reduced by 50% relative to the unplanned
incentive rate to reflect less inconvenience to consumers (unchanged from
draft decision);
M3.4 incentives are introduced to encourage additional notification of planned
(“notified”) interruptions by further discounting the planned incentive rates
by 50% (modified from draft decision);
M3.5 incentives are revenue-neutral at the average of the reference period, also
known as the target (unchanged from draft decision);
M3.6 the SAIDI caps (maximum losses) are set equal to the SAIDI limit, namely:
M3.6.1 2.0 standards deviations above the normalised reference period
annual average for unplanned SAIDI (updated from draft
decision); and
M3.6.2 triple the reference period annual average for planned SAIDI
(unchanged from draft decision);
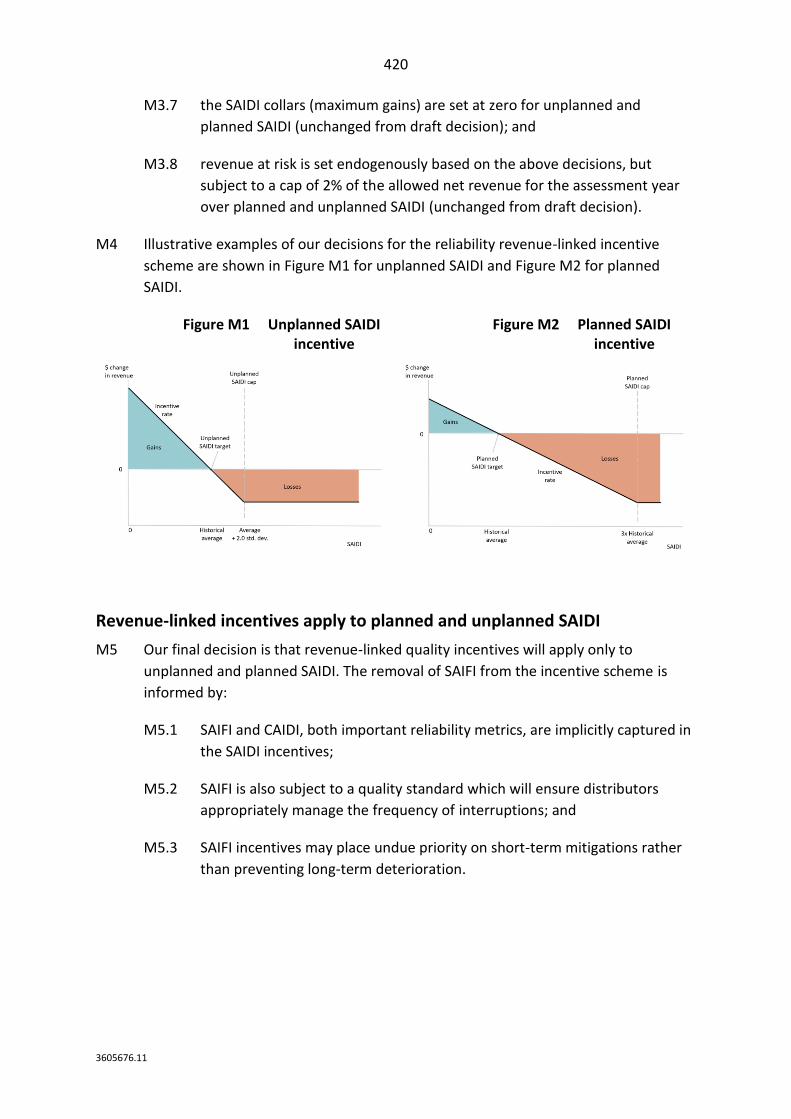
420
3605676.11
M3.7 the SAIDI collars (maximum gains) are set at zero for unplanned and
planned SAIDI (unchanged from draft decision); and
M3.8 revenue at risk is set endogenously based on the above decisions, but
subject to a cap of 2% of the allowed net revenue for the assessment year
over planned and unplanned SAIDI (unchanged from draft decision).
M4 Illustrative examples of our decisions for the reliability revenue-linked incentive
scheme are shown in Figure M1 for unplanned SAIDI and Figure M2 for planned
SAIDI.
Figure M1 Unplanned SAIDI incentive
Figure M2 Planned SAIDI incentive
Revenue-linked incentives apply to planned and unplanned SAIDI
M5 Our final decision is that revenue-linked quality incentives will apply only to
unplanned and planned SAIDI. The removal of SAIFI from the incentive scheme is
informed by:
M5.1 SAIFI and CAIDI, both important reliability metrics, are implicitly captured in
the SAIDI incentives;
M5.2 SAIFI is also subject to a quality standard which will ensure distributors
appropriately manage the frequency of interruptions; and
M5.3 SAIFI incentives may place undue priority on short-term mitigations rather
than preventing long-term deterioration.
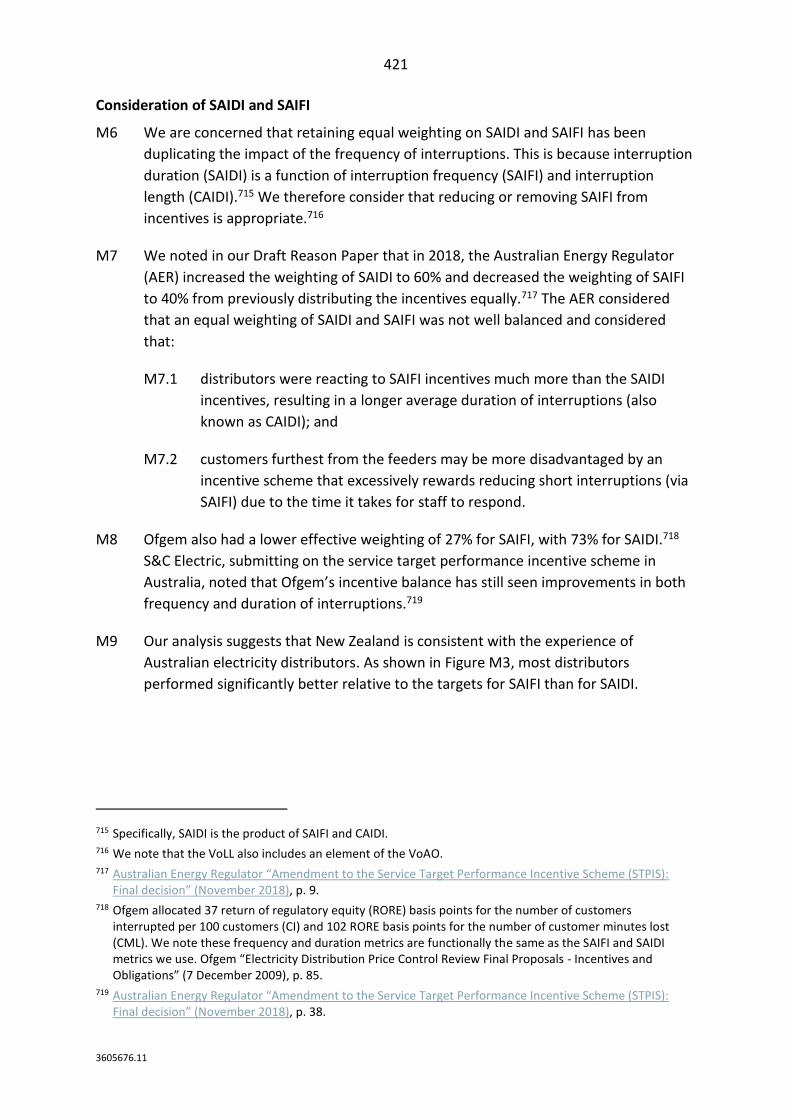
421
3605676.11
Consideration of SAIDI and SAIFI
M6 We are concerned that retaining equal weighting on SAIDI and SAIFI has been
duplicating the impact of the frequency of interruptions. This is because interruption
duration (SAIDI) is a function of interruption frequency (SAIFI) and interruption
length (CAIDI).715 We therefore consider that reducing or removing SAIFI from
incentives is appropriate.716
M7 We noted in our Draft Reason Paper that in 2018, the Australian Energy Regulator
(AER) increased the weighting of SAIDI to 60% and decreased the weighting of SAIFI
to 40% from previously distributing the incentives equally.717 The AER considered
that an equal weighting of SAIDI and SAIFI was not well balanced and considered
that:
M7.1 distributors were reacting to SAIFI incentives much more than the SAIDI
incentives, resulting in a longer average duration of interruptions (also
known as CAIDI); and
M7.2 customers furthest from the feeders may be more disadvantaged by an
incentive scheme that excessively rewards reducing short interruptions (via
SAIFI) due to the time it takes for staff to respond.
M8 Ofgem also had a lower effective weighting of 27% for SAIFI, with 73% for SAIDI.718
S&C Electric, submitting on the service target performance incentive scheme in
Australia, noted that Ofgem’s incentive balance has still seen improvements in both
frequency and duration of interruptions.719
M9 Our analysis suggests that New Zealand is consistent with the experience of
Australian electricity distributors. As shown in Figure M3, most distributors
performed significantly better relative to the targets for SAIFI than for SAIDI.
715 Specifically, SAIDI is the product of SAIFI and CAIDI. 716 We note that the VoLL also includes an element of the VoAO. 717 Australian Energy Regulator “Amendment to the Service Target Performance Incentive Scheme (STPIS):
Final decision” (November 2018), p. 9. 718 Ofgem allocated 37 return of regulatory equity (RORE) basis points for the number of customers
interrupted per 100 customers (CI) and 102 RORE basis points for the number of customer minutes lost (CML). We note these frequency and duration metrics are functionally the same as the SAIFI and SAIDI metrics we use. Ofgem “Electricity Distribution Price Control Review Final Proposals - Incentives and Obligations” (7 December 2009), p. 85.
719 Australian Energy Regulator “Amendment to the Service Target Performance Incentive Scheme (STPIS): Final decision” (November 2018), p. 38.
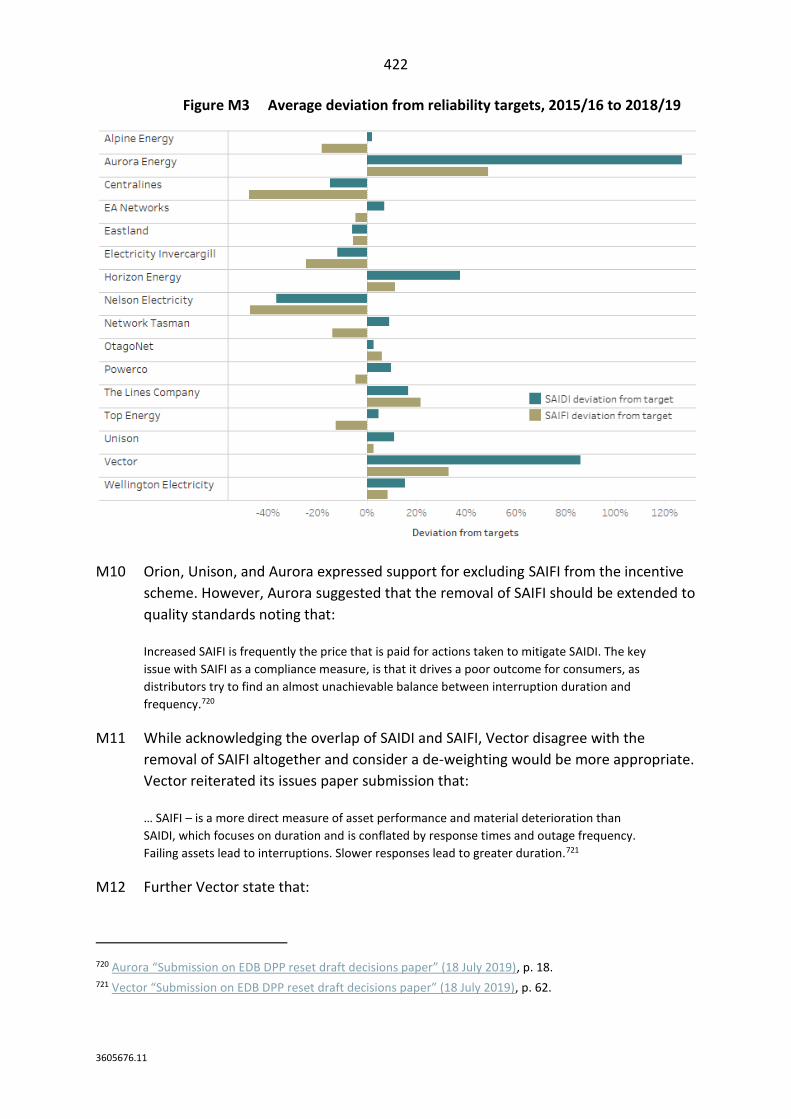
422
3605676.11
Figure M3 Average deviation from reliability targets, 2015/16 to 2018/19
M10 Orion, Unison, and Aurora expressed support for excluding SAIFI from the incentive
scheme. However, Aurora suggested that the removal of SAIFI should be extended to
quality standards noting that:
Increased SAIFI is frequently the price that is paid for actions taken to mitigate SAIDI. The key
issue with SAIFI as a compliance measure, is that it drives a poor outcome for consumers, as
distributors try to find an almost unachievable balance between interruption duration and
frequency.720
M11 While acknowledging the overlap of SAIDI and SAIFI, Vector disagree with the
removal of SAIFI altogether and consider a de-weighting would be more appropriate.
Vector reiterated its issues paper submission that:
… SAIFI – is a more direct measure of asset performance and material deterioration than
SAIDI, which focuses on duration and is conflated by response times and outage frequency.
Failing assets lead to interruptions. Slower responses lead to greater duration.721
M12 Further Vector state that:
720 Aurora “Submission on EDB DPP reset draft decisions paper” (18 July 2019), p. 18. 721 Vector “Submission on EDB DPP reset draft decisions paper” (18 July 2019), p. 62.
423
3605676.11
… by narrowing the scope of the quality incentive the Commission – in the unique way
proposed – is implicitly signalling that other service outcomes do not matter, or at least
should not be a focus for EDBs.722
M13 We reiterate that we consider performance of SAIFI is important to consumers, and
as such remains a part of the quality standard.723 However, to the extent a
distributor reduces the frequency of interruption events to its consumers this will
generally reduce SAIDI. We also agree with Aurora that, assuming SAIFI is
appropriately recorded for each interruption, incentives on SAIFI may inadvertently
discourage distributors to partake in staged restorations which would likely not be in
consumers interest.
Consideration of CAIDI
M14 To the extent that longer interruptions are less desirable from a consumer
perspective, we considered whether a CAIDI incentive could be introduced. This
would incentivise distributors to reduce the average length of interruptions
experienced by consumers. However, we consider that there may be perverse
outcomes of the CAIDI incentive. For example:
M14.1 a deterioration in both SAIDI and SAIFI can lead to an “improvement” in
CAIDI if SAIFI deteriorates more than SAIDI; and conversely
M14.2 an improvement in both SAIDI and SAIFI can lead to an “deterioration” in
CAIDI if SAIFI improves more than SAIDI.
M15 At worst, the introduction of a CAIDI incentive may give distributors scope for
increasing the number of short interruptions to improve observed CAIDI. At best, it
may disincentivise reducing the number of short interruptions.
M16 CAIDI incentives may be considered in conjunction with SAIDI and/or SAIFI
incentives. However, we consider this adds greater complexity than it is worth at this
stage. As noted above, SAIDI incentives naturally incentivise reductions in the
number (SAIFI) and length (CAIDI) of interruptions.
M17 CAIDI remains useful as an analytical metric to assess performance, as it can act as
an ‘early warning’ indicator of distributors with underlying declines in performance,
as it points to lower levels of network performance, even where temporary
measures (like reclosers) are masking this decline in the short-term.
722 Vector “Submission on EDB DPP reset draft decisions paper” (18 July 2019), p. 63. 723 As discussed in Attachment L.
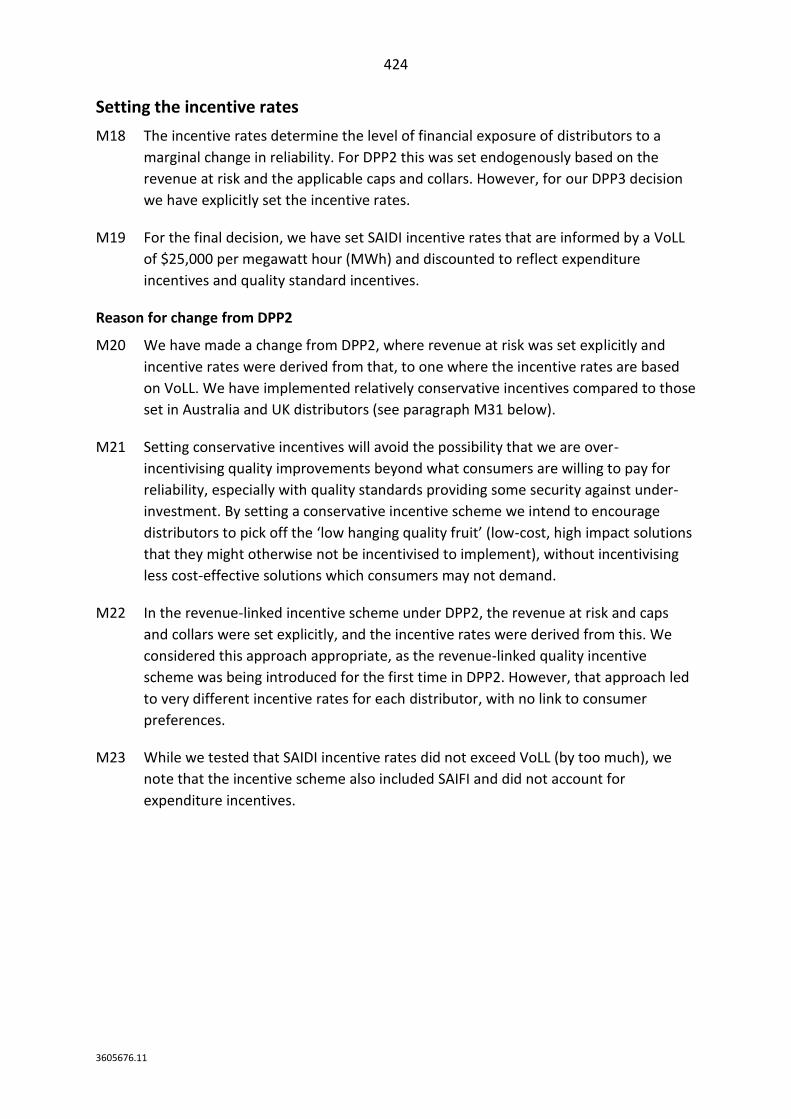
424
3605676.11
Setting the incentive rates
M18 The incentive rates determine the level of financial exposure of distributors to a
marginal change in reliability. For DPP2 this was set endogenously based on the
revenue at risk and the applicable caps and collars. However, for our DPP3 decision
we have explicitly set the incentive rates.
M19 For the final decision, we have set SAIDI incentive rates that are informed by a VoLL
of $25,000 per megawatt hour (MWh) and discounted to reflect expenditure
incentives and quality standard incentives.
Reason for change from DPP2
M20 We have made a change from DPP2, where revenue at risk was set explicitly and
incentive rates were derived from that, to one where the incentive rates are based
on VoLL. We have implemented relatively conservative incentives compared to those
set in Australia and UK distributors (see paragraph M31 below).
M21 Setting conservative incentives will avoid the possibility that we are over-
incentivising quality improvements beyond what consumers are willing to pay for
reliability, especially with quality standards providing some security against under-
investment. By setting a conservative incentive scheme we intend to encourage
distributors to pick off the ‘low hanging quality fruit’ (low-cost, high impact solutions
that they might otherwise not be incentivised to implement), without incentivising
less cost-effective solutions which consumers may not demand.
M22 In the revenue-linked incentive scheme under DPP2, the revenue at risk and caps
and collars were set explicitly, and the incentive rates were derived from this. We
considered this approach appropriate, as the revenue-linked quality incentive
scheme was being introduced for the first time in DPP2. However, that approach led
to very different incentive rates for each distributor, with no link to consumer
preferences.
M23 While we tested that SAIDI incentive rates did not exceed VoLL (by too much), we
note that the incentive scheme also included SAIFI and did not account for
expenditure incentives.
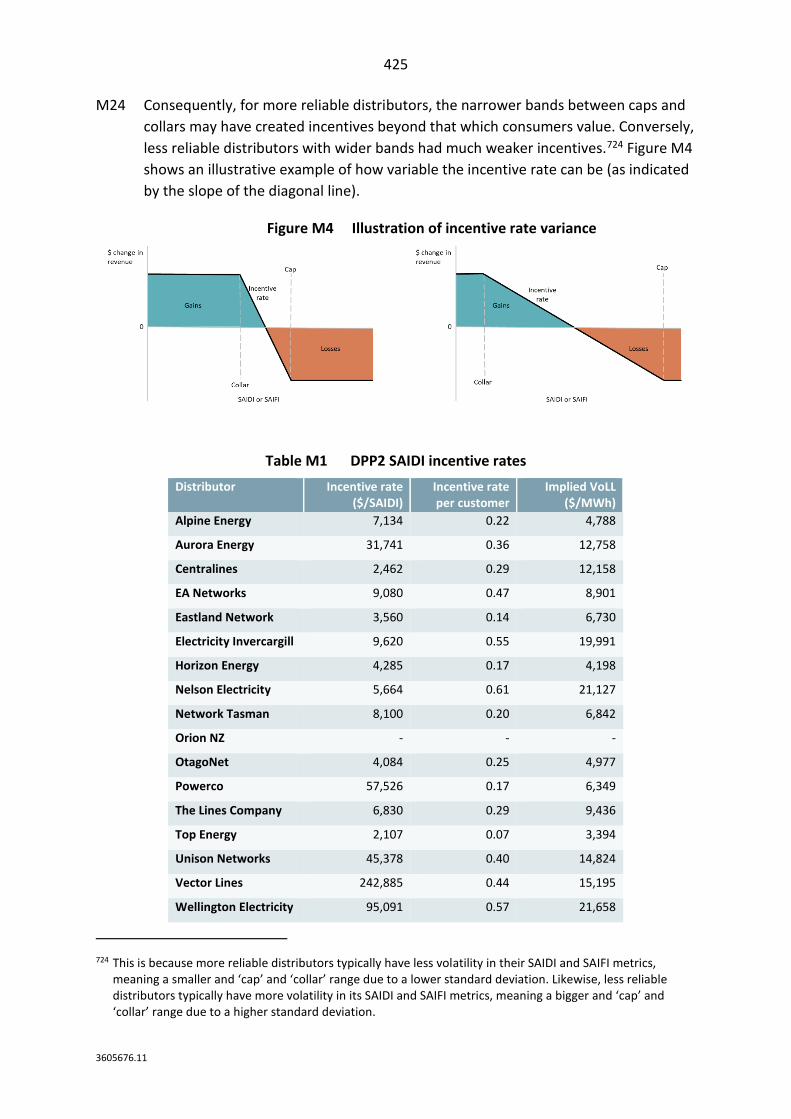
425
3605676.11
M24 Consequently, for more reliable distributors, the narrower bands between caps and
collars may have created incentives beyond that which consumers value. Conversely,
less reliable distributors with wider bands had much weaker incentives.724 Figure M4
shows an illustrative example of how variable the incentive rate can be (as indicated
by the slope of the diagonal line).
Figure M4 Illustration of incentive rate variance
Table M1 DPP2 SAIDI incentive rates
Distributor Incentive rate ($/SAIDI)
Incentive rate per customer
Implied VoLL ($/MWh)
Alpine Energy 7,134 0.22 4,788
Aurora Energy 31,741 0.36 12,758
Centralines 2,462 0.29 12,158
EA Networks 9,080 0.47 8,901
Eastland Network 3,560 0.14 6,730
Electricity Invercargill 9,620 0.55 19,991
Horizon Energy 4,285 0.17 4,198
Nelson Electricity 5,664 0.61 21,127
Network Tasman 8,100 0.20 6,842
Orion NZ - - -
OtagoNet 4,084 0.25 4,977
Powerco 57,526 0.17 6,349
The Lines Company 6,830 0.29 9,436
Top Energy 2,107 0.07 3,394
Unison Networks 45,378 0.40 14,824
Vector Lines 242,885 0.44 15,195
Wellington Electricity 95,091 0.57 21,658
724 This is because more reliable distributors typically have less volatility in their SAIDI and SAIFI metrics, meaning a smaller and ‘cap’ and ‘collar’ range due to a lower standard deviation. Likewise, less reliable distributors typically have more volatility in its SAIDI and SAIFI metrics, meaning a bigger and ‘cap’ and ‘collar’ range due to a higher standard deviation.
426
3605676.11
M25 Table M1 shows the incentive rates for SAIDI for each distributor in DPP2 and the
implied VoLL. For example, Nelson Electricity and Wellington Electricity were
exposed to five times more incentive per customer than Top Energy and Horizon
Energy. We consider that higher incentive rates for the most reliable distributors is
counterintuitive and we did not consider this is appropriate to carry forward into
DPP3.
Using VoLL to set incentive rates
M26 The decision to base SAIDI incentives rates is informed by a VoLL of $25,000 per
megawatt hour (MWh).725 However, as discussed below, we discount this by:
M26.1 76.5% to reflect the 23.5% retention factor for expenditure incentives under
IRIS; and a further
M26.2 10% to reflect incentives associated with the quality standard giving an
adjusted VoLL of $5,288 for each distributor.
M27 To derive the SAIDI incentive rate for each distributor, we have multiplied the
adjusted VoLL by the typical electricity consumption per minute on the network over
the last three years.
M28 The average strength of the SAIDI incentives across affected distributors, as
compared between Table M1 above and Table M2 below, has decreased from $0.33
per customer per SAIDI minute in DPP2 to $0.17 per customer per SAIDI minute for
DPP3. The range of SAIDI incentive rates has also narrowed, with the difference
attributable to differences in average electricity consumption per customer, rather
than the cap and collar settings.
725 VoLL is an estimate of the economic value, in dollars per MWh, that a consumer places on electricity they plan to consume but do not receive because of an interruption. PwC, on behalf of Transpower, has estimated VoLL to be centred at around $25,000. For more information, see Transpower’s VoLL study, available at: https://www.transpower.co.nz/sites/default/files/publications/resources/Value%20of%20Lost%20Load%20%28VoLL%29%20Study%20-%20June%202018.pdf.
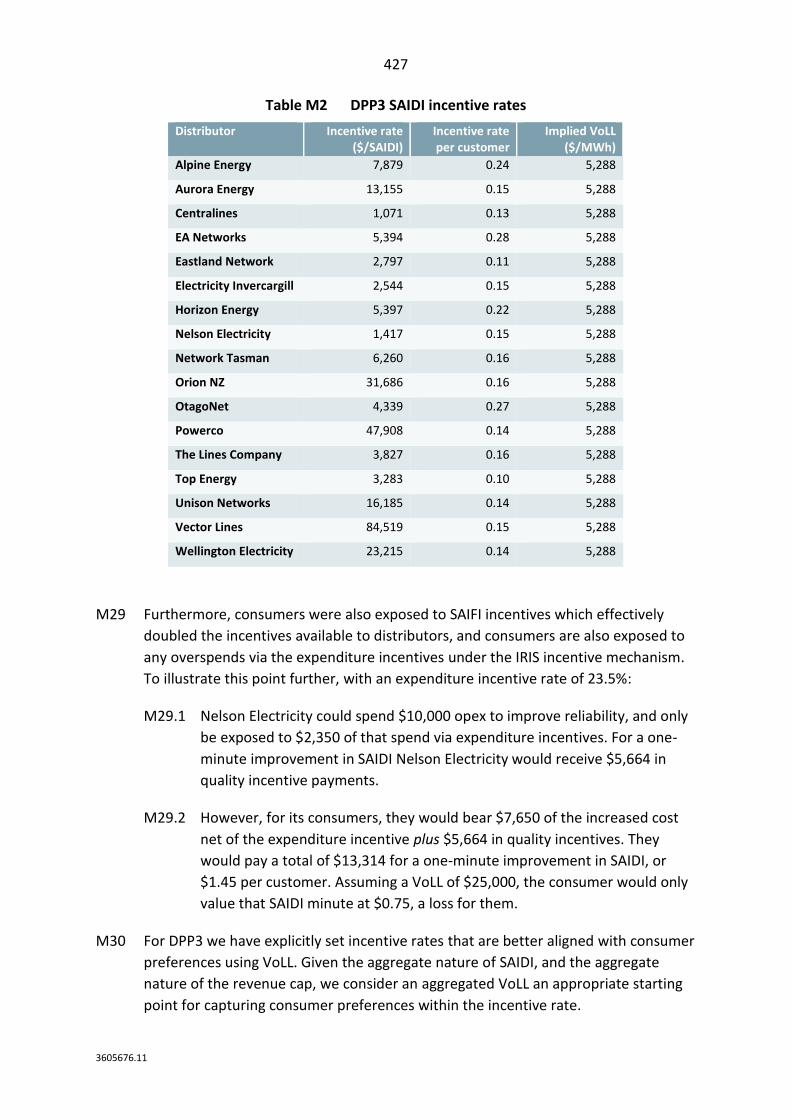
427
3605676.11
Table M2 DPP3 SAIDI incentive rates
Distributor Incentive rate ($/SAIDI)
Incentive rate per customer
Implied VoLL ($/MWh)
Alpine Energy 7,879 0.24 5,288
Aurora Energy 13,155 0.15 5,288
Centralines 1,071 0.13 5,288
EA Networks 5,394 0.28 5,288
Eastland Network 2,797 0.11 5,288
Electricity Invercargill 2,544 0.15 5,288
Horizon Energy 5,397 0.22 5,288
Nelson Electricity 1,417 0.15 5,288
Network Tasman 6,260 0.16 5,288
Orion NZ 31,686 0.16 5,288
OtagoNet 4,339 0.27 5,288
Powerco 47,908 0.14 5,288
The Lines Company 3,827 0.16 5,288
Top Energy 3,283 0.10 5,288
Unison Networks 16,185 0.14 5,288
Vector Lines 84,519 0.15 5,288
Wellington Electricity 23,215 0.14 5,288
M29 Furthermore, consumers were also exposed to SAIFI incentives which effectively
doubled the incentives available to distributors, and consumers are also exposed to
any overspends via the expenditure incentives under the IRIS incentive mechanism.
To illustrate this point further, with an expenditure incentive rate of 23.5%:
M29.1 Nelson Electricity could spend $10,000 opex to improve reliability, and only
be exposed to $2,350 of that spend via expenditure incentives. For a one-
minute improvement in SAIDI Nelson Electricity would receive $5,664 in
quality incentive payments.
M29.2 However, for its consumers, they would bear $7,650 of the increased cost
net of the expenditure incentive plus $5,664 in quality incentives. They
would pay a total of $13,314 for a one-minute improvement in SAIDI, or
$1.45 per customer. Assuming a VoLL of $25,000, the consumer would only
value that SAIDI minute at $0.75, a loss for them.
M30 For DPP3 we have explicitly set incentive rates that are better aligned with consumer
preferences using VoLL. Given the aggregate nature of SAIDI, and the aggregate
nature of the revenue cap, we consider an aggregated VoLL an appropriate starting
point for capturing consumer preferences within the incentive rate.
428
3605676.11
M31 We note that a starting VoLL of $25,000 per MWh is conservative relative to the
measures used by the AER and Ofgem:
M31.1 The AER uses a value of customer reliability of $37,000 (~NZ$40,000);726 and
M31.2 Ofgem uses a rate of around £16,000 (~NZ$32,000).727
M32 To ensure that consumers are not overpaying for quality driven expenditure, we
factor in the expenditure incentives that consumers are also sharing. Taking account
of expenditure incentives, we scale back the VoLL, or incentives rates, to (1 – the
retention factor) or 23.5% of VoLL for DPP3.728 Put another way, under the IRIS,
distributors keep the value of improvements in efficiency for five years before
sharing them with consumers. Under our recommended approach, distributors will
keep the value of quality improvements or declines (VoLL) at least until the end of
the regulatory period.
M33 We also include a further reduction of 10% to the incentive rate to recognise that
there are natural incentives associated with meeting the quality standard (a change
from 20% in the draft). We consider this further de-weighting is appropriate as to
mitigate the risk of over-incentivising investment to improve reliability beyond that
which consumers demand.
M34 These reductions result in an implied VoLL of $5,288 per megawatt hour which is
used as a basis for setting incentive rates, as outlined in Table M2, which reproduces
Table M1 for DPP3.729 We note the variability in the SAIDI incentive rates per
customer is due to the differences in observed annual consumption per customer
between distributors.
M35 The option of explicitly setting the incentive rates and setting either the revenue at
risk or the caps and collars endogenously was first raised in the issues paper.
Submitters to the issues paper had mixed views on this approach, however some
changed their stance after viewing our draft decision.
726 Australian Energy Regulator “Amendment to the Service Target Performance Incentive Scheme (STPIS): Final decision” (November 2018), p. 9.
727 Ofgem “Strategy consultation for the RIIO-ED1 electricity distribution price control: Reliability and Safety” (28 September 2012), para 4.12.
728 Attachment E discusses the IRIS incentive rates. 729 The implied VoLL for implementing the incentive rate is $25,000 x 23.5% x (1 - 10%) = $5,288 per MWh.
429
3605676.11
M36 NZIER, on behalf of MEUG, noted that for DPP2:730
… the wide difference in historical performance of EDB leads to a wide variation in quality
standards and the range over which the incentive for individual EDB. Accordingly, the implied
average cost to customers of achieving improved reliability varies widely across EDB … there
is a potential mis-match between the cost to customers of incentive driven changes in
reliability and the value customers attach to the change in reliability.
M37 NZIER went on to express conditional support for using VoLL as an input in setting
the incentive rate, stating that:731
… subject to consultation on how VoLL would be estimated … an incentive based on the VoLL
is more likely to ensure the incentive reflects the benefit of improved reliability to consumers
than a uniform percentage of maximum allowable revenue.
M38 The Lines Company agree in principle “that linking the incentive rate to VoLL
provides a more transparent methodology”, subject to further detail.732 Unison and
Aurora also agreed with explicitly setting the incentive rates for consistency of
incentives between distributor, although noting the VoLL is a highly averaged
measure.733
M39 Wellington Electricity supported using incentive rates that reflect consumer
preferences in its submission to the issues paper. However, it expressed reservations
as to whether using a national aggregate VoLL was appropriate given the different
customer bases of distributors.734 It considered the incentive rate derived from the
draft methodology for Wellington Electricity too low to incentivise improved quality.
Consequently, it recommended reverting to the DPP2 method whereby the revenue
exposure is explicitly set.735
M40 We refer Wellington Electricity to its issues paper submission which we agree with
stating that:
730 Major Electricity Users' Group “NZIER on behalf of MEUG EDB DPP reset issues paper” (21 December 2018), p. 7.
731 Major Electricity Users' Group “NZIER on behalf of MEUG EDB DPP reset issues paper” (21 December 2018), p. 10.
732 The Lines Company “Default price-quality paths for electricity distribution businesses from 1 April 2020” (21 December 2018), p. 8.
733 Unison “Submission on EDB DPP reset draft decisions paper” (18 July 2019), p. 13; and Aurora “Submission on EDB DPP reset draft decisions paper” (18 July 2019), p. 19.
734 Wellington Electricity “Default price-quality paths for electricity distribution businesses from 1 April 2020 Issues Paper” (21 December 2018), p. 17.
735 Wellington Electricity “Submission on EDB DPP reset draft decisions paper” (18 July 2019), p. 23.
430
3605676.11
… it [is] more appropriate to set the incentive rate at a level which encourages a reasonable
level of investment to support the level of quality that customers want. The incentive rate
should not be too high to encourage overinvestment, or too low so that under-investment
results in asset deterioration.736
M41 As discussed above, we consider that the incentive rates, in combination with
expenditure incentives, resulted in the potential for Wellington Electricity to spend
on quality improvements far in excess of that which consumers would be willing to
pay.
M42 Given the information available, we consider that consistent incentive rates based
on VoLL and discounted for IRIS are sound. Furthermore, we consider that
recognition of incentives associated with not contravening the quality standard
should be factored in. We also note we have reduced the discount for quality
standards from 20% to 10% given we have increased the buffer for unplanned
interruptions from 1.5 standard deviations to 2.0 standard deviations, thereby
weakening the probability of a contravention.737 However, this is largely offset by the
decrease in the IRIS retention factor to 23.5%.738
De-weighted incentives for planned interruptions
M43 Consistent with DPP2, we have de-weighted all planned interruptions by 50%
relative to unplanned interruptions. We consider de-weighting planned interruptions
are appropriate as they are less inconvenient for consumers because, as long as
customers are notified, they can plan accordingly. As noted in Attachment L, planned
interruptions are also generally required by the distributor to perform maintenance
and investment that benefits consumers in the long run.
M44 Vector suggested planned interruptions should be excluded from any revenue-linked
incentive scheme noting that:
… the Australian Energy Regulator (AER) for its Service Target Performance Incentive Scheme
(STPIS). Under STPIS, only unplanned interruptions are taken into account for the reliability
of supply component.739
736 Wellington Electricity “Default price-quality paths for electricity distribution businesses from 1 April 2020 Issues Paper” (21 December 2018), p. 17.
737 See Attachment L 738 See Attachment E 739 Vector “Submission to Commerce Commission Default Price Quality Path Issues Paper” (21 December
2018), p. 35.
431
3605676.11
M45 We do not consider removing planned interruptions appropriate. While it is less
inconvenient for consumers, it is not without inconvenience. We consider it is
important that distributors are incentivised to undertake its planned interruptions
efficiently and consumers are compensated accordingly. Furthermore, our decision
to relax the standards associated with planned interruptions is on the assumption
that revenue-linked incentives are the appropriate avenue to encourage distributors
to manage its planned interruptions appropriately.
M46 This 50% reduction in weighting for planned interruptions was broadly supported by
distributors.740 For example, ENA stated that:
A further 50% discount is applied to the incentive rates for planned interruptions to reflect
the lower levels of disruption for customers from planned outages.
Incentives for notification of planned interruptions
M47 As noted above, planned interruptions are generally less inconvenient for
consumers. However, the current definition of a planned interruption only requires
24-hours’ notice to be provided to consumers.
M48 To incentivise better notification to consumers of planned interruptions, we have
strengthened distributors’ incentives to give greater notification of planned
interruptions. This is achieved by reducing the revenue impact of the planned SAIDI
incentive by a further 50%.
M49 To qualify for the more beneficial incentive rate the planned interruption must:
M49.1 be opted in by specifying in the notice that the planned interruption is a
‘notified interruption’ and be recorded as a ‘notified interruption’ in the
distributors’ internal systems;
M49.2 be notified to relevant parties within a certain time period in advance of the
interruption, specifically:
M49.2.1 all consumers directly impacted by the interruption must be
notified at least four working days in advance of a planned
interruption (unchanged from draft); or
M49.2.2 retailers must be notified at least ten working days in advance of a
planned interruption (modified from draft); and
740 ENA “Submission on EDB DPP reset draft decisions paper” (18 July 2019), p. 36; and Aurora “Submission on EDB DPP reset draft decisions paper” (18 July 2019), pp. 19-20.
432
3605676.11
M49.2.3 any consumer directly billed by the distributor and impacted by
the planned interruption must be notified at least ten working
days’ in advance of a planned interruption (modified from draft);
M49.3 specify the expected start time, the expected completion time, the reason
for the planned interruption, and any alternate day if applicable (added
since draft); and
M49.4 be accessible on the distributor’s website or via other online means, along
with instructions on the notification for accessing updates to the
interruption (changed from draft).
M50 Once a distributor has opted in a planned interruption as a ‘notified interruption’:
M50.1 only the portion of the notified interruption that occurs within the specified
notification window can qualify for the reduced incentive rate (modified
from draft);
M50.2 the notified interruption is still counted for the purposes of assessing
incentives even if that interruption does not eventuate unless it is:
M50.2.1 deferred to an alternate day as specified in the notification
provide the update is made accessible on its website in advance of
the notification window commencing; or
M50.2.2 cancelled provided affected consumers are informed at least 24
hours prior to the expected start time, (modified from draft); and
M50.3 the notified interruption is recorded as the length of the actual interruption
or the length of the notification window less two hours, whichever is
greatest.
M51 As noted in Attachment N, communication with consumers of planned interruptions
was identified as being important in the Powerco application for a CPP. According to
the consumer survey for Powerco, undertaken by PwC and Colmar Brunton, more
than 90% of respondents reported that communication about planned power cuts
was important.
M52 There was general support in submissions to our issues paper for considering
additional dimensions of quality beyond reliability, including notification of planned
interruptions. However, as Attachment N states, the lack of reliable data and robust
information on the new measures would increase the risk of setting parameters for
an incentive scheme (and standards) at an inappropriate level.
433
3605676.11
M53 Like other potential quality metrics, we consider the inclusion of an explicit standard
or incentive for notification of planned interruptions may be considered for future
DPPs once sufficient information is available to set a baseline. However, we
acknowledge that notification of planned interruptions is important to mitigate the
impact of the interruption and that our current definition of a planned interruption
does not adequately reflect this. Currently, a planned interruption is any interruption
where at least 24 hours’ notice has been provided.
M54 For this reason, we have specified minimum notification requirements to qualify for
a further lowering of the implied negative incentive for the interruption. This would
be on top of the 50% deduction for planned interruptions relative to unplanned
interruptions already in place.
M55 As noted above, we have a lack of information to inform the baseline. We consider
using the planned dataset, without adjustment, to incentivise distributors to meet
these requirements is appropriate. This does mean to the extent a distributor is
already meeting the criteria it could be rewarded without changing its practices.
Nominating a notified interruption
M56 Many distributors, via submissions to the draft decision and the targeted quality
workshop, queried whether they could opt in or out of the notification
requirement.741 Initially, we envisaged that the notification incentive would apply to
every distributor subject to DPP3. However, in acknowledgement of the potential
difficulty of recording and auditing all planned interruptions to ascertain whether it
meets the notification criteria, we have allowed a process for distributors to
explicitly opt in or out of the notification incentive for each planned interruption.
M57 To qualify for the notification incentive, it must state on the notice of planned
interruption to retailers or consumers that the specified interruption is a ‘notified
interruption’ and is recorded as such in its internal systems.
M58 Given that this is a new concept for DPP3, we consider it appropriate to provide
some discretion to distributors as to whether it wishes to partake in this incentive,
and the level to which they do so. Due to the asymmetric nature of the notification
incentive in the distributors favour, and the adjustments made since the draft
decision, we would expect distributors to trial it where it is economic to do so.
741 Orion “Submission on EDB DPP reset draft decisions paper” (17 July 2019), p. 9; Powerco "Submission on EDB DPP reset draft decisions paper" (18 July 2019) , p. 11; Commerce Commission “Notes on EDB DPP3 Workshop on Quality of service held 16 August 2019” (25 September 2019).
434
3605676.11
Notice requirements
M59 We have extended the notice required to retailers and directly billed consumers to
ten working days. Alternatively, distributors may advise all customers not directly
billed with at least four working days’ notice rather than the retailer.742
M60 In response to submissions, we are allowing distributors to specify one alternate day
in which the notified interruption can occur, with the expectation it would only be
used when adverse conditions prevent planned works happening on the specified
day.
M61 In response to submissions, we will allow distributors to cancel or amend the
notified interruption provided customers are given at least 24 hours’ notice and a
reason is provided. Any change in date must also meet notice period outlined above
in M49. For example, Orion noted that the draft:
… notification prescriptive requirements reduce EDB flexibility around notifications that may
meet customer needs. This is important because we often alter interruption days and
timeframes to work in with customer feedback. While this might not align with the definition
provided, appropriate notification has been provided, it suits the customer and meets their
expectations.743
M62 All notified interruptions must be easily accessible via the distributor’s website or via
other online means, for example, phone applications, or social media. As standard
practice, we expect that the notification will advise affected consumers where up-to-
date information on the notified interruption can be located online (for example,
cancellations or changes).
Notification window
M63 In the draft decision we had specified four hours as the maximum length of a
notification. Many distributors submitted that this was not sufficient suggesting that
only around half of planned interruptions are completed within four hours.744
Analysis of planned interruptions during the reference period confirms that around
half of all planned interruptions extend beyond four hours.
742 This is in line with the service interruption communication requirements outlined in Schedule 5 of the Draft Default Distribution Agreement. Refer to Electricity Authority “Default Distribution Agreement Template – Version: 22 August 2018” (14 January 2019), pp. 63-64.
743 Orion “Submission on EDB DPP reset draft decisions paper” (17 July 2019), p. 9. 744 Powerco "Submission on EDB DPP reset draft decisions paper" (18 July 2019), pp. 10-11; ENA "Submission
on EDB DPP reset draft decisions paper" (18 July 2019), p. 26; Orion “Submission on EDB DPP reset draft decisions paper” (17 July 2019), p. 15; Eastland Network "Submission on EDB DPP reset draft decisions paper" (18 July 2019), p. 10; Wellington Electricity "Submission on EDB DPP reset draft decisions paper" (18 July 2019), p. 22; Unison "Submission on EDB DPP reset draft decisions paper" (18 July 2019), p. 27; and Commerce Commission “Notes on EDB DPP3 Workshop on Quality of service held 16 August 2019” (25 September 2019).
435
3605676.11
M64 We consider that providing consumers with an excessively wide window in which to
undertake planned works is not particularly helpful to consumers, for example, a
one-week window to replace an insulator or crossarm. However, we recognise that
the scale of planned works can vary considerably and therefore we have not
specified a maximum length.
M65 We will allow distributors as long as they consider necessary to complete the
planned works. However, to mitigate against excessively long windows we use the
window length as a criterion for assessing the incentive, as discussed in more detail
below.
M66 If an interruption extends beyond the specified window then the distributor may still
consider the SAIDI of the interruption duration within the window as a notified
interruption, with the associated incentive. This will ensure that the distributor is not
unduly penalised for not completing the planned works within the allocated window.
Counting notified interruptions that do not occur
M67 We also consider that interruptions that have been notified but do not eventuate
can also be an inconvenience to consumers, especially for vulnerable consumers
who may need to make alternative accommodation arrangements, or for
commercial consumers who may need to arrange for alternative supply or to close.
M68 To that end we consider it appropriate to penalise distributors to some extent if a
notified interruption does not proceed and adequate cancellation notice is not
provided to consumers. This should also mitigate any risk of ‘over-notification’ of
interruptions.
M69 Distributors disagreed with counting SAIDI for those interruptions which were
adequately notified but did not eventuate. Powerco directly addressed our concern
that distributors may be incentivised to notify excessively stating that it considers
“distributors already have natural incentives to mitigate this risk e.g. limiting
consumer complaints and maintaining consumer trust” and that an ID first approach
would be more appropriate.745
745 Powerco “Submission on EDB DPP reset draft decisions paper” (18 July 2019), p. 13.
436
3605676.11
M70 Distributors have provided several examples of where a notified interruption may
need to be cancelled or deferred.746 For example:
M70.1 responding to or preparing for unplanned interruptions;
M70.2 finding a better way to deal with the issue;
M70.3 health and safety considerations;
M70.4 adverse weather or environment;
M70.5 customer requests to defer interruptions; and
M70.6 staff shortages due to illness.
M71 ENA and Unison noted that planned interruptions that do not eventuate are not
included in the reference period dataset that is used as a base to set the planned
SAIDI incentive target.747 Consequently, they considered that distributors would bear
penalties to the extent that notified interruptions do not occur.
M72 We consider that this is outweighed by the half weighting of notified interruptions
relative to planned interruptions without notification which is also excluded from the
reference data. Furthermore, we have allowed distributors to specify alternate days
and an avenue to cancel notified interruptions with at least 24-hours’ notice.
Recording the ‘notified’ SAIDI
M73 While the notified incentive is largely a financial benefit for distributors that opt in, it
is important that this is intended to be a consumer-facing incentive. For this reason,
we consider it important that distributors can gain from this incentive to the extent
it has meaningful benefits for consumers.
M74 For the purposes of measuring SAIDI for the incentive scheme, the length of a
notified interruption that meets the criteria outlined above will be measured as the
greater of the:
M74.1 actual length of the interruption within the notified window; and
M74.2 the length of the notification window less two hours.
746 Vector “Submission on EDB DPP reset draft decisions paper” (18 July 2019), pp. 64-65; ENA “Submission on EDB DPP reset draft decisions paper” (18 July 2019), p.27; and Aurora “Submission on EDB DPP reset draft decisions paper” (18 July 2019), pp. 20-21.
747 ENA “Submission on EDB DPP reset draft decisions paper” (18 July 2019), p. 27.
437
3605676.11
M75 For example, if a notified interruption is specified as lasting eight hours but only lasts
two hours, the length will be counted as six hours. For the avoidance of doubt, if a
notified interruption does not occur the actual length is counted as zero hours.
M76 We consider that using the notification window, with some flexibility, as a criterion
for measuring SAIDI will provide the distributor with an incentive to optimise the
length of the window given the planned works to be undertaken. This should ensure
that consumers are provided meaningful windows in which to plan to.
M77 For any planned interruption that does not meet the notification criteria, or partially
falls outside of the notification window, it will be wholly or partially treated at the
regular planned incentive rate, as specified in Table M4.
Setting the targets (revenue-neutral point)
M78 The reliability targets are the points at which no financial gains or losses are
applicable to the revenue-linked incentive scheme. Our final decision sets incentives
that are revenue-neutral at the average of the reference period (the target) for both
planned and unplanned interruptions.748
M79 We consider an average of normalised SAIDI over the reference period an
appropriate starting point for setting the revenue-neutral base. This is the point at
which there is no observed deterioration or improvement in reliability relative to
reference period.
M80 However, as discussed in Attachment J, we have limited the inter-regulatory period
movement of targets between DPP2 and DPP3 to 5% for unplanned interruptions.
We consider this necessary to ensure that recent performance, both good and bad,
is not unduly captured.
M81 In the future we could consider setting a dynamic target above or below the
historical average based on more informed views of consumer expectations. For
example, we could set an improvement path over the regulatory period if that is
what consumers want and are willing to pay for.
M82 We did not receive any submissions suggesting an alternative method for setting the
targets. However, we note some distributors suggested a step change to reflect a
change in operating policy relating to live line works, among others.749
M83 The unplanned and planned SAIDI targets are outlined in Table M3 and Table M4
respectively at the end of this chapter.
748 This approach is consistent with the ‘ex ante expectation of a normal return, provided quality standards are met’ economic principle discussed in Chapter 3.
749 Discussed in Attachment J.
438
3605676.11
Setting the caps (maximum losses)
M84 The reliability caps are the points at which no further losses are applicable to the
revenue-linked incentive scheme. Our final decision sets planned and unplanned
SAIDI caps equal to the applicable limit for compliance standards, subject to
maximum revenue exposure of 2%. These are set:
M84.1 2.0 standards deviations above the target for unplanned interruptions; and
M84.2 triple the target for planned interruptions.
M85 Once the upper bound of unplanned SAIDI (or the lower bound of reliability)
applicable to the incentive scheme has been exceeded a compliance contravention
will kick in.
M86 We consider that a cost-quality trade-off should always be in place up to the
applicable reliability standard. We therefore do not consider a cap below the quality
standard, or a ‘dead-band’, is necessary. To the extent that there is a lot of volatility
in the metrics used to assess reliability this may be appropriate. However, with our
recommended ‘normalisation’ methodology, more volatility has been removed from
the assessment of SAIDI.
M87 We also did not consider setting incentives beyond the quality standards would be
appropriate.
M88 Alpine Energy, Aurora Energy, and The Lines Company had submitted general
support for widening the band between cap and target to two standard
deviations.750 It was noted this could complement an increase to the revenue at risk
to 2% of allowable revenue each year.
M89 Eastland Network, Orion, and ENA expressed reservations for raising the cap beyond
one standard deviation, considering that it:
M89.1 would increase price volatility;
M89.2 may allow material deterioration, assuming the quality standard is also
increased beyond one standard deviation; and
750 Alpine Energy “Submission on EDB DPP3 Issues paper” (20 December 2018), pp. 3-4; Aurora Energy “Default price-quality paths for electricity distribution businesses from 1 April 2020 Issues Paper” (20 December 2018), p. 7; The Lines Company “Default price-quality paths for electricity distribution businesses from 1 April 2020” (21 December 2018), p. 8.
439
3605676.11
M89.3 is inappropriate to widen the caps and collars to accommodate significant
volatility within the metrics.751
M90 The unplanned and planned SAIDI caps are outlined in Table M3 and Table M4
respectively at the end of this chapter.
Setting the collars (maximum reward)
M91 The reliability collars are the points at which no further rewards are applicable to the
revenue-linked incentive scheme. Our final decision sets planned and unplanned
SAIDI collars at zero, subject to maximum revenue exposure of 2%. In other words,
we have dropped the collars. This means that financial incentives for reliability will
always apply below the SAIDI standards.
M92 As noted above, we consider the cost-quality trade-off should always be in place up
to the applicable reliability standard as long as the incentive rate ensures that the
benefit consumers get from incremental improvements in reliability are greater than
the costs they are exposed to.
M93 We also note that as reliability improves we expect the marginal cost of further
improvements will increase. Rational distributors will look for the least-cost
improvements in reliability, and once exhausted opt for more expensive
improvements until the cost-benefit trade-off is neutralised.
M94 We acknowledge that our recommended settings for caps and collars does create
some asymmetry, as illustrated in Figure M1 and Figure M2 at the start of this
Attachment. Specifically:
M94.1 for unplanned interruptions distributors generally have a wider range for
gains than for losses, however, this asymmetry is somewhat countered by
the potential penalties associated with contravening the unplanned SAIDI
standard; and
M94.2 for planned interruptions distributors generally have three times the range
for losses than for gains, however, this is the compromise made to allow
distributors more flexibility to do more planned interruptions without
contravening the standard.
751 Eastland Network “2020 DDPP Reset Issues Paper” (20 December 2018), p. 4 Orion “Submission on EDB DDP3 Reset “ (20 December 2018), p. 13; ENA “DPP3 April 2020 Commission Issues paper (Part Two, Regulating Quality)” (20 December 2018), pp. 16-17.
440
3605676.11
M95 Much of the asymmetry between the caps and collars of the incentive scheme are
more theoretical than realistic―for example, at the extreme, zero unplanned
interruptions or three times the average planned SAIDI are not outcomes that would
typically be expected.
M96 We note that there were no objections from submitters to the draft decision in
setting the collar at zero SAIDI minutes.
Limiting the revenue exposure
M97 Given our decision to explicitly set SAIDI incentive rates and the SAIDI bounds for
which incentives apply, the revenue exposure to the revenue-linked incentive
scheme is set endogenously. Consequently, the resulting revenue at risk for some
distributors may be considered excessive. We consider that a cap on the total
revenue exposure appropriate to limit price volatility for consumers.
M98 For the final decision the revenue exposure is set endogenously based on the
incentive rates, caps, and collars, but subject to a cap of 2%.
M99 In DPP2 the revenue exposure was explicitly set at 1% (0.5% each for SAIDI and SAIFI)
which was considered a conservative starting point for implementing a revenue-
linked incentive scheme.
M100 However, as noted previously, a consequence of fixing the revenue at risk along with
the caps and collar was significant variability in the relative incentives among
distributors. More reliable distributors generally had much higher derived incentive
rates than less reliable distributors which seems counter-productive. If anything, we
would consider consumers experiencing worse reliability would be more willing to
pay for improved reliability.
M101 For this reason, we have explicitly set the incentive rates rather than the revenue at
risk. Consequently, the revenue exposure will vary between distributors. Less
reliable distributors will generally be exposed to a higher revenue at risk than more
reliable distributors.752 However, we consider it appropriate the least reliable
distributors are subject to more revenue exposure than the most reliable
distributors.
752 Strictly speaking, it is the absolute range between caps and collars that determine the revenue exposure. However, this is closely correlated with the observed level of reliability.
441
3605676.11
M102 Notwithstanding that, to protect consumers and distributors against potential large
inter-year revenue volatility, we consider a cap on the total revenue at risk of ±2% of
allowable revenue in any given year appropriate.753
M103 Some submitters expressed concern that increasing the revenue at risk to 2% would
create price volatility.754 We note that this 2% cap can come into effect for only
some distributors and serves as guard against large price shocks. It is not expected to
be a frequent occurrence. Furthermore, distributors may voluntarily ‘bank’ revenue,
up to 10%, to manage price shocks on consumers.755
M104 Table M5 shows the maximum gains or losses each distributor would face as a
percentage of its (estimated) allowable revenue. While some values appear high, it is
important to note that:
M104.1 the realisation of the maximum unplanned reward would require the
distributor to not have any interruptions during the assessment year; and
M104.2 the realisation of the maximum planned penalty would require the
distributor to triple its historic planned SAIDI during the assessment year.
753 Without a limit on the revenue at risk, we estimate the highest possible revenue impact would be 3.84% of allowed revenue.
754 ENA “Submission on EDB DPP reset draft decisions paper” (18 July 2019), p. 36; Eastland Network “Submission on EDB DPP reset draft decisions paper” (18 July 2019), p. 10; and Unison “Submission on EDB DPP reset draft decisions paper” (18 July 2019), p. 28.
755 The mechanics of the revenue cap, including distributor’s ability to bank revenue and our reasons for limiting this ability are discussed in Attachment H.
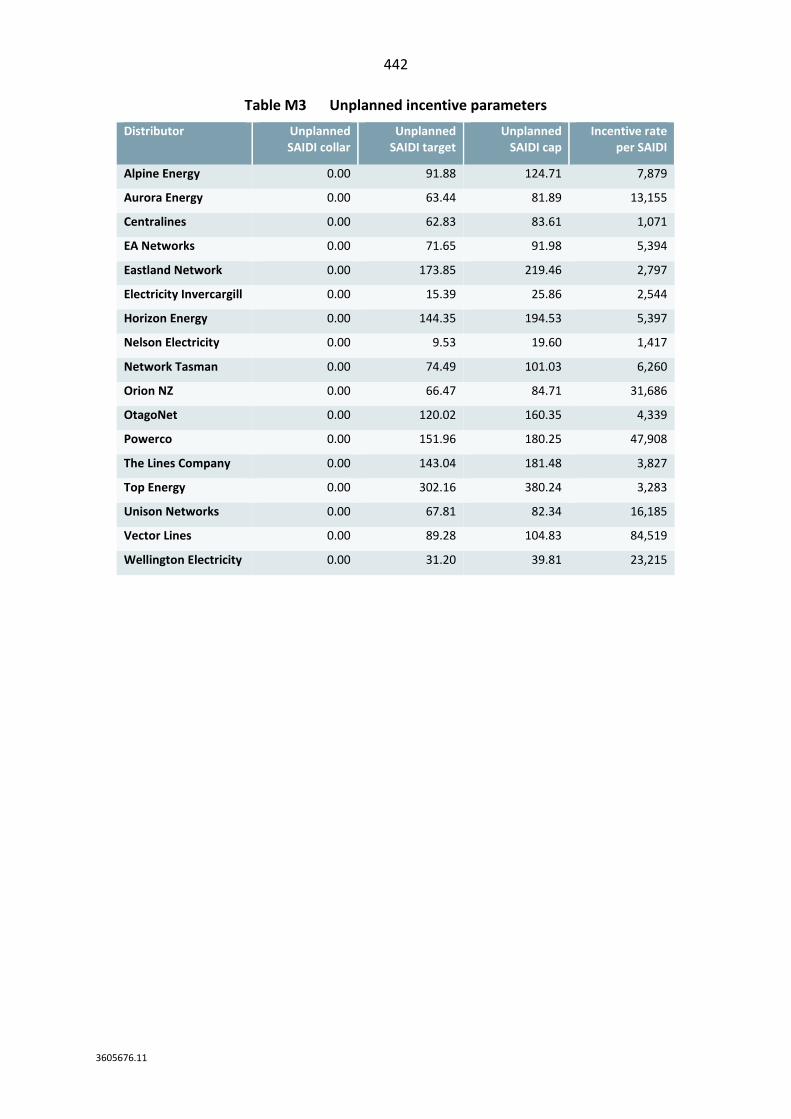
442
3605676.11
Table M3 Unplanned incentive parameters
Distributor Unplanned SAIDI collar
Unplanned SAIDI target
Unplanned SAIDI cap
Incentive rate per SAIDI
Alpine Energy 0.00 91.88 124.71 7,879
Aurora Energy 0.00 63.44 81.89 13,155
Centralines 0.00 62.83 83.61 1,071
EA Networks 0.00 71.65 91.98 5,394
Eastland Network 0.00 173.85 219.46 2,797
Electricity Invercargill 0.00 15.39 25.86 2,544
Horizon Energy 0.00 144.35 194.53 5,397
Nelson Electricity 0.00 9.53 19.60 1,417
Network Tasman 0.00 74.49 101.03 6,260
Orion NZ 0.00 66.47 84.71 31,686
OtagoNet 0.00 120.02 160.35 4,339
Powerco 0.00 151.96 180.25 47,908
The Lines Company 0.00 143.04 181.48 3,827
Top Energy 0.00 302.16 380.24 3,283
Unison Networks 0.00 67.81 82.34 16,185
Vector Lines 0.00 89.28 104.83 84,519
Wellington Electricity 0.00 31.20 39.81 23,215
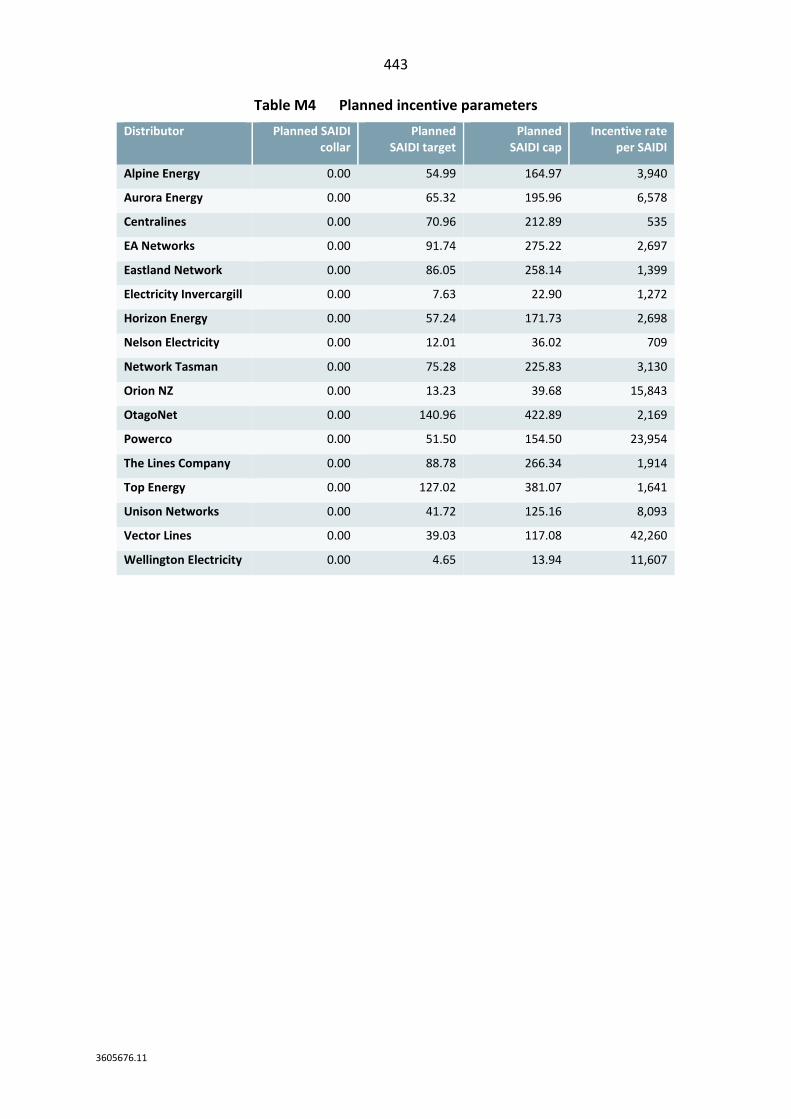
443
3605676.11
Table M4 Planned incentive parameters
Distributor Planned SAIDI collar
Planned SAIDI target
Planned SAIDI cap
Incentive rate per SAIDI
Alpine Energy 0.00 54.99 164.97 3,940
Aurora Energy 0.00 65.32 195.96 6,578
Centralines 0.00 70.96 212.89 535
EA Networks 0.00 91.74 275.22 2,697
Eastland Network 0.00 86.05 258.14 1,399
Electricity Invercargill 0.00 7.63 22.90 1,272
Horizon Energy 0.00 57.24 171.73 2,698
Nelson Electricity 0.00 12.01 36.02 709
Network Tasman 0.00 75.28 225.83 3,130
Orion NZ 0.00 13.23 39.68 15,843
OtagoNet 0.00 140.96 422.89 2,169
Powerco 0.00 51.50 154.50 23,954
The Lines Company 0.00 88.78 266.34 1,914
Top Energy 0.00 127.02 381.07 1,641
Unison Networks 0.00 41.72 125.16 8,093
Vector Lines 0.00 39.03 117.08 42,260
Wellington Electricity 0.00 4.65 13.94 11,607
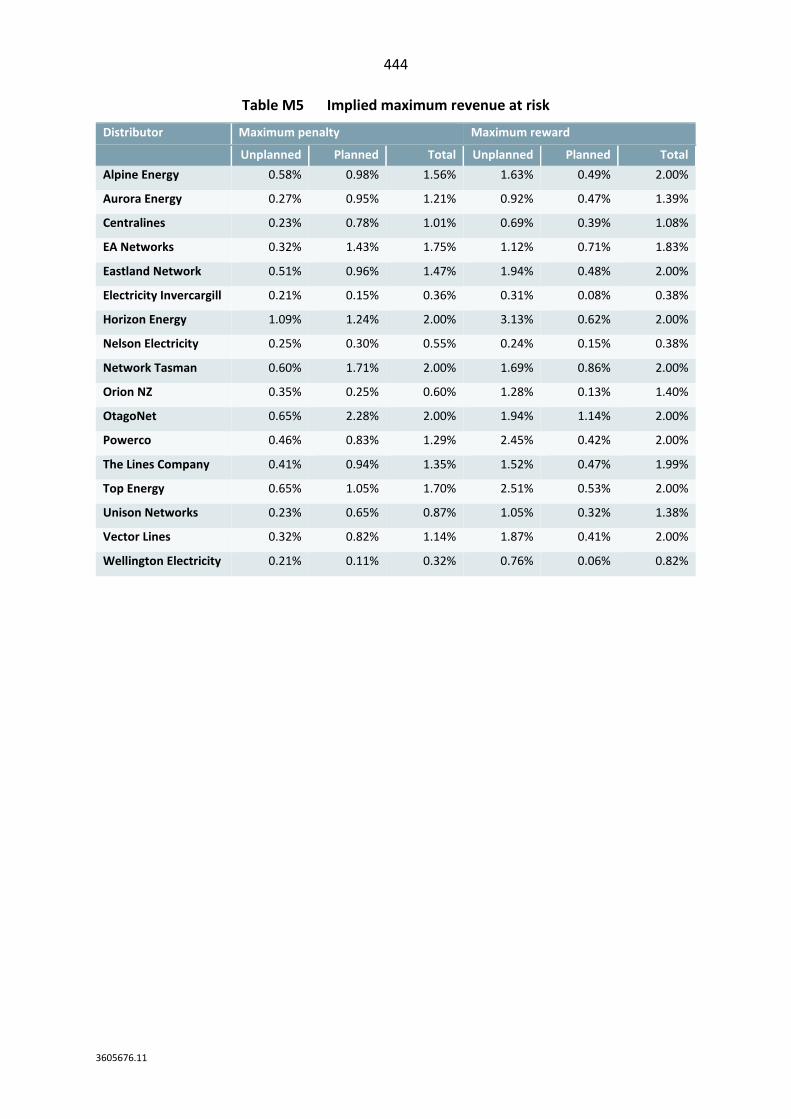
444
3605676.11
Table M5 Implied maximum revenue at risk
Distributor Maximum penalty Maximum reward
Unplanned Planned Total Unplanned Planned Total
Alpine Energy 0.58% 0.98% 1.56% 1.63% 0.49% 2.00%
Aurora Energy 0.27% 0.95% 1.21% 0.92% 0.47% 1.39%
Centralines 0.23% 0.78% 1.01% 0.69% 0.39% 1.08%
EA Networks 0.32% 1.43% 1.75% 1.12% 0.71% 1.83%
Eastland Network 0.51% 0.96% 1.47% 1.94% 0.48% 2.00%
Electricity Invercargill 0.21% 0.15% 0.36% 0.31% 0.08% 0.38%
Horizon Energy 1.09% 1.24% 2.00% 3.13% 0.62% 2.00%
Nelson Electricity 0.25% 0.30% 0.55% 0.24% 0.15% 0.38%
Network Tasman 0.60% 1.71% 2.00% 1.69% 0.86% 2.00%
Orion NZ 0.35% 0.25% 0.60% 1.28% 0.13% 1.40%
OtagoNet 0.65% 2.28% 2.00% 1.94% 1.14% 2.00%
Powerco 0.46% 0.83% 1.29% 2.45% 0.42% 2.00%
The Lines Company 0.41% 0.94% 1.35% 1.52% 0.47% 1.99%
Top Energy 0.65% 1.05% 1.70% 2.51% 0.53% 2.00%
Unison Networks 0.23% 0.65% 0.87% 1.05% 0.32% 1.38%
Vector Lines 0.32% 0.82% 1.14% 1.87% 0.41% 2.00%
Wellington Electricity 0.21% 0.11% 0.32% 0.76% 0.06% 0.82%
445
3605676.11
Attachment N Other measures of quality of service
Purpose of this attachment
N1 This attachment sets out our decisions on not expanding the scope of the quality
standard and quality incentive scheme for EDB DPP3 to include dimensions of quality
other than reliability.
Summary of our decision
N2 Our decisions on new measures of quality for EDB DPP3 are:
N2.1 not to introduce any new measures as part of the quality standard applying
in EDB DPP3 beyond SAIDI and SAIFI;
N2.2 not to introduce any new measures as part of the revenue-linked quality
incentive scheme in EDB DPP3.
N3 In 2020, we intend to consider changes to our ID requirements for distributors to
ensure that distributors are required to report data that may be required for the
future setting of additional quality standards, building on the work undertaken by
the ENA Quality of Service Working Group. This will be as part of a targeted review of
certain ID requirements.
N4 Over the DPP3 period we also intend to consider how we can better support
consumer voice and accountability of distributors, particularly regarding investment
delivery. Investment delivery or output measures could also be considered for future
quality standards.
N5 We note that for DPP3, we have implemented a new incentive for the notification of
planned interruptions. This is a refinement to the existing incentive scheme that
applies to planned interruptions and is discussed further in Attachment M.
Why have we considered other quality dimensions?
N6 Section 53M(1)(b) of the Commerce Act requires that a DPP specifies the quality
standards that must be complied with by regulated suppliers.
N7 The Commerce Act does not prescribe what should be included in a quality standard.
The approach we have taken in previous DPPs is to set quality standards for
distributors based on what is most important to consumers, and what we have the
most reliable historic data on.
446
3605676.11
N8 This is consistent with section 53M(3) of the Commerce Act:
Quality standards may be prescribed in any way the Commission considers appropriate (such
as targets, bands, or formulae) and may include (without limitation) –
(a) responsiveness to consumers; and
(b) in relation to electricity line services, reliability of supply, reduction in energy losses
and voltage stability or other technical requirements.
N9 Quality standards are an important part of determining a price-quality path. Quality
standards ensure that any efficiency gains sought by the regulated suppliers do not
come at the expense of meeting a minimum level of quality.
N10 The quality standards under the current DPP2 are based on measures of network
reliability (specifically, the duration and frequency of interruptions, as measured by
SAIDI and SAIFI respectively), as this was considered to be the most important aspect
of quality for consumers.756
N11 However, the quality of electricity distribution services has a number of dimensions
in addition to reliability. Quality dimensions can relate to the following:757
N11.1 ordering and provisioning of a new connection;
N11.2 management and restoration of faults (including the number and duration
of faults);
N11.3 service performance, reflecting technical characteristics of the service such
as voltage stability; and
N11.4 customer service (such as the time taken to respond to customer
complaints or enquiries).
N12 While reliability remains an important dimension of the quality of electricity
distribution services, we have considered whether further dimensions of quality
should be included in DPP3.
756 Commerce Commission “Default price-quality paths for electricity distributors from 1 April 2015 to 31 March 2020: Main Policy Paper” (28 November 2014), para 6.2.
757 We referred to a number of these dimensions in our decision for DPP2. See Commerce Commission “Default price-quality paths for electricity distributors from 1 April 2015 to 31 March 2020: Main Policy Paper” (28 November 2014), para 6.58.
447
3605676.11
Our reasons for not adopting new quality measures in DPP3
N13 We have three principal reasons for not introducing new measures or quality:
N13.1 a need to gather more information about current levels of performance;
N13.2 the need to engage with consumers on what measures of quality are most
meaningful to them; and
N13.3 the availability of options outside DPP regulation.
Gathering more information about quality performance
N14 Our view, as expressed in the draft decision, was that the lack of information on any
new measures would increase the risk of setting parameters for an incentive scheme
at an inappropriate level. The concerns the ENA expressed around setting a quality
standard for the new measures are also likely to arise in attempting to set
appropriate parameters for an incentive scheme.
N15 Without a robust information base, the targets and other parameters that would
apply under an incentive scheme could either be too tough (resulting in unwarranted
revenue losses for the distributors) or too lax (resulting in unwarranted revenue
gains).
N16 Additionally, the definitions used as part of any new quality measure needs to be
specified in a way that can be consistently applied across all distributors to an
auditable standard. We consider testing the workability of new measures under our
information gathering and disclosure powers prior to attaching a quality standard or
incentive. This will help reduce future compliance costs and the mitigate the risk of
perverse incentives.
N17 Our view is that the information required should first be collated, with a view to
establishing quality standards and potentially a financial incentive scheme for future
DPP resets.
Engaging with consumers on quality
N18 As noted by the Electricity Price Review in its final report, there is a need for greater
consumer engagement by electricity regulators. We consider that is especially true
when it comes to understanding consumers’ perspectives on the aspects of quality
that are most meaningful to them.
N19 As part of a review of ID requirements and future work on quality measures we will
look to engage with consumer groups to shape this process, whether through the
Consumer Advocacy Council, through direct efforts on our own part, or via work with
electricity distributors.
448
3605676.11
Options outside the DPP framework
N20 Finally, we note that both the Commission and distributors have options outside the
DPP for addressing a wider suite of quality measures:
N20.1 information gathering and disclosure;
N20.2 alternate approaches to quality as part of a CPP; and
N20.3 action by distributors beyond the regulatory framework.
N21 Wellington Electricity and Powerco’s CPPs either feature quality measures that go
beyond quality and were based on the particular circumstances of those CPPs or
were accompanied by information gathering requirements that were focused on
what the CPP was intended to deliver. We would consider this as part of any future
CPP applications.
N22 In Powerco’s case, we acknowledge the work that has been done in producing its
Annual Delivery Report as part of the information gathering request that
accompanied its CPP. We are interested in working with Powerco and other
distributors to develop this further to ensure such a report provides full transparency
of how a distributor is performing.
N23 Finally, many distributors have taken steps to measure the quality and performance
of their networks and to communicate with their consumers outside of the formal
regulatory requirements. We consider that these developments, without
prescriptive direction from the Commission are useful, and hope to seem the
continue.
Summary of stakeholder views on draft decision
N24 Some submissions were disappointed with our draft decision not to implement
customer-facing quality measures in DPP3. Powerco stated:758
Powerco is disappointed the proposed quality standards do not include any new customer
service measures that reflect customers’ preferences. We believe the Commission is missing
an opportunity to act on behalf of customers.
758 Powerco “Submission on EDB DPP reset draft decisions paper” (18 July 2019), p. 3.
449
3605676.11
N25 The ENA also continued to support the introduction of the suite of customer-facing
quality measures in DPP3:759
The ENA supports broader measures of service quality from a consumer point of view and we
are disappointed that our suggested package of measures was not included in this reset. We
understand that data availability is an issue for setting new customer service measures and
therefore we support plans to expand Information Disclosures to include customer service
measures. Our earlier research, including consultation with customers and other
stakeholders, indicated that the following services were valued by customers, and were
typically measured by EDBs: The average time taken for an EDB to quote new connection
applications, and the proportion of planned outages notified in advance."
N26 We acknowledge the disappointment expressed by some submitters at our decision
not to implement new quality standards. However, we consider that the data issues
we outlined in the draft still mean it is not in consumers interests to introduce new
standards immediately.
N27 Vector submitted specifically in support of introducing a guaranteed service level
(GSL) incentive scheme, noting the benefits they have had elsewhere. Vector said:760
A GSL scheme, for instance, arguably provides a much better price-quality nexus for
individual consumers than the draft DPP3 does.
Such schemes are also much more akin to service commitments offered for other
infrastructure services, such as telecommunications where service outcomes are measured
for the individual consumer. Measuring and incentivising service outcomes only as an
average across all consumers – as the draft DPP3 decision proposes – misses the key point
that consumers individually face price and quality outcomes not as a collective.
N28 While we accept the possible benefits Vector outlines, we note that our current
approach to quality standards and revenue allowances is consistent. Both the
allowable revenue used to set prices and the SAIDI and SAIFI used to set quality
standards and incentives are specified at a network aggregate level, rather than at a
customer class or individual customer level.
N29 Vector also expressed its interest in developing a trial GSL scheme for Vector
specifically.761 As noted below, other distributors are currently operating GSL
scheme’s independent of the Part 4 regime, and we do not consider that our
regulation prevent this. Consistent with our low-cost DPP principles outlined in
Chapter 3, we do not consider business-specific quality standards appropriate for a
DPP that must be applicable to all distributors.
759 ENA “Submission on EDB DPP reset draft decisions paper” (18 July 2019), p. 37. 760 Vector “Submission on EDB DPP reset draft decisions paper” (18 July 2019), p. 66. 761 Vector “Submission on EDB DPP reset draft decisions paper” (18 July 2019), p. 66.
450
3605676.11
N30 We also note that we can only introduce new quality incentives where there is a
corresponding quality standard.
N31 On the other hand, Wellington Electricity supported the decision not to introduce
any new standards or incentives:762
WELL supports the Draft Decision to not include any new quality measures and to explore
new customer metrics in the DPP period. WELL also supports the proposal to consider
changing information Disclosures to ensure data is collected to support any new standard.
This will also allow the industry to ensure that any new measure reflects the quality that
customers find important.
Background
What we said in the issues paper
N32 In the issues paper, we noted that the quality standards that apply under the current
EDB DPP are based on network reliability as measured by SAIDI and SAIFI
(representing duration and frequency of interruptions respectively). We said these
measures are likely to broadly remain appropriate.
N33 However, we sought views on whether the quality standards to apply during DPP3
should be expanded to include additional standards of quality that are important to
consumers. We referred to our 2017 open letter on our priorities for the EDB DPP
reset (“2017 open letter”), in which we noted that it may be appropriate to consider
other dimensions of quality, beyond the current standards of SAIDI and SAIFI.763
N34 We also sought views on the recommendations submitted to us by the ENA Quality
of Service (QoS) Working Group, as well as other potential measures of quality of
service. We asked whether new measures should be included in the quality regime
to apply under RDB DPP3, or through the ID regime that applies to distributors.
762 Wellington Electricity “Submission on EDB DPP reset draft decisions paper” (18 July 2019), p. 23. 763 Commerce Commission “Our priorities for the electricity distribution sector for 2017/18 and beyond”
(Attachment: Proposed focus areas for the 2020 reset of the default price-quality path) (9 November 2017), para 6.1.
451
3605676.11
ENA Quality of Service Working Group
N35 We acknowledged the work that the ENA had done during 2018 in establishing a QoS
Working Group to consider potential refinements to the current DPP quality
regime.764 The ENA QoS Working Group had been considering current and potential
new quality standards and measures through surveying distributors on their
experiences under the quality regime and on the information that distributors
collect,765 and reviewing international practice.
N36 The ENA QoS Working Group submitted an interim report to the Commission on 1
October 2018, outlining recommendations for the quality regime to apply during
EDB DPP3. This included recommendations for two new customer service measures
to be included in the quality incentive scheme, but not in the quality standard used
for compliance purposes. The two new customer service measures proposed by the
ENA QoS Working Group relate to the time for distributors to provide a quote in
response to applications for new connections, and the notification of planned
interruptions.
N37 The ENA QoS Working Group also proposed that the use of GSL schemes be
considered, where customers who receive a service below a minimum level would
be entitled to a service level payment. Although the ENA QoS Working Group noted
that a considerable amount of work would be required on designing such a scheme,
a GSL scheme funded through the regulatory cost base would “allow appropriate
transparent trade-offs to be made for improving service for customers experiencing
service at levels below that specified by the GSL framework.”766
Our preliminary views in the issues paper
N38 In the issues paper, we said there is merit in considering a wider range of measures
of quality of service for inclusion in the quality regime for EDB DPP3, including but
not limited to those proposed by the ENA QoS Working Group.
764 Commerce Commission “Default price-quality paths for electricity distribution businesses from 1 April 2020: Proposed process” (14 June 2018), para 18.
765 The Working Group undertook a survey of EDBs, using an updated survey from that used by the ENA Working Group in 2014. The survey gathered information on the type and granularity of data collected by the distributors relating to quality measures, and EDB use of customer surveys.
766 Electricity Networks Assoc. “ENA Working Group on quality of service regulation – Interim report to the Commerce Commission” (1 October 2018), page 19.
452
3605676.11
N39 We agreed with the ENA QoS Working Group that the value to consumers of being
notified of a planned interruption is likely to depend on the timeliness, accuracy, and
reliability of the notification given of the interruption. However, we questioned the
ENA QoS Working Group recommendation to include the notification of planned
interruptions only as part of the revenue-linked quality incentive scheme but not as
part of the quality standard for compliance purposes.
N40 We also noted that the ENA QoS Working Group recommendation regarding new
connections is based on the time taken to provide a quote for new connections
rather than the time to physically provision the new connection, and that the latter
is likely to be particularly important to consumers.
N41 We also sought views on whether power quality should be considered, either as part
of the quality standard or as new disclosure requirements or both. We noted that
monitoring and transparency of power quality, including over the LV network, could
assist distributors in identifying issues, allowing them to better target expenditure.
Greater visibility for third parties would also allow them to offer solutions to the
distributor which may be more economic.
N42 We asked for views on the potential use of a GSL scheme. In particular, whether a
GSL scheme that allowed for consumers to be automatically compensated for poor
service levels should be considered, including:
N42.1 how such a scheme would sit within a framework that already includes a
quality incentive scheme; and
N42.2 how such a scheme and its funding as part of the regulatory cost base would
affect incentives for distributors to offer a quality of service that reflects
what consumers want.
N43 We were also interested in views on the use of ‘leading’ indicators of distributor
network reliability performance. The existing measures of network reliability (SAIDI
and SAIFI) are ‘after-the-fact’ measures in that they measure deterioration in
reliability once an interruption has occurred. However, as we acknowledged in our
2017 Open Letter, leading indicators may be challenging to identify and implement.
N44 We noted that the ID framework has an important role in revealing the underlying
condition of distribution networks and highlighting to distributors and to us any
areas which may warrant further attention. In this regard, we may identify additional
quality measures that we want distributors to report their performance against, but
that may not necessarily result in additional quality standards for the DPP3 reset. For
example, this may lead to changes to the ID regulations to require distributors to
disclose this information and that will fall outside of the DPP workstream.
453
3605676.11
N45 In submissions on the issues paper, there was general support for considering
additional dimensions of quality beyond reliability, although there were divergent
views on how any new quality measures should be dealt with in EDB DPP3.
N46 Broadly speaking, the range of views on whether and if so, how, to accommodate
new quality measures within EDB DPP3 were as follows:
N46.1 include new quality measures as part of the compliance quality standard
that would apply under EDB DPP3 (Fonterra and Meridian767);
N46.2 include new quality measures as part of the quality incentive scheme that
would apply under DPP3, but not as part of the compliance quality standard
(ENA,768 supported by Alpine,769 Centralines,770 Network Tasman,771
Powerco,772 and Unison773);
N46.3 exclude new quality measures from DPP3, but further develop the
definition, measurement, and information requirements to consider
introducing new standards as part of a future DPP (Aurora,774 The Lines
Company775 and Orion776). These parties were open to considering new
quality standards, but argued that inclusion in DPP3 would be premature.
N47 Eastland raised concerns around the involvement of third parties (and distributor
control over the new measures).777
767 Fonterra “Consultation Paper EDB DPP3 Issue Paper” (20 December 2018), pp. 3 to 4; Meridian Energy “2020-2025 Distribution default price-quality path – Issues paper” (20 December 2018), p. 5.
768 ENA “DPP3 April 2020 Commission Issues paper (Part Two, Regulating Quality)” (20 December 2018), p. 18. 769 Alpine Energy “Submission on EDB DPP3 Issues paper” (20 December 2018), para 4. 770 Centralines “Submission on DPP Reset Issues Paper” (21 December 2018), p. 1. 771 Network Tasman “Submission on the Commerce Commission's Issue Paper - Default price-quality paths for
electricity distribution businesses from 1 April 2020” (20 December 2018). 772 Powerco “Submission on DDP reset issues paper” (21 December 2018), p. 3. 773 Unison “Submission on default price-quality paths for electricity distribution businesses from 1 April 2020
Issues paper” (21 December 2018), para 1. 774 Aurora Energy “Default price-quality paths for electricity distribution businesses from 1 April 2020 Issues
Paper” (20 December 2018), p. 1. 775 The Lines Company “Default price-quality paths for electricity distribution businesses from 1 April 2020” (21
December 2018), pp. 8 to 10. 776 Orion “Submission on EDB DDP3 Reset “ (20 December 2018), p. 14. 777 Eastland Network “2020 DDPP Reset Issues Paper” (20 December 2018), p. 6.
454
3605676.11
N48 Vector submitted that any new quality standards must not increase the risk of non-
compliance, and that any innovations to the quality framework should be within the
current financial parameters of the service quality incentive scheme.778
N49 A number of submissions responded to the issues paper on the question of power
quality. Several distributors noted that power quality is currently subject to technical
regulations.779 The ENA also submitted that collecting exhaustive information about
voltage fluctuations, particularly on the LV network, would involve significant
investment in monitoring, information systems and communications.780
N50 Orion agreed that it is increasingly important to understand power quality measures
as networks become platforms for two-way flows, although did not support inclusion
of a voltage stability disclosure in EDB DPP3.781
N51 Mercury supported the inclusion of power quality as part of the quality standard
which would require distributors to disclose performance at the LV level.782
N52 Several parties supported introducing new measures as part of the disclosure regime
rather than as part of the quality regime for DPP3.783
Guaranteed service level scheme
N53 In its submission on the issues paper, the ENA noted that GSL schemes, where
customers who receive a service below minimum acceptable levels will be entitled to
a service level payment, are common in other countries. According to the ENA,784
A predetermined amount of revenue set aside for the scheme, funded through the
regulatory cost base will allow a GSL scheme to operate in a manner consistent with price-
quality trade-offs for investment and works programmes. A funded GSL scheme will allow
appropriate transparent trade-offs to be made for improving service for customers
experiencing service at levels below that specified by the GSL framework.
778 Vector “Submission to Commerce Commission Default Price Quality Path Issues Paper” (21 December 2018), para 189.
779 Wellington Electricity “Default price-quality paths for electricity distribution businesses from 1 April 2020 Issues Paper” (21 December 2018), p. 20; The Lines Company “Default price-quality paths for electricity distribution businesses from 1 April 2020” (21 December 2018), p. 9.
780 ENA "DPP3 April 2020 Commission Issues paper (Part Two, Regulating Quality)" (20 December 2018), p. 19. 781 Orion "Submission on EDB DDP3 Reset " (20 December 2018), para 77. 782 Mercury “Default Price-Quality Paths for Electricity Distribution Businesses from 1 April 2020” (20
December 2018). 783 See for example: The Lines Company "Default price-quality paths for electricity distribution businesses from
1 April 2020" (21 December 2018), p. 8; Orion "Submission on EDB DDP3 Reset " (20 December 2018), para 63; Aurora Energy "Default price-quality paths for electricity distribution businesses from 1 April 2020 Issues Paper" (20 December 2018), paras 7.1-7.2.
784 ENA "DPP3 April 2020 Commission Issues paper (Part Two, Regulating Quality)" (20 December 2018), p. 19.
455
3605676.11
N54 A number of other submissions also commented on the introduction of a GSL
scheme.785 There was generally support for looking into a GSL scheme, although
most parties acknowledged that the development of such a scheme would require
considerable time and effort.
Our views on specific new measures of quality
N55 We have considered whether the scope of the quality standard and quality incentive
scheme for DPP3 should be expanded to include dimensions of quality other than
reliability. In doing so, we have looked at whether there are other quality dimensions
that meet the following:
N55.1 the dimensions are valued by customers;
N55.2 the dimensions can be clearly defined and measured;
N55.3 the dimensions are within the control of the distributors; and
N55.4 there is robust information available to implement the measures as part of
DPP3.
N56 We have also considered whether a GSL scheme should be introduced as part of
DPP3.
New quality measures
N57 In this section, we discuss the wider range of quality measures that we raised in the
issues paper. These relate to the notification of planned interruptions, new
connections, and power quality.
N58 We also discuss our consideration of alternative means of influencing output
measures and delivery of planned investment.
Notification of planned interruptions
N59 According to the ENA, communication of planned interruptions is a top priority
identified by distributors’ customers. “Timely, accurate and reliable notification of
planned interruptions reduces the impact of an interruption and leads to a better
customer experience.”786 The ENA recommended a measure of the proportion of
planned interruptions notified in advance of the interruption.
785 Orion "Submission on EDB DDP3 Reset " (20 December 2018), p.16; Wellington Electricity "Default price-quality paths for electricity distribution businesses from 1 April 2020 Issues Paper" (21 December 2018), p. 20.
786 ENA "DPP3 April 2020 Commission Issues paper (Part Two, Regulating Quality)" (20 December 2018), p. 18.
456
3605676.11
N60 Communication with consumers in relation to planned interruptions was also
identified as being important in the Powerco application for a CPP. According to the
consumer survey undertaken by PwC and Colmar Brunton on behalf of Powerco,
more than 90% of respondents reported that communication about planned power
cuts was important.787
N61 In its submission on the issues paper, Fonterra emphasised the importance of
adequate and accurate notification of planned interruptions. Fonterra recommended
that distributors be measured in terms of compliance with a 10-day notice period for
planned interruptions.788
N62 Any new quality measures will need to be clearly defined and measured. In the case
of notification of planned interruptions, the value to consumers of being notified of a
planned power cut is likely to depend on the timeliness, accuracy, and reliability of
the notification. In particular, as we noted in the issues paper:
N62.1 the period of advanced notice should be adequate to allow consumers
(including business consumers) sufficient time to prepare for the power
interruption;
N62.2 the notification should be accurate and reliable, so that the specified period
of the interruption is reasonable; and
N62.3 the work undertaken on the distribution network actually takes place within
the specified period (unless there are factors beyond the control of the
distributor which prevents the work from being done).
N63 A quality measure for the notification of planned interruptions might therefore be
defined by requiring a proportion of planned interruptions to meet criteria which
reflect the dimensions listed above.
N64 According to the ENA, the information base required to set compliance standards for
the ENA’s proposed new measures (notification of planned interruptions, and time
to quote for new connections) is yet to be developed, and as a result, the new
measures should only be included in the quality incentive scheme for EDB DPP3.789
N65 We note that section 53M(2) of the Commerce Act, which allows us to include
incentives for quality in a DPP, refers back to the supplier meeting or failing to meet
or exceeding the required quality standards. This indicates that any incentive scheme
must be accompanied by an enforceable quality standard.
787 Powerco CPP “Consultation report” (12 June 2017), p. 35 (PwC, “Full results from consumer survey”). 788 Fonterra “Consultation Paper EDB DPP3 Issue Paper” (20 December 2018), pp. 3 to 4. 789 ENA “DPP3 April 2020 Commission Issues paper (Part Two, Regulating Quality)” (20 December 2018), p. 18.
457
3605676.11
N66 Although we are not proposing to introduce a new quality standard relating to the
notification of planned interruptions for DPP3, we are proposing to introduce a new
incentive for notification of planned interruptions. A planned interruption is
currently defined as an interruption where 24 hours’ notice has been provided. As
discussed in Attachment M, we are proposing to encourage distributors to provide
greater notification of planned interruptions. We propose to do this by reducing the
revenue impact of the planned SAIDI incentive where adequate notification is
provided by the distributor. To achieve the more beneficial incentive rate, the
distributor must provide at least five working days’ notice of a planned interruption,
and the planned interruption must actually take place within a reasonable
window.790
N67 In our view, the above mechanism is appropriate for DPP3, and we may consider
introducing further measures, including a separate compliance standard and
potentially a financial incentive scheme, for planned interruptions as part of future
DPP resets.
New connections
N68 The ENA QoS Working Group has submitted that the average time to quote for a
new connection is important to consumers:791
Average time taken to quote new connections was identified as being of notable customer
value. This was specifically identified by the ENA Customer working group during the review
of customer values identified from existing individual EDB research, as well as through the
ENA Customer Reference Panel, and through review of overseas regimes.
N69 For new connections, a quality measure could be defined in relation to the time the
distributor takes to provide a quote for a new connection (as proposed by the ENA
QoS Working Group), or the time to physically provision the new connection. A
number of submissions noted that a well-defined measure for new connections
would need to take account of variations in the size and complexity of customer
connections, as well as the involvement of third parties in installation.792 We note
that other regulators have recognised these differences when setting requirements
relating to new connections.
790 See Attachment M for further discussion. 791 ENA “ENA Working Group on Quality of Service Regulation: Interim Report to the Commerce Commission”
(1 October 2018), p. 20-21. 792 Vector “Submission to Commerce Commission Default Price Quality Path Issues Paper” (21 December
2018), para 199.
458
3605676.11
N70 For example, Ofgem note that:793
The type of services a customer requires may depend on the type (or size) of connection they
seek and this in turn may affect how performance should be measured and incentivised. For
connections at the lower voltages (minor connections) the connections process can be
reasonably straightforward. For connections at higher voltages and generation/unmetered
connections (major connections) their requirements are often more complex.
N71 As discussed above in relation to the notification of planned interruptions, the ENA
has submitted that the information required to set compliance standards for new
connections is yet to be developed. The ENA proposed that any new measure
relating to new connections should only be included in the quality incentive scheme
for EDB DPP3, and not as part of the compliance regime.
N72 For the reasons given above, we disagree with the ENA’s proposal to introduce a
new connections measures as part of the quality incentive scheme but not as an
enforceable quality standard. Our view is that the information required should first
be collated, with a view to establishing compliance standards and potentially a
financial incentive scheme for future DPP resets.
Power quality
N73 A number of submissions responded to the issues paper on the question of power
quality. Orion agreed that it is increasingly important to understand power quality
measures as networks become platforms for two-way flows. Orion said that basic
visibility of the LV system is a prerequisite to reporting accurately and dynamically on
power quality measures, and that targeted investment by distributors in the LV
system will facilitate provision of accurate system performance data to inform real-
time and future asset management decision making. As this capability build is in its
early stages, Orion did not support inclusion of a voltage stability disclosure in
DPP3.794
793 Ofgem “Guide to the RIIO-ED1 electricity distribution price control” (18 January 2017), para 9.2. 794 Orion “Submission on EDB DDP3 Reset “ (20 December 2018), para 77.
459
3605676.11
N74 Several distributors noted that power quality is currently subject to technical
regulations,795 although these regulations needed to be updated to reflect technical
challenges that new technology will impose on voltage quality.796 According to the
ENA, the current technical regulations do not reflect the increasing tolerance of most
modern electric devices to wider voltage ranges. The ENA also submitted that
collecting exhaustive information about voltage fluctuations, particularly on the LV
network, would involve significant investment in monitoring, information systems
and communications.797
N75 Mercury did support the inclusion of power quality as part of the quality standard
which would require distributors to disclose performance at the LV level. Mercury
said that failing to maintain voltage within safe ranges can seriously impair the
performance of electrical equipment.
N76 Having considered submissions on the issues paper, we remain of the view that
greater transparency of power quality, including on the LV networks, is increasingly
important.
N77 This is also consistent with draft views expressed by IPAG, that distributors should
have greater visibility of the performance of their LV networks, “so they are better
able to manage reliability with greater penetration of distributed energy resources,
and specify needs which could be obtained from a third-party to support network
management.”798
N78 We are proposing to include a new recoverable cost for expenditure on
innovation.799 As discussed at the DPP3 workshop on 8 March 2019, this could
include LV network monitoring. An ID requirement could increase transparency
around LV network performance and accountability.
795 Wellington Electricity “Default price-quality paths for electricity distribution businesses from 1 April 2020 Issues Paper” (21 December 2018), p. 20; The Lines Company “Default price-quality paths for electricity distribution businesses from 1 April 2020” (21 December 2018), p. 9.
796 Vector “Submission to Commerce Commission Default Price Quality Path Issues Paper” (21 December 2018), para 203.
797 ENA “DPP3 April 2020 Commission Issues paper (Part Two, Regulating Quality)” (20 December 2018), p. 19. 798 IPAG “Advice on creating equal access to electricity networks (draft for discussion)” (6 December 2018),
slide 6. 799 See Attachment F.
460
3605676.11
Investment delivery
N79 In some of our recent price path determinations, such as the Wellington Electricity
CPP, we have introduced output or investment delivery measures into the quality
standards or quality incentive schemes. We are not proposing to do this for DPP3
because we currently consider that these are more appropriate for price paths like
CPPs and IPPs that have a higher level of scrutiny of particular expenditure and are
not in the long-term interests of consumers for DPPs.
N80 However, we are considering options outside of the DPP determination that will
support consumer voice and accountability of distributors in regard to investment
delivery. We consider that increased focus on the delivery of network investment
and maintenance would be helpful in improving the performance of electricity
distributors and in making them more accountable to their customers.
N81 This is consistent with our open letter on priorities for the electricity sector, which
highlighted our planned focus on asset management and investment sufficiency,
among other things.
N82 While this issue is best addressed through our ID rules and analysis of the disclosed
information, we consider that the DPP3 reset is an appropriate time to signal our
intentions. There is an expectation that if the DPP3 reset allows distributors to
charge consumers at a certain level to cover the costs of investing in and maintaining
the network, then we expect them to complete that investment and maintenance
unless the difference is due to an efficiency gain or an optimal deferral.
N83 Additional performance analysis of distributors may lead to us considering additional
quality standards at future DPP resets, or changes to the ID requirements.
N84 However, we received several submissions on other quality standard measures,
suggesting to us that it is best to start with ID of any new measures, which can then
be considered for quality standards at the next reset. This is relevant to the topic of
accountability because stronger requirements on accountability could be ID or
quality standards, for example on output measures or asset health measures. Our
proposed approach is consistent with these submissions.
N85 Mercury said that they “support more transparency, scrutiny, and accountability of
distribution investment and operation decisions”.800 Our proposed approach is
consistent with this.
800 Mercury “Default Price-Quality Paths for Electricity Distribution Businesses from 1 April 2020” (20 December 2018).
461
3605676.11
N86 Orion submitted that an expenditure delivery report to provide accountability would
be “beyond the requirements of a DPP and an unnecessary cost”. Orion noted that
many distributors already publish similar information voluntarily.801 In somewhat of
a contrast to Orion, The Lines Company submitted that “We believe a review by
distributors of their capital expenditure at the end of a DPP period against what was
proposed at the commencement could provide a means of assessing capital
expenditure delivery.”802 The Lines Company also explain that it is important to note
that there are a range of reasons why planned work may be deferred, brought
forward, or not required.
Guaranteed service level scheme
N87 The current approach to the quality standard and quality incentive scheme applying
to non-exempt distributors under the DPP are based on network reliability measured
at the network level. A more granular approach, such as through an appropriately-
designed GSL scheme, may enhance the incentives facing distributors to recognise
and respond to poor service levels.
N88 In its submission on the issues paper, the ENA noted that GSL schemes, where
customers who receive a service below minimum acceptable levels will be entitled to
a service level payment, are common in other countries. According to the ENA:803
A predetermined amount of revenue set aside for the scheme, funded through the
regulatory cost base will allow a GSL scheme to operate in a manner consistent with price-
quality trade-offs for investment and works programmes. A funded GSL scheme will allow
appropriate transparent trade-offs to be made for improving service for customers
experiencing service at levels below that specified by the GSL framework.
N89 A number of other submissions also commented on the introduction of a GSL
scheme. There was generally support for looking into a GSL scheme, although most
parties acknowledged that the development of such a scheme would require
considerable time and effort.
N90 For example, Orion did not support the introduction of a GSL scheme for DPP3 but
submitted that further consideration should be given to a GSL scheme for EDB DPP4.
According to Orion, “contemplating development of a GSL so close to the final
decision date for DPP3 risks compromising the quality of the scheme. We support
801 Orion “Submission on EDB DDP3 Reset “ (20 December 2018), para 24. 802 The Lines Company “Default price-quality paths for electricity distribution businesses from 1 April 2020” (21
December 2018), p. 6. 803 ENA “DPP3 April 2020 Commission Issues paper (Part Two, Regulating Quality)” (20 December 2018), p. 19.
462
3605676.11
further consideration of the construct for a GSL over the next period in conjunction
with the Commission for further consultation at DPP4.”804
N91 Mercury supported the concept of a GSL scheme, subject to appropriate design and
funding.805 Wellington Electricity supported the introduction of a GSL scheme as
proposed by the ENA, although recognised that such a scheme would require
considerable resources and investment to implement.806
N92 Aurora noted that it had operated a GSL scheme for many years, and so was not
concerned about the introduction of such a scheme under the DPP. The key issue for
Aurora related to how such a scheme would be funded.807
N93 In its cross-submission, MEUG said it was unclear what a GSL scheme might look like,
and how such a scheme would be funded. “Neither do we understand if current or
any proposed compensation schemes for loss of or poor service delivery leads
directly to lower returns to distributor shareholders’, or those costs are simply
recovered by an uplift in the revenue path across all other customers. The incentive
effect of the former relative to the latter and comparison with how non-performing
businesses are affected in workably competitive markets should be an important
consideration.”808
N94 We consider that a well-designed and effective GSL scheme could enhance the
incentives facing distributors to recognise and respond to poor service levels. GSL
schemes can improve visibility of the actual level of service experienced by
customers and incentivise distributors to take targeted steps to improve that
experience. Such schemes provide a more direct link between the actual level of
service and customer compensation, compared to quality standards and quality
incentive schemes that are directed at the network level.
N95 A number of parties, including the ENA, have recognised that considerable work
would be required to develop and design an effective GSL scheme. The ENA QoS
Working Group noted some of the practical issues relating to a GSL scheme,
including whether such a scheme should apply service level targets on a national or a
network-specific level, and any exemptions from such a scheme (such as major
events, planned interruptions, and third-party events).
804 Orion “Submission on EDB DDP3 Reset “ (20 December 2018), para 75-76. 805 Mercury “Default Price-Quality Paths for Electricity Distribution Businesses from 1 April 2020” (20
December 2018), p. 6. 806 Wellington Electricity “Default price-quality paths for electricity distribution businesses from 1 April 2020
Issues Paper” (21 December 2018), p. 20. 807 Aurora Energy “Default price-quality paths for electricity distribution businesses from 1 April 2020 Issues
Paper” (20 December 2018), para 7.2(c). 808 MEUG “Cross submission on EDB DPP3 reset issues paper” (31 January 2019), para 4.

463
3605676.11
N96 Another essential part of a GSL scheme relates to the payment amounts of the
scheme, and how such a scheme is funded. The strength of the incentive on the
distributors to respond to poor service levels will depend on the proportion of
funding that is sourced from customers (for example by funding the scheme through
the regulatory cost base).
N97 Given the above, we agree with Orion that the development of a GSL scheme for the
distributors should be considered during the DPP3 period, with a view to potential
implementation for DPP4.
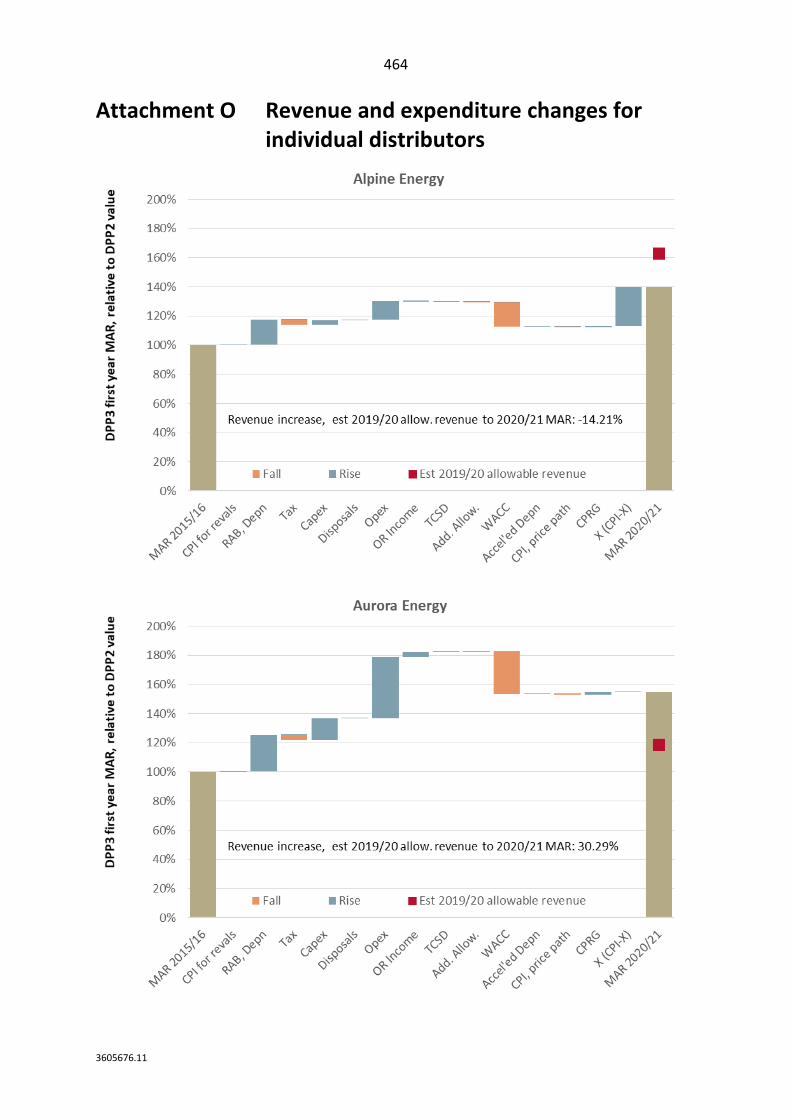
464
3605676.11
Attachment O Revenue and expenditure changes for individual distributors
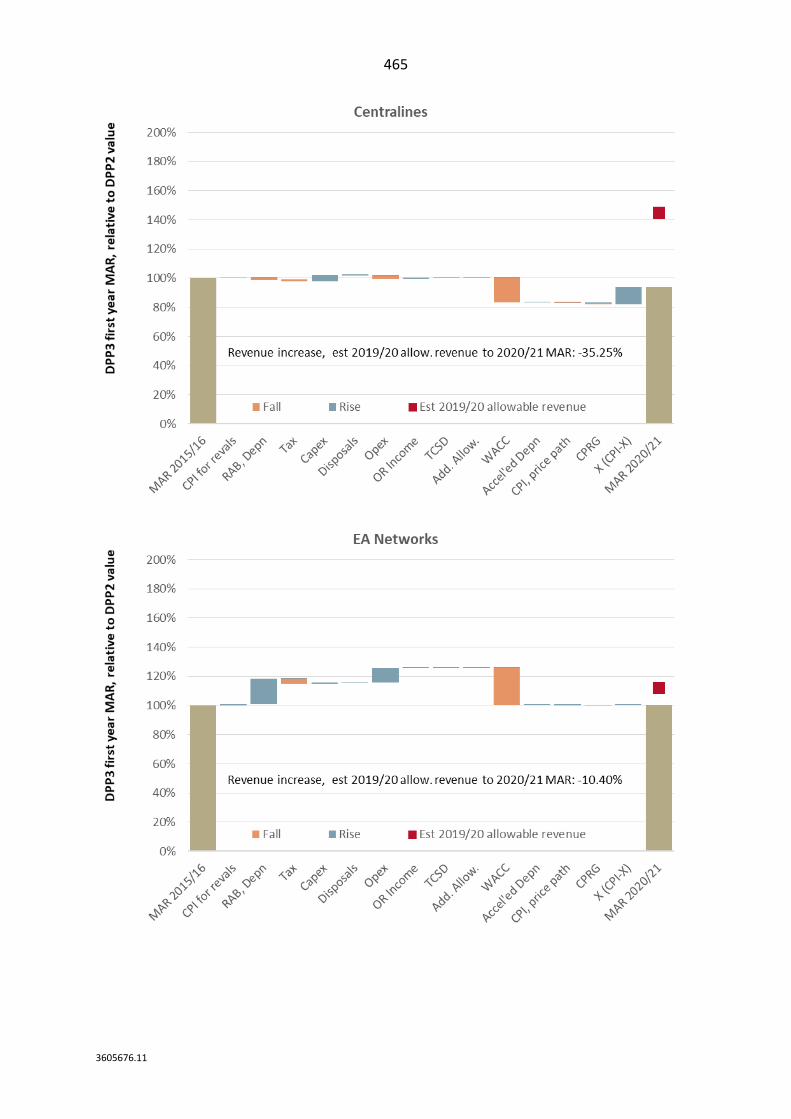
465
3605676.11
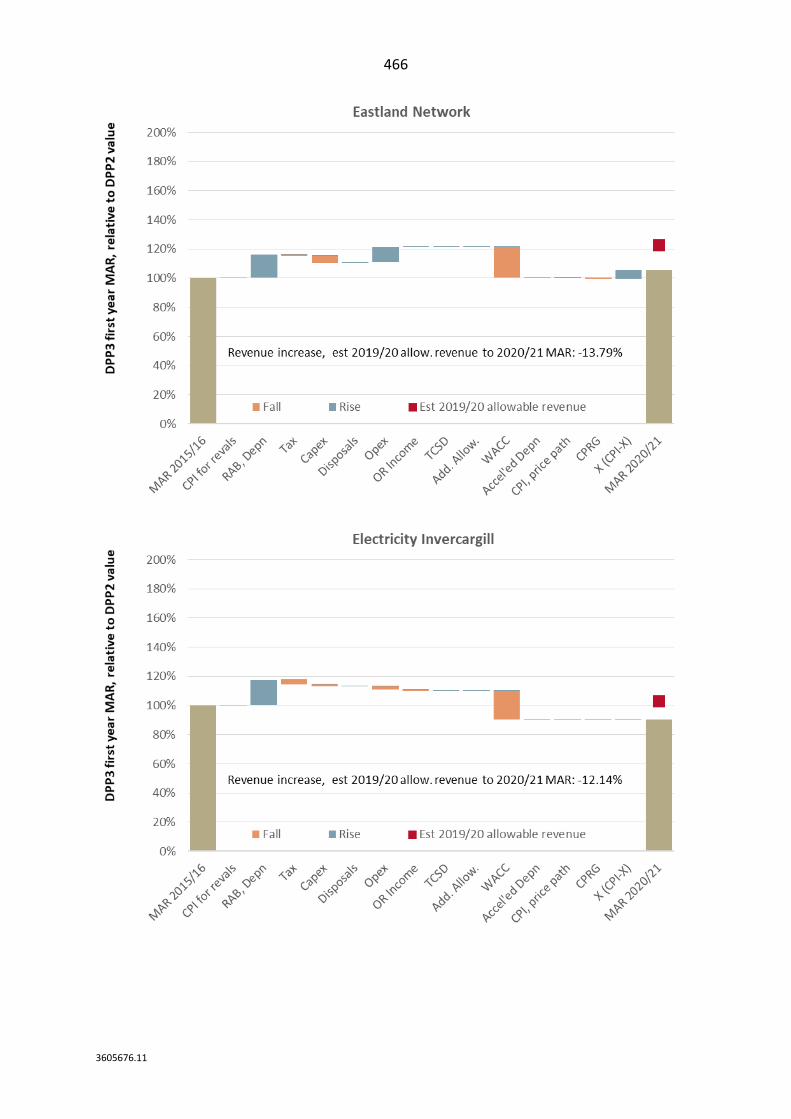
466
3605676.11
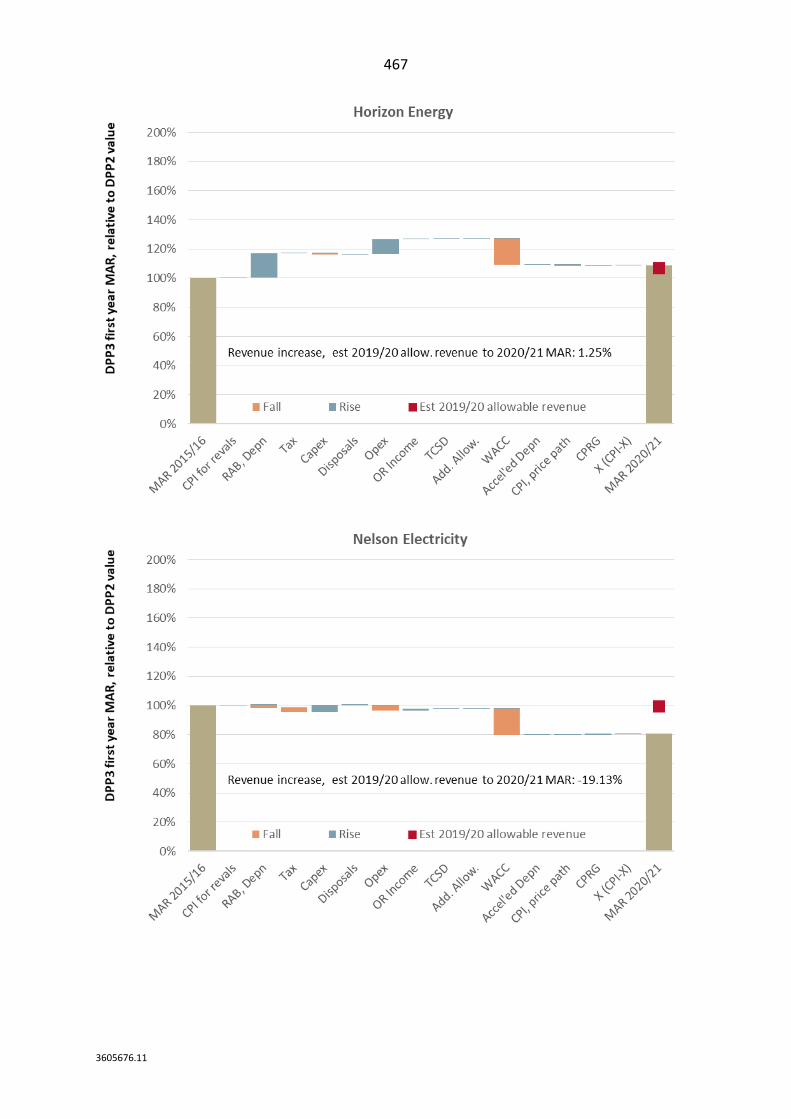
467
3605676.11
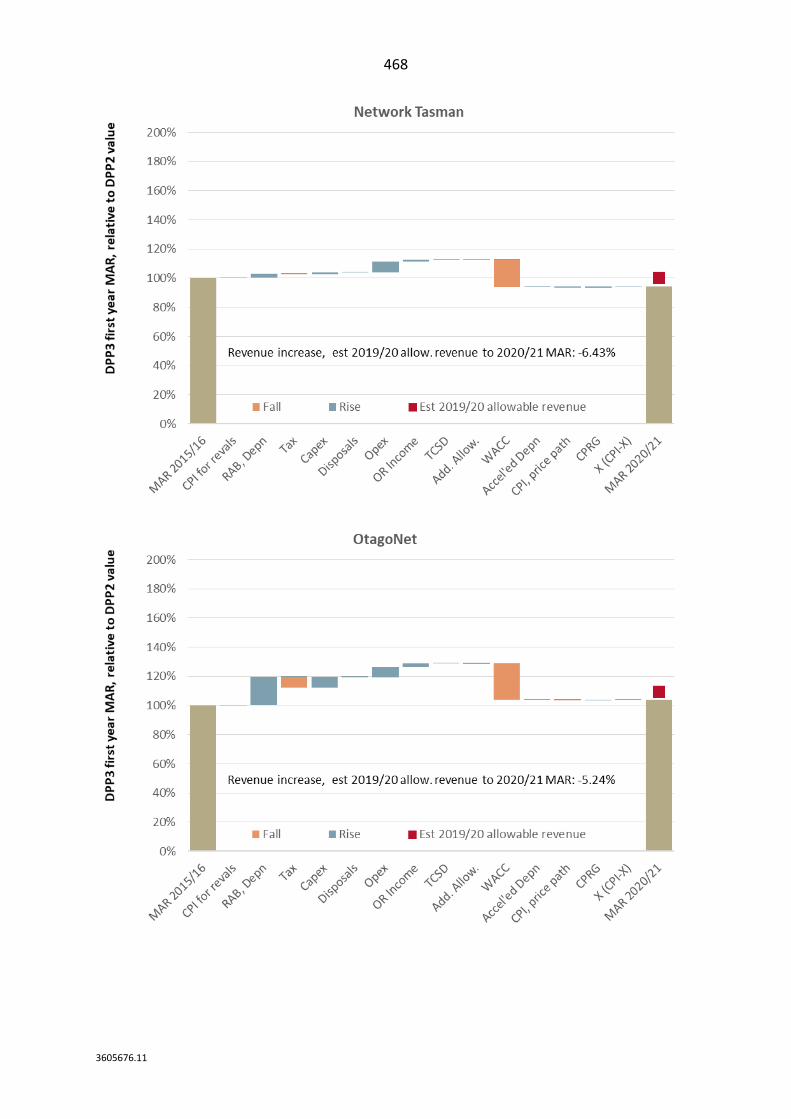
468
3605676.11
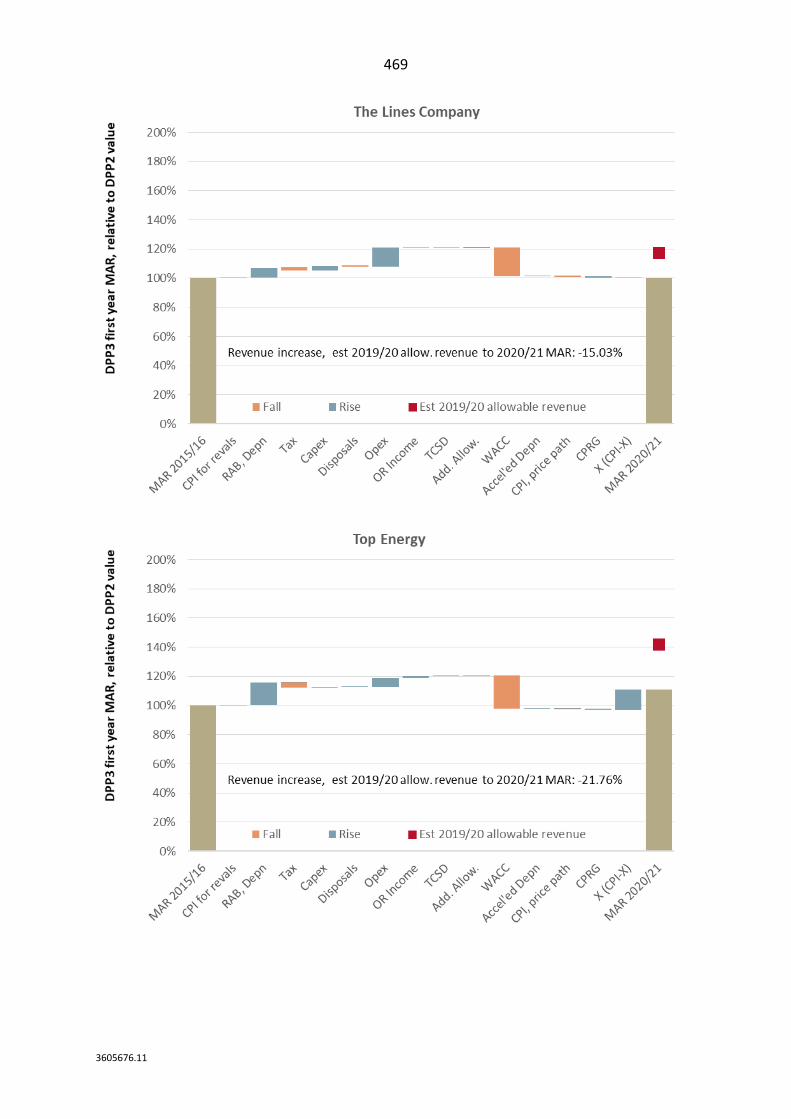
469
3605676.11
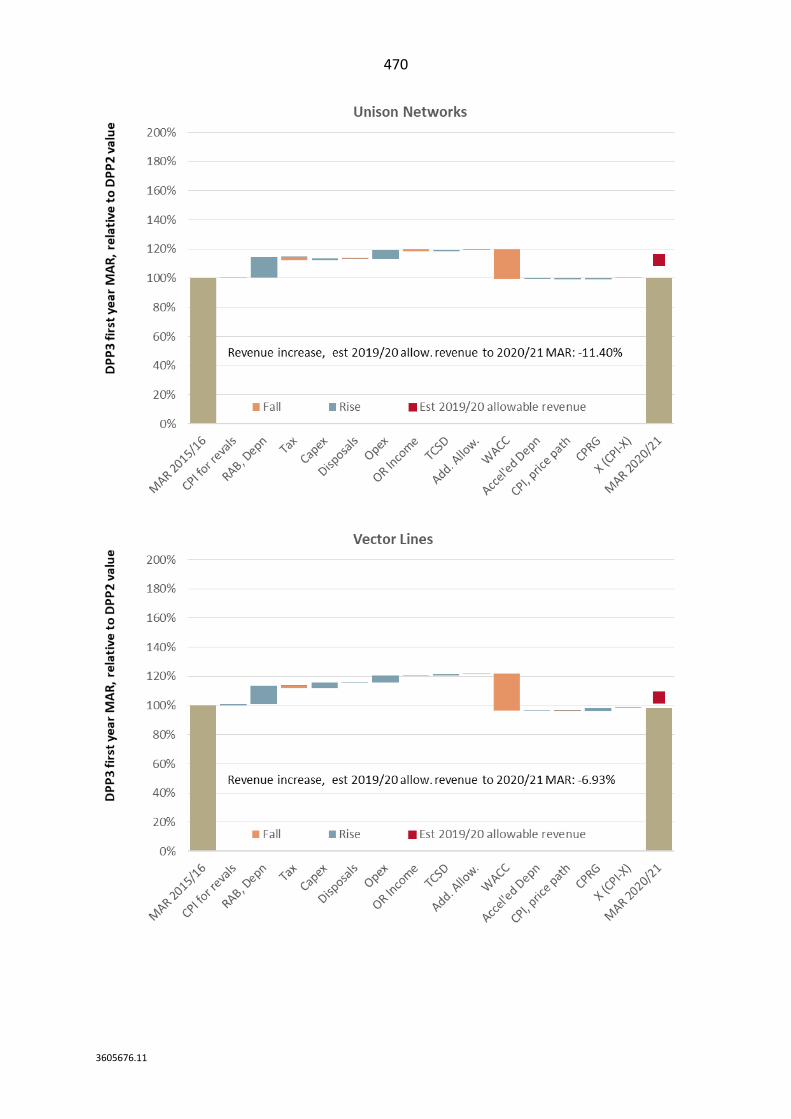
470
3605676.11