
PRHSJ V33 N1 March 2014
37
Transcript of PRHSJ V33 N1 March 2014


Founded in 1982
VOLUME 33 • NUMBER 1 • MaRch 2014
The Journal of the University of Puerto RicoMedical Sciences Campus is indexed in
PubMed/Medline, SCOPUS, Index Pharmacus,
Science Citation Index Expanded (SciSearch®) and Journal Citation Reports/Science Edition
Editor-in-chiefValerie Wojna, MD
Founding EditorLillian Haddock, MD
Past EditorsRafael Villavicencio, MD
Jorge L. Sánchez, MDLuis M. Vilá, MD
Associate EditorsCarmen Mabel Arroyo-Novoa, RN, PhD
Walmor C. De Mello, MD, PhD Estela S. Estapé, PhD
Carlos A. González-Oppenheimer, MDAna Patricia Ortiz, PhD, MPH
Cristina Palacios, PhD Marianela Pérez-Torres, PhD
Erick L. Suárez, PhD
Advisory EditorsPablo I. Altieri, MD
Glorisa Canino, PhD Nelson Escobales, PhD Edgardo Escobar, MDCésar O. Freytes, MD
Sixto García-Castiñeiras, MD, PhD Mario R. García-Palmieri, MD
Robert Hunter, MD Jaime Matta, PhD
Edna M. Mora, MD Julio E. Pérez, MD
Carlos E. Rodríguez-Díaz, PhD Marta Rivero-Méndez, DNS
Eduardo Santiago-Delpín, MD Gregorio Sicard, MD Esther A. Torres, MD Carmen Zorrilla, MD
Journal StaffVivette Resto-Rivera, Assistant EditorRobert A. Ritchie, Manuscript Editor
Mariroan Sellés-Ramírez, Layout Editor
The Puerto Rico health Sciences Journal (ISSN 0738-0658) is published every three months and copyrighted ©1982 by the University of Puerto Rico Medical Sciences Campus. Personal subscription price is $40.00 for one year, $80.00 two years and $120.00 three years. Institutional subscription price is $50.00 for one year, $100.00 two years and $125.00 three years. Permission to reproduce articles in whole or in part must be obtained in writing from the publisher. Address: University of Puerto Rico Medical Sciences Campus, Puerto Rico Health Sciences Journal, PO Box 365067, San Juan, Puerto Rico 00936-5067. Tel: (787) 758-2525 ext. 2311 • Fax: (787) 763-6245 • Email: [email protected]. The arti-cles in this Journal are available online in PDF format before they appear in the print edition. To access the Journal online, visit http://prhsj.rcm.upr.edu
cONtENtS
FULL-LENGth aRtIcLES 3 association of the Use of Statins with Disease activity and Functional Status in Puerto Ricans with Rheumatoid arthritis Magaly Villafrádez-Díaz, MD; Yesenia Santiago-Casas, MD; Mariely Nieves-Plaza, MS; Myraida Morales, MPH; Vanessa Rodríguez, MD; Grissel Ríos, MD; David Martínez, MD; Luis M. Vilá, MD 9 Prevalence of hypodontia in 10- to 14-Year-Olds Seeking Orthodontic treatment at a Group of clinics in Puerto Rico Grace J. Pagán-Collazo, DMD, MSD; Jazmin Oliva, DMD; Lumarie Cuadrado, BA; Sona Rivas-Tumanyan, DMD, DrPH; Augusto R. Elías-Boneta, DMD, MSD 14 Physical Environment, Diet Quality, and Body Weight in a Group of 12-year-old children from Four Public Schools in Puerto Rico Roxana Torres, MHSN, RD, LND; Mónica Serrano, MHSN; Cynthia M. Pérez, PhD; Cristina Palacios, PhD, LND 22 Mohs Micrographic Surgery: 10 year Experience in Puerto Rico Ivette M. Sosa-Seda, MD; Rosbel González, MD; Rogelio Mercado, MD; Hiram Ruiz, MD; Luz D. Figueroa, MD
caSE REPORt 27 Granulomatous Enterocolitis Secondary to Yersinia in an 11-year-old Boy from Puerto Rico, confirmed by PcR: a case Report Fabian J. Rohena, MS-IV; MI Almira-Suárez, MD; Carmen González-Keelan, MD
BOOK REVIEW 31 health and Slavery in Puerto Rico illuminated by Nt Jensen’s For the Health of the Enslaved José G. Rigau-Pérez, MD, MPH
REPORt FROM ScIENtIFIc MEEtING 34 Report of the 2013 University of Puerto Rico-MD anderson cancer center conference entitled “Research on cancer Epidemiology: Risk Factors and control in the caribbean Basin” Erick Suárez, PhD; Marievelisse Soto-Salgado, MS; Camille Moreno-Gorrín, BS; Ana Patricia Ortiz, MPH, PhD; Cynthia M. Pérez, PhD
PRHSJPRHSJPuerto Rico Health Sciences Journal
00 Iniciales v33 n1.indd 163 2/18/2014 8:41:11 AM

00 Iniciales v33 n1.indd 164 2/18/2014 8:41:11 AM

3PRHSJ Vol. 33 No. 1 • March, 2014
• full-length articles •
association of the use of statins with Disease activity and functional status in Puerto ricans with rheumatoid arthritis
Magaly Villafrádez-Díaz, MD*; Yesenia Santiago-Casas, MD*; Mariely Nieves-Plaza, MS†‡; Myraida Morales, MPH†; Vanessa Rodríguez, MD*; Grissel Ríos, MD*; David Martínez, MD*; Luis M. Vilá, MD*
*Division of Rheumatology, Department of Medicine, University of Puerto Rico Medical Sciences Campus, San Juan, Puerto Rico; †Puerto Rico Clinical & Translational Research Consortium (PRCTRC), University of Puerto Rico Medical Sciences Campus, San Juan, Puerto Rico; ‡School of Medicine, University of Pittsburgh, Pittsburgh, Pennsylvania, United States of America
The authors have no conflicts of interest to disclose.
Address correspondence to: Luis M. Vilá, MD, Division of Rheumatology, University of Puerto Rico Medical Sciences Campus PO Box 365067, San Juan, PR 00936-5067. E-mail: [email protected]
Objective: statins, which appear to have anti-inflammatory and immunomodulatory effects, may benefit patients with rheumatoid arthritis (ra). Our study sought to determine the association of statins use with disease activity and functional status in a group of patients with ra.
Methods: a cross-sectional study was performed in 209 Puerto ricans with ra (per the 1987 classification criteria of the american college of rheumatology). Demographic features, lifestyle-related behaviors, disease activity (per Disease activity score 28), comorbid conditions, functional status (per health assessment Questionnaire), pharmacologic therapy, and patients’ and physicians’ global assessments using visual analogue scales, were determined. Data were examined using univariate, bivariate, and multiple logistic regression analyses.
results: the mean (standard deviation [sD]) age of the study population at study visit was 56.8 (13.5) years (range: 24-86 years); 175 patients (83.7%) were women. the mean (sD) disease duration was 10.4 (9.5) years (range: 0.0-44.0 years). thirty-two (15.3%) patients were using statins at study visit, and 36 (17.2%) had used statins in the past. in the multivariable analysis, the current use of statins was associated with higher functional status (odds ratio 0.42, 95% confidence interval 0.22-0.80) than was nonuse, after adjusting for age, disease duration, arterial hypertension, coronary artery disease, and dyslipidemia. no association between either current or past use of statins and disease activity was found.
conclusion: in this group of ra patients, the current use of statins was associated with a higher functional status; conversely, no association was found between statins use and disease activity. however, larger and longitudinal studies are required to confirm these findings. [P R Health Sci J 2014;33:3-8]
Key words: Rheumatoid arthritis, Statins, Disease activity, Functional status, Puerto Ricans
rheumatoid arthritis (RA) is a chronic autoimmune disease characterized by joint inflammation and destruction, which may negatively impact patient’s
functional capacity, quality of life, and working ability (1). The persistent state of inflammation which has been described in RA may promote the progression of atheromatous lesions, thus conferring an increased risk for developing coronary artery disease (CAD) (2). Indeed, RA has been identified as an independent risk factor for CAD (2), with CAD by itself being one of the main causes of morbidity and mortality in RA, particularly in patients with long-standing disease.
Hydroxyl-methyl-glutaryl coenzyme A (HMG-CoA) inhibitors (statins) are indicated for lowering cholesterol levels in patients with hyperlipidemia. However, the benefits of statins may not be limited to their cholesterol-lowering properties or to their impact on the prevention of CAD as recent studies have shown
that statins possess anti-inflammatory and immunomodulatory properties (3). For instance, simvastatin suppresses the secretion of proinflammatory cytokines (4) and induces the apoptosis of fibroblast-like synoviocytes derived from RA patients (5). The immunomodulatory role of statins has been demonstrated by studies showing that atorvastatin increases the number of regulatory T cells and restores their suppressive function in
01 Vilá et al.indd 3 2/18/2014 7:16:53 AM

Rheumatoid Arthritis and Statins
4 PRHSJ Vol. 33 No. 1 • March, 2014
Villafrádez-Díaz et al
RA patients (6). Furthermore, studies have shown that there is an association between statins therapy and the reduced risk of developing RA in patients with hyperlipidemia (7-8).
Although statins appear to have anti-inflammatory and immunomodulatory effects, the clinical benefits of this class of drugs in terms of disease activity and outcome in RA remain to be elucidated. Therefore, we examined a group of patients with RA to evaluate the impact of statins on disease activity and functional status.
Methods
Patient populationA cross-sectional study was performed in 209 patients with
RA. All of the patients were ≥ 21 years old, had Puerto Rican ethnicity (self and 4 grandparents), and met the revised (1987) criteria of the American College of Rheumatology (ACR) classification for RA (9). Patients were evaluated from February 2007 to April 2008 at the rheumatology clinics of the University of Puerto Rico Medical Sciences Campus (UPR-MSC) in San Juan, Puerto Rico, as well as at 3 private rheumatology practices, also located in San Juan, Puerto Rico. The study was approved by the UPR-MSC Institutional Review Board.
RA patients had their routine visits at 2- to 3-month intervals. Additional visits were scheduled as needed (based on disease activity, complications, or both). At each routine visit, laboratory tests such as complete blood cell count, serum chemistries, urinalysis, erythrocyte sedimentation rate (ESR), and lipid panel were routinely ordered. At the time of the study visit, a structured clinical form was completed for each patient to gather data about demographic parameters, lifestyle behaviors, clinical manifestations, comorbidities, pharmacologic treatments, disease activity, and functional status. This form was developed by the UPR-MSC Rheumatology Division to evaluate clinical information uniformly and to allow the assessment of RA outcome measures at each patient’s visit. When necessary, the medical records of RA patients were reviewed to gather further information about clinical manifestations, comorbidities, and pharmacologic therapies.
VariablesThe following demographic features were examined: age,
gender, and disease duration. Age at onset was defined as the age at which the patient had the first symptom attributable to RA, and age at diagnosis as the age at which the patient met the ACR criteria for RA. Disease duration was defined as the time interval between RA diagnosis and study visit. Lifestyle behaviors, including cigarette smoking, consuming alcohol, and exercising, were also evaluated. The latter was defined as regular participation in physical activity as part of a personal fitness plan. Cumulative RA manifestations and the presence of comorbid diseases were determined at study visit. RA manifestations
examined included joint deformities/contractures (defined as loss of more than 20% of range of motion, lax collaterals, malalignment, or subluxation), radiographic evidence of joint damage, joint replacement surgeries, and extra-articular manifestations (subcutaneous nodules and ocular [keratoconjunctivitis sicca, episcleritis, scleritis, scleromalacia, or uveitis], pulmonary [pleuritis, pleural effusion, pulmonary nodules, interstitial lung disease, or pulmonary fibrosis], cardiac [pericarditis, myocarditis, valvular nodules, or coronary vasculitis], and neurologic [neuropathies, peripheral neuropathy, or mononeuritis multiplex] manifestations). The following comorbid conditions were determined: type 2 diabetes mellitus, arterial hypertension, dyslipidemia, coronary artery disease (angina, myocardial infarction, and/or coronary artery bypass graft), and metabolic syndrome (per the American Heart Association and National Heart, Lung, and Blood Institute classification) (10). Cumulative exposure to corticosteroids and traditional and biologic disease-modifying anti-rheumatic drugs (DMARDs) was examined. Also, the current (within the last month) and past uses (up to a month prior to the evaluation date) of statins were determined.
Disease activity was assessed using the European League Against Rheumatism (EULAR) Disease Activity Score 28 (DAS 28) (11). The DAS28 uses the 28-joint count, the ESR, and the patient’s visual analogue scale (VAS) for overall health to assess disease activity. Functional status was assessed with the Health Assessment Questionnaire Disability Index (HAQ) (12). The HAQ is a 20-question validated instrument that assesses the degree of difficulty a patient has in accomplishing each of 8 functional tasks (dressing, rising, eating, walking, hygiene, reaching, gripping, and performing usual activities). HAQ scores range from 0 to 3, with higher scores representing greater levels of disability. The patient’s global assessment and perception of pain were determined by visual analogue scales (13-14). In addition, the physician’s global assessment, and functional impairment and physical damage assessments of the patients studied were also determined using visual analogue scales (13-14).
statistical analysis
Descriptive analyses were performed using the mean, standard deviation (SD), median, and interquartile range (IQR) for continuous variables; frequencies and percentages were used for categorical variables. A comparison between current and past use of statins was made using the unpaired t-test (or the Mann–Whitney U test) and Pearson’s chi-squared test (or Fisher’s exact test), as appropriate. To study the association between disease activity and functional status and the current use of statins, contingency tables were constructed. Variables with a p value ≤ 0.10 in these analyses were entered into multivariable logistic regression models. The statistical software STATA version 11 (StataCorp, College Station, TX, USA) was used to performed the statistical analysis.
01 Vilá et al.indd 4 2/18/2014 7:16:53 AM

Rheumatoid Arthritis and Statins
5PRHSJ Vol. 33 No. 1 • March, 2014
Villafrádez-Díaz et al
results
A total of 209 patients with RA were examined; 175 of the patients (83.7%) were women. The mean age (standard deviation [SD]) of the study population at the time of the study visit was 56.8 (13.5) years (range: 24-86 years), and the mean (SD) disease duration was 10.4 (9.5) years (range: 0.0-44.0 years). Table 1 shows the demographic features, lifestyle behaviors, clinical manifestations, disease activity, comorbidities, and functional status of the study patients.
for the use of statins (current or past). Differences in age and disease duration were observed in both current and past users of statins. The past use of statins was associated with older age and higher disease duration compared to nonuse (61.3 [10.8] years vs. 55.8 [13.9] years, p = 0.026, and 13.5 [10.1] years vs. 9.7 [9.2] years, p = 0.028, respectively). Furthermore, current statins users, compared to nonusers, tended to be older (60.6 [10.9] years vs. 56.1 [13.9] years, p = 0.086) and have had longer disease duration (13.3 [9.9] years vs. 9.9 [9.4] years, p = 0.058). As expected, comorbid conditions such as arterial hypertension, coronary artery disease, and dyslipidemia were associated with both the current and the past use of statins (p<0.05). A tendency toward lower HAQ scores (0.9 [0.8] vs. 1.1 [0.8], p = 0.074) or higher functional status was observed in current users of statins, whereas no such association was observed for the past use of statins (1.0 [0.8] vs. 1.1 [0.8], p = 0.643). There were no associations with disease activity in terms of current or past use of statins. In addition, no associations with RA manifestations were found with regard to the use of statins (current or past) with ESR, patients’ global health and pain assessments, and physicians’ global health, functional impairment, and physical damage assessments.
In the multivariate analysis (Table 3), after adjusting for age, disease duration, arterial hypertension, coronary artery disease, and dyslipidemia, the current use of statins was associated with lower HAQ scores [OR 0.42 (CI 95%, 0.22-0.80)]; thus, with higher functional status.
Discussion
In search of alternative treatments to improve the outcomes of patients with RA and taking into account the increasing amount of literature demonstrating the immunomodulatory and anti-inflammatory effects of statins, we examined a group of Puerto Rican patients with RA to evaluate whether the use of statins could have an impact on their disease activity and functional status. We found that statins use was associated with a higher functional status in our population of RA patients. However, no association was observed between the use of statins and disease activity.
Statins have been demonstrated to have anti-inflammatory properties in animal models and human cell culture studies (3-7, 15). However, the clinical benefits of statins with regard to disease activity and function in RA patients remain controversial. The largest studies performed to assess the effects of statins in RA patients did not show any clinical benefits (16-17). These studies were based on a United States insurance-claims database and had oral steroids use as a surrogate marker of inflammation. There were no direct markers of disease activity or severity for analysis. Conversely, in the first clinical trial designed to study the effects of statins on RA (TARA), a clinically apparent effect was demonstrated (18). The TARA study was a double-blind,
table 1. Demographic features, lifestyle-related behaviors, clinical manifestations, disease activity, comorbidities, and functional status of rheumatoid arthritis (RA) patients (n = 209)
features
Age, mean years (SD) 56.8 (13.5)Age at RA onset, mean years (SD) 44.8 (13.8)Age at RA diagnosis, mean years (SD) 46.4 (14.1)Disease duration, mean years (SD) 10.4 (9.5)Gender, % female 83.7Alcohol use, % 3.8Smoking, % 9.1Exercise, % 18.7Joint deformities/contractures (n = 208), % 56.7Joint surgeries (n = 208), % 18.3Extra-articular manifestations 64.1Erythrocyte sedimentation rate (n = 200), mean mm/hr (SD) 31.8 (23.6)DAS28 (n = 206), mean score (SD) 3.6 (1.7)Body mass index, mean kg/m2 (SD) 28.0 (6.0)Type 2 diabetes mellitus, % 12.0High blood pressure, % 55.5Dyslipidemia, % 51.2Metabolic syndrome (n = 207), % 39.6Coronary artery disease (n = 207), % 6.3Corticosteroid use, % 78.0DMARDs use (n = 208), % 96.6HAQ score (n = 204), mean score (SD) 1.1 (0.8)Patient’s global assessment (n = 208), mean mm (SD) 39.8 (32.4)Patient’s pain assessment (n = 208), mean mm (SD) 40.0 (32.2)Physician’s global assessment (n = 208), mean mm (SD) 19.6 (22.5)Physician’s functional impairment assessment (n = 208), mean mm (SD) 22.1 (23.7)Physician’s physical damage assessment (n = 208), mean mm (SD) 18.1 (23.0)
SD: Standard deviation; CABG: Coronary artery bypass grafting; DMARDs: Disease-modifying anti-rheumatic drugs; DAS28: Disease Activity Score 28; HAQ: Health Assessment Questionnaire
Current users of statins (n = 32) were compared to current nonusers of statins (n = 177), and past users of statins (n = 36) were compared to past nonusers of statins (n = 173). Current users of statins were being treated with atorvastatin (n = 14), simvastatin (n = 10), rosuvastatin (n = 6), or lovastatin (n = 2). Past users of statins had been treated with atorvastatin (n = 16), simvastatin (n = 12), rosuvastatin (n = 7), or lovastatin (n = 1). The majority (n = 30) of the current users of statins had also used statins in the past. Table 2 shows the bivariate analysis
01 Vilá et al.indd 5 2/18/2014 7:16:53 AM

Rheumatoid Arthritis and Statins
6 PRHSJ Vol. 33 No. 1 • March, 2014
Villafrádez-Díaz et al
placebo-controlled trial in 116 RA patients on standard therapy in which atorvastatin (40 mg/day) was added as an adjuvant. After 6 months, swollen joint count, DAS28 scores, and ESR and C-reactive protein (CRP) levels declined in patients receiving atorvastatin. In our study, these parameters of disease activity did not reach statistical significance.
The immunomodulatory effects of statins in RA patients have been further evidenced in 3 small clinical trials (19-21). Thirty patients with early RA were randomly assigned in an unblinded fashion to a group receiving methotrexate and prednisone (n = 15) or to a group receiving those 2 drugs plus atorvastatin (40 mg/day) (19). After 6 months of therapy, a significant suppression of acute phase reactants and marked reduction
in disease activity was seen in the atorvastatin group. Another study was conducted in 15 patients with RA receiving treatment with methotrexate; simvastatin (40 mg/day) was given to 10 patients and chloroquine was given to 5 patients (20). After 8 weeks, the majority (9/10) of patients receiving simvastatin showed an ACR50 or better response; in contrast, that clinical response was not observed in patients who received chloroquine. Finally, one study assessed the efficacy of low-dose simvastatin (10 mg/day) for 12 weeks in 24 RA patients (21). Clinical improvement was reflected in ACR20 and 50 responses of 62% and 38%, respectively, as well as in decreases in ESR and CRP levels, and peripheral blood Th1/Th2 and CD4/CD8 ratios in the simvastatin-treated patients.
Although our study did not demonstrate a significant impact for the use of statins on disease activity parameters, the HAQ scores were lower in patients currently using statins than they were in nonusers. It is plausible that in an interventional study, one in which not only is the sample size increased but also the dose and period of exposure to statins are controlled, the impact on disease activity and functional status measures could be better judged.
There are limitations to our study. First, it had a small sample size; in particular, the number of patients who were taking statins at the time of their study visits was quite low (32/209), thus limiting our ability to analyze the impact of this medication on our population of R A patients. Second, this work has the limitations inherent to any cross-sectional study. The ascertainment of some clinical data was performed by record review; thus, critical information was not available for all patients. Third, we did not determine the actual length of treatment with statins or evaluate any other periods of time besides those corresponding to current (within the last month) and past use of statins. Perhaps, longer periods of exposure would have
table 2. Association of the use of statins with demographic features, lifestyle-related behaviors, clinical manifestations, disease activity, comorbidities, and functional status of rheumatoid arthritis patients
current use of statins Past use of statins
Variable Yes no p-value Yes no p-value (n = 32) (n = 177) (n = 36) (n = 173)
Age at study visit, mean years (SD) 60.6 (10.9) 56.1 (13.9) 0.086 61.3 (10.8) 55.8 (13.9) 0.026Disease duration, mean years (SD) 13.3 (9.9) 9.9 (9.4) 0.058 13.5 (10.1) 9.7 (9.2) 0.028Gender, % female 81.3 84.2 0.679 80.6 84.4 0.570Alcohol use, % 3.1 4.0 0.822 2.8 4.1 >0.999Smoking, % 9.4 9.0 0.952 8.3 9.3 >0.999Exercise, % 21.9 18.1 0.612 16.7 19.1 0.736Joint deformities, % 21.9 18.1 0.612 22.2 17.9 0.547Joint surgeries, % 6.1 18.6 0.738 14.3 19.1 0.504Extra-articular manifestations, % 62.5 64.4 0.836 66.7 63.6 0.726ESR, mean mm/hr (SD) 26.2 (15.0) 32.9 (24.8) 0.318 28.5 (17.3) 32.5 (24.7) 0.699DAS28, mean score (SD) 3.5 (1.6) 3.6 (1.7) 0.833 3.8 (1.7) 3.6 (1.7) 0.544BMI, mean kg/m2 (SD) 29.3 (6.6) 27.7 (5.9) 0.186 28.4 (6.6) 27.9 (5.9) 0.647Type 2 diabetes mellitus, % 15.6 11.3 0.552 13.9 11.6 0.777High blood pressure, % 71.9 52.5 0.043 75.0 51.5 0.010Coronary artery disease, % 15.6 4.6 0.033 19.4 3.5 0.002Dyslipidemia, % 93.8 43.5 <0.001 94.4 42.2 <0.001Corticosteroid use, % 81.3 77.4 0.629 83.3 76.9 0.509DMARDs use, % 96.9 96.6 0.935 97.2 96.5 >0.999HAQ score, mean score (SD) 0.9 (0.8) 1.1 (0.8) 0.074 1.0 (0.8) 1.1 (0.8) 0.643Patient’s global assessment, mean mm (SD) 39.2 (35.7) 39.9 (31.8) 0.915 44.1 (35.7) 38.8 (31.7) 0.375Patient’s pain assessment, mean mm (SD) 38.5 (33.2) 40.3 (32.1) 0.781 40.7 (33.2) 39.8 (32.0) 0.881Physician’s global assessment, mean mm (SD) 17.7 (19.9) 19.9 (22.9) 0.604 20.7 (23.4) 19.4 (22.3) 0.746Physician’s functional impairment assessment, mean mm (SD) 22.9 (23.3) 22.0 (23.8) 0.850 26.8 (26.1) 21.2 (23.1) 0.200Physician’s physical damage assessment, mean mm (SD) 15.8 (19.1) 18.6 (23.6) 0.527 16.7 (22.7) 18.4 (23.0) 0.689
SD: Standard deviation; BMI: Body mass index; CABG: Coronary artery bypass grafting; DMARDs: Disease-modifying anti-rheumatic drugs; DAS28: Disease Activity Score; ESR: Erythrocyte sedimentation rate; HAQ score: Health Assessment Questionnaire
table 3. Association between the current use of statins and HAQ score in bivariate and multivariate models
Variable Bivariate model Or (ci 95%) Multivariate model* Or (ci 95%)
Functional status (HAQ score) 0.64 (0.39, 1.05) 0.42 (0.22, 0.80)
*Adjusted by age, disease duration, high blood pressure, coronary artery disease, and dyslipidemia. OR: Odds ratio; CI: Confidence interval
01 Vilá et al.indd 6 2/18/2014 7:16:54 AM

Rheumatoid Arthritis and Statins
7PRHSJ Vol. 33 No. 1 • March, 2014
Villafrádez-Díaz et al
a stronger association with RA outcome measures. Finally, the study was performed in a group of Hispanics from Puerto Rico evaluated at a tertiary hospital in San Juan, Puerto Rico; thus, our results may not necessarily reflect those of other ethnic groups.
In summary, although no association was found between the use of statins and the parameters of disease activity in this group of RA patients, the current use of statins was associated with a higher functional status. Interventional and longitudinal studies in larger populations are necessary to further elucidate the immunomodulatory benefits and clinical impact of statins in RA patients.
resumen
Objetivo: Las estatinas tienen propiedades antiinflamatorias e inmunomoduladoras. Siendo artritis reumatoide (AR) una enfermedad inflamatoria, evaluamos si existe una asociación del uso de estatinas con la actividad de la enfermedad y función física en un grupo de pacientes con AR. Métodos: Se realizó un estudio transversal en 209 puertorriqueños con AR (según la clasificación de del Colegio Americano de Reumatología de 1987). Se determinaron las características demográficas, estilos de vida, actividad de la enfermedad (utilizando el Disease Activity Score 28), comorbilidades, índice de discapacidad (utilizando el Health Assessment Questionnaire), terapia farmacológica y medidas globales de los pacientes y los médicos utilizando escalas análogas visuales. Los datos fueron evaluados utilizando análisis univariado, bivariado y regresión logística múltiple. Resultados: La edad promedio (desviación estándar, DE) de la población estudiada al momento del estudio fue de 56.8 (13.5) años (rango: 24-86 años); 175 (83.7%) pacientes eran mujeres. El promedio (DE) de la duración de la enfermedad fue de 10.4 (9.5) años (rango: 0.0-44.0 años). Treinta y dos (15.3%) pacientes usaban estatinas al momento de la visita del estudio mientras que 36 (17.2%) usaron estatinas en el pasado. En el análisis multivariado, el uso presente de estatinas se asoció a una mejor función física (odds ratio 0.42, intervalo de confianza de 95% 0.22-0.88) luego de ajustar por la edad, duración de la enfermedad, hipertensión arterial, enfermedad coronaria y dislipidemia. No se encontró una asociación entre el uso presente o pasado de estatinas y la actividad de la enfermedad. Conclusión: En este grupo de pacientes con AR, el uso presente de estatinas se asoció a una mejor función física. Por otro lado, no se encontró asociación con la actividad de la enfermedad. Sin embargo, estudios prospectivos y con una mayor cantidad de pacientes son necesarios para confirmar estos hallazgos.
acknowledgments
Supported by the National Center for Research Resources (NCRR) (U54 RR 026139-01A1), the National Institute on Minority Health and Health Disparities (NIMHD)
(8U54MD007587), and the National Center for Advancing Translational Sciences (TL1TR000145 of the National Institutes of Health, and by an unrestricted educational grant from Abbott Laboratories, Inc.
references
1. Wong JB, Ramey DR, Singh G. Long-term morbidity, mortality, and eco-nomics of rheumatoid arthritis. Arthritis Rheum 2001;44:2746–9.
2. Kaplan MJ. Cardiovascular complications of rheumatoid arthritis: as-sessment, prevention, and treatment. Rheum Dis Clin North Am 2010;36:405–26.
3. Jain MK, Ridker PM. Anti-inflammatory effects of statins: clinical evi-dence and basic mechanisms. Nat Rev Drug Discov 2005;4:977–87.
4. Yokota K, Miyazaki T, Hirano M, Akiyama Y, Mimura T. Simvastatin in-hibits production of interleukin 6 (IL-6) and IL-8 and cell proliferation induced by tumor necrosis factor-α in fibroblast-like synoviocytes from patients with rheumatoid arthritis. J Rheumatol 2006;33:463–71.
5. Yokota K, Miyoshi F, Miyazaki T, et al. High concentration simvastatin induces apoptosis in fibroblast-like synoviocytes from patients with rheu-matoid arthritis. J Rheumatol 2008;35:193–200.
6. Tang TT, Song Y, Ding YJ, et al. Atorvastatin upregulates regulatory T cells and reduces clinical disease activity in patients with rheumatoid ar-thritis. J Lipid Res 2011;52:1023–32.
7. Jick S, Choi H, Li L, McInnes I, Sattar N. Hyperlipidaemia, statin use and the risk of developing rheumatoid arthritis. Ann Rheum Dis 2009;68:546-51.
8. Chodick G, Amital H, Shalem Y, Kokia E, Heymann AD, Porath A, Shalev V. Persistence with statins and onset of rheumatoid arthritis: a population based cohort study. PLoS Med 2010;7:e1000336.
9. Arnett FC, Edworthy SM, Bloch DA, et al. The American Rheumatism Association 1987 revised criteria for the classification of rheumatoid ar-thritis. Arthritis Rheum 1988;31:315–24.
10. Grundy SM, Cleeman JI, Daniels SR, et al. American Heart Association/National Heart, Lung, and Blood Institute. Diagnosis and management of the metabolic syndrome: an American Heart Association/National Heart, Lung, and Blood Institute Scientific Statement. Circulation 2005;112:2735–52.
11. Fransen J, van Riel PL. The Disease Activity Score and the EULAR re-sponse criteria. Clin Exp Rheumatol 2005;23:S93–9.
12. Hochberg MC, Chang RW, Dwosh I, Lindsey S, Pincus T, Wolfe F. The American College of Rheumatology 1991 revised criteria for the classifi-cation of global functional status in rheumatoid arthritis. Arthritis Rheum 1992;35:498–502.
13. Anderson JK, Zimmerman L, Caplan L, Michaud K. Measures of rheu-matoid arthritis disease activity: Patient (PtGA) and Provider (PrGA) Global Assessment of Disease Activity, Disease Activity Score (DAS) and Disease Activity Score with 28-Joint Counts (DAS28), Simplified Disease Activity Index (SDAI), Clinical Disease Activity Index (CDAI), Patient Activity Score (PAS) and Patient Activity Score-II (PASII), Rou-tine Assessment of Patient Index Data (RAPID), Rheumatoid Arthritis Disease Activity Index (RADAI) and Rheumatoid Arthritis Disease Activity Index-5 (RADAI-5), Chronic Arthritis Systemic Index (CASI), Patient-Based Disease Activity Score With ESR (PDAS1) and Patient-Based Disease Activity Score without ESR (PDAS2), and Mean Overall Index for Rheumatoid Arthritis (MOI-RA). Arthritis Care Res (Hobo-ken) 2011;63(Suppl 11):S14–36.
14. Maska L, Anderson J, Michaud K. Measures of functional status and quality of life in rheumatoid arthritis: Health Assessment Questionnaire Disability Index (HAQ), Modified Health Assessment Questionnaire (MHAQ), Multidimensional Health Assessment Questionnaire (MD-HAQ), Health Assessment Questionnaire II (HAQ-II), Improved Health Assessment Questionnaire (Improved HAQ), and Rheumatoid Arthritis Quality of Life (RAQoL). Arthritis Care Res (Hoboken) 2011;63(Suppl 11):S4–13.
01 Vilá et al.indd 7 2/18/2014 7:16:54 AM

Rheumatoid Arthritis and Statins
8 PRHSJ Vol. 33 No. 1 • March, 2014
Villafrádez-Díaz et al
15. Arnaud C, Burger F, Steffens S, Veillard NR, Nguyen TH, Trono D, Mach F. Statins reduce interleukin-6-induced C-reactive protein in human he-patocytes: new evidence for direct antiinflammatory effects of statins. Arterioscler Thromb Vasc Biol 2005;25:1231–6.
16. Lodi S, Evans SJ, Egger P, Carpenter J. Is there an anti-inflammatory effect of statins in rheumatoid arthritis? Analysis of a large routinely collected claims database. Br J Clin Pharmacol 2010;69:85–94.
17. Lodi S, Carpenter J, Egger P, Evans S. Design of cohort studies in chronic diseases using routinely collected databases when a prescription is used as surrogate outcome. BMC Med Res Methodol 2011;11:36.
18. McCarey DW, McInnes IB, Madhok R, Hampson R, Scherbakov O, Ford I, Capell HA, Sattar N. Trial of Atorvastatin in Rheumatoid Arthri-
tis (TARA): double-blind, randomised placebo-controlled trial. Lancet 2004;363:2015–21.
19. El-Barbary AM, Hussein MS, Rageh EM, Hamouda HE, Wagih AA, Is-mail RG. Effect of atorvastatin on inflammation and modification of vas-cular risk factors in rheumatoid arthritis. J Rheumatol 2011;38:229–35.
20. Abud-Mendoza C, de la Fuente H, Cuevas-Orta E, Baranda L, Cruz-Rizo J, González-Amaro R. Therapy with statins in patients with refractory rheumatic diseases: a preliminary study. Lupus 2003;12:607–11.
21. Kanda H, Yokota K, Kohno C, Sawada T, Sato K, Yamaguchi M, Komagata Y, Shimada K, Yamamoto K, Mimura T. Effects of low-dosage simvastatin on rheumatoid arthritis through reduction of Th1/Th2 and CD4/CD8 ratios. Mod Rheumatol 2007;17:364–8.
01 Vilá et al.indd 8 2/18/2014 7:16:54 AM

9PRHSJ Vol. 33 No. 1 • March, 2014
Prevalence of Hypodontia in 10- to 14-Year-Olds Seeking Orthodontic Treatment at a Group of Clinics in Puerto Rico
Grace J. Pagán-Collazo, DMD, MSD; Jazmin Oliva, DMD; Lumarie Cuadrado, BA; Sona Rivas-Tumanyan, DMD, DrPH; Augusto R. Elías-Boneta, DMD, MSD
School of Dental Medicine, University of Puerto Rico Medical Sciences Campus, San Juan, Puerto Rico
The authors have no conflicts of interest to disclose.
Address correspondence to: Augusto R. Elías-Boneta, DMD, MSD, Assistant Dean of Research, School of Dental Medicine, University of Puerto Rico Medical Sciences Campus, PO Box 365067, San Juan, PR 00936-5067. Email: [email protected]
Objective: To estimate the prevalence of hypodontia in a group of 10- to 14-year-olds from a group of orthodontic clinics in Puerto Rico.
Methods: A cross-sectional study was conducted to estimate the prevalence of hypodontia in 10- to 14-year-olds from orthodontic clinics located in each of 9 regions (as determined by the government-run health insurance program, Reforma) in Puerto Rico. A total of 1,911 patients, ranging in age from 10 to 14 years, were evaluated using patient charts covering from May 2004 through June of that same year. A logistic regression model was done to evaluate the relation between the prevalence of hypodontia in the study group and clinic location, gender, and age; a 5% significance level was used.
Results: The overall weighted prevalence of hypodontia was 6.02%. Females showed a higher weighted prevalence of hypodontia than did males (7.02% vs. 4.72%, respectively: p=0.06). The prevalence also varied by geographic region, ranging from 3.21% at the San Juan clinic to 10.68% at the Aibonito clinic (p=0.01). The most prevalent missing teeth were the maxillary lateral incisors, followed by the lower second premolars (1.9%).
Conclusion: The prevalence of hypodontia in Puerto Rico was 6.02%. Females presented a higher prevalence of hypodontia than did males. Each of the clinics in Fajardo, Bayamón, San Juan, and Guayama had a lower prevalence of hypodontia than the Aibonito clinic did. The tooth most frequently missing in the study group was the maxillary right lateral incisor. [P R Health Sci J 2014;33:9-13]
Key words: Hypodontia, Agenesis, Prevalence, Tooth hypodontia, Cross-sectional study, Puerto Rico
Non-syndromic hypodontia of the permanent teeth, defined as the congenital absence of 1 or more teeth, is the most common developmental dental anomaly in
humans (1-2). It ranges in prevalence from 2.7% to 6.9% (3). The variability observed in these studies may be attributed to differences in genetic background and the prevalence of other risk factors in these populations (3-4).
Hypodontia leads to dental malposition, a lack of development of the alveolar bone (height and width), and periodontal damage as well as functional and aesthetic problems (5). Thus, dental management of hypodontia presents a challenge for dental health practitioners (6-7). Therefore, the early detection of hypodontia is an essential factor in the diagnosis and treatment planning for said practitioners. Additionally, orthodontists should consider patient age, the developmental stages of adjacent teeth, and the condition of the primary teeth (7).
Previous studies have demonstrated there to be a higher prevalence of hypodontia in females than in males (5, 8-10). Others have argued that various mutated genes are risk factors for hypodontia (11), pointing out problems of the MSX1 gene located on the 4p chromosome, critical to abnormal
development of teeth (2,11-12). Furthermore, environmental exposures in the form of rubella, drugs, irradiation, trauma, and osteomyelitis, among others, as well as hormonal and metabolic influences, are suggested to be risk factors for hypodontia (7, 12, 13). In addition, evolutionary factors have been postulated as a potential explanation for this trait (13).
Several investigators have reported the upper second premolar as being the most frequently missing tooth (8), whereas various studies have observed the lower second premolar to be the most commonly missing tooth (1, 2, 5, 10-14). In a study of Mexican subjects with hypodontia, the third molar was determined to be the most commonly missing tooth, followed by the upper lateral
02 Pagan et al.indd 9 2/18/2014 8:56:54 AM

Prevalence of Hypodontia in Puerto Rico
10 PRHSJ Vol. 33 No. 1 • March, 2014
Pagán-Collazo et al
incisor and, after that, the lower second premolar (15). However, studies of Swedish and Singaporean Chinese subjects have reported that the lower central incisors are the most likely to be missing in those populations (16, 17). Rose (14) noted that the tooth that most consistently failed to develop in his hypodontic population was the lower second premolar. More recently, in a meta-analysis by Polder, the lower second premolar was found to be the most frequently missing tooth in 6 out of 9 surveys, which was followed by the upper lateral incisor in the other 3 surveys. He also reported that hypodontia of the canines, upper central incisors, and upper and a lower first molar is rare (5).
Bäckman (16) reported that hypodontia is 3 times more common in the mandible than in the maxilla. Arte (11) stated that 81% of unilateral cases of hypodontia affected the left side of the mandible. Nevertheless, Mok (17) has noted there to be a greater number of third molars missing in the maxilla (61.5%) than in the mandible (38.5%).
To the best of our knowledge, there has not been a study that adequate describes the prevalence of hypodontia in Puerto Rico; given that, the aims of this study were to estimate the prevalence of hypodontia in a group of 10- to 14-year-olds in Puerto Rico and describe its distribution by different socio-demographic groups.
Methods
To estimate the prevalence of hypodontia in Puerto Rico, an epidemiological cross-sectional study was performed from May through June 2004. One orthodontic clinic from each of the 9 health regions (as determined by Reforma, the government-run health insurance program) in Puerto Rico was selected by convenience in order to have spatial variation.
A simple random sample of patient charts within each clinic was selected to assess the prevalence of hypodontia. A list was prepared in each clinic using the subjects’ record numbers; from this, a random sample was selected using patient ID numbers. The program Excel was used to randomly select patient IDs.
The sample size was calculated using the expected 7.0% prevalence of hypodontia, a 99.74% confidence level, and a maximum tolerable error of 2.0% (18). Examiner A analyzed patient X-rays from 7 clinics (67.2% of all patient records), whereas Examiner B evaluated the remaining 32.8% of patient X-rays from the Bayamón and Caguas clinics. The research protocol was approved by the IRB Committee of the Medical Sciences Campus, University of Puerto Rico.
Inclusion and exclusion criteriaThe study included patients ranging in age from 10 to 14
years with initial orthodontic records including a panoramic radiograph, a dental and medical history, and treatment progress history. Patients with a history of any syndrome or palatal fissure were excluded from the study.
Assessment of hypodontia and reliabilityThe presence or absence of teeth was assessed by 2 dental
examiners using panoramic X-rays and previous dental histories from the records. A convenience sample (n=30) of charted patients of the Orthodontic Clinic of the Medical Sciences Campus, University of Puerto Rico, was selected to conduct a standardization and calibration exercise prior to the study.
An examiners’ reliability assessment was conducted prior to the evaluations, using inter- and intra-examiner Kappa coefficients. Both intra- (kappa= 1.0, and 1.0) and inter-examiner (kappa = 0.84) reliability were excellent (19).
Statistical analysisA descriptive analysis was performed using relative and
absolute frequencies.The overall prevalence of hypodontia (by socio-demographics)
was estimated using logistic regression, as described in the following equation:
pi =1+e (β0+Bi Xi + 1.96SE)
1(20)
in which equation is the estimator of the prevalence of hypodontia, β0 is the model intercept, xi is a categorical socio-demographical variable, and β1 is the mean change for each category.
For each patient, the presence or absence of hypodontia was coded either as 1 for presence or 0 for absence. Gender was coded as a nominal variable, either as 1 or 0 for female or male, respectively. Age in years was described as a discrete variable. The 9 orthodontic clinics were evaluated as a nominal variable; the clinic in Aibonito was used as the reference clinic.
In the inferential analysis, odds ratios (OR) were calculated to evaluate the statistical association between the prevalence of hypodontia and socio-demographics (sex, age, and location of the orthodontic clinic) throughout the logistic regression model. Statistical analysis was conducted using Statistical Package for the Social Sciences (SPSS, versions 11.5 and 16.0) and Statistical Analysis System software (SAS versions 9.1.).
Results
To estimate the prevalence of hypodontia, a total of 1,911 patient records from the 9 clinics were examined (culled from a total of 2,944) (Table 1).
As described in Table 2, the overall weighted prevalence of hypodontia for the 9 orthodontic clinics was 6.02%. The Aibonito (10.68%), Aguadilla (10.48%), and Arecibo (8.06%) clinics exhibited the highest prevalence of hypodontia, whereas the Guayama (4.26%), Fajardo (3.85%), and San Juan (3.21%) clinics showed the lowest weighted prevalence of hypodontia. Females presented a higher weighted prevalence of hypodontia than males did (7.02% vs. 4.72%, respectively); this conclusion was true for 7 out of 9 clinics. At the Caguas, Ponce, and Fajardo
02 Pagan et al.indd 10 2/18/2014 8:56:54 AM

Prevalence of Hypodontia in Puerto Rico
11PRHSJ Vol. 33 No. 1 • March, 2014
Pagán-Collazo et al
clinics, females showed the highest prevalences, while males showed higher prevalences of hypodontia at the Aguadilla and Aibonito clinics than they did at other clinics.
As depicted in Figure 1, the distribution of the prevalences of hypodontia with regard to the maxillary right and left quadrants was bimodal. The most commonly absent maxillary teeth in the right and left quadrants were the lateral incisors (1.90% and 1.80%, respectively) and second premolars (0.70% and 0.80%, respectively).
regions, with the clinics in Fajardo, Bayamón, San Juan, and Guayama having lower prevalences of hypodontia than the Aibonito clinic had. In this study, we were surprised to observe that age increased the risk of hypodontia (OR = 1.12; CI 95%: 1.012, 1.37), after adjusting by clinic and gender.
Table 1. Sample profile by municipality.
Orthodontic Clinic Number of existing records Sample Municipality N n Aibonito 125 103 Aguadilla 286 229 Arecibo 353 211Ponce 216 146 Caguas† 323 143 Bayamón*† 483 483 Guayama 341 258 Fajardo 451 182 San Juan 366 156 Total 2,944 1,911
*Complete coverage of eligible records; †The Caguas and Bayamón records were evaluated by 1 examiner.
Table 2. Weighted prevalence of hypodontia per each clinic, overall and by gender.
Male Prevalence Female Prevalence Total Prevalence 95% Confidence Interval n % N % n % Lower limit Upper limit Aibonito 44 11.36 59 10.17 103 10.68 4.71 16.64Aguadilla 96 11.46 133 9.77 229 10.48 6.51 14.45Arecibo 95 7.37 116 8.62 211 8.06 4.38 11.73Ponce 60 3.33 86 10.47 146 7.53 3.25 11.82Caguas* 69 2.90 74 10.81 143 6.99 2.81 11.17Bayamón*† 207 5.31 276 5.80 483 5.59 3.54 7.64Guayama 112 2.68 146 5.48 258 4.26 1.80 6.73Fajardo 73 1.37 109 5.50 182 3.85 1.05 6.64San Juan 73 1.37 83 4.82 156 3.21 0.44 5.97Total 829 5.07 1,082 7.49 1,911 6.44 5.34 7.54Weighted Prevalence 4.72 7.02 6.02
*Only 1 examiner; †Complete coverage: standard error=0
0.0
0.2
0.4
0.6
0.8
1.0
1.2
1.4
1.6
1.8
2.0
0 1 2 3 4 5 6 7 8
Prev
alen
ce
tooth number
UR UL
As presented in Figure 2, the distribution of the prevalence of hypodontia with regard to in the right and left mandibular quadrants was unimodal, with the second premolar being the most commonly missing tooth in the right and left quadrants (1.3%).
As can be seen in Table 3, logistic regression analysis was performed to determine differences in the prevalence of hypodontia, explained by the following variables: (1) gender, (2), age, and (3) clinics. In the exploratory data analysis, females showed a higher risk of hypodontia (OR = 1.46; CI 95%: 0.99, 2.10) than did males, after adjusting for region and age. Statistically significant differences were observed between
Figure 1. Prevalence of hypodontia in the maxilla, by tooth number and quadrant
Discussion
The aims of this study were to estimate the prevalence of hypodontia using patient records from a group of 10- to 14-year-olds, each of whom had visited 1 of 9 orthodontic clinics in Puerto Rico from May through June 2004, and to describe its distribution in this sample by socio-demographic group.
This weighted prevalence of hypodontia was 6.02%; other studies report a prevalence of hypodontia ranging from 2.7% to 6.9%. The prevalence of hypodontia was 2.5% in Saudi Arabia, 3.4% in Switzerland, 4.4% in United States, 4.6% in Israel, 6.1% in Sweden, 6.9% in Mongolia, 8% in Finland, and 9.6% in Austria (1, 2, 5, 10, 14). Since none of these studies employed
probabilistic sampling methods, it is difficult to compare the prevalence of hypodontia in Puerto Rico with that of other ethnic groups.
In several studies, females present a higher prevalence of hypodontia than do males. Polder (5) reported an odds ratio for females compared to males that is similar to that of the present study (1.37 vs. 1.46, respectively). The gender differences observed in this study persisted after we stratified by orthodontic clinic; however, a large variability in the prevalence of hypodontia was observed among clinics throughout Puerto Rico. Nunn (12)
02 Pagan et al.indd 11 2/18/2014 8:56:54 AM

Prevalence of Hypodontia in Puerto Rico
12 PRHSJ Vol. 33 No. 1 • March, 2014
Pagán-Collazo et al
proposed that sex hormones explain the higher prevalence of hypodontia in females compared to males. Another explanation may be a higher demand for treatment by females.
The logistic regression analysis demonstrated an association between the prevalence of hypodontia and age. This increase in the prevalence of hypodontia related to age may be explained by a selection bias caused by older children’s seeking orthodontic treatment or by the misclassification of extracted versus absent teeth.
maxillary teeth were the lateral incisors and second premolars; these findings were similar to those described by Silva (2003) (15), who studied a group of 9- to 20-year-old Mexicans. Other studies have confirmed that the most frequently missing teeth in hypodontia cases are the lower central incisors (12). The study described herein, however, identified the second premolar as being the most common missing mandibular tooth in the right and left quadrants.
The strength of this study comes from the standardization and training exercises conducted as well as from the randomized sampling of the patient records selected from the 9 orthodontic clinics, which sampling thereby enhanced the internal validity of the data collected. This approach may have reduced the selection bias in the population of patients in these clinics.
However, a limitation of this study is the fact that the 9 clinics chosen to provide patient charts were selected by convenience and may not be representative of all the orthodontic clinics in Puerto Rico. Moreover, other socio-demographical variables, such as household income and health insurance, were not gathered, which lack may explain the direction of the selection bias.
Conclusions
The prevalence of hypodontia in females was 6.02%, which is a higher prevalence than was seen in males. In addition, the orthodontic clinics in Fajardo, Bayamón, San Juan, and Guayama had lower prevalences of hypodontia than did the Aibonito clinic. The most frequently missing tooth identified in this study was the maxillary right lateral incisor.
Future studies are needed to generalize these findings to the population of 10- to 14-year-old children living in Puerto Rico. Such studies should also attempt to assess socio-demographic, genetic, and environmental risk factors for hypodontia in Puerto Rico.
Resumen
Objetivo: Estimar la prevalencia de hipodoncia en un grupo de niños entre las edades de 10 y 14 años, en Puerto Rico. Métodos: Se realizó un estudio corte-transversal epidemiológico en las clínicas de ortodoncia dentro de cada una de las nueve Regiones de la Reforma de Salud (según lo determinado la Administración de Servicios de Salud administrada del gobierno, La Reforma) en Puerto Rico. Se evaluaron 1,911 expedientes, que incluían radiografías e historiales médicos dentales. Se utilizó un modelo de regresión logística para evaluar la asociación en la prevalencia de hipodoncia en el grupo de estudio y la localización de las clínicas, el género y edad, con una significancia de 5%, para estimar la prevalencia de hipodoncia. Resultados: La prevalencia de hipodoncia fue de 6.02%. Las niñas mostraron una mayor prevalencia de hipodoncia que los niños (7.02% vs. 4.82%, respectivamente) (p=0.055). Hubo diferencias en las
0.0
0.2
0.4
0.6
0.8
1.0
1.2
1.4
0 1 2 3 4 5 6 7 8
Prev
alen
ce
tooth number
LR LL
Figure 2. Prevalence of hypodontia in the mandible, by tooth and quadrant
Table 3. Odds ratios (OR) and 95% confidence intervals for the prevalence of hypodontia, by region and socio-demographic variable*.
OR 95% Confidence Interval p-value Lower Limit Upper Limit
Age (years) 1.18 1.01 1.37 0.03Gender† 1.46 0.99 2.14 0.06Ponce‡ 0.61 0.25 1.46 0.26Guayama‡ 0.31 0.13 0.75 0.01San Juan‡ 0.25 0.08 0.74 0.01Arecibo‡ 0.65 0.30 1.46 0.30Aguadilla‡ 0.80 0.37 1.75 0.56Fajardo‡ 0.31 0.12 0.83 0.02Caguas‡ 0.64 0.26 1.56 0.32Bayamón‡ 0.42 0.20 0.90 0.03
*Logistic regression models included age, clinic location (municipality), and gender; †The referent clinic was that of Aibonito. ‡The reference category was male.
The prevalences of hypodontia were statistically significantly lower in Fajardo, Bayamón, San Juan, and Guayama than was the hypodontia prevalence at the Aibonito clinic. These results should be interpreted cautiously because the lowest effective sample rates were observed at the Fajardo and San Juan clinics; therefore, this finding might simply be a residual effect.
In his early work in 1966, Rose (14) reported a controversy regarding the tooth with the highest frequency of being absent. In our own study, we observed that the most common missing
02 Pagan et al.indd 12 2/18/2014 8:56:54 AM

Prevalence of Hypodontia in Puerto Rico
13PRHSJ Vol. 33 No. 1 • March, 2014
Pagán-Collazo et al
distribuciones de las prevalencias en las clínicas sondeadas, que van desde 3.12% en la clínica de San Juan hasta 10.68% en la clínica de Aibonito (p=0.013). Los dientes que estaban ausentes con mayor frecuencia fueron los laterales maxilares, seguidos por las segundas premolares mandibulares (1.9%). Conclusión: La prevalencia de hipodoncia en Puerto Rico fue de 6.02%. Las niñas presentaron una prevalencia mayor que los niños. Las clínicas en la Fajardo, Bayamón, San Juan y Guayama tuvieron menor prevalencia de hipodoncia al comparar con la clínica de Aibonito. El diente que estaba ausente con mayor frecuencia fue el incisivo lateral derecho de la maxila.
Acknowledgments
The authors would like to express their gratitude to Dr. Jazmín Oliva, the director of the orthodontics program, Dr. Carlos Martínez, for his assistance in data collection, and Dr. Carlos Toro and Dr. Omar García, for their help with the statistical analysis.
References
1. Arte S, Nieminen P, Apajalahti S, Haavikko K, Thesleff I, Pirinen S. Characteristics of incisor-premolar hypodontia in families. J Dent Res 2001;80:1445-50.
2. Mattheeuws N, Dermaut L, Martens G. Has hypodontia increased in Cau-casians during the 20th century? A meta-analysis. Eur J Orthod 2004; 26: 99-103.
3. Ng’ang’a RN, Ng’ang’a PM. Hypodontia of permanent teeth in a Kenyan population. East Afr Med J 2001;78:200-3.
4. Shapira Y, Lubit E, Kuftinec MM, Stom D. Hypodontia in children with various types of clefts. Angle Orthod 2000;70:16-21.
5. Polder BJ, Van’t H of MA, Van der Linden FP, Kuijpers-Jagtman AM. A meta-analysis of the prevalence of dental hypodontia of permanent teeth. Community Dent Oral Epidemiol 2004;32:217-26.
6. Robertsson S, Mohlin B. The congenitally missing upper lateral incisor. A retrospective study of orthodontic space closure versus restorative treat-ment. Eur J Orthod 2000;22:697-710.
7. Fines C, Rebellato J, Saiar M. Congenitally missing second premolar: Treatment outcome with orthodontic space closure. Am J Orthod Dento-facial Orthop 2003;123:676-82.
8. Rolling S, Poulsen S. Oligodontia in Danish schoolchildren. Acta Odon-tol Scand 2001;59:111-112.
9. Thongudomporn U, Freer T. Prevalence of dental anomalies in orthodon-tic patients. Aust Dent J 1998;43:395-98.
10. Nordgarden H, Jensen JL, Storhaug K. Reported prevalence of congeni-tally missing teeth in two Norwegian counties. Community Dent Health 2001;19:258-61.
11. Arte S, Nieminen P, Pirinen S, Thesleff I, Peltonen L. Gene defect in hyp-odontia: Exclusion of EGF, EGFR, and FGF-3 as candidate genes. J Dent Res 1996;75:1346-1352.
12. Nunn JH, Carter NE, Gillgrass TJ, Hobson RS, Jepson NJ, Meechan JG, et al. The interdisciplinary management of hypodontia: background and role of paediatric dentistry. Br Dent J 2003;194:245-51.
13. Brook AH. A unifying aetiological explanation for anomalies of human tooth number and size. Arch Oral Biol 1984;29:373-78.
14. Rose J. A survey of congenitally missing teeth, excluding third molars, in 6000 orthodontic patients. Dent Pract Dent Rec 1966;17:107-114.
15. Silva Meza R. Radiographic assessment of congenitally missing teeth in orthodontic patients. Int J Paediatr Dent 2003;13:112-6.
16. Bäckman B, Wahlin YB. Variations in number and morphology of per-manent teeth in 7-year-old Swedish children. Int J of Paediatr Dent 2001;11:11-17.
17. Mok Y, Ho KK. Congenitally absent third molars in 12 to 16 year old Sin-gaporean Chinese patients: A retrospective study. Ann Acad Med Singa-pore 1996;25:828-30.
18. Cholitgul W, Drummond B. Jaw and tooth abnormalities detected on panoramic radiographs in New Zealand children aged 10-15 years. N Z Dent J 2000;96:13-3.
19. National Institute of Dental Research, Epidemiology and Oral Disease Prevention Program (1991): Oral health surveys of the national institute of dental research/ diagnostic criteria and procedures. (NIH Publication # 91-2847). Maryland: U.S. Department of Health and Human Services.
20. Hosmer DW, Lemeshow S. Applied logistic regression. New York, NY: Wiley; 1989.
02 Pagan et al.indd 13 2/18/2014 8:56:55 AM

14 PRHSJ Vol. 33 No. 1 • March, 2014
Physical Environment, Diet Quality, and Body Weight in a Group of 12-year-old Children from Four Public Schools in Puerto Rico
Roxana Torres, MHSN, RD, LND*; Mónica Serrano, MHSN*; Cynthia M. Pérez, PhD†; Cristina Palacios, PhD, LND*
*Department of Human Development and †Department of Biostatistics and Epidemiology, Graduate School of Public Health, University of Puerto Rico Medical Sciences Campus, San Juan, Puerto Rico
The authors have no conflicts of interest to disclose.
Address correspondence to: Cristina Palacios, PhD, Nutrition Program, Graduate School of Public Health, University of Puerto Rico Medical Sciences Campus, PO Box 365067, San Juan, PR 00936-5067. Email: [email protected]
Objective: Physical environment influences diet and has been proposed as a determinant of childhood obesity. This cross-sectional study explored physical environment and its associations with diet quality and weight status in a sample of 114 12-year-old children from 4 public schools in the metropolitan area of San Juan, PR.
Methods: Physical environment was assessed by asking questions regarding the availability and accessibility of healthy and unhealthy foods and food outlets as well as of recreational and sports facilities and equipment. Food intake was determined using a 24-hour diet-recall questionnaire, with the gathered data being used to assess diet quality and calculate the Healthy Eating Index (HEI)-2010. The HEI includes 12 components that are used to determine the compliance of a given diet with federal guidelines. HEI-2010 total score ranges from 0 to100 and is divided into the following classifications: poor (≤50), needs improvement (51-80), and good (>80). Body mass index was computed using measured weight and height and categorized according to the CDC Growth Charts.
Results: Thirty-six percent of the participating children were overweight or obese. Nearly 57% had poor diet quality. The lowest HEI-2010 component scores were found for total fruits, whole fruits, total vegetables, whole grains, seafood and plant proteins, and fatty acids. However, diet quality was not associated with weight status or physical environment factors. Compared to the other children in the study, overweight or obese children reported having a significantly (p<0.05) lower availability of unhealthy foods and the highest access to recreational and sports facilities at home but also lower utilization of recreational and sports facilities at school and reduced participation in the school breakfast program.
Conclusion: This study showed that some home- and school-environment factors influenced body weight in the children in this sample. However, these same factors did not appear to affect diet quality. [P R Health Sci J 2014;33:14-21]
Key words: Diet quality, Childhood obesity, Physical environment
Childhood overweight or obesity is a major public health concern worldwide, including in Puerto Rico (PR). Childhood obesity is a risk factor for chronic diseases
later in life (1,2). An island-wide study of youths aged 4 to 17 years of age in PR found the prevalences of overweight and obesity to be 17.9% and 21.5%, respectively (3). The highest overweight prevalence has been found in those who are 11 to 12 years old (46.8%) (4). Therefore, the high obesity rates in PR represent a critical situation.
Overweight and obesity are a complex and multidimensional health issues (5). Although studies have investigated the individual determinants of dietary intake and obesity, there is a gap in the knowledge regarding both the environmental determinants of diet quality (DQ) and those of obesity (6,7). In children, DQ and physical activity (PA) may be influenced by environmental factors, such as physical and social surroundings (6,8); therefore, the physical environment (PE) is
an important component of the obesogenic environment (5). In this manuscript, we are using PE to specifically refer to the availability and accessibility of healthy and unhealthy foods and food outlets, recreational and sports facilities, and PA programs (at home, school, or both) (6,9,10).
Access to and the availability of healthy foods at home have been associated with better DQ (9,11), while on the contrary, access to unhealthy food outlets, such as fast food restaurants and convenience stores, can lead to high energy, sugar, and saturated-
03 Palacios et al.indd 14 2/18/2014 7:57:34 AM
Physical Environment, Diet Quality, and Body Weight
15PRHSJ Vol. 33 No. 1 • March, 2014
Torres et al
fat intakes, which have been linked to increases in the prevalence of obesity (12,13). Since school is the place where children spend most of their day, it exerts great influence in their diet and PA. Food outlets, such as vending machines, street vendors, and fast food restaurants in and around schools have been linked to poor DQ and body weight (14,15). However, participation in school breakfast and lunch programs can positively influence DQ and body weight (16,17).
PE factors are also linked to PA (18). PA can be linked to access to such recreational facilities as parks and playgrounds as well as to sports and exercise facilities in the neighborhood (19). In the school setting, PA has been linked to access to and the availability of recreational and sports facilities, recess periods in which activity-related equipment is available, and physical education programs (20).
The study of these factors is essential if we are to better understand how the environment influences diet and obesity (6,8). Therefore, the aim of this study was to explore PE factors and their association with DQ and weight status in a group of 12-year-old children from PR.
Methods
Study design and participantsA cross-sectional design was used to study the association
between PE factors, DQ, and weight status among 12-year-old children enrolled in 4 public schools in the metropolitan area of San Juan, PR. The inclusion criteria were that each participant must be 12 years old, must be enrolled in the 2012-2013 school year, and must have a signed parental consent form and participant’s assent form. There were no exclusion criteria.
The 4 schools selected were the ones identified in a previous island-wide study of 1,550 12-year-olds with the highest prevalence of overweight or obesity in this area (21). Based on an acceptable error of 0.05, a confidence level of 95%, and a population size of 300, the estimated number of study participants aimed for was 168, distributed equally among the schools. For the purpose of this study, participants were selected by convenience within the schools.
At each school, investigators visited 6th- and 7th-grade classrooms to explain the study. At a subsequent visit, interested participants with signed forms were invited to a private classroom in order to complete the questionnaire, 24-hour dietary recall interview, and anthropometric measurements. The Institutional Review Board of MSC-UPR and the Department of Education of PR approved the study.
QuestionnaireA self-administered, short questionnaire was developed to
collect data on socio-demographic characteristics, PE, and diet. Participants were asked if they were users of the Nutritional Assistance Program, which was used as an indicator of low socio-economic status (22).
Questions assessing the total time spent on vigorous and moderate PA and sedentary type activities were included using a modified version of the Team Cool survey (23). The total time that each participant spent in vigorous and moderate PA was dichotomized as meeting or not meeting the U.S. Department of Health and Human Services recommendation that children get at least 60 minutes of exercise every day (24). Similarly, the total sedentary time for each participant was dichotomized as meeting or not meeting the recommendation of the American Academy of Pediatrics that children remain inactive for fewer than 2 hours daily (25).
PE data were collected using a modified version of the Active Where? survey (26). This survey was designed to assess and understand how environment impacts PA and eating behaviors in children. This survey has been previously tested for its validity and reliability in 12- to 19-year-olds, demonstrating satisfactory indicators (27). Several questions of interest were extracted from this survey and translated into Spanish. Experts in child obesity and school health assessed content validity.
Home PE factors included the following: the availability of healthy and unhealthy foods, distance to healthy and unhealthy food outlets, distance to recreational and sports facilities, use of recreational and sports equipment, access to recreational and sports facilities, variety of foods at meals, and frequency of visits to fast food restaurants. The school PE factors included the following: the frequency of visits to unhealthy food outlets, the use of recreational and sports equipment and facilities, participation in breakfast and lunch programs, and physical education class frequency.
24-h dietary recall interviewDiet was assessed by 2 nutritionists using a single 24-hour
dietary recall. Children were asked to list all of the foods and beverages that they had consumed in the past 24 hours, starting with the most recent meal and going backwards and including meals and snacks consumed both on weekends and weekdays, whichever might be the case; parents were not present in the interview. To aid in the estimation of portion sizes, food models were used (Life/form® food replicas; Nasco, Salida, CA). A fruit and vegetable frequency screener was used to corroborate the information from the recall (Rivera-Soto W, unpublished data, 2012). This screener was designed for adolescents in PR, and it is currently being validated. The results of the screener were adjusted to reflect daily intake. There was a perfect correlation between the results from the 24-hour dietary recall and the screener (r = 1.0), which indicates good reliability of the information reported in the recall. Data were analyzed using the Nutrition Data System for Research (NDSR 2011; University of Minnesota).
With information from the 24-hour dietary recall, DQ was assessed using the most recent (at the time of the study) updated version of the USDA’s Healthy Eating Index (HEI-2010) (28).
03 Palacios et al.indd 15 2/18/2014 7:57:34 AM
Physical Environment, Diet Quality, and Body Weight
16 PRHSJ Vol. 33 No. 1 • March, 2014
Torres et al
The HEI is a score that assesses compliance with the US Dietary Guidelines for Americans and captures balance among food groups, including foods to encourage and foods to reduce (28). The HEI-2010 has 12 components, 9 of which assess dietary adequacy (total fruits, whole fruits, total vegetables, greens and beans, whole grains, total proteins, seafood and plant proteins, dairy, and fatty acids) and 3 of which assess dietary components that should be consumed in moderation (refined grains, sodium, and empty calories).
Each component is evaluated with a density approach; that is, food and nutrient components are expressed as an amount per 1,000 kcal. This allows the components to be considered independently of an individual’s energy requirements so that diet quality can be evaluated regardless of the total amount of food consumed (29).
The components related to total fruits, whole fruits, total vegetables, greens and beans, total proteins, and seafood and plant proteins are scored from 0 to 5 points each. Whole grains, dairy, fatty acids (ratio of poly- and monounsaturated fatty acids to saturated fatty acids), refined grains, and sodium are scored from 0 to 10 points each; and the empty-calorie components are scored from 0 to 20 points. For the 9 adequacy components, participants with intakes at the level of the standard or higher received the maximum number of points. Those with no intake received a score of 0. For the 3 moderation components, participants with diet intakes at the level of the standard or lower were given the maximum number of points (28). Scores for intakes between the minimum and maximum standards were prorated linearly; that is, the reported amount per 1,000 kcal was divided by the standard and multiplied by the total possible number of points (30). The total score was calculated as the sum of all scores (0-100) and categorized as one of the following: good DQ (>80), DQ needs improvement (51-80), or poor DQ (≤50). The HEI has proven to be a reliable and valid measure of DQ in children (30,31) when using the NDSR (32).
Anthropometric measurements Trained staff measured weight and height following the
NHANES procedures (33), with the participating children wearing their school uniforms without socks, shoes, or accessories. Weight was measured using a calibrated digital weight scale (Seca 882; GMBH & Co., Germany); this was calibrated between each participant (and before the first) using a 2.3 kg weight. Height was measured using a Height Measuring Rod (BM-9071; Charder Electronic Co., LTD, Taiwan, ROC). Measurements were taken in duplicate, rounded to the nearest 0.1, and averaged. Body mass index (BMI) was calculated dividing weight in kilograms by height in meters squared. Using the Centers for Disease Control and Prevention age- and sex-specific percentiles for BMI (34), participants were categorized as being of normal weight or as being overweight or obese.
Statistical analysisNormality of continuous variables was assessed using
the Shapiro–Wilk test (35). The data were non-normally distributed; therefore, we used non-parametric tests. For descriptive statistics, we used median (25th and 75th percentiles) and frequency distributions. Fisher’s exact test was used to compare socio-demographic characteristics by weight status, while the linear-by-linear association chi-squared test was used for the ordinal categorical variables. The Mann–Whitney U test was used to compare the median HEI scores with the continuous home and school PE variables by weight status. To study the association between total HEI and the scores and PE variables, Spearman’s correlation and Kruskal–Wallis tests were used. Spearman’s correlation was also used to study the association between BMI percentiles, PE, and total HEI variables. All descriptive and inferential statistics were assessed using the SPSS Statistical Package (SPSS version 18.0 for Windows, 2010, SPSS Inc., Chicago, IL). Statistical significance was set at p<0.05.
Results
Of the 165 children who were eligible for the study, 118 (71.5%) were enrolled. Three participants who were underweight and 1 who did not complete the study protocol were excluded from the subsequent analysis. Therefore, 114 participants were included in the analysis; 57% of those participants were females and 43% were males. In terms of weight status classification, 64% were classified as being of normal weight and 36% were classified as being overweight or obese. In addition, 58% reported that they participated in Nutritional Assistance Program (only 63% answered this part). In relation to parental education, 71% of the children reported that their parents (mother and father) had completed at least a high school education, while 29% reported that their parents had completed more than a high school education. This part of the questionnaire was answered by only about 60% of the children.
Table 1 shows median HEI scores by weight status. Total HEI-2010 scores were similar in normal weight and overweight or obese children (48.8 and 49.7, respectively). The lowest median scores (0) for both males and females were found for whole fruits, whole grains, seafood and plant proteins, and fatty acids. However, girls had significantly (p<0.05) higher scores for whole fruits and total vegetables than did boys (data not shown). Normal-weight children appeared to have higher scores for total fruits, greens and beans, and empty calories than overweight or obese children did; however, these and other components were not significantly different by weight status (p>0.05).
Most children (55.6%) were categorized as having “poor DQ,” while none of the children was categorized as having “good
03 Palacios et al.indd 16 2/18/2014 7:57:34 AM

Physical Environment, Diet Quality, and Body Weight
17PRHSJ Vol. 33 No. 1 • March, 2014
Torres et al
DQ,” with no differences by weight status (p>0.05; Table 2). About 30% of the children met the recommended guidelines for moderate and vigorous PA, and less than 10% of the children met the recommended guidelines for sedentary time, with no differences by weight status or gender (p>0.05).
Compared to those of normal weight, overweight or obese children reported significantly (p<0.05) lower availability of unhealthy foods, higher access to recreational and sports facilities at home, less use of recreational and sports facilities at school, and reduced participation in school breakfast programs (Table 3). There was a trend of higher availability of healthy foods and less accessibility to unhealthy food outlets in the homes of children classified as “DQ needs improvement” (p = 0.07; Table 4). Total HEI-2010 and
individual component scores did not vary significantly across PE variables (data not shown).
There was a significant negative correlation between BMI and the availability of unhealthy foods at home (r = -0.25, p = 0.01) and a weak positive correlation between BMI and access to recreational and sports facilities at home (r = 0.25, p = 0.01; Table 5). In addition, there was a negative correlation trend between BMI and the use of recreational and sports facilities (p = 0.06).
Discussion
Overall DQ in the sample was poor, with the lowest scores found for whole fruits, whole grains, seafood and plant proteins,
Table 1. Healthy Eating Index-2010 components and total scores by weight status
Weight status
HEI-2010 component Normal Overweight (maximum score) weight or obese P-value* (n = 73) (n = 41)
median (P25, P75)
Total fruit (includes 100% juice) (5) 1.09 (0.0, 2.5) 0.79 (0.0, 2.6) 0.67Whole fruit (not juice) (5) 0.0 (0.0, 2.7) 0.0 (0.0, 3.7) 0.83Total vegetables (5) 0.3 (0.14, 0.9) 0.41 (0.20, 1.1) 0.32Greens and beans (5) 3.6 (0.6, 5.0) 2.21 (0.0, 5.0) 0.14Whole grains (10) 0.0 (0.0, 0.7) 0.0 (0.0, 2.1) 0.69Dairy (10) 6.4 (3.6, 9.3) 6.4 (3.8, 10.0) 0.54Total protein foods (5) 5.0 (3.3, 5.0) 5.0 (3.8, 5.0) 0.96Seafood and plant proteins (5) 0.0 0.0 0.47Fatty acids† (10) 0.0 0.0 0.55Refined grains (10) 4.9 (3.9, 5.8) 5.4 (4.1, 6.7) 0.20Sodium (10) 6.8 (6.0, 7.7) 7.1 (6.2, 8.1) 0.18Empty calories‡ (20) 20.0 (15.3, 20.0) 18.4 (13.9, 20.0) 0.18Total HEI-2010 score (100) 48.8 (42.5, 54.5) 49.7 (41.9, 55.6) 0.78
*P-value assessed by Mann–Whitney U; †Ratio of poly- and monounsaturated fatty acids to saturated fatty acids; ‡Calories from solid fats, alcohol, and added sugars.
Table 2. HEI-2010 category and physical activity by weight status
Weight status
Normal weight Overweight or obese P-value* n % n %
Total HEI-2010 Category (n = 114) Good DQ 0 0 0 0 0.55 DQ needs improvement 31 57.5 20 48.8 Poor DQ 42 42.5 21 51.2 Moderate to Vigorous Physical Activity (n = 113) <6 hours per week 51 70.8 28 68.3 0.47 ≥6 hour per week 21 29.2 13 31.7 Sedentary Time (n = 106) ≤2 hours per day 7 9.6 4 9.8 0.61 >2 hours per day 66 90.4 29 90.2
*P-value assessed by linear-by-linear association chi-squared. DQ: diet quality.
and fatty acids, and with no differences by weight status. Normal-weight children participated more frequently in school breakfast programs and used recreational and sports facilities at school with greater frequency than did overweight or obese children, while the latter had less availability of unhealthy foods at home and more access to recreational and sports facilities at home. However, PE was not significantly associated with DQ.
The overall HEI-2010 score of our sample was lower than that reported for US Hispanic children (36,37), with scores ranging from 54 to 62. However, consistent with other studies in children (37,38), the lowest scores were found for whole fruits and whole grains. Moreover, scores for seafood and plant proteins and for fatty acids were low, which suggests that children in our sample are consuming too much saturated fat. A study in 633 children in PR ranging in age from 11 to 18 years reported high intakes of fried foods and fast foods, which are high in saturated fats (39). Similarly to other studies (38), we found that girls had significantly better scores for whole fruits and total vegetables than boys had.
In the present study, normal-weight children appeared to have higher scores for total fruits, greens and beans, and empty calories than did their overweight or obese counterparts; however, the differences were not significant. These results are consistent with those of other studies (38). Diet plays an important role in the development of obesity; however, diet varies through time, and overweight or obese participants in this study may have had different diets (which led to fat accumulation) in the years before the study than they did at the time of the study.
Over weight or obese children reported significantly less availability of unhealthy foods at
03 Palacios et al.indd 17 2/18/2014 7:57:34 AM

Physical Environment, Diet Quality, and Body Weight
18 PRHSJ Vol. 33 No. 1 • March, 2014
Torres et al
home than normal-weight children did. In other studies, low BMI has been associated with the highest availability of healthy foods, but not with less availability of unhealthy foods (8,41). Although the foods listed for each category (healthy/unhealthy) consisted of only 5 easy-to-recognize items, it may have been difficult for the participants to recall the frequency of their availability at home. In addition, overweight or obese children are more likely to under-report energy intake (42). Others have reported that parents of overweight or obese children are trying to have more healthy foods at home to help their children be more healthy (43), but the present study did not address this issue, thus it should be further studied.
Access to recreational and sports facilities was higher in overweight or obese children than it was in their normal-weight counterparts. Contrary to a study in 799 US adolescents, access to recreational facilities (which was determined using a geographic information system) was not associated with weight status (19). However, a Canadian study of a sample of 10- to 11-year old children found that those with more access to recreational facilities were less likely to be overweight or obese (44). Differences in these findings may reflect variations in the source of the information and in the measurement techniques used. Complexity in the evaluation of PE has been recognized (6,45,46).
Table 3. Physical environmental factors by weight status
Weight status
Physical Environmental Factors Normal weight Overweight or P-valuea
(n = 73) obese (n = 41)
median (P25, P75)
Home physical environment (number of items) Availability of healthy foods (5)b,c 12.0 (9.0, 15.0) 12.0 (9.7, 15.0) 0.74 Availability of unhealthy foods (5)d,c 13.0 (11.0, 15.0) 11.0 (10.0, 13.2) 0.01 Distance to: Healthy food outlets (3)e,f 10.0 (7.0, 11.0) 9.0 (6.0, 11.0) 0.13 Unhealthy food outlets (3)g,f 9.0 (7.0, 13.0) 9.0 (6.0, 12.0) 0.55 Recreational and sports facilities (6)h,f 20.0 (15.9, 23.2) 20.0 (16.0, 23.0) 0.79 Use of recreational and sports equipment (8)i,j 16.0 (9.0, 20.0) 16.0 (9.0, 18.0) 0.83 Access to recreational and sports facilities (4)k 5.0 (5.0, 6.0) 5.3 (5.0, 6.0) 0.04School physical environment (number of items) Frequency of visits to unhealthy food outlets (4)c 3.0 (2.0, 6.0) 3.0 (2.0, 5.5) 0.65 Use of recreational and sports equipment (3)c 8.0 (5.0, 9.0) 6.0 (4.0, 9.0) 0.29 Use of recreational and sports facilities (2)c 7.0 (6.0, 8.0) 6.0 (4.0, 8.0) 0.01Home physical environment n (%) P-valuel
Variety of foods at meals (n = 112) Never/Rarely 13 (18.1) 10 (25.0) 0.46 Sometimes 31 (43.1) 16 (40.0) Frequently/Always 28 (38.9) 14 (35.0) Frequency of visits to fast food restaurants (n = 112) Never/Rarely 14 (19.2) 8 (20.5) 0.58 Sometimes 48 (65.8) 27 (69.2) Frequently/Always 11 (15.1) 4 (10.3) School physical environment Participation in school breakfast program (n = 109) ≤1 day a week 24 (33.8) 24 (63.2) 0.01 2-3 days a week 7 (9.9) 0 ≥4 days a week 40 (56.3) 14 (36.8) Participation in school lunch program (n = 109) ≤1 day a week 10 (14.1) 8 (21.1) 0.60 2-3 days a week 8 (11.3) 2 (5.3) ≥4 days a week 53 (74.6) 28 (73.7) Physical education class frequency (n = 107) Never 27 (39.1) 14 (36.8) 0.60 1-4 days a week 9 (13.0) 6 (15.8) 5 days a week 33 (47.8) 18 (47.4)
aP-value assessed by Mann-Whitney U test; bIncludes fruits and vegetables, 100% fruit juice, whole grains, and low fat milk; cOn a 5-point scale: Never=1, Rarely=2, Sometimes=3, Frequently=4, Always=5. dIncludes candy, sweet pastries, sweetened beverages, refined grains, and chips; eIncludes super- and mini-markets and fruit and vegetable markets; fOn a 5-point scale: 1-5 minutes (min.)=1, 6-10 min.=2, 11-20 min.=3, 21-30 min.=4, >31 min.=5; gIncludes fast food restaurants and street food vendors; hIncludes playgrounds, parks, fitness centers, and basketball courts. iIncludes bicycles, balls, skates, and video games for exercise; jOn a 5-point scale: Not available=1, Available but never use=2, Use once a month or less=3, Use once every other week=4, Use once a week or more=5; kOn a 2-point scale: No=1, Yes=2. lP-value assessed by linear-by-linear association chi-squared test.
Reduced participation in school breakfast programs was significantly associated with overweight or obese. This is consistent with results from a US national sample of public schools, which showed a significant association between lower BMI and school-breakfast-program participation, but not with similar participation in school lunch programs (17). Regular participation in a school breakfast program influences the prevalence of breakfast consumption (17), which is associated with lower BMI (47). This relationship is unclear, but some theories suggest that it may influence the distribution of daily energy intake, prevent overeating, and promote diet-induced thermogenesis and energy expenditure (17,47).
More than half of the children did not meet the recommended guidelines for PA and sedentary time. Overweight or obese children reported significantly less use of recreational and sports facilities at school than normal-weight children did. Similarly, a study in 410 US schools found that the use and participation in recreational and sports activities at school was associated with lower BMI scores (20). Reduced participation of overweight or obese children in such activities may be influenced by social factors linked to self-esteem, parental or peer support, or perceived peer attitudes about body shape and fitness (48). Therefore,
03 Palacios et al.indd 18 2/18/2014 7:57:34 AM

Physical Environment, Diet Quality, and Body Weight
19PRHSJ Vol. 33 No. 1 • March, 2014
Torres et al
PA programs specifically designed for overweight or obese children are of particular importance (49). A pilot program entitled “Ponte Guillao con Buena Salud” in 8- to 13-year-old obese children from 6 (3 control and 3 intervention) extended-stay elementary schools in PR, which included 13 weeks of nutritional, physical, and self-esteem–building activities, found that obesity was reduced by 5% in the intervention group but underwent a 2% increase in the control group (50).
Children classified as “DQ needs improvement” appeared to report a higher availability of healthy foods and less accessibility to unhealthy food outlets than did children
classified as “poor DQ”; however, this was not significant. A US study in 458 adolescents and their parents found that a diet high in fruits and vegetables was positively associated with the availability of healthy foods at home (9). Furthermore, diets high in sugar have been associated (in adolescents) with the residential proximity to unhealthy food outlets (12). Although this was not observed in the present study, PE is complex and can be influenced by several factors not included in this study (e.g., perception socio-cultural factors). Moreover, a larger sample size may help in the detection of associations with PE; parental reports may also be important to confirm the child’s answers.
This is the first study to explore the PEs of school children in PR. However, some limitations should be considered. Children were self-selected and may have been more motivated and health conscious than those who did not choose to participate. The sample size was limited and the information on diet and PE was self-reported without parental involvement. In addition, individual reports of parental socioeconomic status were missing for a significant number of the participants. On the other hand, among the strengths of this study is the inclusion of measures that have been previously tested and validated in children. Finally, the response rate was similar to that of other pediatric studies in PR, and nutritionists performed the 24-hour recall dietary interview.
Table 4. Physical Environmental Factors by HEI-2010 category
HEI-2010 category
Physical Environmental Factors DQ needs Poor DQ P-valuea
improvement
median (P25, P75)
Home physical environment (number of items) Availability of healthy foods (5)b,c 12.0 (11.0, 15.0) 12.0 (9.0, 14.0) 0.07 Availability of unhealthy foods (5)d,c 12.0 (10.0, 14.0) 12.0 (10.0, 15.0) 0.46 Distance to: Healthy food outlets (3)e,f 9.0 (7.0, 11.0) 9.0 (7.0, 11.0) 0.59 Unhealthy food outlets (3)g,f 10.0 (7.0, 14.0) 9.0 (6.0, 12.0) 0.07 Recreational and sports facilities (6)h,f 20.0 (18.0, 24.0) 19.0 (15.4, 23.0) 0.23Use of recreational and sports equipment (8)i,j 16.0 (10.0, 20.0) 16.0 (8.7, 18.2) 0.84Access to recreational and sports facilities (4)k 5.0 (5.0, 6.0) 5.0 (5.0, 6.0) 0.94School physical environment (number of items) Frequency of visits to unhealthy food outlets (4)c 3.0 (1.2, 5.5) 4.0 (1.0, 6.0) 0.80 Use of recreational and sports equipment (3)c 8.0 (5.0, 8.2) 7.0 (4.5, 9.0) 0.96 Use of recreational and sports facilities (2)c 7.0 (5.0, 8.0) 7.0 (5.0, 8.0) 0.71Home physical environment n (%) P-valuel
Variety of foods at meals (n = 112) 0.49 Never/Rarely 10 (20.4) 13 (20.6) Sometimes 18 (36.7) 29 (46.0) Frequently/Always 21 (42.9) 21 (33.3) Frequency of visits to fast food restaurants (n = 112) 0.96 Never/Rarely 11 (22.0) 11 (17.7) Sometimes 31 (62.0) 44 (71.0) Frequently/Always 8 (16.0) 7 (11.3) School physical environment Participation in school breakfast program (n = 109) 0.20 ≤1 day a week 18 (37.5) 30 (47.6) 2-3 days a week 3 (6.3) 4 (6.6) ≥4 days a week 27 (56.3) 27 (44.3) Participation in school lunch program (n = 109) 0.85 ≤1 day a week 8 (16.7) 10 (16.4) 2-3 days a week 5 (10.4) 5 (8.2) ≥4 days a week 35 (72.9) 46 (75.4) Physical education class frequency (n = 107) 0.76 Never 18 (36.7) 23 (39.7) 1-4 days a week 7 (14.3) 8 (13.8) 5 days a week 24 (49.0) 27 (46.6)
aP-value assessed by Mann-Whitney U test; bIncludes fruits and vegetables, 100% fruit juice, whole grains, and low fat milk; cOn a 5-point scale: Never=1, Rarely=2, Sometimes=3, Frequently=4, Always=5; dIncludes candy, sweet pastries, sweetened beverages, refined grains, and chips; eIncludes super- and mini-markets and fruit and vegetable markets; fOn a 5-point scale: 1-5 minutes (min.)=1, 6-10 min.=2, 11-20 min.=3, 21-30 min.=4, >31 min.=5; gIncludes fast food restaurants and street food vendors; hIncludes playgrounds, parks, fitness centers, and basketball courts; iIncludes bicycles, balls, skates, and video games for exercise; jOn a 5-point scale: Not available=1, Available but never use=2, Use once a month or less=3, Use once every other week=4, Use once a week or more=5; kOn a 2-point scale: No=1, Yes=2; lP-value assessed by linear-by-linear association chi-squared test. DQ: Diet quality.
In conclusion, overweight or obese was associated with a low availability of unhealthy foods, high access to recreational and sports facilities at home, reduced participation in school breakfast programs, and low use of the recreational and sports facilities at school. These findings can help in the development of health-promoting public policies and nutritional interventions to improve participation in school breakfast programs as well as in increasing the use of recreational and sports facilities. More research is needed to develop validated tools for measuring PE and to explore other environmental factors influencing diet and PA in children.
03 Palacios et al.indd 19 2/18/2014 7:57:34 AM
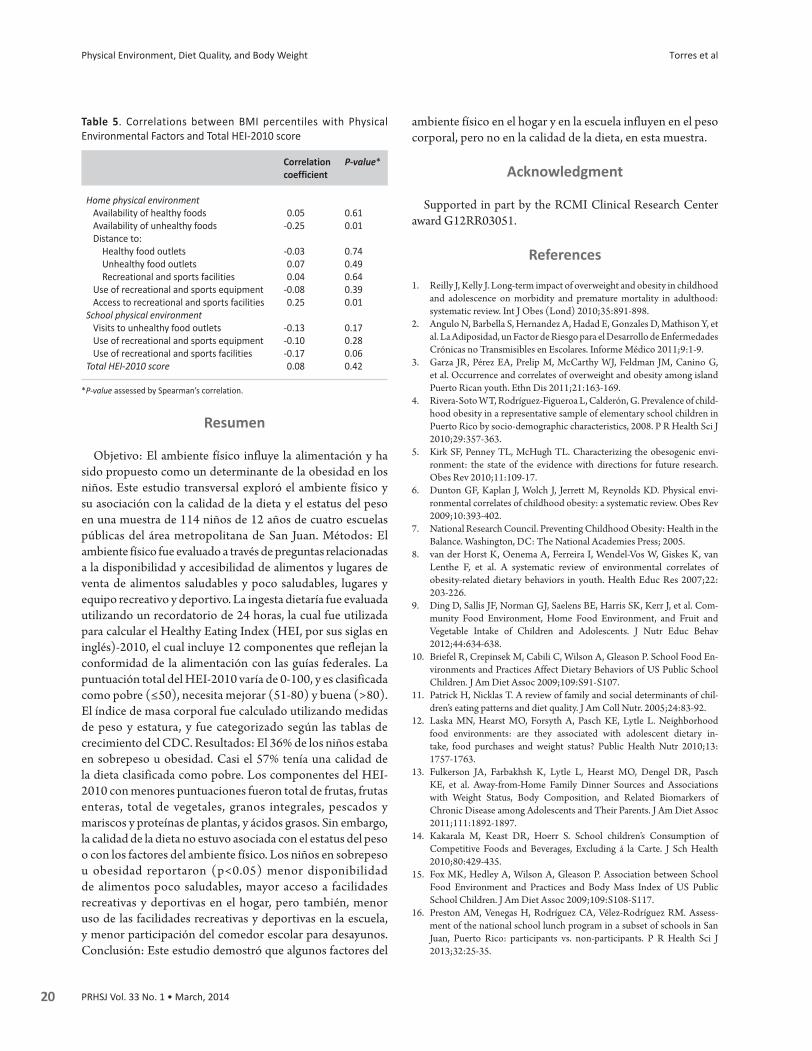
Physical Environment, Diet Quality, and Body Weight
20 PRHSJ Vol. 33 No. 1 • March, 2014
Torres et al
Resumen
Objetivo: El ambiente físico influye la alimentación y ha sido propuesto como un determinante de la obesidad en los niños. Este estudio transversal exploró el ambiente físico y su asociación con la calidad de la dieta y el estatus del peso en una muestra de 114 niños de 12 años de cuatro escuelas públicas del área metropolitana de San Juan. Métodos: El ambiente físico fue evaluado a través de preguntas relacionadas a la disponibilidad y accesibilidad de alimentos y lugares de venta de alimentos saludables y poco saludables, lugares y equipo recreativo y deportivo. La ingesta dietaría fue evaluada utilizando un recordatorio de 24 horas, la cual fue utilizada para calcular el Healthy Eating Index (HEI, por sus siglas en inglés)-2010, el cual incluye 12 componentes que reflejan la conformidad de la alimentación con las guías federales. La puntuación total del HEI-2010 varía de 0-100, y es clasificada como pobre (≤50), necesita mejorar (51-80) y buena (>80). El índice de masa corporal fue calculado utilizando medidas de peso y estatura, y fue categorizado según las tablas de crecimiento del CDC. Resultados: El 36% de los niños estaba en sobrepeso u obesidad. Casi el 57% tenía una calidad de la dieta clasificada como pobre. Los componentes del HEI-2010 con menores puntuaciones fueron total de frutas, frutas enteras, total de vegetales, granos integrales, pescados y mariscos y proteínas de plantas, y ácidos grasos. Sin embargo, la calidad de la dieta no estuvo asociada con el estatus del peso o con los factores del ambiente físico. Los niños en sobrepeso u obesidad reportaron (p<0.05) menor disponibilidad de alimentos poco saludables, mayor acceso a facilidades recreativas y deportivas en el hogar, pero también, menor uso de las facilidades recreativas y deportivas en la escuela, y menor participación del comedor escolar para desayunos. Conclusión: Este estudio demostró que algunos factores del
ambiente físico en el hogar y en la escuela influyen en el peso corporal, pero no en la calidad de la dieta, en esta muestra.
Acknowledgment
Supported in part by the RCMI Clinical Research Center award G12RR03051.
References
1. Reilly J, Kelly J. Long-term impact of overweight and obesity in childhood and adolescence on morbidity and premature mortality in adulthood: systematic review. Int J Obes (Lond) 2010;35:891-898.
2. Angulo N, Barbella S, Hernandez A, Hadad E, Gonzales D, Mathison Y, et al. La Adiposidad, un Factor de Riesgo para el Desarrollo de Enfermedades Crónicas no Transmisibles en Escolares. Informe Médico 2011;9:1-9.
3. Garza JR, Pérez EA, Prelip M, McCarthy WJ, Feldman JM, Canino G, et al. Occurrence and correlates of overweight and obesity among island Puerto Rican youth. Ethn Dis 2011;21:163-169.
4. Rivera-Soto WT, Rodríguez-Figueroa L, Calderón, G. Prevalence of child-hood obesity in a representative sample of elementary school children in Puerto Rico by socio-demographic characteristics, 2008. P R Health Sci J 2010;29:357-363.
5. Kirk SF, Penney TL, McHugh TL. Characterizing the obesogenic envi-ronment: the state of the evidence with directions for future research. Obes Rev 2010;11:109-17.
6. Dunton GF, Kaplan J, Wolch J, Jerrett M, Reynolds KD. Physical envi-ronmental correlates of childhood obesity: a systematic review. Obes Rev 2009;10:393-402.
7. National Research Council. Preventing Childhood Obesity: Health in the Balance. Washington, DC: The National Academies Press; 2005.
8. van der Horst K, Oenema A, Ferreira I, Wendel-Vos W, Giskes K, van Lenthe F, et al. A systematic review of environmental correlates of obesity-related dietary behaviors in youth. Health Educ Res 2007;22: 203-226.
9. Ding D, Sallis JF, Norman GJ, Saelens BE, Harris SK, Kerr J, et al. Com-munity Food Environment, Home Food Environment, and Fruit and Vegetable Intake of Children and Adolescents. J Nutr Educ Behav 2012;44:634-638.
10. Briefel R, Crepinsek M, Cabili C, Wilson A, Gleason P. School Food En-vironments and Practices Affect Dietary Behaviors of US Public School Children. J Am Diet Assoc 2009;109:S91-S107.
11. Patrick H, Nicklas T. A review of family and social determinants of chil-dren’s eating patterns and diet quality. J Am Coll Nutr. 2005;24:83-92.
12. Laska MN, Hearst MO, Forsyth A, Pasch KE, Lytle L. Neighborhood food environments: are they associated with adolescent dietary in-take, food purchases and weight status? Public Health Nutr 2010;13: 1757-1763.
13. Fulkerson JA, Farbakhsh K, Lytle L, Hearst MO, Dengel DR, Pasch KE, et al. Away-from-Home Family Dinner Sources and Associations with Weight Status, Body Composition, and Related Biomarkers of Chronic Disease among Adolescents and Their Parents. J Am Diet Assoc 2011;111:1892-1897.
14. Kakarala M, Keast DR, Hoerr S. School children’s Consumption of Competitive Foods and Beverages, Excluding á la Carte. J Sch Health 2010;80:429-435.
15. Fox MK, Hedley A, Wilson A, Gleason P. Association between School Food Environment and Practices and Body Mass Index of US Public School Children. J Am Diet Assoc 2009;109:S108-S117.
16. Preston AM, Venegas H, Rodríguez CA, Vélez-Rodríguez RM. Assess-ment of the national school lunch program in a subset of schools in San Juan, Puerto Rico: participants vs. non-participants. P R Health Sci J 2013;32:25-35.
Table 5. Correlations between BMI percentiles with Physical Environmental Factors and Total HEI-2010 score
Correlation P-value* coefficient
Home physical environment Availability of healthy foods 0.05 0.61 Availability of unhealthy foods -0.25 0.01 Distance to: Healthy food outlets -0.03 0.74 Unhealthy food outlets 0.07 0.49 Recreational and sports facilities 0.04 0.64 Use of recreational and sports equipment -0.08 0.39 Access to recreational and sports facilities 0.25 0.01School physical environment Visits to unhealthy food outlets -0.13 0.17 Use of recreational and sports equipment -0.10 0.28 Use of recreational and sports facilities -0.17 0.06Total HEI-2010 score 0.08 0.42
*P-value assessed by Spearman’s correlation.
03 Palacios et al.indd 20 2/18/2014 7:57:34 AM

Physical Environment, Diet Quality, and Body Weight
21PRHSJ Vol. 33 No. 1 • March, 2014
Torres et al
17. Gleason PM, Dodd AH. School Breakfast Program but Not School Lunch Program Participation Is Associated with Lower Body Mass Index. J Am Diet Assoc 2009;109:S118-S128.
18. Davison K, Lawson CT. Do attributes in the physical environment influ-ence children’s physical activity? A review of the literature. Int J Behav Nutr Phys Act 2006;3:19.
19. Norman GJ, Nutter SK, Ryan S, Sallis JF, Calfas KJ, Patrick K. Commu-nity design and access to recreational facilities as correlates of adoles-cent physical activity and body-mass index. J Phys Act Health 2006;3: S118S-128.
20. O’Malley P, Johnston L, Delva J, Terry Y. School Physical Activity Envi-ronment Related to Student Obesity and Activity: A National Study of Schools and Students. J Adolesc Health 2009;45:S71-S81.
21. Orraca L, Murillo M, Arencibia R, Marrero H, Rivas-Tumanyan S, Elias-Boneta AR. Dental Caries Prevalence among 12 Years Olds School At-tending Puerto Ricans [abstract]. P R Health Sci J 2012;31:S74. Abstract R-217.
22. Han E, Powell LM, Isgor Z. Supplemental nutrition assistance program and body weight outcomes: The role of economic contextual factors. Soc Sci Med 2012;74:1874-1881.
23. Kubik MY, Davey C, Fulkerson JA, Sirard J, Story M, Arcan C. Alterna-tive high school students: prevalence and correlates of overweight. Am J Health Behav 2009;33:600-609.
24. U.S. Department of Health & Human Services. 2008 Physical Activity Guidelines for Americans. Chapter 3: Active Children and Adolescents. Available at: Url: http://www.health.gov/paguidelines/guidelines/chap-ter3.aspx. Accessed December 9, 2012.
25. American Academy of Pediatrics. Committee on Public Education. American Academy of Pediatrics: Children, Adolescents, and Television. Pediatrics 2001;107:423–426.
26. Kerr J, Sallis J, Roenberg D, Norman G, Saelens B, Durant N. Active-Where? Adolescent Survey. [Active Living Research Web site]. 2008. Available at: Url: http://www.activelivingresearch.org. Accessed Decem-ber 13, 2012.
27. Joe L, Carlson J, Sallis J. Active Where? Individual Item Reliability Sta-tistics Adolescent Survey. Active Living Research. 2011:1–45. Available at: Url: http://www.drjamessallis.sdsu.edu/Documents/AW_item_reli-ability_Adolescent.pdf. Accessed December 13, 2012.
28. Guenther PM, Casavale KO, Reedy J, Kirkpatrick SI, Hiza HA, Kuczyn-ski KJ, et al. Update of the Healthy Eating Index: HEI-2010. J Acad Nutr Diet. 2013;113:569-580.
29. Freedman LS, Guenther PM, Krebs-Smith SM, Kott PS. A population’s mean Healthy Eating Index-2005 scores are best estimated by the score of the population ratio when one 24-hour recall is available. J Nutr 2008;138:1725-1729.
30. Guenther PM, Reedy J, Krebs-Smith SM, Reeve BB, Basiotis PP. De-velopment and Evaluation of the Healthy Eating Index-2005. Technical Report [USDA Web site]. Available at: Url: http://www.cnpp.usda.gov/Publications/HEI/HEI-2005/HEI-2005TechnicalReport.pdf. Accessed February 2008.
31. Guenther PM, Reedy J, Krebs-Smith SM. Development of the Healthy Eating Index-2005. J Am Diet Assoc 2008;108:1896-1901.
32. Miller PE, Mitchell DC, Harala PL, Pettit JM, Smiciklas-Wright H, Hart-man TJ. Development and evaluation of a method for calculating the Healthy Eating Index-2005 using the Nutrition Data System for Research. Public Health Nutr 2011;14:306-313.
33. Centers for Disease Control. National Health and Nutrition Examination Survey (NHANES) Anthropometry Procedures Manual. Available at: Url: http://www.cdc.gov/nchs/data/nhanes/nhanes_07_08/manual_an.pdf. Accessed April 23, 2013.
34. Centers for Disease Control and Prevention. CDC Growth Charts. Avail-able at: Url: http://www.cdc.gov/growthcharts/cdc_charts.htm. Ac-cessed August 23, 2012.
35. Liang J, Tang M-L, Chan PS. A generalized Shapiro–Wilk W statis-tic for testing high-dimensional normality. Comput Stat Data Anal 2009;53:3883-3891.
36. Goodwin DK, Knol LK, Eddy JM, Fitzhugh EC, Kendrick O, Donohue RE. Sociodemographic correlates of overall quality of dietary intake of US adolescents. Nutrition Research 2006;26:105-110.
37. Hiza HA, Casavale KO, Guenther PM, Davis CA. Diet Quality of Ameri-cans Differs by Age, Sex, Race/Ethnicity, Income, and Education Level. J Acad Nutr Diet 2013;113:297-306.
38. Wilson TA, Adolph AL, Butte NF. Nutrient Adequacy and Diet Quality in Non-Overweight and Overweight Hispanic Children of Low Socioeconom-ic Status: The Viva la Familia Study. J Am Diet Assoc 2009;109:1012-1021.
39. Vigo-Valentín A, Hodge SR, Kozub FM. Adolescents’ Dietary Habits, Physical Activity Patterns, and Weight Status in Puerto Rico. Child Obes 2011;7:488-494.
40. de Andrade SC, de Azevedo Barros MB, Carandina L, Goldbaum M, Cesar CLG, Fisberg RM. Dietary Quality Index and Associated Factors among Adolescents of the State of Sao Paulo, Brazil. J Pediatr 2010;156:456-460.
41. Humenikova L, Gates GE. Social and Physical Environmental Factors and Child Overweight in a Sample of American and Czech School-aged Chil-dren: A Pilot Study. J Nutr Educ Behav 2008;40:251-257.
42. Fisher JO, Johnson RK, Lindquist C, Birch L, Goran M. Influence of body composition on the accuracy of reported energy intake in children. Obes Res 2000;8:597-603.
43. Togo P, Osler M, Sørensen TI, Heitmann BL. Food intake patterns and body mass index in observational studies. Int J Obes Relat Metab Disord 2001;25:1741-1751.
44. Veugelers P, Sithole F, Zhang S, Muhajarine N. Neighborhood charac-teristics in relation to diet, physical activity and overweight of Canadian children. Int J Pediatr Obes 2008;3:152-159.
45. Elinder LS, Jansson M. Obesogenic environments – aspects on measure-ment and indicators. Public Health Nutr. 2008;12:307-315.
46. Galvez MP, Pearl M, Yen IH. Childhood obesity and the built environ-ment. Curr Opin Pediatr 2010;22:202-207.
47. Deshmukh-Taskar PR, Nicklas TA, O’Neil CE, Keast DR, Radcliffe JD, Cho S. The Relationship of Breakfast Skipping and Type of Breakfast Consumption with Nutrient Intake and Weight Status in Children and Adolescents: The National Health and Nutrition Examination Survey 1999-2006. J Am Diet Assoc 2010;110:869-878.
48. Kahn JA, Huang B, Gillman MW, Field AE, Austin SB, Colditz GA et al. Patterns and Determinants of Physical Activity in U.S. Adolescents. J Adolesc Health 2008;42:369-377.
49. Safron M, Cislak A, Gaspar T, Luszczynska A. Effects of School-based Interventions Targeting Obesity-Related Behaviors and Body Weight Change: A Systematic Umbrella Review. Behav Med 2011;37:15-25.
50. Cabra O, Galdámez G, García V, Hernández L, Zevallos JC. Ponte Guil-lao con Buena Salud Pilot Study Preliminary Report. Unpublished data. md.rcm.upr.edu. Endowed Health Services Research Center, University of Puerto Rico, Medical Sciences Campus.
03 Palacios et al.indd 21 2/18/2014 7:57:35 AM

22 PRHSJ Vol. 33 No. 1 • March, 2014
Mohs Micrographic Surgery: 10 year Experience in Puerto Rico Ivette M. Sosa-Seda, MD*; Rosbel González, MD†; Rogelio Mercado, MD†; Hiram Ruiz, MD†; Luz D. Figueroa, MD†
*Mayo Clinic, Department of Dermatology, Rochester, Minnesota, United States of America; †Department of Dermatology, School of Medicine, University of Puerto Rico Medical Sciences Campus, San Juan, Puerto Rico
The authors have no conflict of interest to disclose.
Address correspondence to: Luz D. Figueroa, MD, Department of Dermatology, School of Medicine, University of Puerto Rico Medical Sciences Campus; PO BOX 365067, San Juan, Puerto Rico 00936-5067. Email: [email protected]
Objective: The incidence of nonmelanoma skin cancer (NMSC) is increasing rapidly worldwide. As NMSC incidence increases, the modalities to treat this condition have become diverse. However, Mohs surgery remains the standard treatment for skin cancer in several particular locations such as the face. The objective of this study is to compare the changes, occurring over a 10-year period, in the characteristics of those cancers that were treated with Mohs micrographic surgery (MMS) at the dermatology clinics of the University of Puerto Rico as well as the modifications in the repair patterns used to close the surgical defects.
Methods: A retrospective chart review of patients treated with MMS at the dermatology of the University of Puerto Rico in the years 2000 and 2010. Variables analyzed include patient demographics, the anatomic site of each patient’s lesion, pathology, the preoperative tumor size, the postoperative defect size, and the repair method.
Results: Thirty-eight (38) patients in the year 2000 and 55 patients in the year 2010 were treated with MMS, signifying a 44% increase in this kind of treatment over a 10-year period. The 2000 cohort was found to be slightly older (P = 0.22), with no gender predominance (P = 0.44). In both years, the majority of tumors were located on the head and neck region, being the nose the most frequent site of involvement (P = 0.06). Basal cell carcinoma (BCC) was the most common neoplasm (P = 0.65). No statistical difference was found in preoperative tumor sizes (P = 0.27). More stages were required to remove a given tumor completely in the year 2000 (P = 0.025). Postoperative defects were smaller in 2000 (P = 0.027) than they were in 2010. Flap repair was used more often in 2010 (P = 0.001) than in 2000.
Conclusion: This study shows a trend toward larger defects in a slightly younger population of patients in the 2010 cohort compared to the 2000 cohort. It also demonstrates a reduction in the number of stages required to excise the tumors, and a tendency to reconstruct the surgical defects with flaps. However, the tumor types, preoperative tumor sizes, and anatomic sites of the lesions were all similar in the 2 cohorts. [P R Health Sci J 2014;33:22-26]
Key words: Mohs micrographic surgery, Skin cancer, Basal cell carcinoma
Skin cancer is the most common cancer in the United States and Puerto Rico (PR). One in 6 Americans will develop skin cancer during his or her lifetime (1). The incidence
of nonmelanoma skin cancer (NMSC) is increasing rapidly, with an estimated incidence of over 600,000 cases per year in the United States (2). The average annual increase of NMSC in white populations in Europe, the United States, Canada, and Australia has been 3% to 8% per year since 1960 (3). NMSC development is mainly attributed to chronic sun exposure, affecting most frequently those areas of the body exposed to sunlight such as the head, neck, and back of the hands. Furthermore, the incidence of NMSC in white populations increases proportionally with proximity to the equator, with the incidence of SCC doubling for each 8 to 10 degrees of decline in latitude (4). In 2010, De la Torre et al. reported that there was a 305% increase in the incidence of NMSC (41.5/100,000 vs. 167.5/100,000 inhabitants) in 1974 compared to 2005,in the Puerto Rican population (5).
As NMSC incidence increases, the modalities to treat this condition have become diverse (6). Excisional surgery is the most frequent approach; other methods such as electrodessication and curettage, cryosurgery, and topical chemotherapeutics can be used to treat superficial tumors. Although Mohs surgery has been frequently reserved for large, recurrent, or histologically aggressive lesions in high-risk anatomical locations (7), it remains the “gold-standard” treatment for the removal of NMSC on the head and neck. Mohs
04 Figueroa et al.indd 22 2/18/2014 7:37:48 AM
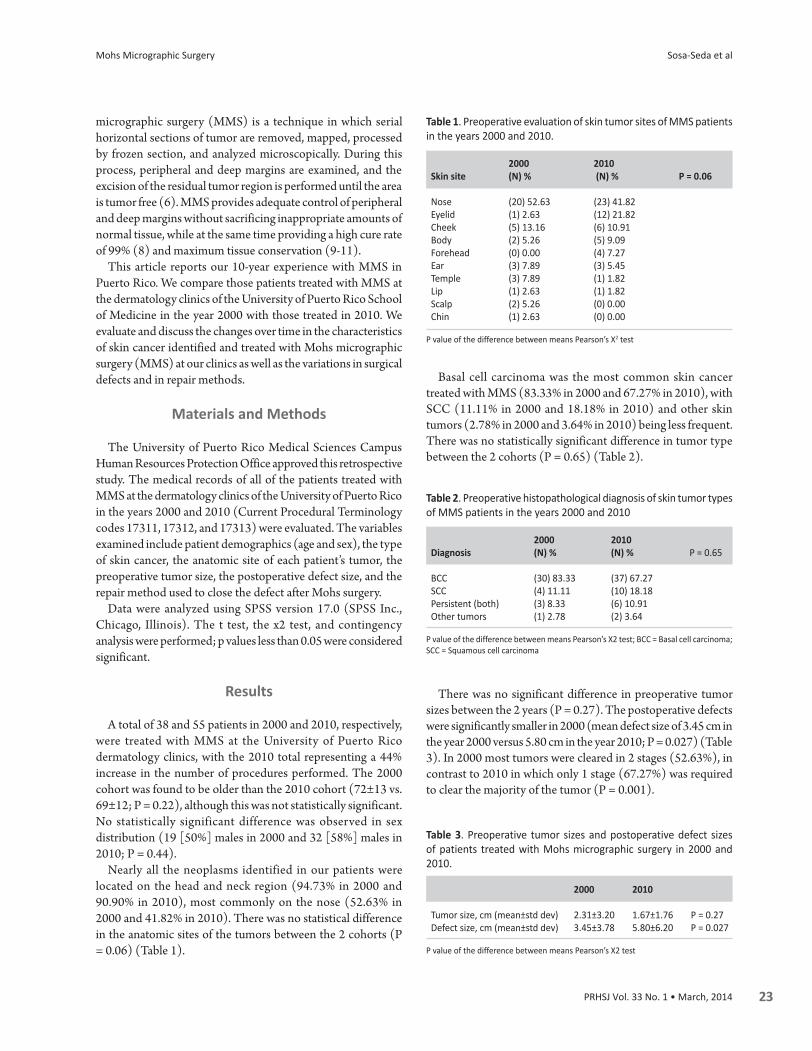
Mohs Micrographic Surgery
23PRHSJ Vol. 33 No. 1 • March, 2014
Sosa-Seda et al
micrographic surgery (MMS) is a technique in which serial horizontal sections of tumor are removed, mapped, processed by frozen section, and analyzed microscopically. During this process, peripheral and deep margins are examined, and the excision of the residual tumor region is performed until the area is tumor free (6). MMS provides adequate control of peripheral and deep margins without sacrificing inappropriate amounts of normal tissue, while at the same time providing a high cure rate of 99% (8) and maximum tissue conservation (9-11).
This article reports our 10-year experience with MMS in Puerto Rico. We compare those patients treated with MMS at the dermatology clinics of the University of Puerto Rico School of Medicine in the year 2000 with those treated in 2010. We evaluate and discuss the changes over time in the characteristics of skin cancer identified and treated with Mohs micrographic surgery (MMS) at our clinics as well as the variations in surgical defects and in repair methods.
Materials and Methods
The University of Puerto Rico Medical Sciences Campus Human Resources Protection Office approved this retrospective study. The medical records of all of the patients treated with MMS at the dermatology clinics of the University of Puerto Rico in the years 2000 and 2010 (Current Procedural Terminology codes 17311, 17312, and 17313) were evaluated. The variables examined include patient demographics (age and sex), the type of skin cancer, the anatomic site of each patient’s tumor, the preoperative tumor size, the postoperative defect size, and the repair method used to close the defect after Mohs surgery.
Data were analyzed using SPSS version 17.0 (SPSS Inc., Chicago, Illinois). The t test, the x2 test, and contingency analysis were performed; p values less than 0.05 were considered significant.
Results
A total of 38 and 55 patients in 2000 and 2010, respectively, were treated with MMS at the University of Puerto Rico dermatology clinics, with the 2010 total representing a 44% increase in the number of procedures performed. The 2000 cohort was found to be older than the 2010 cohort (72±13 vs. 69±12; P = 0.22), although this was not statistically significant. No statistically significant difference was observed in sex distribution (19 [50%] males in 2000 and 32 [58%] males in 2010; P = 0.44).
Nearly all the neoplasms identified in our patients were located on the head and neck region (94.73% in 2000 and 90.90% in 2010), most commonly on the nose (52.63% in 2000 and 41.82% in 2010). There was no statistical difference in the anatomic sites of the tumors between the 2 cohorts (P = 0.06) (Table 1).
Basal cell carcinoma was the most common skin cancer treated with MMS (83.33% in 2000 and 67.27% in 2010), with SCC (11.11% in 2000 and 18.18% in 2010) and other skin tumors (2.78% in 2000 and 3.64% in 2010) being less frequent. There was no statistically significant difference in tumor type between the 2 cohorts (P = 0.65) (Table 2).
There was no significant difference in preoperative tumor sizes between the 2 years (P = 0.27). The postoperative defects were significantly smaller in 2000 (mean defect size of 3.45 cm in the year 2000 versus 5.80 cm in the year 2010; P = 0.027) (Table 3). In 2000 most tumors were cleared in 2 stages (52.63%), in contrast to 2010 in which only 1 stage (67.27%) was required to clear the majority of the tumor (P = 0.001).
Table 1. Preoperative evaluation of skin tumor sites of MMS patients in the years 2000 and 2010.
2000 2010 Skin site (N) % (N) % P = 0.06
Nose (20) 52.63 (23) 41.82 Eyelid (1) 2.63 (12) 21.82 Cheek (5) 13.16 (6) 10.91 Body (2) 5.26 (5) 9.09 Forehead (0) 0.00 (4) 7.27 Ear (3) 7.89 (3) 5.45 Temple (3) 7.89 (1) 1.82 Lip (1) 2.63 (1) 1.82 Scalp (2) 5.26 (0) 0.00 Chin (1) 2.63 (0) 0.00
P value of the difference between means Pearson’s X2 test
Table 2. Preoperative histopathological diagnosis of skin tumor types of MMS patients in the years 2000 and 2010
2000 2010 Diagnosis (N) % (N) % P = 0.65
BCC (30) 83.33 (37) 67.27 SCC (4) 11.11 (10) 18.18 Persistent (both) (3) 8.33 (6) 10.91 Other tumors (1) 2.78 (2) 3.64
P value of the difference between means Pearson’s X2 test; BCC = Basal cell carcinoma; SCC = Squamous cell carcinoma
Table 3. Preoperative tumor sizes and postoperative defect sizes of patients treated with Mohs micrographic surgery in 2000 and 2010.
2000 2010
Tumor size, cm (mean±std dev) 2.31±3.20 1.67±1.76 P = 0.27Defect size, cm (mean±std dev) 3.45±3.78 5.80±6.20 P = 0.027
P value of the difference between means Pearson’s X2 test
04 Figueroa et al.indd 23 2/18/2014 7:37:48 AM

Mohs Micrographic Surgery
24 PRHSJ Vol. 33 No. 1 • March, 2014
Sosa-Seda et al
Regarding repair methods of closure, an increase was observed in the use of surgical flaps (18.42% vs. 21.82%). A decrease was observed both in closures by secondary intention (2.63% vs. 0%) and in side-to-side closures (55.26% vs. 36.36%) (P = 0.025) (Table 4).
MMS is a new service not previously available to our patient population. At the beginning of this clinic, patients came from our general dermatology clinics, but as time passed, specialists, such as oculoplastic, ophthalmologic, and ear, nose, and throat (ENT) surgeons, started referring their patients.
In 2005, a total of 6,568 new skin cancer cases were reported in Puerto Rico, which number represented a 305% increase in incidence compared with the incidence report rates for 1974 (5). The rising incidence rate of nonmelanoma skin cancer is probably multifactorial, secondary to increased sun exposure, increased outdoor activities, increased longevity, and ozone depletion (1). Over 80% of NMSCs occur on areas of the body that are frequently exposed to sunlight, such as the head, neck, and back of the hands. In a large retrospective series of 13,457 patients with BCC at a dermatopathology referral center in France, 85% of the tumors were located on the head and neck (19). Analysis of the anatomic distribution in our series showed that there was a predominance of tumors in such sun-exposed areas as head and neck region, (94.73% in 2000 and 90.90% in 2010), being the nose the most common site of involvement (52.63% in 2000 and 41.82% in 2010). However, there was no statistically significant difference in the anatomic sites of the tumors between the 2 cohorts (P = 0.06) (Table 1).
Our results compare to those reported by Diepgen (3) in the Australian population, but with an increased number of eyelid lesions (nose: 41.82% in PR vs. 41.36% in Australia; eyelid: 21.82% in PR vs. 12.61 % in Australia; cheeks: 10.91% in PR vs. 9.27% in Australia). There has been a dramatic 19% increase of MMS for eyelid tumors, with the lower eyelid and the inner canthus being the most common locations of BCC (53% and 29%, respectively) (20, 21). Because of their complexity, periorbital tumors often require a team approach that utilizes both a Mohs and an oculoplastic surgeon. In fact, most NMSCs on the eyelids are treated through this multidisciplinary approach. Given the risk of invasion to the orbit, nasopharynx, and cranium, it is imperative to ensure complete margin control and tumor clearance with MMS.
BCC is the most common malignancy among white persons in the United States and Australia (13,22-24); the standardized ratio of BCC to SCC is roughly 4: 1 (2). When the rates of BCC, SCC, and melanoma were compared between Hispanic and non-Hispanic whites in New Mexico, the rates in non-Hispanic whites were 5 to 10 times higher than those in darker skinned Hispanic whites (25). Although BCC was the most common skin cancer treated with MMS in our study (83.33% in 2000 and 67.27% in 2010), with SCC (11.11% in 2000 and 18.18% in 2010) and other skin tumors (2.78% in 2000 and 3.64% in 2010) being less frequent, there was no statistically significant difference in tumor types between the 2000 and 2010 cohort (P = 0.65) (Table 2). Furthermore, although male predominance in the development of basal cell carcinoma has been reported
Discussion
Surgical and non-surgical treatments such as curettage and electrodessication, surgical excision, cryotherapy, radiation therapy, photodynamic therapy, topical 5-fluorouracil, and topical imiquimod have been proven to be successful in the treatment of NMSC, especially for BCC (12-14). The treatment of choice is usually decided upon taking into account multiple variables, such as patient-based factors (age, sex, general health), tumor characteristics (size, location, histologic subtype), the treating physician’s preferences, and available resources (12, 15). MMS is indicated for the treatment of NMSC, especially that which occurs in the facial area, where tissue preservation and complete tumor removal is essential to restore function and achieve acceptable aesthetic results. It is also helpful in tumors with clinically indistinct margins and neoplasms with the following histological subtypes: morpheaform, infiltrative, and micronodular (13). It is also a very sensitive technique for identifying perineural involvement of the tumor. Mohs micrographic surgery provides the combination of a high cure rate and tissue conservation, accounting for its increasing popularity. It has shown a cure rate of 99% for primary BCCs, 94.4% for recurrent BCCs(16), and 97% for primary SCCs (8).
In this study, a 44% increase in the number of MMS procedures performed between the year 2000 and 2010 was identified. Although the incidence of NMSC increases with age, the 2010 cohort was found to be slightly younger than the 2000 cohort (72±13 years vs. 69±12 years; P = 0.22); yet this age difference was not statistically significant (3). The fact that the 2010 cohort was larger could be explained by the fact that
Table 4. Number of surgical stages required for tumor clearance and repair methods for closure in 2000 and 2010.
2000 2010 (N) % (N) %
Stages P = 0.025*1 (14) 36.84 (37) 67.27 2 (20) 52.63 (17) 30.91 3 (3) 7.89 (1) 1.82 Repair P = 0.001*Flap (7) 18.42 (12) 21.82 Graft (8) 21.05 (11) 20.00 2nd-intention (1) 2.63 (0) 0.00 Side-to-side (linear) closure (21) 55.26 (20) 36.36 Repair by other specialties (1) 2.63 (12) 21.82
P value of the difference between means Pearson’s X2 test
04 Figueroa et al.indd 24 2/18/2014 7:37:48 AM

Mohs Micrographic Surgery
25PRHSJ Vol. 33 No. 1 • March, 2014
Sosa-Seda et al
in other studies (19, 27, 28), no statistically significant gender predominance was observed in our cohorts (50% male in 2000 and 58% male in 2010; P = 0.44), which is most likely due to the small size of our cohort, which is itself most likely not representative of the entire population.
The preoperative tumor sizes were not significantly different between the 2 years (P = 0.27). However, the postoperative defects were significantly smaller in 2000 (mean defect size of 3.45 cm in the year 2000 versus 5.80 cm in the year 2010, P = 0.027) (Table 3).
Regarding the number of stages needed to excise the tumor (Table 4), 2 stages were more commonly required in the year 2000 (52.63%) while 1 stage was more commonly required in the year 2010 (67.27%) (P = 0.025). The reduction in the number of stages from 2000 to 2010 may be attributed to the earlier referral of primary tumors. On the other hand, the increase in postoperative defect size for patients in 2010 is most likely due to complicated cases that were referred by other surgical specialties and that required a multidisciplinary approach. Similarly, as the postoperative defect increases, more advanced repair techniques are required to close the defect, as evidenced by the increase in surgical flaps for the 2010 cohort.
There are some limitations to this study. First, as a single-center experience, it may not accurately reflect practice trends in private settings or on a national level. Furthermore, all the interventions reported in this study were performed by a single Mohs surgeon. Since all study participants were drawn from a single academic dermatology practice, our study may have been statistically underpowered for the purpose of detecting a true effect or subtle variations in some of the variables explored. We believe that a multicenter prospective study would be able to better determine the changing patterns in MMS referrals, the characteristics of skin tumors, and surgical preoperative and postoperative parameters. A prospective study would allow for more accurate preoperative and postoperative measurements of initial lesions and surgical defects. Furthermore, an evaluation of referral criteria by community physicians would allow for a better understanding of recorded referral patterns within the last years.
In conclusion, this is the first study of NMSC managed by MMS in our academic center in Puerto Rico. It compares the changes, occurring over a 10-year period, in the characteristics of those cancers that were treated with MMS, as well as the modifications in the repair patterns used to close the surgical defects. It is characterized by its high percentage of head and neck cases, predominantly identified as primary BCCs, which not only correlates with the findings of other studies but also with our population’s UV exposure. The increase in MMS cases can be attributed not only to the cost-effectiveness of the surgical procedure but also to an increased acceptance between referring physicians because of its high cure rate, aesthetics, and tissue-sparing properties.
Resumen
Objetivo: La incidencia de cáncer de piel no melanocítico (CPNM) está aumentando rápidamente. A medida que este aumenta, las modalidades para su tratamiento se han ido diversificando. Sin embargo, la cirugía de Mohs se ha mantenido como el tratamiento de elección para lesiones particulares, localizadas en áreas de difícil manejo, como la cara. El objetivo de este manuscrito es comparar los cambios, a través de un periodo de 10 años, en las características de los cánceres de piel tratados con cirugía micrográfica de Mohs (CMM) en las Clínicas de Dermatología de la Universidad de Puerto Rico, así como las modificaciones en las reparaciones de defectos quirúrgicos. Métodos: Un estudio retrospectivo en pacientes tratados con CMM en las Clínicas de Dermatología de la Universidad de Puerto Rico en los años 2000 y 2010. Las variables analizadas incluyen factores demográficos, lugar anatómico de la lesión, patología, tamaño tumoral preoperatorio, tamaño del defecto postoperatorio, y el método de reparación. Resultados: Treintaiocho (38) pacientes (2000) y 55 pacientes (2010) fueron tratados con CMM, mostrando un incremento de 44% en el número de procedimientos. El cohorte del año 2000 era de mayor edad (P = 0.22), sin predominio de género (P = 0.44). Casi todos los tumores en ambos periodos estaban localizados en la cabeza y el cuello, en especial en la nariz (P = 0.06). El carcinoma basocelular (CBC) fue el neoplasma más predominante (P = 0. 65). No se encontró diferencia estadísticamente significativa entre los tamaños tumorales (P = 0.27). Los estadíos operatorios durante el año 2000 fueron mayores (P = 0.025). Los defectos post-operatorios fueron de menor tamaño en el año 2000 (P = 0.027). Igualmente se observó un aumento en la reparación mediante colgajos en el año 2010 (P = 0.001). Conclusión: Este estudio muestra una tendencia a defectos más grandes, en una población de pacientes ligeramente más joven en la cohorte de 2010 en comparación con la cohorte de 2000. También demuestra una reducción en el número de etapas requeridas para remover los tumores, y una tendencia a reconstruir los defectos quirúrgicos mediante colgajos. Por otro lado, no hubo variación en el tipo y tamaño de tumor y la localización anatómica de las lesiones.
Acknowledgments
For their excellent assistance, we would like to thank the medical personnel making up the dermatology clinics at the University of Puerto Rico that were taking place at the time of this study.
References
1. Gloster HM Jr, Brodland DG. The epidemiology of skin cancer. Dermatol Surg 1996;22:217-226.
2. Silverberg E, Boring CC, Squires TS. Cancer statistics, 1990. CA Cancer J Clin 1990;40:9-26.
3. Diepgen TL, Mahler V. The epidemiology of skin cancer. Br J Dermatol 2002;146(Suppl 61):1-6.
04 Figueroa et al.indd 25 2/18/2014 7:37:48 AM

Mohs Micrographic Surgery
26 PRHSJ Vol. 33 No. 1 • March, 2014
Sosa-Seda et al
4. Giles GG, Marks R, Foley P. Incidence of non-melanocytic skin cancer treated in Australia. Br Med J (Clin Res Ed) 1988;296(6614):13-7.
5. De La Torre-Lugo EM, Figueroa LD, Sanchez JL, Morales-Burgos A, Conde D. Skin cancer in Puerto Rico: a multiannual incidence compara-tive study. P R Health Sci J 2010;29:312-316.
6. Neville JA, Welch E, Leffell DJ. Management of nonmelanoma skin can-cer in 2007. Nat Clin Pract Oncol 2007;4:462-469.
7. Kaplan AL, Weitzul SB, Taylor RS. Longitudinal diminution of tumor size for basal cell carcinoma suggests shifting referral patterns for Mohs sur-gery. Dermatol Surg 2008;34:15-9.
8. Rowe DE, Carroll RJ, Day CL Jr. Prognostic factors for local recurrence, metastasis, and survival rates in squamous cell carcinoma of the skin, ear, and lip. Implications for treatment modality selection. J Am Acad Derma-tol 1992;26:976-90.
9. Leibovitch I, Huilgol SC, Selva D, Richards S, Paver R. Basal cell carci-noma treated with Mohs surgery in Australia I. Experience over 10 years. J Am Acad Dermatol 2005;53:445-451.
10. Leibovitch I, Huilgol SC, Selva D, Richards S, Paver R. Basal cell carcino-ma treated with Mohs surgery in Australia II. Outcome at 5-year follow-up. J Am Acad Dermatol 2005;53:452-457.
11. Leibovitch I, Huilgol SC, Selva D, Richards S, Paver R. Basal cell carci-noma treated with Mohs surgery in Australia III. Perineural invasion. J Am Acad Dermatol 2005;53:458-463.
12. Kuijpers DI, Thissen MR, Neumann MH. Basal cell carcinoma: treat-ment options and prognosis, a scientific approach to a common malig-nancy. Am J Clin Dermatol 2002;3:247-259.
13. Telfer NR, Colver GB, Bowers PW. Guidelines for the management of basal cell carcinoma. British Association of Dermatologists. Br J Dermatol 1999;141:415-423.
14. Telfer NR, Colver GB, Morton CA; British Association of Dermatolo-gists. Guidelines for the management of basal cell carcinoma. Br J Derma-tol 2008;159:35-48.
15. Thissen MR, Neumann MH, Schouten LJ. A systematic review of treat-ment modalities for primary basal cell carcinomas. Arch Dermatol 1999;135:1177-83.
16. Rowe DE, Carroll RJ, Day CL Jr. Mohs surgery is the treatment of choice for recurrent (previously treated) basal cell carcinoma. J Dermatol Surg Oncol 1989;15:424-431.
17. Gaston DA, Naugle C, Clark DP. Mohs micrographic surgery referral pat-terns: the University of Missouri experience. Dermatol Surg 1999;25:862-866; discussion 866-867.
18. Fears TR, Scotto J. Estimating increases in skin cancer morbidity due to increases in ultraviolet radiation exposure. Cancer Invest 1983;1:119-126.
19. Scrivener Y, Grosshans E, Cribier B. Variations of basal cell carcinomas according to gender, age, location and histopathological subtype. Br J Dermatol 2002;147:41-47.
20. Mohs FE. Micrographic surgery for the microscopically controlled exci-sion of eyelid cancers. Arch Ophthalmol 1986;104:901-909.
21. Wong VA, Marshall JA, Whitehead KJ, Williamson RM, Sullivan TJ. Management of periocular basal cell carcinoma with modified en face frozen section controlled excision. Ophthal Plast Reconstr Surg 2002;18: 430-435.
22. Miller SJ. Biology of basal cell carcinoma (Part I). J Am Acad Dermatol 1991;24:1-13.
23. Walling HW, Fosko SW, Geraminejad PA, Whitaker DC, Arpey CJ. Ag-gressive basal cell carcinoma: presentation, pathogenesis, and manage-ment. Cancer Metastasis Rev 2004;23:389-402.
24. Wong CS, Strange RC, Lear JT. Basal cell carcinoma. BMJ 2003;327: 794-798.
25. Armstrong BK, Kricker A. The epidemiology of UV induced skin cancer. J Photochem Photobiol B 2001;63:8-18.
26. Roewert-Huber J, Lange-Asschenfeldt B, Stockfleth E, Kerl H. Epide-miology and aetiology of basal cell carcinoma. Br J Dermatol 2007;157 (Suppl 2):47-51.
27. Bastiaens MT, Hoefnagel JJ, Bruijn JA, Westendorp RG, Vermeer BJ, Bouwes Bavinck JN. Differences in age, site distribution, and sex between nodular and superficial basal cell carcinoma indicate different types of tu-mors. J Invest Dermatol 1998;110:880-884.
28. Tran H, Chen K, Shumack S. Epidemiology and aetiology of basal cell carcinoma. Br J Dermatol 2003;149(Suppl 66):50-52.
04 Figueroa et al.indd 26 2/18/2014 7:37:48 AM

27PRHSJ Vol. 33 No. 1 • March, 2014
• Case report •
Granulomatous enterocolitis secondary to Yersinia in an 11-year-old Boy from puerto rico, Confirmed by pCr: a Case report
Fabian J. Rohena, MS-IV; MI Almira-Suárez, MD; Carmen González-Keelan, MD
Department of Pathology, School of Medicine, University of Puerto Rico Medical Sciences Campus, San Juan, Puerto Rico
The authors have no conflicts of interest to disclose.
Address correspondence to: Carmen González-Keelan, MD, Department of Pathology, University of Puerto Rico Medical Sciences Campus, PO Box 365067, San Juan, PR 00936-5067. Email: [email protected]
We report the case of an 11-year-old boy without any history of systemic illness and who developed fever and chills and experienced a 10 lbs. weight loss 3 weeks prior to admission. two days before admission, he experienced abdominal pain that became localized to the right lower quadrant within 24 hours. a non-enhanced abdominal computed tomography scan revealed a 5 mm, amorphous, hyperdense, right lower quadrant calcification associated with a 9 mm fluid-filled structure. an exploratory laparotomy revealed thickening of the proximal vermiform appendix extending to the cecum, with mesenteric adenopathy. an en-bloc excision of the distal ileum, cecum, mesocolon, and vermiform appendix with an end-to-end ileo-ascending colon anastomosis was performed because of a suspected neoplasm. pathologic examination of the specimen revealed granulomatous enterocolitis with associated acute suppurative appendicitis and a cecum abscess. polymerase chain reaction analysis of a paraffin-embedded tissue block confirmed Yersinia enterocolitica DNa in the tissue, pointing to Yersinia as being the etiologic microbe. to our knowledge, this is the first case of yersiniosis to be reported in puerto rico. [P R Health Sci J 2014;33:27-30]
Key words: Yersinia enterocolitica, Cecum abscess, Granulomatous enterocolitis, Mesenteric adenopathy, Puerto Rico
a foodborne pathogen associated with undercooked pork, Yersinia enterocolitica is a gram-negative coccobacillus causing appendicitis, ileitis, colitis, and mesenteric
lymphadenitis (1). It is one of the most common agents of bacterial enteritis in Europe, with a rising incidence both in Europe and in the United States (USA) (2). Granulomatous enterocolitis and mesenteric lymphadenitis are pathologic findings that must be considered in the differential diagnosis of chronic enteritis, including Crohn’s enterocolitis. To our knowledge, we are describing the first confirmed case of Yersinia enterocolitica in Puerto Rico (PR).
Case presentation
An 11-year-old boy with no history of systemic illness developed fever, night chills, and anorexia and experienced a 10 lbs. weight loss that was not accompanied by abdominal pain, nausea, or vomiting. A viral syndrome was diagnosed, and he received oral cefadroxil for 7 days. Symptoms improved for 2 weeks, but he developed generalized abdominal pain not associated with eating or defecation. After 24 hours, the pain became localized in the right lower quadrant (RLQ). A non-enhanced computed tomography scan revealed a 5 mm, suspicious, amorphous, hyperdense, RLQ calcification associated with a 9 mm fluid-filled structure. Acute appendicitis was suspected.
Physical examination revealed an acutely ill, well-nourished boy measuring 137 cm and weighing 47 Kg, with normal vital signs and a temperature of 36°C. A head and neck examination revealed moist oral mucosa and an erythematous pharynx without neck lymphadenopathy. There was no evidence of dehydration. Cardiopulmonary auscultation was normal. The abdomen was distended, and further examination revealed hyperactive bowel sounds, rebound tenderness, and voluntary guarding at the RLQ. No organomegaly was identified upon abdominal palpation. No neurological deficit was identified. Laboratories revealed mild microcytic anemia, indicated by a hemoglobin level of 10.1 g/dL, a mean corpuscular volume of 77f L, a normal platelet count (250,000/µL), and a white blood cell count of 8.8/µL. The comprehensive metabolic panel was unremarkable and the urinalysis was normal. Upon exploratory laparotomy, a proximally thickened appendix with invasion of the cecum and scattered enlarged mesenteric lymph nodes were identified. Suspecting neoplasia, an en-bloc excision of the distal
05 Rohena et al.indd 27 2/18/2014 8:58:48 AM
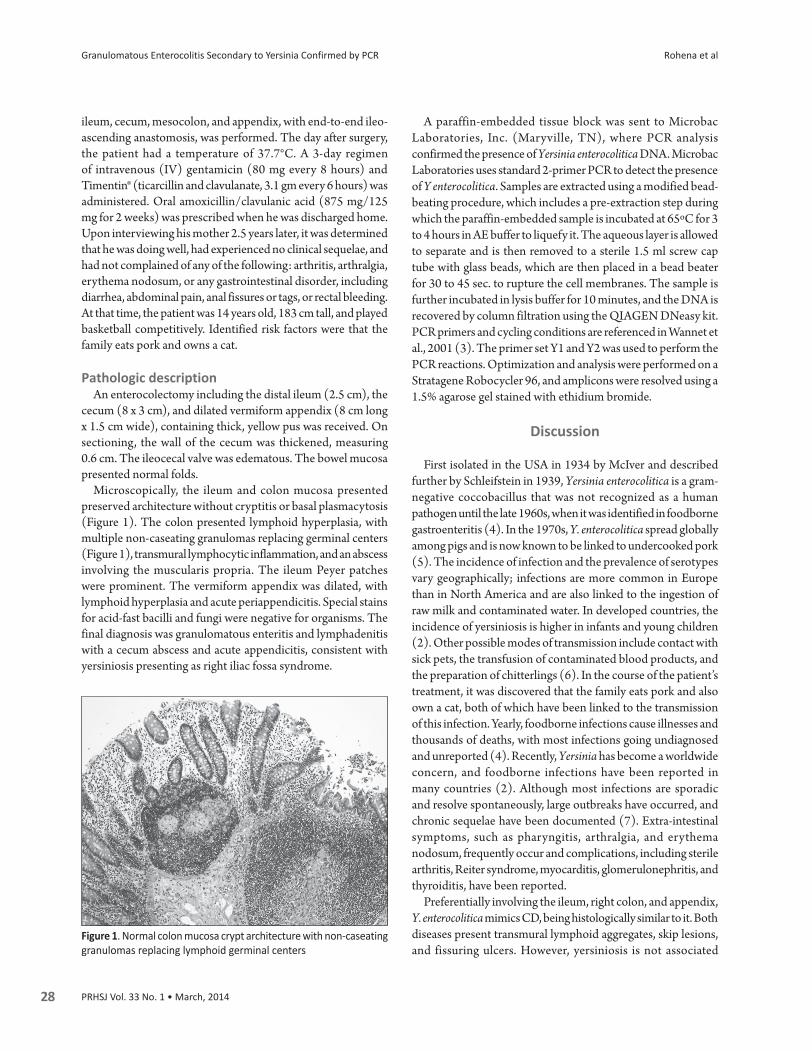
Granulomatous Enterocolitis Secondary to Yersinia Confirmed by PCR
28 PRHSJ Vol. 33 No. 1 • March, 2014
Rohena et al
ileum, cecum, mesocolon, and appendix, with end-to-end ileo-ascending anastomosis, was performed. The day after surgery, the patient had a temperature of 37.7°C. A 3-day regimen of intravenous (IV) gentamicin (80 mg every 8 hours) and Timentin® (ticarcillin and clavulanate, 3.1 gm every 6 hours) was administered. Oral amoxicillin/clavulanic acid (875 mg/125 mg for 2 weeks) was prescribed when he was discharged home. Upon interviewing his mother 2.5 years later, it was determined that he was doing well, had experienced no clinical sequelae, and had not complained of any of the following: arthritis, arthralgia, erythema nodosum, or any gastrointestinal disorder, including diarrhea, abdominal pain, anal fissures or tags, or rectal bleeding. At that time, the patient was 14 years old, 183 cm tall, and played basketball competitively. Identified risk factors were that the family eats pork and owns a cat.
pathologic description
An enterocolectomy including the distal ileum (2.5 cm), the cecum (8 x 3 cm), and dilated vermiform appendix (8 cm long x 1.5 cm wide), containing thick, yellow pus was received. On sectioning, the wall of the cecum was thickened, measuring 0.6 cm. The ileocecal valve was edematous. The bowel mucosa presented normal folds.
Microscopically, the ileum and colon mucosa presented preserved architecture without cryptitis or basal plasmacytosis (Figure 1). The colon presented lymphoid hyperplasia, with multiple non-caseating granulomas replacing germinal centers (Figure 1), transmural lymphocytic inflammation, and an abscess involving the muscularis propria. The ileum Peyer patches were prominent. The vermiform appendix was dilated, with lymphoid hyperplasia and acute periappendicitis. Special stains for acid-fast bacilli and fungi were negative for organisms. The final diagnosis was granulomatous enteritis and lymphadenitis with a cecum abscess and acute appendicitis, consistent with yersiniosis presenting as right iliac fossa syndrome.
A paraffin-embedded tissue block was sent to Microbac Laboratories, Inc. (Maryville, TN), where PCR analysis confirmed the presence of Yersinia enterocolitica DNA. Microbac Laboratories uses standard 2-primer PCR to detect the presence of Y enterocolitica. Samples are extracted using a modified bead-beating procedure, which includes a pre-extraction step during which the paraffin-embedded sample is incubated at 65ºC for 3 to 4 hours in AE buffer to liquefy it. The aqueous layer is allowed to separate and is then removed to a sterile 1.5 ml screw cap tube with glass beads, which are then placed in a bead beater for 30 to 45 sec. to rupture the cell membranes. The sample is further incubated in lysis buffer for 10 minutes, and the DNA is recovered by column filtration using the QIAGEN DNeasy kit. PCR primers and cycling conditions are referenced in Wannet et al., 2001 (3). The primer set Y1 and Y2 was used to perform the PCR reactions. Optimization and analysis were performed on a Stratagene Robocycler 96, and amplicons were resolved using a 1.5% agarose gel stained with ethidium bromide.
Discussion
First isolated in the USA in 1934 by McIver and described further by Schleifstein in 1939, Yersinia enterocolitica is a gram-negative coccobacillus that was not recognized as a human pathogen until the late 1960s, when it was identified in foodborne gastroenteritis (4). In the 1970s, Y. enterocolitica spread globally among pigs and is now known to be linked to undercooked pork (5). The incidence of infection and the prevalence of serotypes vary geographically; infections are more common in Europe than in North America and are also linked to the ingestion of raw milk and contaminated water. In developed countries, the incidence of yersiniosis is higher in infants and young children (2). Other possible modes of transmission include contact with sick pets, the transfusion of contaminated blood products, and the preparation of chitterlings (6). In the course of the patient’s treatment, it was discovered that the family eats pork and also own a cat, both of which have been linked to the transmission of this infection. Yearly, foodborne infections cause illnesses and thousands of deaths, with most infections going undiagnosed and unreported (4). Recently, Yersinia has become a worldwide concern, and foodborne infections have been reported in many countries (2). Although most infections are sporadic and resolve spontaneously, large outbreaks have occurred, and chronic sequelae have been documented (7). Extra-intestinal symptoms, such as pharyngitis, arthralgia, and erythema nodosum, frequently occur and complications, including sterile arthritis, Reiter syndrome, myocarditis, glomerulonephritis, and thyroiditis, have been reported.
Preferentially involving the ileum, right colon, and appendix, Y. enterocolitica mimics CD, being histologically similar to it. Both diseases present transmural lymphoid aggregates, skip lesions, and fissuring ulcers. However, yersiniosis is not associated
Figure 1. Normal colon mucosa crypt architecture with non-caseating granulomas replacing lymphoid germinal centers
05 Rohena et al.indd 28 2/18/2014 8:58:48 AM

Granulomatous Enterocolitis Secondary to Yersinia Confirmed by PCR
29PRHSJ Vol. 33 No. 1 • March, 2014
Rohena et al
with chronic mucosal changes as mucosal cobblestoning, thick muscularis mucosae, neural hyperplasia and crypt distortion. Fistulas and anal tags, which are associated with CD are not seen either. Clinically, chronic yersiniosis may manifest as recurrent abdominal pain, diarrhea, and weight loss, also like CD (7). In fact, several studies have identified Y enterocolitica DNA in CD specimens and Yersinia antibodies in serum from CD patients (7,8,9), raising the possibility that yersiniosis could trigger the development of CD in some patients. Therefore, the presence of Yersinia DNA does not exclude CD.
Compared to other enterobacteria, Yersinia is slow growing, requiring 10 days for incubation and a special medium for identification (4). However, the organism is not always detected, as occurred in this case. Therefore, molecular techniques, including PCR and mass spectrometry, are often needed for confirmation (10). Another difficulty in diagnosing yersiniosis is the deep localization of the granulomas, which are missed in biopsies and are best identified in resected specimens (11). Currently, the most effective treatment for yersiniosis includes the use of fluoroquinolones and third-generation cephalosporins (4).
In 1989, Elias-Montalvo et al. demonstrated that Y. enterocolitica can survive in tropical freshwater in PR (12). They also mentioned 2 stool isolates of Yersinia in 2 asymptomatic paraplegic patients at the Veterans Administration Hospital in San Juan, PR.
Taking into consideration the ability of Yersinia to survive in the tropical freshwater of PR, the high consumption of pork on the island, and the difficulty of growing and isolating this bacterium as well as the deep-seated granulomas in the tissue biopsies, we believe that it (Y. enterocolitica) is being underdiagnosed in PR.
The predominant histological findings in this case were non-caseating granulomas accompanying a cecal abscess. The differential diagnosis of granulomatous enteritis includes Histoplasma capsulatum, tuberculosis bacillus (Tb), Hermansky–Pudlak syndrome (HPS), and Crohn’s disease (CD). Special stains for acid-fast bacilli and fungi were negative, allowing us to rule-out tb and histoplasmosis as the diagnosis. The patient did not have a platelet dysfunction or albinism, symptoms which would suggest HPS. Since the routine culture did not grow Y. enterocolitica, it was only after PCR testing that yersiniosis was confirmed.
In summary, this patient’s 3-week clinical presentation, lack of chronic mucosal changes, and chronic gastrointestinal symptoms argue against CD. Moreover, since short stature is a manifestation of pediatric CD, his growth spurt of 35 cm (reaching a height of 183 cm by age 14) is also an argument against a diagnosis of CD, for the time being.
We were unable to find additional information regarding the incidence or prevalence Y. enterocolitica in PR, where it so far has not been a reportable disease. Furthermore, we found
no reports of yersiniosis, in spite of pork being a traditional local food. It is our aim to increase awareness of this microbe as a potential cause of enteritis locally and to promote its consideration in the differential diagnosis of granulomatous enteritis and appendicitis.
Conclusion
To our knowledge, this is the first report of Yersinia enterocolitis in PR. We aim to increase awareness of this infection since it is probable that it is underdiagnosed or misdiagnosed. Additional research is needed to determine the incidence and prevalence as well as understand the health implications of Y. enterocolitica infections in Puerto Rico.
resumen
Describimos el caso de un niño de 11 años sin historial médico de enfermedades sistémicas que desarrolló fiebre, escalofríos y tuvo una pérdida en peso de 10 libras tres semanas antes de su admisión. Dos días previos a la admisión, desarrolló dolor abdominal, que se localizó al cuadrante inferior derecho en 24 horas. La tomografía computarizada reveló una calcificación amorfa, hiperdensa, midiendo 5 mm, asociada a una estructura líquida de 9 mm, localizada en el cuadrante inferior derecho. La laparotomía exploratoria reveló un apéndice engrosado a nivel proximal con invasión al ciego asociado a una adenopatía mesentérica. Se realizó una resección en bloque del íleo distal, ciego, mesocolon y apéndice, seguida de anastomosis entre el ileo restante y el colon ascendente, porque se sospechó neoplasia. El análisis patológico del espécimen demostró una enterocolitis granulomatosa asociada a apendicitis supurativa aguda y absceso en el ciego. La prueba de reacción en cadena de polimerasa en el tejido de parafina confirmó la presencia de DNA de Yersinia enterocolítica, implicando así a Yersinia como agente etiológico. Hasta donde conocemos, éste es el primer caso a reportarse de yersiniosis en Puerto Rico.
acknowledgments
Special thanks go to University of Puerto Rico librarian Margarita Gonzalez for her assistance with the bibliographical research process and to Robert Brooks, Biotechnology Manager/QAD, of Microbac Laboratories, Inc., in Maryville, TN, for his contribution in describing PCR methodology in the detection of Yersinia.
references
1. El Qouqa IA, El Jarou MA, Samaha AS, Al Afifi AS, Al Jarousha AM. Ye-rsinia enterocolitica infection among children aged less than 12 years: a case-control study. Int J Infect Dis 2011;15:e48-53.
05 Rohena et al.indd 29 2/18/2014 8:58:49 AM

Granulomatous Enterocolitis Secondary to Yersinia Confirmed by PCR
30 PRHSJ Vol. 33 No. 1 • March, 2014
Rohena et al
2. Sabina Y, Rahman A, Ray RC, Montet D. Yersinia enterocolitica: Mode of Transmission, Molecular Insights of Virulence, and Pathogenesis of Infec-tion. J Pathog 2011;2011:429069.
3. Wannet WJ, Reessink M, Brunings HA, Maas HM. Detection of Patho-genic Yersinia enterocolitica by a Rapid and Sensitive Duplex PCR Assay. J Clin Microbiol 2001;39:4483-6.
4. Fabrega A, Vila J. Yersinia enterocolitica: pathogenesis, virulence and an-timicrobial resistance. Enferm Infecc Microbiol Clin. [Research Support, Non-U.S. Gov’t]. 2012;30:24-32.
5. Tauxe RV. Emerging foodborne diseases: an evolving public health chal-lenge. Emerg Infect Dis. [Review] 1997;3:425-34.
6. Lee LA, Gerber AR, Lonsway DR, Smith JD, Carter GP, Puhr ND, et al. Yersinia enterocolitica O:3 infections in infants and children, as-sociated with the household preparation of chitterlings. N Engl J Med 1990;322:984-7.
7. Saebo A, Lassen J. Acute and chronic gastrointestinal manifestations asso-ciated with Yersinia enterocolitica infection. A Norwegian 10-year follow-up study on 458 hospitalized patients. Ann Surg 1992;215:250-5.
8. Lamps, LW, Madhusudhan KT, Havens JM, Greenson JK, Bronner MP, Chiles MC, et al. Pathogenic Yersinia DNA is detected in bowel and mes-enteric lymph nodes from patients with Crohn’s disease. Am J Surg Pathol 2003;27:220-7.
9. Leu SB, Shulman SC, Steelman CK, Lamps LW, Bulut OP, Abramowsky CR, et al. Pathogenic Yersinia DNA in Intestinal Specimens of Pediatric Patients with Crohn’s Disease. Fetal Pediatr Pathol 2013;32:367-70. doi: 10.3109/15513815.2013.768744. Epub 2013 Apr 23.
10. Rosado FG, Stratton CW, Mosse CA. Clinicopathologic correlation of epidemiologic and histopathologic features of pediatric bacterial lymph-adenitis. Arch Pathol Lab Med 2011;135:1490-3.
11. Montgomery E, Voltaggio L. Biopsy interpretation of the gastrointestinal tract mucosa. Volume 1: Non-neoplastic. 2nd ed. Philadelphia, PA; Lip-pincott Williams & Wilkins (LWW); 2012:126.
12. Elias-Montalvo EE, Calvo A, Hazen TC. Survival and Distribution of Yersinia-Enterocolitica in a Tropical Rain-Forest Stream. Curr Microbiol 1989;18:119-26.
05 Rohena et al.indd 30 2/18/2014 8:58:49 AM
31PRHSJ Vol. 33 No. 1 • March, 2014
• book review •
Health and Slavery in Puerto rico illuminated by NT Jensen’s For the Health of the Enslaved
Jensen, Niklas Thode. For the health of the enslaved: Slaves, medicine and power in the Danish West Indies, 1803-1848. Copenhagen, Denmark: Museum Tusculanum Press, 2012. 352 pages, 7 color plates, 3 halftones, 5 maps, 40 tables; 6 3/8 x 9 1/2 paperback, distributed by University of Chicago Press, $70.00 ISBN 978-87-635-3171-9
African slavery supplied the manpower for Caribbean plantation economies, and medicine provided the means to palliate the effects of overwork, deprivation, and neglect. Niklas Jensen’s outstanding analysis of conditions relating to the health of slaves in the Danish west indies (now U.S. virgin islands) from 1803 to 1848 addresses the health service in St. Croix, structured around the enslaved workers; the colonial administration’s policies to promote the health of slaves; and the power relationships between the administration, the planters, and the enslaved. Jensen proposes that the primary cause of excess mortality of slaves in St. Croix may have been insufficient nutrition rather than epidemics or poor hygiene. The historiography of health and medicine in Puerto rico is almost silent on matters relating to slavery, but the sparse information available reveals similarities with St. Croix. The slaves’ need for medical attention may have attracted foreign practitioners, and the diet was deficient in calories and essential nutrients. Jensen’s analysis expands our knowledge of the determinants of the health of the enslaved. A deep archival examination of the subject in Puerto rico might show how the universal fundamentals of slavery, adapted to the specific determinants of the island’s economy, shaped the health of captive and free residents. [P R Health Sci J 2014;33:31-33]
Key words: Slavery, History of medicine, St. Croix, Puerto Rico, Niklas T. Jensen
African slavery provided the manpower for Caribbean plantation economies. In a system that considered the enslaved only as valuable property, slave holders
used their investment for maximum productivity, and spent a minimum on maintenance. Medicine was the means to palliate the effects of overwork, deprivation, and neglect, and has been called “an integral part of the slave-based sugar production process” (1). Niklas Jensen has published an outstanding analysis of the political, social, and medical conditions relating to the health of slaves in the Danish West Indies (now U.S. Virgin Islands) from 1803 to abolition, 1848. The book is beautiful, well-written, and carefully researched. In addition, it may be especially interesting to this journal’s readers for its contribution to an almost unexplored subject in Puerto Rico.
Most slave populations in the Caribbean were unable to maintain their numbers through reproduction ( Jensen, p. 15). Jensen addresses key issues related to such population dynamics, including how health services in St. Croix were structured around the enslaved workers; the colonial administration’s policies to promote the health of slaves; and the power relationships, in the field of health, between the administration, the planters, and the enslaved. Furthermore, Jensen offers as comparison the British and the French West Indies.
The Danish archives preserve not only birth and death records, but also doctors’ annual medical reports, plantation
hospitals’ monthly tallies, and administrative documents of royal farms. In addition, St. Croix’s visitors often published their impressions, with particular attention to slavery and the health of the population. Jensen examines these sources for the analysis of events and concepts, and for the statistical examination of trends and differences. He also integrates and contrasts beliefs (Danish and African), laws, practices, ecology, economic motivations and power relations as determinants of health status.
The health care system for slaves was structured in three sectors: the professional, with European-trained plantation doctors in private practice and estate hospitals; the folk, with Afro-Caribbean healers, including the Obeah (religious) practitioners, herbalists, and nurses; and the popular, composed of relatives, friends, and neighbors. The professional sector was lucrative, and therefore well-populated, to the point that the ratio of persons per doctor was lower (better) in St. Croix than in Denmark throughout the period of study (p. 58-59, figure 2.11).
The four most common categories of disease afflicting slaves were fevers, pains and injuries, gastrointestinal diseases, and boils and sores. Many illnesses were caused by the living conditions, such as pains and injuries from fieldwork ( Jensen’s analysis excludes the subject of bodily punishment), and gastrointestinal complaints from poor-quality food and well-
06 Rigau-Perez.indd 31 2/18/2014 9:00:50 AM
Health and Slavery in the Caribbean
32 PRHSJ Vol. 33 No. 1 • March, 2014
Rigau-Pérez
water (the rainwater in the cisterns was normally reserved for Euro-Caribbeans, p. 141).
The Danish, British, and French governments somehow established a similar minimum weekly food ration for adult slaves - 5 pounds of corn meal and 6 salted herring (p. 159), but as Jensen shows, the rations only covered an estimated two-thirds to three-quarters of the required energy, and were deficient in protein, fat, vitamins and minerals. Health policies for vaccination against smallpox succeeded in preventing smallpox epidemics in St. Croix, but not in St. Thomas, which had a different economic and social structure. In contrast, the administration’s effort to train and examine enslaved midwives for the plantations met with limited success (p. 255). Jensen proposes “the cautious hypothesis” that the primary cause of excess mortality of slaves in St. Croix may have been insufficient nutrition rather than epidemics or poor hygiene (p. 187, 253).
The book is lavishly illustrated with tables, graphs and color reproductions of contemporary images. Extensive textual and numerical data are processed with analytic clarity and statistical sophistication. There are three statements I would have explained more broadly. The term “West Indian rose”, used almost synonymously with “elephantiasis” and not seen in the enslaved before age 25 years, is explained as filariasis, the mosquito-transmitted parasitic disease, but also as erysipelas, the bacterial infection (p. 93-95). It may also represent a conflation with pellagra (mal de la rosa, in Spanish), a nutritional deficiency that produces diarrhea, dementia, and dermatitis, highly prevalent in communities that rely on a corn diet (2). Intestinal worm infestations were due to poor hygiene, not only in the handling of foodstuffs (p. 89), but through contamination of soil and water with human feces. Edema and dirt eating (both less frequent in St. Croix than in the British islands, p. 112) may be connected as symptoms of iron deficiency and severe intestinal worm infestation.
Jensen’s comparisons did not include the Spanish islands – Cuba and Puerto Rico. There are important differences with St. Croix: larger islands, different metropolitan culture, no royal plantations, later conversion to a sugar economy, and longer duration of slave importation and slavery. There are also differences between those two islands. Ownership of slaves in the nineteenth century was regulated by local rules based on a document issued in Madrid in 1789 (3, 4). Cuba enjoyed a “super-abundance” of medical practitioners; there was a medical school, and the needs for slave medical care attracted many foreigners (5).
Puerto Rico was a late and minor actor in export agriculture, compared to Cuba. Even so, slavery, which was abolished as late as 1873, always included a large number of inhabitants (over 51,000 persons at its peak in 1846, or 1 out of every 8 persons in the population). Surprisingly, the historiography of health and medicine in the Island is almost silent on matters relating to slavery. A bibliography of the colonial era lists eleven Cuban
publications on the medical problems of slaves or “different races” from 1817 to 1879, but none from Puerto Rico (6). It is unlikely that newspapers carried such articles, because press censorship allowed no mention of slavery, according to A. S. Pedreira (7). Even official regulations seem to have infrequently touched the issue, as shown by the few cited in the comprehensive history of African slavery in Puerto Rico by Díaz Soler, and local histories of medicine and public health by Arana Soto (8-10). A later historian of slavery, Andrés Ramos-Mattei, noted in 1986 the lack of surviving detailed information on slaves’ quarters and plantation hospitals (11).
Some diseases of the slaves in Puerto Rico were described by Abbad (written ca. 1775) and Romero (1866) (12). Edward Emerson’s journal mentions (7 April, 1831) that “the rose” was prevalent among slaves in Puerto Rico (13). A detailed roster of conditions affecting slaves in Cuba has been compiled by Vázquez and Menéndez de León (1986) (14). George Flinter, in his books of 1832 and 1834, intended to demonstrate that slaves in Spanish islands lived in better conditions than European peasantry or slaves in other European possessions. He decried, though, the scarcity of licensed medical practitioners in Puerto Rico (15, 16).
Three decades later, Renato de Grousourdy, who had practiced medicine for ten years throughout the Caribbean (including Puerto Rico), published El médico botánico criollo (1864), or as he also called it, “Popular and domestic medicine of the Antilles”. Its four volumes provided a complete medical library for an estate without a resident physician (17). Another French doctor, Henri Dumont, after a “tournée” to provide service around Cuban plantations, moved to Puerto Rico. The examination and treatment of hundreds of indigent patients furnished him with material to write a description of the island’s geographic divisions and their attendant pathologies (1875-1876) (18).
The sparse information available for Puerto Rico reveals some similarities with St. Croix. The slaves’ needs for medical attention may have attracted foreign practitioners and may explain why our current knowledge on local health and medicine in the 1860s is in part derived from books written by traveling physicians. Regulations regarding adult slaves in Puerto Rico stipulated a daily (not weekly, as in St. Croix) food supply composed of “6-8 plantains (or their equivalent in sweet potatoes, yams or other roots), 8 ounces of meat, [salted] codfish or Atlantic mackerel, and 4 ounces of rice or other common legume” (19).
In practice, the diet was based on cornmeal, served with codfish or rice and beans, and complemented with plantains (20). According to Ramos-Mattei, many documents attest to slaves’ protests for lack of food. He considered that the diet provided “instant energy, but was deficient in essential nutrients” (21). The detailed analysis of conditions in Saint Croix is consistent with such deficiencies.
06 Rigau-Perez.indd 32 2/18/2014 9:00:51 AM

Health and Slavery in the Caribbean
33PRHSJ Vol. 33 No. 1 • March, 2014
Rigau-Pérez
Jensen’s analysis expands, in depth and breadth, our knowledge of the determinants of the health of the enslaved. This is a magnificent example of how careful research in a well-documented small area (St. Croix) can shed light on the history of a large and diverse region (the Caribbean). The analysis also demonstrates, without resort to sentimentalism or bloody images, the calculated abusiveness of slavery in its denial of the basic requirements for health and survival unless there was some benefit for slave owners. A deep archival examination of the subject in Puerto Rico might show how the universal fundamentals of slavery, adapted to the specific determinants of the island’s economy, shaped the health of enslaved and free residents.
resumen
La esclavitud africana suministró la mano de obra para las economías de plantación del Caribe, y la medicina sirvió para paliar los efectos del exceso de trabajo, la privación y el abandono. Niklas Jensen ha publicado un análisis extraordinario de las condiciones relacionadas a la salud de los esclavos en las Indias Occidentales Danesas (ahora U.S. Virgin Islands) de 1803 a 1848. Examina los servicios de salud en St. Croix, estructurados para atender la servidumbre africana; las políticas de la administración colonial para promover la salud de los cautivos, y las relaciones de poder entre la administración, los hacendados y los esclavizados. Jensen propone que la causa primaria para el exceso de mortalidad en los esclavos de St. Croix podría encontrarse en la dieta insuficiente más que en las epidemias o las deficiencias de higiene. La historiografía de la salud y la medicina en Puerto Rico casi no menciona los asuntos relacionados a la esclavitud, pero la poca información disponible revela parecidos con St. Croix. La necesidad de atención médica de los esclavos puede haber atraído a médicos extranjeros, y la dieta no proveía suficientes calorías y nutrientes esenciales. El análisis de Jensen amplía nuestros conocimientos sobre los factores determinantes de la salud de los esclavizados. Un examen archivístico profundo del tema en Puerto Rico podría mostrar cómo las características fundamentales universales de la esclavitud, adaptadas a los determinantes de la economía de la Isla, moldearon la salud de los residentes, siervos y libres.
José G. rigau-Pérez, MD, Academia Puertorriqueña de la Historia, Assistant Professor ad honorem, Departments of Pediatrics and Epidemiology, Schools of Medicine and Public Health, University of Puerto Rico Medical Sciences Campus, San Juan, Puerto Rico. Email: [email protected]
references
1. Palmer S. From the plantation to the Academy: Slavery and the produc-tion of Cuban medicine in the nineteenth century. In: De Barros J, Palmer S, Wright D, editors. Health and medicine in the circum-Caribbean, 1800-1968. New York: Routledge, 2009. p. 53-75.
2. Kiple K. The Caribbean slave. A biological history. New York: Cambridge University Press, 1984. p. 93-96, esp. p. 94: “this wide range of protean symptoms […] prevented earlier physicians from recognizing pellagra as a disease”.
3. Caro Costas AR. La Real Cédula de 1789 y dos reglamentos antillanos so-bre la educación, trato y ocupación de los esclavos. La Torre (Universidad de Puerto Rico) 1973; 31:103-130.
4. La Torre M de. Reglamento sobre la educación, trato y ocupaciones que deben dar a sus esclavos los dueños o mayordomos de esta isla, […] 12 de agosto de 1826. Boletín Histórico de Puerto Rico 1923;10:262-273.
5. Palmer, p. 60.6. Guerra F. Bibliografía médica americana y filipina. Período formativo.
Madrid: Ollero y Ramos, 1999. 2 vols.; 2: items CU 76, 269, 392, 393, 429, 548, 639, 729, 755, 770, 856.
7. Pedreira AS. El periodismo en Puerto Rico. San Juan: Edil, 1982. p. 186.8. Díaz-Soler LM. Historia de la esclavitud negra en Puerto Rico. 3rd ed.
San Juan: Ed. Universidad de Puerto Rico, 1970, reissued 2005. Chap-ter 7, p. 145-166, at http://books.google.com.pr/books?id=PcwmLZ1_4SUC&printsec=frontcover&dq=Historia+de+la+esclavitud+negra+en+Puerto+Rico&hl=en&sa=X&ei=EpbuUblXkoj2BKfygOAJ&redir_esc=y#v=onepage&q=Historia%20de%20la%20esclavitud%20negra%20en%20Puerto%20Rico&f=false. Accessed 23 July 2013.
9. Arana-Soto S. La sanidad en Puerto Rico hasta 1898. San Juan: Academia Puertorriqueña de la Historia, 1978. p. 25 (1627), 28 (1766), 60-62 (1855), 120-122 (1803), 308-309 (1843).
10. Arana-Soto S. Historia de la medicina puertorriqueña hasta 1898. San Juan: s.e., 1974. p. 427-428 (1860).
11. Ramos-Mattei A. Las condiciones de vida del esclavo en Puerto Rico: 1840-1873. Anuario de Estudios Americanos (Escuela de Estudios His-pano-Americanos, Sevilla) 1986; 43:377-390.
12. Abbad y Lasierra I. Historia geográfica, civil y natural de la isla de San Juan Bautista de Puerto Rico. Anotada por José Julián Acosta y Calvo. Estu-dio introductorio por Gervasio L. García. Madrid: Doce Calles, 2002, p. 537-556.
13. Emerson EB. The Caribbean journal and letters, 1831-1834. Edited by José G. Rigau-Pérez, 2013. Url: http://bibliotecadigital.uprrp.edu/cdm/ref/collection/librosraros/id/1701
14. Salvador-Vázquez M, Menéndez de León C. Higiene y enfermedad del esclavo en Cuba durante la primera mitad del siglo XIX. Anuario de Estu-dios Americanos (Escuela de Estudios Hispano-Americanos, Sevilla) 1986; 43:419-445.
15. Flinter JD. Examen del estado actual de los esclavos de la isla de Puerto Rico. New York: Imprenta Española del Redactor, 1832. Facsimilar ed., San Juan: Instituto de Cultura Puertorriqueña, 1976.
16. Flinter GD. An account of the present state of the island of Puerto Rico. London: Longman, Rees, Orme, Brown, Green, and Longman, 1834. Fac-similar ed., Academia Puertorriqueña de la Historia, 2002. p. 250-251.
17. Grosourdy R de. El médico botánico criollo. Paris: Brachet, 1864. 4 vol.18. Dumont E. Ensayo de una historia médico-quirúrgica de la Isla de Puerto
Rico. Habana: La Antillana, 1875-1876. 2 vol.19. La Torre, p. 265; Flinter (1834), p. 244 (the fish was salted).20. Díaz-Soler, p. 161-162.21. Ramos-Mattei, p. 384-386.
06 Rigau-Perez.indd 33 2/18/2014 9:00:51 AM

34 PRHSJ Vol. 33 No. 1 • March, 2014
• report from scientific meeting in puerto rico •
report of the 2013 university of puerto rico-mD Anderson cancer center conference entitled “research on cancer epidemiology: risk factors and control in the caribbean Basin”
An interdisciplinary conference entitled Research on cancer epidemiology: Risk factors and control in the Caribbean basin was held on February 21-22, 2013 in
Isla Verde, Puerto Rico (PR) under the U54 grant infrastructure, a Partnership for Excellence in Cancer Research between the University of Puerto Rico (UPR) and the MD Anderson Cancer Center (MDACC). This conference was organized by the Biostatistics and Bioinformatics Core (BBC) led by Erick Suárez (UPR-MSC) and Kenneth Hess (MDACC). This year the BBC organized this conference with the aim of enhancing existing networks and partnerships as well as forming new ones in the Caribbean countries. The conference was the first conference held in PR focused cancer research methodological issues in the Caribbean basin. Speakers from different countries (PR, Jamaica, Colombia, México, Peru, France, United Kingdom, and USA) talked about their experiences in cancer-related research in the Caribbean countries. A total of 100 participants attended the conference. This report summarizes various speakers’ presentations, which included specific methodological issues in the areas of epidemiological design, criteria for cancer diagnosis, framework for social determinants of cancer, prostate cancer, breast cancer, cervical cancer, gastric cancer, nutrition, and prevention and control efforts mainly in the Caribbean countries.
scientific highlightsSpeakers of the first dayRobert A. Hiatt, MD, PhD, Director of Population Sciences and
Deputy Director of the University of California at San Francisco (UCSF) Helen Diller Family Comprehensive Cancer Center. Among Hiatt’s research interests are: cancer epidemiology especially breast cancer, prevention and screening, and the social determinants of cancer. His central focus at UCSF is to build a strong, interdisciplinary program in epidemiology and cancer population sciences. His talk addresses the concept and challenge for transdisciplinary science and social determinants of cancer.
Guillermo Tortolero, MD, PhD, Director of Cancer Control and Population Sciences Program at the University of Puerto Rico Comprehensive Cancer Center (UPRCCC). As prior faculty member of the Department of Gynecologic Oncology at the University of Texas MDACC and the UT Houston School of Public Health, he has experience conducting population and clinic-based research studies. His talk highlighted the activities
that have been implanted based on the plan entitled Cancer burden and cancer control strategies in Puerto Rico.
Jorge Gómez, MD, PhD, Senior Advisor in National Cancer Institute (NCI) Center for Global Health (CGH) focused on supporting and advancing international collaboration and partnerships in scientific and clinical cancer research, training, and infrastructure development in Latin America. His talk addressed the current status of the Latin America Cancer Research Network Model and highlighted the activities for increasing the research capacity building in Latin America.
Camille Ragin, PhD, MPH, Associate Professor in the Cancer Prevention and Control Program at Fox Chase Cancer Center, Philadelphia. Her research experience has allowed her to establish a network of collaborators, which stemmed her conceptualization of the African-Caribbean Cancer Consortium (AC3), a research group designed to promote collaboration among cancer researchers who focused their work in populations of African ancestry. Her talk addressed the cancer burden in the Caribbean through capacity building and collaborative research.
Maria Jackson, PhD, Senior Lecturer at the Department of Community Health and Psychiatry University of the West Indies Mona, Kingston, Jamaica. Dr. Jackson conducts nutritional epidemiological research on prostate cancer, obesity in adults and children, and iron deficiency anemia in young children as key health issues relevant to populations of African origin. Her talk highlighted her research findings regarding the associations of circulating vitamin D and calcium with prostate cancer in Jamaican men.
Bernard Rachet, MD, PhD, Senior Lecturer in Cancer Epidemiology at the London School of Hygiene and Tropical Medicine, London, England, United Kingdom. Dr. Rachet worked mainly on cancer risks associated with occupational and environmental exposures, and on developments in methodology. His talk highlighted the activities related with the Concord program and the assessment of cancer survival from global to local.
Erin Kobetz, PhD, MPH, Director of the Center’s Disparities and Community Outreach Core Resource, University of Miami (UM) Sylvester Comprehensive Cancer Center. Dr. Kobetz established Patn en Aksyon (Partners in Action), a campus-community partnership between UM Sylvester Comprehensive Cancer Center and key community-based organizations in
07 Suárez et al.indd 34 2/18/2014 9:01:20 AM

2013 UPR/MDACC Conference Report
35PRHSJ Vol. 33 No. 1 • March, 2014
Suárez et al
Little Haiti, the predominantly Haitian area in Miami. Her talk addressed cancer disparity among Hispanics in Miami and the lessons learned and future challenges, based on her experience in Little Haiti.
Paulo S. Pinheiro, MD, PhD, Assistant Professor at the Department of Environmental and Occupational Health, School of Community Health Sciences, University of Nevada, Las Vegas, Nevada, United States. His recent work has focused on improving the recognition of Hispanic ethnicity among recorded cancer cases as well as subgroup in the Hispanic population of the US and finally the changes of risk when Hispanics immigrate to the US. His talk highlighted the Hispanic paradox and the case of Puerto Rico using the data of cancer incidence and survival.
Speakers of the second dayJuan Martínez-Cruzado, PhD, Professor at Department
of Biology University of Puerto Rico, Mayagüez Campus in Puerto Rico. He is well known for his pioneering work on the Amerindian ancestry of most mitochondrial DNA molecules in the Puerto Rican population. His talk addressed the methodology and the research results related with the ancestry distribution of cancer polymorphisms in Puerto Rico.
Margarita Irizarry-Ramírez, PhD, Professor at the School of Health Professions in the Medical Sciences Campus of the University of Puerto Rico. Dr. Irizarry-Ramírez is also a researcher in the field of prostate cancer. Her main goal is to try to unravel the causes for the high mortality rate in men with prostate cancer in Puerto Rico. Her talk addressed the current status of the research project entitled “Prostate cancer risk and aggressiveness in Puerto Rico: Ancestry and polymorphisms”.
Vivian Colón-López, PhD, MPH, Assistant Professor at the Center for Evaluation and Sociomedical Research of the University of Puerto Rico Graduate School of Public Health (UPR-GSPH) and an Investigator at the Comprehensive Cancer Center (UPR-CCC). She has worked closely with the UPR-GSPH in multiple research projects in the areas of drug use abuse and infectious diseases in men and women from the metropolitan area of San Juan. Her talk addressed the current status of her research activities with HPV-related cancers and HPV infection in Puerto Rican men.
Isabel Torres, DrPH, Associate Professor at the University of Houston, Graduate College of Social Work. Her current area of research addresses ethnic health disparities in palliative cancer care with an emphasis on the factors that ultimately influence access to, and the quality of advanced cancer care among underserved or vulnerable populations. Her talk addressed her experiences with Palliative cancer care in Latin America and the Caribbean.
Maria Dominguez-Bello, PhD, Faculty member at the Department of Biology, University of Puerto Rico, and the
New York University School of Medicine. She works on gut microbiomes of animals and humans, including digestive symbiosis, developmental ecology, microbiome and human health, and impact of modern lifestyle practices on the microbiota. Her presentation addressed the prevalence of H. pylori and digestive cancers in Latin America.
Francisco Javier Torres-López, MD, Infectious Diseases Research Unit, Pediatric Hospital, 21st Century National Medical Center, Mexican Social Security Institute. His talk highlighted the current status for searching biomarkers in the early detection of gastric malignancies.
Oscar Fernando Herrán-Falla, ND, MSc, Escuela de Nutrición y Dietética Centro de Investigaciones Epidemiológicas (CIE), Universidad Industrial de Santander Bucaramanga, Santander, Colombia. His interest is in nutritional epidemiology. He has studied the diet quality in Colombia and developed and validated questionnaires to measure alcohol consumption and dietary Colombian population. He addressed the results to validate a questionnaire (FFQ) to assess the relationship between nutrition and cancer in Colombia.
Maribel Almonte, MPH, MSc, PhD, Scientist of Prevention and Implementation Group, Section of Early Detection and Prevention at the International Agency for Research on Cancer, Lyon, France. Dr. Almonte is founder of the Latin American Cervical Cancer Prevention Consortium which main objective is to prevent deaths from cervical cancer in the Latin American region. Her talk highlighted the future of cervical cancer prevention in Latin America and the Caribbean.
conclusions
The speakers’ presentations fully met the conference goals and the expectations of participants. According to the BBC evaluation, 99% of participants were very satisfied or satisfied with general aspects of the conference such as content, organization, schedule, facilities and speakers’ expertise. Furthermore, approximately 98% of participants either agreed or strongly agreed that the topics were relevant and useful for their professional performance, that the conference fulfilled their expectations, and they would recommend this conference to others. Some of the talks offered in the conference are available on the Internet through the following link: https://www.youtube.com/playlist?list=PLf5LkdIKuHr6oEWzNag8HVSmDzOITs6u6. In conclusion, the assessment of new approaches in the Caribbean will contribute to better understanding of the effect of cancer prevention, early detection, diagnosis, treatment, and control in this community. This conference helped to lay the groundwork for the development of a comprehensive research agenda to address methodological issues in cancer-related research among the Caribbean countries.
07 Suárez et al.indd 35 2/18/2014 9:01:20 AM

2013 UPR/MDACC Conference Report
36 PRHSJ Vol. 33 No. 1 • March, 2014
Suárez et al
Acknowledgments
Funding for this conference was made possible in part by NIH NCI U54 grant CA96297 and CA96300 “UPR-MDACC Partnership for Excellence in Cancer Research Program”; by NIH NCMHD U54 grant MD007587-03 PR Clinical and Translational Research Consortium; by NIH NIMHD G12MD007600 Research Centers in Minority Institutions Program, UPR MSC; by the UPR Comprehensive Cancer Center; and by institutional funds from the UPR Medical Sciences Campus Deanship of Academic Affairs and Deanship of Administration. The authors have no conflict of interest to disclose.
• correction •Dentogingival complex: Dimension Based on Biotypes. Karol Ramírez DDS, MS; Omar García-Rodríguez, MS, DrPh; Margarita Murillo-Arocho, DDS; Ottón Fernández-López, DDS, MSD; Augusto R. Elías-Boneta, DMD, MSD. P R Health Sci J 2013;4:182-186.
There is an error of omission in the manuscript. The following statement must be mention. Post-doctoral Master of Science in Clinical and Translational Research Program (MSc)/Hispanic Clinical and Translational Research Education and Career Development Program (HCTRECD), Award Number: R25MD007607. HISPANICS-IN-RESEARCH CAPABILITY: SoHP & SoM PARTNERSHIP (HiREC) Endowment Program, Award Number: S21MD001830.
erick suárez, PhD, Department of Biostatistics and Epidemiology, Graduate School of Public Health, Medical Sciences Campus, University of Puerto Rico, San Juan, Puerto Rico; marievelisse soto-salgado, MS, UPR/MDACC Partnership for Excellence in Cancer Research Program, School of Medicine, Medical Sciences Campus, University of Puerto Rico, San Juan, Puerto Rico; camille moreno-gorrín, BS, Department of Biostatistics and Epidemiology, Graduate School of Public Health, Medical Sciences Campus, University of Puerto Rico, San Juan, Puerto Rico; Ana patricia ortiz, MPH, PhD, Department of Biostatistics and Epidemiology, Graduate School of Public Health, Medical Sciences Campus, University of Puerto Rico, San Juan, Puerto Rico; Cancer Control and Population Sciences Program, University of Puerto Rico Comprehensive Cancer Center, San Juan, Puerto Rico; cynthia m. pérez, PhD, Department of Biostatistics and Epidemiology, Graduate School of Public Health, Medical Sciences Campus, University of Puerto Rico, San Juan, Puerto Rico
07 Suárez et al.indd 36 2/18/2014 9:01:20 AM