Local people value environmental services provided by forested parks
Upload
independentCategory
view
1download
0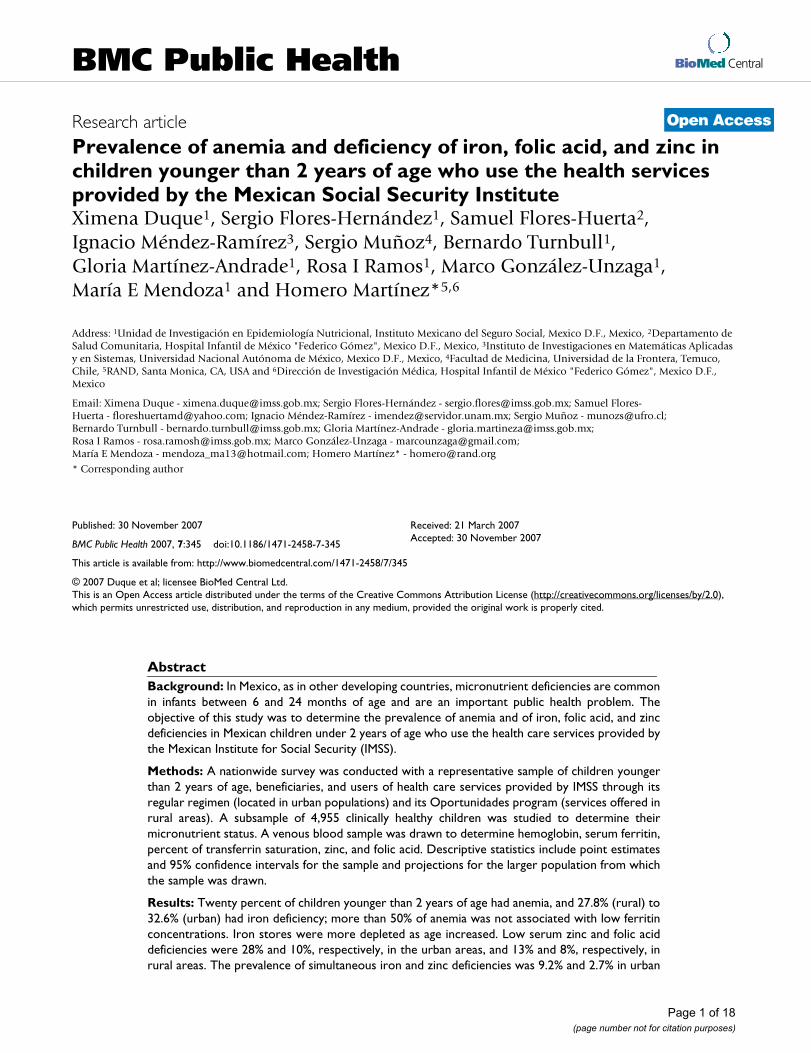
BioMed CentralBMC Public Health
ss
Open AcceResearch articlePrevalence of anemia and deficiency of iron, folic acid, and zinc in children younger than 2 years of age who use the health services provided by the Mexican Social Security InstituteXimena Duque1, Sergio Flores-Hernández1, Samuel Flores-Huerta2, Ignacio Méndez-Ramírez3, Sergio Muñoz4, Bernardo Turnbull1, Gloria Martínez-Andrade1, Rosa I Ramos1, Marco González-Unzaga1, María E Mendoza1 and Homero Martínez*5,6Address: 1Unidad de Investigación en Epidemiología Nutricional, Instituto Mexicano del Seguro Social, Mexico D.F., Mexico, 2Departamento de Salud Comunitaria, Hospital Infantil de México "Federico Gómez", Mexico D.F., Mexico, 3Instituto de Investigaciones en Matemáticas Aplicadas y en Sistemas, Universidad Nacional Autónoma de México, Mexico D.F., Mexico, 4Facultad de Medicina, Universidad de la Frontera, Temuco, Chile, 5RAND, Santa Monica, CA, USA and 6Dirección de Investigación Médica, Hospital Infantil de México "Federico Gómez", Mexico D.F., Mexico
Email: Ximena Duque - [email protected]; Sergio Flores-Hernández - [email protected]; Samuel Flores-Huerta - [email protected]; Ignacio Méndez-Ramírez - [email protected]; Sergio Muñoz - [email protected]; Bernardo Turnbull - [email protected]; Gloria Martínez-Andrade - [email protected]; Rosa I Ramos - [email protected]; Marco González-Unzaga - [email protected]; María E Mendoza - [email protected]; Homero Martínez* - [email protected]
* Corresponding author
AbstractBackground: In Mexico, as in other developing countries, micronutrient deficiencies are commonin infants between 6 and 24 months of age and are an important public health problem. Theobjective of this study was to determine the prevalence of anemia and of iron, folic acid, and zincdeficiencies in Mexican children under 2 years of age who use the health care services provided bythe Mexican Institute for Social Security (IMSS).
Methods: A nationwide survey was conducted with a representative sample of children youngerthan 2 years of age, beneficiaries, and users of health care services provided by IMSS through itsregular regimen (located in urban populations) and its Oportunidades program (services offered inrural areas). A subsample of 4,955 clinically healthy children was studied to determine theirmicronutrient status. A venous blood sample was drawn to determine hemoglobin, serum ferritin,percent of transferrin saturation, zinc, and folic acid. Descriptive statistics include point estimatesand 95% confidence intervals for the sample and projections for the larger population from whichthe sample was drawn.
Results: Twenty percent of children younger than 2 years of age had anemia, and 27.8% (rural) to32.6% (urban) had iron deficiency; more than 50% of anemia was not associated with low ferritinconcentrations. Iron stores were more depleted as age increased. Low serum zinc and folic aciddeficiencies were 28% and 10%, respectively, in the urban areas, and 13% and 8%, respectively, inrural areas. The prevalence of simultaneous iron and zinc deficiencies was 9.2% and 2.7% in urban
Published: 30 November 2007
BMC Public Health 2007, 7:345 doi:10.1186/1471-2458-7-345
Received: 21 March 2007Accepted: 30 November 2007
This article is available from: http://www.biomedcentral.com/1471-2458/7/345
© 2007 Duque et al; licensee BioMed Central Ltd. This is an Open Access article distributed under the terms of the Creative Commons Attribution License (http://creativecommons.org/licenses/by/2.0), which permits unrestricted use, distribution, and reproduction in any medium, provided the original work is properly cited.
Page 1 of 18(page number not for citation purposes)
BMC Public Health 2007, 7:345 http://www.biomedcentral.com/1471-2458/7/345
and rural areas. Children with anemia have higher percentages of folic acid deficiency than childrenwith normal iron status.
Conclusion: Iron and zinc deficiencies constitute the principal micronutrient deficiencies inMexican children younger than 2 years old who use the health care services provided by IMSS.Anemia not associated with low ferritin values was more prevalent than iron-deficiency anemia.The presence of micronutrient deficiencies at this early age calls for effective preventive publicnutrition programs to address them.
BackgroundThe first 2 years of life are crucial for children's presentand future health and nutritional status and, more specif-ically, for their mental, physical, and emotional develop-ment. In the last decade, micronutrient deficiencies havereceived much attention as it has been demonstrated thateven subclinical states, such as mild iron deficiency or lowconcentrations of zinc, are associated with functional out-comes [1]. These include, among others, impaired psy-chomotor development [2,3], decreased work capacity,diminished immunological response, and linear growthretardation [4-6]. Likewise, mild zinc deficiency has a neg-ative influence on growth and development and increasesthe risk of diarrhea and acute respiratory infections [5,7-9]. Folic acid deficiency affects erythropoiesis, which, inturn, may be responsible for macrocytic anemia [10].
In Mexico, as in other developing countries, micronutri-ent deficiencies occur mainly between 6 and 24 months ofage and are a significant public health problem [11-15].Children under 2 have increased nutritional requirementsbecause of their growth spurt, which often leads to a neg-ative nutrient balance [16,17]. Preterm babies, as well asthose born small for gestational age, are particularly vul-nerable to iron deficiency in their first months [17]. Dur-ing the first year of life, another risk factor for nutritionaldeficiencies occurs from inadequate complementary feed-ing practices. These are characterized by consumption offoods with low amounts of bioavailable micronutrients aswell as with inhibitors of their absorption, and the prac-tices often extend up to the age of 2 years. In the cases ofiron and zinc, risk of inadequate intake is increased incountries where diets at this age include cereals with ahigh content of phytic acid coupled with low intake ofanimal foods [1,7].
According to results from the National Nutrition Survey(NNS) in Mexico, carried out in 1999 (NNS-99), the high-est prevalence of anemia was found in children betweenthe ages of 12 and 24 months (48.9%); there was a slightlyhigher prevalence in rural areas (52.9%) as compared tourban ones (46.8%) [15]. In children under 5 years old,35% of anemia cases were not associated with iron defi-ciency but rather with one or more vitamin deficiencies[13]. In children between 1 and 2, 66.6% of children had
iron deficiency, as estimated by the percentage of transfer-rin saturation [13]. Folic acid deficiency was estimated in8.8% of children under 2 and zinc deficiency in 34%[13,14]. However, NNS-99 was not designed to be repre-sentative of children under 2 years old, so results for thisage group are based on very small sample sizes.
When the study was conducted, the population of Mexicowas approximately 100 million people. More than half ofthem were right-holders of the Instituto Mexicano del Seg-uro Social-IMSS (Mexican Institute for Social Security).Through two branches, IMSS provides social, welfare, andmedical benefits for nongovernment employees and theirdirect dependents as well as for the underserved popula-tion living in rural or semi-rural areas. The regular regi-men (RR) provides care to salaried employees, whereasIMSS-Oportunidades (IO) provides care to those inunderserved, rural/semi-rural areas.
The present survey was carried out in primary health care-level facilities, which offer services for infants and chil-dren such as medical care for common childhood ill-nesses (i.e., the common cold, acute diarrhea) as well aswell-baby clinic, including growth monitoring, promo-tion and support of breast-feeding, and primary preven-tive actions (i.e., vaccination). Additionally, severalgovernment-sponsored programs geared to the unders-erved population are offered through IO program like dis-tribution of fortified foods for pregnant women, infants,and malnourished children. In communities where IOoperated, the whole community is a beneficiary of thisprogram and no other public medical services are availa-ble, making it unlikely that people living in those commu-nities will use other services. Also, IO has a strongcomponent of home visits and community developmentactivities, which tend to strengthen the relationshipbetween health providers and community members.
This study was commissioned by the IMSS to learn aboutthe prevalence of anemia and micronutrient deficiencies,particularly of iron, folic acid, and zinc, in children under2 years of age; it was part of a larger study to document thegeneral health and nutritional status of this age group. Tothis end, we carried out a national survey, drawing tworepresentative samples of children under 2 years of age,
Page 2 of 18(page number not for citation purposes)
BMC Public Health 2007, 7:345 http://www.biomedcentral.com/1471-2458/7/345
beneficiaries of RR and IO. For each of these populations,the sampling frame was designed to be representative ofthe four regions in which the country has been divided byother national surveys, which take into consideration dif-ferences in socioeconomic development (i.e., North,Center, South, and Mexico City (the nation's capital) withits surrounding periurban area, which includes the Fed-eral District and some municipalities of the surroundingState of Mexico); IO does not operate in this last region, asno major semi-rural or indigenous population lives there.Within each of these regions, RR is based in urban areas,while IO provides its services in the rural/semi-rural areas.We expect that the results of this survey will provide thebasis for public health interventions and programstrengthening, oriented to alleviate and prevent micronu-trient deficiencies in the target population.
MethodsThe survey was carried out between 1999 and 2001 [18].From this larger study, which included 35,997 childrenyounger than 24 months of age, a subsample was selectedto determine micronutrient status to assess the prevalenceof iron, folic acid, zinc deficiency, and anemia. Regardingethical considerations, the Institutional Research ReviewBoard approved the protocol study and, the informedconsent letter was signed by mothers of the children in thesubsample. The larger sample followed a stratified, two-staged random model by which we obtained a represent-ative sample for each of the two care regimens as well asfor each of the four regions of the country that have beenused by other national surveys in the past. The samplingframe from which primary sampling units were selectedwas drawn from a list of all primary health care units inthe country, which included 1,160 family medicine units(FMU) for RR and 3,367 rural medical units (RMU) forIO. FMUs were organized by region and number ofattending physicians in each of them; RMUs were organ-ized by region and number of children under 2 living inthe communities where these units were located. Second-ary sampling units were drawn from the children youngerthan 2 years old who attended the out-patient clinic, vac-cination clinic, and well-baby clinic, all based in the pri-mary health care units already described.
Stratification of primary sampling unitsIn RR, we defined five strata based on the number of phy-sicians in each FMU. In each region, the sample size foreach stratum was proportionally distributed by thenumber of children under 2 years of age, according to the1997 census. In IO, we defined three strata, according tothe number of children under 2 who lived in communi-ties where the RMUs were located. In each region, samplesize in each stratum was proportionally distributed by thenumber of children younger than 2 registered in 1998. In
each stratum, we randomly selected one or more primarysampling units to complete the required sample size.
The sample size for the whole study was calculated basedon the estimate of known prevalence in a finite popula-tion, according to the prevalence of moderate and severemalnutrition based on weight-for-height criteria, whichwas 5.3%, according to the NNS-1988 [19]. The subsam-ple required to determine the prevalence of anemia andthe deficiencies of iron, zinc, and folic acid was also calcu-lated with a formula to estimate population prevalenceunder the following assumptions: confidence level 95%,maximum allowable error between the estimate and theparameter: 5%; the resulting sample size was multipliedby a factor of 2.0 because of study design; a 35% overesti-mate was calculated to account for potential hemolysis ofthe biological samples as well as for nonrespondents.
The only published information available at the time ofthe study related to micronutrient deficiency at countrylevel was the prevalence of anemia found in NNS-99,which showed 48% prevalence for children between theages of 12 and 23 months [20]; although not exactly onthe same age range, this was the only available informa-tion to use. The resulting sample size was 1,030 childrenfor each region. The sample size was weighted by the pro-portion with which each primary sampling unit contrib-uted to the overall sample. The overall sample for RR was4,120 children, and for IO, 3,090 children because an IOis not included in the Mexico City region.
Data collectionData for the present study were collected between May2000 and November 2001. In a series of structured inter-views, we collected information on socioeconomic status;birth weight, size, and gestational age; complementaryfeeding; immunization status; morbidity on the monthpreceding the interview; nutritional anthropometricmeasures; and psychomotor development. Preliminaryinformation has been published elsewhere [18]. Only par-ents who reported no infectious disease in their childrenin the two-week period preceding the interview wereinvited to participate in the micronutrient study. Thosewho agreed were asked to sign informed consents.
Biological samplesThree ml of venous blood were collected by dropletsobtained from venipuncture by trained personnel. Theywere collected in 250–500 micro liter tubes filled withEDTA K2. Hemoglobin was determined by cyanide-meta-hemoglobin. Three amber-colored 800 micro-liter trace-element-free micro-tubes with separating gel were used tocollect samples for determination of: ferritin by a two-tierimmunoradiometric assay (CTK-IRMA, DiaSorin)–per-centage of transferrin saturation and zinc by atomic mass
Page 3 of 18(page number not for citation purposes)
BMC Public Health 2007, 7:345 http://www.biomedcentral.com/1471-2458/7/345
spectrometry (AAnalyst 300, Perkin-Elmer, EUA). Fourblood droplets were collected in filter paper to determinefolic acid by a microbiological method using Lactobacilluscasei [21]. Red blood cell analyses were carried out in eachof the medical care unit laboratories. The blood samplesobtained in the amber-colored micro-tubes were centri-fuged for 20 minutes at 3000 rpm and serum was sepa-rated. Samples for folic acid determination were saved infilter paper (Schleicher & Schuell, No. 903), protectedfrom light, and kept in dark envelopes with desiccant inplastic bags. Samples were kept frozen at -20°C and sentfor analysis at a Central facility where they were kept at -70°C until analyzed. All tests were run with the qualitycontrol samples recommended by the manufacturer. Thestandards set by the National Institute of Standards andTechnology were used for the Fe, Zn, and folic acid analy-ses: the coefficient of variation for serum Fe was <5%, forZn < 10%, and for folic acid <15%. Determinations of fer-ritin, Fe, and Zn were run against known values from con-trol serum obtained from a pool of healthy donors withcoefficients of variation <10%.
Cut-offsAnemia: Hemoglobin values were adjusted for altitudewith the following formula: %Hb = [93.3197 (10(0.0000251)(altitude))] [22]. Cut-offs for hemoglobin (Hb)concentration to classify anemia were: Hb < 13.5 g/dL forchildren under 2 weeks of age; Hb< 12.5 g/dL for childrenbetween 2 and 3 weeks; Hb < 10 g/dL for childrenbetween 1 month and < than 2 months; Hb <9 g/dLbetween 2 and < 3 months; Hb < 9.5 between 3 and < 6months; Hb<10.5 g/dL between 6 and < 12 months; andHb <10.7 g/dL for children between 12 and 23 months[23,24].
Iron deficiency: A cut-off of <10 µg/L of ferritin was used[25].
Folic acid deficiency: Folic acid concentration = 57 ng/mLin whole blood [14].
Low zinc concentration: Serum zinc <65 µg/dL [13,26].
Statistical analysesEstimates of the prevalence of anemia, as well as deficien-cies in iron, folic acid, and zinc, were carried out for thenational and regional levels by age group, taking into con-sideration the sampling design. In other words, inferencesfor the whole population considered the stratified two-stage design to apply expansion factors to the sampledpopulation. Each point estimate is presented with 95%confidence intervals (CI). Statistical comparisons betweenregions and care regimens was carried out with Pearson'schi-square statistics, using the analyses routines for com-plex surveys; differences between means were assessed
using linear models within the same routine to take intoconsideration the sampling design [27,28]. All statisticalanalyses were carried out with STATA version 8, specialedition [29].
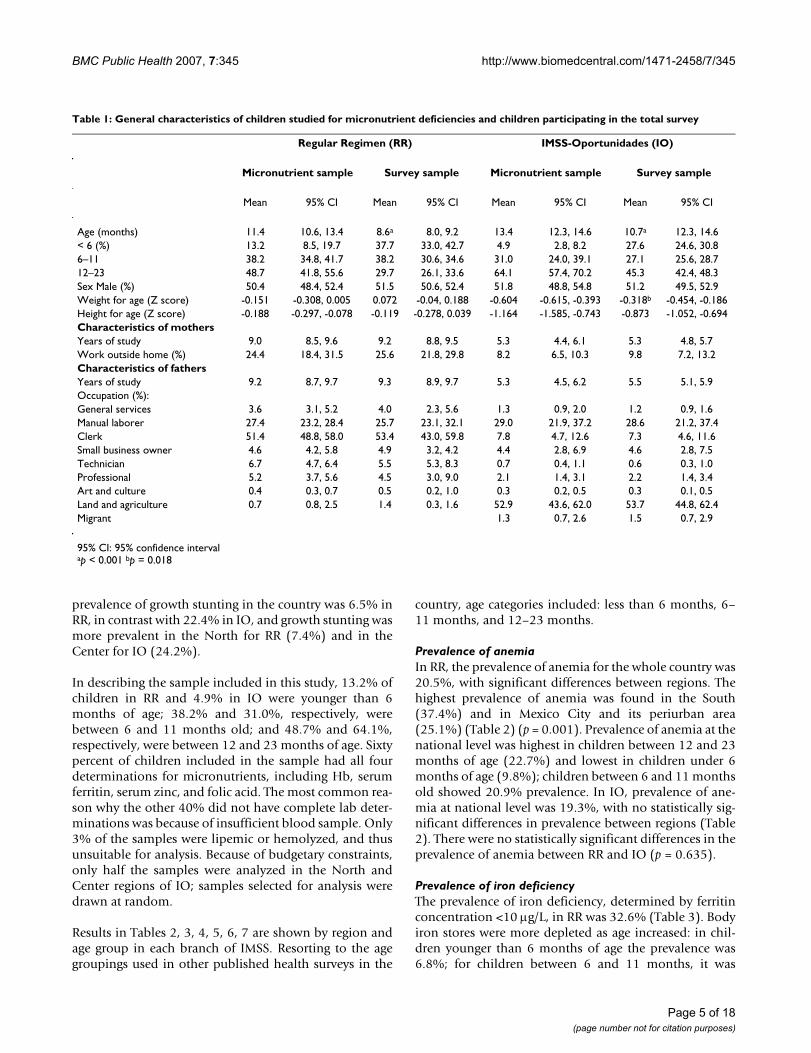
ResultsResponse rates were 64.2% (n = 2,646) in RR and 74.7%(n = 2,309) in IO. Response rates differed in differentregions of the country. For RR in the North region, wewere able to recruit 76.2% of the expected sample; in theCenter, 73.9%; in the South, 58.7%; and in Mexico Cityand periurban area, 44.8%. For IO, the North recruited85.8% of the expected sample; the Center, 93.6%; and theSouth, 44.8%. Children who participated in the micronu-trient sample were significantly older than children whoparticipated in the other parts of the larger study. In IO,there was also a significant difference in weight for age:children participating in the micronutrient sample hadlower Z score (-0.604) than those in the larger sample (-0.318). The other characteristics–including sex, height forage, years of education of either parent, and percent ofworking mothers' or fathers' occupation–showed no sta-tistically significant differences between the micronutrientand the general sample (Table 1). Between regions, theonly significant difference was found in the years ofschooling of RR of mothers coming from the North,which were less than in the rest of the sample.
At the time of this survey, 84% of children in RR and 94%of children in IO had attended the health care facilitysearching for some kind of preventive service, like a well-baby clinic or routine vaccination. Only 15.7% of chil-dren in RR and 6.4% in IO attended because of an acuteillness. Additionally, 20% of mothers reported that thechild had had one or more signs of acute infection (e.g.,diarrhea, cough, nasal discharge, fever) during the twoweeks before the study, which was an exclusion criterionfor the micronutrient sample, as acute infections affect theserum status of zinc and iron, making interpretation diffi-cult.
There were some sociodemographic differences in thestudy sample when comparing regimen by region. Par-ents' schooling was higher in RR as compared with IO; alarger percentage of mothers in RR worked outside home(24.4% vs. 8.2%); and the proportion of houses with dirtfloors was lower in RR than in IO (4.3% vs. 33.1%). Otherdifferences included: at 4 months of age, 23.8% of chil-dren in RR were exclusively breast-fed, in comparisonwith 46.2% in IO; at this age, children in the South had ahigher prevalence of exclusive breast feeding compared tothe rest of the country (31.5% in RR and 48.4% in IO); theproportion of children still receiving some breast milk at12 months of age was larger in the South than in the restof the country: 26.9% in RR and 66.2% in IO. Lastly, the
Page 4 of 18(page number not for citation purposes)
BMC Public Health 2007, 7:345 http://www.biomedcentral.com/1471-2458/7/345
prevalence of growth stunting in the country was 6.5% inRR, in contrast with 22.4% in IO, and growth stunting wasmore prevalent in the North for RR (7.4%) and in theCenter for IO (24.2%).
In describing the sample included in this study, 13.2% ofchildren in RR and 4.9% in IO were younger than 6months of age; 38.2% and 31.0%, respectively, werebetween 6 and 11 months old; and 48.7% and 64.1%,respectively, were between 12 and 23 months of age. Sixtypercent of children included in the sample had all fourdeterminations for micronutrients, including Hb, serumferritin, serum zinc, and folic acid. The most common rea-son why the other 40% did not have complete lab deter-minations was because of insufficient blood sample. Only3% of the samples were lipemic or hemolyzed, and thusunsuitable for analysis. Because of budgetary constraints,only half the samples were analyzed in the North andCenter regions of IO; samples selected for analysis weredrawn at random.
Results in Tables 2, 3, 4, 5, 6, 7 are shown by region andage group in each branch of IMSS. Resorting to the agegroupings used in other published health surveys in the
country, age categories included: less than 6 months, 6–11 months, and 12–23 months.
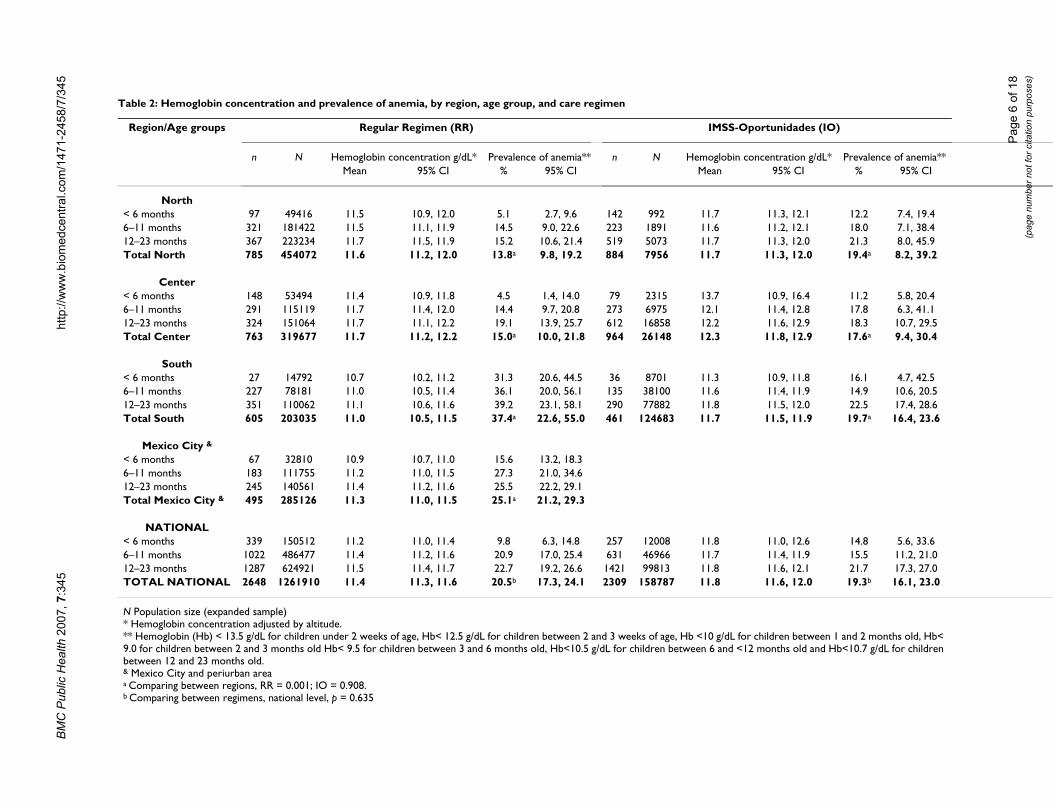
Prevalence of anemiaIn RR, the prevalence of anemia for the whole country was20.5%, with significant differences between regions. Thehighest prevalence of anemia was found in the South(37.4%) and in Mexico City and its periurban area(25.1%) (Table 2) (p = 0.001). Prevalence of anemia at thenational level was highest in children between 12 and 23months of age (22.7%) and lowest in children under 6months of age (9.8%); children between 6 and 11 monthsold showed 20.9% prevalence. In IO, prevalence of ane-mia at national level was 19.3%, with no statistically sig-nificant differences in prevalence between regions (Table2). There were no statistically significant differences in theprevalence of anemia between RR and IO (p = 0.635).
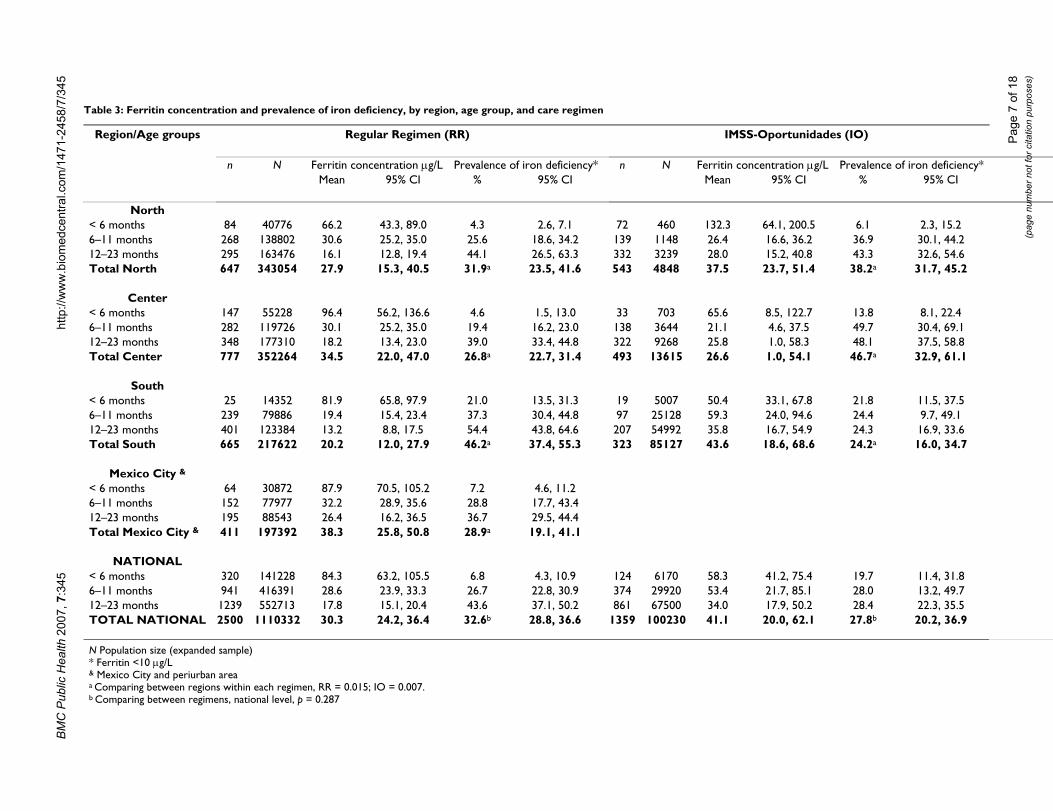
Prevalence of iron deficiencyThe prevalence of iron deficiency, determined by ferritinconcentration <10 µg/L, in RR was 32.6% (Table 3). Bodyiron stores were more depleted as age increased: in chil-dren younger than 6 months of age the prevalence was6.8%; for children between 6 and 11 months, it was
Table 1: General characteristics of children studied for micronutrient deficiencies and children participating in the total survey
Regular Regimen (RR) IMSS-Oportunidades (IO)
Micronutrient sample Survey sample Micronutrient sample Survey sample
Mean 95% CI Mean 95% CI Mean 95% CI Mean 95% CI
Age (months) 11.4 10.6, 13.4 8.6a 8.0, 9.2 13.4 12.3, 14.6 10.7a 12.3, 14.6< 6 (%) 13.2 8.5, 19.7 37.7 33.0, 42.7 4.9 2.8, 8.2 27.6 24.6, 30.86–11 38.2 34.8, 41.7 38.2 30.6, 34.6 31.0 24.0, 39.1 27.1 25.6, 28.712–23 48.7 41.8, 55.6 29.7 26.1, 33.6 64.1 57.4, 70.2 45.3 42.4, 48.3Sex Male (%) 50.4 48.4, 52.4 51.5 50.6, 52.4 51.8 48.8, 54.8 51.2 49.5, 52.9Weight for age (Z score) -0.151 -0.308, 0.005 0.072 -0.04, 0.188 -0.604 -0.615, -0.393 -0.318b -0.454, -0.186Height for age (Z score) -0.188 -0.297, -0.078 -0.119 -0.278, 0.039 -1.164 -1.585, -0.743 -0.873 -1.052, -0.694Characteristics of mothersYears of study 9.0 8.5, 9.6 9.2 8.8, 9.5 5.3 4.4, 6.1 5.3 4.8, 5.7Work outside home (%) 24.4 18.4, 31.5 25.6 21.8, 29.8 8.2 6.5, 10.3 9.8 7.2, 13.2Characteristics of fathersYears of study 9.2 8.7, 9.7 9.3 8.9, 9.7 5.3 4.5, 6.2 5.5 5.1, 5.9Occupation (%):General services 3.6 3.1, 5.2 4.0 2.3, 5.6 1.3 0.9, 2.0 1.2 0.9, 1.6Manual laborer 27.4 23.2, 28.4 25.7 23.1, 32.1 29.0 21.9, 37.2 28.6 21.2, 37.4Clerk 51.4 48.8, 58.0 53.4 43.0, 59.8 7.8 4.7, 12.6 7.3 4.6, 11.6Small business owner 4.6 4.2, 5.8 4.9 3.2, 4.2 4.4 2.8, 6.9 4.6 2.8, 7.5Technician 6.7 4.7, 6.4 5.5 5.3, 8.3 0.7 0.4, 1.1 0.6 0.3, 1.0Professional 5.2 3.7, 5.6 4.5 3.0, 9.0 2.1 1.4, 3.1 2.2 1.4, 3.4Art and culture 0.4 0.3, 0.7 0.5 0.2, 1.0 0.3 0.2, 0.5 0.3 0.1, 0.5Land and agriculture 0.7 0.8, 2.5 1.4 0.3, 1.6 52.9 43.6, 62.0 53.7 44.8, 62.4Migrant 1.3 0.7, 2.6 1.5 0.7, 2.9
95% CI: 95% confidence intervalap < 0.001 bp = 0.018
Page 5 of 18(page number not for citation purposes)
BM
C P
ublic
Hea
lth 2
007,
7:3
45ht
tp://
ww
w.b
iom
edce
ntra
l.com
/147
1-24
58/7
/345
Page
6 o
f 18
(pag
e nu
mbe
r not
for c
itatio
n pu
rpos
es)
Table 2: Hemoglobin concentration and prevalence of anemia, by region, age group, and care regimen
Region/Age groups Regular Regimen (RR) IMSS-Oportunidades (IO)
n N Hemoglobin concentration g/dL* Prevalence of anemia** n N Hemoglobin concentration g/dL* Prevalence of anemia**Mean 95% CI % 95% CI Mean 95% CI % 95% CI
North< 6 months 97 49416 11.5 10.9, 12.0 5.1 2.7, 9.6 142 992 11.7 11.3, 12.1 12.2 7.4, 19.46–11 months 321 181422 11.5 11.1, 11.9 14.5 9.0, 22.6 223 1891 11.6 11.2, 12.1 18.0 7.1, 38.412–23 months 367 223234 11.7 11.5, 11.9 15.2 10.6, 21.4 519 5073 11.7 11.3, 12.0 21.3 8.0, 45.9Total North 785 454072 11.6 11.2, 12.0 13.8a 9.8, 19.2 884 7956 11.7 11.3, 12.0 19.4a 8.2, 39.2
Center< 6 months 148 53494 11.4 10.9, 11.8 4.5 1.4, 14.0 79 2315 13.7 10.9, 16.4 11.2 5.8, 20.46–11 months 291 115119 11.7 11.4, 12.0 14.4 9.7, 20.8 273 6975 12.1 11.4, 12.8 17.8 6.3, 41.112–23 months 324 151064 11.7 11.1, 12.2 19.1 13.9, 25.7 612 16858 12.2 11.6, 12.9 18.3 10.7, 29.5Total Center 763 319677 11.7 11.2, 12.2 15.0a 10.0, 21.8 964 26148 12.3 11.8, 12.9 17.6a 9.4, 30.4
South< 6 months 27 14792 10.7 10.2, 11.2 31.3 20.6, 44.5 36 8701 11.3 10.9, 11.8 16.1 4.7, 42.56–11 months 227 78181 11.0 10.5, 11.4 36.1 20.0, 56.1 135 38100 11.6 11.4, 11.9 14.9 10.6, 20.512–23 months 351 110062 11.1 10.6, 11.6 39.2 23.1, 58.1 290 77882 11.8 11.5, 12.0 22.5 17.4, 28.6Total South 605 203035 11.0 10.5, 11.5 37.4a 22.6, 55.0 461 124683 11.7 11.5, 11.9 19.7a 16.4, 23.6
Mexico City &
< 6 months 67 32810 10.9 10.7, 11.0 15.6 13.2, 18.36–11 months 183 111755 11.2 11.0, 11.5 27.3 21.0, 34.612–23 months 245 140561 11.4 11.2, 11.6 25.5 22.2, 29.1Total Mexico City & 495 285126 11.3 11.0, 11.5 25.1a 21.2, 29.3
NATIONAL< 6 months 339 150512 11.2 11.0, 11.4 9.8 6.3, 14.8 257 12008 11.8 11.0, 12.6 14.8 5.6, 33.66–11 months 1022 486477 11.4 11.2, 11.6 20.9 17.0, 25.4 631 46966 11.7 11.4, 11.9 15.5 11.2, 21.012–23 months 1287 624921 11.5 11.4, 11.7 22.7 19.2, 26.6 1421 99813 11.8 11.6, 12.1 21.7 17.3, 27.0TOTAL NATIONAL 2648 1261910 11.4 11.3, 11.6 20.5b 17.3, 24.1 2309 158787 11.8 11.6, 12.0 19.3b 16.1, 23.0
N Population size (expanded sample)* Hemoglobin concentration adjusted by altitude.** Hemoglobin (Hb) < 13.5 g/dL for children under 2 weeks of age, Hb< 12.5 g/dL for children between 2 and 3 weeks of age, Hb <10 g/dL for children between 1 and 2 months old, Hb< 9.0 for children between 2 and 3 months old Hb< 9.5 for children between 3 and 6 months old, Hb<10.5 g/dL for children between 6 and <12 months old and Hb<10.7 g/dL for children between 12 and 23 months old.& Mexico City and periurban areaa Comparing between regions, RR = 0.001; IO = 0.908.b Comparing between regimens, national level, p = 0.635
BM
C P
ublic
Hea
lth 2
007,
7:3
45ht
tp://
ww
w.b
iom
edce
ntra
l.com
/147
1-24
58/7
/345
Page
7 o
f 18
(pag
e nu
mbe
r not
for c
itatio
n pu
rpos
es)
Table 3: Ferritin concentration and prevalence of iron deficiency, by region, age group, and care regimen
Region/Age groups Regular Regimen (RR) IMSS-Oportunidades (IO)
n N Ferritin concentration µg/L Prevalence of iron deficiency* n N Ferritin concentration µg/L Prevalence of iron deficiency*Mean 95% CI % 95% CI Mean 95% CI % 95% CI
North< 6 months 84 40776 66.2 43.3, 89.0 4.3 2.6, 7.1 72 460 132.3 64.1, 200.5 6.1 2.3, 15.26–11 months 268 138802 30.6 25.2, 35.0 25.6 18.6, 34.2 139 1148 26.4 16.6, 36.2 36.9 30.1, 44.212–23 months 295 163476 16.1 12.8, 19.4 44.1 26.5, 63.3 332 3239 28.0 15.2, 40.8 43.3 32.6, 54.6Total North 647 343054 27.9 15.3, 40.5 31.9a 23.5, 41.6 543 4848 37.5 23.7, 51.4 38.2a 31.7, 45.2
Center< 6 months 147 55228 96.4 56.2, 136.6 4.6 1.5, 13.0 33 703 65.6 8.5, 122.7 13.8 8.1, 22.46–11 months 282 119726 30.1 25.2, 35.0 19.4 16.2, 23.0 138 3644 21.1 4.6, 37.5 49.7 30.4, 69.112–23 months 348 177310 18.2 13.4, 23.0 39.0 33.4, 44.8 322 9268 25.8 1.0, 58.3 48.1 37.5, 58.8Total Center 777 352264 34.5 22.0, 47.0 26.8a 22.7, 31.4 493 13615 26.6 1.0, 54.1 46.7a 32.9, 61.1
South< 6 months 25 14352 81.9 65.8, 97.9 21.0 13.5, 31.3 19 5007 50.4 33.1, 67.8 21.8 11.5, 37.56–11 months 239 79886 19.4 15.4, 23.4 37.3 30.4, 44.8 97 25128 59.3 24.0, 94.6 24.4 9.7, 49.112–23 months 401 123384 13.2 8.8, 17.5 54.4 43.8, 64.6 207 54992 35.8 16.7, 54.9 24.3 16.9, 33.6Total South 665 217622 20.2 12.0, 27.9 46.2a 37.4, 55.3 323 85127 43.6 18.6, 68.6 24.2a 16.0, 34.7
Mexico City &< 6 months 64 30872 87.9 70.5, 105.2 7.2 4.6, 11.26–11 months 152 77977 32.2 28.9, 35.6 28.8 17.7, 43.412–23 months 195 88543 26.4 16.2, 36.5 36.7 29.5, 44.4Total Mexico City & 411 197392 38.3 25.8, 50.8 28.9a 19.1, 41.1
NATIONAL< 6 months 320 141228 84.3 63.2, 105.5 6.8 4.3, 10.9 124 6170 58.3 41.2, 75.4 19.7 11.4, 31.86–11 months 941 416391 28.6 23.9, 33.3 26.7 22.8, 30.9 374 29920 53.4 21.7, 85.1 28.0 13.2, 49.712–23 months 1239 552713 17.8 15.1, 20.4 43.6 37.1, 50.2 861 67500 34.0 17.9, 50.2 28.4 22.3, 35.5TOTAL NATIONAL 2500 1110332 30.3 24.2, 36.4 32.6b 28.8, 36.6 1359 100230 41.1 20.0, 62.1 27.8b 20.2, 36.9
N Population size (expanded sample)* Ferritin <10 µg/L& Mexico City and periurban areaa Comparing between regions within each regimen, RR = 0.015; IO = 0.007.b Comparing between regimens, national level, p = 0.287
BM
C P
ublic
Hea
lth 2
007,
7:3
45ht
tp://
ww
w.b
iom
edce
ntra
l.com
/147
1-24
58/7
/345
Page
8 o
f 18
(pag
e nu
mbe
r not
for c
itatio
n pu
rpos
es)
Table 4: Iron nutritional status by hemoglobin and ferritin concentrations, by region and care regimen
Regular Regimen (RR)
Total Regular Regimenn = 2324
N = 1022247
Northn = 639
N = 337,221
Centern = 712
N = 301,192
Southn = 574
N = 193,493
Mexico City and periurban arean = 399
N = 190,340
Iron status n N % 95% CI n N % 95% CI n N % 95% CI n N % 95% CI n N % 95% CI
Normal a 1298 582313 57.0f 52.1, 61.7 375 206383 61.2g 50.3, 71.1 499 203988 67.7g 58.9, 75.4 207 67839 35.1g 32.4, 37.8 217 104103 54.7g 41.9, 66.9Iron deficiency without anemia b 530 224550 22.0 18.2, 26.3 168 82056 24.3 17.8, 32.3 116 51229 17.0 14.6, 19.8 169 53701 27.8 16.0, 43.6 77 37563 19.7 14.9, 25.7Anemiac 496 215385 21.0 17.1, 25.6 96 48781 14.5 11.0, 18.8 97 45976 15.3 10.1, 22.5 198 71953 37.2 22.7, 54.5 105 48675 25.6 18.6, 34.0Iron deficiency anemia d 248 105942 10.3 8.6, 12.4 49 24073 7.1 4.6, 10.9 59 30173 10.0 7.0, 14.1 102 34511 17.8 12.2, 25.4 38 17185 9.0 5.2, 15.3Anemia due to other causes e 248 109443 10.7 8.0, 14.2 47 24708 7.3 4.8, 11.1 38 15803 5.2 2.5, 10.5 96 37442 19.4 10.2, 33.7 67 31490 16.5 13.0, 20.8
IMSS-Oportunidades (IO)
Total IMSS-Oportunidadesn = 1325
N = 98150
Northn = 539
N = 4195
Centern = 479
N = 10882
Southn = 307
N = 83074
Iron status n N % 95% CI n N % 95% CI n N % 95% CI n N % 95% CI
Normal a 681 60873 62.0f 53.2, 70.2 294 2308 55.0h 46.8, 63.0 192 4668 42.9h 33.9, 52.4 195 53897 64.9h 54.6, 73.9Iron deficiency without anemia b 362 20110 20.5 13.8, 29.2 132 1140 27.2 21.0, 34.4 171 4240 39.0 29.3, 49.6 59 14730 17.7 10.9, 27.6Anemiac 282 17167 17.5 13.2, 22.8 113 746 17.8 9.1, 31.9 116 1974 18.1 8.0, 36.2 53 14447 17.4 12.7, 23.4Iron deficiency anemia d 137 6873 7.0 4.7, 10.3 62 441 10.5 4.8, 21.4 57 984 9.0 4.2, 18.3 18 5448 6.6 4.0, 10.5Anemia due to other causes e 145 10294 10.5 7.4, 14.7 51 305 7.3 3.9, 13.2 59 990 9.1 3.6, 21.1 35 5448 10.8 7.4, 15.7
N Population size (expanded sample)a Hemoglobin above the cut-off point for anemia and ferritin > = 10 µg/Lb Ferritin < 10 µg/L and Hb > = cut-off for anemiac Hb < cut-off for anemiad Ferritin < 10 µg/L and Hb < cut-off for anemiae Ferritin = 10 µg/L and Hb < cut-off for anemiaf Comparing nutritional iron status between regimens p = 0.499g,h Comparing iron status between regions gRR<0.001; hIO = 0.012
BM
C P
ublic
Hea
lth 2
007,
7:3
45ht
tp://
ww
w.b
iom
edce
ntra
l.com
/147
1-24
58/7
/345
Page
9 o
f 18
(pag
e nu
mbe
r not
for c
itatio
n pu
rpos
es)
Table 5: Folic acid concentration and prevalence of folic acid deficiency, by region, age group, and care regimen
Region/Age groups Regular Regimen (RR) IMSS-Oportunidades (IO)
n N Serum folic acid concentration ng/mL Prevalence of folic acid deficiency* n N Serum folic acid concentration ng/mL Prevalence of folic acid deficiency*Mean 95% CI % 95% CI Mean 95% CI % 95% CI
North< 6 months 96 48932 102.7 51.0, 154.3 25.2 11.0, 47.9 97 601 124.8 105.0, 144.6 6.6 2.5, 16.36–11 months 298 176084 120.9 65.4, 176.3 14.5 3.2, 47.1 154 1169 120.5 98.6, 142.4 6.9 2.4, 18.312–23 months 314 196452 112.1 72.0, 152.2 13.4 2.7, 46.5 362 2640 125.8 110.8, 140.9 3.1 1.4, 6.5Total North 708 421468 114.7 55.9, 173.4 15.2a 3.3, 48.7 613 4410 124.3 109.2, 139.4 4.6a 2.3, 9.0
Center< 6 months 142 49708 131.4 100.6, 162.2 9.7 2.2, 33.5 72 2065 163.6 149.4, 177.8 0.0 ---6–11 months 291 119236 149.0 122.1, 175.9 4.3 1.4, 13.0 239 6278 168.1 142.3, 193.9 3.0 0.8, 11.012–23 months 333 159516 127.5 99.6, 155.4 6.4 1.7, 21.7 546 15902 147.1 113.6, 180.7 1.4 0.2, 7.3Total Center 766 328460 135.9 103.8, 167.9 6.1a 1.7, 20.2 857 24246 154.0 124.9, 183.0 1.7a 0.4, 6.2
South< 6 months 10 3973 118.7 58.3, 179.2 16.6 3.6, 51.7 25 6861 155.9 135.1, 176.7 0.0 ---6–11 months 202 62292 111.7 81.0, 142.4 8.6 1.6, 36.1 110 34142 134.4 108.5,160.3 5.8 2.4, 13.312–23 months 320 85651 111.4 88.4, 134.3 14.1 4.5, 36.1 228 68987 112.0 81.9, 142.1 12.6 3.0, 40.4Total South 532 151917 111.7 82.8, 140.5 11.9a 3.4, 34.2 363 109991 121.7 92.9, 150.5 9.7a 2.5, 30.6
Mexico City&
< 6 months 45 23968 107.0 103.6, 110.3 5.4 4.1, 7.26–11 months 118 63812 121.3 108.7, 133.9 5.0 2.2, 11.012–23 months 137 70367 106.8 104.2, 109.5 5.6 0.7, 32.1Total Mexico City & 300 158146 112.7 105.0, 120.3 5.1a 2.6, 10.1
NATIONAL< 6 months 293 126581 115.3 87.3, 143.2 15.1 5.8, 33.7 194 9528 155.6 139.9, 171.3 0.4 0.1, 1.46–11 months 909 421424 127.5 101.9, 153.2 9.3 3.2, 24.2 503 41589 139.1 119.7, 158.5 5.4 2.6, 11.012–23 months 1104 511986 116.0 98.0, 134.1 10.3 4.3, 22.5 1136 87530 118.8 95.2, 142.4 10.2 2.7, 32.0TOTAL NATIONAL 2306 1059991 120.5 99.3, 141.7 10.4b 4.0, 24.4 1833 138646 127.4 105.5, 149.4 8.1b 2.4, 23.7
N Population size (expanded sample)* ≤ 57 ng/mL in whole blood sample& Mexico City and periurban areaa Comparing between regions within each regimen, RR = 0.458; IO = 0.046.b Comparing between regimens, national level, p = 0.720
BM
C P
ublic
Hea
lth 2
007,
7:3
45ht
tp://
ww
w.b
iom
edce
ntra
l.com
/147
1-24
58/7
/345
Page
10
of 1
8(p
age
num
ber n
ot fo
r cita
tion
purp
oses
)
Table 6: Zinc concentration and prevalence of low zinc concentration, by region, age group, and care regimen
Regular Regimen (RR) IMSS-Oportunidades (IO)
Zinc concentration µ/dL Prevalence of low zinc concentration* Zinc concentration µ/dL Prevalence of low zinc concentration*Region/Age Groups n N Mean 95% CI % 95% CI n N Mean 95% CI % 95% CI
North< 6 months 94 46028 82.8 76.6, 89.0 20.6 8.1, 43.3 60 406 83.1 61.3, 104.9 35.2 11.0, 70.56–11 months 289 151419 86.4 74.0, 98.8 22.7 10.2, 43.2 126 1104 84.0 70.7, 97.3 21.6 6.3, 53.112–23 months 330 189064 81.6 66.3, 96.9 31.2 14.6, 54.5 307 2914 83.0 78.5, 87.6 21.1 8.8, 42.7Total North 713 386511 83.6 70.8, 96.4 26.6a 11.6, 50.1 493 4425 83.3 75.5, 91.0 22.5a 8.2, 48.7
Center< 6 months 148 55798 76.3 70.5, 82.1 34.6 20.3, 52.2 33 981 72.5 49.9, 95.1 63.2 30.1, 87.26–11 months 293 123937 76.1 68.9, 83.2 31.3 23.1, 41.0 131 3516 79.8 73.2, 86.5 29.4 21.4, 38.812–23 months 351 178793 75.1 73.3, 76.9 32.3 25.6, 39.8 315 9230 79.7 74.3, 85.1 26.6 19.2, 35.6Total Center 792 339398 75.6 71.7, 79.6 32.4a 26.0, 39.4 479 13727 79.2 75.4, 83.0 29.9a 24.1, 36.5
South< 6 months 29 15312 72.4 64.8, 79.9 38.1 21.2, 58.5 25 6605 87.5 74.9, 100.2 5.9 1.4, 22.16–11 months 247 81878 77.7 72.7, 82.7 25.6 17.3, 36.2 100 25968 91.6 84.7, 98.5 14.4 6.6, 28.812–23 months 404 124130 78.6 71.6, 85.7 26.1 18.4, 35.6 211 55166 90.4 82.9, 97.9 9.0 3.2, 22.8Total South 680 222491 77.9 71.8, 83.9 26.6a 18.4, 36.8 336 87740 90.5 84.3, 96.8 10.4a 5.2, 19.5
Mexico City and periurban area< 6 months 60 28968 87.5 70.4, 104.5 20.2 4.0, 60.66–11 months 161 82599 81.6 65.2, 98.0 25.6 19.0, 33.612–23 months 198 89905 88.2 73.0, 103.3 22.5 11.8, 38.8Total Mexico City and periurban area 419 211391 85.4 69.1, 101.7 24.0a 12.8, 40.4
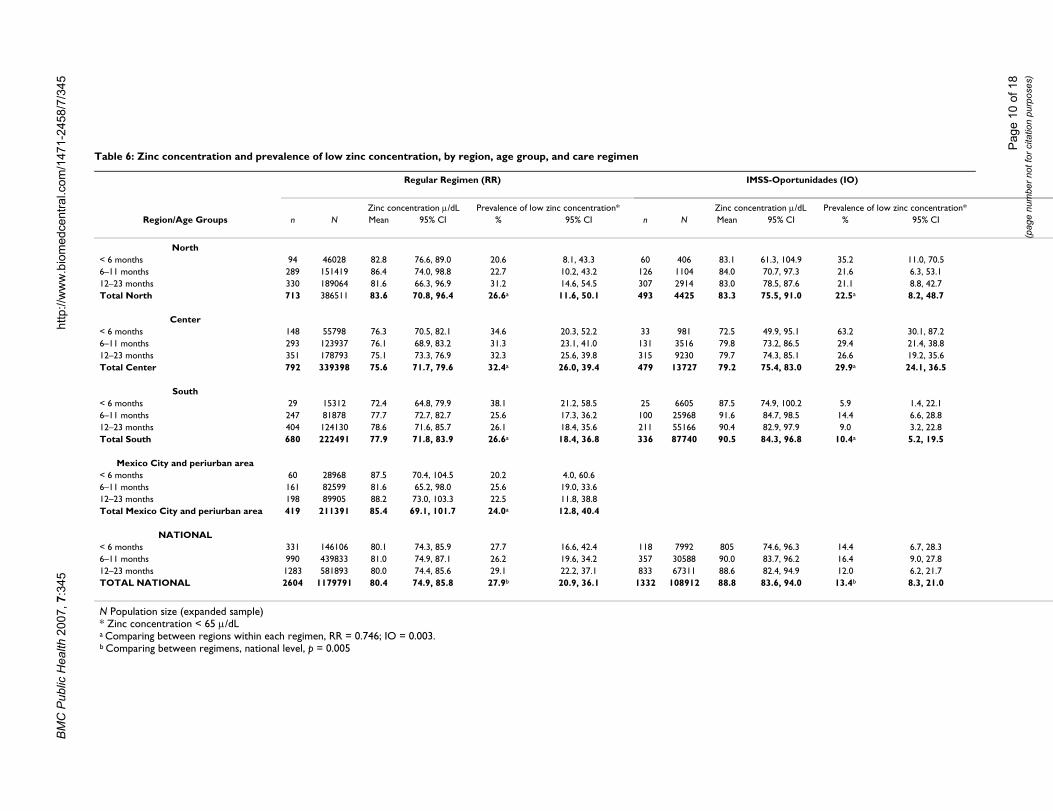
NATIONAL< 6 months 331 146106 80.1 74.3, 85.9 27.7 16.6, 42.4 118 7992 805 74.6, 96.3 14.4 6.7, 28.36–11 months 990 439833 81.0 74.9, 87.1 26.2 19.6, 34.2 357 30588 90.0 83.7, 96.2 16.4 9.0, 27.812–23 months 1283 581893 80.0 74.4, 85.6 29.1 22.2, 37.1 833 67311 88.6 82.4, 94.9 12.0 6.2, 21.7TOTAL NATIONAL 2604 1179791 80.4 74.9, 85.8 27.9b 20.9, 36.1 1332 108912 88.8 83.6, 94.0 13.4b 8.3, 21.0
N Population size (expanded sample)* Zinc concentration < 65 µ/dLa Comparing between regions within each regimen, RR = 0.746; IO = 0.003.b Comparing between regimens, national level, p = 0.005
BMC Public Health 2007, 7:345 http://www.biomedcentral.com/1471-2458/7/345
26.7%; and for children 12–23 months old, it was 43.6%.There were marked differences in overall prevalencebetween regions, with the lower and higher values in theCenter (26.8%) and South (46.2%), respectively (p =0.015) (Table 3).
In IO, iron deficiency had a prevalence of 27.8%. Asdescribed for RR, iron deficiency increased with age: inchildren younger than 6 months of age, prevalence of irondeficiency was 19.7%; in children between 6 and 11months old, prevalence was 28.0%; and in children 12–23 months old, prevalence of iron deficiency was 28.4%.The highest prevalence of iron deficiency was found in theCenter (46.7%), followed by the North (38.2%) and bythe South (24.2%) (p = 0.007). There were no statisticallysignificant differences in the overall prevalence of irondeficiency between regimens (p = 0.287).
Other studies have used a cut-off for ferritin concentration<12 µg/L to evaluate low iron stores in this age group, sowe ran a second analysis with this cut-off. In RR, the prev-alence of iron deficiency at the national level was 37.0%(95% CI: 33.6, 40.6), and by regions, the North showed36.3% (95% CI: 28.1, 45.4), the Center, 32.4% (95% CI:28.4, 36.7), the South, 50.8% (95% CI: 42.5, 59.2), andMexico City and periurban area, 31.5% (95% CI: 23.0,41.4). In IO, the national prevalence was 32.1% (95% CI:23.7, 41.9); in the North, 42.4% (95% CI: 37.5, 47.4); inthe Center, 50.2% (95% CI: 35.5, 64.9); and in the South,28.7% (95% CI: 19.6, 39.9). Between regions there werestatistically significant differences, with a p = 0.006 for RRand p = 0.017 for IO, but the prevalence of iron deficiencybetween the two IMSS regimens was not statistically sig-nificantly different (p = 0.326).
Table 7: Folic acid deficiency and low zinc concentration by iron status
Regular Regimen (RR)
Iron status Folic acid deficiency by iron status hn = 2025
N = 856,699
Low zinc concentration by iron statusi
n = 2268N = 996,996
Cases/n N %f 95% CI Cases/n N %g 95% CI
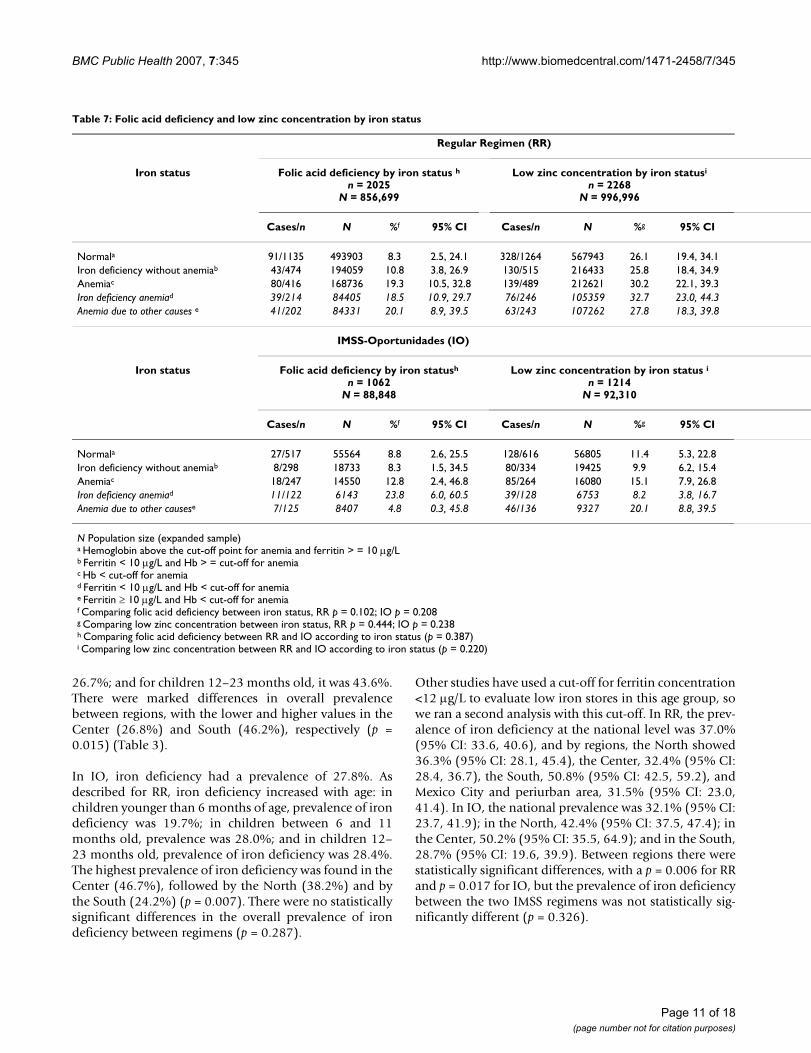
Normala 91/1135 493903 8.3 2.5, 24.1 328/1264 567943 26.1 19.4, 34.1Iron deficiency without anemiab 43/474 194059 10.8 3.8, 26.9 130/515 216433 25.8 18.4, 34.9Anemiac 80/416 168736 19.3 10.5, 32.8 139/489 212621 30.2 22.1, 39.3Iron deficiency anemiad 39/214 84405 18.5 10.9, 29.7 76/246 105359 32.7 23.0, 44.3Anemia due to other causes e 41/202 84331 20.1 8.9, 39.5 63/243 107262 27.8 18.3, 39.8
IMSS-Oportunidades (IO)
Iron status Folic acid deficiency by iron statush
n = 1062N = 88,848
Low zinc concentration by iron status in = 1214
N = 92,310
Cases/n N %f 95% CI Cases/n N %g 95% CI
Normala 27/517 55564 8.8 2.6, 25.5 128/616 56805 11.4 5.3, 22.8Iron deficiency without anemiab 8/298 18733 8.3 1.5, 34.5 80/334 19425 9.9 6.2, 15.4Anemiac 18/247 14550 12.8 2.4, 46.8 85/264 16080 15.1 7.9, 26.8Iron deficiency anemiad 11/122 6143 23.8 6.0, 60.5 39/128 6753 8.2 3.8, 16.7Anemia due to other causese 7/125 8407 4.8 0.3, 45.8 46/136 9327 20.1 8.8, 39.5
N Population size (expanded sample)a Hemoglobin above the cut-off point for anemia and ferritin > = 10 µg/Lb Ferritin < 10 µg/L and Hb > = cut-off for anemiac Hb < cut-off for anemiad Ferritin < 10 µg/L and Hb < cut-off for anemiae Ferritin ≥ 10 µg/L and Hb < cut-off for anemiaf Comparing folic acid deficiency between iron status, RR p = 0.102; IO p = 0.208g Comparing low zinc concentration between iron status, RR p = 0.444; IO p = 0.238h Comparing folic acid deficiency between RR and IO according to iron status (p = 0.387)i Comparing low zinc concentration between RR and IO according to iron status (p = 0.220)
Page 11 of 18(page number not for citation purposes)
BMC Public Health 2007, 7:345 http://www.biomedcentral.com/1471-2458/7/345
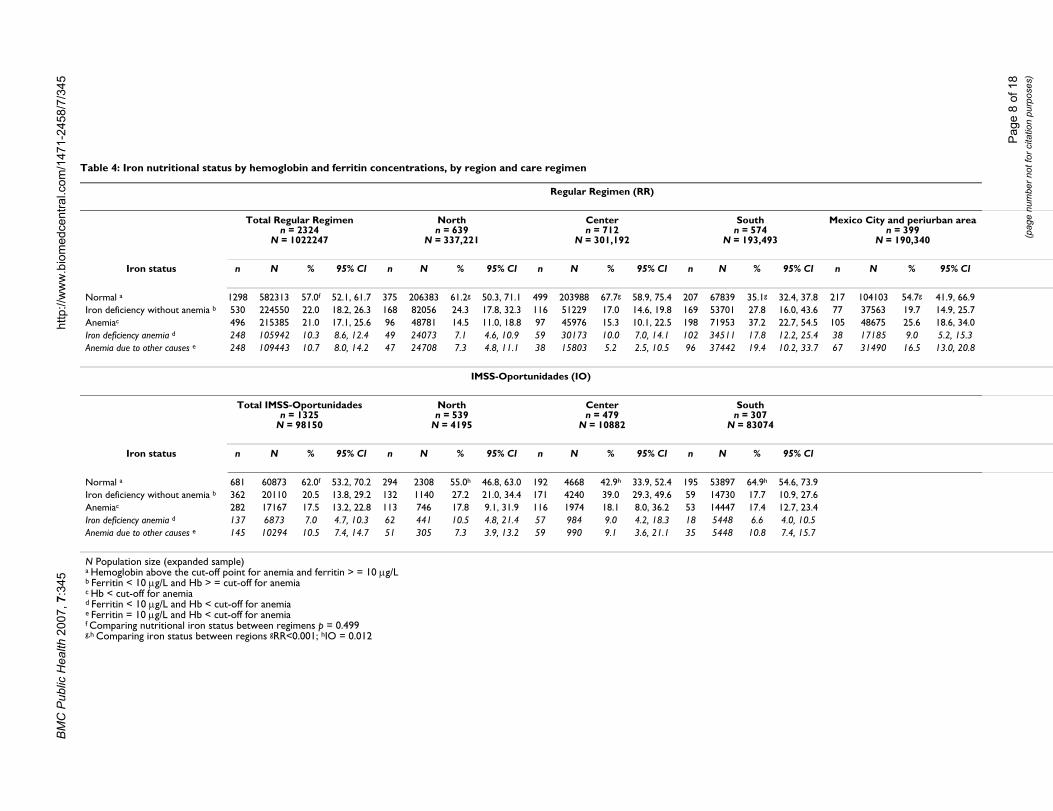
Iron status by hemoglobin and ferritin concentrationIn RR, 57.0% of all children had a normal iron status, asjudged by normal hemoglobin and ferritin concentra-tions. Thus, 43% of children had iron deficiency and/oranemia. Only half (10.3%) of the 21% of cases with ane-mia were associated with iron deficiency. The highestprevalence of both iron deficiency without anemia andanemia was found among children in the South, whereonly 35.1% of children had normal iron status; this wasfollowed by Mexico City and its periurban area, with54.7%. In the North, 61.2% of children had normal ironstatus; in the Center, 67.7% did (p < 0.001) (Table 4).
In IO, 62.0% of children had normal iron status. The rest(38.0%) had iron deficiency and/or anemia. Of all casesof anemia found in IO (17.5%), fewer than half (7.0%)were due to iron deficiency; the rest (10.5%) were fromother causes. In the Center, only 42.9% of children hadnormal iron status, compared to 55.0% of children in theNorth and 64.9% of children in the South (p = 0.012)(Table 4). There were no statistically significant differ-ences in the overall prevalence of iron deficiency withoutanemia and anemia between regimens (p = 0.499).
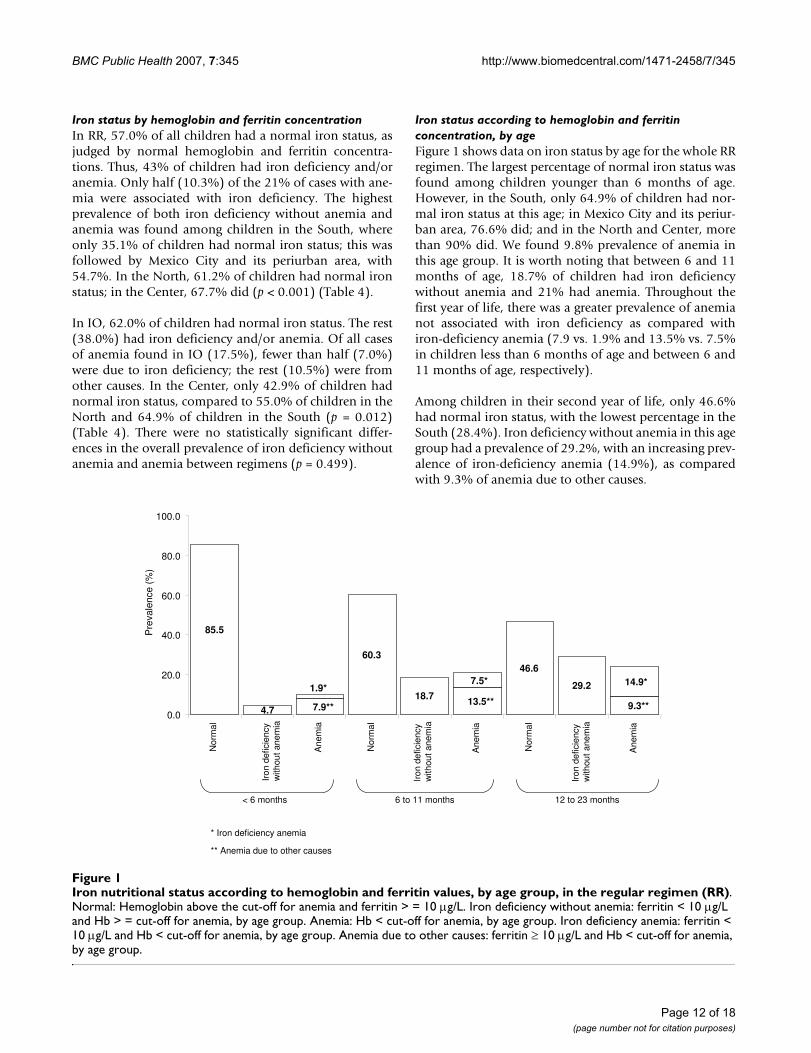
Iron status according to hemoglobin and ferritin concentration, by ageFigure 1 shows data on iron status by age for the whole RRregimen. The largest percentage of normal iron status wasfound among children younger than 6 months of age.However, in the South, only 64.9% of children had nor-mal iron status at this age; in Mexico City and its periur-ban area, 76.6% did; and in the North and Center, morethan 90% did. We found 9.8% prevalence of anemia inthis age group. It is worth noting that between 6 and 11months of age, 18.7% of children had iron deficiencywithout anemia and 21% had anemia. Throughout thefirst year of life, there was a greater prevalence of anemianot associated with iron deficiency as compared withiron-deficiency anemia (7.9 vs. 1.9% and 13.5% vs. 7.5%in children less than 6 months of age and between 6 and11 months of age, respectively).
Among children in their second year of life, only 46.6%had normal iron status, with the lowest percentage in theSouth (28.4%). Iron deficiency without anemia in this agegroup had a prevalence of 29.2%, with an increasing prev-alence of iron-deficiency anemia (14.9%), as comparedwith 9.3% of anemia due to other causes.
Iron nutritional status according to hemoglobin and ferritin values, by age group, in the regular regimen (RR)Figure 1Iron nutritional status according to hemoglobin and ferritin values, by age group, in the regular regimen (RR). Normal: Hemoglobin above the cut-off for anemia and ferritin > = 10 µg/L. Iron deficiency without anemia: ferritin < 10 µg/L and Hb > = cut-off for anemia, by age group. Anemia: Hb < cut-off for anemia, by age group. Iron deficiency anemia: ferritin < 10 µg/L and Hb < cut-off for anemia, by age group. Anemia due to other causes: ferritin ≥ 10 µg/L and Hb < cut-off for anemia, by age group.
< 6 months 6 to 11 months 12 to 23 months
* Iron deficiency anemia
** Anemia due to other causes
7.9**13.5**
9.3**
46.6
60.3
85.5
4.7
1.9*14.9*7.5*
18.7
29.2
0.0
20.0
40.0
60.0
80.0
100.0
No
rma
l
Iro
nde
ficie
ncy
with
ou
tane
mia
Anem
ia
No
rma
l
Anem
ia
No
rma
l
Anem
ia
Pre
vale
nce
(%)
Iro
nde
ficie
ncy
with
ou
tane
mia
Iro
nde
ficie
ncy
with
ou
tane
mia
Page 12 of 18(page number not for citation purposes)
BMC Public Health 2007, 7:345 http://www.biomedcentral.com/1471-2458/7/345
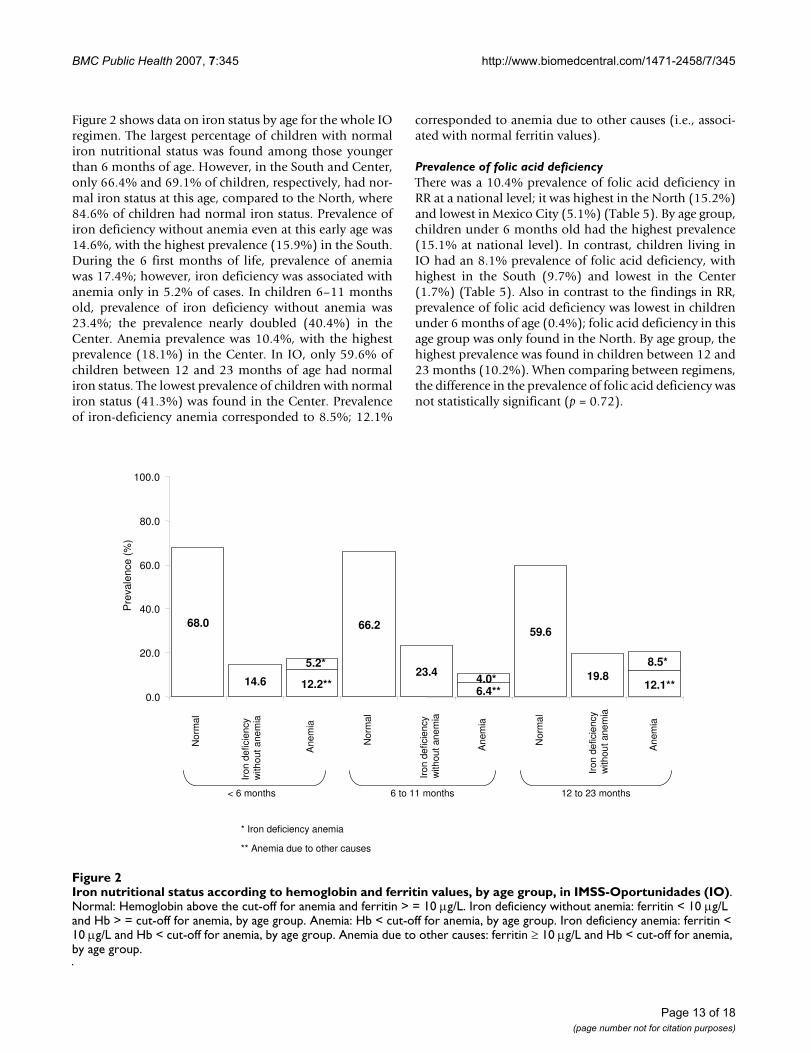
Figure 2 shows data on iron status by age for the whole IOregimen. The largest percentage of children with normaliron nutritional status was found among those youngerthan 6 months of age. However, in the South and Center,only 66.4% and 69.1% of children, respectively, had nor-mal iron status at this age, compared to the North, where84.6% of children had normal iron status. Prevalence ofiron deficiency without anemia even at this early age was14.6%, with the highest prevalence (15.9%) in the South.During the 6 first months of life, prevalence of anemiawas 17.4%; however, iron deficiency was associated withanemia only in 5.2% of cases. In children 6–11 monthsold, prevalence of iron deficiency without anemia was23.4%; the prevalence nearly doubled (40.4%) in theCenter. Anemia prevalence was 10.4%, with the highestprevalence (18.1%) in the Center. In IO, only 59.6% ofchildren between 12 and 23 months of age had normaliron status. The lowest prevalence of children with normaliron status (41.3%) was found in the Center. Prevalenceof iron-deficiency anemia corresponded to 8.5%; 12.1%
corresponded to anemia due to other causes (i.e., associ-ated with normal ferritin values).
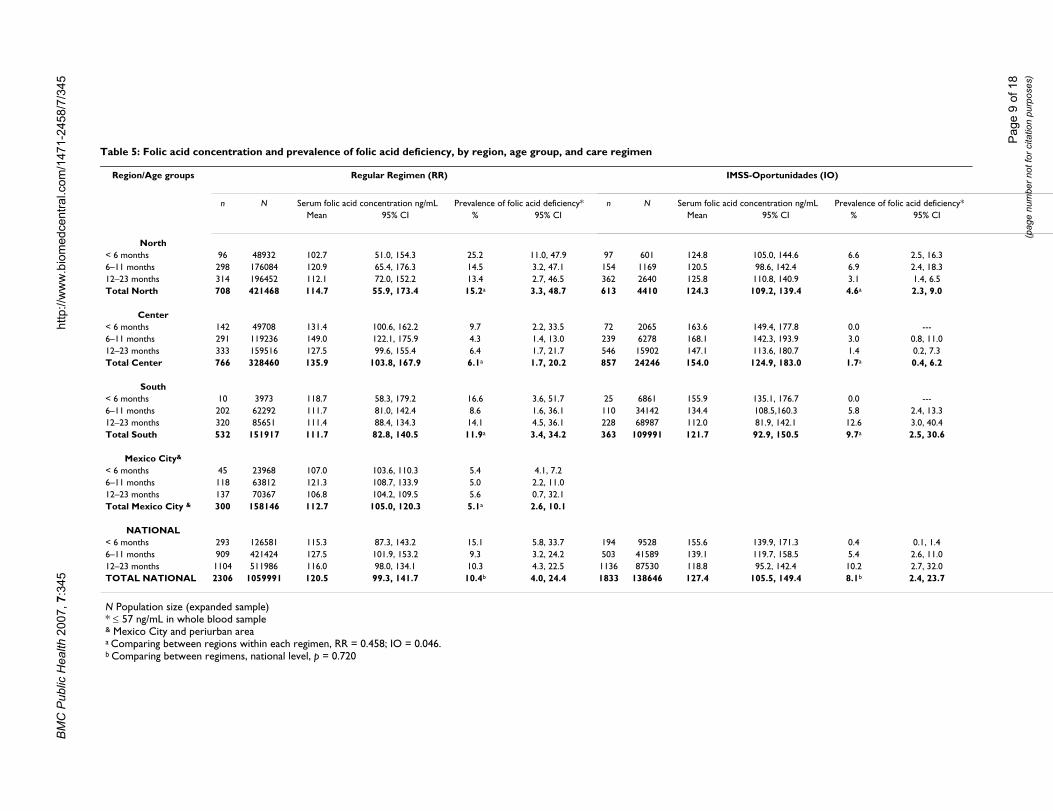
Prevalence of folic acid deficiencyThere was a 10.4% prevalence of folic acid deficiency inRR at a national level; it was highest in the North (15.2%)and lowest in Mexico City (5.1%) (Table 5). By age group,children under 6 months old had the highest prevalence(15.1% at national level). In contrast, children living inIO had an 8.1% prevalence of folic acid deficiency, withhighest in the South (9.7%) and lowest in the Center(1.7%) (Table 5). Also in contrast to the findings in RR,prevalence of folic acid deficiency was lowest in childrenunder 6 months of age (0.4%); folic acid deficiency in thisage group was only found in the North. By age group, thehighest prevalence was found in children between 12 and23 months (10.2%). When comparing between regimens,the difference in the prevalence of folic acid deficiency wasnot statistically significant (p = 0.72).
Iron nutritional status according to hemoglobin and ferritin values, by age group, in IMSS-Oportunidades (IO)Figure 2Iron nutritional status according to hemoglobin and ferritin values, by age group, in IMSS-Oportunidades (IO). Normal: Hemoglobin above the cut-off for anemia and ferritin > = 10 µg/L. Iron deficiency without anemia: ferritin < 10 µg/L and Hb > = cut-off for anemia, by age group. Anemia: Hb < cut-off for anemia, by age group. Iron deficiency anemia: ferritin < 10 µg/L and Hb < cut-off for anemia, by age group. Anemia due to other causes: ferritin ≥ 10 µg/L and Hb < cut-off for anemia, by age group.
< 6 months 6 to 11 months 12 to 23 months
* Iron deficiency anemia
** Anemia due to other causes
12.2**6.4**
12.1**
59.666.268.0
14.6
5.2* 8.5*
4.0*23.4 19.8
0.0
20.0
40.0
60.0
80.0
100.0
No
rma
l
Iro
nde
ficie
ncy
with
ou
tane
mia
Anem
ia
No
rma
l
Anem
ia
No
rma
l
Anem
ia
Pre
vale
nce
(%)
Iro
nde
ficie
ncy
with
ou
tane
mia
Iro
nde
ficie
ncy
with
ou
tane
mia
Page 13 of 18(page number not for citation purposes)
BMC Public Health 2007, 7:345 http://www.biomedcentral.com/1471-2458/7/345
Prevalence of low zinc concentrationsPrevalence of low serum zinc concentrations was 27.9%in RR and 13.4% in IO (p = 0.005). The Center had thehighest prevalence of low zinc concentration, both in RR(32.4%) and in IO (29.9%). Although there were no sta-tistically significant differences in the prevalence of lowzinc concentrations by region in RR, these were statisti-cally significantly different in IO, the highest prevalencefound in the Center (29.9%) and the lowest in the South(10.4%). (Table 6).
Multiple micronutrient deficiencies: folic acid and zinc according to iron nutritional statusPrevalence of folic acid deficiency according to iron nutri-tional status was not statistically significant differentwhen comparing RR with IO. In RR, children with normaliron status had a prevalence of folic acid deficiency of8.3%; children with iron deficiency without anemia had aprevalence of folic acid deficiency of 10.8%; and thosewith anemia had 19.3%: folic acid deficiency were foundin 18.5% of children with anemia because of iron defi-ciency, and 20.1% was found in children with anemia dueto other causes (p = 0.10). Similarly, in IO the prevalenceof folic acid deficiency was 8.8% in children with normaliron status, 8.3% in iron-deficient children without ane-mia, and 12.8% in children with anemia: 23.8% in chil-dren with anemia due to iron deficiency and 4.8% withanemia due to other causes (p = 0.21), (Table 7).
Prevalence of low zinc concentrations according to ironstatus was also not statistically significantly differentwhen comparing RR and IO. Children in RR who showednormal iron status had a 26.1% prevalence of low zincconcentrations; children with iron deficiency withoutanemia had a prevalence of 25.8%; those with anemiahad 30.2% prevalence, with 32.7% in iron-deficiency ane-mia and 27.8% in anemia due to other causes (p = 0.44).Children in IO with normal iron status had a prevalenceof low zinc concentrations in 11.4% of cases; childrenwith iron deficiency without anemia had low zinc concen-tration in 9.9%; children with anemia had 15.1%: 8.2%corresponded to children with iron-deficiency anemiaand 20.1% in those with anemia due to other causes (p =0.24) (Table 7).
In RR, 1.2% of children had iron, zinc, and folic acid defi-ciencies simultaneously; 3.0% had zinc and folic aciddeficiencies; 4.3% had iron and folic acid deficiencies;and 9.2% had zinc and iron deficiencies. In IO, 0.2% ofchildren had simultaneous iron, zinc, and folic acid defi-ciencies; 0.8% had zinc and folic acid deficiencies; 3.4%had iron and folic acid deficiencies; and 2.7% had zincand iron deficiencies.
In RR, 8.2% of children with anemia had simultaneouszinc and folic acid deficiencies; 7.0% corresponded tochildren with iron-deficiency anemia; and 9.4% corre-sponded to children with anemia due to other causes.
In IO, 0.3% of children with anemia had simultaneousfolic acid and zinc deficiencies: 0.6% of children had iron-deficiency anemia, and 0.1% had anemia from othercauses. Folic acid and zinc deficiencies were present in0.9% of children with iron deficiency without anemia andin 1.0% of children with normal iron status.
DiscussionThe evidence presented in this article is disturbing interms of public nutrition. It shows that children youngerthan 2 years old have several micronutrient deficienciesthat may stop them from attaining their full growth anddevelopment potentials. One of every five children hadanemia, and one of every three had iron deficiency. Morethan half the anemia cases were not accompanied by lowferritin levels, reflecting that they may be from causesother than iron deficiency. Low serum zinc concentrationswere found in one out of three children living in the urbanareas and in one out of ten of those living in rural areas;10% of children of RR and 8% of children in IO had folicacid deficiencies. Low serum zinc and iron deficiencyappeared together in 9% and 3% of children living inurban and rural areas, respectively.
Although we have the largest sample size published in thecountry in this age group, there are several possiblesources of bias in our sample. The sample was only repre-sentative of children who use the health care services pro-vided by the institution and who were free of acuteinfectious diseases during the two weeks before giving theblood sample. Although the decision to exclude dataabout children with acute infectious diseases ensured thatthe values of iron and zinc would not be affected by theinfectious state, it is possible that children who were illmay have had a different micronutrient status than thoseincluded in the sample, introducing a further potentialbias.
In RR, our study sample was only 64.2% of the calculatedsample size; in IO, it was 74.7%; with differences byregions. In view of the different response rates, which ledto underrepresentation of the South and Mexico Cityregions for RR and the South region for IO, there is a like-lihood of biases in some of the results presented. The dif-ferent regions in the country have noticeable contrasts insocioeconomic indicators, as the North is more developedthan the South. Likewise, the two regimens care for popu-lations with noticeable differences in economic develop-ment, favoring the urban areas over the rural/semi-rural.Other possible sources of bias emerge from the composi-
Page 14 of 18(page number not for citation purposes)
BMC Public Health 2007, 7:345 http://www.biomedcentral.com/1471-2458/7/345
tion of the subsample of children who participated in themicronutrient study. In comparison with the rest of thechildren who participated in the larger study, those whowere sampled for micronutrient status were older. Also,children in the IO subsample had lower weight for age Zscores. Therefore, it is possible that the true prevalencemight be overestimated, as older children and those withlower weight for age may also be more likely to havemicronutrient deficiencies. We also can not rule out thepossibility that some characteristics of the study samplemight have been influenced by parental acceptance of thestudy, which might have been affected by their own per-ceptions and concerns about their children's health status.It is difficult to estimate how the different sampling biasesmight have influenced the results, however, we are confi-dent that, whatever the direction of the biases, the sam-pled population reflects the population who use theprimary health care facilities of IMSS. To correctly inter-pret our results, it is necessary to consider some method-ological issues. The criterion that we used to define irondeficiency was based only on ferritin values, defining acutoff of <10 µg/L to reflect low iron stores. Other indica-tors of iron status, like the percentage of transferrin satu-ration (with a cut-off at <10%) were not useful, as it onlyclassified 0.2% and 3.3% of children in RR and IO, respec-tively, as iron deficient. This may be because transferrinsaturation has ample variation in the first year of life, sothere is no agreement on the best cut-off [16,30,31]. Inview of the low sensitivity that this indicator has to detectiron deficiency in this age group, we decided not to use it.
There is no general agreement about the preferred cut-offpoint for ferritin in this age group. We used a cut-off of <10 µg/L, but other authors suggest a different one. Someauthors have pointed out that the cut-off values for chil-dren under 5 should vary between 8 and 12 µg/L, depend-ing on the specific age group [32-36]. WHO [36]recommends using a cut-off of < 12 µg/L. We ran our anal-ysis with this WHO-recommended cut-off and found adifference in prevalence of about 4 percentage pointshigher with it. In NHANES III (1988–1994), the value ofthe 5th percentile for serum ferritin in children under 1year of age was equivalent to 11 µg/L; the correspondingvalue for children between 1 and 2 years of age was 6 µg/L. However, for the Mexican American sample included inthis study, the corresponding values were 8 and 3 µg/L,respectively [37]. Looking at healthy Honduran andSwedish children–exclusively breast-fed infants at 4 and 6months of age–Domellöf et al. found -2 SD cut-off valuescorresponding at 4 mo of age to 20 µg/L, at 6 mo of age to9 µg/L, and at 9 mo of age, to 5 µg/L [38]. Soh et al. havesummarized this controversy, stating that until the valid-ity of cut-off points of iron indices is confirmed, preva-lence estimates of iron deficiency in children youngerthan 2 must remain conjectural [39].
Anemia, on the other hand, was defined based on hemo-globin values that were adjusted for each age category inthe range of our study. The issue here is whether these cut-offs are adequate to identify anemia. The use of a singlecut-off for children under 5 years of age has been a pointfor discussion [24]. Some authors consider that 11 g/dL,as proposed by WHO for this age group, may be too highfor children less than 2 years old [16,30,34]. In fact,changes in iron metabolism found in this age, character-ized by a rapid growth spurt and exposure to differentinfectious diseases, many of which happen subclinically,may affect the biochemical response of the iron statusindicators, so there is uncertainty about the proper cut-offs that may best reflect functional outcomes [16,30].Sheriff et al. found that the 5th percentile for hemoglobinvalues for toddlers 8 months of age was 9.7 g/dL, whereasthe corresponding value for children between 12 and 18months was 10 g/dL [34]. Further, a study carried out inSweden with healthy babies born at term found that morethan 30% had hemoglobin concentrations under 11 g/dLby 6 months of age, although fewer than 3% had ferritinvalues less than 12 µg/L, so few had low iron stores [16].
In our own study, more than 50% of cases with hemo-globin under the age-specific cut-off were not associatedwith low ferritin values. It may be that, even when we usedcut-off values adjusted for age, we overestimated the prev-alence of anemia. The possibility exists that, although weleft out any child with data of acute infection and oursample population was mostly drawn from the well-babyclinic and preventive programs, a certain proportion ofcases might have had a subclinical infection that raisedferritin values; however, we do not think that this is themost likely explanation. Therefore, children who pre-sented low hemoglobin and normal ferritin values wereconsidered as having anemia from causes other than irondeficiency.
Other micronutrient deficiencies are also known to causeanemia; this is the case of folic acid deficiency, as well asothers, like vitamin A and B12, which were not assessed inour study [40]. Anemia without iron deficiency has beenreported by other authors, in some instances in as manyas over 50% of cases, a prevalence similar to the onefound in our study [25,41,42]. It should be noted that thislast figure also holds true when we analyzed our datausing a cut-off of < 12 µg/L for serum ferritin to identifyiron deficiency.
Even when most of the Mexican population is covered bythe IMSS system, this population has several differentcharacteristics. On the one hand, for RR, at least one of theparents has to have a regular salary to be an IMSS benefi-ciary. On the other hand, the populations served by IO arealso beneficiaries of other subsidy and nutrition allevia-
Page 15 of 18(page number not for citation purposes)
BMC Public Health 2007, 7:345 http://www.biomedcentral.com/1471-2458/7/345
tion government programs, such as Oportunidades [43].This and other programs are targeted at low-incomehouseholds, and include the provision of micronutrient-fortified products for pregnant/lactating women andinfants between the ages of 4 and 23 months old, as wellas for underweight children aged 2–4 and may have someinfluence in improving the micronutrient status of thesegroups [44]. Thus, it is relevant to compare our data withthose collected by the NNS conducted in 1999, in Mexicoas both studies were carried out at approximately the sametime. However, there were some methodological differ-ences: our survey used venous blood for sampling,whereas NNS used capillary samples; our study used age-adjusted hemoglobin cut-offs values to identify anemia,whereas NNS used two cut-offs: 9.5 g/dL for children 6–11 months old (compared to 10.5 g/dL used in thepresent study for this age group), and 11 g/dL for children12–23 months old (compared to 10.7 g/dL for this agegroup in our study) [13].
With these caveats in mind, we noted that children 6–11months old in RR had a prevalence of anemia of 20.9(95% CI = 17.0–25.4), higher than that found by NNS:11.3% (95% CI = 11.2–21.0). In comparison, the preva-lence found in children in IO was very similar to the onefound in the NNS rural areas of the country: 15.5%, 95%CI = 11.2–21.0 vs. 16.2%, 95% CI = 11.8–20.6, respec-tively. In our study, children between 12 and 23 monthsold had lower prevalence of anemia than the general Mex-ican population reported by NNS, both in the RR and theIO areas: 22.7%, 95% CI = 19.2–26.6 vs. 46.8%, 95% CI= 43.1–50.5 in urban areas and 21.7%, 95% CI = 17.3–27.0 vs. 52.9%, 95% CI = 48.0–57.9, for the IMSS and thegeneral population, respectively. Taking an external refer-ence as comparison, in the 2002 report of the WHO forLatin America, the prevalence of anemia in children under5 varied between 16% and 28% [45]. Although the preva-lence that we found in our study lies well within thisrange, it is known that the prevalence of anemia is higherin the first 2 years of life. Therefore, the prevalence that wefound in our population may be lower than that in otherLatin American countries and was lower than that foundin the general Mexican population.
Another interesting comparison was found when con-trasting iron deficiency between RR and IO. In both regi-mens, iron deficiency without anemia and anemia werepresent since the first 6 months of life in 15% of childrenunder RR and 32% of children under IO. Iron deficiencyat this early age has often been found to be related to acombination of the poor iron stores accumulated over thelast trimester of pregnancy and the poor quality of com-plementary foods, which may be either low in iron or insources of highly bio-available iron [18,39]. Further, itwas clear that the prevalence of iron deficiency increased
with age, a fact that calls attention to the need for earlyactions by primary health care public services.
With respect to other micronutrient deficiencies, the onlystatistical significant difference between RR and IO was ahigher prevalence of low serum zinc concentration in theformer. Although it would be expected to find higherprevalences of micronutrient deficiencies in the moreunderprivileged areas, the targeted food and nutritionalassistance that the underserved population has receivedover the past years may be reflected in an improvement intheir micronutrient status [44]. It is generally acceptedthat we do not have good indicators to assess zinc nutri-tional status, especially as related to biological responsesthat may translate functional outcomes of mild to moder-ate deficiency. Some studies have evaluated the adequacyof dietary consumption, whereas others have used plasmaor serum concentration of zinc. The WHO has estimatedthe prevalence of zinc deficiency based on dietary intake,which has a mean of 31% worldwide, ranging between 6and 73% in different populations in the under-5-year-oldgroup [45]. The most widely used indicator, however, hasbeen plasma or serum zinc concentration [7,26]. Usingthis indicator, we found a high prevalence of zinc defi-ciency, particularly in children of RR. Even when the con-sequences of zinc deficiency have been fairly welldocumented in the literature and include limitations ongrowth potential, impaired psycho-motor development,impaired immune function, and delayed bone and sexualmaturation onset [5-7,46,47], the extent of zinc deficiencyhas not been properly established worldwide, nor arethere specific public nutrition programs addressing it,aside from the recent zinc supplementation recom-mended for children with acute diarrhea [5,46,48].
Another result worth discussing is the presence of multi-ple micronutrient deficiencies. When compared to chil-dren with normal iron status, children with anemia had ahigher prevalence of folic acid deficiency. Similarly, lowplasma zinc concentrations were more prevalent in chil-dren with anemia. Although the prevalence of childrenwith three simultaneous deficiencies of the micronutri-ents studied was relatively low, the coincidence of two ofthese deficiencies singled out those of zinc and iron as themost common deficiencies in RR children, and iron andfolic acid in IO. These deficiencies will manifest them-selves as anemia–not necessarily related to iron defi-ciency. They call for more comprehensive interventions–whether food based, supplement based, or fortificationbased–than the ones usually considered by public healthprograms. Further, the early age at which these deficien-cies present themselves is a call for public health interven-tions to consider preventive approaches rather thancurative ones.
Page 16 of 18(page number not for citation purposes)
BMC Public Health 2007, 7:345 http://www.biomedcentral.com/1471-2458/7/345
ConclusionIron and zinc are the principal micronutrient deficienciesin Mexican children younger than 2 years old who use thehealth care services provided by IMSS. Anemia not associ-ated with low ferritin values was more prevalent thaniron-deficiency anemia. The fact that we found multiplemicronutrient deficiencies at this early age reveals a needto establish effective preventive public health nutritionprograms to address them.
Competing interestsThe author(s) declare that they have no competing inter-ests.
Authors' contributionsThe authors' contributions to this publication are as fol-lows: designing the study, analyzing the data, writing themanuscript, and obtaining funding for this research(MXDL, SFH, SFH, IMR, SM, HMS); supervising theproject, evaluating data, reviewing the draft, and contrib-uting comments for the final manuscript (MEM, BT, GMA,RIR, MGU). All authors read and approved the final man-uscript.
AcknowledgementsThe authors recognize the participation of Dr. José Olvera and Dr. Marcela Valverde, from IMSS-Oportunidades, who collaborated with the sample design and coordinated the field study in IO. They also appreciate the col-laboration of Dr. Salvador Villalpando, who gave advice as to the chemical determinations and laboratory techniques used in the analyses, and of chemists Guadalupe Matute, Irene Montalvo, Rosa Imelda Moreno, Catalina Ramírez, and Roberto Cervantes for their careful laboratory determina-tions. Nurse Rosa Alicia García helped organize lab samples and the data-base. Analysts Vanessa Hernández and Javier Montaño spent a great deal of time designing, receiving, and putting together the databases. The research team also wants to acknowledge fieldworkers and lab technicians at the pri-mary health care units who participated in the study. Special thanks are due to the children and parents whose participation made this study possible.
The project received funding from CONACYT, project. No. 38771-M as well as from Fondo para el Fomento de la Investigación Médica–IMSS, project numbers FP-0245 and FP-2001/257.
References1. Allen LH: The nutrition CRSP: what is marginal malnutrition,
and does it affect human function? Nutr Rev 1993,51(9):255-267.
2. Pollitt E, Saco-Pollitt C, Leibel RL, Viteri FE: Iron deficiency andbehavioral development in infants and preschool children.Am J Clin Nutr 1986, 43(4):555-565.
3. Walter T, De Andraca I, Chadud P, Perales CG: Iron deficiencyanemia: adverse effects on infant psychomotor develop-ment. Pediatrics 1989, 84(1):7-17.
4. Allen LH: Nutritional influences on linear growth: a generalreview. Eur J Clin Nutr 1994, 48(Suppl 1):S75-S89.
5. Bhutta ZA, Black RE, Brown KH, Gardner JM, Gore S, Hidayat A,Khatun F, Martorell R, Ninh NX, Penny ME, Rosado JL, Roy SK, RuelM, Sazawal S, Shankar A: Prevention of diarrhea and pneumoniaby zinc supplementation in children in developing countries:pooled analysis of randomized controlled trials. Zinc Investi-gators' Collaborative Group. J Pediatr 1999, 135(6):689-697.
6. Salgueiro MJ, Zubillaga M, Lysionek A, Cremaschi G, Goldman CG,Caro R, De Paoli T, Hager A, Weill R, J. B: Zinc status and immunesystem relationship: a review. Biol Trace Elem Res 2000,76(3):193-205.
7. Brown KH, Wuehler SE, Peerson JM: The importance of zinc inhuman nutrition and estimation of the global prevalence ofzinc deficiency. Food and Nutrition Bulletin 2001, 22(2):113-125.
8. Dutta P, Mitra U, Datta A, Niyogi SK, Dutta S, Manna B, Basak M,Mahapatra TS, Bhattacharya SK: Impact of zinc supplementationin malnourished children with acute watery diarrhoea. J TropPediatr 2000, 46(5):259-263.
9. Umeta M, West CE, Haidar J, Deurenberg P, Hautvast JG: Zinc sup-plementation and stunted infants in Ethiopia: a randomisedcontrolled trial. Lancet 2000, 355(9220):2021-2026.
10. Fishman SM, Christian P, West KP: The role of vitamins in theprevention and control of anaemia. Public Health Nutr 2000,3(2):125-150.
11. Osorio MM, Lira PI, Batista-Filho M, Ashworth A: Prevalence ofanemia in children 6-59 months old in the state of Pernam-buco, Brazil. Rev Panam Salud Publica 2001, 10(2):101-107.
12. Sharmanov A: Anaemia in Central Asia: Demographic andhealth survey experience. Food and Nutrition Bulletin 1998,19(4):307-317.
13. Villalpando S, García-Guerra A, Ramírez-Silva CI, Mejía-Rodríguez F,Matute G, Shamah-Levy T, Rivera JA: Iron, zinc and iodide statusin Mexican children under 12 years and women 12-49 yearsof age. A probabilistic national survey. Salud Publica Mex 2003,45 (Suppl 4):S520-S529.
14. Villalpando S, Montalvo-Velarde I, Zambrano N, García-Guerra A,Ramírez-Silva CI, Shamah-Levy T, Rivera JA: Vitamins A, and C andfolate status in Mexican children under 12 years and women12-49 years: a probabilistic national survey. Salud Publica Mex2003, 45(suppl 4):S508-519.
15. Villalpando S, Shamah-Levy T, Ramírez-Silva CI, Mejía-Rodríguez F, JA.R: Prevalence of anemia in children 1 to 12 years of age.Results from a nationwide probabilistic survey in Mexico.Salud Publica Mex 2003, 45(Suppl 4):S490-S498.
16. Aggett PJ, Agostoni C, Axelsson I, Bresson JL, Goulet O, Hernell O,Koletzko B, Lafeber HL, Michaelsen KF, Micheli JL, Rigo J, SzajewskaH, Weaver LT: Iron metabolism and requirements in earlychildhood: do we know enough? A commentary by theESPGHAN Committe on Nutrition. J Pediatr Gastroenterol Nutr2002, 34(4):337-345.
17. Zetterström R: Iron deficiency and iron deficiency anaemiaduring infancy and childhood. Acta Paediatr 2004, 93(4):436-439.
18. Flores-Huerta S, Martínez H: Prácticas de alimentación, estadode nutrición y cuidados a la salud en niños menores de 2 añosen México. Atendidos por el Instituto Mexicano del SeguroSocial. Mexico City ; 2004.
19. Sepúlveda A, Lezana M, Tapia C, Valdespino J, Madrigal H, Kumate J:Estado nutricional de preescolares y mujeres en México:resultados de una encuesta probabilística nacional. Gac MedMex 1990, 126(3):207-224.
20. Rivera-Dommarco J, Shamah-Levy T, Villalpando-Hernández S,González-de Cossío T, Hernández-Prado B, Sepúlveda J: EncuestaNacional de Nutrición 1999. Estado nutricio de niños ymujeres en México . In Encuestas de Salud Cuernavaca, Morelos ,Instituto Nacional de Salud Pública; 2001.
21. O´Broin SD, Gunther EW: Screening of folate status with use ofdried blood spots on filter paper. Am J Clin Nutr 1999,70(3):359-367.
22. Ruiz-Argüelles GJ, Llorente-Peters A: Predictive equations fornormal red cell values at altitudes from sea level to 2,670meters. Rev Invest Clin 1981, 33(2):191-193.
23. Brugnara C: References values in Infancy and Childhood. InHematology of Infancy and Childhood Volume 1. 5th edition. Edited by:Oski FA, Brugnara C, Nathan D. Philadelphia , W.B. Saunders Com-pany; 1993:i-xxviii.
24. World Health Organization: Report of WHO/UNICEF/UNUConsultation on indicators and strategies for iron deficiencyand anemia programmes. In WHO/UNICEF/UNU CONSULTATIONGeneva , WHO; 1994.
25. Male C, Persson LA, Freeman V, Guerra A, van´t Hof MA, Haschke F,Euro-Growth Iron Study Group: Prevalence of iron deficiency in12-mo-old infants from 11 European areas and influence of
Page 17 of 18(page number not for citation purposes)
BMC Public Health 2007, 7:345 http://www.biomedcentral.com/1471-2458/7/345
Publish with BioMed Central and every scientist can read your work free of charge
"BioMed Central will be the most significant development for disseminating the results of biomedical research in our lifetime."
Sir Paul Nurse, Cancer Research UK
Your research papers will be:
available free of charge to the entire biomedical community
peer reviewed and published immediately upon acceptance
cited in PubMed and archived on PubMed Central
yours — you keep the copyright
Submit your manuscript here:http://www.biomedcentral.com/info/publishing_adv.asp
BioMedcentral
dietary factors on iron status (Euro-Growth study). Acta Pae-diatr 2001, 90(5):492-498.
26. Hotz C, Peerson JM, Brown KH: Suggested lower cutoffs ofserum zinc concentrations for assessing zinc status: reanaly-sis of the second National Health and Nutrition ExaminationSurvey data (1976-1980). Am J Clin Nutr 2003, 78(4):756-764.
27. Shackman G: Sample size and design effect. 2001 [http://faculty.smu.edu/slstokes/stat6380/deff%20doc.pdf]. Presented at AlbanyChapter of American Statistical Association, March 2001. Accessed16 August 2007.
28. Sturgis P: Analysing Complex Survey Data: Clustering, Strat-ification and Weights. Social Research UPDATE 2004:2-5.
29. Stata Corporation 4905 Lakeway Drive: STATA-PC. In College Sta-tion Special Edition. 8.2 Texas 77845 USA; 2005.
30. Hernell O, Lönnerdal B: Is iron deficiency in infants and youngchildren common in Scandinavia and is there a need forenforced primary prevention? Acta Paediatr 2004,93(8):1024-1026.
31. Saarinen UM, Siimes MA: Developmental changes in serum iron,total iron-binding capacity, and transferrin saturation ininfancy. J Pediatr 1977, 91(6):875-877.
32. Demaeyer EM, Dallman P, Gurney JM, Hallberg GL, Sood SK, SrikantiaSG: Preventing and Controlling Iron Deficiency Anemiathrough Primary Health Care: A Guide for Health Adminis-trators and Programme Managers. World Health Organiza-tion; 1989:8-9.
33. Emond AM, Hawkins N, Pennock C, Golding J: Haemoglobin andferritin concentrations in infants at 8 months of age. Arch DisChild 1996, 74(1):36-39.
34. Sherriff A, Emond A, Hawkins N, Golding J: Haemoglobin and fer-ritin concentrations in children aged 12 and 18 months.ALSPAC Children in Focus Study Team. Arch Dis Child 1999,80(2):153-157.
35. Soh P, Ferguson EL, McKenzie JE, Skeaff S, Parnell W, Gibson RS: Die-tary intakes of 6-24-month-old urban South Island New Zea-land children in relation to biochemical iron status. PublicHealth Nutr 2002, 5(2):339-346.
36. UNICEF/UNU/WHO Consultation: Iron deficiency anaemia:Assessment, prevention and control. A guide for pro-gramme managers. World Health Organization; 2001:38.
37. Hollowell JG, van Assendelft OW, Gunter EW, Lewis BG, Najjar M,Pfeiffer C, Centers for Disease Control and Prevention, NationalCenter for Health Statistics: Hematological and iron-relatedanalytes. Reference data for persons aged 1 year and over:United States, 1988-94. In Vital Health Stat 11 Hyattsville, Mary-land , National Center for Health Statistics; 2005:136.
38. Domellöf M, Dewey KG, Lönnerdal B, Cohen RJ, Hernell O: Thediagnostic criteria for iron deficiency in infants should bereevaluated. J Nutr 2002, 132(12):3680-3686.
39. Soh P, Ferguson EL, McKenzie JE, Homs MY, Gibson RS: Iron defi-ciency and risk factors for lower iron stores in 6-24-month-old New Zealanders. Eur J Clin Nutr 2004, 58(1):71-79.
40. Allen LH, Rosado JL, Casterline JE, Martinez H, Lopez P, Muñoz E,Black AK: Vitamin B-12 deficiency and malabsorption arehighly prevalent in rural Mexican communities. Am J Clin Nutr1995, 62(5):1013-1019.
41. Stoltzfus RJ: Defining iron-deficiency anemia in public healthterms: a time for reflection. J Nutr 2001, 131(2S-2):565S-567S.
42. Stoltzfus RJ: Iron-deficiency anemia: reexaminig the natureand magnitude of the public health problem. Summary:implications for research and programs. J Nutr 2001, 131(2S-2):697S-701S.
43. Secretaría de desarrollo Social: Más oportunidades para lasfamilias pobres: Evaluación de resultados del Programa deEducación, Salud y Alimentación. Primeros avances,1999.Mexico City ; 1999:397.
44. Rivera JA, Sotres-Alvarez D, Habicht JP, Shamah T, Villalpando S:Impact of the Mexican program for education, health, andnutrition (Progresa) on rates of growth and anemia in infantsand young children: a randomized effectiveness study. JAMA2004, 291(21):2563-2570.
45. World Health Organization: The world health report 2002.Reducing Risks, Promoting Healthy Life. In The world healthreport World Health Organization; 2002.
46. Sandström B: Diagnosis of zinc deficiency and excess in individ-uals and populations. Food and Nutrition Bulletin 2001,22(2):133-136.
47. Scott ME, Koski KG: Zinc deficiency impairs immune responsesagainst parasitic nematode infections at intestinal and sys-temic sites. J Nutr 2000, 130(5S Suppl):1412S-1420S.
48. Penny ME, Marin RM, Duran A, Peerson JM, Lanata CF, Lönnerdal B,Black RE, Brown KH: Randomized controlled trial of the effectof daily supplementation with zinc or multiple micronutri-ents on the morbidity, growth, and micronutrient status ofyoung Peruvian children. Am J Clin Nutr 2004, 79(3):457-465.
Pre-publication historyThe pre-publication history for this paper can be accessedhere:
http://www.biomedcentral.com/1471-2458/7/345/prepub
Page 18 of 18(page number not for citation purposes)
Copyright © 2022 FDOKUMEN