Preservation Phoenix Style Report_Draft for Council (4).pdf
74
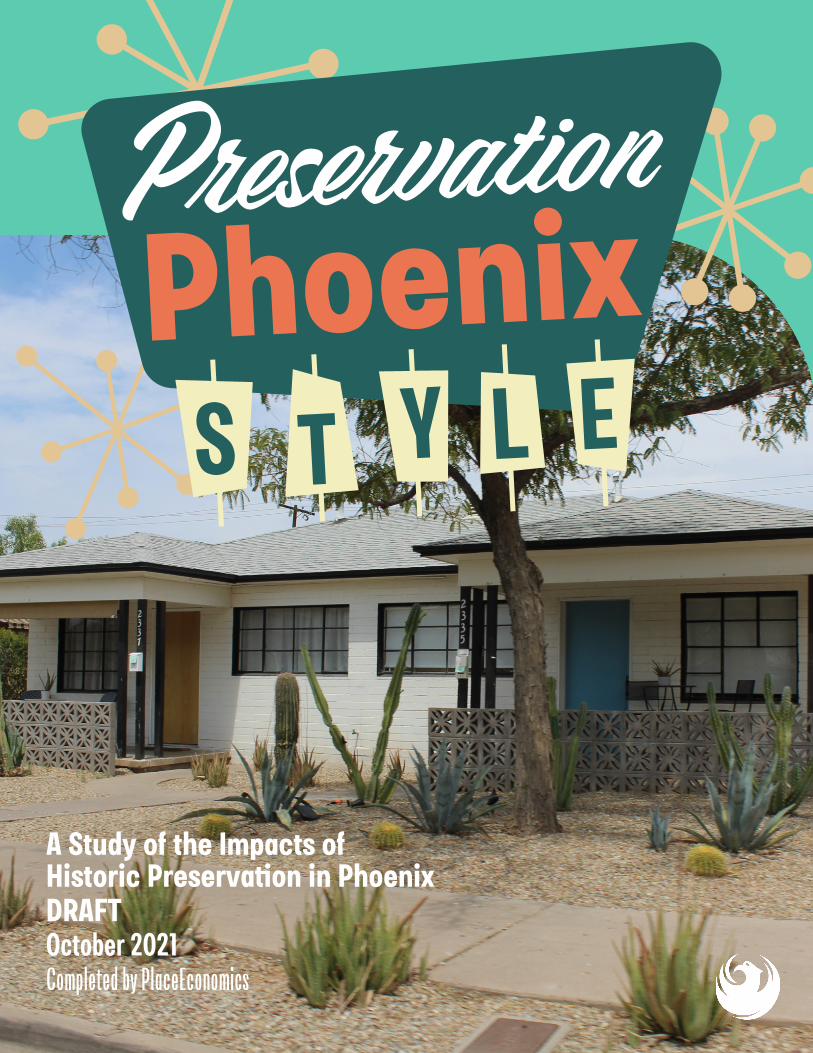
h h October 2021 A Study of the Impacts of Historic Preservaon in Phoenix DRAFT g 6 abcde S T Y L E Phoenix Preservation Preservation Completed by PlaceEconomics
-
Upload
khangminh22 -
Category
Documents
-
view
4 -
download
0
Transcript of Preservation Phoenix Style Report_Draft for Council (4).pdf
hhOctober 2021
A Study of the Impacts of Historic Preservation in Phoenix DRAFT
g6abcdeS T Y L EPhoenixPreservationPreservation
Completed by PlaceEconomics

CONTENTSTable of
Key Findings1
Letter from Mayor Kate GallegoiiiLetter from Historic Preservation Commission Chair Dan Klocke
iv
Introduction2Preservation in Phoenix 4 Timeline of Preservation in PhoenixPreservation Tools in PhoenixLand Area of Historic Districts
Connectivity10 Walkability, Bikeability, and TransitProximityParksCultural InstitutionsSense of Cohesion
Sustainability16 Tree Cover Density
Diversity20 RaceEthnicityIncomeTenureDiversity of Housing Types
Prosperity30 Property ValuesForeclosuresHeritage Commercial DistrictsCatalytic Impact of Construction Activity
Older Housing and Affordability50Age of UnitsDemographic CharacteristicsHousing CostsCost Burdened HouseholdsDemolition of Older Housing
Conclusion63 AcknowledgementsAbout PlaceEconomics
Preservation Phoenix Style | i
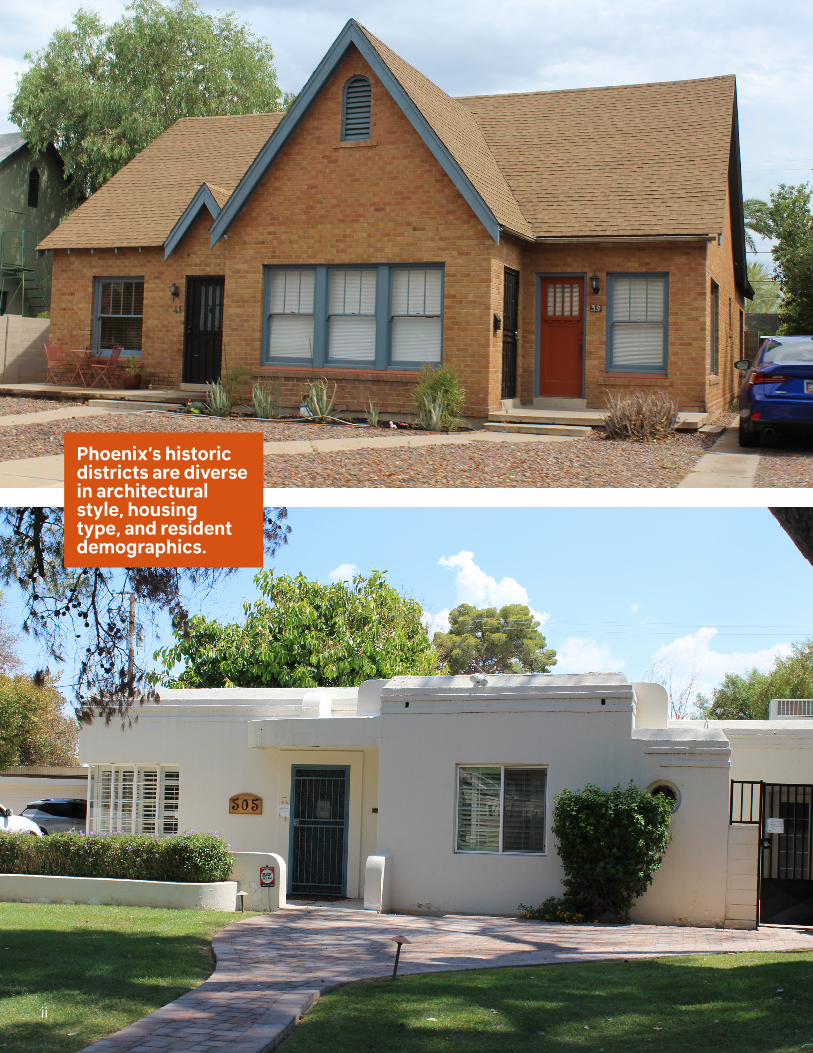
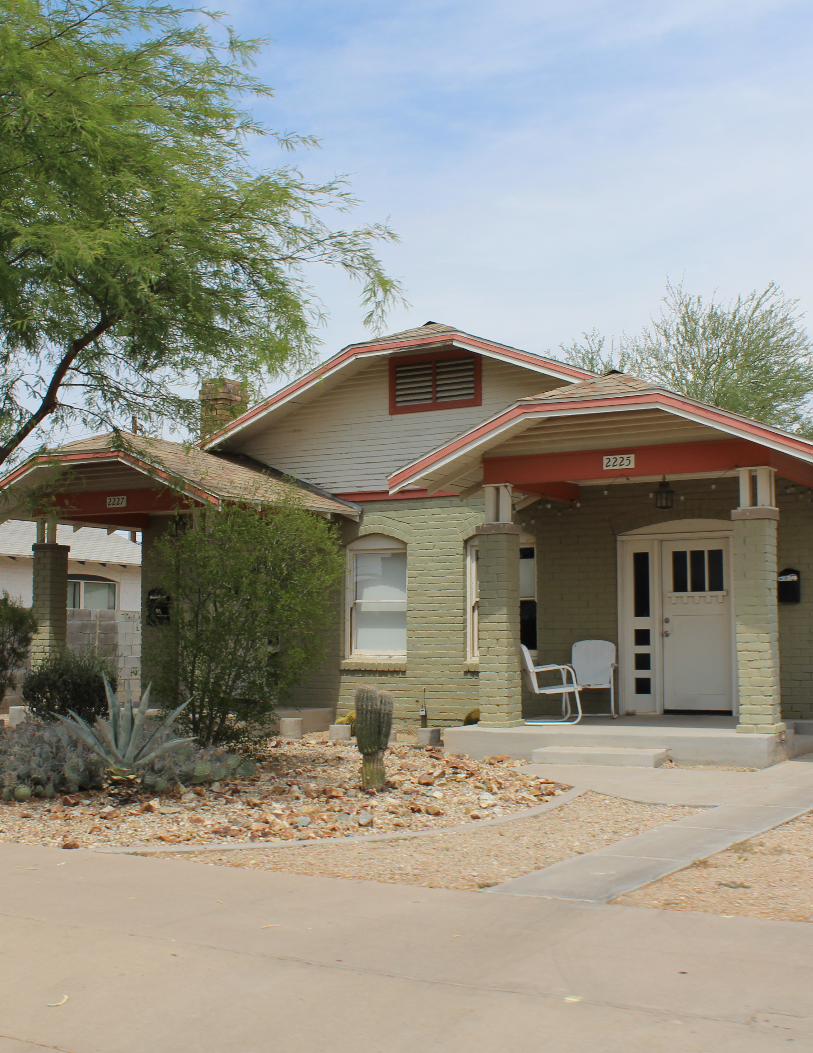
Phoenix’s historic districts are diverse in architectural style, housing type, and resident demographics.
ii
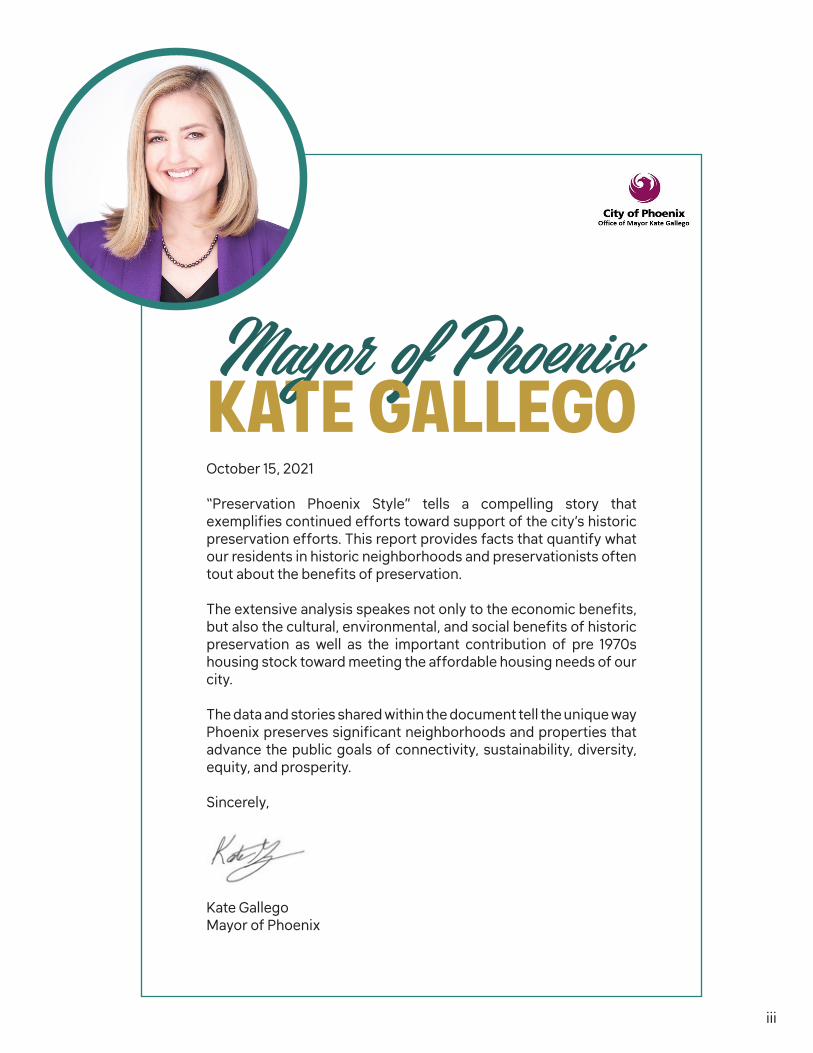
October 15, 2021
“Preservation Phoenix Style” tells a compelling story that exemplifies continued efforts toward support of the city’s historic preservation efforts. This report provides facts that quantify what our residents in historic neighborhoods and preservationists often tout about the benefits of preservation.
The extensive analysis speakes not only to the economic benefits, but also the cultural, environmental, and social benefits of historic preservation as well as the important contribution of pre 1970s housing stock toward meeting the affordable housing needs of our city.
The data and stories shared within the document tell the unique way Phoenix preserves significant neighborhoods and properties that advance the public goals of connectivity, sustainability, diversity, equity, and prosperity.
Sincerely,
Kate GallegoMayor of Phoenix
KATE GALLEGOMayor of Phoenix
iii
DAN KLOCKEHistoric Commission Chair
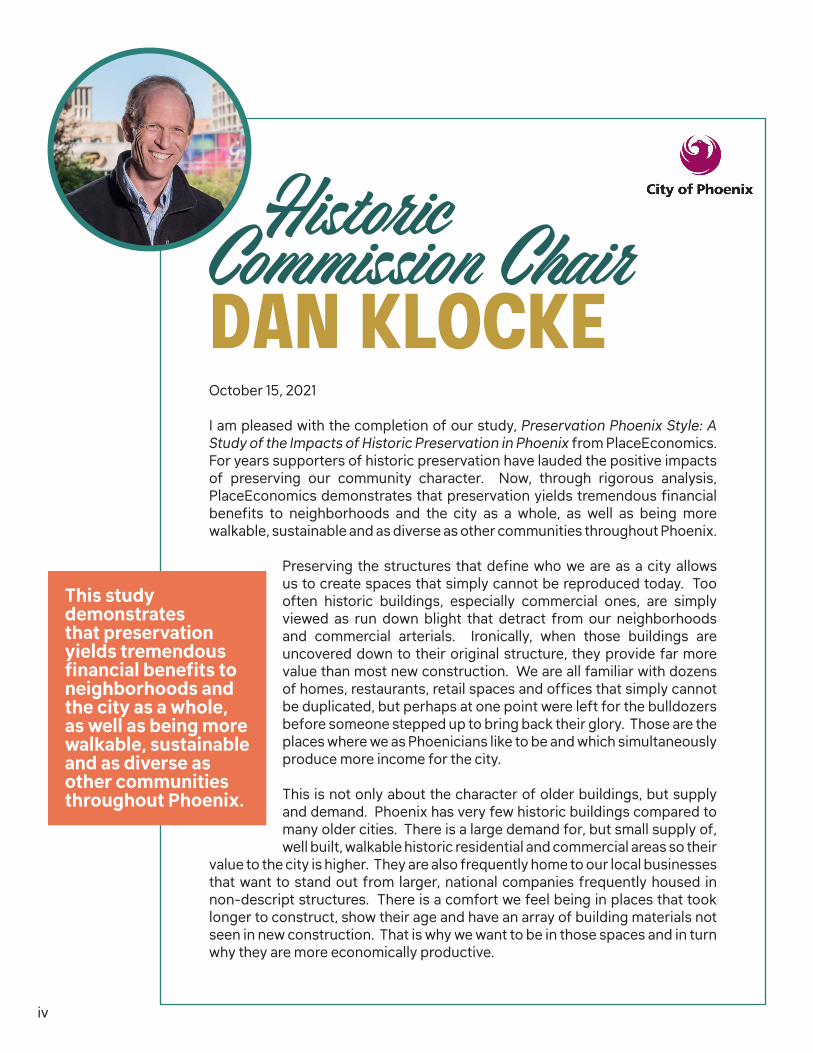
October 15, 2021
I am pleased with the completion of our study, Preservation Phoenix Style: A Study of the Impacts of Historic Preservation in Phoenix from PlaceEconomics. For years supporters of historic preservation have lauded the positive impacts of preserving our community character. Now, through rigorous analysis, PlaceEconomics demonstrates that preservation yields tremendous financial benefits to neighborhoods and the city as a whole, as well as being more walkable, sustainable and as diverse as other communities throughout Phoenix.
Preserving the structures that define who we are as a city allows us to create spaces that simply cannot be reproduced today. Too often historic buildings, especially commercial ones, are simply viewed as run down blight that detract from our neighborhoods and commercial arterials. Ironically, when those buildings are uncovered down to their original structure, they provide far more value than most new construction. We are all familiar with dozens of homes, restaurants, retail spaces and offices that simply cannot be duplicated, but perhaps at one point were left for the bulldozers before someone stepped up to bring back their glory. Those are the places where we as Phoenicians like to be and which simultaneously produce more income for the city.
This is not only about the character of older buildings, but supply and demand. Phoenix has very few historic buildings compared to many older cities. There is a large demand for, but small supply of, well built, walkable historic residential and commercial areas so their
value to the city is higher. They are also frequently home to our local businesses that want to stand out from larger, national companies frequently housed in non-descript structures. There is a comfort we feel being in places that took longer to construct, show their age and have an array of building materials not seen in new construction. That is why we want to be in those spaces and in turn why they are more economically productive.
This study demonstrates that preservation yields tremendous financial benefits to neighborhoods and the city as a whole, as well as being more walkable, sustainable and as diverse as other communities throughout Phoenix.
iv
From a sustainability perspective, historic places were often built before Phoenix became a car dominant city, meaning they are usually not set in the middle of a large parking lot. Therefore, they are frequently less hot and produce more revenue per square foot for the owner and the city as more area is dedicated to building not parking which generates little value and a lot of heat.
It is true historic homes and communities can be more expensive. However, it is in these neighborhoods where accessory dwelling units provide affordable options that cannot be found in newer subdivisions in which all of the homes are similar sized and prohibit opportunities for smaller backyard units. Historic neighborhoods are places where residents of all income levels can live together.
The team at PlaceEconomics has now shown with hard data why we need to preserve and invest in the buildings and places that make Phoenix special. Historic preservation is not simply about nostalgia. It is about financial strength, sustainability and stronger welcoming neighborhoods.
A special thanks to the Historic Preservation staff who worked diligently with PlaceEconomics to help this report come to fruition. I would ask as we continue to have situations where it appears there are only two alternatives, to demolish or not, that we use this report and our own creativity and resources to find ways to preserve the old and build new together, in order to celebrate our history and grow an economically stronger, more sustainable and welcoming Phoenix. Thank you for your support of this report and historic preservation.
Sincerely,
Dan KlockeChair, Historic Preservation Commission
Historic preservation is not simply about nostalgia. It is about financial strength, sustainability and stronger welcoming neighborhoods.
v
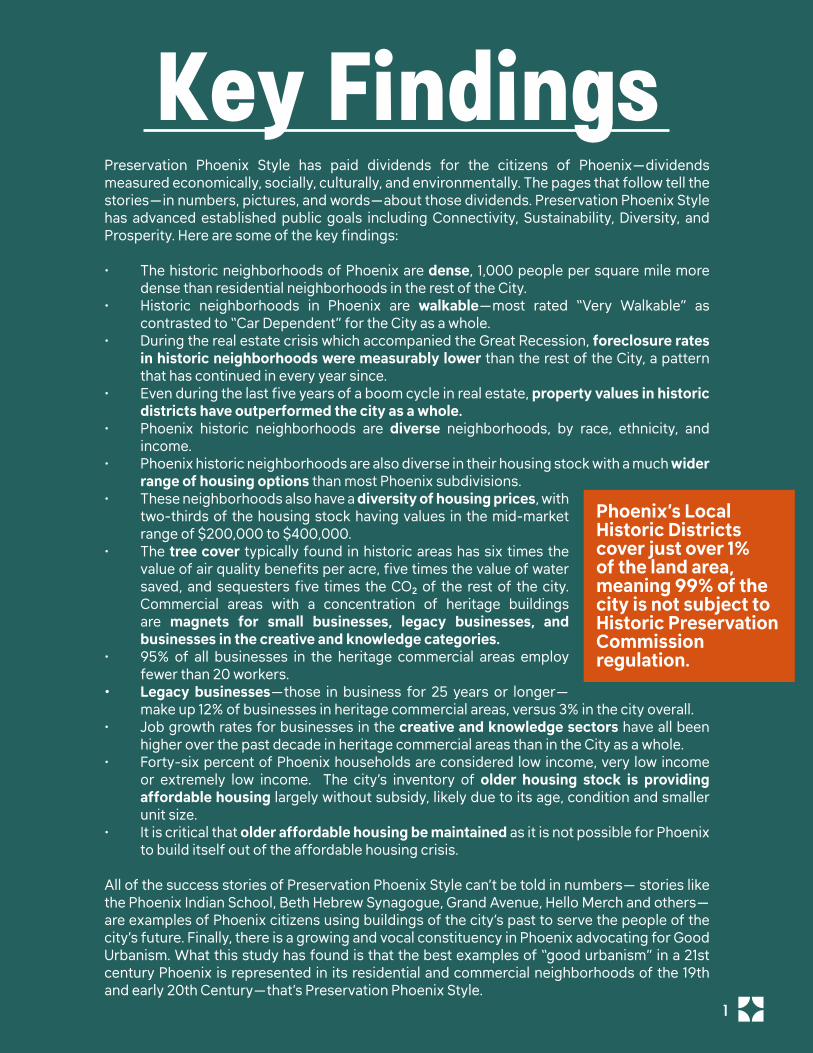
Key FindingsPreservation Phoenix Style has paid dividends for the citizens of Phoenix—dividends measured economically, socially, culturally, and environmentally. The pages that follow tell the stories—in numbers, pictures, and words—about those dividends. Preservation Phoenix Style has advanced established public goals including Connectivity, Sustainability, Diversity, and Prosperity. Here are some of the key findings:
• The historic neighborhoods of Phoenix are dense, 1,000 people per square mile more dense than residential neighborhoods in the rest of the City.
• Historic neighborhoods in Phoenix are walkable—most rated “Very Walkable” as contrasted to “Car Dependent” for the City as a whole.
• During the real estate crisis which accompanied the Great Recession, foreclosure rates in historic neighborhoods were measurably lower than the rest of the City, a pattern that has continued in every year since.
• Even during the last five years of a boom cycle in real estate, property values in historic districts have outperformed the city as a whole.
• Phoenix historic neighborhoods are diverse neighborhoods, by race, ethnicity, and income.
• Phoenix historic neighborhoods are also diverse in their housing stock with a much wider range of housing options than most Phoenix subdivisions.
• These neighborhoods also have a diversity of housing prices, with two-thirds of the housing stock having values in the mid-market range of $200,000 to $400,000.
• The tree cover typically found in historic areas has six times the value of air quality benefits per acre, five times the value of water saved, and sequesters five times the CO2 of the rest of the city.Commercial areas with a concentration of heritage buildings are magnets for small businesses, legacy businesses, and businesses in the creative and knowledge categories.
• 95% of all businesses in the heritage commercial areas employ fewer than 20 workers.
• Legacy businesses—those in business for 25 years or longer—make up 12% of businesses in heritage commercial areas, versus 3% in the city overall.
• Job growth rates for businesses in the creative and knowledge sectors have all been higher over the past decade in heritage commercial areas than in the City as a whole.
• Forty-six percent of Phoenix households are considered low income, very low income or extremely low income. The city’s inventory of older housing stock is providing affordable housing largely without subsidy, likely due to its age, condition and smaller unit size.
• It is critical that older affordable housing be maintained as it is not possible for Phoenix to build itself out of the affordable housing crisis.
All of the success stories of Preservation Phoenix Style can’t be told in numbers— stories like the Phoenix Indian School, Beth Hebrew Synagogue, Grand Avenue, Hello Merch and others—are examples of Phoenix citizens using buildings of the city’s past to serve the people of the city’s future. Finally, there is a growing and vocal constituency in Phoenix advocating for Good Urbanism. What this study has found is that the best examples of “good urbanism” in a 21st century Phoenix is represented in its residential and commercial neighborhoods of the 19th and early 20th Century—that’s Preservation Phoenix Style.
Phoenix’s Local Historic Districts cover just over 1% of the land area, meaning 99% of the city is not subject to Historic Preservation Commission regulation.
1 Y
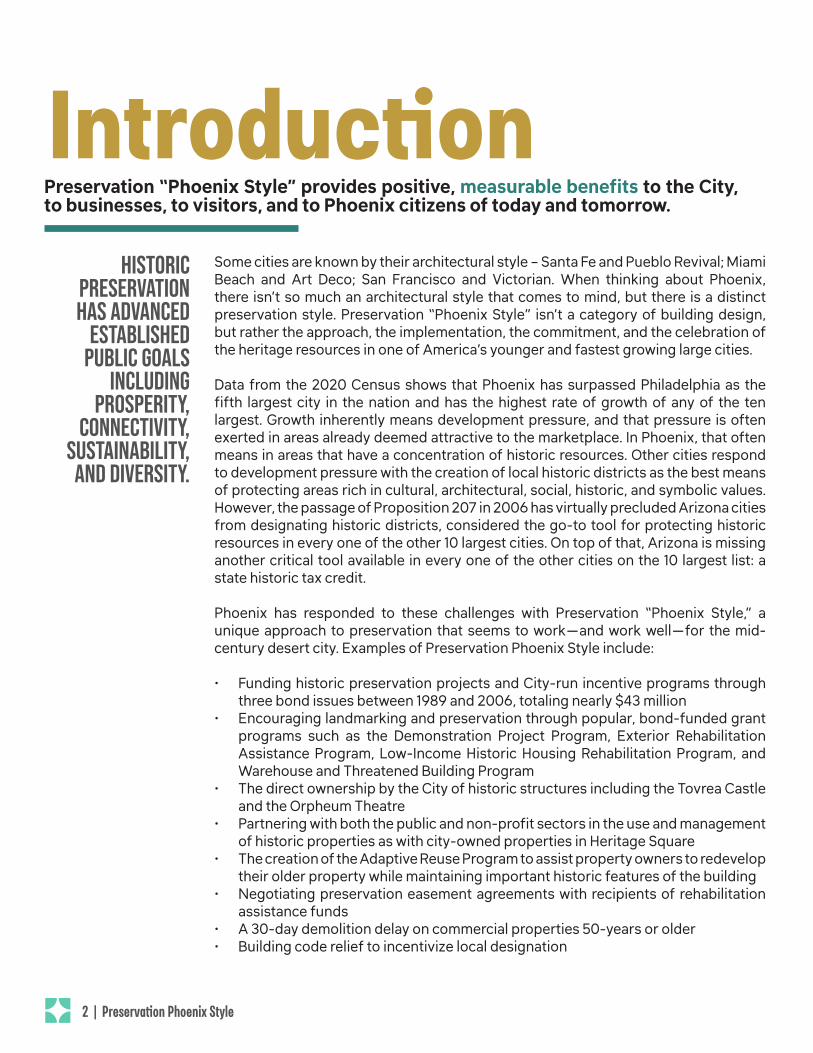
Some cities are known by their architectural style – Santa Fe and Pueblo Revival; Miami Beach and Art Deco; San Francisco and Victorian. When thinking about Phoenix, there isn’t so much an architectural style that comes to mind, but there is a distinct preservation style. Preservation “Phoenix Style” isn’t a category of building design, but rather the approach, the implementation, the commitment, and the celebration of the heritage resources in one of America’s younger and fastest growing large cities.
Data from the 2020 Census shows that Phoenix has surpassed Philadelphia as the fifth largest city in the nation and has the highest rate of growth of any of the ten largest. Growth inherently means development pressure, and that pressure is often exerted in areas already deemed attractive to the marketplace. In Phoenix, that often means in areas that have a concentration of historic resources. Other cities respond to development pressure with the creation of local historic districts as the best means of protecting areas rich in cultural, architectural, social, historic, and symbolic values. However, the passage of Proposition 207 in 2006 has virtually precluded Arizona cities from designating historic districts, considered the go-to tool for protecting historic resources in every one of the other 10 largest cities. On top of that, Arizona is missing another critical tool available in every one of the other cities on the 10 largest list: a state historic tax credit.
Phoenix has responded to these challenges with Preservation “Phoenix Style,” a unique approach to preservation that seems to work—and work well—for the mid-century desert city. Examples of Preservation Phoenix Style include:
• Funding historic preservation projects and City-run incentive programs through three bond issues between 1989 and 2006, totaling nearly $43 million
• Encouraging landmarking and preservation through popular, bond-funded grant programs such as the Demonstration Project Program, Exterior Rehabilitation Assistance Program, Low-Income Historic Housing Rehabilitation Program, and Warehouse and Threatened Building Program
• The direct ownership by the City of historic structures including the Tovrea Castle and the Orpheum Theatre
• Partnering with both the public and non-profit sectors in the use and management of historic properties as with city-owned properties in Heritage Square
• The creation of the Adaptive Reuse Program to assist property owners to redevelop their older property while maintaining important historic features of the building
• Negotiating preservation easement agreements with recipients of rehabilitation assistance funds
• A 30-day demolition delay on commercial properties 50-years or older• Building code relief to incentivize local designation
Preservation “Phoenix Style” provides positive, measurable benefits to the City, to businesses, to visitors, and to Phoenix citizens of today and tomorrow.
historic preservation has advanced
established public goals
including Prosperity,
Connectivity, Sustainability, and Diversity.
Introduction
2 | Preservation Phoenix StyleY
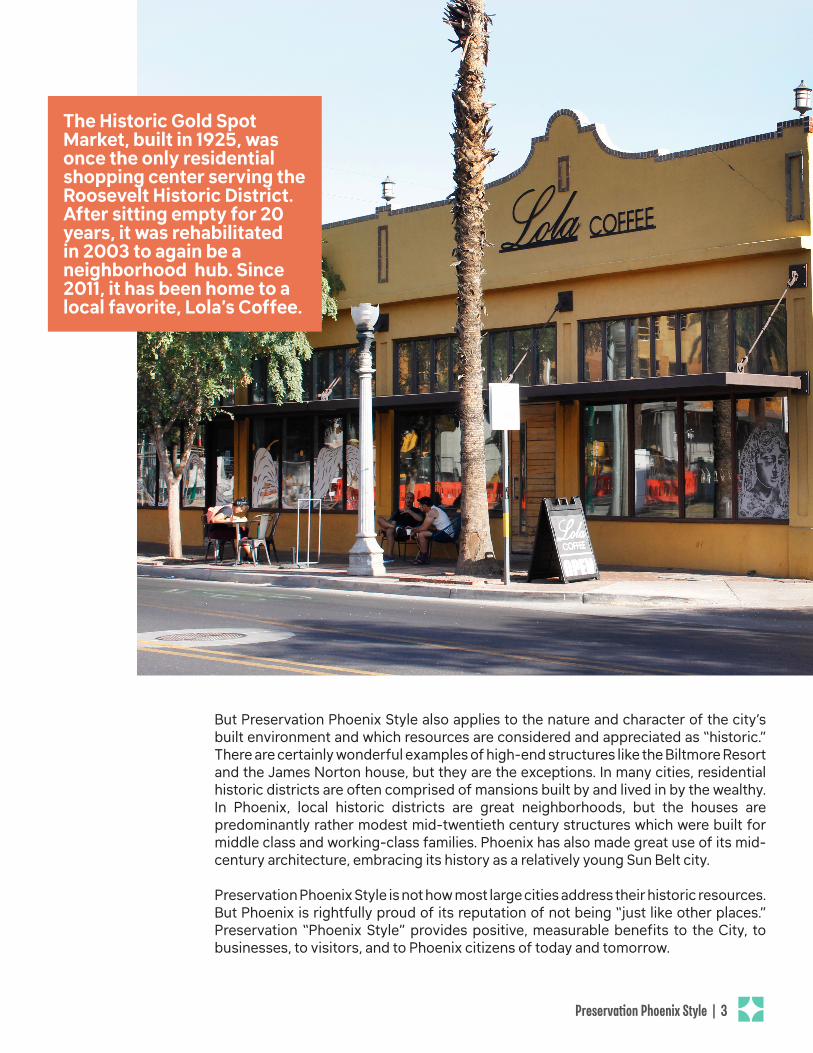
But Preservation Phoenix Style also applies to the nature and character of the city’s built environment and which resources are considered and appreciated as “historic.” There are certainly wonderful examples of high-end structures like the Biltmore Resort and the James Norton house, but they are the exceptions. In many cities, residential historic districts are often comprised of mansions built by and lived in by the wealthy. In Phoenix, local historic districts are great neighborhoods, but the houses are predominantly rather modest mid-twentieth century structures which were built for middle class and working-class families. Phoenix has also made great use of its mid-century architecture, embracing its history as a relatively young Sun Belt city.
Preservation Phoenix Style is not how most large cities address their historic resources. But Phoenix is rightfully proud of its reputation of not being “just like other places.” Preservation “Phoenix Style” provides positive, measurable benefits to the City, to businesses, to visitors, and to Phoenix citizens of today and tomorrow.
The Historic Gold Spot Market, built in 1925, was once the only residential shopping center serving the Roosevelt Historic District. After sitting empty for 20 years, it was rehabilitated in 2003 to again be a neighborhood hub. Since 2011, it has been home to a local favorite, Lola’s Coffee.
Preservation Phoenix Style | 3 Y
Preservation in Phoenix
Timeline of Preservation in Phoenix
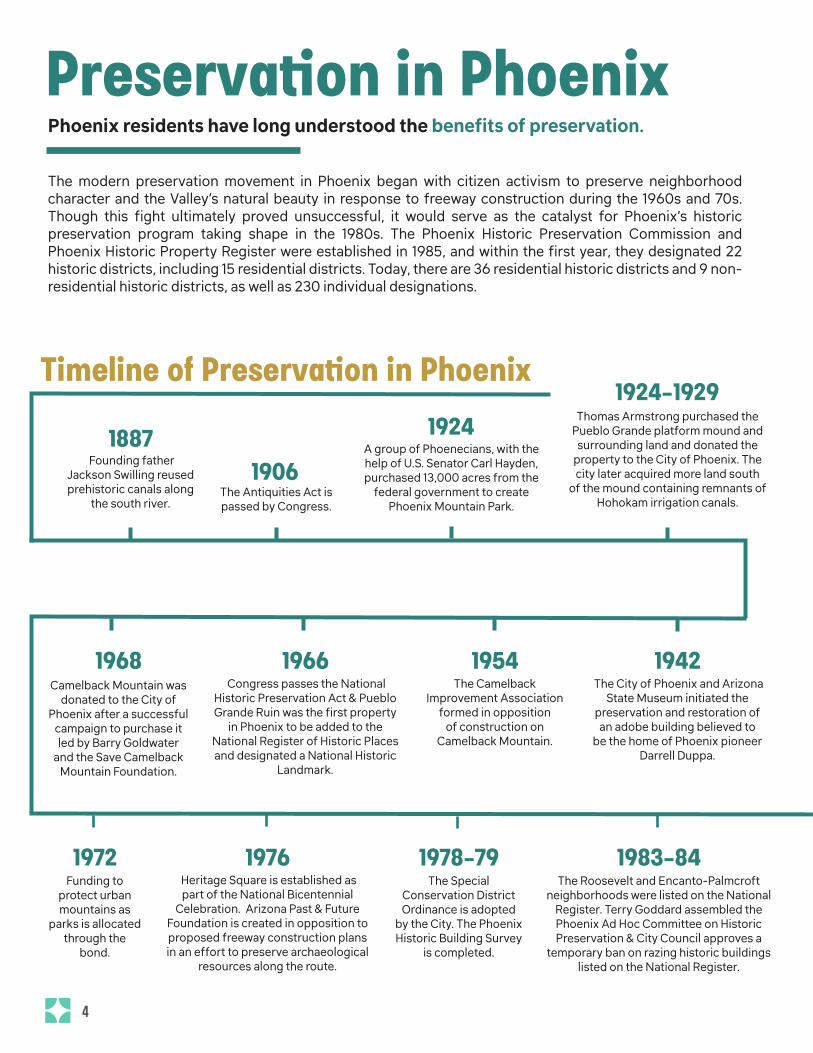
The modern preservation movement in Phoenix began with citizen activism to preserve neighborhood character and the Valley’s natural beauty in response to freeway construction during the 1960s and 70s. Though this fight ultimately proved unsuccessful, it would serve as the catalyst for Phoenix’s historic preservation program taking shape in the 1980s. The Phoenix Historic Preservation Commission and Phoenix Historic Property Register were established in 1985, and within the first year, they designated 22 historic districts, including 15 residential districts. Today, there are 36 residential historic districts and 9 non-residential historic districts, as well as 230 individual designations.
1887 Founding father
Jackson Swilling reused prehistoric canals along
the south river.
1906The Antiquities Act is passed by Congress.
1924A group of Phoenecians, with the help of U.S. Senator Carl Hayden, purchased 13,000 acres from the
federal government to create Phoenix Mountain Park.
1924-1929Thomas Armstrong purchased the
Pueblo Grande platform mound and surrounding land and donated the
property to the City of Phoenix. The city later acquired more land south
of the mound containing remnants of Hohokam irrigation canals.
1942 The City of Phoenix and Arizona
State Museum initiated the preservation and restoration of an adobe building believed to
be the home of Phoenix pioneer Darrell Duppa.
1954The Camelback
Improvement Association formed in opposition
of construction on Camelback Mountain.
1966 Congress passes the National
Historic Preservation Act & Pueblo Grande Ruin was the first property
in Phoenix to be added to the National Register of Historic Places and designated a National Historic
Landmark.
1968Camelback Mountain was
donated to the City of Phoenix after a successful
campaign to purchase it led by Barry Goldwater
and the Save Camelback Mountain Foundation.
1972Funding to
protect urban mountains as
parks is allocated through the
bond.
Phoenix residents have long understood the benefits of preservation.
1976 Heritage Square is established as part of the National Bicentennial
Celebration. Arizona Past & Future Foundation is created in opposition to proposed freeway construction plans in an effort to preserve archaeological
resources along the route.
1978-79The Special
Conservation District Ordinance is adopted
by the City. The Phoenix Historic Building Survey
is completed.
1983-84The Roosevelt and Encanto-Palmcroft
neighborhoods were listed on the National Register. Terry Goddard assembled the Phoenix Ad Hoc Committee on Historic Preservation & City Council approves a
temporary ban on razing historic buildings listed on the National Register.
4 Y
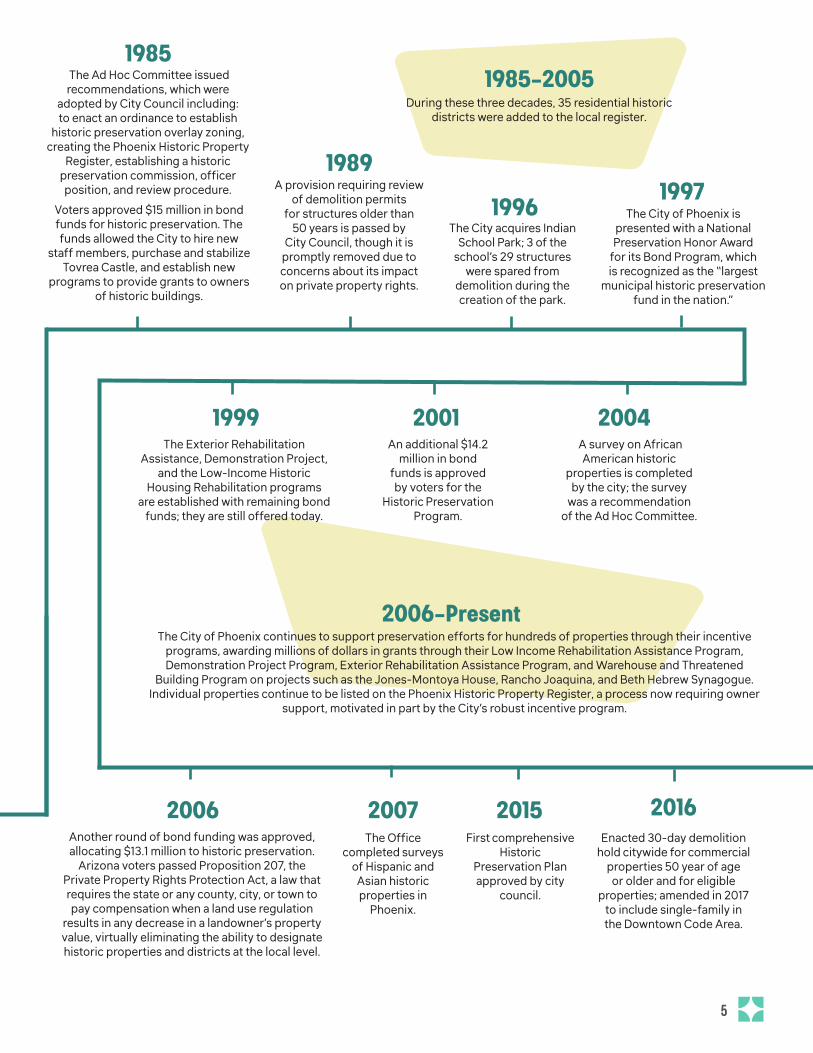
661985-2005
During these three decades, 35 residential historic districts were added to the local register.
2015First comprehensive
Historic Preservation Plan approved by city
council.
2006-PresentThe City of Phoenix continues to support preservation efforts for hundreds of properties through their incentive
programs, awarding millions of dollars in grants through their Low Income Rehabilitation Assistance Program, Demonstration Project Program, Exterior Rehabilitation Assistance Program, and Warehouse and Threatened
Building Program on projects such as the Jones-Montoya House, Rancho Joaquina, and Beth Hebrew Synagogue. Individual properties continue to be listed on the Phoenix Historic Property Register, a process now requiring owner
support, motivated in part by the City’s robust incentive program.
1985 The Ad Hoc Committee issued recommendations, which were
adopted by City Council including: to enact an ordinance to establish
historic preservation overlay zoning, creating the Phoenix Historic Property
Register, establishing a historic preservation commission, officer position, and review procedure.
Voters approved $15 million in bond funds for historic preservation. The funds allowed the City to hire new
staff members, purchase and stabilize Tovrea Castle, and establish new
programs to provide grants to owners of historic buildings.
A provision requiring review of demolition permits
for structures older than 50 years is passed by
City Council, though it is promptly removed due to concerns about its impact on private property rights.
1989
1996The City acquires Indian
School Park; 3 of the school’s 29 structures
were spared from demolition during the creation of the park.
1997The City of Phoenix is
presented with a National Preservation Honor Award
for its Bond Program, which is recognized as the “largest
municipal historic preservation fund in the nation.”
1999The Exterior Rehabilitation
Assistance, Demonstration Project, and the Low-Income Historic
Housing Rehabilitation programs are established with remaining bond
funds; they are still offered today.
2001An additional $14.2
million in bond funds is approved by voters for the
Historic Preservation Program.
2004 A survey on African
American historic properties is completed
by the city; the survey was a recommendation
of the Ad Hoc Committee.
2006Another round of bond funding was approved, allocating $13.1 million to historic preservation.
Arizona voters passed Proposition 207, the Private Property Rights Protection Act, a law that requires the state or any county, city, or town to pay compensation when a land use regulation
results in any decrease in a landowner’s property value, virtually eliminating the ability to designate historic properties and districts at the local level.
2007The Office
completed surveys of Hispanic and
Asian historic properties in
Phoenix.
2016Enacted 30-day demolition
hold citywide for commercial properties 50 year of age
or older and for eligible properties; amended in 2017
to include single-family in the Downtown Code Area.
5 Y
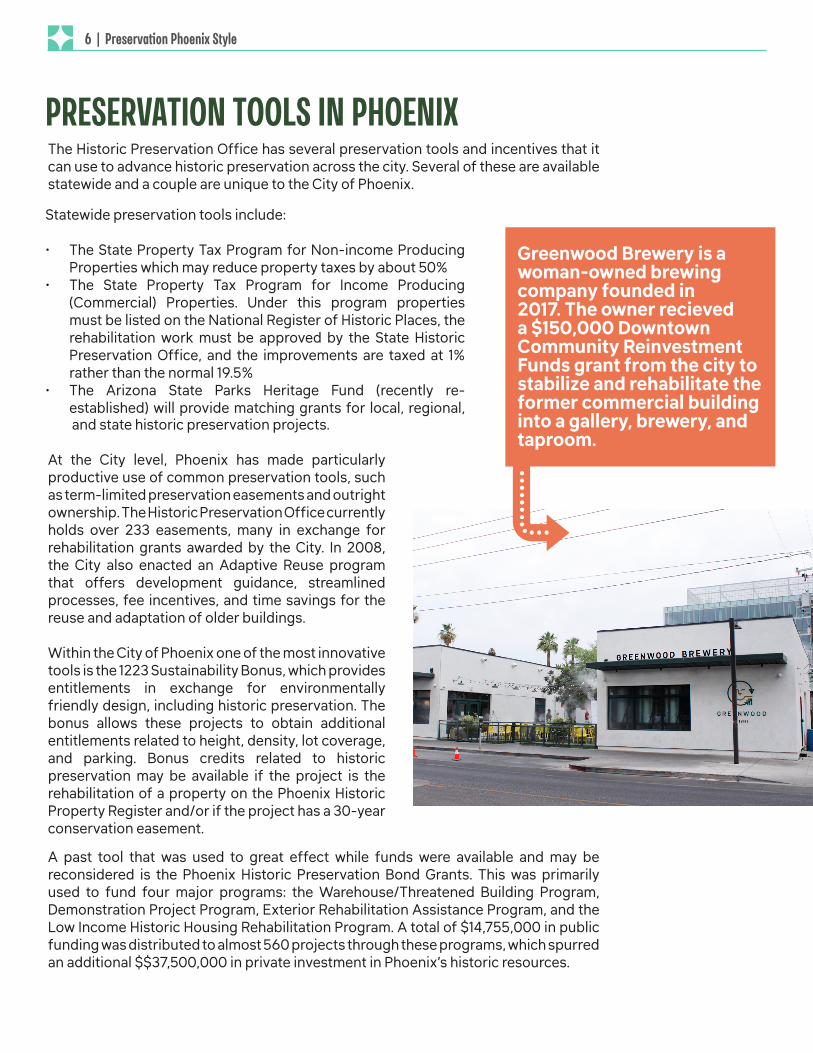
The Historic Preservation Office has several preservation tools and incentives that it can use to advance historic preservation across the city. Several of these are available statewide and a couple are unique to the City of Phoenix.
Greenwood Brewery is a woman-owned brewing company founded in 2017. The owner recieved a $150,000 Downtown Community Reinvestment Funds grant from the city to stabilize and rehabilitate the former commercial building into a gallery, brewery, and taproom.
Statewide preservation tools include:
• The State Property Tax Program for Non-income Producing Properties which may reduce property taxes by about 50%
• The State Property Tax Program for Income Producing (Commercial) Properties. Under this program properties must be listed on the National Register of Historic Places, the rehabilitation work must be approved by the State Historic Preservation Office, and the improvements are taxed at 1% rather than the normal 19.5%
• The Arizona State Parks Heritage Fund (recently re-established) will provide matching grants for local, regional, and state historic preservation projects.
At the City level, Phoenix has made particularly productive use of common preservation tools, such as term-limited preservation easements and outright ownership. The Historic Preservation Office currently holds over 233 easements, many in exchange for rehabilitation grants awarded by the City. In 2008, the City also enacted an Adaptive Reuse program that offers development guidance, streamlined processes, fee incentives, and time savings for the reuse and adaptation of older buildings.
Within the City of Phoenix one of the most innovative tools is the 1223 Sustainability Bonus, which provides entitlements in exchange for environmentally friendly design, including historic preservation. The bonus allows these projects to obtain additional entitlements related to height, density, lot coverage, and parking. Bonus credits related to historic preservation may be available if the project is the rehabilitation of a property on the Phoenix Historic Property Register and/or if the project has a 30-year conservation easement.
A past tool that was used to great effect while funds were available and may be reconsidered is the Phoenix Historic Preservation Bond Grants. This was primarily used to fund four major programs: the Warehouse/Threatened Building Program, Demonstration Project Program, Exterior Rehabilitation Assistance Program, and the Low Income Historic Housing Rehabilitation Program. A total of $14,755,000 in public funding was distributed to almost 560 projects through these programs, which spurred an additional $$37,500,000 in private investment in Phoenix’s historic resources.
4
PRESERVATION TOOLS IN PHOENIX
6 | Preservation Phoenix StyleY
LAND AREA IN HISTORIC DISTRICTS
Papago Freeway
I-10 Reliever
Pim
a Fr
eew
ay
South Mountain Freeway
Agua Fria Freeway
Blac
k C
anyo
n Fr
eew
ay
Pric
e Fr
eew
ay
Pies
tew
a Fr
eew
ay
Santan Freeway
Maricopa Freeway
Superstition Freeway
Pearl Harbor Mem
orial Highway
Red Mountain Freeway
Hohokam
Expressway
Pim
a Fr
eew
ay
Pies
tew
a Fr
eew
ay
Mar
icop
a Fr
eew
ay
Red Mountain Freeway
LegendNonRes_LocalHDs
Res_LocalHDs
Freeways
Papago Freeway
I-10 Reliever
Pima Freew
ay
South Mountain Freeway
Agua
Fria
Fre
eway
Black Canyon Freew
ay
Price Freeway
Piestewa Freew
ay
Santan Freeway
Maricopa Freeway
Superstition Freeway
Pear
l Har
bor M
emor
ial H
ighwa
y
Red Mountain Freeway
Hoh
okam
Exp
ress
way
Pima Freew
ay
Piestewa Freew
ay
Maricopa Freew
ay
Red Mountain Freeway
LegendNonRes_LocalHDs
Res_LocalHDs
Freeways LegendResidential Historic DistrictsNon-Residential Historic DistrictsFreeways
Papago Freeway
I-10 Reliever
Pima Freew
ay
South Mountain Freeway
Agua
Fria
Fre
eway
Black Canyon Freew
ay
Price Freeway
Piestewa Freew
ay
Santan Freeway
Maricopa Freeway
Superstition Freeway
Pear
l Har
bor M
emor
ial H
ighwa
y
Red Mountain Freeway
Hoh
okam
Exp
ress
way
Pima Freew
ay
Piestewa Freew
ay
Maricopa Freew
ay
Red Mountain Freeway
LegendNonRes_LocalHDs
Res_LocalHDs
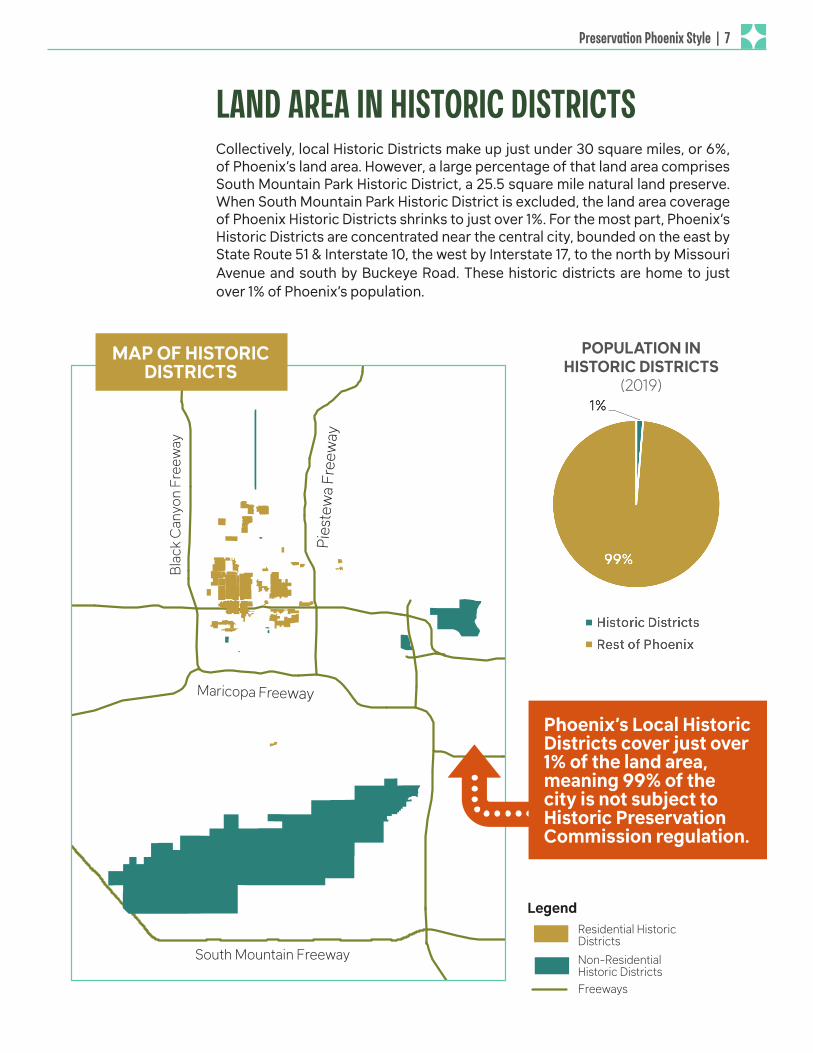
FreewaysCollectively, local Historic Districts make up just under 30 square miles, or 6%, of Phoenix’s land area. However, a large percentage of that land area comprises South Mountain Park Historic District, a 25.5 square mile natural land preserve. When South Mountain Park Historic District is excluded, the land area coverage of Phoenix Historic Districts shrinks to just over 1%. For the most part, Phoenix’s Historic Districts are concentrated near the central city, bounded on the east by State Route 51 & Interstate 10, the west by Interstate 17, to the north by Missouri Avenue and south by Buckeye Road. These historic districts are home to just over 1% of Phoenix’s population.
POPULATION IN HISTORIC DISTRICTS
(2019)
LegendNonRes_LocalHDs
Res_LocalHDs
Freeways
Blac
k C
anyo
n Fr
eew
ay
Maricopa Freeway
South Mountain Freeway
Pies
tew
a Fr
eew
ay
4 Phoenix’s Local Historic Districts cover just over 1% of the land area, meaning 99% of the city is not subject to Historic Preservation Commission regulation.
MAP OF HISTORIC DISTRICTS
Preservation Phoenix Style | 7 Y
Over the past thirty-five years, PlaceEconomics has worked with hundreds of towns and cities of every size throughout the US and in more than fifty countries worldwide. We have seen examples of great urbanism and commiserated with local activists when the quality of their urbanism was the opposite of great. We have learned from both ends of the spectrum. Based on that wide-ranging experience and supplemented by an international survey of professionals committed to good urbanism, we have assembled Twelve Principles of Great Urbanism.
WALKABILITY: Walkable cities benefit our health, improve our environment, increase our cities’ economic well being, and support community engagement and familiarity. Good walkability is defined by the ease with which residents can get to places they want to go on foot and is supported by the presence of pleasant, narrow streets, sidewalks and foot paths, shade, pedestrian amenities like crosswalks and safety measures, density at a human scale, accessibility, and connectivity.
DENSITY AT A HUMAN SCALE: Density at a human scale refers to urban environments that feel comfortable for people to exist in and move through, as opposed to spaces that are primarily designed for automobile access. Places with density at a human scale typically have a variety of housing options, transparent ground floor commercial buildings, a granular street presence, and walkable streets.
DISTINCTIVENESS: Distinctiveness is a city or place’s unique character, including defining geographic and environmental features, local culture, and regional styles or blends of architecture and infrastructure. Distinctiveness is the combination of features and forces that make a place feel unlike others: Paris’s metro signs, Cincinnati’s “Seven Hills,” Chicago’s continuous public lakefront, and New Orleans’s cuisine and music scene all contribute to distinctiveness.
CONNECTIVITY: Connectivity measures how easy it is to move between places of importance within a city. A connected city provides a comprehensive transit system, offers multiple modes of transit, has a clear and efficient hierarchy of streets to disperse traffic, and is generally easy to navigate.
HUMAN DIVERSITY: Human diversity refers to the presence of people of different cultural and ethnic groups, ages, and socioeconomic backgrounds. Achieving human diversity requires a variety of housing types and affordable housing options, a range of job opportunities, and support and resources for immigrants and refugee communities.
ECONOMIC DIVERSITY: A diverse economy is characterized by a range of economic activities, including a mix of small and large businesses, and a variety of industries. Cities with diverse economies are more resilient to economic downturns.
HISTORIC PRESERVATION VERSUS GOOD URBANISM: A FALSE CHOICE
8 Y
CULTURE: Access to art, performance, music, restaurants, cultural gatherings and events, and proximity to museums and other institutions make urban living more interesting and fulfilling. Culture is both formal and informal, and includes both the opera in a grand concert hall and the tradition of pancake suppers at the local VFW club.
QUALITY PUBLIC SPACE: Access and equitable proximity to quality public space including, parks, squares, plazas, promenades, trails, beaches, and libraries. Quality public spaces are well-maintained, accessible to all types of communities, encourage a variety of uses, and feel safe and comfortable to all.
ACCESSIBILITY: Accessibility primarily refers to the ability of persons with disabilities to comfortably navigate cities and spaces to the same extent of those without disabilities. Other attributes of accessibility include the ability of all citizens to access affordable housing, access to quality public spaces and amenities, public transportation, and bike infrastructure.
SUSTAINABILITY: Sustainability aspires to meet the needs of the present without compromising the ability of future generations to meet their needs. Sustainable cities and urban environments promote the wise use of resources, build resilient systems, and understand sustainability in four parts: environmental, economic, social, and cultural. Sustainability is a prerequisite for a city to be resilient.
EQUITY: Equity refers to just and fair inclusion of all groups in civic life and means that race, class, and other aspects of identity do not influence life outcomes. Realizing the goal of equitable cities requires acknowledging how past and present policies such as redlining have disproportionately and negatively impacted lower-income and communities of color and actively engaging and listening to members of those communities as part of any efforts to address issues of equity.
PUBLIC SAFETY: Public safety is enhanced in cities and urban spaces when there is activity on the streets, strong social cohesion, good infrastructure, and preventive crime reduction measures like investment in public and social services, after school programs, mental health care, workforce development, and violence interruption.
What is most apparent from these principles is that there is no conflict between being for great urbanism and being for historic preservation. In fact, in almost every town and city we’ve worked in, and certainly in all of the cities for which we have done in-depth analysis, it is a city’s historic residential and commercial neighborhoods that are most representative of the Principles of Great Urbanism. As this study demonstrates, this is true of Phoenix as well. Whether it is walkability, density at a human scale, human or economic diversity, distinctiveness, or any of the other principles, the models of good urbanism are the historic neighborhoods of Phoenix.
9 Y
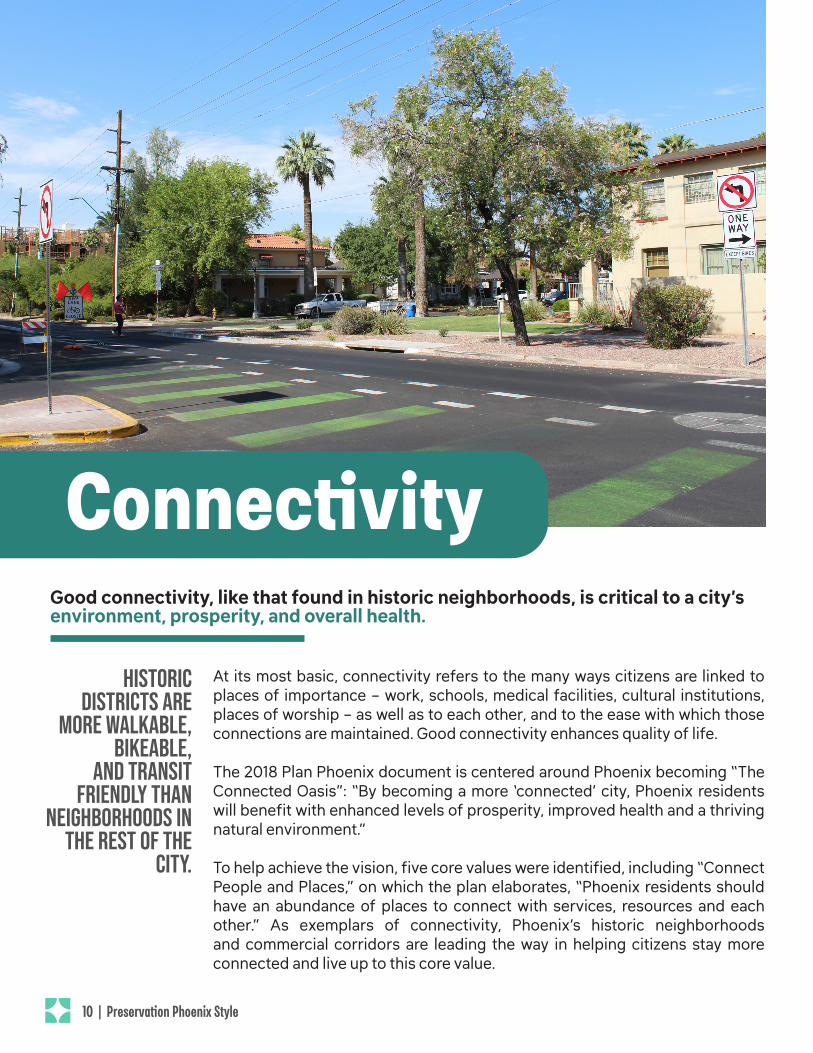
Good connectivity, like that found in historic neighborhoods, is critical to a city’s environment, prosperity, and overall health.
historic districts are
more walkable, bikeable,
and transit friendly than
neighborhoods in the rest of the
city.
At its most basic, connectivity refers to the many ways citizens are linked to places of importance – work, schools, medical facilities, cultural institutions, places of worship – as well as to each other, and to the ease with which those connections are maintained. Good connectivity enhances quality of life.
The 2018 Plan Phoenix document is centered around Phoenix becoming “The Connected Oasis”: “By becoming a more ‘connected’ city, Phoenix residents will benefit with enhanced levels of prosperity, improved health and a thriving natural environment.”
To help achieve the vision, five core values were identified, including “Connect People and Places,” on which the plan elaborates, “Phoenix residents should have an abundance of places to connect with services, resources and each other.” As exemplars of connectivity, Phoenix’s historic neighborhoods and commercial corridors are leading the way in helping citizens stay more connected and live up to this core value.
Connectivity
10 | Preservation Phoenix StyleY
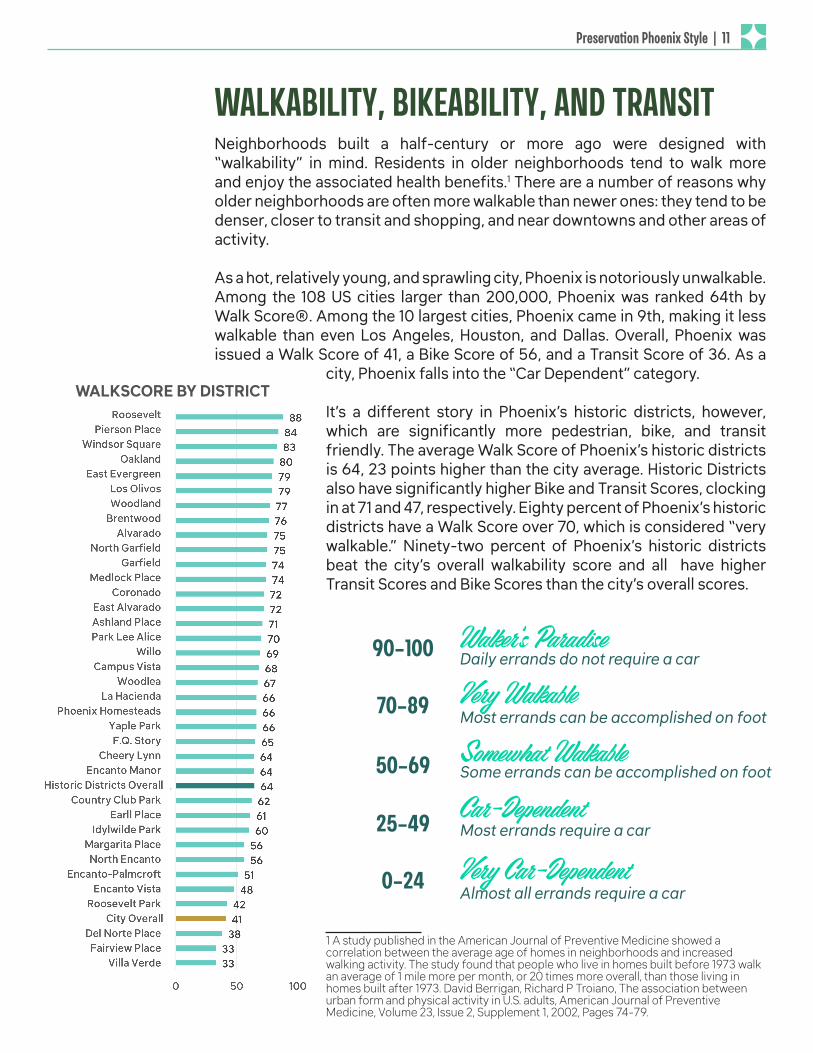
WALKABILITY, BIKEABILITY, AND TRANSIT Neighborhoods built a half-century or more ago were designed with “walkability” in mind. Residents in older neighborhoods tend to walk more and enjoy the associated health benefits.1 There are a number of reasons why older neighborhoods are often more walkable than newer ones: they tend to be denser, closer to transit and shopping, and near downtowns and other areas of activity.
As a hot, relatively young, and sprawling city, Phoenix is notoriously unwalkable. Among the 108 US cities larger than 200,000, Phoenix was ranked 64th by Walk Score®. Among the 10 largest cities, Phoenix came in 9th, making it less walkable than even Los Angeles, Houston, and Dallas. Overall, Phoenix was issued a Walk Score of 41, a Bike Score of 56, and a Transit Score of 36. As a
city, Phoenix falls into the “Car Dependent” category.
It’s a different story in Phoenix’s historic districts, however, which are significantly more pedestrian, bike, and transit friendly. The average Walk Score of Phoenix’s historic districts is 64, 23 points higher than the city average. Historic Districts also have significantly higher Bike and Transit Scores, clocking in at 71 and 47, respectively. Eighty percent of Phoenix’s historic districts have a Walk Score over 70, which is considered “very walkable.” Ninety-two percent of Phoenix’s historic districts beat the city’s overall walkability score and all have higher Transit Scores and Bike Scores than the city’s overall scores.
1 A study published in the American Journal of Preventive Medicine showed a correlation between the average age of homes in neighborhoods and increased walking activity. The study found that people who live in homes built before 1973 walk an average of 1 mile more per month, or 20 times more overall, than those living in homes built after 1973. David Berrigan, Richard P Troiano, The association between urban form and physical activity in U.S. adults, American Journal of Preventive Medicine, Volume 23, Issue 2, Supplement 1, 2002, Pages 74-79.
WALKSCORE BY DISTRICT
90-100 Walker ’s Paradise Daily errands do not require a car
50-69 Somewhat WalkableSome errands can be accomplished on foot
25-49Car-DependentMost errands require a car
0-24 Very Car -DependentAlmost all errands require a car
70-89 Very WalkableMost errands can be accomplished on foot
Preservation Phoenix Style | 11 Y
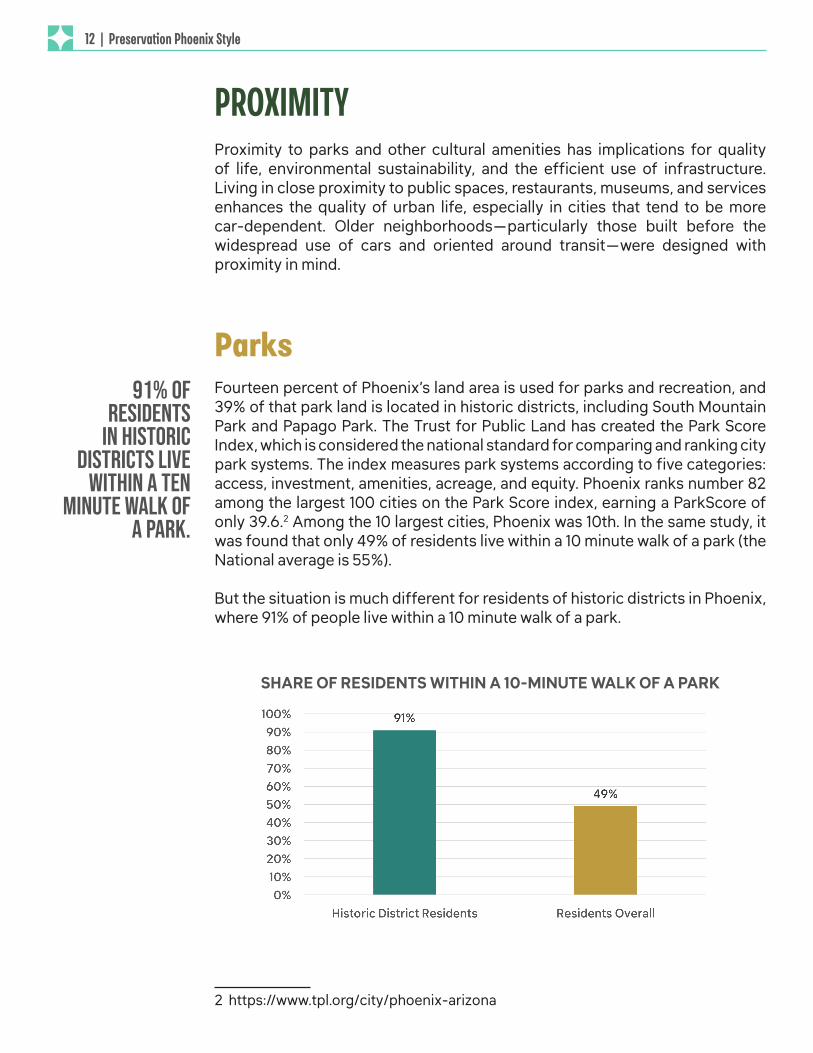
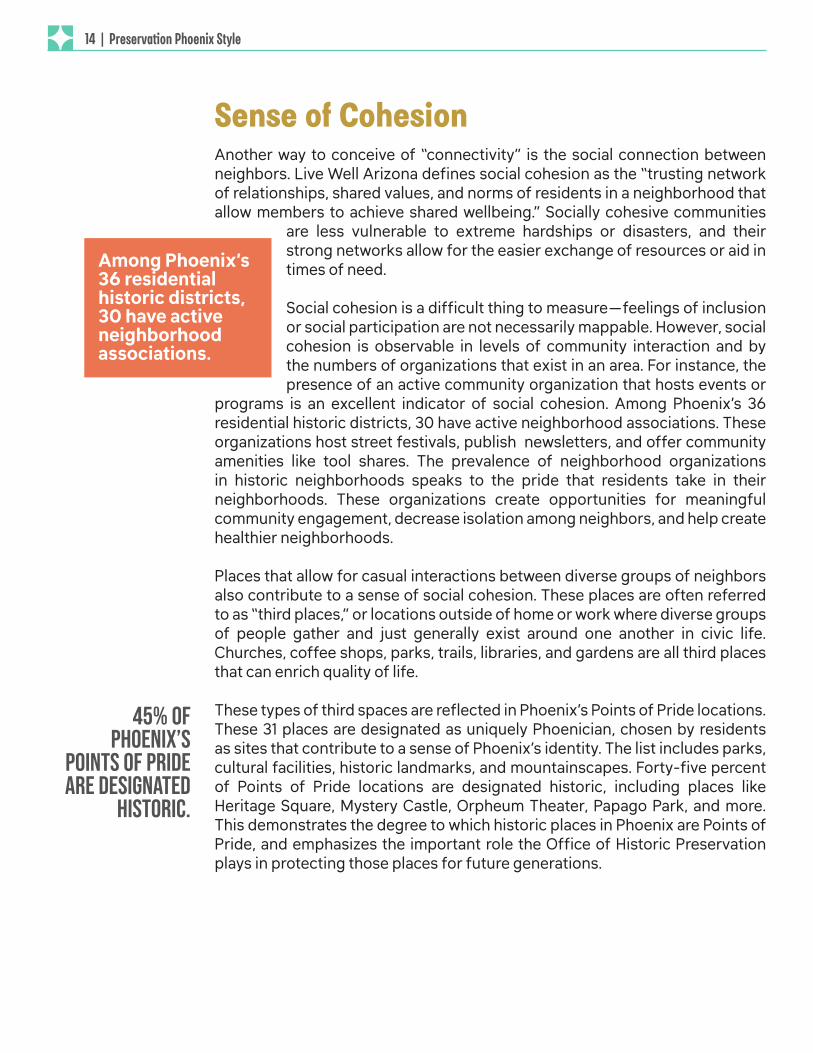
PROXIMITY Proximity to parks and other cultural amenities has implications for quality of life, environmental sustainability, and the efficient use of infrastructure. Living in close proximity to public spaces, restaurants, museums, and services enhances the quality of urban life, especially in cities that tend to be more car-dependent. Older neighborhoods—particularly those built before the widespread use of cars and oriented around transit—were designed with proximity in mind.
ParksFourteen percent of Phoenix’s land area is used for parks and recreation, and 39% of that park land is located in historic districts, including South Mountain Park and Papago Park. The Trust for Public Land has created the Park Score Index, which is considered the national standard for comparing and ranking city park systems. The index measures park systems according to five categories: access, investment, amenities, acreage, and equity. Phoenix ranks number 82 among the largest 100 cities on the Park Score index, earning a ParkScore of only 39.6.2 Among the 10 largest cities, Phoenix was 10th. In the same study, it was found that only 49% of residents live within a 10 minute walk of a park (the National average is 55%).
But the situation is much different for residents of historic districts in Phoenix, where 91% of people live within a 10 minute walk of a park.
2 https://www.tpl.org/city/phoenix-arizona
SHARE OF RESIDENTS WITHIN A 10-MINUTE WALK OF A PARK
91% of residents
in historic districts live
within a ten minute walk of
a park.
12 | Preservation Phoenix StyleY
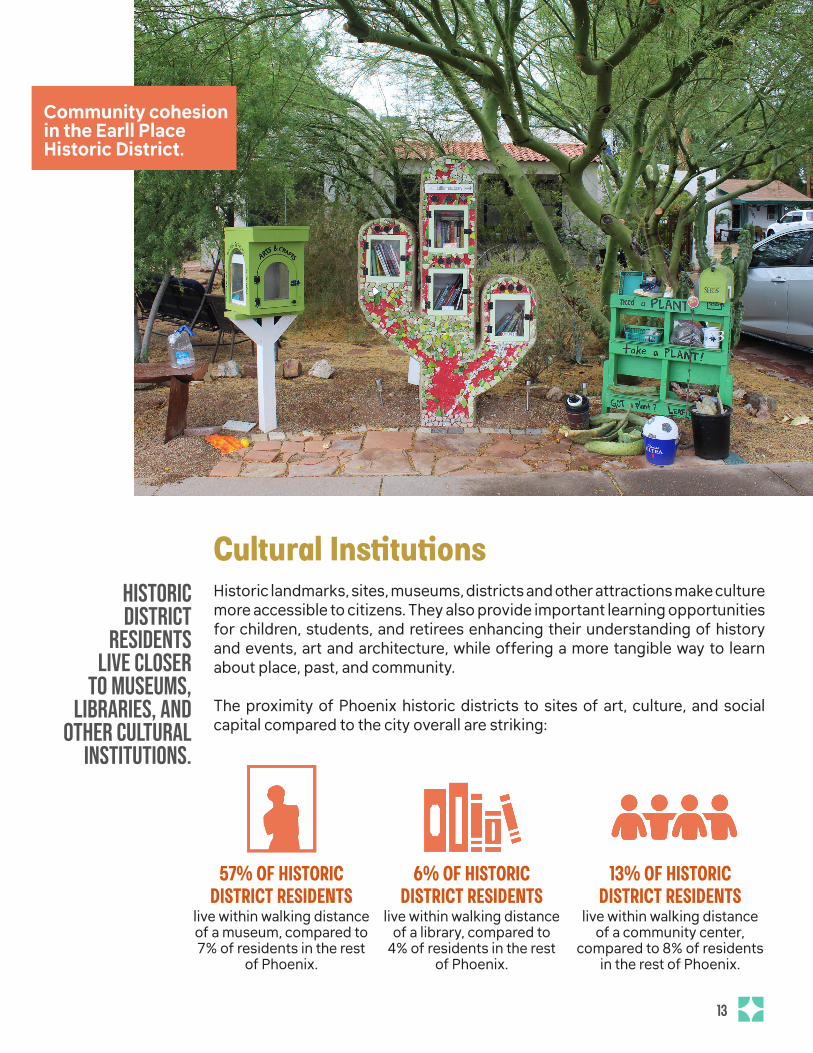
Cultural Institutions Historic landmarks, sites, museums, districts and other attractions make culture more accessible to citizens. They also provide important learning opportunities for children, students, and retirees enhancing their understanding of history and events, art and architecture, while offering a more tangible way to learn about place, past, and community.
The proximity of Phoenix historic districts to sites of art, culture, and social capital compared to the city overall are striking:
57% OF HISTORIC DISTRICT RESIDENTS
live within walking distance of a museum, compared to 7% of residents in the rest
of Phoenix.
6% OF HISTORIC DISTRICT RESIDENTS
live within walking distance of a library, compared to
4% of residents in the rest of Phoenix.
13% OF HISTORIC DISTRICT RESIDENTS
live within walking distance of a community center,
compared to 8% of residents in the rest of Phoenix.
Community cohesion in the Earll Place Historic District.
Historic district
residents live closer
to museums, libraries, and
other cultural institutions.
13 Y
Another way to conceive of “connectivity” is the social connection between neighbors. Live Well Arizona defines social cohesion as the “trusting network of relationships, shared values, and norms of residents in a neighborhood that allow members to achieve shared wellbeing.” Socially cohesive communities
are less vulnerable to extreme hardships or disasters, and their strong networks allow for the easier exchange of resources or aid in times of need.
Social cohesion is a difficult thing to measure—feelings of inclusion or social participation are not necessarily mappable. However, social cohesion is observable in levels of community interaction and by the numbers of organizations that exist in an area. For instance, the presence of an active community organization that hosts events or
programs is an excellent indicator of social cohesion. Among Phoenix’s 36 residential historic districts, 30 have active neighborhood associations. These organizations host street festivals, publish newsletters, and offer community amenities like tool shares. The prevalence of neighborhood organizations in historic neighborhoods speaks to the pride that residents take in their neighborhoods. These organizations create opportunities for meaningful community engagement, decrease isolation among neighbors, and help create healthier neighborhoods.
Places that allow for casual interactions between diverse groups of neighbors also contribute to a sense of social cohesion. These places are often referred to as “third places,” or locations outside of home or work where diverse groups of people gather and just generally exist around one another in civic life. Churches, coffee shops, parks, trails, libraries, and gardens are all third places that can enrich quality of life.
These types of third spaces are reflected in Phoenix’s Points of Pride locations. These 31 places are designated as uniquely Phoenician, chosen by residents as sites that contribute to a sense of Phoenix’s identity. The list includes parks, cultural facilities, historic landmarks, and mountainscapes. Forty-five percent of Points of Pride locations are designated historic, including places like Heritage Square, Mystery Castle, Orpheum Theater, Papago Park, and more. This demonstrates the degree to which historic places in Phoenix are Points of Pride, and emphasizes the important role the Office of Historic Preservation plays in protecting those places for future generations.
Sense of Cohesion
45% of Phoenix’s
Points of Pride are designated
historic.
Among Phoenix’s 36 residential historic districts, 30 have active neighborhood associations.
14 | Preservation Phoenix StyleY
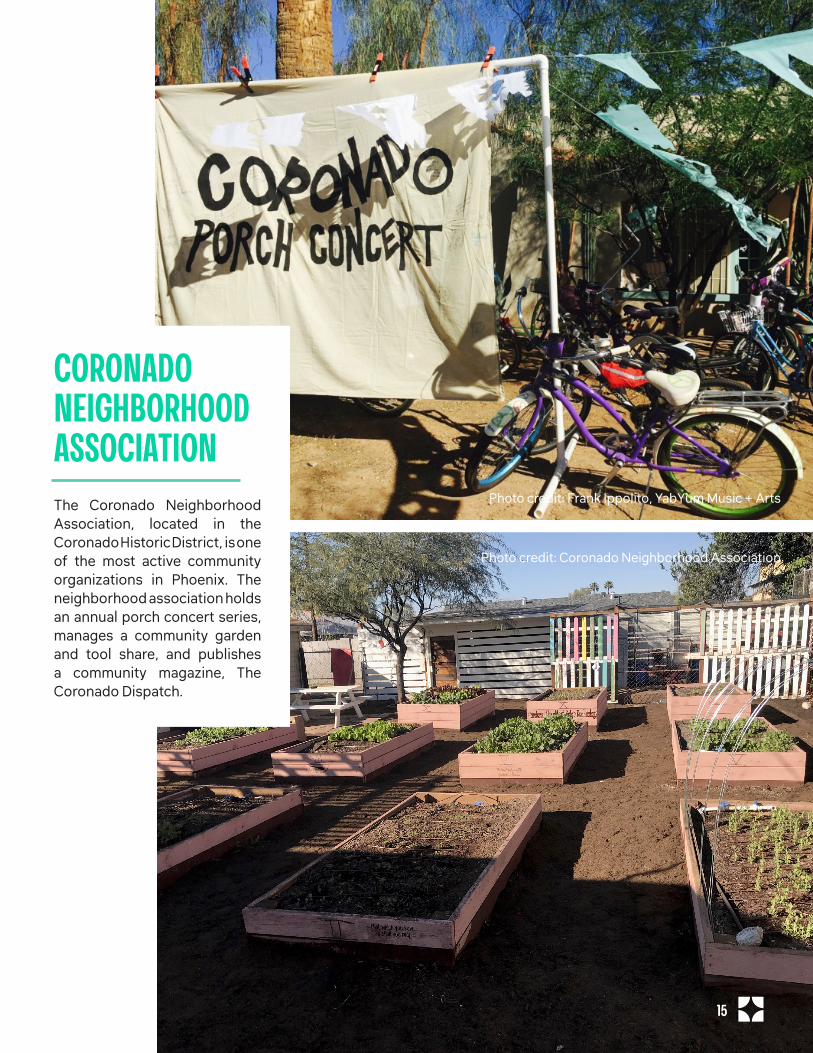
Photo credit: Frank Ippolito, YabYum Music + Arts
Photo credit: Coronado Neighborhood Association
The Coronado Neighborhood Association, located in the Coronado Historic District, is one of the most active community organizations in Phoenix. The neighborhood association holds an annual porch concert series, manages a community garden and tool share, and publishes a community magazine, The Coronado Dispatch.
CORONADO NEIGHBORHOOD ASSOCIATION
15 Y
historic districts are
more dense both in population
and tree cover.
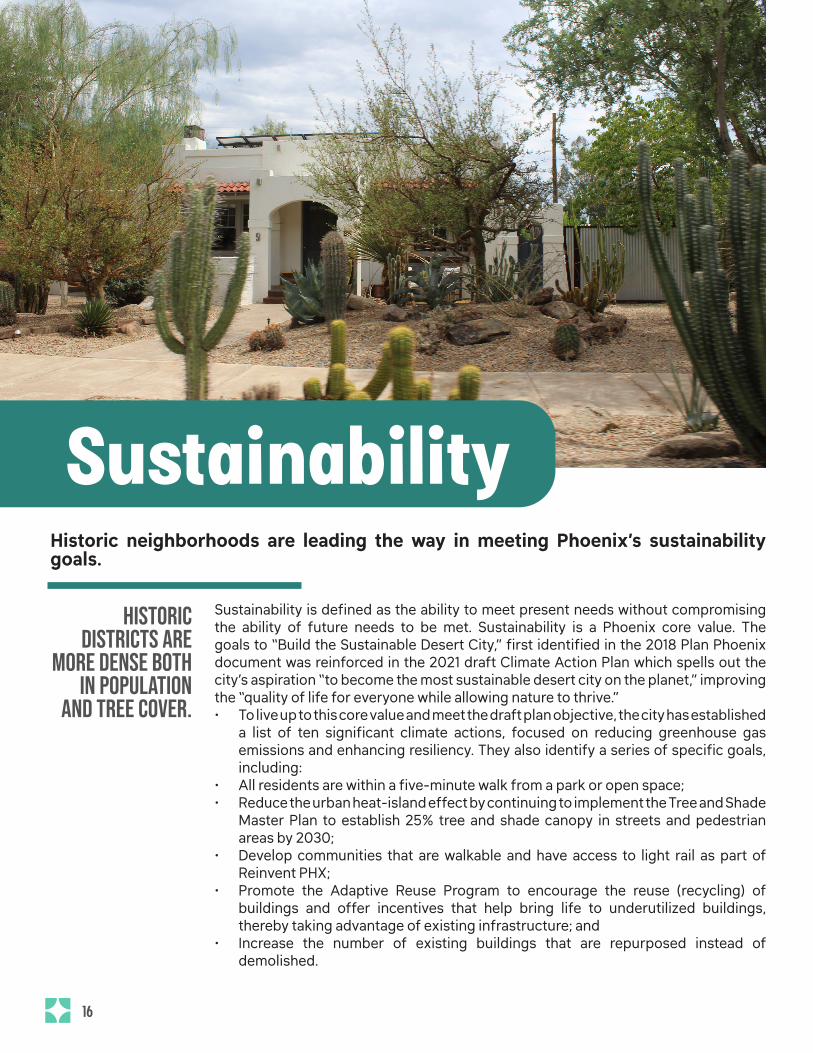
Sustainability is defined as the ability to meet present needs without compromising the ability of future needs to be met. Sustainability is a Phoenix core value. The goals to “Build the Sustainable Desert City,” first identified in the 2018 Plan Phoenix document was reinforced in the 2021 draft Climate Action Plan which spells out the city’s aspiration “to become the most sustainable desert city on the planet,” improving the “quality of life for everyone while allowing nature to thrive.”• To live up to this core value and meet the draft plan objective, the city has established
a list of ten significant climate actions, focused on reducing greenhouse gas emissions and enhancing resiliency. They also identify a series of specific goals, including:
• All residents are within a five-minute walk from a park or open space; • Reduce the urban heat-island effect by continuing to implement the Tree and Shade
Master Plan to establish 25% tree and shade canopy in streets and pedestrian areas by 2030;
• Develop communities that are walkable and have access to light rail as part of Reinvent PHX;
• Promote the Adaptive Reuse Program to encourage the reuse (recycling) of buildings and offer incentives that help bring life to underutilized buildings, thereby taking advantage of existing infrastructure; and
• Increase the number of existing buildings that are repurposed instead of demolished.
SustainabilityHistoric neighborhoods are leading the way in meeting Phoenix’s sustainability goals.
16 Y
TREE COVERThe city’s existing historic neighborhoods and commercial corridors are already leading the way in meeting the sustainability challenge as several metrics below will attest.Arizona is known for its extreme heat and sparse desert environment, making its cities particularly susceptible for the urban heat island effect. Street trees are a great way to mitigate excessive heat. By simply providing shade, tree canopies can make neighborhoods and sidewalks feel significantly cooler and, when planted around buildings, can reduce cooling costs. Trees also improve air quality, enhance biodiversity, and provide habitats for urban fauna. They also play a vital role in carbon sequestration, which keeps climate change-contributing greenhouse gas out of the atmosphere.
In 2010, the City of Phoenix adopted the Tree and Shade Master Plan, which sets an ambitious goal to cover 25% of the metropolis with tree shade by 2030 . As part of this planning initiative, the Parks and Recreation Department conducted an inventory of all the city-maintained trees to set a baseline for existing canopy coverage, identify species, and assess the condition of the urban forest. To do this, the department employed the TreeKeeper Inventory Management Software® which helps users understand the benefits that these trees provide to the surrounding community.
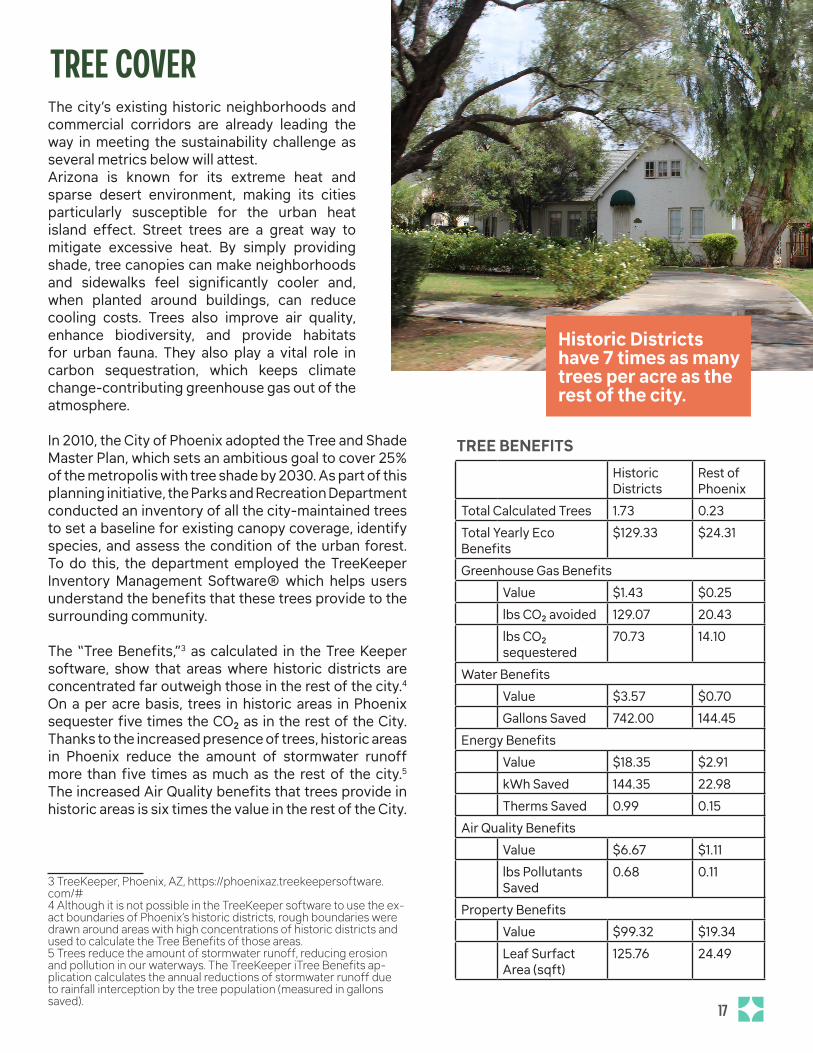
The “Tree Benefits,”3 as calculated in the Tree Keeper software, show that areas where historic districts are concentrated far outweigh those in the rest of the city.4 On a per acre basis, trees in historic areas in Phoenix sequester five times the CO2 as in the rest of the City. Thanks to the increased presence of trees, historic areas in Phoenix reduce the amount of stormwater runoff more than five times as much as the rest of the city.5 The increased Air Quality benefits that trees provide in historic areas is six times the value in the rest of the City.
3 TreeKeeper, Phoenix, AZ, https://phoenixaz.treekeepersoftware.com/# 4 Although it is not possible in the TreeKeeper software to use the ex-act boundaries of Phoenix’s historic districts, rough boundaries were drawn around areas with high concentrations of historic districts and used to calculate the Tree Benefits of those areas.5 Trees reduce the amount of stormwater runoff, reducing erosion and pollution in our waterways. The TreeKeeper iTree Benefits ap-plication calculates the annual reductions of stormwater runoff due to rainfall interception by the tree population (measured in gallons saved).
Historic Districts
Rest of Phoenix
Total Calculated Trees 1.73 0.23Total Yearly Eco Benefits
$129.33 $24.31
Greenhouse Gas BenefitsValue $1.43 $0.25lbs CO2 avoided 129.07 20.43lbs CO2 sequestered
70.73 14.10
Water BenefitsValue $3.57 $0.70Gallons Saved 742.00 144.45
Energy BenefitsValue $18.35 $2.91kWh Saved 144.35 22.98Therms Saved 0.99 0.15
Air Quality BenefitsValue $6.67 $1.11lbs Pollutants Saved
0.68 0.11
Property BenefitsValue $99.32 $19.34Leaf Surfact Area (sqft)
125.76 24.49
TREE BENEFITS
Historic Districts have 7 times as many trees per acre as the rest of the city.
17 Y
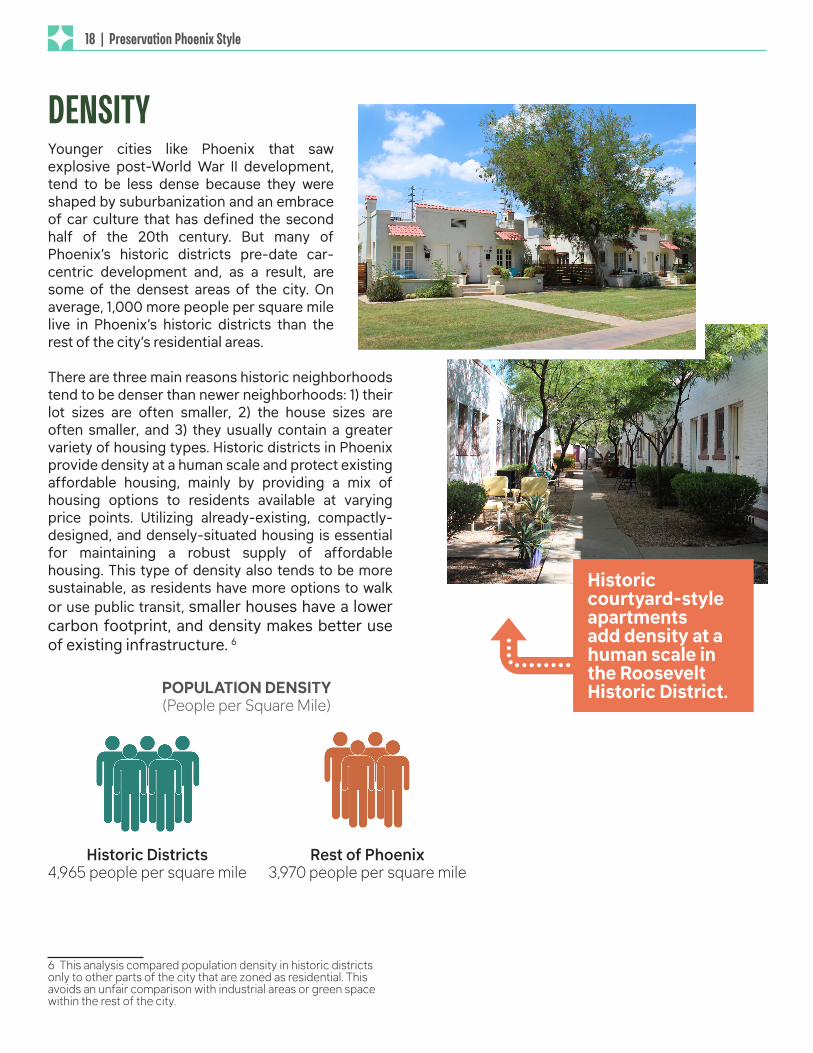
Younger cities like Phoenix that saw explosive post-World War II development, tend to be less dense because they were shaped by suburbanization and an embrace of car culture that has defined the second half of the 20th century. But many of Phoenix’s historic districts pre-date car-centric development and, as a result, are some of the densest areas of the city. On average, 1,000 more people per square mile live in Phoenix’s historic districts than the rest of the city’s residential areas.
There are three main reasons historic neighborhoods tend to be denser than newer neighborhoods: 1) their lot sizes are often smaller, 2) the house sizes are often smaller, and 3) they usually contain a greater variety of housing types. Historic districts in Phoenix provide density at a human scale and protect existing affordable housing, mainly by providing a mix of housing options to residents available at varying price points. Utilizing already-existing, compactly-designed, and densely-situated housing is essential for maintaining a robust supply of affordable housing. This type of density also tends to be more sustainable, as residents have more options to walk or use public transit, smaller houses have a lower carbon footprint, and density makes better use of existing infrastructure. 6
6 This analysis compared population density in historic districts only to other parts of the city that are zoned as residential. This avoids an unfair comparison with industrial areas or green space within the rest of the city.
4,965 people per square mile Historic Districts
3,970 people per square mile Rest of Phoenix
DENSITY
4 Historic courtyard-style apartments add density at a human scale in the Roosevelt Historic District. POPULATION DENSITY
(People per Square Mile)
18 | Preservation Phoenix StyleY
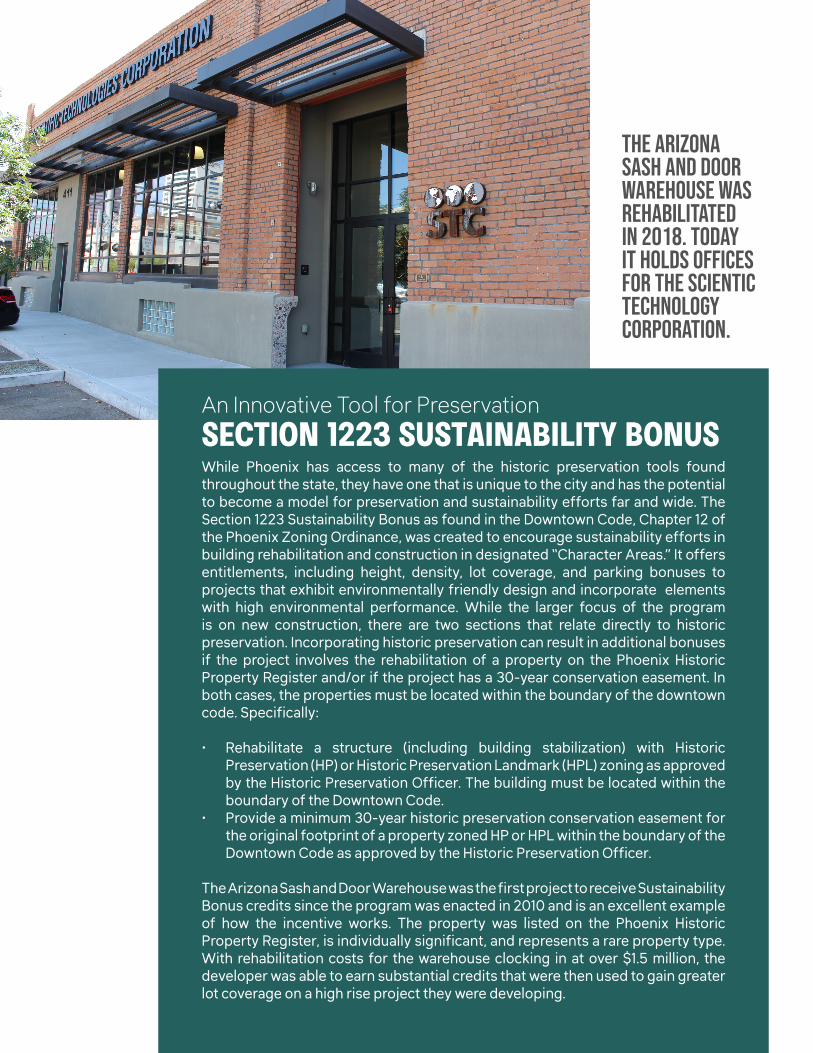
An Innovative Tool for Preservation SECTION 1223 SUSTAINABILITY BONUSWhile Phoenix has access to many of the historic preservation tools found throughout the state, they have one that is unique to the city and has the potential to become a model for preservation and sustainability efforts far and wide. The Section 1223 Sustainability Bonus as found in the Downtown Code, Chapter 12 of the Phoenix Zoning Ordinance, was created to encourage sustainability efforts in building rehabilitation and construction in designated “Character Areas.” It offers entitlements, including height, density, lot coverage, and parking bonuses to projects that exhibit environmentally friendly design and incorporate elements with high environmental performance. While the larger focus of the program is on new construction, there are two sections that relate directly to historic preservation. Incorporating historic preservation can result in additional bonuses if the project involves the rehabilitation of a property on the Phoenix Historic Property Register and/or if the project has a 30-year conservation easement. In both cases, the properties must be located within the boundary of the downtown code. Specifically:
• Rehabilitate a structure (including building stabilization) with Historic Preservation (HP) or Historic Preservation Landmark (HPL) zoning as approved by the Historic Preservation Officer. The building must be located within the boundary of the Downtown Code.
• Provide a minimum 30-year historic preservation conservation easement for the original footprint of a property zoned HP or HPL within the boundary of the Downtown Code as approved by the Historic Preservation Officer.
The Arizona Sash and Door Warehouse was the first project to receive Sustainability Bonus credits since the program was enacted in 2010 and is an excellent example of how the incentive works. The property was listed on the Phoenix Historic Property Register, is individually significant, and represents a rare property type. With rehabilitation costs for the warehouse clocking in at over $1.5 million, the developer was able to earn substantial credits that were then used to gain greater lot coverage on a high rise project they were developing.
The arizona sash and Door Warehouse was rehabilitated in 2018. Today it holds offices for the scientic technology corporation.
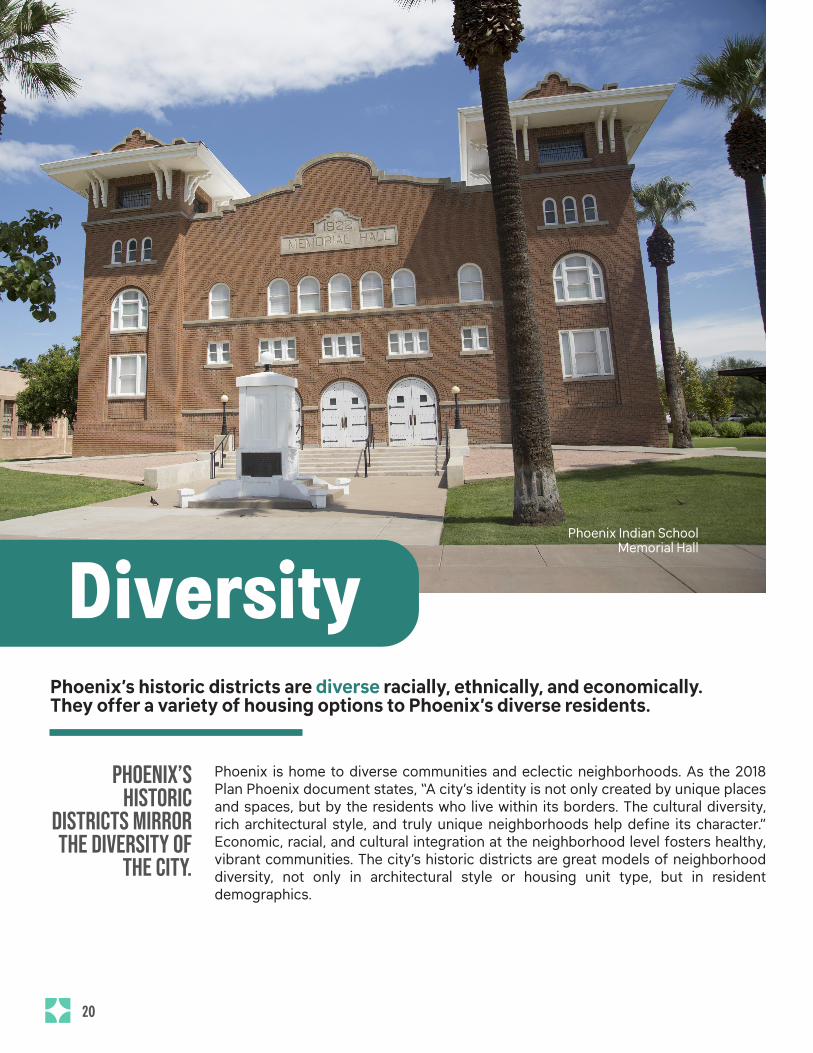
Phoenix is home to diverse communities and eclectic neighborhoods. As the 2018 Plan Phoenix document states, “A city’s identity is not only created by unique places and spaces, but by the residents who live within its borders. The cultural diversity, rich architectural style, and truly unique neighborhoods help define its character.” Economic, racial, and cultural integration at the neighborhood level fosters healthy, vibrant communities. The city’s historic districts are great models of neighborhood diversity, not only in architectural style or housing unit type, but in resident demographics.
Phoenix’s historic districts are diverse racially, ethnically, and economically.They offer a variety of housing options to Phoenix’s diverse residents.
Phoenix’s historic
districts mirror the diversity of
the city.
Phoenix Indian School Memorial Hall
Diversity
20 Y
Race
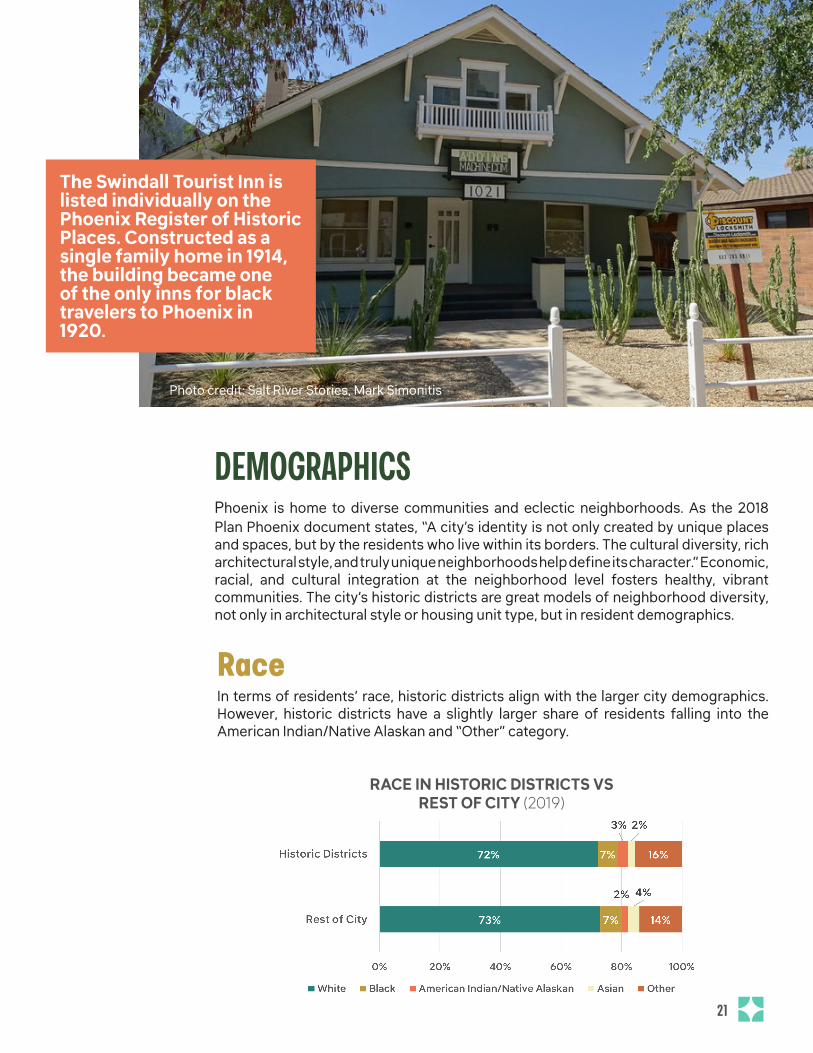
DEMOGRAPHICSPhoenix is home to diverse communities and eclectic neighborhoods. As the 2018 Plan Phoenix document states, “A city’s identity is not only created by unique places and spaces, but by the residents who live within its borders. The cultural diversity, rich architectural style, and truly unique neighborhoods help define its character.” Economic, racial, and cultural integration at the neighborhood level fosters healthy, vibrant communities. The city’s historic districts are great models of neighborhood diversity, not only in architectural style or housing unit type, but in resident demographics.
In terms of residents’ race, historic districts align with the larger city demographics. However, historic districts have a slightly larger share of residents falling into the American Indian/Native Alaskan and “Other” category.
RACE IN HISTORIC DISTRICTS VS REST OF CITY (2019)
The Swindall Tourist Inn is listed individually on the Phoenix Register of Historic Places. Constructed as a single family home in 1914, the building became one of the only inns for black travelers to Phoenix in 1920.
Photo credit: Salt River Stories, Mark Simonitis
21 Y
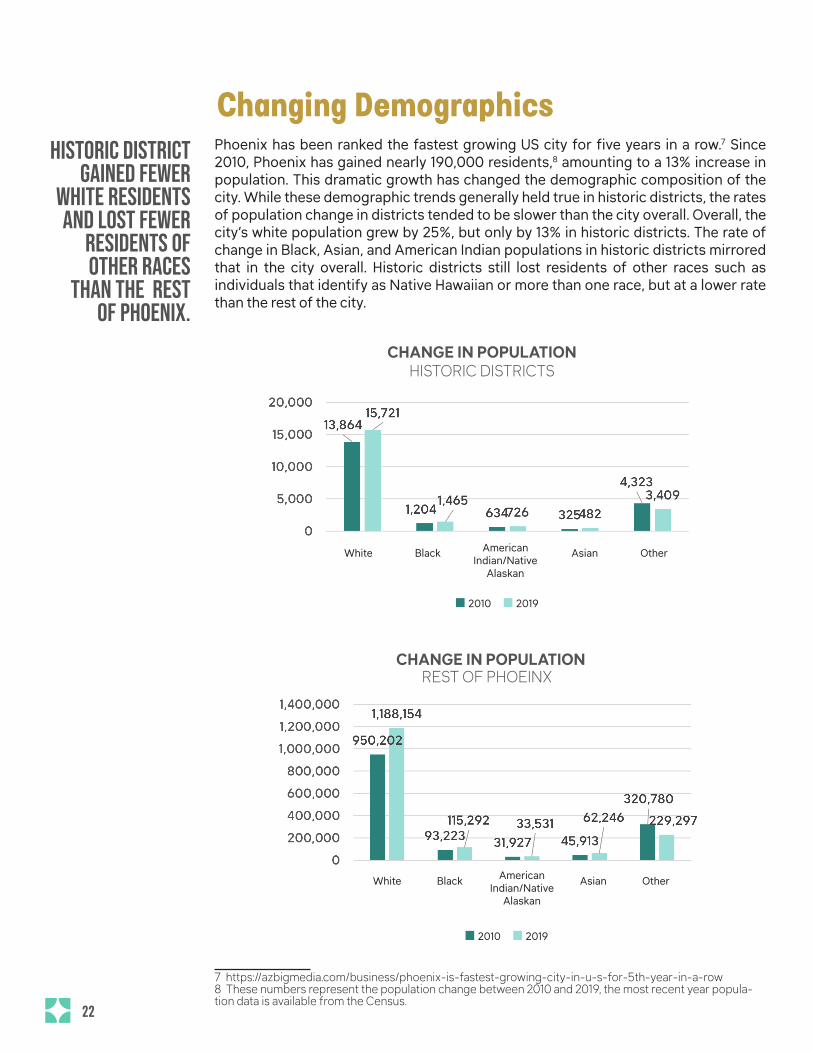
Changing DemographicsPhoenix has been ranked the fastest growing US city for five years in a row.7 Since 2010, Phoenix has gained nearly 190,000 residents,8 amounting to a 13% increase in population. This dramatic growth has changed the demographic composition of the city. While these demographic trends generally held true in historic districts, the rates of population change in districts tended to be slower than the city overall. Overall, the city’s white population grew by 25%, but only by 13% in historic districts. The rate of change in Black, Asian, and American Indian populations in historic districts mirrored that in the city overall. Historic districts still lost residents of other races such as individuals that identify as Native Hawaiian or more than one race, but at a lower rate than the rest of the city.
7 https://azbigmedia.com/business/phoenix-is-fastest-growing-city-in-u-s-for-5th-year-in-a-row8 These numbers represent the population change between 2010 and 2019, the most recent year popula-tion data is available from the Census.
CHANGE IN POPULATIONHISTORIC DISTRICTS
White Black American Indian/Native
Alaskan
Asian Other
2010 2019
CHANGE IN POPULATIONREST OF PHOEINX
White Black American Indian/Native
Alaskan
Asian Other
2010 2019
historic district gained fewer
white residents and lost fewer
residents of OTHER RACES
THAN the rest of phoenix.
22 Y

BETH HEBREW SYNAGOGUEThe story of the Beth Hebrew Synagogue, its founders, and champions is one of improbable survival. Elias Loewy, a German-born Holocuast survivor and one of the founders of Beth Hebrew, rescued more than 1,500 people from concentration camps in France during World War II. After a brief stint in New York City, Elias came to Phoenix to seek warmer climes for his declining health. In the 1950s, he helped found Beth Hebrew, the city’s first Orthodox synagogue. The Synagogue was built in the mid-century style, designed by Egyptologist and architect Max Kaufman, who built into the architecture symbols of the Jewish deliverance from ancient Babylon. In its heyday, the Beth Hebrew Synagogue was home to a vibrant congregation, many of whom were Holocuast survivors. Beth Hebrew has another very special claim to fame: acclaimed director Steven Speilberg was bar mitzvahed there in 1960.
Members of the congregation have since migrated elsewhere, and the building ceased to be a place of worship in 1979. It served for a short time as the home of an African American theater troupe before ultimately sitting empty and only narrowly escaping the wrecking ball. By 2015, when local developer Michael Levine purchased the building for $850,000, it was boarded up and covered in graffiti. Thanks to various grants, including a $140,000 grant from the Office of Historic Preservation, the former synagogue has been cleaned up and the windows have been restored, such that light enters the main worship space just as it did in the 1950s.
Levine has plans to redevelop the space into a multi-purpose community event center so that it can be enjoyed and remembered by the Jewish community and beyond. He believes that the inspiring survival story of its founders—and the building’s own unlikely survival story—will resonate with all people of all backgrounds.
Michael LevinePhoto by Phil Latzman - KJZZ
23 Y
Income
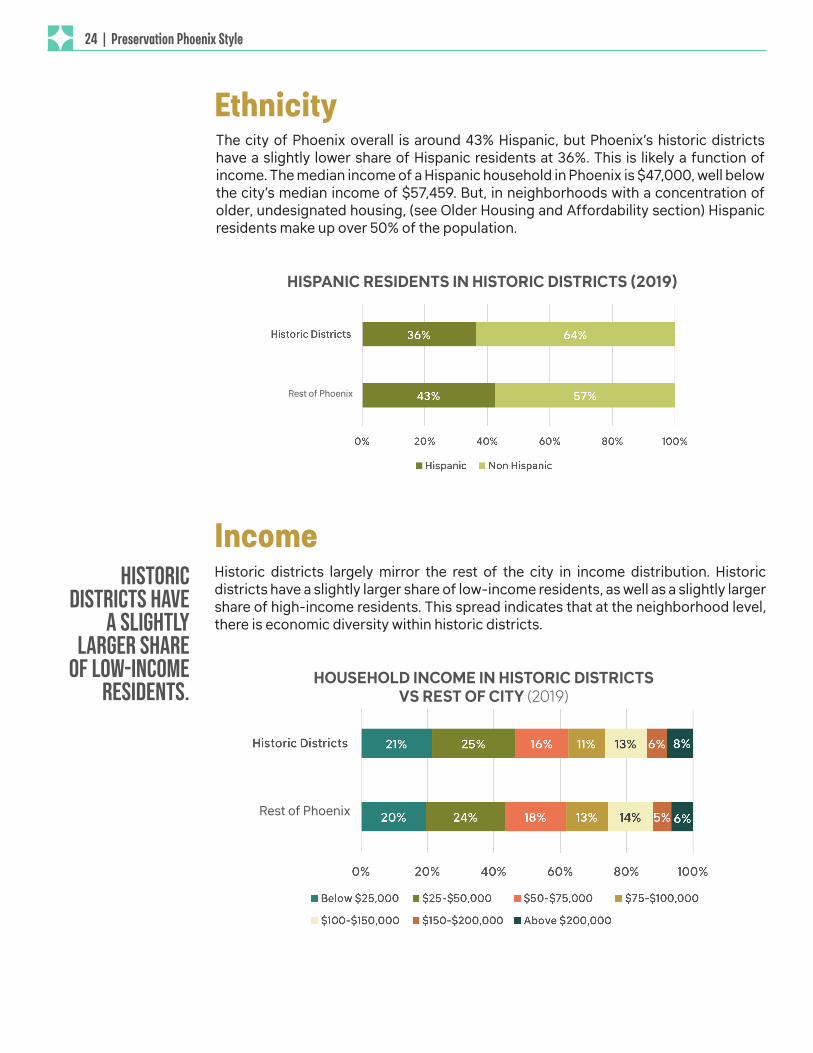
EthnicityThe city of Phoenix overall is around 43% Hispanic, but Phoenix’s historic districts have a slightly lower share of Hispanic residents at 36%. This is likely a function of income. The median income of a Hispanic household in Phoenix is $47,000, well below the city’s median income of $57,459. But, in neighborhoods with a concentration of older, undesignated housing, (see Older Housing and Affordability section) Hispanic residents make up over 50% of the population.
HISPANIC RESIDENTS IN HISTORIC DISTRICTS (2019)
HOUSEHOLD INCOME IN HISTORIC DISTRICTS VS REST OF CITY (2019)
Rest of Phoenix
Rest of Phoenix
Historic districts largely mirror the rest of the city in income distribution. Historic districts have a slightly larger share of low-income residents, as well as a slightly larger share of high-income residents. This spread indicates that at the neighborhood level, there is economic diversity within historic districts.
Historic districts have
a slightly larger share
of low-income residents.
24 | Preservation Phoenix StyleY
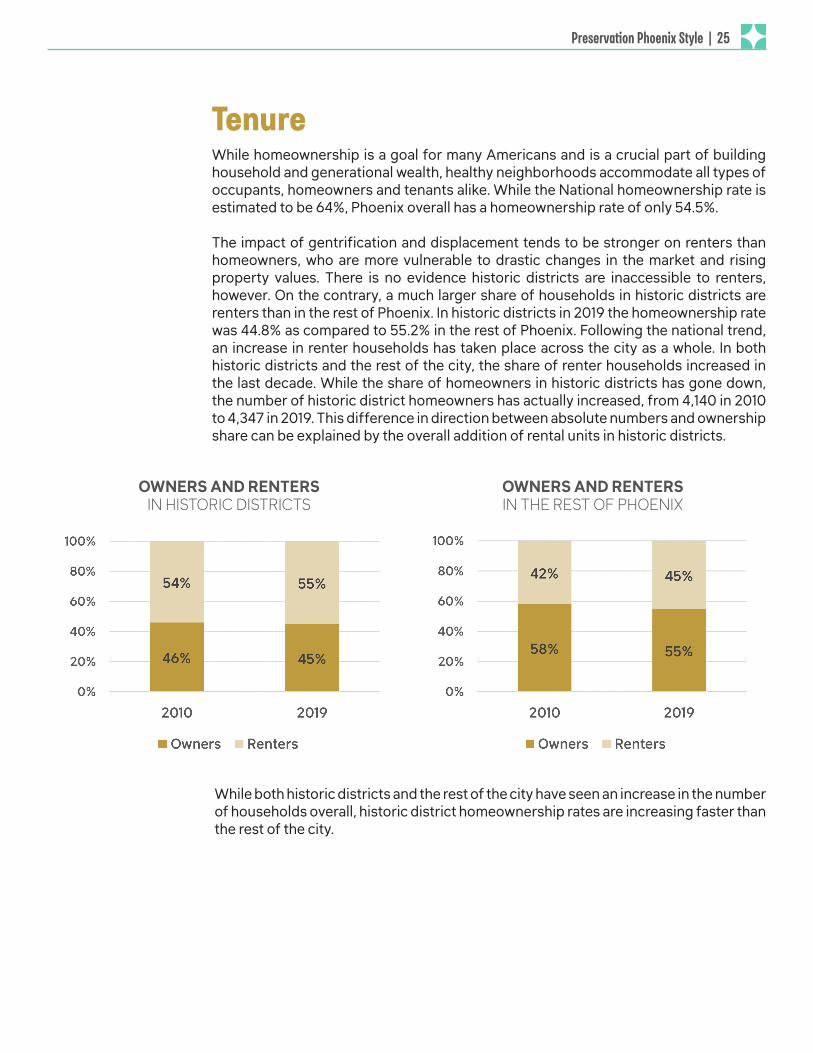
TenureWhile homeownership is a goal for many Americans and is a crucial part of building household and generational wealth, healthy neighborhoods accommodate all types of occupants, homeowners and tenants alike. While the National homeownership rate is estimated to be 64%, Phoenix overall has a homeownership rate of only 54.5%.
The impact of gentrification and displacement tends to be stronger on renters than homeowners, who are more vulnerable to drastic changes in the market and rising property values. There is no evidence historic districts are inaccessible to renters, however. On the contrary, a much larger share of households in historic districts are renters than in the rest of Phoenix. In historic districts in 2019 the homeownership rate was 44.8% as compared to 55.2% in the rest of Phoenix. Following the national trend, an increase in renter households has taken place across the city as a whole. In both historic districts and the rest of the city, the share of renter households increased in the last decade. While the share of homeowners in historic districts has gone down, the number of historic district homeowners has actually increased, from 4,140 in 2010 to 4,347 in 2019. This difference in direction between absolute numbers and ownership share can be explained by the overall addition of rental units in historic districts.
OWNERS AND RENTERSIN HISTORIC DISTRICTS
OWNERS AND RENTERSIN THE REST OF PHOENIX
While both historic districts and the rest of the city have seen an increase in the number of households overall, historic district homeownership rates are increasing faster than the rest of the city.
Preservation Phoenix Style | 25 Y
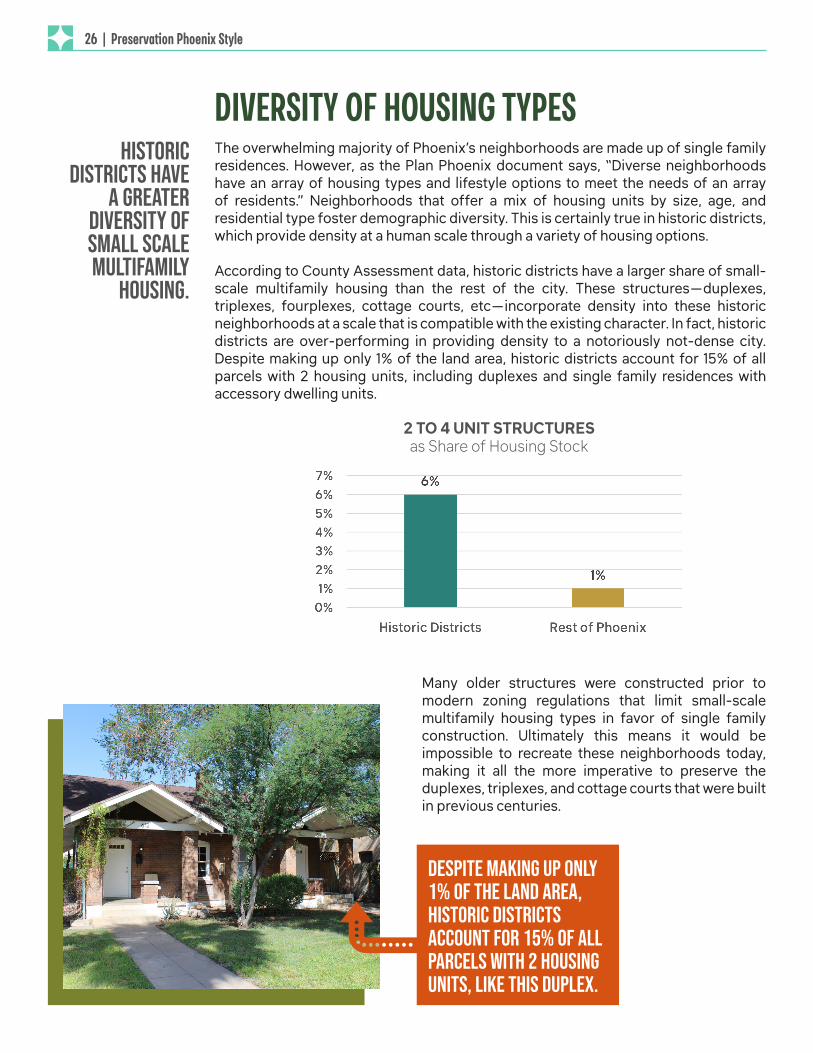
DIVERSITY OF HOUSING TYPESThe overwhelming majority of Phoenix’s neighborhoods are made up of single family residences. However, as the Plan Phoenix document says, “Diverse neighborhoods have an array of housing types and lifestyle options to meet the needs of an array of residents.” Neighborhoods that offer a mix of housing units by size, age, and residential type foster demographic diversity. This is certainly true in historic districts, which provide density at a human scale through a variety of housing options.
According to County Assessment data, historic districts have a larger share of small-scale multifamily housing than the rest of the city. These structures—duplexes, triplexes, fourplexes, cottage courts, etc—incorporate density into these historic neighborhoods at a scale that is compatible with the existing character. In fact, historic districts are over-performing in providing density to a notoriously not-dense city. Despite making up only 1% of the land area, historic districts account for 15% of all parcels with 2 housing units, including duplexes and single family residences with accessory dwelling units.
2 TO 4 UNIT STRUCTURESas Share of Housing Stock
Many older structures were constructed prior to modern zoning regulations that limit small-scale multifamily housing types in favor of single family construction. Ultimately this means it would be impossible to recreate these neighborhoods today, making it all the more imperative to preserve the duplexes, triplexes, and cottage courts that were built in previous centuries.
4 Despite making up only 1% of the land area, historic districts account for 15% of all parcels with 2 housing units, like this duplex.
historic districts have
a greater diversity of small scale multifamily
housing.
26 | Preservation Phoenix StyleY
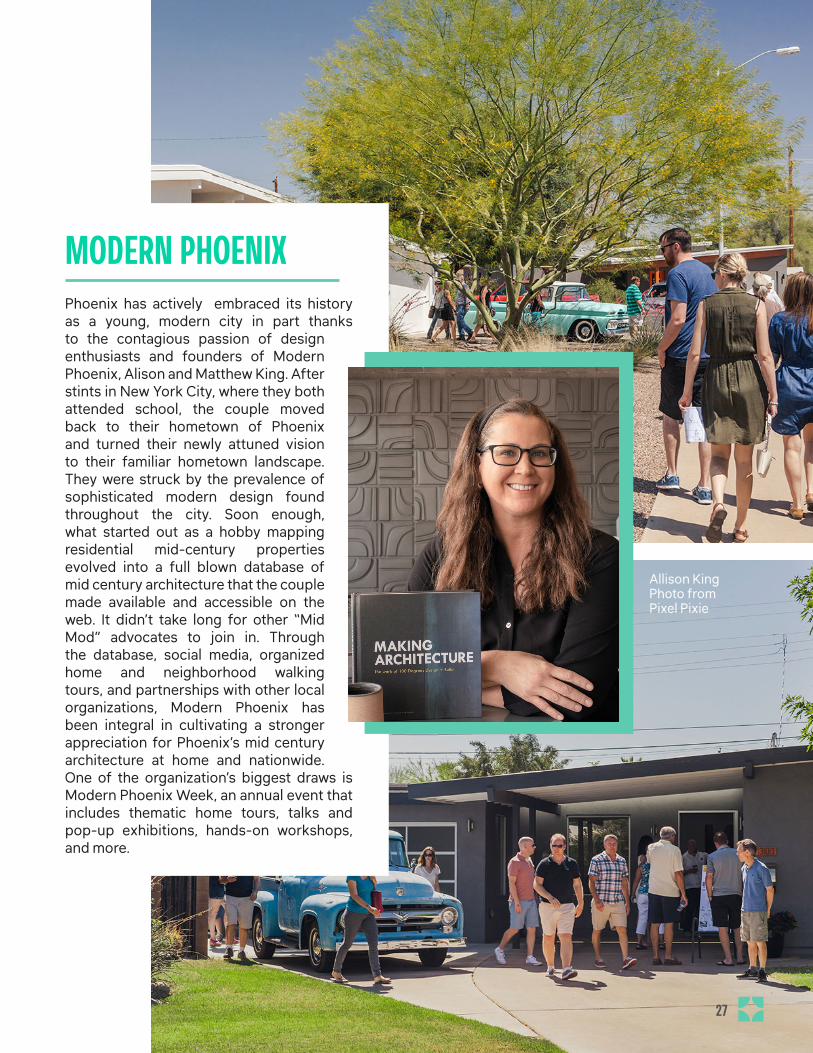
Phoenix has actively embraced its history as a young, modern city in part thanks to the contagious passion of design enthusiasts and founders of Modern Phoenix, Alison and Matthew King. After stints in New York City, where they both attended school, the couple moved back to their hometown of Phoenix and turned their newly attuned vision to their familiar hometown landscape. They were struck by the prevalence of sophisticated modern design found throughout the city. Soon enough, what started out as a hobby mapping residential mid-century properties evolved into a full blown database of mid century architecture that the couple made available and accessible on the web. It didn’t take long for other “Mid Mod” advocates to join in. Through the database, social media, organized home and neighborhood walking tours, and partnerships with other local organizations, Modern Phoenix has been integral in cultivating a stronger appreciation for Phoenix’s mid century architecture at home and nationwide. One of the organization’s biggest draws is Modern Phoenix Week, an annual event that includes thematic home tours, talks and pop-up exhibitions, hands-on workshops, and more.
MODERN PHOENIX
Allison KingPhoto from Pixel Pixie
27 Y
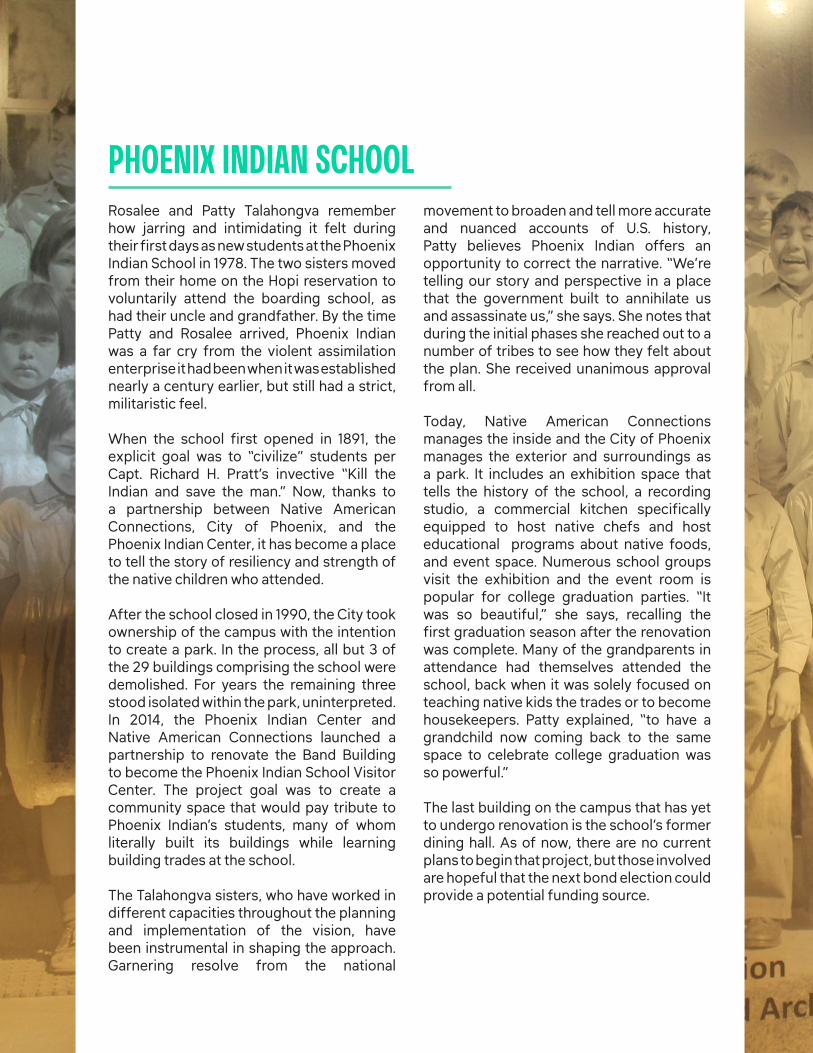
PHOENIX INDIAN SCHOOL Rosalee and Patty Talahongva remember how jarring and intimidating it felt during their first days as new students at the Phoenix Indian School in 1978. The two sisters moved from their home on the Hopi reservation to voluntarily attend the boarding school, as had their uncle and grandfather. By the time Patty and Rosalee arrived, Phoenix Indian was a far cry from the violent assimilation enterprise it had been when it was established nearly a century earlier, but still had a strict, militaristic feel.
When the school first opened in 1891, the explicit goal was to “civilize” students per Capt. Richard H. Pratt’s invective “Kill the Indian and save the man.” Now, thanks to a partnership between Native American Connections, City of Phoenix, and the Phoenix Indian Center, it has become a place to tell the story of resiliency and strength of the native children who attended.
After the school closed in 1990, the City took ownership of the campus with the intention to create a park. In the process, all but 3 of the 29 buildings comprising the school were demolished. For years the remaining three stood isolated within the park, uninterpreted. In 2014, the Phoenix Indian Center and Native American Connections launched a partnership to renovate the Band Building to become the Phoenix Indian School Visitor Center. The project goal was to create a community space that would pay tribute to Phoenix Indian’s students, many of whom literally built its buildings while learning building trades at the school.
The Talahongva sisters, who have worked in different capacities throughout the planning and implementation of the vision, have been instrumental in shaping the approach. Garnering resolve from the national
movement to broaden and tell more accurate and nuanced accounts of U.S. history, Patty believes Phoenix Indian offers an opportunity to correct the narrative. “We’re telling our story and perspective in a place that the government built to annihilate us and assassinate us,” she says. She notes that during the initial phases she reached out to a number of tribes to see how they felt about the plan. She received unanimous approval from all.
Today, Native American Connections manages the inside and the City of Phoenix manages the exterior and surroundings as a park. It includes an exhibition space that tells the history of the school, a recording studio, a commercial kitchen specifically equipped to host native chefs and host educational programs about native foods, and event space. Numerous school groups visit the exhibition and the event room is popular for college graduation parties. “It was so beautiful,” she says, recalling the first graduation season after the renovation was complete. Many of the grandparents in attendance had themselves attended the school, back when it was solely focused on teaching native kids the trades or to become housekeepers. Patty explained, “to have a grandchild now coming back to the same space to celebrate college graduation was so powerful.”
The last building on the campus that has yet to undergo renovation is the school’s former dining hall. As of now, there are no current plans to begin that project, but those involved are hopeful that the next bond election could provide a potential funding source.
Patty Talahongva
29 Y
Phoenix’s historic
districts mirror the
diversity of the city.
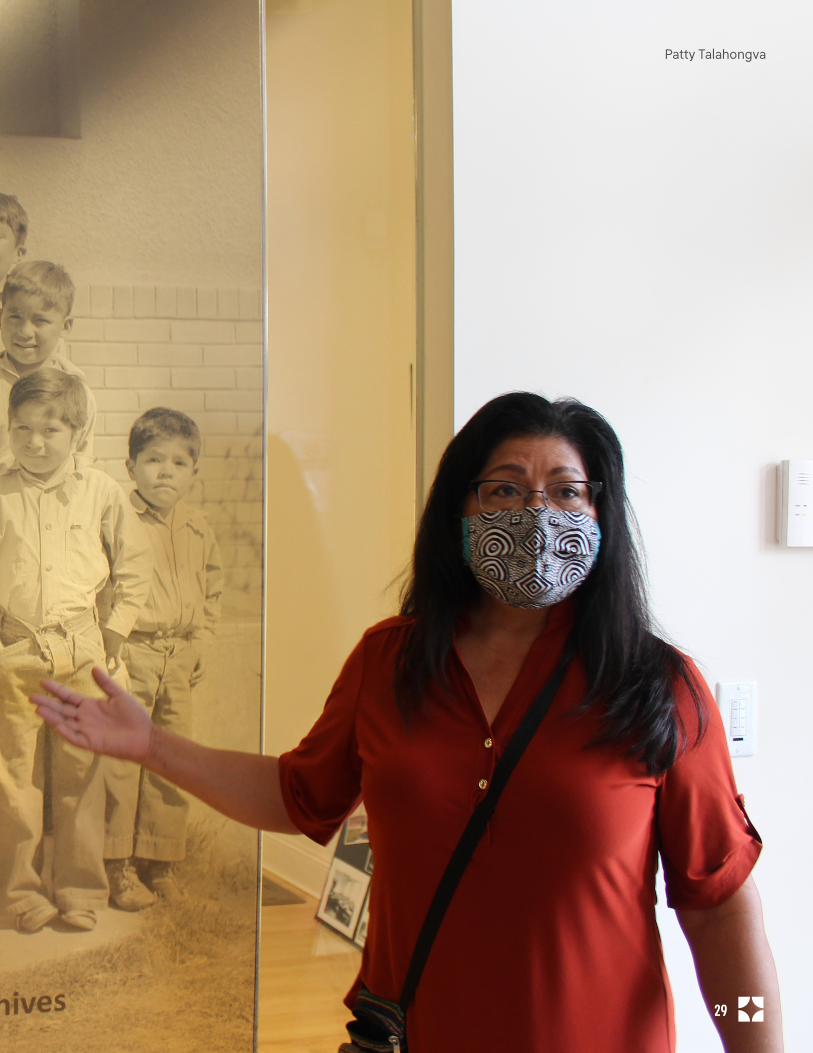
Prosperity
The prosperity of a community can be measured in many ways – the number and variety of businesses, the presence of different jobs, a strong tax base, housing affordability, the availability of goods and services, and the collective wealth of its residents – to name just a few. Prosperity may also be measured through the lens of equity, social cohesion, cultural offerings, and other non-economic attributes.
In its 2018 Plan Phoenix document, the city identified a core value as “Strengthen Our Local Economy - Cores, Centers & Corridors.” It is understandable that one of the three stated community benefits driving the plan would be “prosperity.” The plan gives primary attention to economic indicators with a focus on job creation and local and small business development.
Declaring that “our community’s success depends on local and small businesses,” the plan highlights two goals: “Promote the growth and prosperity of Phoenix’s locally owned and small businesses and encourage the growth and expansion of locally owned and small businesses as a means of creating jobs.” These goals, essential to building community prosperity, are being met today in the city’s historic commercial corridors and downtown.
Investments in historic preservation are investments in the vibrancy and character of Phoenix.
30 | Preservation Phoenix StyleY
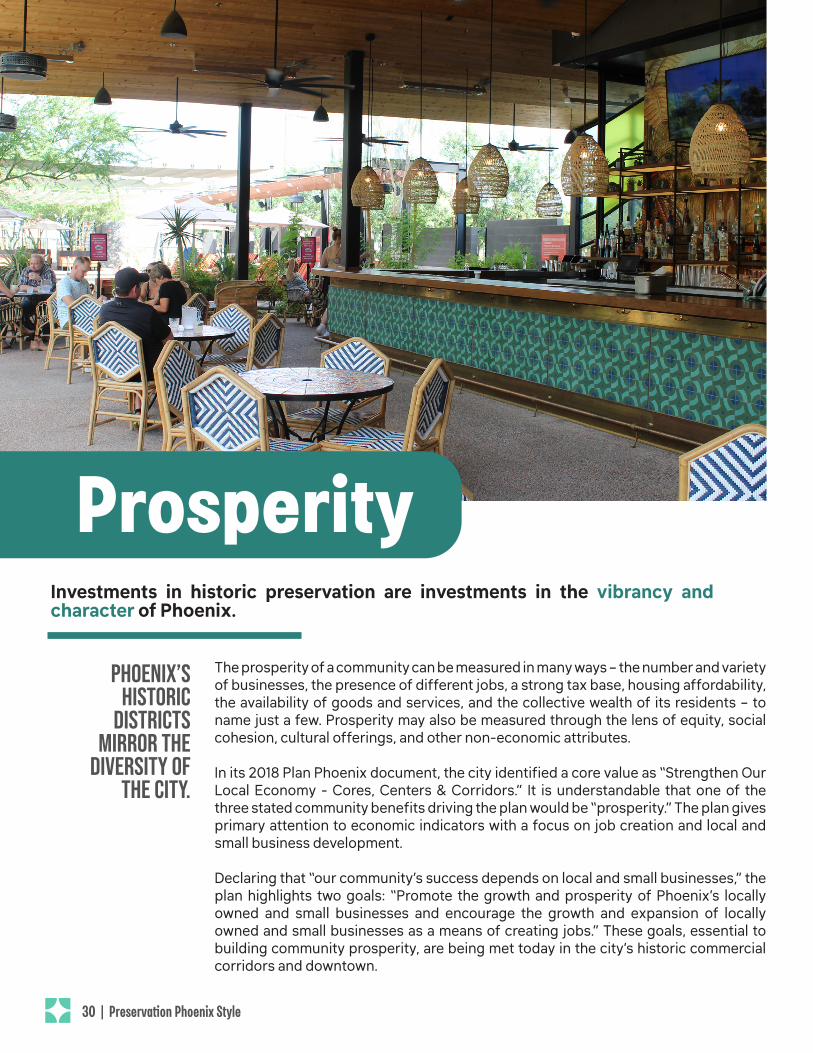
Homes in historic
districts have higher property
values per square foot
than those in the rest of
Phoenix.
PROPERTY VALUES For the vast majority of American households, the family home is the largest asset. A home provides a place to live, but also may be an asset whose value increases over time. When Proposition 207 was passed in 2006, it was supported, in part, by a concern that land use regulations might have an adverse effect on property values. The proposition was alternatively called the Arizona Homeowners Protection Act. As is noted elsewhere in this report, one consequence of Proposition 207 has been the disinclination of cities to enact local historic districts, as they are a form of land use regulation.
Far from negatively impacting property values, historic districts in Phoenix have had the opposite impact. Not only do homes in historic districts have higher values per square foot than the rest of the city, the rate of increase of the value per square foot of houses in those districts is greater than the rest of the Phoenix.
AVERAGE VALUE PER SQUARE FOOT Homes in Local Historic Districts vs Rest of Phoenix
While many fear that designation will hurt their property values, historic districts have had the opposite impact.
Preservation Phoenix Style | 31 Y
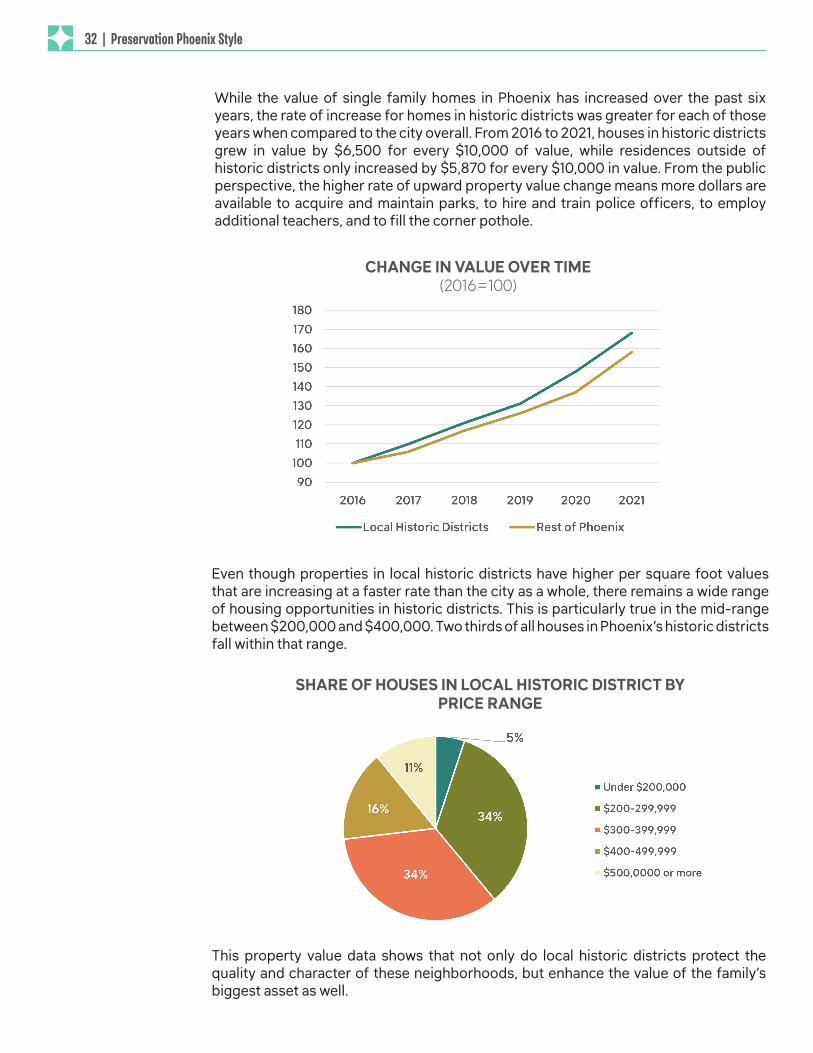
While the value of single family homes in Phoenix has increased over the past six years, the rate of increase for homes in historic districts was greater for each of those years when compared to the city overall. From 2016 to 2021, houses in historic districts grew in value by $6,500 for every $10,000 of value, while residences outside of historic districts only increased by $5,870 for every $10,000 in value. From the public perspective, the higher rate of upward property value change means more dollars are available to acquire and maintain parks, to hire and train police officers, to employ additional teachers, and to fill the corner pothole.
CHANGE IN VALUE OVER TIME (2016=100)
Even though properties in local historic districts have higher per square foot values that are increasing at a faster rate than the city as a whole, there remains a wide range of housing opportunities in historic districts. This is particularly true in the mid-range between $200,000 and $400,000. Two thirds of all houses in Phoenix’s historic districts fall within that range.
This property value data shows that not only do local historic districts protect the quality and character of these neighborhoods, but enhance the value of the family’s biggest asset as well.
SHARE OF HOUSES IN LOCAL HISTORIC DISTRICT BY PRICE RANGE
32 | Preservation Phoenix StyleY
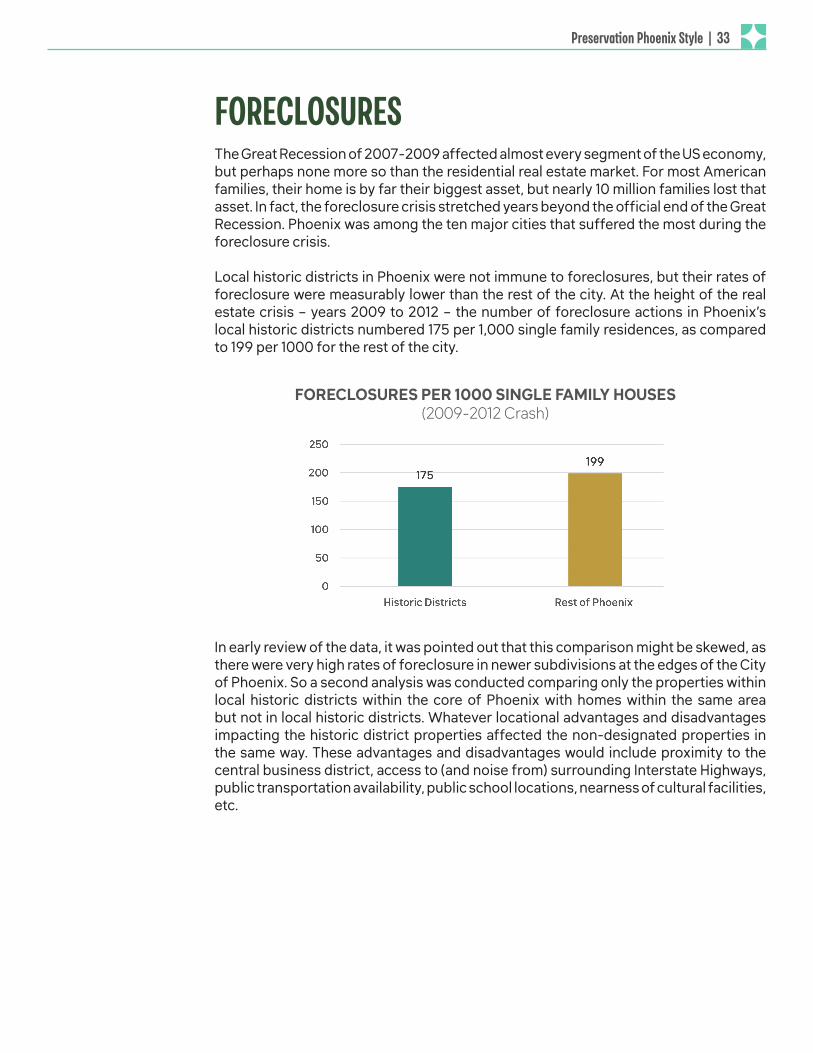
FORECLOSURESThe Great Recession of 2007-2009 affected almost every segment of the US economy, but perhaps none more so than the residential real estate market. For most American families, their home is by far their biggest asset, but nearly 10 million families lost that asset. In fact, the foreclosure crisis stretched years beyond the official end of the Great Recession. Phoenix was among the ten major cities that suffered the most during the foreclosure crisis.
Local historic districts in Phoenix were not immune to foreclosures, but their rates of foreclosure were measurably lower than the rest of the city. At the height of the real estate crisis – years 2009 to 2012 – the number of foreclosure actions in Phoenix’s local historic districts numbered 175 per 1,000 single family residences, as compared to 199 per 1000 for the rest of the city.
FORECLOSURES PER 1000 SINGLE FAMILY HOUSES (2009-2012 Crash)
In early review of the data, it was pointed out that this comparison might be skewed, as there were very high rates of foreclosure in newer subdivisions at the edges of the City of Phoenix. So a second analysis was conducted comparing only the properties within local historic districts within the core of Phoenix with homes within the same area but not in local historic districts. Whatever locational advantages and disadvantages impacting the historic district properties affected the non-designated properties in the same way. These advantages and disadvantages would include proximity to the central business district, access to (and noise from) surrounding Interstate Highways, public transportation availability, public school locations, nearness of cultural facilities, etc.
Preservation Phoenix Style | 33 Y
Missouri Road
Buckeye Road
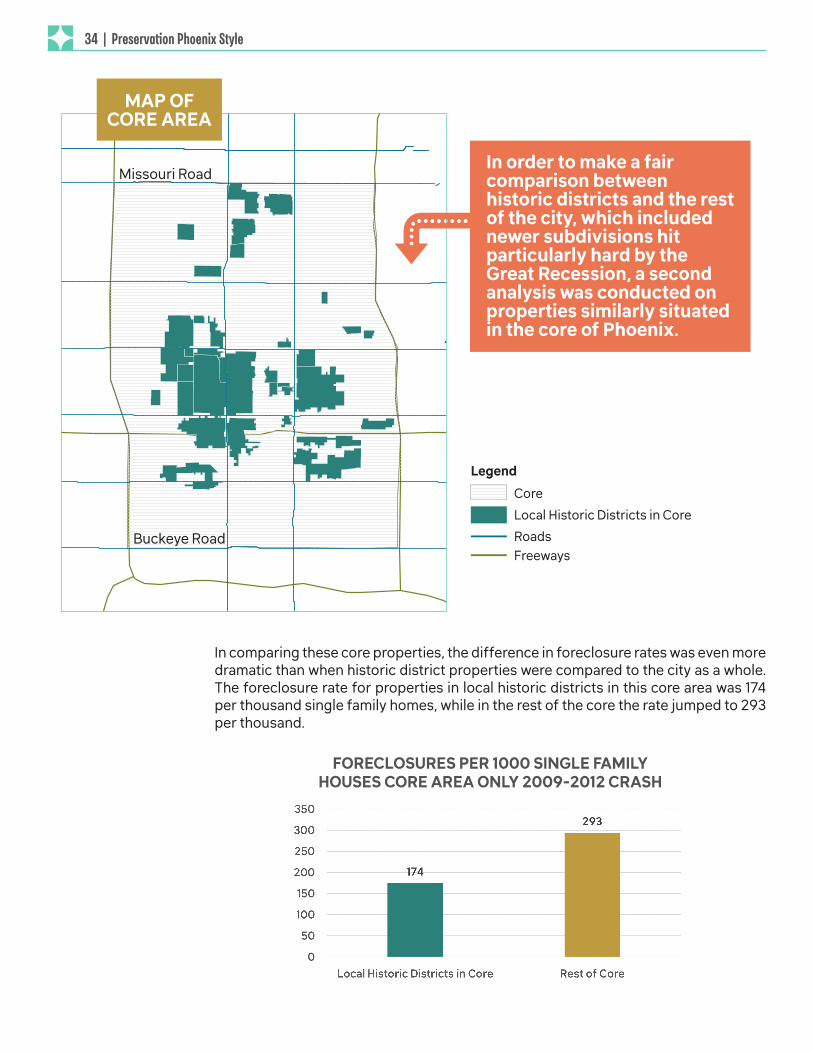
In comparing these core properties, the difference in foreclosure rates was even more dramatic than when historic district properties were compared to the city as a whole. The foreclosure rate for properties in local historic districts in this core area was 174 per thousand single family homes, while in the rest of the core the rate jumped to 293 per thousand.
In order to make a fair comparison between historic districts and the rest of the city, which included newer subdivisions hit particularly hard by the Great Recession, a second analysis was conducted on properties similarly situated in the core of Phoenix.
4
FORECLOSURES PER 1000 SINGLE FAMILYHOUSES CORE AREA ONLY 2009-2012 CRASH
CoreLocal Historic Districts in CoreRoadsFreeways
Legend
MAP OF CORE AREA
34 | Preservation Phoenix StyleY
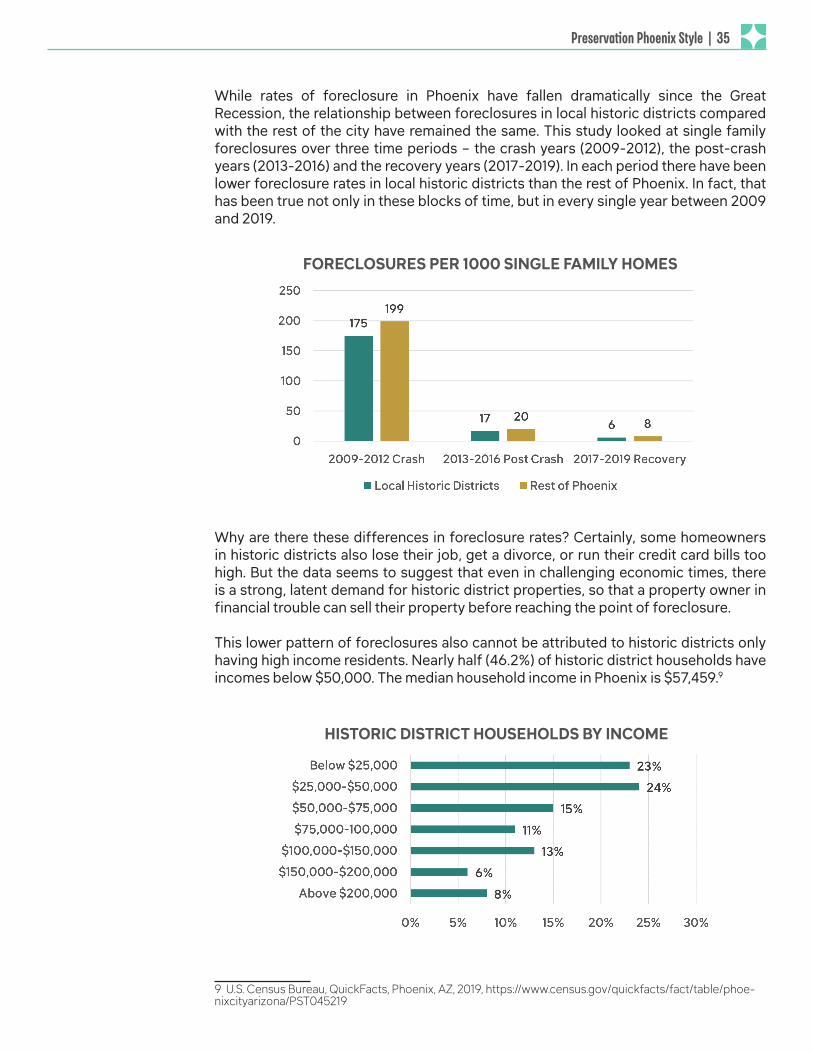
While rates of foreclosure in Phoenix have fallen dramatically since the Great Recession, the relationship between foreclosures in local historic districts compared with the rest of the city have remained the same. This study looked at single family foreclosures over three time periods – the crash years (2009-2012), the post-crash years (2013-2016) and the recovery years (2017-2019). In each period there have been lower foreclosure rates in local historic districts than the rest of Phoenix. In fact, that has been true not only in these blocks of time, but in every single year between 2009 and 2019.
FORECLOSURES PER 1000 SINGLE FAMILY HOMES
Why are there these differences in foreclosure rates? Certainly, some homeowners in historic districts also lose their job, get a divorce, or run their credit card bills too high. But the data seems to suggest that even in challenging economic times, there is a strong, latent demand for historic district properties, so that a property owner in financial trouble can sell their property before reaching the point of foreclosure.
This lower pattern of foreclosures also cannot be attributed to historic districts only having high income residents. Nearly half (46.2%) of historic district households have incomes below $50,000. The median household income in Phoenix is $57,459.9
9 U.S. Census Bureau, QuickFacts, Phoenix, AZ, 2019, https://www.census.gov/quickfacts/fact/table/phoe-nixcityarizona/PST045219
HISTORIC DISTRICT HOUSEHOLDS BY INCOME
Preservation Phoenix Style | 35 Y
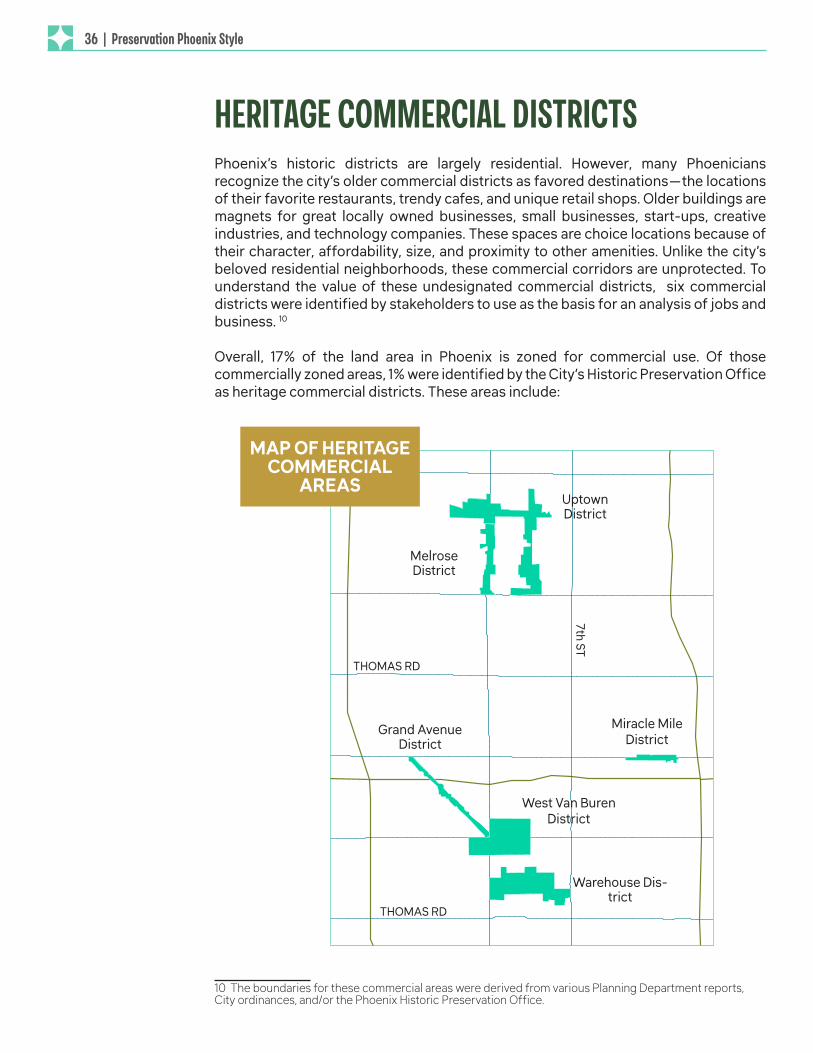
HERITAGE COMMERCIAL DISTRICTSPhoenix’s historic districts are largely residential. However, many Phoenicians recognize the city’s older commercial districts as favored destinations—the locations of their favorite restaurants, trendy cafes, and unique retail shops. Older buildings are magnets for great locally owned businesses, small businesses, start-ups, creative industries, and technology companies. These spaces are choice locations because of their character, affordability, size, and proximity to other amenities. Unlike the city’s beloved residential neighborhoods, these commercial corridors are unprotected. To understand the value of these undesignated commercial districts, six commercial districts were identified by stakeholders to use as the basis for an analysis of jobs and business. 10
Overall, 17% of the land area in Phoenix is zoned for commercial use. Of those commercially zoned areas, 1% were identified by the City’s Historic Preservation Office as heritage commercial districts. These areas include:
10 The boundaries for these commercial areas were derived from various Planning Department reports, City ordinances, and/or the Phoenix Historic Preservation Office.
Uptown District
Melrose District
Grand Avenue District
West Van Buren District
Miracle Mile District
Warehouse Dis-trict
THOMAS RD
7th ST
THOMAS RD
MAP OF HERITAGE COMMERCIAL
AREAS
36 | Preservation Phoenix StyleY
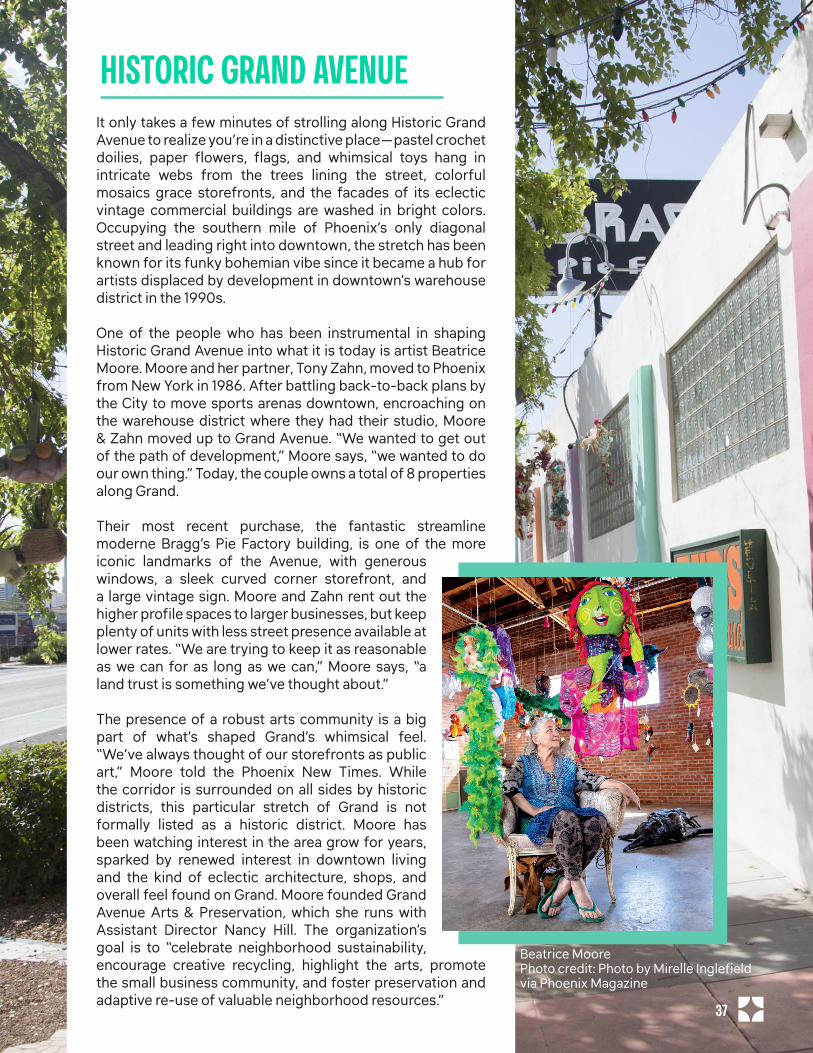
HISTORIC GRAND AVENUEIt only takes a few minutes of strolling along Historic Grand Avenue to realize you’re in a distinctive place—pastel crochet doilies, paper flowers, flags, and whimsical toys hang in intricate webs from the trees lining the street, colorful mosaics grace storefronts, and the facades of its eclectic vintage commercial buildings are washed in bright colors. Occupying the southern mile of Phoenix’s only diagonal street and leading right into downtown, the stretch has been known for its funky bohemian vibe since it became a hub for artists displaced by development in downtown’s warehouse district in the 1990s.
One of the people who has been instrumental in shaping Historic Grand Avenue into what it is today is artist Beatrice Moore. Moore and her partner, Tony Zahn, moved to Phoenix from New York in 1986. After battling back-to-back plans by the City to move sports arenas downtown, encroaching on the warehouse district where they had their studio, Moore & Zahn moved up to Grand Avenue. “We wanted to get out of the path of development,” Moore says, “we wanted to do our own thing.” Today, the couple owns a total of 8 properties along Grand.
Their most recent purchase, the fantastic streamline moderne Bragg’s Pie Factory building, is one of the more iconic landmarks of the Avenue, with generous windows, a sleek curved corner storefront, and a large vintage sign. Moore and Zahn rent out the higher profile spaces to larger businesses, but keep plenty of units with less street presence available at lower rates. “We are trying to keep it as reasonable as we can for as long as we can,” Moore says, “a land trust is something we’ve thought about.”
The presence of a robust arts community is a big part of what’s shaped Grand’s whimsical feel. “We’ve always thought of our storefronts as public art,” Moore told the Phoenix New Times. While the corridor is surrounded on all sides by historic districts, this particular stretch of Grand is not formally listed as a historic district. Moore has been watching interest in the area grow for years, sparked by renewed interest in downtown living and the kind of eclectic architecture, shops, and overall feel found on Grand. Moore founded Grand Avenue Arts & Preservation, which she runs with Assistant Director Nancy Hill. The organization’s goal is to “celebrate neighborhood sustainability, encourage creative recycling, highlight the arts, promote the small business community, and foster preservation and adaptive re-use of valuable neighborhood resources.”
Beatrice MoorePhoto credit: Photo by Mirelle Inglefield via Phoenix Magazine
37 Y
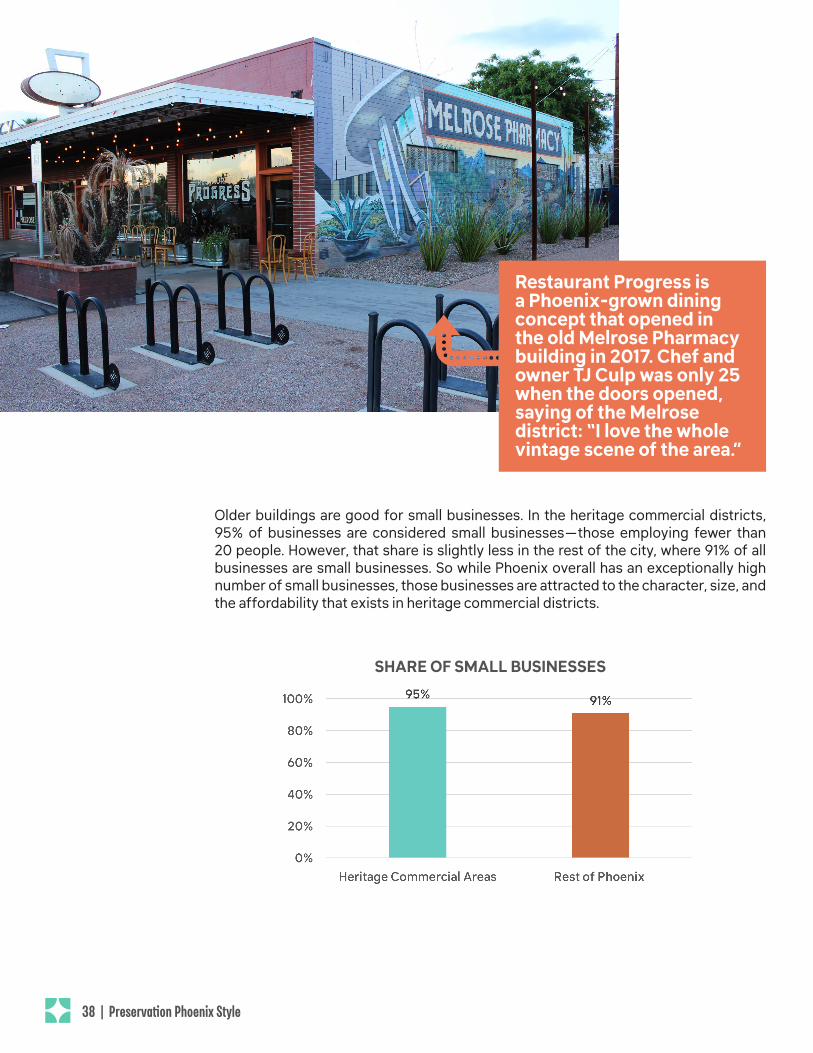
Older buildings are good for small businesses. In the heritage commercial districts, 95% of businesses are considered small businesses—those employing fewer than 20 people. However, that share is slightly less in the rest of the city, where 91% of all businesses are small businesses. So while Phoenix overall has an exceptionally high number of small businesses, those businesses are attracted to the character, size, and the affordability that exists in heritage commercial districts.
Restaurant Progress is a Phoenix-grown dining concept that opened in the old Melrose Pharmacy building in 2017. Chef and owner TJ Culp was only 25 when the doors opened, saying of the Melrose district: “I love the whole vintage scene of the area.”
4
SHARE OF SMALL BUSINESSES
38 | Preservation Phoenix StyleY
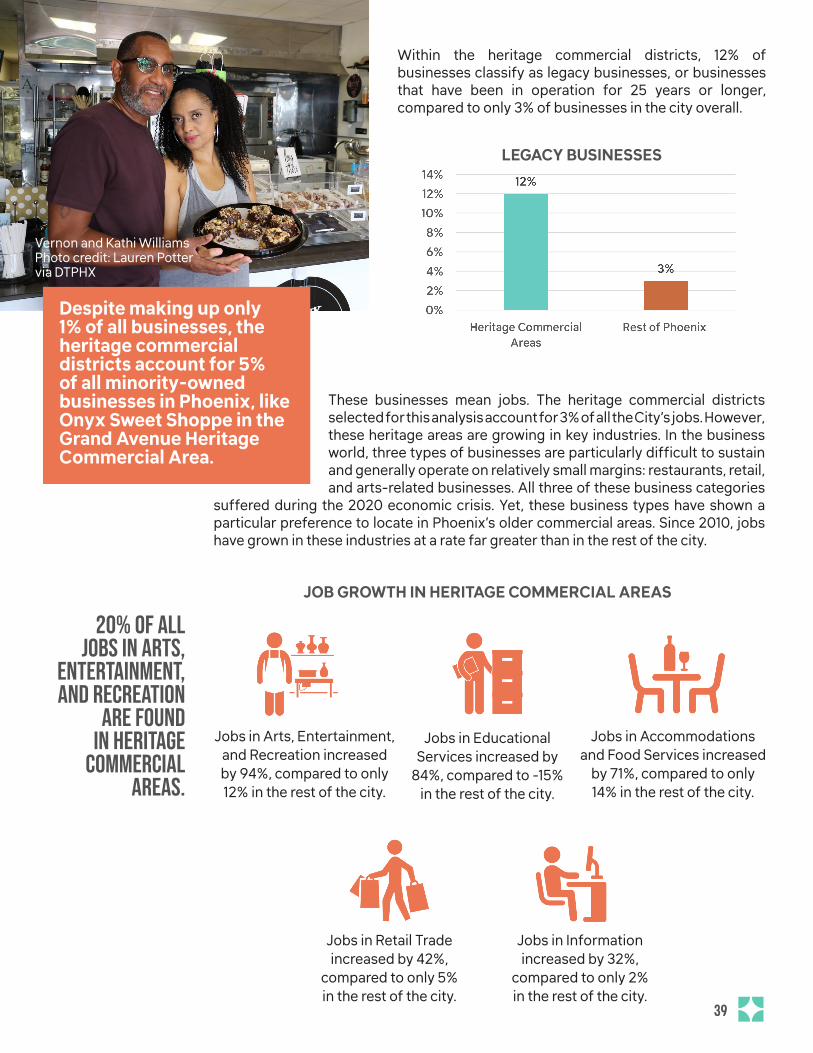
Despite making up only 1% of all businesses, the heritage commercial districts account for 5% of all minority-owned businesses in Phoenix, like Onyx Sweet Shoppe in the Grand Avenue Heritage Commercial Area.
Vernon and Kathi WilliamsPhoto credit: Lauren Potter via DTPHX
Within the heritage commercial districts, 12% of businesses classify as legacy businesses, or businesses that have been in operation for 25 years or longer, compared to only 3% of businesses in the city overall.
LEGACY BUSINESSES
These businesses mean jobs. The heritage commercial districts selected for this analysis account for 3% of all the City’s jobs. However, these heritage areas are growing in key industries. In the business world, three types of businesses are particularly difficult to sustain and generally operate on relatively small margins: restaurants, retail, and arts-related businesses. All three of these business categories
suffered during the 2020 economic crisis. Yet, these business types have shown a particular preference to locate in Phoenix’s older commercial areas. Since 2010, jobs have grown in these industries at a rate far greater than in the rest of the city.
20% of all jobs in Arts,
Entertainment, and Recreation
are found in heritage
commercial areas.
Jobs in Arts, Entertainment, and Recreation increased by 94%, compared to only 12% in the rest of the city.
Jobs in Accommodations and Food Services increased
by 71%, compared to only 14% in the rest of the city.
Jobs in Information increased by 32%,
compared to only 2% in the rest of the city.
Jobs in Retail Trade increased by 42%,
compared to only 5% in the rest of the city.
Jobs in Educational Services increased by
84%, compared to -15% in the rest of the city.
JOB GROWTH IN HERITAGE COMMERCIAL AREAS
39 Y
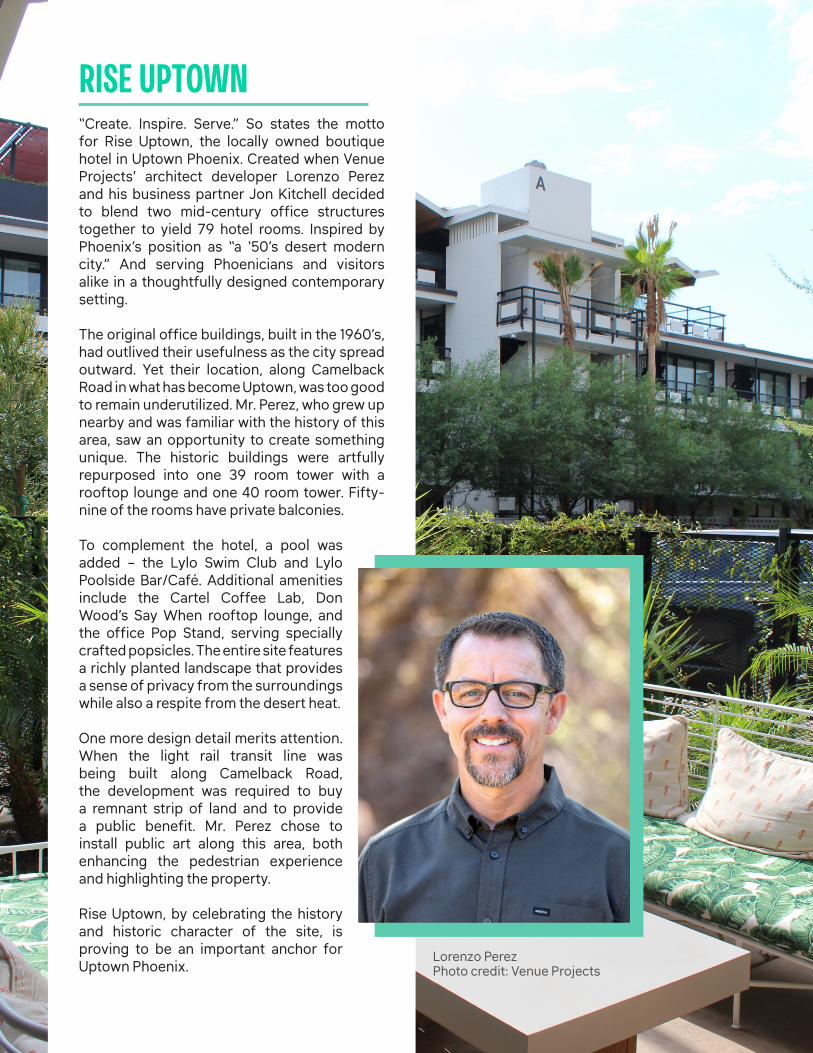
“Create. Inspire. Serve.” So states the motto for Rise Uptown, the locally owned boutique hotel in Uptown Phoenix. Created when Venue Projects’ architect developer Lorenzo Perez and his business partner Jon Kitchell decided to blend two mid-century office structures together to yield 79 hotel rooms. Inspired by Phoenix’s position as “a ‘50’s desert modern city.” And serving Phoenicians and visitors alike in a thoughtfully designed contemporary setting.
The original office buildings, built in the 1960’s, had outlived their usefulness as the city spread outward. Yet their location, along Camelback Road in what has become Uptown, was too good to remain underutilized. Mr. Perez, who grew up nearby and was familiar with the history of this area, saw an opportunity to create something unique. The historic buildings were artfully repurposed into one 39 room tower with a rooftop lounge and one 40 room tower. Fifty-nine of the rooms have private balconies.
To complement the hotel, a pool was added – the Lylo Swim Club and Lylo Poolside Bar/Café. Additional amenities include the Cartel Coffee Lab, Don Wood’s Say When rooftop lounge, and the office Pop Stand, serving specially crafted popsicles. The entire site features a richly planted landscape that provides a sense of privacy from the surroundings while also a respite from the desert heat.
One more design detail merits attention. When the light rail transit line was being built along Camelback Road, the development was required to buy a remnant strip of land and to provide a public benefit. Mr. Perez chose to install public art along this area, both enhancing the pedestrian experience and highlighting the property.
Rise Uptown, by celebrating the history and historic character of the site, is proving to be an important anchor for Uptown Phoenix.
RISE UPTOWN
Lorenzo PerezPhoto credit: Venue Projects
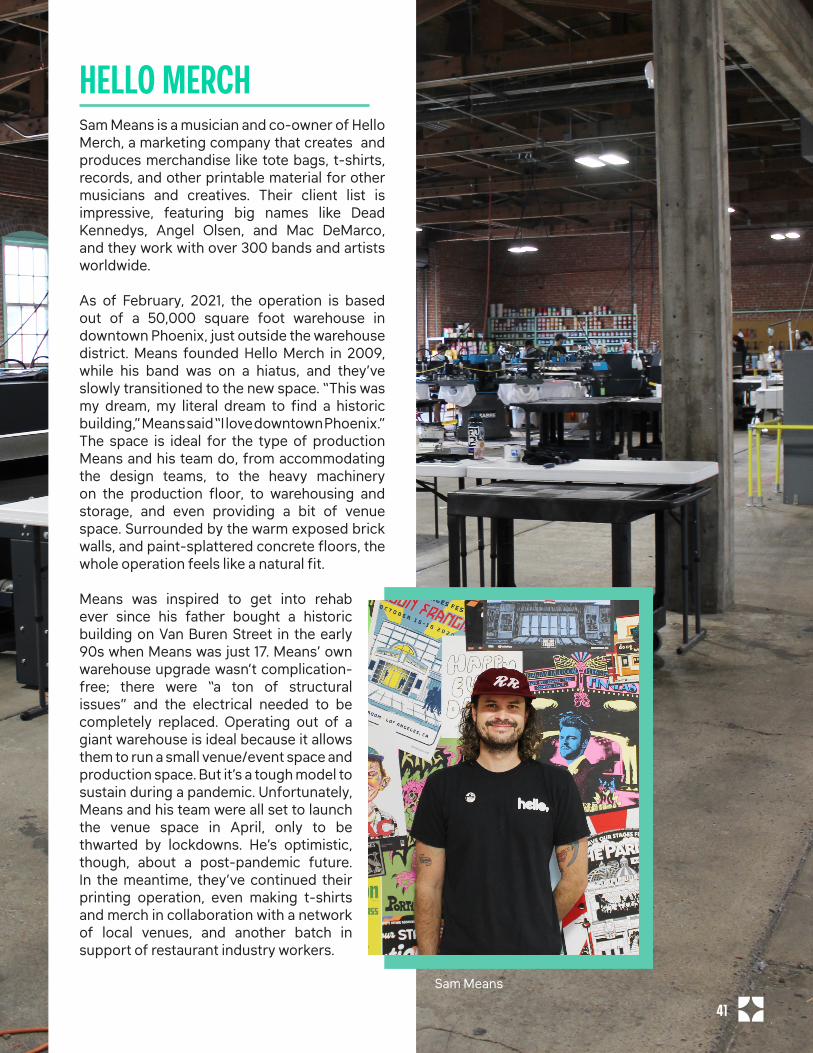
Sam Means is a musician and co-owner of Hello Merch, a marketing company that creates and produces merchandise like tote bags, t-shirts, records, and other printable material for other musicians and creatives. Their client list is impressive, featuring big names like Dead Kennedys, Angel Olsen, and Mac DeMarco, and they work with over 300 bands and artists worldwide.
As of February, 2021, the operation is based out of a 50,000 square foot warehouse in downtown Phoenix, just outside the warehouse district. Means founded Hello Merch in 2009, while his band was on a hiatus, and they’ve slowly transitioned to the new space. “This was my dream, my literal dream to find a historic building,” Means said “I love downtown Phoenix.” The space is ideal for the type of production Means and his team do, from accommodating the design teams, to the heavy machinery on the production floor, to warehousing and storage, and even providing a bit of venue space. Surrounded by the warm exposed brick walls, and paint-splattered concrete floors, the whole operation feels like a natural fit.
Means was inspired to get into rehab ever since his father bought a historic building on Van Buren Street in the early 90s when Means was just 17. Means’ own warehouse upgrade wasn’t complication-free; there were “a ton of structural issues” and the electrical needed to be completely replaced. Operating out of a giant warehouse is ideal because it allows them to run a small venue/event space and production space. But it’s a tough model to sustain during a pandemic. Unfortunately, Means and his team were all set to launch the venue space in April, only to be thwarted by lockdowns. He’s optimistic, though, about a post-pandemic future. In the meantime, they’ve continued their printing operation, even making t-shirts and merch in collaboration with a network of local venues, and another batch in support of restaurant industry workers.
HELLO MERCH
Sam Means
41 Y
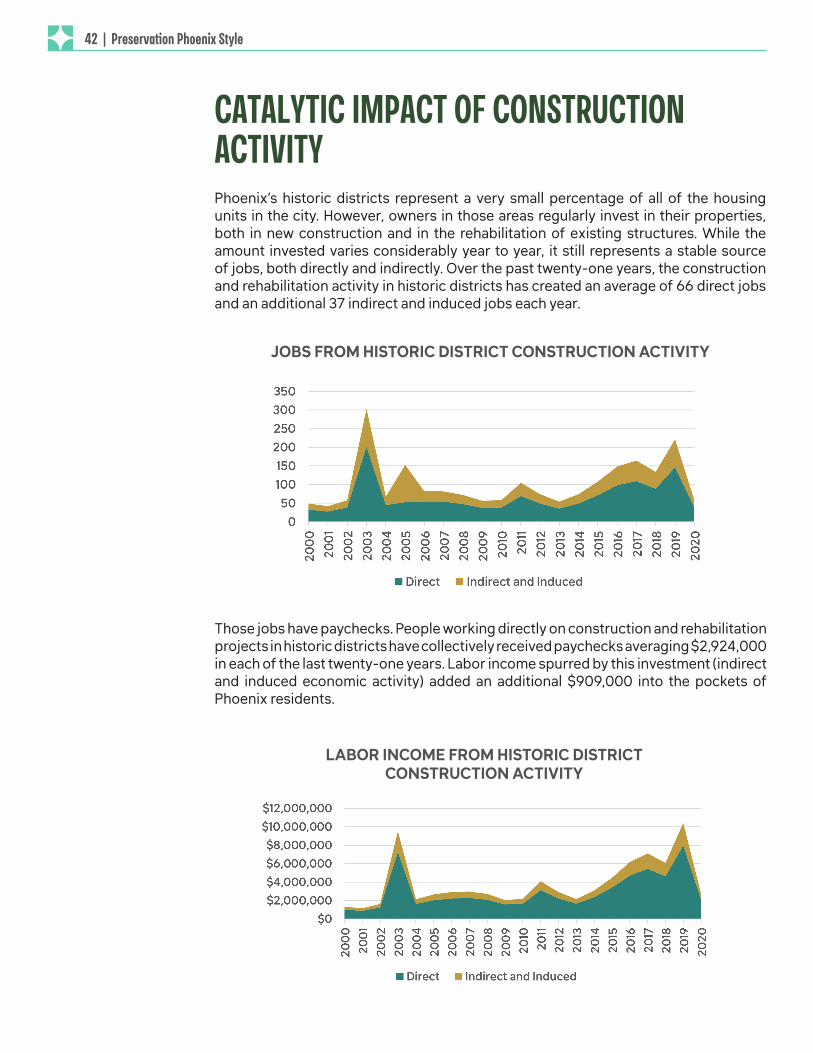
CATALYTIC IMPACT OF CONSTRUCTION ACTIVITY Phoenix’s historic districts represent a very small percentage of all of the housing units in the city. However, owners in those areas regularly invest in their properties, both in new construction and in the rehabilitation of existing structures. While the amount invested varies considerably year to year, it still represents a stable source of jobs, both directly and indirectly. Over the past twenty-one years, the construction and rehabilitation activity in historic districts has created an average of 66 direct jobs and an additional 37 indirect and induced jobs each year.
Those jobs have paychecks. People working directly on construction and rehabilitation projects in historic districts have collectively received paychecks averaging $2,924,000 in each of the last twenty-one years. Labor income spurred by this investment (indirect and induced economic activity) added an additional $909,000 into the pockets of Phoenix residents.
JOBS FROM HISTORIC DISTRICT CONSTRUCTION ACTIVITY
LABOR INCOME FROM HISTORIC DISTRICT CONSTRUCTION ACTIVITY
42 | Preservation Phoenix StyleY
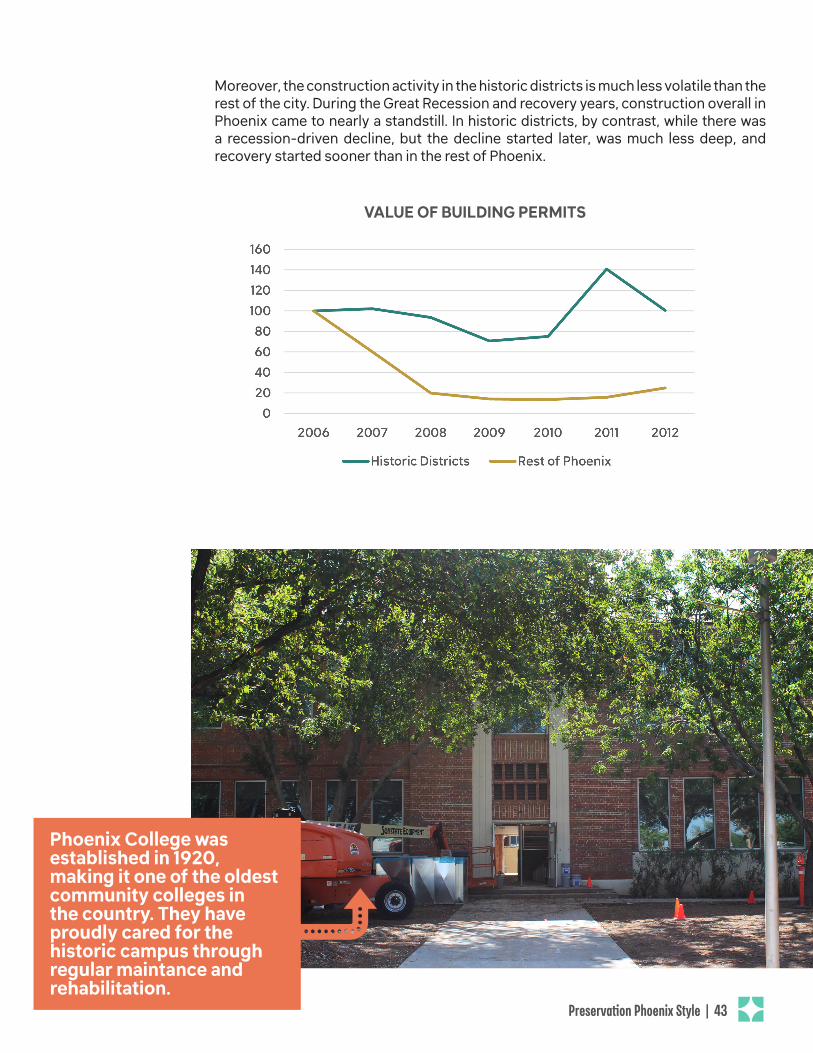
Moreover, the construction activity in the historic districts is much less volatile than the rest of the city. During the Great Recession and recovery years, construction overall in Phoenix came to nearly a standstill. In historic districts, by contrast, while there was a recession-driven decline, but the decline started later, was much less deep, and recovery started sooner than in the rest of Phoenix.
VALUE OF BUILDING PERMITS
Phoenix College was established in 1920, making it one of the oldest community colleges in the country. They have proudly cared for the historic campus through regular maintance and rehabilitation.
4
Preservation Phoenix Style | 43 Y
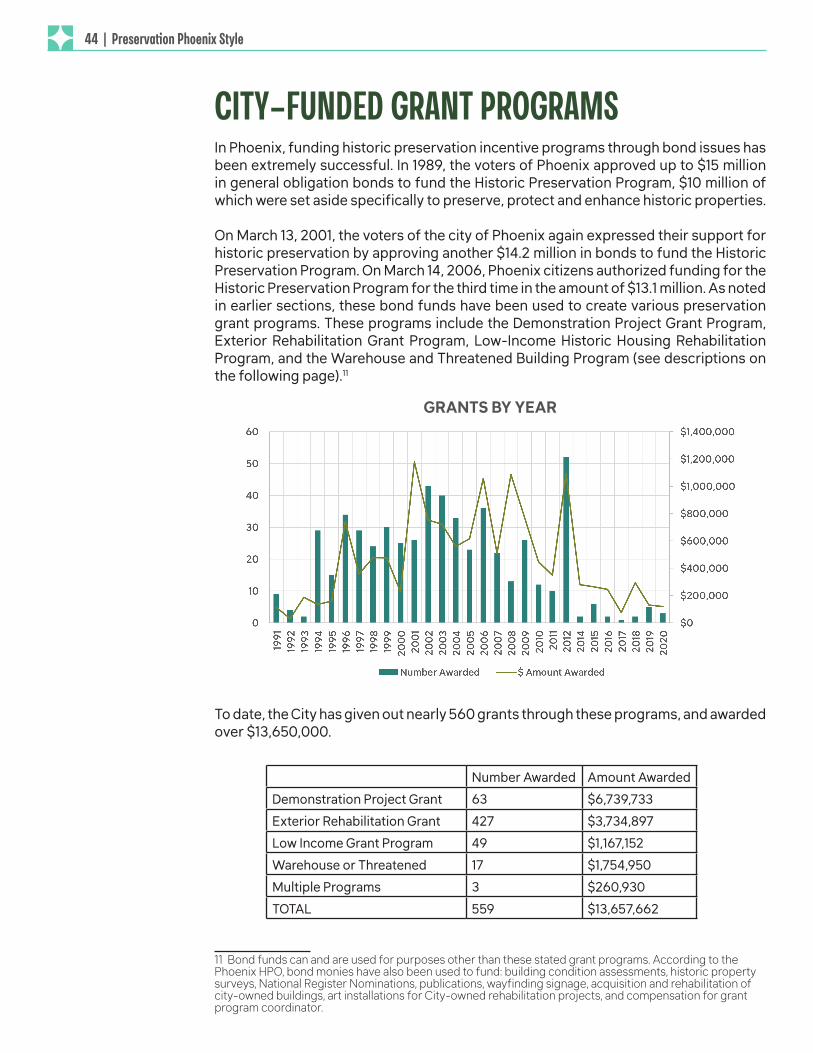
CITY-FUNDED GRANT PROGRAMSIn Phoenix, funding historic preservation incentive programs through bond issues has been extremely successful. In 1989, the voters of Phoenix approved up to $15 million in general obligation bonds to fund the Historic Preservation Program, $10 million of which were set aside specifically to preserve, protect and enhance historic properties.
On March 13, 2001, the voters of the city of Phoenix again expressed their support for historic preservation by approving another $14.2 million in bonds to fund the Historic Preservation Program. On March 14, 2006, Phoenix citizens authorized funding for the Historic Preservation Program for the third time in the amount of $13.1 million. As noted in earlier sections, these bond funds have been used to create various preservation grant programs. These programs include the Demonstration Project Grant Program, Exterior Rehabilitation Grant Program, Low-Income Historic Housing Rehabilitation Program, and the Warehouse and Threatened Building Program (see descriptions on the following page).11
To date, the City has given out nearly 560 grants through these programs, and awarded over $13,650,000.
11 Bond funds can and are used for purposes other than these stated grant programs. According to the Phoenix HPO, bond monies have also been used to fund: building condition assessments, historic property surveys, National Register Nominations, publications, wayfinding signage, acquisition and rehabilitation of city-owned buildings, art installations for City-owned rehabilitation projects, and compensation for grant program coordinator.
GRANTS BY YEAR
Number Awarded Amount AwardedDemonstration Project Grant 63 $6,739,733Exterior Rehabilitation Grant 427 $3,734,897Low Income Grant Program 49 $1,167,152Warehouse or Threatened 17 $1,754,950Multiple Programs 3 $260,930TOTAL 559 $13,657,662
44 | Preservation Phoenix StyleY
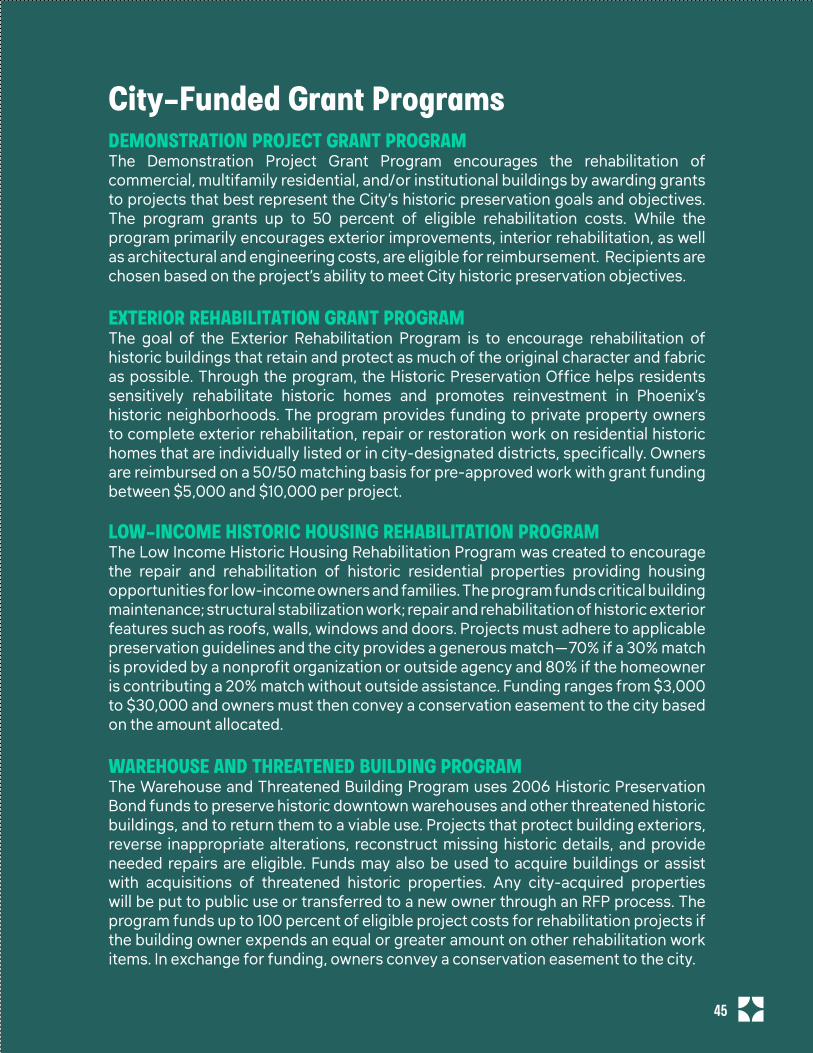
DEMONSTRATION PROJECT GRANT PROGRAMThe Demonstration Project Grant Program encourages the rehabilitation of commercial, multifamily residential, and/or institutional buildings by awarding grants to projects that best represent the City’s historic preservation goals and objectives. The program grants up to 50 percent of eligible rehabilitation costs. While the program primarily encourages exterior improvements, interior rehabilitation, as well as architectural and engineering costs, are eligible for reimbursement. Recipients are chosen based on the project’s ability to meet City historic preservation objectives.
EXTERIOR REHABILITATION GRANT PROGRAMThe goal of the Exterior Rehabilitation Program is to encourage rehabilitation of historic buildings that retain and protect as much of the original character and fabric as possible. Through the program, the Historic Preservation Office helps residents sensitively rehabilitate historic homes and promotes reinvestment in Phoenix’s historic neighborhoods. The program provides funding to private property owners to complete exterior rehabilitation, repair or restoration work on residential historic homes that are individually listed or in city-designated districts, specifically. Owners are reimbursed on a 50/50 matching basis for pre-approved work with grant funding between $5,000 and $10,000 per project.
LOW-INCOME HISTORIC HOUSING REHABILITATION PROGRAM The Low Income Historic Housing Rehabilitation Program was created to encourage the repair and rehabilitation of historic residential properties providing housing opportunities for low-income owners and families. The program funds critical building maintenance; structural stabilization work; repair and rehabilitation of historic exterior features such as roofs, walls, windows and doors. Projects must adhere to applicable preservation guidelines and the city provides a generous match—70% if a 30% match is provided by a nonprofit organization or outside agency and 80% if the homeowner is contributing a 20% match without outside assistance. Funding ranges from $3,000 to $30,000 and owners must then convey a conservation easement to the city based on the amount allocated.
WAREHOUSE AND THREATENED BUILDING PROGRAMThe Warehouse and Threatened Building Program uses 2006 Historic Preservation Bond funds to preserve historic downtown warehouses and other threatened historic buildings, and to return them to a viable use. Projects that protect building exteriors, reverse inappropriate alterations, reconstruct missing historic details, and provide needed repairs are eligible. Funds may also be used to acquire buildings or assist with acquisitions of threatened historic properties. Any city-acquired properties will be put to public use or transferred to a new owner through an RFP process. The program funds up to 100 percent of eligible project costs for rehabilitation projects if the building owner expends an equal or greater amount on other rehabilitation work items. In exchange for funding, owners convey a conservation easement to the city.
City-Funded Grant Programs
45 Y
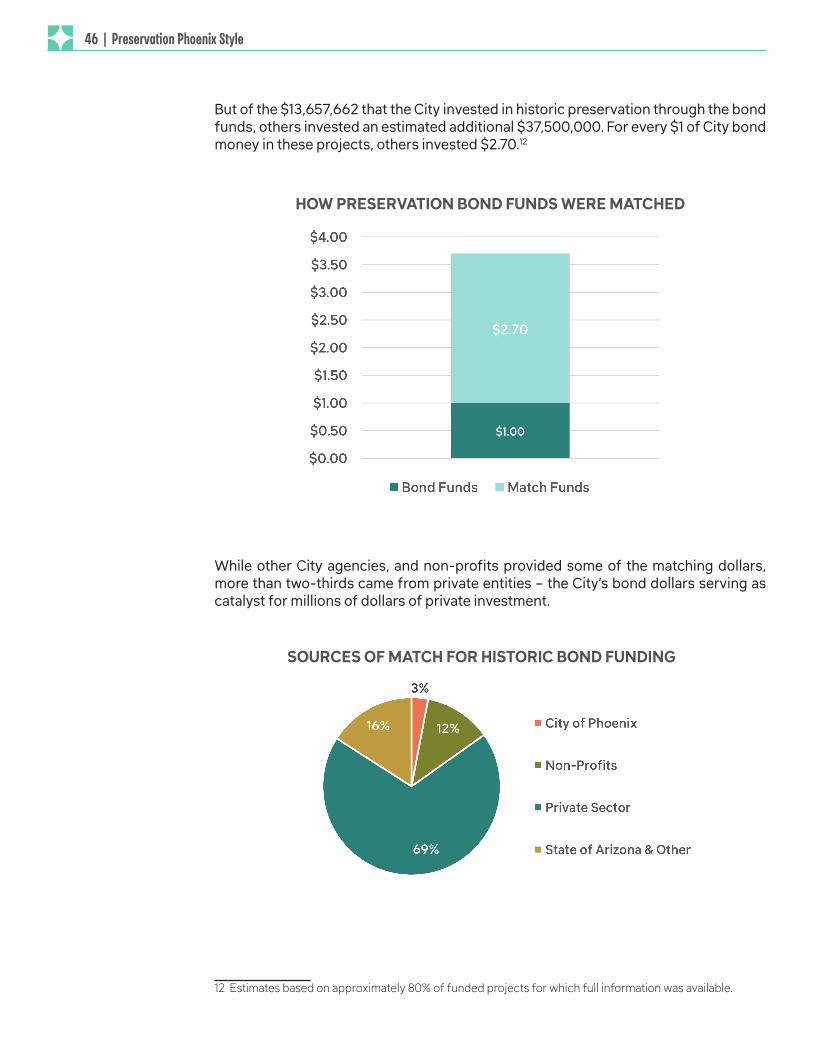
But of the $13,657,662 that the City invested in historic preservation through the bond funds, others invested an estimated additional $37,500,000. For every $1 of City bond money in these projects, others invested $2.70.12
While other City agencies, and non-profits provided some of the matching dollars, more than two-thirds came from private entities – the City’s bond dollars serving as catalyst for millions of dollars of private investment.
12 Estimates based on approximately 80% of funded projects for which full information was available.
HOW PRESERVATION BOND FUNDS WERE MATCHED
SOURCES OF MATCH FOR HISTORIC BOND FUNDING
46 | Preservation Phoenix StyleY
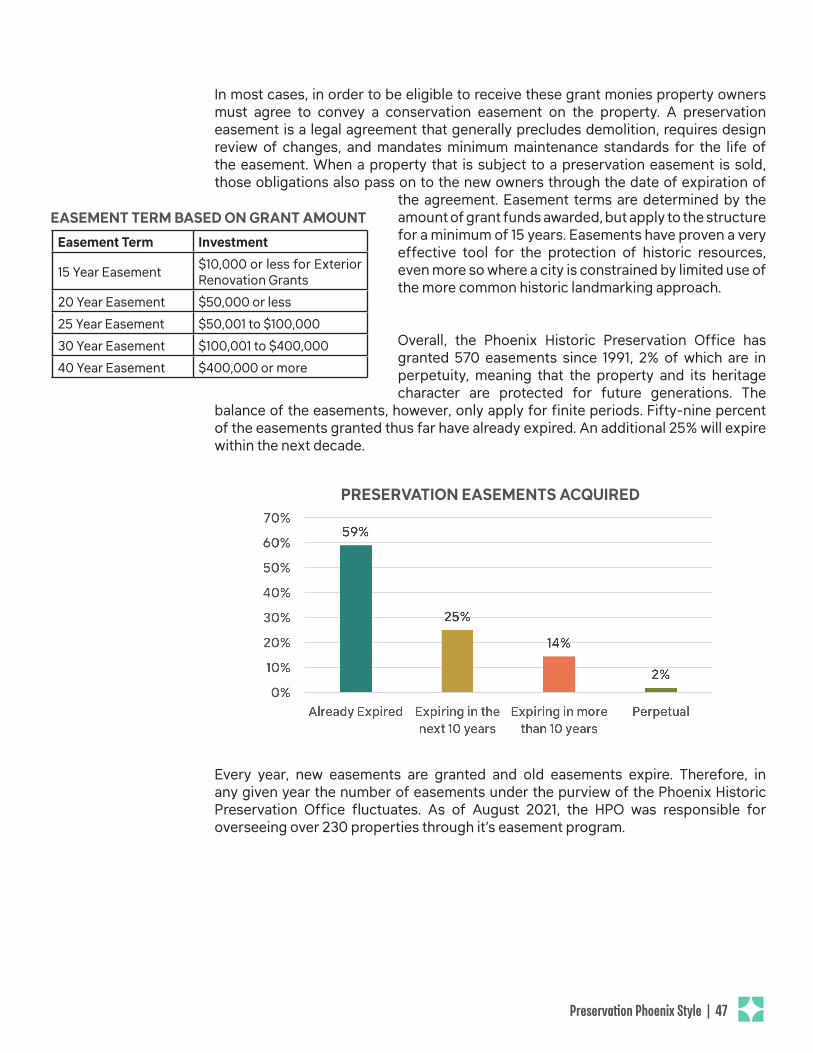
In most cases, in order to be eligible to receive these grant monies property owners must agree to convey a conservation easement on the property. A preservation easement is a legal agreement that generally precludes demolition, requires design review of changes, and mandates minimum maintenance standards for the life of the easement. When a property that is subject to a preservation easement is sold, those obligations also pass on to the new owners through the date of expiration of
the agreement. Easement terms are determined by the amount of grant funds awarded, but apply to the structure for a minimum of 15 years. Easements have proven a very effective tool for the protection of historic resources, even more so where a city is constrained by limited use of the more common historic landmarking approach.
Overall, the Phoenix Historic Preservation Office has granted 570 easements since 1991, 2% of which are in perpetuity, meaning that the property and its heritage character are protected for future generations. The
balance of the easements, however, only apply for finite periods. Fifty-nine percent of the easements granted thus far have already expired. An additional 25% will expire within the next decade.
PRESERVATION EASEMENTS ACQUIRED
Every year, new easements are granted and old easements expire. Therefore, in any given year the number of easements under the purview of the Phoenix Historic Preservation Office fluctuates. As of August 2021, the HPO was responsible for overseeing over 230 properties through it’s easement program.
Easement Term Investment
15 Year Easement $10,000 or less for Exterior Renovation Grants
20 Year Easement $50,000 or less 25 Year Easement $50,001 to $100,00030 Year Easement $100,001 to $400,00040 Year Easement $400,000 or more
EASEMENT TERM BASED ON GRANT AMOUNT
Preservation Phoenix Style | 47 Y
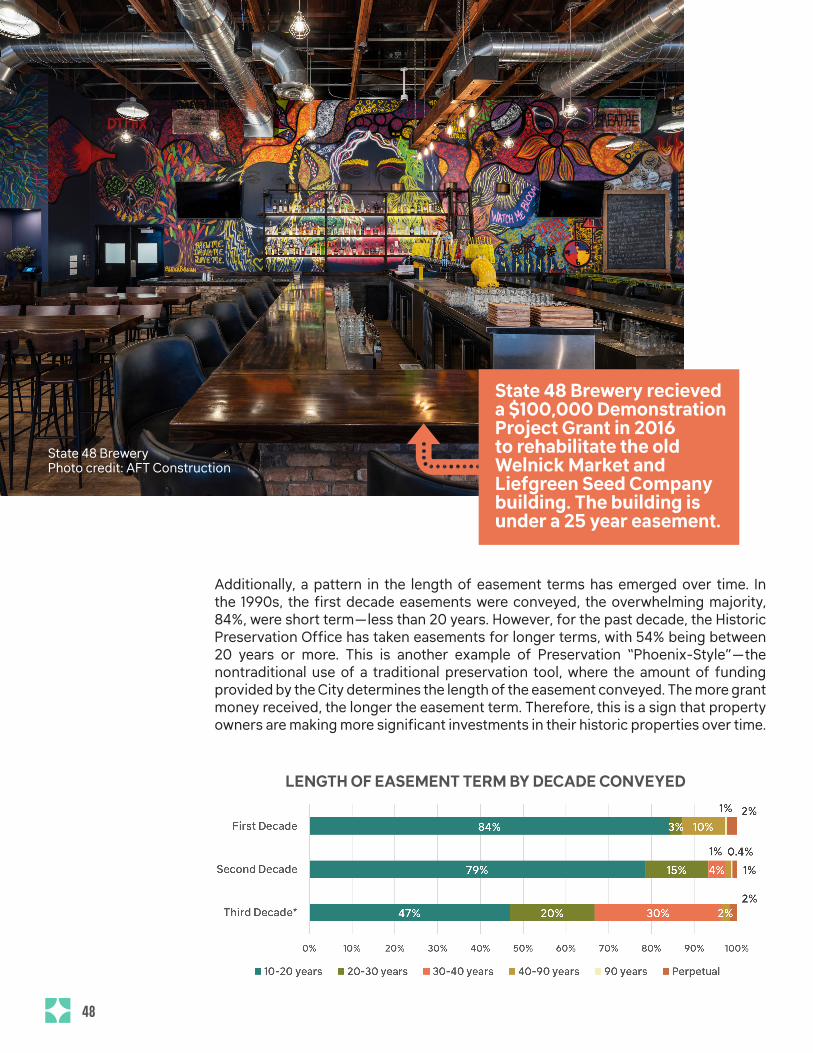
Additionally, a pattern in the length of easement terms has emerged over time. In the 1990s, the first decade easements were conveyed, the overwhelming majority, 84%, were short term—less than 20 years. However, for the past decade, the Historic Preservation Office has taken easements for longer terms, with 54% being between 20 years or more. This is another example of Preservation “Phoenix-Style”—the nontraditional use of a traditional preservation tool, where the amount of funding provided by the City determines the length of the easement conveyed. The more grant money received, the longer the easement term. Therefore, this is a sign that property owners are making more significant investments in their historic properties over time.
LENGTH OF EASEMENT TERM BY DECADE CONVEYED
State 48 Brewery recieved a $100,000 Demonstration Project Grant in 2016 to rehabilitate the old Welnick Market and Liefgreen Seed Company building. The building is under a 25 year easement.
4State 48 BreweryPhoto credit: AFT Construction
48 Y

Terry Goddard jokes that he was brought to Phoenix “under duress” when his father Samuel Goddard was elected governor in 1965 and the family moved to the capital from Tucson, Phoenix’s dustier and older southern neighbor. Though he’s made a name for himself as one of Phoenix’s most prominent preservationists, particularly during his tenure as former Mayor, Goddard says he always appreciated Tucson’s authentic feel. “This building has a little bit of that sense,” he says, referring to his current project, rehabbing the massive 1929 former First Baptist Church at the corner of Monroe and Third Avenue in downtown Phoenix, so badly damaged by a fire that the city condemned it in 1992.
Soon after, Goddard’s nonprofit Housing Opportunity Center, Inc., stepped in to buy the shell with the intent, Goddard states plainly, to keep the City from destroying it. “Nobody wanted it,” he says.The City had declared the building a hazard, but Goddard saw its potential and the National Trust gave a $40,000 loan to stabilize the building. It then took more than two decades to secure sufficient funds, but stabilization of the Monroe Street Abbey, as it was renamed, finally began in 2014. Since then, they’ve secured nearly $300,000 in City grants to stabilize and rehab it.
We meander through the former sanctuary of the church, which now feels more like a large, open courtyard, looking up past the fire-licked walls at the deep blue sky. It is like entering a little pocket of old Phoenix, what feels like an ancient ruin nestled in amongst the sleek, large-scale government buildings and towers that otherwise characterize downtown. As we walk, Goddard paints a picture of what he envisions for the space: the atrium could be a performance and event venue, the wing a pop-up restaurant incubator, the rooftop patio a beer garden—a place for the community to come together.
Redevelopment plans for the Abbey, long in the making, have slowed down due to the pandemic. The group was set to sign final tenant papers right before the mandated lockdown, but in the meantime, the space has been used for photography shoots and outdoor events. It’s especially popular with photographers and has become somewhat of a coveted, exclusive wedding venue. “The Abby is breathtaking, largely in part due to its age, size and the amount of wear and tear it’s endured over time,” said photographer Jamie Allio, who photographed an intimate wedding ceremony at The Abbey in 2017. “The spacious area in the center remains roofless which creates the perfect light and backdrop at every angle.” There’s no doubt that once it’s finally up and running, the space will be a welcome addition to the downtown scene.
THE ABBEYTerri Goddard
Photo by Lauren Gilger - KJZZ
49 Y
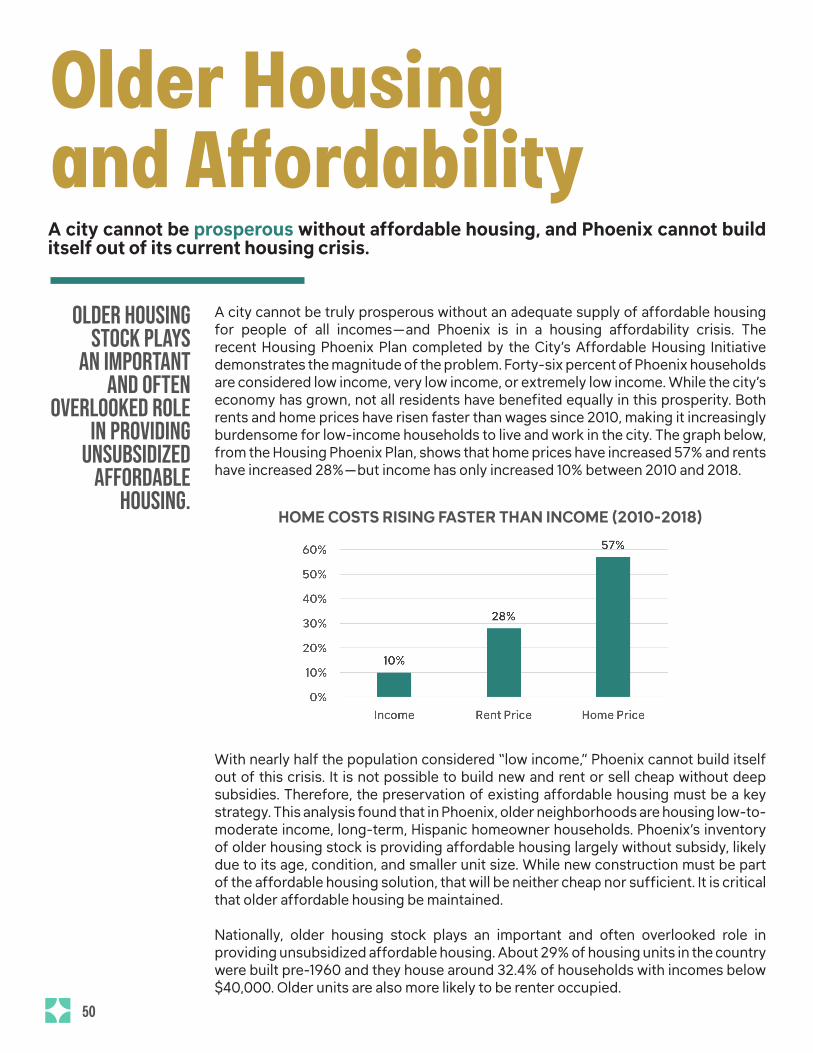
Older housing stock plays
an important and often
overlooked role in providing
unsubsidized affordable
housing.
Older Housing and AffordabilityA city cannot be prosperous without affordable housing, and Phoenix cannot build itself out of its current housing crisis.
A city cannot be truly prosperous without an adequate supply of affordable housing for people of all incomes—and Phoenix is in a housing affordability crisis. The recent Housing Phoenix Plan completed by the City’s Affordable Housing Initiative demonstrates the magnitude of the problem. Forty-six percent of Phoenix households are considered low income, very low income, or extremely low income. While the city’s economy has grown, not all residents have benefited equally in this prosperity. Both rents and home prices have risen faster than wages since 2010, making it increasingly burdensome for low-income households to live and work in the city. The graph below, from the Housing Phoenix Plan, shows that home prices have increased 57% and rents have increased 28%—but income has only increased 10% between 2010 and 2018.
With nearly half the population considered “low income,” Phoenix cannot build itself out of this crisis. It is not possible to build new and rent or sell cheap without deep subsidies. Therefore, the preservation of existing affordable housing must be a key strategy. This analysis found that in Phoenix, older neighborhoods are housing low-to-moderate income, long-term, Hispanic homeowner households. Phoenix’s inventory of older housing stock is providing affordable housing largely without subsidy, likely due to its age, condition, and smaller unit size. While new construction must be part of the affordable housing solution, that will be neither cheap nor sufficient. It is critical that older affordable housing be maintained.
Nationally, older housing stock plays an important and often overlooked role in providing unsubsidized affordable housing. About 29% of housing units in the country were built pre-1960 and they house around 32.4% of households with incomes below $40,000. Older units are also more likely to be renter occupied.
HOME COSTS RISING FASTER THAN INCOME (2010-2018)
50 Y
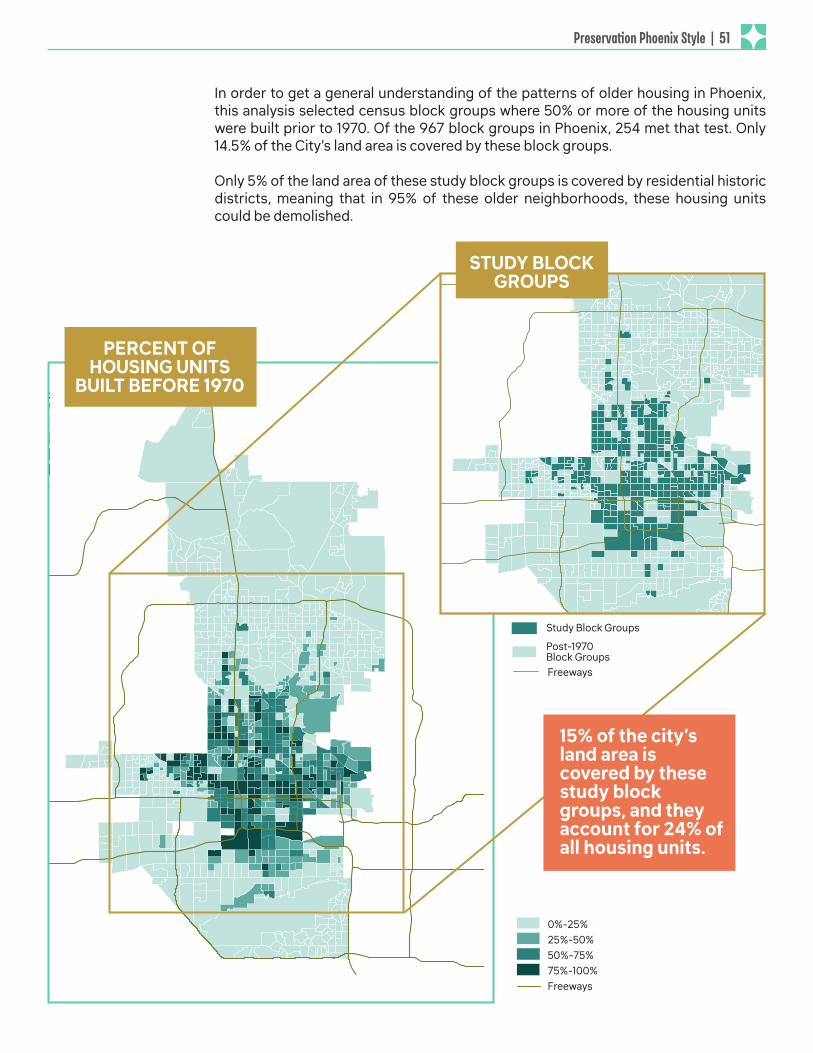
In order to get a general understanding of the patterns of older housing in Phoenix, this analysis selected census block groups where 50% or more of the housing units were built prior to 1970. Of the 967 block groups in Phoenix, 254 met that test. Only 14.5% of the City’s land area is covered by these block groups.
Only 5% of the land area of these study block groups is covered by residential historic districts, meaning that in 95% of these older neighborhoods, these housing units could be demolished.
Block Groups with a Concentration of Pre-1970 Housing
Study Block Groups
Census Block Groups
Percent of Housing Units Built Before 1970
Freeways
0% - 25%
25% - 50%
50% - 75%
75% - 100%
LegendFreeways
Study Block Groups
HousingAge_citywide
STUDY BLOCK GROUPS
PERCENT OF HOUSING UNITS
BUILT BEFORE 1970
Block Groups with a Concentration of Pre-1970 Housing
Study Block Groups
Census Block Groups
Percent of Housing Units Built Before 1970
Freeways
0% - 25%
25% - 50%
50% - 75%
75% - 100%
0%-25%25%-50%50%-75%75%-100%Freeways
15% of the city’s land area is covered by these study block groups, and they account for 24% of all housing units.
LegendFreeways
Study Block Groups
HousingAge_citywide Study Block Groups
Freeways
Post-1970 Block GroupsLegend
Freeways
Study Block Groups
HousingAge_citywide
Preservation Phoenix Style | 51 Y
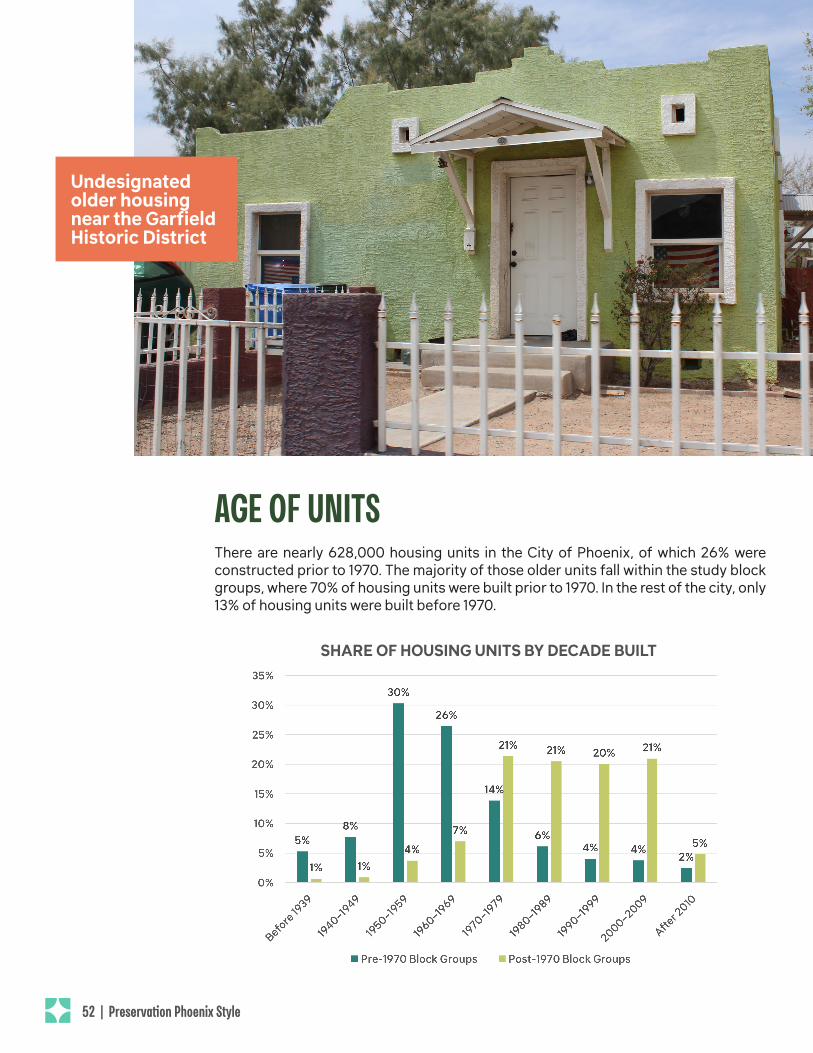
AGE OF UNITSThere are nearly 628,000 housing units in the City of Phoenix, of which 26% were constructed prior to 1970. The majority of those older units fall within the study block groups, where 70% of housing units were built prior to 1970. In the rest of the city, only 13% of housing units were built before 1970.
SHARE OF HOUSING UNITS BY DECADE BUILT
Undesignated older housing near the Garfield Historic District
52 | Preservation Phoenix StyleY
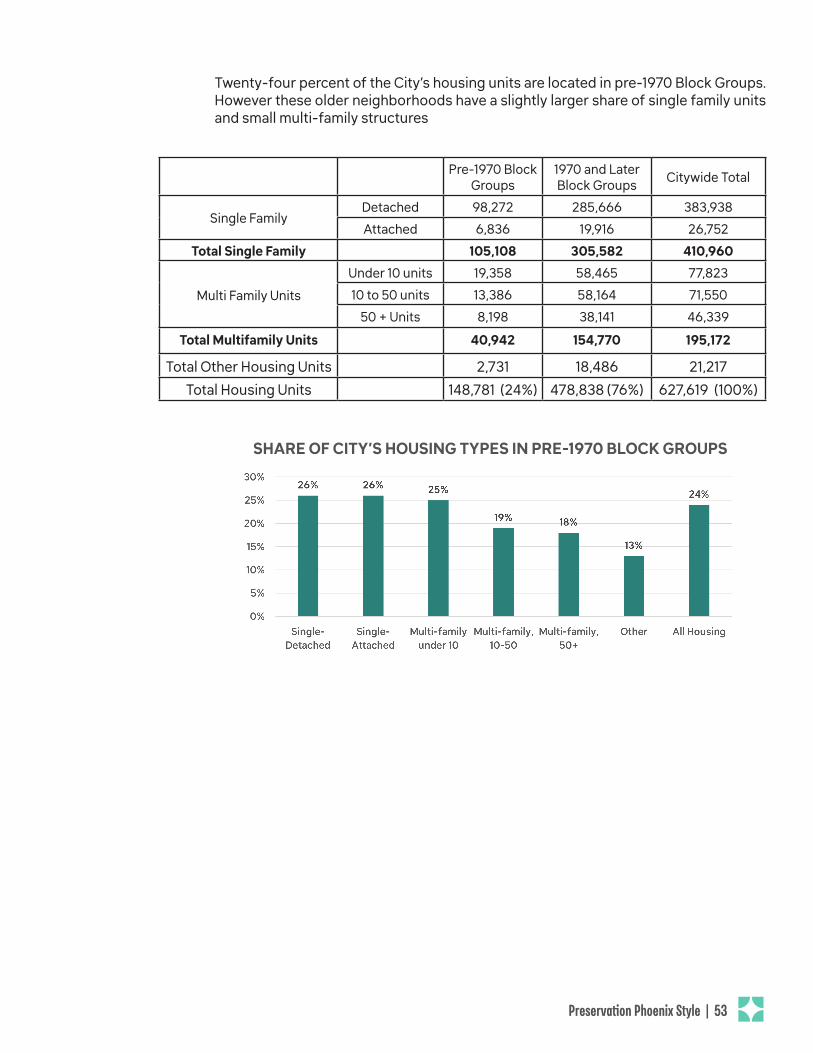
Twenty-four percent of the City’s housing units are located in pre-1970 Block Groups. However these older neighborhoods have a slightly larger share of single family units and small multi-family structures
Pre-1970 Block Groups
1970 and Later Block Groups Citywide Total
Single FamilyDetached 98,272 285,666 383,938Attached 6,836 19,916 26,752
Total Single Family 105,108 305,582 410,960
Multi Family UnitsUnder 10 units 19,358 58,465 77,82310 to 50 units 13,386 58,164 71,550
50 + Units 8,198 38,141 46,339Total Multifamily Units 40,942 154,770 195,172
Total Other Housing Units 2,731 18,486 21,217Total Housing Units 148,781 (24%) 478,838 (76%) 627,619 (100%)
SHARE OF CITY’S HOUSING TYPES IN PRE-1970 BLOCK GROUPS
Preservation Phoenix Style | 53 Y
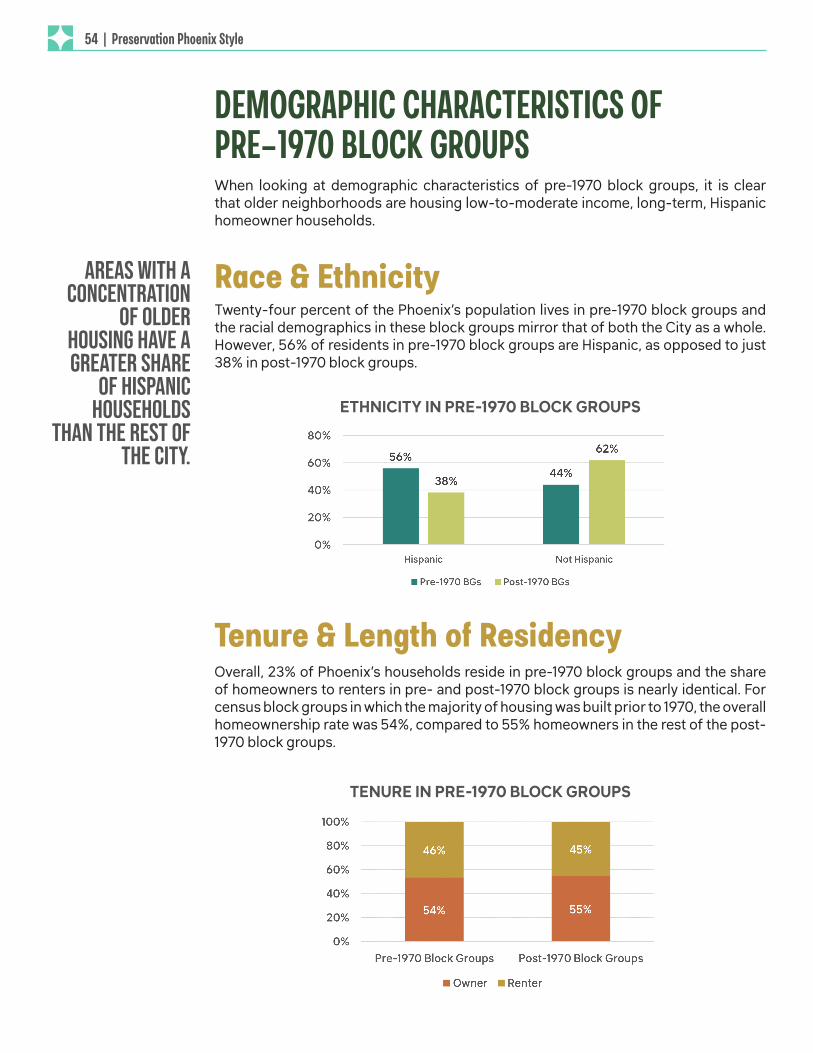
DEMOGRAPHIC CHARACTERISTICS OF PRE-1970 BLOCK GROUPSWhen looking at demographic characteristics of pre-1970 block groups, it is clear that older neighborhoods are housing low-to-moderate income, long-term, Hispanic homeowner households.
Race & Ethnicity
Tenure & Length of Residency
Twenty-four percent of the Phoenix’s population lives in pre-1970 block groups and the racial demographics in these block groups mirror that of both the City as a whole. However, 56% of residents in pre-1970 block groups are Hispanic, as opposed to just 38% in post-1970 block groups.
ETHNICITY IN PRE-1970 BLOCK GROUPS
TENURE IN PRE-1970 BLOCK GROUPS
Overall, 23% of Phoenix’s households reside in pre-1970 block groups and the share of homeowners to renters in pre- and post-1970 block groups is nearly identical. For census block groups in which the majority of housing was built prior to 1970, the overall homeownership rate was 54%, compared to 55% homeowners in the rest of the post-1970 block groups.
Areas with a concentration
of older housing have a greater share
of hispanic households
than the rest of the city.
54 | Preservation Phoenix StyleY
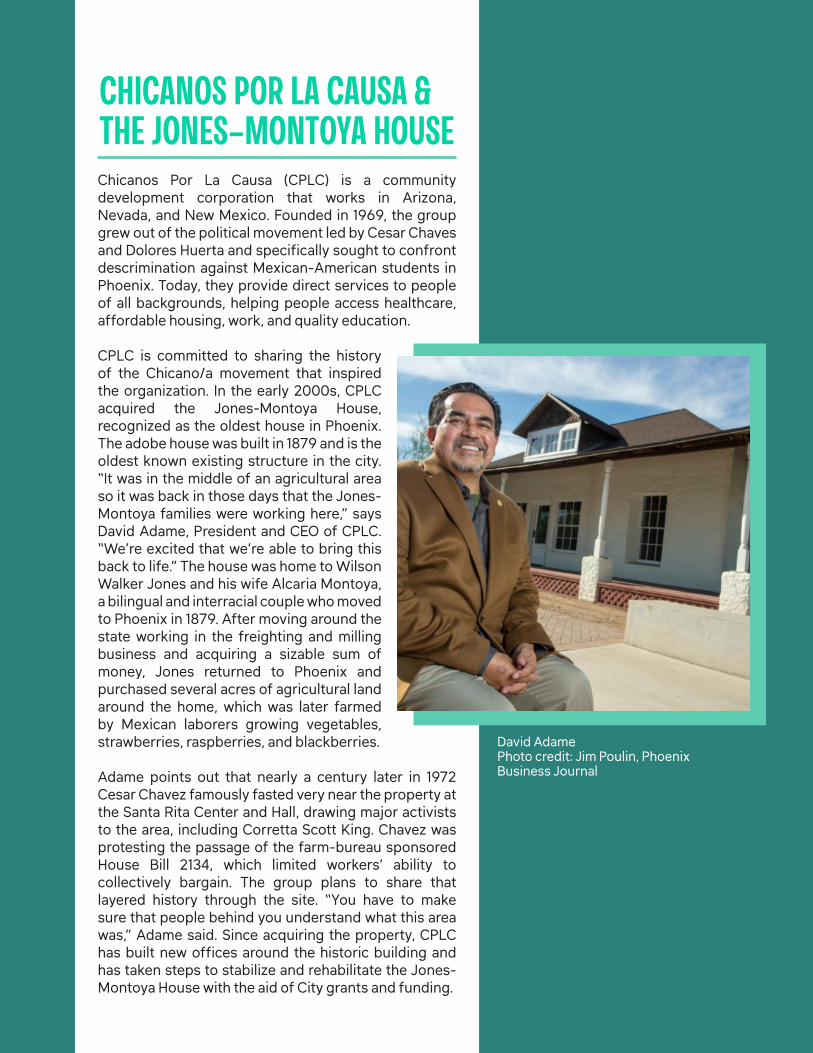
Chicanos Por La Causa (CPLC) is a community development corporation that works in Arizona, Nevada, and New Mexico. Founded in 1969, the group grew out of the political movement led by Cesar Chaves and Dolores Huerta and specifically sought to confront descrimination against Mexican-American students in Phoenix. Today, they provide direct services to people of all backgrounds, helping people access healthcare, affordable housing, work, and quality education.
CPLC is committed to sharing the history of the Chicano/a movement that inspired the organization. In the early 2000s, CPLC acquired the Jones-Montoya House, recognized as the oldest house in Phoenix. The adobe house was built in 1879 and is the oldest known existing structure in the city. “It was in the middle of an agricultural area so it was back in those days that the Jones-Montoya families were working here,” says David Adame, President and CEO of CPLC. “We’re excited that we’re able to bring this back to life.” The house was home to Wilson Walker Jones and his wife Alcaria Montoya, a bilingual and interracial couple who moved to Phoenix in 1879. After moving around the state working in the freighting and milling business and acquiring a sizable sum of money, Jones returned to Phoenix and purchased several acres of agricultural land around the home, which was later farmed by Mexican laborers growing vegetables, strawberries, raspberries, and blackberries.
Adame points out that nearly a century later in 1972 Cesar Chavez famously fasted very near the property at the Santa Rita Center and Hall, drawing major activists to the area, including Corretta Scott King. Chavez was protesting the passage of the farm-bureau sponsored House Bill 2134, which limited workers’ ability to collectively bargain. The group plans to share that layered history through the site. “You have to make sure that people behind you understand what this area was,” Adame said. Since acquiring the property, CPLC has built new offices around the historic building and has taken steps to stabilize and rehabilitate the Jones-Montoya House with the aid of City grants and funding.
CHICANOS POR LA CAUSA & THE JONES-MONTOYA HOUSE
David Adame Photo credit: Jim Poulin, Phoenix Business Journal
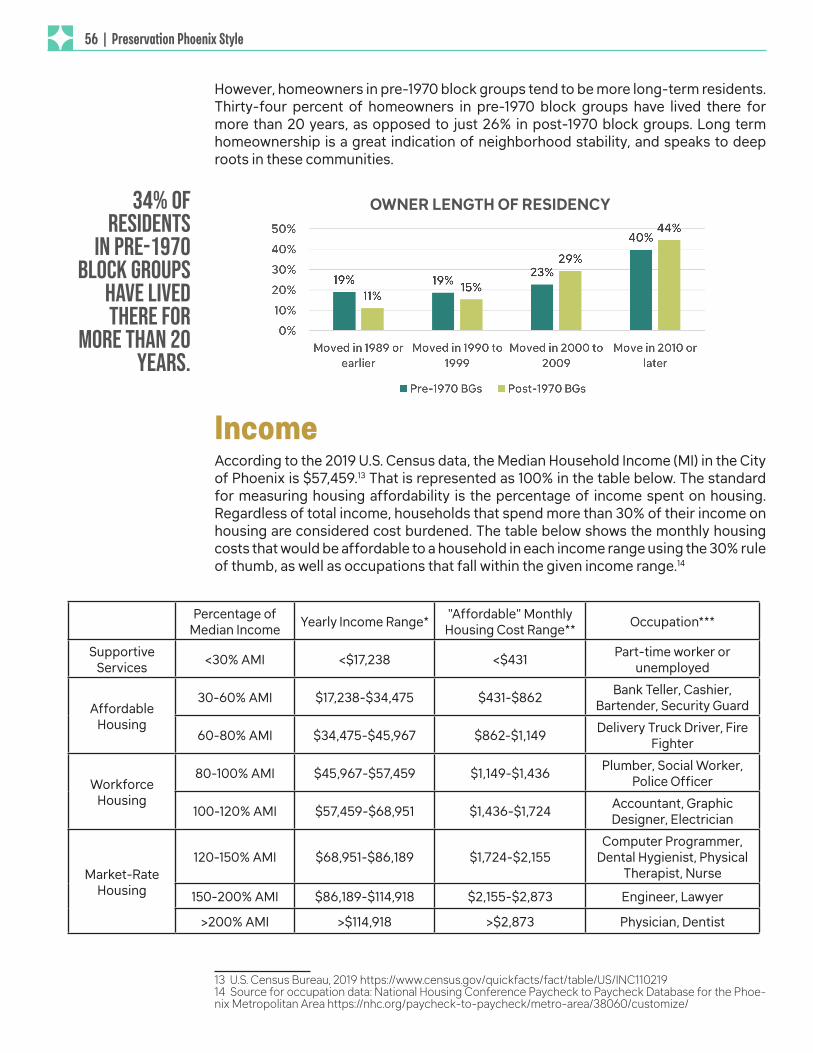
34% of residents
in pre-1970 block groups
have lived there for
more than 20 years.
Income
OWNER LENGTH OF RESIDENCY
However, homeowners in pre-1970 block groups tend to be more long-term residents. Thirty-four percent of homeowners in pre-1970 block groups have lived there for more than 20 years, as opposed to just 26% in post-1970 block groups. Long term homeownership is a great indication of neighborhood stability, and speaks to deep roots in these communities.
According to the 2019 U.S. Census data, the Median Household Income (MI) in the City of Phoenix is $57,459.13 That is represented as 100% in the table below. The standard for measuring housing affordability is the percentage of income spent on housing. Regardless of total income, households that spend more than 30% of their income on housing are considered cost burdened. The table below shows the monthly housing costs that would be affordable to a household in each income range using the 30% rule of thumb, as well as occupations that fall within the given income range.14
13 U.S. Census Bureau, 2019 https://www.census.gov/quickfacts/fact/table/US/INC110219 14 Source for occupation data: National Housing Conference Paycheck to Paycheck Database for the Phoe-nix Metropolitan Area https://nhc.org/paycheck-to-paycheck/metro-area/38060/customize/
Percentage of Median Income Yearly Income Range* "Affordable" Monthly
Housing Cost Range** Occupation***
Supportive Services <30% AMI <$17,238 <$431 Part-time worker or
unemployed
Affordable Housing
30-60% AMI $17,238-$34,475 $431-$862 Bank Teller, Cashier, Bartender, Security Guard
60-80% AMI $34,475-$45,967 $862-$1,149 Delivery Truck Driver, Fire Fighter
Workforce Housing
80-100% AMI $45,967-$57,459 $1,149-$1,436 Plumber, Social Worker, Police Officer
100-120% AMI $57,459-$68,951 $1,436-$1,724 Accountant, Graphic Designer, Electrician
Market-Rate Housing
120-150% AMI $68,951-$86,189 $1,724-$2,155Computer Programmer,
Dental Hygienist, Physical Therapist, Nurse
150-200% AMI $86,189-$114,918 $2,155-$2,873 Engineer, Lawyer
>200% AMI >$114,918 >$2,873 Physician, Dentist
56 | Preservation Phoenix StyleY
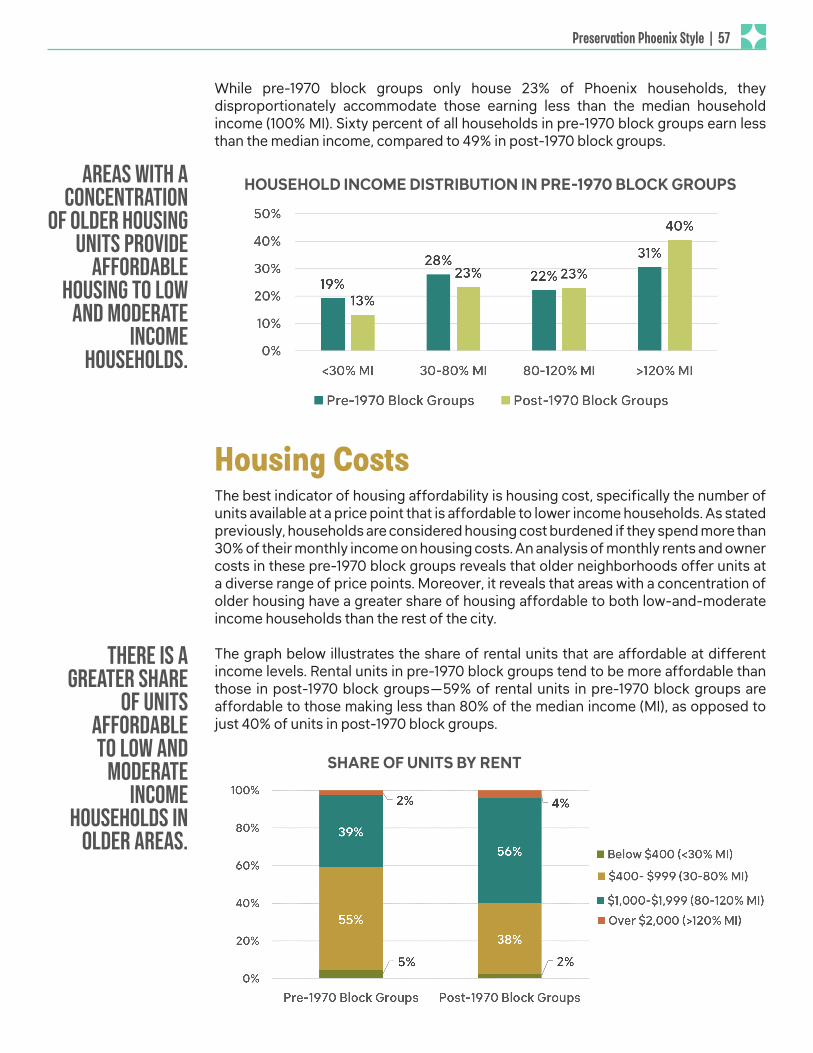
While pre-1970 block groups only house 23% of Phoenix households, they disproportionately accommodate those earning less than the median household income (100% MI). Sixty percent of all households in pre-1970 block groups earn less than the median income, compared to 49% in post-1970 block groups.
HOUSEHOLD INCOME DISTRIBUTION IN PRE-1970 BLOCK GROUPSAreas with a concentration
of older housing units provide
affordable housing to low
and moderate income
households.
THere is a greater share
of units affordable to low and
moderate income
households in older areas.
Housing CostsThe best indicator of housing affordability is housing cost, specifically the number of units available at a price point that is affordable to lower income households. As stated previously, households are considered housing cost burdened if they spend more than 30% of their monthly income on housing costs. An analysis of monthly rents and owner costs in these pre-1970 block groups reveals that older neighborhoods offer units at a diverse range of price points. Moreover, it reveals that areas with a concentration of older housing have a greater share of housing affordable to both low-and-moderate income households than the rest of the city.
The graph below illustrates the share of rental units that are affordable at different income levels. Rental units in pre-1970 block groups tend to be more affordable than those in post-1970 block groups—59% of rental units in pre-1970 block groups are affordable to those making less than 80% of the median income (MI), as opposed to just 40% of units in post-1970 block groups.
SHARE OF UNITS BY RENT
Preservation Phoenix Style | 57 Y
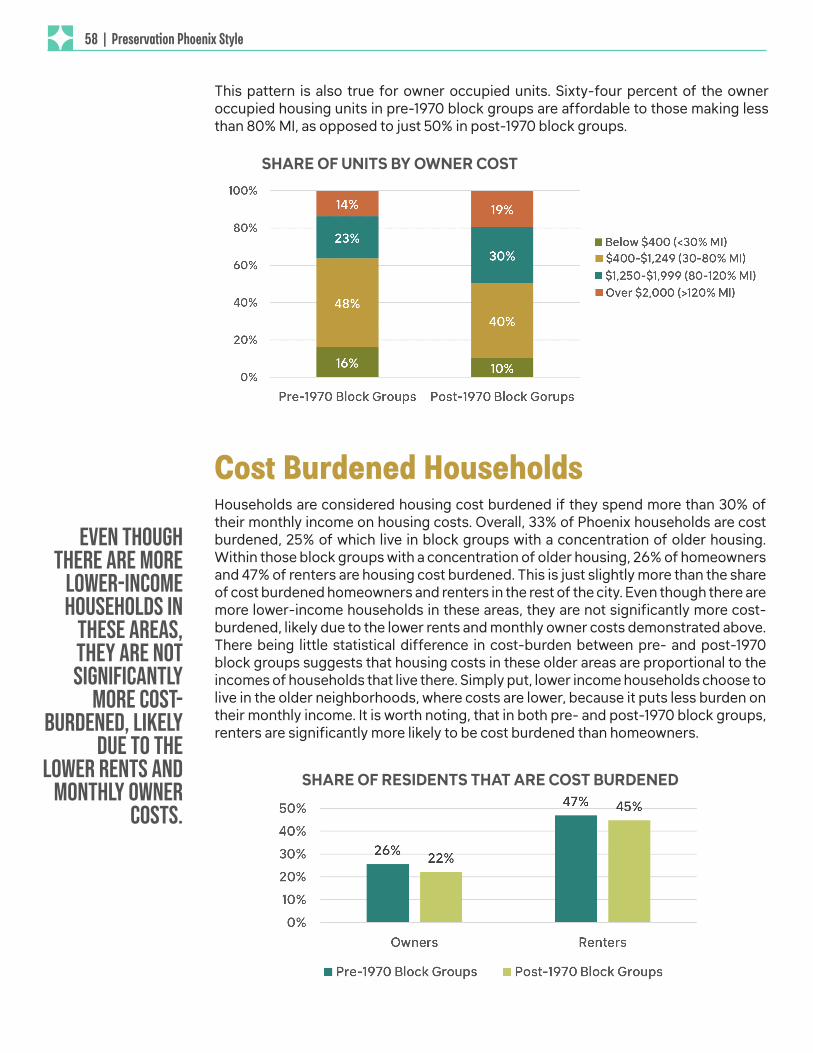
Cost Burdened Households
SHARE OF UNITS BY OWNER COST
This pattern is also true for owner occupied units. Sixty-four percent of the owner occupied housing units in pre-1970 block groups are affordable to those making less than 80% MI, as opposed to just 50% in post-1970 block groups.
Households are considered housing cost burdened if they spend more than 30% of their monthly income on housing costs. Overall, 33% of Phoenix households are cost burdened, 25% of which live in block groups with a concentration of older housing. Within those block groups with a concentration of older housing, 26% of homeowners and 47% of renters are housing cost burdened. This is just slightly more than the share of cost burdened homeowners and renters in the rest of the city. Even though there are more lower-income households in these areas, they are not significantly more cost-burdened, likely due to the lower rents and monthly owner costs demonstrated above. There being little statistical difference in cost-burden between pre- and post-1970 block groups suggests that housing costs in these older areas are proportional to the incomes of households that live there. Simply put, lower income households choose to live in the older neighborhoods, where costs are lower, because it puts less burden on their monthly income. It is worth noting, that in both pre- and post-1970 block groups, renters are significantly more likely to be cost burdened than homeowners.
SHARE OF RESIDENTS THAT ARE COST BURDENED
Even though there are more
lower-income households in
these areas, they are not significantly
more cost-burdened, likely
due to the lower rents and
monthly owner costs.
58 | Preservation Phoenix StyleY
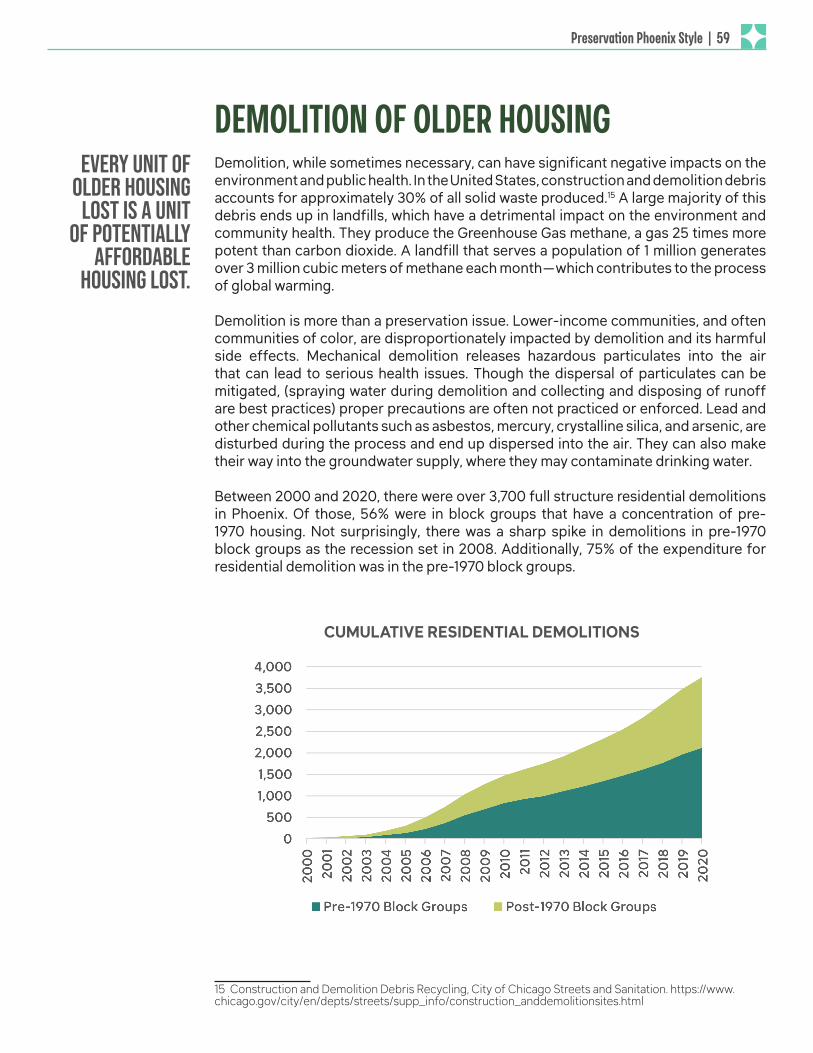
DEMOLITION OF OLDER HOUSINGDemolition, while sometimes necessary, can have significant negative impacts on the environment and public health. In the United States, construction and demolition debris accounts for approximately 30% of all solid waste produced.15 A large majority of this debris ends up in landfills, which have a detrimental impact on the environment and community health. They produce the Greenhouse Gas methane, a gas 25 times more potent than carbon dioxide. A landfill that serves a population of 1 million generates over 3 million cubic meters of methane each month—which contributes to the process of global warming.
Demolition is more than a preservation issue. Lower-income communities, and often communities of color, are disproportionately impacted by demolition and its harmful side effects. Mechanical demolition releases hazardous particulates into the air that can lead to serious health issues. Though the dispersal of particulates can be mitigated, (spraying water during demolition and collecting and disposing of runoff are best practices) proper precautions are often not practiced or enforced. Lead and other chemical pollutants such as asbestos, mercury, crystalline silica, and arsenic, are disturbed during the process and end up dispersed into the air. They can also make their way into the groundwater supply, where they may contaminate drinking water.
Between 2000 and 2020, there were over 3,700 full structure residential demolitions in Phoenix. Of those, 56% were in block groups that have a concentration of pre-1970 housing. Not surprisingly, there was a sharp spike in demolitions in pre-1970 block groups as the recession set in 2008. Additionally, 75% of the expenditure for residential demolition was in the pre-1970 block groups.
15 Construction and Demolition Debris Recycling, City of Chicago Streets and Sanitation. https://www.chicago.gov/city/en/depts/streets/supp_info/construction_anddemolitionsites.html
CUMULATIVE RESIDENTIAL DEMOLITIONS
Every unit of older housing
lost is a unit of potentially
affordable housing lost.
Preservation Phoenix Style | 59 Y
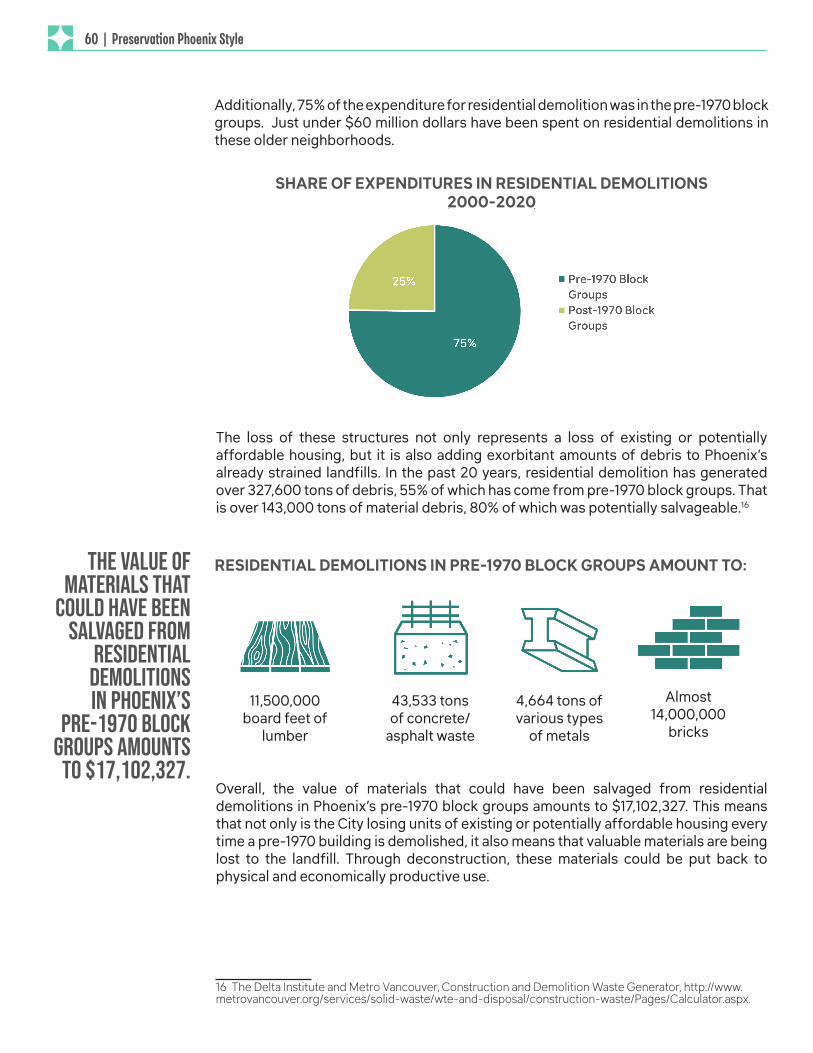
The loss of these structures not only represents a loss of existing or potentially affordable housing, but it is also adding exorbitant amounts of debris to Phoenix’s already strained landfills. In the past 20 years, residential demolition has generated over 327,600 tons of debris, 55% of which has come from pre-1970 block groups. That is over 143,000 tons of material debris, 80% of which was potentially salvageable.16
Overall, the value of materials that could have been salvaged from residential demolitions in Phoenix’s pre-1970 block groups amounts to $17,102,327. This means that not only is the City losing units of existing or potentially affordable housing every time a pre-1970 building is demolished, it also means that valuable materials are being lost to the landfill. Through deconstruction, these materials could be put back to physical and economically productive use.
16 The Delta Institute and Metro Vancouver, Construction and Demolition Waste Generator, http://www.metrovancouver.org/services/solid-waste/wte-and-disposal/construction-waste/Pages/Calculator.aspx.
SHARE OF EXPENDITURES IN RESIDENTIAL DEMOLITIONS2000-2020
Additionally, 75% of the expenditure for residential demolition was in the pre-1970 block groups. Just under $60 million dollars have been spent on residential demolitions in these older neighborhoods.
RESIDENTIAL DEMOLITIONS IN PRE-1970 BLOCK GROUPS AMOUNT TO:
Almost 14,000,000
bricks
4,664 tons of various types
of metals
11,500,000 board feet of
lumber
43,533 tons of concrete/
asphalt waste
the value of materials that
could have been salvaged from
residential demolitions in Phoenix’s
Pre-1970 block groups amounts
to $17,102,327.
60 | Preservation Phoenix StyleY
An oft used phrase in preservation is “the greenest building is the one that’s already built.” Just as building reuse is more green than new construction, deconstruction and material reuse are more green than traditional mechanical demolition. Deconstruction is the process of dismantling a structure component by component, usually in the reverse order in which it was installed, in order to harvest materials to be salvaged. The deconstruction process is part of a larger movement to transition away from a linear economy to a circular economy—an economic model in which products and services move in closed loops that employ practices like reuse, sharing, refurbishment, recycling, and remanufacturing. This model is both waste free and regenerative by design.
Deconstruction provides numerous benefits:• Reduces the amount of construction and demolition
(C&D) waste entering landfills. • Allows for material reuse in a myriad of ways, including
in new construction, in-kind replacement, value-added product manufacturing, etc.
• Increases labor income due to larger crew sizes and more time on-site, which translates into more money getting circulated into the local economy
• Provides an opportunity for workforce development in skilled labor.• Acts as an employment multiplier by not only providing on-site jobs, but also
warehouse jobs, retail and sales jobs, and value-added manufacturing jobs, all of which bring more workforce development opportunities.
• Reduces air and groundwater pollution by mitigating hazardous materials, such as lead paint and asbestos, off-site in controlled environments.
• Preserves the embodied energy of existing building materials.
Municipalities around the country, such as Portland, OR, Palo Alto CA, and Hennepin County, MN, are starting to realize the benefits of deconstruction over traditional mechanical demolition and have passed legislation to implement it. Stardust Building Supplies, Phoenix’s local nonprofit deconstruction contractor, the Phoenix Historic Preservation Office and the Department of Waste have been working to educate City Council and the general public about the benefits of deconstruction. These efforts, along with those already underway at Arizona State University’s Resource Innovation & Solutions Network, are leading the way in normalizing the process of deconstruction.
THE BENEFITS OF DECONSTRUCTION
In 2018 alone, 600 million tons of construction and demolition (C&D) debris were generated in the United States, 90% of which was generated through demolition. That is more than twice the amount generated by municipal solid waste.
61 Y
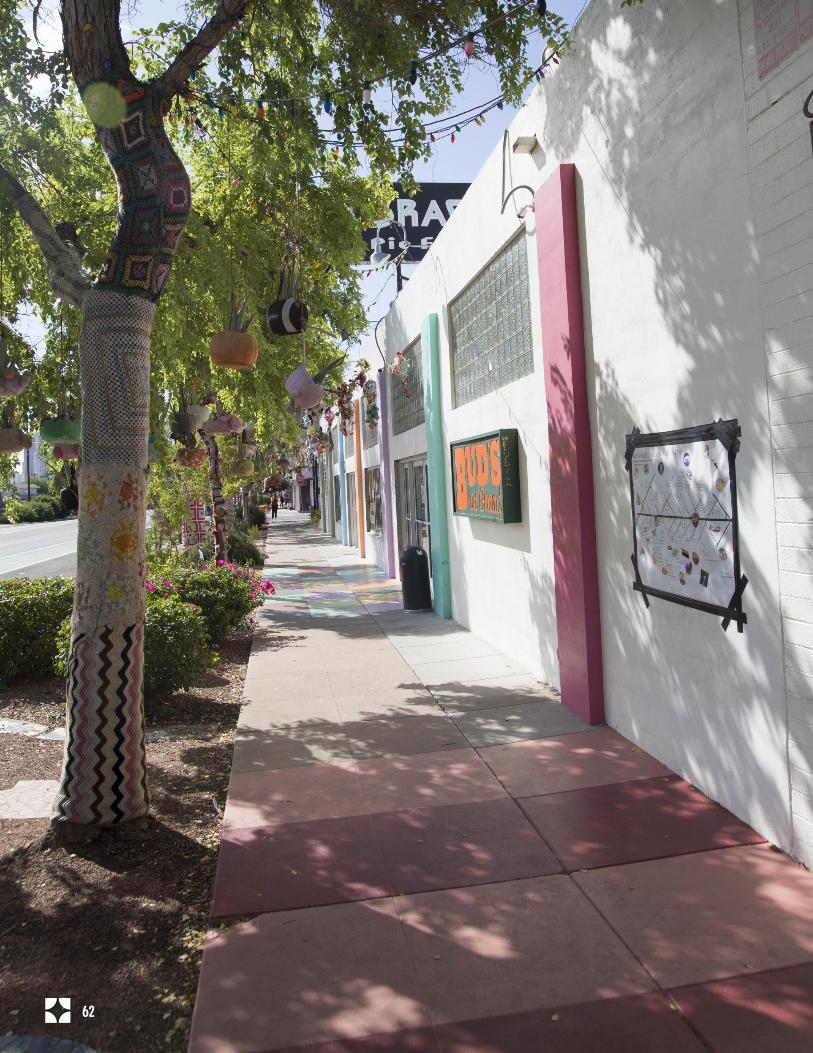
62 Y
Thanks to a commitment to
preservation, citizens have
reaped tangible benefits to the local economy,
the local environment,
and the local culture.
ConclusionPhoenix has identified and protected its historic resources using innovation, creativity, and persistence.
Phoenix does not have the early 19th century Brownstones of Back Bay in Boston. Nor does it have the 1733 city plan of Savannah or the two century tradition of the Charleston Single House. What Phoenix does have is Preservation Phoenix Style. This is an approach to historic preservation that finds ways to succeed in spite of the lack of both regulatory and incentive tools that every other large city in America has. Phoenix has identified and protected its historic resources using innovation, creativity, and persistence.
As a result the City of Phoenix and its citizens have reaped tangible benefits to the local economy, the local environment, and the local culture. The future of Preservation Phoenix Style is not altogether clear. The award winning preservation bond funding for preservation has all been invested. Easements which have protected historic properties are expiring. Great commercial neighborhoods with a concentration of heritage buildings are under almost constant development pressure.
But if the past is a good indication — and it usually is — Preservation Phoenix Style will continue to adjust, to adapt, to evolve. With support from preservation advocates in the public, private, and non-profit sectors, ways will be found to identify, protect, and enhance the historic resources treasured by this mid-century desert city.
Preservation Phoenix Style | 63 Y
AcknowledgementsWe would like to thank everyone who contributed their time and expertise for this report. We would especially like to thank Michelle Dodds, Historic Preservation Officer for the City of Phoenix, for her coordination of this project. Thanks also to the Historic Preservation Office Staff, Kevin Weight, Liz Wilson, Jodey Elsner, Helana Ruter, Crystal Carrancho, Maura Jackson, Bridget Collins. The Historic Preservation Office was instrumental in providing the data, context, and resources necessary to complete this report.
We would especially like to acknowledge our core focus group for their excellent feedback and guidance:
• Andi Abkarian, Downtown Phoenix Voices• Frank Barrios, Pioneers’ Cemetery
Association• Roger Brevoort, Preserve Phoenix• Chris Cody, Former Deputy State Historic
Preservation Officer• Robert Graham, Architect, Motley Design
Group• Alison King, Modern Phoenix• Patty Talahongva, Phoenix Indian School
• Jim McPherson, Arizona Preservation Foundation
• Beatrice Moore, Grand Avenue Members Association
• Sherry Rampy, Historic Preservation Commissioner
• Matt Seaman, MetroWest Development• Robert Warnicke, Phoenix Historic
Neighborhood Association
Thanks finally to the members of the Historic Preservation Commissioners for their support of this project:
• Dan Klocke, Chair• Greta Rayle, Vice Chair• Tricia Amato• Richard de Uriarte• Dan Garcia
• Christina Noble• Sherry Rampy• Bill Scheel• John Wilenchik
• Mayor Kate Gallegos, City of Phoenix • Terry Goddard, Former Mayor, City of
Phoenix• Dan Klocke, Historic Preservation
Commission Chair• Chris Mackay, Economic Development
Director • Alan Stephenson, Planning and
Development Director• Councilperson Laura Pastor• Kathryn Leonard, State Historic
Preservation Officer• Tony Motola, Senior Policy Advisor, Mayor’s
Office
• Lorenzo Perez, Venue Projects• Kimber Lanning, Local First AZ• Grady Gammage, Jr., Gammage and
Burnham • Patty Talahongva, Phoenix Indian School• Rosalie Talahongva, Phoenix Indian School • Martin Ball, NCARB, CCBG Architects, Inc• Michael Levine, Artist and Historic Property
Owner• Beatrice Moore, Artist and Historic Property
Owner• Jim Howard, Dudley Ventures• Sam Means, Hello Merch
Thanks also to the following individuals who gave us their time:
64 Y
About PlaceEconomicsPlaceEconomics is a private sector firm with over thirty years experience in the thorough and robust analysis of the economic impacts of historic preservation. We conduct studies, surveys, and workshops in cities and states across the country addressing issues of downtown, neighborhood, and commercial district revitalization and the reuse of historic buildings.
This report was prepared and written by Donovan Rypkema, Rodney Swink, Katlyn Cotton, Alyssa Frystak, and Starr Herr-Cardillo. Rypkema is principal and founder of PlaceEconomics. Frystak is the Director of Research and Data Analytics at PlaceEconomics and handled research methodologies, data collection, and analysis. Cotton is the Director of Marketing and Design at PlaceEconomics and handled graphic design, as well as data analysis. Herr-Cardillo is a Content Writer and conducted stakeholder interviews and writing. Site visits were conducted by Rypkema, Cotton, and Swink, Senior Associate for Planning and Development. Editing was done by Starr Herr-Cardillo, Alyssa Frystak, and Rodney Swink.
65 Y
October 2021
A Study of the Impacts of Historic Preservation in Phoenix
Completed by PlaceEconomics
6abcdeS T Y L EPhoenixPreservationPreservation