

presentations-of-the-conference-on-the-role-of-tax ... - OECD
135
WHAT IS DRIVING TAX MORALE? An empirical analysis on social preferences and attitudes towards taxation The Task Force on Tax and Development The Role of Tax Morale in Development 25 th January 2019, Paris Joseph Stead René Orozco
-
Upload
khangminh22 -
Category
Documents
-
view
0 -
download
0
Transcript of presentations-of-the-conference-on-the-role-of-tax ... - OECD
WHAT IS DRIVING TAX MORALE?
An empirical analysis on social
preferences and attitudes towards
taxation
The Task Force on Tax and DevelopmentThe Role of Tax Morale in Development25th January 2019, Paris
Joseph SteadRené Orozco

What is driving tax morale?
• Individuals
• Business
2
What is driving tax morale?
• Individuals
• Business
3
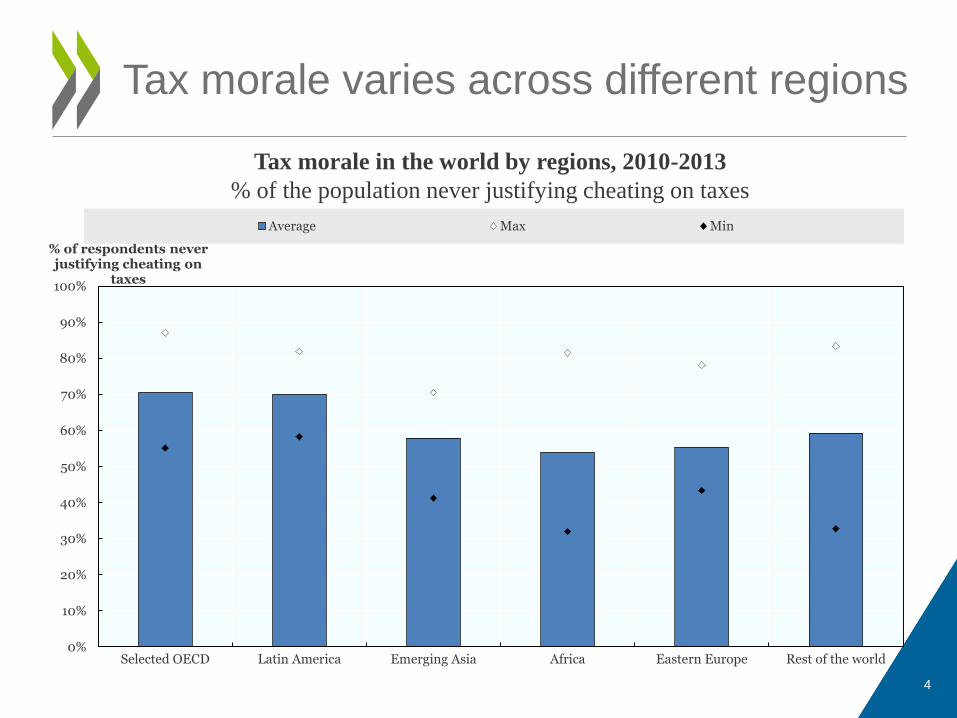
Tax morale varies across different regions
4
Tax morale in the world by regions, 2010-2013
% of the population never justifying cheating on taxes
0%
10%
20%
30%
40%
50%
60%
70%
80%
90%
100%
Selected OECD Latin America Emerging Asia Africa Eastern Europe Rest of the world
% of respondents never justifying cheating on
taxes
Average Max Min

Socio-economic factors are key determinants of
tax morale in the global analysis
5
Socio-economic factors associated with tax morale
0.0% 1.0% 2.0% 3.0% 4.0% 5.0% 6.0% 7.0% 8.0%
Religious
Female
Educational Attainment
Citizen
Age
2005 2010-2013
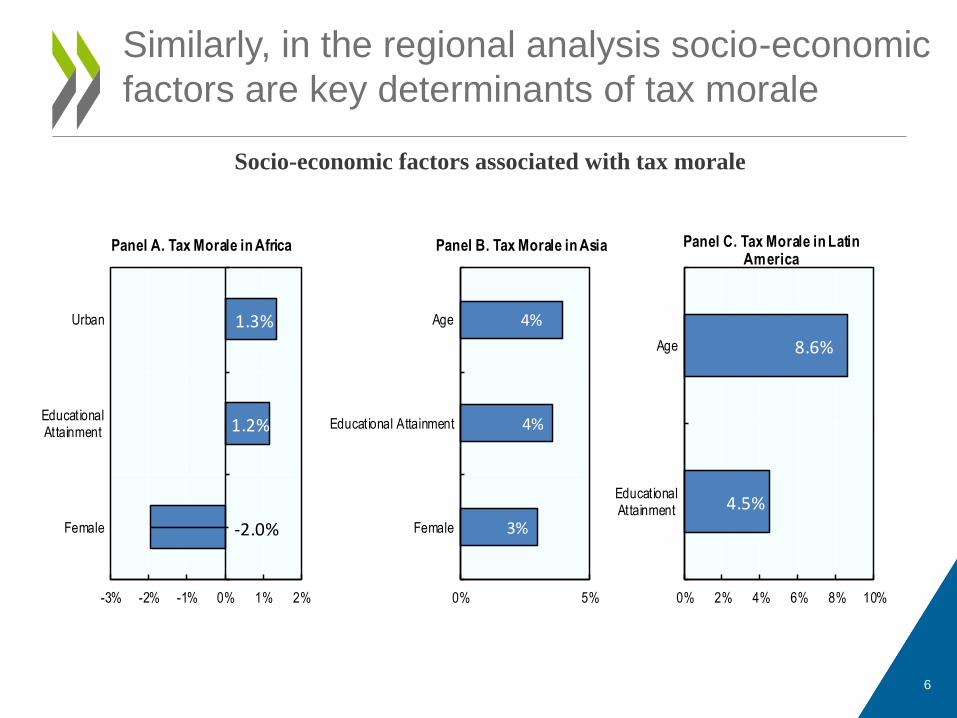
Similarly, in the regional analysis socio-economic
factors are key determinants of tax morale
6
Socio-economic factors associated with tax morale
3%
4%
4%
0% 5%
Female
Educational Attainment
Age
Panel B. Tax Morale in Asia
4.5%
8.6%
0% 2% 4% 6% 8% 10%
EducationalAttainment
Age
Panel C. Tax Morale in Latin America
-2.0%
1.2%
1.3%
-3% -2% -1% 0% 1% 2%
Female
EducationalAttainment
Urban
Panel A. Tax Morale in Africa
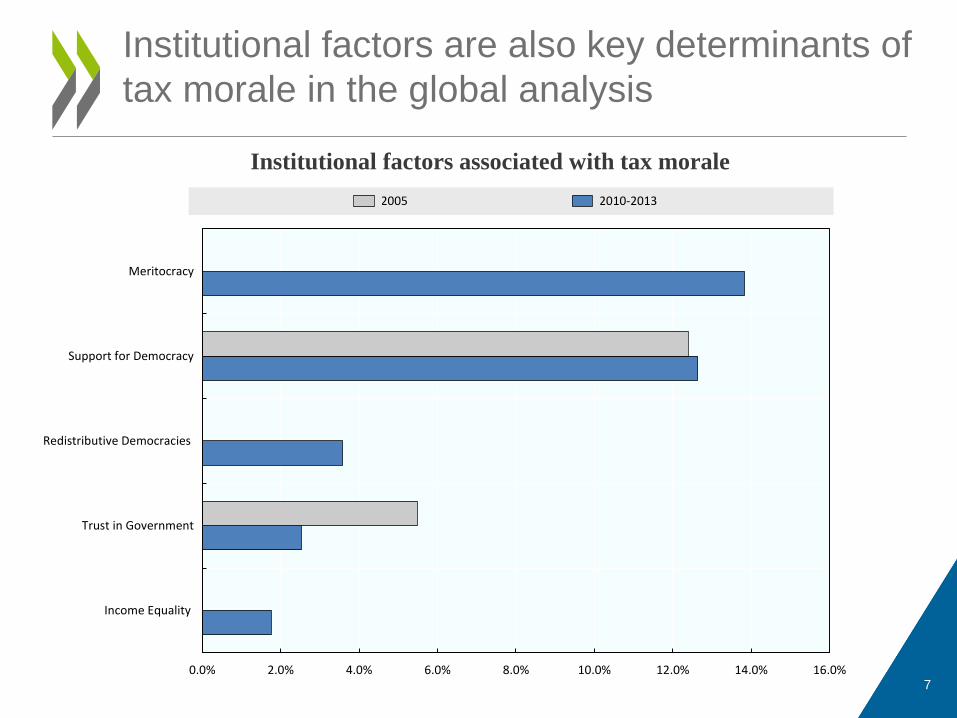
Institutional factors are also key determinants of
tax morale in the global analysis
7
Institutional factors associated with tax morale
0.0% 2.0% 4.0% 6.0% 8.0% 10.0% 12.0% 14.0% 16.0%
Income Equality
Trust in Government
Redistributive Democracies
Support for Democracy
Meritocracy
2005 2010-2013

The analysis highlights the positive link between
tax morale and public services in Africa
8
Factors associated with tax morale and taxation in Africa,
2016
4.2%
4.4%
6.2%
0% 5% 10%
Satisfaction withEducation
Satisfaction withRoads
Satisfaction withHealth
Panel C. Factors associated with the willingness to increase
spending on health in Africa
3.8%
0% 5% 10%
Satisfaction withHealth
Panel A. Tax Morale in Africa
4%
0% 5% 10%
Satisfaction withRoads
Panel B. Citizens must pay their taxes to the gov in order for the
country to develop in Africa
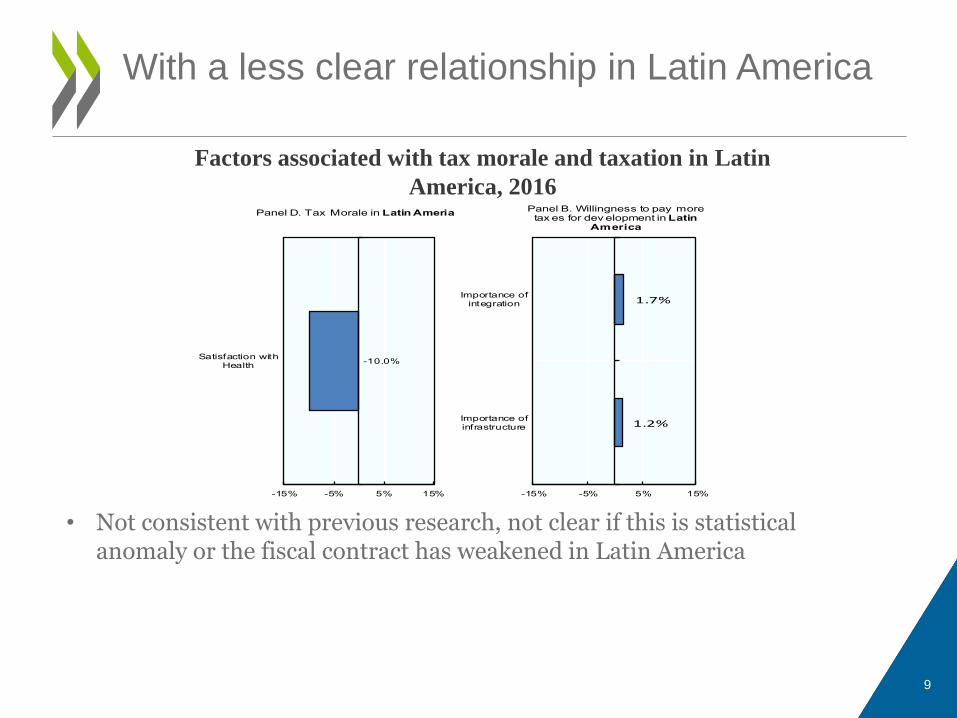
With a less clear relationship in Latin America
9
Factors associated with tax morale and taxation in Latin
America, 2016
1.2%
1.7%
-15% -5% 5% 15%
Importance ofinfrastructure
Importance ofintegration
Panel B. Willingness to pay more tax es for dev elopment in Latin
America
-10.0%
-15% -5% 5% 15%
Satisfaction withHealth
Panel D. Tax Morale in Latin Ameria
• Not consistent with previous research, not clear if this is statistical anomaly or the fiscal contract has weakened in Latin America
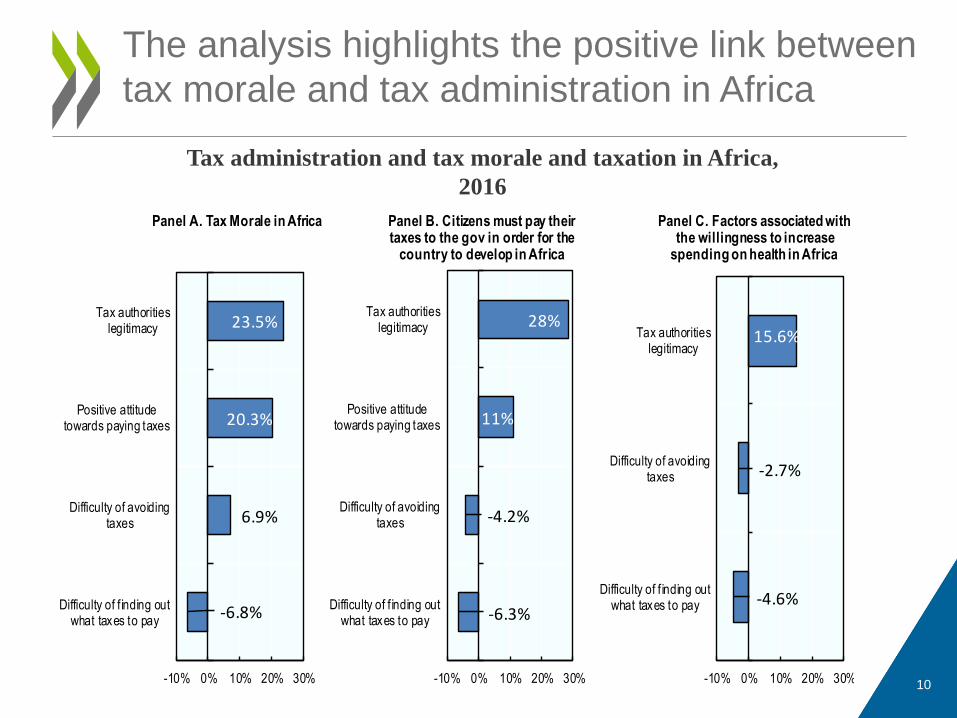
The analysis highlights the positive link between
tax morale and tax administration in Africa
10
Tax administration and tax morale and taxation in Africa,
2016
-4.6%
-2.7%
15.6%
-10% 0% 10% 20% 30%
Difficulty of f inding outwhat taxes to pay
Difficulty of avoidingtaxes
Tax authoritieslegitimacy
Panel C. Factors associated with the willingness to increase
spending on health in Africa
-6.8%
6.9%
20.3%
23.5%
-10% 0% 10% 20% 30%
Difficulty of f inding outwhat taxes to pay
Difficulty of avoidingtaxes
Positive attitudetowards paying taxes
Tax authoritieslegitimacy
Panel A. Tax Morale in Africa
-6.3%
-4.2%
11%
28%
-10% 0% 10% 20% 30%
Difficulty of f inding outwhat taxes to pay
Difficulty of avoidingtaxes
Positive attitudetowards paying taxes
Tax authoritieslegitimacy
Panel B. Citizens must pay their taxes to the gov in order for the
country to develop in Africa
Policy considerations
11
• Taxpayer education programmes can be informed by tax morale data
• Careful consideration is needed before introducing hypothecated taxes
• Build taxpayer profiles
• Support the development of tax administrations
• Deepen the understanding of the drivers of trust in government
• More in-depth country-level surveys can be used to identify the factors at the local level, and where relevant at sub-national level
• Increase the research and data on tax and gender
What is driving tax morale?
• Individuals
• Business
12

Measuring business tax morale is
challenging
13
• Data sources are limited
• Likely to be differences between SMEs and MNEs
• Need to use proxies – e.g. fraction of sales concealed from tax authorities
• Tax certainty survey provides a new data source that may be useful proxy
for MNE tax morale
0
10
20
30
40
50
60
70
OECD Emerging Asia World Africa LAC

Given current limitations, tax certainty can be a
useful proxy to measure tax morale among MNEs
14
Frequency of tax uncertainty seriously affecting business
decisions
0.0%
5.0%
10.0%
15.0%
20.0%
25.0%
30.0%
35.0%
Never Very occasionally Sometimes Frequently Very frequently
Africa LAC Asia OECD
** **** * *
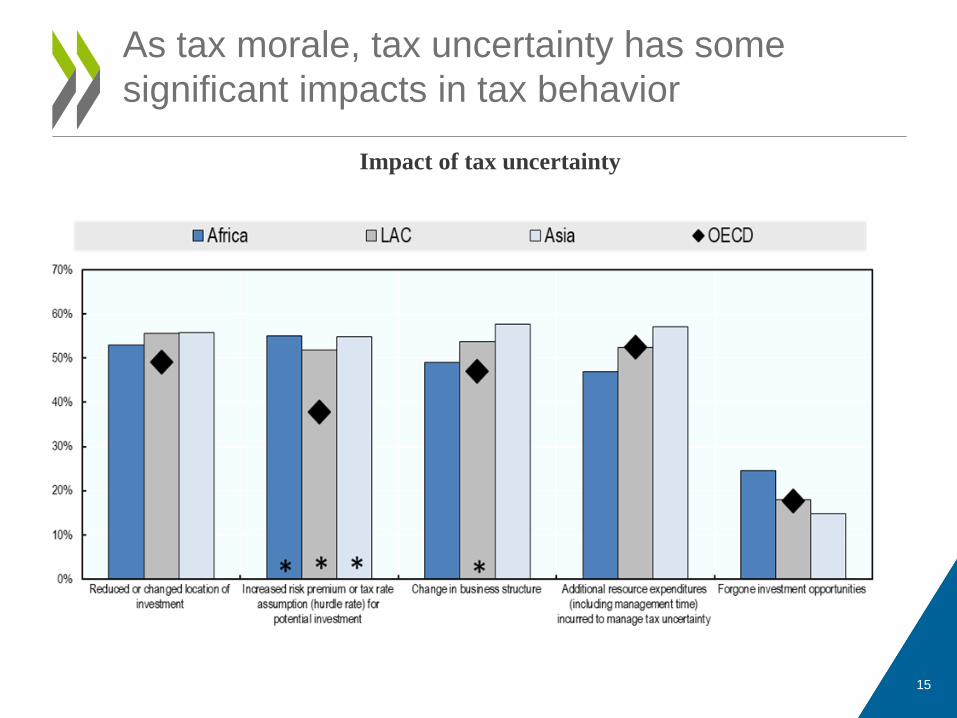
As tax morale, tax uncertainty has some
significant impacts in tax behavior
15
Impact of tax uncertainty
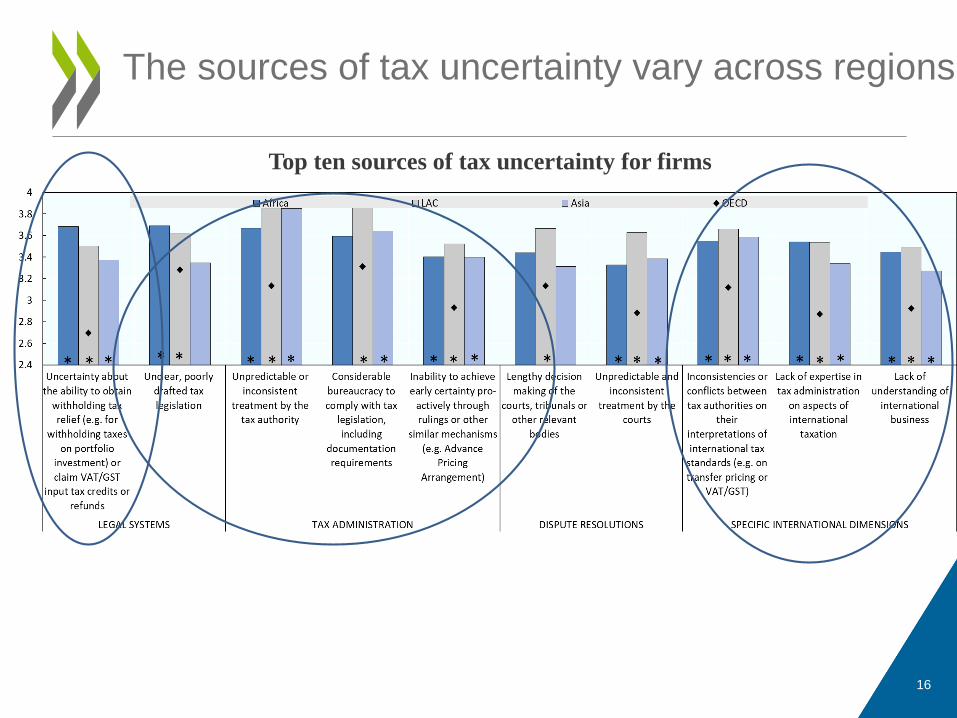
The sources of tax uncertainty vary across regions
16
Top ten sources of tax uncertainty for firms

The analysis identifies key tools to foster tax
certainty
17
Top 10 tools to foster tax certainty

Policy considerations
18
• Increase capacity building on international taxation issues in tax administrations in developing countries
• Increase business engagement in capacity building for tax administrations in developing countries
• Support the development of effective VAT and withholding tax systems
• Unlock the experience from other tax administrations
• Look for synergies in building tax morale across the whole tax system
• Develop country-level surveys to identify key issues affecting tax morale across different types of businesses (both size and sectors)

What is driving tax morale?
Appendix
19

Main messages
20
• There has been relatively limited research on business tax morale, especially in developing countries
• With limited evidence to draw on, businesses’ views on tax certainty in developing regions have been used as a proxy for tax morale
• Tax certainty appears to have a greater impact on business decisions in developing countries than OECD countries, resulting in modified business structures, increased costs, and changes to investment decisions
• With some regional variations, both international taxation and the relationship between the authorities and businesses are consistent concerns across developing countries

Main messages
21
• Tax morale is generally higher in countries that tax more (fiscal contract?)
• New data confirms previous findings that age, education, religion and trust in government all appear to influence tax morale
• While at the global level women have higher tax morale than men, in Africa they have lower tax morale
• More detailed data, currently only available with respect to Africa, shows that the perceived quality of the tax administration is a key determinant of tax morale.
• Data from Africa highlight the positive link between tax morale and public service provision, with a less clear relationship in Latin America.
SESSION 1: TAX MORALE IN
INDIVIDUALS – WHAT DO WE KNOW?
25th January, 2019
9:00 – 11:00
Speakers:
Patrick Mukiibi, Commissioner for Tax Investigations, Uganda Revenue Authority
Dr. Katharina Gangl, Assistant Professor, University of Göttingen, Germany
Anette Erling Jivenius, Swedish Tax Agency
Moderator: Sebastian Nieto, Head of Unit, Latin America and the Caribbean,
OECD Development Centre
Tax Morale in Individuals
Swedish Tax Agency
25 January 2019
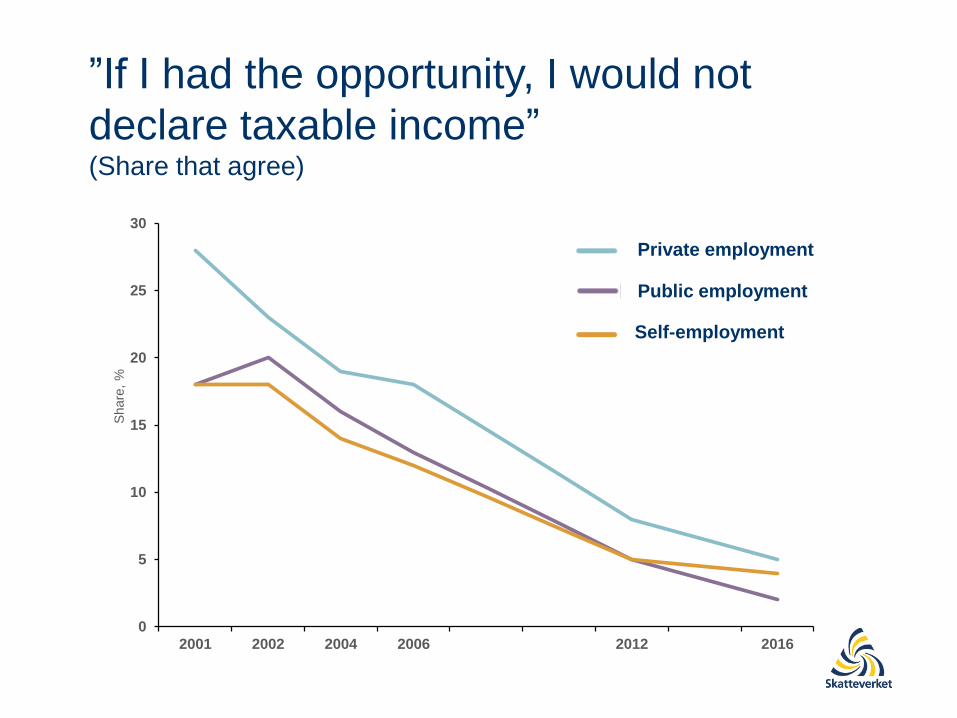
”If I had the opportunity, I would not
declare taxable income”(Share that agree)
0
5
10
15
20
25
30
2001 2002 2004 2006 2012 2016
Share
, %
Public employment
Private employment
Self-employment
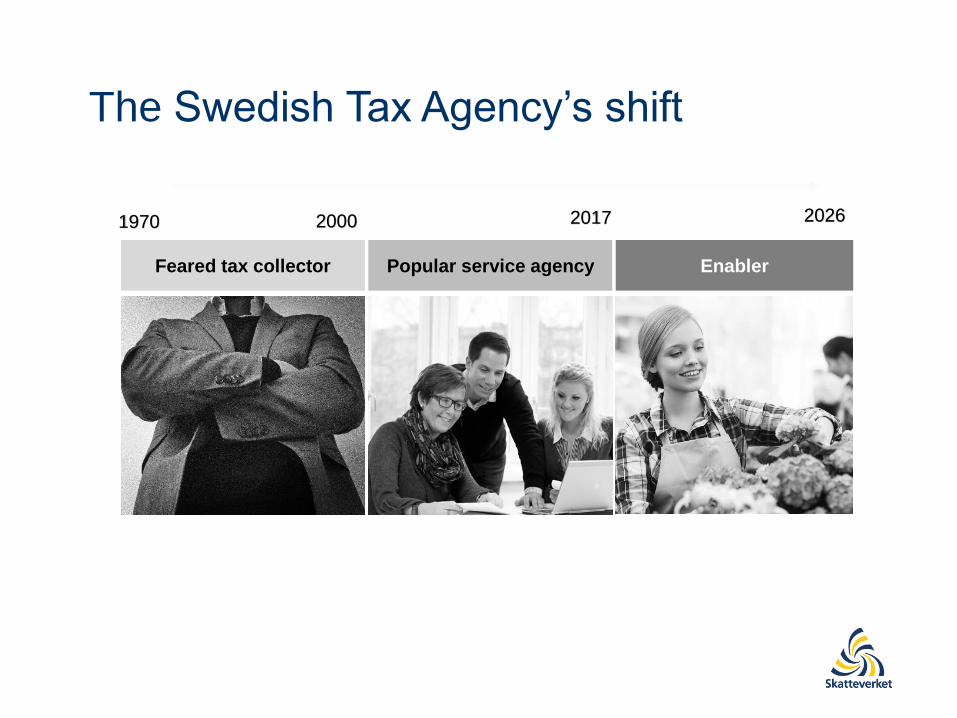
The Swedish Tax Agency’s shift
1970 2000 2017 2026
Feared tax collector Popular service agency Enabler

Procedural justice
§
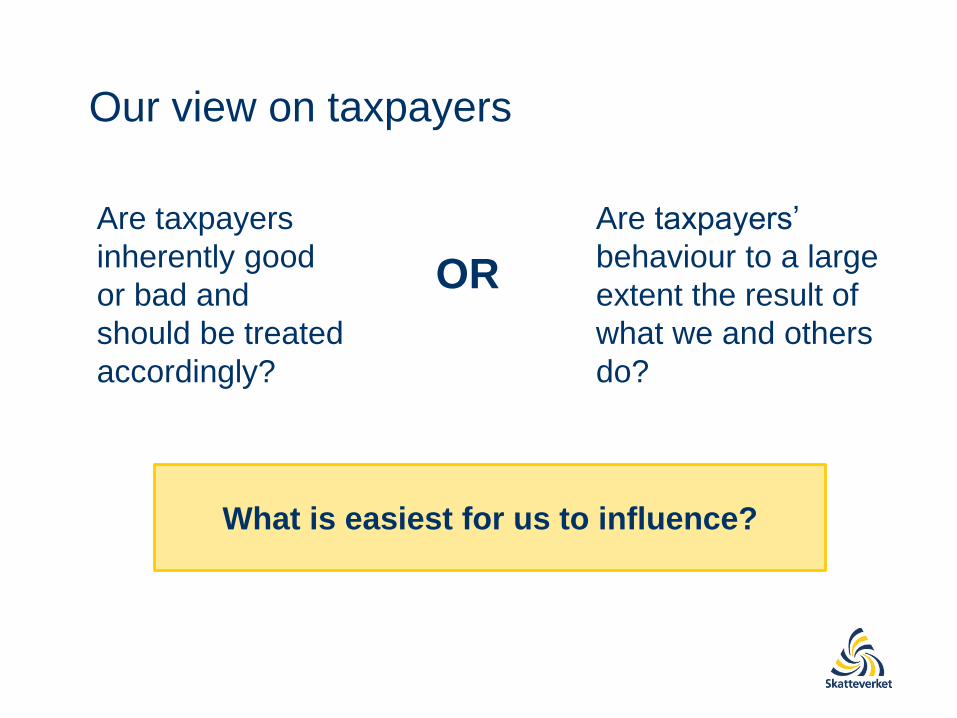
Our view on taxpayers
Are taxpayers
inherently good
or bad and
should be treated
accordingly?
Are taxpayers’
behaviour to a large
extent the result of
what we and others
do?
OR
What is easiest for us to influence?

Trust based climateAntagonistic climate
Voluntary compliance
Enforcement
contributes to trust
Coerced compliance
Enforcement destroys
trust
A strategic choice
Enforcement that supports
social norms and the
willingness to comply
Enforcement used as
deterrence
“We will make sure that
others comply”“You must comply, or else..”
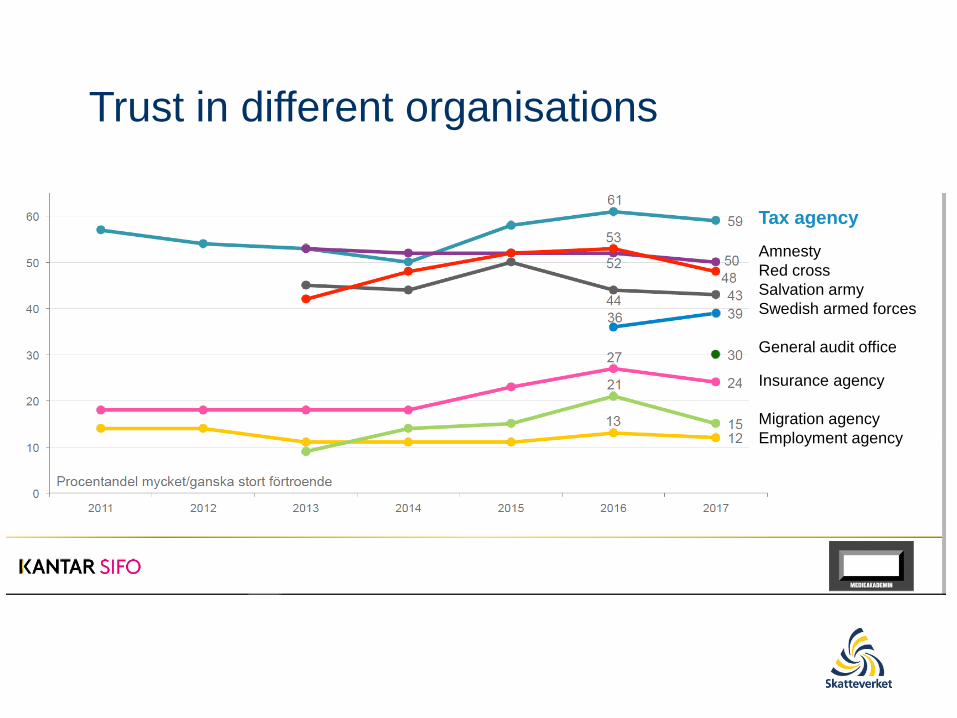
Trust in different organisations
Tax agency
Amnesty
Red cross
Salvation army
Swedish armed forces
General audit office
Insurance agency
Migration agency
Employment agency

SESSION 2: TAX MORALE IN
BUSINESS – WHAT DO WE KNOW?
11:30 – 13:00
Speakers:
Janine Juggins, EVP Global Tax, Unilever
Yamuna Sastry, Founder, CabDost (social enterprise), India
Darlingston Y. Talery, Commissioner - Domestic Taxes, Liberia Revenue
Authority
Moderator: Matthew Gbonjubola (FIRS, Nigeria)
Tax Morale ConferenceLiberia’s TIWB Transfer Pricing
Program in Perspective
by: Mr. Darlingston Y. Talery, Commissioner Domestic Taxes
Department, Liberia Revenue Authority
31
Outline
ATAF/OECD/WBG Interventions – 2015 to 2018
Transfer pricing regulations
Transfer pricing practice notes
Transfer pricing return schedules
Transfer pricing risk assessment Toolkit
Advance Pricing Agreements (APA) Guidelines
Capacity building - auditors
Awareness training – BOTA and Judiciary
Background to Our Transfer Pricing Program

An OECD – UNDP initiative to facilitate long-term skills-building to tax
administrations
Matches developing country needs with experienced auditors, providers
and donors
Focuses on auditing – mostly large taxpayers and multinational
enterprises
Involves hands-on working on audit cases
Focus on largest MNEs in the mining sector; Major Diamond dealers;
and Sub-contractors in the mining sector.
Challenging complex avoidance issues including transfer pricing and
thin capitalisation
Tax Inspectors Without Borders Program

Completed two audits in the Mining sector Over US$ 60M assessed including penalty and interest
Two audits in the mining sector nearing completion
Two audits just begun in the telecommunication and insurance
sectors
Audit of the agriculture sector to begin shortly
Filing of 2017 TP Tax returns – expected 50; received 30 on time
and 15 after the due date.
Successes/Achievements

Capacity building and knowledge transfer
Do it alone as a result of the on-site one on one knowledge
transfer
Perform better critical analysis – Functional and
comparability analysis
Successes/Achievements cont’d
Synergy between LRA and tax practitioners
Enhanced dialogue between LRA and tax preparers (Tax
Clinics
Increased TP returns received (even though about 25% were
received after the due date)
Increase awareness among taxpayers to keep transactional
documentations (LRA is watching!)
Successes/Achievements cont’d
Finding comparable databases
Taxpayer difficulty in understanding the principles and
intricacies of transfer pricing
High cost of filing TP returns – tax advisors/preparers
Current Challenges

Constituted the Transfer Pricing Team for both audit and other
compliance purposes
Compose of auditors, lawyers and economists – eight auditors, one
lawyer, and one economist.
For peer learning – transfer of knowledge and skills between peers
Further training and capacity building with BOTA and Judiciary
Seeking funding for comparable databases
What are we doing currently?


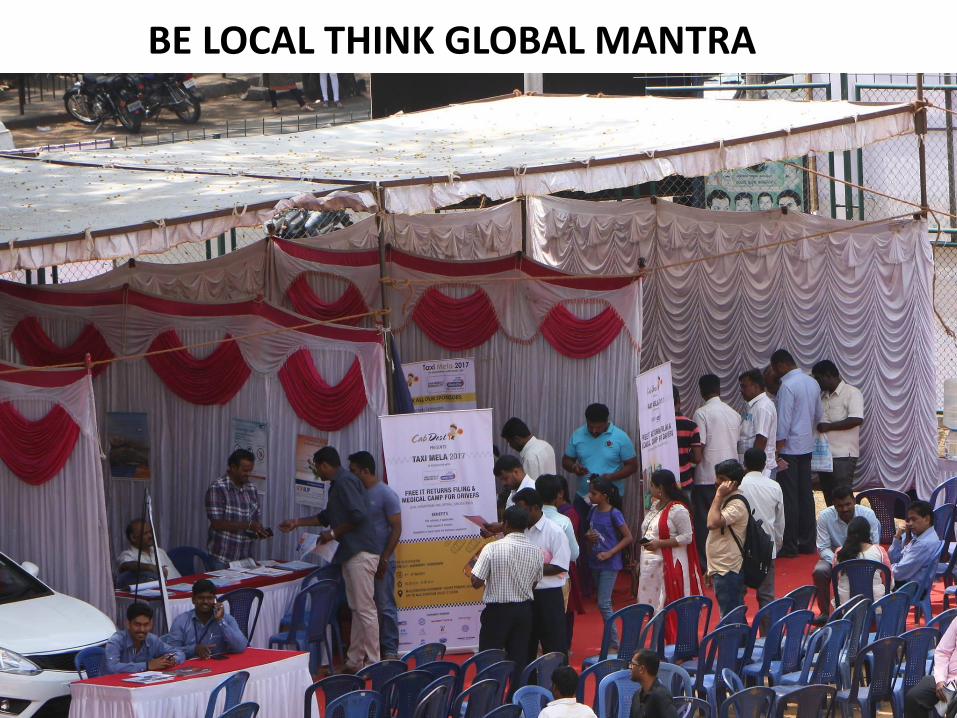
BE LOCAL THINK GLOBAL MANTRA

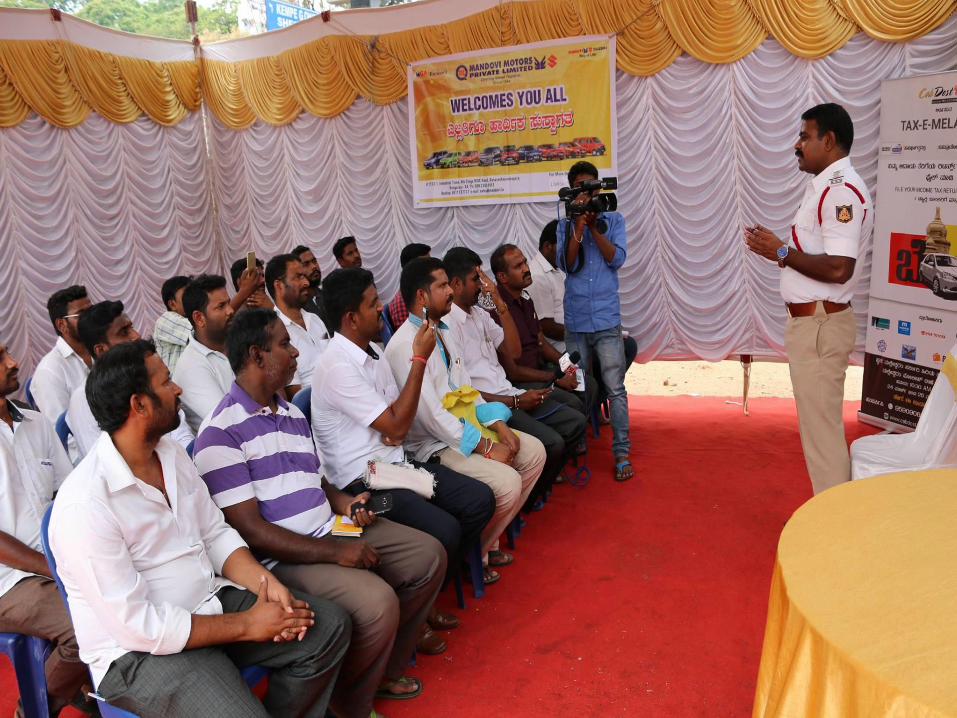
MARKET PLACE BASED FREE TAX FILING CAMPAIGN
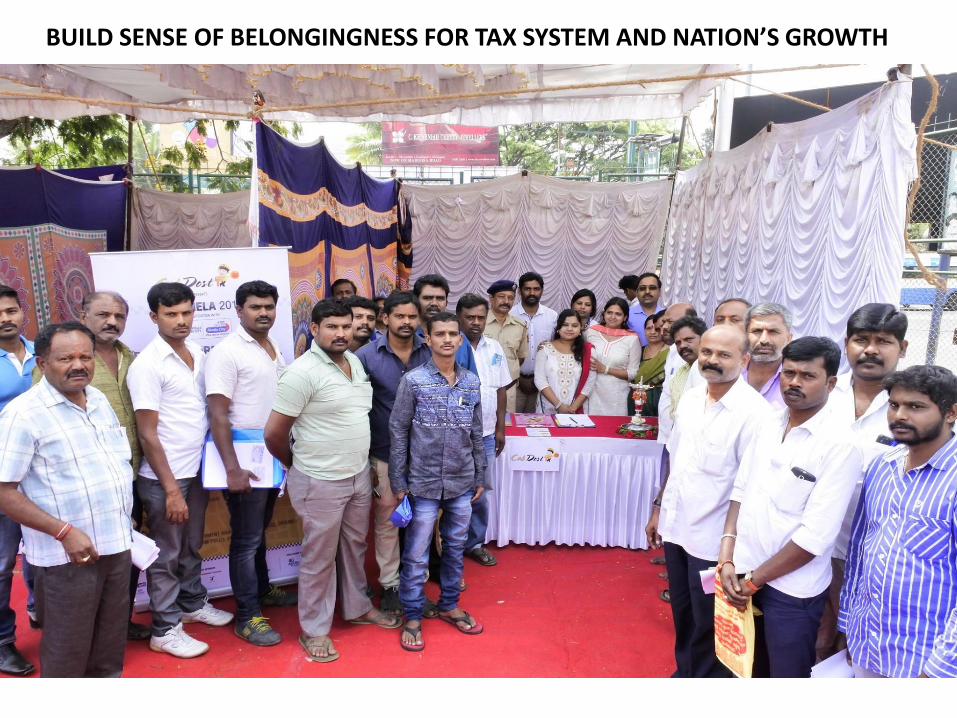
BUILD SENSE OF BELONGINGNESS FOR TAX SYSTEM AND NATION’S GROWTH
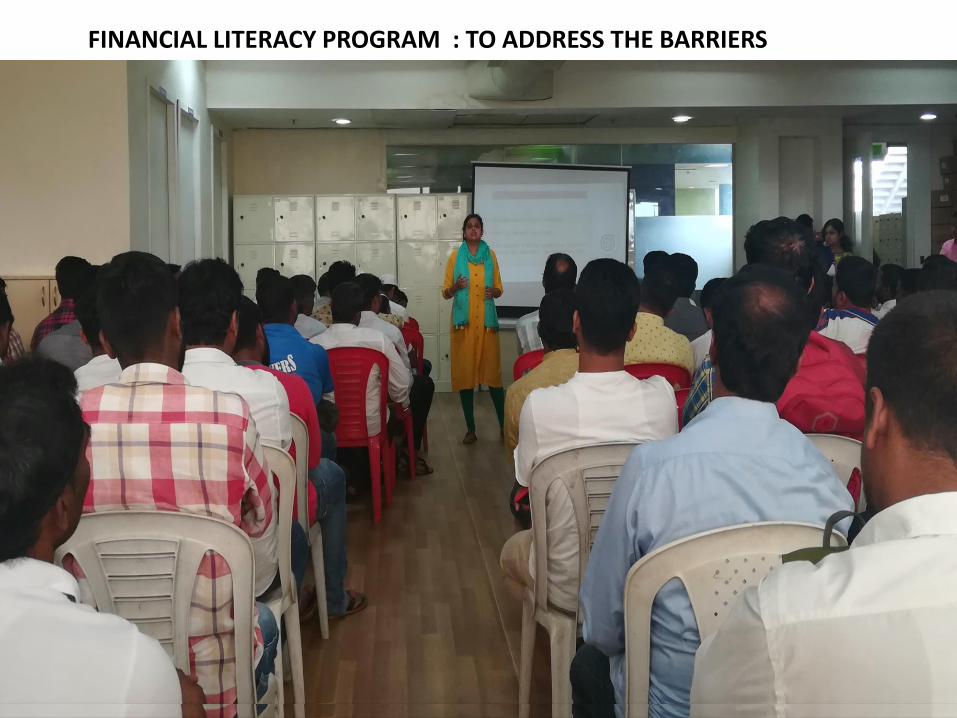
FINANCIAL LITERACY PROGRAM : TO ADDRESS THE BARRIERS
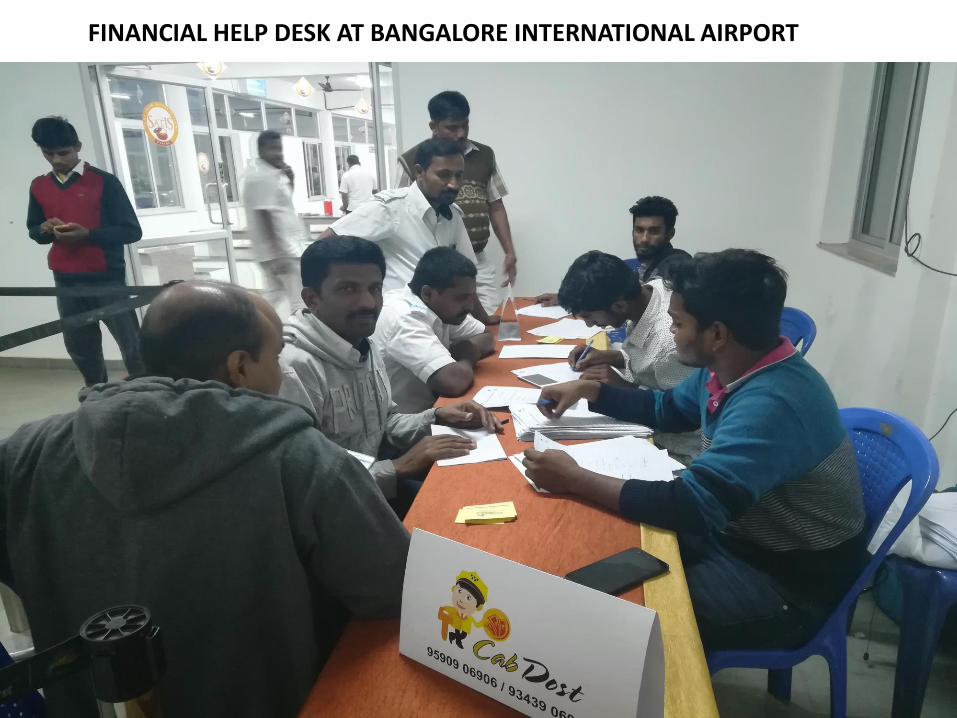
FINANCIAL HELP DESK AT BANGALORE INTERNATIONAL AIRPORT
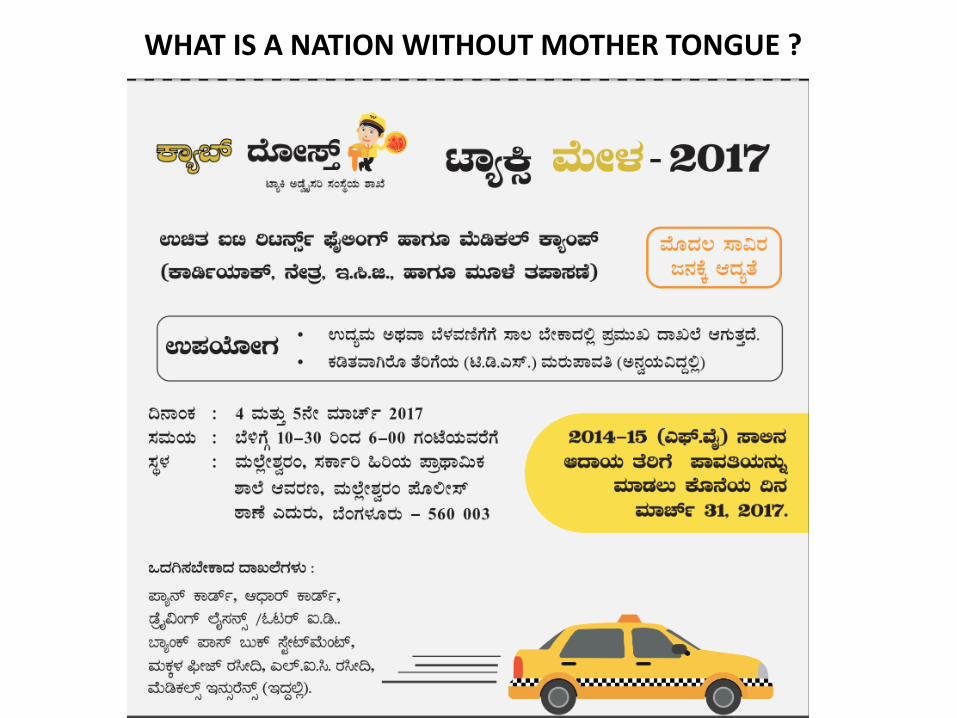
WHAT IS A NATION WITHOUT MOTHER TONGUE ?


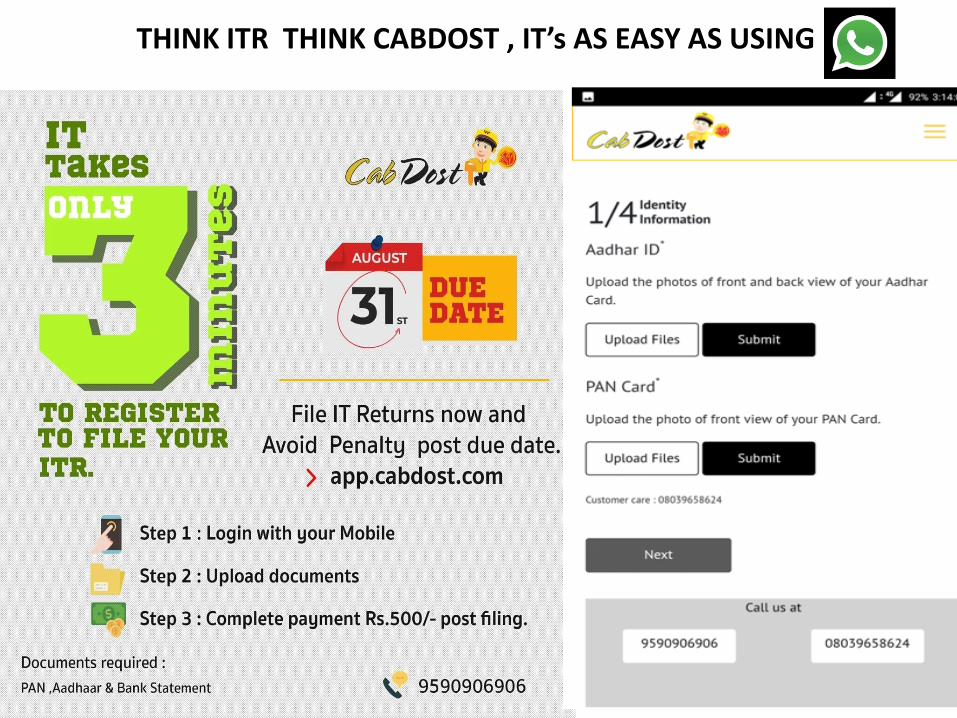
THINK ITR THINK CABDOST , IT’s AS EASY AS USING

COMMUNITY KEY TO SUCCESS

SECRET SAUCE = PUBLIC
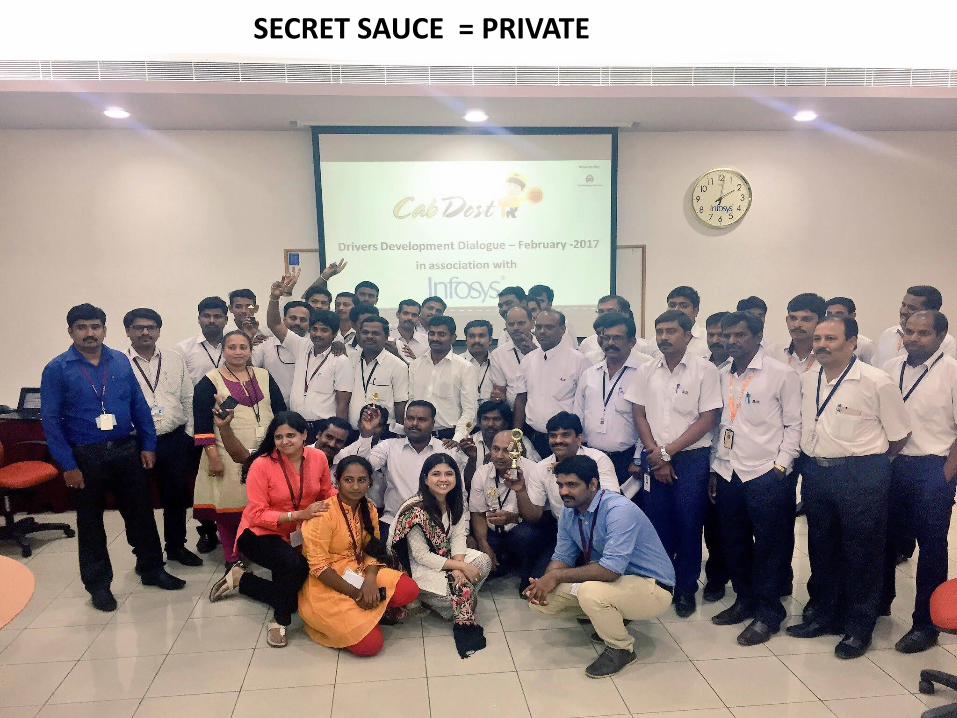
SECRET SAUCE = PRIVATE

SECRET SAUCE = PARTNERSHIPS

8000 Drivers + 12000 TAX FILING + Half Million Tax Credits =
FINANCIAL DIGNITY FOR TAXI DRIVERS

IT TAKES A VILLAGE ! TO BRING INFORMAL ECONOMY TO TAX UMBRELLA
TAX = MY FUTURE

SESSION 3: TOOL TO BUILD TAX MORALE –
CURRENT AND FUTURE APPROACHES
14:00 – 15:30
Speakers:
Anna Custers, Economist, World Bank Group
Borja Diaz, Senior Technician, Eurosocial
Cassiel Forson MP, Ranking Member, Finance Committee Parliament of Ghana
Nida Broughton, Head of Economic Growth and Productivity, Behavioural
Insights Team
Moderator: Grace Perez-Navarro, Deputy Director CTPA, OECD
Innovations in Tax Compliance
The Role of Tax Morale in Development
OECD, Paris, January 2019
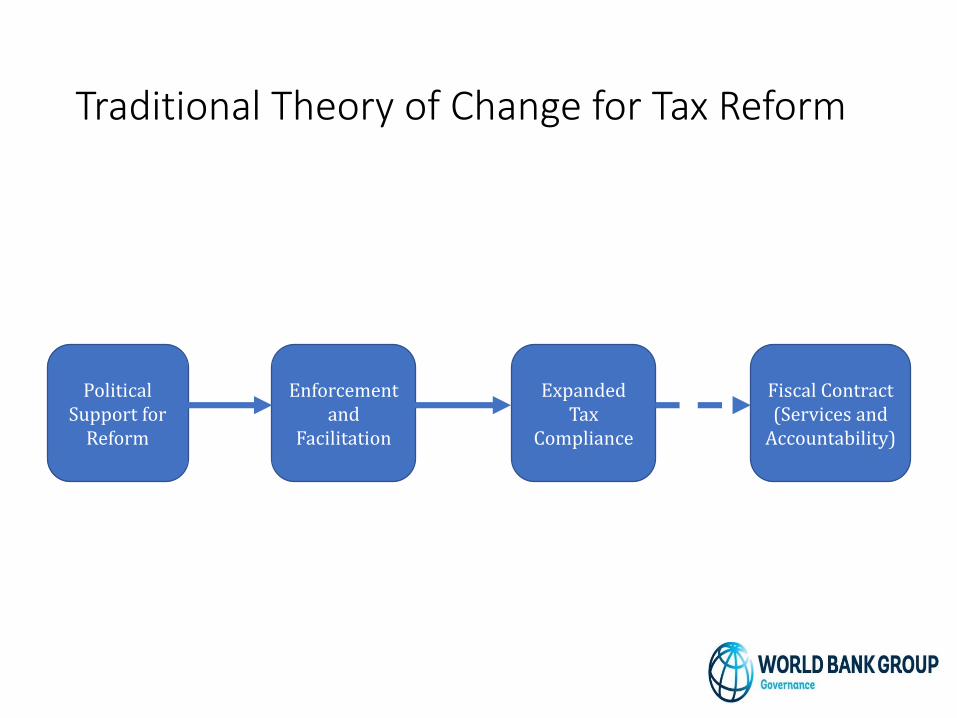
Traditional Theory of Change for Tax Reform
Political Support for
Reform
Enforcement and
Facilitation
Expanded Tax
Compliance
Fiscal Contract (Services and
Accountability)
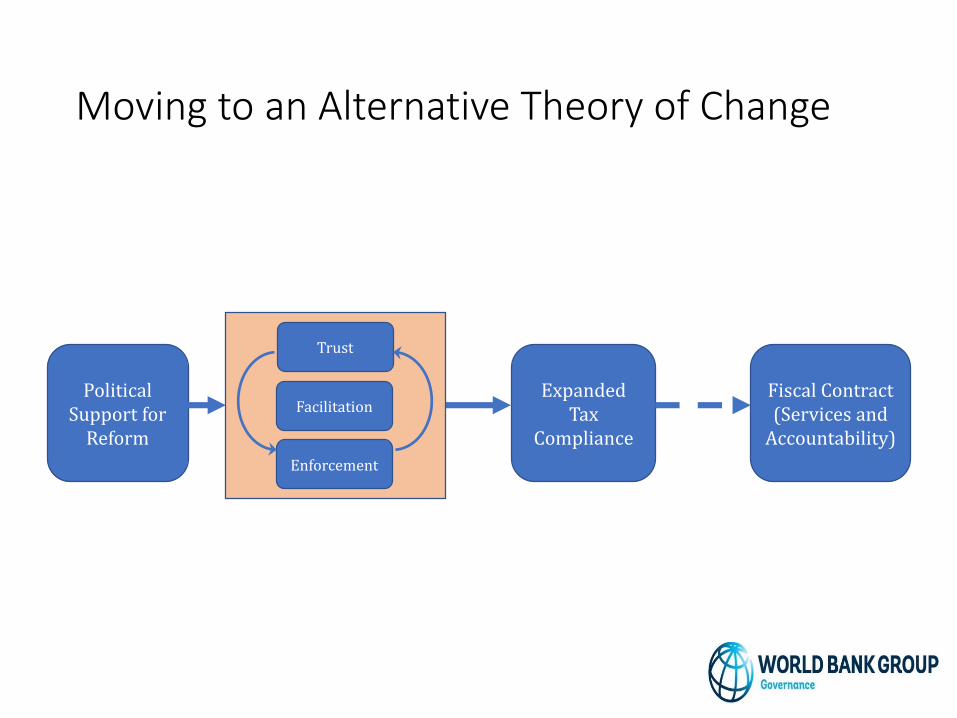
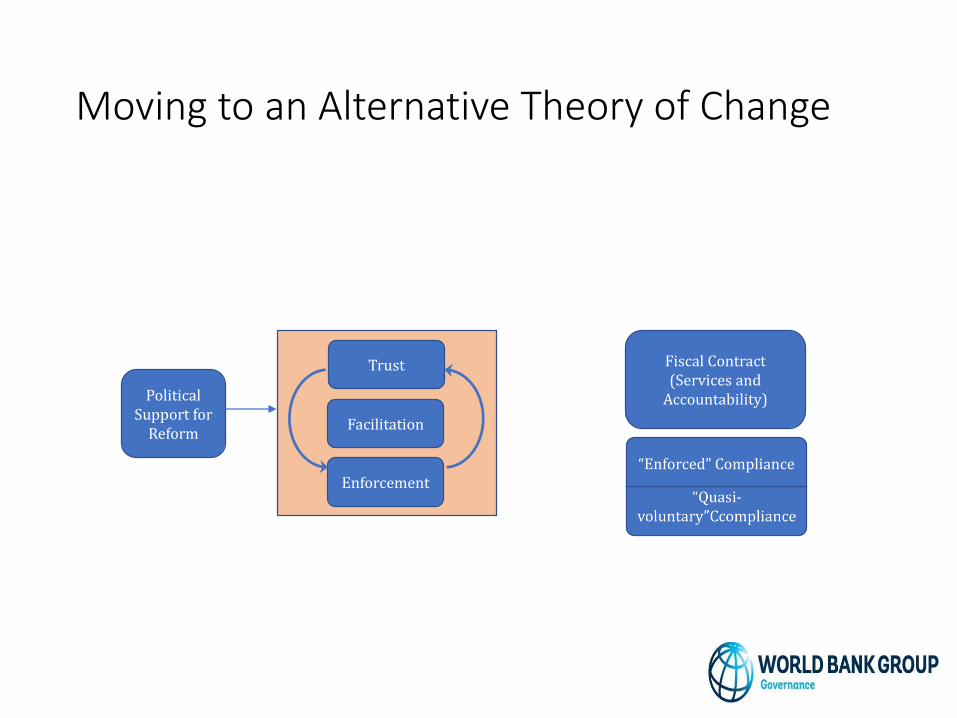
Moving to an Alternative Theory of Change
Political Support for
Reform
Expanded Tax
Compliance
Fiscal Contract (Services and
Accountability)
Trust
Facilitation
Enforcement
Moving to an Alternative Theory of Change
Political Support for
Reform
Trust
Facilitation
Enforcement“Enforced” Compliance
Fiscal Contract (Services and
Accountability)
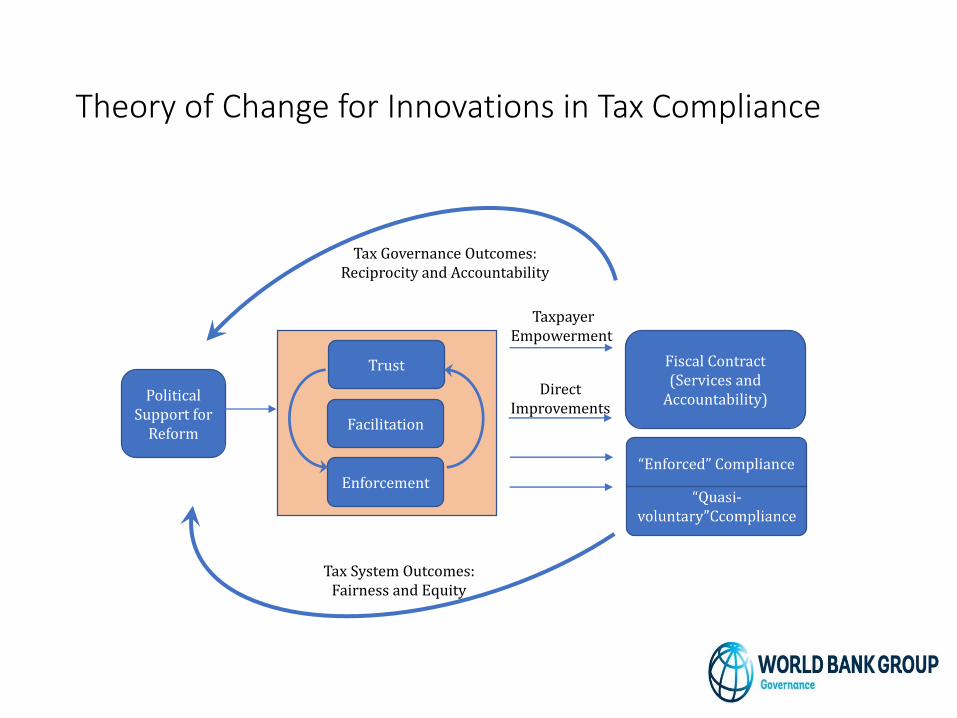
Theory of Change for Innovations in Tax Compliance
Direct Improvements
Taxpayer Empowerment
Tax Governance Outcomes: Reciprocity and Accountability
Political Support for
Reform
Trust
Facilitation
Enforcement“Enforced” Compliance
Fiscal Contract (Services and
Accountability)
Tax System Outcomes: Fairness and Equity

Set of Questions Guiding Reformers
- What are the reform objectives?
- What types of reform can best meet these objectives?
- What is the binding constraint on reform?
- How can investments in enforcement, facilitation and trust best be combined?
- What types of investments can best be combined, and is there adequate political support for reform?
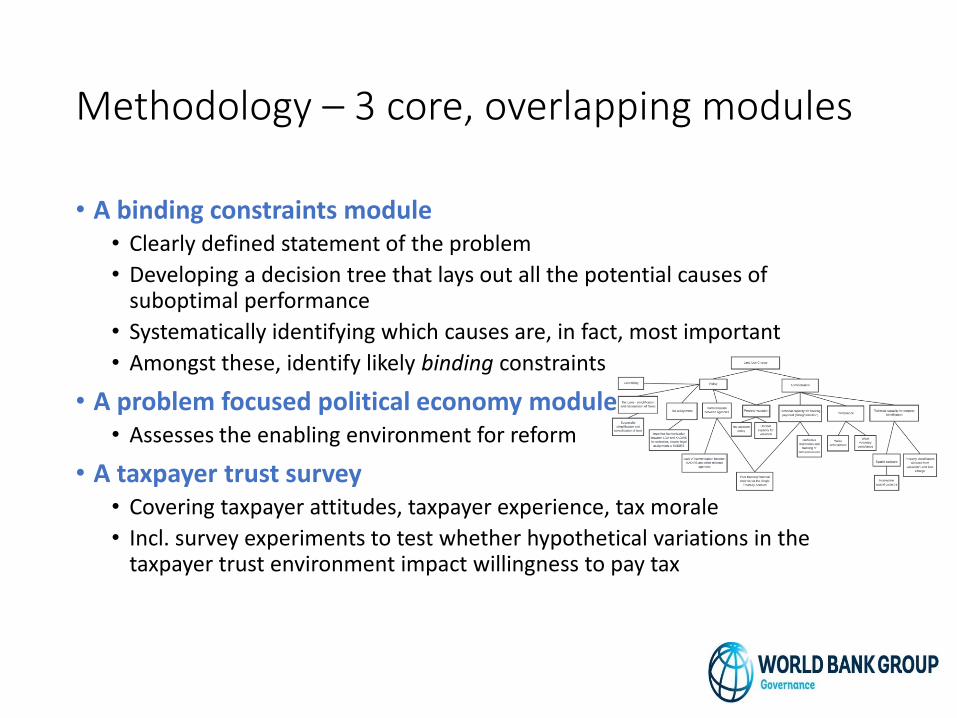
Methodology – 3 core, overlapping modules
• A binding constraints module• Clearly defined statement of the problem
• Developing a decision tree that lays out all the potential causes of suboptimal performance
• Systematically identifying which causes are, in fact, most important
• Amongst these, identify likely binding constraints
• A problem focused political economy module• Assesses the enabling environment for reform
• A taxpayer trust survey• Covering taxpayer attitudes, taxpayer experience, tax morale
• Incl. survey experiments to test whether hypothetical variations in the taxpayer trust environment impact willingness to pay tax
Setting: Property Tax in Kaduna State
• The main objective of the work was a property tax compliance assessment, aimed at assisting Kaduna State to unlock its bottlenecks in tax collection
• Property tax is set to become one of Kaduna’s main sources of internally generated revenue, but, at <1% of IGR in 2017, it currently is negligible
• The Kaduna State government has started with transformative investments in new IT systems, and a harmonization of the tax law;
• While this has resulted in some significant gains, the assessment highlights binding constraints to further progress in property tax compliance, notably:
(i) strengthening core elements of the Kaduna Inland Revenue Service (KADIRS);
(ii) building broader based support and taxpayer trust in the face of mounting skepticism

What is different?
Trust
Facilitation
Enforcement
Inattention to strengthening core elements of tax administrations may risk mounting resistance from local governments, tax administrators and taxpayers
Two-pronged approach, focusing on strengthening enforcement and trust would address the most pressing binding constraints

Thank you!

72
Borja Díaz Rivillas
Senior Project Manager EUROsociAL+ /
FIIAPP
Paris, January the 25th
Taxpayer education
in Latin America
Fiscal culture
Citizenship
Values
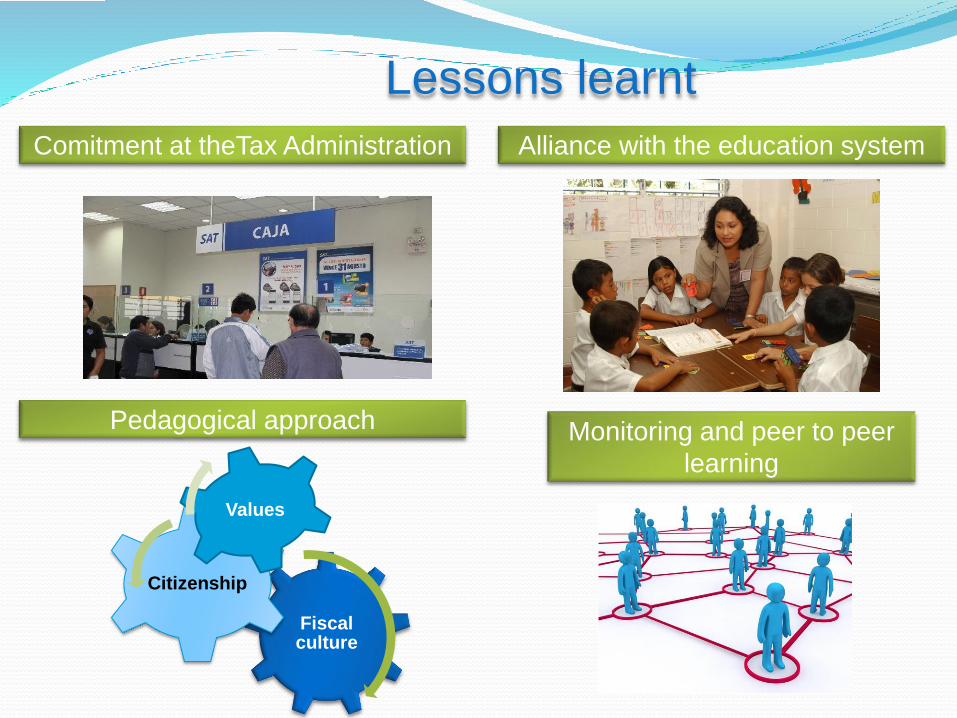
Alliance with the education system
Pedagogical approach
Comitment at theTax Administration
Monitoring and peer to peer
learning
Lessons learnt

74
Case study: El Salvador
• Tax education in the
curriculum
• 800,000 school children/
year
• Training of comercial
technical teachers.
• Tax moral base line (2015)
75
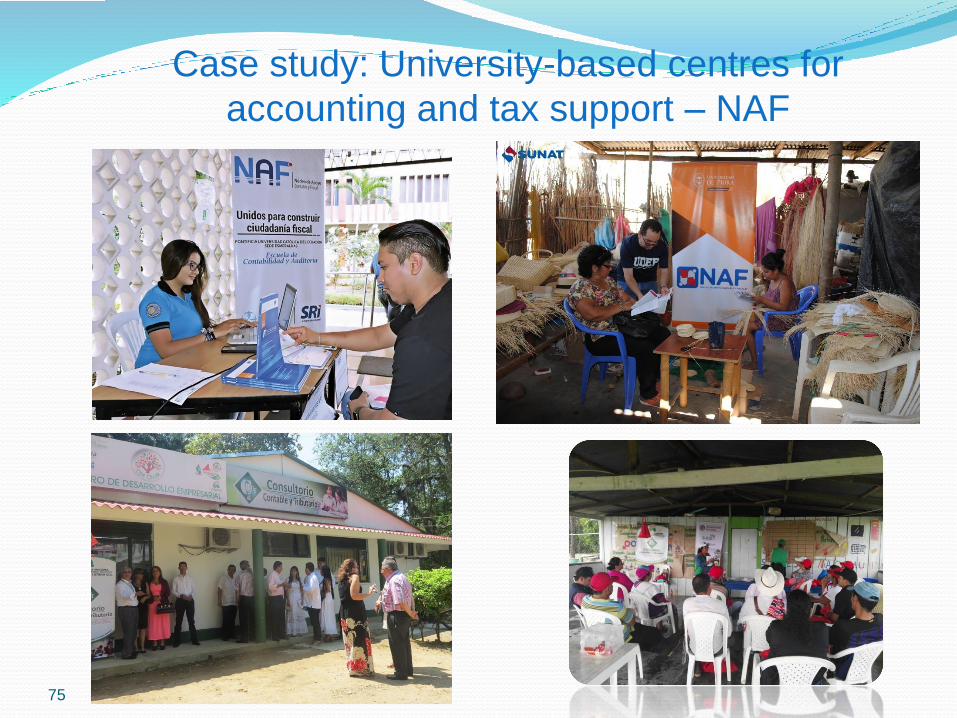
Case study: University-based centres for
accounting and tax support – NAF

76
Impact
University
• Empowerment of students: updated and practical knowledge, softskills, personal experience.
• Social responsibility and image enhancement in the community.
• Generates tax nowledge.
Tax administration
• Improves tax moral and ethics of accountants
• Better working relationship with accountants
• Improves voluntary payment of taxes of citizens
Comunity
• Support low income taxpayers in basic tax issues free of charge
• Friendly and personalized environment for people who distrust or have difficulty communicating with the tax administration.
• Improving small business
77
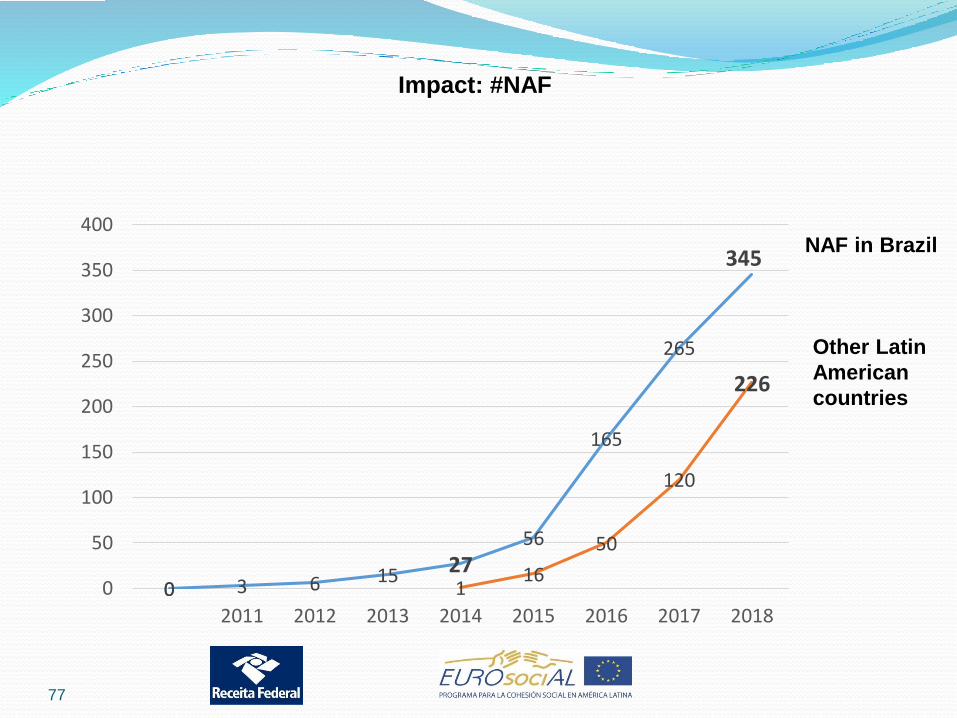
Impact: #NAF
NAF in Brazil
Other Latin
American
countries
0 3 6 15 2756
165
265
345
0 116
50
120
226
0
50
100
150
200
250
300
350
400
2011 2012 2013 2014 2015 2016 2017 2018
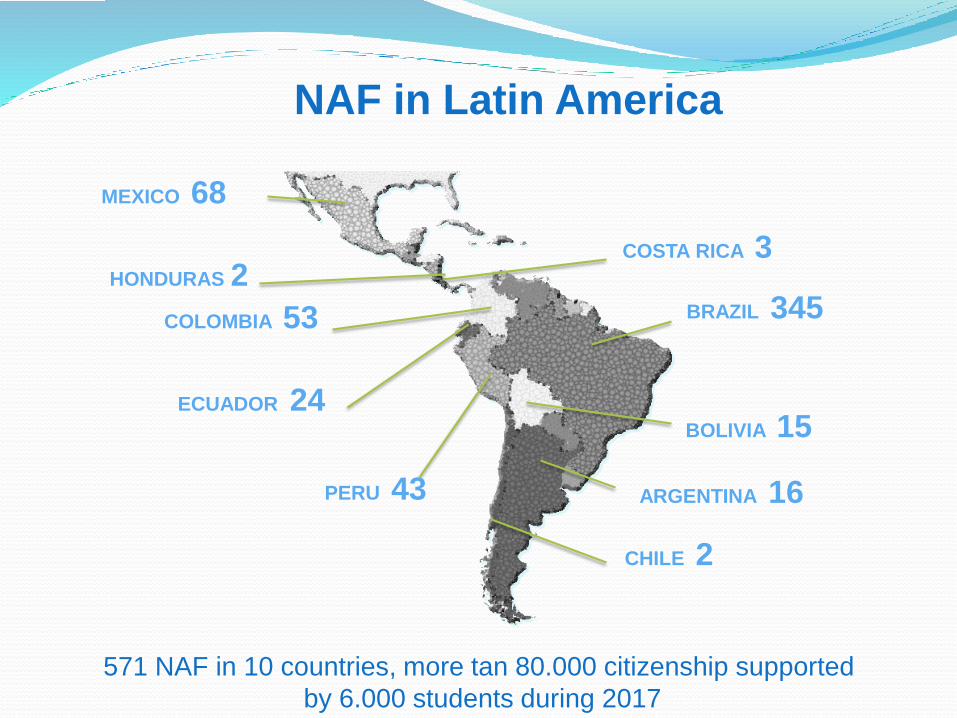
BOLIVIA 15
COSTA RICA 3
BRAZIL 345
ECUADOR 24
CHILE 2
COLOMBIA 53
MEXICO 68
PERU 43 ARGENTINA 16
571 NAF in 10 countries, more tan 80.000 citizenship supported
by 6.000 students during 2017
NAF in Latin America
HONDURAS 2
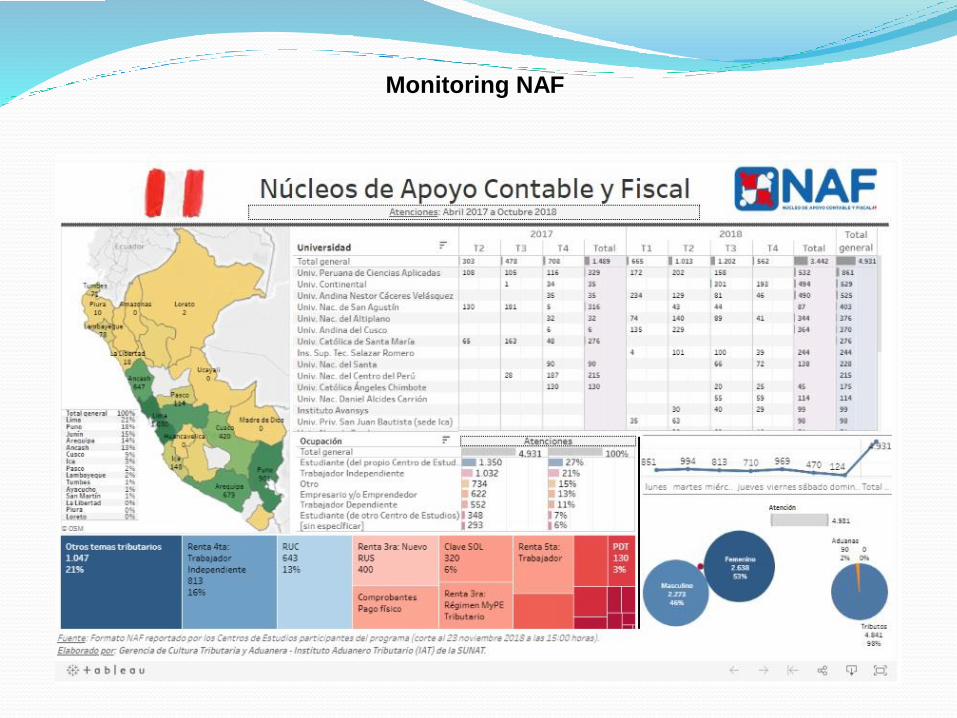
Monitoring NAF

EARMARKING OF VAT REVENUES AND THE IMPLICATIONS FOR BUILDING TAX MORALES IN
GHANA
BY:
CASSIEL FORSON
MEMBER OF PARLIAMENT AND RANKING MEMBER OF FINANCE
COMMITTEE – PARLIAMENT OF GHANA.

INTRODUCTION
Most of the literature makes it clear that the whole purpose of earmarking tax revenue is to create a reliable source
of funding to support critical central government expenditures such as education, health, infrastructure, etc (Cheryl
et al., 2017; Bird et al., 2005; Marsiliani & Renstrom, 2000). They are charged as a fixed percent of a broad tax or a
separate tax.
In the case of Ghana, specific VAT handles are used as earmarked taxes. The rationale for imposing these
earmarked taxes was to create a sustainable source of funding for health (NHIL), education (GETFund) and
infrastructure (GIIF).
E.g. Health (NHIL) (2.5% VAT and 2.5% SSNIT), Education (GETFund) (2.5% VAT), Infrastructure (GIIF) (2.5% VAT)
Earmarked funds Capping and Realignment Act was introduced in 2017 to create fiscal space for government.
CAPPING OF EARMARKED TAX REVENUE
In the past, the total disbursement to earmarked generated from earmarked taxes was
about forty (40) percent of tax revenue.
The passage of the Act brought about the capping of earmarked fund tax revenue to
twenty-five to (25) percent of tax revenue and to align central government expenditure
to statutory funds.
An assessment of the policy after two (2) years of implementation has found the policy
to be counterproductive because most of the earmarked funds can’t meet their statutory
obligations.
The capping and alignment of earmarked funds resulted in a transfer of nearly GH¢ 2.9
billion ($590million) from GETFund to the central budget as indicated in Table 1 below.

CAPPING OF EARMARKED TAX REVENUE
Table 1: Revenue from Capping and Realignment of GETFund Allocation
Source: Budget Statement of Government of Ghana
YearExpected
YieldCapping (GH¢) Alignment (GH¢) Total (GH¢)
2017 737,013,575 490,706,605 215,000,000 705,706,605
2018 1,078,982,848 552,741,110 447,511,600 1,000,252,710
2019 1,895,100,000 688,336,455 440,000,000 1,128,336,455
Total
(GH¢)
($)
3,711,096,423 1,731,784,170 1,102,511,600 2,834,295,770
773,145,088 360,788,369 229,689,917 590,478,285
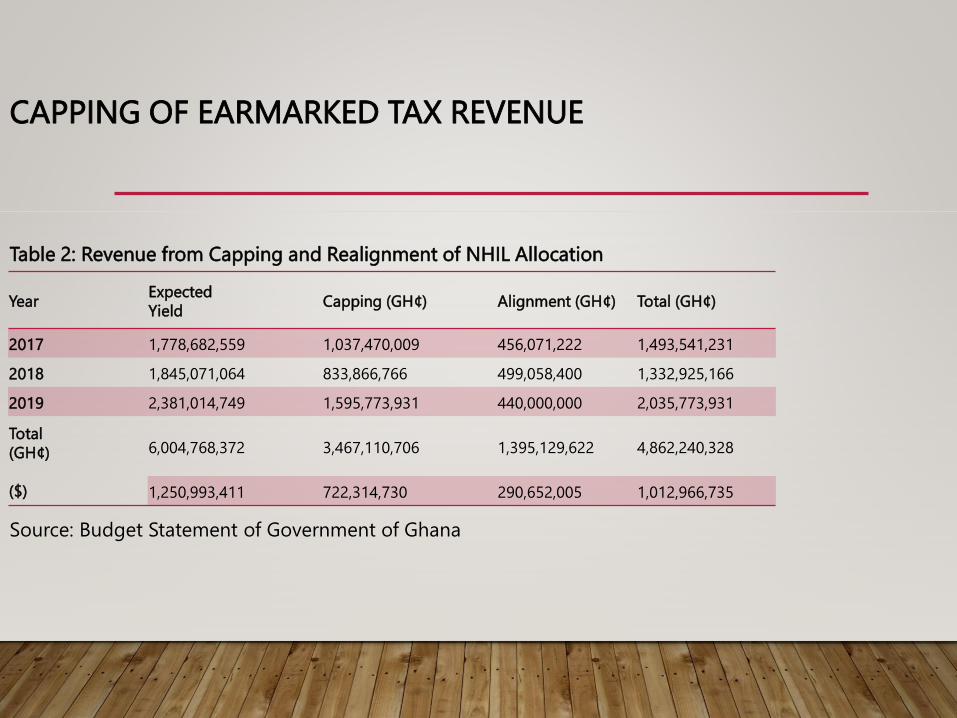
CAPPING OF EARMARKED TAX REVENUE
Table 2: Revenue from Capping and Realignment of NHIL Allocation
Source: Budget Statement of Government of Ghana
YearExpected
YieldCapping (GH¢) Alignment (GH¢) Total (GH¢)
2017 1,778,682,559 1,037,470,009 456,071,222 1,493,541,231
2018 1,845,071,064 833,866,766 499,058,400 1,332,925,166
2019 2,381,014,749 1,595,773,931 440,000,000 2,035,773,931
Total
(GH¢)
($)
6,004,768,372 3,467,110,706 1,395,129,622 4,862,240,328
1,250,993,411 722,314,730 290,652,005 1,012,966,735

THE ECONOMIC IMPLICATIONS OF CAPPING EARMARKED TAXES The implications of the cap are that:
The cap has constrained GETFund’s ability to deliver on its core mandate of making funds available to supplement
Government’s role of providing educational infrastructure and facilities within the public sector (from the pre-tertiary
to the tertiary level);
Government made a move to increase public debt by contracting a loan facility for GETFund to clear the outstanding
claims, when there is the option to exempt GETFund from the capping and alignment policy. A total amount of $ 1.5
billion loan is proposed for critical projects by GETFund, which will be disbursed in three tranches.
More so, GETFund is unable to pay contractors which leaves outstanding claims high at GH¢ 734,813,381, thereby
collapsing their working capital;
Contractors are unable to honor their debt service obligations to financial institutions, which has translated into
systemic liquidity crisis in the banking sector. About 70% of loan default cases over the past two years, is attributed
to rising government arrears;

THE ECONOMIC IMPLICATIONS OF CAPPING EARMARKED TAXES
The provision of universal health care will be compromised;
There is general call to impose new taxes on some selected goods such as sugar, cigarettes
and alcohol to raise revenue for the Insurance Scheme;
There is deterioration in physical capital such as roads, schools, etc;
It imposes a constraint on key government expenditure;
Reduces an individuals willingness to pay their taxes;
CONCLUSIONS
The general principle governing the imposition of earmarked taxes is to ensure that there are able to generate
enough revenue to finance the purpose for which they were established.
These taxes as already stated in the literature are mostly established to serve as a reliable source funding to
most statutory funds.
The imposition of a cap on earmarked/statutory funds weakens their financial strength and this bring about the
need to raise additional revenue by introducing new taxes or acquiring additional debt or using some other
means to finance the gap created as a result of the capping.
This situation is more worrisome and leaves the tax payer unfulfilled when the earmarked taxes are not used for
the reason for which they were established.
CONCLUSIONS
This practice does not promote tax morale since it weakens the drivers of trust in good
tax governance.
More so, it does not Support the development of tax administration and compliance
and will eventually weaken the links between revenue and expenditure.
THANK YOU
OECD Tax Morale conference
Nida Broughton, Head of Work & the Economy, BehaviouralInsights Team
Behavioural insights and tax
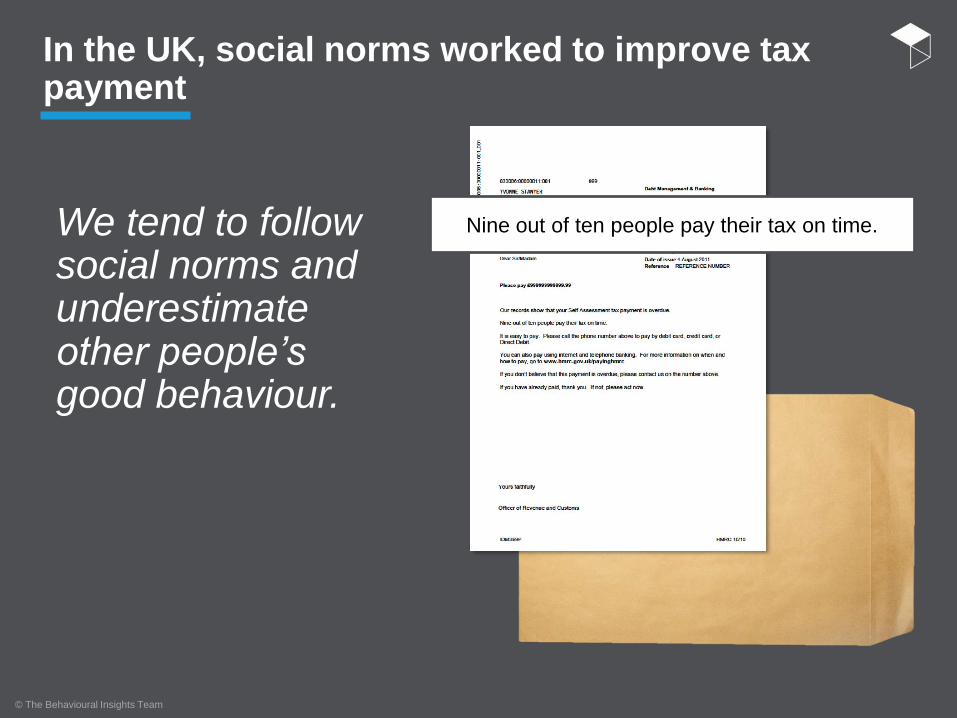
In the UK, social norms worked to improve tax payment
© The Behavioural Insights Team
Nine out of ten people pay their tax on time.We tend to follow social norms and underestimate other people’s good behaviour.
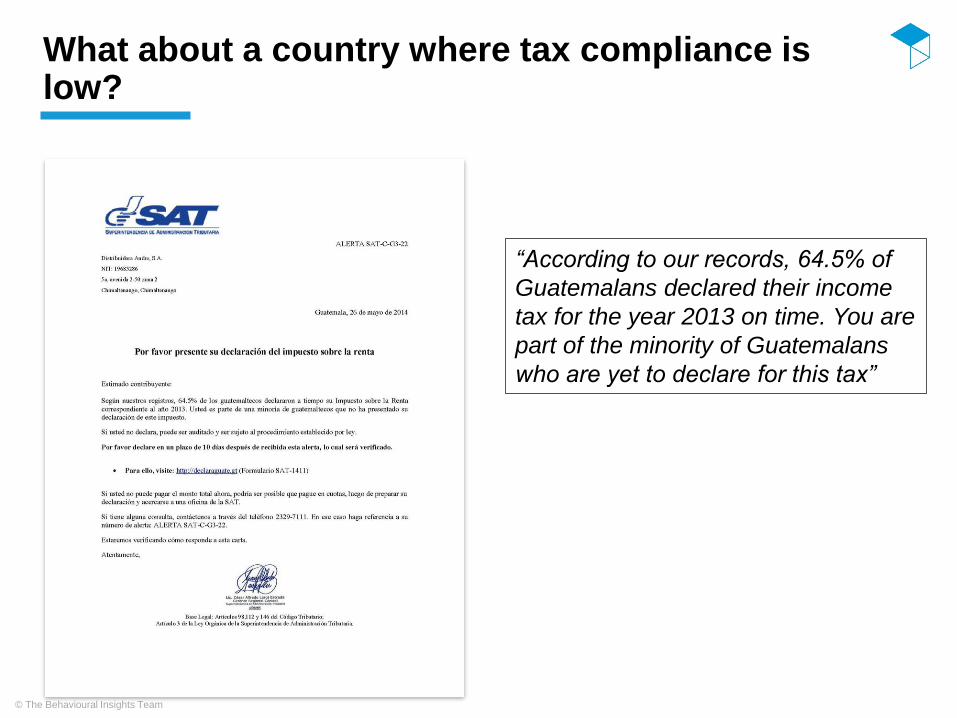
What about a country where tax compliance is low?
© The Behavioural Insights Team
“According to our records, 64.5% of
Guatemalans declared their income
tax for the year 2013 on time. You are
part of the minority of Guatemalans
who are yet to declare for this tax”

What about a country where tax compliance is low?
© The Behavioural Insights Team
“Previously we have considered your
failure to declare an oversight.
However, if you don’t declare now we
will consider it an active choice. You
may therefore be audited and could
face the procedure established by
law.”
“According to our records, 64.5% of
Guatemalans declared their income
tax for the year 2013 on time. You are
part of the minority of Guatemalans
who are yet to declare for this tax”
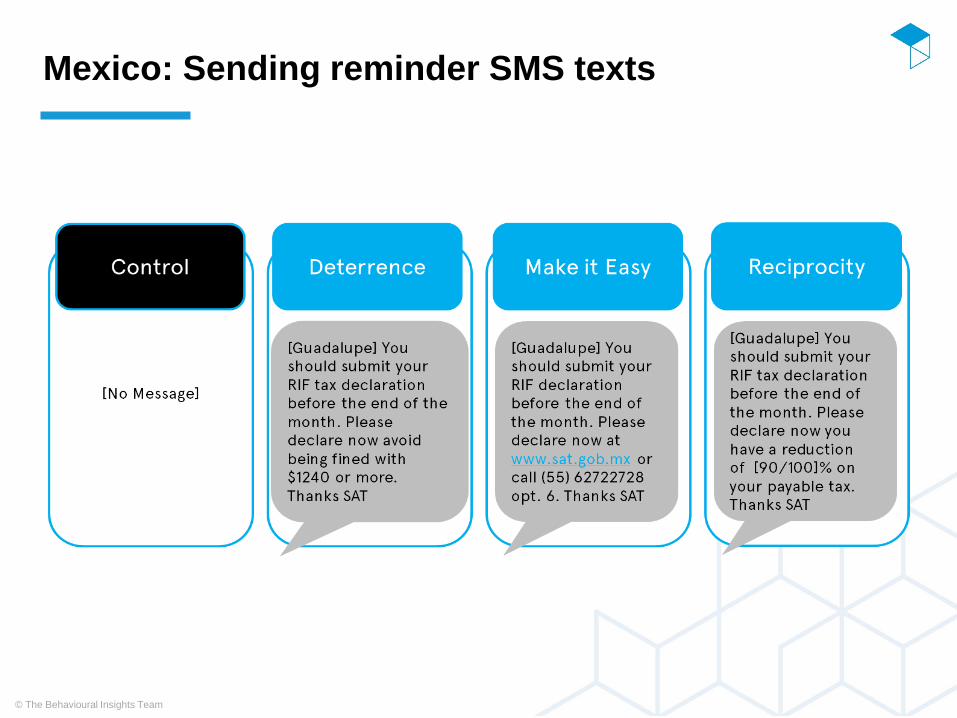
Mexico: Sending reminder SMS texts
© The Behavioural Insights Team

Mexico: Sending reminder SMS texts
© The Behavioural Insights Team
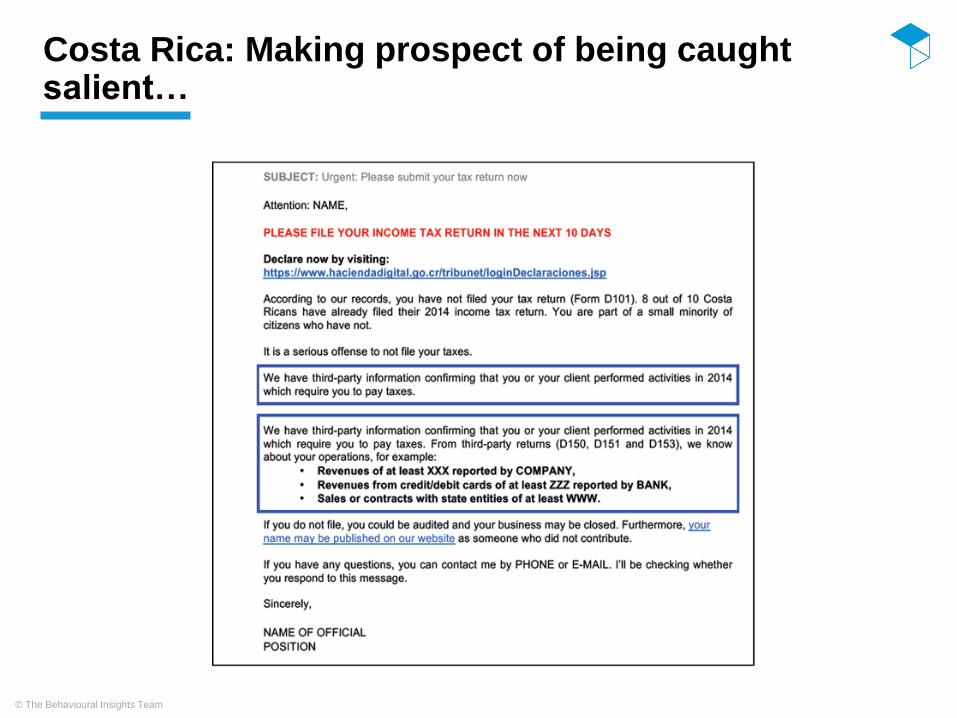
Costa Rica: Making prospect of being caught salient…
© The Behavioural Insights Team

Costa Rica: Making prospect of being caught salient…
© The Behavioural Insights Team

Rewarding good tax compliance can backfire…
© The Behavioural Insights Team
Winning lottery
number
Matched to taxpayer accounts
Good vs. Bad
taxpayers
Create control group
Montevideo
Municipal
Government uses
National Lottery
results to reward
tax compliance
- Head tax
- Vehicle
- Property
- Sewage
“Good” = no debt
and compliant in
previous year,
eligible for tax
holiday in coming
year
Randomly selected
by lottery simulation
then assessed as
“Good” taxpayers
Comparison
between holiday
winners & control
group
Methodology: Natural experiment (2004-2014)
▪ Winning the tax holiday reduced tax compliance by three percentage
points, an effect that lasted up to three years.
▪ This is likely due to habit interruption because no effect for vehicle tax
(winners still pay small amount) or those with automatic debit.
Analyse compliance
post holiday
Dunning, Thad et al. “Is Paying Taxes Habit Forming ? Evidence from Uruguay.” (2016).
SESSION 4: WHAT NEXT FOR TAX MORALE?
16:00 – 17:00
Speakers:
Susana Ruiz, Global Lead, Tax Justice, Oxfam
Fabrice Murtin, OECD TrustLab
Moderator: Ben Dickinson, Head of Division, Global Relations and Development, CTPA,
OECD

OECD, TAX MORALE CONFERENCE -Paris, 25 th January 2019
Susana Ruiz. Oxfam
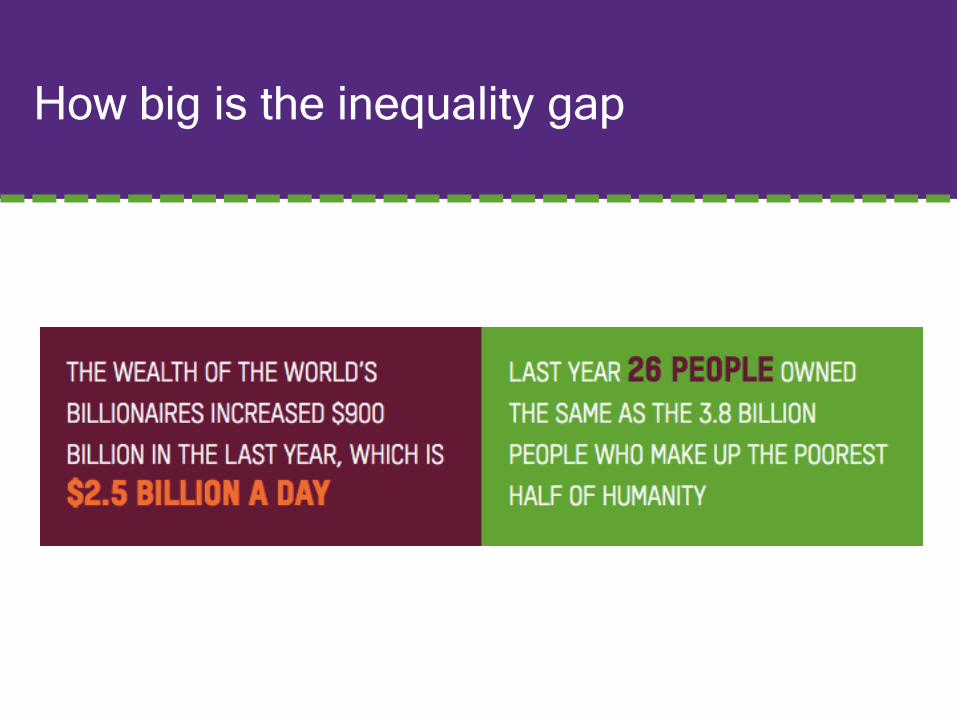
How big is the inequality gap

THE “INEQUALITY CALCULATOR” – HOW MANY YEARS FOR A
CITIZEN IN LOW INCOME LEVEL TO EARN AS MUCH AS A SUPER
WEALTHY IN HIS COUNTRY IN ONE MONTH
174
years
405
years
314
años
442
yeas
264
years
387
years
603
years
196
years
336
years
214
years

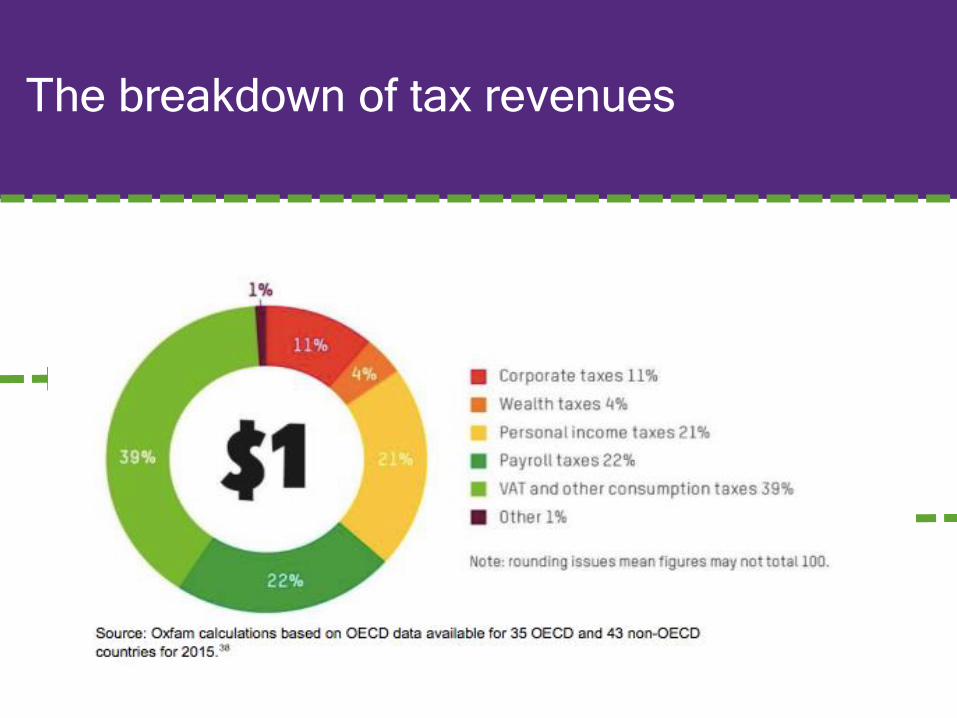
The breakdown of tax revenues
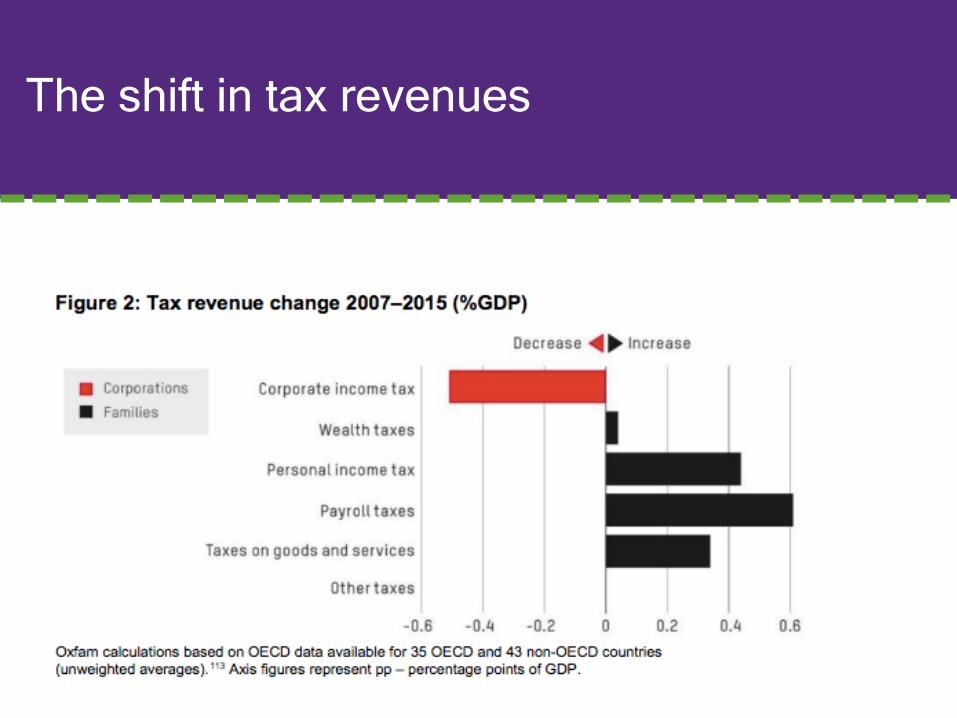
The shift in tax revenues
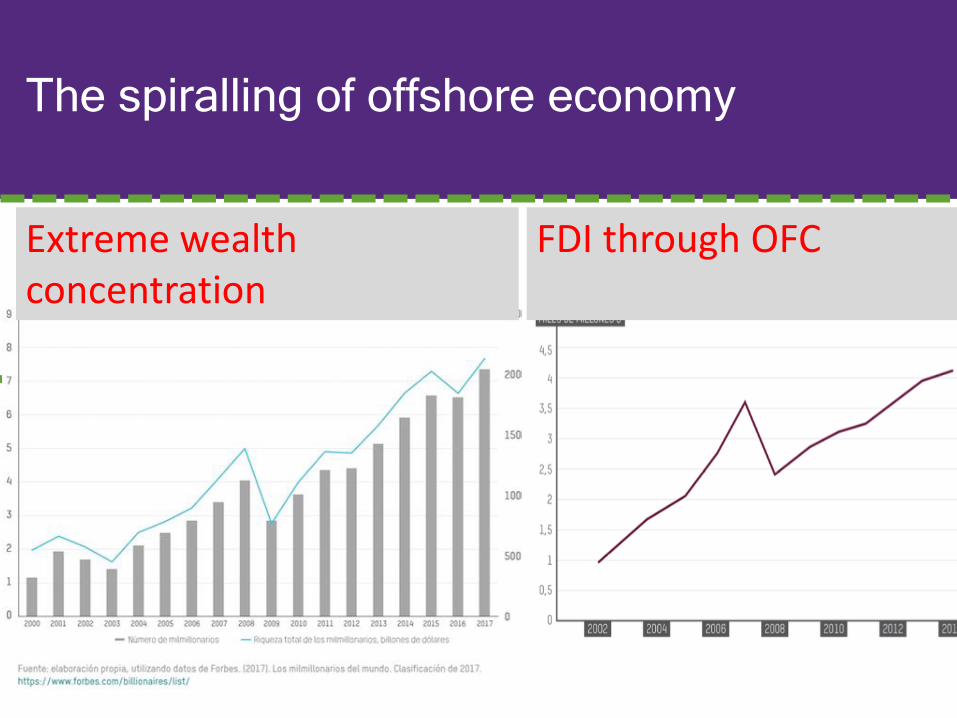
The spiralling of offshore economy
Extreme wealthconcentration
FDI through OFC

POWER IMBALANCE:
WHO MAKES THE RULES
POWER IMBALANCE:
WHO MAKES THE RULES
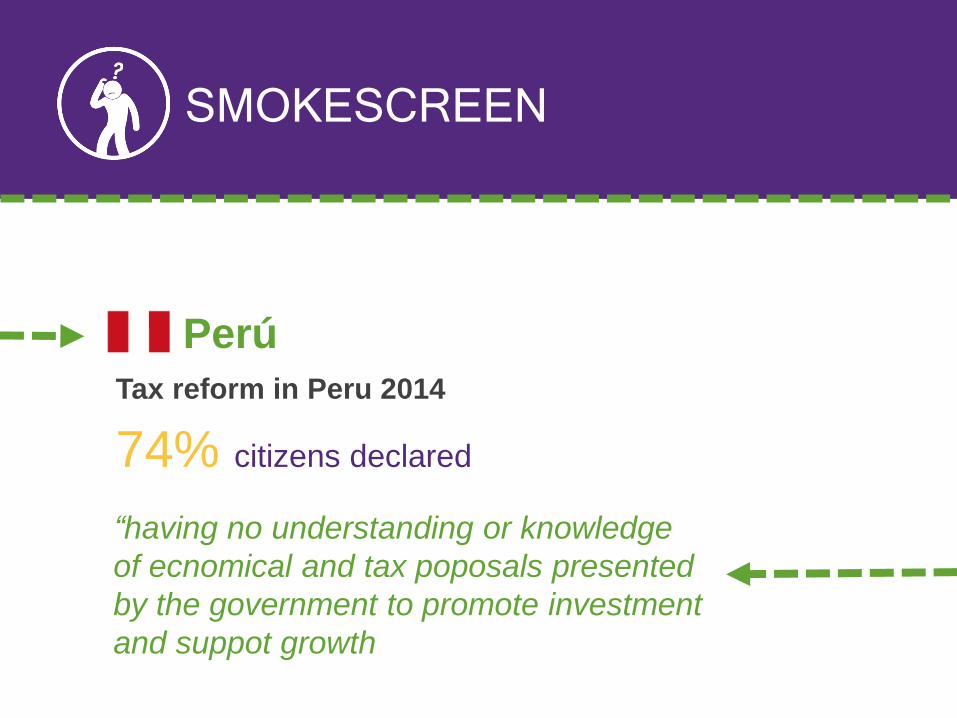
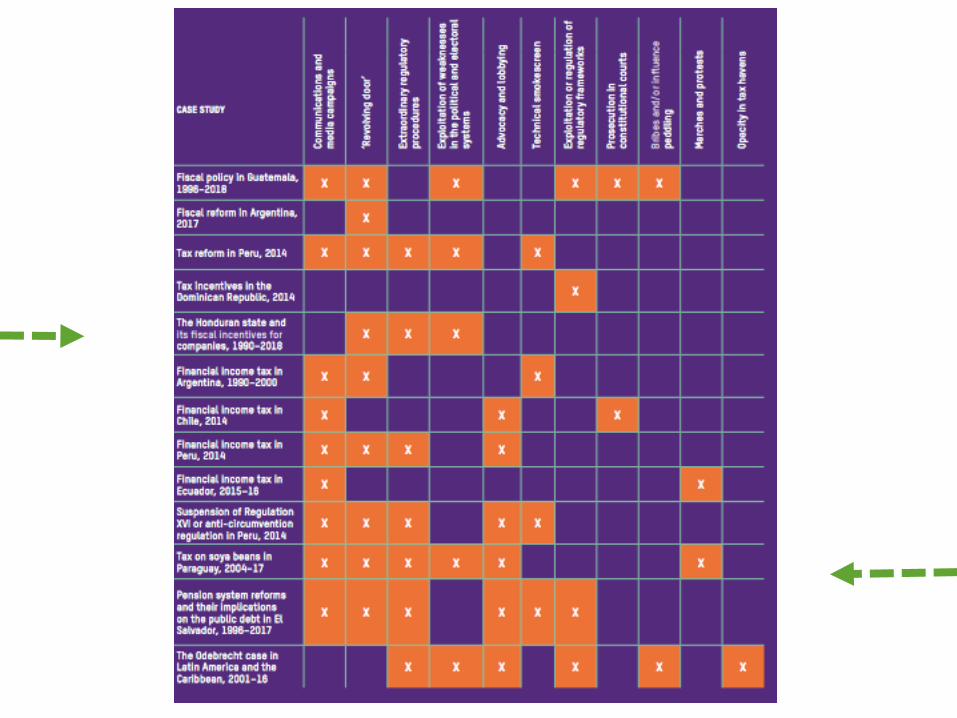
SMOKESCREEN
Perú
Tax reform in Peru 2014
74% citizens declared
“having no understanding or knowledge
of ecnomical and tax poposals presented
by the government to promote investment
and suppot growth

Aggressive lobby
Pharma companies
“invest” more than any
other sector in lobby
activities in the US.
More than 1.500
lobbyists, and
200 million USD
bb
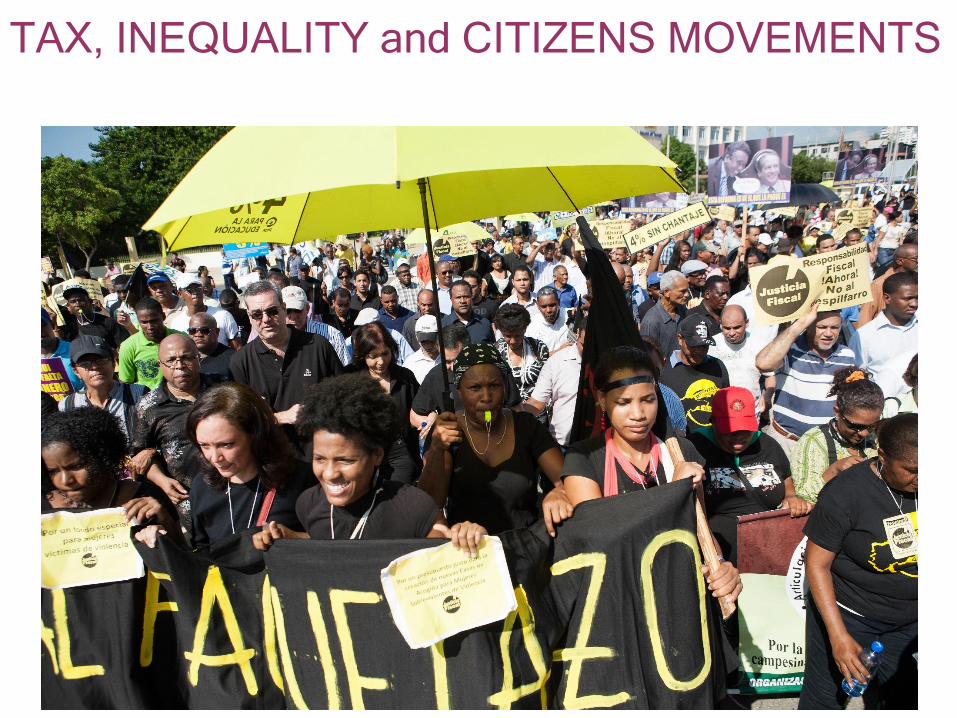
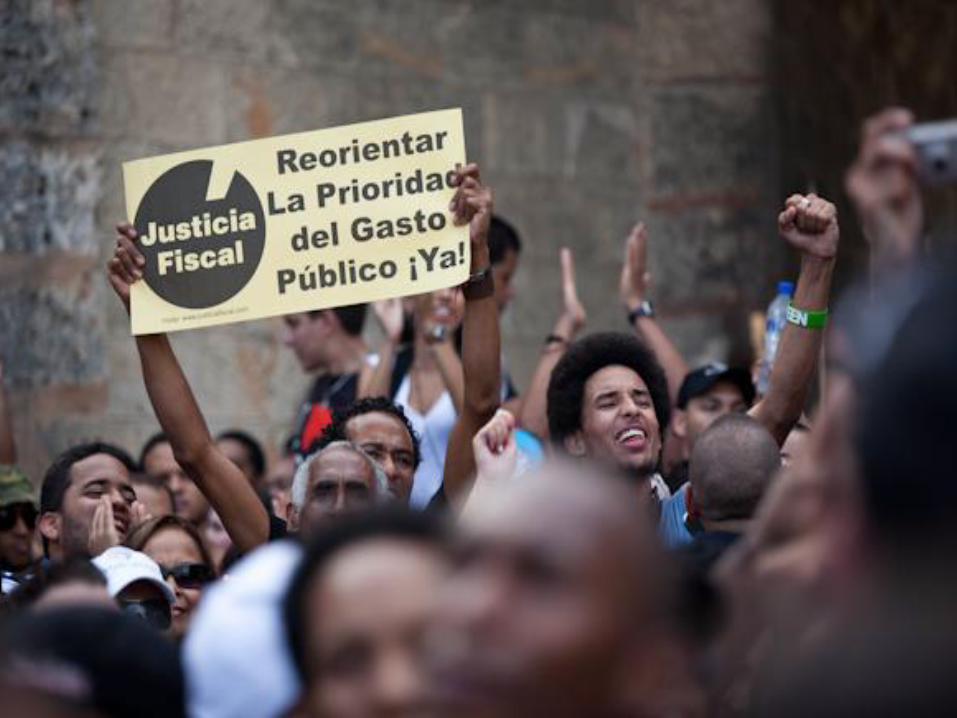
TAX, INEQUALITY and CITIZENS MOVEMENTS
Perú
strengthen social change to tackle
inequality

Peru’s inequality
40% population vulnerable
12 million people
risk of moving backwards and returning
to a situation of poverty

Fiscal Justice GroupNGO’s Alliance
Research
Journalism
TAX Justice
Online campaignFiscal Justice Lab
Policy changeTax reform – Parliament
Commission
Evidence based advocacy
Public Opinion
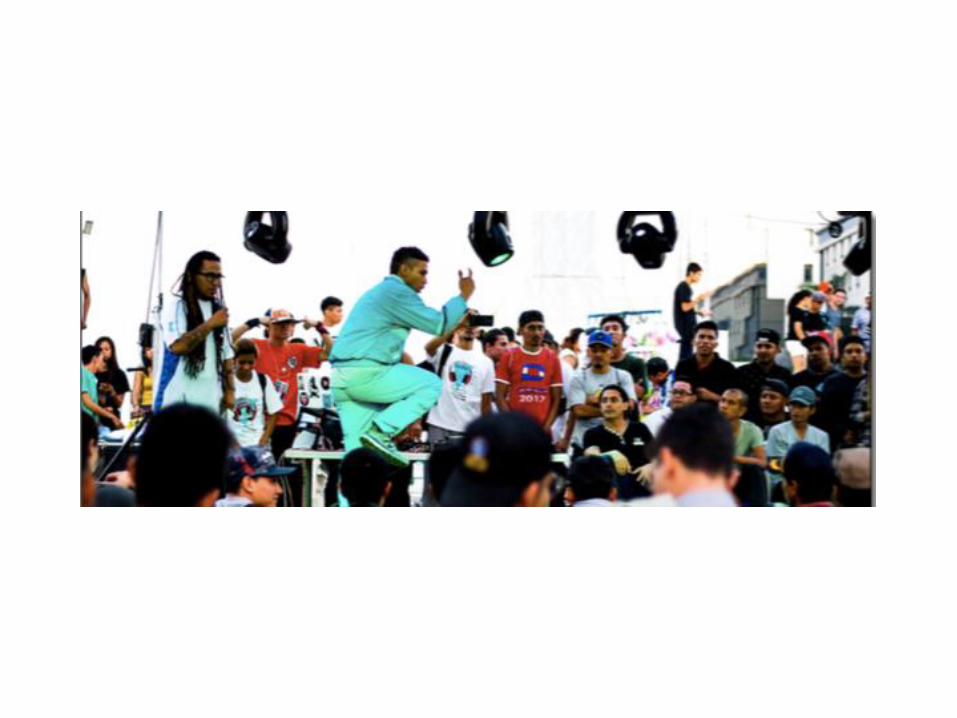
Public Engagement
+ mobilization

empowering change
GRACIAS!!
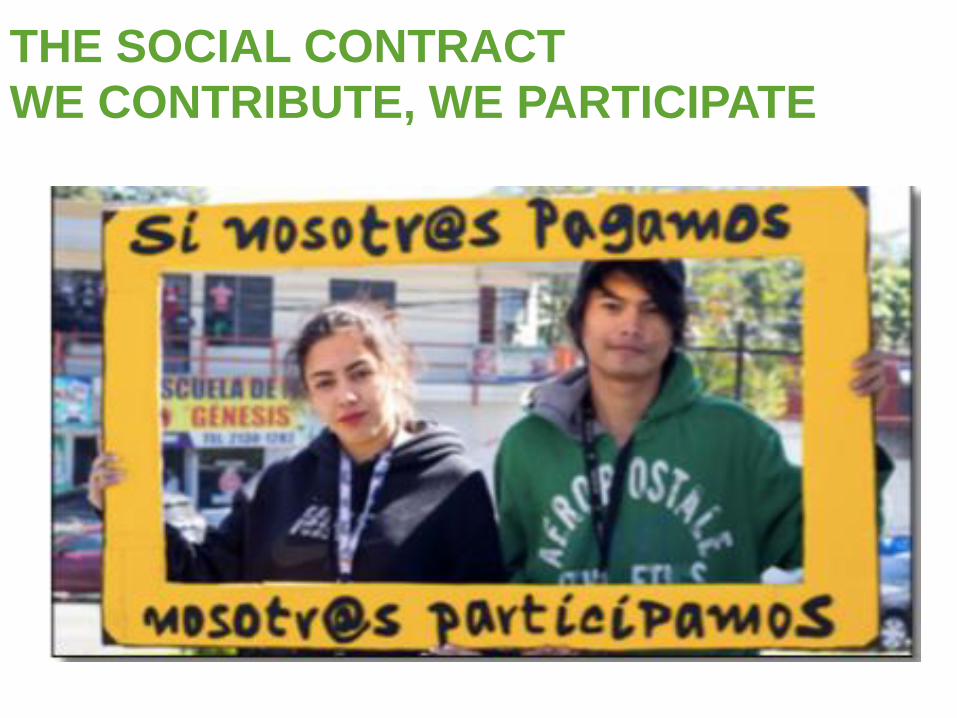
we
THE SOCIAL CONTRACT
WE CONTRIBUTE, WE PARTICIPATE

THE DETERMINANTS OF TRUST:
EVIDENCE FROM TRUSTLAB
Fabrice MurtinHead of Section, SDD/HSPM
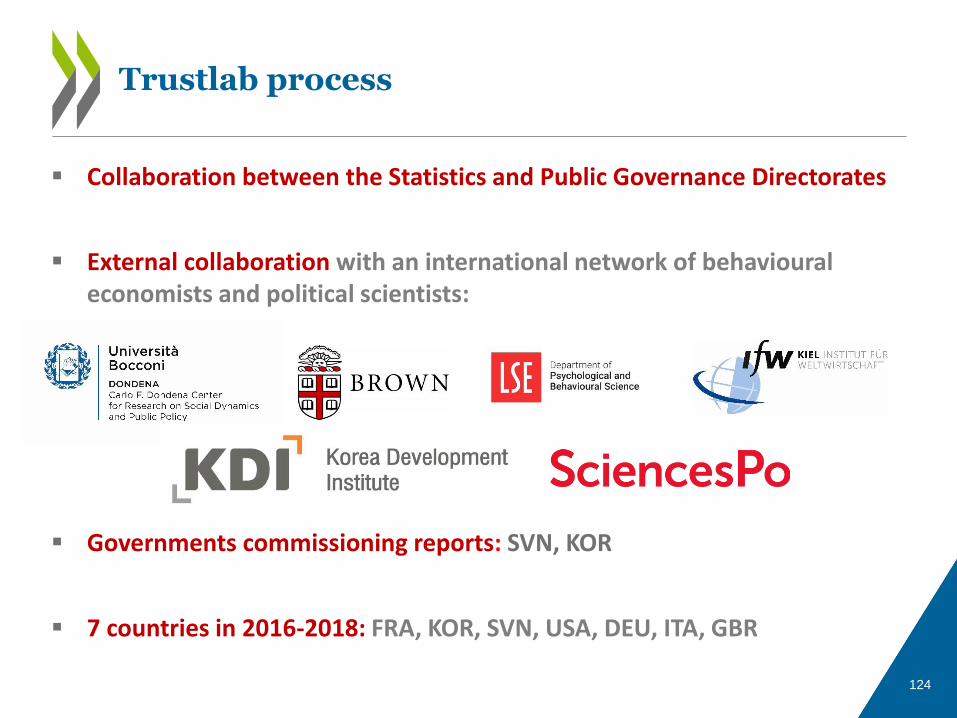
Collaboration between the Statistics and Public Governance Directorates
External collaboration with an international network of behaviouraleconomists and political scientists:
Governments commissioning reports: SVN, KOR
7 countries in 2016-2018: FRA, KOR, SVN, USA, DEU, ITA, GBR
124
Trustlab process
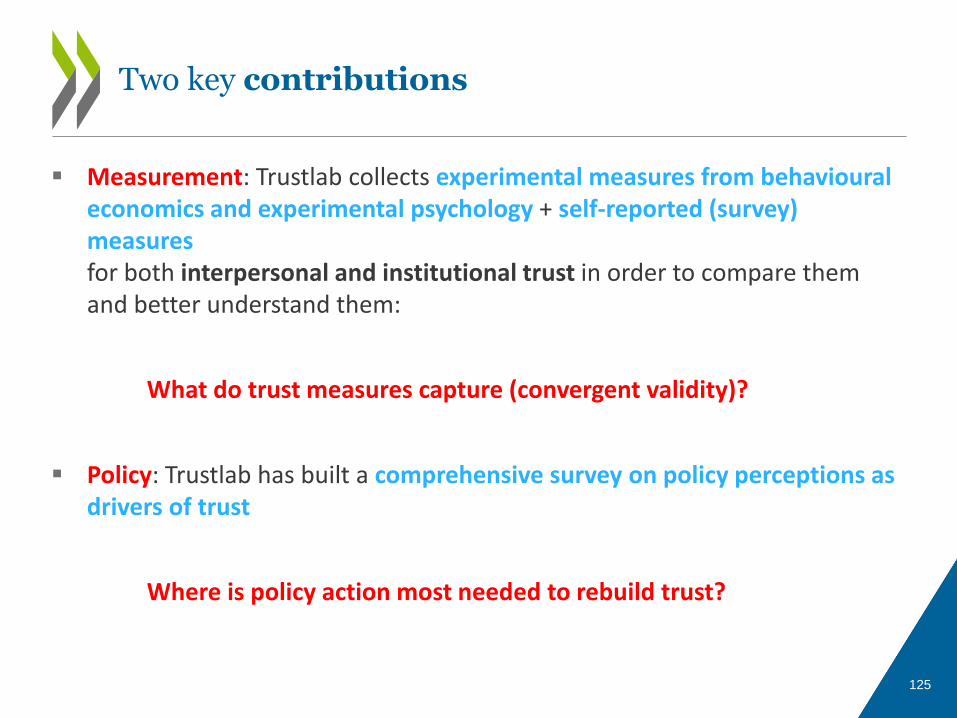
Measurement: Trustlab collects experimental measures from behavioural economics and experimental psychology + self-reported (survey) measuresfor both interpersonal and institutional trust in order to compare them and better understand them:
What do trust measures capture (convergent validity)?
Policy: Trustlab has built a comprehensive survey on policy perceptions as drivers of trust
Where is policy action most needed to rebuild trust?
125
Two key contributions

Online platform run on nationally representative samples ofn=1000
126
Module Focus
Generalised
Trust; Social Norms
Trust in
Institutions
Generalised Trust
Trust in Institutions
Trust in
Institutions Drivers of Trust
Behavioural Games Trust + Public Goods + Dictator + Risk games
Implicit Association Tests
Survey and Demographic Module
Experimental
Quasi-experimental
Traditional
self-reported
survey questions
1
2
3
Optional modules
Optional modules
The Trustlab Survey

1 2
3 4
Both players start with €10
Player A’s transfer (trust) to player B is multiplied by 3
Player B transfers back some money(trust-worthiness)
Player A’s payoff depends on decision byPlayer B
127
Behavioural Game I: The Trust GameMeasuring Trust and Trustworthiness
1 2
3 4
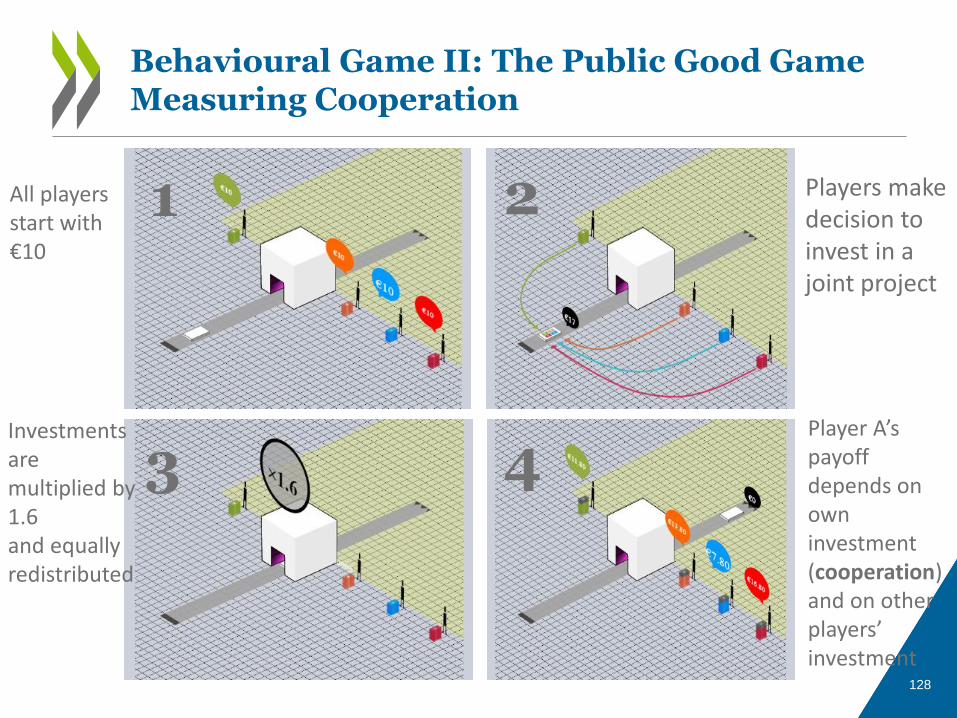
All playersstart with €10
Players make decision to invest in ajoint project
Investmentsare multiplied by 1.6and equally redistributed
Player A’s payoff depends on own investment (cooperation)and on other players’ investment
Behavioural Game II: The Public Good GameMeasuring Cooperation
128
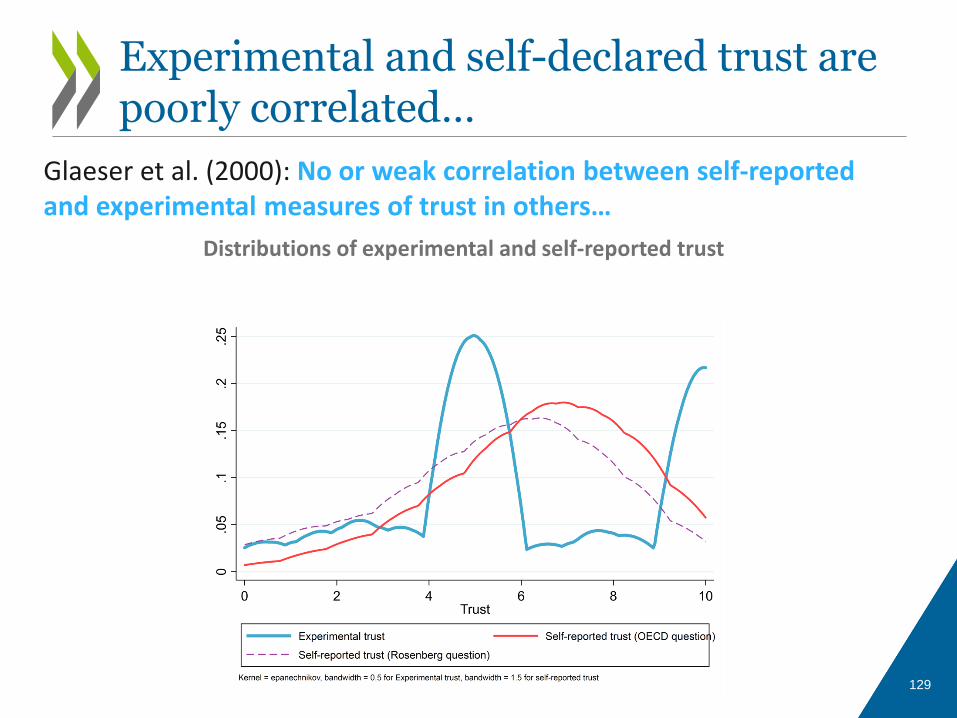
Glaeser et al. (2000): No or weak correlation between self-reportedand experimental measures of trust in others…
Distributions of experimental and self-reported trust
129
Experimental and self-declared trust are poorly correlated…
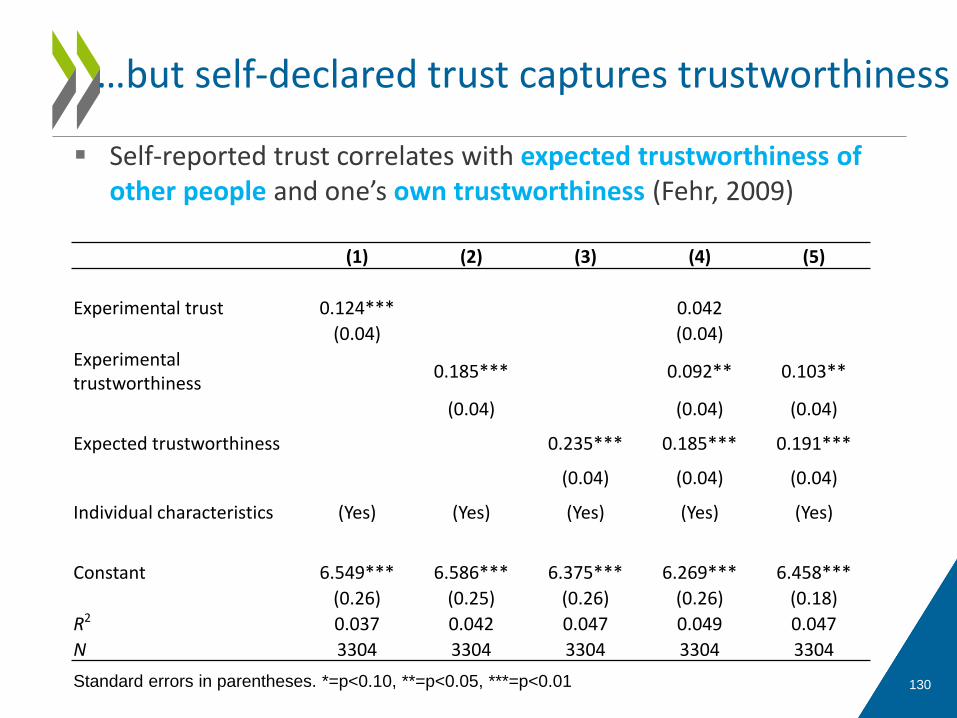
Self-reported trust correlates with expected trustworthiness of other people and one’s own trustworthiness (Fehr, 2009)
130
…but self-declared trust captures trustworthiness
(1) (2) (3) (4) (5)
Experimental trust 0.124*** 0.042
(0.04) (0.04)
Experimental trustworthiness
0.185*** 0.092** 0.103**
(0.04) (0.04) (0.04)
Expected trustworthiness 0.235*** 0.185*** 0.191***
(0.04) (0.04) (0.04)
Individual characteristics (Yes) (Yes) (Yes) (Yes) (Yes)
Constant 6.549*** 6.586*** 6.375*** 6.269*** 6.458***
(0.26) (0.25) (0.26) (0.26) (0.18)
R2 0.037 0.042 0.047 0.049 0.047
N 3304 3304 3304 3304 3304
Standard errors in parentheses. *=p<0.10, **=p<0.05, ***=p<0.01

131
Individual
Institutions
Preferences (8)
Expectations (7)
Socio-economicCharacteristics (10)
Government competence (11)
Government values (6)
Community (3)
Diversity (3)
Digitalization and globalization (2)
Values (3)
Society
The Determinants of Trust
Trust (12)
Determinants of trust and number of corresponding survey or experimental variables:

Government and the Parliament are the least trusted institutions in most countries
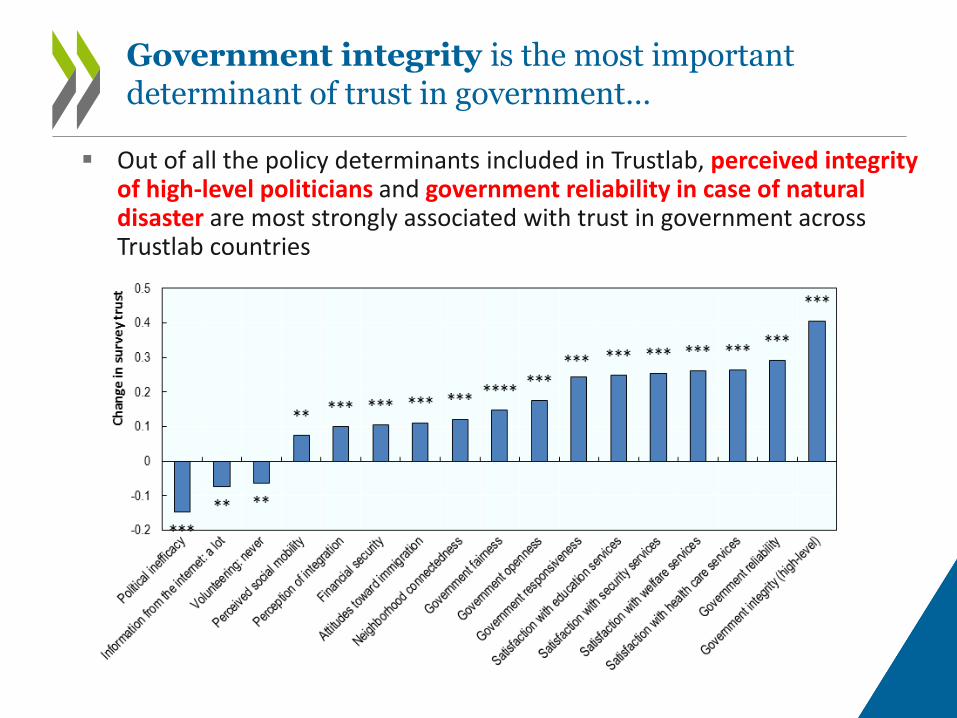
Government integrity is the most important determinant of trust in government…
Out of all the policy determinants included in Trustlab, perceived integrity of high-level politicians and government reliability in case of natural disaster are most strongly associated with trust in government across Trustlab countries
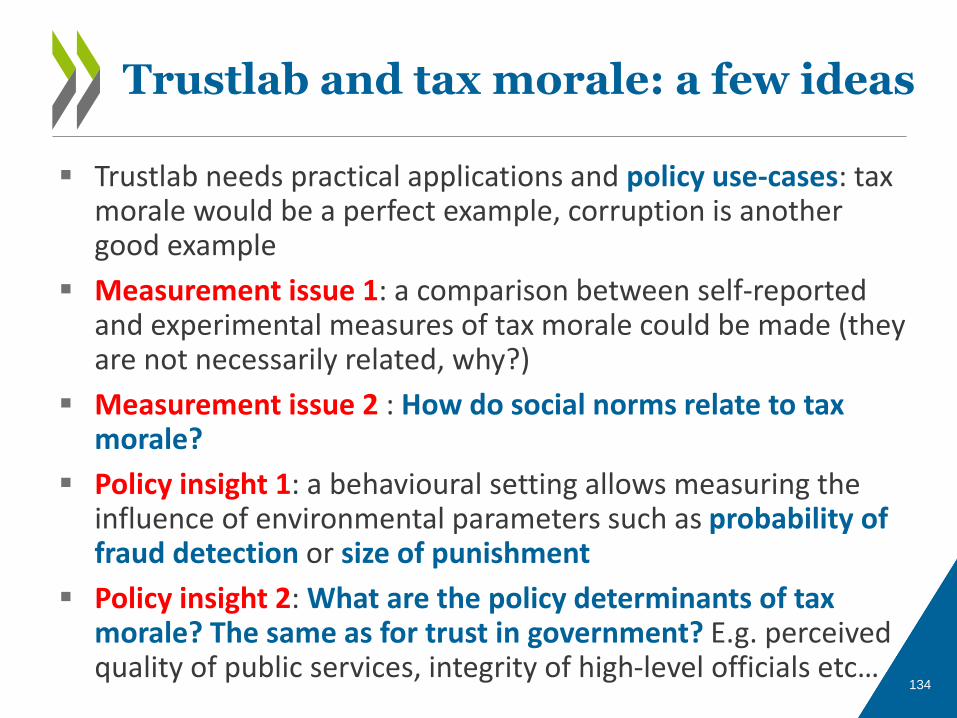
Trustlab needs practical applications and policy use-cases: tax morale would be a perfect example, corruption is another good example
Measurement issue 1: a comparison between self-reportedand experimental measures of tax morale could be made (theyare not necessarily related, why?)
Measurement issue 2 : How do social norms relate to tax morale?
Policy insight 1: a behavioural setting allows measuring the influence of environmental parameters such as probability of fraud detection or size of punishment
Policy insight 2: What are the policy determinants of tax morale? The same as for trust in government? E.g. perceived quality of public services, integrity of high-level officials etc…
134
Trustlab and tax morale: a few ideas
135
Trustlab needs funding, thank you!
Follow our working papers on:
The determinants of trust: evidence from the Trustlabexperiment (Murtin et al.,
2018)
…and others (forthcoming)