Présentation PowerPoint - Excemed
64
www.excemed.org IMPROVING THE PATIENT’S LIFE THROUGH MEDICAL EDUCATION MS Academia: Multiple sclerosis advanced course 6 October 2015 - Barcelona, Spain
-
Upload
khangminh22 -
Category
Documents
-
view
1 -
download
0
Transcript of Présentation PowerPoint - Excemed
www.excemed.org
IMPROVING THE PATIENT’S LIFE THROUGH
MEDICAL EDUCATION
MS Academia: Multiple sclerosis advanced course
6 October 2015 - Barcelona, Spain

2
DECLARATION DISCLOSURE
Letizia Leocani:
Advisory board: Abbvie, Novartis, Biogen
Travel support: Novartis, Genzyme, Merck Serono, Almirall
Research support: Merck Serono, Almirall
Speakers bureau: Serono Symposia International
Foundation; Excemed
Faculty disclosure
Neurophysiology in diagnosis and monitoring of MS Letizia Leocani Experimental Neurophysiology Unit and MAGnetic IntraCerebral Stimulation-MAGICS Center INSPE-Institute of Experimental Neurology Hospital San Raffaele, Milan, Italy
MS Academia
Barcelona, Oct 6, 2015

MS functional deficits: pathological substrates
A
B
N1 N2
Demyel.N1 N2
Conduction block in demyelinated fiber
Courtesy of Dr. J. Black
Segmental demyelination: conduction slowing (block if >5mm; McDonald& Sears 1979)
5mm
Inflammation(+Demyelination) axonal conduction block
Axonal/neuronal degeneration acute, delayed, transynaptic
Trapp et al. 1999
Redford et al. 1997
Smith et al 2001
Low sodium channel density in the demyelinated axon membrane contributes to conduction failure, with the negative signs and symptoms

Evoked Potentials “Expanded Neuro(physio)logical Examination”
• Somatosensory-SEP, Motor-MEP
• brain - spinal cord
• Visual-VEP
• optic nerve
• Auditory-BAEP
• brainstem
• Cognitive-Event-related Potentials
• brain
EPs abnormalities
•Delayed latency
•Demyelination
•most often asymptomatic (if without conduction block)
•detection of subclinical lesions
•may be predictive of future axonal loss
•Reduced amplitude
•Transient: conduction block (demyelination/inflammation)
•Permanent: axonal loss
•Corresponds with clinical impairment but difficult to demonstrate because of high variability (synaptic activity!!)
EPs for measuring axonal damage - Limits
Problems in interpreting standard EPs amplitude measures
Amplitude results from a combination of axons/neurons available for conduction, synaptic efficiency, neuronal excitability
-Highly influenced by:
•Axonal/neuronal loss (irreversible)
•Mediators of inflammation (reversible)
•Synaptic activity (reversible)
plus equipment, electrode/source distance (skull thickness, atrophy…)
Variability between individuals, labs, time from event
8
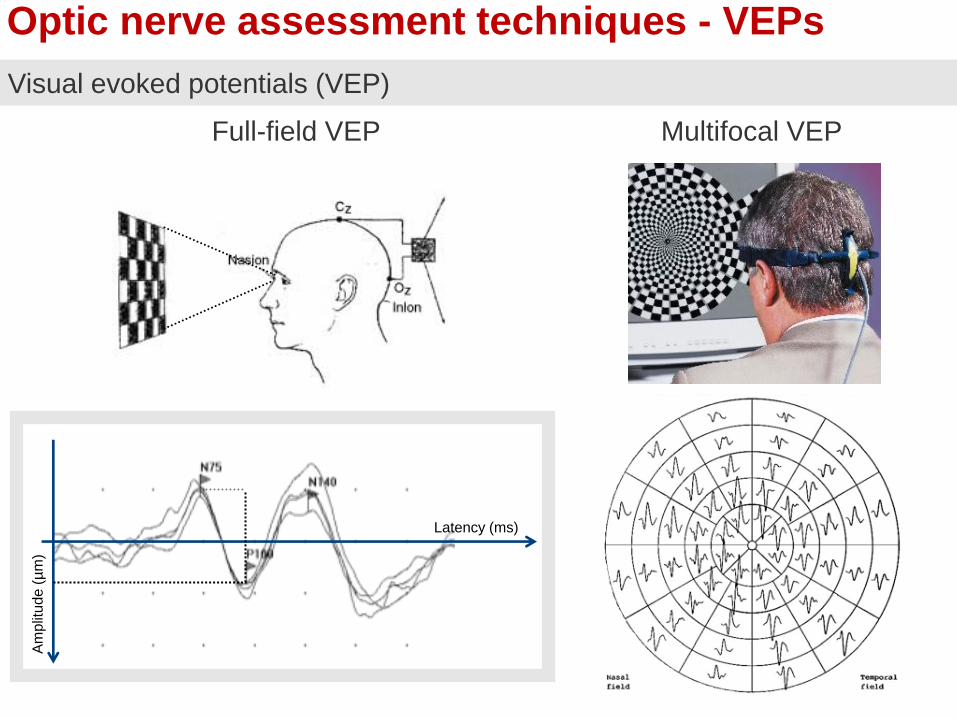
Optic nerve assessment techniques - VEPs
Visual evoked potentials (VEP)
Latency (ms)
Am
plit
ude
(µ
m)
Full-field VEP Multifocal VEP

Visual EPs in MS
1- Normal
2- Amplitude asymmetry
3- Latency delay
4- Amplitude asymmetry & latency delay
Anderson et al 1987
1
2
3
4
normal
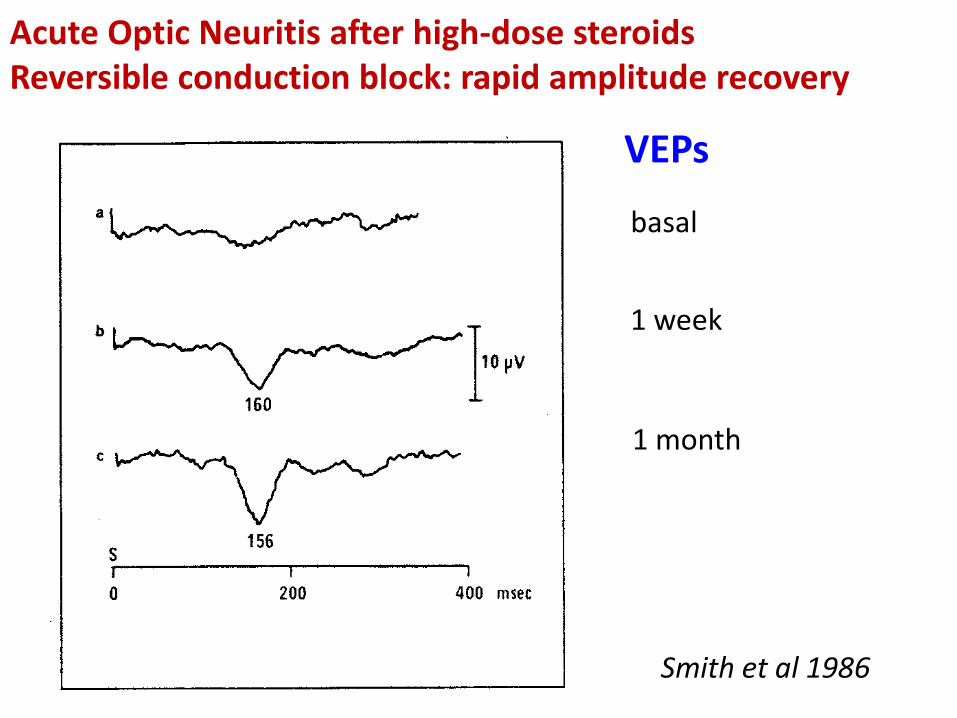
Smith et al 1986
basal
1 week
1 month
Acute Optic Neuritis after high-dose steroids Reversible conduction block: rapid amplitude recovery
VEPs

Somatosensory evoked potentials
C3 C4
Fpz
Erb
Extra
Glott
Cv7
GND

Somatosensory EPs – abnormalities
from Anderson et al 1987 - modified
3
Normal > N20 latency
N13 absent N13 and N20 absent
Progression no longer detectable!
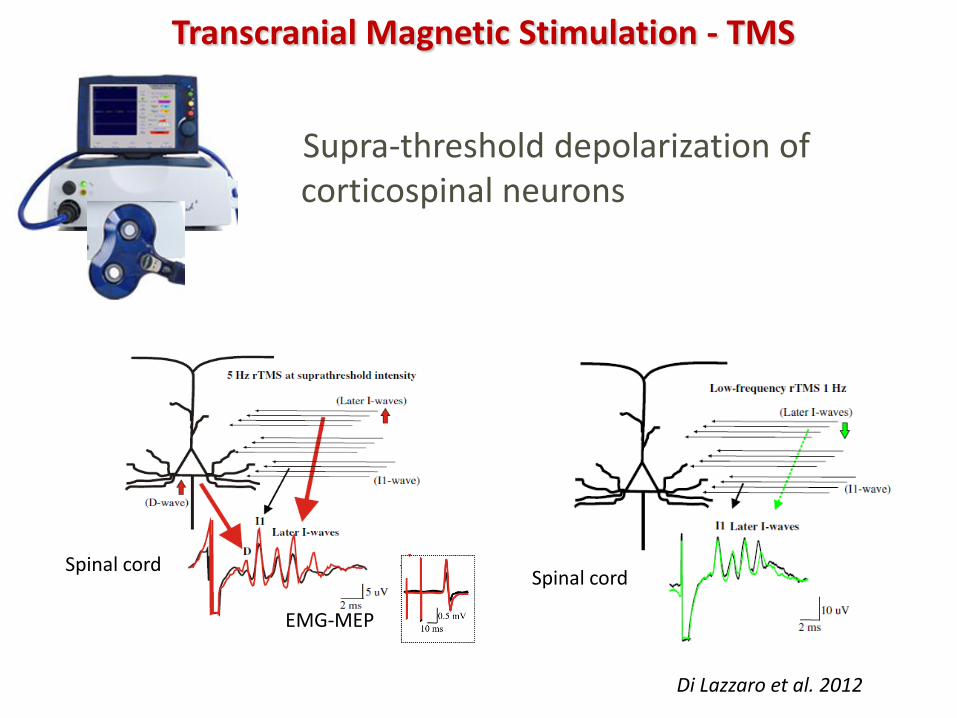
Supra-threshold depolarization of corticospinal neurons
Transcranial Magnetic Stimulation - TMS
Di Lazzaro et al. 2012
Spinal cord
EMG-MEP
Spinal cord
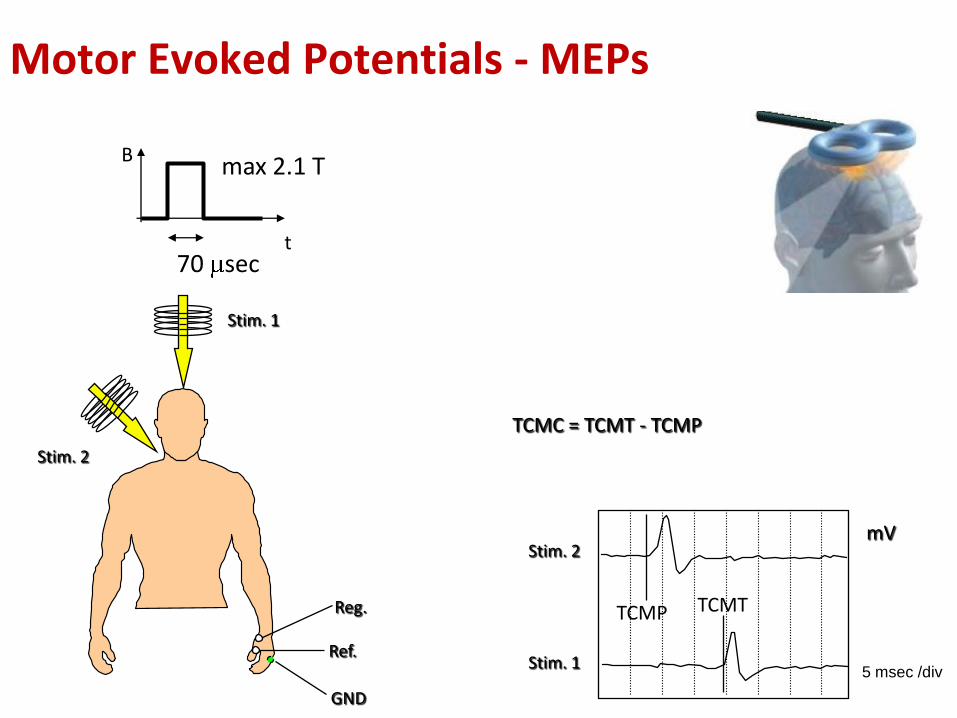
Stim. 1
Stim. 2
Reg.
Ref.
GND
5 msec /div
TCMC = TCMT - TCMP
mV
TCMP TCMT
t
B
70 sec
max 2.1 T
Stim. 1
Stim. 2
Motor Evoked Potentials - MEPs

A.B. , female, 27 yrs Multiple Sclerosis relapse upper limbs MEPs July 29th 03
right left Acute paresis (1st week)
Recovery (1 month follow-up) Sept 1, 03
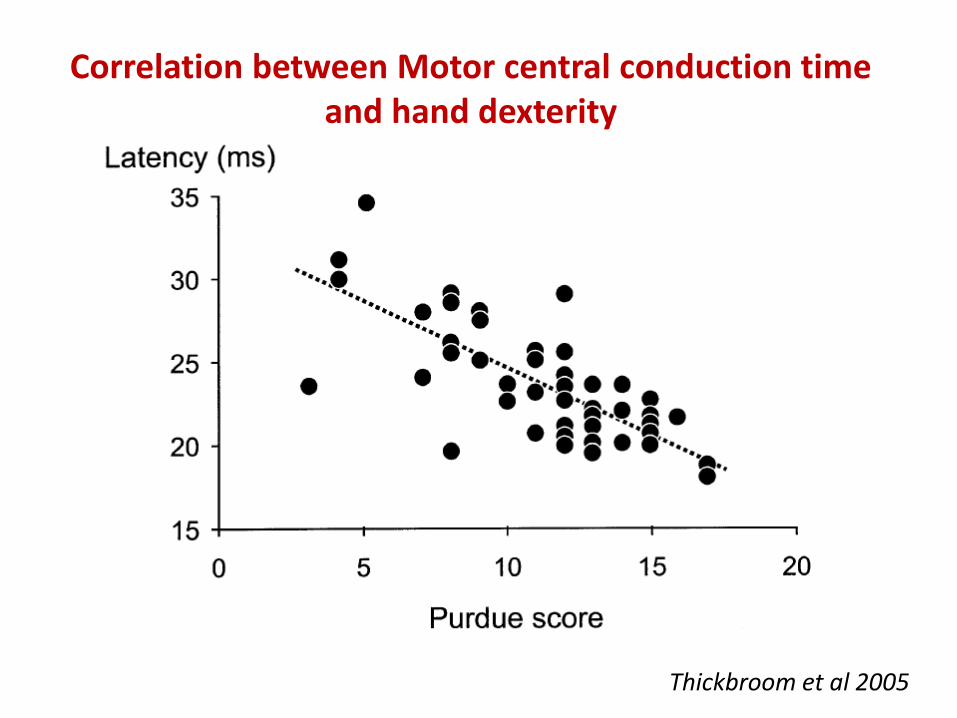
Thickbroom et al 2005
Correlation between Motor central conduction time and hand dexterity
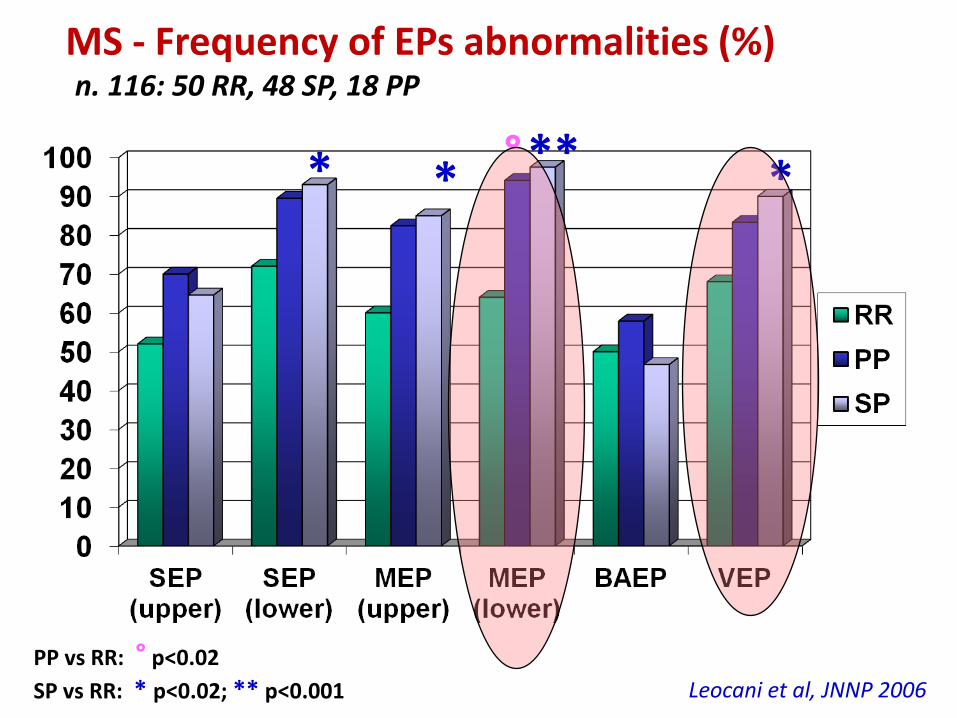
**
MS - Frequency of EPs abnormalities (%) n. 116: 50 RR, 48 SP, 18 PP
°
PP vs RR: ° p<0.02
SP vs RR: * p<0.02; ** p<0.001
* * *
Leocani et al, JNNP 2006

115 CIS patients (all with > MRI lesions) followed for 5 years
abnormal VEPs in 47.0% • symptomatic: 83% • asymptomatic: 34.1% abnormal MEPs in 50.6% • symptomatic: 58.5% • asymptomatic: 35.7%
Di Maggio et al. in prep.
VEPs
(115)
BAEPs (109)
SEPs (114)
MEP (93)
Total EP abnormalities 47% 17.5% 67.5% 50.6%
Sensitivity (symptomatic) 83.3% 27.0% 67.7% 58.5%
Sensitivity (asymptomatic) 34.1% 12.5% 67.3% 35.7%
Low EPs sensitivity in CIS even if MRI+
Asymptomatic MEP abnormalities (N=31) predicted CDMS (p=0.008): sensitivity 52.7%, specificity 86.7%, NPV 33.3%, PPV 93.5%, Odds Ratio 7.25 No association: VEPs (p=0.77. N=67) SEPs (p=1.0, N=42) BAEPs (p=0.45, N= 68)

EPs and conversion to CDMS over 2 years 115 CIS with >2 brain MRI lesions
Pro
po
rtio
n o
f d
isea
se-f
ree
pts
months
Di Maggio et al. in prep
n: 115 (MRI+)
EPs<4
EPs<4
Eps>4
Eps>4
MR
I > 9
M
RI <
9

Subclinical MEPs involvement in CIS predicts future motor FS involvement (5 yrs)
• VEPs: PPV=15.8% • BAEPs: PPV=55.6% • SEPs: PPV=38.8% • MEPs: PPV=90.0% (p=0.03)
Di Maggio et al. in prep.
115 CIS with >2 brain MRI lesions
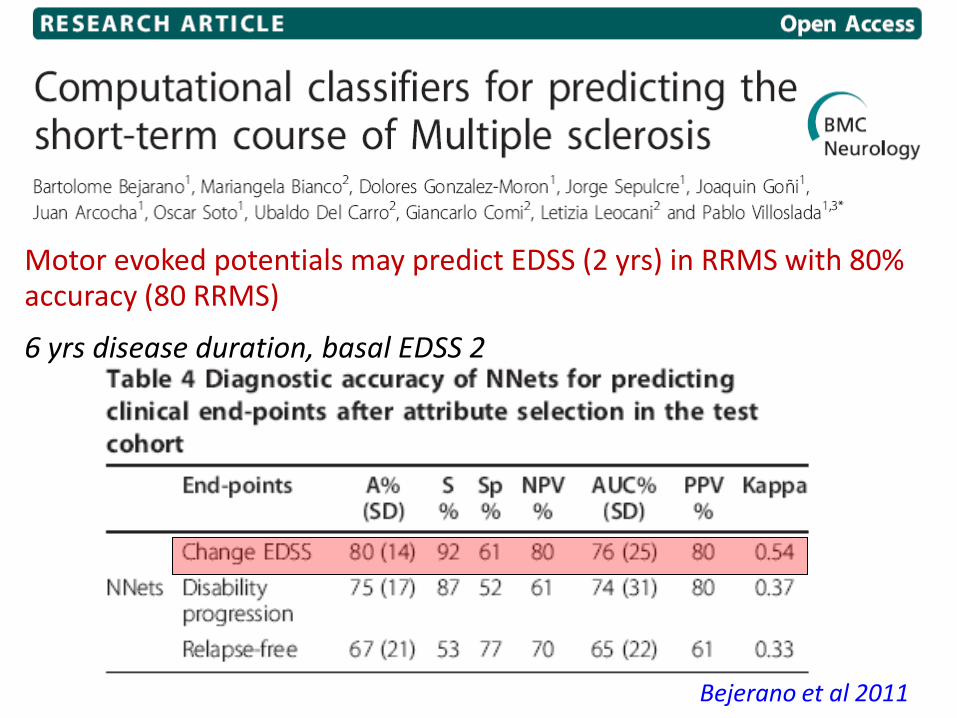
Motor evoked potentials may predict EDSS (2 yrs) in RRMS with 80% accuracy (80 RRMS)
6 yrs disease duration, basal EDSS 2
Bejerano et al 2011
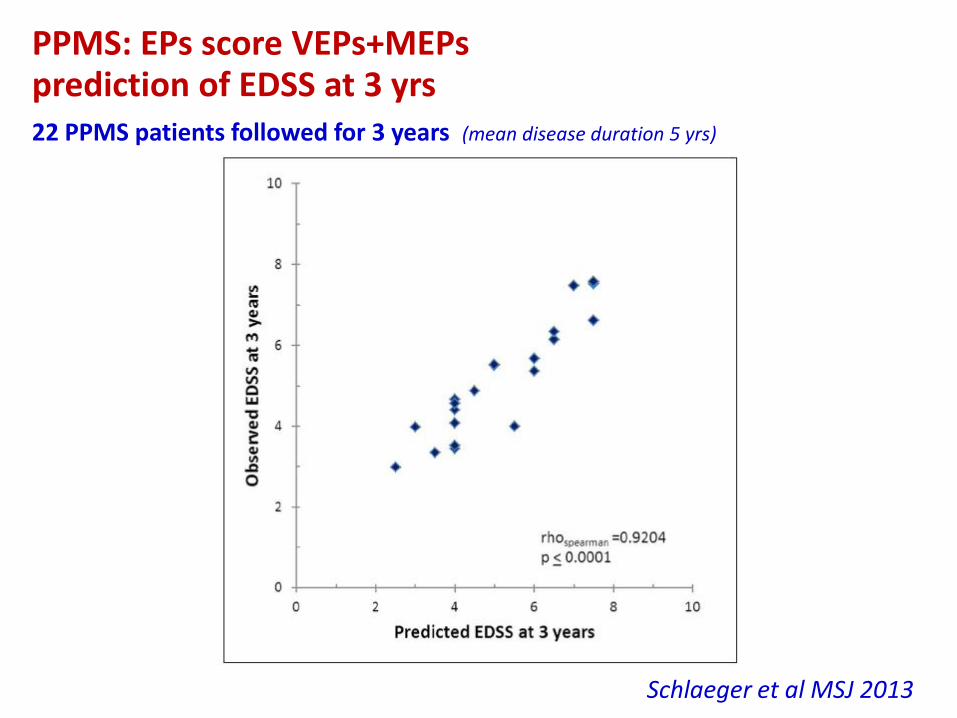
PPMS: EPs score VEPs+MEPs prediction of EDSS at 3 yrs
22 PPMS patients followed for 3 years (mean disease duration 5 yrs)
Schlaeger et al MSJ 2013
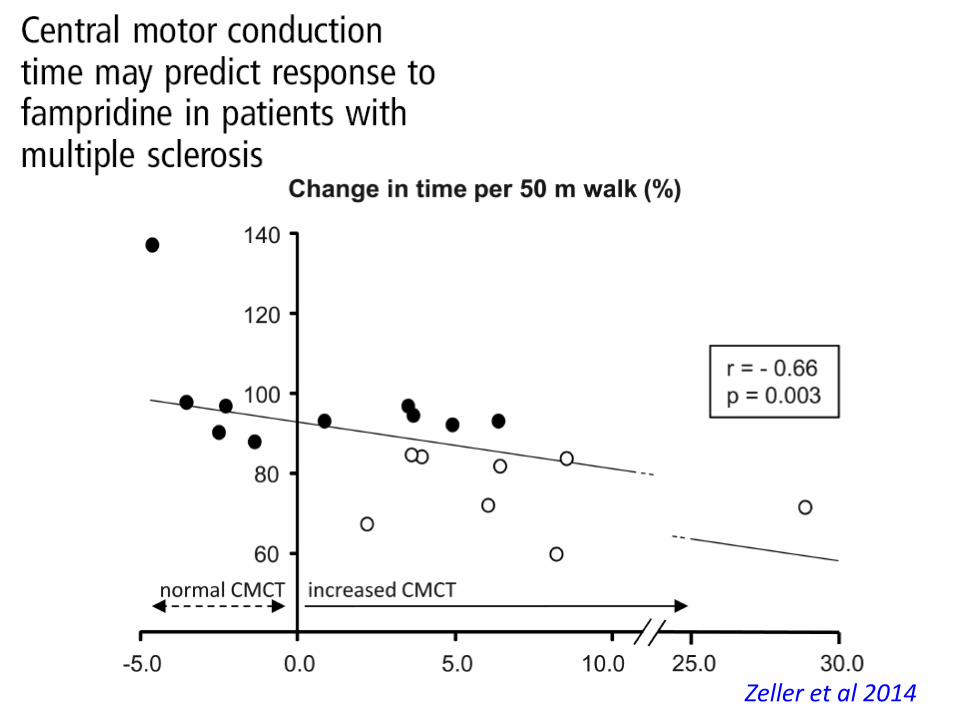
Zeller et al 2014
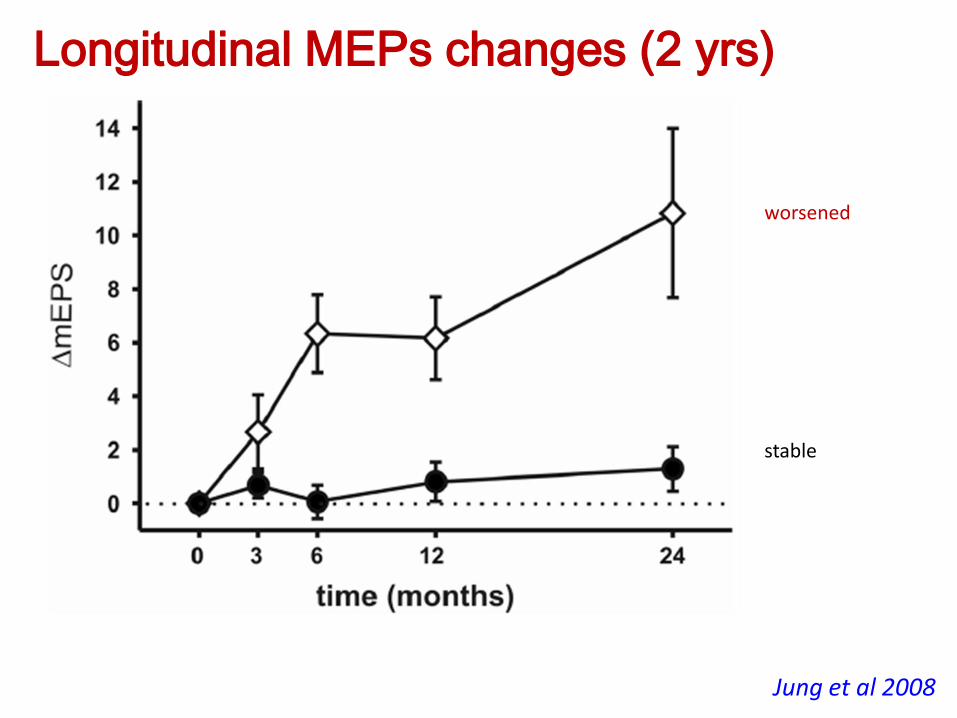
Jung et al 2008
worsened
stable
Longitudinal MEPs changes (2 yrs)

Central Motor Conduction Time
EDSS MRC (strength)
1 g/day
2 g/day
Fierro et al 2002
MEPs changes after 5 days of steroids (24 pts)
Motor Threshold intensity
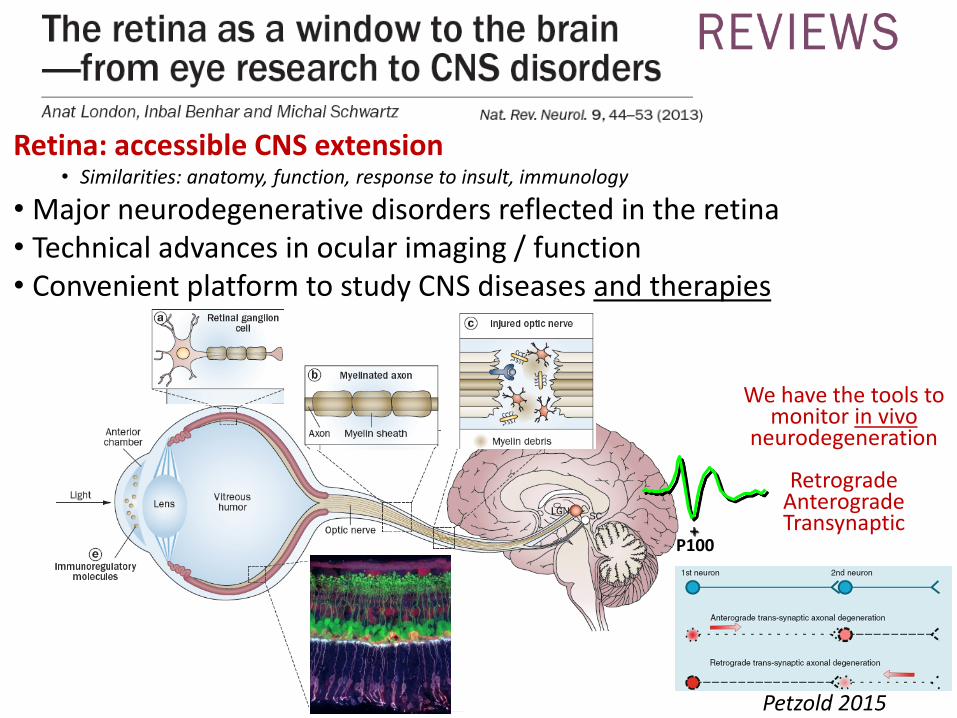
Retina: accessible CNS extension • Similarities: anatomy, function, response to insult, immunology
• Major neurodegenerative disorders reflected in the retina • Technical advances in ocular imaging / function • Convenient platform to study CNS diseases and therapies
+ P100
We have the tools to monitor in vivo
neurodegeneration
Retrograde Anterograde Transynaptic
Petzold 2015

Human optic nerve vs corticospinal tract
Number of axons in the optic nerve
• 800,000-1 million (Polyak, 1941)
• 564,776-1,140,030 (Bruesch and Arey, 1942)
• 1,200,000 (Quigley et al., 1982; Balaszi et al., 1984)
Number of cones to ganglion cells in the fovea
• 1 cone to 2 ganglion cells out to about 2.2o (Schein, 1988)
Number of corticospinal axons in the pyramids
• 1 million (700,000 myelinated)(Lassek 1940, Lassek&Evans 1945)
• Myelination starts at the internal capsule and peduncles in the 10-14 day in the neonate and completes in the second year after birth, along with the acquisition of motor skills

…. Examination of the retinal nerve fibre layer at the optic disc revealed that more than 50% of neural tissue must be lost before a visual defect is clinically evident
Quigley and Addicks 1982
CNS redundancy

Jenkins et al, Ann Neurol 2010;67:99–113
Neuroplasticity Predicts Outcome of Optic Neuritis Independent of Tissue Damage
Clinical/Instrumental paradox – 2
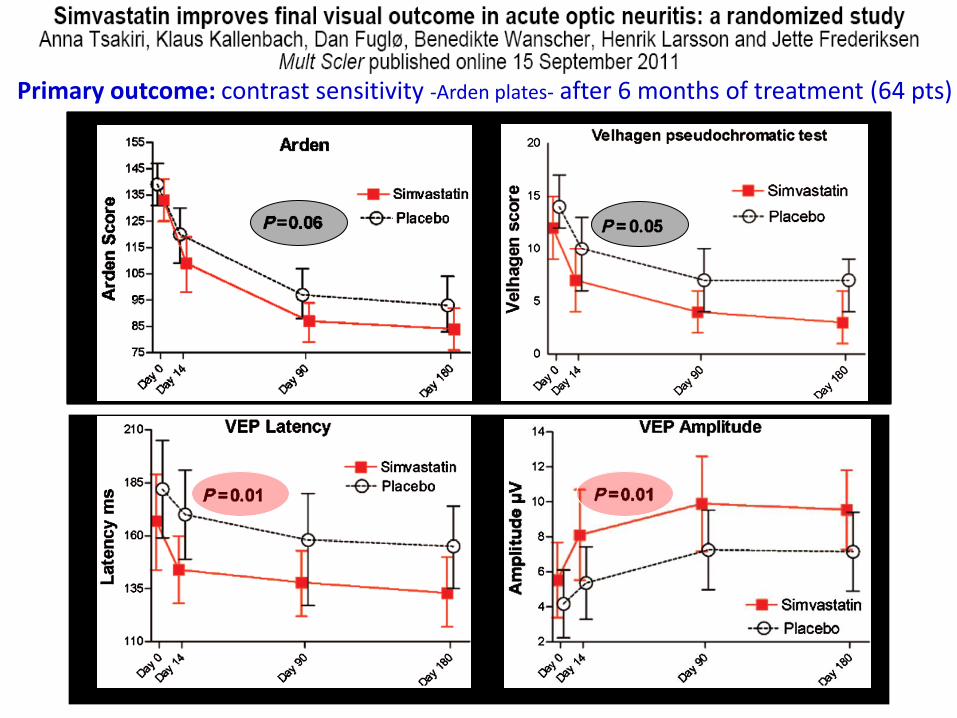
Primary outcome: contrast sensitivity -Arden plates- after 6 months of treatment (64 pts)
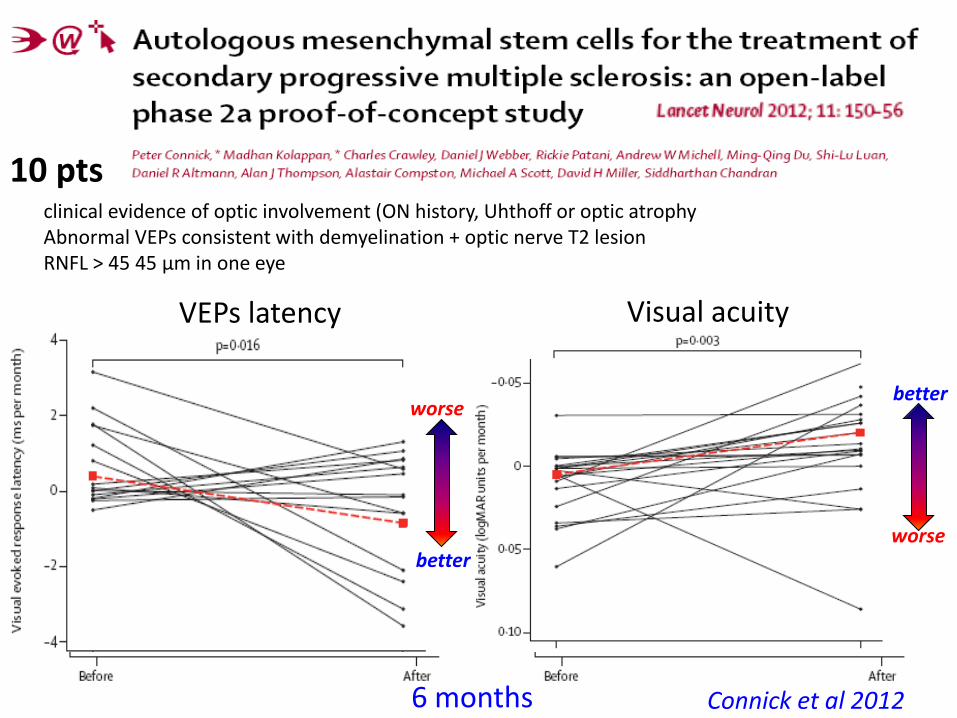
10 pts
VEPs latency Visual acuity
better
worse better
worse
Connick et al 2012
clinical evidence of optic involvement (ON history, Uhthoff or optic atrophy Abnormal VEPs consistent with demyelination + optic nerve T2 lesion RNFL > 45 45 μm in one eye
6 months
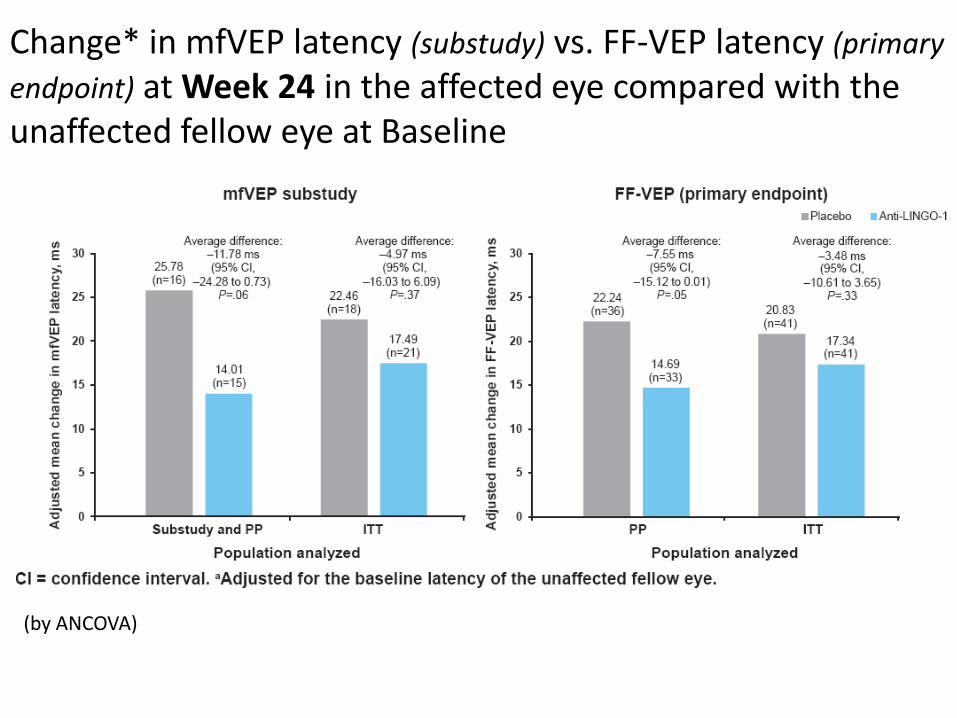
Change* in mfVEP latency (substudy) vs. FF-VEP latency (primary
endpoint) at Week 24 in the affected eye compared with the unaffected fellow eye at Baseline
(by ANCOVA)

Gordon Lipkin 2007
Brain atrophy and RNFL thickness
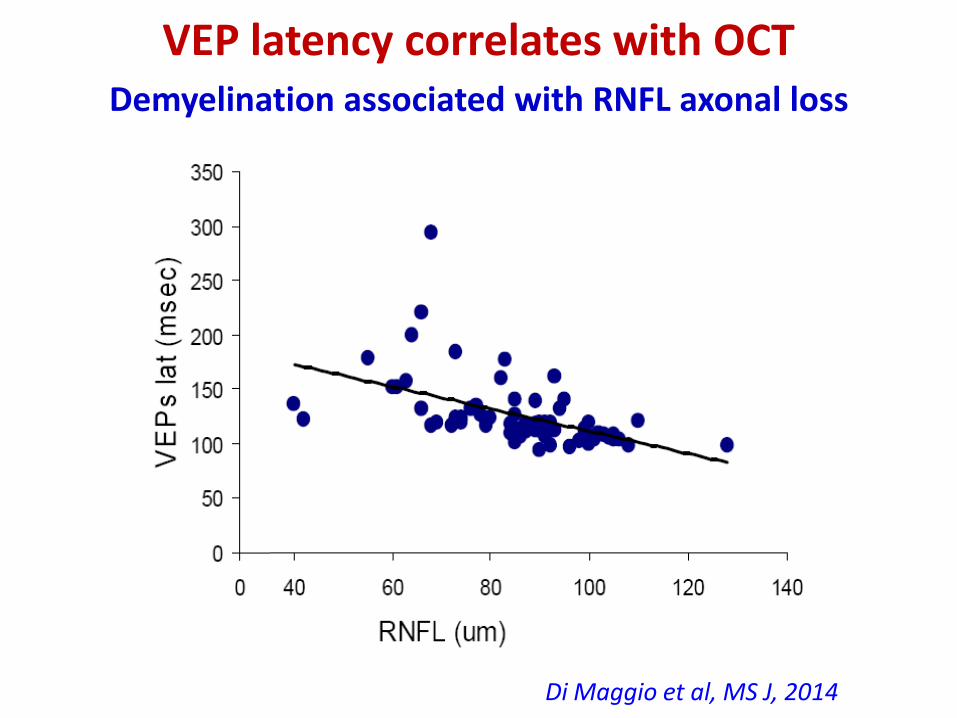
VEP latency correlates with OCT Demyelination associated with RNFL axonal loss
r=-0.64; p<0.001
Di Maggio et al, MS J, 2014

Abnormal tests (%) in eyes with acute ON (<3 months), chronic ON and without ON
0
20
40
60
80
100
AON CON non ON
OCT
VEP
OCT + VEP
McNemar Test
Acute ON (AON) OCT 38.9% VEP 77.3%; p= 0.02 Chronic ON (CON) OCT 68.5% VEP 81.5%; P=0.124 non ON OCT 19.9% VEP 31.7%; p=0.005
Di Maggio et al, in prep
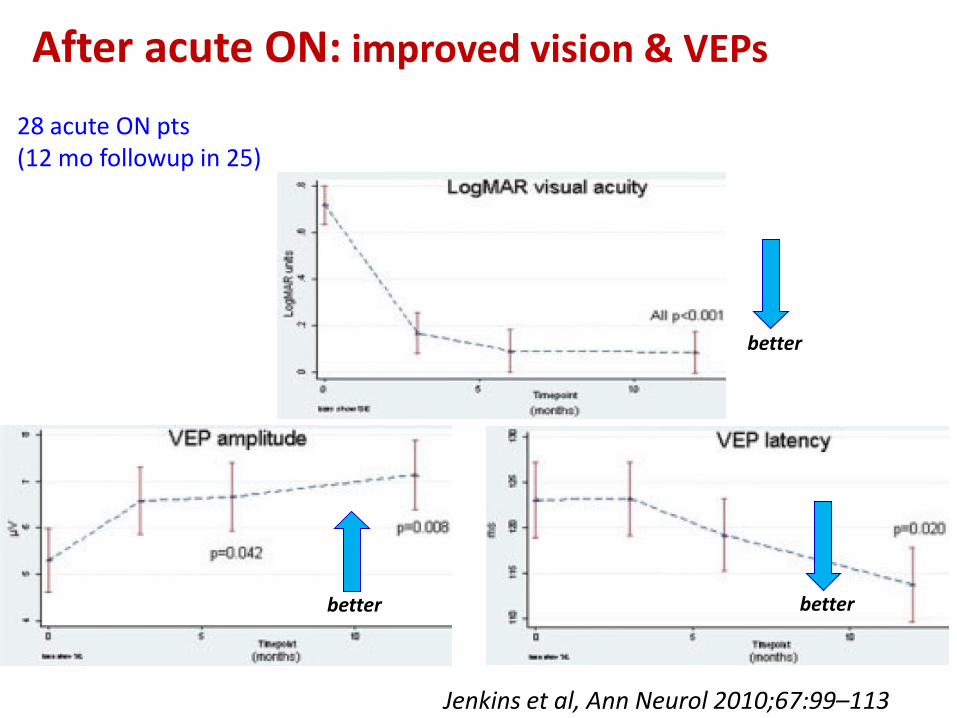
Jenkins et al 2010
better
better better
28 acute ON pts (12 mo followup in 25)
Jenkins et al, Ann Neurol 2010;67:99–113
After acute ON: improved vision & VEPs

Chatziralli et al 2012
After ON: VEP amplitudes improve, RNFL worsens
worse
23 MS pts
RNFL
worse

Kapoor et al - AAN 2015 • Phenitoin (sodium channel blocker) started <15 days from
onset of Optic Neuritis-ON protects axons from neurodegeneration
• 81 pts randomized within 14 days from ON • 39 Ph 4 mg/kg/day
• 42 placebo) 3 mo
• OCT : significant difference vs placebo • protective treatment effect 30% RNFL, 34% macula
• VEPs: n.s.
• Vision recovered well in both groups • No significant difference between treatments
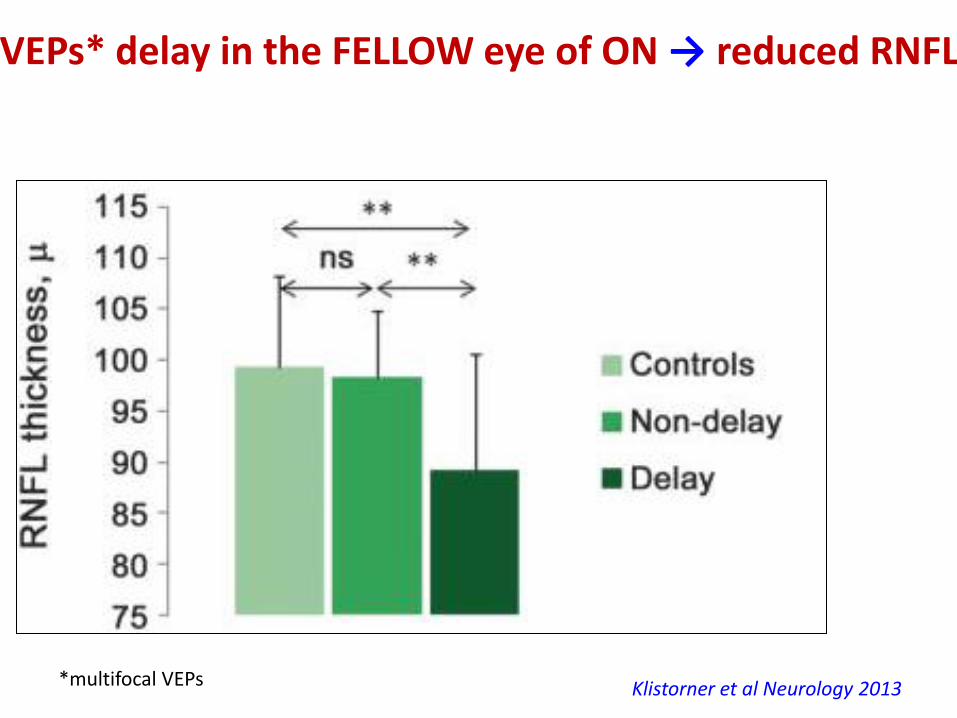
VEPs* delay in the FELLOW eye of ON → reduced RNFL
Klistorner et al Neurology 2013 *multifocal VEPs
40
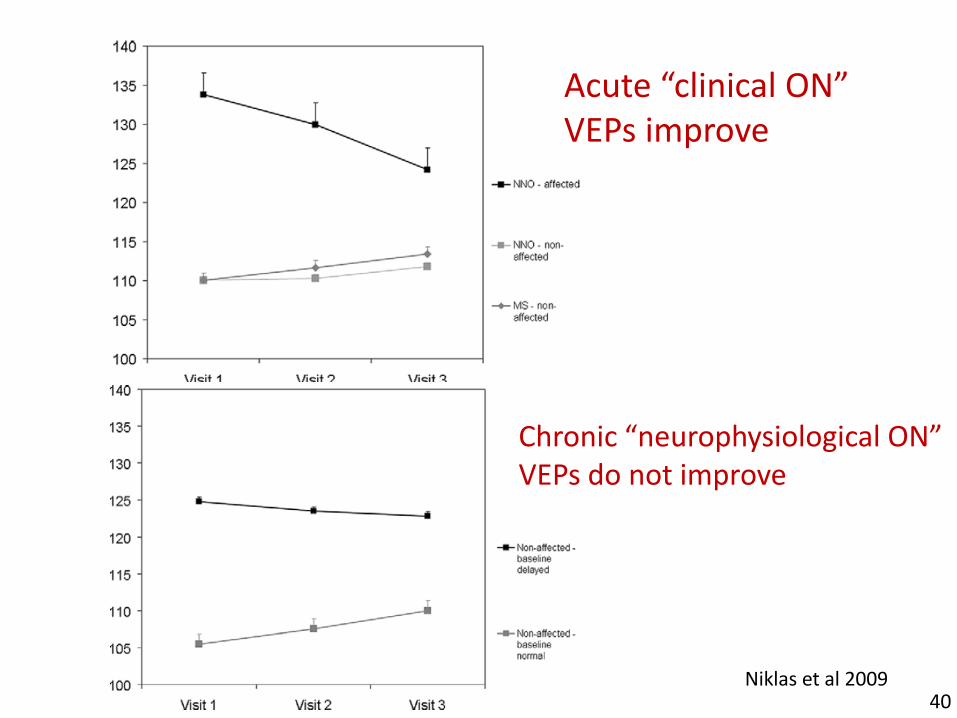
Acute “clinical ON” VEPs improve
Chronic “neurophysiological ON” VEPs do not improve
Niklas et al 2009
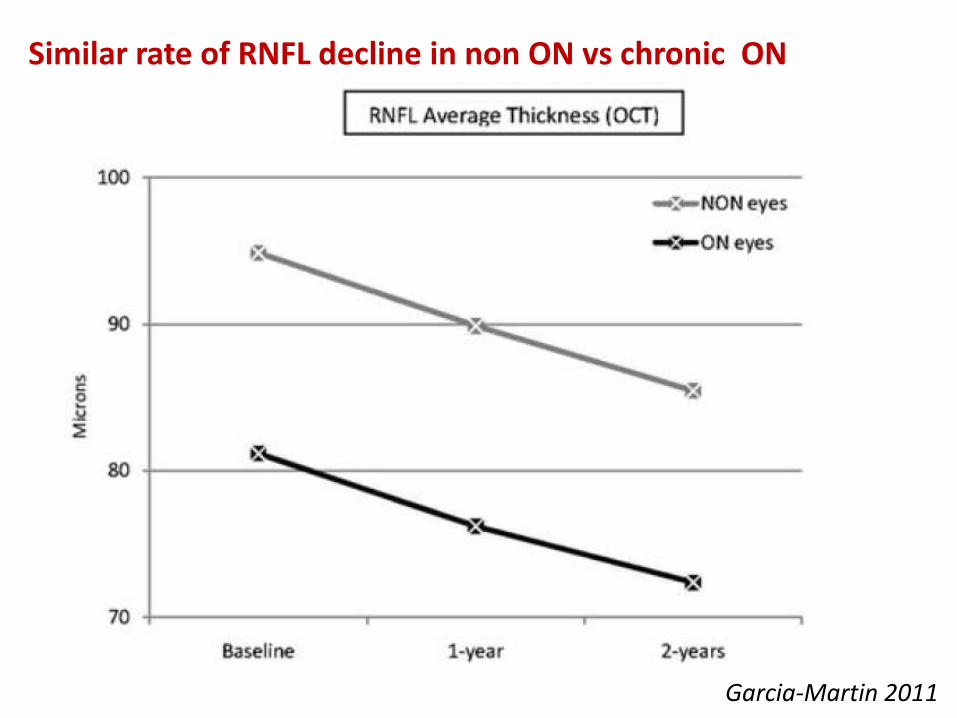
Garcia-Martin 2011
Similar rate of RNFL decline in non ON vs chronic ON

RNFL decline* → EDSS worsening *independent of optic neuritis
no ON during follow-up excluded 16 pts with ON <6 months at baseline (18 eyes: 2 pts had bilateral ON)
75 pts followed for 1.5-2.5 years
Pisa et al ECTRIMS 2015
(25) (26)
n. 29
n. 103
N. 59 pts N. 59 pts (132 eyes)
p < 0.001

Multiple sclerosis Neuromyelitis optica
from Wingerchuk, Lancet Neurol 2007
Oligoclonal bands

VEPs in MS-NMOab+ more frequently absent
Watanabe et al Mult Scler 2009
Mealy et al AAN 2014
Optic neuritis in NMO: longer lesions (as in the spinal cord)

Neto SP, Papais Alvarenga RM, et al.; Multiple Sclerosis 2012
VEPs in NMO 19 pts; average n. of visual attacks 2.5 (chronic)
109 ms
99 ms
Latency normal (or mildly delayed? Asymmetry not considered) Amplitude reduced in …%; absent in …%
MS pattern: delayed latency, preserved amplitude NMO pattern: preserved latency*, reduced amplitude (cutoff 5.8 mV)
*Normal latency compared with upper limits (in this example, asymmetry ~10 ms)
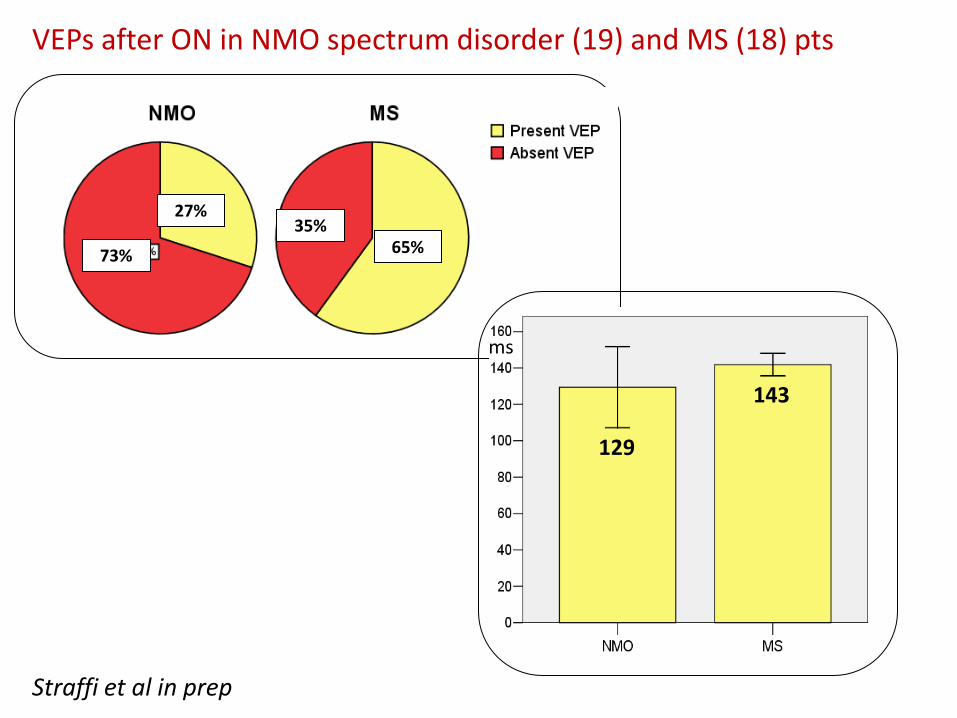
73%
27% 35%
65%
143
129
ms
Straffi et al in prep
VEPs after ON in NMO spectrum disorder (19) and MS (18) pts

Study design
• Observational, cross-sectional study
50 NMOSD patients 57 MS patients 68 healthy controls
(HC)
with comparable age
and gender distribution
Full-field VEP
Multifocal VEP
RNFL scans
Macular scans
OCT
High- and low-contrast
visual acuity test
Clinical evaluation
Binocular optic nerve integrated structural-functional evaluation
Differentiate
NMOSD from MS
in ON+ eyes
Better characterize
subclinical damage
in NMOSD eyes
Highlight in vivo differences
in pathophysiology
3 objectives
① ② ③
56 eyes with
previous ON
44 eyes
without ON
55 eyes with
previous ON
59 eyes
without ON

48 Distribution of peripapillary RNFL thickness. Generalized estimating equation (GEE) model with diagnostic group as regressor
(chi-squared test, p < 0.001 overall) and post-hoc comparisons. Significance: [*] = p < 0.05, [**] = p < 0.01, [***] = p < 0.001.
60 µm threshold MS
N
MO
SD
Differentiate NMOSD and MS in ON+ eyes
RNFL lower in NMOSD than MS

Distribution of full-field VEP latency. GEE model with diagnostic group as regressor
(chi-squared test, p < 0.001 overall) and post-hoc comparisons.
Differentiate NMOSD and MS in ON+ eyes
VEP latency higher in MS than in NMOSD
• Differently from MS, latency in NMOSD is rarely delayed over 150 ms
Proportion of eyes with alteration of full-field VEP
latency according to 150 ms threshold. Chi-squared
test between MS and NMOSD, p = 0.006.
150 ms threshold MS
N
MO
SD
/MS
Sensitivity for MS: 14% (95% CI: 7-26%)
Specificity for MS: 98.2% (95% CI: 89.0-99.9%)
Latency
> 150 ms
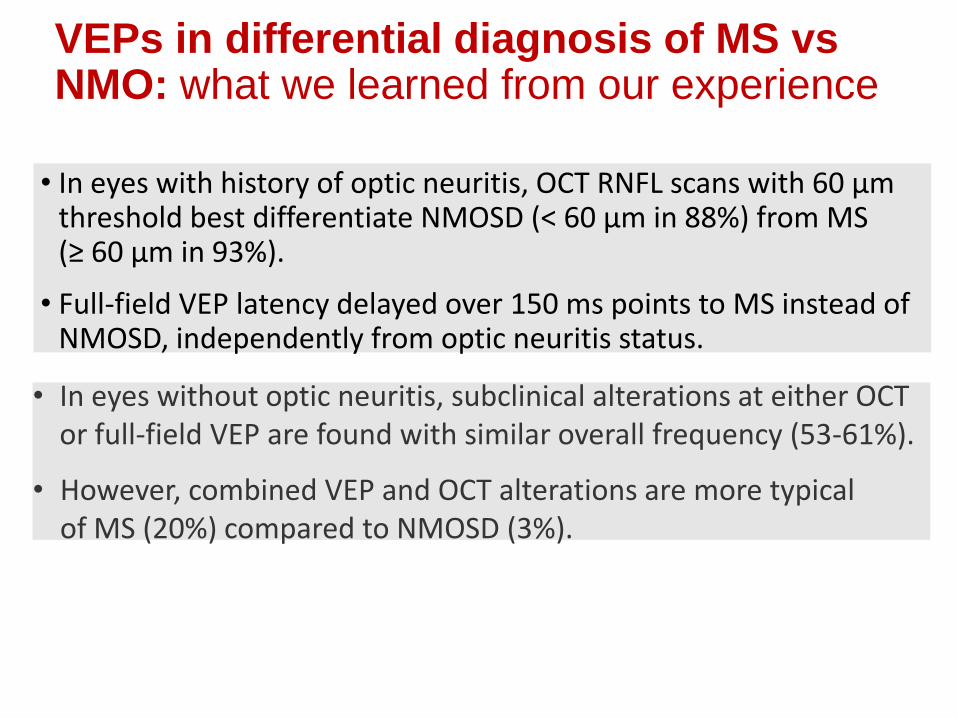
VEPs in differential diagnosis of MS vs NMO: what we learned from our experience
• In eyes with history of optic neuritis, OCT RNFL scans with 60 µm threshold best differentiate NMOSD (< 60 µm in 88%) from MS (≥ 60 µm in 93%).
• Full-field VEP latency delayed over 150 ms points to MS instead of NMOSD, independently from optic neuritis status.
• In eyes without optic neuritis, subclinical alterations at either OCT or full-field VEP are found with similar overall frequency (53-61%).
• However, combined VEP and OCT alterations are more typical of MS (20%) compared to NMOSD (3%).
51
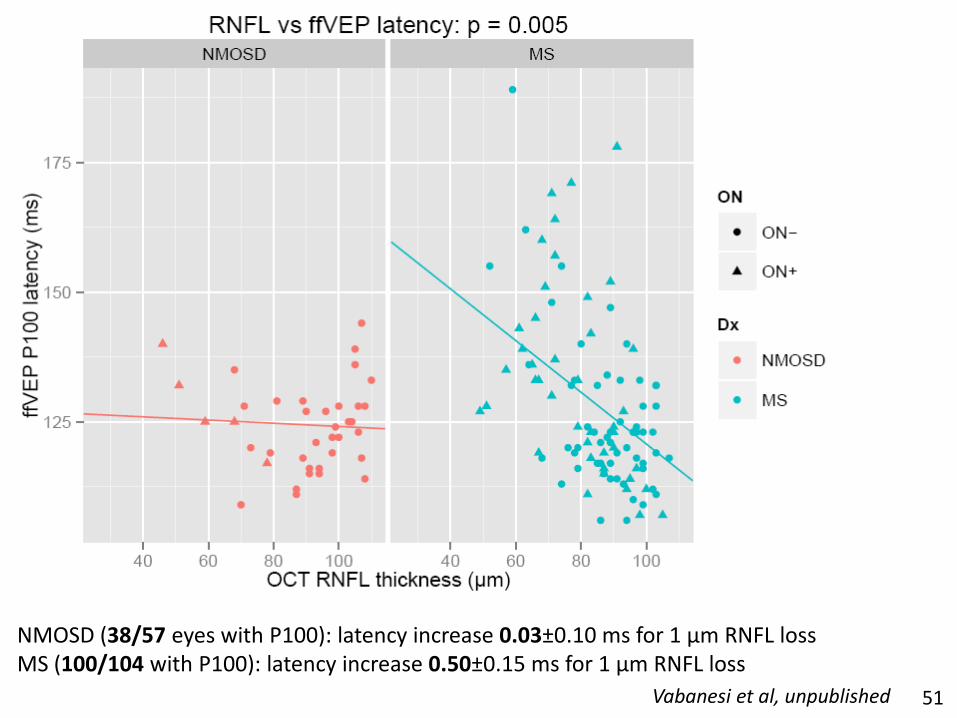
NMOSD (38/57 eyes with P100): latency increase 0.03±0.10 ms for 1 µm RNFL loss MS (100/104 with P100): latency increase 0.50±0.15 ms for 1 µm RNFL loss
Vabanesi et al, unpublished

52
NMOSD Axonal loss
NMO vs MS: Different pathophysiological patterns reflected by the balance between demyelination and axonal damage
• Axonal damage predominates over demyelination
• Full-field VEP absent in 83% eyes under 60 µm RNFL (mfVEP suggested)
• Severe atrophy due to overt, rather than subclinical, optic neuritis events
MS Demyelination
• Demyelination predominates over axonal loss
• VEP rarely absent, latency delay can be over 150 ms
• Demyelination and axonal loss also due to subclinical events (36%)
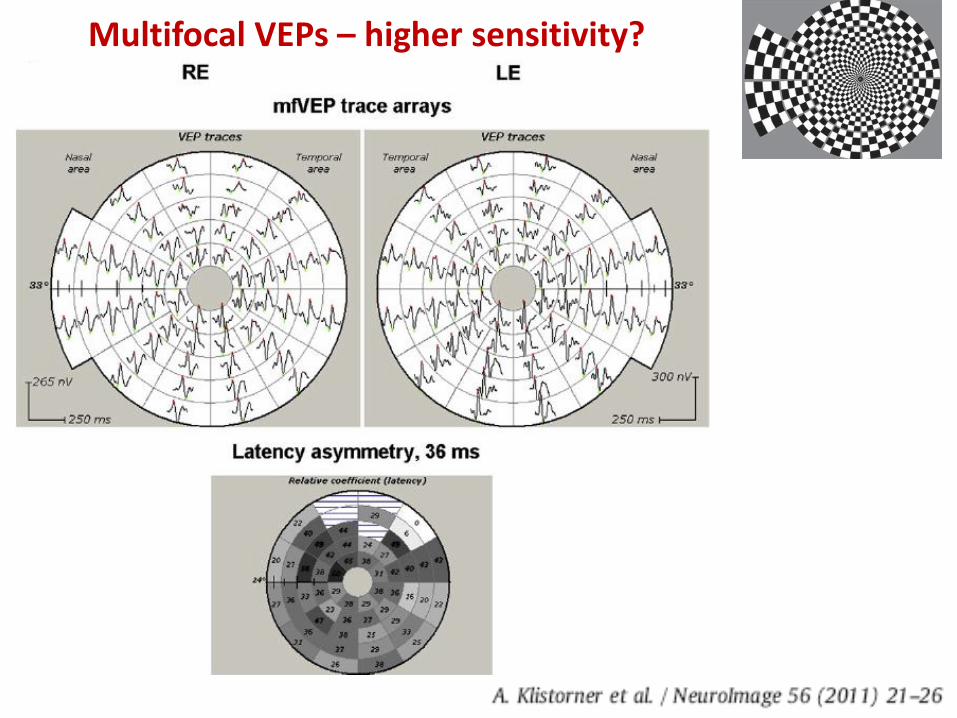
Multifocal VEPs – higher sensitivity?
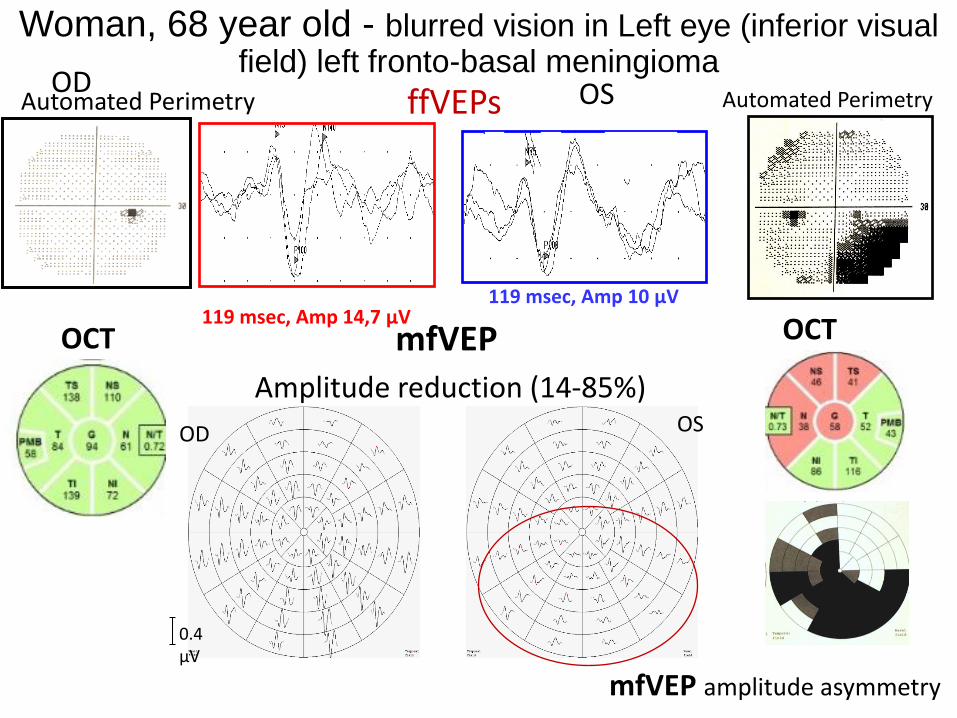
Woman, 68 year old - blurred vision in Left eye (inferior visual field) left fronto-basal meningioma
ffVEPs
119 msec, Amp 14,7 µV 119 msec, Amp 10 µV
Automated Perimetry Automated Perimetry OD OS
mfVEP amplitude asymmetry
OCT mfVEP
OD OS
Amplitude reduction (14-85%)
0.4 µV
OCT

OCT:
VEPs Right: normal VEPs Left: absent
Normal ↑ RNFL = edema (mild)
Woman, 19 year old (E.L)
ON left eye 7 days before (Emergency dep.t)
March 7, 2013
116 msec

VEPs Right (“unaffected”): mild latency Left (ON): improvement - increase 126 msec marked delay 160 msec
160 msec 126 msec 3 days before: 116msec!!!
March 13, 2013
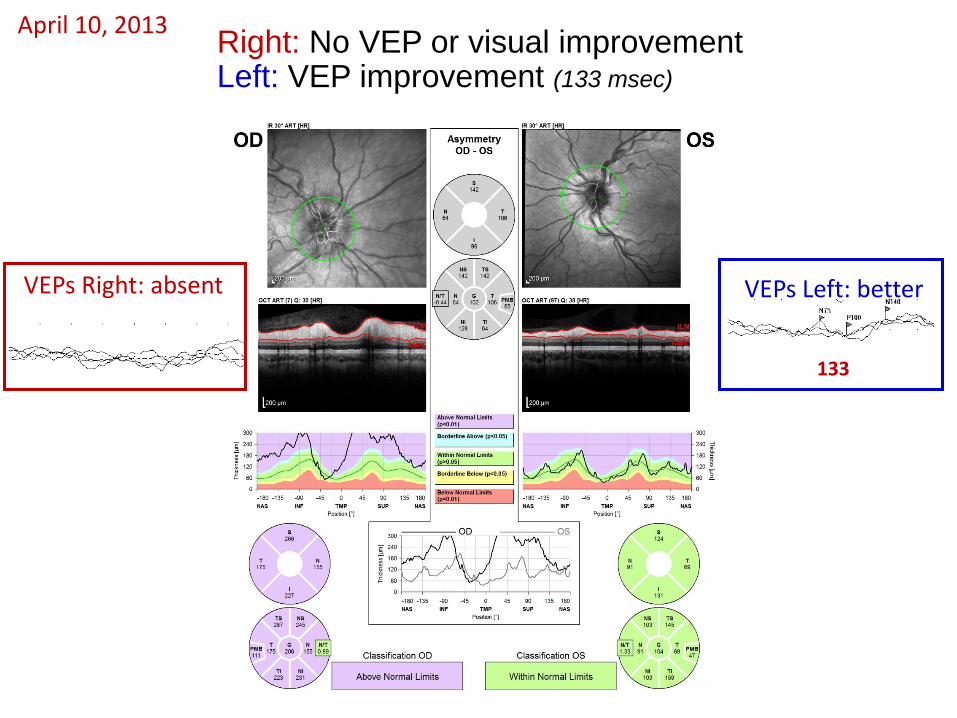
Right: No VEP or visual improvement Left: VEP improvement (133 msec)
VEPs Right: absent
133
VEPs Left: better
April 10, 2013

Right: RNFL loss starts to be evident
Left: normal
VEPs Right: absent
120
VEPs Left: ~normal
Right: mild visual improvement (VEPs still absent )
Left: further VEP improvement (120 msec, upper limit)
May 5, 2013
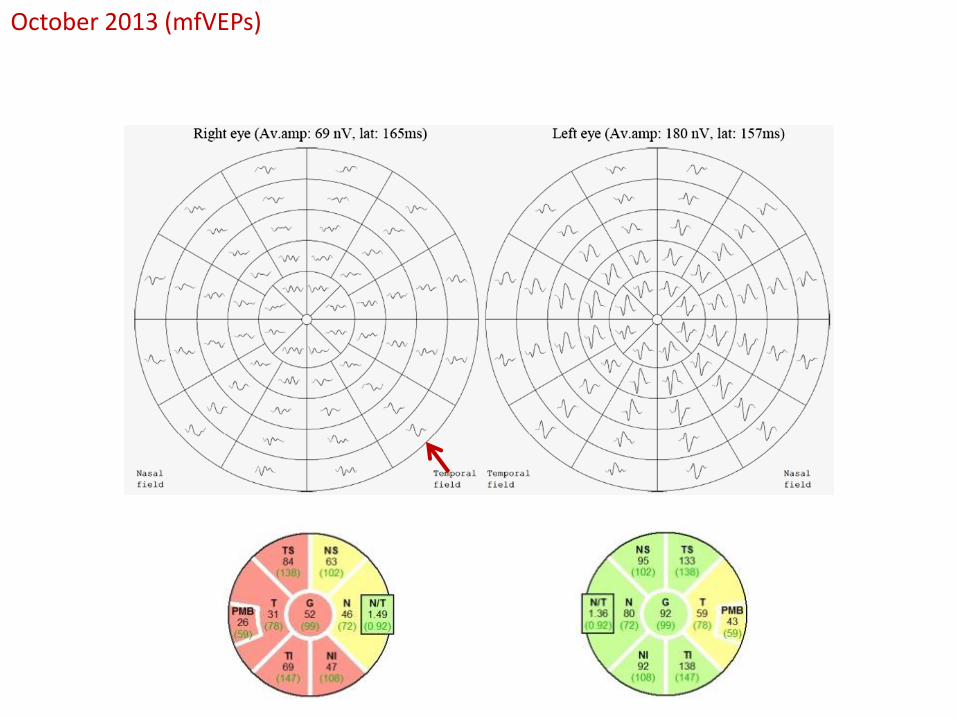
October 2013 (mfVEPs)
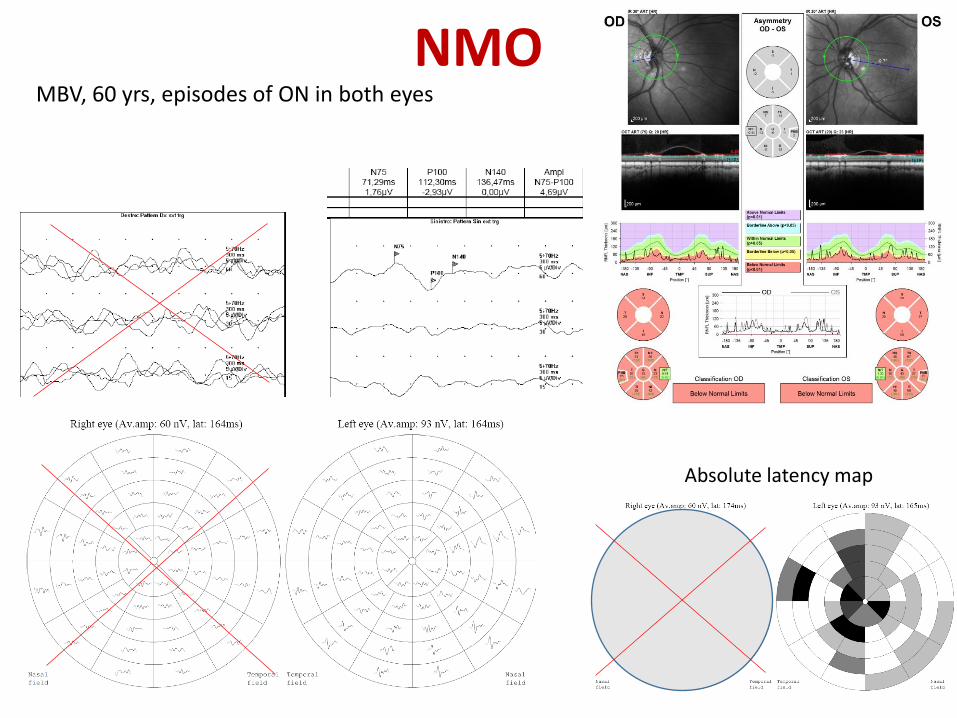
NMO MBV, 60 yrs, episodes of ON in both eyes
Absolute latency map
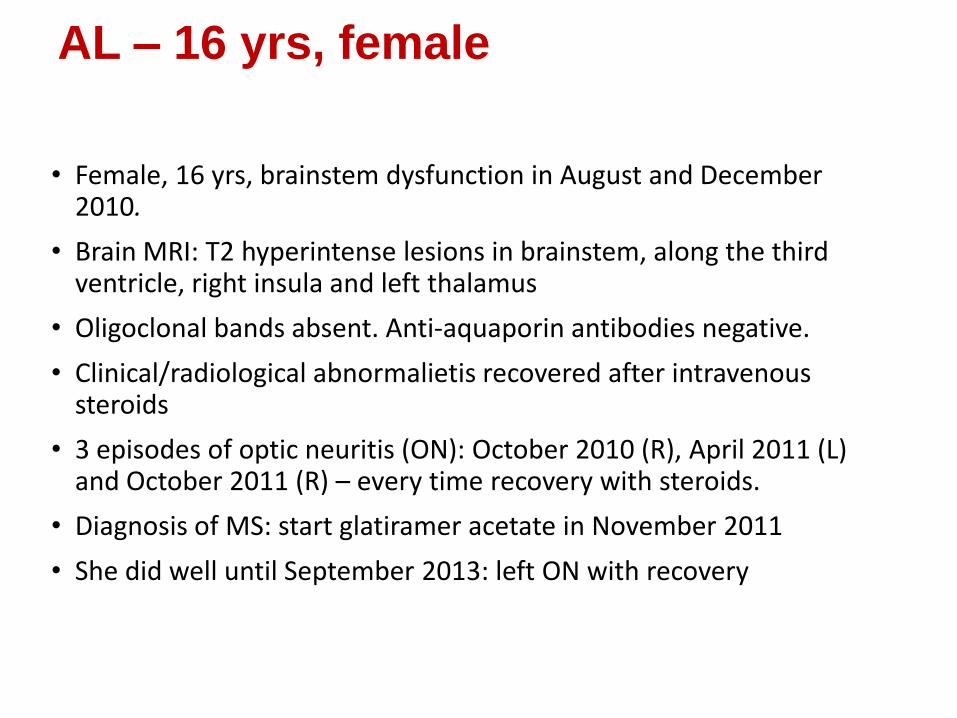
AL – 16 yrs, female
• Female, 16 yrs, brainstem dysfunction in August and December 2010.
• Brain MRI: T2 hyperintense lesions in brainstem, along the third ventricle, right insula and left thalamus
• Oligoclonal bands absent. Anti-aquaporin antibodies negative.
• Clinical/radiological abnormalietis recovered after intravenous steroids
• 3 episodes of optic neuritis (ON): October 2010 (R), April 2011 (L) and October 2011 (R) – every time recovery with steroids.
• Diagnosis of MS: start glatiramer acetate in November 2011
• She did well until September 2013: left ON with recovery

AL, 16 yrs, female
Global RNFL 71um vs 87um 5 months before
5 months after the last left ON (March 2014)
Full field VEP improved but delayed, RNFL reduced, asymmetry of multifocal VEP amplitudes (worse in left eye)
Right eye
Left eye
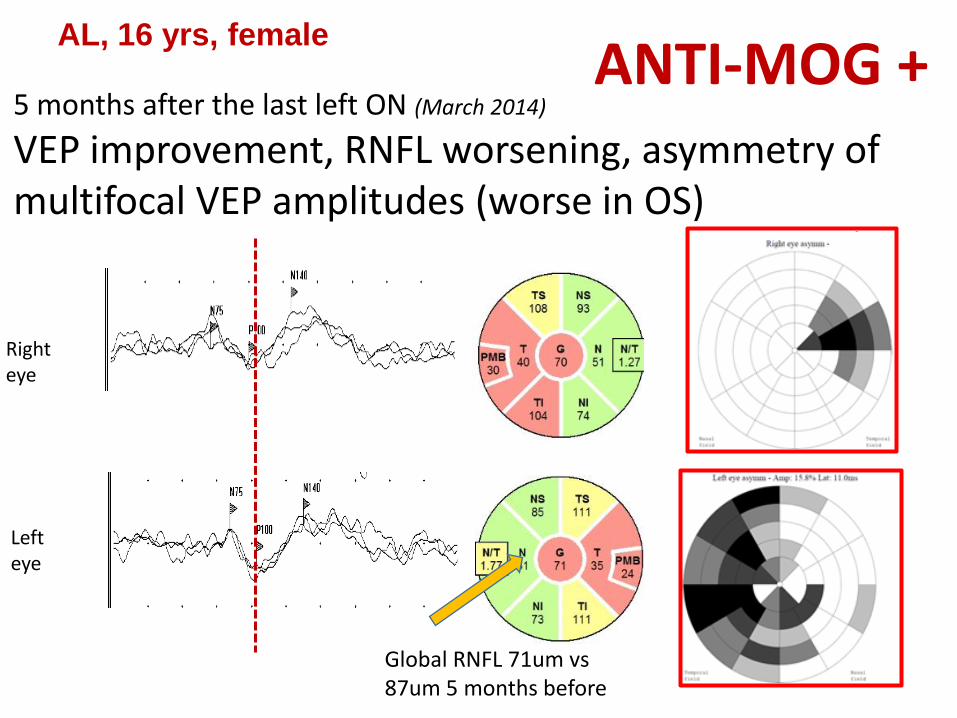
AL, 16 yrs, female
Global RNFL 71um vs 87um 5 months before
5 months after the last left ON (March 2014)
VEP improvement, RNFL worsening, asymmetry of multifocal VEP amplitudes (worse in OS)
Right eye
Left eye
ANTI-MOG +
INSPE - Institute of Experimental Neurology, San Raffaele, Milan Director: Prof Giancarlo Comi
Exp. Neurophysiology Unit – MAGICS Center Neurorehabilitation
Raffaella Chieffo Giovanni Di Maggio Laura Ferrari Mario Fichera Simone Guerrieri Elise Houdayer Arturo Nuara Roberto Santangelo Francesco Vitali
Mauro Comola Filippo Martinelli Boneschi Antonella Poggi Federica Esposito Filippo Martinelli-Boneschi
MS center Vittorio Martinelli Lucia Moiola Mariaemma Rodegher Bruno Colombo
NeuroImmunology
G. Martino R. Furlan M. Bacigaluppi & Co